How did women count? A note on gender-specific age heaping differences in the sixteenth to...
10
How did women count? A note on gender-specific age heaping differences in the sixteenth to nineteenth centuries 1 By PETER FÖLDVÁRI,* BAS VAN LEEUWEN,** and JIELI VAN LEEUWEN-LI The role of human capital in economic growth is now largely uncontested. One indicator of human capital frequently used for the pre-1900 period is age heaping, which has been increasingly used to measure gender-specific differences. In this note, we find that in some historical samples, married women heap significantly less than unmarried women. This is still true after correcting for possible selection effects. A possible explanation is that a percentage of women adapted their ages to that of their husbands, hence biasing the Whipple index.We find the same effect to a lesser extent for men. Since this bias differs over time and across countries, a consistent compari- son of female age heaping should be made by focusing on unmarried women. T he role of human capital in economic growth is largely uncontested. 2 Recently, research in this field has started to focus on the effect of gender inequality in education on economic growth, often finding a negative relation. 3 However, for the pre-1900 period, data on human capital are scarce, so researchers have reverted to proxies. In the last few decades, age heaping has began to fulfil that role. 4 Age heaping describes the tendency of people with a lower level of human capital/numeracy to round off their ages to multiples of five (such as 25, 30, 35, and so on). 5 This is expressed in the form of the so-called Whipple index, defined as the number of people ending their ages in 0 or 5 divided by 1/5 of the total sample, multiplied by 100. Consequently, a Whipple index of 100 indicates no heaping, while a Whipple index larger than 100 indicates a certain degree of heaping. Clearly, a higher level of age heaping indicates less human capital or less strict numeracy. Hence, most studies find a strong negative relationship between literacy and the Whipple index. 6 Within the general trend of an increase in the 1 We would like to thank three anonymous referees for their extensive comments on an earlier version of this article. 2 See, for example, Schultz, ‘Investment’; Becker, Human capital; Lucas, ‘Mechanics’; Romer, ‘Technological change’. 3 For example, Barro and Lee, ‘Sources’; D. Dollar and R. Gatti, ‘Gender inequality, income, and growth: are good times good for women?’,World Bank Policy Research Report on Gender and Development working paper ser. no. 1 (1999); Klasen, ‘Low schooling for girls’. 4 Mokyr, Why Ireland starved; Crayen and Baten, ‘New evidence’; A’Hearn, Baten, and Crayen, ‘Quantifying quantitative literacy’; Clark, Farewell to alms. 5 Although the heaping at multiples of five dominates, some authors have found other heaping patterns as well. For example, de Moor and van Zanden, ‘Uit fouten kun je leren’, pp. 63–5, andThomas, ‘Numeracy’, pp. 125–7, show that heaping on other numbers also happened, such as multiples of 12 and even numbers. 6 Nagi, Stockwell, and Snavley, ‘Digit preference’; Crayen and Baten, ‘Global trends’. Economic History Review, 65, 1 (2012), pp. 304–313 © Economic History Society 2011. Published by Blackwell Publishing, 9600 Garsington Road, Oxford OX4 2DQ, UK and 350 Main Street, Malden, MA 02148, USA.
Transcript of How did women count? A note on gender-specific age heaping differences in the sixteenth to...
How did women count? A note ongender-specific age heaping differencesin the sixteenth to nineteenth centuries1
By PETER FÖLDVÁRI,* BAS VAN LEEUWEN,** andJIELI VAN LEEUWEN-LI
The role of human capital in economic growth is now largely uncontested. Oneindicator of human capital frequently used for the pre-1900 period is age heaping,which has been increasingly used to measure gender-specific differences. In this note,we find that in some historical samples, married women heap significantly less thanunmarried women. This is still true after correcting for possible selection effects. Apossible explanation is that a percentage of women adapted their ages to that of theirhusbands, hence biasing the Whipple index.We find the same effect to a lesser extentfor men. Since this bias differs over time and across countries, a consistent compari-son of female age heaping should be made by focusing on unmarried women.
The role of human capital in economic growth is largely uncontested.2
Recently, research in this field has started to focus on the effect of genderinequality in education on economic growth, often finding a negative relation.3
However, for the pre-1900 period, data on human capital are scarce, so researchershave reverted to proxies. In the last few decades, age heaping has began to fulfilthat role.4 Age heaping describes the tendency of people with a lower level ofhuman capital/numeracy to round off their ages to multiples of five (such as 25, 30,35, and so on).5 This is expressed in the form of the so-called Whipple index,defined as the number of people ending their ages in 0 or 5 divided by 1/5 of thetotal sample, multiplied by 100. Consequently, a Whipple index of 100 indicatesno heaping, while a Whipple index larger than 100 indicates a certain degree ofheaping. Clearly, a higher level of age heaping indicates less human capital or lessstrict numeracy. Hence, most studies find a strong negative relationship betweenliteracy and the Whipple index.6 Within the general trend of an increase in the
1 We would like to thank three anonymous referees for their extensive comments on an earlier version of thisarticle.
2 See, for example, Schultz, ‘Investment’; Becker, Human capital; Lucas, ‘Mechanics’; Romer, ‘Technologicalchange’.
3 For example, Barro and Lee, ‘Sources’; D. Dollar and R. Gatti, ‘Gender inequality, income, and growth: aregood times good for women?’,World Bank Policy Research Report on Gender and Development working paperser. no. 1 (1999); Klasen, ‘Low schooling for girls’.
4 Mokyr, Why Ireland starved; Crayen and Baten, ‘New evidence’; A’Hearn, Baten, and Crayen, ‘Quantifyingquantitative literacy’; Clark, Farewell to alms.
5 Although the heaping at multiples of five dominates, some authors have found other heaping patterns as well.For example, de Moor and van Zanden, ‘Uit fouten kun je leren’, pp. 63–5, andThomas, ‘Numeracy’, pp. 125–7,show that heaping on other numbers also happened, such as multiples of 12 and even numbers.
6 Nagi, Stockwell, and Snavley, ‘Digit preference’; Crayen and Baten, ‘Global trends’.
Economic History Review, 65, 1 (2012), pp. 304–313
© Economic History Society 2011. Published by Blackwell Publishing, 9600 Garsington Road, Oxford OX4 2DQ, UK and 350 MainStreet, Malden, MA 02148, USA.
number of age heaping studies in recent years, gender-specific age heaping studieshave also become increasingly common in the literature.7
Many studies look at gender-specific human capital in the medieval and earlymodern periods. Those that focus on literacy generally find that women are wellbehind men (up to 20 percentage points).8 Yet, as recent research has shown, thegender difference in age heaping is small.9 Sometimes, women even have lower ageheaping (and hence higher numeracy) than men. This result seems strange, sinceit not only deviates from the picture suggested by other measures of human capital,but also fails to find support in other material on numeracy. Indeed, as Thomasobserved for early modern England: ‘[w]omen lagged behind in numeracy,perhaps even more than they did in literacy’,10 while the Revd Andrew Urquhartfound in a statistical survey of Portpatrick in 1832 that women were only slightlybehind men in reading, but much further behind in simple arithmetic.11
In this note, we argue that age heaping can be a misleading measure ofnumeracy if its interrelatedness with marriage is not taken into account. Ageheaping differences between the two genders are much lower in the case of marriedcouples than in the case of the non-married population, even after correcting forpossible differences in their age structure and selection effects (where data avail-ability makes it possible).
There are basically three possible explanations for finding lower age heaping formarried than for unmarried women. The first one is selection, that is, a possibletendency that spouses were selected on the basis of their abilities and skills, amongothers numeracy. The second one is learning within marriage, namely, that wiveslearned basic arithmetic skills from their spouses, making it possible for them toreport their age with greater accuracy. If these explanations are valid, the ageheaping statistics of married women reflect the truth and can be trusted.We argue,however, that these two factors alone, even though there are certainly numerousexamples of both, cannot offer an adequate explanation for the observed lowerlevel of age heaping among married women in this time period.
What remains as a third explanation is that wives (and to a lesser extenthusbands)12 adjusted their reported ages to that of their spouses, causing anunderestimation of age heaping for women.13 As a result, data on non-marriedpeople should be used when estimating gender differences in numeracy.
7 de Moor and van Zanden, ‘Uit fouten kun je leren’; Manzel and Baten, ‘Gender equality’; Manzel, Baten, andStolz, ‘Convergence’.
8 For example, Kuijpers, ‘Lezen en schrijven’, p. 498; Reis, ‘Economic growth’, p. 202.9 de Moor and van Zanden, ‘Uit fouten kun je leren’, p. 71.
10 Thomas, ‘Numeracy’, p. 113.11 Tranter, ‘Reverend Andrew Urquhart’, pp. 55–6.12 In general, women have a higher age heaping that is associated with a lower level of numeracy. See, for
example, de Moor and van Zanden, ‘Uit fouten kun je leren’, p. 71. Hence, if any adaptation takes place, womenadapt to the age of their husbands and much less vice versa. Indeed, we show later in this note that the age heapingbetween married and unmarried men is not statistically different, while married women heap significantly lessthan unmarried women.
13 For example, de Moor and van Zanden, ibid., pp. 71, 75, also found that age heaping among women wasabout equal to that of men, even though literacy (as calculated by the number of people able to sign their names)was considerably lower for women. They approached this problem by suggesting that women deliberatelyexaggerated their level of illiteracy so as not to outshine their husbands who could not write.We look at this froman opposite perspective and argue that, because their information is partly based on marriage certificates, it islikely that women adapted their ages to those of their husbands, hence downward biasing age heaping.
HOW DID WOMEN COUNT? 305
© Economic History Society 2011 Economic History Review, 65, 1 (2012)
I
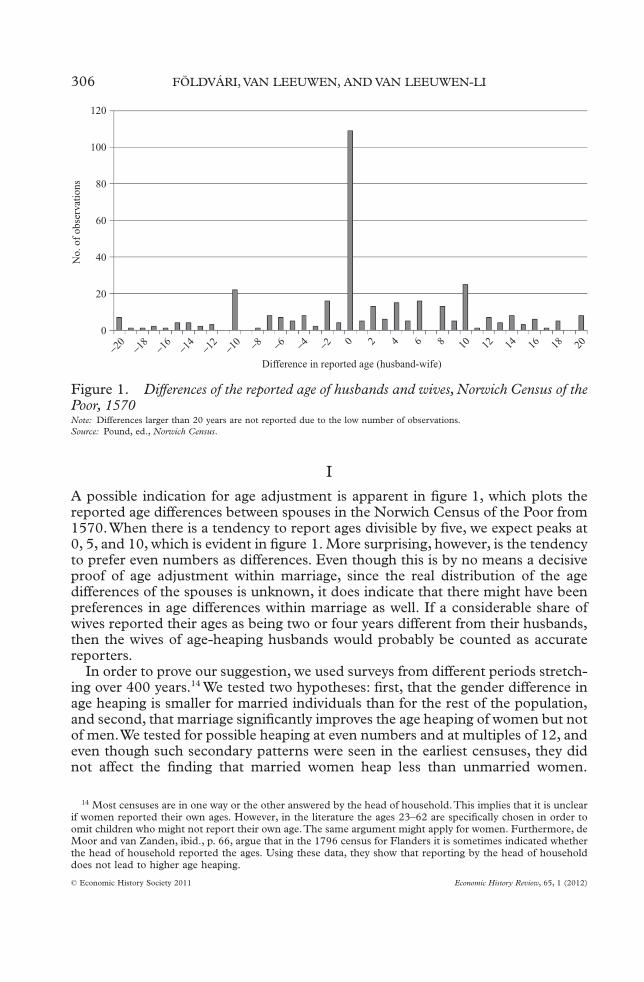
A possible indication for age adjustment is apparent in figure 1, which plots thereported age differences between spouses in the Norwich Census of the Poor from1570.When there is a tendency to report ages divisible by five, we expect peaks at0, 5, and 10, which is evident in figure 1. More surprising, however, is the tendencyto prefer even numbers as differences. Even though this is by no means a decisiveproof of age adjustment within marriage, since the real distribution of the agedifferences of the spouses is unknown, it does indicate that there might have beenpreferences in age differences within marriage as well. If a considerable share ofwives reported their ages as being two or four years different from their husbands,then the wives of age-heaping husbands would probably be counted as accuratereporters.
In order to prove our suggestion, we used surveys from different periods stretch-ing over 400 years.14 We tested two hypotheses: first, that the gender difference inage heaping is smaller for married individuals than for the rest of the population,and second, that marriage significantly improves the age heaping of women but notof men.We tested for possible heaping at even numbers and at multiples of 12, andeven though such secondary patterns were seen in the earliest censuses, they didnot affect the finding that married women heap less than unmarried women.
14 Most censuses are in one way or the other answered by the head of household.This implies that it is unclearif women reported their own ages. However, in the literature the ages 23–62 are specifically chosen in order toomit children who might not report their own age.The same argument might apply for women. Furthermore, deMoor and van Zanden, ibid., p. 66, argue that in the 1796 census for Flanders it is sometimes indicated whetherthe head of household reported the ages. Using these data, they show that reporting by the head of householddoes not lead to higher age heaping.
20
40
60
80
100
120
0
Difference in reported age (husband-wife)−20 −18 −16 −14 −12 −10 −8 −6 −4 −2 0 2 4 6 8 10 12 14 16 18 20
No.
of
obse
rvat
ions
Figure 1. Differences of the reported age of husbands and wives, Norwich Census of thePoor, 1570Note: Differences larger than 20 years are not reported due to the low number of observations.Source: Pound, ed., Norwich Census.
306 FÖLDVÁRI, VAN LEEUWEN, AND VAN LEEUWEN-LI
© Economic History Society 2011 Economic History Review, 65, 1 (2012)
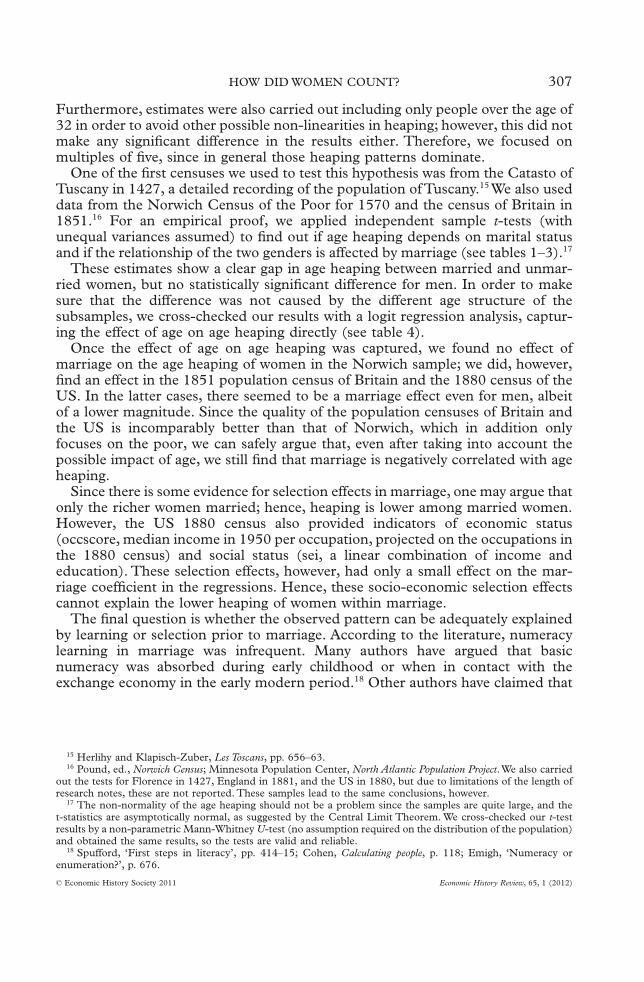
Furthermore, estimates were also carried out including only people over the age of32 in order to avoid other possible non-linearities in heaping; however, this did notmake any significant difference in the results either. Therefore, we focused onmultiples of five, since in general those heaping patterns dominate.
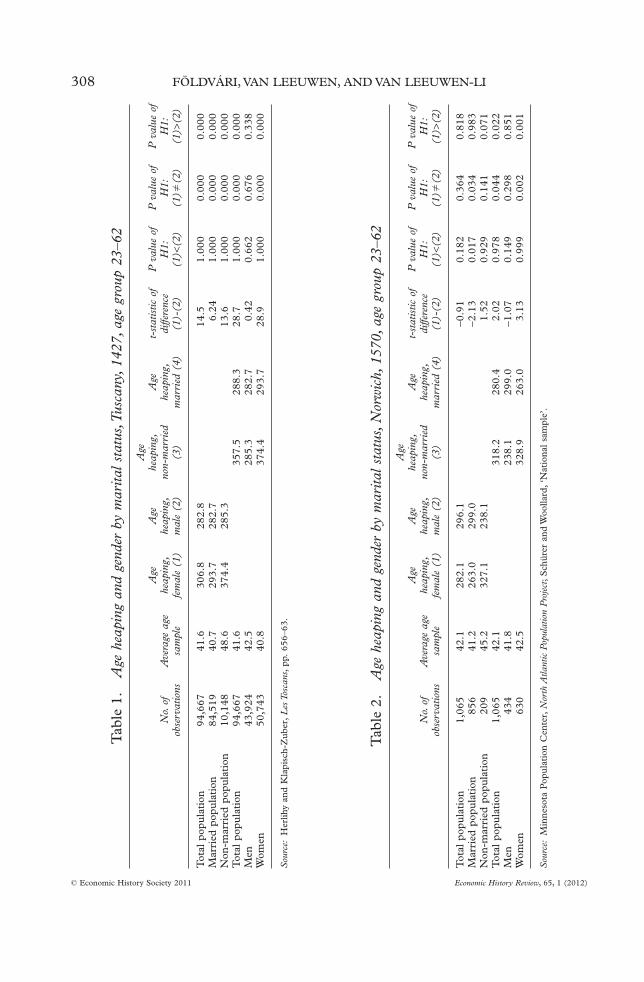
One of the first censuses we used to test this hypothesis was from the Catasto ofTuscany in 1427, a detailed recording of the population ofTuscany.15 We also useddata from the Norwich Census of the Poor for 1570 and the census of Britain in1851.16 For an empirical proof, we applied independent sample t-tests (withunequal variances assumed) to find out if age heaping depends on marital statusand if the relationship of the two genders is affected by marriage (see tables 1–3).17
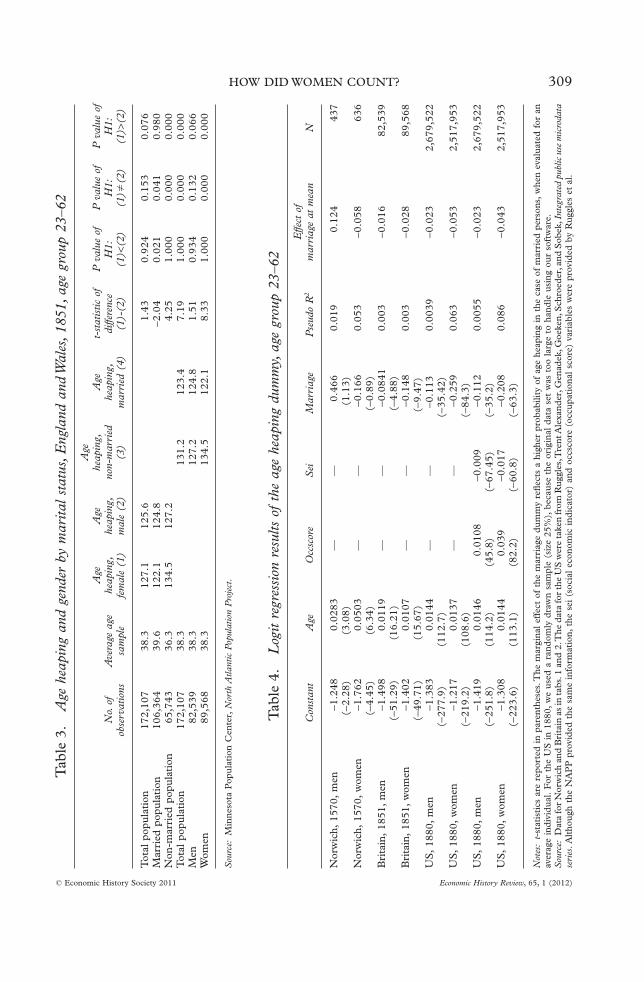
These estimates show a clear gap in age heaping between married and unmar-ried women, but no statistically significant difference for men. In order to makesure that the difference was not caused by the different age structure of thesubsamples, we cross-checked our results with a logit regression analysis, captur-ing the effect of age on age heaping directly (see table 4).
Once the effect of age on age heaping was captured, we found no effect ofmarriage on the age heaping of women in the Norwich sample; we did, however,find an effect in the 1851 population census of Britain and the 1880 census of theUS. In the latter cases, there seemed to be a marriage effect even for men, albeitof a lower magnitude. Since the quality of the population censuses of Britain andthe US is incomparably better than that of Norwich, which in addition onlyfocuses on the poor, we can safely argue that, even after taking into account thepossible impact of age, we still find that marriage is negatively correlated with ageheaping.
Since there is some evidence for selection effects in marriage, one may argue thatonly the richer women married; hence, heaping is lower among married women.However, the US 1880 census also provided indicators of economic status(occscore, median income in 1950 per occupation, projected on the occupations inthe 1880 census) and social status (sei, a linear combination of income andeducation). These selection effects, however, had only a small effect on the mar-riage coefficient in the regressions. Hence, these socio-economic selection effectscannot explain the lower heaping of women within marriage.
The final question is whether the observed pattern can be adequately explainedby learning or selection prior to marriage. According to the literature, numeracylearning in marriage was infrequent. Many authors have argued that basicnumeracy was absorbed during early childhood or when in contact with theexchange economy in the early modern period.18 Other authors have claimed that
15 Herlihy and Klapisch-Zuber, Les Toscans, pp. 656–63.16 Pound, ed., Norwich Census; Minnesota Population Center, North Atlantic Population Project.We also carried
out the tests for Florence in 1427, England in 1881, and the US in 1880, but due to limitations of the length ofresearch notes, these are not reported. These samples lead to the same conclusions, however.
17 The non-normality of the age heaping should not be a problem since the samples are quite large, and thet-statistics are asymptotically normal, as suggested by the Central Limit Theorem. We cross-checked our t-testresults by a non-parametric Mann-Whitney U-test (no assumption required on the distribution of the population)and obtained the same results, so the tests are valid and reliable.
18 Spufford, ‘First steps in literacy’, pp. 414–15; Cohen, Calculating people, p. 118; Emigh, ‘Numeracy orenumeration?’, p. 676.
HOW DID WOMEN COUNT? 307
© Economic History Society 2011 Economic History Review, 65, 1 (2012)
Tab
le1.
Age
heap
ing
and
gend
erby
mar
itals
tatu
s,Tu
scan
y,14
27,a
gegr
oup
23–6
2
No.
ofob
serv
atio
nsA
vera
geag
esa
mpl
e
Age
heap
ing,
fem
ale
(1)
Age
heap
ing,
mal
e(2
)
Age
heap
ing,
non-
mar
ried
(3)
Age
heap
ing,
mar
ried
(4)
t-st
atis
ticof
diffe
renc
e(1
)-(2
)
Pva
lue
ofH
1:(1
)<(2
)
Pva
lue
ofH
1:(1
)�(2
)
Pva
lue
ofH
1:(1
)>(2
)
Tot
alpo
pula
tion
94,6
6741
.630
6.8
282.
814
.51.
000
0.00
00.
000
Mar
ried
popu
lati
on84
,519
40.7
293.
728
2.7
6.24
1.00
00.
000
0.00
0N
on-m
arri
edpo
pula
tion
10,1
4848
.637
4.4
285.
313
.61.
000
0.00
00.
000
Tot
alpo
pula
tion
94,6
6741
.635
7.5
288.
328
.71.
000
0.00
00.
000
Men
43,9
2442
.528
5.3
282.
70.
420.
662
0.67
60.
338
Wom
en50
,743
40.8
374.
429
3.7
28.9
1.00
00.
000
0.00
0
Sou
rce:
Her
lihy
and
Kla
pisc
h-Z
uber
,L
esTo
scan
s,pp
.65
6–63
.
Tab
le2.
Age
heap
ing
and
gend
erby
mar
itals
tatu
s,N
orw
ich,
1570
,age
grou
p23
–62
No.
ofob
serv
atio
nsA
vera
geag
esa
mpl
e
Age
heap
ing,
fem
ale
(1)
Age
heap
ing,
mal
e(2
)
Age
heap
ing,
non-
mar
ried
(3)
Age
heap
ing,
mar
ried
(4)
t-st
atis
ticof
diffe
renc
e(1
)-(2
)
Pva
lue
ofH
1:(1
)<(2
)
Pva
lue
ofH
1:(1
)�(2
)
Pva
lue
ofH
1:(1
)>(2
)
Tot
alpo
pula
tion
1,06
542
.128
2.1
296.
1-0
.91
0.18
20.
364
0.81
8M
arri
edpo
pula
tion
856
41.2
263.
029
9.0
-2.1
30.
017
0.03
40.
983
Non
-mar
ried
popu
lati
on20
945
.232
7.1
238.
11.
520.
929
0.14
10.
071
Tot
alpo
pula
tion
1,06
542
.131
8.2
280.
42.
020.
978
0.04
40.
022
Men
434
41.8
238.
129
9.0
-1.0
70.
149
0.29
80.
851
Wom
en63
042
.532
8.9
263.
03.
130.
999
0.00
20.
001
Sou
rce:
Min
neso
taP
opul
atio
nC
ente
r,N
orth
Atla
ntic
Popu
latio
nP
roje
ct;
Sch
ürer
and
Woo
llard
,‘N
atio
nal
sam
ple’
.
308 FÖLDVÁRI, VAN LEEUWEN, AND VAN LEEUWEN-LI
© Economic History Society 2011 Economic History Review, 65, 1 (2012)
Tab
le3.
Age
heap
ing
and
gend
erby
mar
itals
tatu
s,E
ngla
ndan
dW
ales
,185
1,ag
egr
oup
23–6
2
No.
ofob
serv
atio
nsA
vera
geag
esa
mpl
e
Age
heap
ing,
fem
ale
(1)
Age
heap
ing,
mal
e(2
)
Age
heap
ing,
non-
mar
ried
(3)
Age
heap
ing,
mar
ried
(4)
t-st
atis
ticof
diffe
renc
e(1
)-(2
)
Pva
lue
ofH
1:(1
)<(2
)
Pva
lue
ofH
1:(1
)�(2
)
Pva
lue
ofH
1:(1
)>(2
)
Tot
alpo
pula
tion
172,
107
38.3
127.
112
5.6
1.43
0.92
40.
153
0.07
6M
arri
edpo
pula
tion
106,
364
39.6
122.
112
4.8
-2.0
40.
021
0.04
10.
980
Non
-mar
ried
popu
lati
on65
,743
36.3
134.
512
7.2
4.25
1.00
00.
000
0.00
0T
otal
popu
lati
on17
2,10
738
.313
1.2
123.
47.
191.
000
0.00
00.
000
Men
82,5
3938
.312
7.2
124.
81.
510.
934
0.13
20.
066
Wom
en89
,568
38.3
134.
512
2.1
8.33
1.00
00.
000
0.00
0
Sou
rce:
Min
neso
taP
opul
atio
nC
ente
r,N
orth
Atla
ntic
Popu
latio
nP
roje
ct.
Tab
le4.
Log
itre
gres
sion
resu
ltsof
the
age
heap
ing
dum
my,
age
grou
p23
–62
Con
stan
tA
geO
ccsc
ore
Sei
Mar
riag
eP
seud
oR
2E
ffect
ofm
arri
age
atm
ean
N
Nor
wic
h,15
70,
men
-1.2
48(-
2.28
)0.
0283
(3.0
8)—
—0.
466
(1.1
3)0.
019
0.12
443
7
Nor
wic
h,15
70,
wom
en-1
.762
(-4.
45)
0.05
03(6
.34)
——
-0.1
66(-
0.89
)0.
053
-0.0
5863
6
Bri
tain
,18
51,
men
-1.4
98(-
51.2
9)0.
0119
(16.
21)
——
-0.0
841
(-4.
88)
0.00
3-0
.016
82,5
39
Bri
tain
,18
51,
wom
en-1
.402
(-49
.71)
0.01
07(1
5.67
)—
—-0
.148
(-9.
47)
0.00
3-0
.028
89,5
68
US
,18
80,
men
-1.3
83(-
277.
9)0.
0144
(112
.7)
——
-0.1
13(-
35.4
2)0.
0039
-0.0
232,
679,
522
US
,18
80,
wom
en-1
.217
(-21
9.2)
0.01
37(1
08.6
)—
—-0
.259
(-84
.3)
0.06
3-0
.053
2,51
7,95
3
US
,18
80,
men
-1.4
19(-
251.
8)0.
0146
(114
.2)
0.01
08(4
5.8)
-0.0
09(-
67.4
5)-0
.112
(-35
.2)
0.00
55-0
.023
2,67
9,52
2
US
,18
80,
wom
en-1
.308
(-22
3.6)
0.01
44(1
13.1
)0.
039
(82.
2)-0
.017
(-60
.8)
-0.2
08(-
63.3
)0.
086
-0.0
432,
517,
953
Not
es:
t-st
atis
tics
are
repo
rted
inpa
rent
hese
s.T
hem
argi
nal
effe
ctof
the
mar
riag
edu
mm
yre
flect
sa
high
erpr
obab
ility
ofag
ehe
apin
gin
the
case
ofm
arri
edpe
rson
s,w
hen
eval
uate
dfo
ran
aver
age
indi
vidu
al.
For
the
US
in18
80,
we
used
ara
ndom
lydr
awn
sam
ple
(siz
e25
%),
beca
use
the
orig
inal
data
set
was
too
larg
eto
hand
leus
ing
our
soft
war
e.S
ourc
e:D
ata
for
Nor
wic
han
dB
rita
inas
inta
bs.1
and
2.T
heda
tafo
rth
eU
Sw
ere
take
nfr
omR
uggl
es,T
rent
Ale
xand
er,G
enad
ek,G
oeke
n,S
chro
eder
,and
Sob
ek,I
nteg
rate
dpu
blic
use
mic
roda
tase
ries
.Alt
houg
hth
eN
AP
Ppr
ovid
edth
esa
me
info
rmat
ion,
the
sei
(soc
ial
econ
omic
indi
cato
r)an
doc
csco
re(o
ccup
atio
nal
scor
e)va
riab
les
wer
epr
ovid
edby
Rug
gles
etal
.
HOW DID WOMEN COUNT? 309
© Economic History Society 2011 Economic History Review, 65, 1 (2012)
illiterate women were less in contact with a commercialized economy than men;19
the same applies to married women.20
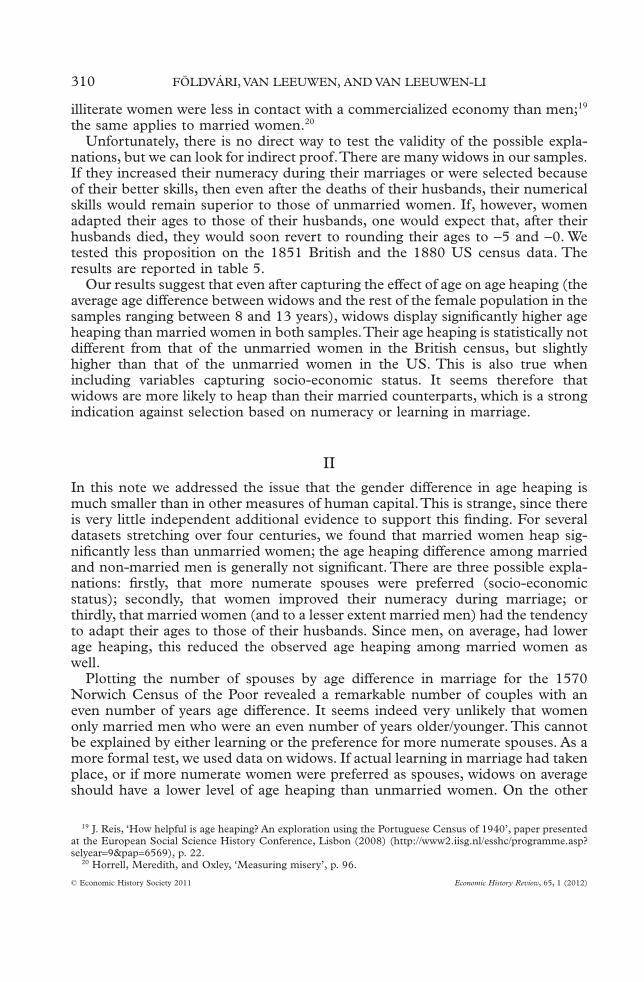
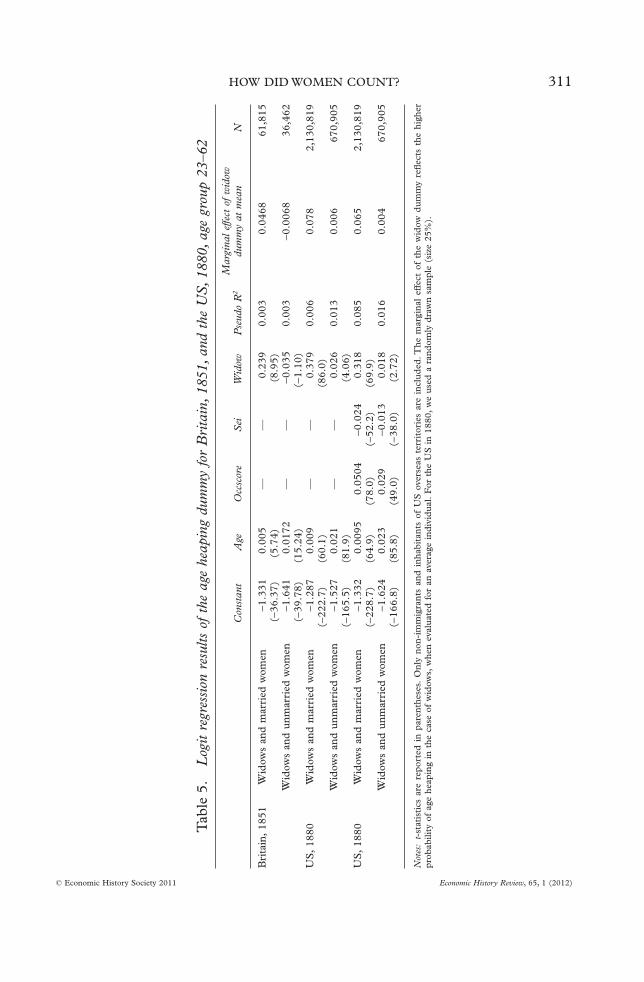
Unfortunately, there is no direct way to test the validity of the possible expla-nations, but we can look for indirect proof.There are many widows in our samples.If they increased their numeracy during their marriages or were selected becauseof their better skills, then even after the deaths of their husbands, their numericalskills would remain superior to those of unmarried women. If, however, womenadapted their ages to those of their husbands, one would expect that, after theirhusbands died, they would soon revert to rounding their ages to -5 and -0. Wetested this proposition on the 1851 British and the 1880 US census data. Theresults are reported in table 5.
Our results suggest that even after capturing the effect of age on age heaping (theaverage age difference between widows and the rest of the female population in thesamples ranging between 8 and 13 years), widows display significantly higher ageheaping than married women in both samples.Their age heaping is statistically notdifferent from that of the unmarried women in the British census, but slightlyhigher than that of the unmarried women in the US. This is also true whenincluding variables capturing socio-economic status. It seems therefore thatwidows are more likely to heap than their married counterparts, which is a strongindication against selection based on numeracy or learning in marriage.
II
In this note we addressed the issue that the gender difference in age heaping ismuch smaller than in other measures of human capital.This is strange, since thereis very little independent additional evidence to support this finding. For severaldatasets stretching over four centuries, we found that married women heap sig-nificantly less than unmarried women; the age heaping difference among marriedand non-married men is generally not significant. There are three possible expla-nations: firstly, that more numerate spouses were preferred (socio-economicstatus); secondly, that women improved their numeracy during marriage; orthirdly, that married women (and to a lesser extent married men) had the tendencyto adapt their ages to those of their husbands. Since men, on average, had lowerage heaping, this reduced the observed age heaping among married women aswell.
Plotting the number of spouses by age difference in marriage for the 1570Norwich Census of the Poor revealed a remarkable number of couples with aneven number of years age difference. It seems indeed very unlikely that womenonly married men who were an even number of years older/younger. This cannotbe explained by either learning or the preference for more numerate spouses. As amore formal test, we used data on widows. If actual learning in marriage had takenplace, or if more numerate women were preferred as spouses, widows on averageshould have a lower level of age heaping than unmarried women. On the other
19 J. Reis, ‘How helpful is age heaping? An exploration using the Portuguese Census of 1940’, paper presentedat the European Social Science History Conference, Lisbon (2008) (http://www2.iisg.nl/esshc/programme.asp?selyear=9&pap=6569), p. 22.
20 Horrell, Meredith, and Oxley, ‘Measuring misery’, p. 96.
310 FÖLDVÁRI, VAN LEEUWEN, AND VAN LEEUWEN-LI
© Economic History Society 2011 Economic History Review, 65, 1 (2012)
Tab
le5.
Log
itre
gres
sion
resu
ltsof
the
age
heap
ing
dum
my
for
Bri
tain
,185
1,an
dth
eU
S,18
80,a
gegr
oup
23–6
2
Con
stan
tA
geO
ccsc
ore
Sei
Wid
owP
seud
oR
2M
argi
nale
ffect
ofw
idow
dum
my
atm
ean
N
Bri
tain
,18
51W
idow
san
dm
arri
edw
omen
-1.3
31(-
36.3
7)0.
005
(5.7
4)—
—0.
239
(8.9
5)0.
003
0.04
6861
,815
Wid
ows
and
unm
arri
edw
omen
-1.6
41(-
39.7
8)0.
0172
(15.
24)
——
-0.0
35(-
1.10
)0.
003
-0.0
068
36,4
62
US
,18
80W
idow
san
dm
arri
edw
omen
-1.2
87(-
222.
7)0.
009
(60.
1)—
—0.
379
(86.
0)0.
006
0.07
82,
130,
819
Wid
ows
and
unm
arri
edw
omen
-1.5
27(-
165.
5)0.
021
(81.
9)—
—0.
026
(4.0
6)0.
013
0.00
667
0,90
5
US
,18
80W
idow
san
dm
arri
edw
omen
-1.3
32(-
228.
7)0.
0095
(64.
9)0.
0504
(78.
0)-0
.024
(-52
.2)
0.31
8(6
9.9)
0.08
50.
065
2,13
0,81
9
Wid
ows
and
unm
arri
edw
omen
-1.6
24(-
166.
8)0.
023
(85.
8)0.
029
(49.
0)-0
.013
(-38
.0)
0.01
8(2
.72)
0.01
60.
004
670,
905
Not
es:
t-st
atis
tics
are
repo
rted
inpa
rent
hese
s.O
nly
non-
imm
igra
nts
and
inha
bita
nts
ofU
Sov
erse
aste
rrit
orie
sar
ein
clud
ed.T
hem
argi
nal
effe
ctof
the
wid
owdu
mm
yre
flect
sth
ehi
gher
prob
abili
tyof
age
heap
ing
inth
eca
seof
wid
ows,
whe
nev
alua
ted
for
anav
erag
ein
divi
dual
.F
orth
eU
Sin
1880
,w
eus
eda
rand
omly
draw
nsa
mpl
e(s
ize
25%
).
HOW DID WOMEN COUNT? 311
© Economic History Society 2011 Economic History Review, 65, 1 (2012)
hand, if the lower level of age heaping is caused by women adjusting their age tomatch that of a spouse, we would expect widows to revert to heaping on -0 and -5again after their husbands passed away. We find that age heaping of widows, evenafter correction for the age structure and selection effects, does not significantlydiffer from that of unmarried women.
Unfortunately, the third possibility—that women (and to a lesser extent men)adapt their ages to that of their husband (wife)—cannot be tested directly given thedual distribution (an age distribution of both men and women). However, afteranalysing the other two arguments, we concluded that the age adaptation bymarried women to that of their husband may have been a factor in the unexpect-edly low overall level of age heaping among women. This implies that, in order tocalculate actual age heaping among women reliably, it is preferable to use data onnon-married women.
*University of Debrecen, Utrecht University**Free University, Utrecht University, University ofWarwick
Date submitted 24 July 2009Revised version submitted 27 July 2010Accepted 14 September 2010
DOI: 10.1111/j.1468-0289.2010.00582.x
Footnote referencesA’Hearn, B., Baten, J., and Crayen, D., ‘Quantifying quantitative literacy: age heaping and the history of human
capital’, Journal of Economic History, 69 (2009), pp. 783–808.Barro, R. and Lee, J.-W., ‘Sources of economic growth’, Carnegie-Rochester Conference Series on Public Policy, 40
(1994), pp. 1–46.Becker, G. S., Human capital: a theoretical and empirical analysis with special reference to education (NewYork, 1964).Clark, G., A farewell to alms. A brief economic history of the world (Princeton and Oxford, 2007).Cohen, P. C., A calculating people.The spread of numeracy in early America (Chicago, 1982).Crayen, D. and Baten, J., ‘Global trends in numeracy 1820–1949 and its implications for long-term growth’,
Explorations in Economic History, 47 (2010), pp. 82–99.Crayen, D. and Baten, J., ‘New evidence and new methods to measure human capital inequality before and
during the industrial revolution: France and the US in the 17th to 19th centuries’, Economic History Review, 53(2010), pp. 452–78.
Emigh, R. J., ‘Numeracy or enumeration? The uses of numbers by states and societies’, Social Science History, 26(2002), pp. 653–98.
Herlihy, D. and Klapisch-Zuber, C., Les Toscans et leur familles (Paris, 1978).Horrell, S., Meredith, D., and Oxley, D., ‘Measuring misery: body mass, ageing and gender inequality inVictorian
London’, Explorations in Economic History, 46 (2009), pp. 93–119.Klasen, S., ‘Low schooling for girls, slower growth for all? Cross-country evidence on the effect of gender
inequality in education on economic development’, World Bank Economic Review, 16 (2002), pp. 345–73.Kuijpers, E., ‘Lezen en schrijven. Onderzoek naar het alfabetiseringsniveau in zeventiende-eeuws Amsterdam’,
TijdschriftVoor Sociale Geschiedenis, 23 (1997), pp. 490–523.Lucas, R. E., ‘On the mechanics of economic development’, Journal of Monetary Economics, 22 (1988),
pp. 3–42.Manzel, K. and Baten, J., ‘Gender equality and inequality in numeracy—the case of Latin America and the
Caribbean, 1880–1949’, Revista de Historia Económica—Journal of Latin American and Iberian Economic History,27 (2009), pp. 37–74.
Manzel, K., Baten, J., and Stolz, Y., ‘Convergence and divergence of numeracy: the development of age heapingin Latin America, 17th to 20th century’, Economic History Review (forthcoming).
Mokyr, J., Why Ireland starved: a quantitative and analytical history of the Irish economy, 1800–1850 (1983).de Moor, T. and van Zanden, J. L., ‘Uit fouten kun je leren. Een kritische benadering van de mogelijkheden van
‘leeftijdstapelen’ voor sociaal-economisch historisch onderzoek naar gecijferdheid in het pre-industriële Vlaan-deren en Nederland’, TijdschriftVoor Economische En Sociale Geschiedenis, 5 (2008), pp. 55–86.
312 FÖLDVÁRI, VAN LEEUWEN, AND VAN LEEUWEN-LI
© Economic History Society 2011 Economic History Review, 65, 1 (2012)
Nagi, M. H., Stockwell, E. G., and Snavley, L. M., ‘Digit preference and avoidance in the age statistics of somerecent African censuses: some patterns and correlates’, International Statistical Review, 41 (1973), pp. 165–74.
Minnesota Population Center (2008) North Atlantic Population Project: complete count microdata, version 2.0[machine-readable database]. URL http://www.nappdata.org/napp [accessed on 2 June 2009].
Pound, J. F., ed., The Norwich Census of the Poor, 1570 (Norfolk Rec. Soc., 40, Norwich, 1971).Reis, J., ‘Economic growth, human capital formation and consumption in western Europe before 1800’, in R. C.
Allen, T. Bengtsson, and M. Dribe, eds., Living standards in the past: new perspectives on well-being in Asia andEurope (Oxford, 2005), pp. 195–225.
Romer, P. M., ‘Endogenous technological change’, Journal of Political Economy, 98 (1990), pp. S71–S102.Ruggles, S., Trent Alexander, J., Genadek, K., Goeken, R., Schroeder, M. B., and Sobek, M., Integrated public use
microdata series: version 5.0 [machine-readable database] (Minneapolis, 2010).Schultz, T., ‘Investment in human capital’, American Economic Review, 51 (1961), pp. 1–17.Schürer, K. and Woollard, M., ‘National sample from the 1851 Census of Great Britain’ [computer file],
Colchester, Essex: History Data Service, UK Data Archive [distributor] (2008) [accessed on 2 June 2009].Spufford, M., ‘First steps in literacy: the reading and writing experiences of the humblest seventeenth-century
spiritual autobiographers’, Social History, 4 (1979), pp. 407–35.Thomas, K. J., ‘Numeracy in early modern England: the Prothero Lecture’, Transactions of the Royal Historical
Society, 37 (1987), pp. 103–32.Tranter, N., ‘The Reverend Andrew Urquhart and the social structure of Portpatrick in 1832’, Scottish Studies, 18
(1974), pp. 39–62.
HOW DID WOMEN COUNT? 313
© Economic History Society 2011 Economic History Review, 65, 1 (2012)