Housing consumption and residential crowding in U.S. Housing Markets
Upload
khangminh22Category
view
3download
0


Housing
NYC
New
Yo
rk C
ity
Ren
t Gu
idel
ines
Bo
ard
Board Members
Chair: David Reiss Public Members: Cecilia Joza • Alex Schwartz German Tejeda • May Yu Owner Members: Patti Stone • Scott Walsh Tenant Members: Sheila Garcia • Leah Goodridge
Staff Members
Executive Director: Andrew McLaughlin Research Director: Brian Hoberman Deputy Research Director: Danielle Burger Office Manager: Charmaine Superville
Rents, Markets & Trends
2019


Chair’s Acknowledgments ...............................7 Exec Director’s Acknowledgments ............9
INCOME AND EXPENSE Price Index of Operating Costs
What’s New.............................................................13 Introduction ...........................................................14 Overview .................................................................14 Price Index Components ...................................15
Taxes..................................................................15 Labor Costs .....................................................16 Fuel ....................................................................16 Utilities..............................................................17 Maintenance...................................................17 Administrative Costs....................................17 Insurance Costs .............................................18
PIOC by Building Type ........................................18 Rent Stabilized Hotels.........................................18 Rent Stabilized Lofts............................................19 The Core PIOC........................................................19 PIOC Projections for 2020 .................................19 Commensurate Rent Adjustments ................20 Methodology.........................................................22
Owner Survey ................................................22 Taxes..................................................................22 Labor Costs .....................................................23 Fuel ....................................................................23 Utilities..............................................................23 Maintenance...................................................24 Administrative Costs....................................24 Insurance Costs .............................................24 Price Index Projections ...............................24
Acknowledgments...............................................25
Income and Expense Study What’s New.............................................................27 Introduction ...........................................................28
Local Law 63 ...................................................28 RPIE Study
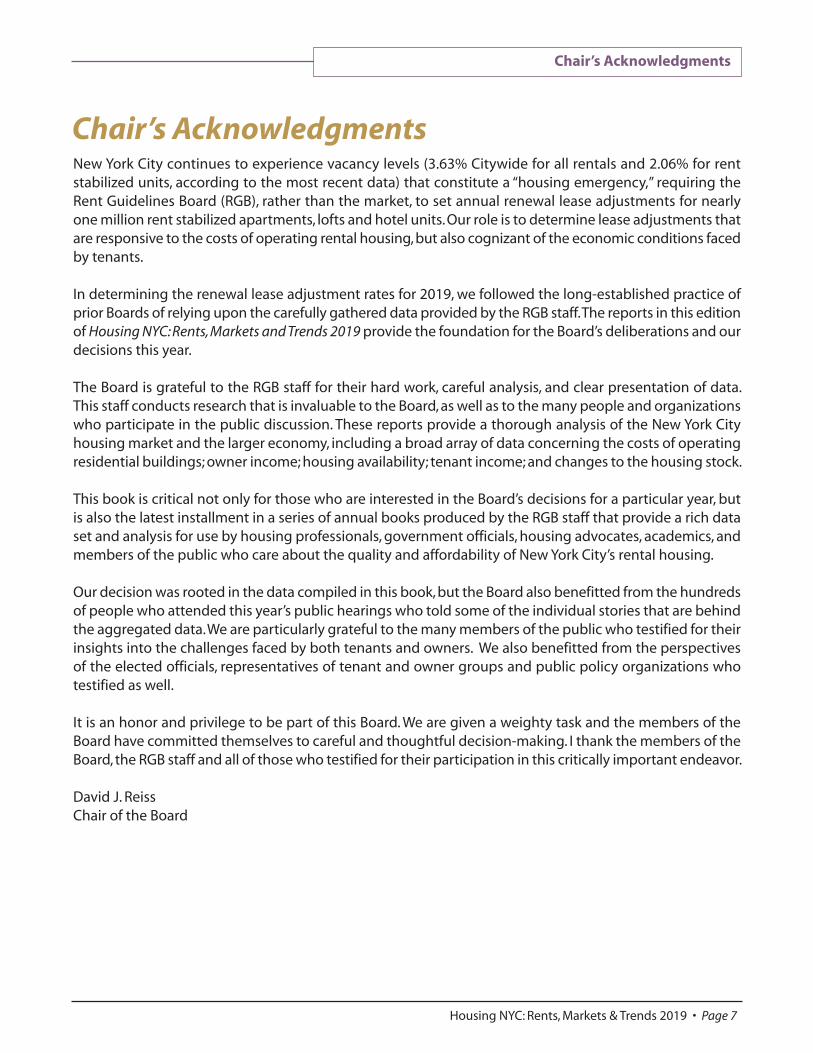
Rents and Income.........................................28 Comparing Rent Measurements .............29 Operating Costs.............................................31 “Distressed” Buildings .................................32
Net Operating Income ................................33 Operating Cost Ratios .................................33 Net Operating Income After Inflation.........................................................35
Longitudinal Study Rents and Income.........................................37 Operating Costs.............................................38 RPIE Expenses and the PIOC .....................38 Operating Cost Ratios .................................39 Net Operating Income ................................39
Summary .................................................................40 Methodology.........................................................40
Mortgage Survey Report
What’s New.............................................................45 Introduction ...........................................................46 Overview .................................................................46 Survey Respondents ...........................................46 Mortgage Survey Analysis
Financing Availability and Terms ............47 Underwriting Criteria ..................................48 Non-Performing Loans & Foreclosures.................................................49 Characteristics of Rent Stabilized Buildings ..................................50 Loan Expectations ........................................51
Longitudinal Analysis Financing Availability and Terms ............51 Underwriting Criteria and Loan Performance ........................................52
Sales Data Analysis Building Sales Volume.................................52 Building Sales Prices ....................................53
Summary .................................................................54
INCOME AND AFFORDABILITY Income and Affordability Study
What’s New................................................................57 Introduction ..............................................................58 Overview ....................................................................58 Economic Conditions
Economic Output & Consumer Prices......58 Unemployment Statistics ............................59 Employment Statistics ..................................60
Table of Contents
Housing NYC: Rents, Markets & Trends 2019 • Page 3
Table of Contents

Wage Data..........................................................61 Bankruptcy Statistics......................................62 Poverty Statistics ............................................62
2017 Housing & Vacancy Survey Affordability of Rental Housing..................63 Income ................................................................63 Rent ......................................................................64 Vacancy Rates ..................................................64
Other Measures of Income & Affordability American Community Survey ....................65 Consumer Price Index....................................67 Section 8 Housing Availability....................68 Non-Government Sources of Affordability Data....................................68 Real Property Tax Credit................................69
Cash Assistance & Benefit Programs ................70 Housing Policy..........................................................70 Homelessness & Housing Court
Homelessness ..................................................71 Housing Court ..................................................73
Summary....................................................................73
HOUSING SUPPLY Housing Supply Report
What’s New................................................................79 Introduction ..............................................................80 Overview ....................................................................80 NYC’s Housing Inventory ......................................80 Changes in the Housing Inventory
Housing Permits ..............................................82 Housing Completions....................................83 City-Sponsored Construction ....................83 Tax Incentive Programs ................................84 Conversions and Subdivisions....................86 SRO Housing and Airbnb Rentals..............87 Co-op and Condo Activity............................88 Rehabilitation ..................................................88
Tax-Delinquent Property and Anti-Abandonment Strategies ........................90 Demolitions ..............................................................90 Summary....................................................................91
Changes to the Rent Stabilized Housing Stock in New York City
What’s New................................................................93 Overview ....................................................................94
Additions to the Rent Regulated Housing Stock Section 421-a and J-51 Programs..............94 Mitchell-Lama Buyouts ................................95 Loft Units ............................................................95 Changes in Regulatory Status ....................95 Other Additions to the Stabilized Housing Stock ..............................................95
Subtractions from the Rent Regulated Housing Stock
High-Rent High-Income Deregulation ....96 High-Rent Vacancy Deregulation..............97 Co-op and Condo Conversions ..................98 Expiration of Section 421-a and J-51 Benefits ..................................................98 Substantial Rehabilitation............................98 Conversion to Commercial or Professional Status ................................99 Other Losses to the Housing Stock ..........99
Summary ..........................................................................99 Summary Table of Additions and Subtractions................................................101
Appendices ..............................................................105 Glossary ......................................................................148 Index ..............................................................................159
Table of Contents
Page 4 • Table of Contents

Appendix A: Guidelines Adopted by the Board
A.1 Apartments & Lofts—Order #51 ...............105
A.2 Hotel Units—Order #49................................105
Appendix B: Price Index of Operating Costs
B.1 PIOC Sample, Number of Price Quotes per Item, 2018 vs. 2019 .................................106
B.2 Expenditure Weight, Price Relatives, Percent Changes and Standard Errors, All Apartments, 2019 .....................................107
B.3 Price Relative by Building Type, Apartments, 2019............................................108
B.4 Price Relative by Hotel Type, 2019 ............108
B.5 Percentage Change in Real Estate Tax Sample by Borough and Source of Change, Apartments and Hotels, 2019.....................109
B.6 Tax Change by Borough and Community Board, Apartments, 2019..............................109
B.7 Expenditure Weight, Price Relatives, Percent Changes and Standard Errors, All Hotels, 2019 ................................................110
B.8 Expenditure Weight and Price Relatives, Lofts, 2019..........................................................111
Appendix C: Income and Expense Study
C.1 Average Operating & Maintenance Cost in 2017 per Apartment per Month by Building Size and Location, Structures Built Before 1947 .......................................................112
C.2 Average Operating & Maintenance Cost in 2017 per Apartment per Month by Building Size and Location, Structures Built After 1946 ..........................................................113
C.3 Average Rent, Income and Costs in 2017 per Apartment per Month by Building Size and Location............................................114
C.4 Median Rent, Income and Costs in 2017 per Apartment per Month by Building Size and Location............................................115
C.5 Average Net Operating Income in 2017 per Apartment per Month by Building Size and Location.....................................................116
C.6 Distribution of Operating Costs in 2017, by Building Size and Age .............................116
C.7 Number of “Distressed” Buildings in 2017 ................................................................117
C.8 Operating Cost-to-Income Ratios by Decile in 2017.............................................117
C.9 Number of Buildings and Dwelling Units in 2017 by Building Size and Location....118
C.10 Longitudinal Income and Expense Study, Estimated Average Rent, Income and Costs Changes (2016-2017) by Building Size and Location.....................................................119
C.11 Longitudinal Income and Expense Study, Estimated Median Rent, Income and Costs Changes (2016-2017) by Building Size and Location.....................................................120
C.12 Longitudinal Income and Expense Study, Average Net Operating Income Changes (2016-2017) by Building Size and Location.....................................................121
C.13 Longitudinal Income and Expense Study, Change in Rent and Net Operating Income by Community District (2016-2017) .......................................................122
C.14 Longitudinal Analysis, Number of Buildings and Dwelling Units in 2016 & 2017, by Building Size and Location....................123
Appendix D: Mortgage Survey Report
D.1 Mortgage Interest Rates and Terms, 2019.......................................................124
D.2 Typical Lending Portfolio Characteristics of Rent Stabilized Buildings, 2019............124
D.3 Interest Rates and Terms for New Financing, Longitudinal Study, 2018-2019 .................125
D.4 Lending Standards and Vacancy & Collection Losses, Longitudinal Study, 2018-2019 .........................................................125
D.5 Retrospective of NYC’s Housing Market, 1982-2019 .........................................................126
List of Appendices
Housing NYC: Rents, Markets & Trends 2019 • Page 5
List of Appendices

D.6 2019 Survey of Mortgage Financing for Multifamily Properties ..................................127
D.7 Rent Stabilized Building Sales Volume, Citywide and by Borough, and Percent Change, 2006-2018........................................128
D.8 Rent Stabilized Building Median Sales Price and Sales Volume, by Borough and Building Size, and Percent Change in Sales, 2017-2018.........................................128
Appendix E: Income and Affordability Study
E.1 Average Annual Employment Statistics by Area, 2007-2018 ........................................129
E.2 Average Payroll Employment by Industry for NYC, 2009-2018 (in thousands) ..........130
E.3 Average Real Wage Rates by Industry for NYC, 2010-2018 (2018 Dollars) ...........130
E.4 Average Nominal Wage Rates by Industry for NYC, 2010-2018 ......................131
E.5 Consumer Price Index for All Urban Consumers, New York-Northeastern New Jersey, 2008-2018..................................131
E.6 Housing Court Actions, 1983-2018..........132
E.7 Homeless Statistics, 1982-2018 .................133
E.8 Poverty Rates, 2007-2017 ............................133
Appendix F: Housing Supply Report
F.1 Permits Issued for Housing Units in New York City, 1961-2018 ............................134
F.2 Permits Issued by Building Size & Borough, (In Percentages), 2010-2018 ....135
F.3 Permits Issued for Housing Units by Quarter, 2008-2019.........................................136
F.4 New Dwelling Units Completed in New York City, 1963-2018 ............................137
F.5 Number of Residential Co-op and Condo Plans Accepted for Filing by the NYS Attorney General’s Office, 2013-2018......138
F.6 Number of Units in Co-op and Condo Plans Accepted for Filing by the NYS Attorney General’s Office, 1990-2018......138
F.7 Tax Incentive Programs, 2016-2018 .........139
F.8 Tax Incentive Programs — Units Receiving Initial Benefits, 1981-2018.......139
F.9 Building Demolitions in New York City, 1985-2018..........................................................140
Appendix G: Changes to the Rent Stabilized Housing Stock
G.1 Additions to the Stabilized Housing Stock, 1994-2018 ..........................141
G.2 Additions to the Stabilized Housing Stock by Borough, 2018................................142
G.3 Average and Median Rent of Initially Registered Rent Stabilized Apartments by Borough, 2018............................................142
G.4 Subtractions from the Stabilized Housing Stock due to High-Rent High-Income Deregulation by Borough, 1994-2018.....143
G.5 Subtractions from the Stabilized Housing Stock due to High-Rent Vacancy Dereg- ulation by Borough, 1994-2018 .................144
G.6 Subtractions from the Stabilized Housing Stock, 1994-2018...........................145
G.7 Subtractions from the Stabilized Housing Stock by Borough, 2018................................145
List of Appendices
Page 6 • List of Appendices
New York City continues to experience vacancy levels (3.63% Citywide for all rentals and 2.06% for rent stabilized units, according to the most recent data) that constitute a “housing emergency,” requiring the Rent Guidelines Board (RGB), rather than the market, to set annual renewal lease adjustments for nearly one million rent stabilized apartments, lofts and hotel units. Our role is to determine lease adjustments that are responsive to the costs of operating rental housing, but also cognizant of the economic conditions faced by tenants. In determining the renewal lease adjustment rates for 2019, we followed the long-established practice of prior Boards of relying upon the carefully gathered data provided by the RGB staff. The reports in this edition of Housing NYC: Rents, Markets and Trends 2019 provide the foundation for the Board’s deliberations and our decisions this year. The Board is grateful to the RGB staff for their hard work, careful analysis, and clear presentation of data. This staff conducts research that is invaluable to the Board, as well as to the many people and organizations who participate in the public discussion. These reports provide a thorough analysis of the New York City housing market and the larger economy, including a broad array of data concerning the costs of operating residential buildings; owner income; housing availability; tenant income; and changes to the housing stock. This book is critical not only for those who are interested in the Board’s decisions for a particular year, but is also the latest installment in a series of annual books produced by the RGB staff that provide a rich data set and analysis for use by housing professionals, government officials, housing advocates, academics, and members of the public who care about the quality and affordability of New York City’s rental housing. Our decision was rooted in the data compiled in this book, but the Board also benefitted from the hundreds of people who attended this year’s public hearings who told some of the individual stories that are behind the aggregated data. We are particularly grateful to the many members of the public who testified for their insights into the challenges faced by both tenants and owners. We also benefitted from the perspectives of the elected officials, representatives of tenant and owner groups and public policy organizations who testified as well. It is an honor and privilege to be part of this Board. We are given a weighty task and the members of the Board have committed themselves to careful and thoughtful decision-making. I thank the members of the Board, the RGB staff and all of those who testified for their participation in this critically important endeavor. David J. Reiss Chair of the Board
Chair’s Acknowledgments
Housing NYC: Rents, Markets & Trends 2019 • Page 7
Chair’s Acknowledgments


This edition of Housing NYC: Rents Markets and Trends is a compilation of the primary reports produced by the Rent Guidelines Board (RGB) staff in 2019. The Board used these reports in its effort to establish rent adjustments for rent stabilized dwelling units in New York City. Although this compendium of housing research represents a collaborative effort by the RGB staff, it would not be possible without assistance from many others. The RGB is fortunate to have a seasoned research staff that provides comprehensive data to the Board members. Our Research Director, Brian Hoberman, authored the 2019 Income and Expense Study, 2019 Mortgage Survey Report and Changes to the Rent Stabilized Housing Stock in New York City in 2018. Deputy Research Director Danielle Burger penned the 2019 Income and Affordability Study and the 2019 Housing Supply Report and contributed to the 2019 Price Index of Operating Costs. The outstanding efforts of these two talented professionals are much appreciated. The annual Price Index of Operating Costs (PIOC), which measures the change in operating and maintenance costs for rent stabilized buildings, is the most extensive project performed by the RGB. Although each member of the staff spends time working on this project, it would not be possible without our team of temporary survey personnel. Our thanks go out to our dedicated and hard-working team of data collectors: Michael Taylor and Josephine Lalama. Finally, and perhaps most importantly, we once again thank James Hudson for his invaluable and prompt assistance with numerous situations regarding both the PIOC and income and expense data. The primary purpose of the RGB staff is to produce housing research. However, this would not be possible without our Office Manager/Public Information Officer, Charmaine Superville. She answers the myriad of housing questions our office receives each day with precision and kindness, organizes the Board’s public meetings and hearings and is responsible paying our bills. As Executive Director, I work closely with the members of the Board. I witness firsthand their dedication to public service. I enjoyed working with each and every member and I thank them for their hard work. I would especially like to extend my gratitude to Chair David Reiss. His support of the staff is unwavering and his passion for understanding the complex issues surrounding rent stabilized housing is both refreshing and admirable. Although RGB reports are produced entirely “in-house,” our research efforts would not be possible without assistance from many others. For both the information and expertise they provided, our gratitude goes out to: Bill Sears at the Department of City Planning, for data on new housing completions; Farid Heydarpour at the NYC Comptroller's Office, who provides labor force data; Floralba Paulino at the Bureau of City Marshals, for information on evictions and possessions; Eddy Valdez and Karen Kane at the NYC Civil Court, for data on housing court proceedings; Martha Cruz at the NYC Loft Board, for data concerning loft conversions to rent stabilization; Jackie Bray and Luis Ortiz at the Department of Homeless Services, for help with homeless statistics; Emre Edev at the City Council’s Finance Division for tax levy data; Aditi Sen of the Mayor's Office of Special Enforcement for illegal hotel violations data; and Yaw Owusu-Ansah of the Independent Budget Office (IBO), for lending his expertise on real estate tax projections. At the Division of Housing and Community Renewal (DHCR), which is a division of New York State Homes and Community Renewal (HCR), we would like to thank Deputy Commissioner Woody Pascal, as well as Michael Berrios and Tracey Stock, for
Executive Director’s Acknowledgments
Housing NYC: Rents, Markets & Trends 2019 • Page 9
Executive Director’s Acknowledgments

their assistance and expertise regarding owner registration data and Mohammed Siddiqui and Amy Keefe for their assistance with Mitchell-Lama data. In addition, our thanks goes out to the following staff members of the NYC Department of Housing Preservation and Development (HPD): Elyzabeth Gaumer, Assistant Commissioner of Research and Evaluation, for facilitating the collection of additional City-sponsored housing construction and sales data; Meilan Chiu of the Tax Incentives Program, who provided data on tax benefit programs; and Julie Walpert, Assistant Commissioner, Office of Housing Operations, who provides information regarding Mitchell-Lama units. We would like to thank the staff of NYC Department of Finance, in particular, John Blaskovich and Andreen McDonald, for providing summary data from the Real Property Income and Expense (RPIE) filings. Over the years, we have maintained a strong partnership with HPD. We would like to thank Commissioner Louise Carroll, Elyzabeth Gaumer, and Sheree West for continuing and strengthening this relationship. We are fortunate to have such a dedicated and responsive group meeting the needs of the Board and its staff. Finally, we give special thanks to those who testified at RGB meetings this year: from HPD, Lucy Joffe, Assistant Commissioner, Housing Policy and Elyzabeth Gaumer, Assistant Commissioner, Research and Evaluation; from HCR, Woody Pascal, Deputy Commissioner for Rent Administration; and from the Community Preservation Corporation (CPC), Rafael E. Cestero, President and Chief Executive Officer. Andrew McLaughlin Executive Director
Executive Director’s Acknowledgments
Page 10 • Executive Director’s Acknowledgments

Income & Expense 2019 Price Index of Operating Costs.................... pg. 13
2019 Income and Expense Study ..................................pg. 27
2019 Mortgage Survey Report ......................................pg. 45


Housing NYC: Rents, Markets & Trends 2019 • Page 13
New York City Rent Guidelines Board 2019 Price Index of Operating Costs
R The Price Index of Operating Costs (PIOC) for Rent Stabilized Apartment Buildings increased 5.5% this year.
R Costs in natural-gas heated buildings increased 5.5%, while costs in fuel-oil heated buildings increased 5.8%.
R The “Core” PIOC, which excludes the changes in fuel oil
prices, natural gas, and steam costs, is useful for analyzing inflationary trends. The Core PIOC rose by 4.9% this year.
R Fuel costs increased 13.8%, the highest increase of any
PIOC component. R Real estate taxes increased 7.1%, primarily due to a rise in
assessments for Class Two properties. R The Utilities component increased by 0.4%, primarily due
to an increase in water and sewer costs. R The Price Index of Operating Costs for Rent Stabilized
Apartment Buildings is projected to increase 3.2% next year.
What’s New14 Introduction
14 Overview
15 Price Index Components
18 PIOC by Building Type
18 Rent Stabilized Hotels
19 Rent Stabilized Lofts
19 The Core PIOC
19 PIOC Projections for 2020
20 Commensurate Rent Adjustments
22 Methodology
25 Acknowledgments
106 Appendices

2019 Price Index of Operating Costs
Introduction The Price Index of Operating Costs (PIOC) measures changes in the cost of purchasing a specified set of goods and services (market basket) used in the operation and maintenance of rent stabilized apartment buildings in New York City. The PIOC consists of seven cost components: Taxes, Labor Costs, Fuel, Utilities, Maintenance, Administrative Costs and Insurance Costs. The specific goods and services (items) within each component were originally selected
based on a study of 1969 expenditure patterns by owners of rent stabilized apartment buildings. The specific items included in each component have changed over time in order to reflect changes in owner expenditure
patterns. The methodology for determining the costs for each component is described in the final section of this report. The measured price changes (price relatives) in each index component are presented in Appendix B.2. The relative importance of each index component as a percentage of total operating and maintenance expenditures is shown by its “expenditure weight” (see Appendix B.2). The 2018-2019 price changes and expenditure weights are then combined to provide the overall change in the PIOC for 2018-2019.1
Changes in the overall PIOC result from changes in the prices of individual goods and services, each weighted by its relative importance as a percentage of total operating and maintenance (O&M) expenditures. Because the market basket is fixed in the sense that the quantities of goods and services of each kind remain constant, the relative importance of the various goods and services will change when their prices increase either more quickly or more slowly than average. Thus, the relative importance, or weight, attached to each good or service changes from year to year to reflect the different rates of price change among the various index items.
Overview This year, the PIOC for all rent stabilized apartment buildings increased by 5.5%. Increases occurred in all PIOC components. The largest proportional increase was seen in Fuel (13.8%), followed by Taxes (7.1%), Labor Costs (6.0%) and Insurance Costs (6.0%). More moderate increases occurred in the Maintenance (3.8%) and Administrative Costs (3.5%) components, while the growth in Utilities (0.4%) was nearly flat. The growth in the Consumer Price Index (CPI), which
Page 14 • Income & Expense
Change In Costs for Rent Stabilized Apartment
Buildings, March 2018 to March 2019
Taxes 7.1% Labor Costs 6.0% Fuel 13.8% Utilities 0.4% Maintenance 3.8% Administrative Costs 3.5% Insurance Costs 6.0%
All Costs 5.5%
Price Index - the measure of price change in a market basket of goods and services. Component - categories of goods and services, such as Labor Costs or Taxes, that comprise the market basket of a price index. Item - representative individual goods and services within a component, such as Plumbing, Non-union Wages, Faucet or Roof Repair. Price Relative - the change of current and prior year’s prices. Expenditure Weight - the relative importance of the change in costs of different goods and services.
Specification - defined pricing units with specific terms of sale, such as cash, volume or trade discounts.
The Price Index of Operating Costs for
Rent Stabilized Apartment Buildings
rose ... 5.5
%
Apartments
Terms and Definitions

2019 Price Index of Operating Costs
Housing NYC: Rents, Markets & Trends 2019 • Page 15
measures inflation in a wide range of consumer goods and services, during this same time period was lower than the PIOC, rising 1.9%.2 See the sidebar on the previous page and Appendix B.2 for changes in costs and prices for all rent stabilized apartment buildings from 2018-2019.
The “Core” PIOC, which excludes changes in fuel oil, natural gas, and steam costs used for heating buildings, is useful for analyzing long-term inflationary trends. The Core PIOC rose by 4.9% this year and was lower than the overall PIOC due to the exclusion of costs in the Fuel component, which rose 13.8%.
Price Index Components Taxes
The Taxes component of the PIOC is based entirely on real estate taxes and accounts for nearly 30% of the overall price index. The change in tax cost is estimated by comparing aggregate taxes
levied on rent stabilized apartment buildings in Fiscal Year (FY) 2018 and FY 2019. Aggregate real estate taxes rose this year by 7.1%. The growth in taxes was
primarily due to a 9.1% rise in assessments. The rise in assessments was offset by a rise in the total value of exemptions, which had the effect of lowering the total rise in taxes by 1.2%. In addition, a decline in the tax rate of 0.8% also helped to offset the rise in assessments. Change in tax abatements had little impact on the change in Taxes for 2019. Tax Levy — The total tax levy for all properties in the City (commercial and residential) increased by 6.0% from FY 2018 to FY 2019. The large majority of rent stabilized apartments are contained in multi-family buildings that are in Tax Class 2.3 The total Class 2 property levy rose at a faster pace than that of the City as a whole, at a rate of 7.2%. The distribution of the levy among property classes tends to shift from year to year. From FY 2018 to FY 2019, the levy share for Class 2 properties increased by 0.2 percentage points, from 37.4% to 37.6% of the total tax burden. This is significantly higher than the 26.3% share that was established at the inception of the four-class tax system in 1983. Tax Rate — The average annual FY 2018 Tax Class 2 rate of 12.719% decreased by 0.8%, resulting in a
7.1
%
-8%-6%-4%-2%0%2%4%6%8%
10%12%14%16%18%
2019201820172016201520142013201220112010200920082007200620052004200320022001
Assessments Exemptions, Abatements and Tax Rate Overall Tax Change
Source: New York City Department of Finance
Assessments for Rent Stabilized Buildings Continue to Rise in 2019
Percent Change in Taxes due to Assessments and Exemptions/Abatements/Tax Rate 2001-2019

new annualized rate of 12.612% for FY 2019. This is the fifth time in the past seven years that the Class 2 tax rate decreased. For a historical perspective on changes in the tax rate, abatements, and exemptions, see the graph on the previous page. Assessments — Assessed valuations of properties containing rent stabilized units rose by 9.1% Citywide in FY 2019. Assessments rose in all five boroughs, with the Bronx witnessing the highest growth at 12.5%, followed by Brooklyn at 11.8% and Staten Island at 11.0%. Manhattan and Queens witnessed the lowest growth in assessments, both rising 8.5%. Buildings in Manhattan drive much of the change in assessed value Citywide. This was true in FY 2019, with 61% of the total assessed value attributed to this borough. For a historical perspective on changes in tax assessments, see the graph on the previous page. Abatements and Exemptions — This year, the number of rent stabilized buildings receiving tax abatements decreased by 6.8% from the previous fiscal year. In addition, the average benefit value of the typical tax abatement decreased by 2.5% from FY 2018 to FY 2019. The net impact of the decrease in the number of buildings receiving abatements and the decrease in the average abatement value was a negligible increase in the overall change in Taxes of just 0.1%.
In FY 2019, 0.4% fewer rent stabilized buildings benefited from tax exemptions. However, the value of the average tax exemption increased by 6.6%. This combination of an increase in the average value of tax exemptions and the decrease in the number of buildings receiving exemptions resulted in reducing the increase in the overall change in Taxes by 1.2% (see Appendices B.5 and B.6).
Labor Costs
The Price Index measure of Labor Costs includes union and non-union salaries and benefits, in addition to Social Security and unemployment insurance. The cost of unionized labor makes up
two-thirds of the Labor Costs component. The
entire Labor Costs component comprises 15.7% of the overall Price Index.
Labor Costs rose 6.0%, 2.8 percentage points higher than last year’s rise of 3.2%. The rise in Labor Costs was primarily due to increases in non-union wages, as well as rising costs in healthcare. An increase in unemployment insurance of 8.2% had minimal impact, since it accounts for less than one-half of one percent of this component’s weight.
Wages comprise three-quarters of the Labor Costs component. Non-union pay increased by 5.7%, 0.6 percentage points higher than the increase seen in the 2018 PIOC (5.1%). Unionized wages also rose, rising by 2.2%, a smaller increase than the 2.7% witnessed last year.
Health and welfare benefits, which comprises more than 21% of the Labor Costs component, increased 14.7%.4 See Appendix B.2 for all Labor Costs item weights and price relatives.
Fuel
The Fuel component comprises 6.9% of this year’s Price Index. The change in cost measured in this component considers both the change in weather and the change in prices for heating
multifamily buildings by fuel oil, natural gas, and steam.5
This year the Fuel component increased 13.8%, following a 16.4% rise in the prior year. Natural gas costs, which account for 48% of the overall costs in this component, increased 14.7%. The cost for heating buildings by fuel oil makes up 44% of this component, and increased 14.4%. Steam costs rose 4.9%, but these costs account for only 8% of the Fuel component.
Along with measuring price, the PIOC also takes into account the effect of weather on the demand for fuel, especially during the heating season when the large majority of fuel is burned. Since the weather this year was colder than last year, the increase in fuel cost was greater than it would have been if prices alone were considered. For instance, the increase in fuel oil costs was greater than the rise in fuel oil prices, with prices increasing 9.4%, but
6.0
%
13
.8%
2019 Price Index of Operating Costs
Page 16 • Income & Expense

costs rising 14.4%. In years where the weather does not vary much from the prior year, the change in the cost of fuel oil is roughly equal to that of the change in price, such as in 2015. See the table on this page for a comparison of the past ten years of fuel oil cost relatives to fuel oil prices. See Appendix B.2 for all Fuel item weights and price relatives.
Utilities
The Utilities component consists of non-heating natural gas and electricity costs, as well as water and sewer charges, and it comprises 9.9% of this year’s Price Index. In the case of the
gas and electricity items, changes in costs are measured using the PIOC specifications (e.g., the quantity of electricity and gas being purchased) and the changes in rate schedules. Water and sewer costs are based on rate adjustments set by the NYC Water Board and they account for 72% of the Utilities component.
This year Utilities increased 0.4%, compared to a 0.5% increase in the previous year. The increase in
this component was driven primarily by the increase in the cost of water and sewer. Electricity costs, which account for 27% of this component, decreased by 5.2%, while gas costs, which account for less than one percent of the Utilities component, rose 10.2%. But water and sewer charges, which account for more than 72% of this component, rose by 2.4%, following two years of no change in cost. See Appendix B.2 for all Utilities item weights and price relatives.
Maintenance
The Maintenance component accounts for 17.7% of this year’s Price Index. The Maintenance component rose 3.8%, more than last year’s rise of 3.4%. Of the 29
expense items contained in this component, just four items account for 51% of its expenditure weight: Repainting, Plumbing (faucet), Plumbing (stoppage), and Electrician Services. This year, painters’ rates rose 5.7%, less than the 6.3% recorded last year. Combined plumbing rates increased at a slightly slower pace, rising 2.6%, less than last year’s rise of 2.7%. Electrician Services rose at a faster pace, 4.2%, more than last year’s increase of 0.5%.
Other price increases of note were boiler repairs (5.7%), floor maintenance (0.2%), Roof Repair (9.2%), and Extermination Services (3.6%), which represent a total of seven expense items and account for over 23% of this component. See Appendix B.2 for all Maintenance item weights and price relatives.
Administrative Costs
Fees paid to management companies, accountants, and attorneys make up 87% of this component. This year, Administrative Costs rose 3.5%, 1.9 percentage points more than last
year’s rise of 1.6%. Administrative Costs comprise 15.2% of the PIOC.
A large portion of the growth in the Administrative Costs component can be attributed
0.4
%
3.8
%3
.5%
2019 Price Index of Operating Costs
Housing NYC: Rents, Markets & Trends 2019 • Page 17
PIOC Fuel Oil Cost Change in Year Relative* Fuel Oil Price** 2019 14.4% 9.4% 2018 19.9% 16.3% 2017 22.1% 7.3% 2016 -45.5% -30.9% 2015 -23.4% -22.5% 2014 7.8% 0.3% 2013 20.0% 2.9% 2012 1.6% 20.8% 2011 23.1% 20.3% 2010 0.5% 6.7% * The Fuel Oil Cost Relative factors in the effect of weather on total fuel oil consumption. In months that are colder than the same month in the prior year, the weather factor will put upward pressure on the fuel oil relative. In months that are warmer than the same month in the prior year, downward pressure is placed on the Fuel Oil Cost Relative. ** Weighted change in #2, #4 and #6 fuel oil prices. From 2016 forward, weighted change in #2 and #4 fuel oil prices only. Source: Price Index of Operating Costs reports (2010-2019)
Fuel Oil Cost Relatives vs. Change in Fuel Prices, 2010-2019

to a rise in management company fees (2.9%) that comprise over half of this component. Management fees are often tied to apartment rental income and are affected by changes in rents and vacancies. This year’s growth is more than last year’s (0.8%), indicating that management companies’ fees and/or rents increased at a faster pace than last year. This faster rise in management fees may also indicate that vacancies and/or collection losses in managed buildings fell as compared to the previous year.
Accounting fees increased in this year’s PIOC by 4.4%, more than last year’s rise of 2.6%. Attorney fees rose 4.3%, 0.2 percentage points less than last year’s growth of 4.5%.
Communications, which accounts for about 5% of the Administrative Costs component, decreased 4.4%. See Appendix B.2 for all Administrative Costs item weights and price relatives.
Insurance Costs
For the eighth consecutive year there was an increase in the Insurance Costs component, rising 6.0%, compared to last year’s increase of 3.3%. Insurance Costs account for
5.0% of the PIOC. Changes in insurance costs for owners varied by
the amount of the policy. Policies that cost more than $6,337.96, which represent half of all verified insurance quotes, saw an increase in cost of 6.4% upon renewal. Buildings with policies that cost $6,337.96 or less saw an increase of 3.6% (see Appendix B.2.)
PIOC by Building Type The 1983 Expenditure Study provided a basis for calculating separate sets of expenditure weights for different types of buildings that contain rent stabilized units. In addition to the price index for all rent stabilized apartments, the PIOC includes separate indices for buildings constructed before 1947 (pre-1947) and for buildings constructed in 1947 or later (post-1946), as well as for gas-heated and oil-heated buildings (see Appendices B.2 and B.3).
Typically, pre-1947 buildings incur a lower percentage of operating and maintenance costs for property taxes and labor costs than post-1946 buildings. However, fuel costs, which had the highest proportional increase of any component in this year’s PIOC, represent a significantly higher percentage of total operating and maintenance costs in pre-1947 buildings. As a result, total costs in the Pre-1947 Index rose by 5.7%, while costs in the Post-1946 Index rose by a lesser amount, 5.1%.
Indices were also calculated for different types of heating systems. These heating system indices differ from the price index for all apartments because the expenditure weight for the Fuel component differs from index to index. Because the Fuel component carries more weight in oil-heated buildings versus those heated by gas, the Oil-Heated Index (5.8%) rose more than the Gas-Heated Index (5.5%).
Rent Stabilized Hotels The Hotel Price Index includes separate indices for each of three categories of rent stabilized hotels (due to their dissimilar operating cost profiles) and a general index for all rent stabilized Hotels. The three categories of hotels are: 1) “traditional” hotels — a multiple dwelling that has amenities such as a front desk, maid or linen services; 2) Rooming Houses — a multiple dwelling other than a hotel with thirty or fewer sleeping rooms; and 3) single room occupancy hotels (SROs) — a multiple dwelling in which one or two persons reside separately and independently of other occupants in a single room.
The Price Index for all rent stabilized Hotels increased 5.5% this year, a 1.6 percentage point difference from the 3.9% rise in 2018.
This year there were increases in all seven of the PIOC Hotel components. The Fuel component witnessed the highest increase, rising 13.8%. The Fuel component accounts for just over 15% of the entire Hotel Index. The remaining six components witnessed more moderate cost increases, with Insurance Costs rising 6.0%, Labor Costs 4.4%, Taxes 4.9%, Maintenance 2.4%, Administrative Costs 1.8%, and Utilities 1.5%. See the sidebar on
6.0
%
2019 Price Index of Operating Costs
Page 18 • Income & Expense

2019 Price Index of Operating Costs
Housing NYC: Rents, Markets & Trends 2019 • Page 19
this page for changes in costs and prices for all rent stabilized hotels from 2018-2019.
Among the different categories of Hotels, the index for “traditional” hotels increased 4.7%, Rooming Houses by 6.2%, and SROs by 6.4% (see Appendices B.4 and B.7).
Rent Stabilized Lofts The increase in the Loft Index this year was 6.2%, 1.0 percentage points higher than the 5.2% increase in 2018. Increases in costs were seen in all eight components that make up this index. Fuel Costs witnessed the highest rise, increasing 13.7%. More moderate increases were seen in Taxes (7.1%), Labor Costs (6.4%), Insurance Costs (6.0%), Administrative Costs-Legal (4.3%), Administrative Costs-Other (3.2%), Maintenance (4.1%), and Utilities (1.6%). Note that historically Administrative Costs in the Loft Index has been split into two components — Administrative Costs-Legal and Administrative Costs-Other. Therefore, the Loft Index has eight components. See the sidebar on this page and Appendix B.8 for changes in costs and prices for all rent stabilized lofts from 2018-2019.
The Core PIOC The Core PIOC, which measures long-term trends by factoring out shifts in fuel costs for heating rent stabilized buildings in NYC, rose 4.9% in 2019. The rise in the 2019 Core PIOC was 0.6 percentage points lower than this year’s Apartment Index (5.5%), but 1.2 percentage points higher than last year’s Core Index (3.7%). This year’s Core PIOC rose at a slower pace than the overall PIOC because fuel costs, which were not used to calculate the Core, increased 13.8%.
PIOC Projections for 2020 Section 26-510 of the Rent Stabilization Law requires the Board to consider prevailing and projected operating and maintenance costs for buildings containing rent stabilized apartments. Projections for components of the PIOC are calculated to provide the RGB with an estimate of how much costs are expected to rise in the year following the current Price Index.
Projecting changes in the PIOC has become more challenging in recent years. Energy prices have become increasingly volatile. Unpredictable geo-political events, recession and changing weather patterns are some of the forces behind large changes in fuel costs that have in turn limited the accuracy of the PIOC projections in recent studies. The tax component, which accounts for nearly 30% of the entire Price Index, has also become harder to project due to
Change In Costs for Rent Stabilized Hotel
Buildings, March 2018 to March 2019
Taxes 4.9% Labor Costs 4.4% Fuel 13.8% Utilities 1.5% Maintenance 2.4% Administrative Costs 1.8% Insurance Costs 6.0%
All Costs 5.5%
Change In Costs for Rent Stabilized Loft
Buildings, March 2018 to March 2019
Taxes 7.1% Labor Costs 6.4% Fuel 13.7% Utilities 1.6% Maintenance 4.1% Admin Costs-Legal 4.3% Admin Costs-Other 3.2% Insurance Costs 6.0%
All Costs 6.2%
Hotels
Lofts

changes in tax policy, such as tax rate adjustments and changes to the City’s tentative assessment roll, after the period covered in this Price Index.
This year, operating costs in rent stabilized apartment buildings increased by 5.5%, versus last year’s projected PIOC increase of 3.4%, a difference of 2.1 percentage points. The component with the largest deviation between actual and projected changes in costs was Fuel. Fuel was projected to rise 1.1%, but actually rose 13.8% in 2019, a 12.7 percentage point difference. Other notable differences were found in the Labor Costs and Maintenance components. Labor Costs, which were projected to increase by 3.2%, rose instead by 6.0%, a 2.8 percentage point difference (see Endnote 4). Maintenance, which was projected to rise by 1.8%, rose instead by 3.8%, a difference of 2.0 percentage points. The remaining 2019 projected components of the PIOC were all within 1.5 percentage points of the actual measured changes.
Overall, the PIOC is expected to grow by 3.2% from 2019 to 2020. Costs are predicted to rise in each component except Fuel, with the largest growth (5.7%) projected to be in Insurance, with Taxes, the component that carries the most weight in the Index, close behind at 5.6%. Other projected increases include Labor Costs (3.5%), Maintenance (3.3%), Administrative Costs (2.8%), and Utilities (1.4%). Fuel is the only component predicted to decrease, by 6.9%. The table on this page shows projected
changes in PIOC components for 2020. The core PIOC is projected to rise 3.9%, 0.7 percentage points more than the overall projected Apartment PIOC.
Commensurate Rent Adjustments Throughout its history, the Rent Guidelines Board has used a formula, known as the commensurate rent adjustment, to help determine annual rent guidelines for rent stabilized apartments. In essence, the “commensurate” combines various data concerning operating costs, revenues, and inflation into a single measure to determine how much rents would have to change for net operating income (NOI) in rent stabilized buildings to remain constant. The different types of “commensurate” adjustments described below are primarily meant to provide a foundation for discussion concerning prospective guidelines.
In its simplest form, the commensurate rent adjustment is the amount of rent change needed to maintain owners’ current dollar NOI at a constant level. In other words, the commensurate provides a set of one- and two-year renewal rent adjustments, or guidelines, that will compensate owners for the change in prices measured by the PIOC and keep net operating income constant.
The first commensurate method is called the “Net Revenue” approach. While this formula takes into consideration the term of leases actually signed by tenants, it does not adjust owners’ NOI for inflation. The “Net Revenue” formula is presented in two ways: first, by adjusting for the mix of lease terms; and second, by adding an assumption for rent stabilized apartment turnover and the subsequent impact of revenue from vacancy increases. Under the “Net Revenue” formula, a guideline that would preserve NOI in the face of this year’s 5.5% increase in the PIOC is 4.0% for a one-year lease and 8.0% for a two-year lease. Using this formula, and adding assumptions for the impact of vacancy increases on revenues when apartments experience turnover, results in guidelines of 3.0% for one-year leases and 5.25% for two-year leases.
The second commensurate method considers the mix of lease terms while adjusting NOI upward to reflect general inflation, keeping both operating
2019 Price Index of Operating Costs
Page 20 • Income & Expense
Projected Change In Costs for Rent Stabilized Apartment Buildings,
March 2019 to March 2020
Taxes 5.6% Labor Costs 3.5% Fuel -6.9% Utilities 1.4% Maintenance 3.3% Administrative Costs 2.8% Insurance Costs 5.7%
All Projected Costs 3.2%
2020 Projections

2019 Price Index of Operating Costs
Housing NYC: Rents, Markets & Trends 2019 • Page 21
and maintenance (O&M) costs and NOI constant. This is commonly called the “CPI-Adjusted NOI” formula. A guideline that would preserve NOI in the face of the 1.9% increase in the Consumer Price Index (see Endnote 2) and the 5.5% increase in the PIOC is 4.75% for a one-year lease and 9.25% for a two-year lease. Guidelines using this formula and adding the estimated impact of vacancy increases are 3.75% for one-year leases and 6.75% for two-year leases.6
The third commensurate method, the “traditional” commensurate adjustment, is the formula that has been in use since the inception of the Rent Guidelines Board and is the only method that relies on the PIOC projection. The “traditional” commensurate yields 3.6% for a one-year lease and 4.7% for a two-year lease. This reflects the increase in operating costs of 5.5% found in the 2019 PIOC and the projection of a 3.2% increase next year.
All of these commensurate methods have limitations. The “Net Revenue” formula does not attempt to adjust NOI based on changes in interest rates or the effect of inflation. The “CPI-Adjusted NOI” formula inflates the debt service portion of NOI, even though interest rates have been historically low over recent years. For both of these commensurate methods, including a consideration of the amount of income owners receive on vacancy assumes that turnover rates are constant across the City.
As a means of compensating for cost changes, the “traditional” commensurate rent adjustment has two major flaws. First, although the formula is designed to keep owners’ current dollar income constant, the formula does not consider the mix of one- and two-year lease renewals. Since only about two-thirds of leases are renewed in any given year, with a slight majority of leases being renewed having a one-year duration, the formula does not necessarily accurately estimate the amount of income needed to compensate owners for O&M cost changes.
A second flaw of the “traditional” commensurate formula is that it does not consider the erosion of owners’ income by inflation. By maintaining current dollar NOI at a constant level, adherence to the formula may cause profitability to decline over time. However, such degradation is not an inevitable consequence of using the “traditional” commensurate formula.7
Finally, it is important to note that only the “traditional” commensurate formula uses the PIOC projection and that this projection is not used in conjunction with, or as part of, the “Net Revenue” and “CPI-Adjusted NOI” formulas. As stated previously, all three formulas attempt to compensate owners for the adjustment in their operating and maintenance costs measured each year in the PIOC. The “Net Revenue” and the “CPI-Adjusted NOI” formulas attempt to compensate owners for the adjustment in O&M costs by using only the known PIOC change in costs
"Net Revenue" Commensurate Adjustment
1-Year Lease 2-Year Lease 4.0% 8.0%
"Net Revenue" Commensurate Adjustment
with Vacancy Increase 1-Year Lease 2-Year Lease
3.0% 5.25%
"CPI-Adjusted NOI"
Commensurate Adjustment 1-Year Lease 2-Year Lease
4.75% 9.25%
"CPI-Adjusted NOI"
Commensurate Adjustment with Vacancy Increase
1-Year Lease 2-Year Lease 3.75% 6.75%
"Traditional" Commensurate Adjustment
1-Year Lease 2-Year Lease 3.6% 4.7%
Commensurates

(5.5%). The traditional method differs from the other formulas in that it uses both the PIOC’s actual change in costs as well as the projected change in costs (3.2%).
Each of these formulae may be best thought of as a starting point for deliberations. The data presented in other Rent Guidelines Board annual research reports (e.g., the Income and Affordability Study and the Income and Expense Study) along with public testimony can be used in conjunction with these various commensurates to determine appropriate rent adjustments.
Methodology The Price Index measures changes in the cost of purchasing a specified set of goods and services, which must remain constant both in terms of quantity and quality from one year to the next. The need to exclude the effect of any alterations in the quality of services provided requires that very careful specifications of the goods and services priced must be developed and applied. The pricing specifications must permit the measurement of changes in prices paid for carefully defined pricing units with specific terms of sale, such as cash, volume or trade discounts.
Note that The various components of the PIOC utilize cost/price changes from differing time periods throughout the PIOC year (April through March, the most current time period available for analysis). For instance, the change in Taxes is based on a point-to-point change from one fiscal year to the next, while other components, such as Maintenance, Labor Costs, Administrative Costs, and Insurance Costs reply on a point-to-point change from one PIOC year to the next. For those components where owners receive a bill every month, such as Fuel and Utilities, prices are gathered each month and a bill for the entire year (April through March) is calculated and compared to the same period of the previous year.
The Methodology section of this report outlines the methods used to calculate each component of the 2019 PIOC, as well as the PIOC projection for 2020.
Owner Survey The Owner Survey gathers information on management fees, insurance, and non-union labor from building managers and owners. Survey questionnaires, accompanied by a letter describing the purpose of the PIOC, were mailed to the owners or managing agents of rent stabilized buildings. If the returned questionnaire was not complete, an interviewer contacted the owner/manager and gathered the missing information. Owners could complete the survey online or by mail. All of the price information given by the owner/managing agent was then confirmed by calling the relevant insurance and management companies and non-union employees. The data gathered by the Owner Survey is the only owner-reported data used in the PIOC.
The sample frame for the Owner Survey included over 42,000 rent stabilized buildings registered with the New York State Homes and Community Renewal (HCR). For the second consecutive year, in an effort to increase the number of surveys returned to the RGB, staff used a random sampling scheme to choose 7,500 addresses from this pool for the Owner Survey, up from 5,100 used in previous years. The number of buildings chosen in each borough was nearly proportional to the share of rent stabilized buildings in that borough. Three successive mailings were sent at timed intervals to the owner or managing agent of each property selected in the survey sample.
Roughly 8.1% of the questionnaires mailed out received a response, a lower rate than last year (8.8%). A total of 569 returned surveys contained usable information, down from 630 the prior year. As a result, RGB staff was able to validate 428 annual insurance premiums, 113 non-union labor wage rates and 68 reported management fees. The number of verified prices in 2018 and 2019 for the Owner Survey is shown in Appendix B.1.
Taxes The 2019 tax price relative was calculated by providing a list of rent stabilized properties registered with HCR to the NYC Department of
2019 Price Index of Operating Costs
Page 22 • Income & Expense

Finance. Finance “matched” this list against its records to provide data on assessed value, tax exemptions, and tax abatements for 40,000 buildings in FY 2018 and FY 2019. This data was used to compute a tax bill for each rent stabilized building in each of these fiscal years. The change computed for the PIOC is simply the percentage difference in aggregate tax bills for these buildings from FY 2018 to FY 2019.
Labor Costs The Labor Costs component consists of the cost of unionized and non-unionized labor. Rate increases for unionized labor, including wage increases and health benefits, come directly from the contracts of unions that represent workers in rent stabilized apartment buildings and hotels. The cost of Social Security and unemployment insurance is obtained from the NYS Department of Labor and the Internal Revenue Service (IRS). Wage increases for non-union labor are obtained from the Owner Survey (see methodology on the previous page).
Fuel The Fuel component consists of all types of fuel used for heating buildings, including oil, natural gas, electricity and steam.
In order to calculate the change in cost of fuel oil, prices set by fuel oil vendors for a gallon of heating oil are gathered on a monthly basis. A monthly survey makes it possible to keep in touch with fuel oil vendors and to gather the data on a consistent basis (i.e., on the same day of the month for each vendor). Vendors are called each month to minimize the likelihood of misreporting and also to reduce the reporting burden for the companies by eliminating the need to look up a year’s worth of prices. The number of fuel oil quotes gathered this year for #2 and #4 oil is similar to last year and is contained in Appendix B.1.
To calculate changes in fuel oil costs, monthly price data is weighted using a degree-day formula to account for changes in the weather. The number of Heating Degree Days (see Endnote 5) is a
measure of heating requirements. The Fuel component includes not only the cost of
fuel oil, but also the cost to heat buildings with natural gas, electricity and steam. For these items, RGB staff calculates a hypothetical monthly bill for utilities based in part on supply rates, fuel adjustments, delivery charges, taxes, and other surcharges and fees. Bills are calculated based on typical usage in a multi-family building in New York City, an amount that remains constant from year to year.
Because these items represent prices to heat buildings, monthly price data is adjusted to account for changes in weather. The price relatives for all items in the Fuel component were calculated by comparing the most recent 12-month period from April-March with the prior April-March period.
Note the following changes to the specifications for steam and gas heating in 2019:
• 407 (Steam) uses Service Classification No. 3, Rate I, with usage decreased from an average of 1,200 Mlb per month to 1,150 Mlb per month (to comply with the usage guidelines of Rate I)
• 408 (Steam) uses Service Classification No. 3, Rate II. Average consumption remains the same.
• The Con Edison portion of gas for heating (405 and 406) uses Service Classification No. 3. Average consumption remains the same.
• For hotels only, 405 (gas heating, smaller buildings) uses rate schedules for both Con Edison and National Grid, while 406 (gas heating, larger buildings) uses only the Con Edison rate schedule.
Utilities The Utilities component consists of costs for non-heating electricity and natural gas, as well as water and sewer charges. RGB staff calculates a hypothetical monthly bill for electricity and natural gas based in part on supply rates, fuel adjustments, delivery charges, taxes, and other surcharges and fees. Bills are calculated based on typical usage in a multi-family building in New York City, an amount that remains constant from year to year. The price relatives for electricity and natural gas items in the Utilities component were calculated by comparing
2019 Price Index of Operating Costs
Housing NYC: Rents, Markets & Trends 2019 • Page 23

the most recent 12-month period from April-March with the prior April-March period. Water and sewer price changes are based on annual rate adjustments set by the NYC Water Board.
Note the following change to the specifications for gas utilities: the National Grid portion of gas for utilities (404) uses Service Classification No. 2. Average consumption remains the same.
Maintenance All prices for items in this component are obtained using a Vendor Survey. This Survey is used to gather price quotes for items such as painting and other services performed by contractors; hardware and cleaning items (e.g., buckets and pine disinfectant); and appliances that need periodic replacement (e.g., refrigerators and stoves). Each year the vendor database is updated by adding new vendors and by deleting those who no longer carry the products or perform the services outlined in the Vendor Survey item specifications. Vendor quotes were obtained over the telephone, and for non-service based items by telephone and from websites that carry items in the PIOC’s market basket of goods. A total of 573 recorded price quotes were gathered. For a description of the items priced and the number of price quotations obtained for each item, refer to Appendix B.1.
Administrative Costs Management fees are obtained directly from building owners and managers, using the Owner Survey (see “Owner Survey” section on page 22). Other expense items, such as accountant and attorney fees, are obtained using the Vendor Survey (see “Maintenance” section, on the this page). For communications costs, because there are so many variations in types of plans for internet and phone service, staff relied on the national Consumer Price Index to obtain price changes for these items. Monthly price changes were obtained from the U.S. Bureau of Labor Statistics website and were calculated by comparing the most recent 12-month
period from March-February with the prior March-February period. For a list of all the expense items contained in the Administrative Costs component, see Appendix B.1.
Insurance Costs The Owner Survey asks owners to provide information about their current and prior year’s insurance policies. Temporary workers call the relevant insurance agents/brokers to verify this information. Only verified insurance costs are included in the PIOC.
Price Index Projections The PIOC Projections are estimated by using data from federal, state and local agencies; estimates from industry experts; and trend forecasting using three-year or long-term averages. The projections in this report are based on the time period from April 2019 to March 2020.
Taxes were projected by using data from the Department of Finance's tentative assessment roll for FY 2020 adjusted by estimates of how the final PIOC tax index has compared to the change in the tentative assessment roll over the last decade. These estimates produce a projected tax cost for owners of rental properties. Labor costs are projected by calculating the average wage and benefit increases of the most recent labor contracts for apartment workers union Local 32-BJ and a ten-year geometric average of all other Labor Costs items. Fuel oil and natural gas costs for the Fuel component are projected by using data and information from the U.S. Energy Information Administration’s (EIA) current “Short-Term Energy Outlook” report, which includes assumptions about changes in usage according to a projected return to the average temperature over the last five years. Utility costs are projected by taking the average of the last four New York City Water Board water and sewer rate adjustments as well as EIA projections for residential gas and electricity costs.8
The other components — Administrative Costs, Insurance Costs, and Maintenance — are projected
2019 Price Index of Operating Costs
Page 24 • Income & Expense

by using three-year geometric averages of the component price relatives.
Acknowledgments The Rent Guidelines Board would like to acknowledge the following individuals for their assistance in preparing the Price Index of Operating Costs this year: Dr. James F. Hudson for technical assistance, expense component reweighting, methodology, and report review; and Michael Taylor and Josephine Lalama for collecting owner and vendor data. r
Endnotes 1. Prior to 2015, the relative importance of the various goods and
services in the market basket was based on a 1983 study of expenditure patterns of owners of rent stabilized apartment buildings. In 2015, the Price Index of Operating Costs (PIOC) component expenditure weights for apartment buildings were changed to the expenditure patterns found in the Rent Guidelines Board’s annual Income and Expense (I&E) Study, which allows for the annual updating of expenditure patterns based on what owners report to the New York City Department of Finance as their actual costs on Real Property Income and Expense (RPIE) statements required by Local Law 63 (enacted in 1986). Note that only the Apartment PIOC is weighted with data from RPIE reports. The Hotel and Loft PIOCs continue to use the 1983 study. For a full description of the methodological changes to the expenditure weights used in the current PIOC, please refer to the RGB 2015 Price Index of Operating Costs report at http://www1.nyc.gov/site/ rentguidelinesboard/research/rgb-research-reports.page.
2. The average CPI for All Urban Consumers, New York-Northeastern
New Jersey for the year from March 2018 to February 2019 (274.3) compared to the average for the year from March 2017 to February 2018 (269.2) rose by 1.9%. This is the latest available CPI data and is roughly analogous to the ‘PIOC year’.
3. New York City has four property tax classes. Most rent stabilized
buildings are Tax Class 2, which consists of rental buildings of four units or more and cooperative and condominium buildings of two units or more. A small building which is rent stabilized only because of a tax abatement or exemption program (such as 421-a or J-51) would more likely be in Tax Class 1, which consists of most residential property of up to three units (family homes and small stores or offices with one or two apartments attached), and most condominiums that are not more than three stories. In the tax file used by the RGB to compute the Taxes component, almost 95% of the more than 40,000 buildings analyzed were Tax Class 2.
4. The rise in Health and Welfare Benefits was underestimated in
PIOC reports from 2016, 2017, and 2018. To compensate, the entirety of the underestimation was applied to this year’s PIOC. Had the correct figures been used in 2016-2018, the rise in labor costs would have been 4.1% between 2018 and 2019, and the overall PIOC would have been 5.2%.
5. The cost-weight relatives are calculated on an April to March time period. The April 2018 to March 2019 time period was 4.6% colder than the previous April to March period. “Normal” weather, which is the standard set by National Oceanic and Atmospheric Administration (NOAA), refers to the typical number of Heating Degree Days measured at Central Park, New York City, over the 30-year period from 1981-2010. NOAA recalculates this 30-year average and issues a new “normal’ every ten years. A Heating Degree Day is defined as, for one day, the number of degrees that the average temperature for that day falls below 65 degrees Fahrenheit.
6. The following assumptions were used in the computation of the
commensurates: (1) the required change in owner revenue is 64.6% of the 2019 PIOC increase of 5.5%, or 3.6%. The 64.6% figure is the most recent ratio of average operating costs to average income in rent stabilized buildings; (2) for the “CPI-Adjusted NOI” commensurate, the increase in revenue due to the impact of inflation on NOI is 35.4% times the latest 12-month increase in the CPI ending February 2019 (1.9%), or 0.67%; (3) these lease terms are only illustrative—other combinations of one- and two-year guidelines could produce the adjustment in revenue; (4) assumptions regarding lease renewals and turnover were derived from the 2017 Housing and Vacancy Survey; (5) for the commensurate formulae, including a vacancy assumption, the 10.5% median increase in vacancy leases found in the rent stabilized apartments that reported a vacancy lease in the 2018 apartment registration file from the New York State Homes and Community Renewal was used; and (6) the collectability of these commensurate adjustments are assumed.
7. Whether profits will actually decline depends on the level of
inflation, the composition of NOI (i.e., how much is debt service and how much is profit), and changes in tax law and interest rates.
8. Source: “Short-Term Energy Outlook,” March 2019. U.S. Energy
Information Administration, Department of Energy. https://www.eia.gov/outlooks/steo/report/.
2019 Price Index of Operating Costs
Housing NYC: Rents, Markets & Trends 2019 • Page 25


Housing NYC: Rents, Markets & Trends 2019 • Page 27
New York City Rent Guidelines Board 2019 Income and Expense Study
R From 2016 to 2017, Net Operating Income (revenue remaining after operating expenses are paid) grew 0.4%. This is the 13th consecutive year that Net Operating Income has increased.
R Rental income increased an average of 3.0% from
2016-2017. R Total income increased an average of 3.0% from
2016-2017. R Operating costs increased an average of 4.5% from
2016-2017.
What’s New28 Introduction
28 RPIE Study
37 Longitudinal Study
40 Summary
40 Methodology
112 Appendices

Introduction As part of the process of establishing rent adjustments for stabilized apartments, as required by the Rent Stabilization Law, the NYC Rent Guidelines Board (RGB) has analyzed the cost of operating and maintaining rental housing in New York City since 1969. Historically, the Board's primary instrument for measuring changes in prices and costs has been the Price Index of Operating Costs (PIOC), a survey of prices and costs for various goods and services required to operate and maintain rent stabilized apartment buildings.
In 1990, the RGB acquired a new data source that has greatly expanded the information base used in the rent adjustment-setting process: Real Property Income and Expense (RPIE) statements from rent stabilized buildings collected by the NYC Department of Finance. RPIE data encompasses both revenue and expenses, allowing the Board to accurately gauge the overall economic condition of New York City's rent stabilized housing stock. By using consecutive RPIE filings from an identical set of buildings, a longitudinal comparison can also be made that illustrates changes in conditions over a two-year period.
This report examines the conditions that existed in New York's rent stabilized housing market in 2017, the year for which the most recent data set is available, and the extent to which these conditions changed from the prior year, 2016.
Local Law 63 The income and expense (I&E) data for stabilized properties originate from Local Law 63, enacted in 1986. This statute requires owners of apartment buildings to file RPIE statements with the NYC Department of Finance annually. While certain types of properties are exempt from filing RPIE forms (cooperatives, condominiums, most residential-only buildings with fewer than 11 units or with an assessed value under $40,000), the mandate produces detailed financial information on thousands of rent stabilized buildings. To ensure only rent stabilized buildings are analyzed, the NYC
Department of Finance releases to the RGB summary data only after matching I&E data with building registration data from NYS Homes and Community Renewal (HCR). The data used in this year’s RGB Income and Expense (I&E) Study includes 15,395 properties containing 694,485 units.
RPIE Study Rents and Income1 In 2017, rent stabilized property owners collected monthly rent averaging $1,353 per unit. As in previous years, units in pre-war buildings rented for less on average ($1,273 per month) than those in post-war buildings ($1,534 per month).2 At the borough level, the average monthly rents in stabilized buildings were $1,850 in Manhattan ($2,247 in Core Manhattan3 and $1,343 in Upper Manhattan); $1,301 in Queens; $1,224 in Brooklyn; $1,046 in Staten Island; and $1,006 in the Bronx. Average monthly rent per unit in the City, excluding Core Manhattan, was $1,204.
The median monthly rent Citywide was $1,208. At the borough level, median rent was $1,632 in Manhattan ($1,898 in Core Manhattan and $1,226 in Upper Manhattan); $1,267 in Queens; $1,140 in Brooklyn; $1,080 in Staten Island; and $997 in the Bronx.
Many owners of stabilized buildings augment income from their apartment rents by selling services to their tenants as well as by renting commercial space. Current RPIE filings show an average monthly gross income of $1,524 per unit in 2017, with pre-war buildings earning $1,440 per unit and post-war properties earning $1,716 per unit. Gross income was highest in Manhattan, at $2,297 per unit per month ($2,729 in Core Manhattan, and $1,562 in Upper Manhattan) and lowest in the Bronx, at $1,122. In between are Queens, at $1,385, Brooklyn, at $1,301; and Staten Island, at $1,141. Monthly income per unit in the City, excluding Core Manhattan, was $1,299. These gross income figures encompass rent from apartments as well as the sale of services (e.g., laundry, parking) and commercial income (e.g.,
2019 Income and Expense Study
Page 28 • Income & Expense

retail, cell towers, billboards). Such proceeds accounted for an 11.2% share of the total income earned by building owners in 2017, down half a percentage point from the previous year. By borough, income earned from services and commercial rents was 16.5% in Manhattan (17.7% in Core Manhattan and 14.1% in Upper Manhattan); 10.4% in the Bronx; 8.3% in Staten Island; and 6.0% in both Brooklyn and Queens. The graph on this page shows the average rent and income collected in 2017 by borough, and for the City.
Median Citywide income for owners in 2017 was $1,309. At the borough level, Manhattan had the highest median income, at $1,897 ($2,219 in Core Manhattan and $1,384 in Upper Manhattan); followed by Queens at $1,317; Brooklyn at $1,193; Staten Island at $1,153; and the Bronx at $1,083. Median monthly income per unit in the City, excluding Core Manhattan, was $1,196. (For rent and
income averages and medians by borough and building age and size, see details in Appendices C.3 and C.4.)
Comparing Rent Measurements Two independent data sources, the triennial NYC Housing and Vacancy Survey (HVS) and the NYS Homes and Community Renewal (HCR) annual registration data, provide important comparative rent data to the collected rents stated in NYC Department of Finance (RPIE) filings. A comparison of the collected RPIE rents to the HVS and HCR rents reflects both how well owners are able to collect the rent roll and the prevalence of vacancies.
Rents included in RPIE filings are different than HVS and HCR figures primarily because of differences in how average rents are computed. RPIE data reflects actual building-wide rent collections
2019 Income and Expense Study
Housing NYC: Rents, Markets & Trends 2019 • Page 29
$0 $250 $500 $750 $1,000 $1,250 $1,500 $1,750 $2,000 $2,250 $2,500 $2,750
NYC w/out Core Manhattan
NYC
Bronx
Staten Island
Brooklyn
Queens
Upper Manhattan
Core Manhattan $2,729$2,247
$1,562$1,343
$1,385$1,301
$1,141$1,046
$1,006
$1,524$1,353
$1,299$1,204
RentIncome
$1,122
$1,224$1,301
* See endnote 1 Note: Core Manhattan refers to the area south of W 110th and E 96th Streets. Upper Manhattan refers to the remainder of the borough.
Source: NYC Department of Finance, 2017 RPIE Data
Income and Rent Highest in Manhattan in 2017
Average Monthly Collected Income/Rent per Dwelling Unit by Borough*

that account for vacancies; non-payment of rent and both regulated and unregulated apartments. HVS data consists of contract rent (the amounts stated on leases, which includes both legal and preferential rents) while HCR data consists of legal rents registered annually with the agency. Furthermore, RPIE information reflects rents collected over a 12-month period; HCR data reflects rents registered on April 1, 2017; and 2017 HVS figures are contract rents in effect during the first four months of 2017. Because 2017 was the most recent year in which the HVS was conducted, it is possible to compare rent data from all three sources.
The latest RPIE and HVS data (2017) shows that the HVS average contract rent of $1,269 for all rent stabilized apartments was 6.2% less than the RPIE average collected rent of $1,353 among buildings containing rent stabilized buildings.4 In 2014, the RPIE average collected rent was 4.1% more than the HVS average rent.
HVS and RPIE data can also be analyzed by the age of the building. The 2017 HVS average contract rent in older, pre-war apartments was $1,225, which
was 3.8% lower than the 2017 RPIE average collected rent of $1,273. And the HVS average rent for units built after 1946, $1,400, was 8.7% lower than the RPIE average rent of $1,534.
Another comparison can be made between annual RPIE and HCR average rents. From 2016 to 2017, the gap was 27.9%, as indicated by the average RPIE rent of $1,353 and HCR’s average stabilized rent of $1,876. This is a 3.8 percentage point increase from the 24.1% gap the previous year, and is the largest gap since the RGB began measuring the data, continuing a trend from 2002, where the gap has grown in most years. The increase in the gap between collected and legal rent indicates that building owners are collecting a smaller proportion of the maximum legal rent in 2017. (See graph on this page for a historical comparison of RPIE and HCR rent differences.)
At the borough level, the gap between collected and legal rent varies significantly. In 2017, Queens property owners collected an average rent ($1,301) that was 25.1% below HCR's average legal rent for the borough ($1,738), while owners in the other boroughs collected average rents that were 25.2% lower in the Bronx; 26.4% lower in Brooklyn; 29.3% lower than legal rents in Manhattan; and 37.4% lower in Staten Island. At least part of this differential is due to preferential rents, usually offered when the legal stabilized rent exceeds the market rate for the area.5
Another benchmark that can help place RPIE rent data in context is the RGB Rent Index, which measures the overall effect of the Board's annual rent increases on contract rents each year. As the table on the next page shows, average RPIE rent growth was higher than the renewal lease increases allowed by the RGB's guidelines for a seventh consecutive year. RPIE rent growth, up 3.0%, was greater than the increase in the RGB rent index, which was up 2.0%, between 2016 and 2017 (adjusted to a calendar year).6
There are several ways in which rents may be raised beyond the RGB's guidelines, including the deregulation of apartment units; raising preferential rents; vacancy allowances; and through individual apartment and building-wide improvements.
2019 Income and Expense Study
Page 30 • Income & Expense
70%
75%
80%
85%
90%
95%
100%
'17'15'13'11'09'07'05'03'01'99'97'95'93'91
Source: HCR Annual Rent Registrations; NYC Department of Finance, 1990-2017 RPIE Data
Percentage of Legal Rent Collected Decreased in 2017
Average Monthly Citywide Collected Rents as a Share of Average Monthly HCR Legal
Registered Rents, 1990-2017

An extended view of the three indices illustrates that overall, HCR legal rents have grown faster than both collected rents and RGB rent guidelines from 1990 to 2017. During that period, HCR adjusted legal rents increased 229.5%7; RPIE collected rents
increased 200.3%; and the RGB Rent Index increased 174.3% (figures not adjusted for inflation).8
Operating Costs Rent stabilized apartment buildings regularly incur several types of expenses. RPIE filings categorize operating and maintenance (O&M) costs into eight major categories: taxes; labor; utilities; fuel; insurance; maintenance; administrative; and miscellaneous costs. Costs do not include debt service. However, in contrast to revenues, this data does not distinguish between expenses for commercial space and those for apartments, making the calculation of “pure” residential operating and maintenance costs impossible, except in a smaller data set of residential-only buildings. Thus, the operating costs reported are comparatively high because they include maintenance costs for commercial space.
The average monthly operating cost for units in stabilized buildings was $984 in 2017. Costs were lower in units in pre-war structures ($944), and higher among post-war buildings ($1,075). Geographically, average costs were lowest in the Bronx ($763); Staten Island ($768); Brooklyn ($837); and Queens ($892); and highest in Manhattan ($1,397). Within Manhattan, costs for units located in Core Manhattan averaged $1,678 a month, while the costs in Upper Manhattan were $1,037. Excluding Core Manhattan, the average monthly operating costs for stabilized building owners in New York City was $846. The graph on the next page details average monthly expenses by cost category and building age for 2017. The graph shows that taxes make up the largest share of expenses, averaging 29.6% of all costs among rent stabilized buildings.
Citywide, 2017 median expenses were $870. By borough, Manhattan had the highest median costs, at $1,182 ($1,350 in Core Manhattan and $929 in Upper Manhattan); followed by Queens at $825; Brooklyn at $778; Staten Island at $738 and the Bronx at $737. Median monthly expenses in the City, excluding Core Manhattan, was $795. (Appendices C.1, C.2 and C.3 break down average costs by borough and building age; Appendix C.4 details median costs; and Appendix C.6 details distribution of costs.)
2019 Income and Expense Study
Housing NYC: Rents, Markets & Trends 2019 • Page 31
2016-17 HCR Legal Rents Grew Faster Than RPIE Collected Rents and RGB Rent Index
RPIE HCR RGB Rent Rent Rent
Growth Growth Index (Adjusted)§ (Adjusted)Ø
1990-91 3.4% 4.1% 4.1% 1991-92 3.5% 3.0% 3.7% 1992-93 3.8% 3.0% 3.1% 1993-94 4.5% 2.4% 2.9% 1994-95 4.3% 3.1% 3.1% 1995-96 4.1% 4.1% 4.5% 1996-97 5.4% 4.6% 5.2% 1997-98 5.5% 3.3% 3.7% 1998-99 5.5% 3.7% 3.8% 1999-00 6.2% 4.4% 4.2% 2000-01 4.9% 5.3% 5.0% 2001-02 4.0% 4.4% 4.5% 2002-03 3.6% 6.9% 4.1% 2003-04‡ - 1.6% 5.5% 2004-05 4.6% 5.8% 4.6% 2005-06 5.6% 7.2% 4.3% 2006-07 6.5% 6.0% 4.2% 2007-08 5.8% 5.9% 4.7% 2008-09 1.4% 5.4% 7.5% 2009-10 0.7% 5.4% 5.2% 2010-11 4.4% 5.7% 3.7% 2011-12 5.0% 5.8% 4.4% 2012-13 4.5% 5.4% 4.1% 2013-14 4.8% 5.1% 4.1% 2014-15 4.4% 4.5% 2.2% 2015-16 3.1% 4.0% 1.6% 2016-17 3.0% 3.9% 2.0%
1990 to 2017*‡ 200.3% 229.5% 174.3%
Ø See endnote 6 § See endnote 7 ‡ See endnote 8 * Not adjusted for inflation Sources: NYS HCR Annual Rent Registrations; NYC Department of Finance, 1990-2017 RPIE Data
Rent Comparisons, 1990-2017

In 1992, the NYC Department of Finance and RGB staff tested RPIE expense data for accuracy. Initial examinations found that most “miscellaneous” costs were administrative or maintenance costs, while 15% were not valid business expenses. Further audits on the revenues and expenses of 46 rent stabilized properties revealed that O&M costs stated in RPIE filings were generally inflated by about 8%. Costs tended to be less accurate in small (11-19 units) properties and more precise for large (100+ units) buildings. However, these results are somewhat inconclusive since several owners of large stabilized properties refused to cooperate with the NYC Department of Finance's assessors. Adjustment of the
2017 RPIE O&M cost ($984) by the results of the 1992 audit results in an average monthly O&M cost of $904.
Just as buildings without commercial space typically generate less revenue than stabilized properties with commercial space, operating expenses in these buildings tend to be lower on average than in buildings with a mixture of uses. In 2017, unaudited average O&M costs for “residential-only” buildings were $893 per month and average audit-adjusted O&M costs for these buildings were $820 per month.
“Distressed” Buildings Buildings that have operating and maintenance costs that exceed gross income are considered, for the purposes of this study, distressed. Among the properties that filed RPIEs for 2017, 768 buildings, equal to 5.0% of the total number of rent stabilized buildings, had reported O&M costs that exceeded gross income, a tenth of a point higher than the prior year, when the lowest figure ever recorded in this study
occurred. Since 1990, when 13.9% of stabilized properties were considered distressed, the proportion of distressed buildings declined each year until 1999, reaching 6.1%. From 1999 until 2004, the proportion generally increased, but then declined ten times over twelve years, reaching in 2016 its lowest level in the 28-year history of this study. This year’s 5.0% figure represents the second lowest ever recorded (see graph on the next page).
Most distressed stabilized properties (60%) are mid-sized buildings, containing 20 to 99 units. In addition, the vast majority (93%) are pre-war buildings. By borough, 51% of the buildings are in Manhattan; while the remaining buildings are in the
2019 Income and Expense Study
Page 32 • Income & Expense
Post-46 Bldgs.Pre-47 Bldgs. All Stabilized
$0 $50 $100 $150 $200 $250 $300 $350
Misc.
Insur.
Utilities
Labor
Admin.
Fuel
Maint.
Taxes$279
$291$319
$174
$86$107
$154
$140$149
$170
$98$97$97
$42$48
$60
$74$68
$54
$52$50
$43
$173
$177
Source: NYC Department of Finance, 2017 RPIE Data
Taxes Remain Largest Expense in 2017
Average Monthly Expense per Dwelling Unit per Month

Bronx or Brooklyn (20% each); Queens (8%) and Staten Island (less than 1%). (See Appendix C.7 for a complete breakdown of distressed buildings by borough, building size and building age.)
Net Operating Income Revenues exceed operating costs in nearly all stabilized buildings, yielding funds that can be used for mortgage payments, improvements and/or pre-tax profit. The amount of income remaining after operating and maintenance (O&M) expenses are paid is typically referred to as Net Operating Income (NOI). While financing costs, income taxes and appreciation determine the ultimate value of a property, NOI is a good indicator of its basic financial condition. Moreover, changes in NOI are easier to track on an aggregated basis than changes in profitability, which require an individualized examination of return on capital placed at risk.
On average, apartments in rent stabilized buildings generated $540 of net income per month in 2017, with units in post-war buildings earning more ($641 per month) than those in pre-war buildings ($496 per month). Average monthly NOI is greater among stabilized properties in Manhattan ($820) than for those in the other boroughs: $493 in Queens; $464 in Brooklyn; $373 in Staten Island; and
$359 per unit per month in the Bronx. There was a notable difference when looking at NOI on a sub-borough level in Manhattan. Core Manhattan properties earned on average $1,051 per unit per month in NOI, twice as much as properties in Upper Manhattan, which earned an average NOI of $525. The monthly NOI average calculated Citywide, excluding Core Manhattan, was $453. Looking at the NOI using audit-adjusted expense figures, the Citywide NOI in 2017 was $620.
Average monthly unaudited NOI in “residential-only” properties Citywide was $482 per unit in 2017, 10.8% lower than the average for all stabilized buildings.
NOI reflects the revenue available after payment of operating costs; that is, the amount of money owners have for financing their buildings; making improvements; and for pre-income tax profits. While NOI should not be the only criterion to determine the ultimate profitability of a property, it is a useful exercise to calculate the annual NOI for a hypothetical “average stabilized building” with 11 or more units. Multiplying the average unaudited monthly NOI of $540 per unit by the typical size of buildings in this year's analysis (an average of 45.1 units) yields an estimated average annual NOI of about $292,394 in 2017. Excluding Core Manhattan, the monthly NOI of $453 per unit multiplied by the typical size of buildings in this year's analysis outside Core Manhattan (an average of 46.1 units) yields an estimated average annual NOI of about $250,797.
Operating Cost Ratios Another way to evaluate the financial conditions of New York City's rent stabilized housing is by measuring the ratio of expenses to revenues. Traditionally, the RGB has used O&M Cost-to-Income and O&M Cost-to-Rent ratios to assess the overall health of the stabilized housing stock, assuming that buildings are better off by spending a lower percentage of revenue on expenses. The graph on the next page shows how over the period from 1990 to 2017, the proportion of total income and rent collections spent on audit-adjusted operating costs has fluctuated. The audit-adjusted Cost-to-Income
2019 Income and Expense Study
Housing NYC: Rents, Markets & Trends 2019 • Page 33
0%
3%
6%
9%
12%
15%
'17'15'13'11'09'07'05'03'01'99'97'95'93'91
Source: NYC Department of Finance, 1990-2017 RPIE Data
Share of Distressed Properties Increases Slightly
Percent of Distressed Properties, 1990-2017

ratio in 2017 was 59.3%, a one percentage point increase from the prior year's 58.3%. This means that on average, owners of rent stabilized properties spent roughly 59.3 cents out of every dollar of revenue on operating and maintenance costs in 2017. Looking at unaudited expenses, the cost-to-income ratio in 2017 was 64.6, a 1.2 percentage point increase from the prior year. The unaudited median cost-to-income ratio was 64% in 2017.
Examining the ratio of costs to rent collections, audit-adjusted operating costs in 2017 were 66.8% of revenues from rent, up eight-tenths of a percentage point from the prior year. Using unaudited expenses, the cost-to-rent ratio in 2017 was 72.7%, a 0.9 percentage point increase. Looking at the unaudited median cost-to-rent ratio, it was 71% in 2017.
Rents, income, and costs per unit were on average highest in Core Manhattan in 2017 (see map and graphs below). Excluding Core Manhattan, the average revenue and costs figures are lower,
Core ManhattanNYC excluding
Core Manhattan
Cost-to-Income Ratio*56.5%
Cost-to-Income Ratio*59.8%
$0
$500
$1,000
$1,500
$2,000
$2,500
$3,000
NOICostsIncomeRent$0
$500
$1,000
$1,500
$2,000
$2,500
$3,000
NOICostsIncomeRent
*Ratios use audit-adjusted costs. Source: NYC Department of Finance, 2017 RPIE Data
Cost-to-Income Ratio Remains Lower in Core Manhattan
Average Monthly Rent, Income, Operating Costs and Net Operating Income per Dwelling Unit and Cost-to-Income Ratios, Core Manhattan and the Rest of the City, 2017
2019 Income and Expense Study
Page 34 • Income & Expense
45%
50%
55%
60%
65%
70%
75%O&M to Rent O&M to Income
'17'15'13'11'09'07'05'03'01'99'97'95'93'91
Source: NYC Dept. of Finance, 1990-2017 RPIE Data
Cost-to-Income and Cost-to-Rent Ratios Increase in 2017
Ratios of Citywide Average Monthly Audit-Adjusted O&M Costs to Average Monthly
Gross Income and Rent 1990-2017

resulting in different expense to revenue ratios. The audit-adjusted Cost-to-Income Ratio for the rest of the City was 59.8%, higher than the Cost-to-Income Ratio for stabilized buildings in Manhattan's Core (56.5%). These figures indicate that on average, owners of stabilized properties outside of Core Manhattan spend about 3.3 cents more of every dollar of revenue on expenses, as compared to their counterparts in Core Manhattan.
In an analysis of the distribution of operating costs in relation to total income in buildings by decile, it may be useful to examine the percentage of buildings with cost-to-income ratios at or below certain levels. The Department of Finance calculated decile levels, revealing that half of all rent stabilized buildings Citywide have unaudited cost-to-income ratios of 0.64 or less. This means that half the
building owners spent no more than 64 cents out of every dollar of revenue on operating and maintenance costs in 2017. Looking at the 70% decile level Citywide, seven out of every ten building owners pay no more than 73 cents of every dollar of revenue on operating and maintenance costs, and the remaining three pay more. The complete table of all ten decile levels Citywide and by borough can be found in Appendix C.8.
Net Operating Income After Inflation The amount of net operating income is a function of the level of expense and the level of revenue in each year (revenues minus operating expenses equals net operating income). Adjusting NOI as well as rent, income and costs figures for inflation (in constant
2019 Income and Expense Study
Housing NYC: Rents, Markets & Trends 2019 • Page 35
$0
$100
$200
$300
$400
$500
$600
$700
$800
$900
$1,000
$1,100
$1,200
$1,300
$1,400
$1,500
$1,600
20172015201320112009200720052003200119991997199519931991
RentIncome Costs NOI
Costs32.9%
NOI53.1%
Income39.4%
Rent38.5%
➡➡
➡➡
Note: Percent changes are point-to-point measurements. Sources: NYC Rent Guidelines Board Income and Expense Studies, 1992-2019;
NYC Department of Finance, 1990-2017 RPIE Data
Inflation-Adjusted Net Operating Income Up 53.1% Since 1990 (Average Monthly Income, Rent, Operating Costs and NOI per Dwelling Unit in Constant 2017 Dollars)
Citywide Income, Rent, Costs and NOI After Inflation, 1990-2017

2019 Income and Expense Study
Page 36 • Income & Expense
$0
$300
$600
$900
$1,200
$1,500
$1,800
$2,100
$2,400
'17'15'13'11'09'07'05'03'01'99'97'95'93'91
Costs43%
NOI48%
Income45% ➡ ➡➡ Rent
44%➡Manhattan 1990-2017
$0
$300
$600
$900
$1,200
$1,500
$1,800
$2,100
$2,400
'17'15'13'11'09'07'05'03'01'99'97'95'93'91
Costs41%
NOI106%
Income59% ➡ ➡➡ Rent
56%➡
Brooklyn 1990-2017
$0
$300
$600
$900
$1,200
$1,500
$1,800
$2,100
$2,400
'17'15'13'11'09'07'05'03'01'99'97'95'93'91
Costs37%
NOI74%
Income48% ➡ ➡➡ Rent
47%➡
Queens 1990-2017
$0
$300
$600
$900
$1,200
$1,500
$1,800
$2,100
$2,400
'17'15'13'11'09'07'05'03'01'99'97'95'93'91
Costs32%
NOI71%
Income42% ➡ ➡➡ Rent
34%➡
Bronx 1990-2017
Notes: Percent changes are point-to-point measurements. Staten Island is excluded due to insufficient data from prior years.
Sources: NYC Rent Guidelines Board Income and Expense Studies, 1992-2019; NYC Department of Finance, 1990-2017 RPIE Data
Since 1990, Inflation-Adjusted NOI Rises Citywide and in Each Borough (Average Monthly Income, Rent, Operating Costs and Net Operating Income per
Dwelling Unit in Constant 2017 Dollars)
Income, Rent, Costs and NOI After Inflation per Borough, 1990-2017

2017 dollars) and comparing different base years to the latest data available is a useful way to assess the health of the stabilized housing stock and how well revenues have been meeting or exceeding expenses without erosion by inflation.
Point-to-point comparisons of average figures show that, from 1990 to 2017, after adjusting for inflation, NOI has increased 53.1% (see graph on page 35). This indicates that revenues have outpaced expenses to the extent that average monthly NOI was worth 53.1% more in 2017 than it was in 1990, after adjusting for inflation.9
Another way to look at how rent, income and costs, as well as NOI, have changed after accounting for inflation is to graph inflation-adjusted monthly figures for each of the components measured in the I&E studies. Between 1990 and 2017, inflation-adjusted rent increased a cumulative 38.5%, income by 39.4%, and costs by 32.9%, resulting in the increase in NOI, after inflation, of 53.1%.
Examining the ratio of NOI to income, since 1990, the ratio has varied. From 1990-96, the ratio of NOI/income averaged 33%; from 1997-2002, 39%; from 2003-2009, 31%; and since 2010, the average ratio of NOI/income has been about 34%. This means that on average, over the past eight years, 34 cents of every dollar earned is net operating income for the owner.
While the Citywide graph of inflation-adjusted revenue, expense and NOI figures is useful for demonstrating the overall stabilized rental housing market, disaggregating the same figures by borough shows how the market can differ from area to area. Looking at each of the boroughs individually, from 1990 to 2017, all boroughs saw sizable increases in their net income, with Brooklyn seeing the largest increase, with NOI increasing 106%; followed by Queens, up 74%; the Bronx, up 71%; and Manhattan, up 48% (see graphs on previous page).
Longitudinal Study The longitudinal section of this study measures changes in rent, income, costs, operating cost ratios,
and net operating income that occurred in the same set of 14,332 buildings from 2016 to 2017.
Rents and Income Rent collections increase for a number of reasons, including increases allowed under RGB renewal guidelines; vacancy allowances; termination of preferential rents; individual apartments improvements; and building-wide major capital improvements (MCIs).
Average rent collections in stabilized buildings grew by 3.0% in 2017. Rent collections in pre-war buildings grew at a higher rate, up 3.2%, than in post-war buildings, which rose by 2.8%. Rent collections increased the greatest among smaller, 11-19 unit buildings, up 3.5%; while rents grew 3.2% among mid-sized, 20-99 unit buildings; and the least among large, 100+ unit buildings, up 2.3%. Examining rent collections by borough, Brooklyn saw the largest increase, up 4.1%; followed by Queens, up 3.4%; Staten Island, up 3.3%; the Bronx, up 3.0%; and Manhattan, up 2.3%. Within Manhattan, Upper Manhattan rents grew at a faster rate, up 3.5%, than the 1.7% increase in rents in Core Manhattan. Rent collections in the City, excluding Core Manhattan, rose 3.5%. The growth in median rent Citywide was 3.3%.
Looking at rent collections throughout New York City, every Community District saw increases in average rent from 2016 to 2017.10
At the neighborhood level, the greatest rent growth was found in Rockaway, Queens, seeing rents rise by 7.0%, and in Central Harlem, Manhattan, rising 6.0%. Comparatively, higher rent increases were also seen in several Brooklyn neighborhoods, including Park Slope/Carroll Gardens, up 5.8%; Bedford Stuyvesant, up 5.6%; Brownsville/Ocean Hill, up 5.4%, and East New York/Starett City, up 5.1%. The neighborhood in the Bronx seeing the highest growth in rents was Riverdale/Kingsbridge, up 4.1%. See map on next page and Appendix C.13 for a breakdown of changes in rent collections by Community District throughout NYC.
The average total income collected in rent
2019 Income and Expense Study
Housing NYC: Rents, Markets & Trends 2019 • Page 37
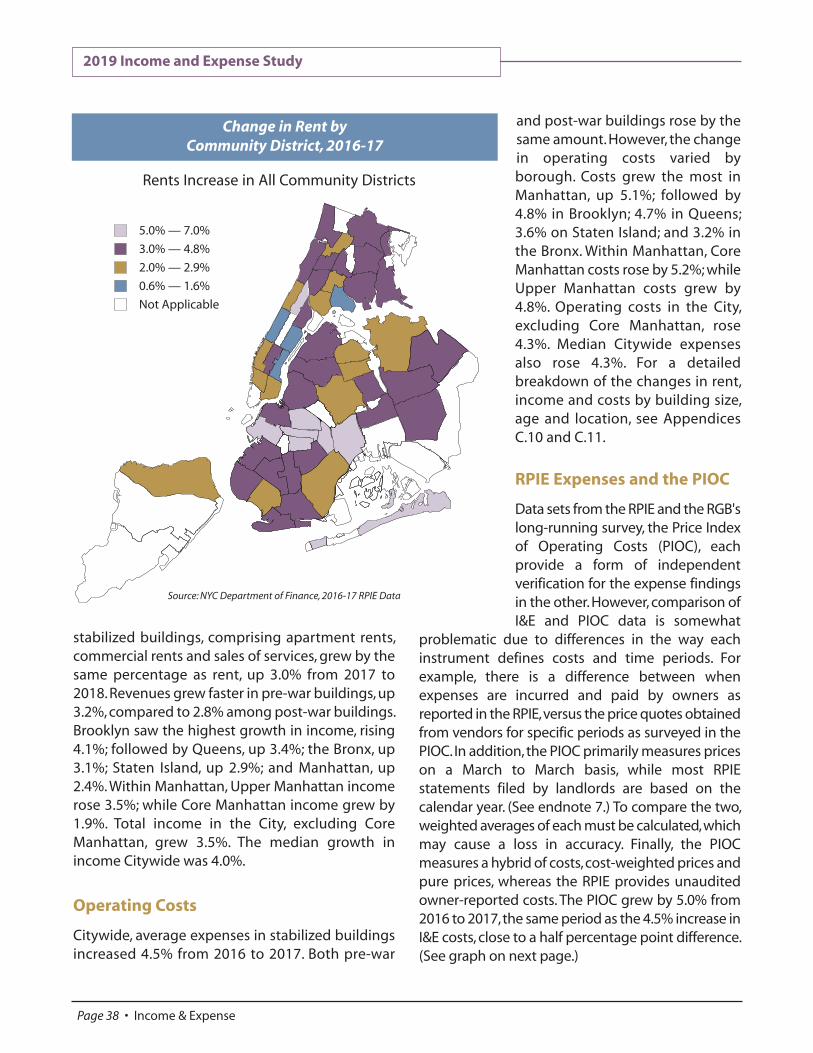
stabilized buildings, comprising apartment rents, commercial rents and sales of services, grew by the same percentage as rent, up 3.0% from 2017 to 2018. Revenues grew faster in pre-war buildings, up 3.2%, compared to 2.8% among post-war buildings. Brooklyn saw the highest growth in income, rising 4.1%; followed by Queens, up 3.4%; the Bronx, up 3.1%; Staten Island, up 2.9%; and Manhattan, up 2.4%. Within Manhattan, Upper Manhattan income rose 3.5%; while Core Manhattan income grew by 1.9%. Total income in the City, excluding Core Manhattan, grew 3.5%. The median growth in income Citywide was 4.0%.
Operating Costs Citywide, average expenses in stabilized buildings increased 4.5% from 2016 to 2017. Both pre-war
and post-war buildings rose by the same amount. However, the change in operating costs varied by borough. Costs grew the most in Manhattan, up 5.1%; followed by 4.8% in Brooklyn; 4.7% in Queens; 3.6% on Staten Island; and 3.2% in the Bronx. Within Manhattan, Core Manhattan costs rose by 5.2%; while Upper Manhattan costs grew by 4.8%. Operating costs in the City, excluding Core Manhattan, rose 4.3%. Median Citywide expenses also rose 4.3%. For a detailed breakdown of the changes in rent, income and costs by building size, age and location, see Appendices C.10 and C.11.
RPIE Expenses and the PIOC Data sets from the RPIE and the RGB's long-running survey, the Price Index of Operating Costs (PIOC), each provide a form of independent verification for the expense findings in the other. However, comparison of I&E and PIOC data is somewhat
problematic due to differences in the way each instrument defines costs and time periods. For example, there is a difference between when expenses are incurred and paid by owners as reported in the RPIE, versus the price quotes obtained from vendors for specific periods as surveyed in the PIOC. In addition, the PIOC primarily measures prices on a March to March basis, while most RPIE statements filed by landlords are based on the calendar year. (See endnote 7.) To compare the two, weighted averages of each must be calculated, which may cause a loss in accuracy. Finally, the PIOC measures a hybrid of costs, cost-weighted prices and pure prices, whereas the RPIE provides unaudited owner-reported costs. The PIOC grew by 5.0% from 2016 to 2017, the same period as the 4.5% increase in I&E costs, close to a half percentage point difference. (See graph on next page.)
2019 Income and Expense Study
Page 38 • Income & Expense
5.0% — 7.0%
3.0% — 4.8%
2.0% — 2.9%
0.6% — 1.6%
Not Applicable
Source: NYC Department of Finance, 2016-17 RPIE Data
Rents Increase in All Community Districts
Change in Rent by Community District, 2016-17

From 1990-91 to 2016-17, cumulative growth in owners’ costs as measured by the two indices varied. Overall nominal costs measured in the PIOC increased at a greater rate, 210.7%, compared to RPIE data, which grew 186.0% over this period.11
Operating Cost Ratios Between 2016 and 2017, the proportion of gross income spent on audit-adjusted expenses (the O&M Cost-to-Income ratio) increased, rising by eight-tenths of a percentage point. The proportion of rental income used for audit-adjusted expenses (the O&M Cost-to-Rent ratio) likewise rose, increasing by one percentage point.
Net Operating Income Net Operating Income (NOI) refers to the earnings that remain after operating and maintenance (O&M) expenses are paid, but before payments of
income tax and debt service. Since actual average collected income grew more than actual average operating costs, Citywide net operating income in rent stabilized buildings increased but the increase was just 0.4% in 2017, the smallest increase over the thirteen consecutive years that NOI has grown. Citywide, NOI in pre-war buildings increased 0.6%, while newer, post-war buildings grew by 0.1%.
The average change in NOI from 2016 to 2017 differed throughout the City. NOI increased in each borough except Manhattan. NOI grew the most in the Bronx, rising 2.9%; while it rose 2.7% in Brooklyn; 1.5% on Staten Island; and 1.3% in Queens. In Manhattan, NOI declined 2.0%, though the decline occurred solely in Core Manhattan, falling 3.1%, while NOI rose 1.0% in Upper Manhattan. Monthly NOI in the City, excluding Core Manhattan, increased 2.1%. See Appendix C.12 for a breakdown of NOI by borough, building age and building size.
At the Community District level, NOI rose in two-thirds of the City. The neighborhoods seeing the
2019 Income and Expense Study
Housing NYC: Rents, Markets & Trends 2019 • Page 39
-2%
0%
2%
4%
6%
8%
10%
12%
14%
'17'16'15'14'13'12'11'10'09'08'07'06'05'04*'03'02'01'00'99'98'97'96'95'94'93'92'91'90
7.2
%7
.1%
5.4
%
5.9
%
0.6
%
3.5
%
0.1
%
3.3
%
2.5
%
4.8
%
6.9
%1
2.3
%
0.7
%
7.3
%
1.0
%
1.5
%
4.5
%2
.5%
4.5
%3
.4% 4
.5%
4.2
%2
.7%
8.5
%8
.4% 9
.4%
12
.5%
6.0
%5
.8%
4.1
%
2.1
%
1.9
%
6.1
% 7.1
%5
.2%
4.9
%6
.4%
0.1
%3
.6%
5.5
%
3.6
% 4.1
% 5.1
%3
.2%
5.8
%5
.0%
0.9
% 1.8
%5
.6%
-0.8
%1
.1%
4.3
%2
.4%
PIOC (adjusted) RPIE Expenses
N.A
.
4.5
%5
.0%
*Longitudinal RPIE data for 2004 is unavailable (see endnote 11). Sources: NYC Department of Finance, 1990-2017 RPIE Data; RGB Price Index of Costs (PIOC) 1990-2017
In 2017, PIOC Costs Grew More Than Owner-Reported RPIE Expenses
Change in Operating & Maintenance Costs, RPIE and the PIOC, 1990 to 2017

greatest growth in NOI were Central Harlem, Manhattan, up 18.4%; the Rockaways, in Queens, up 16.8%; Bedford Stuyvesant, Brooklyn, up 15.6%; and Mott Haven/Port Morris, the Bronx, up 10.7%. Meanwhile, of the one-third of neighborhoods seeing NOI decline, the largest was on the Upper West Side of Manhattan, declining 5.7%; Throgs Neck/Co-op City, down 4.8%; Stuyvesant Town/Turtle Bay, falling 4.6%; and Forest Hills/Rego Park, Queens, down 3.9%. The largest decline in Brooklyn was in Bensonhurst, falling 2.2%. The map on this page and Appendix C.13 shows how NOI varied in each neighborhood throughout NYC. (See endnote 10.)
Summary RPIE filings, from almost 15,400 rent stabilized buildings containing close to 694,500 units in the
main RPIE study, and from over 14,300 buildings containing almost 653,000 units in the longitudinal study, were analyzed in this year's Income and Expense Study. Citywide, average rent and revenue collections each rose 3.0%; and expenses rose by 4.5%. Despite the greater rate of increase in expenses, Net Operating Income (NOI) Citywide increased by 0.4%. (This is because the larger percentage increase for expenses is on a smaller basis.) This is the 13th consecutive year that NOI has increased. (See table on next page for historical data.) However, the proportion of distressed properties Citywide rose 0.1 percentage point, to 5.0%. While an uptick is of concern, the proportion of distressed properties remains low by historical standards. In addition, the audit-adjusted cost-to-income ratio was 59.3%, an increase of one percentage point from the previous year.
Methodology The information in this report was generated by analyzing data sets derived from RPIE forms filed with the NYC Department of Finance in 2018 by owners of apartment buildings with primarily eleven or more dwelling units. The data in these forms, which reflects financial conditions in stabilized buildings for the year 2017, was made available to the RGB beginning in December 2018 for analysis. Unit averages contained in this analysis were computed by the NYC Department of Finance. The averages were then weighted by the RGB using data from the 2017 NYC Housing and Vacancy Survey, the most recent comprehensive data available, to calculate averages that are representative of the population of residential buildings in New York City. In addition, medians were calculated and included
2019 Income and Expense Study
Page 40 • Income & Expense
8.1% — 18.4%
3.2% — 7.2%
0.2% — 2.9%
-5.7% — -0.2%
Not Applicable
Net Operating Income Grows in Two-Thirds of Community Districts
Change in NOI by Community District, 2016-17
Source: NYC Department of Finance, 2016-17 RPIE Data

2019 Income and Expense Study
Housing NYC: Rents, Markets & Trends 2019 • Page 41
Note: Longitudinal data from 2003-04 is unavailable. Source: NYC Department of Finance, 1990-2017 RPIE Data
Avg. Rent Growth Avg. Income Growth Avg. Cost Growth Avg. NOI Growth
1990-91 3.4% 3.2% 3.4% 2.8%
1991-92 3.5% 3.1% 4.2% 1.2%
1992-93 3.8% 3.4% 2.1% 6.3%
1993-94 4.5% 4.7% 2.5% 9.3%
1994-95 4.3% 4.4% 2.5% 8.0%
1995-96 4.1% 4.3% 5.4% 2.3%
1996-97 5.4% 5.2% 1.9% 11.4%
1997-98 5.5% 5.3% 1.5% 11.8%
1998-99 5.5% 5.5% 3.5% 8.7%
1999-00 6.2% 6.5% 8.4% 3.5%
2000-01 4.9% 5.2% 4.8% 5.9%
2001-02 4.0% 4.1% 6.9% -0.1%
2002-03 3.6% 4.5% 12.5% -8.7%
2003-04 - - - -
2004-05 4.6% 4.7% 6.0% 1.6%
2005-06 5.6% 5.5% 4.1% 8.8%
2006-07 6.5% 6.5% 5.2% 9.3%
2007-08 5.8% 6.2% 6.4% 5.8%
2008-09 1.4% 1.8% 0.1% 5.8%
2009-10 0.7% 1.2% 0.9% 1.8%
2010-11 4.4% 4.5% 4.1% 5.6%
2011-12 5.0% 5.3% 3.2% 9.6%
2012-13 4.5% 4.5% 5.0% 3.4%
2013-14 4.8% 4.9% 5.6% 3.5%
2014-15 4.4% 4.4% 1.1% 10.8%
2015-16 3.1% 3.1% 2.4% 4.4%
2016-17 3.0% 3.0% 4.5% 0.4%
Changes in Average Monthly Rent, Income, Operating Costs and Net Operating Income per Dwelling Unit, 1990-2017
Net Operating Income (NOI) Increased for 13th Consecutive Year in 2016-17

in this report. The medians derived from the data were also produced by the NYC Department of Finance. It is important to note that these medians were not adjusted by the 2017 HVS and are considered to be unweighted.
Two types of summarized data, primary RPIE data and longitudinal data, were obtained for stabilized buildings. The primary RPIE data, which provides a “snapshot” or “moment-in-time” view, comes from properties that filed RPIE forms in 2017, or alternatively, TCIE (Tax Commission Income & Expense) forms.12 Data from the forms was used to compute average and median rents, operating costs, etc., that were typical of the year 2017. Longitudinal data, which provides a direct comparison of identical elements over time, encompasses properties that filed RPIE/TCIE forms for the years 2016 and 2017. The longitudinal data describes changing conditions in average rents, operating costs, etc., by comparing forms from the same buildings over two years. Thus, the main part this report measures conditions existing throughout 2017, while the longitudinal data section measures changes in conditions that occurred from 2016 to 2017.
This year, 15,395 buildings containing rent stabilized units were analyzed in the main RPIE study and 14,332 buildings were examined in the longitudinal study. The collection of buildings was created by matching a list of properties registered with HCR against building data found in 2018 RPIE or TCIE statements (or 2017 and 2018 statements for the longitudinal study). A building is considered rent stabilized if it contains at least one rent stabilized unit.
Once the two data sets were drawn, properties that met the following criteria were not included: • Buildings containing fewer than 11 units. Owners
of buildings with fewer than 11 apartments (without commercial units) are not required to file RPIE forms;
• Owners who did not file an RPIE or TCIE form in 2018 for the main part of this study, or an RPIE or TCIE form in both 2017 and 2018 for the longitudinal study;
• No unit count could be found in RPIE/TCIE records; and
• No apartment rent or income figures were recorded on the RPIE or TCIE forms. In these cases, forms were improperly completed or the building was vacant.
Three additional methods were used to screen
the data so properties with inaccurate building information could be removed to protect the integrity of the data: • In early I&E studies, the NYC Department of
Finance used the total number of units from their Real Property Assessment Data (RPAD) files to classify buildings by size and location. RGB researchers found that sometimes the unit counts on RPIE forms were different than those on the RPAD file, and consequently deemed the residential counts from the RPIE form more reliable;
• Average monthly rents for each building were compared to rent intervals for each borough to improve data quality. Properties with average rents outside of the borough rent ranges were removed from all data. Such screening for outliers is critical since such deviations may reflect data entry errors and thus could skew the analysis; and
• Buildings in which operating costs exceeded income by more than 300% as well as buildings above the 99th percentile or below the 1st percentile were excluded.
As in prior studies, after compiling both data
sets, the NYC Department of Finance categorized data reflecting particular types of buildings throughout the five boroughs (e.g., structures with 20-99 units). r
Endnotes
1. RPIE rent figures include money collected for apartments, owner-
occupied or related space and government subsidies. Income encompasses all revenue from rent, including commercial rent, sales of services, such as laundry, parking, and vending, and all other operating income.
2. Pre-war buildings refer to those built before 1947; post-war
buildings refer to those built after 1946.
2019 Income and Expense Study
Page 42 • Income & Expense

3. Core Manhattan represents the area south of W 110th and E 96th Streets. Upper Manhattan is the remainder of the borough.
4. Average rent stabilized contract rents for 2017 were computed
using the 2017 NYC Housing and Vacancy Survey (HVS). 5. Preferential rents refer to actual rent paid, which is lower than the
“legal rent,” or the maximum amount the owner is entitled to charge. Owners can offer preferential rents when the current market cannot bear the legal rent. According to HCR, approximately 30% of all 2017 apartment registrations filed indicate a preferential rent.
6. Since the 2008 Income and Expense Study, adjustment of the RGB
Rent Index has been calculated on a January-to-December calendar year. Also see Endnote 7.
7. According to the NYC Department of Finance, over 90% of owners
filing RPIEs report income and expense data by calendar year. In earlier reports, adjusted HCR data was calculated on a July-to-June fiscal year. Beginning with the 2008 Income and Expense Study, adjustment of HCR Citywide data was calculated on the January-to-December calendar year, so figures may differ from data reported in prior years.
8. RPIE longitudinal data from 2003-04 is excluded from this study
because no longitudinal data was available for 2003-04. Therefore, the growth in RPIE collected rents, 200.3%, is understated. To make a more valid comparison between the three indices, cumulative increases in both the RGB Rent Index and HCR contract rent calculations exclude 2003-04 data as well. If 2003-04 data were included, the RGB Rent Index increased 189.3% and the HCR rent increased 234.9%.
9. The year 1990 is used as the beginning of a point-to-point
comparison because that is the first year in which a greatly expanded base of Real Property Income and Expense (RPIE) data was made available.
10. Six Community Districts were excluded from this analysis because
they contained too few buildings for the data to be reliable. Unlike Citywide and borough level rent and expense data, average CD rents and expenses are unweighted (not adjusted by the 2017 HVS) and do not necessarily represent the population of buildings in these Community Districts. All averages were computed by the NYC Department of Finance.
11. Due to the unavailability of RPIE longitudinal data for 2003-04,
PIOC data from 2003-04 is also excluded from this comparison. 12. TCIE (Tax Commission Income & Expense) forms are used by the
NYC Department of Finance when RPIE forms are not filed by owners. An owner may file a TCIE form when making a claim that their property was incorrectly assessed or improperly denied an exemption from real property tax.
2019 Income and Expense Study
Housing NYC: Rents, Markets & Trends 2019 • Page 43


Housing NYC: Rents, Markets & Trends 2019 • Page 45
New York City Rent Guidelines Board 2019 Mortgage Survey Report
R Average interest rates for new multifamily mortgages decreased 18 basis points, to 4.65%.
R Vacancy and collection losses decreased 0.24 percentage
points, to 2.59%, the lowest level ever recorded by this survey.
R Average service fees for new loans declined from 0.44
last year to 0.38 points this year, the lowest level ever recorded by this survey.
R Average maximum loan-to-value ratios fell from 73.5%
last year to 72.0% this year. R A total of 885 buildings containing rent stabilized units
were sold Citywide in 2018, a 12% increase from the prior year.
What’s New46 Introduction
46 Overview
46 Survey Respondents
47 Mortgage Survey Analysis
51 Longitudinal Analysis
52 Sales Data Analysis
54 Summary
124 Appendices

2019 Mortgage Survey Report
Introduction Section 26-510 (b)(iii) of the Rent Stabilization Law requires the NYC Rent Guidelines Board (RGB) to consider the “costs and availability of financing (including effective rates of interest)” in its deliberations. To assist the Board in meeting this obligation, each winter the RGB research staff surveys lending institutions that underwrite mortgages for multifamily rent stabilized properties in New York City. See Appendix D.6 for a reproduction of the survey. The survey provides details about New York City’s multifamily lending market during the 2018 calendar year as well as the first few months of 2019.
The survey is organized into three sections: financing availability and terms for rent stabilized buildings; underwriting criteria; and additional mortgage questions, including vacancy and collection losses, operating and maintenance expenses, and portfolio performance information. In addition to the survey analysis, rent stabilized building sales data, obtained from the NYC Department of Finance, are also examined.
Overview The Mortgage Survey this year revealed that both interest rates and service fees declined. In addition, collection losses continued to fall, reaching a record low; maximum loan-to-value ratios fell; and underwriting criteria remained similar. Furthermore, our analysis of rent stabilized building sales data found that sales volume grew Citywide between 2017 and 2018.
This report will more fully detail this data, beginning with a discussion of the characteristics of all of this year’s survey respondents, followed by a longitudinal analysis of those responding both last and this year. Further, it will examine rent stabilized building sales data by volume and price.
Survey Respondents Eleven financial institutions responded to this year’s survey, one fewer than last year. This year’s respondents include a variety of traditional lending institutions, such as savings and commercial banks, as well as non-traditional lenders.
Institutions holding deposits insured by the Federal Deposit Insurance Corporation (FDIC) supply details about their holdings on a quarterly basis, including their multifamily real estate holdings, which vary considerably among the respondents. Eight surveyed lenders report their multifamily real estate holdings to the FDIC, with values ranging between $22.1 million and $29.9 billion.1 Five of this
Page 46 • Income & Expense
Actual LTV - the typical loan-to-value ratio of buildings in lenders’ portfolios Basis Points - a common unit of measure for interest rates and other percentages in finance. One basis point is equal to 1/100th of 1%, or 0.01 percentage point Debt Service - the repayment of loan principal and interest Debt Service Ratio - net operating income divided by the debt service; measures the risk associated with a loan; the higher the ratio, the less money an institution is willing to lend Loan-to-Value Ratio (LTV) - the dollar amount institutions are willing to lend based on a building’s value; the lower the LTV, the lower the risk to the lender Maximum LTV - the loan-to-value ratio set by the lenders as part of their underwriting criteria Points - up-front service fees charged by lenders as a direct cost to the borrowers Term - the amount of time the borrower has to repay the loan; generally, the term should not exceed the remaining economic life of the building
Terms and Definitions

year’s respondents reported multifamily holdings of over one billion dollars, while two institutions held less than $100 million. The multifamily real estate portfolio of our survey respondents averaged $6.5 billion, up 26% from the prior year.
Mortgage Survey Analysis Financing Availability and Terms As of February 2019, the average interest rate for new multifamily mortgages was 4.65%, an 18 basis points (or 4%) decline from the previous February, the first decline in three years (see graph on this page and Appendix D.1). Over the last five years, the average interest rate was 4.40%. In addition, the average interest rate reported by lenders for the 2018 calendar year was 4.79%, a 36 basis points (or 8%) increase from 2017.
Average interest rates decreased during the year among the institutions surveyed, despite interest rate increases throughout 2018 by the
Federal Reserve (The Fed). The Discount Rate — the interest rate at which depository institutions borrow from the Federal Reserve Bank of New York — rose 25 basis points on four occasions in 2018 (March, June, September and December). The Federal Funds Rate — the interest rate at which depository institutions lend balances at the Federal Reserve to other depository institutions — also rose 25 basis points in each of those aforementioned months.2 The Fed is not expected to increase interest rates in 2019, assuming inflation remains low and economic expansion continues.3
Points charged for new loans reached a record low this year. Among survey respondents, they ranged between zero and one, with five surveyed lenders charging no points on new loans. The average service fee charged on new loans by lenders was 0.38 points, a six basis points (or 14%) decrease from last year’s 0.44 points. Average fees reported in the survey have remained around or below one point for the past two decades (see the graph on next page).
2019 Mortgage Survey Report
Housing NYC: Rents, Markets & Trends 2019 • Page 47
0%1%2%3%4%5%6%7%8%9%
10%11%12%13%14%15%16%17%
2005
2004
2003
2002
2001
2000
1999
1998
1997
1996
1995
1994
1993
1992
1991
1990
1989
1988
1987
1986
1985
1984
1983
1982
1981
2006
2007
2008
2009
2010
2011
2012
2013
2014
2015
2016
2017
2019
2018
Source: NYC Rent Guidelines Board, annual Mortgage Surveys.
Multifamily Mortgage Interest Rates Decrease This Year
Average Interest Rates for New Loans to Rent Stabilized Buildings, 1981-2019

Surveyed lenders, for the most part, remained flexible in the loan maturity terms they offered their borrowers. Since survey respondents typically offer a wide range of terms rather than a single number, it is not possible to provide an average for the range of terms offered by institutions, but they remained similar to those offered in recent years. Mortgage terms reported by respondents fell within a wide 5- to 40-year range. This continued mortgage term flexibility over recent years is in great contrast to terms reported in the surveys of the early- to mid-1990s, when close to half of respondents offered maximum loan maturities of just five years.
The average volume of new mortgage originations in our survey rose from 43 last year to an average of 94 new loans per institution financed this year, a 116% increase, in part due to the addition of one larger lender in this year’s survey. In addition, the average number of refinanced loans increased more modestly this year, rising from 53 last year to 57 this year, a 7% increase. Overall loan volume is well below the peak year of 2004, when our survey reported an average of 160 new loans per
institution. This year, a majority of lenders reported no change in new loan volume, while about a third reported an increase in loan volume, and just one lender reported a decline.
Underwriting Criteria The survey asked lenders for their typical underwriting standards when approving new and refinanced mortgages to rent stabilized building owners. Lenders this year, on average, reported lending standards similar to last year. For all institutions, the typical maximum Loan-to-Value (LTV) ratio — the maximum dollar amount respondents were willing to lend based on a building’s value — ranged from 60% to 82.5%. This year’s average, 72.0%, declined 1.5 percentage points from last year’s 73.5% (see graph on next page).
Another important lending criterion is the debt service ratio — an investor’s ability to cover mortgage payments using its net operating income (NOI). The higher the debt service coverage requirements, the less money a lender is willing to
2019 Mortgage Survey Report
Page 48 • Income & Expense
0.0
0.2
0.4
0.6
0.8
1.0
1.2
1.4
1.6
1.8
2.0
2.2
2.4
2.6
2.8
2005
2004
2003
2002
2001
2000
1999
1998
1997
1996
1995
1994
1993
1992
1991
1990
1989
1988
1987
1986
1985
1984
1983
1982
1981
2006
2007
2008
2009
2010
2011
2012
2013
2014
2015
2016
2017
2019
2018
Source: NYC Rent Guidelines Board, annual Mortgage Surveys.
Service Fees Decrease To Record Low in 2019
Service Fees for New Loans to Rent Stabilized Buildings, 1981-2019
loan given constant net income. The debt service ratio (or NOI divided by the debt service) remained little changed, with an average debt service requirement of 1.21, versus 1.23 last year. Because the average debt service ratio remained about the same, lenders have maintained the amount of money they are willing to lend in relation to the net operating income of buildings (see Appendix D.2). Overall, debt service coverage at all institutions ranged between 1.15 and 1.25, and no surveyed lenders reported adjusting their underwriting standards over the past year.
Lenders also noted additional standards they use when evaluating loan applications. The most commonly cited standard is good building maintenance, with almost half of lenders indicating that it is an important consideration when reviewing a loan application.
The survey asked lenders whether their lending standards differ for rent stabilized buildings versus non-stabilized multifamily properties. Respondents were asked whether their new financing rates; refinancing rates; loan-to-value ratios; and debt
service coverage requirements for rent stabilized properties were higher, lower, or the same as for other properties. While the majority of lenders reported no difference, one lender reported higher refinancing rates, while two lenders reported more conservative LTV ratios and debt service coverage for stabilized buildings. By contrast, one lender reported more favorable financing rates; two lenders reported better refinancing rates; one lender reported more beneficial LTV ratios; and another two lenders reported more lenient debt service coverage requirements for stabilized buildings in their portfolios.
Non-Performing Loans & Foreclosures The number of lenders reporting that they had non-performing loans was about the same this year, with two lenders reporting that less than 1% of their portfolios were non-performing, compared to one lender last year. In addition, like last year, just one lender reported foreclosures this year, also representing less than 1% of its portfolio.
2019 Mortgage Survey Report
Housing NYC: Rents, Markets & Trends 2019 • Page 49
0%
60%
62%
64%
66%
68%
70%
72%
74%
76%
78%
'19'18'17'16'15'14'13'12'11'10'09'08'07'06'05'04'03'02'01'00'99'98'97'96
Source: NYC Rent Guidelines Board, annual Mortgage Surveys.
Maximum Loan-to-Value Ratios Decline
1996-2019 Average Loan-to-Value Standards
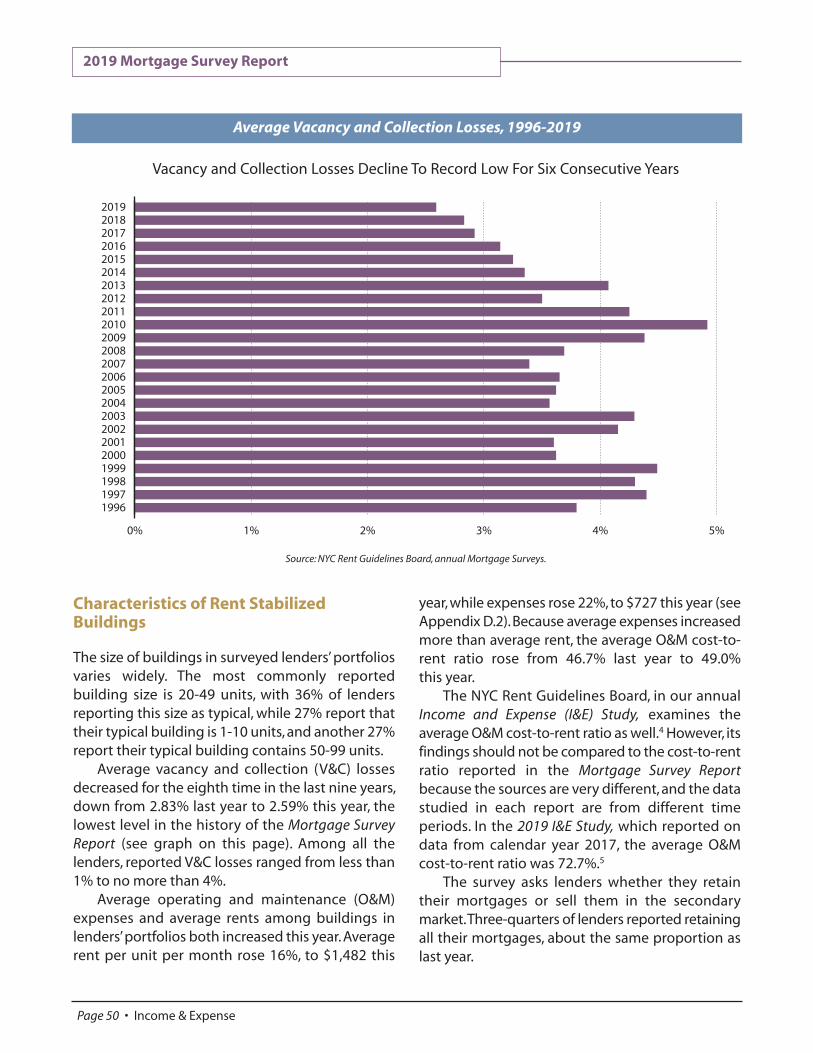
Characteristics of Rent Stabilized Buildings The size of buildings in surveyed lenders’ portfolios varies widely. The most commonly reported building size is 20-49 units, with 36% of lenders reporting this size as typical, while 27% report that their typical building is 1-10 units, and another 27% report their typical building contains 50-99 units.
Average vacancy and collection (V&C) losses decreased for the eighth time in the last nine years, down from 2.83% last year to 2.59% this year, the lowest level in the history of the Mortgage Survey Report (see graph on this page). Among all the lenders, reported V&C losses ranged from less than 1% to no more than 4%.
Average operating and maintenance (O&M) expenses and average rents among buildings in lenders’ portfolios both increased this year. Average rent per unit per month rose 16%, to $1,482 this
year, while expenses rose 22%, to $727 this year (see Appendix D.2). Because average expenses increased more than average rent, the average O&M cost-to-rent ratio rose from 46.7% last year to 49.0% this year.
The NYC Rent Guidelines Board, in our annual Income and Expense (I&E) Study, examines the average O&M cost-to-rent ratio as well.4 However, its findings should not be compared to the cost-to-rent ratio reported in the Mortgage Survey Report because the sources are very different, and the data studied in each report are from different time periods. In the 2019 I&E Study, which reported on data from calendar year 2017, the average O&M cost-to-rent ratio was 72.7%.5
The survey asks lenders whether they retain their mortgages or sell them in the secondary market. Three-quarters of lenders reported retaining all their mortgages, about the same proportion as last year.
2019 Mortgage Survey Report
Page 50 • Income & Expense
0% 1% 2% 3% 4% 5%
199619971998199920002001200220032004200520062007200820092010201120122013201420152016201720182019
Source: NYC Rent Guidelines Board, annual Mortgage Surveys.
Vacancy and Collection Losses Decline To Record Low For Six Consecutive Years
Average Vacancy and Collection Losses, 1996-2019

Lenders are asked whether the rent stabilized buildings that are offered mortgage financing contain commercial space. This information is useful to help understand the extent to which owners earn income from sources other than residential tenants. All but two surveyed lenders this year reported that buildings in their portfolio contain commercial space, though the average number varies depending on the lender. On average, lenders report that 25% of their portfolios contain commercial space, compared to 35% last year.
Loan Expectations The survey asks lenders about the performance of their portfolios, compared with expectations at the time of initial loan origination, regarding net operating income (NOI); debt service coverage; and O&M expenses. A majority of lenders reported that their expectations had been met or exceeded in all areas among their rent stabilized portfolio. Specifically, at least 82% said this year that their expectations were equaled or exceeded among all three categories, about the same as in the prior year.
Longitudinal Analysis Information regarding rent stabilized buildings can also be examined longitudinally to more accurately assess changes in the lending market, since many respondents reply to the Mortgage Survey in at least two successive years. This longitudinal comparison helps to clarify whether changes highlighted in the primary mortgage survey analysis reflect actual variations in the lending market or simply the presence of a different group of lenders from year-to-year. Among the 11 respondents that completed the survey this year, all but one also responded last year. The 10 lenders that make up the longitudinal group, and their responses from both this year and last year, are compared in this section to illustrate changes between the two years.
Financing Availability and Terms In contrast to the main survey analysis, where the average interest rate declined, the longitudinal group saw interest rates rise. As of February 2019, interest rates were reported as 4.72%, an increase
2019 Mortgage Survey Report
Housing NYC: Rents, Markets & Trends 2019 • Page 51
Average Interest Rates, Loan Volume, Points, Loan-to-Value Ratios, Debt Service Coverage, and Vacancy & Collection Losses
NF= New Financing RF= Refinancing LTV=Loan-to-Value V&C=Vacancy and Collection
Source: NYC Rent Guidelines Board, Annual Mortgage Surveys.
Selected 2019 Mortgage Survey Data Compared to 2019 Longitudinal Data
(Averages)
NF Interest
Rate
NF Loan Volume
RF Loan Volume
NF Points
Max LTV
Ratio
Debt Service
Ratio V&C
Losses
2019 Mortgage Survey Data 4.65% 94 57 0.38 72.0% 1.21 2.59%
2019 Longitudinal Data 4.72% 91 60 0.42 71.8% 1.21 2.55%

from a year earlier, when the average interest rate was 4.68% (see Appendix D.3).
Among the longitudinal group, average points offered by lenders increased from last year, rising from 0.33 to 0.42. This differs from the main survey analysis, where average points declined. Underwriting Criteria and Loan Performance Compared to the main mortgage survey analysis, underwriting criteria and loan performance was similar among the longitudinal group. The average maximum loan-to-value (LTV) ratio declined, falling among the longitudinal group from 73.3% last year to 71.8% this year. The average debt service ratio declined slightly, down from 1.23 last year to 1.21 this year. And vacancy and collection (V&C) losses among the longitudinal group declined, falling slightly, from 2.60% last year to 2.55% this year (see Appendix D.4).
Looking at the rate of delinquencies among the longitudinal group, two lenders reported non-performing loans, the same as last year. However, only one lender reported foreclosures this year, compared to two in the previous year.
Sales Data Analysis The NYC Department of Finance collects and provides public property sales information. Utilizing this data, this report examines rent stabilized building sales from 2018, and compares it with the prior year. Rent stabilized properties are identified by matching buildings that are registered with NYS Homes and Community Renewal (HCR); have not converted to co-op/condo; and have sold for at least $1,000.
Building Sales Volume In 2018, 885 buildings containing rent stabilized units were sold in New York City, up 12% from the prior year. Most boroughs saw sales volume increase. Sales grew the most in the Bronx, rising 25%, and in Manhattan, increasing 24%. Sales also rose in
Queens, up 7%. However, sales fell in Brooklyn, declining 4%. As in prior years, Staten Island was not included in this analysis because there were too few rent stabilized building sales to meaningfully measure change from year-to-year.6 See the table on this page for a numerical breakdown in the change in the number of buildings sold in each borough and Citywide.
Among buildings containing 6-10 residential units, sales volume was up 2% Citywide. However, the change in volume varied widely by borough. Sales among 6-10 unit buildings grew the most in Manhattan, rising 50%, and also rose in the Bronx, up 15% and Queens, up 6%. Meanwhile, sales fell 17% in Brooklyn.
Sales volume among 11-19 unit buildings also increased Citywide, up 12%. By borough, sales increased in two boroughs, rising 38% in Manhattan. Sales in Queens rose from 8 buildings in 2017 to 15 buildings in 2018, an 88% increase. By contrast, sales declined 21% in Brooklyn and 3% in the Bronx.
Among 20-99 unit buildings, sales volume also increased Citywide, rising 22%. By borough, sales of 20-99 unit buildings climbed the most in Brooklyn, increasing 63%; followed by the Bronx, up 43%; and Manhattan, up 3%. However, sales fell 26% in Queens.
2019 Mortgage Survey Report
Page 52 • Income & Expense
Sales Volume Change Varies by Borough
2017 2018 Change
Bronx 156 195 25.0%
Brooklyn 292 281 -3.8%
Manhattan 233 289 24.0%
Queens 112 120 7.1%
Citywide 793 885 11.6%
Note: Citywide figures exclude Staten Island Source: NYC Department of Finance.
Comparison of Building Sales in 2017 vs. 2018

Among the largest buildings, which contain 100 or more units, sales volume Citywide rose 38%. However, we do not analyze year-to-year changes in sales by borough among the largest building category because of the comparatively small number of buildings sold. However, these buildings sales are included in the totals by borough and Citywide.7
Over the 16-year period for which we have data, Citywide sales were at their peak in 2005, with 1,816 buildings sold, and at their lowest in 2009, with 521 sold. Following two consecutive years of decline, sales rose in 2018, by 12%. See the graph on this page and Appendix D.7 for annual sales volume Citywide.
Building Sales Prices We also examine 2018 rent stabilized building sales prices Citywide and by borough. However, in reporting sales prices, we are not able to take into consideration the condition of the building or the neighborhood where each building is sold, factors important in determining the sales price.
Examining sales for all sizes of buildings, the median Citywide sales price was $4.4 million in 2018. The highest median sales price was in Manhattan ($7.2 million); followed by the Bronx ($4.6 million); Brooklyn ($3.0 million); and Queens ($2.1 million).
Examining the smallest buildings (containing 6-10 residential units), the median sales price Citywide was $2.1 million. By borough, prices were highest in Manhattan, at $3.8 million; followed by Brooklyn, at $2.0 million; Queens, at $1.6 million; and the Bronx, at $1.4 million.
Among 11-19 unit buildings, the median Citywide price was $5.1 million. By borough, prices were highest in Manhattan, at $7.3 million; followed by Brooklyn, at $3.7 million; and the Bronx, at $2.6 million. (There were too few 11-19 unit building sales in Queens to analyze.)
Buildings with 20-99 units sold Citywide at a median price of $8.3 million. By borough, these buildings sold for the most in Manhattan, at a median price of $10.0 million followed by Brooklyn, at $9.3 million; Queens, at $8.7 million; and the Bronx, at $6.4 million.
2019 Mortgage Survey Report
Housing NYC: Rents, Markets & Trends 2019 • Page 53
0
200
400
600
800
1,000
1,200
1,400
1,600
1,800
2,000
2018201720162015201420132012201120102009200820072006200520042003
Note: Figures exclude Staten Island Source: NYC Department of Finance.
Citywide Building Sales Grew Over Prior Year
Rent Stabilized Building Sales, 2003-2018

Among the largest buildings, which contain 100 or more units, buildings Citywide sold for a median price of $78.9 million. However, as previously mentioned, too few buildings containing 100 or more residential units were sold to accurately report borough building prices in more detail. See Appendix D.8 for a breakdown of median sales prices in each borough among different sized buildings.
Summary Average interest rates declined, and both service fees as well as vacancy and collection losses fell to their lowest levels in this survey’s history. However, interest rates and service fees among the longitudinal group rose. In addition, the number of rent stabilized buildings sold increased from the prior year. r
Endnotes 1. Federal Deposit Insurance Corporation (FDIC) website:
https://fdic.gov. 2. Federal Reserve Board website:
https://www.federalreserve.gov/monetarypolicy/openmarket.htm and https://www.frbdiscountwindow.org.
3. “Fed Signals End of Interest Rate Increases,” by Binyamin
Appelbaum, New York Times. January 30, 2019. 4. The per unit, per month O&M expense and rent figures reported in
the Mortgage Survey reflect a very small, non-random sample of the City’s regulated stock and are included for informational purposes only. The rent and expense figures in the NYC Rent Guidelines Board’s Income and Expense Study are derived from a substantially larger number of stabilized buildings and can be viewed as more authoritative.
5. The O&M cost-to-rent ratio from the 2019 Mortgage Survey reflects
estimates by lenders of expenses and rents for rent stabilized buildings as of approximately February 2019. The average ratio is calculated from just six respondents. By comparison, the latest available O&M cost-to-rent ratio from the Income and Expense (I&E) Study, in which average rent was $1,353 and average unaudited cost was $984, reflects rents and expenses reported by owners for calendar year 2017. Average monthly costs per unit in the Mortgage Survey this year are lower than those reported in the I&E Study. This is due to differences in the two data sources: Lenders’ estimated average of buildings in an institution’s portfolio vs. a weighted average of a large number of owner-reported data; the large variance between the two sample sizes; and the difference between the buildings studied in each analysis. (Buildings required to file Real Property Income and Expense (RPIE) forms must generally have an assessed value greater than $40,000 and eleven or more units, while the Mortgage Survey does not exclude these buildings).
6. The data reflect sales of buildings that had been registered with the New York State Homes and Community Renewal (HCR) as containing rent stabilized units in 2017, the most recent year for which comprehensive registration records are available. It excludes those buildings where the sales price was listed as less than $1,000. It also excludes those buildings listed as co-ops/condos. Furthermore, all of Staten Island is excluded from all analyses due to the small number of eligible buildings sold.
7. All 100+ unit building borough categories are excluded due to the
small number of buildings sold. However, while these categories are not discussed, these buildings are included in the overall statistics and analyses.
2019 Mortgage Survey Report
Page 54 • Income & Expense

Income & Affordability 2019 Income and Affordability Study.................. pg. 57


Housing NYC: Rents, Markets & Trends 2019 • Page 57
58 Introduction
58 Overview
58 Economic Conditions
632017 NYC Housing and Vacancy Survey
65 Other Measures of Affordability
70 Cash Assistance & Benefit Programs
70 Housing Policy
71 Homelessness & Housing Court
73 Summary
129 Appendices
New York City Rent Guidelines Board 2019 Income and Affordability Study
R Results from the 2017 American Community Survey show that median renter income is $47,116, median gross rent is $1,379, and the median gross rent-to-income ratio is 31.7%.
R NYC’s economy grew by an inflation-adjusted 3.0%
in 2018. R Inflation-adjusted wages were up 3.5% in the most recent
time period studied (the fourth quarter of 2017 through the third quarter of 2018).
R The City gained 86,600 jobs in 2018, a 1.9% increase
from 2017. R The unemployment rate fell in 2018, to an average of
4.1%, down from 4.6% in 2017. R An average of 60,028 persons were staying in NYC
Department of Homeless Services shelters each night of 2018, up 0.9% from 2017.
R Non-payment filings in housing court decreased 4.7% in
2018, while cases actually heard decreased 10.5%. The number of tenant evictions fell 5.0%.1
R Cash assistance caseloads fell 2.8% in 2018, while the
number of SNAP (food stamp) recipients fell 3.6%, and Medicaid enrollees fell by 7.8%.
What’s New

Introduction Section 26-510(b) of the Rent Stabilization Law requires the Rent Guidelines Board (RGB) to consider “relevant data from the current and projected cost of living indices” and permits consideration of other measures of housing affordability in its deliberations. To assist the Board in meeting this obligation, the RGB research staff produces an annual Income and Affordability Study, which reports on housing affordability and tenant income in the New York City (NYC) rental market.
The study highlights year-to-year changes in many of the major economic factors affecting NYC’s tenant population and takes into consideration a broad range of market forces and public policies affecting housing affordability. Such factors include NYC’s overall economic condition — unemployment rate, wages, Consumer Price Index and Gross City Product — as well as the number of eviction proceedings and the impact of federal housing policies.
Overview NYC’s economy in 2018 showed many strengths as compared with the preceding year. Positive indicators include growing employment levels, which rose for the ninth consecutive year, increasing 1.9% in 2018. The unemployment rate also fell, declining by 0.5 percentage points, to 4.1%, the lowest level recorded in at least the last 43 years. Gross City Product (GCP) also increased for the ninth consecutive year, rising in inflation-adjusted terms by 3.0% in 2018.
Also during 2018, the number of non-payment filings in Housing Court fell by 4.7%, calendared cases by 10.5%, and tenant evictions by 5.0%.2 There was also a decrease in cash assistance caseloads of 2.8%, while SNAP caseloads fell 3.6% and Medicaid enrollees fell 7.8%. Inflation also rose at a slightly slower pace, with the Consumer Price Index rising 1.9% in 2018, 0.1 percentage points slower than 2017. In addition, following two years of stagnation, inflation-adjusted wages rose during the most recent 12-month period for which data is
available (the fourth quarter of 2017 through the third quarter of 2018), rising 3.5% over the corresponding time period of the prior year.
Negative indicators include personal bankruptcy filings, which rose 8.2% in New York City in 2018. In addition, homeless levels rose for the tenth consecutive year, although at a slowing rate, by 0.9%.
The most recent numbers, from the fourth quarter of 2018 (as compared to the fourth quarter of 2017), show many positive indicators, including cash assistance levels down 1.5%; SNAP recipients down 3.5%; GCP rising, by 3.0% in real terms; employment levels up 1.7%; the unemployment rate down 0.3 percentage points; and in Housing Court, the number of cases heard (calendared) down 3.2%3 and the number of non-payment filings down 2.7%.4 However, homeless rates were up 1.0% during the fourth quarter of 2018.
Economic Conditions Economic Output and Consumer Prices NYC’s economy expanded during 2018, growing for the ninth consecutive year. NYC’s Gross City Product (GCP), which measures the total value of goods and services produced, increased by 3.0% in inflation-adjusted (“real”) terms during 2018, following an increase of 2.6% in 2017.5 There has been positive economic growth in real terms in all but two quarters since the beginning of 2009. During 2018, the greatest growth was during the fourth quarter, a 3.9% annualized rise. For comparison, GCP increased in real terms by an annualized average of 1.7% per year between 2000 and 2009 and 2.8% in the 1990s. The analogous national number, United States Gross Domestic Product (GDP), increased a “real” 2.9% during 2018, compared to an increase of 2.2% during 2017.6
The Consumer Price Index (CPI), which measures the change in the cost of typical household goods, increased 1.9% in the NYC metropolitan area during 2018, a slightly slower rate of inflation than seen in the previous year, when prices rose on average 2.0%.7 Inflation was lower than that of urban consumers in the U.S. as a
2019 Income and Affordability Study
Page 58 • Income & Affordability

whole, with prices rising 2.4%, following an increase of 2.1% during 2017.
Unemployment Statistics NYC’s unemployment rate fell for the sixth consecutive year, declining 0.5 percentage points, to 4.1%.8 This is the lowest unemployment rate in at least the last 43 years9 (the first year for which data is available), besting the second lowest rate of 4.6% in 2017 and the third lowest rate of 5.0% in both 2006 and 2007. The U.S. unemployment rate also declined by 0.5 percentage points, falling from 4.4% in 2017 to 3.9% in 2018.10 (See graph on this page and Appendix E.1.)
In January and February of 2019, the most recently available data, the unemployment rate for NYC (4.9% and 4.6%, respectively) was equal to or
higher than that of the same months of the previous year, with the rate 0.3 percentage points higher in January and an equal rate in February. The analogous national figure was 4.4% in January of 2019 and 4.1% in February, 0.1 percentage points lower than January of 2018 and 0.3 percentage points lower than the previous February.
For all of 2018, Queens had the lowest unemployment rate of the boroughs, 3.6%, with Manhattan’s rate just slightly higher, at 3.7%; Staten Island at 4.1%; Brooklyn, at 4.2%; and the Bronx, consistently the borough with the highest unemployment rate, averaging 5.7%. Unemployment rates fell in every borough during 2018, declining 0.4 percentage points in Manhattan and Queens, 0.5 percentage points in Brooklyn, and 0.6 percentage points in both the Bronx and Staten Island.
2019 Income and Affordability Study
Housing NYC: Rents, Markets & Trends 2019 • Page 59
0%
1%
2%
3%
4%
5%
6%
7%
8%
9%
10%
2004
7.1% 5.0%
4.6% 5.5%
NYC
US
2005
5.8%
5.1%
2006
5.0%
4.6%
5.6%
5.8%
9.3%
9.3%
2007 2009
9.5% 9.1%
9.6% 8.9%
9.3%
8.1%
2010 2011 2012
8.8%
7.4%
2013
7.3%
6.2%
5.7%
5.3%
2014 2015
5.2%
4.9%
20162008
4.6%
4.4%
2017
4.1%
3.9%
2018
Source: U.S. Bureau of Labor Statistics and NYS Department of Labor; Data is updated annually and may differ from that in prior reports.
NYC & U.S. Unemployment Rates Fall in 2018
NYC and U.S. Unemployment Rates, 2004-2018

Employment Statistics For the ninth consecutive year, the number of people employed in NYC increased, following gains in all but one year since 2003 (see graph on this page). Overall, among both City residents as well as those commuting into the City, NYC gained 86,600 jobs in 2018, a 1.9% increase from 2017.11
Employment levels rose in all but two industries, rising by the greatest proportion in the Education and Health Services sector, which grew by 4.6% (44,300 jobs) during 2018. The Construction sector also grew, rising by 3.5% (5,300 jobs), and the Professional and Business Services sector grew by 2.6% (19,300 jobs). In the Manufacturing sector, which has declined in all but five years since 1990 (the first year for which data is available), employment fell by 3.6% (2,600 jobs), and is down more than 73% as compared with 1990. The Trade, Transport and Utilities sector also fell slightly,
declining by 0.05% (300 jobs). All other sectors rose from between 0.6% and 1.9%. (See Appendix E.2 for more detailed employment data.)
During the first two months of 2019, total employment levels were up as compared to the same months of 2018, with levels 2.1% higher in January and 1.7% higher in February of 2019 as compared with 2018. Employment levels were up in all but two sectors in January, and three in February (with Manufacturing and Leisure and Hospitality employment levels down in both months).
Two other employment indices are tracked in the I&A Study. The NYC labor force participation rate measures the proportion of all non-institutionalized people, age 16 and older, who are employed or actively looking for work. This ratio increased in 2018, to 60.9%, up from 60.8% in 2017, the highest ratio since at least 1990 (the first year for which data is available).12 This was lower than the U.S. rate, which remained at 62.9% in both 2017 and 2018.13
2019 Income and Affordability Study
Page 60 • Income & Affordability
3,500
3,600
3,700
3,800
3,900
4,000
4,100
4,200
4,300
4,400
4,500
4,600
20182017201620152014201320122011201020092008200720062005200420032002
Tho
usa
nd
s
NYC Employment Levels Rise for Ninth Consecutive Year
Source: NYS Department of Labor
Average Annual Payroll Employment, NYC, 2002-2018

A related statistic, the NYC employment/population ratio, measures the proportion of those who are actually employed as a ratio of all non-institutionalized people age 16 or older. This rate rose for the sixth consecutive year, from 57.9% in 2017 to 58.1% in 2018. This is the highest ratio since at least 1990 (the first year for which data is available). The U.S. employment/population ratio also rose in 2018, rising 0.3 percentage points from 2017, to reach 60.4%.
Wage Data This report also examines wage data of employees working in NYC (regardless of where they live). Highly accurate wage data can be derived from the NYS Department of Labor’s Quarterly Census of Employment and Wages (QCEW), though the analysis is limited by the fact that there is a significant lag time in the reporting of wage data. The most recent annual numbers cover the 2017 calendar year and show an increase in both nominal wages (wages in current dollars), as well as in “real” wages (wages adjusted for inflation). “Real” wages increased by 2.5% in 2017, following a decrease of 0.9% in the prior year. “Real” wages rose from $87,650 in 2016 (in 2017 dollars) to $89,836 in 2017, with wages rising in most sectors. This includes an 8.3% increase in the Financial and Insurance sector, the sector with the highest average wages, as well as the largest proportion of overall wages.14 Nominal wages increased by 4.5% over the same time period, following a 0.2% increase in the prior year.
QCEW data is submitted by employers quarterly to New York State and released to the public approximately six months later. Due to this lag time, as of the publication of this report, QCEW data is current only through the third quarter of 2018 (note that 2018 data is preliminary). In order to present the most recent statistics possible, staff has formulated a “year” of QCEW data that comprises the four most recent quarters (in this case, the fourth quarter of 2017 through the third quarter of 2018). This “year” was then compared with the equivalent period of the preceding “year,” which in this most recent time period showed that overall wages increased by 3.5% in real terms and
by 5.4% in nominal terms. This compares to increases in the preceding 12-month period of 0.1% in real terms and 2.0% in nominal terms. (See Appendices E.3 and E.4, and graph on this page.)
Wages in the Finance and Insurance sector, which account for just over a quarter of all wages during the most recent time period, increased by a “real” 4.4% during the most recent 12-month time period. This compares to an increase of 2.6% in the prior 12-month period. The sector with the second greatest weight, Administrative, Waste, Educational, and Health Services (accounting for 16% of all wages), rose by a “real” 2.2% during this time period. The Professional and Technical Services sector (accounting for 13% of all wages) rose by a “real” 2.1%. The Government sector, with 11% of all wages, rose by the largest proportion of any sector, 10.9% in real terms. The only decrease in “real” wages was in the Transportation sector, which declined 1.4%, but accounts for less than 2% of all wages. (See Appendices E.3 and E.4 for more detailed wage data.)
On a quarterly basis, “real” wages as reported by the QCEW rose by 1.6% in the first quarter of 2018, 3.5% in the second quarter, and 3.0% in the third
2019 Income and Affordability Study
Housing NYC: Rents, Markets & Trends 2019 • Page 61
$55,000
$60,000
$65,000
$70,000
$75,000
$80,000
$85,000
$90,000
$95,000
$100,000
2018
2017
2016
2015
2014
2013
2012
2011
2010
2009
2008
2007
2006
2005
2004
2003
Nominal Wages Real Wages (2018$)
Both Nominal and “Real” Wages Increase in 2018
“Real” and Nominal Wages, 2003-2018
Source: NYS Department of Labor
Note: Each “year” consists of the first three quarters of that year, and the fourth quarter of the preceding year.

quarter. “Yearly” wage growth also includes the fourth quarter of 2017, when wages rose 6.5% in real terms. Each year this report estimates “yearly” QCEW wage growth absent the impact of the Finance and Insurance sector. Overall wages are often pulled higher or lower as a result of this sector, which has both the largest proportion of overall wages, as well as the highest average wages. However, in 2018, this sector had no impact on overall wage growth. If the Finance and Insurance sector were removed from the analysis, wages would have risen by 3.5% in real terms and 5.4% in nominal terms, the same growth rate as with this sector included.
The U.S. Bureau of Labor Statistics (BLS) also tracks wage data, as part of its Current Employment Statistics (CES) survey.15 While both data sets track wages, they differ in their methodologies. Unlike the QCEW, which is based on quarterly tax filings of all employers in New York State, the CES is a monthly survey of approximately one-third of employers conducted by the BLS. CES data cannot be analyzed for specific industries (and does not include wages for government employees). In addition, while the CES is more current than that of the QCEW, it is based on a much smaller sample size. Also, unlike the QCEW, CES data does not include certain types of monetary compensation such as bonuses and sums received when exercising stock options, so it is therefore less variable on a quarterly basis than data from the QCEW.
According to the CES survey, weekly wages rose by a “real” 1.2% in NYC in 2018, just lower than the rate of growth in 2017 of 1.3%, but higher than that of the nation as a whole in 2018 (an increase of 0.8%). In nominal terms, weekly wages rose by 3.1% in NYC and 3.3% for the nation as a whole between 2017 and 2018. On a quarterly basis, the CES data shows that NYC weekly wages (in real terms) rose in each quarter of 2018, by the most in the third quarter (2.0%) and by the least in the second quarter (0.5%).
Bankruptcy Statistics Staff examined bankruptcy filings for NYC residents from 2000-2018. Between 20,000 and 30,000
persons filed for personal bankruptcy annually between 2000 and 2004, before surging to 42,852 in 2005 as bankruptcy laws were set to change. In the following year, with new laws in place making it more difficult to file for bankruptcy, only 7,961 persons filed for personal bankruptcy, an 81.4% decline. Filings then increased every year through 2010, reaching a high of 17,685, before generally starting to decline. In 2018, for the third consecutive year, personal bankruptcy filings rose among NYC residents. Filing reached 10,578, an 8.2% increase and the highest level since 2013. Filings in the U.S. as a whole declined for the eighth consecutive year, by 1.9%.16
Poverty Statistics The most recently available data from the Census Bureau’s American Community Survey (ACS) reports that the NYC poverty rate for all individuals was 18.0% in 2017, 0.9 percentage points lower than in 2016. This compares to 13.4% for the nation as a whole, a decline from 14.0% in 2016.17 Poverty rates vary widely depending on borough. Rates range from a low of 11.8% in Staten Island, to 12.1% in Queens, 16.2% in Manhattan, 19.8% in Brooklyn, and 28.0% in the Bronx, consistently the highest rate of the boroughs. As compared to the prior year, rates fell in every borough, by as much as 1.4 percentage points. (See Appendix E.8.)
Also reported are poverty rates by age. The poverty rate for persons under the age of 18 in NYC was 25.2% in 2017. The rate was 15.6% for individuals 18 to 64 and 18.0% for persons 65 years and over. For families, 14.7% were living under the poverty line in 2017. This includes 21.3% of families in rental units (the lowest proportion since at least 2005, the first year for which data is available) and 4.2% of families in owner-occupied units. For families containing related children under the age of 18, the figure is higher than that of all families, 21.2%. For married-couple families, the overall poverty rate was 8.9% in 2017, while for female- and male-headed families (i.e., no spouse present) it was 27.3% and 12.8%, respectively. Rates fell for every category noted here, as compared to the prior year, by as much as 2.2 percentage points.
2019 Income and Affordability Study
Page 62 • Income & Affordability

The Census Bureau has begun work on a “Supplemental Poverty Measure,” an additional measure of poverty that includes more components (such as non-cash benefits and location, among other factors) in estimating income and expenses.18 Using a similar methodology, the NYC Center for Economic Opportunity (CEO) calculated household poverty rates for NYC from 2005-2016 and found poverty rates higher than official rates released by the Census Bureau.19 For instance, the official household poverty rate in 2016 was 17.6% and the CEO estimate was 19.5%. The gap between official and CEO estimates has been as high as 3.0 percentage points over the 12 years studied by the CEO.
2017 Housing & Vacancy Survey Preliminary results from the 2017 Housing and Vacancy Survey (HVS) were released in February of 2018.20 This triennial survey provides data on the housing and demographic characteristics of NYC residents, including affordability of housing, rents, incomes, and vacancy rates for both tenants and owners. It is also the only survey that is able to provide data specifically for rent stabilized tenants.
Affordability of Rental Housing Generally, housing is considered affordable when a household pays no more than 30% of its income in gross rent.21 Gross rent includes contract rent (the rent paid to the owner of the apartment by either a tenant or a subsidizing agency) plus additional payments for fuel and/or utilities. The 2017 HVS reported that the median gross rent-to-income ratio for all renters was 33.7%, meaning that half of all households residing in rental housing pay more than 33.7% of their income in gross rent, and half pay less. This is the third consecutive survey in which the median gross rent-to-income ratio has remained virtually unchanged, declining just 0.1 percentage points from both 2011 and 2014. Furthermore, a third (32.4%) of rental households pay more than 50% of their household income in gross rent (down from 33.5% in 2014). The contract rent-to-income ratio was 31.3% for all renters in 2017, up 0.1 percentage points from 2014, and the highest ratio ever reported by the HVS.
Rent stabilized tenants are reported to have a median gross rent-to-income ratio of 36.0%, meaning a majority of rent stabilized tenants are not able to afford their apartments, based on the U.S. Department of Housing and Urban Development (HUD) benchmark for housing affordability of a 30% gross rent-to-income ratio. This figure includes those tenants in pre-war apartments, who are facing a median rent burden of 36.8%, and tenants in post-war units, with a median ratio of 34.4% in 2017. Median ratios decreased 0.4 percentage points for rent stabilized tenants as a whole, 0.2 percentage points for tenants in pre-war units, and 0.3 percentage points in post-war units from 2014.
It is important to note that an analysis done by RGB staff of the last four triennial HVS surveys found that officially reported rent-to-income ratios were somewhat high due to an anomaly in the way rents for tenants receiving Section 8 are recorded by the HVS. While generally paying no more than 30% of their income towards rent, tens of thousands of rent stabilized tenants receiving Section 8 are recorded with gross rent-to-income ratios in excess of 100%. An RGB analysis of 2017 HVS data found that the gross rent-to-income ratio for rent stabilized tenants not receiving Section 8 was 33.5%, a difference of 2.5 percentage points from the overall rent stabilized rate of 36.0%. Similarly, rates for rent stabilized tenants not receiving Section 8 were 2.7 percentage points lower than overall rent stabilized rates in 2014, when the rate was also 33.5%. The estimated “out of pocket” gross rent-to-income ratio for rent stabilized tenants as a whole in 2017 was 31.5%, a 0.7 percentage point decrease from 2014.
Rent controlled tenants had a median gross rent-to-income ratio of 43.1% (a 7.6 percentage point rise), unregulated tenants paid a median of 31.4% in 2017 (a decrease of 1.6 percentage points), and tenants in “other” regulated units, such as public housing and Mitchell-Lama, paid a median of 33.8% (an increase of 3.5 percentage points).
Income According to the 2017 HVS, which reflects household income for 2016, the median income for rental households was $47,200, an inflation-
2019 Income and Affordability Study
Housing NYC: Rents, Markets & Trends 2019 • Page 63

adjusted (“real”) increase of 10.9% from 2013.22
Owner households earned substantially higher income, which in 2016 was a median of $87,000, almost double the income of renters, and a “real” increase of 6.0% from 2013.
The 2017 HVS found different income levels among those living in units that were rent controlled, rent stabilized, unregulated, or part of some other regulation program. The lowest median income was found among those tenants in “other” regulated units, which at $18,792 was a “real” increase of 0.1% from 2013. Those in rent controlled units had a median household income of $28,260 in 2016, a “real” decrease of 5.0%. Tenants living in stabilized buildings built prior to 1947 (“pre-war”) had a median income of $42,000, and post-46 (“post-war”) tenants earned a median income level of $50,000, “real” increases of 2.4% and 6.0%, respectively. Stabilized tenants on the whole had a median income of $44,560 (a “real” increase of 7.0%), while those tenants in unregulated23 apartments earned a median of $67,000 in 2016 (a “real” increase of 12.6%).
Rent The HVS also examines rent levels, and it revealed that in 2017, the median monthly contract rent for all rental units was $1,337, an inflation-adjusted (“real”) increase of 8.1% from 2014. Rent stabilized tenants on the whole paid less ($1,269) in median contract rent, including $1,225 for pre-war rent stabilized apartments, and $1,400 for post-war rent stabilized apartments. These are “real” increases in median rents from 2014 of 2.6% for rent stabilized units as a whole, and 3.1% and 4.5% for pre- and post-war units, respectively. Among the other categories of rental units, rent controlled tenants paid a median of $915 (a 1.4% “real” decrease), tenants living in unregulated rentals paid a median of $1,700 (a “real” increase of 10.0%), and tenants living in “other” regulated units paid the least in median contract rent, $610 (a “real” increase of 1.5%).
Median gross rent was $1,450 for all renters, a “real” increase of 6.2%. Rent stabilized tenants on the whole paid a median gross rent of $1,375 in 2017, including $1,343 for pre-war rent stabilized apartments, and $1,485 for post-war rent stabilized
apartments. Adjusting for inflation, that is an increase from 2014 of 2.6% for all rent stabilized units over the three-year period, and increases of 2.9% and 2.0%, respectively, for pre- and post-war rent stabilized units. Rent controlled tenants paid less than the average rent stabilized tenant, with a median gross rent of $1,039 in 2017 (a “real” decrease of 1.2%), while those in unregulated units paid the most, a median of $1,830 (a “real” increase of 9.3%). Those in “other” regulated units paid the least, a median of $649 in gross rent (a “real” increase of 5.8%).
The HVS also breaks down the distribution of renter occupied housing by gross rent level. Of the more than two million rental units in New York City that report cash rent, 6.4% rent for less than $500, and 14.1% rent for between $500-$999. The vast majority of rental units (79.6%) rent for over $1,000, including 25.2% that rent for more than $2,000.24 (See the pie chart on this page for a further breakdown.)
Vacancy Rates The HVS also surveys vacancy rates, with 2017 data revealing the continuation of a very tight New York
2019 Income and Affordability Study
Page 64 • Income & Affordability
Less Than $500
$500-$799
$800-$999
$1,000-$1,499
$2,000 or more
32.2%
$1,500-$1,999
6.4%6.3%
7.8%
22.1%
25.2%
Source: 2017 NYC Housing and Vacancy Survey
Wide Range of Apartment Rents in NYC
Gross Rent Levels of Apartments, 2017

City housing market.25 The survey found that the Citywide vacancy rate was 3.63% in 2017, well below the 5% threshold required for rent regulation to continue under State law, but higher than that found during the last HVS, 3.45%.23 The Bronx had the lowest vacancy rate in the City, at 2.71%, translating into the availability of just 10,558 rentals in a borough with 389,310 rental apartments. Manhattan, by contrast, had the highest vacancy rate in 2017, at 4.73%. Of the remaining boroughs, Brooklyn had a vacancy rate of 3.28%, Queens was at 3.50%, and the small sample size in Staten Island made the rate too inaccurate to report.
The HVS found vacancy rates varying significantly among different asking rents. As might be expected, apartments renting for the least had the lowest vacancy rates, while those apartments renting at the high end had substantially higher vacancy rates. Apartments with an asking rent of less than $800 had a vacancy rate of just 1.15%, while those renting for at least $2,500 had a vacancy rate of 8.74%. (See graph above for a further breakdown.)
Other Measures of Income & Affordability American Community Survey In addition to the triennial HVS, the Census Bureau also publishes an annual study, the American Community Survey (ACS). Unlike the HVS, the ACS cannot provide data specifically for rent stabilized tenants, but does provide in-depth data on rents and incomes for renters as a whole. According to the most recent survey, the 2017 ACS, NYC’s median gross rent-to-income ratio ranks 26th highest among 84 big cities (those with populations of at least 250,000).26 At 31.7%, the median gross rent-to-income ratio in NYC fell 0.2 percentage points from 2016 levels (see graph below). By borough, rates ranged from a low of 27.3% in Manhattan, to 32.2% in Queens, 32.7% in Brooklyn, 33.4% in Staten Island, and 36.8% in the Bronx. This ratio fell in Queens, Manhattan, and Staten Island as compared to the prior year (by 1.0, 0.8, and 0.4 percentage points, respectively), while rising in both Brooklyn and the Bronx (by 0.4 and 1.9 percentage points, respectively).
The proportion of households Citywide paying 50% or more of their income towards gross rent fell
2019 Income and Affordability Study
Housing NYC: Rents, Markets & Trends 2019 • Page 65
0% 1% 2% 3% 4% 5% 6% 7% 8% 9%
Less than $800
$800 to $999
$1,000 to $1,249
$1,250 to $1,499
$1,500 to $1,999
$2,000 to $2,499
$2,500 or more 8.7%
5.2%
4.1%
2.9%
2.2%
1.2%
2.1%
Source: 2017 NYC Housing and Vacancy Survey
Vacancy Rates Vary with Monthly Asking Rent Levels
Vacancy Rate by Monthly Asking Rent Level, 2017
29.0%
29.5%
30.0%
30.5%
31.0%
31.5%
32.0%
32.5%
33.0%20
17
2016
2015
2014
2013
2012
2011
2010
2009
2008
2007
2006
2005
Gross Rent-to-Income Ratio Falls for Third Consecutive Year
Gross Rent-to-Income Ratio, 2005-2017
Source: American Community Survey, 2005-2017

for the third consecutive year, decreasing from 29.3% to 28.4%. At the borough level, rates ranged from 21.3% of households paying at least 50% of their income towards gross rent in Manhattan, to 27.9% in Queens; 30.3% in Brooklyn; 32.5% in Staten Island; and 35.3% of households in the Bronx.
This survey also reports that the median contract rent in NYC was $1,263, and the median gross rent was $1,379 in 2017 (see graph below). Between 2016 and 2017, median monthly contract rents for all apartments in NYC increased an inflation-adjusted (“real”) 0.3% and median gross rents increased by 0.1%. In nominal terms the increases were 2.3% and 2.1%, respectively. Inflation-adjusted gross rents rose by 1.3% in both Queens and Staten Island, and by 1.6% in the Bronx. However, they fell 0.2% in Brooklyn and 5.5% in Manhattan.
During 2017, median household income rose both nominally and in real terms, by 3.4% and 1.5% respectively, to $60,879. Unlike the previous year, median household income for owners rose by a greater proportion than that of renter households, rising by a “real” 4.0% and 1.0%, respectively. Since the inception of this survey in 2005, renter income has fluctuated in “real” 2017 dollars from a low of
$41,073 in 2011 to a high of $47,116 in 2017. Measuring income inequality, the survey also
provides average household income for cities in quintiles. In NYC the top quintile (i.e., the average of the top 20% of household incomes) makes 28.61 times more than the lowest quintile (i.e., the lowest 20%), the sixth highest ratio among big cities, and an increase from 27.49 in 2016. While New York’s income disparity ratio does rank near the top nationwide, it lags behind Philadelphia, with a ratio of 55.17, the highest disparity among big cities. Other major cities, such as Los Angeles (21.88), Houston (22.16), Chicago (23.88), and San Francisco (24.35), all have smaller differentials between income levels than NYC. Not including the aforementioned Philadelphia, the cities ranking higher than NYC are Washington, DC; Boston; Atlanta; and New Orleans, which have ratios ranging from between 28.91 and 31.88. The smallest disparity among big cities is in Santa Ana, California, with a ratio of 9.16. For the U.S. as a whole, the ratio is 16.59, a slight increase from the 16.54 ratio in 2016. While the ratio between the upper and lower quintiles was 28.61 for all of NYC, it was 43.70 in Manhattan, where the top quintile makes an
2019 Income and Affordability Study
Page 66 • Income & Affordability
$1,000
$1,050
$1,100
$1,150
$1,200
$1,250
$1,300
$1,350
$1,400
2017
2016
2015
2014
2013
2012
2011
2010
2009
2008
2007
2006
2005
Contract Rent Gross Rent
Inflation-Adjusted Contract and Gross Rents Climb Annually
Source: American Community Survey, 2005-2017
Rent in Constant 2017 Dollars, 2005-2017
-0.5%
0.0%
0.5%
1.0%
1.5%
2.0%
2.5%
3.0%
3.5%
HighestQuintile
FourthQuintile
ThirdQuintile
SecondQuintile
LowestQuintile
“Real” Change Nominal Change
Avg
. An
nu
al C
han
ge
in H
ou
seh
old
Inco
me
Highest Quintiles Grow at a Faster Pace than Lowest Quintiles
Source: American Community Survey, 2006-2017
Average Annual Household Income Change by Quintiles, 2006-2017
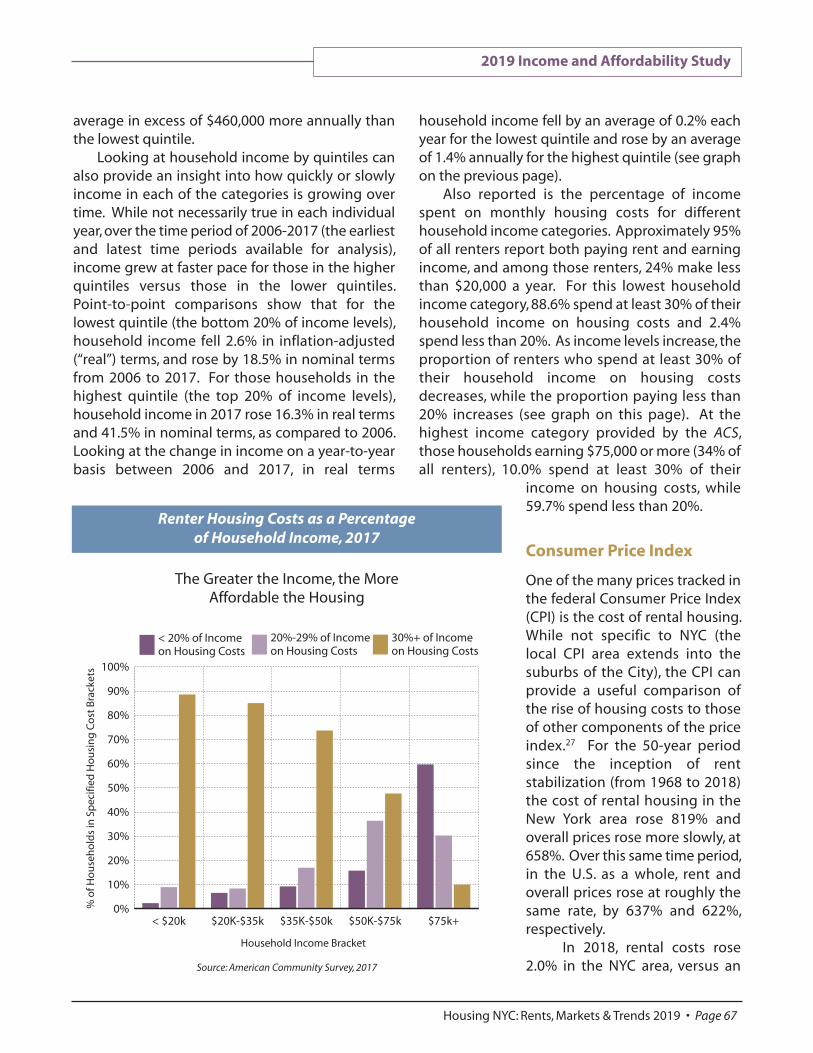
average in excess of $460,000 more annually than the lowest quintile.
Looking at household income by quintiles can also provide an insight into how quickly or slowly income in each of the categories is growing over time. While not necessarily true in each individual year, over the time period of 2006-2017 (the earliest and latest time periods available for analysis), income grew at faster pace for those in the higher quintiles versus those in the lower quintiles. Point-to-point comparisons show that for the lowest quintile (the bottom 20% of income levels), household income fell 2.6% in inflation-adjusted (“real”) terms, and rose by 18.5% in nominal terms from 2006 to 2017. For those households in the highest quintile (the top 20% of income levels), household income in 2017 rose 16.3% in real terms and 41.5% in nominal terms, as compared to 2006. Looking at the change in income on a year-to-year basis between 2006 and 2017, in real terms
household income fell by an average of 0.2% each year for the lowest quintile and rose by an average of 1.4% annually for the highest quintile (see graph on the previous page).
Also reported is the percentage of income spent on monthly housing costs for different household income categories. Approximately 95% of all renters report both paying rent and earning income, and among those renters, 24% make less than $20,000 a year. For this lowest household income category, 88.6% spend at least 30% of their household income on housing costs and 2.4% spend less than 20%. As income levels increase, the proportion of renters who spend at least 30% of their household income on housing costs decreases, while the proportion paying less than 20% increases (see graph on this page). At the highest income category provided by the ACS, those households earning $75,000 or more (34% of all renters), 10.0% spend at least 30% of their
income on housing costs, while 59.7% spend less than 20%.
Consumer Price Index One of the many prices tracked in the federal Consumer Price Index (CPI) is the cost of rental housing. While not specific to NYC (the local CPI area extends into the suburbs of the City), the CPI can provide a useful comparison of the rise of housing costs to those of other components of the price index.27 For the 50-year period since the inception of rent stabilization (from 1968 to 2018) the cost of rental housing in the New York area rose 819% and overall prices rose more slowly, at 658%. Over this same time period, in the U.S. as a whole, rent and overall prices rose at roughly the same rate, by 637% and 622%, respectively.
In 2018, rental costs rose 2.0% in the NYC area, versus an
2019 Income and Affordability Study
Housing NYC: Rents, Markets & Trends 2019 • Page 67
0%
10%
20%
30%
40%
50%
60%
70%
80%
90%
100%
$75k+$50K-$75k$35K-$50k$20K-$35k< $20k
Household Income Bracket
30%+ of Income on Housing Costs
20%-29% of Income on Housing Costs
< 20% of Income on Housing Costs
% o
f Ho
use
ho
lds
in S
pec
ified
Ho
usi
ng
Co
st B
rack
ets
Source: American Community Survey, 2017
The Greater the Income, the More Affordable the Housing
Renter Housing Costs as a Percentage of Household Income, 2017

overall increase in the CPI of 1.9%. This is lower than the 2017 rent increase of 2.5% and is the lowest proportional increase in the NYC area since 1966.
In the U.S. as a whole, rental costs rose at a faster pace than the NYC area, rising by 3.6% in 2018. Rental costs in the NYC metropolitan area rose more slowly than all of the seven cities selected for comparison, including San Francisco, where rents rose 5.3%, and Boston and Los Angeles, where rents rose by 4.9%.28
Section 8 Housing Availability Following increased funding in 2007 to the Section 8 housing voucher program (which allows recipients to live in privately owned housing, paying 30% of their income towards rent), the NYC Housing Authority (NYCHA) opened the waiting list for the first time since 1994.29 These expanded funding levels led to increases in the number of Section 8 occupied units funded by NYCHA (which increased from 82,801 in Fiscal Year (FY) 2007 to a high of 100,570 in FY 2010), as well as significant increases in the number of people placed through Section 8 vouchers during those years. The number of Section 8 apartments has since fallen, to 85,117 units (the most current data, as of the first four months of FY 2019, and a 0.4% increase from the same period of the prior year).30 NYCHA also tracks the number of applicants newly placed through the program. Following three consecutive years of increase, placements fell in FY 2018, falling from 2,758 in FY 2017 to 1,735 in FY 2018. But placements rose in the first four months of FY 2019 as compared to the first four months of FY 2018, from 458 to 613. There are approximately 141,000 persons currently on the NYCHA Section 8 waiting list.
The NYC Department of Housing Preservation and Development (HPD) also maintains a Section 8 program, although as opposed to NYCHA, applicants must fall within specific HPD preference categories or special admission programs, and applications are not accepted from the general public.31 As of December of 2018, HPD was funding 39,623 Section 8 vouchers, approximately the same number as the previous year. Over the last 10 years the number of HPD Section 8 vouchers has increased by nearly 8,000. Notably, 47.1% of HPD’s
Section 8 vouchers are utilized by tenants with disabilities. And among all HPD Section 8 rentals, the average tenant share of rent is $403, with an average income level of $17,263.32
Non-Government Sources of Affordability Data Each year, Con Edison reports on the average cost of electricity bills for residential customers using 300kWh of electricity per month. Per their data, electricity costs rose 3.8% during 2018, following an increase of 0.7% during 2017.33 New Yorkers pay some of the highest electricity bills in the nation, with the average cost per kWh in 2017 just less than two times that of the nation as a whole.34
Another measure of affordability is the Council for Community and Economic Research’s Cost of Living Index (COLI), which tracks the cost of living in 270 urban areas, including Manhattan, Brooklyn, and Queens. Based on 60 different items, the survey collects more than 90,000 prices for housing, utilities, groceries, transportation, health care, and miscellaneous goods and services on a quarterly basis. During the first three quarters of 2018, the COLI found that Manhattan, Brooklyn, and Queens ranked as numbers one, four and nine, respectively, on the list of most expensive urban areas.35 The study calculated that Manhattan was approximately 2.5 times as expensive to live in as the national average, while Brooklyn was approximately 1.8 times more expensive and Queens was 1.5 times as expensive. Per the study, overall housing costs rose in both Manhattan and Brooklyn during 2018, by 6.1% and 0.4%, respectively (comparison data for Queens was not available for 2017). The subcategory of apartment rents showed a steeper rise than overall housing costs, with increases of 7.2% in Manhattan, and 10.6% in Brooklyn. Overall prices were found to have risen 4.5% in Manhattan and 0.1% in Brooklyn.36 Another quarterly index, the Housing Opportunity Index (HOI), showed that during the fourth quarter of 2018 the New York metropolitan area was the twenty-third least affordable area (of 237 HUD-defined metro areas) to buy a home, compared to twentieth in the fourth quarter of 2017. The survey found that 29.9% of owner-occupied
2019 Income and Affordability Study
Page 68 • Income & Affordability

housing in the metropolitan area was affordable to households earning the median household income in the fourth quarter of 2018, down from 32.7% in the fourth quarter of 2017. Over the last ten years, the survey’s quarterly data found that anywhere from 19.2% (in the third quarter of 2009) to 38.7% (in the first quarter of 2017) of owner-occupied homes were affordable to buyers earning the median household income. Over this same time period, the metropolitan area’s affordability ranking ranged anywhere from least affordable (in 15 of the 40 quarters of the last ten years) to a high of twenty-fourth least affordable (in the first quarter of 2018).37
Every year the National Low Income Housing Coalition (NLIHC) issues a study to determine whether rents are affordable to the lowest wage earners. The 2019 study has not been released as of the publication of this report, but in line with their methodology,38 in order to afford a two-bedroom apartment at the City’s Fair Market Rent, ($1,831 a month, as determined by HUD39) a full-time worker must earn $35.21 per hour, or $73,240 a year. Alternately, those who earn minimum wage would have to work 94-104 hours a week (or two persons would each have to work 47-52 hours a week) to be able to afford a two-bedroom unit priced at Fair Market Rent. Because the Fair Market Rent rose by $42, the amount of annual wages necessary to afford this apartment went up by 2.3%. However, the minimum wage increased by $1.50-$2.00 an hour in 2019 (depending on the size of the employer), meaning the number of hours working at minimum wage in order to afford this apartment went down by 9.0%-11.3%. Over the last ten years the number of hours working at minimum wage needed to afford a two-bedroom apartment at the current Fair Market Rent has ranged from a high of 156 in 2013, to a low of 94-104 in 2019.
The Community Service Society’s “The Unheard Third 2017” interviewed 1,132 “low-income” residents (those making up to 200% of the federal poverty level (FPL)) in the summer of 2017.40 The survey found that 27% of low-income residents (under the age of 65) had fallen behind on their rent or mortgage in the past year. In addition, among a subset of “poor” respondents (just over half of the sample of low-income respondents, making at or
below 100% of the FPL), 28% of those under the age of 65 had fallen behind on their rent or mortgage, while only 7% of those 65 and over had. In addition, 43% of the low-income sample group reported that they had less than $500 in savings, while 23% of the group that makes above 200% of the FPL (a sample size of 629 respondents), reports the same. Among a subset of low-income rent stabilized renters, 37% reported that being able to afford their rent was very serious or somewhat serious problem, down from 50% that reported the same during 2015. Among low-income unregulated tenants, this proportion fell from 50% in 2015 to 48% in 2017. In addition, approximately 50% of low-income renters in the survey report that they would not be able to afford a $25 a month increase in rent.
Real Property Tax Credit For the fifth consecutive year, a tax credit for NYC renters, the “Enhanced Real Property Tax Credit for Homeowners and Renters,” offers a maximum tax credit of $500 to NYC residents with federally adjusted household incomes of less than $200,000 a year.41 The amount of this credit depends on both income level and the amount of rent paid. For instance, a tenant with a household income of $50,000 a year, who pays $1,250 in rent (30% of their income), would receive a tax credit of $16.31. But a tenant making $50,000 a year and paying $2,083 in rent (50% of their income), would receive a credit of $87.19. A higher income household, earning $100,000 a year, would need a rent in excess of $2,646 (31.7% of their income) before they could receive any tax credit.42
New York State (NYS) offers a similar tax credit for renters, the “Real Property Tax Credit,” but with filing limitations much more stringent than that for NYC.43 To apply for the NYS credit, renters must have a federally adjusted gross income of $18,000 or less and adjusted rent of $450 or less a month (a tenant’s actual rent is adjusted downward based on amenities such as heat, gas, electricity and/or furnishings provided by the owner of the property at no cost). Credits range from $86-$375 when at least one household member is 65 or older, to $41-$75 when no seniors are present. The amount of the
2019 Income and Affordability Study
Housing NYC: Rents, Markets & Trends 2019 • Page 69

credit is dependent on both the income levels and the amount of rent, with the largest credits for households making less than $1,000 a year, with rents at or near the upper limit of $450 a month.
Cash Assistance & Benefit Programs New York State funds two cash assistance programs — the Family Assistance program and the Safety Net Assistance program, each of which provides cash payments to eligible participants to help pay for living expenses such as food, transportation, housing, and utilities.44 For just the third time in the past ten years, (and the second consecutive year) the average number of cash assistance cases in NYC decreased, falling by 2.8% in 2018 to reach 356,130 cases.45 This follows a decrease of 1.1% in the prior year (see graph below). Also reported by the NYC Human Resources Administration is the number of
unduplicated recipients of cash assistance during 2018. Over the course of the year, a total of 593,821 persons received a cash assistance payment, a decrease of 0.5%. This figure includes 111,587 cases of emergency grants, a 9.0% increase from 2017. One-time emergency grants (known as “one shots”) can help pay for expenses like rent arrears.46 And despite rates increasing in all but three years since 2008, over the last two plus decades the number of cash assistance recipients has dropped significantly, falling 70.2% since March 1995, when the City’s welfare reform initiative began and 1,161,000 recipients were on the rolls.
The number of applications for cash assistance also fell in 2018, decreasing 1.9% over 2017 levels, including a decrease of 3.3% in approved applications, but a 0.5% increase in denied applications.47 At the same time, the number of reported job placements among cash assistance
recipients increased during 2018, rising by 0.9%, or 359 jobs (to 40,496), after falling by more than 7,000 jobs in the prior year.48
Other benefit programs include the Supplemental Nutrition Assistance Program (SNAP, formerly known as food stamps) and Medicaid. The number of recipients of SNAP decreased for the fifth consecutive year, by 3.6% in 2018, to an average of 1.61 million. Despite this drop, SNAP levels have more than doubled in recent years, rising from an average of just over 800,000 in the early 2000s, to more than 1.6 million today.49 The number of Medicaid enrollees also fell for the fifth consecutive year, decreasing 7.8% during 2018, to 1.72 million recipients.50
Housing Policy NYC receives funding for a variety of housing programs from the U.S. Department of Housing and Urban Development (HUD). NYC
2019 Income and Affordability Study
Page 70 • Income & Affordability
0
50
100
150
200
250
300
350
400
88.6
SNA
FAP 151.7
101.4
88.1
153.3
105.5
FAP-SNA
Tho
usa
nd
s
87.7
152.8
109.9
86.7 86.9
148.9 145.2
116.1 121.9
83.6
147.0
125.5
77.0
141.3
124.0
83.5
144.2
134.2
87.7
141.8
140.9
88.7
131.4
146.3
2016 2017
87.5
121.6
147.0
201820152014201320122011201020092008
Source: NYC Human Resources Administration Note: FAP-SNA refers to welfare recipients who were converted from the
Family Assistance Program (FAP) to the Safety Net Assistance Program (SNA)
Cash Assistance Caseloads Fall 3%
Cash Assistance Programs, 2008-2018, in Thousands

was granted $931.3 million from federally funded programs in FY 2018.51 These programs include $166.6 million in a Community Development Block Grant (CDBG), which funds housing and community development programs; $75.5 million for the HOME Investment Partnership Program, which helps preserve existing housing stock; $13.5 million for the Emergency Shelter Grant (ESG) program, which is used for homeless programs; $44.2 million for Housing Opportunities for Persons with AIDS (HOPWA); and a competitive HUD Continuum of Care (CoC) grant of $107.9 million for homeless programs. NYCHA will also receive $523.5 million for its capital modernization program.
As compared to FY 2017, federal funding in FY 2018 increased by 30.2% in nominal terms and 27.9% in inflation-adjusted (“real”) terms. The largest source of funding, for NYCHA capital projects, rose by 48.4% in real terms. The increase in NYCHA funding was the greatest proportional increase over the year, while the greatest proportional decrease was in Emergency Shelter
Grant funding, which declined by 1.8% in real terms. Overall federal funding, not including that for NYCHA capital projects, rose by a real 8.6%.
Homelessness & Housing Court Homelessness Homelessness in the City, based on data from the NYC Department of Homeless Services (DHS), increased for the tenth consecutive year during 2018, rising by 0.9%.52 Each night, an average of 60,028 persons stayed in DHS shelters during 2018, up 562 persons from a year earlier, and up considerably from the average of 20,000-25,000 found in the 1990s (see graph below and Appendix E.7). However, the subcategory of the number of families sheltered each day fell, by an average of 0.9%.53 The figure for families includes the number of families with children sheltered each night, which fell 0.9% during 2018 (to reach an average of 12,573), and the number of adult families sheltered each night, which decreased 1.2%
2019 Income and Affordability Study
Housing NYC: Rents, Markets & Trends 2019 • Page 71
15,000
20,000
25,000
30,000
35,000
40,000
45,000
50,000
55,000
60,000
65,000
2018
2017
2016
2015
2014
2013
2012
2011
2010
2009
2008
2007
2006
2005
2004
2003
2002
2001
2000
1999
1998
1997
1996
1995
1994
1993
1992
1991
1990
1989
1988
NYC Homeless Levels Rise for Tenth Consecutive Year
Source: NYC Department of Homeless Services
Average Nightly Homeless Shelter Census, NYC, 1988-2018
over the year (to an average of 2,471). The increase in overall homelessness is due to a rise in the number of single adults sheltered, increasing 9.9% during 2018, to an average of 15,470 persons.
The average number of homeless staying in DHS shelters increased at a roughly even pace throughout 2018. Levels rose 0.9% in both the first and third quarters, with increases of 1.1% in the second quarter and 1.0% in the fourth quarter, all as compared to the same quarters of the previous year. On a monthly basis, the greatest increase was seen in April of 2018, when 844 more persons stayed in City shelters than the previous April, an increase of 1.4%.
Permanent housing placements for families with children increased during 2018, rising from 8,612 to 8,873, a 3.0% increase. Placements also rose for single adults, increasing from 7,687 placements in 2017 to 8,666 in 2018, an increase of 12.7%. For adult families, placements fell from 537 in 2017 to 492 in 2018, an 8.4% decline.
Other homeless indicators include the average amount of time spent in temporary housing, which increased for all categories of shelter residents. In 2018, for families with children, the average amount of time spent in temporary housing rose 16 days (to 443 days), with increases of nine days for single adults (to 405 days), and 19 days for adult families (to 570 days). DHS also reports the number of homeless persons placed in permanent housing who return to the shelter system within one year. In 2018, 8.1% of families with children returned to DHS shelters within one year (down from 8.5% the prior year); 7.3% of adult families returned (down from 8.5% in the prior year); and 17.7% of single adults returned (up from 16.3% in the prior year). The vast majority of those who returned to the shelter system were initially placed in unsubsidized housing.54
Data from the U.S. Department of Housing and Urban Development, which asks municipalities to submit homeless counts on a single day in January of each year, show that NYC has the largest number of homeless people of any city in the nation. NYC reported a total of 78,676 sheltered and unsheltered persons in January of 2018, followed by Los Angeles, with 49,955 persons, and Seattle, with 12,112. Per this report, in NYC homeless levels rose 2.8% from
January 2017 to January 2018, while nationally levels fell by 0.2%.55
In February of 2017, the de Blasio Administration released “Turning the Tide of Homelessness in New York City,” detailing a comprehensive plan to combat the rise in homelessness, including efforts already underway.56 In part, the report detailed plans to end the use of cluster units (individual apartments in buildings that usually have rent-paying tenants in other apartments, with limited or no social services on site) and commercial hotels to house homeless persons. Plans call these types of accommodations, which house approximately 30% of the homeless population, to be replaced with 90 new shelters by 2022, in addition to the conversion of some cluster units into permanent housing. In December of 2017, the Administration further detailed its plans to acquire and rehabilitate cluster site buildings and convert them into permanent affordable housing through long-term regulatory agreements between the owners and HPD.57 When voluntary negotiations are unsuccessful, the City may employ eminent domain to take ownership of buildings with a large number of cluster units. In December of 2018, the Administration announced that the first phase of this initiative was nearly complete, with agreements to convert 17 cluster buildings (containing a total of 468 units of housing) into permanent housing for the homeless families already living there. Homeless families already sheltering in these units will be offered rental assistance, services and support to help them learn to live independently, and rent stabilized leases. Any non-homeless tenants living in these buildings will be allowed to remain in place, with rent stabilized leases.58
Another facet of the City’s effort to reduce homelessness went into effect on October 29, 2018.59 The City has now consolidated and streamlined seven different rental initiatives into one, the City Fighting Homelessness & Eviction Prevention Supplement (CityFHEPS). The program aims to help both those in shelter and those facing eviction to find, or keep, permanent housing.60 To be eligible, households much have a gross income at or below 200% of the federal poverty level and meet certain other criteria. Those wishing to apply for rental assistance must apply in person at one of more than 20 offices across NYC. The program will
2019 Income and Affordability Study
Page 72 • Income & Affordability

provide a rent supplement of up to $1,047 for SRO housing, $800 for a single room in an apartment, or between $1,246 and $2,600 for an apartment, depending on household size.61
Housing Court For the seventh consecutive year, non-payment filings in Housing Court decreased, falling 4.7%, to 191,893.62 Non-payment cases resulting in an actual court appearance (“calendared”) also decreased, by 10.5%. Because the number of calendared cases fell at a greater pace than the number of filings fell, the proportion of non-payment cases which resulted in an appearance fell by 3.5 percentage points, to 53.6%. For comparison, during the mid-to-late 1980s, an average of 27.1% of non-payment filings were calendared. (See graph on this page and Appendix E.6.)
Approximately 18% of non-payment filings and 25% of calendared cases in 2018 were against
tenants of public housing (NYCHA). If these cases were taken out of the analysis, filings against non-NYCHA tenants would have fallen 2.4% between 2017 and 2018, and calendared cases would have fallen by 16.7%. The percentage of calendared cases to non-payment filings in 2018 among non-NYCHA tenants is 49.0%, 4.5 percentage points lower than the overall proportion.
Evictions of tenants also fell during 2018, by 5.0%, following a decrease of 4.6% in the prior year, and an increase of 0.5% in 2016.63 Evictions are down 30.6% over 2013 levels. This is also the fewest number of evictions since at least 1983 (the first year data is available for). The proportion of non-payment proceedings Citywide that resulted in an eviction/possession ruling in 2018 increased from 18.3% to 19.5%. This translates to 20,013 court decisions ruling for the tenant’s eviction from a total of 102,789 non-payment proceedings calendared (see graph on this page).
In August of 2017, a City bill granting all households under 200% of the federal poverty level eligibility for free legal representation in Housing Court was signed into law. An additional $93 million will be added to programs in place since 2014, for a total funding level of $155 million a year by FY 2022.64 It is estimated that the number of tenants in Housing Court with legal representation has risen from 1% in 2013 to 30% in 2018.65 The NYC Human Resources Administration reports that the number of cases in Housing Court that received legal representation in FY 2018 rose 50.6% over FY 2017 levels (to reach 25,156) and during the first four months of FY 2019 there was an 11.0% rise as compared to the same period of the previous year (to reach 8,899 cases).66 The program also now helps represent NYCHA tenants during administrative hearings brought by that agency to end a resident’s tenancy.67
Summary In 2018, most economic indicators for NYC were positive, including rising employment levels, declining unemployment, increased Gross City Product, and a slowing of Housing Court non-payment filings, evictions, public assistance
2019 Income and Affordability Study
Housing NYC: Rents, Markets & Trends 2019 • Page 73
15%
20%
25%
30%
35%
40%
45%
50%
55%
60%
65%
2018
2016
2014
2012
2010
2008
2006
2004
2002
2000
1998
1996
1994
1992
1990
1988
1986
Proportion of Calendared that Result in Eviction/Possession
Proportion of Filingsthat are Calendared
* See Endnote 1 Source: Civil Court of NYC and NYC Department of Investigations
Proportion of Non-Payment Cases Calendared Falls and
Proportion of Evictions* Rises
Housing Court Statistics, 1986-2018

caseloads, and SNAP recipients. However, homelessness continues to increase, the vacancy rate remains low, and personal bankruptcy filings increased for the third straight year.
Looking forward, both the Office of the NYC Comptroller and the NYC Office of Management and Budget have made predictions about the future health of the NYC economy. Among the predictions, they estimate that in 2019 the City will gain anywhere between 54,800 and 60,600 jobs, unemployment will rise to 4.2%, GCP growth will potentially grow anywhere from 1.9% to 2.6%, and wages will rise from 2.7% to 2.9%. They also see the economy as strong, but slowing, during the next few years, with increasing unemployment rates (to as high as 5.7% in 2023), more moderate job gains and GCP growth, and slowing wage rate growth.68 r
Endnotes 1. In July of 2019, the NYC Department of Investigation modified 2018
evictions to reflect updated filings from two marshalls who had provided incomplete reports. As a result, the number of evictions in 2018 rose from 18,152 (as reported in the 2019 I&A, published in April of 2019) to 20,103 and the decrease in the number of evictions from 2017 to 2018 rose from 13.9% to 5.0%.
2. See Endnote 1. 3. This data is obtained from the Civil Court of the City of New York, which
cannot provide exact “quarterly” data. The Court has 13 terms in a year, each a little less than a month long. This data is for terms 10-13, which is from approximately the middle of September through the end of the year. It is compared to the same period of the prior year.
4. See Endnote 3. 5. Data from the Office of the NYC Comptroller as of March, 2019. GCP
figures are adjusted annually by the Office of the NYC Comptroller. The figures in this report are the latest available estimate from that office, based on inflation-adjusted 2012 chained dollars.
6. U.S. Bureau of Economic Analysis. https://www.bea.gov/data/gdp/gross-
domestic-product; Accessed March, 2019. 7. U.S. Bureau of Labor Statistics; http://www.bls.gov; Accessed February,
2019. 8. NYS Department of Labor; http://www.labor.state.ny.us; Accessed March 2019.
Data is revised annually and may not match data reported in prior years. 9. U.S. Bureau of Labor Statistics; http://www.bls.gov; Accessed March,
2019. 10. U.S. Bureau of Labor Statistics; http://www.bls.gov; Accessed March,
2019. 11. New York State Department of Labor; http://www.labor.state.ny.us;
Accessed March 2019. Data is revised annually and may not match data reported in prior years.
12. The NYC labor force participation rate and employment/population ratio are derived from unpublished data from the U.S. Bureau of Labor Statistics, obtained from the Office of the NYC Comptroller. Note that prior years’ data are annually revised, and may differ from figures reported in prior years’ Income and Affordability Studies.
13. U.S. Bureau of Labor Statistics; http://www.bls.gov; Accessed March,
2019. 14. New York State Department of Labor; http://www.labor.state.ny.us;
Accessed March 2019. 15. U.S. Bureau of Labor Statistics; http://www.bls.gov; Accessed March,
2019. 16. Administrative Office of the U.S. Courts; https://www.uscourts.gov/
statistics-reports/caseload-statistics-data-tables; Accessed March, 2019. . 17. Poverty statistics were researched on the U.S. Census Bureau’s Factfinder
Site: http://factfinder2.census.gov in February of 2019. The U.S. Census Bureau reports that in 2017 the weighted average poverty threshold for a one-person household is $12,488; $15,877 for a two-person household; $19,515 for a three-person household; $25,094 for a four-person household; $29,714 for a five-person household; $33,618 for a six-person household; $38,173 for a seven-person household; $42,684 for an eight-person household; and $50,681 for a nine-person or more household.
18. U.S. Census Bureau; https://www.census.gov/newsroom/blogs/
random-samplings/2017/09/what_is_the_suppleme.html. 19. “New York City Government Poverty Measure, 2005-2016.” April, 2018.
NYC Center for Economic Opportunity. Note that the CEO poverty rates are adjusted periodically and may not match figures found in prior reports.
20. The New York City Housing and Vacancy Survey (HVS) is sponsored by the
NYC Department of Housing Preservation and Development (HPD) and conducted by the U.S. Census Bureau. All HVS data reported herein, with the exception of the gross rent-to-income ratio excluding Section 8 tenants and the estimated out of pocket rent-to-income ratio, is from “Selected Initial Findings of the 2017 New York City Housing and Vacancy Survey,” prepared by HPD.
21. The HUD benchmark for housing affordability is a 30% rent-to-income
ratio. Source: Basic Laws on Housing and Community Development, Subcommittee on Housing and Community Development of the Committee on Banking Finance and Urban Affairs, revised through December 31, 1994, Section 3.(a)(2).
22. Total household income in the HVS includes wages, salaries, and tips;
self-employment income; interest dividends; pensions; and other transfers and in-kind payments.
23. Private non-regulated units consist of units which were never rent
controlled or rent stabilized; units which were decontrolled; and unregulated rentals in cooperatives or condominium buildings.
24. There were 65,223 units which did not report a cash rent because they
were being occupied rent-free. 25. State law requires the City to formally extend rent stabilization every
three years, after publication of vacancy rates from the triennial Housing and Vacancy Survey. NYC Introductory Number 0600-2018 extends rent stabilization until April 1, 2021.
26. 2017 American Community Survey, U.S. Census Bureau.
http://factfinder2.census.gov. American Community Survey data does not specifically identify rent stabilized units.
27. U.S. Bureau of Labor Statistics; http://www.bls.gov; Accessed February, 2019. 28. The seven cities selected for comparison are Philadelphia, San Francisco,
2019 Income and Affordability Study
Page 74 • Income & Affordability

Boston, Chicago, Atlanta, Los Angeles, and Washington, D.C. Rent increases in these cities ranged from 2.3%-5.3%.
29. Press Release, Mayor’s Office. “Mayor Bloomberg and NYCHA Chairman
Hernandez Announce that Section 8 Voucher List Will Open For First Time in Twelve Years,” January 29, 2007.
30. Preliminary FY 2019 Mayor’s Management Report, NYC Housing Authority
section. The City’s FY runs from July 1 through June 30 of each year. 31. Eligibility guidelines via the NYC Housing Preservation and
Development website: http://www1.nyc.gov/site/hpd/section-8/applicants-eligibility.page.
32. Division of Tenant Resources Section 8 General Program Indicators, HPD
website: http://www1.nyc.gov/assets/hpd/downloads/pdf/hpd-section-8-program-statistics.pdf. December 10, 2018.
33. “CECONY Average Monthly NYC Residential Bills 300 kWh.” Con Edison
website at http://www.coned.com/rates. 34. U.S. Energy Information Administration: Electric Sales, Revenue, and
Average Price (2017 Tables T6 and T5.a). http://www.eia.gov/electricity/sales_revenue_price/.
35. “2018 Annual Average Cost of Living Index Release.” The Council for
Community and Economic Research. http://www.coli.org/media. 36. ACCRA cost of living report. The Council for Community and Economic
Research. https://store.coli.org/compare.asp. 37. National Association of Home Builders. Various tables on website:
http://www.nahb.org/en/research/housing-economics/housing-indexes/housing-opportunity-index.aspx; Accessed March 2019. Affordability defined as no more than 28% of gross income spent on housing costs.
38. The methodology that the National Low Income Housing Coalition uses
is at: http://nlihc.org/sites/default/files/oor/OOR_2018.pdf. 39. Fair Market Rents are published annually by the U.S. Department of
Housing and Urban Development. http://www.huduser.org/ datasets/fmr.html.
40. “Tenants at the Edge (April, 2018)” and “Upward Mobility (August 2018).”
The Unheard Third 2017. Community Service Society. 41. New York State Department of Taxation and Finance Form NYC-208
(2018). 42. Calculations based on New York State Department of Taxation and
Finance Form NYC-208 (2018). 43. New York State Department of Taxation and Finance Form IT-214 (2018). 44. Cash assistance programs in New York State include the Family
Assistance program and the Safety Net Assistance program: https://www.nycbar.org/get-legal-help/article/public-benefits/new-york-state-cash-assistance-program/.
45. NYC Human Resources Administration. HRA Charts (Cash Assistance
Recipients): http://www1.nyc.gov/site/hra/about/facts.page#charts. 46. NYC Human Resources Administration. HRA Monthly Fact Sheets
(December 2018): http://www1.nyc.gov/site/hra/about/ facts.page#caseloads.
47. Data directly from the NYS Office of Temporary and Disability Assistance,
March, 2019. 48. NYC Human Resources Administration. HRA Charts (Assisted Entries to
Employment): http://www1.nyc.gov/site/hra/about/facts.page#charts.
49. NYC Human Resources Administration. HRA Charts (SNAP Recipients): http://www1.nyc.gov/site/hra/about/facts.page#charts.
50. NYC Human Resources Administration. HRA Charts (HRA Administered
Medicaid Enrollees): http://www1.nyc.gov/site/hra/ about/facts.page#charts.
51. U.S. Department of Housing and Urban Development. 52. Data from the Policy & Planning Office of the NYC Department of
Homeless Services (DHS), DHS daily reports, DHS Data Dashboard Tables, and monthly Citywide Performance Reporting reports. Note that in addition, the NYC Department of Housing Preservation and Development, the NYC Department of Youth and Community Development, and the NYC Human Resources Administration also operate emergency shelters, which house approximately 5,000 persons per night, which is not included in the totals presented in this report.
53. The NYC Department of Homeless Services (DHS) splits families into two
groups – families with children and adult families (generally spouses and domestic partners). Approximately 84% of “families” in 2018 are families with children.
54. Based on data from annual Mayor’s Management Reports. 55. “The 2018 Annual Homeless Assessment Report (AHAR) to Congress:
Part 1, Point-in-Time Estimates of Homelessness.” U.S. Department of Housing and Urban Development, December 2018.
56. “Turning the Tide of Homelessness in New York City,” Mayor’s Office,
February, 2017. 57. Press Release, Mayor’s Office. “New Tool to Combat Homelessness: Mayor
de Blasio Moves to Convert Cluster Buildings Into Permanent Affordable Housing for Homeless Families.” December 12, 2017.
58. Press Release, Mayor’s Office. “Affordable Homes for Homeless Families:
City Advances Plan to Convert Cluster Units to Permanent Housing.” December 4, 2018.
59. “Notice of Adoption of Amendment to Title 68 of the Rules of the City of
New York to Add a New Chapter 10 Establishing the City Fighting Homelessness and Eviction Prevention Supplement (CityFHEPS) Program.”
60. Press Release, NYC Department of Homeless Services. “City Proposes
Single Unified Rental Assistance Program to Streamline and Simplify Rehousing Process” July 18, 2018.
61. CityFHEPS Frequently Asked Questions: https://www1.nyc.gov/site/
hra/help/cityfheps.page. 62. Civil Court of the City of New York data. 63. Eviction data from the NYC Department of Investigation, Bureau of
Auditors data. See Endnote 1 for an explanation of updated figures. 64. Press Release, Mayor’s Office. “Mayor de Blasio Signs Legislation to
Provide Low-Income New Yorkers with Access to Counsel for Wrongful Evictions.” August 11, 2017.
65. Press Release, Mayor’s Office. “Mayor de Blasio: Record-breaking 37%
Decrease in Evictions Citywide.” February 4, 2019. 66. Preliminary FY 2019 Mayor’s Management Report, NYC Human
Resources Administration section. 67. See Endnote 64. 68. “Comments on New York City’s Preliminary Budget for FY 2020 and
Financial Plan for Fiscal Years 2019-2023.” Office of the NYC Comptroller. March 6, 2019.
2019 Income and Affordability Study
Housing NYC: Rents, Markets & Trends 2019 • Page 75


Housing Supply2019 Housing Supply Report .............................. pg. 79
Changes to the Rent Stabilized Housing Stock in NYC in 2018 ............................................pg. 93


Housing NYC: Rents, Markets & Trends 2019 • Page 79
New York City Rent Guidelines Board 2019 Housing Supply Report
R Permits for 20,910 new dwelling units were issued in NYC in 2018, a 5.5% decrease from the prior year.
R The number of new housing units completed in 2018
increased 4.5% over the prior year, to 26,992. R City-sponsored programs spurred 32,203 new housing starts
in FY 2018, 29% of which were newly constructed units. R The number of housing units newly receiving 421-a
exemptions increased 36.0% in 2018, to 28,292. R The number of “Certificates of No Harassment,” which
allow for the conversion of SRO housing, decreased by 9.8%, to 83.
R There was a 29.0% increase in the number of co-op or
condo units accepted in 2018, to 10,784 units contained in 289 plans.
R The number of housing units newly receiving J-51
abatements and exemptions increased 30.3% in 2018, to 29,815.
R Demolitions were up in 2018, increasing by 9.6%, to
1,888 buildings.
What’s New80 Introduction
80 Overview
80 New York City’s Housing Inventory
82 Changes in the Housing Inventory
90Tax-Delinquent Property and Anti-Abandonment Strategies
90 Demolitions
91 Summary
134 Appendices

Introduction Section 26-510(b) of the Rent Stabilization Law requires the Rent Guidelines Board (RGB) to consider the “over-all supply of housing accommodations and over-all vacancy rates” and “such other data as may be made available to it.” To assist the Board in meeting this obligation, the RGB research staff produces an annual Housing Supply Report, which reports on current conditions in the housing market, including vacancy and overcrowding rates, new housing production, co-op and condo conversions, demolitions, housing created through tax incentives, and government-sponsored housing starts.
Overview Between 2017 and 2018 there was a 5.5% decrease in the number of permits issued for new housing units, falling to 20,910. The number of completed housing units rose during 2018, increasing 4.5% to
26,992 units. Following five consecutive years of decrease, the number of units newly receiving 421-a benefits rose for the second consecutive year, increasing 36.0% from 2017 levels. The number of units newly accepted in co-op and condo plans rose by 29.0%, with the number of plans rising by 3.6%. Rehabilitation of housing units under the J-51 tax abatement and exemption program also rose during 2018, up 30.3%. The number of demolitions rose by 9.6% during 2018. As of 2017, a tight housing market also remains in New York City (NYC), with a Citywide rental vacancy rate of 3.63% and 11.5% of all rental housing considered overcrowded.
New York City’s Housing Inventory Most New Yorkers live in multi-family rental housing rather than owning homes. According to the 2017 Housing and Vacancy Survey (HVS),1 rental units comprise 62.9% of NYC’s available housing stock, a far greater share than the nationwide average of 36.1%.2 NYC in 2017 had a total of 3,469,240
2019 Housing Supply Report
Page 80 • Housing Supply
ConventionalHomes593,827
Co-Op328,529
Condo115,844
Homeowners
Renters
StabilizedPost-'46273,755
Rent Controlled
21,751
StabilizedPre-'47
692,687 Other Regulated
258,021
Non-Regulated936,850
Source: U.S. Bureau of the Census, 2017 New York City Housing and Vacancy Survey Note: Above figures exclude 247,977 vacant units that are not available for sale or rent.
New York City’s Housing Stock Is Predominantly Renter-Occupied
Number of Renter and Owner Units

housing units, the largest housing stock since the first HVS was conducted in 1965. NYC’s housing is not only distinguished by the size of its rental housing stock, but unlike most cities, the bulk of rental units are rent regulated. Of the 2,183,064 occupied and vacant rental units reported in the most recent HVS, 42.9% were unregulated, or “free market.” The remaining units were rent regulated, including pre-war (pre-47) rent stabilized (31.7%), post-war (post-46) rent stabilized (12.5%), rent controlled (1.0%), or regulated under various other3 types of programs (11.8%). (See pie chart on the previous page.)
The HVS also indicated that NYC’s housing market remains tight, finding a Citywide rental vacancy rate of 3.63% in 2017, below the 5% threshold required for rent regulation to continue under State law. This translates into the availability of just 79,190 vacant units out of almost 2.2 million rental units Citywide. The vacancy rate ranged from a low of 2.71% in the Bronx to a high of 4.73% in Manhattan. The Brooklyn vacancy rate was 3.28%,
and the Queens rate was 3.50%. The sample size in Staten Island was too small to permit calculation of an accurate vacancy rate.4
Vacancy rates also varied by rent regulation status. Both post-war and pre-war stabilized units had low vacancy rates, at 1.21% and 2.40%, respectively. Stabilized vacancy rates on the whole were 2.06%, while private, non-regulated units were vacant at a 6.07% rate.
The frequency of crowding also varied by rent regulation status. Overall, 11.5% of all rental housing in NYC in 2017 was overcrowded (defined as more than one person per room, on average) and 4.5% was severely overcrowded (defined as an average of more than 1.5 persons per room). Post-war stabilized housing was more crowded than pre-war, with 13.4% of units overcrowded and 6.6% severely overcrowded, while 12.9% of pre-war units were overcrowded, and 5.1% were severely overcrowded. Overall, 13.1% of rent stabilized housing was overcrowded and 5.5% was severely overcrowded. By comparison, in non-regulated
2019 Housing Supply Report
Housing NYC: Rents, Markets & Trends 2019 • Page 81
0
5
10
15
20
25
30
35
40
45
50
55
60
'18'17'16'15'14'13'12'11'10'09'08'07'06'05'04'03'02'01'00'99'98'97'96'95'94
Tho
usa
nd
s
Source: U.S. Bureau of the Census, Manufacturing and Construction Division Building Permits Branch
Number of Permits Issued for New Construction of Housing Decreases by More Than 5%
Units Issued New Housing Permits, 1994-2018, in Thousands

housing, 11.3% was overcrowded and 4.2% was severely overcrowded.
Changes in the Housing Inventory Housing supply grows, contracts, and changes in a variety of ways — new construction, substantial rehabilitation, conversion from rental housing to owner housing, and conversion from non-residential buildings into residential use.
Housing Permits The number of permits authorized for new construction is a measure of how many new housing units will be completed and ready for occupancy, typically within three years, depending on the type of housing structure. In 2018, permits newly issued for housing units fell for just the third time in the past
ten years. Following an increase of 36.0% in 2017 (to 22,131 units), permits were issued in 2018 for 20,910 units of new housing, a decrease of 5.5% from 2017.5 (See graph on the previous page.)
Permits fell by double digits in every borough except Brooklyn, where they rose 37.8%, to 8,445 units. Permits in the Bronx fell by the greatest proportion, decreasing 31.5%, to 3,698 units. Newly issued permits also fell in Manhattan, by 25.5% (to 3,584 units); in Staten Island, by 11.5% (to 606 units); and by 10.3% in Queens (to 4,577 units). (See Appendix F.1 and the map on this page.)
Permits for new housing units fell despite the average building size increasing. While the average size of buildings receiving permits rose 9.3% between 2017 and 2018 (from 13.2 units to 14.5 units), the number of buildings being newly permitted fell by a greater proportion, 13.6%.
On a quarterly basis in 2018, permits fell by the greatest proportion in the first quarter, with issued permits decreasing by 18.5%. Permits also fell by 3.6% in the second quarter, before beginning to rise, increasing by 0.6% in the third quarter and 2.3% in the fourth quarter. For historical permit information by quarter, see Appendix F.3.
The most recently available data, from the first quarter of 2019, showed that newly issued permits were up as compared to the same period of the prior year, with increases in three of the five boroughs. The number of permits issued in NYC increased from 5,170 in the first quarter of 2018 to 6,329 during the first quarter of 2019, a 22.4% increase. While permits fell 21.8% in Manhattan and 29.0% in the Bronx, they rose by 30.3% in Staten Island; 30.7% in Brooklyn; and 153.1% in Queens. Although there was a decrease of 6.0% in the number of buildings newly permitted during this quarter, units newly permitted rose because the average building size rose, increasing from 14.2 units to 18.5 units.
Permit data can also be analyzed more deeply by looking at the reported size of the buildings receiving permits. In 2018, a total of 1,446 buildings received permits (containing a total of 20,910 housing units). Citywide, 28.8% of these buildings were single-family, 28.1% were two-family, 9.0% were three- or four-family structures, and 34.1%
2019 Housing Supply Report
Page 82 • Housing Supply
3,698
4,577
8,445
606
3,584(-26%)
(-32%)
(-10%)
(+38%)
(-12%)
Total Number of Permits Issued in 2018 and Percentage Change
From 2017, by Borough
Residential Building Permits, 2018
Source: U.S. Bureau of the Census, Manufacturing and Construction Division - Building Permits Branch

were buildings with five-or-more units. In 2018, 92.1% of all permits issued Citywide were for units in five-family or greater buildings (a total of 19,266 units), with the average five-family or greater building containing 39 units for the City as a whole, and 64 units in Manhattan (both decreases from the prior year). As the graph on this page illustrates, almost all building permits in Manhattan were for the largest buildings, while in Staten Island virtually all permits were for either one- or two-family buildings. Building size was more evenly distributed in the Bronx and Brooklyn (and to a lesser extent in Queens). (See Appendix F.2.)
Housing Completions This report also examines the number of units completed in the City each year, indicative of what housing actually enters the market in a particular year. In 2018, an estimated 26,992 new housing units were completed, a 4.5% increase from 2017.6 Completions rose in three of the five boroughs, rising by the greatest proportion in the Bronx, which
rose 78.2% (to 4,761 units). Completions also rose in Staten Island, up 28.6% (to 863 units); and Queens, up 25.3% (to 6,318 units); Completions declined in Brooklyn, down 15.2% (to 9,378 units); and Manhattan, down 11.2% (to 5,672 units). Citywide, 92.9% of the newly completed units were in five-family or greater buildings, down from 93.3% in the prior year. The average size of completed buildings, by borough, ranged from 1.8 units per building in Staten Island, to 13.4 units in Queens; 20.2 units in Brooklyn; 36.6 units in the Bronx; and 82.2 units in Manhattan.7 (See Appendix F.4 for a historical breakdown of completions by borough.)
City-Sponsored Construction Housing is created and preserved in part through publicly funded sources, including programs sponsored by the NYC Department of Housing Preservation and Development (HPD) and the NYC Housing Development Corporation (HDC). HPD’s Office of Development operates a number of programs that develop affordable housing for low- and moderate-income New Yorkers. Programs include the Extremely Low and Low-Income Affordability Program, which is HPD’s multi-family new construction housing initiative, financed through both public and private sources; the Affordable Neighborhood Cooperative Program, which provides very low interest loans for the rehabilitation of buildings into affordable cooperatives for low and moderate-income households; and the Multifamily Housing Rehabilitation Loan Program, which provides rehabilitation loans at a maximum 3% interest for the replacement of major building systems. HDC operates some of the same programs as HPD, in addition to programs such as the Mitchell-Lama Repair Loan Program, which offers loans to Mitchell-Lama owners in order to make needed capital improvements, and the Preservation Program, which provides tax-exempt bond financing to affordable housing developments with at least 50 units.
In May of 2014, Mayor Bill de Blasio announced details of his ten-year, $41 billion plan to build and/or preserve 200,000 units of affordable housing.
2019 Housing Supply Report
Housing NYC: Rents, Markets & Trends 2019 • Page 83
0%
20%
40%
60%
80%
100%
Staten IslandQueensManhattanBrooklynBronx
5 or More Family
3/4 Family
2 Family
1 Family
Size of Newly Permitted Buildings: Most New Buildings in Manhattan are Five Family or More, in Staten Island
One- and Two-Family Homes Predominate
Residential Building Permits, 2018
Source: U.S. Bureau of the Census, Manufacturing and Construction Division - Building Permits Branch

“Housing New York: A Five-Borough, Ten-Year Plan” projected that 60% of the units would be preservations, and 40% would be new construction. The majority, 58%, were slated for “low-income” residents (defined at the plan’s inception as $42,000-$67,000 for a family of four), with 22% geared for residents making more than this amount, and 20% for residents making less than this amount.11
That plan has now been modified and expanded. In “Housing New York 2.0,” released in November of 2017, the de Blasio administration outlined a plan to complete the promised 200,000 units of housing two years ahead of schedule, and add another 100,000 units to the goal, for a total of 300,000 affordable units by 2026. The new guidelines call for 55.5% to be affordable for “low-income” families making between 51% and 80% of Area Median Income (currently $42,951-$68,720 for a family of three), with 19.5% geared toward residents making more than this amount, and 25.0% for residents making less than this amount. The plan also creates new programs aimed at increasing affordable housing for seniors, preserving Mitchell-Lama housing, and creating more micro units.12
As part of Housing New York 2.0, HPD- and HDC-sponsored programs spurred a total of 32,303 housing starts8 in Fiscal Year (FY) 2018, a 32.3% increase over the prior FY. Of these starts, 22,976 (71.3%) were preservation, and 9,227 (28.7%) were new construction. A total of 25,000 units are targeted for both FY 2019 and FY 2020.9 During the first nine months of FY 2019 there were 13,289 starts by HPD and HDC, an increase of 16.2% over the same period of the prior FY.10
Through March of 2019, the de Blasio administration reports it has financed 123,466 units of affordable housing since the start of the Mayor’s tenure, 68% preservation and 32% new construction. By borough, 30.7% of the starts were located in Brooklyn, with 29.9% in the Bronx, 28.3% in Manhattan, 9.3% in Queens, and 1.8% in Staten Island. By affordability level, 16.6% of the starts were aimed at extremely low-income households, 24.4% at very low-income households, 42.9% at low-income households, 5.9% at moderate-income households, and 10.2% at middle-income
and higher households.13 Almost 18,000 of these units (15% of the total) were dedicated to special needs populations (the homeless and seniors).
Tax Incentive Programs The City offers various tax incentive programs to promote the development of new housing. One such program is the 421-a tax exemption program, which began in the early 1970s. While there have been various iterations of the program over the years, all have allowed both renter- and owner-occupied multifamily properties to reduce their taxable assessed value for the duration of the benefit period. That is, owners are exempt from paying additional real estate taxes due to the increased value of the property resulting from the new construction. Rental apartments built with 421-a tax exemptions are subject to the provisions of the Rent Stabilization Laws during the exemption period. Initial rents are required to be approved when obtaining certification by HPD at the completion of construction, and units are then subject to increases established by the NYC Rent Guidelines Board.
A variety of factors are used to establish the level and period of 421-a benefits, and properties are also subject to construction guidelines. Prior to 2016 (under the previous iteration of the 421-a program, which is still newly certifying units in those buildings that started construction prior to this date), eligible buildings received an exemption for 10 to 25 years depending on location, the number of units reserved for low- and moderate-income tenants, and whether they were located in a City-designated neighborhood preservation area. Longer exemption periods applied in northern Manhattan and boroughs outside Manhattan, and to projects that received governmental assistance or contained no fewer than 20% low-income units. For buildings within the Geographic Exclusion area (all of Manhattan, and parts of each of the other boroughs), affordable housing was required to be contained within the newly constructed building.14
After expiring at the end of 2015, the latest iteration of the 421-a program was reinstated in April of 2017 (retroactive to January 1, 2016), with a new
2019 Housing Supply Report
Page 84 • Housing Supply

name (Affordable New York Housing Program) and policy changes. Per the Affordable New York Housing Program, rental developments with 300 units or more in Manhattan (south of 96th Street) and the Brooklyn and Queens waterfront will be eligible for a full property tax abatement for 35 years if the development creates one of three options for affordable rental units and meets newly established minimum construction wage requirements. The units must remain affordable for 40 years. For all other rental developments in NYC utilizing the tax benefit, the full tax exemption benefit period is 25 years, with a phasing out of benefits in years 26-35. For developers who use the benefit program to build co-op or condo housing, the building must contain no more than 35 units, be located outside of Manhattan, and have an assessed value of no more than $65,000 per unit. The benefit lasts for a total of 20 years, with a full exemption for the first 14.15 The governor estimates that the new program, which expires in 2022, will create 2,500 new units of affordable housing a year.16
In March of 2017, the NYC Independent Budget Office analyzed the then-proposed Affordable New York Housing Program and estimated that it would cost the City a total of $8.4 billion in lost tax revenue
over the next ten years, an estimated $1.2 billion more than the cost if the now-expired 421-a program continued unchanged.17
At the end of construction, buildings receiving 421-a benefits are required to file for a Final Certificate of Eligibility (FCE) with HPD. In 2018, the number of housing units in buildings newly receiving a 421-a FCE increased for the second consecutive year. Newly certified units rose 36.0% in 2018, to 28,292 units (see graph on this page), including increases in all of the boroughs.18 Newly certified units rose by the greatest proportion in Staten Island, rising from 32 units in 2017 to 579 in 2018. Units newly certified also rose in Brooklyn, by 44.5%; in Queens, by 42.6%; in the Bronx, by 21.5%; and in Manhattan, by 19.3%.
Citywide, the largest proportion of units newly certified in 2018 were in buildings located in Brooklyn, with 41.9% of the total units in the City. Manhattan had 31.4% of these units, Queens had 18.1%, the Bronx had 6.6%, and 2.0% of units were in Staten Island. Because buildings in Manhattan are so much larger than buildings in the outer boroughs, almost a third of units were in Manhattan, despite having only 64 of the 1,411 buildings (5%) newly certified for 421-a benefits Citywide. (See Appendices F.7 and F.8.)
While the overall (both owner- and renter-occupied) number of newly certified 421-a units rose 36.0% between 2017 and 2018, the number of rental units in this program rose by a greater proportion, 39.2%, than owner units, 18.7%. Newly certified rental units rose in each borough during 2018, including 47.5% in Brooklyn; 30.5% in Queens, 30.3% in Manhattan; 18.9% in the Bronx; and from zero to 573 units in Staten Island. More than 86% of newly certified units in 2018 were rental units.
In FY 2019, 204,466 units will benefit from 421-a exemptions and abatements, including 116,000 rental units; 54,000 co-op and condo units; and 34,000 1-3 family and mixed-use structures. It is estimated that the 421-a program will cost the City $1.6 billion in lost tax revenue for all housing types in FY 2019.19
In order to be eligible for tax benefits, properties must register for an FCE with HPD on the
2019 Housing Supply Report
Housing NYC: Rents, Markets & Trends 2019 • Page 85
0
3
6
9
12
15
18
21
24
27
30
'18'17'16'15'14'13'12'11'10'09'08'07'06'05'04'03'02
Tho
usa
nd
s
36% Increase in Units Newly Issued 421-a Certificates in 2018
Units Newly Receiving 421-a Certificates, 2002-2018 in Thousands
Source: NYC Dept. of Housing Preservation and Development
completion of construction. HPD began notifying non-compliant owners in December of 2016 that their benefits would be suspended if they did not apply for an FCE. HPD announced in March of 2018 that it had suspended 421-a benefits, representing $66 million in tax revenue for 2018, to 1,788 “properties.” The “properties” (individual block and lots comprising approximately 1,300 buildings, including 109 rental buildings with 4,373 units) had received 421-a benefits for at least five years, but had not filed for an FCE.20 HPD estimates that approximately 77% of the properties receiving an FCE in 2017 were due to prior compliance issues, as were 73% of the properties in 2018.21 In February of 2019, an additional 301 buildings were sent notices of non-compliance (including 67 as part of a single complex).22
Another program that has offered affordable housing, the New York State Mitchell-Lama program, has suffered from a loss of housing since “buyouts”23 from the program began in 1985. Between 1955 and 1978, approximately 140,000 units of low- and middle-income housing were built in NYC through this tax-break and mortgage subsidy program. Since buyouts began in 1985, the City has lost approximately 48,000 units of Mitchell-Lama housing (including 4,000 units of hospital/university staff housing), although some has transitioned to rent stabilization. After averaging an annual loss of more than 5,000 units between 2004 and 2007, the pace has slowed considerably. Three developments bought out in 2018, with a total of 974 units. All of these developments were rentals, and have plans in place to retain affordability for tenants.24 As part of the Housing New York plan, in place since 2014, the City works to preserve the affordability of units in the Mitchell-Lama program (both rentals and co-ops). In FY 2018, 13,137 units were preserved through City efforts, with a total of 29,356 units preserved from the plan’s inception through FY 2018.25
Conversions and Subdivisions Housing units are both gained and lost through subdivisions and conversions. Subdivisions
involve the division of existing residential space into an increased number of units. Non-residential spaces, such as offices or other commercial spaces, can also be converted for residential use, or existing residential spaces can be converted into a smaller number of units by combining units to increase their size. As chronicled in prior Housing Supply Reports, during the mid-2000s, with a tight housing market and high demand for luxury apartments, there were an increasing number of non-residential conversions in neighborhoods Citywide. Conversions occurred in facilities as diverse as hospitals, recording studios, power plants, office buildings, and churches.
One indicator of conversions is the number of non-residential buildings newly receiving J-51 benefits for conversion to residential use. In 2018, for the third consecutive year, no formerly non-residential buildings received J-51 benefits for conversion to a residential property.26
More housing may also be created in the near future through the conversion of basements into legal housing units. A newly passed law, along with modified building codes, establishes a three-year demonstration program to facilitate the creation and alteration of habitable apartments in basements and cellars of certain one- to three-unit homes in Brooklyn’s Community District 5 (the East New York and Cypress Hills neighborhoods). The Basement Apartment Conversion Pilot Program provides homeowners in this District, earning less than 165% of Area Median Income (AMI), with financial and technical assistance to convert their basements into residential units for rental occupancy. Eligible homeowners are provided with financial assistance in the form of a low- or no-interest loan, with a maximum loan amount of $120,000, and the technical assistance necessary for completing the construction project. In addition to creating more rental units in this District, the pilot program will also allow the City to more easily facilitate this type of conversion program in the future in other neighborhoods.27
Units can also be lost through conversion. Real estate listing site StreetEasy examined Certificate of Occupancy data from the NYC Department of Buildings from 2015-2018 to determine how many
2019 Housing Supply Report
Page 86 • Housing Supply

units have been lost due to the conversion of multi-family residential buildings into single-family homes or into a smaller number of units than were present during initial construction. The report found 1,241 buildings across the City that had lost units during this time period and highlights the five neighborhoods with the largest number of buildings that lost units — Central Harlem, the Upper West Side, the Upper East Side, Park Slope, and Bedford-Stuyvesant. These five neighborhoods had a total of 397 buildings with a decrease in units between 2015 and 2018, with a net loss of 2,056 units.28
SRO Housing and Airbnb Rentals Conversion of single room occupancy (SRO) buildings also continued over the past year. SRO owners may convert SRO housing to other uses after obtaining a “Certificate of No Harassment” from HPD. For the third consecutive year, the number of approved certificates fell, from 92 in 2017 to 83 in 2018, a decrease of 9.8%.29
Efforts are also underway to ensure that SROs are used for permanent housing rather than as transient hotels. As of May 1, 2011, laws were newly passed strengthening the City’s ability to crack down on housing being used illegally for transient occupancy. Transient occupancy is now clearly defined as stays of fewer than 30 days.30 Governor Cuomo signed a bill in October of 2016 that further increased the fine for illegally advertising short-term rentals to as much as $7,500.31
Between May of 2011 and April of 2019, approximately 16,000 violations were issued to illegal hotel operators (including private apartments, hostels, and SROs). This includes more than 3,000 violations issued between May, 2018 and April, 2019), a decrease from the approximately 3,500 violations over the same time period of the prior year.32
The effect in NYC of Airbnb and other short-term rental companies, which facilitate short-term and vacation rentals worldwide, continues to be studied by various City agencies and interest groups. Two 2018 reports (explored in depth in the 2018 Housing Supply Report) found that Airbnb both removes permanent housing from NYC’s housing
stock, and increases rents.33 In an effort to curb the influence of companies like Airbnb (and other short-term rental companies), NYC continues to push for additional legislation and oversight of these companies. A law which was passed last July would require online home-sharing sites to disclose to the Mayor’s Office of Special Enforcement, on a monthly basis, all listings within NYC. The data would include the identities and addresses of the hosts, and companies would be subject to a $1,500 fine for each listing not disclosed. The law was intended to go into effect in February of this year, but in January a federal judge issued a preliminary injunction of the law on constitutional grounds.34
A 2019 report from the School of Urban Planning at McGill University (an update to one of the aforementioned 2018 reports; see Endnote 33) analyzes the effect the short-term rental disclosure regulations (currently blocked) would have on the NYC rental market.35 It also analyzes the effect of not having these regulations, as is the case as of the publication of this report.
Starting with a baseline of August 31, 2018 (when the report found that there were 30.6% more units renting for 120 nights or more as compared to the previous year, or a total of 9,000 such listings), the authors found that without new regulations, over the next year the number of housing units taken off the market would increase by an additional 1,800 units (to 10,800); average daily listings would increase 0.8%, to 57,300; 68% of listing revenue would be earned from illegal reservations; rent would increase for permanent tenants by an aggregate of $8.6 million (with a $60 million increase over three years); and commercial operators would manage 18.5% of all entire-home listings (up from 16.7% today).
Using San Francisco as a guide (where more stringent regulations went into place in January of 2018), the report predicts that with the new regulations there would be an average daily listing decline of 46% (to 31,000); 8,700 housing units would come back into the permanent market; rental vacancy rates would increase, especially in those neighborhoods most popular on listing websites; rent would decrease by an aggregate of $19 million
2019 Housing Supply Report
Housing NYC: Rents, Markets & Trends 2019 • Page 87
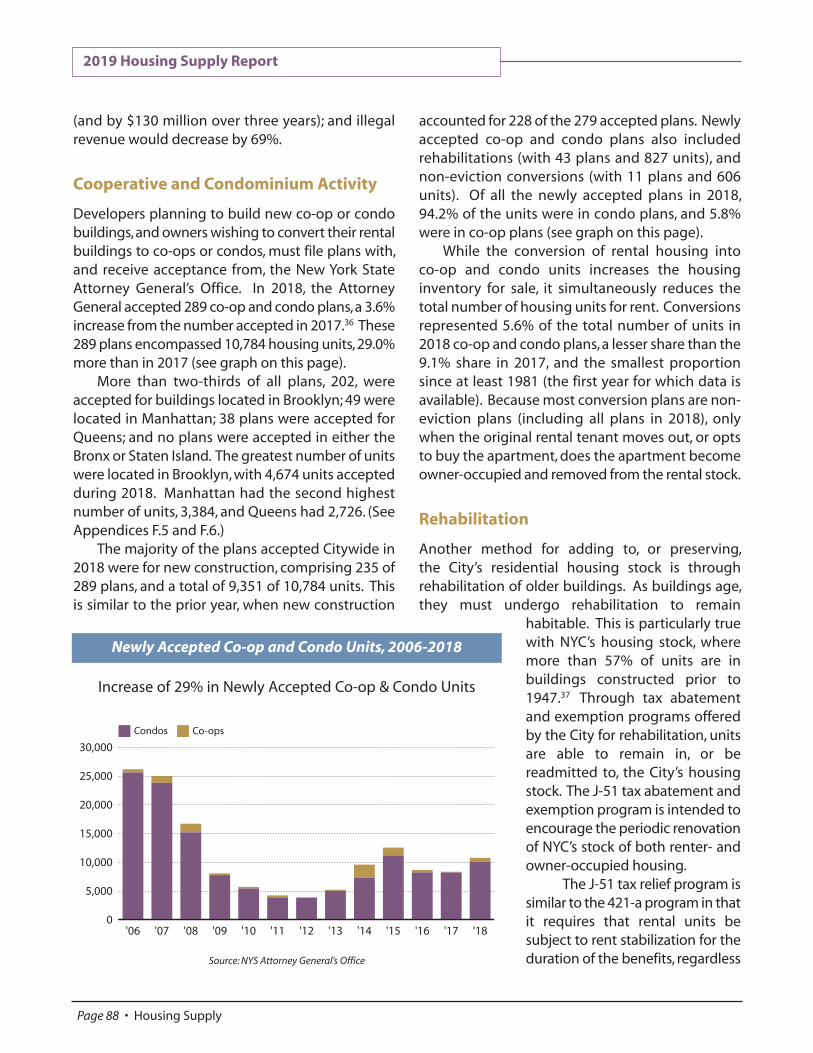
(and by $130 million over three years); and illegal revenue would decrease by 69%.
Cooperative and Condominium Activity Developers planning to build new co-op or condo buildings, and owners wishing to convert their rental buildings to co-ops or condos, must file plans with, and receive acceptance from, the New York State Attorney General’s Office. In 2018, the Attorney General accepted 289 co-op and condo plans, a 3.6% increase from the number accepted in 2017.36 These 289 plans encompassed 10,784 housing units, 29.0% more than in 2017 (see graph on this page).
More than two-thirds of all plans, 202, were accepted for buildings located in Brooklyn; 49 were located in Manhattan; 38 plans were accepted for Queens; and no plans were accepted in either the Bronx or Staten Island. The greatest number of units were located in Brooklyn, with 4,674 units accepted during 2018. Manhattan had the second highest number of units, 3,384, and Queens had 2,726. (See Appendices F.5 and F.6.)
The majority of the plans accepted Citywide in 2018 were for new construction, comprising 235 of 289 plans, and a total of 9,351 of 10,784 units. This is similar to the prior year, when new construction
accounted for 228 of the 279 accepted plans. Newly accepted co-op and condo plans also included rehabilitations (with 43 plans and 827 units), and non-eviction conversions (with 11 plans and 606 units). Of all the newly accepted plans in 2018, 94.2% of the units were in condo plans, and 5.8% were in co-op plans (see graph on this page). While the conversion of rental housing into co-op and condo units increases the housing inventory for sale, it simultaneously reduces the total number of housing units for rent. Conversions represented 5.6% of the total number of units in 2018 co-op and condo plans, a lesser share than the 9.1% share in 2017, and the smallest proportion since at least 1981 (the first year for which data is available). Because most conversion plans are non-eviction plans (including all plans in 2018), only when the original rental tenant moves out, or opts to buy the apartment, does the apartment become owner-occupied and removed from the rental stock.
Rehabilitation Another method for adding to, or preserving, the City’s residential housing stock is through rehabilitation of older buildings. As buildings age, they must undergo rehabilitation to remain
habitable. This is particularly true with NYC’s housing stock, where more than 57% of units are in buildings constructed prior to 1947.37 Through tax abatement and exemption programs offered by the City for rehabilitation, units are able to remain in, or be readmitted to, the City’s housing stock. The J-51 tax abatement and exemption program is intended to encourage the periodic renovation of NYC’s stock of both renter- and owner-occupied housing.
The J-51 tax relief program is similar to the 421-a program in that it requires that rental units be subject to rent stabilization for the duration of the benefits, regardless
2019 Housing Supply Report
Page 88 • Housing Supply
Condos Co-ops
0
5,000
10,000
15,000
20,000
25,000
30,000
'18'17'16'15'14'13'12'11'10'09'08'07'06
Source: NYS Attorney General’s Office
Increase of 29% in Newly Accepted Co-op & Condo Units
Newly Accepted Co-op and Condo Units, 2006-2018

of the building’s regulation status prior to receiving tax benefits. Rehabilitation activities that are permitted under J-51 regulations are Major Capital Improvements (MCIs); moderate and gut rehabilitation of both government-assisted and privately-financed multiple dwellings (which requires significant improvement to at least one major building-wide system); as well as improvements to co-ops and condos (subject to certain assessment guidelines if the project does not include substantial governmental assistance). While prior iterations of the J-51 program allowed for conversion of lofts and non-residential buildings into multiple dwellings, regulations effective January 1, 2012 allow only for conversions if there is substantial governmental assistance.38
In 2018, 29,815 units newly received J-51 benefits, an increase of 30.3% from the previous year (see graph on this page and Appendix F.8).39 These units were contained in 529 buildings, a decrease of 50.7% from 2017 levels. The location of the units newly receiving benefits ranged from 43.7% located in Queens, to 26.5% in the Bronx;
23.9% in Brooklyn; 5.3% in Manhattan; and 0.6% in Staten Island. Units newly receiving benefits rose, by double digits, in every borough but Manhattan. Units increased 21.4% in the Bronx, 53.9% in Brooklyn, 63.0% in Queens, and from 38 to 178 units in Staten Island. Units newly receiving J-51 benefits fell 57.4% in Manhattan. (See Appendices F.7 and F.8.) The average size of the buildings receiving benefits rose dramatically, from 16.2 units in 2017 to 56.4 units in 2018. In 2018, 32.8% of the units newly certified for the J-51 program were rentals, as were 44.0% of the buildings.
In FY 2019, the J-51 tax program will cost the City $297.9 million in lost tax revenue for all housing types, including approximately 250,000 rental units, 209,000 owner units, and 2,000 1-3 family and mixed-use structures.40
Rehabilitation work is also carried out through HPD’s “Alternative Enforcement Program (AEP),” now in its twelfth year of identifying the 200-250 “worst” buildings in the City, based on housing code violations. The most recent group of 250 buildings include 4,600 units of housing, with 8,044 non-
2019 Housing Supply Report
Housing NYC: Rents, Markets & Trends 2019 • Page 89
0
15
30
45
60
75
90
105
120
135
150
'18'17'16'15'14'13'12'11'10'09'08'07'06'05'04'03'02'01'00'99'98'97'96
Tho
usa
nd
s
Source: NYC Department of Housing Preservation and Development
2018 Saw 30% Increase in Number of Units Newly Receiving J-51 Benefits
Units Receiving Initial J-51 Benefits, 1996-2018, in Thousands

hazardous A-class violations, 23,732 hazardous B-class violations, and 5,388 immediately hazardous C-class violations. If building owners in this program do not make repairs to their buildings, the City steps in to do so, and then charges the owners. Through the first eleven rounds of the program, the City discharged 1,946 of 2,387 buildings that entered the program, with a combined total of 26,085 of 30,680 units of housing.41
Tax-Delinquent Property and Anti-Abandonment Strategies Historically, the City foreclosed on thousands of tax-delinquent residential properties, becoming the owner and manager of these buildings, known as in rem properties. By its peak in 1986, the City owned and managed 4,000 occupied buildings containing 40,000 units of housing and almost 6,000 vacant buildings containing 55,000 units of housing.
HPD’s Alternative Management Programs began in 1994 with the goal of returning City-owned properties to private owners and reducing its share of in rem buildings by identifying buildings at risk and helping owners. HPD has successfully reduced the number of occupied and vacant in rem units in HPD central management to 323 through June of 2018, a 99.3% decline since FY 1994.42 Key initiatives to prevent abandonment include tax lien sales; the Third Party Transfer Program, which targets distressed and other buildings with tax arrears;43 and housing education courses, which teach owners and superintendents basic management, maintenance, and finance skills to improve their properties.44
The City no longer forecloses and takes title to properties that are tax delinquent or in arrears for water and sewer charges. Instead, tax liens for properties that are not distressed are sold in bulk to private investors after notice is given to property owners, who are given 90 days to pay the arrears. After the lien is sold, the lien holder is entitled to collect the entire lien amount, plus other interest and charges, from the property owner. In addition, the property owner must
continue to pay current taxes to the City. If the owner has not paid the lien or entered into a payment plan, the lien holder can file for foreclosure on the property.45 The Lien Sale Task Force, a task force authorized by law to review and evaluate the Lien Sale Program, reported in September of 2016 that between 2008 and 2016, an average of 25,100 properties were added to the lien sale list annually. But the number of liens actually sold was an annual average of 4,600, or 18.3% of the liens published on this list. Of the 41,400 liens sold during this period, just 354 (0.8%) ultimately went into foreclosure, with less than half of these foreclosed properties being residential.46
An additional facet of the City’s anti-abandonment strategy is third party transfer. For buildings that are distressed and in tax arrears, the City can initiate an in rem tax foreclosure action against property owners. The policy, authorized under Local Law 37 of 1996, transfers the title of in rem properties directly to new owners (qualified third parties) without the City ever taking title itself.47 Since it began in 1996, the NYC Department of Finance has collected at least $536 million in revenue associated with properties in this program, and 530 buildings have been transferred to for-profit and non-profit owners. No new properties have been transferred since 2013, although Round 10 of this program has identified 139 buildings (comprising 2,132 units) which will be transferred in the near future.48
Demolitions A total of 1,888 buildings were demolished in 2018, a 9.6% increase over the prior year, following a decrease of 6.9% in 2017. Brooklyn accounted for 35.0% of all the buildings demolished in 2018, Queens had 33.1%, Staten Island had 14.1%, the Bronx had 10.1%, and Manhattan had the lowest proportion, 7.7%. Demolitions rose in every borough but Staten Island, where they fell by 16.6%. Demolitions rose by the greatest proportion in the Bronx, rising 39.7%, while they rose 28.1% in Manhattan, 15.4% in Brooklyn, and 7.8% in Queens.49 (See Appendix F.9.)
2019 Housing Supply Report
Page 90 • Housing Supply

Obtaining a permit for demolition or significant alterations may be harder going forward. A three-year pilot program, which started in the Fall of 2018, requires certain owners to obtain a “Certificate of No Harassment” (CONH) before Department of Buildings approval of demolition or significant alteration permits. Among the buildings that will need this approval are those in which either a court or New York State Homes and Community Renewal found at least one case of harassment since September of 2013; distressed buildings in one of 11 Community Districts; buildings that have been the subject of a full vacate order; or those buildings that participated in the AEP program for at least four months since February 1, 2016. Following a hearing to determine whether harassment of tenants has taken place within the previous 60 months, those buildings found not eligible for a CONH have the choice of entering into a “cure agreement,” where affordable housing is developed within the Community District in exchange for the permit. Absent a cure agreement, no permits will be issued to those buildings who fail to obtain a CONH for at least 60 months following the denial.50 In October of 2018, the City published a list of buildings subject to the new regulations, including more than 1,000 buildings and 26,000 units of housing.51
Summary In 2018, housing permits fell, decreasing by 5.5%, while the number of completed housing units increased by 4.5%. The number of units newly receiving 421-a tax benefits rose 36.0% in 2018, while units newly receiving J-51 tax abatements and exemptions increased by 30.3%. There was an increase in newly accepted co-op and condo units, with units increasing 29.0% and plans increasing by 3.6%. Rental housing availability remains tight, with a Citywide vacancy rate of 3.63% in 2017, and more than 11% of rental units overcrowded. Mayor de Blasio’s expanded housing initiative calls for the development and preservation of 300,000 units of housing by 2026, more than 123,000 of which have already been started, to help reduce the affordable housing shortage. r
Endnotes 1. The NYC Housing and Vacancy Survey is conducted triennially,
sponsored by the NYC Department of Housing Preservation and Development (HPD) and conducted by the U.S. Census Bureau. Data is based on “Selected Initial Findings of the 2017 NYC Housing and Vacancy Survey,” prepared by HPD.
2. The U.S. housing stock was comprised of 36.1% renter-occupied
units, according to the 2017 American Community Survey, conducted by the U.S. Census Bureau. To calculate the ratio of renter-occupied units in NYC, staff did not include vacant units that are not for sale or for rent in the total number of housing units.
3. Other units include public housing, Mitchell-Lama, In Rem, HUD-
regulated, Article 4 and Loft Board units. 4. Since the number of vacant units available for rent in Staten Island
is small, and the HVS is a sample survey, the sampling error of the vacancy rate is likely to be large, and thus, the U.S. Census Bureau could not calculate an accurate vacancy rate.
5. U.S. Census Bureau website: https://www.census.gov/construction/bps/. 6. NYC Department of City Planning Housing Database 19v1,
compilation of NYC Department of Buildings Applications and Certificates of Occupancy data. Note that the data is continually updated and is subject to change, including data from prior years.
7. Beginning with the 2006 Housing Supply Report, the NYC
Department of City Planning (DCP) defines a housing completionas any unit receiving either a final or a temporary Certificate of Occupancy in the stated year. DCP provided this information for the 2004 calendar year and beyond, and believes it is a more accurate representation of new housing in NYC than previous methodologies which only counted final Certificates of Occupancy.
8. Starts refer to the number of units beginning construction or
rehabilitation in a given period. 9. Preliminary Fiscal 2019 Mayor's Management Report:
http://www1.nyc.gov/site/operations/performance/mmr.page. 10. Housing New York By the Numbers website: http://www1.nyc.gov/
site/housing/action/by-the-numbers.page; accessed April 2019, with data through 3/31/2019.
11. “Housing New York: A Five-Borough, Ten-Year Plan,” NYC
Department of Housing Preservation and Development, May 5, 2014.
12. “Housing New York 2.0,” NYC Department of Housing Preservation
and Development, November 15, 2017. 13. Housing New York By the Numbers website: http://www1.nyc.gov/
site/housing/action/by-the-numbers.page; accessed April 2019, with data through 3/31/2019. Per “Housing New York 2.0” Extremely Low-Income is defined as 0-30% of Area Median Income (AMI); Very Low-Income: 31-50% of AMI; Low-Income: 51-80% of AMI; Moderate-Income: 81-120% of AMI; Middle-Income: 121-165% of AMI.
14. Program information available at: http://www1.nyc.gov/site/hpd/
developers/tax-incentives-421a.page. 15. Program information available at: https://www1.nyc.gov/site/hpd/
developers/tax-incentives-421a-main.page. 16. “Governor Cuomo and Legislative Leaders Announce Agreement on
FY 2018 State Budget,” State of New York Press Release, April 7, 2017.
2019 Housing Supply Report
Housing NYC: Rents, Markets & Trends 2019 • Page 91

17. “Estimated Cost to New York City of Governor Cuomo’s Proposed Affordable New York Housing Program,” NYC Independent Budget Office, March, 2017.
18. NYC Department of Housing Preservation and Development, Tax
Incentives Program data. A large part of the increase in newly issued Final Certificates of Eligibility (FCE) in 2018 is due to enforcement policies by HPD, requiring owners to file for FCEs or lose their tax benefits.
19. “Annual Report on Tax Expenditures,” NYC Department of Finance,
February, 2019. 20. “City Suspends 421-a Benefits to More Than 1,700 Non-Compliant
Owners.” HPD Press Release. March 9, 2018. Note that the 1,788 properties include condo buildings, with each unit within the building having an individual block and lot designation.
21. This information was provided to the RGB by the New York City
Department of Housing Preservation and Development at the same time it provided tax incentives data for 2018 (April, 2019). See Endnote 18.
22. NYC Department of Finance website; https://www1.nyc.gov/
site/finance/benefits/benefits-421a.page; accessed April, 2019. 23. Developments are eligible to withdraw from the Mitchell-Lama
program (buyout), after 20 years upon prepayment of the mortgage (or after 35 years in the case of developments aided by loans prior to May 1, 1959).
24. The number of Mitchell-Lama buyouts was provided most recently
through the NYC Department of Housing Preservation and Development and the NYS Homes and Community Renewal, and in previous years through other sources, such as the report “Affordable No More: An Update” by the Office of the New York City Comptroller, Office of Policy Management on May 25, 2006. Two of the developments that bought out in 2018 will remain affordable through Article 11, while the other will convert to a co-op, with present tenants able to purchase their apartments at 30% below market, or remain renters with rent adjustments following RGB guidelines.
25. “Your Key to NYC: Mayor de Blasio Announces Largest Year for
Affordable Housing Production in City’s History.” Mayor’s Office Press Release, July 19, 2018.
26. NYC Department of Housing Preservation and Development, Tax
Incentives Program data. 27. NYC Department of Housing Preservation and Development
website; https://www1.nyc.gov/site/hpd/developers/development-programs/basement-conversion.page; accessed April, 2019.
28. “NYC’s Disappearing Homes: When Updated Buildings Mean
Fewer Units,” StreetEasy, April 1, 2019; https://streeteasy.com/ blog/nyc-disappearing-homes/.
29. NYC Department of Housing Preservation and Development. 30. Mayor Bloomberg Announces Results of City’s Efforts to Curb
Dangerous Illegal Hotels in New York City After State Legislation Enhances Enforcement Abilities.” Mayor’s Office Press Release 157-12, April 27, 2012.
31. “Cuomo signs bill that deals huge blow to Airbnb,” New York Post,
October 21, 2016. 32. Office of the Criminal Justice Coordinator, Mayor’s Office of Special
Enforcement. Complete April 2019 data was not yet finalized as of the publication of this report. Inclusive of data through approximately April 23, 2019.
33. See the 2018 Housing Supply Report for more information on the following two reports: “The High Cost of Short-Term Rentals in New by York City,” by David Wachsmuth, David Chaney, Danielle Kerrigan, Andrea Shillolo, and Robin Basalaev-Binder (McGill University), January 30, 2018 and “The Impact of Airbnb on NYC Rents,” NYC Comptroller’s Office, April 2018.
34. “Judge Blocks New York City Law Aimed at Curbing Airbnb Rental,”
New York Times, January 3, 2019. 35. “The Impact of New Short-term Rental Regulations on New York
City,” by David Wachsmuth Jennifer Combs and Danielle Kerrigan (McGill University), January, 2019.
36. NYS Attorney General’s Office, Real Estate Financing Bureau data
and the NYC Department of Housing Preservation and Development, Sales Unit. Virtually all accepted units reported are from data provided by the NYS Attorney General. For the purposes of this report, “accepted” refers only to those co-op and condo plans that require offering plans. Those that do not, and receive a “no-action” letter from the NYS Attorney General’s office, are not included in this data.
37. 2017 NYC Housing and Vacancy Survey, U.S. Census Bureau. 38. NYC Department of Housing Preservation and Development
website; http://www1.nyc.gov/site/hpd/developers/tax-incentives-j51.page.
39. NYC Department of Housing Preservation and Development, Tax
Incentives Program data. Note that, similar to the 421–a program, J-51 provides tax abatements and incentives to both renter- and owner-occupied units.
40. “Annual Report on Tax Expenditures,” NYC Department of Finance
publication, February, 2019. 41. “HPD Announces Enforcement Action Against 250 Troubled
Buildings.” HPD Press Release, February 5, 2019. 42. NYC Department of Housing Preservation and Development. 43. NYC Department of Housing Preservation and Development
website; http://www1.nyc.gov/site/hpd/owners/compliance-property-tax-delinquency.page.
44. NYC Department of Housing Preservation and Development
website; http://www1.nyc.gov/site/hpd/community/outreach-and-education.page.
45. NYC Department of Finance, General Information on the City’s Tax
Lien Sale Process; http://www1.nyc.gov/site/finance/taxes/ property-lien-sales.page.
46. “Report of the Lien Sale Task Force,” September 2016. 47. “New York City Case Study: Third Party Transfer Initiative: A
Solution To Property Abandonment,” by Lisa Mueller, Local Initiative Support Corporation report, January 14, 2003.
48. Most recent figures obtained from NYC Department of Housing
Preservation and Development, April, 2019. 49. NYC Department of Buildings (DOB) data. Note that demolition
statistics include both residential as well as commercial buildings, as the DOB does not specify the type of building in its data.
50. City of New York Local Law 1 of 2018. 51. “City Targets Over 1,000 Buildings for New Tenant Protection
Program.” HPD Press Release, October 12, 2018.
2019 Housing Supply Report
Page 92 • Housing Supply

Housing NYC: Rents, Markets & Trends 2019 • Page 93
New York City Rent Guidelines Board Changes to the Rent Stabilized Housing Stock in NYC in 2018
R The study finds a net estimated gain of 4,377 rent stabilized units in 2018.
R Most of the additions to the rent stabilized stock in 2018
were due to the 421-a tax incentive program, accounting for 80% of the additions.
R The median rent of initially registered rent stabilized
apartments in 2018 was $3,000, a 12% increase from the prior year.
R High-Rent Vacancy Deregulation made up the largest
category of subtractions from the stabilized stock, accounting for 62% of the units removed in 2018.
R Since 1994, New York City’s rent stabilized housing stock
has seen an approximate net loss of 142,868 units.
What’s New94 Overview
94Additions to the Rent Stabilized Housing Stock
96Subtractions to the Rent Stabilized Housing Stock
99 Summary
141 Appendices

Overview Rent regulation has been a fixture in New York City’s housing market for over 75 years, although the laws that govern rent regulated housing have been substantially changed and/or modified over time. The laws governing rent regulation allow for dynamic changes in the regulatory status of a significant portion of the rent regulated housing stock in any given year. Units enter, exit or change status within the regulatory system.
The figures in this study represent additions and subtractions of dwelling units to and from the rent stabilization system in 2018. These statistics are gathered from various City and State agencies.
This report is an update of previous studies done annually since 2003, when an analysis was done of the changes in New York City’s rent stabilized housing stock from 1994 to 2002. The total number of additions and subtractions to the rent stabilized housing stock since 1994 is contained in the appendices of this report. These totals are estimates because they do not represent every unit that has been added or subtracted from the rent stabilized stock since 1994, but rather those that have been recorded or registered by various City and State agencies. They represent a ‘floor,’ or minimum count, of the actual number of newly regulated and deregulated units in these years.
Additions to the Rent Stabilized Housing Stock Since newly constructed or substantially rehabilitated units are exempt from rent regulation, increases to the regulated housing stock are frequently a result of owners placing these new units under rent stabilization in exchange for tax benefits. These owners choose to place units under rent stabilization because of cost/benefit analyses concluding that short-term regulation with tax benefits is more profitable than free market rents without tax benefits. According to NYS Homes and Community Renewal (HCR), the median legal rent of initially registered rent stabilized apartments in 2018 Citywide was $3,000, a 12% increase from
$2,685 in 2017. (See Appendix H.3 for initially registered rents Citywide and by borough.) Events that lead to the addition of stabilized units include: • Section 421-a Tax Exemption Program • J-51 Property Tax Exemption and
Abatement Program • Mitchell-Lama buyouts • Lofts converted to rent stabilized units • Rent controlled apartments converting
to rent stabilization • Other additions
Section 421-a and J-51 Programs The NYC Department of Housing Preservation and Development (HPD) administers programs to increase the supply of rental housing. Two of these programs have an impact on the inventory of stabilized housing: The Section 421-a Program and the J-51 Program. Under Section 421-a of the Real Property Tax Law, newly constructed dwellings in New York City could elect to receive real estate tax exemptions in exchange for placing units in rent stabilization for a specified period (10-25 years). In 2018, an estimated total of 9,452 units were added to the rent stabilized stock through the 421-a program, 1% more than the prior year. The largest number of units was in Brooklyn (3,910); followed by Manhattan (2,455); Queens (2,349); and the Bronx (738). There were none on Staten Island. According to HCR, the median legal rent of currently registered rent stabilized apartments receiving 421-a tax abatements in 2018 was $3,350, a 2% increase from the prior year.
The J-51 Program provides real estate tax exemptions and abatements to existing residential buildings that are renovated or rehabilitated. This program also provides these benefits to residential buildings converted from commercial structures. In exchange for these benefits, owners of these buildings agree to place under rent stabilization those apartments that otherwise would not be subject to regulation. The apartments remain stabilized, at a minimum, until the benefits expire. In 2018, 309 units were added to the rent stabilized
Changes to the Rent Stabilized Housing Stock in NYC in 2018
Page 94 • Housing Supply

stock through the J-51 program, 49% more than in the prior year.1 (See Appendices H.1 and H.2.)
Mitchell-Lama Buyouts Mitchell-Lama developments were constructed under the provisions of Article 2 of the Private Housing Finance Law (PHFL). This program was primarily designed to increase the supply of housing affordable to middle-income households. Approximately 75,000 rental apartments and 50,000 cooperative units were constructed through the program from the 1950’s through the 1970’s. For these units to be affordable, the State or City provided low interest mortgages and real estate tax abatements, and the owners agreed to limit their return on equity.
While the State and City mortgages are generally for a term of 40 or 50 years, the PHFL allows owners to buy out of the program after 20 years. If an owner of a rental development buys out of the program and the development was occupied prior to January 1, 1974, the apartments become subject to rent stabilization.
In 2018, no Mitchell-Lama rental units became rent stabilized, compared to 233 in 2017. Since 1994, 11,393 rental units have left the Mitchell-Lama system and become a part of the rent stabilized housing stock. (See Appendices H.1 and H.2.)
Loft Units The New York City Loft Board, under Article 7-C of the Multiple Dwelling Law, regulates rents in buildings originally intended as commercial loft space that have been converted to residential housing. When the units are brought up to code standard, they become stabilized. A total of 43 units entered the rent stabilization system in 2018, compared to ten added in 2017. (See Appendices H.1 and H.2.)
Changes in Regulatory Status Chapter 371 of the Laws of 1971 provided for the decontrol of rent controlled units that were
voluntarily vacated on or after July 1, 1971. Since the enactment of vacancy decontrol, the number of rent controlled units has fallen from over one million to fewer than 22,000.2 When a rent controlled unit is vacated, it either becomes rent stabilized or leaves the regulatory system. A rent controlled unit becomes rent stabilized when it is contained in a rental building with six or more units and the incoming tenant pays a legal regulated rent less than the Deregulation Rent Threshold (DRT), currently $2,774.76 per month.3 This process results in a reduction of the rent controlled stock and an increase in the rent stabilized stock. Otherwise, the apartment is subject to deregulation and leaves the rent regulatory system entirely.
According to rent registration filings with NYS Homes and Community Renewal (HCR), 141 units were decontrolled and became rent stabilized in 2018, virtually unchanged from 142 units decontrolled the prior year. By borough, 47% of the units were in Manhattan; 23% were in Brooklyn; 18% were in Queens; 13% were in the Bronx; and there were none on Staten Island. (See Appendices H.1 and H.2.)
Other Additions to the Stabilized Housing Stock Additionally, several other events can increase the rent stabilized housing stock: tax incentive programs (other than the 421-a and J-51 programs), “deconversion,” returned losses, and the sub-division of large units into two or more smaller units. The 420-c program, a tax exemption program for low-income housing projects developed in conjunction with the Low-Income Housing Tax Credit Program, produces affordable housing with rents that are regulated, but not necessarily rent stabilized.4 The RGB is unable to determine the number of these units that became rent stabilized.
However, there are other tax incentive programs, which as part of their regulatory agreements may require their rental units to be rent stabilized, and whose stabilization status could be determined. These tax incentive programs include
Changes to the Rent Stabilized Housing Stock in NYC in 2018
Housing NYC: Rents, Markets & Trends 2019 • Page 95

Articles 11, 14 and 15 of the Private Housing Finance Law (PHFL), which together added 1,900 units Citywide.5 Among these tax incentive programs, the largest number of units were in Queens (587 units); followed by Manhattan (535 units); Brooklyn (524 units) and the Bronx (254 units). There were no units added on Staten Island.
Deconversion occurs when a building converted to cooperative status reverts to rental status because of financial difficulties. Returned losses include abandoned buildings that are returned to habitable status without being substantially rehabilitated, or City-owned in rem buildings being returned to private ownership. These latter events, as well as sub-division of large units, do not generally add a significant number of units to the rent stabilized stock and cannot be quantified for this study.
Subtractions from the Rent Regulated Housing Stock Deregulation of rent controlled and stabilized units occurs because of statutory requirements or because of physical changes to the residential dwellings. Events that lead to the removal of stabilized units include the following: • High-Rent High-Income Deregulation • High-Rent Vacancy Deregulation • Cooperative/Condominium Conversions • Expiration of 421-a Benefits • Expiration of J-51 Benefits • Substantial Rehabilitation • Conversion to Commercial or Professional Status • Other Losses to the Housing Stock – Demolitions,
Condemnations, Mergers, etc.
High-Rent High-Income Deregulation Since enactment of the Rent Regulation Reform Act of 1993 (RRRA), occupied apartments may be deregulated under certain circumstances. Beginning with the RRRA, apartments renting for $2,000 or more in which the tenants in occupancy had a combined household income more than
$250,000 in each of the immediately two preceding calendar years could be deregulated. In 1997, the RRRA reduced the income threshold to $175,000. Fourteen years later, with passage of the Rent Act of 2011, the rent threshold was raised to $2,500 and the income requirement increased to $200,000.
The passage of the Rent Act of 2015, effective June 15, 2015, maintained the same income requirement but modified the Deregulation Rent Threshold (DRT) for High-Rent High-Income Deregulation. The DRT was increased to $2,700 and is adjusted each January 1st thereafter by the one-year renewal lease guideline percentage issued the prior year by the Rent Guidelines Board. Most recently, the DRT rose to $2,774.76, effective January 1, 2019.
Deregulation occurs upon application by the owner and upon the expiration of the rent stabilized lease. This income-based deregulation process, which is administered by HCR, relies upon data furnished to the NYS Department of Taxation and Finance as part of the income verification process. Both the rent level and household income criteria should be met for deregulation to take place. For
Changes to the Rent Stabilized Housing Stock in NYC in 2018
Page 96 • Housing Supply
0
200
400
600
800
1,000
'18'16'14'12'10'08'06'04'02'00'98'96'94
Number of Units Deregulated Due to High-Rent High-Income Deregulation Increase
High-Rent High-Income Deregulation, 1994-2018
Source: NYS Homes and Community Renewal (HCR) annual registration data.

example, currently, if a household earning at least $200,000 paid less than $2,774.76 per month, rent regulation would remain in effect. In addition, the owner must apply to HCR to deregulate the unit. If the owner does not submit a deregulation application, the occupying tenant remains regulated regardless of rent level and household income. Because HCR must approve the orders of deregulation, an exact accounting exists of units leaving regulation because of High-Rent High-Income Deregulation.
Based on HCR processing records, High-Rent High-Income Deregulation removed a total of 109 apartments from rent regulation in 2018, 2% more than in the prior year.6 Of these units, 50% were in Manhattan; 27% in Brooklyn; 17% in Queens; and 6% were in the Bronx. No units were located on Staten Island.
Since 1994, a total of 6,455 units have been deregulated due to High-Rent High-Income Deregulation, of which 86% have been in Manhattan. (See graph on previous page and Appendix H.4.)
High-Rent Vacancy Deregulation In 1993, the New York State legislature instituted High-Rent Vacancy Deregulation, provisions of which have changed several times since its inception.7 (See the Changes to the Rent Stabilized Housing Stock in NYC in 2014 report for a detailed discussion of the numerous changes over the years.)
Under the Rent Act of 2015, when a tenant moves into a vacant apartment and the rent has lawfully reached the Deregulation Rent Threshold (DRT), the apartment qualifies for permanent High-Rent Vacancy Deregulation. The DRT is adjusted each January 1st by the one-year renewal lease guideline percentage issued the prior year by the NYC Rent Guidelines Board. Most recently, the DRT rose to $2,774.76, effective January 1, 2019.
Furthermore, HCR’s Rent Code Amendments of 2014 require an owner to serve the first deregulated tenant with two documents. The first
is a notice created by HCR detailing the previous rent and how the new rent was calculated. The second is HCR annual apartment registration, indicating the apartment status as permanently exempt, which should be filed on the April 1st following the deregulation. These documents notify the tenant of the right to file a formal complaint with HCR challenging the rent and the deregulation status.
According to HCR rent registration records, 4,628 units were deregulated in 2018 due to High-Rent Vacancy Deregulation, a 32% increase from 2017. Of these deregulated units, 49% were in Manhattan; 26% were in Brooklyn; 20% were in Queens; 4% were in the Bronx; and 1% were on Staten Island. Since 1994, at least 160,292 units were registered with the HCR as being deregulated due to High-Rent Vacancy Deregulation, 69% of which have been in Manhattan. (See graph on this page and Appendices H.5 through H.7.)
Changes to the Rent Stabilized Housing Stock in NYC in 2018
Housing NYC: Rents, Markets & Trends 2019 • Page 97
0
3,000
6,000
9,000
12,000
15,000
'18'16'14'12'10'08'0604'02'00'98'96'94
Increase in 2018 in Number of Units Deregulated Due to High-Rent Vacancy
High-Rent Vacancy Deregulation, 1994-2018
Note: Prior to 2014, registration of deregulated units with HCR was voluntary. These totals represent a ‘floor’ or minimum count of the
actual number of deregulated units in these years.
Source: NYS Homes and Community Renewal (HCR) annual registration data.

Co-operative & Condominium Conversions When rent regulated housing is converted through cooperative or condominium conversion to ownership status, apartments are immediately removed from rent regulation if the occupant chooses to purchase the unit.
For tenants who remain in their apartment and do not purchase their unit, the rent regulatory status depends on the type of conversion plan. In eviction conversion plans, non-purchasing tenants may continue in residence until the expiration of their lease. In non-eviction plans (which are the overwhelming majority of approved plans) the regulated tenants have the right to remain in occupancy until they voluntarily leave their apartments. When a tenant leaves a regulated unit, the apartment in most cases becomes deregulated, whether the incoming tenant purchases or rents.
In 2018, a total of 791 units located in co-ops or condos left the stabilized housing stock, an 18% increase over the prior year. By borough, the largest proportion of units leaving rent stabilization and becoming co-op/condo was in Brooklyn, with 33% of the units; followed by Queens (28%); Manhattan (27%); and the Bronx (12%).8 In addition, a single unit on Staten Island left rent stabilization due to co-op/condo conversion. An estimated total of 50,431 co-op or condo units have left the stabilized stock since 1994. (See Appendices H.6 and H.7.)
Expiration of Section 421-a and J-51 Benefits As discussed earlier in this report, rental buildings receiving Section 421-a and J-51 benefits remain stabilized, at least until the benefits expire. Therefore, these units enter the stabilized system for a prescribed period of the benefits and then exit the system.
In 2018, expiration of 421-a benefits resulted in the removal of 1,016 units from the rent stabilization system, 25% fewer than the prior year. Most 421-a expirations were in Manhattan (79%),
while the remainder were in Brooklyn (8%); Queens (8%); Staten Island (3%); and the Bronx (2%).
The expiration of J-51 benefits in 2018 resulted in the removal of 375 units, 3% more than in the prior year. Among J-51 expirations, the vast majority were in Manhattan, with 71%; followed by Brooklyn (27%); and Queens (1%). No units were removed on Staten Island or in the Bronx. (See Endnote 8.)
Since 1994 Citywide, 26,141 421-a units and 16,591 J-51 units have left the rent stabilization system. (See Appendices H.6 and H.7.)
Substantial Rehabilitation The Emergency Tenant Protection Act (ETPA) of 1974 exempts apartments from rent regulation in buildings that have been substantially rehabilitated on or after January 1, 1974. HCR processes applications by owners seeking exemption from rent regulation based on the substantial rehabilitation of their properties. Owners must replace at least 75% of building-wide and apartment systems (i.e., plumbing, heating, electrical wiring, windows, floors, kitchens, bathrooms, etc.). In general, buildings that have been substantially rehabilitated and vacated tend to have been stabilized properties. Therefore, when these buildings are substantially rehabilitated, the apartments are no longer subject to regulation and are considered new construction. This counts as a subtraction from the regulated stock. Notably, these properties do not receive J-51 tax incentives for rehabilitation.
In 2018, 209 units were removed from stabilization through substantial rehabilitation, 1% fewer than the prior year. By borough, the largest proportion of units leaving rent stabilization was in Brooklyn, with 58% of the units; followed by Manhattan (32%); Queens (7%); and the Bronx (3%). One unit was also subtracted on Staten Island. A total of 9,687 units have been removed from the rent stabilization system through substantial rehabilitation since 1994. (See Appendix H.6.)
Changes to the Rent Stabilized Housing Stock in NYC in 2018
Page 98 • Housing Supply

Conversion to Commercial or Professional Status Space converted from residential use to commercial or professional use is no longer subject to rent regulation. In 2018, 7 units were converted to nonresidential use, compared to 24 the prior year. Since 1994, 2,479 residential units have been converted to nonresidential use. (See Appendix H.6.)
Other Losses to the Housing Stock Owners may register units as permanently exempt when smaller units are merged into larger ones, or when the building is condemned or demolished. HCR annual registration data shows that 333 units were removed from the stabilized housing stock in 2018 due to these reasons, a 17% decline from the prior year. By borough, the largest proportion of units leaving rent stabilization due to other losses was in Manhattan, with 56% of the units; followed by Brooklyn (24%); Queens (13%); and the Bronx (8%). No units were removed on Staten Island. (See
Endnote 8) Since 1994, 26,350 units have been removed from rent stabilization due to these other types of losses. (See Appendix H.6.)
Summary In 2018, at least 7,468 housing units left rent stabilization and approximately 11,845 units entered the stabilization system.
The built-in fluidity of the system resulted in a net gain of 4,377 units in the rent stabilized housing stock in 2018, following an estimated net gain of 4,595 units in 2017. (See graph on this page and Summary Table on page 101.)
By borough, Brooklyn saw the most additions (40%); followed by Manhattan (26%) ; Queens (25%); and the Bronx (9%). There were no additions on Staten Island. Units added to the stabilized stock in 2018 registered median legal rents of $3,000, a 12% increase from the prior year. The vast majority of units added were the result of the 421-a program, which comprised 80% of the additions, with an initial median rent of $3,350 (See Appendices H.1 and H.2.)
Changes to the Rent Stabilized Housing Stock in NYC in 2018
Housing NYC: Rents, Markets & Trends 2019 • Page 99
-20,000
-15,000
-10,000
-5,000
0
5,000
2018201720162015201420132012201120102009200820072006200520042003
-9,3
36
-6,6
82
-9,0
42
-7,8
20
-7,6
46
-13,
034
-15,
465
-8,7
71
-10,
078
-6,3
73
-880
-5,1
10
-8,0
09
-618
4,59
5
4,37
7
Note: 2016 and 2017 numbers revised from prior years. See Endnote 1.
Sources: NYC Department of Housing Preservation and Development (HPD), Tax Incentive Programs and Division of Housing Supervision (Mitchell-Lama Developments); NYS Homes and Community Renewal (HCR), Office of Rent
Administration and Office of Housing Operations; and NYC Loft Board.
Increase in Units Under Rent Stabilization in 2018
Annual Net Change of Rent Stabilized Units, 2003-2018

Meanwhile, 52% of all units leaving rent stabilization were located in Manhattan, a total of 3,873 units. The second largest reduction was in Brooklyn, representing 25% removed; followed by Queens, 18%; the Bronx, 4%; and Staten Island, representing 1% of the total number of units removed from rent stabilization in 2018. High-Rent Vacancy Deregulation was the largest source of measured subtractions from the rent stabilized housing stock in 2018, accounting for 62% of the total decrease. (See Appendix H.7.)
Since 1994, the first year for which we have data, a total of at least 155,558 units have been added to the rent stabilization system, while a minimum of 298,426 rent stabilized units have been deregulated, for an estimated net loss of 142,868 units over the last 25 years. r
Endnotes 1. The number of J-51 units added to the rent stabilized stock was
adjusted for 2016 and 2017 due to a change in the source of the data. Previously obtained from the NYC Department of Housing Preservation and Development (HPD), the data source is now NYS Homes and Community Renewal (HCR).
2. The 2017 Housing and Vacancy Survey reported a total of 21,751
rent controlled units in New York City. 3. The Rent Act of 2015, effective June 15, 2015, raised the
Deregulation Rent Threshold for deregulation upon vacancy from $2,500 to $2,700, subsequently increased to $2,733.75 effective January 1, 2018 and to $2,774.76 effective January 1, 2019. See “High-Rent High-Income Deregulation” section on page 96 for more information.
4. The 420-c tax incentive program provides a complete exemption
from real estate taxes for the term of the regulatory agreement (up to 30 years). While the RGB is unable to quantify the number of units that became rent stabilized since 2003, the previously reported figure for the period 1994-2002, 5,500 rent stabilized units created through the 420-c program, is assumed to be correct. The figure is based upon units identified in rental projects with funding sources that require rent stabilization.
5. Article 11, 14 and 15 tax incentive programs encourage new
construction or rehabilitation of affordable housing to be carried out by a Housing Development Fund Corporation (HDFC). The benefit consists of complete or partial exemption from real estate taxes for up to 40 years.
6. The final count for petitions for High-Rent High-Income
Deregulation may be slightly reduced as they are subject to appeal or in some cases, to judicial review.
7. Deregulation of certain high rent apartments was instituted in New
York City twice before, in 1964 and in 1968. 8. Numbers may not add up to 100% due to rounding.
Changes to the Rent Stabilized Housing Stock in NYC in 2018
Page 100 • Housing Supply

Changes to the Rent Stabilized Housing Stock in NYC in 2018
Housing NYC: Rents, Markets & Trends 2019 • Page 101
Program Number of Units
ADDITIONS
421-a + 9,452
J-51 + 309
Mitchell-Lama buyouts + 0
Loft conversions + 43
Article 11, 14 or 15 + 1,900
CHANGES
Rent control to rent stabilization + 141
Subtotal Additions & Changes + 11,845
SUBTRACTIONS
Co-op and Condo subtractions - 791
High-Rent Vacancy Deregulation - 4,628
High-Rent High-Income Deregulation - 109
421-a Expiration - 1,016
J-51 Expiration - 375
Substantial Rehabilitation - 209
Commercial/Professional Conversion - 7
Other Subtractions - 333
Subtotal Subtractions - 7,468
NET TOTAL
Net Estimated Gain + 4,377
Sources: NYC Department of Housing Preservation and Development (HPD), Tax Incentive Programs and Division of Housing Supervision (Mitchell-Lama Developments); NYS Homes and Community Renewal (HCR), Office of Rent Administration and Office of Housing Operations; and NYC Loft Board.
Summary Table of Additions and Subtractions to the Rent Stabilized Housing Stock in 2018


AppendicesAppendix A: Guidelines Adopted by the Board...pg. 105 Appendix B: Price Index of Operating Costs......pg. 106 Appendix C: Income and Expense Study ...........pg. 112 Appendix D: Mortgage Survey Report ..............pg. 124 Appendix E: Income and Affordability Study ....pg. 129 Appendix F: Housing Supply Report..................pg. 134 Appendix G: Changes to the Rent Stabilized Housing Stock in NYC....................pg. 141


Appendix A: Guidelines Adopted by the Board
Housing NYC: Rents, Markets & Trends 2019 • Page 105
A.1 Apartments & Lofts - Order #51 On June 25, 2019, the Rent Guidelines Board (RGB) set the following maximum rent increases for leases commencing or being renewed on or after October 1, 2019 and on or before September 30, 2020 for rent stabilized apartments:
One-Year Lease Two-Year Lease 1.5% 2.5%
For Loft units that are covered under Article 7-C
of the Multiple Dwelling Law, the Board established the following maximum rent increases for increase periods commencing on or after October 1, 2019 and on or before September 30, 2020:
One-Year Two-Year Increase Period Increase Period
1.5% 2.5%
Leases for units subject to rent control on September 30, 2019, which subsequently become vacant and then enter the stabilization system, are not subject to the above adjustments. The rents for these newly stabilized units are subject to review by NYS Homes and Community Renewal (HCR). In order to aid HCR in this review, the RGB has set a special guideline. For rent controlled units which become vacant after September 30, 2019, the special guideline shall be 39% above the maximum base rent.
A.2 Hotel Units - Order #49 On June 25, 2019, the Rent Guidelines Board (RGB) set the following maximum rent increases for leases commencing or being renewed on or after October 1, 2019 and on or before September 30, 2020 for rent stabilized hotels: Single Room Occupancy Buildings (SRO) 0% Lodging Houses 0% Class A Hotels 0% Class B Hotels 0% Rooming Houses 0%
Appendix A: Guidelines Adopted by the Board
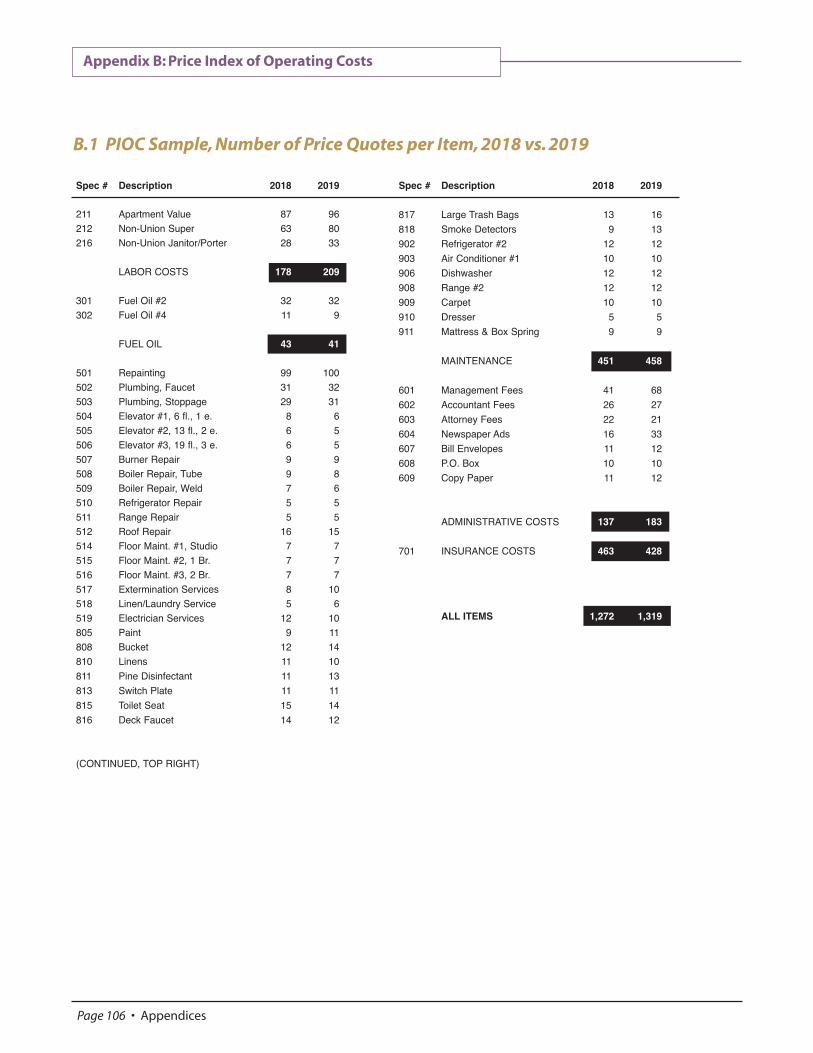
Appendix B: Price Index of Operating Costs
Page 106 • Appendices
B.1 PIOC Sample, Number of Price Quotes per Item, 2018 vs. 2019
Spec # Description 2018 2019
211 Apartment Value 87 96
212 Non-Union Super 63 80
216 Non-Union Janitor/Porter 28 33
LABOR COSTS 178 209
301 Fuel Oil #2 32 32
302 Fuel Oil #4 11 9
FUEL OIL 43 41
501 Repainting 99 100
502 Plumbing, Faucet 31 32
503 Plumbing, Stoppage 29 31
504 Elevator #1, 6 fl., 1 e. 8 6
505 Elevator #2, 13 fl., 2 e. 6 5
506 Elevator #3, 19 fl., 3 e. 6 5
507 Burner Repair 9 9
508 Boiler Repair, Tube 9 8
509 Boiler Repair, Weld 7 6
510 Refrigerator Repair 5 5
511 Range Repair 5 5
512 Roof Repair 16 15
514 Floor Maint. #1, Studio 7 7
515 Floor Maint. #2, 1 Br. 7 7
516 Floor Maint. #3, 2 Br. 7 7
517 Extermination Services 8 10
518 Linen/Laundry Service 5 6
519 Electrician Services 12 10
805 Paint 9 11
808 Bucket 12 14
810 Linens 11 10
811 Pine Disinfectant 11 13
813 Switch Plate 11 11
815 Toilet Seat 15 14
816 Deck Faucet 14 12
(CONTINUED, TOP RIGHT)
Spec # Description 2018 2019
817 Large Trash Bags 13 16
818 Smoke Detectors 9 13
902 Refrigerator #2 12 12
903 Air Conditioner #1 10 10
906 Dishwasher 12 12
908 Range #2 12 12
909 Carpet 10 10
910 Dresser 5 5
911 Mattress & Box Spring 9 9
MAINTENANCE 451 458
601 Management Fees 41 68
602 Accountant Fees 26 27
603 Attorney Fees 22 21
604 Newspaper Ads 16 33
607 Bill Envelopes 11 12
608 P.O. Box 10 10
609 Copy Paper 11 12
ADMINISTRATIVE COSTS 137 183
701 INSURANCE COSTS 463 428
ALL ITEMS 1,272 1,319
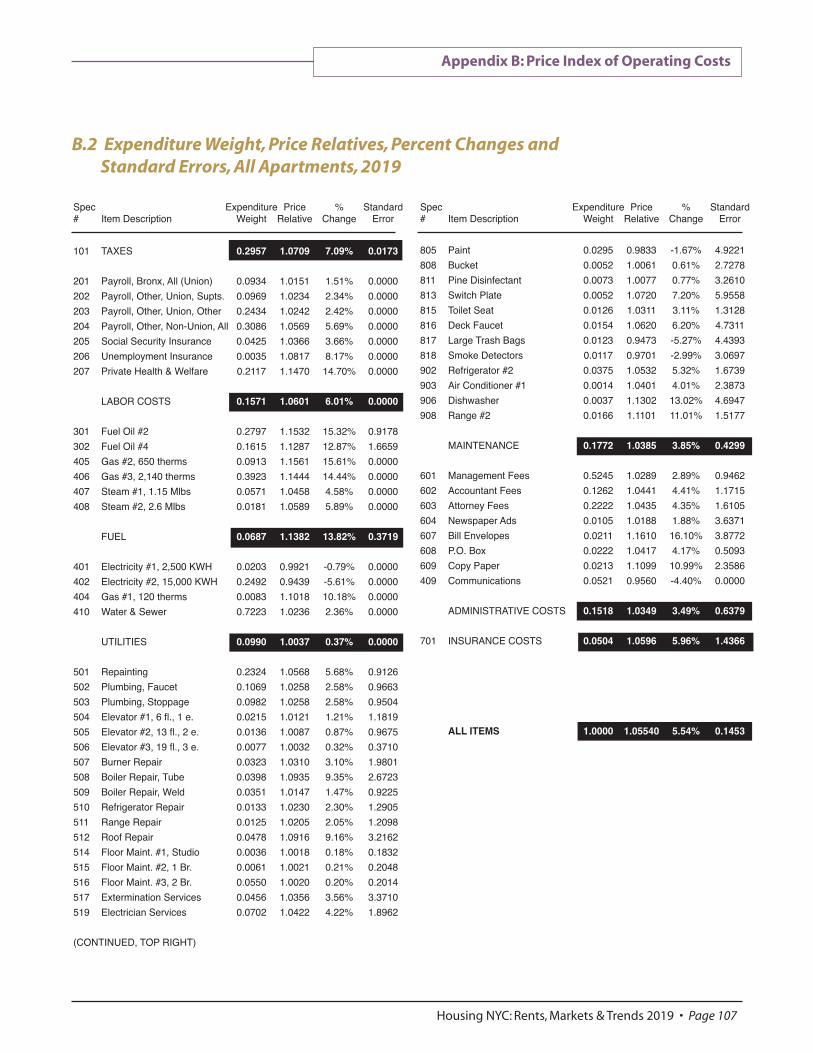
Appendix B: Price Index of Operating Costs
Housing NYC: Rents, Markets & Trends 2019 • Page 107
B.2 Expenditure Weight, Price Relatives, Percent Changes and Standard Errors, All Apartments, 2019
Spec Expenditure Price % Standard # Item Description Weight Relative Change Error
101 TAXES 0.2957 1.0709 7.09% 0.0173
201 Payroll, Bronx, All (Union) 0.0934 1.0151 1.51% 0.0000
202 Payroll, Other, Union, Supts. 0.0969 1.0234 2.34% 0.0000
203 Payroll, Other, Union, Other 0.2434 1.0242 2.42% 0.0000
204 Payroll, Other, Non-Union, All 0.3086 1.0569 5.69% 0.0000
205 Social Security Insurance 0.0425 1.0366 3.66% 0.0000
206 Unemployment Insurance 0.0035 1.0817 8.17% 0.0000
207 Private Health & Welfare 0.2117 1.1470 14.70% 0.0000
LABOR COSTS 0.1571 1.0601 6.01% 0.0000
301 Fuel Oil #2 0.2797 1.1532 15.32% 0.9178
302 Fuel Oil #4 0.1615 1.1287 12.87% 1.6659
405 Gas #2, 650 therms 0.0913 1.1561 15.61% 0.0000
406 Gas #3, 2,140 therms 0.3923 1.1444 14.44% 0.0000
407 Steam #1, 1.15 Mlbs 0.0571 1.0458 4.58% 0.0000
408 Steam #2, 2.6 Mlbs 0.0181 1.0589 5.89% 0.0000
FUEL 0.0687 1.1382 13.82% 0.3719
401 Electricity #1, 2,500 KWH 0.0203 0.9921 -0.79% 0.0000
402 Electricity #2, 15,000 KWH 0.2492 0.9439 -5.61% 0.0000
404 Gas #1, 120 therms 0.0083 1.1018 10.18% 0.0000
410 Water & Sewer 0.7223 1.0236 2.36% 0.0000
UTILITIES 0.0990 1.0037 0.37% 0.0000
501 Repainting 0.2324 1.0568 5.68% 0.9126
502 Plumbing, Faucet 0.1069 1.0258 2.58% 0.9663
503 Plumbing, Stoppage 0.0982 1.0258 2.58% 0.9504
504 Elevator #1, 6 fl., 1 e. 0.0215 1.0121 1.21% 1.1819
505 Elevator #2, 13 fl., 2 e. 0.0136 1.0087 0.87% 0.9675
506 Elevator #3, 19 fl., 3 e. 0.0077 1.0032 0.32% 0.3710
507 Burner Repair 0.0323 1.0310 3.10% 1.9801
508 Boiler Repair, Tube 0.0398 1.0935 9.35% 2.6723
509 Boiler Repair, Weld 0.0351 1.0147 1.47% 0.9225
510 Refrigerator Repair 0.0133 1.0230 2.30% 1.2905
511 Range Repair 0.0125 1.0205 2.05% 1.2098
512 Roof Repair 0.0478 1.0916 9.16% 3.2162
514 Floor Maint. #1, Studio 0.0036 1.0018 0.18% 0.1832
515 Floor Maint. #2, 1 Br. 0.0061 1.0021 0.21% 0.2048
516 Floor Maint. #3, 2 Br. 0.0550 1.0020 0.20% 0.2014
517 Extermination Services 0.0456 1.0356 3.56% 3.3710
519 Electrician Services 0.0702 1.0422 4.22% 1.8962
(CONTINUED, TOP RIGHT)
Spec Expenditure Price % Standard # Item Description Weight Relative Change Error
805 Paint 0.0295 0.9833 -1.67% 4.9221
808 Bucket 0.0052 1.0061 0.61% 2.7278
811 Pine Disinfectant 0.0073 1.0077 0.77% 3.2610
813 Switch Plate 0.0052 1.0720 7.20% 5.9558
815 Toilet Seat 0.0126 1.0311 3.11% 1.3128
816 Deck Faucet 0.0154 1.0620 6.20% 4.7311
817 Large Trash Bags 0.0123 0.9473 -5.27% 4.4393
818 Smoke Detectors 0.0117 0.9701 -2.99% 3.0697
902 Refrigerator #2 0.0375 1.0532 5.32% 1.6739
903 Air Conditioner #1 0.0014 1.0401 4.01% 2.3873
906 Dishwasher 0.0037 1.1302 13.02% 4.6947
908 Range #2 0.0166 1.1101 11.01% 1.5177
MAINTENANCE 0.1772 1.0385 3.85% 0.4299
601 Management Fees 0.5245 1.0289 2.89% 0.9462
602 Accountant Fees 0.1262 1.0441 4.41% 1.1715
603 Attorney Fees 0.2222 1.0435 4.35% 1.6105
604 Newspaper Ads 0.0105 1.0188 1.88% 3.6371
607 Bill Envelopes 0.0211 1.1610 16.10% 3.8772
608 P.O. Box 0.0222 1.0417 4.17% 0.5093
609 Copy Paper 0.0213 1.1099 10.99% 2.3586
409 Communications 0.0521 0.9560 -4.40% 0.0000
ADMINISTRATIVE COSTS 0.1518 1.0349 3.49% 0.6379
701 INSURANCE COSTS 0.0504 1.0596 5.96% 1.4366
ALL ITEMS 1.0000 1.05540 5.54% 0.1453

Appendix B: Price Index of Operating Costs
Page 108 • Appendices
B.3 Price Relative by Building Type, Apartments, 2019
B.4 Price Relative by Hotel Type, 2019
Component Description Hotel Rooming House SRO
TAXES 3.6% 6.4% 6.0%
LABOR COSTS 4.3% 4.3% 5.0%
FUEL 13.4% 15.3% 14.4%
UTILITIES 0.9% 3.2% 0.4%
MAINTENANCE 2.3% 2.8% 2.6%
ADMINISTRATIVE COSTS 1.4% 3.2% 2.8%
INSURANCE COSTS 6.0% 6.0% 6.0%
ALL ITEMS 4.7% 6.2% 6.4%
Pre- Post- Gas Oil
Component Description 1947 1946 Heated Heated
TAXES 7.2% 6.8% 7.1% 7.1%
LABOR COSTS 5.9% 6.1% 5.9% 6.0%
FUEL 14.4% 11.8% 14.7% 14.4%
UTILITIES 0.7% -0.3% 0.7% 0.4%
MAINTENANCE 3.9% 3.7% 3.9% 3.8%
ADMINISTRATIVE COSTS 3.6% 3.2% 3.5% 3.5%
INSURANCE COSTS 6.0% 6.0% 6.0% 6.0%
ALL ITEMS 5.7% 5.1% 5.5% 5.8%

Appendix B: Price Index of Operating Costs
Housing NYC: Rents, Markets & Trends 2019 • Page 109
B.6 Tax Change by Borough and Community Board, Apartments, 2019
Note: No Community Board (CB) could be assigned to the following number of buildings for each borough: Manhattan (9), Bronx (19), Brooklyn (8), Queens (57). The number of buildings in the category “ALL” for each borough includes the buildings that could not be assigned a Community Board. In addition, 28 buildings in Manhattan are a part of Community Board 8 in the Bronx. These buildings are not included in the total for CB 8 in the Bronx, but are represented in the Manhattan total and the total for “ALL” buildings. Core and Upper Manhattan building totals are defined by block count and cannot be calculated by using Community Board numbers alone.
% Change % Change % Change % Change % Change Due to Due to Due to Due to Due to Total
Assessments Exemptions Tax Rates Abatements Interactions* % Change APARTMENTS Manhattan 8.5% -0.8% -0.8% -0.1% -0.1% 6.8% Bronx 12.5% -3.8% -1.0% -0.5% -0.1% 7.2% Brooklyn 11.8% -2.1% -0.8% 0.1% -0.1% 8.9% Queens 8.5% -1.1% -0.8% 0.2% -0.1% 6.7% Staten Island 11.0% -1.5% -0.8% -0.6% -0.1% 8.0%
All Apartments 9.1% -1.2% -0.8% 0.1% -0.1% 7.1%
HOTELS Hotel 3.2% 0.5% -0.2% 0.2% 0.0% 3.6% Rooming House 7.3% 0.0% -0.8% 0.0% -0.1% 6.4% SRO 6.5% 0.9% -0.6% -0.8% 0.0% 6.0% All Hotels 4.9% 0.6% -0.4% -0.2% 0.0% 4.9%
Note: Totals may not add due to rounding. * Real estate tax interactions are the cumulative effects of changes in tax rates, assessments, exemptions and abatements in the same year, after subtracting out the individual effects of each of these changes. Interactions have minimal impact on the overall change in real estate taxes.
B.5 Percentage Change in Real Estate Tax by Borough and Source of Change, Apartments and Hotels, 2019
Community Number of Tax Borough Board Buildings Relative Manhattan 12,255 6.75%
1 88 14.67% 2 1,095 7.31% 3 1,556 7.48% 4 935 9.98% 5 244 6.01% 6 794 6.55% 7 1,741 5.58% 8 1,839 4.97% 9 735 8.70%
10 1,057 9.32% 11 696 9.30% 12 1,438 8.71%
Lower 7,828 6.45%
Upper 4,427 8.58%
Bronx 6,131 7.19%
1 455 0.15% 2 302 10.62% 3 422 0.46% 4 765 6.56% 5 699 6.62% 6 627 8.75%
Community Number of Tax Borough Board Buildings Relative
7 966 7.94% 8 363 6.23% 9 358 4.74%
10 254 11.29% 11 345 7.75% 12 556 12.57%
Brooklyn 13,569 8.93%
1 1,742 12.68% 2 636 7.45% 3 1,168 6.15% 4 1,408 9.66% 5 486 12.32% 6 884 16.65% 7 885 9.28% 8 1,037 9.97% 9 613 11.73%
10 788 7.75% 11 734 8.18% 12 630 8.01% 13 191 7.67% 14 902 7.88% 15 364 7.31% 16 382 1.31%
Community Number of Tax Borough Board Buildings Relative
17 626 7.10% 18 85 9.29%
Queens 7,558 6.66%
1 2,032 7.43% 2 904 6.15% 3 607 7.61% 4 646 6.89% 5 1,235 5.94% 6 335 6.52% 7 511 7.11% 8 251 6.08% 9 269 5.67%
10 47 7.73% 11 147 6.60% 12 259 5.30% 13 55 4.77% 14 203 9.90%
Staten Island 212 8.03%
1 135 7.29% 2 55 4.22% 3 22 12.90%
ALL 39,725 7.09%
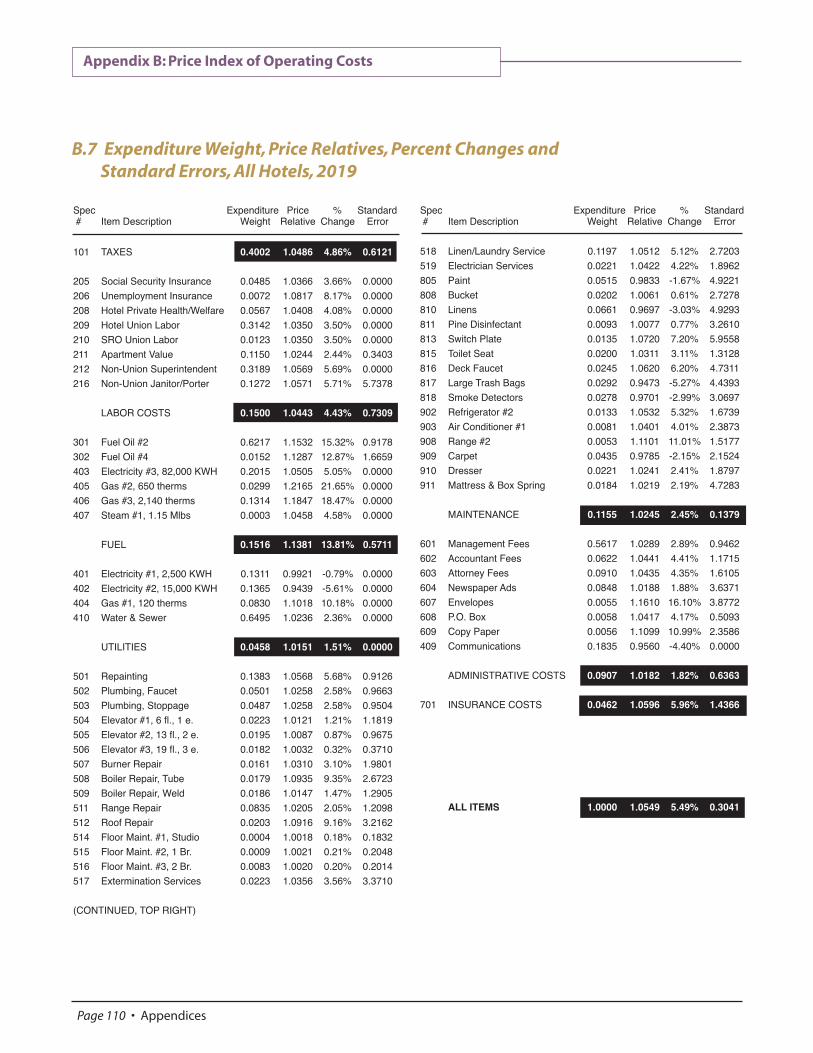
Appendix B: Price Index of Operating Costs
Page 110 • Appendices
B.7 Expenditure Weight, Price Relatives, Percent Changes and Standard Errors, All Hotels, 2019
Spec Expenditure Price % Standard # Item Description Weight Relative Change Error
101 TAXES 0.4002 1.0486 4.86% 0.6121
205 Social Security Insurance 0.0485 1.0366 3.66% 0.0000
206 Unemployment Insurance 0.0072 1.0817 8.17% 0.0000
208 Hotel Private Health/Welfare 0.0567 1.0408 4.08% 0.0000
209 Hotel Union Labor 0.3142 1.0350 3.50% 0.0000
210 SRO Union Labor 0.0123 1.0350 3.50% 0.0000
211 Apartment Value 0.1150 1.0244 2.44% 0.3403
212 Non-Union Superintendent 0.3189 1.0569 5.69% 0.0000
216 Non-Union Janitor/Porter 0.1272 1.0571 5.71% 5.7378
LABOR COSTS 0.1500 1.0443 4.43% 0.7309
301 Fuel Oil #2 0.6217 1.1532 15.32% 0.9178
302 Fuel Oil #4 0.0152 1.1287 12.87% 1.6659
403 Electricity #3, 82,000 KWH 0.2015 1.0505 5.05% 0.0000
405 Gas #2, 650 therms 0.0299 1.2165 21.65% 0.0000
406 Gas #3, 2,140 therms 0.1314 1.1847 18.47% 0.0000
407 Steam #1, 1.15 Mlbs 0.0003 1.0458 4.58% 0.0000
FUEL 0.1516 1.1381 13.81% 0.5711
401 Electricity #1, 2,500 KWH 0.1311 0.9921 -0.79% 0.0000
402 Electricity #2, 15,000 KWH 0.1365 0.9439 -5.61% 0.0000
404 Gas #1, 120 therms 0.0830 1.1018 10.18% 0.0000
410 Water & Sewer 0.6495 1.0236 2.36% 0.0000
UTILITIES 0.0458 1.0151 1.51% 0.0000
501 Repainting 0.1383 1.0568 5.68% 0.9126
502 Plumbing, Faucet 0.0501 1.0258 2.58% 0.9663
503 Plumbing, Stoppage 0.0487 1.0258 2.58% 0.9504
504 Elevator #1, 6 fl., 1 e. 0.0223 1.0121 1.21% 1.1819
505 Elevator #2, 13 fl., 2 e. 0.0195 1.0087 0.87% 0.9675
506 Elevator #3, 19 fl., 3 e. 0.0182 1.0032 0.32% 0.3710
507 Burner Repair 0.0161 1.0310 3.10% 1.9801
508 Boiler Repair, Tube 0.0179 1.0935 9.35% 2.6723
509 Boiler Repair, Weld 0.0186 1.0147 1.47% 1.2905
511 Range Repair 0.0835 1.0205 2.05% 1.2098
512 Roof Repair 0.0203 1.0916 9.16% 3.2162
514 Floor Maint. #1, Studio 0.0004 1.0018 0.18% 0.1832
515 Floor Maint. #2, 1 Br. 0.0009 1.0021 0.21% 0.2048
516 Floor Maint. #3, 2 Br. 0.0083 1.0020 0.20% 0.2014
517 Extermination Services 0.0223 1.0356 3.56% 3.3710
(CONTINUED, TOP RIGHT)
Spec Expenditure Price % Standard # Item Description Weight Relative Change Error
518 Linen/Laundry Service 0.1197 1.0512 5.12% 2.7203
519 Electrician Services 0.0221 1.0422 4.22% 1.8962
805 Paint 0.0515 0.9833 -1.67% 4.9221
808 Bucket 0.0202 1.0061 0.61% 2.7278
810 Linens 0.0661 0.9697 -3.03% 4.9293
811 Pine Disinfectant 0.0093 1.0077 0.77% 3.2610
813 Switch Plate 0.0135 1.0720 7.20% 5.9558
815 Toilet Seat 0.0200 1.0311 3.11% 1.3128
816 Deck Faucet 0.0245 1.0620 6.20% 4.7311
817 Large Trash Bags 0.0292 0.9473 -5.27% 4.4393
818 Smoke Detectors 0.0278 0.9701 -2.99% 3.0697
902 Refrigerator #2 0.0133 1.0532 5.32% 1.6739
903 Air Conditioner #1 0.0081 1.0401 4.01% 2.3873
908 Range #2 0.0053 1.1101 11.01% 1.5177
909 Carpet 0.0435 0.9785 -2.15% 2.1524
910 Dresser 0.0221 1.0241 2.41% 1.8797
911 Mattress & Box Spring 0.0184 1.0219 2.19% 4.7283
MAINTENANCE 0.1155 1.0245 2.45% 0.1379
601 Management Fees 0.5617 1.0289 2.89% 0.9462
602 Accountant Fees 0.0622 1.0441 4.41% 1.1715
603 Attorney Fees 0.0910 1.0435 4.35% 1.6105
604 Newspaper Ads 0.0848 1.0188 1.88% 3.6371
607 Envelopes 0.0055 1.1610 16.10% 3.8772
608 P.O. Box 0.0058 1.0417 4.17% 0.5093
609 Copy Paper 0.0056 1.1099 10.99% 2.3586
409 Communications 0.1835 0.9560 -4.40% 0.0000
ADMINISTRATIVE COSTS 0.0907 1.0182 1.82% 0.6363
701 INSURANCE COSTS 0.0462 1.0596 5.96% 1.4366
ALL ITEMS 1.0000 1.0549 5.49% 0.3041

Appendix B: Price Index of Operating Costs
Housing NYC: Rents, Markets & Trends 2019 • Page 111
B.8 Expenditure Weight and Price Relatives, Lofts, 2019
Spec Expenditure Price % # Item Description Weight Relative Change
101 TAXES 0.3232 1.0709 7.09%
202 Payroll, Other, Union, Supts. 0.2288 1.0234 2.34%
204 Payroll, Other, Non-Union, All 0.5550 1.0569 5.69%
205 Social Security Insurance 0.0397 1.0366 3.66%
206 Unemployment Insurance 0.0037 1.0817 8.17%
207 Private Health & Welfare 0.1728 1.1470 14.70%
LABOR COSTS 0.0866 1.0641 6.41%
301 Fuel Oil #2 0.2943 1.1532 15.32%
302 Fuel Oil #4 0.5547 1.1287 12.87%
405 Gas #2, 650 therms 0.0352 1.1561 15.61%
406 Gas #3, 2,140 therms 0.0953 1.1444 14.44%
407 Steam #1, 1.15 Mlbs 0.0157 1.0458 4.58%
408 Steam #2, 2.6 Mlbs 0.0048 1.0589 5.89%
FUEL 0.0808 1.137 13.7%
401 Electricity #1, 2,500 KWH 0.0080 0.9921 -0.79%
402 Electricity #2, 15,000 KWH 0.0984 0.9439 -5.61%
404 Gas #1, 120 therms 0.0033 1.1018 10.18%
410 Water & Sewer - Frontage 0.8904 1.0236 2.36%
UTILITIES 0.0632 1.0158 1.58%
501 Repainting 0.2846 1.0568 5.68%
502 Plumbing, Faucet 0.0858 1.0258 2.58%
503 Plumbing, Stoppage 0.0788 1.0258 2.58%
504 Elevator #1, 6 fl., 1 e. 0.0353 1.0121 1.21%
505 Elevator #2, 13 fl., 2 e. 0.0225 1.0087 0.87%
506 Elevator #3, 19 fl., 3 e. 0.0128 1.0032 0.32%
507 Burner Repair 0.0239 1.0310 3.10%
508 Boiler Repair, Tube 0.0294 1.0935 9.35%
509 Boiler Repair, Weld 0.0260 1.0147 1.47%
510 Refrigerator Repair 0.0082 1.0230 2.30%
511 Range Repair 0.0077 1.0205 2.05%
512 Roof Repair 0.0487 1.0916 9.16%
514 Floor Maint. #1, Studio 0.0001 1.0018 0.18%
515 Floor Maint. #2, 1 Br. 0.0003 1.0021 0.21%
516 Floor Maint. #3, 2 Br. 0.0023 1.0020 0.20%
517 Extermination 0.0267 1.0356 3.56%
519 Electrician 0.0264 1.0422 4.22%
(CONTINUED, TOP RIGHT)
Spec Expenditure Price % # Item Description Weight Relative Change
805 Paint 0.0509 0.9833 -1.67%
808 Bucket 0.0090 1.0061 0.61%
811 Pine Disinfectant 0.0132 1.0077 0.77%
813 Switch Plate 0.0061 1.0720 7.20%
815 Toilet Seat 0.0217 1.0311 3.11%
816 Deck Faucet 0.0266 1.0620 6.20%
817 Large Trash Bags 0.0178 0.9473 -5.27%
818 Smoke Detectors 0.0169 0.9701 -2.99%
902 Refrigerator #2 0.0748 1.0532 5.32%
903 Air Conditioner #1 0.0027 1.0401 4.01%
906 Dishwasher 0.0074 1.1302 13.02%
908 Range #2 0.0332 1.1101 11.01%
MAINTENANCE 0.0907 1.0412 4.12%
ADMINISTRATIVE COSTS-
LEGAL 0.0605 1.0435 4.35%
601 Management Fees 0.8335 1.0289 2.89%
602 Accountant Fees 0.1324 1.0441 4.41%
604 Newspaper Ads 0.0093 1.0188 1.88%
607 Envelopes 0.0061 1.1610 16.10%
608 PO Box 0.0064 1.0417 4.17%
609 Copy Paper 0.0061 1.1099 10.99%
409 Communications 0.0061 0.9560 -4.40%
ADMINISTRATIVE COSTS-
OTHER 0.0882 1.0317 3.17%
701 INSURANCE COSTS 0.2067 1.0596 5.96%
ALL ITEMS 1.0000 1.0620 6.20%

Appendix C: Income and Expense Study
Page 112 • Appendices
C.1 Average Operating & Maintenance Cost in 2017 per Apartment per Month by Building Size and Location, Structures Built Before 1947
Taxes Labor Fuel Water/Sewer Light & Power Maint. Admin. Insurance Misc. Total
Citywide $279 $86 $74 $74 $24 $173 $140 $52 $42 $944 11-19 units $352 $82 $81 $74 $26 $183 $157 $56 $59 $1,072 20-99 units $248 $74 $74 $75 $23 $169 $132 $52 $40 $887 100+ units $455 $206 $56 $65 $31 $197 $192 $46 $35 $1,283
Bronx $151 $72 $84 $82 $25 $159 $109 $58 $23 $762 11-19 units $158 $81 $99 $89 $27 $162 $109 $62 $29 $817 20-99 units $151 $71 $83 $81 $25 $159 $109 $58 $23 $758 100+ units $152 $90 $73 $82 $20 $172 $118 $54 $16 $779
Brooklyn $223 $65 $64 $74 $19 $161 $121 $50 $35 $813 11-19 units $245 $70 $74 $71 $22 $178 $129 $51 $36 $877 20-99 units $215 $61 $64 $75 $19 $157 $118 $50 $36 $794 100+ units $262 $101 $52 $71 $22 $166 $132 $47 $29 $881 Manhattan $458 $121 $74 $69 $29 $204 $201 $52 $72 $1,279 11-19 units $524 $99 $82 $76 $32 $206 $220 $61 $97 $1,398 20-99 units $400 $92 $74 $69 $25 $198 $184 $51 $71 $1,166 100+ units $677 $311 $55 $57 $44 $231 $263 $44 $34 $1,716
Queens $267 $76 $69 $66 $20 $158 $108 $47 $33 $844 11-19 units $247 $64 $81 $65 $21 $150 $87 $48 $28 $790 20-99 units $268 $71 $68 $66 $21 $162 $112 $47 $30 $844 100+ units $293 $131 $54 $65 $15 $153 $117 $45 $60 $933
Core Man $647 $150 $65 $60 $31 $219 $240 $51 $74 $1,536 11-19 units $646 $101 $77 $71 $30 $224 $239 $62 $95 $1,544 20-99 units $597 $100 $63 $56 $25 $206 $223 $49 $81 $1,400 100+ units $780 $351 $54 $54 $48 $245 $288 $45 $28 $1,892 Upper Man $275 $92 $82 $78 $27 $189 $162 $52 $69 $1,027 11-19 units $287 $95 $92 $84 $36 $171 $182 $60 $100 $1,107 20-99 units $270 $87 $82 $77 $26 $193 $159 $52 $65 $1,011 100+ units $320 $171 $60 $67 $30 $182 $175 $42 $53 $1,099
City w/o Core $212 $74 $75 $76 $23 $165 $122 $53 $37 $837 11-19 units $240 $75 $83 $75 $25 $167 $126 $54 $46 $891 20-99 units $205 $71 $75 $77 $23 $165 $121 $53 $35 $825 100+ units $259 $118 $58 $71 $21 $167 $133 $47 $38 $912 Notes: The sum of the lines may not equal the total due to rounding. Totals in this table may not match those in Appendix 3 due to rounding. Data in this table is NOT adjusted for the results of the 1992 NYC Department of Finance audit on I&E reported operating costs. The category “Utilities” used in the I&E Study is the sum of “Water & Sewer” and “Light & Power.” The number of Pre-47 rent stabilized buildings in Staten Island was too small to calculate reliable statistics. Owners are not required to report tax expenses; therefore, tax figures used in this report were calculated by the NYC Department of Finance. Source: NYC Department of Finance, RPIE Filings

Appendix C: Income and Expense Study
Housing NYC: Rents, Markets & Trends 2019 • Page 113
C.2 Average Operating & Maintenance Cost in 2017 per Apartment per Month by Building Size and Location, Structures Built After 1946
Taxes Labor Fuel Water/Sewer Light & Power Maint. Admin. Insurance Misc. Total
Citywide $319 $154 $54 $63 $34 $177 $170 $43 $60 $1,075 11-19 units $209 $78 $55 $59 $42 $170 $135 $50 $50 $847 20-99 units $240 $95 $55 $64 $29 $163 $142 $45 $44 $879 100+ units $416 $225 $53 $61 $38 $191 $203 $41 $77 $1,304
Bronx $143 $98 $67 $75 $37 $149 $133 $45 $23 $771 11-19 units - - - - - - - - - - 20-99 units $143 $80 $70 $74 $36 $145 $119 $48 $25 $739 100+ units $147 $127 $62 $76 $38 $153 $157 $41 $20 $822
Brooklyn $226 $109 $47 $62 $30 $169 $148 $46 $58 $895 11-19 units - - - - - - - - - - 20-99 units $230 $90 $47 $63 $26 $170 $156 $46 $54 $882 100+ units $226 $151 $44 $63 $35 $153 $126 $43 $63 $903
Manhattan $660 $307 $57 $53 $44 $220 $280 $44 $93 $1,758 11-19 units $597 $106 $68 $59 $46 $235 $230 $54 $11 $1,406 20-99 units $472 $141 $57 $54 $35 $189 $215 $47 $53 $1,264 100+ units $706 $350 $57 $52 $47 $227 $296 $43 $103 $1,880 Queens $266 $119 $51 $64 $29 $168 $134 $39 $62 $932 11-19 units $220 $70 $52 $58 $40 $135 $108 $43 $41 $767 20-99 units $262 $101 $54 $63 $28 $162 $128 $41 $48 $885 100+ units $282 $152 $47 $65 $27 $183 $149 $36 $83 $1,025
St. Island $193 $95 $50 $58 $23 $165 $107 $47 $21 $759 11-19 units - - - - - - - - - - 20-99 units $176 $70 $50 $59 $22 $159 $105 $51 $15 $706 100+ units - - - - - - - - - - Core Man $772 $346 $57 $51 $44 $224 $305 $44 $117 $1,961 11-19 units - - - - - - - - - - 20-99 units $628 $165 $51 $49 $31 $215 $239 $44 $65 $1,487 100+ units $799 $380 $58 $52 $46 $225 $317 $44 $127 $2,049
Upper Man $295 $183 $57 $57 $46 $205 $199 $41 $15 $1,099 11-19 units - - - - - - - - - - 20-99 units $258 $109 $65 $61 $40 $153 $182 $51 $37 $956 100+ units - - - - - - - - - -
City w/o Core $226 $114 $54 $65 $32 $166 $142 $43 $48 $890 11-19 units $199 $78 $55 $59 $41 $168 $132 $50 $50 $832 20-99 units $219 $91 $56 $65 $29 $160 $137 $45 $43 $846 100+ units $240 $154 $50 $66 $34 $174 $150 $39 $54 $962 Notes: The sum of the lines may not equal the total due to rounding. Totals in this table may not match those in Appendix 3 due to rounding. Data in this table is NOT adjusted for the results of the 1992 NYC Department of Finance audit on I&E reported operating costs. The category “Utilities” used in the I&E Study is the sum of “Water & Sewer” and “Light & Power.” The number of Post-46 rent stabilized buildings with 11-19 units in the Bronx, Brooklyn, Staten Island, Core Manhattan and Upper Manhattan; as well as 100+ unit buildings in Upper Manhattan and Staten Island, was too small to calculate reliable statistics. Owners are not required to report tax expenses; therefore, tax figures used in this report were calculated by the NYC Department of Finance. Source: NYC Department of Finance, RPIE Filings

Appendix C: Income and Expense Study
Page 114 • Appendices
C.3 Average Rent, Income and Costs in 2017 per Apartment per Month by Building Size and Location
Post-46 Pre-47 All
Rent Income Costs Rent Income Costs Rent Income Costs Citywide $1,534 $1,716 $1,075 $1,273 $1,440 $944 $1,353 $1,524 $984 11-19 units $1,398 $1,544 $847 $1,361 $1,642 $1,072 $1,367 $1,628 $1,039 20-99 units $1,288 $1,395 $879 $1,211 $1,348 $887 $1,228 $1,358 $885 100+ units $1,807 $2,071 $1,304 $1,720 $1,986 $1,283 $1,782 $2,046 $1,298
Bronx $1,075 $1,191 $771 $987 $1,104 $762 $1,006 $1,122 $763 11-19 units - - - $973 $1,133 $817 $971 $1,132 $814 20-99 units $1,055 $1,139 $739 $985 $1,100 $758 $992 $1,104 $756 100+ units $1,117 $1,278 $822 $1,074 $1,171 $779 $1,094 $1,222 $799
Brooklyn $1,334 $1,434 $895 $1,177 $1,245 $813 $1,224 $1,301 $837 11-19 units - - - $1,221 $1,323 $877 $1,238 $1,340 $881 20-99 units $1,326 $1,415 $882 $1,156 $1,216 $794 $1,174 $1,237 $803 100+ units $1,282 $1,404 $903 $1,300 $1,384 $881 $1,289 $1,397 $895
Manhattan $2,453 $2,903 $1,758 $1,655 $1,994 $1,279 $1,850 $2,217 $1,397 11-19 units $1,640 $2,273 $1,406 $1,655 $2,186 $1,398 $1,655 $2,186 $1,398 20-99 units $1,806 $2,115 $1,264 $1,550 $1,820 $1,166 $1,571 $1,844 $1,174 100+ units $2,616 $3,098 $1,880 $2,200 $2,654 $1,716 $2,476 $2,948 $1,825 Queens $1,343 $1,442 $932 $1,251 $1,316 $844 $1,301 $1,385 $892 11-19 units $1,327 $1,459 $767 $1,152 $1,218 $790 $1,174 $1,248 $787 20-99 units $1,295 $1,384 $885 $1,261 $1,321 $844 $1,271 $1,339 $855 100+ units $1,402 $1,506 $1,025 $1,358 $1,449 $933 $1,391 $1,492 $1,003
St. Island $1,031 $1,135 $759 - - - $1,046 $1,141 $768 11-19 units - - - - - - - - - 20-99 units $1,008 $1,065 $706 - - - $1,034 $1,092 $732 100+ units - - - - - - - - -
Core Man $2,724 $3,225 $1,961 $2,008 $2,480 $1,536 $2,247 $2,729 $1,678 11-19 units - - - $1,808 $2,455 $1,544 $1,804 $2,451 $1,542 20-99 units $2,144 $2,501 $1,487 $1,943 $2,319 $1,400 $1,957 $2,332 $1,406 100+ units $2,835 $3,360 $2,049 $2,411 $2,941 $1,892 $2,666 $3,194 $1,987
Upper Man $1,576 $1,858 $1,099 $1,307 $1,517 $1,027 $1,343 $1,562 $1,037 11-19 units - - - $1,351 $1,651 $1,107 $1,357 $1,650 $1,101 20-99 units $1,338 $1,582 $956 $1,290 $1,489 $1,011 $1,291 $1,492 $1,010 100+ units - - - $1,463 $1,648 $1,099 $1,553 $1,783 $1,127
City w/o Core $1,286 $1,401 $890 $1,168 $1,255 $837 $1,204 $1,299 $846 11-19 units $1,392 $1,525 $832 $1,147 $1,232 $891 $1,193 $1,286 $816 20-99 units $1,241 $1,334 $846 $1,153 $1,232 $825 $1,173 $1,255 $819 100+ units $1,335 $1,479 $962 $1,289 $1,389 $912 $1,322 $1,455 $945 Notes: Citywide and borough totals as well as building size categories are weighted (see Methodology). Cost figures in this table are NOT adjusted for the results of the 1992 NYC Department of Finance audit on I&E reported operating costs. The number of Post-46 rent stabilized buildings with 11-19 units in the Bronx, Brooklyn, Staten Island, Core Manhattan and Upper Manhattan; as well as 100+ unit buildings in Upper Manhattan and Staten Island, was too small to calculate reliable statistics. In addition, the number of Pre-47 rent stabilized buildings of all size groupings in Staten Island was too small to calculate reliable statistics. Source: NYC Department of Finance, RPIE Filings

Appendix C: Income and Expense Study
Housing NYC: Rents, Markets & Trends 2019 • Page 115
C.4 Median Rent, Income and Costs in 2017 per Apartment per Month by Building Size and Location
Post-46 Pre-47 All
Rent Income Costs Rent Income Costs Rent Income Costs Citywide $1,290 $1,379 $891 $1,196 $1,297 $867 $1,208 $1,309 $870 11-19 units $1,260 $1,417 $835 $1,321 $1,490 $1,010 $1,319 $1,486 $998 20-99 units $1,215 $1,294 $835 $1,163 $1,246 $835 $1,168 $1,252 $835 100+ units $1,430 $1,537 $1,056 $1,342 $1,419 $909 $1,391 $1,508 $1,018
Bronx $1,058 $1,114 $721 $991 $1,078 $740 $997 $1,083 $737 11-19 units - - - $953 $1,082 $776 $952 $1,082 $774 20-99 units $1,056 $1,093 $723 $992 $1,073 $735 $997 $1,076 $734 100+ units $1,091 $1,199 $686 $1,093 $1,197 $776 $1,092 $1,199 $757
Brooklyn $1,260 $1,334 $848 $1,128 $1,175 $770 $1,140 $1,193 $778 11-19 units - - - $1,141 $1,206 $814 $1,146 $1,210 $820 20-99 units $1,257 $1,322 $825 $1,120 $1,162 $751 $1,129 $1,174 $757 100+ units $1,258 $1,348 $872 $1,285 $1,325 $819 $1,259 $1,328 $846
Manhattan $2,179 $2,522 $1,465 $1,600 $1,865 $1,164 $1,632 $1,897 $1,182 11-19 units $1,545 $1,856 $1,177 $1,678 $2,054 $1,297 $1,672 $2,052 $1,295 20-99 units $1,962 $2,138 $1,208 $1,554 $1,734 $1,088 $1,573 $1,757 $1,093 100+ units $2,835 $3,242 $1,889 $2,091 $2,456 $1,650 $2,586 $2,956 $1,773
Queens $1,331 $1,408 $915 $1,241 $1,283 $796 $1,267 $1,317 $825 11-19 units $1,286 $1,353 $728 $1,145 $1,193 $753 $1,158 $1,200 $749 20-99 units $1,280 $1,357 $872 $1,268 $1,311 $809 $1,271 $1,320 $830 100+ units $1,389 $1,490 $1,014 $1,364 $1,427 $890 $1,380 $1,475 $976
St. Island $1,056 $1,144 $737 - - - $1,080 $1,153 $738 11-19 units - - - - - - - - - 20-99 units $1,068 $1,092 $706 - - - $1,089 $1,099 $711 100+ units - - - - - - - - -
Core Man $2,495 $2,855 $1,636 $1,868 $2,176 $1,328 $1,898 $2,219 $1,350 11-19 units - - - $1,796 $2,211 $1,399 $1,794 $2,209 $1,396 20-99 units $2,113 $2,325 $1,301 $1,901 $2,123 $1,268 $1,920 $2,135 $1,272 100+ units $2,897 $3,398 $1,998 $2,389 $2,822 $1,876 $2,797 $3,227 $1,964
Upper Man $1,459 $1,610 $921 $1,221 $1,380 $930 $1,226 $1,384 $929 11-19 units - - - $1,253 $1,499 $996 $1,264 $1,499 $992 20-99 units $1,239 $1,368 $884 $1,217 $1,356 $913 $1,217 $1,356 $912 100+ units - - - $1,254 $1,391 $985 $1,433 $1,610 $1,022
City w/o Core $1,223 $1,301 $836 $1,105 $1,180 $790 $1,120 $1,196 $795 11-19 units $1,238 $1,347 $772 $1,125 $1,215 $820 $1,128 $1,217 $818 20-99 units $1,177 $1,238 $808 $1,097 $1,169 $782 $1,106 $1,176 $784 100+ units $1,310 $1,399 $940 $1,235 $1,310 $827 $1,277 $1,367 $896 Notes: Cost figures in this table are NOT adjusted for the results of the 1992 NYC Department of Finance audit on I&E reported operating costs. The number of Post-46 rent stabilized buildings with 11-19 units in the Bronx, Brooklyn, Staten Island, Core Manhattan and Upper Manhattan; as well as 100+ unit buildings in Upper Manhattan and Staten Island, was too small to calculate reliable statistics. In addition, the number of Pre-47 rent stabilized buildings of all size groupings in Staten Island was too small to calculate reliable statistics. Source: NYC Department of Finance, RPIE Filings

Appendix C: Income and Expense Study
Page 116 • Appendices
C.5 Average Net Operating Income in 2017 per Apartment per Month by Building Size and Location
C.6 Distribution of Operating Costs in 2017, by Building Size and Age
Taxes Maint. Labor Admin. Utilities Fuel Misc. Insurance Total
Pre-47 29.5% 18.4% 9.1% 14.9% 10.4% 7.8% 4.5% 5.6% 100% 11-19 units 32.8% 17.1% 7.7% 14.7% 9.4% 7.6% 5.5% 5.3% 100% 20-99 units 27.9% 19.1% 8.3% 14.9% 11.0% 8.3% 4.5% 5.9% 100% 100+ units 35.5% 15.3% 16.1% 15.0% 7.5% 4.4% 2.7% 3.6% 100%
Post-46 29.7% 16.4% 14.3% 15.8% 9.0% 5.1% 5.6% 4.0% 100% 11-19 units 24.6% 20.1% 9.3% 15.9% 11.9% 6.5% 5.9% 5.9% 100% 20-99 units 27.3% 18.6% 10.8% 16.2% 10.7% 6.3% 5.0% 5.1% 100% 100+ units 31.9% 14.6% 17.3% 15.5% 7.6% 4.1% 5.9% 3.1% 100%
All Bldgs. 29.6% 17.7% 10.8% 15.2% 9.9% 6.9% 4.8% 5.0% 100% 11-19 units 31.8% 17.5% 7.9% 14.8% 9.7% 7.5% 5.6% 5.3% 100% 20-99 units 27.8% 19.0% 8.9% 15.2% 10.9% 7.9% 4.6% 5.7% 100% 100+ units 32.9% 14.8% 16.9% 15.4% 7.6% 4.2% 5.0% 3.3% 100%
Source: NYC Department of Finance, RPIE Filings
Post-46 Pre-47 All Post-46 Pre-47 All
Citywide $641 $496 $540 Core Man $1,264 $944 $1,051 11-19 units $698 $570 $589 11-19 units - $911 $909 20-99 units $516 $461 $473 20-99 units $1,014 $919 $926 100+ units $767 $703 $748 100+ units $1,311 $1,049 $1,207
Bronx $420 $342 $359 Upper Man $759 $490 $525 11-19 units - $316 $318 11-19 units - $544 $549 20-99 units $400 $342 $348 20-99 units $626 $478 $482 100+ units $456 $392 $423 100+ units - $549 $656
Brooklyn $540 $432 $464 City w/o Core $511 $428 $453 11-19 units - $446 $459 11-19 units $693 $419 $470 20-99 units $533 $422 $434 20-99 units $488 $421 $436 100+ units $501 $503 $502 100+ units $517 $490 $509 Manhattan $1,145 $715 $820 11-19 units $867 $788 $789 20-99 units $851 $654 $670 100+ units $1,218 $938 $1,123
Queens $510 $472 $493 11-19 units $692 $428 $461 20-99 units $499 $477 $484 100+ units $481 $516 $489
St. Island $376 - $373 11-19 units - - - 20-99 units $295 - $360 100+ units - - - Notes: Citywide and borough totals as well as building size categories are weighted (see Methodology). Cost figures used to calculate NOI in this table are NOT adjusted for the results of the 1992 NYC Department of Finance audit on I&E reported operating costs. The number of Post-46 rent stabilized buildings with 11-19 units in the Bronx, Brooklyn, Staten Island, Core Manhattan and Upper Manhattan; as well as 100+ unit buildings in Upper Manhattan and Staten Island, was too small to calculate reliable statistics. In addition, the number of Pre-47 rent stabilized buildings of all size groupings in Staten Island was too small to calculate reliable statistics. Source: NYC Department of Finance, RPIE Filings

Appendix C: Income and Expense Study
Housing NYC: Rents, Markets & Trends 2019 • Page 117
C.7 Number of “Distressed” Buildings in 2017
C.8 Operating Cost-to-Income Ratios by Decile in 2017
Citywide Bronx Brooklyn Manhattan Queens Staten Island Core Manh Upper Manh Pre-47 11-19 units 282 30 59 169 24 0 120 49 20-99 units 427 110 86 202 28 1 84 118 100+ units 5 1 1 3 0 0 2 1 All 714 141 146 374 52 1 206 168
Post-46 11-19 units 7 3 2 2 0 0 2 0 20-99 units 35 11 6 8 9 1 4 4 100+ units 12 0 2 7 3 0 6 1 All 54 14 10 17 12 1 12 5
All Bldgs. 11-19 units 289 33 61 171 24 0 122 49 20-99 units 462 121 92 210 37 2 88 122 100+ units 17 1 3 10 3 0 8 2 All 768 155 156 391 64 2 218 173
Note: “Distressed” buildings are those that have operating and maintenance costs that exceed gross income. Source: NYC Department of Finance, RPIE Filings
# of Bldgs 10% 20% 30% 40% 50% 60% 70% 80% 90% 100%
Citywide 15,395 0.49 0.54 0.58 0.61 0.64 0.68 0.73 0.79 0.89 4.63
Manhattan 6,215 0.47 0.52 0.56 0.59 0.62 0.66 0.71 0.78 0.92 4.63
Bronx 3,378 0.52 0.58 0.62 0.65 0.68 0.72 0.76 0.81 0.90 1.90
Brooklyn 3,654 0.50 0.54 0.58 0.62 0.65 0.68 0.72 0.77 0.87 3.15
Queens 2,064 0.49 0.54 0.57 0.60 0.63 0.67 0.71 0.76 0.85 2.43
St. Island 84 0.53 0.56 0.60 0.64 0.65 0.71 0.74 0.78 0.89 1.16 Source: NYC Department of Finance, RPIE Filings

Appendix C: Income and Expense Study
Page 118 • Appendices
C.9 Number of Buildings and Dwelling Units in 2017 by Building Size and Location
Post-46 Pre-47 All Bldgs. DUs Bldgs. DUs Bldgs. DUs
Citywide 1,942 195,557 13,453 498,928 15,395 694,485 11-19 units 157 2,322 3,603 54,451 3,760 56,773 20-99 units 1,186 67,594 9,475 377,176 10,661 444,770 100+ units 599 125,641 375 67,301 974 192,942
Bronx 398 30,554 2,980 129,976 3,378 160,530 11-19 units 20 306 356 5,364 376 5,670 20-99 units 306 17,821 2,544 112,269 2,850 130,090 100+ units 72 12,427 80 12,343 152 24,770
Brooklyn 409 39,187 3,245 117,337 3,654 156,524 11-19 units 29 429 914 13,706 943 14,135 20-99 units 264 16,379 2,260 95,105 2,524 111,484 100+ units 116 22,379 71 8,526 187 30,905
Manhattan 445 60,806 5,770 193,995 6,215 254,801 11-19 units 44 657 1,932 29,199 1,976 29,856 20-99 units 205 10,413 3,681 128,027 3,886 138,440 100+ units 196 49,736 157 36,769 353 86,505
Queens 628 60,417 1,436 56,414 2,064 116,831 11-19 units 57 833 394 6,076 451 6,909 20-99 units 372 21,405 979 41,315 1,351 62,720 100+ units 199 38,179 63 9,023 262 47,202
St. Island 62 4,593 22 1,206 84 5,799 11-19 units 7 97 7 106 14 203 20-99 units 39 1,576 11 460 50 2,036 100+ units 16 2,920 4 640 20 3,560
Core Man 345 50,722 3,557 113,867 3,902 164,589 11-19 units 30 452 1,463 22,148 1,493 22,600 20-99 units 147 7,445 1,983 61,552 2,130 68,997 100+ units 168 42,825 111 30,167 279 72,992
Upper Man 100 10,084 2,213 80,128 2,313 90,212 11-19 units 14 205 469 7,051 483 7,256 20-99 units 58 2,968 1,698 66,475 1,756 69,443 100+ units 28 6,911 46 6,602 74 13,513 Note: DU = Dwelling Unit Source: NYC Department of Finance, RPIE Filings

Appendix C: Income and Expense Study
Housing NYC: Rents, Markets & Trends 2019 • Page 119
C.10 Longitudinal Income and Expense Study, Estimated Average Rent, Income and Costs Changes (2016-2017) by Building Size and Location
Post-46 Pre-47 All
Rent Income Costs Rent Income Costs Rent Income Costs
Citywide 2.8% 2.8% 4.5% 3.2% 3.2% 4.5% 3.0% 3.0% 4.5% 11-19 units 3.8% 3.6% 5.0% 3.4% 3.4% 4.7% 3.5% 3.4% 4.7% 20-99 units 3.1% 3.3% 3.6% 3.3% 3.3% 4.3% 3.2% 3.3% 4.2% 100+ units 2.4% 2.5% 5.1% 2.0% 1.7% 5.9% 2.3% 2.2% 5.3%
Bronx 2.4% 2.4% 2.7% 3.1% 3.3% 3.3% 3.0% 3.1% 3.2% 11-19 units - - - 4.5% 4.5% 3.3% 4.1% 4.5% 4.4% 20-99 units 2.0% 2.0% 3.1% 3.0% 3.2% 3.3% 2.9% 3.0% 3.2% 100+ units 3.0% 2.9% 1.5% 4.0% 3.4% 3.4% 3.2% 3.0% 1.9%
Brooklyn 4.2% 4.1% 4.2% 4.0% 4.0% 5.1% 4.1% 4.1% 4.8% 11-19 units - - - 4.9% 4.9% 6.3% 4.9% 4.7% 5.8% 20-99 units 4.1% 4.3% 4.4% 4.1% 4.0% 4.8% 4.1% 4.1% 4.7% 100+ units 4.2% 3.8% 3.9% 1.9% 2.9% 5.2% 3.3% 3.5% 4.4%
Manhattan 1.5% 1.8% 5.1% 2.6% 2.6% 5.1% 2.3% 2.4% 5.1% 11-19 units 1.6% 4.0% 3.2% 2.4% 2.5% 4.3% 2.4% 2.6% 4.3% 20-99 units 1.1% 1.8% 2.6% 3.0% 3.0% 4.9% 2.8% 2.9% 4.7% 100+ units 1.6% 1.8% 5.5% 1.6% 1.1% 6.5% 1.6% 1.6% 5.8%
Queens 3.4% 3.4% 4.9% 3.3% 3.4% 4.4% 3.4% 3.4% 4.7% 11-19 units 3.7% 3.5% 4.8% 3.6% 3.6% 4.4% 3.6% 3.6% 4.6% 20-99 units 3.4% 3.5% 3.6% 3.3% 3.5% 4.3% 3.3% 3.5% 4.0% 100+ units 3.4% 3.3% 6.2% 2.9% 2.8% 4.6% 3.3% 3.2% 5.9%
Staten Island 3.9% 3.3% 4.1% - - - 3.3% 2.9% 3.6% 11-19 units - - - - - - - - - 20-99 units - - - - - - 3.0% 2.9% 2.5% 100+ units - - - - - - - - -
Core Manhattan 1.3% 1.9% 4.8% 2.0% 1.9% 5.5% 1.7% 1.9% 5.2% 11-19 units - - - 1.7% 2.0% 5.2% 1.7% 2.0% 5.2% 20-99 units 1.4% 2.0% 2.9% 2.3% 2.2% 4.8% 2.2% 2.2% 4.6% 100+ units 1.3% 1.8% 5.0% 1.6% 0.9% 7.4% 1.3% 1.5% 5.7%
Upper Manhattan 3.1% 1.8% 6.8% 3.6% 3.8% 4.4% 3.5% 3.5% 4.8% 11-19 units - - - 4.0% 4.2% 2.0% 4.0% 4.2% 2.0% 20-99 units 0.5% 1.4% 2.0% 3.7% 3.9% 5.1% 3.5% 3.7% 4.9% 100+ units - - - 2.0% 1.9% 1.5% 3.4% 1.9% 6.3%
All City w/o Core 3.5% 3.3% 4.4% 3.5% 3.6% 4.2% 3.5% 3.5% 4.3% 11-19 units 3.9% 3.6% 5.1% 4.4% 4.4% 4.4% 4.3% 4.3% 4.5% 20-99 units 3.3% 3.4% 3.7% 3.5% 3.6% 4.2% 3.5% 3.5% 4.1% 100+ units 3.6% 3.1% 5.1% 2.5% 2.8% 4.0% 3.3% 3.0% 4.8% Notes: Citywide and borough totals as well as building size categories are weighted (see Methodology). Cost figures in this table are NOT adjusted for the results of the 1992 NYC Department of Finance audit on I&E reported operating costs. The number of Post-46 rent stabilized buildings with 11-19 units in the Bronx, Brooklyn, Staten Island, Core Manhattan and Upper Manhattan, as well as 20-99 and 100+ unit buildings on Staten Island and 100+ units buildings in Upper Manhattan was too small to calculate reliable statistics. In addition, the number of Pre-47 rent stabilized buildings in all categories in Staten Island was too small to calculate reliable statistics. Source: NYC Department of Finance, RPIE Filings

Appendix C: Income and Expense Study
Page 120 • Appendices
C.11 Longitudinal Income and Expense Study, Estimated Median Rent, Income and Costs Changes (2016-2017) by Building Size and Location
Post-46 Pre-47 All
Rent Income Costs Rent Income Costs Rent Income Costs
Citywide 2.4% 3.2% 3.9% 3.4% 4.0% 4.4% 3.3% 4.0% 4.3% 11-19 units 3.7% 2.6% 6.1% 4.9% 2.9% 4.7% 5.0% 3.0% 4.8% 20-99 units 1.6% 2.4% 3.2% 3.5% 3.8% 4.4% 3.2% 3.6% 4.1% 100+ units 4.2% 3.7% 3.0% 3.4% 2.2% 4.3% 2.6% 3.0% 4.0%
Bronx 1.4% 1.2% 4.9% 3.2% 2.9% 3.6% 3.2% 2.7% 3.5% 11-19 units - - - 4.0% 2.6% 2.8% 4.3% 3.3% 3.1% 20-99 units 1.1% 0.7% 3.5% 3.2% 2.7% 3.7% 3.0% 2.5% 3.4% 100+ units 2.8% 1.8% 5.9% 4.3% 3.2% 2.7% 4.0% 1.9% 2.7%
Brooklyn 3.2% 3.2% 4.6% 3.3% 3.3% 4.1% 3.4% 3.6% 4.3% 11-19 units - - - 3.4% 3.1% 6.4% 3.9% 2.4% 6.1% 20-99 units 2.9% 3.3% 4.1% 3.5% 3.0% 3.2% 3.3% 2.9% 3.0% 100+ units 3.5% 2.3% 5.5% 4.5% 1.5% 0.9% 3.5% 2.6% 3.4%
Manhattan 1.9% 3.4% 4.2% 2.9% 3.7% 5.1% 2.9% 3.2% 5.5% 11-19 units 0.7% 4.4% 11.3% 2.6% 2.1% 3.3% 2.7% 1.8% 3.4% 20-99 units 2.5% 2.2% 3.7% 3.8% 3.4% 5.1% 3.7% 3.4% 5.0% 100+ units 1.6% 2.3% 7.0% 0.4% -2.8% 4.8% 2.4% 1.6% 6.8%
Queens 3.2% 3.9% 3.5% 3.7% 4.2% 4.9% 3.5% 3.8% 4.9% 11-19 units 5.2% 2.5% 4.5% 3.2% 4.6% 5.5% 2.7% 4.1% 5.4% 20-99 units 2.5% 3.4% 3.8% 3.7% 3.9% 4.6% 3.5% 3.6% 5.2% 100+ units 2.7% 3.2% 4.1% 3.3% 4.0% 4.6% 3.3% 2.8% 3.0%
Staten Island 5.9% 2.3% 3.1% - - - 6.9% 1.7% 3.3% 11-19 units - - - - - - - - - 20-99 units - - - - - - 7.0% 8.3% 2.6% 100+ units - - - - - - - - -
Core Manhattan 1.8% 2.3% 3.3% 2.2% 1.4% 4.5% 2.0% 1.6% 4.6% 11-19 units - - - 2.7% 0.7% 4.3% 2.8% 0.5% 4.3% 20-99 units 0.9% 3.8% 0.2% 1.4% 2.0% 5.7% 2.0% 2.0% 5.4% 100+ units 1.5% 3.0% 5.0% -0.8% -0.3% 10.3% 1.0% 1.9% 5.3%
Upper Manhattan 5.3% 3.1% 5.3% 4.4% 4.4% 5.5% 4.3% 4.3% 5.4% 11-19 units - - - 5.5% 7.1% 2.2% 5.8% 7.0% 2.1% 20-99 units -1.9% -0.8% 5.2% 4.6% 3.6% 5.2% 4.5% 3.6% 5.2% 100+ units - - - 2.5% 2.1% 7.9% 4.5% 6.2% 3.9%
All City w/o Core 2.0% 2.9% 4.4% 3.7% 3.2% 4.2% 3.4% 3.3% 4.5% 11-19 units 5.4% 2.5% 5.9% 3.8% 3.8% 4.8% 3.6% 4.1% 4.8% 20-99 units 2.4% 2.4% 4.7% 3.5% 3.0% 4.3% 3.4% 3.0% 4.1% 100+ units 2.8% 2.4% 1.5% 3.4% 4.2% 1.8% 2.7% 2.7% 4.4% Notes: Cost figures in this table are NOT adjusted for the results of the 1992 NYC Department of Finance audit on I&E reported operating costs. The number of Post-46 rent stabilized buildings with 11-19 units in the Bronx, Brooklyn, Staten Island, Core Manhattan and Upper Manhattan, as well as 20-99 and 100+ unit buildings on Staten Island and 100+ units buildings in Upper Manhattan was too small to calculate reliable statistics. In addition, the number of Pre-47 rent stabilized buildings in all categories in Staten Island was too small to calculate reliable statistics. Source: NYC Department of Finance, RPIE Filings

Appendix C: Income and Expense Study
Housing NYC: Rents, Markets & Trends 2019 • Page 121
Post-46 Pre-47 All Post-46 Pre-47 All Citywide 0.1% 0.6% 0.4% Core Manhattan -2.4% -3.6% -3.1% 11-19 units 1.9% 1.1% 1.2% 11-19 units - -3.0% -2.8% 20-99 units 2.6% 1.5% 1.8% 20-99 units 0.6% -1.4% -1.1% 100+ units -1.8% -5.0% -2.7% 100+ units -2.9% -9.0% -4.7%
Bronx 2.0% 3.2% 2.9% Upper Manhattan -5.4% 2.5% 1.0% 11-19 units - 7.8% 4.7% 11-19 units - 9.0% 9.0% 20-99 units 0.0% 3.0% 2.5% 20-99 units 0.5% 1.5% 1.4% 100+ units 5.8% 3.4% 5.2% 100+ units - 2.8% -4.7%
Brooklyn 4.0% 2.1% 2.7% All City w/o Core 1.4% 2.5% 2.1% 11-19 units - 2.5% 2.9% 11-19 units 1.7% 4.5% 3.8% 20-99 units 4.1% 2.4% 2.9% 20-99 units 2.8% 2.4% 2.5% 100+ units 3.6% -0.8% 1.8% 100+ units -0.5% 0.6% -0.2%
Manhattan -2.9% -1.6% -2.0% 11-19 units 5.4% -0.4% -0.3% 20-99 units 0.6% -0.1% -0.1% 100+ units -3.5% -7.6% -4.7%
Queens 0.8% 1.8% 1.3% 11-19 units 2.0% 2.2% 2.1% 20-99 units 3.4% 2.1% 2.7% 100+ units -2.4% -0.2% -2.0%
St. Island 1.6% - 1.5% 11-19 units - - - 20-99 units - - 3.8% 100+ units - - - Notes: Citywide and borough totals as well as building size categories are weighted (see Methodology). Cost figures used to calculate NOI in this table are NOT adjusted for the results of the 1992 NYC Department of Finance audit on I&E reported operating costs.The number of Post-46 rent stabilized buildings with 11-19 units in the Bronx, Brooklyn, Staten Island, Core Manhattan and Upper Manhattan, as well as 20-99 and 100+ unit buildings on Staten Island and 100+ units buildings in Upper Manhattan was too small to calculate reliable statistics. In addition, the number of Pre-47 rent stabilized buildings in all categories in Staten Island was too small to calculate reliable statistics. Source: NYC Department of Finance, RPIE Filings
C.12 Longitudinal Income and Expense Study, Avg. Net Operating Income Changes (2016-2017) by Building Size & Location

Appendix C: Income and Expense Study
Page 122 • Appendices
C.13 Longitudinal Income and Expense Study, Change in Rent and Net Operating Income by Community District (2016-2017)
CD Neighborhood Rent Change NOI Change Manhattan 102 Greenwich Village 2.0% -1.8% 103 Lower East Side/Chinatown 2.3% -1.4% 104 Chelsea/Clinton 2.9% -0.8% 105 Midtown 4.2% 5.8% 106 Stuyvesant Town/Turtle Bay 1.2% -4.6% 107 Upper West Side 1.6% -5.7% 108 Upper East Side 1.6% -1.7% 109 Morningside Hts./Hamilton Hts. 2.9% 1.0% 110 Central Harlem 6.0% 18.4% 111 East Harlem 4.3% 2.4% 112 Washington Hts./Inwood 3.8% 2.0% Bronx 201 Mott Haven/Port Morris 2.6% 10.7% 202 Hunts Point/Longwood 0.6% 9.2% 203 Morrisania/Melrose/Claremont 2.1% 1.3% 204 Highbridge/S. Concourse 3.2% 3.2% 205 University Heights/Fordham 3.2% 0.9% 206 E. Tremont/Belmont 3.9% -2.0% 207 Kingsbridge Hts./Mosholu/Norwood 2.7% 2.0% 208 Riverdale/Kingsbridge 4.1% 4.8% 209 Soundview/Parkchester 4.0% 6.8% 210 Throgs Neck/Co-op City 3.0% -4.8% 211 Pelham Parkway 3.3% 5.9% 212 Williamsbridge/Baychester 3.5% 7.2% Brooklyn 301 Williamsburg/Greenpoint 4.0% 3.3% 302 Brooklyn Hts./Fort Greene 5.0% 3.2% 303 Bedford Stuyvesant 5.6% 15.6% 305 East New York/Starett City 5.1% 2.2% 306 Park Slope/Carroll Gardens 5.8% 3.7% 307 Sunset Park 3.6% -2.1% 308 North Crown Hts./Prospect Hts. 5.0% 6.0% 309 South Crown Hts. 5.0% 4.7% 310 Bay Ridge 3.5% -0.5% 311 Bensonhurst 2.2% -2.2% 312 Borough Park 3.5% 1.3% 313 Coney Island 4.2% -0.2% 314 Flatbush 4.4% 2.5% 315 Sheepshead Bay/Gravesend 3.5% 0.5% 316 Brownsville/Ocean Hill 5.4% -1.7% 317 East Flatbush 4.8% 3.5% 318 Flatlands/Canarsie 2.2% 8.8% Queens 401 Astoria 3.8% 3.4% 402 Sunnyside/Woodside 3.8% 4.2% 403 Jackson Hts. 2.4% -1.1% 404 Elmhurst/Corona 2.7% -1.9% 405 Middle Village/Ridgewood 2.0% -3.8% 406 Forest Hills/Rego Park 3.3% -3.9% 407 Flushing/Whitestone 2.9% 0.2% 408 Hillcrest/Fresh Meadows 3.2% -1.3% 409 Kew Gardens/Woodhaven 4.1% 4.9% 411 Bayside/Little Neck 3.6% 8.1% 412 Jamaica 3.4% 2.9% 414 Rockaways 7.0% 16.8% Staten Island 501 North Shore 2.9% 1.8% Note: Six Community Districts (CDs) contained too few buildings to be included in the analysis. Source: NYC Department of Finance, RPIE Filings

Appendix C: Income and Expense Study
Housing NYC: Rents, Markets & Trends 2019 • Page 123
C.14 Longitudinal Analysis, Number of Buildings and Dwelling Units in 2016 & 2017, by Building Size and Location
Post-46 Pre-47 All
Bldgs. DUs Bldgs. DUs Bldgs. DUs
Citywide 1,788 183,041 12,544 469,937 14,332 652,978 11-19 units 128 1,880 3,293 49,898 3,421 51,778 20-99 units 1,096 63,192 8,893 356,417 9,989 419,609 100+ units 564 117,969 358 63,622 922 181,591
Bronx 367 28,134 2,784 122,067 3,151 150,201 11-19 units 15 234 309 4,680 324 4,914 20-99 units 286 16,755 2,399 106,777 2,685 123,532 100+ units 66 11,145 76 10,610 142 21,755
Brooklyn 370 36,787 2,997 110,242 3,367 147,029 11-19 units 21 310 814 12,264 835 12,574 20-99 units 240 15,321 2,116 90,061 2,356 105,382 100+ units 109 21,156 67 7,917 176 29,073
Manhattan 406 55,476 5,401 183,423 5,807 238,899 11-19 units 40 587 1,802 27,279 1,842 27,866 20-99 units 188 9,572 3,449 120,452 3,637 130,024 100+ units 178 45,317 150 35,692 328 81,009
Queens 591 58,390 1,340 52,999 1,931 111,389 11-19 units 46 664 361 5,569 407 6,233 20-99 units 350 20,295 918 38,667 1,268 58,962 100+ units 195 37,431 61 8,763 256 46,194
St. Island 54 4,254 22 1,206 76 5,460 11-19 units 6 85 7 106 13 191 20-99 units 32 1,249 11 460 43 1,709 100+ units 16 2,920 4 640 20 3,560
Core Manhattan 321 46,569 3,384 109,004 3,705 155,573 11-19 units 28 417 1,390 21,084 1,418 21,501 20-99 units 140 7,117 1,890 58,830 2,030 65,947 100+ units 153 39,035 104 29,090 257 68,125
Upper Manhattan 85 8,907 2,017 74,419 2,102 83,326 11-19 units 12 170 412 6,195 424 6,365 20-99 units 48 2,455 1,559 61,622 1,607 64,077 100+ units 25 6,282 46 6,602 71 12,884 Note: DU = Dwelling Unit Source: NYC Department of Finance, RPIE Filings

Appendix D: Mortgage Survey Report
Page 124 • Appendices
D.2 Typical Lending Portfolio Characteristics of Rent Stabilized Buildings, 2019
D.1 Mortgage Interest Rates and Terms, 2019 Lending Interest New Refin Institution Rates Points Term Type Volume Volume
5 4.20% 0.50 Ω fixed 5 10 7 4.00% 0.00 Ω fixed 121 19 28 4.28% NR Ω both 450 350 30 4.50% 1.00 Ω fixed 4 11 35 4.75% 0.00 Ω both 44 16 37 5.45% 1.00 5/10 years fixed 0 2 107 4.75% 0.00 Ω both 332 90 117 4.13% 0.00 Ω both 25 100 301 4.10% 0.30 140 bps fixed 10 10 401 5.50% 0.00 Ω fixed 30 9 402 5.50% 1.00 10 years fixed 10 5 AVERAGE 4.65% 0.38 † † 94 57
† No average computed NR no response BPS Basis Points Ω #5 = 1.5-1.75% over swaps #7 = 7 & 10 yr swaps / 122-135 bps spread #28 = 7-yr 230 bps; 10-yr 225 bps #30 = Commitment fee of 1% #35 = 25 year amortization #107 = 5 and 7 year fixed w/ 5 year option #117 = 1.25%-1.55% at par #401 = 30-40 years; commitment fee: 75-100 bps Note: Averages for interest rates and points are calculated by using the midpoint when a range of values is given by the lending institution. Source: 2019 NYC Rent Guidelines Board Mortgage Survey
Maximum Debt Vacancy & Typical Average Average
Lending Loan-to-Value Service Collection Building Monthly O&M Monthly Institution Standard Coverage Losses Size Cost/Unit Rent/Unit
5 65% 1.20 3.0% 50-99 $700 $1,500 7 75% 1.20 3.0% 50-99 $900 $1,800 28 80% 1.25 3.0% 20-49 NR $1,200 30 80% 1.20 4.0% 20-49 NR $1,800 35 65% 1.20 3.0% 1-10 $1,000 $1,350 37 65% NR 3.0% 1-10 $372 $1,224 107 75% 1.20 0.5% 50-99 NR $1,500 117 75% 1.20 2.0% 20-49 $750 $1,800 301 60% 7.5% DY 3.0% 20-49 NR NR 401 83% 1.15 3.0% 100+ $638 $1,350 402 70% 1.25 1.0% 1-10 NR $1,300 AVERAGE 72.0% 1.21 2.59% † $727 $1,482
NR no response DY Debt Yield † No average computed. Notes: Average loan-to-value (LTV) and debt service coverage ratios are calculated using the midpoint when a range was given by the lending institution. Debt Yield refers to Net Operating Income (NOI) divided by the first mortgage debt (loan) amount, times 100. Source: 2019 NYC Rent Guidelines Board Mortgage Survey

Appendix D: Mortgage Survey Report
Housing NYC: Rents, Markets & Trends 2019 • Page 125
Interest Rates Points Term Type
Lending Inst. 2019 2018 2019 2018 2019 2018 2019 2018
5 4.20% NR 0.50 0.75 Ω ◆ fixed both 28 4.28% 4.50% NR 0.00 Ω NR both both 30 4.50% 4.75% 1.00 0.25 Ω 110-210 BPS fixed both 35 4.75% 3.75% 0.00 0.00 Ω ◆ both adj 37 5.45% 5.85% 1.00 1.00 5/10 years 10 yrs fixed fixed 107 4.75% 4.19% 0.00 0.00 Ω 5, 7 and 10 yrs both fixed 117 4.13% 3.75% 0.00 0.00 Ω ◆ both fixed 301 4.10% 4.13% 0.30 0.25 140 bps ◆ fixed fixed 401 5.50% 5.69% 0.00 0.00 Ω ◆ fixes fixed 402 5.50% 5.50% 1.00 1.00 10 years 10 year fixed adj AVERAGE 4.72% 4.68% 0.42 0.33 † † † † NR no response † No average computed Adj = adjustable rate mortgage BPS Basis Points Ω #5 = 1.5-1.75% over swaps #7 = 7 & 10 yr swaps / 122-135 bps spread #28 = 7-yr 230 bps; 10-yr 225 bps #30 = Commitment fee of 1% #35 = 25 year amortization #107 = 5 and 7 year fixed w/ 5 year option #117 = 1.25%-1.55% at par #401 = 30-40 years; commitment fee: 75-100 bps ◆ #5 = 1.75-2.25% over swaps #35 = 5/5/5 based on amortization #117 = 5 years; 1.50 over swaps #301 = 5 yr-1.30 bps; 7 yr-1.40 bps; 10 yr-1.50 bps #401 = 30-40 years; commitment fee: 75 bps Note: Averages for interest rates and points are calculated by using the midpoint when a range of values is given by the lending institution. Source: 2018 and 2019 NYC Rent Guidelines Board Mortgage Surveys
D.3 Interest Rates and Terms for New Financing, Longitudinal Study, 2018-2019
Max Loan-to-Value Debt Service Coverage V&C Losses
Lending Inst. 2019 2018 2019 2018 2019 2018
5 65% 75% 1.20 1.20 3% 2% 28 80% 80% 1.25 1.25 3% 2% 30 80% 80% 1.20 1.20 4% 5% 35 65% 65% 1.20 1.25 3% 3% 37 65% 65% NR 1.20 3% 3% 107 75% 80% 1.20 1.20 1% 1% 117 75% 75% 1.20 1.25 2% 4% 301 60% 60% 7.5% DY 7.5% DY 3% 3% 401 83% 83% 1.15 NR 3% 3% 402 70% 70% 1.25 1.25 1% 1% AVERAGE 71.8% 73.3% 1.21 1.23 2.55% 2.60%
NR no response DY Debt Yield
Notes: Average loan-to-value and debt service coverage ratios are calculated using the midpoint when a range is given by the lending institution. Debt Yield refers to Net Operating Income (NOI) divided by the first mortgage debt (loan) amount, times 100.
Source: 2018 and 2019 NYC Rent Guidelines Board Mortgage Surveys
D.4 Lending Standards and Vacancy & Collection Losses, Longitudinal Study, 2018-2019

Appendix D: Mortgage Survey Report
Page 126 • Appendices
D.5 Retrospective of New York City’s Housing Market, 1982-2019
Permits for Permits for Interest Rates for New Housing Units in New Housing Units
Year New Mortgages NYC and northern suburbs in NYC only
1982 16.3% 11,598 b 7,649 1983 13.0% 17,249 b 11,795 1984 13.5% 15,961 11,566 1985 12.9% 25,504 20,332 1986 10.5% 15,298 9,782 1987 10.2% 18,659 13,764 1988 10.8% 13,486 9,897 1989 12.0% 13,896 11,546 1990 11.2% 9,076 6,858 1991 10.7% 6,406 4,699 1992 10.1% 5,694 3,882 1993 9.2% 7,314 5,173 1994 8.6% 6,553 4,010 1995 10.1% 7,296 5,135 1996 8.6% 11,457 8,652 1997 8.8% 11,619 8,987 1998 8.5% 13,532 10,387 1999 7.8% 15,326 12,421 2000 8.7% 18,077 15,050 2001 8.4% 19,636 16,856 2002 7.4% 21,423 18,500 2003 6.2% 23,778 21,218 2004 5.8% 27,695 25,208 2005 5.5% 33,606 31,599 2006 6.3% 32,609 30,927 2007 6.3% 34,514 31,902 2008 6.1% 34,715 33,911 2009 6.5% 6,665 6,057 2010 6.3% 7,406 6,727 2011 5.8% 10,326 8,936 2012 4.6% 11,170 10,334 2013 4.4% 18,963 17,995 2014 4.9% 21,580 20,428 2015 4.3% 57,559 56,183 2016 4.0% 18,116 16,280 2017 4.3% 23,911 ◆ 22,101 ◆ 2018 4.8% 23,021 Ø 20,910 Ø 2019 4.7% * *
b Prior to 1984, Bergen Co., NJ permit figures are included. Ø Figures are preliminary.
◆ This figure has been revised from the preliminary figure reported last year to reflect the final adjusted count. *Permit data for 2019 will be available in next year’s Mortgage Survey Report. Notes: Interest rate data was collected in January-February and represents a 12-month average of the preceding year. Permit data is for the entire 12-month period of the shown year. The northern suburbs include Putnam, Rockland, and Westchester counties. Sources: NYC Rent Guidelines Board, Annual Mortgage Surveys; U.S. Bureau of the Census, Manufacturing & Construction Division, Residential Construction Branch. Sources: NYC Rent Guidelines Board Mortgage Surveys; U.S Census Bureau

Appendix D: Mortgage Survey Report
Housing NYC: Rents, Markets & Trends 2019 • Page 127
I. Financing Availability and Terms for Multifamily Buildings
1a. Do you currently offer new permanent financing Interest rate : ___________ % ___________ % (i.e., loans secured by a property not previously (current) (2018 average) mortgaged by your institution) for rent stabilized buildings? Points : __________ ❏ Yes (Indicate typical terms and conditions at right.) Terms: Current 5, 7 and 10 yr spreads over swap rates and note commitment fee amount: ❏ No ______________________________ ______________________________ ______________________________ ______________________________ Type: Fixed / Adjustable (circle one) Special conditions: ____________________________ ____________________________ 1b. How many loans were made by your institution in 2018 for new permanent financing of rent stabilized buildings? Number of loans: ______________________
2. How many loans did your institution refinance in 2018 for rent stabilized buildings? Number of loans: ______________________ 3a. In the past year, has the total volume of new and ❏ Yes, we have experienced a significant refinanced loans underwritten by your institution ____________ of about _______ %. changed significantly (by at least 5%)? (increase / decrease ) ❏ No, it is about the same. (Please skip Question 3b). 3b. If loan volume has changed significantly, is the ❏ A significant _________________ in the volume of change attributable to: (increase / decrease ) loan applications of about _____ %. (Please check and fill in all applicable choices.) ❏ A significant _________________ in the rate of (increase / decrease ) application approvals of about _____ %. Are there any trends related to financing availability and terms on which you wish to comment? _______________________________________________________________________________________________ _______________________________________________________________________________________________
_______________________________________________________________________________________________ _______________________________________________________________________________________________
2
II. Underwriting Criteria for Rent Stabilized Buildings N.A.
4a. What standards does your institution employ when Maximum LTV: __________________ ❏ assessing loan applications for rent stabilized buildings? Minimum DSCR or Debt Yield: __________________ ❏ 4b.Please provide any other standards your institution N.A. employs when assessing loan applications. If you do not employ the standard given, Number of Units in Building: __________ ❏ place an “X” in the “N.A.” column. Building Age: ______________________ ❏ (Indicate an average, minimum, or maximum criteria.) Borrower Lives in Building: ____________ ❏ Overall Building Maintenance: __________ ❏ Co-op / Condo Conversion ❏ Potential: ____________ Other (Please Specify): ________________ ❏ 5. Did your institution change its underwriting ❏ Yes. practices for financing or refinancing rent stabilized buildings over the past year? ❏ No. (If no, please skip to Question 7).
6. Yes, we changed our underwriting practices ❏ Use ________ stringent approvals. for rent stabilized buildings to: ( more / less )
(Please check and fill in all applicable choices.) ❏ Require _________ fees ( i.e., points or fees). ( higher / lower )
❏ __________________ loan-to-value ratio. ( Increase / Decrease )
❏ __________________ monitoring requirements. ( Increase / Decrease )
❏ _____________________ lending to rent stabilized ( Discontinue / Reduce / Expand ) buildings.
❏ Other : _________________________________
III. Additional Mortgage Questions 7. How many dwelling units are contained in the average ❏ 1 -10 ❏ 11 - 19 ❏ 20 - 49 rent stabilized building financed by your institution? ❏ 50 - 99 ❏ 100 or more (Please check only one.) 8. Which of the following best describes the average ❏ < 1% ❏ 1% ❏ 2% vacancy and collection loss for rent stabilized buildings ❏ 3% ❏ 4% ❏ 5% during the past year? (Please check only one.) ❏ 6% ❏ 7% ❏ > 7% 9. Approximately what percentage of your loans to ❏ None
rent stabilized buildings are currently non-performing? ❏ Approximately ________ %. 3
10. Approximately what percentage of your loans to ❏ None
rent stabilized buildings are currently in foreclosure? ❏ Approximately ________ %.
11a. Does your institution retain the mortgages you offer ❏ We retain all the mortgages sold. (If so, please skip or do you sell any to secondary markets? to question 12.) ❏ We sell all our mortgages to secondary markets. ❏ We sell ____% of our mortgages to secondary markets. 11b. To whom do you sell your mortgages? ❏ Fannie Mae (Please check all that apply) ❏ Freddie Mac ❏ Other: ________________________________ ________________________________ ________________________________ 12. In your sector, who are your major competitors in multi-family lending? ______________________________________________________________________________________________ ______________________________________________________________________________________________ 13. Do the mortgages offered to rent stabilized buildings ❏ No
include any commercial space? ❏ Yes. Approximately what percentage of buildings in
your portfolio have commercial space? ________% 14. What is your best estimate of average operating and maintenance costs per unit per month in the $ per unit per month rent stabilized buildings financed by your institution? (Include the following operating and maintenance costs in your estimate: Real Estate & Other Taxes, Labor, Fuel, Utilities, Contractor Services, Administration — including Legal, Management and other costs — Insurance, Parts & Supplies, and Replacement Costs.) 15. What is your best estimate of average rent per unit per month in the rent stabilized buildings $ per unit per month financed by your institution? 16. Do any of your lending or underwriting standards New Financing Rates: ❏ Higher ❏ Lower ❏ Same differ for rent stabilized buildings as opposed to Refinancing Rates: ❏ Higher ❏ Lower ❏ Same non-stabilized multifamily properties? LTV Ratio: ❏ Higher ❏ Lower ❏ Same (Please check all that apply) Debt Service Coverage: ❏ Higher ❏ Lower ❏ Same 17. On average, how does your portfolio of rent stabilized Net Operating Income: ❏ Better ❏ Worse ❏ Same buildings perform as compared with expectations Debt Service Coverage: ❏ Better ❏ Worse ❏ Same at the time of the initial loan originations? O&M Expenses: ❏ Better ❏ Worse ❏ Same (Please check all that apply)
4
18. Please estimate the average mortgage loan payment per unit per month for a typical building in your portfolio: $ __________. 19. Are there any additional trends relating to underwriting criteria, non-performing loans & foreclosure, or the mortgage market in general on which you wish to comment?
______________________________________________________________________________________________
______________________________________________________________________________________________
______________________________________________________________________________________________
______________________________________________________________________________________________
______________________________________________________________________________________________
Thank you for taking the time to complete the survey. If you have any questions, please contact RGB Research Director Brian Hoberman at (212) 669-7484 or [email protected]. Findings will be published in the 2019 Mortgage Survey Report, which is scheduled to be released in Spring 2019.
5
D.6 2019 Survey of Mortgage Financing for Multifamily Properties

Appendix D: Mortgage Survey Report
Page 128 • Appendices
D.7 Rent Stabilized Building Sales Volume, Citywide and by Borough, and Percent Change, 2006-2018
2006 2007 2008 2009 2010 2011 2012 2013 2014 2015 2016 2017 2018
Citywide* 1,433 1,474 1,021 521 541 709 1,135 1,431 1,356 1,361 1,167 793 885 % Change from Prior Yr - 2.9% -30.7% -49.0% 3.8% 31.1% 60.1% 26.1% -5.2% 0.4% -14.3% -32.0% 11.6%
Bronx 224 319 171 100 131 130 204 245 302 262 234 156 195 % Change from Prior Yr - 42.4% -46.4% -41.5% 31.0% -0.8% 56.9% 20.1% 23.3% -13.2% -10.7% -33.3% 25.0% Brooklyn 593 520 426 199 185 258 396 472 494 499 378 292 281 % Change from Prior Yr - -12.3% -18.1% -53.3% -7.0% 39.5% 53.5% 19.2% 4.7% 1.0% -24.2% -22.8% -3.8% Manhattan 403 470 243 146 144 225 419 466 393 438 407 233 289 % Change from Prior Yr - 16.6% -48.3% -39.9% -1.4% 56.3% 86.2% 11.2% -15.7% 11.5% -7.1% -42.8% 24.0% Queens 213 165 181 76 81 96 116 248 167 162 148 112 120 % Change from Prior Yr - -22.5% 9.7% -58.0% 6.6% 18.5% 20.8% 113.8% -32.7% -3.0% -8.6% -24.3% 7.1% *Note: Staten Island buildings are excluded due to the small number of rent stabilized buildings sold. Source: NYC Department of Finance
D.8 Rent Stabilized Building Median Sales Price and Sales Volume, by Borough and Building Size, and Percent Change in Sales, 2017-2018
2017 2018 2017 2018 Change in Sales
Median Sale Price Median Sale Price # of Sales # of Sales from 2017-18 Citywide All buildings* $3,800,000 $4,380,000 793 885 11.6% 6-10 units $1,585,392 $2,087,500 374 382 2.1% 11-19 units $3,675,000 $5,100,000 122 137 12.3% 20-99 units $9,000,000 $8,314,452 281 344 22.4% 100+ units $35,000,000 $78,850,000 16 22 37.5%
Bronx All buildings* $4,215,500 $4,550,000 156 195 25.0% 6-10 units $1,190,000 $1,400,000 41 47 14.6% 11-19 units $2,645,000 $2,577,000 31 30 -3.2% 20-99 units $5,887,500 $6,365,198 81 116 43.2%
Brooklyn All buildings* $2,100,000 $3,016,379 292 281 -3.8% 6-10 units $1,575,000 $2,000,000 199 165 -17.1% 11-19 units $3,275,000 $3,654,095 38 30 -21.1% 20-99 units $7,500,000 $9,300,000 51 83 62.7%
Manhattan All buildings* $8,300,000 $7,200,000 233 289 24.0% 6-10 units $5,525,000 $3,800,000 64 96 50.0% 11-19 units $7,595,000 $7,250,000 45 62 37.8% 20-99 units $12,000,000 $10,012,500 118 122 3.4%
Queens All buildings* $1,725,000 $2,125,000 112 120 7.1% 6-10 units $1,450,000 $1,599,000 70 74 5.7% 11-19 units - $4,750,000 8 15 87.5% 20-99 units $11,546,512 $8,725,000 31 23 -25.8% Note: All Staten Island buildings; Queens 11-19 unit buildings (2017 sale price only); and all 100+ unit buildings in individual boroughs, are excluded due to the small number of buildings sold. * “All buildings” totals include buildings with 100 or more units. Therefore, these figures may not equal the sum of their subsets. In addition, Citywide figures do not contain Staten Island building sales. Source: NYC Department of Finance

Appendix E: Income and Affordability Study
Housing NYC: Rents, Markets & Trends 2019 • Page 129
Unemployment Rate 2007 2008 2009 2010 2011 2012 2013 2014 2015 2016 2017 2018 Bronx 6.8% 7.6% 12.0% 12.0% 11.9% 12.4% 11.8% 9.8% 7.8% 7.1% 6.3% 5.7% Brooklyn 5.4% 6.0% 9.9% 9.9% 9.6% 9.8% 9.4% 7.6% 5.9% 5.3% 4.7% 4.2% Manhattan 4.3% 4.9% 8.4% 8.6% 7.8% 8.0% 7.5% 6.1% 4.9% 4.6% 4.1% 3.7% Queens 4.5% 5.0% 8.4% 8.6% 8.1% 8.3% 7.7% 6.4% 5.0% 4.5% 4.0% 3.6% Staten Island 4.6% 5.1% 8.2% 9.4% 9.2% 9.5% 9.0% 7.4% 5.8% 5.2% 4.7% 4.1% NYC 5.0% 5.6% 9.3% 9.5% 9.1% 9.3% 8.8% 7.3% 5.7% 5.2% 4.6% 4.1%
U.S. 4.6% 5.8% 9.3% 9.6% 8.9% 8.1% 7.4% 6.2% 5.3% 4.9% 4.4% 3.9% Labor Force Participation Rate
NYC ∅ 59.1% 59.6% 60.1% 59.7% 59.7% 60.2% 60.5% 60.5% 60.6% 60.7% 60.8% 60.9% U.S. 66.0% 66.0% 65.4% 64.7% 64.1% 63.7% 63.2% 62.9% 62.7% 62.8% 62.9% 62.9%
Employment-Population Ratio
NYC ∅ 56.2% 56.4% 55.0% 53.6% 54.3% 54.2% 54.8% 55.5% 56.7% 57.4% 57.9% 58.1%U.S. 63.0% 62.2% 59.3% 58.5% 58.4% 58.6% 58.6% 59.0% 59.3% 59.7% 60.1% 60.4%
Gross City Product (NYC)
Billions, in 2012$ 648.4 639.1 626.3 650.1 662.9 682.6 704.3 726.5 754.9 775.2 795.1 819.0 % Change 3.32% -1.44% -2.00% 3.80% 1.97% 2.98% 3.18% 3.15% 3.90% 2.69% 2.57% 3.01%
Gross Domestic Product (U.S.)
Billions, in 2012$ 15,626.0 15,604.7 15,208.8 15,598.8 15,840.7 16,197.0 16,495.4 16,899.8 17,386.7 17,659.2 18,050.7 18,571.3 % Change 1.88% -0.14% -2.54% 2.56% 1.55% 2.25% 1.84% 2.45% 2.88% 1.57% 2.22% 2.88%
Notes: Both Gross City Product (GCP) and Gross Domestic Product (GDP) are revised periodically. The GCP & GDP figures presented here may not be the same as those reported in prior years. The NYS Department of Labor also periodically revises unemployment rates, and rates reflected here might not match those figures reported in prior years. ∅ Unpublished data from the Bureau of Labor Statistics. These figures are revised periodically. Sources: U.S. Bureau of Labor Statistics; U.S. Bureau of Economic Analysis; NYS Department of Labor; Office of the NYC Comptroller
E.1 Average Annual Employment Statistics by Area, 2007-2018

Appendix E: Income and Affordability Study
Page 130 • Appendices
2017-2018
Industry Employment 2009 2010 2011 2012 2013 2014 2015 2016 2017 2018 Change Manufacturing 81.6 76.3 75.7 76.4 76.4 76.6 77.9 76.2 73.2 70.6 -3.6% Construction, Natural Resources & Mining 120.8 112.5 112.4 116.2 122.3 129.3 139.4 147.2 152.5 157.8 3.5% Trade, Transport & Utilities 551.9 559.0 574.9 589.7 603.9 619.2 628.6 628.3 631.5 631.2 -0.05% Leisure & Hospitality 309.5 323.1 343.2 366.7 386.6 409.7 429.1 441.6 458.4 463.0 1.0% Financial Activities 432.9 427.3 438.1 437.8 436.4 448.0 457.9 464.6 467.5 474.7 1.5% Information 165.9 166.6 171.5 176.5 180.2 186.3 190.4 194.2 200.5 204.4 1.9% Professional & Business Svcs. 569.1 575.3 597.4 619.2 643.0 669.1 700.0 722.7 742.8 762.1 2.6% Educational & Health Svcs. 752.6 771.6 789.2 805.6 831.1 866.4 896.9 928.7 961.9 1006.2 4.6% Other Services 160.3 160.6 165.2 170.4 174.9 180.2 185.7 190.1 191.6 193.1 0.8%
Total Private Sector 3,144.7 3,172.4 3,267.5 3,358.5 3,454.5 3,584.6 3,705.9 3,793.5 3,880.0 3,963.0 2.1% Government ∅ 586.3 579.0 573.3 570.6 570.6 573.3 579.5 583.7 584.7 588.3 0.6%
City of New York 481.4 472.4 474.5 474.4 476.3 480.7 486.8 490.2 491.1 496.0 1.0%
Total 3,730.9 3,751.4 3,840.8 3,929.0 4,025.0 4,157.9 4,285.4 4,377.2 4,464.7 4,551.3 1.9% Notes: Totals may not add up due to rounding. Figures may have been revised from prior years by the NYS Department of Labor. Total excludes farm employment but includes unclassified jobs. ∅ “Government” includes federal, state, and local (City of New York) jobs located in NYC. Local government figures include those employed by the City of New York as well as city-based public corporations such as the Health and Hospitals Corporation and the Metropolitan Transportation Authority. Source: NYS Department of Labor
E.2 Average Payroll Employment by Industry for NYC, 2009-2018 (in thousands)
2017-18
Industry 2010 2011 2012 2013 2014 2015 2016 2017 2018 % Change
Construction $79,709 $79,182 $77,219 $77,067 $76,826 $78,417 $81,765 $81,351 $81,927 0.7% Manufacturing $59,226 $60,127 $57,031 $54,910 $56,204 $58,093 $60,181 $60,893 $61,641 1.2% Transportation $54,522 $54,610 $53,755 $53,683 $56,314 $55,352 $58,063 $58,585 $57,749 -1.4% Trade* $53,606 $54,554 $54,144 $55,331 $54,445 $55,137 $56,864 $56,585 $58,528 3.4% Finance and Insurance $297,391 $299,874 $271,985 $289,459 $305,753 $305,934 $291,982 $299,645 $312,943 4.4% Real Estate $67,879 $69,450 $69,824 $71,774 $73,891 $77,957 $80,462 $82,085 $82,393 0.4% Admin/Waste/Edu/Health** $55,018 $54,554 $53,748 $53,809 $53,908 $55,192 $56,457 $55,655 $56,857 2.2% Arts, Entertainment & Rec $72,769 $72,281 $68,432 $66,914 $68,056 $72,179 $74,709 $73,673 $74,256 0.8% Accomm & Food Svcs. $32,314 $32,430 $32,131 $32,005 $32,587 $33,060 $34,610 $34,938 $35,764 2.4% Other Svcs. $50,369 $49,863 $46,849 $46,477 $46,944 $48,250 $50,093 $50,622 $51,163 1.1% Professional & Tech Svcs. $121,822 $125,776 $122,947 $123,402 $125,924 $129,468 $131,947 $131,749 $134,527 2.1% Management of Companies $207,395 $212,554 $201,741 $200,458 $201,245 $200,200 $190,948 $183,706 $193,038 5.1% Information $120,413 $122,647 $123,616 $128,436 $134,185 $138,568 $141,985 $140,200 $147,404 5.1% Utilities $108,181 $109,889 $121,068 --∅ --∅ $117,480 $121,743 $123,627 $127,442 3.1%Unclassified/Agri/Mining*** $43,982 $44,814 $42,923 $42,541 $45,023 $43,453 $45,363 $48,979 $52,958 8.1%
Private Sector $92,324 $93,271 $88,803 $89,984 $91,793 $93,014 $92,943 $92,821 $95,397 2.8% Government $64,477 $64,878 $63,307 $62,760 $63,833 $65,903 $66,901 $67,795 $75,168 10.9%
Total Industries $88,045 $89,107 $85,171 $86,183 $88,013 $89,433 $89,561 $89,629 $92,765 3.5%
E.3 Average Real Wage Rates by Industry for NYC, 2010-2018 (2018 dollars)
Notes: Each year refers to the first three quarters of that year, and the fourth quarter of the prior year. The New York State Department of Labor revises these statistics annually. Real wages reflect 2018 dollars and differ from those found in this table in prior years. ∅ Wages for the this industry were not reported by the NYS Department of Labor during this time period due to the small number of respondents, and corresponding privacy concerns. *The Wholesale Trade and Retail Trade sectors have been combined into one category. **The Administrative and Waste Service, Educational Services, and Health Care and Social Assistance Service have been combined into one category. ***The Unclassified; Agriculture, Forestry, Fishing Hunting; and Mining sectors have been combined into one category. Source: New York State Department of Labor, Research and Statistics Division

Appendix E: Income and Affordability Study
Housing NYC: Rents, Markets & Trends 2019 • Page 131
2008 2009 2010 2011 2012 2013 2014 2015 2016 2017 2018
March 233.1 235.1 240.1 245.6 251.9 256.6 260.0 259.6 261.5 267.6 272.2 June 238.6 237.2 240.8 248.5 252.4 256.9 261.4 261.5 263.9 268.7 274.2 September 240.1 238.6 241.5 250.6 254.6 258.5 261.1 261.9 264.6 270.1 275.5 December 233.0 238.4 241.9 248.3 253.6 257.3 258.1 259.9 265.4 269.6 273.8
Quarterly Average 236.2 237.3 241.1 248.2 253.1 257.3 260.1 260.7 263.9 269.0 273.9 Yearly Average 235.8 236.8 240.9 247.7 252.6 256.8 260.2 260.6 263.4 268.5 273.6
12-month percentage change in the CPI
2008 2009 2010 2011 2012 2013 2014 2015 2016 2017 2018 March 3.82% 0.83% 2.14% 2.30% 2.55% 1.87% 1.32% -0.12% 0.72% 2.32% 1.72% June 4.52% -0.59% 1.54% 3.19% 1.57% 1.78% 1.73% 0.06% 0.90% 1.81% 2.05% September 5.16% -0.63% 1.22% 3.76% 1.59% 1.55% 0.99% 0.31% 1.04% 2.06% 2.00% December 1.58% 2.32% 1.45% 2.66% 2.11% 1.47% 0.31% 0.72% 2.11% 1.56% 1.58%
Quarterly Average 3.77% 0.47% 1.58% 2.98% 1.96% 1.67% 1.09% 0.24% 1.19% 1.94% 1.84% Yearly Average 3.90% 0.44% 1.71% 2.85% 1.97% 1.68% 1.32% 0.13% 1.08% 1.96% 1.91% Source: U.S. Bureau of Labor Statistics; Base Period: 1982-1984=100
E.5 Consumer Price Index for All Urban Consumers, NY-Northeastern NJ, 2008-2018
2017-18
Industry 2010 2011 2012 2013 2014 2015 2016 2017 2018 % Change
Construction $70,232 $71,478 $71,262 $72,436 $73,247 $74,900 $78,731 $79,865 $81,927 2.6% Manufacturing $52,184 $54,277 $52,631 $51,611 $53,586 $55,488 $57,947 $59,781 $61,641 3.1% Transportation $48,040 $49,296 $49,608 $50,457 $53,691 $52,870 $55,908 $57,515 $57,749 0.4% Trade* $47,232 $49,247 $49,967 $52,007 $51,909 $52,665 $54,754 $55,552 $58,528 5.4% Finance and Insurance $262,032 $270,698 $251,002 $272,067 $291,510 $292,213 $281,146 $294,172 $312,943 6.4% Real Estate $59,809 $62,692 $64,438 $67,462 $70,449 $74,461 $77,476 $80,586 $82,393 2.2% Admin/Waste/Edu/Health** $48,476 $49,246 $49,601 $50,575 $51,397 $52,717 $54,362 $54,638 $56,857 4.1% Arts, Entertainment & Rec $64,117 $65,249 $63,153 $62,894 $64,886 $68,942 $71,936 $72,327 $74,256 2.7% Accomm & Food Svcs. $28,472 $29,275 $29,652 $30,082 $31,069 $31,577 $33,326 $34,300 $35,764 4.3% Other Svcs. $44,380 $45,012 $43,235 $43,685 $44,757 $46,086 $48,234 $49,697 $51,163 3.0% Professional & Tech Svcs. $107,338 $113,538 $113,462 $115,987 $120,058 $123,662 $127,050 $129,343 $134,527 4.0% Management of Companies $182,736 $191,873 $186,178 $188,413 $191,870 $191,221 $183,862 $180,351 $193,038 7.0% Information $106,097 $110,714 $114,080 $120,719 $127,934 $132,353 $136,716 $137,639 $147,404 7.1% Utilities $95,318 $99,197 $111,728 --∅ --∅ $112,211 $117,225 $121,369 $127,442 5.0%Unclassified/Agri/Mining*** $38,753 $40,454 $39,612 $39,985 $42,926 $41,504 $43,679 $48,085 $52,958 10.1%
Private Sector $81,347 $84,196 $81,952 $84,577 $87,517 $88,842 $89,493 $91,126 $95,397 4.7% Government $56,811 $58,566 $58,423 $58,989 $60,860 $62,947 $64,419 $66,557 $75,168 12.9%
Total Industries $77,577 $80,437 $78,600 $81,005 $83,913 $85,422 $86,237 $87,992 $92,765 5.4%
E.4 Average Nominal Wage Rates by Industry for NYC, 2010-2018
Note: Each year refers to the first three quarters of that year, and the fourth quarter of the prior year. The NYS Department of Labor revises these statistics annually. ∅ Wages for the this industry were not reported by the NYS Department of Labor during this time period due to the small number of respondents, and corresponding privacy concerns. *The Wholesale Trade and Retail Trade sectors have been combined into one category. **The Administrative and Waste Service, Educational Services, and Health Care and Social Assistance Service have been combined into one category. ***The Unclassified; Agriculture, Forestry, Fishing Hunting; and Mining sectors have been combined into one category. Source: New York State Department of Labor, Research and Statistics Division
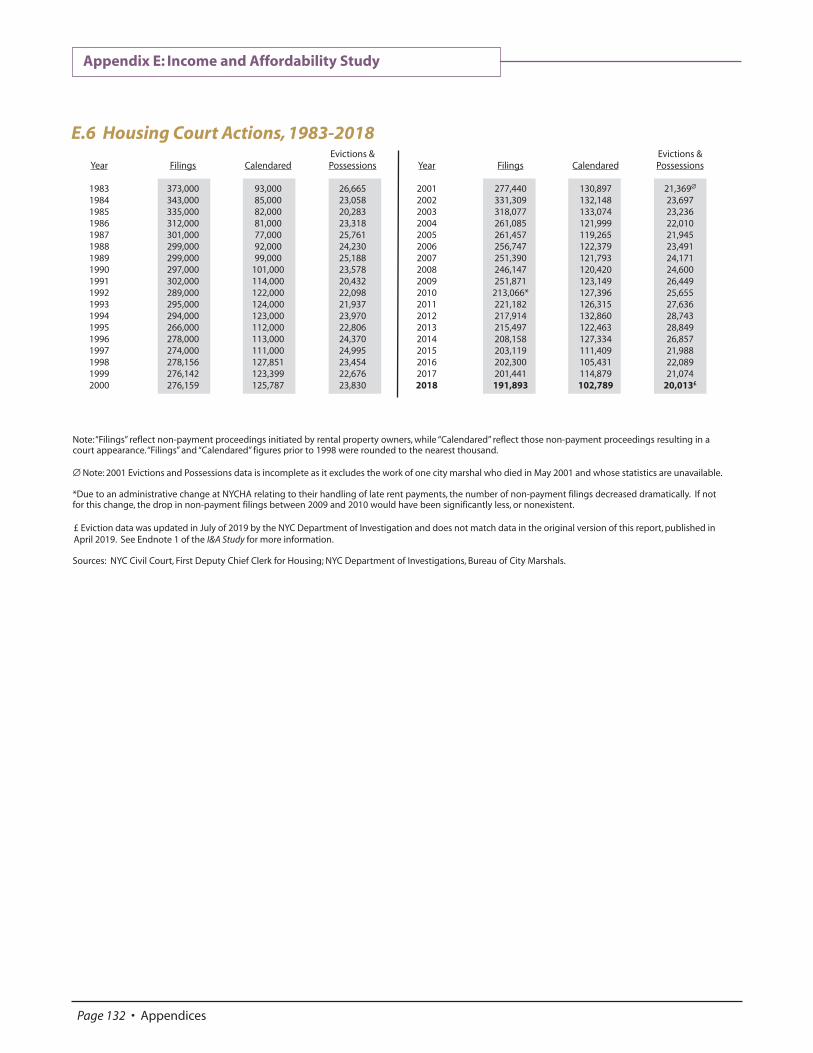
Appendix E: Income and Affordability Study
Page 132 • Appendices
Note: “Filings” reflect non-payment proceedings initiated by rental property owners, while “Calendared” reflect those non-payment proceedings resulting in a court appearance. “Filings” and “Calendared” figures prior to 1998 were rounded to the nearest thousand. ∅ Note: 2001 Evictions and Possessions data is incomplete as it excludes the work of one city marshal who died in May 2001 and whose statistics are unavailable. *Due to an administrative change at NYCHA relating to their handling of late rent payments, the number of non-payment filings decreased dramatically. If not for this change, the drop in non-payment filings between 2009 and 2010 would have been significantly less, or nonexistent. £ Eviction data was updated in July of 2019 by the NYC Department of Investigation and does not match data in the original version of this report, published in April 2019. See Endnote 1 of the I&A Study for more information. Sources: NYC Civil Court, First Deputy Chief Clerk for Housing; NYC Department of Investigations, Bureau of City Marshals.
Evictions & Year Filings Calendared Possessions
1983 373,000 93,000 26,665 1984 343,000 85,000 23,058 1985 335,000 82,000 20,283 1986 312,000 81,000 23,318 1987 301,000 77,000 25,761 1988 299,000 92,000 24,230 1989 299,000 99,000 25,188 1990 297,000 101,000 23,578 1991 302,000 114,000 20,432 1992 289,000 122,000 22,098 1993 295,000 124,000 21,937 1994 294,000 123,000 23,970 1995 266,000 112,000 22,806 1996 278,000 113,000 24,370 1997 274,000 111,000 24,995 1998 278,156 127,851 23,454 1999 276,142 123,399 22,676 2000 276,159 125,787 23,830
Evictions & Year Filings Calendared Possessions
2001 277,440 130,897 21,369∅ 2002 331,309 132,148 23,697 2003 318,077 133,074 23,236 2004 261,085 121,999 22,010 2005 261,457 119,265 21,945 2006 256,747 122,379 23,491 2007 251,390 121,793 24,171 2008 246,147 120,420 24,600 2009 251,871 123,149 26,449 2010 213,066* 127,396 25,655 2011 221,182 126,315 27,636 2012 217,914 132,860 28,743 2013 215,497 122,463 28,849 2014 208,158 127,334 26,857 2015 203,119 111,409 21,988 2016 202,300 105,431 22,089 2017 201,441 114,879 21,074 2018 191,893 102,789 20,013£
E.6 Housing Court Actions, 1983-2018

Appendix E: Income and Affordability Study
Housing NYC: Rents, Markets & Trends 2019 • Page 133
E.7 Homeless Statistics, 1982-2018Families
Year Single Adults Children (inc. children) Total Individuals
1982 3,786 2,507 1,005 7,584 1983 5,061 4,887 1,960 12,468 1984 6,228 7,432 2,981 17,491 1985 7,217 9,196 3,688 21,154 1986 8,890 10,493 4,286 24,896 1987 9,628 11,163 4,986 27,225 1988 9,675 11,401 5,091 27,646 1989 9,342 8,614 4,105 23,254 1990 8,535 6,966 3,591 20,131 1991 7,689 8,867 4,581 22,498 1992 6,922 9,607 5,270 23,494 1993 6,413 9,760 5,626 23,748 1994 6,235 9,610 5,629 23,431 1995 6,532 9,927 5,627 23,950 1996 7,020 9,945 5,692 24,554 1997 7,090 8,437 4,793 22,145 1998 6,875 8,054 4,558 21,277 1999 6,778 8,826 4,965 22,575 2000 6,934 9,290 5,192 23,712 2001 7,479 11,427 6,154 27,799 2002 7,750 14,952 8,071 34,576 2003 8,199 16,705 9,203 38,310 2004 8,612 15,705 8,922 37,319 2005 8,174 13,534 8,194 33,687 2006 7,662 12,597 8,339 32,430 2007 6,942 14,060 9,075 34,109 2008 6,530 14,327 8,856 33,554 2009 6,764 15,326 9,719 35,915 2010 7,825 14,788 9,635 36,175 2011 8,543 15,501 9,573 37,765 2012 9,047 18,068 10,705 43,295 2013 9,862 21,163 12,062 49,408 2014 10,591 23,511 13,317 54,122 2015 12,014 23,658 14,037 57,158 2016 13,148 23,199 14,953 58,770 2017 14,074 22,733 14,384 59,467 2018 15,470 22,300 15,077 60,028
Note: Data presented are the annual averages of the Department of Homeless Services shelter population. Street homelessness is not quantified in this data. Source: NYC Department of Homeless Services
E.8 Poverty Rates, 2007-2017
2007 2008 2009 2010 2011 2012 2013 2014 2015 2016 2017
U.S. 13.0% 13.2% 14.3% 15.3% 15.9% 15.9% 15.8% 15.5% 14.7% 14.0% 13.4%
New York City 18.5% 18.2% 18.7% 20.1% 20.9% 21.2% 20.9% 20.9% 20.0% 18.9% 18.0%
Bronx 27.1% 27.6% 28.5% 30.2% 30.4% 31.0% 30.9% 31.6% 30.4% 28.7% 28.0%
Brooklyn 21.9% 21.1% 21.8% 23.0% 23.6% 24.3% 23.3% 23.4% 22.3% 20.6% 19.8%
Manhattan 17.6% 16.9% 16.6% 16.4% 18.3% 17.8% 18.9% 17.6% 17.6% 17.3% 16.2%
Queens 12.0% 12.1% 12.6% 15.0% 15.8% 16.2% 15.3% 15.2% 13.8% 13.2% 12.1%
Staten Island 9.8% 10.0% 11.2% 11.8% 11.7% 11.6% 12.8% 14.5% 14.4% 13.2% 11.8%
Source: 2007-2017 American Community Survey
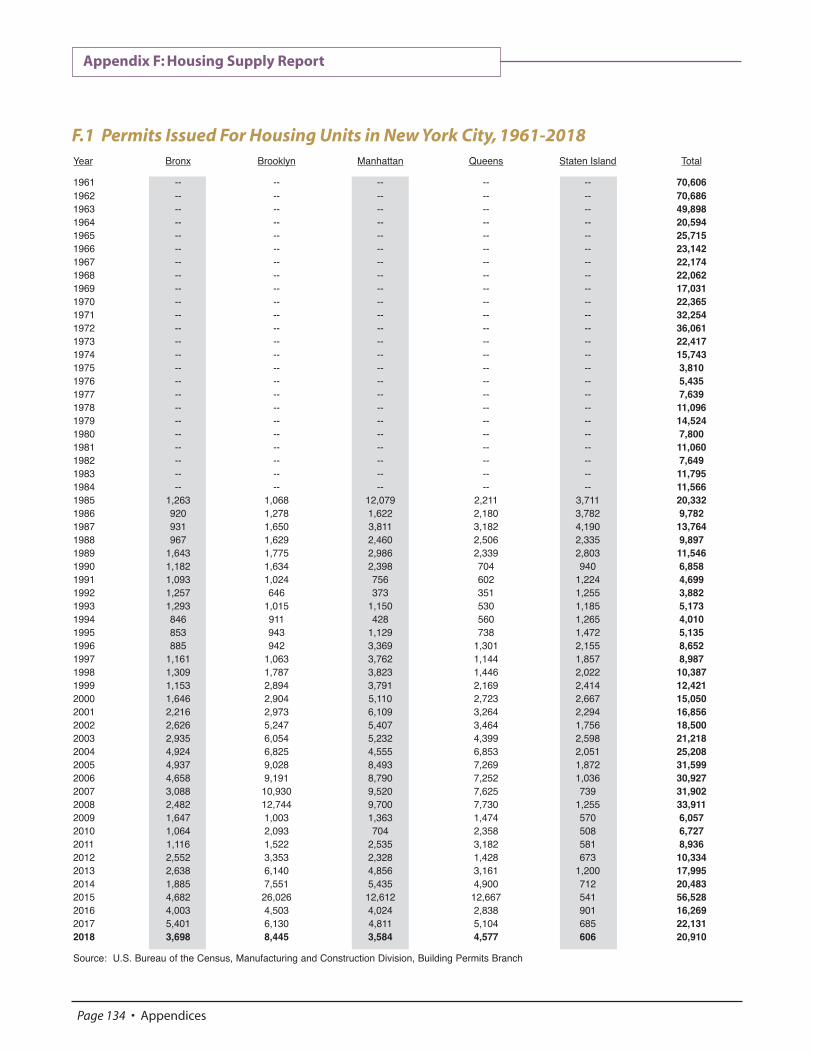
Appendix F: Housing Supply Report
Page 134 • Appendices
Year Bronx Brooklyn Manhattan Queens Staten Island Total 1961 -- -- -- -- -- 70,606 1962 -- -- -- -- -- 70,686 1963 -- -- -- -- -- 49,898 1964 -- -- -- -- -- 20,594 1965 -- -- -- -- -- 25,715 1966 -- -- -- -- -- 23,142 1967 -- -- -- -- -- 22,174 1968 -- -- -- -- -- 22,062 1969 -- -- -- -- -- 17,031 1970 -- -- -- -- -- 22,365 1971 -- -- -- -- -- 32,254 1972 -- -- -- -- -- 36,061 1973 -- -- -- -- -- 22,417 1974 -- -- -- -- -- 15,743 1975 -- -- -- -- -- 3,810 1976 -- -- -- -- -- 5,435 1977 -- -- -- -- -- 7,639 1978 -- -- -- -- -- 11,096 1979 -- -- -- -- -- 14,524 1980 -- -- -- -- -- 7,800 1981 -- -- -- -- -- 11,060 1982 -- -- -- -- -- 7,649 1983 -- -- -- -- -- 11,795 1984 -- -- -- -- -- 11,566 1985 1,263 1,068 12,079 2,211 3,711 20,332 1986 920 1,278 1,622 2,180 3,782 9,782 1987 931 1,650 3,811 3,182 4,190 13,764 1988 967 1,629 2,460 2,506 2,335 9,897 1989 1,643 1,775 2,986 2,339 2,803 11,546 1990 1,182 1,634 2,398 704 940 6,858 1991 1,093 1,024 756 602 1,224 4,699 1992 1,257 646 373 351 1,255 3,882 1993 1,293 1,015 1,150 530 1,185 5,173 1994 846 911 428 560 1,265 4,010 1995 853 943 1,129 738 1,472 5,135 1996 885 942 3,369 1,301 2,155 8,652 1997 1,161 1,063 3,762 1,144 1,857 8,987 1998 1,309 1,787 3,823 1,446 2,022 10,387 1999 1,153 2,894 3,791 2,169 2,414 12,421 2000 1,646 2,904 5,110 2,723 2,667 15,050 2001 2,216 2,973 6,109 3,264 2,294 16,856 2002 2,626 5,247 5,407 3,464 1,756 18,500 2003 2,935 6,054 5,232 4,399 2,598 21,218 2004 4,924 6,825 4,555 6,853 2,051 25,208 2005 4,937 9,028 8,493 7,269 1,872 31,599 2006 4,658 9,191 8,790 7,252 1,036 30,927 2007 3,088 10,930 9,520 7,625 739 31,902 2008 2,482 12,744 9,700 7,730 1,255 33,911 2009 1,647 1,003 1,363 1,474 570 6,057 2010 1,064 2,093 704 2,358 508 6,727 2011 1,116 1,522 2,535 3,182 581 8,936 2012 2,552 3,353 2,328 1,428 673 10,334 2013 2,638 6,140 4,856 3,161 1,200 17,995 2014 1,885 7,551 5,435 4,900 712 20,483 2015 4,682 26,026 12,612 12,667 541 56,528 2016 4,003 4,503 4,024 2,838 901 16,269 2017 5,401 6,130 4,811 5,104 685 22,131 2018 3,698 8,445 3,584 4,577 606 20,910 Source: U.S. Bureau of the Census, Manufacturing and Construction Division, Building Permits Branch
F.1 Permits Issued For Housing Units in New York City, 1961-2018

Appendix F: Housing Supply Report
Year/Borough 1-Family 2-Family 3/4 Family 5 or More-Family Total Buildings 2010 Bronx 9.2% 38.5% 23.1% 29.2% 65 Brooklyn 3.6% 31.4% 27.9% 37.1% 140 Manhattan 0.0% 18.2% 9.1% 72.7% 11 Queens 12.4% 67.2% 11.2% 9.2% 509 Staten Island 71.9% 27.2% 0.6% 0.3% 349 Citywide 30.3% 47.3% 10.6% 11.8% 1,074 2011 Bronx 1.5% 35.3% 19.1% 44.1% 68 Brooklyn 0.0% 44.3% 30.5% 25.3% 174 Manhattan 3.6% 0.0% 3.6% 92.9% 28 Queens 21.5% 57.0% 11.9% 9.6% 386 Staten Island 52.5% 47.2% 0.0% 0.3% 341 Citywide 26.5% 48.3% 11.3% 13.8% 997 2012 Bronx 5.9% 39.3% 17.0% 37.8% 135 Brooklyn 0.4% 20.5% 36.9% 42.2% 249 Manhattan 9.5% 4.8% 0.0% 85.7% 42 Queens 26.8% 41.9% 16.9% 14.4% 284 Staten Island 64.1% 34.6% 0.0% 1.3% 298 Citywide 27.8% 32.5% 16.2% 23.5% 1,008 2013 Bronx 2.4% 41.6% 12.0% 44.0% 125 Brooklyn 0.0% 19.8% 31.6% 48.6% 364 Manhattan 1.6% 7.8% 0.0% 90.6% 64 Queens 39.3% 32.6% 13.3% 14.8% 399 Staten Island 55.9% 42.5% 0.2% 1.4% 431 Citywide 29.1% 32.0% 13.3% 25.7% 1,383 2014 Bronx 0.0% 33.3% 20.4% 46.3% 108 Brooklyn 0.0% 19.3% 25.8% 55.0% 400 Manhattan 1.3% 9.0% 2.6% 87.2% 78 Queens 47.8% 25.4% 10.5% 16.3% 448 Staten Island 68.1% 31.1% 0.2% 0.6% 479 Citywide 35.8% 25.3% 11.6% 27.4% 1,513 2015 Bronx 2.9% 26.3% 9.5% 61.3% 137 Brooklyn 5.3% 7.0% 14.7% 73.0% 812 Manhattan 3.8% 1.9% 2.9% 91.4% 105 Queens 31.0% 26.3% 11.6% 31.2% 552 Staten Island 63.0% 36.7% 0.0% 0.3% 392 Citywide 23.5% 19.2% 10.0% 47.3% 1,998 2016 Bronx 1.8% 25.2% 17.1% 55.9% 111 Brooklyn 30.6% 14.6% 14.0% 40.9% 487 Manhattan 6.3% 3.2% 3.2% 87.3% 63 Queens 39.8% 38.4% 10.3% 11.5% 477 Staten Island 52.2% 46.4% 0.0% 1.4% 414 Citywide 36.1% 30.7% 8.9% 24.3% 1,552 2017 Bronx 6.4% 22.1% 13.6% 57.9% 140 Brooklyn 16.7% 17.1% 13.2% 53.0% 491 Manhattan 5.3% 6.6% 3.9% 84.2% 76 Queens 23.1% 43.5% 15.7% 17.8% 490 Staten Island 57.8% 41.6% 0.4% 0.2% 476 Citywide 28.9% 31.7% 9.9% 29.5% 1,673 2018 Bronx 5.6% 21.0% 6.5% 66.9% 124 Brooklyn 11.0% 10.6% 17.7% 60.7% 453 Manhattan 0.0% 5.1% 0.0% 94.9% 59 Queens 30.4% 39.1% 10.7% 19.7% 391 Staten Island 57.5% 42.0% 0.0% 0.5% 419 Citywide 28.8% 28.1% 9.0% 34.1% 1,446
Source: U.S. Bureau of the Census, Manufacturing and Construction Division, Building Permits Branch
F.2 Permits Issued by Building Size & Borough (In Percentages), 2010-2018
Housing NYC: Rents, Markets & Trends 2019 • Page 135

Appendix F: Housing Supply Report
Page 136 • Appendices
Year Bronx Brooklyn Manhattan Queens Staten Island Total 2008 Q1 862 1,603 485 705 238 3,893 Q2 701 8,970 7,623 5,497 546 23,337 Q3 695 1,520 880 1,016 397 4,508 Q4 224 651 712 512 74 2,173 2009 Q1 164 137 151 508 117 1,077 Q2 130 511 716 353 233 1,943 Q3 497 243 336 331 144 1,551 Q4 856 112 160 282 76 1,486 2010 Q1 56 175 326 249 199 1,005 Q2 490 867 166 612 121 2,256 Q3 231 246 176 394 83 1,130 Q4 287 805 36 1,103 105 2,336 2011 Q1 205 291 146 411 88 1,141 Q2 508 624 1,199 1,416 228 3,975 Q3 248 303 391 459 178 1,579 Q4 155 304 799 896 87 2,241 2012 Q1 564 600 556 197 193 2,110 Q2 619 310 1,041 643 134 2,747 Q3 409 1,496 421 378 142 2,846 Q4 960 947 310 210 204 2,631 2013 Q1 214 1,184 568 428 162 2,556 Q2 1,066 1,117 1,162 730 689 4,764 Q3 336 1,918 1,708 1,006 172 5,140 Q4 1,022 1,921 1,418 997 177 5,535 2014 Q1 379 1,725 1,809 1,067 121 5,101 Q2 583 1,617 1,041 1,471 140 4,852 Q3 736 2,675 1,506 812 207 5,936 Q4 187 1,534 1,079 1,550 244 4,594 2015 Q1 561 3,574 1,154 782 112 6,183 Q2 1,269 15,453 9,760 9,182 151 35,815 Q3 1,651 1,163 1,057 250 175 4,296 Q4 1,201 5,836 641 2,453 103 10,234 2016 Q1 866 482 297 368 145 2,158 Q2 1,060 912 506 854 476 3,808 Q3 764 1,666 1,776 931 145 5,282 Q4 1,313 1,443 1,445 685 135 5,021 2017 Q1 1,124 2,097 1,486 1,434 202 6,343 Q2 1,267 1,454 1,004 1,801 154 5,680 Q3 1,050 1,000 1,183 1,033 170 4,436 Q4 1,960 1,579 1,138 836 159 5,672 2018 Q1 1,181 1,737 1,326 794 132 5,170 Q2 1,403 1,768 673 1,465 167 5,476 Q3 562 2,346 647 735 171 4,461 Q4 552 2,594 938 1,583 136 5,803 2019 Q1 839 2,271 1,037 2,010 172 6,329 Source: U.S. Bureau of the Census, Manufacturing and Construction Division, Building Permits Branch
F.3 Permits Issued For Housing Units by Quarter, 2008-2019

Appendix F: Housing Supply Report
Housing NYC: Rents, Markets & Trends 2019 • Page 137
Year Bronx Brooklyn Manhattan Queens Staten Island Total 1963 8,780 12,264 19,398 17,166 2,423 60,031 1964 9,503 13,555 15,833 10,846 2,182 51,919 1965 6,247 10,084 14,699 16,103 2,319 49,452 1966 7,174 6,926 8,854 6,935 2,242 32,131 1967 4,038 3,195 7,108 5,626 3,069 23,036 1968 3,138 4,158 2,707 4,209 3,030 17,242 1969 1,313 2,371 6,570 3,447 3,768 17,469 1970 1,652 1,695 3,155 4,230 3,602 14,334 1971 7,169 2,102 4,708 2,576 2,909 19,464 1972 11,923 2,593 1,931 3,021 3,199 22,667 1973 6,294 4,340 2,918 3,415 3,969 20,936 1974 3,380 4,379 6,418 3,406 2,756 20,339 1975 4,469 3,084 9,171 2,146 2,524 21,394 1976 1,373 10,782 6,760 3,364 1,638 23,917 1977 721 3,621 2,547 1,350 1,984 10,223 1978 464 345 3,845 697 1,717 7,068 1979 405 1,566 4,060 1,042 2,642 9,715 1980 1,709 708 3,306 783 2,380 8,886 1981 396 454 4,416 1,152 2,316 8,734 1982 997 332 1,812 2,451 1,657 7,249 1983 757 1,526 2,558 2,926 1,254 9,021 1984 242 1,975 3,500 2,291 2,277 10,285 1985 557 1,301 1,739 1,871 1,939 7,407 1986 968 2,398 4,266 1,776 2,715 12,123 1987 1,177 1,735 4,197 2,347 3,301 12,757 1988 1,248 1,631 5,548 2,100 2,693 13,220 1989 847 2,098 5,979 3,560 2,201 14,685 1990 872 929 7,260 2,327 1,384 12,772 1991 656 764 2,608 1,956 1,627 7,611 1992 802 1,337 3,750 1,498 1,136 8,523 1993 886 616 1,810 801 1,466 5,579 1994 891 1,035 1,927 1,527 1,573 6,953 1995 1,166 1,647 2,798 1,013 1,268 7,892 1996 1,075 1,583 1,582 1,152 1,726 7,118 1997 1,391 1,369 816 1,578 1,791 6,945 1998 575 1,333 5,175 1,263 1,751 10,097 1999 1,228 1,025 2,341 2,119 2,264 8,977 2000 1,385 1,353 6,064 2,096 1,896 12,794 2001 1,617 2,404 6,036 1,225 2,198 13,480 2002 1,220 2,248 8,326 1,981 2,453 16,228 2003 1,473 2,575 3,798 2,344 2,589 12,779 2004* 3,326 4,512 6,150 3,087 2,291 19,366 2005* 3,012 5,007 5,006 4,526 1,942 19,493 2006* 4,311 6,418 5,199 5,940 1,900 23,768 2007* 4,422 7,109 7,498 5,907 1,446 26,382 2008* 4,217 7,254 6,118 5,437 1,019 24,045 2009* 2,964 7,522 8,110 4,969 887 24,452 2010* 3,948 7,181 7,801 4,401 714 24,045 2011* 3,417 4,728 2,375 2,852 612 13,984 2012* 1,413 3,611 1,159 2,632 640 9,455 2013* 1,272 3,948 3,126 3,854 482 12,682 2014* 1,660 4,485 2,231 2,961 530 11,867 2015* 2,396 5,324 2,986 3,110 541 14,357 2016* 2,532 9,148 6,900 3,444 1,223 23,247 2017* 2,672 11,065 6,390 5,041 671 25,839 2018* 4,761 9,378 5,672 6,318 863 26,992 Note: Housing unit count is based on the number of Certificates of Occupancy issued by NYC Department of Buildings (DOB), or equivalent action by the Empire State Development Corporation or NYS Dormitory Authority. Prior years’ data may be adjusted and may not match prior reports. *Data from 2004-2018 now includes Final Certificates of Occupancy (as with all other years) as well as Temporary Certificates of Occupancy data for the first time. Data will be updated every year to reflect the most current estimates. Source: NYC Department of City Planning, Housing Database 19v1, compilation of NYC DOB Applications and Certificates of Occupancy data
F.4 New Housing Units Completed in New York City, 1963-2018

Appendix F: Housing Supply Report
Page 138 • Appendices
2013 2014 2015 2016 2017 2018
Plans (Units) Plans (Units) Plans (Units) Plans (Units) Plans (Units) Plans (Units)
Private Plans New Construction 150 (3,658) 211 (5,171) 219 (8,880) 210 (6,653) 228 (6,906) 235 (9,351) Rehabilitation 21 (649) 37 (462) 43 (607) 45 (416) 33 (688) 42 (815) Conversion (Non-Eviction) 16 (819) 20 (3,956) 28 (3,065) 27 (1,602) 18 (764) 11 (606) Conversion (Eviction) 0 0 0 0 0 0 Private Total 187 (5,126) 268 (9,589) 290 (12,552) 282 (8,671) 279 (8.358) 288 (10,772)
Plans (Units) Plans (Units) Plans (Units) Plans (Units) Plans (Units) Plans (Units)
HPD Sponsored Plans New Construction 1 (95) 0 0 0 0 0 Rehabilitation 0 0 0 0 0 1 (12) Conversion (Non-Eviction) 0 0 0 0 0 0 Conversion (Eviction) 0 0 1 (70) 0 0 0 HPD Total 1 (95) 0 1 (70) 0 0 1 (12)
Grand Total 188 (5,221) 268 (9,589) 291 (12,622) 282 (8,671) 279 (8,358) 289 (10,784) Note: Figures exclude “Homeowner,” “No Action,” and “Commercial” plans/units. Source: New York State Attorney General’s Office, Real Estate Financing Bureau
F.5 Number of Residential Co-op and Condo Plans Accepted for Filing By the NYS Attorney General’s Office, 2013-2018
Total
New Conversion Conversion New Construction Units in HPD Year Construction Eviction Non-Eviction Rehabilitation Conversion & Rehab Sponsored Plans 1990 4,203 364 14,640 -- 19,207 1,175 1991 1,111 173 1,757 -- 3,041 2,459 1992 793 0 566 -- 1,359 1,674 1993 775 41 134 -- 950 455 1994 393 283 176 807 1,659 901 1995 614 426 201 1,258 2,499 935 1996 83 16 196 284 579 0 1997 1,417 38 131 852 2,438 533 1998 3,225 0 386 826 4,437 190 1999 1,123 343 359 1,029 2,854 295 2000 1,911 203 738 220 3,072 179 2001 3,833 22 1,053 124 5,032 22 2002 2,576 260 1,974 348 5,158 260 2003 4,870 0 639 418 5,927 0 2004 6,018 274 1,550 334 8,176 274 2005 12,210 269 2,356 223 15,058 269 2006 19,870 273 6,331 0 26,474 273 2007 19,511 248 5,441 71 25,271 248 2008 13,998 241 2,582 130 16,951 241 2009 7,270 274 725 73 8,342 274 2010 4,907 59 812 0 5,778 59 2011 3,785 209 457 14 4,465 209 2012 2,554 97 1,293 81 4,025 97 2013 3,753 0 819 649 5,221 95 2014 5,171 0 3,956 462 9,589 0 2015 8,880 73 3,065 607 12,622 70 2016 6,653 0 1,602 416 8,671 0 2017 6,906 0 764 688 8,358 0 2018 9,351 0 606 827 10,784 12 Note: Rehabilitated units were tabulated separately beginning in 1994. NYC Department of Housing Preservation and Development (HPD) Plans are a subset of all plans. Source: New York State Attorney General’s Office, Real Estate Financing Bureau
F.6 Number of Units in Co-op and Condo Plans Accepted for Filing By the NYS Attorney General’s Office, 1990-2018

Appendix F: Housing Supply Report
Housing NYC: Rents, Markets & Trends 2019 • Page 139
1981 3,505 -- 1982 3,620 -- 1983 2,088 -- 1984 5,820 -- 1985 5,478 -- 1986 8,569 -- 1987 8,286 -- 1988 10,079 109,367 1989 5,342 64,392 1990 980 113,009 1991 3,323 115,031 1992 2,650 143,593 1993 914 122,000 1994 627 60,874 1995 2,284 77,072 1996 1,085 70,431 1997 2,099 145,316 1998 2,118 103,527 1999 6,123 82,121
2000 2,828 83,925 2001 4,870 81,321 2002 4,953 70,145 2003 3,782 74,005 2004 6,738 117,503 2005 5,062 66,370 2006 3,875 66,010 2007 4,212 55,681 2008 4,521 64,478 2009 4,613 37,867 2010 5,895 50,263 2011 11,007 54,775 2012 10,856 45,886 2013 7,890 55,659 2014 6,945 40,787 2015 5,468 44,259 2016 4,493 34,311 2017 20,804 22,877 2018 28,292 29,815
F.8 Tax Incentive Programs – Units Receiving Initial Benefits, 1981-2018
Buildings Newly Receiving Certificates for 421-a Exemptions, 2016-2018
2016 2017 2018
Certificates Buildings Units Certificates Buildings Units Certificates Buildings Units
Bronx 8 10 209 273 117 1,542 139 204 1,874 Brooklyn 72 92 2,672 162 442 8,195 458 594 11,841 Manhattan 16 16 839 63 67 7,448 63 64 8,884 Queens 37 38 773 240 338 3,587 373 516 5,114 Staten Island 0 0 0 2 2 32 4 33 579 TOTAL 133 156 4,493 740 966 20,804 1,037 1,411 28,292
Buildings Newly Receiving J-51 Tax Abatements and Exemptions, 2016-2018
2016 2017 2018 Certified Certified Certified
Buildings Units Cost ($1,000s) Buildings Units Cost ($1,000s) Buildings Units Cost ($1,000s) Bronx 346 13,312 $22,934 180 6,519 $13,847 134 7,915 $16,993 Brooklyn 175 7,694 $18,682 126 4,625 $12,044 154 7,116 $21,274 Manhattan 40 1,778 $9,859 34 3,703 $12,578 50 1,578 $11,351 Queens 1,630 11,525 $10,807 1,072 7,992 $7,511 190 13,028 $8,705 Staten Island 1 2 $65 1 38 $195 1 178 $1,039
TOTAL 2,192 34,311 $62,347 1,413 22,877 $46,175 529 29,815 $59,362 Source: NYC Department of Housing Preservation and Development, Office of Development, Tax Incentive Programs
F.7 Tax Incentive Programs, 2016-2018
Year 421-a J-51 Year 421-a J-51

Appendix F: Housing Supply Report
Page 140 • Appendices
F.9 Building Demolitions in New York City, 1985-2018
Bronx Brooklyn Manhattan Queens Staten Island Total
5+ 5+ 5+ 5+ 5+ 5+ Year Units Total Units Total Units Total Units Total Units Total Units Total
1985 81 157 3 101 59 73 3 133 1 31 147 495 1986 48 96 14 197 19 38 3 273 4 67 88 671 1987 14 55 2 130 22 33 1 273 6 83 45 574 1988 3 34 2 169 25 44 2 269 0 160 32 676 1989 6 48 8 160 20 38 3 219 0 109 37 574 1990 4 29 3 133 20 28 5 119 0 71 32 380 1991 10 33 15 95 9 14 1 68 0 32 35 242 1992 12 51 6 63 2 5 1 41 0 33 21 193 1993 0 17 4 94 0 1 3 51 0 5 7 168 1994 3 14 4 83 5 5 2 42 0 8 14 152 1995 2 18 0 81 0 0 2 37 0 17 4 153 1996 - 30 - 123 - 25 - 118 - 84 - 380 1997 - 29 - 127 - 51 - 168 - 119 - 494 1998 - 71 - 226 - 103 - 275 - 164 - 839 1999 - 67 - 211 - 53 - 227 - 159 - 717 2000 - 64 - 499 - 101 - 529 - 307 - 1,500 2001 - 96 - 421 - 160 - 519 - 291 - 1,487 2002 - 126 - 500 - 89 - 600 - 456 - 1,771 2003 - 161 - 560 - 100 - 865 - 564 - 2,250 2004 - 238 - 691 - 141 - 1,128 - 547 - 2,745 2005 - 245 - 1,080 - 145 - 1,545 - 477 - 3,492 2006 - 334 - 1,109 - 259 - 1,485 - 381 - 3,568 2007 - 302 - 984 - 282 - 1,407 - 308 - 3,283 2008 - 206 - 925 - 252 - 1,082 - 215 - 2,680 2009 - 166 - 467 - 153 - 663 - 177 - 1,626 2010 - 121 - 326 - 76 - 464 - 129 - 1,116 2011 - 93 - 308 - 124 - 463 - 141 - 1,129 2012 - 121 - 284 - 144 - 434 - 139 - 1,122 2013 - 105 - 367 - 145 - 453 - 216 - 1,286 2014 - 125 - 454 - 121 - 555 - 258 - 1,513 2015 - 116 - 668 - 225 - 612 - 266 - 1,887 2016 - 139 - 642 - 178 - 655 - 235 - 1,849 2017 - 136 - 573 - 114 - 579 - 320 - 1,722 2018 - 190 - 661 - 146 - 624 - 267 - 1,888
Note: The Census Bureau discontinued collecting demolition statistics in December, 1995. The New York City Department of Buildings began supplying the total number of buildings demolished from 1996 forward, but does not specify whether buildings are residential or whether they have 5+ units. Demolition statistics from 1985 though 1995 are solely residential buildings.
Source: U.S. Bureau of the Census, Manufacturing and Construction Division, Building Permits Branch; New York City Department of Buildings

Appendix G: Changes to the Rent Stabilized Housing Stock
Housing NYC: Rents, Markets & Trends 2019 • Page 141
G.1 Additions to the Stabilized Housing Stock, 1994-2018
Mitchell-Lama Buyouts Article Formerly Year 421-a J-51 State City Lofts 421-g 420-cΩ 11/14/15 Controlled Total☨
1994 - 114 0 0 - - - - - 114
1995 - 88 306 0 - - - - - 394
1996 - 8 0 0 - - - - - 8
1997 - 38 323 0 - - - - - 361
1998 - 135 574 1,263 64 - - - - 2,036
1999 - 33 286 0 71 - - - - 390
2000 - 224 0 0 96 - - - - 320
2001 - 494 0 0 56 - - - - 550
2002 - 260 0 232 16 - - - - 508
1994-2002 20,240 1,394 1,489 1,495 303 865 5,500 - 31,159 62,445
2003 1,929 171 0 279 20 41 0 - 916 3,356☨
2004 4,941 142 0 229 129 188 0 - 706 6,335☨
2005 3,380 25 251 481 66 79 0 - 721 5,003☨
2006 2,264 130 285 2,755 81 5 0 - 634 6,154☨
2007 2,838 135 2,227 290 35 441 0 - 592 6,558☨
2008 1,856 55 0 101 35 865 0 - 887 3,799☨
2009 2,438 18 112 0 36 0 0 - 519 3,123☨
2010 7,596 80 0 0 9 0 0 - 451 8,136☨
2011 3,155 498 0 0 6 0 0 - 438 4,097☨
2012 2,509 108 132 0 17 0 0 - 360 3,126☨
2013 5,975 407 0 0 26 0 0 - 309 6,717☨
2014 3,110 243 318 0 21 0 0 - 211 3,903☨
2015 2,515 0 0 0 18 0 0 - 270 2,803
2016 4,921 59* 0 716 5 0 0 828 377 6,906*
2017 9,376 208* 143 90 10 0 0 1,283 142 11,252*
2018 9,452 309 0 0 43 0 0 1,900 141 11,845
Total 88,495 3,982 4,957 6,436 860 2,484 5,500 4,011 38,833 155,558
Ω Figures for 2003-2014 have been revised from those reported in prior reports, due to the removal of 420-c program units. See Changes to the Rent Stabilized Housing Stock in NYC in 2015, for more information: http://www1.nyc.gov/assets/rentguidelinesboard/pdf/changes16.pdf. ☨ Totals have been revised from those reported in prior years due to the removal of 420-c additions. See above note. * Number of J-51 units revised from prior year. See Endnote 1. 421-a Notes: Between 1994-2002, a count of 26,987 421-a units includes co-op and condo units that were created under the 421-a program. Analysis of the Real Property Asset Database (RPAD) shows that on average from 1994 to 2002, 25% of 421-a units were owner units and 75% were rental units. Therefore an estimated 20,240 units were added to the rent stabilized stock. Since 2003, 421-a data is obtained from HCR, which provides 12 months worth of data from April 1 to March 31 of the following year, as shown above. J-51 Notes: The numbers represent units that were not rent stabilized prior to entering the J-51 Program. Most units participating in the J-51 Program were rent stabilized prior to their J-51 status and therefore are not considered additions to the rent stabilized stock. Article 11, 14 and 15 Notes: Data prior to 2016 not available. Loft Notes: Loft conversion counts are not available from 1994 to 1997. 421-g, 420-c and Rent Controlled Notes: Counts for individual years between 1994 and 2002 are not available; only an aggregate is available. 421-g Note: The 421-g tax incentive program provides a 14-year tax exemption and abatement benefits for the conversion of commercial buildings to multiple dwellings in the Lower Manhattan Abatement Zone, generally defined as the area south of the centerline of Murray, Frankfort and Dover Streets, excluding Battery Park City and the piers. All rental units in the project become subject to rent stabilization for the duration of the benefits. No additional units will be added since the program required that building permits be dated on or before June 30, 2006. Sources: NYC Department of Housing Preservation and Development (HPD), Tax Incentive Programs and Division of Housing Supervision (Mitchell-Lama Developments); NYS Homes and Community Renewal (HCR), Office of Rent Administration, annual registration data, and Office of Housing Operations; and NYC Loft Board.

Appendix G: Changes to the Rent Stabilized Housing Stock
Page 142 • Appendices
G.2 Additions to the Stabilized Housing Stock by Borough, 2018
Bronx Brooklyn Manhattan Queens Staten Island Total
421-a 738 3,910 2,455 2,349 0 9,452
420-c 0 0 0 0 0 0
J-51 0 279 0 30 0 309
Mitchell-Lama Buyouts (City & State) 0 0 0 0 0 0
Lofts 0 16 27 0 0 43
Article 11, 14 & 15 254 524 535 587 0 1,900
Formerly Controlled 18 32 66 25 0 141
Total Additions 1,010 4,761 3,083 2,991 0 11,845 Sources: NYC Department of Housing Preservation and Development (HPD), Tax Incentive Programs and Division of Housing Supervision (Mitchell-Lama Developments); NYS Homes and Community Renewal (HCR), Office of Rent Administration, annual registration data, and Office of Housing Operations; and NYC Loft Board.
G.3 Average and Median Rent of Initially Registered Rent Stabilized Apartments by Borough, 2018
Bronx Brooklyn Manhattan Queens Staten Island Citywide
Average Rent $1,574 $3,309 $4,550 $3,999 - $3,490
Median Rent $1,579 $2,975 $4,300 $3,617 - $3,000
Total Additions 376 1,035 610 781 1 2,803 Note: There were no initially registered units on Staten Island in 2018. Source: NYS Homes and Community Renewal (HCR), Office of Rent Administration, annual registration data.

Appendix G: Changes to the Rent Stabilized Housing Stock
Housing NYC: Rents, Markets & Trends 2019 • Page 143
G.4 Subtractions from the Stabilized Housing Stock Due to High-Rent High-Income Deregulation by Borough, 1994-2018
Year Bronx Brooklyn Manhattan Queens Staten Island Total
1994 0 0 904 0 0 904
1995 0 0 346 0 0 346
1996 1 0 180 4 0 185
1997 1 0 157 2 0 160
1998 3 0 366 3 0 372
1999 2 1 279 1 0 283
2000 2 1 227 0 0 230
2001 3 0 209 2 0 214
2002 1 1 258 2 0 262
2003 2 13 177 6 0 198
2004 0 13 173 8 0 194
2005 4 30 220 11 0 265
2006 8 28 244 21 0 301
2007 9 45 241 14 0 309
2008 10 50 198 20 0 278
2009 16 57 364 20 0 457
2010 9 44 256 27 0 336
2011 6 38 149 19 0 212
2012 5 31 119 10 0 165
2013 3 32 74 18 0 127
2014 4 21 149 12 0 186
2015 13 37 50 9 0 109
2016 1 30 92 23 0 146
2017 6 32 49 20 0 107
2018 7 29 54 19 0 109
Total 116 533 5,535 271 0 6,455 Source: NYS Homes and Community Renewal (HCR), Office of Rent Administration, annual registration data.

Appendix G: Changes to the Rent Stabilized Housing Stock
Page 144 • Appendices
G.5 Subtractions from the Stabilized Housing Stock Due to High-Rent Vacancy Deregulation by Borough, 1994-2018
Year Bronx Brooklyn Manhattan Queens Staten Island Total
1994 3 9 544 9 0 565
1995 1 111 927 8 0 1,047
1996 10 106 1,203 6 0 1,325
1997 6 77 1,121 0 0 1,204
1998 7 116 2,247 14 0 2,384
1999 11 151 3,586 37 0 3,785
2000 7 279 2,586 62 0 2,934
2001 53 294 4,490 145 0 4,982
2002 64 391 5,431 251 7 6,144
2003 83 640 7,048 416 17 8,204
2004 101 758 7,271 697 29 8,856
2005 184 852 7,303 904 29 9,272
2006 217 1,408 7,187 1,106 65 9,983
2007 375 1,409 7,114 1,380 64 10,342
2008 447 1,884 8,600 1,787 82 12,800
2009 537 2,013 8,718 2,195 94 13,557
2010 581 2,154 7,807 2,290 79 12,911
2011 654 2,256 6,378 2,032 44 11,364
2012 281 1,189 4,289 922 32 6,713
2013 197 994 2,924 654 32 4,801
2014 309 1,247 3,572 1,056 51 6,235
2015 432 1,773 4,280 1,510 54 8,049
2016 179 1,132 2,522 824 33 4,690
2017 186 870 1,738 695 28 3,517
2018 175 1,197 2,276 941 39 4,628
Total 5,100 23,310 111,162 19,941 779 160,292 Note: Prior to 2014, registration of deregulated units with HCR was voluntary. These totals therefore represent a ‘floor’ or minimum count of the actual number of deregulated units in these years. Since 2014, the annual apartment registration must indicate that an apartment is permanently exempt. See “High-Rent Vacancy Deregulation” section on page 97 for more information. Source: NYS Homes and Community Renewal (HCR), Office of Rent Administration, annual registration data.

Appendix G: Changes to the Rent Stabilized Housing Stock
Housing NYC: Rents, Markets & Trends 2019 • Page 145
G.7 Subtractions from the Stabilized Housing Stock by Borough, 2018
Bronx Brooklyn Manhattan Queens Staten Island Total
High Rent/High Income Deregulation 7 29 54 19 0 109
High Rent/Vacancy Deregulation 175 1,197 2,276 941 39 4,628
Co-op/Condo Conversion 98 259 210 223 1 791
421-a Expirations 20 80 806 79 31 1,016
J-51 Expirations 0 103 268 4 0 375
Substantial Rehabilitation 6 121 67 14 1 209
Commercial/Professional Conversion 0 0 6 1 0 7
Other 25 80 186 42 0 333
Total Subtractions 331 1,869 3,873 1,323 72 7,468 Source: NYS Homes and Community Renewal (HCR), Office of Rent Administration, annual registration data.
G.6 Subtractions from the Stabilized Housing Stock, 1994-2018
High-Rent High-Rent Commercial/ High-Income Vacancy Co-op/Condo 421-a J-51 Substantial Professional
Year Deregulation Deregulation Conversion Expiration Expiration Rehab Conversion Other Total 1994 904 565 5,584 2,005 1,345 332 139 1,904 12,778
1995 346 1,047 4,784 990 1,440 334 113 1,670 10,724
1996 185 1,325 4,733 693 1,393 601 117 1,341 10,388
1997 160 1,204 3,723 1,483 1,340 368 109 1,365 9,752
1998 372 2,384 3,940 2,150 1,412 713 78 1,916 12,965
1999 283 3,785 2,822 3,514 1,227 760 110 1,335 13,836
2000 230 2,934 3,147 3,030 884 476 729 1,372 12,802
2001 214 4,982 2,153 770 1,066 399 88 1,083 10,755
2002 262 6,144 1,774 653 1,081 508 45 954 11,421
2003 198 8,204 1,474 651 854 340 59 912 12,692
2004 194 8,856 1,564 493 609 268 79 954 13,017
2005 265 9,272 1,692 451 545 692 111 1,017 14,045
2006 301 9,983 1,567 263 236 350 135 1,139 13,974
2007 309 10,342 1,455 161 270 297 66 1,304 14,204
2008 278 12,800 1,405 376 176 421 56 1,321 16,833
2009 457 13,557 1,153 1,075 286 441 62 1,557 18,588
2010 336 12,911 1,130 657 143 274 32 1,424 16,907
2011 212 11,364 1,098 415 230 174 29 653 14,175
2012 165 6,713 924 336 244 481 74 562 9,499
2013 127 4,801 774 757 188 308 31 611 7,597
2014 186 6,235 789 1,011 137 226 13 416 9,013
2015 109 8,049 618 1,079 287 288 13 369 10,812
2016 146 4,690 665 749 460 216 160 438 7,524
2017 107 3,517 672 1,363 363 211 24 400 6,657
2018 109 4,628 791 1,016 375 209 7 333 7,468
Total 6,455 160,292 50,431 26,141 16,591 9,687 2,479 26,350 298,426
Co-op/Condo Note: Subtractions from the stabilized stock in co-ops and condos are due to two factors: (1) stabilized tenants vacating rental units in previously converted buildings and (2) new conversions of stabilized rental units to ownership. High-Rent Vacancy Deregulation Note: Prior to 2014, registration of deregulated units with HCR was voluntary. These totals therefore represent a ‘floor’ or minimum count of the actual number of deregulated units in these years. Since 2014, the annual apartment registration must indicate that an apartment is permanently exempt. See “High-Rent Vacancy Deregulation” section on page 97 for more information. Source: NYS Homes and Community Renewal (HCR), Office of Rent Administration, annual registration data.


Glossary & IndexGlossary of Rent Regulation ..............................pg. 148
Index ..................................................................pg. 159

Adjustable Rate Mortgage (ARM): Similar to a variable rate mortgage except that interest rate adjustments are capped in order to protect lenders and borrowers from sudden upturns or downturns in a market index. Affordable Housing: As defined by the United States Department of Housing and Urban Development, any housing accommodation for which a tenant household pays 30% or less of its income for shelter. Affordable New York Housing Program: See "421-a Tax Incentive Program“ Class A Multiple Dwelling: As defined under the Multiple Dwelling Law, a multiple dwelling building which is generally occupied as a permanent residence. The class includes such buildings as apartment houses, apartment hotels, maisonette apartments, and all other multiple dwellings except Class B dwellings. Class B Multiple Dwelling: A multiple dwelling which is occupied, as a rule, transiently, as the more or less temporary abode of individuals or families. This class includes such buildings as hotels, lodging houses, rooming houses, boarding schools, furnished room houses, college and school dormitories. Condominium (Condo): A form of property ownership in which units are individually owned and the owners acquire shares in an association that owns and cares for common areas. Cooperative (Co-op): A form of property ownership in which a building or complex is owned by a corporation. Shares in the corporation are allocated per apartment and the owners of those shares, who are called proprietary lessees, may either live in the apartment for which the shares are allocated or rent that apartment to a sub-tenant. Core Manhattan: The area of Manhattan south of
96th Street on the East Side and 110th Street on the West Side. See also “Upper Manhattan.” Debt Service: Repayment of loan principal and interest; the projected debt service is the determining factor in setting the amount of the loan itself. Debt Service Ratio: The net operating income divided by the debt service; it measures a borrower’s ability to cover mortgage payments using a building’s net operating income. Decontrol: See "Deregulation." Department of Housing Preservation and Development (HPD): The New York City agency with primary responsibility for promulgating and enforcing housing policy and laws in the City. See also Division of Housing and Community Renewal. Deregulation: Also known as “Decontrol” or “Destabilization.” Deregulation occurs by action of the owner when an apartment under either rent control or rent stabilization legally meets the criteria for leaving regulation. When an apartment is deregulated, the rent may be set at ‘market rate.’ There are two types of deregulation, “High-Rent/High-Income Deregulation” and “High-Rent Vacancy Deregulation.” See these individual terms for more details. Destabilization: See "Deregulation." DHCR: See "Division of Housing and Community Renewal." Disability Rent Increase Exemption (DRIE): A program which freezes the rent of a New York City tenant or tenant’s spouse who is disabled (defined as receiving either Federal Supplemental Security Income, Federal Social Security Disability Insurance, US Department of Veterans Affairs disability pension or compensation, or Disability-related
Glossary
Page 148 • Glossary & Index
Glossary of Rent Regulation

Medicaid) and living in a rent regulated apartment. To currently qualify for this benefit, a household of any size must make a combined household income no more than $50,000 per year, as well as paying at least 1/3 of their income toward their rent. Discount Rate: The interest rate Federal Reserve Banks charge for loans to depository institutions. Distressed Buildings: Buildings that have operating and maintenance expenses greater than gross income are considered distressed. Division of Housing and Community Renewal (DHCR): Part of NYS Homes & Community Renewal (HCR), the New York State agency with primary responsibility for formulating New York State housing policy, and monitoring and enforcing the provisions of the state’s residential rent regulation laws. Emergency Tenant Protection Act of 1974 (ETPA): Chapter 576 Laws of 1974: In Nassau, Rockland and Westchester counties, rent stabilization applies to non-rent controlled apartments in buildings of six or more units built before January 1, 1974 in localities that have declared an emergency and adopted ETPA. In order for rents to be placed under regulation, there has to be a rental vacancy rate of less than 5% for all or any class or classes of rental housing accommodations. Some municipalities limit ETPA to buildings of a specific size, for instance, buildings with 20 or more units. Each municipality declaring an emergency and adopting local legislation pays the cost of administering ETPA (in either Nassau, Rockland or Westchester County). In turn, each municipality can charge the owners of subject housing accommodations a fee (up to $10 per unit per year). Eviction: An action by a building owner in a court of competent jurisdiction to obtain possession of a tenant’s housing accommodation. Fair Market Rent (FMR): In New York City, when a tenant voluntarily vacates a rent controlled
apartment, the apartment becomes decontrolled. If that apartment is in a building containing six or more units, the apartment becomes rent stabilized. The owner may charge the first stabilized tenant a fair market rent. All future rent increases are subject to limitations under the Rent Stabilization Law, whether the same tenant renews the lease or the apartment is rented to another tenant. The Rent Stabilization Law permits the first stabilized tenant after decontrol to challenge the first rent charged after decontrol, through a Fair Market Rent Appeal, if the tenant believes that the rent set by the owner exceeds the fair market rent for the apartment. The Appeal is decided taking into consideration the Fair Market Rent Special Guideline and rents for comparable apartments. Family Assistance Program (FAP): NY State’s TANF program. See “Temporary Assistance to Needy Families.” Federal Deposit Insurance Corporation (FDIC): Established by the federal government in 1950 to insure the deposits of member banks and savings associations. Federal Reserve Board: The central bank of the United States founded by Congress in 1913 to provide the nation with a safer, more flexible, and more stable monetary and financial system. Federal Funds Rate: Set by the Federal Reserve, this is the rate banks charge each other for overnight loans. Fixed Rate Mortgage (FRM): The interest rate is constant for the term of a mortgage. 421-a Tax Incentive Program (a.k.a. Affordable New York Housing Program): Created in 1970 and amended periodically by the NYS Legislature. Offers tax exemptions to qualifying new multifamily properties containing three or more rental units. Apartments built with 421-a tax exemptions are subject to the provisions of the Rent Stabilization Laws during the exemption
Glossary
Housing NYC: Rents, Markets & Trends 2019 • Page 149

period. Thus, 421-a tenants share the same tenancy protections as stabilized tenants and initial rents are then confined to increases established by the Rent Guidelines Board. Gross City Product (GCP): The dollar measurement of the total citywide production of goods and services in a given year. Guideline Rent Increases: The percentage increase of the Legal Regulated Rent that is allowed when a new or renewal lease is signed. For renewal leases, this percentage is determined by the New York City Rent Guidelines Board for renewal leases signed between October 1 of the current year and September 30 of the following year. For renewal leases, the percentage increase allowed is dependent on the term of the lease. Sometimes additional factors, such as the amount of the rent, whether or not electricity is included in the rent and the past rental history, have also resulted in varying adjustments. Although in the past the RGB customarily set increases for vacancy leases, this responsibility shifted to the State for the period between the passage of the Rent Regulation Reform Act of 1997, which established statutory vacancy increases, and the passage of the Rent Laws of 2019, which repealed these allowances. High-Rent/High-Income Deregulation (“Luxury Decontrol”): Starting with the Rent Regulation Reform Act of 1993, the change in an apartment’s status from being rent regulated to being deregulated because the household income of the tenant’s in the apartment exceeded a certain threshold AND the rent of the apartment exceeded a certain threshold. These guidelines were modified periodically with the passage of various Rent Laws/Acts through 2015. In 2019, with the passage of the Rent Laws of 2019, deregulation was repealed indefinitely. Refer to the NYS Division of Housing and Community Renewal for the thresholds that applied prior to 2019. High-Rent/Vacancy Deregulation (“Vacancy De-control”): Starting with the Rent Regulation
Reform Act of 1993, a process by which a rent regulated unit became deregulated upon the vacancy of the prior tenant, when the rent of the apartment exceeded a certain threshold. These guidelines were modified periodically with the passage of various Rent Laws/Acts through 2015. In 2019, with the passage of the Rent Laws of 2019, deregulation was repealed indefinitely. Refer to the NYS Division of Housing and Community Renewal for the thresholds that applied prior to 2019. Homes and Community Renewal (HCR): See "Division of Housing and Community Renewal." Hotel: Under rent stabilization, a multiple dwelling that provides all of the following services included in the rent: (1) Maid service, consisting of general house cleaning at a frequency of at least once a week; (2) Linen service, consisting of providing clean linens at a frequency of at least once a week; (3) Furniture and furnishings, including at a minimum a bed, lamp, storage facilities for clothing, chair and mirror in a bedroom; such furniture to be maintained by the hotel owner in reasonable condition; and (4) Lobby staffed 24 hours a day, seven days a week by at least one employee. Housing and Vacancy Survey (HVS): A triennial survey of approximately 18,000 households conducted by the United States Census Bureau data. The survey is used, inter alia, to determine the vacancy rate for residential units in New York City, and gather other information necessary for HPD, RGB, HCR and other housing officials to formulate policy. HPD: See "Department of Housing Preservation and Development." HUD: The United States Department of Housing and Urban Development, which is the federal agency primarily responsible for promulgating and enforcing federal housing policy and laws.
Glossary
Page 150 • Glossary & Index

HVS: See "Housing and Vacancy Survey." I&E: Refers to the annual Income and Expense Study performed by the Rent Guidelines Board drawn from summarized data on RPIE forms, the income and expense statements filed annually by owners of stabilized buildings with the New York City Department of Finance. Individual Apartment Improvements (IAI): An increase in rent based on increased services, new equipment, or improvements. This increase is a NYS policy and is in addition to the regular annual Rent Guidelines Board increases for rent stabilized apartments and Maximum Base Rent increases for rent controlled apartments. If owners add new services, improvements, or new equipment to an occupied rent regulated apartment, owners of rent regulated units can a portion of the cost of qualifying improvements to the legal rent of those units. Owners must get the tenant’s written consent to pay the increase and an order from HCR is not required. If any apartment is vacant, the owner does not have to get written consent of a tenant to make the improvement and pass-on the increase. Prior to the passage of the Rent Laws of 2019, the increase remained permanently in the monthly rent, even after the cost of the improvement was recouped. Going forward, the new law caps the amount of reimbursable IAI spending at $15,000 over a 15 year period, for up to three separate IAIs; removes IAI increases and RGB increases based on the IAI after 30 years, instead of allowing them to remain permanent; lowers increases by lengthening the IAI formula's amortization period; and strengthens enforcement by requiring HCR to randomly audit and inspect at least 10 percent of IAIs annually. Initial Legal Registered Rent: Under rent stabilization, the lawful rent for the use and occupancy of housing accommodations under the Rent Stabilization Law or the Emergency Tenant Protection Act, as first registered with HCR, which has not been challenged pursuant to regulation, or if challenged, has been determined by HCR.
In Rem: In Rem units include those located in structures owned by the City of New York as a result of an in rem proceeding initiated by the City after the owner failed to pay tax on the property for one or more years. Though many of these units in multiple dwellings had previously been subject to either rent control or rent stabilization, they are exempt from both regulatory systems during the period of city ownership. J-51 Tax Incentive Program: A New York City program under which, in order to encourage development and rehabilitation, property tax abatements and exemptions are granted. In consideration of receiving these tax abatements, and at least for the duration of the abatements, the owner of these buildings agree to place under rent stabilization those apartments which would not otherwise be subject to rent stabilization. This program provides real estate tax exemptions and abatements to existing residential buildings that are renovated or rehabilitated in ways that conform to the requirements of the statute. It also provides these benefits to residential buildings that were converted from commercial structures. Legal Rent: The maximum rent level that a landlord is entitled to charge a tenant for a rent regulated unit. The landlord of a rent stabilized unit must annually register that legal rent with HCR. Loft Board: A New York City agency that regulates lofts. Lofts are governed by Article 7-C of the Multiple Dwelling Law, and are not (until brought up to Code) within HCR’s rent regulatory jurisdiction. Loan-to-Value Ratio (LTV): An expression of the safety of a mortgage principal based on the value of the collateral (e.g., an LTV of 50% means that a lender is willing to provide a mortgage up to half the value of a building). A decline in LTV may indicate a tightening of lending criteria and vice versa. Longitudinal: The type of analysis that provides a comparison of identical elements over time, such as comparing data from 2019 to the same data in 2018.
Glossary
Housing NYC: Rents, Markets & Trends 2019 • Page 151

Major Capital Improvements (MCI): When owners make improvements or installations to a building subject to the rent stabilization or rent control laws, they may be permitted to increase the building’s rent based on the actual, verified cost of the improvement. To be eligible for a rent increase, the MCI must be a new installation and not a repair to old equipment. For example, an owner may receive an MCI increase for a new boiler or a new roof but not for a repaired or rebuilt one. Other building-wide work may qualify as MCls as well, such as "pointing and water-proofing" a complete building where necessary. The Rent Stabilization Code also stipulates that applications for MCI rent increases must be filed within two years of completion of the installation. MCI rent increases must be approved by HCR. Prior to the passage of the Rent Laws of 2019, the increase remained permanently in the monthly rent, even after the cost of the improvement was recouped. Going forward, the new law caps the annual MCI rent increase at two percent statewide, down from the current six percent in New York City and 15 percent in other counties currently covered by ETPA; caps any MCI rent increases approved within the last seven years at the lower percentage beginning in September 2019; removes MCI increases and RGB increases based on an MCI after 30 years, instead of allowing them to remain in effect permanently; tightens the rules governing the spending that qualifies for an MCI increase; strengthens enforcement by requiring that 25 percent of MCIs be inspected and audited by DHCR annually.; and lowers rent increases by lengthening the MCI formula's amortization period. Maximum Base Rent Program (MBR): The Maximum Base Rent Program is the mechanism for authorizing rent increases for New York City apartments subject to rent control so as to ensure adequate income for their operation and maintenance. New York City Local Law 30 (1970) stipulates that MBRs be established for rent controlled apartments according to a formula calculated to reflect real estate taxes, water and sewer charges, operating and maintenance expenses, return on capital value and vacancy and
collection loss allowance. The MBR is updated every two years by a factor that incorporates changes in these operating costs. Maximum Collectible Rent (MCR): The rent that rent controlled tenants actually pay is called the Maximum Collectible Rent (MCR). The MCR generally is less than the MBR. By law, the MCR cannot be increased by more than 7.5% per year for each year of the two year MBR cycle unless there are Major Capital Improvements or individual apartment rent increases. For example, if a tenant's rent (MCR) on 12/31/15 was $1,000, and the MBR was $1,200, then on 1/1/16 (effective date of MBR) the rent (MCR) would rise 7.5% to $1,075 and the MBR ceiling would rise by 9.6% (the 2016-17 MBR factor) to $1,315.20. On 1/1/17, the MBR would remain the same (since MBRs cover a two-year period), but the MCR would rise by another 7.5% to $1,155.63. Mean and Medians: The "mean" is an arithmetic average of numbers. Numbers at the extreme of a range can have a potentially distorting effect on the mean. The "median" is considered by many as a more constant measure of that same set of numbers because it moderates the distorting effect of any extremes or other aberrations, because it is the 50th percentile of the numbers under analysis, or the number in the middle. Net Operating Income (NOI): The amount of income remaining after operating and maintenance expenses are paid is typically referred to as Net Operating Income (NOI). NOI can be used for mortgage payments, improvements, federal, state and local taxes and after all expenses are paid, profit. New York City Housing Authority (NYCHA): The New York City agency that administers public housing and rental assistance programs. NYC Rent Guidelines Board: See "Rent Guidelines Board." Nominal Dollars: Dollars not adjusted to take inflation into account. See also “Real Dollars.”
Glossary
Page 152 • Glossary & Index

O&M: Refers to the operating and maintenance expenses in buildings. Operating Cost Ratio: The "cost-to-income" ratio, or the percentage of income spent on O&M expenses, is traditionally used by the RGB to evaluate estimated profitability of stabilized housing, presuming that buildings are better off by spending a lower percentage of revenue on expenses. Order: See “Rent Guidelines Order.” Outer Boroughs: Queens, Brooklyn, the Bronx and Staten Island, or the boroughs of New York City not including Manhattan. These boroughs are often grouped together for purposes of analysis because their economic and demographic attributes are more similar to each other than those found in Manhattan. PIOC: Price Index of Operating Costs. The major research instrument performed by the RGB staff to determine the annual change in prices for a market basket of goods and services used by owners to operate and maintain rent stabilized buildings. Points: Up-front service fees charged by lenders. Post-46 or Post-war: A common classification of residential buildings used by City agencies to describe buildings built after World War II. Buildings with six or more residential units constructed between 1947 and 1973, or after 1974 if the units received a tax abatement such as 421-a or J-51, are generally stabilized. Preferential Rent: A rent charged by an owner to a tenant that is less than the established legal regulated rent. Starting with the Rent Law of 2003, and continuing through the passage of the Rent Laws of 2019, owners were not required to base renewal lease increases on the preferential rent. Going forward, the new law requires renewal leases to be based on the previously charged preferential rent, if there is one, as was the law prior to 2003.
Pre-47 or Pre-war: A common classification of residential buildings used by City agencies to describe buildings built before the World War II. Buildings with six or more units constructed before February 1, 1947 are generally stabilized when the current tenant moved in on or after July 1, 1971. Real Dollars: Dollars adjusted to take inflation into account. Real dollar figures offer a comparison between years that are pegged to the value of a dollar in a given year. See also “Nominal Dollars.” Registration: Owners are required to register all rent stabilized apartments with HCR by filing an Annual Apartment Registration Form which lists rents and tenancy information as of April 1st of each year. Renewal Lease: The lease of a tenant in occupancy renewing the terms of a prior lease entered into between the tenant and owner for an additional term. Tenants in rent stabilized apartments have the right to select a lease renewal for a one- or two-year term. The renewal lease must be on the same terms and conditions as the expiring lease unless a change is necessary to comply with a specific law or regulation or is otherwise authorized by the rent regulation. The owner may charge the tenant a Rent Guidelines Board authorized increase based on the length of the renewal lease term selected by the tenant. The law permits the owner to adjust the rent during the lease term if the Rent Guidelines rate was not finalized when the tenant signed the lease renewal offer. A renewal lease should go into effect on or after the date that it is signed and returned to the tenant as well as on the day following expiration of the prior lease. In general, the lease and any rent increase may not begin retroactively. Penalties may be imposed when an owner does not timely offer the tenant a renewal lease or timely return to the tenant an executed copy thereof. Rent Act of 2011: The law passed by the New York State Legislature in June, 2011 which revised several regulations of rent stabilized units. Most notably, it
Glossary
Housing NYC: Rents, Markets & Trends 2019 • Page 153

provides for a maximum of one vacancy increase a year, modified the way individual apartment improvements are calculated, and raised the thresholds for both high-rent/vacancy deregulation and high-rent/high-income deregulation. Rent Act of 2015: The law passed by the New York State Legislature in June, 2015 which revised several regulations of rent stabilized units. Most notably, it raised the rent thresholds for deregulation of rent stabilized units, altered the formula for calculating Major Capital Improvement Increases, and altered the formula for calculating vacancy lease increases. Rent Control: The rent regulation program which generally applies to residential buildings constructed before February, 1947 in municipalities for which an end to the postwar rental housing emergency has not been declared. For an apartment to be under rent control, the tenant must generally have been living there continuously since before July 1, 1971 or for less time as a successor to a rent controlled tenant. When a rent controlled apartment becomes vacant, it becomes rent stabilized if the building has six or more units and if the community has adopted Emergency Tenant Protection Act. Formerly controlled apartments may have been decontrolled on various other grounds. Rent control limits the rent an owner may charge for an apartment and restricts the right of an owner to evict tenants. It also obligates the owner to provide essential services and equipment. In New York City, rent increases are governed by the MBR system. Rent Guidelines Board (RGB): The New York City agency responsible for setting the yearly rent-rate adjustments for the City’s rent stabilized apartments, and also the agency which produced this publication. The Board is appointed by the Mayor and consists of two members who represent tenants, two members who represent the real estate industry and five public members. RGB Rent Index: An index that measures the overall effect of the Board’s annual rent increases on contract rents.
RGB: See "Rent Guidelines Board." Rent Guidelines Order: Rent guideline orders are issued by the rent guidelines boards annually, usually before July 1. For the most part, they establish the percentage change that may be given to rent stabilized/ETPA apartments upon lease renewal. These adjustments are based on the review of operating expenses and other cost of living data. Rent Laws of 2019: The law passed by the New York State Legislature on June 14, 2019 which promulgated many new provisions for rent regulated units. Among these changes, deregulation of rent stabilized units is no longer permitted, as are vacancy allowances for vacant units. In addition, preferential rents are considered the base rent of the apartment until the unit is vacated; the formulas for IAIs, MCIs and rent controlled rent increases are reformed; and HCR will look back six years when processing overcharge complaints. The law does not have a sunset date. This law is also referred to as the Housing Stability and Tenant Protection act of 2019. RPIE Forms: Owners of stabilized buildings are required by Local Law 63 to file Real Property Income and Expense (RPIE) forms annually with the New York City Department of Finance. RPIE forms contain detailed financial information regarding the revenues earned and the costs accrued in the operation and maintenance of stabilized buildings. Buildings with fewer than 11 apartments (except those with commercial units); an assessed value of $40,000 or less; or exclusively residential cooperatives or condominiums are exempt from filing. RPIE forms are also known as I&E forms. Rent Regulation Reform Act of 1997 (RRRA-97): The law passed by the New York State Legislature in June, 1997 which promulgated several new provisions for rent regulated units. See "High-Rent/ High Income Deregulation", "Vacancy Allowance", and "High-Rent/Vacancy Deregulation". Also known as the “Rent Act.”
Glossary
Page 154 • Glossary & Index

Rent Stabilization: In New York City, rent stabilized apartments are generally those apartments in buildings of six or more units built between February 1, 1947 and January 1, 1974. Tenants in buildings built before February 1, 1947, who moved in after June 30, 1971 are also covered by rent stabilization. A third category of rent stabilized apartments covers buildings subject to regulation by virtue of various governmental supervision or tax benefit programs. Generally, these buildings are stabilized only while the tax benefits or governmental suspension continues. In some cases, a building with as few as three units may be stabilized. Similar to rent control, stabilization provides other protections to tenants besides regulation of rental amounts. Tenants are entitled to receive required services, to have their leases renewed, and not to be evicted except on grounds allowed by law. Leases may be entered into and renewed for one or two year terms, at the tenant’s choice. Rent Stabilization Code: The Rent Stabilization Code is the body of regulations used by HCR to implement the Rent Stabilization Law and Emergency Tenant Protection Act in New York City. These regulations affect nearly 1 million rent stabilized apartments in New York City. Chapter 888 of the Laws of 1985 authorized HCR to amend the Rent Stabilization Code for New York City. The current Rent Stabilization Code became effective on May 1, 1987, with the latest revision in 2014. Rental Vacancy Rate: The percentage of the total rental units in an area that are vacant and available for occupancy. The vacancy rate for New York City is determined every three years by the Housing and Vacancy Survey. Rooming House: Under rent regulation, in addition to its customary usage, a building or portion of a building, other than an apartment rented for single-room occupancy, in which housing accommodations are rented, on a short-term basis of daily, weekly or monthly occupancy, to more than two occupants for whom rent is paid,
not members of the landlord’s immediate family. The term shall include boarding houses, dormitories, trailers not a part of a motor court, residence clubs, tourist homes and all other establishments of a similar nature, except a hotel or a motor court. Safety Net Assistance (SNA): An income assistance program set up under the New York State Welfare Reform Act of 1997 to replace Home Relief (HR). Section 8 Vouchers: A federally-funded housing assistance program that pays participating owners on behalf of eligible tenants to provide decent, safe, and sanitary housing for very low income families at rents they can afford. Housing assistance payments are generally the difference between the local payment standard and 30% of the family’s adjusted income. The family has to pay at least 10% of gross monthly income for rent. In NYC, the program is administered by NYCHA. Section 8 Certificates: A federally-funded housing assistance program that provides housing assistance payments to participating owners on behalf of eligible tenants to provide decent, safe and sanitary housing for low income families in private market rental units at rents they can afford. This is primarily a tenant-based rental assistance program through which participants are assisted in rental units of their choice; however, a public housing agency may also attach up to 15% of its certificate funding to rehabilitated or newly constructed units under a project-based component of the program. All assisted units must meet program guidelines. Housing assistance payments are used to make up the difference between the approved rent due to the owner for the dwelling unit and the family’s required contribution towards rent. Assisted families must pay the highest of 30% of the monthly adjusted family income, 10% of gross monthly family income, or the portion of welfare assistance designated for the monthly housing cost of the family. Senior Citizen Rent Increase Exemption (SCRIE): If a New York City tenant or tenant’s spouse is 62
Glossary
Housing NYC: Rents, Markets & Trends 2019 • Page 155

years of age or over (living in a rent regulated apartment), and the combined household income is currently $50,000 per year or less and they are paying at least 1/3 of their income toward their rent, the tenant may apply for the Senior Citizen Rent Increase Exemption (SCRIE). In New York City, the Department of Finance administers the SCRIE program. Outside of New York City, Senior Citizen Rent Increase Exemption is a local option, and communities have different income eligibility limits and regulations. If a New York City tenant qualifies for this program, the tenant is exempt from future rent guidelines increases, Maximum Base Rent increases, MCI increases, and increases based on the owner’s economic hardship. New York City senior citizen tenants may also carry this exemption from one apartment to another upon moving, upon the proper application being made to the Department of Finance. Single-Room Occupancy Housing (SRO): Residential properties in which some or all dwelling units do not contain bathroom or kitchen facilities. Under rent regulation, the occupancy by one or two persons of a single room, or of two or more rooms which are joined together, separated from all other rooms within an apartment in a multiple dwelling, so that the occupant or occupants thereof reside separately and independently of the other occupant or occupants of the same apartment. Special Guideline: The New York City Rent Guidelines Board is obligated to promulgate special guidelines to aid the NYS Division of Housing and Community Renewal in its determination of initial legal regulated rents for housing accommodations previously subject to rent control. This is determined each year by the RGB as applicable to the determination of Fair Market Rent Appeals. Surcharge: An added charge which is paid by the tenant but not included in the legal regulated rent and is not compounded by guidelines adjustments. Examples of surcharges are: the $5.00 a month charge for an air conditioner that protrudes beyond the window line; the electrical charge for air
conditioners in electrical inclusion buildings; and for the installation of window guards. Tax Commission Income and Expense Form (TCIE): An application by building owners to appeal their tax assessments. Temporary Assistance to Needy Families (TANF): An income assistance program set up under the federal Personal Responsibility and Work Opportunity Reconciliation Act of 1996 to replace Aid to Families with Dependent Children (AFDC). Under TANF block grant system, each state has the authority to determine who is eligible, the level of assistance, and how long it will last. The New York State’s TANF program is called the Family Assistance Program (FAP). Term: The length of time in which a mortgage is expected to be paid back to the lender; the shorter the term, the faster the principal must be repaid and consequently the higher the debt service and vice versa. Transient Occupancy: Among the criteria that must be met for hotel rooms, tourist homes, and motor courts to be exempt from rent regulation is that they are used for transient occupancy. Whether occupancy is transient depends on a number of factors, including whether rates are charged by the day, week, or month, and the proportions of occupants who stay for various lengths of time. Upper Manhattan: The area of Manhattan north of 96th Street on the East Side and 110th Street on the West Side. See also "Core Manhattan." Vacancy Allowance: A provision in the Rent Regulation Reform Act of 1997 (and following Laws/Acts, prior to the Rent Laws of 2019) allowing owners of rent stabilized units to raise by a certain percentage the legal rent of a vacant unit. For an incoming tenant who opted for a two-year lease, the vacancy allowance was 20%. For an incoming tent who opted for a one-year lease, the vacancy allowance was 20% minus the percentage
Glossary
Page 156 • Glossary & Index

difference between the RGB’s current guidelines for a two-year and a one-year lease. Other factors affected these percentages as well (see also the "Vacancy Bonus" and the "Special Low Rent Increase" definitions in prior editions of this book). Changes to the formula for those apartments previously paying a preferential rent were also enacted in the Rent Act of 2015. For the 2018-2019 guideline period, the one-year vacancy guideline was 19% and the two-year guideline was 20%. With the passage of the Rent Act of 2011, as of June 24, 2011, landlords were permitted only one vacancy allowance per calendar year, regardless of the number of vacancies. With the passage of the Rent Laws of 2019, vacancy allowances are now repealed in their entirety. Vacancy Lease: When a person rents a rent stabilized apartment for the first time, or, when a new name (not the spouse or domestic partner) is added to an existing lease, this is a vacancy lease. This written lease is a contract between the owner and the tenant which includes the terms and conditions of the lease, the length of the lease and the rights and responsibilities of the tenant and the owner. The Rent Stabilization Law gives the new tenant (also called the vacancy tenant) the choice of a one- or two-year lease term. The rent the owner can charge may not be more than the last legal regulated rent plus all increases authorized by the Rent Stabilization Code, including increases for improvements to the vacant apartment. With the passage of the Rent Laws of 2019, vacancy allowances are no longer part of the calculation of the rent charged with a vacancy lease.
Glossary
Housing NYC: Rents, Markets & Trends 2019 • Page 157


A Administrative costs, 14, 17-19, 20, 22, 24, 31-32 Affordability, 58, 63, 65-69 Affordable Housing, 83-86, 91, 95, 148 Affordable New York Housing Program; see 421-a
tax exemption program Anti-abandonment programs, 90 Attorney General, NYS, 88
B Billable assessments, 13,15-16, 20, 23-24 Bronx, 16, 28-31, 33, 36-40, 52-53, 59, 62,
65-66, 81-85, 88-90, 94-100, 153 Brooklyn, 16, 28-31, 33, 36-40, 52-53, 59, 62,
65-66, 68, 81-86, 88-90, 94-100, 153
C Calendared, aka “cases reaching trial,” 57-58, 73 Cash assistance, 57-58, 70 Class A multiple dwellings, 105, 148 Class B multiple dwellings, 105, 148 Class Two properties, 13, 15-16; see also Real estate taxes Commensurate rent adjustment, 20-22; see also Net operating income Commercial income/space, 28-29, 31-32, 38
42, 51, 86, 94-95, 99, 101, 151, 154 Consumer Price Index (CPI), 14-15, 21, 24, 58,
67-68 comparison with PIOC, 15, 21 Conversion of properties, 72, 79, 86-89, 94-96,
98-99, 101 Cooperatives/condominiums, 28, 52, 79-80, 85,
88-89, 91, 98, 101, 148, 154 conversions, 88-89, 98, 101 new construction, 85, 88 RPIE, 28, 154 Cost-to-income ratio, 33-35, 39-40, 153 Cost-to-rent ratio, 33-34, 39, 50
D Debt service, 21, 31, 39, 46, 48-49, 51-52, 148, 156 ratio, 46, 48-49, 51-52, 148 Decontrol/deregulation, 30, 93-98, 100-101, 149-150, 154 Demolition of properties, 79-80, 90-91, 99 Discount rate, 47, 149; see also Interest rates
Distressed buildings, 32-33, 40, 90-91, 149
E Emergency Tenant Protection Act (ETPA),
98, 149, 151-152, 154-155 Employment, 57-58, 60-62, 73-74;
see also Unemployment Eviction Conversion Plans, 98;
see also Non-Eviction Conversion Plans Evictions/Possessions, 57-58, 72-73, 149
F Fair market rent, 69, 149, 156 Family Assistance Program (FAP) 70, 149, 156 Federal Deposit Insurance Corporation (FDIC),
46, 149 Federal Funds Rate, 47, 149; see also Interest rates Federal Reserve Board (“the Fed”), 47, 149 Finance (NYC Dept. of ), 15, 23-24, 28-36,
38-42, 52-53, 90, 151, 154, 156 Fixed rate mortgages, 149 421-a tax exemption program, 79-80, 84-86, 91,
93-95, 98-99, 101, 149-150, 153 Fuel costs, 13-20, 22-24, 31-32, 63 Fuel price, 16-17, 22-23
G Gross City Product (GCP), 57-58, 73-74, 150 Gross income (rental properties), 21, 27-29, 32,
34-38, 41, 149; see also Net Operating Income
H Homeless(ness), 57-58, 71-72, 74 High-Rent/High Income Deregulation, 96-97, 101,
150, 154 High-Rent/Vacancy Deregulation, 93, 97, 100-101,
150, 154 Homes and Community Renewal (HCR); see NYS
Homes and Community Renewal Hotel, 18-19, 23, 72, 87, 105, 148, 150, 155-156;
see also Rooming House and Single Room Occupancy
PIOC for Hotels, 18-19 Household income/wages, 16, 57-58, 61-69, 74 Housing Court actions, 57-58, 73, 149 Housing and Vacancy Survey (HVS), 29-30, 40, 42,
63-65, 80-81, 150
Index
Housing NYC: Rents, Markets & Trends 2019 • Page 159
Index

Housing market, 28, 30, 37, 65, 80-81, 83, 86-87, 94 Housing Preservation and Development (NYC
Dept. of ) (HPD), 68, 72, 83-87, 89-90, 94, 99, 101, 148, 150
I In rem housing, 90, 96, 151 Income; see Household income (for renters) or Gross
Income or Net Operating Income (for owners) Income and Expense (I&E), 22, 27-42, 50, 151 Individual apartment improvements (IAI), 30, 37, 151-152, 154 Inflation, 13, 15, 20-21, 31, 35-37, 47, 57-58 ,
61, 63-64, 66-67, 71, 152-153 Insurance costs, 14, 16, 18-20, 22-24, 31-32 Interest rates, 21, 45-47, 51-52, 54, 83, 86,
90, 95, 148-149
J J-51 real estate tax benefits, 79-80, 86, 88-89, 91,
94-95, 98, 101, 151, 153
L Labor Costs, 14, 16, 18-20, 22-24, 32 Labor market, 57, 59-62, 73-74;
see also Employment and Unemployment Labor unions, 16, 22-24 Loan-to-value ratio (LTV), 45-46, 48-49, 51-52, 151 Lofts, 19, 89, 95, 101, 151 PIOC for lofts, 19 Longitudinal, 151 Income and Expense Study, 28, 37-42 Mortgage Survey, 46, 51-52, 54 Luxury deregulation; see High Rent/High Income Deregulation
M Major Capital Improvement (MCI), 30, 37, 89,
152, 154, 156 Maintenance Costs (PIOC component), 14,
17-20, 22, 24 Manhattan, 28-40, 52-53, 59, 62, 65-66, 68, 81-85,
88-90, 94-100, 148, 153, 156 Core, 28-29, 31, 33-35, 37-39, 85, 148 Upper, 28-29, 31, 33, 37-39, 156 Miscellaneous costs, 31-32 Mitchell-Lama housing, 63, 83-84, 86, 95, 101 Mortgage, 33, 45-54, 69, 86, 95, 148-149, 151-152, 156 financing (new originations), 45-54
foreclosure, 49, 52, 90 interest rates; see Interest rates refinancing, 48-49, 51 terms, 47-48, 51-52, 149, 156
N Net operating income (NOI), 20-21, 27, 33-37,
39-41, 46, 48-49, 51, 148, 152 New housing construction, 81-86, 88, 98; see also
Coop/condo, new construction; Permits for new housing
Non-eviction conversion plans, 88, 98 Non-payment filings, 57-58, 73 Non-performing loans, 49, 52 NYCHA (NYC Housing Authority) 68, 71, 73, 152, 155 NYS Homes and Community Renewal (HCR), 22, 28-
31, 42, 52, 91, 94-99, 101, 105, 149-155
O 1/40th increase and 1/60th increase;
see Individual Apartment Improvements Operating and maintenance costs (O&M),
13-28, 31-42, 50-51, 149, 152-154 Operating cost ratios; see Cost-to-income ratio and Cost-to-rent ratio Outer boroughs, 84-85, 153; see also Bronx;
Brooklyn; Queens; Staten Island Owner-occupied housing, 62, 64, 66, 68-69, 80,
84-85, 88-89
P Permits for new housing, 79-83, 91 PIOC; see Price Index of Operating Costs Post-war (post-46) buildings, 18, 28, 30-33, 37-39,
63-64, 80-81, 153 Pre-war (pre-47) buildings, 18, 28, 30-33, 37-39,
63-64, 80-81, 153 Price Index of Operating Costs (PIOC), 13-25,
28, 38-39, 153 apartments, 13-25 commensurate rent adjustment, 20-21 comparison with income and expenses, 38-39 core PIOC, 13, 15, 19-20 hotels, 18-19 lofts, 19 projections, 19-20, 24-25 Profitability of rental housing, 21, 33, 94, 153;
see also Net Operating Income (NOI) Property taxes; see Real Estate Taxes Public housing; see NYCHA
Index
Page 160 • Glossary & Index

Q Queens, 16, 28-31, 33, 36-40, 52-53, 59, 62,
65-66, 68, 81-85, 88-90, 94-100, 153
R Real estate taxes, 13-16, 18-20, 22-24, 31-33, 39,
69-70, 80, 83-86, 88-91, 93-96, 98, 149, 151-153,155-156 abatements, 15-16, 23, 79-80, 85, 88-89, 91, 95,
151, 153 arrears, 90 assessments, 13, 15-16, 20, 23-24, 28, 84-85, 154, 156 exemptions, 15-16, 23, 79-80, 83-85, 88-89, 91,
94-95, 149, 151 rate, 15-16, 20 Real Property Income and Expense forms (RPIE),
28-42, 151, 154 Rehabilitation, 72, 80, 83, 88-90, 94, 96, 98, 101,
151, 155 substantial, 94, 96, 98, 101 Rent Act of 2011, 96, 153, 157 Rent Act of 2015, 96-97, 150, 154, 157 Rent control, 63-64, 80-81, 95, 101, 105,
149, 151-152, 154-156 Rent Guidelines Board (RGB), 19-23, 25, 28
30-33, 35-40, 42, 46-51, 58, 63, 80, 84, 95-97, 105, 150-154, 156-157
Rent Guidelines Order, 105, 154 RGB Rent Index, 30-31, 154 Rent Regulation Reform Acts (RRRA) of 1993/1997,
96-97, 150, 154, 156 Rent-to-income ratio, 57, 63, 65 Rental market; see Housing Market Rents, 18, 28-31, 34-38, 40-41, 50, 57, 63-69,
93-95, 99, 148-157 contract rent, 30, 64, 66, 154 fair market, 69, 149, 156 gross rent, 57, 63-66 HVS/Census/BLS-reported, 30, 57, 64, 66-68 lender-reported, 50 legal, 30-31, 94-95, 99, 150-153, 156-157 owner-reported, 18, 28-31, 34-38, 40-41 preferential, 30, 37, 153-154, 157 registered (HCR), 30-31, 93-94, 99, 151 tenant-reported, 64, 66 unregulated/market rate, 30, 64, 148 Rooming houses, 18-19, 105, 148, 155;
see also Hotels and Single Room Occupancy
S Safety Net Assistance (SNA), 70, 155
Savings banks, 46, 149 Section 8 certificates and vouchers, 63, 68, 155 Single room occupancy hotels (SRO), 18-19, 73, 79,
87, 105, 156; see also Hotels and Rooming Houses Social Security, 16, 23, 148 Staten Island, 16, 28-31, 33, 36-39, 52-53, 59, 62,
65-66, 81-85, 88-90, 94-100, 153 Subdivision of properties, 86
T Tax incentive programs; see 421-a and J-51 Temporary Assistance to Needy Families, 149, 156; see also Family Assistance Program (FAP)
U Unemployment insurance, 16, 23 Unemployment rate, 57-59, 73-74 U.S. Department of Housing and Urban
Development (HUD), 63, 68-71, 148, 150 Utility costs, 13-14, 17-20, 23-24, 31-32, 63, 68
V Vacancy allowance/increase, 20-21, 30, 37, 150,
154, 156-157 Vacancy and collection losses, 18, 29-30, 45,
50-52, 54, 152 Vacancy decontrol; see High Rent/
Vacancy Deregulation Vacancy rate, 63-65, 74, 80-81, 87, 91, 149, 155 Vacancy lease, 150, 157
W Wages/salaries; see Household Income/wages Water/sewer costs, 13, 17, 23-24, 152 Welfare benefits; see Cash assistance Welfare reform, 70, 155
Index
Housing NYC: Rents, Markets & Trends 2019 • Page 161
Copyright © 2022 FDOKUMEN