Housing and Economy Committee - Notice of meeting and ...
344
Notice of meeting and agenda Housing and Economy Committee 10.00am, Thursday 2 November 2017 Dean of Guild Court Room, City Chambers, High Street, Edinburgh This is a public meeting and members of the public are welcome to attend. Contacts Email: [email protected] / [email protected] Tel: 0131 529 4261 / 0131 529 4107
-
Upload
khangminh22 -
Category
Documents
-
view
2 -
download
0
Transcript of Housing and Economy Committee - Notice of meeting and ...

Notice of meeting and agenda
Housing and Economy Committee
10.00am, Thursday 2 November 2017
Dean of Guild Court Room, City Chambers, High Street, Edinburgh
This is a public meeting and members of the public are welcome to attend.
Contacts
Email: [email protected] /
Tel: 0131 529 4261 / 0131 529 4107

Housing and Economy Committee – 2 November 2017 Page 2 of 5
1. Order of business
1.1 Including any notices of motion and any other items of business submitted as
urgent for consideration at the meeting.
2. Declaration of interests
2.1 Members should declare any financial and non-financial interests they have in
the items of business for consideration, identifying the relevant agenda item
and the nature of their interest.
3. Deputations
3.1 If any
4. Minutes
4.1 Minute of the Housing and Economy Committee of 7 September 2017
(circulated) – submitted for approval as a correct record.
5. Forward planning
5.1 Housing and Economy Committee Key Decisions Forward Plan (circulated)
5.2 Housing and Economy Committee Rolling Actions Log (circulated)
6 Business Bulletin
6.1 Housing and Economy Committee Business Bulletin 2 November 2017
(circulated)
7. Executive decisions
7.1 Cost of Tenant and Resident Engagement Services – report by the Executive
Director of Place (circulated)
7.2 Empty Homes Update Report – report by the Executive Director of Place
(circulated)
7.3 City Deal – Proposal for New Housing Partnership with Scottish Futures Trust
– report by the executive Director of Place (circulated)
7.4 Strategic Housing Investment Plan (SHIP) 2018-2023 – report by the
Executive Director of Place (circulated)
7.5 Edinburgh Economy Strategy – report by the Executive Director of Place
(circulated)

Housing and Economy Committee – 2 November 2017 Page 3 of 5
7.6 Housing and Economy Committee – Strategic Work Programme – report by
the Executive Director of Place (circulated)
7.7 Housing Land Audit and Delivery Programme 2017 – referral from the
Planning Committee (circulated)
7.8 Supplementary Guidance – Review of Tollcross, Corstorphine and
Gorgie/Dalry Town Centres – referral from the Planning Committee
(circulated)
7.9 Supplementary Guidance – Review of Nicolson Street/Clerk Street, Portobello
and Stockbridge Town Centres – referral from the Planning Committee
(circulated)
7.10 Housing Revenue Account – Financial Monitoring 2017/18 – Month Five
Position – report by the Executive Director of Place (circulated)
7.11 Appointments to Working Groups 2017/18 – report by the Chief Executive
(circulated)
7.12 Homelessness – Winter Readiness Update Report – report by the Acting
Head of Safer and Stronger Communities (circulated)
7.13 Homelessness Task Force – Remit, Scope and Membership – report by the
Acting Head of Safer and Stronger Communities (circulated)
8. Routine decisions
8.1 City Housing Strategy 2018 – report by the executive Director of Place
(circulated)
8.2 Internal Audit Quarterly Update Report: 1 January 2017 – 30 June 2017 -
referral from the Governance, Risk and Best Value Committee (circulated)
9. Motions
9.1 None
Laurence Rockey
Head of Strategy and Insight
Committee Members
Councillors Barrie (Convener), Cameron (Vice-Convener), Kate Campbell, Jim
Campbell, Gardiner, Lang, McLellan, Miller, Munro, Rae and Rose.

Housing and Economy Committee – 2 November 2017 Page 4 of 5
Information about the Housing and Economy Committee
The Housing and Economy Committee consists of 11 Councillors and is appointed by
the City of Edinburgh Council. The Housing and Economy Committee usually meets
every eight weeks.
The Housing and Economy Committee usually meets in the Dean of Guild Court
Room in the City Chambers on the High Street in Edinburgh. There is a seated
public gallery and the meeting is open to all members of the public.
Further information
If you have any questions about the agenda or meeting arrangements, please
contact Stephen Broughton or Rachel Gentleman, Committee Services, City of
Edinburgh Council, Waverley Court, Business Centre 2:1, 4 East Market Street,
Edinburgh, EH8 8BG, Tel 0131 529 4261/0131 529 41075, e-mail
[email protected]/[email protected]
A copy of the agenda and papers for this meeting will be available for inspection prior
to the meeting at the main reception office, City Chambers, High Street, Edinburgh.
The agenda, minutes and public reports for this meeting and all the main Council
committees can be viewed online by going to www.edinburgh.gov.uk/cpol.
Webcasting of Council meetings
Please note: this meeting may be filmed for live and subsequent broadcast via the
Council’s internet site – at the start of the meeting the Convener will confirm if all or
part of the meeting is being filmed.
You should be aware that the Council is a Data Controller under the Data Protection
Act 1998. Data collected during this webcast will be retained in accordance with the
Council’s published policy including, but not limited to, for the purpose of keeping
historical records and making those records available via the Council’s internet site.
Generally the public seating areas will not be filmed. However, by entering the
meeting room and using the public seating area, you are consenting to being filmed
and to the use and storage of those images and sound recordings and any
information pertaining to you contained in them for webcasting and training purposes
and for the purpose of keeping historical records and making those records available
to the public.
Any information presented by you at a meeting, in a deputation or otherwise, in
addition to forming part of a webcast that will be held as a historical record, will also
be held and used by the Council in connection with the relevant matter until that
matter is decided or otherwise resolved (including any potential appeals and other
connected processes). Thereafter, that information will continue to be held as part of
the historical record in accordance with the paragraphs above.

Housing and Economy Committee – 2 November 2017 Page 5 of 5
If you have any queries regarding this, and, in particular, if you believe that use
and/or storage of any particular information would cause, or be likely to cause,
substantial damage or distress to any individual, please contact Committee Services
on 0131 529 4261/0131 529 4107 or [email protected].

Minutes Item No 4.1
Housing and Economy Committee
10.00am, Thursday 7 September 2017
Present
Councillors Barrie (Convener), Cameron (Vice-Convener), Kate Campbell, Jim
Campbell, Gardiner, Lang, McLellan, Miller, Munro, Rae and Rose.
1. Tenant Participation and Engagement Services
1.1 Deputation – Edinburgh Tenants Federation
The Committee agreed to hear a deputation from Betty Stevenson and Clare
MacGillivray on behalf of the Edinburgh Tenants Federation (ETF) in relation to the
report by the Executive Director for Place on tenant participation and engagement. The
deputation highlighted the following:
The funding outlined in the report was welcomed as it would allow the ETF to
plan its future work, complete a governance review and deliver new initiatives for
Edinburgh’s tenants.
The ETF opposed the tendering of tenant participation services as the ETF was
run by and provided support for tenants themselves.
Tenant participation services needed to deliver what was best for tenants and
decision making processes should involve tenants.
The ETF appreciated the report’s recognition of the strong representative voice
ETF has in debating housing policy in Edinburgh.
The report indicated a desire to further strengthen the voice of the ETF and to
improve the effectiveness of the Council in listening to tenants’ issues, while also
recommending that the Council should be involved in the management of the
campaigning and engagement activities of ETF.
The independence of the organisation and its staff was stressed as it was highly
valued by tenants.
The ETF disagreed that it’s campaigning role interfered with its ability to provide
tenants with impartial information.
As an independent organisation, ETF staff needed to be free to advise tenants in
an independent way and not have this curtailed by the Council.
The longstanding history of the ETF as a campaigning and representative
organisation.

Housing and Economy Committee – 7 September 2017 Page 2 of 8
The deputation requested the Committee consider the following:
The lack of information provided in the report regarding how the tendering
process for tenant participation services would be implemented.
To recognise that participation methods have changed across Scotland and the
ETF responded well to this through the use of various methods of
communication.
The ETF encourages elected members to inform the ETF of issues tenants raise
to them and help set up tenants’ groups across their wards.
To support the extension of the ETF funding to March 2019 as outlined in the
report.
To consider concerns raised regarding retaining the independent voice of the
ETF.
1.2 Report by the Executive Director of Place
Approval was sought to extend the funding arrangements for Edinburgh Tenants Federation (ETF), Neighbourhood Alliance (NA) and registered tenants organisations (RTOs) until March 2019. During this period both ETF and NA would have the financial stability to properly focus on governance and funding challenges they need to resolve. It would allow the Council and ETF to agree a protocol setting out how campaigning and engagement activities can be more effectively managed.
The report also sought approval to procure a framework of independent professional
participation and engagement services to support engagement between the Council,
other public services and local tenants and residents.
Decision
1. To extend funding arrangement for Edinburgh Tenants Federation (ETF) the Neighbourhood Alliance (NA) and registered tenants organisations (RTOs) to March 2019.
2. To procure a framework of independent, professional participation and engagement
services to assist tenants’ and residents’ organisations engage with the Council and other public services submitted to Committee for consideration in December 2017. An update on the progress of the informal consultation process would be submitted to Committee in November 2017.
3. To instruct officers to report with indicative costs of tenant engagement services
provided by the Council as opposed to services provided via the contract with
Edinburgh Tenants Association and the Neighbourhood Alliance for the next
meeting of the Committee.
(Reference – report by the Executive Director of Place - submitted)

Housing and Economy Committee – 7 September 2017 Page 3 of 8
2. Fire Safety in Council Tower Blocks
On 29 June 2017, The Council in response to a motion by Councillor Mowat agreed that a full review of fire safety in tower blocks was underway, working with the Scottish Fire and Rescue Service and residents and that that the outcome of that review be reported to the Housing and Economy Committee An update was provided on the Council’s response to concerns regarding tower block fire safety following the fire at Grenfell Towers in London the report set out what had been done to ensure that Council tenants were safe in their homes and that they were engaged in shaping the future shape of the service arising from any findings from the Grenfell Towers inquiry. The report also set out the approach taken, jointly with Scottish Government, to ensure the safety of other buildings in the city. Councillor Mowat was heard in respect of her motion
Decision
1. To note the response to concerns about fire safety in tower blocks; 2. To agree to review its waste management and vehicle access arrangements
in Council owned tower blocks; 3. To note the revised inspection arrangements with Scottish Fire and Rescue
Services (SFRS); and 4. To discharge the motion agreed by Council on 29 June 2017.
5. To note the Directorate would work with the Fire Service to raise awareness of the
risks associated with waste storage in this type of property
(Reference – Act of Council 10, 29 June 2017 and report by the Executive Director of
Place - submitted.)
3. Minutes
Decision
1. To approve the minute of the Health, Social Care and Housing Committee of 18
April 2017 as a correct record.
2. To approve the minute of the Economy Committee of 25 April 2017 as a correct
record

Housing and Economy Committee – 7 September 2017 Page 4 of 8
4. Housing and Economy Committee Key Decisions Forward Plan
The Housing and Economy Committee Key Decisions Forward Plan for the period
November 2017 was presented.
Decision
To note the Key Decisions Forward Plan
(Reference – Key Decisions Forward Plan, submitted.)
5. Education, Children and Families Committee Rolling Actions
Log – August 2017
The Housing and Economy Committee Rolling Actions Log for September 2017 was
presented.
Decision
1. To approve the closure of actions 1, 4 and 5.
2. To otherwise note the remaining outstanding actions.
(Reference – Rolling Actions Log, submitted.)
6. Housing and Economy Committee Business Bulletin
The Housing and Economy Committee Business Bulletin for September 2017 was
presented.
Decision
To note the business bulletin.
(Reference – Business Bulletin, submitted.)
7. Housing Revenue Account (HRA) Budget Strategy
Approval was sought to consult tenants on the development of the 2018/19 Housing Revenue Account (HRA) budget. Each year tenants were asked for their views on how the Housing Service can be improved. Tenants have previously prioritised the acceleration and expansion of affordable housebuilding, investment in affordable energy and accessible and responsive and local services.

Housing and Economy Committee – 7 September 2017 Page 5 of 8
In addition to the above, new proposals were outlined to increase investment in existing
homes and neighbourhoods with the aim of bringing these up to the same quality as
new developments. Tenants would be consulted on these priorities.
Decision
1. To agree to seek tenants’ views on the HRA budget strategy for inclusion in the 2018/19 HRA budget report;
2. To approve the revised 2017/18 Capital Investment Programme set out in Appendix
3 of the report by the Executive Director of Place; and 3. To note the 2017/18 Capital Investment Programme had increased by 80% on
2016/17 levels. (Reference – report by the Executive Director for Place - submitted)
8. Development Plan Scheme
Since then, the Edinburgh Local Development Plan (LDP) had been adopted. A feedback survey was carried out seeking comment from stakeholders on the LDP process as a whole. The findings of that survey will be used to make improvements to the engagement of stakeholders and different communities in the next LDP process: LDP 2. Planning authorities have to publish a scheme setting out their programme for preparing their local development plan at least once a year. The last such scheme was approved and published in May 2016. An indicative timetable for LDP 2 was provided, the timetable showed LDP 2 being adopted within four years of the first one, rather than the statutory five year target. Approval was sought of a new Development Plan Scheme Decision 1. To approve the Development Plan Scheme detailed in appendix 1 of the report by
the Executive Director for Place 2. To note the feedback on first Edinburgh Local Development Plan project detailed in
appendix 2 of the report by the Executive Director for Place
(Reference – report by the Executive Director of Place - submitted)
9. Supplementary Guidance: Developer Contributions and
Infrastructure Delivery
Approval was sought of a revised final version of Supplementary Guidance (SG) on Developer Contributions and Infrastructure Delivery.

Housing and Economy Committee – 7 September 2017 Page 6 of 8
Decision 1. To approve Appendix 1 of the report by the Executive Director of Place as a revision
to finalised Supplementary Guidance on Developer Contributions and Infrastructure Delivery; and
2. To note that it would be adopted as part of the statutory development plan following
procedural steps.
(Reference – report by the Executive Director for Place - submitted)
10. Edinburgh Economy Strategy
Proposals for an approach to develop a new Economy Strategy for the city for the
period beyond 2017 were provided.
Decision
1. To notes the progress so far and proposed forward plan for the development of the city’s new economy strategy.
2. To agree the next steps for elected member engagement in the strategy
development.
3. A progress report to be submitted to the Committee on 2 November 2017 (Reference – report by the Chief Executive - submitted)
11. The EDI Group Ltd – Transition Strategy
An update was provided on the progress made in relation to The EDI Group Ltd (EDI) and
sets out the strategy for closing down its activities and transferring certain assets to the
Council.
Decision
1. The Executive Director of Place to report to the Housing and Economy Committee
on 2 November 2017 on the financial aspects of the proposals
2. The Executive Director to arrange a briefing for members on the proposals
(Reference – report by the Executive Director of Place - submitted)
Declaration of Interests
Councillor Barrie declared a non-financial interest in the above item as a director of The EDI Group Ltd. Councillor Cameron declared a non-financial interest in the above item as a director of The EDI Group Ltd. Councillor Rose declared a non-financial interest in the above item as a director of CEC Holdings Ltd.

Housing and Economy Committee – 7 September 2017 Page 7 of 8
12. Investing in Jobs: Economic Development Service Performance
Update
An update was presented on the performance of the Economic Development Service in
delivering the key performance indicators (KPIs) for the period January to March 2017.
Decision
To note the progress made against the three KPIs between January to March 2017. (Reference – report by the Executive Director of Place - submitted)
13. Civic International Programme
Details were provided on a range of activities during 2017 to be supported by the Lord
Provost. The selected activities will profile the Council and the city internationally, and
enhance strategic relationships, from which the city and service areas across the
Council will benefit.
Decision
1. To approve the following outlined commitments to be undertaken by the Lord Provost in positioning the city internationally through a programme of visits, events and strategic international collaborations which underpin existing partnerships and reflect mutual international interests and civic relationships.
i. EUROCITIES Conference and AGM – 28 – 30 November 2017;
ii. EUROCITIES Mayor’s Summit – May 2018;
iii. Community Events in Krakow – 29 – 30 September 2017;
iv. Future of Europe and the role of Cities – 20 October 2017;
v. China Outbound Investment Conference – 29 – 30 November 2017; and vi. Kyoto Tea Festival – November 2017.
2. To agree that a summary report be compiled for each event, detailing the value of
the visit, the relevant contacts made and follow up actions required; and that these reports be included for noting at future meetings of the committee.
(Reference – report by the Executive Director of Place - submitted)
14. Motion by Councillor Rae – Empty Homes Service
The following motion by Councillor Rae was submitted in terms of Standing Order 16
“Committee notes:

Housing and Economy Committee – 7 September 2017 Page 8 of 8
1. According to standard council tax statistics, across Scotland, Edinburgh has the
highest number of private sector properties empty for more than 6 months,
standing at 4,997 as at September 2016.
2. More than half of Scottish councils employ a dedicated empty homes officer. In
2016-17 97% of empty homes brought back into use were in councils where
there is a dedicated empty homes officer.
3. The action agreed at Health, Social Care and Housing Committee on 31 January
2017: "The Executive Director of Place to review the data from other Councils on
extra revenue raised through the additional Council Tax generated through
empty homes being brought back into use and consider the possibility of funding
a dedicated Empty Homes Officer post from similar revenue."
4. That, until 2016, Edinburgh had a dedicated empty homes service but, at that
point the service was discontinued, and responsibility for dealing with empty
homes has been allocated to generic private sector officers, with a consequent
loss of focus on empty homes.
5. That re-use of empty homes can meet a number of council objectives: improving
housing supply; reducing pressure on greenfield sites; improving neighbourhood
amenity; and reducing risks of vandalism or anti-social behaviour.
6. That the experience of other councils is that having a dedicated empty homes
service can more than cover its own costs through a greater focus on identifying
and reclassifying property for council tax purposes and associated higher yield.
7. And therefore agrees:
8. In principle, to re-introduce a dedicated post to deal with private sector empty
homes, subject to a report within one cycle setting out the costs of a service and,
based on evidence from other councils, the additional income derived from
improved intelligence on empty homes and associated council tax yield.
9. Further agrees to ensure that, within the same period, the council an easily
accessible means by which members of the public can directly log details of
empty property in their neighbourhood.”
Decision
1. To note the motion had been withdrawn.
2. The Executive Director of Place review the data from other Councils on extra
revenue raised through the additional Council Tax generated through empty homes
being brought back into use and to report to the Health and Economy Committee on
2 November 2017 on the possibility of funding a dedicated Empty Homes Officer
post from similar revenue
(Reference – report by the Executive Director for Communities and Families -
submitted)

Housing and Economy Committee – 2 November 2017
Key decisions forward plan Item 5.1
Housing and Economy Committee
November 2017 – January 2018
Item Key decisions Expected date of
decision
Wards affected Director and Lead Officer
1 LDP Action Programme
January 2018 All Paul Lawrence Executive Director of Place Lead Officer: David Leslie Tel: 0131 529 3948 Email: [email protected]
2 Heat Mapping Supplementary Guidance
January 2018 All Paul Lawrence Executive Director of Place Lead Officer: David Leslie Tel: 0131 529 3948 Email: [email protected]
3 LDP Monitoring Statement
January 2018 All Paul Lawrence Executive Director of Place Lead Officer: David Leslie Tel: 0131 529 3948 Email: [email protected]

Housing and Economy Committee – 2 November 2017
Item Key decisions Expected date of
decision
Wards affected Director and Lead Officer
5 Economic Strategy January 2018 All Paul Lawrence Executive Director of Place Lead Officer: Paul Lawrence Tel: 0131 529 7325 Email: [email protected]
6 Place Directorate:
Revenue Monitoring
Month 7 position
January 2018 All Stephen Moir Executive Director of Resources Lead Officer: Susan Hamilton Tel: 0131 469 3718 Email: [email protected]

Rolling Actions Log Item 5.2
Housing and Economy Committee
November 2017
No Date Report Title Action Action
Owner
Expected
completion
date
Actual
completion
date
Comments
1 26.01.16 Redevelopment at
Coatfield Lane
To agree to receive a report
on housing development
proposals following
completion of a capacity
study.
Executive
Director of
Place
2 November
2017
Recommended for
closure - An update on
this will be included in
the Business Bulletin to
Housing and Economy
Committee on 2
November 2017 (item
6.1)

Housing and Economy Committee – November 2017 Page 2 of 3
No Date Report Title Action Action
Owner
Expected
completion
date
Actual
completion
date
Comments
2 19.04.16 Review of Letting
Policy for Affordable
Homes
To agree to a further update
on the implementation of the
letting provisions of the
Housing (Scotland) Act 2014
and any implications for and
changes required to the
letting policy arising from
these in Autumn 2017.
Executive
Director of
Place
2 November
2017
Recommended for
closure - included in
the Business Bulletin to
Housing and Economy
Committee on 2
November 2017 (item
6.1)
3 07.09.17 Tenant Participation
Engagement
Services
To instruct officers to
report with indicative costs
of tenant engagement
services provided by the
Council as opposed to
services provided via the
contract with Edinburgh
Tenants Association and the
Neighbourhood Alliance for
the next meeting of the
Committee.
Executive
Director of
Place
2 November
2017
Recommended for
closure – report
submitted to Housing
and Economy
Committee on 2
November 2017 (item
7.1)

Housing and Economy Committee – November 2017 Page 3 of 3
No Date Report Title Action Action
Owner
Expected
completion
date
Actual
completion
date
Comments
4 07.09.17 Edinburgh Economy
Strategy
A progress report to be
submitted to the Committee
on 2 November 2017
Executive
Director of
Place
2 November
2017
Recommended for
closure – report
submitted to Housing
and Economy
Committee on 2
November 2017 (item
7.5)
5 07.09.17 The EDI Group Ltd –
Transition Strategy 1. The Executive Director of Place to report to the Housing and Economy Committee on 2 November 2017 on the financial aspects of the proposals
2. The Executive Director to arrange a briefing for members on the proposals
Executive
Director of
Place
2 November
2017
Recommended for
closure
1. report submitted to
Housing and Economy
Committee on 2
November 2017 (item
B2.1)
2. Members briefing
taken place in
September 2017.

Item 6.1 - Business Bulletin
Housing and Economy Committee
10.00am, Thursday, 2 November 2017
Dean of Guild Court Room, City Chambers, Edinburgh

Housing and Economy Committee – 2 November 2017 Page 2 of 7
Housing and Economy Committee
Convener: Members: Contact:
Councillor Gavin Barrie (Convener)
Councillor Lezley Marion Cameron (Vice Convener)
Councillor Gavin Barrie (Convener), Councillor Lezley Marion Cameron (Vice Convener), Councillor Kate Campbell, Councillor Jim Campbell, Councillor Neil Gardiner, Councillor Kevin Lang, Councillor John McLellan, Councillor Claire Miller, Councillor Gordon Munro, Councillor Susan Rae, Councillor Cameron Rose.
Stephen Broughton Committee Clerk Tel: 529 4261 Paul Lawrence Executive Director of Place Tel: 529 7325

Housing and Economy Committee – 2 November 2017 Page 3 of 7
Recent News Background
Council Homes Letting Policy Update
On Tuesday 31 January 2017, the Health, Social Care and
Housing Committee considered an update report on the
Council Homes Letting Policy. The report advised that the
Housing (Scotland) Act 2014 will change certain aspects of
the law on social housing allocations and management. The
implementation timetable is dependent on commencement
orders being enacted by the Scottish Parliament.
A Commencement Order is a Statutory Instrument that
brings into force all or part of an Act of Parliament at a date
later than the date the Act was passed.
The latest update from the Scottish Parliament suggests that
the commencement orders for the social housing allocations
and management parts of the Housing (Scotland) Act 2014
are now expected during October 2017. Any changes will
then be applied from October 2018 following a 12 month
consultation period. As a result, the Council’s planned
consultation with partners and customers, originally
expected to take place between February and July 2017,
has been postponed.
Any further update on implementation, including any
implications or changes required to the Letting Policy, will be
provided once the legislation has been brought in to force by
the Scottish Parliament and the Council’s consultation with
partners and customers undertaken.
For more information
contact:
Jennifer Hunter, Tenant
and Resident Services
Manager - Housing and
Regulatory Services. Tel:
0131 529 7532.

Housing and Economy Committee – 2 November 2017 Page 4 of 7
Recent News Background
Tenant Led Inspection of Rent Collection Update
The most recent service to be scrutinised closely by tenants
is the City of Edinburgh Council’s rent collection process; the
sixth service inspection carried out by tenants providing vital
customer feedback to help to make sure that services are
tailored to tenants’ needs and priorities.
All the work involved in the inspections is carried out by
tenants on a voluntary basis and the Council would like to
take this opportunity to thank the tenant inspectors for their
hard work and thoughtful contributions.
The purpose of the inspection was to assess the
effectiveness of the various communication methods used
by the Council when collecting rent. The tenant inspectors
reviewed rent collection related correspondence, interviewed
a range of staff, hosted a focus group for tenants and
compared Edinburgh’s approach with that of two other
councils. The methodology was agreed with the Council in
advance of the inspection.
The tenant inspectors have made a number of
recommendations. These are now being considered and an
action plan will be produced, in consultation with tenants, to
take forward the agreed recommendations. Implementation
of the action plan will then be monitored on a six monthly
basis by the tenant inspectors.
Tenant Led Inspections provide an independent, objective
and affordable assessment of housing services and assist
with increasing the Council’s understanding of customer
needs. They provide tenants with an opportunity to
scrutinise how their landlord is performing, have a direct
impact on service provision and develop new skills and
confidence.
Edinburgh’s tenant inspections have been recognised as
good practice by the Scottish Housing Regulator and the
Tenants’ Information Service.
For more information
contact:
Jennifer Hunter, Tenant
and Resident Services
Manager - Housing and
Regulatory Services. Tel:
0131 529 7532.

Housing and Economy Committee – 2 November 2017 Page 5 of 7
Recent News Background
Coatfield Lane Redevelopment Proposals
Background
There are 21 properties in two blocks at 1-9 (odd numbers)
Coatfield Lane and 13-31 (odd numbers) Giles Street. The
layout and design of these properties and the surrounding
garages and underground car park to the front of Linksview
House, have for a number of years, contributed significantly
to a high level of anti-social behaviour in the surrounding
area. In February 2016, the Health, Social Care and
Housing Committee agreed to approve the demolition of the
area, allowing for the development of a higher number of
new sustainable homes.
An initial capacity study was carried out in 2015 to establish
the viability of redeveloping this area. Collective Architecture
were subsequently appointed in November 2016 to carry out
a feasibility study. The study was developed in consultation
with relevant stakeholders and the community. The
proposed design consists of 43 one and two bedroom
homes and five small commercial units which could be
contained within the homes as workspaces.
Next Steps
Several local consultation events have been held and two
more will be held before a planning application is submitted
by the end of December.
In order to take forward development of the site, the Council
requires to buy back five homes that are in private
ownership. Two purchases have concluded with the
remainder in progress.
Subject to the conclusion of all buy backs and the required
statutory consents and approvals, this project should
commence on site in 2019.
For further information
contact:
Rachel Fraser,
Construction Project
Manager, Development
and Regeneration. Tel:
0131 529 2250

Housing and Economy Committee – 2 November 2017 Page 6 of 7
Recent News Background
Essential Edinburgh, Business Improvement District
Formal Notice of Renewal Ballot
Housing and Economy Committee is asked to note the proposal to hold an Essential Edinburgh Renewal Ballot in April 2018. Essential Edinburgh Business Improvement District (BID) was the first BID to be established in 2008 following a successful inaugural BID ballot. The second term of the BID is due to end on 30 June 2018.
The Business Improvement Districts (Scotland) regulations
2007 require a renewal ballot every five years. It is also a
requirement of the regulations that the BID provides not less
than 98 days notice to the relevant Local Authority prior to
calling a renewal ballot. Essential Edinburgh are preparing
for a third term which would run from June 2018. The BID
has approximately 600 members and raises an annual levy
of £1.2m.
Essential Edinburgh’s vision is to ensure that Edinburgh city
centre excels as a place to work, a place to do business, a
place to shop and a place to visit. The BID maintains a key
stakeholder relationship with the Council in the management
of the public realm in the city centre.
Details of the draft business plan and the renewal process
are available online.
For further information contact
Jim Galloway, Service Manager, 0131 529 3211
Vivienne Robertson, Senior Economic Development Officer, 0131 529 4623

Housing and Economy Committee – 2 November 2017 Page 7 of 7
Recent News Background
Safer and Stronger Communities – Revenue Monitoring
2017-18 – month three position
The Culture and Communities Committee on 12 September
2017 considered an update on the month three revenue
budget monitoring position for Safer and Stronger
Communities. A total projected unfunded budget pressure of
£8.6m, which was partially offset by mitigations totalling
£5.1m, resulting in a net residual unfunded budget pressure
of £3.5m was detailed.
The Committee agreed to note the report with concern, and
referred the report for information to the Housing and
Economy Committee.
For further information:
Harry Robertson,
Community Justice Senior
Manager, 0131 553 8237
Jane Brown, Principal
Accountant - Children and
Families, 0131 469 3196
Safer and Stronger
Communities – Revenue
Monitoring 2017-18 – month
three position
A Decision was made by the Transport and Environment
Committee on 10 August 2017 to appoint Councillors Barrie
and Cameron to the Central Edinburgh Development
Working Group.
Housing and Economy Committee
10.00am, Thursday, 2 November 2017
Cost of Tenant and Resident Engagement Services
Executive Summary
This report provides indicative costs for tenant participation and engagement services provided by the City of Edinburgh Council, excluding services provided through the Edinburgh Tenants’ Federation (ETF) and the Neighbourhood Alliance (NA) service level agreements, as requested by the Housing and Economy Committee on 7 September 2017. It also provides quality measures of tenant satisfaction on how the Council performs in involving and keeping its tenants informed.
Item number 7.1 Report number
Executive/routine Executive
Wards
Council Commitments
All

Housing and Economy Committee – 2 November 2017 Page 2
Report
Cost of Tenant and Resident Engagement Services
1. Recommendations
1.1 It is recommended that the Housing and Economy Committee:
1.1.1 Notes the information provided on the indicative costs for tenant participation and engagement services provided by the City of Edinburgh Council.
2. Background
2.1 On 7 September 2017, Housing and Economy Committee requested a report on the costs of tenant participation and engagement services provided by the Council.
3. Main report
3.1 The Council provides an annual return to HouseMark; a leading provider of social housing data insight and one of the largest membership organisations in the UK housing sector. Through its membership, the Council can benchmark itself against over 200 social UK landlords, including 18 similar size landlords in its peer group.
3.2 In 2015/16, the Council spent £1,179,255, or £60.73 per property, on resident involvement, inclusive of Edinburgh Tenants’ Federation (ETF) and Neighbourhood Alliance (NA) funding. If ETF and NA spend is excluded, the Council spent £44.85 per property, or a total of £870,972. This calculation includes staff, operational costs and overheads e.g. ICT, finance and premises. The table below breaks down these figures further:
Edinburgh Tenants’ Federation 241,083 Neighbourhood Alliance 67,200 Grants provided to tenants’ organisations 14,008 Overheads 378,651 Staff costs 434,519 Communications 43,794 Total spend £1,179,255
Spend per property £60.73 Spend per property excluding ETF and NA costs £44.85
3.3 The Council has the second highest landlord spend on resident involvement within its HouseMark cost benchmarking group. However, it has the highest satisfaction

Housing and Economy Committee – 2 November 2017 Page 3
rating of 82.9%, with a significant margin of more than 12%, to the next closest performing landlord, which received a rating of 70.1%. The lowest landlord spend was £12.28 but there is no comparative satisfaction figure provided. The second lowest landlord spend was £18.31 per property with a satisfaction rating of 67%. The highest landlord spend was £73.46 per property with a satisfaction rating of 44%. Appendix 1 provides further detail.
3.4 For HouseMark purposes, housing management costs are broken down in to three service areas of which resident involvement is one. The costs for each service are then further broken down in to three main headings: staff costs, operational costs and overheads. HouseMark defines what landlords should provide for each heading.
3.5 Operational costs are the direct costs for running the service. In the case of resident involvement these are primarily the ETF and NA service level agreements and the grants provided to registered tenants’ organisations (RTOs) for running costs.
3.6 Overheads are costs required to run the Council’s landlord service, which cannot be directly attributed to any specific business activity, product, or service. Overheads include ICT costs, Housing Revenue Account (HRA) contributions to centralised services and office facilities. Each service shares the cost of HRA overheads.
3.7 Staff costs are an apportionment of the amount of time each relevant staff member works on tasks associated with resident involvement, this includes staff based in the localities and those working city wide, e.g. on strategy development.
3.8 Communication costs include the tenant newsletter, the Tenants’ Courier, the costs of the Tenants’ Survey and a small amount of miscellaneous spend.
3.9 The Scottish Housing Regulator also benchmarks landlord performance. This includes a requirement for landlords to measure and report tenant satisfaction in a number of important areas. Satisfaction with opportunities to participate in decision-making increased from 66% in 2013/14 to 81% in 2015/16, well above the Scottish Local Authority average of 72%. At the same time, satisfaction with how the Council listens to tenants’ views and acts upon them increased from 73% to 81%.
4. Measures of success
4.1 Increased tenant satisfaction with services and opportunities to participate Tenant satisfaction with the overall service provided by the Council at 89% is the third highest satisfaction rating in Scotland of local authority landlords.
4.2 Effective engagement with tenants and residents in the development of housing and other services and in the way neighbourhoods are managed.

Housing and Economy Committee – 2 November 2017 Page 4
4.3 In taking forward this work, an outcome measurement framework for tenant participation and engagement will be put in place to assist with carrying out future value for money assessments.
5. Financial impact
5.1 Tenant participation and engagement spend is included within the HRA 2018/19 Business Plan.
5.2 Housing and Economy Committee guidance will be sought on any future prioritisation of resources beyond 31 March 2019.
5.3 This work is contributing to ensuring best value for tenants by ensuring that tenants’ views inform the Council’s approach to delivering services and investing in homes.
5.4 The figures provided in this report relate to 2015/16. The 2016/17 resident involvement costs will not be available until early 2018. The 2016/17 costs are expected to reflect a more stream lined management structure and the move to generic patch working.
6. Risk, policy, compliance and governance impact
6.1 Councils and housing associations have a statutory duty to publish a tenant participation strategy and provide support to RTOs.
6.2 All social landlords must achieve continuous improvement, through supporting tenants to take part in and influence decision making.
6.3 Best practice requires co-operative working with customers to ensure effective public services informed by the views of those who use them.
7. Equalities impact
7.1 There are concerns that many groups are underrepresented in some of the tenant participation and engagement processes. Future approaches will ensure actions to support greater involvement of a wider range of groups and individuals, including those who traditionally face barriers to engaging.
8. Sustainability impact
8.1 There are no adverse environmental implications arising from this report.

Housing and Economy Committee – 2 November 2017 Page 5
9. Consultation and engagement
9.1 This report has been informed by previous discussions with stakeholders and the services directly affected by the proposed approach to ensure continuity of support and no adverse impact on the continuity of the representative function and the development of tenant participation and engagement services.
10. Background reading/external references
10.1 Tenant Participation and Engagement Services, Housing and Economy Committee – 7 September 2017
10.2 Urgent Decision Tenant Participation and Engagement Services, The City of Edinburgh Council – 24 August 2017
10.3 Tenant Participation and Engagement Services Update - referral from the Health, Social Care and Housing Committee, Finance and Resources Committee - 29 September 2016
10.4 Tenant Participation and Engagement Services Update, Health, Social Care and Housing Committee – 13 September 2016
10.5 Implications for Co-production and Procurement, Finance and Resources Committee - 9 June 2016
10.6 Tenant Participation and Engagement Services, Health, Social Care and Housing Committee - 19 April 2016
10.7 Procuring Tenant Participation Services, Health, Social Care and Housing Committee - 26 January 2016
10.8 Review of Tenant Participation Service Procurement Options – referral from the Health, Social Care and Housing Committee, Finance and Resources Committee - 24 September 2015
10.9 Review of Tenant Participation Service Procurement Options, Health, Social Care and Housing Committee - 8 September 2015
10.10 Tenant Participation Strategy 2015-18, Health, Social Care and Housing Committee - 21 April 2015
Paul Lawrence
Executive Director of Place
Contact: Elaine Scott, Housing Services Manager E-mail: [email protected] Tel: 0131 529 2277
11. Appendices
Appendix 1- HouseMark resident involvement and satisfaction 2015/16

Housing and Economy Committee – 2 November 2017 Page 6
Appendix 1- HouseMark resident involvement and satisfaction 2015/16
Within the HouseMark benchmarking peer group, the Council has the highest satisfaction rating of 82.9%, for resident involvement. This is more than 12%, to the next closest performing landlord, which received a rating of 70.1% and significantly above the average of just over 64%.
Resident involvement cost
per property
Satisfaction with resident
involvement
£ Rank Quartile % Rank Quartile
Number in sample 17 18 18 17 12 12
Upper Quartile 22.18 67.25
Median 33.48 64.15
Lower Quartile 45.87 52.50
City of Edinburgh Council (2015/2016) 60.73 17 Q4 82.90 1 Q1
Comparator Group Results
Aberdeenshire Council 24.48 7 Q2 53.00 9 Q3
Brighton and Hove City Council 60.49 16 Q4 70.10 2 Q1
Dudley MBC 27.89 9 Q2 No Data No Data No Data
East Riding of Yorkshire Council 23.16 6 Q2 58.40 8 Q3
Falkirk Council 21.85 5 Q1 No Data No Data No Data
Hull City Council 20.05 3 Q1 68.00 3 Q1
LB of Croydon 39.22 11 Q3 51.00 10 Q4
LB of Southwark 73.46 18 Q4 44.00 12 Q4
LB of Wandsworth 20.74 4 Q1 No Data No Data No Data
North Lanarkshire Council 12.28 1 Q1 No Data No Data No Data
North Tyneside Council 39.06 10 Q3 64.00 7 Q3
Norwich City Council 47.10 14 Q4 67.00 4 Q2
Perth and Kinross Council 42.18 13 Q3 64.30 6 Q2
Renfrewshire Council 24.58 8 Q2 No Data No Data No Data
South Lanarkshire Council 39.49 12 Q3 No Data No Data No Data
Southampton City Council 54.07 15 Q4 48.00 11 Q4
West Dunbartonshire Council 18.31 2 Q1 67.00 4 Q2

Housing and Economy Committee
10.00am, Thursday, 2 November 2017
Empty Homes Update Report
Executive summary
This report sets out the Council’s approach to bringing empty homes into use and the various approaches to empty homes work across different local authorities.
This report discharges the request from Housing and Economy Committee on 7 September 2017 to provide a further report to bringing privately owned empty homes back into use.
Item number 7.2 Report number
Executive/routine
Executive
Wards
Council Commitments
All Wards 1
Housing and Economy Committee – 2 November 2017 Page 2
Report
Empty Homes Update Report
1. Recommendations
1.1 The Housing and Economy Committee is asked to:
1.1.1 note that the number of empty homes in Edinburgh is in line with the Scottish average;
1.1.2 note the progress that has been made to bring empty homes back into use; and
1.1.3 note that this report discharges the request from Housing and Economy Committee on 7 September 2017 to provide a report on the Council’s approach to empty homes work, the work of other local authoriries, revenue generated and the cost of a dedicated empty homes officer.
2. Background
2.1 In September 2012, the Edinburgh Empty Homes Task Force was established in response to Capital Coalition Pledge 10, to investigate ways to bring empty homes in the city back into use.
2.2 On 13 February 2014, Council requested a report on the feasibility of introducing a dedicated Empty Homes Officer post. On 17 June 2014, Health, Social Care and Housing Committee approved a one year pilot project to appoint an Empty Homes Officer.
2.3 On 26 January 2016, Health, Social Care and Housing Committee agreed to integrate empty homes work by moving from one dedicated officer managing policy, strategy and case work to a team of six officers taking on the case-management and a senior officer taking on strategic direction and policy development of the empty homes work stream.
2.4 On 31 January 2017, Health, Social Care and Housing Committee received a report which provided a progress update on empty homes work, including details of the number of homes brought back into use in each locality.
3. Main report
3.1 Empty homes figures are collated each month by the Council. The data from 31 August 2017 showed that 4,993 homes in Edinburgh were empty. Of these, less

Housing and Economy Committee – 2 November 2017 Page 3
than a quarter (1,167) had been empty for 12 months or more. Over half (2,708) had been empty for less than 12 months and around a quarter (1,118) were on the market for sale or let. The Council has concentrated its efforts on long term empty homes, those which are empty for 12 months or more, recognising that homes which are empty for shorter periods of time are often vacant due to natural turnover.
3.2 The Scottish Government annually publish data on the number of empty homes in each local authority area. The data from 2016 showed that 4,997 homes in Edinburgh were empty. This is the highest absolute figure; however, this is 2.1% of the total number of homes in the city. When compared as a percentage of all homes, Edinburgh has the tenth highest number of empty homes among the 32 local authorities.
3.3 Empty homes data is also published annually by the National Records of Scotland (NRS). These figures are larger than the Scottish Government figures, as they include exempted homes, for example if the owner is in hospital or prison. The NRS data from 2016 shows that, even with the inclusion of exempted homes, 3.1% of homes in Edinburgh are vacant. This figure is the same as the Scottish average and the same as the previous year.
Empty Homes work in Edinburgh
3.4 There is a current case-load of around 50 homes, most of which are complex, long term empty homes cases. This primarily involves tracing owners; and providing advice and information to help them bring their empty home back into use. Officers also work with other Council service areas which may be able to use enforcement powers to assist in dealing with issues resulting from empty homes.
3.5 Within the last year, 20 empty homes have been brought back into use and an additional 11 homes have been reclassified as either being no longer empty or a second home. This is a similar caseload and success rate achieved by the dedicated officer during the pilot project.
3.6 A senior officer is responsible for steering the strategic direction of the Council’s empty homes work, monitoring performance, jointly developing policies and engaging in the national network for knowledge exchange; which is facilitated by the Scottish Empty Homes Partnership. There is also an ongoing partnership with Link Housing, who manage the Edinburgh Empty Homes Initiative. This is a national scheme supported by Scottish Government funding. To date, three homes in Edinburgh have been brought into use through this initiative, which involves Link overseeing the renovation of the home before letting it out.
Benefits of Empty Homes work
3.7 Within the last year, 20 empty homes cases have been closed; 16 of these were sold, three are under renovation and one is being rented privately. Only one home out of over 50 cases closed over the last three years has been brought into use for social rent.

Housing and Economy Committee – 2 November 2017 Page 4
3.8 The greatest benefit of empty homes work is the positive impact it can have on local communities. Bringing empty homes back into use can significantly improve neighbourhood amenity, as well as reducing risks of vandalism or anti-social behaviour.
3.9 Homes can become long term empty for a variety of reasons which vary depending on the area. For example, national figures previously collated by the Scottish Empty Homes Partnership demonstrate that in over a quarter of cases, homes were empty due to issues with unsuccessful marketing. In these instances, officers were able to assist owners within relatively short timescales, by providing basic advice and information around marketing and selling. By comparison, no homes in Edinburgh were empty for this reason. Cases in Edinburgh often involve complex issues such as absent landlords or complications with legal proceedings for estate settlements.
Empty Homes work in other local authority areas
3.10 Consultation with the Scottish Empty Homes Partnership has established that there is no data publicly available which presents a complete picture of how empty homes work is funded across all local authorities, or which quantifies the role of empty homes work in the generation of additional revenue.
3.11 Local authorities across the country have different approaches to empty homes work. The Scottish Empty Homes Partnership reported that just over half (19 of the 32) of local authorities in Scotland currently have a dedicated empty homes resource; although not all of these officers work full-time on empty homes. In terms of neighbouring local authorities, Midlothian, East Lothian and West Lothian do not have dedicated empty homes officers. South Lanarkshire Council have taken a similar approach to Edinburgh in mainstreaming the empty homes work within their area.
3.12 In 2013, legislation was introduced to allow local authorities to increase the Council Tax payable on certain types of long-term empty homes. From 1 January 2014, the Council introduced a 100% Council Tax surcharge on homes that have been empty for more than 12 months. This measure is designed to discourage owners from leaving their homes empty.
3.13 Bringing homes back into use can generate additional revenue in instances where there has been Council Tax arrears and it has been possible to reclaim this debt when the home is sold. However, in many cases, the retrieval of arrears is not straight forward. The Council’s Debt Recovery team manages the pursuit of Council Tax arrears. Empty homes cases often do not involve Council Tax arrears and not all closed cases result in additional revenue. As such, it would be difficult to guarantee that sufficient revenue would be generated annually to cover the cost of a post.
3.14 The Council has previously funded a post through the interest earned on the balance of the Council Tax Discount Fund. On 26 January 2016, Health, Social Care and Housing Committee agreed to mainstream and increase capacity for empty homes work, by moving from one officer to a team of officers managing

Housing and Economy Committee – 2 November 2017 Page 5
case work and a lead officer managing strategy and policy. This work is now funded within existing budgets, which means the income from the Council Tax Discount Fund can be fully committed to support the delivery of the Council’s housebuilding programme. The estimated cost of an officer was £50,000. To put this in context, £50,000 could be used to fund borrowing for the development of five new affordable homes.
4. Measures of success
4.1 Bringing long term empty homes back into use has a positive impact on communities by improving neighbourhood amenity and reducing the risk of vandalism or anti-social behaviour.
4.2 Empty homes work strengthens partnership working across various Council service areas, as well as with partner agencies.
4.3 Every home brought back into use has a positive impact in increasing the supply of housing and ensuring the best use of existing stock.
5. Financial impact
5.1 Bringing empty homes back into use can generate Council Tax income, including recovery of outstanding Council Tax arrears. The additional revenue cannot be guaranteed and may not be sufficient to fund an additional post.
5.2 There will be a loss of income where the 100% surcharge is no longer applied, but the wider social and economic benefits offset this loss.
3.15 Prior to the Council decision in 2017 to increase resources for managing empty homes, a dedicated empty homes officer was funded from the Council Tax Discount Fund. Since then the Council has committed to expanding it housebuilding programme and the Fund is fully committed. The cost of funding a dedicated officer was estimated to be £50,000; this could be used to fund borrowing for the development of five new affordable homes.
6. Risk, policy, compliance and governance impact
6.1 Engaging neighbourhood staff in empty homes work within their patches supports the Housing Transformation Plan and the implementation of generic working for housing officers. Housing officers can support empty homes work by identifying vacant, privately-owned homes in their area and referring to the PRS Officers for investigation.

Housing and Economy Committee – 2 November 2017 Page 6
7. Equalities impact
7.1 Continued empty homes work will have a positive impact on individual, family and social life through reducing anti-social behaviour in areas with long standing empty homes and bringing homes back into use for sale or rent.
8. Sustainability impact
8.1 Making the best use of existing homes has a positive impact on sustainability as it helps to increase the supply of homes. Advice on energy efficiency grants, loans and subsidies is included in the information provided to owners of empty homes seeking to carry out repairs or renovations.
9. Consultation and engagement
9.1 Consultation and discussion on pledge activity took place at quarterly meetings of the Housing Pledges Working Group and Affordable Housing Political Sounding Board.
9.2 The Council engages in the national network for knowledge exchange, which is facilitated by the Scottish Empty Homes Partnership.
10. Background reading/external references
10.1 Empty Homes and Housing Pledges Update – Health, Social Care and Housing Committee, 31 January 2017
10.2 Empty Homes Pilot Project: 12 Month Update – Health, Social Care and Housing Committee, 26 January 2016
10.3 Feasibility Study of Appointing an Empty Homes Officer – Health, Social Care and Housing Committee, 17 June 2014
Paul Lawrence
Executive Director of Place
Contact: Elaine Scott. Housing Services Manager
E-mail: [email protected] | Tel: 0131 529 2277
11. Appendices
None.

Housing and Economy Committee
10.00am, Thursday, 2 November 2017
City Deal – Proposal for New Housing Partnership
with Scottish Futures Trust
Executive Summary
The purpose of this report is to provide members with an update to the Council’s proposal to establish a new housing partnership to acquire and manage homes for mid-market and market rent.
This report sets out how the proposal has been developed in partnership with Scottish Government and the Scottish Futures Trust through the City Deal programme. It sets out the next steps for establishing the partnership.
Item number 7.3 Report number
Executive/routine Executive Wards All Council Commitments
1, 6, 10

Housing and Economy Committee – 7 November 2017 Page 2
Report
City Deal – Proposal for New Housing Partnership with
Scottish Futures Trust
1. Recommendations
1.1 It is recommended that the Housing and Economy Committee:
1.1.1 Notes the progress in establishing a new partnership with Scottish Futures Trust to accelerate the delivery of more affordable and low-cost homes in the city.
2. Background
2.1 At its meeting on 17 September 2015, the Council considered a report, Accelerating House Building, and agreed to work with the Scottish Futures Trust (SFT) to establish a city-wide Limited Liability Partnership (LLP) to acquire and manage housing for rent. The report had been referred to Council by the Health, Social Care and Housing Committee, following its consideration at the Committee meeting on 8 September 2015.
2.2 Following the Council decision, the LLP proposal was developed further with colleagues in Scottish Government and SFT. It was included as one of a range of housing proposals in the City Deal programme.
2.3 On 20 July 2017 the Heads of Terms of the Edinburgh and South East City Region Deal was published. The Heads of Terms includes a commitment to provide a financing and funding package comprised of consent to on-lend up to £248m and an additional one off £15m capital grant to enable the City of Edinburgh Council to establish a new regional housing company to deliver a minimum of 1,500 homes at mid-market and market rent.
2.4 The Council’s Programme for the Capital - Business Plan, approved at Council on 24 August 2017, sets out an ambitious housebuilding programme with the aim of building 20,000 social and affordable homes over the next ten years. This is an increase of 4,000 homes on the previously agreed programme of 16,000 affordable homes over ten years which had been agreed in 2016.
2.5 The SFT was established by the Scottish Government in 2008 with the aim of increasing the efficiency and effectiveness of investment in public sector infrastructure across Scotland. As a public sector company, SFT works with the public and private sectors to deliver major infrastructure programmes, promotes the

Housing and Economy Committee – 7 November 2017 Page 3
use of innovative financing solutions to procure new infrastructure and works with the public sector to look for efficiencies in the use of their assets.
2.6 Working with Edinburgh and other Councils, SFT has developed the National Housing Trust (NHT) programme and is a partner in 29 LLPs across the country. In Edinburgh, SFT and the Council are partners in eight LLPs, established between 2011 and 2015, that together provide 886 mid market rent homes across the city. In addition, SFT assisted in the setting up of the LAR Housing Trust, a Scottish Charitable Incorporated Organisation which has the sole aim of providing mid market rent housing across Scotland.
3. Main report
3.1 Prior to consideration of the report Accelerating House Building in September 2015, the Health, Social Care and Housing Committee had considered a number of reports setting out how housing market pressures, including high and increasing private sector rents, declining home ownership among young people, low levels of affordable housing and low rates of housebuilding were adversely affecting the economic circumstances of people on low to middle incomes and contributing to homelessness in the city.
3.2 The report Accelerating House Building was referred to the meeting of the City of Edinburgh Council on 17 September 2015, where the Council agreed to take forward proposals to establish an LLP to acquire and manage homes for rent.
3.3 In addition to the decision to establish an LLP, consultation with partners led to a joint commitment in 2016 between the Council and housing associations to deliver a programme of 16,000 new affordable and low cost homes over ten years.
3.4 The September 2015 report updated Committee and Council on the delivery of the National Housing Trust (NHT) Programme in Edinburgh. The NHT programme was established to help bring forward sites that had were stalled following the financial crash of 2008.
3.5 Under the NHT programme, Councils on lend around 70% of the development cost to the LLP in return for building mid-market rented homes. This on lending is underwritten by a revenue and capital guarantee from the Scottish Government. On-lending decisions are made by the City of Edinburgh Council. The Council has loaned £112m to support this programme. The interest on the loan is paid to the Council from the rental income of each development.
3.6 Mid-market rent homes provide an affordable home for those who cannot afford to buy or rent a home in the private market and who do not have sufficient priority to realistically qualify for a social rented home.
3.7 The September 2015 report also set out how the experience gained through the NHT Programme informed the proposal to establish a city-wide LLP.
Housing and Economy Committee – 7 November 2017 Page 4
3.8 The Council’s role within the LLP is to acquire good quality homes to rent at affordable levels for people on low to moderate incomes and to manage the operator who provides day to day management of letting, repairs and rent collection. SFT’s role is to provide commercial and market advice and assist with financial viability assessment of proposals, a similar role to the one established in the NHT programme.
3.9 Further development of the proposal took place through the negotiations on the Edinburgh and South East Scotland City Region Deal. In summary this led to an in principle agreement as part of City Region Deal:
3.9.1 Establishing two LLPs, one for mid market rent and another for market rent;
3.9.2 Ministerial consent for the Council to on lend up to £248m and a Scottish Government grant of £15m, (subsequently revised to £16.1m);
3.9.3 The delivery of an initial programme of at least 1,500 homes;
3.9.4 That the LLPs may operate on a region wide basis.
3.10 The Council will enter into contracts with housebuilders to build new homes, subject to committee approval. On completion, homes identified for mid market rent and market rent will be transferred to the LLPs in return for a capital receipt. The homes developed for social rent will be retained on the Housing Revenue Account (HRA) with housing management and maintenance services provided by the Council.
3.11 The Council has a small stock of mid market rent homes that are currently held on the HRA. In order to consolidate ownership and provide consistency of service to tenants, approval will be sought to transfer these homes to the mid market rent LLP when vacant.
Next steps
3.12 A further report will come forward to the Committee meeting in January 2018 setting out the detail of the pipeline programme, arrangements for day to day management of the homes and approval will be sought for the governance arrangements of the LLPs, including appropriate political oversight.
3.13 Prior to this, briefings on these proposals will be available to committee members and groups.
4. Measures of success
4.1 Increase the supply of new homes in the city, bringing supply more in line with demand.
4.2 Predictable and stable rents for affordable and market rent housing and tenancy security.
4.3 Private sector development sites are brought forward, delivering more low-cost market homes and accelerating the delivery of sites for affordable housing.

Housing and Economy Committee – 7 November 2017 Page 5
4.4 Establishing a landlord in the private rented market delivering good quality, energy efficient, well managed homes, providing outstanding customer service at an affordable cost to people on low to middle incomes.
4.5 Reduce cost of living for people on low to middle incomes.
5. Financial impact
5.1 The Scottish Government has approved on lending from the Council to the LLPs of up to £248m and provided a grant of £16.1m to support the development of mid market rented homes through this initiative.
5.2 Initially the Council’s housebuilding programme, 21st Century Homes, will take forward the development of homes. These homes would be acquired by the LLPs at cost plus short-term funding costs. The financial impact on the HRA will be cost neutral and the capital expenditure associated with funding the construction forms part of the approved HRA Budget Strategy for 2017/18 to 2021/22.
5.3 Approval will be sought from the Council to on lend funds to the LLPs. The LLPs will purchase homes using these funds. The costs associated with on-lending will be recharged to the LLPs, who will meet these costs from net rental income generated from letting the properties. A sinking fund will also be generated and earmarked from surplus net rental income to cover future life-cycle maintenance of the homes.
5.4 A viability test has been developed in order to ensure that any homes purchased by the LLPs are capable of generating a sustainable income stream that can cover running costs and repayment of principal and interest on the on-lending provided by the Council’s General Fund. A surplus will be earmarked to cover future life-cycle maintenance.
6. Risk, policy, compliance and governance impact
6.1 The report considered by Committee and Council in September 2015 set out how decisions relating to the LLPs would be made within the Council’s framework of governance. Delivery against strategic and policy outcomes would be scrutinised through the Executive Committee with responsibility for housing and financial decisions including the acquisition of homes and on-lending from the Council would be scrutinised and approved through the Executive Committee with responsibility for finance and resources. Council decisions would be required to approve on lending to the LLPs. The detailed governance framework for the LLPs will be brought forward for approval by Committee at its meeting in January 2017.
6.2 The LLPs are responsible for covering the servicing and repayment costs of Council borrowing. This is repaid to the Council via rental income collected by the LLPs. Ultimately the financial risk to the Council in the event of LLP default is mitigated by the Council having first ranking security on the homes after repayment of Scottish Government Grant.

Housing and Economy Committee – 7 November 2017 Page 6
7. Equalities impact
7.1 An equalities impact assessment has been carried out for this project. A range of positive impacts have been identified against the areas of rights and protected characteristics. These include:
• More accessible homes that are suitable for people who have mobility difficulties;
• More affordable homes to enable people to have a good standard of living;
• More people able to access housing which enhances rights in relation to privacy and family life; and
• Community benefits secured through housing contracts can enhance rights to education and learning through development of links with schools.
8. Sustainability impact
8.1 The partnership will support the delivery of new homes on brownfield sites, reducing pressure on Edinburgh’s green belt.
8.2 New build homes are built to high standards in terms of energy efficiency and sustainability. There will be a strong emphasis on providing homes that are cheap to heat and affordable to manage for tenants.
8.3 Community benefits secured through housing contracts can enhance the local environment.
9. Consultation and engagement
9.1 Consultation has taken place on accelerating housebuilding and establishing housing LLPs with a range of partners including; Registered Social Landlords (RSLs), housing developers, land agents, institutional investors, Scottish Government and the SFT.
9.2 Rettie carried out market research for the Council in April 2017 indicating interest from private sector developers in developing homes for purchase by the LLPs.
9.3 There is strong support from Council tenants for delivery of more affordable homes.

Housing and Economy Committee – 7 November 2017 Page 7
10. Background reading/external references
10.1 Accelerating House Building – referral from the Health, Social Care and Housing Committee, City of Edinburgh Council, Thursday 17 September 2015
10.2 21st Century Homes – Housing Development at Fountainbridge and Meadowbank, Health Social Care and Housing Committee, Tuesday 19 April 2016
10.3 City Housing Strategy Update, Health, Social Care and Housing Committee, Tuesday 13 September 2016
Paul Lawrence
Executive Director of Place
Contact: Elaine Scott, Housing Services Manager
E-mail: [email protected] | Tel: 0131 529 2277
11. Appendices
None

Housing and Economy Committee
10.00am, Thursday, 2 November 2017
Strategic Housing Investment Plan (SHIP) 2018- 2023
Item number 7.4
Report number
Executive/routine Executive
Wards
Council Commitments
All
Executive Summary
The purpose of this report is to seek approval for the Strategic Housing Investment Plan (SHIP) for 2018/19-2022/23 prior to its submission to the Scottish Government. The SHIP sets out a detailed plan to deliver the first phase of the Council’s commitment to build 20,000 affordable homes over the next ten years. It also begins to identify the delivery of around 3,000 affordable homes and integrated health, care and support services for people with complex physical and health needs.
It outlines a programme over the next five years which would deliver nearly 8,000 homes. Of the 5,218 homes that form part of the Affordable Housing Supply Programme nearly 70% are for social rent with the remainder being for mid market rent and low cost home ownership. The Council will work with partners, including Scottish Government, to bring forward development of sites currently identified for development beyond the SHIP period; in order to deliver the Council’s commitment of 10,000 homes in five years.
The strong history of partnership working and award winning housing development means that work is already well under way to achieve these ambitious commitments, with over 2,000 affordable homes under construction on 33 sites in the city. This is the largest SHIP ever put forward to Committee for approval.

Housing and Economy Committee – 2 November 2017 Page 2
Report
Strategic Housing Investment Plan (SHIP) 2018- 2023
1. Recommendations
It is recommended that Housing and Economy Committee:
1.1 Approve submission of the Strategic Housing Investment Plan 2018- 2023 to the Scottish Government.
2. Background
2.1 Local authorities are required to submit an annual Strategic Housing Investment Plan (SHIP) to the Scottish Government. The purpose of the SHIP is to:
2.1.1 Set out investment priorities for affordable housing;
2.1.2 Demonstrate how these will be delivered;
2.1.3 Identify the resources required to deliver these priorities; and
2.1.4 Enable the involvement of key partners.
2.2 In January 2016, the Council approved the ambitious Housing Revenue Account (HRA) Budget Strategy 2016/17 to 2020/21. Within that Strategy the Council had committed to delivering 8,000 new affordable homes over the next ten years. This commitment was subsequently matched by housing associations partners to deliver a joint commitment of 16,000 homes; including around 3,000 affordable homes for older people and others with care and support needs.
2.3 Following the formation of the capital coalition this target was further increased to 20,000 homes, with 10,000 being delivered over the next five years. This clearly demonstrates Edinburgh's commitment to support the Scottish Government's target to deliver 50,000 affordable homes by 2021.
2.4 On 20 July 2017, the Heads of Terms for the South East Scotland City Region Deal was announced. This includes a range of measures to support the delivery of new homes, including grant funding for affordable housing, support for local authorities on a risk sharing basis to deliver infrastructure for strategic housing sites. Consent was also granted to Edinburgh to on-lend up to £248m and an additional one-off £16m capital grant to enable the Council to establish a new partnership to deliver 1,500 homes. A separate report to this committee sets out the business model and governance arrangements for the new partnership as well as the contribution it will make to delivering the Council’s 20,000 homes commitment.

Housing and Economy Committee – 2 November 2017 Page 3
2.5 Through the City Region Deal, Governments have agreed to work with regional partners to maximise the potential of public sector land and property to deliver new homes and to build on the recently committed additional £125m between 2018/19-2020/21 to support the regional partners’ ten-year affordable housing programme.
3. Main report
Context
3.1 Edinburgh is one of the most highly pressured housing markets in the country. Falling incomes and rising housing costs in the private market and an insufficient number of new affordable homes are the main drivers of poverty and inequality in the city. Demand currently outstrips supply resulting in rents that are not affordable to people on low and moderate incomes. The latest Housing Need and Demand Assessment (HNDA2) states there is demand for between 38,000 and 46,000 new homes in Edinburgh over ten years; over 60% of these homes need to be affordable. Appendix three sets out the average housing costs per tenure, in relation to the average income in the city.
3.2 There is high demand across all housing types. In 2016/17 there was an average of 167 bids for every social rented home advertised through the common housing register. Social rented homes are let to those in highest housing need, including homeless people and people who are in hospital and unable to return to their existing home.
3.3 The Council continues to maximise the number of social rented homes that can be delivered through Scottish Government grant funding. This has included working with housing associations to keep grant levels below Scottish Government benchmarks to maximise the number of affordable homes that can be delivered. Significant work has also been done with housing associations and Government partners to maximise the amount of social rent being progressed in future years of the programme and align it with Scottish Government targets of 70% Social Rent; 30% mid rent.
3.4 In addition to providing social rented housing for those in highest housing need, the Council works in partnership with housing associations and private developers to build affordable homes for working households who cannot afford to buy or rent a home in Edinburgh’s pressured housing market. The average house price is six times the average gross annual earnings in the city, making it least affordable city in Scotland to buy a home. The average monthly private rent in Edinburgh is over £1,000 and it is projected that rent will account for 45% of the average income by 2020.
3.5 Over the past five years, the Council has supported the delivery of more than 2,000 mid rent homes that are targeted at households with incomes of less than £39,000. This has included on lending of around £100 milli0n from the General Fund to Limited Liability Partnerships to purchase 1,000 homes from private developers. The Council’s innovative mid rent programme is one of the main mechanisms

Housing and Economy Committee – 2 November 2017 Page 4
available to the Council to support the local economy by providing affordable housing for key workers, young graduates and others contributing to the growth of the city. Mid market rent requires on average around 38% less grant than a home let at social rent levels. The introduction of mid market since 2010 has aided the Council in driving more value for every pound of Scottish Government grant provided. Over the last five years Edinburgh has consistently delivered homes requiring grant at least 8% below benchmark on average across the whole programme.
Current delivery
3.6 Work is well underway to accelerate the delivery of affordable housing in the city. Each year, following submission to the Scottish Government, the SHIP is used by the Council to set the Affordable Housing Supply Programme (AHSP) which is the Scottish Government’s grant funding programme for new affordable homes.
3.7 The 2017/18 AHSP has an affordable approvals target of 1,001 homes. To date, this is the largest number of homes identified for approval through the programme and is a 42% increase on last year. In addition to this there are over 2,000 homes currently under construction on 33 sites across the city. See Appendix 1 for details.
SHIP Outputs
3.8 The SHIP 2018-2023 aims to help all residents on low to moderate incomes to access the right type of housing to meet their needs The SHIP 2018-2023 has identified a pipeline of 7,454 affordable homes that could be approved for site start and 7,935 potential completions, with delivery strongest in the first three years. This is due to greater levels of certainty around delivery timescales in the earlier years. The SHIP is reviewed annually and will be increased to meet the 10,000 target, as confidence in the development pipeline grows.
3.9 The approvals are split into three categories:
3.9.1 5,218 homes delivered through Affordable Housing Supply Programme;
3.9.2 2,088 homes delivered through the Council’s Limited Liability Partnerships; and
3.9.3 148 homes delivered through Scottish Government Mid Market Rent Invitation scheme.
3.10 The 5,218 homes that have been identified to be approved through the AHSP require grant of £272.662m, or £54.532m per year on average.
3.11 The majority (69%) of the 5,218 AHSP approvals are for social rent, with the remaining split between mid market rent (27%) and low cost home ownership (4%). This is in line with Scottish Government targets for delivery of social rented homes.
3.12 The table below provides a summary of the projected outputs and funding requirements of the AHSP projects identified in the SHIP.

Housing and Economy Committee – 2 November 2017 Page 5
Table 1 Summary – AHSP
YEAR HOMES
APPROVED HOMES
STARTED HOMES
COMPLETED
GRANT REQUIREMENT
(£M)
SG RESOURCE PLANNING
ASSUMPTIONS (£M)
2018/19 1,729 1,266 609 £71.231 £37.269 2019/20 1,594 1,428 945 £62.020 £42.117 2020/21 1,166 1,644 1,583 £50.213 £45.147 2021/22 669 1,550 1,414 £58.541 £45.147* 2021/23 60 593 1,087 £30.657 £45.147* TOTAL 5,218 6,481 5,638 £272.662 £214.827
*RPA only known for the next three years; years four and five assume grant levels
remain static.
3.13 The remaining 2,236 homes will be delivered through innovative funding schemes that require little or no grant. This includes the Council’s two new Limited Liability Partnerships (LLP) to be set up with Scottish Futures Trust to own and manage housing for market and mid market rent. The SHIP includes the potential approval of 2,088 homes over the next five years through these LLPs; with over 60% of the homes being for mid market rent. This is an increase in the 1,500 homes identified in the “New Housing Partnership and Delivery” report, which are being delivered through a new grant funding stream of £16.1m from the Scottish Government. The additional 588 homes identified in the SHIP will be funded through the AHSP The remaining 148 homes will be delivered through more homes Scotland mid market rent scheme which offers loan financing to organisations who can deliver homes without grant subsidy. A more comprehensive breakdown of innovative funding mechanisms is set out in Appendix 2.
Challenges
3.14 In June this year the Scottish Government announced long term resource planning assumptions which provided certainty over forward funding until 2020/21. For Edinburgh this was on average of £41.511m, an increase of around £10m on the previous year. This is welcomed, however, should this level of funding be maintained there will be an annual funding shortfall of around £14m required to deliver the current commitments set out in the SHIP.
3.15 In order to achieve the Council’s affordable house building target of delivering 2,000 homes a year (1,400 through AHSP grant funding and 600 from non-grant funded sources) £74m of grant funding will be required annually. The programme therefore requires almost double the funding currently set out in Scottish Government’s three-year resource planning assumptions. It is, therefore, essential to continue the work initiated through City Region Deal, to secure an uplift in grant funding in years four and five of the SHIP and greater certainty in future years.
3.16 The Council also needs to work pro-actively with the Scottish Government and with public and private landowners and developers to maintain a pipeline of sites and new developments. The Affordable Housing Policy can go some way to securing land for affordable homes, but as these sites are developer-led they can impose

Housing and Economy Committee – 2 November 2017 Page 6
limitations in the type and tenure of housing and lead to delays in delivery as developers seek to secure the maximum return for their initial investment. There is therefore a requirement to develop rather than dispose of Council land and to purchase additional public and private sector sites. The Council may also have to explore interventionist techniques to unlock stalled sites.
3.17 The development pipeline and long term housing strategies developed at city and city region level can deliver certainty to construction related businesses operating within the region enabling them to invest in innovation to be incorporated into the construction process, such as offsite manufacturing to meet ambitions to significantly speed up the delivery of new homes. This can generate new jobs and skills and can lead to industrial growth through increased manufacturing output, whilst also addressing some of the concerns regarding supply of adequately skilled labour.
3.18 The City Region Deal will see the Scottish Government invest up to £25m in an Integrated Regional Employability and Skills Programme. This programme is being designed to reduce skills shortages and gaps, and boost the flow of individuals from disadvantaged groups into the good career opportunities that will be generated through the City Region Deal investment. Collaboration between public, private and construction industry professionals, combined with City Region Deal investment, can help to increase the supply of skilled construction sector workers needed across the city region.
3.19 Coinciding with collaborative working across the region, within Edinburgh a whole Council approach needs to be adopted to ensure the housing development process runs as efficiently as possible from beginning to end. The identification and release of land is also essential, as is the commitment from Scottish Government to increase grant allocation in line with delivery targets.
4. Measures of success
4.1 The SHIP sets out a strategy for delivering almost 8,000 affordable homes by 2022/23. This would:
4.1.1 Generate additional investment in the local and national economy;
4.1.2 Develop strategically important sites in the city;
4.1.3 Deliver additional council tax revenue for Council services; and
4.1.4 Deliver new accessible homes, built to meet the needs of older and disabled people
5. Financial impact
5.1 The SHIP notes that grant funding of £272.662m is required to approve 5,218 new homes. This is significantly above the £214,827m that would be received, should

Housing and Economy Committee – 2 November 2017 Page 7
funding levels continue at the same level of the final year of the long term resource planning assumptions announced in June this year.
6. Risk, policy, compliance and governance impact
6.1 One key strategic risk to delivery of the SHIP is the availability of funding to deliver projects. Section 3.14, identifies an annual average shortfall of £14 million to deliver the current commitments set out in the SHIP.
6.2 Another key strategic risk to delivery of the SHIP is the availability of land. The “Affordable Housing Policy” section of the main report, identifies that 3,155 homes, or 42% of the total number of approvals are to be provided on AHP land. These are sites which are developer-led and not in the control of affordable housing delivery partners and therefore present a risk to the overall delivery timetable.
6.3 Under the Housing (Scotland) Act 2001, Local Authorities are required to have a Local Housing Strategy (called the City Housing Strategy in Edinburgh). The affordable housing priorities of the City Housing Strategy (CHS) are delivered through the SHIP.
6.4 The CHS is reviewed annually. This ensures the strategic housing priorities and work streams continue to reflect changes to policy and legislation, economic changes, financial pressures and wider Council priorities. An update is provided to Committee.
6.5 Guidance on SHIP completion was issued by the Scottish Government in July 2017.
7. Equalities impact
7.1 The Equalities Impact Assessment (EIA) concludes that the SHIP should have a positive impact on tackling inequality through investment in new affordable homes for people on low to medium incomes.
7.2 The SHIP contributes to the public sector equality duty and advances equality of opportunity. It will increase access to affordable housing and well-designed, safer and cleaner communities. It will contribute to improved health by increasing the supply of good quality homes, reducing fuel poverty and providing homes which are physically accessible.
7.3 The majority of new build properties delivered by the Council and its housing association partners are accessible for people of limited mobility, meaning particular needs housing requirements can often be met through allocation of a standard general needs property.
7.4 Each year the Council allocates and spends around £500,000 on adaptations through the AHSP to enable housing association tenants to remain in their own homes and to live independently. In addition to this, the Council funds adaptations to Council homes through the HRA.

Housing and Economy Committee – 2 November 2017 Page 8
7.5 A successful partnership has been established between the Scottish Veterans Garden City Association (SVGCA) and the Council and housing association delivery partners. The Council seeks to identify opportunities to provide at least 150 new homes for disabled veterans over the next ten years.
8. Sustainability impact
8.1 The SHIP seeks to maximise delivery of homes on brownfield sites, reducing pressure on Edinburgh’s green belt. New homes are built to high standards in terms of energy efficiency and sustainability.
9. Consultation and engagement
9.1 All developing housing associations have been involved in producing the SHIP and will be prominent in delivering the housing projects contained within.
9.2 Local Authorities working across the Edinburgh and South East Scotland City Region all produce SHIPs which outline the collaborative measures being undertaken to accelerate new housing delivery. This includes working together to identify and to unlock sites suitable for affordable housing development to address the housing crisis facing the region.
9.3 The Edinburgh Affordable Housing Partnership has established a health and social care sub group and the Chair of this sub group is the housing representative on the Strategic Planning Group. A workshop is being held on 27 September to progress work on establishing how the 3,000 homes will be delivered. A focus of this workshop is to consider how the homes identified in the SHIP can be designed to support specialist housing needs. This is part of the ongoing consultation and liaison between Health and social Care and housing association delivery partners.
10. Background reading/external references
10.1 Housing Revenue Account (HRA) Budget Strategy September 2017
10.2 Edinburgh Partnership Board 17 March 2016 – report on Building 16,000 affordable homes and low cost homes in Edinburgh over the next ten years
10.3 Housing investment to support health and social care priorities – Health, Social Care and Housing Committee 19 April 2016
10.4 Housing Improvement Programme: Delivering the Budget Strategy in 2016/17 – Health, Social Care and Housing Committee 21 June 2016
10.5 Investment and Regeneration in Edinburgh – Next Steps – Economy Committee 28 June 2016
10.6 The Edinburgh and South East Scotland City Region (ESESCR) Deal – The City of Edinburgh Council 30 June 2016
Housing and Economy Committee – 2 November 2017 Page 9
10.7 Guidance on the Preparation of Strategic Housing Investment Plans (SHIP) July 2017
10.8 City Housing Strategy Update – Health, Social Care and Housing Committee 13 September 2016
Paul Lawrence
Executive Director of Place
Contact: Elaine Scott, Housing Services Manager
E-mail: [email protected] | Tel: 0131 529 2277
11. Appendices
1 – Affordable homes under construction
2 – Strategic Housing Investment Plan 2018/19 – 2022/23
3 - Average housing costs per tenure, in relation to income

Appendix 1 - Affordable homes under construction

Housing and Economy Committee – 2 November 2017 Page 1
Appendix 2 – SHIP Context Statement
Strategic Housing Investment Plan 2018/19 – 2022/23

Housing and Economy Committee – 2 November 2017 Page 2
Index
1. Summary
2. Strategic Context
3. Means of Delivery
4. Carbon Emissions and Energy Efficiency
5. Consultation and engagement
6. Equalities impact
7. Conclusion

Housing and Economy Committee – 2 November 2017 Page 3
1. Summary
The Strategic Housing Investment Plan (SHIP) sets out the approach by the City of Edinburgh Council and our housing association partners to investing in affordable housing in the city over a five-year period.
This SHIP outlines a programme which would deliver nearly 8,000 completed homes over the next five years. Of these, there are around 6,000 homes which require £272m of grant funding through the Scottish Government’s Affordable Housing Supply Programme (AHSP). The remaining 2,000 homes are being delivered through innovative funding schemes which either do not require grant, or do so at significantly reduced levels.
2. Strategic Context
Edinburgh is one of the most highly pressured housing markets in the country. Falling incomes and rising housing costs in the private market and an insufficient number of new affordable homes are the main drivers of poverty and inequality in the City. Demand currently outstrips supply resulting in rents that are not affordable to people on low and moderate incomes. The latest Housing Need and Demand Assessment (HNDA2) states there is demand for between 38,000 and 46,000 new homes in Edinburgh over ten years; over 60% of these homes need to be affordable.
There is a high demand for social rented housing in the city. Over 21,000 people in the city are registered for social rented housing through Edindex, the Council’s common housing register In 2016/17 there was an average of 167 bids for every social rented home advertised through Edindex.
Mid market rent is also in high demand. There has been over 6,000 notes of interest for the 600 mid market homes already completed through the National Housing Trust initiative. Almost 2,000 people have also noted interest in mid market rent homes through the Edindex application process.
The percentage of households living in private rented sector has doubled from 13% in 2001 to 27% in 2015, making it the second largest tenure in the city after home ownership. The average monthly private rent in Edinburgh is over £1,000. It is projected that rent will account for 45% of average income by 2020. There is consequently a clear need for quality, secure private rented homes that provide value for money to tenants.
Edinburgh’s average house price is six times the average gross annual earnings in the city, making it least affordable city in Scotland to buy a home. There is also a need to help first time buyers to get on the property ladder.
In response to this, the Council in partnership with housing associations, set out an ambitious strategy to deliver 16,000 affordable homes over the next ten years, a target which has recently been increased by the newly formed Council, to 20,000 homes. This clearly demonstrates Edinburgh’s commitment to support the Scottish Government’s target to deliver 50,000 affordable homes by 2021.
Affordable housing providers play a significant role in supporting health and social care priorities, through the development of accessible, easy to heat homes. The Council’s

Housing and Economy Committee – 2 November 2017 Page 4
housing strategy aims to commit up to £300m to support the delivery of around 3,000 affordable homes and integrated health, care and support services for people with complex physical and health needs.
The Strategic Housing Investment Plan sets out an accelerated affordable house building programme that seeks to provide affordable housing to all residents on low to moderate incomes over the next five years.
Affordable Housing Partnership - Supporting Council Priorities
The recent commitment to provide 20,000 affordable homes builds upon a strong foundation of partnership working between the Council and our developing housing associations partners. Our strategy is to build much needed new affordable homes and to provide a range of innovative services to reduce social and economic inequalities for our tenants. This commitment goes a long way beyond the building of new homes; providing a framework for future investment and joint working with partners which is closely aligned with the Council’s strategic goals set out in the City Housing Strategy 2018 and more widely in The Programme for the Capital: The City of Edinburgh Council Business Plan
2017-22. Figure 1 below illustrates the range of commitments, outputs, services and projects undertaken by housing association partners.
Figure 1 Housing Association Services and the Council Business Plan
Supporting Regional priorities - Edinburgh and South East Scotland City Deal
The housing crisis outlined above affects not only Edinburgh but also neighbouring Local Authorities as rising inequality and cost of living impacts on households in other parts of the region. Over the last 18 months, as part of the Edinburgh and South East Scotland City Region Deal process, colleagues from across the region worked collaboratively to develop an ambitious set of housing proposals to address this. The proposals included infrastructure funding to unlock strategic sites, additional grant, a longer-term grant funding commitment

Housing and Economy Committee – 2 November 2017 Page 5
to aid strategic planning, ministerial consent to on-lend to new housing companies and the set-up of a regional land commission to ensure best use of the public-sector estate.
The heads of terms announced on 20 July 2017, supported some of these proposals. The Scottish Government has offered support to local authorities on a risk sharing basis to deliver infrastructure for strategic housing sites. Consent was granted to Edinburgh to on-lend up to £248m and an additional one-off £15m capital grant to enable the Council to establish a housing delivery vehicle to deliver 1,500 homes. Both Governments have agreed to work with regional partners to maximise the potential public sector land and property to deliver new homes.
Scottish Government have agreed to work on the next phase of the programme and the associated funding profile beyond 2020/21 to achieve agreed outcomes over the next 10 years.
The city region will continue to collaborate to develop and deliver the city region deal housing programme. The regional housing partnership provides a unique opportunity to share resources, learning and thinking across six local authorities. The aim is to unlock the major challenges of; accessing land, funding infrastructure and to drive innovation in the supply chain required to accelerate the delivery of new homes.
3. Key Outputs
Development of the SHIP
The core purpose of the SHIP is to set out strategic investment priorities for affordable housing over a five-year period. The SHIP provides the basis for the development of agreed Strategic Local Programme Agreements (SLPA) between local authorities and the Scottish Government. The SLPAs set out the programme of housing projects that will be funded over the next three years. This is reviewed and updated annually to ensure delivery remains on track.
Each year, following submission to the Scottish Government, the SHIP is used by the Council to draft SLPAs in partnership with all local delivery partners and for final agreement with the Scottish Government. These individual programmes will combine to form the grant funded Affordable Housing Supply Programme (AHSP) for the city.
The 2017/18 AHSP has an affordable approvals target of 1,001 homes. This is the largest number of homes identified for approval through the programme to date and is a 42% increase on last year. In addition to this there are currently over 2,000 affordable homes under construction on 33 sites across the city.
Prioritisation
Projects have been selected for inclusion in the SHIP on the following basis:
• The tenure mix; priority is given to social rent in line with Scottish Government targets.
• Development of brownfield sites.

Housing and Economy Committee – 2 November 2017 Page 6
• Sites within the Local Development Plan (LDP) which have been identified as land for housing.
• Deliverability considerations such as site ownership, planning status and delivery timetable.
Housing type, such as family housing, whilst a priority for the city is not considered in the core criteria, but is determined on an individual project basis in consultation with local communities and housing management colleagues. Furthermore, Planning Design Guidance advises that 20% of the total number of homes delivered on sites of 12 or more should be designed for growing families.
Key Outputs
The SHIP has identified a pipeline of 7,454 affordable homes that could be approved and 7,935 potential completions over the next five years. The approvals are split into three categories:
• 5,218 homes delivered through Affordable Housing Supply Programme (AHSP) • 2,088 homes delivered through the Council’s Limited Liability Partnerships (LLPs) • 148 homes delivered Scottish Government Mid Market Rent Invitation scheme
The AHSP is the Scottish Government’s grant funding programme for new affordable homes and is managed by the Council. The 5,218 homes that have been identified to be approved through the AHSP require grant of £272.662m, or £54.532m per year on average.
Of the 5,218 AHSP homes proposed for approval, 69% are for social rent, 27% for mid market rent and 4% for low cost home ownership. This is in line with Scottish Government targets for delivery of social rented homes. Table 1 provides a summary of the projected outputs and funding requirements of the AHSP projects identified in the SHIP.
Table 1 Summary – AHSP
YEAR HOMES APPROVED
HOMES STARTED
HOMES COMPLETED
GRANT REQUIREMENT
(£M)
SG RESOURCE PLANNING
ASSUMPTIONS (£M) 2018/19 1,729 1,266 609 £71.231 £37.269 2019/20 1,594 1,428 945 £62.020 £42.117 2020/21 1,166 1,644 1583 £50.213 £45.147 2021/22 669 1,550 1414 £58.541 £45.147* 2021/23 60 593 1087 £30.657 £45.147*
TOTALS 5218 6481 5638 £272.662 £214.827
*RPA only known for the next three years; years four and five assume grant levels remain
static.
The SHIP identifies a number of specialist housing projects which match the joint outcomes shared between Health, Housing and Social Care. There are three specialist housing projects identified in the SHIP, delivering 165 homes, which are all designed for older people and a further 319 properties specifically designed as wheelchair accessible homes. As projects are closer to completion all partners will work towards identifying further opportunities to provide specialist housing.

Housing and Economy Committee – 2 November 2017 Page 7
The remaining 2,236 homes will be delivered through innovative funding schemes that require little or no grant, the detail of which is set out in the following section.
Land supply
A total of 65 new sites are included in the SHIP. Priority is given to Brownfield sites. Of the 65 new sites contained within the SHIP, 40 (or 62%) are on brownfield land and 24 (38%) is on greenfield land. Almost all the homes being developed on greenfield sites are private developer-led through the Affordable Housing Policy.
A quarter (16), of the 65 new sites identified in the SHIP are being delivered by the Council’s own house building programme, with the remaining 50 sites to be taken forward by housing association partners. However, the majority of the sites taken forward by housing association partners are in control of the private sector as they are being delivered through the affordable housing policy. The paragraph below on Affordable Housing Policy and Figure 2 outlines this in more detail.
Figure 2 – SHIP New Approvals
Three sites are not supported in principle by the Local Development Plan policies and at this stage do not have a planning consent. However, these sites have been included in the SHIP as they have been identified by a housing association partner as having housing potential. Should they receive planning consent then it is important the affordable housing provision is secured.
5. Means of Delivery
20,000 Homes Delivery
In June this year The Scottish Government announced long term resource planning assumptions which provided certainty over forward funding until 2020/21. For Edinburgh
14, 21%
16, 25%
35, 54%
SHIP NEW APPROVALS - SITE OWNERSHIP
RSL Control CEC Control AHP - Developer Led

Housing and Economy Committee – 2 November 2017 Page 8
this was on average of £41.511m, an increase of around £10m on the previous year. This is welcomed, however, should this level of funding be maintained there will be an annual funding shortfall of around £14m required to deliver the current commitments set out in the SHIP.
However, as Table 1 demonstrates, approvals and associated funding requirements slowdown in years four and five of the SHIP. This has been the standard pattern for the SHIP since it was first introduced. In general, years one to three contain sites which partners have both knowledge of, and confidence in their ability to deliver and this begins to tail off in later years.
In order to achieve the Council’s affordable house building target of delivering 2,000 homes a year (1,400 through AHSP grant funding and 600 from non-grant funded sources) £74m of grant funding will be required annually. This assumes a programme that will deliver a tenure split of 70% social rent and 30% mid market rent, which is in line with Scottish Government targets. The programme therefore requires almost double the funding current set out in Scottish Governments three-year resource planning assumptions.
Affordable Housing Policy
The Affordable Housing Policy is a planning policy which ensures that 25% of homes on all housing sites with 12 homes or more, are required to be affordable. This is an important delivery mechanism and contributes 59% of AHSP sites funded through the SHIP. The Council’s own house building programme uses land secured either from its own assets or by acquisition on the open market. For housing associations, the AHP is a vital to ensuring land supply with 3,155 homes, or 78% of their programme being delivered on AHP land. The AHP will also deliver a number of homes for low cost ownership, which will be negotiated on a site by site basis.
Innovative funding mechanisms
The Council works with partners to identify opportunities for innovation to deliver affordable housing without using funding provided through the AHSP, examples of which are provided below.
National Housing Trust (NHT) NHT provides a delivery mechanism for mid market rent homes in partnership with councils and developers. The Council has committed over £100m for the development of eight NHT developments in Edinburgh, which will deliver close to 1,000 affordable homes. NHT projects have been supported by Council investment through on-lending of over £100m and Scottish Government capital and revenue guarantees. There are no further NHT approvals within the lifetime of this SHIP, but the remainder NHT completions are identified within the SHIP.
The Council’s New Limited Liability Partnership On 17 September 2015, the Council agreed to establish arm’s length companies to own and manage housing for market and mid market rent. The Council is working with the Scottish Futures Trust to establish two Limited Liability Partnerships.

Housing and Economy Committee – 2 November 2017 Page 9
As part of Edinburgh and South East Scotland City Region Deal, a financing and funding package was agreed, comprised of consent to on-lend up to £248m and an additional one-off £15m capital grant to enable the Council to establish a new housing company. This will deliver a minimum of 1,500 homes at mid-market rent and competitive market rent levels. The SHIP includes the potential approval of 2,088 homes over the next five years, over 60% of which will be for mid market rent. This is an increase in the 1,500 homes identified in the “New Housing Partnership and Delivery” report, which are being delivered through a new grant funding stream of £16.1m from the Scottish Government. The additional 588 homes identified in the SHIP will be funded through the AHSP.
Local Affordable Rent (LAR) Housing Trust
LAR Housing Trust is a charity backed by the Scottish Government, which has plans to build around 1,000 mid-market rent homes across Scotland. LAR is now an active member of the Council’s delivery partnership and can take forward both AHP and market sites without the requirement for grant. LAR is supported in Edinburgh and while there are no new projects identified in the SHIP, they are close to securing opportunities to deliver homes in the City. It is anticipated that by the time next year’s SHIP is completed, LAR will be in a position to identify new projects.
More Homes Scotland – Mid Market Rent Invitation scheme
The More Homes Scotland MMR offer was released by the Scottish Government in February 2016 and offers loan financing to organisations who can deliver mid market rent homes without the need for grant. There is currently one project identified in the SHIP that seeks to deliver 148 mid market rent homes.
Maximising land supply
The scale and ambition of achieving the 20,000 homes should not be underestimated. In order to reach the 20,000 homes target a wider strategic partnership approach needs to be adopted that looks at a wide range of issues, including accessing land.
It is clear that public land, owned by the Council, has a major role to play in delivering housing growth and wider regeneration. A dual strategy of securing land from both public sector sites and through acquisition of sites from the open market is key to accelerate the programme of affordable house building. Strategic partnership with NHS and other public sector landowners will also be critical in achieving this goal.
The Edinburgh and South East City Region Deal provides a unique collaboration opportunity that can aid the acceleration the region’s rate of economic performance by a twin focus on innovation and inclusive economic growth. Following the heads of terms announced on 20 July 2017, the city region housing partners have expressed a desire to continue to build on this regional collaboration, including a strategic use of public sector land and property.
The Council also needs to work pro-actively with the Scottish Government and with public and private landowners and developers, to maintain a pipeline of sites and new developments. The AHP can go some way to securing land for affordable homes, but as these sites are developer-led they can impose limitations in the type and tenure of housing and lead to delays in delivery as developers seek to secure the maximum return for their

Housing and Economy Committee – 2 November 2017 Page 10
initial investment. There is therefore a clear need to directly secure land to enable delivery partners to accelerate affordable housing delivery. The Council may have to explore interventionist techniques to unlock stalled sites.
Homes to meet complex needs
It is important to note that the majority of new build properties funded through the AHSP are designed to meet the generous space requirements of the Housing for Varying Needs Standard. Many properties delivered through the AHSP are therefore accessible for people of limited mobility, meaning particular needs housing requirements can often be met through allocation of a standard general needs property.
Adaptations
It may be that slight modifications to existing designs and layouts are required to allow people to remain in their own homes and to live independently. Adaptations will continue to be a strategic housing investment priority. Each year the council allocates and spends around £500,000 on adaptations through the AHSP.
Working with Disabled Veterans
A successful partnership has been established between the Scottish Veterans Garden City Association (SVGCA) and the Council and housing association delivery partners. The Council seeks to identify opportunities to provide at least 150 new homes for disabled veterans over the next ten years. The SHIP will be the tool for developing housing associations to identify suitable homes to meet the needs of disabled veterans.
4. Carbon Emissions and Energy Efficiency
Energy efficiency standards are in place for new affordable housing in Scotland. All new developments are required to meet the Building Regulations, which contain stringent targets for energy efficiency. The Council requires affordable housing developments to have a low environmental impact and to contribute to the wider equality objective of eradicating fuel poverty. Housing association and Council house building partners are working to sustainability principles which promote local material sourcing, recycling, insulation standards, and renewable energy. It is expected that all SHIP partners will continue to follow these principles. The environmental impact of individual projects is assessed through the planning process.
5. Consultation and engagement
There is a strong partnership approach to delivering new build affordable housing in the city. This is evidenced by the joint and ambitious commitment to deliver 20,000 homes over the next ten years. To ensure delivery of this pipeline of projects the SHIP is kept under constant review through continuous discussion with partners at regular meetings, working groups and forums. The projects are refined and revised throughout the year, to ensure a high number of quality sites are selected for inclusion in the SHIP.

Housing and Economy Committee – 2 November 2017 Page 11
Regular meetings are held with RSL development directors and chief executives to ensure the efficient and effect delivery of the programme and alignment of strategic objectives.
The Edinburgh Affordable Housing Partnership has established a health and social care sub group and the Chair of this sub group is the housing representative on the Strategic Planning Group. A workshop was held in September 2017 to progress work on establishing how the 3,000 homes will be delivered. A focus of this workshop was to consider how the homes identified in the SHIP can be designed to support specialist housing needs. This is part of the ongoing consultation and liaison between Health and Social Care and housing association delivery partners.
6. Equalities impact
The Equalities Impact Assessment (EIA) concludes that the SHIP should have a positive impact on tackling inequality through investment in new affordable homes for people on low to medium incomes.
The SHIP contributes to the public sector equality duty and advances equality of opportunity. It will increase access to affordable housing and well-designed, safer and cleaner communities. It will contribute to improved health by increasing the supply of good quality homes, reducing fuel poverty and providing homes which are physically accessible.
7. Conclusion
There is a significant shortfall of affordable housing in Edinburgh and that is why the Council and housing associations are working in partnership to significantly increase the number of new affordable homes in the city. This has been further strengthened with the coalition’s commitment to increase this target to 20,000 homes over the next ten years. The strong history of partnership working and award winning housing development means that work is already well under way to achieve these ambitious commitments, with over 2,000 affordable homes under construction on 33 sites in the city.
The SHIP sets out the approval of almost 8,000 homes over the next five years, with delivery strongest in the first three years. This is due the reducing levels of certainty around planning, land and delivery timetables in later years of the SHIP. The SHIP is reviewed annually and will be increased to meet the 20,000 target, as confidence in the development pipeline grows.
The delivery of this ambitious programme is not without its challenges. A whole Council approach needs to be adopted to ensure the housing development process runs as efficiently as possible from beginning to end. The identification and release of land is also essential, as is the commitment from Scottish Government to increase grant allocation and provide greater certainty regarding future levels of funding.

Housing and Economy Committee – 2 November 2017 Page 12
Appendix 3 Average housing costs per tenure in relation to income
The table below sets out the average cost (rent) of living in a two bedroom flat in Edinburgh. It sets out the ratio of expenditure against the average gross disposable income.
Tenure
Average housing cost a
(2 Bedroom flat) Ratio of Income to
Housing Cost b
Monthly Annual
Social Rent 1 £394.92 £4,739.00 22.35%
Mid Market Rent 1 £590.00 £7,080.00 33.40%
New Housing partnership market rent d
£787.75 £9,452.95 44.6%
Private Market Rent 2c £950.00 £11,400.00 53.77%
a Rent only; does not include council tax, or service charges etc. b Average Gross Disposable Income per head in Edinburgh is £21,2263. c The average private market rent across all homes is £1,037 per month2. d Estimated market rent of 2 bed homes to be provided by the Council’s new housing partnership
1 Social Rent and Mid Market Rent are based on average rent for two-bedroom flats advertised through Key to Choice and RSLs’ websites in 2017/18. 2 Private Rent is based on latest Citylets data for rented properties in 2017 Q2 www.citylets.co.uk/research/datahub 3 Office of National Statistics https://www.ons.gov.uk/economy/regionalaccounts/grossdisposablehouseholdincome/datasets/regionalgrossdisposablehouseholdincomegdhibylocalauthorityintheuk

Housing and Economy Committee
10.00am, Thursday, 2 November 2017
Edinburgh Economy Strategy
Executive Summary
This report provides an update on progress towards the development of a new Edinburgh Economy Strategy. It gives a summary of engagement activity undertaken with elected members, businesses, and partner organisations during Autumn 2017, and provides a recommended timetable for committee approval of a draft strategy.
Item number 7.5 Report number
Executive/routine Executive
Wards
Council Commitments
All 2, 3, 7

Housing and Economy Committee – 2 November 2017 Page 2
Report
Edinburgh Economy Strategy
1. Recommendations
1.1 It is recommended that Committee:
1.1.1 Notes the progress made towards engagement of elected members, businesses, and partners in development of a new economy strategy, and
1.1.2 Agrees the proposed timetable for Committee approval of a draft strategy.
2. Background
2.1 In September 2012, The City of Edinburgh Council launched a strategy to drive and define the Council’s approach to economic development. Within a context of slow recovery from recession across the UK, this ‘Strategy for Jobs’ aimed to deliver ‘sustainable growth through investment in jobs’ and set out four integrated programmes of work for Council services to deliver this aim.
2.2 The period covered by the existing Strategy for Jobs comes to a close in 2017, and work is now needed to develop a new Edinburgh approach to economic development over the next few years, recognising the changing policy environment for economic development in Scotland, and challenges emerging for the Edinburgh economy over the next five years and beyond.
2.3 Scoping work has been underway in recent months to prepare for this strategy development. On 7 September, the Housing and Economy Committee agreed proposals for a series of engagement workshops to take place to ensure the strategy would be built around the priorities of elected members. The committee further requested that:
2.3.1 Additional engagement sessions be undertaken with the Housing and Economy committee members and key strategic business and third sector partners, and that
2.3.2 This report be brought to the Housing and Economy Committee to provide an update on progress and a recommendation on timescales for committee approval of a draft strategy.
3. Main report
3.1 A key priority for the project is to ensure that the priorities of elected members lead the development of the strategy, that the strategy reflects the views and priorities of

Housing and Economy Committee – 2 November 2017 Page 3
citizens and communities across Edinburgh, and is built around meaningful engagement with businesses, strategic partners and Council services. Towards this a range of engagement activities and approaches have been used to inform the strategy development process.
Elected member engagement
3.2 In order that all elected members have the opportunity to contribute to and shape the development of the new strategy, engagement activity has included the invitation to all elected members to attend one of five workshops held during October 2017. These sessions have been workshop discussions aimed at highlighting challenges to be met and opportunities for improvement. Sessions were led by the Convener and Vice Convener of the Housing and Economy Committee.
3.3 In addition to these sessions, a further workshop is scheduled to take place during November 2017. This session, with invitations to all elected members to attend, will provide an opportunity for members to review and discuss the project team’s draft responses to all engagement activity undertaken.
Strategic partner engagement
3.4 Alongside elected member workshops, engagement activity has also been undertaken with strategic economic development partners in the city. This has included:
3.4.1 Three Business Engagement Workshops held in late October 2017. These sessions were led by the Convener and Vice Convener of the Housing and Economy Committee. The sessions were designed to facilitate dialogue between Committee members, and strategic partners across the city (including key businesses, business and sector representative groups, social enterprises, higher and further education institutions and, economic development agencies).
3.4.2 One workshop planned for early November, organised with the support of the Compact Partnership, and focusing on the role of third sector organisations and social enterprises.
3.4.3 Engagement with community planning partners through Edinburgh Partnership networks. Led by the project team, this has included officer engagement workshops with colleagues in economic development partner agencies (including Scottish Enterprise, Skills Development Scotland, Visit Scotland, and others). The activity has also involved engagement workshops with the wider community planning network.
3.4.4 Officer led discussions with subject specialists in partner organisations across Scotland. This activity has involved discussion with 16 external advisors on topics associated with the development of the strategy – including inclusive growth, skills development, internationalisation and inward investment, entrepreneurship, and the digital economy. Organisations who

Housing and Economy Committee – 2 November 2017 Page 4
have been represented in these discussions include University of Edinburgh, Scottish Enterprise, Skills Development Scotland, Scottish Government, the Hunter Centre for Entrepreneurship, Enterprise Scotland, Women’s Enterprise Scotland, and others.
Council services
3.5 Alongside engagement with external partners, the project has also included a core strand of work to engage and involve all council services in the development of this economy strategy. Activity undertaken as part of this strand has included:
3.5.1 Early engagement and briefings with the Council Leadership Team.
3.5.2 A workshop attended by 20 council officers and managers representing all services across the Council. This workshop, led by the project team, has been followed up with further and ongoing one to one discussions with attendees.
3.5.3 Five workshop and discussion sessions with the Council’s core economic development service, including detailed sessions with business growth advisors and employability advisors.
Citizens and communities
3.6 The development of this strategy will be informed by analysis of the findings of a range of community engagement activity undertaken across the city during 2017. This analysis has delivered insight into both the priorities and aspirations of Edinburgh citizens and businesses, as well as into the challenges and opportunities the city economy faces in the next few years. Key inputs to this process so far has included the findings of city-wide engagement activity carried out as part of the 2050 Edinburgh City Vision project, as well as local community engagement carried out as part of the Locality Improvement Planning project. Findings from these projects have been drawn from over 10,000 responses and ideas submitted during workshops, events and online engagement carried out across the city.
Timetable
3.7 The activities outlined above allow for parallel workstreams running to the following timetable:
3.7.1 Elected member workshops – continuing through October to mid November 2017;
3.7.2 Strategic Partner workshops – continuing through late October to early November 2017;
3.7.3 Council service engagement – continuing through October to early December 2017;
3.7.4 Strategy drafting – commencing early October and continuing to early January 2018;

Housing and Economy Committee – 2 November 2017 Page 5
3.8 On this basis, it is recommended that Committee approve the preparation of a draft strategy, including next steps for implementation and ongoing engagement, for approval by the Housing and Economy Committee on 18 January 2018.
Table 1: Timetable for engagement, drafting and approval
September October November December January
Week commencing 4
th
11
th
18
th
25
th
2n
d
9th
16
th
23
rd
30
th
6th
13
th
20
th
27
th
4th
11
th
18
th
25
th
1st
8th
15
th
22
nd
29
th
Elected Member Engagement * *
Strategic Partner Engagement
Council Service Engagement
Drafting
Committee Approval
*
*: Housing and Economy Committee Meetings
4. Measures of success
4.1 Measures of success will be incorporated in the draft strategy presented for approval in January 2018, and will support the Council Outcomes identified in the Council’s Business Plan 2016-2020.
5. Financial impact
5.1 There are no significant financial impacts as a result of this report.
6. Risk, policy, compliance and governance impact
6.1 As this is an update report outlining the existing and required work to produce a new economic strategy there are no adverse impacts relating to risk, policy, compliance or governance.
7. Equalities impact
7.1 Assessment of equalities impacts arising from the new strategy will be included in the draft strategy presented for approval by Committee in January 2018.
8. Sustainability impact
8.1 Assessment of sustainability impacts arising from the new strategy will be included in the draft strategy presented for approval by Committee in January 2018.

Housing and Economy Committee – 2 November 2017 Page 6
9. Consultation and engagement
9.1 This paper provides a summary of consultation and engagement activities undertaken in development of the new strategy.
10. Background reading/external references
10.1 Edinburgh’s existing economic strategy: A Strategy for Jobs 2012-17
10.2 Economy Committee Report: 7 February 2017 “Approach for Developing a New Economic Strategy”
10.3 Housing and Economy Committee Report: 7 September 2017 “Edinburgh Economy Strategy”
Paul Lawrence
Executive Director of Place
Contact: Chris Adams, Strategy Projects Manager
E-mail: [email protected] | Tel: 0131 529 6258
11. Appendices
None.

Housing and Economy Committee
10.00am, Thursday, 2 November 2017
Housing and Economy Committee
Strategic Work Programme
Executive Summary
The Programme for the Capital: The City of Edinburgh Council Business Plan 2017-22 was approved by Council on 24 August 2017.
This report sets out the elements of the Programme for the Capital which sit within the remit of the Housing and Economy Committee.
Item number 7.6 Report number
Executive/routine Executive Wards All Council Commitments
1, 2, 3, 4, 5, 6, 7, 8, 9, 41
9074241
Cross-Out

Housing and Economy Committee – 2 November 2017 Page 2
Report
Housing and Economy Committee
Strategic Work Programme
1. Recommendations
1.1 Housing and Economy Committee is asked to note the work programme for the Committee, as set out in the Programme for the Capital and summarised below.
2. Background
2.1 The Programme for the Capital: The City of Edinburgh Council Business Plan 2017-22 was approved by Council on 24 August 2017.
2.2 This sets out the commitments of the Council Administration in the context of the Council strategy, City Vision, the Community Plan, the budget plan, the people plan and Directorate Business Plans.
2.3 A detailed Business Plan for Place will be developed to reflect these plans and will reflect how services will approach challenges and improve services for citizens.
2.4 A report detailing how progress against the Programme for the Capital will be measured will be presented to Council in October. This will be reflected in the Place Directorate Business Plan and in future reports to the Housing and Economy Committee.
3. Main report
Strategic Context
3.1 The Council has set out five strategic aims:
• A Vibrant City - Edinburgh to be a vibrant and thriving city with a unique heritage, leading economy and a world-renowned reputation for culture and sport.
• A City of Opportunity - Edinburgh to be a city in which everyone has access to opportunities to live fulfilling lives and ensure no one is left behind.
• A Resilient City - Edinburgh to be a city that is resilient with citizens that are protected and supported with access to sustainable and well maintained facilities.
• A Forward Looking Council – An organisation that collaborates effectively with our partners, focuses on prevention and ensures we are fit for the future.
Housing and Economy Committee – 2 November 2017 Page 3
• An Empowering Council - A council which empowers our citizens to take action, participate and make decisions for themselves.
3.2 The Council have made 52 Commitments to the city, all based around six themes:
• Deliver an economy for all – local jobs, growth and affordable housing.
• Build for a future Edinburgh – a planning system that works to protect and develop our city.
• Deliver a sustainable future – a better environment and transport system that works for all.
• Deliver for our children and families – improving lives and future.
• Deliver a healthier city for all ages – strong and vibrant communities.
• Deliver a Council that works for all – more empowered, transparent and improved public services.
Housing and Economy Committee Remit
3.3 The Housing and Economy Committee remit includes: Economic Development, Homelessness, Housing Development, Housing Property and Planning Policy.
3.4 The remit is primarily focused on the theme: Delivering an Economy for all – local jobs, growth and affordable housing.
3.5 The detail of the commitments is provided in appendix 1 of this report.
3.6 The work programme for the Committee will be focused on these Commitments with regular reports for approval and/or information throughout the course of the Business Plan period.
3.7 The Key Decisions Forward Plan on today’s agenda outlines the reports which are already scheduled for decision at upcoming Committee meetings.
4. Measures of success
4.1 The measures for success are still be developed and will be reported to the Housing and Economy Committee in December 2017.
5. Financial impact
5.1 The activities set out in this report are currently reflected in the Place and Safer and Stronger Communities budget 2017/18.
5.2 The Council’s proposals for budget savings in future years will be presented to Finance and Resources Committee in October 2017 for consultation. The final proposals will be submitted to Council early in the new year for approval.

Housing and Economy Committee – 2 November 2017 Page 4
6. Risk, policy, compliance and governance impact
6.1 The Place Directorate Business Plan will be updated to reflect the Programme for the Capital.
6.2 The risk, compliance and governance impacts of the Programme for the Capital are being considered within the Council’s framework for managing these activities and will then be reviewed regularly.
7. Equalities impact
7.1 There are no direct Equalities impacts arising from this report.
7.2 As services develop to deliver the Programme for the Capital, Equalities impacts will be assessed in the normal way.
8. Sustainability impact
8.1 There are no direct Sustainability impacts arising from this report.
8.2 As services develop to deliver the Programme for the Capital, Sustainability impacts will be assessed in the normal way.
9. Consultation and engagement
9.1 The Programme for the Capital has been developed to incorporate feedback from consultation and engagement.
9.2 Consultation and engagement will be undertaken at the appropriate time as services develop activities to align with the commitments set out in the Place Directorate Business Plan.

Housing and Economy Committee – 2 November 2017 Page 5
10. Background reading/external references
None.
Paul Lawrence
Executive Director of Place Contact: Paul Lawrence, Executive Director of Place
E-mail: [email protected] | Tel: 0131 529 7325
11. Appendices
1 Council Commitments – Delivering an economy for all

Housing and Economy Committee – 2 November 2017 Page 6
Appendix 1 – Delivering an economy for all – local jobs, growth and affordable housing C1. Deliver a programme to build at least 10,000 social and affordable homes over the next five years, with a plan to build 20,000 by
2027. C2. Create conditions for businesses to thrive. Invest in supporting businesses, social enterprise, training in hi tech, creative and other
sectors including co-operatives. Help link business with young people to ensure the workforce of the future is guaranteed work, training or education on leaving school.
C3. Work with the business community to grow the number of Living Wage employers year on year. C4. Direct development to growth corridors as the best way to accommodate extra housing needed for Edinburgh’s growth and allowing
the city to manage and protect green belt. C5. Sign Edinburgh to the Pay Fair Tax Initiative. C6. Deliver the City Region Deal. Make sure the benefits of investment are felt throughout the city and create space for new business
to start and grow. C7. Improve access to employment and training opportunities for people with disabilities. C8. Explore the introduction of fair rent zones. C9. Create a Homeless Task Force to investigate the growing homelessness problem in the city. The team will review the use of bed
and breakfast premises and explore alternatives that better meet the needs of individuals and families with an aim to end the use of bed and breakfast facilities. Appoint a Homelessness Champion who will chair the Task Force.
C41. Review the application process and increase the budget for housing adaptations with a view to supporting more disabled tenants
and owners to remain in their own homes. Help older and disabled home owners to move to more suitable housing should they wish to do so.

Housing and Economy Committee
10.00am, Thursday, 2 November 2017
Housing Land Audit and Delivery Programme 2017 -
referral from the Planning Committee
Executive Summary
On 12 October 2017 the Planning Committee considered a report by the Executive Director of Place on the Housing Land Audit and Delivery Programme 2017.
Item number 7.7 Report number
Executive/routine Executive Wards Council Commitments

Housing and Economy Committee – 2 November 2017 Page 2
Terms of Referral
Housing Land Audit and Delivery Programme 2017 -
Terms of Referral
1.1 On 12 October 2017 the Planning Committee considered the attached report by the Executive Director of Place on the Housing Land Audit and Delivery Programme 2017
1.2 The Housing Land Audit and Delivery Programme (HLADP) is a monitoring tool
used to assess the performance of Strategic Development Plan (SDP) housing land policies and targets. The HLADP records the amount of land available for house building, identifies any constraints affecting development and assess the adequacy of the land supply against the supply target and housing land requirement set by the SDP.
1.3 In order for a housing site to be considered ‘effective’, it must be free of all
constraints that would prevent development. Sites are considered against a range of criteria set out in Planning Advice Note 2/2010 “Affordable Housing and Housing Land Audits” (PAN 2/2010). These criteria include ownership, physical (e.g. slope, aspect, stability, flood risk, access), contamination, deficit funding, marketability, infrastructure and land use. PAN 2/2010 also states that “The contribution of any site to the effective land supply is that portion of the expected output from the site which can be completed within the five-year period”.
1.4 The housing supply target for the City of Edinburgh is set by the South East Scotland SDP (approved 2013) and its supplementary guidance (2014). The housing supply target was set at 22,300 units from 2009 to 2019 and a further 7,210 from 2019 to 2024. The LDP Report of Examination (June 2016) recommended extending the housing supply target to 2026, increasing the target by a further 2,884 houses. Taking account of completions to date, this results in a housing supply target of 18,384 for the period 2016 to 2026. Adding in a 10% ‘generosity’ margin to help ensure that the target will be met, the housing land requirement is 20,222. The 2017 HLADP identified an effective land supply of 23,329 units; more than sufficient to meet the requirement.
1.5 There is sufficient land, free from development constraints, to meet the housing
land requirement in the city. However, despite a recovery in the housing market, anticipated output from the five year delivery programme is still insufficient to meet the five year output target (90%). The five year delivery programme is closer to the output target now than it was in 2016. The five year delivery programme reported in the 2016 housing land audit was 11,970 – 88% of the five year output target at the time. However there is still a need to measure the rate of delivery output over the next five years and to seek ways to increase it.

Housing and Economy Committee – 2 November 2017 Page 3
The Planning Committee agreed:
1) To note the findings of the report by the Executive Director of Place including Appendix 2, 'The Housing Land Audit and Delivery Programme 2017';
2) The actions proposed in paragraphs 3.27 and 3.28 of the report by the Executive
Director of Place to help increase delivery of new homes;
3) To refer the report to the Housing and Economy Committee with a request to consider the actions identified in paragraph 3.27 of the report by the Executive Director of Place and Appendix 3 to help accelerate housing delivery;
4) To refer the report to the SESplan Project Board for its information; and
5) To refer the report to the Scottish Government to assist in the ongoing
development of planning practice in relation to housing delivery and measuring the availability of land.
For Decision/Action
2.1 The Housing and Economy Committee is asked consider the actions identified in paragraph 3.27 of the report by the Executive Director of Place and Appendix 3 to help accelerate housing delivery;
Background reading/external references
Planning Committee, 12 October 2017
Laurence Rockey
Head of Strategy and Insight
Contact: Stephen Broughton, Committee Services
E-mail: [email protected] | Tel: 0131 529 4261
Appendices
Appendix 1 - Housing Land Audit and Delivery Programme 2017 – report by the Executive Director of Place

Planning Committee
10.00am, Thursday, 12 October 2017
Housing Land Audit and Delivery Programme 2017
Executive Summary
The Housing Land Audit and Delivery Programme (HLADP) is a monitoring tool used to
assess the performance of Strategic Development Plan (SDP) housing land policies and
targets. The HLADP records the amount of land available for house building, identifies
any constraints affecting development and assess the adequacy of the land supply against
the supply target and housing land requirement set by the SDP. Edinburgh’s 2017
HLADP has been completed. Completion rates have been increasing over recent years
and the 2017 figure is back to the pre-recession high rate.
The HLADP examines both the supply of land (an input) and the expected delivery of new
homes (an output). The delivery of new homes is dependent on many economic and
demand related factors unrelated to the supply of land and although the delivery
programme is currently below the level needed to meet the housing supply target for the
next five years, the HLADP demonstrates that this is not due to a lack of effective housing
land and the supply of land is sufficient to meet the housing land requirement. Actions to
help increase delivery are identified.
Item number
Report number
Executive/routine Executive
Wards
Council Commitments
All

Planning Committee - 12 October 2017 Page 2
Report
Housing Land Audit and Delivery Programme 2017
1. Recommendations
1.1 It is recommended that Committee:
1.1.1 notes the findings of this report including Appendix 2, 'The Housing Land
Audit and Delivery Programme 2017';
1.1.2 agrees the actions proposed in paragraphs 3.27 and 3.28 to help increase
delivery of new homes;
1.1.3 agrees to refer this report to the Housing and Economy Committee with a
request to consider the actions identified in paragraph 3.27 and Appendix 3
to help accelerate housing delivery;
1.1.4 agrees to refer this report to the SESplan Project Board for its information;
and
1.1.5 agrees to refer this report to the Scottish Government to assist in the ongoing
development of planning practice in relation to housing delivery and
measuring the availability of land.
2. Background
2.1 The Strategic Development Plan (SDP) for Edinburgh and South East Scotland was
approved by Scottish Ministers in June 2013. SESplan supplementary guidance on
housing land was approved in 2014 and sets the Housing Supply Target for the City
of Edinburgh Council area.
2.2 Scottish Planning Policy (SPP) requires local authorities to maintain a five year
supply of effective housing land at all times to ensure that the housing land
requirement is met. The annual Housing Land Audit and Delivery Programme
(HLADP) is used to monitor the effective housing land supply. It will also be used to
inform infrastructure decisions through the Local Development Plan (LDP) Action
Programme.
Planning Committee - 12 October 2017 Page 3
2.3 On 6 October 2016, the Planning Committee considered a report on the 2016
housing land audit that utilised a new approach to auditing land for housing and
housing delivery. Previously, the housing land supply was measured in terms of the
anticipated output or delivery programme. The report recognised that:
Land for housing is an input to a process
The delivery of new homes is an output from the process
Housing land and the delivery of new homes should be measured as separate things.
2.4 The report concluded that although there was sufficient effective housing land to
meet the housing land requirement set by the SDP, the anticipated delivery of new
homes was below the five year output target. The report acknowledged that there
was a need to increase delivery of new homes in the short term and set out several
ways that the council was seeking to do so.
2.5 This report provides an update on the supply of housing land and the delivery of
new homes based upon the findings of the 2017 HLADP and assesses the
adequacy of the land supply against the housing land requirement set by the SDP.
2.6 This report also further refines the methodology used to monitor supply of housing
land and delivery of new homes by identifying the factors that could increase
delivery on a site by site basis.
3. Main report
3.1 In order for a housing site to be considered ‘effective’, it must be free of all
constraints that would prevent development. Sites are considered against a range
of criteria set out in Planning Advice Note 2/2010 “Affordable Housing and Housing
Land Audits” (PAN 2/2010). These criteria include ownership, physical (e.g. slope,
aspect, stability, flood risk, access), contamination, deficit funding, marketability,
infrastructure and land use. PAN 2/2010 also states that “The contribution of any
site to the effective land supply is that portion of the expected output from the site
which can be completed within the five-year period”.
3.2 The report considered by Planning Committee in October 2016 used an alternative
approach to measuring housing land supply and delivery. The new approach
recognises that delivery of new homes can be affected by many economic and
demand factors unrelated to the supply of effective land available for development.
The anticipated output programme, therefore, is not the only assessment that the
Council considers to measure the adequacy of the land supply. Land supply is also
considered in terms of the capacity of unconstrained land available for
development. A revised approach is supported by the SESplan Joint Committee
which at its meeting on 14 December 2015, noted 'the difficulty in maintaining the
five-year effective supply in Edinburgh is not related to a shortage of unconstrained
land in that area'.
3.3 The 2017 HLADP is attached as Appendix 2.

Planning Committee - 12 October 2017 Page 4
Housing Land Supply
3.4 As at 31 March 2017, there was sufficient land free of planning constraints and
available for development for 23,329 houses. In addition to this, there was land for
a further 7,945 houses on sites where there is currently a constraint preventing
development. Whilst there are many factors that affect the rate of development on
particular sites, constrained sites are those where no development can take place
without some form of remedial action. Schedule 4 in Appendix 2 lists the housing
sites that are currently regarded as constrained and notes the nature of the
constraint that is currently preventing development from taking place.
3.5 The effective land supply is varied in type, size and location. It is spread over a
range of locations and includes brownfield (55%) and greenfield (45%) sites.
3.6 The locations and status of housing sites making up the established housing land
supply in the City of Edinburgh is shown on the map attached as Appendix 1.
Housing Land Requirement
3.7 The housing supply target for the City of Edinburgh is set by the South East
Scotland SDP (approved 2013) and its supplementary guidance (2014). The
housing supply target was set at 22,300 units from 2009 to 2019 and a further
7,210 from 2019 to 2024. The LDP Report of Examination (June 2016)
recommended extending the housing supply target to 2026, increasing the target by
a further 2,884 houses. Taking account of completions to date, this results in a
housing supply target of 18,384 for the period 2016 to 2026. Adding in a 10%
‘generosity’ margin to help ensure that the target will be met, the housing land
requirement is 20,222. The 2017 HLADP identified an effective land supply of
23,329 units; more than sufficient to meet the requirement.
Housing Delivery
3.8 Following the steep decline in the housing market brought about by the credit
crunch and subsequent recession in the mid 2000’s, a recovery has been taking
place. The number of new homes completed has more than doubled over the last
four years from 1,191 in 2012/13 to 2,457 in 2016/17. The current completion rate is
back to the pre-recession level and at 2,561 completions, 2002/03 is the only year
to have recorded a higher rate since the millennium.
3.9 With the exception of last year, the forward programme of anticipated construction
is also the highest it has been since the early 2000s. 11,396 houses are
programmed to be built over the next five years – an average of 2,280 houses per
year.
3.10 Emerging from the recession, the delivery of new housing was helped by an
increase in the building of affordable homes. Prior to the recession, affordable
tenures accounted for around 17% of all houses built in the city but for the period
2011 to 2015, the proportion increased to nearly 50%. Over the last two years the
number of affordable completions has remained high and along with the recovery of
the market completions, the total completion rate is now back to the pre-recession
level.

Planning Committee - 12 October 2017 Page 5
3.11 Delivery of new homes is not solely dependent on the supply of effective land. The
housing market will react to both local and national changes in the economy
causing completions rates to increase and decrease according to fluctuations in
demand.
3.12 The housing supply target is the policy view of the number of homes that will be delivered over the LDP period to 2026. This is set by the SDP and its Supplementary Guidance, extended to 2026 by the LDP Report of Examination. To ensure that the target can be met, additional land must be made available to allow for flexibility of range and choice. An additional 10% is added to the target to obtain the housing land requirement.
3.13 The five year delivery programme, previously referred to as the five year effective
land supply, is the anticipated number of houses to be delivered from the land
supply of the following five year period.
3.14 The effective housing land supply and anticipated output from the supply are
summarised, alongside the housing land requirement and five year output target, in
Table 1 below.
Table 1. Housing Land Supply and Anticipated Delivery Output
Housing Supply Target 2009 to 2019 22,300
Housing supply Target 2019 to 2024 7,210
Housing Supply Target 2024 to 2026 2,884
Completions 2009 to 2017 14,010
Housing Supply Target 2016 to 2027 18,384
Land Supply Delivery Output
Housing Land Requirement Output Target 2016 to 2021
20,222 12,616
Effective Housing Land Supply Five year Delivery Programme (2017 to
2022)*
23,329 11,396
* Previously referred to as the five year effective land supply
3.15 The 2017 table demonstrates that there is sufficient land, free from development
constraints, to meet the housing land requirement in the city. However, despite a
recovery in the housing market, anticipated output from the five year delivery
programme is still insufficient to meet the five year output target (90%). The five
year delivery programme is closer to the output target now than it was in 2016. The
five year delivery programme reported in the 2016 housing land audit was 11,970 –
88% of the five year output target at the time.
3.16 At current build rates, based upon the agreed five year delivery programme, there is
sufficient effective housing land in Edinburgh to last for over ten years.

Planning Committee - 12 October 2017 Page 6
3.17 Chart 1 demonstrates how the current supply of housing land can meet the housing
supply target to 2026. The amount of available land is represented by the bars in
the chart. The housing supply target, set by the SDP, is shown as the red line. The
chart demonstrates that the supply of housing land is sufficient to meet the overall
target. As land is developed, the remaining target reduces as does the amount of
land remaining. There will be some increases in the effective land supply, both
through new windfall sites and some sites that are currently constrained becoming
effective. The number of completions anticipated over the next five years may
fluctuate with changes in demand and economic factors but this is not a function of
the supply of land.
Chart 1. Housing Delivery
3.18 Homes for Scotland are consulted during the preparation of the HLADP and they
give their advice on the likely delivery rates for each site. As well as agreeing the
likely output for each site, factors that could increase the delivery rates were also
agreed. The 2017 HLADP is the first audit to include an assessment of factors that
could accelerate delivery. These factors are not intended to be viewed as solutions
in themselves to increasing delivery, rather they should be viewed as identifying the
steps that would need to be taken in order for the agreed delivery rates to be
accelerated. In many cases, the site may already be being developed at an
acceptable rate.12 different actions were identified and applied on an individual site
by site basis. The 12 factors can be broadly grouped as;
factors relating to ownership or control of a site
factors related to the planning system and other regulatory processes
0
5,000
10,000
15,000
20,000
25,000
30,000
35,000
2017 2018 2019 2020 2021 2022 2023 2024 2025 2026

Planning Committee - 12 October 2017 Page 7
factors related to the development industry
3.19 Chart 2 shows the numbers of units (excluding small sites) affected by each of the
12 delivery factors. For each factor, the graph shows the number of units
programmed for completion within five years as a lighter shade and units
programmed beyond five years as a darker shade.
Chart 2. Factors affecting housing delivery
3.20 Sites categorised as affected by factors related to the development industry have a
greater proportion of units programmed within the next five years than sites affected
by other factors. These sites are already in the control of house builders with
planning consent secured and in many cases, are already under construction.
However, increased delivery rates on these sites could still increase the five year
delivery programme by 1,800 – more than sufficient to make up for the shortfall in
the five year delivery programme. Most of the delivery programmed beyond 5 years
relates to the last phases of large scale developments.
3.21 Sites affected by factors related to the planning system are fewer in number than
those affected by development industry factors but, due to uncertainty around the
issuing of planning permission/legal agreements, have a higher proportion of units
programmed beyond the five year period. In total, there are 4,790 units
programmed beyond the five year period on effective sites affected by factors
related to the planning system.
3.22 Finally, there are around 5,350 units programmed beyond the five year period on
effective sites affected by factors related to ownership or control. These are largely

Planning Committee - 12 October 2017 Page 8
allocated sites that are not yet in the control of a house builder or sites for which a
planning application has yet to be submitted. In addition, there are a further 7,330
units on constrained sites that are affected by ownership or control of the site. In
fact the majority of constrained sites are categorised as affected by
ownership/control with only 510 units categorised as affected by other factors.
Increasing Housing Delivery
3.23 The 2016 HLADP was reported to Planning Committee with a series of
recommended actions intended to develop this approach further and to help
increase delivery rates. These were also referred to the Health, Social Care and
Housing Committee for its consideration (15 November 2016).
3.24 The actions identified at that time have been progressed as follows:
3.24.1 Working with Homes for Scotland to identify factors affecting delivery rates -
this has been progressed, as described above.
3.24.2 Use of the HLADP information to inform site selection for Council-led
programmes to deliver housing - this is being progressed, as described
below.
3.24.3 Use of the Scottish Government's Housing Infrastructure Fund to unlock
brownfield sites - this has been progressed and several brownfield sites in
strategic development areas are due to be supported in this way.
3.24.4 Intervention to progress housing development on brownfield land occupied
by low-rise commercial uses - this has been progressed through work
analysing relevant areas of the city for their housing development potential.
This work has also been looking at the commercial/employment uses on site,
and opportunities for providing replacement space. In particular, there is a
need to provide new-build industrial unit of various sizes, to replace the
ageing stock and retain diverse employment and service activities in the city.
This can also help unlock potential brownfield housing sites.
3.24.5 Infrastructure planning to avoid unnecessary constraints on housing delivery
- the LDP Action Programme is being used for this purpose and is the
subject of separate reports to relevant committees.
3.25 The above were general actions, not site-specific. The new level of detail provided
in the appended 2017 HLADP allows actions to increase housing delivery to be
identified with greater precision than previously.
3.26 The following new actions are proposed to address the factors summarised in Chart
2 above. They are grouped by the three headings identified above.
3.27 Ownership/Control:
3.27.1 Identify a long-list of potential candidate sites for direct intervention by the
Council with a view to ensuring timely delivery of housing. An indicative
long-list is attached as Appendix 3. It is based on the analysis in the HLADP.
3.27.2 The appended long-list (Appendix 3) should be reported to the Housing and
Economy Committee for its consideration, potentially as part of existing

Planning Committee - 12 October 2017 Page 9
housing and other development programmes. It may also be appropriate to
identify associated actions in a future iteration of the LDP Action Programme.
It should be noted that the Council has defined powers under planning and
housing legislation to assemble land for the purpose of housing
development. Scottish Government Circular 6/2011 provides advice on the
scope and use of these powers.
3.27.3 Chart 2 demonstrates that there is also significant housing capacity awaiting
the submission of proposal of application notices or planning applications.
An exercise is underway to investigate the development intentions of
relevant parties.
3.28 Planning/Other Regulatory Systems:
3.28.1 Some housing capacity is awaiting the determination of pending planning
applications. This will always be the case for an audit carried out at a single
point in time. The need to determine applications timeously is already well
established, with identified targets, and use of processing agreements to
support efficiency. However, it is proposed that the appended HLADP
analysis will be provided to development management team managers to
help identify where any issues may exist.
3.28.2 A significant amount of housing capacity is the subject of minded to grant
planning applications which are awaiting the conclusion of legal agreements.
There is a six-month target for this process. It is proposed to continue to
work towards meeting this target. There is a parallel exercise underway to
update the Council's model section 75 agreement to reflect recent changes
in planning policy, to help reduce the time needed for section 75
negotiations.
3.29 Development Industry:
3.29.1 The analysis shows that increased delivery rates on these sites would be
more than sufficient to cover the shortfall in the five year delivery
programme. However, for the relevant sites, the time taken to commence
development and the delivery rates of market housing are not unusual. It is
not proposed to take action regarding these at this time. Any sites still
awaiting commencement of development in next year's audit may need to be
investigated further with the relevant parties.
3.29.2 A small number of sites have affordable housing units which are expected to
be delivered outwith the five year period. This is to be expected, as they are
the last phases of large scale regeneration programmes.
Planning Committee - 12 October 2017 Page 10
Conclusions
3.30 These are as follows:
3.30.1 Delivery of new homes is affected by many economic and demand factors
unrelated to the supply of effective land available for development. The
anticipated output programme will not be the only assessment that the
Council will consider to measure the adequacy of the land supply. Land
supply will also be considered in terms of the capacity of unconstrained land
available for development.
3.30.2 There is sufficient effective land supply available for development in the City
for Edinburgh to meet the housing land requirements set by the SDP for the
periods 2009 to 2019, 2019 to 2024 and 2024 to 2026.
3.30.3 There is still a need to measure the rate of delivery output over the next five
years and to seek ways to increase it. There are several ways that the
Council is seeking to do so and this report can help to inform them.
4. Measures of success
4.1 The statutory development plan and national planning policy are implemented,
resulting in housing need being met without unnecessary adverse environmental,
social and economic impacts. Infrastructure is used efficiently. Council
programmes are fully aligned to achieve desired outcomes.
5. Financial impact
5.1 This report and its recommendations have no financial impact on service or Council
budgets.
6. Risk, policy, compliance and governance impact
6.1 The HLADP is a strategic planning policy monitoring tool. The risks associated with
this area of work are not considered significant in terms of finance, reputation and
performance in relation to the statutory duties of the Council as Planning Authority,
Roads Authority and Education Authority.

Planning Committee - 12 October 2017 Page 11
7. Equalities impact
7.1 There is no equalities impact arising as a result of this report’s analysis and
recommendations. SESplan undertook an Equality and Rights Impact Assessment
as part of the process of preparing the Edinburgh and South East Scotland SDP.
Details can be found at:
http://www.sesplan.gov.uk/assets/Strategic%20Development%20Plan%201/Strateg
ic%20Developme/Housing%20Land%20Supplementary%20Guidance/Housing%20
Land%20SG%20-%20EqHRIA.pdf
8. Sustainability impact
8.1 The SDP has been subject to a Strategic Environmental Assessment. Details can
be found at:
http://www.sesplan.gov.uk/assets/Strategic%20Development%20Plan%201/Strateg
ic%20Developme/Housing%20Land%20Supplementary%20Guidance/Housing%20
Land%20SG%20-%20Environmental%20Report.pdf
8.2 The impacts of this report in relation to the three elements of the Climate Change
(Scotland) Act 2009 Public Bodies Duties have been considered, and the outcomes
are summarised below. Relevant Council sustainable development policies have
been taken into account.
8.2.1 The proposals in this report will have no impact on carbon emissions as it is
simply an assessment of the housing land supply position in the City of
Edinburgh Council area at 31 March 2017.
8.2.2 The need to build resilience to climate change impacts is not directly relevant
to the proposals in this report because the report is simply an assessment of
the housing land supply position in the City of Edinburgh Council area at
31 March 2017.
8.2.3 Social justice, economic well being and environmental good stewardship is
not considered to impact on the proposals in this report because it is simply
an assessment of the housing land supply position in the City of Edinburgh
Council area at 31 March 2017.
9. Consultation and engagement
9.1 No formal consultation is required in connection with this report. However, the
contents of the schedules within the housing land audit and delivery programme
were agreed as reasonable with the representative body of the private house
building industry, Homes for Scotland.

Planning Committee - 12 October 2017 Page 12
10. Background reading/external references
10.1 Planning Committee: 6 October 2016. Item 7.1 - Housing Land Audit and delivery
programme 2016
10.2 Health, Social Care and Housing Committee: 15 November 2016. Item 7.6 -
Housing Land Audit and Delivery Programme 2016 - referral report from Planning
Committee
10.3 Health, Social Care and Housing Committee: 15 November 2016. Minute of
meeting
10.4 Strategic Development Plan for Edinburgh and South East Scotland, SESplan,
2013
10.5 Local Development Plan
10.6 City Housing strategy
10.7 Scottish Government Circular 6/2011 Compulsory Purchase Orders
Paul Lawrence
Executive Director of Place
Contact: David Leslie, Service Manager and Chief Planning Officer
E-mail: [email protected] | Tel: 0131 529 3948
11. Appendices
Appendix 1: Map of Established Land Supply
Appendix 2: Housing Land Audit and Delivery Programme 2016
Appendix 3: List of Sites Affected by Ownership/Control Factors
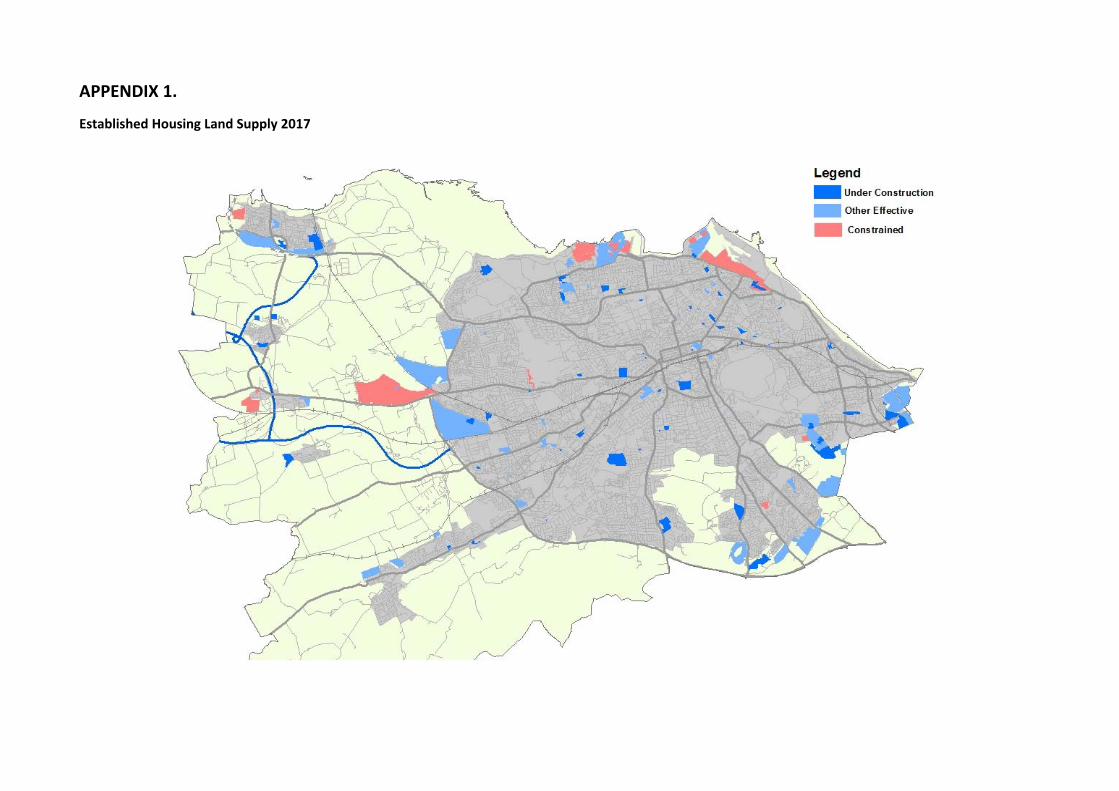
APPENDIX 1.
Established Housing Land Supply 2017

APPENDIX 2
Housing Land Audit and Delivery Programme 2017
1. Introduction
2. Housing Land Supply
• Established land supply
• Effective land supply
• Constrained land
• Greenfield / Brownfield analysis
3. Housing Delivery
• Completions
• Factors affecting delivery
• Affordable housing
• Accuracy of the audit
4. Housing Land Requirement
1. INTRODUCTION
The Housing Land Audit and Delivery Programme (HLADP) 2017 is an assessment of the
housing land supply in the City of Edinburgh Council area as at 31 March 2017. The audit
attempts to programme expected housing completions over the audit period, 2017 to 2022
and details completions that took place over the year April 2016 to March 2017.
Sites included in the HLADP are housing sites under construction, sites with planning
consent, sites in adopted or finalised Local Plans and, as appropriate, other buildings and
land with agreed potential for housing development. All new housing development,
redevelopment, conversions and subdivisions are included but rehabilitation of existing
housing is excluded. The HLADP gives a detailed picture of the supply of housing land in
terms of the number of housing units that it can accommodate. It also sets out a programme
of expected completions over the next 5 years and in the longer term.
The HLADP comprises schedules for each housing site with four or more units. Smaller sites
are not detailed individually but are included as an aggregate figure only. The estimates of
programmed completions are prepared by the City of Edinburgh Council in consultation with
Homes for Scotland, other private sector house builders, Housing Associations and public
agencies. A summary of the housing land supply, site details including delivery programme,
details of units completed over the previous 12 months and a list of constrained sites are
contained in schedules 1 to 4 at the end of this report.

2. HOUSING LAND SUPPLY
Established Land Supply
The established land supply is all land identified for housing including sites allocated in the
local development plan, sites which have been granted planning consent for housing and
other land with agreed potential for new house building. The established land supply is made
up of “effective housing land” - land free of all constraints that would prevent development
taking place and “constrained” sites - sites which cannot be developed without some form of
remedial action.
As at 31 March 2017, the established land supply in the City of Edinburgh Council area was
31,274. This included land free of all planning constraints for 23,329 houses and land for a
further 7,945 houses on sites that are currently considered constrained.
Effective land supply
In order for a housing site to be considered effective, it must be free of all constraints that
would prevent development. Sites are considered against a range of criteria set out in
Planning Advice Note 2/2010 “Affordable Housing and Housing Land Audits” (PAN 2/2010).
These criteria include ownership, physical (e.g. slope, aspect, stability, flood risk, access),
contamination, deficit funding, marketability, infrastructure and land use.
When assessed against the criteria contained in PAN 2/2010, there is land free of planning
constraints for 23,329 houses in the City of Edinburgh Council. This includes 5,963 houses
on sites currently under construction, 9,937 houses on sites with planning consent but where
development has not yet started and a further 7,120 houses on sites that have not yet
received planning consent – mostly sites allocated in the Local Development Plan. The
remaining 309 houses are on small sites that are not listed separately in the audit.
Figure 1 below shows how the established land supply in Edinburgh has changed over the
last ten years. Prior to 2016, only units programmed for development over the first 5 years
were considered to represent the effective land supply. Since 2016, the HLADP considers
the supply of land separately from programmed delivery and defines land as either:
‘Effective’. Land free of development constraints and available for the construction of
houses; and
‘Constrained.’ Land on which development cannot currently take place without remedial
action.
The chart, therefore, shows three categories of land up to 2015 - the effective land supply
programmed for development over the next five years, effective land supply programmed in
the longer term and constrained land. From 2016, only two categories of land are shown –
effective and constrained.

The five year effective land supply fell dramatically following the credit crunch in 2008/09. As
reduced credit availability affected both the development industry and house buyers, the rate
of development slowed, reducing the five-year programme of development intentions. Fewer
new applications were submitted on windfall land, resulting in the reduction of the overall
land supply as completions on land already partially developed, outstripped new land
entering the supply. Between 2009 and 2012, the five-year effective supply fell to around
5,200 (1,050 per year) – around half the level of the previous three years. The effective land
supply has been increasing in recent years and the allocation of new land in the local
development plan for over 8,500 houses brought the effective land supply to the highest it
has been for over 10 years with the exception of 2010. There was a large increase in land
supply in 2010 caused by local plan allocation and an application for around 18,000 units at
Leith Docks. As the consent was not issued, the site was moved from the long term effective
supply into constrained in 2011. Following a change in Forth Ports’ intentions to concentrate
on port-related activities and changes to the national and local planning policy context, a
large part of the area around Leith Docks was removed from the housing land supply entirely
in 2014, reducing the capacity from 18,000 to around 5,600. This has been reduced further
in 2016 to 2,700 following the publication of the LDP report of examination.
Figure 1: Make-up of the established land supply
Constrained Land
Constrained sites are those on which development cannot take place without some form of
remedial action. Such constraints include:
• Ownership: the site is in the ownership or control of a party which can be expected to
develop it or to release it for development. Where a site is in the ownership of a local
authority or other public body, it should be included only where it is part of a
programme of land disposal;
0
5000
10000
15000
20000
25000
30000
35000
40000
45000
50000
2006 2007 2008 2009 2010 2011 2012 2013 2014 2015 2016 2017
Constrained
Long Term Effective
5 Year Effective
Effective (post 2015)

• Physical: the site, or relevant part of it, is free from constraints related to slope,
aspect, flood risk, ground stability or vehicular access which would preclude its
development. Where there is a solid commitment to removing the constraints in time
to allow development in the period under consideration, or the market is strong
enough to fund the remedial work required, the site can be included in the effective
land supply;
• Contamination: previous use has not resulted in contamination of the site or, if it has,
commitments have been made which would allow it to be developed to provide
marketable housing;
• Deficit funding: any public funding required to make residential development
economically viable is committed by the public bodies concerned;
• Marketability: the site, or a relevant part of it, can be developed in the period under
consideration;
• infrastructure: the site is either free of Infrastructure constraints, or any required
infrastructure can be provided realistically by the developer or is committed to by
another party to allow development;
• Land use: housing is the preferred use of the land in planning terms, or if housing is
one of a range of possible uses other factors such as ownership and marketability
point to housing being a realistic option.
Map 1 below shows the land supply in terms of effective and constrained sites and a
schedule of constrained sites, including the nature of constraint, is included as appendix 4.
Map 1. Housing Land Supply 2016

Greenfield / Brownfield analysis
Excluding small sites, 10,450 units of the remaining capacity (23.020) of effective sites are
categorised as being on greenfield land. This represents 45% of the total. The proportion of
effective greenfield sites is the highest ever recorded. Ten years ago, less than 10% of the
effective land supply was greenfield. The Local Development Plan allocated over 8,500 units
on greenfield land and this has been a major factor in increasing the overall proportion of
greenfield sites in the city.
3. HOUSING DELIVERY
Completions
Mirroring the situation with changes to the effective land supply, the effect of the credit
crunch and subsequent recession was followed by a steep decline in the annual number of
completed dwellings. There has been an increase in completions over the last 4 years and
the rate is now almost back to the pre-recession high.
The recovery in the housing market is expected to continue and the number of completions
over the next 5 years is expected to average nearly 2,300 homes per year. The number of
completions could actually be higher as there will likely be some additional housing
completions on windfall sites. Figure 2 below charts historic housing completions and
programmed completions for the next 5 years.
Figure 2. Historic and Programmed Housing Completions
0
500
1000
1500
2000
2500
3000
2001
2002
2003
2004
2005
2006
2007
2008
2009
2010
2011
2012
2013
2014
2015
2016
2017
2018
2019
2020
2021
Market Affordable Programme

Factors Effecting Housing Delivery
Delivery of new homes is not solely dependent on the supply of effective land. The housing
market will react to both local and national changes in the economy causing completions
rates to increase and decrease. This was particularly noticeable following the credit crunch
in the late 2000s. Reduced credit availability affected both purchasers’ ability to obtain a
mortgage, thus vastly decreasing real demand for new homes and also developers’ ability to
secure loans to enable development to take place. With no real change to the availability of
effective housing land, delivery rates fell to less than half of previous rates. Figure 3 below
shows the effective land supply, the five year delivery programme (previously referred to as
the five year effective land supply) and the number of completions that actually took place
over the period 2003 to 2016. As the land supply and five year delivery programme relate to
a period of five years and the number of completions refers to a single year, they are shown
against different scales on the chart.
Figure 3. Housing land supply and housing delivery
Affordable Housing
Affordable housing tenures account for 25% of the current established land supply (7,800
units). Whilst the remaining land supply reflects the 75/25 split intended by the affordable
housing policy, historical completion rates have varied. Between 2001 and 2011, affordable
tenures accounted for 19% of all dwellings completed in Edinburgh. Over the last few years,
affordable completions have accounted for a much higher proportion, averaging over 40% of
all houses completed since 2011. Numerically, affordable housing completions have
increased in recent years but the large proportional shift is more a consequence of a
reduction in market completions. The number of market completions has increased markedly
over the last two years, from 890 in 2014/15 to 1,663 in 2015/16 and 1,726 in 2016/17.
0
1,000
2,000
3,000
4,000
5,000
6,000
0
5,000
10,000
15,000
20,000
25,000
30,000
2003 2004 2005 20062007200820092010201120122013201420152016 2017
Completions
Land Supply
5 Year delivery programme Effective Actual completions

Accuracy of Delivery Programme
Estimating future completions for the delivery programme is not an exact science – some sites
will be built out faster than anticipated and some slower. Further, some sites may not be
developed at all or be developed for uses other than housing and additional windfall sites will
provide completions not anticipated at the base date of the audit. Figure 3 below compares
the number of completions programmed for the following five year period to the number of
completions that actually occurred for each audit year since 1995.
Figure 3: 5 Year delivery programme and actual completions over the five year period
During the mid 1990s to early 2000s, far fewer units were programmed than the number of
completions that actually took place. This may be due to development taking place at a faster
pace with many windfall sites gaining consent and being built out in the five year period in
question. From 2003 until 2008, the audit programme was much closer to actual completions.
The programme was actually slightly higher than actual completions, the difference increasing
up to 2008. This period of time included the credit crunch which caused a steep decline in
completions which wasn’t anticipated when the audits were programmed. The opposite effect
can be seen for 2009 and 2010 when anticipated completions were low, but as recent
completion rates have started to increase once more, the five year completions count is higher
than was anticipated at the base date of the audits.
4. HOUSING SUPPLY TARGET AND HOUSING LAND REQUIREMENT
SPP defines the Housing Supply Target as “a policy view of the number of homes the authority has agreed will be delivered in each housing market area over the periods of the development plan and local housing strategy, taking into account wider economic, social and
0
2000
4000
6000
8000
10000
12000
14000
1995
1996
1997
1998
1999
2000
2001
2002
2003
2004
2005
2006
2007
2008
2009
2010
2011
2012
Programmed
Completed

environmental factors, issues of capacity, resource and deliverability, and other important requirements ...”
The housing supply target for the City of Edinburgh is set by the approved 2013 Strategic
Development Plan (SDP) and its supplementary guidance on housing land (SG). The SG
sets the housing supply target for the city at 22,300 units for the period to 2019 and a further
7,210 for the period to 2024. The LDP Report of Examination recommended extending the
supply target by an additional 2,884 for the two years to 2026. To ensure that the target can
be met, additional land must be made available to allow for flexibility of range and choice. An
additional 10% is added to the target to obtain the housing land requirement.
The annual average supply target for the period up to 2019 is considerably higher than for
the periods beyond 2019. This is due to two factors:
• The Housing Needs and Demand Study identified a significant backlog of households
currently in need of affordable housing which should be addressed early. This
backlog is on top of newly arising need and demand and is all added to the housing
land requirement of the first period.
• House building during the first period has been affected by the credit crunch and
subsequent recession resulting in lower completion rates than required. The shortfall
is added to the remaining requirement of the first period raising the annual average
needed even further, to a level nearly 15% above the highs achieved in the early
2000s.
Table 1 below compares the supply of effective land available for housing in the City of
Edinburgh to the remaining housing supply target. The table also shows the 5 year delivery
programme compared to the output target for the next 5 years.
Table 1: Effective housing land supply against requirement by period
Housing Supply Target 2009 to 2019 22,300
Housing supply Target 2019 to 2024 7,210
Housing Supply Target 2024 to 2026 2,884
Completions 2009 to 2016 14,010
Housing Supply Target 2017 to 2026 18,384
Land Supply Delivery Output
Housing Land Requirement Output Target 2017 to 2022
20,222 12,606
Effective Housing Land Supply 5 year Delivery Programme (2017 to 2022)*
23,329 11,396
* Previously referred to as the 5 year effective land supply

The table demonstrates that there is sufficient land, free from development constraints, to
meet the housing land requirement in the City. However, despite a recovery in the housing
market, anticipated output from the five year delivery programme is still insufficient to meet
the five year output target.
Increasing Housing Delivery
Further to identifying constraints that prevent delivery of new homes, HLADP2017 also
attempts to identify the actions that would be required to increase the delivery rates on
effective sites. These factors affecting delivery were discussed and agreed with Homes for
Scotland alongside the programmed delivery rate. These factors are not intended to be
viewed as solutions in themselves to increasing delivery, rather they should be viewed as
identifying the steps that would need to be taken in order for the agreed delivery rates to be
accelerated. In many cases, the site may already be being developed at an acceptable
rate.12 different actions were identified and applied on an individual site by site basis. The
12 factors can be broadly grouped as;
• factors relating to ownership or control of a site
• factors related to the planning system
• factors related to the development industry
Figure 4 below shows the numbers of units (excluding small sites) affected by each of the 12
delivery factors. For each factor, the graph shows the number of units programmed for
completion within 5 years as a lighter shade and units programmed beyond 5 years as a
darker shade.
Figure 4. Factors affecting the delivery of homes

Sites categorised as affected by factors related to the development industry have a greater
proportion of units programmed within the next 5 years than sites affected by other factors.
These sites are already in the control of house builders with planning consent secured and in
many cases, are already under construction. However, increased delivery on these sites
could still increase the five year delivery programme by 1,800 – more than sufficient to make
up for the shortfall in the five year delivery programme. Sites affected by factors related to
the planning system are fewer in number than those affected by development industry
factors but, due to uncertainty around the issuing of planning permission/legal agreements,
have a higher proportion of units programmed beyond the five year period. In total, there are
4,790 units programmed beyond the five year period on effective sites affected by factors
related to the planning system. Finally, there are around 5,350 units programmed beyond
the five year period on effective sites affected by factors related to ownership or control.
These are largely allocated sites that are not yet in the control of a house builder or sites for
which a planning application has yet to be submitted. The majority of constrained sites are
constrained by factors relating to ownership or control of the site, especially sites that are still
in use for other uses and sites that are not being promoted for housing development by the
land owner.

Schedule 1: Summary

Housing Land Audit and Delivery Progranme 2017
Schedule 1. Land supply and delivery summary
Total Total All Total
Statussite
capacity
affordable
units
completions by
31/3/17
dwellings
remaining17/18 18/19 19/20 20/21 21/22
Total 16/21 22/23 23/24 Post 2024
Under Construction 9,507 2,784 3,544 5,963 2,089 1,451 825 587 226 5,178 158 100 527
Consent 9,937 2,457 0 9,937 55 545 1,141 1,242 1,154 4,137 881 563 4,356
No Consent 7,120 1,941 0 7,120 20 209 264 606 673 1,772 854 866 3,628
Small Sites 309 0 0 309 62 62 62 62 61 309 0 0 0
Total Effective Supply 26,873 7,182 3,544 23,329 2,226 2,267 2,292 2,497 2,114 11,396 1,893 1,529 8,511
Constrained 8,318 1,690 373 7,945
Total Established Supply 35,191 8,872 3,917 31,274in City of Edinburgh
Programmed Completions
Delivery ProgrammeHousing Land Supply

Schedule 2: Site Details

Housing Land Audit and Delivery Progranme 2017
Schedule 2: Site Details
Site Ref Site Name /Address Developer (Or Owner) Area Brf/ Total Total Complete Remaining
(N=New site in 2017) /ha Grf Type Date U/C Dwellings Houses Flats affdble by 04/17 as at 04/17 17/18 18/19 19/20 20/21 21/22 Total 22/23 23/24 Post
units 17-22 2024
LDP Allocations
3825 LDP CC2: New Street Artesan 0.7807 B FULL May‐13 164 10 154 0 0 164 0 0 34 50 50 134 30 0 0
4338.5 LDP CC3: Fountainbridge Fountain North Ltd. 1.7233 B FULL Dec‐16 141 0 141 0 0 141 0 0 41 50 50 141 0 0 0
4338 LDP CC3: Fountainbridge
Fountain North Ltd + Scottish
Newcastl 2.25 B OUT Dec‐16 250 0 250 0 0 250 0 0 0 0 50 50 50 50 100
4516 LDP CC3: West Tollcross Knightsbridge Student Housing Ltd. 0.7648 B FULL Mar‐15 Mar‐10 113 0 113 22 22 91 45 46 0 0 0 91 0 0 0
4900 LDP CC3: Fountainbridge EDI 5.7396 B FULL Dec‐16 321 0 321 80 0 321 0 0 50 50 50 150 50 50 71
3957 LDP CC4: Quartermile Southside Capital Ltd. 6.24 B FULL Mar‐08 Mar‐06 983 0 983 171 880 103 103 0 0 0 0 103 0 0 0
5245.1
LDP Del 5: Edinburgh Park / South
Gyle David Wilson Homes 3.666 G FULL Jan‐15 Mar‐16 200 96 104 50 103 97 47 50 0 0 0 97 0 0 0
5245
LDP Del 5: Edinburgh Park / South
Gyle LDP Site 121.75 G NONE 375 0 0 94 0 375 0 0 0 50 50 100 50 50 175
3424 LDP EW 1A: Western Harbour Forth Properties Limited. 17.6 B OUT Jul‐02 1,155 0 1,155 304 0 1,155 0 0 0 0 0 0 50 50 1,055
3424.9
LDP EW 1A: Western Harbour ‐
Newhaven Place FP Newhaven Two Ltd. 1.2498 B FULL Aug‐16 Mar‐17 146 0 146 138 0 146 55 91 0 0 0 146 0 0 0
4894.1 LDP EW 1C: Salamander Place Teague Developments Ltp 5.9804 B FULL Dec‐11 Mar‐13 781 15 766 195 145 636 0 0 25 50 50 125 50 50 411
3105A
LDP EW 2A: West Shore Road ‐ Forth
Quarter Secondsite Property 4.319 B OUT Oct‐03 350 0 0 350 0 0 0 0 50 50 50 50 200
3733A.5 LDP EW 2B: Upper Strand Phs 2
�Upper Strand Developments Ltd
Waterf 0.4877 B NONE 64 0 64 16 0 64 0 0 30 34 0 64 0 0 0
3733A
LDP EW 2B: Waterfront WEL ‐ Central
Dev Area Various 7.1 B OUT Jul‐03 1,604 0 1,604 235 0 1,604 0 0 50 50 50 150 50 50 1,354
3744A LDP EW 2C: Granton Harbour Various 14.824 B OUT Jan‐14 951 229 722 107 0 951 0 0 0 50 50 100 50 50 751
3744.6 LDP: EW2C: Granton Harbour ‐ Plot 3 Port Of Leith Housing Association. 0.6972 B FULL Dec‐16 104 0 104 104 0 104 0 104 0 0 0 104 0 0 0
4723.2
LDP HSG 2: Scotstoun Avenue
(Agilent) Cala Homes 14.706 B FULL Dec‐13 Mar‐15 156 0 0 0 92 64 32 32 0 0 0 64 0 0 0
4723.1
LDP HSG 2: Scotstoun Avenue
(Agilent) Barratt 14.706 B FULL Dec‐13 Mar‐15 294 0 0 112 175 119 60 59 0 0 0 119 0 0 0
3745.4 LDP HSG 3: Queensferry Road Walker Group 2.1693 G FULL Jul‐14 Mar‐17 75 75 0 0 5 70 41 27 2 0 0 70 0 0 0
3745.5 LDP HSG 3: Queensferry Road Barratt East Scotland. 2.0689 G FULL Jul‐14 Mar‐15 69 69 0 0 56 13 13 0 0 0 0 13 0 0 0
3747 LDP HSG 5: Hillwood Rd Lp Site 2.057 G NONE 132 33 0 132 0 0 25 50 50 125 7 0 0
4898 LDP HSG 6: South Gyle Wynd Persimmon Homes. 3.3188 G FULL Dec‐14 Mar‐16 203 92 111 48 110 93 83 10 0 0 0 93 0 0 0
4508 LDP HSG 8: Telford College (North) Miller Homes Ltd. 3.9422 B FULL Jun‐07 Mar‐11 329 0 329 89 268 61 61 0 0 0 0 61 0 0 0
4812 LDP HSG 9: City Park Link Group Ltd And J Smart + Co (Cont 2.0755 G FULL Sep‐13 Mar‐14 203 0 203 152 157 46 46 0 0 0 0 46 0 0 0
4899 LDP HSG 10: Fairmilehead Water Treat CALA / Barratt 1.029 B FULL Nov‐14 Mar‐14 280 180 100 73 255 25 25 0 0 0 0 25 0 0 0
4773 LDP HSG 11: Shrub Place Places For People (Shrubhill) Ltd. 2.0765 B FULL May‐16 Mar‐17 346 0 346 346 0 346 0 198 72 76 0 346 0 0 0
3965 LDP HSG 12: Albion Road Places for People 2.7208 B FULL Mar‐14 Mar‐15 205 48 157 0 50 155 75 80 0 0 0 155 0 0 0
4509.3
LDP HSG 13: Eastern General Hospital
ph 3 Hillcrest HA 0.6034 B FULL Dec‐15 Mar‐17 76 0 76 76 0 76 38 38 0 0 0 76 0 0 0
3756 LDP HSG 14: Niddrie Mains Parc Craigmillar Ltd. 21.573 B OUT Sep‐15 214 0 214 214 0 214 0 0 0 0 25 25 25 50 114
3756.8 LDP HSG 14: Niddrie Mains Road Cruden Homes (East) Ltd. 2.1433 B FULL Nov‐16 149 79 70 38 0 149 0 0 50 50 49 149 0 0 0
3756.7 LDP HSG 14: Niddrie Mains Road JV ‐ CCG (Scotland) Limited / PARC Cra 2.357 B FULL May‐16 Mar‐17 121 65 56 42 0 121 21 50 50 0 0 121 0 0 0
Consent Expected Completions
Housing Land Supply Delivery Programme

Housing Land Audit and Delivery Progranme 2017
Schedule 2: Site Details
Site Ref Site Name /Address Developer (Or Owner) Area Brf/ Total Total Complete Remaining
(N=New site in 2017) /ha Grf Type Date U/C Dwellings Houses Flats affdble by 04/17 as at 04/17 17/18 18/19 19/20 20/21 21/22 Total 22/23 23/24 Post
units 17-22 2024
Consent Expected Completions
Housing Land Supply Delivery Programme
3755 LDP HSG 16: Thistle Foundation Edinvar 7.7976 B NONE 143 143 0 143 0 58 42 43 0 143 0 0 0
3754 LDP HSG 17: Greendykes Craigmillar JVC 15.578 B OUT Oct‐15 426 133 0 426 0 0 0 25 50 75 50 50 251
3754.6 LDP HSG 17: Greendykes Road PARC Craigmillar Ltd.. 3.9281 B OUT Dec‐16 172 120 52 0 0 172 0 0 23 50 50 123 49 0 0
3754.4 LDP HSG 17: Greendykes Road BDW Trading Ltd 2.988 B FULL May‐16 Mar‐17 158 123 35 0 0 158 25 50 50 33 0 158 0 0 0
3754.5 LDP HSG 17: Greendykes Road 21st Century Homes. 1.3552 B FULL Dec‐16 75 13 62 75 0 75 0 25 50 0 0 75 0 0 0
3753 LDP HSG 18: New Greendykes Persimmon Homes. 21.245 G FULL Oct‐12 Mar‐14 291 222 69 25 0 291 0 0 0 25 50 75 50 50 116
3753.1
LDP HSG 18: New Greendykes Area
AH2 Persimmon Homes. 2.1409 G FULL Oct‐14 Mar‐14 130 0 130 130 91 39 39 0 0 0 0 39 0 0 0
3753.3 LDP HSG 18: New Greendykes Area F Persimmon Homes. 0.8871 G FULL Jul‐16 Mar‐17 58 58 0 0 0 58 28 30 0 0 0 58 0 0 0
3753.4
LDP HSG 18: New Greendykes Areas G
& AH3 Persimmon Homes (East Scotland) 3.0718 G FULL Nov‐16 165 87 78 70 0 165 0 0 25 50 50 125 40 0 0
3753.2
LDP HSG 18: New Greendykes Areas
I&J Taylor Wimpey 3.3752 G FULL Nov‐14 Mar‐16 160 108 52 0 104 56 56 0 0 0 0 56 0 0 0
5246.2 LDP HSG 19: Maybury Central West Craigs Ltd. 58.82 G NONE 1,470 0 0 368 0 1,470 0 0 0 50 100 150 160 160 1,000
5246.1 LDP HSG 19: Maybury East Taylor Wimpey 12.993 G NONE 250 0 0 63 0 250 0 0 25 50 50 125 50 50 25
5246.3 LDP HSG 19: Maybury West Roseberry Estates 4.5319 G NONE 130 0 0 33 0 130 0 0 0 0 25 25 50 55 0
5247 LDP HSG 20: Cammo LDP Site 28.184 G NONE 600 0 0 150 0 600 0 0 0 25 50 75 100 100 325
5248 LDP HSG 21: Broomhills David Wilson Homes and Barratt 24.601 G NONE 633 611 22 158 0 633 0 50 50 50 50 200 50 50 333
5249 LDP HSG 22: Burdiehouse Road
Hallam Land Management Ltd & BDW
Tradi 13.969 G FULL Apr‐16 Mar‐17 210 145 65 52 0 210 36 36 36 36 36 180 30 0 0
5250 LDP HSG 23: Gilmerton Dykes Road Miller Homes 2.4311 G FULL Mar-16 Apr-16 61 0 0 15 25 36 36 0 0 0 0 36 0 0 0
5251.1 LDP HSG 24: Gilmerton Station Road Miller Homes Ltd 8.4483 G FULL Mar‐17 198 151 47 0 0 198 20 50 50 50 28 198 0 0 0
5251 LDP HSG 24: Gilmerton Station Road Mac & Mic 36.314 G OUT Dec‐16 502 0 0 175 0 502 0 0 0 50 50 100 50 50 302
5252 LDP HSG 25: The Drum
South East Edinburgh Development
Compa 6.2319 G OUT Aug‐15 149 125 24 43 0 149 0 0 0 25 50 75 50 24 0
5253 LDP HSG 26: Newcraighall North
EDI Group Ltd And Barratt
Homes/BDW Tr 8.602 G FULL Jul‐14 Mar‐15 220 194 26 55 80 140 36 36 36 32 0 140 0 0 0
5254 LDP HSG 27: Newcraighall East LDP Site 17.048 G NONE 154 0 0 83 0 154 0 0 0 25 50 75 50 29 0
5254.1
LDP HSG 27: Newcraighall East 1sr
phase Avant Homes 9.4114 G FULL Mar‐16 Mar‐17 176 152 24 0 0 176 26 50 50 50 0 176 0 0 0
5711 LDP HSG 29: Brunstane LDP site 48.288 G NONE 1,330 0 0 332 0 1,330 0 0 0 25 50 75 100 100 1,055
5257 LDP HSG 30: Moredunvale Road LDP Site 5.408 G NONE 185 0 0 46 0 185 0 0 0 25 25 50 35 50 50
5256 LDP HSG 31: Curriemuirend LDP Site 5.7342 G NONE 165 0 0 41 0 165 0 0 0 25 25 50 25 45 45
5712 LDP HSG 32: Buileyon Road LDP site 38.409 G NONE 840 0 0 210 0 840 0 0 25 50 50 125 100 100 515
5713 LDP HSG 33: South Scotstoun Taylor Wimpey 18.835 G NONE 375 0 0 94 0 375 0 35 35 50 50 170 50 50 105
5714 LDP HSG 34: Dalmeny Westpoint Homes 0.6781 G NONE 15 0 0 4 0 15 0 15 0 0 0 15 0 0 0
5715 LDP HSG 36: Curiehill Road Miller Homes 2.6391 G NONE 53 0 0 15 0 53 20 33 0 0 0 53 0 0 0
5716 LDP HSG 37: Newmills Road Cala Management 8.0162 G None 206 91 115 58 0 206 0 18 32 54 48 152 27 27 0
5706 LDP HSG 38: Ravelrig Road Cala 13.647 G OUT Dec‐15 140 140 0 35 0 140 0 35 35 35 35 140 0 0 0
5717 LDP HSG 39: North of Lang Loan Wallace Land 14.247 G OUT 220 220 0 55 0 220 0 0 55 55 55 165 55 0 0
5704
LDP HSG 40: SE Wedge South ‐
Edmonstone Sheratan Limited 27.233 G OUT Jul‐15 368 368 0 92 0 368 0 0 0 30 60 90 60 60 158
5718
LDP HSG 41: SE Wedge North ‐ The
Wisp Springfield Properties 3.4113 G FULL 81 81 0 18 0 81 15 35 31 0 0 81 0 0 0

Housing Land Audit and Delivery Progranme 2017
Schedule 2: Site Details
Site Ref Site Name /Address Developer (Or Owner) Area Brf/ Total Total Complete Remaining
(N=New site in 2017) /ha Grf Type Date U/C Dwellings Houses Flats affdble by 04/17 as at 04/17 17/18 18/19 19/20 20/21 21/22 Total 22/23 23/24 Post
units 17-22 2024
Consent Expected Completions
Housing Land Supply Delivery Programme
Total for LDP allocated sites 21,063 3,967 9,090 5,510 2,618 18,445 1,082 1,341 1,079 1,578 1,661 6,741 1,693 1,500 8,511
Other Effective Sites
N 5719 Abbey Lane Bellway Homes Ltd (Scotland). 0.7976 B FULL Jun‐16 Mar‐17 139 0 139 31 0 139 0 25 50 50 14 139 0 0 0
N 5720 Abbey Mount Abbey Mount Estates Ltd C/O Agent 0.0483 B FULL Dec‐16 11 0 11 0 0 11 0 0 11 0 0 11 0 0 0
N 5722 Abercromby Place Mr Robert John Dobson 0.0795 B FULL Aug‐16 11 0 11 0 0 11 0 0 11 0 0 11 0 0 0
5552 Annandale Street WPH Developments Ltd. 0.3997 B FULL Jun‐15 Mar‐16 60 0 60 15 45 15 15 0 0 0 0 15 0 0 0
5687 Atholl Crescent Westerwood Ltd. 0.0573 B FULL Feb‐16 Mar‐16 6 0 6 0 0 6 6 0 0 0 0 6 0 0 0
5562 Balcarres Street Morningside Manor Ltd. 0.4624 B FULL Aug‐15 Mar‐16 10 0 10 0 0 10 10 0 0 0 0 10 0 0 0
3781 Bath Road Mr Spence 0.0245 B FULL Oct‐15 6 0 6 0 0 6 0 6 0 0 0 6 0 0 0
3206 Bath Street Hopemangreen (East) Ltd. 0.0159 B FULL Nov‐14 Mar‐17 6 0 6 0 0 6 6 0 0 0 0 6 0 0 0
5560 Bath Street Mr Jamal Jabir. 0.0748 B FULL Dec‐15 6 2 4 0 0 6 0 0 6 0 0 6 0 0 0
5698 Beaverbank Place Beaverbank Place LLP. 0.1664 B FULL Apr‐15 41 0 41 0 0 41 0 21 20 0 0 41 0 0 0
5139 Beaverhall Road
Springfield Properties & MD & JG
Rutte 0.628 B FULL Nov‐15 Mar‐14 83 5 78 20 43 40 40 0 0 0 0 40 0 0 0
5558 Bell's Brae YOR Ltd. 0.1756 B FULL Mar‐16 Mar‐17 10 0 10 0 0 10 10 0 0 0 0 10 0 0 0
5874 Bernard Street J & M Cameron Properties Ltd. 0.0909 B FULL Nov‐16 6 0 6 0 0 6 0 0 6 0 0 6 0 0 0
N 5732 Bonnington Road Lane
Miller Homes Limited & Bonnington
Part 1.4809 B FULL Nov‐16 201 0 201 50 0 201 20 44 50 50 37 201 0 0 0
4402 Brunstane Road South South Castle Properties Limited. 0.3355 B FULL May‐14 Mar‐12 12 12 0 0 6 6 0 3 3 0 0 6 0 0 0
5551A Brunswick Road
Cala Management Ltd & Atiuia (BR)
Ltd. 1.6264 B FULL Jun‐15 Mar‐16 121 0 121 0 72 49 49 0 0 0 0 49 0 0 0
5551B Brunswick Road (AHP) Port of Leith HA 1.6264 B FULL Jun‐15 Mar‐16 43 0 43 43 0 43 43 0 0 0 0 43 0 0 0
5406 Bruntsfield Terrace Northumberland Street Properties. 0.1973 B FULL Nov‐16 5 3 2 0 0 5 0 0 5 0 0 5 0 0 0
N 5739 Calder Gardens Mr Iain Murray 0.2137 B FULL Feb‐17 29 0 29 0 0 29 0 10 19 0 0 29 0 0 0
N 5740 Calder Gardens Robertson Partnership Homes. 0.6781 B FULL Aug‐16 Mar‐17 37 15 22 37 0 37 0 17 20 0 0 37 0 0 0
4917B Calder Road The City Of Edinburgh Council. 4.3487 B FULL Mar‐17 132 73 59 0 0 132 0 0 20 40 40 100 32 0 0
4917A Calder Road The City Of Edinburgh Council. 4.578 B FULL Nov‐15 184 35 149 184 0 184 0 24 40 40 40 144 40 0 0
5665 Canning Street Lane Mr & Mrs ‐ Majdalani 0.0271 B FULL May‐16 Mar‐17 10 0 10 0 0 10 0 10 0 0 0 10 0 0 0
5244.1 Castle Gogar Rigg Quarry Investments. 0.8464 B FULL Sep‐15 9 1 8 0 0 9 0 0 9 0 0 9 0 0 0
5574 Clearburn Crescent Mr David Rae 0.1534 B FULL Oct‐15 10 0 10 0 0 10 0 0 10 0 0 10 0 0 0
5554 Cockburn Street Cameron Guest House Group. 0.0188 B FULL Aug‐15 5 0 5 0 0 5 0 0 5 0 0 5 0 0 0
5542 Corstorphine Road Barnardos. 0.3982 B FULL Aug‐15 Mar‐16 30 0 30 7 0 30 30 0 0 0 0 30 0 0 0
5553 Couper Street Chamberlain Bell Developments. 0.0615 B FULL Jul‐15 Mar‐16 27 0 27 6 0 27 27 0 0 0 0 27 0 0 0
4536 Craighall Road J Anderson. 0.0211 B FULL Dec‐13 Mar‐16 5 0 5 0 0 5 5 0 0 0 0 5 0 0 0
5423 Craighouse Road Quatermile 19.765 B FULL Nov‐14 Mar‐17 145 43 102 0 0 145 0 25 50 50 20 145 0 0 0
3667 Cramond Road North AMA 7.7465 B FULL Mar‐06 Mar‐04 155 87 68 0 142 13 13 0 0 0 0 13 0 0 0
5550 Dalgety Road Evantyr Properties Ltd. 0.3037 B FULL Nov‐15 Mar‐16 52 0 52 0 0 52 26 26 0 0 0 52 0 0 0
5679 Drumsheugh Gardens Drumsheugh Gardens LLP 0.0575 B FULL Jan‐16 9 0 9 0 0 9 0 0 0 9 0 9 0 0 0
N 5759 Drumsheugh Gardens
Westerwood Ltd/ Dunedin House
Properti 0.0509 B FULL Sep‐16 5 0 5 0 0 5 0 0 5 0 0 5 0 0 0
N 5758 Drumsheugh Gardens
Westerwood Ltd ‐ Dunedin House
Propert 0.0673 B FULL Jun‐16 11 0 11 0 0 11 0 0 11 0 0 11 0 0 0
N 5757 Drumsheugh Gardens Square And Crescent Ltd. 0.0972 B FULL Apr‐16 Mar‐17 11 0 11 0 0 11 0 11 0 0 0 11 0 0 0
5634 Drumsheugh Gardens Yor Ltd 0.1277 B FULL Nov‐15 Mar‐16 17 0 17 0 0 17 17 0 0 0 0 17 0 0 0
5289 Duddingston Park South Barratt East Scotland 4.4683 B FULL Feb‐15 Mar‐15 186 138 48 48 72 114 36 36 36 6 0 114 0 0 0

Housing Land Audit and Delivery Progranme 2017
Schedule 2: Site Details
Site Ref Site Name /Address Developer (Or Owner) Area Brf/ Total Total Complete Remaining
(N=New site in 2017) /ha Grf Type Date U/C Dwellings Houses Flats affdble by 04/17 as at 04/17 17/18 18/19 19/20 20/21 21/22 Total 22/23 23/24 Post
units 17-22 2024
Consent Expected Completions
Housing Land Supply Delivery Programme
3544A
ECLP HSG2: Chesser Avenue ‐ FRUIT
MARKET New City Vision/ West Register 3.5806 B FULL Jun‐14 Mar‐16 114 34 80 80 28 86 86 0 0 0 0 86 0 0 0
N 5765 Ellersly Road S1 Developments Ltd. 1.1253 B FULL Jun‐16 Mar‐17 42 6 36 0 0 42 0 20 22 0 0 42 0 0 0
N 5769 Ferry Road Drive Robertson Partnership Homes. 0.4353 B FULL Aug‐16 29 14 15 29 0 29 0 0 10 19 0 29 0 0 0
4942 Ferrymuir
Bellway Homes & Forth Bridges
Business 3.9147 G FULL Dec‐15 Mar‐16 151 82 69 38 29 122 30 30 30 32 0 122 0 0 0
5300 Fort House The City Of Edinburgh Council. 1.8542 B FULL May‐13 Mar‐16 94 2 92 94 0 94 30 30 34 0 0 94 0 0 0
5673 Gayfield Place Cameron Guest House Group. 0.0321 B FULL Jan‐16 5 0 5 0 0 5 0 5 0 0 0 5 0 0 0
4728 Groathill Road South Beaufort Property Company Ltd. 0.133 B FULL Nov‐14 11 1 10 0 0 11 0 11 0 0 0 11 0 0 0
N 5777 Hailesland Place Robertson Partnership Homes. 0.3535 B FULL Mar‐17 32 10 22 32 0 32 0 0 16 16 0 32 0 0 0
5641 High Street Mr Steven Garry. 0.0409 B FULL Jan‐16 Mar‐17 13 0 13 0 0 13 13 0 0 0 0 13 0 0 0
N 5784 Horne Terrace AMA (New Town) Ltd. 0.0196 B FULL Sep‐16 11 0 11 0 0 11 0 11 0 0 0 11 0 0 0
4677 Inglis Green Road Cruden Homes (East) Ltd. 0.3284 B FULL Dec‐15 Mar‐16 54 0 54 54 0 54 25 29 0 0 0 54 0 0 0
5314 Kinnear Road Kinnear Road Ltd. 0.4629 B FULL May‐13 Mar‐14 15 3 12 0 14 1 1 0 0 0 0 1 0 0 0
N 5791 Ladywell Avenue Mr J M MacDonald 0.1377 B OUT May‐16 10 0 10 0 0 10 0 0 0 10 0 10 0 0 0
5459 Lanark Road West Cruden Homes (East) Ltd. 1.0514 B FULL Mar‐15 Mar‐16 48 21 27 12 29 19 19 0 0 0 0 19 0 0 0
5463A Liberton Gardens David Wilson Homes 10.279 B FULL Oct‐15 Mar‐16 206 116 90 71 25 181 25 50 50 50 6 181 0 0 0
5463B Liberton Gardens CALA 10.279 B FULL Oct‐15 Mar‐16 92 68 24 0 42 50 44 6 0 0 0 50 0 0 0
5694 Loaning Road Ryce Limited. 0.0554 B FULL Mar‐16 6 0 6 0 0 6 0 0 6 0 0 6 0 0 0
N 5799 Loaning Road Cullross Ltd, Hillcresst Hsg Asoc . Ca 0.4028 B FULL Nov‐16 59 0 59 0 0 59 0 19 20 20 0 59 0 0 0
5027 London Road Caledonian Trust PLC. 0.9115 B OUT Nov‐16 81 0 81 21 0 81 0 0 0 40 41 81 0 0 0
N 5800 Longstone Road
Castle Rock Edinvar Housing
Associatio 5.6255 G FULL Nov‐16 157 50 107 39 0 157 0 25 50 50 32 157 0 0 0
N 5801 Madeira Street Port Of Leith Housing Association. 0.1191 B FULL May‐16 Mar‐17 12 0 12 12 0 12 0 12 0 0 0 12 0 0 0
5544 Marionville Road Glendinning Assets Limited. 0.45 B FULL Nov‐15 34 0 34 0 0 34 0 0 17 17 0 34 0 0 0
N 5803 Maritime Lane Zonal Retail Data System Ltd. 0.0472 B FULL Oct‐16 6 0 6 0 0 6 0 0 6 0 0 6 0 0 0
N 5806 Mcdonald Place Albany Street Developments Ltd. 0.0615 B FULL Feb‐17 11 0 11 0 0 11 0 0 11 0 0 11 0 0 0
5472 Mcdonald Road Kingsford Developments. 0.178 B FULL Jan‐15 Mar‐16 75 0 75 18 0 75 25 25 25 0 0 75 0 0 0
N 5809 Mill Lane 000906461120 0.0403 B FULL Sep‐16 6 0 6 0 0 6 0 0 6 0 0 6 0 0 0
N 5810 Minto Street Merchant Capital (Edinburgh) Ltd. 0.2414 B FULL Sep‐16 11 3 8 0 0 11 0 0 11 0 0 11 0 0 0
5676 Montpelier Terrace JNL Property Investments. 0.0148 B FULL Feb‐16 5 0 5 0 0 5 0 0 5 0 0 5 0 0 0
5707 Morrison Crescent
Fountain North Ltd And Dunedin
Canmore 0.1506 B FULL Mar‐16 19 0 19 19 0 19 0 0 9 10 0 19 0 0 0
5197 Muirhouse Avenue Springfield Properties. 2.9228 B FULL Mar‐16 Mar‐13 202 50 152 202 124 78 78 0 0 0 0 78 0 0 0
5478 Newbattle Terrace Weymss Steadings 2006 Ltd. 0.0581 B FULL Dec‐14 Mar‐17 7 0 7 0 0 7 7 0 0 0 0 7 0 0 0
5477 Newbattle Terrace Wemyss Steadings 2006 Ltd. 0.1251 B FULL Jun‐14 Mar‐17 11 0 11 0 0 11 11 0 0 0 0 11 0 0 0
5709 Newbattle terrace Wemyss Steadings 2006 Ltd. 0.0715 B FULL Mar‐16 Mar‐17 7 0 7 0 0 7 7 0 0 0 0 7 0 0 0
5651 North Bridge Jo Rowe Property. 0.0176 B FULL Dec‐15 Mar‐17 5 0 5 0 0 5 5 0 0 0 0 5 0 0 0
5383 Old Dalkeith Road Sheratan Ltd. 9.6208 G FULL Nov‐14 110 110 0 28 0 110 0 25 50 35 0 110 0 0 0
N 5821 Parkgrove Terrace Robertson Partnership Homes. 0.5978 B FULL Dec‐16 44 0 44 44 0 44 0 0 22 22 0 44 0 0 0
5159 Pennywell Road City Of Edinburgh Council. 11.484 B OUT Aug‐12 154 0 154 154 0 154 0 0 0 25 50 75 50 29 0
4996.4 Pennywell Road CEC 2.214 B OUT Sep‐13 68 2 66 20 0 68 0 0 30 38 0 68 0 0 0
4996.3 Pennywell Road Urban Union. 3.6228 B FULL Aug‐15 Mar‐17 177 85 92 75 0 177 30 50 50 47 0 177 0 0 0
4710 Pitsligo Road Telereal Trillium. 1.8712 B FULL Aug‐13 Mar‐15 81 24 57 0 45 36 36 0 0 0 0 36 0 0 0
5540A Portobello High Street Barratt East Scotland. 1.4116 B FULL Nov‐15 Mar‐17 105 105 0 0 0 105 38 38 29 0 0 105 0 0 0

Housing Land Audit and Delivery Progranme 2017
Schedule 2: Site Details
Site Ref Site Name /Address Developer (Or Owner) Area Brf/ Total Total Complete Remaining
(N=New site in 2017) /ha Grf Type Date U/C Dwellings Houses Flats affdble by 04/17 as at 04/17 17/18 18/19 19/20 20/21 21/22 Total 22/23 23/24 Post
units 17-22 2024
Consent Expected Completions
Housing Land Supply Delivery Programme
5540B Portobello High Street Cruden Property Developments Ltd. 0.4264 B FULL Nov‐15 Mar‐17 52 0 52 52 0 52 26 26 0 0 0 52 0 0 0
5540C Portobello High Street
McCarthy & Stone Retirement
Lifestyles 0.2859 B FULL Nov‐15 Mar‐17 42 0 42 0 0 42 42 0 0 0 0 42 0 0 0
5561 Portobello High Street Kerwick Ltd. 0.1947 B FULL Nov‐15 Mar‐16 26 0 26 0 0 26 26 0 0 0 0 26 0 0 0
N 5829 Princes Street Malcolm Hollis. 0.0341 B FULL Apr‐16 6 0 6 0 0 6 0 0 0 6 0 6 0 0 0
5496 Queensferry Road Mr Jim Dolan 0.3234 B FULL Mar‐15 6 0 6 0 0 6 0 0 6 0 0 6 0 0 0
3762 RWELP HSG : Ferrymuir Gait Corus Hotels Ltd. 4.6627 B OUT Oct‐15 108 78 30 0 0 108 0 0 0 18 40 58 50 0 0
1000 RWELP HSG 1: Kinleith Mills Cala Homes 1.4115 B FULL Jan‐15 Mar‐16 89 65 24 22 33 56 30 26 0 0 0 56 0 0 0
3746 RWELP HSP 3: Kirkliston Distillery Miller Homes and Cruden 3.6111 B FULL Jun‐15 Mar‐13 122 89 29 20 85 37 37 0 0 0 0 37 0 0 0
3750 RWELP HSP 6: Craigpark Quarry Cala Management Ltd. 7.5386 B FULL Nov‐14 Mar‐16 111 111 0 17 36 75 25 25 25 0 0 75 0 0 0
5585 Saughton Mains Street Haig Housing Trust. 1.4604 B FULL Sep‐15 15 0 15 0 0 15 0 15 0 0 0 15 0 0 0
5265 South Gayfield Lane TRI Scotland. 0.0686 B FULL Apr‐16 5 0 5 0 0 5 0 5 0 0 0 5 0 0 0
N 5844 St Andrew Square St Andrew Square (Property) Limited. 0.1321 B FULL Jun‐16 Mar‐17 53 0 53 0 0 53 0 23 30 0 0 53 0 0 0
4793 St James Centre TIAA Henderson Real Estate. 0.487 B FULL Sep‐16 150 0 150 0 0 150 0 50 50 50 0 150 0 0 0
N 5850 Sunnybank Place Enemetric. 0.2041 B FULL Jun‐16 35 0 35 35 0 35 0 0 15 20 0 35 0 0 0
N 5851 Tennant Street Persimmon Homes (East Scotland). 0.4318 B FULL Jun‐16 Mar‐17 33 13 20 8 20 13 13 0 0 0 0 13 0 0 0
4819 Tennant Street Persimmon Homes 0.138 B FULL Jan‐16 Mar‐16 49 27 22 11 35 14 14 0 0 0 0 14 0 0 0
5699 Timber Bush KAAS Properties Limited 0.0171 B FULL Jan‐16 6 0 6 0 0 6 0 0 6 0 0 6 0 0 0
N 5857 Trinity Road Mr John and Moira Paterson 0.1355 B FULL Feb‐17 5 5 0 0 0 5 0 0 5 0 0 5 0 0 0
5546 Warriston Road Gurney Ghatoray. 0.0699 B FULL Nov‐15 10 0 10 0 0 10 0 0 10 0 0 10 0 0 0
5370 West Bowling Green Street J Smart & Co. 0.8321 B FULL Mar‐17 97 0 97 24 0 97 0 25 25 25 22 97 0 0 0
N 5866 West Bowling Green Street Johnstone & Graham. 0.3892 B FULL Sep‐16 24 0 24 0 0 24 0 0 12 12 0 24 0 0 0
4502 West Coates Cala Evans Restoration Ltd And City & 7.4209 B FULL Jun‐16 Mar‐17 203 0 203 0 0 203 0 25 50 50 50 175 28 0 0
N 5868 West Harbour Road
David Gallacher Retirement Benefit
Sch 0.1264 B FULL Mar‐17 13 0 13 0 0 13 0 0 13 0 0 13 0 0 0
4191 West Mill Road
Change Homes (West Mill Road) Ltd +
Ca 0.1963 B FULL Aug‐12 Mar‐16 7 7 0 0 1 6 6 0 0 0 0 6 0 0 0
N 5869 West Pilton Place Salus Developments. 0.0063 B FULL Oct‐16 8 0 8 0 0 8 0 0 8 0 0 8 0 0 0
Small sites 309 0 309 62 62 62 62 61 309 0 0 0
Total for Non-allocated sites 5,810 1,595 3,902 1,672 926 4,884 1,144 926 1,213 919 453 4,655 200 29 0
Total for City of Edinburgh 26,873 5,562 12,992 7,182 3,544 23,329 2,226 2,267 2,292 2,497 2,114 11,396 1,893 1,529 8,511

Schedule 3: Completions

Housing Land Audit and Delivery Progranme 2017
Schedule 3: Completions 2016/17
Site Ref Site Name Brf/ Total Total Remaining
(C= Site completed Grf Dwellings Houses Flats affordable To Mar-16 16-17 To Mar-17 at Apr-17 17/18 18/19 19/20 20/21 21/22 Total 22/23 23/24 Post
during 2016/17) units 17-22 2024
Y 5548 Advocate's Close B 14 0 14 0 14 14 0
5552 Annandale Street B 60 0 60 15 45 45 15 15 0 0 0 0 15 0 0 0
C 5394 Baberton Loan B 6 6 0 0 6 6 0
C 5269 Barnton Park Wood B 8 8 0 0 8 8 0
C 5596 Baxter's Place B 5 0 5 0 5 5 0
5139 Beaverhall Road B 83 5 78 20 31 12 43 40 40 0 0 0 0 40 0 0 0
C 5384 Blackchapel Close B 91 67 24 22 46 45 91 0
C 5575 Blackfriars Street B 8 0 8 0 8 8 0
5551A Brunswick Road B 121 0 121 0 72 72 49 49 0 0 0 0 49 0 0 0
C 5419 Cockburnhill Road B 5 5 0 0 5 5 0
C 5573 Craigmount Avenue B 5 5 0 0 5 5 0
3667 Cramond Road North B 155 87 68 0 139 3 142 13 13 0 0 0 0 13 0 0 0
C 5134 Derghorn Loan (Polo Fields) G 79 66 13 19 43 36 79 0
C 5682 Dublin Street B 5 0 5 0 5 5 0
5289 Duddingston Park South B 186 138 48 48 36 36 72 114 36 36 36 6 0 114 0 0 0
C 4365 Duke Street B 53 0 53 0 53 53 0
C 4249 ECLP HSG 10: Clermiston Campus B 328 118 210 118 317 11 328 0
3544A
ECLP HSG2: Chesser Avenue ‐ FRUIT
MARKET B 114 34 80 80 28 28 86 86 0 0 0 0 86 0 0 0
C 4544 Ellersly Road B 19 6 13 1 6 13 19 0
4942 Ferrymuir G 151 82 69 38 29 29 122 30 30 30 32 0 122 0 0 0
C 4841 Gracemount Drive B 116 46 70 116 80 36 116 0
C 5674 Great Stuart Street B 5 0 5 0 5 5 0
C 5310 Greenbank Drive B 9 9 0 0 9 9 0
C 5450 Harvesters Way B 183 40 143 183 38 145 183 0
C 5549 Horne Terrace B 17 0 17 0 17 17 0
5459 Lanark Road West B 48 21 27 12 29 29 19 19 0 0 0 0 19 0 0 0
C 4338.2 LDP CC3: Fountainbridge B 191 0 191 0 115 76 191 0
3957 LDP CC4: Quartermile B 983 0 983 171 835 45 880 103 103 0 0 0 0 103 0 0 0
5245.1 LDP Del 5: Edinburgh Park / South Gyle G 200 96 104 50 16 87 103 97 47 50 0 0 0 97 0 0 0
C 3424.8 LDP EW 1A: Western Harbour B 96 0 96 96 12 84 96 0
4899 LDP HSG 10: Fairmilehead Water Treat B 280 180 100 73 221 34 255 25 25 0 0 0 0 25 0 0 0
Completions Delivery Programme

Housing Land Audit and Delivery Progranme 2017
Schedule 3: Completions 2016/17
Site Ref Site Name Brf/ Total Total Remaining
(C= Site completed Grf Dwellings Houses Flats affordable To Mar-16 16-17 To Mar-17 at Apr-17 17/18 18/19 19/20 20/21 21/22 Total 22/23 23/24 Post
during 2016/17) units 17-22 2024
Completions Delivery Programme
3965 LDP HSG 12: Albion Road B 205 48 157 0 50 50 155 75 80 0 0 0 155 0 0 0
C 4509.2 LDP HSG 13: Eastern General Hospital B 155 10 145 155 24 131 155 0
C 3756.4 LDP HSG 14: Niddrie Mains Road B 110 26 84 17 87 23 110 0
C 3753.0 LDP HSG 18: New Greendykes Area E G 75 45 30 0 60 15 75 0
3753.2
LDP HSG 18: New Greendykes Areas
I&J G 160 108 52 0 25 79 104 56 56 0 0 0 0 56 0 0 0
4723.1 LDP HSG 2: Scotstoun Avenue (Agilent) B 294 0 0 112 90 85 175 119 60 59 0 0 0 119 0 0 0
4723.2 LDP HSG 2: Scotstoun Avenue (Agilent) B 156 0 0 0 71 21 92 64 32 32 0 0 0 64 0 0 0
C 5133
LDP HSG 22: Burdiehouse Road phase
1 G 122 91 31 30 83 39 122 0
5250 LDP HSG 23: Gilmerton Dykes Road G 61 0 0 15 0 25 25 36 36 0 0 0 0 36 0 0 0
5253 LDP HSG 26: Newcraighall North G 220 194 26 55 34 46 80 140 36 36 36 32 0 140 0 0 0
C 3745.6 LDP HSG 3: Queensferry Road G 125 81 44 81 105 20 125 0
3745.5 LDP HSG 3: Queensferry Road G 69 69 0 0 40 16 56 13 13 0 0 0 0 13 0 0 0
3745.4 LDP HSG 3: Queensferry Road G 75 75 0 0 5 5 70 41 27 2 0 0 70 0 0 0
C 5255 LDP HSG 35: Riccarton Mains Road G 17 17 0 0 17 17 0
4898 LDP HSG 6: South Gyle Wynd G 203 92 111 48 38 72 110 93 45 48 0 0 0 93 0 0 0
4508 LDP HSG 8: Telford College (North) B 329 0 329 89 211 57 268 61 31 30 0 0 0 61 0 0 0
4812 LDP HSG 9: City Park G 203 0 203 152 56 101 157 46 46 0 0 0 0 46 0 0 0
5463A Liberton Gardens B 206 116 90 71 25 25 181 25 50 50 50 6 181 0 0 0
5463B Liberton Gardens B 92 68 24 0 6 36 42 50 44 6 0 0 0 50 0 0 0
C 5469 Manor Place B 9 0 9 0 7 2 9 0
C 5556 Mcleod Street B 25 0 25 6 25 25 0
5197 Muirhouse Avenue B 202 50 152 202 122 2 124 78 78 0 0 0 0 78 0 0 0
C 5476 Murrayfield Drive B 17 0 17 0 17 17 0
C 5484 North Castle Street B 11 0 11 0 8 8 3
C 4996.1 Pennywell Road B 193 70 123 108 63 130 193 0
4710 Pitsligo Road B 81 24 57 0 18 27 45 36 36 0 0 0 0 36 0 0 0
C 5495 Princes Street B 5 0 5 0 5 5 0
C 5570 Queen Street B 6 0 6 0 6 6 0
C 5102 Queensferry Road B 8 8 0 0 8 8 0

Housing Land Audit and Delivery Progranme 2017
Schedule 3: Completions 2016/17
Site Ref Site Name Brf/ Total Total Remaining
(C= Site completed Grf Dwellings Houses Flats affordable To Mar-16 16-17 To Mar-17 at Apr-17 17/18 18/19 19/20 20/21 21/22 Total 22/23 23/24 Post
during 2016/17) units 17-22 2024
Completions Delivery Programme
C 5507 Russell Road B 6 0 6 0 6 6 0
1000 RWELP HSG 1: Kinleith Mills B 89 65 24 22 2 31 33 56 30 26 0 0 0 56 0 0 0
3746 RWELP HSP 3: Kirkliston Distillery B 122 89 29 20 30 55 85 37 37 0 0 0 0 37 0 0 0
3750 RWELP HSP 6: Craigpark Quarry B 111 111 0 17 16 20 36 75 25 25 25 0 0 75 0 0 0
C 5510 Salvesen Gardens B 5 5 0 5 5 5 0
C 5702 Slateford Road B 34 13 21 8 6 28 34 0
C 5143 South Oswald Road B 10 0 10 0 10 10 0
C 4528 St Andrew Square B 6 0 6 0 6 6 0
4819 Tennant Street B 49 27 22 11 35 35 14 14 0 0 0 0 14 0 0 0
5851 Tennant Street B 33 13 20 8 20 20 13 13 0 0 0 0 13 0 0 0
C 5569 Torphichen Street B 11 0 11 0 11 11 0
4191 West Mill Road B 7 7 0 0 1 1 6 6 0 0 0 0 6 0 0 0
C 5375 Westfield Court B 5 0 5 0 5 5 0
C 5647 York Place B 11 0 11 0 11 11 0
Small sites 114
Total completions 2016/17 2457

Schedule 4: Constrained Sites

Housing Land Audit and Delivery Progranme 2017
Schedule 4: Constrained Sites
Ref Address Developer/applicant Total Afford. Comp. Remain Type Date Constraint
5244 LDP Emp 6 IBG LDP Site 350 88 0 350
No specific residential capacity established in statutary
planning document
3424.1
LDP EW 1A: Western Harbour ‐
Platinum Point Gregor Shore Plc. 452 0 226 226 Full Apr‐04 Developer in administration
3424.6
LDP EW 1A: Western Harbour
View AB Leith Ltd. 258 0 0 258 Full May‐13 Intention of owner unknown
4893
LDP EW 1B: Central Leith
waterfront Forth Ports 2,680 670 0 2,680 Various including air quality and current land use
4894
LDP EW 1C: Leith Waterfront ‐
Salamander Place 719 180 0 719 Site in use (light industry)
3105B
LDP EW 2A: West Shore Road ‐
Forth Quarter Secondsite Property 691 125 0 691 Out Oct‐03 Land contamination
3733A.1 LDP EW 2B: Granton Park Avenue
Buredi + Waterfront Edinburgh
Ltd. 95 26 14 81 Full Sep‐05 None housing use being investigated
3733A.6 LDP EW 2B: West Harbour Road Waterfront Edinburgh Limited. 42 7 0 42 Out Apr‐09 Consent expired
3744.2 LDP EW 2C: Granton Harbour Gregor Shore PLC. 288 0 133 155 Full Jul‐05 Developer in administration
3744B LDP EW 2C: Granton Harbour Various 426 190 0 426 Out Jan‐14 Site in use (Industrial)
3733B
LDP EW 2D: Waterfront ‐ WEL ‐
North Shore Various 850 170 0 850 Site in use (Industrial)
3760 LDP HSG 1: Springfield Lp Site 150 0 0 150 Controlled by Forth Road Crrossing until project complete
4157 LDP HSG 15: Castlebrae LP site 145 0 0 145 Site in use (High School)
3754.3 LDP HSG 17: Greendykes Road Craigmillar Eco Housing Co‐op 10 0 0 10 Full Oct-14 Consent about to expire - no progress
5132 LDP HSG 4: West Newbridge Lp Site 500 125 0 500 No developer interest / site viability
4897 LDP HSG 7: Edinburgh Zoo 80 20 0 80 Site in use (Edinburgh Zoo)
5710 LDP HSG 28: Ellens Glen Road LDP site 240 60 0 240 Still in use as donor centre
3623 Ocean Drive Wimpey City 193 29 0 193 Full Jul‐02 No consent / not marketed
3533 RWELP HSP 4: Newbridge Nursery Kinleith Industrial Estates Ltd. 25 0 0 25 Out Sep‐06 No consent / not marketed
5547 Craigleith Road Motor Fuel Limited. 10 0 0 10 Out Dec‐15 In use as petrol station
5011 Shandwick Place Mr T Diresta 11 0 0 11 Full Nov‐15 Not marketed
Small sites 103 103
8,318 1,690 373 7,945
Housing Units Consent

Schedule 5: Factors affecting delivery

Housing Land Audit and Delivery Progranme 2017
Schedule 5: Factors affecting delivery
Ref Site Name Developer/applicant Capacity Affordable Complete Remaining
Delivery in 5
years
Delivery
beyond year
5
Programming allready at maximum
5552 Annandale Street WPH Developments Ltd. 60 15 45 15 15 0
5687 Atholl Crescent Westerwood Ltd. 6 0 0 6 6 0
5562 Balcarres Street Morningside Manor Ltd. 10 0 0 10 10 0
3206 Bath Street Hopemangreen (East) Ltd. 6 0 0 6 6 0
5139 Beaverhall Road Springfield Properties & MD & JG Rutte 83 20 43 40 40 0
5558 Bell's Brae YOR Ltd. 10 0 0 10 10 0
5551A Brunswick Road Cala Management Ltd & Atiuia (BR) Ltd. 121 0 72 49 49 0
5551B Brunswick Road (AHP) Port of Leith HA 43 43 0 43 43 0
5665 Canning Street Lane Mr & Mrs ‐ Majdalani 10 0 0 10 10 0
5542 Corstorphine Road Barnardos. 30 7 0 30 30 0
5553 Couper Street Chamberlain Bell Developments. 27 6 0 27 27 0
4536 Craighall Road J Anderson. 5 0 0 5 5 0
3667 Cramond Road North AMA 155 0 142 13 13 0
5679 Drumsheugh Gardens Drumsheugh Gardens LLP 9 0 0 9 9 0
5634 Drumsheugh Gardens Yor Ltd 17 0 0 17 17 0
5757 Drumsheugh Gardens Square And Crescent Ltd. 11 0 0 11 11 0
3544A ECLP HSG2: Chesser Avenue ‐ FRUIT MARKET New City Vision/ West Register 114 80 28 86 86 0
4677 Inglis Green Road Cruden Homes (East) Ltd. 54 54 0 54 54 0
5314 Kinnear Road Kinnear Road Ltd. 15 0 14 1 1 0
5459 Lanark Road West Cruden Homes (East) Ltd. 48 12 29 19 19 0
3957 LDP CC4: Quartermile Southside Capital Ltd. 983 171 880 103 103 0
3424.9 LDP EW 1A: Western Harbour ‐ Newhaven Place FP Newhaven Two Ltd. 146 138 0 146 146 0
4899 LDP HSG 10: Fairmilehead Water Treat CALA / Barratt 280 73 255 25 25 0
4509.3 LDP HSG 13: Eastern General Hospital ph 3 Hillcrest HA 76 76 0 76 76 0
3756.8 LDP HSG 14: Niddrie Mains Road Cruden Homes (East) Ltd. 149 38 0 149 149 0
3753.1 LDP HSG 18: New Greendykes Area AH2 Persimmon Homes. 130 130 91 39 39 0
3745.5 LDP HSG 3: Queensferry Road Barratt East Scotland. 69 0 56 13 13 0
4812 LDP HSG 9: City Park Link Group Ltd And J Smart + Co (Cont 203 152 157 46 46 0
5801 Madeira Street Port Of Leith Housing Association. 12 12 0 12 12 0
5197 Muirhouse Avenue Springfield Properties. 202 202 124 78 78 0
5709 Newbattle terrace Wemyss Steadings 2006 Ltd. 7 0 0 7 7 0
5478 Newbattle Terrace Weymss Steadings 2006 Ltd. 7 0 0 7 7 0
5477 Newbattle Terrace Wemyss Steadings 2006 Ltd. 11 0 0 11 11 0
5651 North Bridge Jo Rowe Property. 5 0 0 5 5 0
4710 Pitsligo Road Telereal Trillium. 81 0 45 36 36 0
5561 Portobello High Street Kerwick Ltd. 26 0 0 26 26 0
5540C Portobello High Street McCarthy & Stone Retirement Lifestyles 42 0 0 42 42 0
3746 RWELP HSP 3: Kirkliston Distillery Miller Homes and Cruden 122 20 85 37 37 0
5851 Tennant Street Persimmon Homes (East Scotland). 33 8 20 13 13 0
4819 Tennant Street Persimmon Homes 49 11 35 14 14 0
4191 West Mill Road Change Homes (West Mill Road) Ltd + Ca 7 0 1 6 6 0
Rate determined by market demand
5719 Abbey Lane Bellway Homes Ltd (Scotland). 139 31 0 139 139 0
4402 Brunstane Road South South Castle Properties Limited. 12 0 6 6 6 0
5740 Calder Gardens Robertson Partnership Homes. 37 37 0 37 37 0
5423 Craighouse Road Edinburgh Napier University And Craigh 145 0 0 145 145 0
5550 Dalgety Road Evantyr Properties Ltd. 52 0 0 52 52 0
5289 Duddingston Park South Barratt East Scotland 186 48 72 114 114 0
5765 Ellersly Road S1 Developments Ltd. 42 0 0 42 42 0
4942 Ferrymuir Bellway Homes & Forth Bridges Business 151 38 29 122 122 0
4516 LDP CC3: West Tollcross Knightsbridge Student Housing Ltd. 113 22 22 91 91 0
5245.1 LDP Del 5: Edinburgh Park / South Gyle David Wilson Homes 200 50 103 97 97 0
4894.1 LDP EW 1C: Salamander Place Teague Developments Ltp 781 195 145 636 125 511
4773 LDP HSG 11: Shrub Place Places For People (Shrubhill) Ltd. 346 346 0 346 346 0

Housing Land Audit and Delivery Progranme 2017
Schedule 5: Factors affecting delivery
Ref Site Name Developer/applicant Capacity Affordable Complete Remaining
Delivery in 5
years
Delivery
beyond year
5
3965 LDP HSG 12: Albion Road Places for People 205 0 50 155 155 0
3754.4 LDP HSG 17: Greendykes Road BDW Trading Ltd 158 0 0 158 158 0
3753.3 LDP HSG 18: New Greendykes Area F Persimmon Homes. 58 0 0 58 58 0
3753.4 LDP HSG 18: New Greendykes Areas G & AH3 Persimmon Homes (East Scotland) 165 70 0 165 125 40
3753.2 LDP HSG 18: New Greendykes Areas I&J Taylor Wimpey 160 0 104 56 56 0
4723.2 LDP HSG 2: Scotstoun Avenue (Agilent) Cala Homes 156 0 92 64 64 0
4723.1 LDP HSG 2: Scotstoun Avenue (Agilent) Barratt 294 112 175 119 119 0
5249 LDP HSG 22: Burdiehouse Road Hallam Land Management Ltd & BDW Tradi 210 52 0 210 180 30
5253 LDP HSG 26: Newcraighall North EDI Group Ltd And Barratt Homes/BDW Tr 220 55 80 140 140 0
5254.1 LDP HSG 27: Newcraighall East 1sr phase Avant Homes 176 0 0 176 176 0
3745.4 LDP HSG 3: Queensferry Road Walker Group 75 0 5 70 70 0
5706 LDP HSG 38: Ravelrig Road Cala 140 35 0 140 140 0
4898 LDP HSG 6: South Gyle Wynd Persimmon Homes. 203 48 110 93 93 0
4508 LDP HSG 8: Telford College (North) Miller Homes Ltd. 329 89 268 61 61 0
5463A Liberton Gardens David Wilson Homes 206 71 25 181 181 0
5463B Liberton Gardens CALA 92 0 42 50 50 0
5472 Mcdonald Road Kingsford Developments. 75 18 0 75 75 0
5540A Portobello High Street Barratt East Scotland. 105 0 0 105 105 0
5540B Portobello High Street Cruden Property Developments Ltd. 52 52 0 52 52 0
1000 RWELP HSG 1: Kinleith Mills Cala Homes 89 22 33 56 56 0
3750 RWELP HSP 6: Craigpark Quarry Cala Management Ltd. 111 17 36 75 75 0
5844 St Andrew Square St Andrew Square (Property) Limited. 53 0 0 53 53 0
4502 West Coates Cala Evans Restoration Ltd And City & 203 0 0 203 175 28
Rate determined by affordable housing programme
4917A Calder Road The City Of Edinburgh Council. 184 184 0 184 144 40
5300 Fort House The City Of Edinburgh Council. 94 94 0 94 94 0
3744.6 LDP EW 2C: Granton Harbour ‐ Plot 3 Port Of Leith Housing Association. 104 104 0 104 104 0
3756 LDP HSG 14: Niddrie Mains Parc Craigmillar Ltd. 214 214 0 214 25 189
3756.7 LDP HSG 14: Niddrie Mains Road JV ‐ CCG (Scotland) Limited / PARC Cra 121 42 0 121 121 0
3754.5 LDP HSG 17: Greendykes Road 21st Century Homes. 75 75 0 75 75 0
3754.3 LDP HSG 17: Greendykes Road Craigmillar Eco Housing Co‐op 10 10 0 10 0 0 Constrained
5799 Loaning Road Cullross Ltd, Hillcresst Hsg Asoc . Ca 59 0 0 59 59 0
5800 Longstone Road Castle Rock Edinvar Housing Associatio 157 39 0 157 157 0
5159 Pennywell Road City Of Edinburgh Council. 154 154 0 154 75 79
4996.4 Pennywell Road CEC 68 20 0 68 68 0
4996.3 Pennywell Road Urban Union. 177 75 0 177 177 0
Commence Development
5698 Beaverbank Place Beaverbank Place LLP. 41 0 0 41 41 0
5874 Bernard Street J & M Cameron Properties Ltd. 6 0 0 6 6 0
5732 Bonnington Road Lane Miller Homes Limited & Bonnington Part 201 50 0 201 201 0
4917B Calder Road The City Of Edinburgh Council. 132 0 0 132 100 32
5554 Cockburn Street Cameron Guest House Group. 5 0 0 5 5 0
5759 Drumsheugh Gardens Westerwood Ltd/ Dunedin House Properti 5 0 0 5 5 0
5758 Drumsheugh Gardens Westerwood Ltd ‐ Dunedin House Propert 11 0 0 11 11 0
5769 Ferry Road Drive Robertson Partnership Homes. 29 29 0 29 29 0
5673 Gayfield Place Cameron Guest House Group. 5 0 0 5 5 0
4728 Groathill Road South Beaufort Property Company Ltd. 11 0 0 11 11 0
5777 Hailesland Place Robertson Partnership Homes. 32 32 0 32 32 0
5784 Horne Terrace AMA (New Town) Ltd. 11 0 0 11 11 0
3825 LDP CC2: New Street Artesan 164 0 0 164 134 30
4900 LDP CC3: Fountainbridge EDI 321 80 0 321 150 171
4338.5 LDP CC3: Fountainbridge Fountain North Ltd. 141 0 0 141 141 0
3753 LDP HSG 18: New Greendykes Persimmon Homes. 291 25 0 291 75 216
5248 LDP HSG 21: Broomhills David Wilson Homes and Barratt 633 158 0 633 200 433
5251.1 LDP HSG 24: Gilmerton Station Road Miller Homes Ltd 198 0 0 198 198 0

Housing Land Audit and Delivery Progranme 2017
Schedule 5: Factors affecting delivery
Ref Site Name Developer/applicant Capacity Affordable Complete Remaining
Delivery in 5
years
Delivery
beyond year
5
5715 LDP HSG 36: Curiehill Road Miller homes 53 15 0 53 53 0
5718 LDP HSG 41: SE Wedge North ‐ The Wisp Springfield Properties 81 18 0 81 81 0
5806 Mcdonald Place Albany Street Developments Ltd. 11 0 0 11 11 0
5809 Mill Lane 000906461120 6 0 0 6 6 0
5707 Morrison Crescent Fountain North Ltd And Dunedin Canmore 19 19 0 19 19 0
5821 Parkgrove Terrace Robertson Partnership Homes. 44 44 0 44 44 0
5829 Princes Street Malcolm Hollis. 6 0 0 6 6 0
5585 Saughton Mains Street Haig Housing Trust. 15 0 0 15 15 0
4793 St James Centre TIAA Henderson Real Estate. 150 0 0 150 150 0
5857 Trinity Road Mr John and Moira Paterson 5 0 0 5 5 0
5370 West Bowling Green Street J Smart & Co. 97 24 0 97 97 0
5869 West Pilton Place Salus Developments. 8 0 0 8 8 0
Discharge existing planning conditions / legal agreements
3760 LDP HSG 1: Springfield Lp Site 150 0 0 150 0 0 Constrained
3754.6 LDP HSG 17: Greendykes Road PARC Craigmillar Ltd.. 172 0 0 172 123 49
Sign legal agreements for Minded to Grant cases
3733A LDP EW 2B: Waterfront WEL ‐ Central Dev Area Various 1604 235 0 1604 150 1454
3744A LDP EW 2C: Granton Harbour Various 951 107 0 951 100 851
3755 LDP HSG 16: Thistle Foundation Edinvar 143 143 0 143 143 0
5711 LDP HSG 29: Brunstane LDP site 1330 332 0 1330 75 1255
5716 LDP HSG 37: Newmills Road Cala Management 206 58 0 206 152 54
Determine pending application
5244 LDP Emp 6 IBG LDP Site 350 88 0 350 0 0 Constrained
3733A.5 LDP EW 2B: Upper Strand Phs 2 �Upper Strand Developments Ltd Waterf 64 16 0 64 64 0
5246.1 LDP HSG 19: Maybury East Taylor Wimpey 250 63 0 250 125 125
5250 LDP HSG 23: Gilmerton Dykes Road Miller Homes 61 15 25 36 36 0
5252 LDP HSG 25: The Drum South East Edinburgh Development Compa 149 43 0 149 75 74
5712 LDP HSG 32: Buileyon Road LDP site 840 210 0 840 125 715
5713 LDP HSG 33: South Scotstoun Taylor Wimpey 375 94 0 375 170 205
5714 LDP HSG 34: Dalmeny LDP site 15 4 0 15 15 0
3747 LDP HSG 5: Hillwood Rd Taylor Wimpey 132 33 0 132 125 7
Submit planning application (if PAN period concluded for major applications)
5791 Ladywell Avenue Mr J M MacDonald 10 0 0 10 10 0
4338 LDP CC3: Fountainbridge Fountain North Ltd + Scottish Newcastl 250 0 0 250 50 200
5245 LDP Del 5: Edinburgh Park / South Gyle LDP Site 375 94 0 375 100 275
3424 LDP EW 1A: Western Harbour Forth Properties Limited. 1155 304 0 1155 0 1155
3733A.6 LDP EW 2B: West Harbour Road Waterfront Edinburgh Limited. 42 7 0 42 0 0 Constrained
3754 LDP HSG 17: Greendykes Craigmillar JVC 426 133 0 426 75 351
5246.2 LDP HSG 19: Maybury Central West Craigs Ltd. 1470 368 0 1470 150 1320
5246.3 LDP HSG 19: Maybury West Roseberry Estates 130 33 0 130 25 105
5251 LDP HSG 24: Gilmerton Station Road Mac & Mic 502 175 0 502 100 402
5704 LDP HSG 40: SE Wedge South ‐ Edmonstone Sheratan Limited 368 92 0 368 90 278
3762 RWELP HSG : Ferrymuir Gait Corus Hotels Ltd. 108 0 0 108 58 50
Submit Proposal of Application Notice (major applications)
5247 LDP HSG 20: Cammo LDP Site 600 150 0 600 75 525
5254 LDP HSG 27: Newcraighall East LDP Site 154 83 0 154 75 79
5257 LDP HSG 30: Moredunvale Road LDP Site 185 46 0 185 50 135
5256 LDP HSG 31: Curriemuirend LDP Site 165 41 0 165 50 115
Market Site / Secure Developer
5720 Abbey Mount Abbey Mount Estates Ltd C/O Agent 11 0 0 11 11 0
5722 Abercromby Place Mr Robert John Dobson 11 0 0 11 11 0

Housing Land Audit and Delivery Progranme 2017
Schedule 5: Factors affecting delivery
Ref Site Name Developer/applicant Capacity Affordable Complete Remaining
Delivery in 5
years
Delivery
beyond year
5
3781 Bath Road Mr Spence 6 0 0 6 6 0
5560 Bath Street Mr Jamal Jabir. 6 0 0 6 6 0
5406 Bruntsfield Terrace Northumberland Street Properties. 5 0 0 5 5 0
5739 Calder Gardens Mr Iain Murray 29 0 0 29 29 0
5244.1 Castle Gogar Rigg Quarry Investments. 9 0 0 9 9 0
5574 Clearburn Crescent Mr David Rae 10 0 0 10 10 0
5641 High Street Mr Steven Garry. 13 0 0 13 13 0
3424.1 LDP EW 1A: Western Harbour ‐ Platinum Point Gregor Shore Plc. 452 0 226 226 0 0 Constrained
3424.6 LDP EW 1A: Western Harbour View AB Leith Ltd. 258 0 0 258 0 0 Constrained
3744.2 LDP EW 2C: Granton Harbour Gregor Shore PLC. 288 0 133 155 0 0 Constrained
5717 LDP HSG 39: North of Lang Loan Wallace Land 220 55 0 220 165 55
5132 LDP HSG 4: West Newbridge Lp Site 500 125 0 500 0 0 Constrained
5694 Loaning Road Ryce Limited. 6 0 0 6 6 0
5027 London Road Caledonian Trust PLC. 81 21 0 81 81 0
5803 Maritime Lane Zonal Retail Data System Ltd. 6 0 0 6 6 0
5810 Minto Street Merchant Capital (Edinburgh) Ltd. 11 0 0 11 11 0
5676 Montpelier Terrace JNL Property Investments. 5 0 0 5 5 0
5496 Queensferry Road Mr Jim Dolan 6 0 0 6 6 0
5011 Shandwick Place Mr T Diresta 11 0 0 11 0 0 Constrained
5265 South Gayfield Lane TRI Scotland. 5 0 0 5 5 0
5850 Sunnybank Place Enemetric. 35 35 0 35 35 0
5699 Timber Bush KAAS Properties Limited 6 0 0 6 6 0
5546 Warriston Road Gurney Ghatoray. 10 0 0 10 10 0
5866 West Bowling Green Street Johnstone & Graham. 24 0 0 24 24 0
5868 West Harbour Road David Gallacher Retirement Benefit Sch 13 0 0 13 13 0
Align ownership with intention to develop
4893 LDP EW 1B: Central Leith waterfront Forth Ports 2680 670 0 2680 0 0 Constrained
3105B LDP EW 2A: West Shore Road ‐ Forth Quarter Secondsite Property 691 125 0 691 0 0 Constrained
3105A LDP EW 2A: West Shore Road ‐ Forth Quarter Secondsite Property 350 0 0 350 50 300
3733A.1 LDP EW 2B: Granton Park Avenue Buredi + Waterfront Edinburgh Ltd. 95 26 14 81 0 0 Constrained
3623 Ocean Drive Wimpey City 193 29 0 193 0 0 Constrained
5383 Old Dalkeith Road Sheratan Ltd. 110 28 0 110 110 0
3533 RWELP HSP 4: Newbridge Nursery Kinleith Industrial Estates Ltd. 25 0 0 25 0 0 Constrained
Release site from existing land use
5547 Craigleith Road Motor Fuel Limited. 10 0 0 10 0 0 Constrained
4894 LDP EW 1C: Leith Waterfront ‐Salamander Place 719 180 0 719 0 0 Constrained
3744B LDP EW 2C: Granton Harbour Various 426 190 0 426 0 0 Constrained
3733B LDP EW 2D: Waterfront ‐ WEL ‐ North Shore Various 850 170 0 850 0 0 Constrained
4157 LDP HSG 15: Castlebrae LP site 145 0 0 145 0 0 Constrained
5710 LDP HSG 28: Ellens Glen Road LDP site 240 60 0 240 0 0 Constrained
4897 LDP HSG 7: Edinburgh Zoo 80 20 0 80 0 0 Constrained
5544 Marionville Road Glendinning Assets Limited. 34 0 0 34 34 0
Constrained sites are highlighted in grey

Planning Committee 12 October 2017
Appendix 3 Sites affected by ownership/control
Market Site / Secure Developer
Ref Site Name Capacity
5132 LDP HSG 4: West Newbridge 500
3424.6 LDP EW 1A: Western Harbour View 258
3424.1 LDP EW 1A: Western Harbour ‐ Platinum Point 226
5717 LDP HSG 39: North of Lang Loan 220
3744.2 LDP EW 2C: Granton Harbour 155
5027 London Road 81
5850 Sunnybank Place 35
5739 Calder Gardens 29
5866 West Bowling Green Street 24
5641 High Street 13
5868 West Harbour Road 13
5011 Shandwick Place 11
5720 Abbey Mount 11
5722 Abercromby Place 11
5810 Minto Street 11
5546 Warriston Road 10
5574 Clearburn Crescent 10
5244.1 Castle Gogar Rigg 9
3781 Bath Road 6
5496 Queensferry Road 6
5560 Bath Street 6
5694 Loaning Road 6
5699 Timber Bush 6
5803 Maritime Lane 6
5265 South Gayfield Lane 5
5406 Bruntsfield Terrace 5
5676 Montpelier Terrace 5
Release site from existing land use
Ref Site Name Capacity
3733B LDP EW 2D: Waterfront ‐ WEL ‐ North Shore 850
4894 LDP EW 1C: Leith Waterfront ‐Salamander Place 719
3744B LDP EW 2C: Granton Harbour 426
5710 LDP HSG 28: Ellens Glen Road 240
4157 LDP HSG 15: Castlebrae 145
4897 LDP HSG 7: Edinburgh Zoo 80
5544 Marionville Road 34
5547 Craigleith Road 10

Planning Committee 12 October 2017
Align ownership with intention to develop
Ref Site Name Capacity
4893 LDP EW 1B: Central Leith waterfront 2680
3105B LDP EW 2A: West Shore Road ‐ Forth Quarter 691
3105A LDP EW 2A: West Shore Road ‐ Forth Quarter 350
3623 Ocean Drive 193
5383 Old Dalkeith Road 110
3733A.1 LDP EW 2B: Granton Park Avenue 81
3533 RWELP HSP 4: Newbridge Nursery 25

Housing and Economy Committee
10.00am, Thursday, 2 November 2017
Supplementary Guidance – Review of Tollcross,
Corstorphine and Gorgie/Dalry Town Centre - referral
from the Planning Committee
Executive Summary
On 12 October 2017 the Planning Committee considered a report by the Executive Director of Place on the revised Supplementary Guidance for Review of Tollcross, Corstorphine and Gorgie/Dalry Town Centres.
Item number
Report number
Executive/routine
Wards
Council Commitments
9074241
Typewritten Text
7.8
9074241
Typewritten Text
Executive
9074241
Typewritten Text

Housing and Economy Committee – 2 November 2017 Page 2
Terms of Referral
Supplementary Guidance – Review of Tollcross,
Corstorphine and Gorgie/Dalry Town Centre s
Terms of Referral
1.1 On 12 October 2017 the Planning Committee considered the attached report by the
Executive Director of Place on the revised Supplementary Guidance (SG) of
Tollcross, Corstorphine and Gorgie/Dalry Town Centre
1.2 The Local Development Plan (LDP) identifies nine town centres with their boundaries shown on the Proposals Map. Of the nine town centres, six SGs have already been adopted, City Centre, Corstorphine, Gorgie/Dalry, Tollcross, Bruntsfield/Morningside and Leith.
1.3 The LDP requires statutory SG to be prepared for individual town centres. The SG
will guide the balance of uses within the town centres. It will be used to determine planning applications for the change of use of shop units to non-shop uses and help deliver the Council’s wider placemaking and sustainability aims.
1.4 The original Tollcross, Corstorphine and Gorgie/Dalry Town Centre SG documents were formally adopted in February 2017, but were originally prepared and finalised in 2013/14. This is the first review to have taken place and suggests minor amendments based on analysis of the shop front survey, officer feedback and a public consultation.
1.5 Following the period for consultation, the following changes are proposed for approval by Committee:
Removal of aims and objectives which will not be delivered by the SG; Greater clarity in the purpose and use of the Public Life Street Assessment findings;
Review wording of policy to ensure changes of use are an appropriate commercial or community use and do not have a detrimental impact on the vitality of viability of the town centre;
Remove suggestion to amend Tollcross town centre boundary;
Add 1 – 65 Home Street as a primary frontage in Tollcross; and
Other minor amendments detailed in the report by the Executive Director of Place.
The Planning Committee agreed:
1) The response to the issues raised from the consultation on the review of the Tollcross, Corstorphine and Gorgie/Dalry Town Centres Supplementary

Housing and Economy Committee – 2 November 2017 Page 3
Guidance (SG);
2) To approve Appendix 2 of the report by the Executive Director of Place as the finalised SG for Tollcross Town Centre;
3) To approve Appendix 3 of the report by the Executive Director of Place as the
finalised SG for Corstorphine Town Centre;
4) To approve Appendix 4 of the report by the Executive Director of Place as the finalised SG for Gorgie/Dalry; and
5) To refer all three to the Housing and Economy Committee for approval prior to the
adoption as part of the statutory development plan.
For Decision/Action
2.1 The Housing and Economy Committee is asked approve the Supplementary Guidance for Tollcross, Corstorphine and Gorgie/Dalry Town Centres prior to the adoption as part of the statutory development plan.
Background reading/external references
Planning Committee, 12 October 2017
Laurence Rockey
Head of Strategy and Insight
Contact: Stephen Broughton, Committee Services
E-mail: [email protected] | Tel: 0131 529 4261
Appendices
Appendix 1 - Tollcross, Corstorphine, Gorgie/Dalry Town Centre Supplementary Guidance Review – report by the Executive Director of Place
Planning Committee
10.00am, Thursday, 12 October 2017
Supplementary Guidance: Review of Tollcross,
Corstorphine and Gorgie/Dalry Town Centre
Executive Summary
The Council’s Town Centre Supplementary Guidance (SG) guides the balance of uses in
town centres and will be used to determine change of use planning applications. The
Guidance is required by Policy Ret 9 of the Edinburgh Local Development Plan and gives
detailed policy on when changes of use are likely to be acceptable.
The SG for Tollcross, Corstorphine and Gorgie/Dalry town centres was originally finalised
in 2013/14 and is being reviewed to ensure it is up-to-date and reflects the Council’s
objectives and practice. A draft version of the revised SG was available on the City of
Edinburgh Council Consultation Hub from 17 July to 28 August 2017.
The purpose of this report is to seek Committee approval of the revised SG for Tollcross,
Corstorphine and Gorgie/Dalry town centres. The approved SG will be referred to the
Housing and Economy Committee for approval prior to formal adoption as part of the
development plan, supplementing the Edinburgh Local Development Plan.
Item number
Report number
Executive/routine Executive
Wards
Council Commitments
All

Planning Committee – 12 October 2017 Page 2
Report
Tollcross, Corstorphine, Gorgie/Dalry Town Centre
Supplementary Guidance Review
1. Recommendations
1.1 It is recommended that the Committee:
1.1.1 Agrees the response to the issues raised from the consultation on the review
of the Tollcross, Corstorphine and Gorgie/Dalry Town Centre Supplementary
Guidance (SG);
1.1.2 approves Appendix 2 as the finalised SG for Tollcross Town Centre;
1.1.3 approves Appendix 3 as the finalised SG for Corstorphine Town Centre; and
1.1.4 approves Appendix 4 as the finalised SG for Gorgie/Dalry; and
1.1.5 refers all 3 to the Housing and Economy Committee for approval prior to the
adoption as part of the statutory development plan.
2. Background
2.1 The Edinburgh Local Development Plan (LDP) was adopted on 24 November 2016.
The LDP requires statutory SG to be prepared for individual town centres. The SG
will guide the balance of uses within the town centres. It will be used to determine
planning applications for the change of use of shop units to non-shop uses and help
deliver the Council’s wider placemaking and sustainability aims.
2.2 The original Tollcross, Corstorphine and Gorgie/Dalry Town Centre SG documents
were formally adopted in February 2017, but were originally prepared and finalised
in 2013/14. They can be viewed online. It is intended to review the SG regularly to
take account of changing circumstances. This is the first review to have taken place
and suggests minor amendments based on analysis of the shop front survey, officer
feedback and a public consultation.
3. Main report
Drivers for Change
3.1 The main factors which have indicated a need to review the SG are as follows:
Adoption of the LDP;

Planning Committee – 12 October 2017 Page 3
Changes in the town centres, as indicated by the shop front survey research
undertaken; and
Officer feedback on use of existing policies and where further clarification is
needed.
The Local Development Plan
3.2 Policy Ret 9 of the Edinburgh LDP requires that statutory SG is prepared to set out
criteria for assessing the proposals for the change of use of a shop unit to a non-
shop use within the city centre retail core and town centres. Statutory SG is
prepared under Section 22 of the Planning etc. (Scotland) Act 2006 and aims to
deliver the policies and principles as set out in the LDP.
3.3 The SGs aim to deliver two objectives in Part 2, Section 6 (Shopping and Leisure)
of the LDP:
to maintain the existing and proposed distribution of centres throughout the city
and sustain their vitality and viability; and
to improve the appearance, quality and attractiveness of all centres of the
development.
3.4 The LDP identifies nine town centres with their boundaries shown on the Proposals
Map. Of the nine town centres, six SGs have already been adopted - City Centre,
Corstorphine, Gorgie/Dalry, Tollcross, Bruntsfield/Morningside and Leith. Draft SG
for Nicolson Street/Clerk Street, Portobello and Stockbridge was approved for
consultation in March 2017. A finalised version of Nicolson Street/Clerk Street,
Portobello and Stockbridge is the subject of a separate report.
Town Centre Shop Front Survey
3.5 A shop front survey of Edinburgh’s town centres has been undertaken and recorded
regularly from 1986 – 2017. The shop front survey records the types of use of retail
units and vacancy rates of the town centres and city centre.
3.6 The 2017 survey shows similar trends across the three town centres being
reviewed: Tollcross, Corstorphine and Gorgie/Dalry. All have experienced a
reduction of class 1 (shop) units from 1986 – 2017. In most cases the vacancy rate
remains low and the class 1 (shop) uses have been replaced by class 2 financial,
professional and other services and class 3 foods and drink.

Planning Committee – 12 October 2017 Page 4
Figure 1: Number of Units in Shop Use in Town Centre’s
3.7 The current SG seeks to retain a level of class 1 retail provision on primary
frontages and details appropriate uses for other units within the town centre
boundaries. The trends shown in Figure 1 suggest we should consider a mix of
uses that create vibrant and vital town centres.
Officer Feedback
3.8 Pre-draft engagement and consultation work was undertaken with colleagues within
the planning teams in April 2017, including discussion at an internal Policy Working
Group. The main areas of change suggested by officers based on their practice of
using the document include:
Considering how to protect class 1 shop uses outside of the primary frontages;
Supporting a mix of uses to keep the vacancy rate of town centres low;
Supporting class 4 (business) uses;
Including findings from a series of ‘Public Life Street Assessment’ in the SG;
Update references to the LDP and guidance;
Add additional primary frontage to Tollcross town centre to retain retailing as the
primary function in the town centre; and
Recommend removing Gilmore Place from Tollcross town centre boundary in
the next iteration of the LDP.
Consultation Summary
3.9 A formal public consultation period allowed service users an opportunity to suggest
improvements to the SG. This lasted for six weeks from 17 July – 28 August 2017,
including:
Publication on the Council’s Consultation Hub;
Promoted on social media and blog; and
Email to stakeholders.
0
20
40
60
80
100
120
140
160
180
200
1986 1996 2004 2010 2015 2017
Number of Units in Class 1 (shop) Use in Town Centres
Corstophine Gorgie/Dalry Tollcross

Planning Committee – 12 October 2017 Page 5
3.10 30 responses were received across the three consultations in the period. A
summary of responses is provided in Appendix 1. Responses were received from
householders, architects, community councils and planners.
Proposed Changes
3.11 Following the period for consultation, the following changes are proposed for
approval by Committee:
Removal of aims and objectives which will not be delivered by the SG;
Greater clarity in the purpose and use of the Public Life Street Assessment
findings;
Review wording of policy to ensure changes of use are an appropriate
commercial or community use and do not have a detrimental impact on the
vitality of viability of the town centre;
Remove suggestion to amend Tollcross town centre boundary;
Add 1 – 65 Home Street as a primary frontage in Tollcross; and
Other minor amendments.
3.12 The proposed changes to the SG are shown in the bold italic text in Appendices 2,
3 and 4. Because these are reviews of existing SG, they are available as designed
documents at this stage.
Conclusions
3.13 While there continues to be change in the use and composition of town centres the
current policies in the SG remain relevant. As such, no fundamental changes are
being made to the SG but it has been improved to give clarification on some areas
and detail the findings of the Public Life Street Assessment undertaken on behalf of
the Council.
Next steps
3.14 This report will be referred to the Housing and Economy Committee for approval, as
the SG will be adopted as part of the statutory development plan. Following
approval, the revised final versions of the SG will be submitted to Ministers,
together with evidence of how representations have been taken into account.
Following a period of 28 days, unless directed otherwise, the SG can be formally
published and adopted as part of the development plan.
4. Measures of success
4.1 The vitality and viability of the three town centres are preserved and enhanced. A
clear, consistent and adaptable policy context is provided to communities and
businesses.

Planning Committee – 12 October 2017 Page 6
5. Financial impact
5.1 There are no direct financial impacts arising from this report.
6. Risk, policy, compliance and governance impact
6.1 There are no perceived risks associated with this report.
7. Equalities impact
7.1 The impacts of this report in relation to the Public Sector Equalities Duty and the ten
key areas of rights have been considered. The report has no significant direct
impact on the Council’s three equalities duties. The SG will have positive impacts
on rights. The process of preparing the SG enhances the rights to participation,
influence and voice by allowing people to participate in the formation of policy. The
Guidance will enhance the rights to health, physical security and standard of living.
8. Sustainability impact
8.1 The proposals in this report will:
reduce carbon emissions because they support and provide local services in
sustainable locations, reducing the need for travel;
increase the city’s resilience to climate change impacts because supporting
town centres reduces the need to travel for services;
help achieve a sustainable Edinburgh because town centres are places for
social and economic interaction, and fostering their vitality and viability will
protect their identity within our communities;
help achieve a sustainable Edinburgh because it supports the town centres
where many local businesses choose to locate; and
help achieve a sustainable Edinburgh because they promote the continued use
of shop units in beneficial use.
9. Consultation and engagement
9.1 A draft update of the Town Centre SG was available on the Council consultation hub
for six weeks from 17 July – 27 August 2017. Responses to the consultation have
been taken into account when finalising the document for Committee approval. These
are summarised in Appendix 1.

Planning Committee – 12 October 2017 Page 7
10. Background reading/external references
10.1 Annual review of the guidance, report to Planning Committee 2 March 2017
10.2 www.edinburgh.gov.uk/supplementaryguidance
10.3 www.edinburgh.gov.uk/localdevelopmentplan
Paul Lawrence
Executive Director of Place
Contact: David Leslie, Service Manager and Chief Planning Officer
E-mail: [email protected] Tel: 0131 529 3948
11. Appendices
Appendix 1: Summary of Consultation Hub Responses
Appendix 2: Tollcross Supplementary Guidance
Appendix 3: Corstorphine Supplementary Guidance
Appendix 4: Gorgie/Dalry Supplementary Guidance

Planning Committee – 12 October 2017 Page 8
Appendix 1: Summary of Consultation Hub Responses
Aims and Objectives
- More should be done to tackle traffic/pollution and enhance active travel;
- Some of the aims and objectives cannot be delivered by the Supplementary Guidance; and
- General support for aims and objectives.
Public Life Street Assessment
- General agreement with findings;
- Little information on how the findings of the Public Life Street Assessment will be addressed; and
- Diagrams are difficult to read;
Proposed Amendments
- More should be done to address traffic pollution and enhance active travel;
- Supportive of a range of commercial and community uses town centres;
- Stronger statement should be given to not allowing units to change use to housing;
- Policies do not address findings of SWOT analysis; and
- Support retaining retail as the primary use.
Town Centre Boundary
- Respondents generally did not support any changes to the Corstorphine town centre boundary. However, it was suggested Kirk
Loan be added to the boundary as many of the community facilities are there. As the purpose of the boundary is to assess
change of use applications and there are few shops in this area it was felt the amendment would not bring any benefit.
- No amendments to the Gorgie/Dalry town centre boundary were proposed;
- There was a mixed response to the proposal to suggest removing Gilmore Place from the town centre boundary in the next
Local Development Plan. As there is currently a low vacancy rate on the street it was felt changing the boundary would not
bring any benefit.
Other Comments

Planning Committee – 12 October 2017 Page 9
- More needs to be done to address pollution and traffic issues across the three town centres;
- It is important to support improvements to public realm and active travel; and
- Support retailing retail as the primary use of town centres.

SUPPLEMENTARY GUIDANCE
CORSTORPHINE TOWN CENTRE
NOVEMBER 2017

Supplementary Guidance Corstorphine Town Centre
1
IntroductionCorstorphine Town Centre is one of Edinburgh’s nine town centres. Within these centres,
the Council is committed to ensuring they continue to serve those who live, work, visit
and shop there. One way it does this is by producing guidance setting out when a shop
unit can change from a shop use to another use suited to a town centre. It is intended
to frequently review this guidance to reflect changing shopping trends.
This document sets out when the Council will give planning permission for changing
the use of a shop unit in Corstorphine Town Centre from a shop use to a non-shop use.
It is prepared in accordance with Policy Ret 9: Alternative Use of Shop Units in Defined
Centres of the Local Development Plan and applies to all units within the town centre.
Corstorphine Town CentreCorstorphine Town Centre area is shown on the map at the back of the document. A mix
of uses currently exists within the town centre including shops, cafes and pubs. Where a
unit is used as a shop, it is necessary to get planning permission to change to a non-shop use.
Ensuring that Corstorphine Town Centre has a variety of shops is important in maintaining
it as a destination for shopping. However, there are also benefits in allowing shops to
change to non-shop uses that complement shop uses and make the best of the town
centre’s accessible location for the local community. Allowing non-shop uses may also
help to address vacancies that have arisen due to changing behavioural patterns in
shopping such as an increase in online shopping. It is therefore felt that, in certain areas,
permitting a change of use to a service use such as an office or a cafe/ restaurant use
would enhance the town centre. To prevent non-shop uses that detract from the streets’
liveliness, changes to uses such as residential will not be permitted.
Aims and ObjectivesThis document will support the vitality of Corstorphine town centre as well as contributing
to the success and vision of Edinburgh. The Guidance supports Corstorphine town
centre in being inspired, connected, fair and thriving through
• Creating a thriving town centre through supporting a mix of uses, whilst retaining retailing
as the primary function of the town centre
• Consider the contribution the use of units can make to placemaking
• Providing a flexible approach to change of uses to meet the demands of a growing
economy and changing society and
• Contributing to the quality of life of Corstorphine residents and visitors.

Supplementary Guidance Corstorphine Town Centre
2
What is a shop unit? Premises opening directly onto the street and designed primarily
for shop use. In some locations the shop unit can be above street
level or at basement level but still have direct access and be
visible from the street.
What is a shop use? A unit used for the sale of goods (not hot food),e.g. post office,
sale of tickets, travel agency, cold food for consumption off
the premises, hairdressing, funeral parlour, launderette or dry
cleaners.
All where the sale, display or service is mainly to members of the
public. These types of use are grouped together and collectively
called Class 1 Shops.
Types of non-shop use Changing a shop to non-shop use is known as a “change of use” and will always require an application
for planning permission. The non-shop uses which may be acceptable in Corstorphine town centre
includes:
• Service Uses - lawyers, accountants, estate agents, health centres, surgeries of dentists, doctors and
vets. (These types of use are grouped together and collectively called Class 2 Financial, professional
and other services. Other services may also include tanning salons and pawn brokers).
• Food and Drink consumed on premises - restaurant, cafe, snack bar (These types of use are grouped
together and collectively called Class 3 Food and Drink).
Some changes of use are allowed without planning permission, for example, a cafe (Class 3) being
turned into a shop unit (Class 1). We have produced Guidance on what changes of use are permitted
and when an application for planning permission will be required.
Key FindingsThe review of the
Supplementary Guidance has
been informed by a ‘public life
street assessment’ carried out
by design consultants for the
Council. Some of the findings
are shown here:
8
MOVEMENT FUNCTIONBASED ON DIRECT OBSERVATION TECHNIQUES + USER INTERVIEWS
PLACE FUNCTIONASSESSED AGAINST GEHL’S 12 QUALITY CRITERIA
MINIMAL OBSTACLES + HINDRANCES [STREET CLUTTER, NARROW PAVEMENTS]
MINIMAL PEDESTRIAN WAITING POINTS [CROSSINGS, PAVEMENT CONGESTION]
A
B
PINCH POINTS [EFFECTIVE PAVEMENT WIDTH TOO NARROW FOR ACCESS + HIGH FOOTFALL]
C
ENOUGH PEDESTRIAN CROSSING POINTS [LESS JAYWALKING]D
PERCEPTION OF SAFETY FROM TRAFFICE
CONTINUOUS LEVEL PAVING SURFACE + PEDESTRIAN PRIORITY
F
CYCLE LANES
G
PERCEPTION OF SAFETY FROM TRAFFIC H
CYCLE RACKS + PARKING FACILITIES I C
YCLIN
G
PED
ESTR
IAN
FEELING SAFE [PROTECTION FROM TRAFFIC+ACCIDENTS]
FEELING SECURE [PROTECTION FROM CRIME+VIOLENCE]
1
2
CLIMATE AND POLLUTION [PROTECTION AGAINST UNPLEASANT SENSORY EXPERIENCES]3
OPPORTUNITIES TO WALK [NO OBSTACLES, GOOD SURFACING, ROOM]4
OPPORTUNITIES TO STAND/STAY [ATTRACTIVE EDGES, DEFINED SPOTS]5
OPPORTUNITIES TO SIT [BENCHES TO REST, SEATING ZONES, PRIMARY + SECONDARY]
6OPPORTUNITIES TO SEE
[LIGHTING, INTERESTING VIEWS]
7
OPPORTUNITIES TO TALK + LISTEN [NOISE
LEVEL, SEATING ARRANGEMENTS]
8
OPPORTUNITIES FOR PLAY + UNFOLDING
ACTIVITIES [TEMPORARY USES + ENTERTAINMENT,
SUMMER + WINTER]
9
DIMENSIONED AT HUMAN SCALE
OPPORTUNITIES TO ENJOY POSITIVE
ASPECTS OF CLIMATE
AESTHETIC QUALITY + POSITIVE SENSORY EXPERIENCE
[MATERIALS, PLANTS, DESIGN]
12
P
ROTE
CTIO
N - KEPT SAFE
COMFORT - QUALITY OF MOVING + STAYING
ENJOYMENT - GOOD DESIGN
11
10
8
MOVEMENT FUNCTIONBASED ON DIRECT OBSERVATION TECHNIQUES + USER INTERVIEWS
PLACE FUNCTIONASSESSED AGAINST GEHL’S 12 QUALITY CRITERIA
MINIMAL OBSTACLES + HINDRANCES [STREET CLUTTER, NARROW PAVEMENTS]
MINIMAL PEDESTRIAN WAITING POINTS [CROSSINGS, PAVEMENT CONGESTION]
A
B
PINCH POINTS [EFFECTIVE PAVEMENT WIDTH TOO NARROW FOR ACCESS + HIGH FOOTFALL]
C
ENOUGH PEDESTRIAN CROSSING POINTS [LESS JAYWALKING]D
PERCEPTION OF SAFETY FROM TRAFFICE
CONTINUOUS LEVEL PAVING SURFACE + PEDESTRIAN PRIORITY
F
CYCLE LANES
G
PERCEPTION OF SAFETY FROM TRAFFIC H
CYCLE RACKS + PARKING FACILITIES I C
YCLIN
G
PED
ESTR
IAN
FEELING SAFE [PROTECTION FROM TRAFFIC+ACCIDENTS]
FEELING SECURE [PROTECTION FROM CRIME+VIOLENCE]
1
2
CLIMATE AND POLLUTION [PROTECTION AGAINST UNPLEASANT SENSORY EXPERIENCES]3
OPPORTUNITIES TO WALK [NO OBSTACLES, GOOD SURFACING, ROOM]4
OPPORTUNITIES TO STAND/STAY [ATTRACTIVE EDGES, DEFINED SPOTS]5
OPPORTUNITIES TO SIT [BENCHES TO REST, SEATING ZONES, PRIMARY + SECONDARY]
6OPPORTUNITIES TO SEE
[LIGHTING, INTERESTING VIEWS]
7
OPPORTUNITIES TO TALK + LISTEN [NOISE
LEVEL, SEATING ARRANGEMENTS]
8
OPPORTUNITIES FOR PLAY + UNFOLDING
ACTIVITIES [TEMPORARY USES + ENTERTAINMENT,
SUMMER + WINTER]
9
DIMENSIONED AT HUMAN SCALE
OPPORTUNITIES TO ENJOY POSITIVE
ASPECTS OF CLIMATE
AESTHETIC QUALITY + POSITIVE SENSORY EXPERIENCE
[MATERIALS, PLANTS, DESIGN]
12
P
ROTE
CTIO
N - KEPT SAFE
COMFORT - QUALITY OF MOVING + STAYING
ENJOYMENT - GOOD DESIGN
11
10
Place Function Diagram

Supplementary Guidance Corstorphine Town Centre
3
1616
Also visible on the diagram are key areas of conflict between pedestrians and traffic. It is worth noting that the town centre was particularly affected by traffic throughout - particularly in terms of vehicle speeds and driver aggression, noise, prevalence of car parking (including on pavements and double red lines) and pollution (which users felt detracted from their desire to be outside in the street environment). However, these key areas of conflict between traffic and pedestrians refer to particular trouble spots that should be addressed as a priority. These include a lack of pedestrian route between the north and south retail car parks to the west of the town centre, extremely narrow and discontinuous pavements on Kirk Loan and Manse Road (vital connections between the historic village to the south and St John’s Road), and fast-turning cars, pavement parking and congestion over minor roads making walking difficult at the two car parks on St John’s Road (at Featherhall Avenue, and Kirk Loan).
These two car parks also offer an opportunity for public life through reducing parking, pedestrian movement priority, creation of seats close to bus stops and shop frontages but set back from the road and buffered by street trees, and an improvement to materiality. Other locations shown on the diagram as having potential for public life include the gateway to the retail park at the bus stop - where additional seating, shelter, and planting combined with a pedestrian priority route could create a nodal spot to pause with shopping or more pleasant place to wait for the bus, and outside the existing ‘Corstorphine Hub’, where any new development could build on this central location and wider pavement to create active frontages at ground level spilling onto seating, street trees and improved public realm.
OVERVIEWCORSTORPHINE
This analysis diagram summarises the overarching research observations of the current condition of the town centre. It has been compiled based on a synthesis of researcher observations and diaries, sub-studies by the research team and analysis of the data collected from test walks and direct observation at each key location.
This analysis diagram presents a holistic spatial understanding of the town centre, its current movement and place function, and key opportunities and strategies to enhance the street environment both as a place for public life and easier movement on foot or by bike. It also shows the four locations (A, B, C, D) that research was focussed on during research days.
The analysis diagram reveals the significant barriers created by the major traffic thoroughfare, particularly at and near Drumbrae Roundabout. It also highlights the frequent driveways to the north and side roads off St John’s Road to both the north and south, that would benefit from smaller corner radii, raised tables and/or wider pavements to better facilitate pedestrian movement and create a smooth continuous pavement surface. Additionally the central area on St John’s Road between Manse Road and Kirk Loan seen by users and researchers as the ‘heart’ of the town centre is shown in green. This area is suggested as a potential location for increased pedestrian priority, with more continuous wide pavements, avenue trees and a feeling of decreased car priority to create a more pedestrian friendly environment adjacent to the small-scale active frontages of shops and cafes.
Increase visual and walkable connection between both sides of the road.
Potential opportunity for key improvement for public life
Parking, including loading bays and single yellow lines. Places cars regularly stop - creating a barrier restricting pedestrian connection with the opposite side of the road, and effectively prioritising car parking over bus lane, cycle route or wider pavement for pedestrians.
Potential for improved connection.
Better prioritising of pedestrians needed at road junctions, driveways e.g. addition of raised tables, reduced corner radii, or increased pavement width, improved drop kerbs.
Key walking / cycling connections to nearby green spaces.
Existing public life - primarily relating to active shop fronts, bus stops, parks, benches or other gathering places conducive to staying activities.
Existing pedestrian crossings.
Key positive views
Favourable microclimate (sun, mostly sheltered from wind)
Key areas of conflict between pedestrians and traffic. Where pedestrians are trying to move freely between different parts of the town centre or cross the street but traffic or parked cars are proving a hazard or barrier.
Key location at which research was conducted [labelled A to D].
A
Barrier to urban connectivity
Key town centre area to enhance as a more pedestrian priority area for local shops and staying activities.
17Analysis
17Analysis
A
BC
D
N
OVERALL ANALYSIS MAP
Overall Analysis Map
1616
Also visible on the diagram are key areas of conflict between pedestrians and traffic. It is worth noting that the town centre was particularly affected by traffic throughout - particularly in terms of vehicle speeds and driver aggression, noise, prevalence of car parking (including on pavements and double red lines) and pollution (which users felt detracted from their desire to be outside in the street environment). However, these key areas of conflict between traffic and pedestrians refer to particular trouble spots that should be addressed as a priority. These include a lack of pedestrian route between the north and south retail car parks to the west of the town centre, extremely narrow and discontinuous pavements on Kirk Loan and Manse Road (vital connections between the historic village to the south and St John’s Road), and fast-turning cars, pavement parking and congestion over minor roads making walking difficult at the two car parks on St John’s Road (at Featherhall Avenue, and Kirk Loan).
These two car parks also offer an opportunity for public life through reducing parking, pedestrian movement priority, creation of seats close to bus stops and shop frontages but set back from the road and buffered by street trees, and an improvement to materiality. Other locations shown on the diagram as having potential for public life include the gateway to the retail park at the bus stop - where additional seating, shelter, and planting combined with a pedestrian priority route could create a nodal spot to pause with shopping or more pleasant place to wait for the bus, and outside the existing ‘Corstorphine Hub’, where any new development could build on this central location and wider pavement to create active frontages at ground level spilling onto seating, street trees and improved public realm.
OVERVIEWCORSTORPHINE
This analysis diagram summarises the overarching research observations of the current condition of the town centre. It has been compiled based on a synthesis of researcher observations and diaries, sub-studies by the research team and analysis of the data collected from test walks and direct observation at each key location.
This analysis diagram presents a holistic spatial understanding of the town centre, its current movement and place function, and key opportunities and strategies to enhance the street environment both as a place for public life and easier movement on foot or by bike. It also shows the four locations (A, B, C, D) that research was focussed on during research days.
The analysis diagram reveals the significant barriers created by the major traffic thoroughfare, particularly at and near Drumbrae Roundabout. It also highlights the frequent driveways to the north and side roads off St John’s Road to both the north and south, that would benefit from smaller corner radii, raised tables and/or wider pavements to better facilitate pedestrian movement and create a smooth continuous pavement surface. Additionally the central area on St John’s Road between Manse Road and Kirk Loan seen by users and researchers as the ‘heart’ of the town centre is shown in green. This area is suggested as a potential location for increased pedestrian priority, with more continuous wide pavements, avenue trees and a feeling of decreased car priority to create a more pedestrian friendly environment adjacent to the small-scale active frontages of shops and cafes.
Increase visual and walkable connection between both sides of the road.
Potential opportunity for key improvement for public life
Parking, including loading bays and single yellow lines. Places cars regularly stop - creating a barrier restricting pedestrian connection with the opposite side of the road, and effectively prioritising car parking over bus lane, cycle route or wider pavement for pedestrians.
Potential for improved connection.
Better prioritising of pedestrians needed at road junctions, driveways e.g. addition of raised tables, reduced corner radii, or increased pavement width, improved drop kerbs.
Key walking / cycling connections to nearby green spaces.
Existing public life - primarily relating to active shop fronts, bus stops, parks, benches or other gathering places conducive to staying activities.
Existing pedestrian crossings.
Key positive views
Favourable microclimate (sun, mostly sheltered from wind)
Key areas of conflict between pedestrians and traffic. Where pedestrians are trying to move freely between different parts of the town centre or cross the street but traffic or parked cars are proving a hazard or barrier.
Key location at which research was conducted [labelled A to D].
A
Barrier to urban connectivity
Key town centre area to enhance as a more pedestrian priority area for local shops and staying activities.

Supplementary Guidance Corstorphine Town Centre
4
SWOT Analysis
Strengths• Strong local community
• Well connected bus route
• Varied retail offering
• Perception of safety
Weaknesses• High pollution levels
• Traffic congestion
• Uneven pavement surfaces
• Historic village separated from centre
Opportunities• Re-instatement of community hub
• Improve pedestrian environment
• Increase seating
• Reduce pollution
Threats• Car dominance
• Lack of places to meet
• Uneven surfaces
Policies CT1 Planning permission will be granted for the change of use of a unit in shop use to a non-shop use
that is an appropriate commercial or community use on the following frontages
provided the change will not result in more than one third of the total number of units in the
frontage being in non-shop use:
• 109-163 St John’s Road
• 1-12 Ormiston Terrace & 181-195 St John’s Road
• 243-295B St John’s Road
CT2 Elsewhere within the defined Corstorphine Town Centre a change of use from a shop use to a non-
shop use will be permitted provided the proposal is:
• Class 2 – Financial, professional or other services
• Class 3 – Food and drink uses
• An appropriate commercial or community use which would complement the character of the
centre and would not be detrimental to its vitality and viability

Supplementary Guidance Corstorphine Town Centre
5
Other Relevant InformationOther relevant policies in the Local Development Plan include:
• Ret 1 Town Centres First
• Ret 3 Town Centres
• Ret 7 Entertainment and Leisure Developments
• Ret 9 Alternative Use of Shop Units in Defined Centres
• Ret 11 Food and Drink Establishments
• Des 13 Shopfronts
• Env 3 Listed Buildings – Setting
• Env 4 Listed Buildings – Alterations and Extensions
• Hou 7 Inappropriate Uses in Residential Areas
• Guidance for Businesses
• Edinburgh Design Guidance
This document deals with the principles of changes of use for planning purposes. Food
and drink, pub and hot-food takeaway uses will often require other consents and are
subject to separate controls for alcohol, hours of operation and outdoor pavement
seating. For more infomration on these see the Council’s website on the One Door
Approach to development consents.

Supplementary Guidance Corstorphine Town Centre
6
Corstorphine Policies Map
Town Centre Boundary
No loss of shop units will be allowed
Conservation Area
Bus stops

Further information
online: www.edinburgh.gov.uk/supplementaryguidance
email: [email protected]
SUPPLEMENTARY GUIDANCE
CORSTORPHINE TOWN CENTRE NOVEMBER 2017

SUPPLEMENTARY GUIDANCE
GORGIE / DALRY TOWN CENTRE NOVEMBER 2017

Supplementary Guidance Gorgie / Dalry Town Centre
1
IntroductionGorgie/Dalry Town Centre is one of Edinburgh’s nine town centres. Within these centres,
the Council is committed to ensuring they continue to serve those who live, work, visit
and shop there. One way it does this is by producing guidance setting out when a shop
unit can change from a shop use to another use suited to a town centre.
This document sets out when the Council will give planning permission for changing
the use of a shop unit in Gorgie/Dalry Town Centre from a shop use to a non-shop use.
It is prepared in accordance with Policy Ret 9: Alternative Use of Shop Units in Defined
Centres of the Local Development Plan and applies to all units within the town centre.
It is intended to frequently review this guidance to reflect changing shopping trends.
Gorgie/Dalry Town CentreGorgie/Dalry Town Centre area is shown on the map at the back of the document. A mix
of uses currently exists within the town centre including shops, cafes and pubs. Where a
unit is used as a shop, it is necessary to get planning permission from the Council to
change to another use.
Ensuring that Gorgie/Dalry Town Centre has a variety of shops is important in maintaining
it as a destination for shopping. However, there are also benefits in allowing shops to
change to non-shop uses that complement shop uses and make the best of the town
centre’s accessible location for the local community. Allowing non-shop uses may also
help to address vacancies which have arisen due to changing behavioural patterns in
shopping such as an increase in online shopping. It is therefore felt that, in certain areas,
permitting a change of use to a service use such as an office or a cafe/ restaurant use
would enhance the town centre.
Pubs and hot-food takeaway uses will also be considered if these are felt to be appropriate
for a certain location in the town centre provided they do not lead to an unacceptable
impact on living conditions for nearby residents. To prevent non-shop uses that detract
from the streets’ liveliness, changes to uses such as residential will not be permitted.
Aims and ObjectivesThis document will support the vitality of Gorgie/Dalry town centre as well as contributing
to the success and vision of Edinburgh. The Guidance supports Gorgie/Dalry town
centre in being inspired, connected, fair and thriving through:
• Creating a thriving town centre through supporting a mix of uses, whilst retaining
retailing as the primary function of the town centre
• Consider the contribution the use of units can make to placemaking
• Providing a flexible approach to change of uses to meet the demands of a growing
economy and changing society and
• Contributing to the quality of life of Gorgie/Dalry residents and visitors.

Supplementary Guidance Gorgie / Dalry Town Centre
2
What is a shop unit? Premises opening directly onto the street and designed primarily for shop use. In
some locations the shop unit can be above street level or at basement level but still
have direct access and be visible from the street.
What is a shop use? A unit used for the sale of goods (not hot food),e.g. post office, sale of tickets, travel
agency, cold food for consumption off the premises, hairdressing, funeral parlour,
launderette or dry cleaners. All where the sale, display or service is principally to
visiting members of the public. (These types of use are grouped together and
collectively called Class 1 Shops)
Types of non-shop usesChanging a shop to non-shop use is known as a “change of use” and will always
require an application for planning permission. Non-shop uses where the Council
will consider a change are:
• Service uses - lawyers, accountants, estate agents, health centres, surgeries
of dentists, doctors and vets (These types of use are grouped together and
collectively called Class 2 Financial, professional and other services)
• Food and Drink consumed on premises - restaurant, cafe, snack bar (These types
of use are grouped together and collectively called Class 3 Food and Drink)
• Pubs -sale and consumption of alcoholic beverages on premises
• Hot-food takeaways - Consumption of hot-food off premises
We have produced Guidance on what changes of use are permitted and when an
application for planning permission will be required.
Key FindingsThe Supplementary Guidance has been informed by a 'public life street
assessment' carried out by design consultants for the Council. Some of the
findings are shown below:
Place Function Diagram
8
MOVEMENT FUNCTIONBASED ON DIRECT OBSERVATION TECHNIQUES + USER INTERVIEWS
PLACE FUNCTIONASSESSED AGAINST GEHL’S 12 QUALITY CRITERIA
FEELING SAFE [PROTECTION FROM TRAFFIC+ACCIDENTS]
FEELING SECURE [PROTECTION FROM CRIME+VIOLENCE]
1
2
CLIMATE AND POLLUTION [PROTECTION AGAINST UNPLEASANT SENSORY EXPERIENCES]3
OPPORTUNITIES TO WALK [NO OBSTACLES, GOOD SURFACING, ROOM]4
OPPORTUNITIES TO STAND/STAY [ATTRACTIVE EDGES, DEFINED SPOTS]5
OPPORTUNITIES TO SIT [BENCHES TO REST, SEATING ZONES, PRIMARY + SECONDARY]
6OPPORTUNITIES TO SEE
[LIGHTING, INTERESTING VIEWS]
7
OPPORTUNITIES TO TALK + LISTEN [NOISE
LEVEL, SEATING ARRANGEMENTS]
8
OPPORTUNITIES FOR PLAY + UNFOLDING
ACTIVITIES [TEMPORARY USES + ENTERTAINMENT,
SUMMER + WINTER]
9
DIMENSIONED AT HUMAN SCALE 10
OPPORTUNITIES TO ENJOY POSITIVE
ASPECTS OF CLIMATE 11
AESTHETIC QUALITY + POSITIVE SENSORY EXPERIENCE
[MATERIALS, PLANTS, DESIGN]
12
P
ROTE
CTIO
N - KEPT SAFE
COMFORT - QUALITY OF MOVING + STAYING
ENJOYMENT - GOOD DESIGN
MINIMAL OBSTACLES + HINDRANCES [STREET CLUTTER, NARROW PAVEMENTS]
MINIMAL PEDESTRIAN WAITING POINTS [CROSSINGS, PAVEMENT CONGESTION]
A
B
PINCH POINTS [EFFECTIVE PAVEMENT WIDTH TOO NARROW FOR ACCESS + HIGH FOOTFALL]
C
ENOUGH PEDESTRIAN CROSSING POINTS [LESS JAYWALKING]D
PERCEPTION OF SAFETY FROM TRAFFICE
CONTINUOUS LEVEL PAVING SURFACE + PEDESTRIAN PRIORITY
F
CYCLE LANES
G
PERCEPTION OF SAFETY FROM TRAFFIC H
CYCLE RACKS + PARKING FACILITIES I
CYC
LING
PED
ESTR
IAN
8
MOVEMENT FUNCTIONBASED ON DIRECT OBSERVATION TECHNIQUES + USER INTERVIEWS
PLACE FUNCTIONASSESSED AGAINST GEHL’S 12 QUALITY CRITERIA
FEELING SAFE [PROTECTION FROM TRAFFIC+ACCIDENTS]
FEELING SECURE [PROTECTION FROM CRIME+VIOLENCE]
1
2
CLIMATE AND POLLUTION [PROTECTION AGAINST UNPLEASANT SENSORY EXPERIENCES]3
OPPORTUNITIES TO WALK [NO OBSTACLES, GOOD SURFACING, ROOM]4
OPPORTUNITIES TO STAND/STAY [ATTRACTIVE EDGES, DEFINED SPOTS]5
OPPORTUNITIES TO SIT [BENCHES TO REST, SEATING ZONES, PRIMARY + SECONDARY]
6OPPORTUNITIES TO SEE
[LIGHTING, INTERESTING VIEWS]
7
OPPORTUNITIES TO TALK + LISTEN [NOISE
LEVEL, SEATING ARRANGEMENTS]
8
OPPORTUNITIES FOR PLAY + UNFOLDING
ACTIVITIES [TEMPORARY USES + ENTERTAINMENT,
SUMMER + WINTER]
9
DIMENSIONED AT HUMAN SCALE 10
OPPORTUNITIES TO ENJOY POSITIVE
ASPECTS OF CLIMATE 11
AESTHETIC QUALITY + POSITIVE SENSORY EXPERIENCE
[MATERIALS, PLANTS, DESIGN]
12
PROT
ECTI
ON-KEPTSAFE
COMFORT - QUALITY OF MOVING + STAYING
ENJOYMENT-GOODDESIGN
MINIMAL OBSTACLES + HINDRANCES [STREET CLUTTER, NARROW PAVEMENTS]
MINIMAL PEDESTRIAN WAITING POINTS [CROSSINGS, PAVEMENT CONGESTION]
A
B
PINCH POINTS [EFFECTIVE PAVEMENT WIDTH TOO NARROW FOR ACCESS + HIGH FOOTFALL]
C
ENOUGH PEDESTRIAN CROSSING POINTS [LESS JAYWALKING]D
PERCEPTION OF SAFETY FROM TRAFFICE
CONTINUOUS LEVEL PAVING SURFACE + PEDESTRIAN PRIORITY
F
CYCLE LANES
G
PERCEPTION OF SAFETY FROM TRAFFIC H
CYCLE RACKS + PARKING FACILITIES I
CYC
LING
P
EDES
TRIA
N
8
MOVEMENT FUNCTIONBASED ON DIRECT OBSERVATION TECHNIQUES + USER INTERVIEWS
PLACE FUNCTIONASSESSED AGAINST GEHL’S 12 QUALITY CRITERIA
FEELING SAFE [PROTECTION FROM TRAFFIC+ACCIDENTS]
FEELING SECURE [PROTECTION FROM CRIME+VIOLENCE]
1
2
CLIMATE AND POLLUTION [PROTECTION AGAINST UNPLEASANT SENSORY EXPERIENCES]3
OPPORTUNITIES TO WALK [NO OBSTACLES, GOOD SURFACING, ROOM]4
OPPORTUNITIES TO STAND/STAY [ATTRACTIVE EDGES, DEFINED SPOTS]5
OPPORTUNITIES TO SIT [BENCHES TO REST, SEATING ZONES, PRIMARY + SECONDARY]
6OPPORTUNITIES TO SEE
[LIGHTING, INTERESTING VIEWS]
7
OPPORTUNITIES TO TALK + LISTEN [NOISE
LEVEL, SEATING ARRANGEMENTS]
8
OPPORTUNITIES FOR PLAY + UNFOLDING
ACTIVITIES [TEMPORARY USES + ENTERTAINMENT,
SUMMER + WINTER]
9
DIMENSIONED AT HUMAN SCALE 10
OPPORTUNITIES TO ENJOY POSITIVE
ASPECTS OF CLIMATE 11
AESTHETIC QUALITY + POSITIVE SENSORY EXPERIENCE
[MATERIALS, PLANTS, DESIGN]
12
PROT
ECTI
ON-KEPTSAFE
COMFORT - QUALITY OF MOVING + STAYING
ENJOYMENT-GOODDESIGN
MINIMAL OBSTACLES + HINDRANCES [STREET CLUTTER, NARROW PAVEMENTS]
MINIMAL PEDESTRIAN WAITING POINTS [CROSSINGS, PAVEMENT CONGESTION]
A
B
PINCH POINTS [EFFECTIVE PAVEMENT WIDTH TOO NARROW FOR ACCESS + HIGH FOOTFALL]
C
ENOUGH PEDESTRIAN CROSSING POINTS [LESS JAYWALKING]D
PERCEPTION OF SAFETY FROM TRAFFICE
CONTINUOUS LEVEL PAVING SURFACE + PEDESTRIAN PRIORITY
F
CYCLE LANES
G
PERCEPTION OF SAFETY FROM TRAFFIC H
CYCLE RACKS + PARKING FACILITIES I
CYC
LING
PED
ESTR
IAN

Supplementary Guidance Gorgie / Dalry Town Centre
3
17Analysis
17Analysis
24
23
22
19
16
18
17
313
GO
RG
IE P
AR
K CL
OS
E
Chy
32 to
38
Fn
1 to 3
4
6
17
SL
Sla te f o rdGre en
14
16 to
22
1
4
2
429
SA U G H TO N A VE N U E
46.3m
2
466
464
8
387
12
Cott ages
Glen lea
CO X F IEL D
427
470
389
El Sub Sta
Dis mantl ed Ra il wa y
36
L Tw r
Tanks
Sto re
42.7m
44
Gran
dst an
d
M P 2
Distillery House
House
El Sub Sta
MP .25
MP .2
5
Tan k s
64
Cou rt
42.7m
Gran
dst an
d
25
En gine Shed s
TCB
Tanks
North British Distillery
40
44.5m
43.6m
Club
94
TkTank
Tank
Bo w lin g G r een
M ill H o use
WE
STFIE
LD RO
AD
Rose burn House
Playg round
44.5m
68
SL
M em or ial
44
Chy
Roseb urn
43.6m
43.3m
Cool
ing
Tow
ers
Wo rks
Clock Tower
Works
War
Wes tfie ldHo use
Rugby Foo tba ll G round
(Gatew ay)
M urra y fi el d
RO
SE
BU
RN
ST
RE
ET
104
46
42
84
74
Club
RO SEB UR N ST
70
LB
ROSEBURN
WE S T A PP R O A C H R O A D
9
40
37
13
72
29
33
23
1
35
L Tw rs
El S ub S ta
SP
Ice Rink
MP .25
Hay mark et We st Junc tion
Play ing F iel ds
8
298
396
El
398
8
32
4
Gorgi e
18
46.6m
274 to 290
Gospel
TE RR A C E
G or gie
7a
17
17
20
388
351 to 355
242 to 252
WH E AT FIE LD P LA C E
300 to 306
9
SINC
LAIR
PLA
CE
227
El Sub Sta
13
to
99
23
26
258 to 266
44.8m
6
1 to 3
29
Tank
1
45.4m
26
PH
10
Pav ilion
341
3
10 to
14
PH
Sub Sta
27
396a
23
22
PH
MP .5
45 .4m
Pav ilion
18 to 22
5
El Sub Sta
Works
1
3
GORGIE
19
233 to 247
30
292
GO
RG
IE PA
RK RO
AD
221
El Sub Sta
26
56 to 8
7
10
WE
STFIE
LD ST
REE
T
WH
EAT
FIE
LD R
OA
D
223
WE
STFIE
LD RO
AD
Shelter
16
WE
STF
IEL
D RO
AD
to
224 to 232
16
7
213 to 219
45.4m
10
20
SMI TH
FIELD
STR
EE
T
2
3
24
4
31
7 to
17
12 to 16
46.9m
43.9m
G O R G IE R O A D
5
LB
10
Bo w lin g G r een
6
47.5m
100
2 to 8
1
El Sub Sta
El Sub Sta
4
24
18
9 to 1
17
25 to 29
31 to 37
5
3
Play gr oun d
WH E AT FIE LD
Sla te f o rdGre en
13
392
394
7
9
44.8m
1
1
Jun ctio n
46.3m
6
TCB
2
254
96
Playg round
4
44.5m
256
12 to 15
46.3m
15
Bo w lin g G r een
Wes
tf ie ld
Court
21
LB
1
251 to 259
390
ROB
ER
TSO
N AV
EN
UE
5
9
Hall
TCB
Playg round
2 to 6
Me mori al Hal l
340 to 346
310 to 320
3
12
ALEX
AN
DER
DR
IVE
Ba nk
261 to 269
2
14
268 to 272
47.9m
46.6m
7
410
44.2m
45.7m
4
37
1
Fac to
ry
454
STEVE NSO N G R OVE
35
We
stf i
eld
3
383
ALEX
AND
ER
5
43
58
400
3
Nu rs ery
44.8m
62
4
Go rgi e H ouse
Ga ra ge
Depot
WE
STFIE
LD A
VEN
UE
El Sub Sta
GO
RG
IE R
OA
D
1
CO X F IEL D
7
(s ite of )
385
43.9m
41
39
45
Facto r's Park
1
68
60
2
1
410
454
Cour
t
410
43.9m
Shelter
Ga ra ge
DRIV
E
3
1a
PO
236
31
SL
Tanks
Nurser y
LB
1 to 4
5 to 8
LB
LB
PDB
Posts
2
3
4
1RO B E R TS O N GA IT
ESS
Playg round
G or gie M ills S ch ool
18
20
22
17
11
CR
Burgh C onst Bd y
Burgh C onst Bd y
CR
War d Bdy
War d Bdy
Def
Def
1 to 6
War
d Bdy
P Const B
dy
20
24
22
El Sub Sta
28
26
10
7
ESS
6a
Ro seb ur nPr ima rySch oo l
ST N IC HO L A S P L AC E
343
349
5
ESS
8
Def
P Const B dy
War d Bdy
86
45845
6
84
6466
10
23
11
9294
Tanks
35
8280
96
102
98
100
78
76
CO X F IEL D LA N E
4
460
462
348 to 386
WB
1 to 5
Underpass
1 to 14
1 to 13
1 to 13
Line O f Post s
Shelters
Haymarket Depot
Mur rayfie
ld S
tad ium (T
r am)
Gospe l
Mi ss ion
HA N D Y SIDE P
LA C E
8
10
2d
2
1
3
2b
6
ESS 5
9
2a
38
27
Tanks
RO S E B UR N P LA C E
21 1 to 5
719
42
Sta
7
25
PC
9
6
24
PH
RO S E B UR N T ER R A C E49 to 55
1 to 7
3
28
57
2
Shelter
109
18
42.7m
19
1
14
ROS
EB
URN
DR
IVE
23
1
15
Ho tel
41.1m
ROS
EB
URN
STR
EE
T
20
8
1
9
14
13
Ha ll
19
15
1
10
1
2
1 to
3
Murray fie ld
19
New Bridge
CRE
SCE
NT
13
22
29
Hal l
39
Roseb urn Pu bl ic Park
20
24
37
Paris h Churc h 12
6
1c
El Sub
D Fn
17
Water of Lei th
4
6
AB IN G E R G A R D EN S
1
Posts
RO S E B UR N A VE N U E
26
40
12 to 16
CO R S TO R P H IN E R O A D
2
32
20
59
ROS
EB
URN
12
43 to 47
35 to 41
11
7 to 11
43.6m
1311
11
36
TCBs
3
2
1
21
30
ORM
IDA
LE TE
RR
ACE
41
7
6 to 10
13
Posts
24a
4 to
8
COL
TBR
IDG
E AV
ENU
E
5
12
5
42.7m
43.0m
18
7
43.9m
35
LB
2 to 16
30
ROS
EB
URN
GA
RD
ENS
17
19
27
Mur
ray f
i el d
Pla
c e
Clinic
28
43.9m
PCB
1
Old B ri dgePape's C
ottages
Sloping masonry
17
Ga rage
32
29 to 33
11
Sh elter
4
32
44.2m
Su rg ery
16 to 28
Bank
57
12
18aLB
19
Slop
ing
mas
onry
4 7
PA R K
Gas G over nor
13
33
Ho tel
STA IR
5
39
41
Wat
er o
f Lei
th
Tenn is C ou rt
SM
12
2
32
16
KIN G S B U R G H R O A D
Path
45
14
49.4m
43.0m
27
RIV
ER
SDA
LE C
RE
SCE
NT
14
Slop
ing
mas
onry
Pavilion
Ho tel
18
3
Pat h
20
SM
13b
Ch ine se C on sula te
55
Surgery
14b
1b
2
22 to 24
3133
45
23
43
21
Roya l Et tr ic k H o te l
101 to 105
34
75.9m
19
76.8m
9c to 9e
Tow
ing
Pat
h
28
95 to 99
11d
13
28a
HAR
RIS
ON
RO
AD
LB
22
1472.2m
NAP
IER RO
AD
30
8
Posts
FS
19
Iv y Te rrac e
ST EWA RT TE R R A C E
6 to 10
48
3
Slat ef o rd R oa d
61.9m
64.0m
40
42
16 to
20
PCB
to
36 to
40
HA R R IS O N PL A C E
3 to 7
17
Youth C lub
11
8 to
10
64.0m
ROB
ER
TSO
N AV
EN
UE 2
10
Brid ge
4
Ba nk
Sub Sta
19
Dai sy Te rra ce
3
46
SINC
LAIR
CL
OSE
TCB
1
79 SHA
ND
ON
PLA
CE
14
2344
68
SL AT EF O R D ROAD
6
12
67 to 77
Shelter
Terr ace
5
4
1
Myrt le Terra ce
Pr imr ose
66
4
Shelter
9
2
72
62
MER C H ISTO N G
R O V E
13
6
70
El
to
2 to 6
179
237 to
241
97
113 to 121
LB
174
27
MU RIES TON CR ESC ENT L ANE
196
168 to
176
14
51.2m
11
9 to 15
5
21
2 to
24
4
58
10 to 16
WASHINGTO
N LANE
PH
1
52.7m
PO
20
17
39
3
107 to 111
7
24
88
WEST E
ND PLAC
E
El
158
55.2m
26
4
30 to 34
ORW
ELL
TER
RAC
E
36
14
13
8
18
42
26
EA S TE R D AL R Y R O A D
WEST APPR OA CH RO AD
159 to 163
236
7 to 11
53.3m
14
21
EAS
TER
DAL
RY R
IGG
3
16
93
200
6
36
26
SP R IN G WE L L P LA C E
El S ub S ta
4
44
22
19
Li b rary
9
13
6
65
CA TH C A R T P LA C E
14
171 to 177
6
51.8m
8 to 12
PH
23
Sub20
18
2
14
LB
ORW
ELL
TE
RRA
CE
24
1
1 to 5
5 to 9
43
4
Sub
60.7m
68.6m
DO WN FI EL D PL A CE
14
12
2
Gorgi e
11
161 to 169
Sports Pit ch
3
DU N D E E T ER R A C E
3
176 to 180
11
Sta
2
13
5
El
8
9
214 to
222
DU F F STR E ET
50.3m
11
29
32
16 to 20
22
3
234
184 to
192
22
ORW
ELL
PLA
CE
94
16
El Sub
118
2
12
7
4 to
8
22
Dal ry Ce met ery
4 to 84
57.3m
187
De pot
181
54
60.4m
57
Coffin Lane
TCBs
38
160
5
1
5
14
90
73 to 77
26 to 30
183
2
48
124
Sta
15
23
7
159
165 to 173
162 to
166
WEST PA RK PLAC E
24
1
1 to 7
5
TCBs
Play A rea
13
Sta
185 to 191
41
28
El Sub Sta
23
22
224 to
230
DU N D E E S TR E E T
149 to 155
26
3
29
242 to
247
25
1
3 to 9
St B
ride
's
Church
35 to 41
3
to
PO
40
Cottage
Lodge
106 to 112
61
15
32
22
139 to 147
DALRY
131 to 137
69.5m
PCB
69.5m
1
3
Parish
128
37
1
WEST APPR OA CH RO AD
54.9m
202 to
212
LB
53.3m
95
1
Sub
WEST A
PPROA
CH RO
AD
178
EA S TE R D AL R Y D R IV E
149 to 157
NOR
TH
COTE
STR
EET
4
52.4m
126
30
6
6
18
8 to 12
Dal ry Pr ima ry Sc hoo l
DUFF STRE ET LAN E
23
25
92
14
128
56
Court
8
40
2
Sta
St Colm's
122 to 134
El
Da lry Hous eWas hi ng t on
Bapt ist
DU F F R O A D
11
45
24 to 28
11
55
14
157
182
24
Co
mm
un
i ty C
ent re
99
5
17
YEAMAN LANE
10
193 to 199
248 to
253
42
Path
25
DAL
RY R
OA
D
38
254 to
258
79 to 85
1a
13
Churc h
51
15
SM
Orwell
100 to 104
1
114
Telfer Subw
ay
175 to 181
139 to 147
8
57
Work s
Clu b
School
Mas
oni
c
M U R IES TO N C R E SC E N T
Ch y
22
50
MURI
ESTO
N L
ANE
26
8
17
4
MU
RIES
TON
RO
AD
SP
8/1
Stand
2
10
22
Comm
unity Cen
tre
Tanks
34
14
23
Tyneca stle High Sch ool
16 to
20
22
MC
LEO
D ST
REE
T
7
25
7
RU S S EL L GA R D EN S
37
22
53
52
18
RUS
SEL
L RO
AD
12
Works
MP .75
9
8/2
SAU CH IEBA NK
RU S S EL L R O A D
3
Tyne ca st le
SP
MU
RIE
STO
N P
LAC
E
10 to 14
Nurs ery
Tanks
Tyn
eca
st le B
uild
i ng
s
Cli n ic
10
G ara ge
23
Tanks
13
MU
RIE
STO
N T
ERR
AC
E
Dep o t
Wa re h o u s e
WB
20
SP
19
Te le phone
59
Ho us e
8/4
14
Hall
Depo t
MP .5
Exc ha nge
51
19
Sort in g Of fic e
BA L B IRN IE P LA C E
36
50
38
SP
2
WE S T A PP R O A C H R O A D
20
MP .25
32
4
7
L Tw r
15
5
Tk
Hay mark et Ce n tral Ju n ct io n
21
44.2m
1
2 to
6
11 to 15
31
YEA
MA
N PL
AC
E
11
48 to 52
62
27
PO LW A R TH T ER R A C E
8
51
10
DUN
DE
E T
ERR
AC
E
HARRIS
ON LAN
E
5
13
9
78.0m
6
7
El
47
53
13 to 23
3
17
Hotel
10
110 to 114
36
29
20
8
5
17
28
16
71.9m
22
North
FOW
LER
TER
RAC
E
61.6m
l
ARDM
ILLAN
9
63
PH
56.7m
35
1 to 5
23 to 27
12
Path
PH
32
1
21
10
32
4 to 8
60
4
9
40
43
50
Works
Tow
ing
Pat
h
41
23
The
47
45
2 to 8
10
37
18
ANG
LE P
AR
K TERR
AC
E
25
30
116
39
77.4m
73
29
22 to
26
31
1
21
27
66
24
39
27
2
74.1m
4
39
19
21
18
49
20 to
24
81 to 87
14
41
9
Tenn is C ou rt s
33
55
17
1
81.1m
Pavilion
TCB
22
Pav
68 to 72
POLWA
RTH PAR
K
37
19
WE
ST
BR
YSO
N R
OA
D
26
10
20 to 24
2 to 6
1
3 to
7
19 to
23
19
5l
Play gr oun d
89 to 93
73.2m
26 to 30
El Sub Sta
4l
6
45
78
96
17
BR Y SO N RO A D
38
49 to 53
PO LW A R TH G A R D EN S
30
17
HAR
DE
N PLA
CE
3
3 to 5
10
10
77
64.6m
11 to
17
71
22
11
44
14
2
15
El Sub Sta
31 to 37
WEST A
PPROA
CH R
OAD
26
5 to 9
5
PH
1
24
14 to 18
24
35
23 to 27
46
13
CR E S CE N T
51
16
60
19
1
16
8
45
53
26b
17
31
40
PLAC E
34 to 42
8 to 1
3
Bo w lin g G r een
28
RITC
HIE P
LAC
E
TCB
3
59
Pav
38
36
9
75
Ha ll
259
62
14
2
1
18
41 to 45
81 to 87
2
38
Union
Can
al1
41 to 47
41 to 45
24 to
26
11
WA TS O N CRE S C EN T
20
43
Club
28 to 32
65
1
49
2
5
30 to
32
27
43
21 to 25
17
27
12 1 to 5
45
90 to
94
15
79
Bo w lin g G r een
2
MER
TO
UN PL
ACE
50 to 54
2
7
37
34
64
1 to 5
9
3
39
M erc h is ton
12 to 16
2
26
29 to 33
27 to 31
25 to 29
Club
Harr is on Pa rk
43
32
74 to 76
26
7 to 11
68
39
POLW
AR
TH G
RO
VE
10
37
9
15 to
19
El Sub Sta
55 to 63
7
33
18
52
92 to 96
36
TE MP LE PA R K
HE N D ER S O N TE R R A CE
25
FB
20
72.8m
to 72
39
42
28
TAY ST
REE
T
Walk er B ri dge
28 to
32
4 to 7
35
47
2 to 10
20
3
Co tta ge
POLW
AR
TH P
LAC
E
8
Sub Sta
9 to 13
52.4m
ESS
Po lw ar th G r ov e
POLWA RTH GR OV E
6
TYNE
CAS
TLE
LANE
22
160 to 168
Sp ringw el l Hou se
El Sub Sta
58.5m
Stand
Clinic
4
1
4
LB
3
14
Myrt le Terra ce
6
MS
6
WA
RD
LAW
STRE
ET
35
Sta
61.6m
7
Slopi
ng m
ason
ry
172
13
9 to
17
3
to 208
SL AT EF O R D ROAD
TYNE
CA
STLE
216
62.5m
49.4m
1a
11
46.6m
(Cl in ic)
6
112 to 11
8
4
3
1
1
87
NEW
TON
STR
EET
1
to 222
8
25 to 29
48.8m
to 169
81
3 to 11
2
Ga rag e
10
Laure l T
errac
e 17
57 to 61
39 to 45
GO RG I E R OA D
2
Sub
PH
31 to 35
Stan d
Chy
68
WH ITE P
A RK
194
123 to 127
SINC LA IR
GA R D E N S
WA
RD
LAW
PLAC
E
20 to 25
66.4m
to 185
60.7m
MERCHISTON
2
15
Playg round
9
NORTH
2
MP .7
5
61.0m
3
PC
71
El Sub Sta
3
Shelter
33
4
24
187
140 to 148
69
1
212
21
54 to 58
PCB
6
1
5
El Sub Sta
5
51
23 to 29
64
67
4
31
El Sub Sta
69.2m
3
129 to 133
TERR
AC
E
75
170
195
214
47.9m
179
176
18
Posts
1
23
76 to 82
Lod ge
to 202
1
5
37
109
31 to 37
3
Gas G ov
Vi ol et
Terra
c e
Iv y Te rrac e
92 to 102
135 to 139
13
70.7mAR
DM
I LLA
N T
ERR
AC
E
TCB
Stan d
19
Ba nk
50.9m
20
El
8
17
TCB
El Sub Sta
60.4m
Putting G reen
120 to 128
61.9m
64.0m
61.6m
38 to
42
Clu b
26
35 to
37
171 to 177
5
Centre
18 to 24
55.2m
STEW
ART
TER
RA
CE
204
PCB
62Shelter
10 to 16
64
52.1m
Medical
45.7m
Primros e Te rrac e
Go rg ie C it y F arm
82
Tyn e ca st le Park
7 to
9
19
24
Lod ge
Ch u rch
3
2
10 to
12
67.7m
2
25
49.1m
63 to 67
Pat h
TCB
9
PH
WH
EAT
FIELD
STR
EE
T24
3
WA
RD
LAW
TE
RRA
CE
North M erch is to n Cemeter y
to 199
13
to 193
48.4m
110
28
39
47 to 57
76
HAR
RIS
ON
St Mic hae
l's P
arish
Church
104 to 108
60
42
13 to 21
ROA
D
34
60.4m
165
42119
50.0m
3
18
26
12
1
8
35
5
18
8
TERR
AC
E
15
BL A N TY RE T ER R A C E
6
7 to 11
12 to
14
25 to 29
2
ROC
HE
STE
R
1
CR E S CE N T
1
MER C H ISTO N
2
3
92.4m
10a
37 to 41
Sub
10
2
21
2
Car Pa rk
Sta
121
22
26
2
1
3
1
7
DO RSE T PLAC E
El Sub Sta
King 's C hurc h
Ba ths
1
5
4
4
CA L ED O N IA N R O A D
24
13
8
6
DU N D E E STR E E T
32
25
12
13
CA L ED O N IA N P LA C E
15
22
TCB
7
68.9m
MU
RDO
CH
TER
RA
CE
119
15 to 18
GIB
SON
TER
RA
CE
St Pe te r 's Pla c e
1
(Leisure Centre)
68.3m
109
7 to 9
29
4
16
Gas G ov
1 to 6
10
35
36
81 to 85
68.0m
9
El Sub Sta
UP P ER GR O V E PL A CE
31
102
24
3
20
33
MC
NEIL
L STR
EET
Works
Smithy
11
Un io n Canal
St Pe te r 's Pla c e
12
24
28
11
127 to 131
FOUNTAINBRIDGE
15
16
30
4
122 to
134
14 to 18
123
66.8m
Gas G ov
31 to
35
1
HO R N E TE R R A CE
22
WEST APPR O AC H R
O AD
10 to 14
5
28
68.0m
15a
3
5
2
7 to
11
117
PH
63.4m
4 to 8
12
5
El
34
61.6m
Garage
3
EAS
T CA
STLE
RO
AD
G ILMORE P
LA C E
5
14
58
5
2
12a
6
17
6
44
5 to 9
PO LW A R TH T ER R A C E
1
6
21
Su rg ery
7
18
13
WB
M ER C H IS TO N M EW S
25
203
22
10 to 14
2 to 8
4
3
39
MO N TP EL IER
1a
ETTRIC K
13
1
4
TERR
AC
E
16 to 20
197
12c
15c
4
20a
7
8c
90.5m
MU
RDO
CH
12
GR OV E
66
163 to 171
84.9m
15
26
82.9m
34 to 38
4
68
3 to 7
12d
16
114
24
29
44
1
G RA N V ILL E TE RR A C E
to 50
El
89.6m
5
52 to
56
16 to 20
to
14c
PCB
6
DO R S E T P LA C E
50
23
44 to 48
8
5
93.3m
16a
23 to
27
1
El Sub Sta
15a
48
11
14a
120 to 124
Sta
9
28 to
36
41
78.9m
20
20b
21
7b
8
THIS
TLE P
LAC
E
108
60
14
173 to 183
30
CRE
SCE
NT
22
126
22
3
13c
7
6
12
1
39
VIEW
FOR
TH
WE
ST C
AST
LE R
OA
D
8
Tow Path
to 26
195
18
5c
40
35
84.4m
22
2
8
28
14
5
46
Sub
to 26
2 to 8
81.1m
19
6
20
28 to 32
Surg
ery
5d
52
42
13
POLW
AR
TH
9 to 13
TCB
116
90 to
94
El Sub Sta
32
4
TERR
AC
E
19
13a
15
15b
30
5
14
18
10
2
42
TE RR A C E
11
13b
14d
15
79.2m
10
1
36 to 40
73.8m
12
50
22 to 26
78.6m118
90.5m
12b
29to
35
34
31
136
Union Can al
15 to 19
16
11
8
MER
CH
ISTO
N A
VEN
UE
87.2m
42
LB
4a
14b
9
7
185 to 193
MER
CH
ISTO
N P
ARK
5b
4b
POLWA RTH G AR DE NS
199
14
13b
16b
1
37
10
11a t
o d
1 to 5
10
10b
10f
10d
8
9
2b
41
2
4
LB
14
Fountainpark
1
5
Playg round
44
46
Playg round
ESS
4
6
8
3
1
2
7
5
Mast
16
18
17
Murie st on Pa rk
In du s tr ia l Es ta te
19
Ru ss ell Road
20
Gantr y
Gantr y
Gantr y
L Tw r
17
15 to 17
ESS
6a
60
62
64
No rt h M e rch isto nCa re H o me
2
Shelters
ESS
Moor ing Posts
CRES LANEWATSO
N
1
MC
EWA
N SQ
UA
RE
3
2
4
13
L Tw r
L Tw r
DRY
SDA
LE R
OA
D
Younger Steps
3
114
Playground
ESS
ESS
Burg
h C
onst
Bd
yCC
Burgh C onst Bd y
CR
CC
Burg
h C
onst
Bd
y
Burgh C onst Bd y
CC
Burgh C onst Bd y
CC
War
d Bd
y
War d Bdy
War d Bdy
War
d Bd
y
War d Bdy
War d Bdy
War
d Bd
y
War d Bdy
War d Bdy
War d Bdy
P Const Bdy
P Const Bdy
1
38
Mast (Telecommunicatio
n)
2
El Sub Sta
1 to 5
38 to
44
P Const Bdy
P Co
nst B
dy
P Const Bdy
P Const Bdy
P Const B
dy
War
d Bdy
73
8
1
8
7
6
6
12
2
11
5
8
31
29
34
33
8
32
30
7
7
7
8
75
35
361
2
28
27
1423
12
24
11
13
2
2
67
37
1
85
39
38
12
1
2
1
40
11
201
to 207
45
27 to
31
8 1
2221
31 to 37
154
156
101 to 105
87 to 91
28
33
123
125
2 to 8
26
31
2 to
8
2 to 6
67
21
22 2020a21a
19
2217
18
21
7
15
2
1
24
8
6
20
3
1719
18
16
1920
23
16
15
26
25
29
12
3011
Me lv in
Walk
CAL
EDO
NIA
N C
RES
CE
NT
1917
67 to 71
2624
3331
35
10
10b
11c11
L Tw r
L Tw r
L Tw r
L Tw r
6
7
10 to 20
34 -
38
7072
21
1513
2
El Sub Sta
5
66
4
12
10
BA INF IEL D D
RI VE
BA INF IEL D PL A C E
1Braid H ill Hous e FB
FB
12
Cal ton Hil lHous e
3
Bla ck fo rd Hill House
ESS
5
4
Cas tl e R oc k House
6
6a
10
ArthursSea tHous e
2
Craig loc khart Hi ll
Hous e
7
2
Cors to rphi ne Hi ll
Hous e
24 to 28
93 to 101
84
96
ESS
HAYM A RK ET TER RA CE
PL AC E
6
12
3
28 to 38 Cli fto n Ter r ace
El Sub Sta
54.6m
69 to 77
55.8mWEST CO ATES
3
Chy
91
65
2 to 6
TCB
2
Roseb ery
3
6
5
Hou se
16
8
ROSEB
ERY
56.1m
10 to 14
42Ho tel
Ga ra ge
Ho tel
SP
Ho tel
5
Easter Dalry House
6
7
56 to 62
1
El
Ho tel
44
CR
ES
CE
NT
Elg in H o use
4
G over nm en t O ff ices
El Sub Sta
1
15
1
64 to 68
9
Os borne Te rrac e
SP
4
6
10
PCB 80 to 88
Ho tel
10
20
79 to 87
DIS T ILLE R Y LA N E
14
49
Sta
2
G RO SV EN O R G A R D E N S
EA S TE R D AL R Y W Y ND
3
6
13
8 to 16
11
13
STRE
ET
4
EAS
TER
DAL
RY R
OA
D
76 to
80
to
Lod geHo tel
5
EA S TE R D AL R Y
48 to 54
11
Ho tel
5
Su rg ery
54.3m
40
Sub
9
55.5m
95 to 99
El Sub Sta
2
70 to 78
15
74
42
9
Ho tel
Ho tel 158.2m
1
12
18 to 26
14
90
1
42
15
6
1
54.6m
Ho tel
SUTH
ER
LAN
D
Ho tel
3
89
1
COATES
HA Y M A R KE T YA R DS
46
48
CO
AT
ES
GA
RD
EN
S
2
Ho tel
2
2
DE V O N PL A C E
WE S T C AT H ER IN E P LA C E
6
STA N H O P E P LA C E
9
1
63
36
Roseb
ur n
1
ROS
EB
URN
13
4
5
41
47.9m
11
9a
LB
3
1
2
21
3
All o
tmen
t G
arde
ns
45
25
6
Soc ie ty
1
34
4
2
10
3
2
2b
5
Hote l
28
1
Sub Sta
4
Nu rs in g
1
BAL
BIRN
IE P
LAC
E
5
1
BORTH
WICK
PLACE
WE
ST
ER
CO
AT
ES
RO
AD
1
53.9m
5a
7
17
24
Hampto n Terrac e
12
11
2
ROSEB
URN C
LIFF
Nat io n al
5
29
Su rg ery
27
14 to 17
MA
LTING
S
9
MS
5
WEST CO ATES
45
7 to 11
1
14
8
7
6
Hampt on Pl ac e
1
9
16
1
49.4m
of
RU S S EL L G A R D EN S 6
24
47
46
21
11
LB
33
28
23
20
El
Bar
4 to 14
18
60
3
40
1
15
BA L B IRN IE P LA C E
Kew Terrac e45.7m
5
37
22
Pl ay Area
1
El Sub Sta
Ho te l
1
42.7m
CAR BE RRY PLAC E
2
46
31
38
19
51.8m
7
62
21
32
1
4
4
2
WE
STE
R COAT
ES TE
RR
ACE
STAN
HO
PE S
TRE
ET
44
21
8
27
12
1
54.9m
18
26
3
11
7
6
Bib le
34
(PH)
54
Ho tel
7
26
Sco tl an d
PEM BR OK E PLA CE
RUS
SEL
L RO
AD
33
7
to 29
56
34
ROS
EB
URN
7
Post
s
42
1
13
15
25
2a
Sta nhope Pla c e
19
BA L B IRN IE P LA C E
MA
LTING
S
Os borne Te rrac e
12
Ho me
We st
El Sub Sta
7
Lod ge
512
44
2
14
20
6
3
14
2
13 to 21
17
5b
15
38
2
10
7
7
22
9
M O R R ISO N L IN K
8
262
31 to 35
Hay mark et
8
2 to
6
Hous e
9
45
Lewi
s Ter
rac e
11
15
M OR RI SO N S TR EET
60.0m
Shelters
15
LB
PC
TOR
PHIC
HE
N P
LA
CE
18
29
22
7
Hote l
228
15 to 18
Walk
er T
erra
c e
PH
65
56.7m
14
Pol ice
16
Tunn els
48 to
56
Brig
ht T
erra
c e
4
Sta tion
8
2
DALR
Y R
OAD
236
3 to 5
20
12
1
1
14
Doug
las
Terra
ce
12
Shel
ter
40 to
46
26
7
13
2
58.5m
Brea
dalb
ane
Terra
ce
70
17
El Sub Sta
PH
39
266 to 270
Hote l
Cli fton Terr
a ce
McLa
ren
Terr
ace
MO
RR
ISON
271
1
9
58 to
66
PH
5
3
Atho
ll Te
rrace
3
3
El Sub Sta
13
10
16
67
8
64.6m
10
17
18 to
30
59 to 6368
PH
10
Fa it h M i ss ion Ha ll
57.9m
10
242 to 250
242
56.1m
11 to 14
M O R R ISO N C IR C U S
17
Hotel
11
55.5m
PO
9
32 to
38
256272 to 278
Clu b
1
Da lry Plac e
19
Club
4
2
6
9
6
TCB
39a
1
19 to 24
6
Pol Sta
16
254
24
62.5m
2
8
9
30
4
13
212 to 218
59.7m
14
10
2
3
51 to 55
6 to 8
5
PH
to 6
258264
GRO
SVEN
OR
STR
EE
T21 to 25
14
9
56a
202 to 210
6
CRE
SCE
NT
10
1
Argy
ll Te
rrace
15
240
47
4
41
2
5
War M emo rial
15
to 234
5
58.2m
Fra ser C our t
252
8
Clu b
181 to 187
TC B
5
43
3
4
1
16
27
SP
18
Cobd
e n T
e rra
ce
11
15
37
26
20
24
30
5
56b
Verity House
65
32
Sti llho use
1
DAL
RY G
AIT
9
6
5
4
2
3
1011
7f7a
SP
SP
1 to 5
5
TO R PH IC H E N PL A C ELA N E
22
21
Roseb
ur n Path
8911 10
7
Burgh C onst Bd y
CR
CR
Burg
h C
onst
Bd
y
War d Bdy
War d Bdy
3
87
RO S E B ER Y C RE S C EN T LA N E
1211
12
2021
17
26
18
27
3029
RIC H M O ND T ER R A C E
RIC H M O ND T ER R A C E
HA Y MA R KE T
3
87
1516
9
210
1
19
21
109
1
8
15
2
7
2
7
78
15
15
9
16
816
16
10
1
104
9
910
21
3
1710
2
89 21
7 1516
8
21
4
Cit y P oin t
O sbo rn e H ou se
Shelters
Shelter
Shelters
TCBs
Ha yma rket (Tr am )
SL
SLs
SL
SLsSLs
SLDEV
ON
GA
RDE
NS
6
17
7
13
Def
1
Hay mark et Sta t ion
11
23
26
War
d Bd
y
Def
A North Merchiston Park
Westfield Park
Westfield Park
Harrison Park + canal
Saughton Park
Fountainbridge + canal
24
23
22
19
16
18
17
313
GO
RG
IE P
AR
K CL
OS
E
Chy
32 to
38
Fn
1 to 3
4
6
17
SL
Sla te f o rdGre en
14
16 to
22
1
4
2
429
SA U G H TO N A VE N U E
46.3m
2
466
464
8
387
12
Cott ages
Glen lea
CO X F IEL D
427
470
389
El Sub Sta
Dis mantl ed Ra il wa y
36
L Tw r
Tanks
Sto re
42.7m
44
Gran
dst an
d
M P 2
Distillery House
House
El Su b Sta
MP .25
MP .2
5
Tan k s
64
Cou rt
42.7m
Gran
dst an
d
25
En gine Shed s
TCB
Tanks
North British Distillery
40
44.5m
43.6m
Club
94
TkTank
Tank
Bo w lin g G r een
M ill H o use
WE
STFIE
LD RO
AD
Rose burn House
Playg round
44.5m
68
SL
M em or ial
44
Chy
Roseb urn
43.6m
43.3m
Cool
ing
Tow
ers
Wo rks
Clock Tower
Works
War
Wes tfie ldHo use
Ru g b y F o o tb a ll G rou n d
(Gatew ay)
M urra y fi el d
RO
SE
BU
RN
ST
RE
ET
104
46
42
84
74
Club
RO SEB UR N ST
70
LB
ROSEBURN
WE S T A PP R O A C H R O A D
9
40
37
13
72
29
33
23
1
35
L Tw rs
El S ub S ta
SP
Ice Rink
MP .25
Hay mark et We st Junc tion
Play ing F iel ds
8
298
396
El
398
8
32
4
Gorgi e
18
46.6m
274 to 290
Gospel
TE RR A C E
G or gie
7a
17
17
20
388
351 to 355
242 to 252
WH E AT FIE LD P LA C E
300 to 306
9
SINC
LAIR
PLA
CE
227
El Sub Sta
13
to
99
23
26
258 to 266
44.8m
6
1 to 3
29
Tank
1
45.4m
26
PH
10
Pav ilion
341
3
10 to
14
PH
Sub Sta
27
396a
23
22
PH
MP .5
45 .4m
Pav ilion
18 to 22
5
El Sub Sta
Works
1
3
GORGIE
19
233 to 247
30
292
GO
RG
IE PA
RK RO
AD
221
El Sub Sta
26
56 to 8
7
10
WE
STFIE
LD ST
REE
T
WH
EAT
FIE
LD R
OA
D
223
WE
STFIE
LD RO
AD
Shelter
16
WE
STF
IEL
D RO
AD
to
224 to 232
16
7
213 to 219
45.4m
10
20
SMI TH
FIELD
STR
EE
T
2
3
24
4
31
7 to
17
12 to 16
46.9m
43.9m
G O R G IE R O A D
5
LB
10
Bo w lin g G r een
6
47.5m
100
2 to 8
1
El Sub Sta
El Sub Sta
4
24
18
9 to 1
17
25 to 29
31 to 37
5
3
Play gr oun d
WH E AT FIE LD
Sla te f o rdGre en
13
392
394
7
9
44.8m
1
1
Jun ctio n
46.3m
6
TCB
2
254
96
Playg round
4
44.5m
256
12 to 15
46.3m
15
Bo w lin g G r een
Wes
tf ie ld
Court
21
LB
1
251 to 259
390
ROB
ER
TSO
N AV
EN
UE
5
9
Hall
TCB
Playg round
2 to 6
Me mori al Hal l
340 to 346
310 to 320
3
12
ALEX
AN
DER
DR
IVE
Ba nk
261 to 269
2
14
268 to 272
47.9m
46.6m
7
410
44.2m
45.7m
4
37
1
Fac to
ry
454
STEVE NSO N G R OVE
35
We
stf i
eld
3
383
ALEX
AND
ER
5
43
58
400
3
Nu rs ery
44.8m
62
4
Go rgi e H ouse
Ga ra ge
Depot
WE
STFIE
LD A
VEN
UE
El Sub Sta
GO
RG
IE R
OA
D
1
CO X F IEL D
7
(s ite of )
385
43.9m
41
39
45
Facto r's Park
1
68
60
2
1
410
454
Cour
t
410
43.9m
Shelter
Ga ra ge
DRIV
E
3
1a
PO
236
31
SL
Tanks
Nurser y
LB
1 to 4
5 to 8
LB
LB
PDB
Posts
2
3
4
1RO B E R TS O N GA IT
ESS
Playg round
G or gie M ills S ch ool
18
20
22
17
11
CR
Burgh C onst Bd y
Burgh C onst Bd y
CR
War d Bdy
War d Bdy
Def
Def
1 to 6
War
d Bdy
P Const B
dy
20
24
22
El Sub Sta
28
26
10
7
ESS
6a
Ro seb ur nPr ima rySch oo l
ST N IC HO L A S P L AC E
343
349
5
ESS
8
Def
P Const B dy
War d Bdy
86
45845
6
84
6466
10
23
11
9294
Tanks
35
8280
96
102
98
100
78
76
CO X F IEL D LA N E
4
460
462
348 to 386
WB
1 to 5
Underpass
1 to 14
1 to 13
1 to 13
Line O f Post s
Shelters
Haymarket Depot
Mur rayfie
ld S
tad ium (T
r am)
Gospe l
Mi ss ion
HA N D Y SIDE P
LA C E
8
10
2d
2
1
3
2b
6
ESS 5
9
2a
38
27
Tanks
RO S E B UR N P LA C E
21 1 to 5
719
42
Sta
7
25
PC
9
6
24
PH
RO S E B UR N T ER R A C E49 to 55
1 to 7
3
28
57
2
Shelter
109
18
42.7m
19
1
14
ROS
EB
URN
DR
IVE
23
1
15
Ho tel
41.1m
ROS
EB
URN
STR
EE
T
20
8
1
9
14
13
Ha ll
19
15
1
10
1
2
1 to
3
Mu rray fie ld
19
New Brid g e
CRE
SCE
NT
13
22
29
Hal l
39
Roseb urn Pu bl ic Park
20
24
37
Paris h Ch urc h 12
6
1c
El Sub
D Fn
17
Water of Lei th
4
6
AB IN G E R G A R D EN S
1
Posts
RO S E B UR N A VE N U E
26
40
12 to 16
CO R S TO R P H IN E R O A D
2
32
20
59
ROS
EB
URN
12
43 to 47
35 to 41
11
7 to 11
43.6m
1311
11
36
TCBs
3
2
1
21
30
ORM
IDA
LE TE
RR
ACE
41
7
6 to 10
13
Posts
24a
4 to
8
COL
TBR
IDG
E AV
ENU
E
5
12
5
42.7m
43.0m
18
7
43.9m
35
LB
2 to 16
30
ROS
EB
URN
GA
RD
ENS
17
19
27
Mur
ray f
i el d
Pla
c eClinic
28
43.9m
PCB
1
Old B ri dgePape's C
ottages
Sloping masonry
17
Ga rage
32
29 to 33
11
Sh elter
4
32
44.2m
Su rg ery
16 to 28
Bank
57
12
18aLB
19
Slop
ing
mas
onry
47
PA R K
Gas G over nor
13
33
Ho tel
STA IR
5
39
41
Wat
er o
f Lei
th
Tenn is C ou rt
SM
12
2
32
16
KIN G S B U R G H R O A D
Path
45
14
49.4m
43.0m
27
RIV
ER
SDA
LE C
RE
SCE
NT
14
Slop
ing
mas
onry
Pavilion
Ho tel
18
3
Pat h
20
SM
13b
Ch ine se C on sula te
55
Surgery
14b
1b
2
22 to 24
3133
45
23
43
21
Roya l Et tr ic k H o te l
101 to 105
34
75.9m
19
76.8m
9c to 9e
Tow
ing
Pat
h
28
95 to 99
11d
13
28a
HAR
RIS
ON
RO
AD
LB
22
1472.2m
NAP
IER RO
AD
30
8
Posts
FS
19
Iv y Te rrac e
ST EWA RT TE R R A C E
6 to 10
48
3
Slat ef o rd R oa d
61.9m
64.0m
40
42
16 to
20
PCB
to
36 to
40
HA R R IS O N PL A C E
3 to 7
17
Youth C lub
11
8 to
10
64.0m
ROB
ER
TSO
N AV
EN
UE 2
10
Bridge
4
Ba nk
Sub Sta
19
Dai sy Te rra ce
3
46
SINC
LAIR
CL
OSE
TCB
1
79 SHA
ND
ON
PLA
CE
14
2344
68
SL AT EF O R D ROAD
6
12
67 to 77
Shelter
Terr ace
5
4
1
Myrt le Terra ce
Pr imr ose
66
4
Shelter
9
2
72
62
MER C H ISTO N G
R O V E
13
6
70
El
to
2 to 6
179
237 to
241
97
113 to 121
LB
174
27
MU RIES TON CR ESC ENT L ANE
196
168 to
176
14
51.2m
11
9 to 15
5
21
2 to
24
4
58
10 to 16
WASHINGTO
N LANE
PH
1
52.7m
PO
20
17
39
3
107 to 111
7
24
88
WEST E
ND PLAC
E
El
158
55.2m
26
4
30 to 34
ORW
ELL
TER
RAC
E
36
14
138
18
4226
EA S TE R D AL R Y R O A D
WEST APPR OA CH RO AD
159 to 163
236
7 to 11
53.3m
14
21
EAS
TER
DAL
RY R
IGG
3
16
93
200
6
36
26
SP R IN G WE L L P LA C E
El S ub S ta
4
44
22
19
Li b rary
9
13
6
65
CA TH C A R T P LA C E
14
171 to 177
6
51.8m
8 to 12
PH
23
Sub20
18
2
14
LB
ORW
ELL
TE
RRA
CE
24
1
1 to 5
5 to 9
43
4
Sub
60.7m
68.6m
DO WN FI EL D PL A CE
14
12
2
Gorgi e
11
161 to 169
Sports Pit ch
3
DU N D E E T ER R A C E
3
176 to 180
11
Sta
2
13
5
El
8
9
214 to
222
DU F F STR E ET
50.3m
11
29
32
16 to 20
22
3
234
184 to
192
22
ORW
ELL
PLA
CE
94
16
El Sub
118
2
12
7
4 to
8
22
Dal ry Ce met ery
4 to 8
4
57.3m
187
De pot
181
54
60.4m
57
Coffin Lane
TCBs
38
160
5
1
5
14
90
73 to 77
26 to 30
183
2
48
124
Sta
15
23
7
159
165 to 173
162 to
166
WEST PA RK PLAC E
24
1
1 to 7
5
TCBs
Play A rea
13
Sta
185 to 19141
28
El Sub Sta
23
22
224 to
230
DU N D E E S TR E E T
149 to 155
26
3
29
242 to
247
25
1
3 to 9
St B
ride
's
Church
35 to 41
3
to
PO
40
Cottage
Lodge
106 to 112
6115
32
22
139 to 147
DALRY
131 to 137
69.5m
PCB
69.5m
1
3
Parish
128
37
1
WEST APPR OA CH RO AD
54.9m
202 to
212
LB
53.3m
95
1
Sub
WEST A
PPROA
CH RO
AD
178
EA S TE R D AL R Y D R IV E
149 to 157
NOR
TH
COTE
STR
EET
4
52.4m
126
30
6
6
18
8 to 12
Dal ry Pr ima ry Sc hoo l
DUFF STRE ET LAN E
23
25
92
14
128
56
Court
8
40
2
Sta
St Colm's
122 to 134
El
Da lry Hous eWas hi ng t on
Bapt ist
DU F F R O A D
11
45
24 to 28
11
55
14
157
182
24
Co
mm
un
i ty C
ent re
99
5
17
YEAMAN LANE
10
193 to 199
248 to
253
42
Path
25
DAL
RY R
OA
D
38
254 to
258
79 to 85
1a
13
Churc h
51
15
SM
Orwell
100 to 104
1
114
Telfer Subw
ay
175 to 181
139 to 147
8
57
Work s
Club
School
Mas
oni
c
M U R IES TO N C R E SC E N T
Chy
22
50
MURI
ESTO
N L
ANE
26
8
17
4
MU
RIES
TON
RO
AD
SP
8/1
Stand
2
10
22
Comm
unity Cen
tre
Tanks
34
14
23
Tyneca stle High Sch ool
16 to
20
22
MC
LEO
D ST
REE
T
7
25
7
RU S S EL L GA R D EN S
37
22
53
52
18
RUS
SEL
L RO
AD
12
Works
MP .75
9
8/2
SAU CH IEBA NK
RU S S EL L R O A D
3
Tyne ca st le
SP
MU
RIE
STO
N P
LAC
E
10 to 14
Nurs ery
Tanks
Tyn
eca
st le B
uild
i ng
s
Cli n ic
10
G ara ge
23
Tanks
13
MU
RIE
STO
N T
ERR
AC
E
Depo t
Wa re hous e
WB
20
SP
19
Te le phone
59
Hous e
8/4
14
Hall
Depo t
MP .5
Exc ha nge
51
19
Sort ing Of fic e
BA L B IRN IE P LA C E
36
50
38
SP
2
WE S T A PP R O A C H R O A D
20
MP .25
32
4
7
L Tw r
15
5
Tk
Hay mark et Ce n tral Junct ion
21
44.2m
1
2 to
6
11 to 15
31
YEA
MA
N PL
AC
E
11
48 to 52
62
27
PO LW A R TH T ER R A C E
8
51
10
DUN
DE
E T
ERR
AC
E
HARRIS
ON LAN
E
5
13
9
78.0m
6
7
El
47
53
13 to 23
3
17
Hotel
10
110 to 114
36
29
20
8
5
17
28
16
71.9m
22
North
FOW
LER
TER
RAC
E
61.6m
l
ARDM
ILLAN
9
63
PH
56.7m
35
1 to 5
23 to 27
12
Path
PH
32
1
21
10
32
4 to 8
60
4
9
40
43
50
Works
Tow
ing
Pat
h
41
23
The
47
45
2 to 8
10
37
18
ANG
LE P
AR
K TERR
AC
E
25
30
116
39
77.4m
73
29
22 to
26
31
1
21
27
66
24
39
27
2
74.1m
4
39
19
21
18
49
20 to
24
81 to 87
14
41
9
Tenn is C ou rt s
33
55
17
1
81.1m
Pavilion
TCB
22
Pav
68 to 72
POLWA
RTH PAR
K
37
19
WE
ST
BR
YSO
N R
OA
D
26
10
20 to 24
2 to 6
1
3 to
7
19 to
23
19
5l
Play gr oun d
89 to 93
73.2m
26 to 30
El Sub Sta
4l
6
45
78
96
17
BR Y SO N RO A D
38
49 to 53
PO LW A R TH G A R D EN S
30
17
HAR
DE
N PLA
CE
3
3 to 5
10
10
77
64.6m
11 to
17
71
22
11
44
14
2
15
El Sub Sta
31 to 37
WEST A
PPROA
CH R
OAD
26
5 to 9
5
PH
1
24
14 to 18
24
35
23 to 27
46
13
CR E S CE N T
51
16
60
19
1
16
8
45
53
26b
17
31
40
PLAC E
34 to 42
8 to 1
3
Bo w lin g G r een
28
RITC
HIE P
LAC
E
TCB
3
59
Pav
38
36
9
75
Ha ll
259
62
14
2
1
18
41 to 45
81 to 87
2
38
Union
Can
al1
41 to 47
41 to 45
24 to
26
11
WA TS O N CRE S C EN T
20
43
Club
28 to 32
65
1
49
2
5
30 to
32
27
43
21 to 25
17
27
12 1 to 5
45
90 to
94
15
79
Bo w lin g G r een
2
MER
TO
UN PL
ACE
50 to 54
2
7
37
34
64
1 to 5
9
3
39
M erc h is ton
12 to 16
2
26
29 to 33
27 to 31
25 to 29
Club
Harr is on Pa rk
43
32
74 to 76
26
7 to 11
68
39
POLW
AR
TH G
RO
VE
10
37
9
15 to
19
El Sub Sta
55 to 63
7
33
18
52
92 to 96
36
TE MP LE PA R K
HE N D ER S O N TE R R A CE
25
FB
20
72.8m
to 72
39
42
28
TAY ST
REE
T
Walk er B ri dge
28 to
32
4 to 7
35
47
2 to 10
20
3
Co tta ge
POLW
AR
TH P
LAC
E
8
Sub Sta
9 to 13
52.4m
ESS
Po lw ar th G r ov e
POLWA RTH GR OV E
6
TYNE
CAS
TLE
LANE
22
160 to 168
Sp ringw el l Hou se
El Sub Sta
58.5m
Stand
Clinic
4
1
4
LB
3
14
Myrt le Terra ce
6
MS
6
WA
RD
LAW
STRE
ET
35
Sta
61.6m7
Slopi
ng m
ason
ry
172
13
9 to
17
3
to 208
SL AT EF O R D ROAD
TYNE
CA
STLE
216
62.5m
49.4m
1a
11
46.6m
(Cl in ic)
6
112 to 11
8
4
3
1
1
87
NEW
TON
STR
EET
1
to 222
8
25 to 29
48.8m
to 169
81
3 to 11
2
Ga rage
10
Laure l T
errac
e 17
57 to 61
39 to 45
GO RG I E R OA D
2
Sub
PH
31 to 35
Stan d
Chy
68
WH ITE P
A RK
194
123 to 127
SINC LA IR
GA R D E N S
WA
RD
LAW
PLAC
E
20 to 25
66.4m
to 185
60.7m
MERCHISTON
2
15
Playg round
9
NORTH
2
MP .7
5
61.0m
3
PC
71
El Sub Sta
3
Shelter
33
4
24
187
140 to 148
69
1
212
21
54 to 58
PCB
6
1
5
El Sub Sta
5
51
23 to 29
64
67
4
31
El Sub Sta
69.2m
3
129 to 133
TERR
AC
E
75
170
195
214
47.9m
179
176
18
Posts
1
23
76 to 82
Lod ge
to 202
1
5
37
109
31 to 37
3
Gas G ov
Vi ol et
Terra
c e
Iv y Te rrac e
92 to 102
135 to 139
13
70.7m
ARD
MI L
LAN
TER
RA
CE
TCB
Stan d
19
Ba nk
50.9m
20
El
8
17
TCB
El Sub Sta
60.4m
Putting G reen
120 to 128
61.9m
64.0m
61.6m
38 to
42
Club
26
35 to
37
171 to 177
5
Centre
18 to 24
55.2m
STEW
ART
TER
RA
CE
204
PCB
62Shelter
10 to 16
64
52.1m
Medical
45.7m
Primros e Te rrac e
Gorg ie C it y Farm
82
Tyne ca st le Park
7 to
9
19
24
Lod ge
Church
3
2
10 to
12
67.7m
2
25
49.1m
63 to 67
Pat h
TCB
9
PH
WH
EAT
FIELD
STR
EE
T24
3
WA
RD
LAW
TE
RRA
CE
North M erch is to n Cemeter y
to 199
13
to 193
48.4m
110
28
39
47 to 57
76
HAR
RIS
ON
St Mic hae
l's P
arish
Church
104 to 108
60
42
13 to 21
ROA
D
34
60.4m
165
42119
50.0m
3
18
26
12
1
8
35
5
18
8
TERR
AC
E
15
BL A N TY RE T ER R A C E
6
7 to 11
12 to
14
25 to 29
2
ROC
HE
STE
R
1
CR E S CE N T
1
MER C H ISTO N
2
3
92.4m
10a
37 to 41
Sub
10
2
21
2
Car Pa rk
Sta
121
22
26
2
1
3
1
7
DO RSE T PLAC E
El Sub Sta
King 's C hurc h
Ba ths
1
5
4
4
CA L ED O N IA N R O A D
24
13
8
6
DU N D E E STR E E T
32
25
12
13
CA L ED O N IA N P LA C E
15
22
TCB
7
68.9m
MU
RDO
CH
TER
RA
CE
119
15 to 18
GIB
SON
TER
RA
CE
St Pe te r 's Pla c e
1
(Leisure Centre)
68.3m
109
7 to 9
29
4
16
Gas G ov
1 to 6
10
35
36
81 to 85
68.0m
9
El Sub Sta
UP P ER GR O V E PL A CE
31
102
24
3
20
33
MC
NEIL
L STR
EET
Works
Smithy
11
Un io n Canal
St Pe te r 's Pla c e
12
24
28
11
127 to 131
FOUNTAINBRIDGE
15
16
30
4
122 to
134
14 to 18
123
66.8m
Gas G ov
31 to
35
1
HO R N E TE R R A CE
22
WEST APPR O AC H R
O AD
10 to 14
5
28
68.0m
15a
3
5
2
7 to
11
117
PH
63.4m
4 to 8
12
5
El
34
61.6m
Garage
3
EAS
T CA
STLE
RO
AD
G ILMORE P
LA C E
5
14
58
5
2
12a
6
17
6
44
5 to 9
PO LW A R TH T ER R A C E
1
6
21
Su rg ery
7
18
13
WB
M ER C H IS TO N M EW S
25
203
22
10 to 14
2 to 8
4
3
39
MO N TP EL IER
1a
ETTRIC K
13
1
4
TERR
AC
E
16 to 20
197
12c
15c
4
20a
7
8c
90.5m
MU
RDO
CH
12
GR OV E
66
163 to 171
84.9m
15
26
82.9m
34 to 38
4
68
3 to 7
12d
16
114
24
29
44
1
G RA N V ILL E TE RR A C E
to 50
El
89.6m
5
52 to
56
16 to 20
to
14c
PCB
6
DO R S E T P LA C E
50
23
44 to 48
8
5
93.3m
16a
23 to
27
1
El Sub Sta
15a
48
11
14a
120 to 124
Sta
9
28 to
36
41
78.9m
20
20b
21
7b
8
THIS
TLE P
LAC
E
108
60
14
173 to 183
30
CRE
SCE
NT
22
126
22
3
13c
7
6
12
1
39
VIEW
FOR
TH
WE
ST C
AST
LE R
OA
D
8
Tow Path
to 26
195
18
5c
40
35
84.4m
22
2
8
28
14
5
46
Sub
to 26
2 to 8
81.1m
19
6
20
28 to 32
Surg
ery
5d
52
42
13
POLW
AR
TH
9 to 13
TCB
116
90 to
94
El Sub Sta
32
4
TERR
AC
E
19
13a
15
15b
30
5
14
18
10
2
42
TE RR A C E
11
13b
14d
15
79.2m
10
1
36 to 40
73.8m
12
50
22 to 26
78.6m118
90.5m
12b
29to
35
34
31
136
Union Can al
15 to 19
16
11
8
MER
CH
ISTO
N A
VEN
UE
87.2m
42
LB
4a
14b
9
7
185 to 193
MER
CH
ISTO
N P
ARK
5b
4b
POLWA RTH G AR DE NS
199
14
13b
16b
1
37
10
11a t
o d
1 to 5
10
10b
10f
10d
8
9
2b
41
2
4
LB
14
Fountainpark
1
5
Playg round
44
46
Playg round
ESS
4
6
8
3
1
2
7
5
Mast
16
18
17
Murie st on Pa rk
Indus tr ia l Es ta te
19
Russ ell Road
20
Gantr y
Gantr y
Gantr y
L Tw r
17
15 to 17
ESS
6a
60
62
64
No rt h M e rch isto nCa re H o me
2
Shelters
ESS
Moor ing Posts
CRES LANEWATSO
N
1
MC
EWA
N SQ
UA
RE
3
2
4
13
L Tw r
L Tw r
DRY
SDA
LE R
OA
D
Younger Steps
3
114
Playground
ESS
ESS
Burg
h C
onst
Bd
yCC
Burgh C onst Bd y
CR
CC
Burg
h C
onst
Bd
y
Burgh C onst Bd y
CC
Burgh C onst Bd y
CC
War
d Bd
y
War d Bdy
War d Bdy
War
d Bd
y
War d Bdy
War d Bdy
War
d Bd
y
War d Bdy
War d Bdy
War d Bdy
P Const Bdy
P Const Bdy
1
38
Mast (Telecommunicatio
n)
2
El Sub Sta
1 to 5
38 to
44
P Const Bdy
P Co
nst B
dy
P Const Bdy
P Const Bdy
P Const B
dy
War
d Bdy
73
8
1
8
7
6
6
12
2
11
5
8
31
29
34
33
8
32
30
7
7
7
8
75
35
361
2
28
27
1423
12
24
11
13
2
2
67
37
1
85
39
38
12
1
2
1
40
11
201
to 207
45
27 to
31
8 1
2221
31 to 37
154
156
101 to 105
87 to 91
28
33
123
125
2 to 8
26
31
2 to
8
2 to 6
67
21
22 2020a21a
19
2217
18
21
7
15
2
1
24
8
6
20
3
1719
18
16
1920
23
16
15
26
25
29
12
3011
Me lv in
Walk
CAL
EDO
NIA
N C
RES
CE
NT
1917
67 to 71
2624
3331
35
10
10b
11c11
L Tw r
L Tw r
L Tw r
L Tw r
6
7
10 to 20
34 -
38
7072
21
1513
2
El Sub Sta
5
66
4
12
10
BA INF IEL D D
RI VE
BA INF IEL D PL A C E
1Braid H ill Hous e FB
FB
12
Cal ton Hil lHous e
3
Bla ck fo rd Hill House
ESS
5
4
Cas tl e R oc k House
6
6a
10
ArthursSea tHous e
2
Craig loc khart Hi ll
Hous e
7
2
Cors to rphi ne Hi ll
Hous e
24 to 28
93 to 101
84
96
ESS
HAYM A RK ET TER RA CE
PL AC E
6
12
3
28 to 38 Cli fto n Ter r ace
El Sub Sta
54.6m
69 to 77
55.8mWEST CO ATES
3
Chy
91
65
2 to 6
TCB
2
Roseb ery
3
6
5
Hou se
16
8
ROSEB
ERY
56.1m
10 to 14
42Ho tel
Ga ra ge
Ho tel
SP
Ho tel
5
Easter Dalry House
6
7
56 to 62
1
El
Ho tel
44
CR
ES
CE
NT
Elg in H o use
4
G over nm en t O ff ices
El Sub Sta
1
15
1
64 to 68
9
Os borne Te rrac e
SP
4
6
10
PCB 80 to 88
Ho tel
10
20
79 to 87
DIS T ILLE R Y LA N E
14
49
Sta
2
G RO SV EN O R G A R D E N S
EA S TE R D AL R Y W Y ND
3
6
13
8 to 16
11
13
STRE
ET
4
EAS
TER
DAL
RY R
OA
D
76 to
80
to
Lod geHo tel
5
EA S TE R D AL R Y
48 to 54
11
Ho tel
5
Su rg ery
54.3m
40
Sub
9
55.5m
95 to 99
El Sub Sta
2
70 to 78
15
74
42
9
Ho tel
Ho tel 158.2m
1
12
18 to 26
14
90
1
42
15
6
1
54.6m
Ho tel
SUTH
ER
LAN
D
Ho tel
3
89
1
COATES
HA Y M A R KE T YA R DS
46
48
CO
AT
ES
GA
RD
EN
S
2
Ho tel
2
2
DE V O N PL A C E
WE S T C AT H ER IN E P LA C E
6
STA N H O P E P LA C E
9
1
63
36
Roseb
ur n
1
ROS
EB
URN
13
4
5
41
47.9m
11
9a
LB
3
1
2
21
3
All o
tmen
t G
arde
ns
45
25
6
Soc ie ty
1
34
4
2
10
3
2
2b
5
Hote l
28
1
Sub Sta
4
Nurs ing
1
BAL
BIRN
IE P
LAC
E
5
1
BORTH
WICK
PLACE
WE
ST
ER
CO
AT
ES
RO
AD
1
53.9m
5a
7
17
24
Hampto n Terrac e
12
11
2
ROSEB
URN C
LIFF
Nat ional
5
29
Su rg ery
27
14 to 17
MA
LTING
S
9
MS
5
WEST CO ATES
45
7 to 11
1
14
8
7
6
Hampt on Pl ac e
1
9
16
1
49.4m
of
RU S S EL L G A R D EN S 6
24
47
46
21
11
LB
33
28
23
20
El
Bar
4 to 14
18
60
3
40
1
15
BA L B IRN IE P LA C E
Kew Terrac e45.7m
5
37
22
Pl ay Area
1
El Sub Sta
Ho te l
1
42.7m
CAR BE RRY PLAC E
2
46
31
38
19
51.8m
7
62
21
32
1
4
4
2
WE
STE
R COAT
ES TE
RR
ACE
STAN
HO
PE S
TRE
ET
44
21
8
27
12
1
54.9m
18
26
3
11
7
6
Bib le
34
(PH)
54
Ho tel
7
26
Scotl and
PEM BR OK E PLA CE
RUS
SEL
L RO
AD
33
7
to 29
56
34
ROS
EB
URN
7
Post
s
42
1
13
15
25
2a
Sta nhope Pla c e
19
BA L B IRN IE P LA C E
MA
LTING
S
Os borne Te rrac e
12
Home
We st
El Sub Sta
7
Lod ge
512
44
2
14
20
6
3
14
2
13 to 21
17
5b
15
38
2
10
7
7
22
9
M O R R ISO N L IN K
8
262
31 to 35
Hay mark et
8
2 to
6
Hous e
9
45
Lewi
s Ter
rac e
11
15
M OR RI SO N S TR EET
60.0m
Shelters
15
LB
PC
TOR
PHIC
HE
N P
LA
CE
18
29
22
7
Hote l
228
15 to 18
Walk
er T
erra
c e
PH
65
56.7m
14
Pol ice
16
Tunn els
48 to
56
Brig
ht T
erra
c e
4
Sta tion
8
2
DALR
Y R
OAD
236
3 to 5
20
12
1
1
14
Doug
las
Terra
ce
12
Shel
ter
40 to
46
26
7
13
2
58.5m
Brea
dalb
ane
Terra
ce
70
17
El Sub Sta
PH
39
266 to 270
Hote l
Cli fton Terr
a ce
McLa
ren
Terr
ace
MO
RR
ISON
271
1
9
58 to
66
PH
5
3
Atho
ll Te
rrace
3
3
El Sub Sta
13
10
16
67
8
64.6m
10
17
18 to
30
59 to 6368
PH
10
Fa it h M i ss ion Ha ll
57.9m
10
242 to 250
242
56.1m
11 to 14
M O R R ISO N C IR C U S
17
Hotel
11
55.5m
PO
9
32 to
38
256272 to 278
Clu b
1
Da lry Plac e19
Club
4
2
6
9
6
TCB
39a
1
19 to 24
6
Pol Sta
16
254
24
62.5m
2
8
9
30
4
13
212 to 218
59.7m
14
10
2
3
51 to 55
6 to 8
5
PH
to 6
258264
GRO
SVEN
OR
STR
EE
T21 to 25
14
9
56a
202 to 210
6
CRE
SCE
NT
10
1
Argy
ll Te
rrace
15
240
47
4
41
2
5
War M emo rial
15
to 234
5
58.2m
Fra ser C our t
252
8
Clu b
181 to 187
TC B
5
43
34
1
16
27
SP
18
Cobd
e n T
e rra
ce
11
15
37
26
20
24
30
5
56b
Verity House
65
32
Sti llho use
1
DAL
RY G
AIT
9
6
5
4
2
3
1011
7f7a
SP
SP
1 to 5
5
TO R PH IC H E N PL A C ELA N E
22
21
Roseb
ur n Path
8911 10
7
Burgh C onst Bd y
CR
CR
Burg
h C
onst
Bd
y
War d Bdy
War d Bdy
3
87
RO S E B ER Y C RE S C EN T LA N E
1211
122021
17
26
18
27
3029
RIC H M O ND T ER R A C E
RIC H M O ND T ER R A C E
HA Y MA R KE T
3
87
1516
9
210
1
19
21
109
1
8
15
2
7
2
7
78
15
15
9
16
816
16
10
1
104
9
910
21
3
1710
2
89 21
7 1516
8
21
4
Cit y P oin t
O sbo rn e H ou se
Shelters
Shelter
Shelters
TCBs
Ha yma rket (Tr am )
SL
SLs
SL
SLsSLs
SLDEV
ON
GA
RDE
NS
6
17
7
13
Def
1
Hay mark et Sta t ion
11
23
26
War
d Bd
y
Def
B
C
D
NOVERALL ANALYSIS MAP
1616
Gorgie, Dalry Place, and to a limited extent the wider pavement corner at Co-op on Dalry Road. Some intermittent activity is also present by those window shopping along small-scale independent shop frontages. It is also possible to see where car parking currently coincides with the bus lane/cycle lane, which was mentioned by some users as prioritising cars and vehicles over cycling. The physical separation of the two sections of the town centre - Gorgie to the west, and Dalry to the east - is also visible.
OVERVIEWGORGIE / DALRY
Increase visual and/or walkable connection between both sides of the road e.g. new pedestrian crossing.
Potential opportunity for key improvement for public life
Parking, including loading bays and single yellow lines. Places cars regularly stop - creating a barrier restricting pedestrian connection with the opposite side of the road, and effectively prioritising car parking over bus lane, cycle route or wider pavement for pedestrians.
Potential for improved connection.
Better prioritising of pedestrians needed at minor road junction e.g. addition of raised tables, reduced corner radii, increased pavement width, improved drop kerbs.
Key walking / cycling connections to nearby green spaces and canal.
Existing public life - primarily relating to active shop fronts, bus stops, parks, benches or other gathering places conducive to staying activities.
Existing pedestrian crossings.
Key positive views
Favourable microclimate (sun, mostly sheltered from wind)
Key areas of conflict between pedestrians and traffic. Where pedestrians are trying to move freely between different parts of the town centre or cross the street but traffic or parked cars are proving a hazard or barrier.
This analysis diagram summarises the overarching research observations of the current condition of the town centre. It has been compiled based on a synthesis of researcher observations and diaries, sub-studies by the research team and analysis of the data collected from test walks and direct observation at each key location.
This analysis diagram presents a holistic understanding of the town centre, its current movement and place function, and key opportunities and strategies to enhance the street environment both as a place for public life and easier movement on foot or by bike. It also shows the four locations (A, B, C, D) that research was focussed on during research days.
The analysis diagram reveals the impact the railway line has on truncating minor roads and reducing the connectivity of Gorgie and Dalry to other nearby areas. This has an impact on both footfall, and ability to access other nearby larger green spaces and facilities. It’s also possible to see that public life currently relates primarily to people waiting at bus stops, with the exception of White Park in
Key location at which research was conducted [labelled A to D].
A
New foot/cycle bridge or crossing would enable improved connectivity.
Barrier to urban connectivity e.g. railway line.
Popular destination locally
Overall Analysis Map

Supplementary Guidance Gorgie / Dalry Town Centre
4
SWOT Analysis
Strengths
• Diverse small independent local businesses
• High footfall
• Good transport links
• Links to amenities and cycle routes
Weaknesses• Lack of places to meet/gather
• Lack of green space
• Lack of dedicated cycle routes
• Fragmentation between Gorgie/Dalry
Opportunities• Provide opportunities to meet socially
• Improve walking/cycling experience
• Integrate planting and street trees
• Enhance connectivity
Threats• Car dominance
• Lack of green space
• Uneven pavements
• Street clutter
PoliciesGD1 Planning permission will be granted for the change of use of a unit in shop use to a non-shop
use that is an appropriate commercial or community use on the following frontages provided the change
will not result in more than one third of the total number of units in the frontage being in non-shop use:
194-256 Gorgie Road
15-65 Dalry Road
18-78 Dalry Road
98-128 Dalry Road
GD2 Elsewhere within the defined Gorgie/Dalry Town Centre a change of use from a shop use to a non-
shop use will be permitted provided the proposal is:
• Class 2 – Financial, professional or other services
• Class 3 – Food and drink uses
• An appropriate commercial or community use which would complement the character of the centre
and would not be detrimental to its vitality and viability.

Supplementary Guidance Gorgie / Dalry Town Centre
5
Other Relevant InformationOther relevant policies in the Local Development Plan include:
• Ret 1 Town Centres First
• Ret 3 Town Centres
• Ret 7 Entertainment and Leisure Developments
• Ret 9 Alternative Use of Shop Units in Defined Centres
• Ret 11 Food and Drink Establishments
• Des 13 Shopfronts
• Env 3 Listed Buildings – Setting
• Env 4 Listed Buildings – Alterations and Extensions
• Hou 7 Inappropriate Uses in Residential Areas
• Guidance for Businesses
• Edinburgh Design Guidance
This document deals with the principles of changes of use for planning purposes. Food
and drink, pub and hot-food takeaway uses will often require other consents and are
subject to separate controls for alcohol, hours of operation and outdoor pavement
seating. For more information on these see the Council’s website on the One Door
Approach to development consents.

Supplementary Guidance Gorgie / Dalry Town Centre
6
Gorgie Policies Map
Town Centre Boundary
Up to one third of frontage permitted to be in non-shop use
Cycle lanes
Bus stops

Supplementary Guidance Gorgie / Dalry Town Centre
7
Dalry Policies Map
Town Centre Boundary
Up to one third of frontage permitted to be in non-shop use
Conservation area
Cycle lanes
Bus stops

SUPPLEMENTARY GUIDANCE
GORGIE / DALRY TOWN CENTRE NOVEMBER 2017

SUPPLEMENTARY GUIDANCE
TOLLCROSS TOWN CENTRENOVEMBER 2017

Supplementary Guidance Tollcross Town Centre
1
IntroductionTollcross Town Centre is one of Edinburgh’s nine Town Centres. Within these centres, the
Council is committed to ensuring they continue to serve those who live, work, visit and
shop there. One way it does this is by guiding when a shop unit can change from a shop
use to another use suited to a Town Centre. This document sets out when the Council will
give planning permission for changing the use of a shop unit in Tollcross Town Centre.
This document sets out when the Council will give planning permission for changing
the use of a shop unit in Tollcross Town Centre from a shop use to a non-shop use. It
is prepared in accordance with Policy Ret 9 : Alternative Use of Shop Units in Defined
Centres of the Local Development Plan and applies to all units within the town centre. It
is intended to frequently review this guidance to reflect changing shopping trends.
Tollcross Town Centre The Town Centre is shown on the map at the back of the document. A mix of uses
currently exist including shops, offices, cafes and bars. Where a unit is used as a shop, it
is necessary to get planning permission from the Council to change to another use.
The continued existence of a variety of shops is seen as critical to the health of Tollcross.
However, there are also benefits in allowing shops to change to other uses that maximise
the Town Centre’s easily accessible location for the community. It is therefore felt that,
in certain areas, permitting a change of use to a office or a cafe/ restaurant use would
enhance the town centre.
To prevent non-shop uses that detract from the streets’ liveliness, changes to uses such
as residential are not acceptable. To prevent excessive concentration, no new hot food
takeaways will be allowed. New cafes and restaurants must not lead to an unacceptable
impact on living conditions for nearby residents.
Aims and ObjectivesThis document will support the vitality of Tollcross town centre as well as contributing
to the success and vision of Edinburgh. The Guidance supports Tollcross town centre in
being inspired, connected, fair and thriving through
• Creating a thriving town centre through supporting a mix of uses, whilst retaining
retailing as the primary function of the town centre
• Consider the contribution the use of units can make to placemaking
• Providing a flexible approach to change of uses to meet the demands of a growing
economy and changing society and
• Contributing to the quality of life of Tollcross residents and visitors.
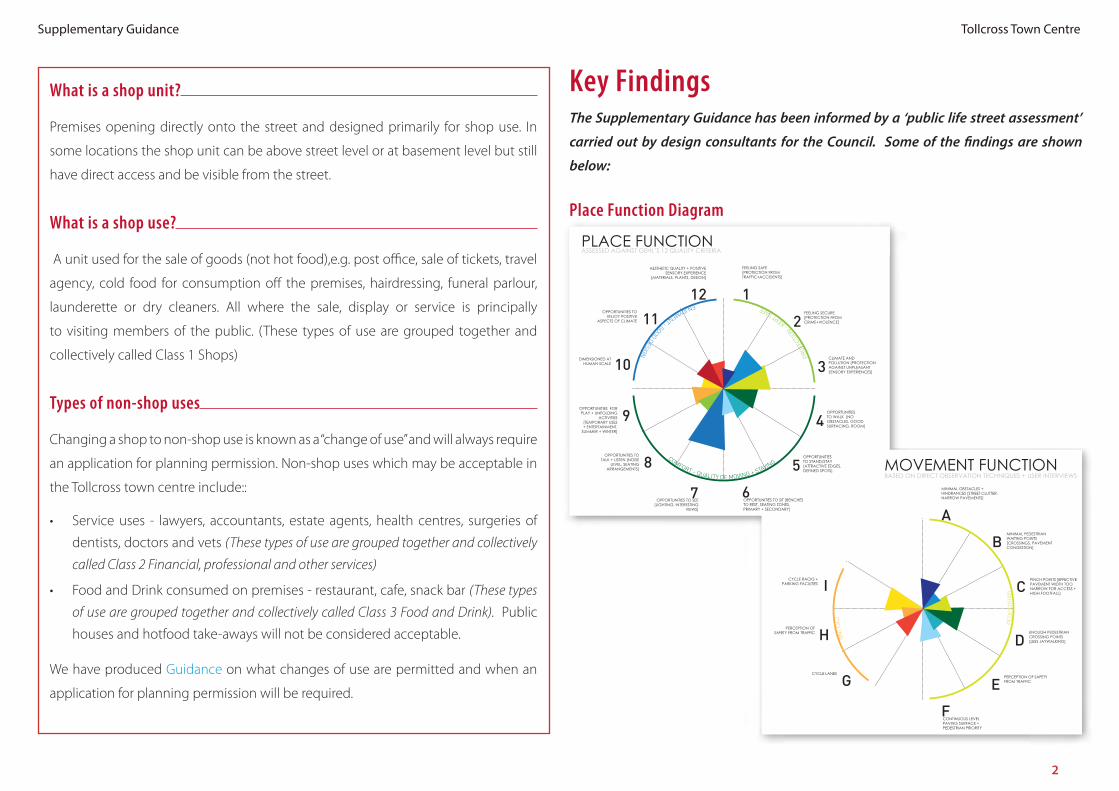
Supplementary Guidance Tollcross Town Centre
2
What is a shop unit?
Premises opening directly onto the street and designed primarily for shop use. In
some locations the shop unit can be above street level or at basement level but still
have direct access and be visible from the street.
What is a shop use?
A unit used for the sale of goods (not hot food),e.g. post office, sale of tickets, travel
agency, cold food for consumption off the premises, hairdressing, funeral parlour,
launderette or dry cleaners. All where the sale, display or service is principally
to visiting members of the public. (These types of use are grouped together and
collectively called Class 1 Shops)
Types of non-shop uses
Changing a shop to non-shop use is known as a “change of use” and will always require
an application for planning permission. Non-shop uses which may be acceptable in
the Tollcross town centre include::
• Service uses - lawyers, accountants, estate agents, health centres, surgeries of
dentists, doctors and vets (These types of use are grouped together and collectively
called Class 2 Financial, professional and other services)
• Food and Drink consumed on premises - restaurant, cafe, snack bar (These types
of use are grouped together and collectively called Class 3 Food and Drink). Public
houses and hotfood take-aways will not be considered acceptable.
We have produced Guidance on what changes of use are permitted and when an
application for planning permission will be required.
Key FindingsThe Supplementary Guidance has been informed by a ‘public life street assessment’
carried out by design consultants for the Council. Some of the findings are shown
below:
Place Function Diagram
8
MOVEMENT FUNCTIONBASED ON DIRECT OBSERVATION TECHNIQUES + USER INTERVIEWS
PLACE FUNCTIONASSESSED AGAINST GEHL’S 12 QUALITY CRITERIA
FEELING SAFE [PROTECTION FROM TRAFFIC+ACCIDENTS]
FEELING SECURE [PROTECTION FROM CRIME+VIOLENCE]
1
2
CLIMATE AND POLLUTION [PROTECTION AGAINST UNPLEASANT SENSORY EXPERIENCES]3
OPPORTUNITIES TO WALK [NO OBSTACLES, GOOD SURFACING, ROOM]4
OPPORTUNITIES TO STAND/STAY [ATTRACTIVE EDGES, DEFINED SPOTS]5
OPPORTUNITIES TO SIT [BENCHES TO REST, SEATING ZONES, PRIMARY + SECONDARY]
6OPPORTUNITIES TO SEE
[LIGHTING, INTERESTING VIEWS]
7
OPPORTUNITIES TO TALK + LISTEN [NOISE
LEVEL, SEATING ARRANGEMENTS]
8
OPPORTUNITIES FOR PLAY + UNFOLDING
ACTIVITIES [TEMPORARY USES + ENTERTAINMENT,
SUMMER + WINTER]
9
DIMENSIONED AT HUMAN SCALE 10
OPPORTUNITIES TO ENJOY POSITIVE
ASPECTS OF CLIMATE 11
AESTHETIC QUALITY + POSITIVE SENSORY EXPERIENCE
[MATERIALS, PLANTS, DESIGN]
12
P
ROTE
CTIO
N - KEPT SAFE
COMFORT - QUALITY OF MOVING + STAYING
ENJOYMENT - GOOD DESIGN
MINIMAL OBSTACLES + HINDRANCES [STREET CLUTTER, NARROW PAVEMENTS]
MINIMAL PEDESTRIAN WAITING POINTS [CROSSINGS, PAVEMENT CONGESTION]
A
B
PINCH POINTS [EFFECTIVE PAVEMENT WIDTH TOO NARROW FOR ACCESS + HIGH FOOTFALL]
C
ENOUGH PEDESTRIAN CROSSING POINTS [LESS JAYWALKING]D
PERCEPTION OF SAFETY FROM TRAFFICE
CONTINUOUS LEVEL PAVING SURFACE + PEDESTRIAN PRIORITY
F
CYCLE LANES
G
PERCEPTION OF SAFETY FROM TRAFFIC H
CYCLE RACKS + PARKING FACILITIES I C
YCLIN
G
PED
ESTR
IAN
8
MOVEMENT FUNCTIONBASED ON DIRECT OBSERVATION TECHNIQUES + USER INTERVIEWS
PLACE FUNCTIONASSESSED AGAINST GEHL’S 12 QUALITY CRITERIA
FEELING SAFE [PROTECTION FROM TRAFFIC+ACCIDENTS]
FEELING SECURE [PROTECTION FROM CRIME+VIOLENCE]
1
2
CLIMATE AND POLLUTION [PROTECTION AGAINST UNPLEASANT SENSORY EXPERIENCES]3
OPPORTUNITIES TO WALK [NO OBSTACLES, GOOD SURFACING, ROOM]4
OPPORTUNITIES TO STAND/STAY [ATTRACTIVE EDGES, DEFINED SPOTS]5
OPPORTUNITIES TO SIT [BENCHES TO REST, SEATING ZONES, PRIMARY + SECONDARY]
6OPPORTUNITIES TO SEE
[LIGHTING, INTERESTING VIEWS]
7
OPPORTUNITIES TO TALK + LISTEN [NOISE
LEVEL, SEATING ARRANGEMENTS]
8
OPPORTUNITIES FOR PLAY + UNFOLDING
ACTIVITIES [TEMPORARY USES + ENTERTAINMENT,
SUMMER + WINTER]
9
DIMENSIONED AT HUMAN SCALE 10
OPPORTUNITIES TO ENJOY POSITIVE
ASPECTS OF CLIMATE 11
AESTHETIC QUALITY + POSITIVE SENSORY EXPERIENCE
[MATERIALS, PLANTS, DESIGN]
12
P
ROTE
CTIO
N - KEPT SAFE
COMFORT - QUALITY OF MOVING + STAYING
ENJOYMENT - GOOD DESIGN
MINIMAL OBSTACLES + HINDRANCES [STREET CLUTTER, NARROW PAVEMENTS]
MINIMAL PEDESTRIAN WAITING POINTS [CROSSINGS, PAVEMENT CONGESTION]
A
B
PINCH POINTS [EFFECTIVE PAVEMENT WIDTH TOO NARROW FOR ACCESS + HIGH FOOTFALL]
C
ENOUGH PEDESTRIAN CROSSING POINTS [LESS JAYWALKING]D
PERCEPTION OF SAFETY FROM TRAFFICE
CONTINUOUS LEVEL PAVING SURFACE + PEDESTRIAN PRIORITY
F
CYCLE LANES
G
PERCEPTION OF SAFETY FROM TRAFFIC H
CYCLE RACKS + PARKING FACILITIES I C
YCLIN
G
PED
ESTR
IAN

Supplementary Guidance Tollcross Town Centre
3
17Analysis
17Analysis
N
The Meadows The Meadows
A
B
CD
Fountainbridge canal
The Links
The Meadows
25
1
1
2
29
8 to 12
13
16 to 20
52 to
60
119
75.0
m
Wright's Houses
2
Prim
ary
Scho
ol
61
34
35
6
Loch
rin B
uild
ings
31
PH
23
37
2
1
LOC
HR
IN P
LAC
E
THO
RN
YBA
UK
117
30
Barc
lay
(PH
)
9
71.6
m
2
49
6
Loch
rin
Chur
ch
2
41 to 45
26
32
6 to
8
27
14 to
18
78.6
m
11 to
17
30 to 38
Chalmers Buildings
14a
4
28
10
38
45 to 51
5 to 8
1
Cha
pel
30 to
40
19
23 to 31
6
DUNBAR STREET
16
Gillespie Place
41
38
GILLESPIE STREET
43
PONTON STREET
43
30 to 36
1 to 5
39
2
TOLL
CROS
S
28
42 to
50
FOUN
TAIN
BRID
GE
7
13 to 17
Sub Sta
8 to
14 13 to 15
16
21to23
117
39 to 43
PO
1 to 3
73.2
m
TOLL
CR
OS
S
11
10
UPPER GILMORE TERRACE
Tollc
ross
75.6
m
Cent
ral
2
24
El Sub Sta
Presbyterian
Bow
ling
Gre
en
35
12
PH
2 to
6
TCB
s
GIL
LESP
IE C
RE
SC
ENT
47
28
3 to
5
PH
Nurse
ry S
choo
l
15
PC
Gar
age
12
PH
Hall
9 to 19
1
b31
42
5 to 11
to
Ban
k
El
30
(Hom
e fo
r the
Age
d)
79.6
m
Gilmore Place
39 to 47
HOME STREET
Leven Close
40 to 44
5
8
21 to
23
1 to 5
and School
Ye O
lde
Royal Blin
d Asylum
53 to 57
Hal
l
18
18 to
28
51
HAILES STREET
3
88
2
PH
Pavi
lion
39 to
41
74.4
m
TOLL
CR
OS
S
St J
osep
h's
Hou
se
21 to 4
253a
25
18
Kin
g's
Thea
tre
(priv
ate)
1
17 to 21
4
6
8 to 12
Gol
f Tav
ern46
123
48
3
8 to
12
5 to 11
73.2
m
47
14 to 22
14
62 to 66
Fire
Sta
tion
50 to 60
1ato1b
18 to 24
GIL
MO
RE
PLA
CE
17
1 to
9
45
Loch
rin 48
DRUMDRYAN STREET
72.2
m
Loch
rin T
erra
ce
17
21
71.6
m37
TOLL
CROSS
3 to
5
14
2
Cine
ma
4 1 to 11
103 to 115
WES
T
WEST TOLLCROSS
Barclay Place
21
19
20 to
28
72.5
m
15 to 21
79.6
m
7 to 13
1 to
6
11 to 15
3 18
1
46
Free
3
23
1
33 to 37
2
5 to 9
7
LEVEN STREET
28
16
6
UPPER G
ILM
ORE P
LAC
E
16
345
49
23
6
7
6 to
16
to 28
43
20
TCB
s
31
1
117 to 141
GILMORE PLAC E LANE
15 to 19
11 to 15
97 to 101
72.2
m
22 to 26
BRUNTSFIELD PLACE
BROU
GHAM
STR
EET
Ban
k
3
Cam
eo
6
125
Ban
k
LB4
Hea
lth C
entr
e
10
29
1 to 9
WES
T
45
84.4
m7
to 1
2
32 to 36
BA
RC
LAY
TER
RA
CE
29
26
33
20
16 to 20
PH
Loch
rin B
asin
Qua yside House
Foun
tain
Cou
rt
11 to 15
22
5
Union Path
Foun
tain
brid
ge S
quar
e
129 1 to 3
4
17
24
13
11
15
20
22
21
ESS
1
19
92
Hig
h R
iggs
LOC
HR
IN B
ASI
N L
AN
E
1
2
ESS
Burgh Const B dy
CR
War
d B
dy
Ward Bdy
Def
2 to 12
24
St T
hom
as O
f Aqu
in's
Hig
h Sc
hool
(Dar
roch
Cam
pus)
Low
er G
ilmor
e Ba
nk
Loch
rin S
quar
e
1
4
40 to 44
59 to 69
2
39
1
3
3
41
94
Lin
e O
f Po
sts
Dra
inLi
ne O
f Pos
ts PDB
Gar
age
9
22 to 26
Def
War
d B
dy
19
Asso
ciat
ion
1
44 to 48
1 to 7
LB
15
EARL GREY STREET
142
CHUCKIE PEND
1
RIEGO STREET
13
161 to 165
BREA D STREET LAN E
83
El
111 to 117
125
5
Shel
ter
Gov
ernm
ent O
ffice
93
SEMPLE STREET
85
131
Sub
23 to
27
87
127
6
11
77 to 81
67
El
PH
Com
mun
ity J
ustic
e
3
PH
69
DUNBAR STREET
97
Car
Par
k
Sta
57
9 to 13
PCB
72.5
m
9
7 to
13
70.4
m
2 to 6
72.5
m
89
122
101
120
Posts
143
EAST
FO
UNTA
INBR
IDGE
Buildings
PLAC
E
85a
2
50
1 to 11
TCB
91
73.2
m
105 to 109
PHPH
90 to 98
5
12 to 18
8
MO
RRI
SON
STR
EET
133 to 141
Gri
ndla
y C
ourt
36 to
40
106 to 110
101
to 149
Cin
ema
71.0
m
8
12
Post
151 to 159
29 to
33
119 to 123
SPITTAL STREET
54
22 to 42
48
52
to
26 to
32
LAURIS
TON
Chalmer's
30
Chi
mne
y
PORT HAMILTON
2 to 10
FOUN
TAIN
BRIDG
E
PH
Loth
ian
Hou
se
20
13a
112 to 116
Bank
GRINDLAY STREET COURT
15 to
19
Sub
Sta
99
BREA
D ST
REE
T
20
El S
ub S
ta
THORNYBAUK
20
47 to
55
42 to
46
8
72.8
m
89 to 95
15
PH
124 to 144
4
22 to 26
103
12 to
32
95
PH
High Riggs
17
60
3
Cin
ema
51 to 11
118
Prin
ces
Exc
hang
e C
ar P
ark
(bel
ow)
3
1
5
Post
s
Soci
al W
ork
Cen
tre
TCB
War
d Bd
y
War
d B
dy
Def
65 to 75
8 to
1886 88
22 24
28 to 58
35 3739
to 4
5
144
22
7
4
20
4 to 8
19 to 23
22
3 to 5
72.8
m
VALL
EYFI
ELD
STR
EET
12
STREET
9 to
11
9 to 11
1
Pavilion
21
5
LAURISTON PARK
Cycle
Trac
k
529 to 33
19
10
13 to 15
PAN
MU
RE
PLA
CE
Bow
ling
Gre
en
16
7
19
GLE
NG
YLE
TE
RR
AC
E
Chu
rch
33
3 to 5
15 to
17
3
18
10 to
14
LEVEN TERRA CE
St M
icha
el
23 to 26
GLEN ST REET
TAR
VIT
13
14
PH
Bow
ling
Gre
en
5a
3
Surg
ery
20 to
24
12
8 to
12
73.5
m
14
1
2
9
23
Surg
ery
7
15
Gas
5 to 9
Play
grou
nd
6
Bru
ntsf
ield
Lin
ks
14 to 16
21
21
26
11
20
7 to 9
25
1 to 3
20
BROUGHAM PLACE
4 to
8
17
6
4
5
73.1
m11
10 to 14
Gov
PH
22 to 30
2 to
4
17 to 21
18
73.2
m
8
36
19
5
8 to 10
1
2
15a to 17
1
2
and
All
Sai
nts
16
2
1
1
27 to 33
Tree
s
Pilla
r
Pilla
r
7 to 9
2927
Hos
tel
PH
18 to 24
10 to 16
140
1
Land
137
to 1
41
Fire B
rigad
e H
112
to 1
16
75.0
m
69 to
77
78.0
m
Spi tt
al S
treet
Cordiner's
Hot
el27 to
31
to
Church of th
e
4 to 10
32
54 to 56
138
1
77
El S
ub S
ta
PH
28
145
1 to 11
2
151
to 1
55
1 to
6
122
to 1
26
Lane
2134
105 to 115
3
80.2
m
LADY LAWSON STREET
79
2
143
106
to 1
10
46 to 52
MA
IN P
OIN
T
91 to 101
128
1 to
24
Laur
isto
n
59
46
and M
useu
m
Cha
lmer
s-
26
60
PH PH
3
WES
T P
OR
T
4 to 8
33 to
37
Lauriston Hall
4
LAURISTON GARDENS
LAURISTON PARK
130
7
12
11 to 19
12 to 16
Sacred Heart
LAURISTON S
TREET
62 to 68
GLEN ST REET
149
Chu
rch
40
67
Aithison's C l
HIGH RIGGS
23
80
Hot
el
Hot
el
82
56
FBES
S
78
Evol
utio
n H
ouse
102
26 to 32
72 to 76
118
810
120
Fact
ory
59
OVERALL ANALYSIS MAPMAP KEY
Overall Analysis Map
1616
The diagram also highlights where there are particularly favourable sunny south-facing microclimates, or other key opportunities to enhance public life. For example at the Home St end of Lochrin Place for pedestrian/cycle priority and outdoor seating, along Leven St to build upon the sensory interest, character and active frontages of the street, around the police box cafe at High Riggs, near Tollcross Primary school on Thornybauk/Lochrin Terrace/West Tollcross to create an improved pedestrian (and child) friendly context to the school entrance, or on the sunny wider corner of Fountainbridge/Lothian Road. More detail about these opportunities is available in the ‘Opportunities’ section of this report.
The analysis diagram also shows where current conflict is occurring between pedestrians and vehicles. This should be a priority to address.
OVERVIEWTOLLCROSS
This analysis diagram summarises the overarching research observations of the current condition of the town centre. It has been compiled based on a synthesis of researcher observations and diaries, sub-studies by the research team and analysis of the data collected from test walks and direct observation at each key location.
This analysis diagram presents a holistic spatial understanding of the town centre, its current movement and place function, and key opportunities and strategies to enhance the street environment both as a place for public life and easier movement on foot or by bike. It also shows the four locations (A, B, C, D) that research was focussed on during research days.
The analysis diagram reveals the potential for rationalising vehicular traffic lanes, reducing corner radii, and reclaiming various large areas of road carriageway that are currently inefficiently used at Tollcross junction, and instead harnessing these spaces as catalysts for public life, as well as enhancing the pedestrian and cycle movement experience. The additional wider pavement and plaza spaces created would also help provide - via the addition of street trees, public realm seating and outdoor cafe seating - a more pleasant street environment in which to spend time, enhancing public life.
Increase visual and walkable connection between both sides of the road / possible new pedestrian crossing.
Potential opportunity for key improvement for public life
Places cars or coaches regularly park, including loading bays and single yellow lines, as well as unofficial locations cars/coaches/taxis observed stopping regardless of legality. This creates a barrier restricting pedestrian visual and movement connection with the opposite side of the road, and effectively prioritises car parking over bus lane, cycle route or wider pavement for pedestrians.
Road carriageway that could be used instead for wider pavement to better prioritise pedestrian experience e.g. addition of raised tables, reduced corner radii, increased pavement width, improved drop kerbs.
Key walking / cycling connections to nearby green spaces and canal.
Existing public life - primarily relating to active shop fronts, bus stops, parks, benches or other gathering places conducive to staying activities.
Existing pedestrian crossings.
Key positive views
Favourable microclimate (sun, mostly sheltered from wind)
Key areas of conflict between pedestrians and traffic. Where pedestrians are trying to move freely between different parts of the town centre or cross the street but traffic or parked cars are proving a hazard or barrier.
Key location at which research was conducted [labelled A to D].
A
Barrier to urban connectivity e.g. road with multiple lanes
Locations pedestrians particularly vulnerable [lack of protection from vehicles on traffic islands, narrow corners]
Particularly long waiting times for pedestrian crossings.
Town centre boundary.
MAP KEY

Supplementary Guidance Tollcross Town Centre
4
SWOT Analysis
Strengths
• Small scale active independent shops
• Proximity to larger open spaces
• High footfall
• Vibrant, young, diverse and multi-cultural community
Weaknesses
• Lack of planting and street trees
• Poor pedestrian priority at crossings
• Large bins and insufficient bike parking
• Uneven pavement surfaces
Opporunities
• Enhance pedestrian and cycle connections
• Addition of seating and street trees
• Opportunities for redesign of Tollcross junction
• De-clutter town centre
Threats
• Street clutter
• Lack of safe, easy, walking routes
• Uneven surfaces
• Traffic volume
Policies TC1 The change of use of a shop unit to a non-shop use will not be permitted,
(with the exception of the corner units where Class 3 Food and Drink uses are
considered appropriate) on the following frontages: :
• 120–148 Lothian Road
• 2-48 Earl Grey Street
• 1-65 Home Street
TC2 Elsewhere within the defined boundary of Tollcross the change of use of a shop
unit to a non-shop use will be permitted provided the proposal is:
a) Class 2 Financial, professional or other services
b) Class 3 Food and Drink uses
c) an appropriate commercial or community use which would compliment the
character of the centre and would not be detrimental to its vitality and viability.
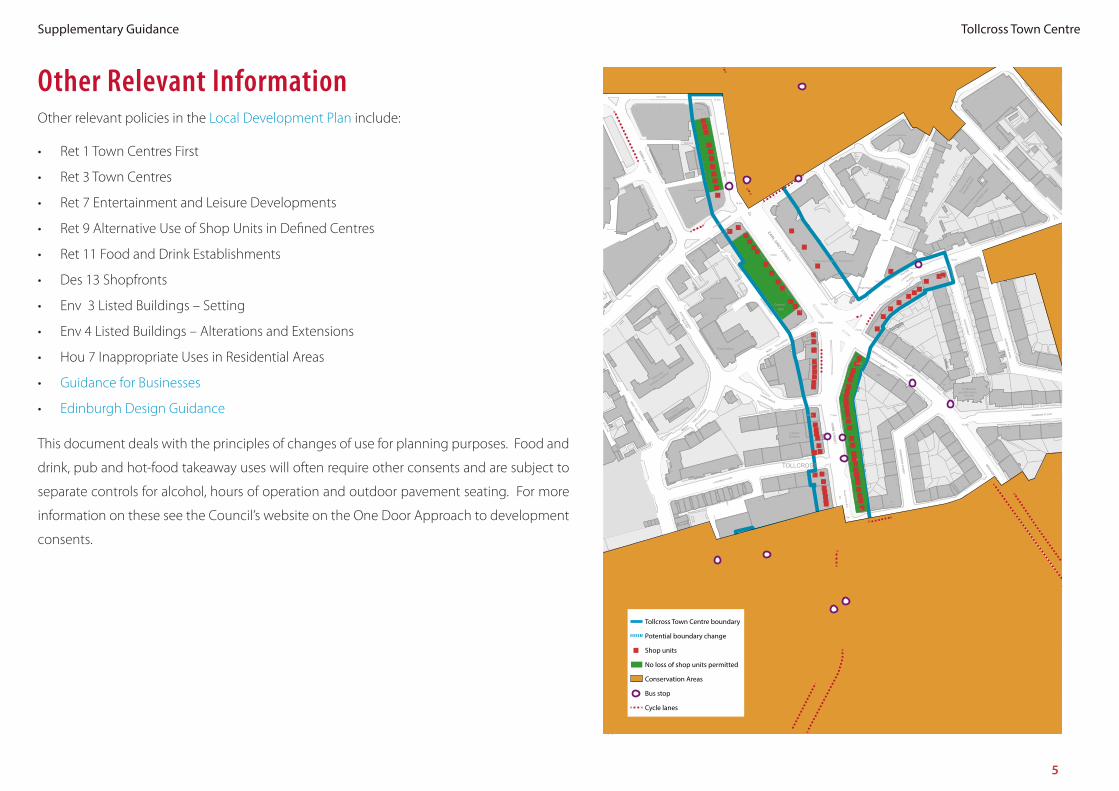
Supplementary Guidance Tollcross Town Centre
5
Other Relevant InformationOther relevant policies in the Local Development Plan include:
• Ret 1 Town Centres First
• Ret 3 Town Centres
• Ret 7 Entertainment and Leisure Developments
• Ret 9 Alternative Use of Shop Units in Defined Centres
• Ret 11 Food and Drink Establishments
• Des 13 Shopfronts
• Env 3 Listed Buildings – Setting
• Env 4 Listed Buildings – Alterations and Extensions
• Hou 7 Inappropriate Uses in Residential Areas
• Guidance for Businesses
• Edinburgh Design Guidance
This document deals with the principles of changes of use for planning purposes. Food and
drink, pub and hot-food takeaway uses will often require other consents and are subject to
separate controls for alcohol, hours of operation and outdoor pavement seating. For more
information on these see the Council’s website on the One Door Approach to development
consents.
1
2
13
16 to
20
52 to 60
119
75.0m
2
Primary School
6
Lochrin Buildings
31
LOCHRIN PLACE
THORNYBAUK
117 2
Lochrin
41 to 45
78.6m
Chalmers Buildings
28
10
Chapel
30 to 40
19
6
DUNBAR STREET
41
38
GILLESPIE STR
EET
PONTON STREET
43
39
TOLLCROSS
42 to 50
7
Sub Sta
8 to 14
13 to 15
16
117
TOLLCROSS
11
Tollcross
Central
El Sub Sta
Bowling Green
35
GILLESPIE CRESCENT
47
Nursery School
15
PC
12
Hall
42
El
(Home for the Aged)
8
21 to 23
1 to
5
and S
choo
l
Royal
Blind A
sylum
18
18 to 28
HA
ILES STREET
88
Pavilion
St Joseph's House
18(Private)
1
17 to 21
4
123
5 to 11
Fire Station
GILMORE PLACE
45
Lochrin Terrace
17
21
71.6m
37
TOLLCROSS
3 to 5
Cinema
103 to 115
WEST
WEST TOLLCROSS
Barc
lay
Plac
e
3
18
1
3
23
2
16
49
6
7
20
31
1
97 to 101
BRUN
TSFI
ELD
PLAC
E
Cameo
6
Health Centre
10
29
WEST
33
20
5
17
24
13
11
15
20
22
19
ESS
Ward Bdy
Ward Bdy
Ward Bdy
2 to
12
St Thomas Of Aquin's
High School (Darroch Campus)
13
1
44 to
48
EARL GREY STREET
CH
UC
KIE PEN
D
161 to 165
BR
EAD
STREET LA
NE
83
111 to 117
125
Shelter
SEMPLE STREET
85
131
23 to 27
87
127
6
77 to 81
PH
PH
DUNBAR STREET
Car Park
7 to 13
72.5m
122
101
120
Posts
143
Buildings
85a
2
50
TCB
73.2m
105 to 109
PH
90 to
98
12 to 18
133 to 141
36 to 40
106
to 1
10
to 149
8
Post
151 to 159
119 to 123
54
22 to
42
48
52
to
26 to 32
Chalmer's
30
Chimney
FOUNTAINBRIDGE
Lothian House
112
to 1
16
Bank
GR
IND
LAY STREET C
OU
RT
15 to 19
BREAD STREET
THORNYBAUK
20
42 to 46
72.8m
89 to 95
PH
124
to 1
44
22 to 26
60
3
Cinema5
118
1
5
Social Work Centre
TCB
Ward Bdy
Def
65 to 75
8 to 18
2224
25
1
29
8 to
12
35
PH
37
2
1
Barclay
9
71.6m
6
Church
2
26
32
6 to 8
27
14 to 18
11 to 17
30 to 38
14a
38
45 to 51
5 to
8
1
23 to 31
16
Gill
espi
e Pl
ace
43
30 to
36
1 to 5
2
13 to 17
39 to 43
PO
73.2m
10
75.6m
2
24
12
PH
2 to 6
TCBs
3 to 5
PH
PH
9 to
19
1
b31
5 to 11
to
Bank
30
HO
ME STR
EET
Leve
n C
lose
40 to 44
53 to 57
Hall
2
PH
74.4m
TOLLCROSS
21
to 4
25
King's Theatre
6
8 to 12
4648
8 to 12
73.2m
14 to 22
14
62 to
66
50 to
60
1ato1b
18 to
24
17
1 to 9
DR
UM
DRYA
N STR
EET
72.2m
14
2
4
1 to 11
19
20 to 28
72.5m
15 to 21
79.6m
7 to 13
11 to 15
1
33 to 37
5 to 9
7
LEVE
N S
TREE
T
28
6
16
523
6 to 16
to 28
TCBs
117 to 141
11 to 1572.2m
BROUGHAM STREET
Bank
3
Bank
LB
4
1 to 9
PH
11 to 15
21
High Riggs
Burgh C
onst Bdy
CR
4
40 to
44
59 to 69
2
39
13
41
1 to
7
15
142
1
RIEGO STREET
13
Government Office
Sub
11
El
Community Justice
3
Sta
57
9 to
13
PCB
72.5m
9
EAST FOUNTAINBRIDGE
PLACE
1 to 11
PH
5
101
Works
12
29 to 33
SPIT
TAL
STREE
T
LAURISTON
2 to 10
PH
13a
20
El Sub Sta
47 to 55
15
103
12 to 32
High
Rig
gs
17
1 to 11
Princes Exchange Car Park (below)
Posts
Ward Bdy
28 to 58
3537
39 to 45
4
20
4 to
8
19 to 23
22
3 to
5
VALLEYFIELD STREET
12
STREET
9 to 11
9 to 11
1
Pavilion
21
LAU
RISTO
N PA
RK
Cycle Track
5
19
10
13 to
15
PANMURE PLACE
Bowling Green
16
7
19
GLENGYLE TERRACE
Church
33
3 to 5
15 to 17
3
18
10 to 14
LEVEN TER
RA
CE
St Michael
23 to
26
GLEN
STREET
TARVIT 13
14
PH
Bowling Green
3
Surgery
20 to 24
12
8 to 12
73.5m
14
1
2
9
23
Surgery
7
15
Gas
5 to 9
Playground
6
14 to
16
21
21
26
11
7 to 9
25
1 to 3
20
BROUGHAM PLACE
4 to 8
17
6
4
5
10 to
14
Gov
PH
22 to
30
2 to 4
17 to 21
18
73.2m8
36
19
5
8 to
10
1
2
15a
to 1
7
1
2
and All Saints
16
2
1
1
27 to
33
Pillar
Pillar
7 to 9
2927
Hostel
PH
18 to
24
10 to
16
140
1
137 to 141
112 to 116
75.0m
69 to 77
78.0m
Hotel
27 to 31
to
Chur
ch o
f the
4 to 1
0
59
32
138
1
77
El Sub Sta
Works
PH
28
145
1 to 11
2
151 to 155
122 to 126
2
134
105 to 115
LADY LAWSON STREET
79
143
106 to 110
46 to
52MAIN POINT
91 to 101
128
1 to 24
Lauriston
59
46
Chalmers-
26
PH
PH 3
33 to 37
Laur
iston
Hall
4
LAU
RISTO
N PA
RK
130
7
12
11 to 19
12 to
16
Sacr
ed H
eart
LAURISTON STREET
GLEN
STREET
149
Church
40
67
HIGH
RIG
GS
23
Hotel
82
56
FBESS
78
Evolution House
102
26 to
32
72 to 76
118
810
120
Tollcross Town Centre boundary
Potential boundary change
Shop units
No loss of shop units permitted
Conservation Areas
Bus stop
Cycle lanes

Housing and Economy Committee
10.00am, Thursday, 2 November 2017
Supplementary Guidance – Review of Nicolson
Street/Clerk Street, Portobello and Stockbridge Town
Centres - referral from the Planning Committee
Executive Summary
On 12 October 2017 the Planning Committee considered a report by the Executive Director of Place on the revised Supplementary Guidance for – Nicolson Street/Clerk Street, Portobello and Stockbridge town centres.
Item number
Report number
Executive/routine
Wards
Council Commitments
1652356
New Stamp
9074241
Typewritten Text
Executive

Housing and Economy Committee – 2 November 2017 Page 2
Terms of Referral
Supplementary Guidance – Review of Nicolson
Street/Clerk Street, Portobello and Stockbridge Town
Centres
Terms of Referral
1.1 On 12 October 2017 the Planning Committee considered the attached report by the
Executive Director of Place on the revised Supplementary Guidance (SG) for
Nicolson Street/Clerk Street, Portobello and Stockbridge town centres.
1.2 The Local Development Plan (LDP) identifies nine town centres with their boundaries shown on the Proposals Map. Of the nine town centres, six SGs have already been adopted, City Centre, Corstorphine, Gorgie/Dalry, Tollcross, Bruntsfield/Morningside and Leith.
1.3 The LDP requires statutory SG to be prepared for individual town centres. The SG
will guide the balance of uses within the town centres. It will be used to determine planning applications for change of use.
1.4 There was broad support for the change of use policy set out for each of the Town Centres which identifies primary shopping frontages where the proportion of nonshop uses should not exceed a set threshold.
The Planning Committee agreed:
1. To approve Appendix 1 of the report by the Executive Director of Place as the finalised Supplementary Guidance (SG) for Nicolson Street/Clerk Street Town Centre;
2. To approve Appendix 2 of the report by the Executive Director of Place as the
finalised SG for Portobello Town Centre; and
3. To approve Appendix 3 of the report by the Executive Director of Place as the finalised SG for Stockbridge Town Centre; and
4. to refer all three to the Housing and Economy Committee for approval prior to
adoption as part of the statutory development plan.
For Decision/Action
2.1 The Housing and Economy Committee is asked approve the Supplementary Guidance for Nicolson Street/Clerk Street, Portobello and Stockbridge Town Centres prior to the adoption as part of the statutory development plan.
Housing and Economy Committee – 2 November 2017 Page 3
Background reading/external references
Planning Committee, 12 October 2017
Laurence Rockey
Head of Strategy and Insight
Contact: Stephen Broughton, Committee Services
E-mail: [email protected] | Tel: 0131 529 4261
Appendices
Appendix 1 - Supplementary Guidance: Nicolson Street/Clerk Street, Portobello, Stockbridge Town Centres – report by the Executive Director of Place

Planning Committee
10.00am, Thursday, 12 October 2017
Supplementary Guidance: Nicolson Street/Clerk
Street, Portobello, Stockbridge Town Centres
Executive Summary
The Edinburgh Local Development Plan (LDP) was adopted on 24 November 2016. The
LDP requires statutory Supplementary Guidance (SG) to be prepared for individual town
centres. The SG will guide the balance of uses within the town centres. It will be used to
determine planning applications for the change of use of shop units to non-shop uses and
help deliver the Council’s wider placemaking and sustainability aims.
The purpose of this report is to seek Committee approval of the finalised SG for Nicolson
Street/Clerk Street, Portobello and Stockbridge Town Centres. The appended SG will be
referred to the Housing and Economy Committee for approval prior to formal adoption as
part of the development plan, supplementing the Edinburgh LDP.
Item number
Report number
Executive/routine Executive
Wards
Council Commitments
City Centre, Inverleith, Portobello/Craigmillar, Southside/Newington

Planning Committee – 12 October 2017 Page 2
Report
Supplementary Guidance: Nicolson Street/Clerk Street,
Portobello, Stockbridge
1. Recommendations
1.1 It is recommended that Committee:
1.1.1 approves Appendix 1 as the finalised Supplementary Guidance (SG) for
Nicolson Street/Clerk Street Town Centre;
1.1.2 approves Appendix 2 as the finalised SG for Portobello Town Centre; and
1.1.3 approves Appendix 3 as the finalised SG for Stockbridge Town Centre; and
1.1.4 refers all 3 to the Housing and Economy Committee for approval prior to
adoption as part of the statutory development plan.
2. Background
2.1 Policy Ret 9 of the Edinburgh Local Development Plan (LDP) requires that statutory
SG is prepared to set out criteria for assessing the proposals for the change of use
of a shop unit to a non-shop use within the city centre retail core and town centres.
Statutory SG is prepared under Section 22 of the Planning etc. (Scotland) Act 2006
and aims to deliver the policies and principles as set out in the LDP.
2.2 The SGs aim to deliver two objectives in Part 2, Section 6 (Shopping and Leisure)
of the LDP:
to maintain the existing and proposed distribution of centres throughout the city
and sustain their vitality and viability; and
to improve the appearance, quality and attractiveness of all centres of the
development.
2.3 The LDP identifies nine town centres with their boundaries shown on the Proposals
Map. Of the nine town centres, six SGs have already been adopted - City Centre,
Corstorphine, Gorgie/Dalry, Tollcross, Bruntsfield/Morningside and Leith. Draft SG
for Nicolson Street/Clerk Street, Portobello and Stockbridge was approved for
consultation in March 2017. A review of Corstorphine, Gorgie/Dalry and Tollcross
is underway and is the subject of a separate report.
2.4 The SGs demonstrate the Council’s requirement to apply the Scottish
Government’s Town Centre First Policy and the desire to promote the town centres
as the heart of the community and a hub for a range of activities.
Planning Committee – 12 October 2017 Page 3
2.5 Once adopted, they will form part of the statutory development plan.
2.6 It is intended to review the guidance regularly to take account of changes of use
over time.
3. Main report
3.1 The three appended SGs (Appendix 1, 2 and 3) are similar to one another in
structure and style, but some of their content differs as a reflection of the Town
Centres distinct characteristics and the tailored processes. Each of the SGs set out:
3.1.1 a vision for the town centre
3.1.2 principles to be considered when submitting and assessing planning
applications within the town centre
3.1.3 change of use policies.
3.2 The process of preparation has included:
3.2.1 analysing the results of shop surveys, including trends over time in the
proportion of non-shop uses and vacancy rates;
3.2.2 assessing effectiveness of previous policies;
3.2.3 analysing a series of ‘Public Life Street Assessments’ carried out by
consultants (HERE+NOW) and funded by the ‘Smarter Choices Smarter
Places’ programme;
3.2.4 consideration of results from a Place Standard exercise within the Southside:
3.2.5 meetings with the relevant Locality teams and community councils; and
3.2.6 consideration of the responses to consultation on the draft SGs.
Responses to consultation
3.3 The draft SG for Nicolson Street/Clerk Street received 32 responses, Portobello
received 60 responses and Stockbridge 272 responses.
3.4 Each of the draft SG set out a vision and principles to be applied in assessing
applications for change of use in that particular Town Centre. There was broad
support for the Vision and Principles set out in the draft SG for each of the Town
Centres.
3.5 There was broad support for the change of use policy set out for each of the Town
Centres which identifies primary shopping frontages where the proportion of non-
shop uses should not exceed a set threshold.
3.6 Many of the comments received expressed concern about the occupiers of shops
within the Town Centres, mainly the desire to restrict charity shops and national
retailers, or a specific service within the shop use class e.g. hair and beauty. This
issue is outwith the control of the statutory planning system.
3.7 The number of food and drink outlets was also a common concern. Generally the
view was that there were too many of such uses. The policy in the SG aims to

Planning Committee – 12 October 2017 Page 4
ensure that within defined primary retail frontages the number of non-shop uses
such as food and drink are limited to certain proportions, there-by limiting the
number of these uses. The Council’s separate non-statutory Guidance for
Businesses identifies areas of restriction for hot food take-aways, which includes
part of Nicolson Street/Clerk Street Town Centre. It must be recognised that a
range of uses are essential to the vitality and viability of the town centre and food
and drink outlets can add to that vitality. The approach of the SG allows increased
flexibility in areas outwith defined frontages. In these areas, out with the defined
retail frontages, non-shop use will be permitted provided proposals are for class 2
(financial, professional or other services), class 3 (food and drink – not including hot
food take-ways) or other appropriate commercial, community or leisure uses. This
frontage approach is intended to ensure a balance between the level of shopping
provision across the centre as a whole while acknowledging the value of
complementary uses.
3.8 There was broad support across the town centres for continuing to not allow
conversion of shop units to residential use. For placemaking purposes it is
important that ground floor uses help bring activity onto the street. Residential units
at ground floor level tend to add little vitality to town centres.
3.9 The consultation suggested some potential changes to existing town centre
boundaries as defined in the LDP Proposals Map. Within Nicolson Street/ Clerk
Street there were two suggested changes. There was support for a change to
include Nicolson Square to provide a consistent approach to the whole square, part
of which is currently included. There was less support for a change to exclude the
southern part of the existing town centre.
3.10 Suggestions to amend the Portobello Town Centre boundary – to the west to
Figgate Bur/Fishwives Causeway, and to incorporate all shop units on the
southside of Portobello High Street – were generally supported.
3.11 Within Stockbridge there were two suggested changes. There was general support
for an extension of the boundary to include the north side of Raeburn Place
although concerns were expressed that this area was not viewed as part of
Stockbridge. There were similar concerns about the extension of the boundary to
include North West Circus Place.
3.12 Procedurally there is no scope to make such changes to this LDP as it is recently
adopted. However, these suggestions for changes to the town centre boundary will
be considered during the preparation of LDP2.
The Finalised SG
3.13 Comments received have been considered in the finalisation of the SG. A summary
of responses received and a response to these is set out at Appendix 4.
3.14 No substantive changes have been made to the draft SG. Wording of the Nicolson
Street/Clerk street vision has been altered to reflect the desire to focus on active
travel, definitions have been supplemented and graphical changes have been made
to improve clarity.

Planning Committee – 12 October 2017 Page 5
3.15 The SGs will be used to determine planning applications for the change of use of
shop units to non-shop uses, and by identifying a vision and principles for each of
the town centres, they will also help to deliver the wider placemaking agenda
alongside other Council and partner policies and plans.
Next steps
3.16 This report will be referred to the Housing and Economy Committee for approval, as
the SG will be adopted as part of the statutory development plan. Following
approval, the revised final versions of the SG will be submitted to Ministers,
together with evidence of how representations have been taken into account.
Following a period of 28 days, unless directed otherwise, the SG can be formally
published and adopted as part of the development plan.
3.17 The adopted SGs will be published as designed documents, in a similar style to
other SG.
4. Measures of success
4.1 The vitality and viability of the three town centres are preserved and enhanced. A
clear, consistent and adaptable policy context is provided to communities and
businesses.
5. Financial impact
5.1 There are no direct financial impacts arising from this report.
6. Risk, policy, compliance and governance impact
6.1 There are no perceived risks associated with this report.
7. Equalities impact
7.1 The impacts of this report in relation to the Public Sector Equalities Duty and the ten
key areas of rights have been considered. The report has no significant direct
impact on the Council’s three equalities duties. The SG will have positive impacts
on rights. The process of preparing the SG enhances the rights to participation,
influence and voice by allowing people to participate in the formation of policy. The
Guidance will enhance the rights to health, physical security and standard of living.
8. Sustainability impact
8.1 The proposals in this report will:

Planning Committee – 12 October 2017 Page 6
8.1.1 reduce carbon emissions because they support and provide local services in
sustainable locations, reducing the need for travel;
8.1.2 increase the city’s resilience to climate change impacts because supporting
town centres reduces the need to travel for services;
8.1.3 help achieve a sustainable Edinburgh because town centres are places for
social and economic interaction, and fostering their vitality and viability will
protect their identity within our communities;
8.1.4 help achieve a sustainable Edinburgh because it supports the town centres
where many local businesses choose to locate; and
8.1.5 help achieve a sustainable Edinburgh because they promote the continued
use of shop units in beneficial use.
8.2 All three SGs have been considered through the Strategic Environment
Assessment (SEA) screening process which has determined that there are no
significant environmental impacts.
9. Consultation and engagement
9.1 The principle of preparing SG for town centres was consulted on through the LDP
process. Pre-draft engagement took place with the relevant Locality teams and
community councils.
9.2 A Place Standard exercise within the Southside informed the preparation of the
Nicolson Street/Clerk Street SG. The exercise involved two public events and an
online survey and provided an opportunity for people to put forward their views on
the Southside as a place. A presentation was given to Southside Community
Council during the consultation period. Portobello Community Council carried out a
survey on relevant aspects of the town centre, which informed the preparation of
the SG.
9.3 The consultation period on the draft SGs ran for six weeks between 18 April and 30
May 2017. Letters, emails and advertisement posters were sent to community
councils, amenity bodies, and local businesses. During this time, the draft SG for
Nicolson Street/Clerk Street, Stockbridge and Portobello were available on the
Council’s Consultation Hub.
9.4 A summary of the consultation responses are set out in Appendix 4.

Planning Committee – 12 October 2017 Page 7
10. Background reading/external references
10.1 www.edinburgh.gov.uk/localdevelopmentplan
10.2 www.edinburgh.gov.uk/supplementaryguidance
10.3 Supplementary Guidance: Nicolson Street/Clerk Street, Portobello, Stockbridge –
drafts for consultation, Report to Planning Committee, 2 March 2017
Paul Lawrence
Executive Director of Place
Contact: David Leslie, Service Manager/Chief Planning Officer
E-mail: [email protected] | Tel: 0131 529 3948
11. Appendices
11.1 Appendix 1 - Nicolson Street/Clerk Street Town Centre Supplementary Guidance
11.2 Appendix 2 - Portobello Town Centre Supplementary Guidance
11.3 Appendix 3 - Stockbridge Town Centre Supplementary Guidance
11.4 Appendix 4 – Summary of Consultation Responses

Planning Committee 12 October 2017 Appendix 1 Nicolson Street/Clerk Street Town Centre Supplementary Guidance
Nicolson Street/Clerk Street Town
Centre
Supplementary Guidance
www.edinburgh.gov.uk/supplementaryguidance
November 2017

Planning Committee 12 October 2017 Appendix 1 Nicolson Street/Clerk Street Town Centre Supplementary Guidance
CONTENTS
1. Introduction
2. Nicolson Street/Clerk Street Town Centre
3. Vision and Principles
4. Change of use policies
5. Links to other policies and guidance
6. Definitions

Planning Committee 12 October 2017 Appendix 1 Nicolson Street/Clerk Street Town Centre Supplementary Guidance
2
1. INTRODUCTION
This Supplementary Guidance sets out the approach to the
change of use of shop units within Nicolson Street / Clerk
Street Town Centre.
Nicolson Street/Clerk Street is one of Edinburgh’s nine town
centres (including the City Centre) defined and protected in the
Edinburgh Local Development Plan (LDP) as a hub for
shopping, local services and as a leisure destination.
The LDP provides a framework for a tailored approach to
assessing proposals for change of use applications in individual
town centres. The Supplementary Guidance has been
prepared in accordance with Policy Ret 9: Alternative Use of
Shop Units in Defined Centres and applies to all shop units
within the town centre.
The Supplementary Guidance aims to deliver two LDP
objectives set out in Part 2, Section 6 (Shopping and Leisure)
of the Plan:
- To maintain the existing and proposed broad distribution
of centres throughout the city and sustain their vitality
and viability; and
- To improve the appearance, quality and attractiveness
of all centres.
This Supplementary Guidance will form part of the statutory
development plan. Applications for change of use must be
determined in accordance with the development plan unless
material considerations indicate otherwise. To assist in
interpreting the LDP the Council issues non-statutory guidance.
Guidance for Businesses provides guidance on change of use.
This is a material consideration in the determination of
applications and should be considered alongside this
Supplementary Guidance.
The Supplementary Guidance has been informed by a ‘public
life street assessment’ carried out by design consultants for the
Council, which explored how the town centre should evolve to
maximise the potential for benefitting public life and a Place
Standard exercise carried out within the Southside, which

Planning Committee 12 October 2017 Appendix 1 Nicolson Street/Clerk Street Town Centre Supplementary Guidance
4
includes the town centre of Nicolson Street/Clerk Street, to gain
views of quality of place from residents and those who use the
town centre. A health check has considered the centre’s
strengths, vitality and viability, weaknesses and resiliencies.
2. NICOLSON STREET/CLERK STREET TOWN CENTRE
Nicolson Street/Clerk Street Town Centre is located on a main
arterial route leading from Edinburgh’s historic Old Town
through the inner suburb of the Southside. It extends for 1.7km
from North Bridge south to the junction of Newington Place and
Salisbury Place.
The Town Centre lies within the Conservation Areas of Old
Town and Southside and contains a number of listed buildings.
The northern section is located within the Old and New Towns
of Edinburgh World Heritage Site. There are a number of
prominent buildings and the proximity of Arthur’s Seat and
Salisbury Crags allow dramatic views throughout the area.
The area is densely populated with approximately 15,400
people within approximately 400 metres of the Town Centre.
The University of Edinburgh has a major presence and
reflecting the high student population more than half of the
resident population is aged 16 to 24. This is much higher than
that of Edinburgh as a whole.
It is a diverse lively area with a number of active evening uses
including the Festival Theatre. There are three public squares
within the town centre – Nicolson Square, St Patrick Square
and Hunter Square.
There are a number of community cafes and churches
providing a focus for the community. There is a strong sense
of identity within the area. There are two active Community
Councils and an established amenity group - The Southside
Association.

Planning Committee 12 October 2017 Appendix 1 Nicolson Street/Clerk Street Town Centre Supplementary Guidance
4
Map 1: Nicolson Street/Clerk Street Town Centre

Shop and other town centre uses
The Town Centre consists of a mix of primarily smaller shops
and eating places, bars and different types of takeaway
combined with a few larger cultural institutions. Shop units
range in size from relatively small shop units up to small
supermarket sized units. The majority of units are located within
traditional tenement buildings with residential units above.
Residential is therefore a major town centre use.
National retailers are represented in the Town Centre,
particularly in the South Bridge area. A number of these
operators have multiple units along the length of the centre.
There are also a number of independent operators.
The northern section of the Town Centre intersects with the
Royal Mile. Around this location there are a number of hotels.
This area is increasingly focussed on the service for visitors.
Eating places are well represented and spread out fairly evenly
throughout the Town Centre. The area is well served with
services such as hairdressers, pharmacies, opticians, banks
and a post office. There is no dentist or doctors within the town
centre boundary, although there are practices within the
surrounding area.
The mix of uses has been monitored in city-wide shop surveys
periodically undertaken since 1986. There has been a steady
decline in class 1 (retail) use and a subsequent increase in
class 2 (office), class 3 (food and drink) and pubs and hot food
take-aways. Just under half of the shop units in the Town
Centre are in retail use. Vacancy rate is low and footfall is high.
Health check indicators point towards a relatively healthy
centre overall. The analysis below summarises the strengths
weaknesses, opportunities and threats.

Planning Committee 12 October 2017 Appendix 1 Nicolson Street/Clerk Street Town Centre Supplementary Guidance
Strong sense of local identity
High footfall
Good public transport
Access to natural space
Diverse mix of shops and
services
Low vacancy rate
Narrow footpaths and pinch
points
Traffic noise and air pollution
Linear centre inhibiting
wayfinding
Poor quality materials
Integration of communities
Perceived threat of anti‐social
behaviour
Improve cross connections
Build on high footfall
Enhance spaces
Build on existing retail
Improve quality of materials
Improve conditions and facilities
for cyclists
Safeguarded tram route
Traffic noise, volume and
pollution
Length of centre
Perceptions of threat in terms of
anti‐social behaviour
STRENGTHS WEAKNESSES OPPORTUNITIES THREATS

Planning Committee 12 October 2017 Appendix 1 Nicolson Street/Clerk Street Town Centre Supplementary Guidance
3. VISION AND PRINCIPLES
The Public Life Street Assessment and health check highlight areas for potential improvement in the Town Centre, particularly relating
to the movement and place function. The vision for Nicolson Street/Clerk Street is to:
ensure a mix of shopping and other services for residents and
visitors
facilitate movement by active travel
modes
enhance the appearance and comfort of the centre

Planning Committee 12 October 2017 Appendix 1 Nicolson Street/Clerk Street Town Centre Supplementary Guidance
The Supplementary Guidance goes some way to achieve the
wider vision through the following principles, which should be
considered when submitting and assessing a planning
application for a change of use within Nicolson Street/Clerk
Street Town Centre:
1. Supporting high quality shopfront design (see the
Council’s Guidance for Businesses and Listed Buildings
and Conservation Area Guidance). Particular attention
should be given to measures which could reduce anti-
social behaviour such as gates on recessed doors and
frontages that allow natural surveillance.
2. Ensuring active frontages to the street by permitting
glazing which will allow for natural surveillance, whilst
prohibiting the change of use from shop use to
residential in ground floor units.
3. Supporting outdoor seating where pavements are wider.
4. Supporting class 3 food and drink uses around public
squares and on corner sites where there is opportunity
to activate the public street life and encourage people to
spend time in the town centre.
5. Ensuring development makes a positive contribution to
the public realm by meeting the Street Design Guidance
and Edinburgh Design Guidance.
6. Incorporating and enhancing natural and built features
where they can contribute positively to the Town Centre
7. Supporting additional cycle parking facilities at key
points along the Town Centre.
8. Taking opportunities to remove street clutter and other
redundant items identified in any relevant street audits
prepared by the Council or Living Streets.
9. Ensuring appropriate arrangements are in place for
storage of waste, internally and externally.
A number of programmes and plans have the potential to
address some of the other issues:

Planning Committee 12 October 2017 Appendix 1 Nicolson Street/Clerk Street Town Centre Supplementary Guidance
The Old Town Conservation Area Character Appraisal
has recently been reviewed and identifies opportunities
for enhancement.
The World Heritage Site Management Plan is under
review and will set out future actions within the site.
A bus shelter replacement programme has recently
taken place, including replacement bus shelters with
advertising panels in the town centre. Future
replacement programmes may present an opportunity to
improve placement of shelters.
Review of Air Quality Action Plan
Road and footway investment – Capital Programme
The Council and other stakeholders are currently
progressing a Wayfinding system for the City and the
intention would be to include town centres as part of the
project.
Quiet Routes – Edinburgh’s local walking and cycling
routes.
A 20mph speed limit has applied to much of the town
centre since July 2016. The remainder of the centre
introduced a 20mph limit in February 2017. Reduced
traffic speed will improve the sense of security for
pedestrians and cyclists.
A trade waste policy applies to the town centre that only
allows trade waste to be presented on the street/outside
premises for one-hour within set collection windows.
A locality based approach to service delivery operates in
Edinburgh. The town centre is part of the South East
Locality and the South Central Neighbourhood
Partnership area. The Locality Improvement Plan sets
out a small area plan for the Southside Corridor which
includes Nicolson Street/Clerk Street Town Centre. It
includes actions to improve public spaces.

Planning Committee 12 October 2017 Appendix 1 Nicolson Street/Clerk Street Town Centre Supplementary Guidance
4. CHANGE OF USE POLICIES
The policies apply shop units.
What is a shop unit? Premises opening directly onto the street
and designed primarily for shop use. In some locations the shop
unit can be above street level or at basement level but still have
direct access and be visible from the street.
Changing a shop unit to a non-shop use will always require
planning permission.
What is a shop use? A unit used for the sale of goods (not hot
food),e.g. post office, sale of tickets, travel agency, cold food
for consumption off the premises, hairdressing, funeral parlour,
launderette or dry cleaners.
All where the sale, display or service is principally to visiting
members of the public.
Shop use is defined in the Town and Country Planning (Use
Classes) (Scotland) Order 1997. These types of use are
grouped together and collectively called class 1 shops.
Some other changes of use are permitted development, for
example, a cafe (class 3) being turned into a shop unit (class
1). The Scottish Government Circular 1/1998 contains
guidance on use classes.
To ensure that the retailing role of the centre is maintained
while providing flexibility to allow a diverse mix of other uses a
tiered approach will be applied. Separate polices are set out
for defined Primary and Secondary retail frontages and
elsewhere within the Town Centre.
A Primary Retail Frontage is a grouping of shops that has been
identified as having a primarily retail focus. Within these areas
the proportion of shop units in non-retail use is low. The policy
will continue this focus while allowing an element of other uses
which are appropriate to town centres and can add or maintain
vitality and viability.
A Secondary Retail Frontage is a grouping of shops identified
as an area where retailing should be protected but not at the
same level as within the Primary Retail Frontage areas. The

Planning Committee 12 October 2017 Appendix 1 Nicolson Street/Clerk Street Town Centre Supplementary Guidance
Secondary Retail Frontages retain a majority of units in shop
use (54% and 59%), however at lower levels than the Primary
Retail Frontages. The policy aims to preserve the retail
provision within these frontages around current levels ensuring
that the majority of shop units are retained in retail use.
Outwith the areas defined in Policy NCTC1 and NCTC2 there
is a wide range of uses which contribute to the vitality and
viability of the Town Centre. The policy will provide a flexible
approach which will allow appropriate uses, accepting that
retailing and the role of town centres are changing, to ensure
the vitality and viability of the town centre overall.
Policy NCTC1 Alternative Use of Shop Units - Primary
Retail Frontages
In the Primary Retail Frontages defined in Table 1 and Map 2,
the change of use of a shop unit from a shop use to a non-shop
use will be permitted provided:
a) as a result of permitting the change of use, no more
than one third of the total number of units will be in non-
shop use; and
b) the proposal is for an appropriate commercial,
community or leisure use which would complement the
character of the centre and would not be detrimental to
its vitality and viability.
Table 1
Primary Retail Frontages
36-76 Nicolson Street
78a-140 Nicolson Street
44-66 Clerk Street and 1-29 South Clerk Street
85-108 South Bridge
Policy NCTC2 Alternative Use of Shop Units - Secondary
Retail Frontages
In the Secondary Retail Frontages, defined in Table 2 and map
2, the change of use of a shop unit from a shop use to a non-
shop use will be permitted provided:

Planning Committee 12 October 2017 Appendix 1 Nicolson Street/Clerk Street Town Centre Supplementary Guidance
a) as a result of permitting the change of use, no more
than 45% of the total number of units will be in non-
shop use; and
b) the proposal is for an appropriate commercial,
community or leisure use which would complement the
character of the centre and would not be detrimental to
its vitality and viability.
Table 2
Secondary Retail Frontages
47-87 Nicolson Street
37-85 Clerk Street and 2-10 South Clerk Street
Policy NCTC3 - Alternative use of shop units - elsewhere
For those locations not within an identified frontage, but
elsewhere within the Nicolson Street/Clerk Street Town Centre
boundary, a change of use of a shop unit from a shop use to a
non-shop use will be permitted provided a proposal is:
• Class 2 – financial, professional or other services
• Class 3 – food and drink uses
• An appropriate commercial, community or leisure use which
would complement the character of the centre and would not
be detrimental to its vitality and viability.

Planning Committee 12 October 2017 Appendix 1 Nicolson Street/Clerk Street Town Centre Supplementary Guidance
Map 2 Frontages

Planning Committee 12 October 2017 Appendix 1 Nicolson Street/Clerk Street Town Centre Supplementary Guidance
Residential use
For placemaking purposes it is important that ground floor uses
help bring activity onto the street. Residential units at ground
floor level tend to add little vitality to the town centre. Nicolson
Street/Clerk Street already has a large population living within
walking distance of the main shopping streets and within the
town centre itself, changes from shop units to residential is not
supported.

Planning Committee 12 October 2017 Appendix 1 Nicolson Street/Clerk Street Town Centre Supplementary Guidance
5. LINKS TO OTHER POLICIES AND GUIDANCE
Other relevant policies in the Edinburgh Local Development
Plan include:
Ret 1 Town Centres First
Ret 3 Town Centres
Ret 7 Entertainment and Leisure Developments
Ret 11 Food and Drink Establishments
Des 13 Shopfront
Env 1 World Heritage Sites
Env 3 Listed Buildings - Setting
Env 4 Listed Buildings – Alterations and Extensions
Env 5 Conservation Areas – Demolition of Buildings
Env 6 Conservation Areas – Development
Policy Ret 3 generally supports shop uses in town centres.
Policy Ret 7 supports leisure and entertainment facilities in
town centres. Policies Ret 11 considers the impact on nearby
residents for proposals such as public houses and hot-food
takeaways. Des 13 supports improvements to shop fronts.
Guidance For Businesses – non-statutory guidance to assist
businesses in preparing applications to change the use of a
property as well as providing guidance on shopfront design.
One-Door Approach - Food and drink, public house and hot-
food takeaway uses will often require other consents and are
subject to separate controls by licensing for: alcohol; hours of
operation and outdoor pavement seating. For more information
on these, see the Council’s website on the One Door Approach.
Edinburgh Street Design Guidance - guidance on street
design to achieve coherence and co-ordination across the city.
Edinburgh Design Guidance - sets out the Council’s
expectations for the design of new development in Edinburgh.
Old Town and Southside Conservation Area Character
Appraisal - describes what is special about the conservation
area and helps in making decisions on proposals that affect the
area's special character.

Planning Committee 12 October 2017 Appendix 1 Nicolson Street/Clerk Street Town Centre Supplementary Guidance
World Heritage Management Plan- sets out how the
Outstanding Universal Value of the site will be protected. The
management plan informs a separate action plan.
6. DEFINITIONS
Shop unit - As defined in the Edinburgh Local Development
Plan (2016), a shop unit is a premises accessed directly onto
the street and designed primarily for shop use.
Primary Retail Frontage - a group of shop units that has been
identified as providing a focus for retail within the town centre.
Secondary Retail Frontage –a group of shop units identified
as areas where retailing should be protected but not at the
same level as within the Primary Retail Frontage areas.
Class 1 shop use - A unit used for the sale of goods to visiting
members of the public, for example, post office, sale of tickets,
cold food for consumption off the premises, and hairdressing.
This is further defined in the Town and Country Planning (Use
Classes) (Scotland) Order 1997.
Non-shop uses – Any use falling outwith the definition of Class
1 shop use. Examples of non-shop uses are:
Service uses – e.g. lawyers, accountants, estate agents,
health centres, tanning salons and pawn brokers.
Food and drink – e.g. restaurant, cafe, snack bar.
Commercial/business use – general office, light industry
or research and development, which can be carried out
without detriment to the amenity of any residential area.
Community use – e.g. social and cultural activities
Leisure use – e.g. cinema and gymnasium
Other uses – e.g. betting shops, pay day loan shops,
pubs and hot food takeaways.
Some changes of use are permitted development, for example,
a cafe (Class 3) being turned into a shop unit (Class 1). The
Scottish Government Circular 1/1998 contains guidance on use
classes.

Planning Committee 12 October 2017 Appendix 2 Portobello Town Centre Supplementary Guidance
Portobello Town Centre
Supplementary Guidance
www.edinburgh.gov.uk/supplementaryguidance
November 2017

Planning Committee 12 October 2017 Appendix 2 Portobello Town Centre Supplementary Guidance
CONTENTS
1. Introduction
2. Portobello Town Centre
3. Vision and Principles
4. Change of use policies
5. Links to other policies and guidance
6. Definitions

Planning Committee 12 October 2017 Appendix 2 Portobello Town Centre Supplementary Guidance
1. INTRODUCTION
Portobello Town Centre is one of Edinburgh’s nine town
centres (including the City Centre Retail Core) defined,
protected and promoted as a hub for a wide range of activities
from shopping and providing local services and as a leisure
destination in the Edinburgh Local Development Plan (LDP).
This guidance sets out an approach to the change of use of
shop units within Portobello Town Centre.
The LDP provides a framework for a tailored approach to
assessing proposals for change of use applications for
individual town centres. The Supplementary Guidance has
been prepared in accordance with Policy Ret 9: Alternative
Use of Shop Units in Defined Centres, in the LDP and applies
to all shop units within the town centre. It aims to deliver two
LDP objectives set out in Part 2, Section 6 (Shopping and
Leisure) of the Plan:
To maintain the existing and proposed broad
distribution of centres throughout the city and sustain
their vitality and viability; and
To improve the appearance, quality and
attractiveness of all centres.
This Supplementary Guidance forms part of the statutory
development plan. Applications for change of use must be
determined in accordance with the development plan unless
material considerations indicate otherwise. To assist in
interpreting the LDP the Council issues non-statutory guidance.
Guidance for Businesses provides guidance on change of use.
This is a material consideration in the determination of
applications and should be considered alongside this
Supplementary Guidance.
2. PORTOBELLO TOWN CENTRE
Portobello Town Centre (defined in Map 1) lies to the north east
of the city centre and takes in Portobello High Street from Pipe
Street to the west and ends at Pittville Street at Abercorn Park
in the east. Portobello High Street is an arterial route into
Edinburgh from the east and serves as the main shopping and
commercial street for Portobello. The entire town centre falls
within the Portobello Conservation Area. The promenade and
beach play a key role in giving Portobello its unique setting and
identity, and make Portobello a popular ‘destination’ for
daytrips, especially in the summer months. It retains its village
feel with an engaged community that promotes local initiatives
such as the community buyout of the former Portobello Old

Planning Committee 12 October 2017 Appendix 2 Portobello Town Centre Supplementary Guidance
Parish Church, in Bellfield Street, and Brighton Park hosts a
monthly market.
Shops and other town centre uses
Similar to Edinburgh’s other town centres, the shop units are
predominantly ground floor units under traditional tenemental
housing or purpose built shop units with terraced housing to the
rear. The shopfront design is of varying quality across the
centre. The main anchor supermarket is located off Bath Street
and is not visually connected to the main high street. The
second main food retailer to enter is the new purpose built
medium sized supermarket with car park located a short
distance outwith the town centre boundary to the west.
The town centre boundary excludes the southern side of the
High Street east of Regent Street. This results in a number of
shop units that are adjacent to the town centre, but outwith the
scope of the retail polices that follow in this guidance. Changes
of use would be assessed with LDP policy Ret 10: Alternative
uses of shop units in other locations.
Strengths and weaknesses
To assess how the Town Centre functions in terms of
pedestrian and cyclist movement and as a place to visit, a study
called a public life street assessment was carried out by design
consultants for the Council, and explored how the town centre
should evolve to maximise the potential for benefitting public
life. This study used a mixture of techniques, including direct
observation (pedestrian counts, behavioural mapping and
tracing studies), user interviews and land use surveys.
A health check has also been carried out to assess the Town
Centre’s strengths, vitality and viability, weaknesses and
resilience.

Planning Committee 12 October 2017 Appendix 2 Portobello Town Centre Supplementary Guidance
Map 1: Portobello Town Centre

Planning Committee 12 October 2017 Appendix 2 Portobello Town Centre Supplementary Guidance
Village feel with presence of
civic buildings acting as
architectural landmarks eg
police station and town hall.
Poor wayfinding from the
Promenade to the High Street.
Better links and connections
between the High Street and
Promenade, including improved
wayfinding.
Traffic noise, volume and pollution.
Community capital – community
run assets and monthly market.
Slightly high vacancy rate. Better use of space outside
Town Hall.
Lack of cycle lanes and parking.
High proportion of independent
shops. Stable shop to non‐shop
ratio.
Limited crossing points, parts of
the street feels one‐sided.
Protection from climate and
traffic.
The Promenade and beach make
Portobello a destination, and is
an active travel route and
alternative to the high street.
Narrowest section of the street
between Brighton Place/Bath
Street and Windsor Place, is
perceived as a pinch point and an
area of conflict between cyclists,
buses and on‐street parking.
Build on social capital and
chance encounters by redressing
the lack of spaces for unfolding
activities and play, opportunities
to stand and stay, and rest.
Relatively minimal pedestrian
congestion.
STRENGTHS WEAKNESSES OPPORTUNITIES THREATS

Planning Committee 12 October 2017 Appendix 2 Portobello Town Centre Supplementary Guidance
3. VISION AND PRINCIPLES
The Public Life Street Assessment and health check highlight
areas for improvement in the town centre, particularly relating
to the movement and place function. The vision for Portobello
is to create and promote:
a place with an active public street life with a quality
public realm that is comfortable for all users and thereby
would encourage people to stay longer;
streets and public realm that prioritises pedestrians and
cyclist and thereby increases the ease of movement and
increases footfall; and
a mix of shopping and other town centre services that
supports the resident community and creates a
destination for visitors.
The Supplementary Guidance goes some way to achieve the
wider vision through the following ten principles, which should
be considered when submitting and assessing a planning
application for a change of use within the Town Centre:
1. Supporting high quality shopfront design (see the
Council’s Guidance for Businesses and Listed Buildings
and Conservation Area Guidance).
2. Ensuring active frontages to the street by permitting
glazing which will allow for natural surveillance, create a
visual interest on the street and encourage street users
to linger, whilst prohibiting the change of use from shop
use to residential in ground floor units. Supporting
outdoor seating where pavements are wider and micro-
climate is favourable.
3. Supporting Class 3 food and drink uses on corner units
where there is an opportunity to activate the public street
life.
4. Maximising opportunities for formal and informal outdoor
seating incorporating shelter or shop front awnings at
key points along the town centre.
5. Ensuring development makes a positive contribution to
the public realm by meeting the Street Design Guidance
and Edinburgh Design Guidance.
6. Incorporating and enhancing natural and built features
where they can contribute positively to the Town Centre,
for example the connections to the Promenade/beach.
7. Supporting additional cycle parking facilities at key
points along the Town Centre.

Planning Committee 12 October 2017 Appendix 2 Portobello Town Centre Supplementary Guidance
8. Taking opportunities to remove street clutter and other
redundant items identified in any relevant street audits
prepared by the Council or Living Streets.
9. Ensuring appropriate arrangements are in place for
storage of waste, internally and externally.
A number of other programmes and plans have the potential to
address some of the other issues raised in the Public Life Street
Assessments:
A bus shelter replacement programme has recently
taken place, including replacement bus shelters with
advertising panels in the town centre. Future
replacement programmes will present an opportunity to
improve placement of shelters.
The recently reviewed Portobello Conservation Area
Character Appraisal provides the context to manage
change that affects the conservation area’s unique
characteristics and set out opportunities for
enhancement.
Road and footway investment – Capital Programme
The Council’s Wayfinding Project. This could improve
navigation, wayfinding and appreciation of assets such
as the Promenade/beach.
Quiet Routes – Edinburgh’s local walking and cycling
routes.
A locality based approach to service delivery operates in
Edinburgh. The town centre is within the North East
Locality and the Locality Improvement Plan sets out the
future priorities for the area and consider opportunities
to enhance the local sense of identity and belonging.
The Portobello area now benefits from a 20mph speed
limit that aims to improve the sense of security for
pedestrians and cyclists.
Portobello has benefitted from the trade waste policy
that only allows trade waste to be presented on the
street/outside premises for one-hour within set collection
windows. This has significantly reduced pavement
clutter and improved pedestrian movement, especially at
peak times of the day.

Planning Committee 12 October 2017 Appendix 2 Portobello Town Centre Supplementary Guidance
4. CHANGE OF USE POLICIES
Where a unit is used as a shop it is necessary to get planning
permission from the Council to change to another use. In
addition to the retail sale of goods, ‘shop use’ covers a variety
of other similar uses where a service is provided principally to
visiting members of the public e.g. post offices, travel agents,
hairdressers, laundrettes, dry cleaners, etc. However, the
planning system has limited control of what goods shops are
selling, nor can it control which company occupies a shop.
The policies below (Policy PTC1 and Policy PTC2) set out
when a shop unit can change from a shop use to a non-shop
use. The policies apply to ground floor shop units only or
basement/first floor units that are directly accessed from the
pavement.
Frontages are used to ensure that a minimum percentage of
shop units are retained in shop use to meet the basic shopping
needs and provision of the walk-in population. Keeping this
level of protection is balanced against the benefits of extending
economic activity and footfall into the evening. Elsewhere in the
town centre a flexible approach to appropriate changes of use
applies. Corner units for example towards the eastern end of
the centre with streets leading perpendicular to the Promenade,
could capitalise on the outdoor street spaces, improving the
public realm and providing for an active public life.
Policy PTC 1 – Alternative Use of Shop Units in Defined
Frontages
In the frontages at defined in the table below (and in Map 2),
the change of use of a shop unit to a non-shop use will be
permitted provided:
a) as a result of permitting the change of use, no more
than one third of the total number of units in the
frontage will be in non-shop use; and
b) the proposal is for an appropriate commercial or
community use which would complement the character
of the centre and would not be detrimental to its vitality
and viability.
Frontages
100 – 162 Portobello High Street
111 – 153 Portobello High Street
164 – 208 Portobello High Street
210 – 240 Portobello High Street

Planning Committee 12 October 2017 Appendix 2 Portobello Town Centre Supplementary Guidance
Map 2: Frontages

Planning Committee 12 October 2017 Appendix 2 Portobello Town Centre Supplementary Guidance
Policy PTC 2 – Alternative Use of Shop Units Elsewhere in
Portobello Town Centre
For those locations not within a ‘frontage’, but elsewhere within
the Portobello Town Centre boundary, a change of use from a
shop to a non-shop use will be permitted provided a proposal
is:
Class 2 – financial, professional or other services
Class 3 – food and drink uses
An appropriate commercial or community use which
would complement the character of the centre and would
not be detrimental to its vitality and viability
Residential use
For placemaking purposes it is important that ground floor uses
help bring activity onto the street. Residential units at ground
floor level tend to add little vitality to the town centre. Portobello
already has a significant - and growing - population living within
walking distance of the main shopping streets and within the
town centre itself, changing shop units to residential is not
supported. However, opportunities should be considered for
promoting residential use above shop units in any new
development or redevelopment schemes within and on the
edge of the town centre boundary.

Planning Committee 12 October 2017 Appendix 2 Portobello Town Centre Supplementary Guidance
5. LINKS TO OTHER POLICIES AND GUIDANCE
Other relevant policies in the Edinburgh Local Development
Plan include:
Ret 1 Town Centres First
Ret 3 Town Centres
Ret 7 Entertainment and Leisure Developments
Ret 11 Food and Drink Establishments
Des 13 Shopfront
Env 3 Listed Buildings - Setting
Env 4 Listed Buildings – Alterations and Extensions
Env 5 Conservation Areas – Demolition of Buildings
Env 6 Conservation Areas – Development
Policy Ret 3 generally supports shop uses in town centres.
Policy Ret 7 supports leisure and entertainment facilities in
town centres. Policies Ret 11 considers the impact on nearby
residents for proposals such as public houses and hot-food
takeaways. Des 13 supports improvements to shop fronts.
Guidance For Businesses – non-statutory guidance to assist
businesses in preparing applications to change the use of a
property as well as providing guidance on shopfront design.
One-Door Approach - Food and drink, public house and hot-
food takeaway uses will often require other consents and are
subject to separate controls by licensing for: alcohol; hours of
operation and outdoor pavement seating. For more information
on these, see the Council’s website on the One Door Approach.
Edinburgh Street Design Guidance - guidance on street
design to achieve coherence and co-ordination across the city.
Edinburgh Design Guidance - sets out the Council’s
expectations for the design of new development in Edinburgh.
Portobello Conservation Area Character Appraisal -
describes what is special about the conservation area and
helps in making decisions on proposals that affect the area's
special character.

Planning Committee 12 October 2017 Appendix 2 Portobello Town Centre Supplementary Guidance
6. DEFINITIONS
Shop unit – As defined in the Edinburgh Local Development
Plan (2016), a shop unit is a premises accessed directly onto
the street and designed primarily for shop use.
Primary Retail Frontage - a group of shop units that has been
identified as providing a focus for retail within the town centre.
Class 1 shop use - A unit used for the sale of goods to visiting
members of the public, for example, post office, sale of tickets,
cold food for consumption off the premises, and hairdressing.
This is further defined in the Town and Country Planning (Use
Classes) (Scotland) Order 1997.
Non-shop uses – Any use falling outwith the definition of Class
1 shop use. Examples of non-shop uses are:
Service uses – e.g. lawyers, accountants, estate agents,
health centres, tanning salons and pawn brokers.
Food and drink – e.g. restaurant, cafe, snack bar.
Commercial/business use – general office, light industry
or research and development, which can be carried out
without detriment to the amenity of any residential area.
Community use – e.g. social and cultural activities
Leisure use – e.g. cinema and gymnasium
Other uses – e.g. betting shops, pay day loan shops,
pubs and hot food takeaways.
Some changes of use are permitted development, for example,
a cafe (Class 3) being turned into a shop unit (Class 1). The
Scottish Government Circular 1/1998 contains guidance on use
classes.

Planning Committee 12 October 2017 Appendix 3 Stockbridge Town Centre Supplementary Guidance
Stockbridge Town Centre
Supplementary Guidance
www.edinburgh.gov.uk/supplementaryguidance
November 2017

Planning Committee 12 October 2017 Appendix 3 Stockbridge Town Centre Supplementary Guidance
CONTENTS
1. Introduction
2. Stockbridge Town Centre
3. Vision and Principles
4. Change of use policies
5. Links to other policies and guidance
6. Definitions

Planning Committee 12 October 2017 Appendix 3 Stockbridge Town Centre Supplementary Guidance
2
1. INTRODUCTION
This Supplementary Guidance sets out the approach to the
change of use of shop units within Stockbridge Town Centre.
Stockbridge is one of Edinburgh’s nine town centres (including
the City Centre) defined and protected in the Edinburgh Local
Development Plan (LDP) as a hub for a wide range of activities
from shopping, providing local services and as a leisure
destination.
The LDP provides a framework for a tailored approach to
assessing proposals for change of use applications in individual
town centres. The Supplementary Guidance has been
prepared in accordance with Policy Ret 9: Alternative Use of
Shop Units in Defined Centres and applies to all shop units
within the town centre.
The Supplementary Guidance aims to deliver two LDP
objectives set out in Part 2, Section 6 (Shopping and Leisure)
of the Plan:
- To maintain the existing and proposed broad distribution
of centres throughout the city and sustain their vitality
and viability; and
- To improve the appearance, quality and attractiveness
of all centres.
This Supplementary Guidance forms part of the statutory
development plan. Applications for change of use must be
determined in accordance with the development plan unless
material considerations indicate otherwise. To assist in
interpreting the LDP the Council issues non-statutory guidance.
Guidance for Businesses provides guidance on change of use.
This is a material consideration in the determination of
applications and should be considered alongside this
Supplementary Guidance.
The Supplementary Guidance has been informed by a ‘public
life street assessment’ carried out by design consultants for the
Council, which explored how the town centre should evolve to
maximise the potential for benefitting public life and a health
check which has considered the centre’s strengths, vitality and
viability, weaknesses and resiliencies.

Planning Committee 12 October 2017 Appendix 3 Stockbridge Town Centre Supplementary Guidance
3
2. STOCKBRIDGE TOWN CENTRE
Stockbridge Town Centre is located north of the city centre.
Originally a small outlying village, it was incorporated into the
City of Edinburgh in the 19th century. The historical expansion
of the New Town from around 1813 increased the demand for
property, leading to the incremental replacement and
development of Stockbridge village. Despite such historical
changes, Stockbridge has retained much of its village character
and atmosphere, comprising of small shop units and a variety
of house types including low rise colonies and terraces. For this
reason, it is not quite as densely populated as some of the other
town centres (approximately 5,000 people within a walking
distance of approximately 400m).
There are a number of listed buildings. The Town Centre lies
within the New Town Conservation Area and the New Towns
Garden and Dean Historic Garden/Designed Landscape
Inventory Site. The southern part of the Town Centre along St
Stephen Street, is located within the Old and New Towns of
Edinburgh World Heritage Site. Within these designations,
specific LDP policies apply to protect and enhance the
appearance and setting of the city. It is within close proximity to
the Water of Leith.
Jubilee Gardens, located within the Town Centre, is home to
the popular Stockbridge Market; a central meeting place for
public life every Tuesday and Sunday. It is a diverse and lively
Town Centre with a strong identity, supported by a community
council.

Planning Committee 12 October 2017 Appendix 3 Stockbridge Town Centre Supplementary Guidance
4
Map 1: Stockbridge Town Centre

Planning Committee 12 October 2017 Appendix 3 Stockbridge Town Centre Supplementary Guidance
Shops and other town centre uses
Stockbridge Town Centre consists of a mix of mostly smaller
shops and eating places. There are also two small supermarket
sized units. Similar to Edinburgh’s other town centres, the
shops and other uses are predominantly located in ground floor
units under traditional tenements. The exceptions to this are
Raeburn Place where single storey projections from terraces
are common, and the northern side of Deanhaugh Street,
where the majority of the units are single storey in height with
no residential above.
National retailers are commonplace, particularly along sections
of Deanhaugh Street and Raeburn Place. There are also a
number of high-end independent specialist operators. These
are particularly concentrated towards the southern end of the
Town Centre, along streets such as St Stephen Street. Cafes
and restaurants are well represented and spread out fairly
evenly, resulting in a well distributed level of active evening
uses. The area is also well served by services such as
hairdressers, pharmacies, a post office, a bank, an opticians,
and repair shops. There are no dentists or doctors within the
town centre boundary itself, but practices are located within the
surrounding area.
The mix of uses has been monitored in city-wide shop surveys
periodically undertaken since 1986. The survey shows a steady
decline in class 1 (retail) use and subsequent increase in other
uses since 1986. The vacancy rate is low. Health check
indicators point towards a relatively healthy centre overall. The
analysis below summarises the strengths weaknesses,
opportunities and threats.

Planning Committee 12 October 2017 Appendix 3 Stockbridge Town Centre Supplementary Guidance
6
Friendly village atmosphere and
strong sense of community
Nearby parks, walking routes
and green space
Jubilee Gardens and Stockbridge
Market act as a central meeting
place for public life
Low vacancy rate and diverse
mix of shops and services
Positive architectural and
historic character and features
of interest
Narrow pavements and
prevalence of bollards hinder
pedestrian movement
Priority of vehicles over
pedestrians, cyclists and place
function.
Parking has been prioritised
throughout the town centre
Lack of cycle facilities including
dedicated cycle lanes and
enough cycle parking.
Make the connection clearer to
the Water of Leith to enhance
wayfinding.
Remove bollards
Extend the public realm at key
points along the Town Centre,
for example at the entrance to
Bernard’s Row.
Heavy traffic at weekday rush
hour
Perception of drivers that it is an
arterial route rather than a place
for people.
Resistance from
businesses/residents to reduce
parking.
STRENGTHS WEAKNESSES OPPORTUNITIES THREATS

Planning Committee 12 October 2017 Appendix 3 Stockbridge Town Centre Supplementary Guidance
7
3. VISION AND PRINCIPLES
The Public Life Street Assessment and health check highlight
areas for potential improvement in the Town Centre,
particularly relating to the movement and place function. The
vision for Stockbridge is to;
increase the relative importance of pedestrian and cycle
movement, whilst recognising the importance of
Raeburn Place and Deanhaugh Street as important
through traffic routes;
promote and facilitate staying times by enhancing the
character, identity, visual interest and comfort; and
ensure a mix of uses to meet the needs and demands of
the population.
The Supplementary Guidance goes some way to achieve the
wider vision through the following 10 principles, which should
be considered when submitting and assessing a planning
application for a change of use within Stockbridge Town
Centre;
1. Supporting high quality shopfront design (see the
Council’s Guidance for Businesses and Listed Buildings
and Conservation Area Guidance for details).
2. Ensuring active frontages to the street by permitting
glazing which will allow for natural surveillance, visual
interest on the street and encourage street users to stay.
3. Supporting outdoor seating where pavements are wider
and micro-climate is favourable, for example the junction
of Raeburn Place and St Bernard’s Row.
4. Supporting class 3 food and drink uses on corner units
where there is an opportunity to activate the public street
life.
5. Maximising opportunities for formal and informal outdoor
seating incorporating shelter in the form of trees,
planters or shop front awnings at key points along the
town centre.
6. Ensuring development makes a positive contribution to
the public realm by meeting the Street Design Guidance
and Edinburgh Design Guidance.

Planning Committee 12 October 2017 Appendix 3 Stockbridge Town Centre Supplementary Guidance
8
7. Incorporating and enhancing natural and built features
where they can contribute positively to the Town Centre,
for example the Water of Leith.
8. Supporting additional cycle parking facilities at key
points along the Town Centre.
9. Taking opportunities to remove street clutter and other
redundant items identified in any relevant street audits
prepared by the Council or Living Streets.
10. Ensuring appropriate arrangements are in place for
storage of waste, internally and externally.
A number of other programmes and plans have the potential to
address some of the other issues highlighted in the Public Life
Street Assessment:
A bus shelter replacement programme has recently
taken place. Future replacement programmes will
present an opportunity to improve placement of shelters.
A review of The New Town Conservation Area
Character Appraisal is underway. The appraisal
manages change and will set out opportunities for
enhancement.
The World Heritage Site Management Plan is currently
under review. It sets out how the Outstanding Universal
Value (OUV) of the site will be protected. The
management plan informs a separate action plan.
Road and footway investment – Capital Programme.
The Council’s Wayfinding Project could improve
navigation, wayfinding and appreciation of assets such
as Water of Leith.
A locality based approach to service delivery operates in
Edinburgh. The Town Centre is within the North West
Locality. Locality Improvement Plans set out future
priorities for the area.
QuietRoutes – Edinburgh’s local walking and cycling
routes.
A 20mph speed limit has applied to much of the town
centre since February 2017. Reduced traffic speed will
improve the sense of security for pedestrians and
cyclists.
A trade waste policy applies in the town centre that only
allows trade waste to be presented on the street/outside
premises for one-hour within set collection windows.

Planning Committee 12 October 2017 Appendix 3 Stockbridge Town Centre Supplementary Guidance
4. CHANGE OF USE POLICIES
The policies apply shop units.
What is a shop unit? Premises opening directly onto the street
and designed primarily for shop use. In some locations the shop
unit can be above street level or at basement level but still have
direct access and be visible from the street.
Changing a shop unit to a non-shop use will always require
planning permission.
What is a shop use? A unit used for the sale of goods (not hot
food),e.g. post office, sale of tickets, travel agency, cold food
for consumption off the premises, hairdressing, funeral parlour,
launderette or dry cleaners.
All where the sale, display or service is principally to visiting
members of the public.
Shop use is defined in the Town and Country Planning (Use
Classes) (Scotland) Order 1997. These types of use are
grouped together and collectively called class 1 shops.
Some other changes of use are permitted development, for
example, a cafe (class 3) being turned into a shop unit (class
1). The Scottish Government Circular 1/1998 contains
guidance on use classes.
Separate policies are set out for defined Primary Retail
Frontages and elsewhere within the Town Centre boundary. A
Primary Retail Frontage is a group of shop units that has been
identified as providing a focus for retail within the town centre.
The identification and protection of Primary Retail Frontages
will ensure that a minimum percentage of units are retained in
shop use. The Primary Retail frontages are below the threshold
set in Policy STC1 meaning that there is still potential for other
uses to locate here should there be demand. This is critical to
the continued health of the Town Centre.
Outwith the areas defined in Policy STC1, there are a wide
range of uses. Policy STC2 provides a flexible approach which
will allow appropriate uses, whilst accepting that retailing and
the role of town centres are changing, to ensure vitality and
viability of the town centre overall. This should allow for units to
capitalise on the outdoor street spaces, improving the public
realm and providing for an active public life.

Planning Committee 12 October 2017 Appendix 3 Stockbridge Town Centre Supplementary Guidance
10
Policy STC 1 – Alternative Use of Shop Units in Primary
Retail Frontages
In the Primary Retail Frontages defined in the table below and
Map 1, the change of use of a shop unit to a non-shop use will
be permitted provided:
a) as a result of permitting the change of use, no more
than one third of the total number of units in the Primary
Retail Frontage will be in non-shop use; and
b) the proposal is for an appropriate commercial or
community use which would complement the character
of the centre and would not be detrimental to its vitality
and viability.
Primary Retail Frontages
4 - 102 Raeburn Place
1 - 47 Deanhaugh Street
1 – 77 Raeburn Place
Policy STC 2 – Alternative Use of Shop Units – Elsewhere
For those locations not identified as Primary Retail Frontage,
but elsewhere within the Town Centre boundary, a change of
use from a shop to a non-shop use will be permitted provided
a proposal is:
class 2 – financial, professional or other services
class 3 – food and drink uses
An appropriate commercial, community or leisure use
which would complement the character of the centre,
support the main shopping function, and would not be
detrimental to its vitality and viability

Planning Committee 12 October 2017 Appendix 3 Stockbridge Town Centre Supplementary Guidance
Map 2 Frontages

Planning Committee 12 October 2017 Appendix 3 Stockbridge Town Centre Supplementary Guidance
Residential use
For placemaking purposes it is important that ground floor uses
help bring activity onto the street. Residential units at ground
floor level tend to add little vitality to the town centre.
Stockbridge already has a large population living within walking
distance of the main shopping streets and within the town
centre itself, changes from shop use to residential is not
supported.

Planning Committee 12 October 2017 Appendix 3 Stockbridge Town Centre Supplementary Guidance
5. LINKS TO OTHER POLICIES AND GUIDANCE
Other relevant policies in the Edinburgh Local Development
Plan include:
Ret 1 Town Centres First
Ret 3 Town Centres
Ret 7 Entertainment and Leisure Developments
Ret 11 Food and Drink Establishments
Des 13 Shopfront
Env 1 World Heritage Sites
Env 3 Listed Buildings - Setting
Env 4 Listed Buildings – Alterations and Extensions
Env 5 Conservation Areas – Demolition of Buildings
Env 6 Conservation Areas – Development
Env 7 Historic Gardens and Designed Landscapes
Policy Ret 3 generally supports shop uses in town centres.
Policy Ret 7 supports leisure and entertainment facilities in
town centres. Policies Ret 11 considers the impact on nearby
residents for proposals such as public houses and hot-food
takeaways. Des 13 supports improvements to shop fronts.
Guidance For Businesses – non-statutory guidance to assist
businesses in preparing applications to change the use of a
property as well as providing guidance on shopfront design.
One-Door Approach - Food and drink, public house and hot-
food takeaway uses will often require other consents and are
subject to separate controls by licensing for: alcohol; hours of
operation and outdoor pavement seating. For more information
on these, see the Council’s website on the One Door Approach.
Edinburgh Street Design Guidance - guidance on street
design to achieve coherence and co-ordination across the city.
Edinburgh Design Guidance - sets out the Council’s
expectations for the design of new development in Edinburgh.
New Town Conservation Area Character Appraisal -
describes what is special about the conservation area and
helps in making decisions on proposals that affect the area's
special character.

Planning Committee 12 October 2017 Appendix 3 Stockbridge Town Centre Supplementary Guidance
11
World Heritage Management Plan- sets out how the
Outstanding Universal Value of the site will be protected. The
management plan informs a separate action plan.
6. DEFINITIONS
Shop unit - As defined in the Edinburgh Local Development
Plan (2016), a shop unit is a premises accessed directly onto
the street and designed primarily for shop use.
Primary Retail Frontage - a group of shop units that has been
identified as providing a focus for retail within the town centre.
Class 1 shop use - A unit used for the sale of goods to visiting
members of the public, for example, post office, sale of tickets,
cold food for consumption off the premises, and hairdressing.
This is further defined in the Town and Country Planning (Use
Classes) (Scotland) Order 1997.
Non-shop uses – Any use falling outwith the definition of Class
1 shop use. Examples of non-shop uses are:
Service uses – e.g. lawyers, accountants, estate agents,
health centres, tanning salons and pawn brokers.
Food and drink – e.g. restaurant, cafe, snack bar.
Commercial/business use – general office, light industry
or research and development, which can be carried out
without detriment to the amenity of any residential area.
Community use – e.g. social and cultural activities
Leisure use – e.g. cinema and gymnasium
Other uses – e.g. betting shops, pay day loan shops,
pubs and hot food takeaways.
Some changes of use are permitted development, for example,
a cafe (Class 3) being turned into a shop unit (Class 1). The
Scottish Government Circular 1/1998 contains guidance on use
classes.

Planning Committee 12 October 2017 Appendix 4 Summary of Consultation Responses
1
Appendix 4 Summary of Consultation Responses Draft Nicolson Street/Clerk Street Town Centre Supplementary Guidance March 2017 32 responses were received. This included one community council, one consultant and 30 individuals.
Questions/Issues Council Response
The Vision Agree – 81% Disagree – 19% Most respondents agreed with the Vision. Most of those who did not agree felt that active travel was not properly reflected or prioritised within the vision. Others who did not agree stated that only certain aspects of the Vision were good and that: there was no requirement to encourage people to spend time on the street (as set out in the Vision); more importance should be given to providing shops that are needed and providing a good environment and allow commercial enterprises to look after themselves; and more should be done to enforce good design and maintain buildings and improving green infrastructure and biodiversity should also be included. Some of those who agreed with the vision also commented that active travel should be the priority and that easing movement on the street would be welcomed. Particular issues of A-boards and bus shelters were mentioned. Other comments called for air, quality, noise and safety to be priorities alongside appearance and comfort.
The wording of the Vision has been changed to reflect the desire to focus on active travel modes. While the Vision is intended to be read as a whole and bullets are not listed in any order of priority it is clear from response that priority is implied. The Vision is therefore now presented in diagrammatic form to reflect the equal importance of the three elements. Encouraging people to spend time in the town centre can add to its vitality and viability. As part of the change to the presentation of the Vision this specific reference has been removed. This does not change the aim of the Vision. The scope of the Vision “to enhance the appearance and comfort of the centre” would include enforcement of design and building maintenance. The Vision is to ensure a mix of shopping and services. The planning system can only control the Use Class of the shop units e.g. whether it is a shop or professional service and not the type of shop. There is existing Council policy on A-boards
which controls number and placement of A-
boards and general guidance is provided in
the Edinburgh Street Design Guidance.
Part of the Vision is to enhance the appearance and comfort of the town centre-this could include air quality, noise, safety, green infrastructure and biodiversity.
Principles Agree - 91% Disagree – 9%

Planning Committee 12 October 2017 Appendix 4 Summary of Consultation Responses
2
Most respondents agreed with the Principles. One respondent who did not agree stated that people were not mentioned. Another questioned if seating related to commercial uses or public benches and that there was a need to widen pavements, have continuous footways and segregated cycle lanes. Another respondent stated that storage of waste and street clutter are the top priorities and expressed doubt that public life could be activated and that if main problems were addressed the area would become more attractive and that the reference to visitors neglected the fact that the area is primarily a local shopping street for residents. Concern was also expressed that in past decisions views of the community have not been taken into account. One respondent questioned how the principles addressed changes to the physical environment. Another respondent supported the principles but not more Class 3. Comments from five respondents related to the need for additional cycle infrastructure with greater cycle priority given to cycling and more cycle parking. Other comments:
Need to reduce car use in the city centre
Give priority to local businesses
Use key locations as Council assets.
Provide planting
Outdoor seating and advertising boards block pavements.
Need to have regard to role as route into city.
Outdoor seating should not be encouraged on narrow pavements.
High quality shop front design should be encouraged.
Consider the Place Standard
Consider installing solar bins
The scope of the guidance is to control the change of use of shop units to non-shop uses. Within this scope the principles set out will be considered in assessing applications. They are intended to aim towards improving the town centre for the benefit of people. The Principles are intended to be read as a whole and are not listed in any order of priority. Numbering provides a reference for assessing applications. Principles support class 3 use in those locations where they may bring benefit to vitality of the town centre and the principle on outdoor seating is related to commercial properties and those in the public realm. Where related to commercial premises tables and chairs are controlled by permits which take account of space available for movement. The principles do not specifically reference visitors (this is included in the Vision). The Place Standard exercise carried out in the Southside has influenced the Principles. The Principles are intended to ensure that positive improvements to the public realm - which would include planting are considered. A number of the comments relate to issues which are addressed by existing Council policy or guidance. There is existing Council policy on trade waste and A-boards and the Council's Guidance for Businesses sets out the expectations for quality shop fronts. Other issues are outwith the scope of the guidance. The planning system cannot control the type of occupier and there is no scope for the introduction of solar bins through this guidance. .
Extend Boundary around Nicolson Square

Planning Committee 12 October 2017 Appendix 4 Summary of Consultation Responses
3
Agree – 84% Disagree – 16% Most respondents agreed that a change should take place. Those who did not agree stated that they wished the buildings on the west side of the square to remain primarily residential and questioned why it is felt to be inappropriate for residential properties to be at ground floor level.
The units around Nicolson Square meet the description of shop units and form an extension of the main shopping street. Extending the boundary to include this area would provide a consistent approach to policy for the entire square and protect it for appropriate town centre uses. For placemaking purposes it is important that ground floor uses help to bring activity onto the street. Generally, residential units at ground floor level tend to add little vitality to the town centre. Procedurally there is no scope to make changes to the town centre boundary through this SG. However, these suggestions for changes to the town centre boundary will be considered during the preparation of the next LDP
Change boundary at East/West Preston Street Agree – 47% Disagree – 53% There was a mixed response to this suggestion. Those who disagreed stated that Newington Road is an existing shopping street and should remain this way and that that city centre should be extended and the area proposed to be excluded is an integral part of the town centre. That the consequences of relaxation were not known but that it was recognised that this part of the street is less attractive to businesses and the neighbourhood would be improved if they were restored to front garden but in the absence of positive action this could cause blight.
The proposed change would remove the southernmost part of the existing town centre. At the time of the survey only 4 of 41 units were vacant. Removing this area from the town centre boundary would allow other uses including residential where appropriate. While the area has a different character from other parts of the town centre it maintains the appearance of a town centre due to the nature of the units. The vacancy rate does not indicate any particular difficulty for viability of town centre uses in this location. Procedurally there is no scope to make changes to the town centre boundary through this SG. However, these suggestions for changes to the town centre boundary will be considered during the preparation of the next LDP.
Frontage Approach Agree – 78%

Planning Committee 12 October 2017 Appendix 4 Summary of Consultation Responses
4
Disagree – 22% Most respondents agreed with the frontage approach. Of those who disagreed a variety of comments were made: provision should be demand led, there should not be shops for the sake of shops and there should be diversity to allow a shift to the circular economy; there are no good shops so no point requiring more and more concerned that they should be in some use; increasing proportions of Class 3 could cause blight; more concerned about retaining historic shopfronts and should focus restrictions on specific types of use. Doubt was expressed that due to past experience proportions would not be controlled. Comments from those who agree were that residents should be considered; that there were too many take-aways; local shops should be given priority; that the number of supermarkets should be restricted and it was important to retain as many shops as possible. One respondent agreed with the approach but stated that each change of use application should be assessed on its own merits to allow changes which do not fall within a single use class.
Town centres play an important role in providing shopping for local people. The frontage approach is intended to ensure a minimum percentage of units are retained in shop use to meet these basic shopping needs. It recognises that a range of uses are necessary to provide a vital and viable town centre and tries to ensure a balance between maintaining a level of shopping provision and avoiding being over restrictive by allowing other appropriate uses. The frontage policy allows for class 3 café uses outwith the defined frontages and within those defined frontages where the minimum proportion of shop use is provided. The Principles support high quality shop front design and refer to Council Guidance for Businesses which supports retention and restoration of traditional shopfronts. The planning system can only control the class of use not the occupier therefore prioritising local shops and restricting national retailers are not within its control. The Supplementary Guidance once adopted will form part of the development plan. Applications for change of use are required to be determined in accordance with the development plan unless there are material considerations which indicate otherwise.
Removal of 1-52 South Bridge as defined frontage Agree – 82% Disagree - 18% Most respondents agreed that the frontage should not be included in the supplementary guidance. Comments were made by four of these respondents: should be demand led; should not forget the people who live in the area; makes sense in short term but should be monitored; and need to encourage better ethnic cafes. Those who disagreed stated that is was a
There was little support for identifying 1-52 South Bridge as a frontage. This has not been identified in the finalised Supplementary Guidance. The Supplementary Guidance will be reviewed regularly and if the policy is not having the desired effect of ensuring a balance of shop uses and non-shop uses, restrictions on further changes of use would be considered. The approach in the Supplementary Guidance requires that no more than one
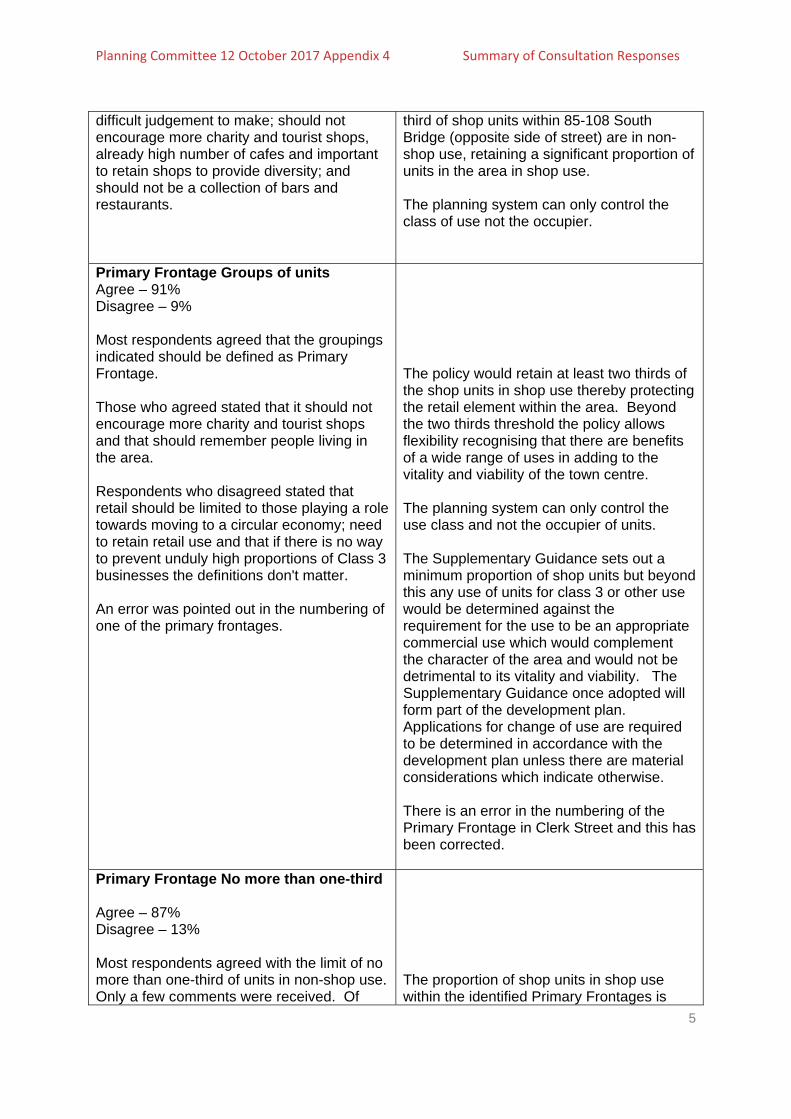
Planning Committee 12 October 2017 Appendix 4 Summary of Consultation Responses
5
difficult judgement to make; should not encourage more charity and tourist shops, already high number of cafes and important to retain shops to provide diversity; and should not be a collection of bars and restaurants.
third of shop units within 85-108 South Bridge (opposite side of street) are in non-shop use, retaining a significant proportion of units in the area in shop use. The planning system can only control the class of use not the occupier.
Primary Frontage Groups of units Agree – 91% Disagree – 9% Most respondents agreed that the groupings indicated should be defined as Primary Frontage. Those who agreed stated that it should not encourage more charity and tourist shops and that should remember people living in the area. Respondents who disagreed stated that retail should be limited to those playing a role towards moving to a circular economy; need to retain retail use and that if there is no way to prevent unduly high proportions of Class 3 businesses the definitions don't matter. An error was pointed out in the numbering of one of the primary frontages.
The policy would retain at least two thirds of the shop units in shop use thereby protecting the retail element within the area. Beyond the two thirds threshold the policy allows flexibility recognising that there are benefits of a wide range of uses in adding to the vitality and viability of the town centre. The planning system can only control the use class and not the occupier of units. The Supplementary Guidance sets out a minimum proportion of shop units but beyond this any use of units for class 3 or other use would be determined against the requirement for the use to be an appropriate commercial use which would complement the character of the area and would not be detrimental to its vitality and viability. The Supplementary Guidance once adopted will form part of the development plan. Applications for change of use are required to be determined in accordance with the development plan unless there are material considerations which indicate otherwise. There is an error in the numbering of the Primary Frontage in Clerk Street and this has been corrected.
Primary Frontage No more than one-third Agree – 87% Disagree – 13% Most respondents agreed with the limit of no more than one-third of units in non-shop use. Only a few comments were received. Of
The proportion of shop units in shop use within the identified Primary Frontages is

Planning Committee 12 October 2017 Appendix 4 Summary of Consultation Responses
6
those who agreed one respondent commented that one-third may be too much and another that that this was a nice idea but that it is not enforced in practice. One respondent qualified their answer by stating that a flexible approach is needed to assess each application on its own merits to allow changes which do not fall within a single use class One respondent who disagreed stated that provision should be demand led.
currently 10-30%. The policy will continue to protect these frontages that are currently concentrated on retail use while allowing an element of other uses which are appropriate to town centres and can add and maintain vitality and viability. Retaining two thirds of the units in shop use is therefore considered an appropriate level to achieve this. The Supplementary Guidance once adopted will form part of the development plan. Applications for change of use are required to be determined in accordance with the development plan unless there are material considerations which indicate otherwise.
Secondary Frontage- Groupings Agree – 87% Disagree – 13% Most respondents agreed that the groupings indicated should be defined as Secondary Frontages. Some respondents were unclear of the terminology. Only a few comments were received. Of those who disagreed one respondent stated that retail frontages should be defined in line with the requirements of moving towards a circular economy. Another stated that the shops in the defined frontages are a particularly diverse group which brings benefits to the local area, rather than just another supermarket
The Supplementary Guidance provides a definition of frontages within a footnote. To make it clearer this has been included within the main text of the document. The definition as Secondary Frontage recognises that these areas play an important part in providing a retail function but that the current level of retail provision is below that of the Primary Frontages. It aims to preserve this function by aiming to maintain the retail provision around current levels and ensure that the majority of shop units within the frontages are retained in retail use. The planning system can only control the use class of the property and not the occupier.
Secondary Frontage - No more than 45% in non-shop use Agree – 87% Disagree – 13% Most respondents agreed with the 45% limit on non-shop uses. Few comments were received. Of those who disagreed one commented that 45% was too high. Another that the policy
The definition as Secondary Frontage recognises that these areas play an important part in providing a retail function but that the current level of retail provision is below that of the Primary Frontages. It aims to preserve this function by maintaining retail

Planning Committee 12 October 2017 Appendix 4 Summary of Consultation Responses
7
only recognises that non-shop use has already reached high levels and that some of the new cafes are valuable additions to the neighbourhood and some are not, for example chains selling unhealthy foods and that opinions of residents should be taken account of and that it is more important to avoid loss of independent businesses than to dictate what kind they must be. Of those who agreed one respondent qualified their answer by stating that a flexible approach is needed to assess each application on its own merits to allow changes which do not fall within a single use class
provision around current levels. The 45% limit on non-shop uses should ensure that the majority of shop units within the frontages are retained in retail use. The planning system can only control the use class of the shop units and not the occupier.
Additional frontages Yes – 31% No – 69% The following additional frontages were suggested by respondents:
the whole centre
Retail frontages facing St. Patrick's Square
The other respondents who said that other areas should be included as frontage did not indicate which areas these were. One respondent who did not think there should be other areas included as frontage stated that dwelling units at street level add to diversity and reduce vacant properties.
The policy aims to provide flexibility while protecting the retail function of the town centre to provide for local shopping needs. It allows for a diversity of complimentary uses where appropriate. Applying the frontage approach to the entire town centre would remove this flexibility and could lead to increased vacancy levels.
The suggested frontage is located between two sections of Primary Frontage. It is considered that the identification of these Primary Frontages provides sufficient retail protection and concentration of retail uses with this area. The policy allows more flexibility within St Patrick Square than the areas of Primary Frontage and allows a higher level of complimentary uses to the retail function of these protected areas. This is considered to provide the appropriate balance within the centre overall.
For placemaking purposes it is important that

Planning Committee 12 October 2017 Appendix 4 Summary of Consultation Responses
8
ground floor uses help bring activity onto the street. Residential uses at ground floor level tend to add little vitality to the town centre.
Other frontages policy Agree – 81% Disagree – 19% Most respondents agreed with the approach outwith defined frontages. Of those who disagreed four respondents considered there are too many food and drink units, Another that the policy applies a blanket approach and they questioned if a density approach to change of use application could be applied. One respondent asked that it be made easier for people to shop locally and to improve short term parking. Also to encourage small businesses to display their stock online. Comments from those who agreed were that: the use of cultural premises in the area should be encouraged; food and drink should only be allowed if adequate off road storage of waste is provided; there should be no student housing and as retailing increasingly becomes more about the overall ‘experience’ it is imperative to continue to increase the flexibility for non-retail uses in centres. One respondent stated that: there should be a requirement for any changes to be part of creating a circular economy; food and drink changes should only be permitted where there is a commitment to providing healthy, locally sourced, low environmental impact products and a separate Class should be considered for enterprises contributing directly to circular economy. One respondent stated that the policy would mean replacing shops with take-aways and hairdressers.
The frontage approach allows an appropriate balance between retaining the retail function of the town centre and allowing other appropriate uses. Outwith defined frontages the policy provides a flexible approach which recognises that food and drink uses can add to the vitality and viability of town centres. The approach overall provides protection while allowing flexibility to allow a range of complimentary uses. Policy Ret 11 of the Edinburgh Local Development Plan controls the change of use of shop units to food and drink establishments where they may be detrimental to the area. The policy requires that shop units (ground floor) are retained for appropriate commercial, community or leisure uses which would not be detrimental to the vitality and viability of the town centre. Any use, including student housing would be considered in the context of this policy. The planning system can only control the Use Class of a property and not the occupier. Use classes are set out in legislation. Within a use class it would not be possible to control the type of shop as changes could be made to any use within that class without the need for planning permission. The Supplementary Guidance does not contain an active policy to change the use of shop units from their retail function. It aims to protect the retail function of the town centre by setting out minimum levels of shop use within defined areas of the town centre while providing flexibility to recognise that a range of complimentary uses are required within the town centre. The provision of parking is outwith the scope of the guidance.

Planning Committee 12 October 2017 Appendix 4 Summary of Consultation Responses
9
Residential Use Agree – 84% Disagree – 16% Most respondents agreed that residential use should not be supported in shop units. One respondent agreed that the policy should not support change to residential use but that a system should be developed to relocate businesses in Newington Road to the more northern part of the street to allow restoration of gardens. Another stated that a mechanism to allow a change of use within certain scenarios should be considered (e.g. unit vacant and actively marketed for a significant period of time). Of those who disagreed one respondent stated there shouldn't be measures put in place that actively drive out the working class from the city centre. Another stated that residential units at ground floor level add to diversity and are more vital than an empty unit. Two respondents raised the issue of requirement for ground floor accommodation for disabled people. One of these asked that should a restriction on residential use be applied that the exclude any residential premises to be adapted for disabled / elderly.
Uses which bring activity to the street are important. The policy protects ground floor units for this purpose. It is to be expected that vacancies will arise within shop units but a longer term view of the impact on the town centre needs to be taken. The Supplementary Guidance does not include an active policy to convert residential units to other uses. The policy applies to ground floor shop units.
Other Comments 15 respondents made further comments. Some comments related to issues outwith the town centre boundary. The most common theme related to the condition of surfaces in the town centre and movement.
Reduce car use in the city centre
Reduce the dominance of vehicular traffic and improve experience for walking and cycling.
Long-term goal should be zero private transport and as little space taken up by vehicles as possible.
Noise and air pollution make the street unpleasant and difficult to move along for shoppers and other pedestrians and cyclists.
The policy set out in the Supplementary Guidance controls the change of use of shop units. Principles are included which should be considered when submitting and assessing planning applications. These include ensuring a positive contribution to the public realm and reference is made to Edinburgh Street Design and Edinburgh Design Guidance. Principles also include supporting additional cycle parking, taking opportunities to remove street clutter, and ensuring appropriate arrangements are in place for storage of waste. Changes to road layouts and maintenance of the surfaces are outwith the scope of the guidance. The policy in the Supplementary Guidance restricts change of use to non-shop uses –

Planning Committee 12 October 2017 Appendix 4 Summary of Consultation Responses
10
Reduce road to one lane in each direction with the pavements extended into the current right hand lanes, ideally incorporating a segregated cycle-lane on each side.
Reduce traffic and to increase the amount of space available for people to pause without breathing in fumes.
Invest in pedestrian environment through maintenance and enhanced crossing facilities.
Surface improvements required around Scotmid store, and remove car park space and railings at junction
More radical review of road space could cut down on the cars and improve the area
Main problem is crowded pavements and the balance between pedestrian use and traffic.
The impact of food and drink outlets was mentioned by 3 respondents. One of these requested a restriction on this use. Another that food and drink units should have adequate storage for waste. The other respondent expressed concern that increasing the proportion of Class 3 use may blight the area by creating a situation in which only landlords (with cash) can buy flats due to difficulties securing mortgages for properties above Class 3 use. Other comments were:
Light touch without too much interference
Demolish out of town malls
Need to recognise that the centre of Edinburgh is distinctive because people live there.
Dominance of national supermarkets will result in more vacancies in future therefore residential and office use should be considered.
which includes class 3 food and drink uses- in the defined frontages. Policy Ret 11 of the Edinburgh Local Development Plan controls the change of use of shop units to food and drink establishments where they may be detrimental to the area. Residential use at ground floor level is not supported as it adds little to vitality and viability. Class 2 office uses and other appropriate commercial uses are permitted within frontages if they are within the threshold of non-shop uses. Outwith these defined areas there is no set threshold. The Council cannot control occupancy with buildings which it does not own.

Planning Committee 12 October 2017 Appendix 4 Summary of Consultation Responses
11
Council powers should be used to aim for 100% occupancy rate during summer with the focus on promoting local businesses.
Draft Portobello Town Centre Supplementary Guidance March 2017 60 responses were received. This included one amenity society.
Questions/Issues Council Response
Do you agree with the vision for the town centre? Agree – 90% Disagree 10% The majority responded positively to the SG’s vision and a number of comments relating to the vision were made:
Attraction of visitors a priority
Must also meet the basic shopping
needs of residents
Enforcement of retail policies is
required
Improve shop front design
Concern that pavement tables and
chairs would impact on the blind,
wheelchair users, prams, mobility
scooters
To be a destination, better transport/parking management required including provision for disabled parking
Streets need to be safer
Divert traffic from the high street, use
Edinburgh Suburban railway, better
signage to by-pass
Create park walkway along Figgate
Burn from High Street to Promenade
Of those who disagreed, the concerns raised included:
Special treatment for cyclists
Shops lose business due to lack of
No changes to the vision proposed. The vision is wide-ranging and aspirational, its delivery and ability to address the other comments made here is reliant on a range of Council services and the Locality team.

Planning Committee 12 October 2017 Appendix 4 Summary of Consultation Responses
12
parking
Reducing cars won’t increase footfall
Prioritises able bodied pedestrians,
more recognition of access for
all/wheelchair users
Recognise that Portobello is a
thoroughfare and key public transport
route.
Do you agree with the Principles? Agree – 95% Disagree – 5% Comments and suggestion made in support
of the Principles include:
The intentions of the guidance needs
to be understood corporately and the
intentions in this planning document
are not always fully understood by all
in the Council and a more managed,
holistic approach needs to be taken
to improving the public realm and
more importantly maintaining it. For
instance staff at the local office
removed seating from a town centre
area because of a few concerns
about youths gathering there. The
intention of one department is
undermined by the actions of another
department.
Improved route to and more facilities
on the Promenade.
Shop design improvements: more
accessible design, reflect design in
other successful centres e.g.
Stockbridge and needs to be followed
up with effective development
management.
Principles help ambience for
pedestrians, encourage cycling,
removing clutter especially important.
Waste storage design important.
Until traffic is reduced, the high street
No changes to the principles proposed. The SG has been prepared in consultation with the North East Locality and other Council services and to address the issue raised in the Principles, a corporate approach is required. The route of the South Suburban railway is

Planning Committee 12 October 2017 Appendix 4 Summary of Consultation Responses
13
will not be a welcoming place.
Utilise the suburban rail network,
especially as pressure on the roads
in Portobello will increase as sites in
East Lothian develop.
Better cycle parking, however, this is
of little use when it is a difficult place
to safely and enjoyably cycle to.
Outdoor seating should not impact on
pushchair or wheelchair users.
Don’t need more cafes and bars.
Comments from those who disagreed with the Principles include:
Doesn’t agree with principle 2
regarding large glazing for food
premises.
Street waste storage bins seem to be
increasing.
Enough food outlets (contributing
litter) and too many hair and beauty
uses.
High quality shop design with
accessible access required.
safeguarded in the Local Development Plan.
Changes to the town centre boundary – east of 207 Portobello High Street Agree with suggestion - 88% Disagree with suggestion – 12% There is general support for this proposed extension to the town centre, and other comments include:
Logical but if new parking restrictions
and permits will move problem
outwards.
Although pavement is narrow here,
the shops are well patronised.
One comment against the proposal was
made, as follows:
No, without proper enforcement of
planning policy, any extension of the
town centre will only dilute and
Any changes to this boundary are required to be made through future review of the Local Development Plan (LDP). Comments on this section will be relayed during the preparation of the next LDP.

Planning Committee 12 October 2017 Appendix 4 Summary of Consultation Responses
14
weaken the town centre. Real effort
should be made to ensure the units in
the primary frontages are within the
limits of the retail policy.
Other general points and suggestions
include:
Consider extending north down Bath
Street.
Consider extending south further up
Brighton Place as it is a key entry
point to the centre and important part
of the conservation area.
Why visit a beach town if access to
the Promenade is poor?
Changes to the town centre boundary – west end /King’s Road end of Portobello Agree with suggestion – 85% Disagree with suggestion – 15%
Although there is a clear majority in support
of this proposal, with one comment agreeing
that linking the new Aldi would be good to
make it feel part of whole town centre, there
were comments opposing this idea:
No, other than the supermarket, nothing
at this end warrants inclusion. Pointless
as there is a substantial residential zone
that prevents the extension.
Greater clarity required to understand the
proposed extension. Should it include the
new supermarket and new development?
Potentially reduces the viability of the
existing centre as a hub for shops and
services. Given poor protection of shops
in the current centre, unlikely that the
units proposed to be included will be
given additional protection. Potential
redevelopment of the 5-aside football
pitches, may shift the town westwards,
especially if shops are provided
underneath residential. There is no visual
connection between the new

Planning Committee 12 October 2017 Appendix 4 Summary of Consultation Responses
15
supermarket and the existing town
centre. Use of the large car parking is not
advertised for linked trips. The constant
number of Class 1 shop units hides the
fact that many are charity shops or
bakeries that act as takeaways or cafes.
Using frontages Agree – 80 Disagree 20% High support for the existing approach to
defining frontages within the town centre. A
range of comments were received on retail
generally, not specifically on the principle of
identifying frontages:
Prefer units in use than left empty.
Relax the policy.
Need more varied businesses, specialist
shops.
Restrict the number of low quality units,
charity shops, takeaways, hair and
beauty.
Restrict non-shop uses to support
independent shops and that all shopping
needs can be met in the town centre on
foot.
Access should be improved when
designing alterations to shopfronts.
Re-look at proportion in food and drink
use. Primary reason for restricting food
should be to prevent nuisance and loss
of amenity to local residents than trying
to enforce a mix of shops.
Control is essential to protect the viability
and vitality of the town centre. Range of
shops in Class 1 shop use distorts what
the range of goods are available for
everyday shoppers in the centre, for
example charity shops, hairdressers.
More support required for Class 1 retail
Continue the use of frontages in the SG. The planning system cannot control the type of occupier. Residential amenity is a material planning consideration in determining planning applications where there may be issues of odour, ventilation, late opening times etc. Outwith the scope of this guidance.

Planning Committee 12 October 2017 Appendix 4 Summary of Consultation Responses
16
in form of lower business rates and rents
(where owned by Council).
Defining frontages – individual groups of addresses Agree – 95% Disagree – 5% The majority agreed with the proposed
addresses for defined frontages comments
include :
Yes, these frontages relate to the
primary retail outlets that maintain the
town centre.
Yes, they are the heart of Portobello,
close to other town centre uses such
as the town hall, library and police
station. Having a nucleus of useful
retail shops reduces need to travel.
The easier, convenient to access the
centre, combined with good number
of useful and diverse shops, the more
sustainable it is. Issue remains that
charity shops for example are Class 1
Shop.
Still there were comments on the type and
detailed character of the shops:
Reduce number of
charity/beauty/barber shops.
Quality of shops important.
Design of shopfronts integral to
character of Portobello.
Include south side of Brighton Place
up to Lee Crescent and south side of
the High Street running east form the
cross, maybe as far as Windsor
Place, should be included.
Continue to use same frontages. Many of the comments relate to the type of service or goods provided by businesses. However, the planning system does not control the details of goods or services other than by the definitions in the Use Class Scotland Order. The Use Class Order is primary legislation and any change to the way a charity shop is classed, would have to be done through an amendment to this primary legislation. The planning system can only control the use class of a property and not the occupier. Use classes are set out in legislation. Within a use class it would not be possible to control the type of shop as changes could be made to any use within that class without the need for planning permission. No changes to the proposed frontages.
Defining Frontages – amount in non-shop use: Do you agree that no more than one third in non-shop use?
Continue the use of the frontages using the proposed thresholds.

Planning Committee 12 October 2017 Appendix 4 Summary of Consultation Responses
17
Agree – 80% Disagree – 20% Majority support the proposed permitted
amount of non-shop uses in the frontages,
stating that:
Yes, otherwise as a retail destination it
would die. Enforcement needs to take
action when limits are breached.
Better to be used than left empty.
Yes but has to be led by demand, no use
if left empty.
Yes, maintain healthy balance, but third
might be high.
The comments and reasons for not
supporting the proposed amount include:
No, Need more bistros, reduce to 20%.
No, good shops don’t last, there isn’t the
interest. Plus crippling business rates.
Need good quality chains, not Aldi, to
send the right message.
Some guidelines should be in place, with
a discretionary band below an upper
limit. Planners, with the help of
community views, could have some
discretion.
No, suggests no more than one quarter
in non-shop use, but accept one third if
properly enforced.
The planning system cannot control the type of occupier. The policies need to be clear and easy to use. The planning process of determining applications has a discretionary element, if a material planning consideration is present.
Elsewhere in the TC, do you agree with
the approach to allow flexibility and
permit change of use to Class 2, 3 or
other appropriate town centre uses?
Agree – 90% Disagree – 10% Most agreed that elsewhere a more relaxed
approach could be taken and commented
that this would help protect core frontages.
However, some hoped only if the right quality
maintained with no more charity shops, and
No changes to the proposed policy. The planning system cannot control the type of occupier.

Planning Committee 12 October 2017 Appendix 4 Summary of Consultation Responses
18
let the community regenerate.
Others stated that there is already enough
food and drink outlets and that Class 2
service providers of more value to the town.
Once again the issue of the large number of
hairdressers/barbers was raised and
suggested that this use accounts for the
amount of Class 1 uses. Others stated:
No, don’t agree with frontage approach,
the town centre’s character should be
considered as a whole with consistent
approach across the town. Harder to
manage but more flexible approach could
help.
No, strict limits on the number of types of
premises should be imposed. As many of
the uses listed would not improve vitality
and viability of the high street.
Do you agree that change of use of shop units to residential use should not be permitted in the town centre boundary? Agree – 85% Disagree – 15% Some thought that there may be some circumstances where it could be allowed for example, impose a time limit and prove how long a property has been vacant; if percentage in shop use doesn’t change and if it could create an accessible home. Many run down shops could be better in residential use. Those that agreed stated that allowing residential use shows a failure in the town centre, resulting in a lack of vitality with no evening uses, and highlighted that it is difficult to achieve a good design in such conversions.
Continue the proposed policy to resist converting shops units into residential use. This suggested approach would rely on how the shop unit has been actively marketed for sale or let.
Other comments A range of other comments on the challenges and opportunities of Portobello. Comments on the street environment included the conflict between cyclists and pedestrians, potential for minor junctions off
A number of issues raised are outwith the scope of the Supplementary Guidance. Comments received have been shared internally with other Council services.

Planning Committee 12 October 2017 Appendix 4 Summary of Consultation Responses
19
the High Street to be resurfaced to give pedestrian priority. Provide segregated bike paths to reduce traffic speed. Improve active traffic routes from Northfield and the Durhams. The King’s junction is a barrier to cycling and walking into Portobello. To relieve traffic congestion in the town centre suggestions include, divert to and have better signage for to Harry Lauder Way; reuse the South Suburban railway. Accessibility should be integrated into the design at all stages. Care that the policies don’t lose the Portobello’s distinctive character. Allow more commercial opportunities to support the Prom and more ‘high end’ housing to support the high street generally, while protecting the skyline. No more community centres needed, better to convert to housing. Remove reference to finding an alternative location for the monthly market as this has previously been explored but no better location found. Guidance needs practical measures to improve the appearance, quality and attractiveness of the town centre. Portobello has declined in quality and variety of useful shops due to competition from nearby supermarkets.
Summary of Consultation Responses – Draft Stockbridge Town Centre Supplementary Guidance March 2017 272 responses were received. This included one community council, one residents association, 34 business interests and 236 individuals.
Questions/Issues Council Response
The Vision Agree –82% Disagree – 18% Most respondents agreed with the Vision. Of those who agreed a small number
The Vision intends to facilitate all movement. It recognises the importance of Raeburn Place and Deanhaugh Street for vehicle

Planning Committee 12 October 2017 Appendix 4 Summary of Consultation Responses
20
commented on cycling. Half of these stating that there should be less emphasis on cycling and half that there should be more provision. The importance of traffic was highlighted, however some commented that the area did not need to be a through route. The need for short term parking to allow drivers to stop and shop was raised along with the need for residents parking. There was support for a mix of uses but the number of charity shops was a particular concern. The improvement of pedestrian movement was also a reason for supporting the Vision. Amongst those who did not support the Vision the emphasis on pedestrians and cyclists was considered to be too great. Traffic was also an issue. Most of those commenting on this issue did not consider that the town centre should be a through route. There was concern that improving provision for pedestrians and cyclists could mean a reduction in parking provision and this was considered to be more of an issue than pedestrian/cyclist movement. A number of those who did not support the vision stated that the area was fine as it is. Other points made:
Trade waste regulations not enforced.
Vision is meaningless.
Important to focus on character and identity of the area.
Maintenance of facilities vital.
movement. It aims to increase the importance of cycling and pedestrians in line with the Council’s Transport 2030 Vision. The Vision as presented includes enhancement of the character and identity of Stockbridge. Most respondents agree with the Vision. The Vision as presented remains unchanged.
Principles Agree - 87% Disagree – 13% Most respondents agreed with the Principles,
Outdoor seating is encouraged on wider

Planning Committee 12 October 2017 Appendix 4 Summary of Consultation Responses
21
although there was a mixed response from some in that some were supported while others were not. A number of comments were made on outdoor seating. Where this was supported it was considered that it would encourage people to stay in the town centre and be beneficial. One respondent suggested minimising parking to provide space for outdoor seating. Where outdoor seating was not supported concerns were that it would take away space for cars, lessen pavement space, create additional clutter, create waste issues, cause night time disturbance to residents and that there was sufficient seating already. The reference to the junction of Raeburn Place and St Bernard’s Row had mixed support with most who commented on this stating that it does not offer a good opportunity. There was support for the principle to take opportunities to remove street clutter and in particular bins, bollards and A boards. The issue of the impact of street clutter on disabled persons was raised. One comment did not support removal of bollards as these were considered to offer protection to pedestrians. A contradiction between the principle of removing street clutter and opportunities for outdoor seating was raised. Comments relating to cycling mostly did not support the provision of additional facilities-these were considered to be a waste of resources and space with one respondent commenting that not many people cycle in Stockbridge and that there were already places to secure bikes. One response stated that a cycle lane would help cyclists. A number of comments were made on the principle of ensuring appropriate arrangement for waste. Comments supported this principle and concerns were that bins takes up too much space, are unsightly and there is a need for enforcement.
pavements. Where related to commercial premises tables and chairs are controlled by permits which take account of space available for movement. The Principles extend to non-commercial seating. Removing street clutter would not necessarily contradict with opportunities for outdoor seating. There may be opportunities to rationalise existing street furniture/signage, remove unnecessary items and utilise street furniture for more than one purpose including seating. The junction of Raeburn Place and St Bernard’s Row was identified in the Public Life Street Assessment carried out by HERE+NOW as providing an opportunity for outdoor seating. It is a spacious location with a positive sunny microclimate on good weather days. A lack of cycling facilities was identified in the Public Life Street Assessment carried out by HERE+NOW. The principle to support additional facilities supports the vision to increase cycle movement and is in line with the Council’s Active Travel Action Plan objective to increase the numbers of people in Edinburgh walking and cycling, both as means of transport and for pleasure. The Principles support de-cluttering which would include removal of unnecessary street furniture including bins. There is existing Council policy on trade waste. Principles for siting domestic waste and recycling are set out in the Edinburgh Street Design Guidance. Class 3 food and drink uses can add to the vitality of town centres. The frontage approach is designed to ensure that a minimum level of shopping provision is provided and thereby protecting the level of these uses in defined areas. Corner sites are particularly suited to such uses as they bring an opportunity to activate public street life. Principles support high quality shop front design as set out in the Council’s guidance for Businesses.

Planning Committee 12 October 2017 Appendix 4 Summary of Consultation Responses
22
There was a mixed response to the principle of supporting Class 3 food and drink units on corner sites. Most of those commenting felt that there are enough food and drink outlets, however one respondent commented that they wanted to encourage these uses. There was support for high quality shop front design. One respondent commented that they supported the provision of active frontages, which could preclude residential, as retaining shops would sustain the liveliness of the area. Others commented that change from commercial to residential should be allowed while another commented that such changes do not look good. Other comments:
Limit number of charity shops.
Promote real shops.
Consider how change of use fits with vision.
Need to ensure quality and character.
Stockbridge a village – not a town.
Removal of shop fronts on Raeburn. Place and restoration to garden use.
Need to address pressure from traffic to realise principles.
Need to ensure adequate parking.
Principles seem restrictive.
Provision of green infrastructure would help create a sense of place.
Uses which bring activity to the street are important. The policy set out in the SG policy protects ground floor units for this purpose. The planning system can only control the use class of a property and not the occupier. Use classes are set out in legislation. Within a use class it would not be possible to control the type of shop as changes could be made to any use within that class without the need for planning permission. The Principles will be applied in the determination of applications for change of use these are intended to meet the Vision. Principles require that development meets the Council’s Edinburgh Design Guidance, this includes addressing landscaping. Stockbridge is defined as a town centre in the Local Development Plan. This recognises its role in providing shopping and services in an accessible location. Within the defined town centre policy is intended to retain shop units for appropriate commercial, leisure or community uses. Loss of units to restore garden ground are best controlled through a change in the town centre boundary. Any changes to this boundary are required to be made through future review of the LDP. Principles are wide ranging and will apply to proposals where appropriate. Not all principles will be relevant to each proposal. Traffic and parking are outwith the scope of the Supplementary Guidance.
Extend boundary to include north side of Raeburn Place (Edinburgh Academicals Site) Agree – 70% Disagree – 30% Most respondents agreed with the proposed change.
There is an active planning consent

Planning Committee 12 October 2017 Appendix 4 Summary of Consultation Responses
23
A number of respondents expressed support for the extension of the town centre but not for the consented development. There was concern that the consented development has not yet gone ahead and that it may have a different look and feel. Amongst those supporting the change respondents stated that development should be in keeping with surroundings, should not lose residential properties, that there should be pavement improvements and it would be important to retain trees. Considered that development of the area will create an important anchor and more shops will encourage growth and would like to see independent shops developed in the area. The mix of shops should be maintained and dominance of licensed premises avoided. One respondent was uncertain and stated that if there was evidence of a requirement for more shops this should be allowed. Area should be included so that appropriate guidance can be applied and same scrutiny applied as current Stockbridge town centre, Those who did not support the change stated that this area was not part of Stockbridge, that the location is out of centre and that a clearly defined area is needed to market Stockbridge. The change would stretch out the town centre too far and reduce the village feel. The amount of green space would be reduced and change the character of the area. Parking resulting from development in this area was a concern. The view was expressed that there are already enough shops in Stockbridge and not enough capacity to support additional shops and that the area will be occupied by chain stores. The area is designated as open space and should remain so and inclusion within the town centre would reduce the level of protection for residents and make it easier for a range of town centre uses to get
(12/03567/FUL) which includes retail/commercial units at ground floor level. Implementation of this consent would impact on the suitability of including this area within the town centre boundary. The current Town Centre boundary includes units in Dean Park Terrace which are a continuation of units on Raeburn Place. The current boundary excludes 3 commercial units on the East Side of Dean Park Terrace. Inclusion of these units would provide a sensible boundary to the Town Centre. Procedurally there is no scope to make changes to the town centre boundary through this SG. However, these suggestions for changes to the town centre boundary will be considered during the preparation of the next LDP. 104 and 106 Raeburn Place are included within the current Town Centre Boundary. They are not part of an identified Primary Retail Frontage where a more restrictive policy applies to changes from shop use to non-shop use.

Planning Committee 12 October 2017 Appendix 4 Summary of Consultation Responses
24
planning permission. Other comments:
Implications of including this area within the boundary were not clear.
Raeburn Hotel and shops in Dean Park Street should also be included.
104 and 106 Raeburn Place not marked as shops.
Extend boundary to include 1-8 North West Circus Place Agree – 77% Disagree – 23% Most respondents agreed with the extension. There was confusion expressed by some as to what was being proposed. Those who did not support this extension considered that the area is part of the New Town, not a natural extension and that is would change the look of the street. That there were already sufficient shops and the town centre was adequate as it is. Inclusion within the town centre would reduce the level of protection for residents and make it easier for a range of town centre uses to get planning permission. The area needs to stay concentrated to minimise its possible gradual disintegration. Those who supported the extension stated that this already felt like part of the town centre, there are individual shops which promote the area as being different, nicest part of village and should be a model for the remainder. Other comments:
Heath centre should be included.
Too many food outlets
Noise pollution is an issue
Extend new paving into North Circus Place and Kerr Street.
Should not result in more charity shops
The inclusion of this area would extend the boundary of the current Town Centre to include the adjacent area currently occupied by commercial uses despite not being subject to the town centre policy and would protect these units for such use. The extension could be argued to provide a more definable boundary for the town centre by including these units which meet the description of shop units after which the use changes to residential. A shop unit on the opposite side of North Circus Place – No. 35 could also be included as it is continuation of the units on this side of North West Circus Place. Procedurally there is no scope to make changes to the town centre boundary through this SG. However, these suggestions for changes to the town centre boundary will be considered during the preparation of the next LDP.
Frontage Approach

Planning Committee 12 October 2017 Appendix 4 Summary of Consultation Responses
25
Agree –82% Disagree – 18% Most respondents supported the approach. Some confusion was expressed over implications/explanation. Amongst those who support the approach the need to prevent further food and drink outlets was the main reason. Concern was expressed about the number of charity shops and the need to limit these. While supporting the approach one respondent stated that each unit should be considered on its own merits and a flexible approach should be taken. Amongst those who did not support the approach charity shops were a concern and food and drink outlets preferred to charity shops as they are considered to encourage more footfall. Independent shops should be encouraged and a restriction placed on high street chains. Approach considered to be a box ticking exercise rather than taking a holistic view of the town centre. Intervention not important in a thriving market. Need should follow demand. Should encourage a wide variety of uses. Use should be determined on a case by case basis. Better to have maximum occupancy than place restrictions. Should avoid bookmakers and gambling outlets. Approach considered to prevent smaller retailers expanding into adjacent stores. Other Comments:
Shortage of buildings for childcare
Business rates
To address the confusion over the use of the term frontage the Supplementary Guidance has been changed. The term Primary Retail Frontage has been used to describe the areas where a more restrictive policy will apply. This reflects their primary focus on shop use. A definition has been included within the definitions section. The planning system can only control the use class of a property and not the occupier. Use classes are set out in legislation. Within a use class it would not be possible to control the type of shop as changes could be made to any use within that class without the need for planning permission. Town centres play an important role in providing shopping for local people. The frontage approach is intended to ensure a minimum percentage of units are retained in shop use to meet these basic shopping needs. It recognises that a range of uses are necessary to provide a vital and viable town centre and tries to ensure a balance between maintaining a level of shopping provision across the centre as a whole and avoiding being over restrictive by allowing other appropriate uses. The frontage approach allows increased flexibility in those areas outwith the defined frontages where each case will be considered on its own merits. Scottish Planning Policy states that where a town centre strategy indicates that further provision of particular activities would undermine the character and amenity of centres or the well-being of communities, policies to prevent such over-provision and clustering should be in place. There are no indications that this would be the case in Stockbridge. The SG policy requires proposals to be for an appropriate commercial, community or leisure use which would complement the character of the centre. Applications for uses including betting shops would be considered individually against this criteria.

Planning Committee 12 October 2017 Appendix 4 Summary of Consultation Responses
26
The policy would not prevent retailers from expanding shop use into adjacent units. Depending on the individual circumstances use for childcare may fall within the definition of an appropriate commercial use. Business rates are outwith the scope of the guidance.
Defined frontages Agree – 86% Disagree - 14% Most respondents supported the defined frontages. Amongst those who commented there was some confusion expressed over what frontages meant and what the definition of a shop is. Some comments questioned the need to identify frontages and highlighted that south facing units may be more suited to non-shop uses. Also that there is a need to be more inclusive rather than defining boundaries. A numerical approach to the visual impact of shops was questioned and it was considered that each unit should be considered under its own merits. The approach was not considered to be working as there were felt to be fewer shops in these areas. Some comments related to charity shops and a desire to restrict these and some additionally that their preference would be for more food and drink uses than charity shops while others asked for no more pubs. Suggestions were made for additional frontages:
Raeburn House Hotel and the southern side of Raeburn Place.
South side of Deanhaugh Street, Kerr Street and the first stretch of Hamilton Place
North West Circus Place and the new development at the Accies ground.
Hamilton Place and St Stephen Street.
To improve clarity over the meaning of frontages the defined frontages have been renamed Primary Retail Frontage to reflect that they are the primary areas for retail provision and distinguish them from the other shop frontages within the town centre. A definition has also been included within the text and in the definitions section. Shop use is defined within the definitions section of the Supplementary Guidance. The town centre provides a mix of uses and this is essential to ensuring its vitality and viability. However provision of shopping is a key part of a town centre’s function and a frontage approach is considered an appropriate means of protecting this function while allowing for a certain level of complementary uses. Within the identified Primary Retail Frontages the proportion of shops in non-shop use is below the 33% threshold. Legislation does not distinguish between the types of shops therefore it is not possible to restrict the occupiers of shops through the planning system. The frontage approach would restrict the number of non-shop uses such as pubs if the threshold of non-shop uses were to be exceeded by the proposal. Policy Ret 11 of the Edinburgh Local Development Plan controls the change of use of shop units to pubs where they may be detrimental to the area. The Supplementary Guidance applies to the town centre only. The town centre is defined

Planning Committee 12 October 2017 Appendix 4 Summary of Consultation Responses
27
Other points raised:
Removal of shop premises built in front gardens of villas on Raeburn Place should be promoted.
Should require owners of shops to give up leases if they do not open.
Approach would be a waste of time
If vacancies are low should not have allowed development at Edinburgh Academicals.
in the proposals map of the Local Development Plan (LDP). The adopted LDP does not include the Edinburgh Academical Ground or Raeburn House Hotel within the town centre boundary and only part of North West Circus Place is included. The draft Supplementary Guidance suggested that this area could be considered for inclusion in the town centre. Any changes to this boundary are required to be made through future review of the LDP. It is therefore not possible within the current Supplementary Guidance to define these areas as frontages. At the time of survey in 2016 the percentage of units in non-shop use within the stretch of North West Circus Place which is currently included in the town centre was 50%. This is in well in excess of the 33% non-shop use which would be applied if it were defined as Primary Retail Frontage. Defining the area as Primary Retail Frontage would require that there could be no change from a shop unit to another use until such time as there was an increase in the overall number of units in shop use. This is considered to be overly restrictive and inflexible and as the use of shop units is dependent on the market there is a risk that it could lead to vacancies. The southern part of Raeburn Place (1-77) is already included as Primary Retail Frontage within the Supplementary Guidance. The Raeburn House Hotel falls between the existing town centre boundary and an area proposed in the draft SG for potential inclusion in this boundary. The appropriateness of its inclusion should be assessed as part of the next LDP process. Extending frontages to include the south side of Deanhaugh Street, Kerr Street and the first stretch of Hamilton Place is considered to be overly restrictive and could impact on vitality and viability of the town centre by preventing complementary uses as supported by Scottish Planning Policy. Hamilton Place and St Stephen Street are side streets extending from the main thoroughfare. At present the proportion of non-shop uses is 40% and 54% respectively. This is in in excess of the 33% non-shop use which would be applied if it were these areas

Planning Committee 12 October 2017 Appendix 4 Summary of Consultation Responses
28
were defined as Primary Frontage. Primary Retail Frontages contain 77 units of a total of 170 units in the town centre. This is 45% of the centre. The Primary Retail Frontages as defined are considered to provide an appropriate balance between ensuring retail provision and allowing complementary uses. Vacancies within the centre are low indicating a relatively healthy centre. The Supplementary Guidance will be reviewed regularly and if the policy is not having the desired effect then further restrictions on change of use would be considered. The policy is intended to retain shop units within the defined town centre for appropriate commercial, leisure or community uses. Loss of units to restore garden ground are best controlled through a change in the town centre boundary. Any changes to this boundary are required to be made through future review of the LDP. The operation of shops is outwith the scope of the planning system therefore lease requirements cannot be addressed through this guidance.
One Third non-shop use Agreed – 72% Disagree – 28% Most respondents agreed with one-third non-shop use. Amongst both those who said they agreed and those who did not there were some suggested variations in the percentage to be applied:
Should be 40%
Should be 50%
Should be less
20-25% would better protect shops.
With move to online shopping unrealistic to expect 33%.
Should apply to the whole town centre. Other comments were that it is important to keep variety/balance and some flexibility should be allowed on a case by case basis
The defined Primary Retail Frontages are below the 33% non-shop use threshold. Continuation of this threshold will ensure protection of the retail function and still allow for a mix of other uses. Increasing the proportion of non-shop use could erode the retail function. The policy applies only to the defined Primary Retail Frontages and outwith these areas, but within the town centre boundary, a more flexible approach applies which would allow for higher levels of alternative uses should they be considered appropriate to the town centre. Decreasing the proportion of non-shop use to 20% would be below the levels currently

Planning Committee 12 October 2017 Appendix 4 Summary of Consultation Responses
29
and if demand is for other things then this should be encouraged. A preference for occupancy rather than thresholds was expressed. The acceptability of 33% was considered to be dependent on the occupier of the shop. A number of comments related to charity shops. It was considered that it would be better to have something contributing to the economy rather than charity shops. Charity shops should not be included as shops and restrictions on their numbers should be considered. Preponderance of charity shops suggests that there is scope for some further conversion to higher quality uses and would rather have pubs/restaurants than charity shops. Others considered that there were too many/enough pubs and another that restaurants and cafes should be considered as shops. Other comments received:
Shop owners should be assisted.
Development of the Edinburgh Academicals ground will destroy shops.
Should not allow shops to become residential units.
within the defined frontages. Applying such a level is considered to be overly restrictive and would prevent any changes from shop use. The definition of shops is set out nationally in the Use Class Order. Within a use class it would not be possible to control the specific use as changes could be made to any use within that class without the need for planning permission. The Supplementary Guidance does not support change of use of shop units which are in shop use to change to residential.
Outwith Frontages Agree – 84% Disagree – 16% Most respondents agreed with the approach suggested to those areas outwith identified frontages. Comments received included that the approach was okay as long as it genuinely contributes to vitality. All areas should be frontage, no change is needed and should be more restrictive with no more chain stores. It was considered by some that there were too many food or drink uses and restrictions should be applied but also a comment that more class 3 uses and community/leisure would be welcomed. Office or residential use considered
The frontage approach allows an appropriate balance between retaining the retail function of the town centre and allowing other appropriate uses. The approach overall provides protection while allowing flexibility to allow a range of complementary uses. Applying the policy of 33% non-shop use to the entire centre is considered to be overly restrictive and it is not possible to control the occupier of shops through the planning system. Outwith Primary Retail Frontages the policy provides a flexible approach which recognises that food and drink uses can add to the vitality and viability of town centres. Policy Ret 11 of the Edinburgh Local Development Plan controls the change of use of shop units to food and drink

Planning Committee 12 October 2017 Appendix 4 Summary of Consultation Responses
30
appropriate. Class 2 contribute little and should not be included, and there is an abundance of available offices. Emphasis should be on Class 2 rather than Class 3. Concern that units are turned into offices and then converted to flats. Sufficient food and drink and professional services. Should be more shops rather than restaurants. Detrimental to lose shop frontages to financial, professional or other services and food and drink uses. Food and drink should not be limited by number but should be restricted to local businesses. There should be fewer charity shops and appropriate uses should not include charity shops. Should exclude betting shops and brothels and there should be no more chain stores and independent retailers/enterprise encouraged. Appropriate leisure uses would complement-small cinema suggested. The appearance of shop units was mentioned in some comments: Shop fronts should be in keeping with the area; openness of facades important; and acceptability of use would be dependent on design and layout. Other comments:
Class 3 uses should be responsible for litter.
Shortage of premises suitable for childcare.
Cannot allow food premises to open up and then close.
Change of use regulations ignored.
Lack of support for development of Edinburgh Academical ground.
establishments where they may be detrimental to the area. Class 2 uses include a range of services e.g. doctors, dentists, beauticians and estate agents which are considered appropriate for town centres. The Supplementary Guidance does not support change of use of shop units to residential. The planning system can only control the use class of a property and not the occupier. Use classes are set out in legislation. Within a use class it would not be possible to control the specific use as changes could be made to any use within that class without the need for planning permission. It is therefore not possible to control the number of charity shops though this guidance. Scottish Planning Policy states that where a town centre strategy indicates that further provision of particular activities would undermine the character and amenity of centres or the well-being of communities, policies to prevent such over-provision and clustering should be in place. There are no indications that this would be the case in Stockbridge. The Supplementary Guidance requires proposals to be for an appropriate commercial, community or leisure use which would complement the character of the centre. Applications for uses including betting shops and leisure uses would be considered individually against this criteria. The principles set out in the Supplementary Guidance support high quality shop front design and active frontages. The Supplementary Guidance does not preclude use of units for childcare, either within the defined frontages if the threshold is being met and in any case outwith the defined frontages, if they are determined to meet the criteria set out in the supplementary guidance and other relevant policy.
Change of use to residential Agree – 85%

Planning Committee 12 October 2017 Appendix 4 Summary of Consultation Responses
31
Disagree – 15% Most respondents agreed that shop units should not be converted to residential. Those who disagreed commented that done well residential can be part of town centre and more attractive than some other uses and that the village feel requires a focus on residential. The area was considered to be active already and would be balanced by residential. Should be restriction but not a total ban and should be determined on a case by case basis and units should not be used for short term lets. Residential should be considered due to shortage of housing options. Those who agreed that residential use should not be supported stated that the shopping area needs to be kept for shops otherwise it will not be viable. The area would not be well served by ground floor residential and it could cause existing shops to be non-viable by reducing number of shops. The appearance of residential was of concern and the view expressed that the current level of housing in the area is sufficient and schools are oversubscribed. Removal of shop premises built in front gardens of villas on Raeburn Place should be promoted providing the space is properly restored to historical garden use.
For placemaking purposes it is important that ground floor uses help bring activity onto the street. Residential units at ground floor level tend to add little vitality to the town centre. Stockbridge already has a large population living within walking distance of the main shopping streets and within the town centre itself. The policy is intended to retain shop units within the defined town centre for appropriate commercial, leisure or community uses. Loss of units to restore garden ground are best controlled through a change in the town centre boundary. Any changes to this boundary are required to be made through future review of the Local Development Plan.
Other Comments Many of the comments were related to traffic with mixed views. Comments made were that through traffic is the biggest problem and the document does not address problems caused by dominance of traffic and a more holistic approach to changing behaviours so people use cars less is needed. However the view was also expressed that the role as through route must be kept as a priority and do not want measures to further reduce traffic flow. Policies around traffic reduction need to change to promote free flowing motoring and accept people will not convert to cycling or
A number of the issues raised are outwith the scope of the supplementary guidance. Comments received have been shared internally with other Council services. In response to the specific points raised relating to the Supplementary Guidance:
It is not possible to control the number of charity shops or national retailers through the Supplementary Guidance. The planning system can only control the use class of a property and not the occupier. Use classes are set out in legislation.

Planning Committee 12 October 2017 Appendix 4 Summary of Consultation Responses
32
walking. A reduction in traffic speed, parked cars and a simplified and attractive public realm critical. Issue of delivery vans causing obstruction. It was commented that pavement cafes are undeliverable while the route continues to be a main thoroughfare. One comment expressed support for a one way system and another suggested that scheduling of buses would be a simple way to improve traffic safety. It was suggested that Raeburn Place was closed to through traffic with the use of smart bollards and a shared pedestrian/cycle surface created. A further suggestion was that a 'mini-holland' approach to Raeburn Place might serve to reduce motor vehicle flows, while providing a safe space to cycle and more room for people to linger. One comment expressed annoyance at the inability to access Stockbridge from Trinity due to closure of St Bernard’s Row. Should consider combining cycleways with green infrastructure and shared spaces considered good for safety and vibrancy. A number of comments were also made in relation to parking. It was considered that Stockbridge needs more affordable parking and spaces to encourage people from out of town shopping. There was support for short-term parking and disabled parking and a view that there is limited on street metered parking. That resident parking should be increased and concern that parking on Hamilton Place makes it effectively a single track road. One respondent stated that parking should be banned and another that loading bays should be provided. Some specific suggestions were made on parking:
change the length of parking allowed at East Fettes Avenue
restrict car parking to one side of Leslie Place
explore options for off-street shopper car park.
Comments were also received on pedestrians and crossings. It was considered by some that footpaths are in poor repair and improvements in street surfaces should be extended. Suggestion
Within use class it would not be possible to control the specific use as changes could be made to any use within that class without the need for planning permission.
The Supplementary Guidance does not preclude use of units for childcare or soft play, either within the defined frontages if the threshold is being met and in any case outwith the defined frontages, if they are determined to meet the criteria set out in the supplementary guidance and other relevant policy.
The vision is to ensure a mix of uses to meet the needs and demands of the population. The Supplementary Guidance provides a flexible approach which allows a range of uses which could include arts, cinema, theatre, galleries and community centres.
The level of intervention is considered to be appropriate. The frontage approach allows an appropriate balance between retaining the retail function of the town centre and allowing other appropriate uses. The approach overall provides protection while allowing flexibility to allow a range of complimentary uses.
The map identifies the Academical ground as open space. Reference on page 8 does not state that the ground is public. It states that “the area also benefits from having some community, leisure and public uses located within and in close proximity, “and cites Edinburgh Academical Sport Ground as an example of a leisure use.
Glenogle swim Centre is outwth the town centre boundary but in close proximity. It has been included finalised SG in the examples of uses close to the town centre.

Planning Committee 12 October 2017 Appendix 4 Summary of Consultation Responses
33
that improvement to pavement surface at Leslie Place should be a priority. There should be more priority to cyclists and pedestrians with bike stands a priority but also that cycling is given too much prominence. There were mixed views expressed on a pedestrian crossing at Leslie Place and Deanhaugh Street which has some support but also a comment that there is no need for additional crossing facilities as existing lights are sufficient to allow crossing and a comment that making Leslie Place a one way street would provide an alternative. It was considered that good pedestrian access between frontages is desirable but the absence of a pulsed flow arrangement risks increasing pollution. An additional crossing place at the bottom of Cheyne Street was suggested and the crossing at the start of Hamilton place considered dangerous. One respondent called for no more crossings and another commented that the crossing times were inadequate. Some comments were received relating to obstructions on the pavement. The placement of the bus stop outside Hectors and in Hamilton Place considered to be poor and a bus shelter needed in Leslie Place. It was suggested that the number and location of bus stops was rationalised. The south side of Raeburn Place considered to be narrow and unpleasant and issues of dog fouling. Consideration should be given to widening the south side of Raeburn Place. Bollards should be retained to avoid vehicles mounting the pavements but also the removal of bollards would benefit pedestrians. One respondent commented that bins and narrow pavements restrict pedestrian flow and not bollards. It was suggested that commercial bins and wheely bins be removed from streets. More tree/flower planting, good public art and traffic restrictions was supported. Some support was expressed for external seating and a suggestion of benches and plants along Saunders Street. Trade waste, communal waste, A boards and illegal parking were issues along with maintenance of railings. Low quality shop design and signage were
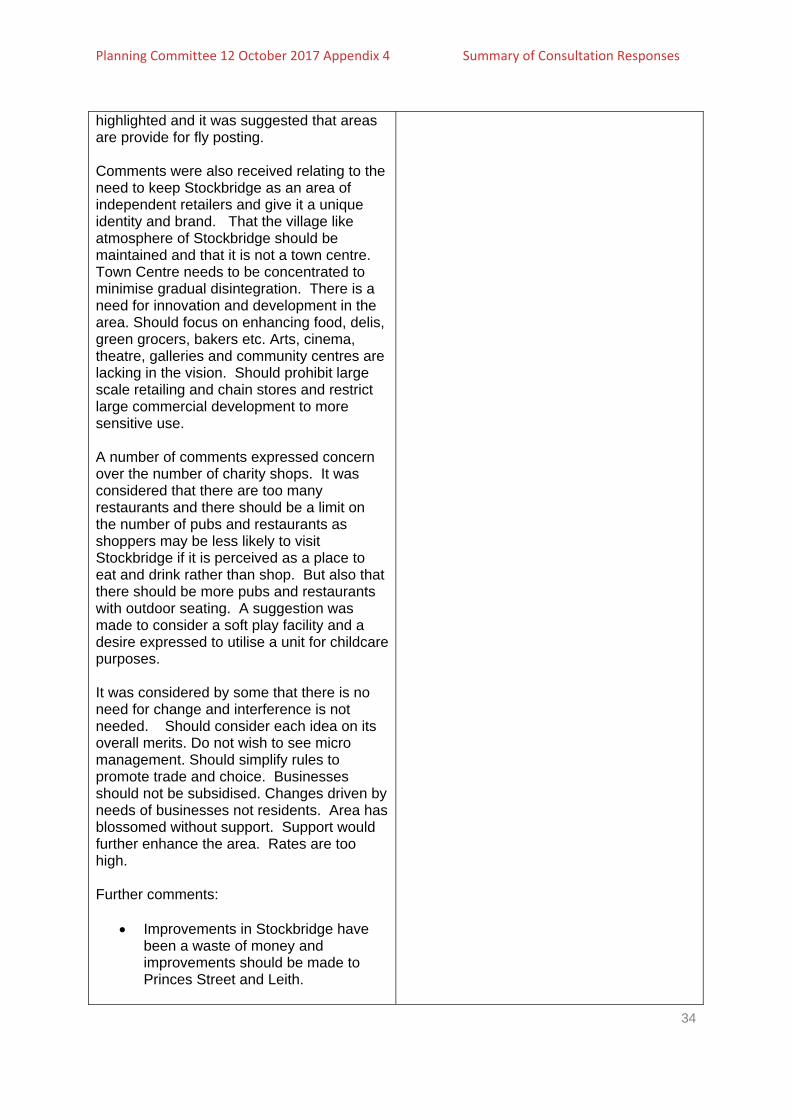
Planning Committee 12 October 2017 Appendix 4 Summary of Consultation Responses
34
highlighted and it was suggested that areas are provide for fly posting. Comments were also received relating to the need to keep Stockbridge as an area of independent retailers and give it a unique identity and brand. That the village like atmosphere of Stockbridge should be maintained and that it is not a town centre. Town Centre needs to be concentrated to minimise gradual disintegration. There is a need for innovation and development in the area. Should focus on enhancing food, delis, green grocers, bakers etc. Arts, cinema, theatre, galleries and community centres are lacking in the vision. Should prohibit large scale retailing and chain stores and restrict large commercial development to more sensitive use. A number of comments expressed concern over the number of charity shops. It was considered that there are too many restaurants and there should be a limit on the number of pubs and restaurants as shoppers may be less likely to visit Stockbridge if it is perceived as a place to eat and drink rather than shop. But also that there should be more pubs and restaurants with outdoor seating. A suggestion was made to consider a soft play facility and a desire expressed to utilise a unit for childcare purposes. It was considered by some that there is no need for change and interference is not needed. Should consider each idea on its overall merits. Do not wish to see micro management. Should simplify rules to promote trade and choice. Businesses should not be subsidised. Changes driven by needs of businesses not residents. Area has blossomed without support. Support would further enhance the area. Rates are too high. Further comments:
Improvements in Stockbridge have been a waste of money and improvements should be made to Princes Street and Leith.

Planning Committee 12 October 2017 Appendix 4 Summary of Consultation Responses
35
Glenogle public swimming pool should have been listed as one of the amenities of the area.
Question why Edinburgh Academical Ground is listed as a public amenity.
Concern about development consent at Edinburgh Academical and threat to town centre.
Loss of control within the Stockbridge area.
Views of residents should have more weight than those outwith.
Document should go further to articulate it is a place for people.
Would like to see Housing Associations encouraged into the area.

Planning Committee 12 October 2017
Sites Affected by Ownership/Control

Housing and Economy Committee
10.00am, Thursday, 2 November 2017
Housing Revenue Account– Financial Monitoring
2017/18 – Month Five Position
Executive Summary
The Executive Director of Place is forecasting the following positions against Housing Revenue Account (HRA) budgets:
• Revenue – A balanced position is forecast for 2017/18 after contributing £11.576m to the Strategic Housing Investment Fund.
• Capital – Projected capital spend of £71.341m in 2017/18 against a budget of £78.004m
These forecasts should be considered in the context of significant pressures and risks in both capital and revenue budgets.
Item number 7.10 Report number
Executive/routine Executive
Wards
Council Commitments

Housing and Economy Committee - 2 November 2017 Page 2
Report
Housing Revenue Account– Financial Monitoring
2017/18 – Month Five Position
1. Recommendations
1.1 It is recommended that the Housing and Economy Committee notes the current revenue and capital financial position of the HRA and the forecast position of the Place Directorate for 2017/18
2. Background
2.1 The Housing Revenue Account (HRA) is a ring fenced statutory account that the Council manages on behalf of tenants. The HRA is funded from rents relating to Council housing and related assets and is used to fund the provision of Council housing in line with tenants’ priorities.
2.2 On 9 February 2017, the Council approved the five year HRA Budget Strategy 2017/18 to 2021/22. This was informed by extensive consultation with tenants, focused on investing in goods and services that reduce tenants’ cost of living and includes significant investment in new and existing affordable housing, while keeping rent increases affordable. As part of the five-year strategy, the Council approved an annual rent increase of 2% which took effect on 1 April 2017. Rent levels are reviewed annually in consultation with tenants.
2.3 The approved HRA budget for 2017/18 is derived from the longer-term strategy. It comprised budgeted income of £101.807m, costs of £88.296m and a £13.511m contribution towards housing investment.
2.4 The five-year HRA Budget Strategy 2017-22 included a five-year capital programme of £531m and a one year investment programme of £79.5m; a 79% increase on 2016/17 investment levels.
2.5 This report provides an update on financial performance against the above budgets.

Housing and Economy Committee - 2 November 2017 Page 3
3. Main report
HRA - Revenue Budget
Overall Position
3.1 An exercise has been undertaken since approval of the HRA budget strategy in February 2017 to revise and realign the budget based on the 2016/17 outturn and recent committee decisions. This revised 2017/18 budget is set out within Appendix 1 of this report.
3.2 At month five, a contribution of £11.576m towards housing investment is projected by the financial year end.
Treasury Management
3.3 As debt charges amount to almost 40% of HRA expenditure, good treasury management is essential to running an efficient housing service. Over recent years, surpluses have been used to repay debt which will allow more capacity to fund housing investment.
Pressures, Risks and Contingency Planning
3.4 The 2017/18 HRA budget is relatively low risk as high demand for Council housing has resulted in a low level of empty homes and a stable income stream. However, there are elements of this budget that are demand led and can potentially be volatile. In order to mitigate the risks and pressures the budget is set on the basis of prudent assumptions, which are tested and modelled before seeking Council approval.
3.5 As set out in Appendix 1, a forecast over spend of £1.76m has been identified in Repairs & Maintenance. This is demand led spend and the number of repairs requested in 2017/18 is projected to exceed the budgeted level. This is in part mitigated by favourable variances in other areas.
3.6 Work is being undertaken to understand this level of repairs activity and develop current year and future year mitigations, to deliver savings in Repairs & Maintenance costs.
3.7 Longer term the Housing Service faces several significant risks, these risks are detailed in the (HRA) Budget Strategy Update 2018/19 Report previously noted by this committee.
HRA - Capital Budget
3.8 Since the budget was approved in February 2017, a detailed delivery programme has been developed. Following prudent programme management principles, the budget has been revised down to £78m; a 1.8% reduction.
3.9 At month five £6.663m slippage is projected against the revised capital budget of £78.004m, with capital spend projected of £71.341m.
3.10 This slippage is largely due to delays in the 21st Century Homes programme. Measures are being identified to accelerate other capital investment programmes in

Housing and Economy Committee - 2 November 2017 Page 4
the current year to offset this slippage. This delayed expenditure is expected to be incurred within the approved five year plan.
General Fund – Place Revenue Budget
3.11 An update on the provisional Council revenue monitoring position at month five was received by Finance and Resources Committee on 28 September 2017. For Place Directorate, budget pressures of £4.430m were identified at period five. A corresponding set of actions has now been developed to fully offset pressures and while a number of risks remain around their subsequent delivery, a break-even position is being forecast at this time. Progress will continue to be reported in respect of mitigation delivery.
4. Measures of success
4.1 HRA revenue expenditure and income for 2017/18 is within budgeted levels.
4.2 Successful delivery of HRA capital programme and new affordable housing within budget levels.
5. Financial impact
5.1 There are no direct financial implications arising from this report.
6. Risk, policy, compliance and governance impact
6.1 There are no direct risk, policy, compliance or governance implications arising from this report.
7. Equalities impact
7.1 The contents of this report, analysis and recommendations do not impact the Equality Act 2010 public sector general equality duty.
8. Sustainability impact
8.1 Successful delivery of the HRA budget will support investments to improve the energy efficiency of Council homes.
9. Consultation and engagement
9.1 Consultation was undertaken as part of the HRA budget-setting process.

Housing and Economy Committee - 2 November 2017 Page 5
10. Background reading/external references
10.1 Housing Revenue Account Budget Strategy 2017/18 – 2021/22 – City of Edinburgh Council 9 February 2017.
10.2 Housing Revenue Account Budget (HRA) Budget Strategy Update 2018/19 Report – Housing and Economy Committee 7 September 2017.
Paul Lawrence
Executive Director of Place
Contact: Susan Hamilton, Principal Accountant
E-mail: [email protected] | Tel: 0131 469 3718
11. Appendices
Appendix 1 – HRA Revenue Projection: 2017/18 – Month 5.

Housing and Economy Committee - 2 November 2017 Page 6
Appendix 1: HRA Revenue Projection: 2017-18 - Month 5
Approved Budget
Revised Budget
Forecast Variance
£000s £000s £000s £000s
Income -101.807 -99.893 -99.729 0.164
Housing Management 29.778 28.670 28.47 -0.200
Repairs and Maintenance 17.528 17.530 19.292 1.762
Environmental Maintenance 2.698 2.775 2.54 -0.235
Debt Service 38.292 37.911 37.851 -0.060
Strategic Housing Investment 13.511 13.007 11.576 -1.431
Total Expenditure 101.807 99.893 99.729 -0.164

Housing and Economy Committee
10.00am, Thursday 2 November 2017
Appointments to Working Groups – 2017/18
Executive Summary
The Housing and Economy Committee is required to appoint the membership of its Working Groups for 2017/18. The appendices to this report detail the proposed membership structures and remits for each of these groups.
Item number 7.11 Report number
Executive/routine Executive
Wards All

Housing and Economy Committee – 2 November 2017 Page 2
Report
Appointments to Working Groups – 2017/18
1. Recommendations
1.1 To agree the remits of the working groups set out in Appendices 1 and 2 to the report.
1.2 To appoint the Conveners of the Edinburgh Affordable Homes and Edinburgh Homelessness Forum working groups.
1.3 To appoint the membership of the Edinburgh Affordable Homes and Edinburgh Homelessness Forum working groups.
1.4 To agree to discontinue the Housing Pledges working group.
2. Background
2.1 At its meeting on 22 June 2017, the Council approved the membership of the Housing and Economy Committee.
3. Main report
3.1 The Committee is requested to appoint the membership of its working groups for 2017/18.
3.2 While there is no requirement for the membership of working groups to be proportionate to that of the Council, it is suggested that this is good practice.
3.3 The proposed membership has therefore been adjusted to reflect the overall political balance on the Council. It is, however, open to the Committee to alter the membership where it feels this is warranted.
3.4 There are currently two active working groups. These are Edinburgh Homelessness Forum and Edinburgh Affordable Homes. The proposed membership structure of these working groups is set out in Appendices 1 and 2 of this report with one addition to the Forum’s membership to allow full cross-party representation.
3.5 The Housing Pledges working group was set up by the previous Council to consider the pledges made by the coalition relating to housing issues. As such, there is no requirement for this working group to continue.
4. Measures of success
4.1 Not applicable.

Housing and Economy Committee – 2 November 2017 Page 3
5. Financial impact
5.1 The resources for working groups will be met from existing directorate budgets.
6. Risk, policy, compliance and governance impact
6.1 Committee is required to appoint the membership of working groups within its remit.
7. Equalities impact
7.1 There are no equality impacts as a result of this report.
8. Sustainability impact
8.1 There is no sustainability impact as a result of this report.
9. Consultation and engagement
9.1 Not applicable.
10. Background reading/external references
10.1 Political Management Arrangements 2017 – report by the Chief Executive
10.2 Minute of Council Meeting of 22 June 2017
Andrew Kerr
Chief Executive
Contact: Rachel Gentleman, Committee Services
E-mail: [email protected] | Tel: 0131 529 4107
11. Appendices
Appendix 1 – Edinburgh Homelessness Forum
Appendix 2 – Edinburgh Affordable Homes

Housing and Economy Committee – 2 November 2017 Page 4
Appendix 1
Edinburgh Homelessness Forum
7 members - 2 SNP, 2 Conservative, 1 Green, 1 Labour, 1 SLD
Councillor Councillor
Councillor Councillor
Councillor Councillor
Councillor
Remit
Be the oversight body for the Prevention of Homelessness Plan and recommend any deviations/additions to the plan.
Be the oversight body for the implementation and review of the commissioning Plan.
Be the oversight body for the performance framework, highlighting key area of concerns and driving forward mitigation solutions.
Provide overall strategic direction for the Homelessness Planning Group.
Agree any deviations/additions to the Prevention of Homelessness Plan.
Request updates on the key themes being developed by the working groups.
Consider proposals put to them by the Homelessness Planning Group.

Housing and Economy Committee – 2 November 2017 Page 5
Appendix 2
Edinburgh Affordable Homes
10 members - 3 SNP, 3 Conservative, 2 Labour, 1 Green, 1 SLD
Councillor Councillor
Councillor Councillor
Councillor Councillor
Councillor Councillor
Councillor Councillor
Remit
Provide elected members with an opportunity to consider the impact of affordable housing on local communities.
Provide elected members with the opportunity to review the options for the future development of affordable homes.
Receive regular progress reports and scrutinise the affordable housing project boards.

Housing and Economy Committee – 2 November 2017
Housing and Economy Committee
10.00am, Thursday, 2 November 2017
Homelessness – Winter Readiness Update Report
Executive Summary
An update on the services that are available over the winter period, for people who are homeless or at risk of homelessness.
Item number 7.12 Report number
Executive/routine Executive Wards Council Commitments

Housing and Economy Committee – 2 November 2017 Page 2
Report
Homelessness – Winter Readiness Update Report
1. Recommendations
1.1 Committee notes the content of the report.
1.2 An update on the use of services will be provided to the Housing and Economy Committee on 18 January 2018.
2. Background
2.1 To ensure that rough sleeping is minimised in the city, particularly during the winter months, the Council and its partners work together to provide a range of service to support vulnerable people.
2.2 In 2016/17, 3,386 households were assessed as homeless in Edinburgh. Eighty-one of these people reported having slept rough the previous night.
2.3 The Council is committed to minimising rough sleeping and have scheduled a series of rough sleeping counts to assess the levels of need in the city. In August 2017, a rough sleeping count was conducted jointly with Streetwork, Cyrenians and Turning Point and 53 people were identified as rough sleeping. All rough sleepers with whom the teams engaged were provided with information about local services and how to access support.
2.4 Following this rough sleeping count, there was a significant increase in the number of people presenting as homeless, following a period of rough sleeping, which highlights improved access to services.
3. Main report
3.1 The Council operates an out of hours homelessness service, with a free phone number. This service operates outside standard Council opening times and ensures that people can access temporary accommodation, if required, twenty-four hours a day, seven days a week, year-round.
3.2 When people access the out of hours service, a short assessment is completed, and where eligibility for service is established if required and capacity allows, accommodation will be offered.

Housing and Economy Committee – 2 November 2017 Page 3
3.3 During periods of cold weather, the Council operates a winter contingency where if the temperature, or the “feels like” temperature, reaches zero degrees Celsius or below, then accommodation will be offered to anyone who is homeless and requires it, even if they are not eligible for a service.
3.4 During the period 9 October 2017 to 22 April 2018, Bethany Christian Trust will operate care shelters.
3.5 A range of church halls will be used for this purpose and generally the capacity provided will be around 45 beds. However, Bethany is actively looking to increase the capacity for the peak period, 1 December 2017 to 28 February 2018, to around 60 beds if possible.
3.6 People can access the shelters from 9.30pm and will be provided with a two-course hot meal, a bed space and breakfast, before the shelters close at 7am.
3.7 To provide support to people using the shelters, a range of partner agencies provide staff who regularly attend, such as:
• Streetwork – will engage with existing service users or people new to the city. They will also direct people to the Holyrood Hub where they can access showers, laundry facilities and storage, in addition to further advice and support.
• Edinburgh Access Practice – a practice nurse and Community Psychiatric Nurse visit the shelters. They provide medical advice if appropriate and will encourage people staying in the shelter to register with a GP.
• Shelter – will attend to provide legal advice to shelter users and support appeals around their rights to housing.
• Homelessness Services – council officers will attend the shelters, where they will provide housing options advice and advise people on their eligibility for services.
• Rock Trust – will support any young people accessing the service. They will also provide information around their Night Stop Service which would positively divert them from future use of the shelters.
• Crisis – will attend to offer support services that can assist in getting people into accommodation, claim benefits and finding work.
• General Practitioners –will engage with shelter users on site, providing advice where required and signpost to relevant GP and medical services.
• Bethany Visiting Support – available to provide advice at the point of contact but also to work with any service users, who are willing to engage in support, to ensure that they receive an appropriate service from the right provider.
3.8 The Council will work with partner agencies to ensure that anyone who requires a statutory homeless service or housing advice is routed from the shelters to the Homelessness Services teams and we ensure that we hold appointment spaces each morning to ensure staff are available to provide this service to people who have accessed the care shelters the previous night.

Housing and Economy Committee – 2 November 2017 Page 4
4. Measures of success
4.1 A reduction in rough sleeping.
4.2 Care shelters operate within capacity.
4.3 An increase in people who are rough sleeping accessing statutory services.
5. Financial impact
5.1 N/A
6. Risk, policy, compliance and governance impact
6.1 N/A
7. Equalities impact
7.1 N/A
8. Sustainability impact
8.1 N/A
9. Consultation and engagement
9.1 N/A
10. Background reading/external references
10.1 N/A
Harry Robertson
Acting Head of Safer and Stronger Communities
Contact: Nicky Brown, Homelessness and Housing Support Senior Manager
E-mail: [email protected] | Tel: 0131 529 7589
11. Appendices

Housing and Economy Committee – 2 November 2017
Housing and Economy Committee
10.00am, Thursday, 2 November 2017
Homelessness Task Force – Remit, Scope and
Membership
Executive Summary
A homelessness task force is being created to support the coalition commitment, C9:
Create a homelessness task force to investigate the growing homelessness problem in the city. The team will review the use of bed and breakfast premises and explore alternatives that better meet the needs of individuals and families, with an aim to end the use of bed and breakfast facilities. The task force will be chaired by the appointed Homelessness Champion, Councillor Kate Campbell.
This report will outline the scope, remit and membership of the task force.
Item number 7.13 Report number
Executive/routine Executive Wards Council Commitments
C9

Housing and Economy Committee – 2 November 2017 Page 2
Report
Homelessness Task Force – Remit, Scope and
Membership
1. Recommendations
1.1 To confirm the political make up and appoint the members of the task force.
1.2 To note the chair of the task force.
1.3 To agree the remit.
1.4 To note the task force will provide an update report in January 2018.
2. Background
2.1 The Council’s homelessness services are facing unprecedented pressures, with demand for both permanent and temporary accommodation exceeding supply and addressing these pressures will require a city-wide partnership approach to ensure that sustainable solutions are found.
2.2 The Council has a statutory duty to provide temporary accommodation for anyone who is assessed as homeless and requires it, until an offer of settled housing is made.
2.3 Homelessness presentations continue to fall year on year in the city, due to a Council wide increase in focus on prevention and early intervention. In 2016/17, 3,386 households presented as homeless, down from the peak of 5,517 in 2006/7.
2.4 During the same period, the average homelessness case length has increased from 109 days to 303 days, as a result of welfare reform, lack of affordable housing options, the removal of non-priority status and a growing population, despite the delivery of 8,565 affordable homes in the city during that same period.
2.5 Because of the increase in case length, there is greater pressure on the Council’s temporary accommodation services. Each evening the Council, through a range of services, accommodates approximately 1,850 households.
2.6 The breakdown of average use of accommodation each evening is included in appendix one. The largest increase in use over this period by accommodation

Housing and Economy Committee – 2 November 2017 Page 3
type is in bed and breakfast and short term lets, 349 and 184 households per night respectively.
2.7 The Council also operates the Private Sector Leasing Scheme, managed by Link Housing, which provides accommodation for around 1500 homeless households at any time, on a longer-term basis. The contract for this scheme allows up to 1750 properties, however, numbers are currently decreasing due to difficulties in attracting landlords, such as:
• A buoyant market, with greater income available by letting directly to tenants;
• Increased demand for private rented properties ensuring no long void periods;
• Increase in landlords using properties for short term lets;
• House price increases in Edinburgh leading to landlords who held properties during recession now selling.
2.8 The net cost of providing temporary accommodation in 2016/17 is £10.173 million, included in this figure is the net cost of bed and breakfast provision at £5.738 million. Future welfare reform changes are likely to see net costs of the Council fulfilling its statutory duties to homeless people increase significantly and officers are currently modelling the potential impact, based on up to date information around proposed welfare benefit changes.
3. Main report
3.1 The remit and outcomes which the task force will seek to achieve are:
• Build on existing prevention work which further reduces homelessness presentations;
• Reduce the number of people rough sleeping, accessing temporary accommodation and living in insecure accommodation;
• Increase the supply of quality council led temporary accommodation provision, reducing the reliance on bed and breakfast;
• Ensure that appropriate support is available for all homeless people who require it.
3.2 The Council has appointed Councillor Kate Campbell as Homelessness Champion, as part of her role she will chair the Homelessness Task Force.
3.3 Members of the task force should include an elected member from each political party, nominated and agreed through the Housing and Economy Committee.
3.4 The national Homelessness and Rough Sleeping Action Group, announced by the Local Government and Housing Minister on 19 September 2017, shares common goals with the Homelessness Task Force and through the convener and vice convener of the Housing and Economy Committee, the Council will

Housing and Economy Committee – 2 November 2017 Page 4
seek to identify synergies and contribute to pilots and initiatives delivered by this group.
3.5 To support the development of potential solutions a range of evidence gathering is required which will cover areas, such as:
• Review of the costs of existing temporary accommodation and provide costs for potential alternative provision.
• Assessment of the complexity of service users need.
• Examine the suitability of existing temporary accommodation options.
• Analysis of additional temporary accommodation required to eliminate the use of bed and breakfast accommodation.
• Establish the range of advice and support available to homeless people.
• Highlight existing barriers to move on or settled accommodation.
• Identify Council properties which could be developed to provide temporary or move on accommodation.
• Establishing what works, reviewing cases where successful outcomes have been achieved.
• Assess barriers to tenancy sustainment by reviewing cases of repeat homelessness.
• Analysis of the impact of current and future welfare reform.
3.6 An update on the evidence gathering exercise and recommendations for work streams, based on this analysis will be considered at the Housing and Economy Committee on 18 January 2018.
3.7 A further update report detailing the progress of these workstreams and proposed solutions will be considered and the Housing and Economy Committee on 7 June 2018.
3.8 The Housing and Economy Committee will agree and progress any change in service delivery which can be managed within existing department budgets. Any change in service provision which requires investment, on a spend to save basis, will be referred to the Finance and Resources Committee.
4. Measures of success
4.1 A continued reduction in homelessness presentations.
4.2 A reduction in repeat homelessness presentations.
4.3 A reduction in rough sleeping.
4.4 A reduction in the use of bed and breakfast accommodation.

Housing and Economy Committee – 2 November 2017 Page 5
4.5 A reduction in homelessness case lengths.
4.6 A reduction in the time spent in temporary accommodation.
5. Financial impact
5.1 N/A
6. Risk, policy, compliance and governance impact
6.1 N/A
7. Equalities impact
7.1 An equalities and rights impact assessment will be developed to support the work of the task force and will be constantly reviewed to reflect proposed changes to models of service delivery.
8. Sustainability impact
8.1 N/A
9. Consultation and engagement
9.1 A full programme of consultation will be developed to support the work of the task force. This will be created following the initial data gathering exercise and included in the report for the Housing and Economy committee on xx January 2018.
10. Background reading/external references
10.1 The Scottish Government statement relating to the creation of the national Rough Sleeping and Homelessness Action Group can be found here: https://news.gov.scot/news/homelessness-and-rough-sleeping-action-group.
Harry Robertson
Acting Head of Safer and Stronger Communities
Contact: Nicky Brown, Homelessness and Housing Support Senior Manager
E-mail: [email protected] | Tel: 0131 529 7589
Housing and Economy Committee – 2 November 2017 Page 6
11. Appendices
Appendix 1 – Homelessness Data Sheet

Housing and Economy Committee – 2 November 2017
Homelessness Data Sheet Appendix 1
2006-07 2007-08 2008-09 2009-08 2010-11 2011-12 2012-13 2013-14 2014-15 2015-16 2016-17
Homeless Presentations 5517 5147 4881 4779 4662 4448 4289 4065 3986 3601 3386
Average Homeless Case Length 109.0 128.4 164.4 174.4 180.7 205.2 202.9 209.2 217.9 247.3 303.1 Table 1: Homeless Presentations and Average Homeless Case Length 2006-07 to 2016-17
2006-07 2007-08 2008-09 2009-08 2010-11 2011-12 2012-13 2013-14 2014-15 2015-16 2016-17
Households in
Temporary
Accommodation
(1 April)
B&B 220 251 286 310 295 312 317 340 392 391 569
Flats 277 293 332 298 302 314 309 328 328 346 375
Supported Units 111 134 142 143 143 157 159 177 173 175 192
STLs 0 0 4 2 7 50 53 88 83 135 184
Hostels 528 528 528 528 528 528 528 528 528 528 528
Total 1136 1206 1292 3281 1275 1361 1366 1461 1504 1575 1848
Table 2: No of Households Accommodated in Temporary Accommodation on 1 April 2006-07 to 2016-17
2006-07 2007-08 2008-09 2009-08 2010-11 2011-12 2012-13 2013-14 2014-15 2015-16 2016-17
Affordable
Homes Built by
Tenure
Social Rent 371 469 259 471 465 458 307 375 263 217 283
Mid Market Rent 18 31 18 255 584 430 351 410
Low Cost Home Ownership 89 30 152 91 29 181 297 326 362 490 483
Total 460 499 411 580 525 657 859 1285 1055 1058 1176
Running Total 460 959 1370 1950 2475 3132 3991 5276 6331 7389 8565
Table 3: No of Affordable Homes Built by Tenure 2006-07 to 2016-17

Housing and Economy Committee
10.00am, Thursday, 2 November 2017
City Housing Strategy 2018
Executive Summary
This report sets out the updated City Housing Strategy (CHS). It provides information on current priorities and delivery plans which are addressing housing challenges and helping to reduce inequality in the city. The CHS has three outcomes:
• People live in a home they can afford; • People live in a warm, safe home in a well-managed neighbourhood; and • People can move home if they need to.
The CHS has a regional, city and locality focus to ensure that solutions to housing challenges are addressed at different levels, from working with our regional partners to secure a City Deal, to discussions with citizens at locality level on their priorities for housing and wider placemaking. Strategic engagement with partners, residents and stakeholders is a continuous process.
The CHS is reviewed annually and reported to Committee.
f
Item number 8.1 Report number
Executive/routine Routine Wards All Council Commitments
1, 8, 9, 10, 12, 41

Housing and Economy Committee – 2 November 2017 Page 2
Report
City Housing Strategy 2018
1. Recommendations
1.1 Housing and Economy Committee is recommended to:
1.1.1 Note the City Housing Strategy (CHS) update for 2018 for submission to Scottish Government.
2. Background
2.1 Under the Housing (Scotland) Act 2001, local authorities are required to prepare a Local Housing Strategy (referred to as the City Housing Strategy in Edinburgh). The CHS sets out the strategy, priorities and plans for the delivery of housing and related services.
2.2 The CHS has three outcomes:
2.2.1 People live in a home they can afford;
2.2.2 People live in a warm, safe home in a well-managed neighbourhood; and
2.2.3 People can move home if they need to.
2.3 There is a strong partnership approach to the delivery of the CHS which is supported by key delivery plans. These include the Council’s Housing Revenue Account (HRA) Business Plan and Capital Investment Programme, the Strategic Direction for Preventing Homelessness and the Strategic Housing Investment Plan (SHIP). The SHIP is the subject of a separate report to this Committee.
2.4 The CHS is reviewed annually, with a report provided to Committee to update on progress and highlight emerging issues.
3. Main report
3.1 The CHS has been updated for 2018 (Appendix 1), continuing to focus on the delivery of three outcomes (see 2.2)
3.2 The CHS covers all housing tenures. It sets out the role of the Council’s Housing Service and its partners in driving change, with a commitment to addressing housing need by delivering a range of housing options to meet the requirements of different households, as well as, investment to improve the quality of existing homes and neighbourhoods.

Housing and Economy Committee – 2 November 2017 Page 3
3.3 The updated CHS identifies key priorities under each of the three outcomes. The success of this strategy can only be achieved through collaboration and strong partnership working. The Council consults continuously, and in a variety of ways, on the delivery of existing commitments and the development of new initiatives. Detail of this consultation activity is set out in Consultation and Engagement section below. Ongoing discussions with partners will continue to inform the strategic direction and key priorities.
3.4 Progress will be reported annually with the aim of bringing together the ongoing activity around housing-related strategies and initiatives in one place, as well as setting out opportunities to build stronger links with partners and stakeholders in areas where there are gaps, or where further work is needed.
4. Measures of success
4.1 More quality, affordable and energy efficient homes are built.
4.2 Inequality is reduced and residents’ quality of life is improved.
4.3 Greater joint working with partners.
4.4 Existing homes and neighbourhoods are improved.
5. Financial impact
5.1 The financial impacts of delivering the CHS are set out in relevant Delivery Plans.
5.2 The financial impact of delivering the Council’s Housing Service is set out in the HRA Business Plan.
6. Risk, policy, compliance and governance impact
6.1 Under the Housing (Scotland) Act 2001, local authorities are required to prepare a Local Housing Strategy. The Strategy is reviewed annually to ensure it continues to support key strategic priorities and customer needs and is responding to drivers within the housing market, as well as, policy or legislative changes. The updated CHS for 2018 will be submitted to the Scottish Government for comment and discussion as part of their five-year local housing strategy review process.
7. Equalities impact
7.1 The Equalities Impact Assessment (EIA) concludes that the CHS should have a positive impact on tackling inequality through investment in new affordable homes for people on low to medium incomes.

Housing and Economy Committee – 2 November 2017 Page 4
7.2 The commitment within the Housing Contribution Statement will help increase the supply of homes, linked to support services, suitable for older people, people with disabilities and people with complex physical and health needs. A separate EIA was undertaken for the Health, Social Care and Housing Committee report of 19 April 2016 on Housing Investment to Support Health and Social Care Priorities
7.3 The HRA budget strategy 2017/18-2021/22 of prioritising investment in services and improvements that reduce the cost of living for tenants will have a significant financial benefit for tenants who are under financial pressure.
8. Sustainability impact
8.1 The Council led house building programme seeks to maximise delivery of homes on brownfield sites, reducing pressure on Edinburgh’s green belt. New homes are built to high standards in terms of energy efficiency and sustainability.
8.2 Investment in existing homes will increase energy efficiency and lead to a reduction in carbon emissions.
9. Consultation and engagement
9.1 Consultation on the CHS is a continuous process which identifies and responds to new challenges and national and local priorities. This includes supporting the strategic aims, outcomes and commitments in the Programme for the Capital: Council Business Plan 2017-22.
9.2 The Council consults with tenants on an ongoing basis and in a variety of ways. The Housing Budget Strategy is an annual consultation to seek tenants’ views on how their rent money should be spent. The HRA Budget Strategy is informed by tenant feedback and delivers on tenant priorities. For the last few years, the top priority for tenants has been for the Council to build more homes. Tenant views have also shaped the development of services designed to help improve quality of life and reduce living costs.
9.3 The Edinburgh Affordable Housing Partnership (EAHP) is a partnership of Housing Associations, Co-operatives and the Council. The partnership aims, at a strategic level, to share information and promote joint working to increase the provision of affordable homes within Edinburgh, continue to develop services which help to reduce inequality and support people to live independently.
9.4 There is also a health and social care sub group of the EAHP, which has been meeting regularly to help strengthen joint working between health and social care partners. Progress on delivering the housing commitments in the Health and Social Care Strategic Plan is being monitored through the Housing, Health and Social Care Forum that sits within the Health and Social Care Partnership’s governance structure. Last December, the Integration Joint Board held a development session on housing and more recently, in September 2017, a seminar was held between

Housing and Economy Committee – 2 November 2017 Page 5
partners to progress joint working on delivering 3,000 homes to meet health and social care priorities.
9.5 The Locality Improvement Plans (LIPs) for each of the four localities set out the priorities for improving outcomes over a five-year period (2017-22) at locality and small area levels. The development of LIPs has been a collaborative process involving the community and partners. This commitment to partnership working will continue with the action planning and further development of the LIPs, the outcome of which will continue to inform the CHS.
9.6 The Strategic Direction for Tackling Homelessness was developed following extensive consultation with providers, key stakeholders and service users. Any new procurement process following the pilots set out in the Homeless Prevention Commissioning Plan will be co-produced with existing providers, new interested parties, key stakeholders and service users.
9.7 A new Edinburgh Partnership Community Plan is under development for 2018 onwards, with housing identified as a key priority. A housing association representative from the Edinburgh Affordable Housing Partnership now sits on the Edinburgh Partnership Board, which will strengthen the links to the interconnected priorities and commitments in the Community Plan.
10. Background reading/external references
10.1 Housing Service Transformation Plan 2015-17 – Health, Social Care and Housing Committee 8 September 2015
10.2 Accelerating House Building – City of Edinburgh Council 17 September 2015
10.3 Housing Revenue Account – Budget Strategy 2017-22– City of Edinburgh Council 9 February 2017
10.4 City Housing Strategy Update – Health, Social Care and Housing Committee 13 September 2016
10.5 The Edinburgh and South East Scotland City Region (ESESCR) Deal – The City of Edinburgh Council 26 January 2017
10.6 Strategic Direction for Tackling Homelessness – Finance and Resources Committee 23 February 2017
Paul Lawrence
Executive Director of Place
Contact: Elaine Scott, Housing Services Manager
E-mail: [email protected] | Tel: 0131 529 2277

Housing and Economy Committee – 2 November 2017 Page 6
11. Appendices
Appendix 1: Updated City Housing Strategy 2018
Housing and Economy Committee – 2 November 2017 Page 7
Appendix 1:
City Housing Strategy 2018

Housing and Economy Committee – 2 November 2017 Page 8
City Housing Strategy 2018
Contents
1. City Wide Context 2. Background 3. Outcome 1 – People live in a home they can afford 4. Outcome 2 – People live in a warm, safe home in a well-managed
neighbourhood 5. Outcome 3 – People can move home if they need to 6. Working in Partnership to Deliver the Strategy

Housing and Economy Committee – 2 November 2017 Page 9
City Wide Context
Edinburgh continues to be a pressured housing market, with high housing costs and a high
need and demand for affordable housing. A sixth of all residents in Edinburgh live in low
income households and the poorest households have seen their incomes reduce by almost
20% over the last 10 years, increasing the inequality gap in the city. The City Housing
Strategy (CHS) ensures there is a strategic approach to addressing these housing
challenges. It has a strong focus on partnership working and stakeholder engagement to
ensure solutions are targeted at those in greatest need.
The city population is projected to increase at a greater rate than the Scottish average,
growing by 20.7% between 2014 and 2039. The Scottish population is projected to
increase by 6.6% over the same period. In line with the general trend, the Edinburgh
population in the 75+ age group is expected to have the greatest percentage increase over
this time1.
The private rented sector has doubled over the last 15 years and now accounts for 27% of
all homes in the city. This is significantly higher than the Scottish average of 14%. The
owner-occupied sector has reduced from its peak of 69% in 2001 to 58% in 2015. Social
rented homes account for 14% of the housing stock in Edinburgh, compared to the
Scottish average of 23%2.
Edinburgh has the oldest housing in Scotland, with almost half (48%) of homes built before
19453, posing significant challenges on upgrading homes to modern standards and
improving energy efficiency of homes to tackle fuel poverty. Almost two thirds of all
homes in Edinburgh are flats, increasing the challenges in relation to maintenance and
improvement of communal areas.
The Council’s Housing Service provides affordable homes and other services to nearly
20,000 tenants and 500 home owners in the city. It is the sixth largest landlord in Scotland.
Edinburgh is in the top three local authorities in Scotland for tenant satisfaction in relation
to the housing service, quality of home and neighbourhood. The Council delivers a housing
repairs service with standards that are consistently higher than the average employed by
other landlords, with consistently high levels of satisfaction. The Housing service
continues to work towards the aim of becoming a world class public service where
customers are at the heart of service design and service delivery.
1 National Records of Scotland DATA – Population Projections for Scottish Areas (2014-based) 2 Scottish House Condition Survey, 2013-15 3 Scottish House Condition Survey, 2013-15

Housing and Economy Committee – 2 November 2017 Page 10
Background
Local authorities are required to have a Local Housing Strategy. This sets out the strategy,
priorities, and plans for the delivery of housing and related services. Edinburgh’s CHS
focuses on delivering three key outcomes:
• People live in a home they can afford
• People live in a warm, safe home in a well-managed neighbourhood
• People can move home if they need to
The CHS is reviewed annually, reporting on achievements and areas of strength, while
continuing to identify and respond to new challenges and national and local priorities.
This includes supporting the strategic aims, outcomes and commitments in the
Programme for the Capital: Council Business Plan 2017-22.
The CHS has a regional, city and locality focus to ensure that solutions to housing
challenges are addressed at different levels, from working with our regional partners to
secure a City Deal to discussions with citizens at locality level on their priorities for housing
and wider placemaking: themes which featured heavily during consultation on the Locality
Improvement Plans.
The CHS is informed and delivered through partnership. Council and housing association
partner investment in existing homes and new affordable homes drives wider
neighbourhood improvements, including improvements to private homes.
http://www.edinburgh.gov.uk/info/20204/council_planning_framework/1255/council_business_plan_2016-20

Housing and Economy Committee – 2 November 2017 Page 11
Outcome 1: People live in a home they can afford
Context – key facts and figures
• There is demand for between 38,000 and 46,000 new homes in Edinburgh over ten
years; over 60% of these homes need to be affordable4.
• In 2016/17 there was an average of 167 bids for every social rented home
advertised through choice based lettings.
• There are over 21,000 applicants registered on EdIndex (the Common Housing
Register) each year. Over a quarter of applicants are actively bidding for around
2,700 homes each year.
• Private rents have increased by more than 30% over the last five years, and the
average monthly rent is over £1,0005. It is projected that rent will account for 45%
of average income by 2020.
• The average house price in Edinburgh is six times the average gross annual earnings,
42% higher than Scottish average6; making Edinburgh the least affordable city in
Scotland to buy a home.
Why this is a priority
Edinburgh is an affluent city with a strong economy but not everyone in the city is able to
share in this success. High housing costs pose a risk to the longer term economic growth of
the city and widen the inequality gap. Young graduates and workers in key sectors such as
construction and health and social care need access to affordable homes. The challenge of
securing affordable housing extends to students in Edinburgh, particularly those from
poorer backgrounds. The high rental costs of student accommodation are making it
increasingly difficult for those who self-fund through loans and part-time employment.
Failure to respond to the need and demand for affordable homes will impact upon the
ability of businesses to grow whilst other companies may choose not to locate in the city
due to difficulties in attracting a workforce.
What we are doing about it
In 2016, the Council agreed to expand its own housebuilding programme from 3,000 to
8,000 homes, and made a joint commitment with its housing association partners to
deliver 16,000 affordable homes over the next ten years. The current Council
4 The second Housing Need and Demand Assessment (HNDA2) for the SESplan 5 Citylets 6 Bank of Scotland Affordable Cities Review 2017.

Housing and Economy Committee – 2 November 2017 Page 12
administration has expanded this commitment to 20,000 homes over the next decade.
This is one of the largest Council led housebuilding programmes in the UK, which will make
a significant contribution to the Scottish Government target to deliver 50,000 new homes
in Scotland by 2021. This significant investment of around £3 billion is expected to deliver
over 4,000 permanent jobs, as well as bringing wider economic benefits to the city.
The Council works in partnership with housing associations and private developers to
deliver a mix of affordable housing options to meet the needs of different households
across the city, through a range of innovative approaches. Through Scottish Government
grant funding, the Council continues to maximise the number of affordable homes that
can be delivered. Over the past five years, the Council has supported the delivery of more
than 2,000 mid rent homes targeted at working households who cannot afford to buy or
rent a home privately in Edinburgh’s pressured housing market.
Annual and ongoing consultation has shown that building new affordable homes in the city
remains a top priority for Council tenants. Tenant views on how the housing service can be
improved have helped to shape the current Housing Revenue Account (HRA) budget
strategy, which seeks to tackle inequality by improving the quality of life and reducing cost
of living for tenants by:
• Building more new affordable homes;
• Investing in affordable energy and energy efficiency measures to make homes
easier to heat; and
• Expanding services aimed at reducing living costs, including the development of low
cost broadband service, tailored energy advice, a tenant discount scheme, and the
expansion of community food growing initiatives.
Going Forward
A project is underway to develop an ambitious and inclusive vision for Edinburgh. City Vision
2050 has four emerging themes: ‘inspired, connected, fair and thriving city’. The housing
service and its partners can play a key role in helping to deliver this vision for the city by
building homes that people can afford; creating places that people want to live in; and
maximising the social and economic benefits of this investment.
The Strategic Housing Investment Plan (SHIP) sets out the investment and identifies the
sites that will be brought forward by the Council and housing association partners over a
five-year period. The current SHIP 2018/19 – 22/23 outlines a programme which would
deliver nearly 8,000 homes over the next five years. The Council will work with partners,
including Scottish Government, to bring forward development of sites currently identified
for development beyond the SHIP period in order to deliver the Council’s commitment of
10,000 homes in five years.

Housing and Economy Committee – 2 November 2017 Page 13
A whole Council approach is also needed to ensure the housing development process runs
as efficiently as possible from beginning to end. The identification and release of land is
also essential, as is the commitment from Scottish Government to increase grant
allocation and provide greater certainty regarding future levels of funding.
The Edinburgh and South East Scotland City Region Deal provides a unique collaboration
opportunity with partners across the region to aid the acceleration of housing
development. Innovative approaches to delivery of infrastructure are being explored
alongside new approaches to procuring and building homes. Governments have agreed to
work with regional partners to maximise the potential of public sector land to deliver new
homes.
Government also agreed to provide grant funding and consents to enable the Council to
establish two Limited Liability Partnerships (LLP’s), in partnership with Scottish Futures
Trust. These LLP’s will own and manage housing for mid-market and market rent,
delivering a minimum of 1,500 homes for people on low and moderate incomes.
As part of the holistic approach to addressing the challenges within Edinburgh’s housing
market, the Council has committed to explore the introduction of fair rent zones for the
private rented sector, as introduced in the Private Housing (Tenancies) (Scotland) Act
2016. An officer working group is also reviewing the impact of increasing numbers of short
term commercial visitor lets in the city, in terms of management and neighbourhood
impact, as well as, potential impact on supply of homes, which links to the wider Council
commitment to review its policy on promoting mixed communities. The Council has also
contributed to the work of the Expert Advisory Panel on the Collaborative Economy, set up
by the Scottish Government, which includes short term lets within its remit.

Housing and Economy Committee – 2 November 2017 Page 14
Outcome 2: People live in a warm, safe home in a well-managed
neighbourhood
Context – key facts and figures
• The annual Edinburgh People’s survey shows that residents are very satisfied with
their neighbourhood (89%) and more widely, Edinburgh (92%), as a place to live7.
• Edinburgh has the highest percentage of homes (48%) that were built before 19458,
compared to the Scottish average of 32%. Edinburgh also has the second highest
percentage of flats (at 67%, second only to Glasgow’s 74%).
• Edinburgh has the lowest percentage of households in fuel poverty (Scottish House
Condition Survey 2013-15); however, this still equates to 24% of all households,
with 6% of these in extreme fuel poverty.
• Nearly half (46%) of older people households are found to be in fuel poverty and
almost a third (30%) of all social tenants.
• Social rented homes have the highest average EER (energy efficiency rating) at 69.5,
compared to 66.6 for the private rented sector and 65.1 for the owner-occupied
sector.
• Almost a third (30%) of the private rented sector in Edinburgh is reported as being
in urgent disrepair9.
• 3.1% of homes in Edinburgh are empty, the same as the Scottish average10.
Why this is a priority
The age and tenure mix of Edinburgh’s homes presents significant management and
maintenance challenges. Almost half of the city’s homes were built before 1945, posing
significant challenges for upgrading homes to modern standards and improving energy
efficiency of homes to tackle fuel poverty. Almost half of the homes in Edinburgh are flats
with most located within mixed tenure blocks.
Edinburgh has the lowest percentage of households living in fuel poverty in Scotland;
however, almost a third of social rented tenants experience fuel poverty. Across all
sectors, social rented homes have the highest energy efficiency ratings. Low incomes and
the cost of fuel are, therefore, the key factors impacting upon the prevalence of fuel
poverty in the city.
7 The Edinburgh People’s Survey 2016 8 Scottish House Condition Survey, 2013-15 9 Scottish House Condition Survey, 2013-15 10 National Records of Scotland, 2016

Housing and Economy Committee – 2 November 2017 Page 15
The private rented sector has doubled over the last 15 years and is likely to increase
further, alongside growth in the Build to Rent and purpose built student accommodation
sectors. Quality and affordability of private rented accommodation continues to be a
major priority.
It is important that new homes form part of well-designed sustainable places. Through the
provision of high quality homes and public realm alongside effective services, housing
helps to create environments which promote physical and mental wellbeing. Successful
places will unlock opportunities, build vibrant communities, and create economic benefits.
What we are doing about it
Over the last five years almost half of all Council homes have benefited from the
installation of new heating systems, insulation, or other energy efficiency measures. By
2020 all Council homes will have benefited from internal modernisation programmes
including the installation of modern kitchen and bathrooms. This investment will ensure
that Council homes meet and go beyond the Energy Efficiency Standard for Social Housing
(EESSH). To help support energy efficiency programmes in areas of mixed tenure, Scottish
Government funding (through HEEPS: ABS, SEEPs and ECO) is used to maximise the
benefits of investment for all residents.
New Council and housing association homes are being built to the highest possible
industry standards to ensure that they are amongst the most energy efficient across the
country. All new Council homes will make use of renewable, clean or efficient energy
sources to help reduce tenants’ energy bills and contribute to Council carbon reduction
targets.
Working with other social landlords the Council has also taken a lead role in the creation of
Our Power, a new not-for-profit energy company. Our Power is helping the most
vulnerable in Edinburgh by providing low, competitive and stable tariffs. Energy advice
continues to play an important role in helping residents change the way they use their
energy and cut costs. Over 50,000 residents have contacted Home Energy Scotland (part
funded by the Council) for advice and information since 2013.
The Council has developed an Acquisition and Disposal strategy to help address the
significant challenges of mixed tenure. The Council is acquiring homes in blocks where we
are already a majority owner, thus, enabling works to be carried out to common areas
within blocks. These purchases are funded by the sale of homes in blocks where the
Council is the minority owner and unlikely to be able to achieve full ownership. Several
housing associations in the city have also developed their own acquisitions and disposals
initiatives for similar purposes.
The Private Rented Services Team play a role in overseeing the quality of the private
rented sector, by managing the landlord registration scheme and reviewing whether

Housing and Economy Committee – 2 November 2017 Page 16
landlords are ‘fit and proper’. Enforcement measures have increasingly been used in
recent years to tackle problematic landlords who undermine confidence in the sector. The
Private Rented Services Team also help bring long term empty homes back in use.
Edinburgh has a relatively small number of empty homes. However, it is recognised that
the impact of a long-term empty home on neighbouring residents can be significant.
Bringing empty homes back into use can improve neighbourhood amenity, as well as
reducing risks of vandalism or anti-social behaviour. It is for that reason that the Council’s
approach is to focus on long term problem cases, particularly where they are causing
issues for neighbours or the wider community.
The Council’s Scheme of Assistance promotes the principle that homeowners have the
primary responsibility for maintaining and repairing their own homes. If essential repairs
are not carried out, the Council can issue a statutory notice to enforce repair works. In
order to prevent a minority of owners delaying essential repairs and maintenance work,
the Housing (Scotland) Act 2006 allows local authorities to pay the “missing shares”.
The Council approved a new service in September 2017 to pay for the "missing shares" of
essential repairs and maintenance (i.e. not improvement) in communal areas of tenement
blocks. This enhances the existing intervention service, which has been successful in a
number of cases in actively encouraging owners to organise repairs themselves without
having to progress to enforcement.
In 2016, the Council’s Housing Service underwent a transformational change process,
adopting a new service model. This transition was driven by the twin objectives of
increasing efficiency and delivering better integrated local services. The service has now
moved to a patch based model for housing officers, and there are around 100 patches
across the four localities, with an average of 200 tenants per patch.
Locality working will be further enhanced by the four Locality Improvement Plans (LIPs).
The LIPs set out the priorities for improving outcomes over a five-year period (2017-22) at
locality and small area levels based on community intelligence drawn from a range of
sources. They are a key component of the Council and partners approach to localities
working and provide a means of achieving more effective public sector integration and of
strengthening the meaningful involvement of communities.
Creating sustainable places is a major priority within the house building programme. This is
ensured by engaging with all stakeholders, working closely with local communities and
maximising funding to align development to meet priorities, reduce inequality and
increase health and wellbeing. This approach can be seen in Pennywell/ Muirhouse; where
new homes have been developed alongside a new school and partnership centre with
plans to develop a new civic centre.

Housing and Economy Committee – 2 November 2017 Page 17
Going Forward
The Council and housing association partners will continue to drive quality through the
new supply programme. The two LLP’s which the Council is establishing with Scottish
Futures Trust will offer quality homes and reliable customer service at good value rents. All
new developments are required to meet the Building Regulations, which contain stringent
targets for energy efficiency.
Affordable, clean and reliable energy can only be delivered in collaboration with partners.
Social landlords and environmental charities have emphasised the need for partners
across the city to work together to help people who are suffering as result of energy
inequality. The Council is committed to make energy more affordable for residents and
one of the most energy efficient, clean energy cites in the UK.
The Council will continue to promote energy advice help to all residents and will pilot a
new energy advice service in early 2018 to provide tailored advice and support to over
1,000 Council tenants a year. The energy advisors will be based in each of the four
localities and will be targeting support at those most affected by the impact of high energy
costs.
Consultation is currently underway on the 2018/19-2022/23 HRA Budget Strategy. One of
the key strands of the strategy is a plan to invest in existing homes and neighbourhoods to
bring them up to the quality of new build. The approach will be piloted in each of the four
localities, before it is rolled out city-wide. The Shared Repairs Service will be key partners
in helping to shape and deliver policy and practice to assist work to progress in mixed
tenure areas.
The Scottish Government have recently consulted to seek views on making changes to the
repairing standard, which sets out minimum condition standards for privately rented
housing. The consultation also considered changes to the energy efficiency standard, to
bring the private sector up to the same standard as social housing. The Council will
continue to work with the Scottish Government in relation to the development and
implementation of any new policies or regulations.
The Programme for the Capital: The City of Edinburgh Council Business Plan 2017-22 sets
out the need to review the Council's policy on promoting mixed communities. The review
should be completed by summer of 2018 and will include homes of multiple occupancy,
short term temporary lets and student housing.
A new Edinburgh Partnership Community Plan is under development for 2018 onwards,
with housing identified as a key priority. A housing association representative from the
Edinburgh Affordable Housing Partnership now sits on the Edinburgh Partnership Board,
which will strengthen the links to the interconnected priorities and commitments set out
in the Plan.

Housing and Economy Committee – 2 November 2017 Page 18
Outcome 3: People can move home if they need to
Context – key facts and figures
• More than 5,700 households received housing options advice and assistance in
2016/17. Over 45% of these households did not go on to make a homeless
application11.
• Homeless presentations have fallen year by year from the peak of over 5,500 in
2006/07 to around 3,400 in 2016/17. However, the average length of stay in
temporary accommodation has increased by 72% to 141 days over the same period.
• The number of people who slept rough the night before their homeless
presentation has increased slightly in the last two years.
• An average of 700 adaptations are carried out every year in Council, housing
association or privately owned homes to help people live independently.
• There are 21,100 applicants registered with EdIndex at any one time. Almost 20%
(4,100) have some level of re-housing priority:
• 490 applicants have urgent gold or gold priority because their current homes
cannot be adapted or they are awaiting hospital discharge;
• 2,400 applicants have silver homeless priority, as they have been assessed as
statutory homeless; and
• 1,000 applicants have overcrowding priority.
• 4% of households in social housing in Edinburgh are overcrowded. This is lower
than the percentage for the private rented sector (5%) and slightly higher than the
overall figure for Scotland (3%)12.
Why this is a priority
As the population is growing and people are living longer in the community, it is envisaged
that more support services would be required to help people access suitable housing and
live independently in their own homes.
Providing adequate housing support for people to lead an independent life remains a
priority. This includes providing housing advice and assistance to prevent homelessness
happening in the first place and for those whose current homes can no longer meet their
11 Housing Options (PREVENT 1) statistics in Scotland: 2016-17 12 Scottish House Condition Survey 2013-15

Housing and Economy Committee – 2 November 2017 Page 19
needs or who become homeless, advice on housing options and assistance to access
suitable housing is the key for their resettlement.
The number of people presenting as homeless has fallen year by year over the last decade,
however the number of people who slept rough the night before their presentation has
increased slightly in the last two years. Homeless people are also now spending significant
longer in temporary accommodation. A survey13 by Shelter England has found that the
longer the people live in temporary accommodation, the greater their health problems
become, resulting in more frequent use of health services. Reducing the time spent in
temporary accommodation and moving on to suitable settled accommodation is therefore
a shared priority for housing providers, as well as, health and social care partners in the
city.
What we are doing about it
The Council approved the current Homeless Prevention Commissioning Plan in September
2011. The focus of the plan is to deliver services which seek to prevent homelessness; to
ensure people spend as little time as possible without a home; and if they do become
homeless, that resettlement is effective and adequate support is in place to ensure people
to live sustainable, independent lives. It includes plan to develop four pilots in relation to
Advice and Support; Crisis and Complex Needs; Domestic Abuse Services; and Young
Persons Services.
The strong partnership approach through EdIndex, the common housing register
partnership between the Council and 19 partner landlords, continues to provide
opportunities for improvements in the way people access affordable housing options in
Edinburgh. It also provides an effective framework to support delivery of the housing
contribution to health and social care integration.
Housing partners continue to strengthen joint working with health and social care partners
to ensure new homes can meet the needs of priority groups and that support services are
integrated with housing. Through the Housing Contribution Statement, which forms part
of the Edinburgh Health and Social Care Partnership's Strategic Plan for 2016 – 2019,
housing partners have committed to invest up to £300 million of the housing investment
programme to build around 3,000 affordable homes, integrated with health and social
care services, to meet the needs of older people and people with complex physical and
health needs.
Going Forward
13 Living in limbo: Survey of homeless households living in temporary accommodation, Shelter England, 2003, https://england.shelter.org.uk/__data/assets/pdf_file/0020/66404/Living_in_limbo.pdf

Housing and Economy Committee – 2 November 2017 Page 20
Responding to homelessness remains challenging and joint working to assist households
affected by homelessness will remain a priority for EdIndex partners. In November 2016,
the EdIndex partners agreed their priorities for the next three years and to strengthen the
partnership with an aim to support access to affordable housing in the city. With high
demand for affordable and other forms of suitable accommodation, innovative options are
required to deliver successful outcomes. In addition, the partners acknowledged the new
challenges facing them and agreed to explore and develop services in relation to digital
inclusion, supporting people affected by welfare reforms and getting housing applicants
‘tenancy ready’.
Under the new administration, the Council has committed to setting up a Homelessness
Task Force, which will be chaired by the newly appointed Homelessness Champion. The
remit of the task force will include reviewing the use of temporary accommodation and
exploring alternative delivery models.
The Council works with a range of third sector partners to provide services for homeless
people. Some of the services provided in partnership with the third sector include, street
based outreach, hostels, supported accommodation, multiple and complex needs services
and housing support. As agreed by Finance and Resources Committee14 on 23 February
2017, the Council will continue to progress towards the delivery of the commissioning plan
for homelessness services with partners and its strategic direction for tackling
homelessness.
Inadequate physical features or layout of homes could be a barrier for people leading an
independent life. Adaptation is therefore key to helping people to remain in their own
homes within the community setting. Recognising the importance role of adaptations, the
Council has made a commitment to “review the application process and increase the
budget for housing adaptations with a view to supporting more disabled tenants and
owners to remain in their own homes. As well as, helping older and disabled homeowners
to move to more suitable housing should they wish to do so.” Partners involved in the
adaptations process have started initial discussions on how best to take forward this policy
commitment.
In September 2017, a seminar was held with health and social care partners to inform the
delivery of the 3,000 new affordable homes. Participants at the seminar considered who
these homes are to be built for, what they should look like, and how they should be
planned and designed. The annual SHIP planning process will help to ensure the design
and location of new homes helps to meet these specific needs.
14 Strategic Direction for Tackling Homelessness in Edinburgh http://www.edinburgh.gov.uk/meetings/meeting/4131/finance_and_resources_committee

Housing and Economy Committee – 2 November 2017 Page 21
Working in Partnership to Deliver the Strategy
There is a strong partnership approach, and supporting governance arrangements, to
deliver and monitor the progress of the CHS. The CHS covers all housing tenures, it sets
out the role of the Council’s Housing Service and its partners in driving change, with a
commitment to addressing housing need by delivering a range of housing options to meet
the requirements of different households, as well as investment to improve the quality of
existing homes and neighbourhoods.
The success of this strategy can only be achieved through collaboration and strong
partnership working. Consultation on the CHS is a continuous process, rather than one-off
consultation. The CHS is supported by key delivery plans. These include the Council’s HRA
Business Plan and Capital Investment Programme, Strategic Direction for Tackling
Homelessness and the Strategic Housing Investment Plan (SHIP).
Ongoing discussions with partners will continue to inform the strategic direction and key
priorities. Progress will be reported annually with the aim of bringing together the
ongoing activity around housing-related strategies and initiatives in one place.

Housing and Economy Committee
10.00am, Thursday, 2 November 2017
Internal Audit Quarterly Update Report: 1
January 2017 – 30 June 2017 – referral from the
Governance, Risk and Best Value Committee
Executive summary
The Governance, Risk and Best Value Committee on 26 September 2017 considered a report which detailed the Internal Audit progress for the period 1 January 2017 to 30 June 2017.
The report has been referred to the Housing and Economy Committee on the recommendation that high risk findings from audit reports be submitted to their parent Committee for information. This relates to the internal audit report for Short Term Homelessness.
Item number 8.2 Report number
Wards All

Housing and Economy Committee – 2 November 2017 Page 2 of 3
Terms of Referral
Internal Audit Quarterly Update Report: 1
January 2017 – 30 June 2017
Terms of referral
1.1 On 26 September 2017, the Governance, Risk and Best Value Committee considered a summary of the findings and status of work from the Internal Audit plan of work. The plan is updated throughout the year with additional reviews and any emerging risks.
1.2 The report by the Chief Internal Auditor highlighted the progress made along with 13 reports, categorised by level of risk.
Details of the action plans with implementation dates to mitigate any findings were also contained within the report. Any action which remained outstanding after the agreed implementation date would be reported back to the Governance, Risk and Best Value Committee.
1.3 The Governance, Risk and Best Value Committee agreed:
1.3.1 To note the progress of Internal Audit in issuing 11 Internal Audit reports during Quarter 4 of the 2016/17 plan year and 2 Internal Audit reports during Quarter 1 of the 2017/18 plan year.
1.3.2 To note the areas of higher priority findings for reviews issued during this six month period.
1.3.3 To refer the 6 reports noted in Appendix 1 as potentially being of interest to the Audit and Risk Committee of the Edinburgh Integration Joint Board (IJB) to that Committee.
1.3.4 To note the 6 audit in progress during Quarter 1 of the 2017/18 plan year as detailed in Appendix 1 of the report.
1.3.5 To request information on:
• the total spend on homelessness provision
• the checks in place for recovering money from the Government.
• the governance of the Homelessness Taskforce.

Housing and Economy Committee – 2 November 2017 Page 3 of 3
1.3.6 To request a report on the operation of homelessness services which included costs and a map of facilitates in the city to the Housing and Economy Committee and Homelessness Taskforce
For Decision/Action
2.1 The Housing and Economy Committee is asked to note the attached audit report with high risk findings concerning Short Term Homelessness.
2.2 To note the additional information and report called for at 1.3.5 and 1.3.6 above.
Background reading / external references
Webcast of Governance, Risk and Best Value Committee – 26 September 2017
Laurence Rockey
Head of Strategy and Insight
Contact: Laura Millar, Assistant Committee Clerk
Email: [email protected] | Tel: 0131 529 4319
Links
Appendices Appendix 1 – Internal Audit Quarterly Update Report: 1 January 2017 – 30 June 2017 – report by the Chief Internal Auditor

Governance, Risk and Best Value Committee
10.00am, Tuesday 26 September 2017
Internal Audit Quarterly Update Report: 1 January
2017 – 30 June 2017
Executive summary
Internal Audit has made reasonable progress in the last quarter of the 2016/17 plan year and the first quarter of the 2017/18 plan year.
This report provides details of the activity from 1 January – 30 June 2017.
Item number Report number
Executive/routine
Wards
Council Commitments

Governance, Risk and Best Value Committee – 26 September 2017 Page 2
Report
Internal Audit Quarterly Update Report: 1 January
2017 – 30 June 2017
Recommendations
1.1 Committee is requested to note the progress of Internal Audit in issuing 11 Internal Audit reports during Quarter 4 of the 2016/17 plan year and 2 Internal Audit reports during Quarter 1 of the 2017/18 plan year.
1.2 Committee is requested to note the areas of higher priority findings for reviews issued during this six month period.
1.3 Committee is requested to refer the 6 reports noted in Appendix 1 as potentially being of interest to the Audit and Risk Committee of the Edinburgh Integration Joint Board (IJB) to that Committee.
1.4 Committee is requested to note the 6 audit in progress during Quarter 1 of the 2017/18 plan year as detailed in Appendix 1.
Background
2.1 Internal Audit is required to deliver an annual plan of work, which is scoped using a risk-based assessment of Council activities. Additional reviews are added to the plan where considered necessary to address any emerging risks and issues identified during the year, subject to approval from the relevant Committees.
2.2 Status of work and a summary of findings are presented to the Governance, Risk and Best Value Committee for consideration on a quarterly basis.
Main report
Audit Findings for the period
3.1 Internal Audit has made reasonable progress in the final quarter of the 2016/17 plan year with 13 reports being issued for the quarter. These reports contain a total of 11 High, 18 Medium and 4 Low rated findings.
3.2 Reasonable progress was also evident in the first quarter of the 2017/18 plan year with 2 audits completed and 6 in progress. The 6 audits in progress include a thematic review performed across the Council’s 10 care homes which has involved circa 120 audit days. Detailed outcome reports and management action

Governance, Risk and Best Value Committee – 26 September 2017 Page 3
plans have been issued to individual care homes and the overarching report that outlines the consolidated outcomes and findings will be issued in September 2017.
3.3 The current status of all outstanding recommendations from reports issued prior to this period is discussed in the report ‘Internal Audit follow-up arrangements: status report’ presented separately to the Committee.
3.4 No reports were referred by the Edinburgh Integration Joint Board (EIJB) Audit and Risk Committee at their meeting in June 2017. It is recommended that the Committee refers 4 of the reports issued in Quarter 4 2016/17 to the next EIJB Audit and Risk Committee meeting (refer Appendix 1). None of the reports completed in Quarter 1 2017/18 are recommended for referral.
3.5 Appendix 1 provides a summary of reports and the classification of findings in the period. A full copy of all final reports is available to members upon request.
3.6 Appendix 2 provides a summary of the High-Risk findings and associated management actions.
Measures of success
4.1 Once implemented, the recommendations contained within these reports will strengthen the Council’s control framework.
Financial impact
5.1 None.
Risk, policy, compliance and governance impact
6.1 If Internal Audit recommendations are not implemented, the Council will be exposed to the risks set out in the relevant detailed Internal Audit reports. Internal Audit recommendations are raised as a result of control gaps or deficiencies identified during reviews therefore overdue items inherently impact upon compliance and governance.
6.2 To mitigate the associated risks, the Committee should review the progress of Internal Audit and the higher classified findings, and consider if further clarification or immediate follow-up is required with responsible officers for specific items.
Equalities impact
7.1 No full ERIA is required.

Governance, Risk and Best Value Committee – 26 September 2017 Page 4
Sustainability impact
8.1 None.
Consultation and engagement
9.1 None.
Background reading/external references
10.1 None.
Lesley Newdall
Chief Internal Auditor
E-mail: [email protected] | Tel: 0131 469 3216
11. Appendices
Appendix 1 – Summary of Internal Audit report findings issued for period of 1 January 2017 – 31 March 2017. Appendix 2 – Summary of High Risk Findings and Management Actions for period of 1 January 2017 – 31 March 2017
Appendix 1

Governance, Risk and Best Value Committee – 26 September 2017 Page 5
Appendix 1
Summary of Internal Audit reports issued during Quarter 4
2016/17 (1 January 2017 – 31 March 2017)
Internal Audit reports
Title of Review High Risk Findings
Medium Risk Findings
Low risk Findings
Advisory Comment
# Leavers Process (RES1603) 4 1 - -
# Property Maintenance – (RES1615) 2 2 1 -
Health and Safety – Contractor Management (RES1601)
1 2 - -
Complaints (CF1619) - 3 1 -
# Information Commission Officer Audit Follow Up (RES 1606)
- 3 1 -
Royal Edinburgh Military Tattoo – Stock Management and Anti-Fraud procedures (JB1604)
- 2 1 -
Lothian Valuation Joint Board (JV1601)
- 1 - 1
# Contentious Testing – Working Time Regulations (RES1618)
- 1 - -
Prevent Strategy (CF1618) - 1 - -
Lothian Borders Community Justice Authority (JB1603)
- - - -
SesTrand (JB1602) - - - -
* # IT Disaster Recovery (CW1602) 1 - - -
* # Review of External Security (CW1603)
3 2 - -
Total 11 18 4 1
Audit report referred by the Edinburgh Integration Joint Board Audit and Risk
Committee
Management Information 1 3 - -
# These reviews may be of interest to members of the Audit and Risk Committee of the Edinburgh Integrated Joint Board and it is proposed that these reviews are referred to that Committee.
* These audits were included in the 2016/17 plan. Whilst work had commenced prior to year end, reports were not finalised until May 2017.

Governance, Risk and Best Value Committee – 26 September 2017 Page 6
Summary of Internal Audit reports issued during Quarter 1
2016/17 (1 April – 30 June 2017)
Internal Audit reports
Title of Review High Risk Findings
Medium Risk Findings
Low risk Findings
Advisory Comment
Short Term Homelessness Housing Provision (SSC1701)
2 3 1 -
Edinburgh Shared Repairs Service (RES1701)
- - 2 1
Total 2 3 3 1
No Audit reports were referred by the Edinburgh Integration Joint Board Audit and Risk
Committee from their June meeting.
Summary of Internal Audits in progress during Quarter 1
2016/17 (1 April – 30 June 2017)
Internal Audit reports
Title of Review Start Date Estimated Completion Date
Property Conservation Lessons Learned (RES17)
February 2017 Final report issued August 2017
Care Homes (HSC1701) March 2017 Final overarching report expected by end September 2017 – individual reports have been issued to each of the 10 care homes reviewed.
HR and Payroll – Starters Process (RES1704)
April 2017 Final report issued July 2017
Ross Bandstand (PR1701) May 2017 Final report expected by end August 2017
Treasury (RES1703) June 2017 Final report issued August 2017
Local Development Plan (PL1705)
August 2017 Final Report expected by end August 2017

Appendix 2
City of Edinburgh Council
Internal Audit
Summary of Critical/High Risk Findings and
Management Actions
(1 January 2017 – 30 June 2017)

Contents
Section 1 – Leavers Process ................................................................................................................................................................................................................... 2
Section 2 – Property Maintenance ........................................................................................................................................................................................................10
Section 3 – Health & Safety – Contractor Management .......................................................................................................................................................................15
Section 4 - IT Disaster Recovery…………………………………………………………………………………………………………………………………………………...20
Section 5 - Review of External Security……………………………………………………………………………………………………………………………………………23
Section 6 - Short Term Homelessness…………………………………………………………………………………………………………………………………………….29
Section 7 – Management Information – Referral from the Edinburgh Integration Joint Board .............................................................................................................20

2
Total
number of findings
Background An extended audit of the leavers process which reported in December 2014 raised concerns over the tracking of Council assets and the management of non-payroll staff. Following this report, Internal Audit was asked to perform a ‘review recommend’ of the end-to-end leavers process to assess key controls and recommend control design enhancements. Internal Audit mapped the full process and considered the controls in place to address 5 key risks associated with the leavers process:
• Overpayment to individuals for services rendered; • Inappropriate access to Council data, systems and property; • Council assets being retained by leavers; • Council assets not being utilised in the most effective way; and • Issues regarding staff morale and satisfaction not being identified and rectified.
Both payroll and non-payroll leavers processes were considered. Non-payroll leavers include fixed term contractors and agency workers from Adecco and ASA. The review identified 5 potential weaknesses in the payroll leavers process, and 3 further weaknesses in the non-payroll leavers process. Internal Audit made 15 recommendations in total as a result of this review.
Section 1 – Leavers Process RES 1603
Critical High Medium Low
Total - 4 1 1
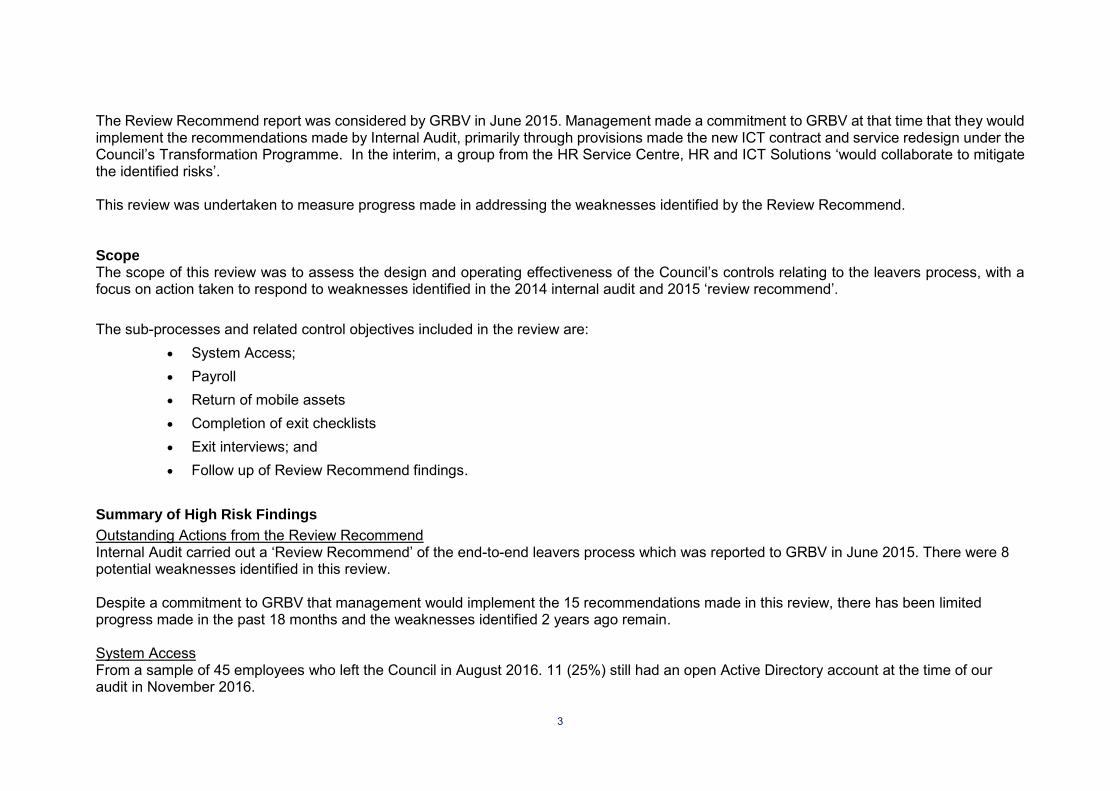
3
The Review Recommend report was considered by GRBV in June 2015. Management made a commitment to GRBV at that time that they would implement the recommendations made by Internal Audit, primarily through provisions made the new ICT contract and service redesign under the Council’s Transformation Programme. In the interim, a group from the HR Service Centre, HR and ICT Solutions ‘would collaborate to mitigate the identified risks’. This review was undertaken to measure progress made in addressing the weaknesses identified by the Review Recommend. Scope The scope of this review was to assess the design and operating effectiveness of the Council’s controls relating to the leavers process, with a focus on action taken to respond to weaknesses identified in the 2014 internal audit and 2015 ‘review recommend’. The sub-processes and related control objectives included in the review are:
• System Access; • Payroll • Return of mobile assets
• Completion of exit checklists
• Exit interviews; and
• Follow up of Review Recommend findings.
Summary of High Risk Findings
Outstanding Actions from the Review Recommend Internal Audit carried out a ‘Review Recommend’ of the end-to-end leavers process which was reported to GRBV in June 2015. There were 8 potential weaknesses identified in this review. Despite a commitment to GRBV that management would implement the 15 recommendations made in this review, there has been limited progress made in the past 18 months and the weaknesses identified 2 years ago remain. System Access From a sample of 45 employees who left the Council in August 2016. 11 (25%) still had an open Active Directory account at the time of our audit in November 2016.

4
An Active Directory account permits access to core Council IT systems including computer terminals, email and the intranet. User accounts for other Council systems such as Oracle (finance), Swift (social work), iTrent (HR and payroll) and Seemis (schools) are linked to the user’s Active Directory account. Note that we did not review access to other Council systems, or systems hosted by third parties. However, we observed that there is no record of which systems any one employee has access to. Leavers’ accounts are therefore only closed if the leaver or their line manager contacts the relevant systems administrator. Email Redirection Email redirect rules can be set up on any Outlook account. This allows emails sent to a Council email address from any source to be automatically forwarded to any internal or external email address. In the case of leavers, this means that the leaver may still have access to Council emails and potentially sensitive data as long as their Active Directory account remains open (see finding 2). However, this is also a risk for current employees. Employees are able to automatically forward to a business or personal email account. The Council has no guarantee that external email accounts are secure, and no control over or access to information held there. We note that the Council decided to close web-based email accounts due to concerns over security some years ago. The current Outlook accounts are intended to be accessed only from encrypted Council-managed devices. Email redirect rules allow users to bypass these controls. Mobile Assets Register CGI have a list of all laptops and desktops allocated a BTED reference number. However, there is no record of the location or user of each device. There are no central records of who holds Council-owned iPads and other mobile devices as these are managed locally by service areas and teams. This means the central IT hub does not know if leavers have returned all Council-owned assets.

5
Recommendations and Agreed Management Action for High Risk Findings Recommendations Agreed Management Actions Target Date Status of Actions
Due
Outstanding Actions from Review Recommend Management should honour the commitment made to GRBV in June 2015 and implement the recommendations made by Internal Audit in connection with leavers.
A process review workshop will be held on 29 March when issues and improvements in the leavers process (including HR, Customer Services and ICT) will be mapped and identified.
HR guidance available to managers and staff on the Orb will be refreshed to reflect the new process and to give managers accurate information about their responsibilities when an employee leaves.
We seek to gain insight re: staff morale and satisfaction from a number of different methods, some of which are short term timely interventions with others seeking insight into longer term cultural change we are seeking to achieve. This includes activities ranging from team and service area surveys, staff focus groups and events such as talk with Andrew Kerr. Exit interview template and guidance are available for line managers to use if required, but they are not mandatory. We do however encourage exit interviews for ‘regretted’ leavers and the Orb guidance will be updated to reflect this.
Responsible Officers: Head of Human Resources/Head of ICT/ Head of Customer
30 April 2017 First meeting will be held on 22 August 2016 30 September 2017 30 September 2017
Complete Not Due. Not Due.

6
Recommendations Agreed Management Actions Target Date Status of Actions Due
System Access Active Directory accounts must be closed when a member of staff (whether payroll or non-payroll) leaves the Council.
Access to other Council IT systems, including those hosted by third parties such as eIRD (which holds child protection records and is hosted by NHS Lothian), must be terminated when the member of staff leaves the Council, or moves to a role where access to that system is no longer required.
Responsibility for the closing down of all account/access for leavers remains with the line manager, the reason amongst other things, to give consideration to any data retrieval/ retention of content that is legislative or required before accounts are deleted. However:
1) ICT Solutions receive weekly leaver reports from HR to close specific system accounts, ITrent, IWorld, Swift etc.
2) ICT will suspend leaver’s Active Directory accounts (so the leaver no longer has access to Active Directory and linked systems) once the weekly report is received from HR. ICT will consult with the business on the appropriate period to keep leavers’ accounts ‘suspended’ before deleting them.
3) ICT has now checked the Active Directory accounts of all employees who left in 2016/17, and has deleted any accounts that were still open.
4) ICT will investigate setting an expiry date on all temporary AD accounts covering agency, contractors & partners.
5) Processes have now been tightened to suspend any inactive account where there is an exception ‘not known’ for 90 days. Accounts will
First meeting will be held on 22 August 2016 Immediate Immediate Immediate 30 April 2017 Immediate
Complete Complete Complete Outstanding Complete

7
Recommendations Agreed Management Actions Target Date Status of Actions Due
subsequently be deleted after 180 days of inactivity.
6) ICT will investigate the possibility of reporting on a subset of temporary accounts (i.e. those beginning with ‘990’ which are assigned to agency staff, contractors and partners) with a view to further investigation with the business areas to validate them.
As per the previous finding, a process review workshop will be held on 29 March when issues and improvements in the leavers process (including HR, Customer Services and ICT) will be mapped an identified. HR guidance will then be refreshed. This will include mechanisms to notify administrators of systems hosted by third parties.
Responsible Officers: Head of ICT/ Head of Customer/Head of Human Resources
30 September 2017 30 June 2017
Not Due Not Due
Email redirection Email redirect rules which allow the forwarding of email to a non-Council account should be disabled.
This will be discussed at the Joint Council & CGI Security working group (1st March 2017). CGI will be requested to progress and investigate all potential auto forwards currently active on our network. With the understanding gained from this process, ICT will propose a policy on the use of auto forwards. Current options include, do nothing, disable auto forwards completely, or restrict the functionality to certain individuals or addresses. Once the above action has been completed and a
30 September 2017 31 October 2017
Not Due Not Due

8
Recommendations Agreed Management Actions Target Date Status of Actions Due
decision reached on the appropriate option, this may need to go to CLT to get agreement to the ICT proposed policy on auto forwards. Responsible Officers: Head of ICT/ Data Services Manager
Mobile Assets Register 1) All Council-owned and managed devices
should be allocated to a named user. 2) Final salary payments should be withheld
until the employee has returned all Council-owned and managed devices to the IT central hub.
This will be addressed fully once the Device refresh programme is completed. All assets issued will be tagged, allocated to a named user and recorded. In the interim:
1) CEC partially holds information on unique asset reference, user name and details of user, last log on etc. for currently active devices. Unfortunately, we don’t know the specific site detail where the machines are connecting from within the network. There is an action on CGI to address the level of detail down to site location, a follow up is expected.
2) All managers have been asked to return unused assets to the ICT Hub.
3) HR guidance on the Orb will be refreshed to instruct line managers that assets must be returned to the ICT Hub.
Final salary payments withheld or payroll deduction for assets not returned – concept understood however we will reinforce change of process before revisiting for consideration as this would require a significantly
31 December 2017 30 September 2017 Immediate 30 September 2017 Review 31 December 2017
Not Due. Not Due. Complete Not Due Not Due

9
Recommendations Agreed Management Actions Target Date Status of Actions Due
robust process and extensive communication with all staff prior to taking such action. This recommendation will only be considered should the new processes not close out this issue. Responsible Officers: Head of ICT/ Head of Customer/Head of Human Resources
Status of actions due will be validated by Internal Audit as part of the follow-up review process.

10
Section 2 – Property Maintenance RES 1615
Total number of findings
Critical High Medium Low
Total - 2 1 1
Background
It is widely recognised that much of the Council estate is in a poor condition and that the Council does not have a complete understanding of the current state of its operational property portfolio. There is an extensive exercise underway to carry out condition surveys of all buildings owned and operated by the Council, and to use that data to inform the redesign of the Facilities Management service and the development of the Asset Management Strategy. An in-house survey team was established in 2015 to undertake a 5 year rolling programme of visual condition surveys to identify latent defects in operational property. These surveys would supplement information from more regular surveys such as statutory inspections, insurance inspections and routine maintenance inspections. Following a recommendation to the Finance and Resources Committee as part of the Asset Management Strategy, a decision was made in 2016 to accelerate the initial 5 year condition survey programme by appointment of external consultants to work in tandem with the in-house survey team. The accelerated survey programme is expected to be completed by the Autumn of 2017. A programme of “rope access” surveys will also precede and supplement the results of the condition surveys. The Findings surveys will inform the future 5 year Asset Management Works capital programme, any future Planned Maintenance programme and the prioritisation of works.
Scope
The scope of this report is to review the design and operating effectiveness of the Council’s framework and controls for identifying repairs required and prioritizing both capital and revenue works. The sub-processes and related control objectives included in the review are:
• Identification of repairs; • Management Information; and
• Prioritisation of work.

11
Summary of High Risk Findings Maintenance Budget Shortfalls
The Asset Condition & Maintenance Strategy issued in March 2016 and subsequent quarterly reports to the Finance and Resources Committee have highlighted the significant funding gap between the estimated cost of addressing backlog capital repairs and introducing a planned preventative maintenance programme, and the current Property Maintenance budget.
The Asset Condition & Maintenance Strategy sets out a high level, medium-term strategic budget forecast for the capital and revenue expenditure required over a 5-year period to 2020/21. This estimates a backlog of capital works of £110m over 5 years, as well as the costs of a planned preventative maintenance programme using a benchmark of £26.75 per square meter per year.
This results in a shortfall (clearly reported to the Finance & Resources Committee) of £8m per year on the capital budget (a cumulative shortfall of £40m over 5 years), and £15m per year by 2020/21on the revenue budget (cumulative shortfall of £61m). There is a risk that, once capital works have been completed and operational buildings retained by the Council have been brought up to an acceptable condition, the buildings again deteriorate due to the lack of funding for ongoing maintenance. In-house surveyors have begun a programme of condition surveys, covering 27.8% of the Council’s operational estate to date. £29.6m of backlog capital works have been identified so far. Extrapolated across the remaining estate this gives a cost of £108.7m to carry out backlog capital works. This would indicate that the £110m backlog capital maintenance budget is reasonable if the surveys performed to date are reflective proportion of the population as a whole. However, this £29.6m does not include revenue backlog costs identified as part of the surveys. Based on three surveys reviewed, revenue spend identified to date was identified as £32k per property. If extrapolated across the full operational estate, this suggests work to carry out backlog revenue works could amount to £32.8 million. This is not included in the £110m identified works, or ongoing planned preventative maintenance. High Risk Items Identified in Conditional Surveys It is expected that any health and safety (priority 1), wind and watertight (priority 2) or service disruption (priority 3) issues identified during the condition surveys will be reported to the Facilities Management helpdesk for immediate action.
Condition surveys
We reviewed condition surveys for 3 properties. 3 ‘Priority 1’ health and safety issues were identified at 2 of the properties.
One of these three issues was identified appropriately on the survey, communicated directly to the Facilities Management helpdesk by the

12
surveyor, and actioned accordingly.
On the second property, two health & safety issues were identified in the narrative of the report issued in June 2016:
- Cracks to a boundary wall - No finger guards on hinged edges of nursery doors.
The boundary wall was highlighted as a ‘Priority 1’ issue in the condition survey report. It was reported to the area facilities manager (not the Facilities Management helpdesk) in an email and resolved in August 2016. The lack of finger guards was not highlighted as a ‘Priority 1’ issue in the condition survey report, but was reported to the area facilities manager by email. It was not actioned. Finger guards have now been procured through the Facilities Management helpdesk as a result of this audit.
Health & Safety issues
We selected a further seven additional high risk items identified across 10 condition surveys to confirm that appropriate action had been taken. We found three issues which were not reported to the Facilities Management helpdesk.
- One issue has not been actioned; - One issue was actioned by janitorial staff on-site; and - One action was ultimately deemed unnecessary by the facilities manager.
It was noted during our testing that issues arising from the condition surveys are not consistently reported to the Facilities Management helpdesk, and, if reported, it is not noted that they were identified through a condition survey. This means it is difficult to verify that issues identified in condition surveys have been addressed.

13
Recommendations and Agreed Management Action for High Risk Findings Recommendations Agreed Management Actions Target Date Status of Actions
Due
Maintenance Budget Shortfalls We emphasise the need for the Corporate Leadership Team to consider remedial revenue works and future planned preventative maintenance as part of Asset Management Strategy.
The Corporate Leadership Team (CLT) recognises the maintenance shortfalls noted above. It also recognises that the current situation will likely lead to continued deterioration of the property portfolio with corresponding impacts on service provision and increased whole life costs of individual properties. The CLT recognises the long term benefits of addressing this backlog but given the current financial climate, the priorities of the Council’s ruling coalition and the competing demands on the Councils’ finite financial resources, does not consider that clearing the backlog is realistically achievable at this time. CLT are proposing to allocate additional resources to the extent feasible and a report to the Finance & Resources Committee in January 2017 includes an option for an additional £1m of expenditure to help ensure that the Council can continue to ensure that its buildings remain in a stable condition, and that they met the Council’s Health & Safety and Wind & Watertight criteria.
N/A
N/A
High Risk Items Identified in Conditional Surveys 1) We recommend that condition survey
reports are reviewed by a second surveyor to verify that Priority 1-3 issues have been correctly identified and reported.
1. Recommendation 1 is now in place.
Immediate
Complete

14
Recommendations Agreed Management Actions Target Date Status of Actions Due
2) Formalise process for responding to issues
identified in condition surveys. We recommend that Priority 1-3 issues are reported to the Facilities Management helpdesk.
3) Issues identified during condition surveys and reported to the Facilities Management helpdesk should be given a unique identifier to allow monitoring of actions
2. This process has been agreed by Strategic Asset
Management and will be implemented during the external condition survey.
3. The items reported to the helpdesk are separately to be recorded and forwarded to the Technical Operations Manager
Note that any urgent items (priority 1, 2 or 3) identified during condition surveys will be reported to the helpdesk but also recorded on the said condition survey and separately noted on an action tracker spreadsheet between SAM and FM. This process is an interim process until the CAFM condition module is fully operational and will allow tracking of items within the system.
Responsible Officer: Capital Asset Planning Manager
28 February 2017 28 February 2017
Complete Complete
Status of actions due will be validated by Internal Audit as part of the follow-up review process.

15
Section 3 – Health & Safety – Contractor Management RES 1601
Total number of findings
Critical High Medium Low
Total - 1 2 -
Background
The Council recognises that in order to deliver its targets and objectives, the health and safety of its staff, contractors and customers is key. Furthermore, in order to keep its employees, contractors and service users safe, it is important to have a robust health and safety management system and strategy in place. Non-compliance with Health & Safety requirements remains a significant risk to the Council. In February 2015, during PwC’s independent review of the proposed changes to the Health and Safety management system, a key finding around contractor management was identified. This finding noted that there were no safety expectations/requirements provided to contractors or included in contract negotiations. On occasions, contractors were found to have begun work without an agreed H&S plan.
This current review was commissioned to check progress against recommendations for improvement of contractor management as well as to carry out a more detailed review of the process of tendering, prequalification, on-boarding and ongoing monitoring of contractors. Scope
The scope of the review will be to consider the design and operating effectiveness of the arrangements within the Council to manage contractors from a Health & Safety perspective.
The sub-processes included in the review are:
• Procurement of Contractors; and • Management of Contractors.

16
Summary of High Risk Finding Supplier Management
While the Council has a number of standing orders in place to provide guidance on Contractor procurement, there is no overarching strategy and/or policy in place for the control and management of contractors/suppliers. The standing orders in existence have been developed to meet various needs that are being identified as the procurement process becomes more robust. There is a need for a Contractor Management Policy to give structure to the whole process. There are three particular areas of weakness, we have identified: 1. Unclear roles and responsibilities The lack of a structured contractor/supplier management process has led to a lack of clarity around roles and responsibilities with the majority of attention/responsibility reverting back to procurement. Procurement accepts that the initial phase of procuring contractors, is its responsibility but it does not accept that the ongoing monitoring should lie with Procurement. Contract owners are named under each framework, but the individuals are not currently mandated to do anything in regards to H&S and, moreover, there is no guidance provided as to how they should discharge their duties. Contract owners are therefore unsure what is required of them which contributes to inconsistency across the Council with regards to how it manages contractors. For example, it is good practice to request health and safety documentation such as risk assessments, method statements and training certificates prior to commencing with safety critical works. However, all contract owners and contractors interviewed during the audit process reported that this is not currently taking place. 2. Lack of contractor performance reporting/review process There is no quarterly or annual review of contractor performance, covering topics such as Safety but also financial and quality aspects of contract performance. The council is therefore missing potentially valuable management information which could provide benefits such as cost saving and performance feedback. In certain cases, KPIs are set for contractors but there is no evidence that this information is requested and followed through to check how contractors are performing against agreed targets. Some contractors are providing this on a monthly basis but this is often being driven by the contractor rather than being specifically requested by the Council. 3. Over-reliance on initial prequalification There is an over-reliance on the initial prequalification of contractors as a safety risk control measure. The prequalification process can only provide a snapshot in time and should be supplemented by ongoing monitoring of contractors. For example, Procurement may request a sample of risk assessments and method statements to review during the tendering stage but that does not mean that this review should be relied upon for all on-going activities by contractors. Further review should be undertaken by Contract Owners within the Council.

17
Recommendations and Agreed Management Action for High Risk Findings Recommendations Agreed Management Actions Target Date Status of Actions
Due
Supplier Management 1. (a) Create a central team that has cross
departmental oversight and is responsible for driving the different facets (Financial, Operational and Risk, plus Policy owners for H&S, data protection, resilience, etc.) of the control and management of contractors/suppliers. In the interest of consistency, we recommend that the current procurement team is augmented to be able to perform this additional oversight role. In order to effectively carry out this function, there would need to be an increase in resource and possible changes to responsibilities within CPS.
(b) The monitoring of contractors and subcontractors will remain within the service areas as per the Contract Standing Orders. Where contractors are subcontracting work, a monitoring mechanism must be agreed to ensure that subcontractors are held to the council’s performance standards.
2. Create a policy for the control and management of contractors and suppliers that aligns to recognised standards, leveraging sources of contractor management good practice. This policy should specify responsibilities for the
It is proposed that the findings will be addressed through the implementation of a Council-wide approach to Contract Management. The establishment of a dedicated team to facilitate the development of an overarching strategy and architecture to define common processes, best practice and to support management and reporting on a tiered basis was previously approved by CLT and will support the delivery of some of the recommendations within the report.
1. a.) Establish a team within CPS to work in partnership with service areas to facilitate the development of overarching processes, information, advice and guidance for Service Areas and Contract Owners.
b.) Monitoring of Contractors and subcontractors remains the responsibility of service areas as part of the Contract Standing Orders. A reminder will be sent to service areas in this regard. Contract owners need to ensure that Contractors and Suppliers operate to acceptable standards in all aspects of their performance including quality of work, financial cost and safety standards.
2. CPS will work closely with Service Areas and the H&S and other teams to create a policy for the control and management of contractors &
1a.) 31 December 2017 1b.) Ongoing 2.) 31 December 2017
Not Due N/A Not Due

18
Recommendations Agreed Management Actions Target Date Status of Actions Due
different stakeholders involved in the contractor management process.
3. Schedule and maintain regular reviews of contractor performance that consider the financial, operational, quality and H&S performance of the contractor. The frequency of these reviews should be determined by such factors as the significance of the safety risk, the amount of spend, etc.
4. A communication plan for contractor management should also be determined by the Chief Procurement Officer, specifying the reporting arrangements to the central team in charge of contractor management.
5. Develop a training programme for those with responsibilities within the contractor management process, especially for Contract Owners and users. A contractor management ‘roles and responsibilities’ training plan should be developed with specific focus on Contract Owners, Contract Users, Contractors, as well as Managers and any other specific staff as agreed by the Council.
suppliers that aligns to recognised standards and good practice. The policy will specify responsibilities for the different stakeholders involved in contract management process.
3. CPS will work with Service Areas, CPS, Risk and Policy owners for key risks (incl H&S, data protection, resilience) to identify key measures and KPIs required to ensure consistency around contractors performance and review including guidance on good practice for Contract Owners and Service Areas. Using this appropriate measurement, a process on reporting, and escalation will be developed for use by Service Areas adopting a risk based approach.
4. Service Areas and CPS to develop a communication plan which will specify the escalation, reporting and feedback arrangements to the central Contract Management team and/or other relevant team on risks, poor performance or contract breaches.
5. Chief Procurement Officer to determine generic principles of contract management with specific focus on Contract Owners, Contract Users, Contractors, as well as Managers and any other specific staff as agreed. Specific and relative skills training for contract owners will need to be assessed and implemented by Directors. Directors should ensure that suitably skilled staff are identified as Contract Owners. Head of HR will be
3.) 31 December 2017
4.) 31 December 2017 5.) 31 December 2017
Not Due
Not Due Not Due

19
Recommendations Agreed Management Actions Target Date Status of Actions Due
responsible for the establishment of a Training Programme for those with responsibilities within the contractor management process.
Responsible Officers: Directors of Resources, Place, Communities & Families, Health & Social Care, Chief Procurement Officer, Head of HR
Status of actions due will be validated by Internal Audit as part of the follow-up review process.

20
Section 4 – IT Disaster Recovery
Total number of findings
Critical High Medium Low
Total - 1 - -
Background
Until 31 March 2016, BT were responsible for the provision of Edinburgh Council’s DR capability. BT had access to a recovery site that held backups but there were no clear plans for how these would be used to re-establish service following a major disruptive incident. DR plans had never been reviewed or tested.
On 1 April, CGI replaced BT as the Council’s IT service provider and responsibility of the provision of DR capability transferred to CGI. As part of the new contractual arrangements, CGI agreed to test the effectiveness of this capability on a timely basis, based on the criticality of ICT systems.
The CGI Head of Services is responsible for ensuring the following take place:
• Plan the test and share the plans with the Council; • Obtain approval of test data to be used, test plan, specification and schedules prior to test execution and for the test to proceed; • Ensuring that the DR tests are carried out according to the contracted schedules; • Reporting back to the Council with the results of the tests including recommended actions and monitoring of these actions; • Providing notice of testing and agree witnessing with the Council; and • Perform retests where necessary.
The design of the DR programme proposed by CGI has only recently been agreed by the Council and testing on its effectiveness has yet to be performed. It is expecting that testing will commence at some point in 2017.
Scope
The scope of this review was to:
• Assess the design and operating effectiveness of processes to identify critical systems; and • Assess the current roadmap, action plans and governance activity to embed IT DR capability for council systems managed by CGI.

21
Summary of High Risk Finding
The current DR capability is not sufficiently robust to allow confidence that ICT services across the Council can be fully recovered in a prioritised and timely manner following a significant ICT incident. Following the transition of IT managed services to CGI, a DR programme has been established which, it is anticipated, would allow the Council to recover critical services and data in the event of major disruption or loss of IT infrastructure. However, enhancements are required to allow confidence that the DR programme will meet the recovery requirements of the Council and its stakeholders.
The weaknesses in the DR programme, set out below may adversely impact upon the ability of the Council to recover critical systems effectively:
• Robust testing in line with the CGI contractual requirement, of the Council’s recovery processes has not been performed to determine whether the recovery solution is fit for purpose and to validate the effectiveness of the current design of recovery provisions and processes.
• The approach to classifying critical systems, as either P1, P2 or P3 (High, Medium, Low), is not consistent and does not consider other prioritisations within the Council. The application of these ratings are determined by business owners and is a subjective process, which may result in systems being misclassified from a Council wide perspective.
• The inventory of system dependencies between critical Council systems is not regularly reviewed or maintained. Management review this on an ad hoc basis or when CGI identify any weaknesses in infrastructure.
• There is no mandatory requirement for, or oversight of, DR provisions or testing for IT systems that are procured, managed or maintained either outside the CGI contract or without oversight from ICT.
• Business owners and stakeholders for IT systems and services have not been updated, which may result in delays in implementing improvements and establishing business requirements.
Recommendations Agreed Management Actions Target Date Status of Actions
Due
Management should ensure that ICT systems within the Council have been identified and classified appropriately. Disaster recovery processes should be vigorously tested to validate the ability of the Council to successfully recover systems and data within the defined timescales set by stakeholders.
For systems that are identified which are not managed by central ICT (Shadow IT), Management should consider how they could
Differing implementation dates are proposed for the distinct elements of the recommendation as follows: • ‘Management should ensure that ICT systems
within the Council have been identified and classified appropriately’ – This will be conducted for all centrally managed IT. See below for consideration of ‘Shadow IT’.
• ‘Disaster recovery processes should be vigorously tested to validate the ability of the Council to successfully recover systems and date within the
30 June 2017 31 March 2018
30 November
IA Validation Not Due

22
Recommendations Agreed Management Actions Target Date Status of Actions Due
work with the system owners in ensuring that that these systems are resilient and can recover following a major incident.
defined timescales set by stakeholders’ – DR plan in place covering 8 keys systems to be executed by end 2017, thereafter DR plan/testing will be re-programmed in line with the status of the transformation. A prioritised DR plan incorporating the testing of systems as per their classification will be in place by 31 March 2018.
• ‘For systems that are identified which are not managed by central IC (Shadow IT), Management should consider how they could work with the system owners in ensuring that these systems are resilient and can recover following a major incident’ - Please refer to recommendation No 3 of the ‘Review of External Security Internal Audit Report (CW1603).
Responsible Officers: Enterprise Architect, ICT Solutions
2017 First meeting will be held on 22 August 2016 30 November 2017
Not Due.
Status of actions due will be validated by Internal Audit as part of the follow-up review process.
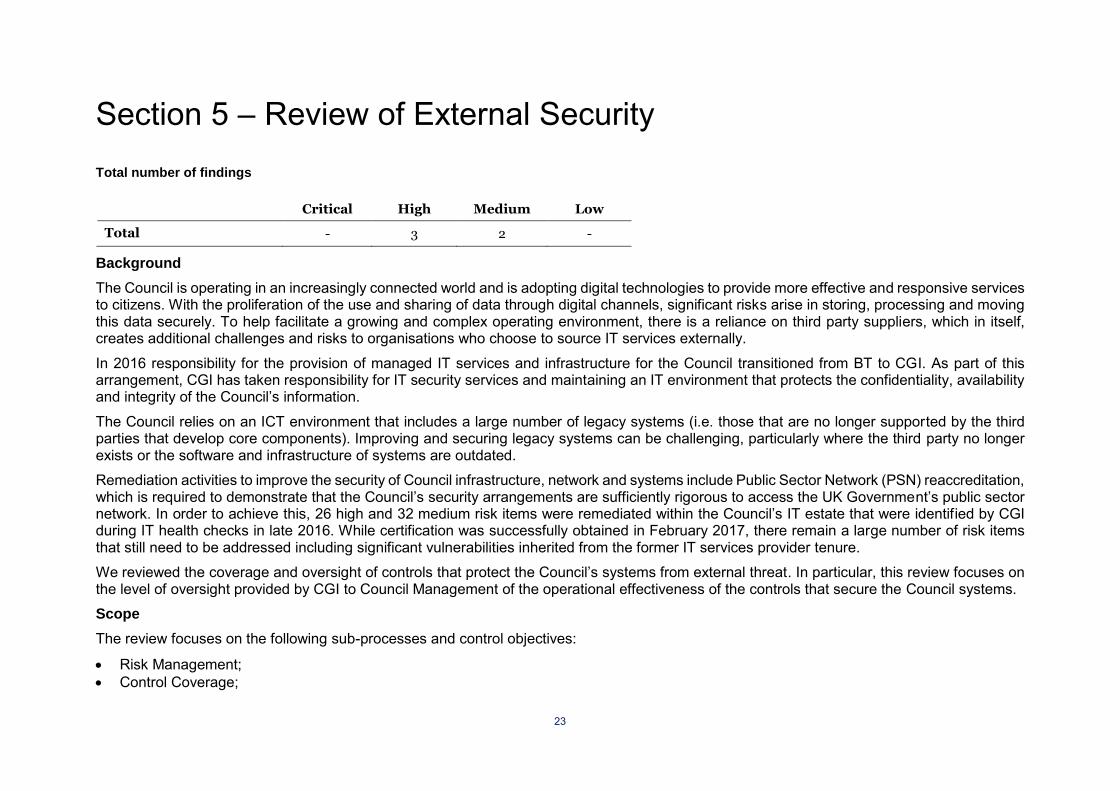
23
Section 5 – Review of External Security
Total number of findings
Critical High Medium Low
Total - 3 2 -
Background
The Council is operating in an increasingly connected world and is adopting digital technologies to provide more effective and responsive services to citizens. With the proliferation of the use and sharing of data through digital channels, significant risks arise in storing, processing and moving this data securely. To help facilitate a growing and complex operating environment, there is a reliance on third party suppliers, which in itself, creates additional challenges and risks to organisations who choose to source IT services externally.
In 2016 responsibility for the provision of managed IT services and infrastructure for the Council transitioned from BT to CGI. As part of this arrangement, CGI has taken responsibility for IT security services and maintaining an IT environment that protects the confidentiality, availability and integrity of the Council’s information.
The Council relies on an ICT environment that includes a large number of legacy systems (i.e. those that are no longer supported by the third parties that develop core components). Improving and securing legacy systems can be challenging, particularly where the third party no longer exists or the software and infrastructure of systems are outdated.
Remediation activities to improve the security of Council infrastructure, network and systems include Public Sector Network (PSN) reaccreditation, which is required to demonstrate that the Council’s security arrangements are sufficiently rigorous to access the UK Government’s public sector network. In order to achieve this, 26 high and 32 medium risk items were remediated within the Council’s IT estate that were identified by CGI during IT health checks in late 2016. While certification was successfully obtained in February 2017, there remain a large number of risk items that still need to be addressed including significant vulnerabilities inherited from the former IT services provider tenure.
We reviewed the coverage and oversight of controls that protect the Council’s systems from external threat. In particular, this review focuses on the level of oversight provided by CGI to Council Management of the operational effectiveness of the controls that secure the Council systems.
Scope
The review focuses on the following sub-processes and control objectives:
• Risk Management; • Control Coverage;

24
• Oversight; and • Education and Awareness Summary of High Risk Findings
The Council have not embedded a security programme to coordinate security improvement activities across the organisation
Following the transition of IT managed services from BT to CGI in early 2016, there have been remediation activities across the Council’s estate to improve the security across infrastructure, networks and systems. Remediation plans to recertify for Public Sector Network (PSN) accreditation and ongoing progress with the Security Management Plan (which defines the baseline security measures CGI will implement) have helped to further secure the Councils defences since this time.
The Council have attempted to define an overarching security programme to coordinate these security improvement efforts. However Management have been constrained by a need to remediate current control issues. As a result, this overarching programme has not been progressed. Security improvement activities are not being carried out as part of a wider programme (joining together the SMP as well as other security activities such as user education and identification of shadow IT elements) to ensure that efforts are coordinated and prioritised in such a way that would allow the most significant risks to the organisation to be addressed.
Furthermore, the lack of security programme means that there is not a consolidated approach that would inform Senior Management of progress, provide oversight over the status of enterprise security and allow visibility over significant security gaps within the Council. It is therefore challenging for ICT Management to obtain the required engagement from stakeholders to make meaningful progress.
A security programme would also help to provide additional oversight over CGI’s contractual obligations, in particular those stated within the Security Management Plan. We also note that security measures that would help to secure the Council’s enterprise security have not yet been implemented by CGI, for example:
• An Information Security Management System (ISMS), that would detail CGI’s policies and processes to manage information risk, has not been shared with the Council despite Management requesting assurance that this is in place and operational.
• Inventories that detail the Council’s external facing systems (and network ingress/egress points) have not been completed. • Registers have not been completed that detail which third parties services are employed, the connections that exist and the security measures
that protect Council data when transacting with these suppliers. Council Management have requested this from CGI however this is still outstanding.

25
The Council does not have assurance over the design or operating effectiveness of controls in place over its infrastructure, data and systems CGI, a third party IT service solutions provider, maintains the Council’s systems, infrastructure, networks and controls that safeguard these technologies. While a contract is in place that determines what CGI will do, and a Security Management Plan that details the security activities to be delivered and managed, there are no processes in place that allow Management to obtain comfort that these controls are meeting the security requirements of the Council. We note that Management have provided challenge to third party suppliers and have requested evidence of effective operation of control. Despite this effort, they have yet to obtain sufficient assurance and evidence of whether baseline security controls operated by CGI are:
• Appropriate for the data or systems they safeguard; • In place, operating effectively and have not been compromised; • Consistently updated to remove known exploits or vulnerabilities; or • Configured in line with best practice
Furthermore, evidence has not consistently been provided by CGI to Management over the following IT security activities:
• Penetration testing over Council projects and new technologies; • Continuous vulnerability scanning over the Council’s IT estate; • Intrusion Detection Systems (IDS) are in place and operating effectively; • Restricting privileged roles and access over critical systems that contain sensitive or PII data; and • Compliance activities that ensure that third party services have sufficient controls in place to handle and protect Council data and systems
Without suitable assurance and management information, the Council is unable to form a view of the security or integrity of its IT infrastructure, systems and services. Management, without such evidence, cannot gain comfort over whether the “crown jewels” of the organisation (i.e. data on vulnerable persons) have the appropriate controls in place to safeguard it, or assess whether additional controls are required.
There is limited control and oversight over areas of ‘Shadow IT’ within the Council In discussion with Management, it was noted that there are areas of ‘shadow’ IT (where technology is implemented and maintained without knowledge or oversight from central IT Services) in operation at the Council. This poses an unquantifiable risk to the Council as it is unknown what types of data are stored, what security measures and processes are in place, who has access to this data and what if any Disaster Recovery provision is in place.

26
Management have recognised these vulnerabilities in IT and information security however and are actively trying to remediate these areas. A new process has been implemented that requires all Council IT purchases made out with of standard CGI adoption processes to be applied via a procurement waiver, which will enable ICT to assess the adoption of new technologies prior to their acquisition.
Areas of shadow IT that are currently in operation range from:
• Schools which implement their own hardware without being risk assessed or configured to a security baseline by Council IT Services. Desktops or laptops that are used to store and process sensitive or personable identifiable information (PII) may not have appropriate controls in place to safeguard this data.
• Departments within the Council that operate their own IT infrastructure or databases that are independent of central ICT services. As some departments operate autonomously and with little dependence on central ICT, there is limited oversight over the maintenance of information systems or the robustness of security controls in place. For example, traffic light management systems run on legacy operating systems that are no longer vendor supported and limited consideration has been given to the secure architecture or protection of these systems.
• Council websites (Management have noted over 200 instances) that are not administered through CGI or Council ICT services. Some instances are hosted with third party suppliers that have not considered security arrangements within the contract. Similarly many have not been subject to security testing (for example penetration testing to identify vulnerabilities or weaknesses). Management have identified the websites in operation and a programme is ongoing to consolidate these within the Council, however it is important that sufficient governance be applied to ensure that websites processing personal or sensitive data are managed securely.
Recommendations Agreed Management Actions Target Date Status of Actions
Due
The Council have not embedded a security programme to coordinate security improvement activities across the organisation The Council, with the support of CGI, should implement a formal programme of security that would consolidate the security improvement and remediation activities across the organisation.
A security programme will be prepared by CGI, reviewed by the ICT Security Manager and subject to approval by the Head of ICT. CGI will be responsible for the implementation of the Security plan
Responsible Officers: ICT Security Manager
30 June 2017
IA Validation
The Council does not have assurance over the design or operating effectiveness of controls in place over its infrastructure, data and systems It is recommended that the Council define with CGI the security metrics, KPIs and reporting
The ICT security manager will derive suitable security metrics, KPI’s and reporting mechanisms. Agreement will be sought from CGI prior to the implementation of these metrics An assurance review process will then be put in place.
31 August 201 30 September
IA Validation Not due

27
Recommendations Agreed Management Actions Target Date Status of Actions Due
mechanisms that would provide Management assurance over the: • controls in place over their systems,
infrastructure and staff • management of these controls • operating effectiveness of these controls Additionally, positive assurance reviews should be carried out by the Council to give comfort over the effectiveness of ICT controls embedded by CGI.
Responsible Officers: ICT Security Manager 2017
There is limited control and oversight over areas of ‘Shadow IT’ within the Council
It is recommended that a risk assessment be performed to scope the technologies and systems in operation across the Council that are not managed by central ICT services.
Following this, Senior Management should determine, on a case by case basis, whether to:
• accept the risk that these systems pose to the Council’s security and allow them to operate autonomously; or
• ‘on-board’ these systems to allow them to be administered by Central ICT services.
An ‘on-boarding’ process should be developed, with sufficient oversight and governance, to facilitate the transition of systems and technologies to central management.
CIO/Head of ICT Solutions
The four elements to this recommendation are agreed. These actions also address the 3rd action in Finding 1 of the ‘IT Disaster Recovery’ Internal Audit Report (CW1602)
The proposed implementation dates are as follows:
• Risk assessment • Senior management decisions on technologies
and systems • ‘On-boarding’ process incorporated within
decision making stage above • Procurement route(s) and appropriate risk
assessment process embedded within the first two stages above.
Responsible Officers: CIO/Head of ICT Solutions
30 September 2017 31 March 2018 31 March 2018 31 March 2018
Not Due Not Due Not Due Not Due

28
Recommendations Agreed Management Actions Target Date Status of Actions Due
Management should also consider how they can work with the functions and departments that are able to procure IT autonomously, to ensure that shadow IT systems are appropriately identified and risk assessed prior to acquisition.
Status of actions due will be validated by Internal Audit as part of the follow-up review process.
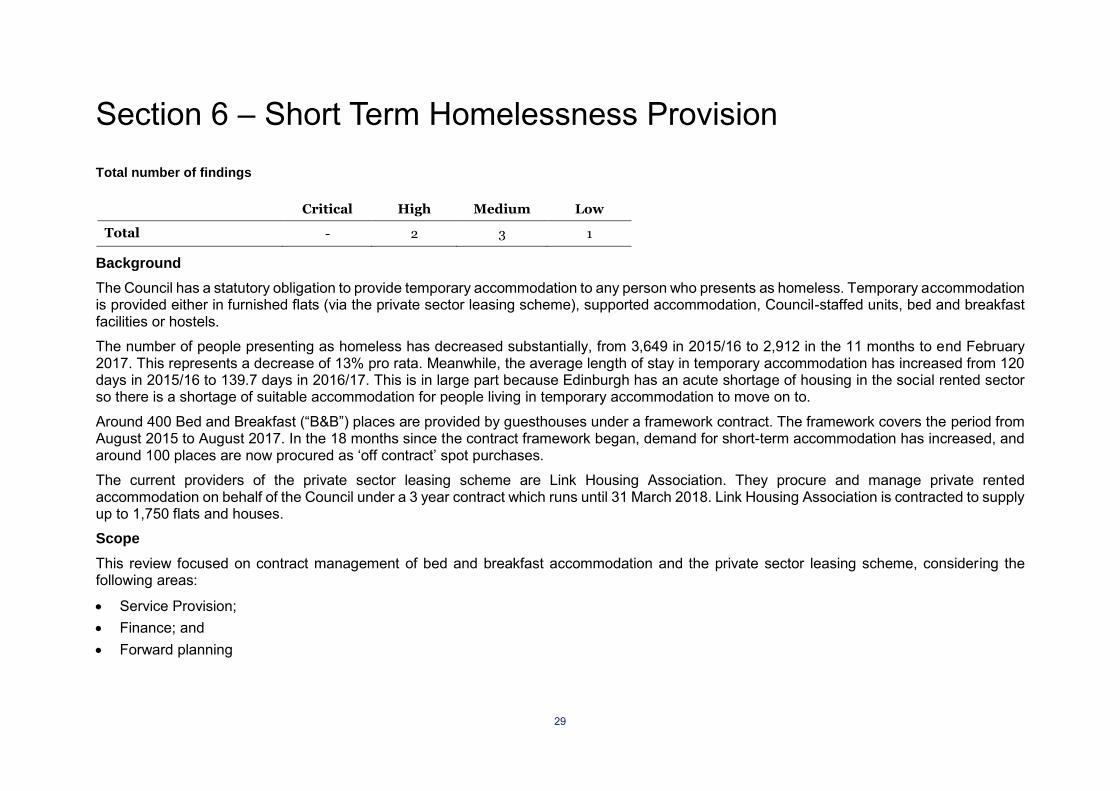
29
Section 6 – Short Term Homelessness Provision
Total number of findings
Critical High Medium Low
Total - 2 3 1
Background
The Council has a statutory obligation to provide temporary accommodation to any person who presents as homeless. Temporary accommodation is provided either in furnished flats (via the private sector leasing scheme), supported accommodation, Council-staffed units, bed and breakfast facilities or hostels.
The number of people presenting as homeless has decreased substantially, from 3,649 in 2015/16 to 2,912 in the 11 months to end February 2017. This represents a decrease of 13% pro rata. Meanwhile, the average length of stay in temporary accommodation has increased from 120 days in 2015/16 to 139.7 days in 2016/17. This is in large part because Edinburgh has an acute shortage of housing in the social rented sector so there is a shortage of suitable accommodation for people living in temporary accommodation to move on to.
Around 400 Bed and Breakfast (“B&B”) places are provided by guesthouses under a framework contract. The framework covers the period from August 2015 to August 2017. In the 18 months since the contract framework began, demand for short-term accommodation has increased, and around 100 places are now procured as ‘off contract’ spot purchases.
The current providers of the private sector leasing scheme are Link Housing Association. They procure and manage private rented accommodation on behalf of the Council under a 3 year contract which runs until 31 March 2018. Link Housing Association is contracted to supply up to 1,750 flats and houses.
Scope
This review focused on contract management of bed and breakfast accommodation and the private sector leasing scheme, considering the following areas:
• Service Provision; • Finance; and • Forward planning

30
Summary of High Risk Findings
Off-contract purchasing
A significant element of expenditure on B&Bs is on off-contract properties that are consistently used and in some cases fully occupied by the council for the whole year.
In 2016/17, 15,362 bed nights were purchased in off-contract B&Bs for a total of £953,006.51. The detailed table included in the Finding in the main report following table shows a total of 11 frequently used off-contract B&Bs in 2016/17.
There are no contracts in place with these providers and there was no competitive tendering. Rates are often more than equivalent on-contract provision, and in a number of cases the Council pays these providers more than their advertised rate.
These providers are not subject to the same contractual obligations and contract monitoring as contracted providers, which include annual inspections of the property and health & safety certification.
The level of off-contract spend suggests that the current contract framework was based on inaccurate estimates of future need. The Bed & Breakfast contracts expire in August 2017. The procurement exercise for new Bed & Breakfast contracts has begun, but at present future service demand has not been forecast, and there is no clearly articulated plan for the provision of this type of accommodation as part of a wider strategy to tackle homelessness.
Invoices are not checked for accuracy of prices
B&B providers submit invoices (usually weekly) detailing the individual’s name, the length of the stay, the price for the stay and any other costs such as flex rates.
The rate per room and flex rates on the invoice are not checked before approving the invoice for payment.
We inspected a sample of 25 invoices:
• 12 invoices were from contracted B&Bs. We were unable to agree any of these to contract rates. • 9 invoices were from off-contract B&Bs. We were only able to agree 2 of these invoices to rates recorded on the HIS database. • We were unable to obtain documentation in support of 4 invoices. Recommendations Agreed Management Actions Target Date Status of Actions
Due
Off-contract purchasing The Service should work with the Corporate
For future contract delivery, a forecast analysis will be completed. Although the service is demand-led and at times subject to external influences, for example,
Completed
IA Validation

31
Recommendations Agreed Management Actions Target Date Status of Actions Due
Procurement Office to develop a service specification which will meet the needs of the Service and service users over the next 3-4 years. We recommend that this work includes: • A forecast of future service demand; • Evaluation of the potential impact of external
factors such as Welfare Reform; • Consideration of supplier capacity/appetite
and alternative service models; • Analysis of where numbers of units in a ward
are breached; and • A ‘lessons learned’ review of the current
contract framework. If under the new contract there is a need for spot purchasing or an increased demand for temporary accommodation, the Service should seek to comply with Contract Standing Orders.
The Service should also seek to satisfy itself that ‘spot’ purchase and off-contract accommodation hold the necessary licenses and meet the appropriate Health & Safety standards.
welfare benefits changes, the service holds enough information on historic and current provision for a realistic forecast of contract requirements to be completed. To ensure city-wide provision to meet the needs of our customers and minimise community impact, there has been a cap on the number of contracted properties in each ward (currently 8). Given the increase in demand, following future procurement, it is likely that some wards will have more bed and breakfast provision than others. Based on the demand projections, this cap may need to be reviewed and increased by agreement with elected members.
Use of non-contracted properties will be kept to a minimum, only being used in short-term emergency situations, and service users will be transferred to contracted properties as soon as practicable. A process will be implemented to ensure that use of non-contracted properties is in line with the Council’s Contract Standing Orders. Cumulative cost per supplier will be monitored to ensure £3000 threshold is not breached and waivers are put in place if necessary. Regular review meetings will be conducted to ensure that records are kept and that everything possible is being done to minimise use of these properties.
Responsible Officers: Homelessness and Housing Support Senior Manager
31 July 2017
30 November 2017 First meeting will be held on 22 August 2016 30 June 2017
IA Validation IA Validation
Rates should be checked against contracted or agreed rates before invoices are approved for payment.
We will ensure there is a process in place to provide bed costs accurately at the point of initial contact and record this on the system. This will happen for each placement to ensure that every placement has the correct price. Invoices will be checked against these
30 June 2017
IA Validation

32
Recommendations Agreed Management Actions Target Date Status of Actions Due
A quality assurance process over the invoice check should be introduced.
prices before being approved for payment. A pro-forma will be developed for audit purposes and a 2% audit check of all invoices will be undertaken monthly to ensure accuracy of price, occupancy and invoice checking. Responsible Officers: Temporary Accommodation Team Leader and Business Support Manager aligned to Homelessness and Housing Support Service
31 October 2017
Not Due
Status of actions due will be validated by Internal Audit as part of the follow-up review process.

33
Section 7 – Management Information – Referral from the Edinburgh Integration Joint Board Audit & Risk Committee
Total number of findings
Critical High Medium Low
Total - 1 3 1
Background
The Edinburgh Integration Joint Board (‘EIJB’) approved the Strategic Plan for Health and Social Care in Edinburgh in March 2016. This plan forms the basis for directions issued to NHS Lothian and City of Edinburgh Council setting out how services should be delivered. The EIJB is required to establish a performance management framework to enable it to monitor progress against the priorities and actions set out in the Strategic Plan. As part of the performance management framework, the EIJB will need data from the organisations of the Edinburgh Health & Social Care Partnership which is accurate, timely, and curated to meet the particular needs of the EIJB, allowing them to monitor performance effectively and make informed decisions on the provision of health and social care in the City. The Public Bodies (Joint Working) (Scotland) Act 2014 also requires all Integrated Joint Boards to publish an Annual Performance Report, with the first due in July 2017 for the 2016/17 financial year. Boards will report performance in each locality against the 9 National Outcomes. Scope
The scope of this review will be to assess the design and operating effectiveness of the EIJB’s controls relating to management information. This included:
• The development of the Performance Management Framework; and • Review performance reporting on delays across the Health & Social Care system

34
Summary of High Risk Findings Performance Management Framework in Development A key part of the strategic plan is the development of a performance management framework, which will allow the EIJB to monitor progress against national and local outcomes, and embed quality improvement. The EIJB is also required by the Public Bodies (Joint Working) (Scotland) Act 2014 to publish a performance report each year, with the first report due in July 2017. The Scottish Ministers have indicated that this will be a report on performance against the 9 National Outcomes and 23 core indicators. At the time of audit fieldwork, 6 months into the 2016/17 performance year, both the Performance Management Framework and the Annual Performance Report are in development. Management are building a performance management framework from scratch and, in consultation with stakeholder groups, are in the process of developing metrics for the 44 strategic objectives set by the EIJB, and the 23 core indicators set by the Scottish Ministers. Rubrics (definitions of what ‘excellent’, ‘acceptable’ and ‘poor’ look like for that section) are being trialled for 5 of the 44 strategic objectives. Progress against the remaining 39 strategic objectives will be tracked by monitoring whether key milestones in the project plan are met. The project plans are currently being drafted. Until the Performance Management Framework is developed, however, regular performance reporting to the EIJB and its subgroups is limited to financial updates and statutory delayed discharge reporting. Recommendations and Agreed Management Action for High Risk Finding Recommendations Agreed Management Actions Target Date Status of Actions
Due
Performance Management Framework in Development The Performance Management Framework, including preparation for the Annual Performance Report, should be finalised and embedded. This should include:
We now monitor and have data against the 23 core indicators. However, the 2016/17 data will not be available by July 2017. This is a national issue and Scottish Government is aware of it.
28 February 2017
Complete

35
Recommendations Agreed Management Actions Target Date Status of Actions Due
- Performance measures (whether criteria for rubrics, or ‘traditional’ performance indicators);
- Data required to assess performance against the National Outcomes and internal performance measures;
- Establishing the source and timing of data; - Defining the roles of Committee and key
management groups in relation to performance monitoring; and
- Agreeing the frequency and format of performance reporting
A Performance Board is being established as part of the overall governance framework for the Health and Social Care Partnership which will work closely with the IJB Performance and Quality Group. The main role of the Performance Board will be to agree the core set of performance indicators and monitor delivery against these. The Board will have its first meeting in February 2017. An initial meeting has taken place to discuss the content of the Annual Performance Report. A core group has been identified to take this forward and a series of meetings is being arranged for early in the New Year. The intention is for a draft report to go to the IJB Development session in April 2017. A governance framework will be developed and documented setting out the roles remits and membership of the various committees and groups and the relationship between them. Responsible Officer: Strategic Planning Manager
31 July 2017 28 February 2017 Governance framework document to be completed by 28 February 2017
Not Due Complete
Status of actions due will be validated by Internal Audit as part of the follow-up review process.

36
Summary of High Risk Findings
Off-contract purchasing
A significant element of expenditure on B&Bs is on off-contract properties that are consistently used and in some cases fully occupied by the council for the whole year. In 2016/17, 15,362 bed nights were purchased in off-contract B&Bs for a total of £953,006.51. The following table shows frequently used off-contract B&Bs in 2016/17: Off Contract B&B
No of Bed nights Cost of Bed nights Average cost per night
Abbot House Hotel* 3658 £191,982.50 £52.48 Abbey Lodge 2372 £158,200.00 £66.69 Aaron Lodge 2287 £119,058.57 £52.06 Edinburgh Regency Guest House
1605 £108,270.00 £67.46
Parkview Hotel 909 £80,648.80 £88.72 Heriott Park B&B 586 £56,185.00 £95.88 Premier Inn (South Queensferry)
208 £33,625.95 £161.66
John's Place (No 9)* 614 £28,838.00 £46.97 Ravensdown 677 £27,200.00 £40.18 Premier Inn (Leith) 119 £12,656.94 £106.36 Premier Inn (Haymarket) 112 £11,958.70 £106.77

37
Section 7 – Management Information – Referral from the Edinburgh Integration Joint Board Audit & Risk Committee
Total number of findings
Critical High Medium Low
Total - 1 3 1
Background
The Edinburgh Integration Joint Board (‘EIJB’) approved the Strategic Plan for Health and Social Care in Edinburgh in March 2016. This plan forms the basis for directions issued to NHS Lothian and City of Edinburgh Council setting out how services should be delivered. The EIJB is required to establish a performance management framework to enable it to monitor progress against the priorities and actions set out in the Strategic Plan. As part of the performance management framework, the EIJB will need data from the organisations of the Edinburgh Health & Social Care Partnership which is accurate, timely, and curated to meet the particular needs of the EIJB, allowing them to monitor performance effectively and make informed decisions on the provision of health and social care in the City. The Public Bodies (Joint Working) (Scotland) Act 2014 also requires all Integrated Joint Boards to publish an Annual Performance Report, with the first due in July 2017 for the 2016/17 financial year. Boards will report performance in each locality against the 9 National Outcomes. Scope
The scope of this review will be to assess the design and operating effectiveness of the EIJB’s controls relating to management information. This included:
• The development of the Performance Management Framework; and • Review performance reporting on delays across the Health & Social Care system

38
Summary of High Risk Findings Performance Management Framework in Development A key part of the strategic plan is the development of a performance management framework, which will allow the EIJB to monitor progress against national and local outcomes, and embed quality improvement. The EIJB is also required by the Public Bodies (Joint Working) (Scotland) Act 2014 to publish a performance report each year, with the first report due in July 2017. The Scottish Ministers have indicated that this will be a report on performance against the 9 National Outcomes and 23 core indicators. At the time of audit fieldwork, 6 months into the 2016/17 performance year, both the Performance Management Framework and the Annual Performance Report are in development. Management are building a performance management framework from scratch and, in consultation with stakeholder groups, are in the process of developing metrics for the 44 strategic objectives set by the EIJB, and the 23 core indicators set by the Scottish Ministers. Rubrics (definitions of what ‘excellent’, ‘acceptable’ and ‘poor’ look like for that section) are being trialled for 5 of the 44 strategic objectives. Progress against the remaining 39 strategic objectives will be tracked by monitoring whether key milestones in the project plan are met. The project plans are currently being drafted. Until the Performance Management Framework is developed, however, regular performance reporting to the EIJB and its subgroups is limited to financial updates and statutory delayed discharge reporting. Recommendations and Agreed Management Action for High Risk Finding Recommendations Agreed Management Actions Target Date Status of Actions
Due
Performance Management Framework in Development The Performance Management Framework, including preparation for the Annual Performance Report, should be finalised and embedded. This should include:
We now monitor and have data against the 23 core indicators. However, the 2016/17 data will not be available by July 2017. This is a national issue and Scottish Government is aware of it.
28 February 2017
Complete

39
Recommendations Agreed Management Actions Target Date Status of Actions Due
- Performance measures (whether criteria for rubrics, or ‘traditional’ performance indicators);
- Data required to assess performance against the National Outcomes and internal performance measures;
- Establishing the source and timing of data; - Defining the roles of Committee and key
management groups in relation to performance monitoring; and
- Agreeing the frequency and format of performance reporting
A Performance Board is being established as part of the overall governance framework for the Health and Social Care Partnership which will work closely with the IJB Performance and Quality Group. The main role of the Performance Board will be to agree the core set of performance indicators and monitor delivery against these. The Board will have its first meeting in February 2017. An initial meeting has taken place to discuss the content of the Annual Performance Report. A core group has been identified to take this forward and a series of meetings is being arranged for early in the New Year. The intention is for a draft report to go to the IJB Development session in April 2017. A governance framework will be developed and documented setting out the roles remits and membership of the various committees and groups and the relationship between them. Responsible Officer: Strategic Planning Manager
31 July 2017 28 February 2017 Governance framework document to be completed by 28 February 2017
Not Due Complete
Status of actions due will be validated by Internal Audit as part of the follow-up review process.