Hosb1706stats juveniles
108
Home Office Statistical Bulletin The Research, Development and Statistics Directorate exists to improve policy making, decision taking and practice in support of the Home Office purpose and aims, to provide the public and Parliament with information necessary for informed debate and to publish information for future use. Statistical Bulletins are produced by the Research, Development and Statistics Directorate. For further copies contact: s d r / k u . v o g . e c i f f o e m o h . w w w © Crown Copyright 2006 ISSN 1358-510X 17 /0 6 Dec ember 200 6 Young People and Crime: Findings from the 2005 Offending, Crime and Justice Survey Debbie Wilson, Clare Sharp and Alison Patterson
Transcript of Hosb1706stats juveniles

Home Office Statistical Bulletin
The Research, Developmentand Statistics Directorate existsto improve policy making,decision taking and practicein support of the Home Officepurpose and aims, to providethe public and Parliament withinformation necessar y forinformed debate and topublish information for futureuse.
Stat i stical Bu l let ins areproduced by the Research,Development and StatisticsDirectorate. For further copiescontact:
sdr/ku.vog.eciffoemoh.www
© Crown Copyright 2006ISSN 1358-510X
17/06
December2006
Young People and Crime: Findings from the 2005 Offending, Crime and Justice Survey Debbie Wilson, Clare Sharp and Alison Patterson

2
Acknowledgements Many people have been involved in the 2005 Offending, Crime and Justice Survey, from its design through to the production of this first report. The efforts of everyone involved are appreciated by the authors. Special thanks are due to Alison Walker and David Matz who provided advice throughout the production of this report, and to Jane Ashe, Tony Ellis, Rachel Murphy, and Charlotte Wood, who provided invaluable assistance in data checking. We are also grateful to all the research teams and interviewers at the National Centre for Social Research and BMRB Social Research, and to the members of the public who kindly agreed to take part in this survey. Finally, we would like to thank colleagues in the Communication Development Section who assisted in preparing this report for publication.

3
Contents Acknowledgements 2 Summary 8 1. Introduction 12 Aims of the survey 12 The Offending, Crime and Justice Survey design 12 2. Extent of offending 14 Extent of offending in the last 12 months 15 Concentration of offending 22 Profile of offences 22 Trends over time: 2003 to 2005 OCJS 24 Other offences 25 3. Characteristics of offending 34 Risk of offending 34 Problem behaviours and offending 36 Offending and victimisation 38 4. Contact with the criminal justice system 47 General contact with the criminal justice system 48 5. Anti-social and other problem behaviours 52 Extent of anti-social behaviour 52 Risk factors 55 Trends over time: 2003 to 2005 OCJS 57 Other problem behaviours 57 6. Personal victimisation 66 Extent of personal victimisation: personal thefts and assaults 66 Repeat victimisation 71 Risk factors 71 Trends over time: 2003 to 2005 OCJS 73 Appendix A Nature of offending tables 90 Appendix B Survey design 97 Appendix C Definitions of risk factors 101 References 107

4
List of figures and tables Chapter 2 Figure 2.1 Proportion of 10- to 25-year-olds committing an offence in last 12 months,
2005 OCJS Figure 2.2 Offending status of young people aged from 10 to 25, 2005 OCJS Figure 2.3 Proportion of 10- to 25-year-olds committing offence in last 12 months, by
sex, 2005 OCJS Figure 2.4 Proportion of 10- to 25-year-olds committing offence in last 12 months, by
age, 2005 OCJS Table 2a Proportion of 10- to 25-year-olds offending in the last 12 months, by age and
sex Table 2b Estimated number of young offenders (aged from 10 to 25) in England and
Wales Table 2c Estimated number of young offenders (aged from 10 to 25) in England and
Wales by age and sex Table 2d Proportion of sample, offenders, and offences accounted for by frequent
offenders Figure 2.5 Profile of offences measured by the survey, 2005 OCJS Table 2e Profile of offences measured in the last 12 months, by age and sex Table 2f Trends in offending in last 12 months (10- to 25-year-olds), by sex Figure 2.6 Type of knife carried by 10- to 25-year-olds in the last 12 months among
those carrying knives, 2005 OCJS Table 2.1 Offending in last 12 months (10- to 25-year-olds), by age and sex Table 2.2 Frequency of offending in last year among those who had committed each
offence Table 2.3 Proportion of last 12 months offenders defined as serious/frequent Table 2.4 Prevalence of offending in the last 12 months, by age and sex Table 2.5 Trends in offending in last 12 months, by age group Table 2.6 Proportion of young people buying/selling stolen goods in the last 12 months Table 2.7 Proportion of young people carrying weapons in last 12 months Table 2.8 Details of knives carried in last 12 months Chapter 3 Table 3a Factors associated with offending for 10- to 15-year-olds Table 3b Factors associated with offending for 16- to 25-year-olds Table 3c Profile of young people’s involvement in anti-social behaviour or offending in
the last 12 months, by age groups

5
Figure 3.1 Profile of offending and anti-social behaviour among those who have committed either in the last 12 months, by age, 2005 OCJS
Figure 3.2 Proportion of young people (aged10 to 25) committing an offence in the last
12 months, by drug status, 2005 OCJS Table 3d Profile of young people’s involvement in crime, victim or offender in the last
12 months, by age groups Table 3.1 Offending committed in last 12 months by 10- to 15-year-olds, by socio-
demographic and lifestyle variables Table 3.2 Offending committed in last 12 months by 16- to 25-year-olds, by socio-
demographic and lifestyle factors Table 3.3 Factors associated with serious offending in last 12 months for 10- to 15-
year-olds Table 3.4 Factors associated with frequent offending in last 12 months for 10- to 15-
year-olds Table 3.5 Factors associated with serious offending in last 12 months for 16- to 25-
year-olds Table 3.6 Factors associated with frequent offending in last 12 months for 16- to 25-
year-olds Table 3.7 Proportion of 10- to 25-year-olds committed offending in last 12 months, by
drug status Chapter 4 Table 4a Level of contact with the criminal justice system in last 12 months, by age and
sex Table 4b Level of contact with the criminal justice system for 10- to 25-year-olds, by
offender status Table 4c Level of contact with the criminal justice system in last 12 months, by
offender status and age Table 4.1 Proportion of offenders aged from 10 to 25 in contact with the criminal justice
system regarding their offence in last 12 months, by type of offence Table 4.2 Proportion of offences committed by 10- to 25-year-olds resulting in contact
with the criminal justice system in the last 12 months, by type of offence Chapter 5 Figure 5.1 Proportion of young people committing anti-social behaviour, by age and sex,
2005 OCJS Table 5a Mean age of those who committed each of the four anti-social behaviours in
the last 12 months Table 5b Frequency of committing the four anti-social behaviours in last 12 months Table 5c Factors associated with committing anti-social behaviour for 10- to 15-year-
olds Table 5d Factors associated with committing anti-social behaviour for 16- to 25-year-
olds

6
Table 5.1 Prevalence of anti-social and other problem behaviours in the last 12 months,
by age and sex Table 5.2 Proportion of 10- to 15-year-olds committed anti-social behaviour in the last
12 months, by socio-demographic and lifestyle variables Table 5.3 Proportion of 16- to 25-year-olds committed anti-social behaviour in the last
12 months, by socio-demographic and lifestyle variables Table 5.4 Trends in ASB and other problem behaviours in last 12 months, by sex Table 5.5 Trends in ASB and other problem behaviours in last 12 months, by age Table 5.6 Prevalence of other problem behaviours in the last 12 months, by age and
sex Table 5.7 Prevalence of driving-related problem behaviours in the last 12 months
among those who had driven a motor vehicle in the last 12 months, by age and sex
Chapter 6 Table 6a Proportion of young people aged from 10 to 25 who were victims once or
more in the last 12 months, by age Figure 6.1 Proportion of young people aged from 10 to 25 who were victims once or
more in the last 12 months, by sex Figure 6.2 Injuries sustained in assaults with injury in the last 12 months, by age group,
2005 OCJS Figure 6.3 Proportion of victims victimised more than once in the last 12 months, by age,
2005 OCJS Table 6b Factors associated with personal victimisation against 10- to 15-year-olds Table 6c Factors associated with personal victimisation against 16- to 25-year-olds Table 6.1 Proportion of young people who were victims once or more in the last 12
months, by age and sex Table 6.2 Where the incident took place Table 6.3 Where the incident took place, by age of victim Table 6.4 Details of perpetrator(s) Table 6.5 Details of perpetrator(s), by age of victim Table 6.6 Relationship between victim and perpetrator(s) where known Table 6.7 Relationship between victim and perpetrator(s) where known, by age of victim Table 6.8 Items stolen Table 6.9 Items stolen, by age of victim Table 6.10 Threats of violence used Table 6.11 Threats of violence used, by age of victim Table 6.12 Injuries sustained

7
Table 6.13 How upset were the victims and did they think it was a crime Table 6.14 How upset were the victims and did they think it was a crime, by age of victim Table 6.15 Who the incidents came to the attention of Table 6.16 Who the incidents came to the attention of, by age of victim Table 6.17 Proportion of victims who were victimised more than once in the last 12
months, by age Table 6.18 Proportion of victims who were victimised more than once in the last 12
months, by sex Table 6.19 Proportion of 10- to 15-year-olds who had been a victim in last 12 months, by
socio-demographic and lifestyle variables Table 6.20 Proportion of 16- to 25-year-olds who had been a victim, by socio-
demographic and lifestyle variables Table 6.21 Trends in victimisation for young people aged from 10 to 25 in the last 12
months, by age Table 6.22 Trends in victimisation for young people aged from 10 to 25 in the last 12
months, by sex Appendix A Table A.1 Where and when incidents happened Table A.2 Type of force used in assaults Table A.3 Involvement of co-offenders in incidents Table A.4 Characteristics of co-offenders, based on incidents involving co-offenders Table A.5 Characteristics of victims of assaults, as reported by offenders Table A.6 Characteristics of victims of assaults, by age and sex of offender Table A.7 Whether the offence was spur of the moment or planned Table A.8 Motivation for the offence Table A.9 Whether the offender had taken alcohol or drugs at the time of the incident Table A.10 Attitudes of offender to the likelihood of being caught and their concerns
about the consequences Table A.11 Value of items damaged Appendix B Table B.1 Response rates Table B.2 Interview content

8
Summary This report presents the first findings from the 2005 Offending, Crime and Justice Survey (OCJS). It focuses on levels and trends in youth offending, anti-social behaviour and victimisation among young people aged from 10 to 25 living in the general household population in England and Wales. The survey does not cover young people living in institutions, including prisons, or the homeless, and thus omits some high offending groups. Extent of offending – Chapter 2 Chapter 2 provides an overview of the extent of offending in those crimes covered by the survey and the proportion of young people who have committed these offences in the last 12 months. In addition, it examines levels of serious and frequent offending, identifies the proportion of crime accounted for by frequent offenders, and the proportion of young people who in the last 12 months have committed other offences covered in the survey, e.g. carried weapons (knives or guns), handling stolen goods and racially/religiously motivated assaults. • Three-quarters (75%) of young people had not offended in the last 12 months. Of the 25
per cent that committed at least one of the offences in the last 12 months, many had offended only occasionally or committed relatively trivial offences. The proportion of young people committing an offence remained stable across all three waves of the survey. This pattern held for frequent and serious offenders.
• The most commonly reported offence categories were assault (committed by 16%) and
other thefts (11%). Criminal damage, drug selling offences and vehicle-related thefts were less common and burglary and robbery were relatively rare at one per cent or less.
• Males were more likely to have offended in the last 12 months than females (30%
compared to 21% respectively). For males the prevalence of offending peaked among 16- to 19-year-olds, whilst for females the prevalence peaked earlier at age 14 to 15.
• Seven per cent of all young people were classified as frequent offenders, i.e. they had
committed an offence six or more times in the last 12 months. This group was responsible for the vast majority (83%) of all offences measured in the survey.
• Thirteen per cent of all 10- to 25-year-olds had committed at least one of the serious
offences measured. The majority (71%) of serious offenders had committed an assault resulting in injury and no other serious offence. One per cent of all 10- to 25-year-olds had frequently committed serious offences (i.e. committed serious offences six or more time in the last 12 months) and were classified as frequent serious offenders.
• The proportion of 10- to 25-year-olds who said they had physically attacked someone
because of their skin colour, race or religion (racially/religiously motivated assault) in the last 12 months was relatively low, at less than one per cent. The level of racially/religiously motivated assaults has remained stable between the 2004 and 2005 waves of the survey.
• Overall, four per cent of young people had carried a knife in the last 12 months. Males
were significantly more likely than females to have carried a knife (5% versus 2%). Of the

9
four per cent that had carried a knife, over eight in ten (85%) said the reason for doing so was for protection and nine per cent said it was in case they got into a fight.
• One-fifth (20%) of 12- to 25-year-olds had handled (bought or sold) stolen goods in the
last 12 months. Seven per cent had sold stolen goods and 19 per cent had bought stolen goods. The levels of handling stolen goods for 12- to 25-year-olds have remained stable between 2004 and 2005. This pattern held for both selling and buying stolen goods.
Characteristics of offenders – Chapter 3 Risk factors associated with offending (including serious and frequent offenders) for different age groups are presented in this chapter. In addition it examines the overlaps of committing offences and anti-social behaviour; offending and drug use; and offending and personal victimisation. • For 10- to 15-year-olds the particular attributes that were independently statistically
associated and showed the strongest association with committing an offence were: committing anti-social behaviour; being a victim of personal crime; being drunk once a month or more; having friends/siblings in trouble with the police; and taking drugs. Similar factors were found for serious and frequent offending.
• For 16- to 25-year-olds the particular attributes that were independently statistically
associated and showed the strongest association with committing an offence were: being a victim of personal crime; committing anti-social behaviour; taking drugs; having friends/siblings in trouble with the police; and being more likely to agree criminal acts are OK. Again for frequent and serious offending, similar factors were found to be strongly associated.
Contact with the criminal justice system – Chapter 4 This chapter focuses on the extent to which offenders and offences are dealt with by the police and the courts. It is well established that the proportion of offences that result in a criminal justice sanction is low. Some offences may never become known to anyone and of those that are known about not all are reported to the police. Furthermore, many offences that are known to the police do not result in the offender being detected. • In the last 12 months, four per cent of all 10- to 25-year-olds had been arrested, two per
cent had been to court accused of committing a criminal offence and one per cent had been given a community/custodial sentence or fine. The general levels of contact with the criminal justice system were similar between the survey waves (there were no significant changes).
• Young people who committed an offence in the last 12 months were significantly more
likely than those who had not offended in the last 12 months to have been arrested, taken to court or have been given a fine, community or custodial sentence. Just under one in ten (8%) of those who said they had offended in the last 12 months reported that they had been arrested in the same period, while one in twenty offenders (5%) had been to court.
• Thirteen per cent of young people who had offended in the last year said the police had
spoken to them about at least one of the offences they had committed in the last 12

10
months, although not necessarily arrested them. Three per cent said they had appeared in court or were due to appear in court, and two per cent had been convicted of an offence.
• Violent offences were the offences most likely to result in the respondent having contact
with the police. Anti-social and other problem behaviours – Chapter 5 Levels of anti-social behaviour and other problem behaviours are presented including associated risk factors. Anti-social behaviour as measured by the OCJS covers: being noisy or rude in a public place so that people complained or the individual got into trouble with the police; behaving in a way that resulted in a neighbour complaining; graffiti in a public place; threatening or being rude to someone because of their race or religion. • Over three quarters (77%) of young people had not committed at least one of the four
anti-social behaviours in the last 12 months. Of the 23 per cent who had committed anti-social behaviour, most had only done so once or twice.
• The proportions of young people committing each of the four anti-social behaviours, and
the proportion committing at least one, were stable across the three waves of the survey. This was true for both males and females and for both 10- to 17-year-olds and 18- to 25-year-olds.
• Similar to offending, males were significantly more likely than females to have committed
anti-social behaviour in the last 12 months; 10- to 17-year-olds were more likely than 18- to 25-year-olds to have committed anti-social behaviour.
• For both age groups (10- to 15-year-olds and 16- to 25-year-olds) the factors that were
independently strongly associated with committing anti-social behaviour were: committing an offence; having friends/siblings in trouble with the police; and taking any drug. For 10- to 15-year-olds, perceiving their parents to have poor parenting skills was also strongly associated, while for 16- to 25-year-olds, being highly impulsive was strongly associated. These results are similar to those found for offending.
Personal victimisation – Chapter 6 The extent and nature of personal victimisation among young people is presented in this chapter together with the associated risk factors. Crimes included in the definition of personal victimisation are robbery, theft from the person, other personal thefts, assault with injury and assault without injury. • Just over a quarter (27%) of young people had been the victim of personal crime in the
last 12 months. The most common forms of victimisation were assault without injury (11%) and other personal thefts (9%). Overall levels of victimisation remained stable across the three waves of the survey.
• 10- to 15-year-olds were more likely than 16- to 25-year-olds to have been victims of
personal crime in the last 12 months. However the majority of incidents against 10- to 15-year-olds happened at school, perpetrated by pupils or friends and seen by the victims as ‘something that happens’ and ‘wrong but not a crime’. The most common forms of

11
victimisation for both age groups (10- to 15-year-olds and 16- to 25-year-olds) were assault without injury (11%) and other personal thefts (9%).
• For 10- to 15-year-olds the factors most strongly independently associated with being a
victim of personal crime were: committing an offence, being male and identifying one or more disorder problem in their area. For 16- to 25-year-olds committing an offence, having a negative attitude towards their local area and not trusting the police were the most strongly associated factors.
Table numbering Smaller tables are included within the body of the text in chapters (e.g. Tables 2a, 2b). Larger tables are found at the end of chapters (e.g. Tables 2.1, 2.2) or in Appendices (e.g. Tables A.1, A.2).

12
1 Introduction This report presents the first findings from the 2005 Offending, Crime and Justice Survey (OCJS). It focuses on levels and trends in youth offending, anti-social behaviour (ASB) and victimisation among young people aged from 10 to 25 living in the general household population in England and Wales. Comparisons are made, where relevant, with the results from the 2004 and 2003 waves of OCJS. AIMS OF THE SURVEY Self-report offending surveys, such as the OCJS, are primarily designed to provide a better measure of the extent and nature of offending than can be obtained through official records. Data from the criminal justice agencies only provide a partial measure of offending because many offenders (and offences) are never formally processed. Moreover, most official data sources do not allow examination of the criminal careers of individual offenders. Two exceptions to this are the Home Office’s Offenders Index and the Police National Computer, both of which allow access to criminal conviction histories.1 Self report offending surveys ask people directly about their offending. Such surveys therefore include offenders and offences that are not dealt with by the criminal justice system and also enable patterns of offending and the factors associated with different forms of offending behaviour to be examined. However there are some limitations and key methodological issues that need to be considered in interpreting the findings presented in this report. These are described in Box 1.1 below. THE OFFENDING, CRIME AND JUSTICE SURVEY DESIGN The 2005 OCJS sample comprised respondents who had previously been interviewed2 in 2003, 2004 or both and a fresh sample of 10- to 25-year-olds. Eighty-four per cent of those first interviewed in 2003 and 82 per cent from those first interviewed in 2004 were interviewed in 2005 giving a total ‘panel’ sample of 4,421 people (4,164 were aged from 10 to 25 at the time of the 2005 interview). A total of 816 new respondents aged from 10 to 25 (70% response rate) were added to give an overall sample size of 4,980 aged from 10 to 25. Appendix B provides further information on the design of the survey. The results presented in this report have been weighted to be nationally representative. Trends over time are based on the fresh sample data only to ensure direct comparability with previous waves of the survey.
1 The Offenders Index holds information on those individuals convicted of standard list offences since 1963. It is an established system for obtaining data on criminal histories but holds very little socio-demographic information. With the co-operation of the Police Information Technology Organisation, access to a wider range of data on criminal histories and offenders is available through the Home Office Police National Computer. Further details are available at http://www.homeoffice.gov.uk/rds/offenderindex1.html. 2 Panel respondents were interviewed, where possible, in the same month as their previous interview. If this was not possible, for example because they were unavailable, they were interviewed in subsequent months.

13
Box 1.1 Key methodological issues The OCJS was designed to take on board lessons from previous self-report offending surveys and incorporates some innovative techniques to improve the quality of the data collected. However, it is subject to the following design and methodological issues which should be considered when interpreting the findings:
Sampling error – based on a sample of the general household population aged from 10 to 25, estimates are subject to sampling error. This means that results obtained may differ from those that would be obtained if the entire population of 10- to 25-year-olds had been interviewed. Statistical theory enables the calculation of the degree of error. Throughout this report differences between groups are statistically significant at the five per cent level (i.e. the level at which there is a one in twenty chance of an observed difference being solely due to chance) unless otherwise specified.
Non-response bias – despite the high response rate (83% for the panel sample; 70% for the fresh), it may be that non-respondents differ in key respects to those who took part. For example, those with particularly chaotic lifestyles might be difficult to contact and more likely to refuse.
Accuracy of responses – the survey is designed to provide information that is as accurate as possible, e.g. by using self-completion (CASI) for more sensitive questions, and audio-CASI to assist those with literacy problems. However the accuracy of information obtained through all surveys depends on respondents’ ability to understand questions, their ability to recall events accurately, and their willingness to provide complete honest and accurate responses. These factors may vary across different groups. Respondents were asked at the end of the interview how honest they had been when asked about offending and drug use; 98 per cent said they answered all or most offending questions honestly.
Exclusions from the sample – people in institutions (including prisons), or who are homeless are not covered in the OCJS sample. The results therefore relate to the general household population aged from 10 to 25 only. As such, and because of the limited sample size, there will be relatively few ‘serious’ offenders included in the sample.
Offence coverage – the survey does not cover all offences. In particular very serious offences including homicide and sexual offences are omitted. The main focus of the OCJS was on the 20 core offences, and the wording of these questions was carefully considered to reflect legal definitions in simple, understandable language which was suitable for a survey including respondents aged as young as ten.

14
2 Extent of offending This chapter examines the extent and trends of offending among young people in the general household population aged from 10 to 25. The focus is on the 20 core offences that are covered in most detail in the Offending, Crime and Justice Survey. Information about other offences which are included in the survey but in less detail, i.e. handling stolen goods, carrying weapons and racially/religiously motivated assault, are also presented in this chapter. The 20 core offences are grouped into the following offence categories: Property related offences
• Burglary: domestic burglary; commercial burglary.
• Vehicle-related thefts: theft of a vehicle; theft of parts off outside of a vehicle; theft of items inside a vehicle; attempted theft of a vehicle; attempted theft from a vehicle.
• Other thefts: theft from place of work; theft from school; theft from shop; theft from the person; miscellaneous thefts.
• Criminal damage: damage to a vehicle; damage to other property.
Violent offences
• Robbery: robbery of an individual; robbery of a business.
• Assault: assault resulting in injury; non-injury assault.
Drug selling
• Selling drugs: selling Class A drugs; selling other drugs.
Although the core offences all pertain to legal offences, some of the incidents reported to interviewers, while technically illegal, will be relatively minor transgressions (e.g. a low value theft from the workplace or a child stealing a small item from school).3 It is less likely that such incidents will come to police attention and those which do may not result in a formal sanction. Where the term ‘offender’ is used throughout this report, it refers to young people who have committed at least one of the 20 core offences. In order to distinguish between young people who occasionally transgress and those who may have more problematic patterns of offending, this chapter also identifies frequent offenders and those committing more serious offences.
3 There is value in collecting information about lower level offending or offending which is less likely to be detected by the police. Exploring the full range of offending behaviour can throw light on what differentiates serious and frequent offenders.

15
Frequent offenders - those young people who committed six or more offences, including the less serious, in the last 12 months.4 Serious offences include the following5:
theft of a vehicle burglary robbery theft from the person assault resulting in injury selling Class A drugs
Frequent serious offenders – those young people who had committed a serious offence at least six times in the last 12 months.
EXTENT OF OFFENDING IN THE LAST 12 MONTHS Respondents were asked about offending in the 12 months prior to interview (interviews took place between January and October 2005).6 • A quarter (25%) of young people aged from 10 to 25 said they had committed at least one
core offence in the last 12 months.
• The most commonly reported offence categories were assault (committed by 16%) and other thefts (11%). Criminal damage, drug selling offences and vehicle-related thefts were less common (4%, 4% and 2% respectively). Only one per cent or less had committed burglary or robbery in the last 12 months (Figure 2.1).
• Table 2.1 gives more detailed figures for the individual offence types. Within the other theft category, thefts from the workplace and from school were most common (4% and 5% respectively). The selling of non-Class A drugs was more common than the selling of Class A drugs (3% and 1% respectively).
4 The decision to use six or more offences to define frequent offenders was based on the need to have a cut-off that differentiated offenders while also ensuring there were a sufficient number of frequent offenders for subsequent analysis. 5 These were defined as serious based on the general nature of the offence compared with other offence types covered in the survey. Some distinctions are relatively straightforward (e.g., assault resulting in injury being more serious than assaults with no injury), while others are more a matter of judgement (e.g. thefts involving confrontation with a person or deliberately gaining entry to a property being more serious than thefts of items from public places). 6 The majority (81%) of interviews took place between January and April 2005; therefore, for most respondents the offending reference period ranges from January 2004 to April 2005.

16
Figure 2.1 Proportion of 10- to 25-year-olds committing an offence in last 12 months, 2005 OCJS
• Among the quarter of young people who had committed a core offence in the last 12
months, half (51%) reported committing a serious offence (assault with injury, theft from a person, theft of a vehicle, burglary, selling Class A drugs or robbery). This equates to 13 per cent of all 10- to 25-year-olds.
• The majority (71%) of serious offenders had committed an assault resulting in injury and no other serious offence. The types of injury included in these assaults varied from minor bruising and scratches to more serious injuries.
• Totalling up offending for all offence types shows that many young people who had committed an offence had offended on only a few occasions. Almost a third (31%) of young people who reported offending said they had only committed one offence in the last 12 months; and a further 28 per cent had committed two or three offences. However, almost a third (31%) of offenders (equating to 7% of all 10- to 25-year-olds) reported committing six or more offences in the last 12 months and were classified as frequent offenders (Table 2.2).
• Within offence types, repeat offending was particularly common for the selling of drugs. Among the four per cent of young people who said they had sold drugs in the last 12 months, 82 per cent had done so more than once, with 41 per cent reporting doing so six or more times. Frequent offending was also relatively common for thefts from work, shop theft and assault without injury (of those who had committed these offences, 17%, 16% and 15% respectively had done so six or more times in the last 12 months) (Table 2.2).
• There is some overlap between these groups of serious and frequent offenders. Three per cent of young people had committed at least one but less than six serious offences and offended six or more times, including less serious offences. One per cent had frequently committed serious offences (i.e. committed serious offences six or more times in the last 12 months) and were classified as frequent serious offenders. Nine per cent had committed a serious offence but had offended less than six times, while two per cent
Perc
enta
ge
25
16
11
4 4 2
1 <1
0
5
10
15
20
25
30
Any offence
Assault Other thefts
Criminal damage
Selling drugs
Vehicle- related thefts
Burglary Robbery

17
had offended more than six times but had only committed less serious offences. A further ten per cent had only committed less serious offences and committed these less than six times. The large majority (75%) had not offended at all (Figure 2.2).
Figure 2.2 Offending status of young people aged from 10 to 25, 2005 OCJS
Non offender75%
Neither frequent nor
serious10%
Frequent & at least one serious
3%
Serious but not frequent
9%
Frequent serious
offenders1%
Frequent but not serious
2%

18
Offending in last 12 months, by sex and age patterns • Males were more likely to have offended in the last 12 months than females. Nearly a
third (30%) of males had committed at least one of the core offences, compared with a fifth (21%) of females. This pattern held across almost all offence categories (with the exception of robbery), with males being significantly more likely to have committed each offence type than females (Table 2.1; Figure 2.3).
Figure 2.3 Proportion of 10- to 25-year-olds committing offence in last 12 months, by sex, 2005 OCJS
30
19
13
6 53
2
21
14
9
32 1 1 <1 <1
0
5
10
15
20
25
30
35
Anyoffence
Assault Otherthefts
Criminaldamage
Sellingdrugs
Vehicle-relatedthefts
Burglary Robbery
Per
cent
age
Male Female
• Overall, 14 per cent of males aged from 10 to 25 said they had committed a serious
offence; nine per cent were classified as frequent offenders and two per cent as frequent serious offenders. These figures were significantly lower for females (11%, 4% and 1% respectively) (Table 2a).
• Male offenders were also more likely to report offending frequently. A third (33%) of male offenders said they had offended six or more times in the last 12 months compared with 24 per cent of female offenders. The apparent difference between males and females in the proportions of offenders classified as serious offenders (50% compared with 54%) was not statistically significant (Table 2.3).
• For males the prevalence of offending peaked among 16- to 19-year-olds. Forty per cent in this age group had reported committing one or more of the core offences (significantly higher than among males aged under 14 and those aged 20 or more). Levels of serious offending peaked among males aged from 18 to 19 (22%), whilst levels of frequent offending were more spread out across the different age groups (Figure 2.4).
• Female offending peaked earlier than male offending, at age 14 to 15. A third (33%) of females in this age group had offended, a significantly higher proportion than in other age groups (Figure 2.4).
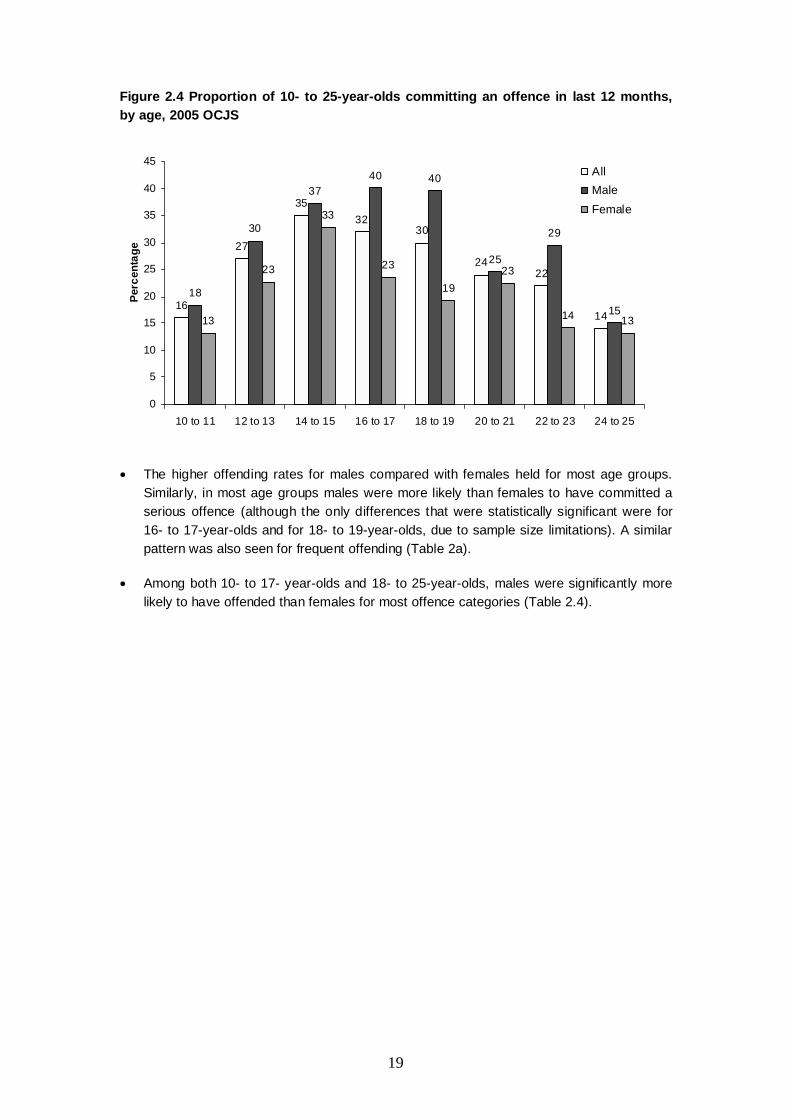
19
Figure 2.4 Proportion of 10- to 25-year-olds committing an offence in last 12 months, by age, 2005 OCJS
16
27
3532
30
2422
14
18
30
3740 40
25
29
1513
23
33
23
1923
14 13
0
5
10
15
20
25
30
35
40
45
10 to 11 12 to 13 14 to 15 16 to 17 18 to 19 20 to 21 22 to 23 24 to 25
Perc
enta
ge
AllMaleFemale
• The higher offending rates for males compared with females held for most age groups. Similarly, in most age groups males were more likely than females to have committed a serious offence (although the only differences that were statistically significant were for 16- to 17-year-olds and for 18- to 19-year-olds, due to sample size limitations). A similar pattern was also seen for frequent offending (Table 2a).
• Among both 10- to 17- year-olds and 18- to 25-year-olds, males were significantly more likely to have offended than females for most offence categories (Table 2.4).

20
Table 2a Proportion of 10- to 25-year-olds offending in the last 12 months, by age and sex
2005 OCJS Percent Offender Serious
offender Frequent offender
Serious and frequent offender
Frequent serious
offender
Unweighted base
Males *30 *14 *9 *6 *2 2,274
10 to 11 18 7 3 3 1 115
12 to 13 *30 16 6 5 2 446
14 to 15 37 19 12 9 3 456
16 to 17 *40 *18 *13 *9 *4 381
18 to 19 *40 *22 *12 *10 2 309
20 to 21 25 9 6 3 1 230
22 to 23 *29 11 *12 4 1 176
24 to 25 15 10 *5 3 1 161
10 to 17 *32 *15 *9 *6 *2 1,398
18 to 25 *28 *13 *9 *5 1 876 Females 21 11 4 3 1 2,367 10 to 11 13 9 3 2 1 90
12 to 13 23 12 4 3 1 376
14 to 15 33 16 8 6 2 423
16 to 17 23 10 4 3 <1 409
18 to 19 19 10 3 2 2 357
20 to 21 23 14 8 4 2 217
22 to 23 14 9 4 2 0 240
24 to 25 13 6 <1 <1 0 255
10 to 17 24 12 5 4 1 1,298
18 to 25 17 9 4 2 1 1,069
All 25 13 7 4 1 4,641 Notes: 1. Unweighted base varies slightly for each 'definition' due to different levels of ‘don't know’ responses. 2. * indicates the figure for males is significantly higher than for females in the same age group. Estimated number of offenders By applying the OCJS estimates of the prevalence of offending to population figures for England and Wales7 it is possible to estimate the number of young offenders in the general household population. As these estimates are based on a sample of the population of interest, they are subject to sampling error – that is the sample estimate may differ from figures that would have been obtained if the whole population had been interviewed. Tables 2b and 2c present the results with the 95 per cent confidence intervals – i.e. there is a one in twenty chance that the true population figure is outside this range. • It is estimated that 2.8 million (95% CI 2.6m to 2.9m) young people aged between 10 and
25 in the general household population had committed at least one of the core offences in the last 12 months; 1.8 million young people had committed a violent offence (over half of
7 The estimated population aged from 10 to 25 in 2005 is 11,041,500 (Office for National Statistics mid-year 2005 population estimates).

21
which involved assault without injury); 1.5 million a property offence and 0.4 million a drug selling offence (Table 2b). Included in this are 0.5 million frequent and serious (i.e. committed at least one serious offence and offended six or more times, including less serious offences). Within this latter group 0.2 million were frequent serious offenders – committing a serious offence six or more times in the last 12 months (Table 2b).
Table 2b Estimated number of young offenders (aged from 10 to 25) in England and Wales 2005 OCJS Number Estimated number of offenders (in millions) Mid Lowest Highest All last year offenders 2.8 2.6 2.9 Violent offender 1.8 1.7 1.9 Property offender 1.5 1.3 1.6 Drug dealing offender 0.4 0.3 0.5 Serious offender, not frequent 0.7 0.6 0.8 Frequent offender, not serious 0.3 0.2 0.3 Frequent and serious 0.5 0.4 0.5 Frequent serious offender 0.2 0.1 0.2 Notes: 1. 95 per cent confidence intervals presented. Uses Office for National Statistics mid-year 2005 population
estimates. • An estimated 1.6 million 10- to 17-year-olds and 1.2 million 18- to 25-year-olds had
committed an offence in the last 12 months in England and Wales. It is also estimated that 1.7 million males and 1.1 million females had committed an offence. Table 2c gives the full results including 95 per cent confidence intervals.
Table 2c Estimated number of young offenders (aged from 10 to 25) in England and Wales by age and sex 2005 OCJS Age and Sex Estimated number of offenders
(in millions) Mid Lowest Highest
10 to 17 1.6 1.4 1.7 18 to 25 1.2 1.1 1.3
Males 1.7 1.5 1.8 Females 1.1 1.0 1.2
All last year offenders 2.8 2.6 2.9 Notes: 1. 95 per cent confidence intervals presented. Uses Office for National Statistics mid-year 2005 population
estimates.

22
CONCENTRATION OF OFFENDING • Previous studies have shown that offending is highly concentrated in the general
household population with a small proportion of people being responsible for the majority of offences committed (Flood-Page et al., 2000; Budd et al., 2005). This pattern was also found in the 2005 OCJS data.
• Table 2d shows that 10- to 25-year-olds who had committed six or more offences (7% of the population and 30% of offenders in this age group) were responsible for the vast majority of all offences measured by the survey. Just over eight in ten (83%) offences measured were committed by this group. Frequent offenders also accounted for 82 per cent of all serious offences measured.
Table 2d Proportion of sample, offenders, and offences accounted for by frequent offenders
2005 OCJS Number of offences committed in last 12 months
% of all offenders
% of all offences
% serious offenders
% serious offences
% % % % One offence 31 4 22 4
Two to five offences 39 13 38 14
Six or more offences (frequent offender) 301 83 40 82 100 100 100 100
Unweighted base 1,097 10,282 521 2,763 Notes:
1. Respondents who had offended but the number of offences was unknown have been excluded. 2. Frequent offender – committed six or more offences in the last 12 months. 3. The total number of offences committed is the sum of how many times offenders had committed each
individual offence in the last 12 months, excluding those who did not know the number of times. PROFILE OF OFFENCES This section focuses on the volume of offences reported, examining the profile of offences measured by the survey. • Overall, 45 per cent of incidents reported to the OCJS were violent offences, 36 per cent
were property and 20 per cent were drug selling offences (due to rounding, the figures do not add up to 100%). Assaults accounted for 44 per cent of all offences reported by 10- to 25-year-olds (non-injury assaults accounting for 25% and assaults resulting in injury accounting for 19% of all offences). Other thefts accounted for 27 per cent of all offences (thefts from work and school being the most common) and drug selling accounted for a fifth of all offences (selling non-Class A drugs being most common at 16% of all offences) (Figure 2.5).

23
Figure 2.5 Profile of offences measured by the survey, 2005 OCJS
Other thefts27%
Burglary1%
Vehicle related thefts
2%Robbery
<1%Criminal damage
5%
Assault without injury
25%
Selling drugs20%
Assault with injury19%
Profile, by sex and age patterns
Table 2e presents the offending profile for males and females aged from 10 to 17 and from 18 to 25 respectively. The main patterns are shown below. • Violent offences accounted for a large proportion of offending by both 10- to 17-year-olds
and 18- to 25-year-olds (48% and 40% respectively). The higher figure for 10- to 17-year-olds was due to a higher proportion of no injury assaults (respectively 28% and 21%).
• Among both male and female offenders aged from 10 to 17, violent offences accounted for about half of the total number of offences. Property offences accounted for a higher proportion of female than male offences; the differences were mainly due to other theft offences. Drug selling accounted for a higher proportion of male than female offences, mostly the sale of non Class A drugs (e.g. cannabis).
• Differences in offending profiles were also found when comparing 18- to 25-year-old males and females. Whilst property offences accounted for a higher proportion of female offences (47% compared with 33% for males), violent offences accounted for a higher proportion of male offences (44% compared with 28% for females). The overall proportion of drug selling offences was similar for male and female offenders, but selling Class A drugs accounted for a higher proportion of female offences (10% compared with 3% for males). However it should be noted that overall there were twice as many male drug sellers as female.
• Just over a quarter of offences among males and females aged from 10 to 17 were classified as serious offences (27% and 29% respectively). The equivalent figures for those aged from 18 to 25 were 25 per cent for males and 28 per cent for females.

24
Table 2e Profile of offences measured in the last 12 months, by age and sex 2005 OCJS
Males Females All 10 to 17 18 to 25 10 to 17 18 to 25 10 to 17 18 to 25 % % % % % % Property offences 31 33 43 47 35 37 Burglary 2 <1 1 5 1 2 Vehicle related thefts 3 1 4 1 3 1 Other thefts 20 27 32 39 24 31 Criminal damage 6 4 6 2 6 3 Violent offences 47 44 49 28 48 40 Robbery 1 - 1 - 1 - Assault with injury 20 22 19 12 19 19 Assault no injury 27 23 30 16 28 21 Selling drugs 22 23 7 25 17 23 Selling Class A drugs 3 3 <1 10 2 5 Selling other drugs 18 20 7 15 15 18 All offences 100 100 100 100 100 100 Unweighted base1 4,785 2,234 2,412 851 7,197 3,085 % % % % % % Serious offences 27 25 29 28 28 26
Notes: 1. Based on total number of offences.
TRENDS OVER TIME: 2003 TO 2005 OCJS • The 2005 results on levels of offending were compared with those from previous waves of
the survey. For comparative purposes the 2004 and 2005 results are based on ‘fresh’ sample respondents only.8
• The proportion of young people who reported committing an offence remained stable across all three waves of the survey at 22 per cent. This pattern held for all seven offence categories (Table 2f).
• Similarly the proportion who reported committing an offence remained stable for both males and females and for 10-to 17-year-olds and 18-to 25-year-olds (Table 2f and 2.5).
• The proportion of young people who were serious offenders, or frequent offenders also remained at the same level in all three waves (Table 2f and 2.5).
• These results are broadly consistent with those from the British Crime Survey which showed that the risk of victimisation had remained relatively stable over a similar period (25.7% in 2003/04; 23.5% in 2005/06: Crime in England and Wales 2005/06, HOSB July 2006, 12/06).
8 The OCJS trend data are based on fresh sample only to ensure direct comparability to 2003. There are two reasons for this. 1) Panel cases in the 2004 and 2005 OCJS were not asked some questions where the information was available from their responses in 2003 (e.g. offending in lifetime). 2) Panel cases may be influenced in how they respond given their participation in the previous year.

25
Table 2f Trends in offending in last 12 months (10- to 25-year-olds), by sex 2003, 2004 and 2005 OCJS Per cent Male Female All
2003 2004 2005 2003 200
4 2005 2003 2004 2005 Any ‘core’ offence 27 29 27 16 16 16 22 22 22 Any property offence 14 15 13 8 9 9 11 12 11 Burglary 1 1 1 <1 <1 <1 <1 <1 1 Vehicle-related thefts 2 2 3 1 1 1 2 1 2 Other thefts 11 12 10 7 8 8 9 10 9 Criminal damage 4 4 4 1 2 1 3 3 3 Any violent offence 18 18 18 10 9 9 14 14 14 Robbery <1 <1 - <1 - - <1 <1 - Assault 18 18 18 10 9 9 14 14 13 Any drug offence 4 5 5 1 2 1 3 3 3 Serious or frequent offender Serious offender 13 13 13 7 6 7 10 9 10 Frequent offender 9 10 8 4 3 3 6 7 6 Frequent and serious offender 6 5 6 2 2 2 4 4 4 Frequent serious offender 2 2 2 1 1 1 2 1 1 Unweighted base 2,155 848 341 2,121 847 376 4,276 1,695 717
Notes: 1. Source: 2003, 2004 & 2005 Offending Crime and Justice Survey. Based on respondents aged from 10 to 25
fresh sample only. 2. Unweighted base given is for the 'serious and frequent' definition. OTHER OFFENCES In addition to asking respondents whether they had committed any of the twenty core offences covered in the survey, the OCJS also asked respondents about other activities that are classified as offences, these were: • bought anything that they knew or thought had been stolen
• sold anything that they knew had been stolen
• physically attacked someone because of their skin colour, race or religion
• carried a knife or gun with them for their own protection, for use in crimes or in case they got into a fight.
Handling stolen goods Respondents aged from 12 to 25 were asked whether they had sold or bought stolen goods in the last 12 months. • One-fifth (20%) of 12- to 25-year-olds had handled (bought or sold) stolen goods in the
last 12 months. Seven per cent had sold stolen goods and 19 per cent had bought stolen goods.

26
• Similar to the pattern for offenders (those who committed any of the 20 core offences in the last 12 months), males were more likely than females to have handled stolen goods in the last 12 months (24% compared to 16%) (Table 2.6).
• Offenders, frequent offenders and serious offenders were significantly more likely than non-offenders to have handled stolen goods in the same time period (35%, 42% and 40% compared to 15%) (Table 2.6).
• The proportion of 12- to 25-year-olds who had handled stolen goods remained stable between the 2004 and 2005 waves of the survey. This pattern held for both selling and buying stolen goods. This was also true for 18- to 25-year-olds when compared with the 2003 OCJS.
Racially or religiously motivated assaults9 • The proportion of 10- to 25-year-olds who said they had physically attacked someone
because of their skin colour, race or religious in the last 12 months (racially/religiously motivated assault) was relatively low, at less than one per cent. This was the same proportion as found in the 2004 wave of the survey.
Carrying weapons • Overall four per cent of young people had carried a knife in the last 12 months. Less than
one per cent reported having carried a gun in the same time period. For both knife and gun carrying the peak age was 16 to 17 (7% and 1% respectively) (Table 2.7).
• Males were significantly more likely than females to have carried a knife (5% versus 2%). There were no differences between 10- to 17-year-olds and 18- to 25-year-olds.
Carrying a knife may not be linked to any criminal intent. The 2005 OCJS asked, for the first time, more details about carrying knives. These included the usual type of knife they carried, the main reason for carrying knives, whether it has been used to threaten someone and whether it has been used to injure someone. • Of the four per cent that carried a knife, four in ten (41%) had carried a pen knife, 29 per
cent had carried a flick knife and one in ten (10%) had carried a kitchen knife (Figure 2.6). These findings reflect similar results in the 2004 Youth Survey (Mori, 2004), which found that of those who had carried a knife or gun most had carried a pen knife.
9 In 2004 racially/religiously motivated attacks and abuse were asked about separately for the first time. In 2003 one question asked whether respondents had “attacked, threatened or been rude to someone because of their skin colour, race or religion”. See chapter 5 for findings on racially/religiously motivated abuse.

27
Figure 2.6 Type of knife carried by 10- to 25-year-olds in the last 12 months among those carrying knives, 2005 OCJS
• Over eight in ten (85%) of those who said they had carried a knife in the last 12 months
said the main reason for doing so was for protection; nine per cent said it was in case they got into a fight and six per cent mentioned another reason (Table 2.8).
• Less than one in ten (7%) of those who had carried a knife in the last 12 months had used it to threaten someone. Two per cent had used the knife to injure someone. Due to small base numbers it is not possible to break these results down further by age and sex (Table 2.8).
• Overall the proportion of young people carrying a knife in the 2005 wave had decreased from the 2004 wave (4%) to the 2005 wave (3%). This was true for both males and those aged from 18 to 25 years (7% to 4% for males, and from 5% to 2% for 18- to 25-year-olds).
• There was no difference in the (very small) proportion of young people who had carried a gun between the 2004 and 2005 waves of the survey.
10%
20%
29%
41%
Kitchen knife
Other type of knife
Flick knife
Pen knife
10%
20%
29%
41%
0% 10% 20% 30% 40% 50%
Kitchen knife
Other type of knife
Flick knife
Pen knife

28
Table 2.1 Offending in last 12 months (10- to 25-year-olds), by age and sex 2005 OCJS Percentage 10 to 17 18 to 25 Male Female All
Any ‘core’ offence *28 22 *30 21 25 Any property offence *16 11 *17 10 14
Any violence *19 14 *19 14 16
Any drug selling *2 5 *5 2 4
Serious offender 3 *14 11 *14 11 13
Frequent Offender4 7 6 *9 4 7
Any property offence *16 11 *17 10 14 Burglary *2 1 *2 1 1
Domestic burglary+ *1 <1 1 <1 <1
Commercial burglary+ *1 <1 *1 <1 1
Vehicle-related thefts 2 1 3 1 2
Theft of a motor vehicle+ 1 <1 1 <1 1
Attempted theft of a motor vehicle *1 <1 <1 <1 <1
Theft from a vehicle (outside) 1 1 *2 1 1
Theft from a vehicle (inside) <1 <1 <1 <1 <1
Attempted theft from a vehicle <1 <1 <1 <1 <1
Other thefts *13 9 *13 9 11
Theft from person+ *1 <1 *1 <1 <1
Theft from work *2 7 *5 3 4
Theft from school *9 2 6 5 5
Theft from shop *4 2 3 3 3
Miscellaneous theft *2 1 2 2 2
Criminal damage *5 3 *6 3 4
Damage to a motor vehicle 2 1 *2 1 2
Other damage *4 2 *4 2 3
Any violent offence *19 14 *19 14 16 Robbery *<1 <1 <1 <1 <1
Personal robbery+ <1 <1 <1 <1 <1
Commercial robbery+ <1 <1 <1 <1 <1
Assault *19 14 *19 14 16
Assault with injury+ *12 10 *12 9 11
Assault – no injury *13 9 *13 9 11
Any drug selling offence *2 5 *5 2 4 Sold Class A drugs+ *<1 2 1 1 1
Sold other drugs *2 4 *5 2 3
Unweighted base 2,843 2,001 2,394 2,450 4,844 Notes: 1. * indicates a significant difference between 10- to 17-year olds and 18 to 25-year olds and between males
and females 2. + indicates a serious offence. 3. Serious offenders:- those committing: theft of a vehicle; burglary; robbery; theft from the person; assault
resulting in injury; selling Class A drugs. 4. Frequent offenders are those committing six or more offences, of any type, in the last 12 months.

29
Table 2.2 Frequency of offending in last year among those who had committed each offence1 2005 OCJS Percentage Once Twice Three
times Four
times Five
times Six or more time
Unweighted base
Vehicle-related thefts % 51 23 8 4 1 12 86 Other thefts % 39 18 12 6 7 19 534 Theft from work % 39 18 16 1 9 17 164 Theft from school % 42 26 12 4 7 8 312 Theft from shop % 51 13 8 8 3 16 146
Miscellaneous thefts % 53 23 7 4 3 11 87 Criminal damage % 55 19 8 7 3 8 222 Vehicle damage % 66 15 11 2 1 5 91 Other damage % 53 21 9 7 2 8 177 Assault % 40 24 8 6 4 19 775 Assault – with injury % 53 19 11 3 4 10 515 Assault – no injury % 49 20 7 3 6 15 550
Drug selling % 18 12 7 9 12 41 142 All offences % 31 19 9 6 5 30 1,097 Notes: 1. Based on respondents aged from 10 to 25 who reported committing each offence. Table 2.3 Proportion of last 12 months offenders1 defined as serious/frequent 2005 OCJS Percentage % of last year offenders defined as…
…serious offenders
2 …frequent offenders3
….serious and frequent
offenders4
…frequent serious
offenders5 …..diverse offenders
Unweighted base
Age 10 to 13 56 24 17 6 3 221 14 to 15 52 32 25 7 7 270 16 to 17 45 29 20 6 5 222 18 to 19 54 29 23 7 6 162 20 to 21 48 32 15 6 3 97 22 to 25 50 33 14 2 4 125 10 to 17 51 28 21 7 5 713 18 to 25 51 32 17 5 5 384
Males 50 *33 21 7 *6 661 10 to17 50 31 22 8 6 423 18 to 25 49 36 19 5 6 238
Females 54 24 16 5 3 436 10 to17 52 24 18 4 3 290 18 to 25 55 25 15 5 3 146
All 51 30 19 6 5 1,097 Notes: 2. 2. Serious offences include: theft of a vehicle; burglary; robbery; theft from the person; assault resulting in injury;
selling Class A drugs. 3. Frequent offenders are those committing six or more offences, of any type, in the last 12 months. 4. Serious and frequent offenders are those committing at least one serious offence and committing six or more
offences of any type. 5. Frequent serious offenders are those committing a serious offence on at least six occasions in the last 12
months. 6. Diverse offenders are those committing offences in between four and seven categories. 7. * indicates the figure for males is significantly higher than for females.

30
Table 2.4 Prevalence of offending in the last 12 months, by age and sex
2005 OCJS Percentage Burglary Vehicle-
related thefts
Other thefts
Criminal damage
Robbery Assault Selling drugs
Any core
offence Unweighted
base
Males *2 *3 *13 *6 <1 *19 *5 *30 2,394 10 to 11 - - 4 1 - 14 - 18 121 12 to 13 2 4* 13 6 - 23 2 30* 474 14 to 15 4 3 20 10 1 26 3 37 489 16 to 17 *4 *5 20 8 1 *21 *8 *40 399 18 to 19 1 *5 14 *9 - *26 *11 *40 334 20 to 21 <1 <1 9 *6 - 15 5 30 234 22 to 23 1 2 *17 3 - *14 8 *30 179 24 to 25 <1 - 6 1 - 11 4 15 164 10 to 17 *2 *3 15 *6 <1 *21 *3 *32 1,483 18 to 25 1 2 *11 *5 - *17 *7 *28 911 Females 1 1 9 3 <1 14 2 21 2,450 10 to 11 - - 4 - - 11 - 13 91 12 to 13 1 1 11 5 <1 18 <1 23 393 14 to 15 2 2 15 7 1 23 2 33 453 16 to 17 1 1 14 4 <1 13 2 24 423 18 to 19 1 2 9 3 <1 13 3 19 362 20 to 21 1 1 7 1 - 16 4 21 225 22 to 23 - 2 6 <1 - 7 4 14 246 24 to 25 - - 4 <1 - 7 2 13 257 10 to 17 1 1 12 4 <1 17 1 24 1,360 18 to 25 <1 1 6 1 <1 11 3 17 1,090 All 1 2 11 4 <1 16 4 25 4,844 10 to 11 - - 4 <1 - 13 - 16 212 12 to 13 1 2 12 5 <1 20 1 27 867 14 to 15 3 3 18 8 1 24 3 35 942 16 to 17 2 3 17 6 <1 17 5 32 822 18 to 19 1 3 11 6 <1 20 7 30 696 20 to 21 1 1 8 3 - 15 4 24 459 22 to 23 <1 2 11 2 - 10 6 22 425 24 to 25 <1 - 5 1 - 9 3 14 421 10 to 17 2 2 13 5 <1 19 2 28 2,843 18 to 25 1 1 9 3 <1 14 5 22 2,001
Notes: 1. Based on respondents aged from 10 to 25. 2. Unweighted base given is for any offence. 3. * indicates the figure for males is significantly higher than for females in the same age group.

31
Table 2.5 Trends in offending in last 12 months, by age group
2003, 2004, 2005 OCJS Percentage 10 to 17s 18 to 25s All 2003 2004 2005 2003 2004 2005 2003 2004 2005
Any ‘core’ offence 25 26 26 18 19 17 22 22 22
Any property offence 13 15 13 9 8 9 11 12 11
Burglary <1 1 1 <1 - - <1 <1 1
Vehicle-related thefts 2 2 2 1 1 2 2 1 2
Other thefts 10 13 11 8 7 7 9 10 9
Criminal damage 4 5 4 2 1 2 3 3 3
Any violent offence 19 19 18 9 9 9 14 14 14
Robbery <1 <1 - - - - <1 <1 -
Assault 18 19 18 9 9 9 14 14 13
Any drug selling offence 2 2 2 4 5 3 3 3 3
Serious offender 13 13 12 7 6 8 10 9 10
Frequent offender 7 8 6 5 6 5 6 7 6
Frequent and serious offender 5 6 4 3 2 3 4 4 4
Frequent serious offender 2 2 1 1 1 1 2 1 1
Unweighted base 2,569 1,053 465 1,805 642 292 4,374 1,695 757 Notes: 1. Based on respondents aged from 10 to 25. 2004 and 2005 results based on fresh sample only. 2. * indicates significant difference between surveys.

32
Table 2.6 Proportion of young people buying/selling stolen goods in the last 12 months 2005 OCJS
Percentage Buying Selling Buying or
selling Unweighted
base
Age 12 to 13 11 5 12 877 14 to 15 20 9 21 934 16 to 17 23 10 23 818 18 to 19 26 11 27 700 20 to 21 20 6 20 457 21 to 23 19 4 19 423 24 to 25 16 7 18 420 12 to 17 18 8 18 2,629 18 to 25 20 7 21 2,000
Males *23 *9 *24 2,260 12 to 17 22 11 23 1,345 18 to 25 24 8 24 915
Females 16 6 16 2,369 12 to 17 14 5 14 1,284 18 to 25 17 6 17 1,085
Non offender 14 6 15 3,309 Offender *34 *12 *35 1,215 Frequent offender *41 *16 *42 297 Serious offender *38 *13 *39 597 All 19 7 20 4,629 Notes: 1. Based on respondents aged 12 to 15. 2. * indicates significant differences between males and females, and between offenders and non-offenders.

33
Table 2.7 Proportion of young people carrying weapons in last 12 months 2005 OCJS
Percentage Carried a knife Carried a gun Unweighted base
Age 10 to 11 1 <1 225 12 to 13 3 <1 894 14 to 15 6 <1 966 16 to 17 7 1 841 18 to 19 3 <1 710 20 to 21 4 0 464 21 to 23 3 0 432 24 to 25 1 0 427 10 to 17 4 <1 2,926 18 to 25 3 <1 2,034
Males 5 <1 2,456 10 to 17 6 1 1,523 18 to 25 4 <1 933
Females 2 <1 2,504
10 to 17 2 <1 1,403 18 to 25 1 0 1,101
All 4 <1 4,960
Table 2.8 Details of knives carried in last 12 months 2005 OCJS Percentage How often carried a knife
Once or twice 50 Three or four times 23 Between 5 and 10 times 11 10 times or more 16 100 Type of knife carried Pen knife 41 Flick knife 29 Kitchen knife 10 Other type of knife 20 100 Main reason for carrying knife Protection 85 In case got into fight 9 Another reason 6 100 Used knife to threaten someone Yes 7 No 93 100 Used knife to injure someone Yes 2 No 98 100 Unweighted base 187 Notes:
1. Based on 10- to 25-year-olds who carried a knife in the last 12 months

34
3 Characteristics of offending Previous research has identified that certain groups of the population are more likely to offend (Budd et al 2005). This chapter examines the extent of offending among groups of young people with different characteristics, and attempts to identify young people who may be ‘at risk’ of offending. It also covers overlaps between delinquent behaviour (anti-social behaviour) and offending, drug use and offending and also victimisation and offending.
RISK OF OFFENDING
Three types of offender are examined in the risk factor analysis – those who have committed any of the twenty core offences, those who have committed a serious offence and those classified as frequent offenders. Respondents aged from 10 to 15 and from 16 to 25 are considered separately as many of the questions relating to social, lifestyle and behavioural factors were specific to only one of these age groups (for definition of factors examined see Appendix C).
Initial bivariate analysis of the data examined the level of offending across groups with particular attributes. The results for 10- to 15-year-olds and 16- to 25-year-olds are presented in Tables 3.1 and 3.2 and show offending differed across nearly all the attributes examined for any offence, frequent and serious offending. For example offending is higher among males, those who have taken drugs, committed anti-social behaviour, been suspended or expelled, with parents perceived to have poor parenting skills (Table 3.1 and Table 3.2). However, this analysis is limited as it does not show whether one attribute by itself is connected with offending, or whether there are other confounding factors. Multivariate analysis enables identification of those factors which, independent of the effects of others, provide the highest association with offending (see note on logistic regression in Appendix B).
The socio-demographic and lifestyle variables which showed statistically significant association with offending (Table 3.1 and 3.2) were entered into the multivariate models. A forward stepwise technique was used to identify characteristics which were independently statistically associated with a higher likelihood of offending for 10- to 15-year-olds and for 16- to 25-year-olds.
Risk factors for 10- to 15-year-olds
• Table 3a presents the factors independently associated with committing an offence in the last 12 months for 10- to 15-year-olds. Tables 3.3 and 3.4 show the results for serious and for frequent offending.
• The factors showing the strongest associations10 with committing any offence, for 10- to 15-year-olds were: committing anti-social behaviour in the last 12 months; being a victim of personal crime; being drunk once a month or more in the last 12 months; having friends/siblings who were in trouble with the police; and taking any drug.
10 The variables which have the strongest association are those where there is at least a one per cent increase in the proportion of variance explained by the model when the variable is added to the model.
35
• A similar set of results was found for both frequent and serious offending among 10- to 15-year-olds, with the strongest associations being: committing anti-social behaviour; being a victim of personal crime; and taking any drug. Having parents in trouble with the police was also strongly associated with serious offending. For frequent offending how well 10- to 15-year-olds got on with their parents/guardians, having friends/siblings who were in trouble with the police, being more likely to agree criminal acts are OK and being drunk once a month or more in the last 12 months were also strongly associated.
Table 3a Factors associated with offending for 10- to 15-year-olds
2005 OCJS
Factors showing association1 Reference category Odds ratio
Committed anti-social behaviour in the last 12 months
Not committed anti-social behaviour in last 12 months
2.9
Victim of personal crime Not been victim of personal crime 3.4
Have been drunk once a month or more in last 12 months
Have been drunk less than once a month in last 12 months
2.3
Friends/siblings have been in trouble with the police
Friends/siblings have never been in trouble with the police
1.6
Taken drugs in the last 12 months Not taken drugs in last 12 months 2.4
Having been suspended or expelled from school
Never been suspended or expelled from school
2.1
Parents have been in trouble with the police Parents have never been in trouble with the police
1.3
More likely to agree criminal acts are OK Less likely to agree criminal acts are OK
1.8
Spends little or no time with parents/guardians
Spends some to all of time with parents/guardians
1.2
Notes: 1. Factors that did not appear in the model: age, sex, perceived disorder problems in area, how much there is to do in the area, trust in police, whether brought up by natural parents, parents’ attitude towards delinquent activities, perception of parenting skills, how well get on with parents, truanted, perception of school, participates in after school groups, attitude towards schooling, housing tenure. 2. Odds ratio with values above one indicate to higher odds of offending and those with values below one relate to lower odds in relation to the reference category.
Risk factors for 16- to 25-year-olds • Table 3b presents the factors independently associated with committing an offence in the
last 12 months for 16- to 25-year-olds. Tables 3.5 and 3.6 show the results for serious and frequent offending.
• For 16- to 25-year-olds the factors showing the strongest associations were: being a victim of personal crime in the last 12 months; committing anti-social behaviour in the last 12 months; taking any drug in the last 12 months; having friends/siblings who were in trouble with the police; and being more likely to agree criminal acts are OK.
• The strongly associated factors that were the same for serious and frequent offending among 16- to 25-year-olds were: being a victim of personal crime in last 12 months; committing anti-social behaviour in last 12 months; and taking any drugs in the last 12 months.

36
• However there were factors that were separately associated with either serious or frequent offending. For serious offending, ever been expelled or suspended, being highly impulsive and getting on badly with at least one parent were also strongly associated. Whereas for frequent offending, being more likely to agree criminal acts are OK, having friends/siblings who were in trouble with police and being male were strongly associated.
Table 3b Factors associated with offending for 16- to 25-year-olds
2005 OCJS
Factors showing association1 Reference category Odds ratio
Victim of personal crime Not been victim of personal crime 3.7
Committed anti-social behaviour in last 12 months
Not committed anti-social behaviour in last 12 months
2.6
Friends/siblings have been in trouble with the police
Friends/siblings have never been in trouble with the police
1.7
More likely to agree criminal acts are OK Less likely to agree criminal acts are OK
2.5
Taken any drug in last 12 months Not taken drug in last 12 months 2.2
Male Female 1.5
Highly impulsive Not impulsive 1.7
Ever been expelled or suspended Not been expelled or suspended 1.5
Age 16 to 19 Aged 20 to 25 1.4 Have been drunk once a month or more in last 12 months
Have been drunk less than once a month in last 12 months
1.4
Parents have been in trouble with police Parents have never been in trouble with police
1.4
Notes: 1. Factors that did not appear in the model are: perceived problems in area; trust in the police; whether brought up by natural parents; how well household managing on income; and general perception of overall health. PROBLEM BEHAVIOURS AND OFFENDING The results from the multivariate analysis found that both committing anti-social behaviour and drug use were associated with offending for both age groups. This section examines the overlaps between these types of activities in the last 12 months. Anti-social behaviour and offending • Around half (53%) of those who committed one of the four anti-social behaviours11 had
also committed a core offence in the last 12 months. This compares with 17 per cent of those who had not committed any anti-social behaviour. This pattern held for frequent and serious offending, with 18 per cent of those who committed anti-social behaviour being classified as a frequent offender and 30 per cent classified as a serious offender. The equivalent figures for those who did not commit anti-social behaviour were four per cent and seven per cent respectively.
11 The anti-social behaviour as measured by the OCJS cover: being noisy or rude in a public place so that people complained or the individual got into trouble with the police; behaving in a way that resulted in a neighbour complaining; graffiti in a public place; threatening or being rude to someone because of their race or religion.
37
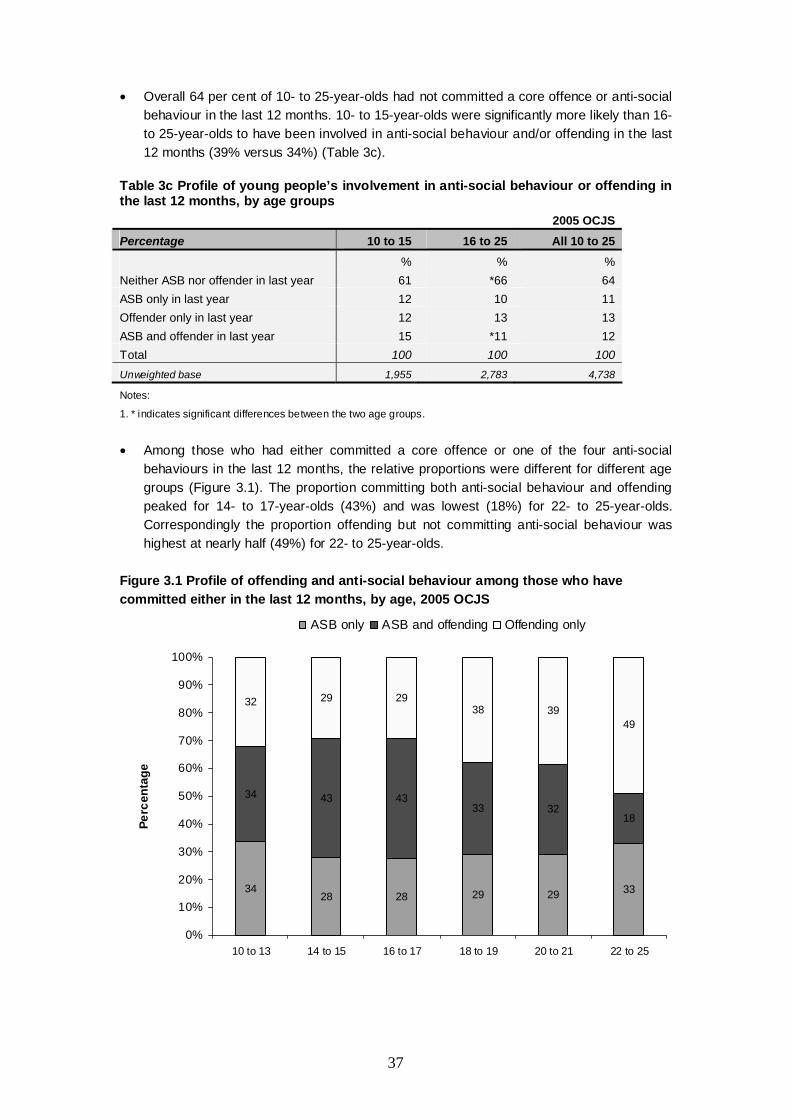
• Overall 64 per cent of 10- to 25-year-olds had not committed a core offence or anti-social behaviour in the last 12 months. 10- to 15-year-olds were significantly more likely than 16- to 25-year-olds to have been involved in anti-social behaviour and/or offending in the last 12 months (39% versus 34%) (Table 3c).
Table 3c Profile of young people’s involvement in anti-social behaviour or offending in the last 12 months, by age groups 2005 OCJS Percentage 10 to 15 16 to 25 All 10 to 25 % % % Neither ASB nor offender in last year 61 *66 64 ASB only in last year 12 10 11 Offender only in last year 12 13 13 ASB and offender in last year 15 *11 12 Total 100 100 100 Unweighted base 1,955 2,783 4,738
Notes:
1. * indicates significant differences between the two age groups.
• Among those who had either committed a core offence or one of the four anti-social
behaviours in the last 12 months, the relative proportions were different for different age groups (Figure 3.1). The proportion committing both anti-social behaviour and offending peaked for 14- to 17-year-olds (43%) and was lowest (18%) for 22- to 25-year-olds. Correspondingly the proportion offending but not committing anti-social behaviour was highest at nearly half (49%) for 22- to 25-year-olds.
Figure 3.1 Profile of offending and anti-social behaviour among those who have committed either in the last 12 months, by age, 2005 OCJS
3428 28 29 29 33
34 43 4333 32
18
32 29 2938 39
49
0%
10%
20%
30%
40%
50%
60%
70%
80%
90%
100%
10 to 13 14 to 15 16 to 17 18 to 19 20 to 21 22 to 25
Perc
enta
ge
ASB only ASB and offending Offending only

38
Offending and drug use
• Young people who took drugs in the last 12 months were significantly more likely (than those who did not) to have committed an offence. This was true for both serious and frequent offending (Figure 3.2).
• Just under half (46%) of those who had taken any drug in the last 12 months had committed an offence in the same time period compared with 19 per cent who had not taken any drug.
Figure 3.2 Proportion of young people (aged from 10 to 25) committing an offence in the last 12 months, by drug status, 2005 OCJS
19
46
52
60
11
24
31 30
4
18
22
28
0
10
20
30
40
50
60
70
No drugs Any drugs Class A druguser
Frequent user
Perc
enta
ge
Any offence
Serious offence
Frequent offending
• The same pattern of offending by drug status was evident for 10- to 17-year-olds and 18-
to 25-year-olds. Most (62%) drug users aged from 10 to 17 had committed an offence in the last 12 months, compared with a quarter (23%) of those who had not taken drugs. The equivalent figures for 18- to 25-year-olds were 40 per cent and 15 per cent respectively (Table 3.7).
OFFENDING AND VICTIMISATION
• Just over half (52%) of those who committed a core offence in the last 12 months had also been a victim, compared with 23 per cent of non-offenders.

39
• Overall, in the last 12 months 10- to 15-year-olds were significantly more likely than 16- to 25-year-olds to have been involved in crime whether as a victim of personal crime and/or as an offender (43% compared to 36% respectively) (Table 3d).
• The younger age group (10- to 15-year-olds) were significantly more likely than 16- to 25-
year-olds to have been either victims only of personal crime (16% versus 13%) or a victim and offender in the last 12 months (15% compared to 12%). However, there was no difference between the age groups for being only an offender (12% for both age groups) (Table 3d).
Table 3d Profile of young people’s involvement in crime, victim or offender in the last 12 months, by age groups
Notes:
1. * indicates significant differences between the two age groups.
2005 OCJS Percentage 10 to 15 16 to 25 All 10 to 25 % % % Neither victim nor offender in last year 57 *63 61 Victim only in last year 16 *13 14 Offender only in last year 12 12 12 Victim and offender in last year 15 *12 13 Total 100 100 100 Unweighted base 2,021 2,823 4,884

40
Table 3.1 Offending committed in last 12 months by 10- to 15-year-olds, by socio-demographic and lifestyle variables
2005 OCJS Socio-demographic variable
Category Offender
%
Unweighted base
Frequent offender
%
Unweighted base
Serious offender
%
Unweighted base
Demographics Sex Female 24 937 5 889 13 949 Male *30 1,084 8 1,017 14 1,094 Age 10 to 11 16 212 3 205 8 218 12 to 13 *27 867 5 822 *14 872 14 to 15 *35 942 *10 879 *18 953 Lifestyle and behaviour Being drunk
Drunk less than once a month in last year 24 1,826 5 1,744 12 1,842
Drunk once a month or more in last year *72 135 *32 113 *43 135
Drug use Not taken drugs in last 12 months 23 1,818 4 1,739 11 1,843
Taken drugs in last 12 months *70 173 *36 147 *49 170
Victim of personal crime
Not victim of any personal crime 18 1,397 3 1,344 7 1,421
Victim of personal crime *47 624 *13 562 *28 622 Attitude to certain criminal acts
Less likely to agree criminal acts are OK 25 1,827 5 1,731 12 1,852
More likely to agree criminal acts are OK *47 191 *18 174 *26 189 No 16 1,390 3 1,354 6 1,412 Whether committed
anti-social behaviour in the last 12 months Yes *55 565 *18 496 *33 561 Area factors
No problems 15 412 4 401 7 416 One to three problems *28 1,321 6 1,242 *12 1,338
Disorder problems in the area Four or more problems *38 288 *11 263 *23 289
Trust police 24 1,633 5 1,551 11 1,656 Whether trust the police Do not trust police *44 350 *15 318 *27 350
3 least deprived areas 27 584 6 554 12 600 4 medium deprived areas 27 721 7 671 15 720
Overall indicator of deprivation
3 most deprived areas 29 568 6 536 16 574 ACORN grouping Wealthy achievers 23 526 4 501 10 539 Urban prosperity 26 150 5 144 16 152 Comfortably off 27 533 8 500 13 536 Moderate means 28 289 8 266 15 288 Hard-pressed *31 508 7 481 16 514
Quite a lot 22 775 5 739 11 789 How much to do in the area
Not very much or nothing *30 1,244 8 1,165 *16 1,252
Attitude towards local area Good attitude 22 475 4 455 9 478 Indifferent attitude *27 1,166 6 1,093 *14 1,186 Negative attitude *35 302 *10 285 *21 301 Economic factors Housing tenure Owners 25 1,489 6 1,402 12 1,508 Renters *33 529 7 502 *19 532
No 26 1,674 7 1,584 13 1,695 Whether receive free school meals Yes *34 302 6 281 *19 303 Family factors
Get on with parent(s) 26 1,929 6 1,833 13 1,953 Whether get on with parents
Get on badly with at least one parent *56 76 *31 62 *35 74 Good parenting skills 25 1,411 6 1,352 12 1,425 Young person's
perception of parents Poor parenting ski lls *38 117 13 105 *26 117
No friends or siblings in trouble with police in last year 20 1,375 4 1,319 10 1,384
Whether friends/siblings been in trouble with the police in the last 12 months
Friends and/or siblings in trouble with police in last year *47 491 *15 448 *24 498

41
Table 3.1 cont. Socio-demographic variable
Category Offender
%
Unweighted base
Frequent offender
%
Unweighted base
Serious offender
%
Unweighted base
Who brings up Both natural parents 23 1,248 5 1,177 11 1,260
One natural parent alone or with step parent or other *34 773 *8 729 *18 783 No 23 1,620 5 1,547 11 1,638 Whether parents
ever been in trouble with the police Yes *52 183 *23 168 *33 184
A lot 22 1,484 5 1,426 11 1,499 How much do you care about what your parents/guardians think A little or not at all *40 501 *12 448 *22 507
Parents know all of friends 19 771 3 743 11 782
Parents/guardians know who your friends are
Parents only know some of friends *32 1,214 *9 1,133 16 1,226 Parents perceived to have less relaxed attitude 25 1,774 5 1,694 12 1,790
Young peoples perception of parents attitudes to delinquent behaviours
Parents perceived to have more relaxed attitude *48 109 *24 96 *29 113 Some to all of time 24 1,704 5 1,426 12 1,727 Free time spent
with parents Little or no time *46 293 *12 406 *23 291 School factors
No 21 1,500 5 1,722 11 1,519 Whether ever truanted Yes *48 358 *25 164 *27 360
Never 25 1,859 5 1,762 12 1,881 Whether been suspended or expelled
Have been suspended or expelled *55 157 *22 136 *35 157 Good perception 26 1,436 6 1,379 12 1,452 Perception of
school Bad perception *38 297 *13 269 *24 296
Very important 24 1,390 5 1,329 11 1,408 Attitude to schooling
Fairly to not very or not at all important *34 630 *9 576 *19 634 Participates in after school groups 26 1,376 6 1,307 12 1,389
Whether participate in after school clubs Does not participate in
after school groups 30 627 9 583 *19 636 Notes: 1. * indicates significant differences between the categories, where more than two categories are present the first one listed is the reference category and all other categories are compared to the reference category.

42
Table 3.2 Offending committed in last 12 months by 16- to 25-year-olds, by socio-demographic and life style factors
2005 OCJS Socio-demographic variable Category
Offender
%
Unweighted base
Frequent offender
%
Unweighted base
Serious offender
%
Unweighted base
Demographics
Sex Female 19 1,513 4 1,478 10 1,524 Male *30 1,310 *10 1,257 *14 1,325 Age 16 to 17 32 822 8 790 14 828 18 to 19 30 696 8 666 16 704 20 to 21 *24 459 7 447 11 461 22 to 23 *22 425 8 416 *10 429 24 to 25 *14 421 *3 416 *8 427
Lifestyle and behaviour Drunk less than once a month in last 12 months 18 1,709 5 1,659 9 1,722
Being drunk
Drunk once a month or more in last 12 months *34 1,072 *10 1,037 *17 1,082
Drug use Not taken drugs in last 12 months 17 1,989 3 1,950 8 2,007
Taken drugs in last 12 months *43 806 *16 759 *22 813 Not victim of any personal crime 16 2,142 4 2,103 7 2,165
Victim of personal crime
Victim of personal crime *48 681 *15 632 *27 684
More likely to agree criminal acts are OK *47 276 *21 253 *22 276
Attitude to certain criminal acts Less likely to agree
criminal acts are OK 22 2,547 5 2,482 11 2,573
No 17 2,163 4 2,125 7 2,176
Whether committed antisocial behaviour in the last 12 months Yes *51 620 *18 571 *29 629 Whether visits the pub
Frequent, visits once a week or more *29 1,110 *8 1,073 13 1,115
Less frequent, less than twice a month 22 1,334 *6 1,293 11 1,351
Never 18 360 3 351 11 364
Frequent, visits once a week or more *33 448 *8 428 *18 449
Whether visits the club
Less frequent, less than twice a month *24 1,691 *7 1,640 11 1,710
Never 19 667 4 650 10 673 Whether impulsive Not impulsive 21 2,083 6 2,035 9 2,099 Highly impulsive *47 215 *19 198 *30 218
Very good or good 23 2,409 6 2,340 11 2,432 Perception of overall health
Fair to poor *32 395 *10 378 *19 398
Area Factors No problems 21 518 4 506 9 524 Disorder
problems in the local area
One or more problems *25 2,305 *7 2,229 *12 2,325
Trust police 23 1,981 6 1,932 10 2,000
Whether trust the police
Do not trust police *28 771 9 735 *17 776
Least deprived areas *21 835 5 805 11 840 Medium deprived areas 26 996 7 974 12 1,009
Overall indicator of deprivation
Most deprived areas 27 768 10 742 13 774

43
Notes: 1. * indicates significant differences between the categories, where more than two categories are present the first one listed is the reference category and all other categories are compared to the reference category.
Table 3.2 cont. 2005 OCJS Socio-demographic variable
Category Offender
%
Unweighted base
Frequent offender
%
Unweighted base
Serious offender
%
Unweighted base
Wealthy achievers 26 691 8 665 11 701
Urban prosperity 25 205 7 200 11 205
Comfortably off 25 752 6 737 12 763
Moderate means 20 412 6 403 10 417
ACORN grouping
Hard-pressed 25 734 6 701 14 734 Good attitude towards local area
22 377 4 367 13 380
Indifferent attitude 24 1,887 7 1,830 11 1,908
Attitudes towards their local area Negative attitude
towards local area 26 477 7 459 14 478
Economic Owners 25 1,908 7 1,852 12 1,932 Housing
tenure Renters 24 909 6 877 12 910
Well 24 1,768 7 1,716 11 1,787 Getting by 24 916 7 887 12 920
How well household managing on income Getting into difficulties *36 109 7 103 *21 111
Family and friends Get on with parent(s) 23 1,812 6 1,754 11 1,828 Whether get
on with parents
Get on badly with at least one parent 26 897 8 873 12 905 No friends or siblings in trouble with police in last year 19 2,091 4 2,052 9 2,105
Whether friends/siblings been in trouble with the police in the last year
Friends and/or siblings in trouble with police in last year *41 644 *15 602 *21 653
Who brings up Both natural parents 22 1,649 7 1,614 10 1,672
One natural parent alone or with step parent or other *28 731 6 698 *15 732
Yes *34 312 10 295 *18 318
Whether parents ever been in trouble with the police No 23 2,313 6 2,252 10 2,333 School factors
Never 22 2,410 6 2,349 10 2,435 Whether been suspended or expelled
Have been suspended or expelled *40 354 *14 328 *26 354

44
Table 3.3 Factors associated with serious offending in last 12 months for 10- to 15- year-olds 2005 OCJS
Factors showing association1 Reference category Odds ratio
Committed anti-social behaviour in the last 12 months
Not committed anti-social behaviour in last 12 months
3.3
Victim of personal crime Not been victim of personal crime 3.7
Taken drugs in the last 12 months Not taken drugs in last 12 months 3.3
Parents have been in trouble with the police Parents have never been in trouble with the police
1.5
Have ever been suspended or expelled Never been suspended or expelled 1.9
Have been drunk once a month or more in last 12 months
Have been drunk less than once a month in last 12 months
1.6
Schooling thought to be fairly, not very or not at all important
Schooling thought to be very important
1.4
More likely to agree criminal acts are OK Less likely to agree criminal acts are OK
1.6
Notes: 1. Factors that did not appear in the model: Sex, age group, perceived problems in area, how much there is to do in the area, trust in police, whether brought up by natural parents, parents attitude towards delinquent activities, perception of parenting skills, how well get on with parents, how much time spent with parents, care about what your parents/guardians think, truanted, perception of school, attitude towards schooling and housing tenure. Table 3.4 Factors associated with frequent offending in last 12 months for 10- to 15- year-olds 2005 OCJS
Factors showing association1 Reference category Odds ratio
Taken drugs in the last 12 months Not taken drugs in last 12 months 4.1
Committed anti-social behaviour in the last 12 months
Not committed anti-social behaviour in last 12 months
2.6
Victim of personal crime Not been victim of personal crime 3.1
Friends/siblings have been in trouble with the police
Friends/siblings have not been trouble with the police
2.1
Get on badly with at least one parent Get on with parent(s) 3.7
More likely to agree criminal acts are OK Less likely to agree criminal acts are OK
2.5
Have been drunk once a month or more in last 12 months
Have been drunk less than once a month in last 12 months
1.4
Have ever been suspended or expelled Never been suspended or expelled 1.8
Notes: 1. Factors that did not appear in the model: age group, perceived problems in area, trust in police, whether brought up by natural parents, perception of parenting skills, how much time spent with parents, care about what your parents/guardians think, truanted, perception of school, participates in after school groups, attitude towards schooling, housing tenure.

45
Table 3.5 Factors associated with serious offending in last 12 months for 16- to 25- year-olds 2005 OCJS
Factors showing association1 Reference category Odds ratio
Victim of personal crime Not been victim of personal crime 3.8
Committed anti-social behaviour in the last 12 months
Not committed anti-social behaviour in last 12 months
2.9
Taken any drug in last 12 months Not taken drug in last 12 months 2.0
Highly impulsive Not impulsive 2.4
Ever been expelled or suspended Not been expelled or suspended 1.9
Get on badly with at least one parent Gets on well with at least one parent 1.1
Male Female 1.4
Parents been in trouble with police Parents have not been in trouble with police
1.4
Notes: 1. Factors that did not appear in model: age group, been drunk once a month or more, perceived problems in area, trust in police, whether brought up by natural parents and general perception of overall health.
Table 3.6 Factors associated with frequent offending in last 12 months for 16- to 25- year-olds 2005 OCJS
Factors showing association1 Reference category Odds ratio
Taken any drug in last 12 months Not taken drug in last 12 months 4.1
Committed anti-social behaviour in the last 12 months
Not committed anti-social behaviour in last 12 months
2.2
More likely to agree criminal acts are OK Less likely to agree criminal acts are OK
3.7
Friends/siblings have been in trouble with the police
Friends/siblings have not been trouble with the police
2.4
Victim of personal crime Not been victim of personal crime 2.5
Male Female 2.3 Highly impulsive Not impulsive 2.1
Parents been in trouble with police Parents have not been in trouble with police
1.4
Age (16 to 23) Age 24 to 25 1.9
Notes: 1. Factors that did not appear in model: been drunk once a month or more, perceived problems in area, trust in police, whether brought up by natural parents, how well got on with parents, whether ever been expelled or suspended and general perception of overall health.

46
Table 3.7 Proportion of 10- to 25-year-olds committed offending in last 12 month, by drug status
Notes: 1. * indicates a significant difference between no drugs and any drugs, Class A and non-Class A drugs, frequent and
non-frequent users, within age groups.
2005 OCJS Percentage No drugs Any drugs Non-Class
A drugs Class A
drugs Not
frequent user
Frequent user
All Non offender 81 *54 58 *48 78 *40 Offender 19 *46 42 *52 22 *60 Serious offender 9 *24 20 *31 11 *30 Frequent offender 4 *18 15 22 5 *28 10- to 17-year- olds Non offender 77 *38 42 *26 74 *31 Offender 23 *62 58 *74 26 *69 Serious offender 11 *33 31 40 12 *37 Frequent offender 4 *25 23 35 6 *33 18- to 25-year-olds Non offender 85 *60 66 *52 82 *44 Offender 15 *40 34 *48 18 *56 Serious offender 7 *21 14 *30 9 *27 Frequent offender 3 *15 12 *20 4 *25 Unweighted base All 3,680 896 611 285 4,232 345 10 to 17 2,309 347 284 63 2,522 135 18 to 25 1,371 549 327 222 1,710 210

47
4 Contact with the criminal justice system This chapter examines the extent to which offenders and offences are dealt with by the police and courts. It is based on respondents' self-reported levels of contact with the criminal justice system, both in relation to contact arising from any criminal or suspected criminal offence and contact resulting from the 20 specific core offences measured by the survey (see chapter 2 for offences covered). Box 4.1 outlines the key issues that should be considered in interpreting the results presented in this chapter. Box 4.1 Issues of interpretation
In interpreting the results presented in this section, the following should be considered: • It is well established that the proportion of offences that result in a criminal justice
sanction is low. Some offences may never become known to anyone and of those that are known about not all are reported to the police.12 Furthermore, many offences that are known to the police do not result in the offender being detected.13
• Different types of offence are more or less likely to result in a formal sanction depending on whether anyone becomes aware of the incident, whether the incident is reported to the police and how easy it is to identify the perpetrator. Thus the contact offenders have with the criminal justice system will be influenced by the types of offence they commit.
• Self-report offending surveys such as the OCJS count many offences that would not be expected to result in criminal justice sanctions. Moreover, some relatively minor offences do not necessarily warrant a formal criminal justice intervention. For example, parents or schools may apply other sanctions to reprimand a young person.
• The OCJS will to some degree under estimate the extent to which offences result in contact with the criminal justice system. This is because the focus is on offending and contact in the 12 months prior to interview. Due to the time lapse between offending and the detection and processing of cases, some incidents may result in contact at a later date after interview. Also, those already in custody were not included in the sample.
12 The 2005/06 BCS estimated that for the crimes it covers that are comparable with police recorded data only 42% per cent were reported to the police and of these 70 per cent are recorded as crimes by the police. The most common reasons for not reporting an offence to the police were that it was too trivial, there was no loss, or the victim believed the police could/would not do anything about it (Walker et al., 2006). 13 In 2005/06 24 per cent of crimes recorded by the police resulted in a 'sanction' detection (offender being charged or summoned, cautioned, having an offence taken into consideration or receiving a fixed penalty notice or a formal warning for cannabis possession) (Walker et al., 2006).

48
GENERAL CONTACT WITH THE CRIMINAL JUSTICE SYSTEM All respondents, irrespective of whether they had offended or not, were asked about various types of contact with the criminal justice system in the last 12 months including whether they had been:
• arrested by the police; • taken to court charged with a criminal offence; • fined by a court; • given a community sentence by a court; • given a custodial sentence by a court;
and whether they had ever been given:
• a caution, reprimand or final warning by the police. • The 2005 OCJS showed that four per cent of all 10- to 25-year-olds had been arrested in
the last 12 months; two per cent had been to court accused of committing a criminal offence and one per cent had been given a community/custodial sentence or fine.14
• The group reporting the highest level of contact with the criminal justice system in the last
12 months were males aged from 18 to 25, of whom five per cent had been arrested, three per cent said they had been taken to court and two per cent had been given a fine, community or custodial sentence (Table 4a).
Table 4a Level of contact with the criminal justice system in last 12 months, by age and sex
2005 OCJS Males Females All All Percentage
10 to 17
18 to 25
10 to 17
18 to 25
10 to 17
18 to 25
Arrested 5 5 2 2 4 4 4 Taken to court 2 3 1 1 1 2 2 Given a fine 1 2 <1 1 1 1 1 Given a community sentence 1 <1 <1 <1 1 <1 <1 Given a custodial sentence 1 0 0 0 <1 0 <1 Given fine, community or custodial sentence 1 2 <1 1 1 1 1
Unweighted base 1,524 932 1,402 1,101 2,926 2,033 4,959
• The 2005 OCJS asked respondents whether they had ever been given a caution,
reprimand or final warning by the police. Overall 10 per cent of 10- to 25-year-olds had been cautioned, reprimanded or received a final warning in their lifetime (Table 4b). As might be expected the older age group (18- to 25-year-olds) were significantly more likely than those aged from 10 to 17 to have ever received a caution, reprimand or final warning (13% versus 8%).
14 It is difficult to compare these self-report measures of contact with the criminal justice system with criminal justice statistics because the OCJS uses relatively broad offence types whereas legal offences are more finely differentiated. However, a comparison of the 2003 OCJS figures with those generated from the Offenders Index suggested that the OCJS figures were broadly in line with expectations, although there was an indication that some respondents may have forgotten or otherwise failed to report contact to the survey.

49
Offenders contact with the criminal justice system
• Young people who reported committing at least one of the 20 core offences were significantly more likely than those who had not offended in the last 12 months to have been arrested, taken to court or have been given a fine, community or custodial sentence. Just under one in ten (8%) of those who said they had offended in the last 12 months reported that they had been arrested in the same period, while one in twenty offenders (5%) had been to court. The comparable figures for non-offenders were two per cent and one per cent (Table 4b).
• Just over one in ten (11%) serious offenders said they had been arrested in the last 12
months, eight per cent had been to court and four per cent had received one of the three sentence types (Table 4b).
• Among frequent offenders (those who reported committing six or more core offences in
the last 12 months), twelve per cent had been arrested, eight per cent had been to court and four per cent had received one of the three types of sentence covered. Frequent offenders were significantly more likely to have been arrested or to have been to court than other offenders15 (12% compared with 6%; and 8% compared with 2% respectively).
• All three categories of offenders were significantly more likely to have ever been
cautioned than non-offenders (Table 4b). Table 4b Level of contact with the criminal justice system for 10- to 25-year-olds, by offender status
Notes: 1. Asked if ever received, not asked if received in the last year.
• Among the quarter of young people who reported committing a core offence in the last 12 months, nine per cent of 18- to 25-year-olds had been arrested compared with eight per cent of 10- to 17-year-olds (differences not significant). However, the older serious offenders were significantly more likely to have been taken to court; 11 per cent of 18- to 25-year-olds compared with five per cent of 10- to 17-year-olds (Table 4c).
15 Other offenders refers to those who have offended in the last year but were neither frequent offenders nor serious offenders.
2005 OCJS Offender status Percentage Non
offender Offender Serious Frequent Other All
Ever given a caution, reprimand or final warning by the police14 8 19 22 28 14 10
Arrested in last year 2 8 11 12 6 4 Taken to court in last year 1 5 8 8 2 2 Given a fine in last year 1 2 3 4 <1 1 Given a community sentence in last year <1 1 2 3 <1 <1 Given a custodial sentence in last year <1 1 1 2 - <1 Given fine, community/custodial sentence in last year 1 2 4 4 <1 1 Unweighted base 3,542 1,284 623 308 475 4,959

50
Table 4c Level of contact with the criminal justice system in last 12 months, by offender status and age
2005 OCJS Percentage Offender Serious offender Frequent offender
10 to 17 18 to 25 10 to 17 18 to 25 10 to 17 18 to 25 Arrested 8 9 10 13 15 9 Taken to court 3 6 5 *11 8 8 Given fine, community or custodial sentence 2 3 3 5 6 2 Unweighted base 848 436 409 214 191 117
Notes: 1. * indicates the figure for 18- to 25-year-olds is significantly higher than the equivalent figure for 10 to 17 year-olds. 2. Unweighted base is based on the figure for 'arrest'. Unweighted bases for other categories are slightly higher. • People who had been arrested in the last 12 months (4% all young people) were
responsible for 13 per cent of offences measured in the survey. Offence specific contact with the criminal justice system In addition to estimating general contact with the criminal justice system, it is also possible to identify the proportion of offenders who had contact with the criminal justice system in relation to the 20 core offences asked about in the survey. Respondents were asked, for each of the offence types committed, whether the police had spoken to them about the incident(s), whether this led to a court appearance and, if so, whether or not they were found guilty16. • Thirteen per cent of young people who had offended in the last year said the police had
spoken to them about at least one of the offences they had committed in the last 12 months, although not necessarily arrested them.17 Three per cent said they had appeared in court or were due to appear in court, and two per cent had been convicted of an offence (Table 4.1).
• Violent offences were the offences most likely to result in the respondent having contact
with the police at 13 per cent of offenders (Table 4.1). It is also possible to estimate the proportion of offences, which resulted in contact with the police and were proceeded against. • The proportion of offences resulting in contact was somewhat lower than the proportion of
offenders dealt with; six per cent resulted in the offender being spoken to by the police (not necessarily arrested); one per cent had led to a court appearance (Table 4.2).
• Violent offences were the offence type most likely to result in police contact (occurring for
10% of such offences), followed by criminal damage (7%) and vehicle related theft including attempts (6%) (Table 4.2).
16 Those who had committed an offence on more than one occasion in the last year were asked exactly how many of these incidents resulted in police contact, a court appearance (either already held or known to be happening in the future) and a finding of guilt. 17 The questions relating to 'core' offences asked whether the police had 'talked to' the respondent about the incident(s). It is therefore consistent that the extent of police contact on this measure is, higher than the arrest figure of eight per cent discussed earlier.

51
Table 4.1 Proportion of offenders aged from 10 to 25 in contact with the criminal justice system regarding their offence in last 12 months, by type of offence
2005 OCJS Percentage % where police
spoke to offender % resulting in
court appearance % resulting in a
conviction Unweighted
base Any property offence 9 3 2 721 Vehicle-related thefts (including attempts) 8 6 5 98 Other thefts 6 1 1 587 Theft from work 1 <1 <1 170 Theft from school 4 2 <1 326 Theft from shop 10 1 1 159 Other theft 9 1 1 98 Criminal damage 9 2 1 239 Damage to a motor vehicle 4 1 - 96 Other damage 10 2 1 189 Any violent offence 13 2 1 864 Assault with injury 12 2 2 549 Assault – no injury 9 1 1 580 Drug selling offences 6 2 2 171 All offenders 13 3 2 1,300 Table 4.2 Proportion of offences committed by 10- to 25-year-olds resulting in contact with the criminal justice system in the last 12 months, by type of offence
2005 OCJS Percentage
% where police spoke to offender
% resulting in court appearance
% resulting in a conviction
Unweighted base
Any property offence 3 1 <1 1,148 Vehicle-related thefts (including attempts) 6 2 1 119 Other thefts 2 <1 <1 716 Theft from work <1 - - 161 Theft from school 3 1 <1 304 Theft from shop 4 <1 <1 143 Other theft 6 1 1 84 Criminal damage 7 1 <1 261 Damage to a motor vehicle 3 - - 88 Other damage 9 1 <1 173 Any violent offence 10 1 <1 1,069 Assault with injury 10 1 1 514 Assault – no injury 10 <1 <1 549 Drug selling offences 1 1 - 168 All offences 6 1 <1 2,385

52
5 Anti-social and other problem behaviours The 1998 Crime and Disorder Act defined anti-social behaviour as acting in a ‘manner that caused or was likely to cause harassment, alarm or distress to one or more persons not of the same household’. However people have different expectations and levels of tolerance and what one person may find offensive or distressing, another person might view as innocuous, and whilst some anti-social behaviours are legally defined offences, others are not. Therefore trying to measure anti-social behaviour is challenging. This chapter describes the extent and trends of four anti-social behaviours committed by young people aged from 10 to 25. Factors associated with committing these anti-social behaviours are also covered. Anti-social behaviour as measured by the OCJS covers: • being noisy or rude in a public place so that people complained or the individual got into
trouble with the police • behaving in a way that resulted in a neighbour complaining • graffiti in a public place (spray paint or written on a building) • threatening or being rude to someone because of their race or religion (racially/religious
motivated abuse) This is by no means a comprehensive list of behaviours and there are some overlaps with offences (e.g. graffiti and racially/religiously aggravated abuse are criminal acts) as is also true for other problem behaviours covered in the survey. These are not included in the overall OCJS measure of the prevalence of committing anti-social behaviour and are discussed separately in this chapter. They include: • fare evasion • truanting • joyriding • driving whilst thought to be over the limit • fined or found guilty for speeding • driven without vehicle insurance or a valid driving licence EXTENT OF ANTI-SOCIAL BEHAVIOUR • Just under a quarter (23%) of young people aged from 10 to 25 had committed at least
one of the four anti-social behaviours measured in the OCJS in the last 12 months. This represents an estimated 2.6 million young people in England and Wales (95% confidence interval – from 2.4m to 2.8m).
• Being noisy or rude in public (15%) and behaving in a way that caused a neighbour
complaint (12%) were the most common anti-social behaviours committed. Graffiti and racial/religious motivated abuse were relatively rare (3% and 2% respectively). This pattern was also found in the 2004 OCJS (Budd et al., 2005) (Table 5.1).

53
Sex and age patterns for ASB • Twenty seven per cent of males had committed at least one anti-social behaviour in the
last 12 months, a significantly higher proportion than females (20%). This was true for each of the four anti-social behaviours with the exception of graffiti where similar levels were found for males and females at three per cent each (Table 5.1).
• 10- to 17-year-olds were significantly more likely than 18- to 25-year-olds to have
committed any anti-social behaviour in the last 12 months. They were also significantly more likely to have committed each of the four anti-social behaviours with the exception of racially/religiously motivated abuse where there was no difference between the two age groups.
• The proportion of young people committing anti-social behaviour was 20 per cent for
those aged 10 to 11, and was highest for those in early adolescence, peaking among 14- to 15-year-olds at 34 per cent. It was lower for older age groups. This pattern is consistent with the results from the 2004 OCJS wave.
• Being noisy or rude in public and committing graffiti also peaked in the mid teenage years
(14- to 15-year-olds). However behaviour causing a neighbour complaint and racially/religiously motivated abuse peaked among slightly older age groups (16- to 17- year-olds and 16- to 19-year-olds respectively) (Table 5.1).
• The proportion of females committing at least one of the anti-social behaviours was
highest at around a third for those aged from 14 to 15, and was somewhat lower for older age groups. By contrast for males the proportion was over a third for those aged from 14 to 19. For each age group a higher proportion of males committed anti-social behaviour than females although small base sizes mean these differences were not statistically significant (Figure 5.1).
Figure 5.1 Proportion of young people committing anti-social behaviour, by age and sex, 2005 OCJS
23
29
35 3634
22 21
16
11
24
32
26
17 1715
7
0
5
10
15
20
25
30
35
40
10-11 12-13 14-15 16-17 18-19 20-21 22-23 24-25
Age group
Perc
enta
ge
Male
Female

54
• Those committing graffiti were on average slightly younger than those who had committed
other forms of anti-social behaviour (mean and median age of 15). Other forms of anti-social behaviour had a mean age ranging from 16 to 17(Table 5a).
Table 5a Mean age of those who committed each of the four anti-social behaviours in the last 12 months
Age in years Mean age Median age Unweighted base
Noisy/rude 16 16 800 Neighbour complaint 17 17 567 Graffiti 15 15 221 Racial/religious abuse 17 17 83 Any ASB 17 16 1,226 Notes
1. Based on respondents aged from 10 to 25 who committed each anti-social behaviour. 2. The ‘any ASB’ measure includes noisy/rude, neighbour complaint, graffiti and racially/religious abuse.
How often committed each individual anti-social behaviour Respondents were asked how often they had committed each of the anti-social behaviours in the last 12 months based on the following categories: once or twice, three or four times, five to ten times or more often. • The majority of those who committed anti-social behaviour did so once or twice in the last
12 months, ranging from 56 per cent for racial/religious abuse to 69 per cent for neighbour complaint (Table 5b).
• Committing anti-social behaviour more than ten times was relatively rare, ranging from
four per cent each for being noisy/rude in a public place and for behaviour causing a neighbour to complain to seven per cent for committing graffiti. However those committing racially/religiously motivated abuse were significantly more likely to have committed it more than ten times (16%), although this equates to less than one per cent of all 10- to 25-year-olds (Table 5b). This pattern was similar to that found in the 2004 OCJS.
Table 5b Frequency of committing the four anti-social behaviours in last 12 months
(of those committing ASB) 2005 OCJS
Proportion committing ASB
Noisy/ rude Neighbour complaint
Graffiti Racial/ religious
abuse
% % % %Once or twice 63 69 59 56 3 or 4 times 21 23 23 18 Between 5 and 10 times 12 4 11 10 More than 10 times 4 4 7 16 Overall prevalence2 15 12 3 2 Unweighted base 778 554 209 79 Notes:
1. Based on respondents aged from 10 to 25 committing each ASB. 2. Based on all respondents aged from 10 to 25.

55
RISK FACTORS Similar to offending, the extent of anti-social behaviour differs among groups of young people. Respondents aged from 10 to 15 and from 16 to 25 are considered separately in this analysis as many of the questions relating to social, lifestyle and behavioural factors were different for the two age groups. Risk factors for 10- to 15-year-olds • Initial bi-variate analysis found that for those aged from 10 to 15 the level of anti-social
behaviour differed across nearly all attributes examined. For example, being male, aged from 14 to 15, committing an offence in the last 12 months, being drunk once a month or more in the last 12 months, being a victim of personal crime in the last 12 months, and getting on badly with at least one parent were all associated with committing anti-social behaviour (Table 5.2).
• Multivariate analysis, as used in Chapter 3, enables identification of those factors which, independent of the effects of others, show the highest association with committing antis-social behaviour. The particular attributes that were found to be independently statistically associated with a higher likelihood of committing anti-social behaviour for 10-to 15-year-olds are shown in Table 5c and are similar to those associated with offending for the same age group.
• The factors that were most strongly associated18 with committing anti-social behaviour for
10- to 15-year-olds were: committing an offence in the last 12 months; having friends/siblings in trouble with the police; taking any drug; and perceiving parents to have poor parenting skills.
18 The variables which have the strongest association are those where there is at least a one per cent increase in the percentage of variance explained by the model when the variable is added to the model.

56
Table 5c Factors associated with committing anti-social behaviour for 10- to 15-year- olds 2005 OCJS
Factors showing association1 Reference category Odds ratio
Committed an offence in last 12 months Not committed an offence in last 12 months
3.1
Friends/siblings have been in trouble with the police
Friends/siblings have not been trouble with the police
2.3
Taken drugs in the last 12 months Not taken drugs in last 12 months 3.4
Parents perceived to have poor parenting skills
Parents perceived to have good parenting skills
2.9
Do not trust police Trust police 1.6
One or more disorder problems in area No disorder problems in area 1.7
Victim of personal crime in last 12 months Not having been victim of personal crime
1.5
Care a little or not at all about what your parents/guardians think
Care a lot about what parents/guardians think
1.5
Brought up by one natural parent alone or with step parent or other
Brought up by both natural parents 1.5
Ever been expelled or suspended from school
Never been expelled or suspended from school
1.7
More likely to agree criminal acts are OK Less likely to agree criminal acts are OK
1.5
Notes: 1: Factors that did not appear in the model: age group, sex, ACORN classifications, parents attitude towards delinquent activities, truanted in last 12 months, perception of parenting skills, parents ever been in trouble with the police, how much time spent with the parents, been expelled/suspended, how well get on with parents/guardians, perception of school, participates in after school groups, how well get on with parents, housing tenure, attitude towards schooling and overall perception of health. 2: Odds ratio with values above one indicate higher odds of committing anti-social behaviour and those with values below one relate to lower odds in relation to the reference category.
Risk factors for 16- to 25-year-olds
• The results of the bi-variate analysis for 16- to 25-year-olds found the following factors
associated with a greater likelihood of reporting committing anti-social behaviour: being male, being aged from 16 to 17, visiting pubs and clubs frequently, being highly impulsive, taking any drugs in last 12 months, committing an offence in the last 12 months, being a victim of personal crime, one or more disorder problems in the local area, not trusting the police, the household getting into difficulties with income and being brought up by only one natural parent (Table 5.3).
• The results from the multivariate analysis found particular factors independently statistically associated with a higher likelihood of committing anti-social behaviour for 16- to 25-year-olds (Table 5d) which were similar to those associated with offending for this age group.
• The factors that were most strongly associated19 with committing anti-social behaviour for
16- to 25-year-olds were: committing any offence in the last 12 months; friends/siblings having been in trouble with the police; being highly impulsive; and taking any drugs in last 12 months.
19 The variables which have the strongest association are those where there is at least a one per cent increase in the percentage of variance explained by the model when the variable is added to the model.

57
Table 5d Factors associated with committing anti-social behaviour for 16- to 25-year- olds 2005 OCJS
Factors showing association1 Reference category Odds ratio
Committed any offence in the last 12 months Not committed an offence in last 12 months
2.6
Friends/siblings have been in trouble with the police
Friends/siblings have not been trouble with the police
2.2
Highly impulsive Not impulsive 3.2
Taken drugs in the last 12 months Not taken drugs in last 12 months 1.8
Household having difficulties managing income
Household managing well or getting by on income
2.7
Visits pub once a week or more Never visited pub or visits pub less than twice a month
1.5
Aged from 16 to 19 Aged from 20 to 25 1.2
Victim of personal crime in last 12 months Not been victim of personal crime in last 12 months
1.4
Brought up by one natural parent alone or with step parent or other
Brought up by both natural parents 1.4
Male Female 1.3
Notes: 1: Factors that did not appear in the model: attitude to certain criminal acts, perceived problems in local area, trust in the police, ever been expelled or suspended, parents ever been in trouble with the police and general health. TRENDS OVER TIME: 2003 TO 2005 OCJS The previous waves of the OCJS (2003 and 2004) also asked about various forms of anti-social and other problem behaviours. The following are directly comparable between the 2003, 2004 and 2005 waves: being noisy or rude in public; acting in a way to cause a neighbour to complain; and graffiti. • The proportion of young people committing each of the four anti-social behaviours and
the proportion committing at least one showed no significant change across the three waves of the survey. This was true for both males and females and for both 10- to 17-year-olds and 18- to 25-year-olds (Table 5.4 and Table 5.5).
OTHER PROBLEM BEHAVIOURS The OCJS also measures a variety of other problem behaviours which are not included in the overall OCJS measure of the prevalence of young people committing anti-social behaviour. They are as follows:
• fare evasion • truanting • joyriding • driving whilst thought to be over the limit • fined or found guilty for speeding • driven without vehicle insurance or a valid driving licence

58
• Just over a fifth (22%) of young people reported that they had committed fare evasion
(avoided paying the correct fare when travelling on public transport) in the last 12 months (Table 5.6). Half (52%) of this group evaded fares once or twice, just under a quarter (23%) had done so three or four times and over one in ten (14%) had evaded fares more than ten times in the last 12 months, the latter group representing three per cent of all 10- to 25-year-olds.
• The proportion of those who reported committing fare evasion was highest amongst 16-
to 17- year-olds at 40 per cent, followed by 34 per cent of 18- to 19-year-olds. This may reflect the greater use of public transport in this age group and ‘adult’ fares applying to those aged 16 and over (Table 5.6).
• Overall nine per cent of 10- to 16-year-olds had truanted in the last 12 months. Truanting
was higher for older age groups, ranging from less than one per cent of 10- to 11-year-olds to 18 per cent of 16-year-olds. There were no differences between males and females. However, those who had offended in the last 12 months were significantly more likely than non-offenders to have truanted (18% compared with 6%). Truanting rates were even higher for serious offenders (22%) and for frequent offenders (31%) (Table 5.6).
• Joyriding in the last 12 months was relatively rare at one per cent. Across the different
age groups the proportions did not exceed two per cent. • Seven per cent of all 16- to 25-year-olds had driven without vehicle insurance or a valid
driving licence in the last 12 months. Four per cent had been fined or found guilty of speeding and 10 per cent had driven when they thought that at the time they could be over the legal limit for alcohol in the last 12 months.
• Male drivers were more likely than female drivers to have committed driving offences.
Amongst those fined or found guilty for speeding in last 12 months no difference was found between males and females.
• Of those who had driven in the last 12 months, those who had offended in the same
period were significantly more likely (25%) than non-offenders (7%) to have driven without insurance, or to have driven whilst they thought they were over the alcohol limit (28% and 13% respectively). This pattern held for serious and frequent offenders (Table 5.7).

59
Table 5.1 Prevalence of anti-social and other problem behaviours in the last 12 months, by age and sex 2005 OCJS Percentage Anti-social behaviour Unweighted
base Any ASB2 Noisy/rude Neighbour
complaint Graffiti Racial/
religious abuse
All 23 15 12 3 2 4,855
Male *27 *18 *13 3 2 2,400 Female 20 13 10 3 1 2,455
10 to 11 20 13 12 2 2 216 12 to 13 27 17 12 6 1 865 14 to 15 34 26 14 10 2 941 16 to 17 31 22 15 5 3 822 18 to 19 26 17 12 2 3 701 20 to 21 20 11 12 1 1 460 22 to 23 18 10 10 <1 1 424 24 to 25 9 4 5 <1 1 426
10 to 17 *29 *20 *13 *6 2 2,844 18 to 25 19 11 10 1 1 2,011 Notes: 1. Based on respondents aged from 10 to 25. 2. The ‘any ASB’ measure includes noisy/rude, neighbour complaint, graffiti and racial/religious abuse. 3. * indicates significant differences between males and females, and between 10- to 17-year- olds and 18- to 25-
year-olds.

60
Table 5.2 Proportion of 10- to 15-year-olds committed anti-social behaviour in the last 12 months, by socio demographic and lifestyle variables 2005 OCJS Socio-demographic variable
Category Committed ASB in last 12 months
%
Unweighted base
Demographics Sex Female 25 939 Male *30 1,083 Age 10 to 11 20 216 12 to 13 27 865 14 to 15 *34 941 Lifestyle and behaviour
Drunk less than once a month in last year 25 1,825 Being drunk Drunk once a month or more in last year *65 134 Drug use Not taken drugs in last 12 months 24 1,824 Taken drugs in last 12 months *71 166
Not victim of any personal crime 21 1,399 Victim of personal crime Victim of personal crime *43 623
Less likely to agree criminal acts are OK 26 1,828 Attitude to certain criminal acts More likely to agree criminal acts are OK *46 191
Did not commit an offence 17 1,369 Whether committed an offence in last 12 months Committed an offence *55 586 Area factors
No problems 14 412 One to three problems *27 1,327
Disorder problems in the area Four or more problems *49 283
Trust police 24 1,644 Whether trust the police Do not trust police *50 345
3 least deprived areas 21 592 4 medium deprived areas *29 722
Overall indicator of deprivation 3 most deprived areas *32 560 ACORN grouping Wealthy achievers 19 531 Urban prosperity *32 150 Comfortably off *25 536 Moderate means *32 286 Hard-pressed *34 504
Quite a lot 21 789 How much to do in the area Not very much or nothing 32 1,231
Good attitude 22 481 Attitude towards local area Indifferent attitude *28 1,164 Negative attitude *36 300 Economic factors Housing tenure Owners 24 1,489 Renters *37 530
No 27 1,676 Whether receive free school meals Yes 31 303 Family factors
Get on with parent(s) 26 1,937 Whether get on with parents Get on badly with at least one parent *62 71
Good parenting skills 24 1,406 Young person's perception of parents Poor parenting skills *56 117
No friends or siblings in trouble with police in last year 19 1,375
Whether friends/siblings been in trouble with the police in the last year
Friends and/or siblings in trouble with police in last year *54 490
Who brings up Both natural parents 19 1,375
One natural parent alone or with step-parent or other *54 490 No 24 1,617 Whether parents ever
been in trouble with the police Yes *55 189

61
Table 5.2 cont. 2005 OCJS Socio-demographic variable
Category Committed ASB in last 12 months
%
Unweighted base
A lot 23 1,486 How much do you care about what your parents/guardians think A little or not at all *42 500
Parents know all of friends 21 777 Parents/guardians know who your friends are Parents only know some of friends *32 1,211
Parents perceived to have less relaxed attitude 25 1,772 Young peoples perception of parents attitudes to delinquent behaviours Parents perceived to have more relaxed attitude *54 113
Some to all of time 24 1,708 Free time spent with parents Little or no time *49 291 School factors
No 22 1,508 Whether truanted in last 12 months Yes *50 352
Never 25 1,859 Whether been suspended or expelled Have been suspended or expelled *56 157 Perception of school Good perception 24 1,435 Bad perception *48 292 Attitude to schooling Very important 23 1,398 Fairly to not very or not at all important *37 623
Participates in after school groups 25 1,376 Whether participate in after school clubs Does not participate in after school groups *34 629 Notes: 1. * indicates significant differences between the categories, where more than two categories are present the first one listed is the reference category and all other categories are compared to the reference category.

62
Table 5.3 Proportion of 16- to 25-year-olds committed anti-social behaviour in the last 12 months, by socio-demographic and lifestyle variables 2005 OCJS Socio-demographic variable
Category Committed ASB in last 12 months
% Unweighted
base Demographics Sex Female 17 1,516 Male *25 1,317 Age 16 to 17 31 822 18 to 19 26 701 20 to 21 *20 460 22 to 23 *18 424 24 to 25 *9 426 Lifestyle and behaviour
Being drunk Drunk less than once a month in last 12 months 15 1,718
Drunk once a month or more in last 12 months *30 1,071
Drug use Not taken drug in last 12 months 16 2,002 Taken drug in last 12 months *35 801 Victim of Crime Not victim of any personal crime 17 2,156 Victim of personal crime *34 677
Attitude to certain criminal acts Less likely to agree criminal acts are OK 20 2,559 More likely to agree criminal acts are OK *31 274
Participates in groups 22 1,491 Whether participates activities Does not participate in groups 21 1,342
Not committed an offence 14 2,105 Whether committed an offence in last 12 months Committed an offence *44 678
Never 21 358 Less frequent, visits less than twice a month 17 1,349
Whether visits the pub
Frequent, visits once a week or more *26 1,107 Whether visits the club Never 17 670
Less frequent, visits less than twice a month *20 1,701
Frequent, visits once a week or more *31 446 Whether impulsive Not impulsive 17 2,094 Highly impulsive *50 217 Perception of overall health Very good to good 20 2,413 Fair to poor 25 402 Area factors
No problems 15 518 Disorder problems in the area One or more problems *20 1,602 Whether trust the police
Trust police 20 1,984 Do not trust police *26 776
Least deprived areas 24 769 Overall indicator of deprivation Medium deprived areas 20 1,005 Most deprived areas 20 836

63
Table 5.3 cont. 2005 OCJS Socio-demographic variable
Category Committed ASB in last 12 months
% Unweighted
base ACORN grouping Wealthy achievers 22 693 Urban prosperity 20 205 Comfortably off 22 763 Moderate means 19 410 Hard-pressed 22 733 Unclassified 10 18 Attitudes of those aged from 16-25 towards their local area Good attitude towards local area 20 377 Indifferent attitude 21 1,900 Negative attitude towards local area 25 476 Economic Housing tenure Owners 20 1,924 Renters 25 903 How well household managing on income Well 20 1,774 Getting by 21 916 Getting into difficulties *37 110
Family and friends Whether get on with parents Get on with parent(s) 20 1,818 Get on badly with at least one parent 22 901
No friends or siblings in trouble with police in last year 15 2,091
Whether friends/siblings been in trouble with the police in the last year Friends and/or siblings in trouble with
police in last year *38 655 Who brings up Both natural parents 16 2,091
One natural parent alone or with step parent or other *39 655
Yes *28 316 Whether parents ever been in trouble with the police
No 19 2,325 School factors Whether been suspended or expelled Never 20 2,420 Have been suspended or expelled *32 353
Notes: 1. * indicates significant differences between the categories, where more than two categories are present the first one listed is the reference category and all other categories are compared to the reference category.

64
Table 5.4 Trends in ASB and other problem behaviours in last 12 months, by sex
2003, 2004 and 2005 OCJS Male Female All 10 to 25 Percentage
2003 2004 2005 2003
2004 2005 2003 2004 2005
Any ASB 32 34 32 21 22 23 26 29 27
Noisy/rude 19 24 19 12 13 13 15 18 16
Neighbour complained 16 16 17 10 11 14 13 13 15
Graffiti 4 4 4 3 4 3 4 4 4
Racial/religious abuse2 NA 2 2 NA 1 1 NA 2 2
Other problem behaviours
Fare evasion 23 24 28 19 19 21 21 22 24
Joyriding 2 2 1 1 1 1 1 1 1 Unweighted base 2,202 896 377 2,182 865 400 4,384 1,761 777 Notes: 1. Based on respondents aged from 10 to 25. 2004 and 2005 OCJS results based on fresh sample only. 2. The ‘any ASB’ measure includes noisy/rude, neighbour complaint, graffiti and racial/religious abuse.
Racially/religiously motivated attacks are included in the 2003 racial/religious abuse question but not in 2004. These figures are therefore not directly comparable though racial/religious attacks are a very small percentage.
Table 5.5 Trends in ASB and other problem behaviours in last 12 months, by age
2003, 2004 and 2005 OCJS 10 to 17 18 to 25 All 10 to 25 Percentage
2003 2004 2005 2003
2004 2005 2003 2004 2005
Any ASB 30 33 33 23 24 22 26 29 27
Noisy/rude 19 23 21 11 14 10 15 18 16
Neighbour complained 13 14 17 14 13 14 13 13 15
Graffiti 6 6 5 1 1 2 4 4 4
Racial/religious abuse2 NA 2 1 NA 2 2 NA 2 2
Other problem behaviours
Fare evasion 21 13 23 22 21 25 21 22 24
Joyriding 2 1 1 1 1 <1 1 1 1
Unweighted base 2,557 1,093 474 1,827 668 303 4,384 1,761 777 Notes: 1. Based on respondents aged from 10 to 25. 2004 and 2005 OCJS results based on fresh sample only. 2. The ‘any ASB’ measure includes noisy/rude, neighbour complaint, graffiti and racial/religious abuse.
Racially/religiously motivated attacks are included in the 2003 racial/religious abuse question but not in 2004. These figures are therefore not directly comparable though racial/religious attacks are a very small percentage.

65
Table 5.6 Prevalence of other problem behaviours in the last 12 months, by age and sex 2005 OCJS Percentage Truanted Unweighted
base Fare
evasion Unweighted
base
All 9 2,452 22 4,909
Male 8 1283 24 2,425 Female 9 1169 20 2,484
10 to 11 <1 227 9 210 12 to 13 5 891 12 886 14 to 15 15 955 23 953 16 to 171 18 379 40 836 18 to 19 - - 34 703 20 to 21 - - 23 464 22 to 23 - - 21 429 24 to 25 - - 12 428
10 to 17 - - 22 2,885 18 to 25 - - 23 2,024
Non offender 6 1,656 16 3,504
Offender 18 710 41 1,280 Frequent offender 31 161 40 625
Serious offender 22 355 52 307 Notes: 1. Truanting in the last 12 months is based on those aged from 10 to 16 who have been at school in the last 12 months. Table 5.7 Prevalence of driving related problem behaviours in the last 12 months among those who had driven a motor vehicle in the last 12 months, by age and sex 2005 OCJS Percentage
Driving without valid
insurance/licence
Driving whilst thought to be
over alcohol limit
Being fined or found guilty of
speeding
Unweighted base
All (16 – 25) (who have driven in the last 12 months)
11 17 7 1,685
Male *14 *22 8 839 Female 7 11 7 846
16 to 17 17 9 2 340 18 to 19 14 14 4 471 20 to 21 11 16 12 305 22 to 23 11 20 7 280 24 to 25 6 23 9 289 Non offender 7 13 7 1,228 Offender *25 *28 7 429 Frequent offender *37 *36 11 118 Serious offender *29 *31 7 215 Notes: 1. Based on those who had driven a motor vehicle in the last 12 months. 2: The percentages for joyriding were small ranging from two per cent to less than one per cent. 3: *indicates significant differences between males and females, and between offenders and non-offenders.

66
6 Personal victimisation This chapter examines the extent and nature of young people's personal victimisation in the last 12 months. The main focus is on personal crimes among those aged from 10 to 15 as the national victimisation survey in England and Wales, the British Crime Survey, does not provide information on personal victimisation for this age group. This chapter also covers detailed information about incidents victims had experienced, repeat victimisation, factors associated with victimisation and trend information, comparing 2005 OCJS results with those from the previous annual waves (2003 and 2004 OCJS). The definition of personal victimisation is shown in Box 6.1 and is consistent with the British Crime Survey. Victimisation covered by the OCJS is less detailed than in the BCS, and uses questions adjusted in light of the OCJS feasibility studies to be suitable for asking younger respondents. Additionally the context of the questions is different within the two surveys. Hence, it is not possible to draw direct comparisons between the OCJS and the BCS of measures of victimisation because of the differences in methodology both in terms of design and context. Box 6.1: Personal victimisation measured in the OCJS Personal thefts Assaults
Robbery20 Assault resulting in injury Theft from the person21 Assault without injury Other personal thefts22
EXTENT OF PERSONAL VICTIMISATION: PERSONAL THEFTS AND ASSAULTS • Just over a quarter (27%) of young people aged from 10 to 25 had been a victim of either
personal theft or of assault in the last 12 months (Table 6a). • 10- to 15-year-olds were more likely to have been a victim than 16- to 25-year-olds (31%
versus 25%). When looking at age in more detail, the victimisation rate was relatively stable between ages 10 to 21 (ranging between 31% and 27%), and was significantly lower at 21 per cent for ages 22 to 25. The same pattern was found in the 2004 OCJS (Budd et al 2005).
20 Definition of robbery: when force or the threat of force is used either during or immediately prior to a theft or attempted theft. Due to the small number of robbery incidents these are not analysed in details in the nature section. 21 Definition of theft from the person: thefts (including attempts) of an item directly from the person (e.g. an item that the victim was carrying or wearing). Physical force or threats are not used. 22 Definition of other personal theft: theft of personal property where there is no direct contact between victim and offender (e.g. sports equipment from changing rooms, money from locker), excluding burglary and vehicle-related thefts.

67
• The most common forms of victimisation for both age groups (10- to 15-year-olds and 16-
to 25-year-olds) were assault without injury (11%) and other personal thefts (9%). Both forms were more common among 10- to 15-year-olds.
• Males were significantly more likely than females to have been a victim of a personal
crime in the last 12 months (32% versus 22%) (Table 6.1). • Males aged from 10 to 15 were more likely than older males (16- to 25-year-olds) to have
been a victim at least once in the last 12 months (37% and 29% respectively). However the apparent difference between these two age groups for females was not statistically significant (Table 6.1).
Table 6a Proportion of young people aged from 10 to 25 who were victims once or more in the last 12 months, by age 2005 OCJS
Age groups Percentage 10-11 12-13 14-15 16-17 18-19 20-21 22-23 24-25 10-15 16-25 10-25
Any personal victimisation1 31 33 29 27 29 27 23 20 31 *25 27
Any personal theft 16 18 16 14 13 11 10 9 17 *11 13
Robbery 3 2 2 3 3 1 1 0 2 2 2
Theft from the person 6 6 5 6 4 4 2 2 6 *4 4
Other personal thefts 10 13 11 8 8 7 7 7 11 *7 9
Any assault 21 21 20 16 21 18 16 12 20 *16 18
Assault (no injury) 12 17 14 10 13 11 11 4 14 *10 11
Assault (with injury) 14 10 10 9 11 10 8 9 11 10 10
Unweighted base 228 899 973 841 712 465 433 429 2,100 2,880 4,980
Notes:
1. Personal victimisation includes robbery, theft from the person, other personal theft and assault.
2. * indicates significant differences compared with the 10- to 15-year-old age group.
Personal thefts • Thirteen per cent of young people had experienced at least one personal theft (robbery,
theft from the person, other personal thefts) in the last 12 months. The most common type of personal thefts was other personal thefts (where there is no direct contact between the victim and offender) at nine per cent.
• 10- to 15-year-olds were more likely than 16- to 25-year-olds to have been a victim of any
personal theft and more likely than 16- to 25-year-olds to have been the victim of other personal theft and of theft from the person (Table 6a).
• The proportion of young people reporting that they had been victims of robbery was
relatively small for all ages at three per cent or lower. • Males were significantly more likely than females to be the victims of robbery (3%
compared with 1%) and other personal thefts (10% versus 7%) (Figure 6.1, Table 6.1).

68
Figure 6.1 Proportion of young people aged from 10 to 25 who were victims once or more in the last 12 months, by sex, 2005 OCJS • In general males aged from 10 to 15 were more likely than those aged from 16 to 25 to
have been a victim of all personal theft categories, except for robbery which was rare for both. There were no differences between female 10- to 15-year-olds and females aged from 16 to 25 for personal thefts (Table 6.1).
Nature of personal theft The 2005 OCJS collected details about the nature of incidents victims had experienced. There were two sets of questions – one pertaining to personal theft incidents and another covering assault. Victims who had experienced more than one offence type within the two groupings were asked about one offence type only, selected in priority order23. In addition, respondents who had experienced the same offence type on more than one occasion in the last 12 months were only asked about the most recent incident. Tables 6.2 to 6.16 present the detailed results. • The items stolen and the location of the thefts were strongly related to the age of the
victim. Incidents against 10- to 15-year-olds were more likely to involve the theft of stationery and sports equipment and to have occurred at school compared with incidents against 16- to 25-year-olds. Those aged between 16 and 25 were more likely than 10- to 15-year-olds to have money, mobile phone and cards (including credit and debit cards) stolen and the most commonly mentioned locations were at a pub/bar/nightclub, in the street and at home (Tables 6.3, 6.9).
• Those aged between 16 and 25 were more likely than 10- to 15-year-olds to say they
were upset about the incident (75% versus 49% for theft from the person and 75% versus 59% for other personal thefts) and considered what had happened to them a crime (77%
23 The priority order for personal theft incidents was robbery, theft from the person and other personal thefts. For assault incidents the priority order was assault with injury and assault without injury. For example, a respondent who had been the victim of a robbery and a theft from the person would only be asked about the robbery incident.
3 4
1012
15
32
1
4
79 8
22
0
5
10
15
20
25
30
35
Robbery Theft from theperson
Otherpersonal theft
Assault withinjury
Assaultwithout injury
Personalcrime
Perc
enta
ge
MaleFemale

69
versus 37% for theft from the person and 73% versus 38% for other personal thefts) (Table 6.14).
• The majority of personal theft incidents did come to the attention of someone. For both
age groups, incidents were most likely to come to the attention of parents and friends. Similar to 2004, those who may be seen as the ‘figure of authority’ for the different age groups were more likely to find out about the incident, for example around a third of incidents against 10- to 15-year-olds came to the attention of their teachers, whereas incidents against 16- to 25-year-olds were more likely to come to the attention of the police (Table 6.16).
Assaults • Just under a fifth (18%) of young people had been a victim of some assault in the last 12
months (10% had been the victim of an assault resulting in injury and 11% an assault that did not result in injury) (Table 6a).
• Those aged between 10 and 15 and 16- to 25-year-olds experienced similar levels of
assault with injury (11% and 10%). Across the age groups the level of assault with injury fluctuated between fourteen per cent and eight per cent, however there were indications of a reduction in the proportion for older age groups, from age 12-13.
• Those aged between 10 and 15 were significantly more likely than those aged from 16 to
25 to have been victims of assault without injury (14% versus 10%). This reflects higher victimisation levels among 12- to 13-year-olds (17%) and lower levels among 24- to 25-year-olds (4%).
• Males were significantly more likely than females to have been a victim of assault (22%
compared to 13%). This pattern held for assault with injury (12% and 9% respectively) and assault without injury (15% and 8% respectively) (Figure 6.1).
• Males aged from 10 to 15 were significantly more likely than males aged from 16 to 25 to
have been a victim of assault without injury (18% and 13% respectively). The pattern was similar for females (Table 6.1).
Nature of assaults • Where injury was caused, assaults against 10- to 15-year-olds were more likely to involve
being grabbed, pushed or pulled, or being kicked, than those against 16- to 25-year-olds, which were more likely to involve being punched, slapped or hit, or to involve being hit with a weapon (Table 6.11).
• The injuries sustained in assaults were mainly minor bruising for both age groups (72%
for 10- to 15-year-olds and 68% for 16- to 25-year-olds). However, 16- to 25-year-olds were more likely than those aged from 10 to 15 to sustain more serious injuries e.g. broken bones (7% and 2% respectively) and severe bruising (16% and 12% respectively) (Figure 6.2). However, serious injury was extremely rare for respondents in this survey.

70
Figure 6.2 Injuries sustained in assaults with injury in the last 12 months, by age group, 2005 OCJS • Similar to the locations of personal theft incidents, assaults against 10- to 15-year-olds
were most likely to happen at school, while for assaults against people aged from 16 to 25 years a pub, bar or nightclub or the street were most common locations. Sixty-one per cent of assaults with injury and sixty-eight per cent of assaults without injury against 10- to 15-year-olds took place at school (Table 6.3).
• Assault victims aged from 10 to 15 were more likely than 16- to 25-year-old assault
victims to know the perpetrator in some way (93% compared with 56%, respectively, for assault with injury). Perpetrators against 10- to 15-year-olds were mainly pupil(s) (60% for both assault with and without injury) or friends (32% for assault with injury and 34% for assault without injury) and in the same age group – 10- to 15-year-olds (81% for assault with injury and 86% assault without injury) (Table 6.5).
• As with personal thefts a higher proportion of 16- to 25-year-olds than 10- to 15-year-olds
said they were upset about the incident and 16- to 25-year-olds were also more likely to say what happened to them was a crime (50% versus 16%, respectively, for assault with injury). For assault with injury 43 per cent of 10- to 15-year-olds considered the incidents to be ‘wrong but not a crime’ and 41 per cent considered the incident to be ‘something that happens’. For assault without injury 10- to 15-year-olds were more likely than 16- to 25-year-olds to say it was ‘something that happens’ (58% compared with 37%) (Table 6.14).
• Assault incidents against 16- to 25-year-olds were more likely to come to the attention of
the police than those against 10- to 15-year-olds. Incidents against 10- to 15-year-olds were most likely to be known to parents, teachers or friends (Table 6.16).
1
7
10
18
16
20
68
2
2
3
10
12
24
72
0 10 20 30 40 50 60 70 80
Other
Broken bones
Nosebleed
Severe bruising
Cuts/stab w ounds
Scratches
Minor bruises
Percentage
Aged 10 to 15
Aged 16 to 25

71
REPEAT VICTIMISATION Respondents who had been a victim at least once in the last 12 months, were asked how many times each category of victimisation had happened. • The highest levels of repeat victimisation were for assault without injury (58% of young
people). Robbery and theft from the person had the lowest repeat victimisation levels with around a quarter of victims (22% and 26% respectively) being victimised more than once (Table 6.17).
• Although a higher proportion of victims aged from 10 to 15 had experienced repeat
victimisation for each category compared with those aged from 16 to 25, assault with injury was the only category for which the difference was statistically significance (Figure 6.3, Table 6.17).
• There were no differences in the levels of repeat victimisation for males and females
(Table 6.18). Figure 6.3 Proportion of victims victimised more than once in the last 12 months, by age, 2005 OCJS RISK FACTORS The following findings are based on analysis similar to that conducted for risks of offending and committing anti-social behaviour. The risk of young people being victims varies according to many social, lifestyle and behavioural factors. Risk factors for 10- to 15-year-olds • Similar to findings for offending and anti-social behaviour the levels of victimisation
against 10- to 15-year-olds differed across many of the attributes examined. Attributes relating to higher levels of victimisation included being male, being drunk once a month or more, taking any drugs, having one or more disorder problems in the local area, having an indifferent or negative attitude towards the local area and being brought up by only one natural parent (Table 6.19).
20
34
38
56
32
43
52
60
26
38
44
58
0 10 20 30 40 50 60 70
Theft from the person
Other personal thefts
Assault w ith injury
Assault no injury
Percentage
All
10 to 15 year olds
16 to 25 year olds

72
• The factors that were found to be independently statistically associated with a higher likelihood of 10- to 15-year-olds being a victim are shown in Table 6a. The results presented here are similar to those found in the 2003 OCJS (Wood, 2005).
• Those that showed the strongest association were: committing an offence in the last 12
months, being male and having one or more disorder problems in the local area. Table 6b Factors associated with personal victimisation against 10- to 15-year-olds
2005 OCJS
Factors showing association1 Reference category Odds ratio
Committed an offence in the last 12 months Not committed an offence in the last 12 months
3.4
Male Female 2.0
One or more disorder problems in the local area
No disorder problems in the local area
2.1
Committed anti-social behaviour in the last 12 months
Not committed anti-social behaviour in last 12 months
1.4
Household rents accommodation Household owns accommodation 1.4
Bad perception of school Good perception of school 1.2
Parents perceived to have poor parenting skills
Parents perceived to have good parenting skills
1.4
Notes: 1: Factors that did not appear in the model: age group, attitude to certain criminal acts, ACORN classifications, whether brought up by natural parents, parents attitude towards delinquent activities, truanted, how well get on with parents, attitude towards schooling, been expelled/suspended, how much care what parent think, parents ever been in trouble with the police, friends/siblings ever been in trouble with the police and time spent with parents.
Risk factors for 16- to 25-year-olds
• For those aged from 16 to 25, initial bi-variate analysis found that the levels of victimisation varied across many of the attributes examined. For example being male, being drunk once a month or more, taking any drugs in the last 12 months, committing an offence in the last 12 months, committing anti-social behaviour in the last 12 months, having one or more disorder problems in the local area, indifferent or negative attitude towards the local area and being highly impulsive were more likely to be associated with being a victim in the last 12 months than other attributes (Table 6.20).
• The particular attributes that were found to be independently statistically associated with a higher likelihood of 16- to 25-year-olds being a victim of personal crime are shown in Table 6c. For 16- to 25-year-olds the factors that were most strongly associated with being a victim were: committing an offence in the last 12 months, having a negative attitude towards the local area and not trusting the police.

73
Table 6c Factors associated with personal victimisation against 16- to 25-year-olds
2005 OCJS
Factors showing association1 Reference category Odds ratio
Committed an offence in last 12 months Not committed an offence in last 12 months
3.7
Negative attitude towards local area Good or indifferent attitude towards local area
1.7
Do not trust police Trust police 1.6
Committed anti-social behaviour in the last 12 months
Not committed anti-social behaviour in last 12 months
1.4
Visits pub more than once a month Never visits pub or visits less than twice a month
1.3
Male Female 1.4
Household having difficulties managing on income
Household managing well or getting by on income
1.7
Taken drugs in the last 12 months Not taken drugs in last 12 months 1.3
Notes: 1: Factors that did not appear in the model: age group, attitude to certain criminal acts, disorder problems in area, whether brought up by natural parents, ever been expelled or suspended, general health, highly impulsive and friends/siblings in trouble with the police. TRENDS OVER TIME: 2003 TO 2005 OCJS The 2005 results were compared with those from the previous waves of the survey (2003 and 2004). For comparative purposes the 2004 and 2005 results are based on fresh sample respondents only24. • Overall the proportion of 10- to 25-year-olds who were victims in the last 12 months
remained broadly similar across the three waves and this was true for males and females and both age groups. There were some minor decreases within crime types but no evidence of an overall trend (Table 6.21, 6.22).
24 The OCJS trend data are based on fresh sample only to ensure direct comparability to 2003. There are two reasons for this. Panel cases in the 2004 and 2005 OCJS were not asked some questions where the information was available from their responses in 2003. Panel cases may be influenced in how they respond given their participation in the previous sweep – the panel effect.

74
Table 6.1 Proportion of young people who were victims once or more in the last 12 months, by age and sex
2005 OCJS Percentage
10 to 15
16 to 25
Male
Female
Male 10 to 15
Male 16 to 25
Female 10 to 15
Female 16 to 25
All
Any personal victimisation 31 *25 32 *22 37 *29 24 21 27
Any personal theft 17 *11 15 *12 21 *12 12 11 13
Robbery 2 2 3 *1 4 2 <1 1 2
Theft from the person 6 *4 4 4 7 *3 4 5 4
Other personal thefts 11 *7 10 *7 14 *8 9 7 9
Any assault 20 *16 22 *13 24 21 16 *11 18
Assault (no injury) 14 *10 15 *8 18 *13 10 *6 11
Assault (with injury) 11 10 12 *9 12 12 11 *7 10
Unweighted base 2,100 2,880 2,469 2,511 1,123 1,346 977 1,534 4,980
Notes: 1. Based on all respondents aged from 10 to 25. 2. * indicates significant differences within the columns e.g. differences between 10 to 15s and 16 to 25s. Table 6.2 Where the incident took place 2005 OCJS Percentage Robbery Theft from
the person Other
personal thefts
Assault with injury
Assault without
injury
Home 5 3 19 9 8
Someone else’s home2 2 3 4 5 5
School/college 10 38 35 28 34
Work - 3 7 5 3
Pub/bar/night club 7 15 9 19 16
Public place3 1 6 5 4 3
Shop/shopping centre 6 5 3 2 2
On the street 51 12 7 22 18
Car park 5 - 2 <1 1
Park/other open space 12 6 3 4 5
On public transport - 4 2 1 2
At station <1 2 2 1 <1
Other 1 3 3 1 3 Unweighted base 91 197 379 487 388 Notes: 1. Based on incidents against 10- to 25-year-olds who were victimised in the last 12 months. 2. Someone else’s home includes home of perpetrator 3. Public place includes restaurant/café, cinema/museum, sports centre and youth club

75
Table 6.3 Where the incident took place, by age of victim 2005 OCJS Percentage Theft from
the person Other
personal thefts
Assault with injury
Assault without injury
10 to
15 16 to
25 10 to
15 16 to
25 10 to
15 16 to
25 10 to
15 16 to
25
Home 5 1 19 20 3 13 7 8
Someone else's home2 - 5 3 5 5 4 3 6
School/college 63 15 62 13 61 5 68 9
Work - 6 - 13 - 8 - 6
Pub/bar/night club 1 28 - 15 1 32 1 28
Public place3 5 7 5 5 2 5 2 3
Shop/shopping centre 3 7 3 4 2 2 - 3
Street 13 12 3 10 17 25 11 24
Car park - - - 2 <1 <1 - 1
Park//other open space 10 2 5 1 6 2 6 5
Public transport - 7 - 3 1 <1 1 2
At station - 5 1 3 1 1 1 <1
Other - 6 - 6 - 1 1 4
Unweighted base 102 95 196 183 226 261 207 181 Notes: 1. Based on incidents against 10- to 25-year-olds who were victimised in the last 12 months. 2. Someone else’s home includes home of perpetrator 3. Public place includes restaurant/café, cinema/museum, sports centre and youth club

76
Table 6.4 Details of perpetrator(s) 2005 OCJS Percentage Robbery Assault with
injury Assault
without injury
How many perpetrator(s) % % %
One 30 46 48
Two 25 15 18
Three 23 16 12
Four or more 22 22 22
Sex of perpetrator(s)
Male 89 67 73
Female 5 24 18
Both 7 9 9
Age of perpetrator(s)2
Under 10 3 4 1
Between 10 and 15 36 36 43
Between 16 and 25 62 50 48
Between 26 and 45 5 13 10
46 and over 1 1 1
How well known % % %
Knew at least one well 14 46 42
Knew at least one by name 14 16 16
Knew at least one by sight 15 9 8
Not at all 58 29 35
Unweighted base 89 488 391 Notes: 1. Based on incidents against 10- to 25-year-olds who were victimised in the last 12 months. 2. More than one response could be given.
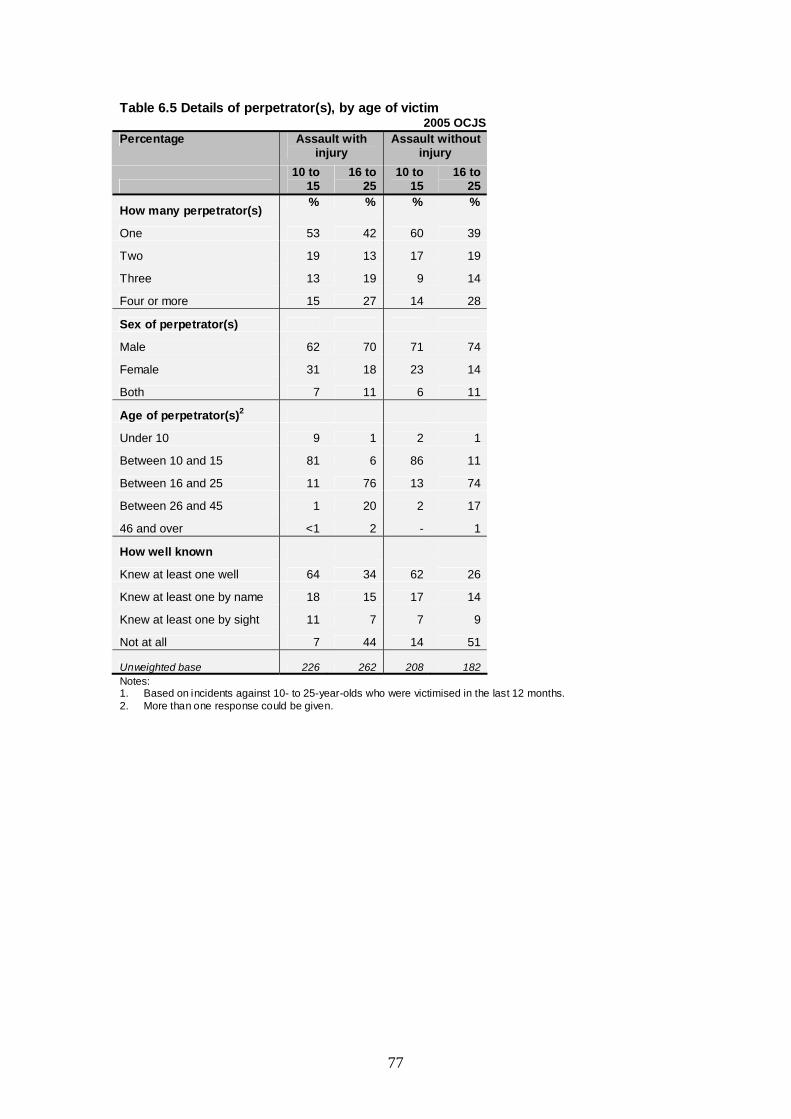
77
Table 6.5 Details of perpetrator(s), by age of victim
2005 OCJS Percentage Assault with
injury Assault without
injury
10 to
15 16 to
25 10 to
15 16 to
25
How many perpetrator(s) % % % %
One 53 42 60 39
Two 19 13 17 19
Three 13 19 9 14
Four or more 15 27 14 28
Sex of perpetrator(s)
Male 62 70 71 74
Female 31 18 23 14
Both 7 11 6 11
Age of perpetrator(s)2
Under 10 9 1 2 1
Between 10 and 15 81 6 86 11
Between 16 and 25 11 76 13 74
Between 26 and 45 1 20 2 17
46 and over <1 2 - 1
How well known
Knew at least one well 64 34 62 26
Knew at least one by name 18 15 17 14
Knew at least one by sight 11 7 7 9
Not at all 7 44 14 51
Unweighted base 226 262 208 182 Notes: 1. Based on incidents against 10- to 25-year-olds who were victimised in the last 12 months. 2. More than one response could be given.

78
Table 6.6 Relationship between victim and perpetrator(s) where known 2005 OCJS Percentage Perpetrator
Assault with injury
Assault without
injury
Partner of victim 9 3
Sibling 2 4
Parent of victim 2 1
Other relative 1 1
Friend of victim 28 30
Pupil 40 45
Neighbour 3 3
Someone seen around 16 15
Someone at work 3 2
Teacher <1 <1
Another friend/relative3 1 2
Other 4 2
Unweighted base 365 286 Notes: 1. Based on incidents against 10- to 25-year-olds who were victimised in the last 12 months and who knew their
perpetrator(s) in some way. 2. More than one response could be given. 3. Another friend/relative includes a friend/relative of another friend/re lative
Table 6.7 Relationship between victim and perpetrator(s) where known, by age of victim 2005 OCJS Percentage Assault with
injury Assault without
injury
Perpetrator 10 to 15 16 to 25 10 to 15 16 to 25
Partner of victim 1 20 <1 7
Sibling 2 2 3 5
Parent of victim 1 3 1 2
Other relative <1 2 - 3
Friend of victim 32 22 34 24
Pupil 60 17 60 24
Neighbour 4 2 <1 7
Someone seen around 11 22 8 24
Someone at work - 7 1 4
Teacher <1 - 1 -
Another friend/relative3 <1 2 - 6
Other 1 6 1 2
Unweighted base 206 159 179 107 Notes: 1. Based on incidents against 10- to 25-year- olds who were victimised in the last 12 months and who knew their
perpetrator(s) in some way. 2. More than one response could be given. 3. Another friend/relative includes a friend/relative of another friend/relative

79
Table 6.8 Items stolen 2005 OCJS Percentage Robbery Theft from
the person Other personal
thefts
Money 50 34 26
Cards (including debit, credit cards) 7 15 5
Mobile phone 50 34 20
Electrical items 4 3 6
Jewellery 6 4 7
Bicycle 15 1 14
Stationery 3 11 13
Sports equipment 1 6 3
Item of clothing 4 4 8
Bag 3 4 1
Purse/wallet 2 5 1
Other 1 16 17
Unweighted base 87 190 357 Notes:
1. Based on incidents where something was stolen in the last 12 months aged from 10 to 25. 2. More than one response could be given.
Table 6.9 Items stolen, by age of victim 2005 OCJS Percentage Theft from the
person Other
personal thefts
10 to
15 16 to
25 10 to
15 16 to
25
Money 25 43 24 27
Cards (including debit, credit cards) - 30 1 9
Mobile phone 24 43 17 23
Electrical items 3 3 3 8
Jewellery 5 3 11 4
Bicycle 1 - 11 17
Stationery 22 - 22 6
Sports equipment 12 - 5 2
Item of clothing 3 6 11 5
Bag 1 8 1 1
Purse/wallet 1 9 - 2
Other 14 17 10 23
Unweighted base 100 90 187 170 Notes: 1. Based on incidents where something was stolen in the last 12 months respondents aged from 10 to 25. 2. More than one response could be given.

80
Table 6.10 Threats and violence used 2005 OCJS Percentage Robbery
Assault with
injury Assault
without injury Threats used
Threat to hurt you 60 37 36
Threat to kill you 9 8 5
Threat to hurt people you knew 4 6 6
Threat to damage something 4 6 1
Rude/swore/called you names 18 23 28
Not specified 21 43 42
Violence used
Grabbed, pushed or pulled 36 39 35
Punched, slapped or hit 31 63 35
Kicked 7 29 8
Knifed or stabbed 1 3 -
Hit with an object or weapon 3 8 4
Scratched 1 9 2
Not specified 34 10 31
Unweighted base 91 483 385 Notes: 1. Based on respondents aged from 10 to 25 who were victimised in the last 12 months. 2. More than one response could be given.

81
Table 6.11 Threats and violence used, by age of victim 2005 OCJS Percentage Assault with
injury Assault
without injury 10 to
15 16 to
25 10 to
15 16 to
25 Threats used
Threat to hurt you 33 39 26 44
Threat to kill you 2 13 1 9
Threat to hurt people you knew 2 8 1 9
Threat to damage something 8 5 2 1
Rude/swore/called you names 23 23 26 30
Other 48 39 53 34
Violence used
Grabbed, pushed or pulled 43 36 30 39
Punched, slapped or hit 55 68 35 35
Kicked 35 25 12 6
Knifed or stabbed 1 4 - -
Hit with an object or weapon 4 12 2 5
Scratched 9 9 3 2
Other 15 6 33 29
Unweighted base 225 258 204 181 Notes: 1. Based on incidents against 10- to 25-year-olds who were victimised
In the last 12 months. 2. More than one response could be given.
Table 6.12 Injuries sustained 2005 OCJS Percentage Assault with
injury
Minor bruises 70
Nosebleed 7
Severe bruising 15
Scratches 21
Cuts/stab wounds 14
Broken bones 5
Gunshot -
Other 1
Unweighted base 461 Notes: 1. Based on incidents against young people aged from 10 to 25 who were injured in the last 12 months. 2. More than one response could be given.

82
Table 6.13 How upset were the victims and did they think it was it a crime 2005 OCJS Percentage Robbery Theft from
the person Other
personal thefts
Assault with injury
Assault without
injury
How upset % % % % %
Very/fairly 69 63 68 58 41
Not very 27 27 25 29 34
Not at all 5 10 7 13 25
Was it a crime
A crime 69 57 57 36 21
Wrong but not a crime 16 25 27 31 33
Something that happens 15 18 16 32 46
Unweighted base 91 198 381 486 390 Notes:
1. Based on incidents against young people aged from 10 to 25 who were victimised in the last 12 months.
Table 6.14 How upset were the victims and did they think it was it a crime, by age of victim 2005 OCJS Percentage Theft from
the person Other
personal thefts
Assault with injury
Assault without injury
10 to
15 16 to
25 10 to
15 16 to
25 10 to
15 16 to
25 10 to
15 16 to
25
How upset % % % % % % % %
Very/fairly 49 75 59 75 49 64 37 43
Not very 35 19 29 22 37 24 29 38
Not at all 15 6 12 3 14 12 34 19
Was it a crime % % % % % % % %
A crime 37 77 38 73 16 50 10 30
Wrong but not a crime 41 11 44 13 43 23 32 33
Something that happens 23 13 18 14 41 26 58 37
Unweighted base 103 95 197 183 225 261 208 182 Notes:
1. Based on incidents against young people aged from 10 to 25 who were victimised in the last 12 months.

83
Table 6.15 Who the incidents came to the attention of 2005 OCJS Percentage Robbery Theft from
the person Other
personal thefts
Assault with injury
Assault without
injury
No-one 15 20 23 10 20
Police 28 13 20 24 16
Teacher 8 21 17 18 13
Colleagues 1 6 12 10 9
Partner 8 13 8 14 7
Parents 61 37 46 46 36
Other relatives 18 5 12 12 8
Friends 49 40 44 50 50
Neighbours 3 <1 3 5 1
Other 1 2 6 2 3
Unweighted base 91 197 379 486 388 Notes: 1. Based on incidents against young people aged from 10 to 25 who were victimised in the last 12 months. 2. More than one response could be given.
Table 6.16 Who the incidents came to the attention of, by age of victim 2005 OCJS Percentage Theft from
the person Other
personal thefts
Assault with injury
Assault without injury
10 to
15 16 to
25 10 to
15 16 to
25 10 to
15 16 to
25 10 to
15 16 to
25
No-one 27 14 22 24 12 9 22 19
Police 4 21 9 30 11 33 3 26
Teacher 34 10 33 5 36 6 28 2
Colleagues 1 11 1 21 <1 16 0 16
Partner 5 19 0 15 4 21 <1 13
Parents 33 40 54 40 55 39 44 31
Other relatives 2 7 8 16 12 13 5 11
Friends 39 40 47 41 44 54 49 50
Neighbours 1 0 3 3 5 4 2 1
Other 1 3 2 8 2 2 2 4
Unweighted base 103 94 196 183 226 260 206 182 Notes: 1. Based on incidents against young people aged from 10 to 25 who were victimised in the last 12 months. 2. More than one response could be given.

84
Table 6.17 Proportion of victims who were victimised more than once in the last 12 months, by age
2005 OCJS
Percentage Unweighted base
All 10 to 15 16 to 25 10 to 25 10 to 15 16 to 25
Robbery 22 - - 92 - -
Theft from the person 26 32 20 226 115 111
Other personal thefts 38 43 34 437 234 203
Assault (no injury) 58 60 56 589 322 267
Assault (with injury) 44 52 38 490 227 263
Notes: 1. Based on young people aged from 10 to 25 who were victimised in the last 12 months. Table 6.18 Proportion of victims that were victimised more than once in the last 12 months, by sex 2005 OCJS
Percentage Unweighted base
Male Female Male Female
Robbery - - - -
Theft from the person 26 25 119 107
Other personal thefts 39 37 244 193
Assault (no injury) 58 57 395 194
Assault (with injury) 44 44 291 199
Notes: 1. Based on all respondents aged from 10 to 25. 2. ‘-‘ indicates unweighted base numbers too small.

85
Table 6.19 Proportion of 10- to 15-year-olds who had been a victim in last 12 months, by socio-demographic and lifestyle variables
2005 OCJS Socio-demographic variable Category Victim in last
12 months %
Unweighted base
Demographics Sex Female 24 977 Male *37 1,123 Age 10 to 11 31 228 12 to 13 33 899 14 to 15 29 973 Lifestyle and behaviour
Drunk less than once a month in last 12 months 30 1,889 Being drunk Drunk once a month or more in last 12 months *43 138 Drug use Not taken drug in last 12 months 30 1,891 Taken drug in last 12 months *46 175
Not committed an offence 22 1,415 Whether offended in last 12 months Committed an offence *54 606 Attitude to certain criminal acts Less likely to agree criminal acts are OK 30 1,899 More likely to agree criminal acts are OK *39 198 Whether anti-social behaviour in the last year
Not committed anti-social behaviour in last 12 months 24 1,434
Committed anti-social behaviour in last 12 months *48 588 Area factors Disorder problems in the area No problems 16 420 One to three problems *31 1,380 Four or more problems *51 300 Whether trust the police Trust police 29 1,704 Do not trust police *45 358 Overall indicator of deprivation 3 least deprived areas 29 612 4 medium deprived areas 30 744 3 most deprived areas 34 589 ACORN grouping Wealthy achievers 21 546 Urban prosperity *36 157 Comfortably off *31 554 Moderate means *31 299 Hard-pressed *38 529
Quite a lot 27 816 How much to do in the area Not very much or nothing *34 1,282 Good attitude 20 488 Indifferent attitude *30 1,221
Attitude towards local area
Negative attitude *50 311 Economic factors Housing tenure Owners 27 1,547 Renters *41 550
No 29 1,741 Whether receive free school meals Yes *41 312 Family factors Whether get on with parents Get on with parent(s) 31 2,007 Get on badly with at least one parent 45 76 Young person's perception of parents Good parenting skills 28 1,453 Poor parenting skills *43 118
No friends or siblings in trouble with police in last year 28 1,420
Whether friends/siblings been in trouble with the police in the last year
Friends and/or siblings in trouble with police in last year *39 507
Who brings up Both natural parents 28 1,294
One natural parent alone or with step-parent or other *36 806 No 29 1,679 Whether parents ever been in
trouble with the police Yes *42 194

86
Table 6.19 cont. Socio-demographic variable Category Victim in last
12 months %
Unweighted base
A lot 30 1,536
A little or not at all 35 524
How much do you care about what your parents/guardians think
Parents know all of friends 30 799 Parents/guardians know who
your friends are Parents only know some of friends 32 1,263 Young peoples’ perception of parents’ attitudes to delinquent behaviours Parents perceived to have less relaxed attitude 31 1,836 Parents perceived to have more relaxed attitude 31 115 Free time spent with parents Some to all of time 30 1,772 Little or no time 36 301 School factors Whether ever truanted No 30 1,886 Yes *45 187 Whether been suspended or expelled Never 30 1,932 Have been suspended or expelled *48 162 Perception of school Good perception 28 1,480 Bad perception *44 305 Attitude to schooling Very important 30 1,444 Fairly to not very or not at all important 33 655
Participates in after school groups 31 1,429 Whether participate in after school clubs Does not participate in after school groups 30 653
Notes: 1. * indicates significant differences between the categories, where more than two categories are present the first one listed is the reference category and all other categories are compared to the reference category.
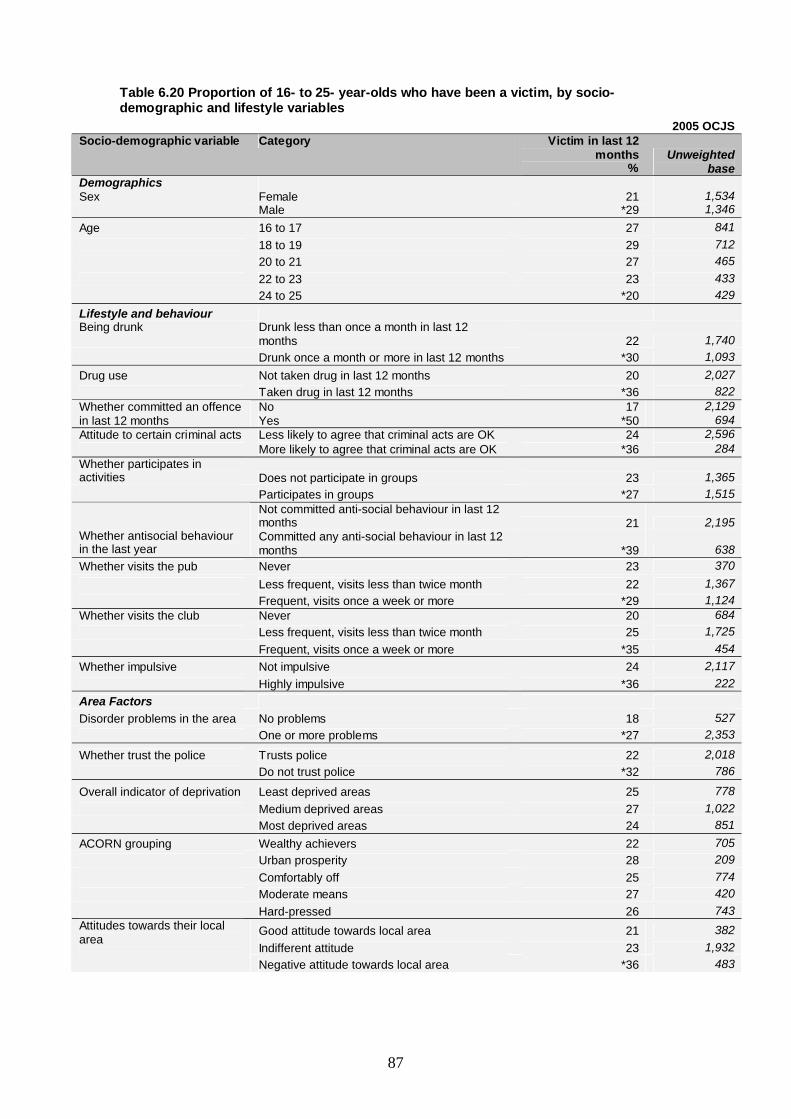
87
Table 6.20 Proportion of 16- to 25- year-olds who have been a victim, by socio-demographic and lifestyle variables
2005 OCJS Socio-demographic variable Category Victim in last 12
months %
Unweighted base
Demographics Sex Female 21 1,534 Male *29 1,346 Age 16 to 17 27 841 18 to 19 29 712 20 to 21 27 465 22 to 23 23 433 24 to 25 *20 429 Lifestyle and behaviour Being drunk Drunk less than once a month in last 12
months 22 1,740 Drunk once a month or more in last 12 months *30 1,093 Drug use Not taken drug in last 12 months 20 2,027 Taken drug in last 12 months *36 822
No 17 2,129 Whether committed an offence in last 12 months Yes *50 694 Attitude to certain criminal acts Less likely to agree that criminal acts are OK 24 2,596 More likely to agree that criminal acts are OK *36 284 Whether participates in activities Does not participate in groups 23 1,365 Participates in groups *27 1,515
Not committed anti-social behaviour in last 12 months 21 2,195
Whether antisocial behaviour in the last year
Committed any anti-social behaviour in last 12 months *39 638
Whether visits the pub Never 23 370 Less frequent, visits less than twice month 22 1,367 Frequent, visits once a week or more *29 1,124 Whether visits the club Never 20 684 Less frequent, visits less than twice month 25 1,725 Frequent, visits once a week or more *35 454 Whether impulsive Not impulsive 24 2,117 Highly impulsive *36 222 Area Factors Disorder problems in the area No problems 18 527 One or more problems *27 2,353
Whether trust the police Trusts police 22 2,018 Do not trust police *32 786
Overall indicator of deprivation Least deprived areas 25 778 Medium deprived areas 27 1,022 Most deprived areas 24 851 ACORN grouping Wealthy achievers 22 705 Urban prosperity 28 209 Comfortably off 25 774 Moderate means 27 420 Hard-pressed 26 743
Good attitude towards local area 21 382 Indifferent attitude 23 1,932
Attitudes towards their local area
Negative attitude towards local area *36 483

88
Table 6.20 cont. Socio-demographic variable Category Victim in last 12
months %
Unweighted base
Economic Housing tenure Owners 24 1,952 Renters 27 921
Well 24 1,801 How well household managing on income Getting by 25 932 Getting into difficulties *47 114
Family and friends Whether get on with parents Get on with parent(s) 27 1,852 Get on badly with at least one parent 21 912
No friends or siblings in trouble with police in last year 23 2,120
Whether friends/siblings been in trouble with the police in the last year Friends and/or siblings in trouble with police in
last 12 months *31 667 Who brings up Both natural parents 23 1,686
One natural parent alone or with step parent or other *29 741
No 25 2,355 Whether parents ever been in trouble with the police Yes 30 321 School factors
Never 24 2,460 Whether been suspended or expelled Have been suspended or expelled *35 360
Notes: 1. * indicates significant differences between the categories, where more than two categories are present the first one listed is the reference category and all other categories are compared to the reference category. Table 6.21 Trends in victimisation for young people aged from 10 to 25 in the last 12 months, by age
2003, 2004 and 2005 OJCS 10 to 15 16 to 25 All 10 to 25 Percentage
2003 2004 2005 2003
2004 2005 2003 2004 2005
Any personal victimisation 35 38 35 32 32 31 33 34 32
Any personal theft 22 24 21 18 17 17 19 19 19
Robbery 3 4 2 4 3 3 4 3 3
Theft from the person 8 8 6 8 8 **4 8 8 **5
Other personal thefts 15 16 15 9 10 10 11 12 12
Any assault 21 24 21 19 20 19 20 21 20
Assault (no injury) 15 18 15 12 11 9 13 15 *11
Assault (with injury) 11 13 13 12 12 13 12 13 13
Unweighted base 2,035 864 392 2,539 978 424 4,574 1,842 816 Notes: 1. 2004 and 2005 are based on fresh respondents only. 2. * indicates significant differences against the 2004 OCJS 3. ** indicates significant differences against the 2003 and 2004 OCJS

89
Table 6.22 Trends in victimisation for young people aged from 10 to 25 in the last 12 months, by sex
2003, 2004 and 2005 OCJS Male Female All 10 to 25 Percentage
2003 2004 2005 2003
2004 2005 2003 2004 2005
Any personal victimisation 39 38 39 27 30 25 33 34 32
Any personal theft 21 21 22 17 18 15 19 19 19
Robbery 5 5 4 2 2 1 4 3 3
Theft from the person 8 8 **5 8 8 **5 8 8 **5
Other personal thefts 13 13 14 10 12 10 11 12 12
Any assault 26 27 25 14 16 14 20 21 20
Assault (no injury) 17 18 15 9 9 8 13 15 *11
Assault (with injury) 15 16 15 8 9 11 12 13 13
Unweighted base 2,306 931 402 2,268 911 414 4,574 1,842 816 Notes: 1. 2004 and 2005 are based on fresh respondents only. 2. * indicates significant differences against the 2004 OCJS 3. ** indicates significant differences against the 2003 and 2004 OCJS

90
Appendix A Nature of offending tables
Further details about the offences committed are also covered in the OCJS e.g. where they happened, details about co-offenders and victims and motivation for the offence. These questions covered the 20 core offences. To reduce respondent burden no more than six offence types were followed up. For those respondents who said that they committed more than six offence types in the last 12 months a priority selection scheme was used to select the six offences to ask about. If respondents had committed one offence type on more than one occasion only the last incident of each offence type was asked about.
The following tables present the results from the 2005 OCJS and are based on incidents committed by 10- to 25-year-olds. Where sample sizes allow, a breakdown of the offences are shown. The number of incidents of burglary and robbery were too small to present detailed results but they are included in the overall totals for property offences and violent offences respectively. The patterns found are broadly consistent with those found and described in the 2003 and 2004 OCJS for 10- to 25-year-olds.
Table A.1 Where and when incidents happened
2005 OCJS Percentage Assault
without injury
Assault with
injury
All violent offences
Vehicle related thefts
Criminal damage
Other thefts
All property offences
Happened in local area 53 45 49 71 44 34 40 Morning (6am to noon) 8 9 9 7 5 21 17 Afternoon (noon to 6pm) 37 30 33 28 13 49 41 Evening (6pm-10pm) 20 24 22 41 37 13 20 Night (10pm-6am) 21 30 25 20 36 4 10 Don’t know/refused 14 8 11 4 9 14 12
Unweighted base 414 381 801 77 149 511 773 Notes: 1. Based on incidents committed by respondents aged from 10 to 25. 2. All violent offences include assault without injury, assault with injury and robbery. All property offences include vehicle-
related thefts, burglary, criminal damage, and other thefts.

91
Table A.2 Type of force used in assaults 2005 OCJS Percentage Assault without injury Assault with injury All assaults
% % % Grabbed, pushed or pulled 61 53 57 Punched, slapped or hit 46 72 58 Scratched 5 7 6 Kicked 16 31 23 Knifed or stabbed 0 1 1 Threatened with a weapon 0 2 1 Hit with an object or weapon 3 13 8 Other 7 5 6
Unweighted base 414 381 795 Notes: 1. Based on incidents committed by respondents aged from 10 to 25. Table A.3 Involvement of co-offenders in incidents
2005 OCJS Percentage Assault
without injury Assault
with injury All violent
offences Vehicle related thefts
Criminal damage
Other thefts
All property offences
% % % % % % % Committed on own 80 72 77 47 40 72 64 One other 4 4 4 14 16 9 10 Two others 5 5 5 7 7 9 8 Three others 3 3 3 12 16 5 7 Four others 3 4 3 4 5 1 2 Five others <1 2 1 14 3 1 3 Six or more 3 10 7 2 13 3 5
Unweighted base 395 373 773 71 130 482 712 Notes: 1. Based on incidents committed by respondents aged from 10 to 25. 2. All violent offences include assault without injury, assault with injury and robbery. All property offences include vehicle-
related thefts, burglary, criminal damage and other thefts.

92
Table A.4 Characteristics of co-offenders, based on incidents involving co-offenders 2005 OCJS
Percentage Assault without injury
Assault with injury
All violent offences
Vehicle related thefts
Criminal damage
Other thefts
All property offences
Sex % % % % % % % Male 78 88 83 64 73 43 54 Female 16 6 11 26 10 42 28 Both 6 6 6 10 17 15 18 Age(s)3 Under 10 <1 7 4 2 0 <1 <1 Between 10 and 15 38 26 31 57 56 48 47 Between 16 and 25 56 58 57 51 53 53 54 Between 26 and 45 11 22 17 10 5 9 7 46 and over 0 6 3 0 <1 0 0 Relationship to offender(s)3 Partner 6 12 9 14 11 5 7 Sibling 0 1 1 0 0 0 0 Relative 0 1 1 0 4 <1 1 Friend 72 55 63 84 85 87 84 Colleague 15 8 11 9 1 12 8 Someone else they knew 10 6 8 12 4 3 4 Stranger 8 10 9 10 2 0 3
Unweighted base 72 73 147 49 94 150 320 Notes: 1. Based on incidents committed by respondents aged from 10 to 25. 2. All violent offences include assault without injury, assault with injury and robbery. All property offences include vehicle-
related thefts, burglary, criminal damage, and other thefts. 3. More than one answer could be given.

93
Table A.5 Characteristics of victims of assault, as reported by offenders 2005 OCJS Percentage Assault without
injury Assault with
injury All assaults
Number of victims One 79 60 70 Two 13 20 16 Three 3 13 8 Four or more 5 6 6
Unweighted base 364 345 709 Sex of victim Male 76 70 73
Female 19 22 20 Both males and females 5 8 6
Unweighted base 363 344 707 Age of victim2 Under 10 4 4 4
Between 10 and 15 43 38 41 Between 16 and 25 42 49 45 Between 26 and 45 8 6 7
Between 46 and 64 3 2 2
Unweighted base 363 345 708 How well victims known All known well 67 54 61 All known by name 7 9 8 All known by sight 7 12 10 All strangers 17 22 19
Known to varying degrees (more than one victim) 2 2 2
Unweighted base 345 364 709
Relationship to offender4 Partner 7 8 7
Child 0 3 1 Parent 3 3 3 Sibling 22 21 22 Other relative <1 1 1 Friend 54 38 47 Neighbour 1 2 1 Colleague 5 5 5 Teacher <1 <1 <1
Someone else 12 31 21
Unweighted base 316 277 593 Notes: 1. Based on incidents of offending by 10- to 25-year-olds. 2. Age of youngest victim. 3. Sex and age of victim and how well known based on incidents where respondent knew the number of victims. 4. Relationship to respondent in cases where at least one victim was known in some way before the incident.

94
Table A.6 Characteristics of victims of assault, by age and sex of offender
2005 OCJS Percentage Assaults
by 10-15s Assaults by
16-25s Assaults by males
Assaults by females
Number of victims One 71 69 66 76 Two 17 16 17 15 Three 7 9 8 8
Four or more 5 6 9 <1 Unweighted base 354 355 430 279
Sex of victim Male 68 79 93 40 Female 27 14 4 49
Both males and females 5 7 4 11
Unweighted base 353 354 429 278
Age of victim2 Under 10 8 <1 2 8 Between 10 and 15 79 6 39 45 Between 16 and 25 12 76 51 36 Between 26 and 45 1 13 7 9
Between 46 and 64 <1 5 2 4 Unweighted base 354 354 430 278
How well victims known All known well 72 51 52 77 All known by name 10 7 8 8 All known by sight 7 12 12 4 All strangers 8 29 25 8
Known to varying degrees (more than one victim) 3 1 2 2
Unweighted base 354 355 430 279 Notes: 1. Based on incidents by 10- to 25-year-olds. 2. Age of youngest victim. 3. More than one answer could be given. Table A.7 Whether the offence was spur of the moment or planned
2005 OCJS Percentage Assault
without injury
Assault with injury
All violent offences
Vehicle related thefts
Criminal damage
Other thefts
All property offences
% % % % % % % Spur of moment 89 84 87 72 89 78 78 Planned 6 10 8 27 6 19 19 Don’t know 4 3 4 1 3 3 3 Refused 0 3 2 0 2 <1 1 Unweighted base 414 381 801 77 149 511 773 Notes: 1. Based on incidents committed by offenders aged from 10 to 25. 2. All violent offences include assault without injury, assault with injury and robbery. All property offences include vehicle-
related thefts, burglary, criminal damage, and other thefts.

95
Table A.8 Motivation for the offence 2005 OCJS Percentage Assault
without injury
Assault with
injury
All violent offences
Vehicle related thefts
Criminal damage
Other thefts
All property offences
Annoyed/upset by someone 48 51 49 2 12 3 5
Self-defence 23 41 31 0 1 <1 0
Revenge 12 17 14 13 10 2 5
For the fun/buzz 18 10 14 46 13 13 17
Was drunk 9 10 9 19 22 2 7
Bored/nothing else to do 9 8 9 34 41 16 23
Friends encouraged/dare 4 2 3 6 5 5 5
Under influence of drugs 2 1 2 12 <1 <1 2
Wanted what stole 0 <1 <1 25 1 26 22
Needed it/necessity 0 0 0 4 0 24 18
Racially motivated 0 1 1 0 0 1 1
Upset/frustrated <1 1 1 0 0 0 0
It was an accident <1 0 <1 0 2 1 1
Other reason 6 8 7 3 2 6 5
Don’t know 5 1 3 7 10 9 8
Unweighted base 414 381 801 77 149 511 773 Notes: 1. Based on incidents committed by offenders aged from 10 to 25. 2. All violent offences include assault without injury, assault with injury and robbery. All property offences include vehicle-
related thefts, burglary, criminal damage, and other thefts. Table A.9 Whether the offender had taken alcohol or drugs at the time of the incident
2005 OCJS Percentage Assault
without injury
Assault with injury
All violent offences
Vehicle related thefts
Criminal damage
Other thefts
All property offences
% % % % % % % Drugs only 1 3 3 2 4 2 2 Alcohol only 16 22 18 7 32 6 10 Drugs and alcohol 3 4 3 27 5 1 4 Neither 80 71 75 64 58 92 84
U i ht d b403 367 775 74 147 500 753
Notes: 1. Based on incidents committed by offenders aged from 10 to 25. 2. All violent offences include assault without injury, assault with injury and robbery. All property offences include vehicle-
related thefts, burglary, criminal damage, and other thefts.
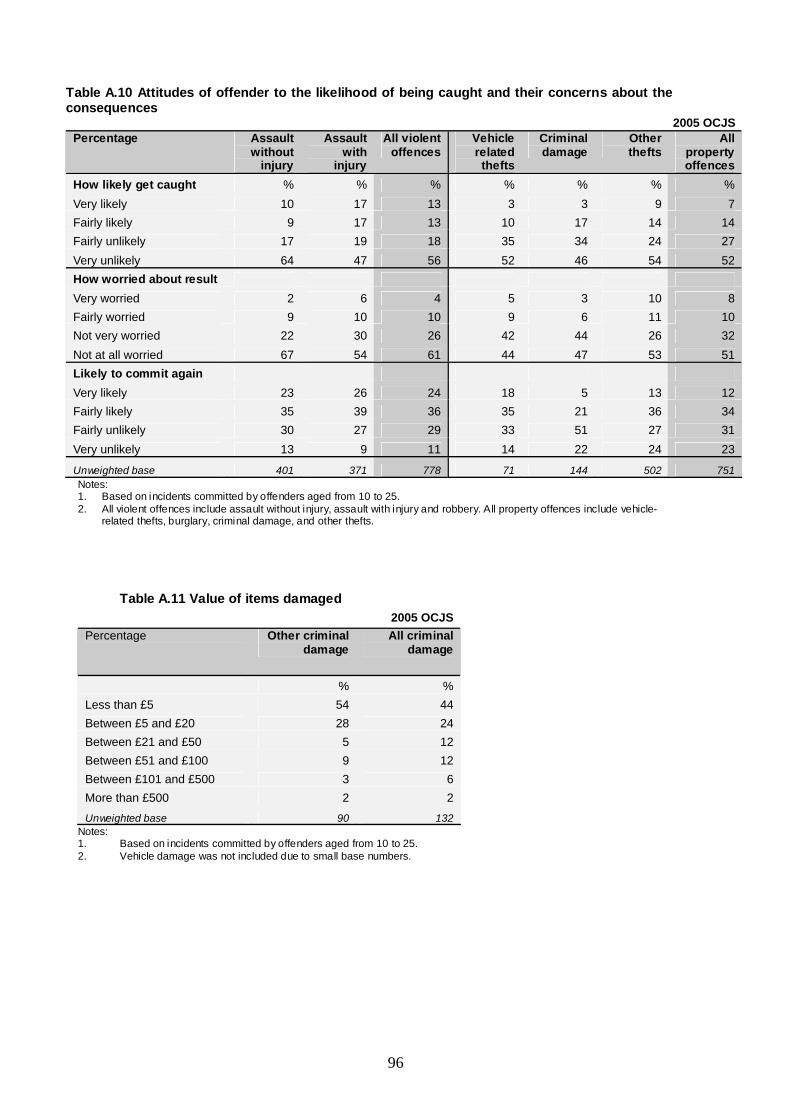
96
Table A.10 Attitudes of offender to the likelihood of being caught and their concerns about the consequences
2005 OCJS Percentage Assault
without injury
Assault with
injury
All violent offences
Vehicle related thefts
Criminal damage
Other thefts
All property offences
How likely get caught % % % % % % % Very likely 10 17 13 3 3 9 7 Fairly likely 9 17 13 10 17 14 14 Fairly unlikely 17 19 18 35 34 24 27 Very unlikely 64 47 56 52 46 54 52 How worried about result Very worried 2 6 4 5 3 10 8 Fairly worried 9 10 10 9 6 11 10 Not very worried 22 30 26 42 44 26 32 Not at all worried 67 54 61 44 47 53 51 Likely to commit again Very likely 23 26 24 18 5 13 12 Fairly likely 35 39 36 35 21 36 34 Fairly unlikely 30 27 29 33 51 27 31 Very unlikely 13 9 11 14 22 24 23
Unweighted base 401 371 778 71 144 502 751 Notes: 1. Based on incidents committed by offenders aged from 10 to 25. 2. All violent offences include assault without injury, assault with injury and robbery. All property offences include vehicle-
related thefts, burglary, criminal damage, and other thefts.
Table A.11 Value of items damaged 2005 OCJS Percentage Other criminal
damage All criminal
damage
% % Less than £5 54 44 Between £5 and £20 28 24 Between £21 and £50 5 12 Between £51 and £100 9 12 Between £101 and £500 3 6 More than £500 2 2
Unweighted base 90 132 Notes: 1. Based on incidents committed by offenders aged from 10 to 25. 2. Vehicle damage was not included due to small base numbers.

97
Appendix B Survey design The Offending, Crime and Justice Survey is conducted jointly by National Centre for Social Research and BMRB Social Research. Both companies collaborated with Home Office, Research, Development and Statistics in its design. Further details can be found in the Technical Reports for the 2003, 2004 and 2005 survey (Hamlyn et al., 2003; Hamlyn et al., 2005; Phelps et al., 2006). Further details about the OCJS and published reports can be accessed at: http://www.homeoffice.gov.uk/rds/offending_survey.html THE SAMPLE The 2005 OCJS sample consisted of two elements – the panel sample and the fresh sample. The intention was to achieve 5,000 interviews in total. Overall 5,237 interviews were obtained including 4,980 respondents aged from 10 to 25 which were used for the analysis in this report. Details of response rates for the panel and fresh sample are shown in Table B.1.
Table B.1 Response rates 2005 OCJS Panel sample Fresh sample
Number
%
Number
%
Issued addresses 5,324 6,372
Ineligible (not residential or no-one aged from 10 to 25) NA NA 4,776
Base for response rate 5,324 1,161
Non-contact 432 8.1% 42 3.6%
Refusal 386 7.3% 216 18.6%
Other unproductive 83 1.6% 26 2.2%
Interview (full) 4,418 83.0% 815 70.2%
Interview (partial) 4 0.1% 2 0.2%
Response rate (%) 83.1% 70.4% Notes: 1. Calculation of this response rate includes correction for the unknown eligibility cases following recommendations
from the Office for National Statistics. The Technical Report has further details. Survey content Similar to the two previous surveys, the 2005 interview was conducted using a laptop computer. Three separate computer-assisted modes were used during the course of the interview – CAPI, Audio-CASI and CASI. The first part of the interview was conducted face to face with the interviewer reading the questions from the computer screen and inputting the answers (Computer Assisted Personal Interviewing, CAPI). This approach was adopted for the least sensitive questions at the beginning of the interview and allowed the interviewer to build rapport with the respondent.

98
The second part of the interview, which included the more sensitive questions, was conducted as a self-completion survey, with the interviewer giving the respondent the laptop to enable him/her to input his/her responses directly (Computer Assisted Self Interviewing, CASI). This allowed respondents to report behaviours or attitudes without having to indicate these directly to the interviewer. The three core modules covering anti-social behaviour and offending behaviour used Audio-CASI, whereby in addition to the questions and response codes appearing on the screen respondents could listen to them through headphones. This assisted those with literacy problems to use the CASI facility. The modules included in the 2005 survey are documented in Table B.2 along with the mode of administration.
Table B.2 Interview content
Module Mode
Household box, socio-demographic information CAPI
Area and social capital CAPI
Attitudes to the criminal justice system CAPI
Victimisation CAPI
Anti-social behaviour A-CASI
Fraud and technology crime A-CASI
Offending – count A-CASI
Offending – nature CASI
Drug use CASI
Alcohol use CASI
Family, education, and health (including gangs) CASI
WEIGHTING AND DATA ANALYSIS Given the complex sample design, a sophisticated weighting system was adopted to ensure that results were representative of the population of 10- to 25-year-olds in England and Wales. Initially separate weights were constructed for the panel and fresh samples respectively. For both samples the first stage was to apply weights for known unequal selection probabilities (relating to the selection of addresses, households and individuals within households) and then for non-response. The panel sample required a further stage of weighting to account for the attrition between the three surveys. The samples were then combined and calibration weighting applied to ensure that the sample distributions on age, sex and Government Office Region matched population distributions.

99
METHODOLOGICAL CONSIDERATIONS Several methodological issues warrant discussion as they bear on how the results presented in this report are interpreted. Sample coverage The 2005 OCJS covered young people resident in general households in England and Wales. It excluded those living in communal or institutional establishments (such as custodial institutions, residential homes, hospitals and hostels) and the homeless. A feasibility study commissioned by the Home Office concluded that the inclusion of such establishments would not significantly impact on overall offending and drug use estimates because these groups form such a small proportion of the overall population (the feasibility study report can be accessed at http://www.homeoffice.gov.uk/rds/offending_survey.html). It was therefore concluded that a full-scale communal establishment survey was not warranted, and that consideration should instead be given to bespoke surveys with specific groups of interest. Sampling error As with any sample survey the results are subject to sampling error – i.e. the results from a sample selected from the population could differ from those that would be obtained if the entire population had been surveyed, or another sample taken. The degree of error depends on the size and design of the sample and the size and variability of the estimate of interest. The OCJS has a relatively large sample but the estimates will still be subject to error. Statistical theory enables the calculation of the degree of error for any estimate. This report mainly draws on the statistically significant results. Where differences between subgroups are highlighted the differences are statistically significant at the five per cent level (the level at which there is a one in twenty chance of an observed difference being solely due to chance) unless otherwise stated. Non-response bias Although the response rate is high for a national survey covering such sensitive topics, it may be that non-respondents differ in some key respects from those who do respond. In addition, for the panel sample a model was constructed to identify characteristics associated with attrition between 2003, 2004 and 2005 and this was used to compute non-response weights. Offence coverage The survey does not cover all legal offences. In particular very serious offences including homicide and sexual offences are omitted. The main focus of the OCJS was on 20 core offences, and the wording of questions on these was carefully considered to reflect legal definitions in simple, understandable language (see Box B.2 for list of offences covered). However, it should be recognised that within any of these legal categories the nature of the incident could vary greatly. The survey also covered some other offences – for example, handling stolen goods which are described in the report but in less detail.

100
Box B.2 Core offences Vehicle-related thefts Other thefts Theft of a vehicle Theft from the person Attempted theft of a vehicle Theft from place of work Theft of parts off outside of vehicle Theft from school Theft of items inside a vehicle Theft from shop Attempted theft from vehicle Other theft Criminal damage Assaults Criminal damage to a vehicle Assaults resulting in injury Other criminal damage Assaults not resulting in injury Burglary Selling drugs Burglary of a dwelling Selling Class A drugs Burglary of commercial premises Selling other drugs Robbery Personal robbery Commercial robbery
Note on logistic regression Logistic regression is a multivariate statistical technique that predicts the outcome of a dependent variable, which has only two possible outcomes (a binary, or dichotomous, variable), from a set of independent variables. Multivariate techniques allow the assessment of which of the independent variables are statistically related to the dependent variable when the influence of all other variables under consideration is taken into account. The logistic regression method used in this report was the forward stepwise selection. Regression models based on social survey data may only explain a small part of the variance in the dependent variable, because it is not possible to capture all of the possible relevant information. Where the attribute to be predicted (e.g. offending in the last year) is rare in the population, the model sometimes predicts that no-one will have the attribute. Such models are still useful, however, as they can show the extent to which having one attribute (e.g. being male) appears to increase the chances of having another attribute (e.g. having offended in the last year). The forward stepwise logistic regression described in this report selects those variables, in order of their strength of prediction, that are statistically associated with the dependent variable independently of the other variables included in the model. This does not imply a causal relationship, and care is needed in selecting variables for inclusion.

101
Appendix C Definitions of risk factors Lifestyle and behaviour Committed any anti-social behaviour All respondents aged from 10 to 25 were asked whether they had been involved in the following: • been noisy or rude in a public place so that someone complained or you got into trouble; • has a neighbour complained because they were annoyed by your behaviour or noise in or
near your home; • written things or sprayed paint on a building, fence, train or anywhere else where you
shouldn’t have; or • threatened or been rude to someone because of their skin colour, race or religion. A dichotomous variable was created and coded: • committed any asb in last 12 months; • not committed any asb in last 12 months. Committed an offence All respondents aged from 10 to 25 were asked if they had committed one or more of the 20 main core offences asked in the survey. A dichotomous variable was created and coded: • committed any offence in last 12 months; • not committed any offence in last 12 months. Victim of personal crime All respondents aged from 10 to 25 were asked if they had been a victim of the following in the last 12 months: • robbery • theft from the person • other theft of personal property • assault resulting in injury • assault without injury A dichotomous variable was created and coded: • victim of personal crime in last 12 months; • not victim of personal crime in last 12 months. Felt drunk more than once a month All respondents aged from 10 to 25 were asked how often they had felt drunk in the last year. Analysis coded as: • felt drunk once a month or less in last year (includes those that never drink alcohol). • felt drunk more than once a month in last year. Taken any drug in last year All respondents aged from 10 to 25 were asked whether they had taken different drugs in the last year, covering: • glues, solvents, gas or aerosols • amyl nitrites • cannabis • amphetamines • ecstasy

102
• LSD or magic mushrooms • cocaine • crack • heroin A dichotomous variable was created and coded as: • not taken any drug in last 12 months • taken any drug in last 12 months. Visits pub All respondents aged from 10 to 25 were asked: About how often do you usually go to a pub or bar (without your parents/guardians)? For analysis, recoded into: • visits pub once a week or more • visits pub less than once a week • has never visited a pub. Visits club All respondents aged from 10 to 25 were asked: About how often do you usually go to a nightclub? For analysis, recoded into: • visits club once a week or more • visits club less than once a week • has never visited a club. Highly impulsive Respondents aged from 17 to 25 were asked a series of questions exploring their personality traits, many of which focused on impulsive tendencies. These questions were as follows: “Do you agree or disagree? • I like taking risks in life • I often say things without thinking • I always give in to temptation • I think carefully about the consequences before making decisions • I easily lose my patience with people”. For each variable a score was assigned for the responses with scores of 1 for the most impulsive response and 4 for the least impulsive. A scoring variable was created and coded as: • not impulsive (scores of 11 to 20) • highly impulsive (scores of 5 to 10) Criminal acts perceived to be ok All respondents aged from 10 to 25 were asked whether or not they thought it was OK to commit criminal acts under various circumstances. They were asked how much do you agree or disagree with the following. • It is ok to steal something if you are very poor • It is ok to steal something from somebody rich who can afford to replace it • It is ok to steal something from a shop that makes a lot of money • It is ok to sometimes break the law. For each variable a score was assigned for the responses with scores of 1 for strongly agree and 5 for strongly disagree. A scoring was created and coded as: • more likely to agree that criminal acts are OK (scores 4 to 13) • less likely to agree that criminal acts are OK (scores 14 to 20)

103
Perception of overall health All respondents were asked how is your health in general nowadays? • very good • good • fair • poor • very poor A dichotomous variable was created and coded as: • very good or good • fair to poor.
Area factors Attitudes towards local area Respondents aged from 10 to 15 were asked how much they agreed or disagreed with the following statements: • This area is a friendly place to live. • You often see strangers in this area. • If children around here are causing trouble, local people will tell them off. • This area is a place where people from different backgrounds get on well together. • They were also asked how safe they felt walking or playing alone in the area after dark. Respondents aged from 16 to 25 were additionally asked how much they agreed or disagreed with the following statements: • I trust most people who live in this area. • People in this area pull together to improve the area. • People move in and out of my area a lot.
They were also asked: “Suppose you dropped a purse or wallet in a street near where you live, with your name and address in it. How likely is it that you would get it back with nothing missing?” For each variable a score was assigned for the responses with scores of 1 for the most positive attitude and 5 for the least positive attitude. A scoring variable was created and coded as: • Positive attitude towards area (scores 5 to 10 for 10 to 15s; 9 to 18 for 16 to 25s) • Indifferent attitude towards area (scores 11 to 15 for 10 to 15s; 19 to 29 for 16 to 25s) • Negative attitude towards area (scores 16 to 25 for 10 to 15s; 30 to 45 for 16 to 25s) Disorder problems in area All respondents were asked if any following things were common in their area: • noisy neighbours • teenagers hanging around causing problems • people sleeping rough on the street or in other public places • people being harassed in the street (because of their skin colour) • people using or selling drugs • people being drunk or rowdy in public A scoring variable was created and coded as: • no problems • one to three problems • four or more problems.

104
Trust local police All respondents aged from 10 to 25 were asked how much do you trust the police in your area? A dichotomous variable was created: • yes (trusts the police a lot or a fair amount) • no (trusts the police not very much or not at all). How much to do in area All respondents aged from 10 to 16 were asked: “How much do you think there is for you to do in this area? • lots of things to do • quite a lot to do • not very much to do • nothing at all to do.” A dichotomous variable was created and coded: • lots or quite a lot to do • not very much or nothing to do. Family and friends Gets/got on with parents when aged from 10-16 All respondents aged from 10 to 25 were asked how well they got on with their parents. • between the ages of 10 and 16 how well did you get on with your mother? • between the ages of 10 and 16 how well did you get on with your father? • between the ages of 10 and 16 how well did you get on with your parents or guardians? The new variable was created and recoded as follows: • gets/got on well with parent(s) • gets/got on badly with at least one parent. Friends or siblings been in trouble with the police All respondents aged from 10 to 25 were asked the following: “Thinking about your closest friends. About how many of them, if any, have been in trouble with the police in the last 12 months? (Do not include driving fines.)” “Thinking about your brother/sister. As far as you know, have any of them been in trouble with the police in the last 12 months?” The new variable was coded as: • no friends/sibling in trouble with police in last 12 months (for analysis purposes those with
no friends and siblings are included in this category) • friend and/or siblings in trouble with police in last 12 months.
Manage on income
All respondents aged from 10 to 25 were asked how well the household is managing on their income? Responses are: • well • getting by • getting into difficulties. Time spent with parents Respondents aged from 10 to 16 were asked: “How much of your free time – that is when you are not at school - do you spend with your parents or guardians?” • all of my free time

105
• most of my free time • some of my free time • a little of my free time • none of my free time For analysis purposes responses were changed and coded as: • spends all or most of my free time with parents • spends some, little or no free time with parents. Parents perceived attitude to certain behaviours Respondents aged from 10 to 16 were asked a series of questions on whether their parents would mind (a lot, a little or not at all) if they did certain things, as follows: • your parent(s) found out you had started a fight with someone • you had written things or sprayed paint on a building • you had skipped school without permission • you had smoked cannabis. For each question a score was assigned for the responses with scores of 1 for ‘parents would mind a lot’ through to 3 for ‘parents would not mind at all’. A dichotomous variable was created and coded as follows: • parents’ attitudes not favourable towards delinquent behaviours (scores 4 to 6) • parents’ attitudes favourable towards delinquent behaviours (scores 7 to 12) Perceptions of parents’ parenting skills Respondents aged from 10 to 16 were asked whether the following statements were true or not: “My parent(s) usually praise me when I have done well, for example at school or playing sport.” • my parent(s) usually listen to me when I want to talk • my parent(s) usually treat me fairly when I have done something wrong • my parent(s) usually want to know where I am when I am not at home • my parent(s) often argue or fight with each other For each question a score was assigned for the responses with scores of 2 for poor parenting skills and 1 for good parenting skills. A variable was created and coded as follows: • perceive parents having good parenting skills (scores 5 to 6) • perceive parents having poor parenting skills (scores 7 to 10) Who brings up/brought up respondents Respondents aged from 10- to 16-year-olds year were asked who brings them up most of the time and for those aged from 17- to 25-years-old were asked who brought them up between the ages of 10 and 16. The responses were as follows: 1 Both natural parents 2 One natural parent only 3 One natural parent and a step parent 4 Other arrangement -8 DK -9 Refused For analysis purposes the variable was changed and coded as: • Both natural parents' • One natural parent alone or with step parent or other

106
School factors Perception of teaching skills and discipline Respondents aged from 10 to 16 were asked: • whether they have seen pupils hit teachers • teachers give praise when due • school has clear rules • how easy it is to play truant. For each question a score was assigned for the responses with scores of 2 for negative perceptions and 1 for positive perceptions. Scoring variable was created and coded as: • school perceived to have good teaching skills and discipline (scores 4 to 5) • school perceived to have poor teaching skills and discipline (scores 6 to 8). Ever been expelled or suspended from school All respondents aged from 10 to 25 were asked: “Have you ever been expelled (permanently excluded) from a school?” “Have you ever been suspended from school for a limited period of time?” A dichotomous variable was created: • never been expelled or suspended from school • has been expelled or suspended from school. Truanted All respondents aged from 10 to 16 and had been in school in the last 12 months were asked In the last 12 months have you skipped school without the school's permission for at least a whole day? • no • yes, once or twice • yes, 3 or 4 times • yes, 5 to 10 times • yes, more than 10 times A dichotomous variable was created and coded: • no • yes School thought not to be important: 10- to 15-year-olds were asked: How important is doing well at school/college to you? A dichotomous variable was created: • school thought to be very or fairly important • school thought not to be very or not at all important.

107
References Budd, T., Sharp, C., Weir, G., Wilson, D. and Owen, N. (2005). Young People and Crime: Findings from the 2004 Offending, Crime and Justice Survey. Home Office Statistical Bulletin 20/05. London: Home Office. Flood-Page, C., Campbell,S., Harrington, V. and Miller, J. (2000). Youth Crime: Findings from the 1998/99 Youth Lifestyle Survey. Home Office Research Study 209. London: Home Office. Hamlyn, B., Maxwell,C., Hales, J. and Tait, C. (2003). 2003 Crime and Justice Survey (England and Wales) Technical Report. London: National Centre for Social Research/BMRB Social Research. Hamlyn, B., Maxwell, C., Phelps, A., Anderson, T., Arch, J., Pickering, K. and Tait, C. (2005). 2004 Crime and Justice Survey (England and Wales) Technical Report. London: National Centre for Social Research/BMRB Social Research. Mori (2004). Youth Survey. London: Youth Justice Board. Phelps, A., Maxwell, C., Anderson, T., Pickering, K. and Tait, C. (2006). 2005 Offending, Crime and Justice Survey (England and Wales) Technical Report. London: National Centre for Social Research/BMRB Social Research. Walker, A., Kershaw, C. and Nicholas, S. (2006). Crime in England and Wales 2005/2006. Home Office Statistical Bulletin 12/06. London: Home Office. Wood, M. (2005). The Victimisation of Young People: Findings from the 2003 Crime and Justice Survey. Home Office Findings 246. London: Home Office.

108
RESEARCH DEVELOPMENT AND STATISTICS (RDS)
MISSION STATEMENT
RDS is part of the Home Office. RDS staff are embedded within delivery
groups working closely with front-line staff. The HO Chief Scientific Advisor,
who is also Director of RDS, oversees professional development for RDS
teams, quality assurance and strategic R & D issues.
The Home Office’s purpose is to build a safe, just and tolerant society in which
the rights and responsibilities of individuals, families and communities are
properly balanced and the protection and security of the public are
maintained.
RDS includes staff within the Government Statistical Service (GSS). One of
the GSS aims is to inform Parliament and the members of the public about the
state of the nation and provide a window on the work and performance of
government, allowing the impact of government policies and actions to be
assessed.
Therefore:
Research Development and Statistics in the Home Office improves policy making, decision taking and practice in support of the Home
Office purpose and aims, to provide the public and Parliament with information necessary for informed debate and to publish information for future use.