The earliest occupation of north-west Europe: a coastal perspective
83
Chapter 7
hopewell oCCupation at the hopeton earthworks: large sCale surfaCe survey using
gps teChnology
By Jarrod Burks and Dawn walter
Current models of Ohio Hopewell settlement (e.g., Dancey and Pacheco 1997) situate earthwork complexes near the center of the community and suggest that Hopewell groups lived a fairly sedentary life in small settlements dispersed across the landscape. Such a model implies that Hopewell earthworks were essentially vacant much of the year until the arrival of visiting groups. With such an influx of perhaps hundreds of individuals, an obvious question is where did everyone eat, sleep, and prepare for these important activities while visiting the ceremonial center and can these occupations be distinguished through archeological means?
If use of the earthwork area was limited to short term occupations focused on activities common to such ceremonial centers (e.g., feasting, dancing, seasonal, and mortuary ceremonies), then the following expectations should hold:
1. unless relatively permanent buildings were in place to house the temporary influx of visitors, debris should be scattered and minimally clustered,
2. tool diversity should be low since only a narrow range of production activities were required,
3. lithic debris should be focused on tool maintenance and use, and
4. subsurface facilities like storage and cooking pits should be small and scattered, except in the case of large communal facilities.
In 2001, National Park Service archeologists from Hopewell Culture National Historical Park, with the assistance of a small number of volunteers, conducted systematic surface collections from a large area within and near the Hopeton Earthworks (Burks et al. 2002; Burks and Walter 2003). In this chapter we present the results of the 2001 surface collection at the Hopeton Earthworks and use these data to explore the above expectations. While a significant amount of Hopewell debris was found, much of it was scattered across the survey area outside of the earthworks. Few high density Hopewell clusters were encountered, suggesting the presence of intermittent occupations rather than longer-term settlements.
84
Footprints
the survey area
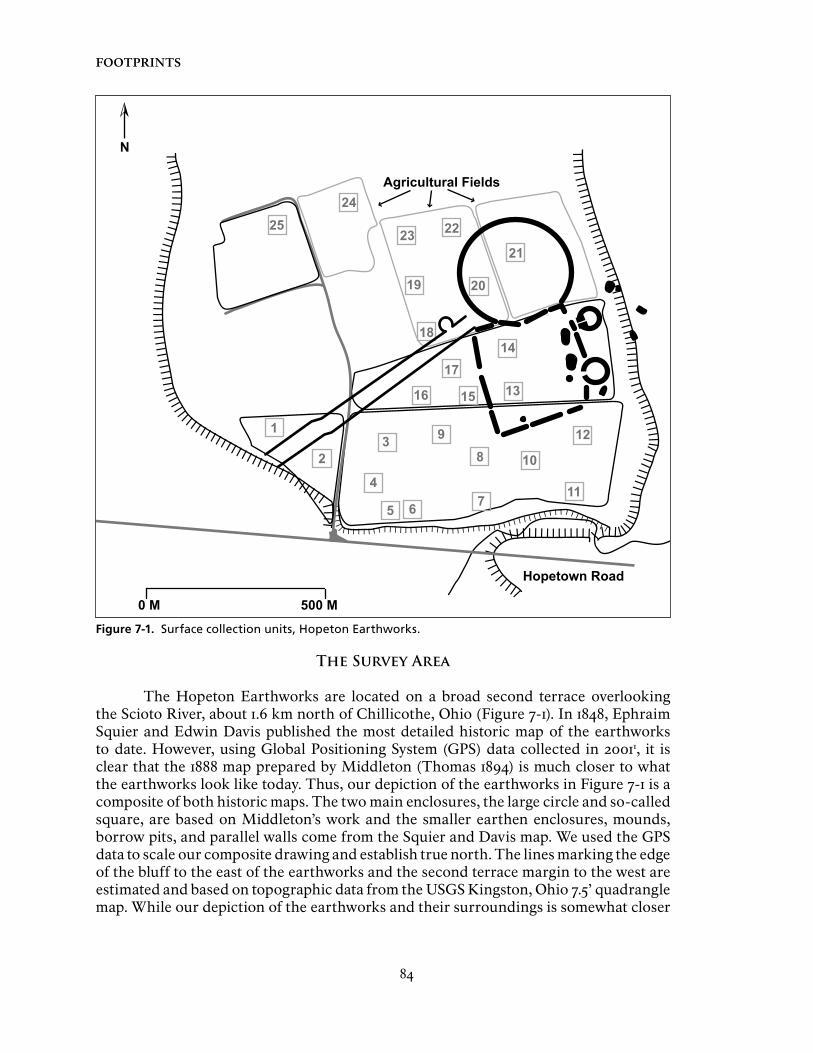
The Hopeton Earthworks are located on a broad second terrace overlooking the Scioto River, about 1.6 km north of Chillicothe, Ohio (Figure 7-1). In 1848, Ephraim Squier and Edwin Davis published the most detailed historic map of the earthworks to date. However, using Global Positioning System (GPS) data collected in 20011, it is clear that the 1888 map prepared by Middleton (Thomas 1894) is much closer to what the earthworks look like today. Thus, our depiction of the earthworks in Figure 7-1 is a composite of both historic maps. The two main enclosures, the large circle and so-called square, are based on Middleton’s work and the smaller earthen enclosures, mounds, borrow pits, and parallel walls come from the Squier and Davis map. We used the GPS data to scale our composite drawing and establish true north. The lines marking the edge of the bluff to the east of the earthworks and the second terrace margin to the west are estimated and based on topographic data from the USGS Kingston, Ohio 7.5’ quadrangle map. While our depiction of the earthworks and their surroundings is somewhat closer
l l l l l l l l l l l l l l l l l l l l l l l l l l l l l l l l l l l l l l l l l l l l l l l l l l l l l l l l l l l l l l l l l l l l l l l l l l l l l l l l l l l l l l l l l l l l l l l l l l l l l l l l l l l l l l l l l
l l l l l l l l
l l l l l l l l l l l l l l l
l l l l
l l l
l l l l l l l l l l l l l l l l l l l l l l l l l
l l l
l l l
l l l
l l l
l l l
l l l
l l l
l l l
l l l
l l l
l l l
l l l
l l l
l l l
l l l
l l l
l l l
l l l
l l l
l l l
l l l
l l l
l
2524
23 22
19 20
21
18
17
16
14
15 13
12
11
108
7
93
4
5 6
Hopetown Road
Agricultural Fields
1
2
N
0 M 500 M
Figure 7-1. Surface collection units, Hopeton Earthworks.
85
Hopewell occupation -- Burks and walter
to reality than either of the historic maps, a National Park Service map based on detailed topographic and geophysical data should be used for future research.
The survey area consists of seven agricultural fields covering 69.6 ha of the terrace on which the earthworks are located (Figure 7-1). Surface conditions were ideal for much of the survey. During the approximate four months over which the survey took place, each of the fields was disked. Survey work was begun in each of the newly disked fields only after significant rainfall.
survey Methodology
The 2001 surface survey at the Hopeton Earthworks was conducted using a series of transects spaced 10 m apart. The survey began in each field by using a laser transit to set out pin flags at 100 m intervals. These flags served as grid nodes. Once in place, we used a 100 m tape measure to set in pin flags every 10 m in long parallel lines in between the grid nodes. This system allowed us to walk long parallel survey transects perpendicular to the rows of pin flags, with each pin flag marking the centerline of a survey transect. As surveyors walked each transect, additional pin flags (of a different color) were used to mark all artifacts at the surveyor’s feet in a 1 m wide corridor. In effect, this allowed us to conduct a 100 percent systematic collection over a 10 percent sample of each field. Only a very few temporally diagnostic objects were encountered by chance in between the survey transects and these were also collected.
The location of every flagged object was measured in using a Trimble ProXR GPS with a backpack-mounted antenna. Each object location is an average of at least three real-time corrected GPS positions, providing an accuracy of no worse than about ±50 cm for each object. Fire-cracked rock (FCR) was left in the field while all other prehistoric objects were collected into sequentially numbered bags and returned to the lab for further analysis. The surface survey covered a total of 69.9 ha and piece-plotted 12,541 objects, a roughly 10 percent sample of what was present on the surface.
survey results
Based on past investigations at Hopeton (Brose 1976; Ruby 1997a, Ruby 1997b, Ruby 1997c), we were aware that our survey universe contained a number of artifact concentrations dating to the Late Archaic, Middle Woodland, Late Woodland, and Late Prehistoric periods. Thus, one of our primary goals was to ascertain whether or not we could tease apart temporally distinctive landuse patterns across the terrace. Specifically, we wondered if GPS piece-plotting would allow us to pinpoint discrete Hopewell occupations and provide enough information to compare one occupation area to another.
In the sections that follow, we examine the overall spatial patterning of time-sensitive objects, including projectile points and bladelets, and compare them to the distribution of chert raw material types in an attempt to identify temporally distinctive debris clusters. We then use a siteless approach to more closely examine debitage characteristics in 25 50 x 50 m sample blocks strategically overlaid on the data so as to sample high and low density areas near to, as well as away from, the earthworks. The
86
Footprints
results of these analyses show that Middle Woodland period debris varies in composition and density based on distance from the earthworks and the terrace margin. Other time periods seem to have been more focused on the terrace margin, with minimal evidence of occupation in the area of the earthworks.
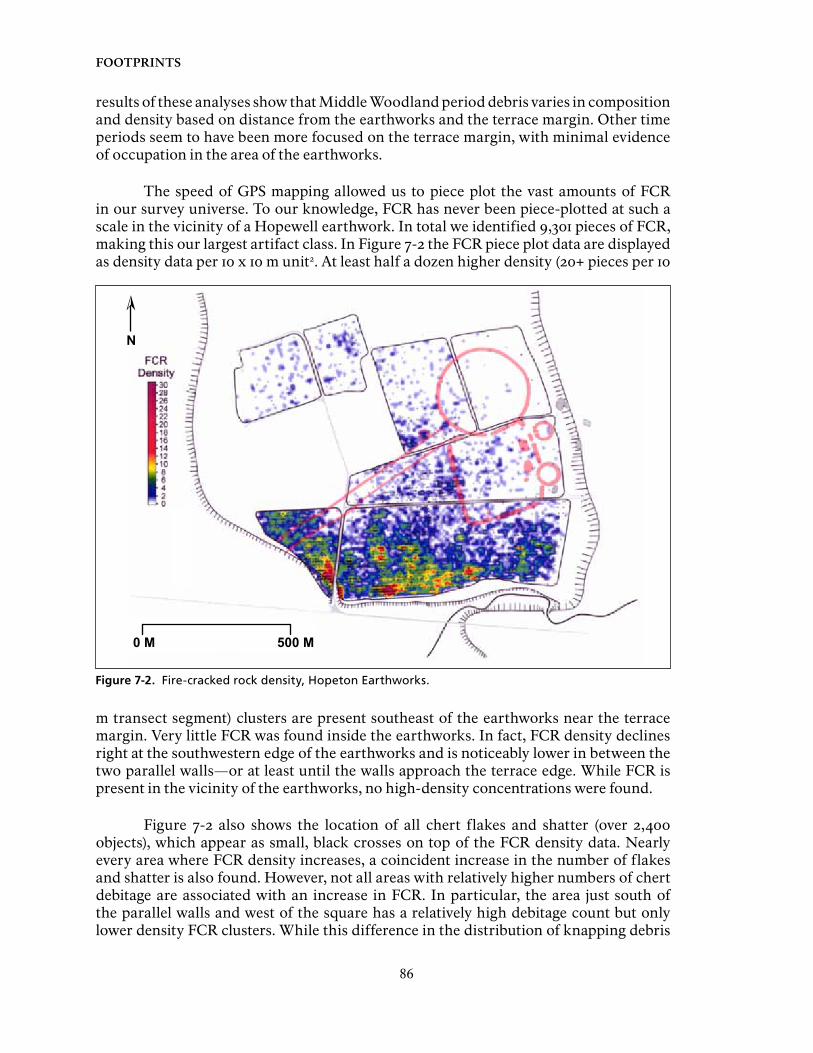
The speed of GPS mapping allowed us to piece plot the vast amounts of FCR in our survey universe. To our knowledge, FCR has never been piece-plotted at such a scale in the vicinity of a Hopewell earthwork. In total we identified 9,301 pieces of FCR, making this our largest artifact class. In Figure 7-2 the FCR piece plot data are displayed as density data per 10 x 10 m unit2. At least half a dozen higher density (20+ pieces per 10
m transect segment) clusters are present southeast of the earthworks near the terrace margin. Very little FCR was found inside the earthworks. In fact, FCR density declines right at the southwestern edge of the earthworks and is noticeably lower in between the two parallel walls—or at least until the walls approach the terrace edge. While FCR is present in the vicinity of the earthworks, no high-density concentrations were found.
Figure 7-2 also shows the location of all chert flakes and shatter (over 2,400 objects), which appear as small, black crosses on top of the FCR density data. Nearly every area where FCR density increases, a coincident increase in the number of flakes and shatter is also found. However, not all areas with relatively higher numbers of chert debitage are associated with an increase in FCR. In particular, the area just south of the parallel walls and west of the square has a relatively high debitage count but only lower density FCR clusters. While this difference in the distribution of knapping debris
0 M 500 M
N
Figure 7-2. Fire-cracked rock density, Hopeton Earthworks.
87
Hopewell occupation -- Burks and walter
versus the byproducts of thermal facilities (e.g., FCR) could be a reflection of occupation length, it most likely represents a functional difference in the use of space, i.e., thermal facilities that produced FCR were less frequent immediately adjacent to the earthworks at Hopeton. Additional evidence presented below shows that this simple difference in the distribution of FCR and debitage is related to time period as well, a fact that can be better resolved by looking at the distribution of select chert raw material types.
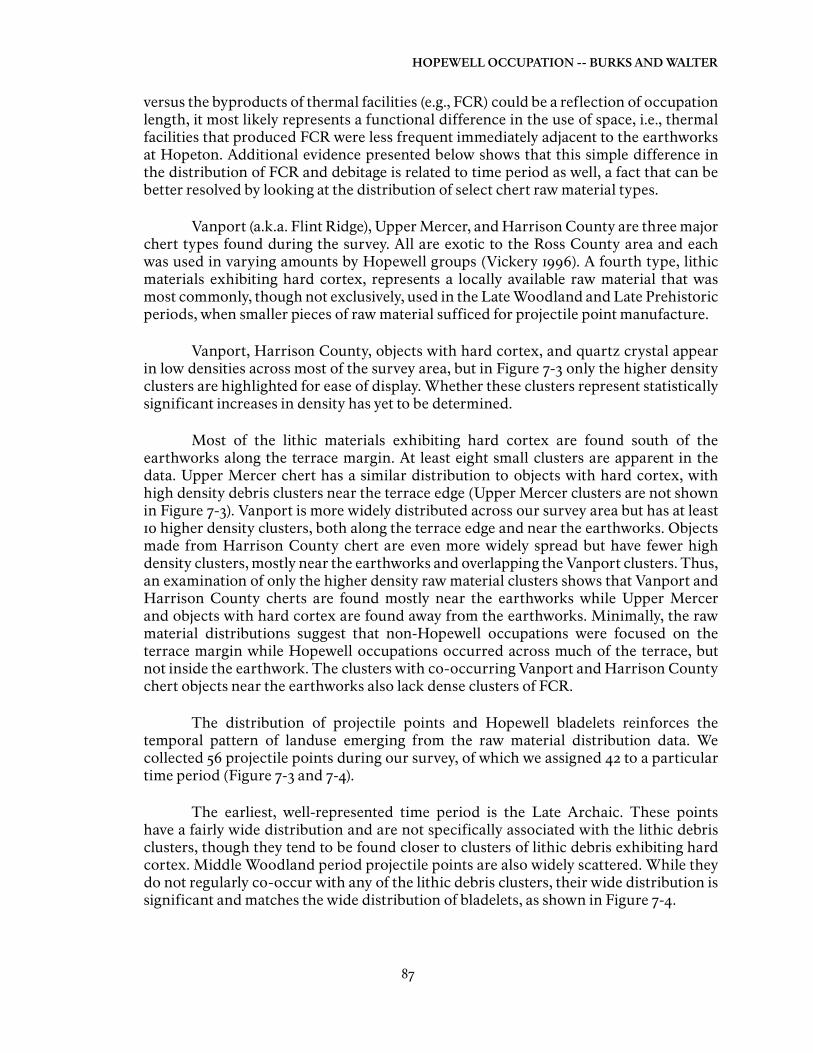
Vanport (a.k.a. Flint Ridge), Upper Mercer, and Harrison County are three major chert types found during the survey. All are exotic to the Ross County area and each was used in varying amounts by Hopewell groups (Vickery 1996). A fourth type, lithic materials exhibiting hard cortex, represents a locally available raw material that was most commonly, though not exclusively, used in the Late Woodland and Late Prehistoric periods, when smaller pieces of raw material sufficed for projectile point manufacture.
Vanport, Harrison County, objects with hard cortex, and quartz crystal appear in low densities across most of the survey area, but in Figure 7-3 only the higher density clusters are highlighted for ease of display. Whether these clusters represent statistically significant increases in density has yet to be determined.
Most of the lithic materials exhibiting hard cortex are found south of the earthworks along the terrace margin. At least eight small clusters are apparent in the data. Upper Mercer chert has a similar distribution to objects with hard cortex, with high density debris clusters near the terrace edge (Upper Mercer clusters are not shown in Figure 7-3). Vanport is more widely distributed across our survey area but has at least 10 higher density clusters, both along the terrace edge and near the earthworks. Objects made from Harrison County chert are even more widely spread but have fewer high density clusters, mostly near the earthworks and overlapping the Vanport clusters. Thus, an examination of only the higher density raw material clusters shows that Vanport and Harrison County cherts are found mostly near the earthworks while Upper Mercer and objects with hard cortex are found away from the earthworks. Minimally, the raw material distributions suggest that non-Hopewell occupations were focused on the terrace margin while Hopewell occupations occurred across much of the terrace, but not inside the earthwork. The clusters with co-occurring Vanport and Harrison County chert objects near the earthworks also lack dense clusters of FCR.
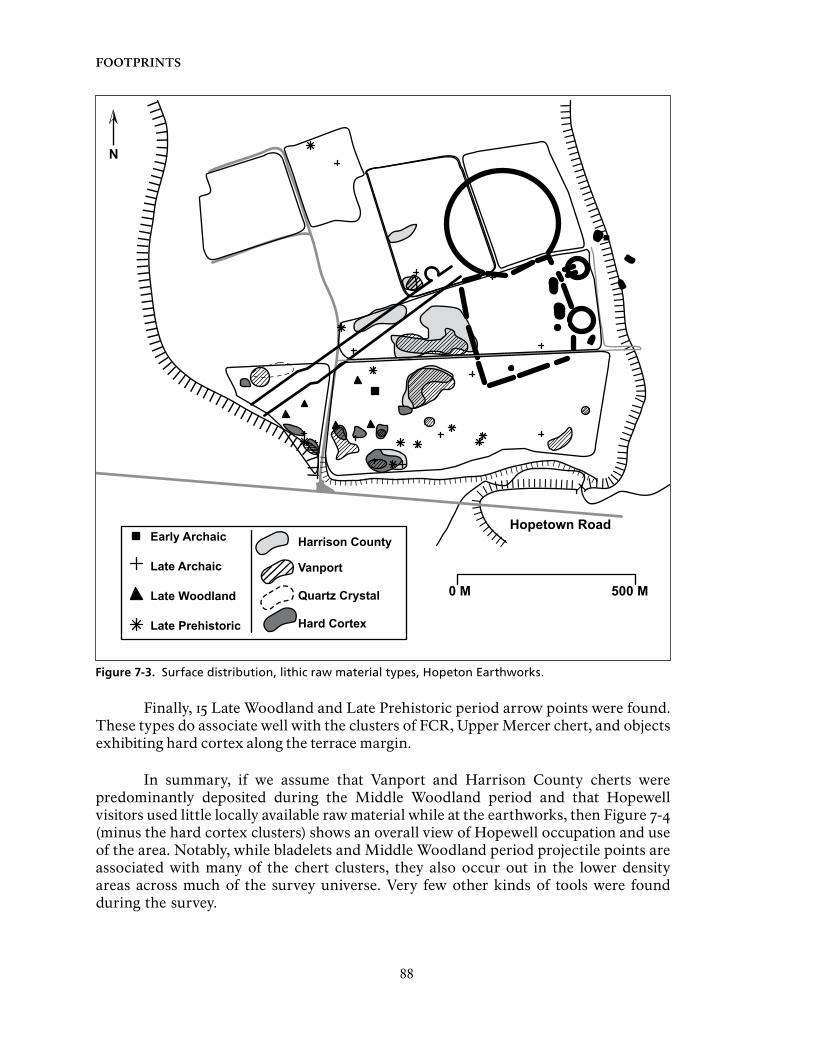
The distribution of projectile points and Hopewell bladelets reinforces the temporal pattern of landuse emerging from the raw material distribution data. We collected 56 projectile points during our survey, of which we assigned 42 to a particular time period (Figure 7-3 and 7-4).
The earliest, well-represented time period is the Late Archaic. These points have a fairly wide distribution and are not specifically associated with the lithic debris clusters, though they tend to be found closer to clusters of lithic debris exhibiting hard cortex. Middle Woodland period projectile points are also widely scattered. While they do not regularly co-occur with any of the lithic debris clusters, their wide distribution is significant and matches the wide distribution of bladelets, as shown in Figure 7-4.
88
Footprints
Finally, 15 Late Woodland and Late Prehistoric period arrow points were found. These types do associate well with the clusters of FCR, Upper Mercer chert, and objects exhibiting hard cortex along the terrace margin.
In summary, if we assume that Vanport and Harrison County cherts were predominantly deposited during the Middle Woodland period and that Hopewell visitors used little locally available raw material while at the earthworks, then Figure 7-4 (minus the hard cortex clusters) shows an overall view of Hopewell occupation and use of the area. Notably, while bladelets and Middle Woodland period projectile points are associated with many of the chert clusters, they also occur out in the lower density areas across much of the survey universe. Very few other kinds of tools were found during the survey.
l l l l l l l l l l l l l l l l l l l l l l l l l l l l l l l l l l l l l l l l l l l l l l l l l l l l l l l l l l l l l l l l ll l l
l l l l
l l l
l l l l l l l l l l l l l l l l l l l l l l l l l
l l l
l l l
l l l
l l l
l l l
l l l
l l l
l l l
l l l
l l l
l l l
l l l
l l l
l l l
l l l
l l l
l l l
l l l
l l l
l l l
l l l
l l l
l
l l l l l l l l l l l l l l l l l l l l l l l l l l l l l l l l l l l l l l l
l l l l l l l
l l l l l l l l l l l l
0 M 500 M
Hopetown Road
N
Early Archaic
Late Archaic
Late Woodland
Late Prehistoric
Harrison County
Vanport
Quartz Crystal
Hard Cortex
Figure 7-3. Surface distribution, lithic raw material types, Hopeton Earthworks.
89
Hopewell occupation -- Burks and walter
Based on these data, our first two expectations presented at the beginning of the chapter are met and the following working hypotheses can be put forth:
1. Hopewell occupation near the earthworks was short term and scattered. The dispersed distribution of Hopewell objects such as bladelets, projectile points, and low density lithic raw materials suggests that most areas of the terrace surrounding the earthworks were occupied. Low densities of FCR in these areas support the idea of short term occupation;
2. There were strict rules against depositing debris inside the earthworks and/or these areas were periodically cleaned of all occupation and use debris;
l l l l l l l l l l l l l l l l l l l l l l l l l l l l l l l l l l l l l l l l l l l l l l l l l l l l l l l l l l l l l l l l l
l l l l l
l l l
l l l l
l l l l l l l l l l l l l l l l l l l l l l l l l
l l l
l l l
l l l
l l l
l l l
l l l
l l l
l l l
l l l
l l l
l l l
l l l
l l l
l l l
l l l
l l l
l l l
l l l
l l l
l l l
l l l
l l
l l l l l l l l l l l l l l l l l l l l l l l l l l l l l l l l l l l l l l l
l l l l l l l
l l l l l l l l l l l l
0 M 500 M
Harrison County
Vanport
Quartz Crystal
Hard Cortex
Middle Woodland Projectile
Bladelet & Blade Core
Hopetown Road
N
Figure 7-4. Surface distribution, bladelets and Middle Woodland projectile points, Hopeton Earthworks.

90
Footprints
3. Select areas near the earthwork edges, and perhaps recognized entrances, were special-use zones. As such, these areas may contain the remains of ceremonial and gearing-up facilities, including preparation areas, buildings, caches, and large cooking pits.
In the next section, we more closely examine the lithic debris in order to address expectation number three and further support the three working hypotheses.
the surface Data: a siteless approach
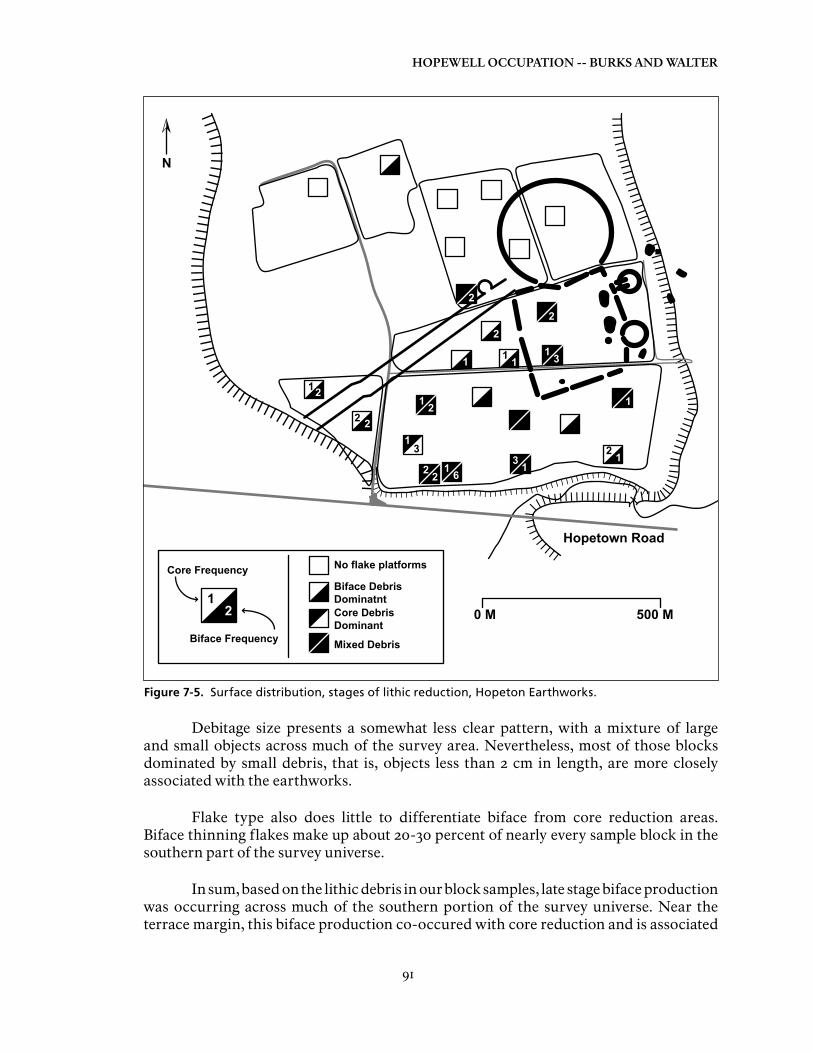
For this chapter, we wanted to speak more specifically about some of the lithic reduction activities represented by the surface collection debris. To this end, we reanalyzed the 2001 assemblage and coded for lithic reduction characteristics such as platform type, debris size, and the presence of biface production debris. To avoid creating site assemblages by drawing arbitrary lines around seemingly clustered groups of artifacts, we have instead overlaid a series of 25 50 x 50 meter sample blocks on the survey universe (Figure 7-1). While these sample blocks were not randomly positioned, their wide distribution allows us to more specifically compare debris between comparable units within, near, and away from the earthworks. For example, the bladelets in Figure 7-4 look to be fairly evenly distributed outside the earthworks, with possible clusters near the parallel walls. However, using the sample block approach, it is clear that none of the 25 sample blocks include an unusual abundance of bladelets and over half of the blocks lack bladelets altogether (Table 7-1). Thus, while bladelets are widely scattered, the block samples show that they do occur more frequently near the earthworks, but in low density.
The sample blocks also work for studying the distribution of the kinds and stages of lithic reduction present around the earthworks. In an attempt to differentiate between core reduction and biface reduction debris, we looked at platform type, debitage size, and flake type. Platforms were differentiated based on Andrefsky’s (1998) four basic platform types: Type 1 is completely covered in cortex, Type 2 has a single facet, Type 3 is multifaceted, and Type 4 has a ground or abraded platform surface. According to Andrefsky, Types 1 and 2 are more typical of core reduction and Types 3 and 4 are commonly associated with later stage biface production. Only one of the sample blocks contained a predominance of flakes with platforms consistent with core reduction debris (platform Types 1 and 2), and it is located away from the earthworks (Figure 7-5). Nine of the blocks have platforms suggesting a mixture of core and biface reduction. Another nine of the blocks closer to the earthworks have assemblages more consistent with later stage biface reduction.
The distribution of cores and bifaces supports this pattern of biface production near the earthworks and mixed biface and core reduction near the terrace margin. Cores are most prevalent in the sample blocks near the terrace margin. The location of early stage bifaces and later stage and complete bifaces supports the pattern presented by the distribution of platform type. Later stage bifaces tend to be more prevalent near the earthwork.
91
Hopewell occupation -- Burks and walter
Debitage size presents a somewhat less clear pattern, with a mixture of large and small objects across much of the survey area. Nevertheless, most of those blocks dominated by small debris, that is, objects less than 2 cm in length, are more closely associated with the earthworks.
Flake type also does little to differentiate biface from core reduction areas. Biface thinning flakes make up about 20-30 percent of nearly every sample block in the southern part of the survey universe.
In sum, based on the lithic debris in our block samples, late stage biface production was occurring across much of the southern portion of the survey universe. Near the terrace margin, this biface production co-occured with core reduction and is associated
l l l l l l l l l l l l l l l l l l l l l l l l l l l l l l l l l l l l l l l l l l l l l l l l l l l l l l l l l l l l l l l l l
l l l l l
l l l
l l l l l l l l l l l l l l l l l l l l l l l l l l l
l l l
l l l
l l l
l l l
l l l
l l l
l l l
l l l
l l l
l l l
l l l
l l l
l l l
l l l
l l l
l l l
l l l
l l l
l l l
l l l
l l l
l l l
l
l l l l l l l l l l l l l l l l l l l l l l l l l l l l l l l l l l l l l l l
l l l l l l l
l l l l l l l l l l l l
2 21 6
3 1
1 2
13
1 1
2
11 3
2
2 1
1
22
21
0 M 500 M
No flake platforms
Biface Debris DominatntCore Debris Dominant
Mixed Debris
Core Frequency
Biface Frequency
12
Hopetown Road
2
N
Figure 7-5. Surface distribution, stages of lithic reduction, Hopeton Earthworks.
92
Footprints
with the Late Archaic, Middle Woodland, Late Woodland, and Late Prehistoric periods. However, closer to the earthworks, where Middle Woodland diagnostics predominate, it seems Hopewell visitors to the earthworks were also finishing, maintaining, and discarding their bifaces. However, as with the bladelets, biface reduction activities were fairly widespread and not concentrated in any one area. Core reduction, especially with locally available pebble cores, on the other hand, is mostly confined to the terrace margins with the largely non-Middle Woodland period debris.
Discussion and Conclusion
The 2001 surface survey at the Hopeton Earthworks encountered a wide range of debris from numerous time periods. By looking at the distribution of chert raw material types and temporally diagnostic stone tools, it seems clear that the debris closer to the earthworks is predominantly Middle Woodland period in origin and that the clusters closer to the terrace margin are a mixture of Woodland and Late Prehistoric period occupations. While the non-Hopewell occupations produced fairly concentrated debris deposits, Hopewell remains are scattered across much of the terrace outside of the earthworks.
The lack of high densities of Hopewell debris suggests that visitors occupied much of the area on the terrace surrounding the earthworks at Hopeton. Such widespread use of the area may indicate that the earthworks were only in use for a short time and/or that there were few limitations in place to control landuse outside the earthworks—be they formal rules of landuse or the presence of fixed buildings.
This compares differently to DeBoer’s modern case from the Cayapas Basin in northern Ecuador (DeBoer 1997). As proposed for Scioto Valley Hopewell groups in Ohio, the Chachi of Ecuador are organized into dispersed communities of small settlements. Periodically, members of these communities aggregate at ceremonial centers that contain permanent structures but are largely vacant for most of the year. Because of the permanency of the ceremonial center accommodations and facilities and the fact that the ceremonial centers are used longer than any one domestic site is occupied, deep middens accumulate at the Chachi centers. As DeBoer notes, the long-term, periodic reuse of the Chachi ceremonial centers “can create the archeological appearance of large, sedentary settlements” (1997:227). Thus, while relatively dense clusters of Hopewell debris are present adjacent to the earthworks at Hopeton, the higher artifact density is likely more a reflection of repeated reuse than occupation permanency. The lack of FCR at these clusters also sets them apart from the known longer-term domestic occupations, which are blanketed in FCR.
Recent geophysical survey in 2003 at a selection of clusters near the earthworks and clusters along the terrace margin further supports these conclusions (Burks and Walter 2003). Few geophysical anomalies, i.e., subsurface facilities, were found at small clusters away from the earthworks, numerous large and small anomalies are present beneath one of the dense clusters near the terrace margin, and unusually large anomalies were present beneath one of the lithic debris clusters near the earthworks. While it is not yet possible to say how many people used the earthwork facilities at any one time,
93
Hopewell occupation -- Burks and walter
the distribution of surface debris suggests that groups visiting the earthworks stayed in small, short term camps spread out around the earthworks.
acknolwedgments
Drafts of this chapter were first presented at the 2002 and 2003 Society for American Archeology meetings in Denver and Milwaukee, respectively. A number of people participated in the various stages of this project. We would like to acknowledge the assistance of the following individuals: Dean Alexander, Lance Love, Michelle Lundy, Susan Lundy, Mandy Murray, Jennifer Pederson Weinberger, Larry Wickliff, and Kathy Brady-Rawlins. While their assistance helped make the project a success, we the authors are ultimately responsible for any errors in detail or logic.
notes
1. The earthworks were mapped with the GPS by walking the inside and outside edges of the currently visible earthworks. GPS data points were collected at a timed interval as the instrument operator walked along the visible break in slope of the earthworks. This mapping technique is limited by two obvious sources of error. First, while surface visibility was excellent and the earthworks were clearly apparent during the survey, the location of the “edges” of the earthworks is somewhat subjective and based on the observations of the instrument operator. Second, each GPS position is only accurate to within about ±1 meter at a 99 percent confidence interval.
2. To convert the continuously distributed FCR piece plot data into density data, a 10 x 10 m, arbitrary grid was laid over a map showing the location of every piece of FCR. The grid for each agricultural field was positioned such that the survey transects crossed the middle of each 10 x 10 m unit. Each unit was assigned northing and easting coordinates and an FCR frequency, the latter of which comes from the 10 meter long segment of the one meter wide survey transect that falls within the 10 x 10 m unit. These data were entered into an Excel database as XYZ data. Once an entire agricultural field was completed, the data were pulled into the Surfer software and gridded using the Nearest Neighbor method with 10 x 10 m grid line spacing. An image map was then produced with the gridded data and each field’s map was independently fit to the final map shown in Figure 7-2.

94
Footprints
Copyright © 2022 FDOKUMEN