HLA genes in Arabic-speaking Moroccans: close relatedness to Berbers and Iberians
11
Key words: Mediterraneans; Imazighen; Berbers; Guanches; Moroccans; Albanians; Turks; Iranians; Egyptians Acknowledgments: This work was supported in part by grants from the Ministerio de Educacio ´n (PM95–57 and PM96–21) and Comunidad de Madrid (06/70/ 97 and 8.3/14/98). Received 1 July, revised, accepted for publication 3 December 1999 Copyright c Munksgaard 2000 Tissue Antigens . ISSN 0001-2815 Tissue Antigens 2000: 55: 239–249 Printed in Denmark . All rights reserved 239 E. Go ´mez-Casado HLA genes in Arabic-speaking Moroccans: P. del Moral close relatedness to Berbers and Iberians J. Martı ´nez-Laso A. Garcı ´a-Go ´mez L. Allende C. Silvera-Redondo J. Longas M. Gonza ´lez-Hevilla M. Kandil J. Zamora A. Arnaiz-Villena Abstract: The gene profile of Arabic-speaking Moroccans has been com- pared with those of other Mediterranean populations in order to provide additional information about the history of their origins. Our HLA data suggest that most Moroccans are of a Berber (Imazighen) origin and that Arabs who invaded North Africa and Spain in the 7th century A.D. did not substantially contributed to the gene pool; however, they imposed their ad- vanced culture and their religion. Present-day Egyptians are also related to Moroccan Berbers and this supports an ancient Saharan origin for part of the present-day Mediterraneans, particularly for the Arabic-speaking ones (also Algerians) and also for the older substratum of Mediterranean people. The highly polymorphic HLA system has been validated as useful for distinguishing and/or relating populations (and individuals) in many papers and in all the subsequent international workshops (n57) since the First International HLA Anthropology Workshop (Evian, 1970). HLA gene frequencies correlates with geographically related populations; the existence or absence of gene flow among neighbours may be assessed with the study of HLA frequencies and the corresponding genetic distances (1, 2). Complementary data from mtDNA, Y chromosome or other nuclear markers are always desirable for population history interpretation. The view that in the Neolithic Period a scattering of Berbers (Imazighen) pastoralists and cultivators (a few hundred thousand) existed in northern Africa and that they remained at a simple Neo- lithic level while other Mediterraneans were evolving through the Bronze and Iron Ages is currently disputed (3). By 1000 B.C., Phoen- icians from Lebanon did not find a Stone Age Neolithic culture in Maghreb (4), but a series of Numid organized states (or complex social groups) which extended from Tunisia to the Canary Islands (3). Indeed, autochthonous Tamazight (Berber) language and in- scriptions are found (the so called Libyc inscriptions). Phoenicians Authors’ affiliations: E. Go ´mez-Casado 1 , P. del Moral 2* , J. Martı ´nez-Laso 1* , A. Garcı ´a-Go ´mez 1 , L. Allende 1 , C. Silvera-Redondo 1 , J. Longas 1 , M. Gonza ´lez-Hevilla 1 , M. Kandil 3 , J. Zamora 1 , A. Arnaiz-Villena 1 1 Department of Immunology and Molecular Biology, 12 de Octubre, Universidad Complutense, Madrid, Spain, 2 Department of Anthropology, Facultad de Biologia, Universidad de Barcelona, Barcelona, Spain, 3 Faculte ´ des Sciences, El Jadida, Morocco *The contribution by E. Go ´mez-Casado, P. del Moral and J. Martı ´nez-Laso is equal and the order of authorship is arbitrary. Correspondence to: Antonio Arnaiz-Villena Departamento de Inmunologı ´a y Biologı ´a Molecular H. 12 de Octubre Universidad Complutense Carretera Andalucı ´a 28041 Madrid Spain e-mail: antonio.arnaiz/inm.h12o.es
-
Upload
independent -
Category
Documents
-
view
1 -
download
0
Transcript of HLA genes in Arabic-speaking Moroccans: close relatedness to Berbers and Iberians
Key words:Mediterraneans; Imazighen; Berbers; Guanches;Moroccans; Albanians; Turks; Iranians; Egyptians
Acknowledgments:This work was supported in part by grants fromthe Ministerio de Educacion (PM95–57 andPM96–21) and Comunidad de Madrid (06/70/97 and 8.3/14/98).
Received 1 July, revised,accepted for publication 3 December 1999
Copyright c Munksgaard 2000Tissue Antigens . ISSN 0001-2815
Tissue Antigens 2000: 55: 239–249Printed in Denmark . All rights reserved
239
E. Gomez-Casado HLA genes in Arabic-speaking Moroccans:P. del Moral close relatedness to Berbers and IberiansJ. Martınez-LasoA. Garcıa-GomezL. AllendeC. Silvera-RedondoJ. LongasM. Gonzalez-HevillaM. KandilJ. ZamoraA. Arnaiz-Villena
Abstract: The gene profile of Arabic-speaking Moroccans has been com-pared with those of other Mediterranean populations in order to provideadditional information about the history of their origins. Our HLA datasuggest that most Moroccans are of a Berber (Imazighen) origin and thatArabs who invaded North Africa and Spain in the 7th century A.D. did notsubstantially contributed to the gene pool; however, they imposed their ad-vanced culture and their religion. Present-day Egyptians are also related toMoroccan Berbers and this supports an ancient Saharan origin for part ofthe present-day Mediterraneans, particularly for the Arabic-speaking ones(also Algerians) and also for the older substratum of Mediterranean people.
The highly polymorphic HLA system has been validated as useful
for distinguishing and/or relating populations (and individuals) in
many papers and in all the subsequent international workshops
(n57) since the First International HLA Anthropology Workshop
(Evian, 1970). HLA gene frequencies correlates with geographically
related populations; the existence or absence of gene flow among
neighbours may be assessed with the study of HLA frequencies and
the corresponding genetic distances (1, 2). Complementary data
from mtDNA, Y chromosome or other nuclear markers are always
desirable for population history interpretation.
The view that in the Neolithic Period a scattering of Berbers
(Imazighen) pastoralists and cultivators (a few hundred thousand)
existed in northern Africa and that they remained at a simple Neo-
lithic level while other Mediterraneans were evolving through the
Bronze and Iron Ages is currently disputed (3). By 1000 B.C., Phoen-
icians from Lebanon did not find a Stone Age Neolithic culture in
Maghreb (4), but a series of Numid organized states (or complex
social groups) which extended from Tunisia to the Canary Islands
(3). Indeed, autochthonous Tamazight (Berber) language and in-
scriptions are found (the so called Libyc inscriptions). Phoenicians
Authors’ affiliations:
E. Gomez-Casado1,P. del Moral2*,J. Martınez-Laso1*,A. Garcıa-Gomez1,L. Allende1,C. Silvera-Redondo1,J. Longas1,M. Gonzalez-Hevilla1,M. Kandil3,J. Zamora1,A. Arnaiz-Villena1
1Department of Immunologyand Molecular Biology, 12de Octubre, UniversidadComplutense, Madrid,Spain,
2Department ofAnthropology, Facultad deBiologia, Universidad deBarcelona, Barcelona, Spain,
3Faculte des Sciences,El Jadida, Morocco
*The contribution by E.Gomez-Casado, P. del Moraland J. Martınez-Laso isequal and the order ofauthorship is arbitrary.
Correspondence to:Antonio Arnaiz-VillenaDepartamento de
Inmunologıa y BiologıaMolecular
H. 12 de OctubreUniversidad ComplutenseCarretera Andalucıa28041 MadridSpaine-mail:antonio.arnaiz/inm.h12o.es

Gomez-Casado et al : HLA genes in Moroccans
set up Carthage (Tunisia) and were later overthrown by the Romans
in 146 B.C., leaving to the Berber Numidic King Massinisa most of
the Kingdom (3). By this time, there were 100,000 Phoenicians and
500,000 Berbers in Tunisia plus another 2.5 million Berbers in the
rest of North Africa. By 50 A.D., Berber King Jugurtha finally lost
North Africa and the Romans absorbed it into the Empire (3). Dur-
ing the 7th century A.D., Muslim people coming from the Arabian
peninsula and Middle East invaded North Africa and recruited
Berbers; these groups also invaded and settled in Spain until 1492
A.D. (3) (see Fig. 1).
In the present work, we report the relative contribution of Arabs
to the present-day Moroccan people genetic pool. Also, the genetic
relationship of Moroccans (from El Jadida area) to other North
Africans (Berbers from Agadir area and Algerians from Algiers),
Iberians (Spaniards, Basques and Portuguese) and to other Mediter-
raneans is examined. For these purposes, both the HLA class I and
class II genes have been studied in Moroccans for the first time,
since the HLA system has been shown to be very polymorphic,
able to be compared among ethnic groups and useful to distinguish
populations (see above) (5).
Material and methods
Population samples
Ninety-six unrelated Moroccans from El Jadida area (Arabic-lan-
guage speakers) were used for HLA genotyping and phylogenetic
calculations. The origin of all other populations used for compari-
sons are detailed in Table 1. Both Moroccan populations 1 [Moroc-
cans-El Jadida, present work] and 2 [Moroccans-Agadir see ref. 6;
Table 1] should be termed Berbers, as about 40% of the population
speaks Berber in Morocco (20–30% in Algeria; E. Gozalbes-Cravi-
oto, in ref. 7). In this latter reference, Camps established that white
North Africans are mostly Berbers, the urban ones speaking only
Arabic, and others speaking Berber and Arabic; Arabs from Arab-
ian Peninsula ascents are thus a small minority (see also (3)). In
addition, Izaabel et al. (6) studied a rural Berber Moroccan popula-
tion from Souss, Agadir area. This population clusters together with
urban Algerians, Iberians and other Mediterraneans (see below) and
justify our own Moroccan population from El Jadida as Berber.
Also, it is genetically supported that most present-day North
Africans have a strong Berber substrate; a blood group study did
not find differences neither among Arabic- and Berber-speaking Mo-
roccans (8).
240 Tissue Antigens 2000: 55: 239–249
Fig. 1. Berber-speaking populations in North-West Africa. Disap-peared Berber (Tamazight)-speaking groups (H). Groups speaking Berber atpresent (M). In gray, isolated Berber-speaking people. | | | Ancient limit ofBerber extension. Other names are toponyms indicating where isolatedBerber-speaking groups nowadays exist. Canary Islands aborigens (‘‘Gu-anches’’) were Imazighen (Berbers) speaking Tamazight (Berber) language (3,36, 37).
HLA genotyping, DNA sequencing and statistics
Generic HLA class I (A and B) genotyping was done using a poly-
merase chain reaction-sequence-specific oligonuoleotide (PCR-SSO)
technique as previously described (9) with slight modifications that
yielded a resolution equivalent to the standard serology techniques
(see Results and Discussion and Table 2). High-resolution HLA class
II (DRB1 and DQB1) was performed by using a reverse dot-blot
technique with the Automated Innolipa system (Innogenetics,
Zwijndrecht, Belgium). HLA-DQA1 alleles were characterized by
using the 11th and 12th International Histocompatibility Work-
shops and local reagents, and PCR-SSO (10, 11). HLA-A, -B, -DRB1,
-DQA1 and -DQB1 allele DNA sequencing was only done when in-
direct DNA typing yielded ambiguous results (12). Statistical analy-
sis was performed with Arlequin v1.1 software kindly provided by
Excoffier and Slatkin (13). In summary, this program calculated
HLA-A, -B, -DRB1, -DQA1 and -DQB1 allele frequencies, Hardy-
Weinberg equilibrium and the linkage disequilibrium between two
alleles at two different loci. Their level of significance (P) for 2¿2
comparisons and also their relative linkage disequilibrium (RLD)
were calculated as previously described (14). In addition, the most
frequent complete haplotypes were tentatively deduced by using a
methodology employed in the Japan International Histocompat-
ibility Workshop: 1) the 2, 3, and 4 HLA loci haplotype frequencies
(15, 16); 2) the previously described haplotypes in other populations

Gomez-Casado et al : HLA genes in Moroccans
Populations used for the present work
Correspondence(Fig. 4)identificationnumbers Region and Population n References
1 Moroccans (El Jadida) 98 Present study
2 Berbers (Agadir) 98 6
3 Jews (Morocco) 94 39
4 Spaniards 176 31
5 Basques 80 31
6 French 179 16
7 Algerians (Algier) 102 5
8 Sardinians 91 16
9 Italians 284 16
10 Jews (Ashkenazi) 80 40
11 Jews (non-Ashkenazi) 80 40
12 Cretans 135 23
13 Greeks (Attica/Aegean) 85 2
14 Greeks (Attica) 96 2
15 Greeks (Cyprus) 101 2
16 Lebanese (NS)1 59 2
17 Lebanese (KZ)2 93 2
18 Iranians 100 24
19 Turks 89 2
20 Albanians 153 16
21 Egyptians (Siwa) 101 2
– San (Bushmen) 77 16
– Japanese 493 16
n5number of individuals analysed for each population; 1NS5 Niha el Souff (town); 2KZ5 KafarZubian (town). Methodologies used for HLA typing are: Moroccans and Cretans, HLA-A, -B by gen-etic low-resolution and HLA-DRB1, -DQA1, -DQB1 by genetic high-resolution; Berbers (Agadir), Jews(Morocco, Ashkenazi, non-Ashkenazi) and Lebanese (NS, KZ), HLA-DRB1 and -DQB1 by genetichigh-resolution; Spaniards, Basques, French, Algerians (Algier), Sardinians, Italians, San (Bush-men) and Japanese, HLA-A, -B by serology and HLA-DRB1 and -DQB1 by genetic high-resolution;Greks (Attica/Aegean, Attica, Cyprus), HLA-A, -B by serology and HLA-DRB1 by genetic high-resol-ution; Iranians, Turks, Albanians and Egyptians (Siwa), HLA-DRB1 and -DQB1 by genetic low-resol-ution.
Table 1
(16); and 3) haplotypes if they appeared in two or more individuals
and the alternative haplotype was well defined (16). In order to
compare phenotype and haplotype HLA frequencies with other
populations, the reference tables of the 11th and 12th International
HLA Workshops were used (1, 2) (Table 1). Phylogenetic trees (den-
drograms) were constructed with the allelic frequencies by using
the Neighbor-Joining (NJ) method (17) with the standard genetic dis-
tances (SGD) (18), by using the software DISPAN which contained
the programs GNKDST and TREEVIEW (19, 20). Correspondence
analysis in three dimensions and its bi-dimensional representation
was carried out by using the VISTA v5.02 computer program (21)
241Tissue Antigens 2000: 55: 239–249
(http:/forrest.psych.unc.edu). Correspondence analysis consists of a
geometric technique that may be used for displaying a global view
of the relationships among populations according to HLA (or other)
allele frequencies. This methodology is based on the allelic fre-
quency variance among populations (similarly to the classical com-
ponents methodology) and on the display of an statistical visualiza-
tion of the differences.
Results
Characteristic HLA allele frequencies of the Moroccan
population compared to other Mediterraneans
The expected and observed genotype frequency values for HLA-
A, -B, -DRB1, -DQA1 and -DQB1 loci did not significantly differ and
the population sample was in Hardy-Weinberg equilibrium. Table 2
shows the HLA allele frequencies found in the Moroccan population
(from El Jadida). Class I antigens, HLA -A and -B, were detected by
a genotyping technology that only distinguished 21 alleles for locus
A and 41 alleles for locus B (9). A lower number of alleles was
studied in the last International HLA Workshop: 21 antigens for
locus A were defined and 35 antigens for locus B (2). However, we
typed class II genes by a high-resolution methodology and most
existing HLA-DRB1 (n5155) and -DQB1 (n527) specificities were
analyzed (22). Therefore, three types of analyses were done to com-
pare Moroccan HLA frequencies with other Mediterranean popula-
tion frequencies: 1) with pooled class I (A and B) and class II (DRB1)
data; 2) with DRB1 data, which is probably a more informative and
discriminating methodology; and 3) with generic (low-resolution)
DR-DQ data. These three types of analyses were also performed
because some of the populations used for comparisons lacked HLA-
A and -B data [Berbers (from Souss, Agadir area, Morocco), Jews
(Ashkenazi), Jews (Morocco), Jews (non-Ashkenazi), Lebanese (NS
and KZ), see Table 1], or high-resolution HLA-DQ data [(Greeks
(Attica), Greeks (Cyprus), Greeks (Attica-Aegean), see Table 1], or
only generic HLA-DR and -DQ data are available [Portuguese (15),
Turks, Iranians, Albanians and Egyptians, see Table 1]. These par-
tially HLA-typed populations should have been ignored, but they
could be analyzed conjointly taking into account only either DRB1
or generic DR and DQ frequencies (Table 2, Figs. 3 and 4). On the
other hand, class I generic typing tends to homogenize the compari-
sons based on DRB1 high-resolution typing; one class I allele ob-
tained by generic DNA typing may contain several class I alleles,
while this is not the case for most DRB1 alleles. Only generic class
I DNA typing is presently available. This phenomenon is also ob-
served in the present work by comparing Figs. 2 and 3 (6, 15, 23).

Gomez-Casado et al : HLA genes in Moroccans
Table 2HLA-A, -B, -DRB1, -DRB3, -DQA1 and -DQB1 allele frequencies in the Moroccan population
Allele Allele AlleleAlleles frequencies % Alleles frequencies % Alleles frequencies %
HLA-A B58 6.3 HLA-DQA1
A1 14.8 B60 5.3 01 12.1
A2 26.2 B61 0.5 0102 21.2
A3 6.7 B62 4.7 0103 5.6
A11 6.7 B63 2.1 0201 12.6
A23 4.1 03 17.2
A24 7.3 HLA-DRB1 0401 4.0
A25 2.0 0101 2.0 0501 27.3
A26 1.4 0102 5.1
A29 3.4 0301 14.8 HLA-DQB1
A30 10.1 0302 1.0 02 29.7
A31 0.6 04* 1.0 0301 14.1
A32 2.7 0402 4.6 0302 8.9
A33 2.7 0403 2.0 03032 1.0
A34 1.4 0404 1.5 0305 1.0
A66 0.6 0405 5.1 0402 6.8
A68 9.3 0406 2.0 0501 12.0
0701 12.3 0502 1.6
HLA-B 08* 1.0 05031 1.6
B7 9.0 0801 2.6 06011 1.0
B8 5.8 0804 1.5 06012 0.5
B13 1.1 0806 0.5 0602 11.4
B14 4.7 0901 1.0 0603 0.5
B18 4.2 1001 3.1 0604 6.8
B27 0.5 11* 2.0 0607 1.6
B35 5.3 1101 2.0 0609 0.5
B38 2.6 1102 2.6 0603/7 0.5
B39 2.1 1104 2.0 0606/9 0.5
B41 2.6 1201 0.5
B42 0.5 1301 3.6
B44 5.3 1302 9.2
B45 7.4 1303 4.1
B48 0.5 1401 1.5
B49 5.8 15* 1.0
B50 5.3 1501 6.6
B51 7.4 1502 1.5
B52 3.7 1503 1.0
B53 4.2 1601 1.0
B54 0.5
B55 0.5
B57 2.1
Alleles DQA1*0101 and 0104 were all assigned as DQA1*01. Alleles DQA1*03011 and 0302 were all assigned as DQA1*03.Alleles DQA1*05011, 05012 and 05013 were all assigned as DQA1*0501. Alleles DQB1*0201 and 0202 were all assigned asDQB1*02. * indicates undefined subtypes, because low-resolution technology had to be used in some individuals from whomsufficient DNA was not available. Allele frequencies considering only the defined DRB1 subtypes were used for the dendrograms,correspondence and haplotype analyses. The Algerians and Basques allelic frequencies are shown: a) Algerians: A1 (11.9), A2(24.6), A3 (8.2), A11 (6.1), A23 (3.5), A24(9.4), A25 (0.5), A26 (2.5), A28 (2.9), A29 (2.5), A30 (5.6), A31 (3.0), A32 (5.1), A33(4.6), A66 (0.5), B7 (6.0), B8 (3.5), B13 (0.5), B14 (5.5), B18 (3.5), B27 (0.9), B35 (10.3), B38 (6.2), B39 (1.5), B41 (1.5), B44(8.8), B45 (2.0), B47 (0.5), B49 (10.0), B50 (5.1), B51 (4.6), B52 (2.5), B53 (4.5), B54 (0.5), B55 (0.9), B57 (5.1), B58 (2.5),B60 (1.0), B61 (2.0), B62 (2.5), B63 (1.0), B70 (1.5), B73 (0.5), DRB1*0101 (1.5), 0102 (8.2), 1501 (11.4), 1502 (1.9), 1601(2.9), 0301 (11.9), 0302 (1.5), 0402 (4.0), 0403 (4.0), 0404 (1.9), 0405 (2.5), 0406 (1.9), 1101 (5.0), 1102 (2.9), 1104 (2.9),1201 (0.5), 1202 (0.5), 1301 (3.5), 1302 (4.0), 1303 (2.5), 1401 (1.9), 07 (12.5), 0801 (0.9), 0803 (0.5), 0804 (0.9), 0806(1.5), 1001 (3.5), data from ref. 5. b) Basques: A1 (12.3), A2 (26.7), A3 (9.6), A11 (8.9), A23 (0.7), A24(4.2), A25 (1.5), A26(1.5), A28 (1.2), A29 (11.8), A30 (3.6), A31 (5.8), A32 (7.2), A33 (1.2), B7 (10.2), B8(8.2), B13(1.2), B14(3.1), B18(6.9), B27(3.7),B35(3.7), B38(0.6), B41(0.6), B44 (23.4), B47(1.2), B49(3.1), B50 (0.6), B51 (8.9), B55 (1.8), B57 (7.5), B60 (3.1), B61 (1.2),B62 (3.7), DRB1*0101 (11.9), 0102 (0.6), 0103 (1.8), 1501 (17.0), 1502 (0.6), 0301 (19.3), 0401(1.8) , 0402 (1.2), 0403 (3.8),1101 (3.1), 1102 (2.5), 1301 (4.4), 1302 (3.8), 1401 (2.5), 07 (19.3), 0801 (1.2), 0803 (0.6) data from ref. 31.
242 Tissue Antigens 2000: 55: 239–249

Gomez-Casado et al : HLA genes in Moroccans
Fig. 2. Neighbor-Joining dendrogramshowing relatedness between Moroccansand other populations. Standard genetic dis-tances (SGD) were calculated by using HLA-Aand -B (generic) and DRB1 (high-resolution)genotyping. Data from other populations weretaken from references detailed in Table 1. Boots-trap values from 1,000 replicates are shown.Only individuals with defined DRB1 subtypesare considered.
Fig. 2 (calculations with other alleles from other loci) supports Fig.
3 topology and this is because it is shown. Greeks and Japanese
tend to cluster together (Fig. 2, in spite of their large genetic dis-
tance) because outgroups among more homogeneous groups tend
to be close in dendrograms.
HLA-DR and -DQ generic data were useful to compare Portugue-
Fig. 3. Neighbor-Joining dendrogram showing relatedness be-tween Moroccans and other populations. Standard genetic distances(SGD) between populations were calculated by using DRB1 (high-resol-ution) genotyping. Data from other populations were from references detailedin Table 1. Bootstrap values from 1,000 replicates are shown. Only individ-uals with defined DRB1 subtypes are considered.
243Tissue Antigens 2000: 55: 239–249
se, Turks, Iranians, Albanians, Egyptians and Moroccans, since this
was the only common HLA typing data available for these popula-
tions (2, 15, 16, 24).
Fig. 2 depicts a HLA class I (A and B) and class II (DRB1) NJ
tree and shows how the three Greek samples group together with
Japanese and Cretans on one side and Middle and Western Mediter-
raneans (both European and Africans) are grouped on the other
side of the tree showing shorter branches; this indicates a closer
relatedness among Western Mediterraneans. High-resolution DRB1
comparisons are more discriminating and do not tend to homogen-
Fig. 4. Correspondence analysis showing a global view of the re-lationship among Mediterranean populations according to HLA al-lele frequencies in three dimensions (bi-dimensional represen-tation). HLA-DRB1 allele frequencies data. Only individuals with definedDRB1 subtypes are considered.

Gomez-Casado et al : HLA genes in Moroccans
ize populations (15, 23). It is shown in Fig. 3 that Moroccans are
closer to Western Mediterraneans (both African and European) than
to Eastern Mediterraneans. Greeks are almost outliers together with
Japanese and San (Bushmen). This effect is more evident in Table
3, where Moroccans-Algerians show the closest genetic distance (–
5.83) followed by Berbers (Agadir), Spaniards and Basques. In fact,
a gradient from Western (both African and European) to Middle-
Eastern Mediterraneans is observed placing distantly Greeks, Ja-
panese and San (Bushmen) as outliers.
HLA-A, -B, -DRB1, -DQA1 and -DQB1 linkage disequilibria and
correspondence analysis in Moroccans
The study of Moroccan HLA haplotypes for the first time (Tables
4, 5 and 6) allows their comparison with previously reported ones
in other populations. There is not observed any predominant haplo-
type (Tables 5 and 6). This was not seen in Iberians, where predomi-
nant A29-B44, A30-B18 and A2-B7 were found (15). However, it is
important to show these results, since it may be reflection of a
higher degree of admixture; further studies are necessary to in-
crease the population and confirm the existence of non-predominant
Standard genetic distances (SGD) betweenMoroccans and other populations (¿102) ob-tained by using HLA-DRB1 allele frequencies(see Table 1 for populations identification.Negative values may be assumed as 0 values;otherwise, the highest negative value may beregarded as the closest one). Standard erroris 0 in all cases.
HLA-DRB1 (SGD)
Algerians (Algiers) ª5.83
Berbers (Agadir) ª2.77
Spaniards 3.02
Basques 8.98
Non-Ashkenazi Jews 10.87
French 11.30
Ashkenazi Jews 15.69
Italians 16.75
Cretans 22.46
Moroccan Jews 25.19
Sardinians 30.06
Lebanese (NS) 46.51
Lebanese (KZ) 54.04
Japanese 86.30
Greeks 89.17
San (Bushmen) 122.71
Table 3
244 Tissue Antigens 2000: 55: 239–249
HLA-A/B, B/DRB1, DQA1/DQB1 and DRB1/DQB1 two-loci haplotypes with sign-icant linkage disequilibrium (P∞0.05 in all cases) in the Moroccan population
Haplotype HF D’ Haplotype HF D’
A-B DQA1-DQB1
A1-B62 0.026 0.50 01–0501 0.101 0.85
A2-B49 0.057 0.87 01–05031 0.015 1.00
A3-B45 0.018 0.24 0102–0602 0.096 0.83
A11-B35 0.019 0.47 0102–0604 0.061 0.90
A11-B52 0.019 0.47 0103–06011 0.010 1.00
A23-B44 0.019 0.47 0103–0607 0.015 1.00
A24-B45 0.026 0.31 0201–02 0.121 1.00
A26-B38 0.013 0.10 03–0302 0.086 1.00
A30-B60 0.019 0.36 03–03032 0.010 1.00
A30-B14 0.013 0.44 03–0305 0.010 1.00
A30-B18 0.026 0.52 03–0402 0.030 0.35
A32-B18 0.013 0.48 0401–0402 0.035 0.87
A33-B14 0.013 0.47 0501–02 0.141 0.23
A68-B13 0.013 0.10 0501–0301 0.127 0.89
A68-B51 0.026 0.27
DRB1-DQB1
B-DRB1 0101–0501 0.021 1.00
B7–0402 0.015 0.27 0102–0501 0.053 1.00
B7–0804 0.010 0.63 0301–02 0.153 1.00
B8–0301 0.045 0.79 0302–0402 0.010 1.00
B13–0701 0.010 1.00 0402–0302 0.026 0.69
B14–0302 0.010 1.00 0402–03032 0.010 1.00
B38–1501 0.010 0.36 0403–0302 0.016 0.72
B39–0801 0.010 0.49 0404–0402 0.010 0.64
B45–1501 0.020 0.25 0405–0302 0.042 0.78
B45–0404 0.010 0.64 0406–0402 0.010 0.64
B49–0403 0.010 0.47 0701–02 0.126 1.00
B49–0406 0.010 0.47 0801–0402 0.014 0.57
B49–0801 0.010 0.36 1001–0501 0.032 0.61
B51–1301 0.010 0.23 1101–0301 0.021 1.00
B51–1302 0.025 0.29 1102–0301 0.021 1.00
B51–1401 0.010 0.64 1104–0301 0.021 1.00
B52–1502 0.015 1.00 1301–0607 0.016 1.00
B57–0402 0.010 0.48 1302–0604 0.063 0.91
B62–0405 0.015 0.30 1303–0301 0.042 1.00
B62–1102 0.010 0.37 1401–05031 0.016 1.00
1501–0602 0.068 1.00
1502–0601 0.010 1.00
1503–0602 0.010 1.00
1601–0502 0.010 1.00
HF, haplotype frequency; D’ or RLD, relative linkage disequilibrium. Only individuals with definedDRB1 subtypes are considered.
Table 4
Gomez-Casado et al : HLA genes in Moroccans
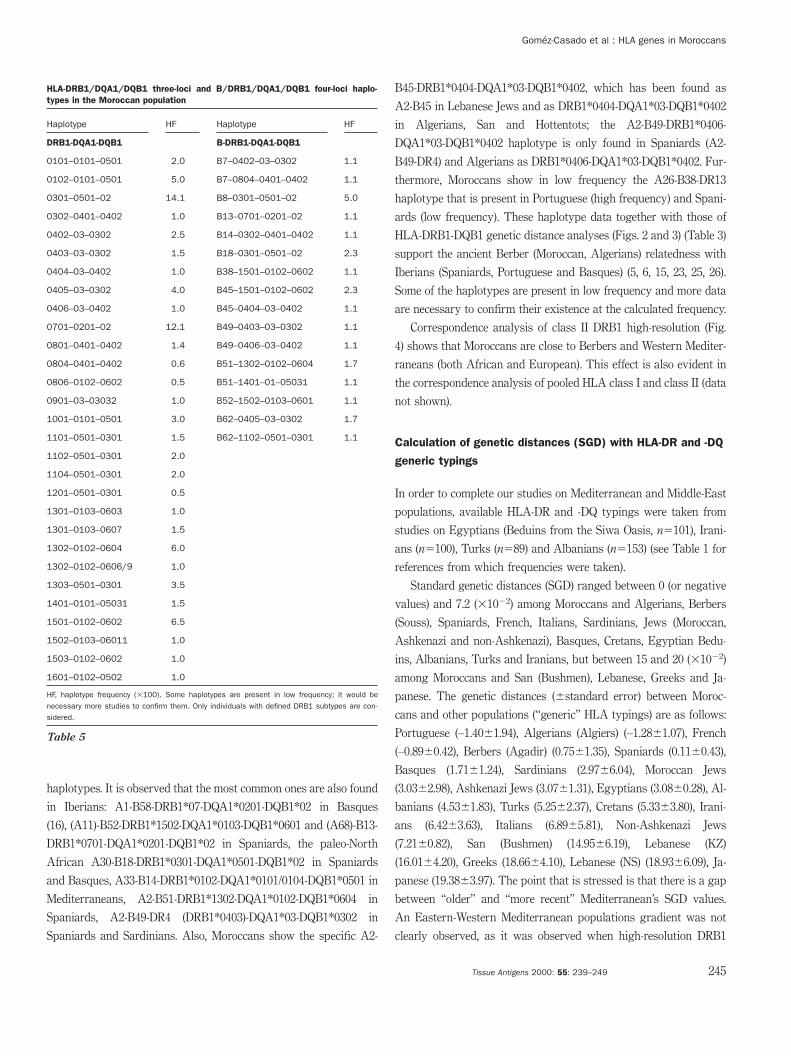
HLA-DRB1/DQA1/DQB1 three-loci and B/DRB1/DQA1/DQB1 four-loci haplo-types in the Moroccan population
Haplotype HF Haplotype HF
DRB1-DQA1-DQB1 B-DRB1-DQA1-DQB1
0101–0101–0501 2.0 B7–0402–03–0302 1.1
0102–0101–0501 5.0 B7–0804–0401–0402 1.1
0301–0501–02 14.1 B8–0301–0501–02 5.0
0302–0401–0402 1.0 B13–0701–0201–02 1.1
0402–03–0302 2.5 B14–0302–0401–0402 1.1
0403–03–0302 1.5 B18–0301–0501–02 2.3
0404–03–0402 1.0 B38–1501–0102–0602 1.1
0405–03–0302 4.0 B45–1501–0102–0602 2.3
0406–03–0402 1.0 B45–0404–03–0402 1.1
0701–0201–02 12.1 B49–0403–03–0302 1.1
0801–0401–0402 1.4 B49–0406–03–0402 1.1
0804–0401–0402 0.6 B51–1302–0102–0604 1.7
0806–0102–0602 0.5 B51–1401–01–05031 1.1
0901–03–03032 1.0 B52–1502–0103–0601 1.1
1001–0101–0501 3.0 B62–0405–03–0302 1.7
1101–0501–0301 1.5 B62–1102–0501–0301 1.1
1102–0501–0301 2.0
1104–0501–0301 2.0
1201–0501–0301 0.5
1301–0103–0603 1.0
1301–0103–0607 1.5
1302–0102–0604 6.0
1302–0102–0606/9 1.0
1303–0501–0301 3.5
1401–0101–05031 1.5
1501–0102–0602 6.5
1502–0103–06011 1.0
1503–0102–0602 1.0
1601–0102–0502 1.0
HF, haplotype frequency (¿100). Some haplotypes are present in low frequency; it would benecessary more studies to confirm them. Only individuals with defined DRB1 subtypes are con-sidered.
Table 5
haplotypes. It is observed that the most common ones are also found
in Iberians: A1-B58-DRB1*07-DQA1*0201-DQB1*02 in Basques
(16), (A11)-B52-DRB1*1502-DQA1*0103-DQB1*0601 and (A68)-B13-
DRB1*0701-DQA1*0201-DQB1*02 in Spaniards, the paleo-North
African A30-B18-DRB1*0301-DQA1*0501-DQB1*02 in Spaniards
and Basques, A33-B14-DRB1*0102-DQA1*0101/0104-DQB1*0501 in
Mediterraneans, A2-B51-DRB1*1302-DQA1*0102-DQB1*0604 in
Spaniards, A2-B49-DR4 (DRB1*0403)-DQA1*03-DQB1*0302 in
Spaniards and Sardinians. Also, Moroccans show the specific A2-
245Tissue Antigens 2000: 55: 239–249
B45-DRB1*0404-DQA1*03-DQB1*0402, which has been found as
A2-B45 in Lebanese Jews and as DRB1*0404-DQA1*03-DQB1*0402
in Algerians, San and Hottentots; the A2-B49-DRB1*0406-
DQA1*03-DQB1*0402 haplotype is only found in Spaniards (A2-
B49-DR4) and Algerians as DRB1*0406-DQA1*03-DQB1*0402. Fur-
thermore, Moroccans show in low frequency the A26-B38-DR13
haplotype that is present in Portuguese (high frequency) and Spani-
ards (low frequency). These haplotype data together with those of
HLA-DRB1-DQB1 genetic distance analyses (Figs. 2 and 3) (Table 3)
support the ancient Berber (Moroccan, Algerians) relatedness with
Iberians (Spaniards, Portuguese and Basques) (5, 6, 15, 23, 25, 26).
Some of the haplotypes are present in low frequency and more data
are necessary to confirm their existence at the calculated frequency.
Correspondence analysis of class II DRB1 high-resolution (Fig.
4) shows that Moroccans are close to Berbers and Western Mediter-
raneans (both African and European). This effect is also evident in
the correspondence analysis of pooled HLA class I and class II (data
not shown).
Calculation of genetic distances (SGD) with HLA-DR and -DQ
generic typings
In order to complete our studies on Mediterranean and Middle-East
populations, available HLA-DR and -DQ typings were taken from
studies on Egyptians (Beduins from the Siwa Oasis, n5101), Irani-
ans (n5100), Turks (n589) and Albanians (n5153) (see Table 1 for
references from which frequencies were taken).
Standard genetic distances (SGD) ranged between 0 (or negative
values) and 7.2 (¿10ª2) among Moroccans and Algerians, Berbers
(Souss), Spaniards, French, Italians, Sardinians, Jews (Moroccan,
Ashkenazi and non-Ashkenazi), Basques, Cretans, Egyptian Bedu-
ins, Albanians, Turks and Iranians, but between 15 and 20 (¿10ª2)
among Moroccans and San (Bushmen), Lebanese, Greeks and Ja-
panese. The genetic distances (∫standard error) between Moroc-
cans and other populations (‘‘generic’’ HLA typings) are as follows:
Portuguese (–1.40∫1.94), Algerians (Algiers) (–1.28∫1.07), French
(–0.89∫0.42), Berbers (Agadir) (0.75∫1.35), Spaniards (0.11∫0.43),
Basques (1.71∫1.24), Sardinians (2.97∫6.04), Moroccan Jews
(3.03∫2.98), Ashkenazi Jews (3.07∫1.31), Egyptians (3.08∫0.28), Al-
banians (4.53∫1.83), Turks (5.25∫2.37), Cretans (5.33∫3.80), Irani-
ans (6.42∫3.63), Italians (6.89∫5.81), Non-Ashkenazi Jews
(7.21∫0.82), San (Bushmen) (14.95∫6.19), Lebanese (KZ)
(16.01∫4.20), Greeks (18.66∫4.10), Lebanese (NS) (18.93∫6.09), Ja-
panese (19.38∫3.97). The point that is stressed is that there is a gap
between ‘‘older’’ and ‘‘more recent’’ Mediterranean’s SGD values.
An Eastern-Western Mediterranean populations gradient was not
clearly observed, as it was observed when high-resolution DRB1

Gomez-Casado et al : HLA genes in Moroccans
Table 6Most frequent HLA-A, -B, -DRB1, -DQA1 and -DQB1 extended haplotypes in the Moroccan population andother Mediterraneans (see refs. 2, 15, 16). HF: Haplotype frequency
HFHaplotypes (%) Possible origin
A2-B7-DRB1*0402-DQA1*03-DQB1*0302a 1.5 Euro-African
A11-B52-DRB1*1502-DQA1*0103-DQB1*0601b 1.5 Ibero-Berber
A30-B18-DRB1*0301-DQA1*0501-DQB1*02c 1.5 Paleo-North African
A1-B58-DRB1*0701-DQA1*0201-DQB1*02d 1.0 Basque-Berber
A2-B45-DRB1*0404-DQA1*03-DQB1*0402e 1.0 Specific
A2-B49-DRB1*0403-DQA1*03-DQB1*0302f 1.0 Western Mediterranean
A2-B49-DRB1*0406-DQA1*03-DQB1*0402g 1.0 Berber
A33-B14-DRB1*0102-DQA1*0101-DQB1*0501h 1.0 Mediterranean
A68-B13-DRB1*0701-DQA1*0201-DQB1*02i 1.0 Arab
A2-B51-DRB1*1302-DQA1*0102-DQB1*0604j 1.0 Ibero-Berber
a Partially found as B7-DR4 in San (6.9%), Armenians (3.8%), Belgians (3.7%), Dane (2.3%), German (2.1%), French (0.9%), Sardinian(0.6%) (16).
b It is found in Spaniards without a specific HLA-A antigen (31).c Also found in Basques (2.4%), Spaniards (3.4%), British (2.9%) and Danish (3.4%) with similar frequencies. Germans (4.8%),
Austrians (5.3%), Yugoslavians (7.7%) show slightly higher frequencies (16).d It is found in French-Basques (16).e It is partially found as B45-DR4 with similar frequency in Lebanese Jews (2).f A2-B49-DR4 is found in Sardinians and Spaniards, who have the DRB1*0403 allele (16).g A2-B49-DR4 is found in Spaniards, who have the DRB1*0406 (0.3%) subtype. Also, French present B49-DR4, who have the
DRB1*0406 (0.3%) allele.h Show the highest frequency in Armenians (3.1%) and is also high in frequency or present in other Mediterranean Caucasoid
populations as Sardinians (2.7%), Spaniards (2.6%), French (1.4%), Greeks (1.1%) and Italians (0.7%) (16).i It is considered as a Mediterranean haplotype with A30 instead, which is present mainly in Arabic Peninsula and Middle EastEurope (31, 41).
j A2-B51-DR13 appears in Spaniards with identical frequency and the allele DRB1*1302 is also present (0.6%) (16). Some haplo-types are present in low frequency; it would be necessary more studies to confirm them. Only individuals with defined DRB1subtypes are considered.
typing was performed and Cretans were the reference population
(23). Also, Lebanese cluster together with other Mediterraneans
when high-resolution data were compared; the latter more specific
data should be taken into account (23). Notwithstanding, Greeks are
confirmed as outliers (23); this suggested the existence of an older
and a more recent Mediterranean people substratum (23). This is
also confirmed in a NJ tree (results not shown).
Historical background and discussion
Moroccans (El Jadida) and Berbers (population 2, Table 1)
An Iberomarussian culture was established in North Africa before
11000 B.C. and a Capsian culture appeared around 7000 B.C. It
seems that Southern Sahara Neolithic transition occurred earlier
than in the North; by 7000 B.C. Southern pottery appeared in the
West and in the East (Nile valley) and may be the predecessor of
pottery production in the Near East (3). There are several types of
skeletons from the Iberomarussian and Capsian periods, but there
246 Tissue Antigens 2000: 55: 239–249
is no sign of discontinuity (27, 28) between individuals belonging
to these cultures. Thus immigration was not the cause of changes
in the culture. The Berber language was spoken across North Africa
from the Canary Islands (Guanche) to the Siwa Oasis in Egypt and
from the Mediterranean coast to Mali and Niger, probably reflecting
the first populations kinship (Fig. 1). Lybic inscriptions are the re-
mains of paleo-Berber language (3). The break of Berber and the
old Egyptian language remains to be explained, but it may be due
to the fact that old Egyptian is still clearly undeciphered, since
every scholar has currently relied on their own transliteration sys-
tem. In summary, a potentially large population who had a generic
linguistic and possibly a genetic identity may have existed across
the Sahara Desert (Fig. 1) and North Africa; it is postulated (6, 15)
that this people was forced to emigrate in the times of arid weather
fluctuations which occurred in the last 18000 years and may have
definitively emigrated towards the Northern Coast of Mediterranean
Sea, Atlantic Islands and eastwards only when desert become wide-
spread and difficult to inhabit (23, 25) (after 6000 B.C.). Numidic
Kings ruled a series of organized states (or complex social groups)
which extended from Tunisia to the Canary Islands when Phoenici-
Gomez-Casado et al : HLA genes in Moroccans
ans arrived to North Africa and set up coastal cities like Cartago;
by 900 B.C., a treaty with indigenous Numids permission was
signed (3).
Romans ruled North Africa since 50 A.D. and by 700 A.D., Mus-
lims coming from the Arabian Peninsula (as far as Yemen) and from
Middle East invaded North Africa, recruited a substantial Berber
army and also occupied Spain until 1492 A.D. The number of east-
ern newcomers was probably very low in comparison with the num-
ber of established Berbers; however, Islamization was particularly
strong and Arabic is currently spoken in many areas along the
southern Mediterranean coast. Possibly, only aristocrats and army
high officers living in North Africa by the 8th century came from
the east; Camps believes that most of the Maghreb countries inhabi-
tants are Berbers, a portion of the population (urbans) not speaking
Berber language (7, 29, 30).
Indeed, the present study confirms that a majority of present-
day North Africans from Morocco (El Jadida) and Algerians (5) are
close to Berbers according to the genetic distances (Table 3), and
also to Iberians (Spaniards, Portuguese and Basques) (15). Eastern
and other Mediterraneans show bigger genetic distances to Moroc-
cans, including Arabs from the Arabian peninsula (unpublished re-
sults). This suggests that the gene flow from 7th century A.D., new-
comers from the Arabian peninsula was low in North Africa. This
is reflected in dendrograms constructed with high- and generic-res-
olution HLA typing (Figs. 2 and 3). Also, these relationships are
also supported by the correspondence analysis, where Moroccans
cluster together with western European and African Mediterran-
eans (Berbers, Algerians and Iberians) apart from the Middle-East
Mediterraneans (Jews and Lebanese).
Moroccans and Iberians
A part of the Iberian genetic pool comes from North Africa. This
probably occurred before the 8th century A.D. as supported by the
following data: 1) Basques show close genetic distances to Berbers
(Table 3) and also share the paleo-North African haplotype A30-
B18-DR3 (Table 6), (5, 23, 25, 26, 31); Berbers share with other Iberi-
ans also A2-B7-DR15 and A33-B14-DR1 (Table 6) (15); 2) there was
no admixture of Berbers with Basques in the 8th century A.D. (and
the admixture with Spaniards was very low due to low numbers of
247Tissue Antigens 2000: 55: 239–249
invaders and cultural barriers) (4, 25); and 3) Basque, Iberian, Lybic
inscriptions and Berber languages are all related and have been
included in the Na-Dene Caucasian group of languages (25, 32–36).
This group of languages were widely spoken in Eurasia and North
Africa at least, and were flooded by languages of foreign popula-
tions (Eurasiatic languages) about 8000–6000 B.C. Nowadays, Eura-
siatic human isolates speaking Na-Dene Caucasian languages re-
main in the Basque Country, North Africa (Berbers), North Cauc-
asus, North Pakistan (at Karakoram, Burushaski) and Yenisei River
(Kets); Athabascans, Navajo and Apache Indians in America also
speak these languages. Dead languages belonging to this group are:
Iberian, Etruscan and Minoan (Linear A) among others (25, 32–36).
Thus, the dating of a genetically important Berber migration to
Iberia and other northern, eastern, and western lands approximates
to after 10000 B.C. and most likely to after 6000 B.C. when hyper-
arid conditions established in the Sahara (23). This is supported by
other genetic markers and other authors: Sanchez-Mazas group with
blood groups and HLA alleles (6, 8), and Cabrera group with
mtDNA markers (37).
Berbers, Egyptians, Turks, Albanians and Iranians
Results comparing Berber with the Egyptian HLA profile show that
they also are closely related (see HLA-DR, -DQ generic typings gen-
etic distances in the Results section). This is concordant with the
recorded historical data suggesting that part of the first Egyptian
predynastic people come from the once fertile Sahara region, where
the Berber language was (and still is) spoken (38). Southern Sahara
pottery and artifacts (8000 B.C.) were precursors of the first predyn-
astic Nile cultures like Khartoum (group C) and El-Badari and also
of southern Iberia cultures (widely discussed in (23, 38). It was pos-
tulated that Saharan hyperarid conditions established between 6000
and 4500 B.C. forced this ancient Berber-speaking people to emi-
grate northwards (Iberians), eastwards (Canary Island ‘‘Guanches’’)
(37) and westwards (Egyptians) (23). This is supported by genetic,
linguistic and geological data (23). Finally, it is found that other
present-day Mediterraneans (Albanians, Turks and Iranians) and
others included in the ‘‘older’’ Mediterranean substratum (23) are
related and may in part come from this primitive Saharan stock
(see generic typing results and manuscript in preparation).
Gomez-Casado et al : HLA genes in Moroccans
References
1. 12. 23.Imanishi T, Wakisaka A, Gojobori T. Arnaiz-Villena A, Timon M, Corell A, Arnaiz-Villena A, Iliakis P, Gonzalez-Genetic relationships among various human Perez-Aciego P, Martın-Villa JM, Regueiro Hevilla M et al. The origin of Cretanpopulations indicated by MHC JR. Primary immunodeficiency caused by population as determined bypolymorphisms. In: Tsuji K, Aizawa M, mutations in the gene encoding the CD3-g characterization of HLA alleles. TissueSasazuki T, eds. HLA 1991. Vol 1. Oxford: subunit of the T-lymphocyte receptor. N Antigens 1999: 53: 213–26.Oxford University Press, 1992: 627–32. Engl J Med 1992: 327: 529–33. 24. Mehra NK, Rajalingam R, Kanga U et al.
2. 13. Genetic diversity of HLA in theClayton J, Lonjou C. Allele and Haplotype Excoffier L, Slatkin M. Maximum-frequencies for HLA loci in various ethnic likelihood estimation of molecular populations of India, Sri Lanka and Iran.groups. In: Charron D, ed. Genetic diversity haplotype frequencies in a diploid In: Charron D, ed. Genetic diversity ofof HLA, functional and medical implica- population. Mol Biol Evol 1995: 12: 921–7. HLA, functional and medical implications.tions. Vol 1. Paris: EDK, 1997: 665–820. 14. Imanishi T, Akaza T, Kimura A, Tokunaga Vol 1. Paris: EDK, 1997: 314–20.
3. K, Gojobori T. Estimation of allele andBrett M, Fentress E. The Berbers. Oxford: 25. Arnaiz-Villena A, Martinez-Laso J, Alonso-Blackwell Publishers, 1997. haplotype frequencies for HLA and Garcia J. Iberia: Population genetics,
4. complement loci. In: Tsuji K, Aizawa M,McEvedy C, Jones C. Atlas of World Anthropology, and linguistics. Hum BiolPopulation History. London: Penguin Books, Sasazuki T, eds. HLA 1991. Vol 1. Oxford: 1999: 71: 725–43.1978: 99. Oxford University Press, 1992: 76–9. 26. Arnaiz-Villena A, Rodrıguez de Cordoba S,
5. 15. Vela F, Pascual JC, Cervero J, Bootello A.Arnaiz-Villena A, Benmamar D, Alvarez M Arnaiz-Villena A, Martınez-Laso J, Gomez-et al. HLA allele and haplotype frequencies Casado E et al. Relatedness among Basques, HLA antigens in a sample of the Spanishin Algerians. Relatedness to Spaniards and Portuguese, Spaniards, and Algerian population: common features amongBasques. Hum Immunol 1995: 43: 259–68. studied by HLA allelic frequencies and Spaniards, Basques and Sardinians. Hum
6. haplotypes. Immunogenetics 1997: 47: 37–Izaabel H, Garchon HJ, Caillat-Zucman S et Genet 1981: 58: 344–8.al. HLA class II DNA polymorphism in a 43. 27. Lubell D, Sheppard P, Gilman A. TheMoroccan population from the Souss, 16. Imanishi T, Akaza T, Kimura A, Tokunaga Maghreb, 20,000–4,000 B.C. In: Ehrich RW,Agadir area. Tissue Antigens 1998: 51: 106– K, Gojobori T. Allele and haplotype ed. Chronologies in old world archeology. 3rd10. frequencies for HLA and complement loci edn. Chicago: University of Chicago Press,
7. in various ethnic groups. In: Tsuji K,Rachid Raha A. Imazighen del Magreb 1992: Vol 1, 301–8; Vol 2, 257–67.entre oriente y occidente (Introduccion a los Aizawa M, Sasazuki T, eds. HLA 1991. Vol 28. Aumassip G, Ferhat N, Heddouche A et al.bereberes). Granada: AR. Raha, 1994. 1. Oxford: Oxford University Press, 1992: Milieux, Hommes et Techniques du Sahara
8. 1065–220.Merghoub T, Sanchez-Mazas A, Tamouza R Prehistorique. Paris: L’Hormttan, 1994.et al. Haemoglobin D-Ouled Rabah among 17. Saitou N, Nei M. The neighbor-joining 29. Camps G. Encyclopedia Berber. Aix-en-the Mozabites: a relevant variant to trace the method: a new method for reconstructing Provence: EDISUD, 1984/99.origin of Berber-speaking population. Eur J phylogenetic trees. Mol Biol Evol 1987: 4: 30. Camps G. Los bereberes. La enciclopedia delHum Genet 1997: 5: 390–6. 406–25. Mediterraneo. Barcelona: CIDOB
9. 18. Ediciones, 1998.Arguello R, Avakian H, Goldman JM, Nei M. Genetic distances betweenMadrigal JA. A novel method for populations. Am Nat 1972: 10: 283. 31. Martınez-Laso J, De Juan D, Martınez-Quilessimultaneous high resolution identification 19. Nei M. Analysis of gene diversity in N, Gomez-Casado E, Cuadrado E, Arnaiz-of HLA-A, HLA-B, and HLA-Cw alleles. subdivided populations. Proc Natl Acad Sci Villena A. The contribution of the HLA-A, -Proc Natl Acad Sci U S A 1996: 93: 10961–5. U S A 1973: 70: 3321–3. B, -C and -DR, -DQ DNA typing to the study
10. 20. of the origins of Spaniards and Basques.Kimura A, Sasazuki T. Eleventh Nei M, Tajima F, Tateno Y. Accuracy ofInternational Histocompatibility Workshop estimated phylogenetic trees from Tissue Antigens 1995: 45: 237–45.reference protocol for the HLA-DNA typing molecular data II. Gene frequency data. J 32. Arnaiz-Villena A, Alonso-Garcıa J. Eltechnique. In: Tsuji K, Aizawa M, Sasazuki Mol Evol 1983: 19: 153–70. origen de los vascos y otros pueblosT, eds. HLA 1991. Vol 1. Oxford: Oxford 21. Young FW, Bann CM. A Visual Statistics mediterraneos. Madrid: EditorialUniversity Press, 1992: 397–419. system. In: Stine RA, Fox J, eds. Statistical Complutense SA, 1998.
11. computing Environments for socialBignon JD, Fernandez-Vina MA. Protocols 33. Arnaiz-Villena A, Alonso-Garcıa J.of the 12th International Histocompatibility Researches. New York: Sage publications, Minoicos, Cretense y Vascos: un estudioWorkshop for typing of HLA class II alleles 1996: 207–36. genetico y linguıstico. Madrid: Editorialby DNA amplification by the polymerase 22. Bodmer JG, Marsh SGE, Albert ED et al. Complutense SA, 1999.chain reaction (PCR) and hybridization Nomenclature for factors of the HLA 34. Ruhlen M. The origin of Language. Newwith sequence-specific oligonucleotide system, 1996. Tissue Antigens 1997: 49: York: John Wiley, 1994.probes (SSOP). In: Charron D, ed. Genetic 297–321. 35. Ruhlen M. The origin of the Na-Dene. Procdiversity of HLA, functional and medical Natl Acad Sci U S A 1998: 95: 13994–6.implications. Vol I. Paris: EDK, 1997: 584–95.
248 Tissue Antigens 2000: 55: 239–249

Gomez-Casado et al : HLA genes in Moroccans
36. 38. 40.Arnaiz-Villena A, Alonso-Garcia J. The Iniesta F. Kuma, historia del Africa Negra. Martınez-Laso J, Gazit E, Gomez-Casado EUsko-Mediterranean languages. In: Barcelona: Biblioteca Estudio Africanos, et al. HLA DR and DQ polymorphism inArnaiz-Villena A, ed.: Prehistoric Iberia: Bellaterra, 1998. Ashkenazi and non-Ashkenazi Jews:genetics, anthropology and linguistics., 39. Roitberg-Tambur A, Witt CS, Friedmann A comparison with other Mediterraneans.New York: Kluwer-Plenum, 2000. et al. Comparative analysis of HLA Tissue Antigens 1996: 47: 63–71.
37. polymorphism at the serologic andFlores C, Hernandez M, Gonzalez AM, 41. Degos L, Dausset J. Human migrations andCabrera VM. Genetic affinities among molecular level in Moroccan and Ashkenazi linkage disequilibrium of HLA system.human subpopulations inhabiting the Jews. Tissue Antigens 1995: 46: 104–10. Immunogenetics 1974: 1: 195–210.Subsaharan area, North West Africa andthe Iberian Peninsula. In: Arnaiz-Villena A,ed. Prehistoric Iberia: genetics,anthropology and linguistics. New York:Kluwer-Plenum, 2000.
249Tissue Antigens 2000: 55: 239–249