Highways England Annual Report and Accounts 2016-2017
152
Highways England Annual Report and Accounts 2016-2017 HC 252
-
Upload
khangminh22 -
Category
Documents
-
view
2 -
download
0
Transcript of Highways England Annual Report and Accounts 2016-2017

Highways EnglandAnnual Report and Accounts
2016-2017
HC 252

Front cover photography: A14 Cambridge to Huntingdon

Highways England Annual Report and Accounts 2016-2017
Presented to the House of Commons pursuant to Section 7 of the Government Resources and Accounts Acts 2000
Ordered by the House of Commons to be printed 19 July 2017
HC 252
Highways England Company Limited registered in England and Wales number 09346363
© Crown copyright 2017
This publication is licensed under the terms of the Open Government Licence v3.0 except where otherwise stated. To view this licence, visit nationalarchives.gov.uk/doc/open-government-licence/version/3 or write to the Information Policy Team, The National Archives, Kew, London TW9 4DU, or email: [email protected].
Where we have identified any third party copyright information you will need to obtain permission from the copyright holders concerned.
This publication is available at www.gov.uk/government/publications
Any enquiries regarding this publication should be sent to us at: [email protected]
Print ISBN 9781474147378
Web ISBN 9781474147385
ID P002887386 07/17
Printed on paper containing 75% recycled fibre content minimum
Printed in the UK by the Williams Lea Group on behalf of the Controller of Her Majesty’s Stationery Office

Contents
Highways England Annual Report and Accounts 2016-2017
Our role and how to contact us 6
01SeCtiOn
Chairman’s statement 7
02SeCtiOn
Chief executive’s review 9
Strategic report
03SeCtiOn
Overview A snapshot of our performance against our KPIs 12 Performance headlines 13
04SeCtiOn
Making our network safer 14
05SeCtiOn
improving customer service Customer satisfaction 18 A better maintained network 21 A free-flowing network 24 An accessible and integrated network 28 Building collaborative relationships 30
06SeCtiOn
Delivering the Road investment Strategy Our major improvement schemes 33 Our work region by region 38 Supporting economic growth 45 Our work, sustainability and the environment 47
07SeCtiOn
Our people 51
08SeCtiOn
Financial Review 57
09SeCtiOn
Principal risks and uncertainties 62
10SeCtiOn
Our governance 69 Corporate governance report 76 Nominations Committee 80 Safety Committee 81 Audit and Risk Committee 83 Investment Committee 86 Remuneration Committee and report 88
11SeCtiOn
the Directors’ report 92
12SeCtiOn
Auditors’ report 96
13SeCtiOn
Financial Statements 101

6
Traffic England: http://www.trafficengland.com
Customer Contact Centre: 0300 123 5000 [email protected]
Contact centre details published at: https://www.gov.uk/government/organisations/highways-england
Twitter: https://twitter.com/highwaysengland or @highwaysengland
App: Live traffic info: get it from Google Play, iTunes or BlackBerry World; links and information about the App published at: http://www.highways.gov.uk/mobile-services
Highways england’s role is to operate, maintain and modernise england’s motorways and major A-roads, known as the Strategic Road network.

7
01SeCtiOnC
hairman’s
statement
Overview
Chief E
xecutive’s review
Making our
network safer
Imp
roving custom
er serviceD
elivering the Road
Investment S
trategy
Our
people
Financial R
eviewP
rincipal risks and uncertainties
Our
governance
The Directors’
report
Auditors’
report
Financial S
tatements
Highways England has an important role keeping England moving. Roads are vital to the effective functioning of our society, with our Strategic Road Network of motorways and trunk roads carrying one-third of all road passenger traffic and over two-thirds of all road freight.
The Company supports the Government’s economic growth agenda by delivering the first of its five-year Road Investment Strategies.
In our second year, as in our first, the Board has concentrated on the Company’s three imperatives. These are to:
� make our roads safer for all users, including those who work on them
� improve the customer service delivered for all road users
� deliver the Government’s five-year Road Investment Strategy
Making our roads saferWe treat safety as our key imperative and believe that every injury is one too many. The hazards inherent in driving demand corresponding steps to keep everyone safe. We have made progress this year and we are determined to do much more to reduce the number of incidents further.
I am pleased to report that safety improvements implemented by Highways England have led to fewer people being hurt while working on the roads. This includes a focus on our traffic officer colleagues and, by working with our construction and maintenance partners, those who work for other companies, on our behalf.
Chairman’s statementColin Matthews explains how we have delivered against our three priorities over the year.
Regarding road users, we are pleased that overall collision and casualty rates on our network appears to have reduced in 2016, but concerned that the rate of those killed and seriously injured did not. To achieve our ambitions we need to improve safety faster than the rate at which traffic is growing. We use the means within our control, such as road improvements at accident hotspots, better information and increasingly extensive and more direct communication campaigns to do this. We must also mobilise road users and a broad range of organisations to respond in a common effort to reduce collisions and the resulting injuries and economic damage that incidents incur.
Our safety ambitions are supported by our refreshed five-year safety plan, which you can read more about in Section 4.
improving our customer service to road usersWe want to improve our customer service and we are talking more with customers and our stakeholder organisations to better understand their opinions. We use the data provided by Transport Focus, the road users’ watchdog, and combine this with our own insight from customer
01SeCtiOn
Colin Matthews CBeChairman

8
panels and surveys to identify targeted initiatives to improve satisfaction. The introduction of new variable message signs was a direct result of this interaction, providing more helpful information to users of the Strategic Road Network.
The sharp increase in the Government’s investment in our roads is leading to more roadworks, in the short-term, while at the same time traffic is growing. We have worked hard to minimise the impact where we can but recognise that we have even more to do to reduce the inconvenience to drivers, including minimising the length of roadworks, speeding the delivery, managing the flow of traffic through works and providing better information.
You can read more on this topic in Section 5.
Delivering the Government’s Road investment StrategyWe are at the end of the second year of the Government’s first five-year programme to deliver the £15bn1 Road Investment Strategy. We are pleased with progress over the past year in which we have opened seven schemes, including the widening of the A45 and the A556 Knutsford to Bowdon dual carriageway. These schemes improve safety, reduce congestion and provide better journeys for road users.
The Strategic Road Network is a major driver of economic growth as it connects businesses and people. As part of our strategy to support economic growth, we have allocated funding towards road improvement schemes across England that will facilitate new housing developments and access to employment.
The delivery of our investment programme means strengthening the technical and commercial capacity of Highways England. We have hired new people and are developing the specialist skills within our existing staff required to deliver our challenging ambitions. Similarly, we are strengthening our relationships with our supply chain partners to ensure that they are resourced to deliver our plans, now and in the future.
the longer-term futureWe support wholeheartedly the Government’s aim that by 2040 the Strategic Road Network will be smoother, smarter and more sustainable. Our work represents a major investment in the country’s infrastructure, and, by harnessing the best technology, engineering and construction expertise, we will bring significant gains to the country. Accordingly, we are already looking beyond the first five years to prepare for the next period of investment.
I thank everyone who works at Highways England and our colleagues across our many partner organisations for their energy, skills and dedication in delivering the challenging commitments.
I am also grateful to Tom Smith and Elizabeth Perelman, who both stepped down from the Board in 2016-17, for all they have contributed and I am pleased to have welcomed Vanessa Howlison and Roger Lowe to the Board during the year.
SeCtiOn 01 / Chairman’s statement
1 The £15bn funding allocated to Highways England includes £11.4bn that relates to the first five-year Road Investment Strategy. The remaining funding has been committed to the first year of the next Road Investment Strategy. Colin Matthews

9
Chairm
an’s statem
entO
verview
02SeCtiOn
Chief E
xecutive’s review
Making our
network safer
Imp
roving custom
er serviceD
elivering the Road
Investment S
trategy
Our
people
Financial R
eviewP
rincipal risks and uncertainties
Our
governance
The Directors’
report
Auditors’
report
Financial S
tatements
Highways England is now two years old. In that time we have focused on safety for both our road users and road workers, and have delivered a number of customer service changes that have improved the customer experience and the information that we provide. We have made good progress delivering the Government’s five-year £15bn1 Road Investment Strategy.
We consider safety, customer service and delivery to be our imperatives and everything we do is aimed at them.
Making our roads saferSafety is our first and most significant imperative. The Government has set us a target to reduce the number of people who are killed or seriously injured on our network by 40% by the end of 2020. We cannot completely eliminate the risk presented by building, maintaining and operating the country’s high-speed Strategic Road Network
Chief executive’s reviewJim O’Sullivan, Chief executive, Highways england
the Strategic Road network makes up only 2% of the UK’s roads, yet it accounts for about 70% of the road freight, 30% of all road journeys and 4 million individual journeys a day – a significant contribution to the economy.
02SeCtiOn
Jim O’SullivanChief Executive
but we can make sure that those risks are managed effectively and that their potential harm is radically reduced.
Working with manufacturers, we are encouraging them to make vehicles safer; particularly in the areas of infotainment systems and autonomous vehicles. We are working hard to make new roads safer and to improve the safety of existing ones. The continued roll-out of concrete central barriers on our motorway network is a significant step in improving safety, as is the £220m announced in the last Autumn Statement for smaller safety and congestion improvement schemes.
Influencing driver behaviour is key. We believe that drivers bringing vehicles onto our network have a responsibility to do so safely. This year, we launched awareness campaigns to communicate with the public on road safety issues such as driving too fast in the rain and the need to comply with ‘red Xs’ on our motorways by not driving through them. We also increased the patrol levels of our Traffic Officer Service to provide a visible reminder of our presence. We introduced video cameras to our vehicles on a trial basis to record evidence of unsafe acts. This will allow us to to take appropriate follow-up action, such as passing it to the police for potential prosecution.
1 The £15bn funding allocated to Highways England includes £11.4bn that relates to the first five-year Road Investment Strategy. The remaining funding has been committed to the first year of the next Road Investment Strategy.

10
We have made progress with our own workforce by significantly reducing the injury rate for traffic officers. In addition, we have worked with our major contractors to improve the safety of road workers on our network. We have particularly focused on vehicle incursions into lane closures and workers being struck by moving plant or materials. We want everyone who works on our roads to be safe, so we are focusing on employees in our supply chain right down to the smallest supplier.
improving our service to customersOur second imperative is to improve our services to all our customers. We know that they want safe, reliable and uninterrupted journeys on smooth roads. As we progress with the delivery of the Road Investment Strategy, our roadworks have increased and we recognise the potential impact that this has on our customers’ satisfaction. No one welcomes more roadworks, even if they appreciate the value of the subsequently completed road. To compensate for this we have shortened roadworks where we can, completing schemes in two phases, rather than one long set of roadworks. We have also trialled raising speed limits to 60mph, where it is safe to do so. We are planning to trial a 55mph speed limit, which would be highly beneficial to the freight industry. We have also improved the quality of information at the roadside, not only about our road schemes and their benefits, but also giving information on distance and likely journey times when travelling through our roadworks.
We have improved the information provided to customers more generally at the roadside. Using our overhead signs, we now show likely journey times to the next junction or significant interchange. Where we have good information, we have started to communicate likely time for a delay and the length of traffic queues to allow customers to make informed decisions about their journeys.
We are giving our traffic officers new technology so that they can provide customers with accurate information at the roadside. We have also improved the accuracy and ease of use of our
Traffic England website, which gives information on our network directly to customers and to sat-nav manufacturers and other information providers, such as radio stations.
Our company values of safety, teamwork, passion, integrity and ownership were in evidence in August 2016, when a footbridge near junction 4 on the M20 was struck by a vehicle and fell onto the carriageway. We were able to work safely and quickly to repair the damage and the carriageway was reopened the following day.
As part of our drive to improve our service to customers, we implemented our new approach to asset management, maintenance and investment in the East Midlands in July 2016. This means that we now directly manage the maintenance and renewal needs of our assets in the region, rather than contracting out this management responsibility to the supply chain. This is already delivering better value and allowing us to improve our service in activities such as litter clearing and grass cutting.
Delivering the Road investment StrategyDelivery is our third imperative. We are at the end of the second year of the five-year programme to deliver the £15bn Road Investment Strategy. Over the past year, we opened the A1 Coal House to Metro Centre scheme near Newcastle and completed roadworks to ease congestion on the M25 junction 30. Additionally, the Smart motorways scheme on the M1 junctions 39-42 went live.
We opened the strategically important Catthorpe Interchange at the M1/M6/A14, providing direct access between these roads and removing the queuing associated with the two very small local roundabouts, previously used by over 45,000 vehicles per day.
We commenced the £1.4bn A14 Cambridge to Huntingdon scheme, establishing a partnership with West Anglia Training Academy to create a dedicated training and apprenticeship course to support local skills and development through this scheme and afterwards.
SeCtiOn 02 / Chief executive’s review

11
Chairm
an’s statem
entO
verview
02SeCtiOn
Chief E
xecutive’s review
Making our
network safer
Imp
roving custom
er serviceD
elivering the Road
Investment S
trategy
Our
people
Financial R
eviewP
rincipal risks and uncertainties
Our
governance
The Directors’
report
Auditors’
report
Financial S
tatements
We have also allocated funding for improvement schemes from our Growth and Housing Fund to unlock new housing developments and jobs. Highways England’s Growth and Housing fund has so far committed to investing over £40m during the current road period towards 13 improvements to support the development of 22,000 new homes and enable 34,000 jobs around the country.
Building collaborative relationshipsWe work closely with our many stakeholders and partners who play a vital role in influencing and delivering our work. Our first stakeholder conference took place at Highways UK 2016 where we focused on what our national stakeholders and partners need from us. Participants included Transport Focus, the Freight Transport Association and other Highways Authorities.
In developing our strategic economic growth plan, we consulted with all 39 Local Enterprise Partnerships and we engaged with a range of stakeholders, including sub-national transport bodies, business representatives, local authorities and national infrastructure providers.
Financial updateThe stability of our five-year capital funding enables us to maintain and enhance our network. It underpins the long-term plan, meaning that we can engage more effectively and work more strategically with our major contractors. Showing them the likely pipeline of future work and giving them a better insight into our plans will result in efficiency savings for both parties.
In the second year of the Road Investment Strategy we have invested £626m on network renewals schemes and £1.3bn on improvements.
The Road Investment Strategy also sets a challenging target of delivering £1.2bn of efficiencies from our capital investment programme over the five-year period. In 2016-17, we achieved efficiency savings of £169m against
our annual milestone of £139m spread across the capital improvement and renewals programme. We are continuing to identify where we can make further efficiency savings and deliver even more value for money across our activities.
Organisational changeWe are proud of our people. In order to meet our ambitious goal over this investment period, we need to make sure that we are able to call on a highly skilled and capable workforce. This year, we have assessed our current capability against recognised technical competency models and introduced measures, such as creating a curriculum of development activities, to enhance the skills of our staff.
In 2016-17, we developed a new job scopes and grading structure that is sufficiently flexible to allow us to attract and retain the right people to deliver our business. We plan to launch this new structure in the early part of the 2017-18 financial year.
This year, we introduced a new set of values and behaviours that support our desire to change company culture to support a continuous improvement approach to performance and safety. These have been embedded into some key processes, such as performance management, learning and development, recruitment, employee engagement and communication.
Looking forwardWe have started the detailed preparation for the second Road Investment Strategy period. This will run from April 2020 to March 2025. We published our strategic economic growth plan, called The Road to Growth, in March 2017 alongside our analysis of the network and its needs in our 18 Route Strategies. We will be ramping up this activity in the coming year as we formulate our proposals for the second Road Investment Strategy.
Jim O’Sullivan

Overview
These results have been validated and recalculated by our Internal Audit team.
03SeCtiOn
target: We must clear at least 85% of incidents on the motorways within
the hour.
We achieved 85.93%
target: We must ensure that 95% of pavement (the carriageway) requires no further investigation
for possible maintenance.
We achieved 94.3%
target: We must make sure there is 97% lane availability in any one year to support the smooth flow of traffic.
We achieved 98.41%
target: We must publish a Biodiversity Action Plan by 30 June 2015 and report annually on how we have
delivered against the plan.
We published our plan in the first year of the Road Investment Strategy and we report on our
delivery annually.
target: We need to make capital expenditure savings of at least
£1.212bn by 2019-20.
We identified £169m of efficiency savings against our 2016-17
milestone of £139m.
target: We must report on the number of new and upgraded crossings.
We have completed 20 new and 7 upgraded crossings.
target: We must mitigate at least 1,150 noise important areas
by 2020.
We delivered 73 noise mitigation schemes in the year.
(121 accumulated total overall).
A snapshot of our performance against our KPis
target: We must achieve a 40% reduction in the number of people
who are killed or seriously injured on our network by the end of 2020.
We noted a 6.1% increase in year.Based on unvalidated data from
January to September 2016
target: We must report on average delays (time lost per vehicle mile).
We achieved an average delay of 8.95 seconds per vehicle per mile.
target: We must achieve a score of 90% road user satisfaction by
March 2017.
We achieved 89.11% in year.
12

13
01SeCtiOn
Overview
Chief E
xecutive’s review
Making our
network safer
Imp
roving custom
er serviceD
elivering the Road
Investment S
trategy
Our
people
Financial R
eviewP
rincipal risks and uncertainties
Our
governance
The Directors’
report
Auditors’
report
Financial S
tatements
Chairm
an’s statem
ent
03SeCtiOnO
verviewC
hief Executive’s
reviewM
aking our netw
ork saferIm
proving
customer service
Delivering the R
oad Investm
ent Strateg
y O
ur p
eopleFinancial R
eviewP
rincipal risks and uncertainties
Our
governance
The Directors’
report
Auditors’
report
Financial S
tatements
An at-a-glance picture of our year
Performance headlines
improving safetyWe have delivered 86 actions from the 122 originally identified in our Health and Safety – our approach outlined to improve safety for our customers and road workers. Our accident frequency rates in our Traffic Officer Service have reduced and we have continued to work with our suppliers to improve the safety performance of road workers. We delivered a number of public awareness campaigns during the year to influence driver behaviour and improve safety on our network.
improving customer serviceWe launched our customer insight survey to better understand their needs. We are managing our roadworks more effectively to minimise the impact on journeys and are providing more timely information on roadworks to our customers to help inform their journeys.
Adding capacityWe delivered seven major projects, providing around 30 extra lane miles of capacity to our network. We also improved four key junctions. More detail is contained in Section 6 – delivering the Road Investment Strategy.
improving our networkWe started the construction of four schemes on schedule and a further three schemes ahead of this investment period’s commitments. Overall, these schemes are forecast to contribute 120 lane miles towards the Strategic Road Network.
A14 Cambridge to HuntingdonWe have started construction on the A14 Cambridge to Huntingdon scheme ahead of schedule. This scheme will increase capacity, reduce congestion and also contribute to the local economy through apprenticeship and job creation.
Accessibility of network for vulnerable road users1
We completed 32 cycling schemes as part of our Delivery Plan commitment to establish 200 cycling facilities and crossing points around the Strategic Road Network by 2021.
Supporting economic growthWe published our strategic economic growth plan, The Road to Growth. We also committed £40m from the Growth and Housing Fund towards 13 improvement schemes to facilitate 22,000 new homes and 34,000 jobs across England.
We investedOver the year, we invested a total of £626m in renewing road surfaces, structures and technology assets and £1.3bn on asset improvements.
1 Non-motorised users of the Strategic Road Network, including cyclists, motorcyclists, pedestrians and equestrians.

1414
Making our network saferthe safety of our customers and those who work on our network is our first imperative.
Our aims and commitmentsWe want our roads to be as safe as possible for people who are travelling or working on them.
We are committed to reducing the number of people who are killed or seriously injured on our network. To that end, our aim is to reduce the overall total by 40% by the end of 2020, and as close as possible to zero by 2040.
What this means for usEngland’s roads are among the safest in the world. We monitor our performance through figures provided in the Road Safety Results for the Strategic Road Network and Great Britain. These are validated on an annual basis by the
Office for National Statistics and published by the Department for Transport at the end of June each year. This year, publication of the 2016 results has been delayed until autumn 2017 to allow sufficient time for data quality assurance owing to ongoing delays in data supply by police forces.
Based on unvalidated data received for the first nine months of the calendar year, we continue to see an overall reduction in the number of casualties by 8%. Serious casualties have increased by 7.8% compared with the same period in 2015. Overall, we believe that this will result in an increase of people killed or seriously injured on our network by 6.1%. This will be confirmed in the autumn.
We understand that the increase may be due to a change in the way that the data is now recorded. This year, the Department for Transport confirmed that the centralised Collision Recording and Sharing system, used by some police forces to record road traffic collisions, has significantly changed the way some injuries are now reported. Further research on the impact that this has had will also be reported in the autumn.
04SeCtiOn
Jan-Sep and full-year KSI casualties against monitoring points by year
0
500
1000
1500
2000
2500
3000KSI monitoring pointsFull-year KSI casualtiesJan-Sep KSI casualties
2020201920182017201620152014201320122011201020092008200720062005
2,00
9
1,80
1
1,80
5
1,63
8
1,50
8
1,43
8
1,37
9
1,25
7
1,26
9
1,36
3
1,30
1
1,38
0
2,32
1
2,25
0
2,17
8
2,10
7
2,03
6
1,96
4
1,89
3
1,82
1
1,75
0
1,67
8
1,60
7
1,53
6
1,46
4
1,39
3
2,69
1
2,44
0
2,40
5
2,10
3
1,96
7
1,88
6
1,82
9
1,69
6
1,70
9
1,85
3
1,78
4
target: We must achieve a 40% reduction in the number of people who are killed or seriously injured on our network by the end of 2020.
We noted a 6.1% increase in year.Based on unvalidated data from January to September 2016

15
01SeCtiOn
Overview
Chief E
xecutive’s review
Making our
network safer
Imp
roving custom
er serviceD
elivering the Road
Investment S
trategy
Our
people
Financial R
eviewP
rincipal risks and uncertainties
Our
governance
The Directors’
report
Auditors’
report
Financial S
tatements
Chairm
an’s statem
entO
verviewC
hief Executive’s
review
04SeCtiOnM
aking our netw
ork saferIm
proving
customer service
Delivering the R
oad Investm
ent Strateg
y O
ur p
eopleFinancial R
eviewP
rincipal risks and uncertainties
Our
governance
The Directors’
report
Auditors’
report
Financial S
tatements
We will use the increased granularity that the system will provide to improve our analysis. This will help us to design and deliver more targeted interventions on our network to reduce the number of incidents that result in people being killed or seriously injured.
Our delivery over the year
In October 2015, we published our five-year health and safety plan: Health and Safety – our approach outlined. To date, we have delivered 86 actions from the 122 originally identified. The plan was refreshed this year to ensure that it continues to help us improve our safety performance.
Our National Incident Casualty Reduction Plan, launched in 2016, provides a more detailed overview of our approach to customer safety and how we are going to achieve our strategic outcomes. It sets out our road safety delivery model and the key roles and responsibilities held across the organisation. It also provides an understanding of the Safe System Approach, with our proposed interventions across safer roads, safer vehicles and safer people.
The accident frequency rates in our Traffic Officer Service have reduced and we have continued to work with our suppliers to improve the safety performance of road workers.
Some key successes this year include:
� the launch of a new health and safety management system that provides a central repository for all of the Company’s health and safety advice
� revising our traffic officer procedure manual to make it easier to use and refer to
� amendments to our tender process to make health and safety more prominent in the selection of future suppliers
This year, we have rolled out health and safety leadership and behavioural training across the Company. This will provide the key facets of a positive safety culture and define safety behaviours expected at all levels of the organisation.
Zero crossing initiativeLive lane crossing on our network is one of the biggest dangers to our suppliers. Action taken has made a significant reduction in the number of carriageway crossings from 3.7 million in 2010, to 20,000 by the end of 2016.
This was achieved by working with our suppliers to understand current carriageway crossings and live lane working practices. We also explored new ways of working, such as using maintenance assistance vehicles for accessing non-accessible gantries, and using our variable signs and signals at the approach to temporary works to reduce the need to place signage directly on the carriageway.
New guidance was published in June 2016 and has been discussed with our suppliers to help familiarise them with the new requirements.
Influencing driver behaviour continues to be a priority for us. We delivered a number of public awareness campaigns during the year. These included campaigns on driving too fast in the rain and the need to comply with ‘red Xs’ on our motorways by not driving past them.

16
Safety campaigns – Driving too fast in the rainOur aim is to modify driver behaviour and reduce serious accidents.
Wet roads and reduced visibility are statistically more dangerous than driving in snow or ice. Yet, driving too fast in the rain is one of the highest causes of accidents on our roads. Our research found that many drivers underestimate this risk because they consider rain to be ‘normal weather’, so are less likely to adjust their driving.
In November 2016, we launched a campaign to change that perception and encourage people to slow down when driving in the rain or in wet conditions.
Using a combination of video-advertising, radio and posters visible from the network, we were able to reach a number of our customers. Messaging systems at motorway services, as well as aligning campaign messages alongside Met Office forecasts, helped alert drivers to road conditions.
We worked in partnership with Joe.co.uk (a social media channel aimed at younger males). Through this, we engaged the support of two well-known YouTube and Facebook stars to promote our safety message in a video viewed more than 600,000 times.
Despite our campaign coinciding with one of the driest winter periods on record, the number of people recognising the danger of rain did increase.
We are monitoring results and may conduct further targeted campaigns in this area over the remainder of this Road Investment Strategy.
SeCtiOn 04 / Making our network safer
17
01SeCtiOn
Overview
Chief E
xecutive’s review
Making our
network safer
Imp
roving custom
er serviceD
elivering the Road
Investment S
trategy
Our
people
Financial R
eviewP
rincipal risks and uncertainties
Our
governance
The Directors’
report
Auditors’
report
Financial S
tatements
Chairm
an’s statem
entO
verviewC
hief Executive’s
review
04SeCtiOnM
aking our netw
ork saferIm
proving
customer service
Delivering the R
oad Investm
ent Strateg
y O
ur p
eopleFinancial R
eviewP
rincipal risks and uncertainties
Our
governance
The Directors’
report
Auditors’
report
Financial S
tatements
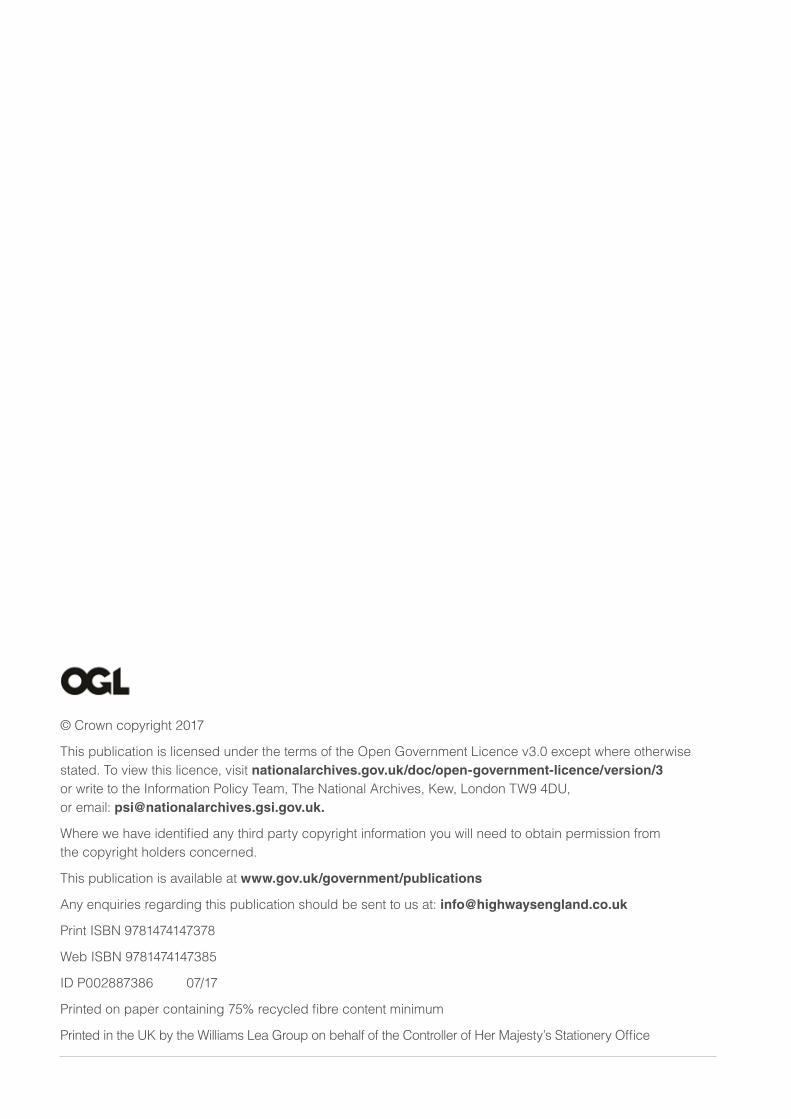
� motorcycling as a practical solution – which outlines the benefits of motorcycling as a transport option
� safer infrastructure – to improve road design to reduce collisions and rider vulnerability
� unlocking the benefits of motorcycling – to improve opportunities for modal integration and support the UK motorcycling industry
� better motorcycle industry engagement – the development of safety products and technology enhancements, such as personal protection equipment and low-emission vehicles
� partnership with cycling – to ensure that joint opportunities are developed
We have established (and now lead) a national motorcycle working group. This includes members from all key motorcycling organisations who are working together to reduce motorcyclist casualties and promote safer motorcycling on our network. We are also delivering a broad range of actions, including a motorcycling safety campaign and supporting advisory activities and safer motorcycling through the BikeSafe initiative.
Motorcycle safety and transport policy frameworkMotorcyclists form one of our most vulnerable customer groups. While the level of incidents may be lower than other types of vehicles, the difference between injury and fatality is significantly higher.
An action in our health and safety five-year plan focuses on identifying the factors that cause these incidents and what measures we can introduce to reduce the risk. We have developed the motorcycle safety and transport policy framework and are working with a number of different partners to take advantage of their experience and expertise. Areas for action include:
� road user awareness – to increase understanding of motorcycle safety and its interrelationship with other modes of transport
� educate to deliver – to improve motorcyclists’ compliance and enhance levels of training and competence

18
improving customer serviceimproving customer service is our second imperative.
What this means for usSatisfaction is currently measured using the National Road User Satisfaction Survey (NRUSS). As of 1 April 2016, Transport Focus took responsibility for managing the survey and now provides us with the data on a monthly basis. One of our commitments in this investment period is to develop better understanding of what makes our customers satisfied, or not, and measure performance against those factors. We use the data provided by Transport Focus and combine this with supporting evidence gathered via the customer panel and regional insight surveys to
05SeCtiOn
This section explains how we are working to deliver:
� customer satisfaction
� a better maintained network
� a free-flowing network
� an accessible and integrated network
� building collaborative relationships
identify targeted initiatives to help us improve satisfaction further. We have also been working with Transport Focus on their development of a more accurate tool for measuring customer satisfaction. The Strategic Road User Survey will be trialled prior to roll-out, and will then replace NRUSS as our primary tool in future years.
This year’s result is slightly below our target and could be as a result of the increase in the number of road schemes now being delivered. This has been taken into account as we develop a more customer-focused approach to our business.
Roadworks are a consequence of us keeping our network in good condition and improving its contribution to the economy. We know it is important to our customers to minimise the disruption that roadworks and unplanned incidents cause and provide them with accurate information to improve their journey. We recognise that how we do this makes a major impact on our customers’ perception of us. As our customers’ expectations continue to rise, we are determined to improve our service to meet their needs.
1 Customer satisfaction Our commitment and objectivesThe Road Investment Strategy sets out the expectation that we would improve customer satisfaction to 90% by the end of March 2017 and maintain it at this level or higher over the remainder of the investment period.
target: We must achieve a score of 90% road user satisfaction by March 2017.
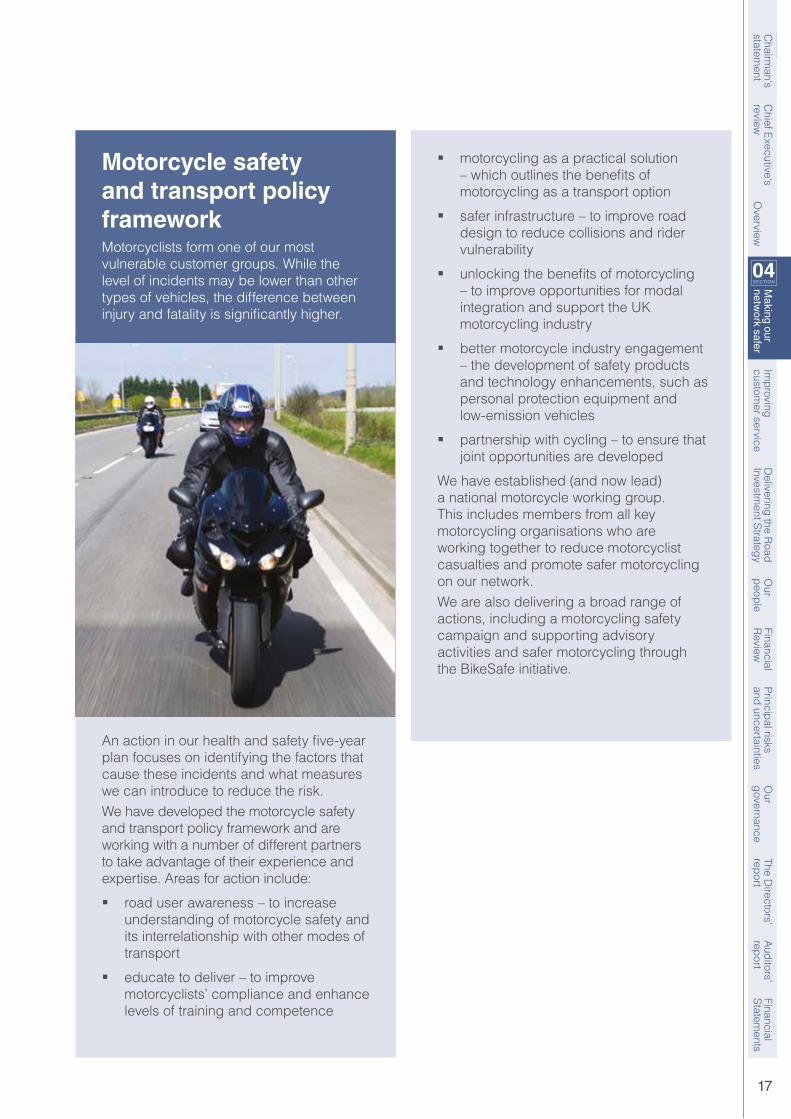
We achieved 89.11% in year.

19
01SeCtiOn
Overview
Chief E
xecutive’s review
Making our
network safer
Imp
roving custom
er serviceD
elivering the Road
Investment S
trategy
Our
people
Financial R
eviewP
rincipal risks and uncertainties
Our
governance
The Directors’
report
Auditors’
report
Financial S
tatements
Chairm
an’s statem
entO
verviewC
hief Executive’s
reviewM
aking our netw
ork safer
05SeCtiOnIm
proving custom
er serviceD
elivering the Road
Investment S
trategy
Our
people
Financial R
eviewP
rincipal risks and uncertainties
Our
governance
The Directors’
report
Auditors’
report
Financial S
tatements
Our delivery over the yearWe know that our customers want to feel safe, be listened to, trust what they are being told and have control of stress-free journeys.
Our Customer Service Strategy: Better Journeys, Better Conversations, published in January 2016, provides our strategic approach in:
� delivering the basics
� improving our service and network
� engaging with our customers
This year, we have focused our priorities on ‘delivering the basics’ to ensure that we have a strong foundation on which to improve our customer service.
We have a customer service plan which supports targeted delivery of initiatives that will make a visible difference to our customers. We have also worked to ensure that our internal processes and policies reflect customer priorities to support future improvements.
Communicating more directly with our usersWorking with Transport Focus, we have reviewed and improved the way we interact with our customers. To provide a high-quality, consistent response we have provided training to the business and our suppliers and have developed a quality metric for written correspondence based on our corporate communication standards, to monitor and improve our performance in this area.
We have set up mystery shopping for our Customer Contact Centre and Dart Charge Service1 to understand the quality of our interaction with our customers and have developed targeted improvements from the results of the research. Our complaints process has been improved to ensure that we deal with and continue to learn from their feedback.
Most of our customers, especially freight drivers, want to be updated ‘in journey’. We have responded by installing improved signage at all major scheme roadworks which provides:
� the scheme name
� the type of improvement, for example, Smart motorway
� the expected date of completion
� the details of the funding and sponsoring organisations
Dartford Crossing
1 A cashless payment system for the Dartford Crossing.

20
We have also introduced travel time information to advise those who are travelling through the works how long it will take them to do so. This will help them take more control of their journeys. This allows customers to understand what is happening, why and how long their journey may be interrupted.
We are aware that customers travelling regularly on routes that are subject to one of our major schemes are impacted greatly by these roadworks. This year, we have held additional road user engagement forums for six of our schemes and asked our customers to undertake over 600 audits of our roadworks and send us detailed feedback. This has helped us to understand how customers are experiencing our roadworks so that we can make improvements over the remainder of this Road Investment Strategy.
This year, we launched our customer insight survey, which has 21,000 respondents across all regions to complement the NRUSS data supplied by Transport Focus. This provides regional and scheme-specific information, which we can feed back into the business to improve our service.
We have embraced technology to enhance the road user experience. New messages on our variable message signs on the network were created with the help of our customers to ensure that they are useful to them. Our traffic officers have received mobile devices that they can use to access up-to-date and relevant information directly at the roadside to help provide a better service to those stranded on our network.
We want our customers to feel safe in the event that we have to divert traffic off the motorway and onto local roads. In preparation for a route to be utilised, we have instructed our suppliers to check each potential diversion route for suitability for all vehicle types. When the route is deployed, the route is checked again to ensure that the signage is accurate and easy to read.
SeCtiOn 05 / improving customer service

21
01SeCtiOn
Overview
Chief E
xecutive’s review
Making our
network safer
Imp
roving custom
er serviceD
elivering the Road
Investment S
trategy
Our
people
Financial R
eviewP
rincipal risks and uncertainties
Our
governance
The Directors’
report
Auditors’
report
Financial S
tatements
Chairm
an’s statem
entO
verviewC
hief Executive’s
reviewM
aking our netw
ork safer
05SeCtiOnIm
proving custom
er serviceD
elivering the Road
Investment S
trategy
Our
people
Financial R
eviewP
rincipal risks and uncertainties
Our
governance
The Directors’
report
Auditors’
report
Financial S
tatements
What this means for usWe are committed to invest £3.7bn in renewing our network by the end of this investment period (2019-20) and to maintain the carriageway (often referred to as the ‘asset’ or the ‘pavement’) in good condition to ensure that it does not fall below the 95% target set by the Department for Transport. This target is determined as the percentage of the carriageway that does not require any investigation for possible maintenance.
Our delivery over the yearDuring the year, we invested £626m in renewing road surfaces, structures and technology, representing 17% of the total planned investment within the five-year period.
We also continued to:
� monitor the condition of the carriageway to check that it was in good condition
� progress with our renewals and maintenance programme
� carry out investigations where inspections showed this was necessary
During 2016-17, we did not reach our target, achieving 94.3% against a target of 95%.
We implemented a recovery action plan to improve the overall condition of our network. We had identified that the poor condition in certain sections was due to low skid resistance and delivered a number of road surface renewal schemes to address this. We recognise that a more robust road renewal delivery plan aligned to meet our target is essential and we are proactively addressing this for 2017-18 and future years.
2 A better maintained network Our commitment and objectivesKeeping our network in good condition for all of our customers is a core requirement of the Road Investment Strategy. We are committed to improve the maintenance of – and operations on – our network to give the best possible service to road users.
target: We must ensure that 95% of pavement (the carriageway) requires no further investigation for possible maintenance.
We achieved 94.3%

22
Our programme of planned renewals and actual renewals is summarised in the table below.
Asset Planned renewal
Actual renewal
New road surface
746 lane miles
1,388 lane miles
Vehicular barriers (VRS)
59 linear miles
80 linear miles
Drainage 110 linear miles
201 linear miles
Technology renewals and upgrades
256 810
Asset deliveryWe continue to improve how our roads are maintained and operated so that we give the safest and best possible service to our customers. A key element to improving our overall asset management capability is to change fundamentally our operating model for maintenance and renewals.
On 1 July 2016, we successfully rolled this out, for the first time in the East Midlands region. This approach now known as ‘asset delivery’ will be implemented in Cumbria and North Lancashire, the North East and in the South West in 2017-18.
This new model enables us to directly manage both routine maintenance and the delivery of capital renewal and improvement schemes. Working more closely with our suppliers, who
physically undertake these activities, we are able to collaborate more effectively, identify more innovations in planning, scheduling and the methods employed to improve the quality and value for money of these services.
Asset delivery builds upon the strong existing capabilities of both our own staff and our supply chain, and creates more flexible and efficient ways of working. For customers, this means far fewer roadworks, shorter periods for lane closures and better value for money on the Government’s investment of £15bn1.
This change means that we have taken on many roles previously delivered by our supply chain, including:
� network occupancy – co-ordinating access to our network, and the associated traffic management, to ensure that we keep delays and congestion to a minimum
� scheme identification – to make sure that we are targeting our funds at schemes that will have the most positive impact
� decision making around incidents such as severe weather – to ensure that we are making the best decisions for our customers
SeCtiOn 05 / improving customer service
Mar 17Feb 17Jan 17Dec 16Nov 16Oct 16Sep 16Aug 16Jul 16Jun 16May 16April 162015-1612014-152013-14
TargetActualRevalidated
Percentage of pavement asset that does not require further investigation
1Additional data was received in May 2016 and subsequently validated in June 2016. This resulted in a reduction in the published year-end performance figure (of 95.4%) to 92.3%.
92.5%
93.5%
94.5%
95.5%
92%
93%
94%
95%
1 The £15bn funding allocated to Highways England includes £11.4bn that relates to the first five-year Road Investment Strategy. The remaining funding has been committed to the first year of the next Road Investment Strategy.

23
01SeCtiOn
Overview
Chief E
xecutive’s review
Making our
network safer
Imp
roving custom
er serviceD
elivering the Road
Investment S
trategy
Our
people
Financial R
eviewP
rincipal risks and uncertainties
Our
governance
The Directors’
report
Auditors’
report
Financial S
tatements
Chairm
an’s statem
entO
verviewC
hief Executive’s
reviewM
aking our netw
ork safer
05SeCtiOnIm
proving custom
er serviceD
elivering the Road
Investment S
trategy
Our
people
Financial R
eviewP
rincipal risks and uncertainties
Our
governance
The Directors’
report
Auditors’
report
Financial S
tatements
in-situ recyclingWe have used an innovative process for the first time in the UK to renew the road surface in the North East in a more efficient way.
Using an in-situ recycling machine, as pictured above, we replaced eight lane kilometres of road surface in half the time and at 40% cheaper than traditional resurfacing methods. The process involves planing the existing surface, mixing it with fresh bitumen and relaying it. A standard hot-mix surfacing is then laid on top of the recycled course.
The project is currently forecasting a 70% reduction in the amount of aggregates used, a 66% reduction in the amount of waste produced and a 33% reduction in carbon emissions.
Given its success, we are now looking at further opportunities to adopt this approach in our roads maintenance programme.
New contracts have been drawn up to work within these new arrangements:
� maintenance and response contract – this contract, of up to 15 years, provides routine maintenance and response to incidents from our depots
� design services contract – this is a five-year contract that will involve a supplier taking our requirements and turning them into well-defined packages of work
� construction works framework – a four-year framework that will deliver capital projects required to repair, renew and improve our road network
� specialist goods and services – under a series of separate contracts areas such as technical surveys, laboratory testing, road safety audits, principle and general inspections and weather forecasting will be supplied
Our people and the suppliers on these contracts will collaborate to ensure efficient and effective delivery is achieved.
improving our data to manage our assets
We recognise that our corporate imperatives of safety, customer service and delivering the Road Investment Strategy require a foundation of good quality data. In 2016-17, we launched the co-ordinated data improvement plan (CDIP). This focuses on delivering a change in the way we value and manage our data as a core company asset. A key element of our approach is to provide stronger governance and leadership in data management.
This year, we have concentrated on improving core datasets such as asset, capital investment, efficiency, organisational and corporate performance and customer satisfaction. These are critical in our ability to meet our obligations under the Licence, Road Investment Strategy and Delivery Plan. Improving these interrelated datasets should lead to a significant improvement to the type and quality of data available to the business, our Shareholder (the Secretary of State for Transport) and the Office for Rail and Road (the Highways Monitor).
Asset information underpins our decisions and planning, and the quality of the underlying asset data is fundamental to the operation of our network. In 2016-17, we worked to improve the integrity of this information including:
� developing new processes for data capture for our structures (bridges) and pavements (roads) information
� improving the quality of pavement data for deployment in 2017-18
� developing and validating new indicators on structures and pavement condition
� continuing the development of the Company’s integrated asset management system

24
3 A free-flowing network Our commitment and objectivesOur aim is to reduce delays on our network and to keep lane availability above 97% across the year and that 85% of all motorway incidents are cleared within one hour. We are also committed to providing more effective information well in advance of peak journey times to help our customers plan ahead or avoid congested areas following an incident.
What this means for usWe have used the Innovation Fund1 to support a range of incident detection projects to help us identify and respond to incidents more quickly. During the year, we started designing the following schemes:
� stopped vehicle detection implementation on the M25 junctions 23-27 to detect stopped vehicles in low-flow conditions in all lane running sections
� wayfinding2 and incident detection technology at the Saltash tunnel in Cornwall
Our delivery over the yearWe have exceeded our target, achieving a lane availabilty rate of 98.41%. While these results are positive, we know that our customers can still get frustrated by delays due to roadworks. We are determined to improve the quality of the advanced information that we give our customers about roadworks. We are also doing more works at night time when there are lower traffic volumes to reduce the impact on customers.
We met our target of clearing at least 85% of incidents on the motorway within the hour, achieving 85.93%. Once again, these are positive results, yet we know that some incidents take longer to clear than we would like. This has an impact on our customers’ journey times. We are improving the quality of the advanced information we give our customers about incidents when they occur and after they have been cleared.
transforming traffic information
Improving the information we give to our customers is a key element of our customer service strategy. Our National Traffic Information Service (NTIS) has been operational since 2015, and it has enhanced our ability to provide accurate and timely traffic information. NTIS collates data on traffic and events and this is communicated on our variable message signs
SeCtiOn 05 / improving customer service
1 A Designated Fund agreed with the Department for Transport providing £150m up to 2021 for innovation in capital projects including emerging technologies, new materials and new ways of working. 2 Two-way, lit signage showing the direction to follow in a tunnel with distance to exit.
target: We must make sure there is 97% lane availability in any one year to support the smooth flow of traffic.
We achieved 98.41%
target: We must clear at least 85% of incidents on the motorways within the hour.
We achieved 85.93%

25
01SeCtiOn
Overview
Chief E
xecutive’s review
Making our
network safer
Imp
roving custom
er serviceD
elivering the Road
Investment S
trategy
Our
people
Financial R
eviewP
rincipal risks and uncertainties
Our
governance
The Directors’
report
Auditors’
report
Financial S
tatements
Chairm
an’s statem
entO
verviewC
hief Executive’s
reviewM
aking our netw
ork safer
05SeCtiOnIm
proving custom
er serviceD
elivering the Road
Investment S
trategy
Our
people
Financial R
eviewP
rincipal risks and uncertainties
Our
governance
The Directors’
report
Auditors’
report
Financial S
tatements
and on the Traffic England website, allowing customers to access it from anywhere. It also provides us with greater visibility of the network, allowing us to respond more quickly to incidents. NTIS considers all factors, including weather conditions, to give customers more accurate estimates of return to normal journey times.
The benefits to our customers are:
� allowing better journey planning, leading to reduced congestion
� quicker clear-up of incidents and restoring the free flow of traffic
� an increase in awareness, promoting a safer and informed choice on journey routes
� cost savings based on the shorter journey times due to faster responses to events and clear-up times
traffic england website
Following feedback from our customers and Transport Focus, a number of detailed enhancements have been made to the Traffic England website, such as:
� the sign in, log out and feedback links made more visible to users
� icons added to show current and future closures
� auto-refresh has been enabled on the traffic report page
� a basic search function has been developed
� an improved reporting functionality and ease of use for our customers has been implemented
Social media
We now have the capability to communicate with our customers using the social media networking service Twitter. From January 2017, the National Incident Liaison Officers (NILO) now monitor and respond to tweets to Highways England as well as tweet information about incidents on our network in real time.
M20 footbridge strikeDuring the busy August bank holiday weekend, the footbridge near junction 4 of the M20 was struck by a digger on a lorry, causing it to partially collapse.
This very serious incident presented a number of challenges to us, our partners and the emergency services, and of course, our customers. Our priority was to ensure the safety of those using that road and, fortunately, no one was seriously injured.
We activated our crisis management procedures and worked closely with our partners and suppliers to make the bridge and carriageway safe. We updated our customers through various media, to ensure that they had timely and accurate information about the ongoing situation and the impact this would have on their journeys. Through our quick response and collaborative working, we were able to reopen the road on the following day.
A week later, after the volume of traffic had reduced, we were able to dismantle the remaining part of the bridge safely and quickly with minimal impact to our customers.

26
For example, we warned customers about the severe weather conditions during Storm Doris in February 2017 and we informed them of the possible impact to their journeys.
Highways england mobile application
In 2016, we expanded the number of platforms that our mobile application is available on. This expanded the platform from IOS and Android to also include Windows-based systems. Following customer feedback, we have been making further improvements to enhance the customer experience such as incident data and local authority roadworks.
Variable message signs
We are listening to our customers and we have made changes to the way we display information on our variable message signs (VMS) to help us better describe locations of disruptions on A-roads to our customers.
Customers tell us that they are not always familiar with the adjoining road and cannot identify the location of the disruption or the effect on their journey. From March 2017, we have begun supplementing the adjoining road information with the name of a nearby town or city.
We have mapped associated place names to over 500 junctions on the wider road network (including local roads). This provides coverage for the vast majority of possible entry and exit points to the trunk road network.
Planning and managing roadworks
Another crucial factor in achieving free-flowing roads and maximum lane availability is how effectively we plan and manage roadworks. This will be even more important as the delivery of our capital programme increases.
This year, we have improved the information provided to our customers both online, through our Traffic England application and on-road, through our variable messaging system to inform customers on the impact that roadworks may have on their journeys. We have also been looking at more efficient ways of working to make better use of lane closures and working towards utilising shorter lengths and trialling increasing speed limits through roadworks to improve productivity.
We have introduced a number of improvements to keep our customers informed on what works are happening, when they are happening and the expected benefits once completed.
A roadworks calendar on scheme webpages has also been launched, allowing customers to easily and clearly locate roadworks and road closure information at their convenience.
Our traffic officers, control room operators and contact centre staff
Our approach to operating and maintaining the network is changing. We have introduced a new way of conducting our business that better co-ordinates the work of our on-road traffic officers and service providers, introducing opportunities to improve the service that we provide to customers.
In tandem, we are providing traffic officers with mobile technology, giving them immediate access to safety-critical work instructions and enabling them to send pictures of the scene to control room operators so that they have a clearer view of the incident. We have trialled fitting traffic officer vehicles with front and rear dash-cam CCTV units. Results have proven that their addition is an effective tool in improving customer safety through influencing driver behaviours.
SeCtiOn 05 / improving customer service

27
01SeCtiOn
Overview
Chief E
xecutive’s review
Making our
network safer
Imp
roving custom
er serviceD
elivering the Road
Investment S
trategy
Our
people
Financial R
eviewP
rincipal risks and uncertainties
Our
governance
The Directors’
report
Auditors’
report
Financial S
tatements
Chairm
an’s statem
entO
verviewC
hief Executive’s
reviewM
aking our netw
ork safer
05SeCtiOnIm
proving custom
er serviceD
elivering the Road
Investment S
trategy
Our
people
Financial R
eviewP
rincipal risks and uncertainties
Our
governance
The Directors’
report
Auditors’
report
Financial S
tatements
Control room staff are at the core of our day-to-day operations, providing responses to incidents through the timely setting of signs. Supporting them in this objective, we have completed the implementation of a new command and control platform, a far more intuitive and responsive system. We continue to collaborate with our Dutch counterparts on the replacement of the rest of the traffic management systems that our operators use. This is expected to be in place in 2018. During the coming year, we will be developing the skills of all of our control room operators, delivering a new customer service training package to improve our interaction in this key area.
Our Customer Contact Centre (CCC) operates 24 hours a day, 365 days a year and remains the main point of contact for our customers with enquiries and feedback. We are part-way through a transformation programme that will see significant improvements to the service that we provide. A new technology platform will see calls answered more quickly and we are investing heavily in how we respond to written enquiries, both in terms of quality and responsiveness.
In addition to the change activities already described, we will be:
� improving the effectiveness of our delivery of the on-road service by giving local managers the tools to better match their traffic officers to regional demands
� enhancing the capabilities of our traffic officers to clear incidents from the carriageway
� ensuring that the next generation of our vehicle recovery contract provides us with all of the capabilities required to operate a network that is undergoing significant changes with the introduction of Smart motorways and expressways

28
4 An accessible and integrated network Our commitment and objectivesAn accessible and integrated road network is a vital part of any effective transport system. Journeys need to be smooth and seamless so that our customers have access at the times that suit them.
Our Delivery Plan commits us to working with our partners to improve integration with other key transport networks, such as local roads, existing and emerging rail links, ports and airports.
We are also committed to help provide safe, accessible routes for all users on and across our network, including making sure that vulnerable road users1 are kept separate from general traffic.
What this means for usHighways England and the Government have a shared ambition, to address the potential barriers our network creates for surrounding communities and biodiversities, expand people’s travel choices, enhance and improve facilities, and make everyday journeys as easy as possible. To help meet this ambition we are improving our provision for vulnerable road users.
Our delivery over the year
Our cycling strategy
Our cycling strategy has been embedded throughout the Company and our supply chain. We have established the cycling leadership group to ensure more effective internal working within Highways England and have taken forward initiatives to build capability, capacity and expertise. A key element has been the publication of an Interim Advice Note (IAN) on cycle traffic and the Strategic Road Network, which is supported by an associated e-learning package. This provides improved and more comprehensive guidance on designing safe and convenient facilities for cycle traffic on and around our network and to provide facilities of a consistently high standard.
Accessibility strategy
Through increasing the number of new and upgraded crossings over our network we have enhanced the safe facilities provided for vulnerable users. This year, we have completed 20 new crossings and upgraded seven existing crossings across our network.
We have provided new cycling facilities, including cycle lanes, crossings and signs which are safe, separate from traffic and can be used by cyclists of all abilities. These measures support our
1 Non-motorised users of the Strategic Road Network, including cyclists, motorcyclists, pedestrians and equestrians.
SeCtiOn 05 / improving customer service
target: We must report on the number of new and upgraded crossings.
We have completed 20 new and 7 upgraded crossings.

29
01SeCtiOn
Overview
Chief E
xecutive’s review
Making our
network safer
Imp
roving custom
er serviceD
elivering the Road
Investment S
trategy
Our
people
Financial R
eviewP
rincipal risks and uncertainties
Our
governance
The Directors’
report
Auditors’
report
Financial S
tatements
Chairm
an’s statem
entO
verviewC
hief Executive’s
reviewM
aking our netw
ork safer
05SeCtiOnIm
proving custom
er serviceD
elivering the Road
Investment S
trategy
Our
people
Financial R
eviewP
rincipal risks and uncertainties
Our
governance
The Directors’
report
Auditors’
report
Financial S
tatements
Delivery Plan commitment to deliver 200 cycling facilities and crossing points on or around the Strategic Road Network by 2021 as part of our £100m investment programme. This year, we have completed 32 cycling schemes, bringing the accumulated total over the two years to 57.
Cycling improvements are being made as part of our major highways construction projects. The improvement schemes on the M1/M6/A14 Catthorpe Interchange and the A45/A46 Tollbar End provide enhanced facilities for pedestrians, equestrians and cyclists.
We have also undertaken a wider programme of feasibility and design work at 150 locations to inform our future cycling investment programme and have currently identified over 20 schemes for construction in 2017-18.
We are working with our key stakeholders and partners to better understand the needs and priorities for cyclists. This has included working closely with Transport Focus building on their Cyclists, pedestrians and equestrians: a summary of priorities for Highways England’s Network report, published in January 2017.
In May 2016, we launched our Accessibility Strategy, setting out our vision for an accessible, inclusive and integrated network offering more flexibility for users and communities. This outlined our commitment to placing accessibility at the heart of what we do, and the importance of helping different types of users to access services and employment across the network. It also outlines our approach to support vulnerable road users, such as pedestrians, cyclists and equestrians, by helping to address the barriers that our roads can sometimes create.
A585 West Drive to Fleetwood cyclewayWorking together to provide safe footpath and cycleways for the benefit of the local community.
This scheme was completed in March 2017. This project involved working in partnership to provide a shared use footway/cycleway to bring communities together.
Following a new housing development to the east of Fleetwood, Lancashire, we worked with the County Council, Cyclist Touring Club, British Cycling and Wyre Borough Council to improve routes into the town centre.
We constructed a shared use footway/cycleway along a section of the A585. The works also included the construction of two new toucan crossings across the A585. We reduced the maximum speed limit on this section of the A585, to ensure that the safety of cyclists and pedestrians was maintained.
Working together meant that we could deliver this £1.5m scheme to the full benefit of the local community.

30
5 Building collaborative relationshipsSince the launch of Highways England, we have continued to build on our relationships with our partners and stakeholders. We aim to work collaboratively to help us to meet our three imperatives of safety, customer service and delivery of this Road Investment Strategy. We proactively work with a wide range of groups including (but not limited to):
� our work partners and road user associations, such as the Road Transport Authority, Retread Manufacturers Association and the Post Office
� our suppliers, including small and medium-sized enterprises (SMEs)
� motorists’ organisations, such as the AA and RAC
� regional transport authorities, such as Transport for the North and Midlands Connect
� the emergency services
� those who do not necessarily use our network but who are affected by it, such as cycling, walking and environmental groups
� our Highways Monitor (the Office of Rail and Road), responsible for monitoring our performance
� Transport Focus, the consumer watchdog that contributes to the ways in which we measure and respond to our customers’ satisfaction levels
� the Government and MPs at both national and local levels
Our commitment and objectivesWe aim to build on our relationships with our stakeholders to enable us to deliver a better service for our customers, while minimising the impact on the environment.
What this means for usInevitably, our customers, partners and stakeholders have many different – and sometimes conflicting – needs and expectations. We listen and engage proactively with our stakeholders and remain flexible and responsive as we continue to deliver our ambitious strategy.
Supplier relationships
We are developing our approach to engaging with our supply chain. This has been particularly important in helping us to meet the Government’s target of 25% spend in procuring goods and services from SMEs. During 2016-17, we met this by spending 26% with our SME community.
SMEs are actively encouraged to bid for work. We regularly engage with them at ‘meet the buyer’ and trade events where we explain how they can work with us. For example, we are now procuring goods and services differently as a result of the introduction of our asset delivery model. Under this new arrangement, we have broken previously large programmes of work into multiple activities, thus enabling smaller suppliers a greater opportunity to bid for work that would traditionally have been part of larger contracts. You can read more about asset delivery on page 22.
SeCtiOn 05 / improving customer service

31
01SeCtiOn
Overview
Chief E
xecutive’s review
Making our
network safer
Imp
roving custom
er serviceD
elivering the Road
Investment S
trategy
Our
people
Financial R
eviewP
rincipal risks and uncertainties
Our
governance
The Directors’
report
Auditors’
report
Financial S
tatements
Chairm
an’s statem
entO
verviewC
hief Executive’s
reviewM
aking our netw
ork safer
05SeCtiOnIm
proving custom
er serviceD
elivering the Road
Investment S
trategy
Our
people
Financial R
eviewP
rincipal risks and uncertainties
Our
governance
The Directors’
report
Auditors’
report
Financial S
tatements
We continue to work with suppliers on better solutions for customers through forums including our Collaboration Board and the Engagement Council, whose membership extends to all who supply services, goods or works to us.
The Engagement Council is the prime route for collaborative engagement between the Company and highways suppliers. It promotes innovation and improvement, sets pace and drives progress.
The Collaboration Board has elected representatives from the Engagement Council and ensures that we deliver on the priority areas we identify with our suppliers. Working through this group in 2016-17, we have jointly:
� designed and are now piloting a new way of procuring a road scheme that increases the emphasis on the outcome for the customer
� rolled out a new approach to promoting better behaviours in delivery with a direct link to boosting performance
� introduced and shared best practice on productivity in building new road schemes
� established our plan for boosting skills and apprenticeship opportunities across the roads sector
the emergency services
We are striving to improve our capability to clear incidents and reinvigorate our relationships with our partners through the Joint Emergency Services Interoperability Programme, and the CLEAR initiative (Collision, Lead, Evaluate, Act, Reopen), which outlines the steps to take.
Government stakeholder relationships
Working with our stakeholders, particularly the Government at national and local levels, improves our knowledge and understanding of the political, economic and social context in which we work and the impact that this might have on future policy decisions.
At the same time, we have communicated regularly with all of our wider stakeholder groups, providing updates, news and background information, particularly when we published our various key strategies over the year. Many of our stakeholders are active contributors to those strategies and we welcome this engagement.
the Highways Monitor
We have continued to work closely with the Highways Monitor over the course of the year to develop and improve the monitoring framework and to strengthen our relationship.
This body is a directorate within the Office of Rail and Road (ORR) and its role is to monitor Highways England and our management of the Government’s investment in the Strategic Road Network.
The ORR monitors our performance and advises Government on our efficient, safe and sustainable delivery of the investment for the benefit of road users and the wider public.
They also require us to submit all appropriate data, when requested, to help them produce regular reports on our performance. These are published on the ORR website at www.orr.gov.uk
transport Focus
Transport Focus is the independent road users’ watchdog. Its primary role is to advise the Secretary of State for Transport on the Company’s performance relating to our customers. This year, it took over responsibility for measuring customer satisfaction performance by carrying out the National Road User Satisfaction Survey.
Highways England and Transport Focus work together to exchange surveys and information gathered from across the regions and road-user groups. These are published on their website at www.transportfocus.org.uk. This helps us be aware of the specific issues that matter to our customers.

32
international relationships
We continue to maintain our strong collaborative working relationships with overseas road administrations. Our published Innovation, Technology and Research Strategy commits us to investing around 5% of our annual research budget with other European road authorities as part of our membership of the Conference of European Directors of Roads (CEDR).
Through resource sharing in joint projects, we are currently funding the safety programme for the Transnational Research Call 2016, which aims to improve guidelines, standards and network strategy in the field of road safety, our first imperative.
We also host a number of visits from international road administrations, enabling best practice, establishing knowledge sharing networks, and helping promote our new company and values. Historically, we have received a high number of requests to visit our control centres, which are soon to roll out our advanced traffic management system, known as CHARM – a good example of collaboration with the Netherlands.
Our continued overseas collaboration is key to helping us avoid repetition and duplication, and gives us access to the best international practice and a wider range of suppliers.
SeCtiOn 05 / improving customer service

33
01SeCtiOn
Overview
Chief E
xecutive’s review
Making our
network safer
Imp
roving custom
er serviceD
elivering the Road
Investment S
trategy
Our
people
Financial R
eviewP
rincipal risks and uncertainties
Our
governance
The Directors’
report
Auditors’
report
Financial S
tatements
Chairm
an’s statem
entO
verviewC
hief Executive’s
reviewM
aking our netw
ork saferIm
proving
customer service
06SeCtiOnD
elivering the Road
Investment S
trategy O
ur p
eopleFinancial R
eviewP
rincipal risks and uncertainties
Our
governance
The Directors’
report
Auditors’
report
Financial S
tatements
Delivering the Road investment Strategy
06SeCtiOn
1 Our major improvement schemes Our commitment and objectivesWe are continuing to deliver our programme of major enhancement works included in this first Road Investment Strategy period. Around £7.7bn of our total capital budget is invested into major schemes, many of which will continue into the next period of investment from 2020.
This significant investment in the country’s infrastructure improves road safety, increases capacity and reduces congestion – all of which support the UK economy.
What this means for usDelivering the Road Investment Strategy is one of our company objectives. We will deliver the investment programme to provide tangible benefits to our customers and the economy, while minimising our environmental impact. We also need to consider the short-term impact on our customers, such as journey times through major roadworks as well as maintaining the safety of our customers and road workers.
Delivering the programme on time and to budget is a priority for us and the Government. We are also focused on providing value for money for the taxpayer and achieving £1.2bn of efficiency savings over this five-year period.
In addition, our progress is monitored against a number of performance indicators and requirements designed to measure our achievements in supporting economic growth.
These include:
� procuring 25% of our goods and services from small and medium-sized enterprises (SMEs)
� responding in a timely fashion to planning applications
� work to support the Government’s five Construction 2025 goals
target: We need to make capital expenditure savings of at least £1.212bn by 2019-20.
We identified £169m of efficiency savings against our 2016-17 milestone of £139m.

34
We also continue to support the Roads Academy, a cross-sector leadership development programme. Our sector faces significant challenges as we deliver vital investment in infrastructure. This two-year programme will deliver industry-wide change by developing senior leaders who can tackle the complex challenges that we face.
We committed in our Delivery Plan to modernise the network and introduce new technology to support the development of:
� expressways
� latest Smart motorway designs
� improved information to the customer
� autonomous vehicles and ultra-low emission vehicles
You can read more about how we are improving information for our customers in Section 5.
Our delivery over the year – summaryThe stability provided by having a long-term plan allows us to give our suppliers an insight into our plans, enabling them to plan, grow and invest in their business to meet the demands of a growing investment programme. It also enables us to find new and more efficient ways to deliver our programme.
During this second year of this Road Investment Strategy, we have invested £626m on asset renewals and £1.3bn on asset improvement.
We started construction on eight schemes against an original target of seven, with seven of these schemes starting well before their committed deadline.
We opened seven schemes to traffic against a target of eight, with one of these schemes opening well before its committed deadline. We missed our milestone on the A30 Temple to Carblake, which is a scheme being delivered by Cornwall County Council.
We have also reviewed the remaining schemes contained in the Road Investment Strategy to ensure that they continue to deliver value for money and minimise disruption to our customers. As a result, we have identified a small number of schemes that may not meet our value for money criteria. For many of these, we were able to develop options to improve their value and for the remaining schemes, we are continuing to review other options (including rescheduling into our future road investment plans).
This year, the National Audit Office conducted a value for money study to examine whether the Department for Transport and Highways England are well placed to achieve value for money from this first Road Investment Strategy. Their report Progress with the Road Investment Strategy1,
published in March 2017, focused on:
� the way that the Department for Transport and Highways England drew up this first Road Investment Strategy
� the governance and delivery structure, and the effectiveness of oversight and challenge applied
� the management of the delivery of the major enhancement projects, which equates to 57% of our planned capital expenditure, by the Department for Transport and the Company
The report recognised that the Road Investment Strategy is an important step towards better long-term planning of England’s Strategic Road Network. It noted that a significant number of the major enhancement projects contained in the Strategy, are scheduled to start in 2019-20, which may cause a high-level of disruption to the road network, increase prices and put pressure on resources at Highways England.
They also noted that we had already identified a small number of projects that presented a risk to value for money and recognised that we were working to manage this risk. This includes revising project design, merging projects on the
SeCtiOn 06 / Delivering the Road investment Strategy
1 The National Audit Office Report Progress with the Road Investment Strategy can be found athttps://www.nao.org.uk/wp-content/uploads/2017/03/Progress-with-the-Road-Investment-Strategy.pdf

35
01SeCtiOn
Overview
Chief E
xecutive’s review
Making our
network safer
Imp
roving custom
er serviceD
elivering the Road
Investment S
trategy
Our
people
Financial R
eviewP
rincipal risks and uncertainties
Our
governance
The Directors’
report
Auditors’
report
Financial S
tatements
Chairm
an’s statem
entO
verviewC
hief Executive’s
reviewM
aking our netw
ork saferIm
proving
customer service
06SeCtiOnD
elivering the Road
Investment S
trategy O
ur p
eopleFinancial R
eviewP
rincipal risks and uncertainties
Our
governance
The Directors’
report
Auditors’
report
Financial S
tatements
same road corridor, and considering cancellation or postponement where projects may not meet value for money criteria.
The report raised four key recommendations, which we are working with the Department for Transport to implement over the coming months. We are also taking the lessons learned from building the first Road Investment Strategy into the development of the next Strategy from 2020 onwards.
efficiency savingsThe Road Investment Strategy sets an expectation on Highways England to deliver at least £1.2bn in efficiencies over this first five-year investment period.
In March 2017, we published our Capital Efficiency Delivery Plan. This plan outlines our processes, governance and assurance mechanisms to manage efficiency generation to ensure that the annual milestones and cumulative targets are met. As part of our drive to improve efficiency, we have conducted a comprehensive review of the business changes which have potential to generate further efficiencies and we have assigned targets to individual programmes.
The most significant efficiency to date on the major improvement portfolio arises from the quicker delivery of the Smart motorway schemes.
This has the dual benefit of reducing cost and improving customer satisfaction with the earlier removal of roadworks and traffic management.
We have identified £169m of efficiency savings against an annual milestone of £139m and the business has evidence of further savings that can be put towards our cumulative total. The reported efficiency savings are subject to validation by the Office of Rail and Road. In Section 8, the Financial Review, we set out more about the measures we take to improve efficiencies.
We have a clear strategy to embed value for money across all of our major programmes. Working with the Department for Transport, we have established and built our capability to meet their required standards for value for money and analytical
assurance advice. The Department also recognise that we have improved our understanding of the value for money risk position for the current investment programme and continue to work with them to maintain appropriate oversight.
Completed projectsDuring this year, we have completed the following seven major projects. Opening these schemes has added around 30 extra lane miles of capacity and improved four key junctions on the Strategic Road Network:
� A1 Coal House to Metro Centre
� A45-A46 Toll Bar End
� M1 junctions 32-35a
� M1 junction 19 improvement
� M25 junction 30
� A556 Knutsford to Bowdon
� A160/A180 Immingham

36
Smart motorwaysSmart motorways use technology and active traffic management techniques to enable the hard shoulder to be converted into a running lane at the busiest times. This provides much-needed capacity managed in an efficient manner.
These roads are designed to be as safe as ordinary motorways and all evidence to date suggests this to be the case. We are upgrading the busiest motorways on our network to a Smart motorway standard.
new schemes on scheduleThe following new schemes started construction on schedule:
� A14 Cambridge to Huntingdon
� A19/A1058 Coast Road
� M4 junctions 3-12
� M1 junctions 24-25
Additionally, we have taken the opportunity to start the following schemes ahead of our commitments:
� M1 junctions 23a-24
� M1 junction 45 improvement
� A47 Acle Straight
� A52 Nottingham junctions
The Smart motorways programme now has six new project design contracts awarded. Major contracts have also been awarded to support the development of large projects, such as the A303 Amesbury to Berwick Down, work to improve and widen the A12/A120, junction improvement to the M6 toll/M54 and major improvements on the M11 and A38.
expresswaysThe Government has set an ambition for some A-roads to be converted into high-quality ‘expressways’.
These expressways will encourage more free-flowing traffic by modernising junctions, introducing advanced technology and incorporating other features, for better journey information.
innovation and technologyFollowing publication of our Innovation Technology and Research Strategy in April 2016, we have further developed both our innovation capability and delivered a number of key innovation projects.
We have established a new central innovation and continuous improvement division to drive forward a more ambitious programme of research and innovation. We have formed new relationships and partnerships with other infrastructure operators, the highways industry, universities, Catapult centres,2 and technology-based small and medium-sized enterprises and start-ups to take forward our open innovation approach.
SeCtiOn 06 / Delivering the Road investment Strategy
2Not-for-profit independent technology and innovation centres.
A14 Cambridge to Huntingdon

37
01SeCtiOn
Overview
Chief E
xecutive’s review
Making our
network safer
Imp
roving custom
er serviceD
elivering the Road
Investment S
trategy
Our
people
Financial R
eviewP
rincipal risks and uncertainties
Our
governance
The Directors’
report
Auditors’
report
Financial S
tatements
Chairm
an’s statem
entO
verviewC
hief Executive’s
reviewM
aking our netw
ork saferIm
proving
customer service
06SeCtiOnD
elivering the Road
Investment S
trategy O
ur p
eopleFinancial R
eviewP
rincipal risks and uncertainties
Our
governance
The Directors’
report
Auditors’
report
Financial S
tatements
3The analysis of the data that we collect as part of our daily operations, for example network traffic conditions, which allows us to learn and understand the correlation between data sets to help us make better decisions about the services we deliver.
Key successes have included:
� forming a consortium with members of the automotive industry to complete the design for the UK Connected Infrastructure Transport Environment in the Midlands. We are also co-funding automated vehicle trials on the Strategic Road Network with industry and the Centre for Connected and Autonomous Vehicles and developing a connected corridor on the A2/M2 in South East England with Department for Transport, Transport for London and Kent County Council
� establishing the key design requirements for expressways. These requirements are being considered in the development of a number of current projects, and the delivery of the A14 Cambridge to Huntingdon scheme
� setting up a Technology Test and Innovation Centre in the East Midlands to provide a safe environment for testing and trialling of new technology and innovations, including our new advanced traffic management system (CHARM)
� starting work on developing longer-term roadmaps to guide our future work in the following innovation challenge areas:
� automation
� decision advantage through Big Data3
� sustainability, communities and the environment
� transforming construction
A good example of our longer-term Big Data research is the initial work we have just completed with the Transport Systems Catapult on developing an early stage massive scale network simulation capability using real-time traffic information, cloud computing and gaming technology.
Looking aheadDeveloping our Route Strategies
We published our 18 Route Strategies in March 2017 alongside the Strategic Economic Growth Plan.
Route Strategies form an important part of the evidence base for developing the next Road Investment Strategy as they provide a high-level view of the current performance of the Strategic Road Network. They allow us to understand the road network as it is now and also to help us plan for the future. Between them they cover all of our roads, providing a description of their features, current performance and constraints and identifying the locations where further study will take place.
This ensures that every decision made further down the line is built on comprehensive evidence about the state of the road network. In developing the Route Strategies we brought together information from our customers, stakeholders, delivery partners and from across our business. We received over 2,700 contributions from stakeholders and also commissioned Transport Focus to undertake research into customer experiences of the road network to help inform the reports.
The Department for Transport has made it clear that a long-term view is needed for our road network – its strategic vision states: “Our ambition for the next 25 years is to revolutionise our strategic roads to create a modern Strategic Road Network (SRN) that supports a modern Britain.”
Our 2050 Master Plan project is responding to this challenge. The intention is to develop a strategic and joined-up vision of transport infrastructure, linking thinking and planning on roads to rail, ports and other modes.
Transport is undergoing a series of changes and developments, and technology is changing the way that people and businesses use roads. This means we and our stakeholders need to change how we approach planning and delivery in the nearer future in order to meet this challenge.
This is also the reason why we are approaching the next Road Investment Strategy in a different way and why we need our people and our stakeholders to understand what this will mean. The 2050 Masterplan will help ensure that money is invested with these future challenges in mind.

38
2 Our work region by region Major infrastructure and regional projects that improve our network help us meet our overriding objectives while supporting economic growth.
Here, region by region across our network, we summarise the major road improvements that are already:
� under construction
� in development
� in the options identification phase
� schemes now completed
The following represents those schemes contained within the Road Investment Strategy and the supporting tables detail the current progress made.
north east and Yorkshire
Schemes contained within the Road investment Strategy
Schemes in construction
1 A1 Leeming to Barton
2 A19/A1058 Coast Road
3 M1 junction 45 improvement
Schemes in development
4 A1 and A19 technology enhancements
5 A1 Morpeth to Ellingham dualling
6 A1 North of Ellingham
7 A19 Down Hill Lane junction improvement
8 A19 Testos
9 A63 Castle Street
10 A1 Scotswood to North Brunton
11 A500 Etruria Valley (Scheme managed out of region)
Schemes in options
12 A1 Birtley to Coal House widening
13 A19 Norton to Wynyard
14 A61 Dualling
SeCtiOn 06 / Delivering the Road investment Strategy
© Crown copyright
39
01SeCtiOn
Overview
Chief E
xecutive’s review
Making our
network safer
Imp
roving custom
er serviceD
elivering the Road
Investment S
trategy
Our
people
Financial R
eviewP
rincipal risks and uncertainties
Our
governance
The Directors’
report
Auditors’
report
Financial S
tatements
Chairm
an’s statem
entO
verviewC
hief Executive’s
reviewM
aking our netw
ork saferIm
proving
customer service
06SeCtiOnD
elivering the Road
Investment S
trategy O
ur p
eopleFinancial R
eviewP
rincipal risks and uncertainties
Our
governance
The Directors’
report
Auditors’
report
Financial S
tatements
15 A628 climbing lanes
16 M62 junctions 20-25
17 M62/M606 Chain Bar
18 M621 junctions 1-7 improvements
Schemes now completed
19 A1 Coal House to Metro Centre
20 M1 junctions 39-42
21 A160/A180 Immingham
22 M1 junctions 32-35a
A1 Coal House to Metro
The A1 Coal House to Metro upgrade was opened to traffic in July 2016. This scheme creates additional lanes and parallel link roads between junctions 68 and 69 to remove traffic from the main carriageway.
The scheme has helped to tackle congestion and increase road capacity. The extra lanes benefit the thousands of drivers who use the route every day, and the new link roads mean local traffic has a dedicated route between Lobley Hill and Gateshead Quays.
This scheme is a crucial part of the Government’s plan to create a Northern Powerhouse, connecting cities and towns and ensuring that economic growth is spread more evenly across the country. To support this initiative, we made sure that 78% of project costs were spent locally, using small and medium-sized companies to help us deliver.
The project created over 800 jobs, with 97% of the construction workers coming from the North East. Work experience and placement opportunities were provided for students from local schools and universities, including two summer placements for civil engineering students from Newcastle University. The scheme also featured a number of sustainability and environmental improvements. We resurfaced 150,000 square metres and laid 12 miles of new kerbs, all of which were made of recycled plastic bottles. We also installed a new footbridge over the A1 at Chiltern Gardens which was suitable for cyclists as well as pedestrians. A new 600-metre cycle track was created crossing the footbridge, linking up to the local cycle network.
M1 junction 32-35a
The upgrade to a Smart motorway of the M1 between junctions 32 and 35a opened on 31 March 2017. This section of motorway carries more than 110,000 vehicles each day and suffered from congestion and delay at peak times. These improvements will relieve congestion, smooth the flow of the traffic, and improve safety and journey times on this section of the network.

40
north West
Schemes contained within the Road investment Strategy
Schemes in options
7 A5036 Princess Way – access to Port of Liverpool
8 A57 (T) to A57 link road
9 A585 Windy Harbour to Skippool
10 M53 junctions 5-11
11 M56 new junction 11a
12 M6 junction 19 improvements
13 M6 junction 22 upgrade
14 Mottram Moor link road
Schemes now completed
15 A556 Knutsford to Bowdon
Schemes in construction
1 M6 junctions 16-19
2 M60 junction 8 to M62 junction 20: Smart motorway
Schemes in development
3 M56 junctions 6-8
4 M6 junctions 21a-26
5 M60 junctions 24-27 and junctions 1-4
6 M62 junctions 10-12
SeCtiOn 06 / Delivering the Road investment Strategy
A556 Knutsford to BowdonImproving strategic links between Manchester and Birmingham by creating a modern dual carriageway road.
The A556 Knutsford to Bowdon scheme constructed four miles of new road, connecting the M6 junction 19 in Tabley with the M56 junction 7 at Bowdon. It was opened to traffic in March 2017 at a cost of £192m and was the first project in the North West to be delivered within the current Road Investment Strategy, on time and on budget.
The scheme also included a unique Green Bridge – providing connectivity over the new road for farm animals, wild mammals, birds and other animals. The bridge is one of seven bridges provided, to either carry key local roads, such as the A50, over the new road or provide a link to the new dual carriageway for local residents.The scheme has already won a number of environmental and considerate constructor awards.
© Crown copyright

41
01SeCtiOn
Overview
Chief E
xecutive’s review
Making our
network safer
Imp
roving custom
er serviceD
elivering the Road
Investment S
trategy
Our
people
Financial R
eviewP
rincipal risks and uncertainties
Our
governance
The Directors’
report
Auditors’
report
Financial S
tatements
Chairm
an’s statem
entO
verviewC
hief Executive’s
reviewM
aking our netw
ork saferIm
proving
customer service
06SeCtiOnD
elivering the Road
Investment S
trategy O
ur p
eopleFinancial R
eviewP
rincipal risks and uncertainties
Our
governance
The Directors’
report
Auditors’
report
Financial S
tatements
Midlands
Schemes contained within the Road investment Strategy
Schemes in construction
1 A43 Abthorpe junction
2 A50 Uttoxeter
3 M1 junctions 13-19
4 M5 junctions 4a-6
5 M5 junctions 5, 6 and 7 junction upgrades
6 A52 Nottingham junctions
7 M1 junctions 23a-24
8 M1 junctions 24-25
Schemes in development
9 A38 Derby junctions
10 A45/A6 Chowns Mill junction improvement
11 A46 Coventry junction upgrades
12 A5 Dodwells to Longshoot widening
13 M6 junction 10 improvement
14 M6 junctions 13-15
15 M6 junctions 2-4
Schemes in options
16 A14 junction 10a
17 M40/M42 interchange Smart motorways
18 M42 junction 6
19 A5 Towcester relief road
20 M54 to M6/M6 Toll
Schemes now completed
21 A14 Kettering bypass widening
22 A453 widening
23 A45-A46 Tollbar End
24 M1 junction 19 improvement
25 M1 junctions 28-31
26 M6 junctions 10a-13
M1 junction 32-35aA45-A46 tollbar end
A45-A46 tollbar end
This £106m improvement scheme at Tollbar End in Coventry was opened to traffic in December 2016 with a formal opening ceremony held with the Secretary of State for Transport in March 2017.
The scheme improves the flow of traffic at the Tollbar End roundabout by providing a two-lane dual carriageway underpass link and a larger layout designed to reduce congestion.
© Crown copyright

42
South West of england
Schemes contained within the Road investment Strategy
London and the South east
Schemes contained within the Road investment Strategy
Schemes in construction
1 A30 Temple to Carblake
Schemes in development
2 M49 Avonmouth junction
3 M5 Bridgewater junctions
Schemes in options
4 A30 Chiverton to Carland Cross
5 A303 Amesbury to Berwick Down
6 A303 Sparkford to IIchester dualling
7 A358 Taunton to Southfields
Schemes in construction
1 A21 Tonbridge to Pembury
2 M3 junctions 2-4a
3 M4 junctions 3-12
Schemes in development
4 M20 junction 10a
5 M20 junctions 3-5
6 M23 junctions 8-10
7 M27 junctions 4-11
8 M3 junction 10-11 improved sliproads
SeCtiOn 06 / Delivering the Road investment Strategy
© Crown copyright
© Crown copyright

43
01SeCtiOn
Overview
Chief E
xecutive’s review
Making our
network safer
Imp
roving custom
er serviceD
elivering the Road
Investment S
trategy
Our
people
Financial R
eviewP
rincipal risks and uncertainties
Our
governance
The Directors’
report
Auditors’
report
Financial S
tatements
Chairm
an’s statem
entO
verviewC
hief Executive’s
reviewM
aking our netw
ork saferIm
proving
customer service
06SeCtiOnD
elivering the Road
Investment S
trategy O
ur p
eopleFinancial R
eviewP
rincipal risks and uncertainties
Our
governance
The Directors’
report
Auditors’
report
Financial S
tatements
Schemes in construction
1 A21 Tonbridge to Pembury
2 M3 junctions 2-4a
3 M4 junctions 3-12
Schemes in development
4 M20 junction 10a
5 M20 junctions 3-5
6 M23 junctions 8-10
7 M27 junctions 4-11
8 M3 junction 10-11 improved sliproads
M25 junction 30This junction upgrade opened for traffic in December 2016. The A13, which passes through the junction, has been widened to four lanes in each direction to relieve congestion, making journeys more reliable for our customers.
This section of the M25 experiences congestion throughout most of the day, with performance susceptible to frequent incidents on the adjacent highway network. It directly services the Port of Tilbury and the Lakeside regional shopping centre and is regarded as the last major transport constraint to the development of the Thames Gateway area. As development gets under way traffic growth is expected to grow by 25% by 2032.
The scheme was completed well ahead of our Delivery Plan target of Spring 2017. It was also delivered safely, with no accidents reported for the duration of the project. The scheme also received the Highways Magazine Excellence Award for Environment and Sustainability and a Golden Green Apple Environmental Award.
9 M3 junction 12-14 improved sliproads
10 M3 junctions 9-14
11 M4 Heathrow slip road
Schemes in options
12 A2 Bean and Ebbsfleet
13 A27 Arundel bypass
14 A27 Worthing and Lancing improvements
15 A31 Ringwood
16 A34 technology enhancements
17 M2 junction 5 improvement
18 M25 junction 10/A3 Wisley interchange
19 M25 junction 25 improvement
20 M25 junction 28 improvement
21 M25 junctions 10-16
22 M27 Southampton junctions
23 M271/A35 Redbridge roundabout upgrade
24 A34 Oxford junctions
25 A27 Chichester bypass
26 M3 junction 9 improvement
Schemes now completed
27 M25 junction 30

44
east of england
Schemes contained within the Road investment Strategy
Schemes in construction
1 A14 Cambridge to Huntingdon
2 A5/M1 junction 11a Link
3 A47 Acle Straight
Schemes in development
4 M11 junctions 8-14 – technology upgrade
SeCtiOn 06 / Delivering the Road investment Strategy
A14 Cambridge to Huntingdon
The A14 Cambridge to Huntingdon Improvement scheme, as pictured on our front cover, started construction on 10 October 2016, nearly three months ahead of schedule. The A14 is a critical east-west route, particularly for businesses and freight, linking the Midlands with the Suffolk ports. The scheme will deliver over 200 lane kilometres of new network, along a 25 kilometres length of the route, relieving a notorious bottleneck between Huntingdon and Cambridge and providing better journeys for all customers who use this route. £100m of funding is being provided by local authorities and enterprise partnerships and their support has contributed to the scheme progressing into construction early. The scheme will support jobs, housing and businesses in the region, as well as contributing to the national economy. This improvement complements other recently completed improvements along the A14 corridor at Kettering and with the M1 at junction 19. The new route is due to be open for traffic by the end of 2020.
Schemes in options
5 A1(M) junctions 6-8 Smart motorway
6 A12 Chelmsford to A120 widening
7 A12 whole-route technology upgrade
8 A428 Black Cat to Caxton Gibbet
9 A47 and A12 junction enhancements
10 A47 Blofield to North Burlingham dualling
11 A47 Guyhirn junction
12 A47 North Tuddenham to Easton
13 A47 Wansford to Sutton
14 A47/A11 Thickthorn junction
15 M11 junction 7 upgrade
© Crown copyright

45
01SeCtiOn
Overview
Chief E
xecutive’s review
Making our
network safer
Imp
roving custom
er serviceD
elivering the Road
Investment S
trategy
Our
people
Financial R
eviewP
rincipal risks and uncertainties
Our
governance
The Directors’
report
Auditors’
report
Financial S
tatements
Chairm
an’s statem
entO
verviewC
hief Executive’s
reviewM
aking our netw
ork saferIm
proving
customer service
06SeCtiOnD
elivering the Road
Investment S
trategy O
ur p
eopleFinancial R
eviewP
rincipal risks and uncertainties
Our
governance
The Directors’
report
Auditors’
report
Financial S
tatements
3 Supporting economic growth Our aims and commitmentsSupporting economic growth is one of our five objectives set out in our strategic business plan. In our Delivery Plan, we committed to launching a new growth and housing fund and to publishing our strategic economic growth plan.
What this means for usDelivering our road schemes supports the economy.
The Strategic Road Network is vital to the economic growth of the country, connecting people and businesses, providing access to jobs, housing and commerce. This year, we have engaged more with our stakeholders, both at national and regional level, as well as working with various industries including housing development and freight.
Our delivery over the yearIn March 2017, we published The Road to Growth – our strategic economic growth plan. This followed on from the publication of a stakeholder discussion paper in November
2016 that outlined the findings of our research to date, set out our economic vision and identified the economic roles that would underpin our approach to supporting growth. Our programme of analytical research has been supplemented by widespread discussions with many stakeholders and business users of the network. This included one-to-one meetings with every Local Enterprise Partnership (LEP) in England, and engagement with sub-national transport bodies, business representatives, local authorities, government departments, national infrastructure providers and devolved administrations. We also discussed our emerging approach with Transport Focus and the Office of Rail and Road.
Drawing on the information gathered through our engagement we have identified four economic roles that underpin our approach to supporting growth, three of which cover the role that the Strategic Road Network can play:
� enabling business performance by facilitating safe, reliable and efficient journeys and by meeting the needs of those sectors most reliant on the network
� providing reliable connectivity with international gateways
� stimulating and supporting the development of homes and employment spaces
We also recognise that our work has a direct economic impact as a procurer and as an employer of 4,000 staff. So our fourth economic role is that of providing employment, skills and business opportunities within our sector.
The Road to Growth sets out how we will begin to increase our economic contribution in each of these four areas.

46
Growth and housing fund
As part of our commitment to support economic growth, the Government established a £100m designated fund for growth and housing. Road improvement schemes help to unlock the development of housing and employment sites across the country. Together with funding from local authorities and the housing developers, this fund helps to deliver schemes which will bring long-term economic benefits to local communities.
To date, we have committed to investing over £40m towards 13 improvements to facilitate the building of almost 22,000 new homes and create more than 34,000 jobs around England. These locations include Swindon, Exeter, Weston-super-Mare, Darlington, Scunthorpe, Grantham, Warrington, Honiton, Derby, Foxdenton, Taunton, Durham and Daventry.
Specific schemes include:
� £8.6m was allocated towards the infrastructure necessary to the M181 Linconshire Lakes development near Scunthorpe, which will allow more than 6,000 new homes to be built and up to 4,000 jobs to be created by 2028, with up to 1,500 homes and 1,500 jobs predicted to be delivered by 2021. The project involves a new terminal motorway junction on the M181 at a cost of £13.4m, with North Lincolnshire Council providing up to £5m using developer contributions
� funding towards three improvement schemes in the South West, comprising a significant capacity upgrade on the M4 junction 15, Swindon (£5m); M5 junction 21, Weston-super-Mare (£750,000) and M5 junction 29/A30 Tithebarn Link Road (£4.5m)
SeCtiOn 06 / Delivering the Road investment Strategy

47
01SeCtiOn
Overview
Chief E
xecutive’s review
Making our
network safer
Imp
roving custom
er serviceD
elivering the Road
Investment S
trategy
Our
people
Financial R
eviewP
rincipal risks and uncertainties
Our
governance
The Directors’
report
Auditors’
report
Financial S
tatements
Chairm
an’s statem
entO
verviewC
hief Executive’s
reviewM
aking our netw
ork saferIm
proving
customer service
06SeCtiOnD
elivering the Road
Investment S
trategy O
ur p
eopleFinancial R
eviewP
rincipal risks and uncertainties
Our
governance
The Directors’
report
Auditors’
report
Financial S
tatements
4 Our work, sustainability and the environment Our commitment and objectivesWe will ensure that all of the activity we carry out on our network is delivered in a manner that contributes towards creating a sustainable future and also delivers long-term benefits to the natural and built environment.
What this means for usThe Road Investment Strategy states that “the network of the future will be smoother, smarter and more sustainable”. Our Licence has a particular focus on enhancing the environment and conforming to the principles of sustainable development. Understanding and applying these essential requirements are critical to our success.
Our approach to all investment decisions is to consider the sustainability and environmental impact of our schemes and to identify the measures we can take to reduce these and any opportunities for environmental enhancement.
The Government’s Environment Fund is investing £225m for the period 2015-20, with the Air Quality Fund investing a further £75m. These funds will be used to deliver environmental and air quality improvements above and beyond ‘business as usual’.
Our delivery over the yearWe are delivering schemes that address long-standing environmental issues. These include:
� the opening of the A556 Knutsford to Bowdon bypass scheme, in March 2017. This scheme removed congested traffic from the villages of Mere, Bucklow Hill and Over Tabley; reduced noise, improved local air quality and reduced community severance in the villages
� the continuing design and development of a twin-bore tunnel for the A303 under the Stonehenge world heritage site will enable this globally iconic structure to be appreciated as part of a wider historic landscape without the visual impact of a strategic road
Significant work has been delivered by the Environment Fund, which includes targeted schemes to improve flood resilience and enhance biodiversity. We have also launched a scheme to provide the latest technology noise-reduction glazing to homes suffering the greatest noise impacts (where such glazing offers the best value approach to reducing noise exposure).
target: We must publish a Biodiversity Action Plan by 30 June 2015 and report annually on how we have delivered against the plan.
We published our plan in the first year of the Road Investment Strategy and we report on our delivery annually.

48
A1(M) Leeming to BartonWorking in partnership with North Yorkshire County Council and the Environment Agency, this scheme will significantly improve the standard of flood protection for around 165 homes and businesses in Catterick village and the A1(M).
A storage reservoir that will contain 91 million gallons of water will be constructed at a cost of £6m. This will slow the water flow down Brough Beck towards Catterick village and the newly built section of the A1(M). The course of Brough Beck will also be altered and a new flow control constructed.
Two large earth embankments will be built between Brough Beck and vulnerable homes. A new 5-hectare wildlife habitat will be created alongside the Beck to introduce greater biodiversity to the area.
A590 nature improvementWorking with Cumbria Wildlife Trust and Natural England, we are enhancing the biodiversity alongside the A590 in Cumbria.
6.38 hectares of grasslands will be enhanced to remove invasive species, such as rhododendron, to allow for native species to flourish. 5.2 hectares of woodland will be managed and together the biodiversity of the area will be improved.
We have a diverse and high level of stakeholder involvement in this project. Volunteers from Highways England, our suppliers and the local community are working together to successfully improve this part of the A590.
SeCtiOn 06 / Delivering the Road investment Strategy

49
01SeCtiOn
Overview
Chief E
xecutive’s review
Making our
network safer
Imp
roving custom
er serviceD
elivering the Road
Investment S
trategy
Our
people
Financial R
eviewP
rincipal risks and uncertainties
Our
governance
The Directors’
report
Auditors’
report
Financial S
tatements
Chairm
an’s statem
entO
verviewC
hief Executive’s
reviewM
aking our netw
ork saferIm
proving
customer service
06SeCtiOnD
elivering the Road
Investment S
trategy O
ur p
eopleFinancial R
eviewP
rincipal risks and uncertainties
Our
governance
The Directors’
report
Auditors’
report
Financial S
tatements
Air quality
We are playing our part to support the Government’s efforts to improve the nation’s air quality. We have started the installation of a network of continuous air quality monitoring stations across our roads, which will provide us with valuable information on the quality of air around our roads.
This data will help us with our scheme assessment work, scheme programming and inform where our improvement efforts should focus to optimise traffic flows for air quality benefits.
We have also continued with our air quality research work, including starting the trial of an innovative mineral polymer barrier that has been constructed adjacent to the M1 in Derbyshire. This material absorbs nitrogen dioxide (NO2) pollution and showed impressive results when tested in a laboratory by the Department for Transport. Sophisticated monitoring is being carried out as part of this trial, which will tell us if the material performs as well in the real world.
noise
Concerns about noise represent one of the greatest areas of complaint from our customers and we understand the annoyance and adverse health effects that noise can cause.
We are committed to mitigate at least 1,150 Noise Important Areas (NIAs) by 2020. To date, we have delivered mitigation at 73 NIAs. We expect the programme to be achieved through:
� a programme of network improvements (for example, the A556 bypass)
� the road resurfacing programme, replacing noisier surfaces with low-noise surfacing
� stand-alone measures such as noise barriers or insulation
Carbon management
We aim to reduce our carbon footprint, and we work closely with our suppliers to reduce emissions from network-related activity. Our performance indicator is to monitor and reduce annual greenhouse gas emissions associated with our activities. The Greening Government Commitment targets include the achievement of a 36% reduction in greenhouse gas emissions by April 2020, compared with the 2009-10 baseline.
Highways England’s 2016-17 corporate greenhouse gas emissions were 32% lower than in 2009-10, having achieved a 5.5% reduction in year.

50
Stover Country Park, A38Together with Devon County Council and Natural England we are working to regenerate the park and improve the natural environment.
A substantial part of Stover Country Park is a Site of Special Scientific Significance (SSSI), currently in ‘unfavourable’ status. Working with our partners, we will reverse the decline in health of the SSSI through improving water quality and implementing a new biodiversity programme to support Stover’s wildlife species.
The conservation of poorly maintained and listed historic structures will be completed. This will involve the repair and restoration of buildings and bridges to allow for improved walking routes and public access. This will provide additional cultural heritage to the area, while improving the landscape.
Work to better treat highway run-off into Stover Lake and to remove unhealthy and contaminated sediment at the bottom of the lake (via dredging) will also be completed as part of this scheme.
M5 titford Pools schemeTo restore water quality and reduce further contamination of the Pools, improve biodiversity and provide new recreational activities for the public.
10,0000 cubic metres of hazardous and contaminated sediment from the Titford Pools, a canal reservoir in the Black Country underneath an elevated section of the M5, is being removed. We are also introducing innovative engineering solutions, such as ‘end of pipe’ sediment traps, sustainable urban drainage and enlarging reedbed filtration systems to reduce future contamination and improve water quality overall.
Increasing habitat connectivity along the local canal, including general improvements to open water, waterside banks and woodland borders will help enhance the area’s biodiversity further.
Working with Sandwell Borough Council and the Canal and River Trust, opportunities for local people to reconnect with nature through activities such as improving the cycling and walking links between junction 2 of the M5 and Langley, providing accessible fishing platforms, canoeing, and boating facilities are being planned.
SeCtiOn 06 / Delivering the Road investment Strategy

51
01SeCtiOn
Overview
Chief E
xecutive’s review
Making our
network safer
Imp
roving custom
er serviceD
elivering the Road
Investment S
trategy
Our
people
Financial R
eviewP
rincipal risks and uncertainties
Our
governance
The Directors’
report
Auditors’
report
Financial S
tatements
Chairm
an’s statem
entO
verviewC
hief Executive’s
reviewM
aking our netw
ork saferIm
proving
customer service
Delivering the R
oad Investm
ent Strateg
y Financial R
eviewP
rincipal risks and uncertainties
Our
governance
The Directors’
report
Auditors’
report
Financial S
tatements
07SeCtiOnO
ur people
Our peoplein this section, we look at the ways in which we are developing our people and our actions to improve equality and diversity across all of our operations.
Our commitment and objectivesWe are proud of our people. In order to meet our ambitious goals over the next five years, we continue to ensure that we have the capability to call on a highly skilled and capable workforce. Building the capacity and capability of our workforce continues to be a priority for us as we deliver this first Road Investment Strategy.
We are committed to equality and embed the principles of equality, diversity and inclusion into all areas of our business to drive change in how we work with our customers, communities, our supply chain and our employees.
07SeCtiOn
Our values As a company, our three imperatives are: safety, customer service and the delivery of the Road Investment Strategy. They are the outcomes of our work and the end result of everything that we do. To build on this, this year we introduced a new set of values and their associated behaviours across the organisation to support our desire to change employee mindsets to maintain our continuous improvement approach to performance and safety. Our new values are:
Safety Keeping ourselves and others safe is at the forefront of everything we do – that’s why it’s an imperative and a value
OwnershipTaking accountability and achieving stretching goals
PassionDelivering with energy and pace, caring about what we do and continuous improvement
integrityBeing open, honest, professional and always doing the right thing
teamworkWorking together effectively, efficiently and flexibly to achieve our goals
Together, the imperatives have been embedded into key business processes, such as performance management, learning and development opportunities and recruitment arrangements. They also shape how we engage and communicate with our people, partners, stakeholders and customers and define what we are endeavouring to achieve.

52
Our delivery over the year
Recruitment
This year, we have successfully delivered a number of recruitment programmes across various disciplines. In total, we have recruited over 1,200 full-time employees for the organisation (including internal and external hires) and are ramping up to meet recruitment delivery needs in the coming year.1
We have focused on developing a strategic early talent pipeline for graduates, undergraduates, work experience and apprenticeships. During the year, we recruited 53 new graduates and 45 apprentices. We have transitioned our apprenticeship processes to the new levy and standards introduced as part of the wider government initiative and we will build on this further in 2017-18.
In July, we welcomed 149 new staff into our East Midlands region, transferring supply chain staff into Highways England when we brought the asset management and maintenance operation
in-house. Over the coming years, we will be transferring more staff under this arrangement to ensure continuity of service and strengthen our delivery capability.
Grading project
Throughout 2016-17, we have developed a new job scopes and grading project for the Company, which we intend to launch in 2017-18. This new grading structure will be flexible and agile to allow us to attract and retain the right people to deliver the Road Investment Strategy and successfully operate the network. It will also support colleagues who wish to move across the business and progress through recognised career paths.
Performance-related pay and performance management
One of the fundamental principles of our remuneration framework is the ability to ‘pay for performance’ to appropriately reward performance and behaviours that drive the delivery of the investment programme. Performance-related pay is linked to the achievement of our corporate key performance indicators and means that
SeCtiOn 07 / Our people
1We recognise the concerns raised by the National Audit Office in their report, Progress with the Road Investment Strategy relating to the challenges that the increase in our recruitment introduces, and are working to manage the risk appropriately.

53
01SeCtiOn
Overview
Chief E
xecutive’s review
Making our
network safer
Imp
roving custom
er serviceD
elivering the Road
Investment S
trategy
Our
people
Financial R
eviewP
rincipal risks and uncertainties
Our
governance
The Directors’
report
Auditors’
report
Financial S
tatements
Chairm
an’s statem
entO
verviewC
hief Executive’s
reviewM
aking our netw
ork saferIm
proving
customer service
Delivering the R
oad Investm
ent Strateg
y Financial R
eviewP
rincipal risks and uncertainties
Our
governance
The Directors’
report
Auditors’
report
Financial S
tatements
07SeCtiOnO
ur people
our performance as a company determines the amount of money available and the performance of each individual determines their own level of performance-related pay.
Following our formation as a company, we have been able to increase the number of employees eligible for a performance-related pay award. This allows us to recognise the wider collective efforts of our people in the delivery of the Road Investment Strategy and the importance of cross-organisational teamwork and collaboration.
In 2016, we introduced a new performance management system to drive a performance-based culture across the Company. This included improved differentiation of individual performance through a new rating system, clearer accountability through objective setting and increased focus on regular performance conversations.
Capability
To support embedding our values and to drive the required performance uplift across the organisation, we have delivered a management development programme for all people managers (from our Executive team to the frontline) to support honest and effective performance conversations. This programme is a key part of our culture change to becoming a high-performance organisation. Many of our people managers have also attended our Health and Safety Leadership programme to help further embed our first imperative of safety within our culture and leadership mindset.
We continue to enhance our successful sector-wide Roads Academy which focuses on leadership development, in partnership with our supply chain. In 2016, we selected a new provider to design and deliver the programme and have successfully seen two cohorts complete the senior leader programme. Further developments with the model are planned throughout 2017-18 to broaden the membership and the support offered.
employee engagement at a time of major change
This year, we designed a new employee engagement approach, incorporating the Company’s imperatives, values and transformation agenda.
We are committed to listening to employees across all segments of our diverse workforce. In our latest survey, carried out in November 2016, 78% of staff chose to share their views with us – the highest proportion since 2012. Although we saw a 3% fall in employee engagement since 2015, this is a realistic reflection of staff sentiment amid a year of continued change.
The company-wide response to these results is reflected in improvement activities, including management and leadership development, corporate planning, an articulation of new company values, and programmes of work to improve safety and customer service.

54
Culturally, the survey results help us to focus on organisation-wide initiatives, that align all employee groups to corporate imperatives and key performance indicators.
Wellbeing
Wellbeing, both physical and mental, is a key component of our safety imperative. This year, we extended our occupational health and employee assistance programme with the appointment of a new provider. We also rolled out further mental health support with the enrolment and training of ‘mental health first aiders’ across the business.
We held a company-wide Health, Safety & Wellbeing week on the theme of ‘healthy workplaces for all ages’, involving over 85 events (some in collaboration with our supply chain partners) and engaging 650 employees.
In 2016, we participated in the Britain’s Healthiest Company Study for the first time. This involved gathering valuable feedback on employees’ wellbeing challenges and priorities from a cross-section of our staff. This has enabled us to design and launch a wellbeing programme running throughout 2017 that will provide employees with support for mental health, promote active lifestyles (including healthy eating and drinking), and healthy ageing.
equality, diversity and inclusion
Increasing diversity and inclusion to promote equality is important to us. We have made progress in delivering actions in support of our public sector equality duty and our related objectives focusing on customers and communities, the supply chain and employment.
Over this year, we have worked with our supply chain and the wider industry to:
� identify best practice and to develop a toolkit to help those involved in scheme delivery to consider disability and accessibility. These workshops are a precursor to piloting the material during 2017 on selected schemes
� use our strategic alignment review tool (StART) in the pre-qualification process for certain high-value contracts and have assessed a number of our core suppliers on how they consider the diverse needs of customers and communities when making decisions, as well as how they attract a diverse workforce and create inclusive working cultures
� introduce our new collaborative performance framework to monitor how suppliers working on our projects are meeting contractual requirements, including evidencing good diversity practice
SeCtiOn 07 / Our people
0
20
40
60
80
100
201720162015201420132012201120102009
Percentage of Highways England staff Gender
29.2
%
30.2
%
29.1
%
29.4
%
28.5
%
30.7
%
31.8
%
33.5
%
33.8
%
70.8
%
69.8
%
70.9
%
70.6
%
71.5
%
69.3
%
68.2
%
66.5
%
66.2
%
Female Male
0
20
40
60
80
100
£70,000 and above
£58,000to £69,999
£40,000to £57,999
£28,000to £39,999
£14,000to £27,999
Percentage of Highways England staff Annual salary
30.6
%
44.6
%
31.0
%
30.7
%
22.9
%
69.4
%
55.4
%
69.0
%
69.3
%
77.1
%
Female Male
0
20
40
60
80
100
201720162015201420132012201120102009
Percentage of Highways England staff Gender
29.2
%
30.2
%
29.1
%
29.4
%
28.5
%
30.7
%
31.8
%
33.5
%
33.8
%
70.8
%
69.8
%
70.9
%
70.6
%
71.5
%
69.3
%
68.2
%
66.5
%
66.2
%
Female Male
0
20
40
60
80
100
£70,000 and above
£58,000to £69,999
£40,000to £57,999
£28,000to £39,999
£14,000to £27,999
Percentage of Highways England staff Annual salary
30.6
%
44.6
%
31.0
%
30.7
%
22.9
%
69.4
%
55.4
%
69.0
%
69.3
%
77.1
%
Female Male

55
01SeCtiOn
Overview
Chief E
xecutive’s review
Making our
network safer
Imp
roving custom
er serviceD
elivering the Road
Investment S
trategy
Our
people
Financial R
eviewP
rincipal risks and uncertainties
Our
governance
The Directors’
report
Auditors’
report
Financial S
tatements
Chairm
an’s statem
entO
verviewC
hief Executive’s
reviewM
aking our netw
ork saferIm
proving
customer service
Delivering the R
oad Investm
ent Strateg
y Financial R
eviewP
rincipal risks and uncertainties
Our
governance
The Directors’
report
Auditors’
report
Financial S
tatements
07SeCtiOnO
ur people
We have established a steering group of industry figures and a working party of leaders who have developed an enhanced vision and structure for our supplier diversity forum which has grown in commitment and size. Activities over the last year have included involvement in a National Women in Engineering Day, annual benchmarking activity, and the launch of a research project looking at attracting and recruiting diversity of talent and the barriers to joining our industry.
0
10
20
30
40
50
60 56.7
% N
ot
shar
ed
0.2%
Jew
ish
0.6%
Hin
du
1.0%
Sik
h
1.4%
Mu
slim
1.8%
Ag
no
stic
2.9%
Ath
eist
3.2%
No
rel
igio
n o
r b
elie
f
5.3%
Oth
er r
elig
ion
or
bel
ief
26.8
% C
hri
stia
nPercentage of Highways England staff Religion
Percentage of Highways England staff Protected characteristic1
0
100
200
300
400
500
600
700
800
65 and above
60-6455-5950-5445-4940-4435-3930-3425-2920-24Under 20
Number of Highways England staff Age group
85
283
551
678646
494569
476
307
176
30
Percentage of Highways England staff Disability
Disabled4.1%
Non-Disabled 53.4%
Not shared 42.5%
Percentage of Highways England staff Ethnic group
Black and Minority Ethnic6.5%
White 49.8%
Not shared 43.7%
Percentage of Highways England staffSexual orientation
Lesbian, Gay and Bisexual1.8%
Heterosexual49.8%
Not shared 48.4%
0
20
40
60
80
100
Religionor belief
Sexual orientation
DisabilityEthnic group
AgeGender
Shared Not shared
100% 100% 79% 56% 49% 40%
21%
44%51%
60%
1Under the Equality Act 2010, it is unlawful to discriminate against anyone because of nine specific areas (protected characteristics)
We have also taken further steps to understanding the diversity issues experienced by our customers and the communities that we serve. Key areas that we concentrated on were:
� how different people wish to be addressed, which led to a revision of our traffic officer procedures
� the introduction of a new engagement model called RETRO
� ensuring that all of our public consultation programmes for major projects take account of non-motorised users
0
10
20
30
40
50
60 56.7
% N
ot
shar
ed
0.2%
Jew
ish
0.6%
Hin
du
1.0%
Sik
h
1.4%
Mu
slim
1.8%
Ag
no
stic
2.9%
Ath
eist
3.2%
No
rel
igio
n o
r b
elie
f
5.3%
Oth
er r
elig
ion
or
bel
ief
26.8
% C
hri
stia
n
Percentage of Highways England staff Religion
Percentage of Highways England staff Protected characteristic1
0
100
200
300
400
500
600
700
800
65 and above
60-6455-5950-5445-4940-4435-3930-3425-2920-24Under 20
Number of Highways England staff Age group
85
283
551
678646
494569
476
307
176
30
Percentage of Highways England staff Disability
Disabled4.1%
Non-Disabled 53.4%
Not shared 42.5%
Percentage of Highways England staff Ethnic group
Black and Minority Ethnic6.5%
White 49.8%
Not shared 43.7%
Percentage of Highways England staffSexual orientation
Lesbian, Gay and Bisexual1.8%
Heterosexual49.8%
Not shared 48.4%
0
20
40
60
80
100
Religionor belief
Sexual orientation
DisabilityEthnic group
AgeGender
Shared Not shared
100% 100% 79% 56% 49% 40%
21%
44%51%
60%
1Under the Equality Act 2010, it is unlawful to discriminate against anyone because of nine specific areas (protected characteristics)

56
For our own workforce, we have:
� used the early talent (graduate and apprenticeship) programmes to fill critical resource gaps sustainably and reached under-represented groups to improve our diversity in the process
� delivered performance management training to managers, which included a session on building an inclusive culture
� expanded our staff networks. In addition to our national leading women’s network, regional forums have formed. Our access for all disability group now consists of seven regional groups and measures are in place to develop a Lesbian, Gay, Bisexual and Trans (LGBT) group
� continued to support our inclusion agenda through a number of initiatives, such as Time to Talk Day, Black History Month, and LGBT History Month
� introduced a new accessibility policy for our buildings and have improved the reasonable adjustments policy
� signed up to the Government’s disability confident scheme. We were also awarded a ‘disability confident committed’ status in recognition of how we strive to recruit and retain disabled people
� undertaken an independent review of our recruitment process to identify changes that can be made to enhance equality
SeCtiOn 07 / Our people

57
01SeCtiOn
Overview
Chief E
xecutive’s review
Making our
network safer
Imp
roving custom
er serviceD
elivering the Road
Investment S
trategy
Our
people
Financial R
eviewP
rincipal risks and uncertainties
Our
governance
The Directors’
report
Auditors’
report
Financial S
tatements
Chairm
an’s statem
entO
verviewC
hief Executive’s
reviewM
aking our netw
ork saferIm
proving
customer service
Delivering the R
oad Investm
ent Strateg
y O
ur p
eople
08SeCtiOnF
inancial R
eviewP
rincipal risks and uncertainties
Our
governance
The Directors’
report
Auditors’
report
Financial S
tatements
Successes in 2016-17 � delivery of planned investment programme
within the funding available
� management of significant cost pressures to ensure operational expenditure within the funding available
� final outturn within 1% of our mid-year forecast
� cash outturn for the year within 1% of target
� efficiency savings above the Road Investment Strategy trajectory
� our asset maintained and its value enhanced
� supplier payment performance continues to be among the very best across the public sector
Financial performance in the yearThe Company has had a successful second year, with financial outturn in line with the funding provided for both capital investment and operational expenditure.
Total capital expenditure
Budget£m
Outturn£m
Variance£m
2,057 2,021 36
Successful management across our capital investment portfolio has resulted in an outturn in line with expectations and aligned to the
08SeCtiOn
Department for Transport (DfT) Supplementary Estimate. The flexibility operated across our portfolio, and the early identification of schedule and cost changes, has ensured that funds are utilised in the most effective way in the year that they are available.
This year, we have not required the flexing of funds between years, as allowed for in our financial framework. This remains a potential financial management tool to ensure the most efficient and effective delivery across the current Road Investment Strategy.
The underspend of £36m (1.8%) relates to the delay to the M20 Lorry park project. These funds have been carried forward into 2017-18.
During the year, we invested £626m on the renewal of the Strategic Road Network (SRN) (mainly in resurfacing and maintenance on structures) and £1,308m on major asset enhancements, which increase network capacity or alleviate congestion.
Total resource expenditure
Budget£m
Outturn£m
Variance£m
1,059 1,052 7
The operational budget for 2016-17 was slightly less than the first year of the Road Investment Strategy. Over the course of the year, we have faced significant cost pressures. This included: the roll-out of the new asset delivery approach to maintenance in the East Midlands and the
Financial Review In operating, maintaining and enhancing the Strategic Road Network, Highways England spent £3.1bn in 2016-17 (£4.3bn including depreciation). This equates to £350k per hour. Two thirds of this relates to investment in the road network, which has an accounting value of £112bn. Behind this expenditure is a robust financial management framework which enabled risks and opportunities across the investment portfolio to be managed and the Company to outturn in line with the funding provided.

58
preparations for the next four asset delivery areas in 2017-18. The challenging position on the Dart Charge Operation,1 and the planning for the end of the concession on the Severn River Crossing has also added to these pressures. We are also supporting our transport partners in their planning to deliver High Speed 2 and additional airport capacity in the South East. Inflationary pressures across the operational cost base have been recognised.
Careful management throughout the year of these cost pressures has meant that we were able to operate within the operational funding provided, with an outturn within 0.6% of our budget.
expenditure 2016-17 (£3,073m)
Our full-year cash outturn was £3.01bn against a forecast of £3.04bn, a variance of less than 1%. This is well within our 5% target. Monthly forecasting performance across the year has been accurate, making a positive contribution to the overall DfT cash forecasting performance.
Description2016-17
£m2015-16
£m
total capital
Asset renewals 626 663
Capital improvements 1,308 1,112
Other capital investment 87 156
Total 2,021 1,931
total resource
Roads PFI 413 393
Operational maintenance 270 282
Operation of the network 176 219
Corporate functions 193 175
Protocols [49] [45]
Total 1,052 1,069
total expenditure
Total 3,073 3,000
The level of other capital investments reduced following the completion of the pinch point programme in 2015-16. Our investment in capital improvements continues to increase in line with the Road Investment Strategy. We opened seven schemes in the year, including the widening of the A45 and the A556 Knutsford to Bowdon dual carriageway.
Corporate functions support the Company’s delivery and include finance, commercial, procurement, safety, engineering, standards, HR, IT, estates, communications, strategy and legal. Growth in these functions reflects the enhanced capacity and capability required to deliver the growing investment programme.
Protocols are specific defined activities which Highways England has been asked to undertake on behalf of the Secretary of State for Transport that sit outside our primary role as a Roads Authority. These include the operation of the Severn River Crossings and the Dart Charge operation.
Protocols
42Asset renewals
626
Capitalimprovements
1308
Other capital investments
87
Roads PFI 413
Operational maintenence
270
Operation ofthe network
176
Corporatefunction
193
Expenditure 2016-17
£m
Comparison with 2015-16
SeCtiOn 08 / Financial Review
1 A cashless payment system for the Dartford Crossing.

59
01SeCtiOn
Overview
Chief E
xecutive’s review
Making our
network safer
Imp
roving custom
er serviceD
elivering the Road
Investment S
trategy
Our
people
Financial R
eviewP
rincipal risks and uncertainties
Our
governance
The Directors’
report
Auditors’
report
Financial S
tatements
Chairm
an’s statem
entO
verviewC
hief Executive’s
reviewM
aking our netw
ork saferIm
proving
customer service
Delivering the R
oad Investm
ent Strateg
y O
ur p
eople
08SeCtiOnF
inancial R
eviewP
rincipal risks and uncertainties
Our
governance
The Directors’
report
Auditors’
report
Financial S
tatements
Valuation of the Strategic Road networkThe Strategic Road Network consists of carriageways, structures, land and communication equipment that forms a single integrated network. It is a specialised asset, with its valuation based on a standard cost, less depreciation. Data from the operational asset databases is used to generate a quarterly valuation and new assets are added to the Strategic Road Network based on a standard cost. Any difference between the actual cost of construction and the standard cost valuation is classified as impairment.
The Strategic Road Network valuation at the end of the year was £111.7bn, an increase of 3.6%, which reflects capital investment of over £2bn, and an increase in the ROCOS index2 (and hence higher standard costs) offset by total depreciation and impairment of £1,163m.
Our efficiencyThe financial framework was set to allow for a more efficient delivery. The Road Investment Strategy sets a challenging efficiency target for Highways England, with an assumption that £1.2bn of efficiencies will be delivered over the investment period. We have set the foundation for delivery through:
� the publication of the Efficiency and Inflation Monitoring Manual, which provides high-level clarity on definition and reporting
� the publication of the Capital Efficiency Delivery Plan in March 2017, which sets out how the efficiency target will be controlled and delivered
� clarity of accountability and responsibility, including disaggregated business change inputs (cause) and outputs (effect), with appropriate targets being included in the performance objectives of relevant directors
� an appropriate mix of organic efficiency growth through scheme focus with suppliers and top-down targeted cross-directorate change led by the Commercial and the Pavement Efficiency Group
� the operation of a robust risk management plan
We have an agreed programme-level pre-efficient unit cost base for renewals and Smart motorways and have developed a proposal for the regional investment programme (RIP) and the A14 schemes, which we will finalise in 2017-18.
The cumulative efficiency claimed in 2016-17 against our Road Investment Strategy target is £169m against a cumulative annual milestone of £139m. We have recorded an additional £84m efficiency which has yet to be verified but will be counted towards our 2017-18 milestone.
Our corporate-level initiatives include the piloting of a number of renewals changes which have been led by our regions. The forward focus is to deploy relevant changes company-wide and knowledge transfer is supported by the creation of an efficiency web portal. The most significant efficiency to date is the quicker delivery of the Smart motorways programme. This has the twin benefit of reducing cost and improving customer satisfaction with the earlier removal of traffic management.
2Road Construction Resource Cost Indices.

60
Highways England is committed to identifying how we can drive greater efficiency in the way we design and deliver transport infrastructure within our Company. We are working with Crossrail, HS2 Ltd, Network Rail, Transport for London and the Department for Transport as part of the DfT’s Infrastructure Efficiency Strategy Group. The Infrastructure Efficiency Strategy (IES) is about sharing good practice and identifying practical, implementable recommendations to equip us to efficiently deliver this Road Investment Strategy capital investment programme and beyond.
It is important that we are also as efficient as possible across our operational expenditure. The operational expenditure funding available to us over the five years of this Road Investment Strategy requires the identification and delivery of efficiencies (as operational expenditure funding is flat over the five years). Our operational excellence programme is assisting us in this efficiency challenge. We are also developing a series of internal regional operational metrics as well as a full understanding of the costs of our corporate functions. This work will allow us to benchmark our activities to identify where we can make improvements and become more efficient.
Relationship with suppliersHighways England is a signatory to the Chartered Institute of Credit Management’s Prompt Payment Charter. The Prompt Payment Code sets standards for payment practices and best practice. Prompt payment can make all the difference to small businesses, boosting their cash flow and allowing them to invest in growth for the future.
During the year, 96.1% of our payments were made to suppliers within five days of receipt of a valid invoice, and 99.8% within 30 days or contract terms. We continue to increase the number of suppliers paid through Project Bank Accounts (PBAs).1
During the year, a total of £910m was paid using PBAs, of which £244m (27%) went to small and medium-sized enterprises. The average time taken to pay tier 2 and 3 suppliers that had opted into the PBA was 18 days from the assessment date. This is far quicker than the industry norm. On average, 84% of our sub-contractors opted in to be paid this way.
events after the year-end After the successful launch of the asset delivery approach to maintenance in the East Midlands this year, we are introducing this approach in the North East, North West and the South West in 2017-18.
British Railways Board (Residuary) Ltd The BRB(R) was wound up on 30 September 2013. Its ongoing functions were subsequently dispersed to a number of successor bodies, including the Company’s predecessor organisation – the Highways Agency. We are managing the BRB(R) Historical Estate on behalf of the Secretary of State for Transport. This includes inspection and maintenance of over 3,400 tunnels, bridges, viaducts, culverts and other structures; plus around 230 public road supporting structures and 85 parcels of land associated with access to these structures. The Historical Estate assets, which are held by the Secretary of State for Transport, together with any related contingent liabilities, are included in the DfT’s accounts.
Future viabilityThe Board has assessed the prospects of the Company over the four years to March 2021. This assessment has been made in accordance with provisions C.2.2 of the UK Corporate Governance Code, taking into account the Licence, the Road Investment Strategy and the current position of the Company, the corporate planning process and the business’s principal risks.
SeCtiOn 08 / Financial Review
1 A PBA is a ring-fenced bank account where payments are made directly and simultaneously to the supply chain down to tier three level, thereby speeding up payments to the second and third tier suppliers, many of whom will be small and medium-sized enterprises.

61
01SeCtiOn
Overview
Chief E
xecutive’s review
Making our
network safer
Imp
roving custom
er serviceD
elivering the Road
Investment S
trategy
Our
people
Financial R
eviewP
rincipal risks and uncertainties
Our
governance
The Directors’
report
Auditors’
report
Financial S
tatements
Chairm
an’s statem
entO
verviewC
hief Executive’s
reviewM
aking our netw
ork saferIm
proving
customer service
Delivering the R
oad Investm
ent Strateg
y O
ur p
eople
08SeCtiOnF
inancial R
eviewP
rincipal risks and uncertainties
Our
governance
The Directors’
report
Auditors’
report
Financial S
tatements
Highways England is funded from the public purse by grants-in-aid from the DfT. We operate on a five-year funding allocation set out in the first Road Investment Strategy. This allows Highways England a high degree of certainty with regard to funding for our operations. The Road Investment Strategy outlines a long-term programme for our motorways and major roads with the stable funding needed to plan ahead. The Road Investment Strategy Statement of Funds Available (SOFA), covering financial periods 2015-16 to 2019-20 inclusive, totals £11.4bn of capital funding across the Road Period (RP1). The total RP1 settlement includes all funds that we will use to enhance and renew our network. Further to this, as part of the Highways England Spending Review Settlement 2015, the DfT confirmed funding for not only the remainder of RP1 but also year one of the period beyond, providing Highways England with funding certainty to March 2021, which takes us to a total of £15bn overall.
Resource funds required to operate our network are set out in the Government’s annual Resource Delegated Expenditure Limit (RDEL). The Spending Review 2015 has confirmed Highways England resource planning assumptions to the end of the RP1 as being £1,050bn and £1,056bn for 2018-19 and 2019-20 respectively.
As a direct response to the Road Investment Strategy, we produced and published a Strategic Business Plan (SBP) and, following on from this, our Delivery Plan 2015-20. The Delivery Plan built on the SBP, sets out in detail how we will deliver our strategic outcomes, how we will measure our success, and how we will identify future goals and plans to keep improving our customers’ and neighbours’ experience of the Strategic Road Network. Performance against the Delivery Plan is monitored on a quarterly basis by the Office of Rail and Road, and the plan is refreshed and republished annually on a bottom-up basis in order to manage outputs effectively within the resources available.
The Delivery Plan, budgets and related financial models are used to project cash flows and monitor financial risks and forecast future funding requirements. As detailed within Section 9 of this report risks and uncertainties). Our Delivery Plan identified a number of key risks and uncertainties,
and while we manage those risks that are within our control, there are, inevitably, some that we do not have control over, and we work closely with our partners and stakeholders to mitigate their impact.
The period over which the Board considers it possible to form a reasonable expectation as to our longer-term viability, based on current approved capital funding, is the four-year period to March 2021.
In November 2015, the Government outlined plans to develop the next Road Investment Strategy, covering the second road period post-2020, and work internally to develop the scope of the related investment is under way; however, the related capital funding is yet to be confirmed.
The second Road Investment Strategy period will run from April 2020 to March 2025. We published our strategic economic growth plan: The Road to Growth in March 2017 alongside our analysis of the network and its needs in our 18 Route Strategies. We will be ramping up this activity in the coming year as we formulate our proposals for the next Road Investment Strategy.
The Government has also proposed that investment in the network is funded from Vehicle Excise Duty from 2020-21. The mechanism for this has yet to be agreed, and this has not yet been included within the Board’s assessment of our viability.
We have also started to consider the longer-term horizon as part of the development of our 2050 Master Plan. This is our long-term view of the direction for the Strategic Road Network, which will be used to inform the recommendations we will make to the Government on future investments. This will be based on an understanding of likely demand, customer service expectations, technological advancements and the strategic levers that can be used to deliver these.
The Board has a reasonable expectation that Highways England will be able to continue in operation and meet its liabilities as they fall due over the period to March 2021.

62
Principal risks and uncertaintiesWe cannot completely eliminate risk and we must identify and manage it. this section outlines how we do this.
Risk managementWe have identified a number of key risks and uncertainties, which are in line with conducting business as the strategic highways authority. Our approach to managing risk is to work closely with our partners and stakeholders to mitigate the impact of all risk on our operations.
early identification and mitigation
Our risk management process is aimed at early identification and mitigation. Our framework provides the structure through which we consistently identify, prioritise, manage, monitor and report risks throughout the Company.
Each year, the Board and the Executive team use the strategic objectives agreed with our Shareholder to identify potential risk and uncertainty. Similar exercises are carried out across all key business areas. The output from these exercises is used to review and refresh risk registers across the organisation, up to and including those captured in the corporate risk register.
09SeCtiOn
Key elements of our risk management framework
The Board has overall responsibility for determining the nature and extent of the significant risks it is willing to take in achieving our strategic objectives. The Chief Executive (as Accounting Officer) is responsible to Parliament for the stewardship of public money and delegations are exercised in line with the Finance and Reporting letter and Accounting Officer letter issued to Highways England and the Chief Executive by the Shareholder.
The Audit and Risk Committee reviews the effectiveness of our internal controls and procedures to identify, assess and report risk. Safety risks are reviewed separately by the Board Safety Committee and feed into the Board’s wider discussions.
Risk reporting is structured so that key concerns are escalated through the Company to the management team and, where appropriate, on to the Board.

63
01SeCtiOn
Overview
Chief E
xecutive’s review
Making our
network safer
Imp
roving custom
er serviceD
elivering the Road
Investment S
trategy
Our
people
Financial R
eviewP
rincipal risks and uncertainties
Our
governance
The Directors’
report
Auditors’
report
Financial S
tatements
Chairm
an’s statem
entO
verviewC
hief Executive’s
reviewM
aking our netw
ork saferIm
proving
customer service
Delivering the R
oad Investm
ent Strateg
y O
ur p
eopleFinancial R
eview
09SeCtiOnP
rincipal risks and uncertainties
Our
governance
The Directors’
report
Auditors’
report
Financial S
tatements
Our underlying principles are that risks are:
� monitored continuously
� identified and their mitigation agreed in line with our corporate risk appetite
� reported through our established procedures
How we evaluate and manage risk
All risk is evaluated using a matrix that recognises that any risk has the potential for multiple impacts and encourages the ‘risk owner’ to determine which impact is the most important. This helps plan the required mitigation.
Any risks with the potential to materially jeopardise our business activity are escalated to the Board and added to the corporate risk
register. All corporate risks are assigned an owner from the Executive team who formally review their risks at least quarterly.
We take a thematic approach to risk reporting. We have identified nine themes linked to our Delivery Plan and the performance specification within the Road Investment Strategy (as detailed in the table on page 66) to create a reporting dashboard. The purpose of the dashboard is to provide useful commentary on the status of the theme (and the risks within it).
Safety We face the risks that the operation of the high-speed road network and construction and maintenance activities, expose us to. Where it is not possible to eliminate risk arising from our activities we will take all practical measures to manage the risk to minimise the potential for harm or loss of life to the public, road user, road worker or staff.
CustomerWe want to be respected by those who use our services. In pursuit of our delivery objectives, we will only tolerate risks with potential low-to-medium impact on our customers and stakeholders.
DeliveryIn the pursuit of our objectives, we are willing to accept some circumstances where risks may impair the delivery of our key performance goals in order to achieve our longer-term aims. We will adapt our approach to meet changing circumstances.
Financial governance We are willing to accept some circumstances where we take risks that could lead to short-term financial costs in order to achieve longer-term objectives. Decisions on these will be taken in accordance with our internal governance arrangements.
Our risk appetite Recognising that Highways England faces risks inherent to the sector that we work in and on behalf of our key stakeholders, our appetite has been defined as follows:

64
All risk is assured through the ‘four lines of assurance model’ to provide the Board with an appropriate level of comfort that risk is being managed properly:
� line one – day-to-day management activity and reporting
� line two – executive oversight and periodic review
� line three – activity carried out by parties with operational independence, such as internal audit
� line four – activity completed by independent parties, such as the National Audit Office or the Highways Monitor
This allows the risk owner to draw from a wealth of information and places reliance at the level most appropriate to the exposure of the risk.
economic crime
The risk of fraud, bribery, corruption and money laundering, collectively referred to as ‘economic crime’, presents significant risks to Highways England and is an inherent part of the sector that we work in. Exposure is not only in terms of the potential for financial loss or delays to delivery, but also because of the impact on customer and stakeholder confidence that can occur where cases are proven.
Highways England is determined to manage this risk across the Company and its supply chain and therefore endorses a zero tolerance approach to any (and all) instances of economic crime. We fully support the creation of a counter-fraud culture throughout the organisation.
This year, we have developed a strategy and engagement plan to reduce the Company’s exposure. This incorporated three key elements:
� improve governance
� understand our risk profile
� enhance our investigation processes
During the year, we have reviewed and updated our key economic crime policies and have delivered a series of raising awareness sessions
across key areas of the Company, including our senior leadership.
We have developed the organisation’s economic crime risk profile. This captures our internal and external economic crime risks (including our risk from cyber-crime) based on industry and government information, and we intend to use the profile to determine further proactive work over our control framework and improve our resilience further. We have enhanced our investigation processes in line with professional standards.
The results of our investigations are reported to the Counter-fraud Group and the Audit and Risk Committee, as appropriate. Any redress from cases of proven fraud is pursued and the monies recouped.
Our principal risksDuring the year, our Board and Executive have each reviewed our corporate risks. This leads to a refresh of the risks captured in the corporate risk register.
We manage risk across a broad range of activities and context. Our framework is based on a hierarchy, covering risk at an operational, tactical and strategic level.
The risks (including examples of the controls and mitigating actions we are taking) set out in this section are defined as our strategic level. They are a subset of our risk assessment and provide the main focus of our Board. Other risks are managed within the Company by the Executive and are not included here.
Within our assessment we have included key factors, such as:
� functioning as a separate legal entity
� the increase in our capital investment for the Strategic Road Network (including numbers of schemes and volume of procurement)
� staff changes (e.g. capability, capacity and maintaining the corporate memory) have also been considered and form part of the network of identified risk across the organisation
SeCtiOn 09 / Principal risks and uncertainties

65
01SeCtiOn
Overview
Chief E
xecutive’s review
Making our
network safer
Imp
roving custom
er serviceD
elivering the Road
Investment S
trategy
Our
people
Financial R
eviewP
rincipal risks and uncertainties
Our
governance
The Directors’
report
Auditors’
report
Financial S
tatements
Chairm
an’s statem
entO
verviewC
hief Executive’s
reviewM
aking our netw
ork saferIm
proving
customer service
Delivering the R
oad Investm
ent Strateg
y O
ur p
eopleFinancial R
eview
09SeCtiOnP
rincipal risks and uncertainties
Our
governance
The Directors’
report
Auditors’
report
Financial S
tatements
While the ultimate responsibility for risk management rests with the Board, it delegates the more detailed oversight of risk management and internal control principally to the Audit and Risk Committee, which reports the findings of its reviews covering all principal risks and material controls (including financial, operational and compliance with key processes) to the Board. More information on their responsibilities can be found in Section 10.
Brexit On 29 March 2017, the UK Government submitted its notification to leave the European Union (EU) in accordance with Article 50. The triggering of Article 50 starts a two-year negotiation process between the UK and the EU. Any subsequent changes in legislation, regulation and funding arrangements are subject to the outcome of these negotiations. During this two year period, which includes the full duration of the next accounting period, the UK remains a full member of the EU with all the rights and obligations arising from membership. Currently, there are no significant impacts on our financial statements in the short-term from the Government making the formal notification. We will keep this under review as negotiations continue.

66
SeCtiOn 09 / Principal risks and uncertainties
Key risk Summary of current mitigation
Safety
Ineffective control over health and safety risks, leading to a greater number of staff, road workers and road users being harmed
� H&S Management System with embedded monitoring system established� strong relationships with supply chain (including application of
Construction, Design and Management 2015 regulations) � monthly reporting of performance and visibility of incidents and near misses� regular site inspections (allocated on risk basis)� requirements to provide safety information as part of tender process and
monitoring of compliance as part of contract management activity � traffic officer process and procedures established and compliance
regularly monitored
Delivering to customers and communities
The organisation fails to communicate effectively, which leads to misinformed public opinion
� Communications Management Strategy, Management Plan and Delivery Plan are complete and embedded into working practices, including controls for corporate channels
� 24/7 media operation established and monitoring all media output relating to the Company
� Business Partner model in place for all road project communications to help liaise with public during consultations and other interactions with the public
Delivering performance and efficiency
Supply chain capacity and capability does not meet the business need due to either failure to prepare or business failure, which critically impacts on the organisation’s ability to deliver the current investment programme and successfully negotiate and deliver the outcome of the next investment programme
� Supply Chain Group (an Executive sub-group) co-ordinates the ongoing monitoring and intervention around supplier stability
� standard procurement evaluations deployed as part of tendering process
� Highways England Supply Chain Skills and Capability Plan in place (published May 2016) and activity is monitored against it. This is linked to the Department for Transport (DfT) skills plan, which was developed by the Strategic Transport Apprentice Taskforce (STAT)
� Highways England Procurement Plan in place (published January 2017) and activity is monitored against it
Efficiency savings may not be captured accurately, leading to the Company failing to demonstrate delivery of value for money, which undermines Shareholder confidence in our delivery capability
� Efficiency Delivery Plan addressing business, commitments in place and supported by an Efficiency Manual, disseminated and used by the business
� Efficiency Managers in place across the business with Commercial team co-ordinating inputs and challenging supporting evidence
� framework for reporting efficiencies to DfT and Office of Rail and Road (ORR) in place, with monitoring of efficiencies built into corporate performance monitoring process
� responsibility matrix developed for delivery of planned efficiencies in place and monitored against

67
01SeCtiOn
Overview
Chief E
xecutive’s review
Making our
network safer
Imp
roving custom
er serviceD
elivering the Road
Investment S
trategy
Our
people
Financial R
eviewP
rincipal risks and uncertainties
Our
governance
The Directors’
report
Auditors’
report
Financial S
tatements
Chairm
an’s statem
entO
verviewC
hief Executive’s
reviewM
aking our netw
ork saferIm
proving
customer service
Delivering the R
oad Investm
ent Strateg
y O
ur p
eopleFinancial R
eview
09SeCtiOnP
rincipal risks and uncertainties
Our
governance
The Directors’
report
Auditors’
report
Financial S
tatements
Key risk Summary of current mitigation
People and company
The business is unable to develop and deliver the skills, capability or capacity required to successfully deliver our objectives relating to the current and future investment programmes
� corporate and directorate capability programmes are in place, and are aligned to our growth areas
� recruitment capacity in place through internal teams, specialist recruitment agencies, advertising and our volume hire partner
� early talent demand recruitment campaign and programmes are operationally developed
� accurate performance data is captured and reported weekly and monthly from recruitment and workforce planning systems
The integrity or completeness of our data may be compromised and/or not validated, which impairs business decisions or the reporting of company progress against objectives
� Consolidated Data Improvement Plan developed and activity monitored
� Information Leadership Group (an Executive sub-group) established and data integrity issues monitored through this forum
� Operational Metrics Manual agreed, in place and compliance monitored against
� assurance processes over KPI/PI data in place and deployed
improving the environment
Requirements to improve air quality may impact on the ability to achieve our Licence obligations, internal performance indicators and successfully deliver our capital programme
� strategy (which is mindful of the Government’s National Air Quality Plan) for supporting the wider air quality risk is in place and delivery supported by Air Quality Programme Office. This includes consideration of health impacts attributable to the Strategic Road Network
� research and pilot study programme to explore new and innovative approaches to supporting improvements in air quality in place and activity monitored on a regular basis
� clear strategies in place to manage air quality for schemes on A556 and M1. Mitigation regularly monitored as part of scheme management
� Air Pollution Strategy Board, which includes DfT, the Department for Environment, Food & Rural Affairs (Defra) and Office for Low Emission Vehicles (OLEV)
� Engagement in place with Defra and DfT on a weekly basis to help support the Government’s air quality plan
� all schemes identified at risk are reviewed by the Air Quality Roads Board, which includes consideration of interventions to mitigate air quality impacts

68
SeCtiOn 09 / Principal risks and uncertainties
Key risk Summary of current mitigation
Asset stewardship
Failure to understand our assets or to respond to our asset intelligence with appropriate maintenance and/or interventions may lead to increased risk of injury to road users or property damage, and more frequent periods of network disruption
� clear liability and requirements for watchman and surveys in place
� contractors’ competence demonstrated at selection and monitored as part of contract management arrangements
� spot monitoring and audit process established and information reported and acted upon
� technical forum established, with supplier inspection leads to agree and implement solutions identified through the structures inspection and improvement plan
� Service Quality Review process developed to assess regional inspection programmes on ongoing basis
� regions maintain and oversee service provider updates to the SMIS (structures) database and monitors action plans when remaining overdue structure inspection will be completed
� TRACS surveys on pavement condition on our network are undertaken on a regular basis
Strategic planning
Lack of long-term network and service strategy may impair our ability to demonstrate value for money and realise the benefits of targeted investments over the longer-term
� improved strategic planning process that includes 2050 vision, The Road to Growth and route strategies
� innovative and robust analytical approach established and implemented
� clear strategic objectives for the Company now set in relation to the second investment programme
� robust approach to developing Business Case and Strategic Business Plan implemented and monitored

69
01SeCtiOn
Overview
Chief E
xecutive’s review
Making our
network safer
Imp
roving custom
er serviceD
elivering the Road
Investment S
trategy
Our
people
Financial R
eviewP
rincipal risks and uncertainties
Our
governance
The Directors’
report
Auditors’
report
Financial S
tatements
Chairm
an’s statem
entO
verviewC
hief Executive’s
reviewM
aking our netw
ork saferIm
proving
customer service
Delivering the R
oad Investm
ent Strateg
y O
ur p
eopleFinancial R
eviewP
rincipal risks and uncertainties
10SeCtiOnO
ur governance
The Directors’
report
Auditors’
report
Financial S
tatements
Our governancethis section outlines how our arrangements align with the principles and provisions set out in the UK Corporate Governance Code and public sector governance codes.
10SeCtiOn
Colin Matthews CBeChairman
‘In our second year, the Board has maintained its focus on our three imperatives: to make the roads safer; improve customer service and to deliver the roads investment programme.’
Highways England was established on 1 April 2015 under the Infrastructure Act 2015, and appointed and licensed as a strategic highways company by the Secretary of State for Transport. It is the highway authority, traffic authority and street authority for England’s motorways and major A-roads that together are known as the Strategic Road Network.

70
Leadership
Role of the Board
The Board is accountable to the Secretary of State for Transport as Shareholder for all aspects of Highways England’s activities and performance, including the fulfilment of our role and responsibilities as a strategic highways company. The Board is the primary governance arm of Highways England in line with its fiduciary and other duties under company law. Our governance activities include setting strategy, overseeing performance, reviewing risks and appointing senior leaders. The Board delegates responsibility for the day-to-day running of Highways England’s operations to the Chief Executive.
Composition of the Board
The Board is expected to have no more than ten and no fewer than five members, with a balance in favour of independent Non-Executive Directors.
The Chair is appointed by the Secretary of State for Transport, who may also appoint a further Non-Executive Director as their company representative. Other Non-Executive and Board Executive Director appointments must also be approved by the Secretary of State for Transport. The Secretary of State for Transport also approves the salary for all Executive Directors. The Chief Executive must be appointed to the Board together with up to two further Executive Directors, of whom one should be the Chief Financial Officer.
The members of the Board and their length of service, together with the committees on which they serve, are shown in the table on page 71. Their roles and activities are discussed in more detail on the following pages.
During the year, Elizabeth Perelman and Tom Smith left the Board to take up important responsibilities in other organisations. We thank them warmly for their contribution to Highways England during a period of great change. Elizabeth’s position as government appointee was taken over by Roger Lowe. We are currently searching for a successor to Tom.
Vanessa Howlison took up the post of Chief Financial Officer on 20 June 2016.
SeCtiOn 10 / Our governance

71
01SeCtiOn
Overview
Chief E
xecutive’s review
Making our
network safer
Imp
roving custom
er serviceD
elivering the Road
Investment S
trategy
Our
people
Financial R
eviewP
rincipal risks and uncertainties
Our
governance
The Directors’
report
Auditors’
report
Financial S
tatements
Chairm
an’s statem
entO
verviewC
hief Executive’s
reviewM
aking our netw
ork saferIm
proving
customer service
Delivering the R
oad Investm
ent Strateg
y O
ur p
eopleFinancial R
eviewP
rincipal risks and uncertainties
10SeCtiOnO
ur governance
The Directors’
report
Auditors’
report
Financial S
tatements
Board members and Committee membership
Name RoleTerm of
office ends Audit
and riskNominations Remuneration Safety Investment
Colin Matthews
Non-Executive Director
Chairman and Chair Nominations Committee
31/08/2017 - • • • •
Jim O’Sullivan
Executive Director
Chief Executive N/A-
A
-
A
-
A• •
Vanessa Howlison
Executive Director
Chief Financial Officer from 20 June 2016
N/A A - - - •
David Hughes
Non-Executive Director
Chair Audit and Risk Committee
31/03/2018 • • • • •
Simon Murray
Non-Executive Director
Chair, Investment Committee
31/03/2018 • • - • •
Elaine Holt
Non-Executive Director
Chair, Safety Committee
31/03/2018 - • - • •
Roger Lowe
Non-Executive Director
Shareholder-appointed representative from 27 July 2016 Interim Chair, Remuneration Committee from 1 March 2017
31/07/2018 • • • • •
Tom Smith
Non-Executive Director
Chair, Remuneration Committee to 28 February 2017
N/A • • • • -
Elizabeth Perelman
Non-Executive Director
Shareholder-appointed representative to 27 July 2016
N/A • • • • -
Code: • Member A Attendee - Not a member

72
Accountability
Our governance framework
Highways England is an arm’s-length, government-owned company delivering, and contributing to, the Government’s long-term plan for the Strategic Road Network. We are monitored by the Office of Rail and Road (ORR) and Transport Focus, a consumer watchdog body, and both of these organisations advise the Secretary of State for Transport.
Setting out roles and accountabilities
A Framework Document sets out the respective roles and accountabilities of the Secretary of State for Transport, the Department for Transport, and Highways England as we work to achieve the common objective of delivering a network that meets the country’s needs efficiently and provides the best possible service for customers and other stakeholders. The framework also:
� recognises the functional and day-to-day operational independence of Highways England
� sets out how financial control and accountability is achieved, including through a finance and reporting letter
� recognises the governance and decision-making arrangements that are appropriate to Highways England as a corporate, legal entity with its Board, and with executives reporting to that Board
SeCtiOn 10 / Our governance

73
01SeCtiOn
Overview
Chief E
xecutive’s review
Making our
network safer
Imp
roving custom
er serviceD
elivering the Road
Investment S
trategy
Our
people
Financial R
eviewP
rincipal risks and uncertainties
Our
governance
The Directors’
report
Auditors’
report
Financial S
tatements
Chairm
an’s statem
entO
verviewC
hief Executive’s
reviewM
aking our netw
ork saferIm
proving
customer service
Delivering the R
oad Investm
ent Strateg
y O
ur p
eopleFinancial R
eviewP
rincipal risks and uncertainties
10SeCtiOnO
ur governance
The Directors’
report
Auditors’
report
Financial S
tatements
Secretary of State for transport
SofS
Road Users
Parliament
Legislation
Empowers SofS to appoint
a Strategic Highways
Company, set a RIS and issue
directions via a Licence
Highways england’s governance system overview The Infrastructure Act 2015 sets out the overall framework for Highways England including Licence,
Road Investment Strategy, Office of Rail and Road and Transport Focus
Highways england
Ope
rate
s, m
anag
es, m
aint
ains
and
impr
oves
the
Stra
tegi
c R
oad
Net
wor
k, d
eliv
ers
requ
irem
ents
set
thro
ugh
the
Roa
d In
vest
men
t Stra
tegy
and
pro
vide
s se
rvic
es to
road
use
rs. I
n d
oing
so,
we
com
ply
with
our
lega
l dut
ies,
lice
nce
cond
ition
s, o
ther
sta
tuto
ry g
uida
nce
and
rele
vant
sta
ndar
ds
Chief executive
Officer and
Board
SofS remains accountable to Parliament for the activities and performance of the Company
SofS, as sole Shareholder, holds the Board to account for stewardship of the Company
Board is accountable to the SofS for all activities and performance
CEO, as Accounting Officer (AO) for the Company, is accountable to the Department for Transport’s Principal Accounting Officer (PAO) for the day-to-day management of public funds. Both the AO and PAO are accountable to Parliament
Road InvestmentStrategy (RIS)
SofS sets strategic direction, delivery requirements and funding for the Company. The Company feeds into setting the RIS
FrameworkDocument
Defines governance, decision-making roles and working arrangements between the Company, SofS and DfT
Licence
SofS sets directions and guidance for the Company about how it must act, and defines the process for setting and changing the RIS
Articles ofAssociation
Set by SofS, as Shareholder, in consultation with the Company, and sets the internal rules for governing the Company
Office of Rail and Road
The Office of Rail and Road reviews Company performance and advises the SofS on whether obligations have been met and can impose sanctions
TransportFocus
Transport Focus gathersroad user views andadvises Ministers onusers’ interests andpriorities

74
Our Delivery Plan
The Delivery Plan explains how we will meet the specific requirements of the Government’s strategy within the context in which we will work. The Board reviews the plan each year and refines the strategy accordingly. The Board also reviewed other strategies, including our approach to safety.
Relationship with our Shareholder and statutory stakeholders
The Company’s Framework Document also includes arrangements for regular formal meetings with the Shareholder (the Secretary of State for Transport and Ministers) and his officials. These took place throughout the year, supplemented by informal meetings, as necessary. There are also arrangements for regular meetings with the ORR, who monitors our performance through regular reviews, which are published on their website.
We have also established arrangements for regular meetings with customer groups including Transport Focus, the consumer watchdog, which is now responsible for the National Road User Satisfaction Survey, and is key to helping us improve customer service.
Role of non-executive Chairman
The Chairman leads our Board. He is responsible for ensuring that Highways England conducts its affairs openly, transparently and with probity. He is also responsible for ensuring that the Company’s policies and actions are appropriate to those of an arm’s-length body, support those of the Secretary of State for Transport and escalate risks to the Department for Transport as appropriate. The role of Chairman is non-executive and part-time at a minimum of one and a half days a week.
Role of Chief executive
The Chief Executive has day-to-day responsibility for running operations and the performance of the Company and of executive management. He leads the development of strategy and makes recommendations to the Board. He also provides
leadership and promotes the Company’s culture and standards. Under government requirements, the Chief Executive is the Accounting Officer, responsible to Parliament for the stewardship of public funds.
Role of non-executive Directors
Non-Executive Directors are appointed to the Board to contribute their independent external expertise and experience in areas of importance to the Company. They also provide independent challenge and rigour to the Board’s deliberations.
Role of executive Directors
The Executive Directors support the Chief Executive in leading the Company effectively towards the achievement of its strategic objectives and implement the strategic decisions taken by the Board. They are committed to doing this in a responsible way that takes account of our three key imperatives: making the roads safer for everyone; improving customer service and delivering the Government’s increased investment in its five-year Road Investment Strategy.
Our committees
A number of strategic, financial or other significant matters are reserved to the Board for decision.
The Board committees are:
� Audit and Risk Committee
� Safety Committee
� Nominations Committee
� Remuneration Committee
� Investment Committee
The Board and committee framework is shown on the following page. All are mandatory under the Framework Document, except for the Investment and Safety Committees, established by the Board to provide appropriate focus on these key matters. The role of each committee is described in its own committee report in this section.
SeCtiOn 10 / Our governance

75
01SeCtiOn
Overview
Chief E
xecutive’s review
Making our
network safer
Imp
roving custom
er serviceD
elivering the Road
Investment S
trategy
Our
people
Financial R
eviewP
rincipal risks and uncertainties
Our
governance
The Directors’
report
Auditors’
report
Financial S
tatements
Chairm
an’s statem
entO
verviewC
hief Executive’s
reviewM
aking our netw
ork saferIm
proving
customer service
Delivering the R
oad Investm
ent Strateg
y O
ur p
eopleFinancial R
eviewP
rincipal risks and uncertainties
10SeCtiOnO
ur governance
The Directors’
report
Auditors’
report
Financial S
tatements
Governance bodies – Board and Committees framework
Safety Safety management and leadership, strategy development, performance monitoring and compliance
Board Safety Committee
Oversight of our safety ambition and leadership, strategy, performance review and compliance
Resourcing Sub-group
Workforce planning, including decisions under the remuneration framework
Counter-fraud Group Ensuring systems, measures and culture that counter the risk of economic crime
Audit and Risk Committee
Oversight of financial and internal control; risk; and governance; financial reporting; internal audit and assurance programme and external audit
Executive Finance Group
Plan, control and manage resources effectively to support decision making and delivery over the short, medium and long term.
Community and Customers Group
Oversight of the development of an effective relationship with customers and communities
Remuneration Committee
Oversight of remuneration framework, including performance-related pay, Board and senior pay decisions
Information Leadership Group
Lead on data improvement, assurance of quality of reporting and internal decisions in support of the investment programme
Supply Chain Group Oversight of work to develop and manage an effective supply chain
Nominations Committee Board and Executive Appointments
Investment Committee
Investments within delegated authority thresholds of between £200m and £500m
Investment Decision Committee
Investments within delegated authority thresholds of between £50m and £200m
Executive Committees and groups
Governance Committees
Board
executive Committee

76
Corporate governance report
Our work
Having spent our first year embedding the new structure and enhancing our processes and procedures, we have focused this year on delivery against our strategic objectives.
Highways England invests significant amounts of public money and the Board is acutely aware of the importance of delivering good value for money and adopting the highest standards of governance and probity.
We have strengthened our governance arrangements through the creation of the Board Investment Committee this year.
The Board has devoted time in its monthly meetings to strategy, including our ambition to establish a long-term vision for the Strategic Road Network. More work will be required in 2017-18 to further develop our thinking to a conclusion.
The Board approved the annual budget and updated the Delivery Plan that supports our delivery of the Government’s five-year Road Investment Strategy.
The Road Investment Strategy requires a significant increase in the number of projects undertaken, and we recognise the need to employ more engineers and other skilled people. We have kept under close review the progress of our capability, development and recruitment efforts and the associated remuneration.
We have continued to review our approach to asset management, with a greater focus on in-house knowledge of our assets and in-house decision making regarding their maintenance and replacement. We have similarly kept under review our supply chain strategy and information technology.
evaluation
The Board carried out an evaluation of the effectiveness of its collective and individual performance, based on UK Corporate
Governance Code Board Effectiveness Guidance in November 2016. The evaluation also included the Board sub-committees.
This was in addition to the detailed evaluation of the Audit and Risk Committee performance carried out in line with best practice as supported by the National Audit Office.
The Chairman led the process, supported by the Company Secretary, with the assistance of a Non-Executive Director to provide objective feedback on the Chairman’s performance.
Some key actions from the evaluation were agreed to improve the Board’s effectiveness. These were:
� make more time at Board meetings for discussions on strategy, people and customer service by streamlining the monthly review of operational performance
� review relationships with key stakeholders on a regular basis
� review committee structure to ensure continued effectiveness
Activities carried out in-year include:
� risk workshop to refresh strategic risks
� workshops with the Executive team to develop strategy on people, customer service and delivery
The Board’s effectiveness in decision making is enhanced as a result of its engagement outside of formal Board meetings. Developing directors’ understanding about Highways England’s work and the operational demands that are made on the executive leadership is key to improving their performance.
The safety visits conducted this year have also played a key part in familiarising Directors with our operations. These activities, together with our enhancements to the way the Board conducts its business, have improved effectiveness through the year.
SeCtiOn 10 / Our governance

77
01SeCtiOn
Overview
Chief E
xecutive’s review
Making our
network safer
Imp
roving custom
er serviceD
elivering the Road
Investment S
trategy
Our
people
Financial R
eviewP
rincipal risks and uncertainties
Our
governance
The Directors’
report
Auditors’
report
Financial S
tatements
Chairm
an’s statem
entO
verviewC
hief Executive’s
reviewM
aking our netw
ork saferIm
proving
customer service
Delivering the R
oad Investm
ent Strateg
y O
ur p
eopleFinancial R
eviewP
rincipal risks and uncertainties
10SeCtiOnO
ur governance
The Directors’
report
Auditors’
report
Financial S
tatements
Our next evaluation is scheduled for November 2017 and will also review the progress made on actions identified this year. The outcome of this assessment will be agreed by January 2018.
We value the objectivity that an external facilitator could bring and will look to enlist such services in our 2018 evaluation.
Composition, attendance and advice
The composition of our committees is shown in the table bellow.
All Directors have access to the advice and services of the Company Secretary and their team. The Company Secretary is responsible for
ensuring that the Board operates in accordance with the governance framework that it has adopted and that there is an effective flow of information to the Board and its committees and between senior management and the Non-Executive Directors.
The Company’s General Counsel attends Board meetings, the Safety Committee and the Audit and Risk Committee. The Chief Highways Engineer (the Executive Director for the Safety, Engineering and Standards directorate) champions safety on behalf of the Executive team and regularly attends the Board and Board Safety Committee, together with other Executive team members and senior management, by invitation.
Board and Committee attendance
Name Role BoardAudit and
RiskNominations Remuneration Safety Investment
Colin Matthews Non-Executive Director 10(10) N/A 2(2) 6(6) 5(6) 3(3)
Jim O’Sullivan Executive Director 10(10) 5(5) In
Attendance2(2) In
Attendance6(6) In
Attendance 6(6) 3(3)
Vanessa Howlison
Executive Director 6(8) 3(3) In
Attendance N/A N/A N/A 2(3)
David Hughes Non-Executive Director 10(10) 5(5) 2(2) 6(6) 6(6) 3(3)
Simon Murray Non-Executive Director 9(10) 4(5) 2(2) N/A 5(6) 3(3)
Elaine Holt Non-Executive Director 9(10) N/A 1(2) N/A 5(5) 3(3)
Tom Smith Non-Executive Director 9(9) 4(4) 2(2) 5(5) 5(6) N/A
Elizabeth Perelman
Shareholder-appointed representative Non-Executive Director
3(3) 2(2) 1(1) 3(3) 1(1) N/A
Roger Lowe
Shareholder-appointed representative Non-Executive Director
7(7) 2(3) 1(1) 3(3) 5(5) 3(3)

78
Statement of effectiveness of our internal controls and risk management processes
Our system of internal control is based on a continuous process of identifying, assessing and managing risks. The Board is responsible for ensuring that an effective internal control framework is in place. Such a framework is designed to minimise risks to the achievement of our objectives to a reasonable level, in line with our risk appetite. We set our risk management processes in Section 9.
We have a corporate assurance function that encompasses internal audit, risk assurance, counter-fraud activity and programme assurance. The function’s primary purpose is to provide objective and independent assurance on the adequacy and effectiveness of the Company’s internal control, risk management and governance framework.
The annual internal audit programme covers key areas of risk and provides continuous assurance over core operational processes such as finance, procurement and human resources. Results of their work are reported to management and monitored regularly by the Audit and Risk Committee. Of the reports issued in year, of significant importance was the concerns raised over the management of the designated funds portfolio. Management reacted promptly to these concerns, reducing the potential risk exposure quickly.
The Committee also noted the results of the review of the Dart Charge operation1,including the performance of the contractor. Management actions have been agreed and the Committee are closely monitoring their closure.
The Risk Assurance function supports the Executive in maintaining the corporate risk register. It monitors and reviews strategic risk and provides assurance through their continuous check, challenge and reporting process to the Executive and the Board.
In accordance with the Framework Document, management conducts a self-assessment exercise, led by the Risk Assurance team and timed to meet the reporting requirements of our Shareholder. This provides assurance over the effectiveness of controls in key areas including contract management, project management and procurement. The results of the process are reported to the Audit and Risk Committee and to the Department for Transport. For 2016-17, the exercise provided a reasonable assurance rating over the effectiveness of our key controls.
Actions to improve the consistency of control across the Company have been identified and their implementation will be monitored by the Executive and progress reported to the Audit and Risk Committee on a periodic basis during 2017-18.
Following a breach to Cabinet Office controls in relation to approved legal spend, Highways England submitted retrospective requests which were not agreed. Internal controls identified the transactions affected and an improvement action to prevent reoccurrence has been delivered.
In setting up the Defined Benefits Pension Master Trust Fund arrangement for the staff affected by the Transfer of Undertakings (Protection of Employment) in July 2016, the Secretary of State for Transport’s formal approval was not sought in advance as per the requirements of our Framework Document. Retrospective formal approval will be sought from the Secretary of State for Transport in the summer.
Counter-fraud activity is co-ordinated by the Counter-fraud team. A number of allegations were investigated in-year and redress pursued, when appropriate. In year, one case of potential money laundering against a dormant Dart Charge account was identified. A Suspicious Activity Report was logged with the National Crime Agency, who has confirmed that Highways England has been provided with a defence under the Proceeds of Crime Act 2002. This protects the Company from any legal action taken against the perpetrator. The incident was identified through our control framework and the vigilance of our staff. Management is content that this is appropriate and in line with the risk.
SeCtiOn 10 / Our governance
1 A cashless payment system for the Dartford Crossing.

79
01SeCtiOn
Overview
Chief E
xecutive’s review
Making our
network safer
Imp
roving custom
er serviceD
elivering the Road
Investment S
trategy
Our
people
Financial R
eviewP
rincipal risks and uncertainties
Our
governance
The Directors’
report
Auditors’
report
Financial S
tatements
Chairm
an’s statem
entO
verviewC
hief Executive’s
reviewM
aking our netw
ork saferIm
proving
customer service
Delivering the R
oad Investm
ent Strateg
y O
ur p
eopleFinancial R
eviewP
rincipal risks and uncertainties
10SeCtiOnO
ur governance
The Directors’
report
Auditors’
report
Financial S
tatements
Programme Assurance co-ordinates the Gateway review process, ensuring that reviews are scheduled at key milestones in the project’s life cycle. This year, results were collated and reported to the Audit and Risk Committee to enhance their overall assurance coverage.
The Corporate Assurance Director provides an annual assurance statement to the Chief Executive, as Accounting Officer. This statement provides an opinion on the adequacy and effectiveness of the Company’s governance, risk and control mechanisms through incorporating the outputs of the main assurance bodies and other assurance activity from across the Company. The assurance statement provides reasonable, rather than, absolute assurance
over the adequacy of risk management, internal control and governance arrangements. The Accounting Officer retains overall personal responsibility for maintaining an effective internal control framework. This year, the statement applied a Moderate assurance rating.
Based on the arrangements set out above, and the information provided by the Corporate Assurance Director, the Chief Executive considers that there is a sound system of internal control, risk management and governance in place and working effectively across the Company.

80
nominations CommitteeChair: Colin Matthews (Chairman of the Board)
Committee chair overview
Role
The role of the Committee is to make Board and Executive appointments. This is subject to approvals required by the Articles and Framework Document, including the Secretary of State for Transport. Our specific responsibilities include:
� to advise on recommendations in respect of the appointment of Executives and Non-Executive Directors of the Company
� keeping the structure, size and composition of the Board and its committees (including their chairpersons) under review
� the continuation in office of Directors, the appointment process for Board members and Company Secretary
� succession planning for the Board and for posts reporting to the Chief Executive and the arrangements in place for planning for the tier immediately below, giving full consideration to the challenges and opportunities facing the Company and skills needed in the future
Composition
The Committee is chaired by the Chairman of the Board and it is composed of five other Non-Executive Directors (including the Shareholder-appointed Non-Executive Director), who bring the relevant skills and impartiality to assist with the recruitment of senior appointments.
The Committee meets regularly to discuss succession plans for senior managers. It can meet on a flexible ad hoc basis, when required.
Work
The main business covered this year, was a review of succession plans to senior management roles and a review of the role specification for a new Non-Executive Director following the resignation of Tom Smith in February. We also reviewed the composition of the Board and confirmed that two Executive Director members were sufficient.
non-executive ChairmanColin Matthews
Colin (CBE FrEng) was appointed Chairman of Highways England in December 2014, and was appointed Chairman of the Highways Agency in July 2014. Previously, he was also Chief Executive of Heathrow Airport (formerly BAA).
Colin has held the following appointments; Chief Executive, Severn Trent Water PLC; Chief Executive, Hays PLC; Managing Director, Transco Ltd; Engineering Director, British Airways PLC.
He is also the Non-Executive Chairman at Renewi PLC and a Non-Executive Director at Johnson Matthey PLC.
He holds an MA in engineering, an MBA and is a chartered engineer.

81
01SeCtiOn
Overview
Chief E
xecutive’s review
Making our
network safer
Imp
roving custom
er serviceD
elivering the Road
Investment S
trategy
Our
people
Financial R
eviewP
rincipal risks and uncertainties
Our
governance
The Directors’
report
Auditors’
report
Financial S
tatements
Chairm
an’s statem
entO
verviewC
hief Executive’s
reviewM
aking our netw
ork saferIm
proving
customer service
Delivering the R
oad Investm
ent Strateg
y O
ur p
eopleFinancial R
eviewP
rincipal risks and uncertainties
10SeCtiOnO
ur governance
The Directors’
report
Auditors’
report
Financial S
tatements
Safety CommitteeChair: Elaine Holt (Non-Executive Director)
Committee chair overview
Role
The Safety Committee works closely with the Executive team to monitor safety performance and ensure that a strong and robust safety culture lives and thrives across the Company and our suppliers.
Safety risks cannot always be eliminated entirely, so the Safety Committee provides the leadership to ensure that key risks are identified and appropriate risk mitigation is undertaken. It is the responsibility of the Safety Committee to set clear expectations to improve safety standards overall.
Composition
The Committee includes all of the Non-Executive Directors (including the Shareholder-appointed Non-Executive Director), the Chief Executive, the Chief Highways Engineer and the Health, Safety and Wellness Director. Equally important, the Committee is also attended (when required) by those with operational responsibility, including members of the Executive team.
Work
In addition to giving formal approval to the five-year Safety Action Plan, required by the Licence and Company safety policy, the Committee oversees the performance of road-user safety and those who work for Highways England. This includes supplier safety performance and the effectiveness of safety policies.
This year, the Committee has considered a wide range of subjects, including an increased emphasis on road user safety. We have agreed a range of investments and interventions to further improve safety performance in this critical area.
The Committee also focused on:
� monitoring the implementation of the five-year Health and Safety Plan, which is updated periodically to ensure that it reflects evolving business requirements, innovations and best practice
non-executive Directorelaine Holt
Elaine (FCLIT) was appointed as a Non-Executive Director of Highways England on 1 April 2015.
Prior to this, she held a number of senior roles within the UK rail industry including Chairman and Chief Executive of Directly Operated Railways, Chairman of East Coast and Managing Director of First Capital Connect. Elaine was also Executive Vice President guest experience at Carnival UK.
Elaine is also an independent shareholder advisor to the Mayor of Bristol and a Non-Executive Director of Corserv Ltd.

82
� wellbeing and the health of communities affected by our roads and our work
� asset management, including the management of safety-critical infrastructure
� safety performance
This year, the Company has improved its safety performance within the Operations (Traffic Officer Service) team. The staff engagement survey has also demonstrated that Highways England staff clearly understand the importance of their own safety and are committed to our safety vision and objectives. We recognise that there are still too many avoidable incidents within our supply chain and this remains a priority for the Committee.
The Committee is pleased that the safety maturity of the Company is improving and results are moving in the right direction. The Committee knows that we need to continue to build on this success and deliver further improvements. There is more to be done within the Company and with our partners and suppliers to drive commitment to achieving our goals. This remains a priority for the Committee.
Our plans are ambitious, as they should be, to ensure that we achieve our safety goals. Section 4 provides an overview of the Company’s safety activities during the year.
SeCtiOn 10 / Our governance

83
01SeCtiOn
Overview
Chief E
xecutive’s review
Making our
network safer
Imp
roving custom
er serviceD
elivering the Road
Investment S
trategy
Our
people
Financial R
eviewP
rincipal risks and uncertainties
Our
governance
The Directors’
report
Auditors’
report
Financial S
tatements
Chairm
an’s statem
entO
verviewC
hief Executive’s
reviewM
aking our netw
ork saferIm
proving
customer service
Delivering the R
oad Investm
ent Strateg
y O
ur p
eopleFinancial R
eviewP
rincipal risks and uncertainties
10SeCtiOnO
ur governance
The Directors’
report
Auditors’
report
Financial S
tatements
Audit and Risk CommitteeChair: David Hughes (Non-Executive Director)
Committee chair overview
Role
The Committee’s principal role is to assist the Board in carrying out its oversight responsibilities in relation to financial reporting, internal controls and risk management. It also oversees whether an appropriate relationship with our external auditor is maintained. They are responsible for providing advice to the Chief Executive in his capacity as Accounting Officer.
In particular, the Committee oversees:
� the strategic processes for risk management, internal control and governance arrangements
� the acceptability of the Company’s annual report and accounts
� the integrity of the Company’s corporate reporting obligations under the Licence between the Secretary of State for Transport and the Company
� responses to the external auditors’ management letter
� significant proposed changes to accounting policies
� the annual internal audit programme
� the appropriateness of the Company’s counter-fraud, anti-bribery and corruption activity
� the appropriateness and effectiveness of the Company’s mitigation response to the risk of cyber-crime
Composition
The Committee is composed entirely of Non-Executive Directors, as set out in the chart on page 77. In accordance with the requirements of the Framework Document, the Shareholder-appointed Non-Executive Director is a committee member. David holds the Chair as a chartered accountant. In this role as Chair, he is also a member of the Department for Transport Group Audit and Risk Assurance Committee, where he represents the Company, as well as performing a similar check and challenge role to the Department’s senior management.
non-executive DirectorDavid Hughes
David (MA, FCA) was appointed as a Non-Executive Director of Highways England in March 2015. David was a Non-Executive Director of the Highways Agency from 2009. He has been a member of the Department for Transport Group Audit and Risk Assurance Committee since his appointment to the Highways Agency.
A chartered accountant and a former senior partner with Arthur Andersen, David was formerly the client service and audit partner for a number of major engineering and construction companies. He is a member of the Audit Committee of the Royal College of Veterinary Surgeons. Previously, he was a Non-Executive Director of the Animal and Plant Health Agency, a member of the Audit and Risk Committee of the Department for Environment, Food & Rural Affairs (Defra) and a Non-Executive Director of a clinical commissioning group.

84
The Chief Executive, Chief Financial Officer, Financial Controller, Corporate Assurance Director, Head of Internal Audit and the National Audit Office (NAO) Financial Audit Director regularly attend meetings.
Other senior management may be called to attend as necessary to provide information for the Committee to perform its duties.
Periodically, the Committee meets with the Corporate Assurance Director and the NAO Financial Audit Director to provide an opportunity to discuss any matters without executive management being present. The Chair meets separately and periodically with the Chief Financial Officer and the Corporate Assurance Director and also liaises with other senior managers, the Company Secretary and the NAO, as required.
Work
Financial reporting
As part of their remit to ensure the integrity of the accounts and effective management of public funds, the Committee gave careful consideration to the following matters:
� accounting policy updates
� tax strategy and policy
� Annual Report and Accounts review and approval
� external audit approach and findings
� NAO value-for-money study findings
� year-end assurance over reported performance (KPIs and PIs)
internal controls
The Committee is responsible for ensuring that the Company’s internal audit function is properly resourced. The right skills and experience to provide the required level of assurance are essential to the effective operation of internal controls, risk management and governance.
Our work in this area included:
� approval of the annual internal audit programme
� reviewing regular reports on progress of the programme, including a summary of the effectiveness of the areas under review
� conducting a detailed review of the internal audit report on designated funds that received an ‘unacceptable’ assurance rating
� reviewing the implementation of actions from internal audits and review of outstanding and overdue actions
The Committee also considered matters relating to the Company’s approach to mitigating economic crime. This included endorsement of the updated policies, overseeing progress on investigations and the results from proactive work. Our corporate arrangements to mitigate the risk of economic crime are outlined in Section 9.
We are required under the Framework Document to participate in the Department for Transport’s management assurance process. As such, the Committee reviewed and endorsed both the nine and 12-month submissions to the Department.
Risk
During the year, the Committee endorsed the updated risk management policy. They received regular updates on the embedding of risk management within the Company. Deep dives were conducted on a number of areas, such as the supply chain, people and IT to provide greater understanding and assurance over the adequacy of the mitigation measures in place. Our risk management arrangements are detailed in Section 9.
external auditor and policy on provision of non-audit services
In accordance with the Framework Document, the Comptroller and Auditor General (C&AG) is our appointed external auditor. The external audit work is carried out by the NAO on behalf of the C&AG.
SeCtiOn 10 / Our governance

85
01SeCtiOn
Overview
Chief E
xecutive’s review
Making our
network safer
Imp
roving custom
er serviceD
elivering the Road
Investment S
trategy
Our
people
Financial R
eviewP
rincipal risks and uncertainties
Our
governance
The Directors’
report
Auditors’
report
Financial S
tatements
Chairm
an’s statem
entO
verviewC
hief Executive’s
reviewM
aking our netw
ork saferIm
proving
customer service
Delivering the R
oad Investm
ent Strateg
y O
ur p
eopleFinancial R
eviewP
rincipal risks and uncertainties
10SeCtiOnO
ur governance
The Directors’
report
Auditors’
report
Financial S
tatements
The NAO does not provide non-audit services but is responsible for carrying out value-for-money reviews according to their statutory responsibilities. The Company uses professional firms (where it requires specialist advice, such as tax compliance and accounting). In these cases, the firms are engaged through our established procurement framework. In year, the business engaged the services of a tax compliance specialist to help implement HMRC decisions into business as usual activity and embed our new policy and strategy in this area across the Company. The Committee also engaged with, and reviewed, the outcome of the NAO value for money study Progress of the Road Investment Strategy and will continue to monitor the implementation of the response to the recommendations raised throughout 2017-18.
Assurance over published performance information
This year, the Committee Chair met with the Highways Monitor to discuss how the Board could best demonstrate its oversight and approval of the published performance data.
The annual assurance activity, which usually covered the validation of key performance indicator figures, was expanded to include performance indicator and performance requirements information. As such, the Committee reviewed the performance data as a whole and made a recommendation to the Board to approve its publication in this report and within the Performance Monitoring Statements, which are reported separately.

86
investment CommitteeChair: Simon Murray (Non-Executive Director)
Committee chair overview
Role
The Highways England Investment Committee was established in September 2016. Its purpose is to advise the Board on the approval of investments of more than £200m in any individual project and on other matters relating to the delivery of the Company’s investment programme. On decisions relating to schemes of more than £500m or were the treatment is considered novel or contentious (as per HM Treasury definition), the Committee will advise the Department for Transport’s Board Investment and Commercial Committee.
The Committee is an integral part of the Investment Decision Process and works closely with the Executive Investment Decision Committee (IDC) to ensure effective governance of the expenditure of public money. It also supports the Chief Executive in discharging his responsibilities as Accounting Officer. This assurance regime meets the criteria outlined in the Framework Document.
Composition
The members of the Committee are the Chairman of the Board, three Non-Executive Directors (including the Shareholder-appointed Non-Executive Director), the Chief Executive and the Chief Financial Officer. The meetings are attended by the General Counsel and other members of the Executive team who are responsible for the programmes and contracts under consideration.
Work
The Committee held its first meeting in October 2016 and has resolved to meet three times this year. The Committee can meet more frequently if needed to give prompt consideration to investment proposals. The work of the Committee is grouped under three headings.
Monitoring the investment programme
At each meeting, the Committee receives reports on the overall progress and status of the investment programme. It also reviews the forecast outcomes of the major enhancement programmes that have been approved by the Board.
non-executive DirectorSimon Murray
Simon (BSc CEng FICE FCGI) joined the Highways Agency as a Non-Executive Director in 2012. He joinned the Highways England Board in April 2015. He is a chartered civil engineer and has spent the first 19 years of his career working for consultant Arup on infrastructure projects in the UK and overseas.
In 1994, Simon joined BAA plc to lead their airport infrastructure programme and subsequently worked with Sir John Egan on the Government’s construction task force. In 1998, he was appointed Director of Major Projects at Railtrack plc where he was responsible for restructuring Railtrack’s legacy projects.
In 2001, he set up his own consultancy practice and has worked with a number of infrastructure companies, including Transport for London and Anglian Water Services. From 2003 until his retirement in 2012, Simon was Non-Executive Chairman of contractor Geoffrey Osborne Ltd. Simon is also a Director of the Acumen7 network.

87
01SeCtiOn
Overview
Chief E
xecutive’s review
Making our
network safer
Imp
roving custom
er serviceD
elivering the Road
Investment S
trategy
Our
people
Financial R
eviewP
rincipal risks and uncertainties
Our
governance
The Directors’
report
Auditors’
report
Financial S
tatements
Chairm
an’s statem
entO
verviewC
hief Executive’s
reviewM
aking our netw
ork saferIm
proving
customer service
Delivering the R
oad Investm
ent Strateg
y O
ur p
eopleFinancial R
eviewP
rincipal risks and uncertainties
10SeCtiOnO
ur governance
The Directors’
report
Auditors’
report
Financial S
tatements
This year, the Committee focused on:
� the emerging potential risks to the delivery of the investment programme
� considering the information that is to be shared with the Department
� identified a selection of projects for deep-dive reviews
Reviewing proposed investments
At each meeting, the Committee reviewed the Executive team’s proposals for specific investments in projects and advises the Board on their approval. In the early stages of developing major projects, the reviews are focused on strategic issues that will determine the viability of the project. Later on, the review is principally concerned with the award of contracts for delivering the projects, the readiness of the Highways England project team and the arrangements for managing the risks in delivery.
The Committee recommended approval of investments in the following schemes:
� A21 Tonbridge to Pembury – revised construction budget
� A303 Amesbury to Berwick Down – proposed route
� A1 Leeming to Barton – revised construction budget
� Lower Thames Crossing – outline business case and preferred route recommendation
� Asset delivery – award of maintenance response contract for the South West
in-depth reviews of current projects and delivery strategies
The Committee sets aside time for in-depth reviews of projects that are in construction. It also considers emerging strategies for improving the delivery of future projects.
This year, the Committee carried out in-depth reviews, including the current status of the A14 and the Smart motorway programme and the development of the second road investment programme.

88
Remuneration Committee and report
Interim Chair: Roger Lowe (Shareholder-appointed Non-Executive Director)
Committee chair overview
Shareholder-appointed non-executive DirectorRoger Lowe
Roger Lowe joined UKGI (previously the Shareholder Executive) in May 2010.
He has led on a number of projects and transactions, including the privatisation of Royal Mail, the sale of HMG’s shareholding in Eurostar and the sale of the Green Investment Bank. He has also led the Portfolio Governance of UKGI, overseeing its stewardship of some 20 organisations.
Prior to joining Government, Roger was a Director of a corporate finance advisory business, focused on advising clients on acquisitions and disposals, joint ventures and corporate restructurings across Europe. Before this, he worked in industry as group Director of Corporate Finance at TI Group plc. Roger started his career in investment banking at Lazard, where he spent 11 years in corporate finance, including two years on secondment to Lazard Frères in New York.
Role
The Committee’s role is to establish a robust, transparent and formal procedure for developing and implementing policy on executive remuneration. Within this role, the focus and remit of the Committee is on reward, performance and incentivisation of the Chief Executive and the Executive team. Only those members of the Executive team who are (or were) also members of the Highways England Board have their remuneration reported in the final section of this report.
The Committee also takes an overview of reward, performance and incentivisation at the level immediately below the Executive team. The Committee similarly takes a broad overview of reward and incentivisation across the rest of the Company, but without involvement in individual cases.
Composition
The Committee has been chaired by the Shareholder-appointed Non-Executive Director since February 2017. This is on an interim basis until the appointment of a permanent Non-Executive Director is completed.
The membership is set out in the table on page 77. The Shareholder is represented at Committee meetings by the Department for Transport Director General of Resources and Strategy, in the capacity of an observer. The Committee is advised by the Executive Director of Human Resources and Organisational Development; and for relevant agenda items, the Head of Reward also attends. The Chief Executive attends all meetings, except when his own remuneration is under discussion.
Ernst & Young have been appointed as advisors to the Committee on a call-off basis. They were not used during 2016-17.

89
01SeCtiOn
Overview
Chief E
xecutive’s review
Making our
network safer
Imp
roving custom
er serviceD
elivering the Road
Investment S
trategy
Our
people
Financial R
eviewP
rincipal risks and uncertainties
Our
governance
The Directors’
report
Auditors’
report
Financial S
tatements
Chairm
an’s statem
entO
verviewC
hief Executive’s
reviewM
aking our netw
ork saferIm
proving
customer service
Delivering the R
oad Investm
ent Strateg
y O
ur p
eopleFinancial R
eviewP
rincipal risks and uncertainties
10SeCtiOnO
ur governance
The Directors’
report
Auditors’
report
Financial S
tatements
Work
This year saw some significant change for the Company. Initiatives included:
� the launch of our new asset delivery model, where activity that traditionally had been outsourced to our supply chain partners was was brought into the organisation to provide a more agile and responsive service
� the development of a new job scopes and grading project, described below
To support our intention to become a market competitive employer, with the ability to attract key talent, a new pay and grading structure for all the Company has been developed.
The new system assigns roles to broad hierarchical levels within the new structure based on formal job evaluation, with pay bands linked to appropriate market rates. The Committee closely reviewed and approved progress at several stages of the project.
The Committee agreed on four standing agenda items, which were presented at each meeting:
� the use of contingent labour and consultants
� utilisation of the specialist pay freedom1
� an assessment of all perceived senior ‘flight risks’ and consideration of any remedial action
� a summary of decisions made by the Reward and Resourcing Executive, which considers issues at levels below that of the Executive team
1 The ability to pay above the current pay bands, aligned to the market median, for roles deemed to be specialist; where specific skill sets are specialist in nature, scarce or difficult to recruit
Other matters considered by the Committee in 2016-17 include:
� corporate performance against KPIs for 2015-16 and 2016-17
� executive and senior grades’ year-end performance ratings and proposed performance-related pay (PRP) awards for 2015-16 and 2016-17
� pay review approach for 2016
� review of direct contribution pension performance

90
Directors remuneration report (audited)
Name Year Salary PRP Pension related Other Total
Jim O’Sullivan
2016-17 £306,000 £30,868 £30,000 – £366,868
2015-16 £300,000 – £30,000 – £330,000
Vanessa Howlison 2016-17 £152,208(£195,000)
– £15,221 – £167,429
notes
1. Jim O’Sullivan received £30,000 in lieu of pension payments. The PRP paid to Jim related to performance within the financial year 2015-16
2. Vanessa Howlison became Chief Financial Officer on 20 June 2016. The 2016-17 full year equivalent salary was £195,000. Vanessa is a member of the Highways England defined contribution Group Pension Plan. Employer contributions are equal to 10% of salary
3. The 2016-17 performance process is being finalised and the value of payments have yet to be determined. Payments will be made in 2017-18
4. Only those members of the Executive team who are (or were) also members of the Highways England Board have their remuneration reported
independent non-executive Directors (audited)
Member2016-17
Fee2015-16
Fee
Colin Matthews (Chairman)
£129,996 £129,999
Elaine Holt £25,000 £25,000
David Hughes £25,000 £25,000
Simon Murray £25,000 £25,000
Tom Smith £22,917 £25,000
Elizabeth Perelman – –
Roger Lowe – –
notes
1. Service details for directors are shown on page 71
2. David Hughes serves as Chairman of the Audit and Risk Committee at Highways England, but also serves as a member of the Department for Transport’s Group Audit and Risk Assurance Committee (GARAC). He was paid a fee of £4,730 for his DfT services
3. Tom Smith served as Chairman on our Remuneration Committee to 28 February 2017
4. Elizabeth Perelman served as the Shareholder-appointed Non-Executive Director representative to 27 July 2016. She was not paid a fee for serving as the Shareholder-appointed Non-Executive Director for Highways England and did not receive any fees in the 2016-17 financial year
5. Roger Lowe took over from Elizabeth Perelman as the Shareholder-appointed Non-Executive Director representative from 27 July 2016. He is not paid a fee for serving as the Shareholder-appointed Non-Executive Director for Highways England and did not receive any fees in the 2016-17 financial year
SeCtiOn 10 / Our governance

91
01SeCtiOn
Overview
Chief E
xecutive’s review
Making our
network safer
Imp
roving custom
er serviceD
elivering the Road
Investment S
trategy
Our
people
Financial R
eviewP
rincipal risks and uncertainties
Our
governance
The Directors’
report
Auditors’
report
Financial S
tatements
Chairm
an’s statem
entO
verviewC
hief Executive’s
reviewM
aking our netw
ork saferIm
proving
customer service
Delivering the R
oad Investm
ent Strateg
y O
ur p
eopleFinancial R
eviewP
rincipal risks and uncertainties
10SeCtiOnO
ur governance
The Directors’
report
Auditors’
report
Financial S
tatements
notes
1. The median remuneration of the Company’s staff in 2016-17, as shown in the table above, based on full-time equivalents, is £29,169.08, which has increased from the previous year due to natural pay progression
2. The ratio between the median remuneration and the remuneration of the highest-paid director is 11.549. This has decreased from the 2015-16 figure of 12.046
3. In 2016-17, no employee received remuneration in excess of the highest-paid director. Full-time equivalent remuneration ranged from £14,089 to £336,868
Pay multiples (audited)
Name Year
Remuneration £336,867.55
No of staff 4392
Median point 2196
Median remuneration £29,169.08
Ratio 11.549

92
the Directors’ report for the year ended 2016-17
The Directors of Highways England present their Annual Report on the affairs of the Company, together with the financial statements and the Auditors’ Report for the period ending of the financial year on 31 March 2017. Highways England was established on 8 December 2014 and appointed and licensed as a Strategic Highways Company by the Secretary of State for Transport, who is the sole Shareholder. Highways England is the highway authority, traffic authority and street authority for England’s motorways and major A-roads, which together are known as the Strategic Road Network. The Company’s registered number is 09346363.
the Highways england BoardThe Board is responsible for the overall strategy and direction of the Company. Details of the Board’s role, composition and responsibilities are set out in Section 10.
Directors and corporate governanceFull details of the company directors and corporate governance requirements are also set out in Section 10.
11SeCtiOn
employeesThe Company recognises that the commitment of a skilled and experienced workforce is key to the efficient and effective delivery of our objective to operate, maintain and modernise the Strategic Road Network.
Further information about the Company’s employment strategy, including our diversity and employee engagement policies, is in Section 7.

93
01SeCtiOn
Overview
Chief E
xecutive’s review
Making our
network safer
Imp
roving custom
er serviceD
elivering the Road
Investment S
trategy
Our
people
Financial R
eviewP
rincipal risks and uncertainties
Our
governance
The Directors’
report
Auditors’
report
Financial S
tatements
Chairm
an’s statem
entO
verviewC
hief Executive’s
reviewM
aking our netw
ork saferIm
proving
customer service
Delivering the R
oad Investm
ent Strateg
y O
ur p
eopleFinancial R
eviewP
rincipal risks and uncertainties
Our
governance
11SeCtiOnT
he Directors’
reportA
uditors’ rep
ortFinancial S
tatements
The number of the Company’s employees as at 31 March 2017 was 4,392. This figure includes secondees and Executive Directors, but excludes interims, contractors and independent Non-Executive Directors.
Sustainability, corporate responsibility and environmentWe are committed to ensuring that activity on our network is delivered in a manner that does not harm the environment. Details on the measures we are taking to reduce impacts on both the built and natural environment are set out in Section 6.
Human rights in the supply chainThe Company is not a commercial organisation as defined in the Modern Slavery Act 2015, which covers how companies need to be aware of modern slavery practices in their supply chain. Our supply chain is required to comply with all legal requirements and we use our contractual arrangements and regular meetings with our contractors to remind them of the need to comply with all legislation including the Modern Slavery Act.
Payment to suppliersOur payment systems aim to ensure that suppliers to Highways England are paid promptly and that 25% of suppliers are from small and medium-sized enterprises. This is monitored through the application of project bank accounts as well as through our own financial systems. More detail is provided within the Financial Review in Section 8.
Charitable and political contributionsDuring the year, the Company made no charitable or political contributions.
Results, going concern, share capital and dividendThe Company has prepared its financial statements for the reporting period in accordance with International Financial Reporting Standards (IFRS) rules. The audited financial statements for the reporting period ending 31 March 2017 are set out in Section 13.
The directors have a reasonable expectation that the Company has adequate resources to continue to operate for the foreseeable future. The financial statements have therefore been prepared on a going concern basis. The basis of this view is outlined in more detail in note 2.4 to the financial statements. The Company does not pay a dividend.
The Company is a government not-for-profit company incorporated by shares and funded by grant-in-aid. The sole Shareholder is the Secretary of State for Transport and the authorised and paid-up share capital is £10. The way in which the Company’s short-term and long-term funding needs are met, including by the funding commitment from the Government through the Road Investment Strategy, are set out in note 15 to the financial statements.
Directors’ third party indemnity provisionsThe Company has appropriate directors’ and officers’ liability insurance in place in respect of legal action against, among others, its executive and independent non-executive directors.
Conflicts of interestThe Company has established procedures in place in accordance with its Articles of Association to ensure that we comply with the Director’s conflicts of interest duties under the 2006 Companies Act; and for dealing with any situation in which a director may have a direct or indirect interest that conflicts with, or may conflict with, the interests of the Company.

94
Directors’ responsibilities statementThe directors are responsible for preparing the annual report and financial statements in accordance with applicable law and regulations.
Company law requires the directors to prepare the financial statements for each financial year. Under that law, the directors have elected to prepare the company financial statements in accordance with the International Financial Reporting Standards (IFRS), as adopted by the European Union, and in accordance with applicable law. Under company law, the directors must not approve the financial statements unless they are satisfied that they give a true and fair view of the state of affairs and profit or loss of the Company for that period.
In preparing the financial statements the directors are required to:
� select suitable accounting policies and then apply them consistently
� make judgements and accounting estimates that are reasonable and prudent
� state whether applicable IFRS have been followed, subject to any material departures disclosed and explained in the financial statements
� prepare the financial statements on the going concern basis unless it is inappropriate to presume that the Company will continue in business
The directors are responsible for keeping adequate accounting records that are sufficient to show and explain the Company’s transactions and disclose with reasonable accuracy at any time the financial position of the Company and viability to ensure that the financial statements comply with the Companies Act 2006. The directors are also responsible for safeguarding the assets of the Company and hence for taking reasonable steps for the prevention and detection of fraud and other irregularities.
Each of the directors, whose names and functions are described in this annual report, confirms that to the best of his or her knowledge:
� the financial statements have been prepared in accordance with IFRS rules, as adopted by the EU, and give a true and fair view of the assets and liabilities, financial position, and the profit and loss of the Company
� the Directors’ Report and Strategic Report include a review of the development and performance of the business and the position of the Company, together with a description of the principal risks and uncertainties that the Company faces
The directors are responsible for the maintenance and integrity of the corporate and financial information included on the Company’s website.
The directors consider that the annual report and financial statements, taken as a whole, are fair, balanced and understandable and provide the information necessary for the Shareholder to assess the Company’s position, performance, business model and strategy.
Accounting Officer’s responsibilities statementThe Permanent Secretary of the Department for Transport has appointed Jim O’Sullivan as Accounting Officer for the Company. The Accounting Officer shares – on an individual basis – many of the directors’ responsibilities listed above, as well as having responsibility for the propriety and regularity of the public finances for which they are answerable, for keeping proper records and for safeguarding the Company’s assets. These responsibilities are set out in full in Managing Public Money, published by HM Treasury.
Compliance with the UK Corporate CodeThe Company is required to comply with the UK Corporate Governance Code 2016 or specify and explain any non-compliance in its annual
SeCtiOn 11 / the Directors’ report

95
01SeCtiOn
Overview
Chief E
xecutive’s review
Making our
network safer
Imp
roving custom
er serviceD
elivering the Road
Investment S
trategy
Our
people
Financial R
eviewP
rincipal risks and uncertainties
Our
governance
The Directors’
report
Auditors’
report
Financial S
tatements
Chairm
an’s statem
entO
verviewC
hief Executive’s
reviewM
aking our netw
ork saferIm
proving
customer service
Delivering the R
oad Investm
ent Strateg
y O
ur p
eopleFinancial R
eviewP
rincipal risks and uncertainties
Our
governance
11SeCtiOnT
he Directors’
reportA
uditors’ rep
ortFinancial S
tatements
report. The Company believes that the adoption of the principles of the UK Corporate Governance Code is a means of recognising and embedding best practice in corporate governance. The Board considers that for the financial year ending 31 March 2017, Highways England was fully compliant, except for those areas that it cannot comply with, which include:
� provision A4.1 – the Board has not appointed a senior independent Non-Executive Director as the Company has a single Shareholder, the Board is small and there are a number of arrangements in place which provide for the Non-Executive Directors and the Shareholder to raise concerns should they think it necessary
� provisions C3.2, C3.7 and C3.8 – the Company is unable to appoint, reappoint or remove our external auditors. The requirements reflected within the Framework Document agreed between the Department for Transport and the Company requires the National Audit Office to act as the Comptroller and Auditor General and independent auditor for the Company
� provision D.2.1 – the Board should establish a Remuneration Committee, with at least three independent Non-Executive Directors. In February 2017, Tom Smith (Chair of the Remuneration Committee) stepped down from the Board. In the interim, the Shareholder appointed Non-Executive Director has taken his place until the appointment of a permanent Non-Executive Director is completed
� section E – insofar as it requires the Company to maintain a dialogue with shareholders based on a mutual understanding of objectives. Highways England has built and maintains its relationship with its single Shareholder, the Secretary of State for Transport, and is based on frequent contact with the Department for Transport as their representative. The Board recognises that this sits outside of the corporate norms contained within the Code.
Compliance with other Government best practice codesDavid Hughes has served as a Non-Executive Director (and Chair of the Highways Agency and Highways England Audit and Risk Committees) for a period of seven years. He was reappointed for a third term on 1 April 2015 by the Board to provide continuity during the transition from Government agency to Government-owned Company.
Disclosure of information to auditorsThe auditor of the Company is the Comptroller and Auditor General.
Insofar as each person serving as a director of the company (at the date that this directors’ report was approved by the Board) is aware, there is no relevant audit information (that is information needed by the auditor in connection with preparing their report) of which the Company’s auditor is unaware.
Each such director confirms that he or she has taken all the steps that he or she ought to have taken as a director to make himself or herself aware of any relevant audit information and to establish that the Company’s auditor is aware of that information.
This report and its contents are to be taken as the Board’s statement of compliance with our Licence and Framework Document obligations. To the best of the Board’s knowledge and belief, having made all reasonable enquiries, the information contained in this document and the accompanying performance monitoring statements is set out appropriately. It also constitutes our annual progress report under clause 6.26 of the Licence.
The Director’s report was approved by the Board on 5 July 2017 and is signed on its behalf by:
The Chief Executive (in his role as Accounting Officer) on behalf of the Board

96
Auditors’ reportindependent Auditor’s report to the sole shareholder of Highways england Company Ltd
12SeCtiOn
Opinion on financial statementsIn my opinion the financial statements:
� give a true and fair view of the state of the Company’s affairs as at 31 March 2017 and of its net expenditure for the year then ended
� have been properly prepared in accordance with International Financial Reporting Standards as adopted by the European Union; and
� have been prepared in accordance with the Companies Act 2006
Opinion on regularityIn my opinion, in all material respects the expenditure and income recorded in the financial statements have been applied by the purposes intended by Parliament and the financial transactions recorded in the financial statements conform to the authorities which govern them.
Basis of opinionsI have audited the financial statements of Highways England Company Ltd for the year ended 31 March 2017 which comprise:
� Statement of Comprehensive Net Expenditure
� Statement of Financial Position
� Statement of Cash Flows
� Statement of Changes in Taxpayers’ Equity; and
� the related notes
The financial reporting framework that has been applied in their preparation is applicable law and International Financial Reporting Standards as adopted by the European Union and as applied in accordance with the provisions of the Companies Act 2006. I have also audited the
information in the Directors’ Remuneration Report that is described as having been audited.
The regularity framework that has been applied is the Companies Act 2006, the Company’s articles of association, the Framework Document between the Department for Transport and the Company, the Strategic Licence Document issued by the Secretary of State for Transport, relevant legislation, and HM Treasury authorities to the extent it is applicable to the Company.
Overview of my audit approachRisks significant to my audit
I consider the following areas of particular audit focus to be those areas that had the greatest effect on my overall audit strategy, the allocation of resources in my audit and directing the efforts of the audit team in the current year.
I have also set out how my audit addressed these specific areas in order to support the opinion on the financial statements as a whole and any comments I make on the results of my procedures should be read in this context.
This is not a complete list of all risks identified by my audit but only those areas that had the greatest effect on my overall audit strategy, allocation of resources and direction of effort. I have not, for example, included information relating to the work I have performed around the presumed risk of management override of controls under International Standard on Auditing (UK & Ireland) 240, the Auditor’s Responsibility Relating to Fraud in Financial Statements, an area where my work has not identified any matters to report.
The areas of focus were discussed with the Audit and Risk Committee; their report on matters that they considered to be significant to the financial statements is set out on pages 83-85.
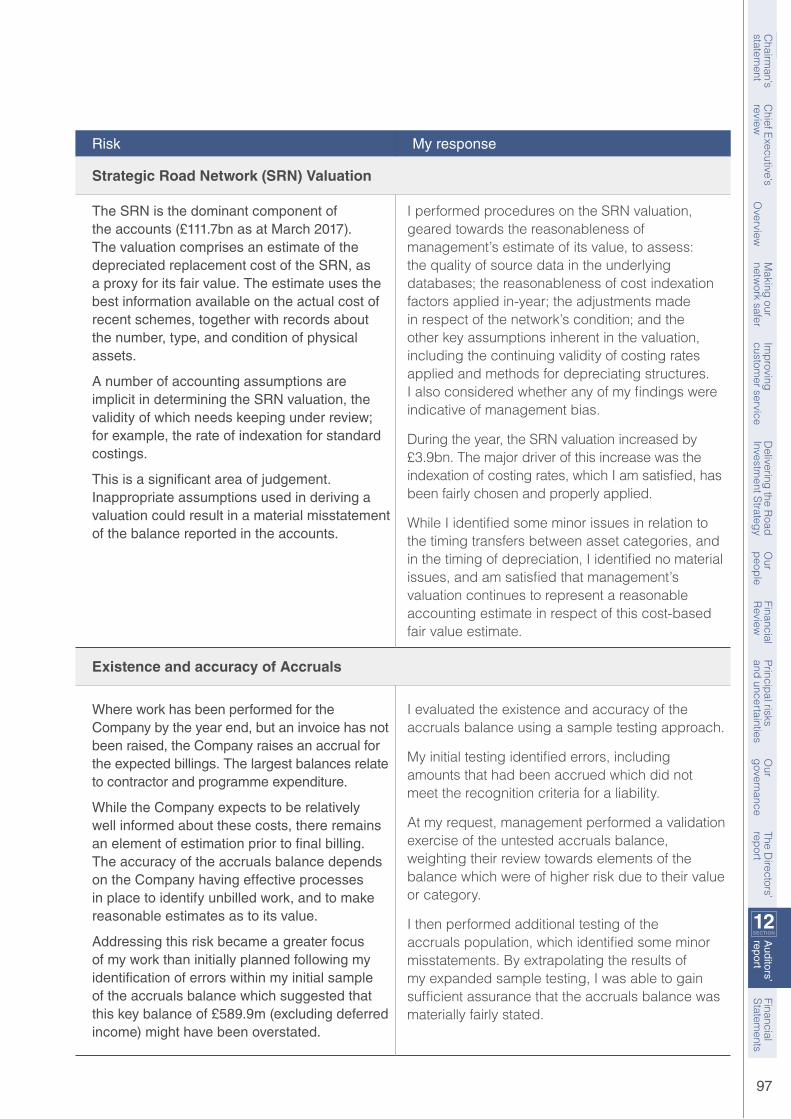
97
01SeCtiOn
Overview
Chief E
xecutive’s review
Making our
network safer
Imp
roving custom
er serviceD
elivering the Road
Investment S
trategy
Our
people
Financial R
eviewP
rincipal risks and uncertainties
Our
governance
The Directors’
report
Auditors’
report
Financial S
tatements
Chairm
an’s statem
entO
verviewC
hief Executive’s
reviewM
aking our netw
ork saferIm
proving
customer service
Delivering the R
oad Investm
ent Strateg
y O
ur p
eopleFinancial R
eviewP
rincipal risks and uncertainties
Our
governance
The Directors’
report
12SeCtiOnA
uditors’ report
Financial S
tatements
Risk My response
Strategic Road network (SRn) Valuation
The SRN is the dominant component of the accounts (£111.7bn as at March 2017). The valuation comprises an estimate of the depreciated replacement cost of the SRN, as a proxy for its fair value. The estimate uses the best information available on the actual cost of recent schemes, together with records about the number, type, and condition of physical assets.
A number of accounting assumptions are implicit in determining the SRN valuation, the validity of which needs keeping under review; for example, the rate of indexation for standard costings.
This is a significant area of judgement. Inappropriate assumptions used in deriving a valuation could result in a material misstatement of the balance reported in the accounts.
I performed procedures on the SRN valuation, geared towards the reasonableness of management’s estimate of its value, to assess: the quality of source data in the underlying databases; the reasonableness of cost indexation factors applied in-year; the adjustments made in respect of the network’s condition; and the other key assumptions inherent in the valuation, including the continuing validity of costing rates applied and methods for depreciating structures. I also considered whether any of my findings were indicative of management bias.
During the year, the SRN valuation increased by £3.9bn. The major driver of this increase was the indexation of costing rates, which I am satisfied, has been fairly chosen and properly applied.
While I identified some minor issues in relation to the timing transfers between asset categories, and in the timing of depreciation, I identified no material issues, and am satisfied that management’s valuation continues to represent a reasonable accounting estimate in respect of this cost-based fair value estimate.
existence and accuracy of Accruals
Where work has been performed for the Company by the year end, but an invoice has not been raised, the Company raises an accrual for the expected billings. The largest balances relate to contractor and programme expenditure.
While the Company expects to be relatively well informed about these costs, there remains an element of estimation prior to final billing. The accuracy of the accruals balance depends on the Company having effective processes in place to identify unbilled work, and to make reasonable estimates as to its value.
Addressing this risk became a greater focus of my work than initially planned following my identification of errors within my initial sample of the accruals balance which suggested that this key balance of £589.9m (excluding deferred income) might have been overstated.
I evaluated the existence and accuracy of the accruals balance using a sample testing approach.
My initial testing identified errors, including amounts that had been accrued which did not meet the recognition criteria for a liability.
At my request, management performed a validation exercise of the untested accruals balance, weighting their review towards elements of the balance which were of higher risk due to their value or category.
I then performed additional testing of the accruals population, which identified some minor misstatements. By extrapolating the results of my expanded sample testing, I was able to gain sufficient assurance that the accruals balance was materially fairly stated.

98
SeCtiOn 12 / Auditors’ report
Application of materiality
I applied the concept of materiality in both planning and performing my audit, and in evaluating the effect of misstatements on my audit and on the financial statements. This approach recognises that financial statements are rarely absolutely correct, and that an audit is designed to provide reasonable, rather than absolute, assurance that the financial statements are free from material misstatement or irregularity. A matter is material if its omission or misstatement would, in the judgement of the auditor; reasonably influence the decisions of users of the financial statements.
Based on my professional judgement, I determined overall materiality for the Company’s financial statements at £1.1bn, which is approximately 1% of the value of Strategic Road Network (SRN) asset. I chose this benchmark given users’ interest in the Company’s performance in managing and enhancing the SRN. I have determined that for financial statement components unconnected with the SRN, misstatements of a lesser amount than overall materiality could influence the decisions of users of the accounts given additional user interest in the publically funded cost of the Company’s activities. I have therefore determined that the level to be applied to these components is £32m, being approximately 1% of the Company’s total expenditure, excluding non-cash costs such as depreciation and impairment, but including capital additions. As well as quantitative materiality there are certain matters that, by their very nature, would if not corrected influence the decisions of users, for example, any errors reported in Directors’ Remuneration. Assessment of such matters would need to have regard to the nature of the misstatement and the applicable legal and reporting framework, as well as the size of the misstatement.
I applied the same concept of materiality to my audit of regularity. In planning and performing audit work in support of my opinion on regularity and evaluating the impact of any irregular transactions, I took into account both quantitative and qualitative aspects that I consider would reasonably influence the decisions of users of the financial statements.
I agreed with the Audit and Risk Committee that I would report to it all uncorrected misstatements identified through my audit in excess of £250,000, as well as differences below this threshold that in my view warranted reporting on qualitative grounds.
Total unadjusted audit differences reported to the Audit and Risk Committee would decrease net assets and increase net expenditure by £2.5m.
Scope of my audit
An audit involves obtaining evidence about the amounts and disclosures in the financial statements sufficient to give reasonable assurance that the financial statements are free from material misstatement, whether caused by fraud or error. This includes an assessment of:
� whether the accounting policies are appropriate to the Company’s circumstances and have been consistently applied and adequately disclosed
� the reasonableness of significant accounting estimates made by the directors; and
� the overall presentation of the financial statements
In addition I read all the information and non-financial information in the Annual Report to identify material inconsistencies with the audited financial statements and to identify any information that is apparently materially incorrect based on, or materially inconsistent with, the knowledge acquired by me in the course of performing the audit. If I become aware of any apparent material misstatements or inconsistencies I consider the implications for my report.
I am also required to obtain evidence sufficient to give reasonable assurance that the expenditure and income recorded in the financial statements have been applied to the purposes intended by Parliament and the financial transactions recorded in the financial statements conform to the authorities which govern them.

99
01SeCtiOn
Overview
Chief E
xecutive’s review
Making our
network safer
Imp
roving custom
er serviceD
elivering the Road
Investment S
trategy
Our
people
Financial R
eviewP
rincipal risks and uncertainties
Our
governance
The Directors’
report
Auditors’
report
Financial S
tatements
Chairm
an’s statem
entO
verviewC
hief Executive’s
reviewM
aking our netw
ork saferIm
proving
customer service
Delivering the R
oad Investm
ent Strateg
y O
ur p
eopleFinancial R
eviewP
rincipal risks and uncertainties
Our
governance
The Directors’
report
12SeCtiOnA
uditors’ report
Financial S
tatements
Other matters on which i report under the Companies Act
Directors’ remuneration
In my opinion, the part of the Directors’ Remuneration Report to be audited has been properly prepared in accordance with the Companies Act.
I also report to you if, in my opinion, certain disclosures of directors’ remuneration required have not been made. I have nothing to report arising from this duty.
the strategic and directors’ reports
In my opinion, based on the work undertaken in the course of the audit, the information given in the strategic and directors’ reports for the financial year are consistent with the financial statements and have been prepared in accordance with applicable law.
Based on my knowledge and understanding of the Company and its environment obtained during the course of the audit, I have identified no material misstatements in these reports.
the corporate governance statement
In my opinion, based on the work undertaken in the course of the audit, the information given in the corporate governance report in respect of internal control and risk management systems in relation to financial reporting processes is consistent with the accounts and has been prepared in accordance with applicable law.
In my opinion, based on the work undertaken in the course of the audit, rules 7.2.2, 7.2.3 and 7.2.7 in the Disclosure Rules and Transparency Rules sourcebook made by the Financial Conduct Authority have been complied with.
Based on my knowledge and understanding of the Company and its environment obtained during the course of the audit, I have identified no material misstatements in this information.
Matters on which i report by exception
Adequacy of accounting records information and explanations received
I report to you if, in my opinion:
� adequate accounting records have not been kept, or returns adequate for my audit have not been received from branches not visited by my staff
� the financial statements and the part of the Remuneration report to be audited are not in agreement with the accounting records and returns; or
� I have not received all of the information and explanations I require for my audit
I have nothing to report arising from this duty.
Consistency of information in the Annual Report
Under International Standards on Auditing (UK & Ireland), I am required to report to you if, in my opinion, information in the annual report is:
� materially inconsistent with the information in the audited financial statements; or
� apparently materially incorrect based on, or materially inconsistent with, the knowledge of the Company that I acquired in the course of performing my audit; or
� otherwise misleading
In particular, I am required to consider:
� whether I have identified any inconsistencies between the knowledge that I acquired during the audit and the directors’ statement that they consider the annual report is fair, balanced and understandable

100
SeCtiOn 12 / Auditors’ report
� whether the annual report appropriately discloses those matters that I communicated to the Audit and Risk Committee which I consider should have been disclosed
I have nothing to report arising from this duty.
the directors’ assessment of principal risks and future prospects
Under International Standards on Auditing (UK & Ireland), I am required to report to you if I have anything material to add, or to draw attention to, in relation to the directors’ disclosures in the annual report and financial statements:
� confirming that they have carried out a robust assessment of principal risks facing the Company, including those that would threaten its business model, future performance, solvency or liquidity
� describing those risks and explaining how they are being managed or mitigated
� on whether they considered it appropriate to adopt the going concern basis, and their identification of any material uncertainties to the entity’s ability to continue over a period of at least twelve months from the date of approval of the financial statements; and
� explaining how they have assessed the prospects of the entity, over what period they have done so and why they consider that period to be appropriate, and their statement as to whether they have a reasonable expectation that the Company will be able to continue in operation and meet its liabilities as they fall due over the period of their assessment, including any related disclosures drawing attention to any necessary qualifications or assumptions
I have nothing material to add, or to draw attention to, on these matters.
Respective responsibilities of the directors and the auditorAs explained more fully in the Directors’ Responsibilities statement, the directors are responsible for the preparation of the financial statements and for being satisfied that they give a true and fair view. My responsibility is to audit and express an opinion on the financial statements in accordance with applicable law and with International Standards on Auditing (UK & Ireland). Those standards require me and my staff to comply with the Auditing Practices Board’s Ethical Standards for Auditors.
Matthew KaySenior Statutory Auditor
For and on behalf of the Comptroller and Auditor General (Statutory Auditor)National Audit Office157-197 Buckingham Palace RoadLondon, SW1W 9SP
7 July 2017

101
Chairm
an’s statem
entO
verviewC
hief Executive’s
reviewM
aking our netw
ork saferIm
proving
customer service
Delivering the R
oad Investm
ent Strateg
y O
ur p
eopleFinancial R
eviewP
rincipal risks and uncertainties
Our
governance
The Directors’
report
Auditors’
report
13SeCtiOnF
inancial S
tatements
Statement of Comprehensive net expenditure for the year ended 31 March 2017
NoteYear to
31 March 2017 £000
Period to 31 March 2016
£000
Staff costs 4 120,458 112,855
Maintenance and similar activities 428,796 446,691
Interest on PFI finance leases 18.3 123,190 127,618
PFI service charges 18.4 308,005 318,459
Depreciation and amortisation 7 and 8 1,185,607 912,736
Impairment 7 and 9 3,280 2,722
Other expenditure 5 110,082 111,669
Operating income 3 (74,025) (36,799)
Net expenditure before taxation 2,205,393 1,995,951
Taxation 6 (153) 570
Net expenditure after taxation 2,205,240 1,996,521
Other comprehensive net expenditure items that will not be reclassified to net expenditure
Net (gain)/loss on remeasurement of property, plant and equipment 7.1c (3,410,527) 2,498,818
Total comprehensive net expenditure for the year (1,205,287) 4,495,339
The accounting policies and notes on pages 105 to 141 form part of these accounts.
Financial Statements
13SeCtiOn

102
Statement of Financial Position as at 31 March 2017
Note 31 March 2017 £000
31 March 2016 £000
non-current assets
Property, plant and equipment 7 113,080,759 108,782,333
Intangible assets 8 2,062 2,014
Trade and other receivables 11 19,139 9,784
Total non-current assets 113,101,960 108,794,131
Current assets
Assets classified as held for sale 9 16,366 8,955
Inventories 10 35,304 31,598
Trade and other receivables 11 156,656 179,622
Cash and cash equivalents 12 39,446 22,922
Total current assets 247,772 243,097
Total assets 113,349,732 109,037,228
Current liabilities
Trade and other payables 13 766,966 651,724
Provisions 14 54,080 37,137
Total current liabilities 821,046 688,861
Non-current assets less net current liabilities 112,528,686 108,348,367
non-current liabilities
Provisions 14 105,088 91,964
Other payables 13 1,547,161 1,612,253
Total non-current liabilities 1,652,249 1,704,217
Assets less liabilites 110,876,437 106,644,150
taxpayers' equity
Share capital - -
Capital contributions 49,411,478 49,204,761
Retained earnings 1,951,839 1,130,079
Revaluation reserve 59,513,120 56,309,310
Total taxpayers' equity 110,876,437 106,644,150
The accounting policies and notes on pages 105 to 141 form part of these accounts.
The issued share capital of the Company is £10, as detailed in note 21.
These financial statements were approved and authorised for issue by the Board of Directors on 5 July 2017, and were signed on its behalf by:
Jim O’Sullivan, Chief Executive Officer
Company registered number: 9346363
SeCtiOn 13 / Financial Statements

103
Chairm
an’s statem
entO
verviewC
hief Executive’s
reviewM
aking our netw
ork saferIm
proving
customer service
Delivering the R
oad Investm
ent Strateg
y O
ur p
eopleFinancial R
eviewP
rincipal risks and uncertainties
Our
governance
The Directors’
report
Auditors’
report
13SeCtiOnF
inancial S
tatements
Statement of Cash Flows for the year ended 31 March 2017
NoteYear to
31 March 2017 £000
Period to 31 March 2016
£000
Cash flows from operating activities
Net operating cost (2,205,240) (1,996,521)
Adjustments for non-cash transactions:
Depreciation and amortisation 7 and 8 1,185,607 912,736
Loss/(profit) on sale of fixed assets 12,606 (4,344)
Net increase in resource provisions 14 3,343 4,103
Programme impairments 3,278 16,116
Increase in inventories 10 (3,706) (2,034)
Decrease/(Increase) in trade and other receivables 11 13,611 (10,690)
Increase/(decrease) in trade and other payables 13 50,150 (96,993)less movement in payables relating to items not passing through the SoCNE - 2,669
Use of provisions 14 (38,530) (51,049)
Adjustment for capital element of PFI payments 18.2 69,744 69,972
Net cash outflow from operating activities (909,137) (1,156,035)
Cash flows from investing activities
Purchase of property, plant and equipment 7 (2,105,070) (1,917,628)
Purchase of intangible assets - cash additions 8 - (2,512)
Proceeds of disposal of assets 8,221 10,926
Capital element of movement in provisions 14 65,254 22,985
Net cash outflow from investing activities (2,031,595) (1,886,229)
Cash flows from financing activities
Capital contribution from shareholder: current year 3,027,000 3,126,600
Capital contribution from shareholder: initial transfer - 8,558 Capital element of payments in respect of on balance sheet PFI contracts 18.2 (69,744) (69,972)
Net financing 2,957,256 3,065,186
Net increase in cash and cash equivalents in the year 12 16,524 22,922
Cash and cash equivalents at the beginning of the year 12 22,922 -
Cash and cash equivalents at the end of the year 12 39,446 22,922

104
Statement of changes in taxpayers’ equity for the year ended 31 March 2017
Note Capital contributions
£000
Retained earnings
£000
Revaluation reserve
£000
Total equity£000
Balance transferred in at 1 April 2015 49,084,434 - 58,928,455 108,012,889
Changes in taxpayers' equity for 2015-16Net loss on remeasurement of property, plant and equipment 7.1c - - (2,498,818) (2,498,818)
Transfers between reserves 120,327 - (120,327) - Net comprehensive (expenditure) for the period - (1,996,521) - (1,996,521)
Total recognised income and expenses for period ended 31 March 2016
49,204,761 (1,996,521) 56,309,310 103,517,550
Funding from shareholder - 3,126,600 - 3,126,600
Balance at 31 March 2016 49,204,761 1,130,079 56,309,310 106,644,150
Balance at 1 April 2016 49,204,761 1,130,079 56,309,310 106,644,150
Changes in taxpayers' equity for 2016-17Net gain on remeasurement of property, plant and equipment 7.1c - - 3,410,527 3,410,527
Transfers between reserves 206,717 - (206,717) -
Net comprehensive (expenditure) for the year - (2,205,240) - (2,205,240)Total recognised income and expenses for year ended 31 March 2017
49,411,478 (1,075,161) 59,513,120 107,849,437
Funding from shareholder - 3,027,000 - 3,027,000
Balance at 31 March 2017 49,411,478 1,951,839 59,513,120 110,876,437
SeCtiOn 13 / Financial Statements

105
Chairm
an’s statem
entO
verviewC
hief Executive’s
reviewM
aking our netw
ork saferIm
proving
customer service
Delivering the R
oad Investm
ent Strateg
y O
ur p
eopleFinancial R
eviewP
rincipal risks and uncertainties
Our
governance
The Directors’
report
Auditors’
report
13SeCtiOnF
inancial S
tatements
2. Accounting policies
2.1. Basis of preparation
The financial statements have been prepared in accordance with International Financial Reporting Standards (IFRS) as adopted by the European Union and applied in accordance with the provisions of the Companies Act 2006 applicable to companies reporting under IFRS.
Where IFRS permits a choice of accounting policy, the accounting policy which is judged to be most appropriate to the particular circumstances of the Company for the purpose of giving a true and fair view has been selected. The particular accounting policies adopted are described below. They have been consistently applied in dealing with items considered material in relation to the accounts.
2.2. Measurement convention
These financial statements have been prepared on the historical cost basis, except where specific departures (including fair value approaches) are described elsewhere in these statements.
2.3. new or amended accounting standards and interpretations
The Company has reviewed all new accounting standards, amendments and interpretations of standards that are effective during the year ending 31 March 2017 to determine the impact on the Company’s financial statements.
A number of new standards, amendments to standards and interpretations are not yet effective for the year ended 31 March 2017, and accordingly have not been applied in preparing these financial statements. The following are those standards, amendments and interpretations that may need to be adopted in subsequent years:
� IFRS 9 Financial Instruments, which will replace parts of IAS 39, deals with the classification and measurement of financial assets and financial liabilities, hedge accounting and (following the July 2014 amendment), the impairment of financial assets. IFRS 9 is intended to improve and simplify the treatment of financial instruments in financial statements. According to the International Accounting Standards Board (IASB), application of this standard is
1. General informationHighways Company Limited (“Highways England” or the Company) is a private company limited by shares and domiciled in the United Kingdom and registered in England and Wales under the Companies Act 2006.
The Company is wholly owned by the Secretary of State for Transport.
The Company registration number is 9346363.
The registered office of the Company is at Bridge House,1 Walnut Tree Close, Guildford, Surrey GU1 4LZ
notes to the financial statements for the year ended 31 March 2017
The Company’s principal activities are to operate, maintain and modernise the strategic road network (SRN) in the interests of its customers. Highways England was incorporated on 8 December 2014 and commenced trading on 1 April 2015, following the transfer of assets and liabilities from the Highways Agency. The period covered by the 2015-16 accounts was therefore 15 months and 24 days, however no economic activity took place at Highways England until 1 April 2015, as a result the period of economic activity described in the Statement of Comprehensive Net Expenditure (SoCNE) was 12 months.

106
required for reporting periods beginning on or after 1 January 2018, though earlier application is permitted. However, it is yet to receive EU endorsement so it is not possible to predict the actual application date. The impact of initial application of IFRS 9 is not expected to be significant. This is because, while the classification of financial assets and liabilities will change, it appears that existing measurement approaches will continue to be appropriate. It is also considered that there will be no significant change to the recognition of impairment on the Company’s financial assets, because the expected credit losses on those assets are considered to be immaterial.
� IFRS 15 Revenue from Contracts with Customers is expected to come into effect from 1 January 2018. It requires the recognition of revenue as the performance obligations under the contracts are satisfied. Its implementation is expected to have no material impact on the Company.
� IFRS 16 covering Leases was issued in January 2016 and will be effective from January 2019. It is expected to eliminate off-balance sheet leasing arrangements, and require recognition of a single right-of-use asset, measured at the present value of lease payments, with a matching liability. The pattern for recognition of the expenditure will depend on the type of leases: for most leases of property, the lessee will recognise expenditure on a straight-line basis; for most leases of other types of asset, the lessee’s expenditure will reduce over the term of the lease. As Highways England currently occupy administrative properties under operating leases, this is likely to have an effect on the statement of financial position, but a more limited effect on the recognition of expenditure. The service charge element of the Private Finance Initiatives will also be reviewed to assess impact in due course.
Other changes due to come into effect after 31 March 2018, are considered to have no material impact on the Company.
2.4. Going concern
The Statement of Financial Position (SoFP) as at 31 March 2017 shows net current liabilities of £573.3m. This reflects the inclusion of current liabilities that will be settled post 31 March 2017; largely from grant in aid funding from the Company’s sponsoring department – Department for Transport (DfT). The 2017-18 grant in aid funding has been included in the Estimates, which have been approved by Parliament.
The Directors have a reasonable expectation that the Company has adequate resources to continue to operate for the foreseeable future. The financial statements are therefore prepared on a going concern basis. In forming this view the Directors/management have:
a) reviewed the Company’s future funding commitments received from the Government through the publication of the Road Investment Strategy, which sets out capital funding for the Company through to 2020-21;
b) kept the DfT fully aware of commitments made which stretch beyond the period covered by the Roads Investment Strategy;
c) reviewed the Company’s budgets, plans and cash flow forecasts; and
d) reviewed the DfT’s main estimate for 2017-18.
2.5. Critical accounting judgements and key sources of uncertainty
Estimates and underlying assumptions are reviewed on an ongoing basis. Revisions to accounting estimates are recognised in the period in which the estimates are revised and in any future periods affected. The most significant areas involving a higher degree of judgement or complexity are described below:
a) Property, Plant and equipment (P,P&e) – The Strategic Road Network (SRN) is valued using an approach to determine depreciated replacement cost, which is described more fully in note 2.6. The valuation is built up using, principally: an understanding of the extent of the
SeCtiOn 13 / Financial Statements

107
Chairm
an’s statem
entO
verviewC
hief Executive’s
reviewM
aking our netw
ork saferIm
proving
customer service
Delivering the R
oad Investm
ent Strateg
y O
ur p
eopleFinancial R
eviewP
rincipal risks and uncertainties
Our
governance
The Directors’
report
Auditors’
report
13SeCtiOnF
inancial S
tatements
network and its component parts on a modern equivalent basis; the application of a number of costing rates for those component parts, by type; and the condition of the network. In this context, it is sensitive to a number of significant areas of estimation, including:
� Costing rates – costings used to inform the valuation of the road and structures elements of the SRN are based on schemes constructed by the Company (and, formerly, the Highways Agency) over the past five years. In some areas, due to the balance of construction projects completed over this year, there may be a limited number of suitable construction schemes providing a direct costing comparator. The Company therefore bases costing rates initially on actual scheme data, but makes adjustments to its extrapolation based on reasonable construction assumptions, such as when and how to extrapolate from small schemes to large ones, in order to ensure that each population of SRN elements is valued in a way that represents its overall composition. Where necessary, the Company also draws on the work of professional cost estimators in determining rates.
� indices – between full valuation years, the Company applies a number of construction related indices to the costing rates for various elements of the SRN. The Company chooses the indices which in its view are most relevant to the replacement costs for the SRN’s component parts, and the extrapolation of data to ascertain an estimated standard cost valuation. Information on specific indices is provided in note 2.6.
� Road condition analysis determining the depreciation charge for roads – this is determined by surveys carried out across all lanes of the SRN that measure, at ten metre intervals, the level of rutting (depressions/grooves in the road surface caused by wear or deformation over time). Rutting measures only the ‘black top’ of the road surface. However, the Company uses the rutting level to determine when a road surface requires maintenance
intervention, and has therefore determined that this provides a fair approximation for the overall condition of the road surface. The Company currently estimates that the level of rutting that is acceptable before intervention is 15.5mm. At this level it is considered there is no further service potential in the road surface and this then triggers the renewals programme.
Rutting data is used to generate the depreciation charge which is the rutting percentage multiplied by the depreciable element of the road. The Company has calculated that the depreciable element of roads is 17.55% of the total road valuation, based on the proportion of cost related to the elements regularly renewed. The Company judges that the balance of the valuation relates to elements (including sublayers) with useful lives long enough, subject to regular renewal of the top layer, as to require no depreciation charge.
Any change in the acceptable level of rutting of 15.5mm will impact the SRN valuation. An increase or decrease of 1mm would result in the valuation increasing by £144.9m and reducing by £144.9m respectively as at 31 March 2017.
� Structures (e.g. bridges) are subject to a depreciation charge based on an asset valuation model reflecting both the impact of deterioration over time, and periodic renewal, as described in note 2.6. The Company keeps information on the condition of its structures under regular review to assess whether an adjustment is required for depreciation.
� impairment of Assets Under Construction (AUC) The write down of AUC has been charged against the SRN revaluation reserve to the extent there is a reserve. This accounting treatment adopts the interpretation of IAS 36, Impairment of Assets, by making no distinction between asset ‘constructed’ and asset ‘under construction’. In compliance with IAS 36 and the Companies Act 2006, the Company is treating its constructed and under construction SRN projects as one asset for the purpose of revaluation.

108
� Useful economic Life (UeL) – the Company makes assumptions about the period of time during which various elements of the SRN will provide service potential. Estimates are made of the UEL of structures, roads and technology equipment, which are based on historic trends and expert knowledge.
b) Classification of legal claims as contingent liabilities or provisions and then as current or non-current provisions – the Company occasionally faces legal claims and challenges, which may result in the possible outflow of economic benefits. The treatment of these as contingent liabilities or provisions, their valuation, and presentation as current or non-current is based on legal advice.
c) PFi – A PFI property is recognised as a fixed asset and the liability to pay for it accounted for as a finance lease. The asset and liability are both initially recorded at the fair value of the property and the asset is subsequently revalued and depreciated in accordance with accounting policies in note 2.6.
The capital value of the earlier PFI schemes was estimated using the public sector comparator (the net present value of cash flows that the public sector would pay to construct, operate and maintain the scheme by traditional means). From 2005-06, the capital value has been based upon the Company’s best estimate of capital cost at the time the contract was awarded.
The yearly unitary charge payable under PFI contracts is split to allocate payments between the cost of services under the contract and the interest element on the liability.
d) Land and Property is acquired as part of improving the network. During the early stages of a project, until the preferred route is announced, acquisitions relating to land and property are treated as contingent liabilities due to the uncertainty over whether the land will need to be acquired. After the preferred route announcement is made and until the
purchase they are treated as provisions. The valuation of these contingent liabilities or provisions are estimated by the District Valuation Service.
2.6. non-Current assets: property, plant and equipment
Property, plant and equipment is sub-categorised into:
� Strategic road network (SRn) – this consists of the motorways and all-purpose trunk roads (APTRs) in England, which form a single integrated network. The SRN constitutes road, land, structures and technology within the SRN’s perimeter.
� non-network assets – these include land and buildings outside the SRN’s perimeter, plant and machinery, and information technology. All residential properties owned by the Company and not forming part of an existing scheme under construction are reported as dwellings.
2.6.1. Strategic road network (SRn)
a) Capitalisation policy
Expenditure on construction schemes in the course of design or construction is capitalised when the scheme is included in the Road Investment Strategy and reasonably certain it will go ahead. Where a scheme is subsequently withdrawn from the capital programme, cumulative design expenditure is written off to the net operating expenditure. Any retained land and property is transferred to surplus land and buildings or dwellings, as appropriate. Surplus land, buildings or dwellings to be sold within one year are valued and reported as assets held for resale, in accordance with IFRS 5.
Internal staff costs that can be attributed directly to the construction of an asset, including capital renewal schemes, are capitalised. Staff costs are capitalised by taking the ratio of capital spend to total programme spend for each division.
SeCtiOn 13 / Financial Statements

109
Chairm
an’s statem
entO
verviewC
hief Executive’s
reviewM
aking our netw
ork saferIm
proving
customer service
Delivering the R
oad Investm
ent Strateg
y O
ur p
eopleFinancial R
eviewP
rincipal risks and uncertainties
Our
governance
The Directors’
report
Auditors’
report
13SeCtiOnF
inancial S
tatements
The SRN is intended to be maintained at a specific level of service potential by continual replacement and refurbishment. The SRN is inspected regularly to enable maintenance to be planned on a priority basis and ensure the continued use of the road. Work on the SRN is capitalised only for projects which extend the network’s service potential, either through enhancement (e.g. road widening schemes, Smart motorway upgrades, new roads or structures) or renewal (e.g. surface replacement works which provide additional years of useful life and major bridge refurbishments). Maintenance expenditure which represents day to day servicing, such as pothole repairs or drainage clearance is charged to the net operating expenditure as incurred.
Technology equipment is capitalised when the equipment is installed and commissioned on the SRN for the first time. This principally comprises variable messaging signs, CCTV and automatic number plate recognition cameras.
All expenditure on SRN is capitalised as summarised below:
Element Threshold
SRN – new build No minimum value
SRN – road and structures renewals No minimum value
SRN – land No minimum value
b) Valuation
The Company has chosen to value the network at fair value. The SRN is a specialised asset and as such neither a market approach nor an income approach is available. The Company has therefore derived the fair value of the SRN using the depreciated replacement cost approach, which determines the value to a theoretical buyer on the basis of how much it would cost to construct a network of equivalent service potential. Consistent with IFRS 13, this basis represents a reasonable method of estimating fair value, in the absence of other possibilities, since in acquiring the existing network a buyer wishing to
acquire equivalent service potential would avoid these replacement costs. At a high level, a depreciated replacement cost estimate involves first creating a gross (‘as new’) replacement cost based on a modern equivalent asset offering the same function (which the Company takes to include identical routing and capacity) and on a greenfield site, before applying depreciation to reflect the current condition of the network.
c) Revaluation
Highways England surveyors undertake a full valuation of the SRN at intervals not exceeding five years with support from professional cost estimators and surveyors on a rolling basis. The five-yearly valuation is undertaken in accordance with the general principles of the Appraisal and Valuation Manual (Red Book) of the Royal Institution of Chartered Surveyors (RICS). These valuations are not based on the historic actual cost of construction for individual elements of the SRN. Rather, the Company determines standard costs for the SRN based on accounting estimates using the best information available and reflect the actual cost of recent schemes, together with physical assets records to provide unit rates for all elements and components of the SRN. Costing rates are kept up to date in intervening years using indexation, as described below. The road, land and technology elements of the SRN were subject to a valuation at 31 March 2015 as part of the rolling five year programme. The next structures revaluation will be carried out during 2017-18 as part of the rolling programme.
d) Costing rates
The SRN valuation is based on a standard cost model, using accounting estimates to determine the valuation. When calculating the unit rates for the various elements of the SRN, a number of accounting assumptions are implicit in determining the SRN valuation. These assumptions are reviewed every five years when the Company provides a new valuation of the SRN.

110
Unit cost Unit cost determination
Road The standard costing for roads is based on a series of road types created to identify all roads and determine the unit costs. There are 31 road types. Each road type has:
� a standard width for the carriageway, hard-strip or hard-shoulder, central reservations, etc.
� a standard unit rate that is applied across the SRN. These rates are generated from suitable schemes constructed by the Company (and, formerly, the Highways Agency) over the past five years that have opened for traffic. Due to a limited number of suitable construction schemes providing a direct costing comparator, the Company makes adjustments to actual scheme data by extrapolation based on reasonable construction assumptions, such as how to extrapolate from small schemes to large ones, in order to ensure that each population of SRN elements is valued in a way that represents its overall composition.
Land Land is an integral part of the SRN and forms an important part of the valuation. Although some of the land occupied by the SRN may not actually be owned by the Company, e.g. Crown land, it is considered that, as the Company has an entitlement to use the land in perpetuity, it is included within the valuation at freehold values. Land valuation is based on the following factors:
1. Location – geographical location of land within England
2. Classification – land is classified as either urban or rural dependent on location.
3. Land rates in England from the Valuation Office Agency (VOA).
Structures Standard structures – Unit rates for bridges, tunnels, gantries and retaining walls are based on a number of standard road types and standard structure types data, which are triangulated from a number of sources, including historic construction costs, engineering data, regional location data and indexation where necessary.
Non-standard structures – These are structures that, due to a combination of their size, construction and character cannot be quantified and valued in the same manner as other structures, e.g. the Dartford-Thurrock River Crossing. The valuation for special structures is based on unit rates and actual cost data.
Technology Technology equipment comprises: variable message signs, CCTV, Automatic Number Plate Recognition cameras, cabling, telephones and signal power supplies etc. Unit costs are developed by the Highways England commercial team, using rates from technology frameworks currently in place between the Company and its contractors and bulk purchase prices for materials procured directly by the Company. The unit costs for technology equipment also includes the cost of individual components; installation costs; commissioning costs; preparation and supervision costs; and traffic management costs where applicable.
e) Dimensional variance of roads and structures
Data on the SRN is held on a number of operational asset management systems. Where appropriate, dimensional data is used from these systems to inform the valuation of individual roads and structures. The consistent application of professional judgement by engineers may impact the variability of dimensional data which in turn will impact the valuation of the SRN. Dimensional variance arises as a result of re-measuring the length,
SeCtiOn 13 / Financial Statements

111
Chairm
an’s statem
entO
verviewC
hief Executive’s
reviewM
aking our netw
ork saferIm
proving
customer service
Delivering the R
oad Investm
ent Strateg
y O
ur p
eopleFinancial R
eviewP
rincipal risks and uncertainties
Our
governance
The Directors’
report
Auditors’
report
13SeCtiOnF
inancial S
tatements
width and height etc. of the road and structures by utilising more up to date measuring technology than previously used. Dimensional variance adjustments are charged directly to the revaluation reserve, whereas other revaluations are reflected in the net operating expenditure as a net (gain)/loss on remeasurement of property, plant and equipment.
f) indexation
Various indices are applied in year between full year valuations of the SRN to ensure the final valuation is at depreciated replacement cost. Indexation of the SRN valuation is applied as follows:
Roads and structures
Road Construction Resource Cost Indices (ROCOS) is the index applied to roads and structures for yearly revaluation and reflects the movement in prices in the construction industry. ROCOS is published on a quarterly basis by the Building Cost Information Service (BCIS).
Land Land indexation is determined by the Company in consultation with external consultants and the following external sources:
� urban land indices from the Land Registry House price index
� rural land indices from the Royal Institute of Chartered Surveyors (RICS) and the Royal Agricultural University (RAU) market surveys.
Technology ROCOS is the index applied to all technology assets.
Indexation based on these indices is applied to all elements of the SRN. However, there may be occasions where the use of indices for particular SRN elements may give an unrealistic outcome. This may happen for example where there has been substantial technological change; when changes in the cost of specific assets are known to have been significantly different from the changes in
the index; or where the historical purchase cost of assets was affected by special circumstances unlikely to be repeated and for which no allowance can be made. In such circumstances the depreciated replacement cost is based on expert opinion or other evidence of the current cost of assets or groups of assets having a similar service potential.
The SRN is valued on the basis that the replacement will be on a ‘greenfield site’. Currently VAT is non-recoverable on ‘greenfield site’ expenditure. The current non-recoverable VAT rate of 20% is used to reflect the depreciated replacement cost of the SRN. However, certain non-standard structures are valued at historical prices appropriately indexed, or insurance valuations have been used as the best approximation of replacement cost.
g) Assets under construction (AUC)
Highways England accounts for all new projects in the course of design or construction as AUC at their actual build cost. On completion of a project, the project is transferred out of AUC and into the SRN at the depreciated replacement cost (which will be different from the actual cost). Any impairment loss that arises on the initial capitalisation of the asset will be offset against any existing revaluation reserve. Since there is no distinction between asset ‘constructed’ and asset ‘under construction’ for the SRN, there will also be no distinction in the revaluation reserve.
h) Write-downs of Assets under construction
The Company writes-down the difference between the cost of construction and the depreciated replacement cost. There are a number of reasons for this difference including:
� One of the standard costing assumptions is that all construction is developed on a ‘greenfield’ site. This is not always the case; therefore the

112
cost of new constructions can be much higher due to additional building costs in urban areas or additional costs of replacing existing roads etc.; and
� Generally it is cheaper to build a three lane motorway as one project rather than two lanes initially and then to widen at some point thereafter. In a road widening scheme, a significant amount of cost will relate to traffic management, which does not increase the value of the SRN and therefore is written-down.
The Company uses standard write-down percentages for construction projects lasting more than one year. These percentages are based on projects constructed over the previous ten years. This ensures the Company writes down the asset on an on-going basis rather than when the project is opened for traffic. When a project is open for traffic, a formal calculation of the write-down required is completed and compared with the cumulative write-down; adjustments are made as necessary.
The write down of AUC has been charged against the SRN revaluation reserve to the extent there is a reserve. In compliance with IAS 36 and the Companies Act 2006, the Company is treating its constructed and under construction SRN projects as one asset for the purpose of revaluation.
i) Depreciation
Depreciation is a measure of the book value of an asset that has been consumed during the accounting period. It allocates the cost of utilising the asset over the accounting periods that will benefit from its use and is charged to the net operating expenditure.
The SRN as reported in the financial statements is based on Depreciated Replacement Cost (DRC). All parts of the SRN, apart from land and the sub-structure of the road which have an unlimited useful life, are depreciated.
Road depreciation
The renewable road element subject to depreciation comprises:
� surface layer
� sub pavement layer
� drainage, lighting, signage, kerbs, footways
� road markings and studs
� rigid concrete roads
For the purpose of depreciation, the road surface is recognised as a single asset and depreciation on these elements (which are estimated to comprise 17.55% of the gross replacement cost) is calculated in two parts:
1. Capital renewal expenditure on the SRN surface is capitalised, to the extent that it restores the service potential of the asset that has previously been consumed. The Company performs renewals so as to maintain the road surface in a steady state and therefore uses the renewals charge as an initial basis for the depreciation charge in the net operating expenditure.
2. The condition of the road surface is measured by rutting, obtained from the Traffic Speed Road Assessment Condition Survey (TRACS). Rutting is a good overall indicator of the condition of the road surface and is a measurement of the deterioration of the wearable element of the road surface. The condition of the road surface, as assessed by condition surveys, is undertaken and any movement in the condition is taken to the net operating expenditure as a depreciation charge or conversely an improvement credit thereby updating the initial depreciation charge based on renewals levels described above to take account of actual changes in condition.
For the balance of road elements not within the 17.55% subject to depreciation, the Company judges that these elements
SeCtiOn 13 / Financial Statements
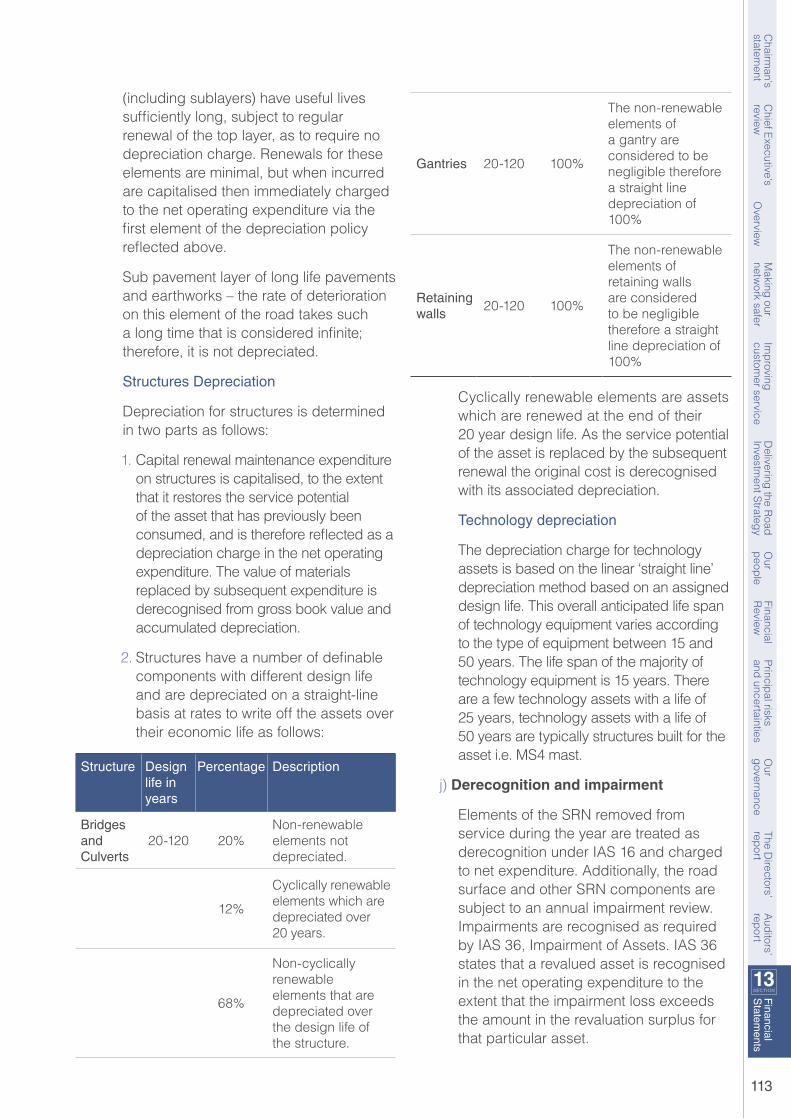
113
Chairm
an’s statem
entO
verviewC
hief Executive’s
reviewM
aking our netw
ork saferIm
proving
customer service
Delivering the R
oad Investm
ent Strateg
y O
ur p
eopleFinancial R
eviewP
rincipal risks and uncertainties
Our
governance
The Directors’
report
Auditors’
report
13SeCtiOnF
inancial S
tatements
(including sublayers) have useful lives sufficiently long, subject to regular renewal of the top layer, as to require no depreciation charge. Renewals for these elements are minimal, but when incurred are capitalised then immediately charged to the net operating expenditure via the first element of the depreciation policy reflected above.
Sub pavement layer of long life pavements and earthworks – the rate of deterioration on this element of the road takes such a long time that is considered infinite; therefore, it is not depreciated.
Structures Depreciation
Depreciation for structures is determined in two parts as follows:
1. Capital renewal maintenance expenditure on structures is capitalised, to the extent that it restores the service potential of the asset that has previously been consumed, and is therefore reflected as a depreciation charge in the net operating expenditure. The value of materials replaced by subsequent expenditure is derecognised from gross book value and accumulated depreciation.
2. Structures have a number of definable components with different design life and are depreciated on a straight-line basis at rates to write off the assets over their economic life as follows:
Structure Design life in years
Percentage Description
Bridges and Culverts
20-120 20%Non-renewable elements not depreciated.
12%
Cyclically renewable elements which are depreciated over 20 years.
68%
Non-cyclically renewable elements that are depreciated over the design life of the structure.
Gantries 20-120 100%
The non-renewable elements of a gantry are considered to be negligible therefore a straight line depreciation of 100%
Retaining walls
20-120 100%
The non-renewable elements of retaining walls are considered to be negligible therefore a straight line depreciation of 100%
Cyclically renewable elements are assets which are renewed at the end of their 20 year design life. As the service potential of the asset is replaced by the subsequent renewal the original cost is derecognised with its associated depreciation.
Technology depreciation
The depreciation charge for technology assets is based on the linear ‘straight line’ depreciation method based on an assigned design life. This overall anticipated life span of technology equipment varies according to the type of equipment between 15 and 50 years. The life span of the majority of technology equipment is 15 years. There are a few technology assets with a life of 25 years, technology assets with a life of 50 years are typically structures built for the asset i.e. MS4 mast.
j) Derecognition and impairment
Elements of the SRN removed from service during the year are treated as derecognition under IAS 16 and charged to net expenditure. Additionally, the road surface and other SRN components are subject to an annual impairment review. Impairments are recognised as required by IAS 36, Impairment of Assets. IAS 36 states that a revalued asset is recognised in the net operating expenditure to the extent that the impairment loss exceeds the amount in the revaluation surplus for that particular asset.

114
k) trunking/detrunking
The Company has responsibility for the maintenance, management and enhancement of the SRN. The value of the SRN can be increased by trunking which is where a SRN asset is transferred from a local authority to the Company. The trunked assets are valued in accordance with similar assets already on the network. This can occur for roads or other SRN assets which are superseded as part of the SRN following the construction of a new road, such as a bypass. Detrunkings are accordingly de-recognised as a partial disposal of the SRN for nil consideration with the resultant net loss charged to net expenditure.
2.6.2. non-network assets
a) Capitalisation Policy
Expenditure on property, plant and equipment for acquisition or enhancement of an asset is capitalised above the thresholds as summarised below:
Element Threshold
Non network assets £2,000
Non network- land No minimum value
Expenditure falling below these values is charged as an expense in the Statement of Comprehensive Net Expenditure (SoCNE) also known as net operating expenditure.
The Company groups assets in relation to bulk purchases of plant and machinery and information technology. This includes the following:
� Plant and machinery resulting from office refurbishments; and
� IT assets resulting from major IT upgrades.
b) Valuation (Land and buildings, including dwellings)
Freehold land and buildings have been valued on the basis of open market value for existing use. External professional surveyors, in accordance
with the RICS Appraisal and Valuation Manual, undertake a full valuation of these assets at intervals not exceeding five years.
Between valuations values are adjusted with regional land and building indices calculated by Atkins using RICS Rural Land Market Survey.
Land and buildings include freehold and leasehold properties. Some Regional Control Centres are leasehold properties under 50 years and are defined as short leasehold properties.
The land and buildings assets were last fully valued as follows:
Asset Valuation date Undertaken by
Motorway maintenance compounds
31 March 2016
VOA
Motorway service areas
31 March 2015
VOA
Surplus properties (including dwellings)
31 December 2013
VOA
Regional control centres
31 March 2016
VOA
National traffic operations centre
31 March 2016
VOA
Plant and machinery
Structural steelwork is stated at fair value using the current market value of steel. Other plant and machinery is stated at fair value using yearly plant and equipment indices supplied by the Office for National Statistics (ONS).
Information technology
Information Technology consists of IT hardware and database development. Information technology assets are stated at fair value.
c) Depreciation
Freehold land is not depreciated. Other non-network assets are depreciated at rates calculated to write off the assets
SeCtiOn 13 / Financial Statements

115
Chairm
an’s statem
entO
verviewC
hief Executive’s
reviewM
aking our netw
ork saferIm
proving
customer service
Delivering the R
oad Investm
ent Strateg
y O
ur p
eopleFinancial R
eviewP
rincipal risks and uncertainties
Our
governance
The Directors’
report
Auditors’
report
13SeCtiOnF
inancial S
tatements
over their expected useful lives on a straight-line basis as follows:
Asset Life in years
Buildings and Dwellings
Freehold buildings up to 60 years
Leasehold buildings length of the lease
Dwellings – non-surplus no depreciation
Plant and machinery
Winter maintenance equipment 10 to 25 years
Office equipment 5 to 10 years
Vehicles 5 to 10 years
Structural steelwork 10 years
Information Technology
Technology equipment 3 to 5 years
Test equipment 5 to 10 years
IT equipment 5 years
Database development expenditure
5 years
2.7. non-current assets classified as held for sale
Non-current assets are classified as assets held for sale in accordance with IFRS 5 and comprise surplus land, buildings and dwellings (being land and property released from road schemes), plant and machinery and other assets no longer used. Assets classified as held for sale are available for sale within 1 year, in their present condition, and are being actively marketed. These assets are valued at the lower of carrying amount and fair value (market value) less selling costs where material.
2.8. intangible assets
Purchased computer software licences are capitalised as intangible fixed assets where expenditure of £2,000 or more is incurred. These are valued at cost.
Internally developed intangible assets, such as software or databases, are recognised as intangible assets if:
� The software or databases are technically feasible;
� There is an identifiable asset that will produce future benefits; and
� The cost can be determined reliably.
Intangible assets are amortised over their useful lives, typically on a straight-line basis, which is considered to be three to five years. The estimated useful life and amortisation method are reviewed at the end of each annual reporting period.
2.9. inventories
Inventories are valued at the lower of cost and net realisable value. The cost of inventories is computed based on the weighted average cost of items acquired over different periods. The cost of inventories comprises all costs incurred in bringing the inventories to their present location and condition. Where excess or obsolete inventory holdings have been identified the carrying value is reduced to the estimated net realisable value.
2.10. Financial instruments
Financial instruments are contractual arrangements that give rise to a financial asset of one entity and a financial liability or equity instrument of another entity. Financial assets are typically cash or rights to receive cash or equity instruments in another entity. Financial liabilities are typically obligations to transfer cash. A contractual right to exchange financial assets or financial liabilities with other entities will also represent a financial asset or liability, depending on whether the conditions are potentially favourable or adverse to the reporting entity.
2.10.1. Financial assets and liabilities
The Company classifies its financial assets and liabilities in the following categories: Financial assets are assets

116
available for sale and loans and receivables. Financial liabilities are any contractual obligations to deliver cash or other financial assets to a third party. Management determines the classification of financial assets and liabilities upon initial recognition.
2.10.2. Cash and cash equivalents
Cash and cash equivalents comprise cash and bank deposits and deposits with corporations. The Company considers all highly liquid investments with a remaining maturity at the date of purchase of three months or less, and that are readily convertible to known amounts of cash to be cash equivalents.
2.10.3. Loans and receivables
Loans and receivables are non-derivative financial assets with fixed or determinable payments that are not quoted in an active market and which are not classified as available for sale. Loans and receivables are initially recognised at fair value and subsequently held at amortised cost using the effective interest method. Fair value is usually the original invoiced amount.
2.10.4. Financial liabilities
The Company determines its financial liabilities as contractual obligations to deliver cash or other financial assets to another entity. Financial liabilities are recognised initially at fair value and are subsequently held at amortised cost using the effective interest method. Financial liabilities are derecognised when the right to receive cash flows has expired.
2.10.5. Embedded derivatives
The Company has carried out a review of its contracts and has determined that it has no embedded derivatives.
2.10.6. Impairment of financial assets
The Company assesses at each SoFP date whether there is objective evidence that financial assets are impaired as a result of one or more loss events that occurred after the initial recognition of the
asset and prior to the SoFP date, and that loss event or events has had an impact on the estimated future cash flows of the financial asset or the portfolio that can be reliably estimated.
For the purposes of a collective evaluation of impairment, financial assets are grouped on the basis of similar risk characteristics, taking into account asset type, industry, geographical location, collateral type, overdue status and other relevant factors. These characteristics are relevant to the estimation of future cash flows for groups of such assets by being indicative of the counterparty’s ability to pay all amounts due according to the contractual terms of the assets being evaluated.
The amount of impairment loss is measured as the difference between the asset’s carrying amount and the present value of estimated future cash flows. Future cash flows in a group of loans and receivables that are collectively evaluated for impairment are estimated on the basis of the contractual cash flows of the assets in the group and historical loss experience for assets with credit risk characteristics similar to those in the group.
The methodology and assumptions used for estimating future cash flows are reviewed regularly to reduce any differences between loss estimates and actual loss experience.
2.11. Provisions
The Company makes provisions for liabilities and charges where, at the balance sheet date, a legal or constructive obligation exists for a future liability in respect of a past event and where the amount of the obligation can be estimated reliably. Where appropriate, this is supported by independent professional advice. Provisions are charged to the net operating expenditure unless they relate to capital projects, in which case the provision is added to the asset’s carrying amount. Provisions are discounted where the effect is material.
SeCtiOn 13 / Financial Statements

117
Chairm
an’s statem
entO
verviewC
hief Executive’s
reviewM
aking our netw
ork saferIm
proving
customer service
Delivering the R
oad Investm
ent Strateg
y O
ur p
eopleFinancial R
eviewP
rincipal risks and uncertainties
Our
governance
The Directors’
report
Auditors’
report
13SeCtiOnF
inancial S
tatements
2.12. Contingent Liabilities
� The Company discloses as contingent liabilities: potential future obligations arising from past obligating events, where the existence of such obligations remains uncertain pending the outcome of future events outside of the Company’s control, and,
� present obligations arising from past events that are not recognised because it is not probable that an outflow of resources will be required to settle the obligation or the amount of the obligation cannot be measured with sufficient reliability;
unless their likelihood is considered to be remote.
Where the time value of money is material, contingent liabilities, which are required to be disclosed under IAS 37, are stated at discounted amounts.
2.13. Contingent Assets
A contingent asset arises where an event has taken place that gives the Company a possible asset whose existence will only be confirmed by the occurrence or otherwise of uncertain future events not wholly within the control of the Company.
Contingent assets are not recognised in the SoFP but disclosed in a note to the accounts where it is probable that there will be an inflow of economic benefits.
2.14. Reserves
As the Company generates minimal income, the Department for Transport provides funds annually in the form of a cash contribution, on behalf of the Secretary of State for Transport in his capacity as the sole Shareholder. The funds received are used to finance expenditure that supports the objectives of the Company in accordance with the general service expectation contained in the Company’s licensing terms. The Company is wholly owned by the Secretary of State for Transport and its licence shall continue in force unless and until revoked in accordance
with its conditions. All reserves are non-distributable other than to the Secretary of State for Transport within the legislative framework and as defined by the Companies Act 2006.
2.15. Operating income
Operating income is income that relates directly to the operating activities of the Company.
It principally comprises fees and charges for services provided on a full-cost basis to external customers in both the public and private sectors. Operating income is stated net of VAT, and is measured at the fair value of the consideration received or receivable.
2.16. Research and development
Expenditure on research is not capitalised. Expenditure on development is capitalised and written off over the useful life of the asset if it meets the criteria for capitalisation. Expenditure that does not meet the criteria for capitalisation is treated as an expense and shown in the net operating expenditure in the year in which it is incurred.
Non-current assets acquired for use in research and development, are depreciated over the life of the associated project.
2.17. Leases
Leases are classified as finance leases when the terms of the lease transfer substantially all the risks and rewards of ownership to the lessee. In making the classification, the Company does not separate the land and buildings elements of arrangements which cover both elements. All other leases are classified as operating leases.
Asset held under finance leases are recorded as property, plant and equipment and a liability to the lessor is recorded as the minimum lease payments discounted by the interest rate implicit in the lease. The interest element of the finance lease payment is charged to the net operating expenditure over the period of the lease at a constant rate in relation to the balance outstanding.

118
Rentals under operating leases are charged to the net operating expenditure on a straight-line basis over the term of the lease. Where the arrangement includes incentives, such as rent-free periods, the related benefits are deferred over the full term of the lease.
2.18. Service concessions – PFi contracts
Under a service concession, a government entity contracts with a private sector entity to develop, build, finance, operate and maintain infrastructure, to deliver services directly or indirectly to the public, but controls or regulates those services and controls any significant residual interest in the infrastructure. Services indirectly provided to the public include those related to assets held for administrative purposes in the delivery of services to the public.
The Company recognises the infrastructure associated with service concessions as an asset and recognises the related liability. The asset is accounted for in a manner consistent with other assets of that type. Interest on the liability and expenditure on services provided under the service concession are recognised in the net operating expenditure as they accrue. Unitary Charges are apportioned between three elements: an element to pay for services; an element to pay interest on the liability and an element to repay the initial liability.
The asset and liability are both initially recorded at the fair value of the property and the asset is subsequently revalued and depreciated in accordance with accounting policies. A PFI scheme is first recognised once the property comes into use, for example when a road is ready to open for traffic. The capital value of the earlier PFI schemes was estimated using the public sector comparator (the net present value of cash flows that the public sector would pay to construct, operate and maintain the scheme by traditional means). From 2005-06, the capital value has been based upon the best estimate of capital cost at the time the contract was awarded.
2.19. employee benefits
Short-term employee benefits
Salaries, wages and employment-related payments are recognised in the period in which the service is received from employees. Where considered material, the cost of leave earned but not taken by employees at the end of the period is recognised in the financial statements to the extent that employees are permitted to carry forward leave into the following period. In practice, all material short-term employee benefits are settled during the period in which they are earned.
Pensions
Employees who transferred from the Highways Agency, as at 31 March 2015, retained access to continued participation in the Principal Civil Service Pension Scheme (PCSPS). Highways England also has a Federated Pension Plan (FPP) which is a Master-Trust defined benefit scheme which is managed on the Company’s behalf by Pan Trustees Limited. The FPP came into effect on 1 July 2016 to accommodate pension benefits protected under TUPE for employees transferring in to Highways England with legacy defined benefit pensions. The FPP currently has a very small membership, but may be used to provide comparable pension benefits for future transfers in to Highways England, where protected under TUPE or similar pension legislation.
The PCSPS is an unfunded multi-employer defined benefit scheme. The Company is unable to identify its share of the underlying assets and liabilities of the scheme on a consistent and reasonable basis and therefore, as required by IAS 19, accounts for the scheme as if it were a defined contribution scheme.
Employees who joined the Company with effect from 1 April 2015 were eligible to participate in a Highways England Personal Pension (Defined Contribution) Scheme (HEPP). The pension scheme came into effect on 1 April 2015 and is
SeCtiOn 13 / Financial Statements

119
Chairm
an’s statem
entO
verviewC
hief Executive’s
reviewM
aking our netw
ork saferIm
proving
customer service
Delivering the R
oad Investm
ent Strateg
y O
ur p
eopleFinancial R
eviewP
rincipal risks and uncertainties
Our
governance
The Directors’
report
Auditors’
report
13SeCtiOnF
inancial S
tatements
managed on the Company’s behalf by Legal & General Ltd.
Under the PCSPS and the Highways England Pension Plan (as a defined contribution scheme), pension liabilities do not rest with the Company. The Company is responsible for pension liabilities of the FPP defined benefit scheme. For all schemes, employer pension contributions are recognised as they become payable following qualifying service by employees.
Termination Benefits
Termination benefits are amounts payable as a result of a decision by the Company to terminate employment before the normal retirement date, or a decision by an employee to accept voluntary redundancy. Amounts payable are charged on an accruals basis to staff costs in the net operating expenditure when the Company is demonstrably committed to the termination of the employment of an employee.
2.20. taxation
VAT
Most of the activities of the Company are non-business in nature and for this reason, outside the scope of VAT. The Company is eligible under s. 41 (3) of the VAT Act 1992 to recover input VAT which is recovered under an annual Treasury Direction. Output tax does not apply to activities that are outside the scope of VAT and respective input tax on purchases is not recoverable. Irrecoverable VAT is charged to the relevant expenditure category or included in the capitalised purchase cost of non-current assets. Where output tax is charged or input VAT is recoverable, the amounts are stated net of VAT.
Corporation Tax
The Company is liable for corporation tax in relation to income earned from business activities. The vast majority of the Company activity is non-business as it has a statutory obligation to operate and maintain the SRN and is not in competition with the private
sector in carrying out this activity, as no one else has a right to maintain the SRN. Non-business activity is further characterised by the fact the Company does not receive any payment in consideration for operating the SRN; instead it is funded from contribution. Non-business activities are not subject to corporation tax.
Business activities for the Company are non-statutory obligations where the Company is in competition with other providers, income from business activities includes rental income and income from sale of properties.
Tax on the profit or loss for the year comprises current and deferred tax. Tax is recognised in the net operating expenditure except to the extent that it relates to items recognised directly in equity, in which case it is recognised in equity.
Current tax is the expected tax payable or receivable on the taxable income or loss for the year, using tax rates enacted or substantively enacted at the balance sheet date, and any adjustment to tax payable in respect of previous years.
Deferred tax is recognised in respect of temporary differences between the carrying amounts of assets and liabilities for financial reporting purposes and the amounts used for taxation purposes.
A deferred tax asset is recognised only to the extent that it is probable that future taxable profits will be available against which the temporary difference can be utilised. The Company is unlikely to have deferred tax as business activity is minimal.
2.21. eU Grants
EU grants are not recognised in the accounts until it is certain they will be received. Grants that relate to specific capital expenditure with attached conditions are credited to deferred income on the SoFP and then credited to the net operating expenditure over the asset’s construction period. Grants for revenue expenditure are credited to the net operating expenditure.

120
3. Operating incomeOperating income principally arises from:
� recoveries from third parties in respect of claims for damage to the motorways and trunk roads; and
4. Staff numbers and related costs
4.1. Staff costs
� fees and charges for work carried out on a full-cost basis to external customers in both the public and private sectors.
Operating income analysed by classification and activity is as follows:
31 March 2017£000
31 March 2016£000
Operating income analysed by classification and activity is as follows:
Recoveries from third parties for damage to the strategic road network 5,845 10,252
Fees and charges to external customers 56,483 12,436
Other income 11,697 14,111
Total operating income 74,025 36,799
31 March 2017 31 March 2016
Permanent staff£000
Other£000
Total£000
Total£000
Wages and salaries 142,044 26,469 168,513 137,972
Social security costs 15,002 - 15,002 10,774
Other pension costs 25,346 - 25,346 24,704
Total gross costs 182,392 26,469 208,861 173,450
Capitalised staff costs (74,487) (13,880) (88,367) (60,515)Less recoveries in respect of outward secondments (36) - (36) (80)
Total net costs 107,869 12,589 120,458 112,855
Permanent staff are those staff with a permanent employment contract with the Company. Other staff are those employed on temporary or short term contracts. Wages and salaries includes gross salaries, performance pay or bonuses, overtime, recruitment and
The increase in fees and charges income relates to third party funding of £26.7m in relation to the A5- M1 link (Dunstable Northern Bypass), a 2.8 mile dual carriageway which opened to traffic in May 2017.
retention allowances, ex-gratia payments and any other taxable allowances or payments as well as costs relating to agency, temporary and contract staff engaged by the Company on a contract to undertake a project or task.
Further information and disclosure under HM Treasury Managing public money can be found at Annex 1 (ii) of the accounts.
SeCtiOn 13 / Financial Statements

121
Chairm
an’s statem
entO
verviewC
hief Executive’s
reviewM
aking our netw
ork saferIm
proving
customer service
Delivering the R
oad Investm
ent Strateg
y O
ur p
eopleFinancial R
eviewP
rincipal risks and uncertainties
Our
governance
The Directors’
report
Auditors’
report
13SeCtiOnF
inancial S
tatements
Staff costs for the year include backdated salaries as well as lump sum payments, the obligation for which arose in the year.
Pensions
The Company makes contributions under the Civil Service Pension arrangements, its own Highways England Pension Plan and the Federated Pension Plan (see also note 2.19):
a) the Principal Civil Service Pension Scheme (PCSPS) is an unfunded multi-employer defined benefit scheme. The Company is unable to identify its share of the underlying assets and liabilities. A full actuarial valuation was carried out as at 31 March 2012. Details regarding the scheme can be found in the resource accounts of the Cabinet Office: Civil Superannuation (www.civilservice.gov.uk/pensions).
For 2016-17, employers’ contributions of £22.6m (2015-16 £23.9m) were payable to the PCSPS at one of four rates in the range 20.0% to 24.5% (2015-16 20.0% to 24.5%) of pensionable earnings, based on salary bands. The Scheme Actuary reviews employer contributions usually every four years following a full scheme valuation. The contribution rates are set to meet the cost of the benefits accruing during 2016-17 to be paid when the member retires and not the benefits paid during this period to existing pensioners.
Employees can opt to open a partnership pension account, a stakeholder pension with an employer contribution. Employer’s contributions of £173.1k (2015-16 £191.7k) were payable to one or more of the panel of three appointed stakeholder pension providers. Employer contributions are age-related and range from 8% to 14.75% (2015-16 3% to 12.5%). The Company also match’s employee contributions up to 3% of pensionable earnings. In addition, employer’s contributions of £5.6k (2015-16 £6.9k), 0.5% (2015-16 0.8% to September 2015 and then 0.5% from October 2015.) of pensionable pay, were payable to the PCSPS to cover the cost of the future provision of lump sum benefits on death in service or ill health retirement of these employees.
Contributions due to the partnership pension providers at the balance sheet date were £13.8k (2015-16 £15.9k). Contributions prepaid at that date were £nil (2015-16 £nil).
b) the Highways england Pension Plan is a defined contribution Group Personal Pension Plan administered by a third party provider. Highways England matches employee contributions to personal pension plans on a 2:1 basis, up to a maximum of 10% of gross salary. The default contributions are 5% (employee) and 10% (employer). In addition, life insurance cover is provided for members of the Plan at an average cost of 0.55% of gross salary. This meets our statutory obligation to provide a workplace pension under current legislation.
As this is a defined contribution scheme, Highways England incurs no liability for future pension costs of members of the Pension Plan. For 2016-2017, employers’ contributions of £2.5m (2015-16 £0.6m) were payable to the Plan.
c) the Federated Pension Plan is a master-trust defined benefit pension plan, administered by PAN Trustees. Employer contributions are set between 41.0% and 41.5% of pensionable earnings (dependent upon contractual employee contribution rates at the time of transfer). Employer’s contributions of £111.2k were paid to the FPP during 2016-17. The contribution rates were set based on an actuarial valuation of the scheme at inception in July 2016.

122
4.2. Average number of persons employed
The average number of full time equivalent persons employed during the year was as follows:
31 March 2017 31 March 2016
Permanent staff Other Total Total
Traffic officer staff 1,580 3 1,583 1,919Direct support to front line projects and service delivery 970 52 1,022 729
Staff engaged on capital projects 1,440 77 1,517 1,183
Average FTE persons employed 3,990 132 4,122 3,831
During the year ending 31 March 2017 the actual Full Time Equivalents (FTE) increased from 3,878 to 4,348.
Excluding VAT, the audit fee of the Comptroller and Auditor General was £225k (2015-16 £225k) in respect of these financial statements. Statutory audit costs are included in ‘Other’ above and also
5. Other expenses
Note 31 March 2017 £000
31 March 2016 £000
Information technology 33,661 30,242
Research and development expenditure 9,857 11,292
Rent, rates and building costs 10,533 9,701
Provisions provided for in year 14 12,296 9,058
Derecognition of SRN assets - 13,393
Rentals under operating leases 7,756 7,629
Travel and subsistence 6,655 6,226
Traffic management vehicle costs 5,021 6,050
Recruitment and training 4,635 3,392
Consultancy 2,193 1,870
Maintenance 3,655 1,534
Communication 1,397 1,039
Stationery 701 929
Professional fees 305 675
Other 11,417 8,639
Total 110,082 111,669
include the costs of the C&AG’s audit of the Dartford-Thurrock River Crossing Charging Scheme, expected to be £40k for 2016-17 (2015-16: £50k).
SeCtiOn 13 / Financial Statements

123
Chairm
an’s statem
entO
verviewC
hief Executive’s
reviewM
aking our netw
ork saferIm
proving
customer service
Delivering the R
oad Investm
ent Strateg
y O
ur p
eopleFinancial R
eviewP
rincipal risks and uncertainties
Our
governance
The Directors’
report
Auditors’
report
13SeCtiOnF
inancial S
tatements
From a corporation tax perspective, the Company is not trading with a view to a profit and the contributions received from DfT in relation to the Company’s principal activity of managing the UK road network are not chargeable to Corporation Tax. The Company’s tax liability for the year arises in respect of taxable profit attributable to capital disposals, rental income and interest income received.
At Summer Budget 2015, the Government announced legislation setting the Corporation Tax main rate (for all profits except ring fence profits) at 19% for the years starting 1 April 2017, 2018 and 2019 and at 18% for the year starting 1 April 2020. These changes were enacted at March 2016 and represent the rates expected by the Company to apply to its future taxable profits. Further changes announced at Budget 2016, if enacted, would reduce the same rate, for the year starting 1 April 2020, to 17%.
6. taxation
31 March 2017 £000
31 March 2016 £000
a) Analysis of the tax charge
Current taxationUK Corporation taxAdjustments in respect of prior years
119(272)
570-
(153) 570
b) Factors affecting the tax charge for the period
The effective rate of tax for the period is equal to the standard rate of Corporation tax in the UK of 20%
The differences are explained below:Net expenditure on ordinary activities (2,205,393) (1,996,521)Net expenditure on ordinary activities multiplied by standard rate of Corporation Tax in the UK of 20% (441,079) (399,304)Effect of:Incomes and expenditure not subject to Corporation tax 441,198 399,874
119 570

124
7. Property, plant and equipment 2016-17
Strategic road network
£000
Assets under construction
£000
Land
£000
Buildings
£000
Dwellings
£000
Plant and machinery
£000
Information technology
£000
Total
£000
Cost or valuationAt 1 April 2016 121,156,212 595,929 177,094 188,331 51,457 133,431 2,956 122,305,410
Capital additions 620,255 1,484,815 - - - - - 2,105,070
Write down - (509,672) - - - - - (509,672)
Disposals - - (77) (920) (932) (80) (1) (2,010)
Revaluation 4,567,017 - 4,668 (26,066) 15,539 9,287 - 4,570,445
Valuation adjustments (620,255) - 21 (261) - - - (620,495)
Derecognition (22,185) - - - - - - (22,185)
Impairment - charged to SOCNE - - (46) (2,141) (125) (152) - (2,464)
Transfers 522,648 (547,044) 2,947 10,657 2,263 5,465 394 (2,670)
Reclassifications to assets held for sale - - (3,192) (324) (6,919) (267) - (10,702)
At 31 March 2017 126,223,692 1,024,028 181,415 169,276 61,283 147,684 3,349 127,810,727
Strategic road network
£000
Assets under construction
£000
Land
£000
Buildings
£000
Dwellings
£000
Plant and machinery
£000
Information technology
£000
Total
£000
Depreciation and impairment
At 1 April 2016 13,327,336 - - 105,118 - 89,960 663 13,523,077
Disposals - - - (558) - (58) - (616)
Charged in year 1,163,319 - - 5,840 - 12,761 1,101 1,183,021
Valuation adjustments (620,255) - - (199) - - - (620,454)
Derecognition (5,306) - - - - - - (5,306)
Revaluation 659,358 - - (17,667) - 8,555 - 650,246
Reclassifications to assets held for sale - - - 25 - (25) - -
At 31 March 2017 14,524,452 - - 92,559 - 111,193 1,764 14,729,968
Strategic road network
£000
Assets under construction
£000
Land
£000
Buildings
£000
Dwellings
£000
Plant and machinery
£000
Information technology
£000
Total
£000
net book valueAt 1 April 2016 107,828,876 595,929 177,094 83,213 51,457 43,471 2,293 108,782,333
At 31 March 2017 111,699,240 1,024,028 181,415 76,717 61,283 36,491 1,585 113,080,759
SeCtiOn 13 / Financial Statements

125
Chairm
an’s statem
entO
verviewC
hief Executive’s
reviewM
aking our netw
ork saferIm
proving
customer service
Delivering the R
oad Investm
ent Strateg
y O
ur p
eopleFinancial R
eviewP
rincipal risks and uncertainties
Our
governance
The Directors’
report
Auditors’
report
13SeCtiOnF
inancial S
tatements
Strategic road network
£000
Assets under construction
£000
Land
£000
Buildings
£000
Dwellings
£000
Plant and machinery
£000
Information technology
£000
Total
£000
Cost or valuationAt 1 April 2015 123,393,543 379,323 163,062 179,143 48,964 121,178 96 124,285,309
Capital additions 576,574 1,341,054 - - - - - 1,917,628
Write down - (857,250) - - - - - (857,250)
Disposals - - (1,148) (5,177) 481 (1,312) - (7,156)
Revaluation (2,456,130) - 10,809 16,684 5,846 4,517 - (2,418,274)
Valuation adjustments (576,574) - (177) - - (2,107) - (578,858)
Derecognition (17,668) - - - - - - (17,668)
Impairment - charged to SOCNE - - (636) (6,084) (209) (45) - (6,974)
Impairment - charged to revaluation reserve
(7,655) - - (1,832) - - - (9,487)
Transfers 244,122 (267,198) 228 6,276 - 11,200 2,860 (2,512)
Reclassifications to assets held for sale - - 4,956 (679) (3,625) - - 652
At 31 March 2016 121,156,212 595,929 177,094 188,331 51,457 133,431 2,956 122,305,410
Strategic road network
£000
Assets under construction
£000
Land
£000
Buildings
£000
Dwellings
£000
Plant and machinery
£000
Information technology
£000
Total
£000
Depreciation and impairment
At 1 April 2015 13,804,616 - - 103,095 - 82,054 96 13,989,861
Disposals - - - (3,134) - (1,282) - (4,416)
Impairment - - - (5,456) - (1) - (5,457)
Charged in year 897,941 - - 5,220 - 8,510 567 912,238
Valuation adjustments (576,574) - - - - (2,107) - (578,681)
Derecognition (4,274) - - - - - - (4,274)
Revaluation (794,373) - - 5,393 - 2,786 - (786,194)
At 31 March 2016 13,327,336 - - 105,118 - 89,960 663 13,523,077
Strategic road network
£000
Assets under construction
£000
Land
£000
Buildings
£000
Dwellings
£000
Plant and machinery
£000
Information technology
£000
Total
£000
net book valueAt 1 April 2015 109,588,927 379,323 163,062 76,048 48,964 39,124 - 110,295,448
At 31 March 2016 107,828,876 595,929 177,094 83,213 51,457 43,471 2,293 108,782,333
2015-16

126
7.1. Strategic Road network (SRn)
The SRN consists of roads, land, structures, and technology which form a single integrated network. The SRN is unique and a market value is not available, therefore it is valued using depreciated replacement cost.
Roads
£000
Land
£000
Structures
£000
Technology
£000
Total
£000
Cost
At 1 April 2016 68,145,066 11,642,838 38,429,600 2,938,708 121,156,212
Capital additions 473,753 - 146,501 - 620,255
Valuation adjustments (473,753) - (146,501) - (620,255)
Revaluation 1,939,443 890,896 1,322,350 414,328 4,567,017
Derecognition (2,658) - (12,374) (7,153) (22,185)
Transfers 245,939 15,282 165,135 96,292 522,648
At 31 March 2017 70,327,790 12,549,016 39,904,711 3,442,175 126,223,692
Accumulated depreciation
At 1 April 2016 2,037,894 - 9,910,499 1,378,943 13,327,336
Full year charge 636,538 - 390,419 136,362 1,163,319
Valuation adjustments (473,753) - (146,501) - (620,255)
Revaluation 50,024 - 295,925 313,409 659,358
Derecognition (117) - (3,230) (1,959) (5,306)
At 31 March 2017 2,250,584 - 10,447,112 1,826,755 14,524,452
Net book value at 1 April 2016 66,107,172 11,642,838 28,519,101 1,559,765 107,828,876
Net book value at 31 March 2017 68,077,206 12,549,016 29,457,599 1,615,420 111,699,240
Gross cost
a) Capital additions The Company invested £620.3m (2015-16 £576.6m) during the year on capital renewal schemes. Renewal schemes replace the service potential of the SRN and is therefore deemed capital expenditure. Renewal schemes are usually small (less than £10m) and usually completed within 6 to 18 months. Significant additions during the year include the continuing work on the M3 junctions 2-4a of £27.8m, M5 Oldbury waterproofing of £18.5m and M1 junctions 20-21 resurfacing of £14.2m.
b) Valuation adjustments The valuation adjustments reduction of £620.2m (2015-16 £576.6m) within gross cost and accumulated depreciation is the value of materials that is removed from the SRN when they are replaced as a result of the capital
renewal programme. These materials are removed at the end of their service life so are derecognised from the gross cost and the accumulated depreciation of the roads and structures elements of the SRN.
c) Revaluation The SRN was revalued upwards by £3.9bn (2015-16: £1.7bn downwards revaluation). This comprises:
� ROCOS indexation for the year moved upwards from 238 to 243, an increase of 2.1% (2015-16 decrease of 2.5%). As a result, there was £2.8bn upwards (2015-16 £2.7bn downwards) movement in roads, structures and technology valuations. There has also been an increase in the lands indices which resulted in an upward revaluation of land amounting to £901.7m (2015-16 £788.1m);
SeCtiOn 13 / Financial Statements

127
Chairm
an’s statem
entO
verviewC
hief Executive’s
reviewM
aking our netw
ork saferIm
proving
customer service
Delivering the R
oad Investm
ent Strateg
y O
ur p
eopleFinancial R
eviewP
rincipal risks and uncertainties
Our
governance
The Directors’
report
Auditors’
report
13SeCtiOnF
inancial S
tatements
� Revaluation includes an increase of £167.6m (2015-16 £219.6m) due to changes in the measurement of elements of the SRN; this is identified as dimensional variance.
This combines with other items, including writedown of AUC, to create a net remeasurement through Other Comprehensive Expenditure of an increase of £3.4bn (2015-16 a decrease of £2.5bn)
Net Gain / (loss) on remeasurement of property, plant and expenditure recognised in other comprehensive expenditure
SRN
£000
AUC
£000
Other
£000
Total
£000
Revaluation – indexation 3,847,250 - 12,540 3,859,790
AUC writedown - (509,672) - (509,672)
Revaluation – dimensional variance 60,409 - - 60,409
3,907,659 (509,672) 12,540 3,410,527
d) Derecognition Disposal and derecognition for the year was £16.9m (2015-16 13.4m). This relates to portal gantries removed as part of the ongoing Smart motorway scheme upgrade and a number of technology equipment removed from the SRN as being beyond economic repair. During the year, a transfer from the revaluation reserve to the capital contribution fund of £6.1m was made, to reflect the cumulative revaluation attributed to the assets since it was added to the SRN.
Depreciation
The depreciation charge over the year to 31 March 2017 was £1,163.3m (2015-16 £897.9m). This consists of:
e) Road depreciation – the decrease in the economic value of the road surface was £636.5m (2015-16: £364.5m), this is made up of:
� Renewals spend of £473.4m (2015-16: £421.7m) is used as the basis of an initial depreciation charge, based on the assumption that the network is maintained in a roughly steady state;
� Analysis of road condition surveys provides evidence on the actual condition of the network which allows for more precise depreciation of the road surface, leading this year to a charge of £163.1m (2015-16: credit of £57.2m).
f) Structures depreciation – the SRN structures depreciation charge for the year was £390.4m (2015-16: £410.7m) which consists of:
� £243.9m (2015-16: £255.8m) for the depreciation of the structures element of the SRN in line with the policy in note 2.6;
� £146.5m (2015-16: £154.9m) to reflect more accurately the deterioration associated with those cyclically renewable elements, using the in-year spend on current renewals work on the basis that the network is maintained in a roughly steady state.
g) technology depreciation – £136.4m (2015-16: £122.8m) depreciation charge for the economic decrease in value of technology on the SRN.
7.2. Assets under construction (AUC)
Capital expenditure in relation to partly built improvements in the SRN is classified as assets under construction.
a) Capital additions During the year, the Company invested £1,485.2m (2015-16 £1,341.0m) in a number of ongoing road schemes. This includes £540.1m for SR10 schemes, £290.2m for Smart motorway schemes, £123.7m for SR13 Regional Investment

128
Programme (RIP) schemes and £193.7m for complex schemes.
During the year, the Company spent money on preparing a number of renewal schemes for later works. These renewal schemes are classified as capital renewal ‘Pipeline schemes’ as the start of works date will not take place until after 1 April 2017. Pipeline scheme expenditure is reported as asset under construction (AUC) and not as an addition to in-year SRN valuation. Cumulative pipeline scheme expenditure in AUC is £36.2m (2015-16 £140m).
b) AUC transfers The Company transferred £522.6m (2015-16 £267.2m) of completed roads, structures and technology equipment from AUC to the SRN at depreciated replacement cost during the year.
c) Write-downs The SRN valuation is based on standard cost and all additions are added at standard cost. The difference between the actual cost of construction and the standard cost valuation of the SRN is defined as write-down. For the year, the write-down was £509.7m (2015-16 £857.2m) which represents 34% (2015-16 66%) of the amount invested for the full year. This large reduction is due to the number of schemes that are opened for traffic in the year, the value of which is removed from AUC before the write down is calculated. The write down includes
£237.1m for SR10 schemes, £242.4m for Smart motorway schemes, and £27.7m for SR13 RIP schemes. This write down has been charged against the revaluation reserve. (Also refer to note 2.6h of the accounting policies)
7.3. Other property plant and equipment
a) Land Land consists of surplus land and land reserved for current and future road schemes. As at 31 March 2017 this includes commercial land £38.0m (2015-16 £38.0m); motorway service areas land £77.9m (2015-16 £77.9m) and motorway maintenance compounds land £26.9m (2015-16 £26.4m).
b) Buildings As at 31 March 2017 the net value of buildings includes motorway maintenance compounds £52.0m (2015-16 £40.4m), regional control centres £20.2m (2015-16 £14.5m), and commercial buildings at Dartford £10.1m (2015-16 £26.4m).
c) Dwellings As at 31 March 2017 the value of dwellings is £61.3m (2015-16 £51.5m), these are dwellings acquired under CPO as part of a scheme to enable construction.
This includes dwellings relating to the following schemes:
31 March 2017
£m
31 March 2016
£m
M42 junction 3 A7 widening 8.8 8.2
A57/A628 Mottram, Hollingworth & Tintwhistle 6.2 5.7
A3 Hindhead improvement 7.3 5.5
A21 Flimwell to Robertsbridge improvement 7.5 4.3
M4 junction 4B-8/9 widening 5.3 3.6
SeCtiOn 13 / Financial Statements

129
Chairm
an’s statem
entO
verviewC
hief Executive’s
reviewM
aking our netw
ork saferIm
proving
customer service
Delivering the R
oad Investm
ent Strateg
y O
ur p
eopleFinancial R
eviewP
rincipal risks and uncertainties
Our
governance
The Directors’
report
Auditors’
report
13SeCtiOnF
inancial S
tatements
7.4. Analysis of land and buildings, excluding dwellings is as follows:
31 March 2017
£000
31 March 2016
£000
Freehold land and buildings 248,782 251,895
Short leasehold buildings (less than 50 years) 9,350 8,412
Total 258,132 260,307
8. intangible assets
The Company has a number of bespoke databases that are fully amortised but continue to provide economic benefits. The databases will be updated or replaced at a future date. The significant in-house databases by cost value are; ERP system
(based on Oracle) – £26m (2015-16 £26m), ESDAL (abnormal loads management software) – £10m (2015-16 £10m) and HAPMS (pavement management system) – £10m (2015-16 £10m).
Software licences£000
Development expenditure£000
Total£000
Cost or valuation
Balance transferred in at 1 April 2015 6,417 75,574 81,991
Transfers from AUC 2,471 41 2,512
At 31 March 2016 8,888 75,615 84,503
Amortisation
Balance transferred in at 1 April 2015 6,417 75,574 81,991
Charged in year 494 4 498
At 31 March 2016 6,911 75,578 82,489
net book value at 31 March 2016 1,977 37 2,014
Cost or valuation
At 1 April 2016 8,888 75,615 84,503
Disposals - (41) (41)
Transfer from AUC 2,670 - 2,670
At 31 March 2017 11,558 75,574 87,132
Amortisation
At 1 April 2016 6,911 75,578 82,489
Charged in year 2,585 1 2,586
Disposals - (5) (5)
At 31 March 2017 9,496 75,574 85,070
net book value at 31 March 2017 2,062 - 2,062

130
9. Assets classified as held for sale
Land and buildings£000
Dwellings£000
Total£000
Balance transferred in at 1 April 2015 10,900 3,737 14,637
Disposals (1,394) (2,431) (3,825)
Impairment - charged to SOCNE (698) (507) (1,205)Reclassifications (to) / from property, plant and equipment (4,277) 3,625 (652)
At 31 March 2016 4,531 4,424 8,955
At 1 April 2016 4,531 4,424 8,955
Valuation adjustments 42 - 42
Disposals (609) (1,908) (2,517)
Impairment - charged to SOCNE (381) (435) (816)Reclassifications (to) / from property, plant and equipment 3,783 6,919 10,702
At 31 March 2017 7,366 9,000 16,366
Disposals in the year ended 31 March 2017 include the following sales:
� Crossacres, Honiton, Devon;
� Land at Bescot Crescent, Walsall, West Midlands;
� Arnesby Avenue, Sale, Gtr. Manchester;
� Darlaston County Kennels, Stone, Staffordshire; and
� Land at Littlefair Road, Hull.
10. inventories
31 March 2017£000
31 March 2016£000
Communication/electrical equipment for the strategic road network 23,672 20,064
Salt 10,876 10,566
Other 756 968
35,304 31,598
The communication/electrical equipment inventory include variable messaging signs which are extensively used in the ongoing roll-out of Smart motorway schemes across the strategic road network.
The Company’s salt stock includes reserves held for the English Local Highways Authorities. This reserve is only for use as a last resort in the event of normal domestic salt supply channels being unable to meet the demands of Local Highways Authorities.
The salt is stored to protect it from leaching from rainfall. However, over time salt deteriorates and therefore the Company’s policy is to re-measure the holding each annum, to reflect the loss from deterioration during the year. During the year the salt stock increased as a result of the launch of the asset delivery approach to maintenance in the East Midlands.
SeCtiOn 13 / Financial Statements

131
Chairm
an’s statem
entO
verviewC
hief Executive’s
reviewM
aking our netw
ork saferIm
proving
customer service
Delivering the R
oad Investm
ent Strateg
y O
ur p
eopleFinancial R
eviewP
rincipal risks and uncertainties
Our
governance
The Directors’
report
Auditors’
report
13SeCtiOnF
inancial S
tatements
11. trade and other receivables
31 March 2017£000
31 March 2016£000
Amounts falling due within one year
Trade receivables 4,526 41,995
Deposits and advances 4,874 8,825
VAT 120,756 120,038
Prepayments and accrued income 26,464 7,506
Other receivables 36 1,258
156,656 179,622
Amounts falling due after more than one year
Prepayments and accrued income 19,139 9,784
19,139 9,784
Total receivables 175,795 189,406
12. Cash
£000
Balance transferred in at 1 April 2015 -
Net change in cash 22,922
At 31 March 2016 22,922
the following balances at 31 March 2016 were held at:
Commercial banks 781
Government Banking Service 22,141
At 31 March 2016 22,922
At 1 April 2016 22,922
Net change in cash 16,524
At 31 March 2017 39,446
the following balances at 31 March 2017 were held at:
Commercial banks 1,372
Government Banking Service 38,074
At 31 March 2017 39,446
The Company does not hold any cash equivalent balances.

132
13. trade and other payables
Note 31 March 2017 £000
31 March 2016£000
Amounts falling due within one year
Taxation and social security 7,106 6,402
Trade payables 35,819 45,704
Accruals and deferred income 618,226 495,817
Capital element under on balance sheet PFI contracts 18.2 73,898 74,410
Other payables 31,917 29,391
766,966 651,724
Amounts falling after more than one year
Capital element under on balance sheet PFI contracts 18.2 1,527,403 1,596,635
Deferred income 19,611 15,575
Retentions 147 43
1,547,161 1,612,253
Total payables 2,314,127 2,263,977
14. Provisions
Land and property
acquisition£000
Bridge strengthening
£000
Tunnels
£000
Early retirement
pension £000
Other
£000
Total
£000
Balance transferred in at 1 April 2015
121,180 23,139 2,487 1,051 5,205 153,062
Provided in the year 34,265 50 - 600 3,701 38,616Provisions not required written back (11,038) - - (266) (224) (11,528)
Provisions utilised in the year (27,559) (19,074) (1,145) (528) (2,743) (51,049)
At 31 March 2016 116,848 4,115 1,342 857 5,939 129,101
At 1 April 2016 116,848 4,115 1,342 857 5,939 129,101
Provided in the year 90,866 7 - 6 3,288 94,167Provisions not required written back (23,830) (7) (1,121) (612) - (25,570)
Provisions utilised in the year (31,605) (3,883) (221) (94) (2,727) (38,530)
At 31 March 2017 152,279 232 - 157 6,500 159,168
Analysis of expected timing of flows
Not later than one year 48,820 232 - 55 4,973 54,080Later than one year and not later than five years 103,459 - - 102 884 104,445
Later than five years - - - - 643 643
152,279 232 - 157 6,500 159,168
SeCtiOn 13 / Financial Statements

133
Chairm
an’s statem
entO
verviewC
hief Executive’s
reviewM
aking our netw
ork saferIm
proving
customer service
Delivering the R
oad Investm
ent Strateg
y O
ur p
eopleFinancial R
eviewP
rincipal risks and uncertainties
Our
governance
The Directors’
report
Auditors’
report
13SeCtiOnF
inancial S
tatements
31 March 2017£000
31 March 2016£000
Provisions provided in year 94,167 38,616
Less provisions written back (25,570) (11,528)
Net provisions expenditure 68,597 27,088
Split as follows
Resource expenditure 3,343 4,103
Capital expenditure 65,254 22,985
68,597 27,088
Provision for doubtful debt 1,939 2,929
Provision for slow moving stock 7,014 2,026
Other provisions provided for in year 3,343 4,103
Total provision charge to the SoCNE 12,296 9,058
Provisions provided in year and not required written back reconciles as follows:
Land and property acquisition
Land and property acquisition provisions relate principally to the estimated cost of planning blight, discretionary and compulsory acquisition of property and compensation for property owners arising from physical construction of a road scheme. It may take several years from the announcement of a scheme to completion of the road and final settlement of all liabilities.
Bridge strengthening
The provision is predominately for work required to strengthen the Chelmer Viaduct and River Bridge to comply with legal minimum requirements, as established by European Community legislation and authoritative statements by Ministers in Parliament. The provisions that have been recorded represent the directors’ best
estimate of the expenditure required to settle the obligation, often with the benefit of technical advice.
Other
Other liabilities include those to third parties who have suffered damage or injury as a result of the road network being damaged and are entitled to submit a claim to Highways England for compensation. A provision is made which estimates the value of claims received as at 31 March 2017 that will require settlement by Highways England.
This also includes pension liabilities which relate to former staff that left employment before the formal retirement age of 60. Highways England is responsible for making payments to the pension plan until their retirement age.

134
15. Financial instrumentsIFRS7 requires minimum disclosures about the nature and extent of credit risk, liquidity risk and market risk that the Company faces in undertaking its activities. Due to the largely non-trading nature of its activities and the way in which government entities are financed, the Company is not exposed to the degree of financial risk faced by many business entities. Moreover, financial instruments play a much more limited role in creating or changing risk than would be typical of the listed companies to which IFRS 7 mainly applies. The Company has very limited powers to borrow or invest
surplus funds. Financial assets and liabilities are generated by day-to-day operational activities and are not held to change the risks facing the Company in undertaking its activities. Nevertheless, the Company’s Board of Directors has overall responsibility for the establishment and oversight of the Company’s risk management framework. The core operations of the Company are resourced largely from funds voted by Parliament and so has limited dependency on revenues from customers. This substantially reduces many financial risks.
15.1. Credit risk
Credit risk is the risk of suffering financial loss, should any of the Company’s customers or counterparties fail to fulfil their contractual obligations to the Company. Some of the Company’s customers and counterparties are other public sector organisations. No credit risk arises from these organisations since the receivables are backed by the government. For those customers and counterparties that are not public sector organisations, the Company has policies and procedures in place to ensure credit risk is kept to a minimum.
The carrying amount of financial assets represents the maximum credit risk exposure. Receivables are impaired on the basis of either ageing by receivable type or where a specific receivable is deemed to be recoverable or irrecoverable, based on the information available.
The following table provides an overview of the ageing profile of the financial assets comprising trade and other receivables.
31 March 2017£000
31 March 2016£000
Ageing of financial assets
Neither past due nor impaired 173,288 186,607
Past due 1-30 days 817 272
Past due 31-60 days 254 340
Past due 61-90 days 195 243
Past due >90 days 1,241 1,944
175,795 189,406
SeCtiOn 13 / Financial Statements

135
Chairm
an’s statem
entO
verviewC
hief Executive’s
reviewM
aking our netw
ork saferIm
proving
customer service
Delivering the R
oad Investm
ent Strateg
y O
ur p
eopleFinancial R
eviewP
rincipal risks and uncertainties
Our
governance
The Directors’
report
Auditors’
report
13SeCtiOnF
inancial S
tatements
15.2. Liquidity risk
Liquidity risk is the risk that the company is unable to meet its obligations when they fall due. The Company’s approach to managing liquidity is to ensure, as far as possible, that it will always have sufficient liquidity to meet its liabilities when due, under both normal and stressed condition. The Company’s policy is to determine its liquidity requirements by the use of short-term cash flow forecasts. These forecasts are supplemented by the Government’s long term funding commitment under the Road Investment Strategy.
The company believes that its contractual obligations, including those shown in commitments and contingencies in notes 17,18, 19 and 20, can be met in the short term from existing cash and other current assets, and the funding it receives annually that is voted by Parliament. The longer term needs are met from the funding commitment provided by the Government through the Road Investment Strategy.
31 March 2017 31 March 2016
Contractual cash flows Not later than one year
£000
Later than one year and not later than five
£000
Later than five years
£000
Total
£000
Total
£000
non-derivative financial liabilities
Trade payables 661,151 - - 661,151 547,923Finance lease liabilities (PFI's) 73,898 297,516 1,229,887 1,601,301 1,671,045
Other non-interest bearing liabilities 31,917 19,758 - 51,675 45,009
766,966 317,274 1,229,887 2,314,127 2,263,977
15.3. Market risk
Market risk is the risk that changes in market prices, such as foreign exchange rates and interest rates will affect the Company’s income or the value of its holdings of financial instruments. The objective of market risk management is to manage and control market risk exposures where these are considered to materially impact the business and operations of the Company.
15.3.1. Interest rate risk
This is the risk that the Company will suffer financial loss due to interest rate fluctuations. The Company’s financial assets and its financial liabilities carry nil or fixed rates of interest, therefore the Company is not exposed to significant interest rate risk.
15.3.2. Exchange rate risk
This is the risk that the Company will suffer financial loss due to changes in exchange rates. The Company undertakes a small number of foreign currency transactions primarily in Euro and is not exposed to significant exchange risk. Given the quantum of transactions in foreign currency, the Company has assessed that a strengthening or weakening of Euro will not have any significant impact on the financial statements.
15.3.3. Fair values
For PFI obligations not carried at fair value, there is no active market for them, and it is not possible to make a reliable estimate of fair value. The Company has no intention of disposing of these obligations. Accordingly, it has not disclosed a fair value for these obligations. For other financial assets and liabilities, the carrying value is a reasonable approximation of fair value.

136
The Company’s capital commitments as at 31 March 2017 include the following significant project commitments:
� £1,144.7m relating to the A14 Cambridge to Huntingdon; this is a major upgrade to the A14 between the A1 and North Cambridge, which widens the road to three lanes, providing a new bypass around Huntingdon. This will create distributor roads for local traffic and remodelling key junctions along the route. This scheme supports a number of local developments.
� £656.8m relating to the M4 junctions 3-12; upgrading the M4 to a Smart motorway between junction 3 (Uxbridge) and junction 12 (west of Reading), linking Reading and Heathrow.
� £142.3m relating to M1 junctions 16-19 improvements; upgrading the M6 to a Smart motorway between junction 16 (Stoke) and junction 19 (Knutsford) in Cheshire. Coupled with other improvements to the M6 and M1, this forms the northern end of the ‘smart spine’ linking the North West and London.
� £83.2m relating to M1 junctions 24-25; upgrading the M1 to a Smart motorway between junction 24 and junction 25 in the East Midlands.
� £60.8m relating to the Manchester Smart motorways and installation of technology on the M60 between junction 8 and junction 18, plus the introduction of Smart motorway with all-lane running between M62 junction 18 and junction 20.
� £54.6m relating to A19/A1058 Coast Road; replacement of the junction between the A19 and the A1058, allowing free-flowing movement for traffic. This provides uninterrupted access to the northern end of the recently-widened Tyne Tunnel. Together with the A19 Testos, this scheme raises the A19 to expressway standard from Yorkshire to north Newcastle.
� £43.8m relating to M1 junctions 19-16 advance works; upgrading the M1 to a Smart motorway between junction 13 (Milton Keynes South) and junction 19 (M6 Catthorpe interchange). Coupled with other improvements, this is an important link in the ‘smart spine’ linking London and the North West.
31 March 2017£000
31 March 2016£000
Contracted capital commitments not otherwise included in these accounts
Property, plant and equipment 2,450,166 1,149,454
16. Capital commitments
SeCtiOn 13 / Financial Statements

137
Chairm
an’s statem
entO
verviewC
hief Executive’s
reviewM
aking our netw
ork saferIm
proving
customer service
Delivering the R
oad Investm
ent Strateg
y O
ur p
eopleFinancial R
eviewP
rincipal risks and uncertainties
Our
governance
The Directors’
report
Auditors’
report
13SeCtiOnF
inancial S
tatements
17. Commitments under leasesThe Company has the following minimum future lease commitments under non-cancellable operating leases:
Land and buildings31 March 2017
£000
Land and buildings31 March 2016
£000
Obligations under operating leases comprise
Not later than one year 8,852 7,386
Later than one year and no later than five years 33,544 29,169
Later than five years 31,001 30,834
73,397 67,389
The total payments under on balance sheet PFI contracts for which the Company is committed are given in the tables below, analysed according to the year in which the commitment expires.
The substance of the PFI contract under IFRIC 12 is that the Company has a finance lease, with the asset being recognised as a non-current asset of the Company. Payments under on balance sheet PFI contracts comprise; a capital element, imputed finance lease charge and service charges.
18. Commitments under Private Finance initiatives
Contract start date
Duration Years
Initial capital value
£m
Closing balance obligation
£m
Service charge commitment
£m
M40 Denham to Warwick 06/01/1997 30 71.2 34.7 385.2
A19 Dishforth to Tyne Tunnel DBFO 24/02/1997 30 47.8 22.5 387.0
A30/A35 Exeter to Bere Regis 01/10/1996 30 135.1 64.5 11.5
A1 (M) Alconbury to Peterborough 01/04/1996 30 192.3 82.5 114.6
A419/A417 Swindon to Gloucester 01/04/1996 30 104.6 48.4 118.0
A50/A564 Stoke to Derby Link 01/07/1996 30 37.3 17.3 123.5
M1-A1 Yorkshire link 01/07/1996 30 395.4 183.0 22.6
A69 Carlisle to Newcastle 01/04/1996 30 19.6 9.1 83.9
A1(M) Darrington to Dishforth 07/05/2003 33 236.4 190.9 568.5
A249 Iwade to Queenborough 01/04/2004 30 92.8 72.5 115.3
M25 London Orbital Motorway contract 01/05/2009 30 906.0 871.2 6,005.1
National Roads Telecommunications Services 01/06/2007 10 27.2 4.7 258.2
2,265.7 1,601.3 8,193.4
The Company has entered into the following on balance sheet PFI contracts for the design, build, finance and operation of sections of the SRN:

138
31 March 2017£000
31 March 2016£000
Not later than one year 192,353 197,590
Later than one year and not later than five years 750,745 750,745
Later than five years 2,233,437 2,421,124
3,176,535 3,369,459
Less interest element (1,575,234) (1,698,414)
1,601,301 1,671,045
18.1. imputed finance lease charges under on balance sheet PFi contracts comprise:
18.3. interest element under on balance sheet PFi contracts comprise:
31 March 2017£000
31 March 2016£000
interest commitments
Not later than one year 118,454 123,180
Later than one year and not later than five years 425,928 445,720
Later than five years 1,030,852 1,129,514
1,575,234 1,698,414
The total amount charged in the SoCNE in respect of interest on balance sheet PFI transactions for the year to 31 March 2017 was £123.2m (2015-16 £127.6m).
31 March 2017£000
31 March 2016£000
Not later than one year 73,898 74,410
Later than one year and not later than five years 297,516 305,025
Later than five years 1,229,887 1,291,610
1,601,301 1,671,045
18.2. Capital element under on balance sheet PFi contracts comprise:
The total amount charged in the SoCNE in respect of the capital element of the PFI transactions for the year to 31 March 2017 was £69.7m (2015-16 £70.0m).
31 March 2017£000
31 March 2016£000
Not later than one year 340,702 327,294
Later than one year and not later than five years 1,372,667 1,366,311
Later than five years 6,480,025 6,745,260
8,193,394 8,438,865
18.4. Details of the minimum service charge analysed according to the period in which the commitment expires:
The total amount charged in the SoCNE in respect of the service element of on balance sheet PFI transactions for the year to 31 March 2017 was £308.0m (2015-16 £318.5m).
SeCtiOn 13 / Financial Statements

139
Chairm
an’s statem
entO
verviewC
hief Executive’s
reviewM
aking our netw
ork saferIm
proving
customer service
Delivering the R
oad Investm
ent Strateg
y O
ur p
eopleFinancial R
eviewP
rincipal risks and uncertainties
Our
governance
The Directors’
report
Auditors’
report
13SeCtiOnF
inancial S
tatements
19.1.1. Land and property acquisition
Contingent liabilities relating to land and property acquisitions arise from the following sources:
Acquisition and blight
The construction of any major road construction scheme invariably requires the acquisition of property. The Highways Act 1980 gives the Secretary of State for Transport the power to make compulsory purchases. Possible purchases for schemes in the major projects programme are included as contingent liabilities until the point when Compulsory Purchase Orders are made and a reliable estimate is available.
In addition, road schemes, when announced, can adversely impact surrounding property values and The Town and Country Planning Act 1990 provides for individuals to claim compensation for the blight of their properties. Possible blight costs for schemes in the major projects programme are included as contingent liabilities until the point when Blight Notices are issued and a reliable estimate is available.
Compensation for loss after construction
Home owners can apply for compensation for lost value under Part 1 of The Land Compensation Act 1973, where property, which was not acquired for a road scheme, has lost value because of physical factors, including noise, light, dirt, smell and vibration associated with the new or improved roads.
Claims become inevitable once the construction phase is started and the Company accounts for the constructive obligation as a provision. A legal obligation crystallises one year after the road has opened for traffic when homeowners are entitled to lodge claims that are normally settled in less than a year. Such obligations are treated as contingent liabilities until the start of construction work.
Claims in dispute
As at the SoFP date, the Company is involved in a number of property cases that have been referred to the Lands Tribunal for resolution or are otherwise in dispute. The Company has provided for, in its accounts, management’s best estimate of the outcome of these cases although this may be exceeded by the actual outcome.
19.1.2. Engineering and construction services
The Company is involved in a number of arbitration cases in respect of contractual claims for engineering and construction services and has provided for the best estimates of the outcome of these cases, although this may be exceeded by the actual outcome.
19.1.3. Other
Other contingent liabilities includes partial claims from third parties who have suffered damage or injury as a result of the SRN being damaged, and a number of arbitration cases in respect of contractual
19. Contingent liabilities and assets
19.1. Contingent liabilities disclosed under iAS 37
31 March 2017£000
31 March 2016£000
the Company has the following quantifiable contingent liabilities:
Land and property acquisition 672,795 278,754
Engineering and construction services 3,000 3,400
Other 7,399 8,423
683,194 290,577

140
claims for engineering and construction services. These claims are estimated based on prior years’ experience.
The Historic Estate assets which are held by the Secretary of State for Transport, together with any related contingent liabilities, are included in the DfT’s accounts.
19.2. Contingent assets
The Company seeks to dispose of property surplus to requirement promptly at the best price reasonably obtainable in the market. Sometimes there is uncertainty over potential use of the property and planning permissions, and in these cases the Company may decide to sell the property at the underlying land value.
In these circumstances, the Company will incorporate a “claw back” clause into the terms of the sale, under which it is able to reclaim a percentage of any increase in value arising from a grant of planning permission, for a given term after the sale has been agreed.
As it is not known for some years after the initial disposal whether any further income will arise the Company has an unquantified contingent asset relating to future values.
The Company also has a contingent asset with Midland Expressway Ltd (MEL) in relation to refinancing and developments of the M6 toll road. MEL has an obligation to contribute up to a maximum of £70.0m towards a road enhancement project which would provide a link between the M54 to the M6 Toll. The commitment amount is indexed according to the Road and Construction Tender Index from May 2006.
The Company is an arm’s length body of the Department for Transport. The Department is regarded as a controlling related party. The Company’s primary source of funding is through the DfT based on approved expenditure that is voted on by Parliament. The total amount of funding received from the DfT for the year ended 31 March 2017 amounted to £3.0bn (2015-16 £3.1bn). During the year the Company had a significant number of other transactions with the Department £152.8m (2015-16 £113.1m). In addition the Company had transactions with other government departments and agencies,
HM Revenue and Customs £16.7m (2015-16 £6.6m), Government Legal Department £3.3m (2015-16 £1.3m), Valuation Office Agency £1.8m (2015-16 £1.1m), and a number of Local Authorities. The Company has a contract with Lex Autolease Ltd whose ultimate parent company is Lloyds Banking Group, in which the government held an interest at 31 March 2017. As per Note 22, the Company draws monies from escrow accounts held at Lloyds Bank. No board member, key manager or other related parties have undertaken any material transaction with the Company during the year. There are no conflicts of interest to report.
20. Related party transactions
SeCtiOn 13 / Financial Statements

141
Chairm
an’s statem
entO
verviewC
hief Executive’s
reviewM
aking our netw
ork saferIm
proving
customer service
Delivering the R
oad Investm
ent Strateg
y O
ur p
eopleFinancial R
eviewP
rincipal risks and uncertainties
Our
governance
The Directors’
report
Auditors’
report
13SeCtiOnF
inancial S
tatements
31 March 2017£
31 March 2016£
Authorised
10 Ordinary shares at £1 each 10 10
Allotted, called up and fully Paid
10 Ordinary shares at £1 each 10 10
21. equity shares
23. events after the reporting periodThere have been no events since the 31 March 2017 to the date the accounts were authorised for issue which would affect the understanding of these accounts.
International Accounting Standards require Highways England to disclose the date on which the accounts are authorised for issue. This is the date that the certified
accounts are dispatched by Highways England’s management to the Secretary of State for Transport. The Accounting Officer has authorised these accounts to be issued on the date they were certified by the Comptroller and Auditor General.
31 March 2017£000
31 March 2016£000
Lloyds Bank Escrow Accounts 1,103 1,143
Lloyds Bank Euro Account - 63
1,103 1,206
22. third party assetsThe Company, under Section 278 of the Highways Act 1980, receives payment in advance of works. The work completed on behalf of the developer relates to developments which may have an impact on the SRN. The amounts received are paid into interest bearing Escrow Accounts at Lloyds Bank. Monies are drawn down from the Escrow accounts by the Company as work progresses.
The Company holds a Lloyds Bank Euro account where funding from the EU is deposited and subsequently distributed to the eleven partners across Europe. The final action of this project is to reimburse partners, including the Company, for the remaining costs incurred in this collaboration action.
These bank accounts are not Company assets and therefore are not included in the Company’s SoFP.

142
31 March 2017 31 March 2016
2016-17 - Mar 17Number of
compulsory redundancies
Number of other departures
agreed
Number of compulsory
redundancies
Number of other departures
agreed
<£10,000 - - - 5
£10,000 - £25,000 - - 2 5
£25,000 - £50,000 1 - 1 6
£50,000 - £100,000 - - 1 4
£100,000 - £150,000 - - - -
£150,000 - £200,000 - - - -
£200,000 plus - - - -
total number of packages 1 - 4 20
Total Resource cost (£) 28,819 - 145,359 656,360
Annexe 1Highways england Company Limited Government Financial Reporting Manual (FReM) disclosures for the year ending 31 March 2017
Redundancy and other departure costs have been paid in accordance with the provisions of the Civil Service Compensation Scheme, a statutory scheme made under the Superannuation Act 1972. Exit costs are accounted for in full in the year of departure.
(i) Civil service and other compensation schemes – exit packages
Where Highways England has agreed early retirements, the additional costs are met by the Company and not by the Civil Service pension scheme. Ill-health retirement costs are met by the pension scheme and are not included in the table.
SeCtiOn 13 / Financial Statements

143
Chairm
an’s statem
entO
verviewC
hief Executive’s
reviewM
aking our netw
ork saferIm
proving
customer service
Delivering the R
oad Investm
ent Strateg
y O
ur p
eopleFinancial R
eviewP
rincipal risks and uncertainties
Our
governance
The Directors’
report
Auditors’
report
13SeCtiOnF
inancial S
tatements
Disclosure under HM treasury Managing public money
Fees and charges provided to external and public sector customers can be analysed as follows:
Operating income analysed by classification and activity is as follows:
(ii) Operating income
31 March 2017 31 March 2016
Income
£000
Full Cost
£000
Surplus/ (deficit)
£000
Income
£000
Full Cost
£000
Surplus/ (deficit)
£000
Recoveries from third parties for damage to the strategic road network 5,845 5,912 (67) 10,252 12,202 (1,950)
Fees and charges for third party schemes 56,483 56,483 - 12,436 12,436 -
National vehicle recovery 4,465 5,754 (1,289) 4,205 4,655 (450)
Rental income from properties 3,638 3,053 585 4,174 2,697 1,477
Other income 2,407 2,407 - 2,295 2,294 1
72,838 73,609 (771) 33,362 34,284 (922)
31 March 2017£000
31 March 2016£000
Administration income
Cost recoveries/rental income 1,151 1,774
Other income - 855
1,151 2,629
Programme income
Fees and charges to external customers 56,483 12,436
Rental income from properties 3,638 4,174Recoveries from third parties for damage to the strategic road network 5,845 10,252
Interest receivable 9 13
Recovery of costs incurred on M6 toll scheme 26 17
National vehicle recovery 4,465 4,205
Other 2,408 3,073
72,874 34,170
Income Totals 74,025 36,799
The financial objective for each of these services is full recovery of the service costs in accordance with HM Treasury Managing Public Money. In some instances this objective has not been achieved. In particular, full recovery for damage to the SRN has
not been possible due to value for money considerations, and for national vehicle recovery full recovery is not possible due to issues around level of information available and ability to enforce repayment.

144
(iii) intra-Government receivables
(iv) intra-Government payables
31 March 2017 31 March 2016
Amounts falling due within
one year£000
Amounts falling due after more than one year
£000
Amounts falling due within
one year£000
Amounts falling due after more than one year
£000
Balances with:
Other central government bodies 122,070 - 120,985 -
Local authorities 3,721 - 3,478 -
Public corporations and trading funds 5 - 14 -
Total intra-government balances 125,796 - 124,477 -
Balances with bodies external to Government 30,860 19,139 55,145 9,784
Total receivables 156,656 19,139 179,622 9,784
31 March 2017 31 March 2016
Amounts falling due within
one year£000
Amounts falling due after more than one year
£000
Amounts falling due within
one year£000
Amounts falling due after more than one year
£000
Balances with:
Other central government bodies 14,602 1,983 19,055 298
Local authorities 9,855 3,135 7,536 2,044
NHS Trusts 11 - - -
Public corporations and trading funds 106 - 188 -
Total intra-government balances 24,574 5,118 26,779 2,342
Balances with bodies external to Government 742,392 1,542,043 624,945 1,609,911
Total receivables 766,966 1,547,161 651,724 1,612,253
SeCtiOn 13 / Financial Statements
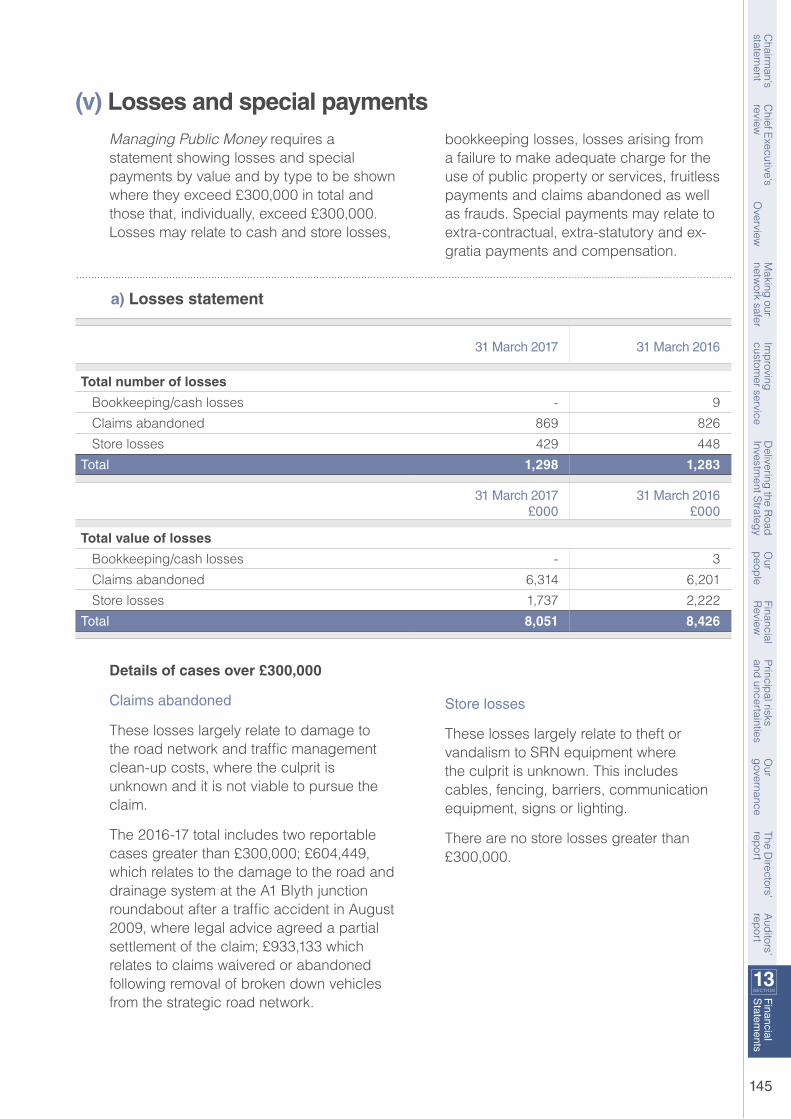
145
Chairm
an’s statem
entO
verviewC
hief Executive’s
reviewM
aking our netw
ork saferIm
proving
customer service
Delivering the R
oad Investm
ent Strateg
y O
ur p
eopleFinancial R
eviewP
rincipal risks and uncertainties
Our
governance
The Directors’
report
Auditors’
report
13SeCtiOnF
inancial S
tatements
Managing Public Money requires a statement showing losses and special payments by value and by type to be shown where they exceed £300,000 in total and those that, individually, exceed £300,000. Losses may relate to cash and store losses,
Details of cases over £300,000
Claims abandoned
These losses largely relate to damage to the road network and traffic management clean-up costs, where the culprit is unknown and it is not viable to pursue the claim.
The 2016-17 total includes two reportable cases greater than £300,000; £604,449, which relates to the damage to the road and drainage system at the A1 Blyth junction roundabout after a traffic accident in August 2009, where legal advice agreed a partial settlement of the claim; £933,133 which relates to claims waivered or abandoned following removal of broken down vehicles from the strategic road network.
bookkeeping losses, losses arising from a failure to make adequate charge for the use of public property or services, fruitless payments and claims abandoned as well as frauds. Special payments may relate to extra-contractual, extra-statutory and ex-gratia payments and compensation.
Store losses
These losses largely relate to theft or vandalism to SRN equipment where the culprit is unknown. This includes cables, fencing, barriers, communication equipment, signs or lighting.
There are no store losses greater than £300,000.
(v) Losses and special payments
a) Losses statement
31 March 2017 31 March 2016
total number of losses
Bookkeeping/cash losses - 9
Claims abandoned 869 826
Store losses 429 448
Total 1,298 1,283
31 March 2017£000
31 March 2016£000
total value of losses
Bookkeeping/cash losses - 3
Claims abandoned 6,314 6,201
Store losses 1,737 2,222
Total 8,051 8,426

146
Details of cases over £300,000
The 2016-17 total includes one reportable case greater than £300,000; £550,000, which relates to the costs incurred by a claimant’s solicitor agreed as part of a settlement relating to an incident leading to a personal injury claim on the A11/A505 slip road in October 2009.
Dart Charge losses
Highways England operates the Dartford-Thurrock River Crossing Charging Scheme on behalf of the Secretary of
State for Transport. During 2015-16 an impairment loss of £26.4m was reported; £4.3m of the impairment relates to road user charge revenue and £22.1m of the impairment relates to enforcement revenue. These losses are disclosed in the DfT accounts and further details are provided in the 2015-16 Dartford-Thurrock River Crossing Charging Scheme Account. The 2016-17 numbers are yet to be finalised.
b) Special payments
31 March 2017 31 March 2016
total number of special payments
Ex-gratia payments/compensation 14 6
Total 14 6
31 March 2017
£000
31 March 2016
£000
total value of special payments
Ex-gratia payments/compensation 755 9
Total 755 9
SeCtiOn 13 / Financial Statements

147
Chairm
an’s statem
entO
verviewC
hief Executive’s
reviewM
aking our netw
ork saferIm
proving
customer service
Delivering the R
oad Investm
ent Strateg
y O
ur p
eopleFinancial R
eviewP
rincipal risks and uncertainties
Our
governance
The Directors’
report
Auditors’
report
13SeCtiOnF
inancial S
tatements
*Income which relates to capital projects is classified as capital for budgetary purposes; however under IFRS this is treated as operating income in the SoCNE.
(vi) Segmental reporting
Year to 31 March 2017
Resource Expenditure
£000
Resource Income
£000
Resource Total
£000
Capital Expenditure
£000
Capital Income*
£000
Capital Total
£000
total by Segment
Asset Renewals - - - 619,917 - 619,917
Asset Improvements - - - 1,333,354 (54,260) 1,279,094
Traffic Management - - - 6,236 - 6,236
Other - - - 115,483 - 115,483
Maintenance (B3) 266,163 (6,538) 259,625 - - -
Renewals (B4) 10,130 - 10,130 - - -
Operate: Roads PFI (B5) 412,123 - 412,123 - - -
Operate: General (B1) 79,397 (11,679) 67,718 (415) - (415)Operate: Cust Ops /Traffic Man (B2) 112,144 (3,363) 108,781 - - -
Support General (C1) 150,365 (5,935) 144,430 - - -
Protocols (D) 49,181 (438) 48,743 - - -
1,079,503 (27,953) 1,051,550 2,074,575 (54,260) 2,020,315
Unallocated Costs:
Depreciation and impairment 1,188,887 - 1,188,887 - - - New Provisions (Resource AME) 3,562 - 3,562 - - -
New Provisions (Capital AME) - - - 30,495 - 30,495
Other 10,706 - 10,706 - - -
Total Budget 2,282,658 (27,953) 2,254,705 2,105,070 (54,260) 2,050,810
Budget to accounts reconciliation
Resource Utilisation - (3,396) (3,396) - - - Capital income in resource transfer - (46,069) (46,069) - 46,069 46,069
Segmental total per accounts 2,282,658 (77,418) 2,205,240 2,105,070 (8,191) 2,096,879
Segmental expenditure
� The operating segments are business activities that are regularly reviewed by the Company’s Board and senior management for decision making purposes.
� Expenditure in the financial statements is split between capital and resource expenditure.
� Assets renewals are a programme of SRN renewals expenditure to ensure the infrastructure continues to deliver according to the service potential, including a significant resurfacing programme.

148
� Asset improvements include an agreed programme of major improvements expenditure which contributes significantly to increasing capacity and removing bottlenecks.
� Maintenance expenditure relates to lump sum duties including winter maintenance, pot hole repairs, drainage clearing and grass cutting.
� Operate expenditure includes the costs of strengthening the Company’s SRN management function, maximising SRN availability and reducing the impact of incidents and recurrent congestion.
� Support expenditure includes the resources to help deliver the programme; including staff costs, IT and research and development.
SeCtiOn 13 / Financial Statements
Period to 31 March 2016
Resource Expenditure
£000
Resource Income
£000
Resource Total
£000
Capital Expenditure
£000
Capital Income*
£000
Capital Total
£000
total by Segment
Asset Renewals - - - 663,313 - 663,313
Asset Improvements - - - 1,112,459 (5,000) 1,107,459
Traffic Management - - - 6,918 - 6,918
Other - - - 111,954 - 111,954
Maintenance (B3) 277,531 (11,372) 266,159 - - -
Renewals (B4) 25,031 - 25,031 - - -
Operate: Roads PFI (B5) 393,512 - 393,512 - - -
Operate: General (B1) 82,058 (8,278) 73,780 - - -
Operate: Cust Ops /Traffic Man (B2) 183,954 (5,088) 178,866 - - -
Support General (C1) 134,424 (6,088) 128,336 - - -
Protocols (D) - - - - - -
1,096,510 (30,826) 1,065,684 1,894,644 (5,000) 1,889,644
Unallocated Costs:
Depreciation and impairment 915,458 - 915,458 - - -
New Provisions (Resource AME) - - - - - -
New Provisions (Capital AME) - - - - - -
Other 20,379 - 20,379 22,984 - 22,984
Total Budget 2,032,347 (30,826) 2,001,521 1,917,628 (5,000) 1,912,628
Budget to accounts reconciliation
Resource Utilisation - - - - - -
Capital income in resource transfer - (5,000) (5,000) - 5,000 5,000
Segmental total per accounts 2,032,347 (35,826) 1,996,521 1,917,628 - 1,917,628

149
Chairm
an’s statem
entO
verviewC
hief Executive’s
reviewM
aking our netw
ork saferIm
proving
customer service
Delivering the R
oad Investm
ent Strateg
y O
ur p
eopleFinancial R
eviewP
rincipal risks and uncertainties
Our
governance
The Directors’
report
Auditors’
report
13SeCtiOnF
inancial S
tatements
(vii) Highways england off payroll appointees, consultancy and temporary staff
For all off payroll engagements as of 31 March 2017, for more than £220 per day and that last for longer than six months
No. of existing engagements as of 31 March 2017 152
Of which:
No. that have existed for less than one year at time of reporting 67
No. that have existed for between one and two years at time of reporting 54
No. that have existed for between two and three years at time of reporting 14
No. that have existed for between three and four years at time of reporting 17
No. that have existed for four or more years at time of reporting 0
a) As part of the Review of tax arrangements of public sector appointees published by the Chief Secretary to the Treasury on 23 May 2012, departments have been asked to report on their off payroll
b) The Company confirms that all existing off payroll engagements, outlined above, have at some point been subject to a risk based assessment as to whether
engagements and related tax arrangements for the periods and scope outlined by HM Treasury. This data is shown in the following tables.
assurance is required that the individual is paying the right amount of tax and, where necessary, that further evidence has been sought.
For all new off payroll engagements, or those that reached six months in duration, between 1 April 2016 and 31 March 2017, for more than £220 per day and that lasted for longer than six months
No. of new engagements, and/or those that reached six months in duration, between 1 April 2016 and 31 March 2017 216
No. of the above which include contractual clauses giving the department the right to request assurance in relation to income tax and national insurance obligations 216
No. for whom assurance has been requested 121
Of which:
No. for whom assurance has been received 54
No. for whom required assurance has not been received 67
No. of those in the line above, who have now left the department 3
No. for whom engagements were terminated as a result of assurance not being received 0
Remaining cases (all in the final stages of review) 64

150
For any off payroll engagements of board members, and/or, senior officials with significant financial responsibility, between 1 April 2016 and 31 March 2017
no. of off-payroll engagements of board members, and/or, senior officials with significant financial responsibility, during the financial year 0
total no. of individuals on payroll and off-payroll that have been deemed “board members, and/or, senior officials with significant financial responsibility”, during the financial year. This figure should include both on payroll and off-payroll engagements
11
c) All contracts included contractual clauses giving the Company and the Department the right to request assurance. All engagements were ones where the
Department requested tax compliance evidence and there were no contracts where an individual was exempt from this requirement.
expenditure on consultancy and temporary staff
d) During the year 2016-17 the Company employed a number of consultancy and temporary staff.
Consultancy here is the provision of objective advice relating to strategy, structure, management or operations of an organisation, in pursuit of its purposes and objectives. Such advice will be provided outside the ‘business-as-usual’ environment when
Expenditure on consultancy and temporary staff is shown in the table below.
Consultancy£m
Temporary staff£m
Total£m
Highways England 2.2 26.5 28.7
in-house skills are not available and will be time-limited. Consultancy may include the identification of options with recommendations, or assistance with (but not the delivery of) the implementation of solutions.
SeCtiOn 13 / Financial Statements


This document is also available on our website at www.gov.uk/highways
If you have any enquiries about this publication email [email protected] or call 0300 123 5000*. Please quote the Highways England publications code PR33/17
Highways England, Creative S160578
*Calls to 03 numbers cost no more than a national rate call to an 01 or 02 number and must count towards any inclusive minutes in the same way as 01 and 02 calls. These rules apply to calls from any type of line including mobile, BT, other fixed line or payphone. Calls may be recorded or monitored.
© Crown copyright and database rights 2017 OS 100030649. You are permitted to use this data solely to enable you to respond to, or interact with, the organisation that provided you with the data. You are not permitted to copy, sub-licence, distribute or sell any of this data to third parties in any form.
Registered office Bridge House, 1 Walnut Tree Close, Guildford GU1 4LZHighways England Company Limited registered in England and Wales number 09346363