
High-speed, Low-level Flight: Aircrew Factors
325
AGARD-CP-267 uC 6. AGARD CONFERENCE PROCEEDINGS No. 267 High-speed, Low-level Flight: Aircrew Factors - DISTRIBUTION AND AVAILABILITY This o~-~~c.~ON BACK %COVER I'lus dc~i -- roved for pub'ýý rc oný ~ sakl; its __ Rn 6 4-9
-
Upload
khangminh22 -
Category
Documents
-
view
1 -
download
0
Transcript of High-speed, Low-level Flight: Aircrew Factors

AGARD-CP-267
uC6.
AGARD CONFERENCE PROCEEDINGS No. 267
High-speed, Low-level Flight:Aircrew Factors
- DISTRIBUTION AND AVAILABILITYThis o~-~~c.~ON BACK %COVER
I'lus dc~i --roved
for pub'ýý rc oný ~ sakl; its__ Rn 6 4-9

BestAvai~lable
Copy

.7AGARD-CýP-267
NORTH ATLANTIC TREATY ORGANIZATION
ADVISORY GROUP FOR AEROSPACE RESEARCH AND DEVELOPMENT
(ORGANISATION DU TRAITE DE L'ATLANTIQUE NORD)
it
(7 AGARDj onference Proceedins No.267
* HIGH-SPEED, LOW-LEVEL FLIGHT: AIRCREW FACTORS,&
Edited bv
Wing Commander 1.1%/laisterRAF Institute of Aviation Medicine
Farnboroughhants GU 14 6SZ
UK
1' -// -
/f
Papers presented at the Aerospace Medical Panel's Specialists' Meeting held inLisbon, Portugal, 22-26 October 1979.
S. . .. . . . . ..)

THE MISSION OF AGARD
The mission of AGARD is to bring together the leading personalities of the NATO nations in the fields of scienceand technology relating to aerospace for the following purposes.
- Exchanging of scientific and technical information;
- Continuously stimulating advances in the aerospace sciences relevant to strengthening the common defenceposture;
- Improving the co-operation among member nations in aerospace research and development;
- Providing scientific and technical advice and assistance to the North Atlantic Military Committee in the fieldof aerospace research --nd development;
- Rendering scientific and technical assistance, as requested, to other NATO bodies and to member nations inconnection with research and development problems in the aerospace field;
- Providing assistance to member nations for the purpose of increasing their scientific and technical potential;
- Recommending effective ways for the member nations to use their research and development capabilities forthe common benefit of the NATO community.
The highest authority within AGARD is the National Delegates Board consisting of officially appointed seniorrepresentatives from each member nation The mission of AGARD is carried out through the Panels which arecomposed of experts appointed by the National Delegates, the Consultant and Exchange Programme and the AerospaceApplications Studies Programme. The results of AGARD work are reported to the member nations and the NATOAuthorities through the AGARD series of publications of which this is one.
Participation in AGARD activities is by invitation only and is normally limited to citizens of the NATO nations.
The content of this publication has been reproduceddirectly from matenal supplied by AGARI) or the authors.
Published March 1980
Copynght © AGARi) 1980All Rights Reserved
ISBN 92-835-0263-9
Printed by Technical lditing and Reprodu tion Ltdularford House. 7 9 Charlotte St. London. I4IP 1J1I
I
SUMMARY
This volume contains the texts and ensuing discLssions of papers presented in Session Bof the AGARD Aerospace Medical Panel's 36th Speciealists' meeting on 'High-Speed, Low-LevelFlight- Aircrew Factors', held in Lisbon, Portugal, from Oztober 24th-26th, 1979. TheSession was sponsored by the Biodynamics Sub-Committee o the Aerospace Medical Panel,and included invited contributions from the Fligh Mechanics, and Guidance and Control Panels.
The Session, of four half-days, was arranged in five parts, the specific subjects consideredin the 28 papers being: Ride Quality and the Effect of the Physical Environment; ThermalEffects, Vibration Effects; Cockpit Design and Aircrew Workload; and Escape and Survival.Particular attention was paid to ride-bumpiness and the influence of airframe design andcontrol strategy, the effects of vibration on vision, and the problems and potential uses ofhelmet mounted sights and displays.
The Proceedings are completed by the summaries of the five sub-session chairmen: andby the techniLal evaluation of the organiser and editor.
/
.-.. 1
- U

AEROSPACE MEDICAL PANEL
Panel Chairman: Dr B.O.Hartman, US
Panel Deputy Chairman: Colonel M1decin J.Bande, BE
Panel Executive: Lt Colonel F.Monesi, IAF, IT
MEETING ORGANIZATION
Session Organizer: Wing Commander D.H.Glaister, RAF, UK
Loal Coordinator: Brig. General J.N.G.Gois, PAF, PO
Iv

I
SESSION ORGANIZER
Wing Commander I).H Glaister
RAF Institute of Aviation MedicineFarnboroughHants GUI 4 6SZUK
SESSION CHAIRMEN
Part I Oberstarzt E.C.BurchardGAF Institute of Aviation MedicinePostfach 172/KFL8080 FurstenfeldbruckFRG
Part 11 Dr H.T.AndersenFlymedisir.sk InstituttZEB bygget BlindernOslo 3Norway
Part III Dr A.J BensonRAF Institute of Aviation MedicineFarnboroughHants GU 14 6SZUK
Part IV M~decin Chef des Services J CohnDirecteur-Adjoint du Centre de Recherches
du Service de Sante des Armies (CRSSA)I bis rue du Lieutenant Raoul Batany92141 ClamartFrance
Part V Dr S.A.NunneleyUSAF School of Aerospace MedicineCrew Technology DihisionCrew Protection BranchBrooks Air Force BaseTexas 78235USA
ýA

CONTENTS
Page
SUMMARY
PANEL AND MEEIING OFFICERS iv
SESSION ORGANIZER AND CHAIRMEN v
TECHNICAL EVALUATION REPORTby D.H.Glaister ix
KEYNOTE ADDRESSby J M.Brochado de Miranda xiii
Reference
PART I - RIDE QUALITY AND THE EFFECT OF THE PHYSICAL ENVIRONMENT
RIDE-BUMPINESS AND THE INFLUENCE OF ACTIVE CONTROL SYSIEMSby J.G.Jones*
INFLUENCE OF GEOPHYSICAL FACTORS (METEOROLOGICAL AND TOPOGRAPEICAL)ON TIlE PILOT-AIRCRAFT SYSTEM IN HIGH SPEED, LOW LEVEL FLIGHT (HSLLF)
by K.Krames*
DEVELOPMENT IN HIGH SPEED, LOW LEVEL FLIGHT - THE PILOT'S VIEWPOINTby J.J.Lee 3
BIOTECHNOLOGY CHALLENGES PRESENT IN OPERATIONAL HIGH-SPEED.LOW-LEVEL FLIGHT
by R.L.DeHart* 4
PART I1 - THERMAL EFFECTS OF HIGH-SPEED, LOW-LEVEL FLIGHT
PROBLEMES THERMIQUES POSES PAR LE VOL A GRANDE VITESSE ET A BASSEALTITUDE
par J.Timbal* et J.Colin 5
EFFECTS ON PERFORMANCE OF THERMAL STRAIN ENCOUNTERED DURINGHIGH SPELD, LOW-LEVEL FLIGHT
by T.M.Gibson*, J.R.Allan, C.J.Lawson and R.G.Green 6
AIRCREW HEAT STRESS DURING HIGH-SPEED. LOW-LEVEL FLIGHT"by R.F.Stribley and S.A.Nunneley* 7
"PART III -- VIBRATION EFFECTS OF HIGH-SPEED, LOIN-LEVEL FLIGHT
ESSAI DE QUANTIFICATION DE L'AGRESSION ENGENDREE PAR LES VIBRATIONS DEBASSE FREQUENCE
par P.Quandieu*, P.Borredon, I.C Rouhet et L Pellieux
A METHOD FOR STUDYING HUMAN BIODYNAMIC RESPONSES FO WHOLE-BOi)YZ-AXIS VIBRATION
by J.C.Guignard*. C.L.Ewing. G.C.Willems. W.Anderson, W H Muzzy I11, D.J.Thomasand P.L.Majewski 9
HEAD MOVEMENTS INDUCED BY VERTICAL VIBRATIONSby L.Vogt*. E.Schwartz and H.Mertens 10
* The presenter of the paper (in sonic zases not an author) is indicated by an asterisk
* vi

Reference
THE EFFECT OF RECLINED SEATING ON THE TRANMISSION OF LINEAR"VIBRATION TO THE HEAD
r! by M.E.Johnston (G.R.Barnes*) 11
THE EFFECTS OF AIRCRAFT VIBRATION ON VISIONby G.R.Barnes* 12
THE EFFECT OF 3-25 Hlz VIBRATION ON THE LEGIBILITY OF NUMERIC LIGHTEMITTING DIODE DISPLAYS
by M.E.Johnston and J.H.Wharf* 13
THE UFFEC f OF TURBULENCE ON HELMET MOUNTED SIGHT AIMINGACCURACIES
by N.O.Tatham (D.N.ýarrett*) 14
CLINICAL MEDICAL EFFECTS OF HEAD AND NECK RESPONSE DURINGBIODYNAMIC STRESS EXPERIMENTS
by D.J.Thomas*. C.L.Ewing, P.L.Majewski and N.S.Gilbert is
PART IV - COCKPIT DESIGN AND AiRCREW WORKLOAD
OPERATIONAL ASPECTS OF GUIDANCE AND CONTROL ADVANCES VERSUS PILOTWORKLOAD FOR LOW ALTITUDE, HIGH SPEED FLIGHT
by M.A.OstgaarL 16
TV OPERATOR PERFORMANCE IN REAL TIME AIR-TO-GROUND RECONNAISSANCEMISSIONS UNDER TASK-LOADING CONDITIONS
by H.Mutschler* 17
THE INFLUENCE OF THE DESIGN OF DISPLAYS ON COCKPIT WORKLOADby R.H.Holmes* 18
COLOUR DISPLAYS: THEIR AVAILABILITY, PERFORMANCE AND APPLICATION TOIMPROVED CREW EFFICIENCY
by D.W.Hussey (R.H.Holmes*) 19
HELMET-MOUNTED DEVICES IN LOW-FLYING, HIGH-SPEED AIRCRAFTby D.N.Jarrett* 20
THE ROLE OF HELMET MOUNTED DISPLAYS IN HIGH-SPEED, LOW-LEVEL FLIGHTby G.T.Chisum* 21
RESEARCH ON VISUAL ENHANCEMENT FOR HIGH SPEED, LOW LEVEL FLIGHTSPONSORED BY THE NAVAL AIR SYSTEMS COMMAND
by H.Rosenwasser, M.L.Wolbarsht*, G.T.Chisum, M.M.Cohen, J.J.Kulik and A.Lewis 22
PART V - ESCAPE AND SURVIVAL
HUMAN FACTORS IN HIGH SPEED, LOW LEVEL ACCIDENTS - A 15 YEAR REVIEWby R.C.Rud and D.F.Leben (R.H.Huxter*) 23
CREW STATION ASSESSMENT USING THE BIOMAN MODELING SYSTEMby G.D.Frisch*, L.A.D'Aulerio and M.Schultz 24
NAVAL AVIATION WATER SURVIVAL PROGRAMby VtA.Mclntosh* 25
HIGH SPEED, LOW LEVEL FLIGHT SURVIVAL ON EJECTIONby M.A.A.Hobbs* 26
' The presenter of the paper (in some cases not an author) is indicated by an asterisk
Vii

Reference
MINIMIZING THE SEQUENCED DELAY TIME FOR ESCAPE FROM HIGH-SPEED,LOW-LEVEL FLIGHT PROFILES
by J.H.Raddin, Jr*, L.J.Specker and J.W.Brinkley 27
LOW LEVEL, ADVERSE ATTITUDE ESCAPE USING A VERTICAL SEEKING EJECTIONSEAT
by ).J.Tyburski*, G.D.Frisch* and L.A.D'Aulerio 28
CONCLUDING REMARKS BY SESSION CHAIRMEN CR
The presenter of the p.-per (in some cases not an author) is maicated by an asterisk
VJIM

TECHNICAL EVALUATION REPORT
by
Wing Commander David H. GlaisterRoyal Air Force Institute of Aviation Medicine, Farnborough, Hampshire, UK,
The subject of 'High-Speed, Low-Level Flight : Aircrew Factors' was proposed as a topic fir a specia-lists' meeting of the Aerospace Medical Panel of AGARD by the Biodynamics Subcommittee at its annualmeeting in Athens in 1976. To quote the theme from the subsequent call for papers: 'Pec-nt developmentsin radar and missile systems indicate that high-speed flight at low levels offers the ,ptimum means forreaching targets deep within defended territory. Furthermore, the faster and closer to the ground thatsuch flight can reliably be achieved, the greater the chance of mission success. Unfortunately, cort±der-able physical and mental stresses are imposed on the aircrew. The physical stres3es are pritzarily depen-dent upon speed, height, terrain and atmospheric conditions, but are amenable to modific.,rion by aircraftdesign and contrcl strategy. Aircrew workload may also be reduced by automation and tV in..rovements irsystem management techniques. Recommendations are needed for current operating sys'ems, for modif~catj.sto existing systems and for the design of new systems. It is, therefore, desirable that workers withinthe compass of Guidance and Control, Flight Mechanics and Aerospace Medicine, should meet to discuss air-crew factors in high-speed, low-level flight, with a view to enhancin•g the performance of the man and thesystem and improving the chances of survival of both in this demanding environment'.
Papers were invited on the influence of the physical environment; the effects of high-speed, low-levelflight on man; and specific high-speed, low-level aspects of cockpit design, aircrew workload, aircrewequipment, and escape and survival. Review papers were invited through the Guidance and Control andFlight Mechanics Panels of AGARD.
In the event, 28 papers were selected from invited and volunteered abstracts and these fell naturallyinto five categories. These were : Ride Quality and the Effect of the Physical Environment (four papersincluding the invited FMP contribution), Thermal Effects (three papers), Vibration Effects (eight papers),Cockpit Design and Aircrew Workload (seven papers including the invited GCP contribution), and Escape andSurvival (six papers). A small amount of juggling then produced the required four, halt-day sessionsallowed for in the timetable for Session B of the 36th Specialists' Meeting of the Aerospace Medical Panelof AGARD. It was held at the Instituto da Defesa Nacional, Cal~ada das Necessidades No 5, 1300 Lisbon,Portugal, on 24-26 October 1979.
The opening paper in Part I was contributed by Mr J.G. Jones on behalf of the Flight Mechanics Faneland was, to coin a phrase, just what the doctors ordered. It showed the relation between the stress,measured either as the probability distribution or power spectral density of the acceleration response,and the speed, height, terrain and atmospheric conditions; and showed how the stress is affected by air-craft design and control strategy, Thus, 'ride-bumpiness' is dependent upon primary airframe character-istics such as wing loading, lift-curve slope (aspect ratio, leading edge sweep) and speed, and can beaccurately predicted (and anticipated). It is essentially intermittent with discrete bumps and posesconsiderable problems in measurement and simulation. A further factor is the 'vibration' caused by theresponse of the flexible airframe structure, A figure of 10 Hz is typical for the dominant mode of asmall highly manoeuvrable aircraft.
Active control systems can be designed specifically to improve ride-quality, but if employedprimarily to improve manoeuvrability, can have the opposite effect. Thus, co-operation between de;ignerand aviation medicine specialist is essential if the optimum overall performance (man plus machip ' is tobe obtained.
In the next paper (K.R. Krames, B2) it was stressed that meteorological factors are responsý ýi fora significant proportion of severe accidents as 4ell as for variations in aircrew performance, fh, mostimportant factors are turbulence caused by winds, low level jets, rotors, temperature gradients, aid so on,and poor visibility occasioned by dust and salt particles, precipitation, industriaL pollutants and insectand bird stril •s. Other factors discussed were icing, thunderstorms, sleet and hail, and the contentiousquestion as .o whether a pilot's reaction time, per se, is affected by meteorological factors. The authorconcluded th-t detailed knowledge of all these various factors enables the assignment of flight routes andlevels presenting minimum flight hazards, and so reduces the influence of the weather factor in aircraftaccidents.
Mr J. Lee then presented a pilot's viewpoint (paper B3) and showed how advances in aircraft design(from Hunter to Tornado) had alterea the effects of weather, terrain following flight and aircraft hand-ling., He concluded that great strides had been made, but that areas where further development is re-quired include performance, handling, guidance and navigation, and 'vehicle design characteristics',
Finally, in Part I, Colonel. De Hart discussed the challenges to biotechnology presented by operationalhigh-speed, low-level flight, and illustrated progress being made by films which compared the manuallycontrolled flight of the B-52 with the automated control of the Flll and the low level agility of theA-10 (paper B4). Thus, vibration has become less of a problem and automated systems have earned the con-fidence of aircrew. However, the specialist in aerospace medicine 'must ensure that sophisticated systemsdo in fact off load peripheral tasks of the pilot and increase his performance and ability to accomplichsuccessfully the mission in a high threat combat environment'.
Part II consisted of three papers on the thermal problems of high-speed, low-level flight. In thesepresentations there was considerable consensus that cabin conditioning has not improved in line with othersystems, that overheating still poses a considerable problem and that deep body temperatures recorded incurrent aircraft when flying at high-speed and low-level in warm conditions can cause a reduction in theoperational capability of the aircrew., Two of the papers presented fresh evidence that hiating decieasesperformance, the tasks employed being a two-axis pursuit plus reaction time (0. Timbal and J. Colin, paper

BS) and a flight simulator (T.M, Gibson et al, paper B6). These latter authors showed that, for the same
deep body temperature, performance is worse during heating than during .ooling, and this can lead todrastic errors as well as to less accurate operation of the simulator. In paper B7, R.F. Stribley andS.A. Nunneley made thL case for having a physiologically based specification for the environmental controlsystem so that mean skin temperature would be kept beloi' 35
0C at all times.
It is apparent that thermal problems will be with us for some time to come and that aircraft
designers should raise the priority with which they treat cabin conditioning. Furthermore, air ventilatedand liquid cooled suits will still be required under certain conditions, especially in view of the addi-tional thermal load from clothing required for chemical defence and cold-water survival.
In Part III, three quarteis of the papers were concerned with the transmission of vibration to thehead and the resulting impairment of vision; a not surprising pr.portion considering the importance ofvicion to aircrew. L. Vogt et al, (paper B1O) described studies in which they had looked at head motionin two axes (Z and X) in response to single axis (Z) whole body vibration. Without a headrest the ampli-tude of the horizontal vibration component at resonance is obout three quarters that of the vertical sothat published transmissibility curves for sitting humans by no means represent the complete reactions ofthe body to vibration stress. These data will be of importance in the formulation of adequate mechanicalor mathematical models of the boLY's response and should stimulate further studies.
In the next paper (M.E, Johnston, BlI) the effect of a 'C-tolerant' reclined seat was considered inrespect to the transmission of vibration to the head. Head motion incre. s as the seat back angle to thevertical is increased, and is considerably exacerbated by contact with the headrest. Thir could pose aproblem to comfort and vision and demands further attention, notably the defign of a headrest incorporatingvibration isolation and the provision of adequate shoulder support to allow the head to be carried con-fortably off the headrest.
In the next paper (B12) Dr G.R Barnes looked at the effect of vibration on vision in relation to thepursuit and vestibulo-ocular refle~es. These effects are especially important with the advent of helmetmounted sights since reflex eye movements may then become inappropriate. These and other studies (i.e.papers B13, M.E. Johnston and J.H. Uharf, and B14, N.O. Tatham) provide information for the design ofhelmet mounted displays - character size, character separation, luminance etc - and suggest that vibrationwill continue to be a problem in the legibility of all types of display. The third of these papers (B14)showed that laboratory data from subjects exposed to a realistic vibration input gives a good correlationwith the accuracy of aiming using helmet mounted sights 'n real flight, Possible methods for improvingaiming accuracy were looked at and one which gives a greater signal to noise ratio by scaling the outputof the sight appears effective, though requires the use of an additional display surface rather than asimple reticle. It is clear that much basic research is still needed to perfect a helmet mounted sightsystem which can be used effectively in high-speed, low-level flight.
Of the other papers in Part III, one (P.Quandieu et al, B8) described basic research on the trans-mission of vibration in non-human primates and introduced the concept of dynamic mass, whilst a second(J.C. Guignard et al, B9) described a method for studying human biodynamic response to similar Z-axiswhole-body vibration. This latter study made use of man-mounted inertial instrumentation and a datareduction technique already established for impact research at the Naval Aerospace Medical Research Lab-oratory Detachment. The final paper in this part (D.J. Thomas et al, B15) summarised clinical effectswhich had been noted since 1974 in studies of head and neck response to impact forces. Symptoms and signs,most comTmonly headaches and neck strain, but also including 11 cases of syncope, had occurrcd in 625 of1621 exposures (40%). Despite this wealth of data, 'the transition levels from transient symptoms toinjury to permanent damage are unknown'. This information is however, essential for the appropriate designof crash restraint systems.
Part IV, on cockpit design and aircrew workload, opened with the Guidance and Control Panel's con-tribution (paper B16) in which Morris A. Ostgaard led us from the first flight stabilizer of 1914, throughearly fly-by-wire systems, to a futuristic cockpit which could provide 'one man, night all-weather lowvisibility at low altitude'. Whilst this technological progress should have reduced workload by takingover many of the pilot's tasks, workload has actually beet, maintained by a parallel development from simplevehicle to an 'air warfare system', The tendency to utilist technology to increase capability rather thanreduce workload is understandable, and probably inevitable if optimum overall performance is to be obtainedfrom the man-machine system. However, improved electronic displays should be capable of reducing workloadin real terms, especially during high-speed, low-level flight in poor visibility, and this must be aprimary design goal.
The next paper (H. Mutschler, B17) considered one feature of an electronic display (in this case ablack and white TV), namely the ability of an operator to detect military vehicles in static ground scenes.Factors examined included viewing time, line resolution and contrast, as well as various aspects of thescene. Many of the conclusions are appropriate to cockpit eisplays, especially to the ise of low-light TV.The following two papers were concerned directly with cockpit displays. In the First of these(R.H. Holmes, B18) the design of the display wys discussed in relation to workload during high-speed, low-level flight. It was concluded that the pilot should not have to look at essential controls in order tooperate them (hence, dedicated controls are still required despite the saving of space offered by themulti-functional approach), and displays should be capable of swift interpretation, both features servingto reduce the time during which vision of the outside world is lost. Arguments were also advanced formaking electronic display formats similar to those of their mechanical forbears, and for eliminatingunessential information, especially in the area of systems and warnings displays. The second of thesepapers (D.W. Hussey, B19) discussed in detail the generation of colour displays and their application toreduce workload. Beam indexed colour displays will soon (early 1980s) become available for airborne use.However, ýolour has to be used sparingly and meaningfully since its indiscriminate use can prove self-defeating.
X

The last three papers in Part IV were again concerned with helmet mounted displays. It was shown(D.N. Jarrett, Paper B20) that movement of the helmet (and display) relative to the head is less with arealistic vibration input than with voluntary head motion. Also, the degrading effect of vibration canbe countered by increasing the luminance of the eisplay. The second paper (G.T. Chisum, B21) discussedthe role of such displays in the high-speed, low-level environment in relation to terrain information,threat detection and aircraft information, and highlighted many areas requiring further research. Theseinclude what information to offer, what symbology to use, the optimum field of view and brightness, andwhether the display should be monocular or binocular. In particular, buffet can make a helmet mountedsight unusable. The final paper in this part (H. Rosenwasser et al, B22) gave a review of programmes ofresearch currently sponsored by the Naval Air Systems Command which are related to visual enhancement.These programmes range from fundamental research on the photo-activation of the retina and the possibleuse of visually evoked cortical responses to control G-suit inflation, to the use of spectrally selective
*. filters to improve visual performance.
Part V opened with a review of human factors in accidents occurring at high-speed and low level(R.C. Rud and D.F. Leben, B22). The observation that weather is the most influential factor and that inEuropean operations it played a part in 10 of 19 accidents supports the conclusion of paper B2. Low ovea-cast and snow showers are the dominant factors. Not surprisingly, visual problems - white-out, visualillusions - were the most significant human factor demonstrated. Other factors not necessarily specifi-cally relating to high-speed, low-level flight, but more likely to lead to an accident under these flightconditions, are the so-called 'mission completion syndrome', physical fatigue, psychological stress andtask overload.
Four of the last five papers were concerned with ejection systems. Paper B24 (G.D. Frisch et al)showed how computor modelling techniques can be used to investigate not only the physical compatabilitybetween man and machine, but also reach envelopes and visual fields. In particular, the model has beenused to investigate an ejection clearance problem, but it is noteworthy that human acceptance tests werestill considered essential in the final analysis. Ejection exoerience for 1977 had shown that the majorcauses for fatality were lack of time and altitude, whilst high-speed ejections led to a significant inci-dence of flail injury (M.ii.A. Hobbs, paper B26). Clearly, improved seat stabilisation and restraint areneeded for successful ejection at high-speed and low-level, and a later paper (J.J. Tyburski et al, B28)showed that a vertical seeking seat can offer safe ejection from adverse attitudes, levels as low as 50feet, and speeds of up to 600 knots. Thus, not only is there a demonstrated need for progress in thisarea, but systems under development may go some way to offering a solution.
The critical factor of delay between initiation of ejection and aircraft clearance was discussed inpaper B27 (J.H. Raddin et al) where it was shown experimentally that torso retraction can be achievedsafely in half the O.3s currently allowed. Furthermore, if the seat back incorporates a sensor and thetorso were already in a desirable position, ejection could be immediate, As the delay is only critical ina minority of ejections 'we must take great care to avoid instituting a solution ...... which would com-promise safe performance ...... in the majority'.
Only one paper considered the subsequent fate of tb.= successful ejectee. Life support systemstypical for tactical jets, patrol ano transport aircraft, and helicopters were discussed (W. McIntosh,paper B25), as were the benefits of apfropriate training programmes - parachute entanglement, underwateregress etc. A word of caution was voiced that the mass and bulk of survival aids can actually hampersurvival and rescue under certain conditions. The US Navy policy is to anticipate recovery within 24 hrsby reducir.g the amount of this equipment : in fact, 91% of tactical jet ejectees are currently rescuedwithin one hour.
Finally, this evaluation would not be complete without mention of the fine films which accompanie,many of the presentations. Whilst they cannot be reproduced in the proceedings, they left an indelibleimpression on the audience and illustrated, far better than mere words, the meanings of such terms as'ride-bumpiness' and 'pilot workload'.
CONCLUSIONS AND RECOMMENDATIONS
As noted earlier 'recommendations are needed for current operating systems, for modifications toexisting systems, and for the design of new systems'. Whether this meeting can be considered a successdepends upon the extent to which these questions can now be answered.
It is clear from the material presented that the major problems currently encountered in high-speed,low-level flight are 'ride-bumpiness', excessive workload and the need for the pilot to divert his atten-tion from the outside view to displays and controls within the cockpit. Ejection also poses a specificproblem due to low altitude and often adverse attitude, a% does weather, since adequate visibility iseasential. Some conclusions and recommendations may be made concerning each of these factors.
I. Ride bumpiness and associated vibration le'd to impaired vision, discomfort and fatigue.
a. To reduce this probl-m at its source, designers of future aircraft should co-operate withaviation medicine specialists at an early stage in order that airframe characteristics and activecontrol systems can be employed to achieve an optimum compromise between aircraft manoeuvrabilityand aircrew performance.
b. To reduce the effect of vibration on the eyes, further research is required into factorsaffecting head vibration, and into methods fc: reducing significant frequency components at headlevel.
c. To ensure that visual information is still readily available to the pilot, work is needed tooptimise display formats, the size and separation of alphanumerics, symbology and the use of colour.
X1
2. The factors already listed would also reduce workload, but the problem of excessive workload shouldbe specifically addressed.
a. Sophisticated electronic systems and displays must be developed with a reduction in workloadas a primary aim. Any improvement in mission capability which results from :uch developments canthen be fully utilised by the aircrew.
b. Only essential and appropriate information should be made available to the pilot, but all such
information must be provided clearly, without possibility of error, and with minimal distractionfrom the outside view (see also ic, above).
3. It is too early to predict the future of helmet mounted sights and displays, but in offering a head-up display which moves with the direction of gaze, they have enormous potential in high-speed, low-levelflight.
a. Considerable research is still required into basic visual problems - inappropriate reflexes,binocular rivalry, changing luminance requirements etc., as well as into the design of an optimumdisplay.
b. Vibration poses a particular problem which needs urgent attention if helmet-mounted sightsor displays are to be used in high-speed, low-level flight.
4. Weather constitutes an important factor in aircrew performance and accidents, especially in CentralEurope. There is an urgent need for visual enhancement techniques (low light TV and infra-red, forexample) capable of use "head-up", to give an all-weather and night capability to single seat aircraft.
5. Ejection at high-speed and low-level offers a particular challenge to the designer because allproblems are compounded by the need to reduce time delays to the minimum.
a. Restraint systems require further development to reduce flail injuries at speeds greaterthan 500 knots.
b. Effective stabilisation of the seat is essential, to reduce flail injuries, as well as toallow the operation of vertical seeking devices which could improve the chance of survival followingejection from adverse attitudes.
c. Any re-design of ejection 3eats required to improve ejection at high-speed and low-level mustnot compromise election safety under other, possibly more common, conditions of flight.
6. The thermal comfort of aircrew is often less than satisfactory in the majority of aircraft types,to the extent that under certain climat c conditions, or when wearing special clothing, performance maybe compromised.
a. Designers should raise the priority with which they treat cabin conditioning, giving theaircrew at least as much attention as the electronics.
b. The performance of the environment• 1 control system should be based on physiological require-ments, these data being readily availabl,.
D H GLAISTERWing Commarder, RAFChairman, Biodynamics Coumni-ee, AMP.
Xil

KEYNOTE ADDRESS
by
General J M.Brochado de MirandaVice Chief of Staff -- Portuguese Air Force
Estado Major da Forqa AereaAlfragide
2100 AmadoraPortugal
On behalf of the Chief of Staff, Portuguese Air Force, it is my great pleasure to greet the members of the AerospaceMedical Panel on the occasion of its meeting for the second time in Portugal.
It is indeed a great privilege for us to host once again this meeting of leading personalities of NATO in the fields ofscience and technology relating to aerospace. We hope that your work will be fruitful and. simultaneously, that you willbe afforded the opportunity of enjoying some of the natural beauties of my country, and of meeting some of its peoplewhose hospitality and friendliness I always like to emphasize.
The short, words of welcome I am honoured to address to you at tLIs opening ceremony have, as a starting point, abrief comment on the circumstances that set the framing for the Portuguese Armed Forces.
Portugal, the oldest state-nation of Europe, is going nowadays through a veýry difficult period of its already long lifeas an independent country. At this historical moment, on its shoulders fell, simultaneously, the consequences of a gravecrisis in the world economy and the effects of a sudden and disordered withdrawal from territories in the African continentwhich we have for centuries, colonized, administered, developed, explored and loved.
The unexpected drying up of preferential sources of raw materials and food products, the closing of complementaryand privileged markets, and the return of over half a million refugees (just to mention the most important events) werealtogether a severe blow for the faint-hearted Portuguese economy, badly shaken already by thirteen years of erosiveguerrilla warfare with no military solution. The progressive rise in oil prices worldwide not only hampered the expectedeconomic recovery, but contributed to an aggravation of the situation
As a corollary to this and also --- why not mention it - a certain tendency of the Portuguese people to the anarchicpopulism, the internal order of the country was badly degraded and, with it. the production output. In parallel, aprofound crisis of national identity developed as well. more profound even than the economic and political crisis, whichwill take a longer time to overcome Confused an, disoriented, the Portuguese question themselves about the "collectivesense of their destiny", and search for the "accurate definition of their own space among the other nations"
The times we are living in are, therefore, times ot crisis political, economical and of national identity
In this national frame, of course, live the Armed Forces.
The effect of the crisis on them is obvious.
During the past stage of greater social instability, the armed forces lived through moments of almost total anarchy.during which they suffered a profound split and were used as a plaything in the hands of the various political groups. Itwas a rather troubled period resulting from the political inexperience and ingenuousness of the servicemen
However, recovered after having been caught by surprise, when the fundamental values from which they stemnaturally emerged again to definitely muffle down the false myths and Utopian demagogism. they managed to freethemselves from the mess where blindly and apathetically they had fallen.
Today, all servicemen - "trustees of tamed violence" - although aware of the importance of their role in thenation's political life, wish to resume the classic role of watching out for the national security, within the frameworkof the estblished democratic rule and in total subordination to the legitimate political power, while responsible fordetermining the time and place where force shall be used.
xiii

I expect that the Portuguese Armed Forces will never again become an instrument of political forces, other than tileones which represent the will of the people and the national interests.
[hey stand watch for the deceiving mermaids' song, for the seducing false pleas, no matter where they come from.because they shatter the unity so peculiar to tile military institution, and indispensable as a solid foundation to itsstrength.
At this time, I believe one can make applicable to the Portuguese Armed Forces the old popular saying "a burntchild dreads the fire".
In what concerns their operational capability, the Armed Forces are obviously affected by the severe constraintsof our economy, and also by a clear anti-mil.htary social attitude based mainly on economic but also on politicalconsideraticns In our particular case, there are still individuals and/or political groups interested in. or determined tofoinent instabdity within the Armnd Forces, for well-known but not publicly stated reasons Others accuse the ArmedForces of uselessly consuming national resources badly needed in projects of economic development. And there are otherswho defend. as a matter of convenience, the existence of the Armed Forces, using them as scapegoats to be blamed foranything that goes wrong in the political and economic fields, and also for their own shortcomings and unfitness.
The development of a situation like this. I believe, is by no means exclusive to Portugal Most likely. it took placeas well in other countries that lived through period- of similar social turniod, economic crisis or stages of development
Although the political leadership hzs thus far, avoided getting involved with the definition of the nationaldefense organization and policy, so to clarify the image and role of tile Armed Forces within the Portuguese society oftoday, mainly because such a definition means assuming responsibility for providing them with the material meansnecessary to carry the assigned mission, one can nevertheless say that the Portuguese Armed Forces deduced missionis relatively evident, at least on it- qualitative aspects.
In so far as the Air Force is concerned, its available resources or the ones it tries to obtain, under the circumstances,represnt a minimum requirement for carrying out the tasks which the Portuguese Constitution broadly defines, forfulfilling international commitments, or simply to enable its routine training in order to keep its valuable experienceacquired in tile operational environment.
Within this line ot thinking, the Air Force does not have, at the present, either the capability to operatehigh-performnance aircralt. such as F1-16. Mirage 2000 or Tornado. or the hope to acquire it in the short term.
Neither is Portugal politically engaged in any sort of armnaments race, nor do we the military people wish to deviateto the armaments field the scarce economic resources, so badly required to satisfy our people's basic needs, throughits investment in projects of economic and social development.
On the other hand, we consider it essential to strike a balance between the sophistication of the air assets in ourinventory and the technological development of the country, thus recognizing that, to P'ave aircraft of sucti highperformance whose maintenance can't be, to a minimum degree, supported by the national industry, is not of nationalinterest We admit. however, as beneficial, the existence of a certain technological gap to act as a challenge, and tostimulate progress and transfer of "know-how".
The Air Force is. therefore, at this time, orientating its main efforts to the optimization of the human and materialresources already available, to the development of the individual capabilities of its men, and to improving its decision-making process.
At the same tune, in tile technical and scientific fields, it tries to be in touch with the most recently producedtechnology or scientific breakthroughs.
Therefore, the Portuguese Air Force, although operating an airplane generation obsolete by the standards of themost developed countries, but nevertheless still fit to carry out its mission in the national framework, permanentlystruggles to keep itself up-to-date with the development and operational use of high-performance airplanes and relatedproblems.
This line of thought justifies our deep interest and great satisfaction in hosting this 36th Panel Business andSpecialist Meeting here in Portugal.
Our Air Force medical doctors, who integrate with the NATO Aerospace medical community, will have theopportunity to learn about the operational performances of the most adv.nced airplanes in being, or projected to be usedin Europe, and also about the problems related to the selection, training and required capacity of their crews to carry outmissions under heav, mental and physical stress. They will, for sure, broaden their views and understanding of theproblems that will affect our crews in the future
XlV

Some of our most qualified pilots also have the opportunity of coming to this meeting. Like all pilots they arealways eager to fly higher and faster. They will, therefore, have the possibility to listen to the interesting communicationsyou are going t, make, according to their proposed titles, and to anticipate some thinking about the problems of theS ~ operational use of high-perfo,,'nance airplanes which, some day, they may have the chance to fly themselves. They canstart getting adjusted to the restrictions imposed by a heavily hostile environment: flying faster, yes, but definitely much
low.er.
When the time comes to do it, a solution may have been found for many of today's problems, as a consequence ofthe studies developed, and the exchange of scientific and technological information, an exchange which is made easierand encouraged by meetings like the one you are goin~g to have here.
From our side, as host nation, we will retain a modest feeling of participation. if not through a direct and productivecontribution to the studies to improve performance of men and weapons in an hostile environment, at least through theadministrative arrangement of this meeting, through our presence here and our great interest in the subtect, and certainlywith our niost warm welcome to all of you. This feeling of participation is, in its simplicity, useful from a psychologicalpoint of liew. It gives us the impression of having moved a step forward no matter how little it may be towards themore developed nations of the North, a step that may not be long enough to narrow the gap, but will be big enough toprevent the gap from widening.
I suppose, that, in fact, one can consider your coming to us, within the perspective of the North-South approach.
We all are oware of the disparity between the highly industrialized nations and the less developed countries - themore seriously affected by the worlu economic crisis and we all know how it tends to aggravate itself and to becomea source of tension and conflicts.
Nowadays, in opposition to the until recently dominant way of thinking, the long-term development a strategicobjective in every country. - is consideied to be far more dependent upon cultural, social and political changes than upona wider availability of matenal iesources
Portugal underwent already and still is undergoing changes of that nature. 'The respective fruits will be pickedeventually, but only in the long term.
In this picture of the Portuguese situ0 tion I have tried to draw for you. using colors somewhat covered by heavyshades, the Portuguese Air Force, with the energy and enthusiasm of its youth, keeping itself strongly motivated andinternally cohesive. In spite of the difficulties, setbacks and not too good perspectives, the Air Force has found initself the necessary stamina to develop its operational capacity, bearing in mind that progress is more dependent upon itsown initiative than upon outside support.
The Organization of which you are distinguished members is a source of stimulus and I believe it can provide ourown human resources with incentive, guidance and support to their endeavours of developing adequate investigationprograms, no matter how limited our available means may be.
After all, no matter how big, the available means are always limited.
As I exjtud iv dlu 4,u ,;,ich one of you, distinguished represen.atives of NATO member countries. a specially warmwelcome to Lisbon, on behalf of the Chief-of-Staff of the Portugucse Air Force, I also wish that you enjoy your stay inPortugal and after your return to your countries that you may keep a pleasant souvenir of the time you spent with us
Xv

I-!
RIDE-BUMPINESS AND THE INFLUENCE OF ACTIVE CONTROL SYSTEMS
J. G. Jones, Flight Systems Department,Royal Aircraft Establishment,
Farnborough,Hampshire
GU14 6TD, UK
(FLIGHT MECHANICS PANEL CONTRIBUTION)
SUMMARY
Stresses on aircrew in high-speed low-altitude flight are dependent upon speed,height, terrain and atmospheric conditions, but are amenable to modification by aircraftdesign and control strategy. As the level of atmospheric turbulence increase4, not onlydoes the task of handling the aircraft become more difficult, but the disturbances causediscomfort to the aircrew and make it harder for them to perform control and weapon-aiming tasks. The low-altitude high.-speed flight mission is particularly liable to givea rough ride both because there is usually a significant amount of turbulence at low alti-tude, associated with wind shear in the earth's boundary layer, possibly aggravated by theproximity of rough terrain, and because the magnitude of fluctuations in normal g due tovertical turbulence is directly proportional to aircraft speed.
Various characteristics of aircraft motion which influence ride quality may be dis-tinguished. One is 'ride-bumpiness', related subjectively to gust-induced fluctuations inacceleration and dependent on primary airframe parameters including wing loading, lift-curve slope and speed. Another is 'vibration', mainly due to the response of the flexibleairframe structure, in which distinct frequencies of oscillatory motion may perhaps bedetectable subjectively at the resonances of the lower-order structural modes.
Active control technology (ACT) permits powerful manipulation of aircraft responseto external disturbances as well as to pilot controls. On the one hand advanced controlsystems mhy be designed specifically to improve the ride quality. Such systems includeride-smoothing systems for small and relatively rigid aircraft, employing direct-liftcontrol to reduce the amplitude of bumps associated primarily with rigid-body motion, andstructural mode control systems for large and relatively flexible aircraft, whose designobjec.-ves include the suppression of response in the lower-order structural modes. Onthe other hand, active control systems designed with some other aspect of performance inview can have an undesirable effect on ride-quality. Such a tendency appears in the caseof the aerodynamically-unstable aircraft where the advantages to aircraft performance andmanoeuvrability of employing artificial stability are well documented but where the trendsin gust response tend to be adverse.
Standard methods for assessing ride-quality are briefly reviewed. In addition, arelatively new technique is described that combines time-plane characteristics of responsewith frequency-plane features usually defined in terms of power-spectra. This method,which has been developed as a tool for assessing the dynamic response of aircraft in turbu-lence, may provide useful additional information for human factors work. The techniqueleads in particular to a 'characteristic signature', in the time plane, of the aircraftresponse to gusts. In determining the dependence on aircraft dynamics of this character-istic energy pattern emphasis is placed on the concept of signal 'increments' or'differences', in contrast to the sinusoidal components of Fourier analysis. It is perhapsrelevant that the role of signal differences in time or space is also stressed in classicalwork on the mechanisms of human sensory perception.
1 INTRODUCTION
High speed aircraft frequently operate at very low altitudes, navigating over longdistances, using terrain-following or other techniques, to locate targets precisely anddeliver their weapons with a high probability of striking the target on the first pass.Low-level operations must be relatively free from the adverse effects of turbulence, gustloadings and manoeuvre restrictions, the aircraft must retain its characteristics as astable weapons platform and pilot fatigue in the low altitude regime must be mininal .
The operational efficiency of the crew during flight in a low-level gust environmentis dependent on a number of factors2 :
(a) atmospheric turbulence structure and levels
(b) the characteristics of the aircraft in responding to turbulence, includingthe effects of structural modes
(c) the tolerance of the crpw to the level and duration of the bumpiness andvibration at the crew station.
The quantification and relation of these featurez depends on an analytical descrip-tion of the aircraft motion. Statistical measures of aircraft motion that have been

traditionally regarded as relevant to ride-quality assessment may be separated into twodistinct classes:
(i) measures based on probability distributions for the amplitude of accelerationresponse peaks
(ii) measures based on frequency-dependent or power-spectral properties ofacceleration response.
To these should be added the influence of aircraft pitching motion which has ameasurable effect on pilot workload through its influence on the assessment of the air-craft as a stable weapons-platform.
Measures of type (i) above have usually been expressed in terms3 of 'I g bumps perminute'. This type of criterion has been applied in particular in the context of high-speed flight of relatively rigid aircraft and is largely dependent on aircraft whole-bodymotion. To assess aircraft response in this form some form of discrete-gust turbulencemodel is usually employed. In recent applications of this approach, statistical familiesof discrete gusts have been used to represent patches of 'continuous' turbulence andtheoretical predictions for the rate-of-occurrence of bumps of arbitrary amplitude (andnot just 1-g bumps) deduced4, see Pig 1.
Measures of type (ii) above, based upon frequency-dependent or power-spectral proper-ties, are widely used at the present time. Standard turbulence models are available (egin MIL-F-8785B) in the form of power spectral densities of either 'Von Karman' or 'Dryden'form, from which various measures of response may be deduced. These include the powerspectral density of response, the normalised rms load factor 5 A, which is based upon thearea under the spectral-density curve, and a Crew Sensitivity Index for ri..e quality6 thatweights the response spectral-density with a function that expresses human tolerance as afunction of frequency.
The influence of primary airframe parameters including the wing loading W/S, thelift-curve slope CL and speed V may be deduced from either a discrete-gust or a power-spectral approach. I In the former case the 'tuned response' (ie response to tuned gust orcritical gust pattern) is given by1 2
a relation that contains, in the 2power, the dependence of gust amplitude on wavelength.In the latter the rms load facto is given by 5
- PVSCL I(k s) (2)
where the term I (k,s) incorporates the effects of the turbulence spectrum.
Equations (1) and (2) may be shown to be essentially equivalent. The dominant factorsat a given flight condition are the wing loading and the lift curve slope. The latter isstrongly influenced by the aspect ratio and the leading-edge sweep. Figures 1 and 2 (fromRefs 4 and 5) illustrate these effects.
The ride quality is further aggravated by the influence of the structural mode res-ponse to gusts. Typical of fighter-aircraft gust response5 are the data shown in Fig 3,obtained from flight tests on a relatively small highly-manoeuvrable aircralt and showingthe contribution of the first body bending mode to the overall power spectral density ofthe gust response at the pilot station. The frequency of the dominant Wode of flexibleresponse may be seen to be at 10 Hz. This contrasts strongly with data for a large andrelatively flexible aircraft, designed to fly in close proximity to the terrain at highspeeds, where spectra of longitudinal response show marked peaks at approximately 3 Hz and7 Hz with lateral response modes appearing in the same range.
It is characteristic of aircraft flexible-mode response tnat its time history ismarkedly oscillatory or quasi-sinusoidal, in contrast with bumpiness associated with whole-body motion, which is essentially intermittent with discrete bumps often distinguishablein relative isolation. This qualitative distinction may be e;-pected to be significant foraircrew performance and subjective impression and should be ,-Olected both in analyticalcriteria for ride quality and in the motion of ground-bEsed simulktorr. We will return tothis topic subsequently.
Although we have concentrated on the influence of normal acceleration on ride quality,effects of aircraft pitching motion need also to be taken into account. The direct effectof angular motion upon smoothness of ride is probably considerably less than that of normalacceleration from the point of view of aircrew capability and efficiency. However, in thecontext of combat aircraft, where the quality of the aircraft as a platform for weaponrelease is of prime importance, the effects of gust-induced pitch disturbances on weaponaccuracy and associated pilot workload are of major concern.
A central topic of this paper is the influence of active control technology (ACT) onaircraft ride characteristics. As a preliminary, however, we briefly review the availablemethods for assessing such influence in quantitative terms.
iA

1-3
2 TOOLS FOR THE ASSESSMENT OF AIRCRAFT RIDE CHARACTERISTICS
The most widely-used methods for the assessment of ride quality involve frequency-dependent or power-spectral density (PSD) characteristics of response. The evaluatiog ofride quality in these terms is illustrated in Fig 4. There are three main components .The gust power spectral density is a measure of the excitation energy in the atmosphereas a function of the wave number (inverse of wavelength) 0; once the speed of the aircraftis defined the wavenumber can be viewed as a frequency parameter (9 = w/V). The second4• component is the frequency response of normal acceleration (normal load factor) at thecrew station due to unit amplitude sinusoidal vertical gusts. Relating this to the gustpower spectral density curve it can be seen (Fig 4) that the energy in the atmosphere canerite the rigid-body (whole vehicle) motion and a number of the lower frequency structuralmodes. The third component takes the form of a weighting of the response motion atvarious frequencies, depending on the dynamic response characteristics of the human body.As shown at the bottom of Fig 4, all of these data are brought together into Hz, a CrewSensitivity Index for Ride Quality. If the 'human frequency response' TD were left out ofthe calculation, the rms load factor A would be obtained. A is sometimes preferred5 to Hzas an indicator of ride quality because it permits direct correlation with various formsof analysis including comparison with simulator results. A typical analytical result inthis form has already been given, equation (2).
A lateral parameter HR is developed similarly to Hz with the gust spectrum remaining- the same, but with lateral aircraft frequency response and the human response function
r-flecting different characteristics.
The levels of Hz and Hv accepted as design criteria are influenced by a number ofSfactors, including mission time; these are discussed and evaluated against response charac-
teristics of a number of typical military aircraft in Ref 6.
Since the 'human frequency response' element of this method (Fig 4) is largely basedon measured numan response to sinusoidal motions, the appropriate applications of measuresof this type arise in situations dominated by response of a highly oscillatory character.In qualitative terms the motion then takes the form of relatively continuous vibration asin the response to structural modes rather than irregular or intermittent sequences ofindividual bumps. We take the view that the use of data based on quasi-sinusoidal vibra-tion to treat aircraft whole-body ride bumpiness in turbulence is a suspect procedure.
For the treatment of d~sbrete fluctuations in normal acceleration, or 'bumps', analternative framework exists 2 comprising a turbulence model in which families of discretegusts are used to represent patches of continuous turbulence. In this statistical discretegust (SDG) method, the turbulence model takes the form of an aggregate of discrete rampgusts which, for the assessment of aircraft rigid-body response, are considered eithersingly (Fig 5) or in pairs (Fig 6). Families of 'equiprobable' ramp gusts follow a lawv. n H1 / 3 as illustrated in Fig 7. These statistical characteristics are consistent withthe energy distribution defined in standard forms of the power-spectrum turbulence model(von Karman spectrum). It is thus possible to employ coordinated discrete-gust and power-spectral turbulence models, both related to a common turbulence reference intensity 5which acts as ar. overall measure of atmospheric disturbances and for which probabilitiesof exceedance are available based on overall global statistics (see Appendix B of Ref 8and also Ref 9). The relationship between the reference intensity 3 and the true rmsintensity 3i of a component of turbulence with scale length L is illustrated in terms ofpower spectra in Fig 8. Turbulence intensity is often described qualitatively as light,severe, etc. Such terms may be approximately related to specific values of the referenceintensity according to the following table:
Grades of turbulence and reference intensities
SNominal Values ofgrade of referencegrade of intensity
turbulence
m/s f/s
Light 0.9 3Moderate 1.8 6
Severe 3.7 12
The discrete-gust analysis of aircraft response takes place in the time plane andinvolves a search over families of equiprobable gust patterns, including both isolatedgusts and gust-pairs, for the 'tuned gust' or 'tuned gust pattern' which produces themaximum or 'worst' response. The theoretical prediction for the rate-of-occurrence ofbumps then takes the form0
S= no exp-- (3)ny
where no : i/AH (14)

and ny is the average number, per unit distance flown, of aircraft normal accelerationpeaks with magnitude greater than an arbitrary magnitude y
as, are parameters which define the statistical properties of the patch of turbulencethrough which the aircraft is flying (see below)
ii is the tuned (or critical) gust length (not to be confused with Crew SensitivityIndices H. and H.)
Sis the tuned response (response to tuned gust or critical gust pattern)
A is the gust length sensitivity.
The tuned response i may be associated with either a single isolated gust or with agust-pair combination; the precise condition is
max 0.85 y2
where yi and r2 are respectively the maximum response to a single isolated ramp gust (Fig 5)and the maximum resonant response to a pair of gusts (Fig 6), and the individual componentgusts are chosen from the same (equiprobable) family (Fig 7).
The statistical result given by equations(3) and (4) may be supplemented by theevaluation of the quantity
T = H/V , (5)
which is strictly a measure of the time taken to traverse a tuned-gust gradient distanceH but may also be used as an approximation to the rise time to peak amplitude of theassociated response. Equivalently T may be regarded as an approximate measure of the'duration' of the response peak. In particular, in the case of normal acceleration response,T may be related to the 'sharpness' of the bump. A generalisation of this approach toincorporate the complete 'characteristic signature' of the bump is described in Section 4.
For the purpose of ride-quality assessment for low-altitude high-speed flight it isproposed in %ef 8 that nominal patch lengths of 5 miles (8 km) be assumed, an overallmission being regarded as a sequence of such patches with varying turbulence intensityfrom patch to patch. It should be emphasised that the assumption of 5 mile patch lengthsis an over-simplified and provisional representation of the patchiness properties of realatmospheric turbulence. In fact, intense patches can sometimes be very short, describableas a burst or cluster of gusts. However, despite its limitations, the nominal patchinesspostulated is believed to be adequate as a basis for the analytical comparison of the ridecharacteristics of differing aircraft configurations. In terms of the assumption of 5mile patch lengths, the provisional statistical model proposed in Ref 8 takes the form
a 0.38 (dimensionless)
• 0.07 a (f/s units)
0.10 ; (m/s units)
where a, 0 appear in equations (3) and (4) and a is the turbulence reference intensity9
(Pig 8).
3 THE INFLUENCE OF ACTIVE CONTROL SYSTEMS
3.1 Preliminary remarks
The benefits of Active Control Technology (ACT) for both fighter aircraft designedfor combat and for large flexible aircraft designed to fly in close proximity to theterrain at high speeds and for long periods have been well documented 7 , 1 0 .
In the case of combat aircraftlO, the benefits include weight reduction, porformanceand handling improvements. Very significant improvements in performance can be achievedwith artificial longitudinal stability coupled with automatic operations of combat flaps.The adoption of spin prevention and automatic manoeuvre limiting will give 'care free'manoeuvring. In addition, improvements in aircraft ride-bumpiness characteristics may inprinciple be achieved by the use of ride-smoothing systems employing direct-lift-control 4 , 5 ,although it should be pointed ou that the benefits may not in all cases justify the costand complexity of such a system.
j In the case of large flexible aircraft, there is a requirement to provide a specified
level of ride quality for the crew. This requirement has been met on the B-1 aircraftthrough the use of an automatic control system called a structural mode control system(SMCS) whose main external feature is a set of vanes near the nose of the aircraft. A
substantial saving in weight was achieved? with this approach as compared with the directalternative of material stiffening of the structure.
Not all changes in aircraft response associated with ACT are necessarily beneficial,however. In particular, the improvement in aircraft manoeuvrability by the use of

artificial longitudinal stability tends to be associated with a degradation in the res-ponse of the aircraft to turbulence (although this, in turn, may be alleviated by theaddition of a ride-smoothing system).
In the fcllowing sections we illustrate some of these trends by means of particular
examples.
3.2 Ride-smoothing system employing direct lift control (DLC)
Earlier results of this paper have confirmed (Figs 1 and 2) that high wing loadingand low lift-curve slope contribute to good longitudinal ride qualities. However, thechoice of such airframe characteristics generally has to be a compromise between therequirements for ride and the requirements for manoeuvrability. A possible course in thissituation is to choose (low) values of wing loading and (high) values of lift slopeprimarily to achieve good manoeuvrability and to attempt to recover adequate ride qualitiesby means of a ride-smoothing system. In the following we compare the changes in ridecharacteristics that may be achieved in this manner 1 1 with analogous improvements thatwould result from an increase of the airframe parameter (W/S)/CLa.
The type of gust-alleviation system considered in this section is aimed to reduceride-bumpiness associated with rigid-body response and the discussion is particularlyrelevant to relatively rigid aircraft (with natural response as in Fig 3, for example).We defer to Section 3.3 the discussion of active control systems whose primary objectiveis to alleviate vibration associated with the response of the flexible structure.
In Ref 4 two alternative types of closed-loop control were discussed, one employingnormal-acceleration feedback and the other incidence feedback, in each case to a DLCmotivator such as a wing flap surface. In addition to the DLC loop, each system had apitch stabilisation loop which employed pitch-rate feedback to an elevator or tailplanemotivator.
Typical results are illustrated in Fig 9 where the effects of basic airframe changes
and of an active ride-smoothing system are contrasted. In terms of the parameters inequations (3), (4) and (5) the following trends occur
increasing additionW/S of ride-smoothing
system
y decreases decreases
n decreases increases
T increases decreases
Thus, whilst the effect of increasing (W/S)/CLa is to decrease both the amplitude ofbumps, as measured by y, and their total number, as measured by the 'zero crossing para-meter' no, the effect of the ride-smoothing system is to decrease j but to increase no.
It thus appears that the improvements in ride quality obtainable using a ride-smoothing system tends to be dissimilar in character from the improvements due toincreasing (W/S)/CL., for example by increasing wing sweep, with which pilots are familiar.
Analogous results may be obtained1 1 using the power-spectral approach, where an
equivalent 'zero-crossing parameter' is given by
n O o (6)
and o--,o. are the rms rate-of-change of acceleration and the rms acceleration respec-tively. O9 the other hand such features are not encompassed explicitly by the Crew Sensi-tivity Index, Fig 4. We draw the conclusion that further work on the human factcrs aspectsis required to determine the extent to which increasing no (and decreasing T) is a genuinedetrimental effect.
The above trends m~y be illustrated, Fig 10, by means of extracts from computer-simulated time historiesT. These show that the theoretical trends need to be interpretedwith some care. The decrease in bump amplitude associated with the ride-smoothing systemis clearly apparent. On the other hand the associated increase in no,and decrease in T,may be seen to be due simply to the removal of low-frequency components of the fluctuationswhilst the higher-frequency content rempins relatively unaltered. As a result, the removalof energy has caused an increase in the rate of sign reversal of the time history ofincremental load factor.--TFI case of increased (W/S)/CLa the bumps are distinctlysofter-edged (Fig 10). The significance of this phenomenonais underlined by the fect thatcases have been reported where pilots have remarked on a 'cobblestone ride' in an aircraftwith a ride-smoothing system. Moreover, the computer simulation illustrated in Fig 10

was based on r!gid-body equations ot motion. With structural flexibility included, the
relativ2 sharpness of the bumps in the case of Fig lOb would probably be accentuated.
3.3 Structural mode control system (SMCS)
The Zollowing material has been obtained from the ,escription of the B-I ride controlsystem presented in Ref 7.
One of the principal missions of the B-I involved flying for long periods of timeclose to the terrain. The design requirements produced a relatively flexible aircraft."This vehicle flexibility, combined with the ever-present low-altitude atmospheric turbu-lence, could have produced an acceleration environment at the crew station which coulddegrade general crew efficiency with a consequent hazard to mission success.
The B-i design employs a variable sweep wing which is swept aft when flying the low-altitude mission. The aft-swept wing has a low lift-curve slope and thus is less suscep-tible to turbulence excitation loads. Despite sweeping the wing the response to turbulencein the structural-response modes was still too high to meet the ride-quality requirements.Two basic design choices remained: (1) add material (and weight) to stiffen the structureover that needed for strength and flutter requirements, or (2) use an active contrcl systemto control the lower structural modes, up to 10 Hz. The latter approach led to significantweight savings. The active control implementation was the so-called ILAF (identical loca-tion of accelerometer and force) concept, previously evaluated during the flight testresearch programme on the XB-70, and incorporates suppression of both vertical and lateral
bending motion.
The Von Karman gus. po'ter spectral density curve was used in calculations of the ridequality (crew sensitivity indices, Hz and Hy) and the rms acclerations due to turbulence,
Crew sensitivity index data are shown in Fig 11. Data are shown for the basic air-craft, the SCAS (stability and control augmentation system) operating, and the SCAS + SMCSoperating. The peak at low frequency is the short-period (rigid-body) response and thelarge structural response at about 18 rad/sec frequency is a mode consisting priL.arily offuselage bending.
As can be seen (Fig 11), the SCAS does its intended job of damping the short-periodmotion, but slightly excites the structural response. The operation of the SMCS substan-tially reduces the structural motion, whilst not interfering with the short period, anddemonstrates a capability for meeting the specification Hz (specification level wasRz 4 0.029). Similar results for the lateral modes of structural response are presentedin Ref 7.
Effects of operating the SMCS are illustrated7 by means of time-history plots inFig 12. The data were recorded in a flight during which considerable light-to-moderateturbulence was present nearly continuously. In both vertical and lateral motions theeffect of operating the SMCS is to reduce the amplitudes significantly. Moreover, in thecase of vertical motion the q of the response may be seen to be changed, by theincrease in damping, from being- aighly oscillatory vibration to a more irregular sequenceof fluctuations not dissimilar (in this particular run) to the bumpiness already shown,Fig 10, to be characteristic of a much smaller and relatively-rigid combat aircraft.
3.4 Artificial longitudinal stability
In an airraft not fitted with a feedback control system, longitudinal stabilitymust be obtained by having the neutral point behind the centre of gravity. This impliesin practice that the tail provides a downward force, or negative ift, with consequentpenaltie., in drag-.
An active control system can profoundly alter this, for by feeding back controlsignals to the elevators (or tailplane) to provide suitable pitching moment the longi-tudinal stability characteristics can be completely changed. In particular, it is nolonger necessary to insist that the centre of gravity lies ahead of the neutral point.
The improvements in aircraft performance achievable in this manner hare been welldocumented elsewherelO. The case for relaxed aerodynamic stability is now aidelyaccepted and its practical implementation hinges only on the safety, reliab4 lity and costof the active control system required to provide the necessary degree of ove. all flightstability.
However, the successful implementation of control laws involves not only stabil:cybut also the broader spectrum of what are generally called 'flying qualities'. Flyingqualities not only involve stability and transient response to pilot's control, which isthe principal concern of much of the studies published on active control, but such mattersas gust response, behaviour near and beyond the stall, steady manoeuvring characteristicsand even control and stability during the ground roll. For any active control system tobe acceptable it must of course maintain in all these areas the standards we demand of theconventional aircraft. Shortcomings, even if they manifest themselves only at the peri-phery of the flight and manoeuvre envelope, must be identified and means devised for theircorrection.
1-7
A review of these topics has recently been presentea in Ref 12, where the conclusionis drawn that whilst currently-designed systems appear to be capable of satisfying themain objective of providing at least short-period stability of the relevant aircraft modesthey all fall short in some way of satisfying all the handling requirements. In particular,response to vertical gusts tends to be significantly amplified with the use of pitch-ratebased feedbacks.
We illustrate these points by comparing the response to vertical gusts of aircraftwhich have positive, neutral and negative longitudinal aerodynamic stability respectively.
Figs 13 and 14 show the response to vertical gusts of aircraft with stabilizing termsinvolving pitch-rate and integral pitch-rate feedback. The results are based on power-spectral-deiksity (PSD) analysis. In each case it can be seen that, in r.oving from thenaturally-stable to the unstable aircraft there is a significant increase in response atthe lower frequencies.
Such results are confirmed by a statistical discrete-gust (SDG) analysis. In thismethod, as outlined in Section 2, the response amplitude is measured in terms of the 'tunedresponse' y ie the 'worst case' response, of maximum amplitude, iorresponding to a pres-cribed family of equiprobable gusts (such a family generalises the traditional concept ofa 'design gust'). y may be associated with a particular time history, or 'tuned responsepattern' which corresponds to the worst-case gust and which may be shown to characterizethe gust response of the system 5n question even when the excitation is due to continuousturbulence (see Section 4).
Fig 15a compares the tuned-response patterns for the normal-acceleration responseof stable and unstable aircraft to vertical gusts. It may be seen that, irn moving fromthe naturally stable to the unstable aircraft, there is boch a significant increase in theamplitude ?f response and a decrease in the dominant frequency, consistent with the trendspredictedl by the PSD analysis.
A further interesting result, obtained from the SDG analysis, concerns the charac-teristic gust-induced pitching motion. The tuned-response patterns for the naturally stableand unstable aircraft are compared in Fig 15b. Not only is the response considerably sloweddown in the case of the unstable aircraft, the characteristic time history extending overa longer period, but the initial direction of response may be seen to be in the oppositesense. This is due to the initial response of the aircraft being dominated by the (nega-tive) aerodynamic stability; only after some pitch rate has developed does this particularcontrol system apply control moments in the sense of (overall) positive stability.
We are here, of course, not implying any inherent and irremedial def3cienciesassociated with the implementation of control laws for the case of relaxed aerodynamicstability. The point being made is that the implementation process requires much morethan a simple consideration of stability questions. A full consideration of flying quali-ties requires the careful investigation of transient responses to both pilot demands andto external disturbances such as gusts. We should not be surprised to find flying charac-teristics that differ considerably from those to today's aircraft and which will requirecareful assessment by pilots. This conclusion is somewhat reminiscent of that reached inthe context of ride-smoothing systems (Section 3.2) and draws attention to the fact thattraditional design requirements for aircraft flying qualities and ride qualities are basedon experience with a restricted class of dynamic response characteristics that is rapidlybecoming outdated.
4 SIGNAL STRUCTURE AND RIDE-QUALITY ASSE3SMENT
In Section 2 we reviewed the tools available for assessing aircraft ride quality inturbulence. It will be apparent that there is more than one way of approaching the problemof signal analysis and synthesis for theoretical or simulation purposes. In this finalsection we take a look at some of the basic issues that have arisen through studies ofaircraft flight dynamics but that appear to have direct relevance to the human factorsspecialist.
We will denote the turbulence input or forcing function (generally the verticalcomponent of turbulence velocity) by v(t) and the aircra.t response (which will generallybe normal acceleration at the crew station but may also be, for example, pitch rate) byy(t). A major concern in the study of ride-bumpiness is then the occurrence and structureof the larger peaks in y(t). In terms of a Fourier decomposition into sinusoidal compo-nents, such peaks occur whenever the components of differing frequencies reinforce oneanother. This phenomenon may be likened to the concept of 'interference' in optics,where it is well known that if two sinusoidal patterns of differing frequencies are super-posed, there result some regions of 'constructive interference', where the amplitudes ofthe waves add together, and other regions where they tend to cancel one another. A regionwhere constructive interference arises may be thought of as a local energy concentration.
In the power spectral density (PSD) method, see Section 2, different Fourier compo-nents are assumed to be statistically uncorrelated and the occurrence of such wave rein-forcement is assumed to take place on a purely random, or chance, basis. This assumptionleads to a particular relation, based on the 'normal' or 'Gaussian' distribution, betweenthe amplitude of a large peak value of y(t) and the local rins value a (evaluated over a'patch' within which the turbulence is assumed to have stationary statistical characteris-tics). On the other hand, the basis of the statistical discrete-gust (SDG) method is thatlarge peaks in aircraft response, associated with wave reinforcement, in fact occur with

increased probability on account of phase correlations between Fourier components ofdifferent frequency. Theoretically, these occur as a result of nonlinear terms in theequations of fluid mechanics. Physically, they take the form of 'ordered structures' inthe turbulent flow field and may be interpreted as intermittently-occurring concentrationsof energy. The SDG model introduces such energy concentrations explicitly in the form ofdiscrete ramp gusts.
The mathematical background of the PSD method is the so-called theory of continuousrandom processes. The study of localised regions of energy concentration, as in the SDGmethod, follows on the other hind from a quite distinct mathematical background. Theoriginal work is due to Gabor 1l and has been particularly fruitful in jhhe area of acousticsignal decomposition and syntheais and the study of sensory processesl . The basic resultconcerns a constraint on the nature of regions of constructive interference (correspondingto energy concentration) between sinusoidal components covering a range of frequencies Af.This is the 'uncertainty relation' which states that if a 'packet' of waves covering thefrequency range Af reinforce one another over an interval of time At, and cancel else-where, then the product Af. At has a minimal possible value, of order unity. An element(Af, At) in the 'time/frequency diagram' which takes this minimum value was called byGabor a 'logon'.
The relation of this work to the SDG method is that the ramp gust profile, illustratedin Fig 5, may be shown to satisfy the minimum area condition on the product Af. At, whereAt is simply the duration of the gust At = H/V as seen by an aircraft travelling with speedV. In Ref 13 Gabor showed how an arbitrary signal could be expressed as a sum of suchelementary signals (logons).
Thus the ramp-gust profile, or 'smooth increment', qualifies as a possible basis forrepresenting arbitrary gust patterns. Moreover, from the point of view of reproducingthose features of a gust pattern that relate to the existence of a large peak in aircraftresponse, there is evidence that the ramp profile is the most efficient signal element inthe sense of requiring the minimum number of significant elements per pattern (and is muchmore efficient than a sinusoidal or Fourier component for instance). Simple examples ofgust patterns synthesised in this manner, together with their representations in the time/frequency plane, are illustrated in Fig 16. Note that these patterns include bothsequences of ramps (Fig 16(a) and (b)) and also the superposition of short ramps on top oflonger ones (Fig 16(c)). Each of the patterns illustrated in Fig 16 has in fact been shownin recent work to be derivable as the 'tuned gust pattern' of some dynamical system charac-teristic of aircraft response (the tuned gust pattern being the input producing the mostcritical system response, see Section 2). Fig 16(a) illustrates a gust pair, comprisingsequential ramps of opposite sign, with the first gust of the pair having rather greaterlength, or gradient distance, than the second. Such a profile is characteristic, forexample, of the tuned gust pattern for aircraft normal acceleration responsg to the verticalcomponent of turbulence when the aircraft pitch damping is sufficiently lowo. It should benoted that the 'energy elements' in the time/frequency plane (Fig 16) have been assignedappropriate positive and negative signs, corresponding to positive and negative incrementsin the time history. Fig 16(b) illustrates a similar pattern, comprising increments ofalternating sign, but with four ramp components. Such a profile is characteristic, forexample, of the tuned gust p~ttern for normal acceleration at the crew station associatedwith a not-too-well damped fuselage bending mode (see Fig 12). Fig 16(c) illustrates apattern comprising superposed ramps of the same sign but having significantly differinggradient distances (such that the corresponding elements in the time/frequency plane arenon-overlapping). Tuned gust patterns of this form have been found in recent studiestIIof the response of an aircraft with a ride-smoothing system employing direct lift control(Section 3.2). With sufficient autostabilisation in pitch, the basic aircraft longitudinalresponse has a tuned gust pattern comprising a single ramp. The introduction of the 'DLCloop', however, adds a hi.gher-frequency mode such that, at a sufficiently large value ofthe gain, the tuned gust pattern takes the form illustrated in Fig 16(c). For intermediategains the tuned pattern comprises a single ramp of intermediate gradient distance.
Thus the SDG method leads to an explicit study of 'gust patterns' and their mathe-matical representation. In addition, for some applications there is equal interest in thenature of the region of wave reinforcement (or energy concentration) is the associatedresponse function y(t). For instance, in the study of ride bumpiness, the SDG method leadsto an associated 'tuned response pattern', or 'characteristic signature' of the response inthe neighbourhood of a large peak value (see Fig 15). Indeed, such a characteristicsignature, which may take the form of a single well-damped fluctuation or may be markedlyoscillatory, may be said to characterize the 'bump'. In recent studies (to be published)the theoretical tuned response pattern, derived in this manner, has been shown to matchvery well the ensemble average of samples of time histories of response to measuredcontinucus turbulence, where the samples each tontain a large peak and are scaled andphased s3 that the peak values are superposed. Thus, whilst the individual time historiesof response in the vicinity of a large peak do contain some random element, it has beenconfirmed that there is also a predictable common underlying pattern.
We referred above to the fact that the ramp profile (Fig 5), or smooth increment, isan economical signal element in the sense of requiring the minimum number of elements torepresent the significant features of a gust pattern. This is somewhat reminiscent of themanner in which the central nervous system (of animals and humans) interprets sensationsin terms of input patterns whose basic ingredients are differences (see Part II of Ref 15or the section 'Form, substance and difference' of Ref 16, for example). It is perhapsnot too far-fetched to regard the structure of an aircraft as an extension of the pilot's
4L nervoua system and the physical sensation associated with a typical 'bump' on that aircraft

1-9
as the recognition of a particular input pattern in the environment. By means of the'tuned response pattern' evaluated as outlined above we may go on to study the 'texture'of that sensation and the manner in which it relates to behaviour such as the simul-taneous performance of tasks (effect on workload).
In this context, the manner in which the characteristic response patterns 'standout' from background noise is of importance. For instance, ground-based simulators thatemploy conventional Gaussian-noise generators to simulate the turbulence environment arecriticised by pilots as being 'too predictable' or 'lacking the occasional large bumps',even though they may reproduce the correct power-spectral chai'acteristics. The point hereis that Gaussian noise is essentially 'structureless' or ' featureless', irrespective ofthe form of the power spectrum. In generating appropriate signals for simulators it isnecessary to accommodate the relevant non-Gaussian features.
One way of achieving this, developed at RAE Bedford, is based on the generation ofrandom sequences of elementdry discrete ramp profiles with statistical characteristics asdescribed in Section 2. Details of this synthesis technique, in which a software algorithmis implemented on a digital computer and used to produce, in real time, a continuous'turbulence' record for aircraft handling qualities studies in a piloted ground-basedsimulator, have been presented in Ref 17. The method has recently been further developedfor use at NLR as described in Ref 18. However, the 'discrete gust' method is not the onlyway to approach the problem of generating a non-Gaussian signal as a model of atmosphericturbulence for real-time simulators. Comparable success has been achieved using a tech-nique originally developed by Reeves 1 , in which the multiplication of two independentS~Gaussian random signals was the basic approach used to generate each of three orthogonalgust components. More recently, this approach has been taken as the basis for further work
on the modelling of turbulence for simulation purposes at Delft University of Technology,S~the Netherlands, of which a report by Van de Moesdijk20 is the most recent example,describing a development which shows promi3e as a means of generating a random signal with
non-Gaussian increments.
For the future, we suggest that both power-spectral and discrete-gust approaches tothe modelling of turbulence are here to stay and that each type of model may be related tospecific aspects of ride-quality, as outlined in Section 2. Turbulence is a complexprocess involving the interplay of randomness on the one hand and order or structure onthe other. This is reflected in the use of random process theory on the one hand and therepresentation of specific signal patterns on the other. The results of recent worksuggest that in the field of signal synthesis the products of the two methods may beconverging (for instance, both methods are currently capable of generating signals withfairly realistic 'patchiness' characteristics). It is, of course, a healthy situationthat the protagonists of the alternative approaches are as firmly entrenched in theirrespective positions as ever. My own preference follows the common-sense view of thephilosopher A N Whitehead, who in 'The Aims of Education' commented 'We perceive thingsin space. For example, among such things are dogs, chairs, curtains, drops of water,gusts of air....
However the element of 'structure' is introduced into a fluctuating signal, whetherby the multiplication of Gaussian random processes or by the introduction of explicitsignal patterns, it is clearly an important aspect of ride quality as perrceived by air-crew. In the past, ride-smoothing systems have generally been linear systems designedto a mean-square error criterion. A possible alternative lies in the use of nonlinearsystems2 , designed specifically for non-Gaussian inputs, whose objective is to remove thenon-Gaussian structure of the onput. A quantitative approach along these lines has infact been proposed by Weidemanne who advocates the use of error entropy rather thanmean-square error amplitude as a measure of system performance. The output of such asystem would ideally be a broad-band Gaussian process and thus essentially structureless.Perhaps here lies a pointer to a future generation of ride-smocthing active controlsystems.
REFERENCES
1. C.H. Hausenfleck, Keynote address. Guidance and Control design considerations forlow-altitude and terminal-area flight. Guidance and Control Panel Symposium, AGARD CPNo 240 (1977).
2. B. Young, Aircraft response to turbulence, crew-comfort assessments using powerspectral density methods. Flight Mechanics Panel Meeting on Flight in Turbulence,AGARD CP No 1i0 (1973).
3. G.F.H. Hemsley, Consideration of air turbulence in aircraft design. Proceedingsof Symposium 'Atmospheric turbulence and its relation to aircraft', Farnborough 1961.HMSO, 1963.
4. J.G. Jones, D.E. Fry, Aircraft ride-bumpiness and the design of ride-smoothingsystems. Guidance and Control Panel Symposium on 'Design considerations for low-altitude and terminal area flight'. AGARD CP No 240 (1977).
5. J.F. Moynes, J.T. Gallagher, Flight control system design for ride qualities ofhighly manoeuvrable fighter aircraft. Guidance and Control Panel Symposium on 'Designconsiderations for low-altitude and terminal-area flight'. AGARD CP No 240 (1977).

REFERENCES (concluded)
6. J.W. Rustenberg, Development of tracking error frequency response functions andaircraft ride quality design criteria for vertical and lateral yibration. ASD-TR-70-18,1971.
7. J.H. Wykes, C.J. Borland, B-1 Ride Control. AGARDograph No 234 on Active Controlsin Aircraft Design, 1978.
8. J.G. Jones, Aircraft longitudinal ride-bumpiness: an application of statisticaldiscrete gust theory. RAE Technical Report 77020, 1977.
5. Joint Airworthiness Committee, Proposed revision for AvP970, Vol 1, Part 6: require-ments for flying qualities of service aeroplanes. Appendix B to JAC Paper No 925, 197T.
10. B.R.A. Burns, Control-configured combat aircraft. AGARDograph No 234 on ActiveControls in Aircraft Design, 1978.
11. D.E. Fry, J.S. Winter, The design of aircraft automatic ride smoothing systemsusing direct lift control. RAE Technical Report 79045, 1979.
12. W.J.G. Pinsker, The flying qualities of aircraft with augmented longitudinal anddirectional stability. Von Karman Institute for Fluid Dynamics, Lecture Series 1979-1,Active Control Technology, 1978.
13. D. Gabor, Theory of communication. Jnl. Inst. Elect. Engrs. 93 pp 429-45?, 1946.
14. T.W. Barrett, The information content of an electromagnetic field with relevanceto sensory processing of information. T.-I.-T. J. Life Sci; Jol 1, pp 129-135, 1971.
15. K.J.W. Craik, The nature of psychology (Papers edited by S.L. Sherwood) CambridgeUniv. Press 1966.
16. 0. Bateson, Steps to an ecology of mind. Paladin, 1973.
17. B.N. Tomlinson, Developments in the simulation of atmospheric turbulence. AGARDCP No 198, 1975.
18. C.J. Jansen, A digital turbulence model for the NLR noving-base flight simulator.NLR Memo VS-77-024U, i977.
19. P.M. Reeves, A non-Gaussian turbulence simulation. AFFDL-TR-69-67, 1969.
20. G.A.J. Van de Moesdijk, Non-Gaussian structure of the simulated turbulent environ-ment in piloted flight simulation. Paper presented at AGARD/FMP specialists meeting,Brussels, 1978.
21. J.S. Winter, A nonlinear control law for a ride-control system. (Unpublished) RAETechnical Memorandum, January, 1979.
22. H.L. Weidemann, Entropy analysis of feedback control systems. Advances in ControlSystems, Vol 7, Academic Press, 1969.
copyri4-ht0
ContivoleS- RPO London-;979
IW

1011
ig~us WOW as$ft 8-
2 r
0 11
Ii
exceIe leoel to)
Fig 1 Influence of wing loading and lift slopeon aggregate of positive and negative bumpsin moderate turbulence at low altitude, M = .7
S~(from Ref 4).
~~F " 0,1 $.410 T0.
go-44 A I 26 0
t IA. law MOM EFFECT
Pig 1 Influenceorrwingeloadindandsliftfolop•on aggregate ofnpouitiveeanignegativerbumps
"(from Rei (r)5
40
39 ta SO 4Do I 0 t
a 10-M
Fig ~~~~ ~ ~ ~ ~ S 2aC Efetofarratpraees n1. fG(fomRf ) 0.1 1. MGO I WOFEC
Fig~hihl 2aouval fiffect ofaircrapraftr o A-
(from Ref 5).
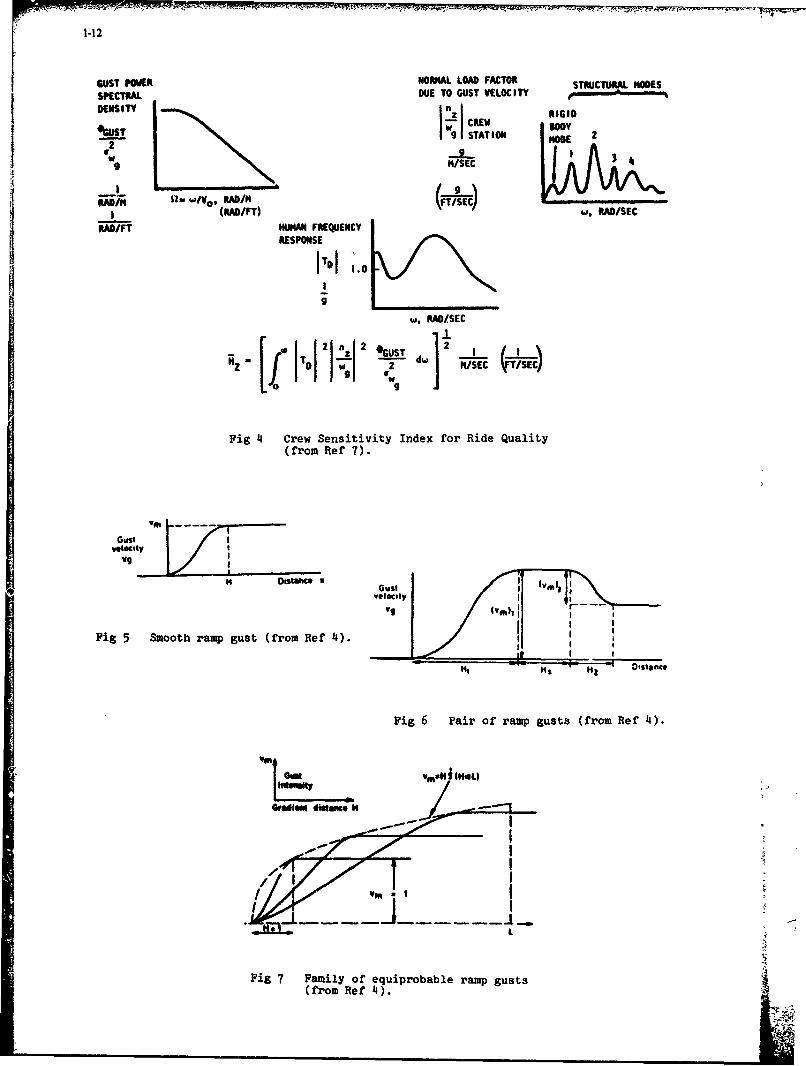
1-12
GUST POWER NOU4AL LOAD FACTOR STRUCTURAL "OES
SPECTRAL DUE TO GUST VELOCITY RIGID
-!IT CREWRID* T1 STATION NO 2
4 /SEC
0- w/V0 , PAD/N (FAEC)I (uAuIFT) w. PAD/SEC
PAD/FT WUAN FREQUENCYRESPONSE
IT01 l .
w, RAD/SEC
2 n 2 *GUST 2iz - a - d N/SEC I!/SECI
Fig 4 Crew Sensitivity Index for Ride Quality(from Ref 7).
Gust Ivowty
,kedI IV9
H Dst~ceo ust lvm11
Fig 5 Smooth ramp gust (from Ref 4). I
HS H stance
Fig 6 Pair of ramp gusts (from Ref 4).
(from Ref 4).
* t.

M'"Pr
1-13
o,:area under Solid curve
V2 :arts under dash@dcre
U t~ Spectrum with scale length 750mN-whaving same high frequency
\asymptote as ~Q
S(caleIle 4 th L)
$1 (log SCale)
Fig 8 Relationship between paver spectral densityand Reference Intensity(from Ref 4l).
CU
- Basic aircraft
FigE Effect of increasing chngs
Bump cancreareasd
Exceedance level (NJ
a Effect of ridesmoticg sirstaemcag
andpca offactive ride-smoothing system(fo ReI I)

1-14
TAGO (M)O2.
Simua�tedime hiMory of response of beak alra'ft
Tim (ew) 27;
Sknuhd time hitory of response wih rsmoothing sysm (86 1-42)
simules., time hisory of response with
i- mredbY 8faclor of 2.14
Fig 10 Contrasting effects on time histories(from Ref 4).
--- M(MT6m. "M - -3•1I
e''
-w SM K
gout - '
Pig 11 Power spectral densities associated withVertical Crew Sensitivity Index, HM = 0.85, altitude 2,500 ft Z(from Ref 7).
_4

SNCS OFFRACME 'r ~ SH ON
~~EEC4 VERTICAL g.V
OVELOCITY
PILOTItPILOT
LATERALSTATIr ON VELOCITYLATERAL •IIVELOCITY
Fig 12 SMCS performance in turbulenceM = 0.70, altitude 1,000 ft(from Ref 7).
I..
0o , 2 4 5 6
1ftadbOck
Fig 13 Contrasting turbulence responseof naturally-stable aircraft and unstable aircraftwith pitch-rate feedback(from Ref 12).
0 I 2 * 4 1
0 I 2 3 4 S 6
Fig 14 Contrasting turbulence response
of naturally-stable aircraft and unstable aircraft
with integral-pitch-rate feedback(from Ref 12).

1-16
/ ,•AUOONUUSCA0C.
a NORMAL ACCELERATION
mSTA"kl
b PITCH HATE
Pig 15 Tuned response patterns(statistical discrete gust theory)
(a) ap.• •
I ,
(b) FO
41 Fig 16 Tuned gust patterns and
related time/frequency diagrams.
'l4

2-1
INFLUENCES OF GEOPHYSICAL FACTORS(METEOROLOGICAL AND TOPOGRAPHICAL)
ON THE PILOT-AIRCRAJPI-SYSTEM IN HIGH SPEED LOW LEVEL FLIGHT (HSLLF)
byDr. Karl Krames
Amt fUr WehrgeophysikMont Royal, 5580 Traben-Tgarbach
F.R. Germany
SUMMARY
Low level flights are conducted in areas of strong interaction between atmosphere,lithosphere, hydrosphere, and biosphere. This means that there is an evei growing number of geo-physical flight hazards encountered in high speed low level flight. Therefore, stringent demandsare placed on the reaction capability of the man-machine-system.
As early as 1941, meteorologists established proof of man's faster reaction to acousticsignals than to optical signals. This fact, only recently verified by human engineers, also hassignificant impact on cockpit design in modern day aircraft construction.
The primary function of geophysical information consists in assessing those flightroutes and flight levels presenting minimum potential hazards to the accomplishment of the indi-vidual military mission. The use of terrain data bases - like the Federal Armed Forces' topographicdata base - offers an optimal approach in achieving a high degree of resolution on the basis of95-by-150-m-grids. The inclusion of weather, vegetation, and surface data will ensure detailedflight information. In Germany it may be hoped to maintain the low rate of flight accidents due toweather factors.
1. GENERAL PROBLEMS
The development of the modern anti-aircraft technology forces the construct.ion of stillfaster and more maneuverable aircraft that can operate as close to the ground as possible. In dis-cussions on the cost-effectiveness of such expensive weapon systems graphical representations likethose shown in Fig. 1 are frequently presented. They demonstrate the correlation of increasing sur-vivability with lower flight levels.
However, such reflections are only valid for models which do not take the influence ofthe atmosphere into account and whose (terrain) relief energy has to be dimensioned in such a waythat terrain-following at high speed is still possible. Also they require such a degree of per-fection of the integrated man-machine-system that the impacts of the general geophysics discussedin the following sections are not allowed to cause any disturbance on the reaction procedure atits most sensitive point - the signal receiving and order-giving human brain. Here, very specialmedico-meteorological problems are touched for which solutions have to be found.
It needs to be emphasized that realistic presentations of the earth's terrain featuresmust also consider the mechanisms of various atmospheric influences, particularly when LLF is in-volved. The American approach, stating that there are "numerous examples in war history tellingthat the conoideration and utilization of certain weather advantages" resulted in ".A bigger chancefor the victory" /1/, is absolutely valid.
The "Yom-Kippur-War" should stand as an example for the crucial importance of visibilityconditicas in determining the time of starting an offensive. This problem will be discussed later.
If one considers that the temporal and local heterogeneity of the surface weather issubstantially more pronounced in midlatitudes than in subtropical latitudes one must conclude thatthe optimal preparation and performance of any defensive system in this region is strongly dependent
on the consideration of geophysical influences.The above-mentioned variability of the geophysical factors may upset the man-machine-
system to such a degree that flight accidents result in critical situations.
It is worth mentioning that recent evaluations of flight accidents in Austrian civilaviation (published in 1978), show 14 % of the severe accidents during the period of 1966 - 1976caused by meteorological impacts /2/. The most serious negative influences are the following:
Wind (turbulence) 96 AccidentsVisibility 37 AccidentsIcing 5 Accidents
Hail 2 AccidentsMedico-Meteorological Phenomena 2 AccidentsLightning strike 1 Accident

2-2
Without asking for the reasons for the significantly lower contribution of weatherfactors to aviation accidents within the German "Bundeswehr" it should be pointed out that the"geofactor" might become increasingly important in the military domaine again, if LLF are per-formed without precise geophysical support, Fig. 2.
This support of course requires the detailed knowledge of the meteorological phenomenain the surface layer of the atmosphere. Therefore the aviation meteorologist often has to makeuse of research methods commonly used by agricultural meteorologists. This especially relates toproblems dealing with visibilities in a realistic battle-field atmosphere which are substantiallydependent on the lithometeors, because different kinds of soil are able to produce very differentstability conditions in the lowest friction layer.
If one simultaneously considers that the air layer near the ground can contain biological
or chemical warfare agents it is evident that questions concerning visibility get an additionalophthalmological aspect,"and therefore cannot be answered without the assistance of an aviationmedical expert.
The participation of an ophthalmologist in investigations of incidents during the twi-
light and night boars seems to be necessary, in order to consider the individual eyesight whendetermining a pilot's range of detection in comparipon with that of a co-pilot aquipped with a lightintensifier or night goggles. For a rough estimation of the visual aids which have just been
mentioned it might be sufficient that such experiments are performed with normal-sighted persons /3/.The results thus obtained are undoubtedly relevant only for slow-flying aircraft, especially heli-copters which are able to hover over one point for a longer period of time to detect an object.
The target detection from low level fast flying aircraft with a high angular velocity,however, is expected to be restricted during the dark; mainly because of adaptation problems whichbecome quite pressing iear the ground because brightness can vary considerably.
A close coaperation between pilot, doctor, and geophysicist becomes urgently necessary,
in order to answer such extremely complex questions.
Some difficult medico-meteorological questions will be discussed later. At first theauthor will give a general view on the geophysical hazards any pilot aircraft system in the lowlevel flight is exposed to.
2. GEOPHYSICAL FACTORS IN THE LOWER FRICTION LAYER OF THE ATMOSPHERE
2.1 General Remarks
v The English as well as the German professional literature is now using the term "boundary-layer" for that part of the Jlower troposphere highly influenced by frictional effects of the earth'ssurface. Its thickness is approximately 560 n over open water, and about 1 O0 m over land. Largevariations from these values may occur depending on the roughness of sea and especially land sur-faces. Besides this the height of the boundary layer is subject to diurnal and seasonal variations.
For the solution of interaction problems between the atmosphere and the lithosphere itis important to note that the lower limit of the atmosphere is not identical with the upper limitof the lithosphere. Depending on the porosity and the permeability of rocks the atmosphere canpenetrate to different depths causing weathering as it is well known. Fine grained rocky fragmentscan then be whirled up by frictional forces of the atmosphere and consequently interfere with etmo-spheric processes in initiating condensation for instance.
Pointing out these "atmosphere-lithosphere interaction phenomena" is so essential be-cause they characterize the battle-field atmosphere in the case of defence due to additional war-fare effects.
Similar conditions occur over the sea because of the interaction between the atmosphereand the hydrosphere within the friction layer. The chloride aerosols represent ideal condensationnuclei. Depending on the circulation conditions they can be transported far into the land where theyendanger the LLF in certain weather situations which will be discussed in a later section.
The interaction between atmosphere, lithosphere, and hydrosphere is caused by frictionalforces. Hence preference is given to the term "friction layer" instead of "boundary-layer".
By the way, the intensive interaction between all three spheres has caused the formationof the biosphere which is highly active in the friction layer. For that reason increasing riskscaused bT the biosphere must be expected with increasine 1"w level flights.
The mathematical treatmen of hazards such as
- increasing possibility of shoot-downs in the HLF due to hostile firing,
- increasing danger of crashes because of the complex geophysical effects in the LLF,
L.

2-3
requires still more intensive and detailed geophysical support which will be possibleonly by use of computers because of the numerous factors that have to be considered, for instance,those touching the domains of medico-meteorology.
The solution of the survival problem of a pilot-aircraft system in any case of conflictwill, therefore, not be
- The use of the lowest FL, but
- The calculation of the optimal FL on a most favorable flight-route by use of extensivedata material.
2.2 Visibility
For VFR flights exact visibility forecasts play a major roýe for the successful accomplish-ment of the military mission. One has to distinguish between the meteorological visibility repor-ted by the observer on the surface and the in-flight and slant visibility observed by the pilot.The latter frequently differs considerably from the meteorological.visibility because of the hetero-geneity of the geophysical factors which reduce the visibility. Moreover, in LLF the horizon isdetermined primarily by the relief forming a maximum visual range. In the following section thisvisibility is denoted as "topographic visibility".
2.2.1 Topographic Visibility
The topographic visibility gives the exact distance of the maximum possible observa-bility of a field from a fixed point. It is a priori clear that the topographic visibility musthave different values
- in the different lines of sight, and
- in the different flight levels.
The value of the topographic visibility which is only defined by the morphology can beassumed to be quasi-constant. It certainly can be influenced by extensive natural or artificialchanges in topographical features. However, if cultivation and vegetation is taken into accounttemporal changes of topographic data have to be considered.
A comparison of figures 3 and 4 shows that, for the gi en terrain example, the vegetationcan not be disregarded when making an exact topographic visibility statement /4/.
It is also fundarental for terrain types of moderate relief eneigy that the horizontalvisibility considerably de-.reases with the approach to the surface. See Fig. 5, 6, 7.
It has to be emphasized here that the topographic visibility can be reduced by geophysicaleffects so that due to the meteorological visibility of the observer ac well as the in-flight visi-bility of the pilot the VFR-flight can be rendered difficult or even impossible in spite of favourableterrain conditions. This is why the terrain data inevitably have to be supplemented by geophysicaldata. These do not only refer to the meteorological visibility, but also to other parameters whichunder certain circumstances can obstruct a LLF. This subject will be treated in the following sections.
2.2.2 Meteorological Visibility and In-Flight Visibility
Because of the interaction of the atmosphere with the earth's surface, decomposed materialsincessently emerge into the atmosphere from which they are sedimented mostly at other plac.s due togeneral circulation and compensation. As figure 8 shows the troposphere and above all the frictionlayer contain dust or lithometeors /5/.
In sparsely vegetated areas, especially within the subtropics, soil heating connectedwith unhindered insolation causes extremely st,-ong instability in the lowest friction layer so thatintensive interaction phenomena like dust and sandstorms frequently occur here.
Satellite pictures have shown how large the areas are in which such conditions prevail. Forexample, at Crete, Sahara dust is observed on an average of 15 times a year causing considerablevisibility reduction /6/. In this context it may be recalled that, due to the effect described, aBritish naval force was able to operate off Crete undetected by German reconnaissance flights duringa decisive phase of World War II.

Of still greater influence on a military operation was the reduction of visibilityby lithometeors at the Syrian front on the outset of the Yom Kippur War. The time of attackwas originally favourably scheduled for sunrise, and later postponed to 1400 hours by theEgyptian Commander in Chief, General Ismail; as a consequence the Syrians had to begin theiroperation at a time of maximum instability, i.e. at the time of the highest degree of litho-meteoric saturation in the friction layer. This forced the Syrians not only to look into thesun, but at the same time also to have extremely poor reconnaissance conditions so that Pccord-ing to the French General Beaufre, the Israelians succeeded in destroying a major portion ofthe Syrian tarks in a quick countermove /7/.
Conversely, after geophysical consultation, the Israelians had scheduled i-hour of theSix-Days-War in the morning (0830) for best visibility conditions. Minimum turbulence, presentat the same time, enabled them to bombard precisely all Egyptian air bases so that the enemyair force was wiped out in almost no time /8/.
But due to certain geological conditions also in mid-latitudes, for instance, in thedrift-sand areas of the "Emeland" (NW Germany) the visibility can be deteriorated to such anextent as to obstruct the terrestrial navigation for the pilot. Such conditions occur to a greatextent in areas where pronounced sources of lithometaors arise from industrialization after theremoval of the vegetational cover. Examples are open-pit coal mines and quarries. Because of theselithometeors, the flight operations at nearby air bases, such as Noervenich, near the soft coalmining region of the "Ville", or Mendig in the margin of the cinder-block production area of the"Neuwieder-Basin", can be disturbed drastically.
Actually all man made or biological contaminants of the atmosphere along with all kindsof aerosols, i.e. all of the solid emissions of settlements as well as industrial and agriculturalproduction areas, belong to the lithometeors in a meteorological sense. They frequently representideal condensation nuclei due to their high hygroscopicity. Pre-condensation, mainly causea bysulphuric pollutants, frequently starts at a relative humidity of only 70 $, rapidly reducingvisibility as humidity increases. VFR can then become a problem especially over largely urbanizedand industrialized terrain.
It is so important to regard these man made aerosols because the experience of the last
wars has shown that considerable aerosol concentrations causing visibility reductions in the LLFhave to be expected from mass employment of various weapons under certain weather situations.
The results of aircraft ascents of several years prior to the 2nd World War in Germanyand the simultaneous meteorological observations (mostly twice a day) have confirmed a high dustconcentration in the layer below the surface inversion which reacts as a kind of barrier for litho-meteors.
This large-scale investigation by the former weather reconnaissance :lights revealed asurprising uniformity of the top of the dust layer on the average for all weather situations. There-fore it was right that this very exact observation material from different stations was compre-hensively evaluated in the research of the vertical structure of the hydrometeozs by Mbller,de Bary et al.
Finally, the author felt free to compare the dust observations of Vienna, Norderney,K3nigsberg, etc. with the inversion heights calculated from English weather reconnaissance flightsover Stornoway, Liverpool, Leuchars, Lerwick, Larkhill, Downham Market, Comborne, a. d Aldergrove.Figure 9 shows with striking clearness how the temperature inversion act. as a barrier for thedust layer below.
It is important for the LLF problems discussed here that in-flight measurements conductedin Germany revealed that the lower limits of nearly all dust layers are identical with the earth'ssurface. There are only a few cases with a suspended dust layer where underflying might be possible.The piesentations of the upper limits of dust include the frequencies of dust layer thickness. Thehigh degree of conformity of both curves indirectly demonstrates that the lower limit of the dustlayer coincides with the uppe- limit of the lithcsphere.
This does of course not mean that the vertical distribution of aerosol particles remainsconstant. Generally one can confidently expect the aerosol-density to increase towards the top ofthe inversion layer. At this height the visibility for the pilot is therefore most unfavourable.
Durinb the 2nd World War, the strong horizontal continuity of the dust layer was verifiedby H. Berg using aircraft ascents /9/. He emphatically called attention to the decrease in visi-bility over industrial regions in weather situations with inversiona. The in-flight or slant visi-bility may drop below 1 km even when relatively good meteorological visibilities are reported from
the observation site on the ground making surface orientation impossible. Some fatal flight-incidentsoccured on the German side under such conditions. Once it even led to an erroneous landing on enemy
* territory.
Figure 10 gives a general view of the influence of dust on visibility.
The degree to which the probably most intensve man made environmental disturbance - thewar - affects interactions between atmosphere, lithosphere, and biosphere was shown during theBerlin bomb-raids between 1943 and 1944. The measurements presented in figure 11 demonstrate anadditional dust content of up to 300 % for the years just mentioned.

2-5
This point is stressed because the imnortance of realistic battlefield atmosphereis not always realized for the assessment of the operational capability of new weapon systems.The estimation of in-flight visibility for LLF is completely unrealistic if this is done onthe basis of a standard atmosphere.
A lot of money has therefore becn spent by the British in field experiments aimingsolely at the measurement of the transmissivity of a battle-field atmosphere in different spec-tral ranges /10, 11/. Hereby the absorption due to dust, chemical warfare agents, and artificialfog is also investigated.
To what extent the coincidence of all previously listed components at their maximumefficiency in the upper haze-layer may inflict upon a pilot's health, disregarding the visibilityobstructions, is a question that has to be answered by physicians.
From the geophysical side it shall only be pointed out once more that hazelayers arefavourable heights for hydrometeors as a result of their supply of ideal condensation nuclei.This easily explains the vertical structure of cloud formation faund by Berg, Skierlo, Mbller,de Bary et al. shown in Fig. 12. The frequent occurrence of low clouds is very characteristicfor large portions of Europe. Especially the fog types, which Dove rightly calles "clouds on theground floor", are considered as being essential for a judgment of visibility otstructions dueto hydrometeors in the low level.
The precipitation resulting from these "clouds" also causes severe visibility obstructionsin the lower friction layer. This is especially valid for the winter months when in connectionwith the low freezing layer the amount of snow in the net precipitation is large. In summer thehigher flight levels may offer somewhat less favourable visibility conditions because of thelarger portion of snow at these altitudes.
The higher amounts of precipitation recorded in mountainous regions are, however, by nomeans representative for the corresponding levels in the free atmosphere. The increase in snowfall and rainfall in high altitudes is the result of the orographic lifting of air masses andthe consequential increase in condensation. In low level flights these areas must be avoided ifcurrent geophysical informa.ions call for it.
Heavy precipitation and the resulting erosion of the front edges of wings, intakes,pressure tubes, brake flaps, infrared-windows, and radomes in HSLLF can create critical flightconditions /12/.
The reference to the different effects of precipitation could be supplemented with re-spect to the PGW-communication and orientation systems installed on board. This is, therefore, atypical example for the fact that only one weather component can affect different parts of acomplicated weapon system in various ways so that under certain circumstances the cumulative effectmay produce critical flight conditions.
For this reason icing in HSLLF should be discussed in this chapter even though it notonly affects the in-flight visibility as a result of ice-accretion on the cockpit windows. Thedifferent aerodynamical heating of various aircraft types and their components cause differenticing risks which of course must be considered for HS aircraft.
It is fundamentally valid for all aircraft that the icing risk is less at temperaturesvery much below 00 C than at temperatures in the range of 00 C to - 10 C, Fig. 13.
In mid-latitudes, especially in the cold season, the risk of icing in the LLF must in-crease due to the fact that in the lower layer the amount of availrble supercooled water ishigher because of a higher frequency of clouds.
It must be emphasized in this context that the dangerous freezing rain is a typicalwin..er phenomeion when cold air at the surface is overrun by warm air. The increase in the numberof low level flights without proper geophysical support, therefore, must result in an increasedicin5 £iik.
The icing risk in the lower friction layer becomes even more critical since aircraftwith ice accretion are more affected by the strongly varying horizontal and vertical winds/13/.
Visibility problems with low flights over the sat are most frequent in connection withglazy sea. The main criterion for this is a wave height < 0.5 m. Such low wave heights are theresult of distinct stability categories and wind speeds in the lower friction layer. Generally oneof the following conditions iu necessary:
- Unstable stratification, i.e. cold air over warm water;
calm winds
- Stable stratification, i.e. warm air over cold water;
wind speed,,/,6 kt
- Strong stable stratification;
wind speed < 10 kt
- Extremely stable stratification;
wind speed _20 kt

Following this it is quite possible that glazy sea can occur even with a relativelyhigh wind speed (5-6 Beaufort), for example, in the case of strongly heated continental airadvection over a cool water surface. Then this warm air is lying over a shallow layer of coldair filled with mist from evaporation so that the pilot can barely realize the transition be-tween water and air.
When higher wind speeds destroy the film of cold air and cause sea spray an aircraftin HSLLF may be covered by a saltfilm which under certain circumstances reduces engine performanceand in-flight visibility. Insidious corrosion can also cause critical flight situations.
In this context it should be emphasised that salt accretion is by no means restricted toaircraft operating in maritime areas. French geophysicists found that F A T A C aircraft crossingeastern France in low-level flights had several times actually been covered by a mouse-grey salt-layer. Following Chappaz e.g. a "significant salt-layer" formed on the aircraft of group 2/13 whichoperated in LLF on 16 Nov 77 in the area Nancy - NeufchAteau, far away from the sea /14, 15, 16/.
According to the analyses of weather maps for the cases observed to date only the AtlanticOcean or the North Sea can be assumed to be the source of this salt.
Following Chappaz the conditions for salt accretion are the following:- vlights at high speed
- Low flight levels
- High windspeed over the sea with spray formation
- High instability
- Low lying inversions
- On-Shore flow patterns in the lower air layer.
For practical use these criteria imply that particularly during winter where high in-stability in the lower friction layer over the open water is created by the advection of very coldair from polar and arctic regions, a chloride concentration below a marked inversion is producedand the salt particles are transported over long distances in o the continent and effect aircraftin the LLF.
As Chappaz for France, W. Fett and H. Ceyp have reported of saltsedimentation on aircraftin England and Germany /17, 18/. H. Ceyp remarked that the salt particles are not necessarily ofmaritime origine. As possible land-bound sources he considered dumps of Salt or potash mines.
In dry areas, as for example Algeria salt-domes which penetrate the surface can emit saltparticles into the air, this is of course also valid for salt-lakes and man made salt gardens. There-fore W. Fett also mentions some extreme cates in the USA., where actual salt storms originating inthe Salt Lake area forced the pilots who at that time were operating over Texas to change from VFR-flight to IFR-flight.
Salt incrustation over the Mediterranean Sea, with its high chloride concentration, veryoften occurs in low level flight /19/.
For the sake of completeness, hut also because of its increasing importance for the HSLLFthe visibility reductions caused by the influence of the biosphere are still to be mentioned. Herefirst of all the insect-strikes at the cockpit-windows are treated whose varying frequency in de-pendence of different weather situations have never been systematically analyzed.
This work would of course require a continous and thorough analysis of all insect-remainson the aircraft and the correlation with the geophysical data such as temperature, humidity, andwind speed in the respective FL as well as in the entire friction layer.
The author's opinion is that this expense would be worthwile for 2 different reasons:
First, the insect swarms increasingly encountered in the LLF during the warm season aleable to cause - according to the available incident reports - visibility reductions for the pilotfrom about 8 km down to less than 100 m. The crust layers on the windshields reached a thickness o'about 4 mm; the author himself had to study a flight accident that could be attributed to a visi-bility reduction from 10 km to only 20 m because of insect strike in the LLF Fig. 14 and 15.
Secondly, an increase in the insect population, which can be regarded as a food supplyfor numerous bird species, show a strong correlation with bird massing. For this reason the "AirForce Engineering and Services Center Bird-Aircraft Strike Hazard Team" (BASH) began research oninsect-populations /20/. It is to be expected that the eytension of this work covering only alimited period of time (30.09.1978 - 12.10.1978 and 28.01. - )0.01.1979) will help to clarily thebiological problems.
However, it should be emphasized tnat especially aircraft in the HSLLF evidently can beenidangered exclusively by insect strike without regard to the visibility obstruction.
For example pitot tubes have been completely clogged by insects in LLF. During a flight
over Sardinia the front windshield of the infrared sight burst after a grasshopper strike.
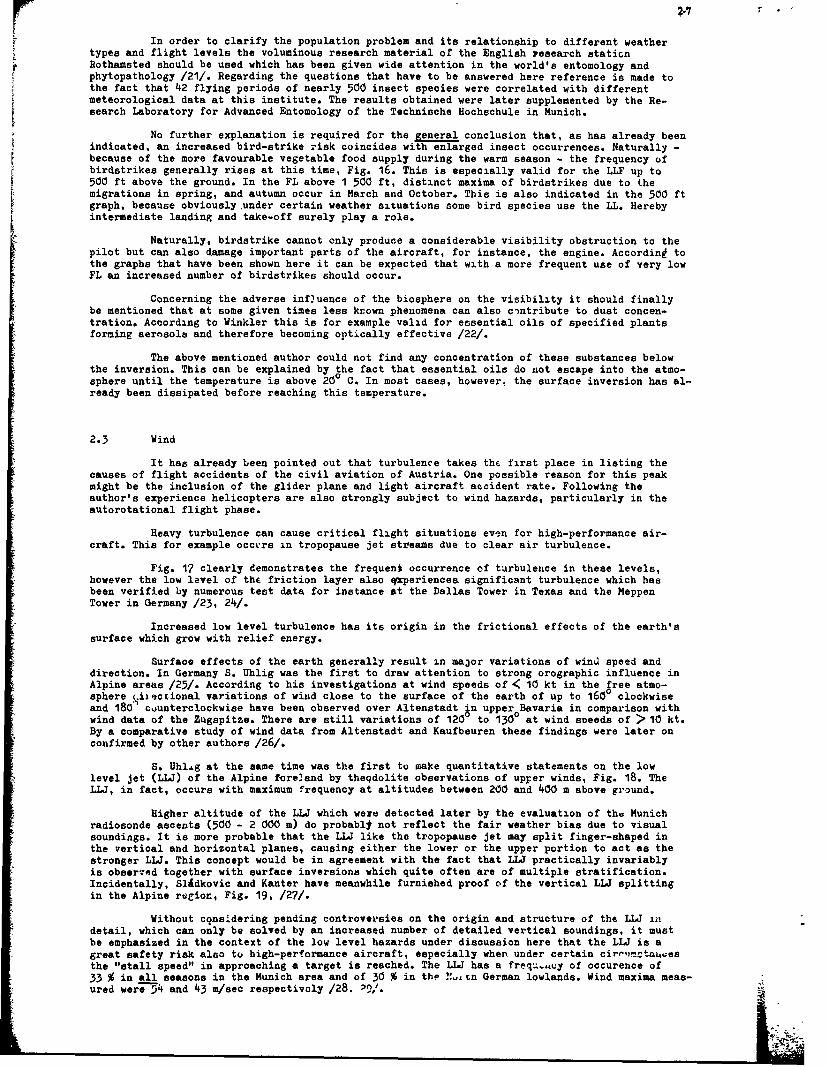
In order to clarify the population problem and its relationship to different weatherL types and flight levels the voluminous research material of the English research staticn
Rothamsted should be used which has been given wide attention in the world's entomology andphytopathology /21/. Regarding the questions that have to be answered here reference is made tothe fact that 42 flying periods of nearly 500 insect species were correlated with differentmeteorological data at this institute. The results obtained were later supplemented by the Re-search Laboratory for Advanced Entomology of the Technische Hochschule in Munich.
No further explanation is required for the general conclusion that, as has already beenindicated, an increased bird-strike risk coincides with enlarged insect occurrences. Naturally -because of the more favourable vegetable food supply during the warm season - the frequency ofbirdstrikes generally rises at this time, Fig. 16. This is especially valid for the LLF up to500 ft above the ground. In the FL above 1 500 ft, distinct maxima of birdstrikes due to themigrations in spring, and autumn occur in March and October. This is also indicated in the 500 ftgraph, because obviously under certain weather situations some bird species use the LL. Herebyintermediate landing and take-off surely play a role.
Naturally, birdstrike cannot only produce a considerable visibility obstruction to thepilot but can also damage important parts of the aircraft, for instance, the engine. Accordint tothe graphs that have been shown here it can be expected that with a more frequent use of very lowFL an increased number of birdstrikes should occur.
Concerning the adverse influence of the biosphere on the visibility it should finallybe mentioned that at some given times less known phenomena can also contribute to dust concen-tration. According to Winkler this is for example valid for essential oils of specified plantsforming aerosols and therefore becoming optically effective /22/.
The above mentioned author could not find any concentration of these substances belowthe inversion. This can be explained by the fact that essential oils do not escape into the atmo-sphere until the temperature is above 200 C. In most cases, however, the surface inversion has al-ready been dissipated before reaching this temperature.
2.3 Wind
It has already been pointed out that turbulence takes the first place in listing thecauses of flight accidents of the civil aviation of Austria. One possible reason for this peakmight be the inclusion of the glider plane and light aircraft accident rate. Following theauthor's experience helicopters are also otrongly subject to wind hazards, particularly in theautorotational flight phase.
Heavy turbulence can cause critical flight situations even for high-performance air-craft. This for example occvrs in tropopause jet stxreams due to clear air turbulence.
Fig. 17 clearly demonstrates the frequent occurrence of turbulence in these levels,however the low level of the friction layer also qexperiencea significant turbulence which hasbeen verified by numerous test data for instance at the Dallas Tower in Texas and the MeppenTower in Germany /23, 24/.
Increased low level turbulence has its origin in the frictional effects of the earth'ssurface which grow with relief energy.
Surface effects of the earth generally result in major variations of wind speed anddirection. In Germany S. Uhlig was the first to draw attention to strong orographic influence inAlpine areas /25/. According to his investigations at wind speeds of < 10 kt in the free atmo-sphere c.ixectional variations of wind close to the surface of the earth of up to 1600 clockwiseand 180 counterclockwise have been observed over Altenstadt gn upperoBavaria in comparison withwind data of the Zugspitze. There are still variations of 120 to 130 at wind sneeds of > 10 kt.By a comparative study of wind data from Altenstadt and Kaufbeuren these findings were later onconfirmed by other authors /26/.
S. Uhl~g at the same time was the first to make quantitative statements on the lowlevel jet (LLJ) of the Alpine foreland by theqdolite observations of upper winds, Fig. 18. TheLUJ, in fact, occurs with maximum frequency at altitudes between 200 and 400 m above ground.
Higher altitude of the LLJ which were detected later by the evaluation of thu Munichradiosonde ascents (500 - 2 000 m) do probablt not reflect the fair weather bias due to visualsoundings. It is more probable that the LLU like the tropopause jet may split finger-shaped inthe vertical and horizontal planes, causing either the lower or the upper portion to act as thestronger LLJ. This concept would be in agreement with the fact that LLJ practically invariablyis observed together with surface inversions which quite often are of multiple stratification.Incidentally, Slgdkovic and Kanter have meanwhile furnished proof of the vertical LUJ splittingin the Alpine region, Fig. 19, /27/.
Without considering pending controversies on the origin and structure of the LLJ indetail, which can only be solved by an increased number of detailed vertical soundings, it mustbe emphasized in the context of the low level hazards under discussion here that the LUJ is agreat safety risk also to high-performance aircraft, especially when under certain cirr,1,zta&Uesthe "stall speed" in approaching a target is reached. The LLJ has a freqe..tuy of occurence of33 % in all seasons in the Munich area and of 30 % in the !,tn German lowlands. Wind maxima meas-ured were-54 and 43 m/sec respectivaly /28. '9/.
!I

ri 2-8
In discussing low level flight it is important to know that shear winds of more thanI m/sec/100 m most frequently are observed in the bottom layers. Maximum shear winds amountedto 17 m/sec/100 m thus exceeding the critical limits for aircraft.
Turbulence near the ground is Aurther increased by the above-mentioned directionalchanges of winds in the horizontal and vertical. The variations are most striking when in ashallow surface layer of cold air the wind direction differs by 1800 from that in the over-running warm air mass.
Temperature lapse rates can reach very high values. The sudden reduction of air densitywhich they bring about causes marked engine power drops so that in combination with turbulence theaircraft may touch the ground and crash.
It seems worth mentioning that several years' radiosonde data in the Munich area re-vealed temperature inversions of 10 degrees to have a frequency of 14 % of all days in January.Weber states a maximum value of 15 degrees for the 00-hour observations /30/. One can almost becertain to assume that at sun-rise, after reaching the minimum of the day, essentially highertemperature gradients will occur.
With foehn winds that do not sweep down to the ground even stronger inversions can beexpected. These conditions primarily build up in basins where extremely cold air accumulatesduring the night.
One of the Lost famous examples of extreme verticcl temperature gradients is the well-known Alpine pasture Gstettneralm near Lui,s/Austria, where temperature gradients of more than 30degrees per 100 m difference in height have been measured. In nights with strong radiationalcooling cold air from all sides flows down into the dolina wzhich is located some 1700 M atove MSLso that Brimarily in winter time a legular cold air pool may form with temperatures as low asminus 50 C and less near the ground. Such extreme temperature gradients norr.'ly occur in arcticregions only.
Naturally, such a dolina of limited horizontal dimension can be a hazard only for sir-craft submerging into the cold air during terrain following. It would constitute no special problemfor helicopters. In any case a pilot must, however, expect considerable reduction of engine androtor perfo2mance because of tne fast change in air density when flying out of the dolina.
Similar conditions, though not as extreme, do occur in other internal drainage de-pressions. The author has knowledge of one case where during the night a cold air pool had formedin the crater of the extinct volcano "Plaidter Hiamerich" n-ar Mendig, Germany, which was used bya VERTOL aircraft for take-off and landing practice. During this training a serious flight accidentoccured which was ceused by the aircraft ,aking off from the cold air mass of the crater and hoveringin lowest level flight into one of the open pit Tines directly on the edge of the crater whrre inthe absence of any protective vegetation the volcanic rock had been heated up to +600 C by unhinderedinsolation. On reaching the edge of the crater a sudden engine pov:er drop caused the VERTOL to hitthe ground and crashed into the pit, Fig. 20, 21, /31/.
High-speed aircraft are. aL a matter of fact, not subject to hazards of such smell-scalecold air pools. Depending on the 6ýze of the pit also higY-speed fixed wing aircraft may encountera similar situation. There is at least one known case where a pilot dared to fly in 1-w levelinto a large open pit brown coal mine, Fig. 22. Here high air 'empertures caused by the high it.-solation aad low heat-conduction of the brown coal reduced the density of the air considerably.This brought about marked reduction of engine power which neailj led to an accident. Similar casesmay occur near extinct volcanoes especially when the low heat-conductivity of the volcanic materialis further reduced by a superimposed layer of extremely poroub diatomites, Fig. 23. which consistsmainly of fossils algae detritus.
Problems could also arise in internal drainage ýepressions for instance in wide Karstbasins (Polje) that may at least cover several hurdred km . If in those areas the top of the in-version is located close to the edge of the basin the ai craft may crash due to an abrupt enginepower reduction when emerging from the cold air laye2. This hazard is enhanced in the uase ofcoincidence of temperature inversion and a moisture inversion and tu:bulence.
There is .onsiderable turbulence in windward and lee eddies near mountain crests. In thecase of high winds these gusty areas are not always manifested by rotor cioid formation so that theymay become a serious threat to aircraft in low level flight.
R.A. Cashmore reported on the heavy turbulence affecting low level flight over theUnited Kingdom /32/. For jet aircraft, the type Lf which was not specified, he s.ated accelerationforces from -0.75 to +2.1 g.
W. Georgii has reported acceleration forces of 3 to 6 g for airliners in rDtors of lee-ward eddies /33, 34/. In general vertical speeds within rotors are extremely variable. In highreaching eddies for example at the Grofglockner drafts of 15 m/sec occurel. Even h'.gner values are14kely to occur in the Owens Valley leeside of the Sierra Nevada mountains, "hich are 4 000 m inheigLt.
A typical aspect of those high reaching eddies is the fact that the turbulence is enhancedclose to the gr,'znd due to the supply of tue thermal erergy. Rotors are further increased by theresonance of lee wares due to the configuration of the terrain. If for inscance parallel mountainranges, are spaced in an optimal way, lee waves which are in phase and their rotors may increaseconsiderably in the case of specific wind directions. In Germany this happens for instance with SWand NE air flow in the hill aras of the Weserbergland, SUntel and Deister causing lee waves of 14 kmin length. Fig. 24.

2-9
Owing to the tectonics of the geologic foundations, which in no way are random, similarphenomena are common. Samples are the Palatinate Forest, Taunusmts, Vosges, Black Forest, SwabianAlps /35/. Recent analysis of satellite cloud photographs has given proof of that view.
In the case of a strong inversion above the mountain ranges a jet forms between the sur-face of the mountain range and the top of the inversion which may lead to critical speeds in theeddies. This is particularly true when aa pointed out earlier additional thermal energy from thesurface contributes to enhancing the turbulence. Condensation processes naturally act in the sameway. They even aggravate hazards due to turbulences by adding visibility problems.
This for instance is the case ahen stratiform cloud formation takes place below thunderclouds. In arid zones engine trouble may occur according to pilot reports when at the same time dustis whirled up due to convectional turbulence. In low level flight it iz not uncommon that bendinglimits of the aircraft GCA antenna are exceeded by heavy wind so that heading and altitude infor-mation from the GCA become inaccurate and perilous /36/.
There is no need to discuss here in extenso the warm and cold fall winds because they aregenerally known. Mention should, however, be made that Bora wind speeds of up to 50 M/sec have beenobserved. Every pilot who has flown in the valley of the Rh8ne river is familiar with the adverseeffects the Mistral wind can exert specifically on low flying aircraft. Katabatic winds of limitedextent may of course also have an influenco on light aircraft. They occur in various areas havinglocal names for example Weifenburger Wind, HBllentiler, Wisperwind, Bohemian Wind etc.
During the warm season of the year low level flight is mainly affected by convectionalturbulence. Gusts are most violent within the up- and downdrafts of thunderstorm cells. Togetherwith abrupt changes of head-, tail-, anu crosswinds they might cause critical flight situations in
high speed low level flight of aircraft.
2.4 Thunderstorms
Problems of visibility, wind, and erosion in connection with thunderstorms have alreadybeen discussed in the foregoing chapters.
During low level flight in thundery weather, the aircraft enhances the field strengthbetween the earth's surface and the thunder cloud so that in this area of a raised potential gradienta high discharge rate is encountered. The hazard becomes even worse when the cross section of theconductor is enlarged by other aircraft flying in echelons formation. Ionized hot engine exhaustgases incidentally act in much the same way so that, a priori, multiple jet engine high performanceaircraft are more exposed to lightning hazards than aircraft with less fuel consumption /37/.
Vertical speeds in thunderstorm cells are generally faster in mountainous terrain thusenhancing the electric charges in the clouds. The number of lightning strokes is increased and thefrequency of cloud-to-ground lightning is much higher than that of cloud-to-cloud lightning thus therisk of lightning-stroke is ra 'sed noticeably over mountain slopes and crests; potential lightningrisk over southern Germany is twice as high as over her northern part /38/-
It has already been mentioned that the raise in the electric field strength by the air-craft is also dependent on its engine performance. Furthermore the structure plays a significant role.The different position of the pitot tube on several models of the Phantom F4 aircraft plays an im-portant role with regard to the lightning stroke rate as shown in the table below /37/:
type pitot tube installed in lightnirg stroke rateper 100 000 flight hours
F-4D 0.89F-4DC tail section 0.86
RF-kC 3.11F-4E nose 3.10
Navigational and control instruments may not remain safe after lightning strokes.
Crew members are frequently subject to adverse physical and psychological effects byelectrization, blinding, and shock so that delayed or improper pilot reaction may lead to crash-down.
2.5 Sleet and Hailstones
Some light has already been shed on the damaging effect of raindrops to high-speed air-craft. Of even higher importance in nature are sleet and hailstones acting like the impact of bulletson the aircraft. Considering that the shelltype structure of hailstones is proof for the repeatedascent and descent of the ice pellets within the turbulent regions of the thunderstorm cell it mustbe concluded that generally hailstones reach their maximum weight by accretion and the freezing ofcloud droplets during the last phase. This is fundamentally valid when in downdrafta the freezinglevel is low, thus precluding the melting process.

2-10
The melting of hailstones is not even effective in summer, Fig. 25. This view issupported by the relatively frequent hail falls in southern latitudes where predominantly higherelevations are affected. Example: On January 15, 1980 a simple hail storm damaged 33 % of thecarrier fleet of the "South African Airways" in Johannesburg, 1694 m +NN: 4 Boeing 747, 4 Boeing 737,1 Boeing ?27, 2 Boeing 707, 1 Airbus.
2.6 Medico-meteorological Problems (med-met-problems)
The foregoing chapters have demonstrated that ,eophysical hazards are at their maximumin low levels. It follows that an extreme reaction ability of the man-machine-system in that domaiueis an absolute requirement.
The question arises, whether the pilot's reaction time may not likewise be influenced bycertain geophysical factors.
During World War II, B. DUll was the first to look into this problem thoroughly in Germany/39/. It may be worthwhile to recall some of DUll's most essential findings and compare them with re-cent studies under the aspec:a of High S'eed Low Level Flight problems to be discussed at the Listonmeeting. In doing so a reasonable degree of criticism is necessary because one can never precludeerrors in the borderland between medical and meteorological sciences. The author as a geophysicisthas chosen to restrict himself exclusively to a discussion of the geophysical aspects of the problem.
Because results of reaction time measurements vary considerably with the type of experi-mental arrangement, as is generally acknowledged, it is only reasonable to compare solely results de-rived by one and the same test method.
DUlI's experimental setup had been designed to determine the "net" reaction time, becausethe immediate objective was to find out if there are variations in reaction time in responding to dcertain stimulus man is confronted with. "Net" reaction time is defined as the sum of the follrc±ngperiods of time:
- perception of an optical or acoustic signal
- response in terms of the smallest motor movement:
pressure exerted by the index finger which already touches the key.
This then is only a determination of time elapsed for:
- transmitting the stimulus from the eye or the ear to the central nervous system, and
- transmitting the order from the central nervous system to the motor organ, i.e. the
index finger.
It would, however, not be acceptable if one would draw conclusions from the human "net"reaction time on the reaction time of the man-machine system. On the other hand it is thought possibleand even likely that similar to the generally accepted fact of a pilot's quicker reaction time inanti-cyclonic weather situations, the aircraft itself may react by a decrease in performance whenpenetrating a pronounced inversion layer. The reaction time of the total man-machine system is thenbalanced out. This problem will be refered to later. In other cases geophysical factors may alsoproduce reaction times where both components of the system have the same direction so that a criticalflight situation may occur due to an additive prolongation of the "ep~tion time.
As for the synopsis of the man-machine system being within the scope of the article, itis a fundamental requirement to consider the accumulation of all forces.
R. Reiter's investigations into the man-automobile-system inferred that it may be admissibleto assume the changes of reaction time of both components being in the same direction. This simpli-fication however, is not allowed in aviatior.
It must be underlined that speed and correctnass of the reaction are not necessarily inconformity with each other. Finally, the question has rem-ined unanswered whether the simple processof responding to a stimulus by pressing down a finger is comparable to the affect of the variety ofsignals working upon the pilot and theii conversion into commands and orders that in turn must befollowed by complex motoric cycles of vaxious muscle systems.
Recent studies of the Fraunhofer-Gesellschaft in Munich have revealed that reaction timesin the cockpit of any means of transportation are longer than the "net" reaction time given by DUll/40/. DUll's finding that the reaction time ir noticeably shorter following an acoustic rather thanoptical stimulus 4as verified. On the average, braking or slowing-down ic carried out after 0.6seconds on optical signals whereas only 0.2 seconds pass after an acoustic signal. Individual caseswere noted where delays in reaction time up to 3 seconds were measured when optical signals had beenemployed.
On the basis of these facts the Fraunhofer-Gesellachaft rightly recommends that elec-tronics used in the automative industry be modified to give primarily acoustic information to thedriver. There is no doubt that such experience must also be applied t. aircraft construction.
Consequently, General Schmitz, who is responsible for the flight safety of the Germanarmed forces, has aephasized this military requirement to aircraft desiqner- aring the 12th Heli-copter Forum held at Buckeburg from the 8th through the 10th May 1978 /41,.

2-11
A cooperation between aircraft constructors and flight surgeons seems to be necessary,to avoid constructions like the "Airbus Master Caution Unit" which produces a multitude of signalsat varying tone levels, causing pilots to ironically call it "The Airbus Symphony".
The difficulty of research work for most efficient layout of display and controls isshown by the recently published "Anilysis of Heart Rate Variability as an Estimate of Pilot Work-load in Human Engineering Research" (DFVLR, F.R. Germany, Sept 1979). The "Method for Semi-Auto-matic Analysis of Eye Movements" as applied by the "Institut fur Flugfihrung" of the "DFVLR" seemsto be a very important tool for human factors research on the layout of displays and controls /42/.By means of such research the problem of the best strategy for identifying a target by eye sightmay also be solved /43/.
The problem of "net" reaction time and its dependence on geophysical parameters is dealtwith in the following section:
During half a year (July - December) R. DUll tested the reaction time of one male andone female individual, daily 5 times each at 0700, 1300, and 1900 hours on an optical and acousticsignal (i.e. 30 test runs per day). The following results were obtained, Fig. 26.
a) Basically, the curves for both individuals are in conformity.
b) The mean reaction time of the male person is shorter by 5.4 milliseconds.
Whether these individual data can be generalized is of course debatable, although Dullmakes reference to the verification of his data derived from test series of 25 US male and femaleuniversity students.
c) The reaction time upon acoustic stimulus is noticeably shorter than to light stimulus(25 milliseconds).
d) The reaction time measured at 1300 hours is slightly shorter than that at 0700 and1900 hours.
e) The reaction time in the fall is distinctly less than in summer and winter.
Dull assumes "with all reservations" a bimodal seasonal distribution of reaction timewith extreme values occurring at the solstices and equinoxes. His reservation, obviously based onreduced periods of observation was justified as shown by later investigations carried out byDaubert /44/.
The analysis of ten-year observations made at Tubingen resulted in a single seasonaloscillation of reaction times with maximum values in March and minimum values in September, Fig. 27.
This unexpected curve of maxima and minima at the equinoxes, i.e. 4t times of similarsolar radiational conditions, proves that there exists no simple correlation between reaction timesand astronomical processes. Rather, there seems to be a relationship between reaction speed andmeteorological meso- and microscale phenomena obviously compensating the radiational effect.
However, it has not yet been fully clarified to date what meteorological parameter orcombination of various parameters are the controlling factor of reaction time.
With good reason Daubert states that "never only one element influences the human organism,but always all stimulant factors of the atmosphere complement, sum-up or weaKen each other in theircoubinatory~p-ay".
Taking also into account that the biological reaction in most cases is delayed due to the
necessary accumulation of varying stimuli, it is realized what a complex job it is to clearly de-fine the causal relations between reaction time and environmental factors to which those of theprivate sphere must be added, too.
Neither does the determination of very high correlation coefficients tell anything aboutcausality, because the correlated parameters may be interdependent.
The close correlation between the reaction time and the intensity of atmospherics (atmo-spheric-electrical parasites in French) found by R. Reiter, does not prove any causality betweenthe physical and the biological processes /45/. Spherics are closely ccrxelated to instabilityzones (cold frorts, troughs) so that it is justified to assume that reaction times are dependentupon temperatuxe, humidity and wind speeds as well. It is generally known that the latter factors
determine the degree of sultriness and this in turn determines the feeling of comfort, which thereaction time depends upon.
This is, as Reiter justly states, the explanation for the test results of reaction time
obtained from some 40 000 individuals on the occasion of the Munich Exhibition of Traffic andTransportation in 1953:
It was found that heat and sultriness during the period of August 26th to September 3rdwere the predominating influences which overcompensated effects of spherics on the human reaction
time. Fig. 28.
Any attempt to analyze a complex biological process as a function of only one singlemeteorological factor, must a priori be deemed mere speculation. This is especially valid whenthe comparison is based upon averaged data calculated from very different extremes.

2-12
Therefore, it is not admissible to generalize the statement made by DUll that on theaverage the days characterized by improved reaction times showed higher air temperatures thanthe days of slower reaction times.
Uncritical comparison of reaction time data with meteorological data may result in con-troversial statements such as the one made by Ddll that improved reaction times are correlatedwith low visibility!
He found the mean reaction time to be lowest in continental tropical air where itamounted to 161,6 milliseconds. According to Linke's turbidity factors, which are an intrinsicproperty of the air mass, however, visibility in this air mass is so reduced because of the highaerosol content. Thus the controversal statement is made that low visibility is correlated withgood reaction times. For ophthalmological reasons this conclusion can only be drawn with testpersons whose reaction times are measured within a laboratory using a light signal on shortestdistance so that the obscuration of the ambient contcnental tropical air has not the slightesteffect on the reduction of the optical stimulus.
It can be taken for granted that a test of reaction times by the application of anoptical signal from a farther distance in the free atmosphere would turn out to be quite different.Therefore there is no doubt that the pilot's reaction capability is, reduced in the turbid andnormally hot or sultry tropical air.
This example quite impressively demonstrates that data derived from laboratory testsmust be applied to the realistic conditions cf the ambient environment with great caution.
Similar critical consideration should be given to DUll's investigations of the reactiontime as a function of the sunshine duration.
What matters here - as most everywhere in the field of medicine and biology - is thedose and time of administration. If the sun is in the pilot's back and at an angular elevationforming optical contrasts in the terrain by shadows his reaction time will no doubt be in-fluenced favourably. This, however, applies only as long as no excessive amount of insolationheats the cockpit.
Based on these explanations it is in no way strange .hat DMll "was unable to discern afirm relationship between reaction time and duration of sunshine".
A similar comment can be given to DUll's statement on the absence of any relationshipbetween reaction time and precipitation. The correlation with precipitation might originate fromthe noise accompanying for instance hail and thunder storm that could divert the test person'sattention. DUll's hint that thunderstorms reduce the reaction time is in support of this view. Asignificant factor in the cockpit of course is the dazzling effect a lightning flash has on thepilot's eyes resulting in a reduction of observability.
Noteworthy is DUll's statement of the very close correlation between the stormy days ofthe German coastal area (wind speed > 8 Beaufort) and the prolongation of reaction time measureu inHamburg.
It is probable that there is an enhancing effect by microseismics which according tou. Berg are caused by the ocean surf; these microwaves have periods of 4-to-I0 seconds. They arefelt inland at varying distances depending on the geological terrain features. /46/
Perhaps microseismics have similar adverse biological effects upon man as do rometricoscillations, which according to E. Brezina and W. Schmidt reduce the working capacity or accordingto Dull the reaction time /47/. The latter quotes periods of between 6 and 12 seconds for very fa6barometric oscillations which is similar to H. Berg's values for the microseismics, so that acausal relationship between litho- and atmospheric oscillations is inferred.
Physicians, however, are challenged to answer the question, whether Storm von Leuwen'sview on the physiological effects of infra sound waves in the "flutter range" are correct /48, 49/.This "flutter range" is also characteristic for certain fluctuations of the earth's magnetic andelectric field. A biological effect possibly exists inasmuch as the electric action centers of thehuman brain also have their greatest amplitudes in the "flutter range".
In view of the a.m. complexity of the performance it should be emphasized, however, thatthe predominating control of single factors as for instance barometric oscillations can, if at all,be confi.med only for very specific activities.
With that in mind it is worthwhile mentioning that H. Reuter in a recent study restrictsthe validity of his statement on the temperature - dependent efficiency to only a few categoriesof workers, for instance sheet metal workers /50/. Just aseis the case with different types ofsports, the optimum performance is achieved in individual occupational activities, when a specificcomfort temperature is provided, which in turn is related to a specific relative humidity andwind speed.
The generalisation of medico-meteorological correlations obtained in a confined areaof activity as being typical for other areas is not acceptable .
Thus it can be taken for granted that the dependence of the reaction time on seismicsand barometric oscillations is completely insignificant for the pilot in flight. Even if litho-spheric vibrations would affect the aircraft and its crew while on the ground the conclusion canbe drawn beyond any doubt that, at the latest, after the start of the engine inherent vibrations
1n,

2-13
overcompensate by far this influence on the man-machine system.
From the geophysical standpoint consideration is also given to the fact that seismicsin industrialized countries are not only due to oceanic surf, but primarily due to traffic andtransportation and other man made vibrations of the ground.
For reproducible evidence of the effectiveness of individual factors on the human reac-tion time a simulator would be required to determine the response to one specific element by elimi-nating all other ones. The construction of such a "geophysical chamber" would, however, lead toconsiderable financial expenditure.
Such an installation, however, might be justifiable for the solution of flight medicalproblems concerning the effect of various geophysical factors. In any case it would help to avoidthe "biased" approach and insistence on certain medico-meteorological relations that DUll criti-cizes. In the overwhelming number of cases certain biological effects are likely to be broughtatout only by the synergism of miscellaneous geophysical factors.
Medico-meteorological research therefore has meanwhile abandoned the study of singlefactors like aran, spherics, infra sound waves, and is making attedpts to clarify the interplay("accord") of various single parameters.
Though measuring the reaction time is a difficult physical task, Reiter was able tofind that the reaction time might be reduced from 253.2 milliseconds to 181.0 milliseconds bytraining. The fact that training plays a significant role, indeed, and varies individually, isan indicative that the reaction times obtained ought to be interpreted with caution. Accordingto what Russian flight physicians have determined, the reaction times of experienced pilots aregenerally believed to be faster by a factor of 1.5 to 2 than those of junior inexperienced pilots/51/.
As mentioned earlier the point in question still is whether the speed of reaction isequivalent to the soundness of reaction. Only when both are identical a correlation between spheric-and accident frequency ought to be found from R. Reiter's observational data. H. Lossagk statesthat 50 % of all traffic accidents happen because of the driver's impaired ability to react /52/.
When prccessing statistical accident data the analyst, however, enters a domains thatmay easily render him a victim of the pitfalls and mantraps cf statistics.
So for instance the Z'tistical n-method, when picking the afternoon as the period underinvestigation, will inevitabl3 4sult in a coincidence of higher accident tolls (increased trafficvolume in the afternoons) and higher frequency of spherics. As a rule, spherics also occur morfrequently during `- second half tf the day because of intensified instability of the air nearthe ground.
Comparative tests on accident frequencies prior to and after the introduction of flexibleworking hours would for sure prove that the correlation with the spherics now is by far not asclose as before. The choice of proper statistical methods with equidistant time intervals may helpto correct biased results.
For the spherics it should be remembered that they primarily occur in cyclonic processes,mainly in connection with cold fronts and throughs, in other words, in rain and snow showers,partly in thunderstorms. Often the sudden onset of these weather phenomena brings severe hazardssuch as aquaplaning or slippery road conditions. Additionally, these reductions of trafficabilitycan be enhanced by other characteristic features of cold fronts and througbs as gusts and visi-bility reduction thus raising the risk of an accident.
Noth et al. therefore seem to be right in expressing their doubt whether the frequencyof accidents is based purely on "biotropical" weather effects /53/.
The synchronous occurrence of accident data and spherics in "the absence of meteoro-logical incidents of a specific type", for example precipitation and thunderstorms, is no counter-evidente. Recent observations have revealed that the intensity of precipitation is liable to con-sider .ble fluctuations during cold front passages due to topographical conditions. The same holdstrue for visibility, wind, and - especially in higher levels - the cloud base. From this it followsthat a statistical analysis of the accident rate claiming to be of scientific significance mustaim at the careful study of each individual case. Under no circumstances meteorological data ofthe nearest weather station should be allowed for extrapolation without caution, because thatstation might for instance be located on the leeside of an orographic obstruction; thus its goodweather conditions might not be valid for the site of the accident which might be located in anextremely windward position with markedly unfavourable weather conditions.
In this context it should be emphasized that also in lowlands the local fluctuations inthe effects of cold fronts and throughs can be relevant. Therefore, in spite of comprehensive datafrom 68 OM traffic accidents in Hamburg, analyzed by Kdhn, no proof could be furnished so far ofthe influence of spherics /5V/. This is also supported by Schrdder's measurements of very longwaves in Hamburg which did not show any coincidence with accidents /55/.
Because of these discrepancies it is justified that Israel, one of the best authoritieson atmospheric electricity, considers the causal relationship between accidents and spherics asa physical freak like a divining rod and earth rays /56/.

's PIP W
Apart from Israel, distinguished physicians and physicists like Abele, Prokop,KUhnke, Zoller, et al. have pleaded against the one-sidedness of the advccates of specificphilosophies in their books "WUnschelrute, Erdstrahlen und Wissenschaft"(divining rod, earthrays, and science) and "Medizinischer Okkultismus" (medical occultism) /57/.
To prove the effects of spherics on accidents it is not admissible to point to thedifferent percentages of the increase of the accident toll due to slippery roads in caseswithout (6.5 %) and with cyclogenesis (40 %). Obviously the number of accidents must not beseen as a function of the frequency of slippery road conditions but as a function of itsabsolute duration in relation to the traffic volume. Besides it can be anticipated that theaccident risk with cyclogenetic processes is enhanced by reduced visibility and the influenceof wind.
The effectiveness of spherics is not evidenced either by the evaluation of industrialaccidents because the results are often biased: Statistics do not tell whether for instanceslippery conditions have caused the accident or not. In this respect the preclujion of accidentstatistics of specific trades like building or shipping does not improve the basic material aslong as it still contains the data of those trades that are practically always exposed to theweather like agriculture, quarries, openoast mining, etc.
This information is indicative of the fact that in order to obtain an unbiased resultit is absolutely necessary to filter out all those cases from accident statistics that accordingto meteorological data were beyond all doubt caused by trivial weather factors. It is better towork with a smaller but purified collectiv than to deal with a non-verified mass of data.
A separate analysis of the data of underground mining again must be carried out withcaution because these areas "are shut-off from natural weather rather completely".
After the war there has been quite a number of underground miniing installations whichare subject to surface water seeping in very fast through cracks of high permeability. Inaddition the trucks continuously returning from the open air in rain or snow introduce the po-tential risk of hazards of a meteorological nature into the underground mining facilities. Thishazard is not to be overstressed here. It is, however, certainly worse than that of possibly in-creased spherics at the time of the beginning of the shift under the influence of which the miningworker is supposed to bring down into the pit "strongly increased preparedness for accident".The latter statement may or may not be termed a speculation. But there is no doubt that the con-clusiuns in the domaine of industrial medicine drawn by those supporters of the spherics theoryare highly objectionable. They for instance hold the argument that "improving ventilation and airconditioning are not considered necessary" because of the hypothetica. importance attached tospherics triggering an accident.
Transferring these ideas to the air conditioning of the cockpit would be irresponsiblewith regard to flight safety.
Meanwhile profit-seeking manufacturers of air conditioning devices take advantage of theabove statements in taking up the production of "pulse field devices". These devices are meant toproduce "favourable" electrical fields in working and living areas, but also in automobiles, andrecently, even in aircraft /58/.
Since no proof could be furnished so far for the causal influence of natural atmosphericelectrical fields, some doubt must be expressed as to the enhancing effects of man-made atmo-spheric electrical fields on human reaction capability.
It must be high)y appreciated therefore that Reiter takes a clear stand against thespeculators of "pulse field devices" in a new publication /59/. His arguments like: "For theeffectiveness of atmospheric electrical parameters there is no receptor in the organism that can,tirectly respond and signal the stimulus" and also "i should be considered that temperature,-elative humidity, air movement, heat radiation, etc determin the cryptoclimate" reveal thatieiter is now looking at things in a more sophisticated way than he did before.
As far as spherics are concerned the above author states that "they are only of secondorder in their influence and can be overcompensated any time by other environmental factors".
The fact is stressed that man himself creates a significant level of electrical inter-ference overcompensating all standard fields by use of clothing, synthetic materials, electricalequipment etc.
With regard to the incorporation of atmospheric ions Reiter says that "strictly speakingno biological effect is to be anticipated". "Ions, however, are adsorbed by the ever presentaerosol particles which due to their low mobility have a good chance to reach the respiratory tractand eventually trigger biological effects."
Medical scientists (Ranscht-Froemsdorff) state that "the effects of natural and man-madespherics are diminished or become ineffective by modified environmental conditions as for in-stance temperature, room lightning, atmospheric pressure. A growth in human preparedness to reactionand mental performance could not be established by any one program" /60/.
By this statement the author mentioned above gives up the statement he made in 1974 thatin "specific electro-climate chambers serial testing of volunteering student groups during a per-mat.ent stay inside inferred direct biological effects of epherics on the functional and biochemicalparameters of blood coagulation, blood count, blood sedimentation rate, blood pressure, pulse rate,temperature, reaction time, allergic vulnerability, mood, and sleep behavior" /61/.

2-15
In 1975 the medical relevance of the electro-climate was turned down by Jessel,Wedler, Krdhling and others during the 80th Congress of the "Deutsche Gesellschaft furPhysikalische Chemie und Rehabilitation " at Freiburg/Breisgau. Summarizing the outcome ofthis congress Gbpfert states that "no conclusions can be drawn from this for practical use" /62/.
Within the geophysical community there is no doubt regarding the biological ineffective-ness of commercial pulse field devices on the market now.
In 1976 and 1977 several authors tried again to convince people that the influence ofatmospheric electrical fields should be an objective of accident research. Thus, the "Bundes-anstalt fUr StraBenwesen" in Germany together with the "Deutacher Wetterdienst" and the "Bundes-ministerium fUr Verkehr" were challenged in 1978 to issue a critical review on pros and cons ofthat complex. The "Bundesanstalt" was fair enough to offer a meeting where proponents and opponentswere given the chance to frankly discuss their respective opinions.I •The expert hearing at the "Bundesanstalt fUr Strafenwesen" in Cologne resulted in plainrefusal /63/: No side was in contradiction to the argument that
"results of tests under review did not give reason to recommend installation of fieldgenerators in automcbiles".
On the contrary, prohibitive action on this equipment was considered because "the moto-rist, possibly depending on the effectiveness of the generator, may be misled to the believe thathe may perform better than usual".
For formal legal reasons, however, it is not possible in Germany to take any prohibitiveaction against the construction and distribution of field generators.
There is no doubt the fact that the installation of such equipment in aircraft must fromthe beginning be precluded for flight safety reasons, especially in the military aircraft.
This is strongly supported by information received from institutes outside Germany, forinstance from the "Naval Aerospace Medical Laboratory, Naval Air Station, Florida", where unbiasedanimal test series furnished no evidence of any relationship between the reaction time and electro-magnetic fields in any kHz frequency range, not even after test series of more than 1 000 hoursduration /64/.
"Day-to-day variations" are "much greater than field-to-field variations" was the note-worthy comment.
Another interesting finding is that none of 23 different blood tests (creatine, hemoglobine,potassium, etc.) revealed any dependence on the extremely low frequency field (ELF-field).
This verifies the results obtained by D.E. Beischer, J.D. Grisset et al. in 1973: "Nodifferences in reaction time in either man or monkey were produced by the ELF-fields" /65/.
In one of their recent works on the weather influence on accidents Jendritzky, Stahl. •and Cordes have made an attempt at an objective assessment of the effectiveness of the individual
weather factors /66/. However, these authors did not make critical selections of their accident{ data either. Likewise, they did without a detailed analysis of the orographic conditions at thelocation of the accident to determine a possible variation of the local weather from that of thenearest observation station. Thus, as mentioned before, no precise statement on the effects ofenvironmental stress, as for instance subtropical air, could be made.
Moreover, the test area of Saarbrdcken choseL by the a.m. authors is definitely unsuitablefor the investigation of the natural weather influenc.e on accidents because of its intensive in-dustrial and urban emissions. The "Arbeitsmedizinis-hes Zentrum" -)f SaarbrUcken has emphasized thatair pollution strongly affects the health conditioi /67/. Taking into account that the air pollutioneven influences the mortality of man it must be concluded that the reaction capability is affected,too.
This assumption is supported by the fact that the perce.itage deviations in the accidentrates in Saarbruecken are highest in anticyclonic weath-r siti¶'Lions with southwesterly to north-westerly flow. Industrial plants are located in the directione mentioned having a high output ofsulfur dioxide (SO2 ), as for instance the Vblklingen-Burbach Rnd Forbach ironworks.
In the presence of such measurable emissions, which are a heavy load on the human health,it is unnecessary to search for a hidden agent being the cause of accidents.
This statement in no way is intended to express any doubt about the environmental stressresulting in discomfort as for instance under Foehn conditions.
In the German military domaine it was G.E. Stolley who specifically stressed the biologicalsignificance of emmissions /68/.
Because of their extremely high concentration just beneath the top of the inversion pol-lutants may adversely affect the pilots' health when flying in low levels without an airborne oxy-gen supply. This especially holds true in wartime when the toxicity at this level may be raised bya factor of 100 to 1 000 by traces of biological and chemical warfare agents. Coalescent togetherwith adsorptive processes and the absorption of water or water vapor in these cases results in thetrapning of these pollutants over extended periods of time.

2-16
Furthermore, E.Pldtzke referred to Goetz's enhancing effect in his discussion of theeffectiveness of chemical warfare /69/. According to his statements it consists in an "extra-ordinarily remarkable pathophysiological effect of chemical warfare of smallest concentration causedby complex molecular kinetic processes acting on natural aerosols". Conversely, molecularshielding (Gibbs effect) can also produce a neutralization of chemical warfare.
These references are necessary with respect to the cooperation between physicians andgeophysicists. In wartime, preventive measures are required to prevent flight accidents due totoxic effects. It could primarily be aimed at calculating - for instance on the basis of S. Uhlig'smethod - the stability index of the lower atmosphere which besides the wind decisively influencesthe propagation of pollutants. Another province of joint medical and geophysical effort is thedefinition of optimal air conditioning of cockpits.
Modern combat aircraft are subject to unhindered insolation through the clear visioncanopy producing increased heat stress and sultriness.
This is especially true in tropical and subtropical regions. The Germans studied theseproblems in North Africa during the World War II /70/. During the AGARD-meeting of 1968 R. Gold-mann gave detailed information on the thermal comfort in flight and its effect on performance /71/.
A recent paper describes the physical effects of the heat stress caused by the green-house effect of the F-16 fighter /72/. It reads: "There is no doubt that heat stress produces asignificant decrease in reaction time together with a rise in error rate".
This finding is in agreement with the results obtained by M.F. Allnutt and J.R. Allan /73/.
The test data of all authors thuE verify the adequacy of J.0. Lorge's and J.D. Grisset'sconcept that the reaction capability is not dependent on any electromagnetic fields, but rather ontemperature, humidity, and barometric pressure.
The authors mentioned above are right in assuming some synergistic effect of the para-meters listed.
It is a difficult job to clarify this synergism with the help of a medico-meteorologicalcomputation model.
Fanger's comfort equation used by the "Deutscher Wetterdienst" could offer a suitableapproach. Not only does it provide for air temperature, air humidity, ventilation and radiationbut also for activity and clothing of the test person /74/.
The application of this approach to the cockpit comfort, however, is difficult due tothe microscale temperature variability in the aircraft.
Following the test data obtained by S6nning, K~nen, and Knepple ultraviolet radiationshould also be included in that concept /75/. They found that these rays affect "the heat balanceof man insofa! as they are significantly involved in hyperthermia". In addition, ultravioletradiation lirectly affects the nervous system. The cumulative effect of the total radiation there-fore must be viewed from different standpoints for various flight levels.
When considering the affect of UV radiation on the pilot the question of the absorptionby the cockpit windows is obviously important. Vogt of the DVLR informel the author that thesynthetic material used for cockpit windows in military aircraft shows unhindered penetration ofUV rays.
Because of the individual differences in the affects of the cockpit climate only approxi-mate comfort data for the "standard pilot" can be evaluated so that practically the air condi-tioning must be adjustable follow~ng the individual comfo t equation.
The heat problem, at least in part, could pose bly also be solved by medical-preventivemeasures. Investigations of the "Institut filr Klimaphysi logie, UniversitUt Freiburg i.Br." havedisclosed that heat-adapted personnel are capable of increasing their physical performance /76/.This ability of compensating for high temperatures can be explained by cellular adaptation whichis more effective than the adaptive enhancement of the ventiiation of the lung.
As for the pilot's task in the cockpit, a medical comment would be required or. theapplicability of the findings of the above Freiburg institute. namely an increase of physicalperformance by 10 % of heat-adapted personnel measured with the help of an ergometer.
In this context the followiig private communication to the author by Prof. Dr. Dr. F.G.Sulman (Department of Pharmacology and Therapeutics, Bioclimatology Unit, Hadassah University,Medical Center Jerusalem. Israel) on the 14th September 1979 is also of interest. Test series withsummer &nd winter adapted athletes revealed an increase in performance in the respective temperatureranges.
The geophysicist cannot commerf on this problem. Hi; prime task is to inform the pilot sothat he uses the optimal flight level on the optimal flight route.
In doing so special attention must be given to the prefrontal processes (phase 3 and 4)which according to M. Kreipl undoubtedly contribute to pilots' errors and flight hazards, Fig. 29
* /77/.

2-17
So far it is of minor concern whether in these cases the pilot's reaction is solelydue to environmental stress or also due to trivial weather phenomcna.
3. SOLUTION TO THE PROBLEM
It has been explained in the foregoing chapters that the atmospheric conditions in thelower friction layer are Lighly influenced by the lithosphere. This implies that those geophysicalfactors which affect low level flight can substantially differ from those observed at the airbases.
During the World War II the Germans gave met. support by describing the meteorologicalconditions along frequented flight routes. They were of course only capable of taking into accountflight meteorological data relevant at the time when the weather reconnaissance flight was conducted.By repeating the flights in different weather situations, however, comprehensive data were collectedfor meteorological support to later flights on the same route.
Additional weather reporting stations were set up for all routes. They were mainly postoffice agencies and their personnel had been briefed on weather observation.
In this way relevant factors like visibility, cloud base, wind etc. could be requestedby phone any time in marginal weather conditions.
Generally this system w'rked so well that it is still partly in use, to back up the met.support. In some areas guardroome of barracks and other military installations serve as auxiliaryweather reporting posts that can be called up around the clock.
This procedure is a more or less adequate means for the better interpolation of the datameasured or observed by the technical personnel of the official weather stations.
It need not be pointed out that in future for high speed low level flight more preciseinformation is required. After a false prognosis a modern jet aircraft can only make an emergencylanding on andestroyed Autobahn strips when an air base is not within reach in wartime. Moreover,for the accomplishment of the military mission it is necessary not only to forecast the weather onthe flight route but rather that of a larger flying zone so that the pilot may be able to choosealternate routes.
This means that the forecast would have to be converted from mere route to zonal weathersupport, including the recommendation to the pilot which route he should prefer for the fulfilmentof the sortie.
The best tool for the selection of the optimal flight routes in low level, no doubt, isa digital terrain data base, supplemented by geophysical inputs.
The German Ministry of Defense therefore has procured a "topographic terrain data base"also suited for other purpose like for instance military technology.
In this system the territory of the Federal Republic is broken down into squares of 150 m4n length in north-south and 95 m in length in east-west directions /78/.
Each field contains the following information:
- terrain elevation in meters
- topographic values:
1. large residential area, major town, industrial area;
2. small residential area, small city, village, settlement;
3- coniferous forest;
4. mixed forest;
5. deciduous forest;
6. heathland, shrubwood, dwarf pine wood;
7. dry plowland, sand, gravel, rock debries;
8. wet soil, moorland, swamp;
9. fresh water;
10. ocean.
In cooperation with the holder of the terrain data base (Industrieanlagen-Betriebs-gessllschaft (IABG)), the "Amt fVr Wehrgeophysik" has supplemented the terrain data base by in-puts of meteorological and plantphenological data for some areas /79/.
For efficiency reasons all squares that did not show any significant meteorologicaldifferences were combined into larger units with uniform weather features. Meynen's map of the"Naturr~umliche Gliederung" (classification of natural regions) was used in that process /80/.
The problem now was to assign to the individual natural squares lacking weather obser-vations regularly reporting weather stations nearby that - for reasons of topography and climat-ology - can be assumed to experience similar weather. [

2-18
These corresponding areas are interchangeable depending on varying weather situations,seasons or time of day.
This type of inter- or extrapolation will provide for better met. support in each indi-vidual case. The data inputs of the working group on "Regional Flight Climatology" of the "DeutscherWetterdienst" and "Amt fUr Wehrgeophysik" are also used. This group conducts analysis of all ex-perience gained in civil and military aviation and evaluates all publications it can get hold of inthe field of flight climatology /81/.
A complete data base should contain additional data relevant for flight information, forinstance phenological data for problems of camouflage, ornithological information for birdstrikehazards, pedological details for dust formation and visibility reduction, oceanographic data on waveheights, glazy sea and saline displacement. Thus the terrain data base must be supplemented in theframework of a technical information system.
Trafficability data must likewise be fed into this system because geophysical support inwartime must also cover litho- and atmospheric parameters, since in the majority of cases air raidsare conducted in connection with tank operations on the ground.
The input of industrial and urban emission data would substantially improve the reliability
of visibility forecasts. Besides, this would offer an ideal opportunity for verifying predictions onthe propagation of other suspensoids, for example chemical and biological warfare agents.
On behalf of all NATO partners the area to be covered by geophysical data should be ex-tended beyond the borders of the Federal Republic of Germany. Only in this way can uniform basic in-formation systeris be established for the benefit of all concerned who by use of computers (GEOVOR)will enable 6he assignement of those flight routes and levels presenting minimum flight hazards tothe man-machine-system. These optimal areas are identified by S. Uhlig-s characterization of "chainsof natural regions of relatively favourable weather conditions", Fig. 30 /82/.
This should be the way to keep down the current low rate of the weather factor in flightcrashes, Fig. 2. This is of special concern since flight accidents due to weather are among the worst.
By selective use of human engineering like the introduction of multisensor systems andthe increased presentation of information by acoustic signals as discussed earlier, an optimalpilot alertness to react can be achieved /83, 84, 85/.
Since the professional interpretation of the great number of data in the near futurecannot be done by a robot but only by man who is himself dependent upon geophysical effects, thecooperation between the medical and tae geophysical community must be intensified especially witha view to high speed low level flight.
4. DISCUSSION AND CONCLUSIONS
To avoid one-sidedness, the geophysical HSLLF-problems must be discussed consideringall the other contributions to the AGARD conference of Lisbon. For this reason the author post-poned the concept of this final chapter until cognizance of the other reprints was gained.
It is noticeable that in practically all discussions the importance of the environ-mental stress was pointed out. If not only the physiological-psychological but also the physicalcomponents which have an effect on the Man-Machine-System are considered, the complexity ofsynergism becomes apparent. This is of special importence when the concept of environmental stressshall include the consequences of all geofactors. These do not only belong to the atmosphere butalso to Hydro-, Litho- and Biosphere. Because of the intensity of interaction of the above mentio-ned spheres in Low Level, the geoscientific problems of the HSLLF can not be considered from themeteorological viewpoint only.
For this reason it is wrong - or at least misleading - to speak of the "all weathercapability" of an aircraft. In this respect, P.V. Kulwicki, therefore, has expressed himself verycautiously in the discussion of the flying capabilities of the F16. It can be supposed that alsoH.M. Archer would like to have understood the "all weather capability" of the Tornado not in thesence of a complete immunity of this aircraft with regard to unfavourable geofactors. Otherwiseit is hardly understandable why J.G. Jones has mentioned the terrain and atmospheric conditionsat all, in his paper on "Ride-Bumpiness and the Influence of Active Control Systems", which imme-diately follows Archer's lecture.
The same is true for the many references of nearly all speakers to the multiple geo-factors which represent special hazards for HSLLF.
The "15 year Review of the HSLLF-accidents of the Canadian Forces" by R.C. Rud and D.F.
Leben, has given the host proof for the accuracy of the thesis that especially HSLLF is influencedto a high degree by geofactors. Accordingly marginal weather "appears to be the one most signifi-
cant factor contributing to HSLLF-Accidents". Considering that the human factors mentioned by the
above-named authors, are also influenced by geophysical factors it is to be concluded that the "all-weather-capability" is merely a futurist idea.
In this respect the references to the work of A.F. Zeller and I.D. Marsch by R.F. Strib-ley and S.A. Nunneley is of interest. In these one has examined the material of 3 060 accidents of

2-19
fighter aircraft of the USAF (accidents examined in Canada = 30) /86/. This extensive statisticalmaterial shows that "the environmental heat may make a significant contribution to the accidents".
Stribley and Nunneley have said that the heat stress is often the highest during HSLLF(also in temperate climates). Therefore more attention must be paid to this medico-meteorologicalproblem from the geophysical point of view in the future.
The importance given to these questions by aero-medicine may be judged from the numberof lectures in Lisbon dealing with the "thermal stress".
Besides the already mentioned authors also T.M. Gibson, J.R. Allan, C.J. Lawson and R.G.Green talked on these problems. Referring to the important research by R.R. Bollinger and G.R. Car-vell they confirmed indirectly the effects of "thermal stress" on the flight-accidents of the Ca-nadian and American AF with data from the UK. According to this data the pilots' errors amount to24.2 % in summer but only 9.5 % in winter! In a combat situation this means of course, considerabledifferences in the success of missions.
In order to improve the rate of success it is absolutely necessary, according to theopinion of the Senior test pilot British Aerospace J.J. Lee, to know the "optimal flight path".This can only be indicated under geophysical aspects. If the geophysicist considers in his briefingthe exact "cloud cover" and the position of the sun, the choice of a suitable flight-route alonecan reduce the thermal stress to a minimum.
Geophysical consultation is all the more important as the technical possibilities of thecockpit-climatisation are still not satisfactory at present as pointed out by Timbal and Colin.
In HSLLF the question of the flight path and the flight altitude with minimal heat-stressis still more important because the g-tolerance can be affected by the temperature (Bollinger et al).Besides, in consequence of sweat dripping into the eyes, there can very often be a considerable re-duction of the flight visibility. Of course, thermal-stress can relatively often be expected withVMC. Because of the above mentioned influence on the g-tolerance meteorological aspects must, in"fair weather", lead to flight paths with a minimum of relief energy. Furthermore paths along wind-ing rivers, as for example the Moselle in France and Germany must be avoided.
These indications show that consultations of HSLLF especially under VMC conditions musttake into consideration topographical and geophysical Structures. In view of the causality of vi-brations P. Quandieu, P. Borredon, J.C. Roumet and L. Pellieux have stressed this demand. The aboveauthors mention further the influence of the geological formations on the air-density in the lowestfriction layer, which, as could be demonstrated by the example of the "Plaidter Hummerich", canlead to flight accidents.
In many cases the risk of accident, is increased, also by the turbulences and vibrationsoccurring at the same time and the visual suppression resulting from it (G.R. Barnes, M.E. Johnston,R.L. De Hart, D.N. Jarrett, L. Vogt, E. Schwartz, H. Mertens, M.E. Johnston, J.H. Wharf). Geophysicalconsultations to HSLLF must therefore point out the many aspects of CAT near the ground-level.
Since the position of the sun and the weather decisively influences the background-brightness and the illumination in the cockpit, both factors determine at the same time the chanceof target-acquisition and the optimal design of cockpit displays. (R.H. Holmes, D.N. Jarrett, H.Rosenwasser, G.T. Chisum, J.J. Kulik, M.L. Wolbash., M.M. Cohen, A. Lewis, D.W. Hossey, M.E. Johnsten,
J.H. Wharf, M.A. Ostgaard). Possibly these optical difficulties in the cockpit will contribute tc-
increased use of acoustic signals in the future. In this respect it is important to note that in
the 23rd Annual Meeting of the Human-Factor-Society in Boston, Mass. (Oct. 29, - Nov. 1, 1979),which followed the conference in Lisbon, the problem of the "auditory vs. visual display" waasubject of a special lecture /8?/. In this Fig 31 shows clearly the faster reaction of the probax.dto acoustical signals than to optical signals. The authors, however, are very cautious with followup conclusions stressing that the application of the auditory channel must not be regarded as theultima ratio, because the tone occasionally caused strongest panic reactions (full braking).
Possibly the "Colour Display", discussed by D.W. Hussey in Lisbon represents a new cock-pit philosophy, which also satisfies the special demands of a hostile environment.
In any case it is noteable that quite an extensive range of colours is planned for usein the civil transport electronic flight instruments currently under development.
R.H. Holmes emphasized in this respect "that also light aircraft which have dials with
coloured segments for normal or caution ranges often have better presentations than military air-craft".
It must be supposed that the developement of the "optimal display technology" will alsoprofit from the geophysical indications of the cockpit environment. The collaboration of the geo-physicist in the solution of aviation problems is necessary in any case when it deals with new"Indicative-Technics", e.g. of the wind shear /88/.
These problems must be emphasised from the geophysical point of view, especially becauseit makes the establishment of priorities possible. The question of the wind shear indication is forexample of considerably greater importance for the correct and quick reaction of the pilot than thepurely academic question of the influence of spherics.
The lectures in Lisbon as well os the recent publications in the sphere of "human factors"showed, how difficult the determination of suitable parameters for the quantification of the en-

i 2-20
vironmental stress is. Remarkable is for example the agreement of the research of H. Radke and M.Voss/D. Bouis, according to which the puls-Crequency cannot be used as a physiological measure forpurely sensomotoric stress /42/89/.
The crucial question to geophys.cs is always "In which way can geophysics make an activecontribution to the decrease of environmenta. stress ?" Here only prophylactic methods are of value.The geophysicist must indicate to the pilot exactly the flight path and the flight altitude, whichare most suitable for the solution of his military mission. This can be done best with the aid ofthe terrain-data-bank, explained in this paper.
The lectures in Lisbon have shown that in addition to the geophysical data aiready mentio-ned especially the values of relief energy must be stored. The potential c-forces on the differentflight paths could be found with the help of so called "Hypsographs" /90/. Because of the consider-able influence of the g-forces on the faculty of the pilot's vision, it is of no use to determinea flight route which shows good meteorological, but poor physical conditions for the pilot.
As the author has shown, an integrated evaluation of the "effective sight", which isdecisive for the pilot in HSLLF especially under battlefield conditions must be car:ied out /91/.
The way chosen by the AWGeophys, namely the use of the terrain-data-bank on the basisof natural regions, is to be regarded as the only right one, as especially the lecture by H. Mutsch-ler has confirmed. It was convincingly shown that the target aquisition is significantly dependenton the contrast values and the local context. A priori one can suppose that the contrast and con-text values in the "Naturfelder" are equal or similar. This is also valid for the cold season inwhich a snow cover can be expected which may lead to visual confusion (R.L. De Hart).
Since comparable visual abberiations and apparent displacement of objects caused by shockwaves at transonic speeds, compression, or turbulence of air can be expected within a natural region,the geophysical consultation tt.sed on these natural regions should be optimal.
The importance of the "Bird-Strike-Hazard" discussed here, has also been stressed by R.L.Dettart for the HSLLF. This is important both for flights over land and sea.
Tactical missions over sea must always take into consideration radar holes caused by thethermic layer of water and air Fig. 32/92/. Besides especially those paths to be preferred whichoffer the greatest survival chance for the air crew in the event of the accidental immersion incold water. It has to be considered that maritime areas with water temperatures higher only by afew degrees centigrade, can bring a decisive increase of the "ultimate survival" that M.A.A. Hobbsspoke of in Lisbon Fig. 33/93/. Only if this is taken into consideration the problems discussed byJ.H. Raddin, L.J. Specker and J.W. Brinkley, about the "sequenced delaytime for escape from HSLLF-profiles" may be dealt with according to their priority.
The above mentioned author is, by the way, convinced as well as W.Mc Intosh of the impor-tance of the problems of "survival under adverse weather conditions". This statement is not onlyvaluable for sea- but also for land-regions, in which the chances of survival can be extremelydifferent.
As an example the relatively high temperatures of +3 C in the vicinity of "Eskers"can be mentioned, which prevail throughout the entire winter while freezing temperatures of -30O Care common in the surrounding area e.g. in Finland Fig. 34/94/.
It is clear that a pilot near such increased temperatures has a considerably higherchance of survival.
The phenomena described above also occur with certainty in other arctic and sub-arcticareas.
The declaration of the admiral F. Turner, mentioned by M.A.A. Hobbs "we have seats andejection systems that literally hurl the man out into the darkness" must be extended in the geo-physical sence as follows: "the pilot needs geophysical information on the areas, where he has thebest chance to survive".

2-21
References
/1/ US Army Intelligence Center and School (USAICS)Army Tactical WeatherTC 30 - 11 (1977)
/2/ Keul, A.G.Wetterbeeinflulte Flugunfdlle in den Usterreichischen AlpenTagungsbericht der 15. Internationalen Tagung fir Alpine Meteorologie,Grindelwald 19. - 23.09.1978, Teil 1, S. 47 - 50
/3/ Hoffmann, H.-E. und Buell, R.H.Die maximale AuffaIreichweite bei Beobachtung Luft - Land und Luft -Wasser mit LichtverstgrkergergtenDFVLR, IB 553 78/1 (1978)
/4/ Bodinet, E., Gillessen, W. und Wassner E.Integriertes Bewertungsmodell f~r Aufkl~rung, Verfahren und Programmezur Nutzung der Datenbank TOPOGRAPHIEIndustrieanlagen-Betriebsgesellichaft mbH B-50-2064/05 (1977)
/5/ Fett, W.Der atmosphdrisoht StaubVEB Deutscher Verlag der Wissensehaften, Berlin 1958
/6/ Bock, K.H.Ein Sandsturm im 6stlichen MittelmeerDer Wetterlotse, Nr 363/364, M~rz/April 1977, S. 29 - 36
/7/ Beaufre, A.War in the Mid EastInfantry - USA -, Nr 64, Juli/Augrust 1974, s. 12 - 16
/8/ Jackson, R.The Israel Air Force StoryTom Stacey Ltd, London 1970
/9/ Wulff, H. und Berg H.Dunst und 6icht im westdeutschen IndustriegebietForschung und Erfahrungsberichte des Reichswetterdienstes,Reihe B, Nr 16, Berlin 1S53
/10/ Tolliday, N.P.Royal Signals and Radar Establishment, ChristchurchTransmission through dust clouds and vegetation firesMemorandum No OL4/1/77 (1977)
/11/ Campbell, P.Review of optical and inirared properties of the battlefielo environmentHavant: Plessey Radar Research Center (1976) 17/76/R/190c
/12/ Hess, H. und Jansen, P.Regen-Erasioa.Flugsicherheit 3/77, Jani 1977, S. 9 - 12
/13/ Tanck, H.J.Der EinfluZ von Vertikalwinden auf Flugzeuge ohne und mit EinsatzFachliche Mitteilungen Nr 168 (1971)
/14/ Chappaz, R.Des avions sal6s sur l'est 4e la FranceBulletin d'Information de la Mft6crologie Nationale, numbro 31April 1976, S. 11 - 13
/15/ Chappaz, R.Dfp8t de sel sur avionsBulletin d'Information de la Mft6orologie Nationale, num6ro 36,Juli 1977, S. 12
/16/ Chappaz, R.
D6p~t de sel sur des avions de la 136me Escadre de ChasseBriefliche Mitteilung an AWGeophys, 04.12.78
/17/Salzstaub in der AtmosphdreSymons "Monthly Met. Mag. January 1895"zitiert in /5/ aus: Met. Zeitschrift 12 (1895) S. 71

2-22
/18/ Ceyp, H.DiskussioasbemerkungFortb. Seminar Flugivetterberatung, Uni Bonn 11. Mai 1977
/19/ AutenriethWaffeneinsatz und Flugsicherheit oder: in Deci ist alles andersFlugsicherheit 2/79, April 1979, S. 11 - 13
/20/ Short, J.J., Kent, J.J. and Ardrah, L.An Evaluation of the Bird-Aircraft Strike Hazard at Hill AFB, Utah, AFLC,Techn. mem. Buddin III, William H., Jan. 1979, Rept No AFESC-TM-1-79
/21/ Haine, E. vo 18167 5.3
/22/ Winkler, P.Zum Verst~ndnis des SommerdunstesAnnalen der Heteorologie Hr 12 (1977) S. 238 - 239
/23/ Platow, G.
Atmozphiirische Turbulenz- und Bdigkeitamal~zahlen in Zusammenhangmit gro~rdumigen StrdmungsparameternTH Darmstadt, Bericht zu dem mit Mitteln des BMVg gefdrdertenForschungsvorhaben T947-I-263, Dezember 1976
/24/ Schmidt, 1.RUckschliiase von Bodenbeobachtungen auf die Windverha..tnissein ten untersten 400 mAbschluBbericht zu den mit Mitteln des BMVg gefbrdertenForsahungsvorhaben "Raumzeitliche Verainderlicbkelt des Windes"T652-I-2d3 bzw. T-548-i-263 15.09.1967
/25/ Uhlig, S.Verg3eich von Hbhenwindmemesungen im Alpenvorland mit den Windwertenbenachbarter Bergstationen und der Aerologischen Station MUnchen-RiemAnnalen der Meteorologie, N.F. Xr 5 (1971) s. 63 - 70
/26/ Nehring, G.Bodenwindvergleiche Kaufbeuren/Altenatadt fUr die Fallschirmsprurgberatungder in Kaufbeuren startenden MeachinenBerichte fUr den GeophysBDBw Ur 13 ( 1973)
/cL7/ Slkdkovic, R. and Kanter, H.J.Low-Level Jet in the Bavarian Pre-Alpine RegionA:-ch. Net. Geoph. Biuk2., Ser. 1, 25 (1977) S. 343 - 355
/28/ Weber, F.Zum Problem des Low Level Jet in n~5rdlichen AlpenvorlandFachliche Mitteilungen Nr 178 (1974)
/29/ Weber, F.Niedertrcposph~riache Windmaxir4A Uber Hannover und emn Vergleichmit den Verhhltnissen im nbrdlichen AlpenvorlandFachliche Mitteilungen Hr 184 (1977)
/36/ Weber, F.Statistische Unterauchungen jiber das Auftreten markanter Temperaturinversionenin den unteren Luftschichten iiber MUnchen-RiemPromet (1978) S. 13 - 14
/31/ Krames, K.Flugunf~lle bei blu+ conditionsVortrag bei Leitbereichstagung, Oldenburg 1974
/32/ Cashmore, R.A.Seiere Turbulence at Low Levels over the United KingdomMeteorol. Mag. Band 95 Hr 1122 (1966) s. 17 -18
/33/ Georgii, W.Kinematik der LeewellenetrdmungDLV Forschurgsbericht 68 - 39 (1968)
/34/ Georgii, W.Kinematik der Leewellenstriimung, Teil II: Turbulenz der LeewellenstrdmungDLV Forachungsbericht 68 - 39 (1968)
/35/ Meyer, IngridLeewellen hinter Ge'jirgen, Modelle und BerechnungenToil 1: Theorie und Modelle
Meteorologische Bundscbau, 4 (1976) S. 97 - 109

2-23
/36/ Malapert-Neufville, P. Frhr. vonFlugerfahrungen im Orient unter BerUcksichtigung geophysikaliacher AspekteBerichte fUr den GeophysBDBw Nr 11 (1975)
/37/ Pauly, E.Blitzeinsohigge in Luftfahrzeuge der BundeswehrBeriobte fUr den GeophysBDBw Mr 7 (1972)
/38/ Friihauf, G. und Amberg, Hans-UlrichErgebnisse von Blitzzdhlungen in Bayern und Schleswig-Holstein£TZ..B Bd 19, H. 17 (1967) S. 505 - 50C
/39/ DUll, B.Wetter und Gesuudheit, Teil IDr. Liesegang, Frankfurt/Main 1941
/40/ Bouis, D. und Voss, M.Aufmerksamkeitsverteilung des Kraftfahrzeugfiihrers bei Aufnahmeoptischer oder akustischer Meldungen im FahrzeugFhG-Berichte, 1/2 - 79 (1979) S. 12 - 15
/1/ Schmitz, Gen./4Vortrag beim 12. Hubschraubc.e-Forum, Bilckeburg 08. - 10. Mai 1978
/42/ Radke, H.Ein Verfahren zur teilautomatisierten Auswertung von Blickbewegungsmessungen 1979,
DFVLR Mitt. 79 - 02 (1979)
/43/ Radke, H.Auslegung von Flugzeug-Cockpits: BlickbewegungsmessungenUmschau in Wissenschaft und Technik H. 24 (1979) S. 786 - 787
AV4 Daubert, K.Macht das Wetter wirklich krank?Fachliche Mitteilungen fleihe I Nr 130 (1967)
/45/ Reiter, R.Meteorobiologie und ElektrizitKt der AtmosphireAkademische Verlagagesellschaft Geest u. Portig KG3, Leipzig 1960
/46/ Berg, H.EinfUhrung in die Physik der feeten ErdeS. Hirzel Verlag, Stuttgart 1949
/47/ Brezing E. und Schmidt, W.Das kiinstliche Klima in der Umgebung des MenschenFerdinand Enke Verlag, Stuttgart 1937
/48/ Leuwen, Storm vanStudien iiber die physiologische Wirkung des FdhnsMediz. Wochenschrift 79 (1932)
/49/ Leuwen, Storm vanLuftelektrizit~t und FdhnkiankheitGerlands Beitr. zur Geophysik 29 (1933)
/50/ Reuter, H.Klima am Arbeitsplatz beeinfluBt Produktivitit und UnfallgefahrenMaschinenmarkt 82 (1976) 96, 1863 - 1865
/51/ Beshevec, A., Ponomarenko, V., Zavalova, N. and Poljakov, V.Wo liegen die Grenzen?Aviacija i kosmonavtika 11 (1977)
/52/ Lossagk, H.
Die Umschau 41, H 32 (1937) S. 731
/53/ Moth, H.Diskussionabemerkung (S. 249) zu:R. Reiter: Biometeorologieche Indikatoren var. gro~r~umiger undprognoatiecher BedeutungBiricht des DWD US-Zone, Nr 35 (1952) S. 235 - 253
/54/ K~hn, W.Hamburger Verkehrsunfhlle u. WetterMediz.-Met. Hefte Mr 11 (1956) s. 137
Ka5hn, W.Verkehrsunfiille in biosynaptischer SichtMediz.-Met. Hefte Mr 12 (1958) s. 88

rW 2-24
/551 Schr5der, B.Unfille und WetterMediz.-Met. Hefte Nr 11 (1956) s. 133
/56/ Israel, H.Die Luftelektrizitdt im Rahmen der BioklimatologieAngew. Met. Nr 1 (1951)
/57/ ProkopWUnschelrute, Erdstrahlen und WisseucchaftMedizinischer OkkultismusVEB 0. Fischer, Jena 1973
/58/ ElevitDas elevit-ImpulsfeldInformation der Elevit-Gesellochaft, Baldham/HUnchen
/59/ Reiter, R.
Gibt es biologische Wirkungen luftelektrischer GrdBen?Promet 3 (1977) S. 20 - 24
/60/ Ranscht-Froemadorff, W.Effizienz natdrlicher u. kdnstlicher Sferics-PrograinmePhysikaliache Medizin 5. Jg. H 2 (1976) S. 76
/61/ Ranscht-Froemsdorff, W.Biologische Bedeutung der Elektro-Wetterstrahlung (Sferics)Promet 2 (1974) S. 20 - 21
/62/ Jessel, Wedler et al.Bericht uber den 80. Kongress der Deutschen GesellschaftfUr Physikaliscbe Medizin und RehabilitationHeilbad und Kurort, Heft 1 (1976) S. 33 - 36
/63/ Bundesanstalt fUr StraBenwesenProtokoll zum Expertengespr~ch "EinfluB luftelektrischerFelder auf das Fahrverhalten von Kraftfahrern" am 21.04.1978in der BASt, KlnBASt, U3. lr-oc-61
/64/ Lorgc, J.0. de and Grisset, J.D.Behavioral Effects in Monkeys Exposed to Extremely Low FrequencyElectromagnetic FieldbInt. J. Biometeor., vol. 21, number 4 (1977) S. 35, 565
/65/ Beischer, D.E., Grisset, J.D. and Mitchel, R.E.Exposure of man to uagnetic fields alternating at ext-emely low frequencyNAMRL-1180, Naval Aerospace Medical Research Laboratory,Pensacola, Florida (AD 770 140)
/66/ Jendritzky, Stahl und CordesDer EinfluB des Wetters auf das VerkehrsunfallgescheheaZeitschrift fUr Verkehrssicherheit Nr 24 (1978) s. 119 - 127
/67/ BUch, D.Darstellung von Luftbelastung und Klima im StadtverbandSaarbrUcken und deren Umsetzung in die BauleitplanungSchriftenreihe der Obersten Naturschutzbehbrde Mr 5: Das Klimain der Landschaft, S. 42 - 58
/68/ Stolley, G.-E.Besondere meteorologiszhe und biopbysikalische Einwirkungsmbglich-keiten auf ABC-Kampfmittel bei tiefliegenden InversionenFachliche Mitteilungen Nr 149 "Seidel-Heft" (1970) S. 121 - 127
/69/ Ploetzke, E.Beitrag zum Problem der Abwehr chemischer KampfstoffeTeil I Explosivstoffe 11 (1963)Teil II " 12 (1964)Teil III " 12 (1964)Toil IV " 3 (1965)
/70/ Bittner, K.Heat and cold in airdraftGerman Aviation Medicine in World War II, US Government PrintingOffice Vol. II, Ch. VIII, B (1956)
/71/ Goldman, R.F.Asseasment of thermal comfort in flight and in effects on performanceAGARD Conf. Proc. No 40
4

/72/ Numnelby and Myhre
22
Physiological Effects of Solar Heat Load in a Fighter CockpitAviation, Space and Environmental Medicine, September 1976, S. 969 - 973
/73/ Alinut, NJF. and Allan, I.R.The effects of core temperature elevation and thermal sensation on performanceErgononics 16 (1973) S. 189 - 196
/7V/ Jendritzky and SUnningDie quantitative Erfassung des thermiachen Komplexee in der KlimatherapieTagungebericht der 15. Internationalen Tagung fUr Alpine Meteorologie, Grindel-vald 19. - ?3.09.1978, Teil 1, s. 104 - 107
/75/ Sdnning, W. und Koenen D.Das Problem der SchwUlePromet 2 (1974) S. 16
/76/ Girtner, W.Nenach und KlimaHeilbad und Kurort, Heft 3 (1972) s. 47 - 50
/77/ Kreipl, M.Beeinflul~ung des (fliegerischen) Leistungoverm~gens durch bioklimatische Faktoren
/ Aerokurier 6 (1978) S. 642 - 645
/78/ Wassner, E.Gelandedatenbank TopographieIndustrieanlagen-Betriebsgesellschaft m.b.fl. B-So-2064/0? (1976)I /79/ Liitkebohmert, G.PrKsentation im Amt fUr Wehrgeophysik am 10.01.1978 uber ZTL/IntegriertesBevertungemodell fUr Aufkl~rungssysteme - Dokumentation -AW~eophys Studie Nr 7ý110 VS-NfD, 16.02.1978
/80/ Institut f;Ir LandeakundeKarte I"Naturriiumliche Gliederung Peutschlands"
/81/ DWD/GeophysBflBwRegionale Flugklimatologie von Deutschland (in Vorbereitung)
/82/ Uhlig, S.Geophysikalische Eingaben in digitale GeldndedatenbankenFachliche Hitteilungen Nr 187 "Baumg~rtner-Heft" (1978) S. 209 - 219
/83/ Paul und PartinnDarstellung und Verkn'upfung von Informationen bei einem MehrsensorensystemFhG-Berichte 1/2 (1979) s.gý6 - 20
/64/ KotterbaVerarbeitung komplexer akustischer Signale durch den Menachen:Arten der Ger~uschwahrnehmung und deren Konsequenzen auf technische ErkennungesystemeYhG-Berichte 1/2 (1979) S. 23 - 26
/85/ Meisel und PatzeltExperimentelle Ergebnisae beim Betrieb eimes bahngefUhrten, dirakt digitdlgeregelten RoboteraFhG-Berichte 1/2 (1979) S. 38 - 43
/86/ Zeller, A.F. and Marnch, J.D.Seasonal trend variations in USAF - Aircraft AccidentsUSAF Insp. and Saf. Center Norton AFB CA Scient. Meet. Aeroap. Ned. Ass., 1993
/87/ Bovis, D., Voss.M., Geiser G. and Haller R.Visual vs Auditory Displays for different Tasks cf Car DriversFhG, Karlsruhe Proc. of the Human Factors Society, 23rd Annual Meeting 1979
/88/ Teezen U."Mbglichkeiten der Systemsimulation zur Bewertung von FlugfUhrungsanzeigen"DFVLR, Braunschweig 79-10, Sept. 1979
/89/ Voss M. and Bovis D.Der Menach ala FahrzeugfUhrerBer. Phase 2, Schriftenreihe de- rorsch. Verein. Automobiltechnik (FAT) Frankfurt/a.M.
/905/ Krames K.Die Bezugabdhe fUr WolkenuntergrenzenStudie Mr 78108, AWGeophys, Traben-TIrarbach, Jan. 1978
/91/ Kramea K.Integriertes Bewertungnmodell fUr Sichtverhiltnisse im Rahmen der Studie fUr endphasenge-lenkte PanzerprojektileIA Konzeptyorschlag, Interner Bericht Mr 79148, AW~eophyc Traben-Trarbach, Sept. 1979

2-26
/92/ Sherav R.C. and Rosenthal J.Don't fall in the Radar HoleProceedings 12 (1973) US Naval Inst. Annapolis, MarylandAls deutsche Ubersetzung erschienen: Vor RadarlUchern wird gewarntFachliche Mitteilungen Nr. 186 (September 1977)
/93/ Enderle U.Zum Auftreten von Kaltwassergebieten an der Meeresoberfl~che in der westlichen Ostsee undin der Deutschen BuchtFachliche Mitteilungen Nr. 198 (Dezember 1979)
/9V/ Okko V.In the thermal behaviour of some Finnish eskersFinnia, Helsinki 81, Nr. 5 (1957)
/95/ Troll C.Seasonal underground winds in Finnish BakersErdkunde, 13 Bd. XIII (1959)

:_), •i2-27
FIG 1
Ei
0.9-
08-
007-
,I03 -- I.
02- GV-
0.M U...
20 30 6 5 60 ,oSNumber of Stations passed
Effectiveness of Air Defense System (A-D ) with Repectto Flight Level
Influence of Weather in Percentage i2on Aircraft Accidents in the BundeswehrFI2
1965 - 1977
W__.
012
9 Annual Values
6
• 3
'--0 1
l I i I I tI1965 67 69 71 703 75 7

2-28
FIG 3 - 7DIAGRAMS OF RADIAL VISIBILITY, RADIUS OF CIRCLE - 7 km, CENTER a POSITION OF PILOT.
SHADED AREAS NOT VISIBLE TO PILOT, INDEPENDENT OF FLIGHT DIRECTION /4/ EXAMPLE FROM
SOUTHERN GERMANY
FIG 3
FLIGHT ALTITUDE 150m
VEGETATION HIGHTS NOT CONSIDEREDFIG 4
FLIGHT ALTITUDE 150m
VEGETATION HIGHTS CONSIDERED

2-29
Flb 5
FLIGHT ALTITUDE 500mVEGETATION HIGHTS CONSIDERED
F IG 6
FLIGHT ALTITUDE i5omVEGETATION NIGHTS CONSIDERED
FIG6 7
FLIGHT ALTITUDE 75mVEGETATION NIGHTS CONS.btREO

L3-
FIG. 8VERTICAL DUST DISTRIBUTION
z
E-4
0|
2-
'\ \I'
C4 *
A%B -"0 " V T I | I
0 1 2 3 4 S 6 7 8 9 10 DUST (REL.UNITS)A FORENOON, B, C AFTERNOON OF 27 JULY 1936THE LIFTING CAUSED BY INCREASING CONVECTION IN THEAFTERNOON IS CLEARLY SHOWN(D6rfel, K., Lettau, Rbtschel, M., Luftkdrperalte-rung als Austauschproblem auf Grund von Staub- u.gerngehaltsmessungen, Met. Z. (1937) S. 16)
*1

2-31
FIG 9
z
4,4
21
wo 0E-8
-c z z c
000
0 aZ4
9K 0 0
O. J
C -
Z W- ~
gar
~IL 0 Wa4I..OO w
W 4 An -
0
a so

2-32
H• CONTENT OF DUST AND VISIBILITYzIO (Bbtscher, M. Meteorological
Research of the Dus'atmosphere,Publications Geophys. Inst.
P3 Leipzig 1 (19.3) H. I
0
~20
0 10 20 30 40 C
VISIBILITY (kM) Hight in meter FIG. 12
[gmZ / month] JESTRUCTIONS30- IN WARTIME 5000-
4700-
"00 -
41 O0 -
200 3eoo -
3500 -
3200-
to- 2900-2600 0--
i2300-
2000 0
193SI36 9S40141 1943144 45/46 1950151 1700-
FIG 11 1400-SEDIMENTATION OF DUST IN BERLIN 10
(Lrner, A., Zehn Jahre Regenwasseranalysen - en Bel- 1100-trag zur Ortsublichkeit von Staubniederschlagen, Ge-sundheitsingenieur 70, (1949) s. 196 - 200) 800
60 500
so0 200
0 I II T
40 0 1000 2000 3000
Occurrence (Number of cases )
30 , f 2OCCURENCE OF CLOUDS AND FOG IN HEIGHTS33 BET~mEEN 0 AND 5 000 m, HAMBURG, SOESTER-U BERG, COLOGNE, MILDENHALL. (Skierlo, U.,
"20 Statistische Bearbeitung def- Wolken-messungen ausgewahlter europaischer"Wetterflugstellen, Forsch. u. Erf. Ber.
to des RWD, RA Nr 3, 1940)
-S -to -is -20 -25 -30 -35 -OC
FIG 13FREQUENCY OF ICING AS A FUNCTION OF AIR TEMPERATURE. (Trunov. O, Zaschtschita otobledenenija sverc0zvykovych samoletov, Aviacija i Kosmonavtika, Nr 2 (1969))1. 1775 TEST FLIGfiTS IN CIVIL AVIATION IN THE USSR - 2. 260 DEBRIEFINGS OF PILOTSOF BOAC AND TU-114 - 3. 220 TEST FLIGHTS OUTSIDE USSR - 4. ENVELiPE

• • 2-33
FIG 14INSECT IMPACTS ON THE COCKPIT OF A BREQUET ATLANTIC, 19.06.1979
FIG 15INSECT IMPACTS Ob THiE COCKPITOF AN ALOUETTE TI IN LU'. THERESTRICTIOh OF VISIBILITY WASTHE CAUSE OF A SEVERE ACCIDENt.ThE HANGAR, DISTANCE 3G m, CANHARDLY BE SEEN.

2-34
SEASONAL VARIATION OF BIRDSTRIKEFIG 16
Bundeswehr(1971 - 1978)
100
90 -/i
80
70 ,
560
4030 !' - ,•
.4-A
20 1,
10
JA FED MAR APR MAY JUN JUL AUG SEP OCT NOV DEC
above 1500 ft GND
,... below 500ft GND
N - number of birdstrikeFIG 17FREQUENCY OF TURBULENCE AS AFUNCTION OF HEIGHTk . (N.N. Vinnicenko N.Z. Pinus,km IG.N. Sur, SOME DATES ABOUT
S•TROPOSPHERICAL AND STRATO-24 |SPHERICAL TURBULENCES, Met. i.
G•Gidrol, 11 (1966) S. 26 - 33)202N 06 05.69 0600 GMT 30 0763 0600 GMT20 GND 0656 O6GM3000- 110 Wind 33018 m 140 Direction 310
16 190 S310200 290
210 31012 3 4 20001 210 300 NW
21 20 31010 240 SW 280
a24.0 360
6 1/ 1000. 2020005
0200 0
4 2 LLJ 190 S L) 040 N0E, 2 i030
0 0 1 •10 20 % 0 10 20 30 40 0 1'0 20 3`0 401. = USSR, SOUTHERN AREA Knots Knots2. = USA Surface 18063. a USA/ U-2-DATAS WIND DIRECTION Surface, Calm4. 3@ USSR MIDDLE LATITUDES FIG 185- a FLIGHT-ROUTES LOW LEVEL JET OVER ALTENSTADT (ALPS, GERMANY) /23/
LONDON - FAR EASTLONDON - NORTH AFRICA

2-35
3000-
m HD 2.1175 NESW2315 CET2500-
0 200001
o 1500 LLJ.0
-- 1000CD
5001
LLJ
0 5 10 15m/s
VIND sPz= DIRNIMON
FIG 19LOW LEVEL JET IN THE BAVARIAN PRE-ALPINE REGION /25/HEIGHT ABOVE GROUND
FIG 20
FLIGHT ACCIDENT IN THE CRATER OF THE EXTINCT VOLCANO"Plaidter Hummerich"
SUNWINDDIRECTION ___
"26800 7-10Knoten
DENSE VEGETATION' PLACE OF ACCIDENT(LAVALIT) - OPEN PIT MINE
L AWITHOUT VEGETATION
LOESS LSTAWIt• - • LAVALIT HIGH POROSITY• "PA D L S H R T T U ~ ~ i
HIGH TEMPERATURE ON THE SURFACEAND IN THE AIR DURING THE IN-
• ------ • OLATION PERIOD
THE ACCIDENT WAS CAUSED BY THE HIGH TEMPERATUREAND DENSITY GRADIENTS NEAR THE POINT OF IMPACT
-a

2-36
CRASHE ALOUETTE 11. IlAN 1U OFIN 1-11 BI113EMINE N~EAR PLAIDT, GE1MN
CRASH OF Ali AIRCRAF! UlR 'jHE RTIR Uf j.
FIG~ 21a CRATER OF- 1AE EXTILCT VOLCAIu LIZE
~~-- H1Ul-MERI~ii. A-D MAR~. 'TuEiF,~~li~THE VERTOL hill GROURN Ih lii:- OF-,EN i-I1LAVALI. MINE
4-
APA -
~? '.Now

1-7
FIG 2_)a
RIA2BASE ho 72t64, he:-. Reg. fuir Rheinhescer., BY COUBIESY Oi'Landesbildstelle Rlild.-1-falz
VOLCANO Kunskopf. Germany
Diatomit highly porous sceletons of fossil olgueFIG 23 b with very tow coefficient for heotconduction
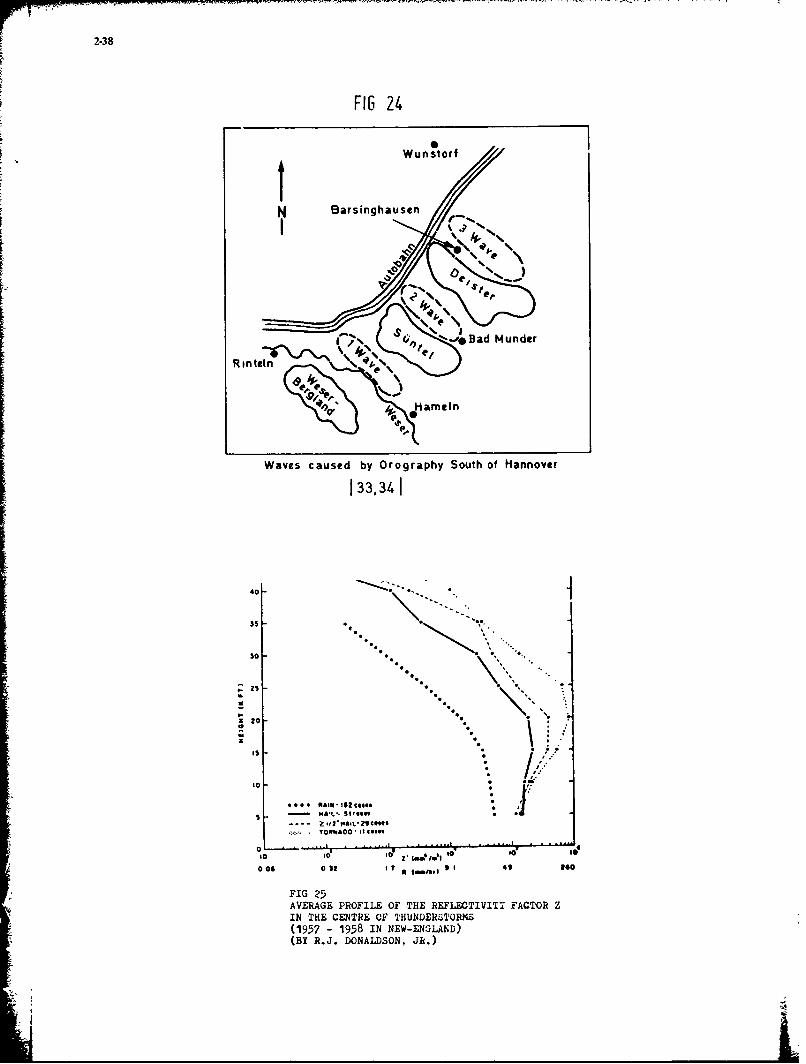
2-38
FIG 24
W u nstor f
N Barsinghausen
"- , . N 'Bad Munder
Rinteln
i •l~•, e.ame in
Waves caused by Orography South of Hannover
133,341
so .
z 20 ,
~ .. CRASI"SZ2CCICC6
,, .~~ /..1-MA-L- 51,GI1"
Z.2 ."iLA.29caC5TOS100kooo gave$~
,o I ";"I
I0 0I0 1 0 1 Z - t • * •* C, * ' I. , 0
006 0 12 I? 9 1 4 too
FIG 25AVERAGE PROFILE OF THE REFLECTIVITY FACTOR ZIN THE CENTRE OF THUNDERSTORMS(1957 - 1958 IN NEW-ENGLASD)(BY R.J. DONALDSON, JR.)
\jL

2-39
ms M EASUREMENT OF ?BE ACTUAL REACTION TINE
F16 26190 FORCE APPILIED TO A TSITSONS FINGER TIP RF.STING ON A KEY
*) H EATIN C KLE2rAND FEMALE TESTP8ONSMt1391 -i6 TO OPTICAL AND ACOUSTICAL SIGNALS
160
"150
ms200 b) TRE REACTION OF DOTE TESTPERSONS (OPTICAL AND ACOUSTICAL
SIGNALS SEPIRATED)
190
170
160 acoustcal
.1501
140
ms0) TIE REACTION TO OPTICAL AND ACOUSTICAL SIGNALS OF BOTH190 TESTPMSONS AT SEPURATZ TINES
IS 7h,
1. 10. 20. 1. 10.. 20. 1. 10 20. 1. 10. 20 1. 10. 20. 1. 10 20JUL AUG SEP OCT NOV OK[

240
ms
195 + 10%/\
/
190 " \Humon Death rote +t 5%
185 mean
Reaction TimeE_
180 .- 5%/
~\ i/S!~~~75 •/• "0
-13%
J F M A M J Ju A S 0 N 0
FIG 27 ANNUAL VARIATION OF HUMAN REACTION TIME(50 000 TESTS DJRING 10 YEARS IN TUEBINGEN) -OF HUMAN DEATH RATE -(DEATHS IN 1950 IN SOUTHERN BAVARIA)THE CONFORMITY OF BOTH CURVES IMPLIES ENVIRONMENTALINFLUENCES /44, 45/
DIAGRAM OF TIME OF REACTION AND ELF (SPHERICS) FIG 28WITH 40 000 PERSONS BEING TESTED,
118 300 INDIVIDUAL MEASUREMENTS 1451 ELF= Extremely Low Frequency
2170
260 REACTIO
250
6 10 ".14 111 .2 253 3O 7 11 15 19 23 27 1 5 9 13
I.August September Obtober I 9 53
240 I
W IL
2 0 1 s 2 2 0 3 7 1 s 19 2 7 1 5 9 1

2-41
0m
al
41
4 64,z4 02z
MUA
00
wI
zw*
z 1w
( W) M OC) 1 UI
44 IL)Uc a. O0I.
a..
41 M
_a L

2-42
335 (
FIG 3033bi
70 3A3362 333
B~E ,,,FORCES
3o number of natural region
r~<FLIGHT ROUTES
3 276 271 ' -- 1
4301
FIG. 50SCHEATI DIGRA OFOPTMAL LIGT RUTE USNG HE NATURAEME"CHAT B MFYNL(UHLG CAIN) WSTERY MISTAIRLOW IL~'2AY STUATON SSUED: ORAGE uRCT i
KREFELD 27 2U70ELOR AREA Z LEFRE NTH OT LEA- AE NE.
SEPT 1979)3

2-43
PROPORTIONOF SiUBJECTS (%)100. -
3 1: abrupt continuoustone
2 2: blinking lamp
50 3: intermittent toneand synchronouslyblinking lamp
0 V-
0 5 10 15
REACTION TIME (s)
FIG 31 Proportion of subjects which have
/89/ reacted versus time for differenttypes of displays.
S"" ~ ~~~OBJV.9SC. •'
-• - R L R .O e -- _. jif_• -- ; __. •-• -• ,.• OpT lr,1ý-
THE DUCT-PHENOMENA CLEARLY DETERMINES THE ALTITUDE OF THE ATTACKING AEROPLANE

10 550.5.
FIG 3-0Ua
:14

2-45
010
00
H H
H 1.
S0
oil 14H, W

2-16
SummerSolarrad/ahon A 0 A
Winter
A 'A
00 00 0- C)00% 0O-J 0 '0 00
0 00 C) O C)O
0
b0o(D oOO' _o, ý oQ 1- 01-
WARM AIR COLD AIR SAND SNOW ."ROUND WATERi '=• 2== 3-''- 4/. 5-i---
FIG 34ESKERS, i.e. DEPOSITS OF THE ICE AGE IN SUB-ARCTIC AREASWARMTH WHICH IS BEING STORED DURING SUMMER WILL BE SET FREE IN WINTER,, THUSINCREASING TEMPERATURE ABOUT MORE THAN 3C° C AND PROLONGING SURVIVAL TIMES /94f'•5/
CfA 0
0 0 . ý
0000• 0 Oc.•

3-I
Development in High Jneed Low Level flight - The Pilot's Viewpoint
J. J. Lee AFC BHc, Senior Experimental Test Pilotbritish Aerospace, Warton Division,Preston, Lancashire PR4 1AX, UK
Introduction
In the nineteen sixties there was a school of thought which stated that 'the fighter aircraft had notchanged significantly bLnce the Second 4orld 'Jar'. being a pilot on a Hunter Ground Attack Squadron at tLetime, a role wnich almost exclusively included flight at high spoed and low level, the sagacity and truthof this statement seemed particularly poignant. This school of thought became silent, Derhans extinct inabout 1975.
To a large extent the Hunter represented the last of a breed which dad, in fact, fulfil the essence ofthe statee hypothesis. Its basic equipment fit, its armament and weapon aiming system had changed little,
if at all, from the days of the Spitfire and Nosquito. it could, however operate in the high sDeed lowlevel role very effectively within certain constraints.
The Tornado, an aircraft development for service in the 1980s, renresents a new breed developed forflight at hi'h sneed low level, having amongst its roles exactly tUe same cloie support mission as theHunter. A comparison between the two aircraft and their eouipment can be made to illustrate the problemsassociated with operating aýrcraft at high speed and low levcl, and how developments in technology haveovercome or minimised them. In so doing the school of thought so active and widely heard until the latesixties, is finally silenced and consigned to history.
Mission Success
mission success is of course of paramount importance and at high sneed and low level the problems aremost acute. The situatbon can be summarised diagrammatically:-
.ýuccessful MissionAccompllshed
Total canability ofvehicle and crew
Handling
Stoblit CenrolPerformance
Vehicle Jes~jnCharacteristics
Requirements an -cnr,
4eather N-ture of ý:ii-,cn ;uidance/Nwvigation
I Human Chiracteristics

3-2
It should be noted that this schematic of aircraft and crew characteristics will fit any aircraft inany role, but let us look at the aircraft specifically in the high speed and low level role. At the bottomthere is the block labelled Human Characteristics which includes sensitiveness tc stimuli (tactile, visualand aural), reaction time, strength/stamina and resistance to fatigue, and adaptability. Indeedadaptability has frequently been responsible for successful mission accomplishment in the low level role inthe face of poor handling, performance and air vehicle design characteristics. Pilots and crews have putup with a degree o; discomfort to achieve mission success, but there is an important borderline betweendiscomfort and distraction sufficient enough to jeopardise mission success or aircraft safety. Fatigue hastoo taken its toll in the hot, bumpy, noisy, high workload environment of high speed low level flight.
Looking further up the schema to requirements and scenario, in which the global nature of the task iscovered, in this case the example of offensive support at high speed and low level in the European theatreis used, with the obvious influence of weather and navigation/weapon guiuance upon the way in which themisoion can be carried out.
Air Vehicle iesign Characteristics describe the nature of the aeroplane, whether it is STOL, number ofengines (safety criterion) number of weapon carriage stations, the type of navipation/weapon aiming system,fixed or vdriable geometry, gust response, one crew or two etr.
Handling, divided classically into stability and control, and performance complete the description ofthe aircraft/crew package and describe the total capability. This total capability will establish thesuccess of the aircraft in its role and the limitations that will have to be taken into account in militaryservice operations in order to accomplish a successful mission.
Human Factors
In the limited time available I should like to choose three factors which relate directly to thelimitations in human characteristics in aviation terms, which enter into different categories on the blockschematic. These are:-
Weather
Terrain Following Flight
Aircraft Handling
A comparison will be made between the Hunter and the Tornado to show the advances that have beenachieved in each case.
Weather
Visual Netereological Condition (VhC) of 5n.ml (9km) (defined as a minimum) visibility and verticalseparation from cloud of 1500' max more or less defined the flight conditions in which a mission could beaccomplished in an aircraft like the Hunter. With practice at low level flight the pilot could do a littlebetter, bein' able to navigate and more important, visually acquire the target, in a vinibility of 5 km,provided that he limited his speed to 360kts (11km/minute) to give himself time to recognise the terrain orthe target.
One import.ant reason for the corstraint in visibility was the lack of essential head-up orientationcues. With a Head-up iisplay as shown having a velocity vector presentation, vertical speed, altitade,speed and heading the pilot only has to refer head down for fuel management and engine and systemmonitoring4. The hUD allows flight to be possible over land up to 500kts in a visibility of 5m. At 16kmper minute the pilot has to be certain of what is coming up ahead, and the limit of the humancharacteristics of recognition/reaction time is reached.
Altering the format of the HUD lo this sort of layout as in Tornado can improve basic safety and easethe flying task. The counter-poijLter altimeter presentation gives an analogue/digital height scale whichis more compulsive than a line of digits.
To improve mission capability a further aid is required, anu this is terrain following radar.
Terrain Followinp Flight
Flight at high sneed low lpvel requires high concentration and intensive tra.ning. It is a lengthycostly exercise to train pilots to fly at low level simply to judge the altitude at which to flf. The highconcentration results in loss of lookout (awareness of other aircraft proxim.ty, be they friend or foe) areduction in time available to navigate, or to keep formation.
Onerational aspects such as radar detection avoidance (avoidance of ballooning over ridges and cols,avoidance of climbing in turns) require the learning and practice of special flying techniques in what isessentially already a hi'h workload environment.
Let us qee some film taken from a hunter-type aircraft over Scotland.
Ary help that can be given to the pilot to reduce the workload by providing a aimple altitude cue, anoptimum flight path over the ground contours and if possible achievement of this optimum profi..e byautomatic pilot must be beneficial. The Tornado provides a full autopilot and flight director system (AFJS)operating through a terrain following radar.
Durinp automatic terrain foilowing the TF computer generates a theoretical envelope in front on theaircraft. This envelope is shaped like a ski toe and its exact shape and offset from the aircraft willdepend on the selected clearance height, aircraft speed, 'ride comfort'.

3-3
Terrain detected penetrating this zero command ski toe locus will cause the TF computer to pass anose-up command, proportional to the degree of penetration, to the autopilot, which in turn passes it ontothe fly by wire control system. Alternatively if the terrain is detected well below the zero command locus,a pushover command is generated proportiondl to the distance below the zero command line.
Let us now look at some film showing the system in action. The pilot can fly the aircraft manually byfollowing the Head-up Display flight director, or monitor the autopilot operation which centres thedirector dot.
This is a tremendous aid to the pilot, relieving him of the most significant work load. It alsoprovides an all weather and night canability.
To set a pilot's mind at rest, if this is at all possible in 1MC or night low level high specd flight,aircraft handling must be of the highest order and thoroughly consistent tnrougnout the flight envelope.This leads to the third factor.
Aircraft Handling
The application of powered flight controls to an aircraft like the Hunter reduced the physicalstrength required by the pilot to handle the aircraft to reasonable proportions. A basic conventionalcontrol system even with autostabilisation cannot provide consistent handling qualities .t all CGs and inall configurations. Alteration in CG leads to a change in pitch inertia, stick force per g and pitchresponse characteristics. Loading stores onto the wings leads to increased roll inertia, reduction inroll response and roll power and perhaps imposes extra limitations on handling.
The pilot would prefer consistent hand],nr and r'krcraft behaviour and this in Tornado is provided bythe fly-by-wire control system incorporating the principle of manoeuvre demard. About all axes and at allloadings the pilot obtains a consistent control response and rate. The slide shows maximum roll rates instores configurations as a function of Nach Number and wing sweep.
The fly-by-wire system guarantees that the aircraft will always handle in a predictable way, will beconsistent, and in this way workload is reduced to a minimum.
Summary and Conclusions
Great strides have been made in aviation technology during the last 11 decades leading to significantbenefits to high speed low level flight. The aim has been, and should always be, to improve thepossibility of accomplishment of a successful mission. In essence the 'Human Characteristics' ofsensitiveness to stimuli, reaction time, strength/stamina and adaptability have remained virtuallyunchanged in evolution terms and will no doubt, at normal mutation rates, be very much the constant at thebottom of the equation. Given the requirements of the mission and the scenario, the areas wheredevelopment can be applied to improve mission success still further remain firmly in the fields ofPerformance, Handling, Guidance/Navigation and that catch-all heading 'Vehicle Design Characteristics'.

4-1
BIOTECHNOLOGY CHALLENGES PRESENT IN OPERATIONAL HIGH-SPEED LOW-LEVEL FLIGHT
Colonel Roy L. DeHart, USAF, MC, CFS
Commander, Aerospace Medical Research LaboratoryAerospace Medical Division, Air Force Systems Command
Wright-Patterson Air Force Base, Ohio 45433USA
SUMMARY
Currently, the United States Air Force is operating aircraft requiring exacting crew performance in the highly
stressful environment of High-Speed Low-Level (HSLL) flight. The strategic role of the B-52 in avoiding surveillance
radar requires a mission profile of low level operation. The F-111 performing its tactical and strategic rolesemploys terrain-following techniques similar to the B-52 but with the important technical difference of automationcontrol. A third mission scenario requiring HSLL flight involves the new tactical support aircraft, the A-10, in its
principal anti-armor role. Little information has appeared in the aeromedical literature in the post five years con-
cerning operational stressors in ttinformation hsaered ithe operational crews flying these missions,observations from the aeromedical teams supporting the crews, and current research investigations relevant to thestresses of these flight regimes formthe data base upon which this paper is based.
INTRODUCTION
Aircrew performance in the aerospace environment is recognized as a demanding task. The most demanding
flight regime requiring constant vigilance, rapid but measured control input, and adaptability to a wide variety of
environmental stresses is High-Speed Low-Level (HSLL) flight. Such demanding flight profiles are not new to themilitary aviator. Missions requiring relatively low level flight and the maximum speed available of the day havebeen required of the vrilitary aviator since the 1920s. More demanding flight regimes in terms of critical time torespond to dynamic changes in the envi.onment were evident during World War II when combat aircraft flew in
combat at altitudes below 100 feet terrain clearance at speeds approaching 350 knots. Following WW 1U, aeromedicalinterest waned with regard to consideration of the HSLL flight regime. Approximately two decades ago, with theconcern for survivability of strategic aircraft in high-threat radar surveillance environments, multi-stress effects
on aircrew performing in sustained HSLL flight again became an interest of the flight surgeon. This ebb and flow ofmedical interest for the concerns of the aviator in this demanding flight environment is clearly evident with review ofrecent aeromedical literature. Ic the mid-A60s concern for the aircrew members on a typical low level B-52 or
B-58 flight sparked numerous publications related primarily to various aspects of vibration. Other publicationsaddressed the problems of fatigue, manual control, visual acuity, and thermal loading in HSLL flights. Medicalinvestigations addressing this type of mission began to wane by the early 1970s. A review of the aeromedical litera-
ture for the period 1972 through September 1978 revealed a sparsity of references primarily addressing seromedical
problems associated with HSLL flight.
Currently, the United States Air Force is flying a variety of combat aircraft requiring exacting crew performancein the highly stressful environment of HSLL. The strategic role of the B-52 in avoiJing surveillance radar requiresa low level mission profile. The F-111 and FB-111 perform tac.ical and strategic roles employing terrain-followingtechniques similar to the B-52 with the important technical difference of automation. A third mission scenariorequiring high-speed low-level flight involves the new tactical aircraft, the A-10, in its principal aLti-armor role.a potentially high stress combat environment. Although each aircraft may impose singularly unique stresses on itscrew, there are general similarities common to the oerall HSLL mission.
THE COMBINED STRESS
In a review of this subject in 1971, it was stated: "The basic problems in low altitude, high speed flight do not
center around life-threatening environments or psychological stress clesrly affecting the crewmember's performance
as the control center of the weapon system." With the experience of HSLL missions in the intense, threat, combatenvironment of North Vietnam, the validity of the statement must be questioned, and considering operational exercisesinvolving the A-10 the question of a life-threatening environment and its direct and indirect effect on man as the
control center of the weapon system becomes a major concern. Mere observation establishes that the aircrew mem-ber's task becomes ever more demanding with increasing speed and decreasing altitude and with the growing complexity
of the weapons system he must operate. The margin for error is ever-narrowing while simultaneously the probability
of operator overload increases. The adequscy of man-machine integration has never been more tested than in the
current case of sophisticated aerospace weapons systems operating in the narrow flight envelope of high-speed, low-
level flight under combat conditions.
Numerous stressors, both physiological and psychological, impair the crewmember singly or more commonlyin combination. It is important for the aeromedical specialist to appreciate the single stressor, yet more important
is the synergism and interaction of these stressors as they act on the crewmember to produce combined stress
compromising the opportunity for optimal performance. Some aircraft are flying mission profiles for which theywere not originally designed and consequently the environmental control system is inadequate to meet the thermal load
of low altitude. Sustained in-flight temperatures in excess of 430 Celsius have been measured at crewstations. Therequirement for constant vigilance reduces the opportunity for fluid intake, thus increasing the chances for subtledehydration when the crewmember is experiencing prolonged thermal loading. Meteorological and topographical
conditions can combine to produce significant turbulence translated as buffet or vibration biodynamic force acting on

4-2
the aircrew member. Both the aircraft and crew experience vertical and lateral acceleration components in thisturbulent environment. Although cockpit accele'ration spectra contain little energy above 10 Hz, gust levels rangingfrom .2 to 2.2G are frequently experi-nced. Although not common in the strategic mission, linear acceleration canbe a stress of some magnitude in the tactical environment. Commonly, linear accelerative forces of 5 to 7 G,with up to 5 G per second onset repeated many times over 30 minutes, are experience by crewmembers in A-10operations. Linear acceleration combined with gusts and vibration reduce human tolerance to combined accelerativeforces. Vibration further induces a number of unfortunate side effects such as difficulty in reading and interpreting,nstruments, inability to accurately conduct map navigation, compromising verbal communications, and serving as amajor contributor to motion sickness. To this already complex combined stress envelope, the aircrew member maybe required to contend with overall sound pressure levels at the crew position in excess of 115 dB. Within thiscomplex stress environment, the aircrew member is expected to perform precisely, innumerable tasks related toweapons systems. In one case, 32 individual control or selection tasks must be performed within 180 seconds in acombat environment. Tn addition, the av~ator is expected to maintain outside vigilance for enemy aircraft, grounddefense systems, targets of opportunity, navigation way points, friendly forces, both in the air and on the ground,and all of this in a visual environment reduced by haze, smoke, and clouds. Thus we see the a -crewman forced toperform ever more precisely and skillfully in an environment which compromises all of his senses, dirr inishes his
powers of concentration, overloads his cognitive ability, and reduces his physiological tolerance.
OPERATIONAL CONDITIONS AND AEROMEDICAL CONCERNS
The stressors described impinge on the crewmembers of the B-52, the FB-111, sand the A-10 in varying degrees,differing not with regard to the flight envelope per se as much as in the characteristics of the aircraft, the crew-station, and the mission. (At this point in the presentation P silent 3-minute film will 1- shown illustrating variousaspects of the operational characteristics of each of the three aircraft under consideration. The first segment ofthe filmstrip will show the B-52 or a low level mission experiencing moderate buffet and turbulence. The secondfilmstrip will be an out-the-windove view of an automatic terrain-following flight of an FB-111. The third segmentwill contain protions of the JAWS-2 exercise involving the A-10 in its low altitude anti-armor tactical role. Thethree segments are film clips which have been taken from full-length narrative films %%hich are cleared for publicrelease.)
The Air Force has its greatest experience in the high-speed lový-level flight regime with training missions ofB-521 perfecting radar avoidance techniques. The aeromedical concerns of this aircraft's flight profile and itseffects on the crew is the first topic with which we will deal. Although the avionics suite aboard the B-52 varieswith the model, the training flight profile for PSLL is essentially the same. Typically the terrain clearance altitudeis 500 feet during daylight operation and raises to 800 feet in non-mountainous terrain at night. Airspeed is main-tained between 325 and 350 knots with a low altitude leg duration ol 1 to 2 1/2 hours. These parameters define thetraining env,'nope but it must be realized that under operational conditions the permissible altitudes may very well belom r and the speeds where feasible higher. Currently the B-52 em-'oys an electro-visual terrain avoidance systemthat depends on manual control of the flight by the pilot. The navigator maintains obstacle clearance responsibilitiesusing both radar and precision tracking on na% igational maps. Aeronautical hazards such as tall structures, radioantc nas, and power lines must be avoided employing way-point navigation. The radar operator uses the greaterrange of his scope for general navigation pe'mitting a 15-20 mile sweep ahead of this flight regime ano consequentlythermal control in high heat environments is poor. Heat loading consequently contributes to fatigue, discomfort, andpotential dehydration. Increasing the ram air to improve air circulation cone :Tiitantly increases significantly thecabin noise level. Flights in hilly or mountainous terrain or in areas of wide temperature differential can result inmoderate vibration and gusts. Sudden. aircraft excursions of + 15 feet are not unusual; thus the crew must be tightlyrestrained by seat belt anD shoulder harness. Missions are normally aborted in severe turbulence, defined as uncon-trolled aircraft movement. Mission cancellationp mr-y occur in situation: where 40 knots or higher winds Prereported in mountaincus areas. During periods ef high vibration the navigator is unable to read a typical aeronauticalchart and must depend solely on the radar display. The physical workload on the pilot and co-pilot can be extremein the constant battling to maintain narrow altitude tclervnces.
High thermal loads, vibration, and attempts to read aeronautlcsa charts contribute to motion sickness. In thrpast this has been a particularly significant problem r. B-52 navigator wastage. A significant reduction in wastagedue to motion sickness has been achieved by reducing the time lag between navigator or electronic warfare officertraining and subsequent assignment to crews. This permits tolerance established during training to be transitioneddirectly into operational crew duties. Interview techni .- es employed with B-52 crews as well as monitoring theintercom channel clearlý establishes increased tension, irritability, an: anxiety among the crew during HSLLmissions. The crew i ognizes the thin margin for error, and as a consequence communications remain strictlybusiness. The psycho. gical strtss operatin.r minimum altitude clearance of 400 feet for parachute deployment, aluxury which very well might not oe available. The toll of this multi- stress environment on the crew can best beplated in context when compared to a high altif ce mission of similar duration. Universally, crewmembers inter-viewed described the HSLL mission leg as fait more fatiguiriz,.
The mission of the FB-111 may parallel that of the PR-52. mlowever, the crew composition and cockpit environ-ment are significantly different. The FB-111 flight profile uwder usual conditions is typically 400 feet at. 63 to. 73mact ,420-480 knots). At nighttime, in non-mountainous terrain, the altitfde will approach 1000 feet. Unlike theB-52, thf-re is a to~ally artcmated terrain-following mode for the FB-ill. Typically, the on-board radar willidentify changing terrain features 10 miles in front of the air,,raft's track. At six miles the computer will calculatethe dynamics of the flight path; at two miles from the changt in terrain feature, the aircraft controls will automaticallyreact. The terrain-following system is displayed such that constant monitoring is possible. In addition to ti'uterrain-following radar display, the aircraft's pitch and roll may be superimposed for instant reference. To

4-3
supplement the visual presentation, audio indications are available to the pilot. During climb there is both an
increasing frequency of beeps and an increasing tone. The frequency of beeps is proportionate to the rate of climb.Likewise durtrg descent the frequency decreases as does the tone. The two-man crew is constantly task-loaded:the right-seater performing navigation checks and way point estimations; the left-seater monitoring aircraft
performance and maintaining vigilance on the terrain-following system. Universally, crews cited the need for evenmore automation of the aircraft's system to permit heads-up, out-of-the-cockpit surveillance. In a high threatcomb-,' environment the pilot must maintain outside visual surveillance and reference. Improvement in the automatedterrain-following system by increasing the permissible bank angle from 100 to 300 has improved both the survivabilityand the flexibility of the weapon system. The aerodynamic features and the speed of the aircraft both contribute toreduce the vibration-induced stress on the aircrew and it is not considered a problem of consequence. Crews onoccasion have experiencea disorientation resulting fro n the confusion of ground lights and star background. Crewfamiliarity with this hazard through briefing appears ta be an effetive preventive measure. Another feature ofnight missions not previously identified leading to visual confusion, disorientation, and possibly flicker vertigo isreflection of the anti-collision strobe light from highly reflective ground surfaces such as snow. A hazard to theFB-111 cre%% which has resulted in aircraft loss and fatalities has been birdstrike. The Air Force currently hasmustered a major program to solve this problem. In the interim, the crews brief birdstrike procedures prior toeach HSLL mission. Simply stated, in case of a birdstrike and the loss of the windscreen, the terrain-following auto-mated feature of the aircraft will be engaged until such a time as the aircraft can be decelerated and the situationanalyzed. This is perhaps the most complimentary statement to be made regarding the automated terrain-followingfeature. Crews praise the reliability of the system and are confident of its performance. Significantly, night flyingmissions are more precise and are considered less dangerous. This appears to be due to the dependence on theautomated system and cross-reference with the altitude radar rather than visually misjudging altitude above theground. The heads-up display is reported as satisfactory; however, there are times when excessive information isportrayed. This can result in clutter on the combining glass, reducing see-thr'i. The environmental control systemfor the cockpit is excellent and excessive thermal loads have not been experience in operations even in the southu estUnited States. Structurally the cockpit has poor outside visibility. It is difficult for the crewmember to have fullright-to-left and down viewing. The location of some of the dials and switches such as the air conditioning systemand the IFF require the pilot to turn his head in order to operate. This can be particularly hazardous during angularacceleration and could contribute to coriolis. Excessive operation of the master caution light usuall) triggered byexceeding the terrain-following system limits requires the pilct to look back into the cockpit to resolve the problemand may lead to momentary but significant distraction. It is a common opinion among the FB-111 crews that themission is at minimum a two-man job and workload and task performance would be overwhelming for one individual.
Low altitude operation of the A-10 in its tactical mission is of short duration but of intense work-load. Theaircraft is frequently belo% 100 feet, flying between 200 and 300 knots. In performing a tactical mission 4019 to 60%of the time will be spent under 500 feet. A typical mission from takeoff to recovery will be 1 1/2 to 2 hours. Duringa recent sortie surge exercise, six tactical missions per day were flown for a period of 3 days. The cockpit environ-ment is comfortable in terms of thermal control and acoustic isolation except in areas of high heat load. Althoughthe main fire power of the aircraft is a large Gatling-type cannon, vibration and noise are at a minimum. The cockpitlayout with regard to instruments and controls is adequate although the heads-up display is limited by field of %ie%.Figure 1 illustrates a typical flight profile for a training mission. The graph portrays airspeed, altitude aboveterrain, accelerative forces, and flight duration. The high threat environment, low altitude, and high maneuver-ability as exemplified by a 1300 foot radius of turn dictates that the pilot maintain a vigilant eyes-out-of-the-cockpit,heads-up posture. It is imperative for successful missions and for general safety that information required by thepilot be presented in a format not requiring his attention uithin the cockpit. Information formatting could be oral orvisual. Realistic training conducted in marginal %eather conditions has demonstrated the need for an inertial naviga-tion system, freeing the pilot from the current high task-loading requirements of navigational pilotage.
DISCUFSION
It has been previously reported low altitude high speed flight does not involve problems of physiological tolerancebut rather alterations in pilot effectiveness through overload and response to a general stress syndro)me, increasingfatigue with increasing periods of exposure. Vibration, at one time ranked as the primary stressor on the aircrewmanperforming IISLL missions, has now become less a concern as different zircraft enter the inventory and the missionof low level flight changes. The popular concept that pilots % ere unwilling to relinquish control to automatic systemscan now be delegated to history as the systems become proven w ith experience and earn the confidence of the aircrecmember.
There exists a common technology need requiring contributions from the aerospace medical practitioner whichbecomes evident in discussing the aircraft in their respective HSLL combat missions. Continued development ofautomated systems integrating components within the cockpit affecting aircraft controls and weapons delivery systemsis required. The specialist in aerospace medicine must ensure chat sophisticated systems do in fact offload peripheraltasks of the pilot and increase his performance and ability to successfully accomplish the mission in a high threatcombat environment. In addition, it is evident opportunities are available for biotechnology to improve or developsystems providing required information to the aircrew member in a method or format which permits him to remainheads-up and eyes-out-of-the-cockpit. The mission requirements are clear. Aircraft survivability dictates a lowlevel flight envelope. The aeromedical community is charged with the obligation to widen the margin between safetyor disaster, mission success or failure, victory or defeat.

4-4
TYPICAL LOW ALTWUOwEAPONS D&LIva[Y MSSION
A-1 O
"law"m
ANII•AII I III
KNOW - - -
Fiqure 1
STRESS OF LOW ALTITUDE HIGH SPEED
FLIGHT
PHYSICAL PSYCHOLLGICAL
VIBRATION TASK OVERLOAD
NOISE SURVIVAL
HEAT FATIGUE
VISIhILITY SYSTEMS CONFIDENCE
MOTION SICKNESS DISORIENTATION
Table I
STRESSORS ON B-52 CREWMEMBERS
VRNATION
GUSTS
HEAT
MOTION SICKNESS
SURVIVAL
EMRGIENCY f IKPE
Table I I

4-5
STRESSORS ON THE FB-111 CREW
a VIBRATION
* VISIBILITY
0 TASK LOAD
o DISORIENTATION
* BIROSTRIKES
o COCKPIT DISTRACTIONS
Table III
STRESSORS ON THE A-10 PILOT
TASK LOAD
FATIGUE
'G FORCES
HEAD UP EYES OUT
VISIMLITY
SURVIVAL
Table :"
CONTRIBUTIONS MADE AND TO BE MADE
BY BIOTECHNOLOGY IN SUPPORT OF
LAHS FLIGHT
VMATIM-
NOISE
a PROTE;TIP
ESCAPE SYSTEMS
VISUAL BISPtAYS
AURAL INFORMATION
COCKPIt CONTACT
TASK .OAOMS
AUTOMATED SYSTEMS
HUMO ENEEMING
Tatle V
L

4-6
REFERENCES
1. Benson, A.J., and F. F. Cuedry, Jr., 1971. Comparison of Tracking-tsk Performance of NystagmusDuring Sinusoidal Oscillation in Yaw and Pitch. Aerospace Med. 42:593-601.
2. Burton, R.R., W.F. Storm, L.W. Johnson, and S.D. L-,verett. 1977. Stress Responses of Pilots FlyingHigh-Performance Aircraft During Aerial Combat Maneuvers. Aviat. Space Environ. Med. 48:301-307.
3. Grether, W.r. 1971. Acceleration and Human Performance. Aerospace Mcd. 42:1157-1166.
4. Griffin, M.J. 1975. Levels of Whole-Body Vibrption Affecting Human Vision. Aviat. Space Fnviron. Med.46:1033-1040.
5. H ilgendorf, R. L. , S. MaecLeod, and R. G. Searle. 1974. Effects of Aircraft Altitude and Speed oni Air-to-Ground Visual Target Acquisition. Aerospace Med. 45:746-749.
6. Holloway, R.B., and S.H. Brumaghim. 1972. Tests and Analyses Applicable to Passenger Ride Qualitv ofLarge Transport Aircraft. In: Symposium on Vehicle Ride Quality. NASA TM X-2620 pp 91-113.
7. International Orga-'ivntion for Standardiration. 1974. Guide for the Evaluation of Human Exposure to Whole-Body Vibratiun. !. M1-1q71.
8. Jex, H.1H., :.nd R. L. . .Žno. 1978. Biomechanical Models for Vibration Feedthrough to Hands Pnd Headfor a Semisuptne Pilot. S, pace Environ. Med. 49:304-316.
9. Lewis, C. E., W. 1. ?onr-. md ,. Roman. 1967. Flight Research Program:- IX. MedicalMonitoring o; -ar,' c.. ,i, C '. "rospace Med. 38:581-592.
10. McKenzie, J. W., ,u -t, *ponses of Pilots to Severe Weather Flying.
Aerospe Med. 18:5'9 '.F
11. Spaer. ,,. , !, - = . •e. 1970. Crew Exposure in the F-4C Aircraft
12. Speak,' , .I • .se . . ,e; Cor; . "'ation Environment in the B-52 Aircraft
Durivp "1 01 i, -Sr.. e- A-A* LTR
13. Spea'a..A, , s., ( . .971, ,'.,'w (. ip"tmen, I Environment in the B-58 Aircraft
During Li -:,.., , '-,. flight. A.1J -TR-'7i-20.
14. O'hdriant, C. V, .. 1970. Visual Acuity DIeri L " ;oated %mth Whole Body + G7Vibration Sti...-'.. .. ' . -0:79-82.
15. Roman, J., H. 01d0,.i ; .. .. Jot es. 1967. Flight Resem.,.¢h Prog , 11, Mc-lical Monitoring of NavyCarrier P}ivts in C.,.. ' .o, ,,sce Med. 38:133-139
16. Ryback, R.S., R.E. Ru . T... . tz, and C.L. Jennings. 1970. Motion Sicl'e n- I "AF FlvingPersonnel. Aerospace Med. 41-6 .:-677.
17. Shoenberger, R.W. 1974. An Investigation of Human Information Processing Dui 'np, " -Roe.- Vibration.Aerospace Med. 45,143-153.
18. Shoenberger, R.W. 1975. Subjective Response to Very Low-Frequency Vibration. Avat.S,ae 'rvitcn. Med.45:143-153.
19. Soliday, S.1M., and B. Schohan. 1965. Perk r .,wm' and Physiological Respons. s of Pilots in Simi itedLow-Altituue, High-Speed Flight. Aerospace a 1. 36:100-104.
20. von Gierke, H.E., and N.P. Clarke. 1971. "Effects of Vibration and Buffeting on Man. - In Armstron,,:Aerospace Medicine. Williams and Wilkins Co., Baltimorc,Md.
21. von Gierke, H.E. 1971. Physiological and Performance .-;ffects on the Airerew During Low-Altitude,High-Speed Flight Missions. AMRL-TR-70-67.
22. Vykukal, H.C. 1968. Dynamic Response of the Human Body to Vibration When Combined with VariousMagnitudes of Linear Acceleration. Aerospace Med. 39:1103-1166.

5-1
PROBLEMES THERr'IOUES POSES PAR LE VOL AGRANDE VITESSE ET A BASSE ALTITUDE
zJ. TIMBAL Midecin en Chef3. COLIN Midecin Chef des Services
Centre d'Etudes et do Recherches do Midacine Airoapatialo5 bis avenue do Ie Porte de Sbvres
PARIS Cidex 15 Air75 731FRANCE
RESUME
La vol a basso altitude grands vitesse eat susceptible do crier3 dana certains cae pour loa pilotos des conditions dipeasant lee limitee
do tolirance. Lee factoure physiques do l'environnament ont faitl'objet do nombreuses itudas ainsi qua loure coneiquences our leeperformances. Una prdvision du tamps do toldranca 6 partir du etockagedo chalour eat prisentie et diecutie. Ella met an 6vidence Is r~leimportant jou6 par l'hygromdtrie de Il'ir at Ilactivitd physique dupilots. La privention de cas inconviniente climatiquss niceseits l~tilisation da moyene relativemont simplas A mattra en oeuvre avant Ie
* vol. En coure do vol ella implique dlevoir dt6 privue lore de Ia con-ception deseavione.
Li~ vol Agrando vitaeaa at bassa altitude eoumot 18 pilots b do noMbrouaeS contraintee, entreautrea dana certains coa h una contrainte theraique plus ou soins importanta. Cadi tiant au fait
* qua lea ayathmea do climatisation dos aviona, satiefaisant an altitude, no la sont plus au voisi-nags du aol, quand Ia tampdrature at lthygromdtria do lli eont ilevias. Dane coo conditions, oncourt Ie risque do voir appearstra una ddtirioration des capacitds peycho-eansori-motrices doespilotos, co qui oet particulibrement prijudiciable dens ce typo do vol. L'eetimation do ca risqueat sa priventio., ont fait Iaobjet do trbe nombroux travaux d'un point do vue giniral. Lee donniesapicifiqusa aux aviona do combat eant beaucoup plus rostraintos. Quoiqulil on soit, il oat actual-lament possible do aso faire une idie relativamont pricise do ce factaur do risque. Lea notions Surce problhme aont regroupoes soua 3 rubriqusa principalsa
- ivaluation do l'ambiance thernique- dvaluation do Is tolirarncs humaina- amilioratian do la tolirance.Un divolappamont original sera consacri h I& priviaion do I& toldranco A partir du etockaga
tharaique.
1. EVALUATION DC L'AM9IANCE THERMIQUE.
La contraints thermique revit do multiples causess- avian surchauffi par un long sijour our un parking ensoloilli,- air chaud at humide an basao altitude,- raoynnoment solaire at offet ds Sarne du cockpit,- dchauffament airodynamique qui commence 6 fairse entir asse effete pour does vitasses voisinos
du mach,- ichauffement p.er ilectronique do bard d'sutant plus important quo los aides h Ia navigation
cant diveloppios,- prodijction calorlque du pilots qu oset plus ilovie quo dana Ia plupart des autree conditions
do vol on raison do Ia difficulti du pilotage at dea contraintas particulibros 5 cotta situa-
- prtdlduiometsginntpour la thermolyse tole quo Oteaents anti-G, :nfi-flack, anti-ca
ell@ fix@ leas conditions thermiqusa initiales. Ainsi HOUDAS at COLIN (1) ont observd pour des tempd-ratura. ambiantes moyannoment chaudes (To . 25,20C), mais avac reoynnomont solaire intonse, uns tam-pirature b Ilintdioiur du cockpit tr~s ilevig, la tempdrature aiche a'ttoignant 32,60 C et Is tempE-rature glob. 500C. Par tempa trhs chaud (Ta 37,50C), at fort onsoleillement, Ia tempdratura shchedona Is cockpit itait do 500C at Ia tempdrature globe do 600C.
Do la mime fagon, NUNNELEY at MYRHE (2) observant, dens cartaines conditions, au bout dtuflahour. d'attsnte au aol an gýlain solail, una tompiraturm siche supirioura b 500C at une temo raturoglobe oupdriourm 6 650C, ce qui, compto tanu do l'humiditd, parmet do calculer un index WBGT uipiriour6 360C.
1-2 Un certain nombra do donnias ant permia d'appnicier loa conditions climatiques en vol. Ainsi,dons un travail antiriour (3), lldvmluatiofl do Is charge thermique par rayonnemsnt avait itd tentie6 bard d'un avian MIRAGE 111 8 Itlaids dlun "Steradiomster". Cat appareil constitud d'une aphbrepourvue do 34 captaura (diaquss do platine noircia, h 16 foci poatirisure deaquele as trouvent leatharsocouplse placda an adirl), rialisO Ln modbl. italonni do fagon A indiquer ce quo regoit un horn-as per m2 do surface ccrp~rollo loraqus cotta surface eat A 320C. Des mesursa effectudes du Soljuoqt-'& 50 000 pioda, saulo. ant iti rotenues cellos offectues amu aol (250 plods) A 10 000 pleds at6 titre do comparaison au-dmasus do 40 000 piods. Los esaisaoont dtd rialiada 3 jours conaicutifaaso 6, 7 at 8 soptembre, l'avion faisant un circuit do 36') dogris efin do recavoir I* solail succes-
aivomant sous tous lea angles. Los risultats sont prisantis our 1. figure 1. Ile montrent quo Ischarge thermiqLe radiants so aitue, dons Ia zons qui noua intoreass, cleat-&-diro du aol h 10 000

5.2
pieda, entre 100 & 200 Wstta/m2 en moyanne. Il exists uno certaine hdtdrogdnditd lids b i'ssymdtriade Is position du capteur b llintdrieur de is cabins. On peut supposer quib dtsutres pdriodee dollannda (Juin, ;uilist, so~t), au milieu do is journia at psr cisi clair, ces velours seraient plusilevies.
La surface corporalle exposie au rayonnament soleire est rolativement modesto, aisi dens tauslee cae la tite eat concernde, ce qui est un facteur difavorable pour Is taidrance. La mi~a au pointdo systbmes do mesure miniaturisis (4) (5) a parmis de multiplier siadment lea enregietrementa b barddes adronesf, de Is tempirature s~che, is tempdraturo globe, l'humiditd, is vitesse do dipiscamentde Ilair at is pression baromitrique.
ALLAN at COLL (6) dana does vole & basso altitude, par des tempiratures oxtdrisures Peu dlevdesont montri lea relations entre is tempirsture do Ilair at las conditions climstiquas & l'intdrieurdu cockpit. A cotta occasion, uls eatimant qus tent qua Is tempdratura extirioure ne dipause pas25 0 C on rasts dana Is zone "prescriptive" do Lind, ceast-&-dire cells oti is thermorigulatian no posepeas ds problbmas particuliesr.
Cat esnemble de donndes , u dtd N llorigine ds comparaisona sntre les conditions ambiantes stcellos rbgnant & Ilintdrieur des adronsfe. A l'sida des risultats do HARRISON at Coil (7) at moyen-nant cartaines approximations, STRIBLEY at NUNNELEY (8) dtablissent un index de contrainte thormi-qua sur avion do combat (F.I.T.S. r ighter Index of Thermal Stress) qui eat l'iquivalant do i'm-dex WBGOT dons le cockpit. L'intirflt du F.I.T.S. sat qu'il nicesaita seulement deux Inasures b Il'x-tiriour, lea tempdraturessbche,(1db) at humids (Twb) au lieu des trois assures utilisiss pour 10biBGT, tempdratura globe, ache at humide, cam derniares devant fitre affectuies dana is cod-pit.Lldquation permettant Ie calcul do ce nouval index est Is suivanta
F.I.T.S. 0 .'281 T wb + 0,3549 T db + A(1
La terms A permot una correction en fonction do l'enaolaillement. 11 eat do 5,080C au soleilat 2923 0C par temps moyannement couvort.
Catto approche I maigrd cartainas approximations, reprdsanta donc un moyon psrticulibrementsimple do prdviaion des conditions climstiques dana Ia cabins.
2. TOLERANCE HUMAINE.
11 s'agit dlun probibme trbs pratique qui a ausciti do trbe nombreux travaux. La toliranca pout6tre dvalude so.ft dlaprbs des critbres tharmiques physiologiquas, aoit dlaprbs las caractdriatiquesdo Ilambiance.
2-1 Las critbres physiologiquaB niont pase tous Ia mgme valour dana Ie cas du pilotage doun siro-nsf. Ainsi, en ca qui concerns la Tempdratuxe rectale, ii a 6t6 montrd qua l'homma pouvait continuer& fitre actif pendant un tamps limitd & 390C. Par contra, lea performances paycho-oensorielles sontdiminudee avant ce asuil. La toldrancs aux autres factaura agiessifa du vol tole qua lea accildrstionsseat dgalemant diminude bien avant (9). En fait, compte tenu dp is dunde relativsment brbve de isplupart des vols basso altitude at compte tonu do is lenteur do l'ivoiution do Is tompdrstura rac-tale, ce parambtre no nous oembla pas Atre un bon critbre. La Tompdrature cutande sat beau,:oup plussenaibla, at constitue un excellent index pour appricier Ic confort, calui-ci dtant obtenu lorsqueIs tempdrature cutande moyanne (Tsk) eat do 340 * 10C. avoc une r~partition 'iumogbne sur Is surfacedu corps. Concernant-la tol~rr-en proproemnt dito, IAMPIETRO (10) conaidbre quo cello-ci eat dodeux heurse lora8nue8 Tak eat do 370C. raisa 16 aussi ii oat vraiaomblable qua cette tempirstura cuts-nde correspond t. un itat th~imique du corps compatible avac 10 maintien des performances du pi-lots. Do plus notammant an ces dlnoeilmn intense, ii exists une cortaine hitiroginditd avacdes tempdratures dlevese au nivesu do la tit aet de is poitrine (2,11). Les conaiquoncoc do ce phdno-mbne, trba difavorablee aur 13 plan du confort, sont difficilas ý apprdcoer sur Ie pirn do is pbrfor-manco.
La stockags do Is chaleur sat un 3utre critbre interaseant mais dont is ditormination aso heurteN cartains probiOmsa. Una apprache thiorique du tamps do tol~rance pout Otro ttontio. Si QS eat 10stockege de chaleur accumulie dana 10 corps et roprdsanta uns limits qui no doit pas Atre ddpassd etS la stockaga par unitd de temps, Is dudes pour attoindro cotta velour limito do US5 sera
t QS(2
SOn connatt par ailleura l'iquation du bilan thermiqus
S = Mflt A -1 C t K - E )
ob M oat Ia production do cheleur mitebolique, R, C, K, sont lee 6changes de chaelur per redlation,c onvection,' conduction at E lea pertes de chaleur par Evaporation, 1e tcut oxpnimd on ddbit caloriquo(kcal /(m2.h) ou WJ/m2).
La d~termination do checun do ces termes doit permettro didtablir 10 tomps do toldrance. Naiscotto d~termination oat trbs difficile at d'un point do vue pratique certainas approximations sontniceasairsa doen un but prdvisionnel. On pout en premibre dpproximation ndgliger lea trenafertspar conduction. 06auto do Il'vaporation pose per contre un problbme trbs ardu, car ello repout Itre assimilda b lq ports do poids sudorala. Les Equipseanta, le contact du sibge limvitat aneffet conaiddrablement lea poasibilitis dvaporatoires. Do plus, lore d'un vol ') basso altitude dansdes pays tropicaux ou au-daaaus do Ia mar, llhygromdtrie ýk Ilextiriour eussi t~ien quoh Il'ntiriourdui cockpit pout Atre plus dlovde. On pout considdrer doux cas extrflmea. Celui o6 l'air Etant gatuzdd'humiditd, aucuno ivaporation nlest possible done la gamma dee tompdraturez3 qL1j nous intaersasot(E = 0), at colui oti l'dvaporation so fait dana los moilloures conditions. Cana ce second cas, ilfaut conaiddrer qu~indvitablemont uno partie importante do Ia surface du corps n'aat le sibge dlau-cuno ou do trba pou 616vaporation. 11 a'agit does macbros infdrieursaot do 1'abdomen du fait desdquipomenta, notamment llnt G, du dos on raison du contact al~oc is sibgo at do Is tolte b cause
du port du caaque at du masque. Cotta surface exclue t~es procoasus dvaporatoires peut Itre 6veluEh sndjron 60 %, do is surface corporalle. Ainsi pour un homce do taille cayenne (surface corporelle= 1,90 M2) avoc un dibit audoral tnbs important (8009 /h), is refroldiaaement dveporstoiro dane ieameiillsuroa conditions serar relativement faible, do l'ordrc do 100 kcal/(c2.h), (L = 100).

5-3
Ltactivitd mitabalique pout aussi varier dens dlasoaz largos proportions. A priori on poutconsiddrar qua Ia ddpensa dnargdtique dolt la plus souvent as altuar entre 10 kcol/(m2.h),(M z: 10) ot 150 kcal/(m2.h), (Mr= 150).
Lam ichangos caloriques par radiation at convaction pauvant Atraeastim6a epproximativoment anconsidirant quo 10 tempdrature cutania mayanne pour un aujot expond N is chalsur oet do 360C at quoIs coefficiant combinE d'ichange par radiation at convoction (12, 13) set do B kcal/(m2.h). 5i persimplification nous considdrona quo 1. tampdraturo do llar seat dgalo h is tempirature radiante iiviant tR + C = 8 (Tg - 36), obi Tg eact la tampdrsturo globe,,Concornant l'accumulation do chalaur dans ls corps (QS) BLOCKELEY at Coll '14) cansidbrant quolea performances mont intactos & 40 kcal/(m2) at quo is limita b no pas dipsasor oat do l'ordro do54 kcai/m2. En prol ant una valour do 50 kcal/m2 10 tampa do toldrance en minutes ýt) pout ainsi Otreprdvu par la rolation 3 : 5 0
Mi +t 8 (Tg - 36)-E (4)
La figure 2 reprdsents lea tampa d, .oldrance calculds dlaprbs cotta dquation dans 4 situationsdiffdrentes melon quo le mdtaboliame eat do 100 ou 150 kcal/ (m2.h) at l'Evsporation do 0 au 100kcal/(m2.h).
Pratiquaemnt loreque llEvaporation pout so faire dans do bonnam conditions, on volt quo pourun vol do 1 houre is tempdrature globe & no pas dipsasor vs do 360C & 420C solon llactivitd du pila-to. Cat dcart eat important. 11 mat l'accent our 10 r8le du factour mitabolique souvant nigligi.Ce typo do vol & basso altitude peut en offet par fortes turbulonces oxigor uno ddponse dnergitiquotrho au-dassus do callo habituallement rbncontrde on vol normal, at ceci aurr- des consequencesnotables our In toldrance.
En atmosphbre 8sturio d'humiditd Is tamps do taldranco chute trbs vita. Toujaurs pour 1 hoursF ~do val, il faut rotonir una tompdrsture globe limits do 24,50 5 300C salon llactivitd. En falt cam
chiffros sont auroment un pout trop bas car on deseous do 360C, en ambiance saturde Una cortaine
quantiti do suour pout a'Evsporer, bian quo son estimastion correcte no salt pas possible. Ella noI pout donc pas Atre primsaon compte.2-2 La d~termination do ia toldrance aur des critbras thormiquee physiologiquos noEtant pas
pratique au point do vue apdrstiannel, do nambrausee tentativos do prdvision ont dtd faitas 6 partirdes carsctfiriatiquoe do liambiance, Toutafola, l'spplication does donndos our is question au coospicifiquo d'un avion do combat rests ddlicate. L'uno des difficultds roncontrdios tient au chaixdes parambtrom dostinds & carectdrisor llambiance. Parmi lee nombreux index proposds, l'un des plusutilimsa oat is Tempdrature affective (To) qul oat fonction do la tempdrature at do Ia vitasso do
r llsir ainsi quo do eon hygromdtrie.Una revue de is littdrature (15), a montrd quelle dtoit Is limits moyonne du maintion des perfor-
mances en fonction do is tempiraturo affective at du tempo (figure 3). Dens l'ensambia, pour destompeir~riours & 90 minutes, il exists des variations aseez importantes dos To toliriem. Ainsi, 6partir do 90 minutes ot au-delb, Is limits do tompiroture effective so situe vera 290C. Pour unvol do 60 minutes, ella eat do 300C at, pour 45 minutes do 31,5'C. Pour une hours, cola correspondachdmatiquoment b des tempdratures dlair calms allant do 300C avec 100 % d'humidltd relative 6 450Cavoc 18 % dthumiditd relative.
Ces conclusions sont en accord ovoc collos do GRETHER (16) qul canaldbre, d'aprhs une approchoqusique pou dlffdronte, quo is limits du msintien dos performances, sans tautefais priciser is tempscorrespond b une tempfirsturo affective do 29,50C.
L'indox WBGT a igalement iti discuti (6, 17) et is limite do aicuritd propoade pour un piloteeat do 320C. Cleat igalement ce qut a itd retsnu pour Is F.l.T.S. avoc on plus une limite dangeroumoh franchir, fixie & 380C. Cotta limits parsit ldgbremant su-doeeus do colls donnde par 10 tempdrs-turo affective t Une tompdrstura affective do 300C correspond en offot 6 pou prim b un index WBGTdo 30,5 & 31,50OC.
Exprimia difffiremmont on conaiddrant Is tempdrature do llalr & i'extdriour du cockpit, Ia limi-to do aicuritd correspond, d'apris lea tables do STRIBLEY at NUNNELEY (8), a des ambiances extdrisures6 l'avion hallnt do 350C on atmosphbrea nche 6 22,50C maturd en plain soleil, ou do 400C en air sec6 250C saturd pour ur. ensolaillemont modir6.
3. AMELIORATION DE LA TOLERANCE.
Un certain nombre da meoures doiuont pormettro d'amiliarer la toldrance lore des vole bassoaltitude grenda vitoase
3-1 Au niveau individual un certain nombre do ri'oiea d'hygline doivent fitre inculquies au pel-sonnel. Celui-ci devra en offot voillor & aso maintonlr done lam moiliouros conditions physiquca atpour cola dviter touta fatigue inutila notommant avant leas vols. Son r~gime alimontaire at hydromodisera particulibroemnt surveilid. On minsisters our Ilimportance do coo pr~cautions pendant lea 15premiers jours du sijour dana un cliant tropical, aD llorganl -is no stoat pea encore adapt6 auxnouvelles conditions. Dana touts Is mesure du poesible, des locaux climatisda dovront stro ala 6 Isdisposition des iquipages.
3-2 Au plan apirationnel prapremant dit, ii parait essential quo, au moment du d~coilage, lee* pilates aoient dons un dtat confortablo. Le temps do toldrance 'Is chaleur via 6 via do cantraintos
qua Il'n pout consldirar comae aiguua, ddpend en effet dtroltemuent des conditions phymiologiquesinitiales. Il sera on effet bion plus court si lea dquipagos ant diii eccumuli de Is chaleur denalour organisms avent Ie dibut do Is mission. Los moyana pour obtenir un tel risuitat mont connus
- asell d'apdrstion bien climatisie avec des balasons froiches non alcoolisios.- protection des sironefa, en ststJonnement sur Ia parking, via & yir du rayonnoment soleiro
par un systime parasoloil.-ventilation des cabines au sal pnr un groups do canditionnament autfisamment puissant pour
iliminar is cholour duo aux conditions climatiquos locales at Avontuelloment si lsvian seat or.alerts, cello diqagie par Il'lectroniquo do bard.

5.4
Do tole dispositits ant fait 1s preuve de leur efficacitd depuis longtemps (18). Par leassocia-tion d'un groups do climatisation fournissant do lfair h 220C avec un dibit do 3 0001/min. at d'unparasol, il a drt possible de ramenor Ia tempdrature globe do 53 0 C & 33,20C avec une tompdratureahche do 22,60C. Un tal systbmo permet un. attents an alerts, l pilots itant & l'intdrieur do sonappeaeil sans problIbme particulier. Dane l'expdrionce ci-dessus, la tempdrsture cutande moyenno sleetI 8stebilisde h 33,90C ce qui set tout h felt compatible avec le confort.
3-3 En cours do vol 3 si lea conditions climatiques at opdrationnellos, sant telles quo lea
prdcautions prdcddentes eouhvront insuffissntos, dlautto8 assures tolles quo 10smdliorotion do Iaclimatiestion do la cabins at lutilisation d'iquipoments individuals ventilis pourront Itre envi-
sagso.Los poosibilitdo des aystbmes do climatiestion do Is plupart des avions en service sant insuf-
fisantes pout assurer Io contort du pilots au cours des vole bases altitude dana des conditionsclimatiquos extrames. Lour amdlioration souhaitable du point do vue mwdical, so heurte 6 des problb-moo techniques complexes at ondreux difficiles 6 rdsoudre.
La climatisation individuelle par combineison ventilde eat une solution plus simple. DO nombrou-sos rialisations do ce type d'dquipoments ant prouvd son officaciti. Ainsi le vOtoment frsn;aisEFA 25 permet do maintenir un pilots dene des conditions confortables malgrd une tempdrature ambiantede 600C (19). Des groupie do ventilation au 8ol permettent d'aoaurer Is confort du pilate porteurde vAtemente apiciaux (preasuriuis, anti-immersion etc...) pendant l'alerts on selle.
Do plus llutllisation d'un groups do ventilation portable do Is taille d'une petite valise,permot dasseurer son contort lore des diplacemente sur Ie parking it dventuallement lore do l'attenteon alerts h 1lintdriour do l'appareil, stil nloxiste pas do groups d'alerts (20). En vol, un dispo-sitif permettant l'inufflattion d'air dane 1evAtement oat niceosaire mals coci suppose ls mese enplace di l'appareillage addquat h lintirieur do l'avion at par consdquent do le prdvoir dbs Bsconception.
REFERENCES
1 - HOUDAS (Y), COLIN (3) - Problhmos phyololagiques posds par Is climatisation d'un ovion dlintsr-caption on alerte ou sol. Rev. Mod. Airo. 1965, 13, 48-51.
2 - NUNNELEY (S.A.), MYHRE (L.G.) - Physiological effecta of solar host load in a fighter cockpitAviat. Space. Environ. Mod. 1976, 47, 969-973.
3 - TIMBAL (3), CHARGE (C), BODINIER - Meoure de la charge thermique par rayonnement h bard duMIRAGE III B C.R.E. no 1 14 fdvrier 1968, pp8.
4 - HIGENBOTTAM (C) - Automatic in-flight thermal date recorder - ATDR 2. IAM Report no 567 -3anv. 1979, pp20.
5 - JAMES (G.R.), BERGQUIST (A.O.), WHITE (D.D.) - A min1r',re environnbntal monitor SAM-TR 75-29,August 1975, pp 8 .
6 - ALLAN (3.R.) HARRISON (M.H.), HIGENBOTTAM (C), RIGDEN (P), SAXTON (C.) - In flight thermal datefrom Harrier, Phasmtom, Buccaneer, Gazelle and Scout Aircraft FPRC/1354, October 1976, pp 64.
7 - HARISSON (M.H.), HIGENBOTTAM (C), RIGBY (R.A.) - Relationship between ambient cockpit, and pilottemperatures during routine air operations - Aviet. Space. Enuiron Med. 1978, 49, 5-13
8 - STRIBLEY (R.F.), NUNNELEY (S.A.) - Fighter index of therral stress s Dpveloppment of interim guidan-ce for hot-weether USAF Operations - SAM-TR-78-6 Fabuary 1978 - ppl8.
9 - ALLAN (J.R.), CROSSLEY (R.J.)-Effect of controlled elevation of body temperature on human tole-rance to + Gz acceleration. 3. Appl. Physiol. 1972, 33, 418-420.
10- IAMPIETRO (P.S.) - Use of skin temperature to predict tolerance to thermal enviromments. Aeros-pace Mod. 1971, 42, 396-399.
11- BOLLINGER (R.R.), CARWELL (G.R.) - Biomedical cost of low-level flight in a hot environnement.Aviat. Space. Environ. Med. 1975, 46, 1221-122C.
12- COLIN (3),'HOUDAS (Y) - Experimental determination of coefficient of heat exchanges by convec-tion of human body - 3. 'ppl. Physiol. 1967, 22, 31-38.
13- COLIN (3), TIMBAL (3), GUIEU (3.D.), BOUTELIER (C), HOUDAS 'Y) - Combined effect of radiationand convection in "Physiological and Behavioral temperature regulation". Charles C. Thoesa.Springfied U.S.A. 1970, Chap. 7, 81-96.
14- BLOCKLEY (W.V.); Mc. CUTCHAN (3.W.), TAYLOR (C.L.) - Prediction of human tolerance for heat inaircraft : A design guide. WAOC-TR 53-346 May 1954 (A.D. 47084).
15- COLIN (3), TIMBAL (3), BOUTELIER (C), h .FRET (R) - Leo performances 5 l chaleur en avion d.)transport superaoniqua. Arch. Sod. Physiol. 1973, 27, A 4G7- A 490.
16- GRETHER (W.F.)- Human performance at elevated environmental temperatures. Aerospace Mad. 1973,"44, 747-755.
17- HORVATH (S.H.), JENSEN (R.R.) - Standards for occupational exposures to hot environments.nroc. of Symposium Heo. Publication no (NIOSH) 76-100 - 1976.

5-5
18 - COLIN (3), HOUDAS (Y), DUCROS (H) - Essaii do I& maquette du group. do conditionnement d'aircabine st pilots du GAMO 2. Rapport CEsai CEV. no 107 - Nov. 64 - pp29.
19 - COLIN (3), HOUDAS (Y) - Protection do l'aviateur contra lee ambiances thermiques ilevies.Rev. Corp. Santd Armies 1965 - 6, 589-611.
20 - COLIN (3), HOUDAS (Y) - Essaio do 1n valise do conditionnement au sal ADV Type R 27.Rapport seasis CEV, n0 131 - Nov. 63. pp 11 .

56
.ift 0* 10.30h *°.300NO
:200
271 i - 2730270° ~ ~ ~ ~ l , ".20 7- 0°--N
0 moure -u Sol
__-- . 3 000f..s. _- Um eswe >40000fets
15.18h °l~k0
FIGURE 1.
Charge radiants h l'intdriour dfun MIRAGE III B meaurds ouStdradiometev au sol (0), 6 3 000 pi1ed () au-dessua do
40 000 pieda ( ------- ), lea 6, 7 et 8 aeptembra, avec mu mtolT air . 24/250C, Hurniditd relative - 50/65 %.V = 0,8 & 0,9 mach au aol st 3 000 pieda, I & 1,2 h haute altitudecouches nuagousesaen desmous do 3 000 pied..
iIU

5-7
FIGURE 2.It
m Tempa do toldrance an fonction de la
r tempdrature globe dane 1s co. ou lI tompdra-Z ture do Vlair set identique At Is temperature
-tE radiants.
I Quatre situations sont reprdsentdesa aslonllactivitd du pilots (M = lOd ou 150 kcal/(m2.h)
4 et le poasibilitie dvaporatoires0 (nulls avec E = 0 at trbc importante avec
II E = 200 kcal/(m2.h). (Cf. texts)
Temvirtutef Globe (VC
FIGURE 3. Perfoman( textts
T~p do toldrenco (t) on minutes on
Tego
fonction do Is tompdrature effective tMU(Ta). Lee donnies sont cellos do e(1) Viteles at Smith 1946(2) Reilly ot Parker 1967 +Seog
(3) Loeb at Coil 1956 241 12 3 0 Pelryitactee
(4) Bursill 1954 0h(5) Moreland at Barnes 1969 Peformacesdhminu(5) Poplar 1963
* (6)(7) Colin at Coil 1973(8)(11) Wing at Touchstone 1963(9) Chile& 1958(10) Carlson 1961(12) Swivel 1971
(13)(15) Blockley at Lyman 1950, 1951 l26(14)(16) Immpietro at Coll 1969.
La ditail do coo riferancee as 7 a9U
trouve dane Ia rifdrenco 15 du prisant 12 1
article. I
31 35 40 45 TWOC]
I
zr-

6-1
EFFECTS ON PERFORMANCE OF THERMAL STRAIN ENCOUNTEREDDURING HIGH SPEED, LOW-LEVEL FLIGHT
by
T M GibsonJ R AllanC J Lawson
andR G Green
Royal Air Force Institute of Aviation Medicine
FarnboroughHampshire GU14 6SZUnited Kingdom
SUMMARY
Performance decrements in simulated flight have previously been demonstrated at levels of thermalstress equivalent to those found in the cockpits of high performance aircraft. However, the levels of bodytemperature at which these performance decrements occur are uncertain. Previous studies have shown thatperformance of a simple, motor task may be degraded by heating the skin when the body temperature is abovea critical level of 37.6
0C. The experiment reported here confirms these findings for performance in a
simple flight simulator. The operational significance of the results is discussed.
INTRODUCTION
Recent advances in technology (e.g. 1) have allowed collections of aircrew and cockpit thermal data tobe made during routine, high speed, low level flight in various military aircraft. Typical results aregiven in Table 1. The highest cockpit temperatures were measured when the aircraft was on the ground. Inaddition, Belyavin et al (7) predict from laboratory experiments that aircrew flying in NBC clothing inGermany in summer could reach a deep body temperature of 37.9
0C in 41 min and 38.5
0C in 72 min.
Table 1. Maximu Aircrew and Cockpit Temperatures Recorded in Various Aircraft1
Aircraft Deep BoJy Skin Cockpit Reference NotesTemperature Temperature Temperature
7Cl Site °C Site WBGT °C
Harrier 38.0 ae2 37.4 mean 31 2
Buccaneer 38 2 ac 36.3 mean 25 2
Phantom 31.8 ec 36.6 mean - 2
Gazelle 37.6 ac 37.1 mean 26 2
Scout - - 37.0 mean 23 2
Jaguar 38.0 ac 37.2 mean 36 3 Failed cabin conditioning
Mohawk 38.0 re 3 37.2 xiphoid 30 4
F15 37.5 re 38.9 arm 36.4 5 Aircraft on ground in sun
FllA - - 38.9 mean - 6
F4E 38.1 ac 36.6 mean 37.8 Allan Aircrew wearing NBC pro-(unpublished tective clothingobservations)
Notes
1. The three temperatures for each aircraft were not necessarily recorded on the same occasion.2. ac - auditory canal.
3. re - rectal.
Recent work at this Institute '8,9,10) showed that performance of a pursuit rotor task was unaffectedby heating or cooling until deep body temperature exceeded 37.6
0C but that above this performance was worse
during heating than cooling (Fig.l). Above the Lritical level of core temperature, the skin temperaturewas found to be a more important determinant of performance than deep body temperature, although it wasimpossible to discount the possible effects of direction and rate of change ,i deep body and skin tem-peratures. It was suggested that absolute levels and rates of change of core and skin temperatures influ-enced performance together through their effect on affective thermal sensation and there appeared to be acritical level of discomfort beyond which decrements of performance developed.
The aim of the experiment reported here was to extend this work to a task more representative offlying, while still using levels of core and skin temperature similar to those measured in or predictedfor aircrev.

6-2
S Heating
x Cooling
' 110
E
L.,
0'= 100 xx
0
80
I I I
37.0 37"3 376 37.9 38.2 38.5
Tac (°C)
Figure 1. The relationship between rotary pursuit task performance and deep body temperature (T a).
METAODS
Nine male volunteers, aged between 19 and 41 years, acted as subjects. Six had previously been exposedto hot conditions although none was acclimatized to heat. Each subject carried out two replicate experi-ments in which he was first heated to a deep body temperature (Tac) of 37.5 0 C, then alternately heated andcooled twice between Tac limits of 37.9 and 38.50C, and finally cooled to a Tac of 37.50C (see Fig.3).Heating or cooling was achieved by controlling the inlet temperature of a liquid conditioned suit (I.CS) ateither 50 0 C or 280 C.
Measurements. Core temperature was measured from the auditory canal using a thermistor near to, but nottouching, the eardrum, and well insulated from the environmLnt using cotton wool and a cloth flying helmet.Thermistors were also used to measure the skin temperature at 4 sites (lateral upper arm, chest, thigh andcalf); mean skin temperature (Tsk) was taken as the arithmetic mean of the four measurements. Core andskin temperatures were measured at I min intervals using a data logger. A subjective assessment of thermalcomfort was obtained by the 10 cm line technique (11) with the line annotated 'thermally ideal' at one endand 'thermally intolerable' at the o'her.
Th- Task. The subject had to 'fly' a simplified form of flight simulator (12) while controlling certainflight vectors within defined limits by use of throttle and control column. The simulator had no rudderc introls. Performance and handling was considered to be equivalent to that of a small business jet, e.g.the HS 125. The visual display, on a television screen (Fig.2), consisted of digital outputs from an &'rspeed indicator, an altimeter and a compais, with analogue presentations of vertical speed, power settingand artificial horizon. Three navigational aids were also displayed but were not used in the presentexperiment. A printed card, placed below the television screer., gave the subject the required altitudesand headings for the task period.
Means and variances of samples taken three times a secord were obtained, through a DEC PDP-12 computer,
of the following vaciables for each manoeuvre:

6-3
(1) (5)• • .:.. .' . ... .. . :.: :'-:: ! :: :: :: :::
: (2)
J .• : *.:. : (6
2 "-." .8. 4
(3)(4k)
(1) Airspeed indicator(2) Artificial horizon and Turn/Bank indicator(3) Compass(4.) Power setting(5) Altimeter(6) Vertical speed indicator
Figure 2. The television diiplay of the flight simulator.

~6-4
a. Heading (ClDG).b. Altitude (ALT).c. Air Speed (LAS).
V d. Vertical Speed (VS).e. Bank angle (BA).
In addition, data was obtained for the number of times in each manoeuvre the major controls passed through,the neutral position (aileron and elevator reversals) as well as for the average maximum extent of the con-trol column movements.
Each 3 min task pericd comprised:
a. An ascending turn from 3,500 ft to 5,000 ft through 1500 from a previously set heading (whichvaried with each task period). Vertical speed had to be maintained at +2,'30 + 230 ft min-I withan angle of bank of 30 _ 2JO.
b. Straight and level flight with random sine wave turbulence (12) at ALl 5,000 + 50 ft, a, +50from the required heading, at VS 0 + 50 ft min- 1 and at BA 0 + 2jo.
c. A descending turn from 5,000 ft to 3,500 ft through 1500. Vertical speed had to be -2,500 +500 ft min-I with an angle of bank of 30 ± 2°o.
Indicated air speed during the three manoeuvres had to be maintained at 210 + 20 knots. Tne three parts ofthe task were separated by periods of up to 20 sec to allow the subject to correct height and headingbetween the measured parts of the task.
Each subject was given a minimum of six, 45 min lessons on the simulator, of which the first four weregeneral instruction, flight theory and control of the simulator, and the remainder were devoted to flyingthe specific manoeuvres. The subject had a further practice within 24 hr of his experimental tuns; inaddition, he received a further practice session if more than 3 days separated experiments.
Procedure. After being instrumented for measurement of core and %kin temperature, the subject dressed inthe LCS, long-limbed acrilan pile underwear, socks, cold weather flying jacket and trousers, boots, glovesand cloth flying helmet. He then entered the climatic chamber, which was maintained at 30 0 C, and carriedout a 3 min practice task. The su-,Ject then mounted a bicycle ergometer and started exercise at 10OW whileheating was started through che suit conditioning unit. He stopped exercise at a Tac of 37.3 0 C and trans-ferred to the seat of the flight simulator. The task was performed at Tac 37.5 0 C, and then at 3 levels ofTac (37.9, 38.2 and 38.5 0 C) during each heating and cooling phase, and finally was performed at 37.5 0 C againduring the final cooling phase (see Fig-3). The task was timed so that its midpoint coincided with the tar-get Tac. Immediately after each task, a subjective assessment ci thermal comfort was obtained from thesubject.
RESULTS
The results for Tac and T sk at the midpoint of each task, averaged for subjects and replicotes, areshown in Table 2 and Fig.3. It can be seen that the intended levels of Tac d&ring performance of the taskhave been accurAtely achieved. Despite a constant inlet temperature to the LCS, T sk continued to riseslightly during heating and to fall during cooling but the differences were small when compared to thedifferences between average levels for heating (39.O°C) and cooling (36.4 0 C). Also shown in Table 2 andFig.3 are the average values for subjective level of thermal comfort immediately after each task.
Table 2. Means and SD (subjects/replicates) for Tac, Tsk and subjective level
of thermal comfort at each task performance during heating and cooling
PHASE FEATING COOLING HEATING COOLING
TASK 1 2 3 4 5 6 7 8 9 10 11 12 13 14
T °C 37.53 37.88 38.19 38.49 38.53 38.20 37.91 37.93 38.26 38.54 38.53 38.21 37.94 37.52ac
SD 0.05 0.03 0.03 0.02 0.051 0.04 0.04 0.02 0.04 0.03 0.03 0.03 0.03 0.04
Tsk C 38.4 38.7 39.0 39.1 36.8 36.4 36.2 38.9 39.0 39.0 36.5 36.3 36.0 34.7
SD 0.5 0.4 0.4 0.4 0.3 0.3 0.3 0.4 0.5 0.5 0.4 0.3 0.4 0.5
Comfort 3.7 5.3 6.2 6.8 2.6 1.4 1.3 5.7 6.5 7.0 2.0 1.4 1.3 0.6S~cm
SD 2.0 2.3 2.3 2.5 1.6 0.9 1.0 2.7 2.8 2.5 1.2 0.9 0.7 0.7
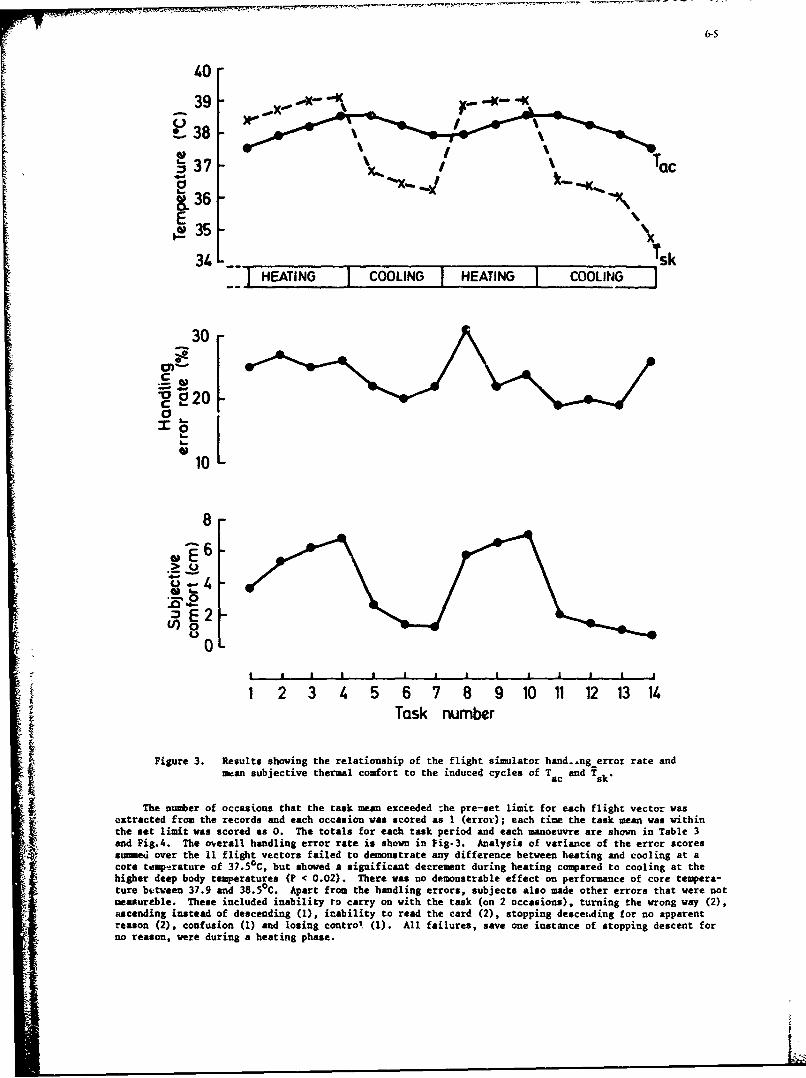
40; 6-5
S38
,37 - TacXI%
•36 -E "x~35 -3f -
Tsk-4 _ HEATING COOLING HEATING COOLING J
30
* 20
X~0L.
0
8
B204-
0L{ I a i I I i I I I I I I I I
1 2 3 4. 5 6 7 8 9 10 11 12 13 14Task number
Figure 3. Results showing the relationship of the flight simulator hand.ngerror rate andmean subjective thermal comfort to the induced cycles of Tac and Tsk.
The number of occasions that the cask mean exceeded :he pre-set limit for each flight vector wasextracted from the records and each occasion was scored as 1 (error); each time the task mean was withinthe set limit was scored as 0. The totals for each task period and each manoeuvre are shown in Table 3and Fig.4. The overall handling error rate is shown in Fig.3. Analysis of variance of the error scoressumed over the 11 flight vectors failed to demonstrate any difference between heating and cooling at acore teuptrature of 37.5 0 C, but showed a significant decrement during heating compared to cooling at thehigher deep body temperatures (P < 0.02). There was no demonstrable effect on performance of core tempera-ture butween 37.9 and 38.5 0 C. Apart from the handling errors, subjects also made other errors that were notmeanurcble. These included inability ro carry on with the task (on 2 occasions), turning the wrong way (2),ascending instead of descending (1), irability to read the card (2), stopping desceiding for no apparentreason (2), confusion (1) and losing control (1). All failures, save one instance of stopping descent forno reason, were during a heating phase.
I-

Table 3. Total number of handling errors in each task for each manoeuvre
PHASE HEATING COOLING HEATING COOLING
TASK 1 2 3 4 5 6 7 891 11 J1213 4
Ascending I
Turn 5 15 8 7 8 11 8 13 7 3I 31 6 5(VS,IAS,BA) IStraight/i
Level 27 29 24 25 23 19 20 27 2. 126 21 24 17 25
(ALT,HDG,IAS, 111SVS,BA)
IDescendingTurn 18 19 17 19 12 7 i15 20 8 V" 9 11 0 .17(VS,IAS,BA)
DISCUSSION
The results demonstrate that differences in performance on the flight simulator can be produced byheatirg or cooling the skin at the same level of deep body temperature. These differences do not exist ata Tac of 37.5 0 C, but at core temperatures between 37.9 and 38.5 0 C, performance during heating is worse thanduring cooling. Above the critical core temperature (i.e. above 37.5 0 C), skin temperature is a more impor-tant determinant of performance than the absolute level of deep body temperature; it is, however, impossibleto exclude possible effects on performance of direction and rate of change of both core and skin temperatures.It may be seen from Fig.3 that at a deep body temperature of 3 7.90(, heating after cooling may be mote stress-ful than heating alone. In addition, the high error rate during cooling at 37.5 0 C may reflect the fact thatcooling to this level took longer than other parts of the experiment and the greater time gap between taskscould have resulted in the subjects losing concentration. The lack of difference in performance l'etweenheating and cooling at a core temperature of 37.5 C could therefore be an artefact but the results comparefavourably with the findings in previous studies (9,10).
A loes of accuracy in simulated flying during heat stress has been reported previously. Blockley &Lyman (13) found that subjects in a flight simulator made an increased number of errors when they werereaching their physiological tolerance to environments up to 1I20C; the maximum level of rectal temperature(Tre) recorded was 39.6 C and the maximum T sk was 42.5 0 C. Moreland & Barnes (14) suggested that pilot per-formance in a helicopter declined, and variability of performance increased, at higher cockpit temperatures,although the changes reported were not statistically significant. The highest Tre that they reported was,however, only 37.7 0 C. Larsson et al (15) recorded a 25% increase in integrated errors of speed and altitudeby subjects flying a Draken simulator at a mean Tac of 38.Oor and T-k of 37.5°C compared to flying withTac 36.8 0 C and Tsk 34.O°C. In that experiment, the rate of ribe of Tac during the flight phase was very low.lampietro et al (16) found significant differences in performance in some phases of ilight in a simulatorbetween one neutral and two hot environments. Overall, there was a 19% greater deviation fror the requiredheading in an environment of 43 0 C compared to 230 C, and a further 19% decrement at 600 C compated to 43 0 C.Mean skin temperature during the hottest flight was 38.5 0 C although there was little change in Trel
Meister (17) reported similar results for subjects exposed to an environment of 43 0 C in a flight simu-lator. A 13% decrement in flying straightforward manoeuvres was observed by the time oesophageal temperaturehad reached 38.0OC; Tsk was not repcrted. Performance in correcting turbulence during straight and levelflight was significantly improved by the time of the third heat exposure although this could have been asimple learning effect. When approximately equivalent skin temperatures are compared, the 252 decrementfound by Larason and the 19% decrement found by Iampietro compare favourably with the overall 27% decrementfor this stuay.
In the present experiment, subjects did not only fly less accurately while being heated compared tobeing cooled, but they also made more drastic errors in controlling the simulator. This type of vnpredict-able lapae has previously been described (18) for vibration and noise combined and could, if it occurred inreal flight, result in the pilot losing control of the aircraft. Bollinger & Carwell (19) state that 'thepotential for crew error is increased and ... thc morgin of safety is, accordingly, decreased during .., hotmissions'. Their study was of operationdi training sorties in the RF4C aircraft in summer (mean maximum teu-perature 31.6'C) and winter (18.8 0 C) conditions. They found an increase in the proportion of unsuccessfulmissions (measured from photo target acquisition scores) attributable to pilot error in summer (24.2%) com-pared to wintgr (9.5%). They also commented that the 1.22 dehydration occurring in tte 90 min zortie wouldhave caused a 15 to 18% diminution in +Gz tolerance. Elevation of core and skin temperatures can alsoreduce +G, toleranre markedly (20).
It is therefore clear that the thermal strain encountered by aircreew in routine high speed, low levelflight in warm conditions could cause a reduction in the operational capability of the aircrew. The situa-tion will be exacerbated by anything that increases the thermal strain such as the wearing oi more insulativeprotective clothing, higher work rates (7) and repea.ed sorties separated by inadequate time for thermalrecovery.

6-7
Heatingx- - - Cooling
20-
10-Ascending
turn0-
60-
0 50- x.I.-...x . . . -
SStraightC level
c 30
40-
4...
301
20-
Descendingturn
10- I I I
37•5 37"9 382 38-5Tac ('C)
j Figure 4. The relationship between T snO handling errors of the flight simulatorin each nanoeuvre during hating and cooling.
g•I

REFERENCES
1. Higenbottam,C. Automatic in-flight thermal data recorder -ATDR 2. 1978. RAF Institute of
Aviation Medicine (IAM) Report No. 567.
2. AllanJ.R., M.H. Harrison, C. Higenbottam, P.W. Rigden & C. Saxton. In-flight thermal data fromHarrier, Phantom, Buccaneer, Gazelle and Scout aircraft. 1976. RAP IAM Aircrew EquipmentGroup (AEG) Report No. 401.
3. Gibson,T.M., M.H. Harrison & P.W. Rigden. In-flight thermal data obtained during warm weatherJaguar operations. 1978. RAF IAM AEG Report No. 440.
4. Joy,R.J.T. Heat stress in army pilots flying combat missions in the Mol-awk aircraft in Vietnam.Aerospace Med. 38: 895-900. 1967.
J. Nunneley,S.A. & L.G. Myhre. Physiological effects of solar heat load in a fighter cockpit,Aviat. Space Environ. Med. 47: 969-973. 1976.
6. Nunneley,S.A. & G.R. James. Cockpit thermal conditions and crew skin temperatures measured inflight. Aviat. Space Environ. Med.48: 44-47. 1977.
7. Belyavin,A.J., T.M. Gibson, D.J. Atton & P. Truswell. Prediction of body temperatures duringexercise in flying clothing. Aviat. Space Environ. Med. (in press). 1979.
8. Allan,J.R., T.M. Gibson & R.G. Green. The effect of induced cyclic changes of deep body temperatureon task performance. Aviat. Space Environ. Med. (in press). 1979.
9. Allan,J.R. & T.M. Gibson. Separation of the effects of raised skin and core temperature on per-formance of a pursuit rotor task. Aviat. Space Environ. Med. (in press). 1979.
10. Gibson,T.M. & J.R. Allan. The effect on performance of cycling deep body temperature between37.0 and 37.6 0 C. Aviat. Space Environ. Med. (in press). 1979.
11. Gedye,J.1., R.C. Aitken & H.M. Ferres. Relative assessment in clinical research. Brit. Med. .1.1: 1828-1834. 1961.
12. Chapman,A.D. & J.W. Chappelow. A simple, digital flight simulator. 1979. RAF LAM Tech. Memo.(in press).
13. Blockley,W.V. & J. Lyman. Studies of human tolerance for extreae heat: IV. Psychomotor performanceof pilots as indicated by a task simulating aircraft instrument flight. 1951. USAF AeromedicalLaboratory Technical Report No. 6521.
14. Moreland,S. & J.A. Barnes. Exploratory study of pilot performance during high ambient temperatures/humidity. In 'Measurement of Aircrew Performance', 1969. AGARD Conference Proceedings No.CP-56, pp. 12-1 to 12-24.
15. Larsson,L.E., H. Nilsson & B.O. Andrae. L'effet de l'augmentation de Ia temperature ambiante surla performance du pilote dans un simtlateur de vol. Rev. Med. Aero. Spatiale 12 (45):183-186. 1973.
16. Iampietro,P.F., C.E. Melton Jr., E.A. Higgins, J.A. Vaughan, S.M. Hoffman, G.E. Funkhouser &J.T. Salvidar. High temperature and performance in a flight task simulator.Aerospace Med. 43 (11): 1215-1218. 1972.
17. Meister,A. Hitzebelastung, Leistungszuverlissigkeit und Effektivitat. 2. Physiol. Bd. 184 (1):63-72. 1976.
18. Stave,A.J. The effects of cockpit environment on long-term pilot performance.Human Factors 19 (5): 503-514. 1977.
19. Bollinger,R.R. & G.R. Carwell. Biomedical cost of low-level flight in a hot environment.Aviat. Space Environ. Med.46 (10): 1221-1226. 1975.
10. Allan,J.R. & R.J. Crossley. Effect of controlled elevation of body temperature on human toleranceto +Gz acceleration. J. Appl. Physiol. 3; (4): 418-420. 1972.
ACKNOWLEDGEMENTS
It is a pleaeure to acknowledge the technical assistance given by Mr P.J. Redman and Cp! C. Williams.The authors are grateful to Ar A.J. Belyavin for performing the statistical analysis and the DirectorGeneral Medical Services (RAF) for permission to submit this paper for publication.

6-9
DISCUSSION
DR. F.H. AUSTIN (US)
Have you been able to detect a difference in effect of heat and cooling on performance dependent onthe birthplace or home (wh-.re raised) cf aircrew; for example, cold climate versus hot, or wet versusdry climates?
AUTHOR'S REPLY
No. Most of our aircrew were raised in the United Kingdom and, because it is a small country, theclimate (cool, temperate) is fairly uniform.
DR. F.H. AUSTIN (US)
Is distraction from the cool or hot air stream a factor in performance decrement in your data?
AUTHOR'S REPLY
Performance seems to be related to thermal comfort - the hotter you feel, the worse you perform.Insofar as this reflects skin temperature, the effect of heating or cooling is to affect performance.However, we used liquid conditioned suits to control heating and cooling in our subjects.
I

7-1
AIRCREW HEAT STRESS DURING HIGH-SPEED, LOW-LEVEL FLIGHT
Richard F. Stribley and Sarah A. NunneleyUSAF School of Aerospace Medicine
Crew Technology DivisionCrew Protection BranchBrooks AFB, Texas 78235
USA
SUMMARY
Heat str,.s is a common problem aboard high-performance aircraft, particularly during high-speed,low-level flight in temperate and hot climates. The degree of heat strain induced in aircrewmembersreflects many factors, including their preflight physiologic status, clothing worn, duration of groundstandby, and the cockpit environment. Radiant heat load is high and cockpit cooling is generallylimited during low-level flight, at the same time tlat personnel must perform critical tasks at peakefficiency.. In addition, new protective equipment is greatly increasing the thermal gtress experiencedby aircrews, A cha,[(c in cock-it-cooling specifications, therefore, appear. .3--sirable for new fighterand close-support aircraft with their demands for maximal human performance. In-flight data and lab-oratory studies simulating cockpit conditions indicate that heat stress can impair performance, notablythe learning of new skills. This is particularly important during trainiihg and low level flight,where new or novel situations often arise and diminished ability of crewmembers to handle new taskscould present a serious problem. Approaches are needed for limiting heat exposure in current aircraft
* and for mar-oriented design and testing of environmental control systems in future aircraft, Thispaper describes some of these approaches,
LIST OF SYMBOLS
c = cockpit Tco = core temperatureECS = Environmental Control System Tdb = dry bulb temperatureFITS = Fighter Index of Thermal Stress ,Idp = dew point temperatureF = ground Tsk = mean skin temperaturePw = water vapor pressure T..(calf) = calf skin temperatureTac = auditory canal temperature Tsk(chest) = chest skin temperatureTbg = black globe temperature V = air velocity
U'TRODUCTION
Humans are well adapted to dealing with heat stress under most n-tural conditions. Unfortunately,* the aviation environment often interferes with the usual means of dissipating heat. Aircrews of
high-performance aircraft must generally work while exposed to sunlight, wear multilayer clothing
hich restricts sweat evaporation, and suffer undesirable physiologic and performance side effectsfrom both vaso..ilation and sweating. The combination of heat and other stresses associated withflight can accelerate the onset of fatigue and degradation of Lritical task performance.
The need to protect avionics from overheating was formerly the main criterion for specifying thecooling capacity of an aircraft environmental control system (ECS). The maintenance of a thermallyitable, comfortable ccckpit environment for aircrewmembers was regarded as less important, and cock-
*- pit heat was rarely recognized as a factor limiting the performance of the man-machine system.However, aircraft demand maximal mental, perceptual, psychomotor, and physiologic performance,particularly during high-speed, low-level flight when heat stress is often the highest.
CURRENT COCKPIT-COOLING DESIGN REQUIREMENTS AND PERFORMANCE
The USAF specification for ECS i- reviewed here as an example of current stindards (1). It is writtenin general termq and applies to both high-performance and transport aircraft. It states that cockpitair temperatuies may not exceed 27 C during &round operations, DurIng flight, mean air temperaturein the crew compartment should not exceed 21 C, but may rise to 270C for 30-min periods. Radiant heatis mentioned only in terms of surfaLe temperature and touch-burn. Moisture control is covered by thestatement that inlet air shall be free of entrainel moisture. The document mandates a series of ECSperformance tests during all phases of development from design through production samplin,, Final hCS
qualification involves assessment of the preproduction unit aboard aircraft in environmental chambers"* and during sojourns at bases selected to present extreme climatic conditions. Failure of the ECS to
imeet original specifications may result in system modificaticn and/or waiver of requirements.
The present method of assessing cockpit cooling fails to consid th* effect of the environment andECS performance waivers upon the physiological status of the aircrews. Miniaturized man-mountedinstrumentation now allows the monitoring of both environmental and physiological variables aboard
t • operational aircraft as well as during dedicated climatic tests. A sensor cluster located at shoulderor head level measures dry bulb temperature (Tdb), dew point t'm~erature (Tdp), air velocity (V),and 50-mm black globe temperature (
Tbg). Measurements from aircrew include skin temperatures (Tsk),
core temperature (Tco), electrocardiogram, and voice, besides ubjective questionnaires. It is use-ful to measure T at multiple locations around aircrewmembers and at ECS inlet (2). Data collectedso far include m'snions oy USAF aircraft with three different ECS types: simple cycle (A-1O, F-5,F-lll), bootstrap (A-7D, F-4E, F-15, F-16), and a variable-geometry, alr-cycle, advanced designtested aboard an F-15. Some of these data are discussed below,
• •, •(

The worst heat stress recorded for aircrews occurs during ground standby. Come combat scenariosdictate that the canopy be either sealed or opened at most a few certimetets while the airclaftsits without active cooling. Significant cockpit heat stress also continue, following takeoff,as shown for the A-10 in f-gures 1 and 2. This aircraft flies close-support missions ot such lowaltitudes that climatic heat remains a significant factor throughout flight., Climatic tests ofthe preproduction models have revealed inadequate cooling capacity and poor air delivery to thepilot (3). ECS inlet temperatures were rarely less than 20
0C, rudder-well temperatures remained
at or above 330
C. Pilots rated heat stress aý i significant factor contributing to their fatigue.The FCS has since been modified and further stL.dies are in progress.
Fighter aircraft often fly a low-level penetration leg as part of their mission. In one tes,three F-4's were stjdied over a series of 36 low-level flights at Eglin AFB, Florida, duringApril-June 1978, when T 23-33 C. As shown itn figsre 3, front-seat temperatures were sig-nificantly cooler than f &ear Tdb, c which was always 41C or more above the present militarystandard (4).
Aerodynamic heating also affects cockpit temperature. The interacting effects of speed and altitudewere shown by a series of flights (5) where an F-l11A flew selected speed/altitude combinations oveLdesert where Tdb = 35-40
0C, The ECS was set on "full cold" throughout. Equilibrium Tdb, c at
2,000-ft AGL ranged frow 19.90
C at Mach number 0.6 to 25.70
C at 0.9. At 5,000 ft and Mach number 1.2,cockpit temperature was 33.40C and still rising after 10 min, when tuel limitation ended the run.This test also clearly showed the large head-to-foot temperature difference which is characteristicof cockpits.
The F-15 and F-16 are new air,;aft whose missions are primarily at medium to high altitude. Bothuse improved cooling technology whch reportedly reduces heat stress below that seer in older aircraft,but insufficient data are available to verify the reported improved ECS performance, Recent avionicsadditions, however, may increase co~ckpit temperatures.
HEAT EXCIUINGE IN THE COCKPIT ENVIRONMENT
C cipit terperature represents a balance betaeen ECS cooling (mass flow and inlet temperature) andheat from various sources, including climatic and aý-od:ynanic heating, sunlight, avionics, and humanmetabolismr Metabolic heat (6), together with any vi:,ironmental contribution, must be dissipated atthe skin to prevent heat storage. Man c~a tolerate storage of only about 100 W.h/m
2, a variation of
iprroxim.tely 7% in body-heat content, before approaching collapse; discomfort and performance changesmay appear at half that level.
Heat exchange actually occurs in the microclimate next to the human skin, Both convective and evapo-rative heat exchange depend upon movement of air through this microclimate; sensible heat transferrequires that Tab be lower than Tsk, while evaporadon occurs only if water vapor pressure (Pw) isless than 42 torr (saturation at skin temperaturc of 35
0C). Sunlight entering through the canopy
not only increases Tdb by the greenhouse effect, but also contributes direct radiant heating on theorder of 100 U (187 kcal/h) for a clothed .,.an (7).
Under hot conditions, cockpits cftcn sLow a large longitudin~l tenierature difference; while the headand upper body are exposed to fuil solar beating, maximal cooling is often routed to the rudder-welland lap area (2), A 10 C difference occurs in some aircaft (3), and pilots sometimes experience
uncomfortably cold feet while sweating profusely,
lircrew clothing severely limits heat dissipation by impeding both coihvectlon and e,'aporation. Thesummer flight ensemble for pilots of high-performance aircraft includes cotton underwear, Nomex flightsuit, anti-G suit, boots, gloves, helmet, oxygen mask, and restraint harness. The total insulationprovided is 1.5-2.0 Clo, where I Clo is 0.155 C.m2/W, approximattly the value for normal indoor cloth-ing. Flight clotning also slows sweat evaporation, with complete impermeability under the helmet,mask, boots, and areas covered by anti-( bladders,
CONSEQUENCES OF HEAT STRESS
Physiological c'efenses against heat include vasodilation, incieased sweat secretion, and increasedheart rate. Skin temperatures in the cockpit reflect both adjacent Tdb and overlying clothes,Sweating has several undesirable side effects, including discomfort, sweat dripping into the eyes,and gradual depletion of body-fluid reserves. If excess heat is not removed, core temperaturerises, For persons at rest or doing light work in heat, Tco = 38
0C represents the average upper
limit at which the body can establish true thermal equilibrium (8). Above this level, regulatorymechanisms begin to lose their efficiency and heat storage accelerates; with such "environmenc-driven" conditions, it is only a matter of time until Tco reaches 39-40 C and collapse ensues.
Impairment of mental performance is among the earliest measurable consequences of heaz stress, Theliterature on this topic is large and often confusing, but it is clear that heat stress of the typeseen in cockpits can be associated with altered learning curves (9, 10), shortened time sense (11),impaired vigilance (11), and increased error rates on tracking (10, 11), Such changes are subtle,but can be important to man in the cockpit. For example, comparisrn of F-4 photoreconnaissancescores in cold and hot weather demonstrated significantly less success in heat (12), Prolonged,moderate heat stress appears t. accelerate mental and physical fatigue associated with flying.Heat stress also diminishes accele.'ation tolerance (13)..
Zeller (14) studied aircraft accident rates based on 7 x 10⁷ flying hours and 3,000 accidents,finding that the rate for fighter aircraft shows a peak during the hot seasun which does notoccur In transports. While multiple factors undoubtedly contribute to this pattern, enviroumentalheat may make a significant contribution to the fighter pattern.

A number of procedures may improve aircrew heat tolerance and thus diminish ECS cooling requirements.Adequate heat acclimatization is an important factor. Aircrews should have ready access to palatablefluids duir.ing ground intervals, and they should also realize the importance of drinking even beyondsatiety. Both body cooling and rehydration are relatively slow processes, requiring from one toseveral hours, depending upon both the initial stress and the environment during recovery.
The limitations of current fighter/trainer cockpit cooling stimulated the recent development of theFighter Index of Thermal Stress (FITS) (15). From a simple FITS table, flying personnel can useT
db, g and Tdo or relative humidity to estimate heat stress in low-level flights and can determineappropriate protective measures. Although FITS i& aimed primarily at training situations, similarestim•tes of stress effects may someday prove useful to commanders weighing combat operations inhot clim3tes.
MAN-ORIENTED COCKPIT COOLING
The current desire to provide only a minimum of cockpit cooling p-ses an important question. Shouldthe ECS insure thermal comfort for aviators, or is some lesser amount of cooling acceptable? Comfortis usually the subjectuve correlate of thermoneutrality, and is therefore more than a luxury. Whenbody temperatures exceed comfortable levels, thermal tolerance becomes time limited due to gradualdepletion of physiological reserves. Exposure to extremely high heat loads may be tolerated for upto l; min if ccnditions return to comfort immediately thereafter, but in aircraft ground operations'he 15-mmn period is often cxceeded, and cooling after takeoff and during low-level, high-speedflight is us' ally less than idequate, so elev.ated Tco persists throughout the flight. Furthermore,even mild heat stress is probably associated with decreased tolerance for the other stresses offlight, including acceleration, hypoxia, and motion sickness.
New ECS designs need to considei the aircrew psychological and physiological reactions during low-level flight. A physiolog~cally based specification is naeded that requires cooling capacity suf-Vcient to maintain Tsk < 35
0C with the cockpit in fnll sunlight and avionics on, with allowance for
aircrew clothing appropriate to the aircraft's intended mission, The Pw should be < 20 torr, and airvelocity around occupants should be 0.5 to 3.0 m/s.. A~rcrewmembers need sufficient individual con-trol of ECS inlet temperature, flow, and direction so that upper-body skin temperature can be kept< 3b C while foot and le, temperatures remain > 20oC. Since the duration and intensity of heat stressexposure are critical, particularly to prevent nonspecific fatigue, we recommend that Tac be main-tained below 38.3
0C for flights of less than 3h and below 37.7
0C for flights of greater duration or
repeated sorties totaling , 3h.
Adequate design and testing of ECS require knowledge of aircraft mission, including flight profile,required clothing, and crew workload. ECS design should allow for "worse case" condition3; i.e.,ground operations and low-level, high-speed flight in hot, humid climates. Where cooling capacityis inadequate, heat can become one of the factors determining training limitations and/or combatcasurlties, especially for low-altitude missions, For this reason it has become imperative todevelop and strictly enforce physiologically sound ECS and p-rsonal-cooling specifications.
REFERENCES:
1. Military specification: Environmental control, environmental protection, and engine bleed airsystems, MIL-E-394538A (USAF), 55 pp., i471,
2. Allan, J. R., k. J. Belyavin, C. Hgeanbottam, S. A. Nunneley, and R. F. Stribley. The effectsor cockpit temperature gradients on the validity of single-point measurements. Aviat SpaceEnviron Med 50:669-671, 1979.
3. Stribley, R. F., S. A. Nunneley. and B, F. Hiott. Thermal conditions in the preproduction A-10cockpit during desert and tropical flights.. Aerospace Medical Assoc Preprints, pp. 50-5, 1977.
4. Stribley, R. F., S, A., Nunneley, and J, R. Allan. Thermal comparison of front and rear cockpitsof the F-4E during low-level flight, Aerospace Medical Assoc Preprints, pp. 269-270, 1979.
5. Nunneley, S. A., and G, R.. James, Cockpit thermal conditions and crew skin temperatures measuredin flight• Aviat Space Environ Med 48:44-47, 1977.
6, Sharp, G, R., G. A. Patrick, and W.. R. Withey. Review of the literature relating to energyexpended by 7ilots flying various types of aircraft. RAF Institute of Aviation Medicine,Aircrew Equipment Group Report No. 173, 22 'p., 1971,
7, Breckenridge, J, R., and R. F. Goldman. Human solar heat load, ASHRAE Trans 78:247-260, 1972.
8. Lhfstedt, B. Human heat tolerance. Dissertation, Universtiy of Lund, Sweden, 106 pp., 1966,
9. Nunneley, S, A., -. J. Dowd, L- G. Myhre, and R. F. Stribley. Physiological and psychologicaleffects of heat stress simulating cockpit conditions. Avlat Space Environ Med 49:763-/67, 1978,
10. Nunneley, S. A., P. J. Dowd, L.. G. Myhre, R. F. Stribloy, and R. C. McNee. TrackIng-taskperformance during hea- stress simulating cockpit conditions in high-performance aircraft.Ergonomics, in press, 1979.
11. Gretber, W. F. Human p-aformance at elevated environmental temperatures. Aerospace Med44:747-755, 1973.
--
Im l ll l "

7-4
12. Bollinger, R. R., and C. R. Carwell. Biomedical cost of low-level flight in a hot environment.Aviat Space Environ Med 46:1221-1226, 1975.
13. Nunneley, S. A., and R. F. Stribley. Heat and acute dehydration effects on acceleration responseSin man., J AppI Physiol, in press, 1979.
14. Zeller, A. F., and J. D. Marsh. Seasonal trend variations in USAF aircraft accidents. USAFInspection and Safety Center, Norton AFB, CA., Paper presented at the Scientific Meetings,Aerospace Medical Association, 1973.
15. Nunneley, S. A., and R. F. Stribley. Fighter index of thermal st-ess (FITS): Guidance for hot-weather aircraft operations. Aviat Space Environ Med 50:639-642, 1979.
CANOPY DOWN -- TAKE OF CANOl
p I
OPE
T I
40-
r36 CALF
S 304
32 0
360
20
1400 3430 3000 '3530 1600 1630 1700TIME OF 0CA LOCALL
Fig., 1., Data from an unmodified oper•. "-nal A-l0 aircraft flying ever desert. Grc.und conditionsavreraged 39°C and 14% relative humidity. Sky was clear. Ta¢ = auditory canal temperature,Tsk (calf) = calf skin teupexature, Tsk (chest) = ch3est skin temperature.
3 1 - -------

7-5
CAMOP DOWN TAKE Off KICXM AND-
Cht~.l START OCEWNO z.D ~ \~
0.... 490
---- TIN
20
to
_37
37,F3?
34 -
338-
32
3300 1130 2P') 1230 1300 1330 1400
TIME OF DAY (LOCALI
/
Fig. 2. Data from a modified operational A-10 aircraft over desert. Ground conditions averaged351C and 23% relative humidity. Sky was clear. See figure 1 for explanation of abbreviations,-
70.00 -
60.00 -+
+ + .
50.00 - +
+ + ~+ + +•r+ 41 4',H
o 4•*4 +0 4o.oo- ++ ÷ ; • • + 1
+ + +
30.00 -•
20.00 -
10 '0 -
0.000.00 20.00 20.00 30.00 40.00 50.00
Tdb FRONT (OC)
Fig 3. kelationship between rear cockpit (Tdb rear) and front c3ckpit (Tdb front) of F-4E duringlow-level flight. The temperatures are related by: Tdb rear - 16.77 + .749 Tdb front.The coefficient of determination was 0.59.

ESSAI VE Q'LANTIFI CATION DE L'AGRESSIOAJ ENGENV7REE PAR LES VIBRATIONS VE BASSE FREIIUENCE
QUANDIEU P., BORREDON P., ROUHET J.C., PELLIEUX L.
LABORATOIRE CENTRAL DE BIOLOGIE AEROSPATIALEI, DIVISION DE PHYSIOLOGIE ACOUSTIQUE ET BIOMECANIQUEDIRECTION DES RECHERCHES, ETUDES ET TECHNIQUES
SERVICE DES RECHERCHES - GROUPE 9, DIVISION ER(.NOHIECITE DE L'AIR - 5 615 AVENUE DE LA PORTE DE SEVRES
75996 PARIS ARMEES FRANCE
RESUMEDu paint de vue biomecanique, .L homrne peut btre considdrt- comme un solide deformable sous 1 'effet
do stimulations mdcaniques pravoquees en particulier par le vol grande vitesse et basso alt'tude. Sais, June stimulation physique, l'hormne fournit une rc~ponse physiologique. 11 met on 3eu ses masses musculairespour lutter cantie les d~formations qul lui sont 'mposdes. Selon le degr6 de tension de la zrnsculature, lardponse vibra Caire du sujet pr~sente un d6phasage plus ou nvins importdnt par rapport A l'oscillation quadonne naissance au mouvement. Les di~formations finalement observees sont la 'osultante de Ilaction meca-nique et de la r6action pn~,siologaque. Cette dernidare implique une contraction musculaire stride Acormmande nerveus. li~e par cons~quent A un certain niveau d'activation des centres nerveux.
Le but ac~ 1 'etude est de mettre en 46vidence une grandeur m~canaque susceptible de rondre camptedu comportement d'un sujet expose aux vibratior.s., La grandeur envisag~e est la masse effective (rapportcomplexo de la farce dynamique A l'acc~l~ration). L16tude est effectude en laboza Caire, sur uwi primate nonhumain, grAce A l'utilisation d'un capteur do force et d'un acc~ldrom~tre plac6 au point d'application desforces. Ainsi A I 'aide de mosures tocalemont exterieures au sujet, on ob~ective un comportement dynamiquedminemment variable tout au long d'une mime agression vibratoire. L'importanco des variations obtenues surles param~tres considerds permottent maintenant d'envisager l'utilisation do la m~thode pour explorer 1ecomportement global do 1 'honmme expose aux vibrations.
INTRODUCTIONL'agressian vibrato-re m~canique A transmission solidienne, nWest certainement pas la maindre des
contraintes subies par un pilate d'avion d'arme en vol A grande vitesse et basso altitude, quo cosvibrations soient engendrees par los turbulences atmosph~riquos ou los variations do densite des massesgazeuses traversees par 1 'adronef.
Dans de tolles conditions, les vibrations m.~caniques des structures de I 'appareil sant transmisosint~gralement au pilate qui subit cette agression sans aucune parade physialagique prealable. Ilya dancdans le vol A grando vitesse et basso altitude un 616ment nouveau, qui s'ajaute aux cantraintes physiques,psychiques et psycholagiquos, ddjA nombreuses imposdos au pilate. Une charge do travail importante,exercee dans do tellas conditions, no permet qu'une adaptation optimale do faible dur~e, avant qu'appa-raisse chez 1e sujet, une baisso du niveau op~rationnel pouvant elle-m~me canduire A des fins do missiondifficiles sinon drama tiquos,
Le but do I 'etude est de mottre en dvidence une grandeur physique, m~canique, susceptible derondro compto du -amportement d'un sujet expoz6 aux vibrations.,
La grandeur envisag~e est la masse effective (ou masse apparente) quii so d~finit camme 1e rapportcomplexe de la force dynamique A l'acc~l~ration. Les travaux ant 6t realisds crn laboratoire, sur unprimate non humain do faible paids, on position assise sur uno table vibrante, utilisdo sur I 'axe z.
La masse effective ost mesuree, grAce A Ilutilisation conjainto d'un cipteur do force et d'unacc6ldrom~tre plac6i au point d'applicatian des farces. L'ltude do Ia quantification do 116nergie meca-nique, ebsorbae par une structure biologique est abordde.
Dans le cas d'une structure industriello, pour une excitation vibrataire donnde, la ruiponse4m~canique suit uno loi invarianto dans le temps la masse dynamique est constante, Dans le cas d'une
structure biologique, il n'en est plus do m~me I 'aido do mesures totalemont ext~rieures a. s.ujet, onobjective un comportement dynamique d~mineninont variable tout au long d'une mAma -!7ression vibratoiro. Surrnotro animal d'experience, do 7 A 8 kg, les variations do masse effective sant do un A doux kilo grammes.Cette dynamique permet maintenant d'envisager Ilutilisation do la m~thode, pour explorer le comportementdo sujets humains, expos6s aux vibrations l'ors do vols A grande vitesse et baise altitude,
LE FAIT EXPERIM4ENTAL- tine expdrionce simple, reprdsent~e sur la figure I est rdalisde d- Ia fagon suivante

8-2-
8.2 Une Masse exerce une force de 20 nevton sur une balance dynamiqjue (capteur de force) ellp-mirnefixde suz un qindrateur de vibrations
-En ar.scnre de mouvasent, pour une acceliration de pesanteur constante, il existe une forcestatique Hg de 20 N.
-Pour une accildration sinusofdale + ig, la Masse exerce une force apparente, instantan~e, compriseentre C0 et 40 N.
-Un anvrt~isseur plac6 entre la Masse et la balance fait apparaitre, pour une excitation identiquede + 1g, des forces dynamiques enregistrees variables ; ce sont ces variations qzzi sont 6tudides. Ainsi pourune mime accil~rati on, une variation de la constitution mdcanique du sys tdme raideur-amortissement, A Masseconstante, entraine une variatini: de la forr~e dynamique en amplitude et en phase.
FORCE ACCELERATION
M(g*6)/j~\ ONI 1 /-4? a
1LJ\ ~ .lg14
FIGURE 1HYPOTHESE
Lh~neentat qe oldedifrmbl, ubi ls ffts e tiult~os dcniuesqu Ii ontrnsiss ar1 irn 5.1 ori n eos hsooiumn dpent~nn a ams nJud
doaine debs es frquncqes se fite pafrmala , m se bi en s jeu deaboce stmuapris s exci atinacivue oui i pssivedu fumseu nearo-1scuairoef. Cett mriseetciainetan une r~os hsooium daptens 'nergime, paurc ]ae faige, en judrapr mavses ucula vlespur efcae tler cotre ps dapplicatiasdui stmluison vibraoire.Dnstetlecodin,
Leir hmanse ~ondutit on u filaeet sre. ie i onrdit une dphasagt e 'fans s rons p~ar rapport de 1a rexcition.
phsooi.Cette notion a dnn nassance gandur premieramdlesqidl m~a:ies acsystmes p luso mom opeesue
Les moibrstrios laremeront sutlis stfontutoujours acrtueflement la ponfeureatiend leur ineriparticuýjjvnet dlanors et dom~aine de a dtermiatio:r~un des.a freuencse rhyisonanuc. r e irain asc
Noaed aissces moquntaes micanitue pa leprisentent 1e dte labumain conine u ex paionmentide m assesiuvenduefs, ne renent puuas en Compte las recin actimptortentri'e uies idividus. C6es mdues sontceinvafiantuedansrpotaelavleu tealcas. etLep 'application d ocs ud dpaet strunidsmauses virtoiu mdule enrde unele rcondtoseL.'jore ideantiqe onui cmimes cus ites 1 prdientrd les mimes ffet Ors che I poinse, 1a rappliction d'unetion
forceet prduitl da des lfet a iffi ents, sc ion destat de encsio de Ia musncultr rgiiid uet, ep
et le point d'application, etc... Les modiles mdcaniques soumis A des vibrations simulent bien la reponsedypamigue de P'hoamme, mais ne rendent pas compte de la variation de catte dynamique en fonction dutemps.

8-3
Pourtant cette relation represente certainement au momns un des 6ldments (dont il convient absolumentd'apprecier I 'impo-tance, do' la d~sadaptation du piloto', soumis au stimulus vibratoire du vol grando vitesse,basse altitude.
Plac6 devant une structure A 6tudier, l'ingdnieur pose une scrie de questions visant A ddterminerlZa durce de vie de cette structure en r~ponse A des excitations connues.,
- La premid~re 6tude porte sur la caract6risation des sources, c'est-A-dire, sur Ilestimation desI fr~quencec excitatrices et leur niveau 6nerg~tique respoctif :c'est le spectre de l'excit-ation, fonc-tion diecoordonn~es spa tia-temporelles.
-La seconde caracterise le systdne vibratoire (charges propres, charges permanentes exter~eures,conditions aux limites, etc... )., Ces param~tres ayant 6t6 determinds, le nowbre de modes propros est choiaidans la bando d'excitation la plus imv~nrtaijjte. Ainsi en possession des caracteristiquos vabrat~ires (dontcerta~nes conms. les coefficients d'amortissement sont fix~s A priori pour un premier calcul), la L-ýponse du
systdme et lcs contraintes dynamiques sunt estimees., Bien stir les hypoth~ses de stabilite dyrm..r.niquo et dolinearit6 (rout au mo~ns au premier ordre) sont adoptdes,
Cor~siderons maintonant la rdponse des structures biologiquos du pilote. Pour &valuer cette reponse,le biom~canicioen doit, de manirer tout . fait analogue A celle de I 'ingenieur, entreprondre doux typesd'6tudes:
- La premi~re.porte stir le niveau energetigue des friequences excitatrices.- La seconde caracterise la reponso du syst~me.Mais quand le systdme opdrateur est un organisme vivant,il faut consid~rer les points suivants- Le coefficient d'amortissemer- n'est pas invariant dans le temps,- La reponse d'un operatour biologigue en oscillation libre nWest pas univogue., La valeur du signal
de sortie ddpend sans doute de la valeur du signal d'entrdo A l'instant consider6, mais e~le depend aussi del'etat du systdme opdrateur A cet instant-,
Pour un mime signal d'entrce F (t.), la reponse sera 6minemment variable d'une experience A l'.utre,car la pulsation propre w.
est variable car, si la Masse m de la stiucture biologixquo ost constante, il en va tout differeinment do sa"raideur" k. Pour une periode d'obsei-fation do durde raisonnablo pour tin biologiste, (.'est-A-dire, pour tinevariation do temps suffisaimnont grande, los hypothases de lincarit6 et do stabilit6 dynarnique doivent 6trerejetdes. La pvlsation w.~ et l'amortissement A restent cependant des paraz"~tres qu- caracterisent- Ia qualit6biomdcanique de la repons..-. Dens le cas d'un organisme vivant, l'-s amortissements no sont pas st'ictementvisquetix, et les ressorts ne sont pas lincaires. Airsi 1 '6quation bjen classique de 1-3 r~ponse '.'un'Springdash-pot."a une excitation F
M d2 x A dx kF
devient pour un opera teur humain
[~1dx2 I+ A (W.~,t)t Ix + zj(x (2)
Soulignons do plus qu'une telle equation ecrite sous forme rnatriciello i-plique quo Ia thcoriodes masses concentr~es s'applique avec une bonne pr~cisior ce gui a etc gdndraloment admis mais no semblopds a-voir 6t6 dPamontr6 lorsn de la mise aui point des modeles mocaniquos ;(un homme pout-il 4ýtre -linsidiscrdftis6).
on peI.t supposer quo, dans le cas des structures biologigues, los variotions en fonction du temps,de I 'dlasticitd, do 1 'amortissement sont des t~'nins do Ia fatigue do 1 organisme., Si ue plus cot to fatiguedue aux vibrations3 est lice A la quantitd d'6nergie absorb~e par l'opcrateur ef .lissipde par colui-ci dansses ressorts (museles, syst~me ATP-myosine) et 505 amortisseurs (systlemc ostco-ligamentaires) alors lagrandeur qu'il faiut prendre on consideration est tine guantit6 globale do travail rapport~e au temps, c'ost-A-dire tine puissance.
A la notion d'effet instantan46 des vibrations m~caniques sur 11homme, gui engendro une g~neponctuello (essentielleme'tt lice aux probld~mes des r~sonnances), il nous est apparti indispensable do fairetine soranation de la gt-ne instantan~e sur le temnps. Ainsi A Ia notioat do gene so substitue la notion dofatigue li~e elle-mhme A la notion do "dose" d'enertrie vibratoire absorbee.
Si P'on fait tine mesure do la reponse glcbale du syst4ýme, alors los lois regissant les vibrationsdes structures industrielles,et qui sont los m~mes pour los structures biologiques, deviennent tr~s facilementobservables.
Lhi honute assis (figure 2) exerce statiquement Sur le sidge une force e6gale au produit do sa Massepar Ilaccd6lration do Ia pesantour (g).,
Le support soumis A tine vibration, presente des motivements qui engendrent tine accdl~ration dited'entrainenent, ff La force devient Ligale aui produitde la Masse par la Soimme des deux acc~l~rations (dopesantetir et d'e:,tralnement).
Si le sujet amortit los vibrations, il presente des motivements rclatifs, donc une acc~l~rationrelative, ýi, par rapport ati si~ge. La force globale exercee par Pindividu stir -)Dn support devient dqale auproduit do sa Masse par la somue des trois acc~I6rations (pesanteir~entrainersent,relative). On d~montre quo,pour tin syjstkme masse-ressort-amortisseur, Ia force globale s'exprime simplement en fonction des soules

accelerations de pesanteur et d'entrainement.
Le travail d'une force est 6gale au produit scalaire de la force par le d~placei'ent au point d'appli-
cation de la force. Ce point d'application n'est autre que le s±hge du sujet dont le d~placement est connu
One structure soumise A des oscillations forcees ne devient 6videtmment pas hyperenerg~tique. L'dner-* gyie appliqu~e est soit transmise, salt absorb6e et dlssipde sous forme de chal cur.
9= gACCELERATION-~DE L.A PESAl41EUR
L J- DPRTI
IMAGItiAIRE
r = COEFFICIEtiT
II AMOIRTISEMEN1
F~m(u~d~g):: m g+(.l+ WFREOUEtCE IMpoSfE
(O),=REOUJEfICE PROPtiE
FIGURE 2
Mais un housie en situation dlactivate ne se contente pas generalem'-nt d'ZLie un passif dissipateurd'energie (figure 3)., C'est 6galement un transformastcur d&energiL susceptible de faire varier ses contrainte-.internes pour lutter centre 1-c ddfcf.irations engendrees par les vabrationb. on peut done amciliorer le modeledes filtrc-- pabsirs par l'adjonctlon de filtres dynanii2queS, en montage sE~rie et paraZld-le.
FORCE DEPLACEMENT
HOMME ________ SOLIDE DEFORMATION
G[NERATEUR AUGMENTATIOND'ENERGIE DE SES CONTRAINTES INTERNES - dF
dS
FATIGUE
DESADAPTATIOFI DE L'HOMMEA SON POSTE DE TRAVAIL
FIGURE 3
Les figures (4,a,b,c) scni~matisent un tel montage. Physiologjquernent, la masse centrale reprtdsenteles viscd~res qul se conduisent canine des filtres passlfs. lls pr~sentent- un coefficient de surte~nslon enrelation avec leur suspension ost~o-ligamentaire. L'amplitude des mouvements est forcemnent limit~e par1 'nveloppe musculo-squelettique.
Cette enveloppe musculaire striee est justenent reprdsent~e par les masses externes qui r6allsent desfiltres dynamiques, rejecteurs, accordables sur les frt~quences d'excitation.
Quand les structures sant parfaitement rigidifides (limite du t~tanos physlologique), le vecteuracc~ldration relat.:! de Pensemble est un vect-eur nul (en dessous de 1 g) et le module des forces dynasniquesest maximum.

8.5
Si les filtres rdjec-teu'-s physiologiqu.Žs redeviennent efficaces (c'est-h-dire Inise en jeu volontairede l muculaurestride squelettique) pour filtrer le ddplacement vibratoire engendre par le support, le
mdule de la force dynasmique reaultante tend vers un minimumn.
M M
MM M
M
MM
AT= fA1~ T A K... AG 77 uand la Phase entre i'et y -80*
A- i.,
FIGURE 4
Bien entendu, entre ces deux valeurs extr~mes se placent toutes les possibilitds, selon que le sujetplus ou vsoins rigide filtre plus ou momns les vibrations appliqudes (Ce qui eat reprefsente dans la figure(4 b) par un couplage plastique des filtres rdjecteurs.
Dans de telles conditions, la force dynamique vanie. 11 eat alors possible A l'aide d'un accdldro-mdtre et d'un capteur de force, de quantifier en N x m une dose de vibrations absorbee par un individupen~dant un temps t. De plus, ayant pos6 1 'hypothdse que la variation d'a.;sorption dans le temps de cette6nergie vibratoire par les structures biologiques du auiet est en rapport direct avec son etat dc tonic it6musculaire, nous nous proposons de verifier ces affirmations par l'.,,zalyse des signaux force et accdldration
* au Point d'application des forces.
METHODOLOGIEL'6tude prdalable eat realisee en laboratoire sur un primate non humain, babouin de 6 A 8 kg.
L'animal assis dans un sidge de contention eat soumis A une excitation vibratoire,
La vibration engendrde eat gdneralement un signal sinuso-fdal pour l'dtude des effcts de lacontraction muscula ire et un bruit blanc A bande 6troite pour lea etudes de traiteinent de signal(Transformde de Fourier, fonction de transfert, fonction de cohdrence).
La frequence de rdsonance d'un animal de 6 A 6 kg a 6td estimde en fonction des considerationssuivantes:
- La frdquence de rdsonance globale d'un sujet humair eat d'environ 3 Hz (variable selon l'etatde conscience ou de rigidite de l'individu). Au-delh de 30 Hz (10 fois la grandeur fonclamentale), onn~observe plus que des frdquences de rdsonance intdressant des organes trds particuliers, (exenple :leglobe oculaire). En prenant arbitrairement une "raideur" identique chez l'hoar-me et le singe, on apprdciela frequence de rdsonance de ce dernier par simple rap.port,
2 1
NS =[2 7 NH) 6] 2NH frdquence de r sonance de 1 hoosne
2 - 8,2 Hz N:frquned toac usig2 dqunc de r8o c dusig
masse de l'homrme to kgmasse du singe 8 kg
Ainsi, en travaillant dana une bande de bruit de 0 A 100 Hz, on 6tudie la rdponse physique del'animal jusqu'A la loe harmonique.
Oine telle 6tude impose:- tin capteur de force plac6 en sdrie entre le support vibrant et le aidge de contention de 1 'animal- UPn acceldromdtre- tine instrumentation ndcessaire A la crdation du signal vibratloire excitant lVanimal. T~te
d'excitation Bruel et Kjaer 4808- Un ensemble de conditionnefnent des signaux acquis- Le traitement arilogique et numdrique des observations reCL'illieaS
-Traitement anatogique-calcul en temps reel de l'dnergie effective, en utilisant deux intdgrateurset un multiplicateUr tel que:
WF., dr J F v.dt, r ddplacelment
r, tj v vitesse

I". L a'sVa m. '.i; i fic1cv tieaS la I '.ac'a'a'l ar., t .1v1at alac la forca' .-p~ri .s I I It.taiac' soa lila'.S conatti nues, c 'uLs t -)~-dlire-, qaprts .,voir fait abstraa i,-i efi.
I',aa'a'a 'rat ioni dt, pe.atitoir at (III potias dva I '.III final
-Le traitement numnrique 6tudie:-I.l aliuss d.aaynafltia i qa do 1 'an llti, , If fa i..sasat Io rappara I 1 r;lrami, doTlln 'a. SI,-
no Un a'r, deas si qna ox force- 'I aoa acc zxt~a tion ( lonct I n dca. t ra lislart P l/1
-It! dt; 'has~aijt forc'a. vi ttssa,- la lli ssalica' iiaiJlquo .alsorir.'a jlu I 'ala mv1.
PROTOCOLF EXPERIMENTAL- i;:All IIdIN'! lr'IIN plli1 Wi ~NTrlW'lION (lPlaa1lll;
l"a tairmca (III Si; Oralid t ria,'lnae o I siionl IV 1 a1 11 151 ,1 snauntis .1 7a'tjria'lati a
(att Pto ;itiol dolnt *,tro 'la phis;lli;'iaaaiia. ;inssiblo. 11 cst Iaa'a'rsairo di''-vi tar ].I z'laava'Iaaa (h01)1(1r~a't ins ,inrsc'ulairc-s .1 vitaw'o nt al.ijz W ;aa rtuarlaarahlant ajravonarit I 'at aida. Iaw lust.' doa I'.1laimr.a Ialit ral I, I a'I ota'nt: st.ali b sa I I IN)t 'I. v Ia' lra' s Ili~oaava',nIts dot qr, aim Iv anp Ii I ti h-n, pri It ic'aaI blaralimiaat taO dm ai -
U Tot J itan 'ra)-podst a'l'lr'a -af Ii-~taraa vr la's triaim-'riatza doa ranatimin. t.antimal loia'a lfaiara ytpa-ltisos inomi,- iis tir Lill p11,111 l~i Ia ihaido' iii TSOFI1i.-atd.' the I ~q O iOý1 so siua 1oil do ala'laIrqaai.ol'1.iia a
dtI Si ia itls 1)1. COWa;truT a.-if11 NIV A AV' IWIU7NI. l'R)C'IIAL 71 aa) ilif, 110 l son'tt pa' dct ala od tan la vibr', ati.1 ataan;i.t rid at ilv.s stintt.nail vibfr.atri ra S;ocondii.aroa I.aiaF l a lamha ~il'srtaora' ,i illniTasolait'a, a't saa fIra ; alatada' I l1fi a'
FIGURE 5 FIGURE 6
L A l'AflL VIRRANTF FILtEaTRaatYIIAMIQIIF tFIC.1t'w aW,taast utaa t~alal tiraaol at Kj~aar taqpaa 41?,,S "lliq Ila'.al 7*.#l'1a'" atllia'a'' l, a aais aa' dcaia 'Iaia'a-p
2.1 ioia qaai a '117m1ar10aa elaria iralraat
vu aar alo 1 foaaa' t ira ý II I r' i.' rampal 2 icat.a i a'rT.' Jo J usts~laywa' of a. * -708, aa t ai j*j--I ~~Jvro'at1o a'taipa 43J.1, Lin amplii fla I a'a condittaiiotnlta'tr ti.p ajra .a..t.axa'urs iota taatal' ala' l~a tablela. (acra'
1ta j Ciet
ast ala' 14' lintl. Lorsala,'oz ala'sira' fairo vil'ra'r aria stii tur,- wita' ,alaraolj 10 l mat lm~al dalras ,aaatra' a't ual) do. m~arnsi Msous uaj a'. aa'.'I, a
1Atinnl y, IIloa aiYoa raaauis Na'alt F - MV. Kitjs il I'ait ti a"iir dfrt'llr a' ivmn ar. aat, la l~a sonwlta alas
misses aa do I'al-Ujllata' aloitlalIa nayolns ala- coatatta'ntion dc Ia.2'.aaimal, plart-ali, ca'l-rctaU tie-la tosraca' a-ta.'.fir lja f('c Tda' alpaamiqaaa' 1 imi te al' l~a t~ablal a'q tit' al'I71)1 N,
1oi :I7Ar) y (M lz)
IIa'1 vita't aloa.' a'S, luznita'f-a I'lla;s iaq tac.,ala I 'a'iaset'ildla ala toict'tiota ala ldraauls'
IN0ti1 la's tra'iaaataa'aa tIttTIa'lTa'rs . .21o lt.iz, f'aut Ias tacaI'teusi aliva'tt at*.ta' lris a'ta a'llllltaa.aI aajlevilmaafat prar a'xa'Illli' diazt a~t Ta ma uttala'ia ,aaa-dlassous ala.' 1') mama, a' Cat p')LT 11ua' I 'a'qipaiq~~.,''i,alila' ii'aaalra' pa'as .'laaNrIlataat .a..'a' las 'ar'aaa9 !I limi tatio da o a ia' ( ta alaaotiursil. FEttri, 21) at llX) II;., a'.' q(t1f la's jr.,indf-ursa a'la'at i talallaMax 1mg la's .aamiSS iblt's (ev~ur~ant ala' 4? A) lueaaa Inte .rviva'raraa'a
I.''txpa'ria'taa'' a Imioato Tapgit' l~a Saul.' impubinjlIasatjaa la' 1III aamil'vl,.talT' I 'tls-bcvbaorý ia'. Uarajara'aaar':t .au ,.Iiat'ý
ala-'I 21 z 0, 'aaSt gjaarqtloi 11 ti ata' gaaa'sait' al'.aataatar l~a Imisma' toltala' vzlar~atjrira, p'ar .aaljoltat i loa l'all,.

8-7
masse sismique de 4 tonnes de baton. Dans cette masse ant etoe noy~es des poutrellos de fer soudees en croisil-Ions et immobilisees, de telle sorte que la base du pot vibrant solt pazzaitement horizontale.,
Ainsi la nouvelle fr~quence de r6sonance de 1l'ensemble se situe en-dessous de 1,5 11z, c'est-a-dire,tres en deCh de notro ganmme de travail.
Dens les: conditions normales d'utilisat ion- la masse du capteur de force insta11~e sur la t~te d'excitation est de 20 kg,- la masse de l'animal est approximee A F~ kg,- la masse du siege est de 4,250 kg.Soit une charge totale de 320 N (approx.).
Comnoo Iaccoleration maxizmalo (crbte-cr~te) ne sera jamais sup~rieure A 0,5 g dans notre experience,pour eviter que la t~te d'excitation ne vienne en but~e sur le silent-bloc et detruise ainsi le capteur deforce, la force maximal o devolopplo par le pot vibrant a etc ramonee 1 1000 N (disjonction au deI4 de cettt-valeur).
- LE CAPTEUR DE FORCE (FIGURES 7 ET 8)Realis6 en AU 4G, il se compose d'un plateau superieur, d'un plateau inferieur, de troisI ailes, d'uno plaque inf~rieure et de tro--s dynamomftres.
Entre 12s doux plateaux sont pris en sandwich, los trois dynamom~tres dont los corpsd'6preuves supportent des jauges A semi -conduct'urs ,. Elles delivrent, par l'intermediaire d'un pont dejauges, des tensions proportionnelles aux forces. La sommation analogigue des trois dynarnometres donne laforce lobale exercee sur le plateau supeizieur.
La plague fixtie au centre du plateau suporiour permet par demontago rapido, do fixer unaccelerometre dans la cavit--s centrale.
Los trois 6l6nonts sensiblos sont des capteurs de force modole N. T. C. fabriguos etcommercialises par la Societe F.G.P. irstrumentation ;les caract~ristigues mantrent
sine 6tude de mesuro 100 daNDdrivo en temperature : 0,1 t/-CFldche sous charge :0,0254 mmFr~quence de resonance :5,5 KHz
Chague .It~ment sensible constitue un pont do jaugo complet. Les signaux obtenus sur les6ldments urnitaires sont amplifi~s au niveau d'un premier 6tage constitu6 de t'~ois amplificateurs analoqiquesd~instrumontation A entr,~os diff~rentielles.-
La sensibilite oest particuli~re i chacune des voies.. Le gain des amplificateurs a et6 adapte pourgue le niveau nominal do ch~icun des captours de force du tripode a l'eptref- de 1'6tag.a suivant, so~t tresexactement ajust6 A 100 mV/daN
L'etago suivant est conStitue d'un sommateur sur les entrees aux-juols ýont connectos- les trcis 616ments unitaires du capteur de force,- los contre tension do - compensation statique
- compensation dynamigue
Au niveau du sorrnatour, un pr~amplificateur a gain variable permet l'ajustement- du zero otevtrique.
La compensation statique ost realisee grAce A l'ajustement potenticn6trique d'une contre tensiondont la valour absolue est 6gale A celle gui reprosento la valour des masses placees sur le captour dA 'nrce,D'autro part, la fixation d-i si~ge de contention sur le plateau superieur du capteur &. force so fait parboulonnage serr6 do cos deux 6l6ments., Une telle solidarisation cree des contrdintos dans It? metal. Ellessont onregistr~es au niveau des 6lements sonsibles du capteur de force comme une tension continue (cit letdes an~vitables disparit~s mecaniques d'usinage), Cotte tension continue ost annulee. Dens le cas contraireelle interdirait l'utilisation du tiroir calcul par mise en saturation des integrateurs,
La compensation dynamique a pour but d'6liminer los forces dynarniques stables, c'est-a-diro, cellosqui no sont pas licos aux variations d'amortissoment d'origino biologi quo. (Elles-mt~mes en rapport avec lesacc~l~rations relatives).
Cotte compensation est r~alisee en multipliant la valour des masses statiques,,'appropriation du gaind'un amplificateur aux masses A compensor) par 1 'inverse de la valeur do I 'acceleration.,
Ainsi, tout 616ment r~gle (zero m~canique =zero 6elctrique), la mise en route du plateau viora:zt,quelles quo soient la frequonce et 1 acceleration choisies, doit delivrer une tension nulle en sort o .sommaateur.
Dans de tellos conditions, los tensions obtonues apr4ýs sorination representont dos variationsd'acco~&16ations relatives. Le gain do ce signal dynamigue est aj~stL& A 100 mV/daN,
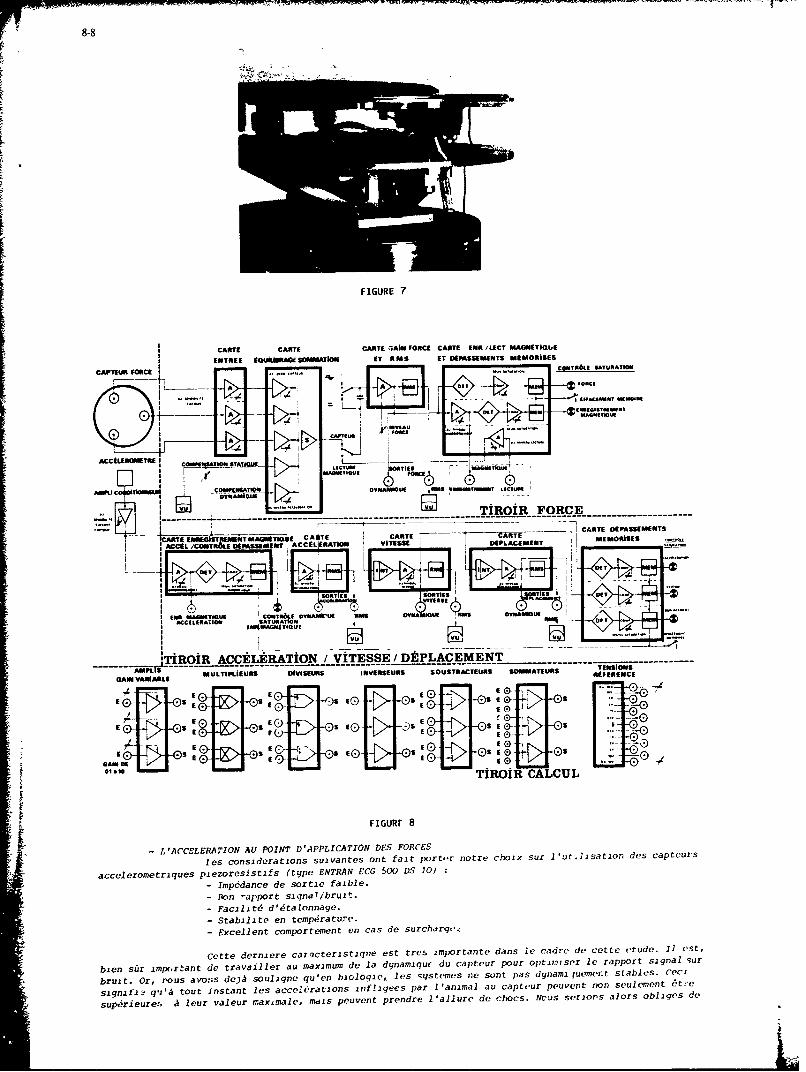
FIGURE 7
CARTE CARTE CAR1TE 1AIN FORCE CAMT ERR /IICT MAGOtiTiOIE
IENTREE iOUkWRAGESOMMAT"O ET RMIS ET EMPSSEMENTS 011MORISES
CAFTEUR FORCE I1CqNTR6LE SATURATION
AA al ORCE
_____ AC-TMEW w f
A j wasmxCPIM ISA10
(OW onCU 6
RREEFFEATiROiR FORCE---------------------- --------- ----------------
CARTE OSMISEMIENTSNMI TMG~TI ECA TE CARTE CATI MERSE
CCELEMI ACC RATiON viTES DEPLACEMRENT IEOMIn AT A PET -
WRT a as OT -
!TiROiR ACCELERATION V VITESSE IDtPLACEMENT -----------
GAM YARIA&LE MULTiPLIEURS OIVISEURS INVERSEURS SOUSTRACTEURIS SOMMNATEURS REFERENCE
-- (D E. &~ QE
E.S ~ EQ (D .)IO~t -0s E0QS. EQS. I (D -s nD EQ [IIK-O
GA. S EQQSE
MiOIR CALCUL
FIGURr 8
- LACCELERATION AU POINT D'APPLICATION DES FORCES
res considerations suivantes ont fait portor notre choix sur Ilut~lisatiofl des capteurs
accelerometriqlles piezoresistifs (type ENTRAN ECG 500 DS 10)
- Impedance de sortic faible.
- Pon -apport siqna7/bruit.- Facilit6 dletalonnage.- Stabilite en temperature.
- Excellent compartement en cas de surcharge.
Cette derniere caracteristiqulC eSt tres importante dans le cadre de cettv etude. 11 est,
bien stir important do travailler au maximum de la dynamiqu( du captour pour optmiso5r le rapport signal sur
bruit. Or, r'ous avo.,s dejA souligne qu'on biologie, les qystemes no sunt pas dynami luemert stables. Ceci
signil'i2 qj'iA tout instant les accele6rations infLigees par l'animal au capteur peuvent non sculement 6t:-e
sup~rieure.-, A leur valeur ,rraX~male, mais peuvent prendre l'allure do chocs. Nous seriors alors obliges do

U travailler i bas naveau avec des capteurs a grande dynamique, donc avec un mauvais rapport signal/brui-
L'arcclerometre utili1se optimise ce rapport pour une etendue de mesure de 10 g (deplace'nent de 2 mmcri~te A crete a 50 Hz, sinus), tou~t en ddmettant un dopassenent sants deterioration de plus de 10 Lois savaleur nmaximale.
Le signal accelerometrique conditlonn6, 6talonne a 100 in V/rn/s est alors disponible selon deux modes?non exclusif s):
-Enregistrernent sur magnetique d'instrumentation.-Poursuite en ligne du traitement du signal accelerometrique i'integrations repetees pour obtentaonde la vitesse et du d~placernent du capteur de force).
Les valeurs efficaces de ces troir parametres (acceleration, vitesse, deplacement sont dispontblesA chaque etage, -,oit en phase, soit en inversion de pha'te.
I ~Le traiternent numerique du signal n'appelle pas de remarque particuliere puisqu'il est r~allse"zen ligne" apr~s ajurtce'nent des niveaux, par analyse en temnps r,~el sur anal yseur "Spectral Dynamics 360".
Deos lors, l'etalonnage dui montage experimental est 1is suivantI a) - Etalonnage de La chaine d'excitation 8 et K- Etudo du spectre du signal vibratoire en mode sinusoidal ou en bande de bruit de 100 liz.- Etude de la regulation par compression.- Etude des acc~l~rom~tres.
b) - Eta tonnage de La mesure d'une masse-Etalonnage du cap ceur de force
- Etalonnage statique :apr~s mise en place de masses marquees sur le cap teur deforce, les forces enregistrees sont compardes A celles qui sont exercees parles masses connues (6talonnage statique).
- Etalonnage pseudo-statiaue :obsePrvation de l'6volution de la valeur moyennede la force developpee par une masse connue, soumise A un deplacement recti-ligne sinusoldal.;
- Etalonnage dynamique :diffdrentes masses marqid~es sont placees tour j toursur le plateau. Un mouvcment rectiligne sinusoidal asservi sur l'accelerationest appliquide A la masse. Les forces dynamiques corresponcantea stint enregis-trees en f',nction du temps. -eurs valeurs efficaces sont relevees.
c) - StabiLit6 des r~suttats en condition normate d'utiLisation- Une masse connue est sct.. tse A une tizbrat~on dont l'amplitude de l'acceleration estdeterminde. Les valeurs enregiatýLeS sont comparees aux valeurs calculdes.
d) - Etude de La masse dynamique- Mesure du rapport de la force instantanee A 1l'acceleration instantanee d'ur.e masse de
valeur connue, placee au cericre du plateau.,
Les moyens mis eni oeuvre pour etudier les variations de masse dynamique et de 1 'absorption del'enerqie vibrato~re d'un animal en fonction de son niveau de tonicite musculaire sont decrits dans lerapport N*3399 EASSAA/CTRMA/RPCH (1979) (QUANDIEU et coll.). La coherence de cet 'asemble ete-nt prouv6,l'expdrimentation animale s'effectue selon le protocole suivant (figure 9)
- Anesthdsie de l'anima- A la ketamine.- Fixation de l'animal sur le siege de contention.- Fixation du sidge sur le capteur de force.- Branchement de l'appareillage mdcanique et electronique.- Atte-te d'une heure pour obtenir la stabilisation en temperature du montage electrique
et 6lectronique.- Vibration de l'animal conscient, puis anvathesie en fin d'experience avec enregistrement:
- de la force dynamique,- de 1'acceleration au point d'aplcto des forces,- de la masse dynamique,- de la fonction de transfert (en module et en phase),- de la fonction de col'drence.
L'experzence eat suivie 'Ln con tinui'par enregistreinent analogique sur enregistreur papier GOULD 2600.
L'enregistreinent sur magndtique analogique permet de calculer en diffdrL& l'dnerqie absorbde A partirde la fonction d'intercorrdlation force vi cease.
RESULTATS - INTERPRETATIONEn prealable A l'experience, on a rdalis6 sur un animal,h titre de vdrification, une etude de
transmissibilit46 de l'acceleration du si~ge vers la t~te, La fixation de l'accdldromdtre sur la voutecrAnienne eat realisee tr~a classiquement p~ar solidarisation du capteur avec du ciment dentaire (1'extori)colle et visse sur la table externe.
Lea enregistrements 10 et 10 bis prdsentent lea transmissibilitds obtenues chez un animal 6veille,puis chez le mime animal anesrhdsie at. Nembital IV excitcs en bande de bruit de zdro A 100 Hlz,
Le trace infdrieur reprdsente le module de la fonction de transfert, le trac6 supteriear la phase.L'arimal 6veilld se crinporte effectivement commue un filtre passe-baa dont la diminution d'amplitude A 3 dBse aitue trds grosaidrement vera 60". Apr~s anes'thdsie a'inscrit une resonance yen., 15 Hz qui n'apparaissaitpas claireinent dans 1lý cas de l'animal tonique. Ceci montre bien que le filtrage realise par l'animal vanieselon que ce dernier vst dveill6 ou endormi., on conatate d'ailleurs une variation de la pente de la ph~ase,

8-10
sans pue !'on puisse dans 1 'avancem.int actuel do nos travaux prdCisez 5 'il existe une relation entre module
44I. -4
FIGURE 90
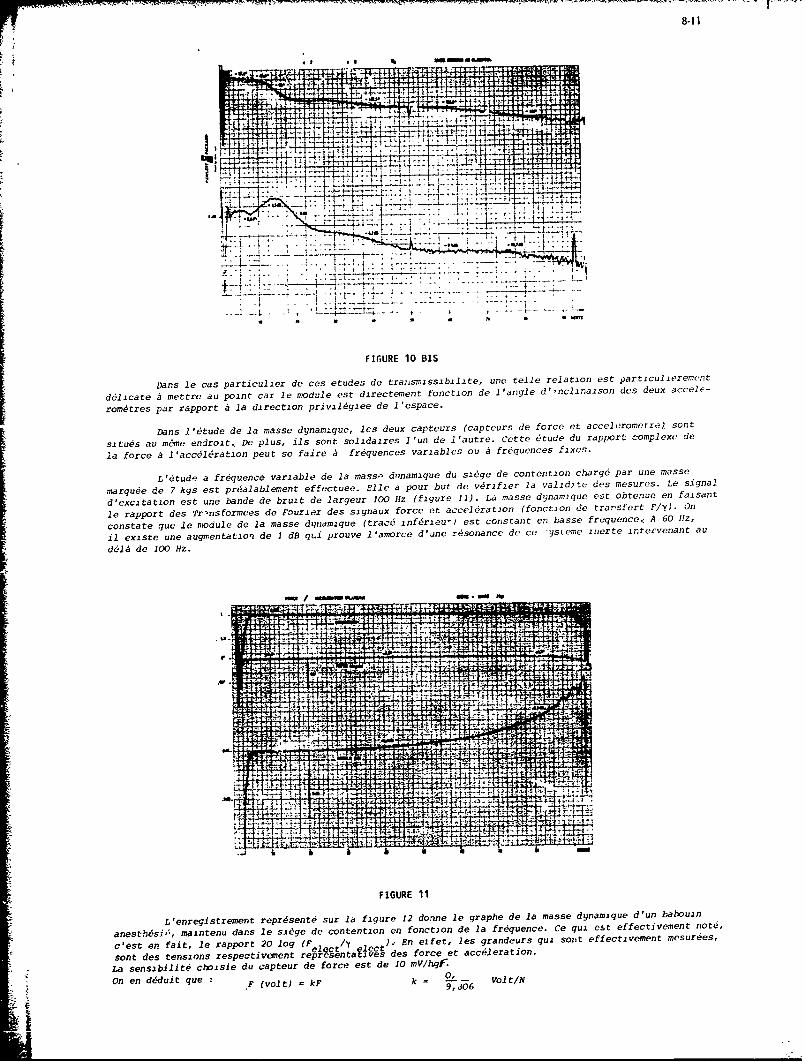
FIGURE 10 BIS
Dans le cas particulier de ces etudes de traznsmissibilite, une telle relation est Partizcul ieremeflt
delicate A mettre au point car le module est directement fonction de l'angle d',nclinaison des deux accele-
rom~tres par rapport a la direction privil~giee de l'espace.
Dans le6tude de la masse dynam-que, les deux capteurs (capteurs de force et accelerometre) sor~t
situes au' m~me endroit., De plus, ils sont solidaires Pun de lautre. Catte 6tude du rapport complexe de
!a force A l'accdl6ration peut so faire a fr6quences variables ot' A fr6quences fixes.
L16tud'e a fr6quence variable de la mass.- diinamique du siege de contention charg6 par une masse
marquee de 7 kgs est prdalable~meflt effectuee. Elle a pour but de verifier la valid.'t& des mesures. Le signal
d'excitation est une bande de bruit de largeur 100 Hz (figure 11). La masse dynamique est obtenue en faisant
le rapport des Tr'nsformees de Fourier des signaux force et acceldration (fonction do trarsifert Fly). On
constate que le module de la masse dyndmique (tracd infdrieu-) est constant en basse frequence.5 A 60 Hz,
11 existe une augmentatiog de I dB qt~i prouve l'amorce d'une resonance de ce -ysL-me inerte intervenant au
delh de 100 Hz.
MWFIGUR *A%
L'erei~remfl rprdene ur a igre 2 one e gape e I mss dyamqu-4,n abui
anesth~~si'X maneudn esbed otnine ocin eI rqec.C u - fet mn oe
c'est~4 ený fat erpot2 o F / . neft esgadusqisn fetvmn eue
ecTeec
sotde enseinstrespcm efent repr e6sentla fivues de2 force let accelderation.ynmqu du bbo
La sensibilit6 choisie du capteur de force est de 10 mV/hqf.
on en d~duit que F (volt) kF k 9,06 volt/N

r 8-12
IV
FIGURE 12
De uwine, l-, sensibilite de 1'a'c ýlc~rommtre cst de IV/q.'
One ydi u elect (volt) = k'y k' volt/rn/s
Ainsi F (elect)20 log = 20 log 2L0,21
y (elect) kOn voit que 20c- lgFel.) = +4 dBA 15 Hz
y(elect)
Alorý. 20 log 0,1-= 4
et -= 15,8 kgY
Cette masse comprend aussi bien sur, !a Masse du siege, celle du plateau superieur et une partie de* ~celle des 616ir~ents sensibles du capteur de force,
Cette Masse "siege" est d~ternin~e de la m~ine fagon, A partir du graphe obtenu, en etudiant la Massedynainique du sidge non charg6. La masse "si~ge" ainsi 6valu~e est comprise entre 9,3 ka et 9,5 kg.
Dans ces conditions, A 15 Hz, la valeur de la Masse dynamique du sidge est 6gale A 15,8-9,4 = 6,4 kg,* ~alors m~ine que la ma'-se statique de l'animal est de l'ordre de 8 kg,
Aux fr~guences 6lev~es le rapport F d~croit., 11 atteint sur le trac6 une valeur de 0 dB (20 log0,1 F = 0 dB =* f = 10 Ag) vers 70 Hz. y L'animal filtre alors parfaitement les vibrations., La masse
dynamique tend vers zdro. L'amplitude cr~te A cr~te de la foz..e exerc~e par I 'animal sur son support decroitcomme sur le dernier tracd de l'enregistrement du fait exp~rimental (figure 1). Une d~croissance apparentede la Masse dynamigue est observ~e en dessous de 5 Hz. La chute de la fonction de coh~rence dans cette bandede frequence (0 A 5 3iz) indique clairement la non validit6 de la mesure, En effet, un syst~me d'excitation6lectrodynamique ne permet pas 1 exploration des fr~quences inferieures A 4 ou 5 Hz. En r~alit6, cosine unfiltre passe-bas, A tr~s basse fr~quence, la Masse dyna'migue tend vers la Masse totale du syst~me, environ17 kg (+ 4,6 dB).
Dans 1'6tude A frequence fixe, le signal d'excitation est sznusoidal A 15 Hz, tdonc dans une zone der~ponse de l'anin'al (cf. figure 12) et dans une zone ou l'amplitude cle la reponse du ri~qe, en fonction dela fr~quence est constante (cf. enregistrement n* 11),
Les experiences sont men~es con form~ment au protocole cit6 (page B9-6)- Anesth~sie douce de l'animal A l'imalg~ne inti-veineuse (7,5 mg.kg).- Mise en place du babouin dans le si~ge de contention.- Attente une heure -. veil de l'animal avec stabilisation en temperature de l'Lolectro-nique.
- La dur~e de l'exposition aux vibrations est variable selon l'etat de nervosire do l'animal(g~n~ralement de une A trois heures).
Les valeurs efficaces de l'acceldration et de la force sont tracees apr85 filtrage des composantescontinues, repr6sent~es par l'acc~ldration de la pesanteur et le poids de l'animal.ý L'etalonnagp de la forceefficace, effectud en fin de manipulation (figure 13) est obtenu en remplacant I animal par des massesmarqu6es de 2, 3, 4, 5 kg etc.., Cette facon de proc~der nous permet de d-4duizre la valeur de la Masse effective,exprim~e en kg A part~r de l'enregistrement de la force. Nous parlerons ainsi indifffiremmnent de force ou de
* ~~masse dynamigue, puisque I acc~l~ration est maintenue constante tout au long de 1 'exp~rience. Le d pha sageforce-vitesse est 69g-lement relev6 a~insi gue la puissanre m~canique absorb~e par l'animal. Plus pr~cisement,4

8-13
on calcule la valeur de la fonction d'intercorrelation force-vitesse prise i l'origine des temps.
Cf.. 4'l-t) 2 f(t) v(t-V) dt
-T2
Si f(t) et v(t) sont lps forces et les vitesses instantanees, alorS
Cf (01T) =- I 2 f(t) v(t) dtI, ~ TI2est la puissanlce rnoyenne absorbee par le systems? pendant le temps T.
FIGURE 13
La figure 14 mo'atre les rcssultats obtewis chez un babouin soumnis A une agression vibratoire sinus,15 Hz, de 0, 20 g efficace, On observe e'emblt e que la masse dynamique de l'animal varie entre 3 kg et 6 kg,donc une variation de 3 kg uniquement en relation avec son etat de contraction,~ Cette grandeur est extremementimportante au regard du paids statique de l'animal egal A 6 kg.. 5il se comportait comme un bloc rigide, unebrique de 8 kg par exemple, la masse dynamique serait 6videmment constante et egale A 8 kg. L'allure 16g~re-ment ascendante du tracd de la force efficace merite d'btre remarquee.. Elie ne s'accompagne pas d'une modifi-cation apparente du comportement de I animal :postLre, tonus, etc. .,. La mesure est probablement plus finequ 'une observation visielle. Line etude tr6Nsinteressanteebt celle qu' met en relation la puissance absorbeepar l'animal, la masse efficace et le de~phasage force-vitesse,
U. .....
V.YA
FIUR.1

8-14
Sur la partie du trace notee 1, on constato une augmentation de la puissance absorbee en relati-on
avec uno baisse du dephasage, la force efficace etant relativemont constante. Dans la partie notde 2, la
puissance absorbee diminue en relation avec une baisse de la force efficace, 1e dephasage roste relativement
constant. Dans la partie notee 3 (figure 15), la force diminue, la phase diminuo, les deux effets sent
opposes, I erergie dissipde vanie peu.
Dans le cas ou Il'animal est d'une taille suffisante pour quo ses pieds prennrnt appui directement
sur la table vibrante, il apparait une dir'n,n:tion tres importante de la masse dynamiclue qui tombe a 2 kg.
L'animal filtre alors tres bien los vibrations a l'aide de ses menbres inferiours, alors que la puissancedissipet ~'mbe a 120 mW ot quoý le dephasage force-vitesse augmente.
Le resultat le plus evident de cette experience est que les hypotheses strictement mecaniques
concernant lutilisation d'un acceldrombt.re et d'un capteur de force pour tester en continu et a l'exterieur
le tonus musculaire d'un individu soumis a deos vibrations sont parfaitement veri1ides.,
Le5 variations do la masse dynamique, d'un animal de faible poids soumiS a des oscillations de
faible vnezgie sont importantes (environ deux kilogs dynamiques pour 8 kg statiques, II u<st 1onic
parfaitemcnt licite de faire maintenant les enregistremonts chez l'hommse. Un tel resultat serait particu-
lierement utile dans le cab du vol A grando viztosse et basso altitude, Ej, effet, 1e pilote exerce le plussouvent une force resultante perpendiculair,? au plan du siege.. Les energies vibratoires &rngendrees dans cot to
configuration de vol dtant importantes, on -eut penser que l'uno quelconque des qrandeurs, masse apparente,
dephasage force-vitesse, puissance absorbee, ou les trois A la fois, donneront des renseignements tres pre-cioux sur I 'e6tat physique du pilote, voire m~me do bon niveau do conscience.
IE ie
T 4 IW'aMMMMMM
ti. kiw
FIGURE 15 FIGURE 16
L'interprdtatiofl biom6canique do ces r~sultats ost partactullremont delicate.. En offet, los expe-* riences montront gu'un filtrago par los membres inf~retious (fig. 16) provoquent une diminution de la puis-
* ~sance absorbeo., Co qui est parfaitoment coherent avoc los donnees des enregistrems-nt. 14 et 15,
Cepondant, une structure biologi quo vivanto et conSCionte no pr~sente aucun des caractbres math6-matzcrues do lineanit6, do stacionarite, de causalite qu: pormottraiont une interpretation simple desresultats Line experimentation conauite chfz 1 homme permct trait au momns de h~er uno ca rc, connt'e etoxprimee par le sujet i un effot roconnu et interprdte par 1 'oxpenimontateur :ce qui ost impossible dans1e cas oz) 1e sujet d'experienco est un animal.
CONCLUSINSDans Ic cas d'une sLructuro industrielle, volt -no excitation vibratoire donnee, la roponse moca-
nique suit une loi invanianto dans 1e temps. Dans 1e cc:s d'une structure biologique, iA Wen est plus do* ~m~m,?, Profitant do cotte opportunit6 coacornant la variance des rosultats, on a pens6~ POUVoir7 suivre le
vomportement dynamique d'un pilote en vol A grando vitesse et A basso altitude A l'aico dL mcsures totalo-mont extezieures A l'Andiv~du. Cos mesures effectu~es A l'aide d'un c-ipteur do force .ýt d'un acceleromoftiep.ace au point d'applzcation des forces pormettent do calculor los valerrs des masses dyne-Piques (definjosromme 1e rapport complexe do Ia force A 1 'c_ýleration), ic 1'4phaisage force-vitesse et la puissance dissi-pee dans los amortissours biolog..quos.
Line excperience prealable 3 et6eof fectudo suz un animal, :'rimato non humain, zfsis dans un sidge docontention. Los donnnees exporimentales montront le bien-fonde des ýypoth,6ses et Ia cooluniew do., frdut':t!

8-15
obtenus. En particulier, l6tendue de mesure cancernant les variations de riasse dynami que nous incite &penser qu'il est judiiclux d'utjliser cette technique pour suivre non seulement 1'etat physique mais6galement le niveau de conscience d~un pilote soumis Al une agression vibratoire A transmission solidienne,
BIBLIOGRAPHIE
(1) ANDERSON, W. R. Empirical model of intracranial pressure and head motion resulting from aROSTER, R.A., vibrating seated rhesus.h'ILLEMS, G.C. Aviat. Space. Environ. Ned. 49 '1) pp, 240-252, 1978.
(2) ANGLIE, J.C. Perception visuelle et mouvements de la tate soumise A des v..brations.MALVACHE, N. 1978, Rapport de synthdse, Direction Rech. et Tech. PARIS.
(3) BERTHOZ, A, Protection de l'homme contre les vibrations.
Lab. Physiol. C.N.A.K., PARIS, 1969, 160 pp.
(4) BHATTACHARYA, A. Parameters for assessing vibration induced cardiovascular responses in awakeKNAPP, C.F. dogs.Mc CUTCHEON, E.P. I,~ AppI. Physiol. Resp, Environ. Exercise Physiol. 42 (5) pp. 682-689, 1977.EDW'ARDS, R.G.
(5) BURTON, R.R, Positive + Gz accelpration tolerances of the miniature swine :Applicationsas a human analog,Aercspace Med., 44 (3) pp, 294-298, 1973,
(6) DUPUIS, H. Human exposure to whole-body vibration in military vehicles and evaluation byapplication of 1501DIS 2631.1974, AGARD CP 145, Vibrations and combined stresses in advanced systems.
(7) DUPUIS, H. Uber den Sin flusz stochastischer (mechanischer) Schwingungen auf physiologischeFEUERLEIN, X.G. und psycholo,,ische Funktionen sowie auf die subjekti~ve Wahrnehmung.FREUND, J.L. et Coll. Wehrmed, Nonatschr., 1974, 18, 193-204.
(8) DUPLYIS, H. Vergleich regelloser Schwingungen eines begrenz ten Frequenzbereiches mitHARTUNG, E. sinusfarmigen Schuingungen hinsichtlich der Einwirkung auf den Menschen.LOUDA, L. Ergonomics, 1972, 15, 23 7-265.
(9) EWING, C .multi axis dynamic response of the human head ari neck to impact acceleration.THOMAS, D.J. 1978, AGARD CP 253, Models and analogues for the evaluation of humanLUSTICK, L. b-odynamic response, perfoimance and protection ;PARIS.
(10) FLOYD, N.M. Effect of whole body vibration on peripheral nerve conduction tiLme ir. theBRODERSON, A.B. Rhesus monkey.GOODNO, J.F. Aerospace Med., 44 (3) pp, 281-285f 1973.
(1 1) GIERKE NVON), H.E. Technical evaluation - Preface - 1374,AGARD CP 145. Vibrations and combined stresses in advanced systems,
(12) JEX, R.H. Progress in measuring and Modelina the effects of low frequency v.ibration onMAGDALENO, R.E. per formance.
1978, AGARD CP 253, M.adeil. and analogues for the evaluation of humanbiodynami~c response. performance and protect-ion ;PARIS.
(13) KALEPS 1, Prediction of whole-body response to impact forces in flight environments.1978, AGARD CP 253, Models and ana~logues for the evaluation of humanbiodgnamic response, performance and protection ;PARIS,
(14) KAZARIAN, L.E. Identification and classificatior of vertebral fractures following emergencycapsule egress from military aircraft.Aviat. Space Environ. Ned., 49 (1) pp. 150-15 7, 1978
(15) KAZARIAN, L.E. The dynamic biomechanical nature of spinal fractures and articular facetBOYD, D.D. derangment.Von GIERKE, H.E. 1971, AGARD CPP N' 88, Linear acceleration.
(16) LANGE, W. A review of biomechanical models for the evaluation of vibration stress.1974, AGARD CP 145, Vibrations and combined stresses in advanced systems,
(17) LE POLITRE, F.X. Analyse et traitement des mesures des courbures du dos d'un sujet dans leplan sagittal, mod~lisation et application bjomecanique..1979, THESE ItvG., VALENCIENNES.
(18) MERTENS, H. Das dynamische 7erhalten des sitzenden Menschen unter Beschleunigungseinfluss.Those Ingenieur-Docteur, Falkultdt fi~r Maschinenwesen der Rheinish-h'estf.dlischen Technischen Hoschschule AACHEN, 1976, 118 pp.
(19) OPNE, D. A maathematical model of spinal response to impact.LIV, Y.K.ý 1971, I. Bicmechanics, vol, 4, pp. 49-71,~

8-16
(20) PANJABI A three dimensional mathematical analogue of the spine structure : acomprehensive approach.1978, AGARD CP 253, Models and analogues for the evaluation of humanbiodynamic response, performance and protectiop ; PARIS.
(21) QUANDIEU, P. Quantification physique du stress vibratoire mecanique chez 1'homme etCAILLER, B. I 'animal.BORREDON, P. Rapport n- 635/EASSAA/CERMA/RECH du 11 f~vrier 1976.,
(22) QUANDIEU, P. Determination of biomechanical parameters of man's vertebral muscular axis.CAILLER, B. European Symposium on life Sciences Research in Space, COLOGNE, PORZ, 1977PELLIEUX, L., (E.S.A. SP-130), pp. 335-341.,BORREDON, P.
(23) QUANDIEU, P. et coll. Etude de la propagation des vibrations m~caniques le long de la colonnevert~brale.Rapport n* 3399/EASSAA/CERMA/RECH, PARIS, 1979.
(24) STURGES, D.V. Laboratory studies on chronic effects of vibration exposure.BADGER, D.W. 1974, AGARD CP 145, Vibrations and combined stresses in advanced systems.SLARJE, R.N.WASSERMAN, D.E.,
(25) VOGT, L.H, Effects of transient vibrations on human safety and performance.1974, AGARD CP 145, Vibration and combined stresses in advanced systems.
-i
-1
:1

8-17
[ DISCUSSION
DR. J. CLEMENT (BE)
Pourquoi avoir employd un bruit blanc come signal d'excitation plutdt que des signaux sinusoidauxsi.npards puisque le syst~me W'est pas lindaire?
AUTHOR'S REPLY
Nous utilisona une excitation en bruit car elle fournit tin bon test de lindaritf et tine approcherialiste pour 1'Etude des vibrations m~caniques en biologie.
1 - Le systbme m~canique conatitud par l'animal poassde h priori une plageob il ent lindaireide lindaritd.
2 - 2a Dans le cas d'une excitation sinusoidale pure, la fonction de cohdrence entrde-sortie peutavoir une valeur dgale h 1 h la frdquence d'excitation, que le systbie considdrd soitlindaire ou non lindaire.
2b En fait, l'excitation n'est jamais purement sinusoidale (distorsion du pot vibrant). Le"faysthme animat'" eat slams excitd par un spectre de raies harmoniques. Si le systbme eatlindaire, ls cohdrence est fgale h 1 pour toutes lea frdquences d'excitation, elle vaut 0partout ailleurs. Si le systbme eat non lindaire, elle peut toujours valoir 1 otir lefondamental. tile ddcroit plus ou momns stir len harmoniques, suivant i'importance de la nonlindaritd. Ainsi, pour une excitation dont le fondamental eat 1 60 Hz, la distorsion semanifeste Al partir de 120 Hz, ce qui n'eit pas visible ai nous observons la bands de 0 t100 Hz. Ce test de lindariti eat alora valable h condition d'avoir une bande de friqucnced'observation dipassant largement Ia bande d'excitation. On perd alors en pouvoir derisolution.
2c. Dana le cas d'une excitation en bande de bruit 0-100 Hz, Ia cohirence eat de 1 dans Is mdmebande si le syst~ine eat Vn~aire. Par contre, une nonlingaritg entraine une distorsion parintermodulation faisant chuter Is coh~rence dans la mime bande. Noun disposons sinsi d'unbon teat de lingariti. C'ent tine raison pour choinir 1'excitation par bruit,
3 -La comportement de l'animal d~pend du spectre d'excitation, et risque de varier en fonction decelui-ci et clent d'iler ce que noun observons. Cela interdit l'utilinstion d'un baisyagesinus I vitesse lente car Ia contraction musculaire de iVanimal, c's-1dr son itat mdcanique,varierait au cours de Ia mesure. Noun cherchons en effet len charactiristiques micaniques dusyst~me dans un 6tat constant. Une excitation aimulanie I toutes lea friquences, pr~cise nietixl'Etat du systhie.
4 -Enf in, le choix d'une excitation en bsode de bruit noun semble une approche rialiste del'environnement vibratoire micaniqtie de 1'houmme.
DR. J. CLEMENT (BE)
Comment expliquer la chute de votre fonction de coh~rence aux frfiquences basses?
AUTHOR'S REPLY
Une chute de la valeur oa Ia fonction de cohirence 6tant observie, qu'il y sit (fig. 12) ou non(fig. 11) tin animal sum Ia table vibmante, montre qu'ii ne s'sgit pas d'tin 'prL.i1lme biologique".
En banss frdquence, lea acc~lirations obtenues sont foibles. Il en eat donc de mime pour lea forces.La rapport signal stir bruit den assures Etant mativais, Ia cohirence chute.
En trks basse frdquence on pourrait remplacer Ia assure de l'accildration par celle du ddplacement.

-- 9-1
A METHOD FOR STUDYING HUMAN BIODYNAMIC RESPONSES TO WHOLE-BODYZ-AXIS VIBRATiON
J. C. Guignard, C. L. Ewing, G., C. Willems, W. Anderson,W, H. Muzzy III, D. J. Thrmaas, and P. L. Majewski
Naval Aerospace Medical Research Laboratory DetachmentBox 29407, Michoud Station
New Orleans, Louisiana 70189United States
SUMMARY
This paper describes the methodology used and presents some illustrative results obtained in current experiments todetermine the transmissibility of mechanical vibration to major axial segments (pelvis, upper torso, head) of the seatedhuman body vibrated in the z-axis. Factors influencing transmissibility are mentioned and the importance of controllingsuch factors in experimental determinations of the human biodynamic response to vibration is discussed. The methodologydescribed, adapted from established use in human impact studies, includes the use of standardized anatomical coordinatesystems for data reference, which is essential to the meaningful comparison of responses measured in different subjects orin different conditions of vibration.
INTRODUCTION
In the proper study of the biomedical and psychological correlates of the human inertial response to force and motioninputs, it is necessary to make precise and repeatable determinations of the inertial response of body segments of interestand, for comparative analytical purposes, it is essential to be able to relate the segmental motion to clearly defined andpreferably standardized anatomical coordinate systems (1, 2). Yet perusal of the published literature on human response tomechanical vibration or impact shows that the use of man-mounted inertial instrumentation in -uch a manner that meaning-ful and repeatable observations of skeletal motion can be reliably made, and related to a precise inertial frame of reference,has rarely been attempted and even more rarely achieved. As a rule, previous investigators, particularly of 'he humanresponse to whole-body vibration (3), have satisfied themselves with estimates of the distribution of mechanical force ormotion within the living body, based upon acceleration or displacement measurements made at the subject's seat, or havedrawn conclusions - perilously subject to experimental error and artifact - from data yielded by instrumentation attachedto arbitrary points on the body surface (sometimes located on soft tissue areas of undetermined dynamic characteristics).Such measurements have not, as a rule, been related to any properly defined anatomical coordinate system.
Using a man-mounted ;nertial instrumentation array and data reduction techniques already developed and provenfor impact research at our laboratory (4), a series of experiments is underway to determine the seat-to subject and point-to-point (intersegmental) acceleration transmissibility of low-frequency whole-body vibration in man. This inte.im reportdescribes approaches to the methodological standardization of certain aspects of human vibration experimentation, includ-ing the manner in which vibration is applied to the subject; the control of certain biodynamic factors (such as the subject'ssitting posture) that can modify measured vibration transmissibility; and the acquisition and normalization of data obtainedfrom vibrated living subjects for the purposes of comparative analysis between different exposure conditions, different sub-jects, and different species (5) used as human analogues in vibration and impact research.
METHODS
The subjects currently used in this program are young Navy enlisted men who have been medically qualified specifically(6) for participation in biodynomic experiments. The use of these volunteer human subjects is in accordance with SECNAVInstruction 3900.39A. Every subject is equipped with individually molde. instrumentation mounts designed (4) to fasten rigidly3-dimensional accelerometer arrays externally to the bony anatomy at the pelvis, the first thoracic vertebra (T1 ) and the upperjaw. An additional mount carrying rate gyroscopes is fixed over the calvarium. The pelvic mount, formed by two half-ringslocated upon the bony prominences of the subject's pelvis, also serves as part of the restraint system used to secure the subjectto the vibrating seat.
The use of these instrumentation mounts permits the instrumentation to be precisely and repeatably located with respectto the subject's bony aiiatomy during every run; and the precise and repeatable location and orientation of the functionalelements of the transducers with respect to defined anatomical landmarks (previously determined for every subject by threedimensional x-ray anthropometry) permits the computational transformation of inertial data to points of interest defined inthe respective anatomical coordinate systems, provided that the bony anatomy of each instrumented body segment can beshown to obey the laws of rigid-body mechanics (7).
Vibration conditions. Vertical sinusoidal (z-axis) vibration is applied tu, the buttocks and feet of the seated subject*y means of a rigid seat (the top of which is shaped like an agricultural tractor dri,,er's seat in order to locate the buttocksover the line of thrust of the vibration machine, currently, a 28,000 lbf electrodynamic device). The subject's feet oresupported by a rigid footplate moving in phase with the seat. During vibration exposures, the subject is constrained to theseat and his posture is adjusted in a standard manner described below. His hands normally rest in his lap, and in his preferredhand he holds a switch which he is instructed to release in the event that he wishes to abort the run at any time (the medicaloff'cer in charge of the run can also abort the run at any time at his discretion by means of a separate, positive action switch).

S~9-2
In order to determine the linearity of the human inertial response as a function of input vibration force, measurem.entsof transmissibility are being made at various acceleration-amplitudes up to and including the "Exposure Limit" defined inReference (9) at selected frequencies of sinusoidal vibration within the bond 2 to 32 Hz, and also during exposures to upgoingand downgoing frequency sweeps, mentioned in more detail below. Current exoosure durations are 3 minutes for steady-statesinusoidal vibration and approximately one minute for sweeps. In addition to the man-mounted inertial instrumentation, refer-ence accelerometers are mounted rigidly on the seat, the substructure of which also incorporates load cells for the purposeof determining the whole-body mechanical input impedance (not reported in this communication) simultaneously Nith trans-missibil ity determinations, for comparative analysis.
Standardizing vibration exposures. The subject's buttocks are constrained to move with the vibrating seat by fourseparately- uckled relatively ;nelastlc straps running approximately vertically from thepelvic mount to the seat frame. Tension-ing the straps augments the compression of the subject's bottom due to gravity. In some experimental runs, a lop-bar, approxi -mately 10 cm in diameter, lodged between the anterior :-tpects of the pelvis and the subject's upper thighs when flexed insitting, has been used as an alternate form of restraint that has proved more comfortable than the pelvic mount for long runs:this device, however, is not a suitable base for inertial instrumentation. In both methods, the tie-down straps carry straingauges whose outputs can be monitored for the purpose of adjusting the tie-down to a standard tension for all runs. However,the effect of varying the strap tension on measured transmissibility, and the optimal tension for general experimental purposes,have yet to be determined: it has proved very difficult in practice to achieve even or repeatable strap tensions, either asinitial conditions or during runs, due to the subject's ability to reposition himself; and we are not yet convinced that to doso is a necessary or desirable objective, which is the reason for use of the pelvic mount.
The subject's sitting posture, a variable known to affect transmissibility determinations markedly (3) is adjusted at theoutset of every run in which inertial data are to be collected, and from time to time during the run, by having the subjectmaintain an image of his own instrumented head (right lateral view) within a template marked for that individual on the screenof a television display in front of him., The display is generated by a television monitoring camera mounted approximately 2 mto the side of the subject's head. This device, developed originally to control the initial conditions in human impact experi-ments (8), has proved to be a simple and effective way to standardize and control the subject's posture and degree of volitionalmuscular effort during vibration.
DATA ACQU!SITION AND ANALYSIS
The inertial data measured by the seat reterence and man-mounted transducers are (in addition to being displayedgraphically in real time for monitoring purposes) recorded initially on analog magnetic tape against a universal time base.The data are later converted to digital form for acceptance by computer programs previously developed in our laboratoryfor human and subhuman primate impact and vibration studies. Formal analysis of the data begins by digitizing each of therecorded transducer signals at 300 samples o,.r second (equivulent to a minimum of 10 samples per cycle of vibration up to30 Hz) and transcribing the values onto digital tape. A computer program analyzes calibration signals for every run to deter-mine the correct scaling information for each channel of data. The resultant d'gital data are then converted to engineeringunits and passed through digital filters to remove unwanted signal components -. 1.60 Hz electrical noise and d.c. bias).Using the geometric relationships between the functional or entation and Ic:-atior; of the transducers and the subject's bonyanatomy, as determined individually by 3-dimensional x-ray anthropometry, the 3-dimensional motions at specific points ofthe anatomy are computed. Figure 1 illustrates this process. The three anatomical points used to represent segmentcl bodymotions in the experiment illustrated below were the nominal center of -'ravity of the head, the anterior superior corner ofthe T1 vertebral body in the midsagittal plane, and an external point related to the anatomical coordinate system for thepelvis (1, 2, 4), All instrumentation is positioned in or near to the midsagittal plane, to take advantage of the presumedlateral symmetry of the subject's response.
Some results obtained. Some experiments have been made in which the frequency is steadily varied, at a rate of 0.5 Hzper second, over the spectrum of interest. Such an approach affords certain advantaqes with regard to experimental andanalytical economy., The mathematical procedures developed for swept-sinusoidal vibration response analysi s, using pri-mate data, have been reported previously (5). In the current human studies, the linear acceleration (in three orthogonalaxes), the angular acceleration and the angular velocity are calculated for each of the anatomical points mentioned above.The data shown in Figuie 1 are a 5-second segment from a 54-second test in which the vibration 'requency was swept from5 to 32 Hz. The excitation frequency was 5 Hz at the start of the segment illustrated, which shows aspects of the segment-to-segment propagation of vertical input vibration up the :coted body in one subject.
The response of the head to whole-body vertica! vibration at low frequencies is a characteristic nodding motion inthe sagittal plane; lateral vibration is negligible, and rotational oscillation occurs only abou+ the head y-axis. The -iotatransformed to the T1 coordinate system indicate a response similar to that of the head; however, two compromising factorsmust be noted. The instrumentation mount at T1 is attached to he torso by straps which (as con be confirmed by means ofhigh-speed cinephotography) can permit a slight rocking motion about the instrumentation point under the vibration stimu-lus; therefore, some error may be expected in the measured values for motions in the z-axis and about the y-axis far T1 ,Scrutiny of the T1 data in figure 1 indicates that these signals do indeed appear distorted, presumably because of imperfec-tion in the fastenirg of the T1 instrumentation rno,,nt to the torso in that run., Moreover, during these preliminary experi-ments, a complete instrumentation package was not yet available for TI; consequently, it was necessary to use the presumedsymmetry of motion with respect to the sagittal plane to transform the data to the reference point in Ti . Errors introducedby that assumption of absolute lateral symmetry r( suit in slow drifts in the baseline for T1 angilar velocity (derived byintegration of acceleration signals) about the TI y-oxis.
The datc. recorded from the pelvic mount hose -)ot yet been precisely defined in relation to the subject',, bony anatomy.This is because the efficacy of various arrangements of pelv.c instrumentation and restraint is still being e'ialuated andtherefore x-ray onthropometry of the region would be premature, ar.d not iustified, Furthermore, we do not yet have a
A

9-3
complete instrumentation package for the pelvis. Provisionally, it may be said that the vector sum (not shown) of the x-,y-, and z-axis linear acceleration is approximately equal to the vertical acceleration at the pelvis. The rotational datafrom the pelvis, however, may contain a component of error undeterminable because of the incomplete instrumentationarray; these data should accordingly be disregarded for the purposes of this presentation.
Results of supplementary analyses. The format used for presenting data in Figure 1 has several deficiencies. First,it is inefficient, showing only a short segment of data from a sweep. Second, it does not define relationships (transmiss-ibilities) between different body segments. Moreover, although the vibration frequency is steadily changing during thesweep, its instantaneous value is not readily ascertainable from figure 1. For these reasons, or, alternative method ofpresenting the data has been developed, in which a computer program has been designed to scan the data for each channel,calculate specific parameters which describe the dloa and their relationships to coriesponding data In other channels, anddisplay the results graphically. Figure 2 shows the rms amplitude of the seat z-axis acceleration as a function of vibrationfrequency swept from 5 to 30 Hz. The rms amplitude is calculated by using an exponential smoothing technique in whichthe data closes! to the point of interest are weighted most heaviy in the computation of th1 . rms valun. In the run illustratedinFgure 2, the seat rms vertical acceleration began at 0.7 m/s and gradually decreased to 0.2 m/s . Because it is possiblethat directional artifacts may occur in the implementation and analysis of swept-sinusoidal vibrat*on tests, a check was madeby repeating the experiment but sweeping in the opposite direction, viz, from 30 down to 5 Hz. The rms c~mputation forthat test is thown in Figure 3. Comparison of the data from Figures 2 and 3 showed approximately 0.01 m/s bias in the twoprocedures. While this is quite small, work is in hand to modify the analysis algorithms to remove most of that bias.
Fisure 4 shows the rms amplitude of the head z-axis acceleration, and Figure 5 shows the comparison (in effect, adetermination of transmissibility) or ratio between the head z-axis and the seat z-axis accelerations. It is immediatelyapparent that a resonance occurred in the body somewhat below 6 Hz. This is in general accord with previously publishedwork using human whole-body mechanical impedance and transmissibility methods (3). Characteristically, the transmiss-ibility is less than unity at frequencies above 10 Hz. Figure 6 shows the phase reiationship between the two signals; again,a phase lag of some 90 0at and above resonance is characteristic. Figure 7 shows the cross-correlation between the same twosignals (this parameter is especially powerful if the input signal approximates a sinusoid). For sinusoidal inputs, a correlationof unity is strongly indicative of a linear relationship between the input and output signals, whereat correlations below about0.75 indicate either that the input signal was not sinusoidal or that the system is nonlinear. From Figure 7 it appears thata linear relationship may exist between the two signals up to some 17 Hz at the acceleration amplitudes investigated. Abovesome 17 Hz, the subject may effectively isolate his head from the transmitted vibration (which at high frequencies is of pro-gressively lessening displacement-amplitude). Figure 8 confirms the stable relationship between the excitation frequency,as determined from +he seat reference accelerometer output, and elapsed time, i.e., that the sweep rate was steady atapproxi-mately 3.5 Hz. All the calculations required for the analysis of the data, and the construction of the plots shown in Figures 2to 8 were done by computer.
Work in progress. To date some 80 human runs have been completed as part of a series intended to cover the fre-quency band 5 to 32 Hz (later frequencies below 5 Hz will be included, using an electrohydraulic vibration machine beingbrought into service for human experimentation) at three acceleration levels for our available range of subject petcent.os.So far, for vibration exposures not exceeding the ISO "Exposure Limit" for short durations (9), the methods of instrume nta-tion, control of the subjects' posture, and constraint of the subject to move with the seat, have caused no serious problems.In the course of the current series of transmissibility determinations, the same subjects are simultaneously carrying out testsof visual resolution acuity using Landolt C test material, and giving subjective ratings of vibration severity on a 9-pointscale. Data from these tests are as yet too few for definitive statistical analysis, which will be carried out and reportedseparately when the series of runs has been completed by all subjects in all conditions.
REFERENCES
1. International Organization for Standardization. Draft proposal on standard biodynamic coordinate systems. Documentin preparation by Subcommittee ISO/TC 108/SC4, Working Group 1. 1979.
2. Thomas, D.J. (chmi.) and others. Guidelines for the comparison of human and human analogue biomedical data.Reports of an ad hoc committee. 1974 and 1975 (availobl2 from D.J. Thomas, NAMRLD, New Orleans, LA 70189)
3. Guignard, J.C. and King, P. F. Aeromedical aspects of vibration and noise. Neuilly-s-Seine: NATO/AGARD.AGARDograph AG-I.A. 1972. Capter 4.
4. Ewing, C.L., Thomas, D.J., Majewskli, P.L., Black, R. and Lustick, L. Measurement of head, T1 , and pelvicresponse to -Gx impact acceleration. In: Proce dings of the Twenty-first Stapp Car Crash Conference (SAE 7,70927),Warrendale, PA: Society of Automotive Engineers. 1977. pp 509-545.
5. Anderson, W.R., Baster, R.A. and Willems, G.C, Empirical model of intracranial pressure and head motion resultingfrom a vibrating seated rhesus. Aviat. Space Environ. Med., 49 (1), 240-252. 1978.
6. Thomas, D.J., Majewski, P.L., Ewing, C.L. and Gilbert, N.S. Medical qualification procedures for hazardous-dutyaeromedical research. In: AGARD Conference Proceedings, Prospective Medicine opportunities in aerospace medicine,AGARD-CP-231. Neuilly-s-Seine: NATO/AGARD. 1978. A3.
7. Ewing, C.L. and Thomas, D.J. Human head and neck respc'se to impact acceleration. Pensacola, Florida: NavalAerospace Medical Research Laboratory. Monograph 21.. August 1972.
i"
L|, •

! 9-4
8. Ewing, C.L., Thomas, D.J., Lustick, L., Muzzy III, W. H., Willems, G.C. and Mojewski, P. Effect of initialposition on the human head and neck response to +Y impact acceleration. In: Proceedings of the Twenty-secondStapp Car Crash Conference (SAE P-77, paper 780888), Warrendale, PA: Society of Automotive Engineers. 1978.pp 103-138.
9. International Organization for Standardization (ISO). Guide for the evaluation of human exposure to whole-bodyvibration. Geneva: ISO. International Standard ISO 2631: 1974 (revised edition, 1978).
ACKNOWLEDGEMENTS
The authors wish to acknowledge the supporting teamwork at NAMRLD that enables this study to continue. Particularmention should be made of the contributions of Walter Keuker, Wissenschaftl!cher Direktor, Bundesakademie fuer VWehrver-waltung und Wehrtechnik, Sockenheimer, Landsteasse 8-10, 6800 Mannheim 25, West Germany (data reduction and analysis),Da•e Ktiouse (conversions from analog to digital format), Pete Gilreath (operation of the data acquisition system, andengineering assistance), and the human volunteer subjects, who also performed dc•ties as experimental assistcmnts.
Opinions and conclusions contained in this report are those of the authors and do not necessarilv reflect the views orendorsement of the Navy Department.

: • 9-5
__Lk ý ý$T~&TO V-TRNCAJ. V!2ATIONi,. .,.,;. HEAD -1X LNEAR ACC ELL
a,. -. ,HEAD -Y LINEAR ACCEL
," HEAD -Z LINEAR ACCEL
... V *VVVVVVVVAVA1 111F'LMOUTH A CEL DATAa., HEAD -X ANGULAR ACCEL
'•'%', i t , HEAD -Y ANGULAR ACCEL-4. T AC C E L E 2
•.,... MOUTH ACCEL 3 -.. •,; HEAD -Z ANGULAR ACCEL
ie,,..,4,n1 * ,5-1
-,1! MOUTH ACCEL 4 A N, MOUT• HA�CLH.",,* , -HEAD -X ANGULAR VEL
'IM MOUTH ACCEL 6:,.T ACCEL.,HEAD -Y ANGULAR VEL
. ... T. MOUTH ACCEL ACCL'•'•-,•.,•'",:•[•.•, .'•.HEAD -Z ANGULAR VZL
TI ACCEL",
"I.�T - Ti -X LINEAR ACCEL
1m4....... Ti -I LINEAR ACCELM.•,, TI ACCEL 1 . .. T
,.s..•,/ t:TI -Z LINEAR ACCEL.. ,TLI ACCEL 5
a.., PELVIC ACCEL -X.,-,., Ti - ANGULAR ACCEL•"• ",:,,t TI -Y ANGULAR ACCZL
SPELVIC ACCEL 2
!'PELVIC -..------- 3..4 Ti -Z ANGULAR VCEL-!i .,:; PELVIC ACCEL 6 ''4
•, ' TI -X ANGULAR VEL--.. ;X.f,PELVIC ACCEL 6 ••,
•,,,',•TI -Y ANGULAR VEL
,,•. B SEAT VERTICAL ACCEL,.,,-..,��A'• TI -Z ANGULAR VEL
Bs 4.1;. SEAT LATERAL ACCEL ., i iem i,
44 ' I a. PELVIC -X LINEAR ACCEL
a, 41 SEAT FORE/AFT ACCEL ',•-',..•, A~ PELVIC -Y LINEAR ACCEL
ttS5�,•,& SET/SUBJECT FORCE ,R -. ,-i-----,
HE*".1HJAD ANGULAP CITY -.. :..,PELVIC -Z LINEAR A
MJTJVVVVV¶ 4.4AMVV*U". i ,•, -- ,. -. ,,,,.-.a ,---iI oa• .- ,aPELVIC -X ANGULAR ACCEL
,,, , PELVIC -Y ANGULAR ACCEL
FIGURE 1. Data reduction process. The right-hand panel shows
the human response to vertical seat vibration yielded b} geo- a..,',,' PELVIC -Z ANGULAR ACCELmetric transformation from the filtered and scaled vibration
data shown in the left-hand panel.. The sample length is .. •.".'.PELVIC -X ANGULAR VEL4.995 seconds in each panel., The data are from the ,irst 5 ".11 .
seconds of an upgoing freqjency sweep beginning at 5 Hz, at a ,,'PELVIC -Y ANGULAR VEL
seat vertical (z-axis) acceleration-amplitude of 0.7 ms"2
rms. .- ,,
The transformations are a mathematical operationi based ipon .- PELVIC -Z ANGULAR VEL
calibrated radiographs showing the precise location of the
inttrjmentation with respect to bony landmarks in each subject. ,, , t,-I4.* ,tU
-I I 4!
" ,-T ; I I I I -
Fr_
SE0
---------- .0
<
2 1 0 20 30 Hz 2 10 20 30 Hz
FREQUENCY FREQUENCY
FIGURE 2. Seat z-axis rms acceleration in FIGURE 3. Seat z-axis rms acceleration
meters/second/second as a function of vibra- (ms2) as a function of vibration freqi-
tion frequency (sweep from 5 to 30 Hz)., ency (sweep from 30 to 5 Hz).,

9-6
1 .5
1.0.
2 10 20 30 2 10 20 30FREQUENCY (Hz) FREQUENCY (Hz)
FIGURE 4. Head z-axis rms acceleration FIGURE 5., TransmissibilitN of seat z-axis(Ms" 2 ) from 5 tc 30 Hz. (The data have acceleration to the head z-axis. Trans-been transformed to the coordinate sys- missibility exceeding 1.0 in the region oftem for the head.) 6 Hz indicates an axial body resonance oc-
.urring between seat and head.,
0 o 12..... ...- , 1.o0 . -.- ""- -. ...
t-. ~ ~ ~ ~ ~ ~ ~ 2 ..... .. ...... 1
S'*- 0.8 -"
S-180
S0.6U
-3601• - -I-'
2 10 20 30 2 10 20 30FREQUENCY (Hz" FREQUENCY (Hz)
FIGURE 6. Phase lag oi head z-axis ac- FIGURE 7. Cross-correlation betweenceleration with respect to the seat z- head z-axis acceleration aind seat z-axisaxis acceleration. acceleration,
30
N20
C.,
0 20 40 60
FIGURE 8. Felationship between vibra-tion frequency and time during upgoingsweep from 5 to 30 Hz,
m • , 5'

9-7
DISCUSSION
DR. P.J. THOMAS (US)
.o what extent does coupling of the man (pelvis to shaker), and the inherent complexity of the
transmissibility matrix, affect efforts to describe a standardised human response?
AUTHOR'S REPLY
When a standard ettempts to prescribe limiting whole-body impacts (as does ISO 2631:1978, forexample), allowance must of course be made for any resilient coupling, such as a seat cushion,between the point of measurement and the point of input to the man. Any standard purporting todescribe or define a human mechanical characteristic, such as whole-body input impedance, or seat-head transmissibility, must recognise the fact that measurements may bE affected by both intrinsic(for example, degree of compression of tissue of the buttocks) and extrinsic (for example, degreeof body loading by a restraint system) biodynamic factors. If the pelvis, ideally, is taken as theinput point for two-axis whole-body vibration (rather than the man-seat interface), when drawingup a standard for transmissibility of vibration to the head, then the resilience or couplingbetween pelvis and seat may be immaterial. External loadings, posture and so on, however, wouldstill be controlling factors.
l0-1
HEAD MCVEMENTS INDUCED BY VERTICAL VIBRATIONS
L. Vogt, E. Schwartz, H. MertensDFVLR, Institut fUr Flugmedizin
Godesberger Allee 70D 5300 Bunn 2
German Federal Republic
SUMMARY
Vibration transmission through the human body from seat tohead under vertical (z-axis) vibration has been investigated inthe past by taking into account only the vertical head movements.To assess the complex head motion induced by z-axis mechanicalvibration, eleven suLjects were vibrated on a shake-table in thefrequency range of 2 Hz to 19 Hz. Acceleration amplitude was sinu-soidal and held constant at 0.35 g (rms). Each subject was giventwo trials: one sitting relaxed without a backrest, the other lean-
ing against a backrest with a 120 inclination from the vertical.Head motion was recorded with a special television camera (x-ytracker) by pursuing a target painted on the temporal part ot thesubject's forehead. This instrument continuously records the hori-zontal and vertical co-ordinates of the tracked point and givesthe output as analogues voltages. For each frequency and experi-mental condition the vertical and horizontal motion of the track-ing target was related to the displacement of the shake-table.
The results are given as different transmissibility curvesfor vertical and horizontal head motion. When relating horizontalto vertical transmissibility it becomes obvious that, without abackrest, at the resonant frequency the horizontal transmissi-bility is about 75 % of the vertical transmissibility.When usinga backrest horizontal transmissibility is reduced to about 35 %of the vertical transmissibility.
INTRODUCTION
Vibration transmissibility has been widely used in the past to describe the res-ponse of the human body to mechanical vibration. Transmissibility is defined as "The non-dimensional ratio of the response amplitude of a system in steady-state forced vibrationto the excitation amplitude. The ratio may be one of forces, displacements, velocities,or accelerations" [1].
Transmissibility ( w output ( ci}input (W)
In the laboratory, transmissibility is usually determined by placing one accelero-meter on the shake-table and a second on that portion of the body whose transmiss'bilityis to be recorded. For eech tested frequency, the complex ratio of the two accelerationsis formed and plotted versus frequency.
Vibration transmission from seat to head is considered most vital by many authors.This is obvious because the head serves as a stabilizating platform for the eyes, themost important sensory crgan for flight. Although many vibration problems have fadedaway with the overall use of jet propulsion and modern aircraft design, there are stillareas in military aviation which pose problems induced by mechanical vibration. One ishigh-speed, low-level flight, while others are related to helicopter operations.
Mechanical vibrations can influence comfort, performance, and health of human beings.* ~In' aviation, performance of aircrews is often adverscly affected by vis'ual disturbances
evoked through mechanical vibrations. Blurting of the visual image on the retina, causedby relative movements between the eye and the viewed object, is the most apparent causeof visual problems during vibration. The effects of mechanical vibration on vision havebeen reviewed among others by Shoenberger (13] and recently by May [9]. While May sum-marizes his review with the general statement that disturbance of vision by vibration isproportional to frequency and input amplitude, Shoenberger gives a more refined rfsum6:'In summary, when vertical, whole-body vibration is applied to a man in upright seatedposition, there are primarily three frequency related factors that appear to have a bear-ing on visual decrements. These are: compensatory tracking movements of the eye at verylow frequencies, arplification or attenuation of vibration from seat to head (includingrotation and resonance of the head itself), and resonance associated with the eyeballand/or its supporting structures at high frequencies."
Different app-oaches have been made in aviation research to overcome the visualproblems associated with mechanical vibration in high-speed, low-level flight. One is toreduce turbulence-inducel aircraft movements by aerodynamic control surfaces which areautomatically activated by a closed control loop. Another approach is to move the visual

10-2
target for the pilot in phase and amplitude with head motion and thus stabilize theimage on the retina. The latter method requires a good knowledge of the response of thehuman body to vibration.
While whole body mechanical driving point impedance is an indication for theoverall response of the human body to mechanical forces, transmissibility measurementscan identify the reactions of special body parts.
Already in 1939 v. Bek~sy [2] described the damping of vibrations by the body, how-ever, without observina any resonances.
Dieckmann [6] investigated the dynamic behaviour of the human body in 1957, andfound the main body resonances between 4 and 5.5 Hz. He explored vibratiun transmissibi-"lity from a vibrating platform to the hip, shoulder, and head. Coermann[4] measuredtransmissibility from a seat to head of subjects in erect and relaxed sitting postures.He described a reduction in head amplitude with a concomitant shift of the main resonancefrequency from 4 Hz to 5 Hz as the subjects changed their posture from sitting relaxedto sitting erect. The latter posture also resulted in a reduction of peak head amplitudes.Coermann and Okada [5] investigated the effect of a backrest and seat-back angles bet-ween 90C and 1400 from the horizontal on vibration transmission to the aead. The resultsshowed that a back-angle of 1400 produced the lowest transmissibility magnitude while1000 produced a maximum head amplitude at whole body resonance. Vibration transmissibilityto the head under various levels of sustained acceleration has been measured by Mertens[10]. His results show an increase of head amplitude between +2 Gz and +3 Gz and a wholebody resonance at approximately 10 Hz under +3 Gz sustained acceleration. The intluenceaf body posture on vibration transmission to the head was investigated by Griffin et al.[8] for a wide variety of postures, subjects, and input functions. Posture and seat con-figuration played the major role in transmissibility while other variables had only minorinfluences. This influence o± seat design and body posture has been likely found byBjurvald et al. [3] and Rowlands [11]. The transmissibility magnitudes from these investi-gations are shown together in Figure 1.
S1.5 .1
Z
,--,-I ,,
S.....LGrffi
S..... =IGugna r_ - :Bjurvald
7E
f= --- CoermannC
+ Okada- 1Iieckmann.=Griffin
lot. Guignci rd=Mertens
....... Vogt (unpubhished)
0.5 0.f3 C.A 1.0 1.25 1 2.0 2.5 3.15 4 5 .3 1 10 125 16 20 25 31.5 Hz
Frequency (Hz)
Figure 1: Vibration transmissibility seat/head for sitting subjects.
I

1 0-3
(I IS
N
2-\A4 6.1- 1 4IIA 11 . LL _LA
O. I I I I i t Is 3J I I 6ý I N 0 as 4
I requency (Hz)
Figure 2: Proposed standard transmissibility curve.
While the first resonance at 4.5 Hz is clearly evident in nearly all curves, theircourses differ considerably after the first maximum. This is caused by different measure-ment techniques and body posture. In spite of that, an attempt was made by Working Group5 of ISO TC IO8/SC 4 to propose a standard transmissibility curve, shown in Figur 2, formagnitude and phase.
Most of the authors quoted employed accelerometers fa~tened to the bead either bya bite-bar or by some other means such as straps or even helmets. For calculating trans-missibility they usel only the vertical (z-axis) component of head vibration. It iswell known, and may easily be observed in the laboratory-, that the head alro moves in thehorizontal direction even when the vibration excitation of the body is strictly vertical.Sandover [2] compared vibration transmission measured with a bite-bar accelerometer andan acceleromete- mounted on the top of a lightweight head harness; the results differin resonant frequency and amplitude. The authcr emphasizes the dangers of not allowingfor the obvious effects of complex movements. Dieckmann [7] recorde(' ccnplex head move-ments induced by horizontal (x-axis) mnechanical vibrations and found considerable, ver-tical displacements of the head. Fijure 3 gives the elliptic movement of the head cal-culated frcm horizontal and vertica accleration components and their phase relation-ship.
The purpose of this paper is to present data of complex head movements inducedby vertical (z-axis) vibrations of sitting subjects.

S 104
1 Hz
1,5 Hz
2 Hz
3 Hz
4 Hz
5 Hz
Figuie 3: Complex head motions of a sitting subject underx-axis horizontal vibration (after Dieckmann [7])
METHOD
Eleven healthy, male subjects were used for this investigation; their age, heightand body weight are given in Tab]c I.
All subjects were volunteers from our laboratory staff. Each subject underwent twotrials on the shake-table, the first with a backrest w icn had an inclination of 120 tothe rear from the vertical. The second experiment was without backrest. The subjects wereinstructed to maintain a relaxed posture in both cases. An electro-hydraulic shaker pro-duced sinusoidal vill-ations in the frequency range of 2 to 19 Hz in one Hertz increments.Acceleration amplitude was kept constant at 0.35 g (rms).
The schematic data acquisitior syst3m is shown in FLUre 4. The temporal regionof the subjects' head was painted black with theatrical make-up to create an even, darkbackground; upon this, two dots were applied with white pain:, two centimeters apart,which presented '-he tracking targets for the x-y tracker. A stencil was used to obtai-a uniform placeiient of targets. During the experii!e,-ts. the foremost point was alwaystracked while the other one was only used for calibration purposes.
The tracking of the target mark was accomplished with a rultipoint 3z-y tracKer(HTV-C 681, Manufacturer: Hamamatsu TV Co., Japan) consisting of a TV camera using theelectrostatic type of image dissector tube. The camera with the associateo electronicsis able to p.-rk up three points simultaneous,; and give the x anI y co-orhznates of
aI

10-5
Table I:
Subject Age Height weightNo. (Years) (cm) (kg)
1 33 183 65
2 47 176 82
3 40 181 85.54 42 172 75
5 29 180 67
6 37 178 74
7 34 175 63
8 28 184 85S27 178 80
10 38 173 64.5
11 46 172 63
Tracking x-yTarget Ta r.---
Shake O --z TTY !
Displac 11/40ment =PLOT
Figure 4: Schematic for the data acquisition system and vibration standemployed in the determination of head motion.:

V these points as analogue voltage outputs. The sampling rate of the camera for threepoints is 5.25 kHz; the accuracy is better than + 2 % of full scale. The resolution ofthe system cannot be stated exactly, since it depends on the focal length of the lensused, and the distance between camera and object. We circumvented this problem by moni-toring the output of the x-y tracker on an oscilloscope together with the displacementsignal of the shaker taking care that a good signal to noise ratio was maintained. Thedata were again checked on the computer display before processing.
All signals were sent through band-pass filters of the same design which weretested for equal phase and amplitude characteristics. The high-pass part of the filterhad a cutoff frequency of 0.5 Hz and the low-pass of 250 .Iz. It was used as an anti-aliasing filter for the analog to digital converter (ADC), while the high-pass com-pensated for the slow movements of body sway during the test-runs without backrest. Thefilters had a rolloff of 20 dB/octave. The sampling rate of the ADC was 512 samples persecond. The data were digitized and stored on a magnetic disk using a PDP 11/40 computer.Data were then checked visually on a graphic display (VT 11) and underwent a process ofdigital filtering. This was accomplished by a forward Fourier Transformation. From theresults only the amplitudes an6 phase of the test-frequency and one each at the adjacentupper and lower frequency were taken, and then a reverse Fourier Transformation was made
RESULTS AND DISCUSSION
Figure 5 shows a typical plot of head movements, before digital filtering, forvibration frequencies of 2 to 19 Hz.
101 01~ 01' 1 4 1 1#
€U
It - fit. 1.. ,. ,,. N..
N I__ _ 131. ,IN. 15N. Lis .l
Figure 5: Complex head motion of one subJect( "nfiltered)
Together with the elliptical head motion, the shake-table displacement is givenas a vertical line. In the lower left corner of each frame a calibration step of onemillimeter is displayed. Because amplification was increased at 5 Hz by a factor of 2.5,at 9 Hz by a factor of 5, and at 14 Hz by a factor of 10, the calibration siqnals becomelarge,- at these respective frequencies. Data were sampled over a period of one second,and for this reason, the number of ellipses drawn in each frame equals the shaker fre-quency.
It is obvious that from 15 Hz upwards the ellipses become increasingly filled.This is due to a deterioration of signal to noise ratio because the absolute displacementsbecome smaller with increasing frequency.
In the next two Figures (Figure 6, Figuze 7), head motions of the sar subject asin Figure 5 are shown after the data were filtered digitall, on the compu'er. In addition,only one ellipse is drawn for each vibration frequency. In the upper hQ.! of the fiqures,the results of test runs with a 120 backrest are shown while the lower half displaysresults achieved without a backrest.

10-7
Iif"" Al f . C N.I. h
21k 31k S~~~k 51k -I.l~ 1k94
'21. . ... "l 1 ""k l"" 6k"
Figure 6: Complex head motion plotted from filtered data for the fre-quency range 2 Hz - 9 Hz. Upper: with backrest, lower: with-out backrest.
Qf () 010 (5 •I n °I
10k 1k I101k111 121ka 13H.k 4 Hz 151 Ha 1 171kz 18 Ha 191a
Figure 7: Complex head motion plotted from filtered data for the fre-quency range 10 Hz - 19 Hz. Upper: with backrest, lower: with-out backrest.

10-8
Looking at the upper part of Figures 6 and 7 first, it becomes obvious that from4 Hz upwards, a considerable horizontal component of vibration is created by the humanbody especially in the region of whole body resonance around 5 Hz. This is indicated bya forward inclination of the long axis of the ellipse. After 10 Hz, this axis assumes anear vertical position again. Without backrest (lower part of Fig. 6 and 7), the maximumhorizortal component, however, is - for this subject - located at 6 Hz.
In Figure 8, the transmissibility values of the same subject with backrest (a)and without ackrest (b) have been calculated and plotted versus frequency. The dottedlines represent only the vertical component of head displacement related to shake-tabledisplacement (vertical transmissibility). The solid lines represent the ratio of thehorizontal component of head motion to table displacement (horizontal transmissibility).Aithough the phase curves given for the latter case do not have much meaning, since theydescribe the phase between two vibrations acting in directions perpendicular to eachother, they are presented for further consideration. The verti'al transmissibility curves(dotted lines) are in good agreement with published results for both test conditions (seeFigure 1). Tt'ey indicate the well-known first resonances at 4 Hz and 5 Hz and a secondpeak at approximately 10 Hz. As could already be presumed from the analogue presentationof head motion in Figures 5 - 7, the largest horizontal motion is also in this frequencyrange.
ITRANSMISSIBILITY1 PHASE3 *18
a
2
0
Li S
0 5 10 15 20 0 5 10 1 (I. 20
S.............. VERICAL
ITRANSMISSIBILITYI PHASE3 190 . ----
II
0 1 -1-0 .0 5 10 15 1H] 20 0 15 [Il20
HORIZONTAL
............. VERTICAL
Figure 8: Vertical and horizontal transmissibi-lity and phase for one subject:a. with backrest,b. without backrest.

-~~w .-f
1TI -"•'/• 10"9I
Figure 9 together with Tables II and T'ables III gives the mean values for 11
subjects with +1standard deviation. For the phase curve in Figure 9c the results ofonly eight subjects were used and for Fiqure 9d only seven. This resulted from the factthat there are two characteristic types of phase curves for vertical transmissibility.
ITRANSMISSIB:LITY1 PHASE ITR"NSMISSIBILITYI PHASE
0
I o I
V 0 0 0 1"Z) 0 0 5 10 i I(IW 20 0 5 10 WI ) 30 0 5 t0 t1Z 0 2"0
ITRANSMISSIBILITYI PHASE - ITRANSMISSIBILITYI PHASE
_+ +I
2 •
5 10 15"•3120 0 so 1is1 91 0 N 0 5 to •15•10 0 5 t0 a1 1t1)
Figure 9: Mean values and standard deviation of horizontal and vertical trans-missibility (N=11 (for phase see text)).a. horizontal with backrest; b. horizontal without backrest;c. vertical with backrest; d. vertical without backrest.
Table II: Means and scandarO deviations for transmissibility modulus and phasewith backrest
Vertical HorizontalModulus [/1 Phase [0] Modulus [/] Phase [1]
Frequ. Means St.Dev. Means St.Dev. Means St.Dev. Means St.Dev.(Hz) _ _
2 1.00 0.00 0.1 2.5 0.23 0.10 -122.4 36.03 1.05 0.10 - 3.5 6.6 0.36 0.08 - 94.1 122.84 1.48 0.23 - 13.2 16.1 0.57 0.13 13.7 151.9
5 1.73 0.59 - 45.5 9.1 0.67 0.30 96.2 46.56 1.43 0.38 - 56.6 8.7 0.48 0.47 73.1 63.37 -. 22 0.27 - 60.6 16.7 0.42 0.39 91.3 62.88 1.21 0.16 - 66.8 21.1 0.40 0.29 92.9 J4.3
9 1.28 0.25 - 76.1 23.1 0.44 0.24 80.8 37.310 1.31 0.37 - 84.2 19.7 0.47 0.28 66.7 38.311 1.35 0.45 - 93.4 15.3 0.51 0.31 50.4 37.412 1.41 0.43 -100.2 14.7 0.52 0.30 35.4 40.9
13 1.34 0.41 -108.9 12.0 0.47 0.28 20.3 43.914 1.32 0.41 -117.o 11.9 0.42 0.23 5.2 46.-
15 1.22 0.35 -124.4 12.1 0.36 0.17 - 4.6 50.516 1.17 0.34 -131.3 .1.1 0.33 0.14 - 15.2 53.317 1.13 0.31 -138.2 13.2 0.28 0.11 - 22.2 55.3
18 1.05 0.29 -144.2 14.1 0.27 0.09 - 30.9 57.219 1.00 0.31 -151.3 13.9 0,25 0.08 - 37.4 61.0
N 11 8 11 11

010-
Table III: Means and standard deviations for transmissibility modulus 0ndphase without backrest
Vertical Horizontal• ' modulus [/] Phase [] " Modulus [/] Phase" o
Frequ. Means St.Dev. Means St.Dev. Means St.Dev. Means St.Dev.
(Hz)
2 1.00 0.00 - 2.9 1.9 0.10 0.06 - 81.2 28.6
3 1.11 0.07 - 21.1 6.1 0.33 0.15 - 99.8 89.4
4 1.38 0.27 - 44.8 16.9 0.51 0.24 50.8 148.7
5 0.83 0.28 - 78.6 17.5 0.55 0.25 111.8 44.7
6 0.53 0.19 - 69.1 8.6 0.40 0.24 87.9 41.5
7 0.51 0.14 - 62.5 14.7 0.33 0.2G 84.9 43.5
8 0.54 0.15 - 64.9 20.2 0.29 0.17 86.3 37.9
9 0.60 0.14 - 71.4 17.0 0.31 0.18 79.6 37.5
10 0.62 0.11 - 84.3 14.0 0.34 0.21 67.2 36.6
11 0.54 0.14 - 95.3 12.3 0.34 0.21 50.0 33.7
12 0.63 0.19 -105.3 10.5 0.34 0.23 35.5 32.0
13 0.62 0.23 -115.6 9.6 0.32 0.24 21.7 34.014 0.58 0.24 -119.2 9.4 0.30 0.23 13.2 29.8
15 k;.56 0.23 -123.7 10.2 0.27 0.18 2.9 37.6
6 0.53 0.20 -129.0 12.8 0.25 0.15 - 6.1 43.8
17 0.51 0.18 -134.2 12.6 0.23 0.14 - 13.1 41.5
18 0.49 0.16 138.8 15.2 0.21 0.14 - 24.3 47.8
S19 0.46 0.14 -143.6 14.7 0.20 0.12 - 29.8 41.7
N 11 7 11 11
An example, therefor, is given in Figure 10. In Figure 1Oa, the phase moves from 0*to -180* then jumps to +1800 and decreases toward zero. In Figure lOb, which gives the re-sults of different subjects, however, the phase moves continuously toward -180*. This dis-crepancy in the behaviour of phase is well known and has been described by other authors(see also Figure 2). Calculating the mean value from both types of phase curves wouldresult in phase values of approximately zero in the higher frequency range which is ob-viously not correct. Since the majority of our subjects had phase curves correspondingto Figure lOb this type was chosen for the calculation of mean values.
The first maximum of all transmissibility curves in Figure 9 is located between 4 and5 Hz. For horizontal transmissibility without backrest, a mean value of 4.5 Hz + 0.6 re-sults while the vertical head movements peak at 4.1 Hz + 0.39. With backrest, the hori-zontal transmissibility maximum is located at 5.0 Hz + 0.95. The vertical component hasthe first maximum at 4.75 Hz + 0.45. (All values for R=11).
It has been shown by our measurements that considerable horizontal motion is pro-duced by the head under vertical (z-axis) vibration This means that for operational con-ditions the published transmissibility curves for sitting humans do not represent thecomplete reactions of the human body to vibration stress.
To demonstrate this fact the ratio of horizontal to vertical transmissibility wascalculated from the values in Table II and III and plotted versus frequency in Figure 11,From this it becomes clearly evident that without backrest 75 % of the vertical trans-missibility is in the horizontal plane at resonance and remains at a level of about 50 %up to 20 Hz. By using a backrest, the horizontal fraction of transmissibility is reductedto about 35 %. It should,however, he noted that the absolute values of magnitude for
* ~ver'-ical transmissibility are greater than those without backrest.
This behaviour of the human head under whole body vibration could also be thecause f.r the wide differences in vertical transmissibility often found in the literature.Out .indings, therefore, confirm the assumption of Sandover [121 that differences in re-sults may be produced by accelerometer mounting alone.
CONCIJUSIONS
This first approach to measure complex head motions induced by vertical vibrationshould .t~mulate firther research in this field. Especially, the head response in thef:equenc range ;3o'.e 2, Hz is of great interest because there is evidence that the reso-z-ances of the reck an~d 'he eyes are located in this reqion [4a]. We were not able to con--tuct any experiments in -h( higher frequency range since the head movements become toosmall to Le m.nitored wits the ..- y tracker. The eita may be used to improve existing mo-deis for the human bodl, !n ý .he :ieae nick system. Further investiqations of this kind
= • . , == • . , =, | I
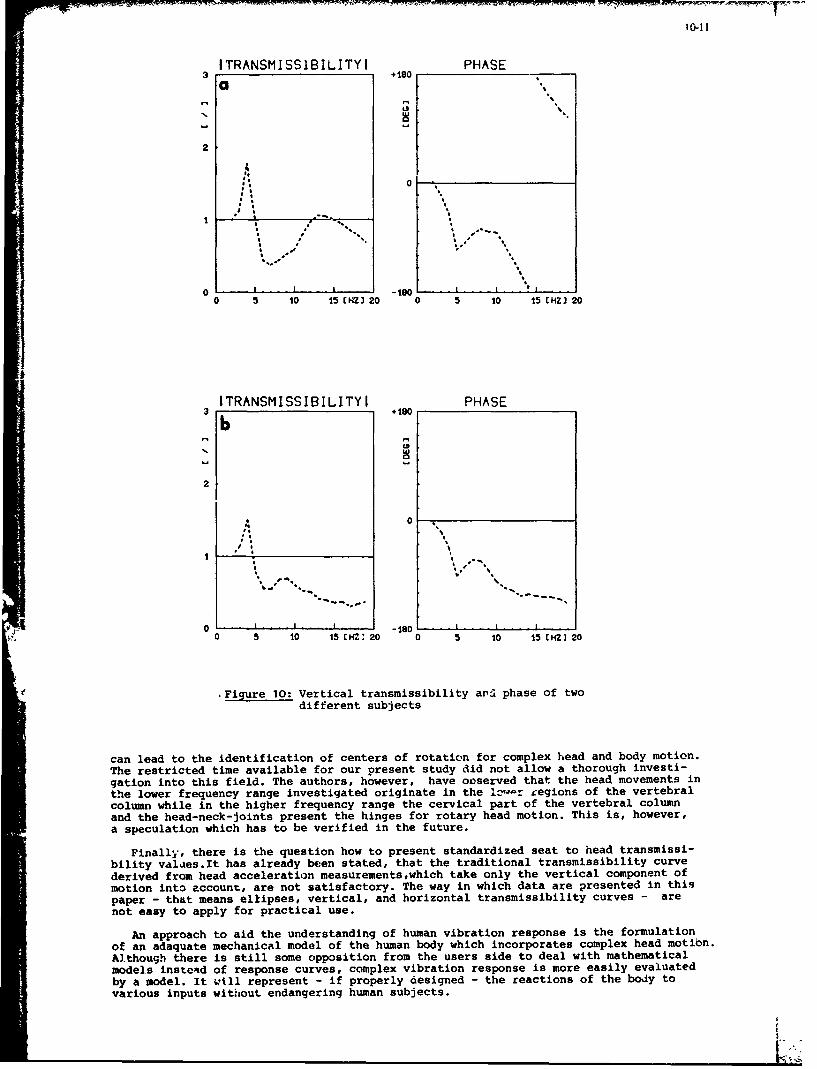
ITRANSMISSlBILITYI PHASE
a
S. . . . .. I-,e . . I . .
L9.
2
0
aI a
2 S ,
S. a.. se *
*.• . . . . I . . - 8 .. . . . . .
0 -'5 1'0 I 0
55 0 15 NZI 20 0 5 10 15 1HZJ 20
ITRANSMISSIBILITY1 PHASE3 .180
* 0
•Figure 10: Vertical transmissibility ara phase of twodifferent subjects
can lead to the identification of centers of rotation for complex head and body motion.The restricted time available for our present study did not allow a thorough investi-gation into this field. The authors, however, have ooserved that the head movements inthe lower frequency range investigated originate in the Ic•-r regions of the vertebralcolumn while in the higher frequency range the cervical part of the vertebral columnand the head-neck-joints present the hinges for rotary head motion. This is, however,a speculation which has to be verified in the future.
Finally0, there is the question how to present standardized seat to head transmissi-bility valaes.It has already be:en stated, that the traditional transmissibility curvederived from head acceleration measurements,which take only the vertical component ofmotion into account, are not satisfactory. The way in which data are presented in thispaper - that means ellipses, vertical, and horizontal transmissibility curves - arenot easy to apply for practical use.
An approach to aid the understanding of human vibration response is the formulationof an adaquate mechanical model of the human body which incorporates complex head motion.Al.though there is still some opposition from the users side to deal with mathematicalmodels instend of response curves, complex vibration response is more easily evaluatedby a model. It witll represent - if properly designed - the reactions of the body to
-'!various inputs without endangering human subjects.
, ,-,.a

10-wthutbakrs
- - withou backrest0a8-
0,6-
C
Q4
0 2 4 8 0 2 4 16 18 20Frequency (Hz)
Figure 11: Ratio of horizontal to vertical transmissibility.
There is however the fact that using the modeling approach, the problems ofstandardizing human vibration response is only -ýhif ted to a higher level. That means,the difficulties which are created by the variability of human response is still withUS.
REFERENCES
1. ANONYMOUS: Vibration and shock vocabulary. ISO 2041-197! (E/F), InternationalOrganization for Standardization, 1975.
2. BEKESY, G. v.: tiber die Empfindlichkeit des stehenden und sitzenden IMenschen gegensinusfdriuige Erschiltterungen. Akust.Z.: 360-369 (1939).
3. BJURVALD, M4.N., CARLS00l. S., HANSSON, J.E., SJOFLOT, L.: Helkroppsvibrationer enteknisk-fysiologisk studie av arbetesstlllnirngar och Fbrarstolar. Arbete ochhalsa-vetenskaplig skrift-serie No.7. Arbetar-Skyddstreyksen, Stockholm, 1973.
4. COERMANN, R.: The mechanical impedance of the human body in sitting and standinaposition at low frequencies. In: S. Lippert (Ed.): Human Vibration Research.Oxford: Pergalnon Press, 1963.
4a. COERMANN, R.: Untersuchungem fiber die Einwirkung v'on Schwingungen auf den mensch-lichen Organismus. Jahrb.d.dtsch.Luftfahrtforschung, 111: 112-142 (1938).
5. COERMANN, R., OKADA, A.: Obertragung von Erschlltterungen auf den Menschen bei ver-schiedenen Aiistellwinkeln der Rtickenlehne. Internat.Z.angew.Physiol. einschl.Arbeitsphysiol. 20: 398-411 (1964).
6. Diejkmann, D.: EinfluB vertikaler mechanischer Schwingungen auf den Menschen.Internat.Z.angew.Physiol. einschl. Arbeitsphysiol. 16: 519-564 (1957).

10-13
7. DIECKMANN, D.: Einflug horizontaler mechanischer Schwingungen auf den Menschen.Internat.Z.angew.Physioi. einschl. Arbeitsphysiol. 17:83-100 (1958).
8. GRIFFIN, M.J., LEWIS, C.H., PARSONS, K.C., WHITHAM, E.M.: The biodynamic respon;eof the haman body and its aplication to standards. AGARD-CP 253 (1979).
9. MAY, N.: EinfluB sinusfdrmiger und regelloser Ganzkdrperschwingungen auf dlevisuelle Informationsaufnahme. BMVg-FBWT 79-17, Federal Ministry of Defence,Bonn, F.R. Germany, 1979.
10. MERTNES, H.: Nonlinear behaviour of sitting humans under increasing gravity.Aviat.Space Environ.Med. 49:287-298 (1978).
11. ROWLANDS, G.F.: The transmission of vertical vibration to the head and shoulders ofseated men. Royal Aircraft Establishment Technical Report 77068, Farnborough,Hants, 1977.
12. SANDOVER, J.: Modelling human responses to vibration. Aviat.Space Environ.Med.49:335-339 (1978).
13. SHOENBERGER, R.W.: Human response to whole-body vibration. Perceptual and MotorSkills 34:127-160 (1Q72).

10-14
DISCUSSION
DR. D.J. THOMAS "US)
The loci of displacement of the head always seems to go vne way in other words, the elipse was
always bent in one direction. lHa-e you any idea why?
AUTHOR'S REPLY
No.
-Ii1L

THE EFFECT OF RECLINED SEATING ON THE TRANSMISSIONOF LINEAR VIBRATION TO THE HEAD
f Miss Mary E. Johnstong Royal Aircraft Establishment
Farnborough, Hampshire GU14 6TD, England
SUMMARYThe transmission of vibration to the heads of subjects seated in a Martin Baker
l Mk 10B ejection seat exposed to vibration within the frequency range 2-25 Hz has beenmoasured. Measurements wero made for the seat conventionally mounted (back angle 200 tothe vertical) and reclined for seat back angles of 300, 450 and 600 to the vertical.
The seat was vibrated using a swept sine wave technique in eit! •r the vertical orlateral direction. Head motion in each of the three head anatomical orthogonal linearaxes (gx, gys g.) was measured on a bite bar fitted with accelerometers. Ten subjects
S~were used, each fitted with a standard Mk 2/3 flying helmet.
The results indicate that in general, for a given input, particularly in the)ateral axis, head motion increased considerably when the head was in contact with thevtest. Also head motion both against and off the rest increased as the seat back angle tothe vertical was increased. Such increases in vibration to the head are very uncomfortableand could well lead to a performance decrement for a visual task.
1 INTRODUCTION
The increasing capability of fighter aircraft to perform sustained high accelerationturns means that humai, g tolerance in the conventional upright seated posture will soon
be exceeded. To date, the anti-g suit has proved a valuable aid for reducing the effectsof g stress on the pilot thus permitting sustained accelerations up to about 8 gz, howeverfor higher g levels it may be necessary to use other techniques such as reclining thepilot seat. It has long been recognised that tolerance to sustained acceleration is con-siderabl; greater when the force is applied perpendicular to the long axis of the body(gx) rather than parallel to it (gz). As early as 1937, Bihrleni showed that toleranceto gx acceleration could be up to several seconds at 17g!
Reclined seats have been designed by Flight Systems Department (FS4), RAE 2' 3 and theInstitute of Aviation Medicine, Farnborough. Such seats have been used on preliminarycentrifuge studies which have shown that both human blackout tolerance 4 and tracking
4 performance 5 under g stress are higher for increased back angles of the seat. Howeverreclined seat design means an increase (compared with an upright seat) in upper bodycontact pressure with the vibrating surfaces of the seat. This may increase vibrationtransmission to the occupant compared with an upright seat resulting in an unacceptableride or deterioration in both manual and/or visual performance. A previous investigation3
has measured the vibration transmission to the head of subjects seated in the FS4 reclinedseat. Conclusions were that vibration levels at the head were greater when the head wasagainst rather than off the rest.
This paper describes measurements of linear vibration at the heads of subjectsseated in a standard Mk 10B ejection seat for a linear vibration input at the floor.Measurements were made with the seat mounted in the conventional upright position (with aseat back angle of 200 to the vertical) and also reclined at seat back angles of 300, 450and 600. The results are in ý he form of vibration acceleration ratios, both single axis[vertical output acceleration/vertical input acceleration] and cross axis [lateral outputacceleration/vertical input acceleration, etc] for both vertical and lateral vibrationinputs.
2 CHOICE OF INPUT FUNCTION - SWEPT SINE TECHNIQUE
Seldom in real life does one encounter the sinusoidal oscillations of constantamplitude and frequency which are often used for input signals in experiments tomeasure body impedance or transmissibility. In such experiments subjects may be exposedto several minutes of sinusoidal oscillation whereas in real life rarely can one findrecords showing more than about ten oscillations. The alternative input functions arerandom input or swept sine input. If a random signal is used the question of statisticalreliability and random error arises. It can be shown 6 that for reasonable random andbias errors and for frequencies up to about 30 Hz, record lengths of about 100-200 secondsmust be considered.
For the swept sine input normally the frequency increases (or decreases) linearlywith time. Past researchers who had used swept sine techniques for testing moderatelydamped systems had reached an empirical law which stared that for a reasonable outputresponse signal sweep rates of approximately 1 Hz/s (for the low frequency end of thespectrum) were to be recommended. Thus swept times of 20 seconds for the 2-25 Hz bandswere selected for this experiment.

However the swept sine technique although overcoming the problem of lengthy and'unreal' experiments has disadvantages. If the response of the body to vibration inputsis non linear such that harmonics of the forcing frequency are generated then the onlytechnique which can be used to give a general solution is of the single sine wave inputtype. To date there is no strong evidence t' suggest that human response to vibration
is non linear either in the upright or reclined postures. The second disadvantage cfthe swept sine technique is that by definition it is a transient and it can be shown thati ti=a uutput levels can be generated which are in excess of the input amplitude.I Mathematically we are still measuring cause and effect, so the calculation of'the
frequency response will not be affected. Investigations by Griffin etaZ7 into the Pactorswhich may affect the transmission of vertical z axis vibration to the head over thefrequency range 1-100 Hz have indicated that there was general agreement in transmissibilitymeasures obtained using the three measurement techniques, discrete sine, swept sine, andrandom input.
In summary, it was felt that the single sine wave technique suffers from the require-ment of a long duration experiment which imposes unnatural constraints on the subjectin terms of maintaining posture etc. Since we have no ?v1J'ne to sugge-c non linearityof the human response to vertical or lateral axis vibratio),7it was felt that the use of aswept sine technique was preferable for this experiment.
3 EQUIPMENT
Thg vibration test was carried out on the RAE two-axis man-carrying vibrationfacility . The frequency range 2-25 Hz was examined. This range was chosen since it coversmost of the known human body major resonances; it also includes the main flexuralfrequencies of aircraft motion during turbulence. The accel2ration amplitudes of 1.5 m s 2
and 3 ms-2 rms were chosen to approximate to those acceleration levels of aircraft motionexperienced during moderate and extreme levels of turbulence.
3.1 Description of the seat
A Martin Baker Mk 10B ejection seat was used as shown in Fig 1, It is current inHawk and Tornado aircraft.
A mounting frame of 6mm thick iron angle was made to support the seat both in theconventional upright position (back angle 200 to the vertical), when the head wassupported vertically upright, and also reclined with back angles: 300, 450 and 600 to thevertical (constant seat pan/back angle), A temporary foot rest was provided for the sub-jects in the 450 and 600 attitudes. The seat was adjusted in back length for each subject,to obtain the most comfortablt positicn and also the correct head position on and off therest. Seat harness was provided and Nas worn tightened to flight standards.
3.2 Subjects
Ten fit male subjects who were well acquainted with vibration experiments or who hadprevious in-flight experience were used, their height and weight being given in Table 1.Each was correctly fitted with a Mk 2/3 flying helmet without a mask.
3.3 Instrumentation
Acceleration was measured dt the vibration table and also at the mouth of the seatedsubject. The linear accelerations of the head were measured by three Ether Type FLA2 straingauge acceleromecers mounted onto a small cube secured to the specially designed bite barwhich also carried three angular accelerometers, as shown in Fig 2. The linear accelero-meters were each of a half bridge strain gauge type, the other half bridge was providedin SEL carrier amplifiers Type SE 42 3 /1. The demodulated outputs from these amplifierswere passed through low pass filters set at 30 Hz to remove the acceleron.eter resonancefrequency before FM recording. Each linear accelerometer was calibrated by re-orientationin the earth gravitational field (±lg) and the dc outputs were measured. The total weightof the bite bar, dental mould and accelerometers wis approximately 300 grams. The maincontribution to the weight was from the angular accelerometers, the results from which areto be included in a separate report, however these were the smallest commercially available"at the time. This additional weight on the head due to the bite bar and accelerometerswas comparable with that of an oxygen mask and hose which is normally worn duriag flight.However for the.,e trials no oxygen mask could be worn because of the use of the bite bar -
and the assumptio., was therefore made that the bite bar and mask provided an equivalentdynamic loading.
3.4 Analysis
The recorded signals were passed through low pass anti-aliasing filters set at 25 Hzprior to analysis via fast Fourier transform LRFTJ techniques on a Hewlett Packard Fourieranalyser Type 5451B. Acceleration ratios were cumputed by dividing the output spectrum ofthe head vibrations for each of the three orthogonal linear axes by the linear spectrum ofthe approximate simultaneouc (input) table vibration. Results for all the subjects werecompared for each condition. The typical acceleration ratio response from one subject outof the ten has been shown for each vibration/seating condition in Figs 3 to 10.
The vibration measurements presented in this paper are with reference to the threeanatomical linear axes of the head (defined in Ref 9) since it is to these reference axesthat most human factors data are referred.

11-3
J EXPERIMENTAL PROCEDURE
The seat was adjusted for each subject and the seat harness tightened to flightstandards. The subject sat relaxed with his feet on the floor (or resting on the footrest for inclinations of 450 and 600) and hands resting on thighs. Subjects wereinstructed to maintain an alert posture during each! 20 second vibration exposure witheyes fixed on a point on the vibrator room wall. Subjects were cbserved to make sure thatthe postures used were representative and consistent. The variation in body posturepossible within the tight strapping conditions over the 20 second duration of the frequencysweep was found to be small.
Acceleration ratio measurements were made using a frequency sweep 2-25 Hz, lasting20 seconds with a nominally constant input acceleration aiaplitude. Table 2 gives thevibration conditions used for each test. Two acceleration levels 1.5 m s- 2 and 3 m s- 2
rms as measured at che vibration table were used in each of the vertical and lateral axes.The cross axis response of the vibration rig was less than 5%, ie vertical input producednegligible lateral motion and vice ver-a. The subject %as exposed to each vibration condi-tion twice, once with his head held firmly against, and once with his head just off therest.
5 RESULTS
Pigs 3 to 6 show typical vibration table to subject head acceleration ratios for avertical input vibration and Figs 7 to 10 those for a lateral input vibration for eachseating condition: 200 (conventional), 300, 450 and 600 seat back angles to the vertical.The ranges of frequency and acceleration ratio of the main peaks (numbered 1 and 2 inFigs 3 to 10) in the response of each cf the ten subjects are shown in Tab~e 3. Initialinvestigations of the vibration response of the seat head rest per ee did not indicate anyvertical or lateral rescnances.
5.1 Vertical vibration input
5.1.2 The effect of reclined seating on vertical axis head motion
Figs 3(i) to 6(i) show the acceleration ratios of vertical vibration to the headwhen the seat was mounted with seat back angles to the vertical of: 200 (conventional),300, 450 and 600 respectively.
When the head was against the rest there were two peaks in the vertical accelerationratio indicated at 4-6 Hz and 8-14 Hz for all seating conditions for both levels of inputvibration. The frequencies of these peaks correspond to main shoulder and headresonances 1 O. The amplitude ratios of the 4-6 Hz peak remained within the same ranges of0.7-1.8 and 0.6-2.2 for the 3 ms- 2 and 1.5 ms- 2 input conditions respectively for allseating conditions. The amylitude of the 8-14 Hz peak increysed as the seat was reclinedto 600 to 2.14-3.2 at 3 ms- input an'. to 1.5-3.7 at 1.5 ms - input.
When the head was off the rest there were also two peaks in vertical accelerationratio at 5-8 Hz and 9-14 Hz for all seating conditions except the 300 seat for the1.5 ms-2 vibration input level. In this condition the 5-8 Hz peak was not evident butmay have been masked in the ldrger amplitudes of the 9-14 Hz peak (amplitude 2.3-3.8).For the conventionally mounted (200 back angle) case, the arplitudes of .he peaks when thehead was off the rest were similar to those with the head against the rest for bothinput conditions. However, as the seat was reclined the amplitudes of both peaksincreased. The amplitudes of the 5-8 Hz peaks increased from 1-1.6 and 1-2.2 for the3 m s-2 and 1.5 m s-2 input conditions respectively for a conventionally mounted seat to1.8-2.8 and 1.5-3 for a seat mounted with a 600 baok angle.
1, is interesting to note that when the head was held against the rest the amplitudeof the main resonance at 4-6 Hz remained constant as the seat was reclined which resultedin the head on shoulder resonance or possible pitching resonancel! of the head at 8-14 Hzpredominating at a 600 seat back mounting. Whereas when the head was off the rest bothresonances were of nominally equal magnitudes for all seat back angles with the curiousexception of the 300 seat inclination.
5.1.2 The effect of reclined seating on cross-axis lateral head motion
Figs 3(ii) to 6(ii) show the acceleration "atios of cross axis lateral vibration(lateral output/vertical input) to the head when the seat wf.s mounted at various backangles to the vertical.
When the head was against the rest there was a single peak in response at between7 and 13 Hz for all seat conditions and input conditions. This corresponds to a possibleresonance of the head at about 8 Hz as 4ndicated in the work by Barnes and Rance1 2 .This work showed an increase in roll motion at about 8 Hz when a subject was vibrated inyaw. When the head was against the rest the point of contact head to rest acted as apivot point of motion. Any roll motion of the head about this pivot point w-uld producea lateral cowponent when measured at the mouth (about 0.2 m in front of the pivot point).This peak at 7-13 Hz was most apparent for the low 1.5 m s- 2 input Londition when itincreased from an amplitude of 0.6-4 for the upright seat to 3.4-6 for the 600 mountedseat. When the head was removed from the rest the acceleration ratios were greatlyreduced to telow 0.5 for most conditions.
L-2'

114
5.1.3 The effect of reclined saating on cross-axis fore/aft head mo.ion
Figs 3(iii) to 6(iii) show tfe effect of reclined seating on the accelerationratios of cross axis fore/aft vibration to the head.
When the seat was mounted conventionally and also when reclined to a bacir angle of300 to the vertical the acceleration ratio was low, peaks occurring of amplitudes up to 1for frequencies below 10 Hz and was less than 0.3 for frequencies above 10 Hz when the1ýead was against or off the rest. For the seat reclined at 450 there were two peaks inresponse when the head was against the rest. The peaks occurred at 7-9 Hz and 11-15 Hz.These were within the amplitude range of 0.5-1.4 and 0.3-1.1 for each input conditionrespectively. When the head was lifted off the rest the 11-15 Hz peak disappeared and the7-9 Hz peak was reduced in amplitude to below 0.7. When the seat was further reclined to600 the acceleration ratios for all vibration conditions showed a peak at 6-9 Hz Whenthe head was against the rest t'is peak had an amplitude of 1-2 and 1-2.5 respectively forthe 3 ms- 2 and 1.5 ms- 2 input conditions. When the head was lifted off the rest theamplitudes of the peaks were approximately halved.
5.2 Lateral vibration input
5.2.1 The effect of reclined seating on cross-axis vertical head mo~ion
Figs 9(i) and 10(i) show the acceleration ratios of cross axis vertical vibrationto the head when the seat was reclined at 450 and 600 back angles. For other seat mountingangles the cross axis response of vertical vibration to the head was small (< 0.8) for Oothhead against or off the rest. At bat'- angles of 45c and 600 when the head was on the restpeaks in rest-onse of up to 1 were found at 5-10 and 12-14 Hz for the 3 m s-2 inputcondition. ,or the 1.5 ms- 2 input condition of the 450 seat only uwe peak was indicatedat 11-15 Hz of amplitude 0.7-1.6 but for the 600 back angle two peaks again occurred at6-9 Hz and 1ý-15 Hz These peaks correspond well with head and head on shoulder resonances-
When the head was lifted off the rest for the 450 back angle one peak was indicatedat 5-12 Hz (amp)ltude 0.5-0.6) for the 3 ms- 2 input and at 12-13 Hz (amplitude 0.3-1.1)for the 1.5 ms- irput. For the 600 back angle a single peaý was indicated at 5-9 Hz(amplitude 0.3-0.9 for 3 ms- 2 input and 0.5-1.4 for 1.5 ms-' input conditions).
5.2.2 The affect of reclined seating on lateral axis head motion
Figs 7(ii) to 10(ii) show the acceleratiorn ratio responses of lateral vibration tothe head for the various seat back Rngles.
When the head was against the rest for all vibration conditions and seat back anglesthere was a peak in response at 5-12 Hz. Its amplitude for the 3 ms- 2 input of 2.1-4.1for the conventional 20 seat mounting position was reduced to 0.5-2.5 and 1.5-2.7 for the300 and 450 reclining positions respectively but was rather higher (2.5-3.2) for the 600back angle. For the 1.5 ms 2 input the amplitudes were sligh-ly higher than for the 3 ms-2
input but showed the same. trend with seat back angle. For the 200 and 450 back angles forboth input conditions there was also a peak at 15-18 Hz of amplitude for the 3 m s-2 inputcondition of 0.9-2.5 and 0.4-1 P respectively for each seat condition and for the 1.5 ms-2input of 0.7-3 and 0.6-2.2 respectively. These 15-18 Hz peaks were probably masked inintersubjtct scatter for the other back angles.
When the head was lifted off the rest the acceleration ratio was greatly reduced(< 0.3) for frequencies above 4 Hz for all vibration and seat conditions. Below 4 Hz therewas some indication of peaks in response but with maximum amplitudes of 1.
5.2.3 The effect of reclined seating on cross axis fore/aft head motion
Figs 9(iii) and l0(iii) show the acceleration ratios of cross axis fore/aft vibrationto the head when the seat was mounted at 450 and 600 seat back angles. Frr other seatmounting bngles the acceleration ratios showed large intersubject scatter and were lessthan 0.5 for both head against or off the rest.
At seat back angles of 450 and 600 when the head was against the rest for bothinput conditions there were two peaks in transmission at 6-10 and 12-15 Hz o: amplitudes0.1-0.7 and 0.2-C.6 respectively for both input conditions at a 450 back angle andamplitudes 0.3-1.1 and 0.8-1.7 respectively for both input conditions at a 600 back angle.
When the head was lifted off the rest the amplitudes of any peaks was minimal (less
than 0.6) and intersubject scatter was increased.
6 CONCLUSIONS AND FURTHER WORk
Transmission of vibration to the head increased as the seat back angle to thevertical was increased. This was most evident when the head was against the rest, par-ticularly in the lateral axis for a vertical input iibration at ,hc 1.5 m s- 2 input level.For some conditions there was a large reduction in transmission fori increased accelerationlevel input. This was possibly due to two main factors. Firstly stiffening up of theneck muscles under the more uncomfortable higher vibration input conditions. Secondly forsome conditions there was a large intersubject variability. This may have been due not only

311s
to the different biomechanical characteristics of each subject but also the variousextents to which each subject pressed his head against the rest. When the vibration wasmore uncomfortable he pressed his head less hard. The amplitude results presented in t1ispaper must be interpreted with care, however, they do indicate the approximate frequenciesof maximum nead motion. If a reclined seat design is to be practical the pilot's head hasto be supported for all or most of the time by a head rest. These results show a largeincrease in vibration transmitted to the head, when it is held against a rest. Thisincrease in vibration would probably be unacceptable from a consideration of comfort andperformance of visual tasks. Since the transmission of vibration to the head when thehead was off the rest did not increase so dramatically with increasing seat angle, itwould seem that with an efficient vibration isolating head rest the use of an inclinedpilot's seat would not adversely affect a pilot's vibration rating of a 'ride' in termsof comfort and task performance, as compared to a seat without such an isolator.
Table 1 Table 2
Subject parameters Test conditions
Subject Age Height Weight Frequent) range 2-25 HzNo. (yearb) (M) (kg)
Test Acceleration Subject1 36 1.73 60. No. levelposture2 25 1.78 73 (m/s 2 )
Su3 29 1.79 694 40 1.79 70.6 3.0 1.5 Head Head5 38 1.75 62.2 on off6 42 1.67 607 35 1.79 61.2 1 / / /8 32 !.80 63.5 2 / / I /9 30 1.79 66.6 3 / /
10 33 1.80 76.2 4 / /
Table 3
The ranges in frequency and acceleration ratio of the major peaks (10 subjects)
Vertical input:
Output axis Vertical Lateral Fore/aft
Head position on rest On Off On Off On Off
Input acceleration 3 -3levelins 2 3 3.5 3 3.5 3 1.5 3 82 3 1.5 3 1.5
Seat angle 200
Peak number 1 2 1 2 1 2 1 1 2 1 I 3
Accelpration ratiorange:
Upper 1.6 1.8 2.2 2.4 1.6 1.5 2.2 1.7 3.214 1.2 <0.4 <0.7 3 3 1.3 1.3
Lower 0.9 0.7 0.6 1 1 3 3 0.8 0.3 0.6 0.2 0.3 0.2 0.2 0.1
Frequency range, Hz
Upper 6 12 7 13 6.5 11 6.5 13 11 10 18 Large Large 7.: 8.5 6 6.5
=.Lower 4.5 S 5 10 5 10 5.5 11.5 7.5 8 17 Scatter Scepter 5 6 13 3
Seat -, le 300
vak number 1 2 1 2 1 2 2 1 1
&celeration ratiojra.8e.
SUpper 1.7 2.2 2.2 3.. 2.3 3.2 3.8 1.2 2.1 <0.3 <0.9 <1.0 <0.7 1.1 1.1
iLower 1.2j 0.5 0.8 1.3 1.5 1.5 1,3 10.5 0.2 _______ -0.3 0.3J Frequency range, Rz
Upper 5 1j 6.5 14 7 11 .3 j 13 Larg, Large Large Large 7 10
Lower 4 8 5.-511 ) 9 9 5 9 Scatter Scatter Scatter Scatter 5 8I - = - ~ = - - = - - = - - - -9

11-6
Table 3 (continued)
Vertical input (concluded):
Output axis Vertical Lateral Fore/aft
Head position on rest On Off On Off On Off
Input accelerationlevel, m 8-2 3 1.5 3 1.5 3 !.5 3 1.5 3 1.5 3 1.5
Seat angle 450 1 1
Peak number 2 2 1 2 1 2 1 2 1 2 1 2 1 2 1 1
Acceleration ratiorange:
Upper 1.8 2.3 1.9 4 2 2 2.6 2.1 1.2 4.2 <0.5 <0.3 1.2 1.1 1.4 1 0.7 0.7
Lower 0.7 1.6 1 2.6 0.9 1.2 1.2 1.4 0.6 1.6 0.5 0.4 0.7 0.3 0.1 0.1
Frequency range, Hz
Upper 6 12 6 it 7 11 8 14 10 9 Large Large 8 14 9 15 8 9
Lower 5 8 4.5 8 5 9 4.5 9 7 8 Scatter Scatter 7 Il 7 il 7 7
Seat angle 600
Peak number 1 2 1 2 I 2 I 2 2 1 2 1 1 1
Acceleration ratio
range:
Upper 1.6 3.2 1.9 3.7 2.A 2 3 2.5 1.5 6.6 <0.4 <0.5 2 2.5 2.2 1
Lower 1.2 2.4 I 1.5 2.8 2.1 1.5 1.5 0.6 3.4 1 1 0.5 0.8
Frequency range, Hz I
Upper 5 13 16 24 8 12 8 24 21 20 Large Large 8 8 9
Lower 45 12 15 8 5 9 5 1 8 7 Scatter Scatter 6 7 7
Lateral input:
Output axis Vertical Lateral Fore/aft
Head position On Off On Off On Offon rest
Input accelera-tion level, 3 I.5 3 1.5 3 1.5 3 1.5 3 1.5 3 1.5
Seat angle 200
Peak number 1 2 2 2 I
Acceleration
ratio range:
Upper <0.7 <0.8 <0.3 <0.5 4.2 2.5 4.7 1 0.6 3.6 <0.5 <0.5 <0.2 <0.2
Lower 2.1 0.9 1.9 0.7 U.2 0.2
Frequency
range, Hz
Upper Large Large Large Large 9 17 II 18 4 4 Large Large Large Large
Lower Scatter Scatter Scatter Scatter 8 16 9 16 3 3 Scatter Scatter Scatter Scatter
Seac angle 300Peak number I
Acceleration
ratio range:
Upper <0.4 <0.5 <0.5 <0.4 2.5 1.6 <1 <1 <0.5 <0.4 <0.3 <0.2Lower 0.5 0.3
Frequencyrange, Hz
Upper Scatter Scatter Scatter Scatter 9 iO Scatter Scatter Scatter Scatter Scatter Scatter
Lower 5 5

rPT 11-7
Table 3 (concluded)
Lateral input (concluded):
Output axis Vertical Lateral Fore/aft
Read position Off On Off On Offon rest on Off o OfnOf
Input accelera5tion level, 3 1.5 3 1.5 1.5 3 1.5 3 1.5 3 1.5m S-2
Seat angle 450 -
Peak number 1 2 1 ! 1 2 1 12 1 1 I1 2 1 2
Accelerationratio r-•ge:
Upper 1 1.6 0.6 1.1 2.7 1.2 3.312.2 0.6 1 0.7 0.4 0.5 0.6 <0.3 <0.3
Lower 0.7 0.5 0.3 1.5 0.4 1.8 0.6 0.3 0.3 0.1 0.2 0.2 0.3
Frequency
0Upper O 14 15 12 13 12 16 14 17 3 4 9 15 9 13 Large Large
Lower 8 13 11 5 12 6 14 6 15 2 1.5 6 14 8 14 Scatter Scatter
Seat angle 600
Peak number 1 2 1 2 1 I 1 ! I 1 1 2 1 2 1 1 2
Acceleration
ratio range:
Upper I I 1 1.2 0.9 1.4 3.2 4.1 1 I 1.1 1.4 i 1.7 0.6 0.6 0.6
Lower 0.3 0.2 0.4 0.4 0.3 0.5 2.5 3.0 0.4 0.4 0.4 0.8 0.3 I 0.1 0.3 0.1
Frequencyrange:
Upper 8 114 9 15 9 9 8 10 3 5 9.5 14 9 15 9 1013
Lower 5.5 12 6 13 5 6 6 7 1 4 .3 12 8 13 8 9 12
REFERENCES
± L. Bahrlen• Versuche Uber die Bedentungl der Richtung beim Einlirken von Fliehkraftenauf den menschlichen K6rper. Luftfahrtmedizin 1:307-325
2 S.W. Chisman, W.G.A. Portf Some implications on cockpit design c•f use of reclinedseats in combat aircraft. RAE Technical Report 78065 (1978)
3 M.E. Johnston, S.C. Bateman, B.H. Rance: Vibration transmission to the head ofsubjects seated in an experimental reclined seat. RAE Technical Memorandum FS 182(1978)
4 D.H. Glaisterf The influence of seat back angle on acceleration tolerance.IAM Report S129 (1977)
5 J.W. Frazier, K.W, McElreath. Test pilot evaluation of a reclined cockpit seat as anaid to g tolerance and performance, AMRL-TR-75-73 (1976)
6 J.S. Bendat, A.G, Piersol, Random data:. analysis and measurement procodure:.Wiley, 1971
7 M.G. Griffin, C.H. Lewis, K.C, Parsons, E.M. Whithamf The biodynamic respo:,se ofthe human body and its application to stpndards. Presented at AGARD AerospaceMedical Panel 35th Specialists' Meeting on 'Models and Analogues for the Evaluationof Human Biodynamic Response and Protection', 6-10 November 1978, Paris
8 G.F. Rowlands: The RAE two-axis man-carrying vibrator, RAE Technical Report 77091(1978)
9 International Organisation for Standardisation, Working draft proposal on standardbiodynamic co-ordinate systems. ISO/TC 108/SC4/WG1(:'), Ai•u-ý Y.(7
I

11-8
REFERENCES (concluded)10 G.F. Rowlands. The transmission of vertical vibration to the heads and shoulders of
seated men. RAE TeT chnical Report 77068 (,977)
11 T. Finnes: Private communication, University of Southampton, August 1978
12 G.R. Barnes, B.H. Rance: Transmission of angular accelerations to the head in theseated human subject. Aerospace Medicine, pp.411-416, tpril 1974
Copyright
Controlter HWlO London1979

UNIT
NAPCMT CIIAIIL
aill
SEAT #AM
Fig 1 Mk lOB ejection seat

11-10
Hi - 3m~rmnsLo - I.Sms-"Irms
Acceleration ratio - Head on rest
Ve:ot 2.0 ---- Head off rest
Vert out O
Vert in Hi1.0 iL
I Hi 2i
Foeaft outVert in L
0 5 10 i5 20 25Frequency Hz
Fig 3 M4k l06 ejection seat -seat back angle 20 0 to the vertical.Typical acceleration ratios for a constant amplitude sweptsine input. Vertical vibration input
30-Acceleration ratio Ho - 3mgs- 2 rmns
Vert outf rs
Vert outHedofrsVert in
Foeaft out .0 LA-Vert in rHi~
Frequency Hz
Fig 4 M~k 108 ejection se3t - seat back angle 300 to the vertical.Typical acceleration rat;..S for a constant amplitude sweptsine input. Vertical vibration input

LiAcceleration ratioHi-3 i2 m
V ____ 2.0HedofrsVert out 2 HVert in
0 -
4.0
3.0Lo
Lat out 2.0Vert in
1.0 1
Hi01
11.0 -Hj ~~~Fore/aft out L.....
Vert in
0 5 10 15 20 25Frequency Hz
Fig 5 Mk l0B ejection seat -seat back angle 450 to the vertical.,Typical acceleration ratios for a constant amplitude sweptsine input, Vertical vibration input

11-12
3.0 -Acceleration ratio 2 Lo Hi - J ms- 2 rmsHi ~ ~ ~ L /7" " L- 1,Sms-2 rms
Hý 1• 2 • - Head on rest
Vert ot 2.0'e 0 -•• --- Head off restL2Vert out , _
Vert in "- >. ;"-i _ __HoLoL
0 ,I I I
4.0
3.0Lat out
Vert in2.0
1.0- Lo
3.0
2.0 HO
Fore/aft out ,Hi
Vert in
1.0 /IN v H,HiLo - ---- --Lo -•..- •. •.- . . . • ""'•----Lo
Frequency Hz 0 5 10 15 20 25
Fig 6 Mk 10B ejection seat - seat back angle 600 to the vertical.,Typical acceleration ratios for a constant amplitude sweptsine input. Vertical vibration input
3*0 hi - 3ms-z rms3.0 Acceleration ratio Lo- I.Sms-zrms
- Head on rest- - -Head off rest
'0Lat outI.t in
1.0 -
"- •Hi/Lo
0 5 10 is 20 25Frequency Hz
Fig 7 Mk lOB ejection seat - seat back angle 200 to the vertical.Typical acceleration ratios for a constant amplitude sweptsine input. Lateral vibration input
2.0 Acceleration ratio Hi- 3n.s-2rms~o - I.Srni-2 rms
LLt out Head on restLat in Head off rest
1.0
0 S 10 is 20 2SFrequency Hz
Fig 8 Nk 108 ejection seat - seat back angle 300 to the vertical.Typical acceleration ratios for a constant amplitude sweptsine input. Lateral vibration input

11-13
1.0 Acceteration ratio Lo
- - a ~ HiVert out [Lat in
1.0'
.0
" Hi - 3ms'2 r ms
2.0Lo- I.Sms-2rms2.0 Head an rest
Lat out Head off rest
Lat in [/
S10iS202
1.0/, L Lo
Hrui Hi
0 Loe"
Forelaft out .r
Lat in /0 I -I Le
S 10 is 20 25Frequency Hz
Fig 9 Mk 10B ejection seat - seat back angle 450 to the vertical.Typical acceleration ratios for a constant amplitude sweptsine input. Lateral vibration input
Ho- 3 ms- rmsLo- 1.3 ms"2 rms
- Huad (n restAcceteration ratio --- Head off restVert out 1.0[ •I L
Lat in 00 Lo
3.0
Lat outLat in
1 0
0 S -- o
2.0-
Fore/aft out " Lo 2
L at in 1.01- 2 LoI • HI H o
K 0 1 I0 io 20 25-JFrequency Hz
Fig 10 Mk lOB ejection seat - seat back angle 600 to the vertical.Typical acceleration ratios for a constant amplitude sweptsine input. Lateral vibration input

- - - , -2'~
11-14
DISCUSSION
LT.COL. W. VONRESTORFF (FRG)
Did you ensures during inclination of the seat, that the head co-ordinates remained constant withrespect to earth co-ordinates?
AUTHOR'S REPLY
The vibration measurements reported are with respect to the anatomical co-ordinates of the head,since it is in these co-ordinates that previous human-factors data were recorded. As the seat wasreclined, these head co-ordinates diverged from the earth co-ordinates. However, we were interestedin the effect of reclining the Hk lOB ejection seat on the transmission of vibration to the head.To have maintained the head in a vertical position would have required an additional, non standard,headrest, and would have contributed an additional variable.
LT. COL. W. VONRESTORFF (FRG)
Why did you use identical acceleration inputs in both vertical and lateral axes?
AUTHOR'S REPLY
This was done for consistency. These conditions include the main flexural frequencies of aircraftmotion during turbulence and embrace the known human body resonances.
WG.CDR. D.H. GLAISTER (UK)
How representative was the headrest used in the reclined seat? In view of its deleterious effecton vibration transmission, have you looked into a headrest incorporating some form of vibrationisolation?
AUTHOR'S REPLY
The standard Martin Baker Ik lOB ejection seat headbox was used. We have done tests on reclinedseats fitted with solid headrests and in general head motion increased considerably with head contact.The design of a headbox to incorporate vibration isolation is included as a possible item on ourfuture programme of work.
GEN. J. FORESTIER (FR)
The exact definition of the seat is still unclear to me. Was it a standard Mk 10B with fixed headrestas referred to in the text, or a similar seat with some kind of headrest "supporting the headvertically upright for all back angles of the seat" as shown in your figure 2?
AUTHOR'S REPLY
I am sorry for the confusion. Figure 2 was intended only to illustrate the acceleration measuringtechnique using a bite-bar. The seat was a standard Mk lOB fitted with its standard headbox. Noadditional head support was used so the head was not held vertically upright for all seat back angles.
IL

12 1
THE EFFECTS OF AIRCRAFT VIBRATION ON VISION
by
G, R. BarnesRAF Institute of Aviation Medicine,Farnborough, Hants, GU14 6SZ, UK
SUMMARY
Movements of the head resulting from aircraft vibration can rerult in a decrement in visual perfor-mance as a result of limitations in the response of two mechanisms, the pursuit reflex and the vestibulo-ocular reflex, which are responsible for eye stabilization. A series of experiments has bepn conducted inorder to assess: (a) the frequency characteristics of the vestibulo-ocular and pursuit reflexes; (b) theability of subjects to suppress reflex vestibular eys movements which become inappropriate when viewing ahelmet-mounted display; (c) the effect of relative movement between the eye and the viewed object on visualperformance, and (d) the biodynamic response of the head during vibration which gives rise to stimulationof the vestibular system. The results of these experiments are discussed in an attempt to estimate theeffects of aircraft vibration on visual performance.
INTRODUCTION
The ability of aircrew to maintain visual acuity is essential for the proper control of the aircraft.Vibration at the head can, under specific conditions, cause movement of the retinal image and hence impairvisual acuity as a result of image smear. One such condition arises during stimulation of the vestibularapparatus of the inner ear, which induces reflex eye movements, the function of which is to compensate forhead movement and thus stabilize the eye in space. As a consequence man is able to maintain fixation ofearth-fixed objects during vibration and to preserve visual performance at levels comparable to those forstatic conditions. However, if the object of fixation is also subject to the same vibration, the vestibu-larly induced eye movement is inappropriate and must be suppressed or modified for visual acuity to bepreserved. This effect is particularly relevant to the use of helmet-mounted display systems, in whichthe head and display move simultaneously.
A number of experiments, which are summarized here, have been conducted in an attempt to estimate theability of human subjects to suppress inappropriate eye movements under specific vibration conditions andto interpret the smeared retinal image characteristics which result from incomplete suppression, Theseverity of the problem is assessed in the light of information about the biodynamic response of the headto aircraft vibration.
EYE MOVEMENT CONTROL MECHANISMS
In man, there are two neural control mechanisms which serve to stabilize the image of a seen objectupon the foveal retina (1). One, the vestibulo-ocular reflex, is an open-loop system which makes use ofinformation from the vestibular apparatus to generate eye movements comp2nsatory to the angular motien ofthe head. The other, the pursuit or fixation reflex, is a closed-loop system which uses information fromthe retina to produce eye movements that track the moving object in order to maintain a foveal image.Thus, the ability to predict whether visual acuity will be impaired in a particular motion environmentdepends upon an understanding of: (a) the dynamics of each of these oculomotor control systems; (b) themechanisms which give rise to the blurred images associated with movement of the image across the retina;and (c) a quantitative description of the motion of the observers head and the relative notion between thevisual target or display and his head.
The principal response of the vestibulo-ocular reflex is that which arises from angular motion of thehead. On either side of the head three semicircular canals, disposed in orthogonal axes, sense movementof the head and effectively transduce head angular velocity over a wile range of frequencies (0.05-5 Hz).Experiments (1) in which eye movements have been recorded during angular acceleration of the head haveshown that this reflex mechanism is highly effective at eye stabilization within the frequency range ofnatural head movement (0.5-2Hz) where the relationship between eye velocity and head velocity exhibits again close to unity and a phase difference of 1800. There is a second type of response which originatesfrom stimulation of the otoliths, receptors within the vestibular syste.; which are sensitive to linearacceleration. Recent experiments (2) have shown that eye velocities of 3-40/s per m/s 2
may be expectedin response to both vertical and lateral linear oscillation. However, tne functional significance of suchrotational eye movements in response to phasic linear acceleration ib unclear at present.
The need for a system to stabilize the retinal image becomes apparent when one considers the limita-tions of the visually induced reflex mechanisms by which man is able to maintain fixation on a movingobject. It has been well established (3,4,5,6,11) that the visually driven pursuit reflex breaks downeither when the velocity of target movement is too great (>40-600/s) or when the frequency of a directionchanging movement is too high (I.1-2 Hz). The rapid decline in gain of the pursuit reflex and the develop-ment of large phase lag at frequencies above I Hz has been well established by recording eye movementsduring attempts to follow oscillating targets (4). Associated with this breakdown is an Inability to pre-serve visual acuity. This feature is demonstrated by the results shown in fig. 1, which summarises theresults of an experiment (1,7) in which subjects were required to read, as quickly and as accurately aspossible, a display consisting of an 8 x 8 digit matrix. Each digit subtended 8 min arc and had a lumin-ance of 7.0 cd/m
2 against a background of 0.7 cd/m 2
. Measures of reading performance, expressed as thenumber of digits read in a 10 sec period and the percentage of errors made, were obtained during sinusoidaloscillation of the display in yaw at frequencies in the range 0.5-10 Hz; peak velocity was maintained at±30
0/s. Control measures were taken with the display stationary at the beginning and end of a test
session. The measures of visual performance (fig. 1) reveal that even at 0.5 Hz there was a significant

12-2
60
400
20
0 L *+WFig. 1
40, comparison of reading per-Staticformance during sinesoidalMeasresangular Oscillation i.. yaw
of the obierver 00) or ofthe target (0).Hace
31 E areas represent ±1 S.D. TheNumbr on peformnce f asubject
of figres Vwithout functioning labyrinths"an in (L-D subject) (+,03) indicates10 sa MUNthe importance of the
01ci'at'a I +vestibulo-ocular reflex dur.-
2D o subecting oscillation of thesubject.
OscEilation
Oftage
10
Frequarcy of Oswcitatodi
60
S1a2ic Fig. 2
Mean 40-%Reading performance of aNumbe S cchead-fixed display during
Read 30~' ¶e angular oscillation of theCorrectly *. head about the yaw axis at
20- Target Size 12 min 10I*/sec three levels of peak angularX A, velocity (5,10 & 200/s),
.- ' "?OStc Performance is based on numberof digits read correctly dur-ing a 30 see period; crosses0 I I I Irepresent calibrations without02 05 1 2 3 '4 6 8 motion at beginning and end
Frequency Hz of run.
60-
50 -1 2 5 5IsecStatics
Correctly 0/e20 - Target Size 18 minse
10
Frequency Hz2 3S 6

12-3
I Lo5-0
1 2Mean 30 - Static
Number " 4*" "
Read *'N 5/secCorrectly 20
Target Size = 12 m in10 N X 10"/sec
20"Isec0 II I I I I I0 02 05 1 13 17 224 3
Frequency Hz
Fig. 3 Reading performance of a head-fixed display during angular oscillatic' of the headabout the pitch axis at three levels of peak angular velocity (5, 10 & 200/a).Performance is based on number of digits read correctly during 20 see period; crossesrepresent calibrations without motion at beginning and end of run.
/Eye Position \ .\}A
(Closed) AIO r
Eye Position(Open)
TurntableVelocity C± 40*/sec
0 1 11z
,-, -' I
/AC
0 5Hz 12 Hz 20Hz
Fig. 4 Oculomotor response during angular oscillation of the head about the yaw axis atvarious frequencies in two conditions; (A) with eyes closed; and (B) with eyes openattempting to read a head-flced display.

12-4
Tracking error/
suppression1.0-
0.8
0.6
/ K ti S.D.0", - o Visual suppression
x Pursuit eye0.2 - movement
0-
0.2 0-5 1 2.0 3.0
Frequency Hz
Fig. 5 A comparison of the frequency response of the pursuit reflex with that of suppressionof the vestibulo-ocular reflex in similar experimental conditions. Suppression isdefined as the ratio between eye velocities in the 'eyes oven' and 'eyes closed' condi-tions. Tracking error is defined as the error between eye velocity and target velocityduring target following in the horizontal plane.
10 ------ Enclosed condition
8 - Open condition
6
4Slow phase
velocity 2 / Fig. 6*/sec
0 The slow phase eye velocity and
, associated reading performance
2 during sinusoidal angular osci-llation at 0.3 Hz (peak veloc'ty""100s0/) when attempting to read
4 a head-fixed display in twoconditions - (a) enclosed and
"6 (b) open, viewing the stationarystructured background.
5 Static
4A
Digits read 3
per 20 cycle 2 •' ''
10 100 /secStmls010 right
Stimulus 0 1O00/sc 20 sec 30
left Mean, 4 cycles x 8 subjects

12-5
impairment in reading speed and accuracy with respect to the static measures. Ac ? Hz, reacn'g soeed hadfallen to about 10% of the control level and there was no significant improveeeut at Jigi f- qLencies.
In contrast, the ability of the vestibulo-ocular reflex to stabilize the eye du-ing head movee.entappears to be maintained at frequencies up to 9-10 Hz. The results shown in fig. 1 were obtafne, --sing thesame display material described above, though in this experimental condition it was the subject who wasexposed to sinusoidal oscillation in yaw (peak velocity ±300/s) while viewing the stationary digit matrix.Statistical analysis of the measures of performance showed that a significant decrement did not occur until10 Hz. It should be borne in mind that the digit size used in this experiment is close to the limit ofstatic visual acuityt so that it is not surprising that a rapid breakdown was observed during pursuit. Onthe other hand the results obtained during head movement a rve to emphaskse the effectiveness of thevestibulo-ccular reflex in stabilizing the eye in the frequency range (1-10 Hz) %?here the pursuit reflexis largely ineffective. This feature is of importance during natural high frequency body movements, suchas occur during walking and running. Subjects without functioning vestibular apparatus experience diffi-culty in maintaining visual acuity during such manoeuvres (see fig. 1). Fortuitously, modern man alsofinds this feature of great assistance during vehicular travel, where frequencies of stimulation are oftenwell above the frequency range of the pursuit reflex.
SUPPRESSION OF THE VESTIBULO-OCULAR REFLEX
The iroblem is, of course, different when one considers the ability of the occupant of a vibratingvehicle to see an object which moves with his head as, for example, a head-mounted display. Eye movements,compensatory to the head motion, are no longer required, so the vestibulo-ocular responses must besuppressed if visual acuity is not to be impaired.
The ability of subjects to read a display which moved with the head during sinusoidal angular oscilla-tion in yaw was assessed in an experiment (8), the results of which are summarised in fig. 2. The subject'stask was to read a display of 3-digit random numbers generated electronically; the luminance of the digitswas 85 cd/m2 . Both the subject's head and the display were rigidly clamped to tbe turntable structure.The measures of visual performance, expressed as the mean number of digits read correctly in a 30-s period(fig. 2), showed a significant decrement above a certain break frequency, which was positively correlatedwith digit size and inversely correlated with the peak angular velocity of the stimulus. Break frequencyvaried from about 0.5 Hz (±200/s stimulus, digit height 12 min arc) to 3 Hz (±50/s stimulus, digit height18 min arc). A similar impairment of visual performance with frequency was also found when the subjectand display were oscillated in pitch (fig. 3) though, in this configuration, the decrement developed morerapidly and could be detected at a slightly lower frequency (for a given target size and stimulus intensity)than whelk the angular vibration was in the yaw axis.
In another experiment with the same display, measurement of the lateral eye movemcnts produced by anangular oscillation in yaw haviug a peak velocity of ±400/s, revealed that at low frequencies (<O.5 Hz)the vestibular nystagmus was effectively suppressed when the subject fixated on the display (fig. 4). Athigher frequencies, however, there was a progressive failure of suppression, such that at 2 Hz the amplitudeof the eye movement, when the subject attempted to fixate, was only some 20% less than when he closed hiseyes and there was no visual feedback. The breakdown in suppression was found to have gain/frequencycharacteristics very similar to those of the ocilomotor control system responsible for target pursuit(fig. 5). This suggests that the mechanism for suppressing the eye movements engendered by vestibularafferents is similar to, if not the same as, that 3ubserving the purz.,it reflex.
THE EFFECTS OF BACKGROUND STRUCTURE ON VISUAL SUPPRESSION
Although the velocity and frequency of the stimulus to the vestibular system modifies the ability tosuppress reflex eye movements, evidence has recently come to light tfat the nature of the stationary back-ground is also an important factor. Results from an experiment by Benson and Cline (9) indicated that theability to suppress could be greatly enhanced if the subject was able to see the surrounding staticenvironment.
The experimental conditions were similar to those described in the previous experiment. However, inoruer to assess the effects of eye velocity without the confounding effects of frequency, the stimulus wasa low frequency (0.03 Hz) high velocity (±1000/s) sinusoidal oscillation. The ability to suppress inappro-priate reflex eye movements was assessed in two conditions: first with the subject and display enclosed ina light-tight compartment which moved with the turntable, as in previous experiments; and second, withthe subject able to view the display against the background of the stationary room. Luminance levels ofboth display and background were maintained constant in both conditions. The subject was given a readingtask similar to that used in previous experiments and eye movements were also recorded simultaneously.
The results, shown in fig. 6, showed quite clearly that the slow-phase velocity of unsuppressed reflexeye movements was significantly greater when the subject was enclosed and had no information about thestatic background. Associated with the increased eye movement was a dec-ea- in the number of digits readduring the same period, and subjectively there was greater difficulty in reading the display because ofsmearing of the retinal image. In a further experiment it was shown that restricting the field of viewof the static room down to as little as 100 made the problem of suppression progressively more difficult.
These effects of background information on visual suppression have recently been substantiated byGuedry et al (10), although their experiments clearly point out the complexity of the relationship betweenperipheral visual motion cues and suppression of the vestibulo-ocular response.
THE EFFLCT OF IMAGE VELOCITY ACROSS THE RETINA ON VISUAL ACUITY
When there is relative movement between the eye and a visual display, as there is when attempting tosuppress inappropriate reflex eye movements, the image of the retina becomes smeared and there is A con-sequent decrement in visual acuity. Miller and Ludvigh (11) showed that when a subject attempts to tracka moving object, the ability to discriminate the visual detail becomes impaired at high levels of target

velocity. They showed that the so-called 'dynamic visual acuity' obeyed a cubic relationship with targetvelocity, falling off sharply at velocities in excess of 40-600/s. They suggested that this effect was theresult of velocity errors in the tracxing process. However, it is difficult to measure the instantaneousvelocity error in such conditions and relate it to the decrement in visual acuity. An alternative approachwas adopted in the following experiment (12), in which an attempt was made to examine the effects of imagemotion across the stationary retina on visual performance.
The subject viewed . display which was a horizontal array of 3 seven-segment red LED digits viewedagainst a superimý.vsed static background. The display was attached to a rotating platform whicn ptrmitLLdtranslational atovement of the display at a predetermined constant velocity in the horizontal plane. Inorder to e'Lminate tracking movements of the eyes, the subject was prevented from seeing the movement ofthe platform and the velocity and direction of movement were randomised to avoid prediction. To ensurefoveal presentation of the display the subject viewed a fixation point indicating the position of displaypresentation which was extinguished as the display was illuminated. Recordings of eye movements, usingelectro-oculography and an infra-red camera, indicated no detectable eye movement up to 200 msec afterpresentation but it was decided to restrict exposure time to 80 msec to ensure stationarity of the retina.The task was to read the digits of the display as they flashed past the field of view.
Visual performance was assessed as the probability of correct detection of the digits of the displayas a function of the direcLion and velocity of target motion. Fig.ý 7 shows the effect of image velocityon the probability of correct detection for 10,20, 40 and 80 msec exposures of the display. Subjectivelyit was considerably easier to read the digits during the shortest exposure since there was less smearingof the retinal image. This is reflected by the probability of correct detection, which fell off moresteeply as a function of velocity for the longer exposures. It was found that the equation for a Gaussiandistribution could be fitted to individual results with a high level of probability, which enabled perfor-mance to be identified by the velocity at which a particular percentage of the digits was read correctly.
In fig. 8 the velociti level for 90% correct detection (V9 0 ) was selected as the dependent variable.,Digit luminance was 8 cd/mi and there were 5 levels of contrast from 1 to 16. Digit height was 38 min arc,so that the width of each LED segment subtended approximately 3 min arc, and the fundamental spatial fre-quency was approximately 6 cycles/deg. Fig. 8 shows that the display could be seen at significantly highervelocities for the briefest exposure than for the longer exposures, but there was no significant differencein the V9 0 value for 40 and 80 ms exposures, The effect of increasing contrast was to increase the velocitylevel for the brief exposure but there was no effect with the longer exposures.
It is of interest to consider the origin of these effects. The effect of the experimentai procedurewas similar to that involved in varying the duration of exposure of a photographic film except that, ofcourse, the film is irreversibly modified, whereas the retinal image decays with time. Thus the tiail leftby the moving image is not of constant density, as in a film, but decays like the image on a CRT with amedium persistence phosphor. The temporal modulation transfer characteristics of the visual system suggestthat the time constant of decay is approximately 10 msec, so that after 40 msec the response will havedecayed to I or 2% of its peak value. The trail left by the image is thus virtually complete and anyfurther exposure will not increase the problem of detection. Therefore it is not surprising to find nosignificant difference in the performance at 40 and 80 msec, and it may be predicted with some confidencethat the values of velocity obtained can be used for the assessment of performance dueing continuous ex-posures, provided that the relative velocity between the eye and the viewed object is known.
As the velocity of the image increases, the trail will increase in breadth and tend to fill thespaces between the LED segments. Thus the problem of detecting the form of the image becomes one ofdete!cting differences in ccntrast within the smeared trail and not of comparing the image with the back-ground. Consequently it is not surprising that there was no effect of background contrast on the performanceat 40 and 80 msec. On the other hand, during the briefest exposure the trail left by the image is abruptlycut off before it becomes fully developed and so there is a well defined contrast edge to be compared withthe background. Hence, contrast with the background has a significant effect on the velocity level at whichthe display can be seen.
The effects of digit luminance on visual performance were also investigated at levels of 0.5, 2 and8 cd/m2 . The velocity level for 90% correct detection (V90 ) increased with digit luminance in a monotonicand significant manner (fig. 9). At these levels of illumination the responses correspond to those obtainedfor the modulation traasfer characteristics of the eye, where increasing luminance increases the contrastsensitivity. Since the zontrast is inversely related to image velocity, higher levels of velocity areachieved for increased luminance. We might expect this effect to disappear at higher luminance levelswhen the ratio of contrast sensitivity to background luminance becomes fairly constant. On the other hand,the temporal modulation transfer characteristics of the eye indicate that the image decays more quicklyat higher luminance levels so that the pioblems of image smear may become less when viewing a bright displayand/or background.
In an attempt to make some correlation with measures of acuity, the effects of digit size on performancewere also investigated, the results of which are shown in fig, 10. There was an apparently linear relation-ship between velocity for 90% correction detection and digit size. This is not unexpected since the formof the image trail should be similar for a target of height 12 min arc moving at 201s and one of 24 min arcmoving at 40/9, although there is a difference in the spatial frequency of tlie display which may modifythe response to a certain extent.
Thus, it may be concluded that the decrement in visual acuity for a target moving across the fovea ofa stationary retina is largely brought about by the decrease in contrast between elements of the displayand by the extent of image overlay, features which are dependent upon the temporal decay characteristicsof the smeared retinal image. The results indicate that there is a 907 probability of correctly readingthe display (digit height 18 min arc) if the image velocity across the retina does not exceed approximately30/s. The results, discussed above, of experiments on suppression of the vestibulo-ocular reflex (figs.2 & 3) indicate that at frequencies between approximately 2 and 10 Hz eye velocity was greater than 30/sfor at least part of the cycle. This enables an explanation to be given for the occrrence of the nodal

12-7
(W)At.WOms P% (bl=20ms P%
A /
g4.5
Fig. 7
• • .... . .... The effect of irage velocity (7) onI -124V' '-6 20 2 4 68 81 14 -4 -12 40 -6-66 -- 0 2 £ 6 U0'12K the percentage number (P) of digitsR-L L-R R-L L-"R read correctly for different dura-
tions of display presentation (0t)
(cIM: ks P%. (d)At=8ODs P(Mean of 8 S's ±- S.D.).
7 7
..50 so5
-14 -12-0 -8 -6 -4-2 0 2£4 6 831 21U -14 12I0-6---£-20 2£4 6 8 V11XR-L L-R R-bL L-R
mog voloaty V(dtgsecl)D0t IW:WM 8cd/m 2 Conriast (Lo-LE/Le =16
Limitingveloaty
15
13 C- =I1
12+- C: 2 Digit lninixinmi =&&cllm12 x----X C 2 Di
0 C= Digit h"Mht =18rim arc
11 Cc Fi. 8
Tine effect of display presentation10 - time (At) on the limiting velocity
for 90% correct detection Cvqo) for9 different ccntrast lpvels (C).
(Mean of 2 Ss).
7
6
3
2
Ep0 10 20 t0 AO°: Exposure time lit (ins)

12-8
Limiting
velocityVId sece)
At: 40ms- L--R
- - - R-*L
4--- -. L cd/M 2 Fig. 9
The effect of contrast on the limitingvelocit-, (Vgo) for 901 correct detec-tion at 3 levels of digit luminance
3 (LD). Display presentation time
ILDo2cd/rr2 (At) 40 is.
2
1 2 8
Contrast (Lo-LB)
Limitingvelocity
Vo(g sec-I1
20 / At =l0ms
18/ Fig. 10
"Digit luminance =8cd/m 2 The effect of digit height (b) on16 Contrast with bodig= =16 the limiting velocity for 90% correct
detection (V9 0 ) for different dinolay
14/ presentation times (At).
12
10 At/20rm
6 At 2WmisAt = ms
2
0 Q Is 2J
12 18 -aDigit hueiht-h~ongle subtne at eye(rinoint)
*

12-9
imagcs observed during the low velocity periods of a sinusoidal image movement.
The relationship between eye velocity and visual acuity has been assessed by Cuedry (13) duringattempts to suppress inappropriate reflex eye movements resulting from a transient stimulus to the vesti-bular system. Eye velocity was measured at the instant when the subject reported the ability to readclearly characters of a particular size from a range of character heights. There was considerable varia-tion in subject performance, but v, iverage the eye velocity levels at which digits of height 12, 18 and 24min of arc could be seen were approximately 5,9 and 120/s respectively. These velocity lexels are some 2to 3 times higher than those predicted for 902 correct detection from Fig. 8 and would correspond to aprobability level for correct detection of approximately 50%. This is a rather low value, since the sub-jects were reporting the ability to read the characters correctly. However, the couditions of the twoexperiments were in mi y respects dissimilar and could account for this apparent discrepancy.
THE BIODYNAMIC RESPONSE OF THE HEAD
The crucial question to be answered here is whether the stimulus conditions which have been shown inthe laboratory to produce significant decrement in visual acuity are likely to prevail in flight. Record-ings of vertical and lateral acceleration within the cockpit have been obtained for several in-serviceaircraft and many of these indicate that during low-level high-speed flight acceleration levels of 2.5 m/s 2
EMS in heave and 1 m/s 2 qMS in sway may be expected in the frequency range A.l to 20 lHz. The head movementresultitZ from such vibration levels has been assessed by Rance (14). Subjects were exposed to eithervertical or lateral sinusoidal oscillation at frequencies between 1 and 20 Hz with a peak accelerationlevel of ±3.9 m/s 2 (2.75 m/s 2 RMS), whilst seated without shoulder restraint on a hard seat. The angularacceleration of the head in pitch, yaw and roll was measured and, as the results in fig. 11 indicate,considerable angular movements were induced, that peaked between 4 and 10 Hz in all axes. Similar mag-nitudes of head angular acceleration were obtained In response to lateral vibration although the predom-inant activity was about the roll axis.
I "4 " Pitch Rot Yaw
5.00 o 5oo 5"00
-I
..... I
2W.. V J I 2.00
00 O&00M 001
--- 1 0 V 'O0001
M O" .G•m 0-05.
1 2 5 10 20 i 2 5 10 21 I 2 5 10S_ •Frsqmwxy I')F'"ancy 11t) r-siquec, (i.l
Fig. 11 The ratio of head acceleration 4) about the pitch, yaw and roll axes to linearacceleration (z) in the vertical axis of magnitude ±3.9 m/s 2 (4ean of 8 S's -1 S.D).)
The responses may be translated into head angular velocity, yielding values of between 10 and 30o/s
at frequencies between I and 10 Hiz. The general form of the frequency response curve for head movementhas been substantiated by results obtained during attempts to align a helmet-mounteC sight with an earth-

12-10
fixed target (15). In these experiments the driving stimulus was provided simultaneously in the verticaland lateral axes by recordings of aircraft vibration in low-level high-speed flight. It is of interestthat the visual feedback provided by attempts to align the helmet-mounted sight with a fixed target wasunable to suppress the head movement to any appreciable extent.
DISCUSSION
The angular velocity of head movements found in these laboratory experiments indicate that there islikely to be a significant decrement in reading performance during aircraft vibration. Tle results ofexperiments on suppression of the vestibulo-ocular reflex (figs. 2 & 3) show that in the specific range offrequencies (1-10 Hz) in which there is the greatest transmission of acceleration to the head, it isdifficult to suppress inappropriate eye movements. Hence, it is to be expected that the velocities of eyemovement generated will reach peak values of similar magnitude to that of the head (i.e. lO-30°os). Thusimages projected from a head-fixed display will move across the retina at such velocity levels. The resultsof experiments on the detection of images moving across the retina (fi . 8) suggest that such velocitylevels will be in excess of that required for 90% correct detection (3 /s for an 18 min arc digit).
It is difficult to predict the decrement in reading performance which is likely to result from therandom head movements in flight given only the results of the experiments cn visual suppression depictedin fig. 2, in which the stimblus was a sinusoidal waveform. As noted earlier, such a stimulus hasregularly repeated periods of velocity which are within the band of ±30/s required for 90% correct detec-tion, leading to the presentation of degraded nodal images (16). In a random movement of the head (andthus of the retinal image) periods of low velocity would occur but in an unpredictable manner, making thetask of image detection more difficult. It would seem that the probability of correct dotection of arandomly moving image is likely to be a function of two factors: (a) the percentage of time for which theimage velocity lies within the threshold levels (say ±30/1 for 90% correct detection) and (b) the timeinterval for which the image velocity lies within such threshold limits. Another important practicalfactor, which may override such considerations, is that the requiremeaits of the observer to assimilate andpossibly act upon the information received are likely to result in the visual material being assessed witha frequency which is less than that at which nodal image presentations appear. Experiments are currentlybeing carried out in an attempt to assess the decrement in visual performance during random head movement.
Apart from the effects of head and eye velocity it is apparent from the experimental results presentedhere that other factors are very important in assessing the probable decrement in visual performance.Chief amongst these is the size of the elements of a display. The results presented in fig. 10 indicatethat increasing the size of digits in a display increases the velocity at which they can be detectedeffectively. This is supported by the results of the visual suppression experiments (fig. 2), in whichthere was a significant improvement in performance when the digit height was increased from 12 to 18 minarc. However, if, as suggested earlier, this is a direct result of the image blur pattern produced bymovement of the image across the retina, it might be expected that digit size, per se, was not the onlycritical fe-tor. A decrease in the stroke-width to height ratio of the digits would lead to the blurredimage tcail filling is5 of the area between display elements and thus making the task of discriminationeasier. Changes in the aspect ratio of display characters is also likely to modify visual performance forsimilar reasons.
A second important factor in assessing the relevance of the experimental results is the luminance ofthe display and the nature of the background against which it is viewed. In general, the brighter thedisplay and the greater the contrast with the background the more easily it can be seen during movementalthough, in the experiments described here, the levels of illumination used do not approach those of thebrightest conditions encountered in flight. Perhaps more important is the fact that the experimentalresults indicate that it is more difficult to achieve suppression when there is no structural stationarybackground against which to view the display. This may 4mply that it is more difficult to use a helmet-mounted display at night or when flying in cloud than when there is full visibility of the external world.Recent pilot experiments in the laboratory have indicatee that this effect is most marked when using ran-dom movement stimuli, and it is intended that the effects of background contrast and structure shall befully investigated in future experiments..
F Finally, in all the preceding discussion on the decrease in visual performance, it has been assumedthat the head movements induced by the appropriate stimuli in the laboratory are representative of thoseencountered in flight. However, there is little information about actual levels of head acceleration inflight. Thus an experiment is currently being planned in which angular head movements will be measured invarious flight co.nditions. The results of this experiment should provide a more definitive indication ofthe accelerations to be expected and thus enable a better assessment of the effects of aircraft vibrationon vision.
REFERENCES
1. BENSON, A.J. & BARNES, G.R. Vision during angular oscillation: the dynamic interaction of visual
and vestibular mechanisms. Aviat.ý Space Environ. Med., 49: 340-345, 1978.
2. BATH, P.M.W. A study of the vestibulo-ocular reflex in man when stimulated by linear acceleration,B.Sc. Ihesis, St. Thomas' Hospital Medical School, London, 1979.
3. HUDDLESTON, J.H.F, Oculomotor pursuit of vertical sinusoidal targets. Nature. 222: 572, 1969.
4. STARK, L. The Control of Fy.. movements. New York, Academic Press. 1971. The control system forversional eye movement, pp 363-428.
5. VON SUNDERHAUF, A, Untersuchungen uber die regelung der augenbewegungen. Klin. Mbl. Augenheilkunde.136: 837-852, 1960.

12-11
6. WESTHEINER, G. Eye movement responses to a horizontal moving visual stimulus. k.rchiv. Ophthal. N.Y.52: 932-941, 1954.
7. BENSON, A.J. Effect of angular oscillation in yaw on vision. Proc. Aerospace Med. Assoc. Mtg.Miami, Fl. 1972. pp 43-44.
8. BARNES, G.R., BENSON, A.J. & PRIOR, A.R.J. Visual-vestibular interaction in the control of eyemovement. Aviat. Space Environ. Med. 49 (4): 557-564, 1978.
9. BENSON, A.J. & CLINE, G. Dyaamics of the vestibulo-ocular reflex. Presentation to Inter-InstitutionalVestibular Research Group, Eye and Ear Hospital, Pittsburgh, Pa. 1975.
10. GUEDRY, F.-., LENTZ, J.M. & JELL, R.M. Visual-vestibular interactions. I. Influence of peri-.heralvision on suppression of the vestibulo-ocular reflex and visual acuity. Aviat. Space Environ. Med.50(3): 205-211, 1979.
ii. MILLER, J.W. & LUDVIGH, E. The effect of relative motion on visual acuity. Survey of Ophthalmology,7: 83-116, 1962.
12. BARNES, G.R. & SMITH, R. The visibility of images moving across the stationary retina. Proc,Physiol. Soc. Mtg. University College, London. 23-24th March 1979 (In press).
13. GUEDRY, F.E. Relations between vestibular nystagmus and visual performance. Aerospace Med.39(6): 570-579, 1968.
14. RANCE, B.H. Angular head motion produced by linear vibration of the seated human subject.Proc. Mtg. on Human Response to Vibration. Shrivenham RMCS. 1976.
15. TATHAM, N.O. Royal Aircraft Establishment, Farnborough, Hants, U.K. An investigation of head aimingunder simulated aircraft vibration conditions. 1976. Tech. Memo. FS 74. 1
16. O'HANLON, 1.G. & GRIFFIN, N.J. Institute of Sound and Vibration Research, Univ. of Southampton.Some e'..'cts of the vibration of reading material upon visual performance. 1971, ISVR Tech. Rpt.No. 49.
tt
--

13-1
THE EFFECT OF 3-25 Hz VIBRATION ON THE LEGIBILITY OF NUMERICLIGHT EMITTING DIODE DISPLAYS
Miss Mary E. Johnston MScMr John H. Wharf
Royal Aircraft EstablishmentFarnborough, Hampshire GU14 6TD, Enqland
SUMMARY
This paper describes the effects of 3-25 Hz 2sinusoidalvibration at an rms acceleration level of 2.5 m/s in both thevertical and lateral axes on the performance of a reading task.The task was to read aloud numeric characters presented on ayellow high luminance light emitting diode display which hadbeen designed for the military cockpit. Random numbers werepresented on the display in sets of four changed every 3 s.The subjects were each fitted with a Mk 2/3 flying helmet andstrapped into a Martin Baker Mk 10B ejection seat which wasmounted on the same vibration platform as the display. Testswere conducted with the subject's head held both against andjust off the head rest.
The results indicate that reading performance was affectedmost by lateral vibration, when the head was against the headrest. Maximum errors occurred for lateral vibration frequenciesof 14-16 Hz which is shown to correspond to the probable onsetof overlapping nodal images due to head vibration.
1 INTRODUCTION
It is a common observation that vibration can interfere with human activitiesparticularly man's ability to observe quickly and accurately. In the past there havebeen many investigations into the effects of vibration on vision. However, such studieshave largely been unrealistic in that the subject has been vibrated relative to astationary display or vice-versa instead of both being vibrated together; also the seat-ing conditions, vibrations and displays used have been non-representative of modernmilitary aircraft. The tasks required of the modern military aircraft, such as terrainfollowing, high speed low altitude flight in turbulence, or high speed helicopter flight,can impose a high degree of vibration on the pilot. This coupled with the higher pilotwork load has made "*he choice of cotkpit displays very important. In this experiment theeffects of vibrations typical of modern aircraft on the readability of proposed futuredisplays was studied using appropriate seating and aircrew equipment.
The choice of display used in these experiments was related to the need to replaceconventional analogue pointer instruments in aircraft cockpits with modern displayshaving a multi-function capability. The advent of modern digital computers means thatmore data is potentially available to the pilot. Traditionally, much of this data wouldhave been displayed on dedicated instruments in the cockpit. However there is not roomfor any more instruments and furthermore the pilot's work load is already high due, partly,to the excessive number of instruments and controls with which he has to deal. Multi-function displays therefore serve two purposes, firstly to reduce the number of controlsand displays within the cockpit and secondly to reduce work load by displaying only thedata immediately required by the pilot.
There are several modern display technologies suitable for displaying data in thisway and it is likely that more than one type will be used in cockpits for the foreseeablefuture. Where a large quantity of data is to be displayed (for example video or graphicpresentations) at present the cathode ray tube is the preferred technology, althoughprototype large area matrix displays are being developed. For displaying a small numberof digits Light Emitting Diodes (LED) displays have many advantages. They are reliable,require low voltages (<10 volts), are of high luminance, are easily multiplexed and canbe as legible as an ideal passive display over a wide renge of incident illuminationlevelsl. A 5ange of LED displays designed specifically for use in high amoientilluminatione has been developed and are to be installed in a variety of military air-craft in the near future. Such a display was used for these experiments.
2 EQUIPMENT
2.1 Vibration rig and seat
The vibration rig used was the RAE two-axis facility. This apparatus has a1.83m x 1.32m platform which can be vibrated in the vertical axis and one horizontil axis.The frequency range of the rig is 0.5-50 Hz, within the limitations of a ±19.6 m/s . Theseat used was a Martin Baker Mk 1OB ejection seat mounted on the vibration platform(Fig 1) such that either vertical or leteral (gz or gy) acceleration could be applied.
13-2
The seat was fitted with a harness which was worn for all tests. The transmission ofvibration to the head of a subject seated in such a seat has been fully reported else-where 3 , and results are summarised in Fig 2 as plots of the ratio of head accelerationsto lateral platform accelerations.
2.2 Visual display
The display shown in Fig 3 was a yellow (peak emission 580 nm) four character LEDdevice, each character comprising seven segments with an overall height of 4 mm. Eachsegment of the display contained two light emitting diodes driven in series, and eachcharacter was refreshed at 1 kHz. The data for all four characters was entered via apaper tape reader and automatically changed every 3 s. The display was mounted rigidlyon the vibration platform aporoximately 0.7 m in front of the subject and 100 below hishorizontal line of sight.
Initially the luminance of the display was adjusted to a level which was considered
and proved to give perfect legibility in non-vibrating conditions and this wassubsequently measured to have an average luminous intensity of 0.38 mcd per character.The drive current was monitored throughout the experiments to ensure that the displayluminance remained constant.
2.3 Ambient illumination equipment
The ambient illumination level during the main experiment was approximately 600 ix,generated by six normal 10OW tungsten filament bulbs. The experimental arrangement isshown in Fig 1.
2.4 Subjects
Six male sabjects who were either aircrew or well acquainted with vibration experi-ments were used in the main experiment. Each subject was fitted with a standard Mk 2/3flying helmet and the ejection seat was adjusted for each individual to the correct backlength. They were asked to tighten the seat harness as they would for flight and take upa typical posture but with their hands on their thighs and their head either lifted offor pushed against the head rest as instructed. It was emphasised that as far as theywere able they should maintain harness tension and posture for all vibration and non-vibration runs.
Table 1 shows the ages, heights and weights of the subjects. All subjects had 6:6vision or better, which was measured prior to the commencement of the experiments.
3 EXPERIMENTAL PROCEDURES
3.1 Vibration conditions
An unreported preliminrry experiment wss conducted to establish the vibration levelto be used in the main experiment. The results indicated that in general, vibrationlevels below about 2.5 m/s 2 rms, were unlikely to affect visual performance. For the mainexperiment sinusoidal vibration of rms acceleration level 2.5 m/s 2 and frequencies3, 5, 7, 10, 12, ±4, 16, 18, 21, 23 and 25 Hz were therefore used in each of the verticaland lateral axes. Such vibration conditions are often encountered in helicopters; how-ever, in fixed wing aircraft, although the vibration acceleration levels of 2.5 m/s 2 maybe encountered in high speed 2ow altitude flight, the frequency spectrum is rarely singlefrequercy. Each subject repeatec each test condition twice in one vibration session, oncewith his head held against and once with his head lifted off the head rest. The twenty-two vibration conditions of one session were presented to the subjects in a random order.Three subjects (3, 4, 5) completed three sessions and three subjects (1, 2, 6), only twosessions (owing to subject availability). Each vibration condition was repeated three andtwo times respectively in each of the vertical and lateral axes,
3.2 Visual task
The subject was asked to read aloud the numbers which were presented to him in setsof four. These were changed every 3 s. A total of 100 numbers (25 sets of 4) werepresented as one run, which therefore lasted approximately 75 s. The visually presenteddata was randomised for eacn vibration condition. A complete test session of twenty-tworuns therefore lasted approximately 30 min. Before each test session there was a periodwith aad without vibration it, which the subject could familiarise himself with the visualtask, character format and the experimental environment. Reading error scores wererecorded to check for any effects of fatigue and to ensure that the condition of 100%readability under no vibration was maintained.
4 RESULTS
4.1 Dependence of legibility upon frequency, mode of vibration and head position
The results of the main experiment are presented in graphical form in Fig 4. Thesegraphs show the error rate for each subject for the range of frequencies used. The dataare averaged o•,er the repetitions of test conditions with both the head on and off therest. However the variation of error rate between runs for each subject is relativelylarge and comparable with the variation seen in Fig 4 between subjects. To establish theperformance of each individual with more certainty would have required a significantly

13-3
larger number of runs. In this situation the most reliable data is that averaged overall runs for all subjects, and this is given in Fig 5.
4.2 Legibility vs frequency
It can be seen that for vertical vibration for most subjects the maximum error ratewas low (below 5%) when the head was either against or lifted off the rest. The distri-bution of errors with frequency was reasonably constant for all subjects.
For lateral vibration when the head was off the rest the maximum error rate wasalso below 5%. However with the head in contact with the rest the error rates for mostsubjects peaked in the region 14-16 Hz when the average error rates were considerablyhigher (up to 15% for subject 5). This peak is shown graphically in Fig 5 where data forall subjects is averaged and gives error rate as a function of frequency for each headposition and mode of vibration.
It was conjectured that the increase in displacement of the head when againstthe rest may account for the increase in errors. Transmission ratio measurements hadbeen made on subject 5, the subject who showed the increase in errors most stronglk,as part of another investigation which is fully described in Ref 3. Head motion ineach of the three linear head fixed axes was measured on a bite bar fitted withaccelerometers. For a lateral vibration input head modion or transmission ratios inall axes were small (below 0.5) when the head was lifted off the rest. However whenthe head was against the rest the transmission ratios increased considerably in allaxes and are shown in Fig 2.
This would seem to correspond with th& increase in error when the head was againstthe rest. However, the increaoe in error rate around vibration frequencies 14-16 Hz wasnot obviously related to any peaks in the transmission ratios. Simple measurements oftransmission ratio however may not accurately reflect changes in visual performance asthese do not include effects due to phase differences between the subject's head and thevitration rig. This parameter was not measured during these investigations.
4.3 Distribution of errors among the digits
It is of interest, from a display designer's point of view, to know the distributionof errors within the digits 0 to 9 for the 7-bar format used. During analysis of thereading errors made, it was found that subjects occasionally transposed two numbers, forinstance when 34 was displayed within a batch of four numbers these were read as 43. Itwas considered that even though these were genuine errors and were included in the othererror data they would not be included in the error distribution matrices shown in Table 2.
This shows the total number of times an error has been maue on a particular digit asa fraction of the total number of digits presented over all subjects rnd all test sessions.For clarity the error fractions have been scaled up by a factor of 10".
The table comprises an error matrix for both vertical and horizontal modes ofvitration, the total error rate for each being 0.99% and 1.61% rLspectively.
During vertical axis v.bration it can be seen from the matrix that 8 was the digitmisread most frequently and it was most often misread as 0. The difference betweendigits 8 and 0 was of course the presence or absence of the centre segment of thecharacter and it was interesting to note that while 8 was read as 0 on 0.22% of theoccasions that it was presented, 0 was read as 8 on only 0.005% of occasions.
The observation was contrary to that found in earlier work 2 concerned with thelegibility of this display under high ambient illuzination but not under vibration whereit was found that 0 was more often read as 8 Lhan vice-versa by a factor of 2 to 3.
14.4 Spatial distribution of errors
* IDuring debriefing, the subjects stated that the display image during vibration waselliptical in form and consisted of multiple images, (both lateral and vertical), of thefour characters which overlapped for some of the vibration conditions. It was proposedthat since the images overlapped the errors per character might be greater for the seconaand third characters than for the outside characters. Results of an analysis of errorsas a function of character position are shown in Table 3. It was clear that more errorsoccurred for characters two and three during lateral vibration and that this was theprime reason for the higher overall errors for lateral vibration. These findings shouldstrongly influence display design, the implications being that the overlapping of nodalimages which is determined by the character to character spacing is an extremely impor-tant parameter when the display must be viewed under relatively high levels of vibration.To further test the hypothesis that the display character spacing was too close fcr14-16 Hz vibration conditions a brief experiment was conducted in which this spacing wesartificially increased by illuminating only every other character. One subject was usedbut under the worst test condition (14 Hz, lateral vibration head on the rest) no readingerrors were made. The character spacing achieved by illuminating every other characterwas 7.8 nm.
5 CONCLUSIONS
The results indicate that all variables studied in this equipment ; vibration,frequency and axis, whether the head was against or off the head resc and subjects, had L

13-4
an effect on the magnit~de of the error rates in reading a four character, 4mm LEDnumeric display.
During debriefing of subjects it became clear that there were several well definedeffects which gave rise to errors. Firstly, the image of the display was elliptical inform which indicated that the motion of the head was in both the vertical and lateraldirections for either single axis input vibration. These cross coupling components atthe head (shown in Fig 2) resulted in a blurring of the vertical image both verticallyand laterally.
Secondly, overlapping of nodal images during lateral vibration made the middlecharacters of the display more difficult to read compared with the end characters.Retinal nodal image displacement due to yaw and pitch motion of the head is a possibleexplanation for the peak in error rates at a vibration frequency of 14-16 Hz.
It may be concluded from the error rate data that as the distribution or errorswithin the digits is not constant over all the digits, the character fount used was not'ideal'. However a different format would not have totally eliminated errors since sub-jects stated that under some conditions the display was extremely difficult to read dueto blurring of the retinal image and it is felt that this contributed far more to theerror rate than the format of the characters. The blurring reported by subjects may bereduced by increasing the character spacing. This has been shown to eliminate errors forthe 4 mm character height using 7.8 mm character spacing and a vibration frequency of14 Hz. It therefore may be possible to predict an optimum character spacing for a dis-play to be used in any particular vibrating environment using measurements of headvibration and consideration of nodal images.
The results of this investigation indicate that over all vibration conditions usedthe average error rate for vertical axis vibration was about 1% and for lateral vibrationwas 1.6%, although errors of up to 10% and 15% respectively were obtained under somevibration conditions. It should be noted that these high error rates were found forsubjects only when the head was against the head rest. This is an unnatural posture andwould normally only be adopted when flying sustained high acceleration manoeuvres, andthen for a limited time. With this in mind, these results are very encouraging andindicate that such displays may be successfully employed in vibrating environments. How-ever performance in a combined high illumination and vibration environment which mayprevail in an Pircraft cockpit has not been investigated. During vibration the retinalnodal images will be of a reduced luminance compared with the display when static andtherefore to achieve the same luminance of the nodal images the display brightness mayhave to be increased when viewed in conditions of vibration.
REFERENCES
1 J.H. Wharf, D.V. Peters, R.N. Tyte and B. Ellis. A comparative study of active andpassive displays for cockpit use. SID Symposium Digest of Tech. Papers, pp 116-117,Los Angeles (1976)
2 R.N. Tyte, J.H. Wharf, B. Ellis, T.F. Krdbb, R.G. O'Rourke, R.M. Gibb. An LEDnumeric display for the aircraft cockpit. I'EE Trans on Electron Devices, Vo'ED 24, No.7, July 1977
3 M.E. Johnston. The effect of inclined seating on the transmission of vibration tothe head. AGARD Symposium 'High Speed Low Level Flight Aircrew Factors',Paper Blla, Portugal 22-25 October 1979
Copyright 4, Conty.Llter' JNSO London 1.97
Tatle I
SUBJECT DATA
Subject number Age Height (m) Weight (kg)
1 35 1.72 73
2 38 1.77 74
3 40 1.78 73
4 29 1.83 70
5 40 1.79 61.2
6 31 1.87 86

13-5
Table 2
DISTRIBUTION OF ERRORS AMONG THE DIGITS
Vertical vibration
"True
1 2 3 4 5 7 8 9 0
R 1 0 0.8 1.3 1.0 0.3 1.0 1.0 0.8 0.3 0.8 7.3E 2 0.3 0 0 0 0.3 0 0.8 0.8 0.8 0.3 3.3AD 3 0 0.8 0 0 1.0 0.3 0 2.5 0.3 0.3 5.2A 4 0.5 0 0.3 0 5.0 4.b 3.8 1.0 3.8 0.5 19.7S 5 0 0.5 0.3 0.8 0 0.5 2.3 0.3 0.3 0 5.0
6 0 0.3 0 0 2.0 0 0 2.5 0 0 4.8
7 0.5 0 0 1.0 0.3 0 0 0.5 4.3 0.8 7.48 0 0 1.0 0 0 0.3 0 0 2.8 0.5 4.6
9 0 0 1.5 1.3 0.5 0 0.8 1.0 0 0 5.1
0 4.3 3.0 3.8 0.5 2.3 0.5 0 21.9 0.3 0 36.61 5.6 5.4 8.2 4.6 11.7 7.4 8.7 31.3 12.9 3.2 99.0Total error =0.99%
Lateral vibration
True1 2 3 4 5 6 7 8 9 0
R 1 0 0.3 2.3 1.3 0 0.5 5.0 1.5 0 0.8 11.7E 2 1.0 0 2.5 0.3 0 1.5 1.3 1.5 1.0 0.8 9.9AD 3 0.8 3.8 0 0.3 2.3 0.3 3.0 4.5 0.5 0 15.5A 4 0.8 0.3 0.8 0 6.1 6.1 2.8 1.3 8.3 1.0 27.5
SS 5 0.5 1.0 1.8 0.8 0 1.0 1.5 0.8 0.5 0.3 9.2
6 0.3 0.8 0.8 0.3 1.8 0 0 4.5 0.3 1.0 9.8
7 1.8 0.8 2.8 0.3 0.3 0 0 0.3 5.0 0.3 11.68 0 2.0 4.3 1.0 1.8 5.0 0 0 3.8 4.0 21.9
9 2.0 0 2.5 5.8 3.5 0.3 2.5 2.0 0 0.8 19.4
0 5.0 3.5 1.8 0.5 1.8 1.3 0.8 9.8 0 0 24.5S12.2 12.5 19.6 10.6 17.6 16.0 16.9 26.2 20.0 9.0 161.0
Total error = 1.61%
This table gives the total number of times an error has been made on a particularSdigit as a fraction of the total number of digits presented over ll subjects and
test conditions. Error fractions are scalej up by a factor of 10 . Worstconfusions underlined (error rate > 2 x 10-).
Table 3
DISTRIBUTION OF ERRORS WITH CHARACTER POSITION
Lateral vibration
Left Right
SCharacter 1 2 3 4
Total niber of errors 106 239 223 110
V(rtical vibration
Left Right
Character 1 2 3 4
Total numbe: of errors 97 127 102 97
All subjects - all experimental conditions

13-6
Fig 1 The equipment used in the experiments
Acceleration ratio
t.o
LAT IN
3.0
LAT OUT
LAT IN
S0 S -t I0is 20 2SFrequency H 5
Fig 2 Mk lOB ejection seat. Transmission of linear axes vibration to the head -
subject 5, head on rest lateral input vibration 3 ms- 2 rmS

13.7
Fig 3 The display used in the experiments
'% error e% errorVERTICAL LATERAL
Subject I w Head against rest* Head off rest
10 -- ~- 10-
10.,
0-10 N
10 10 15 2 5 5 10 1 0 2
Frequency Hz
Fig 4 Average percentage error ratte for each subject under all vibration conditions

10 10* Head on rest 0 Head on rest
* Head off rest e Head off trest* 8
"1. error ?1 errorrate rate
a 6
2 2 7V
0 S 10 1i 20 2S 0 S' 10 1s 20 2S
Frequency (Hz) vertical axis Frequency (H2) lateral axis
Fig 5 Error rate averaged over six subjects
C'
I-2

13-9
DISCUSSION
DR. L. VOGT (nR)
Referring to your slide which shows an increase in reading error around 14 Hz with lateral vibrationand the head on the headrest (figure 5 of text! and which you said you could not explain. Have youlooked into the dynamics of the head helmet headrest system to see if ther. is a resonance there?
"AU•WR' S IMPLY
We have measured the vit ration transmissibility of the subject wearing all the experimental equip-ment. The transmissibility of a single subject measured in all three linear axes has beenanalysed, but has not shown any peak in response at 14 112. There may, however, be something in rollor ya which is giving rise to this increase in error rate.
t
I•
I1=

14-1
THE EFFECT OF TURBUIENCE ON HELMET MOUNTED SIGHT AIMING ACCURACIES
by
N. 0. TathamFlight Systems Department, Royal Aircraft Establishment,
Fernborough, Hants, "Ul4 6TD, UK
SUMMARY
This paper describes some measurements that were made to assess the effects of the turbulence associ-a ted with high-speed, low-level flight on the accuracies achievable with helmet mounted sighting equipment.Experiments were conducted both in flight, during trials in a Canberra aircraft, flying straight and levelat 350 kno 250 ft, and in the laboratory, using a two-axis vibration rig driven by vibration data recordedfrom the same Canberra aircraft to provide simulated turbulence. The sighting equipment used was a Honey-well MOVTAS helmet mounted sight, which presented an alming reticle in front of the wearer's right eyewhile helmet attitude angles were measured by optical sensing devices mounted on the outside of the helmet.
Aiming accuracies were obtained for collimated targets fixed in space in the simulation, and for bothcollimated targets fixed to the airframe and ground targets in flight. The results obtained show a goodcorrelation between aiming errors thieved in flight and those obtained from the simulation, and demon-strate that the aiming errors consist mainly of a low frequency random motion which increases with vibra-tion level. In addition, various techniques were investigated to overcome the errors involved in order toenable fine aiming to be performed with the helmet sight.
INTRODUCTION
A programne of experiments has been .arried out at the Royal Aircraft Establishment supported byBritish Aerosp :e Ltd to assess the capabilities of both helmet mounted sights and displays in high-speed,low-level flight. One important aspect of this work has been the measurement of the effect of the involun-tary head motion caused by turbulent flight on the aiming performance with such devices. This papersummarises some of the data obtained during these experiments on the aiming performance with this sightingequipment and on some of the improvements that can be made to the basic system.
THE HELMET SIGHT
Head pointing angles were measured using a Honeywell HOVTAS helmet mounted sight. This devicepresents the wearer with an aiming reticle, which is reflected from the helmet visor into the right eye.The reticle consists of two concentric rings (50 mrad and 1Omrad diameter), centred on the sight line.This reticle image is collimated to infinity and represents the aiming sight line. Sensors mounted on thesides of the helmet detect rotating beams of infra-red radiation emitted by two units mounted in the cock-pit (or on the vibration rig in the simulation). The sensor signals are decoded into helmet attitudeangles by a computer and a continuous estimate of elevation and azimuth pointing angles are produced.Once harmonised to the aircraft system, this configuration of helmet sight war found to operate to anaccuracy of about 2 mrad over the range of azimuth and elevation mngles used.
THE LABORATORY SIMULATION
Experiments were performed using a two-axis (heave and sway) vibracion rig to simulate the aircraftturbulence. The vibration rig was driven from accelerGmeter recordings taken during high-speed, low levelflight of a Canberra aircraft. This aircraft was flown at 350 kn and 250 ft and gave a rougher ride thanwould be expected from more modern ground attack aircraft with higher wing loading. The vibration wasfiltered to remove any power below 0.5 Hz or above 25 Hz (the vibration rig response) and produced an rmsvibration level of 0.25 g heave and 0.1 g sway. Details of the vibration spectrum are shown in Fig I.Lower levels of vibration were produced by lowering the vibraticn rig transmissibility. Subjects wereseated in an ejection seat on the vibration rig and were told to aim their helmet mounted sight at targetswhich were collimated to infinity and in fixed directions in space relative to them.
FLIGHT TRIALS
The helmet sight was also installed in a Canberra aircraft and used during high-speed, low-levelflight trials. The flight trials program was designed to assess the performance of both the helmet sightand other equipment on the aircraft. The helmet sight was installed in the pilot's cockpit and was usedto designate targets to other systems in the aircraft. For the purposes of these experiments, the outputof the helmet sight was recorded during flight together with other aircraft data and later analysed on theground to provide estimates of aiming accuracy. Two types of target were used. The first (experiment C!)was the aircraft gunsight which was fixed to the aircraft and hence had no motion relative to the aircraft.The second (experiment C2) were ground targets whose motion, relative to the pilot reflected the motion ofthe aircraft through the air. The aircraft was flown at 350 kn, 250 ft, straight and level over levelterrain and aiming commenced at a range of 2-5 km from the ground targets.
AIMING ACCURACIES
Aiming accuracies with the helmet sight against stationary targets were measured in the laboratoryfor a variety of vibration levels and a limited number of subjects. The rms aiming error for each0I0 second aiming run was cilculated and correlated with the input vibration level. The linear regression
lines are shown in Fig 2 (elevation head motion versus heave vibration) and Fig 3 (azimuth head motionversus sway vibration). The amount of head motion varied from almost none under no vibration (head motionlost in system noise) to up to 30 mrcd elevation error and 16 mrad azimuth error under the highest vibra-tion level, although it must be remembered that the vibradion levels are higher in the Canberra aircraftthan in more modern aircraft and that this highest vibration level was rated as severe tvrbulence.

'42
Also shown on these two graphs are the results from the flight trials. The regresston lines fromthe fixed target aiming are labelled C1 while the lines for ground target aiming are labelleJ C2. As canbe seen, agreement with the laboratory data is good except for the C2 azimuth error. This azimuth aimingerror results from the additional target motion in experiment C2. The Canberra aircraft at high-speed,low-level tends to produce a snaking motion in yaw, causing an effective target motion in azimuth andtracking this target motion causes aiming erro.s additional to those for the fixed targets.
Frequency analysis of the helmet sight output was also performed and Fig 4 shows the power spectraof tracking error (ie the involuntary motion) for a typical run. This graph shows that the bulk of thepower occurs at low frequencies, less than about 4 Hz, while higher frequencies present in the vibrationinput are damped out by the human body.
IMPROVEMENT TECHNIQUES
Aiming errors of this magnitude limit the usefulness of helmet mounted sighting equipment. Althoughthese errors are, perhaps, adequate for coarse weapon aiming, somewhat improved errors are required forfine aiming of some weapons. Some attempt was made therefore to find a technique to improve on theseerrors.
The first improvement technique which was applied is that of filtering the data. Since the outputof the turbulent helmet motion is a continuous signal, filtering (analogue or digital) can remove thehigher frequency oscillations, leaving only the low frequency information. This process is identical t-that of time averaging the data. By averaging over I second, say, noise with frequencies greater thanI Hz is removed, leaving only the effective mean aiming point. The drawback of this method is that, fora I second averaging period, a I second lag is put into the system, which may be unacceptable, and also,reliance is put on the subject maintaining his aim for the whole of that second. A few simple filteringtechniques were performed during these experiments, which indeed showed a decrease in error of more than50% at the expense of response time, but insufficient trials were performed to quantitatively assess themethod.
The second technique tried was to enable the pilot to mark the target instantaneously with an eventbutton, when he thought he was aiming precisely on the target. At the instant of mark, the helmet sightoutput was used to compute the instantaneous aiming error. This experiment was performed in the labora-tory and the results are shown in Table I, for three different vibration conditions. Both instantaneousmarking errors and rms tracking errors over 10 seconds of tracking per run are shown, each averaged overa number of runs. As can be seen the marking accuracies are very comparable with the tracking accuraciessuggesting that no improvement can be made by this method. The conclusion is that marking accuracy isequivalent to a random sample of the involuntary head motion, a fact not wholly unexpected since the headmotions contain higher frequencies than the bandwidth of the human headpointing control system.
The third method of improvement, the most complicated, involves a scaling of the output of thehelmet sight. By scaling down the helmet sight output, a greater signal to noise ratio can be achievedbetween the voluntary head aiming motion and the involuntary head turbulent motion. Unfortunately, sincethere is no longer a one-to-one correspondence between head attitude angles and spatial aiming angles, thebelmet sight reticle can no longer be used as an indicator of the aim point. Instead, visual feedbacKmust be given by a display of the aiming process presented on a display surface (head-down, head-up oreven helme-t-mounted). The process, therefore, links best with a sensox, and consists of providing thesubject with a display from the sensor showing the target and an aiming cursor; the helmet sight is then.ted in place ol the more conventional hand controller. The position of the cursor is controlled totallyby the pilot's head position while he looks at the display. For a scaling of 10:1, a 100 mrad head move-ment will result in a 1O mrad (visual angle) cursor movement, while a 10 mrad involuntary head motion willbe scaled to a I mrad cursor movement, etc. An initial course aiming process is required to acquire thetarget onto the display and establish the origin for the subsequent lielmet control inputs. Some labora-tory experimenLal data has been obtained on the ef:iciency of this technique. Experiments were performedof a full weapon aiming process of which this technique was a part. Static targets were presented using aHughes helmet mounted display as the display surface. A*ming error under vibration (low-level Canberrain the laboratory) was extracted from the results of these experiments, and is summarized in Table 2.Scaling factors of 2:1, 4:1 and 10:1 only were used and only radial aiming error (median) was computed.These results, however, are not inconsistent with the results for the effective 1:1 scaling shown inTable 1. A clear improvement can be seen as the scale factor is increased, consistent with the effectivedecrease of the involuntary head motion component. Limits on the desirable total head movement, however,limit the effective coverage of the head as a controller in this mode, especially at the higher scalingfactors.
A very quick test was also performed using the helmet sight as a rote controller with the cursorrate controlled by the subject's head position. The results obtained were encouraging, producing aimingerrors similar to the 10:1 scaling case. This method has the advantage that the head movements can stillremain small without limiting the coverage of the system.
This third improvement technique, therefore, appears to be an effective method of improving theaiming accuracy with the helmet sight, although it can only be used in those cases where the aiming procesucan be linked to a sensor or otherwise transferred to a display surface. However, if no such display isavailable, only the technique of filtering can be employed.
CONCLUSIONS
The major contribution to helmet sight aiming accuracy in high-speed, low-level flight is theinvoluntary head motion caused by the turbulenLe. This involuntary head t.otion consists of a low frequencyrandom motion with a cut-off of 4 Hz and amplitude dependent on the v;bration level. Filtering of thehelmet sightoutputmay be used to reduce the effects of this involuntary motion, while attempts to markinstants of more accurate aiming provide no improvement over random sampling of this involuntary motion.Use of a helmet sight at a control input to aiming tasks on a display shows promise, but this needsfurther investigation with specific applications in minm,

143
Table I
Vibration condition
CanberraValues in mrad None
Low High
Markinj, error Azimuth 5 19 21(standaid deviation - ..over runs) Elevation 4 26 37
Rms tracking error Azimuth 4 j6 19(mean oi-r runs)- -Elevation 4 30 33
Table 2
Scaling factor 2"1 4:1 10:1
Radial aiming errormtrad 8] 5 3
(under Canberra vibration
low level)
Controller HMSO LondonjP99
I I
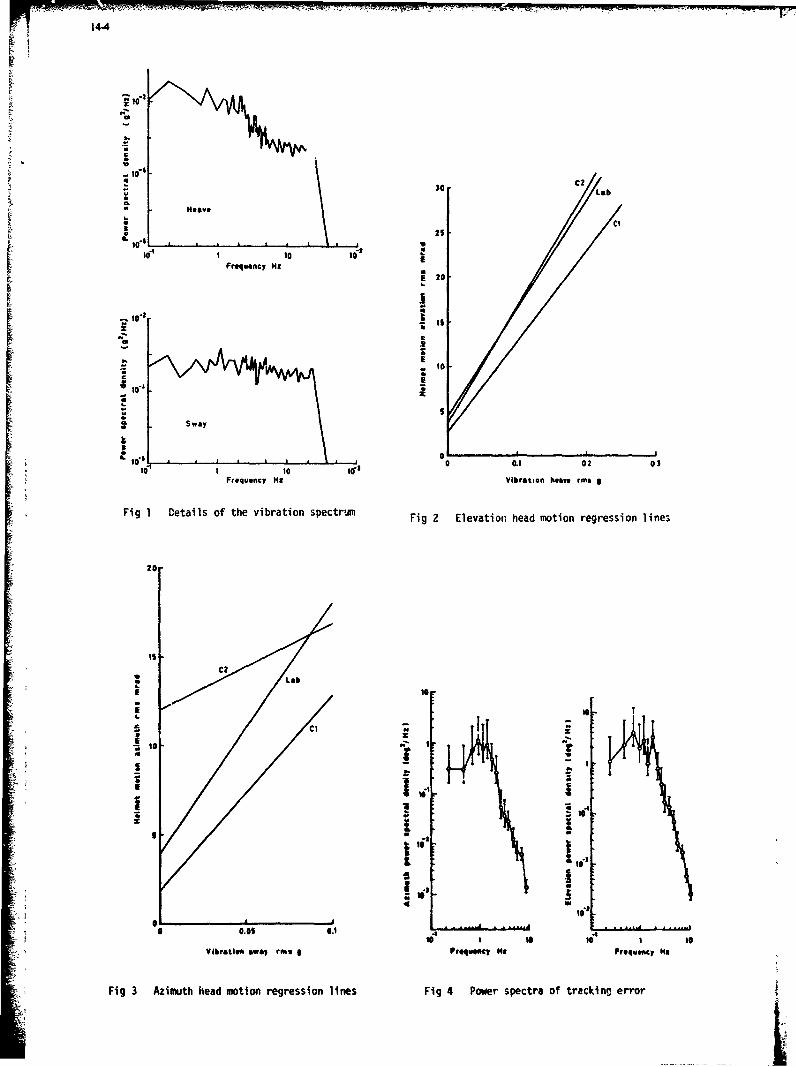
r!1 144
rC , C22:10",
•- 30 b
La"gHave
Frequency HI F 20
I
- 10
0 tO
'- 1 -C.1 .0& 20
0. USSway £
oC 0O2r 00
Frequency Ha Vibration heave rms g
Fig I Details of the vibration spectrum Fig 2 Elevation head motion regression lines
20
C2
2*2 S
Lab
i 0 T
1a1 1 10
Vibration *WSJ rems I Froluieay, Ht Frequency No
Fig 3 Azimuth head motion regression lines Fig 4 Power spectra of tracking error

• I• 15-I
CLINICAL MfEDICAL EFFECTS OF HEAD AND NECK RESPONSE
DURING BIODYNAMIC STRESS EXPERIMENTS
D. J. ThomsaC. L. Ewing
P. L. OaFeANkS
N. S. Gilbert
Naval Aerospace Medical Research Laboratory DetachmentP.O. Box 29407
New Orleans, Louisiana 70189USA
SUMMARY
Volunteer subjects have undergone impact acceleration experiments at the Naval Aerospace MedicalResearch Laboratory Detachment (NAMRLD) since 1974. The directions of the applied acceleration are -X(front to back), +Y (right to left), and -X+Y (45" between -X and +Y). The major categories of symptomswere neck pain, headache, restraint related musculoskeletal symptoms, and syncope. A few special cases hadfindings which required clinical evaluation and followup. The type, extent, duration and severity of thesymptoms were related in some cases to the direction, peak acceleration and acceleration duration. Therewere 1,621 instrumented experiments involving 62 volunteers. Symptoms or signs occurred in 655 (40%)experiments.
INTRODUCTION
The aircrew environment of high performance aircraft includea a complex array of biodynamic stresses.These are: sustained high acceleration, vibration, successive low amplitude impacts often called buffeting,and in emergencies, tho succession of impact forces imposed during egress and descent or crashes. Acritical physiological limit to aircrew effectiveness and maneuverability is the response of the head andneck which is usually unrestrained and encumbered by a helmet (1-5).
NANRLD in New Orleans, Louisiana is conducting a continuing program to determine the dynamic responseof volunteer subjects to impact acceleration (6-12). A major component of this research requires the:zeasurement of the three dimensional kinematic response of the head to the three dimensional kinematic imputat the first thoracic vertebral body (TI). The head and neck are unrestrained. The independent variablesof the experiments are the peak sled acceleration, rate of onset of acceleration, duration of acceleration,direction of acceleration applied to the volunteer and initial positioning of the volunteer's head andneck.
The purpose of these date is to supply a numerical basis for the simulation of the response and forspecifications required to construct an anthropomorphic dumay with humanlike dynamic response. It. additionthe measured kinematic response constitutes a basis to which to relate clinical symptoms, signs andphysiological responses of the volunteers. The kinematic response also serves as a basis for comparison ofhigh level animal experiments to the lower level volunteer experiments. The data, derived simulation anddummy specifications are intended for the evaluation of the impact portion of the biodynamic stressenviroment. The exteat to which the data can be applied to other tiodynamic stress enviroments requiresexperiments beyond the impact experimental design. The clinical signs and symptoms must be carefullyobserved, recorded, and analyzed as an essential effort in the conduct of volunteer experiments and inevaluating the implications of the measured kinematic response. Physiolcgical limit and injury criteria aredeveloped in part from these observations.
METHODOLOGY
SLED ACCELERATION DEVICE - A Bendix HYGER pneumaticaily driven .3048m diameter accelerator is Mped toaccelerate an approxirmtely 1.2m by 3.7m sled of 1,669 kg mass which ip rail mounted on 12 Delrin AF" pucks.This type of accelerator has been described previously (13). The acceleration stroke is limited to 1.52mand sled mounted brakes are not used. The effective deceleration drag is about .2G and the sled is allowedto coast to a stop. Total rail length is 2 13m.
RESTRAINT - During a -X experiment, the volunteer subject is seated in an adjustable chair and fittedwith a lap belt, inverted V pelvic restraint and a bilateral shoulder harness restraint. A loosely fittingchest safety strap is also employed. The restraint system is progressively tightened during the pre--runpreparation phase in order to minimize unwanted movement by the volunteer during impact (Fig. 1). However,the head and neck are unrestcained.
For +Y experiments, the subject is restrained In a nominally upright position by shoulder straps and alap belt, Inverted V pelvic restraint (Fig. 2). A safety belt, loosely fitted around the chest &s alsoemployed. The thrust vector of the sled is directed from the right to the left shoulder and the volunteeris positioned snugly against a lightly padded wooden board used to limit the upper torso motion. Theoffaxis (-X+Y) experiments were conducted using the same seat and restraint cystem as in the +Y experiments.

Figtire 1. P1hotograph or a volmizteer l-ist prior ito if -X limpimIt epeimenIt.CI
.W . r,,I-t -r - tp 2.1 f i'IO I gI hip ..I ýI I.a ;ollI I tI ". 1". 04 to 1 N * l
*;J I 44 mý ,Ir.I ~ tr l '4 4 I~ 4 I )1 * 4 t .I .. ;It. 1, 14 t I .ti.. I I ...I ..... I * : . .. .. . .. mi~ I~.1
11 wtit I -4 r r4'- I 1 ,1- ...), I ... ti 4,4, IfI. I t..I wtI t It t I, Nt I 4 .I4,4 I 4'Ie 41.itI11 1' II 'I' I I44 *t4I4 I~t I 1 I1,.
A.444 h.'r.it I'll] .1l14 1 *lg.'ll'r rI.iFtlt ' ,4 I�. , n '4 V.- .- It. I :I ') .. I Ii 4... . . I- I , !''I''' ",' It,1
it).S44,- w i -,it sy,tor ' Ib I (1. . Ii f . Ill..c1 4 1,1o: litI ') ri~ , s .tc: III It. '' 1. )
Th.,4 ..4 r4It t in 4 r .1y 1 t- ' IIaIV. ... ..lIf m
It I,- . v I-rmys t2
9_______________
v.I Ir tI aIe I i IIUC:1AtI(It.11 ; Ir P f -0 ,~lo0I al'no tt o t-" I__-PAt.t__1__'__2-I t1
N A

15-3
The output of each accelerometer is hardwired to an EAI-pacer 60dWhybrid computer, digitized at 2000samples per second and stored on magnetic disk in real time. The calibration information is available inthe computer memory prior to the run and carried with the accelerometer data. Within minutes after eachexperiment the digital data are scaled and reconverted to analog form. They are plotted on a cathode raytube for validation by comparison with a scaled light besm oscillographic plot of the data, independentlygenerated at the time of the run. In addition, a two axis rate gyroscope is mounted on the head mount andon the T mount. The data from these gyroscopes are used as an independent measurement of two components ofthe angular velocity of the head and of the neck.
Cinephotographic coverage of tM event is ovided by two sled-mounted, pin-registered 16mm, 500 frameper second cameras, Milliken DBM U5' or DIM 5 situated orthogonally t each other at approximately onemeter from the volunteer. These cameras are equipped with 12.5mn Kinopticp" lenses at f4. Each camera has a140 degree shutter and is equipped to print ten digits of the time of day at time of shutter openingresolved to 0.1 ms along the frame dge as well as serial IRIG B timing along the opposite edge. Onehundred foot rolls of Kodak 2479 RAI& film are used.
Lighting is provided by four sled-mounted General Electrie 4582 lamps mot~nted in pairs at each of thecamera sites. One camera is mounted to the right of the volunteer with lens axis approximately normal tothe mid-sagittal plane of the volunteer. The other one is mounted in front of the volunteer. Photographictarge's on the T1 instrumentation mounts as well as the sled-mounted target remain in the field of view ofthe lateral camera. Targets on the mouth mount instrumentation are in the field of view of both cameras.There is an additional overhead camera for the +Y experiments. The Ti mount displacement is constrained tothe mid-sagittal plane and is measured relative to the sled coordinate system for -X experiments. The threedimensional motion of the T1 mount is measured for +Y experiments. The mouth mount displacement can bemeasured in three dimensions relative to the sled. In -X+Y experiments, the photographic coverage isidentically placed relative to the volunteer as in the +Y experiments.
THE PHYSIOLOGIC DATA COLLECTION SYSTEM - The physiologic data collection syste-0 utillzes aneight-electrode harness, signal conditioning amplifiers, an FM trans, itter-receiver telemetry package, aninstrumentation quality analog magu.atic tape recorder, a pen recorder and oscilloscope monitors. Thefrequency response of the entire system is flat from 0.1 ift to 80 Hz, down 4 dB at 0.05 Hz and down 1 dB at'00 Rz. Signal to noise ratio on tape is 55 dB and 80 dB on the pen recorder (17).
Although the electrode placement is in accprdance with the system described by Frank, slightmodifications have been made to accom-odate the anatomic mount placed it T . Electrodes at locations I, F,C, A and M have been placed in agreement with Frank. H has been shifted" from the posterior neck to thespinous process of the third thoracic vertebra. Lead F has been shifted from the left lea to the left iliaccrest (Fig. 4). The electrodes are of the active variety. The skin Is prepared by viguious scrubbing withan acetone moistened sponge. The electrode surface is sparingly coated with a canductive cream and theelectrode is placed in the proper anatomic location. The electrode, along with a loop of wire to providestrain relief, is covered with an adhesive backed pad. The individual electrode wire leads are cabledtogether and attached to the sled mounted amplifier-FM transmitter package by a single connector. Thetrans•mitting antenna is sled mounted and located approximately 6 cm from the receiving antenna which runsthe entire length of the track. The received FM multiplex signal is conducted by shieldet cable to thecontrol room where the electrocardiographic data are appropriately demodulated and storpd on analog magnetictape. The three VCG channels are also written out by a pen recorder and displayed on oscilloscope monitors.
-~ 0
FRANK LEAD ANATOMICAL PLACEMENT
Figure 4 ••

15-4
The vectorcardiographic data are collected within an anatomic coordinate system based on the three-axisCartesian system utiliz'ng the right hand rule. This system is chosen to assure conformity with the otherlaboratory coordinate systems. The anterior-posterior lead pair is termed X, the left-right pair is termedY and the superior-inferior pair is termed Z. Anterior, left and superior are positive in polarity.Therefore, the NAMRLD channels X,Y,Z correspond to Frank -Z,X,-Y and approximate the standard leadsV2,1,-aVf respectively (Fig. 5).
LEAD COORDINATE SYSTEM COMPARISONz Y
Y xx
x Z
YNAMRL FRANK STANDARD
X -Z V2Y X IZ -Y -aVF
Figure 5
CLINiCAL MONITORING PROCEDURES - All volunteer subjects are extensively screened prior to entry intothe biodynamics research program at KW(RLD. The procedures, selection criteria, and selection rates fcr theperiod 1967 through 1977 have been presented (18). Any volunteer candidate found to have an anomaly, judgedto place him at an excess risk of injury from the experiments as compared with a volunteer candidate withoutthe anomaly is disqualified. As a result of this screening effort, a substantial baseline clinical andphysiological record is available.
Each volunteer is examined by an attending physician before and after every experiment. The physiciansare individually qualified as medical monitors after extensive experience with the research equipment,experimental methods and design. Whenever a volunteer is seated on an operating experimental device, theattending physician is present with the capability to abort the experiment at any time. Each volunteeranswers a routine self evaluation at 12 and 24 hours post experiment. In order to standardize and retrievethe clinical record, a highly structured examination record procedure was established. The basic forms,"Medical History Screen" (Fig. 5) and "Physical Examination Screen" (Fig. 7) are presented. This is theentry form to an extensive set of subsidiary forms which are used when a pre-run abnormality or a post-runchange is checked on the basic form. There is a subsidiary form for each numbered item on the basic form.All of the data in "check off" form are reduced to punch cards. Observetions not amenable to "check off" orwhich can not be numerically recorded, are written on one of the numbered forms in a narrative and retained.A special case prevails for item 216, "Physiologic data from run." This is an entry ooint to access thesummary judgments from reviews of physiologic data. In all fully instrumented experiments there is adetailed vectorcardiograph clinical summary on a separate form accessed through item 216. Other physiologicmeasurement systems have been used and are under development.
If the pre and post experiment examinations are normal, the only records are Form 100 "Medical HistoryScreen," Form 200 "Physical Examination Screen," Form 202 "Vital Signs," Form 203 "Visual Acuity andAccommodation," Form 214 "Urinalysis " and Form 216 "Physiological Data from Run." Categories can be addedto the basic form, and details changed on the subsidiary forms without changing t.ae lopic of the system'sability to retrieve and analyze records prior to the change. The observation from these records constitutesthe data base of this report.

NavAerospMedRsLabDe t Forsm (1)(0)(0) Medical History Screen
A. Name Initials ( )( )( )
7 8 9 10 CeB. S u b j e c t N u mb e r ( ) ( ) ( ) C . S p e c i e , sx , r c )
12 13 14 15 16 17 18 19 20 2122D. Run N, vnber ( )( )( H( H( H( E. Dot* of Run )( H )H X ( H
23 24 25 26 27 76
F. Time of Rune )( )( )( ) G. Examination Type () Revision (A)
symptom Category Pr.emn Post Run
Col No Yes No Yes DP.
.. 101. Headache 28. .I102. Visual (blurred, diplopia. field) 29 __
103. Vestibular (dizziness, loss of balance) 30 . .
117. Hearin 3110,. -orate-Attitude Problems 32 __
105. Pain (except heodache) 33 1_106. GI (no.use, anorexia, bowel) Symptms 34 --
- 107. Urinary Symptoms (heatria) 35 I -
108. Remiratory Symptoms dyspnuo) .3 6 I -
109. Cardiac Symptoms 3pItatios) 37 - -
114Y. •.•culoskel.tal Symptms (weicessr stiffness) 381ii. COthen; nt metoe n111039 • m l
*12 IlInrpu since rost -un 40
13 Dru consuption s lt
C esainina Ptysiions Signatui e (POST-uU*04PiihyslclansC
WJDAA PROCESSING (DP) SYM•IOLS N N(Nm1e: IteA 112 113, 114,e los N W
-(arny) N 4 @
Y Y +
*Apply to PRE RUN history ONLY
F•, Figure 6

15-6
NevAeraspMedlsLabDet Form (2XOXO) Flhyical Em•inatim Scw4 5 6
A. Name Initial )( X )
B. Subject Number ( 8 )(9 )( 10) C. Species, M, race ()
12 13 14 15 16 17 18 192 0 21 22D. R un Number ( )( )( )( )( )( ) E. Daft ofl bn() X ){X )
23 24 25 26 27 76F. 7ne of Run ( )( )( )( ) G. Examination Type (5) bvhn (a)
F.amlna*ti *(Normal N, Abnoal = A, Not Done = ND)"(Unchnged = U, Signiflcon Change C, Pm hno Paso Im
Not Done =ND) Co N IA ND U D
6suaV cu; n Acco~mmodat ion 2
zo *. r ai Fields c,.on ro•atn-
Visual ;-eItds (Goldmann)"e 33"20. Cranial nerves (Oxcept ft) 34"},u7. S~Iin lecc •zhymoses, etc.) 32W8. Cardiac 3--
o .'pulmonary .. ... 3721.Abdcwn 3
21./~culeatoi t-RO c) 3e9
12.' xminbfatxio.213. Vestli on' ( ibalnce) 41217. Ear s csf'r.. .... Cor AN214. Urinalp is216. I~soolcdt rmrn4421H . C lin.i cal B~ioc hem ist ry L, 4
Data Processing Symbols (DP): N N a N Y @Y N $ Y Y 4-
(,=No Y= Yes)N Y NY
F ~ -257IV 41 inations4
Medcalycleared to prwVo-n st-iun.mdclrlae 4
113.~~igr Nartve-7
D OATA RIMMING, (CM YIoabwmlniV ~ ~ I "flnsIgtw Poht)9 hsca' oeN U - A C +
r:in,•'lhyl~m' $gn,•e"(Ie •,49 I~•¢m' Cd AI U $ NO u ?I• N NO P•IID C iI
r-IA NO • NO ND 0rmnn Physician, s Sigrt. r s fts, (ln• n ")cie.', Code I N C €
namal FOR HIM of Il -FOR HIM4.Cb*are to P - ow wailvietl
• Goldman m 940w-21411
Figure 7

ii 15-7
EXPERIMENTAL DESIGN
All human impact acceleration experfments with full inertial instrumentation of the head and T arepresented for horizontal accelerator runs #156 through #3291. The experiments as summarized (Fig. 3)constitute the experimental design.
The experimental condit.vn is specified by direction of acceleration applied relative to the seatedvolunteer. The three directions studied are: -X. chest to back; +Y, right to left; and offaxis, designated-X+Y, a direction at 45* between -X and ÷Y. It is further specified by the peak, duration and rate ofonset of acceleration applied to the sled. For each direction three codit.nns of duration and onset areestablished which are high onset long duration (HOLD), high onset short duratio.a (HOSD) and low onset lougduration (LOLD). Selected initial conditions of heed and neck position are studied within the HOLDconfiguration and the effects on the dynamic response for -X and for +Y direction have been reported (6, 12).However, the effect on symptoms and signs is repotted for only one special initial condition of neck forwardchin down (NFCD) in the -X direction.
There is considerable overlap of rate of onset between the high onset condition and the low onsetcotnition. This is due primarily to the characteristic of the accelerator. The rate of onset is dependenton peak acceleration. Therefore, a low level high rate of onset experiment may have a lower rate of onsetthan a high level low rate of oneet experiment. Also there is considerable variability in rate of onset.On the average, at a giver peak sled acceleration the high rate of onset condition is twn to six timeshigher than the low rate of onset condition.
Sled FarametersPcak Acceleration Rate of Onset Duration End Stroke Velocity
Range Range Range Range Number ofDirection Condition e/sec
2 u/Sec3 ms m/sec experiments Totals
-X HOLD 156 - 19(16G-2G) 30600 - 500 125 - 67.5 18 - 3.4 457HOSD 155 - 47(16G-5G) 28700 - 1350 43 - 22.6 5.4 - 2.4 65LOLD 152 - 56(16G-60) 4740 - 1030 116 - 91 18 - 8.2 41
563
.y HOLD 72 - 20(7G-2G) 8700 - 500 150 - 77 6.7 - 3.1 394HOSD 111 - 45(1U0-5G) 23600 - 3120 37 - 27 3.5 - 1.9 178LOLW 75 - 20(8G-2G) 1700 - 590 129 - 62 7.5 - 3.2 160
732
-1+Y HOLD 89 - 20(9G-2G) 9470 - 2140 142 - 53 10 - 3.1 122HOSD 129 - 58(13G-60) 19800 - 6040 35 - 26 3.8 - 2.3 126LOLW 99 - 19(10G-2G) 4600 - 4,3 126 - 69 10 - 3.3 75
3231.621
Figure 8. Experimental Design. The condition mnemonic is defined in the text.
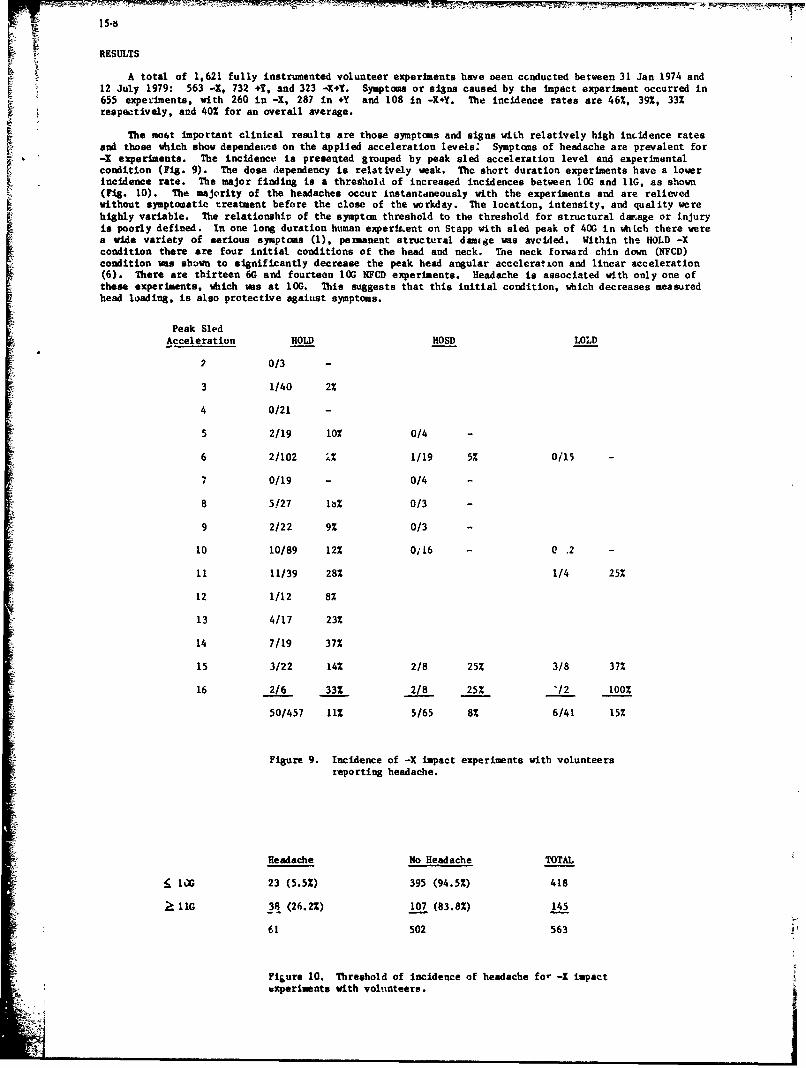
15-8
RESULTS
A total of 1,621 fully instrumented volunteer experiments have oeen ccnducted between 31 Jan 1974 andL 12 July 1979: 563 -X, 732 +Y, and 323 -X+Y. Symptoms or signs caused by the impact experiment occurred in655 expe'iments, with 260 in -X, 287 in +Y and 108 in -X+Y. The incidence rates are 46%, 39%, 33%respectively, and 40% for an overall average.
The moat important clinical results are those symptoms and signs wtrih relatively high incidence ratesand those which show depende•t.e on the applied acceleration levels: Symptoms of headache are prevalent for-X experiments. The incidence is presetited grouped by peak sled acceleration level and experimentalcondition (Fig. 9). The dose dependency is relatively weak. The short duration experiments have a lowerincidence rate. The major finding is a threshold of increased incidences between 10C and 11G, as shown(Fig. 10). The majority of the headaches occur instantdneously with the experiments and are relievedwithout symptomatic treatment before the close of the workday. The location, intensity, and quality werehighly variable. The relationship of the symptom threshold to the threshold for structural dan.age or injuryis poorly defined. In one long duration human experiLent on Stapp with sled peak of 40G in htLch there werea wide variety of serious symptoms (1), pemanent structural damige was avwided. Within the HOLD -Xcondition there are four initial conditions of the head and neck. The neck forward chin down (NFCD)condition was sbuwn to significantly decrease the peak head angular acceleration and linear acceleration(6). There are thirteen 6G and fourteen 10G NFCD experiments. Headache is associated with only one ofthese experiments, which was at 10G. This suggests that this initial condition, which decreases measuredhead loading, is also protective agaiust symptoms.
Peak SledAcceleration HOLD HOSD LOLD
2 0/3 -
3 1/40 2%
4 0/21 -
5 2/19 10% 0/4 -
6 2/102 i% 1/19 5% 0/15
7 0/19 - 0/4 -
8 5/27 l1% 0/3 -
9 2/22 9% 0/3 -
10 10/89 12% 0,16 - 0 .2 -
11 11/39 28% 1/4 25%
12 1/12 8%
13 4/17 23%
14 7/19 37%
15 3/22 14% 2/8 25% 3/8 37%
16 2/6 33% 2/8 25% '/2 100%
50/457 11% 5/65 8% 6/41 15%
Figure 9. Incidence of -X impact experiments with volunteersreporting headache.
Headache No Headache TOTAL
1 l0G 23 (5.5%) 395 (94.5%) 418
>-11G 38 (26.2%) 107 (83.8%) 145
61 502 563
Figure 10. Threshold of incidence of headache for -X impactexperiments with voluanteers.
• •+.I

15-9
The other majc r symptom category is pain, muscular soreness, stiffness, or limitation of range ofmotion of the neck. The incidence of the neck symptoms for -X expetiments is presented (Fig. 11). Theincidence shows a threshold response at about 10G and a rise in incidence through the 16G experiments. Thesymptoms occur promptly with the experiment, tend to persist up to 24 hours, and do not require treatment.
Most of the other -X experiment related symptoms and signs concerned the musculoskeletal systm otherthan the neck. This incidence is much lower. Excluding neck symptoms, complaints of lumbosacral area pain,soreness, stiffness and limitation of mofion were the most common, especially as the peak sledaccelerations approached 16G. The duration of these symptoms ranged from a few moments to as long as 24hours. There were, however, no delayed symptoms. In other words, if a symptom occurred, it occurred withimpact, and not later. This point is of some significaace when compared to the +Y and -X+Y experimentspresented below.
Peak SledAcceleration HOLD HOSD OLD
2 013 -
3 0/40 -
4 0/21 -
5 1/19 5Z 0/4 -
6 6/102 6% 0/19 - 1/15 72
7 0/19 - 0/4 -
8 1/27 4% 0/3 -
9 1/22 5% 0/9 -
10 17/89 19% 1/16 6% 2/12 16%
11 11/39 28Z
12 3/12 25%
13 5/17 29%
14 9/19 47% 2/4 50%
15 8/22 36% 2/8 25% 2/8 25%
16 3/6 50% 2/8 25% 0/2 -
63/457 14% 5/65 6% 7/41 17%
Figure 11. Incidence of -X impact experiments with volunteers- reporting neck symptoms.
The symptoms and signs reported from the volunteers resulting from +Y impact experiments arepredominantly headache and neck related complaints. This is analogous to the findings for -X experiments.The incident rates are presented (Fig. 12 and 13). However, there are major differences. For long durationexperiments, the threshold for a significant rate of headache and neck symptoms is about OG for -Xexperiments and 60 for +Y experiments. However, it has been previously reported (8, 19) that theacceleration peak at T was much h.gher for +Y experiments than for -X experiments at any given sledacceleration. This is Ifue to the rigid right side restraint for the +Y experiments which caused higheracceleration at T1I than in -X experiments at the same sled acceleration. The lower sled accelerationthreshold for significant symptom rate in the +Y experiments is explained by this difference in restraint.Therefore, there appears to be little difference in the threshold of T acceleration response for symptomsbetween lateral and frontal impact.

15-10
Peak SledAcceleration FOLD HOSD LOLW
2 0/39 - 0/11 -
3 2/82 2% 1/26 4%
4 4/42 101 1/26 4%
5 14/118 12% 0/22 - 6/45 13%
6 12/54 22% 1/23 4% 6124 25%
7 15/59 25% 1/24 4% 9/24 37%
8 2/.2 9% 3/4 75%
9 7/27 26%
10 4/37 11%
11 __81...8/23 35%==_
47/394 12% 23/178 13% 26/160 16%
Figure 12. Incidence of +Y impact experiments with volunteersreporting neck symptoms.
Peak SledAcceleration HOLD HOSD LOLD
2 0/39 - 0/11 -
3 0/82 - 1/26 4%
4 2/42 5% 2/26 8%
5 3/118 3% 0/22 0 6/45 13%
6 6/54 11% 1/23 4% 3/24 12%
7 15/59 25% 3/24 12% 4/24 17%
8 0/22 0 0/4 0
9 3/27 11%
10 3/37 11%
1_ 7/z3 30%
26/394 7% 17/178 i0M 16/160 102
Figure 13. Incidence of +Y impact experiments with volunteersreporting headaches.,
The quality and localization of the headache and neck symptoms is vector dependent. Delayed onsetheadaches are usually persistent. Similarly. the neck symptoms are often delayed in onset and almost alwayson the left side of the neck in the area or maximum extension of the neck. Also, "neck popping" occursfrequently, and is noted at impact and without sequelae post run. This symptom has never been reported for-X experiments.
There was one volunteer who was dropped from the program because of neck symptoms as a result of a +Vexperimert. Volunteer H067 sustained electric type sensation, tingling and then numbness of the right aimand shoulder. The peak sled acceleration level was 6.2G. This volunteer was very experienced and had priorexposure up to 7.5G in this direction. The most dramatic symptom lasted only a secend or two and wasgradually replaced by minor discomfort in the right neck area lasting 9 days. Detailed examinations by aneurosurgeon were completely normal except that volunteer carried his head slightly tilted toward his rightshoulder. This postural variation predated his volunteer service. It was finally concluded that a posturalfacet syndrome existed which became manifest indicating in retrospect that he should not have been used as avolunteer. This was confirmed by orthopedic followup several months later.
Three volunteers had unique signs and sym.ýtoms in the +Y vector related to body phys 4 que. VolunteerH097 because of size would routine: y bump his right thigh and ankle upon impact against the rigid lateralrestraint board. Volunteer H078 because of bony prominence of spinous processes and elbow woutld havesoreness of these areas on impact, and also soreress under the T mount. Volunteer HJ96 had frequentdiscomfort in the thoracic spine area from T4 to T1 1 . This could "be related to mild thoracic scoliosis inthis area.

;:" 15-11
Relatively infrequent complaints that appear to be related to the restraint system are (1) soreness of
left shoulder from the snoulder restraint, (2) sore right neck from T strap, (3) soreness in right thigh,shoulder, am, and elbow from the lateral board restraints, (4) abrasion of left arm from metal buckles of
the chest strap system, and (5) soreness on impact at site of ECG electrode placement.
The incidence of -X+Y experiments in which the volunteers experienced headache or neck symptoms ispresented (Fig. 14 and 15). The incidences are comparable to that for +Y experiments. This implies thatthe T- and head loading was at comparable levels for this direction. However the kinematic data analysis ofthe -1÷Y experiments is incomplete. It should be noted that -X÷Y experiments were executed at higher levelsthan ÷Y experiments. In the +Y experiments the levels were limited in order to avoid experimeTits in whichhead strikes against the right shoulder rigid restraint might have occurred.
Peak SledAcceleration HOLD HOSD LOLD
2 0/20 - 0/10
3 1/21 5% 0/11
4 1/16 6% 0/9
5 1/20 5% 1/10 10%
6 5/16 31% 0/16 - 4/14 29%
7 3/17 182 1/16 8% 3/7 43%
8 1/8 12% 0/17 - 2/6 33%
9 2/4 50% 0/15 - 3/5 60%
10 1/15 57% 1/3 33%
11 8/25 32%
12 4/12 33%
13 - 3/10 30%
14/122 11% 17/126 13% 14/75 19%
Figure 14. Incidence of -X+Y impact experiments with volunteersreporting neck symptoms.
Peak SledAcceleration HutLD HOSD LOLD
2 0/20 - 0/10 -
3 0/21 - 0/11 -
4 1/16 62 0/9 -
5 0/20 - 1/10 10%
o 1/16 6% 0/16 - 0/14 -
7 0/17 - 1/16 6ý 2/7 29%
8 0/8 - 0/17 - 1/6 17%
9 0/4 - 2/15 13% 1/5 20%
10 3/15 20% 0/3 -
11 3/25 12%
12 4/12 33%
13 8/10 80%
2/122 2% 21/126 17% 5/75 7%
Figure 15. Incidence of -X+Y impact experiments with volunteersreporting headache.
-I

More than half of the neck symptoms reported for -X+Y experiments were delayed in o iset to a greater
degree than +Y or -X experiments. A minimum of 12 to 24 hours is required to evaluate any delayed onsetsymptoms. One volunteer sustained a strain of left posterior cervical soft tissue and interarticularligaments with traction or compression of the posterior nerve roots C5 through C7. This resulted from a-X+Y experiment at 7G in the LOUa) condit.on. Symptoms did not resolve completely until 10 days postexperiment. X-rays ard bone scan were normal. During a 3-month followup there was no recurrence ofsymptoms. No underlying condition was implicated in this case.
Alterations of the electrocardiogram also occurred. These findings are primarily bradycardia,suppression of the sinoatrial .aode, intraventricular conduction abnormalities, and minor T wave changes.All the electrocardiographic abnormalities returned to baseline within 3 minutes post run. A single case ofevolved EKG changes to suggest myocardial contusion has been reported in detail (17).
Incidence of experiments with VCG changes for -X was 72/2(;1 (35%), for +Y 115/730 (16%), and for -X+Y39/307 (13%). The detailed analysis of the significance of these findings is under investigation. Casereports from impact experiments have been previously reported (17, 20).
Skin abrasions also occurred rather infrequently, and these were always due to the restraint system.None of the skin lesions persisted fr more than a few days.
Another problem which is directly related to the restraint system was syncope. These episodes usuallyoccur with a newly qualified volunteer on his first or second fully Instrumented run. A 7.5om widecircumferential chest sLrap is used to aid in maintaining the TI neck mount in place. This strap is tightlyapplied and definitely limits chest expansion, thus interfering with respiration. The lap belt, inverted Vrestraint, when tightened, restricts venous return from the legs. The shoulder straps restrict venousreturp from the arms. In combination, these straps effectively impede both circulating blood volume andpulmonary gas exchange, predisposing the volunteer to syncope under the additional stress of his firstexperiment. The newly qualified subject, after one of these unpleasant episodes, learns how to breatbediaphragmatically, and in each case, is able to adapt to the stress, so that only four volunteer.• had morethan one such syncopal episode. There were 18 pre-run syncopal episodes. The attending medical officeraborted the experiment in each case. No volunteer was ever impacted while syncopal. One of these casesresulted in 5 seconds of asystole (Fig. 16). No injury resulted, since the subject was removed from therestraint and instrumentation devices within 60 to 90 seconds. However, he was disqualified because of lackof nodal escape mechanism.
Eleven instances of syncope occurred after impact. In seven of these, the sled peak acceleration wasover 10G, with three at 16G. These episodes occurred in well seasoned volunteers, and thus must be due tothese highly stressful experiments. As with the pre-run syncope, each subject was speedily removed from thesled, recovery was rapid, and no injury resulted. Virtually all the syncopal attacks to date occurred inthe -X configuration with only three in the +Y and none in the -X+Y series. Of the three syncopal o:tacksin the +Y experimental series, two occurred pre impact aaio one occurred one minute post run. No problemswere noted after the volunteer was taken out of the restraint system and the mounts removed.
DISCUSSION AND CONCLUSIONS
The clinical findings have been presented and analyzed by vector direction, sled acceleration peak andduration. Those findings which are run re.ated and due to inertial loading of the head and neck areprimarily headache and neck strain. Most headaches occured promptly and some were of delayed onset. Twocases of neck strain were sufficiently severe to warrant removal of the volunteers from furtherexperimentation. The quality of the neck symptoms is markedly different depending on vector direction.This conclusion must be qualified with the unders.anding that the head and neck Inertial loading is muchmore severa in +Y experiments than in -x experiments for a given sled acceleration peak and duration.. Thisis due to the sideboard restraint used in the +Y experiments that increased the T1 and head response for agiven sled acceleration above that seen for -X experiments (8, 19). The transition levels 'rom transientsymptoms to injury to permanent damage in humans are unknown. However, experiments with baboons (PapioAnubis) (21) and rhesus monkeys (Macaca mulatta) (22, 23) indicate structural failure of the"atlanto-occipital articulation for -X experiments between 100G and 120G on the sled. An experimentallybased estimate of injury limits for man is under study by means of measuring transient neurophysiolgicalresponse of the Macaca at the lower sled acceleration levels (24, 25).
Important cardiac changes have been previously discussed (17). They are attrlibted to inertial loadingof the heart and/or inertial loading the vascular and neurological structures of the head and neck. This
remilts in extensive vagal response previously demonstrated by Taylor (20). These changes al.o are relatedto the post exper:mental syncopal episodes.
Other findings are not systematically related to the inertial response. They exhibited vide variationand type or are unique to the physique of Individual volunteers, particularly as related to fýt in therestraint system.

15-13
-4-4L
-~~~C ....
_0--
I.j::~ J: 0
CLC
L 1'4 .~ - . - - - - - - - C
Fa..-
1. 77i

15-14
ACKNOWLEDGEMENTS
Major funding and supp:t for this work is provided by the Bureau of Medicine and Surgery, the NavalMedical Research and Development Command, and the Office of Naval Research.
Volunteer subjects are recruited, e'aluated and eAployed in accordance wiLh procedures specified inSecretary of the Navy Instruction 3900.39A and Bureau of Medicine and Surgery Instruction 3900.6 which arebased on voluntary informed consent, and meet or exceed the most stringent provisions of all prevailingnational and internrtional gu'delines.
Opinions or conclusions contained in this report are those of the authors and do not necessarilyreflect the views or the endorsement of the Navy bepartment.
Trade names of materials or froducts of commercial or nongovernment organizations are cited only whereessential t, precision in describing research procedures or evaluation of results. Their use does notconstitute official endorsement or approval of such commercial hardware or software.
Authors wish to express their appreciation to the ent.re staff of the NAARL Detachment, in particularElke Lewis for editorial assistance. Special acknowledgement goes to the volunteer subjects without whomthis research would be impossible.
REFERENCES
1. J. P. Stapp, "Hunan Exposures to Linear Deceleration - Part 2 - The Forward-Facing Position and theDev-lopment of a Crash Harness." Wright-Patterson Air Force Base, Dayton, Ohic, AF Technical Report No.5915, Part 2.
2. J. P. Stapp, "Collected Data on 48 Rocket Sled Experiments (Holloman Air Force Base)." Prepared forBrooks Air Force Base by Northrop Space Laboratories, #NSL 65-94, May 1965.
3. C. L. Ewing and A. M. Irving, "Evaluation of :lead Protection in Aircraft." Aerospace Medicine,40:96-599, June 1969.
4. D. Call and C. L. Ewing, "Human Head and Neck Response to Multiaxis Acceleration During MilitaryParachuting." Presented at Aerospace Medical Association Meeting, San Francisco, CA, I May 1q75.Unpublished.
5. D. W. Call, J. F. Palmer, and C. L. Ewing, "Further Studies of Human Head and Neck Response to MultiaxisAccelerations During Military Parachuting." Presented at Aerospace Medical Association rec. ing, Miami, FL,May 1976. Preprints enly.
6. C. L. Ewing, D. J. Thomas, L. Lustick, E. Becker, G. Willems, and W. H. Muzzy I1, "The Etfects of theInitial Position of the Head and Neck on the Dynamic Response of the Human Head and Neck to -Gx ImpactAcceleration", Proceedings, Nineteenth Stapp Car Crash Conference, Society of Automotive Engineers, inc.,Warrendale, PA, 1975.
7. C. L. Ewing, D. J. Thomas, L. Lustick, W. H. Muzzy Ill, G. Willems, and P. L. Majewski, "fhe Effect ofDuration, Rate of Onset and Peak Sled Acceleration on the Dynimic Response of the Human Head and Neck",Proccedings, Twentieth Stapp Car Crash Conference, Society of Automotive Engineers, Inc., Warrendale, PA,1976.
8. C. L. Ewing, D. J. Thomas, L. Lustick W. H. Muzzy III, G. Willems. and P. L. Majewski, "DynamicResponse of Human Head and Neck to +Gy Impact Acceleration", Proceedings, Twenty-First Stapp Ca, CrashConference, Society of Automotive Engineers, Inc., Warrendale, PA, 1975.
9. C. L. Ewing e.nd D. J. Thomas, "Human Head "nd Neck Responses to Impact Acceleration," NAMRL Monograph21, p. 84, Naval Aerospace Medical Research Laboratory, AD747988, August 1972.
10. C. L. Ewing, D. J. Thomas, L. M. Pat-ick, C. W. Beeler. and M J. Smith, "Living Human Dynamic Responseto -Gx Impact Acceleration. II Accelerations Measured on the Head and Neck", Proceedings, Thirteenth StappCar Crash Conference, Society of Automotive Engineers, Inc., Warrendale, PA, 1969.
II. C. L. Ewing and D. J. Thomas, "Torque versus Angular Displacement Response of Human Head to -Gx ImpactAcceleration", Proceedings, Seventeenth Stapp Car Crash Conference, Society of Automotive Engineers,Warrendale, PA, 1973.
12. C. L. Ewing, D. .J. Thomas, L. Lustick, W. H. Muzzy 11, C. C. Willems, and P. L. Majewski, "Effect ofInitial Position on the Human Head and deck Response to +Y Impact Acceleration," P'roceedings, NineteenthStapp Car Crash Conference, Society of Automotive Engineers, Inc., Warrendale, PA , 1975.
13. R. L. LeFevre, T. R. Kolhoff, and W. C. Cichcwski, "A Second Generation Impact Sled Facility."Proceedings of General Motors Corporation Automotive Safety Seminar, Safety Research and DevelcpmenLLaboratory, Milford, Michigan, 1968.
14. D. J. "Thomas, "Specialized Anthropometry Requirements for Protective Equipment Evaluation." NATO AGARDConference Proceedings on Current Status in Aerospace Medicine, AGARD-.P-llO, 3973.
15. E. B. Becker and G. Willems, "An Experimentally Validated 3-D Inertial Tracking Package for Applicationin Biodynamics Research." Proceedings, Nineteenth Stapp Car Crash Conference, Society of AutomotiveEngineers, Inc., Warrendale, PA, 1975.

15-15
16. E. B. Becker, "A Photographic Data System for Determination cf 3-Dimensional Effects of Multiaxis ImpactAcceleration on Living Humans." Proceedings of the Society of Photo-Optical Instrumentation Engineers,V.57, Palos Verdes Estates, CA, 1975.
17. P. L. Hajewski, T. J. Borgman, D. J. Thomas, and C. L. Ewing, "Transient Intraventricular tonductionDefects Observed During Experimental Impact in Human Subjects." NATO AGARD Conference on Models andAnalogues for the Evlauation of Human Biodynamic Response, Performance, and Protectinn, AGARD-CP-253, 1979.
18. D. J. Thomas, P. L. Majewski, C. L. Ewing, anO N. S. Gillert, "Medical Qualification Procedures forHazardous-Duty Aeromedical Research." NATO AGARIJ Conference Proceedings on Prospective MedicineOpportunities in Aerospace Medicine, AGARD-CP-231, 1978.
19. C. L. Ewing, D. J. Thomas, and L. lustick, "Multiaxis Dyn&-aic Response of the Human Head and Neck toImpact Acceleration." NATO AGARD Confeit'nce on Models and .nalogues for the Evaluation of Human Bic-dynamicResponse, Perfonmance, and Protection, AGARD-CP-253, 1979.
20. E. R. Taylor and L. W. Rnein, "Physiologic, Effects of Abrupt Deceleration, I. Relative Bradycardla."Aerospace Medicine, pp. 1442-1445, December 1962.
21. T. D. Clarke, D. C. Smedley, W. H. Muzzy, C. D. Gragg, R. E. Schmidt, and E. M. Trout, "ImpactTolerance and Resulting Injury Patterns in the Babboon: Air Force Shoulder Harness-Lap Belt Restraint."Proceedings, Sixteenth Stapp Car Crash Conference, Society of Automotive Engineers, Inc., Warrendale, PA,1972.
22. F. J. Unterharnscheidt and C. L. Ewing, "Potential Relationship Between Central Nervous System Injury
and Impact Forcos Based on Primate Studies." AGARD NATO Conference on Models and Analogues fur theEvalualion of Human Biodynamic Response, Performa~ce, and Protection, AGARD-CP-253, 1979.
23. F. J. Unterharnscheidt, C. L. Ewing, D. J. Thomas, IA. E. Jessop, J. E. Rogers, and G. Willems,"Preliminary Report on the Neuropathological Findings in Rhesus Monkeys Undergoing Short D)uration -GxAcceleration." Presented at the Sixth International Congress of Neurological Surgery, June 1977. Preprintonly.
24. H. S. Weiss and H. D. Berger, "Impact Acceleration Related Changes ia Brain Electrical Activity." NATOConference on Models and Analogues for the Fvaluation of Humun Biodynamic Response, Performance, andProtection, AGARD-0P-253-, 1979.
25. M. D. Berger, H. S. Weiss, A. Sances, P. R. Walsh, and S. J. Larson, "Evaluation of Changes in CNSFunction Due to Impact Acceleration." Presented at the Aerospace Medical Association ,•eting, May 1979.Preprint only.
41.
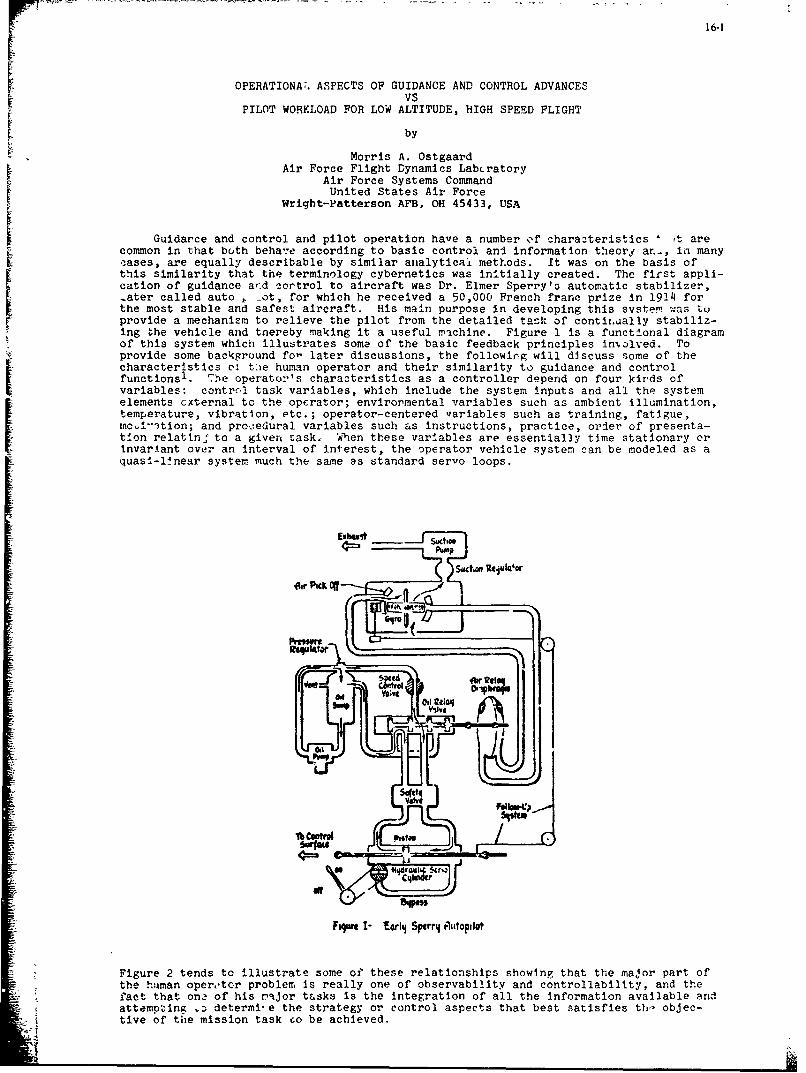
16-1
OPERATIONAL ASPECTS OF GUIDANCE AND CONTROL ADVANCESVS
PILOT WORKLOAD FOR LOW ALTITUDE, HIGH SPEED FLIGHT
by
Morris A. OstgaardAir Force Flight Dynamics Labcratory
Air Force Systems CommandUnited States Air Force
Wright-Patterson AFB, OH 45433, USA
Guidarce and control and pilot operation have a number of charazteristics t arecommon in that buth behave according to basic control and information theori an,, in many
.!ases, are equally describable by similar analytical methods. It was on the basis ofthis similarity that the terminology cybernetics was initially created. The first appli-cation of guidance a,:d zortrol to aircraft was Dr. Elmer Sperry'3 automatic stabilizer,-ater called auto , _ot, for which he received a 50,000 French franc prize in 1914 forthe most stable and safest aircraft. His main purpose in developing this systemn was to
provide a mechanism to relieve the pilot from the detailed task of contii.dally stabiliz-ing the vehicle and tnereby making it a useful nvlchine. Figure 1 is a functilonal diagram
of this system which illustrates some of the basic feedback principles involved. Toprovide some background fo- later discussions, the following will discuss some of thecharacteristics o! t:ie human operator and their similarity to guidance and controlfunctions1 . The oper-ator's characteristics as a controller depend on four kir'ds ofvariables: contr.l task variables, which include the system inputs and all the systemelements cxternal to the operator; environmental variables such as ambient illumination,temperature, vibration, etc.; operator-centered variables such as training, fatigue,nc~i-... tlon; and pro.cedural variables such as instructions, practice, order of presenta-
tion relatlng to a given task. When these variables are essentially time stationary orInvariant over an interval of interest, the operator vehicle system can be modeled as aquasi-l4near system much the same as standard servo loops.
Air AcK Of
14h1
Se•kta
Fq.•I" •1•5i4.tq•.o
v lve ~ la4
1b CastuI
F"q* 1- tor14 SP1"4fltopltt019
Figure 2 tends to illustrate some of these relationships showing that the major part ofthe human opertcr problem Is really one of observability and controllability, and thefact that on. of his r'jor tasks is the integration of all the information available andattempting .o determi'e the strategy or control aspects that best satisfies th,' objec-
• tive of the mission task co be achieved.

FIG 2. OBSERVABILITY-COtI1RLLA BILITY
PRECISE VEHICLE] iSTATE[C
A. ICS
summaized s folows;
AWAS PON '4t
The fundamental abpects of nran,,.al vehicular control theory can be brieflysummarizp.i as follows,
a. r.2o accomplisn guidance and control functions, such as flying a desiredLr~ck i., the presence of disturbances, maintaining position control as in formation,terrain following or refueling, and flying intercepts or approarches, the human opetatorstructures a variety of closed loops about tne vehicle to achieve the control actiensand functions desIred in ter.as of actual vehicle motions and flight path.
b., To be satisfactory, these closed loop systems, which includc both activeand passive elemntu-ts, must share certain of the dynamic characteristics o: a goodclosed-loop control and scanilization system. As t!.e adaptive element to accomplishthis end, the pilot mu3t make up for any dynamic deficiency of the sbster. by appropri-ate adjustme;,' of its dynamic prsnerties. This is the terminology that was referenced,s integration ir the fra, of Figure 2.
c. 'he cost of this acjtstment is fundamentally workload and can consist ofstress, which includes vibration, hazards, and environment, concentration of nperatorfaculties on the mission tesk dynamics, and the capability to cope with tne unexpected.This, then, illustrates why there is a close relationship between guidance and controland pilot workload in that the guidance and control systems can be implemented anddesigned to reduce many of the normal pilot operator functions as well as deflnirg thetruec !nformation or states recuired for the pilot to execute his mission.,
To Illustrate some of the tr nds and history of guidance and control o er the pastfew decades, the nex', i•lide (Figure 3) illustrates briefly what these guidance andcontrol technology trends a,-e. It summarizes some of the transitions that have occurredover the past two and a nail' uecades, beginning with the '-0s2, But most significantly,it illustrates two tasic trends- the first is Vo increas, in guidance and contrcofunctions and requirements; tu,, second is the proF'ession from vehicle tc weapon systembinto what we now call air warfare. systems Duxing the early l9:)s, the trend waspredominately venicle oriented in terms of stability augmentation rystems to improve theresponse In control characteristics. This was followed by zlosea-loop terrain followingsystems to inprove adverse weather, low altitude performanca in safety aspects of thesystem. Adaptive systci cuncepts became operational in tL:. F-Ill. These concepts, whicbhave been discussed extensively in other pablications, contributed suostantially to +hecurrent modern control theory nnd technology. As a sideline, a seldom recognized fact isthat the Kalman filtering theory was a direct outgrowt'- of' the theoretical work under-taken to describe, analyze, and design sdaptive systemF.
Emergence cf fly-by-wvi, technology in various forms Decame evident during the early1960s with fly-by-wire spoiler cont-2ols on the F-111 and the electronic flight controlon the French MIRAGE. Increased use of inertial sensors and navigation systems to augmentvehicle of flight path control fur reducing landing minimums, and ir:prove !nteractionwith area navigation and advanced aix' traffic control concepts during the early 1960s,represents initial steps in the functional• integration for increased performance and work-load reduction. .),ring the mid-1960s, the benefits of feedback contr,l could offer inalleviating structural fat.gue problems and tarl.ulence sensitivity were recognized.This work culminated in the application of maneuver load nontrol and -- ructAre load

FIGURE 3: CONTROL TECHNOLOGY TRENDS
WEAPOSLE AM WARFARE $VITEM
Sii im UUal canm
~~VC1 CommlV JF icln
M=LI INS 11AUOFmom wig WI
SalO
S~control to alleviate turbulence induced fatigue problems, and improve crew ride quality• in the B-l and other systems. Progressing into the early 1970s, the MRCA, the Swedish
Viegin, French Concorde, the F-16, and YC-14 designs witnessed incorporation of side-
stick controllers, electronic displays, increased emphasis on digital techniques,
control and propulsion system dynamic interaction, direct lift control, ride control,
and relaxed static stability, all of wihich were made possible through implementation of
In looking toward the future of air warfare systems, the impact that command andcontrol and communications will have on the vehicle guicance and control in terms oftactical control is significant. This need generates another guidance and controldynamics loop which dictates substantial dynamic and functional interaction to providethe desired operational capability. The time-space positioning capability permittedthrough accurate position fixing, employing advanced navigation systems, and the cnboardvehicle trajectory control permits the implementation of the command and control func-tion to marshal forces for tactical deployment and, also, offers a means for redirectcapabilities.
The six-degree-of-freedom control proJ acted through active control technologypermits design freedom and tactical capabilities unavailable heretofore other than inspecialized rotary wing configurations. These capabilities have stimulated applicationof modern control theories involving strategies, differential gaming, to determine meansthat can provide optimum trajectories and tactical options to increase weapon deliveryaccuracy and minimize pilot workload.
With this brief overview in projection, let's examine advances in guidance andcontrol to determine how they can be employed to reduce pilot workload, particularly inthe low altitude, high-speed regime. A considerable amount of work has been performedon the epplioation of stabilization systems to reduce pilot workload. However, themajority of these systems have net reduced the pilot workload to any large degreebecause, in most cases, they introduce• unconventional methods of control which, inthemselves, created a learning problem•. The learning of these new control techniquesaggrevated, in many cases, tl'e workload problem. Also, many of these developmentsconcentrated primarily on thp control aspects ignoring the information display aspectswhich provides the necessary information for the pilot to act as a closed-loopcontroller.
The problem associated with combining guidance ard control systems or automaticsystems with pilot operation is the mechanism of pilot interaction. This is somewhatanalogous to the cruise conitrol on an automobile which works perfectly for cruising ona highway; its use in traffic, however, involves a tremendous amount of' switch~ing andothe'- unconventional manipulation. In terms of control, the first attempt to solve some
Sof these problems i'as control wheel steering wherein a switching or sensor mechanism onthe wheel or stick was employed to sense applied force by the pilot in a normal manner,deactivating some of the stabilization modes of the system and, thus, restore normal air-
craft maneuvering response. This proved successful to a degree but the fundamental
' made it extremely restrictive and added to the pilot workload rather than easing it. Amore successful approach was the command augmentation system design. This is illustratedin Figure 41 and shows the requirements and characteristics involved, the typical repre-sy M
IM,,~- - -

16-4
AIRCRAFT CONTROL SYSTEMS
EARLY TO CURRENT OPERATIONAL SYSTEMSDESIGN a KELIABILITY COWUTIK
APPLICATIOK ALOUIRKEiUUI CBAAACTAIZATIBU AIALTSS =SUBS On LMEITATE
41111F b MILE AND LLOT M AIATlU I AUIh Al HWTATIICAULLT COINTACT L WE!!Jl fl'. ETAIRLITY AKB CAKtES
STABLE AIAFRAKjj CONTROLAIRCRAFT IU L W
I FJUTVIe ARIC MIT AE STAIILITY SAS $iLESTAUBILITY 1 1 -- I r ANALYSIS ELECTRBO ICS ASALOBCEEARACI ENEFICSIOFt T TICIIIIAIOUS 0ITH NUSSAL
IMB0[ PLOTS OVEUIBAERTIVIST PLOTS FAILUREiL .KICESPLOTS DETECTION
0051 LOCUS
TRANSIENT RESOKNSEAIALTSISUBLATION
I MVYE KISS OIL MLTIU 1 ASICAS woolA/C BUEW* CONTROL ELCTROIOICO MASS15
TTECKNUOUETS? SE UNIAKUL ANALOGOV[InRIo, WITH
FAILURE PFUSI$BLDTCIttONI REDUNDOANCY
TASK pan AR USETMASUS. saETAL 1101011ANT
TATIOMED LO ISTII t ELE~CTRlM DIGITAL
COWMtL ST*ARt
FIGUR 4.
augmentation system provided a means for enhancing the stabilizat. on properties of thevehicle without deteriorating the maneuvering performance while at the same time providedan input and control law capability that made the vehicle behave ii a manner that wasvery desirable from the handling qualities standpoint. This was successful for thetraditioral up-and-away and some precisJon tasks such as approach and landing; however,for certain weanon delivery or mission functiuns, the general control laws were proveninadequate. Further control analysis and flight research experience indicated that anapproach t3rmed task-oriented control laws wherein the control characteristics of thevehicle are deliberatels configured tc provide precision control and performance forthat particula' mission would be a solution. These have eliminated many of the problemsof integrating the pilot with the control system and are proving very successful, andindicate that the vehicle control aspect of the problem is so]',able employing guidanceand control design technology. As stated earlier, the other aspect of pilot workload isinformation integration and how the pilot interacts with the new mission functions thatare beoromir.g information dominated as the c.mplexity of the mission increases, This hasresulted in a design change toward electronic display techniques that crn he made multifunctional and are more amenable to alphanumerics and graphic symbology . One suchconfiguration is shown in Figure 5 and illustrates a multi-function array using elec-tronic cathode ray tubes. This approach permits the selection and presentation ofnecessary information to perform the function while at the same time subduing some ofthe related information thereby reducing clutter. However, one of the basic problemswith this approach is, how can the pilot interact with the display in order to make itnatural and harmonious?.
•44
I
I

16-5
Research activity in this area of attempting to better achieve the more harmonious,or blended system design, is typified in Figure 6 which illustrates in general form boththe nature and characteristics of the problem. This is intended to show that, character-istically, we have worked in the vertical plane which consists of the vehicle, the pilotand advances in basic control elements without really considering the horizontal aspectsor mission function. This approach stresses the need to look across in terms of sensor,the "ehicle, and mission functions, or kill mechanism, thereby illustrating thedominance of information and its role in the mission and system design. This nowaddresses .n integration function and the need to provide a capability to integrate thepilot, the vehicle, and the mission irto a harmonious set. The results of this researchwork has lead to an approach called flight management systems wherein a deliberateattempt is being made to define approaches and implementation that %ill rake the systemmore easily controlled through task-oriented control laws and, at the same time, provideto the crew the necessary Information which is harmonious with control laws to achievethis mission function. Some of these are displayed on Figures 7 and 8, which illustratea basic crew configuration used for discriminatory purposes. As you can see in the chart,through the use of color the identification time is drastically reduced. A specificexperiment in this area indicated about 50 percent reduction in identification time.
BLENDED SYSTEM DESIGN(INTEGRATED CONTROL DESIGN TECHNOLOGY)
mit
IaiME T CCy C €ONTROL~
o f CSRI
A911,8VAST
FIGURE 6.
FIGM~~ ~~ 7. EXEHiNA MCPI

-. 16-6
).,:l b! W[:]ff3 •'11 i} ;.- ilRI |! fl [I r•tll [.'1 r/Ill t i:
€Imfl
[:1 ms
- :l'dl:l•KI •]•[S l'-n:]S t2. I11•1 <
fl•2f 8 HOII?01TkL $llglll0N IAP•+
The next section now will stress specific problems associated with low altitude,high speed envlro.nxnent. The principle factors involved in low altitude, high speedoperation are:b The physical environment, turbulence, vibration, and fatigue; thesecona is vehicle integrity and responsive characteristics. From the vehicle standpoint,the pilot is always concerned about vehicle stability, •afety it, terms of controllabil-ity/control performance, degradation, and visual environment; if it's night and adverseweather, the reliability of sensors that provide synthetic vision needs such as radar orlow light T•. And finally, their concern over the overall hazards and vulnerabilityaspects while in this low altitude environment when vehicle vertical and horizonta!positioning becomes critical. The next chart, Figure 9, illustrates an analysis thatwas performed which tends to show how stress levels increase as proximity to the •roundis approached or when a target is approached in a highly concentrated envlronmentO. Interms of the turbulence or vibration environment, the following chert, Figure 10, showsa tolerable and intolerable region in terms of exposure time in mint, tes and verticalacceleration which illustrates for short periods of time a relatively high level ofvertical acceleration can be tolerated but as exposure time increases the toleranceregion drastically reduces. Similarily, one of the problems with this region of flightis that the higher rms accelerations increase the difficulty to A*ead instruments or toprovide precise tracking because the pilot is unable to discern w•etherl the vehicledisturbance is due to turbulence or due to failures in •he system . Similarily, it isirteresting to note that frequently the major cause of the acceleration at the p•lotstation is body bending modes rot structural elasticity. It is also interesting to notethat the frequencies that occur with this structural mode also tend to coincide with
I internal organ frequencies of the human body, thus making it more fatiguing and less
tolerable.
FIGURE 9. WORKLOAD AIIALYSISIiI Il@3, '--AiSOLU'T•I Y __. ..........
]" #1,..! LJt-/ i-i-
'°--J-l'LT':!:"--I<*,," I I i
"TAll / i I I - Ii ol! I 1_.! lalmo• ,.. _1
i I•1 If i I I I I l i1
Tii
:: From the guidance and control standpoSnt, ;• iave taken approaches whereby throughSstructural mode compensation and i, lde control characteristics such as employed on the
€ B-I and also sh ..... •n the next figure, #ii, a B-52, a means whereby accelerations at theSn!!ot station can be reduced and thereby improve the environment •nd operation at low
_.!;: altitudes•. The second area of concern is that of vehicle precision control and accu-• :• rate positioning at low altitudes. Several approaches have be•n investigated recently
S.• relative to this; one that appears to be of extreme interest is the activity referred tc

16-7
SPLCIRUM PEAK AT 6 -10 CP'S Fj: I RIGID UOOy
REGION OF PILOT FEl.R* FOR AIRFRAMAE STRULTURE
** XC4 POS"G4 4ý11
24 3. .2 10A .912 24 MC*-,9
Dr1 IDMp~DUAINO EXPOSURE .-MIN
FIUR 10 IE-NESIYVBATO OUDRE
A~ssev~COMFONow"~

16-8
CCV FLIGHT TEST SUMMARY
MANEUVER DIRECT FUSELAGE TRANSLATIONAIR-TO-AIR TASKS ENHANCEMENTI FORCE POINTINGGUST ALLEVIATION AN Ay ax, a2, P2 ./4
TRACKING [I]G G GLIFENSIVE MANEUVERING H GFOR/MATION/STATION KEEPING G y NI NAV
AIR-TO-GROUND TASKS
STRAFING G YDIVE BOMBING [ GAPPROACH/IAND ING Glk]
[JGREEN - POTENTIAL IMPROVEMENT
-- " YELLOW - INCONCLUSIVE/CONFLICTING ASSESSMENTFIGUE 13.
The next area of concern !s that of synthesizing the visual environment such thatthe pilot can continually observe his situation and tie characteristics of the terrainbeneath him without having to concentrate on the details of the activity. An approachto this has been the flight management system which has not been flown to any degree,but similar approaches have been flown as I will show later. The key to this ij t"eapplication of color to synthesizing the major features of the terrain and overlaý'ingthese on a horizontal situation display, such as shown on Figure 14, wherein the pilotcan continually observe his vertical and horizontal track over the terrain beneath himand, also, observe the variations in terrain during flight. In addition, threats orother hazards can also be illustrated on this map and groups can be projected such thatthe pilot can fly manually or the system can automatically generate a trajectory tocircumvent these hazards. In general, although this has been a very brief synopsis ofguidance and control activity that can reause workload, I think you can now observethat knowledge and fundamental technologies are availeble to address this problem. Thenext step is developing some of the analytical techniques Papitalizing on those we havealready performed as shown on the followirg chart, Figure 15, to address from a moretotal standpoint the area of pilot workload using modern control theory whereby thecontrollability/observability principles can be applied In a manner such that sensitivi-ties to various states and identification of states that r~ust be presented that can bereadily applied. This next chart, Figure 16, illust..ates how we perceive thefuturistic cockpit to look and provide what we feel is a one-man, night all-weather lowvisibility at low altitude.
I IGU,, 14. TERRAIN FfAIU'•.S (WA DISR{AY)

FIGURE 15. CONTROLLABILITY /OBSERVABILITY
OUT, fl LGOOPAIFICIIAFi TO TACTICAL W
TARGET A 17F Rý2ATR.'LOC ROUTES REDIRECT C3
TARGET
AIflCR'iV 0 POITO
CO..v. floa R~O VEHICLE
L E /Wry STATESIGHT I
DEGREES OF INCREASED ECMFREEDOM GUN CONTROL ACTIONS
If.NZR LOOPAIRCAAFT COs TflOL
FIGURE 16. FEtitRiSl'( -iC. KI I

16-10
REFERENCES
1. D. McRuer and D. H. Weir, Theory of Manual Vehicular Control; Erogomics, 1969,
Vol 12, No. 4, 599633.
2. M. A. Ostgaard, "Active Control Technology"; YKI Lecture, December 1978.
3. Daniel S. Berlinger, M.D., Lt Col., "Medical Aspects of Helicopter Evacuation andRescue Operations"; U.S. Army Agency for Aviation Safety, AGARD ProceedingsAGARD-CP-255, 1-5 May 1978.
4. R. Beyer, "Flight Performance and Pilot Workload in Helicopter Flight Under SimulatedIMC Employing a Forward Looking Sensor"; AGARD Proceedings AGARD-CP-240,17-20 October 1977.
5. G. A. Barnes, "Guidance and Control for Low Level Offensive Aircraft---A Royal AirForce View"; ACARD Proceedings AGARD-CP-240, 17-20 October 1977.
6. C. W. Brinkley, P. S. Sharp, and R. Abrams, "B-I Terrain-Following Development";AGARD Proceedings AGAPD-CP-240, 17-20 October 1977.
7. J. F. Moynes and J. T. Gallagher, "Flight Control System Design for hide Qualitiesof Highly Maneuv2rable Fighter Aircraft"; AGARD Proceedings AGARD-CP-240,17-20 Octobur 1977.
8. J. G. Jones and D. E. Fry, "Aircraft Ride-Bumpiness and the Design of Ride-SmoothingSystems"; AGARD Proceedings AGARD-CP-240, 17-20 October 1977.
x

17-I
TV OPERATOR PERFORMANCE IN REAL TIME AIR-TO-GROUND RECONNAISSANCEMISSIONS UNDER TASK-LOADING CONDITIONS
Dipl.-Ing. H. MutschlerFraunhofer-Institut fOr Informations- und Datenverarbeitung
Sebastian-Kneipp-Str. 12 - 14D-7500 Karlsruhe I
FRG
SUMMARY
The detection performance of a black-and-white-TV operator in real time reconnaissancemissions is determined by the parameters of the RPV-eystem, the scene, and the task. Aseries of 6 experiments was performed with 19 untrained subjects wiko had to fino militaryvehicles in static grodnd scenes displayed on a TV screen. The scenes were presented onlyshortly,for I to 10 secs. This corresponds to a speed of about 50 to 500km/h at a nonover-lapping frame rate. The subjects pointed to located targets with a light-pen. Analysis ofvariance indicate that the detection rate is Influenced by:
- scene parameters which constitute the conspicuity of a target in a natural scene,such as global context, contrast and local context
- short presentation times of less than 3 secs
- system parameters such as resolution and image segmentation
- number of tprgets. Detection rate decreases if the task is to mark all targets anddetection rate increases if the task is only to indicate those scen2s which containat least one target.
The false alarm rate decreases with the number of sessions the subjects took part inand was finally at low level. Taking the confidence level expressed into account proved toincrease the detection-false alarm ratio remarkably. Search times were nearly equal topresentation times f om Ito 5 secs only. The search times for the 50 % detection ratedecreased from 4 secs in the first experiment to 2 secs in the last one. Questionnaireswere filled in.
1. INTRODUCTION
The performance of a TV iperator is of growing interest because of military demcndsfor air-to-ground reconnaissance by remotely piloted vehicles (RPV) under real time cordi-tions. Investigations of real time reconnaissance by a TV operator Is a complex task becausethere are many parameters out from different parameter groups (Table 1). The sceneparameters make up the contents of the image. System parameters comprise the flight andscreening, transmitting and presenting of the TV data. Operator parameters are characteri-stics of the TV operator. Some arbitrary, task variables can be also attached 'o thisgroup. Parameters of all categnries are interrelated in a complex way. There are manystudies about the cited parameters. Some of them are quoted in the last column gf Table I.
In RPV reconnaissance missions the operators have to interprete the transmitted dataon-line. High speed and low level flight is a military demand for RPV. Therefore, viewingtime had to be limited in our experiments with static scenes. We studied only the detectionnot the identification performance.
Investigating the search process researchers present more and more natural scenesbecause they recognized that structure and meaning of natural scenes affect the strateyyand performance of the observer/1/ -/3/. It is insufficient e. g. to specify a lineresolutiorn for 50 % detection rate if one does not specify the territory too from whichexperimental scenes were taken. In order to study the importance of the target surroundingswe vluded variations of context in our experiments. One must differentiate betweenitmm.Late and total surroundings (local and global context).
For high presentation rate cf different scenes the speed of processing of visualinformation is a limiting factor io real time reconnaissance, anyhow. It can be thereforeassumed that the number and the configuration of targets play an important role fordetection performance. For this reascn :-E Investigated these parameters.
There are several aids for target detection, e. g. scene arrangements wh!'•h improvethe search strategy. The question had to be answered if Image partitioning facilitatesthe target detection or not.
2. METHODS
t! PARAMETERS*i iWe investigated the parameters of Table 2 in 6 experiments. Different line resolutions
were realized by presenting scenes with sizes reduced to different levels on thp monitor.The viewing angle was kept constant thereby (Experiment 2). Maninulating the video signal,sections of the image were concelled (Image segmentation, Experiment 3). The contTastvariation was carried out by taking advantage of the different model reflection coefficientsand, additionally, by painting the vehicles with different coloura, 1. a. different

17-2
Size /4/ reflection coefficients (Experiment 4). TheSShape, Type /5/ configurations were divided into linear EndW Colour /6/ random ones with contrast, approximate posi-k Number /7/ tion and range being the same (Experiment 5).m 0 Configuration /2/ Local context was defined as structural- Motion State /11/ camouflage of the targets within their immediate, Contrast surroundings. Level 1 of local context was
SI Context /2/ structural similarity between target and5, 'oUO immediate surroundings (e. g. a vehicle being0, . Targot Position /10/ parallel to the nearby street) or proximity
Terrain /3/ between them (e. g. a vehicle close to a bush).
c Scale /11/ Level 2 was the reverse of lexel 1 (vehicle and0 Luminance /12/ street at an angle of 30 - 60 or a distance of
a c Vegetation /5/ several meters between them, Experiment 5). The.• Colour /13/ number of targets was altered by presentingSC Haze /12/ 1 scene at 4, 2 scenes at 2 or 4 scenes at
W E Sun Angle /14/ 1 target. Scenery and positions were the sameSky/Ground Ratio /12/ at all levels of target rumber (Experiment 6).Season /5/
Height /7/ SCENES, Velocity /11/
14 Yaw, Pitch, Roll /15/ Static scenes were taken as slides fromW u Vibration /15/ a 1:87 terrain model with 4 summer-sceneries:
SSlant Range /16/ forest, meadow, soil, village (Figure 1). Aesolution scene consisted of one of these sceneries and
SRensor Range /15/ covered a ground area of 130 x 130 meters at* a simulated altitude of 300 meters with verticalSDepression Angle /17/
mAperture Angle /18/ aspect angle. The slides were taken from
/8 diffasely illuminated scenes. The targets wereSp l military vehicls of 4 types: 2 different typesSgno /15 of tanks, 2 different types of trucks. A sceneCodwsd/h 9 contained 0 - 5 targets at a target uncertaintySCodes /lg/
Fra:e Rate /16/ of 50 %. The targets were positioned according
Display Size /91/ military demands.
Diuplay Shape /20/Flicker /21/ APPARATUSScreen Decay /22/APRAUReal Time /23/ The slides were either scenes or a neutralR Aids /20/ pause picture. Th y were scanned by a TV camera
m Stereoscopy /24/ and presented on a standard 625-line televisionSTeem /25/ with 38 cm screen size. The viewing distance ofTeLM -25/ the operator was controlled by meanc of a head-Acuity /20/ rest. The viewing angle was about 200 (except in
m Useful Visual Field /26/ experiment 5 where the visual angle of target' 0 Contrast Sensitivity /27/ was examined). The subjects murked each detecteda o Local, Temporal /27/ target with a light pen and then switched offa • Integration the scenes by pushing a button. A timer wasS> Adaptation /27/ stopped in order to get the search time.
a. Q. Colour Vision /27/- Eye Movements /28/
o -SUBJECTS AND PROCEDUREa Presentation Time /29/1-Training /30/ To examine the 9 parameters of Table 2 a0 Experience /20/ series of 6 experiments with 1, 2 or 3 factors
-4 Search StrategV /3/ was performed with 19 untrained male subjects.4.,14 Pattern Recognition /31/ The subjects were schoolboys and collegeSDecision Criterion /32/ students with a Sn2llen visual acuity of 1 or0 Memory /13/ better. Tn balanced incomplete-block desigrsU Motivation /31/ the parameters and their levels were combined
Social Context /33/ so that each scene was presented to a subject- -not more than twice (at different parameter
levels). Memory effects were avoided by torning
Table 1: Parameters which influence the slides. In each experiment each subjectdetection performance of a observed each of the 4 sceneries the same numberTV operptor. of times.
At the beginning of session the subjectsread instructions indicating the nature of thedetection task. They familiarized themselveswith models of the 4 targets. A series of 10
training scenes was shown to each subject with feedback. Real time conditions were simulatedby restricting the maximum viewing time to 4 discrete levels from 1 to 10 sees in each experi-ment. The levels and the examined parameters were balancpd simultaneously.
The investigated dependent variables were detection rpte, false alarm rate, searchtime, end the subject'b confidence about his detection. After locsting the targets, the sub-jects could switch off the scene before elapse of themaximum viewing time mentioned abuve. Thetimer was stopped simultaneously with erasing the scene. Thus the search time wag the actualvieLeing time and there was only one search time per scene (not p~r targot). There are twopossible strategieso'fthe subjects, either a) Erasing the scene early without searchingthoroughly or b) Making the best of maximum viewing time without trying to stop earlier.

17-3
No ofI Parameters Definition Dimen- Levelsexp. sion
1 Maximum viewing time Maximum presentation sec 1, 3, 5, 10time of the scene
2 Line resolution Number of TV lines lines/m 1, 2, 3, 4, 5covering 1 meterof territory
2 Global context Total surroundings of forest, meadow,the target (different soil, villagescenexies)
3 Image segmentation Dividing the image and 1, 1/2 horizontal,presenting the parts 1/2 vertical, 1/4one after the other inequivalently reducedviewing time
4 Contrast I log 7o/s I, L = a 0...0.2, 0.2...0.4
luminance of object, 0 sml or close
Lb = luminance of
immediate surroundings
5 Local Context Local proximity or -similar or close,structural sirilarity neither similarbetween target and nor clomeImmediate surroundings
5 Configuration Arrangement of a group - linear, randomof targets
5 Visual angle of target Vioual angle of target min 23, 32, 53width on the monitor
6 Number t. targets Number of targets - 1, 2, 4in scene
Table 2: Parameters tested for influence on detection performance. With $ indicatedparameters were varied in the other experiments too where they were notanalyzed,however.
By asking the subjects to be quick as well as accurate, it was hoped to avoid uncertaintyof the subjects' reactions mentioned above.Confidence was quantified byf 1 (no confi-dence), 2 (medium confidence), 3(high confidence).
3. RESULTS AND DISCUSSION
MAXIMUM VIEWING TIME
Figure 6 shows that detection rate D increases with maximum viewing time asymptoti-cally like the cumulative probability of detection for unlimited viewing time /34/. A t-testby pairs revealed statistical significant differences for D(O sec) - D(5 sec) and D(q sac) -
D(IO sec), p < .05. There is an increase in detection rate between 1 and 5 secs but thelargest gain is obtained in the first second. False alarm rate was not influenced by maximumviewing time. Search times were nearly equal to maximum viewing times if it did not exceed5 secs. At maximum viewing time of 10 secs the search time was only 6.3 secs. From this onecan conclude that subjects try to chose an area of about 130 2 m2 : 6.3 o 50 2 m2 as unity forsearch to get an optimal performance.
Taking the confidence levels into account the ratio D/FA increases from 1.6 to 2.2.Therefore, if persons have to make more or less uncertain decisions, as it is the case inreal time reconnaissance missions, it is profitable to record confidence levels of the sub-jects and to weight the results of measurement with them.
LINE RESOLUTION
Detection rate depends significantly on line resolution (Figure 6). With increasingresolution mare details become visible. This facilitates to distinguish targets fromsurrounding%. Detection in natural scenes seems to comprise classical detection (findingsomething) as well as recognition (identifying something). Detection requires a searchprocess, recognition is based on distinctior between objects by meatis of cues.
False alarm rate increases drastically for a line resolution of between 2 and 1 line/m(Figure 7). A resolution of 1 line/m corresponds to a line resolution of 3 lines per targetwidth; in this case only few cues can be identified. Subjects have to guess frequently so

1'7-4
that a lot of nontargets were marked.
Line resolution and all following parameters did not influence the search timeaveraged over all maximum viewing times. The strong limitations on search times by generallyshort maximum viewing times provoked the search time be independent of Lny other parameters.
GLOBAL CONTEXT
Figure 6 shows that detection rate depends strongly on global context. In villagescenes only 27 % of the targets were detected. Targets are difficult to find in the villagebecause both contain low and high spatial frequencies.The structural effects compensate increas-ing detection rate due to high contrast of village streets. In forest scenes 92 % of the targetswere detected. In those scenes subjects did not need to scan the forest itself because ofthe absence of low spatial frequencies. Moreover, vehicles could not appear in this denseforest. The consequence of this is ;hat the subjects inspected only the forest street andedge of the forest (as the questionnaires revealed). Therefore, nearly all targets were de-t2cted.
The difference of detection rate according to global context is pronounced at low levelof maximum viewing time. There was no interaction between global context and line resolution.
The order of sceneries in terms of complexity as judged by subjects did not agree wellwith detection rate (r = .35). It is obviously not only the complexity, e. g. in terms ofspatial frequency, which influences the detection performance but also knowledge about thecontents of the images.
False alarm rate docreased clearly between experiment 1 (29 %) and experiment 2 (12 %)as a consequence of the training. It remained at low level until the last experiment. Falsealarm was independent of global context. Scale and line resolution were large enough toprevent confusion between targets and nontargets, but viewing time was too short to allowdetection of all targets.
IMAGE SEGMENTATION
In experiment 3 image segmentation was studied. The parts were presented one after theother. Maximum viewing time was kept constant for tne sum of the parts. Figure 6 shows thatthe degree of segmentation did not affect detectior rate whereas the manner of segmentationdid. In term3 of oetection rate vertical segmentation was superior to horizontal. The bookpage form of the vertical parts would support a search strategy like reading. Therefore apreference for linewise scanning can be assumed.
False alarm rate was again at low level (8 %). False alarm was given the least whenpresenting the entire image (Figure 7). More context provides more reference objects forthe correct estimate of the critical ones (target or nontarget?).
CONTRAST
Contrast values in natural scenes are nearly continuous. For this reason detection ratehad to be plotted as frequency distribution against contrast C (Figure 6). DLtection rateincreases asymptotically up toC .5 which corresponds to a luminance ratio of aboutLu/Ls = 3 respective 1/3. Higher contrasts did not yield a better performance. The highvariance of detection rate is a result of the integrative nature of the measuring method(Figure 4). Structures which were fine but still resolved on the TV monitor were notzegistered by photometer. Therefore it happened that a target with C = .0 was alwaysdetectedl
LOCAL CONTEXT
Local context, configuration and visual angle were studied in the 2x2x3 design experi-ment 5. Influence of local context was highly significant (Figure 6). Targets with struc-tural similarity or close distance to their neighbouring objects (level 1) were detectedless frequently than the others (level 2). Differences in detection rate depending on thelocal context were strongly pronounceL. at low maximum viewing times of a few seconds. Shortpresentation times allow only few fixations. In this case, portions of the display couldonly be considered with the lower acuity of peripheral vision. An observer who looked at theright hand side of the scene saw a target on tne left hand side at aor angle of 200 extra-foveal where acuity declined to 10 % of the foveal one. With this acuity value subjectszould only differentiate distances and angles between target and neighbouring objects whichoccured tnly for level 2 of local context.
False alarm (on average 12 %) was given more frequently at level 1. It is surprisingthat a variable which refers to nontergets (false alarm) is influenced by a parameter whichrefers to targets (local context)' This can be interpreted by regard to the subjects' reac-tions. The sum of markings is constant for level 1 and level 2. They try to mark similarlyfrequently in different scenes. There are fewer correct detections at level 1 of localcontext (as mentioned Ebove) but more wrong ones instead of it.

CONFIGURATION
In linesrl" arranged target groups all targets were detected more frequently as inE randomly arranged groups, whereas in these groups at least one or more targets were
detected more frequently. But these effects were compensated 9,: that on average drtectionrate did not depend on the configuration. In contrast to this, i4entification of groups
Sdo depend on the configuratiin /10/.
VISUAL ANGLE
The visual angle did not influencL detection rate. This result confirms the findingsof Williams '66 /8/ arcording to which screen size does not affect detection performar.e.Distances were always shorter than the range of visual resolution of TV lines (- 4 timesscreen diagonal line)). The subjectivelV agreable viewing distance was about 2.5 x screendiagonal as a separate test revealed.
There were no interactions at all between local context, configuration, and visualangle.
NUMBER OF IARGETS
Though there were the sanie maximum viewing times for each ievel of taraot number,detection rate decreased only sligitly for higher values. It has to be remen._ered thateach detected target had to be marked by light pen (detection related to targets,
Figure 6). Effective sesich times were Identical if thi pure times for marking are sub-tracted(N = I : .8 sec, N = 2 : 1.2, N = 4 : 1.9) from the measured search times. It car
be concluded that scenes are searched regardless of their target number for at least onetime and equal frequently.
Still another dependency can be found if one analyzes the data of this experimcat invieu of the question: "Are therE targets in the 3cene at all?" One detected target is nowsufficient in order to say that the scene contains targets (detection related to scenes).This modified detection rate increases clearly with number of targets since it is moreprobable to detect any target of four than detecting exeactly the only one existing(Figure 6), /1/. Thus, the influence of the number of tergets or detection rate dependsstrongly on the military demand wh.ch can be either to detect eacn target or just tG detectthe existence of enemies generally.
No of Source of df F-ratio FCrtcal Probabilityexp. Variance Level
1 Maximum viewing time 3 1.54 2.2 NS
2 Line resolution R 4 10.5 3.4 < .01
2 Global Context G 3 66.5 3.9 < .01
3 Image vartitioning 3 2.5 2.3 < .1
4 Contrast 3 66.8 3.9 < .01
5 Local context L 1 61.5 8.7 < .01
5 Configuration C 1 . 3.1 NS
5 Visual angle V 2 .1 2.7 NS
6 Number of targets 2 3.1 2.4 < .1
2 RG 12 1.3 1.6 NS
5 CL 1 .1 3.1 NS
5 CV 2 2.5 2.7 NS
5 LV 2t 1.4 2.7 NS
5 CLV 2 2.1 2.7 NS
Table 3: Summary of analysises of variance for detection rate.
QUESTIONNAIRES
After each session subjects filled in a questionnaire to give information about theirstrategy, mental load, and the comfort of handling the apparatus. The results were:
- Subjects became more and more conscious of their search strategy.
- Subjects searched systematically (61 I), in dependence on the scene contents (42 %),with a orientation phase at search teginning (37 %), areas with good target-backgroundcontrast above all (26 %).
- The marked hole of one of the two t~pes of tanks was an effective cue for its detection.
- Rectangular objects e. g. houses are easily taken as targets in search for taigets.
ji-

17-6
- A comple.e search of the 200 x 200 sceneb takes 2 sec. Number of search passes are
proportirnal to the search time.
- The concentratioii of subjects increaes ewith decrcasing maximum viewing time.
- Maximum viewing times beloao 3 sece impose stress.
- The demanded decision criterion "Be ruick as well as accurate" is not fo'lowec..58 % of subjects •ry to be accurate.
- Motivation is itimulated by interest and payment, not by a bonus for godd performance.
- Quick location in static scenes is done comfortably by light-pen.
- Viewing distances below screen diagonal length disturb subjects.
4. CONCLUSION
Figure 8 presents a statistical comparison of all examined parameters. The columpspresent the percent portions of variation in detection rates n2 attributed to the para-meters pi: M2 =( SSpiSStotel). 100 % (SS = sum of squares). ThP relatively greatestinfluence on the detection rate have scene parameters which constitute the conspicuity ofa target in natural scenes: Global context (O2 = 77 %), contrast (57 %), and local context(24 %). The system parameters image partitioning (20 %) and line rasolution (18 %) have asmaller infltence on detection rate.nr of maximum viewing tine, number of targets, visualangle, and configuration are all Lelow in %. The worth of the n2-comparison is restrictedsince ?2 is a descriptive measure in th-, specially chosen sample. Moreover, variationdepends on the parameter ranges which are incomparable because of their different dimen-sions. One has to remember these limitations regarding e. g. the low orders of maximumviewing time and visual angle. But there is no doubt that detection performance Is affectedby scene parameters which can be influenced not at all (context) or only very little(contrast) by reconnaissance party. The effects of the variable system parameters (imagepartitioning, line resolution) had to be cumulated to affect detection performance remark-ably. Maximum view±ig time plays a role at the low levels of 1 and 2 secs. Therefore, withincreasing speed of the RPV the effect of the viewing time will be added to that of theparameters mentioned above.
5. REFERENCEj
/1/ Barnes, J.M.: Factors that affect display Size Criteria in a Cockpit Display System.1978, Procedings of the Human Factors Society, 22nd Annual Meeting, p. 218 - 221.
/2/ Oizak, L.A.: Target-Terrain Classification and Detection Performance. 1978, Proceedingsof the Human Factors Society, 22nd Annual Meeting, p. 393 - 397.
/3/ Scanlan, L.A.: Target Acquisition tn Realistic Terrain. 1977, Proceedings of theHuman Factors Scciety, 21st Anrual Meeting, p. 249 - 253.
/4/ Beamon, W.S.: Observer Peiformance Using a Video Display. 1977, Proceedings of theHuman Factors Society, 21st Annual Meeting, p. 406 - 410.
/5/ Sonntag, H.: Das Lesen van Luftbildern. 1969, Truppenpraxis 11, S. 918 - 922.
/6/ Bloomfield, J.R.: Disruptive Camouflage and Visual Search. 1977, Proceedings of theHuman Factors Society, 21st Annual Meeting, p. 326 - 330.
/7/ Boynton, R.M.; Elwozth, C.; Palmer, R.M.: Laboratory Studies Pertaining to Visusl AirPeconnaissance. 1958, WADC Technical Report 55-304 Wright-Patterson Air Force Base,Ohio.
/8/ Williams, L.G.: Target Conspicuity and Visual Search. 1966, Human Factcrs 8, p. 80 - 92.
/9/ Bernstein, B.R.: Detection Performance in a Simulated Real-Time Airborne ReconnaissanceMission. 1971, Human Factors, 13 (1), p. I - 9.
/10/ G3desen, A.; Reinig, H.-J.; Mutschler, H.: .oeItergefLihrte Untersuchung zur Leistungs-f~higkeit eiries Beobachters bei Echtzeitaufklrung. 1977, Abschlu'bericht zum For-schungsvorhaben T/RF 36/RF 360/51102, IITB.
/11/ Williams L.G.: Target Conspicuity and Visual Search. 1966, Human Factors 8, p.. 80 - 32.
/I'/ Seyb, E.K.: A Simple Monte Carlo Type Air-To-Ground Visual Detection Model. 1974,TecLnical Memorendum STC TM-408, SHAPE Technical Centre, The Netherlands.
/13/ Christ, R G.: Visual Information Processing. 1976, Conference on Cybernetic andSociety, San Francisco, p. 61 - 64.
/14/ Freitag, M.; Hilgendorf, R.L.; Searle, R.G.: Simulated Helo Ground Target Acquisitionunder Different Sun Angles and Ground Textures. 1977, Proceedings of the Human FactorsSuriet.*, 21st Arnual Meeting, p. 473 - 479
/15/ Aisten, H.).; Koch, R.; Mriechbaum, G.: Untersuchung des Konzeptes for ein unbemanntes,fernoelenktes Kampfflugzeug fOr Luft-/Boden-Einsgtze (UMF). 1973, Dornier-Bericht ?3/48.

"17-7
/16/ Self, H.C.; Heckart, S.A.: TV Target Acquisition at Various Frame Rates. 1972,Final Report, ARRL-TR-73-111, Wright-Patterson AFB, OH 45433.
/17/ Wernicke, B.K.: Limitations of Unaided Eye Visual Target Detection from High SpeedLow Flying Aircraft Correlated with Target Background Environment. 1973, Air ForceAvionics Laboratory, Technical Report AFAL-TR-72-188.
/18/ Schmitqen; Dey: Geoinetrische Parameter der Voreussicht zur Zielakquisition. 1976,VFWh-Fokker.
/19/ Huang, T.S.; Tretiak, 3.: Picture Bandwidth Compression. Gordon and Breach (Publ.)New York, London, Paris, 1972.
/20/ Bloomfield, J.R.: Studies on Visual Search. London, Ed. Drury and Fox, 1975,Paper 1:2, p. 31 - 43.
/21/ White, T.A.; Redstall, M.W.; Corbett, J.M.: Subjective assessment of flicker in
visial-telephone pictuzes. 1974, Proc. IEE, Vol. 121, No. 7, p. 594 - 599.
/22/ Snyder, H.L.: Human Performance and photometric Measurement of Electrooptical
Displays. 1976, Electro-optical Systems Design Conference and InternationalExposition, New York, A77-44751.
/23/ Fisher, R.W.: The Real Time Reconnaissance Problem. 1977, SPIE Vol. 101, p. 126 - 130.
/24/ De Loor, G.P.; 3urriens, A.A.; Levelt, Id.J.M.; Van de Geer, J.P.: Line-Scan ImageryInterpretation. 1968, Photogrammetric Engineering, p. 502 ....
/25/ Clement, D.E.: Group Performance in a Visual Signal-Detection Task. 1973, HumanFactors, 15 (1), p. 43 - 52.
/26/ Saida, S.; Ikeda, M.: Useful visual field size for pattern perception. 1979,Perception & Psychophysics, Vol. 25 (2), p. 119 - 125.
/27/ Cornaweet, T.N.: Visual Perception. New York, San Francisco, London, Academic Press.
/28/ Bozkov, V.; Oohdanecky, Z.; Radil-Weiss, T.: Target Point Selection during ScanningEye Moviments. 1977, Biol. Cybernetics 27, p. 215 - 220.
/29/ Schoonaid, J.W. ; Gould, 3.D.: Field of View and Target Uncertainty in Vioual Searchand Inspection. 1973, Human Factors, 15 (1), p. 33 - 42.
/30/ Annett, 3.: Training for Perceptual Skills. 1966, Ergonomics, Vol. 9, No. 6,p. 459 - 468.
/31/ Albertz, J.: Sehen and Wahrnehmen Lei dir Luftbildinterpretation. 1970, Bildmessungund Luftbildwesen, 38, S. 25 - 34.
/32/ Colquhoun, W.P.; Edwards, R.S.: Practice Effects on a VIsu6l Vigilance Task with andwithout Search. 1970, Human Factors, 12 (6), p. 537 - 545.
/33/ Bien, W.: Subjektiv wahrgenommene Kleingruppenstrukturen, eine Datenerhebung. 1979,Tagung experimentell arbeitender Psychologen, Heidelberg.
/34/ Krendel, E.S.; Wodinsky, 3.: Search in an unstructured visual field. 1960, Journalof the 9ptical Society of America. 50, p. 562 - 568.
6. ACKNOWLEDGEMENT
This research was supported by the german federal ministry of defense.

17-8
":igure 1: The 4 different sceneries used in experiments 1 - 6:forest, meadow, soil, village.
Quartering
Monitor
TV Lines 1 Halving
Scene horizontally
m/T Halving/ ~ vertically
D// Undivided
S
Figure 2: Simulation of Different Figure 3: Principle of ImageLine Resolutions by Varying Segmentation.Scene Size and KeepingTV Norm.
Level I Level 2
L8 3 L1 v 4
Monitor
L similar unsimilar
C-j logI I; EI Li
Lb2 L91 close distant
Figure 5: Arrangements of Targets for diffe-rent levels of local context.
Figure 4: Measuring Method for Level 1 = Structural similarity orproximity betw-en target and
immediate Surroundings. Level 2Unsimilarity or distance.

17.9
80.
70 70'
60 1 .60-
4' 50 " S I0'40 40- oio
0 -1 33 5 124
o4 0
170 4-1oo
1 2 5 10 1 2 3 4 5Maximum Viewing Time in secs Line Resolution in ltnes/m
100
90 Cot80.
.~80 70_ __/ similacoe.
u7i m• 60d
60 = 50
20
10
10 Image Segmentation
Vilaage Meadow Sil, Forest
GlobaL Context
100. x
Configuration-490 .
80. 0 iinear randomS:~L similar, closeI .-W.0• 0 (Level ,
m "J ~~unsimilar, distantl-".r- X0c 0 (Level 2)"0: 50. = - ". .... .
-4 4- 80 x ' .• • • • ._._..--=1
u 40 0m ~~~70 -- . .,-• 30 I c-
S20 60
10 4.m504-Con'rast Ilog 1:oa/Cal ?G 30 40 5C
Visual Angle of Target in Minutes of Arc
S100.
"90.
c D related to scenes-4 60 -Igure 6. Detection Rate as a Functiot,42 0 reae/oagt of Maximum Viewing Timp, LineW 50 Resolution, Global Lontkfyt,
S/ Image Partitioning, Contrast,
"• ~Visual Angle, Local Context,Configuration ard Number -f
"1 2 4• Targets with .91- confidence
Number of Targets Itras

17-10I
40
30.
S20-4 E 20• 10- -•10
Line Resolution in lines/m -4 •. LWL Image Partitioning
Configuration
S30 linear Figure 7: False Alarm as a Functionrandom of Line Resolution, Image
S20. Partitioning, Local ContextE 0 and Configuration with .95k 10. klO 1 -confidence intervals.
a unsimilar similarM distant close
L Local Context
b 100c Global context
-4 90
s• 80 Contrast
u 70 Local context
-4 60 /Image segmentationW 50Line resolution> 5 Maximum viewing time
0 /Number of targetsc 30
,I0 2 /20 / Visual anglek /0 Configuration
a. 10 z iVZA //
Pirametei
Figue vriane ,2 -6 i/SS (SS = Sum of
Figure 8: Portion of variance In isP •a = SlStotaI S Smosquares) of detection rates in deoendence on the
examined parameters pi.
SI

DISCUSSION
H. PONGRATZ (FRG)
You showed that a resolution of 5 lineslm gave a detection rate of about 70% (figure 6 of the text).Would the rate continue to rise with increasing resolution, or would it fall off asymptoticdlly?How many lines/m resolution would be :needed to give maximum detection efficiency?
AUTHOR'S REPLY
The required resolution depends upon the task. If you ý.ant to discern objects which differ indetails of length L (m), you need a line resolution of 1/L (lines/m). I was not at the asymptote,but for a rather good acquisition of military vehicles in natural scenes the literature recoamendsa line resolution of 12 lines/m.
Iii -' llr |-

- -1 - v..-. ..
[! THE INFLUENCE OF THE DESIGN OF DISPLAYS ON COCKPIT WORKLOAD
by
R if HOLMESAIRBORNE DISPLAY DIVISION
MARCONI AVIONICSAIRPORT WORKS, ROCHESTER, KENT MEI 2XX,
UK
Summary
This paper discusses the problems invol7ed in designing displays and controls for high speed low levelaircraft with the reduction of cockpit workload as a prime consideration. The cramped confines of fight-er cockpits together with the expanded operational capabilities possible with modern sensors leads to thetonclusion that the displays must be multi-function. Control of the avionics under combat conditions re-quires a high degree of automation; nevertheless the crew must be abie to manually control the systemswith a minimum number of switching operations. Brief descriptions of some modern display techniques aregiven with emphasis on their workload reducing attributes and Lhe paper concludes with the view that theeffectiveness of future aircraft will depend largely on the mission-crew-avionic interface and that thismust be an essential part of the overall cockpit design philosophy.
1. Introduction
The difficulties which occur when flying at high speed and low level are exacerbated when in-flightvisibility is reduced by weather or bad light. Avionic systems can contribute greatly towards overcomingthese difficulties through the display of navigation, sensor and weapon data, However, the operation ofmany current aircraft avionic systems impose very high crew workloads and it is essential that the crew isnot denied the effectiveness that could come from future avionics because the systems are too difficult tooperate. Thus the crew-system interface must be considered at the 'esign stage and reflect a systemoperation logic which is standardised throughout the cockpit, The controls through which the crewcommunicates with the avionics must be simple to operate and the displays must be easy to read under thestresses of combat conditions. Because the displays could arguably, swamp the crew with data it isessential that crew workload is considered during their design, that only clear essential data is presentedand all that is superfluous to each part of the mission is excluded. In other words the oata presentedshould be matched to crew workload with display format and content optimised for the crew-system inter-face. This leads to the conclusion that the displays should be multifunction and capable of format re-configuration to cater with the ever fluid tactical situation together with future changes in threat,mission and sensor developments. Such flexibility is an inherent characteristic of electronic displaysand will be an important feature of future cockpits.
2. Workload
There have been maiy attempts at a definition of "pilot workload" none o' which has proved universallyacceptable. Similarly there have been numerous practical experimental programmes to try to assess whatconstitutes workload. These, as with most tests involving inherently variable human beings have yieldedresults which, if nothing else, indicate that different people at any one time or even the same people atdifferent times do things in many different way% an. that quantifying workload is no easy task. Withthis background of failure by those infinitely more learned than myself it would be presumptuous to tryto define overall pilot workload so I shall confine myself to the subject of ho'ý easy it is for a pilotto communicate with the avionic systems through his display controls and sLggest how the types of displayscan be organised so that he can easily gain the information he necds from them,
It is instructive to note how a pilot gains information in flight by using his visual, aural and tactilesenses - see Figure 1. Of the three, the visual channel clearly is vital and has the largcst number ofinputs but information gathering is a high speed process with rapid correlation of data while aural in-formation gathering is low speed with slow sequential input of data. The tactile channel is not over-loaded, tactile warnings are rarel) used and although the aircraft must be flown, systems controls can beoperated at the same time whereas it is not possible to look at two things at once nor to reliably takein two simultaneous audio signals, I't is clearly uadesireable to further overload the visual channel byrequiring its use for systems control operation. A point I will expand on later.
The process by which man makes decisions based on these sensory inputs can be likened to the operation ofan avionics computer as shown in Figure 2, lowever, while man's lcng term memory has immense rapacityand is his greatest strength, his short term memory is notoriously unreliable ind hi- siigle decisionchannel lacks the high speed of the computer. These factors are of prime importance in the design ofcontrols and displays,
3. Controls
The small size of fighter cockpits when combined with the large number of aircraft systems each with theirassocialed control panel leaves little space for the controls znC displays with which tie pilot inter-acts with te,€ avionirs. a situation which is exacerbated if his reach and vision is lmpaireýd by the con-straints of a reclined high 'g' seat. There is a strong temptation to reduce the panel area requirementsby using multifunction controls and in theory it is possible to contro; all of the avionics shcough onem ultifunction panel. By multifunction I mean that one control hab many ftnctions depending on theoperation of sonm previous control, as shown in Fxiure 3., This, although a neat engineering solution tothe problem of lack of area, is fraught with problems from the point of view of workload, One of the
i.

18-2
important iactors in fighter operations is that most of the short term inputs received by a pilot comefrom outside the cockpit through his vision. These include terrain, obstacles, orientation, other air-craft, ground targets, hostile fire Rnd the head-up display. Conversely most of his long term inputscome from insidz the cockpit through radar, sensor, navigation and map head-down displays, In both caseshe will need to operate controls at the same time, and where possible these operations should not diverthis attention from the visual input,
Thus the controls associated with displays should be adjacent to them. Since displays need to beorientated approximately normal to the pilot's line of vision they will usually be on the main instrumentpanel rather than on the side consoles. As such they will tend to be at arms reach which makes fordifficult operation under 'g' or turbulence, where double entries or failure to enter data are common.
After a relatively short period of familiarisation with a cockpit most pilots when blindfolded are capableof identifying by touch all of the controls. Where these are single function controls he can also operatethem by feel, In this he reli-s on his long term memory and spatial co-ordination. However, when thesecontrols are multifunction his short term memory is involved and being poor it nearly always has to beaugmented by vision. In this case he needs to have visual feedback from the associated display immediatelynext to the controls so that he does not have a large time consuming visual scan angle from the control tothe display. To operate a keyboard by touch is not too difficult when each key has only one function butwhen multifunctioned the task becomes very demanding. To give a very simple example, a four digit radiofrequency selector can be reset by touch without visual augmentation either by resetting each digit to zeroand counting the clicks or by remembering the original frequency and incrementing or decrementing it asappropriate. This can be a very difficult task when one is occupied with controlling the aircraft andvirtually impossible if one has to return ta it at the half way point following an interruption when thestage o.ie had previously reached is easily forgotten, However, thQ process becomes very easy when aug-mented by immediatp visual feedback, The same holds true of most multifunaction controllers unless com-plicated data insert log.c is involved,
It has been stated that retention of short ten., memory may be as low as 3 seconds. After this time thereis a 50% chance that items of information mcy be forgotten especially in high workload conditions, Afterabout 18 seconds there is only a 10% chance of remembering data when working on a simple task,
The essential problem, however, is that the pilot must look at a multifunction controller while operatingit which denies him short and long term outside world and sensor inputs for the period. The consequencesof this obviously vary according to the situation. If heavily involved in manual high speed very lowlevel flight one cannot afford to look in at all hence all control selections must be by touch. Ifinvolved in visual air combat, looking in frequently causes one to lose contact with the other aircraftinvolved in the fight which would be disastrous. If flying head down on instruments, looking away tooperate controls involves loss of instrument scan sufficient to cause significant deviations from thedesired flight path, So, while there are powerful arguments for multifunction controls, there are evenmore powerful arguments for confining their applicaticns to systems which a,e operated during periods whentemporary loss of visua3 input from the outside world or flight displays is not crucial,
It is of interest that, for reasons of workload, manual input ot data into the Flight Management Computerof modern civil airliners usually is effected through a full alphanumeric keyboard which has 26 buttonsfor alpha entry with a separate 10 buttons for numeric entry. For similar reasons ;lew controls andmultifunction push buttons for data entry were consistently rejected as unsuitable during pilot assessmentof the BAe Weybridge Advanced Flight Deck (AFD) Simulator. While commercial pilot workload is quite high,given that there is at least one other pilot to share the load and Lhat virtually the whole flight is onautopiiot, the task cannot compare with *he difficulties of the pilot at a single seat fighter. Eventhose controls which are single function and hence only require touch operation are affected by operationalconstraints, For example, although it is easy to identify controls by touch when seated normally it isanother story when twisted around looking backwards at the opposition or when pulling 'g'. Then the onlycontrols one can be sure of operating are those on the throttle and stick - the HOTAS concept. It is ofinterest that the F-16 has some 370 dedicated switch positions of which 16 are on the stick and thruttleand only about 10 multifunction switches associated with the stores management system display,
One proposed solution to the problem of physically operating controls under high workload or 'g' conditionsis to use Direct Voice Inpit (DVI). My company is curreatly eng.ged in research into this subject usingseveral approaches. Broadly speaking their research ';hows that a subject whose voice pattern has beenpreviously piven to the equipment can achieve about 90% success in giving simple commands by DVI, Theypredict that higher levels of success are likely but that it will be many years before DVI will besufficiently reliable to carry out any flight-critical cockpit switching functions,
In the near future DVI could be used as an "add-on" extension to existing switch systems but the basicswitches must remain in being to give completely reliable functioning plus visual and tactile confirmationof selections which have been made,
A further consideration is that the radio is very busy in fighter operations, and the a'iral channel isalready overloaded., When not transmitting, pilots must lis~en out for other calls hence voicecommunication with one's own aircraft could lead to missed radio calls from others, This, for example,happens more frequently in two seat aircraft where intercockpit voice coL-nunication is used than in singleseaters where it is not,which indicates an important operational d-s-dvantage of DVI. In addition thesystem operates in a similar way to multifunction keyboards in that a set sequence must he followed toreduce the size of vocabulary for each phase and thereby increase the probability of correct recognition.For example to change UUF frequency it may be necessary to say Radio - UHF - 236 point 2, and this sequencemust be correctly followed Under the stress of combat it may be difficult to follow this orderedsequence using the same calm tone of voice that was used when initially feeding one's speech patterns tothe system,
A XI

Nevertheless DVI has considerablt development potential as another communication channel betweenpilot and aircraft ,'hich might ultimately overcome the physical reach constraints associated withconventional cockpit switches,
To summarise, pilots have very little spare sensory capacity for systems management when at high speedand low level and if the full potential of modern avioniLs are to be realised they must be easy tocontrol and be highly automated.
4, Displays
Displays are the means through which the avionic and aircraft systems present data to the pilot, Thereis enough space in the average single seat fighter cockpit for a small radar display and conventionalflight instruments but when further stasors are added or the possibility exists that they could be addedin the future, a solution to the problem of space is to intcgrate data into smaller groups and port,7ay iton electronic displays.
In the civil display field it is proposed to integrate the flight instruments into a Primary FlightDisplay, navigation and weather radar into a Navigation Display, all engine data into an Engines Displayand to also have Systems and Warnings displays. For military aircraft, sensor and weapon aiming displayswould also be required making a total of seven surfaces. Clearly this poses problems of lack of avail-able space and for this reason plus the need to cater for display surface failure, the displays mustnecessarily be multi-function. This implies that some data will not be continuously displayed and thatthe display formats will perforce be iode-dependent.,
It is tempting to take the view that the ability of electronic displays to draw any shape of symbolcreates an opportunity to radically change the traditional display formats for such parameters as attitude,altitude etc, For example, mechanical constraints have limited the format development of electro-mechanical attitude indicators to a ball-type presentation with different colours for above and belowhorizon indications, whereas electronic displays do not have this restraint.
An attitude display has to fulfil two quite different requirements. First it should be possible to re-cover from unusual positions, for example a steep inverted climb, by immediately assessing what is thequickest, safest action to regain wings level horizontal flight, This requires a coarse scale with strongupright/i-'vei ed cues. Pitch and roll rates will be high and the total picture must be available,instantly and unambiguously, Secondly there is the need for f.ne, precision attitude control duringinstrument approach procedures, INC low level, or fighter interception procedures where pitch and rollrates are low. For these phases of flight a larger scale would be advantageous. A large scale presenta-tion near the horizontal and a small scale presentation near the vertical is a feature of the F-16 HUD sym-bolcgy and perfectl) feasible for CRT Flight Displays.
However, there are strong reasons why an electronic flight display should be essentially similar inappearance to existing electro-mechanical units, at ieast to the extent tl-t a pilot used to flying bydials can recognise the display for what it is, see Figu-e 4. Firstly, it is an eartn referencedsituation display hence it should include a horizon lin,- and pitch reference augmented by bank and up/downcues. Secondly, fo: reasons of integrity of vital flight data some dissimilar standby instruments willbe required and to some extent their formats will influence those of the electronic displays, since theyshould be alike so that it is easy to transfe: from one to the other. Nevertheless, it is possible byintegrating airspeed, altitude (baro and radio), attitude, bank, heading, flight path, potential flightpath and ILS guidance into one CRT display to reduce the instrument scan time with consequent improvementin flying accuracy and reduction in workload,
Similarly, an integrated navigation display as shown in Figure S car, reduce workload in two ways, scantime is reduced and the display can pictorially represent %Lere the aircraft is in relation to desiredroute rather than as in traditional displays relying on pilot interpretation of position through bearing/range and a mixture of mental gymnastics and rules of thumb.,
Whether it is necessary to display continuously all engine parameters is open to qdestion. On the onehand automatic engine controls can reduce the need to display anything other than the dominant parameter,be it RPM, EPR or fuel flow. On the other hand if only one engine is fitted it is of such v-talimportance that visual access to its parameters should be more or less continuously available.
It is in the area of systems and warnings displays that the greatest opportunities for reducing workloadlie. Currently the pilot is presey.ted with a diversity of dials and lights many of which are of differentscale and manufacture and not easy to interpret, For example the normal operating area on one dial mayhave the ;:eedle vertical, on others it may be anywhere. Consequently it is difficult to tell at a glancewhether all systems are well and it is often necessary to remember many differ...;t numhers, In thisrespect light aircraft which have dials with coloured segments for normal or caution ranges ofte, h12vehetter presentations than military aircraft•
Most aircralt systems have one or two primary parameters for example pneumatic pressure which give clearindications of their health. It may be sufficient to display only these parameters cantinuously whileretaining the ability to call up a more detailed display of secondary parameters when required for checksor subsequent to a failure. It is also possible to inhibit warnings when these occur naturally as aconsequence of a failure. In some twin engined aircraft the first indication of %ngine failure isillumination of the generator failure warning light followed by low oil pressure and the pilot can betriggered into inappropriate emergency drills. By rationalising systems and warnings the prime cause,engine failure, plus an indication of why it failed and the appropriate emergency driils can be displayedto the exclusion of the consequential failures,
It is virtually impossible to handle paper check" lists at high speed ani low level but perfectly feasibleto carry out electronically displayed emergency drills. Confidence that failures will be disclosed re-liably to the pilot can reduce his need to monitor systems and allow him to concentinte on his mission,

184
Weapon aiming will normally be carried out using a Head-Up Display (HUD) or Helmet Mounted Sight (00S)where the target is outside the field of view (FOV) of the HUD. These are collimated d~splays whichallow the pilot to see both target and display without the need to refocus 'he eyes thus achieving greaterefficiency of visual data input through time sharing. It is likely that target acquisition will beenhanced through the use of some sensor other than the human eye and since the sensor acquisition periodimmediately preceeds visual acquisition it i" vital that the transition between them is quick and positive.In fact the first contact may bz visual, the pilot will acquire using the sensor, then havir3 assessed thesituation and formulated nis tactics he will go head up again for the engagement, More than one sensor,e.g. radar and visual augmentation system.may be involved. Thus there are strong arguments for alsocollimating the sensor displays as an aid to reducing the time needed for accommodation changes from headup to head down and vice versa. A Lollimated display of this type has been fitted to a simulator at BAeWarton, see Figure 6, and a smaller but essentially similar display is used in the SAAB Viggen. Thereare several other advantages in collimating head-down displays; a small display can be magnified to givelarger IFOV through the use of binocular vision and the display is easier to read under turbulent condi-tions since the display format apparently moves up and down in phase with the pilots eyes.
4.1 Display Legibility
The open nilitary cockpiL is a very demanding environment for electronic displays. Unlike nor-luminousconventional instruments whose legibility relies on reflected illumination, electronic displays depend ontheir luminous properties for legibility and as such they have to compete with ambient illumination.The two prime factors governing electronic display legibility are contrast and luminance. Essentiallyone only sees some thing because it contrasts with its surroundings hence this is an important factor tomaximise. This is easily achieved with electronic displays by use of contrast enhancement filterswhich work on the principle that by limiting light transmission to say 10%, while the CRT brightness isreduced to 10%, the ambient illumination which has to pass through the filter twice is reduced to 1%.(Fig.7),
Filters which are wavelength selective can also be used, typically these are matched to the wavelength ofthe CRT phosphor which further improves contrast. Lower transmission filters will give greater contrast,but at the expense of display brightness. When a pilot looks out of the cockpit his eyes adapt to thebright outside world, and so when he looks in at his display he is not able to see low brightness displaysas well as if his eyes were adapted to inside rather than outside light levels, Consequently there hasto be a trade-off between contrast and brightness.
The next speaker will describe colour displays in some detail, and so I will ignore the topic except tonote that colours have strong attention getting properties hence they should only be used for this purpose.
Highly coloured displays, whilst very pretty, probably have less information transferring qualities thanwhere colour is used sparingly since the colour can be another superfluous item for the already overloadedvisual channel to process, Too much colour could arguably increase workload, selective use will decreaseit.
5. Cockpit Integration
In many jet fighters little attempt seems to have been made to place displays and controls where they couldbe easily read or reached. I could cite the Vampire fuel gauge, Hunter compass, Harrer radio and PhantomWeapon switches all of which are hidden behind the stick. Some aircraft had all the "once a flightswitches" on the left console and within easy reach of the free left hand with the switches that need tobe operated frequently on the right console which involved swapping hands on the stick,
Other early aircraft had poor systems integration with incompatibilities between different systemL,., Thisproblem seems to te largely overcome, and indeed, the -eed for avionics to communicate on common data busesdemands system compatibility.
However, it is only on the latest aircraft that the system integration process has spread to include thepilot. The F18 is a particularly good example. This aircraft has the same task as its predecessor theR4 but has only one crew member. Pressure from the operators was for two crew but this was ruled out oncost ground;. As a result extensive human factors work was carried out on the man-machine interface toensure that the task was fea;ible for one man and the cockpit has been described as "as close to perfectas you can get"., However, even this cockpit coule be improved b) the use of colour and more collimateddisplays.
The lesson is that avionics capability has outstripped pilot capability yet he is the key to success andmust be considered at all stages of the design. The cockpit is more than an aerodynamic, inconvenience,it is the heart of the matnine and must be tailored for his task. This fact places a large burden onthe airframe designer who must have staff who understand the needs of the pilot and the nature of his task.
"Experience in the recent past has shown the extreme difficulties and indeed, flight safety hazards, whichhave occurred when system operation, functions and displays have been designed and evaluated vithout takingfull account of the very demanding military flight environment. Simulator and other trials have ofteni,.:,Ited in extremely logical and orderly lay out of controls functions and sequences. Unfortunately,they have z'ten failed to relate the pilot's operation of these system controls and displays to the factthat he may very probably be flying under manual cintrol at 100 - 200 feet at axound 550 knots. Underthese circumstances ano others, such as I have described, the time and attention span, which the pilotcan give system operation, is exceptionally limited and however elegant and logical the control and displayfunctions provided, he will be unable to use them unless their operation can be made in a near instinczivemanner and with the minimum distraction from the flying task.,
I strongly believe that system control and display functions in the past have frequently been evolved onthe basis of what is good for the system operation, rather than what is good for the overall flying task.
III l

18-5
The real problems of survival and avoidance of terminal flight safety hazards in high speed lowaltitude flight and air combat/offensive operations, demand that for future aircraft we should alwaysplace the flying task as the main criteria and attempt to fit system operations to it. Unless we chooseour priorities in this fashion we will continue to run the risk of producing exceptionally good systemswhich are incapable of use by the pilot at the time when he rost needs their assistance."
6. Conclusion
In this paper I have attempted to show how considerations of human factors in the design of controls anddisplays can reduce pilot workload and improve operational efficiency, The high speed low level task isvery demanding and the pilots visual channel in particular is heavily loaded. Consequently the pilotshould not have to look at controls when operating them and displays should be capable of swift interp-retation leaving the visual channel as free as possible for the vital outside world inputs. Collimatedhelmet, head up and head down displays can improve the visual data gathering process through eliminatingthe refocussing time delays and colour displays can reduce scan times through identifying the priorityelements of the format. Human factors considerations throughout the design stages will improveoperational efficiency and safety and help realise the full potential of modern avionic systems.

VISUAL
DOCUMENTATION
CONVISUAL
WAARNINGS
t AVIOICS CMPJTE
Figure E 2AeisoURocssn

MODE SWITCH
16 FUNCTIONSFROM
8 BUTTONS
CONTROLS )
MULTIFUNCTION CONTROLS
00000 0 0 0 16 FUNCTIONSFROM
0 0 0 0 16 BUTTONS
CONTROLS 0 0 0 0DEDICATED CONTROLS
Figure 3 Controls
zL

1 8-8
h('ur *DHml Ih

18 2
.r i . H I ia
f6
.30

18-10
I0
-- EYES-10 POSITION
Figure b Collimated Display
441 AMBIEN. ILLUMINATION
(SUN. CLOUD, ETC S (A))(ILLUMINATION A FT CANDLES)
FILTER (TRANSMISSION TF I X))
FITE ITINS OTA
/ ANTI-REFLECTION
PHOSPHOR SCREEN P IX) COATINGILAMBERTIAN REFLECTANCE R) (REFLECTANCE rI \ /
(BRIGHTNESS BOf L\
o .- > OBJECT WITHIN COCKPIT- 9 (REFLECTANCE k)
NOTE FOR SIMPLICITY REFLEC*IONS OF MINOR CONSIDERATIONHAVE BEEN OMITTED
Figure 7 Gpt;,.l Filter System
M t

19-1
Colour Displays: Their Availability, Performanceand Application to Improved Crew Efficiency
D W HusseyMarconi Avionics Ltd
Airborne Display DivisionAIRPORT WORKS, ROCHESTER, KENT MEl 2XX, UK
Summary
High performance monochrome crt displays have proved both acceptable and even essentialin efficiently prespnting complex data to flight crew. Their usefulness is particularlyenhanced by their inherent flexibility through re-configuration and operation as modedependent multi-fcnction displays. The experience and confidence gained with electronicdisplay systems in modern military aircraft have contributed to the fact that the nextgeneration cockpit is likely to make very extensive use of crt displays. In view of theprimary and therefore critical contribution of crt displays to the mission task, it isessential that every reasonable effort is made to ensure that informttion is presented inthe most easily assimilated form, A colour capability will undoubtedly help in thisregard provided too great a penalty is not paid in other areas.
It now appears feasible to provide the aircrew with a display with full colour capabilityand a generally acceptable performance level.
This paper reviews the arguments governing the choice of technique, establishes the likelyperformance parameters and suggests guidelines that will be of use in determining howcolour will be used to enhance the presentation of information.
1. INTRODUCTION
The thesis that the pilot is now both pivotal to mission success and, as a consequence,acts as the ultimate constraint on mission performance is now generally accepted. Thishas never been more true than in the low level high speed flight regime. While it istrue that in a dual seat aircrait tasks can be shared and the individual work loads re-duced, in a single seat aircraft, possibly operating at night or in adverse weather andin a hostile environment, the peak workload may quite easily reach unacceptably highlevels. The resultant stress on the pilot wil. tend to make him fly higher and sloweror involuntarily omit actions or make erroneous ones. Any or all of these can effectmission performance or crew survival.
The use of advanced technology in the form of multifunction electronic displays,processors, sophisticated sensors and other automated pilot aids is increasing. Theneed for an integrated approach to cockpit design is self-evident and considerable workis taking place both in Europe and in the United States to this end. Monochrome *iulti-function electronic displays have figured in this work, and indeed have now reached ahigh level of maturity and acceptance. Good display system design provides flight andmission data to the crew as efficiently as possible, making optimum use of the vast amountof information available in a moaern aircraft and aims to avoid overloading instrcmentpanel space or the crew information channels. But there are inevitably times wlen work-load reaches such a pitch that tasks are voluntarily or involuntarily rejected, errcrrates increase, and performatnce is degraded to a greater or lesser extent. It is underthese circumstances that the extra dimension of colour in the displays could provide anadditional benefit: used correctly, colour has the potential of reducing scan times and_rror rates.
Monochrome cockpit displays have been very largely brought to their present reliableperformance levels over the last decade. System designers and crew have learnt to livewith the single colour and to use it effectively. However, few would deny that, were itavailable, there would be a strong subjec:ive preference for colour. In recent years,we have seen the introduct) n of penetration phosphor colour displays it' the tactical andcommand and control environment. They could even have .'ome limited application in anexposed cockpi. environment. Since then the use of multicolour shadownimsk weatherradar displays has become c-anonplace ir, the general aviation cockpit and, most re',ently,the latest generation of c.vil transport have adopted more advanced shadowrask display.to provide primary flight 'istrumentation.
* It would seem that the military cockpit has been lagging in applying these newtechnologies: in fact, thcy are not truly compatible with the demanding militaryenvironment. Now, a third technology based on beam indexed colour crts, promises tomeet military needs. This paper outlines the performance expected and suggests waysin which the colour capability might initially be applied.
2. TECHNOLOGY SELECTION
Any discussion of the use of colour crts should be prefaoed by the consideration -fipplication of monochrome electronic displays in the exposed military cockpit environment.Three key design tasks have included:
. achieving adequate display luminance and contrast in Uright sunlitenvironments.

19-2
* ruggedising thie relatively simple crt to enable it to withstand and
maintain adequate performance under conditions of extreme vibration.
0 reduction in power dissipation through raster scan technology.
These same requirements for visibility, ruggedness, and power dissipation have restrictedthe use of colour until now. The choice of available colour crt technologies is inpractice restricted to three, see figure 1:
0 penetration phosphor
* shadowmask
* beam indexing
To understand the performance achievable with these devices, it is necessary to krow alittle of their method of operation.
2.1 Penetration phosphor consists in principle of a dual layer of green and red phosphorob the crt screen. The electron beam is able to reach the red phosphor at relatively lowenergy levels,but when the anode potential is increased significantly, the beam penetratesto the green phosphor causing both red and green light to be emitted simultaneously.Although the red emission is considerably less bright than the green under such circ-umstances, it nevertheless causes the green tc take on a more yellowish hue as it movesa little towards the red end of the spectrum. This effect can be understood withreference to the standard CIE chromaticity chart, figure 2. The low brightness of thered can in part be compensated by drawing red sý.nbols more slowly or more frequently,effectively increasing beam current density and hence symbol luminance. Severalcorollaries follow:
(1) Because of the relatively lengthy tasks of switching high voltage levels, it is notpractical to raster scan a penetration phosphor colour display. While this could beachieved by arranging colours field sequentially,it would result in unacceptably lowbrightness. In practice, penetration crts use stroke writing, enabling energy densitiesto be kept high but restricting considerably the type of formats that can be displayed.To increase symbol quantities in red or amber takes more time, and as a consequence.results in a brightness reduction.
(2) The use of only two phosphors implies that only colours on the red/green colour axiscan be generated, figure 2, Because cI desaturating effects on these colours, cau.'edby-
0 the penetration phosphor itself
a ambient illumination
* peripheral vision
at the very best, it is only possible to define three usable colours, red, amber andyellowish green, which have sufficient colour difference to be identifiable under mostconditions. Clearly this is an unacceptable limitation on colour format design to thepoint when the returns in the form of colour coding do not mateh the cost/reliabilitypenalties of greater complexity.
(3) The single penetration tube gun can be designed to be as simple and rugged as Lhosecurrently used and proven in monochrome crts as can the rcmainder of the bulb andphosphor screen.
(4) As beam scanning speeds are restric'ed to maintain adequate brightness levels,display power dissipation does not usually excead acceptable levels despite the Dorecomplex high voltage switching requirements.
2.2 By Pomoarison, the familiar shawowmask crt technology differs considerably in termsof its des.ign approach, figure 1, and its coiresponding benefits and disadvantages.
In this case a complex triple gun allows three closely aligned electron beams +o bemodulated with their respective red, green and blue informntion sioultaneously. Eachbeam is constrained by an aperture grill to fall on the corresponding co]oured phosphorarranged in dots or stripes on the tube face:
(1) the third phosnhor (blue) permits the selectior of a much broader range of spectraland non spectral cc..ours, figure 2.
(2) the aperture grill absorbs some 80 percent of beam energy, making the 'hadowmaskapproach less efficient. As a result, ri.ster scanning, although feasible, and of coursecommonplace in domestic television, does not produce the brightness necessarý for viewingin an exposed cockpit* again,ihe display must be stroke written, restricting the type offormats practically achievablr.
(3) the relatively fragile aperture grill and the more complex gun ineviLably introducedisturbing problems in thL high vibration military environment. The sensitivity of per-ceived colour to such factors as beam convergence, magnetic fields etc. is also of concern.

19-3
(4) because of the energy dlssipajion in the aperture grill, power dissipation is high.Another related factor is that a bigniflcant amount of the beam energy is dissipated asX-radiation, a potential problem multiplied in a multi-crt cockpit configuration.
2.3 Beam indexed crts on the other hand use only a single gun which scans phosphorstripes on the tube iace in a television roster. The phosphor stxipes are a~ranged inred, green and blue triplets, the sinigle video signal being modulated with red, greenand blue information as the beam Pcans the appropriate phosphor. The frequency andphase of the video modulation is provided by a feedback signal derived from the faceplateitself, figure 1. As the beam scars the phosohor so an indexing signal is generatedwhich identifies the phosphor colour that the beam is energising and causes the viaeo tobe modulatee appropriately.
A number of methods have been devised to generate the index signal and it is beyond thescope of this paper to discuss their merits. Suffice it to say that beam indexingsystems have been under laboratory development for more than twenty years. Such systemshave not succeeded in ousting the conventional and entrenched shadowmask displays in thedomestic market place. However, the peculiar demands of the military cockpit environ-ment make the approach much more attractive, particularly in the light of recentelectronic component development. Beam indexed crts have the multiple colour capabilityof shadowmask systems but they suffer from no aperture grill ineff-ciencies. As aresult, brightness is appreciably higher while energy dissipation, both thermal and X-radiation i., significantly less.
The relative merits of the three technologies are summarised in table 1 and a clearadvantage to beam indexiAg is apparent. It is this colour technique which is believedtj hold the best prospect for general military cockpit use and is the basis for thediscussion which follows,
3. DISPLAY PERIORMANCE
The three main factors waich affect the efficiency of a colour display are luminance,contrast and chromaticity (hue and satu'ation.. The first two can be considered togovern the legibility of the display while the !as' incicates the information contentof the colour code.
The sensitivity of the eye to cciour varies across the spectrum and it is most sensitiveto yellowish-green light. I'Le sensitivity ratio of the three primaries custcmarilyused in television, red, greea, 'lue, is approximately 3:8:1. In other words, greenappears brighter than red which is bribhter than blue even though the same tarr- energyis energising each phosphor. These three primary colours may be combined in variousproportions to give the other colours shown on the stardard CIE colour chart, figure 2.Since luminance values are additive, the luminance of a colour ic the sum of the luminancevalues of its constituunt primaries. Thus thp brightest colours are thos, .ith -1 highproportion of green and the dimmest contains only blue. By simple 4dditive methods,the luminance of any television colour can be found if the lumiiiance of tis constituentsare already known.
Note however, that the above relrtive sensitivities are ir e,'spect of foveal vision:peripheral vision can cause apparently arbitrary and quite striking changes to the ratio,for example blue is most effective as a colour (with rost pt.ople) in the periphery.
The standard CIE colour chart gives the x, y co-ordinaies oi the different speAral andnon-spectral colours but does not readily reflect t!te ab.lity of the eye to discriminatebetween the different vdlues. For this reason, an axis transformation is requireu whichresults in the Uniform Chromaticity Scale (UCr) shown in figure 3 where equal distanceimplies equai visual discrimination. The chart indicates which colours can easily bediiscriminated visually: for exariple, since the distance from green to orange ., twicethat from green to yellow, it follows that it is easier to discriminate between greenand orange than it is to discriminate between green and yellow. It should be notedhowever, that individual phosphors are not perfectly saturated hues: to a greater orlesser extent they emit broad spectrum (white) light in addition to their dominant wave-length. This desaturation is even more apparent when ont considers simultaneousenergising of phosphors* for example, the addition of yellow and blue can result incompletely desatu-ated white. This effect tends to decrease discrimination as iidividualcolours approach each other on the diagram and can occur either deliberately when thenumber of colour codes are increased by mixing different combinations of the threeprimaries, or inadvertently when the display energists other phosphors in addition tileone intended or inzident sunlight is rQflected from the phosphor, an efficient lambertianreflector. Of course, ooth these last factors can be minimised b- good design, bycontrol of the electron beam on the one hand and by the use ,,f contrast enhancing face-plate filters on the other. Nonetheless, chromaticity differences are reduced asambient illumination is increased, and with it, the abiljtý of the crew to extract theinformation inferred by the colour code u-ed. It is one of the reasons why redundancycoding ib praferred, for example symbol shape in addition to colour.
The two factors, luminance and chromaticity can be related to yield a total colourcontrast. One method of doing this is to construct a suitably scaled luminance thirdaxis perpendicular to the figure 3 chart. Tht colour contrast of selected colours isthen the geometric sum of their chromaticity diffeience and luminance contrast.
One purpose of this method is to establish whether colours can be varied slightly to

19-4
improve their egibility. Although the eye is more sensitive t chromaticitydifference than luminance contrast, the most important factor whn viewing the displayin bright cockpit illumination conditions is total colour contrast, hence it isimportant to select colours which are as bright as possible while still retainingsufficient chromaticity difference.
For example, the primary blue used in domestic television is sitated. for colourfidelity, in the bottom left corner of the CIE chart near the boundary of the visiblespectrum. However, such colour fidelity is not a dominant factor in a cockpit dLsplay,colour contrast is. Thus the blue colour selected for a symbol can be of a longerwavelength and hence be of greater luminance, but still of comparable chromaticitydifference to other selected colours.
This longer blue wavelength can be achieved by adding green to the blue video so thatthe colour achieved, while still within the "blue" region of figure 2, exhibitssignificantly greater luminance. For some symbols, particularly the smaller alphanumerics, this tecinique has the further advantage of producing better symbol definitionon the screen. The phosphor stripe structure causes the symbol to be constructed fromsamples of the total symbol video. If only one of the primary phosphors is energised,sampling rates are reduced, if two, they are doubled, and if three as with wnite video,the integrating effect of the eye results in the symbol or scene having a comparablyhigh resolution to a monochrome screen.
The anticipat(d theoretical performance of a typical beam indexed colour display has beancalculated and is shown in table 2. Parameters shown are based on extrapolations on theknown performance of efficient monochrome displays and assume the use of the prilarycolours employed in the NTSC colour television system which have CIE coordisates indicatad.The unenhanced blue primary has (x, y) coordinates of (.14, .08). Note that for thereasons mentioned earlier the actual hues perceived will be desaturated by comparisonwith the ideal %alues shown in the table.
It has been established that the minimum luminance contrast ratio that can be detectedis a-ound 1.1.05 and that a ratio of 1:1.4 is easily and comfortably detected.
Similarly, it has been shown that the minimum chromaticity difference on the U" scalethat is detectable is about 0.00384 and that a difference of 0.027 is easily andcomfortably detected. Accordingly, these values have been used to scale the luminancecontrast axis perpendicular to the UCS chart as mentioned earlier. The resultant coliuicontrast for a typical beam indexed display is shown in table 3. It should be notedthat all the values shown for the eight colours considered are greater, many significantlygreater, than the value of 0.6 established as the colour contrast level necessary toensure comfortable detection of a symbol.
It is anticipated that more sophisticated filters than the simple neutral density oneassumed in the calculations will give rise to an overall improvement in colour contr.:st.
The sensitivity of the eye to cockpit display brightness is temporaril, re,.uced duringthe adaptation period following viewing of a bright outsiue wurld sceh... It has notbeen possible to consider this aspect here, but work with monochrome disp]ay- hasindicated that an omnidirectional autobrilliance sensor cai, halp in this regard,increasing the display brightness with increasing outside world illumination rather thanmerely controlling the display brightness as a function of the ambie-t light incidenL onthe screen itself.
4. USE OF COIDUR
There are many ways of conveying information visually, by pattern, size, shape,intensity,flashing and colour. Each method has different merits: for example, colour has provedextremely effective in aiding a search task. The eye will rapidly scan a complex displaypicking out a known target colour, rejecting other irrelevant factors. This effective-ness can be increased when colour is used redundantly with another coding dimension suchas shape. However, it is quite possible to confuse the task and destroy the effective-ness of colour coding by using it indiscriminately. Available references on the use ofcolour to usefully convey information all agree that it `-'uld be used sparingly and withcaution.
It appears that the use of colour should be systematis a ed on:
0 accepted usage
* display performance
* human visual response
One is reminded that monochrome display formats can in general be devised to provide allthe required information. Colour can best be used to enhance crew performancc inrecognising situations or in search tasks. In this may task times can be r•' :cd,all-w-ing more time to be spent on critical activities that otherwise suffer orriss ons cr errorsin a peak workload environment.
A useful initial gui-e to the use of colour based on the accepted cockpAt conventionb isgiven in MIL-STD-1472B recommendations, summarised in table 4. Note that otter

19-5
specifications govern the actual range oý hue for these colours. In terms ofredundant use of colour for warnings, table 5 compares the use of colour with theconventions used on some current monochrome displays. Not only does the redundantuse of colour serve to accentuate information, if the hue is lost for some reason, theinformation content will still be available to the crew by interpretation of symbolshape, flashing etc. Loss of colour might occur for example whenf
* the display is viewed peripherally - all colours teing seen as white.
* display performance/ambient conditions are such as to cause sufficienthue desaturation that the eye cannot easily discern colour differences.
I the display fails with the indexing circuit open loop resulting in amonochrome display.
L deliberate manual crew intervention to select a monochrome display, e.g.red to preserve night vision.
Another example of the use of colour is in the conventional ADI where blue representspitch angles above the horizontal, a very clear indication of the direction of "up".Although blue is less effective for small symbols, the larger area provided by the "sky"colour is most demanding and effective a long way in to the periphery.
Uses for some 5 colours have been identified in this discussion so far, red, yellow,green, blue and white. A number of authorities recommend the use of only 3 to 5 hues,suggesting that more will only tend to confuse a viewer. While this opinion should beaccepted, it is recommended that any display should be basically capable of generatingmore colours to ensure good colour contiast and to permit growth to more complex use ofcolour in some formats should this prove desirable in the future. It is notable thatquite an extensive range of colours is planned for usc in the civil transport electronicflight instruments ctirrently under developmeut.
The use of white deserves special mention, it provides the best resolution and it can beachieved by applying video to the crt unmodulated by the indexing signal in either rasterscan or stroke writing modes. It provides the greatest peak brightness at a reasonablecontrast level. As such it should probably be used to display imaging sensor information,any symbol overlays being achieved in one of the other colours. However, it should benoted that this use of white will not result in the same high level of contrast andnumber of grey shades achieved with current monochrome displays unless a striking increaseis made in contrast enhancement filter efficiency or the display is used in such a waythat ambient light is not incident directly on it.
A further factor to consider is the likely use of multiple displays in the cockpit. It
is important that they are used consistently, particularly with regard to:
* huý
* saturation
* luminance
* use of colour
Such needs may tend to drive the cockpit designer towards the use of a well specifiedand standardised display technology, if not to actual standard displays.
The scale of the integration and task and range of standardisation required is indicatedin part by figure 4 which suggests some of the many different format categor4's thatwould be required to be considered.
5. CONCLUSION
Current studies suggest that beam indexed displays are likely to be available for air-borne use in the early 1980s. It is notable that studies in the use of colour carriedout to date cannot have been completely representative as suitable high performance hard-ware has not been available for use under operational conditions.
The potential for crew performance enhancement offered by beam indexed colour displayssuggests that their cost-effectiveness should be evaluated for the next generationfighters likely to be used extensively in the demanding high work-load environmentcreated by low level high speed flight.

Bibliography
J A Barnes What Color Display ElementAGARD No.96 19 Oct. 1971.
R Beyer A Limited Study of the Trade-Offs between Luminance andColor Coding in Electronic Aircraft Displays.AGARD No.96 19 Oct. 1971.
K T Burnette The Status of Human Perceptual Characteristic Data forElectronic Flight Display Design.AGARD No.96 19 Oct. 1971.
R E Christ Color Research for Visual DisplaysONR TASK 213 - 102 July 1975.
A R Doucette Color Discrimination in Digital DisplaysSID 77 Digest
C Dowd Color CRT Applications in a High Performance MilitaryAircraft.SID First Quarter 1979.
D G Fink The System Behind Colour Television DisplaysSID 77 Digest.
C If Graham (Ed) Vision and Visual Perception.
John Wiley & Sons Inc. 1965.
J Kamler Luminescent Screens.
J A S Kinney The Use of Color in Wide-Angle Displays.
SID First Quarter 1979.
C J Kopala The Use of Color-Coded Symbols in a Highly Dense SituationDisplay.
Air Force Flight Dynamics LaboratoryWright Patterson Air Force Base, Ohio 1979.
M J Krebs Design Principles for the use of Colour in Displays.SID 78 Digest.
M J Krebs ) Design Principles for the Use of Color in DisplaysJ D Wolf ) SID First Quarter 1979.
M J Krebs ) Colour Display Design GuideJ D Wolf ) ONR-CR213-136-2F.J H Sandvig)
A Martin Contrast Ratios for Colour CRTs.AEEC.
D J Oda The Benefits of Color in an Airborne IntegratedTactical Display System.
Lockheed Aircraft Coxporation.Report LR27948 April 1977.
D J Oda The Use of Coljur in Tactical Displays
Lockheed Ai-craft Corp.Report T'2o.99 August 1978,
D J Oda ) The Applicat.on of Col'ar to .... . .isplays.B W Barker ) SID First Quarter lQ7
Poole H H Fundamentals oi -.sp)Py S.stems'part- - -ks 19AP.
D _ Smith (Ed) -aphic Dhsplays, A Hluman Engineering Guide for Usingcolor in CRT Command and Control Displays.Lockheed Missiles and Space Co. Inc.Report No.D66834 Dec. 1978.
W H Teichner Color and Visual Information Coding.SID First Quarter 1979.
J A Turner An Electron Beam Indexing Colour Display System4 Sept. 1974.Electronic Displays 79 Conference.
J W Wilson ) Human Factors ana the Advanced Flight Deck.L F Bateman ) 32nd International Air Safety Seminar,
London, October 1979.

19-7
Bibliography (Cont.)
J W Wilson ) The Advanced Flight DeckR E Hillman ) Royal Aeronautical Society 16 Ma:, 1979.
F H Wolfe Display Technology for Potential Applications toMODFCS C2 Systems.Task 9.a - Final Report 1 Oct. 1977Naval Ocean Systems CentreCode 8235.
Wystecki & Styles Color Science.SJohn Wiley & Sons Inc. 1967.
IlI

19-8
PENETRATION PHOSPHOR SINGLE BEAM GUN RED/GREENSINGLE BEAM GUNRE/EN
PHOSPHOR[ LAYERS
FOCUS
HIHRESOLUTION RED/GREEN/SHADOW MASK APERTURE GRL BLUE PHOSPHOR/DOTS OR STRIPES
IBCOMPLEX MULTITEAM
RED/ GREEN/SINGLE BEAM GUN /I/BLUE AND UV
BEA D EW LM PPHOSPHOR
BEA M I N D E X OR S T R IP E S
UV EMISSIONFROM SCREENCIRcINTG UV DETECTOR
•, ,.Figure 1 Technology Choice

19.9
U 80 Boo - 30 535
G(540 1
0 700 '550-
505 GREEN - __ __ - - - - - -560
0600VELL0 H-060GREEN
56557
- -0- YEL W GREENISH-YELLOW500GREE 57S
f 580 YE LLOWISH- ORANGE
0400 -- 95 ORAN REDDISH-ORANGEBLUISH-GREE6
WHT 0100
46
Figure~ 2R Stndr CR hoaict hr
03004000000
025 0
~ 0 0 02 0 04 0 6 06
- ~ ~ ~ ~ GEN FigureS PURPLmEroaict caeDiga

19-10
HUD
SSTORES FLIR ENGINES
COMMS +VSD + SYSTEMS?NAV DATA +WARNINGS + ESM
r 'NAVDAA ANNOTATEDMAP (JTIDS)
+ RADAR+ HSD
Figure 4 Multiple Display Consistency
PENETRATION SHADOW BEAMPHOSPHOR MASK INDEX
PRIMARY "PHOSPHOR 2 3 3
USABLECOLOURS 3 8 8RASTER SCANFEASIBLE NO NO YESADEQUATECONTRAST NO MARGINAL YES
RUGGEDNESS YES NO YES
POWERDISSIPATION ACCEPTABLE HIGH ACCEPTABLE
RX RADIATION ACCEPTABLE HIGH ACCEPTABLE
Table 1 Colour Display Techniques

S1911
LUMINANCE OF PEAKPRIMARY LUMINANCE OR E
CONSTITUENTS BEFORE FILTER
DISPLAY COLOUR RED GREEN BLUE Ft. L X, Y U, V
RED 250 - - 250 .67 .33 .48 .35
GREEN - 500 - 500 .21 .71 .08 .38
CYAN - 200 80 280 .16 .22 .12 .25
WHITE 250 500 80 830 .31 .32 .20 .31
PURPLE 97 - 80 177 .26 .13 .26 .19
MAGENTA 250 - 55 305 .43 .21 .37 .27
ORANGE 250 170 - 420 .57 .42 .33 .37
YELLOW 250 390 - 640 .48 .48 .25 .37
Table 2 Display Colour Characteristics
OBSERVED SYMBOL COLOUR CONTRAST AGAINST DIFFERENT BACKGROUND COLOURSPEAK IN AN AMBIENT ILLUMINATION OF 10' LUX
SYBLFt LAMBERTS I -SYBLLUMINANCE -- ---
Density Filter) RED GREEN CYAN WHITE PURPLE MAGENTA ORANGE YELLOW BLACK
RED 25 0 1.52 1.46 095 126 082 069 085 126
GREEN 50 0 125 0.91 1.63 164 1 32 100 1.36
CYAN 26 0 0.71 0.96 120 128 115 1.11
WHITE 83 0 136 1 27 112 0.94 1.46
PURPLE 17.5 0 085 114 118 1 11
MAGENTA 30.5 0 0.88 100 1 22
ORANGE 42 0 068 1 24
YELLOW 64 0 138
Table 3 Theoretical Colour Contrast

r 19-12
(MIL STD 1472B RECOMMENDATIONS)
COLOUR STATE RESULT
ImmediateFlashing Emergency operatorRed action
Corrective/Red Alert override action
must be taken
Caution;Yellow Advise recheck is
necessary
ConditionGreen Proceed stisfactory
White Transitory No "right"W ensitory or "wrong"Function indication
, Blue Advisory Shou!d beavoided
,0
Table 4 Accepted Usage
CONDITION MONOCHROME COLOUR
Emergency Flashing FlashingAlert Area RedArea
Contrast YellowCaution Inverted Contrast
Area Invertion
Green orNormal Positive WhiteOperation Contrast PositiveSymbol Contrast
Table 5 Redundancy

__W4
HELMET-MOUNTED DEVICES IN LOW-FLYING HIGH-SPEED AIRCRAFT
D. N. Jarrett
Flight Systems Department, Royal Aircraft EstablishmentParnborough, Hampshire GUl4 6TD, England
SUMMARY
There is considerable interest in the use of helmet-mounted devices worn by pilotsof military aircraft whilst flying at high speed and low level. It has been anticipatedthat the buffeting vibration associated with this flight regime could affect the use anddesign requirements of helmet-mounted devices, and this paper reports the results fromtwo relevant simulation experiments. The first assessed the amount of movemcnt occurringbetween the pilot's helmet and his eyes, whilst the second concerned the legibility ofinformation presented on an experimental LED matrix display.
It was concluded that aircraft vibration did not cause signifirant helmet movement,in comparison with natural voluntary head motion, and that the degrading effect of air-craft vibration on the legibility of displayed information could be counteracted using abrighter display.
1 INTRODUCTION
During low-level high-speed flight in military aircraft the turbulence encounteredcan subject the pilot to violent body vibrations. It is of considerable interest to the"designers and users of helmet-mounted sights and displays to know what consequences theseirregular forces have on the design requirements of helmet-mounted devices.
This paper describes two separate simulation studies, the first concerned withmeasurements of the movement of the pilot's flying helmet relative to his eyes, whilstthe secord is an assessment of the legibility of information projected from a novel formof helmet-mounted display, in which the image is derived from a matrix of light-emittingdiodes.
2 MOVEMENT OF A PILOT'S HELMET DURING SIMULATED LOW-LEVEL HIGH-SPEED FLIGHI
All the present forms of helmet-mounted sight or display incorporate an image sourcetogether with a means of collecting and redirecting the emitted light so that it entersone of the pilot's eyes, enabling him to see a clear bright virtual image superimposedupon the normal scene. These electronic and optical components are attached to thehelmet, so that displacement of the helmet relative to the pilot's display-yiewing eyecan move his eye beyond the exit pupil of the optics. Although it is known that theinertial forces arising during turning manoeuvres can cause considerable helmet movementrelative to the pilot's eyas, little was known about the magnitude of helmet displace-ments resulting from aircraft buffet vibration. This experiment was conducted primarilyto assess the latter, but it was also of interest to compare the movement of the currentRAF Mk 3B helmet with that of the USAF HGU 22/P helmet, and to assess the effect ofattaching a helmet-mounted display device to the latter.
2.1 Experimental method
2.1.1 The displacement measuring system
The essential requirement for this experiment was a means of measuring thedisplacement of the helmet shell relative to the wearer's right eye, arranged s- thatthis measurement system neither altered the helmet weight significantly nor perturbed itsmovement.
The device developed fulfilled these requirements satisfactorily, and producedseparate electronic signals, corresponding to vertical (Z) and horizontal (Y) displace-ments, which were reasonably linear within 5 mm of the centre. The basis of the systemwas a position-sensitive photodiode attached to the helmet, arranged to receive theimage of a small lamp mounted on an extension from a bite-bar held between the subject'steeth. The lamp filament was thus attached rigidly to the skull and could be positioned12 mm in front of the subject's right eye. The optical arrangement, illustrated in Fig 1was such that any paraxial movement of the filament relative to the lens and photodiodemoved the image of the filament across the photodiode surface, and hence produced stablesignals. The photodiode and lens assembly was mounted on the helmet shell using alloybreckets, as illustrated in Fig 2. For the Mk 3B helmet this necessitated removal of thevizor, but the bracket for the USAF helmet was made as an extension of the oxygen-maskfixing plate. The oxygen-mask was itself modified to allow the bite-bar to protrudeforward by removing the microphone and an annulus of rubber.
2.1.2 The helmets
Although only two types of helmet were considered, the USAF helmet could be usedboth with and without a helmet-mounted display and also with an alternative set of

20-2
'universal' liners replacing the standard items. This resulted in five helmet conditionswhich were as follows:
Helmet condition A - in which the4 USAF helmet was fitted with artificial foam'universal' liners, which provided a tight fit by virtue of the time-dapendent resilienceof the foam. The helmet had also been modified to accept a Hughes Aircraft Co heimet-mounted display with a position-sensing system, and RAF type oxygen-mask and Varphones.
Helmet condition B. This was the same as the first, with the addition 11 a replicaCRT display to the right side of the helmet.
Helmet condition C. In this condition th, USAF helmet was used with the standard'form-fit' liners, tailored to suit the individual pilot. This technique for producing abespoke helmet made use of a rigid plastic foam moulding of the space between thewearer's head and the helmet shell, although the moulding inner surface was rendered morecompliant and comfortable by a thin soft plastic foam layer covered with leather.Modifications to the shell and incorporation of the display coupling were as for thefirst condition. The bespoke liners had receiied about six months of intermittent flightuse.
Helmet condition D. This was the same as condition C but with the additlon of the
Helmet condition E - which was the RAF Mk 3B helmet, differing from the USAF helmet
in both the design of tbh shell and the form of the suspension. The latter was made fromnylon webbing, attached to tne shell and sewn to form a cradle covering the wearer'scrown, so that contact between the shell and the skull was preverted by tensioning thewebbing. The position and fit of the helmet could be adjusted by drawstrings acting onthe webbing, with additional stability resulting from tension applied to a nape strap andthe ear-cups. These helmets were fitted to the subjects using normal operationalcriteria for tightness and comfort.
2.1.3 The subjects
The two RAF test pilots who acted as subjects for this experiment were chosenbecause they had been fitted with the individually tailored liners for the USAF helmets.The first subject was near average but the second was considerably larger, in bothstature and head size, in comparison with RAF aircrew.
2.1.4 Simulation of aircraft motion
Simulated aircraft motion was produced using the RAE two-axis man-carrying rig,arranged to reproduce accelerations in heave and sway recorded from both a Canberra and aPhantom, flown at 250 feet and 350 knots.
The frequency response of the rig was reasonably constant between 0.5 hertz and25 hertz, and the rms acceleration levels were about 0.25 g in heave and 0.1 g in swayfor both aircraft. The characteristics of the Canberra were considered to be realistic-ally reproduced, but those from the Phantom seemed less authentic, perhaps because of theabsence of significant high frequency components.
The subjects sat in a Canberra type ejection seat and used harness tensionsappropriate to the simulated flight regime,
2.2 Experimental procedure
In addition to using the five helmet conditions, two aircraft motions and the twosubjects, each subject was asked to produce two types of head motion. In the first casethe subject was asked to look straight ahead as though aiming the helmet, and in thesecond he was asked to move his head as though searching for other aircraft and groundtargets during flight. During both these head motion conditions the subject underwentthe simulated aircraft vibration.
Both subjects wore the different helmets, the USAF both with and without thereplica display and 'ith both types of liner, experienced the Canberra and the Phantomvibration, and produced minimal or searching head motions, in a random sequence ofcombinations. Signals from the helmet displacement measuring system were recorded on afm tape-recorder, and analysed subsequently using a Hewlett-Packard signal analyser.
2.3 Results
The measurements can best be shown as the locus of the lamp filament with respectto the lens and photodiode, which is equivalent to the right eye displacement relative tothe helmet shell. Two such loci, recorded over 2 minute periods, are shown in Fig 3a&b,where the second subject, wearing the USAF helmet with tailored liners, experienced thePhantom vibration. In Fig 3a, whilst maintaining a fixed forward direction of regard thedisplacement had a range of less than 3 mm, but when the subject product:d head movementsappropriate tc searching, as in Fig 3b, the displaccnment increased considerably, coveringa range of about 12 mm.
An analysis of variance of the results revealed that the only significant facorswere this substantial effect due to voluntary head motion, and a difference between the

displacements due to the different manner in which the subjects carried out theirsimulated searching. It was also apparent that the vertical displacement exceeded thehorizontal when subjects minimised their iizvoluntary head motion, but that horizontaldisplacements dominated during the simulated searching trials. Table 1 summarises theresults as the average rms displacements, in both the horizontal and vertical directions,for the significant variables. The average ranges of helmet displa.'ements wereapproximately four times these rms values.
2.4 Comments
Although the statistical basis of this experiment was poor, since only two subjectswere used, it was reasonably evident that the magnitude of helmet movement duringsimulated low-level high-speed flight was in the order of a few millimetres when thewearer attempted to minimise his head movements. In contrast, comparatively largedisplacements occurred due to natural head motion, and any effects arising from
differences between helmet types, their form of suspension, the addition of a display, orthe variety of aircraft vibration were significantly less marked.
It is suggested that helmet displacement on the wearer's head results mainly fromangular acceleration of the head and the rotational compliance of the human scalp.Consequently all well-fitting helmats would suffer some displacement ander vibration,irrespective of their detailed design.
3 LEGIBILITY OF A HELMET-NJUNTED MATRIX DISPLAY DURING SIMULATED LOW-LEVEL HIGH-SPEED
FLIGHT
3.1 The matrix display
The Flight Automation Research Laboratory of Marconi Avionics has devised a simplehelmet-mounted display in which the image was derived from a miniature matrix of light-emitting diodes (LEDs). An early experimental version of this display consisted of theLED matrix, and its subsidiary circuit boards and optics, mounted on a skeletal head-band, as illustrated in Fig 4. The projected image was seen by the user to be in hisnormal forward direction of regard, to be red in colour and have an angular extent ofabout 10 degrees. The format is illustrated in Fig 5, and includes some fixed charactersbelow the 20 by 23 element matrix.
The LED matrix was operated by switching an energising current to a chosen element,which emitted light when energised. Although only one element could therefore emit atany instant, a format could be displayed by energising the necessary elements in sequenceand, providing the cyclic rate was sufficient, no flickering or discontinuity wasnormally apparent. The repetitive sequence of element address codes was sent from acomputer to the head-mounted electronics as a BCD pulse train along a single cable and,since each address code took 250 us to transmit, a set of characters made up from 40elements could be repeated 100 times per second.
The optical projection system consisted of a glass prism, which collected the lightfrom the downward-facing matrix, and a spherical section combiner, which reflected thelight into the user's right eye. Ih this experimental version of the display thecombiner glass was inserted into the vizor attached to the brow of the head-band. In use,the device gave an unrestricted view to the left eye, but the right eye looked through anarea of confusion, produced by the circular joint between the combiner and the vizor.The right eye's view was also tinted blue because the combiner was coated with a dichroiclayer having a high reflectivity for the red image-forming light.
3.2 Object of the simulation
It had been anticipated that some difficulty in perceiving the display image couldarise due to a combination of high background light level and the irregular bodyvibration due to high-speed low-level flight. In order to assess the legibility of thedisplay under these conditions, two experimental measurements were made, the first beingan assessment of the detectability of an individual LED element, and the second anexamination of the errors arising from the display of numerical symbols.
3.3 Experimental method
3.3.1 Apparatus
The RAE man-carrying two-axis vibration rig was used to reproduce the characteris-tic motion of a Canberra aircraft flown at 250 feet and 350 knots. Mounted on the rigplatform was a seat from a Sea King helicopter, in which the subject was secured. Anartificial bright sk" was produced by supporting a 2 metre diameter fibre-glass resinhemispherical dome above the rig. Four halogen flood-lights attached to the rim of thehemisphere were positioned so that the whole inner diffusing surface was reasonably4 evenly illuminated. This whole experimental arrangement is illustrated in Fig 6, wherethe hemisphere was tilted forward so that the subject had the sensation of flying insunlit cloud and was required to view the projected display against such a brightbackground.
The experimental helmet-mounted matrix display was fitted to the subject so thathis right eye occupied the centre of the optical exit pupil. The display was controlledin both brightness and content by a PDP-11 computer, programmed to produce the visual

•! 2~~~04 .. .. ... .
stimulae, receive the response, carry out timing operations and collate the accumulateddata. For the first task the subject made responses by pressing a hand-held push-buttonbut in the second the response was timed by a signal obtained from a throat-microphnneworn by the subjoet, whilst the correctness of the response was monitored by the experi-menter who signalled the errors using a keyboard.
3.3.2 The tasks
The first task assessed the subject's ability to detect the presence of a singleilluminated element in the display under two conditions of ambient brightness and threelevels of vibration. The brightness of the artificial sky forming the background to thedisplayed image was set at either 680 nits or 5100 nits, and the rig was arranged toproduce vibrations of either the full Canberra level or half this Level, or no vibrations.In all combinations of these conditions the subject was given sufficient time to adapt tohis circumstances and become fimiliar with the task. For this detection experiment theimage was eeen as a small (6.5 minute of arc) red square superimposed on the brighterbackground, each presentation lasting 3 seconds with an interstimulus interval varyingrandomly between 1 and 3 seconds. The brightness of the eiement was controlled to haveone of ten levels, spanning a range between 3.4 nits and 340 nits, and each level waspresented ten times in a random sequeice, necessitating 100 presentations per trialcondition per subject. Six male scientists having 6/6 unaided vision were used assubjects.
For the second experiment the task involved reading a single displayed digit, whichwas made up from a dot matrix of 5 by 7 elements in accordance with the sy~abol designeproposed by Huddleston2 , and the subject was required to call out the number as soon as
he recognised it. All three levels of vibration were used, but the ambient brightnesswas fixed at tie higher level of 5100 nits. Four presentation durations (0.1, 0.3, 0.5and 5.0 secona) and four levels of display brightness (116, 132, 292 and 1160 nits) wereintroduced, but the two subjects did not receive all combinations of these levels. Theshort duration and comparatively low display brightness levels were found to be necessaryto make the task of reading such comparatively large (60 x 75 minutes of arc) charactersmore difficult.
3.3.3 Aesults
Although there was considerable variation between subjects the results of thedecection experiment have been summarised as graphs relating the average probability ofdetecting the single element, and the average response time for such detected stimuli, tothe display brightness. Figs 7 and 8 show the results in this form, for the three levelsof vibration and two levels of brightness employed. The general effect of the simulatedaircraft motion was to decrease the likelihood of detecting a 'signal' r,'nd increase theresponse time.
The results of thb second experiment are show:, in Table 2 as the probability ofsuccessfully recognising a single digit, displayed at certain combinations of brightnes.-and duration, for the three vibration levels. Again, the general effect of the simulatedaircraft motion was to increase the chance of perceptual error.
3.4 Comments
"The measurements of the variation of detection probability with display brightnessshow a series of S-shaped curves characteristic of a complex stochastic threshollphenomenon., The conventional definiti.n of a 'detection threshold' is the stinthisbrightness at which half the stimuli are detected on average over all subjects; using thiscritnrion the effect of vibration was to lift the 'stationary' threshold bj 45% at halfpower and by 60% at full Lower for the lower (680 nits) ambient ligi.t level. In thebrighter surroundings (5100 nits) this effect was more marked, witn the threshold risingby 130% and 200%, for half and full power Canberra motion respectively, which indicatesan exaggerated effect wnen high ambient brightness and high levels of whole-bodyvibrations are combined.
PIthough the threshold brigntnE :s levels for stationary subjects were low (-2%)incomparison with the ambient light levels, the response time data suggested that, at thesethresholds, the average time taken was considerably longer than for brighter displays.Indeed, the average response times for detected stimuli fell to an apparent asympuoticvalue of about 0.35 second, for only those higher levels of display brightness at whichno stimuli passed unnoticed. This effect seems to be constant for all combinations ofambient brightness and vibration levels. This indicates that a more realistic criterionfor assessing the effect of brightness and vibration conditions on detection of astimulus would be to assess the brightness at which all signals could be seen withminimum delay. Using this criterion the effect of vibration, at the lwer ambientbrightness level, was to increas? the 'comfffrtable' brightness level from about 34 nitsto about 70 nits and 160 nits, for the half and full power motion respectively. Theseare changes of about 100% and 460%, and are significantly more marked than the corres-ponding changes of the '50f detection' threshold. Unfortunately the limiting displaybrightness did not allow this effect to be assessed in sufficieit detail at the higher
background light level,
The paucity of data from the digit legibility measurements does not allow hardquantitative conclusions. When the subjects were still they could read the uisplayed.iumbers with very few errors, even when displayed at iow brightness and preent for only0.1 second. When subjected to vibration their performance fell and was only restored by

increasing both the display brigbtness and stimulus duration appreciably. It is likelythat an increase in the minimum display brightness from about 4% to about 50%, if theambient level, would be necessary for adequate legibility in conditiozii of hign externallight levels and the vibration produced by low-level high-speed flight, a conclusionwhich reinforces that from the first detection experiment.
4 CONCLUSIONS
Bearing in inind the small number of subjects used in these experiments, it isreasonable to conclude that the buffeting vibrations associated with low-level high-speedflight had 4 small effect vn the movement of a pilot's helmet, relative to his eyes, incomparison with the helmet movement due to naturai head motion. However, aircraftvibration degraded the legibility of information displayed on a novel form of helmet-mounted LED matrix display, but increasing the display brightness could counteract thisloss.
Table 1THE RMS DISPLACEMENTS (IN MILLIMETRES) AVERAGED OVER ALL HELMET
CONDITIONS AND BOTH CANBERRA AND PHANTOM VIBRATIONS
Subject No.1 Subject No.2
Head still Head moving head still Hea: moving
0.26 0.68 0.40 1.58 Vertical
0.18 0.96 0.20 1.86 Horizontal
Table 2
SUCCESS PROBABILITY (%) WHEN READING A SINGLE DIGIT DISPLAYEDON THE MARCONI AVIONICS LED MATRIX DISPLAY
No vibration I level vibration Full vibrationl -l5.0 100 - 100 100 97 98 100
Presentation 0.5 98 97 84 69time(seconds) 0.3 100 04 99 100 65 89 99
0.1 95 1 4 3_
116 132 292 1160 116 132 296 1260 116 132 296 1160
Display brightness (nits)
REFERENCES
No. Author Title, etc
1 H.E. Kroemer Involuntary head movements and helmet motions during centrifugalW.Y. Kennedy runs with up to 6 gz"
Aerospace Medicine, pp 639-644, June 1973
2 H.F. Huddleston A comparison of two computer-generated alpha-numeric fonts.A.H. Adams RAE Technical Report 71071 (1971)B.M. Robson
Copyright ©, Controller HMSO, London 1979

20-6
lamp Position - sensitive
Fig 1 The opti:s of the displacement measuringsystem
Position- sensitive 0photodiode
Fig 2 Illustration of the displacement measuringsystem on the RAF Mk 3B helmet
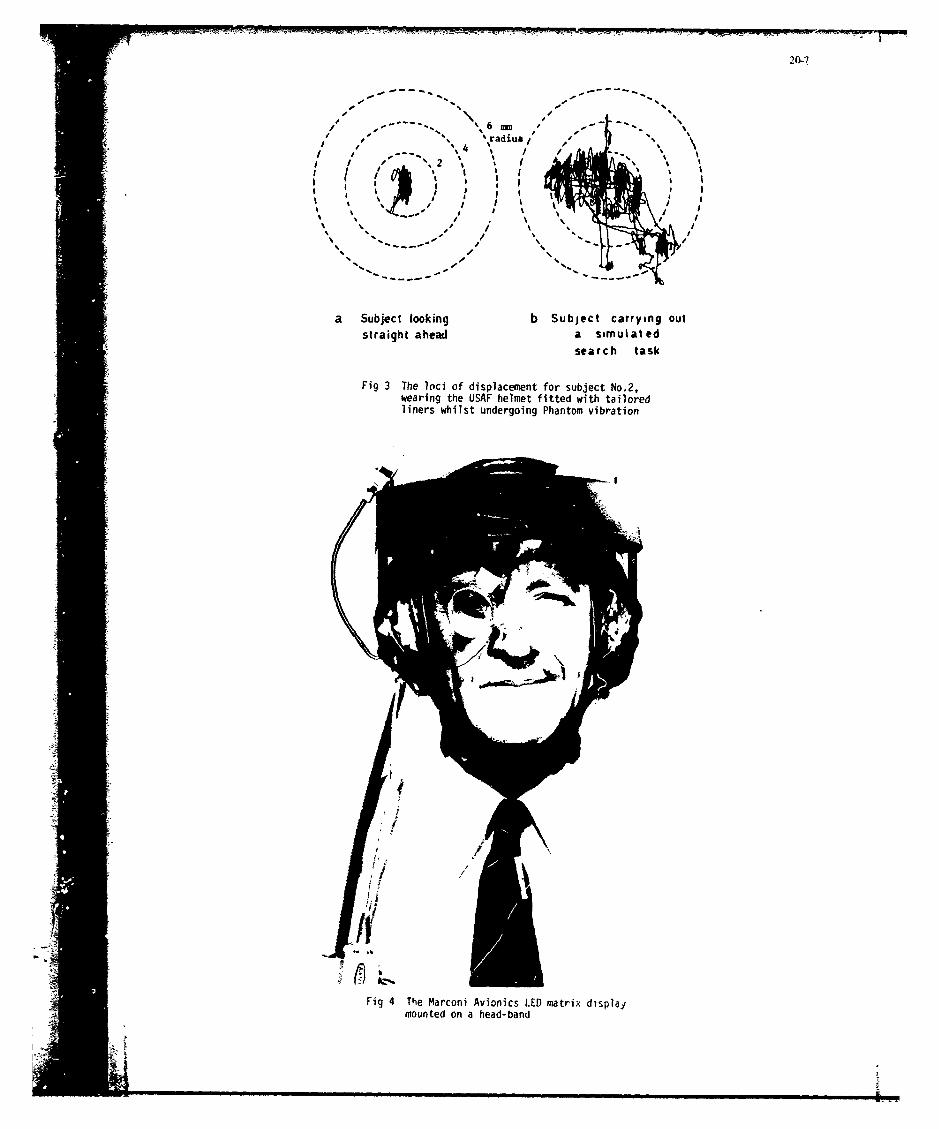
--l -- --- t l w20-7
S/ " ~~~adlius "'% "
I ' II ' I
%,, / ,
%% 4
a Subject looking b Subject carrying outstraight ahead a simulated
search task
Fig 3 The loci of displacement for subject No.2,wearing the USAF helmet fitted with tailoredliners whilst undergoing Phantom vibration
V.4
Fig 4 The Marconi Avionics LED matrix displaymounted on a head-band

20-8
0 oooaooaooooooooaoooaooo ooooooooo000000000000000000000000000000000000o00000000000000000000000
000000000000G00000000000
0000000001000000000000000000000000000 0000O0000 0
00000000000000000
000000000000000000
Fig 5 The LED matrix format
Fig 6 The vibration rig and artificial bright sky

209
0.8. vibration
0.a 6 .- N vibration- -
0.40.2 FuLL Canberra0.2 -ibration
0
o 1.2 '
1.0
*: 0.8CL-• 0.6.
2 3 6 5 6 7 8910 20 30 60 60 80 100 200 300Display luminance (fnits)
Fig 7 Detection probability and response times for viewing a single element against a backgroundbrightness of 680 nits
O2 0.8 1 -vibration4, ., I I.•lv 0.6 e rra
4,W .4
0
= 1.2
"*= 1 .0 1
o .CM 0.8
01 0.6
0.,. 02.
0 102 3 4; 5 6 8 10 20 30 4.0 60 80 100 200 300
Display luminance ( nits)
Fig 8 Detection probability and response times for viewing a single element against a backgroundbrightness of 5100 nits

• 21-1
THE ROLE OF HELMET MOUNTED DISPLAYS IN HIGH-SPEED LOW-LEVEL FLIGHT
GLORIA TWINE CHISUMHead, Vision Research Group
NAVAL AIR DEVELOPMENT CENTER
Warminster, PA18974
U.S.A.
SUMMARYDuring critical phases of flight operations, the requirement for shifts of
gaze between the environment outside the cockpit and the interior of the cockpitis a problem which can be eased by the development of an effective helmet mounteddisplay capable of presenting sensor and aircraft position and condition infor-mation. In both fixed wing and rotary wing aircraft, a "head-out-of-the-cockpit"attitude is considered to be highly desirable. An effective helmet mounted dis--play is one which is comfortable to use, does not deh.ade normal visual function-ing, can present the required information and does not increýase crew fatigue dueto weight and bulk. The general design concerns regarding helmet mounted displaysapply to those to be used in a high-speed low-level environment. Some of thedesign parameters take on special significance, however, in high-speed low-levelflight.
INTRODUCTION - Advances in technology made possible the development of virtual image displays overtwo decades ago. The Head-Up Display, or HUD, was the first virtual image display to become operational.The HUD which is an aircraft mounted device has proven very useful in aircraft operations. Shortly afterthe HUD was developed, efforts to develop a helmet mounted display were initiated. Since the HUD wasaircraft mounted, the information which would be presented by means of the HUD was only available when thepilot looked straight ahead, which is where the HUD is located. In addition, the field of view of the HUDwas small, perhaps twelve degrees. There are many situations in which it would be decidedly advantageousfor a pilot, and perhaps other aircrew members as well, to have certain information available withoutlooking Into the cockpit at an instrument panel or even at a fixed HUD. This is the so-called "head-out-of-the-cockpit" attitude. One situation in which such an attitude is desirable is in high-speed low-levelflight. One method of accomplishing that desired end is by use of a helmet mounted display. A helmetmounted device, whether display or sight, must as a minimum, consist of a device to generate the informationto be displayed, an optical system to transfer the image from the display generator to the eyepoint andsome means of determining where the pilot is looking - a head/eye position sensing scheme. Numerousmechanisms for providing these various elements have been proposed. The proposale will not be reviewedhere, rather this discussion will examine some of the factors which must be considered in selecting andintegrating the elements of the display with particular reference to the high-speed low-level flightregime.
The goal of a helmet mounted display design should be to provide a display which will permit cockpitpersonnel to simultaneously obtain the information reqoired about both the aircraft and the environmentoutside the aircraft accurately and comfortably. The general considerations regarding the design of headcoupled displays have been discussed elsewhere (1). The high-speed low-level flight environment presentsspecial problems which must be evaluated.
If the aircraft is a fixed wing aircraft, the low-level phases of the flight may be conducted ataltitudes of thirty to sixty meters over land and skimming wave tops over water in both attack and fightertype aircraft at subsonic speeds (2). In the attack aircraft, the crew will be required to navigate usingboth speed-time-direction information and terrain or environmental checkpoints. In both types of aircraft,sensor information regarding both terrain features and threat detection is required. In helic,oter low-level operations, the altitude over land can be in the units rather than tens of meters, and while thespeeds may be only one tenth that of the attack or fighter type aircraft, they are still significantrelative to the altitudes - forty to seventy knots (,). In both cases it is extremely important that apilot detect obstructions at as great a distance as possible. It is also important that sensor informationbe provided in a timely manner, and that other vital information regarding aircraft status and navigationbe available.
TERRAIN INFORMATION - Tetrain information is required for two types of operations - terrain avoidanceand terrain following. The aerodynamic qualities of the aircraft will, of course determine the limitswithin which each of these operations can be performed. Within these limits, the information supplied tothe aircrew will significantly affect the level of performance. One study of the extent to which sensorinformation can affect performance in low-level operations at night used performance of the low-leveloperations in daylight as a baseline against which to evaluate the night performance. The results ltdi-cated that performance at night was as good as the baseline performance or poorer, depending on thespecific sensor-display combination being used (3). When that sensor information was displayed via ahelmet mounted display, the results were negative, that is, the maneuvers could not be performed, unlessa boresight reference marker was provided on the display. The assumption is that the night condition,plus the mock-up cockpit from which the operations were conducted in the test helicopter, producedreference conditions which were impoverished artificially, and that a single reference marker was adequateto orient the pilot. With the marker in place, the required maneuvers could be adequately performed.
For both terrain avoidance and terrain following informatici, sensors such as radar altimeters orothers which can provide anticipatory terrain information such as altitude of obstructions, eithet man

21-2
made or natural, or computer generated navigation information which can anticipate rises or sharp dropsof the terrain can be provided via a helmet mounted display to aid flight crews in accomplishing a high-speed low-level maneuver.
THREAT DETECTION - Threat information can be displayed by means of a helmet mounted display durir.
a maneuver which requires a "head-out-of-the-cockpit" attitude. Sensors which detact radar, lasers oranti-aircraft missiles can provide warning information to aircrews so that threat avoidance or neutral-ization procedures can be initiated. If an airctaft has been detected by ground based radar, avoidancemaneuvers including lower level operations can be accomplished. If the detecting sensor indicates an
airborne threat, tactics which have been developed to avoid or neutralize the threat can be employed,again using helmet mounted display information to both diagnose and respond to the threat.
AIRCRAFT INFORMATION - The minimum aircraft condition information required to conduct the high-speedlow-level operation is probably aircraft attitude and speed. These data need not be continuously avail-
able, but should be available on demand. A pilot may call for the desired information by activating a
call mechanism. Since these are important for high-speed low-level operations, the call mechanism forthem should ideally be located on the aircraft controls. Other information may be called for from other
locations, but the critical information should be available at the finger tips.
HELMET MOUNTED DISPLAY DESIGN CONSIDERATIONS - The helmet mounted display design decisions which aremost specifically related to the high-speed low-level operational regime are those related to the selection
of the style of the information to be displayed, acuity requiremerts of the information, the brightnessof the display, and the effect of the display scheme on the visual responses which might degrade ratherthan enhance overall performance.
The style of the presentation requires decisions regarding alpha-numeric information and symbology.
Some types of infurmation are most readily comprehended in numerical form while others are most readily
comprehended in symbolic form. Aircraft condition information which is nurmally displayed via instrumentssuch as altitude and airspeed should probably be displayed numerically via a helmet mounted display.Aircraft condition information such as attitude should be displayed symbolically. Anticipatory terrainavoidance/following information should probably be displayed numerically. Terrain avoidance altitudeinformation should be continuously available while mean sea level altitude should be available on demand.
The acitity requirements of the displayed information would, at first glance, seem to be simple -
large, easily readable numbers and symbols. Large stimuli may not be readily useable on a helmet mounteddisplay. An examination of the situation suggests that the visual angle subtended by numbers and symbolspresented on a helmet mounted display should be only slightly larger than, or equal to, that subtended bycomparable information at the instrument panel. The amount of eye movement required to read a displaysymbol should be effectively zero. Two conditions will interact to degrade performance with the display
if figures which subtend large visual angles are used. Eye movement required to scan the data and theapparently large figures used to convey familiar information will combine to stimulate the accommodationresponse. Incorrect accommodation will interfere with both the use of the displayed information and theview of the outside world. While this is a theoretical interpretation, some preliminary test results dosuggest that these assumptions are correct. Experimental examination to assess the influence of theprojected size of the displayed information on the use of the helmet mounted display is needed.
The brightness of the display images is extremely important in the high-speed low-level environment.
A,. L Lier assessment of the brightness variable considered only nigl-t and day use of the displays (1).
In a low-level environment, at night or under very dim daylight conditions, the earlier analysis of theintensity variable is accurate. In full daylight, which is the environment for most fixed wing low-level
operations, the brightness dimension is more complicated. The terrain brightness range is the source ofthe complication. Against a relatively homogeneous background the intensity of the display can be setwith no adjustment required. Against a non-homogeneous background such as terrain composed of farmlandwith frequently interspersed small forrested areas and bodies of water, helmet mounted display imagery
could be rendered useless for all practical purposes, unless some sort of automatic brightness adjustmentis provided. A pilot could not be expected to add to an already heavy workload, the requirement toconstantly adjust the brightness of a helmet mounted display. This interpretation should also be morefully assessed by experimental analysis.
The effect of a helmet mounted display on the visual responses was referred to briefly above. Ifthe stimuli presented via the helmet mounted display incorrectly stimulate accommodation, convergence or
scan responses, the view of both the environment external to the aircraft and the display can be degraded.The size of the displayed images has been cited as a potential problem, and some difficulty due to sizehas been cited in field evaluations (4). The same field assessment also reported that the accommodationrequired to read the display information was different from that required to view the external environment.
If the optical system of the display is misaligned, the accommodation requitement can be other thaninfinity. The platform on which the optical system is mounted, the helmet, is unstable. In order to makethe platform more stable, rigidity and weight must be added to the helmet. These are both undesirablefrom the point of view of both pilot comfort and fatigue. It was considered highly desirable to determinethe extent to which small deviations frow collimation right influence the accommodation response of an
observer viewing a scene through a beam splitter. A study in which the projected Jistance of the virtualimages was varied from 1.25 meters to optical infinity indicated that the effect on accommodation wassmall and transitory. This result indicates that though it is desirable to have a good optical system
in a helmet mounted display, severe penalties in weight should not be imposed to achieve e perfect system.
Both the overall visual angle subtended by the display and the visual angle of the informationdisplayed, letters, figures and symbols, have not received adequate experimental analysis. It wouldappear that the overall visual angle of the display should be no larger then the angle normally scannedin eye movements without head movement. The reflex response for a larger area is to mve the head. In

S I721-3
"a helmet mounted display, head movement moves the information being scanned. The effort required to scan"a larger area without head movement could degrade performance, and interfere with mission performance.
BINOCUIAR-MONOCUIAR DISPLAYS - Most of the helmet mounted displays and sights have used monocularoptical systems. A few have used binocular optical systems. There are positive and negative aspects tothe design and use of both systems. The optical design and construction of a monocular system are easierthan that of a binocular system. However, binocular conflict, whether rivalry or brightness differencesin the two eyes, make the monocular system somewhat awkward and unnatural to use. The difficulties arenot as obvious in a helmet mounted sight as in a display. In a sight, only a reticle and possibly discreteperipheral signal lights are present. The visual tasks are relatively simple, though the reticle aimingtasks may not be easy. The optical design and construction of a binocular helmet mounted display aremore difficult because the alignment for the two eyes must be maintained and instabllitie3 in the imagegenerating device must be minimal and balanced for the two eyes. Once the design and construction problemshave been solved, use of a binocular device is much more comfortable, and binocular imbalance problems arenot present. The binocular helmet mounted display is the preferred form.
One additional area of concern which has not been discussed is that of buffet. If the buffet is lowfrequency, a helmet mounted display may not be useable. This is another area which should be examinedexperimentally.
CONCLUSIONS - A helmet mounted display can provide an improvement in aircrew performance in high-speedlow-level operations. There are several unanswered questions regarding the uee of such displays in low-leveloperations. These questions can only be answered by careful experimental analysis. These analyses shouldbe conducted to provide the information which display designers can use in developing the displays.
REFERENCES -
1. Chisum, Gloria T. "Head Coupled Display Visual Design Considerations", Aviation, Space andEnvironmental Medicine, 46, 11, 1975, 1373-1377.
2. Schultz, CDR J.R. "Fixed Wing Operations" in Rosenwasser, H., Chisum, G.T. and Norvay, P.E. eds.Proceedings of the Workshop on Research Needs Relating to Aircrew Visual Requirements, April,1979, ?p. 1-3.
3. System Engineering Team, U.S. Army Electronics Command Avionics Laboratory, "Low Level NightOperations Study", 1976, ECOM-4417.
4. Helm, CAPT C.J. and Brotnov, LTC K.W., Edwards Air Force Base, "Helmet Mounted Display", 1974,AFFTC-TR-74-31.
5. Chisum, Gloria Twine and Norway, Phyllis E., "Effect of Virtual Image Projection Distance onthe Accommodative Response of the Eye", Aviation Space and Environmental Medicine, 48, 9, 19/7,819-823.

_.• 2 I-4
DISCUSSION
DR. K.E. HONEY (CAN)
When looking outside the aircraft, and simultaneously seeing a helmet mounted HUD presentation,head rotation will cause a reflex movement of the eyeballs that will stabilise the retinal image ofthe outside world, but will move (over the retina) the retinal image of the HUD presentation. Duringthe head movement, therefore, one would expect a blurring of the HUD display and also possiblydisorientation effects. Have these phenomena been observed and are they serious problems?
AUTHOR'S REPLY
We have not observed such a problea with the helmet mounted sights. However, should there prove tobe a problem of this sort in using the helmet mounted designs in which more complex stimuli will beused, we will have the option of using the helmet position-sensing mechanism and the aircraftcomputers to minimise the blurring to the extent required by either a small delay in the movementof the images, or moving them similar to a saccade. There is also the possibility of using eye
movement in combination with helmet position to manage the display imagery.
DR. M.L. WOLBARSHT (US)
We are also thinking of these displays feeding information when the pilot doesn't really see theoutside world - infra red sensors for example - so that when he looks in a certain direction whathe sees will be appropriate for tLat direction.
AUTHOR'S COMMENT
A further example is the use of a helmet mounted display in helicopters or V/STOL aircraft so thatthe pilot can, in effect, look through the floor of the cockpit.
DR. A.J. BENSON (UK)
You rather skated over the problem of binocular rivalry. This worries us in particular when you arepresenting real world imagery. How do you see thic problem?
AUTHOR'S REPLY
This problem is amplified when rqal w'rld information is presented and I am aware of some of theproblems that have been experienced at Farnborough. It seems most serious when one eye is occludedand receives only display information. There may still be problems with the "see through" systemthat I have been discussing, especially due to brightness differences in the two eyes when one eyereceives environmental plus display information and the other environmental information only.
DR. A.J., BENSON (UK)
In a different luminance and in a diffe-ent colour?
AUTHOR'S REPLY
Exactly. These are the kinds of problem that we are looking at. A greater problem may be toachieve an adequate display size and one answer with a binocular system may be to cheat a littlebit and only overlap a portion of the visual field, so that peripheral areas of the display areseen by one eye only.
COL. R.L. DEHART (US)
The Navy, I believe, are beginning to have experience with helmet mounted systems. What problemsare they experiencing - crew comfort, C-loading for example?
AUTHOR'S REPLY
The only operational experience that the Navy has had with helmet mounted systems has been with ahelmet mounted sight in which the images presented were a fixed reticle for aiming and discrete
lights which signalled "lock-on" of the system being aimed. The pilots who used the system were soenthusiastic about it that they accepted the increased weight and imbalance of the helmet which itcaused. A form fit helmet was required for a useable system. The helmet mounted displays are stillin the development stage.
We are now working on a binocular display using fibre optics so as to take the weight of the imagegenerating device off the helmet, and we are also trying to maintain the balance of the helmet.

21-5
COL. R.L. DEHART (US)
What about vibration?
AUTHOR'S REPLY
I don't think this has been a serious problem, but the information that our friends at Farnboroughhave generated (paper ZS) will be important in making decisions about the display design.
DR. J.P. PAPIN (FR)
Le pilote desire une information pour cela il appuge sur une conamnde. Combien de commandes faut-il
prevoir au minimum?
AUTHOR' REPLY
We do not know exactly how many commands it will be necessary to provide. However, we can estimatethat the critical information will be aircraft speed and perhaps attitude. That information shouldbe available on the control stick or on one of the controls which the pilct could easily operatewithout the requirement to look into the aircraft to locate the call mechanism. The selectormechanism for other less critical information can be located on the instrument panel or console.

22-1
RESEARCH ON VISUAL ENHANCEMENT FOR HIGH SPEED LOW LEVEL FLIGHT SPONSORED BY
THE NAVAL AIR SYSTEMS COMMAND
by
H. Rosenwasser M, L. WolbarshtNaval Air Systems Command (AIR-310C) Professor of Ophthalmology & Biomedical
EngineeringWashington, DC 20361, USA Duke University Eye Center
Durham, NC 27710, USA
G, T., Chisum M. M, CohenCrew Systems Department Crew Systems DepartmentNaval Air Development Center Naval Air Development CenterWarminster, PA 18974, USA Warminster, PA 18974, UqA
J. J. Kulik A, LewisNaval Training Equipment Center Associate Professor of Electrical
EngineeringOrlando, Florida 32813, USA Cornell University
Ithaca, NY 14850, USA
S~ SUMMARY.
Apart from engineering considerations, the proper emphasis of the various parame-ters of visual displays in high speed low level flight depends upon the knowledge of thephysiological variables in the visual system. Psy.hophysical tests can best be inter-preted in conjurction with a detailed examination of the physiological f-nction of thevisual system, A summary of some programs sponsored by the Naval Air Systems Command
L is given to show our progress in this approach.
An examination of the initial steps of photoreception, the activation of the photo-pigment rhodopsin by a photon, has suggested a new theory of dark adaptation. The ab-sorption of a single photon decreases the probability that any future photons absorbedin the same photoreceptor will result in visual excitation. (In this theory all of themolecules of rhodopsin in a single outer segment of a rod could be linked by light-init-iated movement in rhodopsin). To minimize rod contribution to color recognition ofcockpit or heads up 4isplays, light adaptation of the rods might be helpful. This newtheory of light adaption suggests tiat a low intensity of light delivered in shortpulses would be more effective than the same number of photons over longer periods oftime., The data for this model comes from our program at Cornell University under thedirec..ion of Dr. A., Lewis in which resonance Raman spectral analysis is used to measurethe changes in the electronic configurations of the rhodopsin molecules during the firstfew nanoseconds of photoactivation..
After the photoreceptors in the retina have been activated the information is car-ried through the various neuronal channels to tne ganglion cells, The configuration ofall the retinal information is completed in the ganglion cell for passage along the op-tic nerve. The limits of visual acuity depend upon the relation between the receptivefield of the ganglion cells and the size and location of the photoreceptors, Models ofretinal ganglion cell receptive fields, based on physiological data collected in ourprogram at Duke Univernity under the direction of Dr. M, L., Wolbarsht, suggests that theretina does not preserve spatial information on the contrast phenomena of edges in apoint to point relationship; rather the information in the optic nerve is coded in termsof overlapping receptive fields. The information for color and pattern detail travelsalong somewhat separate pathways from the retina, An appreciation of the details ofthis coding in the nervous system together with our knowledge of certain visual illu-sions (such as flicker color) suggests that the cockpit or heads up display systemsshould emphasize border contrast information at the expense of spectral purity where en-gineering requirements make such a choice necessary,
The visor used by pilots in all types of missions, inclucing especially high speedor low level flight, often contains filter material which selectively absorbs or re-flects parts of the visual spectrum This results in distortion of environmental stimu-li and may alter the appreciation of any cockpit or heads up display. The program atthe Naval Air Systems Development Center, Warminister, PA under the direction ofDr., G., Chisum, is designed to furnish information on the effects of such filters on thefunction of the visual system, especially on any degradation or enhancement of visualperformance. In a systems approach to the design of a heads up or cockpit display theprotective features of any filter must be optimized all together, An important part ofthis design information is the interaction between the visual system and the display andthe adverse stimulus from the environment. A knowledge of the detailed function of thevisual system is necessary, in addition to any psychophysical tests which demonstratevisual performance with the specific eye protectioa filt2rs.
The head and eye tracking system study at the Naval Training Equipment Center inFlorida under the direction of Dr. J.. J., Kulik is particularly oriented toward the mea-surement of the helmet mounted (heads up) visual display system as limited by interac-

22-2
tion with human capabilities. The purpose of this research is to insure that the move-ment of visual targets within the helmet display system is properly matched to any pos-sible eye movement, The ideal solution, of course, would be to mount eye trackingequipment in the combat helmet. However, such is not possible at the present stage ofthe art and efforts are now turned toward optimizing the presentation of data to deter-mine the maximum allowable delay in target movement that is available to the observer,and to study proposed techniques which might shorten delay time.
High speed low level flight often has abrupt changes in direction with attendanthigh G forces. These are accompanied by changes in visual function such as decreasedvisual sensitivity, dimming of the visual field, peripheral and central light loss, andeven loss of consciousness. Both the visual changes and loss of consciousness are dueto inadequate blood supply to the eyes and brain when acceleration produces hydrostaticpressures that exceed cardiovascular capabilities. Attempts to measure blood flow byDoppler techniques are subject to many artifacts especially when the subject is not com-pletely relaxed. The measurements of visual evoked cortical responses may be able toindicate the integrity of the visual system irrespective of muscular activity in thepilot. Our program at the Naval Air Development Center at Warminister, PA under the di-rection of Dr. M. Cohen is designed to find il the evoked cortical responses can becorrelated wifh the measures of blood flow by Doppler techr.iques during increased Gfrom acceleration load (under various physiological conditions including strain maneu-vers). If such techniques prove reliable, it may be possible to develop a visual evokedresponse recording system in the helmet to act as an integral part of the feedback inthe G suit and assist in maintaining the pilot in good physiological condition duringmaneuvers characteristic o2 high speed low level flight.
1. INTRODUCTION
The development of aircraft canable of high speed flights at low levels for longdurations has begun to approach the limit of the air crew performance, particularly withregards to the visual system. Although many aspects of the operatioi.al problem have"leen eliminated, or reduced in importance by automation, the implications of the designfeatures imposed by newer aircraft, with regard to visual demands upon the aircrew, havenot been changed., Much could be done by automation, but in order to make this possiblea better knowledge of the physiological variables in the visual system must be obtained.The Naval Air Systems Command has sponsored several programs which are bound by a commonthread to elucidate the ultimate capabilities of the human visual system. The importantaspects of each of the separate projects will be described, together with some indica-tion of what bearings this research has on furnishing assistance to the problem of highspeed, low level flight as related to the capabilities of the visual systems of the aircrew. The programs will be described individually, first with details of the actual re-search performed and current data, and then relating each individual project to thelarger problem of air crew effectiveness.
2, PRIMARY EVENTS IN VISION (Lewis)
In order to have a proper basis for visual displays, the fundamental principlesunderlying certain -spects of visual physiology are being investigated, Specificallythe primary events in rod vision must be known before we can understand the basic mecha-nisms of dark and light adaptation., This is of specific importance since the rod con-tributions to color vision in the mesopic range could cause ambiguity in color recogni-tion of cockpit and heads up displays., Through an understanding of how this processworks, some control is possible to reduce some of the ambiguities associated with colorrecognition in this range. In order to control the contributions of the rods it is im-
portant to understand the initial molecular processes that underlay the activation ofthese cells at various lightlevels,
The primary molecular light processes involved in the absorption of a photon by thephotopigment and its conversion into a neural signal (which begins the traAsfer of in-formation through the retina to the lighter visual centers) was studied by high resolu-tion. resonance Raman spectra of rhodopsin, isorhodopsin, and photostationary state mix-
tures containing a high percentage of bathyrhodopsin. With this technique, new spectralfeatures have been detected. These have not been observed previously due to poorerresolution of the experimental equipment as compared with that used in the present pro-
gram. The bands observed in the photostationar state spectrum can be identified fromresonance Raman spectral results on pure rhod esin and isorodopsin soluticns as well P.s
on alterations in the photostationary state Wixtures 8f the pure compounds, The fea-tures in these spectra are invariant from 20 K to 150 K, indicating that the structuralalberations in the protein component of retinal occur in steady state spectra even at20 K. Those changes are consistent with a model of excitation previously proposed (i).In addition, we have found that certain features in the photostationary state spectraweee altered by using a D2 0 medium for suspending the membrane fragments.
By several isprovements ia our spectral equipment, we havelbeen able to obtain thesolution of 2 cm as opposed to the usual resolution of 10 cm- , This five-fold in-crease in resolution has allowed identification of all bands present in the spectrum,and has shown many special features of bathyxhodopsin previously undetected.
The experiments were performed on bovine retinas and as shown in the d-ta the ex-citing light was 500 nm which is generated by a dye laser. Only 10 perccnt of the sam-
ple was photoconverted or destroyed during the Raman resonance measurements, Figure 1

22-3
shows the spectrum of purified bovine rhodpsin at 95 0 K obtained with 3mw,. 4812.5 nm.,excitation, In figure lB, the same excitation was used but the sample was now siniltane-ously illuminated with an 18mw, 58 nm pump laser beam. This changed the concentrationof bathyrhodoposin from the 60% in Figure I-A to about 1 30% in Figure 1-B. This allowsidentification of the 922, 1019, 1208, 1324, 1537 cm," bands that were not detectedpreviously in either low temperature or flow experiments. These bands are absent in thespectrum of protonated Schiff bases of 11 cis-retinal. Thus, it is evident fhat bathy-rhodopsin is not unique in having vibrational modes between 800 and 900 cm.- ., Theidentification of these bands and similar ones in the other molecules under various con-ditions allows us to model changes in the shape of the molecule during te variousstages of excitation. The work can be summarized as suggesting that the chromophore inbathyrhodopsin must be in a comformation which can be formed from either the 11-cis orthe 9-cis configurations and can relax to an all-trans conformation. All our data indi-cates that this is the important, very crucial step of visual transduction.
As mentioned above, we plan to continue this work in order that an understanding ofthe fundamental molecular processes controlling light adaptation in rod cells can beused to possibly reduce ambiguities in color recognition in cockpit and heads up dis-plays, or control psychophysical phenonema such as light and dark adaptation, or visualsensitivity changes as large as flash blindness in relation to the amount of visual pig-ment bleached or regenerated. Also, it may identify molecular processes that may leadto an appreciation of the color associated with picosecond laser pulses in the infrared,and lastly, it may indicate how the photic energy can be converted into chemical energyin as short as one picosecond.
On the basis of tiese measurements, Lewis and Wolbarsht (2) have proposed a modelwhich couples the loss of visual sensitivity in light adaptation to an allosteric changein the electronic conformation of the protein part of the rhodopsin molecule.. This isanalogous to the electronic changes that occul in hemoglobin when it binds or releasesoxygen., These rearrangements influence the active part of the molecule in hemoglobin(heme moiety that binds the oxygen) and in rhodopsin the chromophore retina, which givesrise to excitation after a photon is absorbed.
In hemoglobin the allosteric forms of the proteins change the molecule's responseto oxygen binding as a function of the environmental oxygen tension. For example, whenthe first oxygen molecule is bound to heme, the electronic levels in the protein change
to allow a second molecule of oxygen to become bound at a lower environmental oxygentension, and so progressively in the same direction until the heme has bound its fullcapacity of four molecules of oxygen., As the fourth oxygen molecule is bound, the hemo-globin molecule changes its overall electronic configuration so that a very great dropin environmental oxygen tension is required before the first molecule of oxygen can bereleased. The release oi the first molecule of oxygen changes the electronic configura-tion of the protein in such a way that the second oxygen molecule can be released, eventhough the tissue oxygen tension is still higher than when the first was released, andthese changes in the protein go on until the fourth is released., At this point, theprotein part ^f the hemoglobin changes appropriatel, again and requires a very muchhigher oxygen tension before the first oxygen molecule can be rebound., It is obviousthat such changes must take place in nemoglobin to bind the oxygen in the lung and re-lease it to the tissues, Indeed, such changes are almost expected once such a mechanismhas been suggested. However, the allosteric change in rhodopsin has a slightly differ-ent type of action,
When a molecule of rhodopsin absorbs a photon, the chromophore is electronicallyraised into the activated state. The electronic state of the protein part of the mole-cule is then changed by interact.on through the linkage to the chromophore, This prob-ably occurs by electron delocalization produced on the charged terminal groups of Lbeneighboring amino acids of the c- linkage of lysine. It also seems that when one mole-cule of rhodopsin has its electronic environment altered it will in turn influence theelectronic environment of nearby rhodopsin molecules., There are many molecules of rho-dopsin in each disc of the outer segment, Recent data of Lewis (1) suggest that if asingle rhodopsin molecule is placed in the activated state (and goes on to becomebleached) this affects the electron distribution of the neighboring molecules. Thischange may lower the probability that the neighboring rhodopsin molecule will give riseto visual excitation after absoibing a photon of light. This model has been carriedfurther by Lewis and Wolbarslit (2) who assume that the entire rod outer se 0 ment formsone compartment in a modified form of Wald's compartment hypothesis (3). All the rho-dopsin molecules in this compartment (the whole outer segment) are in each others' elec-tronic environment. A further analysis of this model shows thac it can meet the re-quirement that there be a shift in photon requirement with light adaptation.
The nature of the link between (or binding) rhodopsin and visual transduction can-not be specified or activated at the moment, It may be the release of calcium ion, achange in conductance of the outer segment, or even (which we feel is the Tost likely) achange in the internal pH of the cell following proton binding by the protein. Suchchanges in the internal pH of the cell could be the first step to visual excitation byinfluencing transmitter release in the rod (or cone) synaptic region. Interaction be-tween the rhodopsin molecules may be mediated by proton migration or some similar phe-nomen. As conformational changes in proteins such as an allosteric rearrangment cantake place in nanoseconds or less, no time lag would be seen on the physiologicai timescale. It is assumed that these conformational changes remain until all of the bleachedrh.'dopsin molecules are isomerised back into the active form, This preserves the de-
- , crease in visual sensitivity resulting from the bleaching of single molecules given by

22-4
Wald's original model (3), but the present model allows a greater amplification factor,and also accounts for the variation in quantum requirement with bleaching (or regenera-tion) of "-isual pigment,
3. VISUAL ACUITY AND RETINAL ORGANIZATION (M. Wolbarsht)
After the photoreceptors in the retina have been activated by photo absorption andstimulate the next neural cell, information is carried to the higher visual centers bythe various neuronal channels. The spatial configuration of the stimulus, along withall other visual parameters passing through the retina, is assembled at the ganglioncell level. All coding of information is then arranged in patterns by thk. particularganglion cells involved for passage along the optic nerve to the higher visual centers.
The limits of visual acuity have been shown to be dependant upon the relation be-tween receptive fields of the ganglion cells and the sizes and locations of the photo-rezeptors (4). Models of retinal ganglion cell receptive fields based on the physio-logical data collected in this program suggest that the retina does not preserve spatialinformation or edge contrast data in a point to point relationship. Rather the informa-tion in the optic nerve is coded in terms of overlapping receptive fields.
Most theories of visual acuity ascribe the ultimate visual acuity attained to the
retinal image size as related to the size and shape of the photoreceptors in the retinalmosaic (5). The details cf the image on the retina are such that the wave properties oflight itself determine tne intensity distribution, that is, something so distant invisual space that it is a point source from the standpoint of geometrical optics. Astar, for example, is focused on the retina not as a point but rather as a diffraction-limited image. The details of the diffraction limited-image are then dissected by thereceptors,
The most important aspects of the retinal mosaic are the minumum center-to-centerspacing of the receptors, their size, shape, and refractive index, all of which deter-mine their waveguide properties. The majority of the analyses of visual acuity in rela-tion to the retinal mosaic have been concerned with how the retinal anatomy is matchedto the image on the retina as calculated and measured with point spread functions andmodulation transfer coefficients derived from a spatial frequency analysis. Modelsbased on such analyses contain an implicit assumption that information transfer throughthe vi3ual system presents a point-to-point topographical representation of the retinalreceptor mosaic up to the cortical levei. Thus, as an end result, each retinal receptoris represented in the cortex by a single cell or group of cells., In these models theresponses of the cortical cell contain coded messages representing the intensity of thelight on the appropriate receptor. However, the details now available of the anatomicalstructures in the human visual system and the functions as presently known of any of thecells within the visual system are not ccmpatible with a strict point--o-point represen-tation for information transfer about location of images on tne retina,
In much of the retina, each ganglion cell is connected to largc- numbers of recap-tors to produce overlapping r..ceptive fields. In the foveal region (the center of theretina) where the visual acuity is the best, the histological analysis of the retinasuggests that there is nearly a one-to one relationship between receptors and ganglioncells with, however, slightly fewer ganglion cells than receptors (6).. However, thisagreement with a point-to-point representation maybe more apparent than real.
Although the standard for visual acuity is usually considered to be a minimum visu-al angle of one minute of arc, this performance can be bettered to 0.5 minutes of arc bymany individuals, presumably with the same type of retinal makeup (5), Also, within thevisual system there are neural mechanisms which could act to increase contrast by ampli-fying small differences in intensity (7). This process could aid in the detection ofthe bcrders which determine visual acuity. It has been the purpose of this project toexamine the basis for visual azuity and especially to consider what role the organiza-
tion of the neural system (that is, its anatomy and coding function as now known) playsin determining the ultimate limit of visual acuity, It is possible that tne distortionof the information by receptor to ganglion cell connections may form the fundamental andultimate limit of visual acuity.
In a model of the human visual system which has point-to-point representation theremust be as many ganglion cells as receptors and the connections between them must besimple. A suggestion that a high degree of visual acuity can be attained without thissort of organization can be found in some animal eyes, For example, in hawk and eagleeyes the optics and visual acuity are as good as in humans, if not better (8, 9, 10)However, in the eagle and hawk foveas, the reeeptor to ganglion cell ratio is quite dif-ferent from that in the human fovea. In both birds there are at least three and possi-bly 10 receptors to one ganglion cell (Miller, 1976; Fite and Rosenfield-Wessels, 1972)..This indicates that good visual acuity does not require as many ganglion cells as re-
ceptors. Furthermore, in these visual systems at least, point-to-point representationof the receptor stage throughout the visual pathway cannot form the basis of visualacuity.
There is an additional cons4 deration in computing the ratio of receptors to gan-glion cells as an indication of nformatioa processing for visual acuity:, ganglioncells are not all the same, They ire not equivalent to each other in their function.On the basis of these differences ir, function they can be grouped into several distinctcategories. As some categories may not be involved with visual acuity, the ratio of

22-5
ganglion cells to receptors for visual icuity may be far less than is calculated fromsimple anatomical examinations, Ganglicn cells carry many different types of informa-tion in a sort of time sharing relationship. They carry the intensity information re-quired for border contrast along with information about color contrast, for informationcan only leave Lhe retina when it is funneled through the ganglion cells.
It is obvious that both visual acuity and color information are changed as they Preencoded by the neural networks in the retina, This process exaggerates certain fea-tures, and eliminates, (or at least compresses) other features. Thus, border and colorcontrast are increased. In some aspects the image on Lhe retina is only considered bythe visual system as the basis for an effort to reconstruct the source in visual 3pac,rather than itself to be accurately perceived by the higher visual centers. It is easyto understand how this information distortion could lead tu certain types of visual il-lusions or even inaccuracips in perceiving visual zpace, If the shapes of the functionsby which the information is distorted in the visual system were known, then a minimumband width visual display could be manipulated to emphasize a desired feature, Also,bandwidth in the display could be conserved if visual features that were known to be ig-nored by the visual system could be eliminated from the display (if desired) presentedin such a way that the retina would emphasize them,
Figure I shows the photon distribution Of the diffraction pattern of the retinalimage of a point, and in Figure 2 are the diffraction images formed by two adjacentpoints as the separation between them is changed, At 2.5 mm, the separaticn of the cen-ters of the two points can be distinguished as separate by many people. However, due tochromatic aberration, a white light image would give a quite different photon distribu-
tion from a worochromazic source, Yet, both are discriminated in approximately the sameway. It is obvious from this that the light distribution of the image on the retina isnot the only important thing for visual acuity. Rather it is the neural network in theretina that treats the information.
Our work has indicated that all retinal receptive ganglion cell fields are quitelarge. This indicates to us that point to point representation of all retinal locationsis not the basis of the type of acuity discrimination shown in Figure 2.
Some sample data on the receptive fields of retinal ganglion cells are shown inFigures 3 and 4. These figures are from a Y cell, which type is generally agreed to bethe major pathway for visual acuity informatin flow. Although the recordings shownare from a cat, similar recordings have been made from monkeys, and presumably suchcells are also in the human retina, especially in the foveal region,
It seems obvious that an understanding of the coding in the ganglion cell will aidin our understanding of visual illvsions and figure color, and also will allow us tooptimize cockpit or heads up display systems as reqards border contrast information.
Our informption is sufficient at this point to suggest that where engineering re-quirements make a choice between spectral purity or border contrast information as partof a heads up display system, border contrast information should be chosen. This will
allow terrain features or other types of information to I'e more quickly assimilated andselected features emphasized by removing certain types of detail that the visual systemwill only recognize as clutter in the visual presentation,
4, VISUAL PERFORMANCE OF AIRCREW PERSONNEL UNDER SPECTRALLY SELECTIVE FILTER
CONDITIONS (G. Chisum)
The visual performance of the aircrew personnel in high speed low level flight ishampered by a variety of problems. One of these is the distortion of the visual sceneby various airplane components, such as the cockpit screen and any individual visors.The Naval Air Development Center Project No, WR041-0110Ol/DGlXX addresses this problemdirectly. The selective absorption or reflection of parts of the visible spectrum canresult in distortion of the visual environment. It may also alter the appreciation ofany cockpit or heads up display by changing the background visual environment. Thisprogram is designed to furnish information on the effects of such filters on the func-tions of the visual system, especially on any degradption or enhancement of visualperformance.
The systems approach to the design of the heads up or cockrit display must take ac-count of the presence of any filter and its protective feaL , so that the overallcombination can be optimized. An important part of this design information is the in-teraction between the visual system and the display, in. combination with any adversestimulus from the environment. Thus, a knowledge of the detailed function of the visualsystem is necessary, in addition to any psychophysical tests which demonstrate thechanges in visual performance with specific eye protection filters.. Ideally, the fil-ters should be chosen so that not only are the unwanted aspects of the environment mini-mized, but also that the desired features of the visual display be emphasized. Thiscould be especially valuable in any combined presentation of the external environmenttogether with a heads up (or helmet) display system with a prerecorded trip map of theflight (mission) in which selected features are projected.,
5., MONITCRING EYE MOVEMENTS FOR WIDE ANGLE DISPLAYS (J, Kulik)

22-6
Head and eye tracking systems are being investigated in order to determine the pi-lot's areas of interest in his visual environment during high speed, low level flight.The purpose of monitoring eye position, and the area of interest is to insure that theselected portion of the display has the highest possible detail in proportion to thatS~of the remaining portion of the presentation at the time the pilot desires it. It is
difficult from engineering and economical considerations for all portions of the visualpresentation to be at the highest level of resolution at all times. However, by ascer-Srtaining where the pilot is looking, the high detail level presentation (insert) can beF made in selected portions of visual space at the expense of other less well appreciated
points. Thus, an eye tracker can assure, that as the fovea is moved around to differentparts of visual space, the detail in the presentation of a projection in visual spacewill be tailored to fit the capabilities of the visual system, This could result 4n aconsiderable saving in terms of allocation of system band width.
Training for low-level, high speed flight, and target acsuisition is eitherdangerous or costly using combat ready aircraft, particularly in terms of the amount offlight time devoted to the actual training. Traditionally training has been mainly ori-ented towards simulation devices.. As a variety of events occur around the pilot, farilywide field-of-view visual displays are needed for effective training. Two technologiesare currently competing to provide such wide-angle displays., a mosaic of large cathoderay tubes around the cockpit to present an out-the-wii.dow image of the world; and pro-jected images on a dome surrounding the cockpit. In order to train for these tasks ef-fectively, high resolution targets (either on the ground or in the air) must be pre-sented. The manner of obtaining this level of resolution in a cost effective manner isthe subject of the present research and devlopment work.
The CRr systems in the Air Force's Advanced Simulator for Pilot Training and theSimulator for Air-to-Air Combat present images of uniform resolution on each CRT face,with wider fields of view achievable bl adding more such channels, yet these displaysystems are expensive and delicate. Dome projection systems have approached the problemof high resolution images by having at least two projection channels - one to displaya low-resolution background spread over the entire field of view, and a second to inserthigh-resolution images of objects of interest. Currently such systems can present fair-ly detailed images of objects if the location of that object relative to the pilot isknown.,
Ideally, the ability of a display system to produce high-resolution images of lim-ited size should be directable by the needs of the pilot being trained, i.e.,, he shouldbe able to examine any object in his visual world (external to the cockpit) in suf-ficient detail to identify it, The Naval Training Equipment Center is currently devel-oping an area-of-interest computer image generation system with a variable level of de-tail scene output. This would allow a computer generated image of non-uniform level ofdetail with the area of greatest detail density placed wherever selected, A helmetmounted projector for dome images is being investigated to minimize the distortionsarising from the differences of position of the pilot's eyes and the projection source,Both types of display must allow the subject to determine the location of the high-de-tail area of the displayed image by his point-of-gaze, The real problem is the mechani-zation of such a capability which involves the tracking of both the position of the pi-lot's head and eyes, and real time calculation of the direction of gaze. Fortunately,some of this problem has been solved as there are operational head trackers to give theposition of the head in three rotational degrees of freedom to an accuracy of about 0.3degrees by means of nutating three axiq, magnetic fields with helmet sensors. Thesystem delay is less than 20 milliseconds, which is sufficient as head velocity is lessthan 300 degrees per second.
Tracking the position of -he eyes poses more of a problem, even though the highaccuracy achievable by some techniques of eye monitoring (11) may not be needed. Also,the =omplex optical arrangements needed fo'r these measurements are not desirable. Simpleinfrared detectors can monitor the horizontal movements of the eyes within a degree.Following vertical eye position requires some developirent work, for infrared detectorscan monitor the position of the low:er or upper lid, but these move with different dynam-ics than the eyeball, Regardless of the technique used, eye position in two rotationaldegrees of freedom must be known to determine the point of gaze.
Of more tpchnical interest is the need to predict the new point of gaze as a changeis detected. This is required by the sequence of operation of the flight simulator inwhich the positions of the various controls in the cockpit are iteratively sampled, Theproper response of the aircraft to thes. inputs is then calculated and simulated, Thenewer systems have 30 sa-iples per second, In computer image generated visual displaysystem, changes in position of the aircraft are calculated and made the basis for theimage by an appropriate picture processor. The processors operate at 30 Hz but takethree frames (about 100 millibeconds) to produce a new image. This means that delayfrom pilot input until the responses of the aircraft are displayed can exceed 120 milli-seconds. However, the Naval Training Equipment Center system can almost halve thattime by operating at 60 Hz.
Obviously for an area-of-interest image generation system, any prediction of thecoordinates of a new point of gaze while the eye is moving will reduce the delay beforethe correct image appears. Several metrics for predicting the new point of gaze whilethe eye is moving are under consideration, but few data exist that could give an indica--tion of how accurate they are. The velocity wave-forms of saccades are roughly sym-rmetric - suggesting that a peak velocity could be used until it levels off at velocities

22-7
of 550 to 750 degrees per second. The velocity at the peak positive acceleration hasalso been suggested as a metric for prediction. Both of these measures are relativelyeasy to obtain, but no data exist correlating them with the resting position of the eyesafter a saccade, However, some data does indicate a continuing variability of peakvelocities and accelerations for saccades of fairly fixed size (12, 13). Possibly themetric selected :ould be stabilized by averaging or filtering.
The amount to which head and eye position can be accurately (and unobtrusively)monitored will determine the feasibility of using a high-level of detail area visualdisplay controlled Ly the pilot's interest. How accurately and early the resting pointof gaze can be predicted during an eye movement will affect the appearance of such avisual display, Although the proper appearance of the area of interest will be delayedby some amount - and that is yet to be determined - how aversive or disruptive this de-lay is must also be determined. Long delays in manual control systems certainly affectpilot control performance (14) but there is no comparable data for visual targettracking. However, tracking is not really the problem. Rather, we are concerned withthe pilot's selection of where he would like more detail in the visual scene, Any delayof that information might be noticed and could disrupt the scan pattern in target ac-quisition tasks,
The importance of delayed presentation of information during scan patterns is nowunder investigation at the Naval Training Equipment Center. A two-gun CRT is used topresent a fixation point and a moveable target, and delays of various durations are in-serted into thý' movement of the target. The task, initially, is to move the eyes insaccades to selected positions at various distances from tae fixation point, and toreport if the delayed appearances of the target was appreciated. Normal forced-choicepsychophysical procedures are used to determine thresholds as a function of the size ofthe saccade, the size of the target, and its relative contrast. Preliminary, but en-couraging, observations indicate that delays below 100 milliseconds are not very notice-able.
The delayed appearance of a part of a visual scene which tracks eye position maynot be well appreciated because of saccadic suppression - the attenuation of visionduring rapid movement of the eye. Any saccadic suppression will make these areas oftargets display systems more acceptalbe, Some estimates of the time course of saccadicsuppression (taken from Volkman, 1976) indicate a period of 100 to 150 millisecond fromthe start of a saccade until the visual thresholds are again normal. Any changes in thevisual scene during that period will be less noticeable than normal, The importantquestions are how much, and is that enough, Presently there are no answers, but reviewsof the suppression literature (15, 16) are encouraging. Only movements in part of thedisplay, which are large relative to the size of the saccade, are noticed, (17, 18).Thus, for a computer generated area-of-interest display as movement is minimized inextent, delay may be less of a problem,
The size of the high level of detail insert is also important in the design of amoveable area-of-interest display, It probably need not exceed foveal dimensions, asvisual acuity falls sharply outside the fovea, Yet much data Was been accumulatedthat indicates that infc-mation is used from larger areas (6 -8 ) at suprathresholdlevels. The size of this "functional field of view" -where information can be extractedfrom a visual display - seems dependent on the density of irrelevant items in displayscontaining descrete elements (19), and on the size of the scence to be processed (20).Is is probably a function, also, of the sort of visual information the observer needsfrom a given scene. From this it is quite likely the display will be improved if anarea larger than the fovea has the greater resolution.
The allocation of system bandwidth within an area-of-interest display which tracksthe point of gaze is another important design consideration. It would be helpful to re-duce the total systam bandwidth needed for wide angle display systems sufficiently thatspecial purpose components would not be needed, Indeed, this was the motivation fordeveloping the present area-of-interest displays, A uniform high resolution is usedacross the insert with a uniform lower resolution for background. This need not be thecase. Computer image generation systems change the density of pixels along a rasterscan line, and an optimal distribution of pixel density about the point of gaze has notbeen found. A non-uniform distribution would conserve bandwidth in the sense that itwould allow more resolution where it can be used by the eye, but the nature of its fall-off about the center of gaze depends upon a number of factors. Clearly as the center ofthis area must respond to eye and head position, the accuracy with which this can bedone will determine how large the insert must be, This and the cost of display equip-ment will determine the bandwidth allocation within the display, and ultimately, the
image resolution. Hopefully, knowledge about the information processing of human ob-
servers can place some boundries on how the bandwidth should be spread with regard tothe visual axis.
6. CONTINUOUS EVOKED RESPONSES AS AN INDICATOR OF "G" TOLERANCE (M. Cohen)
High speed low level flight often has abrupt changes in direction with attendant
high G forces. These high G forces are accompained by changes of visual function, par-
ticularly decreased visual sensitivity, dimming of the visual field, development of pe-
ripheral and central scoatomas, and even blindness. All these changes in the visual
system are due to inadequate blood supply to the eyes and brain when acceleration pro-
duces %ydrostatic pressures that exceed cardiovascular capabilities. We are developing

22-8
a technique to measure the evoked cortical responses as an indicator of G tolerance.The initial experiments have been designed to find which evoked cortical responses canbe correlated with changes in blood flow as measured by Doppler techniques. The bloodflow is modified by increases in G from acceleration, and, also, various physiologicalconditions including straining maneuvers. The purpose of this program is to develop avisual evoked response recording system helmet to act as an integral part of the feed-back system in the G suit. This will assist in maintaining the pilot in good physio-logical conditi3n during the maneuvers characteristic of high speed, low level flight.
Modern high performance jet aircraft are capable of generating and sustaining ac-celerative forces that far exceed the tolerances of their operators., The downward (0)loading of blood in the heart-brain hemodynamic column can exceed the upward forces gin-erated by the action of the heart. This results in blood pooling in the legs and abdo-men. while the eyes and the brain are deprived of freshly oxygenated blood; loss of visu-al sensitivity, first in the periphery and then in the central areas, can be followed bytotal blockout and unconsciousness, all in rapid order.
The 280 mm heart-brain hemodynamic column produces forces of approximately 280 gm.with normal gravity. The heart brain column is roughly equivalent to a column of Hg20.6 mm in height. As the peak systolic pressure of blood at the heart is about 120 mmHg, bloodflow to the brain would cease in an unprotected and uncompensated subject at
Normal intraocular pressures are 20 mm Hg or less.- Thus, bloodflow to the retina
should cease at about 1 G less than when the brain itself is deprived of oxygenatedblood, As the visual changes generally precede the loss of CNS functioning, visual cri-teria for human tolerarce have often been adopted.-
Animal studies have shown that general anoxia affects the more central parts of thevisual pathways first, beginning with the cortex, and progressing to the lateral genicu-late nucleus, to ganglion cells, to bipolar cells, and, finally, to the retinal recep-tors.- However, during G acceleration, ischemia is first manifested in the retina whereas the local arterial piessure falls, the high intraocular pressures of the order of 20mm Hg cause occlusion of the blood vessels beginning with the capillaries., The ischemiaoccurs first in the periphery of the retina because the caliber of the capillaries gene-rally decreases towards the periphery (Ward, 1968), Thus, the loss of peripheralvision, progress to loss of central vision and blackout, may be attributed tv retinalischemia. These retinal events are considered to be precursors of unconsciousness dueto cerebral ischcmia.
This description of the cardiovascular function of unprotected and i.compensatedhuman subjects in acceleration environments represents only a first order approximation;the real situation is by far more complex. Nevertheless, it is sufficient to allow ex-amination of some currently employed methods for enhancing human G tolerance.
One simple method would be to reduce the height of the cardiovascular column.Placing the subject on his back replaces the G (head to toes) accelerative forces by G(chest to spine) forces, In this position the zsubject can tolerate more than an 11 G o•the airframe. Enhanced G tolerance also results when the blood is prevented frompooling in the lower extremities and the abdomen. This increase in the circulatingblood volume results from inflation of the bladders in a conventional G-suit and pro-vides between 1.5 and 2.0 G additional protection. Straining maneuvers, in which thesubject exhales igainst a closed or partially closed glottis (the L-1 and M-1 maneu-vers), increase intrathoracic pressure,, diminish blood pooling, and provide about 1.0to 2.0 G additional protection.
It is extremely important to be able to evaluate the degree of G protection af-forded by all methods, Traditional evaluations have relied on behavioral and subjectivedata based on:-
I) changes in the apparent brightness cf a series of lights,
2) detection of randomly timed presentations of lights in various parts ofthe visual field.
3) Manipulation of the positions of lights to indicate the limitsof the visual field,
4) observations of ocular motility to lights presented atrandom positions.,
In addition to these behavioral tests, an objective physiological ind 4 cator, theDoppler measurement of blood flow velocity in the superficial temporal artery has been
employed, This non-invasive technique has been quite promising. Doppler flow velocitymeasures can provide objective criteria for human G tolerance. However, interpretationof the data is sometimes difficult, for those signals depend on the position of the sen-sors relative to the underlying arteries, This ielation can be disturbed under ac-celeration particularly when coupled with the straining maneuvers L-1 and M-1. Fur-ther, the Doppler techniques do not have the same margin of safety provided in suojec-tive tests in which vision fails before the bloodflow to the brain is impaired-
i

The behavioral measures of G tolerance do have a margin of safety afforded by the
intraocular pressure which terminates lision before cerebral function is impaired.However, these are behaviorally invasive, for when subjects perform the required visu-al tasks, simultaneous performance of other, piloting-related, tasks is hindered, Also,the behavioral measures are frequently unstable, often providing tolerance limits thatdiffer by as much as I - 1.5 G from test to test,
it would be desirable to obtain methods for evaluating G tolerance that have thefollowing characteristics,
1) reliability and reproducibility,.
2) physically and behaviorally, non-invasive,
3) objective..
4) relatively insensitive to experimental artifacts.
5) give rapid, on-line, real-cime discrimination.
6) have a margin of safety for determining G tolerance withoutundue risk of approaching unconsciousness.
The objective measures of the integrity of the visual system during retinal is-chemia appear to have a potential for meeting these criteria.,
It has been demonstrated that visually discriminable photic driving of the filteredEEG follows the frequency of the stimulus. Although all subjects did not demonstratethese phenomena, the results are encouraging. Subject were exposed to accelerativeforces in the human centrifuge while measures of peripheral light loss, photic drivingof the EEG, and ophthalmoscopic observations of the retinal arterioles were obtained.Ophthalmoscopically observed collapse of the retinal arterioles was associated with bothloss of photic driving on the EEG and peripheral light loss, Blackout coincided withsystolic collapse of the arterioles.. In this study, photic driving appeared to be lost1pproximately one second before the subject signalled grayout (dimming of the peripheralvisual field). Electrophysiological measurements may give other objective tests for Gtolerance,
Visual evoked responses (VER) recorded from scalp electrodes constitute a non-spe-cific cortical response to light that does not necessarily stand in a fixed relationshipto conduction along the clasical anatomic visual pathways, For example, cortical andsubcortical injury to the occipital lobes by crushing or ablation is followed by an im-mediate decrease in the amplitude of the VER.
The Electroretinogram (ERG) consists of a negative a wave generated by the retinalreceptors and a positive b wave reflecting activity of the higher neural layers of theretina and may provide an objective measure of retinal ischemia and G tolerance.. Theaveraged ERG is much easier to detect than VER. lowever, as stimulus luminance de-creases the ERG %,irtually disappears, while the VER remains. Thus, the ERG may providea more sensitive index of retinal functioning than the VER, If the sensitivity of ERGto G forces parallels its sensitivity to decreased stimulus intensity, the ERG may pro-vide an excellent indicator. In fact, Ward has observed that the amplitude of the ERGb wave fell by 40% in anesthetized beagles exposed to 1.5 G and disappeared completelywith exposure to 3.0 G . Unfortunately, equivalent research has not yet been conductedwith human subjects, a~d the value of the ERG as an endpoint remains to be determined.
Recent advances in bio-electronics, such as high-gain st~ad9-gtqtellock-in ampli-fiers, fast rourier transform Lechniques, and improved real-time'digital computer pro-cessing methods have combined to make feasible the continuous, real-time analysis ofsmall amplitude bioelectrical signals that, in the past, could not be recovered frombackground noise, Since changes in visual function should provide a reliable indicatorof G tolerance., and since bcth the visual evoked cortical responses and ERGs havebeen shown to provide reliable indicators of visual functioning, it appears that time isnow ripe to exploit these tEchniques in the determination of human tolerance to accel-eration,
7, ACKNOWLEDGEMENTS
The research described in tiis report was supported by the Naval Air Systems Com-mand under th- following contracts:-
N00019-78S-C-0431, Dependance of Foveal visual acuity on the size of the receptivefields of retinal ganglion cells (M, Wolbarsnt)..
Vibual performance of Aircrew personnel under spectrally selective filter condi-
tions (G. T, Chisum),
Evoked cortical responses as an indicator of G tolerance (M. M. Cohen).,
Head and Eye tracking study (J. .1. KuliK).

F 22-10
N00019-78-C-3036 Th., primary events in vision (A. Lewis).
8. REFERENCES
1. Lewis, A,, "The Molecular Mechanics of Excitation in Visual Transduction ard Bac-teriorhodopsin," Proc. Nat, Acad. Sci., USA 75, 549-553, (1978).
2, Lewis, A, and Wolbarsht, M. L. Modification of Visual Sonsitivity by photon absorp-tion:Invest. OphLhalmol. Vis. Sci. 17 Suppl. 125-126, (1978).
3. Wald, G., On the Mechanism of Visual Threshold and Visual Adaptation, Sci. 11_9, 887-892, (1954).
4, Wolbarsht. M. L, and Ringo, J, Visual Acuity and Retinal Organization. Final ReportNaval Air Systems Command Contract No. N00019-77-C-0133•
5. LeGrand, Y. Form and Space Vision (translated by H, Millodot and G., G. Heath),Indiana University Press, Bloomngton (1967).
6. Missoten, L, Estimation of the ratio of cones to neurons in the fovea of the humanretina. Lavest. Ophthalmol, 13:1045-1049, (1974).
7. Ratliff, F. Mach B'nds, Holden Day, San Francisco, (1965),
8. Shlaer, R. An eagle's eye: quality of the retinal image. Science 176:920-922(1972).
9. Miller, W, H., Personal Communication, 1979..
10. Fox, R., Lehmkuhle, S, W. and Westdendorf, D, H. Falcon Visual Acuity. Science 192:.263-265, (1976),
11. Young, L., R. and Sheena, D, Survey of eye movement recording methods. BehaviorResearch Methods and Instrumentation, 7, 397-429, (1975).,
12, Boghen, D., Troost, B. T. Daroff, R. B., Dell'Osso, L. F., and Birkett, Jr. E,Velocity characteristics of normal human saccades, Invest, Ophthalmol., 13, 619-623, (1974).
13, Fricker, S. J, and Sanders, J, J. Velocity and acceleration statistics of pseudorar.-domlv timed saccades in humans. Vision Research, 15, 225-229, (1975).,
14, Ricard, G, L. and Puig, J. £. Delay of visual feedback in aircraft simulators.NAVTRAEQUIPCEN TN-56, Ma':ch 1977.
15. Volkman, F, C. Saccadic suppression:- A brief review. In Monty, R. A, and Senders,J. W. (Eds.) Eye Movements and Psychological Processes. Hillsdale.Erlbaum, pp.73-83, 1976,
16, Matin, L, Saccadic Suppression:. A review and an analysis. Psychological Bulletin,81, 899-917, (1974).
17, Bridgeman, B., Hendry, D., and Stark, L. Failure to detect displacement of thevisual world during saccadic eye movements. Vision Research, 15, 719-722, (1975).
18. Stark, L., Kong, R., Schwartz, S.,, Hendry, D., and Bridgeman, B. Saccaoic suppres-sion of image displacement. Vision Research, 16, ii85-lL87, (1476)
19. Machworth, J. H., Stimulus density limits the u3eful field of view, In Munty,R. A. and Senders, J. W, (Eds.) Eye Movementsand Psychological Processes, Hills-dalef Erlbaum, pp., 307-321, (1976W
20. Saida, S. and Ikeda, M.. Useful visual field size for pattern perception.Perception and Psychophysics 25, pp. 119-125, (1979).

22-1I
9. FIGURES
0 / 3 4 5 6
Retinal Distarce, Amil_ jI
Figure 1 Fieure 2Intensity distribution of the difraction Intensity distrihution on the retinapattern in the retinal image of point source, of the image from two adjacent pointThe solid line shows the Airy disk for a sources of light. The solid linesmonochromatic source at 560 rn. The dathed show the algebraic sum to two mono-line shows the itensity distribution for a chromatic (A= 560nm) point sourcespoint source o1 ;hite light at the same inten- which individually have the same ret-sity in focus a. 560 rm. Adapted from inal image of the point sources asLe Grand (5). shown in Fig. 2. The dashed lines
are for white light. A separation of2.5 pm gives the image correspondingto a visual acuity of 6/3 (20/10). Atthis separation there is a very smalldip in the central intensity distribu-tion of monochromatic light. Forwhite lignt sources there is no dip.
X CELL CAT RETBA
04• -STWUIUS 600
200A 0o
i-Loa X CELL CAT RETIA
>
00 *2-
-20-
0 10 20 go.ASTINAL OSTAWC (mn) __
7 20 112 4"STIMILUS SIZE OW AETNA•j
Figure 3 Figure 4
Sensitivity profilu of an X type gar.lion The Ricco field ploi• (Area X log in-cell in the cat retina. The data points tensity). The data jiints indicateindicates the intensity required to give a the intensity required to give a cri-criterion response. The ON response in the terion response for the ON response ofcenter has a dome shaped sensitivity profile, a cat retinal ganglion cell (X type).The stimulus is 400 'pm on the retina, or The seasitivity profile of the centralapproximately 2 minutes of arc in the visual ON and perLpheral OFF response. of 'h=,field. The sensitivity profile of the peri- this cell are shown in Figure 3. Thispheral OFF response should be compared with Ricco field plot ehows ccmplete inte-the central ON response loss of sensitivity gration within the central ON responsewith distance, More information on the for approximately 100 pm. The fallcentral ON response is given in the Ricco off of sensitivity with increasedfield plot in Figure 4, which suggests that stimulus area is probably due to thethe top of the sensitivity profile should be recruitment of inhibition from theflatter. antagonistic surround.

23-I
HUMAN FACTORS IN HIGH SPEED LOW LEVEL ACCIDENTS - A 15 YEAR REVIEW
Lieutenant-Colonel R.C. Rud
Captain D.7. Leben
Defence and Civil Institute of Environmental Medicine1133 Sheppard Avenue West, P.O. Box 2000, Downsview, Ontario, 13Y 3B9
CANADA
The Canadian Forces introduced the CF 104C into SquadronOperation in 1963 and since that time these aircraft have operatedin the hIgh-speed, low-level environment in both the strike/recon-naissance and tactical support roles. Fifty-seven accidents involv-ing these aircraft are reviewed with regard to cause factors.Marginal weather appears to be the one most significant factorcontributing to low-level, high-speed accidents; however, severalhuman factors such as visual contrast problems, fatigue, stress,reaction time, "mission completion" syndrome, inattention and taskoverload were identified. Aspects of accidents which typify humanfactors problems are described. Suggested possible preventivemeasures are outlined.
The Canadian Armed Forces have been flying aircraft in the high-speed low-level (HELL) operationalmode for the past 17 years. The CF 104 operated in Europe with NATO for nine years in the strike/recon-naissance role and, more recently, for six years in the tactical air support role. In addition, theCanadian Armed Forces have also utilized the CF 5 in the close air support role for the past elevenyears. During these operations, it has become clear that even with effective aircrew operational train-ing and a vigorous flight safety programme, the high speed, low level role vas dangerous and demanding -resulting in what appeared to be a significantly high rate of loss of aircraft and aircrew.
The present survey of high speed low level accidents confirms the findings of a five-year surveycompleted by LCol I.H. Anderson in 1969, (1) whi concluded that, although the cause of most accidents inthis environment cannot be absolutely determined, judgement, decision making and available reaction timeare factors which almost surely have contributed to the accidents. This survey is an attempt to moreclearly identify the human factors associated with HSLL flight and to make recomendations which may en-hance flight safety in this role. The following mission descriptions illustrate the task workload andcomplexities facing aircrew involved.
Strike. A typical strike training mission in a CF 104 was as follows. A preplanned route, chosenon the basis of forecast weather, was flown at 500 feet, 450 knots (800 feet during bird season, April toOctober). The last leg of the route was flown at 50 feet above ground and 550 knots until the simulatednuclear weapon drop. If deteriorating weather was encountered, the pilot was permitted to climb to 2,000feet above ground level and complete the route using ground mapping radar; the weapon could be dropped"blind". Target procedures were clear-cut in that the prime considerations were to arm and drop theweapon.
Reconnaissance. Reconnaissance missions were flown at 500 feet, 420 knots. Routing and the targetfor each mission were different, and therefo-e, a new map was prepared for each. Where possible, missionswere flovn in conjunction with ground force exercises in progress - hence some external pressure existedto reconnoitre a particular target at a particular time and hence some psychological pressure could existto challenge deteriorating weather. Reconnaissance of targets of opportunity was encouraged.
With the requirement to acquire visual contact with the target, reconnaissance pilots would bemore prone than their strike pilot counter parts to remain VMC below cloud. A pull-up into cloudgenerally resulted in an aborted mission.
Pilots were trained to rely upon their visual observations and utilize elements of essential In-formation (EEl) cards. The aircraft mounted cameras were treated as a back-up capability. Last minutedecisions at the target included which cameras to utilize, exposure times and camera settings in additionto flying the aircraft and making mental notes. Some pilots resorted to flying left-handed and usingtheir right hand to record information on their EEl cards.
Tactical Air Support. The most demanding role assumed by Canadian CF 104s is the tactical airsupnort role. Missions are planned at an altitude of 500 fect and a speed of 420 knets. Since thesemissions are flown in support of ground forces, little or no flexibility exists as to the target. Theroute to be flown is pre-planned based on forecast weather and known threats (e.g. surface-to-air missilesites). Aircraft are usually armed with a mixture of ordnance - hence the pilot must mske airbornedecisions as to which weapon to employ.
When operating in conjunction with a Forward Air Controller (FAC), the pilot flies to a pre-deter-mined area by means of a pre-planned route. Once in the area, the FAC calls taiget locstion to the CF104 pilot by means of a map reference. While flytig at 400 knots plus and an altitude of 500 to 1000feet, the pilot refers to-his 1:250,000 mav, locates the target, determines his route to target, decidesupon the weapon to be employed and determines his escape route. Each weapon has its' own envelope and.therefore, the speed, type of delivery (e.g. level, 10, 20, 30 degree dive angles), foul lines (forrichochets) and release points vary with each weapon.

23-2
Whereas the strike and reconnaissance missions were flown as independent aircraft, the tacticalair support missions are flown as formations of two, three and four aircraft. The formation leader isresponsible for navigation and terrain clearance while the wingmen are responsible for station keepingand lookout for aggressor aircraft.
METHODS
All CF 104 accidents from 1963 to early 1979 were reviewed. Only those occurring while en-routeon a low level mission were included in the survey, whereas accidents occurring on the airfield or duringtake-off or landing were not. Similarly, accidents occurring in flying operations above 1000 feet aboveground level (AGL) were not included. Mission types included operational training school missioas, com-bat ready training, and actual NATO operational flights. Where specific cause factors are availablefrom the investigation such as engine malfunctions, bird-strikes or range richochets, these are indi-cated. In these cases, human factors are not significant except in the manner in which the emergency washandled. Where the cause is undetermined or obscure, the most probably cause(s) and human factors in-volved are allocated by the authors.
RESULTSOf the 57 high speed, low level accidents reviewed, 28 were caused by mechanical failure, bird
strike or range richochet and human factors analysis wau not carried out in these cases. This is not tosay that human factors did not play some part in the management of the emergency, but in many casesthere was no Flight Surgeon assigned to the investigation team and human factor investigation wasusually non-existent. In most of these cases, a successful ejection was carried out.
In 29 accidents, the investigating board could not determine a positive cause factor (See TableI). These investigations were studied and the following human factors were found to be present in manyof the situations in varying degrees; psychological stress, fatigue, inattention, task overload, visualcontrast or illusory situation, reaction time, stress of formation flying, mission completion syndrome(this will be discussed later), and pilot incapacitation. These factors were then assigned as possibleprimary, secondary and tertiary factors contributing to the accident. These are tabulated in Table II.
There were two fatal accidents where reduced visual contrast almost certainly caused severe dis-orientation leading to the accidents. One case is suspected to be incapacitation becduse of the autopsyfirdings.
DISCUSSIONWeather. There is no doubt that weather is the single most Influential factor in HSLL accidents.
In 13 of 29 accidents, weather was definitely a contributing factor. This is even more profound in theEuropean environment where weather played a major part in 10 of 19 accidents. Further, if one looks atthe seasons, seven of 19 European accidents occurred in the January to March time frame, and in six ofthese, weather was clearly a deciding factor. Typical weather conditions at the time of the accidentswere low overcast or obscure ceilings with visibilities reduced to zero to one mile in snow showers.It can be fairly safely stated that fifty percent of the HSLL accidents in the European environmentwouLd not have occurred if weather conditions had been better or if the mission had not continued intodeterioracing weather.
Human Factors Demonstrated
a. Visual Problems - Visual contrast or illusion are usually associated with environmental, condi-tions. The most comon variety of this problem is the "WhiLS-out" condition occurring when anexpansive flat snow covered area blends with a high, light overcast and the horizon cannot bedistinguished. It may also occur in other low contras, situations such as dust or haze. Theseconditions are ideal for the induction of disorientation which, in HSLL flight, is usually catas-trophic.
Tllusions also may cause errors in orientation and judgement. A sloping low cloud bank maybe mistaken for the horizon. In one of our cases the height of desert sage brush in comparisonto Canadian trees, combined with sloping ground conditions most likely contributed to the pilot'sunawareness of his critically low altitude.
In one accident, a CF 104 on a target run collided with an RAF Canberra which was on an unre-lated mission. In this case, the other aircraft was not detected until sufficient reaction timewas simply unavailable. The relative closing speed between aircraft was estimated at 400 metersper second.
b. Mission Completion Syndrome - This is a psychological syndrome which causes a pilot to presson in dangerous weather or a dangerous flight profile in order to complete the mission. Manyfactors can make up this syndrome. They are mainly psychological factors involving sel f-imageand peer pressures. It can be claimed that a common personality profile of pilots in general isa contributing factor - "Per Ardua Ad Astra". Of the eight accidents clearly exhibiting thisphenomenon, seven involved experienced seasoned aircrew. They had considerable total flying timewith little time on type and appeared to be attempting to become combat-ready in the shortest pos-sible time. This would allow them to stand alert or take over supervisory duties such as those ofFlight Cocnander. Some had considerable CF 104 time with the possible self-imposed notion thatthey should be ccpable of mission completion under the most adverse conditions. A reputation asone of the squadron's top bombers or gunners seers co contribute to this syndrome as does flyinga mission in an international competition.

23-•
c. Stress - For the purposes of this paper, stress is defined as ... "The presence of one or
more physical or psychological stressors generally leading to inattention and thence to task
overload." The stressors identified in the accidents we reviewed were psychological stress,
fatigue and formation flying.
Physical fatigue probably accounts for more inattention than we may suspect. In one case
examined, it is highly likely that the pilot was physically fatigued severely enough to cause
inattention. He had flown two missions two days previously and his wife commented that he was
fatipued. The day before the accident he held a 24 hour alert. The accident occurred on the
third trip the following day; a day of hectic briefings and debriefings with no evidence of
between flight nourishment.
There were many forms of psychological stress detected in the human factors analysis of
these accidents including a serious argument with a girlfriend, girlfriend pregnant, minor
irritating malfunction of the aircraft, having had to rush to change aircraft at start-up,
deteriorating weather, first flight as section or element lead and flying in an international
competition.
Formation flying is In itself a stressful activity and especially so while low level.
Station keeping on an inexperienced lead at low level is particularly stress'ul as one has a
tendency to keep one eye on the altitude. One accident reviewed (a low level formation col-
lision) can be attributed to this factor.
d. Task Overload - The task of conducting a HSLL mission is extremely demanding of a poorly
trained, Lorderline pilot who is cotatinually behind the aircratt. If adverse weather is then
encountered or an in-flight emergency occurs, conditions become ideai for an accident.
Incapacitation. The one case attributed to pilot incapacitation was based on the fact that the
autopsy findings revealed a 75 percent restriction in the right coronary artery.
The human factors listed above cannot be viewed in isolation since many of them interact to laythe groundwork for an accident. However, there are certain combinations evident in HSLL accidents
which can be divided artifically into four tasic patterns:
a. Type I
STRESS -),INATTENTION -- rASK OVERLOAD -- *REDUCED TIME --- #ACCIDENT(psychological FOR REACTIONor physicai)
This seems to be the most common pattern probably accounting for 13 of the 29 accidents.,
b. Type 11
MISSION COMPLETION .... REDUCED TIME- ACCIDENTSYNDROME ---- TAS OVERLOAD-----OR REACTIOKN--A)
This pattern probably accounted for 10 of the 29 accidents.
c. Type III
VISUAL PROBLE•--4RED CED REACTION4 TIME-----ACCIDENT(low contrast
illusion) /DISORIENTATION
Five of our series seemed to be this type of accident, including two almost certaincases of disorientation.
d. Type IV
PILOT INCAPACIT'ATION---) ACCIDENT
One accident in our series was thought to be this type.
The advantage of splitting the accidents into these types allows each pathway to be analysed asif it were a disease process. As in most disease processer, there are signs (objective observations)and symptoms (subjective feelings) for various stages of each of these pathways. By evaluating thepathways with this approach, one can recognize areas where intervention may be possible in the inter-
eats of accident prevention. For example, recognition of dangerous stress levels with temporary re-moval of the affected aircrew from flight status may prevent some Type I accidents. A means of detect-
ing reduced attention and a method of alerting the subject would also make it possible to interruptthis pathway. Inattention can also be detected by wingmen and perhaps some sort of challenge systemcould be developed to determine alertness.
Task over'load is very difficult to recognize but it may be possible tor n subject to make such
a juigement before reaching the stage where his time for reaction is so short that he is fortunate tobe able to eject from the situation.

23-4
The mission completic. syndrome contains certain ingredients which are often recognizabh; hightotal-time pilots in operational training or combat-ready training; high time-on-type pilots checkingout new crews in adverse weather; pilots assigned to fly in international competition (expecially thosewith previous weapons trophies) end other factors ,robably more readily recognized by operational air-crew.
Conditions which predispose to low visual contrast, loss of horizon or visual illusions are oftenrecognizable and could act as a warning to pilots flying in these conditions.
CONCLUSIO'1S and RECOMMENDATIONSIn summary, 57 HSLL accidents were reviewed. Twenty-nine of these were found to have obscure
causes and were assumed to involve human factors. In effect, these accidents are probably due to thepilot gerting into a situation from which the time needed to recover is greater than the reaction timeavailable. The question is what factors contribute to the development of this situation? We believethat the following factors are involved:
- physical and psychological stress leading to inattention;
- mission completion syndrome which drives a pilot to flý into dangerous conditions; and
- the visual problems which may result from poor weather and conditions of illusion.
It is conceded that these factors are often inter-related and difficult to separate, but for preventionpurposes, they can be looked at separately. It is considered that positive action should be taken toattempt to identify and eliminate, as far as possible, these contributing human factors.
It is recommended that:-
a. The research community study the various stress faztors .n aircrew with a view to providingthe individual aircrew and flight supervisory personnel with some means of identifyingindividuals who are strained to a dangerous level.
b. The research community continue to work on developing a method of detecting dangerouslyreduced levels of alertness or awareness in aircrew wLth a view to providing them witha feed-back alerting system in such circumstances.
c. Operational staffs recognize the factors which pred-spose to the mission completion syndrome,attempt to identify aircrew at risk, and take acticn to eliminate this condition.
d. The operational staffs be particularly aware of conditions predisposing to low visual con-trast situations and visual illusions and to modify flying programmes accordingly when theseconditions exist. In addition, attitudinal change is required. Aircrew must be convincedthat it is not heroic to fly into weather which is deteriorating below safe limits.
It is appreciated that the above recommendations may be difficult to implement without compre-mising the effectiveness of the squadron and without c'estroying the "tiger" spirit in the aircrew.However, it would appear that the human factors discussed have significant accident-producting potentialand efforts should be put forth in thir area.
ACKNOWLEDGEMENIFThe assistance of the Directorate of Flight Safety at National Defence Headquarters, in providing
information for this survey is gratefully acknowledged.
REFERENCESI. ANDERSON I.H. A survey of major accidents incurred en route during high-speed low-level
operational training or practice missicns. DCIEM Report 69-TM-1 July 1969.
2. DEHART R.L. Biotechnology concerns for curr ti military low level high speed flight.Preprints - ASMA Scientific Meeting 1979 pp 12-13 1979.
3. FASSOLD R.W. A few thoughts on white-out and human factorL in helicopter operations.Published in "Hotline" No. 3 1977 pages 20 to 22.
4. THATCHER R.F. and DEAN P.J. An approach to the study of pilot workload in low-levelhigh-speed roles. DCIEN Report 74-)R-1035 1974.

SF - T .. " '23-5
TABLE I
Sumary of Accide.ta Involving Thman Factors
Total Accidents Where Human Factors Played the Major Role 29
Fatalities 21
Ejections: Successful 4
Not Successful 1
Aircraft and Aircrew Safely Recovered 3
Average Pilot Age 27 Years
Average Flying Times: Grand Total 2184 Hours
Time on Type 293 Hours
Last 30 Days 23 Hours
TABLE II
Distribution of Human Factors as Accident Causes
Number of Accidents Where Human Factor was Assigned as PossibleCause Factor (n - 29).
Human Factor Primary Secondary Tertiary
Visual Contrast or Illusion 7 1 4
Mission Completion Syndrome 7 4 1
Inattention 5 10 7
Task Overload 4 1 2
Psychological Stress 2 6 6
Reduced Reaction Time 1 4 7
Fatigue 1 1 2
Stress of Formation Flying 1 2 0
Pilot Incapacitation 1 0 0
I•

23-6L
DISCUSSION
DR. S.A. NUNNELEY (US)
It occurred to me in reading the pre-print for this paper that possibly this business of overloadmight constitute a syndrome which would be recognisable by the individual. It might be possible todevelop a progranne similgr to the USAF hypoxia training programme in which we expose aircrew meubersto hypoxia so that they will find out what is likely to be their own symptom pattern, I wonder ifwe could oevelop some kind of overload situation in the laboratory to which pilots could beroutinely exposed so that they would be aware of their own symptors.

- -- 24-1
CREW STATION ASSESSMENT USING THE BIOMAN MODFLING SYSTEM
Georg D. FrischNaval Aerospace Medical Research Laboratory, Detachment 1
Michoud Station, New Orleans, LA. 70189attached to
Aircraft and Crew Systems Technology DirectorateNaval Ai' Development Center, Warminster, PA. 18974
TTSA
and
Louis A. D'Aulerio and Michael SchultzAircraft and Crew Systems Technology Directorate
Naval Air Development Center, Warminster, PA. 18974USA
ABSTRACT
Physical comlatability of man and machine must be evaluated not only in terms ofphysical and visual interface, but also in terms of reach and clearance envelopes.Information from gross body motion simulation (i.e. movement of body segments,.inresponse to applied forces) 3hould be used to determine and r.vise clearance envelopeswhich can significantly alter the placement of crucial controls or cockpit geometry ingeneral. This paper demonstrates the use of the "Bioman" modeling system in evaluatingthe physical compatability of crew members with crew stations under emergency egressconditions and will illustrate the usefulness of this approach as both a design andevaluation criteria. Validated results from F-18 aircraft investigations, based bothon ejection tower and human physiological acceptance tests, are presented todemonstrate the evaluation process of a given crew station, Furthermore, these resultsare contrasted against those obtained from the A-4 and F-14 and the relative propensityof direct impact injuries are discussed.
INTRODUCTION
Evaluation of a crew station must consider not only the ability of a crew memberto perform his tasks but also assure that the crew station geometry does not pose aproblem during emergency egress. Injuries to aircraft crews during ejection must beviewed in terms of limitations of the escape system as distinguished from inadequatecrew station geometry. Injuries due to the first classification are usually a resultof high G forces and inadequate restraint, whereas injuries due to the latter can berelated to direct impact between body segments and the crew station interior.
Compatability of crew members with crew stations has tracitionally been based onanthropomorphic, acceleration response, and task sequence data. Drawing reviews,mockups, flight simulators, prototype flight, and track and tower tests provide crucialdata but suffer from the limitation of not being able to take into account the fullvariability in crew anthropometry and acceleration environment factors.
Mathematical modeling can ba effectively used to analyze crew member-crew stationcompatability and has become useful as both a design and evaluation tool. Effects ofinitial position and inertial conditions of the occupant and aircraft can beextensively examined as they affect occupant-crew station interaction as a function ofcrew member biodynamic response to acceleration profiles experienced during emergencyegress. Problem areas can be isolated and possible solutions effected before expensivetrack and tower tests are undertaken.
The "Bioman" modeling system previously described (1) was used to evaluate theproposed F-18 crew station and simulation results were compared to those obtained fromtrack and tower tests (using instrumented dummies) as well as to physiologicalacceptance tests (conducted on the ejection tower) using human subjects. Results fromthe mathematical simulations indicated a possible foot-instrument panel contact problemthat became obvious from the extensive dummy and human tests conducted. Using thevarious parameters established during the F-18 simulations, the A-4 and F-14 2rewstations were similarly evaluated. This approach defined specific shortcomings tn theF-18 crew station geometry and a redesign is presently being undertaken.
This paper describes a test procedure consisting of track and ejection towertests, coupled with mathematical simulation, which isolated a problem area relativelyearly in the design of an aircraft when changes to that design are still feasible. Themodel, used together with supportive test data, proved to be invaluable as anevaluation tool and is presently being employed to evaluate occupant-crew stationcompliance in the AV-8B aircraft.
METHODOLOGY
The Cockpit Geometry Evaluation Computer Program System (CGECPS) was used to checkand transform digitized crew station data (2). Al, relevant crew station surfaces,expressed in the design coordinate system (using buttock, water, and station line4),were transformed to a Euclidean coordinate system (x,y,z) with the origin at the designeye reference point (figure 1). On the initial evaluation computer runs, theoccupant's eye midpoint (defined in the head anatomical coordinate system) was madecoincident with the design eye reference point origin. The crew member's anthropometry(95th percentile subject used in sled tests conducted at the Naval Aerospace MedicalResearch Laboratory Detachment, New Orleans) and seating position (estimated from theseat and crew station geometry) was used to define a theoretical seat pan location

74'
which was then checked against the existing allowable seat adjustment range (3). Ifwithin range, an ideal initial seating position was defined (i.e. crew member seatedat the design eye reference point) and the simulation was ready to proceed. Exceedingthe seat adjustment range defined a problem of accomodation, although this was notencountered for the crew stations analyzed.
The formulation of the 3ccupant model (figure 2) has been previously described(4). Briefly, the upper torso was modeled using three segments (thorax, right and leftshoulder elements connected by two sterncclavicular joints), whose masses and inertialproperties were estimated based on Dempster's data, as were the joint locations andranges (5). The definition of the head anatomical coordinate system and the headcenter .f gravity location were based on Walker's analysis (6). Estimates of the neck-torso and neck-head forcing elements (spring and dashpot functions) were obtained fromBecker's preliminary analysis of the data from subjects tested at the Naval AerospaceMedical Research Laboratory Detachment (7). The mass and mass moment of inertia, linklengths, C.G. locations of the limts, and the location of the remaining joints wereestimated by scaling Dempster's approximations.
The model was then exercised using the digitized F-18 crew station dat3, theoccupant representation outlined, and a typical icceleration profile as monitored onthe ejection tower at the Naval Air Development Center, Warminster, PA. The Calspai:model (8) was used to provide estimates of the occupant dynamic response to thisacceleration profile. In order to insure that simulation reqults were stable andconvergent, the accuracy of the integration procedures was checked over several errorlevels and minimum integration step sizes for relevant variables. If the integrationsolutions are stable, then reducing the allowable error limits should not alterresults. Outputs for various convergence tests were virtually identical and theminimum step size was never reached, indicating acceptable results. These preliminaryinveatigations indicated a penetrption of the feet into the lower instrument panel,implying a high probability of impact between the feet and the toe guard (underside ofinstrument panel) (figure 3).
Track tests conducted at the Navol Weapons Center, China Lake, CA., did in factindicate a clearance problem (figure 4). All eight tests, ranging from 0 to 600 KNOTSand using 3 and 98 percentile dummies, resulted in impact between the feet andinstrument panel. Since only the dummy's chest was instrumented in thEse tests it wasimpossible to accurately estimate the acceleration of the lower legs or 'he foi"esgenerated during impact. All 31 ejection tower tests (conducted at the Naval AirDevelopment Center using 6 cross section percentile human subjects), employing astyrofoam mock-up of the crew station, resulted in foot-instrument panel contact ofvarying severity (figure 5). Contact ranged from the tip of the toe to the tibiastriking the !onsole in the region of the mid-shaft, with the more severe impactsgenerally occurring with the larger subjects. Again, however, since the lower legswere not instrumented no estimate of the forces generated was possible.
To adequately define the severity of the strikes in terms of accelerations, forcesgenerated, and time of' occurience, fully instrumented dummy tower teats wereundertaken In addition to the instrumented seat, the 95th percentile dummy employedhad a tri-axial linear acceleration package installed in the chest cavity (figure 6).A rate gyro was rigidly mounted on the lower leg in the region of the knee to quantifythe rate -f piLch experieiced. An additional tri-axial acceleration package wasmounted on the lower leg in close proximity of the ankle pivot and the kick plate (tpeguard), simulating the underside of the instrument panel, was instrumented with astrain gauge.
Since dynamic response is directly related to initial position at time ofejection, great care was taken to assure repetitive position of the dummy relative tothe seat and crew station. Distances between photographic targets mounted on the seat,dummy, and simulated rudder pedals were checked before each test and adjusted whennecessary (figure 7). Both the knees and the P•ikles were made as lousp as possible toreplicate a best ca3e situation and assure renroducibility between tests. Clearly, thestiffer the joints, the more likely contact will occur. In all cases the seat was inthe full down position and the angular orJentation of the legs and feet, relative tothe seat and crew station, were determined from the markers on the dummy. Link lengthsand weights were established for the other relevant segments and used as input to theprogram, as were the existing initial segment Pngular orientations. Three tests werecoiducted without the toe guard installed but wiLh the same dummy initial positions.This pro6ided a direct comparison between the cases with and without contact. As hadbeen the case previously, all 17 dummy tests conducted resulted in impact between the!tet and toe guard.
RESULTS
In conducting the simulations and nalyzing test results sevcral changes to theor~gin~1 modeling effort were undertaken to make results directly comparable to workconducted by McDonnell-Douglas Air'craft Cor . (9). In adaition to the BJoman graphics,ackage, the elliptical represent&tion (tused by Calzpan) of the occupant was employed.Furthermore, the crew station surfaces as digitized by McDonnell-Douglas, weretilihed in the analysis so that the coordinate systems employed and crew station
surfa es monitored would be directly comparable. These crew station surfaces werechecked against the original data set used (figure 3) ard were found to be virtuallyidentical (altcough fewer surfaces were considered in this latter effort). A sample (7cases) oa the seat acceleration profiles Is shown in figure 8, illustrating that thedriving function of the seat-man system remained relatively unchanged from test totest. Similarly, accelerations monitored in the chest showed a high degree of
reprodlcibility and there seemed to be no significant differences between the caseswh~re impact occured vs those There there was no leg obstruction (figure 9). The lower

24-3
leg data however, clearly demonstrates the effect of the strike. The linearaccelerations at the anklf (figure 10) showed significant differences between strike vsno strike situations, as did the angular velocities (figure 11). The loads monitoredat the kick plate, as a result of the impact, were on the order of 200 Lbs and provedto be reproducible from test to test both in magnitude and time of occurrence.
Simulation results were in good agreement with test data. Monitored vs predictedvalues for the chest acceleration of a typical test are shown in figure 12. Comparableresults were obtained for the other segments monitored. Occupant position at time ofinitiation of ejection and at the time when impact occurs is shown in figure 13. Theeffect of the strike (in simulation results) was clearly seen in segments not directlyinvolved in the contact. Figure 14 demonstrates the effect on the thigh angulardisplacement. This demonstrable effect, however, cannot be quantified in terms ofinjury potential. Additicnally, secondary effects on total human body dynamics cannotbe predicted reliably since relatively small changes in force deformation properties ofthe toe guard, boot, or ankle characteristics have a profound effect on the timehistory of the lower leg and foot during and after impact occurs. Since the forcedeformation characteristics employed were estimates based on static tests and since thehuman ankle joint characteristics are not known with certainty, the range of possibleresulting data was broad enough to cause concern from a safety point of view.Consequently, the position taken was that the central problem of human injuryprevention is the elimination of contact and direct i-.pact was viewed as a catastropheto be avoided at all cost.
Using the same dummy characteristics as were employed in the F-18 simulations, themodel was also exercised using digitized A-4 and F-14 crew station data. The initialpositions of the dummy were modified to reflect the seat and crew station geometryexisting in the respective aircraft, as were the ejection angles employed. Theacceleration time histories used were those of the F-18 tower tests conducted. Therelative dimensions of the respective crew stations are shown in figures 15 and 16. Itwill ue noted that using the lower seat reference points as the origin, the F-18 crewstation is smaller than the other two analyzed. Results from the simulation of A-4 andF-14 ejections ara shown in figures 17 and 18 respectively. Both cases resulted in nostrikes, although in the case of the A-4 the clearance provided is marginal. Slightchanges in initial occupant position or acceleration of the man-seat system couldresult in contact between the feet and the instrument panel.
DISCUSSION
The data presented clearly indicates that toe/foot strikes appear to be a veryhigh p.'obability eveat regardless of aviator size or seat adjustment. Antnropometriclimitations therefore will not solve the problem. Furthermore, tibia strikes arepossible and .n larger aviators more probable. Despite no simulated strikes in thecases of the A-4 and F-14 aircraft, there have been strikes in operational use. Thisis primarily due to the fact that during operational ejection the airpraft need not bein a stable situation but might have large angular and linear acceleration component'.Furthermore, the idealized occupant restraint considered in the simulations probablydoes not exist in the operational environment. Consequently, the results indicate thatthe F-18 simulation is underpredictive.
From the tower tests conducted, additional areas of concern were isolated. Withthe large subjects, seat fully down, and with maximum forward throw adjustment in therudder pcdals, the thigh is raiseo above the thigh support. At the time of ejection,therefore, there can be thigh slap on the seat bucket which might cause femur injury.In the simulations, the thigh was supported at all times and the differences betweenhit and no hit situations shown in figure 14 are due to the changed force deformationproperties at the thigh- seat bucket interface. If the seat is raised so that thethighs come in contact with the thigh support, the helmeted head (for a large occupant)may be raised so high that the aviator might have to compromise his seating position tostay within the cockpit, thus pre-loading the vertebrae and increasing the probabilityof vertebral fracture on ejection.
As a result of the data presented, the problems isolated were deemed significantenough to convene a medical panel to analyze the data in terms of injury potential.This medical panel, consisting of representatives from the Naval Aerospace ;.edicalResearch Laboratory Detachment, Naval Air Systems Command, Naval Materiel Cormand, andNaval Air Development Center, considered the problim severe enough to make the presentcrew station configuration unacceptable.
Althojgh a basic redesign of the crew station might have to be undertaken, somepossible engineering concepts involving only the toe board and rudder pedals wereanalyzed. A "Dynamic Kick Plate", deployed from under the instrument panel wasinstalled and tested on the ejection tower. The rather crude mock-up of this conceptconsisted of an aluminum plate hinged to the underside of the instrument panel (figure19) and coming in contact with the toe during ejection initiation. Theoretically themanner of deployment should be such as to maintain constant contact between the kickplate and the foot throughout the entire time period while the foot is under theinstrument panel. The mock-up deployment was simplified through the use of a counterweighted aluminum rod. As the foot moved away from the rudder pedal, the kick platepivoted downward with the rod being forced into the wedge created by the toe guard andkick plate. This arrangement imparted a slight angular accele, stion component to thelower leg and foot but did guide the toes past the point of impact.
Film analysis indicated, however, that contact between the toes and the kick platewas not maintained throughout the entire course of the run. Since the displacement ofthe leh3 exceeded the plate aeployment rate, which was a function of gravity (the rateat which the bar increases the toe guard-kick plate angle was determined by a weightI • pulling the .od into the wedge), motion of the kick plate tended to lag behind hat of

the foot, Spring, hydraulic or ballistic deployment would obviously improve resultsbut since this was considered a feasibility test, the aforementioned improvements werenot undertaken. Nevertheless, results from this pilot study proved to be extremelyencouraging. Figure 20 shows the data obtained from the three tests conducted. Thesolid lines indicate the contact forces monitored on the right foct with tne kick plateinstalled, while the dashed lines demonstrate the data from the left foot where impactwas allowed (no dynamic kick plate). Since the kick plate was initially preloaded, theforces in the early stages go negative because the instrumentation was zeroed out atthe time of initiation (i.e. since the toe exerts a slight force on the kick plate,the fulcrum created by the rod produces a negative component at the strain gauges).Since the foot was not maintained in constant contact with the kick plate some spikesin the data are evident (solid lines) but their magnitude (approx. 50 Lbs) are clearlymuch lower than those monitored on the unprotected leg (approx. 200 Lbs). It must beremembered that these feasibility tests addressed only the foot impact problem andleave the accomodation questions pieviously discussed unresolved.
REFERENCES
1. G. D. Frisch, "A Human Body and Crew Station Modeling System for MotionStudies." Paper No. 821-1, AGARD Conference Preprint No. 253, 1978.
2. R. Katz, "Cockpit Geometry Evaluation." Report No. D162-10127-3, JANAIR Report720402, The Boeing Aerospace Group, Seattle, Washington, 1972.
3. C. L. Ewing, D. J. Thomas, "Human Head and Neck Response co ImpactAcceleration." Naval Aerospace Medical Research Laboratory Detachment, New Orleans,Monograph 21, 1972.
4. G. D. Frisch, L. A. D'Aulerio, J. O'Rourke, "The Mechanism of Head and NeckResponse to -Gx Impact Acceleration. A Math Modeling Approach." Aviation Space andEnvironmental Medicine, 48(3);223-230, 1977.
5. J. T. Dempster, "Space Requirements of the Seated Operator." Report 55-159,Wright Air Development Center, Air Research and Development Command, Wright PattersonAFB, Ohio, 1955.
6. L. B. Walker, E. H. Harris, and U. R. Pontius, "Mass, Volume, Center of Mass,and Mass Moment of Inertia of Head and Neck of Human B<dy." Paper No. 730985,Proceedings 17 Stapp Car Crash Conference. New York- Society of Automotive Engineers,Inc. ;973.
7. E. B. Becker, "Preliminary Discussion of an Approach to Mcdelina Ptuarpn Headand Neck to -Gx Impact Acceleration." Huma Impact Response, pp. 321-328 PlenumPublishing Corp. 1973.
8. J. T. Fleck, F. E. Butler, S. C. Volgel, "An Improved Three DimensionalComputer Simulatf~on of Crash Victims." Volume 1- Volume '4. Final Report for ContractNo. DOT-HS-053-2-485, DOT Report No. DOT-HS-801-507 through 510, NHTSA, 1975.
9. E. R. Winkler, "Thp Use of a Computer Model to Simulate Body Movement in theDevelopment of an Aircraft Escape System." Preprint only, Aerospace Medical Associal-ionMeeting, New Orleins, LA. 9-11 May 1978.

24-5
Fig. I Occup;ant sealed 'It Il~e de;ign eye reference point
HEA
9 SEG MENT HEADs HEAD
0JOINTS NECK- "PIVOTNCK"SHU|F
NECK P I VOT"
4 • 1 STERNOCLAVICULARSU{OUL14•. , JIOINTS
,MASS j ¢. tot ~ in7UPPER ARM.1
OpPP;R ARM UPPE.R TORSO'-
EL',BOW -'- ABDOMINO-PLLVIC MASS
k !•-WAIST PIVOT ORTRS "
vol• \ LOWER TORSO
S 0111p
THIIGHt__ 111PPPR I EG
L--WAER Or-- '
•• L ! 1g.2 wogegmcnt'%. 15 joint%' representation of occupant m~odel

24-6
o -2 -0,
7 71
IoIs

24-7
-. XI
cu~

24-8
j it
I iiI'¢ litnin! p~h•l\N l~IIgk t ,wli,2.'ld , e' Ic"; \ \I1)( l ,,tkkU ,t:I1
lo
br
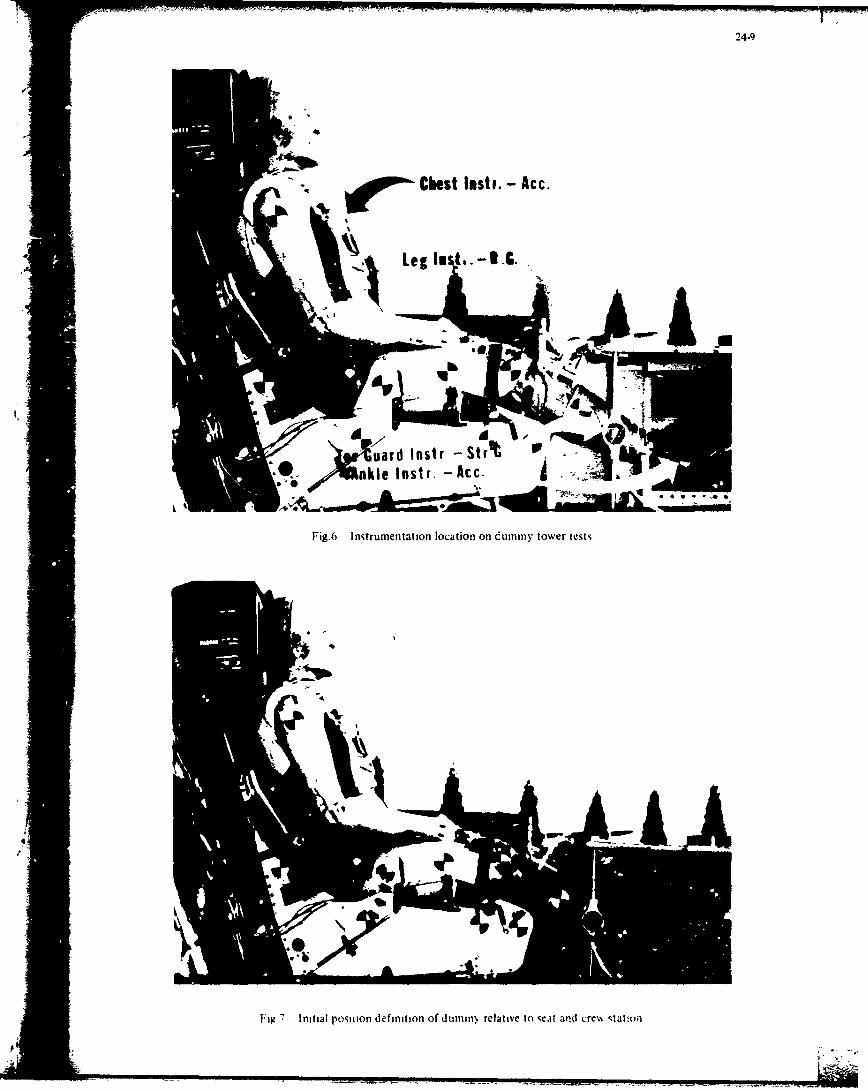
24-9
9
f• -h Chest lmsti.- Acc.
Leg In ..- t .G. ,
uatd Instr -StI A
kle Instr. -Acc.
Fig.6 Instrumentation location on dummy tower tests
Fig Initial position definition of dumin. relative to set and Lrcr Itat!•ti

24-10
SERT GZ
TESTS WITH NU KICK PLRTE.....CDFRSH
I*1 TESTS WITH ISID ItCK PLRTr..(DlL I
2J
w
TIHM" CSEC)
Fig.8 Monitored F•eat acceleration time historie%
F-i I BE IDYNRA I C MOD)EL VRIL DRT I NS TES;T
CHE'ST G;Z
TESTS WITH NO3 KICK PLATE ..... (DRS;HI,A
-" ~TE•STS WIITH RISlD KICIK FLRTE.,€13nLif
z
IL
MbE[M
SII.ll1 .1 11i.21a 10.380
TIME (5EC)
Fig.8 Monitored chest acceleration time histories

24-11 -
TESTS WI TH NOu KICK PLRTE..... CDR•HED)
Iii TESTS WITH RIGID K;CK PLATE..-CnOLID)
N
N-
In
-- ;
z 5
S ia:!.
TIME (SEC)
1-ig.10 Monitored lower leg linear (Gz) acceleration
P-8 I : B laYNRM IC MO3DEL VRL I bT INGE TEST
LEE; ROTATION RRTrE
0TESTS WITH NO KICK PLRTE .. ,.....DRSH
S~TESTS WITH RISID KICK PLAITE.;.,<SILI
14I
-I
I 1
IdI
VW
i-
\ 51
W N,
TIME (5CC)
|tig.!O Monitored lower leg lineuar (Gz)oaccelerttio)
1A
'19
IAi
.-r r
TIE(SC
.1*1 ontrdlwe e nulrvlctyipth

24-12
CHEST RCCELERRTION (Z)
0 SIMULATIONA TOWER TESTS
C5
:72C'a
-o
0 ,.0 2.0•' ibkoa.oo 2bo.oo 24o .coTIME IMSI
Fig. 12 Monitored vs predicted chest linear acceleration
F /
Fig.13 Elliptical representation of F-I18 ejecti,.,1
-]I

24-13
THIGH RNG. DISPLRCEMENT. (Y)
0 HMITa NO HIT
C?
c.
"' 1Io~oo -C.0. 2O- 2110,00•b ~ TIME[ IreS
Fig.14 Thigh angular displacement (pitch)
Fig.15 A4 vs r-18 relative crew station dimensions
ICI-lC

24-14
\ ,'' /
Fig. 16 1-14 \s F-18 relative crew station dimensions
Fig I 7 Composite of ejection sequente from A\-4 aircraft

"24-15
Fig. 18 Composite of ejection sequence from F- 14 alrcr ift
bb
Fig. 19 Dynamic' kick plate deployment during ejection

24-16
F--0a SIDYi-DfHIC MODEL VRLIDRTIhNl TEST
KICK PLATE CRIBHT)
TEST5 WITH RIGID KICK PI.RTE..... 45H1I4
TEST3 WITH DYNAMIC KICK PLATE..(SaLID)
"r4
w
U
"1A0
CZ
II
*.~iBIU 8.23 8.31•
TItlE CSEC)
Fig.20 Monitored kick plate torces durmng ejection
2I
kwai
19 |•

4. 25-1
NAVAkL AVIATION WATER SURVIVAL PROGRAM
WILTON McINTOSH LCDR, MSC, USN
IEAD, AVIATION PHYSIOLOGY, WATER SURVIVALAND TECHNICAL OFFICE, NAVY DEPARTMENT
BUREAU OF MEDICINE AND SURGERY WASHINGTON, D C. 20372UISA
The very nature of naval aviation requires tbit the mejorityof operation flights be conducted overwater. The missionsvary from operations in the immediate vicinity of aircraftcarriers and shore bases to single aircraft flights hundredsof miles from the nearest land. Each situation presents
unique problems in terms of required survival equipment andlength of time to rescue. Major revisions to the Naval Avia-tion Water Survival Program are presently underway, TheTraining curricula are being standarized and water survivalinstructors will be extensively trained to conduct the train-ing, Aviation Life Support Systems are being modified to pro-vide automatic life preserver inflation and parachute divest-ment. New water training devices are being procured and train-ing will be conducted in the devices with the same configurationof life support equipment that the aircrewmembers fly with.
Because of th. equipment, unique operational requirements and differences in lifesupport, three aircraft classifications will be presented- Tactical Jet, Patrol/Transportand Helicopter,
(1) TACTICAL JET: Slide (1) depicts a typically configured jet aircrewmen, Inaddition to the usual protective flight clothing, each individual is equipped tith aninflatable life preserver and a one man inflatable raft contained in the rigid seat kit.The seat kit also contains an emergency supply of o::ygen. The oxygen systems for tacticaljet aircraft are water tight and are required to function properly at a depth of 16 ft. fora minimum of three minutes. During.the ejection sequence the aircraft oxygen supply hoseis separated and the emergency oxygen supply is activated. In this aircraft community theoxygen mask must be worn continuously from take off to landing. In the U.S.. Navy therehave been over 40 reported cages of underwater breathing with this system.
The amount of man-mounted survival equipment has been reduced in the past few years byremoval of the survival vest. The current survival equipment philosophy is to provide lifesupport equipment to sustain the survivor for 24 hours. With the removal of the survivalvest, pockets were sewn directly to the integrated restraint and parachute harness, ab canbe seen in Slide (3). This minimal amount of equipment is obviously no, sufficient forlong term survival, Naval Safety Center records reveal that 91% of the aircrewmembers re-covered are rescued in one hour or less. Thib reduction in man-mounted equipment allowsmore freedom of movement and less encumbrance in the cockpit as a trade-off to less equip-ment available to the survivor. The survival vest contains slightly more survival equip-ment and can be worn at the individual crewmembers discretion. The seat survival kit con-tains and emergency radio beacon, a small survival kit. sianal flares, mirror and sea dyemarker.
Ejection from a jet aircraft can injure the aircrewmember and prohibit use of any ofthe survival equipment, The majority of ejections occur at such low altitude that no timeis available to prepare for water entry. The classical example of this is an unsuccessfulcatapult launch from or recovery on an aircraft carrier, In this instance the ejectee hasonly seconds after the decision to eject until he is in the water. The heavy bulky con-figuration of life support equipment also hampers survival efforts, The Naval WeaponsStation, Yorktown, Va. published a report in December 1978 that described the effec. ofimmersed life support equipment. According to that report the life support equipment of afully configured jet crewmember with the rigid seat survival kit unopened and still at-tached to the man exerts a negative buoyant of 14 2 pounds on the man. This additionalweight combined with the bulk of the equipment and the rigid seat survival kit makes swimm-ing almost impossible. The survival problems encountered after water entry are shown inSlide (5).
As can be seen in this slide, from the period 1971 to 1977 56 of 213 individuals ex-perienced parachute entanglement. Ten of these individuals were not only entangled butwere pulled down, to varying degrees, by the parachute, Of all the survival equipmentcarried the shroud line cutter has been the Diece of equip:ient most often used in the pastfew years, The navy has recently contracted for several parachute disentanglement trainers.With this device the trainee is pulled from a simulated cockpit and swung over the water.There are two modes of operation for the device. In the low altitude mode the student isallowed to drop part way to the water stopped 3bruptlv to simulate a 3-6G parachute open-ing shock, and allowed to drop in the water with no time to prepare for entry. In the highaltitude mode the student is allowed time to inflate the life preserver and perform otherpre-landing maneuvers. The parachute car~opv is approximately 14 ft. in diameter. After ithas collapsed over the student he must then free himself from the parachute and shroudlines, swim free of the parachute and prepare for rescue. The first of these trainers willbe delivered to Pensacola, Florida with additional devices being procured for other watertraining sites. An automatic parachute divestment svstems is currently being developed.
iw

25-2
This system is integrated directly into the parachute attachment hardware (Koch Fitting)and requires total immersion into salt water to actuate. This system is expected to beoperational in 1980.
With the life preserver fully inflated, retention of all the survival equipment and evenand some minor parachute entanglement poses no serious threat to drowning because the headis supported well above water level. However, in mary cases there is not sufficient time toinflate the life preserver prior to water entry, The crewmember must then remain afloat,divest the parachute, and inflate the life preserver while wearing wet gloves. The presenttrend in water survival training is to conduct drills in the water with the same configura-tion of life support equipment that is utilized in the aircraft. Experience to date has re-vealed that a fully equipped tactical jet crewmember with the life preserver uninflated canremain afloat for less than two minutes after water entry, Failure to actuate both sides ofthe life preserver has resulted in several drownings. Typically the individual will inflatethe side of the dominant hand and not be able to locate or actuate the other. The effect ofone half inflation is graphically depicted in the next two slides, As can be seen in Slide(12), during the time period 1973 to November 1977 a total of 188 individuals obtained fullinflation of the life preserver in the water and even with retention of the survival kitand/or parachute only one fatality occurred. With only one half inflation there were 11drownings of 40 eje,.tees reported in the same time period. One half inflation providesapproximately 30-35 pounds of positive buoyancy, Since the survival equipment with the seatpan attached and unopened creates 14.2 pounds of negative buoyancy it causes the individualto float at slightly below chin level in still waters with one half inflation, The neck isnot supported and with any wave action water will break over the head causing the survivorto swallow and aspirate water, further degrading his physical condition.
Two life preserver modifications are curren' y in progress to aid with inflation, Oneis the replacement of the pull toggles for the preserver. The present toggles are smallrounded plastic pieces that are stitched closely to the casing of the life preserver. Thereplacement actuation mechanisms will be beaded handles attached to the ends of the lifepreserver casing. This configuration is very similar to one used for several years in theunited kingdom. An automatic inflation device is also being procured. This device actuateswhen totally immersed in water, fresh or salt, within three seconds. The automatic inflatorwill be utilized only in tactical jet aircraft since escape from a ditched aircraft wouldbe seriously affected with the life preserver inflated. These devices are expected to beoperational in late 1979 or early 1980.
(2) PATROL/TRANSPORT:. The floatation garment used in this community is the sameone utilized in tactical jets with a different attachment scheme to the body. The survivalvest is also utilized by the patrol aircraft crewmembers. Since the suat survival kit isnot utilized in these communities, the survival equipment and single man raft are not avail-able, Multi-man raft are utilized in patrol aircraft and are stowed inside the aircraft,These rafts must be pushed or carried out of the aircraft after ditching, Transport air-crewmembers do not routinely wear life preservers, but stow then aboard the aircraft. Someof the transport aircraft have externally mounted multi-man rafts that are expelled afterwater impact, Duration of survival is the most important consideration for this community
(3) HELICOPTERS:. Helicopters ace not equipped with parachutes and the aircrewmenmust rely on water landings for escape A few helicopters are equipped with fuselage floata-tion bags, but most are not. Because of the weight distribution in helicopters the centerof gravity is high on the aircraft and after impact they tend to roll inverted and sinkrapidly. Approximately one half of all helicopter water accident survivors reported thatthey were forced to escape from submerged or partially submerged aircraft. There have beer306 fatalities in Navy and Marine uorps helicopters from 1969 to November 1977. A total of29 individuals were known to have been drowned and an additional 58 were lost at sea. Manyof those lost at sea were probably drowned, but could not be verified. The most Drevelantcauses of difficulty reported in escape from helicopters are, In-rushing water, confusion/panic/disorientation, hampered by equipment, difficulty reaching the hatches and darkness.
Training in underwater egress has proven to be a definite factor in helicopter surviva-bility for both aircrewmembers and passengers. Between January 1969 and Fcbruary 1975 atotal of 424 individuals were placed in a situation of escaping from an aircraft in thewater. Of those who had been trained in underwater egress, 92% of them survived, while only79% of the untrained individuals survived, Underwater egress has been taught for severalyears in the "dilber dunker" device. This device does not simulate a helicopter in configu-ration or sinking characteristics, but does instill confidence in one's ability to egressunderwater. The device simply slides down the tracks, impacts the water and inverts Thetraining of helicopter crews in underwater egress is being improved by the development of ahelicopter ditching trainer. This device is configured much the same as a helicopter in-terior. Panels can be moved and escape hatches changed to simulate specific aircraft con-4 igurations.
This device can accommodate up to 6 trainees with each cycle. The students enter thedevice from the platform above the pool and attach themselves to the seat with the appropri-[ ate lap belt/shoulder harness. The device is then lowered into the water at a rate of up to
10 FPS. After water impact the trainer floods and sinks at a rate of up to I FPS, Thedevice can be rolled in either direction up to 180 degrees., The students are instructed toremain seated until the device stops and then to disconnect from the seat and move to anexit port and swin, free of the trainer, This trainer requires a dedicated training pool24 ft. by 34 ft. by 15 ft. in depth. The only operational device is presently located inPensacola, Florida and c7 additional four or five devices will be placed at other Na', andMarine Corps activit!.- .'our training cycles are performed with each student, two with

t her25-3
unobstructed vision and two while wearing darkly colored goggles to simulate night escape.
In February 1979 the Chief of Naval Op~racions approved an operational requirement toimprove helicopter aircrew survivability. The major elements of that program are: crashimpact energy attenuation, fu.;el fire suppression, fuselage floatation/sink rate retarda-tion, emergency egress and improved life support equipnent. If a floatation or sink re-
tardation system can be piaced on all helicopters th. requirement for emergency underwateregress would be minimized. One new navy helicopLer is being procured with floatation de-vices and many in-service aircraft can be retrofitted, but some helicopters in inventorycannot accept the weight penalty..
The Naval Aviation School Command at Pensacola, Florida has been designated as the Avia-tion Training Model Manager for water survival training. Tn this capacity that command isdeveloping standardized training curricula. Water survival instructors will be sent toPensacola for a period of approximately four weeks of training in order to provide qualifiedswimmers/instructors and standardized training. Almost all initial aircrewmember watertraining will be conducted at Pensacola. The training will include basic swim skills,device utilization and open water training in the Bay. Refresher training is required everythree years in the swimming pools and every five years in open water. Efforts are presentlyunderway to initiate overwater parasail training as part of the five year open water sylla-bus.
For global operations aircrewmembers must be prepared for all weather and water condi-tions. In late 1978 a naiy operational requirement for anti-exposure protection was ap-
proved. The criteria established for immersion hypothermia protection are: the crewmembermust be able to accomplish the mission, protection in 45 0 F water for two hours with bodycore temperature of not less than 95 0 F, the system must be able to be graduated to affordprotection in 32 0 F water for two hours with a core temperature of not less than 95 0 F. As aninterim measure the navy has selected the British Ventile suit as the primary anti-exposuregarment, and a divers wet suit as an alternative.
REFERENCES
Chief of Naval Operations itr Ser 987/239511 of 16 February 1979
Cooley, L.-- Hazards of overwater helicopter operations. In Aeromedical Aspect of Heli-copter Operations In The Tactical Situation, AGAPD conference proceedings series 24, NorthAt 1 antic Treaty Organization, Advisory Group for Aerospace Research and Development,, May1967, pp. 205-211,
Cunningham, W. F. : Helicopter Underwater Escape Trainer AGARD conference proceedings No
255 operational Helicopter Aviation Medicine pp. 66-1 - 66-3.
Hellman, A. S., Gillispie, G. P.. A Systemized Approach to Helicopter Safety.
Naval Air System Command message 021950Z August 1978.
Naval Safety Center Speedletter 113A:CMR 1300 cf 11 January 1978,
Naval Weapons Station, Yorktown, VA report WOECY 78-62 dated December 1978,
Rice, Erna V., and Greear, John F.., Underwater Escape from Helicopters. In Proceedings ofthe Eleventh Annual Symposium Surivival and Flight Equipment Association, hoenix, Arizona,October 1973, pp. 59-60.

-$ 26-1
HIGH SPE) LOW LEVEL FLIGHT SJRVIVAL ON EJECTION
SQUADRON LEADER M.A.A. HOBBS (RETD.)TECHNICAL AND ENERAL SALES MANAGERMARTIN-BAKER AIRCRAFT COMPANY LIMITEDHIGHER DENHAM, NEAR UXBRIDGE, MIDDLESEX,
UB9 5AJ, U.K.
The aim of this paper in the short time available is to show the history of past work conductedby our Company in association with other Research Establishments on High Speed Low Level Ejection.The paper itself will be split into three phases, Past Experience, Current Day Practice and finallyA Look Into the Future.
As aeroplanes get faster and faster one hears glib talk of tree top level flight at speeds of800 kots and above using terrain following radar. When one conside's that the dynamic pressureexerted on the human body at speeds of 600 knots are in the region of 1,280 lbs. per square foot it iseasy to realize that the man leaving the aircraft can be critically injured by the dynamic forces appliedto him and also inevitably is liable to be deeply shocked by the experience.
In 1962 the TSR2Tactxcal Reconnaissance Aircraft) was designed to travel at speeds of up to800 knots at tree top level. At that time Martin-Baker recognized that a completely new escape systemwas required to meet the problems associated with this type of flight., Bearing in mind that the averagepilot would spend all his life sitting in the seat and never using it as an actual escape vehicle thenthe primary consideration was excellent restraint for the body so that the pilot would be secured firmlyinto his seat thus reducing fatigue caused by constant turbulence. In order to achieve this object aratchet system was used where the crewmember could tighten his harness by means of a ratchet which meantthat he was snugged back into the seat. The seat also produced avongst other notable firsts : HeadRestraint, Arm Restraint and of course Martin-Baker's Leg Restraint System. It was quite an achievementthat Sir James Martin should have recognised in these early days the requirement for such excellentrestraint systems to dllow the ejectee to survive under highspeed bale out. The evidence, which i shallpresent later, will be based on experience in both the American Vietnamese situation and the Yom KippurWar. A slide of the seat is shown here and as can be seen a special helmet, which included head restraint,was under development for the programme.
The TSR2 was unfortunately cancelled during one of our Government's many 'save money by cuttingdefence' campaigns. Thus the actual ejection seat never came into service, however, one point thatshould be made here is that that particular seat weighed very nearly 300 lbs.
During the 1960's further developments took place, however, nothing as sophisticated as tne TSh2seat was introduced to Service. Leg Restraint Systems were improved however it was impossiole to getanybo•y to show interest in Arm Restraint.
During the late 1960's and early 1970's considerable operational use was made of our ejection seatsir. action during the Vietnamese situation and Yom Kippur war. Both these conflicts provided us withvaluable data regarding tze changes likely to take place under operational ejections as opposed to normalpeace time ejections. As may well be expected the speeds at which ejections took place increased. Ibelieve that the main reason for this was the fact that aircraft were flying lower and faster than everbefore and at the same time having little warning before they were hit by surface to air missiles. Theslides that I show here firstly show the combat versus operational ejection altitudes and also combatversus operational ejection speeds. It is notable that the operational nor combat speeds show theirlargest percentage well below 250 knots with a diminishing number of ejections up to 500 knots. Incontrast recovered combat data and data obtained frm prisoners of war in the Vietnamese situation showthat the speed curve rises sharply. As we would expect as the speed rises so does the in lury rate andI show here or. the next !lide evidence taken from the Vietnamese situation showing the percentage ofsurvivors sustaining a major injury. As you notice the major problem is one of limb flail and so onthis next slide I show the incidences of major flail injury versus ejection speed and again as can beseen the percentage of flail injury rises sharply as the speed rises This is hardly surprising aswhen one looks at the dynamic air pressure versus air bpeed which I discussed earlier in the paper andwe see that the dynamic air pressure rises sharply as the speed rises and indeed it varies approximatelywith the square of the indicated air speed.
The other major problem of course is one of lack of time. As aircraft fly faster and faster andlower and lower using terrain following systems the vex.eo problem of altitude gets worse and worse.
My next slide shows the summary of tht ejections of those using Martin-Bker seats d& ring 1977and the major causes for fatality. As you can see the lack of time and altitude is the major cause offatalities, other areas obviously require investigation and we have done so in some depth especially totry and avoid ejecting aircrew suffering the unnecessary fate of drowning., In this particular year of1977 my next slide addresses the question of altitude. As you can see more than 4ý% of all ejectionswhere the neight was reported, started below 500 ft. and the table ahows the altitude bands into whichthey fell. It is also notable that in the "om Kippur War 26% of ejections were made at speeds of 400knots or greater. This is higher than the average and at these speeds limb flailing is liable to occur.t% of all ejections were made at a speed of 600 knots or more. The major injury which occurred duringthe Yom Kippur War was again mainly associated with flail. So now coming back to the subject that Iwas first addressing : where does this lead us with regard to high speed low level flight? It showsus that the major improvement that we can make in ejection systems is to ensure that the man is properlyrestrained and also given the best chance of survival by making the system work as rapidly as possiblewithout causing injury and thus impairing his chance of ultimate survival.

26-2
Early trial work with the MRCA Tornado produced sorme fairly spectacular results as this shortsnip of cine fiLm thal 1 show here indicates. The shot you see is taken from the pod camera of theMRCA Tornado sled and shows f!rst of all the canopy being jettisoned followed by the sequenced ejectionof two seats. The sea-ts themselves functioned correctly, however, you will note that the aircrewequipment assemblies virtually disintegrate as they meet the w'.ndblast at a speed of 625 knots. Thisleads me to my next major point which is that the total aircrew protective system must be integratedand tested fully to ensure its integrity under high windblast situations we must ensure that the helmet,lifepreserver, arm restraint and leg restraint are capable of accepting ejections at speeds of up tc650 to 700 knots. In my opinion the only method of sstisfactorily testing these pieces of equipment isto put them on the dummies during the ejection test shots. Valuable information can be obtained fromdind tunnels but it is usually unidirectional and does not allow for yaw in the seat or indeed any othe-changes in geometry.
Now let us consider those areas that will be most beneficial in saving the life of a man whoejects at high speed and low altitude. We must assume that the man who ejects at any speed above 450knots is going to be winded and suffering from shock to a greater or lesser degree. We therefore needto make his survival as automated as possible. To this end our current state of the art provides anejection seat on which the last physical act that the man needs to make is to pull the handle to set thesequence system, canopy jettison and subsequent ejection of the seats In motion. As he exits theaircraft he is protected from limb flail and arm flail and we have ensured that his nelmet will stay onhis head having been tested at extremely high speeds, up to 700 knots, in a wind tunnel and is fittedwith a polycarbonate visor which will withstand the blast. As the man comes out of the aircraft anautomatic IFF system is tripped which shows that an ejection has taken place on all the radar s'creenswhich are currently painting the aircraft. As the man separates from the seat the automaticallyinflated liferaft and automatically inflated life preserver are armed ready for operation on water entryand the personal locator beacon is switched on to transmit. As the man comes down on his parachute hefalls into the sea and both liferaft and life preserver inflate and at the same time the man is supportedin the water by his life preserver. The beacon is of course continuously transmitting. Obviously Ifthe man is unconscious he will not have been able to remove his oxygen mask from his face and to this endwe have provided a self-closing valve in the lower end of the man's oxygen hose and an anti-suffocationvalve in the mask and this will enable the unconscious pilot, whose head is being supported above thewater by his life preserver, to continue to breathe. We have not at the present time included automaticrelease of .he parachute as this is not a device that is currently accepted by air staffs most pilotsfearing a malfunction due to some mechanical mishap. However, we have conducted trials which show thatthe parachute sinking beneath the sea will not act as a drogue and drag the man under for a period of atleast 25 minutes in a rough sea. Even beyond that time It is unlikely to do so. These systems arealready in service today and provide the man with an increased chance of survival especially under advers.oconditions. However, I am sure that most of the people in this audience are well aware that althoughthe opportunity exists to install such equipment on all aircraft very few Air Forces or Navies indeedhave taken the comprehensive package and I can say that at the present time only the Tornado has taken
the complete overall protection approach. The US Navy are currently working on a man safe design ofequivalent capabilities to the Tornado but glan to automatically discon)nect the parachute at water enty.,Again this seems to be a programme that has had very low priority and therefore I sometimes wonder whatare the chances of persuading today's requirements divisions to accept the designs of tomorrow when wecurrently cannot get our existing equipment up to a reasonable standard.
However, to look at the more cheerful side; where are we heading for in the future? One aeawhich bears considerable investigation is the reclining seat which is now being looked at for aircraftof the future. This seat improves the mans tolerance to 'G' and also decreases the fatigue factor andin fact I know the Chairman of our current panel session Wing Commnander David Glaister has in fact donecentrifuge runs in a supernated seat of around lCG. Now we must make this supernated seat suitablefor ejection and we have therefore been working on this aspect over the last few months and I show herea film of a mock-up employing proven principles that incorporate Into a design giving the reclined seateffect. It is noticeable that during this short snip of film that you can see that whilst the seat isbeing reclined or returned to the upright position then little or no change is taking place in thetension in the harness or the geometry of the eye position, the head remaining in the almost identical
position to that from which it starts. The only area in which the geometry is changing are the rudderpedals and I believe that it should not be beyond the engineering ingenuity of most people to designthis simple feature into a reclining seat aircraft. Again we are up against the problem of time andhere again we have managed to reduce the retraction time of the seat pan with the man in it to .23 sec.and hope shortly to reduce this further to .15 sec. once we have the facilities for doing so. Thiswill mean that if the aircraft has a jettisonable canopy then during the time that the canopy is clearingthe aircraft the seat can be carrying out that retracting movement.
There are other projects such as the U34 sponsored Maximum Escape Performance Seat (MEPS) whichseeks the cold of space and directs a verniered rocket to project the seat upward away from the ground;capsules which are expensive and require frequent expensive modification as weights witnin the cockpitschange - and many other embryo ideas.
I can think of no better way of closing than to quote the words of a distinguished U.S. NavyAdmiral, Vice Admiral Frederick Turner who stated recently :
"We have seats and ejection systems that literall. hurl the man out into the darkness in alldifferent directions, unstabilized, Limbs akimbo, neck snapping and even though he might be extricatedfrom the falling machine and thrown into '.he air, he may be incapacitated when free of the aircraft becauseof injury ..... He needs some mechanical or technical apsistance to reduce the shock, keep his sensesgoing and give him some little time. He needs some automatic systems to divest aim of emcumbering
parachutes, gear about his face and the like, when he is thrown into the sea."
Well gentlemen we in the U.K. have made some progress in this area but we can go no furtherwithout the acceptance by Air Forces and Navies of such systems.

27-1
MINIMIZING THE SEQUENCED DELAY TIMEFOR ESCAPE FROM HIGH-SPEED, LOW-LEVEL FLIGHT PROFILES
James H. Raddin, Jr., MDMajor, United States Air 'orce
Lawrence J. SpeckerJames W. Brinkley
BIOMECHAhICAL PROTECTION BRANCHAEROSPACE MEDICAL RESEARCH LABORATORYWEIGHT-PATTERSON AIR FORCE BASE, OHIO
45433UNITED STATES 0c AMERICA
The time delay that occurs between the actuation of an escape system and the actual initiation of theejection catapult acceleration to separate the crew from an aircraft is one of the critical factors inthe design of escape systems for high-speed low-level (HSLL) flight conditions. This delay may precludewhat could otherwise be a successful escape from certain HSLL profiles. The purpose of this pa,'er is toexamine the significance of current operational delay times and describe techniques to minimize the de-lays. Operational through-the-canopy ejection data are presented to assess the risk of injury incurredin eliminating the delay time altogether. Experimental data from tests with human volunteers are pre-sented to demonstrate the potential for significantly reducing the time required for upper torso retrac-tion. Finally, the implications of available aeromedical evidence are evaluated in the definition of themost promising approaches to minimize the time required for a HSLL escape sequence.
INTRODUCTION
The problem uf providing a successful means of escape from a disabled aircratt is quite severe whenthe aircraft is operating in the high-speed low-level (HSLL) flight regime. Many contemporary escapesystems are capable of providing survivable ejection from a variety of flight profiles, including anaircraft parked on the ramp or one flying at high speed and high altitude. However, when high speed andlow altitude are confronted in combination, these same systems may function poorly. This result derivesprimarily from considerations of available time. Low altitudes and high speeds imply the potential forground coatact befo,.' the escape system can complete its function. The circumstances are particularlycrucial in th,' face of other adverse factors such as terrain variations, high sink rates, or unstableflight conditions.
A timely decision to eject is particularly important in the HSLL regime. However, once that decisionhas been made (either by the pilot or by an automatic system) the crewmember must usually remain in theaircraft unwillingly while the pre-ejection sequence takes place. This period typically involves approx-imately 300 milliseconds, during which the canopy may be jettisoned and the upper torso and/or extremitiespre-positioned for ejection. When these activities are completed, the seated crewmember is acceleratedout of the aircraft. It must be emphasized that this 300 milliseconds is added to variable delaysassociated with recognition of the emergency, decision making, attempts at corrective action (if any),and dctuation of the escape system.(l) The interaction of the various escape factors is diagrammed inFigure 1, Several of the factors will be discussed in greater detail later in this paper.
In a high performance ai'-r.aft, 300 milliseconds can be a significant period of time depending uponsituational variables such as :he nature of the aircraft emergency and the component of aircraft closingvelocity with an obstruction. If the aircraft is breaking up or departing from stable flight, much canbe said for exiting the aircraft promptly, even at high altitude. When the aircraft is appreaching anobstruction, successful ejection must generally occur well before aircraft impact since the ejected massmust clear the aircraft, decelerate, and accomplish parachute deployment before its residual velocitycarries it into the obstruction as well. As an example of the significance of a 300 millisecond delay,it can be seen that an aircraft moving at a velocity of 400 knots will travel approximately 200 feet in300 milliseconds. At 600 knots, the distance covered will be approximately 300 feet. The critical para-meter is not the scalar speed, however, but the ve-tor component of velocity in the direction of the mostserious obstruction. In the majority of cases, the aircraft vector velocity is such that a significantvelocity component is parallel to the obstruction. In order for the 300 millisecond delay to be signifi-cant in determining successful ejection, the trajectory must be such that, with the delay, an otherwisesurvivable ejection is compromised. One simplified way to assess the importance of this parameter may be-een in Figure 2. The maximum recoverable dive angles are plotted as a function of speed for variousaltitudes, with and without the 300 millisecond delay. These figyres are computed from published oerfor-mance data for the A-10 ejection seat in the high speed mode at 0 roll,(2) Each shaded area representsthe range of constant dive angles at that altitude for which the 300 millisecond delay is decisive. Foreach altitude, dive angles above the shaded area are all non-recoverable ejections. Dive angles below theshaded area are all recoverable ejections, with or without the delay6 At 30Q feet, it can be seen tha,the dive angles for which the delay is decisive are linited to a 3.5 to 5.5" ban,!, depending on theaivcraft spesd. For example, at 450 knots, the delay is decisive only for constant dive angles between15 and 18.5 . On either side of that band in this simplified case, th, outcome is independent of tt'epresence or absence of a 300 millisecond delay. As altitude increases 6 tne dslay at first becomes nioresignificant, as at 700 feet in which the critical band ranges from 8.56 to 20 depending on 6he speed.For example, at 250 knots, the delay is decisive for constant dive angles between 63 and 83 . Here,however, the dive angles involved ire much steeper, and consequently less often encountered. As ejectionaltitude is increased still more, tne presence or absence of the delay ev(ntually becomes completelyinconsequential with respect to terrain impact avoidance.
Similar families of curves can be generated for other flight profiles, incorporating various rollangles, roll rates, or more complex trajectories such as a parabolic curve with increasing dive angle.Such analyses will continue to demonst,-ate ,nat the 300 millisecond delay is decisive in only a smallpercentage of potential ejection trajcctorias. This remains true since the delay is significantlysmaller than the time from eiection initiaticn to parachute openinq. Durinq this time, the ejected mass

RECOGNITION
DECISION
ACTUATION
EONCED TORS CAOpy FRAGMENTATION, ?LIMB ?AIRCRAFT FLIGHTTI DELI REP SI IPEITRATON. or JETTISO ERESTRAINT PRMTRC1TO
LDOLLOSIEN
Rigur 1.EECINATE9C LW HR
S-TANE/SABLIE

27-5
U.00.3 SecondDelay
M.M Decisive
73.0
Constant)ilve .UPngl.
(Degrees)
I.M700 Feet
300 Feet
II.i
Airspeed (Knot;•
Figure 2. TRAJECTORIES FOR WHICH 0.3 SECOND DELAY IS DECISIVE
may travy- great distances in the direction of the aircraft flight path at ejection. Thii 's preciselywhy techniques which delay parachute opening in order to produce complex trajectory changes may be delete-rious in some cases. The difficulty is most easily seen with trajectories in which the :lo',ing velocitywith tie qround is greater than can be overcome by the available ejection seat thrust aid in which theinitial ejection direction is already favorable, which is usually the case.
Therefore, when we consider a problem such as the 300 millisecond delay which is expe.ted to be deci-sive in oily a small minority oi potential ejection scenarios, we must take great care to avoid institut-ing a solution to the problem which would compromise safe performance of the escape system in the majorityof si..dations.
TECHNIQUES FOR FASTER EJECTION
The sequenced delay problem could be attacked by reducing the effects of the delay, reducing the delay,or by a combination of both. The potential for reducing the effects of the delay will be briefly examinedfirst. The techniques will include more rapid escape system actuation and aircraft trajectory modifica-tions before and after escape system actuation.
In spite of the significance of the short time intervals of the ejection sequence, it remains truethat the most siqniflcant delays occur prior to ejection sequence initiation. These delays occur as a re-sult of the time required to recognize an emergency, decide on a course of action, and initiate ebcape.Furthermore, thi course of action may include one or more attempts at corrective efforts which involvefurther reaction times to accomplish these efforts and assess results. The importance of a timely deci-sion to eject is frequently st.,essed to aircrew members, and appropriately so. However, significant bene-fits may be realized by automatlc systems to facilifate th's function, particularly in the HSLL flightenvironment. An example of this approach is the pitch-up maneuver that is automatically engaged whenfailure is detected in a terrain following autopilot. This maneuver allows the crewmember additional time
* f3r assessment and, if necessary, escape initiation. .iore sophisticated sensing of aircraft f~ight para-wmters and terrain clearance could allow automatic initiation of emergency aircraft maneuvers, short ofactual ejection, even when the aircraft is being manually flown. The philosophy for such systems wouldrequire special attention to limit their actuation to situations in which a clear departure from con-trolled flight has occurred. Optional manual initiation could be employed. Their function could be todeploy speedhrakes and seek to gain favorable altitude and flight path with respect to terrain. Actualejection initiation could be left to the pilot ur accomp'ished automatically in clearly irrecoverable de-partures from controlled flight. Such systems may allow safe recovery from otherwise impossible situa-tions. Their use seems more reasonable under HSLL flight conditions when it is recalled from Figure 1that i *9 dive angle leads to an irrecoverable ejection from 300 feet at 450 knots, even withoutsequenced delay.
If consideration is limited to manual escape initiation, th~e aircraft may still be designed toautomatically sense critical flight prnfiles, display warnings, and allow escape system actuation fromthe crewmember's flying position with miniium motion consistent with protection against inadvertentoperation.

27-4
The basic intention of this paper will now be served by pursuing an examination of techniques to re-duce the 300 millisecond sequeuced delay time. Since the delay is normally used to jettison the canopyand accomplish upper toeso repositioning, reducing the delhy must affect the perf~rmarce of both functions.Three basic approaches suggest themselves:
1. Decrease canopy rL4oval time;Decrease torso repo~itioning time.
2. Eliminate canopy removal;Decrease torso repositioning time.
3. Eliminate canopy removal;Eliminate torso repositioning.
A fourth permutation (decrease canopy removal time, eliminate torso repositioning) can be discarded if itis assumed that torso --epositioning is desirable and that it can be accomplished at least as r)pidly as afaster canopy removal. An additional assumption is that limb restraint must not necessarily be completebefore firing of the ejection catapult.
Strictly from time considerations, the third alternative appears preferable since it allows immediateejection initiation with system actuation. However, based on conclusions from the previous discussion,such a "solution" would only be preferable if the improvements to be realized outweighed any costs to beincurred in teoms of ejection morbidity and mortality. The improvements to be realized cannot be clearlyquantified without a knowledge of the population statistics of the ejection parameters to be encounteredin future HSIL operations. From the previous analysis, however, it could reasonably be expected that thedelay will be critical in a minority of cases. On the other hand, it is intuitively desirable to increasethe safe ejection envelope, by no matter how small an amount, with the expectation that it will helpsooner or later. The basic question is then related to the possible costs incurred in eliminating uppertorso retraction and ejecting immediately through the canopy.
THROUGH-THE-CANOPY INJURY DATA
Ooerational data are available to assess tha experience with several through-the-canopy (TTC) ejectionsystems in which upper torso retraction was not performed. These data were analyzed in order to assessthe potential risk associated with a proposed modification to a low-level aircraft which would introduce aTTC system as the primary escape mode. Figure 3 demonstrates a comparison of tite results of 16 pairs ofejections from the Uniteo States Navy A-6 aircraft.(3) The pairs were formed by utilizing 16 availablecanopy jettison ejections and obtaining a best match for altitude and speed at ejection from among 114ejections through-the-canopy. The adequacy of the matching can be seen in Table 1. The summary in Figure3 indicates significantly increased injury rates for lacerations in the TTC data (p = 0.1). 'pinal frac-tures appear to be increased in the TTC data but are not found to be significant at the 90% confidencel vel for this small sample. A similar match was performed using 22 non-fatal TTC ejections from theUnited States Navy A7 aircraft (3). lhese were matched with A7 canopy jettison data from among 152 ejec-tions. The matched parameters are shown in Table 2 and the injury compariscn in Figure 4. In this case,the TTC ejections showed a significantly increased rate of spinal fractures (p = 0.1) and lacerations( p = 0.C5)
These data are particularly significant when the ejection equipment is taken into account. In bothcomparisons the nTC system had milder ejection seat thrust profiles than 4id the canopy jettison systems.Thi; should tend to produce fewer spinal injuries in the TTC experience but, in fact, the reverse wastrue.
A further interesting finding in these data was the distribution of spinal fractures observed. Atotal of 394 ejections were examined from a variety of United States Navy aircraft, including 224 TTCejections. The resulting spinal fractures are summarized in Figure 5.(3) The bimodal distribution is incontradistint.tion to the large sample of Un.ted States Air Force spinal fracture data shown in Figure 6.(3) This data is modal about a peak which occurs in the lower thoracic-upper lumbar region. The mid-thoracic peak in some data samples has been previously reported elsewhere, (4) but in this sample wasfound to derive largely from the TTC systems. A similar mid-thoracic peak has been claimed for Air ForceF/FB-lll and F-4 ejection data.(4,5) Surprisely, available data from 64 dnited States Air Force inadver-tent TTC ejections did not demonstrate the mid-thoracic peak (Figure 7).(3)
The operational injury data does r.jt delineate cause and effect mechanisms; however, it does indicatethat a cost in terms of morbidity and mortality may be incurred when the sequenced delay time is elimi-nated altogether. The cost may well be out of proportion to the small benefit to be gained from elimi-nating the delay. This cost may derive from ejecting throuqh the canopy or from failing to retract theupper torso or from a combination of the two. If the source ot spinal injury is related tc ejectingthro,|gh the canopy, the question remains as to the mechanism of injury production. Downward loadingthrough the head or shoulders may be implicated. Alternatively, temporary retardation of the seat, as itforces its way through canopy material, could produce a surge in the acceleration of the seat and, there-fore, the force transmitted to the spine th-ough the seat pan. A third possibility Is flexion of thespine during catapult firing in the absence of windblast force until clearing the canopy. This mechanismis based on the supposition that the head and torso of the. ejectee are benefited by the restraining forceof aerodyamIc pressure acting on the ejectee after canopy jettisoning. Newer approaches to TTC ejectionincorporat.e various designs of canopy weakening or canopy fragmenting pyrotechnics using mild detonatingcord (MDC). Whatever the postulated mechanism of injury, it would appear that active dispersal of thecanopy by a p~rotechntc system would minimize the likelihcod of tlhe canopy being a contributor if a clearpath for the seat/man combination could be provided.
Without a clear definition of cause and effect in the observed injury data, it is unlikely that a testapproach ciuld be proposed which would prospectively assure that a given TTC system would not producesimilar Injuries. The best that can be reasonably expected would be to design a system which avoids theimposition of forces that appear most likely to be implicated and await an operational assessment.

27-5
Figure 3
A6 MATCHED PAIR ANALYSIS
IS
14 • JETTISON
•7 T.T.C.
12 --------- INJURY---------------I
is
!4
TOTAL FATAL MAJOR MINOR NO SPINAL LACERATIONSEJECTIONS INJURY INJURIES
S~Figure 4
A7 MATCHED PAIR ANALYSIS
21-INJURY JETTISON
18 [Z•T.T.C.
EJECTIONS INJURY INJURIES
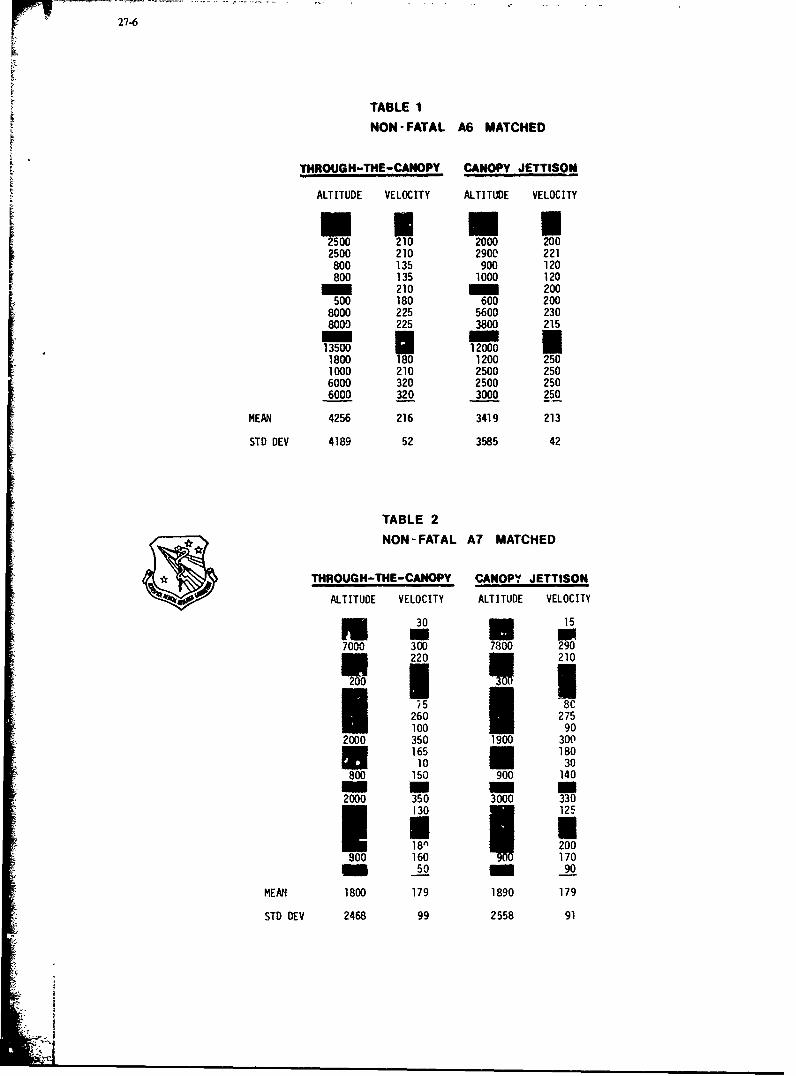
27-6
r TABLE 1
NON-FATAL A6 MATCHED
THROUGH-THE-CANOPY CANOPY JETTISON
ALTITUDE VELOCITY ALTITUDE VELOCITY
l5. .22500 210 2000 2002500 210 2900 221800 135 900 120800 135 1000 120
210 200500 180 600 200
8000 225 5600 2308000 225 3800 215-- U m
13500 12001800 180 1200 2501000 210 2500 2506000 320 2500 2506000 320 3000 250
MEAN 4256 216 3419 213
STD DEV 4189 52 3585 42
TABLE 2S NON-FATAL A7 MATCHED
THROUGH-THE-CANOPY CANOP" JETTISON
ALTITUDE VELOCITY ALTITUDE VELOCITY
30 15
7000 300 7800 290
o220 210
200 1 I
S•5 1814260 275100 90
2000 350 1900 300165 18010 30
800 150 900 140- m m m2000 350 3000 330
130 125
U 118n 200
800 160 1701 50 90
MEAN 1800 179 1890 179
STD DEV 2468 99 2558 91

27-7
Figure 5
CELL ' KNOWN SPINAL FflACTUflE LOCATION:S WNAVY)COUNTS -
I11
I I
C 1-~ T! T2 T1 -_ lTliI{IFigure 6
CELL (" KNOWN SPINA!- FRACTURE LOCATIONS [AIR FOHCE'CouNTS [1964-1970]
24
12
)L
II
SI--1 q--1!, ~~ ~ 7v I:c 1 tz.ý III'. E l !l IZ.- .._ 31 B'I -' ' ... .
Figure 7
COUE-LL KNOWN SPINAL FRACTURE LOCATIONS [AIR FORCE)
qt UNPLANJNEDTHRU CANOPY
I
2-
72 I 13 74M I7 !1117121.1I1:3 L 5S S
Tsl ,3_____ j

27-8
An alternative to the TTC approach is more rapid canopy removal. Some newer systems achieve this, butthe residual time delay penalty seems to be about 160 milliseconds even at high speed. The most desirablesystem would produce a greater decrease in the delay. Since we are dealing with a problem where a solu-tion may yield only a small benefit, it seems ill-advised to spend large sums to correct half of it.
TORSO RETRACTION EXPERIMENTAL DATA
Turning to the problem of upper torso retraction, current ballistic inertia reel specifications appearto be based on present canopy removal t:mes rather than on human tolerance to the retraction provided bythe reel.(6) In order to assess thE potential for shortening this time, a series of human volunteer testswas performed at the Aerospace Medical Researcl, Laboratory (AtIRL) at Wright-Patterson Air Force Base, Ohio.These tests included 179 human exposures during the period from January 1978 to April 1979.
The AMRL Body Positioning and Restraint Device (BPRD) was used to accomplish upper torso retraction.The BPRD is a hydraulically actuated retraction system designed to simulate the force-time history of apowered inertia reel.(6) The subject wore a helmet and USAF restraint harness and was seated on an inqtrij-.- ented seat which allowed recording of the inertial forces reacted by the subject into the seat pan andseat back. The sutject was restrained by a conventional seat belt and torso harness. Force transducerswere used to measure loading applied to the subject. The shoulder straps were attached to the torso har-ness using standari Koch fittings. The other ends of the shoulder harness were attached to the retractioncable of the BPRD. The cable was extended by a measureJ amount prior to each test. The subject was askedto lean into the harness and maintain 10 to 20 pounds of force to simulate the normal reel retraction ten-sion. The actual value was displayed to the subject on a digital meter. The signal was derived from aforce cell linked to the retraction cable. At initiation, the subject was retracted by the hydraulicactuator and impacted the instrumented seat back. Head and chest accelerations were approximated usingtriaxial accelerometer arrays applied over the subject's sternum and fixed to the maxillary teeth. Sub-jects participated no more often tI~an once per week. Medical supervision included pre-test and post-testphysical examinations and blood pressure measurements as well as continuous electrocardiographic monitor-ing with a medical officer in attendance. Twenty-two subjects participated during various stages of theprogram. 20 males and 2 females. Each subject followed a sequence of gradually increasing retractionlengths and/or hydraulic pressures. A sequence of pictures illustrating a typical retraction is includedas Figures 8-11.
Figure 8 Figure 90 Milliseconds 49 Millisecunds
II
Figure 10 Figure 11101 Milliseconds 139 Mlilliseconds
10 INCi. (25.4 CM) RETRACTION SEQUENCE

27-9
Although operational reels generally provide 18 inches (45.7 cm) of retractable length, it has beenfound that a portion of that length is used in order to extend the shoulder straps to reach the attachmentfittings of the torso harness. The practical maximum retraction distance is approximately 14 to 15 inchesfor a crewmember grossly out of position. Such a situation is probably most likely in a multiseat air-craft in which a crewmember may be ejected unprepared in an aircraft undergoing high G maneuvers, or in ar.accidental or automatic ejection. The AMRL experiments investigated retraction distances of 10, 12, and14 inches (25.4, 30.5, and 35.6 cm).
The results of these tests indicated that retraction of the human torso in a one G field could besafely performed in much less than 300 milliseconds even through lorge distances approximat4 ig the maximumextention of a typical reel. The means and standard deviations for selected parameters are presented inTable 3. (The "PSI" notation denotes the hydraulic pressure used to produce the retraction). Figure 12presents a plot of peak caule force versus retraction time. It can be seen that a point of diminishingreturns is eventually reached in w;ich large ;ncreases in cable force produce only small decreases inretraction time. All measured parameters appear to be well within human tolerance. The subjects tole-rated the procedure well in all cases and generally reported enjoying the experience.
Several other points are worthy of note. The retraction time was defined as the time from the onsetof cable force to the peak of seat back force. Approximacely 10 milliseconds should be added to thereported retraction times to allow for the uncertainties in the timing of the pyrotechnic element in theinertia reel. Peak seat back force appeared to be a reasonable retraction completion criterion. Somesubjects had continuing head erection movement following this point, but others maintained a head-forwardposition. The optimum time for ejection initiation, therefore, could nut be based on head orientationafter retraction. This would be particularly true in retracting a subject whose torso was already on theseat back.
One experimental condition purposely did not reproduce an operational retraction. In our tests, the
subject was fastened to the cable with the piston fully retracted and adjusted for comfort. This assuredthat no significant afterload would be placed on the subject by the hydraulics after retraction. Such isnot the case in the cickpit since the inertia reel generally does produce an afterload. A future testseries is planned at AMRL with applied afterloads. It is anticipated that the forces and accelerationsat seat back contact in this case will be more severe. It should be recognized however, that althoughthe reported eyneriment does not duplicate the operational system in all respects, the operational config-uration could be made to duplicate the experiment, if desired, by a procedural change and the provisionof adjusters on the harness.
A final point concerns head impact against the backrest at the end of retraction. During develop-mental testý. for the human test series, anthropomorphic dummies were utilized to determine expectedforce levels. The dummies experienced head impacts in the range of planned human exposures. Some ofthe impacts were of such great force that helmet fractures occurred. Our analysis indicated that activeneck muscular effects in the human would significantly reduce the head velocity at impact allowing asafe exposure. Furthermore, human tests at low levels indicated that the dummy tests predicted higher
accelerations than were observed with volunteers. We therefore proceeded with the plann-d exposures and,to our surprise, observed no significant head impacts at ali. This points up once again the critical needfor continued live human subject testing. Particularly when designing systems intended to bc safe, know-
ledgeable developmental testing with living subjects can yield invilv'ble .dta for optimized designs,allowing demonstrated safe performance at levels which would appear to be injury levels using dummies,human cadavers, or animals.
Table 3. RETRACI•II TEST PARAMETERS
I Retraction Length Retraction Length Retraction Length
10 Inches 12 Inches 14 Inches600 PSI 900 PSI 600 PSI 900 PSI 600 PSI 900 PSI
1. Retraction Time (Seconds) 118 (8.2) 1134 (11.5) 167 ( 9 ) 144 (9 ) 190 (12 ) 158 ( 10
2. Peak Cable Force (Pounds) 185 (24.3) 250 (28.5) 188 (19.4) 259 (35.6) 198 (24.3) 286 ( 34.9)
3. Average Reel RetractionVelocity (Feet/Second) 77.9 ( 2.4) 97.4 ( 2.7) 87.2 ( 2.3) 108.5 (4.1) 86.1 ( 2.5) 110.9 ( 3.5ý
:4. Peak Seat Pan Fcrce (Pounds) 75 (18 ) 102 (23.4) 96 (21 ) 118 ( 34 ) 109 (31 ) 146 ( 40 )
S. Peak Lwoer Back Force (Pounds) * 91.2 (41.1) 86.2 (41.4) 106.3 (31.8) 109 ( 29.8)
6. Peak Upper Back Force (Pounds) 354 (71 ) 466 (70.6) 365 (77.8) 512.4 (111.2) 326.3 (48.7) 463 (106.6)
7. Peak Chest Acceleration
I a. Retraction (W's) 7.2 ( 1.4) 11.6 ( 1.5) 8.2 ( 1.9) 11.8 ( 2.6) 6.9 ( 1.4) 11.5 ( 2.1)
b. Seat Back Impact (c'W) 7.5 ( 1.2) 11.9 ( 1.9) 10.6 ( 2.9) 15.4 ( 3.4) 9.2 ( 3.4) 13.3 ( 2.6)
B. Peak Need Acceleration
a. Retraction Acceleration 7.1 ( i.Zy 11.7 ( 3.0) 9.4 ( 2.6) 15.7 (4.5) 8.2 (2.1) 15.9 (5.4)
b. Deceleration (G'e) 5.9 (2.3) 10.2 (3.3) 7.7 (1.2) 13.5 ( 3.5) 5.86(1.3) 12.0 (2.2)
s No Data Tabulated valuee ar? experimental meana vith the standard deviation in parentheses.

27-10
0 .I
RetractionCompletion
Tim
(Seconds) 10.inc
12 Inch
10 Inch
SI I I I I
Cable Force (Pounds)
SUMMARY AND CONCLUSIONS
The available evidence, therefore, indicates that small but possibly significant improvements increw survivability may be realized through a reduction in the sequenced time delay during ejection. Thisimprovement may be undermined to an unknown degree by other ejection injuries or fatalities if the delayis eliminated altoqether.
Two general approaches appear to hold promise for attaining an improved overall escape performance.The first approach would involve an improved canopy removal system with a faster system for uIper torsoretraction as demonstrated in the experimental series. This appro3ch would be limited to a potential im-provement of approximately a factor of two over present systems due to the limited capability for canopyremoval.
The.second, and ultimately the more promising approach would involve an advanced TTC system in whichthe canopy dispersal pyrotechnics would allow an essentially clear path for crewmember and seat. Further-more, the TTC initiation would occur at the completion of retraction as measured by an active sensor.Such a sensor could be incorporated ir the seat back or in the inertia reel. Should the crewmember be ina nearly desirable position, the ejection would occur elmost immediately. Should the crewmember requireretraction throuqh a greater distance, the ejection would be delayed by a variable time up to a maximum ofapproximately 140 milliseconds. A timed ejection would be initiated at that point to insure that an im-pediment to reel function or sensing would not disable ejection. The human test data p.-esented here indi-cates potential for safe torso retraction within these times.
Either of the above approaches is amenable to the incorporation of automatic trajectory control andactuation techniques discussed earlier. The second approach would produce a worst case delay of less thanhalf that found in current systems with the average delay (dependent on initial torso pesition) being muchless.
It is recommended that such systems be considered for future manned aircraft having HSLL mission re-quirements. It is further recommended that additional concerted effort be directed toward the developmentof new approaches in automatic aircraft emergency sensing and escape sequence actuation. These effortsare necessary to assure maximum likelihood of successful escape from high speed low level flight profiles.

27-1 1
I REFERINCES
li 1. Yoder, James E., and Royce Moser, USAF School of Aerospace Medicine, Midair Collisions' AerumedicalConslderatlons, August 1976, Aeromedlcal Review - 76, SAM-TR-76-29, pp 18 - 20.
2. Douglas Aircraft Company, Long Beach, California, ACES II Advanced Concept Ejection Seat, 1978,j MDCJ4576A.
3. Raddin, James H., USAF Aerospace Medical Research Laboratory, Assessment of Risk Associated with
Ejection Through the Canopy, May 1979, presented at the Annual Scientifi. Meeting of the Aerospace
Medical Association, Washington, D. C.-
4. Kazarian, Leon E., USAF Aerospace Medical Research Laboratory, F/FB-111 Escape Injury Mechanism
Assessment, October 1977, AMRL-TR-77-60.
5. Beers, K. N. and L. W. Kazarian, Rotational Lateral Wedge (RLW) Spinal Injury on Ejection from
USAF F-4 Aircraft, May 1979, presented at the Meeting of the Aerospace Medical Association,
Washington, 0. C.
6. Phillips, Norman S. et. al., an Investigation of Automatic Restraint and Body Positioning Tech-
niques, Dec 1013, AtiRL-TR-71-10I.
-3

27-12
DISCUSSION
DR. R. AWFPET (FR)
Un augmeutation de 1a frequmnce des fractures du rachis ' l'ejection sur le Fill seuible enrelation a'ec le systems de retraction du torse. Qje peusez-vois de cette posftibilitY?
AUTHOR'S REPLY
No fractures were experienced in the current programs which involved 17q retractions. All forcesand loads were well within human tolerance. If some of the fractures experienced in the F/FB-illwere related to retraction (and that has by no means been demonstrated), some evidence suggests thata possible injury mechanism invoved the anchoring of the shoulder harness below the shoulder levelposteriorly. A current programe is investigating the correction of this design anomaly. Webelieve these rapid retractions to be quite safe if conventional geometries are maintained.
DR. D.. MORGAN (UK)
Have you any method of limiting the upward movement of the arm diring retraction, especially forpassively-ejected personnel?
DR. RADDIN (USA)
For passively ejected personnel, the solution must be in the form of an upper extremity windblastf restraint device. This is being explored.
II

28-1
LOW LEVEL, ADVERSE ATTITUDE ESCAPE USING A VERTICAL SEEKING EJECTION SEAT
John J.ý TyburskiNaval Air- Development Center
Aircraft and Crew Systems Technology DirectorateWarminster, PA 18974
USAGeorg D. Frisch
Naval Aerospace Medical Research LaboratoryDetachment 1
4lchoud Station, New Orleans, LA 70189USA
Louis A. D'Aulerio[aa2i -elpetCne
Aircraft and Crew Systems Technology Directorate
Warminster, PA 18974
ABSTRACT
Recent 'dvances in the development of a Maximum Performance Ejection Seat (WFES), with a verticalspeking capability, address the need 'Or safe escape from aircraft at low altitude, high speed and extremeadverse attitude conditions. The performance specifications of this system, as presently envisioned,will provide safe egress from an inverted aircraft at airspeeds of 0 through 600 knot.5 and altitudes aslow as 50 feet above ground level (AGL). The data base and techniques to be used to predict the occupantresponse consisted of instrumented ejection tests (90 degree and 175 degree roll at 100 feet AGLI, mathe-matical simulations, and graphical analysis of teat results. Consideration was also given to the occupant'santhropomorphic properties and physical restrictions such as initial position (as determined by pzsitioningand restraint hardware) and seat configuration.
This paper demonstrates the applicability and efficacy of utilizing biodynemic response simulationand other techniques, not only as a design tool in the evaluation of the physival ccmpatibility of manand ejection system, but also i.n the evaluation of the ejectioi. system performance.
NTODUCTION
A threast to aircrew safety Is present during all aviation flight operations. This threat is comprisedof many interrelated factors. Foremost is the natural and induced hostile flight envirornment encouinteredby the aircrew. During combat operations this environment , ½ frequently more severe due to the tacticalneed to operate the aircraft at extreme lii'its of the flight envelope. When aircraft are disabled, incombat or due to human or mechan4ical fail-are, thin threat expands to include the hazards associated wit'ithe escape environment.
With the advent u high perforns%.-e snru YISTOL "Vertical/Short Take Off r-nd Landing) type airc'aftthe probability of an atten~ted escape frcm %dimý,Thled aircraft it, other than level1 f.iight, at nearground level altitudes, iS in,,: eased. At'tz:; tod' ee,%pe fr( * this advers-! en~vironment requires improve-ments to aircrew escap- . tptb",-, and perfort-.tnce.
-tDespite the suiccess &siii.-'ced wlth L. ½irn r' :rew eqecsr- systemr, 't,-zir eff tiýveness it, -v altituide,
adverse attitudes tund iigh sir-- --- e Ilighr -cnicitions i. limited. lhe.;e escape conditions hq<ve :esulledin a significant per-,ontage -or aix;rev l'2talit..-s in naral airý;rý,ft. TD .. large extent these ejectionsverc oi't of epfe es, -.ve perfcaz-'nce en-velopes of the particular tescape sys6tý-s in-olved.
mprove-tents in advei.3e ettituae escape cspabilit," nave been recently de-iorstrated as p~art of a U.S.Nae,3 aeve~opmaen' efý'or.. (rigure 1). Debignated tl e Maxim'.t Perflormonce Election Seý.t (MWES) this develop-
Ament -f fort, vnen compiete, will provide mujor advances in low level, adverse attitude escape capabilityA and improvements in nircre,; sa:.zty arnl survivability (1). Since development of the seat is a radical
departure from the ejec-.tion sea* a .)reL: -tly empicyed in lavy aircraft, the ev&.uation of the varioussubsystems must consider not, or y tne re~lubility and maintainability of the asso~iated hardwaire, butalso the man-machine-equirment 2oterface. I..zhniques that are used to evaluate this interface, however,have niot kept pace with the ev .,t:, 'r.- 'f a1cacrew station and aircrew equipment design or tleiroperational capabilities. Tradit-'nally there tecniniques include drawing reviews, mockups, flight tests,as uell as track and ejection tower tasts., Allthovogh important, th-e usefulness of data acquired by th~semethods is limitei, since it doas not take into acooup+ the full variability in crew anthropometry andenvironmental factors, nor do those methods produce adequate triaxial tim~e histories for the purpose ofestimating occupwx.t re- inse to partisular acceleratios. profiles.,
To evaluate the physical '.~ibility of 2-rew members with the WPES, the compulterized human Bodyand Crew Station Modeling System for Motion Studies was utilized (2),~ This computer model has distinctiveadvantage in display realisim, movement defir.L~ion, collision and interactior. detect~on and cost effective-ness In real time animation play-back environment. Utili-ýing this ccmluter model during the developmentstagc.; of the WPES can serve asý both a design tool as well as an effective means of evaluation. Due tothe tremendous inc~rease in performance expectation of the WPES it is prudent to obtain proper input datato generate greater computer resulto,.
?4P&S, DESCRIPTICi ANt' 'EPFORMANCE
The WPES whic',- repres'ut a cimbination of tecnnologicai development.., is a significant Ldvancer-ent
in the statte-of-the-art of ercape system technolog3. These advanc~s are reflected in the foliowing m~ajorsubsyatems (Figur( 2),

28-2
The Structural Subsystem is a light weight, high strength seating platform which integrates thevarious other MPES subsystems. It is fabricated of aluminum honeycomb sandwiched between two aluminumsheet facings. Both the core and facings vary in thickness to provide the most efficient structure.Weight of the basic structure is approximately 25 pounds with a demonstrated structural strength capa-bility meeting the U.S. Navy crash safety standards. The structure consists primarily of a seat backwith rails, a bucket for housing the seat propulsion and control subsystem and a seat lid mounted on topof the bucket. Unlike other seats which house the recovery subsystem within a head box or in back of thecrewmember, the area between the guide rails of the MPES has been reserved for the recovery subsystem inaddition to other key components. Contoured space on the front surface of the seat back has been allocatedfor a "soft pack" survival kit which is a departure from the present day cumbersome Rigid Seat SurvivalKit (RSSK). The aluminum honeycomb structure permits the internal routing of control cables and electricallines for maximum shielding and protection.
The Survival Subsystem is mounted on the seat back in the lumbar region of the occupant, This packcontains, in addition to all of t1-e conventional emergency survival equipment, an oxygen accumulator foremergency breathing. Emergency oxygen is supplied to the accumulator by an inert chemical oxygen generatingsystem, thereby eliminating the need for interfacing with liquid oxygen stores aboard air-capable shipsand risking the hazards associated with frequent checking and maintenance.
Occupant Positioning and Restraint is provided by a series of active and passive components workingtogether to keep the crewmember securely restrained in the seat during emergency escape but unimpededduring his normal mission performance routines. It consists of a contoured and adjustable headrest,extendirg seat side panels, ballistic inertia reel, inertia reel strap cutter, automatic lap belt retrac-tion and release devices, and a leg restraint and positioning system.
The headrest acts to support the head during normal take-off and flight conditions. For catapulttake-off, the headrest is manually adjusted to its full furward position to support the crewman's head.In this position, the crewman can keep his eyes focused on the instrument panel displays during thecatapult stroke. Upon initiation of ejection, the headrest automatically retracts into the full aftposition to insure proper head alignment for the ensuing upward acceleration.
The inertia reel is a device from which two straps are connected to a standard torso harness. Atthe time of ejection the inertia reel is gas actuated and retracts the crewman's shoulders back to theseat as part of the spiral alignment procedure. The seat back contour provides support and occupies thearea extending from se-t bucket to the height of the inertia reel take up straps. The seat back/inertiareel geometry pre-- .es the possibility of arcing hyperextension of the upper thorasic spine as a resultof the scapulae pil'oting around the upper portions *f the seat back in response to iiertia reel activation(3).
The lai belt retraction mechanism is activated by the same gas source as the inertia reel. Theretraction operation tightens the lap belt to anchor the crewman's hips and to prevent "submarining" uponejection. Both the inertia reel and lap belt straps are released automatically as part of the seat/manseparation sequence. As an option, the powered inertia reel can function in a recyclable mode to providethe crewman with a powered and controlled retraction within the cockpit. This system permits the pilotto regain proper seating position in the event he is thrust out of his seat by adverse flight conditionsor out of controlled flight.
The Recovery Subsystem takes advantage of the large amount of free space available between the seatguide rails. Its placement on the smooth back surface of the seat gives the best assurance tvat it williot entangle with seat structure, It consists of a seat back mounted chute extraction motor and a vacuumsealed parachute packaging system. The system provides the pilot with the optimum in reliability throughthe ase of a microprocessor control system to precisely time the sequence of events in deploying thepilot/drolue chute and the main recovery chute. The development of the Sealed to Reduce Maintenance(STORM), parachute packing concept permits the parachute to have a 5 to 7 years service-free life and thuseliminate the requirements for a paraloft aboard air capable ships, frequent (217 day) repack cycles andcostly logistics and manning support (4).
The Propulsion and Control Subsystem, located under the seat and utilizing a major portion of theseat jucket (Figure 2), provides the MPES with a unique seat steering and stabilization capability. Therecent results of this development effort demonstrated the leasibility of improving the safe ejectinnenvelope to permit successful ejections from inverted aircraft at a height of 50 feet above ground leveland ground level escape at aircraft attitude of up to 90 degrees of roll. Two of the major elements ofthis subsystem are the prcpulsion steering unit and the autopilot. Two, long thrust time, sphericalrocket motors, independently moveable and driven by hydraulic actuators make up the propulsion steeringunit. The autopilot, which generates the steering commna;a-to the propulsion steering unit, consists ofthree rate gyros and a microcomputer. The microcomputer also controls the timing and sequencing ofevents in the system.
PERFORMANCE DEMONSTRATION TESTS
In an effort to demonstrate the concept feasibility of the vertical seeking aspects of the MPES aseries of flight tests were conducted (5). The two most significant of these ejection tests were initiatedfrom a cockpit section suspended 100 feet above ground leve±. In these two tests the cockpit was orientedto a 900 and 1750 roll attitude, respectively, The seat trajectory plots of these tests (elevation vstime) are illustrated in Figure 3.
Prior to these tests the seat and dunmy were istrumented to provide input data useful in the determina-tion of force parameter8 affecting the seat occupant. The instrumentation and data presented hereinconcentrates on the 175- roll attitude test. The configuration of the propulsion and control subsystemtested contained one spherical rocket motor mounted in a two axes gimbal ring. This arrangement, whi~hprovided seat control in only two axes, made it possible to demonstrate the feasieility of the vertical

28-3
seeking concept and in addition obtain significant data. The development of the configuration having tworocket motors, Figure 2, was pursued subsequent to the feasibility demonstration tests discussed herein.,
The two motor arrangement will provide seat control in the three axes (pitch, roll and yaw) todiminish the effects of cross coupling, provide increased position control in an aerodynamic environmentand aid in proper seat orientation for parachute deployment.
Two triaxial linear accelerometer packages were surveyed on the seat and these, together with threedimensional angular rate sensor data, provide a complete three dimensional time history of any portion ofthe seat. Figure 4 shows the monitored X Y Z linear accelerations., The acceleration measured on theoccupant seat system useQ thi following coordinate notation:. +X, eyeballs out; +Y, eyeballs right; +Z,eyeballs down.
The dummy (Figure 5), was instrumented with a triaxial linear accelerometer package and three dimen-sional rate gyros mounted in the chest cavity. Additionally, triaxial linear accelerometers were mountedon the right leg to detect possible strikes between the dummy and crew station which might effect seattrajectory. Similarly, the dummy head was instrumented using a three dimensional linear accelerometerpackage. Sinre these two tests were primarily feasibility demonstrations the head and lower leg jointswere tightened significantly to prevent adverse motion of the dumy relative to the seat. Linear accelera-tions monitored at the dummy's chest are shown in Figure 6. Yaw, pitch and roll rates monitored at thedummy's chest are shown in Figure 7. The data obtained from tne 175 roll attitude test identified amaximum dummy acceleration of +13 G monitored at the foot. Maximum head, chest and seat bucket accelera-tions were +11 G . These monitored hinear acoelerations (by themselves) are less than those presentlyexperienced in eiection seats in the Na', inventory. 7he effect of combined linear and angular accelera-tion compon.nts however has not, as yet, been quantified,
SIMULATION
in order to be able to estimate occupant response tc a given acceleration profile, the seat timehistory has to be well defined over the time of iinterest., It therefore becomes crucial that 1-.h theseat and :-rmy be properly instrumented so that modification tc the seat-nan driving funotion can berelated to changes in occupant reslonse, Ps was pointed out previously, seat and denny instruientrtionlocations must be sarveyed to readily identifiable landmarks so that the t-ffects •f tLe seating an,restraint can be estimated.
Occupant dynamic response simulation (as related to ejections) poses some r:riens in extrapolating1beyond test data. This is due to the fact that one is aealing with a closed so. system, where occupant
'urn is the driving function of the seat-man system. ':his differs from other cases (such as crash simala-tion) where the mass of the vehicle is such that th. response of the occupant to the crash pulse leavesthe driving function (time history of the seat) unaltered, During the initial phases of an ejectionhowever, when man-machine interface is of major concern, the trajectory and seat forces are well definedsince the seat is still on the rails and propelled by the catapult.
Mathematical modeling has been used to replicate the test conditions previously described. Sincethe dummy's joints are significantly tightened, as was the restraint system, the accelerations munitoredon the seat were not significantly different from those on the dummy, when translated to a common coordonatesystem., The effectiveness of moceling will be realized when the existing test conditions are relaxed,The effect on occupant response, with loosening of the joint characteristics (allowing segment motion) aswell as introduction of restraint harness slack, can then be effectively analyzed, Additionally, magnitudeof segment motion can be interpreted in terms of possible effects on trajectoxy •i.e. flailing, C.G.Shifts, etc.).,
Occupant response to acceleration profiles can be directly related to initial position of the crewmember relative to the crew station as well as the initial inertial conditions of the aircraft. Sincethe preliminary dimension; of the MPES have been defined, problems in seat-aircreft interface can beisolated using the Bioman simulation package (2). Presently, the seat is being evaluatea in terms of theAV-8B crew station geometry. Assuming that the crew member is seated at the design eye reference point,the seat and crew station geometry was used to define an idealized seating position (2). Using theseinitial segment positions, the monitored seat acceleration time history was used to drive the seat-mansystem. Occupant motion, relative to the crew station, was analyzed in terms of crew member-crew stationcompliance. The initial phases of the ejection are shown in Figure 8. The seat trajectory, in relationto the aircraft, is shown in Figure 9., Although still in the preliminary stages, the use of mathematicalmodeling will complement and expand the test data available and help to quantify specific configurationsthat will maximize the efficiency of the future track tests to be conducted,
0Y

28-4
REFERENCES
.. J. J. Tyburski, "An Overview of the U.S. Navy Maximum Performance Ejection System." Proceedings,SAFE Sixteenth Annual Symposium, 8-12 October 1978.
2. G. D. Frisch, "A Human Body and Crew Station Modelling System for Motion Studies." Paper No.,821-1, AGARD Conference Preprint No. 253, 1978.
3. L. E. Kazarian, "P/FB-II1 Escape Injury Mechanism Assessment.' Report No. AMRL-TP-77-60,Aerospace Medical Research Laboratory, Wright-Patterson Air Force Base, Ohio 45433, 1977.
4. G. R. Drew, "Development of Hermetically Sealed Low-11sintenence High-Dersity Packagir.g forEjection Seat-Mounted Personnel Parachutes." Proceedings, SAFE Sixteenth Annual Symposium, 8-12 Octobtr1978.
5. W. J. Stone, "Feasibility Demonstratior of a Vertical Seeking Seat Steering System." Proceedings,
SAFE Sixteenth Annual Symposium, 8-12 October 1978.
[

28 5
~~~,V -7P~I
¾A1

28-6
6iEAO CUSHION
SOFT SURVIVAL PACK
LUMBAR PAD
SEAT GUIDE RAIL UNDERSEAT PROPULSIONIEASY IN - EASY OUT) AND CONTROL MECHANISM
FOR SEAT STEERINGAND STABILIZATION
/ POWERED INERTIAAND RETRACTION REEL
LIGHTWEIGHT ALUMINUMHONEYCOMB STRUCTURE -
--• VACUUM PACKEDPARACHUTE
S• PILOT CHUTE
rPILOT CHUTE
EXTRACTIONMOTOR
PROPULSION AND SURVIVAL FITCONTROL SYSTEM COMPARTMENT
i CHEMICAL
02 GENERATORSLAP BELT RETRACTIONMECHANISM SEAT HEIGHT
ADJUSTMENT ACTUATOR
Fig.2 Maximum performance ejection seat (MPES)Top - front view
Bottom - rear view
SLA

•.28 -7
1502.7 SECDROGUE
CHUTE500" 1 DEPLOYEDS • 5.2 SEC AW
CHUT INFATED1.83 SECDROGUE
400 100 GUN FIRED
I-. .11ESEC
CHUTE DEPLOYED R TC BURNOUT
300 1.0 SEC
SM GUN nRED
1ILOT TOUCHDOWN
0.0 2. 4. 6.0 8.0 10.0 12.0TIME, SEC
0.0 2.0 4.0 69 8 .0TIO, SEC
Fig.3 Trajectory plotsLeft - 90 degree roll attitude ejection
Right - 175 degree roll attitude ejection
0 v
15
iIC
-5 . 1-5' ___ I ____y--!1
0 05 10 5 2;U 25 So
TIME IN SECONDS
Fig.4 Monitored seat accelerations time historiesTop -- X
Middle - YBottom - Z

28low
Le 5 D~ummy instrumentation packages

28-9
V 5--
S I 0
00 )5 '0 'S 20 25 30
7:VE N' SECCNDS
Fig.6 Monitored dummy chest accelerations time historiesTop - X
Middle - YBottom - Z
0
zU
-0
, I MEIN EO
S- - Botto- - roll -
300O
20WO•,,SCOD
:• Fg.7Moniore dumy cest nguar vloctie• Top- y0
•--20D
Fi. Moitrd dumm -ichtaglrvocis
-• Bottomr - roll
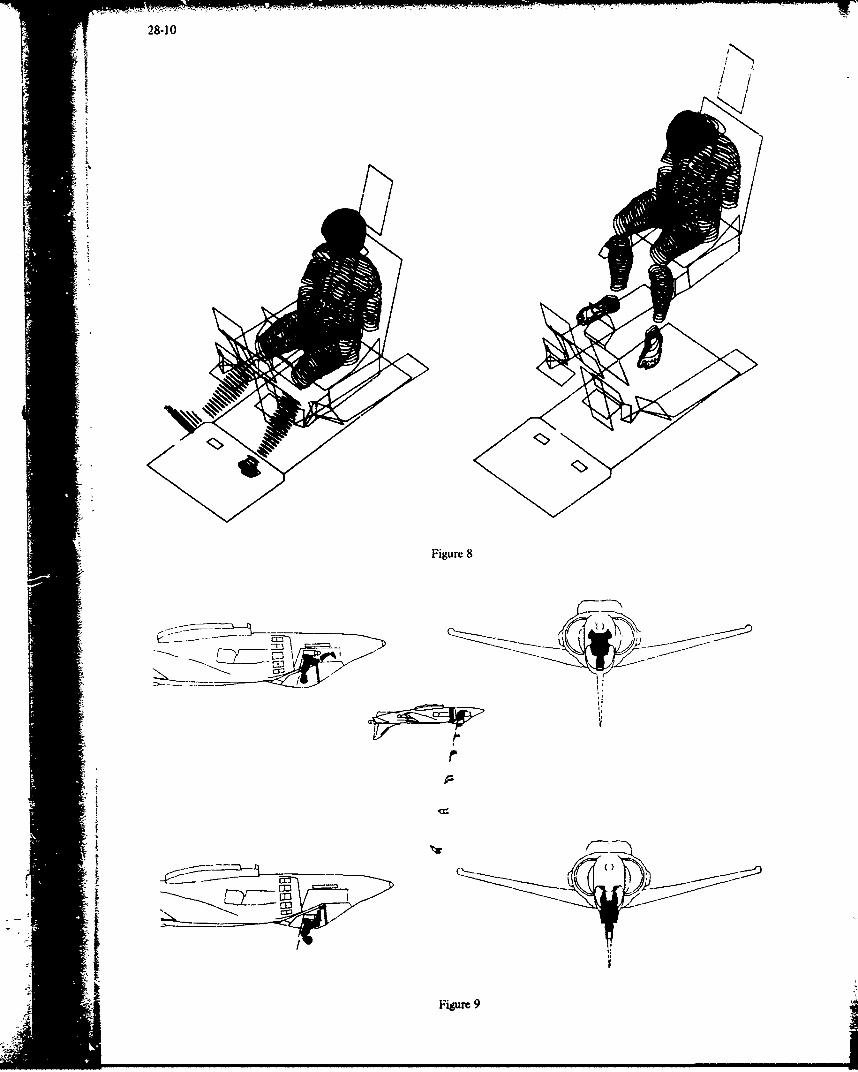
28-10
Figure 8
iI
I,jp
L:1Figure 9

CR.1
CONCLUDING REMARKS BY SESSION CHAIRMEN
E.C.BURCHARDH.T.ANDERSENAJ.BENSONJiCOLINS.ANUNNELEY

CR-2
CONCLUDING REMARKS RY SFSSION CFAI.IPN*
Part I. Ride Quality and the Effect of the Physical Environment (Dr Eduard C. Burchard, FRG)
Four papers were presented in this part and it became clear that the physical environment in theuse of the third generation military high performance aircraft plays a more vital role than everdue to the high speeds involved, and especially due to the tendency toward ever lower flying, i.e.flying closer to the ground. This calls for the best possible analyses of meteorological conditionsand their forecast to aircrew; in the real war situation there also will be intensive battle-fieldactivity that might drastically change terrain and especially meteorological condition in such a waythat additional measures are necessary to enable the flight-crew to cope with the visibility-deterioration in the respective situation.
Active control systems are under development to reduce pilot's workload and the physical stressesencountered during flight in adverse meteorological conditions; a variety of technical ways in thefield of alleviation of ride-bumpiness by the use of ride smoothing systems for instance can be seen;further research in this direction is necessary.
After many years of operational experience in HSLL-flying, the majority of test pilots and opera-tional crews are in agreement with the statement that in the HSLL environment not only the pilot'seffectivenes. is adversely affected, but also that problems of physiological tolerance are becomingapparent.
Several outstanding movie-films addressing various aspects of the operational characteristics ofpresently used HSLL aircraft illustrated the above mentioned problems.
In view of growing surface-to-air anti-aircraft weapon development it can be foreseen that with thenew generation tactical aircraft in an anticipated surface-to-air )riented high threat combatenvironment, there has to be a definite emphasis on continuous development efforts for automatedsystems integrating components within the cockpit affecting aircraft controls and weapons deliverysystems. The goal of accomplishment of successful mission dictates continuous effort for biotech-nological improvement in order to ease the load from the aircrew who in the past in many cases havebeen biought to the limit of physical and psychological tolerance.
Part II. Thermal Effects of High-Speed, Low-Level Flight (Dr Harold T. Andersen, NO)
In sum-arising this session, we may say that high-speed, low-level flight may cause excessivethermal loading of aviators due primarily to solar radiation by the so-called greenhouse effect,but also due to the aerodynamic heating, the heat generated on board by avionics, and the increasedmetabolic heat produced by the demanding physical workload in flight. The aviator is fre.quentlyat a disadvantage as far as unloading excessive heat is concerned due to his multi-layer flyingclothing and the hot and sometimes humid cockpit environment which very adversely interferes withthe dissipation of heat. It has been clearly demonstrated, I think, that pilot overheating maylead to a decrement in task performance, decreased C tolerance and fatigue. Thermal stress, thus,has been identified as an environmental factor which may cause hazardous flying conditions. Mostfighter aircraft in current use have been designed with but little emphasis placed on the thermalcomfort of crew members, as anyone who has flown them will readily testify. The new generation offighter aircraft, among them the Tornado, the Mirage 2000, and the F16, reportedly have very muchbetter cabin conditioning syste-is than their predecessors, although the resulting noise levels maybe excessive; a factor which constantly needs to be ccnsidered. If one accepts thermal overloadas a serious risk factor in high-speed, low-level flight, we would like to submit the following
A recommendations. The specifications for the cooling capacity of an aircraft and environmentalcontrol system ought to be man orientated as was appropriately emphasised in this session. If acockpit conditioning system is chosen it should be effective, and at the same time it should notintroduce new undesirable factors such as a high noisc level, or carry a great weight penalty, oradversely affect the thrust to weight ratio of the aircraft in order to function properly.
Part II. Vibration Effects of High-Speed, Low-Level Flight (Dr Alan J. Benson, UK)
The eight papers presented in this session fell into two broad categories, those that dealt with thetransmission of vibration througi, the body, aad those that described impairment of performanceproduced by whole body vibration. These two areai of research are complementary in so far as anaccurate description of the transmission of vibration from the aircraft structure to different partsof the aviator's body should permit a reliable prediction to be made of the effect of a givenvibration environment on a particular aspect of performance, such as vision or manual contiol.However, the complexity of an adequate biodynamic model was made veT.- apparent by the papers whichdescribed the transmission of sinusoidal vibration (predominantl; z axis vibration) to differentparts of the body. For example, motion of the head, measured in different studies by displacementand accelaration (iinear and angular) transducers, in response to a sin-soidal z axis vibration isnot simply a translational movement in the z axis, but involves translational and angular movementin all thiee orthogonal axes. In addition, at certain frequencies (principally 2-4 Hz) the dominantangular movement of the head is at the second harmonic of the forcing frequency.
The difficulty of developing at adequate biodynamic model war subs-antiated in different ways by thevarious contributions. Measurement of mechanical impedence showed how readily transmission wasmodified by muscle tone, even in a restrained seated posture. Changes in the seat back angle werealso shown to alter transmission to tne head - a factor of some concern in view of the possibleintroduction of reclined seats (with high back angles) to increase G tolerance in future air-cotbataircraft. A further and unwelcome coumplication of the biodynamic model was the demonstration in the

amplitude spectra of head ecceleration of non-linearity in transmission characteristics as afunction of vibration intensity.
The impairment of vision by vibration has long been recognised, and design irinciples for achievingmaximum legibility of instrument displays are well established. However, the problem of modellingvisual performance 'n a vibration environment is a formidable one. Even when the angular and linearmotion of the head is known and a reliable assessment of the relative movement of the eyes withrespect to the visual target car be made, target variables, such as size, contrast, luminance,colour, conspiclity and background structure, all influence the probability of a target beingcorrectly perceived. While an adequate model has yet to be developed, work in this area has provideduseful information on neural mechanisms controlling eye movements and upon the degradation of visualacuity associated with movement of the retinal image.
Other papers dealing with the effects of vibration on performance were more pragmatic. Onedemonstrated that a new, high luminance, numeric display could be read with few errors duringvibration; anothtr examinedothe effect of vibration en the accuracy of aiming a helmet-mounted sight.The latter study showed that during simulated turbulence, accuracy was appreciably degraded by lowfrequency (< 4 Hz) angular head movements which limited the usefulness of the system to coarseweapon aiming. Techniques involving the filtering or scaling of the head position signal showedpromise for improving accuracy in specific applications.
Al..hough the papers p'-esented in this session were of value, in so far as they extended knowledgeof the effect of vibration on man, all the studies were concerned with the effect of either simplesinusoidal vibration or the vibration spectra of old aircraft. Regrettably there was a lack ofinformation on the vibratiou environment of the next generation of aircraft, designed for flight athigh speed and low level, in which high wing loading and active ride smoothing systems sholildmaterially a-eliorate, if not prevent, the deleterious effect of vibration on aircrew performance.
Part IV. Cockpit Design and Aircrev' Workload (Dr J. Colin, FR)
Les communications prisent6es au cours do !a session intitulie "conception du poste de pilotage etcharge de travail de l'6quipage" pcuvent so classer en deux groupes inmgaux. Le premier groupene concerne qu'une communication, celle de Monsieur H. MUTSCHLER qui a prhentZ une btude ayanttrait h la d~tection d'objectifs sur un 6cran de t6l~vision montrant le sol difilait sous la camerad'ur, engin t~l~guid6 de reconnaissance. Bien que correSpundant A une 6tude sur le personnel au sol,lea conclusions tirdev sur lea param~tres influencant le taux de d~tection sont cependant applicablesaux problbmes de presentation des informations dans un poste de pilotage. Le deuxilme groupe a pluspr~cisement concern6 le sujet de la session et peut se subdiviser lui-maue en deux parties portant
10/ sur lea dispositifs de prfsentation des informations tate haute ou tate basse montgssur lea tableau de bord,
20/ sur lea dispositifs de prasentation des informations par dispositifs montds sur casque.
En ca qui concerne lea dispositifs mont~s sur le tableau de bord et la charge de travail desiquipages, Monsieur MORRIS A. OSTGAARD a pr4sent6 de fajox, zaisissante des progr~s rdalis~s dana leguidage et le contr6le des avions grace I l'utilisation de- microprocesseurs et en particulierl'amflioration des performances atteintes par lea nouveaux avion- 4 comntandes 4lcctriques, leurmariabilit6 et l'apparition de performances nouvelles (possibilitds d'accklgratinns lat~ralesavec changements d'altitudz et Ia ligne de vol sans changement d'assiette). 11 a 6tA intiressantde noter au passage qua toutes lea phases de vol ne bindficient pee de la m•me manibre de cesnouvelles technicues.
Monsieur R.H. HOLMES s'est attach6 plus sp~cialement h la disposition des coumandes et la pv~sentationdes informations Sur 6cran de tilivision. I1 a montrg que V'on pouvait diminuer le temps d'accomoda-tion oculaire et simplifier le choix des informations n~cessaires I telle ou telle phase de vol en leeprisflectionnant et lea collimatant. Il a aussi montr6 Ia faisabilit6 actuelle des 4crans detfl~vision en couleur ayant lea caract~ristiques requises pour Otre utillss en vol, et lea b~n~ficesque l'on peut attendre de ce perfectionnement daon Ia diminution de la charge de travail desdquipages.
En ce qui concerne lea dispositifs montis sur casques, Monsieur D.N. JARRETT a 6tudi6 Ia gfne appcrt~epar les mouvements relatifs du casque et de Ia tate au cours des accil~rations et vibrationsrencontries au cours du vol I b.sse altitude et grande vitesse. I a montr6 queen augmentant Iabrillance dr informations on pouvait diminuer Ia gane apport~e par ces mouvements.
Madame Gloria TWIE CHISUM, gr&ce I son exp~rience 6tendue dans ce domaine, a montr4 tour l'int~ratde ces dispositifs suz diff~rents types d'appareils et pour diffdrentes phases de vol. Ella aindiqu4 les axes de recherches qui doivent faire l'objet d'effort : choix des symboles, de la tailledes lettres et chiffres, du contrdle automatique de :eur brillance, de la distance de projection, del'angle visuel couvert par cesinformations et diveloppement dun systame binoculaire.
Le Professeur M.L. WOLBARSHT a enfin dressg un tableau des diffirentes recherches sur la visionentrepr~ses sous l'impulsion de l'U.S. Navy, I !a fois damn lea domaines fondamentaux et lesdomaines appliquEs.
i

En conclusion, cette session a montri qu'en raison des binifices attendus dans l'alligement de lacharge de travail des Squipages, il Stait de la plus haute importance de poursuivre let effortsentrepris dans la prdsentation des informations par ecran de til1viuion, notament en coleurs.Elle a aussi montri que les dispositifs months sur casque pouvaient Atre considirds comme undispositif d'avenir, et peut Stre come une solution pour les avions I haute performance pourassurer, sans trop de problbmes techniques, le pilotage sur sibge basculant ou avec dossier trbsincling.
Part V. Escape and Survival (Dr Sarah A. Nunneley)
We have seen that high-speed, low-level flight presents tremendous challenges in the area of escapeand survival. In particular, benefits can be gained from the analysis of past experience withescape and ejection, and also computor modelling is a very useful technique. We have seen the verygreat extent to which realistic training can contribute to certain types of survival for example,following ditching. However, in the high-speed, low-level mode, especially over land, it appearsthat maximal attomation of the escape processes will be advantageous. Of course the real problemhere is how to prevent completely any mistaken actuation of these system , such as the disengagementof the parachute harness, or, if it is ever possible, to approach the problem of automatic initiationof ejection. Wevere told today of the problem of keeping the pilot unwillingly in the aircraft afterhe had decided to leave; I think it would be considerably worse to find yourself leaving the aircraftwhen you would prefer to remain. We have seen that there are a number of different approaches tothese escape problems and I think it would be good if we can eventually come to a consensus amongour different laboratories and nations as to how beat to solve these problems. In doing so it seemsto me that we need to keep in mind that sometimes our priorities change when we consider two verydifferent conditions: escape and survival in peacetime and training, as opposed to escape andsurvival in wartime. While I am not an expert in this particular area, I wonder for instance, whinwe are eliminating some of the equipment that the man carries with him because we have very rapidpick-up, particularly from the sea, whether in wartime we may rather suddenly find that our pick-upis not so quick. Similarly, I can see some disadvantages to being rocketed to a considerible heightand then floating slowly downwards over enemy territory. In conclusion I think that this sessionhas pointed out that there are considerable grounds for continu;ng discussion on this topic, and Ihope we will see this happen in the future.
*Editor's note:
Summaries for parts II and V are tape transcripts edited by the session organiser: those forparts I, III and IV have subsequently been rewritten by the individual chairmen.
L4

____- REPORT DOCUMENTATION PAGE-_ _
1. Recipient's Reference7 2.Originator's Reference 3. Further Reference 4. Security Clawjficationof Document
SAGARD-CP-267 ISBN 92-835-0263-9 UNCLASSIFIED
5.Originator Advisory Group for Aerospace Research and DevelopmentNorth Atlantic Treaty Organization7 rue Ancelle, 92200 Neuilly sur Seine, France
6.TitleHIGH-SPEED, LOW-LEVEL FLIGHT: AIRCREW FACTORS
7.Presented atthe Aerospace Medical Panel's Specialists' Meeting held inLisbon, Portugal, 22-26 October 1979.
8.Author(s)/Editor(s) - _9.Date
Various Edited by D.H.Glaister March 1980
1O.Author's/Editor's Address I I.PagesVarious RAF Institute of Aviation Medicine
Farnborough 336Hants GUI4 6SZ, UK
12. Distribution Statement This document is distributed in accordance with AGARDpolicies and regulations, which are outlined on theOutside Back Covers of all AGARD publications.
13.Keywords/Descriptors
Fighter aircraft Flight crewsLow level flight Pilots (personnel)Human factors engineering Performance evaluationMan machine systems
14.Abstract
Recent developments in radar and missile systems indicate that high-speed flight atlIw..-levels offers the optimum means for reaching targets deep within defended territorywhile, unfortunately, imposing considerable physical and mental stresses on the aircrew.
The 22 papers presented by experts within the compass of Guidance and Control, FlightMechanics and Aerospace Medicine discussed the effects of ride quality, physical environ-ment, temperature, vibrations as well as the requirements for cockpit design escape andsurvival in low-evel, high-speed flight.
Recommendations were put forward for improvements in systems management techniques,modifications to existing systems and design of new ones in order to enhance theperformance of the man and the system and improve the chances of survival of both in thisdemanding operational environment by reducing the workload imposed on th' aircrew.

0 bo0 : p
NoNc
v. _ -- 0L :,4
to.
'00
*~~~ 0-0 Z .
z. I..-J X S-.
bb- CL) tm .. C a
0
*0
4) 00 0- m oa)Oa) a)
0~ *
> w -
> C
4) W W- co. Kn
.4~~S. -Z-.onCjL
>. -) ~u a-~) a
2 < 0 E
:E W A.e Z 0- .m w- -
to4b

0.. z*~C CD - W. 0 za
- p .- 0C -D CD0
CDJ CD C C
~- C7~ ;CD
CD 0 - CD
oo o. r 0
0 ~ CD p
tC 0CD (.~D-C
7q - C- V . wCD-
0D.. 0D COCD CD n 0CD<~ W
0D CD~: ~ 20. M CD CD CD'
-- : ,
S 0CD w n "CD 0W goCD ~ D 2
D ICD C 0
CDD CD CDC:1. = W ~ C0 r
= -
V, -- 0C0CDD. a <
CD 0 CL C< CD
0~ CD0
CD 0D-
(CD go (D
0C 00 WDC
(I' CD a
-0 0 CD
ýl w a 7 - -4 CD wCD "0D CD-
00DC 0
0DC QCD CD 5" t=a5= .<
Ili 00 00 0j C,0CD
>C 0- (DwwC CD Z0D W w
CD . 2
CD *CZ ~ . CD (D a~. a ICIL =. C-~ =- (b
ca. CD lz
0~~
mCD (D D
200 20
0 0 .1. C
(D 0 00
MD (D Q Q
CD =.C
C. CD CL ~0

I -A.-
NATO OTAN7~~~ RUrNEL 920NUIL/U-EN DISTRIBUTION OF UNCLASSIFIED
7FRAACLL 920NC ULYSRSIE AGARD PUBLICATIONS
Telephone 745.08.10 - Telex 610176
AGARD does NOT hold stocks .)f AGARD publications at the above address for general distribution. Initial distribution of AGARDpublications is made to AGARD Member Nations through the following National Distribution Centres. Further copies are sometimesavailable from these Centres, but if not may be purchased in Microf~che or P'hotocopy form from the Purchase Agencies listed below.
NATIONAL DISTRIBUTION CENTRESBELGIUM ITALY
Coordonnateur AGARD - VSL Aeronautica MilitareEtat-Major de [a Force Airienne Ufficio del Delegate Nazionale all' AGARDQuartier Reine Elisabeth 3, Piazzale AdenaueyRue d'Evere, I1!40 Bruxelles Roma/EUR
CANADA LUXEMBOURGDefence Science Information Services See BelgiumDepartment of National Defence NEHC4ND
Ottaa, Otari KIA0K2Netherlands Delegation to AGARDDENMARK National Aerospace Laboratory, NLR
Danish Defence Research Board P.O. Box 1260sterbrogades Kaserne 2600 A.C. Delft
* ~~Copenhagen 0 NRA
FRANCE Norwegian Defence Research Establishment 0O.N.E.R.A. (Direction) Main LibraryU29 Avenue de Is Division Leclerc P.O. Box 25 092320 Chhtillor, sous Bagneux, N-2007 Kjeller
GERMANY PORTUGALZentralstelle fur Luft- und Raumfahrt- Direcqfo do Serviqo de Materialdlokumentat.-on und -informiation da Forca Aeresc/o Fachinformationszentruzn Energie, Rua dia Escola Polit~naca 42Physik, Mathemnatik GmbH LisboaKernforschungszentrum Attn. AGARD National Delegate7514 Eggenstein-Leopold~hafen 2 JTRE
GREECE Departmetit of Research ard Development (ARGE)>Hlellenic Air Force General Staff Ministry of National Defence, Ankara JResearch and Development Directorate UIE IGOFlolargos, Athens NID NGO
Defence Research finformation Centre 0ICELAND Station Square House -Director of Aviation St. Mary Crayc/o Flugrad Orpington, Kerl BR5 3RE
ReykjavikReykavikUNITED STATES
National Aeronautics and Space Administration (NASA)Langley Field, Virginia 23365Attn: Report Distribution a" Storage Unit
1 HE UNITED STATES NATIONAL DISTRIBUTION CENTRE (NASA) DOES NOT HOLDSTOCKS OF AGARD PUBLICATIONS, AND APPLICATIONS FOR COPIES SHOULD BE MADE
DIRECT TO THE NATIONAL TECH-NICAL INFORMATION SERVICE (NTIS) AT THE ADDRESS BELOW
PURCHASE AGENCIES*Microfche or Photocopy Microfiche Microfiche
National Technical Space Documentation Service Tectinology ReportsInformation Service (NTIS) Europ~ean Sp-.ce Agency Centre (DTI)5285 Port RoyalI Road 10, rut Mario Nikis Station Square HouseSpringfijeld 75015 Paris, France St. Mary CrayVirginia 22161, USA Orpington, Kent BR5 3RF
England
Requests for microfiche or photocopies of AGARD documents shauid include the AGARD seria number, title, auth'or or editor, andpublication date. Requests to NTIS should include the N 4SA accession report number Full bibliographical references and abstracts
of AGARD publications are given in the following journals-Scientific; and Technical Aerospace Rep'ats (STAR) I-ovemment Reports Announcements (GR 'k)4published by NASA Scientific and Technical published bi' the National TechnicalInformation Facility Information Serviccs, SpringfieldPost Office Box 8757 Virginia 22161, USABaltimore/Washington International AirportMaryland 21240; USA
CL
Printed by Technical Editing and Reproduction Lid
Harford House. 7- 9 Charlotte St. London WIP 1111
ISBN 92-835-0263-9