Hierarchical integration of individual motions in locally paired-dot stimuli
20
Hierarchical integration of individual motions in locally-paired-dot stimuli Osamu Watanabe a,* , Masayuki Kikuchi b a Department of Computer Science and Systems Engineering, Muroran Institute of Technology, 27-1 Mizumoto-cho, Muroran, Hokkaido 050-8585, Japan b School of Computer Science, Tokyo University of Technology, 1404-1 Katakura-machi, Hachioji, Tokyo 192-0982, Japan Abstract Recent psychophysical studies suggest that there are two types of motion integra- tion processes in human visual system, i.e., the local and the global integration process. The existence of the local integration process is suggested by the vector- average perception in locally-paired-dot (LPD) stimuli. Here, we investigated the relationship between the two motion integration processes by measuring the sig- nal detection thresholds in three corresponding stimuli: (1) standard random-dot kinematograms (RDKs), (2) LPD stimuli the individual dot motions of which were identical to those of RDKs, and (3) pairwise-averaged stimuli the individual dot motions of which corresponded to the vector-averages of locally-paired motions in LPD stimuli. We found that the thresholds in LPD stimuli were similar to those in pairwise-averaged stimuli rather than in RDKs. In addition, when dots were paired appropriately, observers could detect coherent motions in LPD stimuli even if the proportions of signal dots were less than the detection thresholds in corresponding RDKs. These results suggest that the local and global integrations of individual motions are carried out hierarchically, and that the global motion perception in LPD stimuli does not depend on individual dot motions directly, but depends on locally integrated motions. Key words: Motion integration, Global motion, Transparent motion, Locally-paired-dot stimulus, Threshold * Corresponding author. Tel: +81-143-46-5421; fax: +81-143-46-5499. Email address: E-mail address: [email protected] (Osamu Watanabe). Preprint submitted to Vision Research
-
Upload
independent -
Category
Documents
-
view
0 -
download
0
Transcript of Hierarchical integration of individual motions in locally paired-dot stimuli
Hierarchical integration of individual motions
in locally-paired-dot stimuli
Osamu Watanabe a,∗, Masayuki Kikuchi b
aDepartment of Computer Science and Systems Engineering, Muroran Institute ofTechnology, 27-1 Mizumoto-cho, Muroran, Hokkaido 050-8585, JapanbSchool of Computer Science, Tokyo University of Technology, 1404-1
Katakura-machi, Hachioji, Tokyo 192-0982, Japan
Abstract
Recent psychophysical studies suggest that there are two types of motion integra-tion processes in human visual system, i.e., the local and the global integrationprocess. The existence of the local integration process is suggested by the vector-average perception in locally-paired-dot (LPD) stimuli. Here, we investigated therelationship between the two motion integration processes by measuring the sig-nal detection thresholds in three corresponding stimuli: (1) standard random-dotkinematograms (RDKs), (2) LPD stimuli the individual dot motions of which wereidentical to those of RDKs, and (3) pairwise-averaged stimuli the individual dotmotions of which corresponded to the vector-averages of locally-paired motions inLPD stimuli. We found that the thresholds in LPD stimuli were similar to those inpairwise-averaged stimuli rather than in RDKs. In addition, when dots were pairedappropriately, observers could detect coherent motions in LPD stimuli even if theproportions of signal dots were less than the detection thresholds in correspondingRDKs. These results suggest that the local and global integrations of individualmotions are carried out hierarchically, and that the global motion perception inLPD stimuli does not depend on individual dot motions directly, but depends onlocally integrated motions.
Key words: Motion integration, Global motion, Transparent motion,Locally-paired-dot stimulus, Threshold
∗ Corresponding author. Tel: +81-143-46-5421; fax: +81-143-46-5499.Email address: E-mail address: [email protected] (Osamu
Watanabe).
Preprint submitted to Vision Research

1 Introduction
For several decades, the motion integration mechanism in human visual systemhas been studied with various motion stimuli. It is known that the motion inte-gration mechanism contributes to discriminate global directions of random-dotkinematograms (RDKs) such as Fig. 1a; the directions of individual dot mo-tions are broadly distributed. From this type of global flow displays, observerscan discriminate a mean direction of motions as well as individual dot motions(e.g., Watamaniuk & Sekuler, 1992; Watamaniuk, Sekuler, & Williams, 1989).The integration mechanism also plays an important role in coherent motiondetection in RDKs that contain randomly moving (or noise) dots as well ascoherently moving (or signal) dots (e.g., Fig. 2a). Motion detection thresh-olds in these coherence type displays have been widely adopted as a measureof performance in visual motion processing across conditions (see Braddick,1995; Scase, Braddick, & Raymond, 1996).
When RDKs contain two dot streams with different directions (Fig. 1b), ob-servers can perceive two global motions simultaneously. This transparent mo-tion perception suggests that the brain does not always integrate all dot mo-tions into one global motion. In order to investigate how the brain representstwo distinct motions at the same time, Qian, Andersen, and Adelson (1994)employed locally-paired-dot (LPD) stimuli as illustrated in Fig. 1c. The indi-vidual dot motions in LPD stimuli are identical to those in RDKs that leadto motion transparency. The only difference between them is the distribu-tions of dots; in LPD stimuli, dots moving toward different directions are notrandomly distributed but plotted in closely spaced pairs. LPD stimuli withopposite directions of motions produce no motion perception. Furthermore,in the case that two motion directions are non-opposed, one again does notperceive transparency, but a unitary global motion determined by the vector-average of two motions (Curran & Braddick, 2000). These results indicatethat the motion detection mechanism in the brain is affected by the distribu-tion of dot positions, and suggest that there is a local integration process forco-located motion signals as well as the global integration process.
In the present paper, we investigate the relationship between the two motionintegration processes in human visual system, i.e., the local and the globalintegration process. We measured motion detection performances in threesignal-noise motion displays as follows: (a) RDKs, (b) LPD stimuli the allparameters of which were identical to those of RDKs except for dot distribu-tions, and (c) pairwise-averaged stimuli generated by replacing each dot pairin LPD stimuli with a single dot the motion vector of which was determined bythe vector-average of the paired motions (see Fig. 2). It is considered that theperformance of the signal motion detection in LPD stimuli depends on bothlocal and global integration processes, whereas only the global integration
2
process contributes to the signal detection in RDKs. Therefore, the differencebetween the signal detection thresholds in RDKs and the corresponding LPDstimuli would reflect the effect of the local integration process.
Assuming that paired motions in LPD stimuli are locally integrated priorto the global motion integration, global motions observers perceive in LPDstimuli would not be determined by individual dot motions directly, but bythe distribution of the locally integrated motions. Therefore, if this hierarchicalintegration assumption holds, thresholds in LPD stimuli would depend on theproperties (e.g., coherence levels and/or distributions of signal directions) oflocally integrated motions rather than those of individual dot motions. Inthe case that the properties of individual and locally-integrated motions aredifferent, it is expected that there would be differences between the thresholdsin RDKs and the corresponding LPD stimuli, although component dots ineach stimulus are identical. Furthermore, this assumption predicts that thethresholds in LPD stimuli should be similar to those in the pairwise-averagedstimuli, generated by averaging local pairs in advance, rather than in theRDKs. Contrary to this, if the global motion detection in LPD stimuli isbased on individual dot motions, thresholds in LPD stimuli should be similarto those in the corresponding RDKs rather than in the pairwise-averagedstimuli. In the series of experiments, we employed LPD stimuli the properties(e.g., coherence levels) of which after local integration were different from thoseof the corresponding RDKs. Comparing the thresholds in LPD stimuli withthose in pairwise-averaged stimuli as well as those in RDKs, we examine thehierarchical relationship between the local and global integration processes.
2 General methods
Here we describe the basic methods for all experiments. More specific detailswill be provided for each experiment.
2.1 Apparatus
All experimental stimuli were displayed on a SONY CPD-G220 color moni-tor, driven by an ATI FireGL2 graphic board in a host computer. Experimentswere conducted in a darkened room. Observers sat in a chair in front of themonitor and viewed the screen binocularly from a distance of 85 cm. The spa-tial resolution of the monitor was 49.5 pixel/deg, and a refresh rate was 64Hz.Observers used a chin rest throughout the experiments and were instructedto maintain fixation on a small cross at the center of the screen. The fixationcross was visible for 500 ms prior to each trial and remained on the screen for
3

the stimulus duration.
2.2 Subjects
Five observers participated in all experiments; one was the author (OW), andthe others were naive to the conceptual basis of the experiments. All hadnormal or corrected-to-normal visual acuity.
2.3 Stimuli
Stimuli were composed of moving dots presented within a stationary virtualaperture of a diameter 7.8 deg. RDKs and LPD stimuli consisted of 200 dots,resulting in a dot density of 4.2 dots/deg2. The luminances of dots and thebackground were 68.5 cd/m2 and 1.1 cd/m2, respectively, which gave a Michel-son contrast of 97 %. Each dot subtended about 2.4 arcmin and moved at aspeed of 2 deg/s. Signal dots moved coherently, whereas the directions of noisedots were chosen from a rectangular distribution, covering the full 360 deg.In RDKs, each dot was located randomly, whereas dots moving in differentdirections were plotted in closely spaced pairs in LPD stimuli. The pairwise-averaged stimuli were generated by replacing each dot pair in LPD stimuliby a single dot the motion vector of which was determined by the vector-average of the paired motions. Therefore, pairwise-averaged stimuli consistedof 100 dots (the dot density was 2.1 dots/deg2), and the speed of each dotdid not exceed 2 deg/s. A dot lifetime was set to 78 ms to correspond to adot trajectory length of 0.16 deg, well within the range that transparency wasabolished in LPD stimuli (Qian, Andersen, & Adelson, 1994; Curran & Brad-dick, 2000). When a dot reached the end of its lifetime, its replacement wasplotted at a randomly chosen location. In addition, in the cases of RDKs andpairwise-averaged stimuli, the lifetimes of individual dots began and endedasynchronously. In the case of LPD stimuli, two dots in each pair appearedand disappeared at the same time, and their motion paths crossed at themidpoint of their trajectories.
3 Experiment 1: Threshold for uni-directional signal
The general aim of this study is to investigate the relationship of the localand the global motion integration process by comparing the signal detectionperformances in RDKs, LPD stimuli, and pairwise-averaged stimuli. In Exper-iment 1, we introduced a novel LPD display the dot pairs of which consisted
4
of a signal and a noise dot (Fig. 2b). Previous studies reported that observerscannot perceive component motions in LPD stimuli composed of two coher-ent motions (Qian, Andersen, & Adelson, 1994; Curran & Braddick, 2000).Therefore, there is a possibility that observers cannot detect the directions ofsignal motions in the present LPD display.
In this experiment, the RDK corresponded to a simple coherence-type displaythat was composed of signal dots moving in the same direction and noise dotsmoving in random directions (Fig. 2a). In the LPD stimulus, all signal dotswere paired with a noise dot (Fig. 2b). If each local pair in the LPD stimuli isaveraged prior to the global motion integration as described in Introduction,the global motions observers perceive in LPD stimuli should be similar tothose in the corresponding pairwise-averaged stimuli (Fig. 2c). Although thedirections of the pairwise-averaged motions were broadly distributed, the meandirection of them was identical to the signal motion direction 1 . This pairwise-averaged stimulus is similar to global-flow displays as shown in Fig. 1a. Itis known that observers can discriminate a mean direction of motions fromthis type of RDKs (Watamaniuk & Sekuler, 1992; Watamaniuk, Sekuler, &Williams, 1989). Therefore, if the hierarchical integration assumption holds,the directions of signal motions would be perceived in the present LPD stimuli.
In the first experiment, we examine whether the signal motions can be dis-criminated in this locally-paired signal-and-noise dot stimuli by measuring thedirection discrimination threshold. We also measure the thresholds in the cor-responding RDKs and pairwise-averaged stimuli, and compare them with thethreshold in LPD stimuli.
3.1 Methods
3.1.1 Stimuli
All signal dots in RDKs and LPD stimuli moved toward a single direction. InLPD stimuli, all signal dots were paired with a noise dot, because, in general,each dot in LPD stimuli should be paired with a dot moving toward different
1 Let the motion vector of each dot be (v cos θ, v sin θ), where v and θ representthe speed and the direction of the dot motion, respectively. The pairwise-averagedmotion of a signal-noise pair is represented as ((v cos θS + v cos θN )/2, (v sin θS +v sin θN )/2), where θS and θN are the directions of the signal and the noise motion,respectively. Note that all dots had the same speed in the present experiment.Because the direction of noise motion θN distributes uniformly, the mean motionvector of the pairwise-averaged motions is given by ((v/2) cos θS , (v/2) sin θS). Themean direction is equal to the signal direction, although the mean speed is only ahalf of the signal speed.
5

direction. Therefore, in the case that the proportion of signal dots was lessthan 50 %, some of dot pairs were composed of two noise dots. For example,when the proportion of signal dots was 25 %, half of dot pairs consisted of asignal and a noise dot, and the others two noise dots.
In pairwise-averaged stimuli, we regarded the dots that corresponded to signalcontained pairs in LPD stimuli as “signal” dots, because the mean directionof these motions was equal to the direction of a signal motion as describedpreviously. Similarly, the dots corresponding to noise-only pairs were regardedas “noise” dots, as these dots moved toward random direction. We will plotthe direction discrimination threshold in the pairwise-averaged stimuli withrespect to the percentage of the above mentioned signal dots. Note that thesignal proportions in the pairwise-averaged stimuli become twice as large asthose in the corresponding LPD stimuli. For example, when a signal proportionof an LPD stimulus was 25 %, half of the dot pairs contained a signal dot,and therefore, the proportion of “signal” dots in the corresponding pairwise-averaged stimulus became 50 %.
3.1.2 Procedure
To measure the signal detection performance, we employed a single-intervaltwo-alternative-forced-choice (2AFC) paradigm. In each trial, a signal direc-tion was randomized to be either leftward or rightward, and observers wereasked to indicate the direction of the signal motion. Each stimulus was pre-sented for 400 ms.
Direction discrimination thresholds were measured with an 1-up/4-down stair-case procedure that converged on 84 % correct level; four successive correctresponses were required to decrease the proportion of signal dots while oneincorrect response increased the proportion. The staircase started at a signalproportion of 50 % in both RDKs and LPD stimuli. The step-size in signalproportion was 8 % until the second reversal, 4 % until the fourth reversal, 2 %until the sixth reversal, and 1 % thereafter. In the pairwise-averaged stimuli,the initial level and the step-size were twice as large as those in LPD stim-uli. Each experimental run continued until twelve reversals were collected, butonly the last six reversals were used in data analysis. All subjects completedtwo experimental runs with each stimulus, so that each estimate of thresholdwas based on twelve reversals.
3.2 Results
Figure 3a represents the average thresholds for five observers in RDKs andLPD stimuli. The direction discrimination thresholds in RDKs and LPD stim-
6

uli were 16.8 % and 20.1 %, respectively. Although the threshold in LPD stim-uli was greater than that in RDKs, this result indicates that signal directionscould be detected when signal dots were paired with noise dots; while previousstudies showed that observers could not perceive component motion directionswhen signal dots were paired with dots moving in another direction coherently.
Note that the thresholds obtained in the present study were higher than thoseobtained in some previous studies. For example, Scase, Braddick, and Ray-mond (1996) reported that the coherence thresholds in RDKs were around5–10%. Although we cannot simply compare the present results with the pre-vious ones because the stimulus parameters are different, this difference ismost likely due to the performance level that corresponds to the thresholdvalues. In the present study, threshold values correspond to 84% correct lev-els, whereas the thresholds reported by Scase, Braddick, and Raymond (1996)correspond to 71%. In addition, Baker, Hess, and Zihl (1991) reported that thedirection discrimination ability declines with decreasing dot lifetime. There-fore, introducing dot lifetime would also raise the coherence threshold in thepresent experiments.
Figure 3b shows the direction discrimination threshold in pairwise-averagedstimuli. To compare the thresholds in LPD and pairwise-averaged stimuli, thethreshold in LPD stimuli was replotted as the percentage of the total numberof dot pairs that contain a signal dot. The threshold in pairwise-averagedstimuli was 39.0 % in average.
An ANOVA showed that the effect of stimulus type was significant (F (2, 8) =4.467, p < 0.05). Post hoc multiple comparisons with Tukey’s test showed thata difference was significant between RDK and LPD conditions (p < 0.05).
3.3 Discussion
The results showed that observers could perceive the directions of signal mo-tions that were paired with noise motions. These results can be explained byassuming the hierarchy of motion integration stages; paired motions in LPDstimuli are locally integrated first, and then observers perceive the global direc-tion of the pairwise-averaged motions. This hierarchical integration assump-tion argues that the motion perception in the present LPD stimuli is similarto that in the global flow displays such as Figs. 1a and 2c.
The results confirmed the prediction that observers can detect the signal di-rection of the locally-paired signal-and-noise motions. However, another pre-diction, that is, the thresholds in LPD stimuli should be similar to those inpairwise-averaged stimuli rather than in RDKs, is still unclear. The threethreshold values obtained in this experiment were similar. Although the sta-
7

tistical difference was found between the thresholds in RDKs and LPD stimuli,the statistical test could not found a significant difference between RDKs andpairwise-averaged stimuli. Therefore, to examine the latter prediction, it is nec-essary to employ the RDKs and the corresponding LPD stimuli the thresholdvalues of which would be greatly different.
4 Experiment 2: Threshold for bi-directional signal
In the second experiment, we measured the coherence thresholds in bi-directionalsignal displays as schematically illustrated in Fig. 4. The RDK consisted oforthogonal signal motions and noise motions (Fig. 4a). In the correspondingLPD stimulus, each signal dot was paired with a signal dot, and each noisedot was paired with a noise dot (Fig. 4b). Therefore, the pairwise-averagedstimulus became a uni-directional RDK (Fig. 4c). In these stimuli, observersperceive transparent motion in the RDK and unitary motions in the others.The proportions of signal dots (filled dots in Fig. 4) in these three stimuliwere equal in this experiment. Note that, in the RDK and the LPD stimulus,a half of signal dots moved in one direction while the other half moved in theorthogonal direction, whereas all signal dots move in the same direction in thepairwise-averaged stimulus.
Previous studies reported that extracting motion signals in transparent RDKswas far harder than in uni-directional RDKs. Edwards and Greenwood (2005)showed that the proportion of each coherent motion required to perceive trans-parency was about three times higher than the coherence threshold in uni-directional RDKs. This finding suggests that the perception of motion trans-parency has a high processing cost associated with the need to detect and rep-resent two overlapping motions simultaneously (see also Braddick, Wishart,& Curran, 2002). Contrary to this, when observers were not required to per-ceive overlapping motions simultaneously, the performance of coherent motiondetection in bi-directional RDKs was similar to that in uni-directional RDKs(Edwards & Nishida, 1999; Hibbard & Bradshaw, 1999). In other words, at thethreshold level, the proportion of each coherent motion in bi-directional RDKswas similar to the coherence threshold in uni-directional RDKs. However, evenif the ability to detect a threshold-level signal was not affected by the presenceof a secondary supra-threshold signal when transparency perception was notrequired, observers cannot detect coherent motions the proportions of whichwere less than the uni-directional threshold.
On the other hand, if signal dots in a transparent RDK are paired as illustratedin Fig. 4b, it is predicted that observers can perceive motion coherency whenno coherent signal exceeds the uni-directional threshold. In the case of Fig.4, the proportion of signal dots moving in a particular direction in the LPD
8
stimulus is equal to a half of the proportion of signal dots in the pairwise-averaged stimulus. The hierarchical integration assumption argues that theperformance of coherent motion detection in LPD stimuli would be similarto that in pairwise-averaged stimuli. Because the pairwise-averaged stimulushas a single coherent motion, it is predicted that observers can detect motioncoherency when the proportion of each coherent motion in the LPD stimulusis equal to a half of the uni-directional threshold. Therefore, although thestimulus parameters (e.g., dot density and speed) are different between theRDK and the pairwise-averaged stimulus, it is expected that the signal levelthat is required to perceive motion coherency in the LPD stimulus would befar smaller than that in the transparent RDK.
4.1 Methods
4.1.1 Stimuli
In RDKs and LPD stimuli, half of the signal dots moved in one direction, andthe other half in the orthogonal direction. Each local pair in LPD stimuli was atwo-signal or a two-noise pair; no signal-noise pair was allowed. The directionsof signal motions were fixed at upper and lower right (45 deg and −45 deg), orupper and lower left (135 deg and−135 deg). Therefore, perceived directions inLPD and pairwise-averaged stimuli became rightward (0 deg) or leftward (180deg). In each two-noise pair, one motion direction was determined randomly,and another was restricted to the orthogonal direction. Therefore, the directiondifference of each local pair was 90 deg, and the speed of pairwise-averagedmotions was 1.4 deg/s.
In pairwise-averaged stimuli, dots corresponding to two-signal and two-noisepairs were regarded as signal and noise dots, respectively. Note that, in RDKsand LPD stimuli, we will plot the coherence thresholds with respect to thepercentages of the total number of dots that were assigned as signal dots(e.g., the percentage of all filled dots in Fig. 4). Unlike Experiment 1, theproportions of signal dots in pairwise-averaged stimuli were equal to those inthe corresponding LPD stimuli and RDKs.
4.1.2 Procedure
To measure the coherence thresholds for the bi-directional signal condition,we employed a two-interval 2AFC procedure like previous studies that theobservers did not have to perceive transparency in order to perform the task(Edwards & Nishida, 1999; Hibbard & Bradshaw, 1999). On each trial, ob-servers viewed two stimulus intervals; each lasting 400 ms and separated by aninter-stimulus interval of 500 ms. One interval was designated as the signal-
9

present interval that contained signal dots as illustrated in Fig. 4, and theother as the signal-absent (or noise-only) interval. This order was chosen atrandom from trial to trial. The observers’ task was to indicate which intervalcontained coherent motions.
The coherence thresholds were measured with 1-up/4-down staircase proce-dure like Experiment 1. All subjects completed two staircases; one staircasehad rightward signal motion, and the other leftward signal motion. The stair-case started at a signal proportion of 100 %, and the step-size in signal pro-portion was 16 % until the second reversal, 8 % until the fourth reversal, 4% until the sixth reversal, and 2 % thereafter. Each staircase continued un-til twelve reversals had been completed, and the last six reversals were usedin data analysis. The coherence threshold in each stimulus was calculated byaveraging the twelve reversals from the two staircases.
4.2 Results
Figure 5 shows the results of the experiment. The coherence thresholds in thebi-directional RDKs, i.e., the sum of the percentages of two signal dots, was51.5 % in average, and was about twice as high as the threshold in pairwise-averaged stimuli (23.3%); although the stimulus parameters (e.g., dot densityand speed) were different between these stimuli, this result was consistent withthe previous result (Edwards & Nishida, 1999; Hibbard & Bradshaw, 1999).Note that the threshold values obtained in this experiment were higher thanthe previous results because of the same reason described in Section 3.2.
The threshold in LPD stimuli, i.e., the percentage of the dot pairs composed oftwo signal dots, was 27.4 %. This threshold value was similar to the thresholdin pairwise-averaged stimuli rather than that in RDKs. An ANOVA showedthat the effect of stimulus type was significant (F (2, 8) = 31.60, p < 0.001).Multiple comparisons with Tukey’s test showed that the difference was signifi-cant between the RDK and LPD conditions (p < 0.01) and between the RDKand pairwise-average conditions (p < 0.01).
4.3 Discussion
The results indicated that the coherence threshold in the LPD stimuli wassimilar to that in the pairwise-averaged stimuli rather than that in the cor-responding RDKs. Only pairing signal dots, observers could discriminate co-herent motions in LPD stimuli even if the proportions of signal dots were lessthan the coherence threshold in the corresponding RDKs. This result suggests
10
that the local integration for closely paired motions is unaffected by the globalproportions of signal dots.
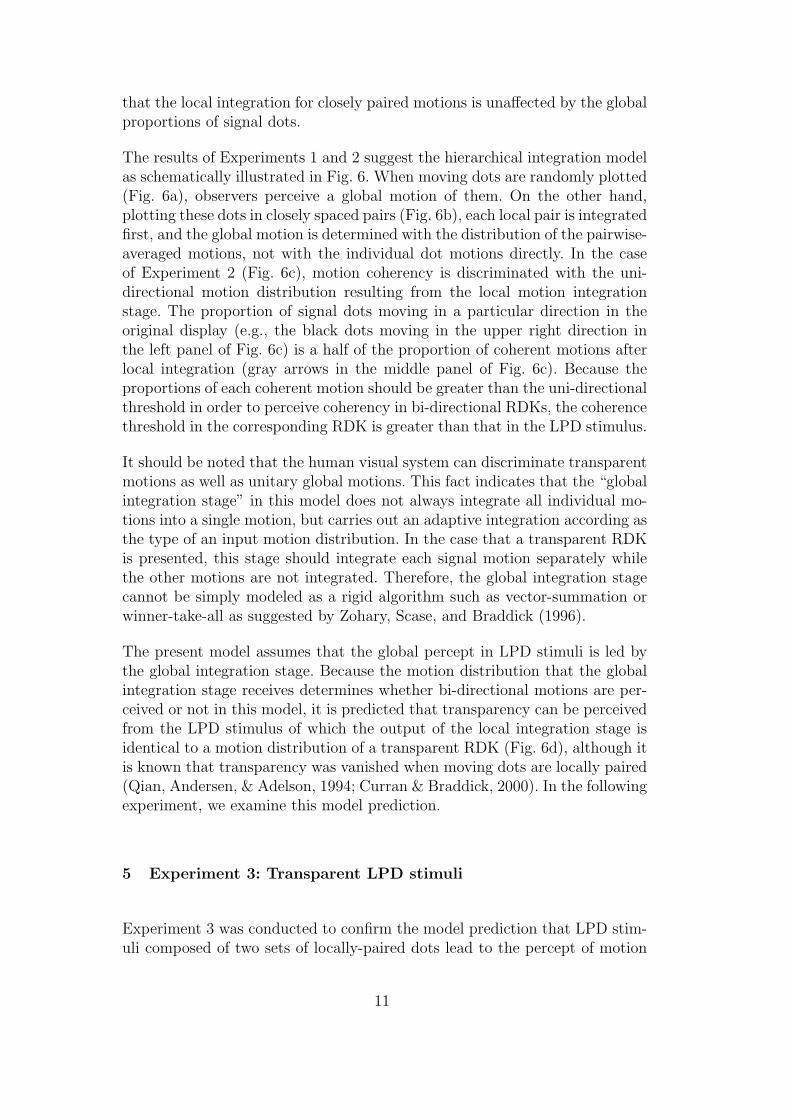
The results of Experiments 1 and 2 suggest the hierarchical integration modelas schematically illustrated in Fig. 6. When moving dots are randomly plotted(Fig. 6a), observers perceive a global motion of them. On the other hand,plotting these dots in closely spaced pairs (Fig. 6b), each local pair is integratedfirst, and the global motion is determined with the distribution of the pairwise-averaged motions, not with the individual dot motions directly. In the caseof Experiment 2 (Fig. 6c), motion coherency is discriminated with the uni-directional motion distribution resulting from the local motion integrationstage. The proportion of signal dots moving in a particular direction in theoriginal display (e.g., the black dots moving in the upper right direction inthe left panel of Fig. 6c) is a half of the proportion of coherent motions afterlocal integration (gray arrows in the middle panel of Fig. 6c). Because theproportions of each coherent motion should be greater than the uni-directionalthreshold in order to perceive coherency in bi-directional RDKs, the coherencethreshold in the corresponding RDK is greater than that in the LPD stimulus.
It should be noted that the human visual system can discriminate transparentmotions as well as unitary global motions. This fact indicates that the “globalintegration stage” in this model does not always integrate all individual mo-tions into a single motion, but carries out an adaptive integration according asthe type of an input motion distribution. In the case that a transparent RDKis presented, this stage should integrate each signal motion separately whilethe other motions are not integrated. Therefore, the global integration stagecannot be simply modeled as a rigid algorithm such as vector-summation orwinner-take-all as suggested by Zohary, Scase, and Braddick (1996).
The present model assumes that the global percept in LPD stimuli is led bythe global integration stage. Because the motion distribution that the globalintegration stage receives determines whether bi-directional motions are per-ceived or not in this model, it is predicted that transparency can be perceivedfrom the LPD stimulus of which the output of the local integration stage isidentical to a motion distribution of a transparent RDK (Fig. 6d), although itis known that transparency was vanished when moving dots are locally paired(Qian, Andersen, & Adelson, 1994; Curran & Braddick, 2000). In the followingexperiment, we examine this model prediction.
5 Experiment 3: Transparent LPD stimuli
Experiment 3 was conducted to confirm the model prediction that LPD stim-uli composed of two sets of locally-paired dots lead to the percept of motion
11
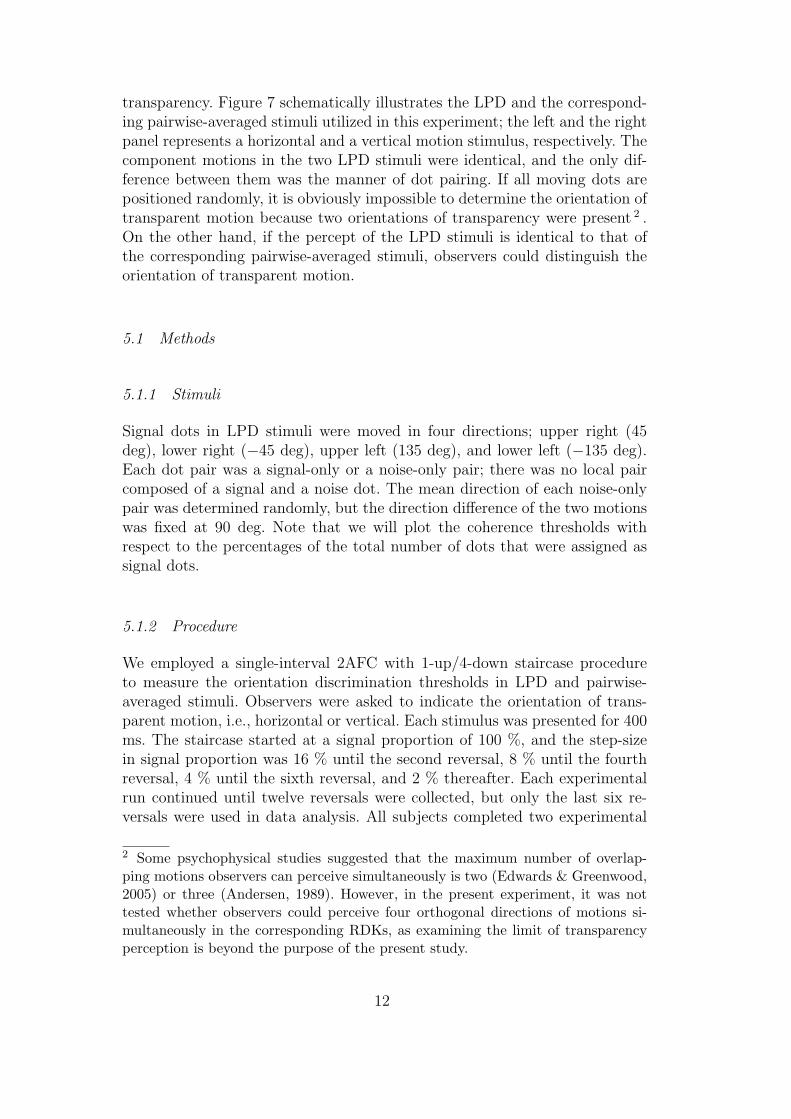
transparency. Figure 7 schematically illustrates the LPD and the correspond-ing pairwise-averaged stimuli utilized in this experiment; the left and the rightpanel represents a horizontal and a vertical motion stimulus, respectively. Thecomponent motions in the two LPD stimuli were identical, and the only dif-ference between them was the manner of dot pairing. If all moving dots arepositioned randomly, it is obviously impossible to determine the orientation oftransparent motion because two orientations of transparency were present 2 .On the other hand, if the percept of the LPD stimuli is identical to that ofthe corresponding pairwise-averaged stimuli, observers could distinguish theorientation of transparent motion.
5.1 Methods
5.1.1 Stimuli
Signal dots in LPD stimuli were moved in four directions; upper right (45deg), lower right (−45 deg), upper left (135 deg), and lower left (−135 deg).Each dot pair was a signal-only or a noise-only pair; there was no local paircomposed of a signal and a noise dot. The mean direction of each noise-onlypair was determined randomly, but the direction difference of the two motionswas fixed at 90 deg. Note that we will plot the coherence thresholds withrespect to the percentages of the total number of dots that were assigned assignal dots.
5.1.2 Procedure
We employed a single-interval 2AFC with 1-up/4-down staircase procedureto measure the orientation discrimination thresholds in LPD and pairwise-averaged stimuli. Observers were asked to indicate the orientation of trans-parent motion, i.e., horizontal or vertical. Each stimulus was presented for 400ms. The staircase started at a signal proportion of 100 %, and the step-sizein signal proportion was 16 % until the second reversal, 8 % until the fourthreversal, 4 % until the sixth reversal, and 2 % thereafter. Each experimentalrun continued until twelve reversals were collected, but only the last six re-versals were used in data analysis. All subjects completed two experimental
2 Some psychophysical studies suggested that the maximum number of overlap-ping motions observers can perceive simultaneously is two (Edwards & Greenwood,2005) or three (Andersen, 1989). However, in the present experiment, it was nottested whether observers could perceive four orthogonal directions of motions si-multaneously in the corresponding RDKs, as examining the limit of transparencyperception is beyond the purpose of the present study.
12
runs with each stimulus, and each estimate of threshold is based on twelvereversals.
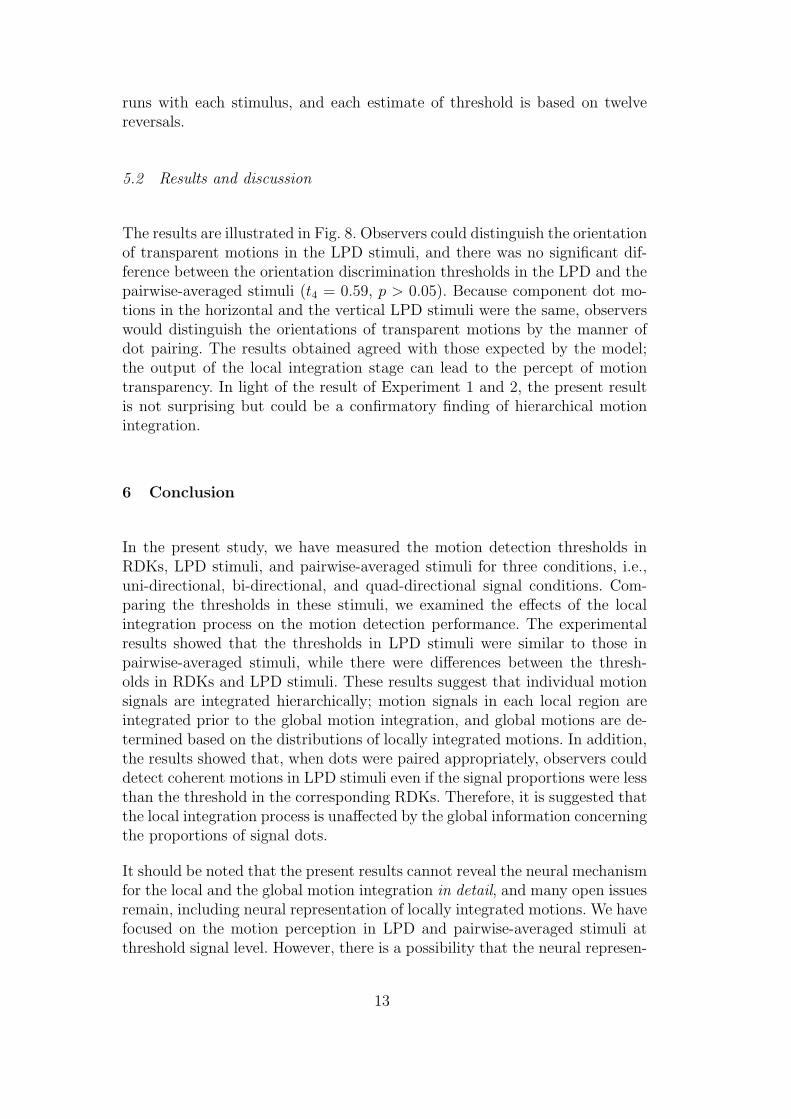
5.2 Results and discussion
The results are illustrated in Fig. 8. Observers could distinguish the orientationof transparent motions in the LPD stimuli, and there was no significant dif-ference between the orientation discrimination thresholds in the LPD and thepairwise-averaged stimuli (t4 = 0.59, p > 0.05). Because component dot mo-tions in the horizontal and the vertical LPD stimuli were the same, observerswould distinguish the orientations of transparent motions by the manner ofdot pairing. The results obtained agreed with those expected by the model;the output of the local integration stage can lead to the percept of motiontransparency. In light of the result of Experiment 1 and 2, the present resultis not surprising but could be a confirmatory finding of hierarchical motionintegration.
6 Conclusion
In the present study, we have measured the motion detection thresholds inRDKs, LPD stimuli, and pairwise-averaged stimuli for three conditions, i.e.,uni-directional, bi-directional, and quad-directional signal conditions. Com-paring the thresholds in these stimuli, we examined the effects of the localintegration process on the motion detection performance. The experimentalresults showed that the thresholds in LPD stimuli were similar to those inpairwise-averaged stimuli, while there were differences between the thresh-olds in RDKs and LPD stimuli. These results suggest that individual motionsignals are integrated hierarchically; motion signals in each local region areintegrated prior to the global motion integration, and global motions are de-termined based on the distributions of locally integrated motions. In addition,the results showed that, when dots were paired appropriately, observers coulddetect coherent motions in LPD stimuli even if the signal proportions were lessthan the threshold in the corresponding RDKs. Therefore, it is suggested thatthe local integration process is unaffected by the global information concerningthe proportions of signal dots.
It should be noted that the present results cannot reveal the neural mechanismfor the local and the global motion integration in detail, and many open issuesremain, including neural representation of locally integrated motions. We havefocused on the motion perception in LPD and pairwise-averaged stimuli atthreshold signal level. However, there is a possibility that the neural represen-
13
tations of LPD stimuli are not the precise equivalent of those of the correspond-ing pairwise-averaged stimuli. Curran and Braddick (2000) reported that, inthe case of no noise condition, the precision of motion direction discriminationin LPD stimuli is worse than that in RDKs. This result would suggest that theneural representation of a locally integrated motion is not completely identicalto a single dot motion. Further investigations should include measuring theprecision of direction discriminations in LPD and pairwise-averaged stimuli atsupra-threshold signal levels.
In addition, Vidnyanszky, Blaster, and Papathomas (2002) pointed out thesimilarity between the perceptions of LPD stimuli and motion aftereffects(MAEs) induced by transparent motions (Mather, 1980; Verstraten, Freder-icksen, & van de Grind, 1994), and argued that these integrated motion per-ceptions result from similar mechanisms. The relationship between the MAEresulting from adaptation to transparent motion and the local integrationprocess discussed in the present paper is the question for further research.
Acknowledgements
This research was supported in part by Grant-in-Aid for Scientific Researchfrom MEXT, Japan.
References
Andersen, G. J. (1989). Perception of three-dimensional structure from opticflow without locally smooth velocity. Journal of Experimental Psychology:Human Perception and Performance, 15, 363–371.
Baker, C. L., Hess, R. F., & Zihl, J. (1991). Residual motion perception in a“motion-blind” patient, assessed with limited-lifetime random dot stimuli.Journal of Neuroscience, 11, 454–461.
Braddick, O. (1995). Seeing motion signals in noise. Current Biology, 5, 7–9.Braddick, O., Wishart, K., & Curran, W. (2002). Directional performance in
motion transparency. Vision Research, 42, 1237–1248.Curran, W. & Braddick, O. J. (2000). Speed and direction of locally-paired
dot patterns. Vision Research, 40, 2115–2124.Edwards, M. & Greenwood, J. A. (2005). The perception of motion trans-
parency: a signal-to-noise limit. Vision Research, 45, 1877–1884.Edwards, M. & Nishida, S. (1999). Global-motion detection with transparent-
motion signals. Vision Research, 39, 2239–2249.Hibbard, P. B. & Bradshaw, M. F. (1999). Does binocular disparity facilitate
the direction of transparent motion? Perception, 28, 183–191.
14

Mather, G. (1980). The movement aftereffect and a distribution-shift modelfor coding the direction of visual movement. Perception, 9, 372–392.
Qian, N., Andersen, R. A., & Adelson, E. H. (1994). Transparent motion asthe detection of unbalanced motion signals. I. Psychophysics. Journal ofNeuroscience, 14, 7357–7366.
Scase, M. O., Braddick, O. J., & Raymond, J. E. (1996). What is noise for themotion system? Vision Research, 36, 2579–2586.
Verstraten, F. A. J., Fredericksen, R. E., & van de Grind, W. A. (1994). Themovement aftereffect of bi-directional transparent motion. Vision Research,34, 349–358.
Vidnyanszky, Z., Blaster, E., & Papathomas, T. V. (2002). Motion integrationduring motion aftereffects. Trends in Cognitive Sciences, 6, 157–161.
Watamaniuk, S. N. J. & Sekuler, R. (1992). Temporal and spatial integrationin dynamic random-dot stimuli. Vision Research, 32, 2341–2347.
Watamaniuk, S. N. J., Sekuler, R., & Williams, D. W. (1989). Direction per-ception in complex dynamic displays: The integration of direction informa-tion. Vision Research, 29, 47–59.
Zohary, E., Scase, M. O., & Braddick, O. J. (1996). Integration across direc-tions in dynamic random dot displays: vector summation or winner tale all?Vision Research, 36, 2321–2331.
15

Figure Legends
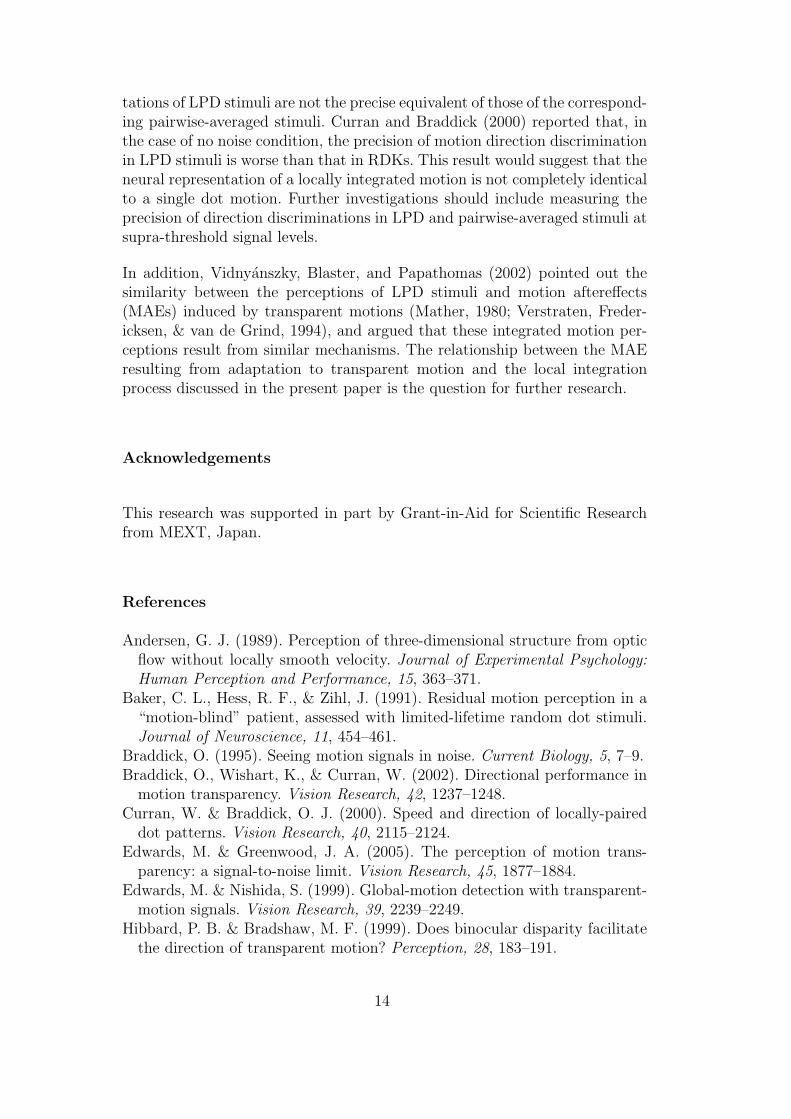
Fig. 1. Schematic illustrations of motion stimuli utilized to investigate the mecha-nism of global motion integration. The large arrows represent perceived directionsof global motions. (a) An RDK stimulus the motion directions of which are broadlydistributed. (b) A transparent motion stimulus. Observers can perceive two globalmotions simultaneously. (c) An LPD stimulus. Dots moving toward different direc-tions are locally paired. Observers perceive a unitary global motion determined bythe vector-average of two motions.
Fig. 2. Schematic illustrations of the motion stimuli used in Experiment 1. Filledcircles represent coherently moving (or signal) dots, and open circles noise dots.(a) An RDK stimulus. (b) The corresponding LPD stimulus generated by pairinga signal and a noise dot. (c) A pairwise-averaged stimulus generated by replacingeach dot pair in the LPD stimulus with a single dot (gray circles) the motion vectorof which is determined by the vector average of the paired motions.
Fig. 3. Result of Experiment 1. (a) Direction discrimination thresholds foruni-directional motion signals in RDKs and LPD stimuli. The thresholds are plottedas the percentage of signal dots. Error bars represent ±1 standard errors. (b) Direc-tion discrimination thresholds in LPD and pairwise-averaged stimuli. The thresholdin the pairwise-averaged stimuli is plotted as the percentage of the dots that corre-spond to signal contained pairs in LPD stimuli (see text). In order to compare thethresholds in LPD and pairwise-averaged stimuli, the threshold in LPD stimuli isreplotted as the percentage of the total number of dot pairs that contain a signaldot.
Fig. 4. Schematic illustrations of bi-directional motion stimuli used in Experiment2; (a) RDK, (b) LPD stimulus, and (c) pairwise-averaged stimulus.
Fig. 5. Result of Experiment 2; coherence thresholds in RDKs, LPD stimuli, andpairwise-averaged stimuli.
Fig. 6. A schematic model for the hierarchical motion integration.
16

Fig. 7. Schematic illustration of the stimuli used in Experiment 3; (a) transparentLPD stimuli and (b) the corresponding pairwise-averaged stimuli.
Fig. 8. Result of Experiment 3; orientation discrimination thresholds for transparentLPD and pairwise-averaged stimuli.
17
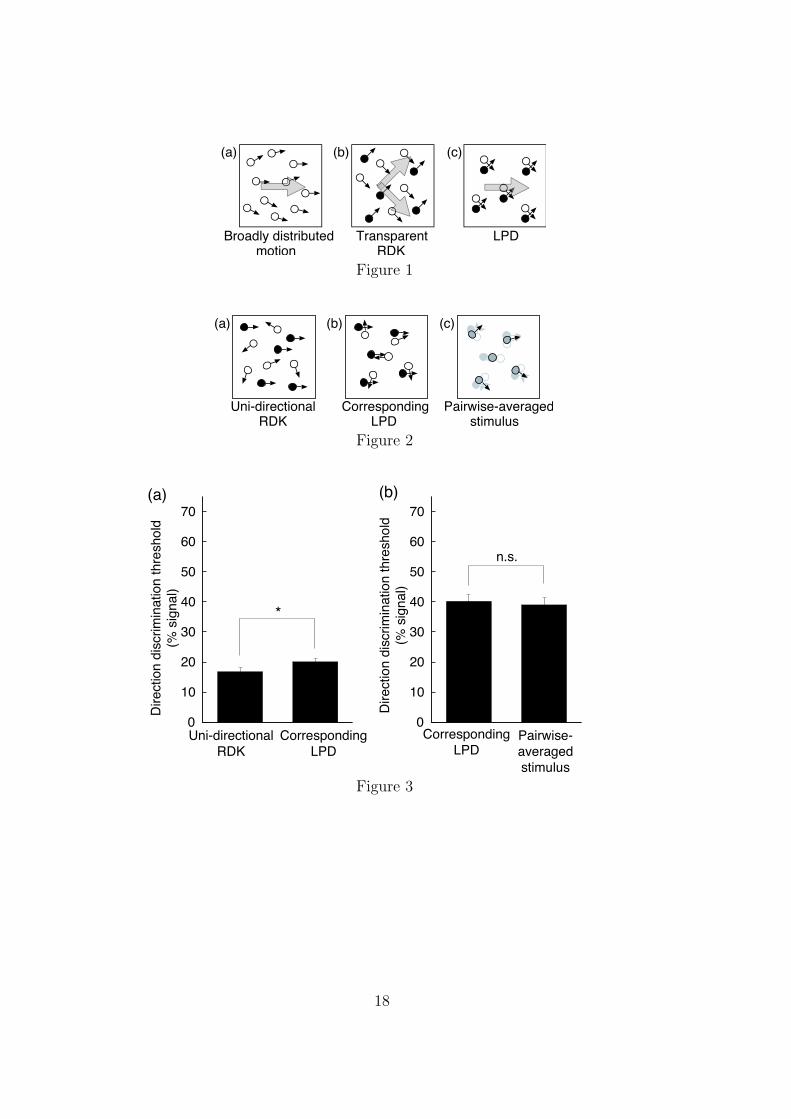
Figure 1
Figure 2
Figure 3
18
Figure 4
Figure 5
Figure 6
19

Figure 7
Figure 8
20