
Henry Ford Health Scholarly Commons
13
Henry Ford Health Henry Ford Health Henry Ford Health Scholarly Commons Henry Ford Health Scholarly Commons Hematology Oncology Articles Hematology-Oncology 2-12-2021 Multiethnic PDX models predict a possible immune signature Multiethnic PDX models predict a possible immune signature associated with TNBC of African ancestry associated with TNBC of African ancestry Evelyn M. Jiagge Henry Ford Health, [email protected] Peter J. Ulintz Shukmei Wong Sean P. McDermott Sabrina I. Fossi Henry Ford Health, [email protected] See next page for additional authors Follow this and additional works at: https://scholarlycommons.henryford.com/ hematologyoncology_articles Recommended Citation Recommended Citation Jiagge EM, Ulintz PJ, Wong S, McDermott SP, Fossi SI, Suhan TK, Hoenerhoff MJ, Bensenhaver JM, Salem B, Dziubinski M, Oppong JK, Aitpillah F, Ishmael K, Osei-Bonsu E, Adjei E, Baffour A, Aldrich J, Kurdoglu A, Fernando K, Craig DW, Trent JM, Li J, Chitale D, Newman LA, Carpten JD, Wicha MS, and Merajver SD. Multiethnic PDX models predict a possible immune signature associated with TNBC of African ancestry. Breast Cancer Res Treat 2021. This Article is brought to you for free and open access by the Hematology-Oncology at Henry Ford Health Scholarly Commons. It has been accepted for inclusion in Hematology Oncology Articles by an authorized administrator of Henry Ford Health Scholarly Commons.
-
Upload
khangminh22 -
Category
Documents
-
view
2 -
download
0
Transcript of Henry Ford Health Scholarly Commons
Henry Ford Health Henry Ford Health
Henry Ford Health Scholarly Commons Henry Ford Health Scholarly Commons
Hematology Oncology Articles Hematology-Oncology
2-12-2021
Multiethnic PDX models predict a possible immune signature Multiethnic PDX models predict a possible immune signature
associated with TNBC of African ancestry associated with TNBC of African ancestry
Evelyn M. Jiagge Henry Ford Health, [email protected]
Peter J. Ulintz
Shukmei Wong
Sean P. McDermott
Sabrina I. Fossi Henry Ford Health, [email protected]
See next page for additional authors
Follow this and additional works at: https://scholarlycommons.henryford.com/
hematologyoncology_articles
Recommended Citation Recommended Citation Jiagge EM, Ulintz PJ, Wong S, McDermott SP, Fossi SI, Suhan TK, Hoenerhoff MJ, Bensenhaver JM, Salem B, Dziubinski M, Oppong JK, Aitpillah F, Ishmael K, Osei-Bonsu E, Adjei E, Baffour A, Aldrich J, Kurdoglu A, Fernando K, Craig DW, Trent JM, Li J, Chitale D, Newman LA, Carpten JD, Wicha MS, and Merajver SD. Multiethnic PDX models predict a possible immune signature associated with TNBC of African ancestry. Breast Cancer Res Treat 2021.
This Article is brought to you for free and open access by the Hematology-Oncology at Henry Ford Health Scholarly Commons. It has been accepted for inclusion in Hematology Oncology Articles by an authorized administrator of Henry Ford Health Scholarly Commons.

Authors Authors Evelyn M. Jiagge, Peter J. Ulintz, Shukmei Wong, Sean P. McDermott, Sabrina I. Fossi, Tahra K. Suhan, Mark J. Hoenerhoff, Jessica M. Bensenhaver, Barbara Salem, Michele Dziubinski, Joseph K. Oppong, Francis Aitpillah, Kyei Ishmael, Ernest Osei-Bonsu, Ernest Adjei, Awuah Baffour, Jessica Aldrich, Ahmet Kurdoglu, Kurt Fernando, David W. Craig, Jeff M. Trent, Jun Li, Dhananjay A. Chitale, Lisa A. Newman, John D. Carpten, Max S. Wicha, and Sofia D. Merajver
This article is available at Henry Ford Health Scholarly Commons: https://scholarlycommons.henryford.com/hematologyoncology_articles/175
Vol.:(0123456789)1 3
Breast Cancer Research and Treatment https://doi.org/10.1007/s10549-021-06097-8
PRECLINICAL STUDY
Multiethnic PDX models predict a possible immune signature associated with TNBC of African ancestry
Evelyn M. Jiagge1,2,3 · Peter J. Ulintz2,3 · Shukmei Wong5 · Sean P. McDermott2 · Sabrina I. Fossi1,2 · Tahra K. Suhan3,4 · Mark J. Hoenerhoff6 · Jessica M. Bensenhaver1 · Barbara Salem10 · Michele Dziubinski3 · Joseph K. Oppong7 · Francis Aitpillah7 · Kyei Ishmael7 · Ernest Osei‑Bonsu7 · Ernest Adjei7 · Awuah Baffour7 · Jessica Aldrich5 · Ahmet Kurdoglu5 · Kurt Fernando1 · David W. Craig8 · Jeff M. Trent5 · Jun Li3 · Dhananjay Chitale1 · Lisa A. Newman9 · John D. Carpten8 · Max S. Wicha2,3 · Sofia D. Merajver2,3
Received: 26 May 2020 / Accepted: 5 January 2021 © The Author(s), under exclusive licence to Springer Science+Business Media, LLC part of Springer Nature 2021
AbstractPurpose Triple-negative breast cancer (TNBC) is an aggressive subtype most prevalent among women of Western Sub-Saharan African ancestry. It accounts for 15–25% of African American (AA) breast cancers (BC) and up to 80% of Ghanaian breast cancers, thus contributing to outcome disparities in BC for black women. The aggressive biology of TNBC has been shown to be regulated partially by breast cancer stem cells (BCSC) which mediate tumor recurrence and metastasis and are more abundant in African breast tumors.Methods We studied the biological differences between TNBC in women with African ancestry and those of Caucasian women by comparing the gene expression of the BCSC. From low-passage patient derived xenografts (PDX) from Ghanaian (GH), AA, and Caucasian American (CA) TNBCs, we sorted for and sequenced the stem cell populations and analyzed for differential gene enrichment.Results In our cohort of TNBC tumors, we observed that the ALDH expressing stem cells display distinct ethnic specific gene expression patterns, with the largest difference existing between the GH and AA ALDH+ cells. Furthermore, the tumors from the women of African ancestry [GH/AA] had ALDH stem cell (SC) enrichment for expression of immune related genes and processes. Among the significantly upregulated genes were CD274 (PD-L1), CXCR9, CXCR10 and IFI27, which could serve as potential drug targets.Conclusions Further exploration of the role of immune regulated genes and biological processes in BCSC may offer insight into developing novel approaches to treating TNBC to help ameliorate survival disparities in women with African ancestry.
Keywords Triple-negative breast cancer · Breast cancer stem cells · African ancestry · Gene expression
AbbreviationsAA African AmericansALDH Aldehyde dehydrogenaseBC Breast cancerBCSC Breast cancer stem cellsCA Caucasian AmericansFACS Fluorescent activated cell sortingGH GhanaianGO Gene Ontology Consortium
H&E Hematoxylin and eosinKATH Komfo Anokye Teaching HospitalKEGG Kyoto Encyclopedia of Genes and GenomesPCA Principal component analysisTNBC Triple-negative breast cancerUM The University of MichiganWSSA Western sub-Saharan Africans
Introduction
An abundance of data shows that triple-negative breast cancer (TNBC) is more prevalent among populations of African ancestry compared to those of European ances-try [1–3]. We have shown previously that breast cancer
* Evelyn M. Jiagge [email protected]
* Sofia D. Merajver [email protected]
Extended author information available on the last page of the article
Breast Cancer Research and Treatment
1 3
(BC) in Africa, especially in Western Sub-Saharan Africa (WSSA), shares similar characteristics to BC in AA [4–6]. Beyond socioeconomic factors, there are signifi-cant genetic and biological differences in the TNBC of women of African ancestry compared to other ethnicities [1]. This alludes to possible genetic or ancestral predispo-sition since diasporan AA have predominant WSSA ances-try through the trans-Atlantic slave trade [7]. Indeed, our recent work found a correlation between WSSA ancestry and TNBC risk [8]. TNBC is an aggressive form of BC with poor prognosis, largely lacking targeted therapies. Thus, these factors may contribute to poor outcomes for BC in women of African ancestry [9, 10].
Strong evidence supports the existence in BC of tumor initiating cells with self-renewing potential, termed breast cancer stem cells (BCSC), which play a major role in tumor recurrence and metastasis [11, 12]. These cells have been shown to be abundant in TNBC [3, 13, 14] especially in tumors of African ancestry [1, 5]. BCSCs mediate resistance to chemotherapy and radiotherapy [15, 16] and contribute to the genotypic and phenotypic diver-sity of TNBC. BCSC populations are diverse and can be isolated from the tumor mass via two groups of markers: CD44+/CD24−/EPCAM+ [17, 18] and ALDH+ cells [13]. ALDH+ BCSC are more abundant in TNBC, espe-cially of WSSA and AA women [3, 5]. Since most stem cell research in humans has been based on specimens from CA populations [1], little is known about BCSC patterns in women of African ancestry. The pathways that contribute to the maintenance of BCSC have not been clearly defined in diverse ethnicities. This study sought to identify the gene expression pathways regulating BCSC in TNBC of African ancestry to identify candidate drug targets.
Methods
Patient‑derived xenograft (PDX) generation
At KATH, excess patient tumor tissue was taken from the operating room, cut into small pieces, and slow- frozen to − 80 °C in 10% DMSO/90% FBS. The samples were then transported overnight on dry ice in a commercial flight to UM. For samples obtained from patients undergoing breast cancer treatment at the UM, excess patient biopsy sample was obtained, and directly transported to the lab. For tumor implantation, the tumor pieces were either implanted freshly, or rapidly thawed and rinsed off with HBSS or PBS, cut into smaller fragments (approximately 1–2 mm in diameter), mixed with matrigel (BD), and injected into the mammary fat pad of female NOD/scid/IL2R (NSG) mice with an 18-gauge needle, with 25 µL of
matrigel per injection site. The mammary fat pad was not cleared. We also used PDX tumors that were developed at Van Andel Institute and Baylor College of Medicine by a similar procedure.
All tumors from Ghana were implanted within 48 h of tumor removal. This was a systematically coordinated method with Delta airlines to ensure that tumors survived. There was no system for long term cold storage of sam-ples at the Ghanaian institutions thus, surgeries were per-formed during the last 24 h of each visit to Ghana so that the tumors could be immediately transported. The samples are implanted immediately on arrival. For tumors that were received at the University of Michigan (UM), were also implanted within 48 h of tumor removal. Thus, there was no difference in the time that elapsed between the various locations.
Immunohistochemistry
Histopathology and Immunohistochemistry assessment of all samples was performed at the UM and Henry Ford Health System (HFHS). Immunohistochemistry for ER and PR was performed with monoclonal mouse antibodies to human ER (Cell Marque, Cat # 249R, rabbit, clone Sp1) and to human PR (Sigma, Cat# SAB55001, rabbit, clone Sp3) and HER2/neu labeling was performed using the (Cell Marque, Cat# 237R-16, Rabbit, clone Sp3). Tumors were scored as ER/PR/HER2-positive based on the recommendations of the Allred scoring system as described in the American Col-lege of Pathologists “Template for Reporting Results of Bio-marker Testing of Specimens from Patients with Carcinoma of the Breast” by Fitzgibbons et al. [19].
For specimens with a score of 2, follow-up fluorescent in situ hybridization (FISH) was used to assess amplifica-tion of the HER2/neu gene. FISH for the HER2/neu gene amplification was interpreted in accordance with ASCO/CAP guidelines. Immunohistochemistry for ALDH1 was performed with a mouse monoclonal antibody (BD Trans-duction, Cat# 61195, clone 44). Expression of ALDH1 was scored as positive if more than 5% of cells showed cytoplas-mic stain. EGFR labeling (Invitrogen, Cat# 28-0005, mouse, clone 31G7) was scored as positive when ≥ 10% of tumor cells showed membrane labeling, and negative when < 10% of cells were labeled. For TP53 labeling (Cell Marque, Cat# 453R-16, Rabbit, clone Sp5), tumors were graded as positive if any tumor cells showed positive nuclear immunoreactivity to TP53.
Tissue dissociation and flow cytometry
Xenograft tumors were dissociated using the Tumor Disso-ciation Kit (Miltenyi # 130-095-929) and the gentleMACS
Breast Cancer Research and Treatment
1 3
Octo Dissociator with the Human Tissue dissociation pro-tocol, running the “gentleMACS Octo Dissociator program 37C_h_TDK_1” (Miltenyi). Mouse cells were removed using the Mouse Cell Depletion Kit (Miltenyi # 130-104-694) and MultiMACS Cell24 Separator Plus (Miltenyi). The cells were then stained with: LIVE/DEAD Near-IR Fixable Dead Cell Stain (Invitrogen, Catalog #L10119), anti-mouse MHC Class I (H-2Kd) eFluor 450 (eBiosciences, Catalog #48-5957-80), Aldefluor (Stem Cell Technology, Catalog #01700), CD44-APC (Clone G44-26; BD), CD24-PECy7 (Clone ML5; Biolegend), and EpCAM-PE (Clone EBA-1; BD). Half of the stained cells were incubated with DEAB (Stem Cell Technology, Catalog #01700), an inhibitor of ALDH. Single color controls were used for compensation. Cell sorting was done on a MoFlo Astrios flow cytometer.
Sequencing and transcriptomic data processing
Whole transcriptome libraries were constructed from flow sorted PDX-derived cell lines using Ovation RNASeq V2 (NuGEN) for cDNA generation and Kapa LTP Library prep-aration kit (Roche). The libraries were sequenced on the Illumina HiSeq4000 platform (Ilumina) with paired 87 bp read lengths. Reads were adapter-trimmed and aligned to the human hg19/GRCh37 reference genome, with reads pref-erentially mapping to mouse mm10 removed. Data were processed using a workflow based on the TopHap2/Bow-tie2 alignment tools and the DESeq2 differential expression modeler with read counts generated using HTSeq (v0.6.0). Ethnicity and SC type (ALDH+, CD44+, or bulk) were specified as main factors in the DESeq2 design formula, generating differentially expressed datasets between each ethnicity and SC type with each sorted cell line sample con-sidered a biological replicate (n = 5 each condition).
Enrichment analysis
Pathway and term enrichment/impact analysis were per-formed against the Kyoto Encyclopedia of Genes and Genomes (KEGG) database release 84.0+/10–26 and the Gene Ontology Consortium (GO) database version 2017-Nov6 utilizing the iPathwayGuide platform [20, 21]. Dif-ferentially expressed genes were selected from gene expres-sion differences using p-value < 0.01 and an absolute fold-change ≥ 1.5. FDR adjusted p-value of 0.05 was used as threshold for pathway enrichment terms. To accommodate the hierarchical nature of the GO ontology terms, the Elim and weight pruning methods were used to rank hits [22]. The STRING database of protein interactions v11.0 was utilized for functional enrichment analysis of gene lists [23].
Tumorsphere formation assay
Cells obtained from FACS sorting of PDX samples were plated in 96-well ultralow attachment flat bottom plates (Corning) at 5000 cells/well in 100 µL of serum-free media. Serum-free media (SFM) contains: DMEM, 1X B27 (Gibco), 50 µg/mL insulin, 1X non-essential amino acids, 10 ng/mL EGF, 10 ng/mL bFGF, and antibiotics. Tumor-spheres formed after 3–5 days and each experiment was per-formed in triplicate. Tumorspheres were counted as follows: all spheres greater than 30 µm were counted on day 4 after plating. The average number of spheres in five wells was used for the plot in Supplemental Fig. 1.
Results
Establishing and characterizing PDX of GH tumors
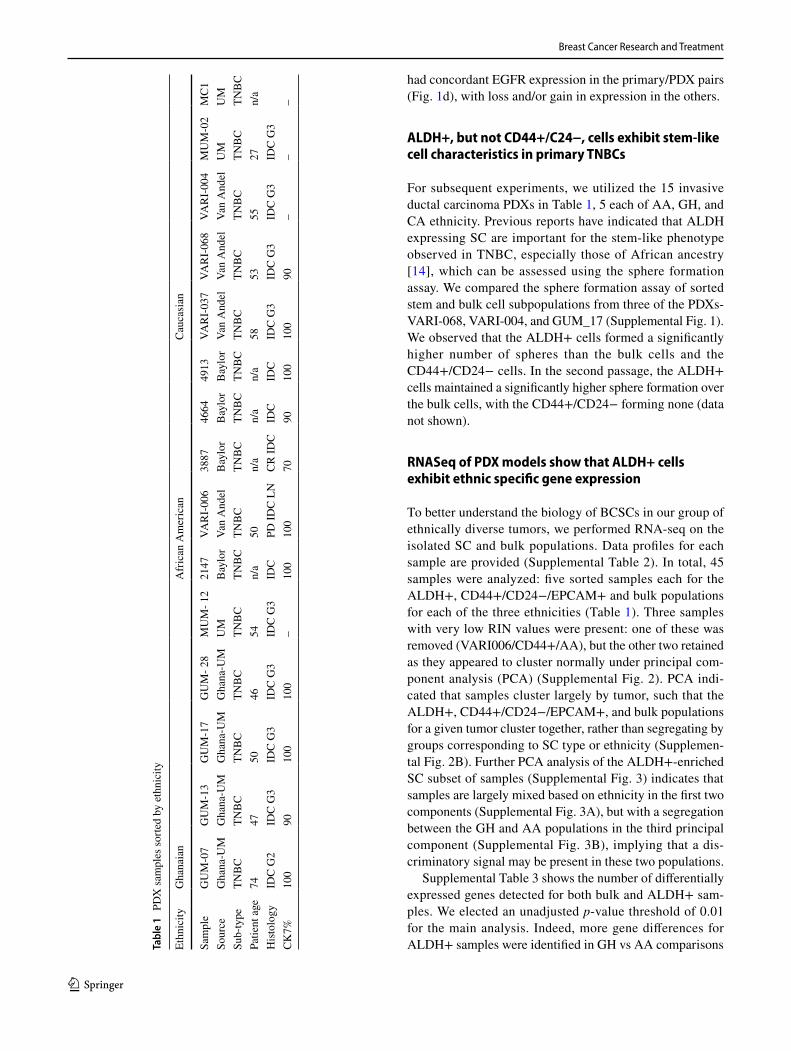
For this work, we utilized PDXs created from GH, AA, and CA tumors at UM, Baylor College of Medicine, and Van Andel Institute. PDXs from GH tumors were established from 2012 to 2017 from fresh tumor samples of GH patients Table 1. To establish the GH. PDXs, the research team from UM travelled to Ghana, operated on the patients with informed consent, and flew to the US with samples on dry ice to implant in mice within 48 h of tumor removal. There was no difference in the time elapsed before implantation between US and GH samples. All PDXs were stained for CK7 to determine breast origin (Table 1). We successfully developed 12 PDX lines from 18 GH. TNBC tumors (67% success rate) and have characterized nine of them with their corresponding primary tumors (Table 2).
Comparison of primary tumor and the corresponding PDX
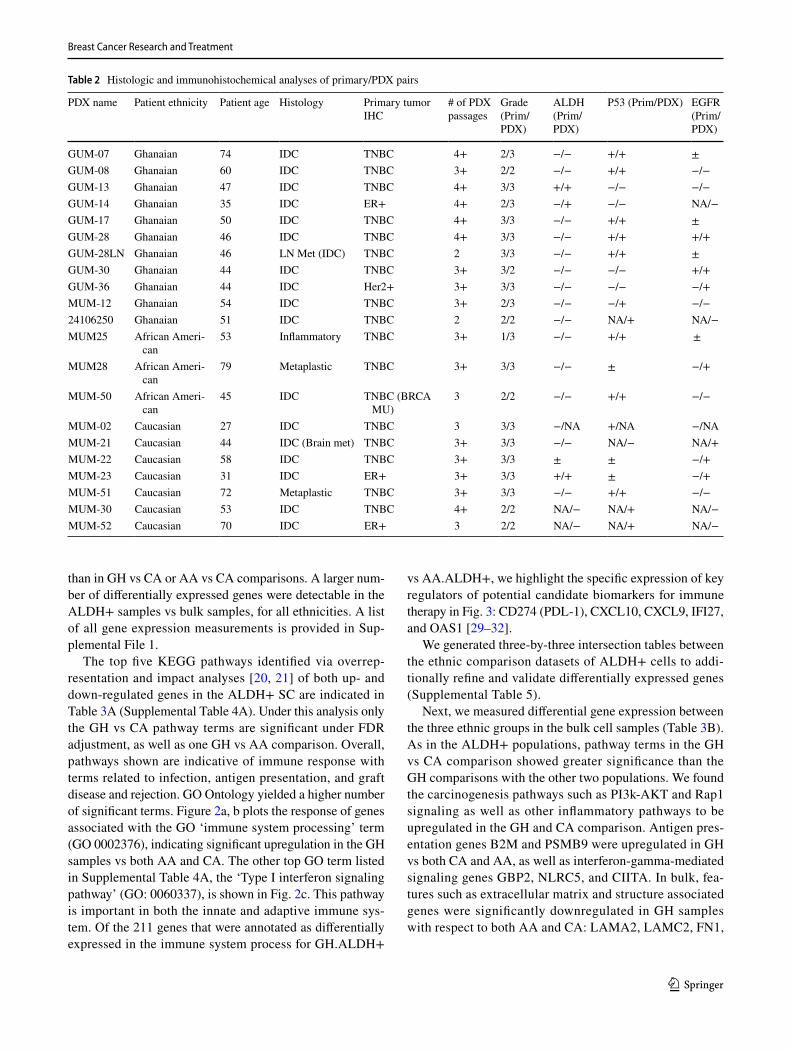
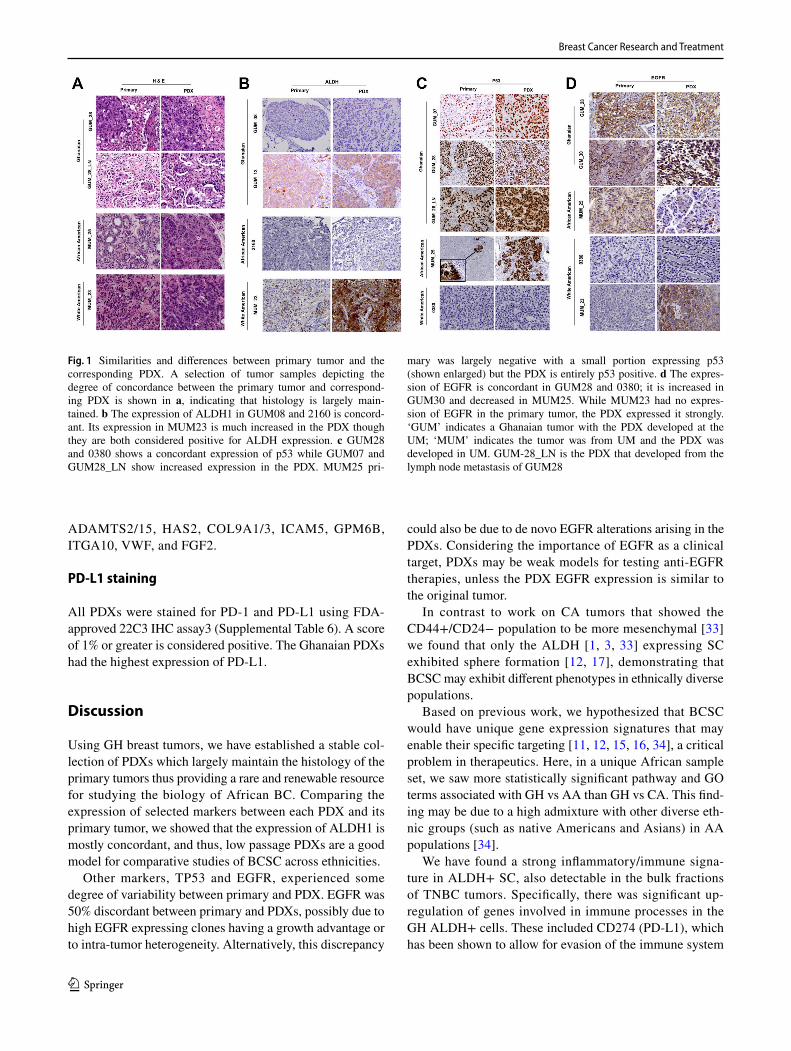
To ascertain the degree of concordance between the primary tumor and the corresponding PDXs, we compared the histol-ogy and selected marker expression (H&E, TP53, EGFR, BRCA1, and ALDH1) [24, 25] (Table 2). We observed vari-able expression of these markers, with over 90% concord-ance in the histology between the paired tumor of origin and its PDX (Fig. 1a). All but one of the tumors were clas-sified as high grade. Figure 1 illustrates examples of the histological similarities of representative tumor/PDX pairs. Figure 1b specifically depicts the spectrum of changes observed for ALDH1 in select samples. The expression of p53 [26, 27] (Table 2, Fig. 1c) was concordant between pri-mary tumor and PDX in the GH samples, with one exception (MUM_12). In contrast, only half of the AA and CA sam-ples had concordant p53 expression. Using 10% expression as the cut-off for positive EGFR [28], 7 of 15 samples (47%)
Breast Cancer Research and Treatment
1 3
had concordant EGFR expression in the primary/PDX pairs (Fig. 1d), with loss and/or gain in expression in the others.
ALDH+, but not CD44+/C24−, cells exhibit stem‑like cell characteristics in primary TNBCs
For subsequent experiments, we utilized the 15 invasive ductal carcinoma PDXs in Table 1, 5 each of AA, GH, and CA ethnicity. Previous reports have indicated that ALDH expressing SC are important for the stem-like phenotype observed in TNBC, especially those of African ancestry [14], which can be assessed using the sphere formation assay. We compared the sphere formation assay of sorted stem and bulk cell subpopulations from three of the PDXs- VARI-068, VARI-004, and GUM_17 (Supplemental Fig. 1). We observed that the ALDH+ cells formed a significantly higher number of spheres than the bulk cells and the CD44+/CD24− cells. In the second passage, the ALDH+ cells maintained a significantly higher sphere formation over the bulk cells, with the CD44+/CD24− forming none (data not shown).
RNASeq of PDX models show that ALDH+ cells exhibit ethnic specific gene expression
To better understand the biology of BCSCs in our group of ethnically diverse tumors, we performed RNA-seq on the isolated SC and bulk populations. Data profiles for each sample are provided (Supplemental Table 2). In total, 45 samples were analyzed: five sorted samples each for the ALDH+, CD44+/CD24−/EPCAM+ and bulk populations for each of the three ethnicities (Table 1). Three samples with very low RIN values were present: one of these was removed (VARI006/CD44+/AA), but the other two retained as they appeared to cluster normally under principal com-ponent analysis (PCA) (Supplemental Fig. 2). PCA indi-cated that samples cluster largely by tumor, such that the ALDH+, CD44+/CD24−/EPCAM+, and bulk populations for a given tumor cluster together, rather than segregating by groups corresponding to SC type or ethnicity (Supplemen-tal Fig. 2B). Further PCA analysis of the ALDH+-enriched SC subset of samples (Supplemental Fig. 3) indicates that samples are largely mixed based on ethnicity in the first two components (Supplemental Fig. 3A), but with a segregation between the GH and AA populations in the third principal component (Supplemental Fig. 3B), implying that a dis-criminatory signal may be present in these two populations.
Supplemental Table 3 shows the number of differentially expressed genes detected for both bulk and ALDH+ sam-ples. We elected an unadjusted p-value threshold of 0.01 for the main analysis. Indeed, more gene differences for ALDH+ samples were identified in GH vs AA comparisons Ta
ble
1 P
DX
sam
ples
sorte
d by
eth
nici
ty
Ethn
icity
Gha
naia
nA
fric
an A
mer
ican
Cau
casi
an
Sam
ple
GU
M-0
7G
UM
-13
GU
M-1
7G
UM
- 28
MU
M- 1
221
47VA
RI-
006
3887
4664
4913
VAR
I-03
7VA
RI-
068
VAR
I-00
4M
UM
-02
MC
1So
urce
Gha
na-U
MG
hana
-UM
Gha
na-U
MG
hana
-UM
UM
Bay
lor
Van
And
elB
aylo
rB
aylo
rB
aylo
rVa
n A
ndel
Van
And
elVa
n A
ndel
UM
UM
Sub-
type
TNB
CTN
BC
TNB
CTN
BC
TNB
CTN
BC
TNB
CTN
BC
TNB
CTN
BC
TNB
CTN
BC
TNB
CTN
BC
TNB
CPa
tient
age
7447
5046
54n/
a50
n/a
n/a
n/a
5853
5527
n/a
Hist
olog
yID
C G
2ID
C G
3ID
C G
3ID
C G
3ID
C G
3ID
CPD
IDC
LN
CR
IDC
IDC
IDC
IDC
G3
IDC
G3
IDC
G3
IDC
G3
CK7%
100
9010
010
0–
100
100
7090
100
100
90–
––
Breast Cancer Research and Treatment
1 3
than in GH vs CA or AA vs CA comparisons. A larger num-ber of differentially expressed genes were detectable in the ALDH+ samples vs bulk samples, for all ethnicities. A list of all gene expression measurements is provided in Sup-plemental File 1.
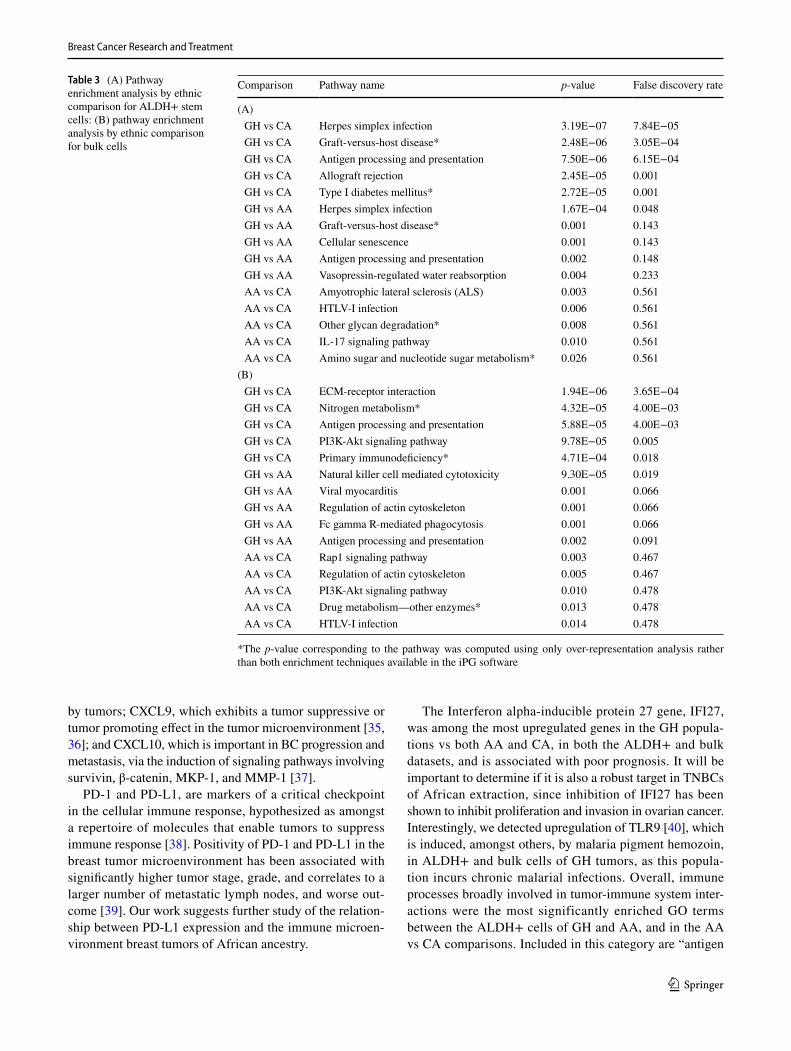
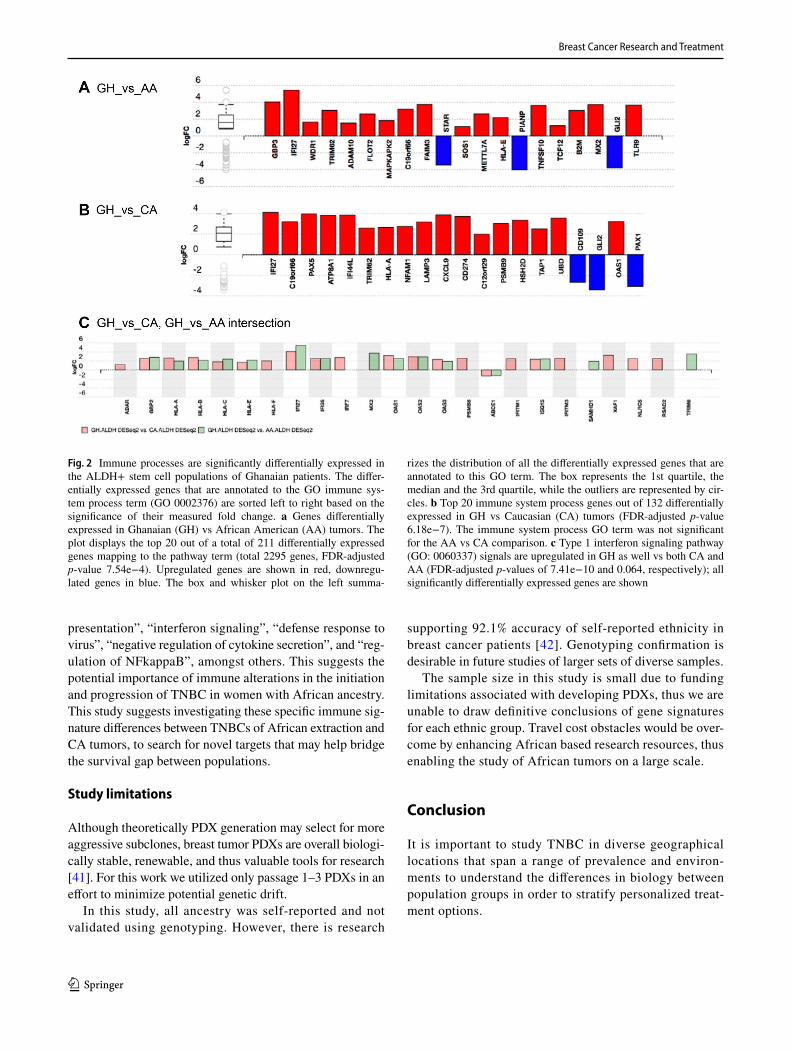
The top five KEGG pathways identified via overrep-resentation and impact analyses [20, 21] of both up- and down-regulated genes in the ALDH+ SC are indicated in Table 3A (Supplemental Table 4A). Under this analysis only the GH vs CA pathway terms are significant under FDR adjustment, as well as one GH vs AA comparison. Overall, pathways shown are indicative of immune response with terms related to infection, antigen presentation, and graft disease and rejection. GO Ontology yielded a higher number of significant terms. Figure 2a, b plots the response of genes associated with the GO ‘immune system processing’ term (GO 0002376), indicating significant upregulation in the GH samples vs both AA and CA. The other top GO term listed in Supplemental Table 4A, the ‘Type I interferon signaling pathway’ (GO: 0060337), is shown in Fig. 2c. This pathway is important in both the innate and adaptive immune sys-tem. Of the 211 genes that were annotated as differentially expressed in the immune system process for GH.ALDH+
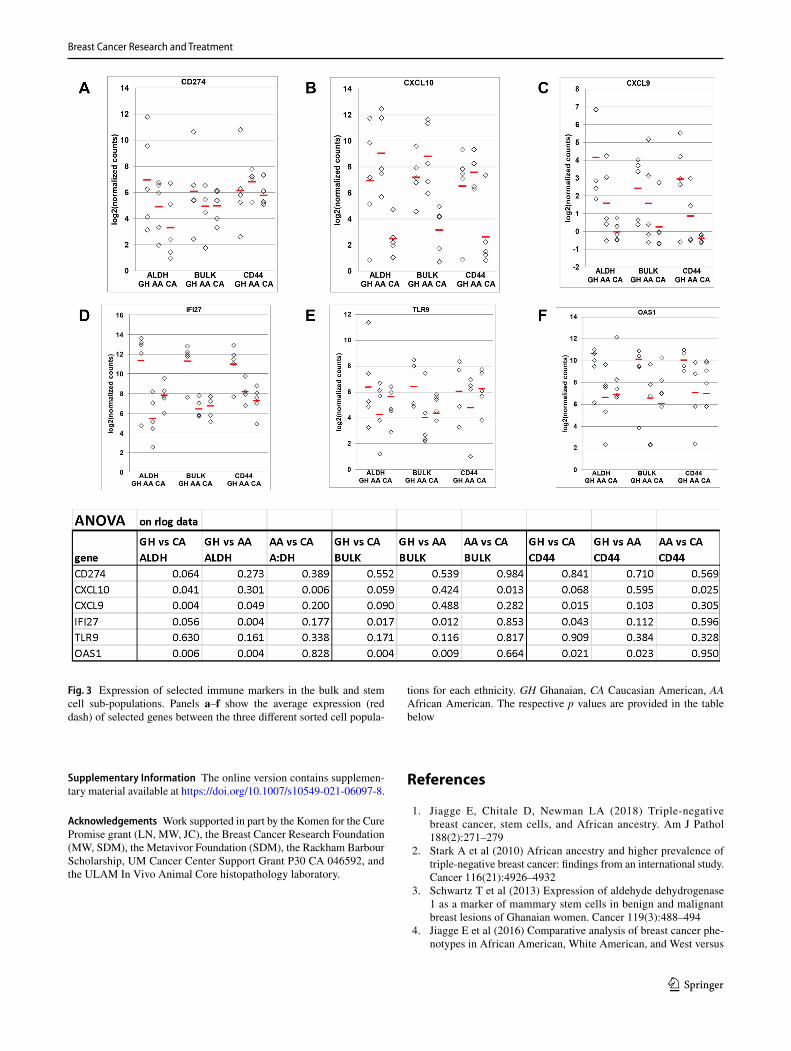
vs AA.ALDH+, we highlight the specific expression of key regulators of potential candidate biomarkers for immune therapy in Fig. 3: CD274 (PDL-1), CXCL10, CXCL9, IFI27, and OAS1 [29–32].
We generated three-by-three intersection tables between the ethnic comparison datasets of ALDH+ cells to addi-tionally refine and validate differentially expressed genes (Supplemental Table 5).
Next, we measured differential gene expression between the three ethnic groups in the bulk cell samples (Table 3B). As in the ALDH+ populations, pathway terms in the GH vs CA comparison showed greater significance than the GH comparisons with the other two populations. We found the carcinogenesis pathways such as PI3k-AKT and Rap1 signaling as well as other inflammatory pathways to be upregulated in the GH and CA comparison. Antigen pres-entation genes B2M and PSMB9 were upregulated in GH vs both CA and AA, as well as interferon-gamma-mediated signaling genes GBP2, NLRC5, and CIITA. In bulk, fea-tures such as extracellular matrix and structure associated genes were significantly downregulated in GH samples with respect to both AA and CA: LAMA2, LAMC2, FN1,
Table 2 Histologic and immunohistochemical analyses of primary/PDX pairs
PDX name Patient ethnicity Patient age Histology Primary tumor IHC
# of PDX passages
Grade (Prim/PDX)
ALDH (Prim/PDX)
P53 (Prim/PDX) EGFR (Prim/PDX)
GUM-07 Ghanaian 74 IDC TNBC 4+ 2/3 −/− +/+ ±GUM-08 Ghanaian 60 IDC TNBC 3+ 2/2 −/− +/+ −/−GUM-13 Ghanaian 47 IDC TNBC 4+ 3/3 +/+ −/− −/−GUM-14 Ghanaian 35 IDC ER+ 4+ 2/3 −/+ −/− NA/−GUM-17 Ghanaian 50 IDC TNBC 4+ 3/3 −/− +/+ ±GUM-28 Ghanaian 46 IDC TNBC 4+ 3/3 −/− +/+ +/+GUM-28LN Ghanaian 46 LN Met (IDC) TNBC 2 3/3 −/− +/+ ±GUM-30 Ghanaian 44 IDC TNBC 3+ 3/2 −/− −/− +/+GUM-36 Ghanaian 44 IDC Her2+ 3+ 3/3 −/− −/− −/+MUM-12 Ghanaian 54 IDC TNBC 3+ 2/3 −/− −/+ −/−24106250 Ghanaian 51 IDC TNBC 2 2/2 −/− NA/+ NA/−MUM25 African Ameri-
can53 Inflammatory TNBC 3+ 1/3 −/− +/+ ±
MUM28 African Ameri-can
79 Metaplastic TNBC 3+ 3/3 −/− ± −/+
MUM-50 African Ameri-can
45 IDC TNBC (BRCA MU)
3 2/2 −/− +/+ −/−
MUM-02 Caucasian 27 IDC TNBC 3 3/3 −/NA +/NA −/NAMUM-21 Caucasian 44 IDC (Brain met) TNBC 3+ 3/3 −/− NA/− NA/+MUM-22 Caucasian 58 IDC TNBC 3+ 3/3 ± ± −/+MUM-23 Caucasian 31 IDC ER+ 3+ 3/3 +/+ ± −/+MUM-51 Caucasian 72 Metaplastic TNBC 3+ 3/3 −/− +/+ −/−MUM-30 Caucasian 53 IDC TNBC 4+ 2/2 NA/− NA/+ NA/−MUM-52 Caucasian 70 IDC ER+ 3 2/2 NA/− NA/+ NA/−
Breast Cancer Research and Treatment
1 3
ADAMTS2/15, HAS2, COL9A1/3, ICAM5, GPM6B, ITGA10, VWF, and FGF2.
PD‑L1 staining
All PDXs were stained for PD-1 and PD-L1 using FDA-approved 22C3 IHC assay3 (Supplemental Table 6). A score of 1% or greater is considered positive. The Ghanaian PDXs had the highest expression of PD-L1.
Discussion
Using GH breast tumors, we have established a stable col-lection of PDXs which largely maintain the histology of the primary tumors thus providing a rare and renewable resource for studying the biology of African BC. Comparing the expression of selected markers between each PDX and its primary tumor, we showed that the expression of ALDH1 is mostly concordant, and thus, low passage PDXs are a good model for comparative studies of BCSC across ethnicities.
Other markers, TP53 and EGFR, experienced some degree of variability between primary and PDX. EGFR was 50% discordant between primary and PDXs, possibly due to high EGFR expressing clones having a growth advantage or to intra-tumor heterogeneity. Alternatively, this discrepancy
could also be due to de novo EGFR alterations arising in the PDXs. Considering the importance of EGFR as a clinical target, PDXs may be weak models for testing anti-EGFR therapies, unless the PDX EGFR expression is similar to the original tumor.
In contrast to work on CA tumors that showed the CD44+/CD24− population to be more mesenchymal [33] we found that only the ALDH [1, 3, 33] expressing SC exhibited sphere formation [12, 17], demonstrating that BCSC may exhibit different phenotypes in ethnically diverse populations.
Based on previous work, we hypothesized that BCSC would have unique gene expression signatures that may enable their specific targeting [11, 12, 15, 16, 34], a critical problem in therapeutics. Here, in a unique African sample set, we saw more statistically significant pathway and GO terms associated with GH vs AA than GH vs CA. This find-ing may be due to a high admixture with other diverse eth-nic groups (such as native Americans and Asians) in AA populations [34].
We have found a strong inflammatory/immune signa-ture in ALDH+ SC, also detectable in the bulk fractions of TNBC tumors. Specifically, there was significant up-regulation of genes involved in immune processes in the GH ALDH+ cells. These included CD274 (PD-L1), which has been shown to allow for evasion of the immune system
Fig. 1 Similarities and differences between primary tumor and the corresponding PDX. A selection of tumor samples depicting the degree of concordance between the primary tumor and correspond-ing PDX is shown in a, indicating that histology is largely main-tained. b The expression of ALDH1 in GUM08 and 2160 is concord-ant. Its expression in MUM23 is much increased in the PDX though they are both considered positive for ALDH expression. c GUM28 and 0380 shows a concordant expression of p53 while GUM07 and GUM28_LN show increased expression in the PDX. MUM25 pri-
mary was largely negative with a small portion expressing p53 (shown enlarged) but the PDX is entirely p53 positive. d The expres-sion of EGFR is concordant in GUM28 and 0380; it is increased in GUM30 and decreased in MUM25. While MUM23 had no expres-sion of EGFR in the primary tumor, the PDX expressed it strongly. ‘GUM’ indicates a Ghanaian tumor with the PDX developed at the UM; ‘MUM’ indicates the tumor was from UM and the PDX was developed in UM. GUM-28_LN is the PDX that developed from the lymph node metastasis of GUM28
Breast Cancer Research and Treatment
1 3
by tumors; CXCL9, which exhibits a tumor suppressive or tumor promoting effect in the tumor microenvironment [35, 36]; and CXCL10, which is important in BC progression and metastasis, via the induction of signaling pathways involving survivin, β-catenin, MKP-1, and MMP-1 [37].
PD-1 and PD-L1, are markers of a critical checkpoint in the cellular immune response, hypothesized as amongst a repertoire of molecules that enable tumors to suppress immune response [38]. Positivity of PD-1 and PD-L1 in the breast tumor microenvironment has been associated with significantly higher tumor stage, grade, and correlates to a larger number of metastatic lymph nodes, and worse out-come [39]. Our work suggests further study of the relation-ship between PD-L1 expression and the immune microen-vironment breast tumors of African ancestry.
The Interferon alpha-inducible protein 27 gene, IFI27, was among the most upregulated genes in the GH popula-tions vs both AA and CA, in both the ALDH+ and bulk datasets, and is associated with poor prognosis. It will be important to determine if it is also a robust target in TNBCs of African extraction, since inhibition of IFI27 has been shown to inhibit proliferation and invasion in ovarian cancer. Interestingly, we detected upregulation of TLR9 [40], which is induced, amongst others, by malaria pigment hemozoin, in ALDH+ and bulk cells of GH tumors, as this popula-tion incurs chronic malarial infections. Overall, immune processes broadly involved in tumor-immune system inter-actions were the most significantly enriched GO terms between the ALDH+ cells of GH and AA, and in the AA vs CA comparisons. Included in this category are “antigen
Table 3 (A) Pathway enrichment analysis by ethnic comparison for ALDH+ stem cells: (B) pathway enrichment analysis by ethnic comparison for bulk cells
*The p-value corresponding to the pathway was computed using only over-representation analysis rather than both enrichment techniques available in the iPG software
Comparison Pathway name p-value False discovery rate
(A) GH vs CA Herpes simplex infection 3.19E−07 7.84E−05 GH vs CA Graft-versus-host disease* 2.48E−06 3.05E−04 GH vs CA Antigen processing and presentation 7.50E−06 6.15E−04 GH vs CA Allograft rejection 2.45E−05 0.001 GH vs CA Type I diabetes mellitus* 2.72E−05 0.001 GH vs AA Herpes simplex infection 1.67E−04 0.048 GH vs AA Graft-versus-host disease* 0.001 0.143 GH vs AA Cellular senescence 0.001 0.143 GH vs AA Antigen processing and presentation 0.002 0.148 GH vs AA Vasopressin-regulated water reabsorption 0.004 0.233 AA vs CA Amyotrophic lateral sclerosis (ALS) 0.003 0.561 AA vs CA HTLV-I infection 0.006 0.561 AA vs CA Other glycan degradation* 0.008 0.561 AA vs CA IL-17 signaling pathway 0.010 0.561 AA vs CA Amino sugar and nucleotide sugar metabolism* 0.026 0.561
(B) GH vs CA ECM-receptor interaction 1.94E−06 3.65E−04 GH vs CA Nitrogen metabolism* 4.32E−05 4.00E−03 GH vs CA Antigen processing and presentation 5.88E−05 4.00E−03 GH vs CA PI3K-Akt signaling pathway 9.78E−05 0.005 GH vs CA Primary immunodeficiency* 4.71E−04 0.018 GH vs AA Natural killer cell mediated cytotoxicity 9.30E−05 0.019 GH vs AA Viral myocarditis 0.001 0.066 GH vs AA Regulation of actin cytoskeleton 0.001 0.066 GH vs AA Fc gamma R-mediated phagocytosis 0.001 0.066 GH vs AA Antigen processing and presentation 0.002 0.091 AA vs CA Rap1 signaling pathway 0.003 0.467 AA vs CA Regulation of actin cytoskeleton 0.005 0.467 AA vs CA PI3K-Akt signaling pathway 0.010 0.478 AA vs CA Drug metabolism—other enzymes* 0.013 0.478 AA vs CA HTLV-I infection 0.014 0.478
Breast Cancer Research and Treatment
1 3
presentation”, “interferon signaling”, “defense response to virus”, “negative regulation of cytokine secretion”, and “reg-ulation of NFkappaB”, amongst others. This suggests the potential importance of immune alterations in the initiation and progression of TNBC in women with African ancestry. This study suggests investigating these specific immune sig-nature differences between TNBCs of African extraction and CA tumors, to search for novel targets that may help bridge the survival gap between populations.
Study limitations
Although theoretically PDX generation may select for more aggressive subclones, breast tumor PDXs are overall biologi-cally stable, renewable, and thus valuable tools for research [41]. For this work we utilized only passage 1–3 PDXs in an effort to minimize potential genetic drift.
In this study, all ancestry was self-reported and not validated using genotyping. However, there is research
supporting 92.1% accuracy of self-reported ethnicity in breast cancer patients [42]. Genotyping confirmation is desirable in future studies of larger sets of diverse samples.
The sample size in this study is small due to funding limitations associated with developing PDXs, thus we are unable to draw definitive conclusions of gene signatures for each ethnic group. Travel cost obstacles would be over-come by enhancing African based research resources, thus enabling the study of African tumors on a large scale.
Conclusion
It is important to study TNBC in diverse geographical locations that span a range of prevalence and environ-ments to understand the differences in biology between population groups in order to stratify personalized treat-ment options.
Fig. 2 Immune processes are significantly differentially expressed in the ALDH+ stem cell populations of Ghanaian patients. The differ-entially expressed genes that are annotated to the GO immune sys-tem process term (GO 0002376) are sorted left to right based on the significance of their measured fold change. a Genes differentially expressed in Ghanaian (GH) vs African American (AA) tumors. The plot displays the top 20 out of a total of 211 differentially expressed genes mapping to the pathway term (total 2295 genes, FDR-adjusted p-value 7.54e−4). Upregulated genes are shown in red, downregu-lated genes in blue. The box and whisker plot on the left summa-
rizes the distribution of all the differentially expressed genes that are annotated to this GO term. The box represents the 1st quartile, the median and the 3rd quartile, while the outliers are represented by cir-cles. b Top 20 immune system process genes out of 132 differentially expressed in GH vs Caucasian (CA) tumors (FDR-adjusted p-value 6.18e−7). The immune system process GO term was not significant for the AA vs CA comparison. c Type 1 interferon signaling pathway (GO: 0060337) signals are upregulated in GH as well vs both CA and AA (FDR-adjusted p-values of 7.41e−10 and 0.064, respectively); all significantly differentially expressed genes are shown
Breast Cancer Research and Treatment
1 3
Supplementary Information The online version contains supplemen-tary material available at https ://doi.org/10.1007/s1054 9-021-06097 -8.
Acknowledgements Work supported in part by the Komen for the Cure Promise grant (LN, MW, JC), the Breast Cancer Research Foundation (MW, SDM), the Metavivor Foundation (SDM), the Rackham Barbour Scholarship, UM Cancer Center Support Grant P30 CA 046592, and the ULAM In Vivo Animal Core histopathology laboratory.
References
1. Jiagge E, Chitale D, Newman LA (2018) Triple-negative breast cancer, stem cells, and African ancestry. Am J Pathol 188(2):271–279
2. Stark A et al (2010) African ancestry and higher prevalence of triple-negative breast cancer: findings from an international study. Cancer 116(21):4926–4932
3. Schwartz T et al (2013) Expression of aldehyde dehydrogenase 1 as a marker of mammary stem cells in benign and malignant breast lesions of Ghanaian women. Cancer 119(3):488–494
4. Jiagge E et al (2016) Comparative analysis of breast cancer phe-notypes in African American, White American, and West versus
Fig. 3 Expression of selected immune markers in the bulk and stem cell sub-populations. Panels a–f show the average expression (red dash) of selected genes between the three different sorted cell popula-
tions for each ethnicity. GH Ghanaian, CA Caucasian American, AA African American. The respective p values are provided in the table below
Breast Cancer Research and Treatment
1 3
East African patients: correlation between African ancestry and triple-negative breast cancer. Ann Surg Oncol 23:3843–3849
5. Jiagge E et al (2018) Androgen receptor and ALDH1 expression among internationally diverse patient populations. J Glob Oncol 4:1–8
6. Jiagge E et al (2016) Breast cancer and African Ancestry: les-sons learned at the 10-year anniversary of the Ghana-Michigan Research Partnership and International Breast Registry. J Glob Oncol 2(5):302–310
7. Newman LA et al (2006) Meta-analysis of survival in African American and white American patients with breast cancer: ethnicity compared with socioeconomic status. J Clin Oncol 24(9):1342–1349
8. Newman LA et al (2019) Hereditary susceptibility for triple nega-tive breast cancer associated with Western Sub-Saharan African ancestry: results from an International Surgical Breast Cancer Collaborative. Ann Surg 270(3):484–492
9. Carey LA et al (2007) The triple negative paradox: primary tumor chemosensitivity of breast cancer subtypes. Clin Cancer Res 13(8):2329–2334
10. Carey LA et al (2006) Race, breast cancer subtypes, and survival in the Carolina Breast Cancer Study. JAMA 295(21):2492–2502
11. Charafe-Jauffret E et al (2009) Breast cancer cell lines contain functional cancer stem cells with metastatic capacity and a distinct molecular signature. Cancer Res 69(4):1302–1313
12. Dontu G et al (2003) In vitro propagation and transcriptional profiling of human mammary stem/progenitor cells. Genes Dev 17(10):1253–1270
13. Ginestier C et al (2007) ALDH1 is a marker of normal and malig-nant human mammary stem cells and a predictor of poor clinical outcome. Cell Stem Cell 1(5):555–567
14. Nalwoga H et al (2010) Expression of aldehyde dehydrogenase 1 (ALDH1) is associated with basal-like markers and features of aggressive tumours in African breast cancer. Br J Cancer 102(2):369–375
15. Dave B, Chang J (2009) Treatment resistance in stem cells and breast cancer. J Mammary Gland Biol Neoplasia 14(1):79–82
16. Li X et al (2008) Intrinsic resistance of tumorigenic breast cancer cells to chemotherapy. J Natl Cancer Inst 100(9):672–679
17. Al-Hajj M et al (2003) Prospective identification of tumorigenic breast cancer cells. Proc Natl Acad Sci USA 100(7):3983–3988
18. Perrone G et al (2012) In situ identification of CD44+/CD24- cancer cells in primary human breast carcinomas. PLoS One 7(9):e43110
19. Fitzgibbons et al (2013) Template for reporting results of bio-marker testing of specimens from patients with carcinoma of the breast. Am Coll Pathologists 138(5):595–601
20. Draghici S et al (2007) A systems biology approach for pathway level analysis. Genome Res 17(10):1537–1545
21. Tarca AL et al (2009) A novel signaling pathway impact analysis. Bioinformatics 25(1):75–82
22. Alexa A, Rahnenfuhrer J, Lengauer T (2006) Improved scoring of functional groups from gene expression data by decorrelating GO graph structure. Bioinformatics 22(13):1600–1607
23. Szklarczyk D et al (2017) The STRING database in 2017: quality-controlled protein–protein association networks, made broadly accessible. Nucleic Acids Res 45(D1):D362–D368
24. Ding L et al (2010) Genome remodelling in a basal-like breast cancer metastasis and xenograft. Nature 464(7291):999–1005
25. du Manoir S et al (2014) Breast tumor PDXs are genetically plastic and correspond to a subset of aggressive cancers prone to relapse. Mol Oncol 8(2):431–443
26. Kobayashi H et al (2013) Hereditary breast and ovarian cancer susceptibility genes (review). Oncol Rep 30(3):1019–1029
27. Coles C et al (1992) p53 mutations in breast cancer. Cancer Res 52(19):5291–5298
28. Witton CJ et al (2003) Expression of the HER1-4 family of recep-tor tyrosine kinases in breast cancer. J Pathol 200(3):290–297
29. Yu LY et al (2017) New immunotherapy strategies in breast can-cer. Int J Environ Res Public Health 14(1):68
30. Mittendorf EA et al (2014) PD-L1 expression in triple-negative breast cancer. Cancer Immunol Res 2(4):361–370
31. Jafarzadeh A et al (2016) Higher circulating levels of chemokine CXCL10 in patients with breast cancer: evaluation of the influ-ences of tumor stage and chemokine gene polymorphism. Cancer Biomark 16(4):545–554
32. Hendrickx W et al (2017) Identification of genetic determinants of breast cancer immune phenotypes by integrative genome-scale analysis. Oncoimmunology 6(2):e1253654
33. Jiagge E et al (2016) Comparative analysis of breast cancer phe-notypes in African American, White American, and West versus East African patients: correlation between African ancestry and triple-negative breast cancer. Ann Surg Oncol 23(12):3843–3849
34. Bryc K et al (2015) The genetic ancestry of African Americans, Latinos, and European Americans across the United States. Am J Hum Genet 96(1):37–53
35. Klemm F, Joyce JA (2015) Microenvironmental regulation of therapeutic response in cancer. Trends Cell Biol 25(4):198–213
36. Fulton A et al (2006) Prospects of controlling breast cancer metas-tasis by immune intervention. Breast Dis 26:115–127
37. Ejaeidi AA et al (2015) Hormone receptor-independent CXCL10 production is associated with the regulation of cellular factors linked to breast cancer progression and metastasis. Exp Mol Pathol 99(1):163–172
38. Planes-Laine G, Rochigneux P, Bertucci F et al (2019) PD-1/PD-L1 targeting in breast cancer: the first clinical evidences are emerging. A literature review. Cancers (Basel) 11(7):1033. https ://doi.org/10.3390/cance rs110 71033
39. Yuan C, Liu Z, Yu Q, Wang X, Bian M, Yu Z, Yu J (2019) Expres-sion of PD-1/PD-L1 in primary breast tumours and metastatic axillary lymph nodes and its correlation with clinicopathological parameters. Sci Rep 9(1):14356. https ://doi.org/10.1038/s4159 8-019-50898 -3
40. Coban C et al (2005) Toll-like receptor 9 mediates innate immune activation by the malaria pigment hemozoin. J Exp Med 201(1):19–25
41. Dobrolecki LE, Airhart SD, Alferez DG, Aparicio S, Behbod F, Bentires-Alj M, Brisken C, Bult CJ, Cai S, Clarke RB, Dowst H, Ellis MJ, Gonzalez-Suarez E, Iggo RD, Kabos P, Li S, Lindeman GJ, Marangoni E, McCoy A, Meric-Bernstam F, Lewis MT (2016) Patient-derived xenograft (PDX) models in basic and translational breast cancer research. Cancer Metastasis Rev 35(4):547–573. https ://doi.org/10.1007/s1055 5-016-9653-x
42. Dominguez TP, Strong EF, Krieger N, Gillman MW, Rich-Edwards JW (2009) Differences in the self-reported racism expe-riences of US-born and foreign-born Black pregnant women. Soc Sci Med 69(2):258–265. https ://doi.org/10.1016/j.socsc imed.2009.03.022
Publisher’s Note Springer Nature remains neutral with regard to jurisdictional claims in published maps and institutional affiliations.
Breast Cancer Research and Treatment
1 3
Authors and Affiliations
Evelyn M. Jiagge1,2,3 · Peter J. Ulintz2,3 · Shukmei Wong5 · Sean P. McDermott2 · Sabrina I. Fossi1,2 · Tahra K. Suhan3,4 · Mark J. Hoenerhoff6 · Jessica M. Bensenhaver1 · Barbara Salem10 · Michele Dziubinski3 · Joseph K. Oppong7 · Francis Aitpillah7 · Kyei Ishmael7 · Ernest Osei‑Bonsu7 · Ernest Adjei7 · Awuah Baffour7 · Jessica Aldrich5 · Ahmet Kurdoglu5 · Kurt Fernando1 · David W. Craig8 · Jeff M. Trent5 · Jun Li3 · Dhananjay Chitale1 · Lisa A. Newman9 · John D. Carpten8 · Max S. Wicha2,3 · Sofia D. Merajver2,3
Peter J. Ulintz [email protected]
Shukmei Wong [email protected]
Sean P. McDermott [email protected]
Sabrina I. Fossi [email protected]
Tahra K. Suhan [email protected]
Mark J. Hoenerhoff [email protected]
Jessica M. Bensenhaver [email protected]
Barbara Salem [email protected]
Michele Dziubinski [email protected]
Joseph K. Oppong [email protected]
Francis Aitpillah [email protected]
Kyei Ishmael [email protected]
Ernest Osei-Bonsu [email protected]
Ernest Adjei [email protected]
Awuah Baffour [email protected]
Jessica Aldrich [email protected]
Ahmet Kurdoglu [email protected]
Kurt Fernando [email protected]
David W. Craig [email protected]
Jeff M. Trent [email protected]
Jun Li [email protected]
Dhananjay Chitale [email protected]
Lisa A. Newman [email protected]
John D. Carpten [email protected]
Max S. Wicha [email protected]
1 Henry Ford Cancer Institute/Henry Ford Health System, 2799 W Grand Blvd, Detroit, MI 48202, USA
2 Department of Internal Medicine, Michigan Medicine, University of Michigan, 1500 East Medical Center Drive, RCC 7314, Ann Arbor, MI 48105, USA
3 Rogel Cancer Center, University of Michigan, Ann Arbor, MI 48105, USA
4 Department of Urology, Michigan Medicine, University of Michigan, Ann Arbor, USA
5 The Translational Genomics Research Institute, Phoenix, AZ, USA
6 Unit for Laboratory Animal Medicine, University of Michigan, Ann Arbor, USA
7 Komfo Anokye Teaching Hospital, Kumasi, Ghana8 Keck School of Medicine, University of Southern California,
Los Angeles, CA, USA9 New York-Presbyterian/Weill Cornell Medical Center
and Weill Cornell Medicine, New York, NY, USA10 Michigan Institute for Clinical & Health Research,
Ann Arbor, USA