Heilmayer etal 2004
12
ARTICLE IN PRESS Population dynamics and metabolism of Aequipecten opercularis (L.) from the western English Channel (Roscoff, France) Olaf Heilmayer * , Thomas Brey, Daniela Storch, Andreas Mackensen, Wolf E. Arntz Alfred Wegener Institute for Polar and Marine Research, P.O. Box 120161, 27515 Bremerhaven, Germany Received 17 March 2003; accepted 18 July 2003 Abstract Population dynamics of the queen scallop, Aequipecten opercularis, was investigated in the western English Channel off Roscoff. Annual formation of natural growth rings on the shell surface was validated by stable isotope (y 18 O and y 13 C) analysis. A von Bertalanffy growth function (H t = 58.9 mm . (1e 0.604 . (t + 0.235) )) was fitted to size-at-age data of 249 individuals. Annual somatic and gonad production amounted to 19.74 kJ m 2 and 0.98 kJ m 2 y 1 , respectively. Total mortality rate Z was estimated to be 1.716 y 1 . Net growth efficiencies (ranging from 45% in 1-y-old to 11% in 6-y-old individuals) were in the same range as in other short-lived scallops. Individual growth, however, was distinctly slower in this population than in other A. opercularis populations from similar latitudes, most likely due to a more stressful environment. D 2004 Elsevier B.V. All rights reserved. Keywords: Bivalvia; Energy budget; Metabolism; Mortality; Pectinidae; Population dynamics 1. Introduction The commercially exploited queen scallop Aequi- pecten opercularis (L.) occurs throughout a wide geographical range on the European continental shelf: from northern Norway to the Mediterranean and from the Adriatic to the west of Ireland (Broom, 1976; Brand, 1991; Waller, 1991). Recruitment success and spatial distribution appear to be highly variable in time, thus inducing major year-to-year changes in extent and position of scallop banks of exploitable size and density, as reported from British waters (Broom, 1976; Brand, 1991) as well as from the eastern part of the English Channel and from northern Brittany (Grainger, 1992; Goulletquer and Heral, 1997). Due to the relatively short time A. opercularis can be kept fresh (Ansell et al., 1991), queen scallops support only a small local fishery and market in France, which is about 1/8 of total French scallop landings (Grainger, 1992). In contrast to the great scallop (Pecten maximus L.), interest in population dynamic parameters of A. opercularis has hitherto been limited. Paul (1980) investigated salinity and temperature tolerances, Vahl (1972) described the relationship between water transport and oxygen uptake, and McLusky (1973) determined the effect of temperature accli- mation on filtration and oxygen consumption rates. 1385-1101/$ - see front matter D 2004 Elsevier B.V. All rights reserved. doi:10.1016/j.seares.2003.07.005 * Corresponding author. Tel.: +49-471-4831-1320; fax: +49- 471-4831-1149. E-mail address: [email protected] (O. Heilmayer). www.elsevier.com/locate/seares SEARES-00396; No of Pages 12 Journal of Sea Research xx (2004) xxx – xxx
Transcript of Heilmayer etal 2004

ARTICLE IN PRESS
www.elsevier.com/locate/seares
Journal of Sea Research xx (2004) xxx–xxx
Population dynamics and metabolism of Aequipecten opercularis
(L.) from the western English Channel (Roscoff, France)
Olaf Heilmayer*, Thomas Brey, Daniela Storch, Andreas Mackensen, Wolf E. Arntz
Alfred Wegener Institute for Polar and Marine Research, P.O. Box 120161, 27515 Bremerhaven, Germany
Received 17 March 2003; accepted 18 July 2003
Abstract
Population dynamics of the queen scallop, Aequipecten opercularis, was investigated in the western English Channel off
Roscoff. Annual formation of natural growth rings on the shell surface was validated by stable isotope (y18O and y13C) analysis.A von Bertalanffy growth function (Ht = 58.9 mm . (1�e� 0.604.(t + 0.235))) was fitted to size-at-age data of 249 individuals.
Annual somatic and gonad production amounted to 19.74 kJ m� 2 and 0.98 kJ m� 2 y� 1, respectively. Total mortality rate Z was
estimated to be 1.716 y� 1. Net growth efficiencies (ranging from 45% in 1-y-old to 11% in 6-y-old individuals) were in the
same range as in other short-lived scallops. Individual growth, however, was distinctly slower in this population than in other
A. opercularis populations from similar latitudes, most likely due to a more stressful environment.
D 2004 Elsevier B.V. All rights reserved.
Keywords: Bivalvia; Energy budget; Metabolism; Mortality; Pectinidae; Population dynamics
1. Introduction size and density, as reported from British waters
The commercially exploited queen scallop Aequi-
pecten opercularis (L.) occurs throughout a wide
geographical range on the European continental shelf:
from northern Norway to the Mediterranean and from
the Adriatic to the west of Ireland (Broom, 1976;
Brand, 1991; Waller, 1991). Recruitment success and
spatial distribution appear to be highly variable in
time, thus inducing major year-to-year changes in
extent and position of scallop banks of exploitable
1385-1101/$ - see front matter D 2004 Elsevier B.V. All rights reserved.
doi:10.1016/j.seares.2003.07.005
* Corresponding author. Tel.: +49-471-4831-1320; fax: +49-
471-4831-1149.
E-mail address: [email protected]
(O. Heilmayer).
(Broom, 1976; Brand, 1991) as well as from the
eastern part of the English Channel and from northern
Brittany (Grainger, 1992; Goulletquer and Heral,
1997). Due to the relatively short time A. opercularis
can be kept fresh (Ansell et al., 1991), queen scallops
support only a small local fishery and market in
France, which is about 1/8 of total French scallop
landings (Grainger, 1992).
In contrast to the great scallop (Pecten maximus
L.), interest in population dynamic parameters of A.
opercularis has hitherto been limited. Paul (1980)
investigated salinity and temperature tolerances,
Vahl (1972) described the relationship between
water transport and oxygen uptake, and McLusky
(1973) determined the effect of temperature accli-
mation on filtration and oxygen consumption rates.
SEARES-00396; No of Pages 12

ARTICLE IN PRESSO. Heilmayer et al. / Journal of Sea Research xx (2004) xxx–xxx2
Data on age and growth have been reviewed by
Taylor and Venn (1978). Little is known, however,
on population biology and production of the queen
scallop populations in the western English Channel,
besides the growth rates determined by Franklin et
al. (1980).
A baseline study on the biology and population
dynamics of A. opercularis in the western English
Channel is presented. In this study growth, mortality,
age-specific somatic and gonadal production as well
as metabolic rates in individual scallops were calcu-
lated and compared with previous findings in the
literature.
2. Material and methods
2.1. Study site and general measurements
Queen scallops (Aequipecten opercularis) were
collected with a small dredge in the western English
Channel next to Roscoff (Trezen Vraz, 48j59VN,4j53VW) in 60 to 80 m water depth at three times
(February, June and October) in 1999. Water temper-
ature varied between 9.7 jC in January/February and
16.4 jC in August (Fig. 1). The summer phytoplank-
ton bloom consisted of two peaks, with a maximum of
1.53 Ag l� 1 in April, and a second one amounting to
1.56 Ag l� 1 by late August. Minimum chlorophyll
Fig. 1. Sea surface water temperatures in Roscoff (1999: circles;
2000: dots; line: cubic spline through two-year mean values). (Data
kindly provided by the Service d’Observation en Milieu Littoral-
SOMLIT-INSU-CNRS.)
concentrations occurred in February (SOMLIT-Data-
base). The investigation area, especially the distribu-
tion of substrate types and phytoplankton, is described
in Sagan and Thouzeau (1998).
After sampling, animals were immediately trans-
ported to the ‘‘Station Biologique de Roscoff’’, where
they were maintained in flow-through aquaria until
used in experiments or transported to the Alfred
Wegener Institute (AWI, Germany). On each occasion
shell height ( = defined as the maximum distance
between the dorsal hinge and ventral margin, Seed,
1980) of a representative subsample was measured to
the nearest 0.1 mm using vernier callipers. A size
frequency distribution (SFD) was obtained by pooling
individuals using class intervals of 1 mm size. For
size-mass relationships freshly caught animals were
dissected and oven dried at 60 jC for 24 h. Individual
gonad and soft tissue dry masses (DM) were weighed
to the nearest 0.1 g, linear regression analysis was
carried out on log-transformed data, estimating the
constants a and b of the allometric equation:
logðMÞ ¼ logðaÞ þ b� logðHÞ ð1Þ
where M is soft tissue mass (g) of somatic or gonad
tissue, respectively, at shell height H (mm).
2.2. Growth band reading and analysis
Bivalve shell growth bands can result from sea-
sonal oscillations in growth, but also from changes in
food availability, spawning events or predation
attempts. Identification and interpretation of annual
growth bands in A. opercularis were based on previ-
ous studies in this species (Broom and Mason, 1978;
Paul, 1980; Hickson et al., 1999) as well as other
scallop species (e.g. Dare and Deith, 1990; Heilmayer
et al., 2003). For growth band analysis only the left
(upper) valve was used. Prior to analysis the shell was
cleaned of organic matter with warm 5% NaOCl
solution, washed with 96% ethanol, rinsed with water
and dried at 60 jC for 12 h. In each animal, the
number of macroscopically visible bands and shell
height were recorded. Stable oxygen (y18O) isotope
values in biogenic CaCO3 reflect ambient water
temperature and oxygen isotopic composition of sea-
water, the latter varying with salinity, while carbon
(y13C) isotope values reflect primary production at the
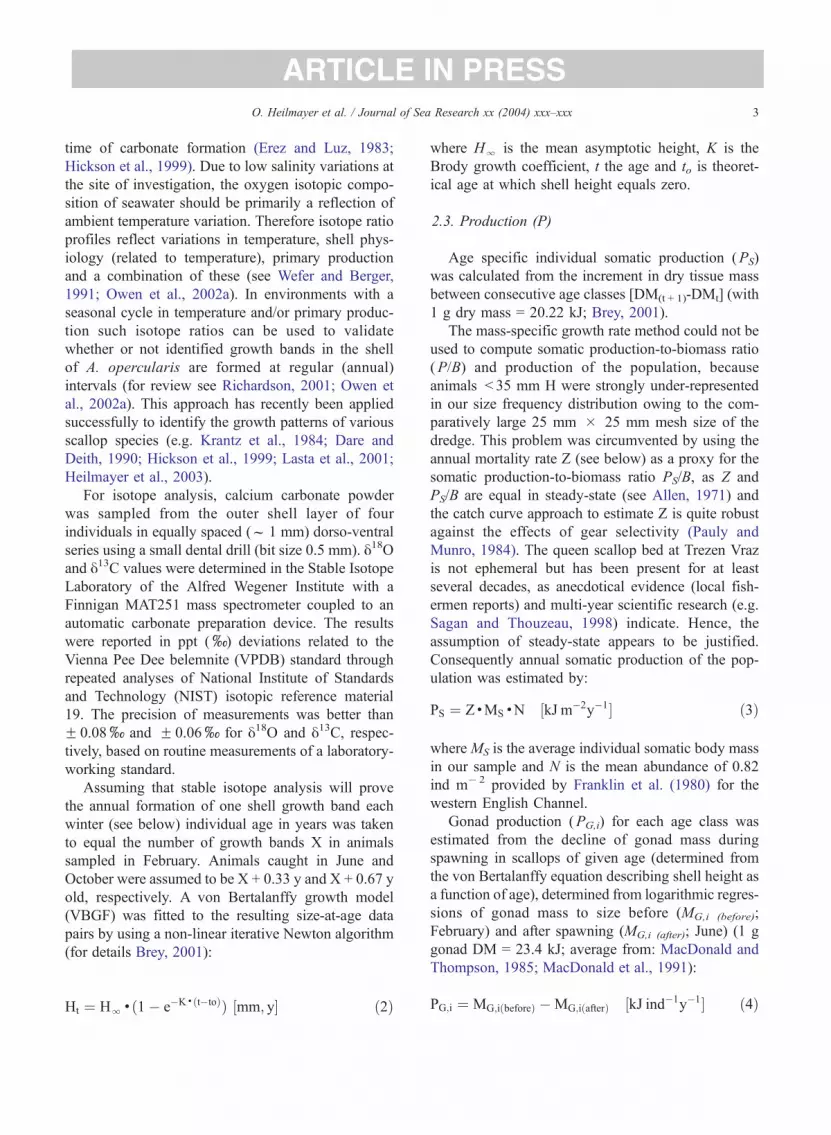
ARTICLE IN PRESSO. Heilmayer et al. / Journal of Sea Research xx (2004) xxx–xxx 3
time of carbonate formation (Erez and Luz, 1983;
Hickson et al., 1999). Due to low salinity variations at
the site of investigation, the oxygen isotopic compo-
sition of seawater should be primarily a reflection of
ambient temperature variation. Therefore isotope ratio
profiles reflect variations in temperature, shell phys-
iology (related to temperature), primary production
and a combination of these (see Wefer and Berger,
1991; Owen et al., 2002a). In environments with a
seasonal cycle in temperature and/or primary produc-
tion such isotope ratios can be used to validate
whether or not identified growth bands in the shell
of A. opercularis are formed at regular (annual)
intervals (for review see Richardson, 2001; Owen et
al., 2002a). This approach has recently been applied
successfully to identify the growth patterns of various
scallop species (e.g. Krantz et al., 1984; Dare and
Deith, 1990; Hickson et al., 1999; Lasta et al., 2001;
Heilmayer et al., 2003).
For isotope analysis, calcium carbonate powder
was sampled from the outer shell layer of four
individuals in equally spaced (f 1 mm) dorso-ventral
series using a small dental drill (bit size 0.5 mm). y18Oand y13C values were determined in the Stable Isotope
Laboratory of the Alfred Wegener Institute with a
Finnigan MAT251 mass spectrometer coupled to an
automatic carbonate preparation device. The results
were reported in ppt (x) deviations related to the
Vienna Pee Dee belemnite (VPDB) standard through
repeated analyses of National Institute of Standards
and Technology (NIST) isotopic reference material
19. The precision of measurements was better than
F 0.08xand F 0.06xfor y18O and y13C, respec-tively, based on routine measurements of a laboratory-
working standard.
Assuming that stable isotope analysis will prove
the annual formation of one shell growth band each
winter (see below) individual age in years was taken
to equal the number of growth bands X in animals
sampled in February. Animals caught in June and
October were assumed to be X + 0.33 y and X + 0.67 y
old, respectively. A von Bertalanffy growth model
(VBGF) was fitted to the resulting size-at-age data
pairs by using a non-linear iterative Newton algorithm
(for details Brey, 2001):
Ht ¼ Hl�ð1� e�K�ðt�toÞÞ ½mm; y� ð2Þ
where Hl is the mean asymptotic height, K is the
Brody growth coefficient, t the age and to is theoret-
ical age at which shell height equals zero.
2.3. Production (P)
Age specific individual somatic production (PS)
was calculated from the increment in dry tissue mass
between consecutive age classes [DM(t + 1)-DMt] (with
1 g dry mass = 20.22 kJ; Brey, 2001).
The mass-specific growth rate method could not be
used to compute somatic production-to-biomass ratio
(P/B) and production of the population, because
animals < 35 mm H were strongly under-represented
in our size frequency distribution owing to the com-
paratively large 25 mm 25 mm mesh size of the
dredge. This problem was circumvented by using the
annual mortality rate Z (see below) as a proxy for the
somatic production-to-biomass ratio PS/B, as Z and
PS/B are equal in steady-state (see Allen, 1971) and
the catch curve approach to estimate Z is quite robust
against the effects of gear selectivity (Pauly and
Munro, 1984). The queen scallop bed at Trezen Vraz
is not ephemeral but has been present for at least
several decades, as anecdotical evidence (local fish-
ermen reports) and multi-year scientific research (e.g.
Sagan and Thouzeau, 1998) indicate. Hence, the
assumption of steady-state appears to be justified.
Consequently annual somatic production of the pop-
ulation was estimated by:
PS ¼ Z�MS�N ½kJ m�2y�1� ð3Þ
where MS is the average individual somatic body mass
in our sample and N is the mean abundance of 0.82
ind m� 2 provided by Franklin et al. (1980) for the
western English Channel.
Gonad production (PG,i) for each age class was
estimated from the decline of gonad mass during
spawning in scallops of given age (determined from
the von Bertalanffy equation describing shell height as
a function of age), determined from logarithmic regres-
sions of gonad mass to size before (MG,i (before);
February) and after spawning (MG,i (after); June) (1 g
gonad DM = 23.4 kJ; average from: MacDonald and
Thompson, 1985; MacDonald et al., 1991):
PG;i ¼ MG;iðbeforeÞ �MG;iðafterÞ ½kJ ind�1y�1� ð4Þ

ARTICLE IN PRESS
Fig. 2. Aequipecten opercularis. Size frequency distribution (1 mm-
height classes, N = 721) of the pooled samples from February (N =
158), June (N = 377), October (N = 186) 1999 taken from the
scallop bed of Trezen Vraz.
O. Heilmayer et al. / Journal of Sea Research xx (2004) xxx–xxx4
Individual gonad production is negligible below 30
mm H (see Results). Therefore population PG/B ratio
was computed from gonad production of total sample
and biomass of total sample:
PG=B ¼ ðRNi�PG;iÞ=ðRNi�MS;iÞ ½y�1� ð5Þ
where MS is the average individual body mass in class
i. Hence population gonad production (PG) can be
estimated by:
PG ¼ ðPG=BÞ�MS�N ½kJ ind�1y�1� ð6Þ
2.4. Mortality rate (Z)
The total mortality rate Z was estimated from the
SFD and the von Bertalanffy growth curve by a size-
converted catch curve (Pauly and Munro, 1984; Brey,
2001):
lnðNi=DtiÞ ¼ aþ bti ZZ ¼ �b ð7Þ
where Ni is the number of individuals in size class
i, Dti is the time required to grow through this size
class and ti is the relative age at the mid-size of
class i.
2.5. Metabolism (R)
Oxygen consumption rates of unfed (deprived of
food for at least 3 days), unstressed and inactive
animals were used as a proxy of standard metabolic
rate as defined by Bayne and Newell (1983) (a
detailed description of animal handling is given in
Heilmayer and Brey, 2003). Measurements of scallops
sampled in June (summer) and October (autumn) were
done at ambient temperatures within 5–20 days after
sampling. Winter rates were measured on animals
sampled in October 1999 and maintained under sim-
ulated winter conditions (reduced food, dimmed light)
in temperate aquaria with recirculating seawater
(10 F 0.5 jC, 33–34 psu). A size range of animals
as large as possible was used on each sampling
occasion.
Oxygen content was assessed using an intermitted
flow system and oxygen microoptodes connected to a
Microx 8-array, as previously described in Gatti et al.
(2002). Individual metabolic rates (VO2) were
obtained by comparison with control chambers (no
animals). VO2 was expressed as a function of soft
tissue dry mass (DM):
logðVO2Þ ¼ aþ b�logðDMÞ ð8Þ
where a is a constant and b the mass scaling exponent.
The model was fitted by least squares linear regres-
sion after logarithmic transformation of both varia-
bles. In order to compare oxygen consumption among
seasons, rates were standardised for body mass (Pack-
ard and Boardman, 1999) by:
VO2;S ¼ VO2�ðDMS=DMEÞb ð9Þ
where VO2,S is the metabolic rate of a standard-sized
scallop of 1 g dry mass (DMS), and VO2 and DME
are observed oxygen rate and body mass of the
experimental scallop. Oxygen consumed was con-
verted to energy by 1 ml O2 = 20.1 J (cited in Brey,
2001).
3. Results
3.1. General measurements
The pooled size-frequency distribution of the
year 1999 (Fig. 2) was polymodal and dominated

ARTICLE IN PRESS
Fig. 3. Aequipecten opercularis. Stable isotope ratio (triangles:
y18O; dots: y13C; weighed moving averages x1 + 3 . x2 + x3)/5)
profiles along transects from umbo to shell edge of two
representative individuals (a. 52.18 mm height, b. 54.2 mm height).
Vertical bars indicate positions of external shell growth bands.
O. Heilmayer et al. / Journal of Sea Research xx (2004) xxx–xxx 5
(>70%) by large individuals (>41 mm). An
ANCOVA showed significant (p < 0.001) season-
al changes in the regressions of somatic and
gonad dry mass against shell height (Table 1,
both log-transformed). Both somatic dry mass
and gonad dry mass of a standard-sized 45 mm
scallop were lowest during the summer period
(soma in g DM: 0.371 in June vs. 0.583 in
February and 0.847 in October; gonad in g DM:
0.0122 in June vs. 0.0465 in February and 0.0204
in October).
3.2. Age and growth
y18O and y13C profiles of the two shells examined
showed more or less synchronous cyclical patterns
reflecting environmental seasonality (Fig. 3). Over
the whole lifetime, y18O values obtained ranged from
� 0.3 to + 1.1 x(Fig. 3a) and � 0.4 to + 1.3x(Fig. 3b). y13C values ranged from � 0.5 to + 0.4x(Fig. 3a), and from � 0.5 to + 0.5 x(Fig. 3b).
There is a distinct spatial coincidence between mac-
roscopically identified growth bands and relative
y18O and y13C maxima of the isotope profile (i.e.
temperature as well as primary production minima),
thus indicating a formation of one growth band each
winter.
Table 1
Allometric relationships of tissue mass and shell height in
Aequipecten opercularis collected in 1999 from Trezen Vraz
February June October
Soma
a � 4.151 � 4.921 � 5.078
b 2.369 2.716 3.028
r2 0.41 0.76 0.71
N 11 27 61
Gonad
a � 12.024 � 10.078 � 6.922
b 6.467 4.938 3.165
r2 0.18 0.89 0.33
N 11 27 61
Regression are of the form log(M) = a + b . log(SH), where M is the
predicted soft tissue dry mass (g) of the somatic tissue or of the
gonad, SH = shell height (mm), and a and b are fitted parameters. N
is number of data, r2 is the determination coefficient. All equations
are statistically significant at p < 0.001.
Size-at-age data of 249 specimens were fitted
best by the von Bertalanffy equation:
Ht = 58.9 mm . (1�e� 0.604 . (t + 0.235)); r2 = 0.827
Fig. 4. Aequipecten opercularis. Von Bertalanffy growth function
fitted to 249 size-at-age data pairs. Growth function parameters are:
Hl = 58.9 mm, K = 0.604, t0 = � 0.235 (N = 249, r2 = 0.827).

ARTICLE IN PRESS
Fig. 6. Aequipecten opercularis. Size-converted catch curve based
on the pooled size-frequency sample (Fig. 2) and the von
Bertalanffy growth function parameters. Dots: data included in
catch curve regression; circles: data excluded from regression:
lnðNi=dtiÞ ¼ 8:237� 1:761�tZZ ¼ 1:761 ðr2 ¼ 0:961Þ:
O. Heilmayer et al. / Journal of Sea Research xx (2004) xxx–xxx6
(Fig. 4). Accordingly, the largest scallop (H = 58.9
mm) found at Roscoff was about six years old.
3.3. Production and mortality
Individual somatic production increased to a max-
imum of 10.66 kJ yr� 1 (0.527 g DM y� 1) at an age of
2 y and decreased thereafter, whereas individual
gonad production increased exponentially with shell
height, reaching 4.17 kJ y� 1 (0.177 g DM y� 1) at an
age of 6 y (Fig. 5a). Mean annual biomass of A.
opercularis was 13.67 kJ m� 2 (0.67 g DM m� 2),
total mortality rate Z amounted to 1.761 y� 1 (Fig. 6).
Correspondingly, annual somatic production PS was
estimated at 19.74 kJ m� 2 y� 1 (0.976 g DM m� 2
y� 1). Annual gonad productivity PG/B and produc-
tion PG amounted to 0.087 y� 1 and 0.98 kJ m� 2 y� 1
(0.042 g DM m� 2 y� 1), respectively. Hence, total
Fig. 5. Aequipecten opercularis. (a) Lifetime production in individual
scallops ( : somatic production per year class i; : gonad production
per year class i; – – : respiratory loss per time interval. (b) Mean
turnover ratios ( : P/B; : P/R) and net growth efficiency ( : K2 =
P/A; A = Ps + PG + R) for each age-class in A. opercularis from
Trezen Vraz.
annual production for the 1999 season amounted to
20.72 kJ m� 2 y� 1 (1.02 g DM m� 2 y� 1),
corresponding to an annual Ptot/B ratio of 1.848
y� 1. The turnover ratio (P/B) calculated for each
age class declined with age from 1.45 to 0.14 (Fig.
5b). Similarly P/R ratio and net growth efficiency (K2
= P/A = P/(P + R)) decreased but levelled off in the
oldest age classes (Fig. 5b).
3.4. Metabolism
Metabolic rates were measured in June (T = 12.4
jC), October (T = 14.4 jC) and December (T = 10.3
jC) over the complete size range of scallops available
at Roscoff (June: 0.06–1.81 g DM, October: 0.47–
1.46 g DM, December: 0.13–0.71 g DM). The
temperature range examined approximates the annual
range encountered by queen scallops in Roscoff
waters. The allometric relationships between body
dry mass (DM) and metabolic rates (VO2) of A.
opercularis were:
June log(VO2) = 2.253 + 0.654 . log(DM);
r2 = 0.483, N = 72, 34 animals
October log(VO2) = 2.408 + 1.014 . log(DM);
r2 = 0.496, N = 101, 34 animals
December log(VO2) = 2.288 + 0.707 . log(DM);
r2 = 0.662, N= 101, 22 animals

ARTICLE IN PRESSO. Heilmayer et al. / Journal of Sea Research xx (2004) xxx–xxx 7
The combined effects of body mass and tempera-
ture on metabolic rate can be described by the
multiple linear model:
logðVO2Þ ¼ 2:093ðF0:059Þ þ 0:774ðF0:029Þ�logðDMÞ þ 0:02ðF0:005Þ�T;
N ¼ 274; r2 ¼ 0:74; F ¼ 381:311;
p < 0:001; temperature injC:
Standard metabolic rates (VO2,S) were indistin-
guishable in June (188.62 F 60.32 Al O2 g DM� 1
h� 1) and December (204.17 F 67.9 Al O2 g DM� 1
h� 1), but significantly higher (ANOVA: p < 0.001)
in October (264.59 F 69.05 Al O2 g DM� 1 h� 1).
This indicated a 30% seasonal factorial rise over the
lowest winter metabolic rates.
4. Discussion
4.1. Age and growth in aequipecten opercularis
Partitioning of oxygen isotopes between mollus-
can shells and seawater has historically been as-
sumed to closely approximate in isotopic equilibrium
(Witbaard et al., 1994; McConnaughey et al., 1997;
Hickson et al., 1999; Schone et al., 2002; Schone,
2003). On the other hand more recently Owen et al.
(2002a, b) showed in a thorough laboratory study a
positive deviation from equilibrium ( + 0.6x) in
Pecten maximus. Although changes in the y18Oand y13C profiles cannot be used for an exact
environmental reconstruction the amplitude still can
be used as a proxy for relative seasonal oscillation
of ambient temperature. The maximum y18O-ampli-
tudes in the two shells shown in Fig. 3 correspond
to a relative temperature range of 5.6 and 6.8 jC(according to Craig’s palaeo-temperature equation as
given by Erez and Luz, 1983), respectively, which is
close to the observed annual range of 6.7 jC (Fig.
1). The close spatial coincidence between shell
growth band position and both the y18O and y13Cpeaks in the isotope profiles (Fig. 3) indicate suffi-
cient evidence that bands are formed during times of
lowest temperature and low primary production, i.e.
one band is formed each winter (for review, see
Richardson, 2001). The same pattern was found in
populations from Plymouth (December-March: Pick-
ett and Franklin, 1975; Broom and Mason, 1978)
and the North Sea (December-February: Ursin,
1956).
Non-linear growth patterns as derived from the
VBGF can be compared indirectly only, e.g. using
composite indices of overall growth performance
(OGP) (e.g. P = log(K) + log(Ml); Pauly and Munro,
1984). According to Brey (1999), this index is more
or less consistent for closely related species. Howev-
er, in suspension feeding bivalves food supply and/or
temperature are the main factors controlling patterns
of life history, whereas the genome commits the range
of possible adaptations (Stearns, 1976; Widdows et
al., 1984; Bayne and Newell, 1983). Hence, the
attainable data of Pectinids populations (N = 134)
were divided into four broad groups regarding to (i)
their hypothetical longevity (estimated as 0.95 . Age
at Hl derived from the appropriate VBGF), and (ii)
the average annual water temperature of the study
sites. An auximetric plot of log(K) versus log(Ml) is
given in Fig. 7. The mean OGPs of the four groups
are with one exception (see below) significantly
different (ANCOVA with Bonferroni-Dunn post-hoc
p < 0.001). OGP of Aequipecten opercularis falls in
the range of other temperate short-lived scallops
(TSL, mean = 1.92 F 0.26, N = 31, Fig. 7). While
previous OGP estimates of A. opercularis range
between 1.9 (Lee, 1973; Taylor and Venn, 1978)
and 2.1 (Rolfe, 1973; Allison, 1994), values of
the Roscoff population (1.74) appear to be compar-
atively low, indicating a potentially more stressful
environment (i.e. lower food availability, increased
depth).
Cold-water long-lived species showed quite similar
values (CLL, mean = 1.81 F 0.23, N = 19, Fig. 7)
and hence are statistically not distinguishable from the
TSL group, albeit having lower K but higher Ml
values. The TSL group consists mostly of species
belonging to the supragenera Aequipecten and Mim-
achlamys (suggested by Waller, 1991), while in the
CLL all species belong to the supragenus Chlamys.
All species of this genus are close relatives, all of
them have been considered as subspecies of C.
islandica at some time of their nomenclatural
history (see Waller, 1991). OGP in both warm water
short-lived (WSL, mean = 2.89 F 0.28, N = 25, Fig.
7) and temperate long-lived species (TLL, mean =

ARTICLE IN PRESS
Fig. 7. Auximetric grid comparing overall growth performance of
Pectinids. ( + ): A. opercularis from Roscoff. CLL: cold water long-
lived species (squares), WSL: warm water short-lived species
(triangles); TLL: temperate long-lived species (grey circles); TSL:
temperate short-lived species (open circles); A. opercularis (dots).
Diagonal lines indicate isolines of growth performance index P =
log(K) + log(Ml). Mass data were converted to kJ by using
conversion factors of Brey (1999, 2001) and references therein.
With one exception mean OGP values of the four groups are
significantly different from each other (ANOVA p < 0.05, with
Bonferroni-Dunn post-hoc test). Mean OGP of TSL is not
significantly (p = 0.076) different from CLL. Data sources: CLL:
Adamussium colbecki (Stockton, 1984; Berkman, 1990; Heilmayer
et al., 2003; Chiantore et al., 2003), Chlamys albidus (Myasnikov
and Kochnev, 1988), Chlamys hastata (MacDonald et al., 1991),
Chlamys islandica (Vahl, 1981; Lambert and Prefontaine, 1995),
Chlamys rosealbus (Silina and Pozdnyakova, 1990); WSL:
Amusium spp. (Heald and Caputi, 1981; Williams and Dredge,
1981; DelNorte, 1991); Argopecten purpuratus (Mendo and Jurado,
1993; Wolff, 1987; Yamashiro and Mendo, 1988); TLL: Mizuho-
pecten yessoensis (Golikov and Scarlato, 1970; Ventilla, 1982; Yoo
et al., 1981, cited by Vakily, 1992), Patinopecten caurinus
(MacDonald and Bourne, 1987; Ignell and Haynes, 2000), Pecten
maximus (Buestel and Laurec, 1975; Dare, 1990; Dare and Deith,
1990; Allison, 1994), Placopecten magellanicus (Brown et al.,
1972; Jamieson, 1979; Jamieson et al., 1981; D’Amours and Pilote,
1982; Chouinhard, 1984: all cited in Naidu, 1991; MacDonald and
Thompson, 1985; Claereboudt and Himmelman, 1996); TSL:
Aequipecten opercularis (Ursin, 1956; Lee, 1973; Antoine, 1979;
Aravindakshan, 1955; Askew et al., 1973, all cited by Shumway,
1991; Broom and Mason, 1978; Taylor and Venn, 1978; Richardson
et al., 1982; Allison, 1994), Chlamys tehuelcha (Orensanz et al.,
1991), Mimachlamys varia (Antoine, 1979; Shafee, 1982; Shafee
and Conan, 1984), Zygochlamys patagonica (Valero, 1999; Lasta et
al., 2001).
O. Heilmayer et al. / Journal of Sea Research xx (2004) xxx–xxx8
2.55 F 0.18, N = 59, Fig. 7) is distinctly higher
(ANOVA, p < 0.001) than in the former two groups
(TSL, CLL).
In general, phylogenetically ‘younger’ species of
the supragenera belong to temperate groups, thus
supporting the general idea (e.g. Arntz and Fahrbach,
1991) that recent scallops evolved from warm water
ancestors, i.e. within the supragenus Pecten. Amusium
spp. belong to the WSL group, while Pecten maximus
belongs to TSL. This remains, however, pure specu-
lation until modern molecular methods (e.g. Canapa et
al., 2000) will clarify the hitherto rather uncertain
phylogeny of pectinids.
4.2. Metabolic rates
Metabolic rate (R) reflects the energy expenditure
of an organism, and hence is an important factor in
estimating energy flow through both populations and
the individual organism (Bayne and Newell, 1983).
Rates measured in this study are 2–3 times lower than
values for the same species published by McLusky
(1973); most likely the latter study used too short an
acclimation time to the holding systems (10–24 h).
Our results indicate a significant seasonality of
metabolic activity in A. opercularis, as previously
observed for many boreal scallops (MacDonald and
Thompson, 1985; Bricelj et al., 1987; Shumway et al.,
1988). Such seasonal cycles in metabolism result from
complex interactions of environmental and endoge-
nous variables acting on the metabolism (for review,
see Bayne and Newell, 1983). Body size, environ-
mental temperature and the energetic demands of
biosynthesis, particularly those associated with game-
togenesis, are considered to have a profound influence
on respiratory activity (Shafee, 1982; Bayne and
Newell, 1983; Bricelj et al., 1987; MacDonald and
Bourne, 1987; MacDonald and Thompson, 1988).
The multiple-regression approach used in the present
work attempts to quantify the simultaneous effects of
body size and seasonal temperature. The equation
obtained explains 74% of total variation recorded in
metabolic rate. Because no interactive effects have
been considered (for the sake of clarity), the two
variables tested can be assumed to account almost
completely for the seasonal fluctuations in metabo-
lism. The metabolic mass exponent obtained by this
equation (b = 0.774, S.E. = 0.03) is slightly below the
mean overall value of 0.807 (S.E. = 0.02) derived
from a large number of scallop studies (N = 80, 13
species; Heilmayer et al., unpubl. data).

ARTICLE IN PRESSof Sea Research xx (2004) xxx–xxx 9
4.3. Individual energy budget model
The partitioning of ingested or metabolizable
energy into maintenance and production and possible
trade-offs between growth and reproduction are im-
portant to characterise the life-history of species (e.g.
Sibly and Calow, 1986; Wieser, 1994). The changing
pattern of individual energy expenditure during the
6-y lifespan of A. opercularis clearly illustrates (i) an
increasing share of maintenance requirements
(expressed as respiration) in the absorbed energy
(Fig. 5a, b), and (ii) a progressive transition of
production from somatic growth to gonad output
with increasing age (Fig. 5a), as previously observed
for other scallop species, too, e.g. Mimachlamys
varia (Shafee, 1982), Mizuhopecten yessoensis (Fuji
and Hashizume, 1974) and Placopecten magellani-
cus (MacDonald and Thompson, 1985, 1988; Claer-
eboudt and Himmelman, 1996). The general decrease
of somatic growth with increasing age (Calow, 1977)
is not necessarily caused only by a shift between Psand Pg (Fig. 5a) or the declining ability of the older
animals to convert assimilated food into new tissue
(Calow and Townsend, 1981), but may also be
caused by a shorter growing season of older indi-
viduals, as already shown for Chlamys islandica
(Vahl, 1981) and Pecten maximus (Chauvaud and
Strand, 1999).
Net growth efficiency (K2) values for each year of
life, which is a measure of the ability to turn assim-
ilated energy into production, decreases during life
time from 45% to 11% in A. opercularis (Fig. 5b).
These data are among the lowest recordings for
populations of suspension and deposit feeding bivalve
molluscs so far (Bayne and Newell, 1983; Shumway,
1991).
4.4. Population production and productivity
With a total P/B ratio of 1.848 y� 1 annual somatic
production of A. opercularis is estimated at 20.717 kJ
m� 2 y� 1 in Trezen Vraz and hence in the same order
of magnitude as previous estimates from other pop-
ulations (Broom and Mason, 1978; Taylor and Venn,
1978; Richardson et al., 1982).
The A. opercularis population from Roscoff waters
invests only around 5% of its total annual production
into gametes. This is clearly less than in other short-
O. Heilmayer et al. / Journal
lived scallops (16% in Mimachlamys varia, Shafee
and Conan, 1984) and far below the investment of
either long-lived scallops (z 50% in Placopecten
magellanicus and in Patinopecten caurinus; MacDon-
ald and Thompson, 1985; MacDonald and Bourne,
1987) or cold-water scallops (20–30% in Chlamys
islandica and in Adamussium colbecki; Vahl, 1981;
Heilmayer et al., 2003). We may, however, have
underestimated gonad productivity by assuming one
single spawning event during the reproductive season.
This view is supported by Aravindakshan (1955) and
Ursin (1956), but Taylor and Venn (1978) reported
repeated spawning in populations from the Clyde Sea.
Conclusive information is lacking so far.
The high Ptot/B ratio is in slight contradiction to the
observed low OGP value of the population. This
might be explained by the comparatively low abun-
dance of large individuals (>60 mm), which is either a
consequence of spatial differences in settlement from
year to year (Brand, 1991) or caused by size-selectiv-
ity of commercial fisheries.
In conclusion, despite its 6-y lifespan, A. opercu-
laris shows some typical features of r-strategy orien-
tated quasi-opportunists, e.g. fast growth and
comparatively low reproductive effort. This life strat-
egy combined with environmental variability causes a
highly dynamic pattern of occurrence in time and
space with typical high-density patches of limited
continuance. Locally these patches of A. opercularis
are likely to play a significant role in system energy
flow. Although the sampling extent may not be
considered adequate for a precise estimate of popula-
tion energy parameters, it is still possible to arrive at
some conclusions on the individual energy level,
which may be considered as a first approximation
for future research in this field.
Acknowledgements
The help of the ‘Mya’ crew and the colleagues
from the logistics of the ‘Station Biologique de
Roscoff’ for fishing and aquarium-maintenance of A.
opercularis is greatly acknowledged. We are grateful
to Gunther Meyer and Katrin Blancke (AWI) for
technical support in stable isotope analysis. We also
thank three anonymous reviewers for constructive
comments that greatly improved the manuscript.

ARTICLE IN PRESSO. Heilmayer et al. / Journal of Sea Research xx (2004) xxx–xxx10
References
Ansell, A., Dao, J.C., Mason, J., 1991. Three European scallops:
Pecten maximus, Chlamys (Aequipecten) opercularis and C.
(Chlamys) varia. In: Shumway, S.E. (Ed.), Scallops: Biology,
Ecology and Aquaculture. Elsevier, Amsterdam, pp. 715–752.
Allen, K.R., 1971. Relation between production and biomass.
J. Fish. Res. Bd Can. 28, 1573–1581.
Allison, E.H., 1994. Seasonal growth models for great scallops
(Pecten maximus (L.)) and queen scallops (Aequipecten opercu-
laris (L.)). J. Shellfish Res. 13, 555–564.
Antoine, L., 1979. La croissance de la Coquille Saint-Jacques
(Pecten maximus) et ses variations en Mer Celtique et en
Manche. PhD Thesis. University of Bretagne Occidentale,
Brest. 148 pp.
Aravindakshan, I., 1955. Studies on the biology of the queen scal-
lop, Chlamys opercularis (L.). PhD Thesis. University of Liver-
pool. 79 pp.
Arntz, W.E., Fahrbach, E., 1991. El Nino. Klimaexperiment der
Natur. Physikalische Ursachen und biologische Folgen Bir-
khauser-Verlag, Basel. 264 pp.
Askew, C.G., Dunn, M.R., Reay, P.J., 1973. The fishery for queen
scallops in Guernsey 1973. Report of a Preliminary Investiga-
tion in 1973 by Marine Resources Research Unit, Portsmouth
Polytechnic, UK. Unpubl., 39 pp.
Bayne, B.L., Newell, R.C., 1983. Physiological energetics of
marine molluscs. In: Saleuddin, A.S.M., Wilbur, K.M.
(Eds.), The Mollusca: Physiology Part 1. Academic Press,
Boston, pp. 407–515.
Berkman, P.A., 1990. The population biology of the Antarctic scal-
lop, Adamussium colbecki (Smith 1902) at New Harbor, Ross
Sea. In: Kerry, K.R., Hempel, G. (Eds.), Antarctic Ecosystems.
Ecological Change and Conservation. Springer-Verlag, Berlin,
pp. 281–288.
Brand, A., 1991. Scallop ecology: distributions and behaviour.
In: Shumway, S.E. (Ed.), Scallops: Biology, Ecology and
Aquaculture. Elsevier, Amsterdam, pp. 517–584.
Brey, T., 1999. Growth performance and mortality in aquatic mac-
robenthic invertebrates. Adv. Mar. Biol. 35, 153–223.
Brey, T., 2001. Population Dynamics in Benthic Invertebrates. A
Virtual Handbook. Version 01.2. WWW Page http://www.
awi-bremerhaven.de/Benthic/Ecosystem/FoodWeb/Handbook/
main.html. Alfred Wegener Institute for Polar and Marine Re-
search, Germany.
Bricelj, V.M., Epp, J., Malouf, R.E., 1987. Comparative physiology
of young and old cohorts of bay scallop Argopecten irradians
irradians (Lamarck): mortality, growth, and oxygen consump-
tion. J. Exp. Mar. Biol. Ecol. 112, 73–91.
Broom, M.J., 1976. Synopsis of biological data on scallops. FAO
Fish. Syn. 114, 1–30.
Broom, M.J., Mason, J., 1978. Growth and spawning in the pectinid
Chlamys opercularis in relation to temperature and phytoplank-
ton concentration. Mar. Biol. 47, 277–285.
Brown, B.E., Parrack, M., Flescher, D.D., 1972. Review of the
current status of the scallop fishery in ICNAF division 5Z. Int.
Comm. Northw. Atl. Fish. (ICNAF) Res. Doc. 72/113, 1–13.
Buestel, D., Laurec, A., 1975. Croissance de la coquille St. Jacques
(Pecten maximus L.) en rade de Brest et en baie de Saint Brieuc.
Haliotis 5, 173–177.
Calow, P., 1977. Ecology, Evolution and Energetics: A Study in
Metabolism Adaptation. In: Macfadyen, A. (Ed.), Advances
in Ecological Research, vol. 10. Academic Press, London,
pp. 1–61.
Calow, P., Townsend, C.R., 1981. Resource utilization in growth.
In: Townsend, C.R., Calow, P. (Eds.), Physiological Ecology:
An Evolutionary Approach to Resource Use. Sinauer Associates
Inc., Sunderland, MA, pp. 220–244.
Canapa, A., Barucca, M., Marinelli, A., Olmo, E., 2000. Molecular
data from the 16S rRNA gene for the phylogeny of Pectinidea
(Mollusca: Bivalvia). J. Mol. Evol. 50, 93–97.
Claereboudt, M., Himmelman, J.H., 1996. Recruitment, growth and
production of giant scallops (Placopecten magellanicus) along
an environmental gradient in Baie des Chaleurs, eastern Canada.
Mar. Biol. 124, 661–670.
Chauvaud, L., Strand, O., 1999. Growth traits in three populations
of Pecten maximus. In: Strand, O. (Ed.), Abstracts: 12th Inter-
national Pectinid Workshop. Inst. Mar. Res., Nordnes, Bergen,
pp. 166–167.
Chiantore, M., Cattaneo-Vietti, R., Heilmayer, O., 2003. Antarctic
scallop (Adamussium colbecki) annual growth rate at Terra Nova
Bay. Polar Biol. 26, 416–419.
Chouinhard, G.A., 1984. Growth of the sea scallop (Placopecten
magellanicus) on the Tormentine Bed, Northumberland Strait.
Canadian Atlantic Fisheries Scientific Advisory Committee
(CAFSAC) Research Document 84 (61), 1–16.
Dare, P.J., 1990. Use of external shell microgrowth patterns for
determining growth and age in the scallop Pecten maximus.
Fisheries, Biology and Aquaculture of Pectinids: 8th Interna-
tional Pectinid Workshop, Cherbourg, Plouzane (France), Actes
Colloq. IFREMER 17, 211–218.
Dare, P.J., Deith, M.R., 1990. Age determination of scallops, Pecten
maximus (Linnaeus, 1758), using stable oxygen isotope analy-
sis, with some implications for fisheries management in British
waters. In: Shumway, S.E., Sandifer, P.A. (Eds.), An Interna-
tional Compendium of Scallop Biology and Culture. World
Aquacult. Soc., Baton Rouge, pp. 118–133.
D’Amours, D., Pilote, S., 1982. Donnees biologiques sur le
Petoncle d’islande (Chlamys islandica) et le Petoncle Geant
(Placopecten magellanicus) de la Basse-Cote-Nord du Quebec
(Secteur de la Tabatire). Cah. Inform. 99, 1–47.
DelNorte, A.G.C., 1991. Fisheries and aquaculture: Philippines.
In: Shumway, S.E. (Ed.), Scallops: Biology, Ecology and
Aquaculture. Elsevier, Amsterdam, pp. 825–834.
Erez, J., Luz, B., 1983. Experimental paleotemperature equation
for planktonic foraminifera. Geochim. Cosmochim. Acta 47,
1025–1031.
Franklin, A., Pickett, G.D., Holme, N.A., Barrett, R.L., 1980. Sur-
veying stocks of scallops (Pecten maximus) and queens (Chla-
amys opercularis) with underwater television. J. Mar. Biol. Ass.
UK 60, 181–191.
Fuji, A., Hashizume, M., 1974. Energy budget for a Japanese com-
mon scallop, Patinopecten yessoensis (Jay), in Mutsu Bay. Bull.
Fac. Fish. Hokkaido Univ. 25, 7–19.
Gatti, S., Brey, T., Muller, W.E.G., Heilmayer, O., Holst, G., 2002.

ARTICLE IN PRESSO. Heilmayer et al. / Journal of Sea Research xx (2004) xxx–xxx 11
Oxygen microoptodes: a new tool for oxygen measurements in
aquatic animal ecology. Mar. Biol. 140, 1075–1085.
Golikov, A.N., Scarlato, O.A., 1970. Abundance, dynamics and
production properties of populations of edible bivalves Mizuho-
pecten yessoensis and Spisula sachalinensis related to the prob-
lem of organization of controllable submarine farms at the
western shores of the Sea of Japan. Helgolander wiss. Meeres-
unters. 20, 498–513.
Goulletquer, P., Heral, M., 1997. Marine molluscan production
trends in France: from fisheries to aquaculture. NOAA Tech.
Rep. 129 (3), 137–162.
Grainger, R.J.R., 1992. ICES Fisheries Statistics: Bulletin Statis-
tique des Peches Maritimes 1988, vol. 73. ICES, Copenhagen,
pp. 64–65.
Heald, D.I., Caputi, N., 1981. Some aspects of growth, recruitment
and reproduction in the southern saucer scallop, Amusium bal-
loti (Bernardi, 1861) in Shark Bay, Western Australia. Dept.
Fish. Wildl. (West Australia). Fish. Res. Bull. 25, 1–33.
Heilmayer, O., Brey, T., 2003. Saving by freezing? Metabolic rates
of Adamussium colbecki in a latitudinal context. Mar. Biol. 143,
477–484 (DOI 10.1007/s00227-003-1079-7).
Heilmayer, O., Brey, T., Chiantore, M., Cattaneo-Vietti, R., Arntz,
W.E., 2003. Age and productivity of the Antarctic scallop
(Adamussium colbecki) in the Ross Sea. J. Exp. Mar. Biol.
Ecol. 288, 239–256.
Hickson, J.A., Johnson, A.L.A., Heaton, T.H.E., Balson, P.S., 1999.
The shell of the queen scallop Aequipecten opercularis (L.) as a
promising tool for palaeoenvironmental reconstruction: evi-
dence and reasons for equilibrium stable-isotope incorporation.
Palaeogeogr. Palaeoclimatol. Palaeoecol. 154, 325–337.
Ignell, S., Haynes, E., 2000. Geographic patterns in growth of the
giant Pacific sea scallop, Patinopecten caurinus. Fish. Bull. 98,
849–853.
Jamieson, G.S., 1979. Status and assessment of Northumberland
Strait scallop stocks. Fish Mar. Serv. Tech. Rept. 904, 1–34.
Jamieson, G.S., Kerr, G., Lundy, M.J., 1981. Assessment of scallop
stocks on Browns and German Banks—1979. Can. Tech. Rept.
Fish. Aquat. Sci. 1014. 17 pp.
Krantz, D.E., Jones, D.S., Williams, D.F., 1984. Growth rates of the
sea scallop, Placopecten magellanicus, determined from the18O/16O record in shell calcite. Biol. Bull. 167, 186–199.
Lambert, J., Prefontaine, G., 1995. The Iceland scallop (Chlamys
islandica) in Nunavik. Can. Tech. Rep. Fish. Aquat. Sci.; Rapp.
Tech. Can. Sci. Halieut. Aquat. 0 (2071), 1–40.
Lasta, M., Valero, J., Brey, T., Bremec, C., 2001. Zygochlamys
patagonica (King and Broderip) beds on the Argentinian shelf.
Part II: Population dynamics of Z patagonica. Arch. Fish. Mar.
Res. 49, 125–137.
Lee, T., 1973. Scallop and queen scallop survey along the east and
south-east coasts of Ireland—August 1972. Resour. Rec. Pap.
Bord Iascaigh Mhara Fish. Dev. Div. 23.
MacDonald, B.A., Bourne, N.F., 1987. Growth, reproductive out-
put, and energy partitioning in weathervane scallops, Patino-
pecten caurinus, from British Columbia. Can. J. Fish. Aquat.
Sci. 44, 152–160.
MacDonald, B.A., Thompson, R.J., 1985. Influence of temperature
and food availability on the ecological energetics of the giant
scallop Placopecten magellanicus: II. Reproductive output and
total production. Mar. Ecol. Prog. Ser. 25, 295–303.
MacDonald, B.A., Thompson, R.J., 1988. Intraspecific variation in
growth and reproduction in latitudinally differentiated popula-
tions of the giant scallop Placopecten magellanicus (Gmelin).
Biol. Bull. 175, 361–371.
MacDonald, B.A., Thompson, R.J., Bourne, N.F., 1991. Growth
and reproductive energetics of three scallop species from British
Columbia (Chlamys hastata, Chlamys rubida and Crassadoma
gigantea). Can. J. Fish. Aqua. Sci. 48, 215–221.
McConnaughey, T.A., Burdett, J., Whelan, J.F., Paull, C.K., 1997.
Carbon isotopes in biological carbonates: respiration and pho-
tosynthesis. Geochim. Cosmochim. Acta 61, 611–622.
McLusky, D.S., 1973. The effect of temperature on the oxygen
consumption and filtration rate of Chlamys (Aequipecten) oper-
cularis (L.) (Bivalvia). Ophelia 10, 141–154.
Mendo, J., Jurado, E., 1993. Length-based growth parameter esti-
mates of the Peruvian scallop (Argopecten purpuratus). Fish.
Res. 15, 357–367.
Myasnikov, V.G., Kochnev, Y.P., 1988. Lifespan, growth and sex
structure of scallop (Chlamys albidus) off the Kuril Islands.
Marine Commercial Invertebrates, Collected Papers. VNIRO,
Moscow, pp. 153–166.
Naidu, K.S., 1991. Sea scallop, Placopecten magellanicus. In:
Shumway, S.E. (Ed.), Scallops: Biology, Ecology and Aquacul-
ture. Elsevier, Amsterdam, pp. 861–898.
Orensanz, J.M., Pascual, M., Fernandez, M., 1991. Fisheries and
aquaculture: Argentina. In: Shumway, S.E. (Ed.), Scallops:
Biology, Ecology and Aquaculture. Elsevier, Amsterdam,
pp. 981–1000.
Owen, R., Kennedy, H., Richardson, C., 2002a. Experimental in-
vestigation into partitioning of stable isotopes between scallop
(Pecten maximus) shell calcite and sea water. Palaeogeo. Pale-
oclim. Paleoecol. 185, 163–174.
Owen, R., Kennedy, H., Richardson, C., 2002b. Isotopic partition-
ing between shell calcite and seawater: effect of shell growth
rate. Geochim. Cosmochim. Acta 66, 1727–1737.
Packard, G.C., Boardman, T.J., 1999. The use of percentages and
size-specific indices to normalize physiological data for varia-
tion in body size: wasted time, wasted effort? Comp. Biochem.
Physiol. 122, 37–44.
Paul, J.D., 1980. Salinity-temperature relationships in the queen
scallop Chlamys opercularis. Mar. Biol. 56, 295–300.
Pauly, D., Munro, J.L., 1984. Once more on the comparison of
growth in fish and invertebrates. Fishbyte 2, 21.
Pickett, G.A., Franklin, A., 1975. The growth of queen scallops
(Chlamys opercularis) in cages off Plymouth, South-West
England. ICES CM (K25). 4 pp.
Richardson, C.A., 2001. Molluscs as archives of environmental
change. Oceanogr. Mar. Biol. 39, 103–164.
Richardson, C.A., Taylor, A.C., Venn, T.J., 1982. Growth of the
queen scallop Chlamys opercularis in suspended cages in the
Firth of Clyde. J. Mar. Biol. Ass. UK 62, 157–169.
Rolfe, M.S., 1973. Notes on queen scallops and how to catch
them. Shellfish Inf. Leafl. Minist. Agric. Fish. Food, U.K. 27.
13 pp.
Sagan, G., Thouzeau, G., 1998. Variabilite spatio-temporelle de la

ARTICLE IN PRESSO. Heilmayer et al. / Journal of Sea Research xx (2004) xxx–xxx12
biomasse microphytobenthique en rade de Brest et en Manche
occidentale. Oceanol. Acta 21, 677–694.
Schone, B.R.A., 2003. A ‘clam-ring’ master-chronology con-
structed from a short-lived bivalve mollusc from the northern
Gulf of California, USA. The Holocene 13, 39–49.
Schone, B.R., Lega, J., Flessa, K.W., Goodwin, D.H., Dettman,
D.L., 2002. Reconstructing daily termperatures from growth
rates of intertidal bivalve mollusc Chione cortezi (northern Gulf
of California, Mexico). Palaeogeo. Palaeoclimat. Palaeoecol.
184, 131–146.
Seed, R., 1980. Shell growth and form in the Bivalvia. In: Rhoadas,
D.C., Lutz, R.A. (Eds.), Skeletal Growth of Aquatic Organisms.
Plenum Press, New York, pp. 23–68.
Shafee, M.S., 1982. Seasonal variation in oxygen consumption
rates of the black scallop Chlamys varia (L.) from Lanveoc
(Bay of Brest). Oceanol. Acta 5, 189–197.
Shafee, M.S., Conan, G., 1984. Energetic parameters of a popula-
tion of Chlamys varia (Bivalvia: Pectinidae). Mar. Ecol. Prog.
Ser. 18, 253–262.
Shumway, S.E., 1991. Scallops: Biology, Ecology and Aquaculture.
Elsevier, Amsterdam.
Shumway, S.E., Barter, J., Stahlnecker, J., 1988. Seasonal changes
in oxygen consumption of the giant scallop, Placopecten magel-
lanicus (GMELIN). J. Shellfish Res. 7, 77–82.
Sibly, R.M., Calow, P., 1986. Physiological Ecology of Animals.
An Evolutionary Approach. Blackwell Scientific Publications,
Oxford.
Silina, A.V., Pozdnyakova, L.A., 1990. Growth of the scallop Chla-
mys rosealbus in the Sea of Japan. Russ. J. Mar. Biol. 16, 32–36.
Stearns, S.C., 1976. Life history tactics: A review of the ideas. Q.
Rev. Biol. 51, 3–47.
Stockton, W.L., 1984. The biology and ecology of the epifaunal
scallop Adamussium colbecki on the west side of McMurdo
Sound, Antarctia. Mar. Biol. 78, 171–178.
Taylor, A.C., Venn, T.J., 1978. Growth of the queen scallop, Chla-
mys opercularis, from the Clyde Sea area. J. Mar. Biol. Ass. UK
58, 687–700.
Ursin, E., 1956. Distribution and growth of the queen, Chlamys
opercularis (Lamellibranchiata) in Danish and Faroese waters.
Medd. Dan. Fisk.-Havunders. 1, 1–31.
Vahl, O., 1972. Particle retention and relation between water trans-
port and oxygen uptake in Chlamys opercularis (L.) (Bivalvia).
Ophelia 10, 67–74.
Vahl, O., 1981. Energy transformation by the Iceland scallop, Chla-
mys islandica (O.F. Muller), from 70jN: II. The population
energy budget. J. Exp. Mar. Biol. Ecol. 53, 297–303.
Vakily, J.M., 1992. Determination and comparison of bivalve
growth, with emphasis on Thailand and other tropical areas.
ICLARM Tech. Rep. 36. 125 pp.
Valero, J., 1999. Variacion estacional, espacial e interannual en el
crecimiento de vieira patagonica (Zygochlamys patagonica) en
la plataforma argentina. Informe Final - Contrato IICA.
Ventilla, R.F., 1982. The scallop industry in Japan. Adv. Mar. Biol.
20, 309–382.
Waller, T.R., 1991. Evolutionary relationships among commercial
scallops (Mollusca: Bivalvia: Pectinidae). In: Shumway, S.E.
(Ed.), Scallops: Biology, Ecology and Aquaculture. Elsevier,
Amsterdam, pp. 1–73.
Wefer, G., Berger, W.H., 1991. Isotope paleontology: growth and
composition of extant calcareous species. Mar. Geol. 100,
207–248.
Widdows, J., Donkin, P., Salkeld, P.N., Cleary, J.J., Lowe, D.M.,
Evans, S.V., Thomson, P.E., 1984. Relative importance of envi-
ronmental factors in determining physiological differences be-
tween two populations of mussels (Mytilus edulis). Mar. Ecol.
Prog. Ser. 17, 33–47.
Wieser, W., 1994. Cost of growth in cells and organisms: general
rules and comparative aspects. Biol. Rev. 68, 1–33.
Williams, M.J., Dredge, M.C.L., 1981. Growth of the saucer scal-
lop, Amusium japonicum balloti Habe in central eastern Queens-
land. Aust. J. Mar. Freshw. Res. 32, 657–666.
Witbaard, R., Jenness, M.I., Van der Borg, K., Ganssen, G., 1994.
Verification of annual growth increments in Arctica islandica L.
from the North Sea by means of oxygen and carbon isotopes.
Neth. J. Sea Res. 33, 91–101.
Wolff, M., 1987. Population dynamics of the Peruvian scallop
Argopecten purpuratus during the El Nino phenomenon of
1983. Can. J. Fish. Aquat. Sci. 44, 1684–1691.
Yamashiro, C., Mendo, J., 1988. Crecimiento de la Concha de
Abanico (Argopecten purpuratus) en la Bahia Independencia,
Pisco, Perœ. Memorias del 2do Congreo Latinoamericano sobre
Ciencias del Mar, Lima, Perœ, pp. 163–168.
Yoo, S.K., Ryu, H.Y., Park, K.Y., 1981. The growth of the
cultured, Patinopecten yessoensis. Bull. Korean Fish. Soc.
14, 221–226.