Height development of shade-tolerant conifer saplings in multiaged Acadian forest...
9
Height development of shade-tolerant conifer saplings in multiaged Acadian forest stands1 Andrew R. Moores, Robert S. Seymour, and Laura S. Kenefic Abstract: Understory growth dynamics of northern conifer species were studied in four stands managed under multiaged silvicultural systems in eastern Maine. Height growth of Picea rubens Sarg., Abies balsamea (L.) Mill., and Tsuga cana- densis (L.) Carr. saplings between 0.5 and 6.0 m in height was related to the proportion open sky (POS), using sapling height as a covariate. Height growth of T. canadensis equaled A. balsamea and exceeded P. rubens under very low light levels (POS < 0.1) but is much less responsive to both increasing POS and taller heights, reaching 50% of its maximum height growth at a POS of only 0.09. Abies balsamea outgrew P. rubens under similar dark conditions; at higher light lev- els (POS > 0.10), both species grew similarly. Evidently, no feasible overstory manipulation of light alone can promote more rapid height development of P. rubens saplings over A. balsamea. A nonlinear light-prediction model using stand basal area is linked with height-growth prediction equations to quantify sapling development from 0.5 to 6 m. Depending on overstory density, P. rubens requires a height advantage of 0.144.33 m over a 0.5 m tall A. balsamea to reach a height of 6 m over the same time period. RdsumC : La dynamique de la croissance en sous-Ctage des coniEres nordiques a Ctk CtudiCe dans quatre peuplements sou- mis i un rCgime sylvicole multi-ige dans l'est de 1'~tat du Maine. Avec la hauteur des gaules comme covariable, la crois- sance en hauteur des gaules d'Cpinette rouge (Picea rubens Sarg.), de sapin baumier (Abies balsamea (L.) Mill.) et de la pruche du Canada (Tsuga canadensis (L.) Carr.) entre 0,5 et 6,O m de haut est relike au pourcentage d'ouverture du cou- vert (POC). La croissance en hauteur de T. canadensis Cgale celle de A. balsamea et dkpasse celle de P. rubens dans des conditions de tr6s faible luminositk (POC < 0,l). Mais la croissance en hauteur de T. canadensis est tr6s peu sensible i l'augmentation du POC et i une hauteur initiale plus ClevCe, atteignant 50 % de sa croissance maximale en hauteur i une valeur de POC de seulement 0,09. Abies balsamea dCpasse P. rubens dans des conditions similaires de luminositk; dans des conditions de plus forte luminositt (POC > 0,10), les deux essences croissent de f a ~ o n similaire. ~videmment, en pra- tique aucune manipulation de 1'Ctage dominant pour augmenter la luminositC ne peut favoriser une croissance en hauteur des gaules de P. rubens plus rapide que celle de A. balsamea. Un mod&le non linkaire de prCdiction de la 1uminositC bask sur la surface terrisre est relic5 aux Cquations de prkdiction de la croissance en hauteur pour quantifier le dkveloppement des gaules de 0,5 i 6 m. DCpendamment de la densit6 de 1'Ctage dominant, une tige d'ipinette rouge doit avoir 0,14 i 0,33 m de plus qu'une tige de sapin de 0,5 m de haut pour atteindre une hauteur de 6 m au cours de la mEme pCriode de temps. [Traduit par la Redaction] Introduction tems for several reasons: greater challenges exist to main- A natural disturbance regime dominated by gap dynamics and a long history of partial cutting have made multiaged, mixed-species forest structures common in the Acadian For- est of northeastern North America (Seymour et al. 2002). However, the dynamics of multiaged stands are complicated and poorly understood despite a century of research in the region. Forest managers commonly eschew multiaged sys- Received 3 March 2007. Accepted 7 June 2007. Published on the NRC Research Press Web site at cjfr.nrc.ca on 9 January 2008. A.R. ~ o o r e s ~ and R.S. SeymourO3 School of Forest Resources, 5755 Nutting Hall, University of Maine, Orono, ME 04469- 5755, USA. L.S. Kenefic. USDA Forest Service, Northern Research Station, Bradley, ME 0441 1, USA. 'Publication 2954 of the Maine Agricultural and Forest Experiment Station, University of Maine, Orono, Maine. 2~resent address: Department of Forest Science, 321 Richardson Hall, Oregon State University, Corvallis, OR 97331, USA. 3Corresponding author (e-mail: [email protected]). taining high stemwood productivity, yields are more difficult to predict, and prescriptions are more complex rela- tive to single-cohort systems. Three principal challenges ex- ist to maintaining maximum productivity in these stands. First, overstory leaf area, which is the strongest predictor of stand stemwood productivity (O'Hara 1996; Ryan et al. 1997), must be kept well below the site potential to promote adequate development of regeneration. Secondly, more of the itand leaf area tends to bk found on large-crowned, old trees, which can be less growth efficient than younger over- story trees with moderate crowns (Assmann 1970; Roberts et al. 1993; Seymour and Kenefic 2002). Finally, at least in Acadian mixed-conifer forests, long periods of suppression in the understory may reduce growth efficiency once trees reach the main canopy, independent of crown size or canopy stratum (Maguire et al. 1998; Seymour and Kenefic 2002). Thus, skillful management of multiaged structures involves allocating leaf area to overstory trees in a way that opti- mizes overstory growth and growth efficiency without de- laying the timely advancement of seedlings and saplings from the understory into taller strata. Previous studies of understory growth dynamics have con- Can. J. For. Res. 37: 2715-2723 (2007) doi:lO.l139/X07-110 O 2007 NRC Canada
Transcript of Height development of shade-tolerant conifer saplings in multiaged Acadian forest...

Height development of shade-tolerant conifer saplings in multiaged Acadian forest stands1
Andrew R. Moores, Robert S. Seymour, and Laura S. Kenefic
Abstract: Understory growth dynamics of northern conifer species were studied in four stands managed under multiaged silvicultural systems in eastern Maine. Height growth of Picea rubens Sarg., Abies balsamea (L.) Mill., and Tsuga cana- densis (L.) Carr. saplings between 0.5 and 6.0 m in height was related to the proportion open sky (POS), using sapling height as a covariate. Height growth of T. canadensis equaled A. balsamea and exceeded P. rubens under very low light levels (POS < 0.1) but is much less responsive to both increasing POS and taller heights, reaching 50% of its maximum height growth at a POS of only 0.09. Abies balsamea outgrew P. rubens under similar dark conditions; at higher light lev- els (POS > 0.10), both species grew similarly. Evidently, no feasible overstory manipulation of light alone can promote more rapid height development of P. rubens saplings over A. balsamea. A nonlinear light-prediction model using stand basal area is linked with height-growth prediction equations to quantify sapling development from 0.5 to 6 m. Depending on overstory density, P. rubens requires a height advantage of 0.144.33 m over a 0.5 m tall A. balsamea to reach a height of 6 m over the same time period.
RdsumC : La dynamique de la croissance en sous-Ctage des coniEres nordiques a Ctk CtudiCe dans quatre peuplements sou- mis i un rCgime sylvicole multi-ige dans l'est de 1 '~ t a t du Maine. Avec la hauteur des gaules comme covariable, la crois- sance en hauteur des gaules d'Cpinette rouge (Picea rubens Sarg.), de sapin baumier (Abies balsamea (L.) Mill.) et de la pruche du Canada (Tsuga canadensis (L.) Carr.) entre 0,5 et 6,O m de haut est relike au pourcentage d'ouverture du cou- vert (POC). La croissance en hauteur de T. canadensis Cgale celle de A. balsamea et dkpasse celle de P. rubens dans des conditions de tr6s faible luminositk (POC < 0,l). Mais la croissance en hauteur de T. canadensis est tr6s peu sensible i l'augmentation du POC et i une hauteur initiale plus ClevCe, atteignant 50 % de sa croissance maximale en hauteur i une valeur de POC de seulement 0,09. Abies balsamea dCpasse P. rubens dans des conditions similaires de luminositk; dans des conditions de plus forte luminositt (POC > 0,10), les deux essences croissent de f a ~ o n similaire. ~videmment, en pra- tique aucune manipulation de 1'Ctage dominant pour augmenter la luminositC ne peut favoriser une croissance en hauteur des gaules de P. rubens plus rapide que celle de A. balsamea. Un mod&le non linkaire de prCdiction de la 1uminositC bask sur la surface terrisre est relic5 aux Cquations de prkdiction de la croissance en hauteur pour quantifier le dkveloppement des gaules de 0,5 i 6 m. DCpendamment de la densit6 de 1'Ctage dominant, une tige d'ipinette rouge doit avoir 0,14 i 0,33 m de plus qu'une tige de sapin de 0,5 m de haut pour atteindre une hauteur de 6 m au cours de la mEme pCriode de temps.
[Traduit par la Redaction]
1 Introduction tems for several reasons: greater challenges exist to main-
A natural disturbance regime dominated by gap dynamics and a long history of partial cutting have made multiaged, mixed-species forest structures common in the Acadian For- est of northeastern North America (Seymour et al. 2002). However, the dynamics of multiaged stands are complicated and poorly understood despite a century of research in the region. Forest managers commonly eschew multiaged sys-
Received 3 March 2007. Accepted 7 June 2007. Published on the NRC Research Press Web site at cjfr.nrc.ca on 9 January 2008.
A.R. ~ o o r e s ~ and R.S. SeymourO3 School of Forest Resources, 5755 Nutting Hall, University of Maine, Orono, ME 04469- 5755, USA. L.S. Kenefic. USDA Forest Service, Northern Research Station, Bradley, ME 0441 1, USA.
'Publication 2954 of the Maine Agricultural and Forest Experiment Station, University of Maine, Orono, Maine.
2~resent address: Department of Forest Science, 321 Richardson Hall, Oregon State University, Corvallis, OR 97331, USA.
3Corresponding author (e-mail: [email protected]).
taining high stemwood productivity, yields are more difficult to predict, and prescriptions are more complex rela- tive to single-cohort systems. Three principal challenges ex- ist to maintaining maximum productivity in these stands. First, overstory leaf area, which is the strongest predictor of stand stemwood productivity (O'Hara 1996; Ryan et al. 1997), must be kept well below the site potential to promote adequate development of regeneration. Secondly, more of the itand leaf area tends to bk found on large-crowned, old trees, which can be less growth efficient than younger over- story trees with moderate crowns (Assmann 1970; Roberts et al. 1993; Seymour and Kenefic 2002). Finally, at least in Acadian mixed-conifer forests, long periods of suppression in the understory may reduce growth efficiency once trees reach the main canopy, independent of crown size or canopy stratum (Maguire et al. 1998; Seymour and Kenefic 2002). Thus, skillful management of multiaged structures involves allocating leaf area to overstory trees in a way that opti- mizes overstory growth and growth efficiency without de- laying the timely advancement of seedlings and saplings from the understory into taller strata.
Previous studies of understory growth dynamics have con-
Can. J. For. Res. 37: 2715-2723 (2007) doi:lO.l139/X07-110 O 2007 NRC Canada
Can. J. For. Res. Vol. 37, 2007
sistently shown that light availability is the primary driver of understory seedling and sapling growth, whereas soil nu- trient status and soil moisture availability play less important roles (Pacala et al. 1994; Finzi and Canham 2000; Mitchell 2001; Kranabetter and Coates 2004). In turn, quality and quantity of light reaching the understory is primarily deter- mined by overstory leaf area and canopy openness (Chason et al. 1991; Sampson and Smith 1993; Baldocchi and Colli- neau 1994). In such cases, it is the interspecific competitive dynamics in the understory, as determined by the light envi- ronment, that ultimately drives the community and succes- sional dynamics of the stand (Klinka et al. 1992; Claveau et al. 2002; Gratzer et al. 2004). Although we know that Abies balsamea (L.) Mill. (balsam fir), Picea rubens Sarg. (red spruce), and Tsuga canadensis (L.) Carr. (eastern hemlock) are all very shade tolerant and capable of responding to re- lease after prolonged periods of suppression in the under- story (Blum 1990; Frank 1990; Godman and Lancaster 1990; Seymour 1992), the relative development of these spe- cies under common understory conditions in multiaged stands has not been studied. Thus, a greater understanding of these species' responses to varying levels of canopy openness is critical to predicting and managing the develop- mental trajectories of these stands.
The purpose of this study was to better understand and quantify the relative growth dynamics of understory A. bal- samea, P. rubens, and T. canadensis trees in multiaged, mixed-species Acadian conifer stands. Specifically, the ob- jectives were to (i) rigorously compare the height growth of these species in different understory environments, (ii) model these height-growth patterns in response to changes in overstory canopy openness and tree size, and (iii) relate overhead canopy openness to stand density (basal area) and, thus, facilitate application under multiaged silvicultural sys- tems.
Methods
Study site Field data were obtained from four mixed-species, multi-
aged stands located on the 1540 ha Penobscot Experimental Forest (PEF) in Bradley, Maine. The PEF lies within the Acadian Forest Region, a transitional forest between the broadleaf forest to the south and the boreal forest to the north (Loo and Ives 2003). The natural disturbance regime is dominated by sporadic partial disturbances, such as insect epidemics and windstorms. Species composition is mixed and highly variable because of small-scale edaphic and topo- graphic heterogeneity. Dominant conifers on the PEF in- clude P. rubens, A. balsamea, T. canadensis, Thuja occidentalis L. (northern white-cedar), Pinus strobus L. (eastern white pine), and Picea glauca (Moench) Voss (white spruce). The more common hardwoods are Acer ru- brum L. (red maple), Betula papyrifera Marsh. (paper birch), and Betula alleghaniensis Britt. (yellow birch). Gla- cial till is the principal soil parent material with soil types ranging from well-drained loams and sandy loams on low- profile ridges to poorly drained and very poorly drained loams and silt loams in flat areas between the ridges (Bris- sette et al. 1999; Brissette and Kenefic 1999).
The PEF, located at approximately 44O52'N and 68"38'W,
is the site of long-term silvicultural experiments established by the USDA Forest Service in the 1950s, which include both even-aged and multiaged silvicultural treatments (Sendak et al. 2003; Seymour et al. 2006). Two of the stands in the present study (C9 and C16) are replicates of selection cutting on a 5 year cycle, whereas the other two (C12 and C20) are replicates of selection cutting on a 10 year cutting cycle; each treatment unit is approximately 10 ha. The struc- tural goal is defined by the BDq method (Guldin 1991): the 5 year cutting cycle uses a target residual basal area (BA) of 26 m2.ha-I and a maximum residual diameter at breast height (DBH) goal of 48 cm, whereas the 10 year treatment uses a target residual basal area of 23 m2-ha-l and a maximum residual DBH goal of 46 cm. The q factor for both treatments is 1.96, based on 5 cm DBH classes (Seymour and Kenefic 1998). Because these selection-cutting treatments contain no truly open conditions, archived measurements of saplings in young even-aged stands (the untreated control plots of a nearby precommercial thinning study established in 1976; Brissette et al. 1999) were used to establish benchmark height-growth rates without overstory competition.
Sampling scheme Samples were obtained from points located on 25 m sys-
tematic grids established in each study stand. To reduce the influence of localized site variability on height growth, po- tential sample locations avoided poorly drained soils; sample points were limited to well drained, moderately well drained, or somewhat poorly drained conditions. Locations with evi- dence of harvesting during the past 5 years (e.g., recent stumps) within a 0.1 ha circular plot were excluded, as were points that included at least one hardwood tree greater than 10 cm DBH within the 0.1 ha zone. At all remaining grid points, all A. balsamea, P. rubens, and T. canadensis saplings between 0.5 and 6.0 m in height were tallied by 2 m height classes on 0.05 ha circular plots to provide a basis for design- ing a sample balanced by species, height, and canopy openness.
Canopy openness (after Machado and Reich 1999) was assessed on these preliminary grid points during July 2002 using a LAI-2000 plant canopy analyzer (LI-COR 1992) at a height of 1.6 m above the ground. To avoid bias from di- rect-beam sunlight, readings were taken without a viewcap within an hour of sunrise or sunset, or on uniformly overcast days. The LAI-2000 records the diffuse nonintercepted light (DIFN) penetrating the canopy (Chason et al. 1991; Lieffers et al. 1999); values are normalized between zero and unity using a second sensor placed above the canopy or in the open. In this study, the unobstructed sensor was in an open field located 1-2.2 km from the sample sites. Hereafter, we refer to a specific value of canopy openness using the abbre- viation POS (for proportion open sky). Each grid point was assigned to a POS bin of 0.1 (0-0.09, 0.10-0.19, 0.20-0.29, . . ., 0.90-1.00).
The target sample in the multiaged stands was 180 sap- lings consisting of 20 trees per species per height class dis- tributed over the acceptable grid points. Using the results from the preliminary POS survey to establish approximate light strata, 20 suitable grid points were chosen for each spe- cies and height class as potential sample-tree locations. Effort was made to equally represent open conditions, intermedi- ate conditions, and closed conditions regardless of their fre-
O 2007 NRC Canada
Moores et al.
quency. However, because of the consistently dense oversto- ries in these stands, there were not enough suitable grid points in the more open POS bins to accomplish this per- fectly. Each chosen grid point was revisited, and a sapling of the appropriate height class and species was randomly chosen within a 4 m radius of the grid point. No more than one tree per species was sampled at each grid point.
Open-grown trees were selected from the archived data by randomly choosing 10 trees per height class per species, if available. These open-grown samples were drawn from an identical range of initial heights as in the multiaged stands. To ensure comparability to the relatively high sapling den- sities in the multiaged stands, archived data were further re- stricted to dominant or codominant trees on untreated control plots only based on earlier work that suggested thinning affected height growth of A. balsamea (Brissette et al. 1999). No T. canadensis met these selection criteria, so data on open-grown trees were limited to only 30 A. bal- samea trees and 26 P. rubens trees.
Data collection
POS and basal area measurements Canopy openness was measured at the top of the terminal
leader for each sample tree between mid-August to mid- September 2002 using the LAI-2000. The below-canopy sensor was mounted to a telescoping height pole and lev- eled to the greatest extent possible with an attached car- penter's level. Four POS readings were taken above each sapling by rotating the height pole 90" between readings and then averaged. POS values for all trees in the archived open-grown data set were simply assigned a value of 1.0. On a subsample of grid points distributed proportionately over the entire POS range found in the preliminary survey, BA (m2+ha-l) of trees >2.5 cm DBH was measured using a 2 m2 BAF prism sweep with the sample tree as plot center.
Height growth Height growth measurements in the multiaged compart-
ments were taken between mid-August and late September in 2002. The distances from the ground to the tip of the ter- minal shoot and from the ground to the base of the most re- cent two internodes were measured using a telescoping pole or measuring tape. The dependent variable in the multiaged sample is annual height increment (AHINC, in m-year1), the total internodal distance measured on the terminal shoot divided by two. Height increments in the archived open- grown data set were obtained by subtracting successive height measurements made at 3 or 4 year intervals during the period 1976-1983 and dividing by the length of the measurement period. Because tree height itself has been shown to significantly affect tree height growth (Duches- neau et al. 2001; Uzoh 2001; Claveau et al. 2002; Boisvenue et al. 2004), height at the beginning of the growth period (initial height; IH) was included as a covariate in models re- lating height growth to canopy openness.
Data analysis
Quantifiing canopy openness The POS estimates from the LAI-2000 are derived from
one to five successive circumferential rings of the light sen- sor. Varying the number of rings changes the size of the cone emanating from the LAI-2000 within which overhead vegetation intercepts light to the sensor below. Using only the innermost ring produces a cone with a zenith angle of 18", whereas using the two, three, four, or five innermost rings produces cones with zenith angles of 28.6", 43.4", 58.1 ", and 74.1 ", respectively (LI-COR 1992). Because wider angles integrate canopy openness over a much larger area, trees on the periphery may be included in the estimate of POS when using all five rings, even though they may not influence the growth of the sapling in question (Bunnell and Vales 1989). Other scientists (Biging and Dobbertin 1992; Puettmann and D'Amato 2002) have reported that using an- gles of view greater than a zenith angle of 30" in the selec- tion of competitors does not improve height and diameter growth models. We tested that assumption by running re- gressions on AHINC using POS estimates based on the in- nermost ring; the innermost two, three, four rings; and all five rings. Although the difference in model performance between using three, four, or five rings was negligible, using four rings produced the lowest MSE and, along with three rings, tied for the highest R2 value. Models in all subsequent analyses were therefore based on the four inner rings (a ze- nith angle of 58.1 ").
Height growth models To test the hypothesis that species differ in their response
to canopy openness, we first conducted an analysis of cova- riance in which trees were assigned to one of five POS zones, labeled as follows: dark, closed, transition, gap, and open. The first four zones encompass the gradient in canopy openness of the multiaged stands and include all three spe- cies, whereas the open zone is represented by the archived data of A. balsamea and P. rubens only. To create roughly equal sample sizes within POS categories, POS values in the multiaged stands were distributed into quartiles. The lower quartile POS value, median POS value, and upper quartile POS values were 0.073, 0.136, and 0.248, respec- tively, roughly proportional to the distribution of overstory canopy openness in the study stands that are dominated by relatively closed-canopy conditions interspersed with occa- sional small gaps. For simplicity, we rounded the upper boundaries of these zones to 0.07, 0.15, and 0.25, respec- tively. The gap zone contained all saplings growing in con- ditions of POS greater than 0.25 and less than 0.73 (fir), 0.80 (spruce), or 0.86 (hemlock). The resulting distribution of samples (Fig. 1) offers precision where it is most valuable, viz., at levels of canopy openness below 25%-30%, the zone within which height growth of shade-tolerant conifers is most responsive (Carter and Klinka 1992; Klinka et al. 1992; Pa- rent and Messier 1995; Duchesneau et al. 2001; Grassi and Bagnaresi 2001).
Analysis of covariance was done using Systat's (version 11) general linear model procedure (SYSTAT, Inc., San Diego, California). The dependent variable was AHINC; in- dependent variables were species and POS zone (both cate- gorical variables), and the species x POS interaction; the covariate was the sapling's height at the beginning of the 2 year growth period. Both continuous variables were natural- log transformed to counteract increasing variance. Because
O 2007 NRC Canada

Can. J. For. Res. Vol. 37, 2007
Fig. 1. Joint distribution of sample trees by species, POS and initial height, showing quartile divisions (based on the untransformed data) used to form POS categories within the multiaged stand data.
8 V P ~ b e n s
DARK i CLOSED TPA~snoi GAP W
In Proportion Open Sky
T. canadensis trees were not represented in the open-grown data set, the comparison among the three species was lim- ited to the multiaged stands only. A separate analysis ex- cluding T. canadensis was run to compare A. balsamea and P. rubens in the open zone. Within each canopy openness zone, pairwise comparisons were made between predicted log-transformed AHINC values for each species, using Fish- er's least significant difference (LSD) to suggest differences among species. Because specific contrasts were carried out only among species within POS zones, not among all possi- ble 12 POS x species categories, more conservative mean separation was deemed unnecessary.
Because all effects proved to be highly significant (see Re- sults section), we elected to formulate a continuous height- growth response function to facilitate modeling applications. The significance of species and its interaction with POS strongly suggested separate models for each species; fur- ther, the lack of any apparent optimum light zone suggested an asymptotic rather than a peaking function. The Michaelis- Menten curve (Wright et al. 1998, York et al. 2004), with IH as a nonlinear modifier, was used to enforce such asymptotic behavior:
where a, b, and c are parameters fitted using Systat's (ver- sion 1 1) nonlinear regression algorithm.
Gap fraction prediction To further facilitate modeling applications in the typical
situation where POS is not measured, we explored various model forms to predict POS from the commonly available stand BA. The following nonlinear model proved to be the most precise and unbiased:
where HT is the height at which the POS measurement was
Table 1. Analysis of covariance comparing the natural-log trans- formed annual height increment (m) among species and POS zones, with the log-transformed initial height of the sample tree (IH, m) as the covariate (multiaged stands only; excludes Abies balsarnea and Picea rubens in the open zone).
Source SS df MS F P Species 2.644 2 1.322 4.099 0.018 POS zone 40.599 3 13.533 41.96 <0.001 Species x POS zone 7.673 6 1.279 3.966 0.001 ln(1H) 12.179 1 12.179 37.77 <0.001 Error 49.338 153 0.322
Note: SS, sum of squares; MS, mean square.
Fig. 2. Least-squares means of mean annual 2 year height incre- ment (natural-log transformed, m) by species and POS zone, based on the analysis of covariance in Table 1. Means plotted at the overall mean log initial height of the multiaged stands = 0.695 (an- tilog = 2.59 m). The boundaries of the POS zones are marked on the upper horizontal axis. Error bars are SEs.
Proportion Open Sky
- A. balsamea - - /? ~ b e n s - - a - - T canadensis
In Proportion Open Sky
taken (height of subsample tree at time of measurement) and BA,, and b are fitted parameters. This equation has three desirable properties: POS approaches full sunlight (1.0) as BA approaches zero for all values of HT > zero; POS approaches zero as the stand BA approaches the site maximum; and POS can increase with increasing HT hold- ing BA constant. Three different basal areas (all centered at the location of the POS reading) were tested: total plot-level BA (BA1), BA of all trees greater than 6.0 m tall (middle- and upper-story trees; BA2), and BA of all trees greater in height than the subject sample tree (BA3).
Results
Height growth All terms in the analysis of covariance were highly signif-
icant (Table I), with the full model explaining 70% of the variation in the log-transformed values of AHINC. Clearly, all species respond to increasing canopy openness, albeit to different degrees (Fig. 2), as reflected in the high signifi- cance of the POS term. The significant species x POS inter- action is best illustrated by the relatively "flat" response of
O 2007 NRC Canada

Moores et al. 271 9
Table 2. Probabilities of differences in annual height growth (natural-log transformed) among species within POS zones, based on the ANOVA in Table 1 (for all but the open zone) using Fisher's least significant differences among the least-squares means from Fig. 2.
POS zone
Dark (n = 39) Closed (n = 48) Transition (n = 38) Gap (n = 41) Open (n = 56)
Contrast A. balsamea vs. Tsuga canadensis 0.35 1 0.648 0.033 0.012 - A. balsamea vs. P, rubens 0.015 0.127 0.223 0.689 0.363 T. canadensis vs. P, rubens <0.001 0.072 0.621 0.034 -
Means Proportion open sky 0.045 0.103 0.198 0.418 1 .OO Initial height (m) 1.55 2.33 2.77 3.74 3.29
Note: The contrast between A. balsamea and P. rubens in the open zone is from a separate ANOVA excluding T. canadensis over all light zones (not shown). Corresponding mean POS and initial heights by zone are also shown.
Fig. 3. Scatterplot of 2 year mean height growth over POS, show- ing fitted Michaelis-Menten height-growth response models (eq. 1, Table 3) plotted at the overall mean initial height of 2.77 m. Letters are species abbreviations, and the associated values are height classes (1, 0.5-1.99 m; 2, 2.0-3.99 m; 3, 4.0-6.0 m).
0.7 Tm Ab2
0.6 - o ~ b 3 Tcl Tc2
0.5 - Tc3 v Prl r PR
A. balsamea F? rubens T: canadensis
Proportion Open Sky
T. canadensis relative to the other species. T. canadensis significantly outgrows P. rubens in the dark zone, equals the others in the closed zone, but is significantly less than A. balsamea in the transition zone and less than both species in the gap zone (Fig. 2, Table 2). Abies balsamea outgrows P. rubens only in the dark zone; these two species do not differ under better illuminated conditions. Importantly, there are no conditions under which height growth of A. balsamea does not at least equal or exceed that of the other species.
The Michaelis-Menten models (Fig. 3; Table 3) help to quantify and generalize the patterns suggested by the com- parisons among least-squares means above. With IH held constant, A. balsamea and P. rubens exhibit similar re- sponses to increasing canopy openness, with little evidence of a saturating pattern. In contrast, height growth of T. can- adensis appears to saturate at or below POS = 0.5 at an asymptotic upper limit that is 38%-53% that of the other species.
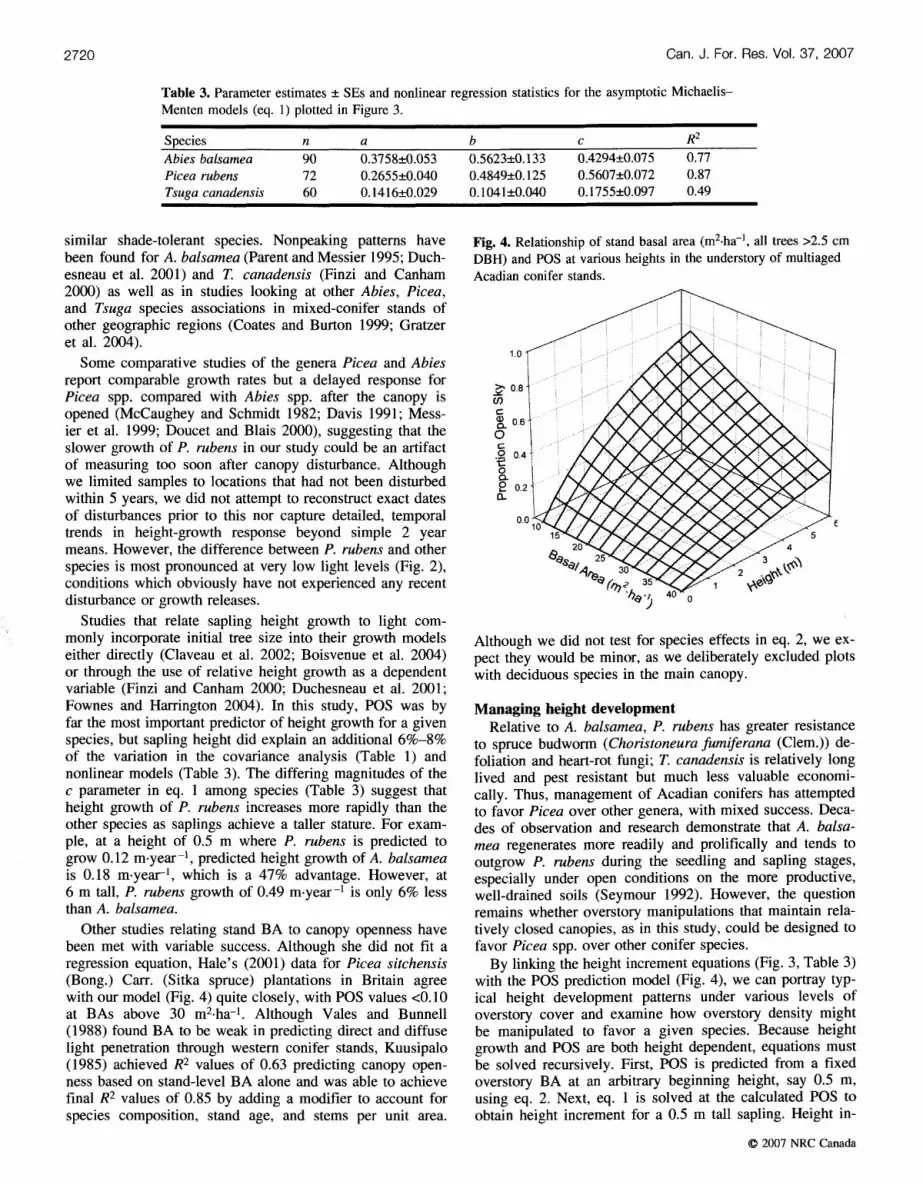
Gap fraction prediction Formulated as eq. 2, BA explained 65% of the variation
in POS at various understory heights with the following pa- rameters: BA,, = 58.959 and b = 0.1387. Differences in R2
among BA1, BA2, and BA3 were negligible, so BA1 (the to- tal stand BA, all trees included) was used for simplicity. HT-I was the optimum weight to stabilize the variance. Note that the fitted value for BA,,, which is intended to represent the biological maximum density, is nearly 60 m2, a reasonable value for fully stocked stands in this forest type (Wilson et al. 1999). This model (Fig. 4) behaves as expected: in these multiaged stands with irregular canopies, a tree's light environment becomes increasingly favorable as it grows taller, presumably because the crowns of neighbor- ing trees intercept relatively less light in the inverted conical zone above the tree's terminal shoot. As BA decreases, this effect becomes more pronounced. For example, the light en- vironment of a tree with a surrounding BA of 10 m2 (the lowest density observed) improves from a POS of 0.22 to 0.77 as it grows from 1 to 6 m tall; comparable values for a BA of 30 m2 (the mean stand density) range from 0.09 to 0.43 (Fig. 4).
Discussion and silvicultural implications Our results support a key finding of previous studies on
shade-tolerant conifers which demonstrate that such species are most responsive to increases in canopy openness under very shaded environments (Carter and Klinka 1992; Klinka et al. 1992; Parent and Messier 1995; Duchesneau et al. 2001; Finzi and Canham 2000). Tsuga canadensis is most remarkable in this respect; based on the equations in Table 3, it reaches 50% of its maximum height growth at a POS of only 0.09, compared with 0.25-0.27 for P. rubens and A. bal- samea, respectively. Gratzer et al. (2004) found essentially the same pattern for Tsuga dumosa (D. Don) Eichler. Both A. balsamea and P. rubens show more sustained responses to increased canopy openness, reaching 75% of their maximum height growth at a POS = 0.50-0.52; in contrast, T. canaden- sis reaches this value at a POS of only 0.22. Clearly, T. cana- densis is competitive in height growth only under very shaded conditions where POS < 0.15, but even in this zone, it does not outgrow A. balsamea. Most importantly, there appear to be no understory light conditions that favor either P. rubens or T. canadensis over A. balsamea of the same height.
The lack of a distinct optimum level of canopy open- ness below fully open conditions (i.e., that would be evi- dent as a peaking pattern in Fig. 2) is consistent with other studies involving established natural regeneration of
O 2007 NRC Canada
2720 Can. J. For. Res. Vol. 37, 2007
Table 3. Parameter estimates k SEs and nonlinear regression statistics for the asymptotic Michaelis- Menten models (eq. 1) plotted in Figure 3.
Species n a b c R~ Abies balsarnea 90 0.3758k0.053 0.5623k0.133 0.4294k0.075 0.77 Picea rubens 72 0.2655k0.040 0.4849k0.125 0.5607k0.072 0.87 Tsuga canadensis 60 0.1416+0.029 0.1041~0.040 0.1755k0.097 0.49
similar shade-tolerant species. Nonpeaking patterns have been found for A. balsamea (Parent and Messier 1995; Duch- esneau et al. 2001) and T. canadensis (Finzi and Canham 2000) as well as in studies looking at other Abies, Picea, and Tsuga species associations in mixed-conifer stands of other geographic regions (Coates and Burton 1999; Gratzer et al. 2004).
Some comparative studies of the genera Picea and Abies report comparable growth rates but a delayed response for Picea spp. compared with Abies spp. after the canopy is opened (McCaughey and Schmidt 1982; Davis 1991; Mess- ier et al. 1999; Doucet and Blais 2000), suggesting that the slower growth of P. rubens in our study could be an artifact of measuring too soon after canopy disturbance. Although we limited samples to locations that had not been disturbed within 5 years, we did not attempt to reconstruct exact dates of disturbances prior to this nor capture detailed, temporal trends in height-growth response beyond simple 2 year means. However, the difference between P. rubens and other species is most pronounced at very low light levels (Fig. 2), conditions which obviously have not experienced any recent disturbance or growth releases.
Studies that relate sapling height growth to light com- monly incorporate initial tree size into their growth models either directly (Claveau et al. 2002; Boisvenue et al. 2004) or through the use of relative height growth as a dependent variable (Finzi and Canham 2000; Duchesneau et al. 2001; Fownes and Harrington 2004). In this study, POS was by far the most important predictor of height growth for a given species, but sapling height did explain an additional 6%-8% of the variation in the covariance analysis (Table 1) and nonlinear models (Table 3). The differing magnitudes of the c parameter in eq. 1 among species (Table 3) suggest that height growth of P. rubens increases more rapidly than the other species as saplings achieve a taller stature. For exam- ple, at a height of 0.5 m where P. rubens is predicted to grow 0.12 m-year -I, predicted height growth of A. balsamea is 0.18 m-year1, which is a 47% advantage. However, at 6 m tall, P. rubens growth of 0.49 m-year-' is only 6% less than A. balsamea.
Other studies relating stand BA to canopy openness have been met with variable success. Although she did not fit a regression equation, Hale's (2001) data for Picea sitchensis (Bong.) Cam. (Sitka spruce) plantations in Britain agree with our model (Fig. 4) quite closely, with POS values <0.10 at BAS above 30 m2-ha-l. Although Vales and Bunnell (1988) found BA to be weak in predicting direct and diffuse light penetration through western conifer stands, Kuusipalo (1985) achieved R2 values of 0.63 predicting canopy open- ness based on stand-level BA alone and was able to achieve final R2 values of 0.85 by adding a modifier to account for species composition, stand age, and stems per unit area.
Fig. 4. Relationship of stand basal area (m2-ha-', all trees >2.5 cm DBH) and POS at various heights in the understory of multiaged Acadian conifer stands.
Although we did not test for species effects in eq. 2, we ex- pect they would be minor, as we deliberately excluded plots with deciduous species in the main canopy.
Managing height development Relative to A. balsamea, P. rubens has greater resistance
to spruce budworm (Choristoneu ra fimiferana (Clem.)) de- foliation and heart-rot fungi; T. canadensis is relatively long lived and pest resistant but much less valuable economi- cally. Thus, management of Acadian conifers has attempted to favor Picea over other genera, with mixed success. Deca- des of observation and research demonstrate that A. balsa- mea regenerates more readily and prolifically and tends to outgrow P. rubens during the seedling and sapling stages, especially under open conditions on the more productive, well-drained soils (Seymour 1992). However, the question remains whether overstory manipulations that maintain rela- tively closed canopies, as in this study, could be designed to favor Picea spp. over other conifer species.
By linking the height increment equations (Fig. 3, Table 3) with the POS prediction model (Fig. 4), we can portray typ- ical height development patterns under various levels of overstory cover and examine how overstory density might be manipulated to favor a given species. Because height growth and POS are both height dependent, equations must be solved recursively. First, POS is predicted from a fixed overstory BA at an arbitrary beginning height, say 0.5 m, using eq. 2. Next, eq. 1 is solved at the calculated POS to obtain height increment for a 0.5 m tall sapling. Height in-
0 2007 NRC Canada

Moores et al.
Fig. 5. Estimated times required to grow from a height of 0.5- 6.0 m, under overstory basal areas of 10 and 30 m2.ha-', by species. Letters are used to abbreviate species, and the associated values are basal areas.
Time after reaching 0.5 m (years)
crement is added to height, eq. 2 is solved again to obtain a new POS value (which will be slightly greater), and eq. 1 is solved again to predict the next height increment. Figure 5 illustrates the resulting height development for BAS of 10 and 30 m2-ha-l as each species grows from 0.5 to 6.0 m tall. In all cases, the curves increase exponentially, a direct result of the fact that height increment improves as trees grow taller and experience a more favorable light environ- ment. The total time required to grow from 0.5 to 6 m, at which point the tree can be considered established in the midstory, was calculated under various overstory densities, and related to the time required if the tree were growing in the open (Table 4).
Study of Fig. 5 and Table 4 reveals that, under any over- story density up to ca. 30 m2 (slightly greater than the target BA used to manage the multiaged stands), A. balsamea is the most competitive species. At a BA of 30 m2-ha-l, at which POS increases from 0.05 to 0.43 as height increases from 0.5 to 6 m (Fig. 4), T. canadensis appears to have an early advantage at shorter heights; however, the much stron- ger response of A. balsamea as it gains stature results in A. bal- samea surpassing T. canadensis at a height of 4 m and reaching 6 m 6 years sooner (Fig. 5). Thus, favoring T. can- adensis would require keeping the BA at 40 m2-ha-l or higher; at that density, T. canadensis would reach 6 m in 66 years, 5 years sooner than A. balsamea and 18 years sooner than P. rubens (Table 4). As overstory BA is re- duced, P. rubens becomes relatively more competitive, equaling T. canadensis at a BA of about 25 m2.ha-l; under a BA of 10 m2.ha-l, P. rubens reaches 6 m 10 years sooner than T. canadensis and only 5 years later than A. bal- samea (Fig. 5). No feasible manipulation of overstory BA alone can favor P. rubens over A. balsamea. For P. rubens to reach 6 m during the time required by A. balsamea, P. ru- bens saplings require a "head start" of 3 years growing in the open to 13 years under a dense canopy of 40 m2-ha-l (Table 4, differences between species). These times corre- spond to P. rubens sapling heights ranging from 0.83 (in the open) to 0.64 m (BA = 40), equal to a height advant-
Table 4. Predicted times (years) required for saplings to grow from 0.5 to 6 m tall under a range of constant overstory basal areas in multiaged Acadian conifer stands (calculated recursively from eqs. 1 and 2).
Overstorv basal area (m2.ha-'1
Species 0 5 10 20 30 40 Abies balsamea 17 23 27 35 47 7 1 Picea rubens 20 28 32 41 56 84 Tsuga canadensis 37 40 42 46 53 66
age of 0.14-0.33 m over a 0.5 m tall A. balsamea. Such an understory structure could be created by developing a healthy population of P. rubens saplings at least 1 m tall, then removing any competing A. balsamea and T. cana- densis taller than 0.5 m in a cleaning treatment. Interest- ingly, this recommendation agrees with Westveld (1931) and Davis (1991), who both found that such Picea saplings compete successfully with shorter A. balsamea.
Acknowledgments Financial support for this research was provided by the
University of Maine Canadian American Center, the Univer- sity of Maine Graduate School, and the University of Maine Department of Forest Ecosystem Science. Contributing fac- ulty include Dr. Jeremy Wilson and Dr. Michael Day. Field assistants were Ted Chernesky, Justin DeRose, and Leah Philips. Field assistance was also provided by Mike Saun- ders. Statistical help was provided by Dr. Bill Halteman at the University of Maine, and Dr. Manuala Huso at Oregon State University. This research was conducted in conjunc- tion with the USDA Forest Service Northern Research Sta- tion in Bradley, Maine. The analysis and manuscript benefited substantially from the contributions of two anony- mous reviewers.
References Assmann, E. 1970. Principles of forest yield study: studies in the
organic production, structure, increment, and yield of forest stands. Pergamon Press Ltd., Oxford, UK.
Baldocchi, D., and Collineau, S. 1994. The physical nature of solar radiation in heterogenous canopies: spatial and temporal attri- butes. In Exploitation of environmental heterogeneity by plants: ecophysiological processes above- and belowground. Edited by M.M. Caldwell and R.W. Pearcy. Academic Press, New York. pp. 21-71.
Biging, G.S., and Dobbertin, M. 1992. A comparison of distance- dependent competition measures for height and basal area growth of individual conifer trees. For. Sci. 38: 695-720.
Blum, B.M. 1990. Red spruce. In Silvics of North America. Vol. 1. Conifers. Edited by R.M. Burns and B.H. Honkala. USDA Ag- ric. Handb. 654. pp. 250-259.
Boisvenue, C., Temesgen, H., and Marshall, P. 2004. Selecting a small tree height growth model for mixed-species stands in the southern interior of British Columbia, Canada. For. Ecol. Man- age. 202: 301-3 12. doi: 10.1016/j.foreco.2004.07.037.
Brissette, J.C., and Kenefic, L.S. 1999. Eastern hemlock response to even- and uneven-age management in the Acadian forest: re- sults from the Penobscot Experimental Forest long-term silvicul- tural study. In Proceedings: Symposium on Sustainable
I
O 2007 NRC Canada I

Can. J. For. Res. Vol. 37, 2007
Management of Hemlock Ecosystems in Eastern North America, 22-24 June 1999, Durham, N.H. Edited by K.A. McManus, K.S. Shields, and D.R. Souto. USDA For. Serv. Gen. Tech. Rep. NE- 267. pp. 23-33.
Brissette, J.C., Frank, R.M., Jr., Stone, T.L., and Skratt, T.A. 1999. Precommercial thinning in a northern conifer stand: 18-year re- sults. For. Chron. 75: 967-972.
Bunnell, F.L., and Vales, D.J. 1990. Comparison of methods for es- timating forest overstory cover: differences among techniques. Can. J. For. Res. 20: 101-107.
Carter, R.E., and Klinka, K. 1992. Variation in shade tolerance of Douglas fir, western hemlock, and western red cedar in coastal British Columbia. For. Ecol. Manage. 55: 87-105. doi: 10.101 61 0378- 1 127(92)90094-P.
Chason, J. W., Baldocchi, D.D., and Huston, M.A. 199 1. A compar- ison of direct and indirect methods for estimating forest canopy leaf area. Agric. For. Meteorol. 57: 107-128. doi: 10.101 6101 68- 1923(9 1)90081-2.
Claveau, Y., Messier, C., Comeau, P.G., and Coates, K.D. 2002. Growth and crown morphological responses of boreal conifer seedlings and saplings with contrasting shade tolerance to a gra- dient of light and height. Can. J. For. Res. 32: 458-468. doi:lO. 1 1391x0 1-220.
Coates, K.D., and Burton, P.J. 1999. Growth of planted tree seed- lings in response to ambient light levels in northwestern interior cedar-hemlock forests of British Columbia. Can. J. For. Res. 29: 1374-1 382. doi: 10.1 139lcjfr-29-9-1374.
Davis, W.C. 1991. The role of advance regeneration of red spruce and balsam fir in east central Maine. In Proceedings of the Con- ference on Natural Regeneration Management, 17-19 March 1990, Fredericton, N.B. Edited by C.M. Simpson. Forestry Ca- nada, Maritimes Forestry Centre, Fredericton, N.B. pp. 157-1 68.
Doucet, R., and Blais, L. 2000. Comparative growth of balsam fir and black spruce advance regeneration after logging. J. Sustain. For. 10: 235-239. doi: 10.13001J091v 10n03-05.
Duchesneau, R., Lesage, I., Messier, C., and Morin, H. 2001. Ef- fects of light and intraspecific competition on growth and crown morphology of two size classes of understory balsam fir sap- lings. For. Ecol. Manage. 140: 2 15-225. doi: 10.10 161S0378- 1 127(00)00281-4.
Finzi, A.C., and Canham, C.D. 2000. Sapling growth in response to light and nitrogen availability in a southern New England forest. For. Ecol. Manage. 131: 153-165. doi: 10.10161S0378-1127(99) 00206-6.
Fownes, J.H., and Hanington, R.A. 2004. Seedling response to gaps: separating effects of light and nitrogen. For. Ecol. Man- age. 203: 297-3 10. doi: 10.101 6lj.foreco.2004.07.044.
Frank, R.M. 1990. Balsam fir. In Silvics of North America. Vol. 1. Conifers. Edited by R.M. Bums and B.H. Honkala. USDA Ag- ric. Handb. 654. pp. 26-35.
Godman, R.M., and Lancaster, K.L. 1990. Eastern hemlock. In Sil- vics of North America. Vol. l. Conifers. Edited by R.M. Bums and B.H. Honkala. USDA Agric. Handb. 654. pp. 604-61 1.
Grassi, G., and Bagnaresi, U. 2001. Foliar morphological and phy- siological plasticity in Picea abies and Abies alba saplings along a natural light gradient. Tree Physiol. 21: 959-967. PMID: 11498343.
Gratzer, G., Darabant, A., Chhetri, P.B., Bahadur Rai, P., and Eck- mullner, 0 . 2004. Interspecific variation in the response of growth, crown morphology, and survivorship to light of six tree species in the conifer belt of the Bhutan Himalayas. Can. J. For. Res. 34: 1093-1 107. doi: 10.11391x03-281.
Guldin, J.M. 1991. Uneven-aged BDq regulation of Sierra Nevada mixed conifers. West. J. Appl. For. 6: 27-32.
Hale, S.E. 2001. Light regime beneath Sitka spruce plantations in northern Britain: preliminary results. For. Ecol. Manage. 151: 61-66. doi: 10.10161S0378- 1 127(00)00696-4.
Klinka, K., Wang, Q., Kayahara, G.J., Carter, R.E., and Blackwell, B.A. 1992. Light-growth response relationships in Pacific silver fir and subalpine fir. Can. J. Bot. 70: 1919-1930.
Kranabetter, J.M., and Coates, K.D. 2004. Ten-year postharvest ef- fects of silviculture systems on soil-resource availability and conifer nutrition in a northern temperate forest. Can. J. For. Res. 34: 800-809. doi: 10.1 1391x03-244.
Kuusipalo, J. 1985. On the use of tree stand parameters in estimat- ing light conditions below the canopy. Silva Fenn. 19: 185- 196.
Lieffers, V.J., Messier, C., Stadt, K.J., Gendron, F., and Comeau, P.G. 1999. Predicting and managing light in the understory of bor- eal forests. Can. J. For. Res. 29: 796-81 1. doi: 10.11 39lcjfr-29-6- 796.
LI-COR. 1992. LAI-2000 plant canopy analyzer instruction man- ual. LI-COR, Inc., Lincoln, Neb.
Loo, J., and Ives, N. 2003. The Acadian forest: historical condition and human impacts. For. Chron. 79: 462-474.
Machado, J.L., and Reich, P.B. 1999. Evaluation of several measures of canopy openness as predictors of photosynthetic photon flux density in deeply shaded conifer-dominated forest understory. Can. J. For. Res. 29: 1438-1444. doi: 10.1139lcjfr-29-9-1438.
Maguire, D.A., Brissette, J.C., and Gu, L. 1998. Canopy structure and growth efficiency of red spruce in uneven-aged, mixed- species stands in Maine. Can. J. For. Res. 28: 1233-1240. doi: 10.1 139lcjfr-28-8-1233.
McCaughey, W.W., and Schmidt, W.C. 1982. Understory tree re- lease following harvest cutting in spruce-fir forests in the Inter- mountain West. USDA. For. Sew. Intermountain For. Range Exp. Stn. Res. Pap. INT-RP-285.
Messier, C., Doucet, R., Ruel, J.C., Claveau, Y., Kelly, C., and Le- chowicz, M. 1999. Functional ecology of advance regeneration in relation to light in boreal forests. Can. J. For. Res. 29: 812- 823. doi: 10.1139lcjfr-29-6-812.
Mitchell, A.K. 2001. Growth limitations for conifer regeneration under alternative silvicultural systems in a coastal montane for- est in British Columbia, Canada. For. Ecol. Manage. 145: 129- 136. doi: 10.1016/S0378-1127(00)00580-6.
O'Hara, K.L. 1996. Dynamics and stocking-level relationships of multi-aged ponderosa pine stands. For. Sci. Monogr. 33.
Pacala, S.W., Canham, C.D., Silander, J.A., Jr., and Kobe, R.K. 1994. Sapling growth as a function of resources in a north tem- perate forest. Can. J. For. Res. 24: 2172-2183. doi:10.1139lcjfr- 24-1 1-2172.
Parent, S., and Messier, C. 1995. Effets d'un gradient de lumisre sur la croissance en hauteur et la morphologie de la cime du sa- pin baumier r6gCnCrC naturellement. Can. J. For. Res. 25: 878- 885. doi: 10.1139lcjfr-25-6-878.
Puettmann, K.J., and D'Amato, A.W. 2002. Selecting plot sizes when quantifying growing conditions in understories. North. J. Appl. For. 19: 137-140.
Roberts, S.D., Long, J.N., and Smith, F.W. 1993. Canopy stratifica- tion and leaf area efficiency: a conceptualization. For. Ecol. Manage. 60: 143-1 56. doi: 10.101 610378- 1 127(93)90028-L.
Ryan, M.G., Binkley, D., and Fownes, J.H. 1997. Age-related de- cline in forest productivity: pattern and process. Adv. Ecol. Res. 27: 213-262.
Sampson, D.A., and Smith, F.W. 1993. Influence of canopy archi- tecture on light penetration in lodgepole pine forests. Agric. For. Meteorol. 64: 63-79. doi: 10.101610168- 1923(93)90094-X.
Sendak, P.E., Brissette, J.C., and Frank, R.M. 2003. Silviculture af-
O 2007 NRC Canada
Moores et al. 2723
fects composition, growth, and yield in mixed northern conifers: 40-year results from the Penobscot Experimental Forest. Can. J. For. Res. 33: 21 16-2128. doi: 10.1 1391x03-140.
Seymour, R.S. 1992. The red spruce - balsam fir forest of Maine: evolution of silvicultural practice in response to stand develop- ment patterns and disturbances. In The ecology and silviculture of mixed-species forests. A festschrift for David M. Smith. Edi- ted by M.J. Kelty, B.C. Larson, and C.D. Oliver. Kluwer, Nor- well, Mass. pp. 217-244.
Seymour, R.S., and Kenefic, L.S. 1998. Balance and sustainability in multi-aged stands: a northern conifer case study. J. For. 96: 12-17.
Seymour, R.S., and Kenefic, L.S. 2002. Influence of age on growth efficiency of T. canadensis, and P. rubens in mixed-species, multi-aged northern conifer stands. Can. J. For. Res. 32: 2032- 2042. doi: 10.1139lx02-120.
Seymour, R.S., White, A.S., and deMaynadier, P.G. 2002. Natural disturbance regimes in northeastern North America - evaluating and formulating silvicultural systems using natural scales and frequencies. For. Ecol. Manage. 155: 357-367. doi: 10.10 161 SO378-1127(01)00572-2.
Seymour, R.S., Guldin, J., Marshall, D., and Palik, B. 2006. Large- scale, long-term silvicultural experiments in the United States:
historical overview and contemporary examples. Allg. Forst Jagdztg. 177: 104-1 12.
Uzoh, F.C.C. 2001. A height increment equation for young ponder- osa pine plantations using precipitation and soil factors. For. Ecol. Manage. 142: 193-203. doi: 10.10 16lS0378- 1 l27(00)00350-9.
Vales, D.J., and Bunnell, F.L. 1988. Relationships between trans- mission of solar radiation and coniferous forest stand character- istics. Agric. For. Meteorol. 43: 201-223. doi:10.101610168- 1923(88)90049-4.
Westveld, M. 1931. Reproduction on the pulpwood lands in the Northeast. USDA Tech. Bull. 223.
Wilson, D.S., Seymour, R.S., and Maguire, D.A. 1999. Density management diagram for northeastern red spruce and balsam fir forests. North. J. Appl. For. 16: 48-56.
Wright, E.F., Coates, K.D., Canham, C.D., and Bartemucci, P. 1998. Species variability in growth response to light across cli- matic regions in northwestern British Columbia. Can. J. For. Res. 28: 871-886. doi: 10.1 139lcjfr-28-6-87 1.
York, R.A., Heald, R.C., Battles, J.J., and York, J.D. 2004. Group selection management in conifer forests: relationships between opening size and tree growth. Can. J. For. Res. 34: 630-641. doi: 10.1 1391x03-222.
8 2007 NRC Canada