A Robust Phase-Locked Loop Algorithm to Synchronize Static-Power Converters With Polluted AC Systems
Upload
independentCategory
view
2download
0
Heavy Metals in Eight Edible Fish Species from TwoPolluted Tributaries (Aik and Palkhu) of the RiverChenab, Pakistan
Abdul Qadir & Riffat Naseem Malik
Received: 27 April 2010 /Accepted: 28 January 2011 /Published online: 22 March 2011# Springer Science+Business Media, LLC 2011
Abstract Concentration of heavy metals (lead (Pb), cadmium (Cd), chromium (Cr), andcopper (Cu)) was determined in the liver, gills, kidneys, and muscles of eight edible fish species(Channa punctata, Cirrhinus reba, Labeo rohita, Heteropneustes fossilis, Mystus cavasius,Oreochromis niloticus, Puntius sophore, and Wallago attu) from upstream and downstreamzones of the Nullah Aik and Palkhu tributaries of the River Chenab located in the Sialkotdistrict known for its tanning industries worldwide. The pattern of metal accumulation instudied organs was in the order: Cr>Pb>Cu>Cd. Liver showed greater metal accumulation,followed by gills, kidneys, and muscles. Accumulation of Pb and Cr was significantlydifferent in organs between upstream and downstream zones. Accumulation was greater infish species dwelling downstream, indicating impairment of ambient stream water due tountreated discharge of industrial and municipal effluents into studied streams. Highestconcentration of Pb and Cr and lowest of Cd was detected in H. fossilis whereas Cu showedhigher concentration and Cr lowest concentration in P. sophore. In contrast, lowerconcentration of Pb and Cu was recorded in M. cavasius, O. niloticus, and W. attu. Meanconcentrations of Cd, Cr, and Cu were higher in pre-monsoon compared to post-monsoonseason. Measured concentrations of Pb, Cd, and Cr in muscles of species such as C. punctata,W. attu, L. rohita, P. sophore, and O. niloticus were above permissible limits of heavy metalsfor human consumption, indicating potential health risks. Therefore, these fish species fromstudied locations should be avoided for human diet.
Keywords Heavymetals . Edible fish . Organs . Industrial and municipal waste . Alluvialstreams . Sialkot . Tanneries . Aik and Palkhu . River Chenab . Pakistan
Introduction
Toxic pollutants such as heavy metals which are released from point and nonpointsources have severe impact on health and ecological integrity of an aquatic ecosystem.
Biol Trace Elem Res (2011) 143:1524–1540DOI 10.1007/s12011-011-9011-3
A. Qadir : R. N. Malik (*)Environmental Biology Laboratory, Department of Plant Sciences, Quaid-i-Azam University, Islamabad45320, Pakistane-mail: [email protected]
Aquatic organisms respond to changes in their environment, which, in turn reflectprevailing health status of an aquatic ecosystem [1, 2]. Heavy metals belong to theimportant group of inorganic pollutants which gained attention from public and scientificcommunity in relation to their toxicity to aquatic organisms and ultimate effect on well-being of humans. Heavy metals such as iron, copper, chromium, and zinc are essential formetabolic activities, but become toxic at higher concentrations, whereas lead andcadmium have no documented role in living organism [3]. Essential and nonessentialmetals at higher concentration can disrupt metabolic and physiological activities ofaquatic organisms. Essential metals also become toxic if their concentration exceeds thepermissible level [4–7].
Fish is an important member of aquatic food chain and is sensitive to heavy metalcontamination. Most of the freshwater fish species are confined to specific microhabitatwithin interconnected stream system. If such system becomes contaminated by heavymetals, fish species either shift to less polluted river/stream system or die, thus ultimatelydisturbing food chain. Toxic level of heavy metals has apparent lethal or chronic effects onfish [1, 4, 6]. Fish does not only indicate pollution status of aquatic ecosystem but is one ofthe main sources of protein in human nutrition.
There are five main pathways through which heavy metals enter and accumulate infish. These include ingestion of food, suspended particulate matter, metal ion exchangethrough gills and skin, and intake of water and integuments [1, 4]. Metals get absorbedinto blood and are transported to various organs for either storage or excretion. Level oftrace metals in different organs is used as an index of metal pollution in an ecosystem,which is considered as an important tool for highlighting health of an organism.Morphological and behavioral abnormalities such as alteration in sensory reception,reduced responses to normal olfactory function (feeding, mating, selection, or homing),reduction in swimming performance, gill purge, ventilation, coughs, learning impairment,loss of equilibrium that lapsed into paralysis, loss of reproductive efficiency, and irregularmetamorphosis appeared as symptoms of toxic exposure to trace metals [8, 9].Concentration of metals becomes toxic to the fish when its level exceeds the permissiblelevel and threshold limit. It varies not only from metal to metal but also from one speciesto another [9]. Toxic effects of metals become more pronounced when various metabolicactivities inside organism fail to perform detoxification function. Heavy metals exhibitdifferent accumulation patterns in organs. Liver, gills, and kidneys accumulate heavymetals in higher concentration in comparison to muscles, which exhibit lowest levels ofmetal accumulation [10].
Heavy metal concentrations in fish organs are highly influenced by spatial andseasonal variations and have been studied worldwide. For example, Tawari-Fufeyin andEkaye [11] highlighted spatial and temporal variations in heavy metal concentration instream biota from mining areas of United States. Similarly, Kojadinovic et al. [12] foundhigher level of trace elements (Cd, Hg, Pb, and Zn) in muscle of commercially importantfish from Western Indian Ocean. Agarwal [13] reported accumulation of Hg and Pbcontents in muscles of wild fish species from the River Gomti, India. Rauf [14], Javed[15], Tariq et al. [16], Nawaz et al. [17], and Tariq [18] reported effects of trace metals oncommercial fish species from various parts of Pakistan. However, no systematic study hasbeen conducted on spatial and temporal variations of heavy metal contents in differentedible fish species from Pakistan and in particular to our study area. Due to scantyinformation about the spatial and temporal bioaccumulation pattern of heavy metals indifferent freshwater fish species, there is a dire need to investigate the deleterious effectof heavy metal on local fish fauna. Therefore, the focus of the current study is to provide
Heavy Metals in Edible Fish 1525
information about heavy metal concentration (Pb, Cd, Cr, and Cu) in organs of eightselected edible fish species from Nullah Aik and Nullah Palkhu inhabiting two pollutedtributaries of the River Chenab, on spatiotemporal basis. Also, heavy metal concen-trations in fish muscles were compared with international guidelines for humanconsumption.
Materials and Methods
Sampling of Fish Species and Dissection
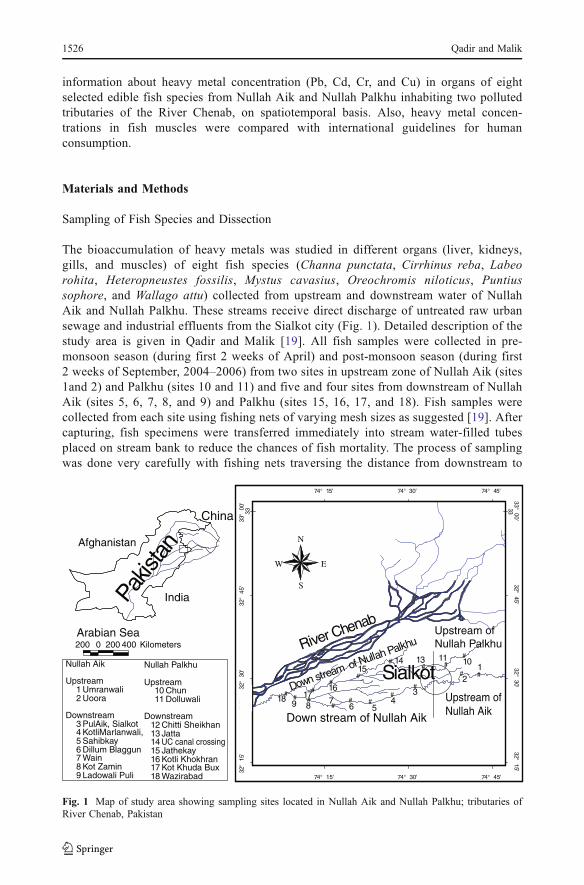
The bioaccumulation of heavy metals was studied in different organs (liver, kidneys,gills, and muscles) of eight fish species (Channa punctata, Cirrhinus reba, Labeorohita, Heteropneustes fossilis, Mystus cavasius, Oreochromis niloticus, Puntiussophore, and Wallago attu) collected from upstream and downstream water of NullahAik and Nullah Palkhu. These streams receive direct discharge of untreated raw urbansewage and industrial effluents from the Sialkot city (Fig. 1). Detailed description of thestudy area is given in Qadir and Malik [19]. All fish samples were collected in pre-monsoon season (during first 2 weeks of April) and post-monsoon season (during first2 weeks of September, 2004–2006) from two sites in upstream zone of Nullah Aik (sites1and 2) and Palkhu (sites 10 and 11) and five and four sites from downstream of NullahAik (sites 5, 6, 7, 8, and 9) and Palkhu (sites 15, 16, 17, and 18). Fish samples werecollected from each site using fishing nets of varying mesh sizes as suggested [19]. Aftercapturing, fish specimens were transferred immediately into stream water-filled tubesplaced on stream bank to reduce the chances of fish mortality. The process of samplingwas done very carefully with fishing nets traversing the distance from downstream to
Afghanistan
India
China
Arabian Sea
Pakis
tan
200 0 200 400 Kilometers River ChenabUpstream ofNullah Palkhu
Down stream of Nullah Aik
SialkotUpstream ofNullah Aik
Down stream of Nullah Palkhu
#
##
# ## #
##
##
##
#
##
N
EW
S
Nullah Aik
Upstream1 Umranwali2 Uoora
Downstream3 PulAik, Sialkot4 KotliMarlanwali,5 Sahibkay6 Dillum Blaggun7 Wain8 Kot Zamin9 Ladowali Puli
Nullah Palkhu
Upstream10 Chun11 Dolluwali
Downstream12 Chitti Sheikhan13 Jatta14 UC canal crossing15 Jathekay16 Kotli Khokhran17 Kot Khuda Bux18 Wazirabad
12
34
567
89
1011131415
1618 17#
32°
15' 32°
15'32°
30'
32°
45' 32°
45'
33°
00' 33°
00'
74° 15'
74° 15'
74° 30'
74° 30'
74° 45'
74° 45'
33
33
32°
30'
Fig. 1 Map of study area showing sampling sites located in Nullah Aik and Nullah Palkhu; tributaries ofRiver Chenab, Pakistan
1526 Qadir and Malik
upstream flow. Fish species were packed, labeled in separate polyethylene bags, placedin icebox, and transported to laboratory within 12 h for the purpose of identification andfurther chemical analysis. The remaining specimens were released back into streamwater at the locality of fishing. Released were only native fish, whereas exotic fish sortswere not returned back to the stream. Fish species were identified following regionalkeys [20–22]. A total of 75 and 79 fish specimens were dissected during post- and pre-monsoon season, respectively. Each specimen was dissected in laboratory withcorrosion-resistant stainless steel knife. Knifes were washed after dissection of eachspecimen with a detergent solution, rinsed in 50% HNO3 and finally by distilled water.Gills were first isolated and homogenized to form a composite sample. After removal ofoperculum, epidermal and subcutaneous tissues were carefully removed to obtain musclesamples. To ensure uniformity, all samples were taken from the dorsolateral muscle ofthe right side. After opening the body cavity with a scalpel, the connective tissuesurrounding the liver was removed and was separated with the gallbladder. Finally,kidneys were also separated from the connective tissues. Each dissected organ wasplaced in a polyethylene bag and provided with necessary information aboutidentification code, date, locality, season, species name, and tissue type. Polyethylenebags containing different organs were stored at −20°C before digestion.
Digestion of Fish Organs
One gram of each wet fish tissues (liver, gills, kidney, and muscles) was digested with 5 mlof HNO3 and 1 ml of HClO3 in a volumetric flask. Digestion was carried out on a hotplate(200°C to 250°C) until colorless liquid was obtained and volume adjusted to 50 ml. Eachdigest was filtered through a 0.42-μm filter paper, transferred to polyethylene bottle, andsealed to avoid contamination and evaporation. All digested samples were stored at 4°Cbefore heavy metal analyses.
Heavy Metal Analysis and Method Validation
The prepared samples (digests) were analyzed in triplicate for Pb, Cd, Cr, and Cu using air/acetylene flame with Fast Sequential Atomic Absorption Spectrometer (Varian FS 240AA)at standard conditions described in Malik and Jadoon [23]. The blanks, external referencematerials, and calibration standard solutions were also analyzed in the same way as the fishsamples. Metal concentration in fish tissues was expressed in micrograms per gram of wetweight. The precision and accuracy of procedure were evaluated by analyzing the referencematerial (Bovine liver BCR 185R). The level of metal accuracy for studied heavy metalswas 83–96% (Table 1).
Reagents
All reagents were of analytical grade unless otherwise stated. Double deionized water(Milli-Q Millipore) was used for all dilutions. HNO3 and HClO3 were of supra-purequality (Merck, Germany). All glassware were cleaned by soaking in dilute HNO3 (10%)and rinsed with deionised water prior to use. Each element standard solution used forcalibration (Sigma) was prepared by diluting stock solutions to the concentration of1,000 mg/L. Standard reference materials (bovine liver BCR 185R) were used. Metalanalyses were carried out in the Environmental Biology Laboratory of the Quaid-i-AzamUniversity, Islamabad.
Heavy Metals in Edible Fish 1527
Statistical Analyses
Basic descriptive statistics of heavy metal concentration in fish organs was performedusing Microsoft Excel. Two-way analysis of variance was used to indicate thestatistically significant differences in mean metal concentration of heavy metals inorgans, sampling zones, and fish species. Significant are considered differences withP<0.05 or less.
Results
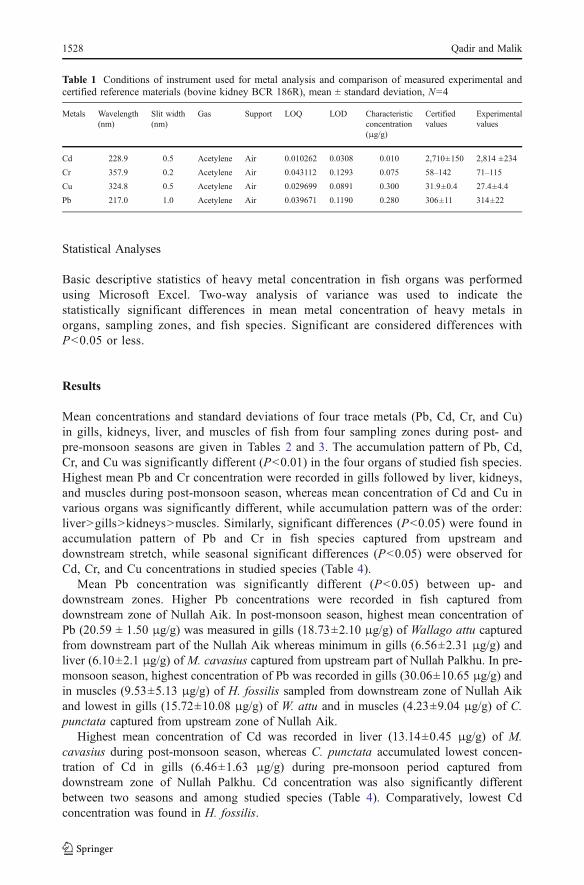
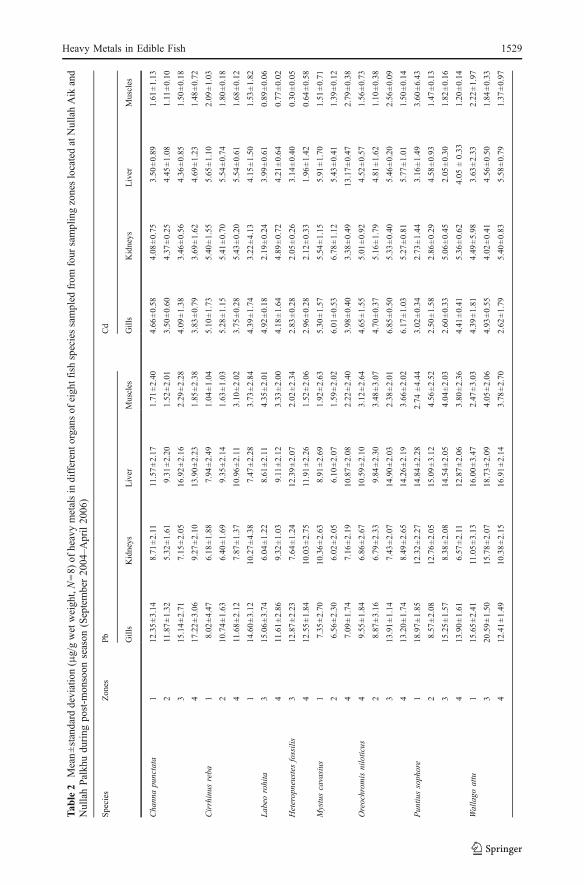
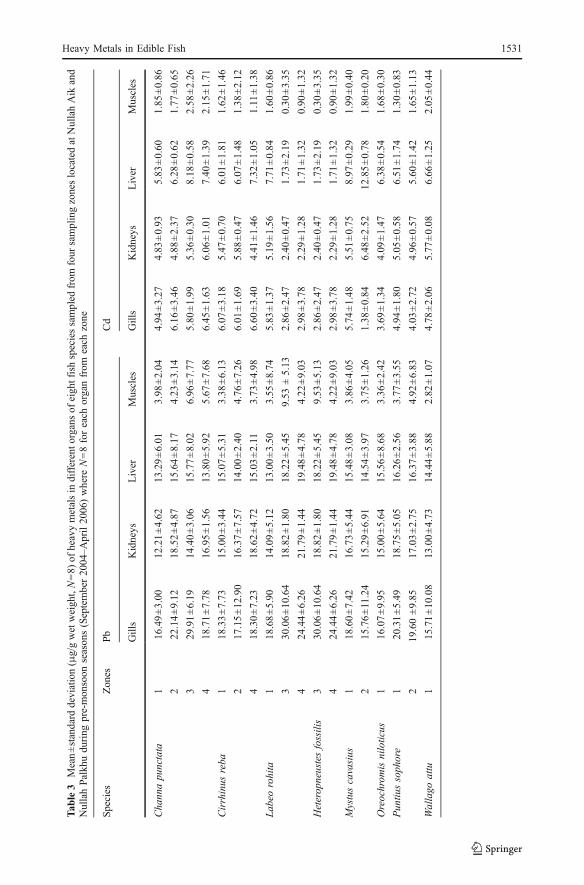
Mean concentrations and standard deviations of four trace metals (Pb, Cd, Cr, and Cu)in gills, kidneys, liver, and muscles of fish from four sampling zones during post- andpre-monsoon seasons are given in Tables 2 and 3. The accumulation pattern of Pb, Cd,Cr, and Cu was significantly different (P<0.01) in the four organs of studied fish species.Highest mean Pb and Cr concentration were recorded in gills followed by liver, kidneys,and muscles during post-monsoon season, whereas mean concentration of Cd and Cu invarious organs was significantly different, while accumulation pattern was of the order:liver>gills>kidneys>muscles. Similarly, significant differences (P<0.05) were found inaccumulation pattern of Pb and Cr in fish species captured from upstream anddownstream stretch, while seasonal significant differences (P<0.05) were observed forCd, Cr, and Cu concentrations in studied species (Table 4).
Mean Pb concentration was significantly different (P<0.05) between up- anddownstream zones. Higher Pb concentrations were recorded in fish captured fromdownstream zone of Nullah Aik. In post-monsoon season, highest mean concentration ofPb (20.59 ± 1.50 μg/g) was measured in gills (18.73±2.10 μg/g) of Wallago attu capturedfrom downstream part of the Nullah Aik whereas minimum in gills (6.56±2.31 μg/g) andliver (6.10±2.1 μg/g) of M. cavasius captured from upstream part of Nullah Palkhu. In pre-monsoon season, highest concentration of Pb was recorded in gills (30.06±10.65 μg/g) andin muscles (9.53±5.13 μg/g) of H. fossilis sampled from downstream zone of Nullah Aikand lowest in gills (15.72±10.08 μg/g) of W. attu and in muscles (4.23±9.04 μg/g) of C.punctata captured from upstream zone of Nullah Aik.
Highest mean concentration of Cd was recorded in liver (13.14±0.45 μg/g) of M.cavasius during post-monsoon season, whereas C. punctata accumulated lowest concen-tration of Cd in gills (6.46±1.63 μg/g) during pre-monsoon period captured fromdownstream zone of Nullah Palkhu. Cd concentration was also significantly differentbetween two seasons and among studied species (Table 4). Comparatively, lowest Cdconcentration was found in H. fossilis.
Table 1 Conditions of instrument used for metal analysis and comparison of measured experimental andcertified reference materials (bovine kidney BCR 186R), mean ± standard deviation, N=4
Metals Wavelength(nm)
Slit width(nm)
Gas Support LOQ LOD Characteristicconcentration(μg/g)
Certifiedvalues
Experimentalvalues
Cd 228.9 0.5 Acetylene Air 0.010262 0.0308 0.010 2,710±150 2,814 ±234
Cr 357.9 0.2 Acetylene Air 0.043112 0.1293 0.075 58–142 71–115
Cu 324.8 0.5 Acetylene Air 0.029699 0.0891 0.300 31.9±0.4 27.4±4.4
Pb 217.0 1.0 Acetylene Air 0.039671 0.1190 0.280 306±11 314±22
1528 Qadir and Malik
Tab
le2
Mean±standard
deviation(μg/gwetweight,N=8)
ofheavymetalsin
differento
rgansof
eightfishspeciessampled
from
four
samplingzoneslocatedatNullahAik
and
NullahPalkh
udu
ring
post-m
onsoon
season
(September20
04–A
pril20
06)
Species
Zones
Pb
Cd
Gills
Kidneys
Liver
Muscles
Gills
Kidneys
Liver
Muscles
Channapunctata
112.35±3.14
8.71
±2.11
11.57±2.17
1.71
±2.40
4.66
±0.58
4.08
±0.75
3.50
±0.89
1.61
±1.13
211.87±1.32
5.32
±1.61
9.31
±2.20
1.52
±2.01
3.50
±0.60
4.37
±0.25
4.45
±1.08
1.11
±0.10
315.14±2.71
7.15
±2.05
16.92±2.16
2.29
±2.28
4.09
±1.38
3.46
±0.56
4.36
±0.85
1.50
±0.18
417.22±3.06
9.27
±2.10
13.90±2.23
1.85
±2.38
3.83
±0.79
3.69
±1.62
4.69
±1.23
1.48
±0.72
Cirrhinus
reba
18.02
±4.47
6.18
±1.88
7.94
±2.49
1.04
±1.04
5.10
±1.73
5.40
±1.55
5.65
±1.10
2.09
±1.03
210.74±1.63
6.40
±1.69
9.35
±2.14
1.63
±1.03
5.28
±1.15
5.41
±0.70
5.54
±0.74
1.80
±0.18
411.68±2.12
7.87
±1.37
10.96±2.11
3.10
±2.02
3.75
±0.28
5.43
±0.20
5.54
±0.61
1.68
±0.12
114.60±3.12
10.27±4.38
7.47
±2.28
3.73
±2.84
4.39
±1.74
3.22
±4.13
4.15
±1.50
1.53
±1.82
Labeo
rohita
315.06±3.74
6.04
±1.22
8.61
±2.11
4.35
±2.01
4.92
±0.18
2.19
±0.24
3.99
±0.61
0.89
±0.06
411.61±2.86
9.32
±1.03
9.11
±2.12
3.33
±2.00
4.18
±1.64
4.89
±0.72
4.21
±0.64
0.77
±0.02
Heteropneustesfossilis
312.87±2.23
7.64
±1.24
12.39±2.07
2.02
±2.34
2.83
±0.28
2.05
±0.26
3.14
±0.40
0.30
±0.05
412.55±1.84
10.03±2.75
11.91±2.26
1.52
±2.06
2.96
±0.28
2.12
±0.33
1.96
±1.42
0.64
±0.58
Mystuscavasius
17.35
±2.70
10.36±2.63
8.91
±2.69
1.92
±2.63
5.30
±1.57
5.54
±1.15
5.91
±1.70
1.51
±0.71
26.56
±2.30
6.02
±2.05
6.10
±2.07
1.59
±2.02
6.01
±0.53
6.78
±1.12
5.43
±0.41
1.39
±0.12
47.09
±1.74
7.16
±2.19
10.87±2.08
2.22
±2.40
3.98
±0.40
3.38
±0.49
13.17±0.47
2.79
±0.38
Oreochrom
isniloticus
49.55
±1.84
6.86
±2.67
10.59±2.10
3.12
±2.64
4.65
±1.55
5.01
±0.92
4.52
±0.57
1.56
±0.73
28.87
±3.16
6.79
±2.33
9.84
±2.30
3.48
±3.07
4.70
±0.37
5.16
±1.79
4.81
±1.62
1.10
±0.38
313.91±1.14
7.43
±2.07
14.90±2.03
2.38
±2.01
6.85
±0.50
5.33
±0.40
5.46
±0.20
2.56
±0.09
413.20±1.74
8.49
±2.65
14.26±2.19
3.66
±2.02
6.17
±1.03
5.27
±0.81
5.77
±1.01
1.50
±0.14
Puntiu
ssophore
118.97±1.85
12.32±2.27
14.84±2.28
2.74
±4.44
3.02
±0.34
2.73
±1.44
3.16
±1.49
3.60
±6.43
28.57
±2.08
12.76±2.05
15.09±3.12
4.56
±2.52
2.50
±1.58
2.86
±0.29
4.58
±0.93
1.47
±0.13
315.25±1.57
8.38
±2.08
14.54±2.05
4.04
±2.03
2.60
±0.33
5.06
±0.45
2.05
±0.30
1.82
±0.16
413.90±1.61
6.57
±2.11
12.87±2.06
3.80
±2.36
4.41
±0.41
5.36
±0.62
4.05
±0.33
1.20
±0.14
Wallago
attu
115.65±2.41
11.05±3.13
16.00±3.47
2.47
±3.03
4.39
±1.81
4.49
±5.98
3.63
±2.33
2.22
±1.97
320.59±1.50
15.78±2.07
18.73±2.09
4.05
±2.06
4.93
±0.55
4.02
±0.41
4.56
±0.50
1.84
±0.33
412.41±1.49
10.38±2.15
16.91±2.14
3.78
±2.70
2.62
±1.79
5.40
±0.83
5.58
±0.79
1.37
±0.97
Heavy Metals in Edible Fish 1529
Species
Zones
Cr
Cu
Gills
Kidneys
Liver
Muscles
Gills
Kidneys
Liver
Muscles
Channapunctata
16.32
±5.22
3.46
±2.14
6.64
±4.76
2.16
±2.17
2.14
±1.25
1.70
±0.77
5.95
±2.32
0.41
±0.04
24.31
±1.80
3.76
±2.33
5.24
±1.21
1.20
±0.95
3.16
±1.71
2.45
±1.35
4.01
±1.56
0.72
±0.15
310.80±3.46
5.79
±1.73
9.07
±1.29
2.01
±0.55
2.65
±1.12
2.25
±0.25
5.91
±1.38
1.38
±0.15
49.73
±4.00
8.97
±5.19
9.69
±2.89
2.05
±1.20
3.28
±1.99
2.82
±1.88
5.76
±2.01
1.53
±0.39
Cirrhinus
reba
14.57
±3.29
4.31
±2.49
5.68
±2.26
1.78
±0.86
3.97
±1.91
6.08
±1.70
6.10
±2.22
0.52
±0.50
25.06
±2.60
7.82
±8.14
7.26
±1.48
3.18
±2.46
7.29
±4.04
6.60
±1.30
8.34
±1.94
1.02
±0.75
45.42
±1.20
9.13
±1.01
2.91
±0.63
1.83
±0.97
7.15
±2.02
8.81
±2.03
9.19
±1.01
1.53
±0.02
16.23
±3.97
4.60
±6.96
6.21
±3.24
3.65
±1.17
5.19
±2.06
4.72
±1.95
9.87
±3.16
1.31
±0.67
Labeo
rohita
322.06±10.83
11.31±1.72
16.75±1.26
3.63
±0.41
8.16
±1.17
5.76
±1.27
12.18±1.11
1.85
±0.08
415.57±6.12
17.45±1.93
17.82±3.66
3.60
±0.53
7.74
±2.01
8.05
±3.03
12.08±0.08
1.48
±0.01
Heteropneustesfossilis
322.03±6.36
8.61
±1.27
21.11±1.74
2.79
±0.21
3.07
±1.35
3.69
±1.02
4.49
±1.00
0.59
±0.02
424.51±7.38
7.01
±2.29
19.82±3.97
2.36
±3.64
5.06
±5.08
3.11
±1.48
5.07
±1.47
0.99
±0.21
Mystuscavasius
16.61
±1.90
5.74
±4.35
4.69
±2.56
1.26
±1.35
3.11
±2.00
4.00
±2.88
3.83
±2.19
1.13
±0.13
27.61
±3.85
5.70
±3.05
7.07
±2.38
1.09
±0.39
2.45
±1.30
3.38
±2.38
5.62
±2.12
1.06
±0.16
417.60±4.05
16.00±4.07
13.59±6.09
5.55
±1.66
4.05
±1.38
3.27
±1.02
6.25
±0.24
1.45
±0.18
Oreochrom
isniloticus
43.44
±2.93
2.81
±2.04
2.68
±2.64
1.41
±1.34
3.29
±3.42
3.29
±0.94
5.10
±5.52
0.56
±0.10
214.27±4.32
2.53
±1.74
3.55
±2.30
1.77
±0.98
3.78
±4.36
3.94
±1.57
6.23
±4.75
1.43
±3.03
35.03
±3.76
3.66
±1.41
5.04
±1.77
1.61
±0.12
3.24
±1.00
4.39
±1.00
4.34
±0.02
1.26
±0.01
48.93
±2.41
4.17
±1.77
3.96
±0.94
1.84
±0.71
4.59
±1.42
5.01
±2.22
5.78
±1.51
1.43
±0.14
Puntiu
ssophore
16.09
±5.19
8.50
±3.17
5.29
±1.45
2.98
±1.62
7.45
±7.71
5.66
±1.37
10.22±1.61
1.05
±0.30
25.49
±3.72
5.54
±1.51
6.89
±6.62
1.70
±1.69
8.58
±6.59
6.67
±3.84
11.86±3.70
1.32
±0.08
311.39±2.40
14.23±3.03
11.10±1.80
2.64
±0.09
5.98
±1.29
6.75
±2.03
14.82±2.16
1.42
±0.01
44.02
±1.56
3.28
±0.83
4.36
±1.84
1.85
±0.52
6.52
±1.87
6.45
±2.14
14.15±2.01
1.09
±0.11
Wallago
attu
112.70±3.70
7.59
±3.20
13.69±6.56
1.97
±1.32
0.82
±0.12
0.81
±0.10
0.94
±0.07
0.47
±0.07
331.24±6.28
23.18±8.74
25.71±8.94
5.17
±1.58
2.28
±0.36
1.58
±0.33
2.67
±0.18
0.96
±0.15
414.02±3.07
5.38
±3.36
20.98±4.06
2.85
±1.61
1.23
±0.71
1.53
±0.11
1.14
±0.26
0.41
±0.08
1530 Qadir and Malik
Tab
le3
Mean±standard
deviation(μg/gwetweight,N=8)
ofheavymetalsin
differento
rgansof
eightfishspeciessampled
from
four
samplingzoneslocatedatNullahAik
and
NullahPalkhuduring
pre-monsoon
seasons(September2004–A
pril20
06)where
N=8foreach
organfrom
each
zone
Species
Zones
Pb
Cd
Gills
Kidneys
Liver
Muscles
Gills
Kidneys
Liver
Muscles
Cha
nnapu
nctata
116
.49±3.00
12.21±4.62
13.29±6.01
3.98
±2.04
4.94
±3.27
4.83
±0.93
5.83
±0.60
1.85
±0.86
222
.14±9.12
18.52±4.87
15.64±8.17
4.23
±3.14
6.16
±3.46
4.88
±2.37
6.28
±0.62
1.77
±0.65
329
.91±6.19
14.40±3.06
15.77±8.02
6.96
±7.77
5.80
±1.99
5.36
±0.30
8.18
±0.58
2.58
±2.26
418
.71±7.78
16.95±1.56
13.80±5.92
5.67
±7.68
6.45
±1.63
6.06
±1.01
7.40
±1.39
2.15
±1.71
Cirrhinus
reba
118
.33±7.73
15.00±3.44
15.07±5.31
3.38
±6.13
6.07
±3.18
5.47
±0.70
6.01
±1.81
1.62
±1.46
217
.15±12
.90
16.37±7.57
14.00±2.40
4.76
±7.26
6.01
±1.69
5.88
±0.47
6.07
±1.48
1.38
±2.12
418
.30±7.23
18.62±4.72
15.03±2.11
3.73
±4.98
6.60
±3.40
4.41
±1.46
7.32
±1.05
1.11
±1.38
Lab
eorohita
118
.68±5.90
14.09±5.12
13.00±3.50
3.55
±8.74
5.83
±1.37
5.19
±1.56
7.71
±0.84
1.60
±0.86
330
.06±10
.64
18.82±1.80
18.22±5.45
9.53
±5.13
2.86
±2.47
2.40
±0.47
1.73
±2.19
0.30
±3.35
424
.44±6.26
21.79±1.44
19.48±4.78
4.22
±9.03
2.98
±3.78
2.29
±1.28
1.71
±1.32
0.90
±1.32
Heterop
neustesfossilis
330
.06±10
.64
18.82±1.80
18.22±5.45
9.53
±5.13
2.86
±2.47
2.40
±0.47
1.73
±2.19
0.30
±3.35
424
.44±6.26
21.79±1.44
19.48±4.78
4.22
±9.03
2.98
±3.78
2.29
±1.28
1.71
±1.32
0.90
±1.32
Mystuscavasius
118
.60±7.42
16.73±5.44
15.48±3.08
3.86
±4.05
5.74
±1.48
5.51
±0.75
8.97
±0.29
1.99
±0.40
215
.76±11.24
15.29±6.91
14.54±3.97
3.75
±1.26
1.38
±0.84
6.48
±2.52
12.85±0.78
1.80
±0.20
Oreochrom
isniloticus
116
.07±9.95
15.00±5.64
15.56±8.68
3.36
±2.42
3.69
±1.34
4.09
±1.47
6.38
±0.54
1.68
±0.30
Pun
tiussophore
120
.31±5.49
18.75±5.05
16.26±2.56
3.77
±3.55
4.94
±1.80
5.05
±0.58
6.51
±1.74
1.30
±0.83
219
.60±9.85
17.03±2.75
16.37±3.88
4.92
±6.83
4.03
±2.72
4.96
±0.57
5.60
±1.42
1.65
±1.13
Wallago
attu
115
.71±10
.08
13.00±4.73
14.44±5.88
2.82
±1.07
4.78
±2.06
5.77
±0.08
6.66
±1.25
2.05
±0.44
Heavy Metals in Edible Fish 1531
Species
Zon
esCr
Cu
Gills
Kidneys
Liver
Muscles
Gills
Kidneys
Liver
Muscles
Cha
nnapu
nctata
17.74
±3.18
5.82
±1.86
5.72
±2.09
2.73
±3.49
3.28
±1.21
6.13
±1.85
12.32±1.15
1.77
±0.52
211.38±5.84
15.60±5.47
9.62
±3.36
3.81
±3.99
4.92
±1.99
3.93
±2.13
6.68
±1.64
1.56
±0.41
319
.73±2.01
16.58±5.58
18.86±5.35
13.69±4.15
5.11
±1.63
4.41
±1.17
5.47
±1.55
1.64
±1.09
416
.86±3.46
14.37±3.80
14.53±4.12
8.83
±1.12
4.46
±1.66
5.48
±2.23
5.64
±2.74
1.60
±1.10
Cirrhinus
reba
116
.79±3.67
8.05
±4.08
12.69±2.62
2.98
±5.57
4.10
±2.07
5.75
±0.90
6.75
±1.29
1.70
±1.06
219
.93±2.70
10.09±5.47
14.98±1.52
5.35
±2.22
3.24
±1.75
5.58
±1.23
4.79
±1.04
1.36
±0.56
419
.33±5.93
14.89±3.74
16.68±4.06
1.64
±2.70
4.43
±2.86
5.38
±2.16
6.30
±2.30
1.84
±0.92
Lab
eorohita
110
.16±1.40
6.32
±4.65
8.07
±0.65
4.57
±2.40
5.40
±1.63
3.62
±1.54
8.15
±0.42
1.33
±0.52
332
.77±4.85
12.63±0.21
30.66±1.88
4.24
±1.29
2.80
±1.74
2.68
±1.22
5.25
±1.92
1.58
±0.57
428
.56±6.85
12.47±0.21
27.45±6.31
5.54
±0.18
3.19
±2.80
4.39
±1.08
7.08
±0.39
2.11
±0.48
Heterop
neustesfossilis
332
.77±4.85
12.63±0.21
30.66±1.88
4.24
±1.29
2.80
±1.74
2.68
±1.22
5.25
±1.92
1.58
±0.57
428
.56±6.85
12.47±0.21
27.45±6.31
5.54
±0.18
3.19
±2.80
4.39
±1.08
7.08
±0.39
2.11
±0.48
Mystuscavasius
16.39
±1.17
5.72
±0.92
8.66
±0.67
4.45
±2.12
3.09
±1.77
3.89
±1.18
4.81
±0.25
1.60
±0.74
25.30
±6.93
3.90
±1.01
9.44
±1.26
4.78
±0.91
1.36
±1.14
2.27
±3.28
5.34
±0.50
1.93
±0.21
Oreochrom
isniloticus
114
.91±2.20
12.01±3.49
13.63±2.57
4.24
±2.11
6.86
±2.03
4.32
±1.54
10.3±0.16
1.54
±0.46
Pun
tiussophore
13.26
±2.93
3.46
±1.55
2.75
±0.86
2.74
±1.32
4.91
±2.08
3.91
±1.31
4.62
±0.68
1.76
±0.16
25.44
±2.10
4.30
±0.38
6.39
±1.51
3.65
±0.41
5.70
±3.42
3.73
±1.07
8.28
±0.85
1.34
±0.v36
Wallago
attu
114
.19±4.65
6.10
±0.70
11.86±7.45
1.80
±0.10
1.72
±1.17
4.21
±1.24
6.17
±2.40
1.49
±0.32
1532 Qadir and Malik
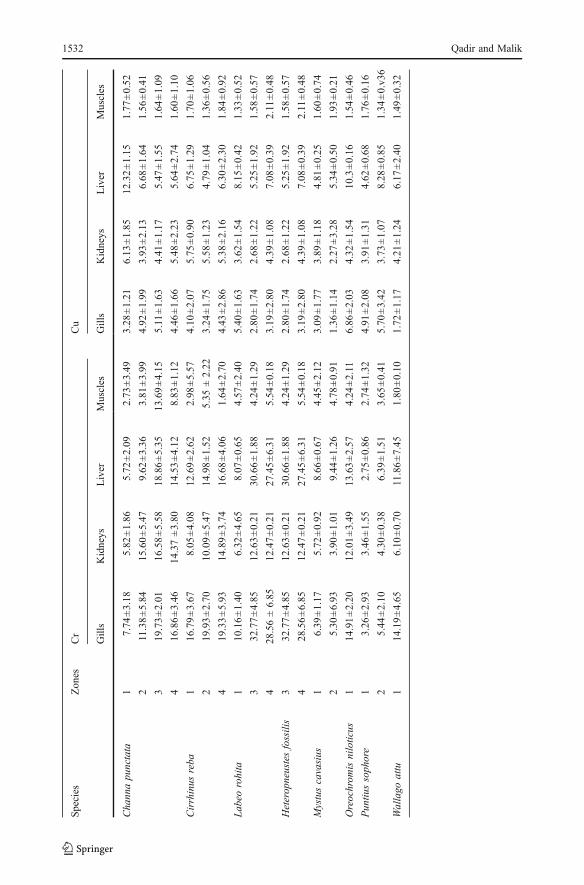
The highest Cr maximum mean concentration (31.27±6.29 μg/g) in gills was recordedin W. attu from downstream part of Nullah Aik during post-monsoon season. In pre-monsoon season, greater mean concentrations were recorded in gills (32.77±4.85 μg/g)from downstream part of both studied streams. Mean Cr concentration varied significantlybetween stream zones, seasons, and species (Table 4). Relatively higher accumulation of Crwas recorded in fish samples from downstream zone of Nullah Aik followed by NullahPalkhu and lowest at upstream zone of Nullah Aik. Among species, H. fossilis accumulatedhigher Cr quantity and lowest quantity was found in P. sophore.
During post-monsoon season, maximum mean concentration of Cu (14.83±2.16 μg/g)was recorded in liver of P. sophore captured from downstream zone of Nullah Aik whilehighest Cu concentration was detected in liver (6.14±1.86 μg/g) of C. punctata capturedfrom upstream zone of Nullah Aik during pre-monsoon season. There was no difference inmean Cu concentration between fish captured in different stream zones (Table 4). However,significant interspecies and seasonal variations were measured. P. sophore and L. rohitagenerally showed highest and W. attu lowest Cu mean concentration.
Discussion
Spatial and Temporal Variability in Heavy Metal Accumulation
Metal accumulation in fish organs provides evidences of exposure to contaminated aquaticenvironment [1]. Fish organs show significant variations in metal accumulation, which isrelated to differences in uptake, absorption, storage, regulation, and excretion abilities ofstudied fish species [1]. We found that Pb and Cr accumulated in gills. Similar results wereobtained by Avenant-Oldewage and Marx [6], El-Shaikh et al. [24], Kargin [25], Mendil etal. [26], and Pickering et al. [27]. Highest Pb was recorded in gills because it enters fishbody through gills from external aquatic medium [24], whereas liver excretes Cr throughdigestive system thus regulating its body concentration [6]. Fish dwelling in contaminatedwater with Pb and Cr can accumulate higher concentration in gills due to slow excretionrate [6, 7]. Generally, fish accumulate higher concentration of Cr at the lowest trophic levels[28]. Highest Cd and Cu concentration were recorded in liver as compared to other bodyorgans and tissues. These results are also in accordance with the findings of Avenant-Oldewage and Marx [6], Kargin [25], and McCarter and Roch [29]. Cadmium is highlytoxic to organisms and can cause anomalies such as reduction in development and growthrates as well as skeletal ossification even at lowest concentration [4]. Mean concentrationsof Cr and Pb were significantly different between upstream and downstream zones. Nullah
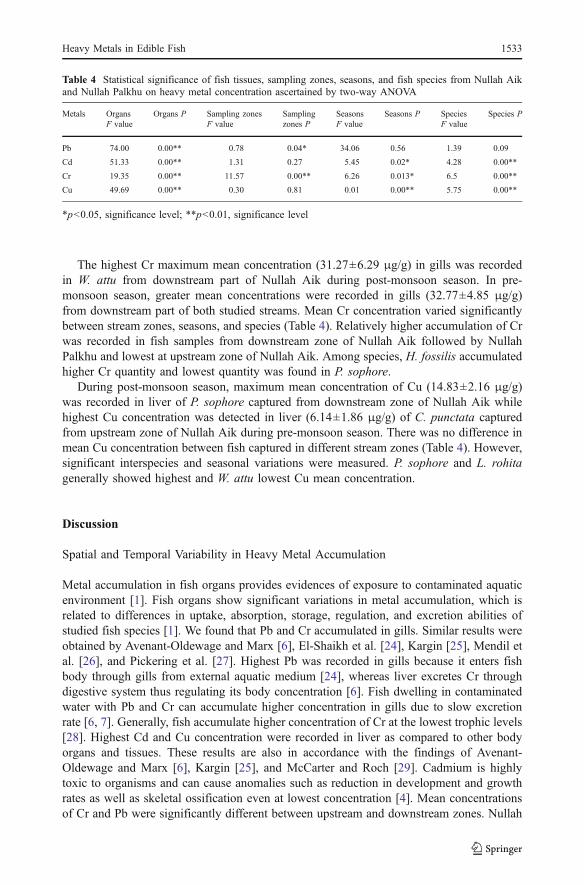
Table 4 Statistical significance of fish tissues, sampling zones, seasons, and fish species from Nullah Aikand Nullah Palkhu on heavy metal concentration ascertained by two-way ANOVA
Metals OrgansF value
Organs P Sampling zonesF value
Samplingzones P
SeasonsF value
Seasons P SpeciesF value
Species P
Pb 74.00 0.00** 0.78 0.04* 34.06 0.56 1.39 0.09
Cd 51.33 0.00** 1.31 0.27 5.45 0.02* 4.28 0.00**
Cr 19.35 0.00** 11.57 0.00** 6.26 0.013* 6.5 0.00**
Cu 49.69 0.00** 0.30 0.81 0.01 0.00** 5.75 0.00**
*p<0.05, significance level; **p<0.01, significance level
Heavy Metals in Edible Fish 1533
Aik and Nullah Palkhu are contaminated by point sources which include effluents fromtanneries, pharmaceutical industries, and municipal sewage. Large quantities of Cr and Pbsalts are used for unhairing of hides which are released in these streams without priortreatments, causing contamination of aquatic resources. Cadmium and Copper come fromfertilizers through agricultural run off and could be the possible sources of contamination [2].
Mean concentration of Pb and Cr showed spatial significant variations in fish organsfrom four sampling zones. Similarly, highest mean Pb concentration recorded atdownstream zone of Nullah Aik and Nullah Palkhu resulted from pollutants received fromurban runoff and municipal sewage that increase the concentration of Pb in stream water.Similar findings were observed in fish captured from three hard-water dams of the MooiRiver catchment, South Africa [30] and Yamuna River, India [31]. Significant spatialvariations recorded in Cr concentration indicate the contribution of tannery effluents whichbring large amounts of Cr salts that may concentrate in the aquatic organism. On thecontrary, nonsignificant spatial and seasonal variations in Cr accumulation were reportedfrom Olifants River segment situated in Kruger National Park, South Africa [6]. Mean Cdand Cu concentration showed nonsignificant spatial differences [32]. Mean Cd and Cuconcentration did not show pronounced variations between upstream and downstreamzones. In accordance with our results are nonsignificant spatial variations of Cdconcentration in common carps captured from Red River [33]. On the contrary, significantspatial variations of Cd concentration in fish from streams polluted by cadmium mines inUnited States were reported [11]. Similarly, nonsignificant Cu differences in metalaccumulation were found in fish species from the Mooi River, South Africa [33]. Duringthe present study, highest Cd, Cr, and Cu accumulation in fish of Nullah Aik and NullahPalkhu was recorded in pre-monsoon, while lowest concentration was recorded in post-monsoon season. Increasing trend of Cu accumulation in fish was observed from autumn tosummer in the Seyhan River, Turkey [25].
Differences in metal concentrations in fish can be attributed to the presence of metalcontaminant in surface water. Bioavailability of metals may be influenced by physiologicalactivities of fish during different seasons [34]. Seasonal variations in metal accumulationare related to feeding behavior of fish species [35] and may be influenced by streamconditions, pollutant loads, water chemistry, and other environmental factors which affectthe availability of metal [36]. Seasonal differences in temperature, rainfall, salinity, andstream flow can also influence metal accumulation and bioavailability [37]. Metalconcentration in surface water varies due to metal sources, rainfall pattern, surface runoff,feeding behavior, and metabolic activities [38]. In the current study, high stream flow inpost-monsoon season may dilute contaminants, while in winter, the stream discharge isrelatively low, and streams experience an elevated level of heavy metals. The results ingeneral showed highest accumulation of heavy metals in pre-monsoon season that can berelated with high temperature favorable for optimum metabolic activities of fish in aquaticmedium. High metabolic rate reduces oxygen concentration in blood and increases theaccumulation of pollutants [39]. Most of the fish species breed during pre-monsoon season,and high metabolic rate with elevated level of heavy metals may influence the embryonicdevelopment of fish individuals [33].
Interspecific Variations in Metal Accumulation
Interspecific variations in heavy metal accumulation are influenced by life history, trophiclevel in food chain, geographic variations, exposure to contaminated environment, andinternal metabolic activities. Ecological requirements of every species differ from each
1534 Qadir and Malik
other in terms of habitat preferences, genetic variations, feeding, and breeding behavior.Fish occupy various positions (herbivore to top carnivore) in the food chain, and species atlower trophic level accumulate low metal concentration in comparison to those at highertrophic level [40]. In our investigation, concentration of metals such as Cd, Cr, and Cu wassignificantly different between fish species. Highest concentration of Cd was recorded in M.cavasius (carnivore) and lowest concentration of Cd in H. fossilis (omnivore). Similarinterspecific differences were reported by Campbell [33], Burger et al. [40], and Vicente-Martorell et al. [41]. Generally, higher level of metals is found in carnivorous speciescompared to herbivores and omnivores [40].
Among fish species, W. attu and H. fossilis showed highest accumulation of Cr, whilelowest accumulation was recorded in O. niloticus. H. fossilis is a bottom dweller omnivorefish, and W. attu eats small fish species and macroinvertebrates, e.g., crustaceans, insectslarvae, and mollusks. Tekin-Özan and Kir [34] reported higher Cr accumulation incarnivore compared to omnivore species. H. fossilis and O. niloticus are omnivorousspecies but have different habitat preferences. H. fossilis shows preferences for downstreamsites contaminated with industrial effluents and urban sewage, while O. niloticus is acolumn dweller and prefers upstream sites (less polluted). Fish dwelling in contaminatedwater with higher load of Cr from tanneries exhibit higher level of Cr in gills and liver dueto slow liver excretion rate under stress conditions. Chromium in aquatic medium is foundin two forms: trivalent (Cr3+) or hexavalent (Cr6+). Cr3+ is less toxic compared to Cr6+ andcan disturb membrane permeability by oxidation processes [42].
High Cu accumulation was recorded in invertebrate eater species (P. sophore) andherbivore species (L. rohita) whereas lowest accumulation in carnivore species (Wallagoattu). El-Shaikh et al. [24] concluded that omnivorous fish can accumulate higher Cuconcentration as compared to carnivorous fish. On the contrary, Terra et al. [43] reportedthat carnivore fish species accumulate highest quantities of Cu compared to herbivorespecies. Carnivore fish species can accumulate Cu at higher concentration than herbivorousand omnivorous. This pattern could be changed due to pollution exposure, feeding habits,and fish breeding behavior.
Toxic Effects of Heavy Metals on Fish
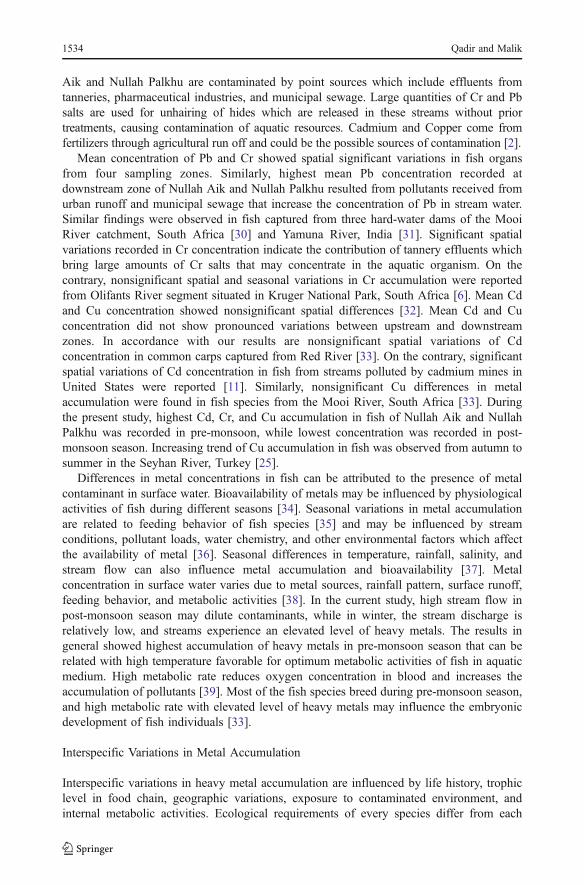
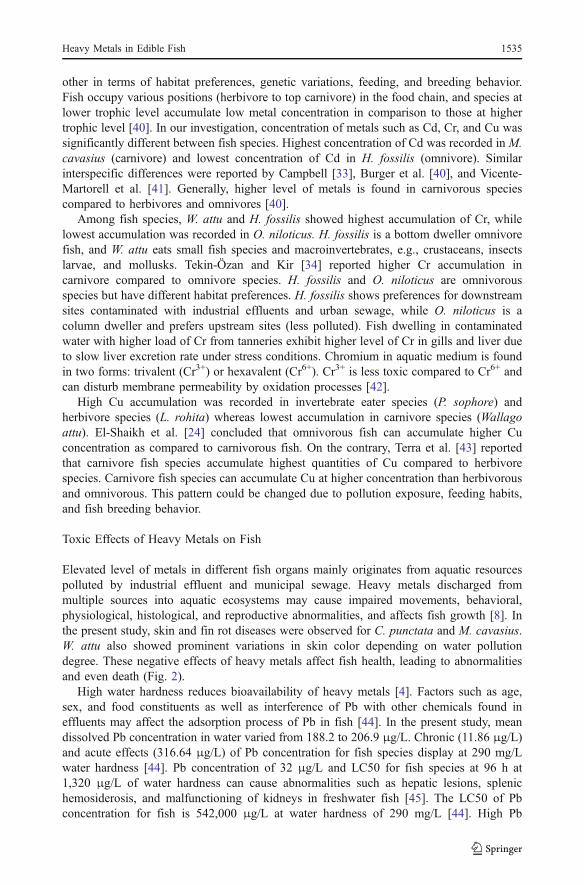
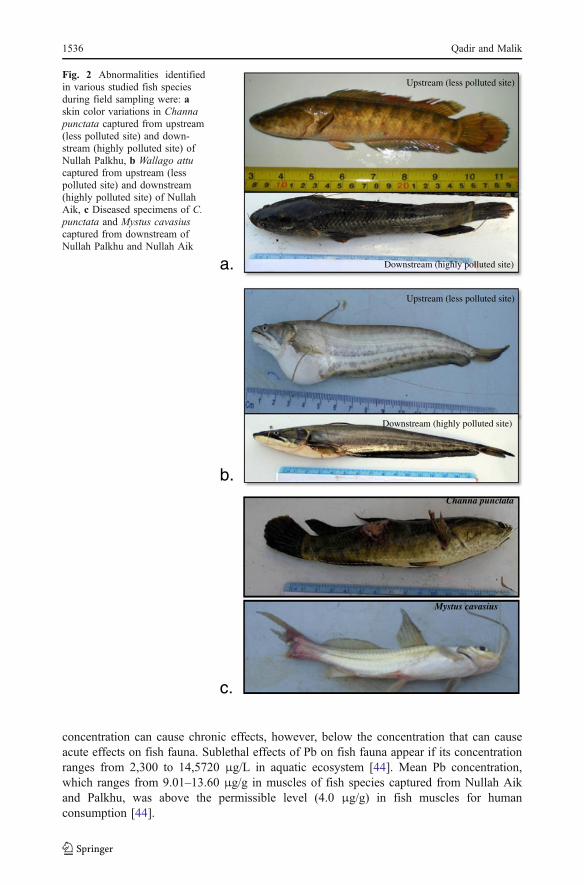
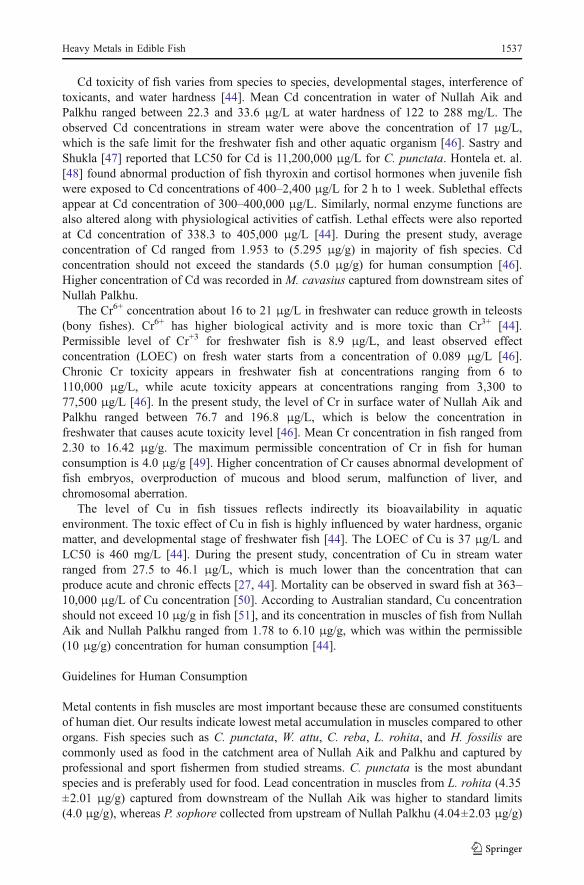
Elevated level of metals in different fish organs mainly originates from aquatic resourcespolluted by industrial effluent and municipal sewage. Heavy metals discharged frommultiple sources into aquatic ecosystems may cause impaired movements, behavioral,physiological, histological, and reproductive abnormalities, and affects fish growth [8]. Inthe present study, skin and fin rot diseases were observed for C. punctata and M. cavasius.W. attu also showed prominent variations in skin color depending on water pollutiondegree. These negative effects of heavy metals affect fish health, leading to abnormalitiesand even death (Fig. 2).
High water hardness reduces bioavailability of heavy metals [4]. Factors such as age,sex, and food constituents as well as interference of Pb with other chemicals found ineffluents may affect the adsorption process of Pb in fish [44]. In the present study, meandissolved Pb concentration in water varied from 188.2 to 206.9 μg/L. Chronic (11.86 μg/L)and acute effects (316.64 μg/L) of Pb concentration for fish species display at 290 mg/Lwater hardness [44]. Pb concentration of 32 μg/L and LC50 for fish species at 96 h at1,320 μg/L of water hardness can cause abnormalities such as hepatic lesions, splenichemosiderosis, and malfunctioning of kidneys in freshwater fish [45]. The LC50 of Pbconcentration for fish is 542,000 μg/L at water hardness of 290 mg/L [44]. High Pb
Heavy Metals in Edible Fish 1535
concentration can cause chronic effects, however, below the concentration that can causeacute effects on fish fauna. Sublethal effects of Pb on fish fauna appear if its concentrationranges from 2,300 to 14,5720 μg/L in aquatic ecosystem [44]. Mean Pb concentration,which ranges from 9.01–13.60 μg/g in muscles of fish species captured from Nullah Aikand Palkhu, was above the permissible level (4.0 μg/g) in fish muscles for humanconsumption [44].
Upstream (less polluted site)
Downstream (highly polluted site)
Upstream (less polluted site)
Downstream (highly polluted site)
a.
b.Channa punctata
Mystus cavasius
c.
Fig. 2 Abnormalities identifiedin various studied fish speciesduring field sampling were: askin color variations in Channapunctata captured from upstream(less polluted site) and down-stream (highly polluted site) ofNullah Palkhu, b Wallago attucaptured from upstream (lesspolluted site) and downstream(highly polluted site) of NullahAik, c Diseased specimens of C.punctata and Mystus cavasiuscaptured from downstream ofNullah Palkhu and Nullah Aik
1536 Qadir and Malik
Cd toxicity of fish varies from species to species, developmental stages, interference oftoxicants, and water hardness [44]. Mean Cd concentration in water of Nullah Aik andPalkhu ranged between 22.3 and 33.6 μg/L at water hardness of 122 to 288 mg/L. Theobserved Cd concentrations in stream water were above the concentration of 17 μg/L,which is the safe limit for the freshwater fish and other aquatic organism [46]. Sastry andShukla [47] reported that LC50 for Cd is 11,200,000 μg/L for C. punctata. Hontela et. al.[48] found abnormal production of fish thyroxin and cortisol hormones when juvenile fishwere exposed to Cd concentrations of 400–2,400 μg/L for 2 h to 1 week. Sublethal effectsappear at Cd concentration of 300–400,000 μg/L. Similarly, normal enzyme functions arealso altered along with physiological activities of catfish. Lethal effects were also reportedat Cd concentration of 338.3 to 405,000 μg/L [44]. During the present study, averageconcentration of Cd ranged from 1.953 to (5.295 μg/g) in majority of fish species. Cdconcentration should not exceed the standards (5.0 μg/g) for human consumption [46].Higher concentration of Cd was recorded in M. cavasius captured from downstream sites ofNullah Palkhu.
The Cr6+ concentration about 16 to 21 μg/L in freshwater can reduce growth in teleosts(bony fishes). Cr6+ has higher biological activity and is more toxic than Cr3+ [44].Permissible level of Cr+3 for freshwater fish is 8.9 μg/L, and least observed effectconcentration (LOEC) on fresh water starts from a concentration of 0.089 μg/L [46].Chronic Cr toxicity appears in freshwater fish at concentrations ranging from 6 to110,000 μg/L, while acute toxicity appears at concentrations ranging from 3,300 to77,500 μg/L [46]. In the present study, the level of Cr in surface water of Nullah Aik andPalkhu ranged between 76.7 and 196.8 μg/L, which is below the concentration infreshwater that causes acute toxicity level [46]. Mean Cr concentration in fish ranged from2.30 to 16.42 μg/g. The maximum permissible concentration of Cr in fish for humanconsumption is 4.0 μg/g [49]. Higher concentration of Cr causes abnormal development offish embryos, overproduction of mucous and blood serum, malfunction of liver, andchromosomal aberration.
The level of Cu in fish tissues reflects indirectly its bioavailability in aquaticenvironment. The toxic effect of Cu in fish is highly influenced by water hardness, organicmatter, and developmental stage of freshwater fish [44]. The LOEC of Cu is 37 μg/L andLC50 is 460 mg/L [44]. During the present study, concentration of Cu in stream waterranged from 27.5 to 46.1 μg/L, which is much lower than the concentration that canproduce acute and chronic effects [27, 44]. Mortality can be observed in sward fish at 363–10,000 μg/L of Cu concentration [50]. According to Australian standard, Cu concentrationshould not exceed 10 μg/g in fish [51], and its concentration in muscles of fish from NullahAik and Nullah Palkhu ranged from 1.78 to 6.10 μg/g, which was within the permissible(10 μg/g) concentration for human consumption [44].
Guidelines for Human Consumption
Metal contents in fish muscles are most important because these are consumed constituentsof human diet. Our results indicate lowest metal accumulation in muscles compared to otherorgans. Fish species such as C. punctata, W. attu, C. reba, L. rohita, and H. fossilis arecommonly used as food in the catchment area of Nullah Aik and Palkhu and captured byprofessional and sport fishermen from studied streams. C. punctata is the most abundantspecies and is preferably used for food. Lead concentration in muscles from L. rohita (4.35±2.01 μg/g) captured from downstream of the Nullah Aik was higher to standard limits(4.0 μg/g), whereas P. sophore collected from upstream of Nullah Palkhu (4.04±2.03 μg/g)
Heavy Metals in Edible Fish 1537
and downstream flow of Nullah Aik (4.56±2.53 μg/g) and W. attu (4.05±2.06 μg/g)collected from downstream flow of Nullah Aik also exceeded the permissible Pbconcentration. During pre-monsoon season, Pb concentration in muscles of C. punctatacaptured from upstream flow (4.24±3.14 μg/g) and downstream (6.96±7.78 μg/g) ofNullah Aik and Nullah Palkhu (5.67±7.68 μg/g) was also above the permissible limits of4.0 μg/g [52]. Similarly, Pb concentration in muscles of L. rohita captured fromdownstream of both streams (9.53±5.13 μg/g, 4.23±9.04 μg/g) and P. sophore (4.92±6.8 μg/g) dwelling in upstream of Nullah Palkhu exceeded the permissible limits. Theconcentration of Cd in muscles of C. reba (2.09±1.04 μg/g), O. niloticus (2.57±0.11 μg/g),and C. punctata (2.58±2.26 μg/g) from downstream of Nullah Aik and Nullah Palkhu washigher than the permissible limits of 2 μg/g described by WHO [53] and FDA [52].Concentration of Cr in muscles of studied fish species did not exceed the permissible limitsof 8 μg/g during post-monsoon season. However, these values were higher in C. punctatacaptured from downstream of Nullah Aik (13.69±4.16 μg/g) and Nullah Palkhu (8.83±1.14 μg/g) during pre-monsoon season.
The present study highlighted the intensity of heavy metal contamination in edible fishspecies, which needs to be addressed urgently. Heavy metal contamination in Nullah Aikand Nullah Palkhu in Sialkot City is a consequence of industrial effluents, municipalsewage, and surface runoff. Effluents discharged into streams contain high load of heavymetals which are not only threatening the ecological integrity of aquatic recourses but alsoputting the health of local population at risk. Therefore, contamination due to heavy metalsshould be considered a priority concern.
Conclusions
In our investigation, we recorded higher quantities of studied metals in fish organs of thosespecies which were captured from downstream zones. Similarly, greater metal concen-trations were found in pre-monsoon as compared to post-monsoon season. In fish muscles,the concentrations of Pb in L. rohita and W. attu, Cd in C. reba, O. niloticus, C. punctata,and Cr in C. punctata were above the permitted limits for human consumption, whichappear to be the major concern, and these species should be avoided for human diet. Theresults strongly advocated detail investigation of heavy metals in other environmentalmatrices and assessment of the risk posed to the local population.
Acknowledgments The first author thanks the Higher Education Commission (HEC), Pakistan for theirfinancial support during the study period and also recognizes the kind support rendered by Professor DrTahira Ahmed during the development of methodology. Thanks are due to Muhammad Hussain (Fisherman),Allah ditta (Fisherman), Arshed Makhdoom Sabir, and Abdul Rehman for their assistance in the field work.
References
1. Kotze P, du PreezHH, vanVuren JHJ (1999) Bioaccumulation of copper and zinc inOreochromis mossambicusand Clarias gariepinus from the Olifants River, Mpumalanga, South Africa. Water SA 25:99–110
2. Qadir A, Malik RN, Husain SZ (2008) Spatio-temporal variations in water quality of Nullah Aik-tributary of the river Chenab, Pakistan. Environ Monit Assess 140:43–59
3. Malik RN, Zeb N (2009) Assessment of environmental contamination using feathers of Bubulcus ibis asa biomonitor of heavy metal pollution Pakistan. Ecotoxicology 8:522–536
4. Wright DA, Welbourn P (2002) Environmental toxicology (Cambridge environmental chemistry series 11).Cambridge University Press, Cambridge
1538 Qadir and Malik
5. Canli M, Atli G (2003) The relationships between heavy metal (Cd, Cr, Cu, Fe, Pb, Zn) levels and thesize of six Mediterranean fish species. Environ Pollut 121:129–136
6. Avenant-Oldewage A, Marx HM (2000) Bioaccumulation of chromium, copper and iron in the organsand tissues of Clarias gariepinus in the Olifants River, Kruger National Park. Water Sanit 26:569–582
7. Sesli E, Tuzen M, Soylak M (2008) Evaluation of trace metal contents of some wild edible mushroomsfrom Black sea region, Turkey. J Hazard Mater 160:462–467
8. Atchison GJ, Henry MG, Sandheinrich MB (1987) Effects of metals on fish behavior: a review. EnvironBiol Fish 18:11–25
9. Langston WJ (1990) Toxic effects of metals and the incidence of marine ecosystems. In: Furness RW,Rainbow PS (eds) Heavy metals in the marine environment. CRC Press, New York
10. Jezierska B, Witeska M (2007) The metal uptake and accumulation in fish living in polluted waters.NATO 69:1568–1238
11. Besser JM, Brumbaugh WG, May TW, Schmitt CJ (2007) Biomonitoring of lead, zinc and cadmium instreams draining lead-mining and non-mining areas, Southeast Missouri, USA. Environ Monit Assess129:227–241
12. Kojadinovic J, Potier M, Le Corre R, Cosson P, Bustamante P (2007) Bioaccumulation of trace elementsin pelagic fish from the Western Indian Ocean. Environ Pollut 146:548–566
13. Agarwal R, Kumar R, Behari JR (2007) Mercury and lead content in fish species from the River Gomti,Lucknow, India, as biomarkers of contamination. Bull Environ Contam Toxicol 78:108–112
14. Rauf A, Javed M, Ubaidullah M (2009) Heavy metal levels in three major carps (Catla catla, Labeorohita and Cirrhina mrigala) from the river Ravi, Pakistan. Pak Vet J 29:24–26
15. Javed M (2005) Heavy metal contamination of freshwater fish and bed sediments in the river Ravistretch and related tributaries. Pak J Biol Sci 8(10):1337–1341
16. Tariq J, Jaffar M, Ashraf M (1994) Trace metal concentration, distribution and correlation in water,sediment and fish from the Ravi River, Pakistan. Fish Res 19:131–139
17. Nawaz S, Nagra SA, Saleem Y, Priydarshi A (2009) Determination of heavy metals in fresh water fishspecies of the River Ravi, Pakistan compared to farmed fish varieties. Environ Monit Assess 167:461–471
18. Tariq J, Ashraf M, Jaffar M (2009) Metal pollution status of the river Chennab, Pakistan through fish,water and sediment analysis. Toxicol Environ Chem 38:175–181
19. Qadir A, Malik RN (2009) Assessment of an index of biological integrity (IBI) to quantify the quality oftwo tributaries of River Chenab, Sialkot, Pakistan. Hydrobiology 621:127–153
20. Mirza MR (2003) Check list of fresh water fishes of Pakistan. Pak J Zool 3:1–3021. Mirza MR, Bhatti MN (1993) Pakistan Ki Machlian aur Mahi Parwari, Part-1. Ferozsons (Pvt.) Ltd,
Lahore22. Talwar PK, Jhingran A (1991) Inland fishes of India and adjacent countries. Oxford and IBH Publishing
Co. Pvt. Ltd., New Delhi23. Malik RN, Jadoon W (2009) Metal contamination of surface soils of industrial city Sialkot Pakistan: a
multivariate and GIS approach. Environ Geochem Health. doi:10.1007/s10653-009-9274-124. El-Shaikh K, Nada AS, Yousief ZA (2005) Assessment of cadmium and lead in water, sediment and
different organs of Procambarus clarkii (Girard, 1852) in the river Nile. Med J Isl Worl Acad Sci15:161–167
25. Kargin F (1998) Metal concentrations in tissues of the freshwater fish Capoeta barroisi from the SeyhanRiver (Turkey). Bull Environ Contam Toxicol 60:822–828
26. Mendil M, UluÖzlÜ ÖD, Hasdemir E, TÜzen M, Sari H, Suiçmez M (2005) Determination of tracemetal levels in seven fish species in lakes in Tokat, Turkey. Food Chem 90:175–179
27. Pickering QH, Brungs WA, Gast MH (1977) Effect of exposure time and copper concentration onreproduction of the fathead minnow (Pimepkales promelas). Water Res 11:1079–1983
28. Bajc ZKŠ, Gačnik JV, Doganoc DZ (2005) The contents of Cu, Zn, Fe and Mn in Slovenian Freshwater.Fish Slov Vet Res 42:15–21
29. McCarter JA, Roch M (1983) Hepatic metallothionein and resistance to copper in juvenile coho salmon.Comp Biochem Physiol 74:133–137
30. Van Aardt WJ, Erdmann R (2004) Heavy metals (Cd, Pb, Cu, Zn) in mudfish and sediments from threehard-water dams of the Mooi River catchment, South Africa. Water SA 2:211–218
31. Tryfonas AE, Tuckerb JK, Brunkow PE, Johnson KA, Hussein HS, Lin Z (2006) Metal accumulation ineggs of the red-eared slider (Trachemys scripta elegans) in the Lower Illinois River. Chemosphere63:39–40
32. Van Eeden PH (2003) Metal concentrations in selected organs and tissues of five Red-knobbed Coot(Fulica cristata) populations. Water SA 29:313–322
33. Campbell KR (1995) Bioaccumulation of heavy metals in fish living in storm water treatment ponds.Technical Publication SJ95-1. St. Johns River Water Management District, Palatka, Florida
Heavy Metals in Edible Fish 1539
34. Tekin-Özan S, Kir I (2007) Seasonal variations of heavy metals in some organs of carp (Cyprinus carpioL., 1758) from Beyşehir Lake (Turkey). Environ Monit Assess 138:201–206
35. Nussey G, van Vuren JHJ, du Preez HH (2000) Bioaccumulation of chromium, manganese, nickel andlead in the tissues of the moggel, Labeo umbratus (Cyprinidae), from Witbank Dam, Mpumalanga.Water SA 26:269–284
36. Johnson I (1988) The effects of combinations of heavy metals, hypoxia and salinity on ion-regulation inCrangon crangon (L.) and Carcinus means (L.). Comp Biochem Physiol C 91:459–463
37. Simkiss K, Mason AZ (1983) Metal ions metabolic and toxic effects. In: Biology of Mollusca. AcademicPress, New York
38. Roesijadi G, Robinson WE (1994) In: Malins DC, Ostrander GK (eds) Aquatic toxicology. LewisPublishers, Boca Raton
39. Grobler E, Du Preez HH, Van Vuren JHJ (1989) Toxic effects of zinc and iron on the routine oxygenconsumption of Tilapia sparrmanii (Cichlidae). Comp Biochem Physiol 94:207–214
40. Burger J, Gaines KF, Boring CS, Warren L, Jr S, Snodgrass J, Gochfeld M (2001) Mercury and seleniumin fish from the Savannah River: species, trophic level and locational differences. Environ Res Section A87:108–118
41. Vicente-Martorell JJ, Galindo-Riaño MD, García-Vargas M et al (2009) Bioavailability of heavy metalsmonitoring water, sediments and fish species from a polluted estuary. J Hazard Mater 162:823–836
42. USEPA (1980) Ambient water quality criteria for chromium. EPA 440/5-80-035. US EnvironmentalProtection Agency, Washington DC
43. Terra BF, Araújo FG, Calza CF, Lopes RT, Teixeira TP (2008) Heavy metal in tissues of three fishspecies from different trophic levels in a tropical Brazilian River. Water Air Soil Pollut 187:275–284
44. USEPA (1999) Biological assessment of the Idaho water quality standards for numeric water qualitycriteria for toxic pollutants. U.S. EPA, Region 10, Seattle Washington, DC
45. Eisler R (1988) Lead hazards to fish, wildlife and invertebrate: a synoptic review. U.S. Fish and WildlifeService, Patuxent Wildlife Research Center, Laurel
46. Canadian Council of Ministers of the Environment (1999) Canadian environmental quality guidelines,Publication No. 1299; ISBN 1- 896997-34–1
47. Sastry BF, Shukla V (1994) Acute and chronic toxic effects of cadmium on some haematological,biochemical and enzymological parameters in the fresh water teleost fish, Channa punctatus. ActaHydroch Hydrob 22:171–176
48. Hontela A, Daniel C, Ricard AC (1996) Effects of acute and subacute exposures to cadmium on theinternal and thyroid function in rainbow trout, Oncorhynchus mykiss. Aquat Toxicol 35:171–182
49. Eisler R (1986) Chromium hazards to fish, wildlife, and invertebrates: a synoptic review. BiologicalReport, 85. U.S. Fish and Wildlife Service, Washington, DC
50. Buhl KJ, Hamilton SJ (1996) Toxicity of inorganic contaminants, individually and in environmentalmixtures, to three endangered fishes (Colorado squawfish, bony-tail, and razorback sucker). ArchEnviron Contam Toxicol 30:84–92
51. Van den Broek JL, Gledhill KS, Morgan DG (2002) Heavy metal concentrations in the mosquito fish,Gambusia holbrooki, in the Manly Lagoon catchment. In: UTS Freshwater Ecology Report 2002,Department of Environmental Sciences, University of Technology, Sydney Australia
52. FDA (1993) Guidance document for lead in shellfish. FDA, Washington, DC53. WHO (1985) Guidelines for drinking water quality. Vol 1. Recommendations. WHO, Geneva
1540 Qadir and Malik
Copyright © 2022 FDOKUMEN