
HIIT the Road Jack: An Exploratory Study on the ... - DUO (uio.no)
Upload
khangminh22Category
view
14download
0
UNIVERSITY OF OSLODepartment of Informatics
HealthInformationSystems in WestAfricaImplementing DHIS2 inGhana
Olav Poppe
2nd August 2012


Abstract
Health Information Systems (HIS) are a critical component of a healthsystem, but have often been neglected in most developing countries. TheHealth Information Systems Programme (HISP) tries to remedy this, byworking closely with end users to improve HIS and thereby increasingthe use of information. Its main vehicle for this is the District HealthInformation System, version 2 (DHIS2), a flexible open source softwaretool based on web technologies, that can be used for collecting, validating,analysing and presenting health data.
The objective of this thesis is to study how a complex informationsystem like DHIS2 can be implemented in a developing country. Mymain focus is West Africa, where I have spent about four months doingfieldwork. Most of the time I have been in Ghana, assisting and studyingthe implementation of DHIS2 there. As part of this, I have evaluatedthe Ghana health information system in general, and participated in theimplementation of DHIS2 there. While Ghana is the main focus of myresearch, I have also worked with other countries in the region, in particularwith Liberia. Consequently, I also discuss and evaluate the situation interms of health information for the region as a whole.
I show how the internet can play a huge for the ICT developmentin Africa in the coming years. Contrasting the implementations inGhana and Liberia, the former using the internet and the latter usingstandalone installations, demonstrates the many benefits internet can havewhen implementing a system like DHIS2, for example by increasing thepossibility of user participation in the design of the system and reducingthe need for local human capacity to support software installations.
i

ii

Acknowledgements
First of all, I would like to thank my supervisor, Jørn Braa, for giving methis opportunity to take part in the HISP project, and for the guidance andfeedback during the research and writing process. I am also very thankfulto the DHIS2 developers and implementers for all help and assistance theyhave provided.
I would like to thank the team in Ghana for the cooperation, and forthe opportunity to do most of my research there. Also thanks to YasouMotoie, whom I stayed with in Ghana, for the trips to various "spots" andfor showing me around Accra.
Finally, I would like to thank my wife and proofreader Pernille, forletting me spend so much time in Africa, and for the feedback in the writingprocess.
iii

iv

Contents
List of Figures ix
List of Tables xi
Abbrevations xiii
1 Introduction 11.1 Motivation . . . . . . . . . . . . . . . . . . . . . . . . . . . . . 11.2 Research Objectives . . . . . . . . . . . . . . . . . . . . . . . . 21.3 Structure of the Thesis . . . . . . . . . . . . . . . . . . . . . . 3
2 Literature Review 52.1 ICT in Developing Countries . . . . . . . . . . . . . . . . . . 5
2.1.1 The Digital Divide . . . . . . . . . . . . . . . . . . . . 52.1.2 Using ICT for Development . . . . . . . . . . . . . . . 7
2.2 Researching ICT in Developing Countries . . . . . . . . . . . 82.2.1 Researching ISDC . . . . . . . . . . . . . . . . . . . . . 82.2.2 Relevant Issues for ICT in Developing Countries . . . 92.2.3 Analysing Technology . . . . . . . . . . . . . . . . . . 10
2.3 Information System Development in Developing Countries . 112.3.1 Participatory Design . . . . . . . . . . . . . . . . . . . 112.3.2 IS Implementation Success and Failure . . . . . . . . 132.3.3 Information Infrastructures . . . . . . . . . . . . . . . 15
2.4 Networks of Action . . . . . . . . . . . . . . . . . . . . . . . . 182.4.1 Networks of Action . . . . . . . . . . . . . . . . . . . . 182.4.2 Networks of Networks . . . . . . . . . . . . . . . . . . 19
2.5 Health Information Systems in Developing Countries . . . . 192.5.1 Defining Health Information Systems . . . . . . . . . 202.5.2 HIS Problems . . . . . . . . . . . . . . . . . . . . . . . 202.5.3 Improving HIS . . . . . . . . . . . . . . . . . . . . . . 22
3 Methodology 273.1 Action Research . . . . . . . . . . . . . . . . . . . . . . . . . . 273.2 Case Study . . . . . . . . . . . . . . . . . . . . . . . . . . . . . 293.3 Methodology of This Thesis . . . . . . . . . . . . . . . . . . . 303.4 Field Work . . . . . . . . . . . . . . . . . . . . . . . . . . . . . 303.5 Methods . . . . . . . . . . . . . . . . . . . . . . . . . . . . . . 31
v

4 Background 334.1 HISP . . . . . . . . . . . . . . . . . . . . . . . . . . . . . . . . 334.2 West Africa . . . . . . . . . . . . . . . . . . . . . . . . . . . . . 334.3 Liberia . . . . . . . . . . . . . . . . . . . . . . . . . . . . . . . 354.4 Ghana . . . . . . . . . . . . . . . . . . . . . . . . . . . . . . . . 354.5 The Ghana Health System . . . . . . . . . . . . . . . . . . . . 35
5 Evaluation of the Ghana HIS 395.1 A Recent History of Integrated HIS in Ghana . . . . . . . . . 39
5.1.1 Problems with DHIMS . . . . . . . . . . . . . . . . . . 405.2 Data Flow . . . . . . . . . . . . . . . . . . . . . . . . . . . . . 415.3 HIS at the National Level . . . . . . . . . . . . . . . . . . . . . 42
5.3.1 Fragmentation . . . . . . . . . . . . . . . . . . . . . . 435.3.2 Resources . . . . . . . . . . . . . . . . . . . . . . . . . 435.3.3 Timeliness and Completeness of DHIMS data . . . . 445.3.4 The National Health Insurance Scheme . . . . . . . . 44
5.4 HIS at the Sub-National Levels . . . . . . . . . . . . . . . . . 455.4.1 Human Resources . . . . . . . . . . . . . . . . . . . . 465.4.2 Other Resources . . . . . . . . . . . . . . . . . . . . . 475.4.3 Data Quality, Timeliness and Completeness . . . . . . 475.4.4 Data Usage . . . . . . . . . . . . . . . . . . . . . . . . 485.4.5 Data Management at the Hospitals . . . . . . . . . . . 495.4.6 Fragmentation . . . . . . . . . . . . . . . . . . . . . . 51
6 Implementing DHIS2 in Ghana 536.1 The Software . . . . . . . . . . . . . . . . . . . . . . . . . . . . 53
6.1.1 DHIS2 . . . . . . . . . . . . . . . . . . . . . . . . . . . 536.1.2 DHIMS and DHIS2 - a Comparison . . . . . . . . . . 60
6.2 Overview of the Implementation Process . . . . . . . . . . . 616.3 Customisation . . . . . . . . . . . . . . . . . . . . . . . . . . . 62
6.3.1 Initial Problems . . . . . . . . . . . . . . . . . . . . . . 626.3.2 Preparing Data Entry . . . . . . . . . . . . . . . . . . . 636.3.3 Data Duplication . . . . . . . . . . . . . . . . . . . . . 696.3.4 Line Listing . . . . . . . . . . . . . . . . . . . . . . . . 706.3.5 Reporting . . . . . . . . . . . . . . . . . . . . . . . . . 716.3.6 Geographical Information System . . . . . . . . . . . 736.3.7 User Authorities . . . . . . . . . . . . . . . . . . . . . 73
6.4 Installation . . . . . . . . . . . . . . . . . . . . . . . . . . . . . 746.4.1 Central Server or Offline Installations? . . . . . . . . . 766.4.2 Server Hosting . . . . . . . . . . . . . . . . . . . . . . 76
6.5 Piloting . . . . . . . . . . . . . . . . . . . . . . . . . . . . . . . 776.6 Training and Knowledge Transfer . . . . . . . . . . . . . . . . 78
6.6.1 Training of the Local Implementers . . . . . . . . . . 786.6.2 Organisation of End User Training . . . . . . . . . . . 796.6.3 Content of the End-User Trainings . . . . . . . . . . . 816.6.4 Training Material . . . . . . . . . . . . . . . . . . . . . 816.6.5 Problems Encountered at the Trainings . . . . . . . . 826.6.6 Feedback on the System . . . . . . . . . . . . . . . . . 83
vi

6.7 Migration of Data . . . . . . . . . . . . . . . . . . . . . . . . . 846.7.1 The Migration Process . . . . . . . . . . . . . . . . . . 846.7.2 Identifying Data To Move . . . . . . . . . . . . . . . . 856.7.3 Transforming the Data . . . . . . . . . . . . . . . . . . 866.7.4 Updating the Metadata . . . . . . . . . . . . . . . . . 876.7.5 Cleaning the Data . . . . . . . . . . . . . . . . . . . . . 886.7.6 Moving the Data to DHIMS2 . . . . . . . . . . . . . . 886.7.7 Status of the Migration . . . . . . . . . . . . . . . . . . 89
6.8 Rolling out DHIMS2 . . . . . . . . . . . . . . . . . . . . . . . 896.8.1 First Impressions from the Rollout . . . . . . . . . . . 89
7 Implementing DHIS2 in Liberia 937.1 Introducing DHIS2 . . . . . . . . . . . . . . . . . . . . . . . . 93
7.1.1 Moving from DHIS1 to DHIS2 . . . . . . . . . . . . . 937.1.2 New Challenges . . . . . . . . . . . . . . . . . . . . . 94
7.2 Improving the DHIS2 Implementation . . . . . . . . . . . . . 947.2.1 Migration of Data . . . . . . . . . . . . . . . . . . . . . 947.2.2 Cleaning the Database . . . . . . . . . . . . . . . . . . 957.2.3 Improving Reporting . . . . . . . . . . . . . . . . . . . 967.2.4 Moving DHIS2 to a Central Server . . . . . . . . . . . 977.2.5 Liberia Moves Online . . . . . . . . . . . . . . . . . . 987.2.6 Promoting DHIS2 in the Ministry . . . . . . . . . . . 98
7.3 Current Status . . . . . . . . . . . . . . . . . . . . . . . . . . . 99
8 Regional Developments 1018.1 Building DHIS2 Capacity . . . . . . . . . . . . . . . . . . . . 102
8.1.1 DHIS2 Academy . . . . . . . . . . . . . . . . . . . . . 1028.1.2 DHIS2 Database Training . . . . . . . . . . . . . . . . 104
8.2 Health Information Systems in West Africa . . . . . . . . . . 1068.2.1 Assessment of the West African HIS . . . . . . . . . . 1068.2.2 The Common Problem: Fragmentation . . . . . . . . 108
8.3 Regional DHIS2 Actors . . . . . . . . . . . . . . . . . . . . . . 1088.3.1 WAHO . . . . . . . . . . . . . . . . . . . . . . . . . . . 1098.3.2 Other DHIS2 Implementers in West Africa . . . . . . 1098.3.3 Countries Considering DHIS2 in West Africa . . . . . 111
9 Discussion 1139.1 ICT Research in Developing Countries . . . . . . . . . . . . . 113
9.1.1 Discourses . . . . . . . . . . . . . . . . . . . . . . . . . 1139.1.2 Addressing the Right Issues . . . . . . . . . . . . . . . 114
9.2 The Ghana HIS . . . . . . . . . . . . . . . . . . . . . . . . . . 1159.2.1 Common HIS Problems . . . . . . . . . . . . . . . . . 1159.2.2 Improving the Ghana HIS . . . . . . . . . . . . . . . . 1179.2.3 Linking Up With the National Health Insurance Scheme118
9.3 DHIS2 in Ghana . . . . . . . . . . . . . . . . . . . . . . . . . . 1199.3.1 Participatory Design of the DHIMS2 . . . . . . . . . . 1199.3.2 DHIMS2 - Success or Failure? . . . . . . . . . . . . . . 1229.3.3 DHIMS2 as an Information Infrastructure . . . . . . . 123
vii

9.3.4 Technology Inscriptions . . . . . . . . . . . . . . . . . 1259.3.5 Networks of Action in Ghana . . . . . . . . . . . . . . 126
9.4 Comparing Liberia and Ghana - The Importance of the Internet1279.4.1 Different Infrastructures . . . . . . . . . . . . . . . . . 1289.4.2 Data Standardisation . . . . . . . . . . . . . . . . . . . 1299.4.3 The Importance of the Internet . . . . . . . . . . . . . 1299.4.4 ICT for Development . . . . . . . . . . . . . . . . . . . 130
9.5 Regional Developments . . . . . . . . . . . . . . . . . . . . . 1329.5.1 Fighting Fragmentation . . . . . . . . . . . . . . . . . 1329.5.2 A Regional Dataset . . . . . . . . . . . . . . . . . . . . 1359.5.3 Creating Networks - the Attractors . . . . . . . . . . . 1379.5.4 Other benefits of Regional Cooperation . . . . . . . . 1389.5.5 Challenges to Regional Cooperation . . . . . . . . . . 138
10 Conclusion 14110.1 Addressing the Research Objectives . . . . . . . . . . . . . . 141
10.1.1 Understanding the Ghana HIS . . . . . . . . . . . . . 14110.1.2 Implementing DHIS2 in Ghana . . . . . . . . . . . . . 14210.1.3 Comparing Liberia and Ghana . . . . . . . . . . . . . 14310.1.4 Regional Developments . . . . . . . . . . . . . . . . . 143
10.2 Further Research . . . . . . . . . . . . . . . . . . . . . . . . . 144
A CHIM Training Feedback Survey 153
B DHIS2 Academy Survey 157
C Some Example DHIMS2 Messages 161
D Terms of Reference from Liberia 165
E TALI Tool from Regional HIS Assesment 169
viii

List of Figures
2.1 Integrated Health Information Architecture . . . . . . . . . . 23
3.1 Action Research Cycle . . . . . . . . . . . . . . . . . . . . . . 28
4.1 Map of West Africa . . . . . . . . . . . . . . . . . . . . . . . . 344.2 Map of Ghana . . . . . . . . . . . . . . . . . . . . . . . . . . . 36
5.1 Studying facility registers . . . . . . . . . . . . . . . . . . . . 415.2 Tallysheet for outpatient cases . . . . . . . . . . . . . . . . . . 425.3 vSat dish outside hospital . . . . . . . . . . . . . . . . . . . . 455.4 Information presented on the wall in a rural clinic . . . . . . 495.5 Hospital records rooms . . . . . . . . . . . . . . . . . . . . . . 505.6 Electronic registration of outpatients . . . . . . . . . . . . . . 50
6.1 Illustration of category combination . . . . . . . . . . . . . . 546.2 Data entry screen . . . . . . . . . . . . . . . . . . . . . . . . . 566.3 Validation rule analysis . . . . . . . . . . . . . . . . . . . . . . 576.4 Anonymous event registration . . . . . . . . . . . . . . . . . 576.5 Standard report . . . . . . . . . . . . . . . . . . . . . . . . . . 586.6 Data visualizer . . . . . . . . . . . . . . . . . . . . . . . . . . . 586.7 GIS module . . . . . . . . . . . . . . . . . . . . . . . . . . . . 596.8 Mydatamart application . . . . . . . . . . . . . . . . . . . . . 606.9 Section data entry form . . . . . . . . . . . . . . . . . . . . . . 656.10 Custom data entry form . . . . . . . . . . . . . . . . . . . . . 656.11 Category option selection . . . . . . . . . . . . . . . . . . . . 666.12 Offline functionality - offline . . . . . . . . . . . . . . . . . . . 676.13 Offline functionality - upload . . . . . . . . . . . . . . . . . . 676.14 Size of datasets in DHIMS2 . . . . . . . . . . . . . . . . . . . 686.15 DHIMS line listing . . . . . . . . . . . . . . . . . . . . . . . . 706.16 DHIMS database tables . . . . . . . . . . . . . . . . . . . . . . 866.17 Spreadsheet for matching metadata during migration . . . . 876.18 Example of communication with end users . . . . . . . . . . 906.19 Example of communication with end users . . . . . . . . . . 91
7.1 Server configuration at MoH, Liberia . . . . . . . . . . . . . . 97
8.1 Participants at DHIS2 Academy . . . . . . . . . . . . . . . . . 103
ix

x

List of Tables
6.1 Size of datasets in DHIMS2 . . . . . . . . . . . . . . . . . . . 696.2 DHIMS2 user roles . . . . . . . . . . . . . . . . . . . . . . . . 756.3 DHIMS table - original format . . . . . . . . . . . . . . . . . . 876.4 DHIMS table - after anti-pivoting . . . . . . . . . . . . . . . . 87
8.1 Countries currently using DHIS2 in West Africa . . . . . . . 101
xi

xii
Abbreviations
CDC Centre for Disease ControlCHIM Centre for Health Information ManagementCSV Comma Separated ValuesDHIMS District Health Information Management SystemDHIS District Health Information SoftwareDRG Diagnostic Related GroupingDWICAMS District Wide Computer Assisted Management SystemECOWAS Economic Community of West African StatesERP Enterprise Resource PlanningGHS Ghana Health ServiceGIS Geographical Information SystemHIO Health Information OfficerHIS Health Information SystemsHISP Health Information Systems ProgrammeHMN Health Metrics NetworkICD-10 International Classification of Diseases, 10th RevisionICT Information and Communication TechnologyIGF Internally Generated FundsIHIA Integrated Health Information ArchitectureII Information InfrastructureIME Information Monitoring and EvaliationIS Information SystemsISDC Information Systems in Developing CountriesJICA Japanese International Cooperation AgencyLMIS Logistics Management Information SystemMDG Milennium Development GoalsNACP National Aids Control ProgrammeNHIS National Health Insurance SchemeODBC Open Database ConnectivityPD Participatory DesignPPME Policy Planning, Monitoring and EvaluationRCH Reproductive and Child HealthTB TuberculosisVPN Virtual Private NetworkWAN Wide Area NetworkWAHO West African Health OrganisationWHO World Health OrganisationWYSWYG What You See Is What You Get
xiii

xiv
Chapter 1
Introduction
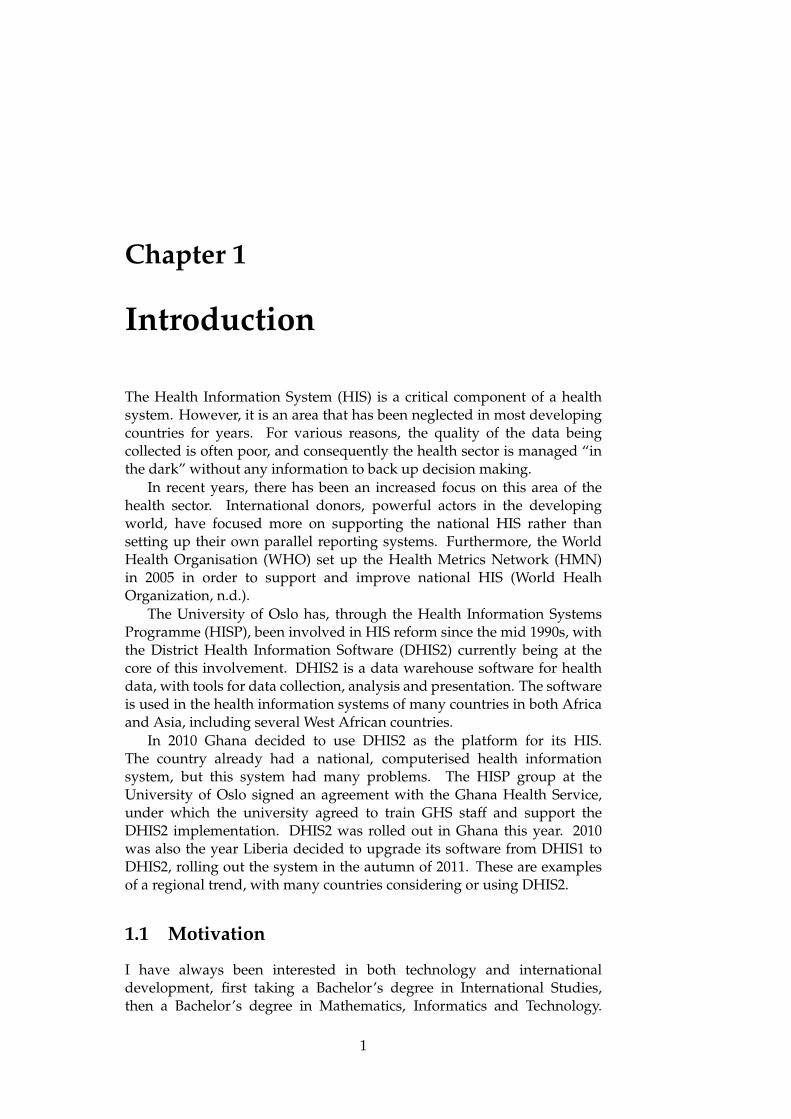
The Health Information System (HIS) is a critical component of a healthsystem. However, it is an area that has been neglected in most developingcountries for years. For various reasons, the quality of the data beingcollected is often poor, and consequently the health sector is managed “inthe dark” without any information to back up decision making.
In recent years, there has been an increased focus on this area of thehealth sector. International donors, powerful actors in the developingworld, have focused more on supporting the national HIS rather thansetting up their own parallel reporting systems. Furthermore, the WorldHealth Organisation (WHO) set up the Health Metrics Network (HMN)in 2005 in order to support and improve national HIS (World HealhOrganization, n.d.).
The University of Oslo has, through the Health Information SystemsProgramme (HISP), been involved in HIS reform since the mid 1990s, withthe District Health Information Software (DHIS2) currently being at thecore of this involvement. DHIS2 is a data warehouse software for healthdata, with tools for data collection, analysis and presentation. The softwareis used in the health information systems of many countries in both Africaand Asia, including several West African countries.
In 2010 Ghana decided to use DHIS2 as the platform for its HIS.The country already had a national, computerised health informationsystem, but this system had many problems. The HISP group at theUniversity of Oslo signed an agreement with the Ghana Health Service,under which the university agreed to train GHS staff and support theDHIS2 implementation. DHIS2 was rolled out in Ghana this year. 2010was also the year Liberia decided to upgrade its software from DHIS1 toDHIS2, rolling out the system in the autumn of 2011. These are examplesof a regional trend, with many countries considering or using DHIS2.
1.1 Motivation
I have always been interested in both technology and internationaldevelopment, first taking a Bachelor’s degree in International Studies,then a Bachelor’s degree in Mathematics, Informatics and Technology.
1
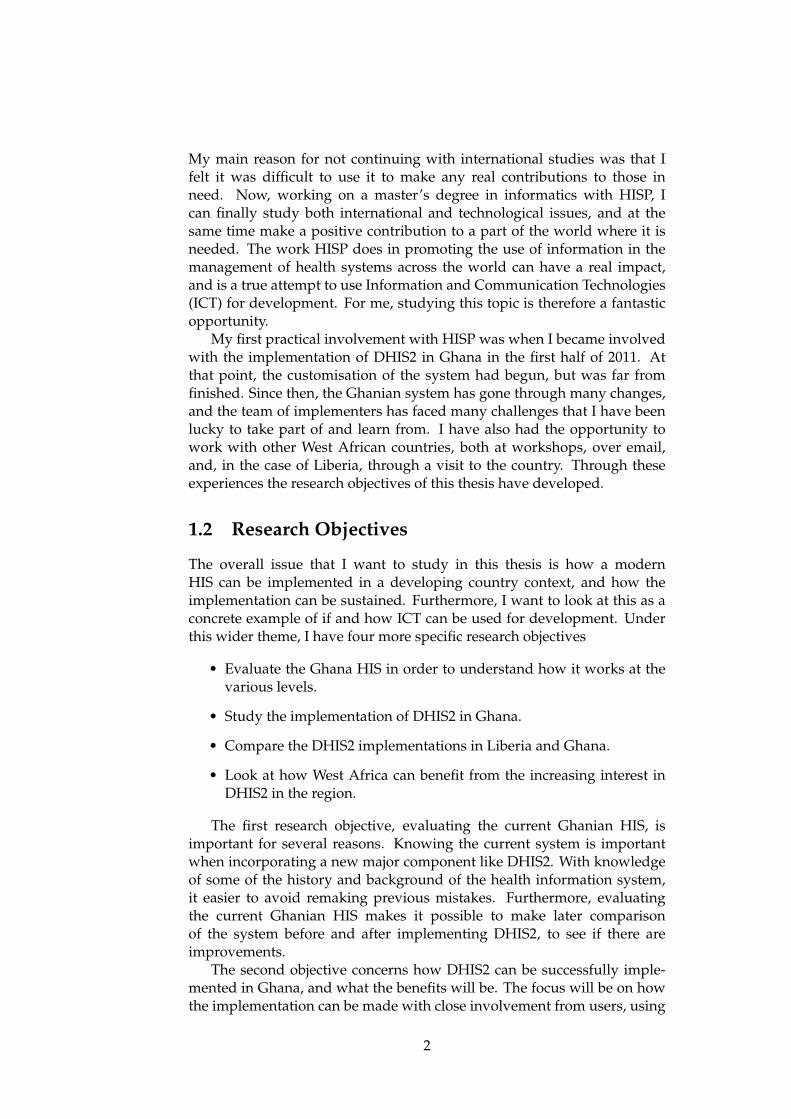
My main reason for not continuing with international studies was that Ifelt it was difficult to use it to make any real contributions to those inneed. Now, working on a master’s degree in informatics with HISP, Ican finally study both international and technological issues, and at thesame time make a positive contribution to a part of the world where it isneeded. The work HISP does in promoting the use of information in themanagement of health systems across the world can have a real impact,and is a true attempt to use Information and Communication Technologies(ICT) for development. For me, studying this topic is therefore a fantasticopportunity.
My first practical involvement with HISP was when I became involvedwith the implementation of DHIS2 in Ghana in the first half of 2011. Atthat point, the customisation of the system had begun, but was far fromfinished. Since then, the Ghanian system has gone through many changes,and the team of implementers has faced many challenges that I have beenlucky to take part of and learn from. I have also had the opportunity towork with other West African countries, both at workshops, over email,and, in the case of Liberia, through a visit to the country. Through theseexperiences the research objectives of this thesis have developed.
1.2 Research Objectives
The overall issue that I want to study in this thesis is how a modernHIS can be implemented in a developing country context, and how theimplementation can be sustained. Furthermore, I want to look at this as aconcrete example of if and how ICT can be used for development. Underthis wider theme, I have four more specific research objectives
• Evaluate the Ghana HIS in order to understand how it works at thevarious levels.
• Study the implementation of DHIS2 in Ghana.
• Compare the DHIS2 implementations in Liberia and Ghana.
• Look at how West Africa can benefit from the increasing interest inDHIS2 in the region.
The first research objective, evaluating the current Ghanian HIS, isimportant for several reasons. Knowing the current system is importantwhen incorporating a new major component like DHIS2. With knowledgeof some of the history and background of the health information system,it easier to avoid remaking previous mistakes. Furthermore, evaluatingthe current Ghanian HIS makes it possible to make later comparisonof the system before and after implementing DHIS2, to see if there areimprovements.
The second objective concerns how DHIS2 can be successfully imple-mented in Ghana, and what the benefits will be. The focus will be on howthe implementation can be made with close involvement from users, using
2

participatory design approaches. Understanding the DHIS2 implementa-tion in Ghana gives valuable insights into the implementation of complexinformation systems in developing countries in general, and how users canbe involved in the design of a complex system in the cloud. This is highlyrelevant, as a large number of countries are currently considering imple-menting DHIS2 or are in the process of doing so, and a number of coun-tries that have already implemented DHIS2 consider moving their systemsto the cloud.
The third research objective is to compare the DHIS2 implementationsin Liberia and Ghana. Both countries have rolled out DHIS2 within the lastyear. Ghana is leveraging the internet for its implementation, while Liberiahas not had the infrastructure for this and is using standalone installations.I will discuss the consequences of this difference, looking at how it can bea concrete example of how the internet can be leveraged for development.
Finally, the last research objective deals with the international andregional developments around HIS and DHIS2, and how West Africancountries can contribute to and benefit from these. Several West-Africancountries use or consider using the DHIS2 software, and the West AfricanHealth Organization (WAHO) has shown interest in supporting the regionin this effort. Can networks be built in order to help sustain DHIS2implementations in the region over time, and facilitate the process forcountries currently implementing it?
1.3 Structure of the Thesis
After this brief introduction, the thesis is structured as follows. The nextchapter will give an overview of the relevant literature and theories. Inchapter three, the methodology and methods used in this thesis will bediscussed.
Chapter four, five, six and seven presents the empirical data. Chapterfour gives a background of HISP, West Africa and Ghana. In the fifthchapter, I present my findings on the functioning of the Ghanian healthinformation system. Chapter six concerns the implementation of DHIS2 inGhana, and is followed by a chapter on the implementation of DHIS2 inLiberia. In chapter eight I present the overall situation and developmentswith regard to HIS in the West African region.
Chapter nine is a discussion of the problem statements, in light of thetheory and empirical findings. Finally, I give my conclusions in chapterten.
3

4

Chapter 2
Literature Review
In this chapter, I will review literature and theory relevant to this thesis.I start by looking at literature on ICT in developing countries, and onresearch of ICT in developing countries. I then continue by reviewingliterature in information systems development and implementation indeveloping countries. The HISP theory of "networks of action is thenpresented. Finally, I look at the literature on health information systems.
2.1 ICT in Developing Countries
HISP aims at improving health information systems, which is one exampleof using ICT for development. In this section, I review literature on the useof ICT for development. I first look at the concept of the “digital divide”,then the discussion on if and how ICT can promote development.
2.1.1 The Digital Divide
The exact origins of the concept of the digital divide is unknown, butit emerged in the mid 1990s (Mutula, 2008). According to Hilbert (2011),there is no clear definition of the “digital divide”, as its use and meaningvaries according to the discussion in which it is used. However, at thecore, the digital divide describes the difference between those with andthose without access to ICT. In recent years, the concept has been expandedsomewhat to also consider the quality of the ICT - what Mutula (2008) callsthe “new digital divide” or “quality digital divide”. Mutula (2008) citesthe World Bank, which reports that the digital divide is closing rapidly.However, he argues that the quality digital divide is not decreasing.
The digital divide exists both within and between countries. Betweencountries, the divide runs mostly along the lines of the developed anddeveloping world. In fact, some authors argue that the digital divide isnothing more than the ICT aspect of the more general development divide(Torero and Braun, 2005). However, there are also substantial differencesbetween countries in the same income categories (James, 2006). Withincountries, it is generally the rich, educated and urban population that hasaccess to ICT, while the rural and un-educated are left out (James, 2006).
5

Looking at the sources of the digital divide, Torero and Braun (2005)argue that economic and policy issues are the main culprits. Theimportance of policy is illustrated by the big difference in growth of mobilephone usage between similar countries with different policies governingthe telecommunication industry (Torero and Braun, 2005). Adam and Wood(1999) also emphasise the importance of policy makers in promoting ICTgrowth.
The Parliamentary Office of Science and Technology (2006) lists sixfactors that contribute to the digital divide within countries:
• Few products are available that fit the developing country context.
• The cost of ICT is too high for large parts of the population.
• People lack skills in using ICT.
• Many ICTs require literacy and knowledge of english, which parts ofthe population does not have.
• There is limited human capacity to support ICT, and skilled ICTpersonnel often migrate to developed countries.
• Poor or non-existing ICT policies limit uptake of ICTs.
Mutula (2008) agrees to several of these points, and emphasisesilliteracy and the diversity of languages as especially big challengesin Africa. Other distinct features that influence the digital divide inAfrica include large differences between urban and rural areas, poorinfrastructure and large physical distances.
When attempting to bridge the digital divide in Africa, Mutula (2008)argues that the above characteristics must be addressed. He suggestsusing outdoor advertising and integration of local content to promote ICTawareness; improving the infrastructure, including electricity; and makingsure technology is adapted to local languages and cultures rather thanbeing transferred directly from the developed world. In terms of internetinfrastructure, he emphasises the importance for African countries to getaccess to fiber optic cables that are linked to other continents, to reduce thereliance on slow and expensive satellite links (Mutula, 2008).
The Parliamentary Office of Science and Technology (2006) offersseveral other suggestions to bridging the digital divide. First, opensource software can contribute by providing a catalogue of software freeof charge. Second, the invention and diffusion of new technologies canbe a factor. A recent example of a relatively new technology making animportant impact is the mobile internet. Third, international initiativesare suggested as a contributor. Examples of such initiatives include theMillennium Development Goals (MDGs) and New Partnership for Africa’sDevelopment (NEPAD). According to Parliamentary Office of Science andTechnology (2006), ICT is considered a mean of achieving many of theMDGs, and NEPAD has identified ICT as a prioritised area. Finally, bothJames (2006) and Parliamentary Office of Science and Technology (2006)
6

point to the importance of human resources and education in bridging thedigital divide.
2.1.2 Using ICT for Development
In the late 1990s, some researchers argued that developing countriescould use ICT as a way of leapfrogging stages of industrial development,becoming “information economies” (Adam and Wood, 1999; Osterwalder,n.d.). Some of that optimism is gone today, but most authors seem to agreethat ICT can contribute to development (Parliamentary Office of Scienceand Technology, 2006; Mutula, 2008; James, 2006; Osterwalder, n.d.). Seinand Harindranath (2004) argues that ICT can contribute to development infour ways. ICT can:
• be a commodity
• support development activity
• be a driver of the economy
• support specific development projects
The main challenge seems to be that access to ICT is limited in manyparts of the world, as shown above, and as Adam and Wood (1999) argues,that even where the technologies are available, they are under-utilised.
While a consensus has emerged that ICT can contribute to develop-ment, there is less agreement as to what extent ICT should be prioritisedas a way of promoting development. Mutula (2008) points out that peoplewill not prioritise access to computers or the internet over access to cleanwater or health services. Similarly, Adam and Wood (1999) argue that ICTcannot solve the overall problem of development. However, according tothe Parliamentary Office of Science and Technology (2006), many research-ers now inreasingly see issues of health, food, sanitation, economic growthand so on as linked to ICT. Thus rather than choosing to prioritise for ex-ample either health or ICT, both are seen as being tied together. This viewis supported by Osterwalder (n.d.), who argue that ICT today is a require-ment for development: ICT underpins all other sectors that are importantfor development, and can increase the efficiency of these.
What is required for ICT to promote development? One importantaspect of ICT is infrastructure, both ICT-specific infrastructures such astelecommunication links for telephone and internet access, and generalinfrastructure such as electricity that is required for most ICT. Calderonand Serven (2010) argue that infrastructure should be the top priority fordevelopment. However, Torero and Braun (2005) argue that while there isa link between ICT infrastructure expansion and growth, this link is verylimited when looking at the lowest (and highest) income countries - thus,for the poorest countries, very large investments in the area are neededbefore any economic growth can be expected in return.
Policies and policy makers are critical to make ICT conducive todevelopment. Policy makers that have the ability to meet challenges of
7

social, political, infrastructural and technical nature are needed, accordingto Adam and Wood (1999). They also argue that it is critical to take the localcontext of the society into account when introducing ICT in developingcountries, something that is also emphasised by James (2006) and Mutula(2008). A more detailed discussion of this issue with regard to software ispresented later in the chapter, in the section on “IS Implementation Successand Failure”.
Local human capacity to make use of the technology is important,according to Adam and Wood (1999); Osterwalder (n.d.) and James (2006).Osterwalder argues that three human capacity issues must be address forICT to be used successfully:
• Local capacity to maintain the required infrastructure.
• Local capacity to make local content and applications available.
• Local users that understand the content and applications.
Thus human resources is critical in order for ICT to contribute todevelopment.
2.2 Researching ICT in Developing Countries
The growth of the internet and the creation of the International Develop-ment Goals (later the Millennium Development Goals, MDGs) in the 1990screated much enthusiasm for using ICT for development (Heeks, 2008).However, many of the initial efforts to leverage ICT for development failed,leading researchers to focus on the sustainability, scalability and evaluationprocess of information system (IS) projects (Heeks, 2008).
In this section, I will look at the literature on research concerning ICTand IS implementations in developing countries. I first look at the variousdiscourses within the literature on information systems in developingcountries (ISDC). Next, I present an article discussing what issues shouldbe addressed in literature on ICT in developing countries. Finally, I presenta theory by Akrich on how technology can be analysed.
2.2.1 Researching ISDC
In her review of research on ISDC, Avgerou (2008) argues that there arethree discernible discourses in the context of ISDC research:
• transfer and diffusion discourse
• social embeddedness discourse
• transformative ISDC discourse
Authors writing in transfer and diffusion discourse study how ISinnovation can help developing countries catch up to the industrialised
8

world by transferring knowledge, technologies and institutional practises.They argue that general research and methods in the field of informationsystems can be used and adapted to developing countries, but that thecontext of use must be taken into account (Avgerou, 2008).
Researchers working within the social embeddedness discourse arguethat IS innovation is the product of a “locally constituted process oftechnology construction and organizational change” (Avgerou, 2008, p.135). In other words, the subject of study is primarily local actors andorganisations, and how they function.
The focus of the transformative ISDC discourse is the various social,economic and political processes around development occuring in de-veloping countries, and how IS innovation takes place in this context(Avgerou, 2008). It is in some ways similar to the social embeddedness dis-course, in its concern for the local social and political processes, but withmore focus on how ICT influences these processes (Avgerou, 2008).
Avgerou (2008) argues that the ISDC discourse focuses primarily onIS innovation and the consequences of this, leaving out issues concerningresource limitations that affect this innovation. She also points out thatthe literature is generally preoccupied with IS failure. The reason is boththe high opportunity cost of IS failure in developing countries, and thehigh expectations that have been attributed to many IS projects in thedeveloping world (Avgerou, 2008).
In general, research has been focused on three types of IS failure:scalability, where limited implementations fail to scale to full operation;sustainability, where seemingly functioning implementations wither awayover time; and assimilation problems, where IS becomes embedded inpoor organisational practises rather than contributing to improving them(Avgerou, 2008).
2.2.2 Relevant Issues for ICT in Developing Countries
Whilst some earlier research on ICT in developing countries discussed ifICT could be beneficial for development, Walsham and Sahay (2006) statethat the question is now how ICT can benefit development. To address thisissue, they argue that research concerning ICT and development shouldalway address four topics:
• what “development” implies
• what the key ICT issues under study are
• the theoretical and methodological stance of the research
• the level and focus of analysis of the research (Walsham and Sahay,2006)
The first topic is what the “development” that ICTS should contributeto actually is. This is often ill-defined in ICT for development literature,or is only defined implicitly. Walsham and Sahay (2006) argue that clearer
9

definitions should be given, and that these definitions could benefit fromdrawing on definitions from other disciplines such as development studiesor economy.
The second topic is what the key issues are that are being studied.Some issues are common, such as local adaption and cultivation, but othertopics have been neglected. This includes scalability and sustainability, e-governance technologies, open source software, large scale infrastructuressuch as telecommunications, and society-based issues like HIV/Aids(Walsham and Sahay, 2006). They thus disagree with Avgerou (2008), whoclaim scalability and sustainability are common research topics.
Third, Walsham and Sahay (2006) argue that the theoretical and meth-odological stance of the research should be made clearer. Furthermore, theyclaim that more studies should be of a critical nature, and that there is needfor more action research and longitudinal studies.
The final topic that needs to be addressed is that of level and focusof analysis. There are several possible levels of analysis, including theindividual, group, organisation, national, and international. The authorsargue that the individual level is underrepresented in current literature,and that this should be addressed in future studies. In terms of focus, theyargue that focus on communities is currently rare compared to researchfocusing on the private and public sectors. Finally, Walsham and Sahay(2006) argue for more research outside the english-speaking world, forexample in China.
2.2.3 Analysing Technology
Technical objects make up networks with both human and non-humanactors. In order to study technical objects, one must therefore look atboth social and technical aspects (Akrich, 1992). Akrich (1992) argues thatfor every technology or artefact, the designer or inventor makes decisionsabout what tasks should be delegated to the user and what should be doneby the technology. This creates a “geography of causes” or responsibilities,a script for the user inscribed in the technology, which in turn lays premisesfor how the technology should be analysed (Akrich, 1992).
According to Akrich (1992), we must look at both the script and the realworld when analysing technological objects and how they function, usingboth the designer’s and the user’s perspectives. She dubs the analysisof the relations and adjustments between the technology and the user,from the perspective of the world as envisaged by the designer, for “de-scription”. This has some similarities with Heeks, who also discusses thedifference between reality and the world as imagined by the designer. Thiswill be discussed later in this chapter.
Technical objects not only define human and non-human actors andtheir relationship in the first place. To continue functioning, Akrich(1992) argues that the technology must stabilise these relationships andthe network between technical and non-technical components. Thisstabilisation only occurs if the script is “acted out” according to how thedesigner created it.
10

2.3 Information System Development in DevelopingCountries
In this section, I review literature on the topic of how informationsystems should be developed, implemented and sustained, especially in adeveloping country context. I start by looking at participatory design, thena theory trying to explain why IS implementations succeed or fail, beforefinally discussing information infrastructure (II) theory.
2.3.1 Participatory Design
Participatory design (PD) has its roots in work by Scandinavian researchersin the 1970s. PD is an approach to design where various stakeholdersparticipate in the design process, and has strong links to the action researchmethodology. From the beginning, PD had a political agenda and linksto labour unions. The workplace was seen as inherently in conflict,and PD researchers wanted to empower and protect the workers in thisenvironment (Bødker, 1996).
One example of early PD was the UTOPIA project in the 1980s.UTOPIA aimed at using PD to develop a software system for printers andtypographers, as a means of strengthening their position and protectingthem against new technologies being introduced in the printing business.This was done in collaboration with the printers and typographers union(Bødker, 1996; Kensing and Blomberg, 1998). As unions have lost some oftheir influence, the traditional link between PD and unions have weakened(Kensing and Blomberg, 1998). However, the goal of empowering usersremains in the PD school of thought.
According to Kensing and Blomberg (1998), PD can take place at threearenas:
• The individual project arena, where the focus is on designing aspecific system.
• The company arena, with focus on diagnosing and reorganisingorganisations.
• The national arena, negotiating legal and political frameworks.
Recently, the individual project arena has been the main focus. How-ever, researchers have argued for more projects linking all three arenas, aswas often done in the early PD projects (Kensing and Blomberg, 1998).
Participatory Design in HISP
Traditional PD projects were aimed at empowering workers at theirworkplaces, and Braa and Sahay (forthcoming) argue that PD in HISP seeksto empower users across the health system by making sure they are not leftout of the technology development and by giving ownership of the HIS to
11

communities and users. These ideas were well received in post apartheidSouth-Africa, were HISP was started (Braa and Sahay, forthcoming).
According to Braa and Sahay (forthcoming), HISP PD is currentlyin its fourth phase. In the first phase, 1997–2002, the DHIS softwarewas developed in South Africa using traditional PD methods: designersand users in the health districts worked closely together, using rapidprototyping. At the same time as the software was developed, the HISPteam worked actively to reform the datasets used for reporting, also usingparticipatory design approaches involving both users and managers athigher levels (Braa and Sahay, forthcoming).
The second phase, from around 2002 to 2006, saw HISP expand outsideSouth Africa, primarily through educational programmes where masterand PhD students worked on DHIS projects in various countries. It becameclear that the PD approach aiming at empowering users did not work wellin all contexts. For example in the highly centralised Cuban system, whereempowering users locally was seen as a threat rather than a goal. In fact,most projects in this phase failed to scale and sustain over time, leading tothe idea of “networks of action” discussed later in this chapter (Braa andSahay, forthcoming).
From 2006 to 2010, DHIS2 brought a new technological paradigm toHISP, being based on open source web technologies. While this madeit easier to adopt DHIS2 and led to increased interest in the system, thesoftware was more complex. Changes in the software was thus now limitedto the core developers. PD in HISP became less about designing the DHISsoftware and more about designing a system based on DHIS. Consequently,DHIS2 implementers took an additional role as mediators between usersand developers (Braa and Sahay, forthcoming).
Braa and Sahay (forthcoming) argue that we are now in a phase definedby systems moving to the cloud, and for HISP this started with Kenyaimplementing DHIS2 online from 2011. Despite the technology movingfurther away from the users, they argue that PD and its premise ofempowering the user is still realistic. In fact, they argue that using a cloudinfrastructure represents an improvement for PD. With the data in thecloud, local access to information can be improved, which can empower thelocal communities and benefactors of the health system. They point to howPD was used during the cloud-based implementation of DHIS2 in Kenya,when parts of the development team more or less moved to the country.By working closely with the users, new important features were added toDHIS2, such as offline data entry and a small application to facilitate offlinestorage of data for analysis (Braa and Sahay, forthcoming).
Throughout these phases, there have been several cyclic developmentprocesses where PD in HISP have taken place according to Braa and Sahay(forthcoming):
• the development of the software - DHIS
• the development of the system, including datasets, indicators anddata models
12

• the development of information for action, finding ways to make sureinformation is used
All these cyclic processes are in turn driven by the action research cycle(Braa and Sahay, forthcoming).
2.3.2 IS Implementation Success and Failure
In his article on IS implementation success and failure in developingcountries, Heeks (2002) categorises the results of such implementations inthree categories:
• total failures
• partial failures
• successful implementations
A total failure is a case where either the IS is never implemented, or theimplementation is never used. If the system is only partly implemented, orhas unintended side effects, the implementation is categorised as a partialfailure. Finally, a successful implementation is a case where the major goalsare met and there are none or insignificant undesirable side effects (Heeks,2002).
This classification may seem straightforward at a first glance, howeversubjectivity is a major issue, especially for the partial failures: while theimplementation might have failed in the eyes of one stakeholder, it couldbe regarded as a success by another. Heeks (2002) therefore argues that anyIS implementation evaluation must take this subjectivity into account.
IS implementation failures are a big problem even in the industrialisedworld, with about one quarter total failures and only a small proportionsuccesses (Heeks, 2002). While Heeks (2002) argues that the literature onthe subject in the context of the developing world is limited, the failurerates are likely to be even higher here.
Design-Actuality Gaps
Heeks (2002) has developed a model to explain the cause of IS implement-ation failures, and how the chance of failure can be reduced. At the core ofthis model is what is dubbed design-actuality gaps. This is the gap betweenthe current reality “on the ground” (actuality) and the future reality as en-visaged in the IS design. The bigger this gap is, the more likely the IS im-plementation is to end in a failure. Because of the focus on design andactuality, system designers and the system users are important factors inthe model. Gaps between design and actuality can occur along seven di-mensions:
• information
• technology
13

• processes
• objectives and values
• staffing and skills
• management systems and structures
• other resources (Heeks, 2002)
For example, if the IS design is based on the availability of highly skilledpersonnel, but there is no skilled staff on the ground, this constitutes a gapand is a threat to a successful implementation.
Two types of gaps are especially relevant in the context of developingcountry IS implementations according to Heeks (2002): country contextgaps, and hard-soft gaps. Country context gaps stem from differencesbetween the industrialised world where most IS are designed, and thecontext in which they are implemented in the developing world. Thesegaps can result from various scenarios. An IS could have been designedfor use in an industrialised setting, and then transferred to a developingcountry, or it may be designed for the developing world context butbased on a wrong understanding of local conditions. Furthermore,an implementation could be driven by a western agency, like a donororganisation, which might have misconceptions about the realities onthe ground. Finally, local organisations can often have key figures witheducation from the industrialised world, who try to bring “western” ideasinto their organisations (Heeks, 2002). All these contribute to creatinga gap between the design and the actuality, and thus contribute to ISimplementation failure.
Hard-soft gaps are gaps between the hard, rational design commonfor information systems, and soft political realities of the real world. Asopposed to country context gaps, which are seldom introduced on purpose,hard-soft gaps are often intentional as part of efforts to introduce morerational management into local organisation (Heeks, 2002). Nonetheless,hard-soft gaps can be a contributor to failure of implementations.
According to the above model, gaps between system design and theactuality on the ground can cause IS implementation failures. Thus toreduce the chance of failure, the gaps must be reduced. This can be donein two ways: by changing the design, or by changing the actuality throughimprovisation. Heeks (2002) argues that there are several factors affectingthe possibilities of design and actuality improvisation:
• the technology
• the nature of the IS design
• local capabilities
• improvisation techniques
14

Technology can be either design imposing or actuality supporting. Adesign imposing technology is deeply inscribed, difficult to improvise overand often results in a large initial gap. Actuality supporting technologyon the other hand, is shallowly inscribed, makes improvisation easier andleaves a smaller gap as a starting point. Choosing an actuality supportingtechnology increases the chances of success, but the technology used in ISimplementations in developing countries is nonetheless typically designimposing (Heeks, 2002).
The next issue is the nature of the design. IS designs can be seen ashaving explicit and implicit components. Explicit components, for examplehow many computers the system requires, can be improvised quite easily.However, the implicit components, like assumptions about the skill levelof the users, are hard to change (Heeks, 2002). Thus a design with manyimplicit rather than explicit assumptions is harder to change than one withonly explicit assumptions.
Another aspect of the nature of the design is the degree of divisibilityof the IS. Divisibility has two dimensions according to Heeks (2002):modularity and incrementalism. A design that is modular can more easilybe adapted to the local settings through improvisation. Similarly, a systemthat can be implemented in stages is easier to adapt and improvise over.
A requirement for local improvisation is human capacity. Heeks (2002)argues that so called hybrids, people with knowledge in several domains,are especially important. Unfortunately, human capacity in developingcountries is often lacking. As a consequence, IS designs that leave littleroom for local improvisation are often chosen.
To improve the chances of local improvisations to succeed, participativeapproaches to implementations have been suggested. Here, implementerswork with end user in order to close design-actuality gaps. Heeks (2002)argues that such approaches might cause problems as well, however, asthese techniques themselves may fail to take the local actualities intoconsideration.
In all then, this model attempts both to describe how design actualitygaps can explain the frequent IS failures in developing countries, and alsosuggest how these gaps can be reduced.
2.3.3 Information Infrastructures
To better understand the complexities of health information systems, theliterature on information infrastructures can be useful. In this section, I willfirst look at how information infrastructures can be defined, before lookingat the recommended principles for building an II.
Information infrastructures are defined by Hanseth and Lyytinen (2010)as a “shared, evolving, heterogenous installed base of IT capabilities amonga set of user communities based on open and/or standardized interfaces”(p. 208). While IIs can have similarities with information systems, theyare more complex and heterogenous, build on existing infrastructures andevolve over time to meet requirements not known at the time they wereconceived (Hanseth, n.d.).
15

According to Hanseth and Monteiro (1998), information infrastructureshave six defining aspects. IIs are
• enabling
• shared
• open
• socio-technical
• interrelated
• build on an installed base
Enabling implies that IIs have a supporting or enabling function thatopens up for new and possibly unintended activities and functions. Thatan II is shared means that the same infrastructure is used by a group ofusers, and that the infrastructure is irreducible: different groups of userscannot use the information infrastructure independently. That IIs are openmeans that the number of stakeholders, users, components and areas ofuse is unlimited, and the consequence is that the activities, requirementsand conditions change over time. Information infrastructures are socio-technical. They include not only the technical components and software, butalso the information, organisations and users related to it. An II is not onemonolithic structure, but is rather a set of interrelated sub-infrastructuresand networks that can be layered on top of each other. Finally, informationinfrastructures are never designed from scratch, but build upon an existinginstalled base. IIs are always connected to or built upon something existing(Hanseth and Monteiro, 1998).
Hanseth (n.d.) argues that there are three main classes of IIs:
• global universal service infrastructures
• business sector infrastructures
• corporate infrastructures
The first type has one prominent example, which is the internet. Theinternet is also the most important foundation for the other two other typesof infrastructures. Business sector infrastructures are infrastructures sharedamong several organisations within a sector or community, for exampleamong actors in e-commerce or telemedicine. Corporate infrastructures areinternal to corporations or organisations. However, these systems oftentraverse geographical and organisational borders within the organisation.A typical example is Enterprise Resource Planning (ERP) systems.
Based on the above definition and classification of information infra-structures, it is interesting to look at how the literature describes develop-ment and evolution of IIs. According to the literature, IIs must be cultivated.Ciborra (2000) describes cultivation as being about “interference with andsupport for a material that is in itself dynamic and possesses its own logic
16

of growth” and goes on to describe technology “as a drifting system andas an organism to be cultivated” (pp. 31–32). The concept of cultivationis based on the notion that IIs are always part of an installed base. Con-sequently, IIs cannot simply be designed or constructed: the installed baselimits what changes are possible at any given time. Any design or con-struction must take into account the installed base, and it thus acts both asa limiting and enabling factor (Hanseth, n.d.).
With II design, Hanseth argues that there are two main dilemmas. Thefirst is how to bootstrap the II, the second is how to avoid technologylock-ins (Hanseth and Lyytinen, 2004). In the following, I will discuss theproposed procedures for how to overcome these dilemmas.
Bootstrapping
An information infrastructure generally has little value until it gains acritical mass of users, at which point its growth will be self-reinforcing.Thus the first dilemma of II design is building a self-reinforcing installedbase: bootstrapping (Hanseth, n.d.). Hanseth and Lyytinen (2004) suggestthree design principles to manage this:
• design initially for usefulness
• use existing installed bases
• expand the installed base fast by persuasive tactics
Designing initially for usefulness is a result of the fact that the firstusers do not benefit from a large installed base, unlike later adopters.Consequently, the design should let the early adopters benefit immediately,without large costs or high learning curves (Hanseth and Lyytinen, 2004).
The second principle is to make use of supporting infrastructuresalready in use by some of the potential users. This reduces the cost, andthe need for training of the initial users, making the barriers to adoptionlower. Furthermore, the new infrastructure should be connected to existingnetworks or infrastructures where possible (Hanseth and Lyytinen, 2004).
Finally, the focus in the early stages should be on expanding theinstalled base rather than adding new functionality. Since the long termvalue of the II is hinged on the number of users, gaining users andmomentum should be the focus of the bootstrapping process (Hansethand Lyytinen, 2004). The purpose of these three design principles isbootstrapping the II, starting a self-reinforcing growth process, and thusovercoming the first II dilemma.
Lock-Ins
The second dilemma in II design is avoiding lock-ins. A lock-in is asituation where a technology has been so widely adopted that changingto a different technology or standard is very hard, both in terms of costand coordination. Hanseth (n.d.) argues that there are two ways to get out
17

of a lock-in situation. The first is evolutionary, changing the infrastructurewhile keeping backward compatibility. The other is a revolutionary strategy,where one starts from scratch. The first one caters for easy adoption, thesecond for a best possible end result (Hanseth, n.d.).
The key to managing technology lock-ins is flexibility. IIs can be seen ashaving two types of flexibility: use flexibility and design/change flexibility(Hanseth, n.d.). As the name implies, use flexibility means flexibility inthe way the II can be used. If the use flexibility is large, the II can beused in many different ways without any technical changes (Hanseth andMonteiro, 1998).
Use flexibility is important, and is essential for the enabling aspect ofIIs (Hanseth and Monteiro, 1998). However, design flexibility is the mostimportant aspect of preventing and getting out of technology lock-ins.Hanseth and Lyyttinen present two design principles to avoid technologylock-ins (Hanseth and Lyytinen, 2004). The first is to keep the II design leanand simple, as simple structures are easier to change than complex ones.The second principle is to modularise the II as much as possible, splittingit into independent sub-infrastructures with standardised interfaces. Suchloose couplings make it easier to effect changes in one part of the II withoutbreaking other parts.
2.4 Networks of Action
Researchers within the HISP network have developed theories of “Net-works of Action” and “Networks of Networks” that are highly relevantin order to understand the dynamics of HIS implementations.
2.4.1 Networks of Action
The “Networks of Action” concept was coined by Braa, Monteiro andSahay (2004). It is a theory for how HIS implementations and researchcan be sustained over time and scaled up in scope. Braa, Monteiro andSahay (2004) define sustainability as making something work over time.In the field of health information system, that implies adapting the systemto local conditions, enabling local learning, and institutionalising routines.Scalability is the issue of making a working local solution spread. Localsustainability and success is irrelevant if the solution cannot be scaled.Scaling involves spreading the technology itself, but also spreading people,funding and the learning process required to make the system work (Braa,Monteiro and Sahay, 2004).
The basic argument is that even successful pilot implementations andresearch at single sites generally fail to scale and sustain over time. Theauthors argue that to scale and be sustainable, “networks of action” shouldbe developed between the individual research projects and pilot sites. Thenetworks would become a mechanism for spreading of artefacts, ideas,people and knowledge, which is required for sustainability and scaling
18

(Braa, Monteiro and Sahay, 2004). They use the HISP network and SouthAfrica as an example where scaling and sustainability was achieved.
2.4.2 Networks of Networks
Building on the concept of networks of action, Sæbø et al. (2011b) argue forbuilding “networks of networks” of action. The argument is that throughsynergy effects, a network of networks adds up to more than the sum ofthe individual networks. Strengthened legitimacy is mentioned as oneexample of such synergy effects. A project might have legitimacy locally,but lack national legitimacy. By linking up with a network on the nationallevel, national legitimacy might be achieved.
The authors argue that attractors are required for networks of networksto emerge. The article discusses how a network of networks emergedaround two attractors during the DHIS2 implementation in Sierra Leone:
• The successful HIS implementation in Sierra Leone.
• Interoperability between software systems (Sæbø et al., 2011b).
The successful implementation of DHIS2 in Sierra Leone, and theparallel process of integrating reporting in the country, created a regionalattractor. The implementation was driven by HISP and HMN. The secondattractor was the system interoperability demonstrated in Sierra Leone,facilitated by a new Statistical Data and Metadata Exchange for the HealthDomain (SDMX-HD) standard, promoted by WHO. SDMX-HD enablesinteroperability between systems dealing with health data (SDMX, n.d.).DHIS2 and the medical record system OpenMRS both supported thisstandard, and it was successfully demonstrated that they could worktogether. The interoperability became an attractor, both for other countriesand for other software developers (Sæbø et al., 2011b).
Finally, Sæbø et al. (2011b) present the HISP strategy for creatingsynergies through networks, which has three main aspects. The first isdirectional improvisation, implying that while HISP has a direction towhich it wants to move, the exact route is open for improvisation shouldopportunities arise. The second aspect of the strategy is to use technologicalarchitectures to create networks, as architectures create networking effects.This was the case with the SDMX-HD mentioned above. The last aspectis to leverage complementaries between networks, making all nodes of thenetwork benefit (Sæbø et al., 2011b).
2.5 Health Information Systems in Developing Coun-tries
Health information systems are the central topic of this thesis, andreviewing the literature on HIS is therefore important. After defining HIS,I will look at typical challenges related to HIS in developing countries andwhat strategies for improvements and solutions are suggested.
19

2.5.1 Defining Health Information Systems
HIS can be defined as
[. . . ]the mechanisms and procedures for acquiring and analys-ing data, and providing information (for example, managementinformation, health statistics, health literature) for the manage-ment of a health programme or system, and for monitoringhealth activities (Lwanga, Tye and Ayeni, 1999, p. 28).
From this definition, we see that the purpose of a health informationsystem is to provide information for management and decision making in thehealth sector. This entails the whole process from collecting the data at thelowest levels; analysing this data and turning it into useful information;and using this information for management. The use of information formanagement is not only relevant at the national level, but its relevance cutsacross from patient management in the health facilities, all the way up tothe international health organisations.
It is also clear from the definition that a HIS is not one clear-cutstructure. It is the “mechanisms and structures” for data collection andanalysis, and thus entails both the paper forms and registers used to recordand report data at the health facilities, the routines and practices of the staffcollecting and analysing the data, the computer systems that store that dataand the procedures that guide the use of information in decision-making.
2.5.2 HIS Problems
The HIS is a critical component of the health sector, but it has long beena neglected area. Sauerborn and Lippeveld (2000) suggest five typicalproblems with HIS in developing countries:
• irrelevant data is collected
• data quality is poor
• parallel reporting and duplicate data collection
• poor timeliness and feedback
• low information usage
In this section, I will discuss these five problems, drawing on therelevant literature.
It is a common problem that data collected at the lowest levels isrelevant for use only at the higher levels. Thus staff at the facilities spendtime collecting and reporting data they have little need for, instead ofdata that could be used for patient or facility management (Sauerborn andLippeveld, 2000). In some cases, the data collected is not really useful at anylevel, and the resources going into data collection is completely wasted.
There are several reasons given in the literature for why data quality isoften poor. First of all, the personnel tasked with collecting and compiling
20

the data does not have the skills required to do this work correctly. Themedical personnel lacks skill and equipment to give the right diagnosis,and the staff filling the reports and registers have been given little or notraining in how to do this (Shrestha and Bodart, 2000). Making this issueworse, the tools used for data collection are often poorly designed and notuser friendly.
When information collected at the facility level has little relevance inthe daily facility management at the lowest levels, there is little motivationamong health workers to ensure good quality (Chatora and Tumusiime,2004). A negative circle is created, where quality is decreasing becauseof limited use of the data, and the data is used even less as the qualitydeteriorates (Braa and Sahay, 2012). This problem is amplified if there is nofeedback on the data being reported, as will be discussed later.
One of the biggest challenges faced by national HIS in developingcountries are the many specialised, parallel information systems that havebeen set up by various donors and health programmes, often called verticalreporting systems. As pointed out by the HMN, these systems are oftenestablished as a result of pressure from international actors that have higherreporting requirements than what the national HIS can provide (HealthMetrics Network, 2008). While the rationale for these parallel systems areclear in many cases, for example when international donors require qualitydata for accountability reasons, they have had a devastating effect on manynational health information systems.
Even though the parallel systems are generally run by health pro-grammes or government divisions focused on specific issues, they have atendency to cause duplicate data collection. While some data is specific foreach vertical system, there is also a substantial amount of data that is col-lected by two or more vertical programmes, and consequently the facilitiesmust report the same data multiple times (Shaw, 2005). The health workersare often overburdened by these reporting requirements, and it has beenargued that as the amount of data increases, data quality decreases (Wil-liamson and Stoops, 2001). Furthermore, the more time that is spent onreporting, the less time is spent on treating patients.
Access to data can also be an issue with parallel systems. Because datais collected and stored separately, accessing the information can be difficult- managers will need to request data from several independent systemsinstead of having one central repository. And if the same data is availablein separate systems but the figures are different, it can cause uncertainty asto which, if any, of the figures can be trusted (Sæbø et al., 2011a).
Feedback and timeliness is important for several reasons, yet bothissues are often problematic. Timeliness is important because delays inreporting can lead to situations where managers at various levels either useoutdated information to support their decisions, or have no informationavailable at all (Sauerborn and Lippeveld, 2000). In such instances, theresources put into producing the information are wasted.
Feedback can first of all help guide health workers and managers at alllevels in their work. However, feedback is also important for motivation,and in turn data quality: if the health workers spend hours filling out forms
21

and sending them to the next level without even a confirmation that thedata has been received, this is clearly demotivating and may lead to poordata quality (Rohde et al., 2008).
Feedback and timeless are related issues. If the timeliness is poor, anyfeedback that is sent is likely to be out of date (Sauerborn and Lippeveld,2000).
Simwanza and Church (2001), in an article on information culture,argue that low information usage is a general problem with healthinformation systems. This notion is supported by Sauerborn and Lippeveld(2000), although they note that there are few studies to back up thissentiment. However, they do refer to three studies1 that show limiteduse of information, especially at the district and facility levels, due to thecentralisation of the health systems. Thus even in cases where timely,quality information is available, it might not be used to support decision-making.
2.5.3 Improving HIS
Above, some of the typical problems with health information systems werepresented. In this section, I discuss what the literature suggests can be doneto reform and improve HIS.
Fragmentation is one of the major sources of problems in healthinformation systems. Fragmentation is reduced through integration.Within the HIS field, integration can have different meanings. According toSæbø et al. (2011a), technical people look at integration from a technologicalpoint of view, and imagine large, unified, and overly complex systemsthat are hard to make work. They therefore warn against integration,and suggest interoperability as an alternative. Health personnel, on theother hand, look at HIS integration as integration of data and information,and procedures used to generate these. In reality, the integration ofhealth information systems entails both integrating the non-technical andtechnical components, and interoperability between computer systemsplays an important role in this.
Braa and Sahay (2012) argue for what they call an Integrated HealthInformation Architecture (IHIA) to reduce fragmentation. IHIA is anenterprise architecture with three levels. Each depends on the level belowit, and all levels are essential to ensure integration (see figure 2.1). The firstlevel is the social system level. This is where the overall architecture isdefined, and it includes information needs and use across organisations,procedures supporting the HIS and other organisational requirements.The second level is the application level. Here we find the softwareand applications that support the information needs and use at the levelabove it. Finally, we have the data level. This level deals with datainteroperability, standards and infrastructures that support the softwareand applications on the level above.
To achieve HIS integration, Braa et al. (2012) emphasise the critical
1(Auxila and Rohde, 1989; World Healh Organization, 1988; Kadt, 1989)
22

lilt-.1
i;
t.. integrated Health informationArchitecture: Power to the Users
/`_ i w “ w i __ __ i & _ _ _ ______ _ _
7 Level 1:_,- / , p ,g _,”»’¢§:~\\-_?_information i we" __-~* 3+* -̀‘,?.';.;._,= tl/if!
‘g 1 Needs, users,usage ___ ,
5' across organisations " H 1 i
“SocialS tem Level' _ "l ; ys _W4/Y wk#....._,y _l ,
T _institutional useof information__)
Level 2 ___ »~
1 Software applications parmH,
Datawarehousg '_ `_,1 and informationsystems lfewfdsii J' @iS Aggregaredata ’1\_____ _' ` 'ApplicationLevel' 1 Z . _ _ _ . ~ -
"iHR|5
"`
OpenMRS Applications supporting .Tl t
. . useofinformation 1 ;
- wtti il Level 3: Data and indicator standards ’"Iei'
SDMXHD'Data ExchangeLev ___ ;'Technical Level' ' O Fa°""Y "St_ interoperability and Dstandards, technical
;% SDMX-HD
h n _‘I
infrastructure 5ii_ Data Standards and infrastructuresupporting the applications_
Three levels ofenterprises architecture
Level 1:information The users'informationneedsand actual usageofinformation;the bullriillneeds, usersand usage processes and functionalities to be supported bythe l-llS. Docuriilntid'SocialSystem Level' through users specifications and requirements within the contlxtDfthl
integrated Health informationArchitectures -Operationaiislnq theVllllhwill get different answers depending on the respondents' roles and ‘iocaiiotill Ahealth technician in the hospital would emphasise medical records, a mattaqli 'MYemphasise information needed for decision-making, and an epidemioloqlii wtiilllpoint to population-based surveys, and so forth. Typically, public health pmt liiluiililand healthmanagers tend to focus on HMIS type of systems; indicators anti nqqtlxllltiara supporting management and decision-making, whereas clinicians and ml itllriractitioners, and IT technicians will tend to focus on electronic medical tlttiltll.A-. argued earlier, the design focus of the IHIA is on information lor ninnnqliiiliil,tier ision-making to support effective health services delivery at all levels ulill! lilllill'.y~.tem, related sectors, and institutions, aswell as information dissernlrialloti iii il'iltietieral public.t»i~~t~tl lor information, for decision-making and management may be delttlbld bythe .ivaiiabiiity of essential information from across the sectors inapprotirlnil ltiiiiillli-.-» that tomparisons, trends, and correlation between areas, across st~Ct0r\ IndWiltime i . in he carried out. Different levels of the health system will have vntyin itlllir. i i .ortiiritr to the role they play in the system and their scope or power of¢¥|¢l\|Bll*mai-int), lite following types and areas of user needs are important:- lite need lor integrated information, so that the Inlormailoti that Orlqlnllil "OM
tiilierent areas isavailable at 'one pointf- iiilletent levels and types of rnanagement in the health sector li|V|Vlfylharrveiit., lor example, the lower levels need richer anti more Qrnnullt dill, Whl
the liltiiier levels need less data in a more aggregator! lortti.- lrrinrtrmtioti lor action, where the louis needs to he on lmtrillll dill IMtiitlit niors, whit it are ilnketl to targets and renl tisnue. _- the iuini anti riresr-nt.1tion oi the inlorrnntion, nnrl how in ation ii. for lllmlllrwiniiin, urnplis, rnnps, statistic \ teal time and online tttitiq tliflltltii itildll.
la» it ni the niiiivo print lpivsmenow vlnlinrriiurl.
lint Nami lor lnieotnteti inlortnniiontmtiiriitiiintitrri in ri rrminr priiiilvrri laimi ity ill’r iii trimi iiuvuitittitiu tIUlllflHI . . | . t _ , _ . , _ t , _ . , | .IL , in A _ . . | A . . t rl t .. |. || .t tt , _ _ _ _ _ _ . . _ ¢
Figure 2.1: Three level Integrated Health Information Architecture. FromBraa and Sahay (2012).
23

importance of using participatory design approaches in which variousstakeholders and users can influence the system. They further arguethat three important aspects to facilitate this process have often beenoverlooked. First, a good data warehouse software is needed. Even ifthere is consensus among all stakeholders to create a data warehouse, ithas been a common problem that integration efforts collapse due to sub-standard software. Secondly, the authors argue that standards for data andindicator sets must be developed. Finally, internet should be used whereever possible to ensure that a true data warehouse is created (Braa et al.,2012).
Braa et al. (2012) suggests a three step approach to HIS integration.The first step is to ensure political consensus on the need for integrationamong all stakeholders in the system. Next, standard data and indicatorsets should be developed to enable sharing of information. Finally, datashould be integrated at a technical level. Either tightly, through a datawarehouse where all data is stored, or loosely, by making data form varioussub-systems available in one common portal. Given that most developingcountries rely on paper reporting and have a poor infrastructure, Braaet al. (2012) suggest that a tight integration through a data warehouse ispreferable. Each of these steps, involving stakeholders, developing anessential dataset and creating a data warehouse is discussed below.
Creating a central data repository or data warehouse in which all datacollected from the national and the parallel systems can be stored is onecommonly suggested solution to the problem of duplicate data collectionand vertical reporting systems (Braa et al., 2007a; Health Metrics Network,2008; Sæbø et al., 2011a). By having a central data warehouse with all thedata available, managers in the vertical programmes might realise that theydo not need a separate system in order to access their data. Creating a datawarehouse can often be done without altering any of the parallel systems,thus this can be a good starting point for a HIS reform in cases wherevertical health programmes are reluctant to give up their own systems(Braa et al., 2007a).
A central data warehouse can also help facilitate access to the collecteddata on a more general basis. Since all the available data is stored in onelocation, managers can easily fetch the information they need, possiblyeven online, independently of who collected or owns the data (Sæbø et al.,2011a).
Overwhelming reporting requirements are one of the main problemsof health information systems, affecting data quality and overburdeninghealth workers. To remedy this, several authors argue for the developmentof a set of core or essential indicators to track, which all stakeholders agree to(Braa et al., 2007a; Health Metrics Network, 2008). A detailed framework onhow to select indicators for the various management functions of the HISis presented by Bodart and Shrestha (2000).
After defining a minimal set of indicators, the data sources requiredfor calculating these indicators can be identified. Based on these datarequirements, integrated data collection instruments can be created. Theend result of this is that the total amount of data to be collected is reduced
24

substantially. Furthermore, because the essential datasets are common forall health programmes, duplication is avoided.
One of the most fundamental recommendations in the HMN frame-work for HIS reform is to involve stakeholders in the process, and builda broad consensus from day one (Health Metrics Network, 2008). This isespecially important because a common goal of HIS reform is to integratestakeholders such as vertical health programmes in the national system.
Braa et al. (2007a) argue that one way to get stakeholders onboard inHIS reform efforts is to start by creating a data warehouse for data from allvertical programmes. They call this a “maximalist” approach, as opposedto the “minimalist” approach of first developing an essential dataset. Sinceall programmes can have their own forms unaltered in the data warehouse,they have little to loose by joining the process.
As described by Tohouri and Asangansi (2009), this “maximalist”approach can be improved by linking datasets in the data warehouse, sothat even though the paper forms used to collect data overlap, identicaldata is stored only once in the data warehouse. The result is anintegrated warehouse without duplication, developed without having tomake stakeholders review any of their data collection instruments.
One common problem discussed is poor information usage. Ifinformation usage is low even when timely and accurate information isavailable, it seems clear that use of information must be promoted - buthow? Rohde et al. (2008) argue that a “culture of evidence-based decisionmaking” should be encouraged in order to increase the use of information(p. 202). They suggest several ways to promote such a culture. The first is toencourage data analysis and use at the facility level, and among managersat the lower levels in the health system - including setting local targets forselected health indicators.
Many of the same points are echoed by Simwanza and Church (2001),who also emphasise the importance of encouraging use of informationlocally. They add that although local use is important, the process ofinstitutionalising an information culture often begins at the central levelwith feedback, review meetings and supervision.
Sauerborn (2000) argues that two issues are important in order topromote information usage: improving the data that is collected, andpresenting and communicating it better to decision-makers. He argues thatusers must feel ownership to the data and trust its validity, and it must beaggregated and customised to fit the user’s needs. Information productsmust be created and communicated to managers and decision-makers in aformat appropriate to the situation.
25

26

Chapter 3
Methodology
This thesis is based on qualitative, interpretive research. In terms ofmethodology, it can be seen primarily as participatory action research, butwith similarities to case studies. Both participatory action research andcase studies will therefore be discussed in the next two sections. I willthen continue by describing the field trips I have made to Ghana, Togo andLiberia during the work on this thesis, before finally looking at the researchmethods used during my research.
3.1 Action Research
Action research (AR), or participatory action research, is a methodologythat aims to solve actual, real world problems, while at the same timecontributing to theoretical understanding (Myers, 2010). Rather than justobserving, the researcher participates and is immersed in the researchsituation (Checkland and Holwell, 2007). Consequently, the line betweenresearcher and practitioner, and between theory and practice, is blurred(Avison, Lau and Myers, 1999). According to Avison, Lau and Myers(1999), AR is well suited to study information systems, because it gives theresearcher an opportunity to understand the complexities of these systemsbetter than other hard methods.
In practice, action researchers do not start with a hypothesis they wantto test, as is typical for research within the natural sciences. Instead, heor she has a broader theme of interest (Checkland and Holwell, 2007). Theaction research process itself is iterative, with the researcher going throughfive main steps in a cyclic fashion, as shown in figure 3.1 (Avison, Lau andMyers, 1999).
The first step is diagnosing, where the researcher, together with thepractitioners (the researched), identify the problem that needs to be solved.Action planning is the second step. Here, a plan is laid out for how thediagnosed problem can be solved. Third in the cycle is action taking, whichimplies executing the planned actions. Evaluating the outcome is the fourthstep. As the last step before starting the next iteration, the researchershould specify the learning that can be gained from the cycle (Avison, Lauand Myers, 1999; Baskerville and Pries-Heje, 1999).
27

Diagnosing
Action Planning
Action Taking
Evaluating
Specifying Learning
onsdag 9. mai 12
Figure 3.1: The Action Research Cycle. Based on Baskerville and Pries-Heje(1999).
Traditionally in natural sciences, a basic premise of research is thatany findings should be repeatable. This is more or less impossible withaction research, as the environment of the research will always be different.However, Checkland and Holwell (2007) argue that the research shouldbe recoverable. Thus although the exact same research cannot be repeated,the researcher should document the research process well and declare inadvance the epistemology - methodology and framework of ideas - theresearch is based on (Checkland and Holwell, 2007). This will allow othersto recover the research process later.
While action research can be immediately useful by solving a concreteproblem, it is hardly academic research unless there is also an elementof contribution to or development of theory. Baskerville and Pries-Heje (1999) suggest using methods drawn from grounded theory in ARtheory development. The idea behind grounded theory is to have a closerelationship between data collection and analysis, and that theory can bedeveloped by systematic analysis of the collected data through an iterativecoding process (Myers, 2010). The three building blocks of grounded theoryare concepts, categories and propositions. Concepts are the basic unit ofanalysis, a conceptualisation of the data. Categories are a higher level unitof analysis, in which concepts can be grouped. Finally, propositions arethe relationships between concepts and categories, and between categories(Pandit, 1996). Baskerville and Pries-Heje (1999) suggest using this samedata analysis process on data gathered from action research as a way todevelop theory from AR. However, they admit that this process will besomewhat biased by the fact that the action researcher is likely to alreadyhave some categories and concepts from the data collection phase whenstarting with the data analysis.
Action research has been criticised for being similar to consultancy.Avison, Lau and Myers (1999) argue that a researcher without a researchtopic and who is not explicit in following the action research methodology,can easily end up functioning as a consultant. Another issue is how theaction researcher can ensure that the knowledge drawn from the action
28

research can be useful to others.Lack of critical distance and fresh outlooks can be another danger
with action research. Because the researcher is immersed in the researchsituation for a long time, he or she can fail to discover important issuesthat someone with an outsider’s perspective would see. Furthermore, afterdeveloping a close relationship with the practitioners who are under study,it might be difficult to discuss them objectively. The close involvementof the researcher can also dissuade the practitioners from being honestor disclosing information (Walsham, 2006). Finally, action research is verytime-consuming, and its benefits must be weighed against less time-consuming forms of research (Walsham, 2006).
3.2 Case Study
A case study, according to Yin (2002), is an empirical investigation of aphenomenon in its real context, in particular when the line between thecontext and the phenomenon is blurry (cited in Myers (2010)). One typicalissue regarding case studies is what constitutes a case. Stake (2005) arguesthat a case must alway be specific, thus a doctor can be a case, but doctoringcannot because it is not specific. Furthermore, he states that the boundarybetween case and context should always be clear enough so that one candecide whether a feature is part of the case or not (Stake, 2005).
Generally, case studies fall in one of three categories:
• intrinsic case study
• instrumental case study
• multiple case study
With intrinsic case studies, the goal of the research is knowledge of thecase itself. The purpose of an instrumental case study is not one particularcase, but to gain insights into a particular issue. The case is an instrument forobtaining knowledge on a more general level. Finally, multiple case studiesinvestigate a common phenomenon through a number of cases. Thus eachof these cases are in themselves instrumental (Stake, 2005).
With action research, the researcher is always deeply involved in theresearch context, immersing himself or herself in the situation. Researchersdoing case studies can also be deeply involved in the context of the case,or they can study it from the outside. Walsham (2006) argues that there isa whole spectrum of involvement that a researcher can have under a casestudy, from “involved” to “outsider,” something that is clearly differentfrom action research.
One typical critique of case studies, especially single-cases, is that onecannot generalise findings from them. Any generalisation from the specificcase is often unconscious, both with the researcher and the audience, but itcan be difficult to justify scientifically (Stake, 2005). Flyvbjerg (2006) arguesthat this is not necessarily the case, depending on the case in question and
29

how it has been selected. Case selection is therefore clearly an importantpart of a case study, with implications on how the collected data can beused.
3.3 Methodology of This Thesis
From the time it was established more than a decade ago, HISP hasbeen focusing on participatory action research following the so-called“Scandinavian tradition” of participatory design (Braa et al., 2007b). Myresearch, too, is following this tradition of action research. A substantialpart of my work can perhaps also be seen as a case study of theGhana Health Information System and the DHIS2 implementation inLiberia. According to Avison, Lau and Myers (1999), however, there isa line between action research and case study, divided by the degree ofimmersion and participation in the research context. I believe I am on theaction research side of that line.
3.4 Field Work
During my time working on this thesis, I have done a total of four tripsto Ghana and one visit to Togo and Liberia. On the trips to Ghana, Iworked with the Centre for Health Information Management (CHIM) inAccra, which is an office under the Ghana Health Service (GHS). In thissection, I will give a brief description of what I did during my trips to WestAfrica.
The first visit I made was to Ghana, for two weeks in June 2011.There was initially some talk that there would be a training of trainers inGhana during this period. However, as the time of the visit came closerit became apparent that the system would not be sufficiently complete forthis. Instead, the main focus of these two weeks was to train the staff atCHIM in the reporting functionality of the DHIS2 software. I also madea manual documenting some of the reporting functionality, most of whichwas later incorporated into the global DHIS2 manual.
My second visit to Ghana lasted for three months, from mid Augustto mid November 2011. The work during this period falls into fourcategories. First, as during the first visit, I had training sessions with theDHIS implementers at CHIM. Second, I assisted in the customisation ofthe Ghana database. Third, I participated in the training of local personnelin a total of four regions around Ghana. And finally, I participated as afacilitator at the “DHIS2 Academy” workshop held in Accra in November.
In January and February 2012 I spent another month in Ghana. Onceagain, I trained staff at CHIM, worked on customising the Ghana databaseand participated in the training of one region. During this visit I wasalso given the opportunity to participate in the field work for a WestAfrican Health Organisation (WAHO) HIS evaluation. This includedinterviewing officers from several health programmes, as well as visiting
30

health directorates, hospitals, clinics and other health facilities in twodifferent regions.
Together with one of the DHIS2 developers, I went back to Ghanafor one week in March 2012. The focus of this week was on makingthe final preparations of the system, training of CHIM staff, again with afocus on reporting, and getting a handful of users started with DHIS2 asa last test before the rollout in April. We also had meetings at the PolicyPlanning, Monitoring and Evaluation (PPME) division of the GHS, wherewe discussed server administration and user rights.
In the last month of April and the first week of May, I participated asone of four facilitators at the “DHIS2 Database Training” in Lomé, Togo,and also spent a week in Liberia, assisting with the DHIS2 implementationthere. At the training in Lomé, I worked with the five English-speakingcountries that were present, helping with practical work on their countrydatabases. In Liberia, which I visited with the same DHIS2 developer asin Ghana in March, we worked on setting up a server in the Ministryof Health, resolving various issues with the Liberian database, migratinghistorical data and also demonstrating DHIS2 for the staff in the ministry.
3.5 Methods
During my field work, I have employed many different methods of datacollection. These will be presented in this section.
Field Notes
My main data collection method has been extensive field notes takenduring all my trips. These notes include observations, thoughts andcomments picked up during the course of the time spent in the field. Intotal, these notes have added up to more than 25 000 words.
Interviews
I have made several interviews during the field trips. These have mostlybeen unstructured and informal interviews made during the course ofwork at CHIM, at trainings with end users, or at workshops. For theWAHO evaluation I participated in, some more formal interviews weremade, although these were also in an unstructured form.
Observations
The observations I have made have been just as important as theinterviews. This has been especially valuable during trainings of endusers, seeing how people interact and respond to the system, but also atworkshops and when working on DHIS2 customisation.
31

Surveys
While I have not personally conducted any surveys, CHIM used a surveyto get feedback from end-users at DHIS2 trainings. The survey wasformulated to get feedback on the training, but users often gave commentson the actual system as well. The survey is found as appendix A. I usedthese surveys to get a better understanding of end users’ perceptions ofboth the training and the software.
A survey was also handed out to the participants of the “DHIS2Academy” workshop, giving valuable information from the participantsthere. This survey along with a summary of the responses can be found asappendix B.
Electronic Communication
Electronic communication has been a valuable source of data. Both emailand instant messages between myself and the staff at CHIM, managers inGHS and with the DHIS2 developers, and also communication with usersin Ghana through the built in feedback and messaging functionality of theDHIS2 software.
Various Documents
Finally, documents on various aspects of the DHIS2 implementation inGhana has been valuable. This includes documents from the GHS, GHSpartners, the Ministry of Health in Liberia, and the University of Oslo.
32

Chapter 4
Background
In this chapter, I will give some background information on different topicsthat are relevant for this thesis. I start by providing details on the HealthInformation System Programme (HISP), before zooming in on the WestAfrican region, Liberia, Ghana and the Ghana Health System.
4.1 HISP
The Health Information Systems Project (HISP) has its roots in post-apartheid South Africa in the second half of the 1990s. It started as acollaboration between researchers at the universities of Oslo and CapeTown, and the aim was to develop a software to support a district-basedhealth information system in South Africa (Braa and Hedberg, 2002). Theresult was the District Health Information Software (DHIS), a MicrosoftAccess-based system developed through close user participation. Fromthe beginning, research in HISP has been built upon participatory actionresearch (Braa and Hedberg, 2002).
After DHIS version 1 became the national standard in South Africain 1999, HISP piloted and implemented the software in other developingcountries. In 2004, work on DHIS2 began, spurring further growth. HISPis today a loose network of researchers, universities, implementers andindividuals, with several “nodes” across the world (Sæbø et al., 2011b).Among the main nodes are the ones at the University of Oslo, in SouthAfrica, Vietnam and India (Sæbø et al., 2009).
The HISP group at the University of Oslo made an agreement with thegovernment of Ghana, through the Ghana Health Service in 2010, underwhich the University agreed to support the implementation of DHIS2 inGhana. My visits to Ghana have been as a part of this agreement.
4.2 West Africa
West Africa is a diverse region, with different peoples, climate, history andcolonial heritage. Sixteen countries are normally regarded as making upthe West African region: Benin, Burkina Faso, Cape Verde, Côte d’Ivoire,
33

The Gambia, Ghana, Guinea, Guinea-Bissau, Liberia, Mali, Mauritania,Niger, Nigeria, Senegal, Sierra Leone, and Togo (Encyclopaedia BritannicaOnline, n.d.[b]). In total, 300 million people live in West Africa, half of themin Nigeria. Due to their colonial heritage, all of these countries have eitherFrench, English or Portuguese as an official language. Politically, somecountries have been peaceful for decades, others, notably Sierra Leoneand Liberia, were ravaged by civil wars lasting into the 2000s. Coupsare still endemic in parts of West Africa, while relatively free and stabledemocracies have developed in other countries.
Figure 4.1: Map of West Africa. From World of Maps (n.d.[a]).
With regard to economic development, the differences are also substan-tial. Using the common measure of Gross Domestic Product (GDP) perCapita, West Africa scores low in general, with figures (2010) ranging froma low of 219 USD in Liberia to 3244 USD in Cape Verde (United NationsStatistics Division, 2012). Looking at the development status more broadly,using the Human Development Index (HDI), West Africa is the lowest scor-ing region in the world. Only Nigeria, Ghana and Cape Verde is categor-ised as “average” countries, the rest are in the lowest category (United Na-tions Economic Commission for Africa, 2010). While there have been im-provements since the turn of the century, West Africa is still lagging farbehind in terms of development. Mali and Cape Verde are the only WestAfrican countries not below the average for Africa in terms of access tohealth services (United Nations Economic Commission for Africa, 2010).
All West African states except Mauritania are members of the EconomicCommunity of West African States (ECOWAS). The purpose of is topromote economical integration (The Economic Community of WestAfrican States, n.d.). However, ECOWAS also has an agency for healthrelated work, the West African Health Organisation (WAHO). Sincebecoming operational in 2000, WAHO aims to be “a proactive instrumentof regional health integration” in West Africa (West African HealthOrganisation, n.d.).
34
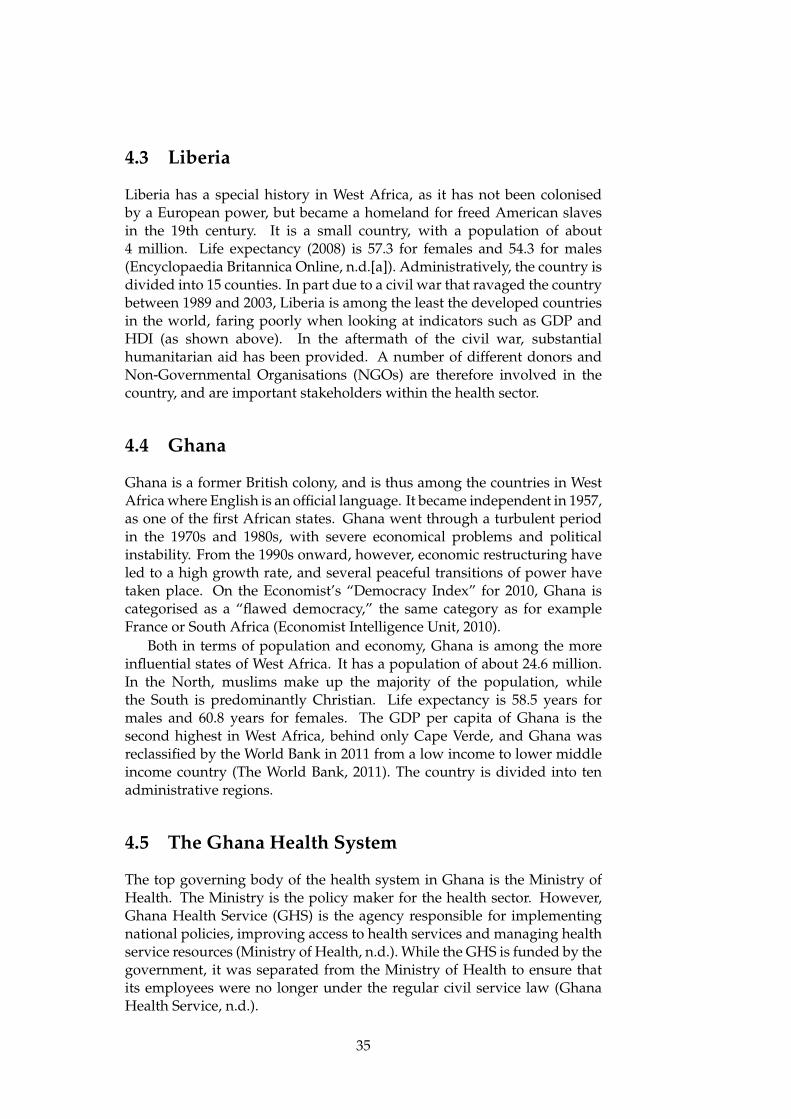
4.3 Liberia
Liberia has a special history in West Africa, as it has not been colonisedby a European power, but became a homeland for freed American slavesin the 19th century. It is a small country, with a population of about4 million. Life expectancy (2008) is 57.3 for females and 54.3 for males(Encyclopaedia Britannica Online, n.d.[a]). Administratively, the country isdivided into 15 counties. In part due to a civil war that ravaged the countrybetween 1989 and 2003, Liberia is among the least the developed countriesin the world, faring poorly when looking at indicators such as GDP andHDI (as shown above). In the aftermath of the civil war, substantialhumanitarian aid has been provided. A number of different donors andNon-Governmental Organisations (NGOs) are therefore involved in thecountry, and are important stakeholders within the health sector.
4.4 Ghana
Ghana is a former British colony, and is thus among the countries in WestAfrica where English is an official language. It became independent in 1957,as one of the first African states. Ghana went through a turbulent periodin the 1970s and 1980s, with severe economical problems and politicalinstability. From the 1990s onward, however, economic restructuring haveled to a high growth rate, and several peaceful transitions of power havetaken place. On the Economist’s “Democracy Index” for 2010, Ghana iscategorised as a “flawed democracy,” the same category as for exampleFrance or South Africa (Economist Intelligence Unit, 2010).
Both in terms of population and economy, Ghana is among the moreinfluential states of West Africa. It has a population of about 24.6 million.In the North, muslims make up the majority of the population, whilethe South is predominantly Christian. Life expectancy is 58.5 years formales and 60.8 years for females. The GDP per capita of Ghana is thesecond highest in West Africa, behind only Cape Verde, and Ghana wasreclassified by the World Bank in 2011 from a low income to lower middleincome country (The World Bank, 2011). The country is divided into tenadministrative regions.
4.5 The Ghana Health System
The top governing body of the health system in Ghana is the Ministry ofHealth. The Ministry is the policy maker for the health sector. However,Ghana Health Service (GHS) is the agency responsible for implementingnational policies, improving access to health services and managing healthservice resources (Ministry of Health, n.d.). While the GHS is funded by thegovernment, it was separated from the Ministry of Health to ensure thatits employees were no longer under the regular civil service law (GhanaHealth Service, n.d.).
35

Figure 4.2: Map of Ghana. From World of Maps (n.d.[b]).
36

Administratively, the Ghanian health system has four sub-nationallevels: regions, districts, sub-districts and community (Ghana HealthService, n.d.). The districts and regions are common for the whole publicsector, whilst the sub-districts are unique to the health sector. The sub-districts are generally not staffed, and the sub-district “office” is usuallya designated health facility in that area. At the community level, a1999 initiative for “Community-based Health Planning and Services” wasintroduced, where the country is divided into zones served by communityhealth workers (Nyonator et al., 2005). However, not all the demarcatedzones are yet functional.
In terms of health information, the data flow generally follows thehierarchy of the health system. Facilities and CHPSs report to the sub-districts, where data is compiled. From the sub-districts, both the compileddata and the individual reports from facilities are sent to the district level,where it is compiled again. From the districts, some data is sent directly tothe national level and some through the regions.
At the national level, the Centre for Health Information Management(CHIM) is responsible for data collection and management in the GHS.CHIM is under the Information Monitoring Evaluation (IME) departmentof the Policy Planing Monitoring and Evaluation (PPME) division. It hasa staff of about 15 people, and is lead by the chief biostatistical officer ofGHS.
37

38

Chapter 5
Evaluation of the Ghana HIS
From April 2012 Ghana started using DHIS2 as a core part of the nationalhealth information system. To understand the consequences of thisintroduction, it is important to know how the previous system worked atthe various levels, how information was collected and used, the system’sstrengths and weaknesses. In this section, I present the empirical data onthis topic. This evaluation is partly based on knowledge I have gatheredthrough working on the DHIS2 implementation in Ghana over manymonths. The primary source of data, however, is from the WAHO HISevaluation I took part in.
I will start by looking at the development of an integrated reportingsystem in Ghana the last 20 years. Then, I describe the current data flow,before looking at how the current HIS works at the national and sub-national levels.
5.1 A Recent History of Integrated HIS in Ghana
The roots of health data collection in Ghana are long and strong. Campbell,Adjei and Heywood (1996) reports that even in the 1990s, Ministry ofHealth reports dating from the 1920s could be found. In more recentyears, an attempt to make an integrated management information systemstarted in the early 1990s. This was a paper based system meant tointegrate and streamline reporting requirements, and improve the useof information. An essential dataset was developed, as well as self-assessment and feedback reports to help users at the lower levels reviewtheir performance (Campbell, Adjei and Heywood, 1996). The long termgoal was an improvement in health service delivery.
This system was piloted in three regions in the first half of the 1990s,but it failed to scale into a national system (Campbell, Adjei and Heywood,1996). Thus in the second half of the 1990s, the situation was one in whicha large number of different and often overlapping forms were used, somenational and some regional.
Work began in 2002 on a new integrated HIS, called the DistrictWide Computer Assisted Management System (DWICAMS). The work onDWICAMS was led by CHIM. The system was piloted in a total of 20
39
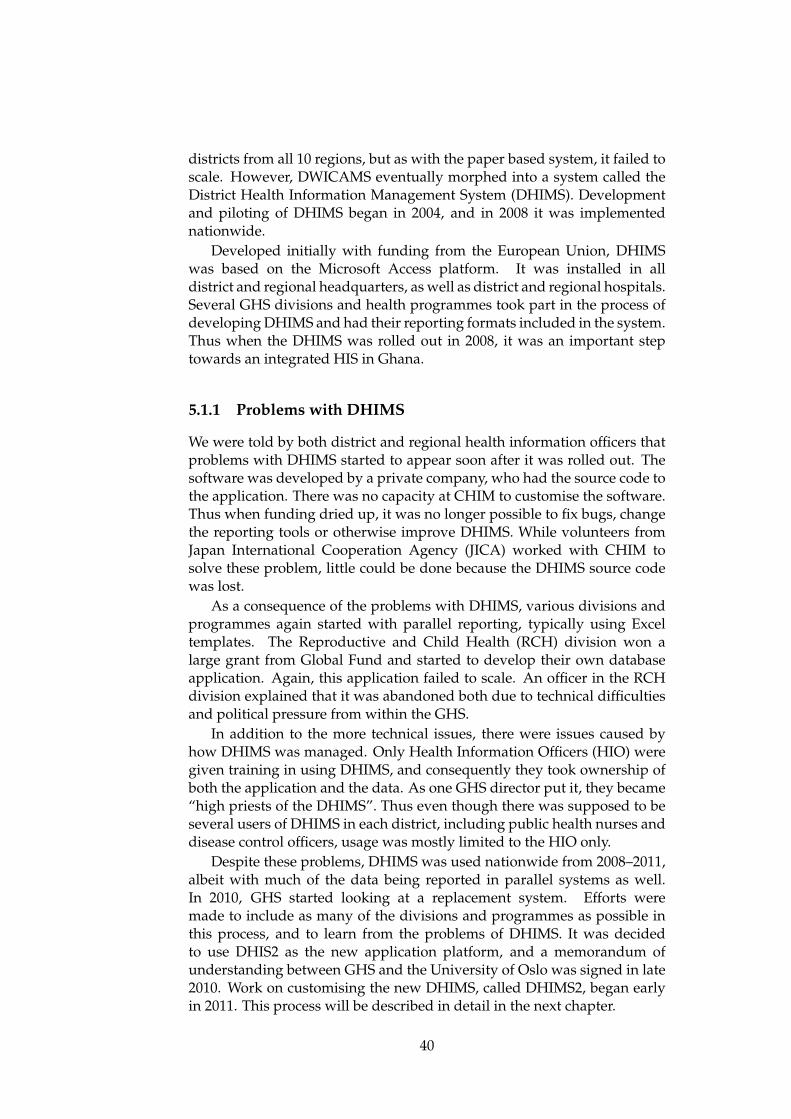
districts from all 10 regions, but as with the paper based system, it failed toscale. However, DWICAMS eventually morphed into a system called theDistrict Health Information Management System (DHIMS). Developmentand piloting of DHIMS began in 2004, and in 2008 it was implementednationwide.
Developed initially with funding from the European Union, DHIMSwas based on the Microsoft Access platform. It was installed in alldistrict and regional headquarters, as well as district and regional hospitals.Several GHS divisions and health programmes took part in the process ofdeveloping DHIMS and had their reporting formats included in the system.Thus when the DHIMS was rolled out in 2008, it was an important steptowards an integrated HIS in Ghana.
5.1.1 Problems with DHIMS
We were told by both district and regional health information officers thatproblems with DHIMS started to appear soon after it was rolled out. Thesoftware was developed by a private company, who had the source code tothe application. There was no capacity at CHIM to customise the software.Thus when funding dried up, it was no longer possible to fix bugs, changethe reporting tools or otherwise improve DHIMS. While volunteers fromJapan International Cooperation Agency (JICA) worked with CHIM tosolve these problem, little could be done because the DHIMS source codewas lost.
As a consequence of the problems with DHIMS, various divisions andprogrammes again started with parallel reporting, typically using Exceltemplates. The Reproductive and Child Health (RCH) division won alarge grant from Global Fund and started to develop their own databaseapplication. Again, this application failed to scale. An officer in the RCHdivision explained that it was abandoned both due to technical difficultiesand political pressure from within the GHS.
In addition to the more technical issues, there were issues caused byhow DHIMS was managed. Only Health Information Officers (HIO) weregiven training in using DHIMS, and consequently they took ownership ofboth the application and the data. As one GHS director put it, they became“high priests of the DHIMS”. Thus even though there was supposed to beseveral users of DHIMS in each district, including public health nurses anddisease control officers, usage was mostly limited to the HIO only.
Despite these problems, DHIMS was used nationwide from 2008–2011,albeit with much of the data being reported in parallel systems as well.In 2010, GHS started looking at a replacement system. Efforts weremade to include as many of the divisions and programmes as possible inthis process, and to learn from the problems of DHIMS. It was decidedto use DHIS2 as the new application platform, and a memorandum ofunderstanding between GHS and the University of Oslo was signed in late2010. Work on customising the new DHIMS, called DHIMS2, began earlyin 2011. This process will be described in detail in the next chapter.
40

5.2 Data Flow
Before going into detail on how the Ghana Health information systemworks at the various levels, I will describe the general flow of data in thesystem. Note that most of the data collection with regard to this chapterwas done while DHIMS was still used, thus there might be some changesnow that DHIMS2 has been rolled out which is not reflected here.
Data collection starts with the registries and tally sheets at the facilities.There are a number of different registers at each facility, typically onefor each service that is provided. At visits in the facilities, I wasshown registries for outpatients, deliveries and inpatients, consulting roomregistries and others. At the hospitals, some of these registers have beencomputerised. In addition, there are tally sheets for some services, tofacilitate the compilation of reports.
Figure 5.1: Studying facility registers in a health centre in Eastern Region.
At the end of each month, or quarter in some cases, summary reportsare made at the facilities. This data is taken directly from the tally sheets, oris tallied from the various registers. Some of these forms are quite simpletables with a count, whilst others involve the calculation of coverages andother indicators.
Data from all facilities are normally summarised into sub-districtreports. Sub-districts are more of an administrative tool than a functioningadministrative office, thus the work of compiling sub-district reports areusually made at a health centre in the sub-district. This was the case in allsub-districts we visited. From the sub-district, both the individual facilityreports and the sub-district reports are sent to the district. An exception isthe district and regional hospitals. They have DHIMS/DHIMS2 installedlocally, and therefore enter their own routine data and send it electronicallyto the districts. The also enter anonymous patient data on inpatient casesand deliveries into DHIMS, in what is called a line listing.
The district level is where these paper reports are computerised.DHIMS is supposed to be the integrated system in which all data isentered. However, most programmes and divisions have their own parallel
41

Figure 5.2: Tallysheet for outpatient cases at a district hospital I visited.The image shows parts of the page for male patients under 1 year. In totalthere are 22 pages like this filled every month for both genders and all agegroups.
systems as well. Thus in the district, data is entered from the paperforms into DHIMS and other parallel systems. For DHIMS, this work wasusually done by the district health information officer, whilst most of thehealth programmes doing parallel reporting have a so-called focal personresponsible for that programme doing its data entry.
From the districts, the DHIMS data was sent to the regional healthdirectorate, where data from all the districts were merged into a regionaldatabase. For the parallel systems, the data flow varies somewhat withregard to whether it is sent through the region or directly to the nationallevel. At the regional level, no changes to the data in DHIMS were allowed- if inconsistencies were discovered, these had to be corrected at the districtlevel after consultations with the facilities, and the data was then re-sentto the region. The regional staff explained that this was a major cause ofdelays.
Once data from all districts in a region was merged, the regionaldatabase was sent to the CHIM office. There, the DHIMS databases fromall the regions were merged into a national database. Data in the parallelsystems are sent to the respective national headquarters.
5.3 HIS at the National Level
In this section, I will look at the status of the Ghana HIS at the nationallevel. I will first look at fragmentation and vertical reporting, secondly theavailability of resources at the national level. Third, I analyse the timelinessand completeness of the national DHIMS database, and finally present theNational Health Insurance Scheme (NHIS).
42

5.3.1 Fragmentation
As mentioned in the previous section, several divisions and programmeswere part of the first integrated DHIMS system. This included importantactors like the Malaria programme, the RCH division and the DiseaseControl division. However, despite being part of the integrated systems,they use parallel reporting systems as well. In interviews, representativesfrom the programmes said the reason for this was that the timeliness andaccuracy of the data in DHIMS was not good enough, as well as the otherissues with DHIMS discussed above - notably that there was no capacity toaffect changes on the data collections tools.
With the new DHIMS2 being implemented from 2012, several pro-grammes that were not in the DHIMS also participate, for example theNational Aids Control Programme (NACP) and the Tuberculosis (TB) Pro-gramme. However, despite the fact that essentially all divisions and pro-grammes participate in DHIMS2, most express that the parallel report-ing will continue until DHIMS2 has been proven to work consistently.One manager in the immunisation programme explained that the data inDHIMS2 will only be used as a validation tool against their excel reportingsystem for now, and only when the data is timely and equal to the Excelsystem will they consider stopping the parallel reporting.
One officer working on the DHIMS2 implementation told me onseveral occasions that he had a feeling that many of the programmeswant the system to fail, since they have all the resources they need to runparallel systems of their own. Programmes working with issues such asmalaria, HIV/AIDS, child health and immunisation are often relativelywell-resourced and can therefore afford to have vertical reporting systems.That is not necessarily the case with those working in areas that havereceived less attention from donors, however. The nutrition departmenttold us that they looked forward to the new system, which has their datacollection form included. They have not had the resources to do parallelreporting, and consequently had to rely on others to get the data they need.
A good illustration of the attitude of some of the programmes wasgiven by an officer working in the immunisation programme. He explainedthat the Disease Control division had decided to build a new office blockthat would house all the programmes under that division. Today onlythe skeleton of the building is ready, and no work has been done for thelast three years due to disagreements on funding. In the meantime, theNACP programme has spent its own money to build a new office for itself.He argued this was similar to the situation with reporting systems: if theintegrated system is not to their liking, programmes will build somethingfor themselves rather than trying to make the common system work.
5.3.2 Resources
From the above discussion it is perhaps clear that resources at the nationallevel is unevenly distributed. Some programmes get substantial fundingfrom external donors and are well resourced, in contrast to those relying
43

only on internal funding. A case in point is CHIM, which is in charge ofboth DHIMS and DHIMS2: for periods during the implementation of theonline DHIMS2, there was no internet access at the CHIM office because oflack of funds to pay the internet bill. On at least one occasion during mytime in Ghana, the head of CHIM payed the internet bill out of his ownpocket because getting funding from GHS was slow and difficult. Andduring power black-outs, the staff at CHIM sit in the dark listening to thehum of the generators outside the NACP and Immunisation programmesnext door.
Resource issues also have more direct effects on the running of theHIS. For example, I found that patient registers and other data collectioninstruments have been in shortage in parts of the country due to lack offunding for printing at the national level. And while the staff at CHIM hasbeen strengthened substantially in the last year, funding for monitoringand evaluation as well as review meetings around the country has beenlimited. When I first came to CHIM, the office had just received a car afterbeing without one for a period. This car, originally donated from the GlobalFund, was lent to CHIM by one of the vertical programmes who seeminglyhad more cars than they actually needed.
5.3.3 Timeliness and Completeness of DHIMS data
The various programmes and divisions gave different explanations as towhy they have established parallel reporting systems when we talked tothem. But one of the most common reasons given was that the timelinessand completeness of the DHIMS data was not good enough. Giving exactfigures on how the timeliness of the data is in DHIMS is difficult, but it doesseem as though the data can be up to several months old before it reachesthe national level. When I migrated data from DHIMS to DHIMS2, it wasnot until March that all the 2011 data finally reached CHIM and eventuallyme.
It is also difficult to give an exact figure for the completeness of thedata. While data for the number of reports submitted to DHIMS 2008–2011 is available, it is difficult to know how many reports should have beencompleted. An admittedly very rough estimate based only on the generaltype of facility, not any detailed information on the services they provide,indicate a completeness of 60–70% in 2011 for the most complete datasets.However, when looking at the trend, it is at least clear that the completenessin DHIMS has increased substantially from 2008 to 2011.
5.3.4 The National Health Insurance Scheme
In 2003, the National Health Insurance Scheme (NHIS) was establishedfor the purpose of covering the primary care services in Ghana (NationalHealth Insurance Scheme, n.d.).1 NHIS insurance claims from the wholecountry is sent monthly to the NHIS, which thus sits on a substantial
1Unfortunately, I have not been able to talk to any representative for the NHIS personallywhile in Ghana.
44

amount of data on the morbidity in Ghana. However, there is no linkbetween the NHIS and the data collection done by the GHS, although bothinstitutions collect essentially the same data.
Staff we spoke to in the districts and facilities reported poor coordin-ation between the GHS and NHIS caused the problems. Both institutionsrequire reports based on a set of diagnosis. However, the diagnosis andcodes used are not the same. Because NHIS money is now the main sourceof income for facilities, facilities must make sure the claims are refunded.Thus they must set a diagnosis that is covered by the insurance schemeeven when that is not the specific diagnosis given by the physician. Becausethe diagnosis must be “adapted” to the insurance scheme, data is lost in thereporting done to GHS. One officer explained: “it will be an interesting re-search to look at the changes in the trend of diseases after the introductionof the Diagnostic Related Grouping (DRG) for insurance claims.”
Figure 5.3: vSat dish outside a district hospital in Eastern region.
The NHIS has built up a satellite (vSat) infrastructure connecting theregional and district hospitals across Ghana to a central database (shownon figure 5.3). Despite the resources put into this, the only purpose of thesystem as of today is to check the validity of insurance cards, and the NHIShas instructed the hospitals that the whole system including the connecteddesktop computers should not be used for any other purpose. According tostaff I talked to at different hospitals, patients rarely show up with expiredor false cards. The director of one regional hospital we talked to was veryunhappy with the vSat system, and expressed that he thought it was awaste of resources to build such an expensive infrastructure serving no realpurpose.
5.4 HIS at the Sub-National Levels
I have looked at the situation at the national level, and now continue to thesub-national level: regional and district health directorates, sub-districts,hospitals, health centres and other facilities. How is the situation here interms of human and other resources, how is the quality of the data, and is
45
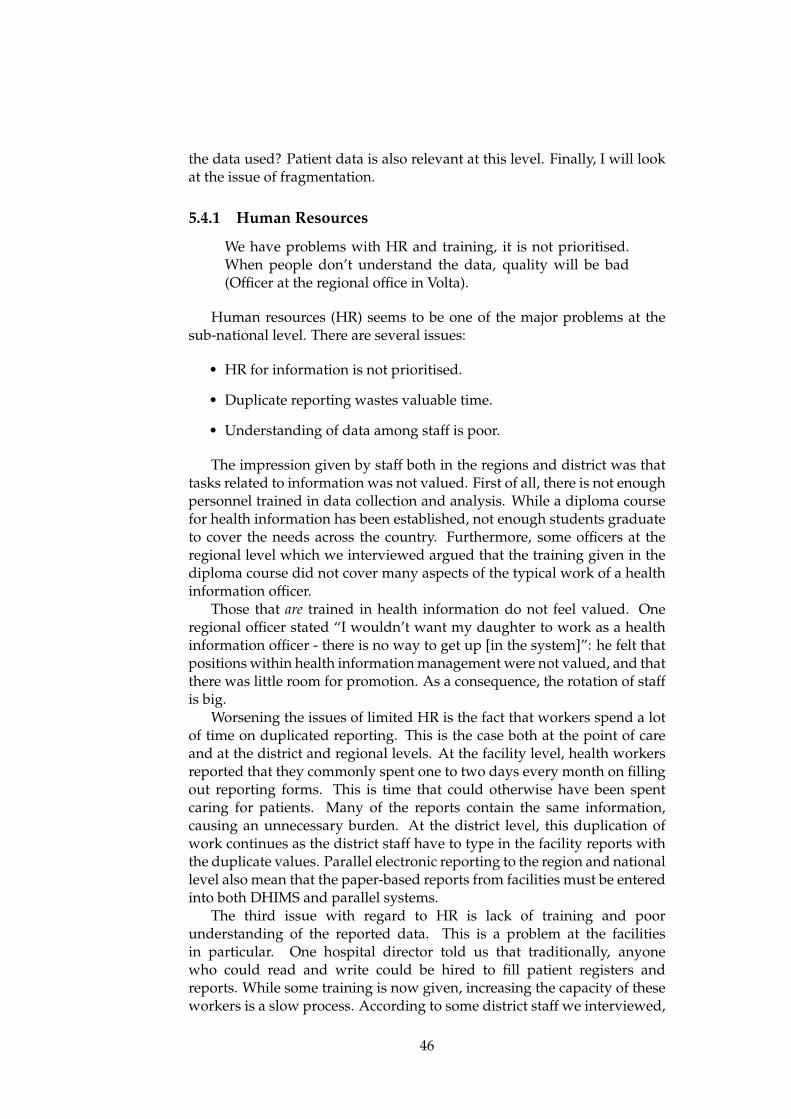
the data used? Patient data is also relevant at this level. Finally, I will lookat the issue of fragmentation.
5.4.1 Human Resources
We have problems with HR and training, it is not prioritised.When people don’t understand the data, quality will be bad(Officer at the regional office in Volta).
Human resources (HR) seems to be one of the major problems at thesub-national level. There are several issues:
• HR for information is not prioritised.
• Duplicate reporting wastes valuable time.
• Understanding of data among staff is poor.
The impression given by staff both in the regions and district was thattasks related to information was not valued. First of all, there is not enoughpersonnel trained in data collection and analysis. While a diploma coursefor health information has been established, not enough students graduateto cover the needs across the country. Furthermore, some officers at theregional level which we interviewed argued that the training given in thediploma course did not cover many aspects of the typical work of a healthinformation officer.
Those that are trained in health information do not feel valued. Oneregional officer stated “I wouldn’t want my daughter to work as a healthinformation officer - there is no way to get up [in the system]”: he felt thatpositions within health information management were not valued, and thatthere was little room for promotion. As a consequence, the rotation of staffis big.
Worsening the issues of limited HR is the fact that workers spend a lotof time on duplicated reporting. This is the case both at the point of careand at the district and regional levels. At the facility level, health workersreported that they commonly spent one to two days every month on fillingout reporting forms. This is time that could otherwise have been spentcaring for patients. Many of the reports contain the same information,causing an unnecessary burden. At the district level, this duplication ofwork continues as the district staff have to type in the facility reports withthe duplicate values. Parallel electronic reporting to the region and nationallevel also mean that the paper-based reports from facilities must be enteredinto both DHIMS and parallel systems.
The third issue with regard to HR is lack of training and poorunderstanding of the reported data. This is a problem at the facilitiesin particular. One hospital director told us that traditionally, anyonewho could read and write could be hired to fill patient registers andreports. While some training is now given, increasing the capacity of theseworkers is a slow process. According to some district staff we interviewed,
46

poor understanding of both information and its importance is especiallya problem among community health workers. However, we also sawduring our visit community health workers who seemed to both use andunderstand their registers and the periodic reports.
5.4.2 Other Resources
When it comes to non-human resources, the issues are similar to those atthe national level, although the resources of the vertical programmes areless prominent. Both regions and districts have limited resources to go onmonitoring and evaluation visits. And because of delays in the printing offorms and registers at the national level, we saw cases where the districtstores were running low of such supplies. Other issues included limitedcomputer hardware and accessories, for example external hard drives forbackup of DHIMS data. The regional and district health directorates wevisited all had some form of internet connection, as did the district andregional hospitals. In health centres and clinics, however, computers werea rare sight.
5.4.3 Data Quality, Timeliness and Completeness
For data to be useful to inform decision making, it has to be timely and ofsufficiently good quality. It also needs to be complete. Timeliness seems tobe a major issue in Ghana. The main delay is not from the facilities, but atthe district or regional level: if there are inconsistencies in the data reported,the facilities must be contacted to reconcile the data. This leads to delays inthe onward reporting to the regional level. Although the districts seem tobe encouraging facilities to have data validation meetings, and the districtsare encouraged to do the same, my impression is that such meetings areoften not held. Another cause of delays was DHIMS, which requires allfacilities or districts to report before data can be sent to the next level. Thiswas discussed in the previous section.
When it comes to completeness, the districts report that they do getreports from most facilities every month, although they are not alwayson time. The exception is the private facilities. While private facilitiesare asked to report to GHS, they cannot be coerced. Many do not report,usually to save money, but in some cases also because they do not want toprovide details of their operations. We were told that on occasion, districthealth directorates have trained staff working at private facilities on datacollection, and there has also been talk of the government paying for staffto work on reporting in private facilities. Reporting from religious facilitiesis generally closer to those that are government owned.
The main impediment to data quality is human resources. Aswas discussed above, understanding among staff at the lowest level issometimes lacking, and combined with high reporting requirements thismeans that data quality suffers. Sometimes, negligence can also leadto poor data quality. For example, one regional officer told us of caseswhere during outreach immunisation activities the number of children
47

immunised were not tallied underway, or where the amount of vaccinesbrought to and from the field were not recorded. Finally, as is the case inany paper-based data collection system, there are always chances of errorsbeing introduced through simple calculation errors.
One final issue in terms of data quality is population estimates.Population data is used to calculate many important indicators, forexample immunisation coverages. In the GHS, the lowest level at whichpopulation data is used is the sub-district.2 However, the sub-districtas an administrative unit is exclusive to the GHS, thus there is nosub-district census data available. District staff must estimate the sub-district population based on district population data and facility catchmentpopulations. During visits to district health directorates, we saw examplesof immunisation coverages computed for sub-districts that were far above100%, and this was explained by the difficulty of getting reliable populationfigures.
5.4.4 Data Usage
Data collection serves no purpose unless the data is analysed and theresulting information used for management of the health system. At thefacility level, data is needed for the management of individual patients, andfor following trends in the utilisation, quality and coverage of the providedservices. For higher levels, patient management information is not needed,whilst measuring the impact of the health service becomes increasinglyimportant (Braa and Sahay, 2012).
The paper based system used at the smaller facilities seems to workwell, except the issues of duplication in data collection. Registers werekept for the various departments, and books used to allow follow-upson pregnant women in the communities, children in the immunisationprogramme, schedules for out-reach visits and so on. While some of thesetasks can be quite cumbersome and time consuming to manage in a paper-based system, the management of patients appear to work quite well: thedata is used.3
Staff at the facilities we visited seemed diligent in tallying the registersand filling the monthly and quarterly reports. Furthermore, tablesand graphs showing trends in for example antenatal coverage andimmunisations were made and displayed on the walls (see figure 5.4).Facilities have quarterly review meetings at the sub-district level wherethe performance and issues are presented and discussed. However, whilethis indicates that information is regularly generated and analysed to adegree, it is difficult to assess if it has any impact on the management ofthe individual facilities.
2Some programmes also use facility catchment population, notably the immunisationprogramme.
3The district and regional hospitals have a somewhat different scale and function in thisregard, their specific issues with regard to dealing with patients will be discussed in thesection.
48
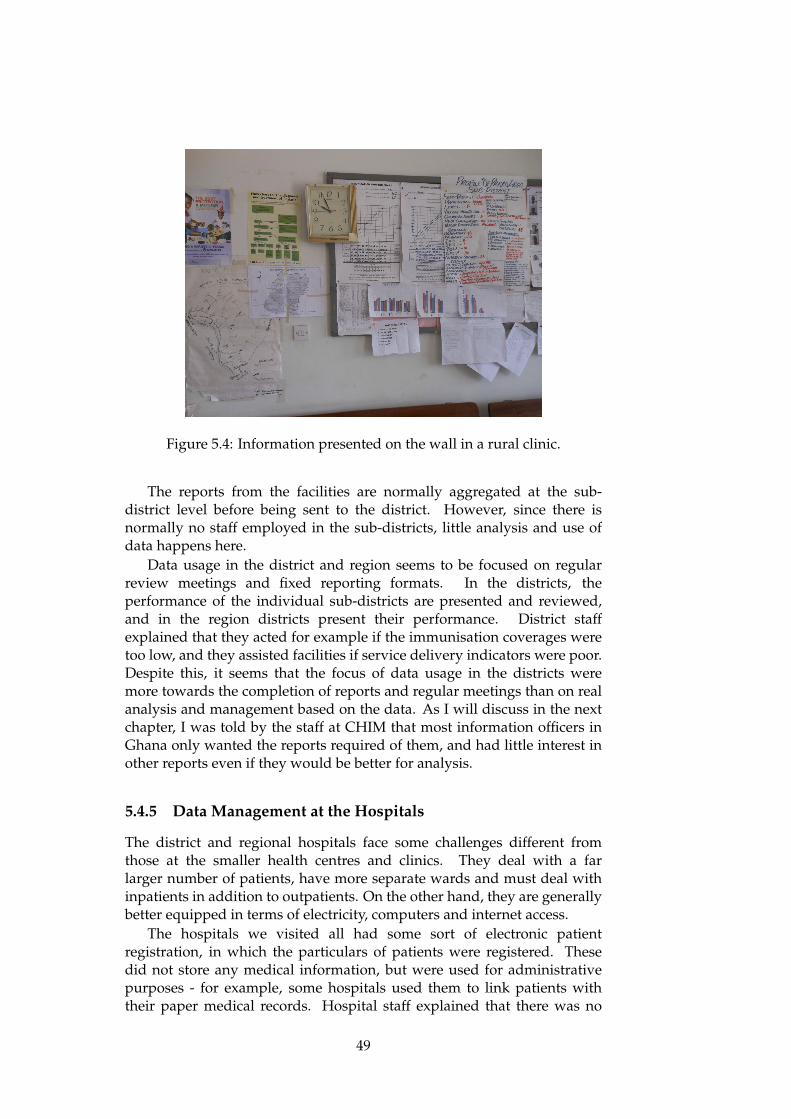
Figure 5.4: Information presented on the wall in a rural clinic.
The reports from the facilities are normally aggregated at the sub-district level before being sent to the district. However, since there isnormally no staff employed in the sub-districts, little analysis and use ofdata happens here.
Data usage in the district and region seems to be focused on regularreview meetings and fixed reporting formats. In the districts, theperformance of the individual sub-districts are presented and reviewed,and in the region districts present their performance. District staffexplained that they acted for example if the immunisation coverages weretoo low, and they assisted facilities if service delivery indicators were poor.Despite this, it seems that the focus of data usage in the districts weremore towards the completion of reports and regular meetings than on realanalysis and management based on the data. As I will discuss in the nextchapter, I was told by the staff at CHIM that most information officers inGhana only wanted the reports required of them, and had little interest inother reports even if they would be better for analysis.
5.4.5 Data Management at the Hospitals
The district and regional hospitals face some challenges different fromthose at the smaller health centres and clinics. They deal with a farlarger number of patients, have more separate wards and must deal withinpatients in addition to outpatients. On the other hand, they are generallybetter equipped in terms of electricity, computers and internet access.
The hospitals we visited all had some sort of electronic patientregistration, in which the particulars of patients were registered. Thesedid not store any medical information, but were used for administrativepurposes - for example, some hospitals used them to link patients withtheir paper medical records. Hospital staff explained that there was no
49
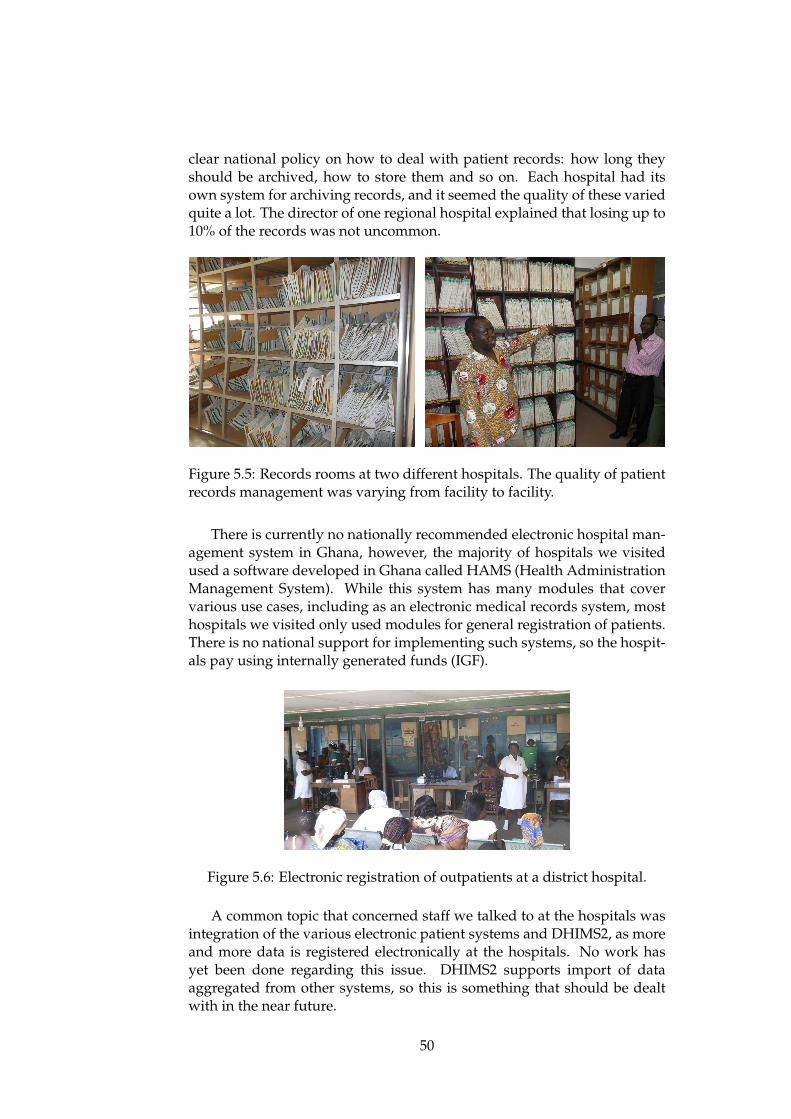
clear national policy on how to deal with patient records: how long theyshould be archived, how to store them and so on. Each hospital had itsown system for archiving records, and it seemed the quality of these variedquite a lot. The director of one regional hospital explained that losing up to10% of the records was not uncommon.
Figure 5.5: Records rooms at two different hospitals. The quality of patientrecords management was varying from facility to facility.
There is currently no nationally recommended electronic hospital man-agement system in Ghana, however, the majority of hospitals we visitedused a software developed in Ghana called HAMS (Health AdministrationManagement System). While this system has many modules that covervarious use cases, including as an electronic medical records system, mosthospitals we visited only used modules for general registration of patients.There is no national support for implementing such systems, so the hospit-als pay using internally generated funds (IGF).
Figure 5.6: Electronic registration of outpatients at a district hospital.
A common topic that concerned staff we talked to at the hospitals wasintegration of the various electronic patient systems and DHIMS2, as moreand more data is registered electronically at the hospitals. No work hasyet been done regarding this issue. DHIMS2 supports import of dataaggregated from other systems, so this is something that should be dealtwith in the near future.
50

5.4.6 Fragmentation
Fragmentation was discussed at length above with regard to the nationallevel. Is the situation similar at the lower levels? Generally, each pro-gramme has an appointed focal person in each region and districts, respons-ible for tasks related to that programme - including health information. Atthe district level, one person is often focal person for more than one pro-gramme at the same time.
Cooperation between the focal persons was reported to be good in thedistricts and regions. One regional officer explained that while problemswith cross-programme cooperation at the national level was mostly due topolitics, any problems that might occur at the lower levels were likely to befor personal reasons.
Health information staff at the district level expressed that they weretired of the duplicate work caused by the vertical reporting. In areas suchas RCH, malaria control and immunisation, data must be entered both inDHIMS and in the vertical systems. There were fears that this problemwould even increase with DHIMS2, because more programmes have theirdatasets included.
51

52

Chapter 6
Implementing DHIS2 in Ghana
In this chapter, the process of implementing DHIS2 in Ghana will bepresented. I will start by giving a description of the DHIMS and DHIS2software, before a brief overview of the implementation process will begiven. Some of the challenges of customising DHIMS2 will then bepresented, followed by the process of setting up a server, discussions aboutpiloting and the training of users around the country. The process ofmigrating data from DHIMS to DHIMS2 will then be discussed. Finally,I look at the experiences from the first weeks of usage after the nationwideimplementation.
Note that I use DHIS2 when discussing the software, and DHIMS2when discussing the Ghanian systems based on DHIS2.
6.1 The Software
This section will give an introduction to both the DHIS2 and the originalDHIMS software, with the main focus on DHIS2. Having some backgroundknowledge on this topic is important in order to understand the issues thatwill be discussed later in the chapter.
6.1.1 DHIS2
Before going into the technical details of DHIS2, a brief history of DHIS canbe useful. Development of the first version of DHIS started in South Africain the second half of the 1990s. It was developed with heavy involvementfrom end users, and the goal was to make it as flexible as possible (Braa andHedberg, 2002). It was based on Microsoft Access, and was thus limitedto standalone, offline installations. However, data could be exported andimported between databases. Development of DHIS2 started in 2004, ledfrom the University of Oslo rather than South Africa. The goal was to createa version of DHIS that was built on modern technologies, was database-and platform-independent, and that was web based - even though it wouldalso work in offline installations (Staring and Titlestad, 2006).
53
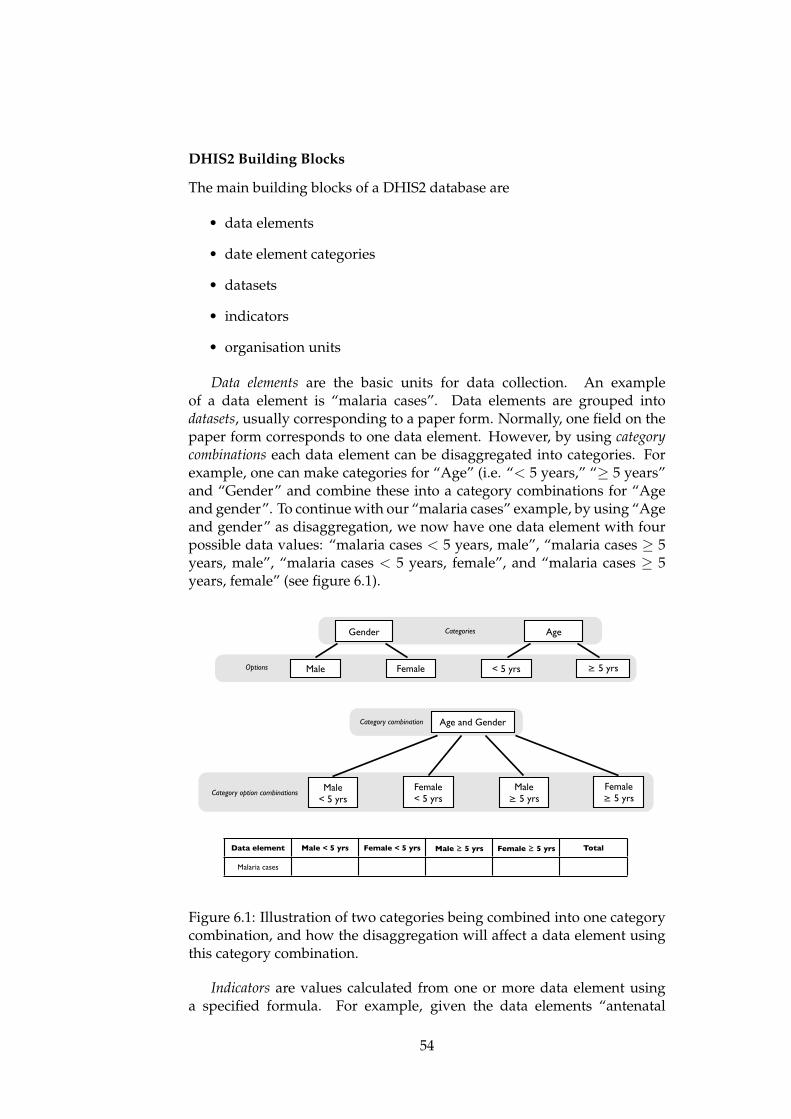
DHIS2 Building Blocks
The main building blocks of a DHIS2 database are
• data elements
• date element categories
• datasets
• indicators
• organisation units
Data elements are the basic units for data collection. An exampleof a data element is “malaria cases”. Data elements are grouped intodatasets, usually corresponding to a paper form. Normally, one field on thepaper form corresponds to one data element. However, by using categorycombinations each data element can be disaggregated into categories. Forexample, one can make categories for “Age” (i.e. “< 5 years,” “� 5 years”and “Gender” and combine these into a category combinations for “Ageand gender”. To continue with our “malaria cases” example, by using “Ageand gender” as disaggregation, we now have one data element with fourpossible data values: “malaria cases < 5 years, male”, “malaria cases � 5years, male”, “malaria cases < 5 years, female”, and “malaria cases � 5years, female” (see figure 6.1).
Gender
Female
Age
Male ≥ 5 yrs< 5 yrsOptions
Categories
Age and GenderCategory combination
Female< 5 yrs
Male < 5 yrs
Female≥ 5 yrs
Male≥ 5 yrs
Category option combinations
Data element Male < 5 yrs Female < 5 yrs Male ≥ 5 yrs Female ≥ 5 yrs Total
Malaria cases
torsdag 10. mai 12
Figure 6.1: Illustration of two categories being combined into one categorycombination, and how the disaggregation will affect a data element usingthis category combination.
Indicators are values calculated from one or more data element usinga specified formula. For example, given the data elements “antenatal
54

registrants” and “antenatal visits,” we can create an indicator for “averageantenatal visits per registrant” by dividing “antenatal visits” by “antenatalregistrants”. Finally, organisation units are the facilities, districts and so onthat make up the organisational hierarchy of a given country. They arelinked to each other to form a tree, with the country as the root.
Organisation of Data and Metadata
Data is stored in the DHIS2 database independently of the datasets(reporting forms). This means that the same data element can be usedin several datasets, and data entered in one of them will appear in allthe others. It also means that datasets can be added, changed or deletedwithout affecting the stored data values, as long as the data elements arenot removed.
Data elements, indicators and organisation units are organised ingroups, to make them easier to find when doing analysis. The groups aregrouped in group sets. Generally, a data element, indicator or organisationunit can be placed in many groups, however, it can only be in one groupper group set.
Aggregation of data in the database is done by a “data mart,” whichstores the aggregated data element and indicator values in the databasefor fast retrieval. Initially, it was possible to aggregate data on the fly asreports were being generated. However, this is no longer possible as itis very resource-intensive, and works poorly in environments where thesystem is used by more than one user at a time. The data mart can be runmanually by an administrator, or be scheduled to run every night. Thelatter approach is used for online installations.
DHIS2 Modules
DHIS2 has many different modules, serving various purposes. I presenthere those most relevant in order to understand the implementationprocess in Ghana.
Perhaps the most important is the data entry module for routine data,where regular data entry takes place. The user selects the organisationunit (facility) he or she wants to enter data for, then selects the datasetand finally the period. The dataset is then displayed for the user to enterdata, as shown on figure 6.2. The data can be immediately validated byusing “validation rules” (explained below) or by auto-generated minimumand maximum values. Upon completing data entry, the user can click a“complete” button to register the dataset as completed. Completeness-reports can then be run based on the number of completed datasets.
For checking the quality of the data, there is a “Data Quality” module.This module lets users run various types of data quality checks, includingchecks based on auto-generated minimum and maximum values, outlieranalysis based on standard deviations, and validation rule analysis.Validation rules are rules configured by the administrators that can be usedduring data entry and for data quality reports (see figure 6.3). Validation
55

Figure 6.2: The data entry screen of DHIS2.
rules use logic to compare data elements and find inconsistencies. Forexample, given the data elements “number of deliveries” and “number ofbabies,” a rule can be created to say that the value in “number of babies”should always be equal to or greater than the “number of deliveries”.
A module for “Name-Based Data Records,” originally called the“Tracker,” has functions for entering and reporting on patient level data.The focus is on tracking patients though programmes with several stages,for example for antenatal care. The module was developed in India tobe used together with DHIS2 Mobile, but is currently not widely usedanywhere. After Ghana requested a way to register anonymous events inDHIS2, this function was added to the Name-Base Data Records module.Data entry for anonymous events work similarly to that of routine data,with the user selecting the organisation unit, dataset and reporting date,and is then shown a form that can be filled in (see figure 6.4).
Next is the reporting module, which includes various types of reports.The simplest report type is the “dataset report,” which summarises dataover time and up the hierarchy of organisation units in the same layout asis used for data entry. The dataset report thus does not allow comparisonof data over time or across organisation units. “Report tables” are a secondtype or report, which are data tables that can be customised to show anydata element, indicators, or completeness value for any organisation unitin any period. Through the use of relative periods and relative organisationunits, the same report table can be re-used by users at different levelsand over time. Output from report tables are shown in DHIS2, but canalso be downloaded to for example Microsoft Excel. Standard reports arereports based on report tables, but with a customised layout which caninclude graphs. See figure 6.5 for an example. They are presented asPDF-files. The customisation of these standard reports are done in a thirdparty application. Report tables and standard reports are shared by all
56
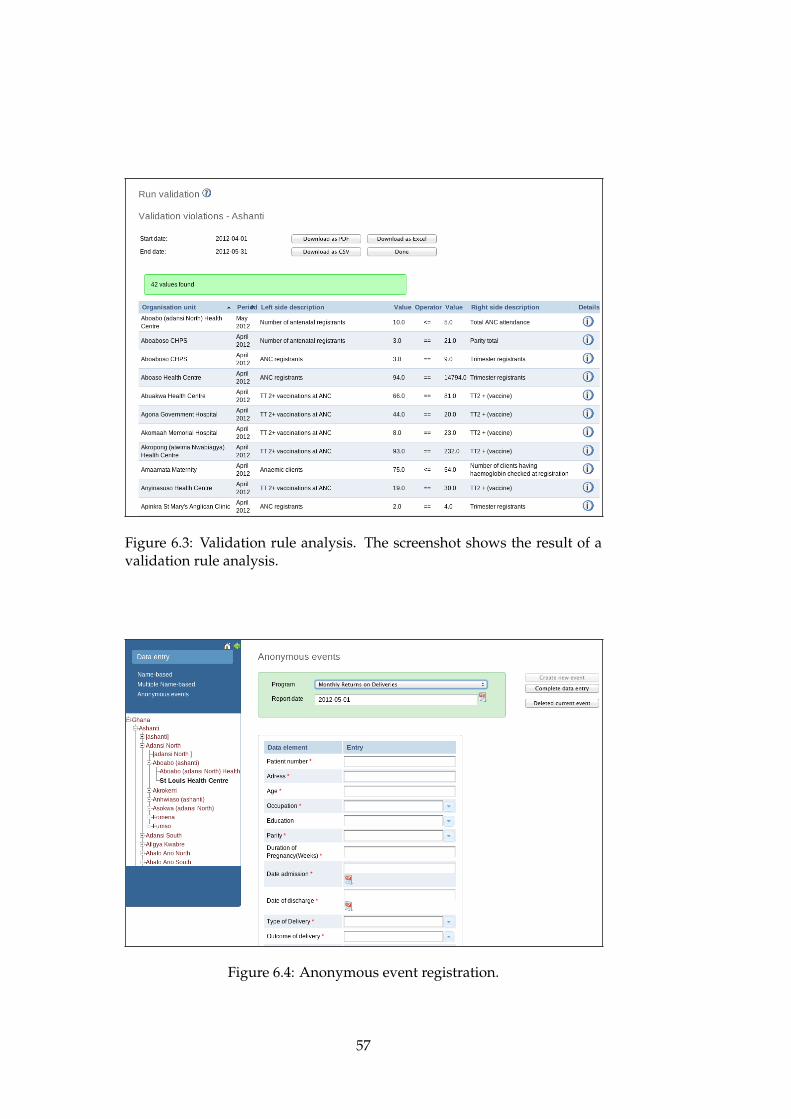
Figure 6.3: Validation rule analysis. The screenshot shows the result of avalidation rule analysis.
Figure 6.4: Anonymous event registration.
57

users of the system, and only users with the right user authorities can add,remove or modify them. There are also functions for creating reporting rate(completeness) reports, for sharing web links and files, and creating simplepivot tables.
Figure 6.5: Example of a standard report.
A module called “Data Visualizer” was introduced in the autumn of2011, allowing any user to create charts for any data in the database (seefigure 6.6). These charts can be saved as favourites for easy retrieval later.For use outside DHIS2, images of the charts can be downloaded.
Figure 6.6: The data visualizer interface.
Finally, a geographical information system (GIS) module allows geo-graphical presentation of the data through maps, granted that there are
58

geographical coordinates associated with the various organisation units(see figure 6.7).
Figure 6.7: The GIS module.
Mydatamart and Excel
In addition to the built-in reporting modules of DHIS2, Microsoft Excelis commonly used for more detailed data analysis. While Excel canconnect directly to the DHIS2 database to retrieve data, this does notwork well in areas with poor internet connectivity. The reason is thatwhen downloading new data from the database with Excel, all data in theexcel file is flushed and everything downloads again, rather than just theupdated values. Mydatamart is a small windows application made to solvethis problem. It serves two purposes: First, it lets the user select specificallywhich organisation units and what periods he or she wants data for, andallows incremental downloads of this data to a local database. Excel canthen connect to this local database instead, where it does not matter that alldata is flushed and reloaded. Secondly, Mydatamart provides an easy-to-use user interface for connecting with DHIS2, shown in figure 6.8.
User Roles
User roles define what authorities users have in the system. The user rolesare completely customisable, and defined by a set of authorities, such as“See Report Module,” “Delete organisation unit” or “Update data value”.
59

Figure 6.8: The Mydatamart application.
They are also linked to datasets, which allows for the creation of user rolesspecific to various health programmes. For instance, a user working forthe Malaria programme can be limited to enter or edit data on the Malariadatasets only by creating a specific user role for the Malaria programme.
6.1.2 DHIMS and DHIS2 - a Comparison
To better understand the challenges of implementing DHIMS2 in Ghana,it is useful to have an understanding of the main differences between theprevious DHIMS software and the DHIS2 software on which DHIMS2 isbased. DHIMS is in some ways similar DHIS1. They are both based onMicrosoft Access, and are intended to be used as decentralised, standalonedatabase applications. However, while both DHIS1 and DHIS2 areflexible, easily customisable and open source, DHIMS is rigid, difficult tocustomise, and currently without any source code available. The flexibilityand customisability of DHIS2 compared to DHIMS is one of the majordifferences, and is a very important issue: lack of flexibility was one ofthe main problems with DHIMS.
DHIS2 is based on web technologies that are very different to those ofDHIMS, and far more modern. In Ghana, the system will be internet-basedand run on one central server. Moving from an offline to an online systemhas several important implications:
60

• Changes made on the central server will automatically be seen by allusers.
• Data is available for all users as soon as it is entered into the system- there is no need to manually transfer data by email or on physicalmedia.
• Use of the system requires internet access.
While the first two points are clearly positive developments, the lattercan cause problems in areas with limited internet coverage.
Improved support for reporting and analysis is another major differ-ence between the two systems. The reporting functionality of DHIMS isvery limited, and attempts to improve it has been hampered by the factthat the source code is not available. DHIS2, on the other hand, has a num-ber of reporting modules, including charts and GIS, and also supports easyloading of data into excel.
6.2 Overview of the Implementation Process
The process of setting up DHIMS2 in Ghana started in earnest in thebeginning of 2011. The organisation unit hierarchy was imported fromDHIMS, and work on customising the system began. Staff at CHIM, theoffice in charge of the implementation, were put together in pairs or groupsand were assigned data collection forms to add to the system.
I was first involved in the process in June 2011, when I visited Ghana fortwo weeks. There was talk that a training of trainers might be held aroundthat time, but as the date approached it became clear that the system wasnot ready for this. Most data collection tools (datasets) had been added,but very little had been done on the reporting side. I was therefore askedto hold training sessions for the CHIM staff in the reporting functionalityof DHIS2 during these two weeks. Although reporting was the main focus,when working with the database I also learnt that more work was left onthe rest of the system than what was anticipated.
For the next months, work on the system continued, focusing primarilyon setting up the data entry functionality properly. The first training ofregional staff was held in late September, and three more regions followedin October. Feedback from the trainings were used in the customisationof the system, which continued in parallel. During the DHIS2 Academy inAccra in November, one of the DHIS2 developers helped clean the databaseof erroneous metadata that had built up during almost a year with lotsof trial and error. By this time, the system was getting close to readyfor rollout, although still little had been done with the reporting. Themain issue that was left was the “line list,” anonymous registrations ofindividual patients. This was not supported by DHIS2 at that stage, but therequirements were discussed with the development team in November.
After the DHIS2 Academy, the metadata in the system was stableenough that work on migrating data from DHIMS to DHIMS2 could begin.
61
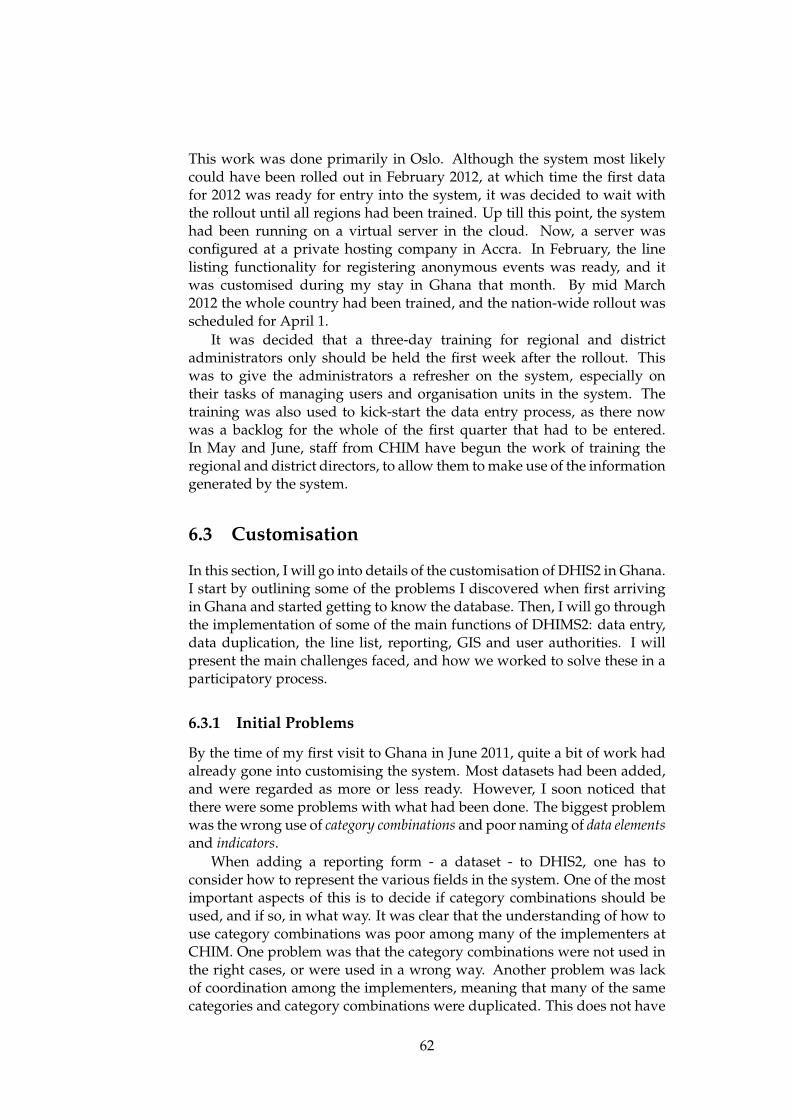
This work was done primarily in Oslo. Although the system most likelycould have been rolled out in February 2012, at which time the first datafor 2012 was ready for entry into the system, it was decided to wait withthe rollout until all regions had been trained. Up till this point, the systemhad been running on a virtual server in the cloud. Now, a server wasconfigured at a private hosting company in Accra. In February, the linelisting functionality for registering anonymous events was ready, and itwas customised during my stay in Ghana that month. By mid March2012 the whole country had been trained, and the nation-wide rollout wasscheduled for April 1.
It was decided that a three-day training for regional and districtadministrators only should be held the first week after the rollout. Thiswas to give the administrators a refresher on the system, especially ontheir tasks of managing users and organisation units in the system. Thetraining was also used to kick-start the data entry process, as there nowwas a backlog for the whole of the first quarter that had to be entered.In May and June, staff from CHIM have begun the work of training theregional and district directors, to allow them to make use of the informationgenerated by the system.
6.3 Customisation
In this section, I will go into details of the customisation of DHIS2 in Ghana.I start by outlining some of the problems I discovered when first arrivingin Ghana and started getting to know the database. Then, I will go throughthe implementation of some of the main functions of DHIMS2: data entry,data duplication, the line list, reporting, GIS and user authorities. I willpresent the main challenges faced, and how we worked to solve these in aparticipatory process.
6.3.1 Initial Problems
By the time of my first visit to Ghana in June 2011, quite a bit of work hadalready gone into customising the system. Most datasets had been added,and were regarded as more or less ready. However, I soon noticed thatthere were some problems with what had been done. The biggest problemwas the wrong use of category combinations and poor naming of data elementsand indicators.
When adding a reporting form - a dataset - to DHIS2, one has toconsider how to represent the various fields in the system. One of the mostimportant aspects of this is to decide if category combinations should beused, and if so, in what way. It was clear that the understanding of how touse category combinations was poor among many of the implementers atCHIM. One problem was that the category combinations were not used inthe right cases, or were used in a wrong way. Another problem was lackof coordination among the implementers, meaning that many of the samecategories and category combinations were duplicated. This does not have
62

any impact on data collection, but makes it difficult to compare the datawhen doing analysis. Consequently, we had to put quite a lot of time intoresolve these problems.
The naming of data elements and indicators was the other majorproblem I found. First of all, there was no agreed-upon standard forcreating names. Thus some data elements had names with symbols like< > =, others used different words like “less than,” “below” and so on.Furthermore, many data elements had been given long prefixes to thenames of the dataset they belonged to. This was done to make it easierto keep track of the data elements in the system, but a side effect was tomake the names very long and difficult to use for analysis purposes.
Indicators and data elements in DHIS2 have a short name property,which is used instead of the full name in many report modules. As thename indicates, it should reflect the name of the data element or indicator,but in a shortened form - 25 characters or less. Short names are mandatorywhen creating data elements and indicators, but the short names used inGhana were in many cases impossible to decipher, even by the person whocreated them. Making reports with these was therefore impossible, andtime had to go into rectifying this as well. The staff at CHIM explainedthat they did not know what the short names where used for, and thereforepayed little attention to them.
To improve the issue of naming, I sat down and made some suggestionsfor naming conventions and how various names could be shortened for useas the short name property. I then sat down with the staff at CHIM, and wediscussed these suggestions and made improvements. Once we had anagreed-upon list, it was distributed to everybody at CHIM. This could thenbe used as a guideline when making new names, and when changing theones that had been added but could not be used.
6.3.2 Preparing Data Entry
Communication Problems
No integrated datasets have been developed in Ghana. Instead, eachdivision and programme define their own reporting formats that are usedthroughout the country. These reporting forms are given to the staff atCHIM in electronic format, usually as a Microsoft Word or Excel file. CHIMthen adds the reporting form as a dataset in DHIMS2.
While this process may sound straightforward, there have been quitea few issues. Communication between CHIM and the various healthprogrammes and divisions has been poor. On occasions, we have receiveda reporting format and added it to the system only to realise later that theform sent from the programme was not the latest version. Other times, thestaff at CHIM knew that a dataset in DHIMS2 had been changed, but stillhad problems getting hold of the newest version.
When working on a particular dataset, we often had concerns orquestions about what was meant with some of the fields or how it shouldbe filled. For example if a particular field could be auto-calculated from
63
other values or not. Sometimes the chief biostatistical officer at CHIMcould answer these questions, but in some cases he was not sure or wasnot available. I then suggested on several occasions that we should makea call to someone in the division or health programme responsible for theform and ask them. However, in almost all the cases I was told that thereeither was no one to call, or that the person that could be contacted wasnever available so there was no point trying.
The perhaps best example of the lack of communication occurred aslate as in February 2012. At the end of the last day of training of usersin the Upper West region, all disease control officers were asked to stayin the conference room for a short briefing. Here, a representative fromthe Immunisation programme presented the new immunisation reportingformat to be used in 2012, replacing the two previous forms that had beenadded to DHIMS2. This was the first time we saw this new form, despitethe CHIM and Immunisation programme offices being only a two minutewalk apart.
Customising the Datasets
The data entry interface in DHIS2 can be laid out in two different ways, ina “Section” or “Custom” layout (see figure 6.9 and 6.10). With the sectionlayout, the user specifies one or more sections and adds data elements tothose sections. The system then generates a table layout automatically.With a custom layout, the user specifies the whole layout manually. Thiscan be done either by writing HTML code directly, by using a built-inHTML editor, or by copy and paste from Microsoft Office, OpenOffice orsimilar.
The pros of the custom forms are that they allow the data entry interfaceto mimic the paper forms more exactly, and that they allow use of indicatorsto have, for example, totals appear during data entry. The cons are that theyare more time consuming to create and edit, and, when copied from thirdparty applications such as Excel, produce less efficient HTML code thattakes longer to load. In addition, tables copied from external applicationsare often of fixed width that extends beyond typical screen sizes, and thusrequire horizontal scrolling during data entry. Section forms are easy tomake and edit, and provide a clean and uniform interface. However, theycannot easily be made to mimic paper forms and do not support showingindicators during data entry.
In Ghana, many of the most widely used datasets had totals or othercalculations together with the actual data entry fields. To make a datasetwith totals, it was at this time necessary to create indicators that areequal to a data element.1 Take for example a data element “Polio cases”disaggregated into “Male” and “Female” by using a category combination.To get the figure for the total of “Polio cases” to appear during data entry,an indicator equal to “Polio cases, male” plus “Polio cases, female” mustbe created. However, this indicator is the same as the data element “Polio
1With the current version of DHIS2, this is no longer necessary.
64
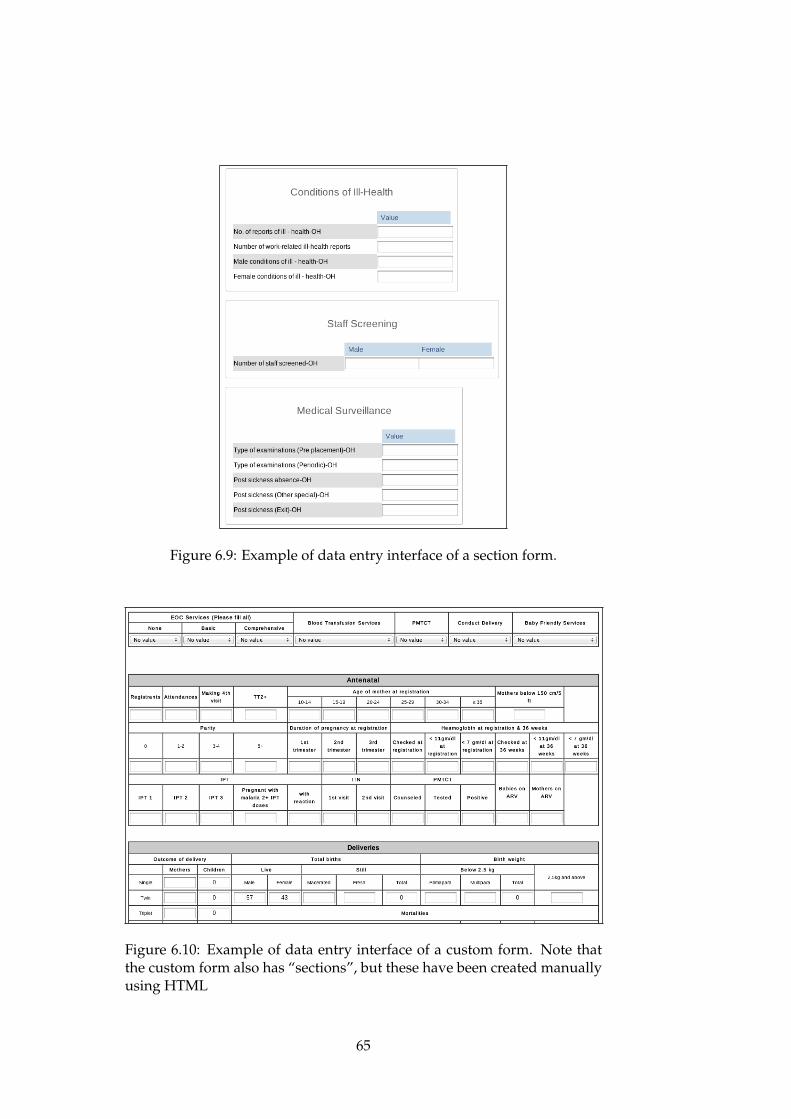
Figure 6.9: Example of data entry interface of a section form.
Figure 6.10: Example of data entry interface of a custom form. Note thatthe custom form also has “sections”, but these have been created manuallyusing HTML
65

cases” without the disaggregation, and it therefore serves no purpose foranalysis: the data element without the disaggregation can be used instead.Having many of these total indicators only makes it more difficult toidentify the indicators that are useful.
There was also initially a misunderstanding among CHIM staff abouthow to create these total indicators: when making the indicator formulas,you can choose to use only one category of the data element, or to use thetotal of all categories (see figure 6.11). To make a total indicator, it is thusoften only necessary to select one object. However, most of the totals inthe Ghana database was initially made by manually summing up all thecategories, in some cases up to 22 of them. Not only was this unnecessary,it also had an impact on the time it took to load the data entry module,because the indicator formulas became very big.
Figure 6.11: Screenshot illustrating how the user can choose between usingonly one category option of a data element, or the total.
After many discussions between myself and the team at CHIM on howbest to address the issue of totals, we decided to suggest to the developersto develop built-in support for totals of category combinations. This featurewas added to the next release of DHIS2. Dozens of unnecessary indicatorscould be deleted from DHIMS2 as a result.
In Ghana, all forms were initially created as custom forms by copyingtables from external applications. Thus they closely resembled the paperforms, and supported the use of indicators. However, I found that manyof the layouts did not function very well on a computer screen, and madedata entry quite slow to load due to the large number of indicators andbloated HTML code. We had many discussions about this at CHIM. Forthe reasons given above, myself and some of the staff argued for changingat least some of the custom forms to use sections, primarily those wherethe section layout would still be similar to the paper form or where thecustom forms were not working well. Others argued that we could notmove away from the custom layout both because managers had promisedall the stakeholders that the data entry would mimic the paper forms, andbecause of concerns that the end users would have problems using it. This
66

discussion went on during several meetings. As a part of this process, Icreated alternative layouts to several of the forms, which we went throughand discussed back and forth, in order to try to identify which could beimproved.
The whole process took a new turn in late August when DHIS 2.4 wasreleased. This version added support for doing data entry offline, usingnew HTML5 standards. The HTML layout for all datasets is stored offlinein the browser so that they are available should the internet connectiondrop. Data can still be entered, and stored locally in the browser. Once theconnection is restored, the user is prompted to upload the newly entereddata to the server (see figures 6.12 and 6.13).
Figure 6.12: Message telling the user he or she is offline.
Figure 6.13: Message telling the user data has been stored in the browserand needs to be uploaded.
Due to the extensive use of custom forms in Ghana, often with bloatedHTML, one of the developers noticed that there simply was not enoughstorage space in the browser cache to store all the forms used in Ghana.Offline data entry would thus not work. Furthermore, downloading all theforms the first time was time consuming, even on a relatively fast internetconnection. For users around the country on slow connections, it would bevery slow. It was later discovered that some of the slowness was a resultof a software bug. However, because we believed the slowness was causedonly by the custom forms and because offline data entry would not work, itwas decided that at least some of them should be changed to use the sectionlayout.
In hindsight, it seems there were three ways we could have changed thedatasets to solve these problems:
• Recreate the datasets with section layout.
• Clean up the custom HTML code.
• Create the datasets from scratch as custom forms with clean HTML.
Since neither the staff at CHIM nor myself had more than a verybasic HTML knowledge, the second option was quickly ruled out. The
67

third option was not really considered: partly because the developersencouraged the use of section layout when possible, and partly becausewe simply didn’t consider it an option at the time. A couple of monthslater, that option was used for several datasets. Consequently, we decidedto identify at least some datasets that could be changed to use a sectionlayout.
The initial criteria when selecting datasets to change was:
• The size of the HTML layout code would be reduced.
• The custom layout did not work well.
• A section layout would still resemble the paper form.
Together, we sat down to identify datasets that met these criteria. Somehad already been made available as section forms during the previousdiscussions, others I quickly redesigned. Thus initially, we changed ahandful of datasets to make offline data entry work. During the next coupleof months, more forms were changed, this time with an improved dataentry interface as the goal.
At the DHIS2 Academy in November 2011, the idea of creating customforms from scratch came up. I sat down to find a free WYSWYG2 editor,and redesigned some of the less user-friendly custom forms. The staff atCHIM liked the result, and I gave them an introduction on how to usethis editor to create custom layouts. As can be seen in the figure 6.14 andtable 6.1, the end result has been that both the total and average size of thedatasets in DHIMS2 has gradually decreased.
0
17,5
35
52,5
70
23. Aug 2011 07. Nov 2011 16. April 2012
23.08.2011 07.11.2011 16.04.2012
Total number of forms 27 33 41
Number of custom forms 23 23 26
Total size in KB (approximate) 1850 1500 1030
Average size 68,5 45,5 25,1
Figure 6.14: Graph showing the size of datasets (in KB) in DHIMS2 overtime
In all, then, getting the datasets into the system has been one of themain challenges with the DHIMS2 implementation. Even though thedatasets were regarded as more or less finished already in June, they
2WYSWYG - What You See is What You Get
68

23/08/2011 07/11/2011 16/4/2012
Total number of forms 27 33 41
Number of custom forms 23 23 26
Total size in KB (approximate) 1850 1500 1030
Average size 68,5 45,5 25,1
Table 6.1: Table showing the size (in KB) of datasets in DHIMS2 over time.
were, in fact, not ready until the end of the year. This has been due totechnical challenges, poor initial training of the implementers, and lack ofcommunication between agencies of the GHS.
6.3.3 Data Duplication
Because the data collection in Ghana has not been integrated, there aremany data elements which are present on more than one form. DHIS2supports using the same data element in several datasets, so that dataentered in one dataset appears in all the others. Thus the data is storedonly once in the database, and an integrated data repository or warehouseis created “behind the scenes”.
As soon as I introduced this linking feature to the staff at CHIM, thisbecame a major focus for them. They wanted to reduce the burden of dataentry personnel by linking data elements across datasets, as they knewhow frustrating the duplicate data collection could be. Together, we satdown and went through some of the datasets where there was data thatcould potentially be linked. In some cases, linking data elements was verystraight forward - the data represented the exact same thing on two or moredatasets, the same categories were used, and the data was collected at thesame interval. However, we found many cases where the definition of thedata element was poorly defined or ambiguous, making it hard to decidewether the data could be linked or not.
Data elements with the same definition but different age groups werealso a common problem. One solution to this is to use indicators. Forexample, let us say we have a situation where one form has the fields“Malaria cases <1” and “Malaraia cases 1–4” and another form has thefield “Malaria cases < 5”. In this case, it is possible to use an indicator topopulate the second form from the first one. However, it is not possible todo it the other way around. That is the main problem with linking of dataelements that have different categories: they only allow data entry fromone of the forms. One of the concerns at CHIM was that this could leadto protests from programmes who had their forms essentially “blocked”for data entry. As soon as the end-users accessed the system at trainings,however, they continuously asked for further linking of data even where itmeant blocking one dataset for data entry. End users also identified severalinstances where additional linking could be done.
69

6.3.4 Line Listing
The original DHIMS was installed at the regional and district hospitals,allowing these facilities to enter anonymous patient data into the system.This was called a line listing, as each patient was registered on one line (seefigure 6.15). Two line listings were used in DHIMS: “In-patient morbidityand mortality” and “Monthly returns on deliveries”. We agreed that it wasimportant to include these into DHIMS2 to avoid a situation where usersin the hospitals had to use both systems in parallel.
Figure 6.15: Line listing interface of DHIMS.
In the spring of 2011, GHS engaged a lecturer at the University ofGhana to work on adding line listing functionality to DHIS2. After afew emails back and forth with HISP at the University of Oslo concerningdocumentation for DHIS2, I was asked to work with this lecturer to helpcoordinate with the main DHIS2 developers. However, I never got anyreply to the mails I sent to him.
At CHIM, the line listing was not initially a topic, since that work hadbeen delegated elsewhere. By October, nothing had been done on theline listing, however, and thus the staff at CHIM and I realised we wouldhave to implement the line listing as well. At the DHIS2 Academy inNovember, two of the CHIM staff and myself sat down with one of theDHIS2 developers to discuss the requirements for the line listing. Thedeveloper would try to have it implemented in time for the rollout ofDHIMS2.
By late January 2012, the new “Anonymous Events” module was ready.During my stay in Ghana in January-Febrary, I sat down with four of theCHIM staff and discussed how we could best implement the two line listingdatasets in DHIMS2. Both datasets presented us with some challenges. Werealised that the paper version of the first line list, “Monthly returns ondeliveries”, had a quite complex way of registering the outcome of births.Consequently, we sat down with the head of CHIM and revised the paperversion of the form, and implemented this new version in DHIMS2.
The other dataset, “In-Patient Morbidity and Mortality returns”, waschallenging in another way. It required a drop-down list of about 1000International Classification of Diseases (ICD) version 10 based diseases,the same as was used in DHIMS. I was eventually able to import this listfrom DHIMS directly in the DHIMS2 database, bypassing the regular userinterface.
While there are some minor issues still outstanding with the anonym-
70

ous events module, for example there is no way to easily edit entries, theline listing was ready for the rollout.
6.3.5 Reporting
I have now looked at the process of configuring data entry in DHIMS2,and in this section the customisation of the reporting functions will bediscussed. An introduction to the reporting in features DHIS2 was givenabove. During the implementation process, new versions of DHIS2 werereleased with new and improved reporting functions. For example, theMydatamart tool was first released in the summer of 2011, and the DataVisualizer in version 2.5 in mid October.
At my first two-week visit to Ghana in June 2011, reporting was themain focus, primarily training of the staff at CHIM on making “standardreports”. Some reports were added to the system during these two weeks,but they had little use beyond being “training material” and were laterremoved. As part of the training, I was asked to make a quite detailedmanual on the process of creating standard reports. This was later mergedwith the partly outdated section on standard reports in the official DHIS2manual.
In the two months from June till I returned to Ghana in August,essentially no new reports had been made. It also became clear to methat few at CHIM actually mastered creating standard reports at this point.When I talked to the staff at CHIM about reporting, they explained thatthey thought the dataset report, which requires no customisation, wouldcover the reporting requirements in Ghana. Although I argued that theother types of reports offered far better options in terms of presenting theinformation in a meaningful way, the answer was that in Ghana the userswould be happy as long as they could get the basic dataset reports theyneeded to submit. I suggested to contact the various health programmesfor feedback on what kind of reports and indicators they were interestedin, but this was never done.
It was not until one of the first end-user trainings that there wasrenewed interest in the standard reports. The reason was talk of whetherthe “RCH Bible” could be added to the system. The “RCH Bible” isa reporting format used by the Reproductive and Child Health (RCH)department all the way from the facility level to the regions. It consists of 21tables, some of which have monthly data and some quarterly. In addition,it is calculated for half years and years. While not all the data required togenerate “the bible” is available in DHIMS2, the majority can be generatedas standard reports. This table has normally been calculated in Excel orby hand, thus having it available as a one-click report was something wethough of as a good way to get buy in from staff working with RCH.
Work on setting up the RCH bible as standard reports was startedby the CHIM staff and myself in free time during the end-user training.We customised the standard reports in plenary sessions, with everyoneworking on one table of the report in parallel, with my computer connectedto a projector so that everybody could follow the process. This allowed us
71

to have both hands-on practice, and get the reports into the system.
A situation in which reports from only one department was includedwas not ideal for a system meant to integrate the whole health system.Participants at some of the training sessions also commented on this. Wetherefore asked them if they could provide us with some report templatesfrom other programmes and divisions, which we could add to the system.However, people were reluctant to give away the templates, and said theywould have to consult their bosses first. Thus in the end, we did not getany new templates to add. Again, I suggested to the staff at CHIM to addsome generic reports that they though could be useful, but this was neverdone. In the end, I have added quite a few reports myself in order to havesomething to show the users both at the training sessions and after therollout.
While the Data Visualizer and GIS module do not require any config-uration, system-wide favourites can be added to give users quick accessto commonly used charts or maps. Again, the staff at CHIM showed littleinterest in adding any favourites, and I ended up creating some to demon-strate for the users.
While not technically a part of the DHIMS2, some work has also goneinto creating Excel templates for use with the Mydatamart application.Initially, Mydatamart did not work with the Ghana database due toproblems with the metadata. This was sorted out in late august, andI created a template to use for demonstrations at the training sessions.Further work on adding more Excel templates was postponed, as there wasmore urgent work left on the rest of the DHIMS2 database.
While in Ghana in Febrary 2012, we had a short training session atCHIM on how to create new Excel templates for use with Mydatamart.Here, we discovered that several indicators did not work as expectedwhen exported to Excel. The problem was primarily caused by indicatorformulas being poorly designed, but also to some degree that they had notbeen grouped in a meaningful way.
During my visit in March, I held a more practical session with the staffat CHIM where we were able to develop several Excel templates. Thesewere kept quite simple, both to simplify the process of making them, butalso to make them easy to understand for end users. We decided that it wasbest to have simple templates that people could make use of easily, andrather add more advanced templates upon request later, or alternatively toteach the end users how to make the templates they require themselves.
One general issue that has made the process of setting up reportingfunctionality more difficult has been the lack of data in the database duringmost of the customisation process. While data can be entered manually totest reports, this is both time consuming and uninspiring, especially sincedata is often required for several data elements, in several organisationunits, over many periods.
72

6.3.6 Geographical Information System
While normally seen as a reporting function, configuration of the geo-graphical information system (GIS) module in DHIMS2 is discussed sep-arately because it has some unique properties. First of all, GIS requiresthat geographical coordinates are available for the organisation units. Bythe time I started working with the Ghana database, there were coordin-ates in the system for all the ten regions, the majority of the districts, butno sub-districts or facilities. However, some of the available coordinateswere wrong, with districts being placed far out in the Bight of Guinea. Atthe DHIS2 Academy in November, the DHIS2 developer working on GIShelped rectify these problems, and was also able to import coordinates forabout 1250 of 3500 facilities in the Ghana database. I travelled with thesame DHIS2 developer to Ghana in March, and during that visit he wasable to store the coordinates for all the remaining districts except one. Thuscurrently, there are coordinates for all regions, all districts except one andfor about one-third of the facilities.
Unfortunately, there are some challenges ahead when it comes to GISand coordinates. First of all, sub-districts are in many ways the primarylevel of analysis for the districts. However, getting coordinates for thesub-districts is difficult. They are an administrative unit exclusive to theGHS, thus unlike coordinates for districts or regions, GHS are on theirown in needing sub-district coordinates. Secondly, I have understoodfrom conversations with district users that the sub-districts change quitefrequently, so having up-to-date coordinates would be a continuousprocess. Districts are more stable, but changes do occur there as well. Ithas recently been decided to increase the number of districts from 170 toover 200, which is likely to require huge changes in DHIMS2 in generaland for the GIS module in particular.
Although there are far more facilities than districts and sub-districtscombined, I believe facility coordinates will be the easiest to obtain. Whileold facilities close and new ones are built regularly, the large majorityremain unchanged over time. A few missing facility coordinates also haveless impact on the usefulness of the GIS than if for example districts aremissing. Furthermore, obtaining facility coordinates can be done by staffat the district using a simple GPS device, for example during monitoringvisits, and the district administrator can personally add the coordinatesinto DHIMS2. According to one officer at CHIM, at least two regions haveor have had the coordinates for all facilities in their area. However, in oneregion, the person sitting on the coordinates have been reluctant to sharethem, and in the other region, the coordinates had simply been lost.
6.3.7 User Authorities
User access to DHIMS2 has been an important issue for GHS. How userroles are set up was discussed in the section on the DHIS2 software. In thissection the focus will be on how the specific user roles in DHIMS2 weredeveloped.
73

Access to DHIS2 is controlled through
• the organisation unit a user is assigned to
• the user role given to a user
What organisation unit or units a user is assigned to is more or lessa given based on where that user is employed. Configuring user roles,however, is less straightforward. A draft of user administration and userroles were made early in the implementation process by two implementersoutside CHIM involved in the initial phases of setting up DHIMS2. Thiswas based on a system with shared user logins, at least initially, and sevendifferent administrative user roles: for each of the national, regional anddistricts level there would be a basic and advanced system administrator,and for “emergency” use there would be a superuser role at the nationallevel. In addition, there would be a supervisor user role in each district,as well as a “health information officer” role and a data entry role. Theseproposed user roles were never implemented in the system.
There were several reasons why a different setup was used in the end.First of all, one of the basic premises for DHIMS2 was that there should beno way to edit data from the regional or national level. The initial proposalallowed the regional administrator to add data entry users, thus making iteasy to bypass this restriction. Secondly, we saw it as more complex thanwhat was necessary, for example having two levels of administrators inthe districts and regions. Thus a new system was developed, shown intable 6.2 below. This setup relies on one separate administrator role at thedistrict, region and national level; a data entry user role; and a user rolewith access to reports. In addition, there is a role for system administratorsand superusers. All users in the system should be personal, not shared ashad been proposed at first.
I had several talks with the directors of PPME, IME and that staff atCHIM on whether or not it would beneficial to have separate data entryuser roles for different programmes and divisions, so that for example onlythe NACP focal person would have access to enter and change the NACPdatasets. In the end, we decided to have only one common user role, forseveral reasons. Letting all users have access to all the data could promotehaving data validation meetings and teamwork in the districts, and helpavoid a situation where one person in the district owned parts of the data. Itwould also make administration of users easier, especially in cases whereone or more user was absent. Furthermore, some data is linked acrossdatasets and even across health programme areas, so there would still bemany situations where users could enter data in datasets they did not haveaccess to. And finally, it would cause questions about who should do dataentry for datasets where there is no focal person, for example nutrition.
6.4 Installation
In parallel with the customisation of DHIMS2, preparations where madefor the rollout. This included discussions on whether or not a fully online
74
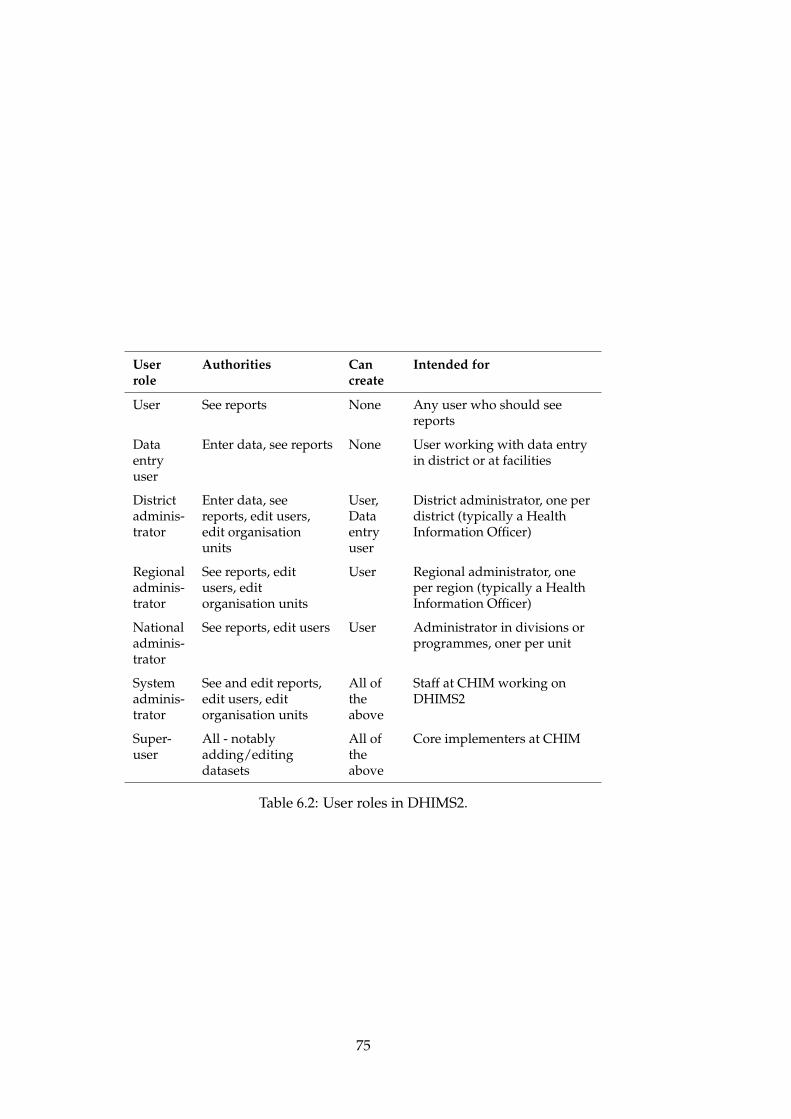
Userrole
Authorities Cancreate
Intended for
User See reports None Any user who should seereports
Dataentryuser
Enter data, see reports None User working with data entryin district or at facilities
Districtadminis-trator
Enter data, seereports, edit users,edit organisationunits
User,Dataentryuser
District administrator, one perdistrict (typically a HealthInformation Officer)
Regionaladminis-trator
See reports, editusers, editorganisation units
User Regional administrator, oneper region (typically a HealthInformation Officer)
Nationaladminis-trator
See reports, edit users User Administrator in divisions orprogrammes, oner per unit
Systemadminis-trator
See and edit reports,edit users, editorganisation units
All oftheabove
Staff at CHIM working onDHIMS2
Super-user
All - notablyadding/editingdatasets
All oftheabove
Core implementers at CHIM
Table 6.2: User roles in DHIMS2.
75

installation would be feasible, and how the system should be hosted.
6.4.1 Central Server or Offline Installations?
As has been explained earlier, DHIS2 can be deployed either online, usingstandalone offline installations, or as a hybrid. The goal in Ghana fromthe beginning was to have an online installation with one central database.Internet access in the country was seen by the GHS as sufficient, andrapidly improving. In an internet access survey of 117 districts made byGHS in July 2010, 18 district reported that they did not have internet access.Not all districts participated, thus the actual number of districts withoutaccess is likely to have been higher. Unfortunately, the report did notindicate whether districts did not have internet access because it was notpossible, or if it was because the district administration had chosen not topay for it.
Because of the uncertainty about internet access in a number of districts,I suggested developing options for using offline installations for districtsunable to connect to DHIMS2 online. However, the director of the IMEdepartment made it clear that no districts should be offline. He explainedthat he had big faith in development of mobile internet access in Ghana,especially with a new operator, Glo, that is expected to launch its operationin Ghana soon. In February 2012, he told me that the GHS was intalks with several internet service providers on how internet access couldbe improved in districts with poor coverage. The options discussedwere improving mobile coverage, using fixed lines or by reviving an oldgovernment Wide Area Network (WAN).
A couple of months into the rollout of DHIMS2, it is still too early to tellwhether internet access has become a major problem or not. There havebeen few complaints in the internal DHIS2 feedback system, however, thatmay not say much as a district without internet access will not have accessto that function. Staff at CHIM have reported that they have received somephone calls about the issue, but not many. Complaints made through thelocal GHS hierarchy might take longer to arrive at the central level.
6.4.2 Server Hosting
Server hosting was another important part of the DHIMS2 implementation.During most of the customisation period, DHIMS2 was running on avirtual server hosted with a commercial company in London, rented bythe HISP group at the University of Oslo. For the rollout, a more powerfulsolution was needed. GHS had already been given a physical server forDHIMS2 as part of an agreement with the U.S.-based Centre for DiseaseControl (CDC), and planned to host this in Ghana. The question was where.
The two main hosting options discussed was a government centrewhich was under development and a private hosting company in Accra.One person at the IME department was given the task of finding the bestoption. It became clear that the government centre could not be used, andinstead “Rack Africa,” a private company, was chosen.
76

The physical server was moved to the hosting company in November2011. A linux-based operating system was installed so that furtherconfiguration could be done remotely over the internet. There was nocapacity in GHS to configure the server further, thus a HISP member withexperience in server hosting was asked to help with the administrationuntil someone could be found locally.
No further work was done on the server until early January 2012. Inthe meantime, the server had been hacked. In a Skype meeting with theperson responsible in IME, the HISP member and myself, it was decidedto reinstall and configure the server properly, and start the process ofobtaining a domain and an SSL certificate.
ghsdhims.org was soon purchased as the domain, and the addresswas soon ready for use. However, the SSL certificate turned out to be aproblem, as the company issuing the certificate spent a long time on theverification process, including sending a third party company to verify thatthe GHS was what it claimed to be. Thus this normally quick process endedup taking about six weeks. As the HISP member configuring the servercommented: “don’t ever let anyone tell you the internet is a neutral spacein which we all participate as equal netizens”, implying that this would nothave happened in a developed country. Despite these problems, the serverwas ready for the rollout April 1.
The server is still administered by the above mentioned HISP member,one of the DHIS2 developers, the person from IME and myself. Mostmaintenance, for example upgrading DHIS2, is done by the former andmyself. There is still no local capacity for this in Ghana, although this wassomething I discussed with the directors of CHIM and PPME during mylast visit to Ghana.
6.5 Piloting
Health information systems are complex, and introducing a large compon-ent like DHIMS2 can have unintended side-effects. There can be issues theimplementers have not thought about, and that will only be discoveredthrough actual use of the system. Because of this, GHS was encouragedby myself and others in HISP to pilot DHIMS2. Especially the offline dataentry functionality was an untested feature at that time, and had not yetbeen widely used elsewhere.
GHS was negative to piloting the system, however. Several reasonswere given. One was that there was no funds for running a pilot. Anotherwas that DHIMS2 was “just a software upgrade” compared to the DHIMSthat was already used. I am under the impression that piloting would senda wrong signal to the various stakeholders, since DHIMS2 had been sold tostakeholders as an upgrade, not a major change.
One of the CHIM staff also told me that his experience with pilotingin Ghana was not good. The primary concern was compensation: withoutcompensation, it would be difficult to persuade users to try a new system inparallel with an old one, but with compensation, colleagues would become
77

jealous.In the end, one of the DHIS2 developers and myself managed to get
a very small “pilot” started during our visit to Ghana in March, with theblessing of CHIM and GHS. This was only two weeks before the rollout. Ahandful of users spread out across the country were contacted and givenaccess to DHIMS2, and asked to start using the system. We told them toreport back on any issues they encountered straight away, so that thesecould be resolved in time for the rollout. The pilot proceeded without anymajor problems, but several smaller issues were identified and resolved.
6.6 Training and Knowledge Transfer
In this section I will discuss issues regarding training and knowledgetransfer. Training of end users is an important part of the implementation.Building local capacity to maintaing and develop the system further isalso critical, and requires the transfer of knowledge from the implementersbased abroad to the local implementers in Ghana.
6.6.1 Training of the Local Implementers
Transfer of knowledge has primarily taken place at CHIM, where theimplementers in Ghana work. The main vehicles of this has been plenarysession held at CHIM, and one-on-one training on particular issues andtopics. I have presented several examples of this in the above sections.Some of the staff has also participated in DHIS2 workshops both in Ghanaand abroad.
Initially, the whole staff at CHIM was part of the development of thesystem, and thus in all trainings related to DHIS2. Over time, however,a core team of five persons developed. These were among the mostexperienced staff at the office, and had been part of the process from thebeginning. They also knew the Ghana health information system well.While the intention of training as many people as possible as implementersand system administration was good, it became obvious that it also had itdownsides. It meant the pace of training at CHIM had to be reduced, andbecause the work was divided between such a large number of people,there was often not enough work for each person to get a thoroughunderstanding of the issues at hand.
As the end-user training begun, it became clear to me that many of theimplementers had limited knowledge of many parts of the system. Thereason was that almost all work before the trainings had been on setting upthe data entry module and adding a handful of reports. As people startedasking questions about how things worked and why the system behavedas it did, new aspects of the system was revealed that the implementers didnot know. Consequently, the end-user trainings helped improve the skillsof the trainers in many important areas.
During the time I spent at CHIM, I held many training sessions withthe staff there, from the first visit in June 2011 to the last one in March
78
2012. These included several sessions on how to make “standard reports,”creating datasets for data entry, excel pivot tables, and also basic server andnetwork administration for use at end user trainings around the country. Ideveloped small written guides for some of these topics, parts of whichwas later added to the official DHIS2 manual. As far as I could tell,however, these guides were never really used, despite many requests tomake additional ones.
As the composition of the implementer group at CHIM changed frombeing a large, inexperienced group to a smaller and more experiencedone, the trainings could progress faster, and it allowed for more practicalexercises. I also tried to increase the amount of practical work during thetrainings because it seemed to be a lot more efficient learning method thanthe combination of demonstrations, lectures and exercises I tried initially.
The DHIS2 Academy, held in Accra November 2011, and the DHIS2Database training, held in Lomé, Togo, April 2012, was important learningopportunities for the local implementers. The Academy and the databasetraining will be discussed in more detail in the next chapter.
6.6.2 Organisation of End User Training
Training of end users was initially planned to start with a trainer of trainersin June. This was delayed when it became clear that the system would notbe ready in time for this. At the same time, it seems there was a changeof plans to use the staff at CHIM as end-user trainers across the country,rather than training a separate set of trainers. The first round of trainingwould focus on users in the districts and facilities responsible for data entry,whilst the district and regional directors as well as users at the nationallevel would be trained later. The trainings were done region by region.
While CHIM became the training institution, neither it nor the GHS ingeneral had funds to hold trainings. Partners were therefore needed tohelp fund and organise the trainings. Funding for the first trainings wereprovided by FOCUS, a programme sponsored by USAID. FOCUS has apresence in three regions of Ghana, Greater Accra, Central and Western,and agreed to organise DHIMS2 trainings in those regions. The fundingexpired by the end of September, setting a deadline for when the traininghad to begin. This had both positive and negative consequences. Havinga deadline for when the system had to be ready increased the speed ofthe work on the system. However, the first users being trained sufferedbecause the system was not completely finished in time.
The fact that CHIM was not involved in organising or planning thetraining caused some problems. Again, this was a problem in the firstregion in particular. For example, it was not clear if CHIM should makethe programme for the training or not. The only information given toCHIM was that there would be two groups being trained, for two and ahalf day each. Furthermore, we assumed there would be internet access atthe hotel where the training was held, since DHIMS2 was on online system.However, there was no internet in the conference facility, and coverage withmodems was poor. Much of the first day of training was consequently
79

wasted. Although we got hold of a desktop to use as a local server forthe second day, this was not configured properly and failed several timesduring the week. Only gradually over the trainings of the first three regionswere the organisational issues resolved.
At the three first trainings, a total of 7 trainers were involved includingmyself. These were the most experienced of the CHIM staff. Seeminglybecause of complaints from the rest of the staff, it was decided that forsubsequent trainings, everybody at CHIM should be involved. A pairof one experienced and one less experienced of the staff should be sentto each of the regional trainings. This concerned the more experiencedstaff at CHIM and myself, as we were concerned this would come at thecost of inadequate end-user training - both the fact that only two personswould facilitating in each region, and that one of these would be amongthe least experienced. The first end-user training had revealed that eventhe most experienced persons at CHIM struggled with many of functionsin DHIMS2 when asked by the users. In the end, the decision was reversed,and only the core team at CHIM was used for the end-user trainings.
As mentioned, the trainings were held in batches, with each batch orgroup being given two and a half days of training. Each group normallyconsisted of 40–50 participants from of 8–10 different districts. In mostregions, there were two such batches, although some had one or threedepending on the number of districts. From each district, one or twopersons from hospitals using DHIMS were present. The participants fromthe district headquarters were usually the health information officer, adisease control officer (representing the disease control division) and apublic health nurse (representing the RCH department).
The original schedule was to have all the ten regions trained by the endof 2011, so that the users would be ready for a January rollout. However,for several reasons, this was not possible:
• “Immunsation week” was held in the end of September/beginningof October, and for a two week period staff at the district healthdirectorates could not leave to participate in the training. Thetrainings in Central and Western regions were therefore pushed backtwo weeks from when they were first scheduled.
• The DHIS2 Academy in November, where the staff from CHIMparticipated, meant that no trainings could be held for the secondweek of November.
• Christmas made trainings during the second half of Decemberdifficult.
• District and regional staff were busy with yearly reviews in parts ofJanuary and February, preventing trainings in this period.
• Because the GHS did not have a training budget, trainings could notbe scheduled before funding had been secured.
80

The consequence of this was that only five of the ten regions weretrained by the end of 2011, with the rest being trained by mid March.In addition to this initial training, it was decided to have a three-dayadministrator training in each region to coincide with the rollout the firstweek of April. This was a training only for one designated administratorfrom each district and region. The primary goal was to have a refresherin user and organisation unit management, and make sure all the districtsgot started with the system. Since the rollout, staff from CHIM have heldregional trainings, this time of managers and directors. In addition tothese trainings organised by GHS centrally, the Western region fundedand organised a refresher training, with two officers from CHIM presentto support it.
6.6.3 Content of the End-User Trainings
The content of the training was dynamic, especially to begin with. Therewere several reasons for this. First of all, as we gained experience in whatthe users struggled with, we tried to adapt the content of the trainingto focus more on those parts of the system. Secondly, the system wasnot finished when the training begun, and new features became availableduring the trainings. Third, the user roles were not clear as the trainingstarted, thus it was not decided what functions users would have access to.Finally, the users gave feedback on what parts of the training they foundmost useful, and we tried to adapt to that. In all, this led to continuousadjustments in the trainings.
Although the content of the training changed over time, approximatelythe same time was spent on the main components of the system. Data entryand reporting each took about two-thirds of the first and second day, whilearound one-third of a day was spent on Mydatamart, data quality, user andorganisation unit management, and introductions and feedback.
6.6.4 Training Material
Extensive documentation is available for DHIS2, compiled in an “Imple-menters manual”, a “User manual” and an “End User Manual”. For thetraining and as a general reference, however, GHS wanted a local user andtraining manual. The director of the IME department started this work bywriting a few pages, before sending it to me and the staff at CHIM askingus to finish it.
As the end result of this manual was meant to be more or less thesame as the official DHIS2 “End User Manual,” I suggested adapting thatrather than starting from scratch. The DHIS2 documentation is available inthe XML-based DocBook format. One can therefore easily pick exactly thechapters and sections one wants through a configuration file, adding anycustom chapters that are required, and compile it to various formats. Whilethe staff at CHIM agreed that adapting the official manual would be a betterapproach, the IME director insisted on a DHIMS2 manual written fromscratch for Ghana. Two officers at CHIM started working on the manual,
81

but as the first regional training approached, it was far from finished.Furthermore, there were many inaccuracies and poor illustrations. Beforethe first training, I therefore sat down to improve the manual, taking betterscreenshots and adding parts that were missing. The manual was still notcomplete for the first training, but the most basic aspects of DHIMS2 werecovered.
As the curriculum of the trainings changed and new features added toDHIS2, the training manual had to be continuously updated. I encouragedthe staff at CHIM to work on this, but nothing was done. This could bebecause they did not feel confident enough with the software, or it maysimply be that no one wanted to take the extra work. Nonetheless, this doesnot bode well for the maintenance of the manual going forward. WhileI have made some further updates to the manual, several topics are stillcovered only in the very basics.
6.6.5 Problems Encountered at the Trainings
Several problems were encountered at the trainings, especially in the firstthree regions. Below are the problems I identified, and issues raised tome by users directly or on a feedback form all participants were asked byCHIM to fill in at the end of the training (see appendix A).
As was mentioned above, the system was not finished when thetraining started - neither the data sets for data entry, nor the reporting.For the first three regions, only the eight most widely used datasets whereavailable to the users. The issue of user roles was also a problem, as wehad not yet reached an agreement on what authorities the district-leveladministrators should have in terms of administering reports. A decisionon this was not made until during the third regional training.
Another major problem for the first half of the regional trainings wasthe lack of data in the system. Because there was not data, it becamedifficult to understand and appreciate the report functionality of DHIMS2.Data had not yet been migrated from DHIMS, and users had not yet startedentering data. We tried to mitigate this by letting users practice on dataentry on the first day of the training, so that this data could be used forreporting the next day. This worked to a certain degree, but the amountof data was not sufficient to give a realistic representation of how thereporting would work.
Facilitation was also a problem at times. Lack of knowledge on manyDHIS2 functions was one part of this. While the CHIM staff knew howthe functions worked in general, both them and at times myself struggledto give explanations on some of the detailed questions from the users.As a consequence, several facilitators often ended up responding to thesame questions, but giving different answers. As one participant noted“It was quite helpful but also confusing as you cannot know who to listento as all have different opinion about the issue that was being discussed.”However, as the training progressed, this improved considerably. At thefourth training, there were fewer complaints about confusion, and oneparticipant instead stated “Bravo trainers, you really know your stuff”.
82
The fact that the number of trainers were reduced contributed to this. Atthe first training in Greater Accra region, there was at times seven trainersinvolved, eight including myself. At the next three trainings, we wereseven persons in total, but after that the, only a core team of four to fivepersons were involved.
Anther common complaint from users was that there should be moretime for practical exercises. Although the goal was to have as shortpresentations as possible to enable exactly that, this was at times difficultto achieve. There were many functions to demonstrate, and users posedmany questions. The fact that not all users had computers to bring to thetraining also reduced the hands-on time of each participants, somethingseveral users complained about.
One final issues that was brought up in the first regions was the longperiod from the training to the planned rollout. Thus refresher trainingswas a common request among users. However, this was not somethingthat could be promised. In addition to lack of funding, no team oftrainers had been established apart from the staff at CHIM, and they hadmore than enough to do covering the country once before the rollout.The only refresher training given in the end was therefore the three dayadministrator training coinciding with the roll-out in April.
6.6.6 Feedback on the System
The regional trainings were an important arena for getting feedback fromusers on the system itself, both requests for additional features, andcomments on problems or errors. This feedback was especially importantbecause there was no pilot. The trainers from CHIM were eager to writedown comments from users, especially in the first regions.
One of the most common requests was stricter controls on what couldbe entered into the system. First, there was the issue of preventing wrongtypes of numbers to be entered, for example decimal numbers in fields thatcaptured numbers of cases. We easily rectified this by changing the numbertype of the data elements to integer, which causes DHIS2 to only storeinteger values. Secondly, some users argued that the system should requireall fields in a form to be filled with zeros before it could be registeredas “completed,” even if it meant filling in hundreds of zeros. This wasnot done, as it would lead to much wasted time for no real benefit. Forexample, one dataset for registering outpatient cases has 76 diseases with11 age groups for both male and female. For most facilities, there are onlycases of a fraction of the diseases for a few age groups, meaning that most ofthe 1672 field would have to be filled with zeros every month. If these zerosmade a difference in the analysis of the data, entering zeros could perhapsbe defended in some cases. However, except for two specific datasets, thezeros are not even stored in the database.
Access to see and change the data was also a major issue. People atthe district level, where data is entered, were concerned that other userscould change the data they entered. They wanted limitations so that onlythe person entering data could change it, and they wanted separate data
83

entry user roles for the different programmes. In this case, all we coulddo was to comfort the users by the fact that no one at the regional ornational level could change their data, but that a decision had been madecentrally that there should only be one data entry user role in the districts.One interesting comment was given on this issue. A user in the CentralRegion stated that with DHIMS2 he “[. . . ] will ensure proper data entryand validation since everyone will have access to my data”, indicating thatthe reasoning behind giving wide access to the data is correct.
Besides the issue of data access and data quality checks, datasets usedfor routine data entry caused the most concerns and questions. Some ofthese were the results of errors and mistakes in the customisation, andthese were quickly rectified. Other questions were caused by the datasetsin DHIMS2 being updated versions of the forms used on the ground.
In general, people expressed that they were happy with the newsoftware. Compared to the first DHIMS, the reporting functionality wasseen as a large step forward in particular. In the five regional trainings Itook part in, only one user said he though DHIS2 was “not user friendlyat all” compared to the old system. This comment was met with protestsfrom other participants.
A final concern raised was that of internet access. Some users wereafraid they would not have good enough coverage in their districts to workonline, others were concerned about who would cover the costs. Privatehospitals in particular were concerned about who would pay for theirinternet access. At the trainings where the director of IME was present,these concerns where rebutted: there would be access, and the districtswould find a way to finance the systems. At the other end of the spectrumwere users who stated that they looked forward to having a web basedsystem, where they did not have to worry about manually sending dataevery month.
6.7 Migration of Data
Stakeholders had been promised early in the process that data from DHIMSwould be migrated to DHIMS2. This was also a great relief for users in thedistricts, who were concerned that they would have to manually key inhistorical data. This section will describe the data migration process.
6.7.1 The Migration Process
At the DHIS2 Academy in Accra November 2011, the Ghana database wascleaned up and the datasets were mostly finalised. The process of movingdata could thus begin. A member of the HISP team from Oslo started thepreparations during the Academy, working with one of the staff at CHIMto identify which datasets that could be moved. There is currently nodocumentation on how to migrate data into DHIS2 from system such asDHIMS. Back in Oslo, I was given a brief introduction to Microsoft Accessand some guidance on the general migration process by the HISP member.
84

I then continued the work from there, spending several weeks working onthe data migration. Overall, the process I followed has five main steps:
1. Identifying the data to move from the source system, and matching itwith the data in the target system.
2. Transpose the data according to the format of the target system.
3. Update the metadata to match the target system format.
4. Clean up the data.
5. Move the data into the new database.
Each step will be described in more detail below. The process describedis a general one, and there were exceptions in the DHIMS database withdata being stored differently in some datasets.
The primary tool I used during the migration process was MicrosoftAccess. First of all because DHIMS is Access-based. DHIMS2 is running ona PostgreSQL database, but using an Open Database Connectivity (ODBC)driver, tables from DHIMS2 can be linked into Access and used almost asif they were regular Access tables.
6.7.2 Identifying Data To Move
The first part of the job was identifying what data in the old system shouldbe migrated. While the datasets in the old database were all meant to beincluded, the format in which the data was stored in the DHIMS databasewas not straightforward. For most datasets there was one main tablewhere the data was stored, sometimes two. However, the names of thetables and also the data elements in the tables were often hard to identify.Furthermore, there were dozens of tables cluttering the database whichit was difficult to understand the purpose of without the source code, asshown in figure 6.16.
Once the tables containing the data for a dataset had been identified,the metadata of the old and new system had to be matched. With fewexceptions, the format of the DHIMS tables was such that each rowrepresented one complete dataset for one facility in one period. Thuseach data field was represented by one column. By extracting the columnheadings, the equivalent of data element names in the old system hadbeen found. These would then have to be matched with data elementsin DHIMS2, along with the period and organisation unit.
For several reasons, matching the data in the old and new databasewas not as straightforward as it initially appeared. First of all, while thenames of data elements in DHIS2 are seen by the users and thereforegenerally make sense in their own right, that was not the case with those inDHIMS. The names found in the database tables are only used internallyin the source code, and the names were therefore often hard to understand.Another complicating factor was the fact that there had been changes inseveral of the datasets between DHIMS and DHIMS2. It was therefore
85
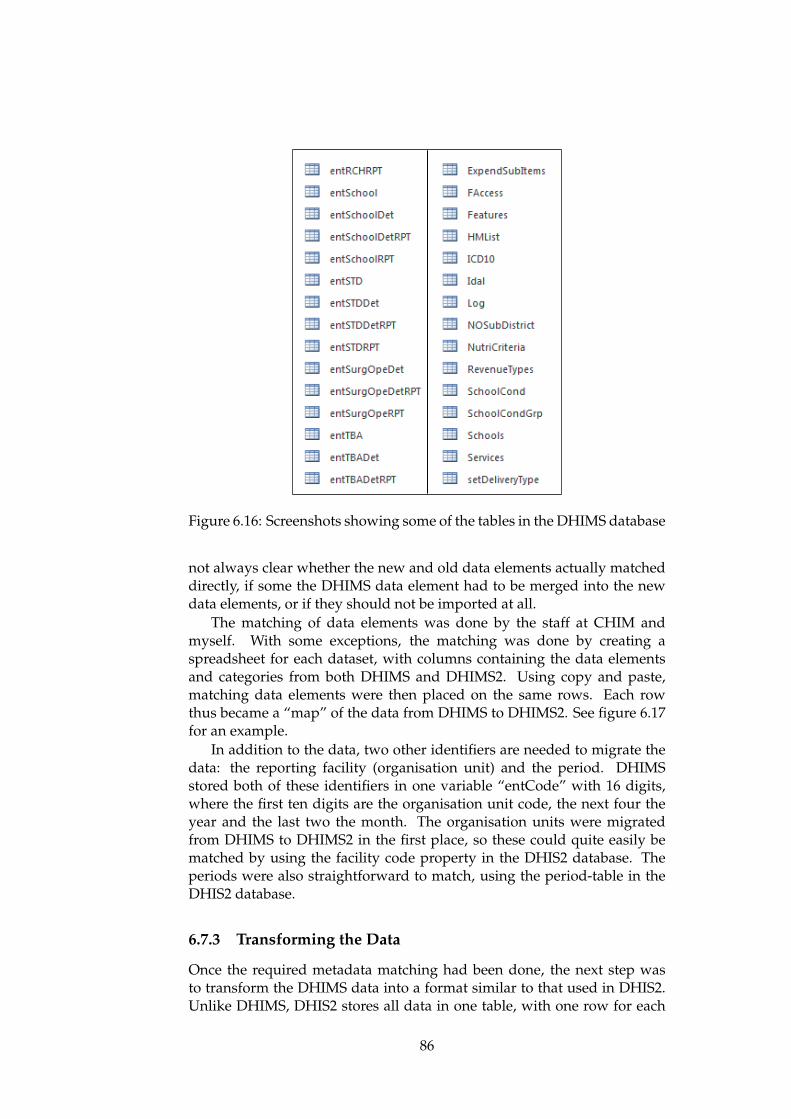
Figure 6.16: Screenshots showing some of the tables in the DHIMS database
not always clear whether the new and old data elements actually matcheddirectly, if some the DHIMS data element had to be merged into the newdata elements, or if they should not be imported at all.
The matching of data elements was done by the staff at CHIM andmyself. With some exceptions, the matching was done by creating aspreadsheet for each dataset, with columns containing the data elementsand categories from both DHIMS and DHIMS2. Using copy and paste,matching data elements were then placed on the same rows. Each rowthus became a “map” of the data from DHIMS to DHIMS2. See figure 6.17for an example.
In addition to the data, two other identifiers are needed to migrate thedata: the reporting facility (organisation unit) and the period. DHIMSstored both of these identifiers in one variable “entCode” with 16 digits,where the first ten digits are the organisation unit code, the next four theyear and the last two the month. The organisation units were migratedfrom DHIMS to DHIMS2 in the first place, so these could quite easily bematched by using the facility code property in the DHIS2 database. Theperiods were also straightforward to match, using the period-table in theDHIS2 database.
6.7.3 Transforming the Data
Once the required metadata matching had been done, the next step wasto transform the DHIMS data into a format similar to that used in DHIS2.Unlike DHIMS, DHIS2 stores all data in one table, with one row for each
86

Figure 6.17: Part of an excel sheet used for matching metadata betweenDHIMS and DHIMS2.
data value. To transform the tables in DHIMS into a similar format, I wasgiven a small “Anti-Pivot” application developed in South Africa for usewith DHIS1. As the name implies, the tool only does one thing, which isanti-pivoting database tables. This was exactly what was required to getthe DHIMS tables into the right format, pivoting the columns containingdata values. The below tables (6.3 and 6.4) show the format of the tablesbefore and after they are anti-pivoted.
EntCode Malaria cases Malaria deaths
0132342456200701 10 2
Table 6.3: Format of DHIMS database table before anti-pivoting.
EntCode Field Name Value
0132342456200701 Malaria cases 10
0132342456200701 Malaria deaths 2
Table 6.4: Format of DHIMS database table after anti-pivoting.
While this Anti-Pivot tool is quite old - it only works with Windows XPand Access databases in 2003 or earlier formats - it could still be used withthe DHIMS database. Using this tool, I was able to transform each datatable from DHIMS into tables in a format similar to that of DHIS2.
6.7.4 Updating the Metadata
Once the DHIMS tables were in the right format, the metadata in thesetables could be updated with the metadata required by DHIS2. In total, the
87

data value table in DHIS2 has nine columns, based on unique IDs ratherthan names or organisation unit codes. These columns can simply be addedto the data tables from DHIMS, and the right IDs written based on themetadata that has been matched.
6.7.5 Cleaning the Data
Once the data is in a table of the right format, and with the right metadata,a rough cleaning of the data can be done. First of all, I removed emptyfields and fields with zeros. Next, by sorting the data values from high tolow, I could delete obvious outliers in the data resulting from errors. In thecase of Ghana, my experience was that there were usually around 10–15such values in each dataset. This may seem insignificant, but a few valuesorders of magnitude larger than the rest can skew the whole datasets quitesignificantly.
More detailed analysis can of course also be done to determine moreexactly which data values are unrealistic, for example sorting data valuesfor each data element in a dataset separately. A realistic maximumnumber of “Malaria cases” will be much higher than one for “Polio cases”.Similarly, a figure that can be valid for a large health centre or hospital canbe totally unrealistic for a small community clinic. Due to time constraints,I did not go through the data with such detail. It would most likelyhave required assistance from health statisticians with knowledge to thesituation in Ghana, and this was difficult as I worked on the migrationfrom Norway. Getting replies on even basic questions relating to the datamigration often took a long time, and if this should also involve a detailedanalysis of the data the process would have been further delayed.
I did a second type of cleaning, or rather filtering, along the timedimension. DHIMS was piloted in a number of districts in 2007. However,this data was not complete. We therefore decided to only import valuesfrom 2008, when it had been rolled out nation-wide, up till the end of 2011.Not only did that leave out the incomplete data from the pilot, but it alsoexcluded quite a few values entered mistakenly, with dates ranging fromthe 1990s to the 2020s.
6.7.6 Moving the Data to DHIMS2
The final step of the migration process is to move the formatted, matchedand cleaned tables from Access into the DHIS2 database. While the data canbe moved directly to PostgreSQL over an ODBC-connection, the numberof rows that can be moved is limited - on the computer I used for themigration it failed at around 200 000 rows. The biggest dataset containedover 6 million rows alone, thus I opted instead export the data values fromAccess to a Comma Separated Value (CSV) text file that could be importeddirectly into the PostgreSQL database. In those cases where several datavalues in the old database are being merged into one value, this is done asthe data is exported from Access. Where there are more than one row with
88
the same data element, category, facility and period, the rows are summedup and merged into one value.
I was able to migrate most of the data before the system was rolledout. Before the rollout, I could copy the online database from the server,import the data locally, and upload the updated database to the server.After rollout, this was no longer possible. Instead, the CSV-files with datahad to be uploaded to the server and imported directly there.
6.7.7 Status of the Migration
Currently, 21,6 million data values have been migrated from DHIMS intoDHIMS2, making it the largest online DHIS2 database anywhere. Thereare currently only two datasets left to migrate into the DHIM2 database.In addition, I have agreed to try to migrate the anonymous event data ifpossible, but work on that has not yet been started.
6.8 Rolling out DHIMS2
DHIMS2 is moving on a higher plane, let us all fuel its engineby using it, and I bet you, DHIMS2 will take us to heavenlyplaces in the GHS. Enjoy the use of DHIMS2. (Regional healthinformation officer in a message to DHIMS2 users).
6.8.1 First Impressions from the Rollout
As I have already mentioned, the system was rolled out nationwide inApril. As of this writing, on July 26h, 7,982,119 data values have beensaved, 177,913 datasets have been registered as completed and 132,657anonymous events have been recorded. The data entered is from the firsthalf of 2012. By comparison, the migrated DHIMS data consists of about22 million values, thus on average less than 2,8 million values per halfyear. While it is difficult to make exact comparisons between DHIMS andDHIMS2 - the number of datasets is greater in DHIMS2 for example - itseems safe to conclude that the system has already been put in wide use.
DHIS2 has a built in messaging and feedback system. The 2533registered users (again per July 26th) have so far sent 1218 messages. Thesecan help give some first impressions of the system, although the main topicis generally requests for assistance on specific issues. Most of the feedbackso far has been related to the data entry part of the system, with questionsand comments on the datasets. The most common issues that have beenraised have been requests for the linking of data across datasets, one datasetin particular, and blocking linked datasets from data entry except fromthe primary source. Both these issues were addressed during the “DHIS2Database Training” in Lomé, Togo, in late April, which will be discussed inthe next chapter. In the first weeks after the rollout in particular, there werea number of questions and issues regarding organisation unit and usermanagement. Lately, there have been fewer messages about this. At the
89

moment, it is the anonymous events that are causing the biggest concerns.Many users have reported that it is very slow, and works poorly in areaswith slow internet connections. There are also complaints on the fact thatevent cannot be deleted or edit after they have been entered. Finally, staff atthe regional level has used the messaging functions to encourage districtsto work on data entry, and to contact districts with low reporting rates, andstaff at CHIM and in IME have also contacted regions about the same.
CHIM has been active in replying to these messages, at least in periods,but also report that they contact many of the users by phone when theysend feedback. I have also used the messaging function extensively tocommunicate with and assist users, and of the 1218 messages that havebeen sent I am responsible for 176 of them. Figures 6.18 and 6.19 are anexamples of message conversations, more examples are found in appendixC.
Figure 6.18: Conversation with an end users in Ghana, using the DHIS2messaging functionality. The result of this conversation was to add a reportto the system that could be used temporarily, while the request for "verticaltotals" were forwarded to the developers.
I have asked the staff at CHIM if they have discovered any particularproblems which I have not been able to pick up through the built inmessaging functions. While they have been receiving various phone callswith questions and suggestions, it has mainly been the same issues as thosediscussed above. There had also been some complaints about poor internet
90

Figure 6.19: Conversation with an end user in Ghana. The user hasdiscovered a error in a "validation rule", which I was able to correct onthe server.
access, but not many. However, the overall the response from users as wellas the use statistics are positive so far.
In June, DHIMS2 was awarded third prize for innovations in PublicService at a Public Service Award ceremony.
91

92
Chapter 7
Implementing DHIS2 inLiberia
In May 2012, I was given the opportunity to visit Liberia for one week witha DHIS2 developer to help with the DHIS2 implementation there. This,as well as meetings at workshops and electronic correspondence with themain DHIS2 focal person in Liberia, has given me valuable insights intothe situation of DHIS2 in particular and the health information system ingeneral.
7.1 Introducing DHIS2
7.1.1 Moving from DHIS1 to DHIS2
Liberia has been using DHIS1 for several years. In 2010, a decision wasmade to upgrade to DHIS2, with the support of several donors, as well asWAHO and the University of Oslo1. Work on implementing DHIS2 startedearly 2011. I first met the main implementer from Liberia at a workshop inOslo February 2011.
The infrastructure in Liberia is poor, after years of civil war. Neitherfixed nor mobile internet is widely available. It was therefore decided thatDHIS2 could not be rolled out on a central server, with districts accessingthe system over the internet. Instead, DHIS2 would be used in the sameway as DHIS1, with standalone installations in the 15 counties and onindividual users’s computers in the ministry of health.
Coinciding with the introduction of DHIS2, Liberia was introducinga new, integrated reporting format. All the various programmes anddivisions had agreed on a common dataset, and duplication of datacollection could thus be avoided since all data is available on the samedataset. The integrated form has separate sections on the various areassuch as immunisation, maternal health and malaria.
To speed up the process of configuring DHIS2, metadata was importedfrom DHIS1. This meant that for example the organisation unit hierarchy
1Donors included GAVI (Global Alliance for Vaccines and Immunisation), Global Fundand USAID through the Rebuilding Basic Health Services (RBHS) project.
93

would not have to be recreated. However, because revised datasets werebeing introduced along with DHIS2, most data elements and indicators hadto be recreated.
In September 2011, DHIS2 was ready for rollout nationally, after beingpiloted in two counties for two months. The new integrated reportingforms were introduced at the same time (Braa et al., 2012). Standaloneinstallations were thus set up in all the 15 counties, just as DHIS1 had beenused.
7.1.2 New Challenges
The DHIS2 implementation in Liberia faced many challenges, to which wewere introduced upon our arrival in the country in May 2012 2. The movefrom DHIS1 to DHIS2 had not been trouble free, even though the systemswere used in the same standalone configuration. The first day of our visit,we met with the IME coordinator in the Ministry, and discussed some of theissues they had. The main DHIS2 implementer in Liberia, who is now theacting HMIS director, was also present. The IME coordinator complainedthat “currently, we are only using 5% of feature of the software”. What weidentified as the main problems with DHIS2 in Liberia, which we wouldwork on during our visit, were:
• migration of DHIS1 data
• removal of unused metadata
• under utilisation of the software
• lack of a central server, even in the ministry of health
• limited capacity to install and maintain DHIS2
The consequence of these problems was that both users in the countiesand data managers and directors in the ministry had become dissatisfiedwith DHIS2, and were questioning whether the software was appropriatefor the Liberian context. This was also something the HMIS director, whoalmost solely runs the DHIS2 implementation in Liberia, had told me hewas worried about in a Skype chat a few weeks earlier. Towards the endof our visit, after some of the problems had hopefully been solved, weagreed to hold a demonstration for data managers and directors who wereinterested, showing some of the things DHIS2 could do.
7.2 Improving the DHIS2 Implementation
7.2.1 Migration of Data
The first issue we tackled was that of data migration from DHIS1.Because the reporting tools were changed at the same time as DHIS2 was
2A Terms of Reference had been prepared for out visit, giving some backgroundinformation, outlining some of the current challenges and listing the priorities issues. Thisis attached as appendix D.
94

introduced, the migration of data required a manual process of matchingdata elements between the new and old system, similar to what I had donein Ghana and was presented in the previous chapter. There were twodifferences from the process in Ghana, however. First, the datasets in theold and new system were completely different, not just slightly updated asin Ghana. Thus the task of matching data elements was a lot more difficult.Second, the metadata and the data in DHIS1 are stored in two separatedatabase tables in the same way as in DHIS2, thus the actual migration ofdata becomes somewhat easier.
As in Ghana, I made two lists of data elements - one from the old systemand one from the new. The HMIS director then sat down and matcheddata elements from DHIS1 with data elements and category options inDHIS2. Some data were easily matched, with the data elements beingsimilar. In other cases, two or more data elements from DHIS1 couldbe merged into DHIS2 data elements. Finally, some data elements weremore disaggregated in DHIS2 than in DHIS1, and could therefore not bemigrated.
In the end, we managed to import most of the data from DHIS1, withtwo main exceptions. First, data elements with few values were simplyskipped. This was done because the matching of data was difficult andtime consuming, and we had to finish the migration before we couldstart the process of removing unused metadata. Secondly, there wassome important data in DHIS1 which could not be imported into the newdatasets, because the data elements was not collected in DHIS2 or becauseof different disaggregation. After some discussions, we decided to keepthis data in DHIS2, in a dataset called “Legacy data”. In all, I importedabout 1 million data values.
After we left Liberia, the HMIS director sat down with representativesfrom different programmes and reviewed the data we had migrated. Theydiscovered some errors in the matching we had done, and made a revisedlist with matching data elements. Consequently, I have to delete some ofthe migrated data and re-import it.
7.2.2 Cleaning the Database
When work started on migrating from DHIS1 to DHIS2 in 2011, most ofthe metadata, such as data elements and indicators, was directly imported.However, due to the reform of the datasets none of the data elements andindicators were actually used in DHIS2. In total, we found more than 2000unused data elements and indicators from DHIS1 cluttering the Liberiandatabase. This was problematic when using the data, as it meant there weremany data elements and indicators where there was no data, and findingout which had data was difficult.
Once we had migrated the historical data into DHIS2, we therefore setabout deleting all data elements which were not used anymore. We thengrouped the rest of the data elements according to datasets. As for theexisting indicators, none of these could be used anymore as the source dataelements were no longer in use. Consequently, we deleted all indicators as
95

well.
7.2.3 Improving Reporting
Under-utilisation of the DHIS2 software was the third issue we looked at.We first tried to find out how users in Liberia used the data in DHIS2, andwhat we found was that the reporting functionality in the system was notreally used. Instead, users downloaded the raw data into Excel and didall the analysis and reporting there. Users did not really have any otheroptions, as the systems had no customised reports of any kind. Not evenusers who had been to DHIS2 workshops, for example the DHIS2 Academyin Accra, appeared to use any built-in reporting functions.
As mentioned, there had been no usable indicators in the system.Furthermore, no population data had been entered into the system, thusmany of the most common indicators could not be calculated. We thereforedecided that we should make sure the population data was put in thesystem, and then identify and add some core indicators. The goal was tohave something to show people so that they could start appreciating thebuilt in reporting features, including automatically calculated indicators.
The HMIS director was able to produce an Excel file with catchmentpopulation data for all public facilities in Liberia from a 2008 census, withestimates until 2021. There is currently no master facility list in Liberia,making it a manual job to match the facilities in the Excel sheet with thefacilities in the system. This seems to be a general problem, as there wereother changes in the organisation unit metadata that the HMIS directoralso wanted to make, but which required manual identification of facilitiesbased on names and districts. Nonetheless, I was able to import thepopulation data into the system in the end.
In the meantime, we also got hold of a list with definitions of coreindicators for the ministry as a whole, and specific indicators for themalaria programme. The DHIS2 developer and myself added these to thesystem. At this point, we thus had a clean database, with historical DHIS1data and population figures, and some core indicators. The next step wasto start making reports.
At the database training in Lomé, I helped the two participants fromLiberia to get started making reports. This was more for the sake ofpracticing than because they had any specific reports they wanted tomake, and the reports themselves were not very useful. Consequently, weremoved the handful of reports that already existed and started addingnew reports from scratch. As we had limited time available, we agreedthat is was best to focus on making many different types of reports, in orderto showcase the system and to give users a reference in terms of what thesystem could produce. With these reports as a reference, they could thenrequest for other reports to be added according to their needs. In the end,we were able to produce a handful of standard reports, as well as someData Visualizer and GIS favourites.
96

7.2.4 Moving DHIS2 to a Central Server
The last two problems Liberia struggled with were in many ways related:because they did not have a central server, DHIS2 had to be installed onthe computer of everyone who wanted to access it - both in the counties,and centrally in the Ministry of Health. There was no sufficient humancapacity for this. Installing and configuring DHIS2 can be a challengefor users only familiar with typical step by step software installers, as itrequires installation of a database system, a Java runtime and a web server.There is a simplified installer package called DHIS2 Live which facilitatesthe installation, but this was not used in Liberia - and even DHIS2 Liverequires a database system to be installed separately.
The HMIS director explained that a lot of his job revolved aroundsupport and installation, rather than managing and improving the overallsystem. For example, he told us that if the computer running DHIS2 out inthe counties crashed, the county user would often have to travel all theway to the capital to have the system reinstalled, or he would have totravel to the county. Thus setting up a central server in the ministry ofhealth, and make in available on the local network, was perhaps our mostimportant task. While users in the counties would still need to deal withtheir offline installations, it meant that users in the ministry could accessthe data from any computer without installations as long as it was on theministry network.
Setting up the server turned out to be a time-consuming tasks. Westarted working on this on Monday, our first day in the Ministry. Wedecided to use Windows Server as the operating system, as no one in theministry had any experience with the preferred Linux operating system.While the installation of the operating system did not pose any problems,the internet was very slow, thus downloading security updates and thesoftware required to configure DHIS2 was problematic. Furthermore, afirewall preventing certain types of downloads also caused problems. Byusing the internet at our hotel for downloading in the evenings, we wereable to get the server up and running by Tuesday afternoon.
Figure 7.1: Server configuration in the Ministry of Health, Liberia.
97

We used the server without any problems on Wednesday. When wearrived in the ministry Thursday morning, however, it had crashed and didnot boot. Luckily, we had made a backup of the database before leaving onWednesday, so no work was lost. Something was clearly wrong with theserver, and we did not have much time for troubleshooting. Thus ratherthan trying to find out what the problem was, we started configuring anidentical server that was available - this time using the linux-based Ubuntuoperating system in case the first server crash was software related.
7.2.5 Liberia Moves Online
To ease the process of configuring the second server, the director of IT inthe ministry provided us with a public IP address, bypassing the firewalland other restrictions on the local network. Not only did this allow us todownload updates more easily. It also meant the server was accessible overthe internet. Although the internet is slow, this event was very important.
First of all, it allowed us to configure the server for remote access. Thuswe would be able to access the server from outside Liberia to providetechnical assistance, help with upgrades and so on. This was especiallyimportant since we did not have much time to teach anyone in the ministryhow to administer a Linux server. After leaving Liberia, I have used theremote access several times to help take extra backups, import data and soon, and other members of the HISP team have done the same.
Secondly, there was an opportunity for counties to do data entry online.We discussed with the HMIS director whether counties with internet accessshould be asked to start using the online server immediately. Becausethe server was hosted in the ministry, with periodic power cuts and slowinternet access, we were a bit reluctant to trust the server for all data entry.However, we all agreed that it would solve many problems to let countieswork online. The HMIS director therefore got two counties to use the serverthe week we were in Liberia.
Since we left, the HMIS director has been working hard to get as manycounties as possible to work online. As of late June, he hopes that all orclose to all counties will enter the data for the next month online. Thosecounties who are unable to do so will be given the cleaned-up databasewith population data and sample reports to work on. They will also getthe latest DHIS2 version 2.8, which makes importing and exporting of dataeasier.
7.2.6 Promoting DHIS2 in the Ministry
The demonstration of DHIS2 to users in the ministry was a success, asall those present expressed that they were very happy with what thesystem could provide. We focused on showing the reporting functionality,since the data entry aspect of the system is less relevant for those in theministry. In addition to the data managers and directors in the ministry,two representatives from the Malaria Control Programme were present.They expressed their satisfaction with the system, and thought it could be
98

an important tool for the Liberian health system - although data qualityhad to be improved at the lowest levels. The IME coordinator, who initiallycomplained that only 5 % of the DHIS2 functions were used, was alsohappy. He thought that they now would be able to use much more of thepossibilities of DHIS2, and even if they only used 65% it would be a bigstep in the right direction.
Two officers from the Clinton Initiative were also present at thepresentation. They had coincidentally seen a “Mobile” menu in DHIS2,and contacted us later for information about the mobile component ofDHIS2. They were planning a mobile tracking system for maternal andchild health, and wanted to know how DHIS2 could support this. Becauseneither the developer I travelled with nor myself were up to date onDHIS2 Mobile, we put them in contact with the DHIS2 Mobile group atthe University of Oslo.
7.3 Current Status
Since our visits, most counties have started doing data entry online, and Ihave been told that the system is being accessed over the local network inthe ministry. Furthermore, after the HMIS director made a presentationof the updated system to the logistics department, work has begun onintegrating the Logistics Management Information System (LMIS) intoDHIS2.
While we were able to make many improvements to the DHIS2implementation in Liberia during the week we spent there, and havecontinued to work with Liberia from Oslo, there are still many issuesremaining. First of all, the IME coordinator explained that they wantedto integrate even more systems into DHIS2, similar to what is now beingdone with the LMIS. Secondly, local human capacity must be increased.Although several data mangers in the ministry have participated in DHIS2workshops and trainings abroad, including the DHIS2 Academy and thetraining in Lomé, our impression was that only the HMIS director had morethan superficial knowledge of DHIS2.
Liberia now has an online database, but there is need for improvementon many aspects of the server configuration. There is currently noautomated offsite backup, the capacity of the internet connection is low,the server might not be powerful enough to support the whole countryover time, and there is no proper domain.3 Many of these issues could besolved by using a commercial cloud service provider. However, hosting theserver outside the country poses other problems. It might not be politicallyor juridically acceptable to store health data abroad, and it still wouldrequire the Ministry of Health to improve its internet connection becausedata would no longer be accessible over the local network. Furthermore, itwould create an additional cost in running the system.
3At first, an IP address was used to access the server. Now, a subdomain of the officialdhis2.org address is used instead (liberia.dhis2.org).
99

100

Chapter 8
Regional Developments
In this chapter, I will take a wider look at developments around healthinformation systems in general, and DHIS2 in particular. The last coupleof years, the interest in DHIS2 has grown across the African continent, andcountries like Kenya, Uganda, Rwanda and Tanzania are currently usingor implementing DHIS2. Interest has also grown in West Africa, and that isthe region I will focus on.
In West Africa, a number of countries are either already using DHIS2,are in the process of implementing it, or are considering whether or notto start using it. Table 8.1 below shows which West African countries arecurrently using or actively working on implementing DHIS2.
Country Roll-Out
Burkina Faso -
The Gambia 2010
Ghana 2012
Guinea Bissau -
Liberia 2011
Nigeria -
Sierra Leone 2008
Togo -
Table 8.1: Countries currently implementing DHIS2 in West Africa.
In this chapter, I will first look at how HISP is trying to support theWest African countries through regional training sessions and workshops.Then, I will give an overview of the status of HIS across the region. Finally,I briefly present the countries considering or using DHIS2 in the region, aswell as describe the role of WAHO.
101

8.1 Building DHIS2 Capacity
Efforts are being made by the HISP network to increase local capacityon HIS and DHIS2. As DHIS2 has become more widely used, theopportunities for regional capacity-building has increased. Consequently,during the period I have worked with DHIS2 in West Africa, there havebeen two DHIS2 workshops: the “DHIS2 Academy” in Accra, Ghana,November 2011, and “DHIS2 Database Training” in Lomé, Togo, April2012. These two workshops will be discussed in this section.
I participated in both of these workshops as a facilitator. For the DHIS2Academy, I was also part of the local organising committee, which helpedarrange for and prepare the conference facilities. Both workshops wereinteresting arenas for me to learn about the DHIS2 implementations inWest Africa first hand, through conversations with participants and workon several of the country databases.
8.1.1 DHIS2 Academy
The idea behind the DHIS2 Academy is to establish an annual conferenceon DHIS2, both for existing and new DHIS2 users. Each year, one Academyworkshop will be held both in East and West Africa. The DHIS2 Academyin Accra was the first Academy to be held in West Africa. At first, the ideawas to invite only two or three persons from each country, preferably themost experienced. However, the interest was huge and several countriesasked to send more participants, and were allowed to do this. A fewcountries from outside the West African region also asked if they couldparticipate, for example Djibouti. Finally, since the workshop was heldin Accra, Ghana ended up including over 20 participants, several ofwhich had never seen DHIS2 before. The event thus became quite a lotbigger than what was initially planned, with over 60 participants and adozen facilitators. The facilitators were primarily DHIS2 developers andimplementers based at the University of Oslo.
The program for the Academy was a combination of presentation onthe use of DHIS2 and DHIS Mobile, and practical work on the databasesof the individual countries. Most of the presentations were held in plenarysessions, and were translated from English into French on the fly. As oneof the least experienced facilitators, I made only one plenary presentation.During the last days there were also some elective presentations on varioustopics chosen through voting.
At the first day of the event, each country made a poster outliningwhat their goal for the week was in terms of practical database work. Twofacilitators were then assigned to each country. Most of the time, however,we walked around from group to group, and assisted where we could. Formy part, I worked primarily with the groups from Ghana, The Gambia andNigeria.
Ghana had the largest delegation at the workshop, which included thestaff at CHIM, some participants from the PPME division and one selecteduser from each of the ten regions. Because the skill level was quite uneven
102

in this group, Ghana worked as two separate groups during the practicalsessions. One group, with those who had little or no experience withDHIS2, used the practical sessions for private presentations and hands-on practice with DHIMS2. These presentations were made by staff fromCHIM. The rest of the CHIM staff worked on finalising the DHIMS2.As I explained in the previous chapter, this included both discussing therequirements for the anonymous events with one of the developers, andimporting geographical coordinates to enable the use of the GIS.
The countries at the workshop were on very different stages in theirimplementations. Some, like Liberia, Sierra Leone and The Gambia hadalready rolled out DHIS2, and were therefore mostly concerned withmaking improvements to what they already had. For example, I workedwith the two participants from The Gambia, adding a new dataset to theirsystem. They had previously only used section forms for data entry, butnow needed to make a custom form for the first time. Other countrieswere starting with a completely new database, for example Djibouti. Theywere thus primarily concerned with learning the basics and setting up anorganisation unit hierarchy.
Figure 8.1: Participants during a practical session at the DHIS2 Academy.
One of the PhD students who participated as a facilitator had madea feedback survey that was distributed to the participant, which he lateranalysed and summarised (see appendix B). The overall results arepresented here. About half of the participants had seen DHIS2 before,the rest were new to the system. Overall, people stated that they weresatisfied with the workshop. The proportion who were satisfied with thepresentations were higher than with the practical sessions. The topics thatpeople found most challenging was the process of setting up a database
103

from scratch and GIS. There were some complaints about the organisationof the workshop. One issue, especially for the Ghanians who had theirdatabase online, was that the internet facilities were unreliable. On-the-fly translations were also discussed, as some participants stated that theywould prefer separate sessions instead. Furthermore, it was suggested tohave separate sessions for users with different skill levels. Finally, therewere some users that felt that not enough information was given in advanceon what to bring and prepare for the workshop.
8.1.2 DHIS2 Database Training
The DHIS2 Database Training, held 23–27 April in Lomé, Togo, was inmany ways a follow-up to the DHIS2 Academy. Compared to the DHIS2Academy in Accra, the database training aimed to be more focused, withfewer participants from each country - as was originally the plan forthe Academy as well. To make sure this plan succeeded this time, twospecific persons were invited from nine countries in which DHIS2 is used orconsidered. This would ensure firstly, that the “right” persons would comefrom each countries, meaning the persons with most DHIS2 experience.Secondly, it would help keep the number of participants down.
The workshop was paid in full by HISP at the University of Oslo. Intotal 17 persons from 9 countries participated. In addition, participantsfrom Togo were present at some of the sessions. There were fourfacilitators: one PhD student at the University of Oslo who live in Togoand one consultant from Senegal to cater for the French-speakers, andone DHIS2 developer and myself to work with the English-speakingparticipants.
There was a natural division between Francophone and Anglophonecountries, not only due to the language, but also because all the English-speaking countries already had a DHIS2 database to work with, whilst allFrench-speaking countries except Burkina Faso had not used the systembefore. Thus the French group focused on lectures and exercises, whilst theEnglish group worked on solving issues and making improvements to thecountry databases.
By the end of the workshop, the French countries had been introducedto all the major modules of DHIS2. Furthermore, they had all configureda working demo database, with a partial organisation unit hierarchyand examples of datasets and reports. This would allow them to betterdemonstrate DHIS2 upon returning to their respective countries, ratherthan relying on a generic DHIS2 demo database. Burkina Faso alreadyhad a mostly working database, thus the Burkinabè participants focusedon finalising user roles.
In the English-speaking group, we started the week by asking eachcountry to make a brief presentation of their current implementation,including problems and improvements they wanted to work on. OnWednesday, the countries gave an update on how far they had come.Friday afternoon, every country in the group presented what they hadachieved during the week, and we discussed what they could work on
104

improving in the time following the workshop.The rest of the time was spent working on the database, with help from
myself and the other English-speaking facilitator. I worked mostly withLiberia, Ghana and The Gambia, but also Sierra Leone. This was thus agreat opportunity for me to learn more about the status of their databases,and talk about their future plans. At the end of the week, the English-speakers expressed that they wanted to keep in touch with each other, andagreed that all should sign up to the “DHIS2 Users” mailing list.
I discovered that for the countries with offline installations of DHIS2,Sierra Leone, Liberia and The Gambia, maintaining the correct metadatain the sub-national and national databases is a major problem. Whenimporting data from the sub-national databases into the national database,meta-data from the sub-national databases is copied along with the datavalues. Thus any attempt to clean up or remove meta-data in the nationaldatabase is overwritten when importing data from the sub-national level.
With DHIS2 version 2.8, released in April 2012, this import processwas improved. It is now possible to import only the actual data, ignoringmeta-data differences. However, this requires both the national and sub-national databases to be running version 2.8. At the end of the workshop,we therefore upgraded the databases of the countries working offline toDHIS 2.8. I discussed with each of the countries how to plan the upgrade ofDHIS2 at the sub-national level in a way that made sure they would not riskimporting the old metadata again. Liberia was the country struggling themost with this, as the counties there had already entered data that neededto be imported into the national database before the counties could haveupgraded to DHIS 2.8. We therefore decided that I should manually importdata for Liberia until the whole country was running 2.8.
Knowing that we had solved the issue of re-importing old metadata,both Liberia, Sierra Leone and The Gambia worked on removing oldmetadata from the system. Liberia had the biggest job in terms of cleaning,as was discussed in the previous chapter. The participants from SierraLeone told me that due to problems with the metadata, they had recentlystarted with a completely blank database, importing only the organisationunits from the old database, and re-designing everything else. Thus theirmain task in terms of cleaning was the removal of closed and duplicatedfacilities. The Gambia had quite a few duplicated data elements in thesystem that they were now able to clean out, along with many indicatorswith invalid formulas.
Besides a general cleaning of the databases, several countries wantedto improve the reporting aspects of their systems. This included Liberia,The Gambia, Ghana and, to a certain degree, Sierra Leone. Except Ghana,none of these countries had any predefined reports in their databases. Itried to work with each of the countries, to get them started on makingreport tables and standard reports. The participants also asked me to havea plenary session on standard reports, which we did on the last day ofthe training. Ghana already had quite a few reports in the system, butmost of these were monthly. They therefore needed to make quarterlyvariants of these. Furthermore, I received an email from the director of
105

IME during the workshop, asking if we could add some reports based onfacility ownership. I taught the Ghanian participants how to do this, andthey added the reports that had been requested.
Liberia, Ghana and The Gambia all had historical data that they wantedto migrate into their current DHIS2 database. Liberia had data from aDHIS1 database, The Gambia from an earlier instance of DHIS2, and therewas still some DHIMS data left to migrate for Ghana. I was able to sit downwith each of these countries to work on this. In the case of Ghana, I hadbeen needing assistance on matching data for I while, which I now got. ForThe Gambia, I was able to help migrate some of the data. However, thereare still some data left from 2010 that we did not have the time to finishmigrating. Finally, I started working on the migration of data in Liberia,work that was completed during our visit there, described in the previouschapter.
One final issue that we discussed was setting up a central, onlineserver. Sierra Leone, Liberia and The Gambia were all interested inthis. Our discussions revealed that it should be feasible to at least startmoving online in all countries in the short term, although complete onlineimplementations might not be possible right now.
Nigeria had different goals than the others. There were actually twogroups form Nigeria at the training, two participants from HISP Nigeria,and one participant from Ekiti state. HISP Nigeria is working on settingup a national DHIS2 database for the federal government, and worked onsetting up the organisation unit hierarchy and configuring GIS. Ektiti stateis still using DHIS1, and worked on synchronising the state metadata withthe DHIS2 database being configured by HISP Nigeria, as a preparation fortheir planned upgrade to DHIS2.
8.2 Health Information Systems in West Africa
In chapter five, an evaluation of the Ghana HIS was presented, and thesituation in Liberia was described in the previous chapter. Here, I look atthe HIS situation in West Africa more generally.
8.2.1 Assessment of the West African HIS
As described in chapter five, I participated in the data collection of anevaluation of health information systems in the West African region,ordered by WAHO and performed by the HISP group at the University ofOslo. Several assessment tools were used in this evaluation. One was the“TALI tool,” used to grade HIS functioning and information use. Sevencountries were visited by researchers and given a grade for the facility,sub-national and national level, on a three-grade scale (see appendix E).This tool revealed that the health information systems at the local and sub-national level work well. Data is collected and used at the facilities, andreported to the next level. However, at the national level, the systemswork poorly, suffering from heavy fragmentation and poor software. In
106

general, data quality appears to be poor, and use of the data is limited.This was attributed more to problems at the higher levels, not locally as isoften assumed. The root cause was found to be fragmentation and donorinitiatives (Braa et al., 2012).
A second tool that was used was the “HMN Light” tool. With thistool, countries are given a grade from 0 to 3 on a number of criteria withinthree categories: context and resources; processes; and results. I will nowsummarise the main findings in each of these three categories.
The first category deals with the HIS context and availability ofresources. The assessment revealed that there is no legal and regulatoryframework to guide and govern the HIS in any of the West Africancountries, bar Ghana and Burkina Faso. Lack of human resources are aproblem in all countries as well, again with Ghana as a partial exception.This problem is amplified by the fact that supervision and routines to guidehealth workers are limited. Staff training is generally focused more on useof IT than on use of information. Career opportunities within the healthinformation field is limited, as we also saw in Ghana.
Infrastructures are another challenge across West Africa, although theproblem varies between and within countries. Both power, internet andcomputers have a high amount of downtime, and the software used forhealth information management is generally poor. No clear conclusionscould be made in terms of financial resources, as this data was not available(Braa et al., 2012).
The second category deals with processes. It was found that there arefew mechanisms to promote use of information. First, most countries donot have agreed-upon data and indicator sets used across the organisations.Secondly, the fragmented nature of the health sector means that there arefew incentives for sharing of data. Finally, there are no links betweenperformance on one side and budgets and promotions on the other. Onthe positive side, there are regular review meetings in several countries,which does help in the promotion of information use. When it comes todata management, it is a general problem that too much data is collected,not all of which is ever used. This affects data quality negatively. There arealso few indications that the quality of the data is checked, and for exampletriangulated with surveys (Braa et al., 2012).
The third and last category in the HMN light tool deals with results,meaning dissemination and use of the collected data. The primary vehiclefor data dissemination in the evaluated countries is annual statisticalreports. These are often delayed, contain mostly raw data and are seldomlinked to policy goals. Consequently, their usefulness for management islimited. Furthermore, there are limited sharing of information to externalpartners and stakeholders. The assessment identified several possiblereasons as to why information was not disseminated more widely:
• The focus of reporting is on pleasing superior officers.
• There are fears of criticism if the data show negative trends.
• There is a perceived need in the government to control access to data.
107

Gaps in the data are often used as an excuse to withhold information.How information is used for advocacy was also discussed, for examplein campaigns to prevent the spreading of HIV/Aids. It was foundthat information is used for advocacy, but mostly at the national andinternational level. However, advocacy is most efficient if done at the locallevel, with local information (Braa et al., 2012).
8.2.2 The Common Problem: Fragmentation
Many of the common West African challenges discussed above have acommon root cause: the vertical fragmentation of the health informationsystems. The WAHO Assessment in turn identifies two root causes of thisfragmentation:
• institutional complexity
• malfunctioning software (Braa et al., 2012).
A primary cause of fragmentation in West Africa is institutionalcomplexity, with Guinea Bissau being a prime example. Because thehealth sector itself is complex and fragmented, with health programmesand divisions receiving direct funding and acting quite independently, thehealth information system also becomes fragmented. Each programmecreates separate reporting systems for its own use, in part to meet thereporting requirements of its donors. Consequently, data and indicatorsare not standardised across the health sector, and the information cannotbe easily shared or compared. Furthermore, sustainability becomes aproblem, as the vertical reporting systems often collapse if the donorfunding ends (Braa et al., 2012).
Another important contributor to fragmentation in West Africa ismalfunctioning software. When software does not work well, eitherfunctionally or because it cannot be adapted to changing requirements,vertical reporting systems are created instead. We have seen in chapterfive and six how this was the case in Ghana, and Braa et al. (2012) points toGuinea and Nigeria as other examples. These vertical reporting systems areoften made by users with little knowledge of information system design,and are therefore often quite poor.
8.3 Regional DHIS2 Actors
In this section, I present some of the main actors interested in DHIS2 in WestAfrica. I first look at WAHO, and its relation to DHIS2. I then present theother DHIS2 implementers in the region. The information here is mostlybased on conversations with representatives at workshops. Finally, I givea brief overview of the West African countries who consider using DHIS2,but have yet to make a decision.
108

8.3.1 WAHO
An increasing number of countries in West Africa are now adopting DHIS2.This is important for the West African Health Organisation (WAHO),which has health system integration across West Africa as its main goal(West African Health Organisation, n.d.). WAHO is collecting data from itsmember states, but the organisation of this data collection is poor: separatedivisions within WAHO collect data independently as there is not centraldatabase, countries are often slow to report, little feedback is given ifthey report, and the data definitions are not harmonised across the region,making the data difficult to use (Braa et al., 2012).
In February 2011, I interviewed Albert Ouedraogo from WAHO at aworkshop in Oslo. He explained that WAHO wanted to support DHIS2in West Africa. This includes supporting countries to get internet accessand standardising definitions of the data being collected. Furthermore,WAHO wanted to use DHIS2 to integrate data collection. WAHO alreadyhas a web-based database system, called SIGIS, but this is not primarily forstatistical health data.
8.3.2 Other DHIS2 Implementers in West Africa
Previously, I have mentioned bits and pieces of information on variousother DHIS2 implementers in West Africa. In this section, I will givean overview of each of these countries. Ghana and Liberia have beendiscussed previously, and will not be discussed further here.
Sierra Leone
Sierra Leone was among the first countries to implement DHIS2 nationally,in 2008, with support from the University of Oslo and the HealthMetrics Network (HMN). The implementation in Sierra Leone was usedto pilot DHIS2 integration with other systems, with DHIS2 as a centraldata warehouse. Using the XML-based SDMX-HD (Statistical Data andMetadata Exchange - Health Data) format, DHIS2 was able to receiveaggregated data from OpenMRS, an electronic medial records systemthat was used for HIV and Tuberculosis patients (Braa et al., 2010).Initially, reporting in Sierra Leone was not integrated, and various healthprogrammes collected the same data on separate forms. To avoidduplication in the database, duplicated data elements were linked “behindthe scenes” in DHIS2, as we have done in Ghana (Sæbø et al., 2009).Gradually, a process of developing an integrated, essential dataset began,and today the reporting is integrated (Tohouri and Asangansi, 2009).
At the Database Training in Lomé, I was told that the biggest challengewith DHIS2 in Sierra Leone today is the use of offline installations inthe districts. Keeping a large number of databases synchronised is acomplicated and error-prone task. We discussed how this process would beimproved with DHIS 2.8, but agreed that moving the system online wouldbe the best solution if possible. I was told that the mobile internet coverage
109

in Sierra Leone has improved lately, and districts already receive financialsupport for mobile internet connectivity. Planning has already begun withregard to moving to an online server. We discussed whether hosting thedatabase outside Sierra Leone would be viable, and that had already beencleared in the ministry. Capacity to host the DHIS2 online in Sierra Leoneis limited for the time being.
The Gambia
The Gambia started implementing DHIS2 in 2009, rolling out the systemfrom January 2010. The Gambia has standalone installations of DHIS2 insix regions (Valbø, 2010). I was told at the Lomé Database Training thatall regions were running version 2.1 of DHIS2, released in March 2011.On the national level, DHIS2 version 2.6 was used. Consequently, usersespecially in the regions, but also at the national level, had been losingout on a lot of new functionality. This also implies that no improvementsmade on the national database since the first half of 2011 has been movedto the sub-national level. At the Database Training in Lomé, I worked withthe Gambian participants to upgrade their server to DHIS2 2.8, and wediscussed how to make sure the regions get the updated database as soonas possible.
When working with the Gambians in Lomé, I discovered the same prob-lem I found when first coming to Ghana: the use of data element categorycombinations did not seem to be properly understood. Consequently, Itried to explain this concept.
As in Sierra Leone, I was told that internet coverage had improvedgreatly in The Gambia since the initial rollout of DHIS2. The HMIS directoris therefore planning to move DHIS2 online. He told us that he planned touse Virtual Private Network (VPN) connections between the regions andthe national level to ensure that the data was securely transmitted. This isa very complex process compared to the recommended approach of usingsecure HTTP, something that we explained to the Gambians. The Gambiansreported that everything was more or less ready for moving online and thatthey had a server and a location to host it. What they needed was onlyassistance from the University of Oslo to assist in configuring everything.
Nigeria
Nigeria has a long history of using DHIS1. As a federal country, statesorganise their health information systems independently, although thedatasets follow a national standard. The Nigerian participants in Lomé toldme that about half of Nigeria’s 37 states use DHIS11. One of the main actorsin Nigeria in terms of DHIS2 is HISP Nigeria, an independent organisationworking as DHIS consultants in the country.
The main focus of HISP Nigeria with regard to DHIS2 is currently acontract for the federal government to set up a DHIS2 database in five
1Two representatives form HISP Nigeria participating in the DHIS2 Database Trainingin Lomé is my main source of information on DHIS in Nigeria.
110
states, in relation to a donor-funded project. While the project is limitedto five states at the moment, HISP Nigeria has told me that they want topromote this database as a national database, with the goal of getting morestates on board over time. Because Nigeria is such a huge country, settingup a database is a massive task. In total, there are about 40 000 facilities inthe country. For now, about 10 % of the facilities have been imported intothe national database.
The main tasks for HISP Nigeria going forwards it to complete thenational DHIS2 database and promote it to potential users. At the sub-national level, some states are starting to move from DHIS1 to DHIS2. Forexample, the University of Oslo is currently in the process of signing acontract with Ekiti state, to support their migration from DHIS1 to DHIS2.
Burkina Faso
Burkina Faso was relatively early with a computerised health informationsystem software, when they introduced the custom-built Ravi system in2005. However, the Ravi software lacked important functionality, and asa consequence it was decided that they would introduce DHIS2 instead(Braa et al., 2012). Customisation of DHIS2 is currently well on the way, butit has not been rolled out nationally yet. The first impressions among usersof the new DHIS2 system have been positive. In fact, the various healthprogrammes seem willing to support the DHIS2 implementation ratherthan their parallel system, which can give a boost to the national system(Braa et al., 2012).
Guinea Bissau
Guinea Bissau is, like Burkina Faso, implementing DHIS2 at the moment.The implementation process is supported by the University of Oslothrough a PhD student. A major challenge in Guinea Bissau is theinfrastructure. There are few computers both nationally and especiallysub-nationally, and access to the internet is limited (Braa et al., 2012).Another challenge is that not all health programmes participate in theimplementation, meaning parallel reporting is likely to continue. However,discussions are now underway to encourage integration (Braa et al., 2012).Due to the recent coup in the country, I have been told that work on DHIS2has been halted as of May 2012.
8.3.3 Countries Considering DHIS2 in West Africa
In addition to the countries discussed above, there are several francophonecountries in West Africa that currently consider using DHIS2 or have yet tostart the implementation in earnest: Togo, Guinea, Niger and Benin. Togois furthest in the process. The country has decided to implement DHIS2,and has started the customisation process.
Guinea, Niger and Benin all got their first introduction to DHIS2 at theworkshop in Lomé. Neither of these three countries have made a final
111

decision on using DHIS2 yet. I have been informed that Niger is close tomaking a decision, and will hold a stakeholders meeting soon where HISPwill be invited. According to the West-Africa-based facilitator at the Loméworkshop, Benin is likely to decide on using DHIS2 soon. The participantsat the workshop were enthusiastic about DHIS2, but were not themselvesin a position to make a decision.
112

Chapter 9
Discussion
In the four previous chapters, I have presented the empirical findings frommy fieldwork in West Africa. In this chapter, I will use these findingstogether with the relevant literature to discuss my research objectives:
• Evaluate the Ghana HIS in order to understand how it works at thevarious levels.
• Study the implementation of DHIS2 in Ghana.
• Compare the DHIS2 implementations in Liberia and Ghana.
• Look at how West Africa can benefit from the increasing interest inDHIS2 in the region.
Each objective will be devoted one section in this chapter, starting withthe evaluation of the Ghana health information system. First, however, Iwill look at how the thesis relates to recent literature within the field of ICTin developing countries.
9.1 ICT Research in Developing Countries
9.1.1 Discourses
According to Avgerou (2008), most research on information systems indeveloping countries is done within one of three discourses: transferand diffusion discourse; social embeddedness discourse; or transformativeISDC discourse. I will argue that this thesis falls most closely in line withthe social embeddedness discourse. The subject of the study is the localactors and organisations. I look at how these relate to and work withinthe health information system in general, and how the DHIS2 software isintegrated as a component of these systems.
Avgerou (2008) further argues that the ISDC research has focused onIS failure to a large degree, perhaps too much so, specifically on the issuesof scalability, sustainability and assimilation. Scalability and sustainabilityare also of concern to this thesis. Scalability is not discussed in themost common sense, of moving from individual pilot sites to full blown
113

implementations. However, I look at scaling both in terms of expanding thescope of DHIS2 implementations by integrating more vertical programmes,and also in terms of scaling up DHIS2 in West Africa as a whole.
Furthermore, I have focused my research on how to make IS projectssucceed, rather than studying why they fail. In fact, my empirical workhas revealed that many positive developments are taking place in thearea of IS and ICT in Africa: the internet and mobile networks aredrastically changing the ICT infrastructure to the better, enabling a numberof information systems such as the DHIS2 project. Consequently, myfindings are more positive and thus different from those of researchers thathave focused on failures, as Avgerou (2008) says is the dominant trend inISDC research. The ongoing internet and mobile network revolution maybe an important reason why my findings, and general experience from theIS and ICT development in Africa recently, are more "positive" than earlierresearch in the area.
9.1.2 Addressing the Right Issues
Four issues should always be addressed when writing literature on ICT indeveloping countries according to Walsham and Sahay (2006):
• what “development” implies
• what the key ICT issues under study are
• theoretical and methodological stance
• the level and focus of analysis used
First, what is “development” in the context of this thesis? I have notdiscussed this explicitly. However, with the core topic being improvinghealth information systems, a natural perspective is to look at developmentin terms of improved health service provisions. In turn, improved healthservice provision can lead to better health for the people of West Africa.Much emphasis has been put on the MDGs lately, and health sectorimprovements are directly related to several of those.
The second issue to address is what the key ICT issues under studyare. The main research topic of this thesis is how to implement a complexinformation system - DHIS2 - in a developing country context, and that isthus the key ICT issue. More specifically, I look at both how such systemscan be implemented through engaging users in participation and relatingthat to the PD tradition, and how they can scale and be sustained over time.Both scaling and sustainability are topics Walsham and Sahay (2006) argueshould receive more attention by researchers, contrary to Avgerou (2008).
Third is the issue of theoretical and methodological stance. This thesis isbased on interpretative assumptions, as I try to bring in the interpretationsof both the objects of study and my own. I have used qualitative methodsfor data collection. The methodology was introduced in chapter threeas participatory action research, with some similarities to case studies.
114

Walsham and Sahay (2006) argue for more use of AR, partly because ofthe unique insights it can provide, partly for moral reasons as it is one wayin which the researcher can make a contribution to the research setting.
Finally, Walsham and Sahay (2006) argue that researchers need toaddress the level and focus of analysis, and they argue for more studiesfocusing on the individual level and on communities. On this issue,I follow the course of the majority of research in this area, as mylevel of analysis is the organisational, national and international level.Furthermore, the focus of the analysis has been the public sector. Involvingindividuals and communities in my research would have been difficultgiven my research objectives.
9.2 The Ghana HIS
How does the current HIS in Ghana function at the various levels? IsGhana facing the typical problems as presented in the literature, or are theproblems different? And does Ghana follow the recommendations in theliterature to solve these problems? These are the questions I will try to sheda light on in this section.
9.2.1 Common HIS Problems
In chapter 2, I looked at what the typical problems facing health inform-ation systems are according to the literature, and identified the five mosttypical problems as being:
• irrelevant data is collected
• poor data quality
• duplicate data collection
• poor timeliness and feedback
• low information usage (Sauerborn and Lippeveld, 2000)
From the data I have collected on the Ghana HIS, we see that manyof the challenges are similar. The first issue is collection of irrelevantdata. No essential or minimal datasets have been developed, thus thereporting requirements are extensive. Comparing one common dataset,for outpatient diseases, the routine dataset in Ghana collects data on 76diseases divided by gender and 11 age categories - in total 1672 potentialdata values. The corresponding dataset in Liberia has 67 diseases with onlytwo age categories (134 fields in total), while the one in Sierra Leone has47 diseases with 4 age groups and gender (a total of 376 field). It seemshighly unlikely that Ghana needs 4 or 12 times more data than Liberia andSierra Leone respectively, two countries which have recently developedstandardised, essential datasets.
115

Poor data quality is the second typical problem. The main culprit togood data quality in Ghana seems to be human resources and lack oftraining. As an officer at the regional office in Volta region said, “whenpeople don’t understand the data, the quality will be poor”. Peoplewithout any training or education are often used to compile reports at thefacilities, and there are not enough trained health information officers tocover the needs around the country.
Duplicate data collection is another issue in Ghana. Data collectionis integrated in one sense, since all data is now entered into DHIMS2.However, the datasets used on the ground have not been integrated. Thusat the facility level, the same data is collected several times on differentforms distributed by various health programmes. Furthermore, at thedistrict level the duplication continues with many health programmesrequiring their data to be reported separately to the national level, inaddition to being entered into DHIMS2.
Fourth, timeliness is not good in Ghana, and there is a lack of feedback.There are regular review meetings at both regional, district and sub-districtlevel, where data is presented, issues discussed and feedback is given.Thus some feedback mechanisms are in place. However, there appears tobe limited day-by-day feedback in the system apart from these meetings.Furthermore, the lack of resources makes monitoring and evaluation visitsfew and far between. Timeliness is also an issue, at all levels. WithDHIMS, it could take months before data reached the national level - bywhich time much of it would be too outdated to be of any use. Hopefully,this will improve with DHIMS2. However, it is too early to tell at thispoint, especially since there was a backlog with three months of data whenDHIMS2 was rolled out.
Finally, if information is not used, it does not matter if the quality ofthe data is perfect and it is delivered on time every month. And datais less likely to be used if the quality and timeliness is poor. In Ghana,use of the data at the lowest levels, for example tracking of pregnantmothers and children for immunisation, seems good. Apart from that,however, the focus often seems to be on filling in the reports to avoidgetting complaints rather than to use the output for decision making. Thishas also been the impression when customising DHIMS2: the focus is onmaking the required reports, not making reports to encourage informationuse. Among the people we interviewed, several expressed that they didnot see any relation between performance as reported and the allocationof resources. Had resource allocation followed performance, it would be aclear indication that information was in fact used for management of thehealth system.
Looking at the above, it is clear that Ghana does struggle with manyof the same issues that are typical for health information systems in thedeveloping world, according to the literature. Efforts are being made tomake improvements on some of these issues. These will be discussed next.
116

9.2.2 Improving the Ghana HIS
The literature has advice to offer when it comes to improving how thehealth information systems function. Are any of these relevant for Ghana,and is the country already following some of these suggestions?
Rohde et al. (2008) offer several suggestions to increase informationusage. This includes regular review meetings, setting of service targetslocally and giving users at the national level access to data online. InGhana, regular review meetings take place at all levels, and throughthe DHIMS2, data will be available online. While having local targetshave been discussed in Ghana before, it does not appear to be commontoday (Campbell, Adjei and Heywood, 1996). Ghana is thus promotinginformation use in some ways, but there is room for improvement.
I would also argue that the implementation of DHIMS2 can promoteinformation usage in other ways than making information available online.First of all, it will give more users access to the data - not just at thenational level, but also in the districts. The fact that five people have beentrained from each district, rather than one as was the case with DHIMS,attests to this. Furthermore, not only will more users have access to thesystem, the information will be far more accessible by being online andaccessible from "everywhere" and through the comprehensive reportingtools in DHIS2. The challenge here is that not enough effort has yet beenput into customising some of the reporting tools.
DHIMS2 can also help solve some of the other issues discussed in theprevious section. First, it can help make it easier to reduce duplication ofdata collection and collection of irrelevant data. One of the reasons forduplicate data collection and fragmentation in Ghana today stems fromthe inflexibility of DHIMS. Because it was not possible to change datasetsor data elements, additional reporting requirements had to be met withparallel systems (Kanjo et al., 2009). DHIMS2 is flexible, however, and thereis local capacity to make changes as required. This reduces the need forparallel systems.
Furthermore, by working as a data warehouse where data from allhealth programmes is available, DHIMS2 can be the first step towardsa realisation among programme directors that collecting the same datais not necessary. Data in DHIMS2 is already integrated, by behind-the-scenes linking of data elements. This approach was first followedin Sierra Leone, where the data warehouse soon led to the work ondeveloping an integrated dataset because the various actors soon realisedthey could access all their data in the shared data warehouse, and thereforedid not need to have their own paper forms (Tohouri and Asangansi,2009). Experiencing the advantage of a shared data warehouse in the newDHIMS2 may also lead the actors in Ghana to revise and harmonise theirpaper based data collection tools.
Secondly, while the introduction of DHIMS2 is not in itself a guaranteefor improved timeliness and more feedback, it has the potential tocontribute towards both of these aspects. With the previous system, thedistrict data could not be forwarded to the regions before all facilities had
117

reported, and the regions could not forward the data to the national levelbefore all districts had reported. Now, data can be entered in the districtsas soon as data is received from the facilities and be available immediatelyeverywhere.
In terms of feedback, the messaging functionality in DHIMS2 is alreadyused: in several instances, messages have been sent from the national levelto the regions with questions about why districts have not reported, andthe same has been done from the regional level to the districts. Feedbackfrom the districts to the facilities are not immediately facilitated by theintroduction of DHIMS2. However, DHIMS2 could help for examplethrough a standard “facility feedback report” with essential indicators,which the districts would be required to provide to the facilities monthlyor quarterly.
Looking at feedback more generally, in the sense of getting access toyour own data and being able to compare it to your peers, for examplein neighbouring districts or regions, DHIMS2 represents a revolutioncompared to DHIMS. Getting this data used to take a long time, now thedata is available as soon as it entered into the system, presented in a morecomprehensible way.
Improving data quality is essential, and DHIMS2 has mechanisms forchecking and improving data quality. However, this requires users tomake use of these tools. Improvements are also being made in termsof improving the capacity of staff working with the data. The schooleducating health information officers is one example. In addition, severalofficers we interviewed reported that there had in fact been increasedfocus on training in recent years, partly as a consequence of internationalpartners requesting access to data.
Local use of data is generally seen as the best way to ensure data quality(Braa and Heywood, 2012). Having immediate online access to your owndata together with analytical tools in DHIMS2 would thus be expected tohelp increase local use of data, and thereby also increase the data quality.Thus the impact of the DHIMS2 implementation and the potential changesin use of data and data quality will be a very important topic for futureresearch.
9.2.3 Linking Up With the National Health Insurance Scheme
One opportunity for increased data quality lays in integrating the NationalHealth Insurance Scheme more closely with the general HIS. NHIS collectsindividual data on all morbidity cases from insured patients. Because theinsurance coverage is very good in Ghana, this data covers the majority ofthe population. Furthermore, insurance is the main source of income forfacilities, thus the reporting completeness is high. I propose two ways inwhich the NHIS and the national HIS could be linked in order to improveboth quality and completeness of the data in the Ghana health informationsystem.
One option is to aggregate the data within the NHIS and send it inaggregate form to DHIMS2, using the import capabilities of DHIS2. This
118

would make the high-quality data available to all DHIMS2 users, andbecause only anonymous, aggregate data is sent from the NHIS, privacyshould not be a problem. However, this requires that the paper insuranceclaims are either available electronically, or that they are tallied. I have notbeen able to find out if any of this is done currently. If not, it would requirea substantial amount of additional human resources.
A second option is to integrated the NHIS reporting fully into thenational system. This would have many benefits. First of all, it wouldincrease data quality and completeness in DHIMS2. Secondly, it couldreduce the cost of data collection for both parties. Finally, it would increasethe importance of DHIMS2, increasing its likelihood of continued supportand increasing the pressure of vertical programmes to integrate moreclosely. In all, however, making NHIS agree to this can be difficult, as itwould mean giving up control on part of their data collection system - theyappear to be well resourced, given their current data collection scheme, andmay see little benefit in improving the national health information system.
Of course, any integration would be limited to morbidity cases, andwould not include important areas like child or maternal health, HIV/Aidsand so on. Another problem is that replacing monthly morbidity reportingfrom the facilities with only case-based reports would be a step away fromthe idea of encouraging local use of data: most facilities do not have accessto DHIMS2, and would thus not be able to see the data aggregated fromthe NHIS. However, I believe the benefits of getting high quality morbiditydata into DHIMS2 are big enough to warrant putting an effort into tryingto integrate NHIS and DHIMS2 data.
9.3 DHIS2 in Ghana
My second research objective is to study the implementation of DHIS2in Ghana. In this section, I will first look at the implementation as aparticipatory design project. Next, I discuss the case of DHIMS2 in thelight of Heeks’ theories of why IS implementations succeed or fail. Third,I analyse DHIMS2 as an information infrastructure, before looking at howthe DHIMS2 implementation has been influenced by the fact that many ofthe technologies were developed in environments different from Ghana.Finally, I look at the networks of action theory and how it can give insightsinto how DHIMS2 can scale further and be sustained over time.
9.3.1 Participatory Design of the DHIMS2
PD has been part of HISP research from the beginning. The implementationof DHIMS2 in Ghana is no exception to this. My work in Ghana involvedall the three cyclic development processes introduced by Braa and Sahay(forthcoming) to varying degrees: development of software; developmentof a system; and to a lesser extent development of information for action.
How was PD used in Ghana to improve the DHIS2 software? Perhapsthe most prominent example of this was the development of line listing
119

functionalities, or anonymous event registration as it is called in DHIS2.As was explained in chapter 6, DHIS2 did not have any functionality forentering such data. However, it had been part of the previous DHIMSsystem in Ghana, and support for it therefore had to be added to DHIS2.The processes started with the staff at CHIM demonstrating and explainingto me how the feature worked in DHIMS. Shortly after, at the DHIS2Academy, two of the officers from CHIM and myself sat down with oneof the core DHIS2 developers, explaining the requirements and discussingin detail in how the line listing could be implemented. For the next DHIS2release, the anonymous event registration was available. The functionalitywas implemented on the ground in Ghana, and a period of interaction onimprovements and bug fixing followed. This participatory process is stillongoing while this is being written, and a lot of feedback is still comingfrom end users. It is also interesting to note that other countries are startingto use this functionality, and it is, for example, about to be implemented inKenya.
There are several other features in DHIS2 that also came as a result ofthe participatory design process in Ghana. Some of these stemmed frommy observations of use of DHIMS2 and some came from the staff at CHIM.Perhaps the most interesting, however, are the cases where the end-usershave had suggestions, which through discussions with the staff at CHIMand myself have ended up being implemented in the DHIS2 software. Anexample of this is improved support for printing of reports, which is beingimplemented for the next DHIS2 release.
My role in this process was mainly to be a link between the end-usersand the local implementers; and the developers, similar to what Sæbø etal. (2011a) call a mediator. Being situated in Ghana has allowed me geta good understanding of the local situation and to work closely with theusers to come up with proposals for features in a way that the developerscannot. At the same time, I have an understanding of the DHIS2 softwarethat allowed me to filter out proposals that were impossible to implement,proposals which had already been planned for inclusion in the future, andproposals that had been discussed by the developers but turned down.
PD has perhaps been most prominent in the development of the system.Who is the user and who is the designer in this case? I argue that here, theuser - designer relationship can be seen in two levels. At one level, the useris the end-user in the districts or hospitals, and the designers are the staffat CHIM and myself. At another level, the users are the staff at CHIM withme in the role as the designer.
The staff at CHIM and myself cooperated with the end-users inimproving the design of the system, first and foremost with regardto customising the data entry and the reports. In this relation, thedesigners are the staff from CHIM. This type of PD was visible at theregional trainings in particular, where the trainers and users cooperatedon improving the system. Simultaneously, there were aspects of DHIS2that the staff at CHIM did not fully master, where I took the role asa designer and together with the staff designed improved datasets oradvanced reports. Ideally, the staff at CHIM would have been able to do
120

these tasks themselves, and this is therefore another example of lack of localhuman capacity.
Development of information for action was perhaps the least prominentPD process in Ghana. However, it was not completely absent. One exampleis the design of the end-user trainings. Particularly in the first regions, thecontent of this training changed substantially, and this was in part as aresult of comments and feedback from the users. Another example wasthe migration of data from the previous system. This was done to facilitatedata analysis, and thus use of information, by allowing longitudinal dataanalysis.
One of the fundamental principles of participatory design according tothe literature is that it should empower the users. In my opinion, this wasthe case in Ghana. The staff at CHIM, which is responsible for running thesystem, was empowered to adjust and improve the software they use inways that was not possible before. With DHIMS, they could do nothingto change or improve neither the software nor the system. Now, they canchange and influence both.
The end users have also been given the power to influence the systemand to some extent the software. During the trainings, all suggestions wereheard, even if not all could be implemented. Datasets and reporting iswhere most of the contributions were made. Some users complained thattheir input had not been taken into consideration with DHIMS, and werehappy to see that many changes in DHIMS2 could be done right away. Themain challenge here is the fact that the general content and layout of thedatasets are fixed by the various health programmes and divisions withinGHS, which put limitations on what changes could be made.
Interesting with regard to participatory design in Ghana is the fact thatbecause the system is online, there is a continuos link between end-users,local implementers, myself and the developers. While I have not beenin Ghana after the system was rolled out, I have been in active contactwith many end-users, sending dozens of messages back and forth usingthe built-in messaging functionality in DHIS2. This has been invaluablein many ways. It has enable me and staff at CHIM to help users directlyif they have problems or need guidance. When users identify problemswith dataset or reports, or request additions, these can quickly and easilybe addressed and be available to the user immediately. Finally, usersprovide feedback on the software itself, which can in turn be forwardedto the development team. Braa and Sahay (forthcoming) argue that a cloudinfrastructure provides a “tremendous improvement in the condition forPD”, and the Ghana case exemplifies this well.
It is of course a dichotomy between the losenessetween the user and thedeveloper in PD, and the concept of "cloud" computing in a countrywideproject. In the pre-online projects where, for example, each district hadtheir own standalone installation of the system, the feedback cycles wherecommunication resulted in changes in the system would take very longtime. It would for example involve physical transport from the capital tothe districts to implement changes, and bug fixing would be complicated.Now, with the online messaging tool combined with having only one
121

online server to update, both communication and feedback in terms ofchanges are, compared with before, immediate. I could sit in Norwayand communicate with users and perform changes directly on the serverin very short cycles. Strangely enough, therefore, PD in the area of cloudcomputing may bring users and developers closer to each others.
Kensing and Blomberg (1998) argue that PD can take place on threedifferent arenas: the individual project arena; the company arena; andthe national arena. The initial stages of the process of moving fromDHIMS to DHIMS2 involved stakeholder in different part of the GHS,including the various vertical programmes and health divisions. Thiscould indicate a process on the company arena. However, while it wouldhave been beneficial if these actors had been more involved throughoutthe implementation, that was not the case. After the initial stakeholdersmeetings, CHIM and the PPME division has taken over almost everyaspect of the system, and involvement from other parts of the GHS - the“company” - has been very limited. Thus the DHIMS2 PD became a processtook place on the individual project arena, as a project run by CHIM andPPME. Changing national legislation and regulation has not been part ofthe process, thus no work has been done on the national arena.
9.3.2 DHIMS2 - Success or Failure?
Heeks (2002) argues that in order to evaluate the chance of an ISimplementation succeeding, one has to look at the situation before theimplementation and compare it to the future situation as imagined by thedesigners. The implementation in Ghana has come quite far, and we canalready see the contours of the “imagined” future. However, the processis still not completed, and problems might still arise and unintended side-effects can appear.
Among the main issues raised in the literature is the notion of design-actuality gaps, gaps between the actual situation on the ground and thatenvisaged by the system designer. Given that the development of DHIS2 islead from Norway with the main developers being Norwegian, this mightappear problematic. However, several factors mitigate this situation. Firstof all, DHIS2 is based on DHIS1, which was developed in Africa with heavyparticipation from end users. Secondly, DHIS2 has been used for severalyears in various developing countries, leaving time for “gaps” betweenthe software design and the reality on the ground to be reduced throughgradual changes. While the context is by no means identical across thedeveloping world, DHIS2 has been used in several countries that are inmany ways comparable to Ghana in terms of issues like infrastructure, forexample Kenya.
Perhaps the best example of gaps being reduced is the developmentof offline functionality in DHIS2. When development started on DHIS2in the mid 2000s, it was decided that the system should be based on webtechnologies. However, DHIS2 implementations were still based on offlineinstallations in the first years because of the limited internet connectivityin the countries where it was used. Support for offline functions on client
122

machines was thus not needed. It was not until Kenya, which has goodcoverage for mobile internet, wanted to deploy DHIS2 online that work onan “offline data entry” feature began to accommodate areas with unstableconnections. This in turn became a very useful feature for DHIMS2 inGhana.
While DHIS2 had been used in contexts similar to that of Ghana, therewere still some gaps between the design of the software and the reality onthe ground. The first was that of internet access, which was solved in timefor the rollout, thanks to a similar requirement in Kenya. A second gapwas that of human resources. DHIS2, especially in an online deployment,requires skills in server administration. This was not available, and isthus still done by HISP members remotely from Europe, including myself.Human resources were also a challenge for the customisation of the system,as more IT skills were required than what was available at CHIM. Thirdly,there was a gap in therms of management structures. GHS is in many waysquite bureaucratic and hierarchical, and on many occasions, tighter controlof access to the data was requested than what is available in the system.While we have been able to work around these issues for now, they showhow the design and reality differed. Finally, there was a gap in terms ofthe objectives of the system. The system was designed for routine data, butGhana wanted to use it for registration of anonymous events as well.
Heeks (2002) suggests design improvisation as one mean of closing design- actuality gaps. Such improvisation took place on at least two occasions inGhana. First with the development of the offline data entry to alleviatethe problem of unstable internet connections, although this stemmed fromthe Kenyan context initially. Secondly, with the adaption of the trackermodule to allow it to be used for registration of anonymous events. Theseimprovisations have thus closed two of the gaps in Ghana.
To avoid design-actuality gaps, DHIS2 is designed to be flexible. Itthus supports what Heeks (2002) calls design divisibility, that varioussub-components of the systems can be used independently in terms ofmodularity and incrementalism. This allow local improvisation, another wayof closing gaps. DHIS2 has several modules that can be used more orless independently, such as routine data reporting, tracking, anonymousevents, mobile and various reporting modules. Several countries have alsodeveloped their own modules to meet specific country requirements, suchas India. Furthermore, DHIS2 supports incremental implementations ofthese functions. In Ghana, the routine system was configured more or lesscompletely before work on the anonymous events even began, and varioustypes of reports were added before coordinates for GIS were available. Theflexibility provided by DHIS2 is important to ensure that the system can beuseful over time as new requirements arise.
9.3.3 DHIMS2 as an Information Infrastructure
Can the Ghana HIS, and more specifically DHIMS/DHIMS2, be regardedas an information infrastructure? And if so, what can the literature on IIteach us? Whether or not DHIMS2 can be classified as an information
123

infrastructure is not a yes or no question. Rather, DHIMS2 can haveproperties making it more or less useful to use II theory to analyse it. If welook at each of the defining properties of an II, as defined in the literature,we see that the Ghana HIS does have many of these:
• Installed base. With the transition from DHIMS to DHIMS2, DHIMSacts as a powerful installed base. Furthermore, the datasets andreporting routines constitute an installed base with roots evenpreceding DHIMS.
• Evolving. DHIMS2 is evolving, with new actors becoming involved,new types of input and output, and plans for linking with othersystems.
• Open. While DHIMS is closed in the sense that access to the system isrestricted to certain users, it is open in the sense that it can connect toother third-party systems.
• Socio-technical. DHIS2 is a technical component of the system, butthere are also non-technical components: users, routines for reportingand feedback, the information flowing through the system and so on.
• Enabling. While not the most distinct property, DHIMS2 does havesome enabling aspects. One example is how the built-in messagingfunction is used for communication not concerned with feedback onthe software or system.
• Interrelated. The system is linked to other networks, most notably theinternet. There are plans to link it to patient records systems as well.
• Shared. DHIMS2 is clearly shared among hundreds of users, andwould not be useful if used by a user in isolation.
We see that DHIMS2 has many of the properties characteristic ofinformation infrastructures. How can this help us in the implementationand analysis of DHIS2 in Ghana? The II literature describes how tobootstrap an II, and how to avoid lock-ins. It argues that IIs should bemanaged through cultivation, rather than strict control and design. Finally,it explains how an information infrastructure is both limited and enabledby the installed base (Hanseth, n.d.).
The latter point, that the installed base has both enabling and limitingeffects, can clearly be seen in Ghana. The implementation of DHIS2 waslimited by the installed base in the sense that the everything was comparedto the existing DHIMS, and requirements were often set based on thatsystem. At the same time, the fact that there was a system ensured that therewas at least some human resources, routines and technical infrastructuresin places, giving the implementation a flying start.
One of the main topics of II theory is how an information infrastructurecan be bootstrapped. This might not seem relevant in the case of DHIMS2,as it is in many ways a system that is “enforced” on the users from
124

above. However, it is still important to get users involved and interestedin actively using the system. Thus there are several lessons that can belearnt. First of all, II theory argues that the system should be useful fromthe start. For DHIMS2, this implied first of all to make good reports thatmake information easily available in a way that the previous system couldnot. Next, it is argued that the installed base should be leveraged as muchas possible. This was clearly the case in Ghana, with the DHIMS2 takingover for DHIMS in the same offices on the same computers. Furthermore,the fact that many of the users already had internet access through themobile internet was exploited. Finally, II theory states that the installedbase should be expanded before new functionality is added. This was whatwas done in Ghana. The first priority was to get the routine data collectionstarted. Then, more advanced tools for data analysis and reporting wereintroduced.
Another major concern in II theory is how lock-ins can be avoided.The key points here are to ensure design flexibility and use flexibility.Design flexibility implies that the system can be changed at any time. ForDHIS2, this happens through customisation or through changes in thefreely available source code. The fact that the system is developed freelyensures an extra flexibility in a resource constrained settings, as requiredfeatures can be requested and often added for free.
The second aspect of flexibility is use flexibility. This implies thatthe system can be used to support different workflows without requiringchanges in the software design. Use flexibility requires human capacity.In Ghana, such capacity is available to affect the most typical changes.However, external assistance will be required for more far-reachingchanges. Furthermore, a system with standardised interfaces givesfreedom when choosing other systems in terms of interoperability.
In many ways, the original DHIMS represented a lock-in situationwhich required action to be resolved. The technology was not flexibleenough, especially after the source code was lost - it was not modular, andhad no standard interfaces to allow interoperability with other systems.From the onset of the DHIMS2 implementation, there was talk of makingsure the mistakes made with DHIMS were not repeated. Focus hastherefore been on flexibility, both in terms of the technology and by havinglocal human capacity. Thus in all, DHIMS2 appears to have the flexibilityto avoid a lock-in situation similar to that of DHIMS.
From the above, we see that the II theory fits well with the caseof DHIMS and DHIMS2, and that most of the advice provided by theliterature has been followed.
9.3.4 Technology Inscriptions
Many functions in DHIS2 were built for quite different environments thanwhat they are currently being implemented in, including the anonymousevent registration. Does this have any consequences for the implementa-tion in Ghana?
The anonymous event registration (line listing) originates as a
125

“tracker”, developed in India for the Indian context. It was meant tobe used as a tool for tracking mothers through antenatal care or childrenthrough child health programmes, often in conjunction with DHIS2 Mo-bile. This tracker module was then adopted to be used for anonymous re-gistration in Ghana rather than tracking in India. While the anonymousevent registration is working in Ghana, it is currently missing some obvi-ous features as a result of how it has been adapted. For example, there isstill no way of editing or deleting events that have been registered, and thereporting functionality is limited. This is in many ways in line with theargument made by Akrich (1992) that technologies are designed to fit in acertain model of the world, and in this case this model does not match thereality.
Another example of this is the development of minimal or essentialdatasets. An essential dataset was successfully developed and implemen-ted in South Africa, the first HISP project. It was also introduced in SierraLeone, the first country to implement DHIS2 nationally, this time as moreof a "maximum" dataset. At the same time, attempts to develop an essen-tial dataset failed in Cuba, where there was skepticism that local access anduse of data would reduce the power of the central level (Braa, Titlestad andSæbø, 2004). Thus the idea of an essential dataset fit the reality in the Si-erra Leonean context, but was too different from the situation in Cuba tosucceed. My impression from Ghana was that there were many users andofficers who wanted to develop a more integrated and possible minimiseddataset. However, both politics and mistrust between divisions and pro-grammes make this difficult.
9.3.5 Networks of Action in Ghana
The idea of networks of action was developed by Braa, Monteiro and Sahay(2004) as a response to the problem of scaling and sustainability. It is basedmostly on cases where the implementations started at pilot sites, and howthese could be scaled and sustained. In Ghana, there were no pilot sites,but an immediate full-blown rollout run by the government. Is a theorydealing with issues of scaling and sustainability still relevant here?
Scaling in the sense of scaling a technology from pilot sites to fullimplementations is not relevant in Ghana. However, I will argue thatscaling is still relevant, not in terms of increasing the coverage of DHIMS2,but in terms of scaling up the use of the system. Currently, many of thehealth programmes that have their datasets in DHIMS2 still in reality usetheir parallel reporting systems instead. Furthermore, the system can bescaled in terms of introducing new functions such as mobile reporting andtracking. Thus there is room for scaling up the usage of the system.
Although DHIMS2 is the official government system, there is noguarantee that the system will be sustained indefinitely. One aspect ispolitical support for the system in Ghana. While all stakeholders areofficially part of the system, they have indicated both in interviews andthrough actions that they are not all fully committed. Political supportfor a national integrated HIS should therefore not be taken for granted. A
126

second aspect is to what extent the needed technical and human capacity isavailable in Ghana to keep the system running. For example, there is stillno local capacity to administer the DHIMS2 server.
In my opinion, the networks of action approach can be beneficial inGhana. First, what are the potential actors in a Ghanian network of action?CHIM and the PPME division of GHS are obviously participants in thenetworks. A second actor is HISP, through the University of Oslo, of whichI am a representative. The US-based Centre for Disease Control (CDC) isanother partner - they provide support for CHIM, and are the donors ofthe server on which DHIMS2 is running. Yet another participant in thenetwork is WAHO, which is working to support DHIS2 implementationsacross West Africa, although not playing an active role in Ghana at themoment.
How can such a network of action address the sustainability andscalability issues discussed above? Political support and technical capacityare in my opinion the main threats in terms of sustainability. Both WAHOand CDC can play important roles in ensuring political support. CHIMand PPME can use the support from CDC as a leverage to ensure supportfor DHIMS2 from other parts or GHS. With WAHO officially supportingDHIS2 as a platform in West Africa, it will be more difficult politicallywithin the GHS to shut down or replace DHIMS2. In terms of technicalcapacity, the partnership with HISP and the University of Oslo can provideCHIM with technical support visits, and help with capacity building. Therehas also been some preliminary talks about the possibility of a cooperationbetween the University of Oslo and the University of Ghana to furtherincrease the efforts of building local capacity.
For scalability, a partnership with WAHO can potentially help convincethe various health programmes and divisions to engage more fully inthe DHIMS2. For example, the Immunisation programme, one of theprogrammes not yet fully committed to DHIMS2, reports regularly toWAHO. WAHO could encourage the Immunisation programme to use theintegrated system, or even ask to be given access to DHIMS2 in order tohave access to the immunisation data directly. Other potentially importantactors in terms of scalability in Ghana are the international donors. Theywould benefit by having immediate access to the data they require online,and could therefore encourage the programmes doing parallel reporting tointegrate with DHIMS2.
9.4 Comparing Liberia and Ghana - The Importanceof the Internet
While Ghana is a comparatively well developed African country, Liberiais one of the poorest countries in the world and is till recovering froma disastrous civil war. These contrasts are reflected when comparingthe implementation of the DHIS2 in the two countries in relation toboth infrastructure and human and institutional capacity. Two majordifferences become immediately obvious when comparing the DHIS2
127

implementations in the two countries. The first is the use of the internet:The infrastructure in Liberia is much poorer than in Ghana. In Ghana, thegoal from the beginning was to run DHIS2 on a central server over theinternet. In Liberia, the internet infrastructure was deemed insufficientand it was decided to run DHIS2 using offline, standalone installations.The second major difference is in the datasets. In Ghana, there has notbeen any reforms or integration of the data being collected. Each divisionand health programme has included their own different, often overlappingforms. When DHIS2 was introduced in Liberia, on the other hand, thedatasets from the facility level and up were changed to a new integratedstandard. In this section, I will compare and contrast these differencesbetween the DHIS2 implementations in Liberia and Ghana in more detail,and discuss how they illustrate the important role internet can play fordevelopment.
9.4.1 Different Infrastructures
When it was decided to use DHIS2 as a replacement for DHIS1 inLiberia, the internet infrastructure in the country was not seen as sufficientto support the system. Due to its history of civil war, the generalinfrastructure in Liberia is poor and the internet infrastructure is noexception. The country relies on satellite connections for internet, even inthe Ministry of Health in Monrovia, which is slow and expensive. Optionsfor hosting a server with DHIS2 in the country was also limited.
In Ghana, on the other hand, internet is widely available. In Accraand major cities, fast broadband connections are available, and there ismobile 3G coverage. Options in other parts of the country are more limited,but some coverage is available across the country. Furthermore, there areseveral companies offering server hosting, as opposed to in Liberia.
There also seems to be a difference in the attitude of the managersin the two countries. From the beginning, Ghanian managers have beendetermined to have a fully online system and have rather pushed forimprovements in the software to support areas with poor connectivity thanto have districts working offline. In Liberia, on the other hand, the internetdid not seem to be considered an option anymore when we arrived there.It was more or less coincidental that we were able to put the Liberian serveronline, as the managers said the internet connection was not good enough.After realising the benefits first hand, however, Liberia now tries to haveall counties doing data entry online.
Another difference that illustrates the different role internet plays inthe two countries are that of finances. In Ghana, there was often talk ofwho would pay for internet connectivity, both centrally in Accra and withregard to users in the districts who sometimes used their private modems.In Liberia, however, the financial aspect of internet connectivity was neverreally raised - the issue here was whether or not using the internet was atall possible. This shows how the internet in Ghana has become a regularcommodity unlike in Liberia.
128

9.4.2 Data Standardisation
Another major element separating the introduction of DHIS2 in Ghanaand Liberia is in the data that is being collected. In Liberia, the rollout ofDHIS2 coincided with the introduction of a new, integrated dataset whichincludes data for all the major divisions and health programmes. This wasan important reform, changing the system from the paper forms used infacilities to the Ministry of Health.
In Ghana, there were no changes in the data being collected on theground. The only changes in terms of data between DHIMS and DHIMS2are some smaller revisions, and the inclusion of more datasets. Thus inGhana, health workers in the facilities are not affected by the change ofsoftware at all.
In terms of data standardisation, Ghana followed what Tohouri andAsangansi (2009) call the “maximalist approach”: including all the datain the system, integrating some of it behind the scenes in the database.Liberia rather followed the “minimalist” approach of creating an essentialdataset. HISP has typically emphasised the importance of developing anessential dataset similar to the approach followed in South Africa, and thisclearly has many benefits (Braa, Monteiro and Sahay, 2004). However, inmany cases this have proven to be difficult to achieve in practice, and asecond-best option has been chosen (Sæbø et al., 2011a). In the case of SierraLeone, for example, a maximalist approach was first taken, followed by anintegration of the data collection later Tohouri and Asangansi (2009). Ghanamay prove to be a similar case.
One reason for the different approaches taken might be historical. TheGhanian health system have a long, continous history, and routines andprocedure have become institutionalised. In Liberia, on the other hand,much of the system was built from scratch after the civil war, makingchanges easier to achieve. Furthermore, the country had experience instandardisation work after the implementation of DHIS 1 only a few yearsearlier.
9.4.3 The Importance of the Internet
Liberia moved from its Microsoft Access-based DHIS1 to a web-basedplatform without going online. Essentially, DHIS2 was used in the sameway as DHIS1. Used this way, DHIS2 is more complex to maintain andmanage, and the implementation in Liberia soon faced major technicalproblems. There was no true central repository where all the data wasavailable at the national level, as individual users in the ministry of healthhad their own databases which they imported new data into. Maintainingthese installations both on individual computers in the Ministry of Healthand in the counties was intensive in terms of human resources, and therewas not enough human capacity available for this.
In Ghana, DHIS2 was run over the internet on a central server from dayone. This is in line with how DHIS2 should ideally be used. As in Liberia,there was limited human capacity available to maintain DHIS2 installations
129

in Ghana. However, because DHIS2 was used over the internet on oneserver, first, it was easier for the national team to assist users around thecountry, second, for more complicated issues, assistance could easily beprovided by HISP from outside the country.
This shows how the “internet revolution” has reached Ghana, butnot yet Liberia. As a consequence, the DHIS2 implementation in Liberiasuffers. It will be interesting to see what the result will be now thatLiberia is attempting to move online as well. There have already beensome positive effects, an example of this is that I have been able to assistin the development of a new dataset on the online server, from Norway,something that would have been quite difficult with offline installations.
The internet infrastructure in Liberia is still limited, relying on satelliteconnections which are generally available in only one location in eachcounty. However, I will argue that the infrastructural requirements inLiberia is somewhat lower than in for example Ghana. An importantreason is the fact that an integrated dataset exists in Liberia. This meansthere is less data to report and thus less online time is needed to completethe data entry. The integrated data collection also means that once thedata is entered into DHIS2, the national reporting requirements have beenmet. Also, should there be any difficulties or delays with reporting throughDHIS2 in Liberia, there is support for and reliance on the integrated systemthroughout the health service. In Ghana, many of the programmes willsimply ignore DHIMS2 should it fail, as they have parallel systems thatthey use in any case.
Reporting in Liberia is generally done through Excel pivot tables,with data drawn from DHIS2. Once data is loaded into Excel, internetconnectivity is not needed. In Ghana, however, many users first enter theirdata into DHIS2, then want to use the built-in reporting tools in DHIS2,for example to generate reports used for parallel reporting. This requiresinternet connectivity. Ghana also uses the anonymous event module, forwhich internet connectivity is required both for data entry and reporting.
Above, I discussed how DHIMS2 was developed using participatorydesign approaches. An important part of this was the use of the builtin messaging functionality of DHIS2 to communicate with users after therollout. Because the system in Liberia has been offline, this has not been anoption there. Instead, users have had to use email or phone, and could onlycommunicate with managers inside the country, not with implementersabroad as in Ghana. Equally important, whilst in Ghana any changes tothe system will be visible for all users immediately on the central server, inLiberia the database will have to be changed and then sent to each countyfor manual updates.
9.4.4 ICT for Development
When comparing Ghana and Liberia, the positive influence of the internetcan be seen quite clearly. Data-wise, Liberia has in many ways a superiorsystem, with an integrated dataset with wide support among stakeholders.However, because of the limited internet coverage in Liberia, DHIS2 has
130

worked poorly so far. In Ghana, on the other hand, it has worked well,despite the system being more complex and adjustments to datasets andreporting being required continuously. The fact that it is running overthe internet has been a major factor in enabling this. This supports theargument made by Calderon and Serven (2010), that infrastructure shouldbe a top priority for development.
In the literature on ICT for development, there is also a lot of focuson the need for local human capacity. The size of the population inthe two countries is very different - Ghana has about 20 million moreinhabitants than Liberia, and it is my clear impression that far more humancapacity is available in Ghana than in Liberia, at least at the central level.In Liberia, the whole DHIS2 implementation is practically run by oneperson. In Ghana, there is a large team of implementers. Increasing thedifference is the fact that Ghana has received far more outside support thanLiberia during the implementation phase. While limits to the local humanresources have not had too severe consequences in Ghana, partly becauseof outside support, it is the cause of many of the technical difficulties inLiberia. Looking at the three human capacities required to use ICT fordevelopment according to Osterwalder (n.d.), it is particularly capacity tomaintain the required infrastructure - the server and network on whichDHIS2 running - that is lacking, in both Ghana and Liberia.
Adam and Wood (1999) stress the importance of policy-makers inenabling ICT for development. Here, policy-makers in the Ghana HealthService have been determined to utilise the opportunities that DHIS2provide, for example by pushing to have the whole country use the systemonline and getting the anonymous event functionality ready. While thesituation in Liberia has been more difficult in terms of human resourcesand infrastructure, managers here have also pushed to make use of moreof the capabilities in DHIS2.
The cases of Liberia and Ghana are thus a very concrete example ofhow ICT infrastructure play an important role for development, in linewith what the literature on ICT for development states. Specifically, itshows the potential importance of the internet in Africa. Internet coveragehas a positive impact on the health information system of Ghana, thisinformation will hopefully be used to make informed decisions that will,we assume, lead to better health for the Ghanian population. Followingthe situation in Liberia will give an indication on whether even very limitedinternet access can be enough to have a positive impact.
The DHIS2 implementations in Liberia and Ghana also show moregenerally that ICT projects can have an influence on the provision of basichealth services, through improving the management of the health system.In this way, DHIS2 follows closely what Osterwalder (n.d.) argues, whichis that ICT underpins other sectors and increase the efficiency of these.By providing better management information, DHIS2 implementations inGhana and Liberia help support and increase the efficiency of the healthsector in the two countries.
131

9.5 Regional Developments
In 2012, more than half of the West African countries use or consider usingDHIS2 to support their national health information systems. It seems clearthat this fact could be leveraged to the benefit of the individual countriesand the region as a whole, and we saw in the previous chapter that thereare many common problems in the West African region. But how can theregion benefit from the growing use of DHIS2?
9.5.1 Fighting Fragmentation
We have seen that fragmentation is perhaps the biggest challenge to healthinformation systems in West Africa. According to Braa et al. (2012),participatory approaches that let various stakeholders and users influencethe system have proven to be critical for HIS reform and integrationto succeed. These social and organisational processes can be aided bytechnical elements: good data warehouse software; use of the internetwhere possible; and creating standards for data and indicators (Braa et al.,2012).
A good data warehouse software enables users to have a prototypingtool when developing the system. In DHIS2, datasets can easily be addedand changed with only limited technical knowledge, making it a usefultool when developing new datasets. Furthermore, good data warehousesoftware is easy to integrate with other system. This can be importantwhen working to create consensus for integration, as stakeholders thatuse software systems for data collection or analysis know that the datawarehouse can be made to interoperate.
The importance of use of the internet as an aid when using participatoryapproaches can be seen when comparing Liberia and Ghana. In Ghana,users have participated in the improvement of the DHIMS2 after therollout, through the use of the messaging functionality of DHIS2. Thishas proven important in resolving various issues, and receiving requestsfor improvements. Nothing similar to this has been possible in Liberia,because the system has been running offline.
Agreeing on data standards is also an essential step in the integrationprocess, and also a difficult one. Without standards for what data toinclude, creating an integrated architecture. As the case of Ghana shows,an agree data standard does not necessarily mean that all data collectiontools must be revised. What is essential is for the stakeholders to agree onhow to approach the issue.
Not only technical elements can facilitate integration and reform,however. Braa and Sahay (2012) have developed a three-levelled integratedarchitecture for health information systems. Next, I will look at howcountries in the region can benefit from direct and indirect cooperation increating such integrated architectures.
132

Data Level
The data level, or data exchange level, is the lowest level in the architec-ture, dealing with data standards, standards for data exchange and inter-operability, and infrastructure supporting software and applications (Braaand Sahay, 2012). For data exchange, the SDMX-HD standard is important,as the official data exchange format promoted by international actors likethe WHO. DHIS2 supports this standard, and as the use of DHIS2 as a datawarehouse grows in West Africa, the importance of SDMX-HD increases.There is a plethora of systems in West Africa dealing with health inform-ation, but few of the local software solutions are likely to have supportfor this standard currently. However, as DHIS2 is rolled out in an increas-ing number of countries, efforts should be made to increase the supportfor SDMX-HD. Having support for data exchange with the national datawarehouse can become a major selling point for software providers, and asthe use of DHIS2 increases in the region, software providers with regionalambitions only need to support one data standard for all countries usingDHIS2.
A standard for exchange of data is important, however, moving databetween systems also requires standards for the data itself. While this isrelated to the development of essential data and indicator sets, it is notexactly the same. The data sets deal mainly with what data to collect. At thetechnical level, it is important to make sure that the data collected from thevarious systems represents the same thing. The ministries in the individualcountries have a paramount role in this work. However, that is not to saythat there is no room for regional actors in influencing the process. Muchdata collection in developing countries are guided by international donorsand organisations such as WHO and WAHO. These are thus in a positionto influence both what data is collected, and the data definitions used.
A final aspect of the data level is the infrastructure over which the datacan be transferred. Here, fixed and mobile internet are the main elements.According to Braa et al. (2012), internet should always be used as far aspossible as a vehicle to enable integration by making access to a shareddata warehouse possible. How can regional efforts support the internetinfrastructure? One way is through international donors. In Sierra Leone,the Global Fund is providing funds for internet access in the districts. Asan actor that is active in many West African countries, it could be possibleto make similar arrangements other places. This require that internet isaccessible however, and not all areas have internet coverage presently.Here, mobile operators might be engaged to improve coverage in criticalareas, as is being done in Ghana. However, engaging mobile operatorsbrings out a new set of challenges, as their focus on commercial gains areoften in conflict with the goals of actors in the health sector (Valbø, 2010).
Application Level
The application level is where the software and applications to supportuse of information is found. This includes not only data warehouses,
133

but also other systems for example for patient management. In anintegrated architecture, these systems should be interoperable through thestandards and infrastructures defined at the data level. As with the datalevel, there are major challenges in most West African countries on theapplication level. One issue is sub-par software that does not support use ofinformation. Another challenge is that few of the systems currently used inWest Africa today are interoperable. Finally, the data warehouse approachrecommended by Health Metrics Network (2008), Braa and Sahay (2012)and others is not widely used except where DHIS2 has been rolled out.
In West Africa, an important step in the right direction would thereforebe for countries to use a good data warehouse software, along withinteroperable systems. By implementing DHIS2, many countries aremoving in the right direction. The major challenge is thus to find softwarefor areas that DHIS2 does not fully support, such as finances, medicalrecords, human resources and so on, that are still compatible with DHIS2through standards such as SDMX-HD. There are several ways in whichinteroperable systems could be promoted in a West African context.
One option is to use the already interoperable systems, such asOpenMRS for patient records and iHRIS for human resources. A casecan be made for international actors such as WAHO, donors, HISP andthe software developers to promote these compatible applications inWest Africa. West Africa as a whole is a large “market,” and throughcooperation the West African countries would have great leverage to havethe applications adapted to their context. Another option is for countriesto develop new compatible systems together, for example for electronicpatient management. This work could either be led by WAHO or by one ormore of the countries in the region. The danger here is the software quality:the home-grown applications we have seen in West-Africa leave a lot to bedesired in terms of quality and features (Braa et al., 2012). For example,the SIGIS software developed and used in WAHO has a reputation ofbeing unreliable. Finally, many of the countries in the region already havehome-grown software, for example for medical records. If this softwareis updated to be interoperable with DHIS2, it could potentially be soldor given to other countries in the region. In addition to providing theregion with additional software options, this would be a huge commercialopportunity for the software maker.
The area of mobile applications has come into focus lately. Much ofthe same issues apply here as for the regular applications: data collectedusing mobile should be interoperable with the data warehouse, and theapplications should support the information needs of the users. In themobile space, DHIS2 Mobile can be one alternative. It is closely integratedwith the DHIS2 data warehouse, and is actively developed. Many of thesame benefits as increased use of DHIS2 has on the region would alsoapply for DHIS2 Mobile, such as support for implementations from theHISP networks, as wells as trainings and workshops.
134

Social System Level
The perhaps most challenging aspect of HIS integration in West Africa isthe integration at the social system level, meaning the procedures govern-ing the health information system across organisations, and informationneeds by the various actors. A primary concern here is for actors to agreeon the need for integration. In some West African countries, this agree-ment is there - for example in Liberia and Sierra Leone - but that is not thecase everywhere. Donor funding was identified as one of the main sourcesof fragmentation by the WAHO HIS evaluation (Braa et al., 2012). Thusdonors are important when it comes to reaching a consensus on the needfor integration. As the actors funding the main vertical programmes andsetting many of the reporting requirements, donors have a lot of leveragein this area.
Once an agreement among stakeholders has been made on the needfor integration, the information needs of various users and stakeholdersmust be identified. Again, donors and international organisations likeWAHO and HMN are important. Then, the data collection tools withineach country should be integrated. In West Africa, several approachesto integration of data collection have been taken. Which of these arefeasible depend to a large extend on the commitment of the involvedstakeholders. In Liberia and Sierra Leone, completely integrated datasets covering all divisions and health programmes have been developed.Ghana has instead included all reporting tools from all stakeholderswithout changes, thus creating an integrated database without integratingthe data collection itself. Finally, in Burkina Faso the governmentdeveloped an integrated dataset in cooperation with the programmes, butthe programmes themselves use separate reporting tools. In my opinion,the former approach should be the goal when possible, and I previouslyargued that Ghana should try to follow that approach. However, itis unlikely to happen without pressure, or at least consent, from theinternational donors.
In time, it might be possible to create a common minimal dataset for thewhole region. Some core data could be collected by all countries basedon the same data standards to make comparisons of data possible, andcountries could collect any additional data as they required. This will bediscussed next.
9.5.2 A Regional Dataset
Developing an essential dataset for the whole West African region withessential data and indicators could be a huge positive development. Datafrom this dataset could be made available in a regional database online,run by WAHO using DHIS2. This would make the data easily availableto stakeholders across the region. It would allow the individual countriesto compare their performance with their peers, and encourage cooperationby learning from the best performers in various areas. Potentially, it couldalso lead to a friendly competition among the countries. The danger with
135

the latter is of course that it could lead to manipulation of the figures ratherthan real improvements.
A regional dataset could also be of great use for WAHO itself, as well asinternational actors such as WHO. As I explained in the previous chapter,WAHO is struggling to get data from the individual countries. A regionaldataset, implemented in DHIS2, could potentially facilitate greatly thework of getting timely and complete regional data.
What is needed for a regional dataset is a standard set of data elementsto report on, as well as clear definitions for these. Only the most essentialdata is needed for a regional dataset, and most countries are likely tocollect this data already. For example, the immunisation programme inGhana explained that there is currently a standard dataset being reportedto WAHO. There might be minor differences in the data definitions thatneed to be solved. A common difference between countries is the use ofage groups, for example for morbidity data. However, at a regional level,such granularity is unlikely to be needed in any case.
Practically, few changes are probably required on the actual datacollection tools used on the ground. As mentioned, most data that isneeded in a regional dataset is already likely to be collected. The exceptionis where different definitions are used and must be harmonised. Forcountries using DHIS2 already, reporting to WAHO would then just be amatter of picking the right data elements from the existing database andputting these into a new dataset. This could in turn be exported fromthe country database, and imported directly to the regional database overthe internet - an operation that can be done in a matter of minutes. Othercountries would either have to make their data available in a CSV-format orXML-format that can be imported into DHIS2, or enter the data manually.
The use of DHIS2 for a regional database can have an additionalbenefit of promoting integration internally in the various countries usingthe software. In Ghana, for example, the immunisation programme iscontinuing to use Excel-templates to report immunisation data to WAHO.This weakens their support for the integrated DHIMS2. If WAHO startedrequesting that this data be reported in a DHIS2-compatible format, itwould push the immunisation programme towards using DHIMS2 ratherthan relying primarily on parallel reporting. While this is an example fromGhana, it is likely that similar situations exist across the region.
I have argued that the above proposal for a regional dataset has greatbenefits. With the increasing number of countries adopting DHIS2, thetechnical aspect does not pose a big challenge. But how realistic is it that aregional dataset can be implemented? First of all, there might be politicalopposition to the idea from within the individual countries. While the bestperformers might be positive, it can be problematic for countries strugglingwith performance to make peer comparisons more easily available. For aMinister of Health, making unfavourable data on the performance of thehealth sector more easily available might not be tempting. On the otherhand, similar data is available from international organisations, thus thereare few real secrets here. Secondly, while only small adjustments mightbe needed in the data that is collected, reaching an agreement on the data
136

definitions to use might be difficult. Furthermore, reaching a consensus ona standard dataset of data to collect might also be difficult. Here, standarddefinitions and indicators laid out by for example WHO can be useful asa starting point. Finally, a challenge is cooperation internally in WAHO.Different divisions dealing with various programme areas are workingrather independently, as discussed in the previous chapter. A commondataset would therefore also require internal cooperation inside WAHO.
A regional dataset will no doubt be difficult to implement, but I arguethat the benefits make an attempt to reach an agreement worthwhile. Thefact that DHIS2 is increasingly used in West Africa makes the technicalaspect less of a problem. A push from international actors such as WAHO,WHO, HMN or donor organisations that are active across the region suchas the Global Fund, is likely to be needed to get a process started. In fact,a WAHO workshop was held in Bobo, Burkina Faso, on July 27 this year,with the purpose of developing a draft for a standard regional indicatorset. This draft contains a list with definitions of 57 indicators, specifying indetail the data sources of each. While there is a long way to go from a draftdeveloped at a workshop to the actual implementation of this standard, thisshow that there is interest in this topic and it is a good point of departurefor further work.
9.5.3 Creating Networks - the Attractors
In the previous sections, I have discussed how integration can be achievedin West Africa, with a focus on how the increased use of DHIS2 can bebeneficial. I also discussed how cooperation among countries as wellas national and international actors are important, and looking at theopportunities for networks of action and networks of networks to developis therefore relevant. Sæbø et al. (2011b) argues that attractors are neededin order for networks of networks to grow. There are several attractors thatcan potentially create and strengthen such networks of networks in WestAfrica:
• software - DHIS2
• training and support
• legitimacy
• success cases
The DHIS2 software is becoming an important attractor in West Africa.The last few years, DHIS2 has been piloted and implemented in anincreasing number of countries, which has led the software to mature andgrow in terms of features. It has become increasingly well known acrossthe continent, in a way creating a self-reinforcing effect.
Another important attractor in West Africa is the training and supportprovided by HISP to the countries implementing DHIS2 in he region. Asthe West African user base has grown, the frequency and scale of the
137

workshops and trainings has also increased. Within the last year, twoDHIS2 workshops have been held in West Africa, and HISP has madesupport visits to several countries. Consequently, countries choosing tomake use of the HISP network and DHIS2 know that they will get supportfor their implementation.
Legitimacy is another attractor, which is also discussed in the articleon networks of networks (Sæbø et al., 2011b). Actors at different levelscan lend each other legitimacy through cooperation. This is important forexample for HMN and WAHO.
Finally, success cases can be important. Proving that somethingworks through an actual implementation can increase interest in both theimplementers, the software and the implementation itself. This will inturn benefit all the networks involved in the implementation. The onlineimplementations of DHIS2 in Kenya and Ghana can potentially be seen asattractors both for new countries, and for countries currently having offlineinstallations but who want to move online.
9.5.4 Other benefits of Regional Cooperation
We saw above some of the benefits of regional cooperation, and we canuse Liberia and Ghana as examples of this. Both countries have benefitedfrom these regional developments in several ways. First of all, they havebenefited through participation in the workshops held in Accra and Loméin recent months. Especially Ghana, as the host country for the DHIS2Academy, was able to train a score of users. Secondly, both countries havereceived support visits from HISP by myself and others, in addition toremote support. In the case of Liberia, the visit resulted in part from thefact that it was only a short flight from Lomé where the database trainingwas held.
WAHO is another potential benefactor of the increased use of DHIS2 inWest Africa. The organisation currently has problems collecting data fromthe member states. Having all member states on the same system, and thedata available online will facilitate the process of sharing data in the sub-region. Furthermore, having one widely used system makes it easier forWAHO to provide support for its members.
9.5.5 Challenges to Regional Cooperation
Two general challenges to regional cooperation are language and politicalinstability. Linguistically, West Africa is clearly divided in a French andEnglish group. While this is by no means a complete barrier to cooperation,as for example ECOWAS and WAHO are examples of, it does pose achallenge. This has been evident at the two workshops in which I haveparticipated, where in both cases two camps have emerged. It is especiallyproblematic because human capacity is one of the main challenges facingthe countries in West Africa. The language barrier is a hinderance to theexchange of ideas and experiences that could have been very valuable forbuilding this human capacity.
138

A second challenge is the political instability that is troubling parts ofthe region. This is primarily a problem internally in the affected countries,where work on implementations can suddenly be halted as was recentlythe case in Guinea Bissau. However, these same problems are also achallenge to cooperation: a country has little incentive to make cooperationan agreement with another state if it is seen as likely that the governmentcan collapse and the agreement be broken.
139

140

Chapter 10
Conclusion
Throughout this thesis I have addressed some central topics of informationsystems in developing countries. Perhaps the most central of theseare the issues of scalability and sustainability, and the use of ICT fordevelopment. My work has been done as a participatory action researchproject. Throughout, participation has been central. The contributions Ihave made to the DHIMS2 in Ghana, and to lesser extent the other DHIS2systems I have worked on in West Africa, have mainly been done throughparticipatory design.
10.1 Addressing the Research Objectives
I have had four main research objectives for this thesis. The first wasto understand how the health information system in Ghana works at thedifferent levels. This is an important issue in itself, but even more so inrelation to the major change that the implementation of DHIS2 in Ghanarepresents.
10.1.1 Understanding the Ghana HIS
What I found was that the health information system in Ghana sharesmany of the typical problems of developing world HIS. More data thanis needed is collected, much of it is duplicated, the quality, timeliness andcompleteness is mediocre, and the usage seems to be limited. As I see it,the main sources of these problems are the fragmentation of the reportingand limited resources, especially in terms of human resources.
There are also positives, however. At the lower level, for patientmanagement facility management, usage of data seems to be good. Thereare reports of more focus on training of personnel to increase humancapacity. At all levels, there are regular review meetings, which cancontribute to increase usage of data. Finally, I believe the implementationof DHIMS2 can contribute to resolve some of the problems the Ghana HISis facing, as shown in the next section.
A separate issue is the National Health Insurance Scheme. Created in2003, the NHIS has become a major force in the Ghana health system, as it is
141

now the main source of income for the health facilities. Almost all Ghanianshave insurance trough this scheme, and the NHIS collects morbidity dataon all insurance cases. This is very valuable data that is currently not linkedthe national health information system in any way. If the NHIS could belinked with the national system, this would be a great opportunity for thenational HIS.
10.1.2 Implementing DHIS2 in Ghana
Looking at the potential benefits of using DHIS2 in Ghana was one part ofmy second research question. As I see it, there are three main benefits to theDHIMS2 implementation in Ghana. The first is that it has the potential toimprove the quality, timeliness and completeness of the data. The qualitybecause DHIS2 provides tools for checking data quality, and through itsreports facilitate feedback and self-assessment. Timeliness because thesystem is online, thus data will be available to all users as soon as it isentered into the system. Completeness because the new system makes itmuch easier to identify the facilities that do not report.
The second benefit DHIMS2 can bring is increased information usage,by making the data more accessible and in a more comprehensible way.DHIS2 has a wide range of easy-to-use reports that can present informationeasily in ways not possible with the previous system. And because it isonline, the information is available to any user as soon as it is entered intothe system.
The last of the major benefits DHIMS2 can bring to the Ghana HIS isthat it, in my opinion, brings integration of data collection one step closer.With DHIMS2, Ghana has an integrated data warehouse with data from allprograms - even if the programmes rely on the data in their parallel systemsfor now. If the DHIMS2 implementation succeeds, which I believe it will,the programmes will realise that an integrated system is possible, and thatis has benefits. This realisation may in turn facilitate a reform process of thedata collection tools that can remove some of the duplicated data collection.
Understanding the benefits of implementing DHIS2 in Ghana was onepart my second research objective. However, the main point was to lookat how DHIS2 could be implemented in Ghana using participatory design,and how to make sure the implementation is sustained.
Users, in this case both the implementers at CHIM and the end users,participated in the implementation process in Ghana at three levels: thedesign of the DHIS2 software; in the design of the DHIMS2; and to someextent in the design of information for action. I believe that this has madeboth the software and the system better than it would have been otherwise.More importantly, the participatory approaches has empowered the users,by letting them influence the system design. This case also shows that PDis a viable option when designing a system in the cloud.
I have previously emphasised the importance of the sustainability ofDHIMS2. One of the theories I used when discussing this was that of Heeks(2002), on why information systems succeed or fail. The main point here isthat there are no major gaps between the reality on the ground in Ghana,
142

and the assumptions about the context designed into the DHIS2 software.Furthermore, because DHIS2 is flexible, it is easy to close such gaps.
Flexibility is also essential according to the information infrastructuretheory. II theory present two types of flexibility: design flexibility and useflexibility. I found the DHIS2 has both. This is important in order to avoidtechnology lock-ins, a situation where the system cannot be changed, aswas the case with the first DHIMS.
Avoiding failure or a technology lock-in can be seen as aspects ofsustainability, but sustainability is more than that. Sustainability is animportant issue in Ghana, and I found that a “network of action” approachcan have a positive influence in that regard. Scaling is less of an issue forDHIMS2, and then in the sense of expanding the scope of the DHIMS2rather than its coverage. Potential nodes in a network of action in Ghanaare the international organisations such as WHO and WAHO, internationaldonors, local universities and HISP.
I think we have finally made it. DHIS2 is going to thrive inGhana, for that I am pretty sure. (Email received from an officerat CHIM).
10.1.3 Comparing Liberia and Ghana
Liberia and Ghana have both implemented DHIS2 during the last year, butthe way the systems have been implemented have been quite different.There are two main differences, the first being the use of internet and thesecond that of data standardisation.
I found that there were many benefits of using DHIS2 over theinternet that Liberia did not benefit from, and the result has been that theimplementation there has suffered serious technical problems. Comparingthe two countries, using the internet has for Ghana meant that collaborationwith end users is easier, remote assistance can easily be provided and thereis less need for human resources in maintaining the software, among otherthings. This can be seen as one way in which ICT and ICT infrastructurescan promote development, in line with what the literature on ICT fordevelopment states.
The Liberian system has continued working despite the initial technicalproblems, an important reason for this is the fact that the country hasreformed and integrated its data collection. By comparison, Ghana hastaken a different approach to data standardisation, by leaving the datacollection tools unchanged and including everything in the system. Whilethis has been working so far, a consequence is that the overwhelmingreporting requirements facing health workers persist, and much duplicatedata is collected.
10.1.4 Regional Developments
Finally, I have discussed how the increased interest in DHIS2 can providebenefits to the region as a whole, and to the individual countries. A major
143

challenge across the region is fragmentation of the health informationsystems. Consequently, I discussed how regional cooperation and useof DHIS2 can facilitate the process of creating an integrated healthinformation architecture.
Building on this, I have further discussed the benefits of creating acommon minimal dataset for the region as a whole, in order to facilitatecomparison of data and further cooperation. While I argue that the makingsuch a dataset would be an important step in the right direction, it is also adifficult task.
Next, I used the networks of action and networks of networks theoryto discuss how cooperation in the region can be promoted. The literaturestates that attractors are needed for such cooperative networks to emerge.I found that several such attractors exist in West Africa today. The DHIS2software is one, and the training and support provided by HISP is anotherexample.
A large group of countries using DHIS2 will increase the opportunitiesfor training and support in the region, something that has manifested itselffor example through two regional DHIS2 workshops in only six months. Itcan be beneficial for both the individual countries and international actorsthat the same or at least compatible systems for health data is used in theregion.
At the same time, there are challenges to regional cooperation as well.One is the fact that the region is linguistically divided into a Francophoneand an Anglophone group. Another is the political instability that stillplagues some countries in the region.
10.2 Further Research
Health information systems in West Africa is an area where more researchis needed. Following the situations in Liberia and Ghana over time canprovide useful insights. Because the systems in these countries are veryrecent, it is difficult to judge whether the attempts to build sustainablesystems have succeeded, and if they contribute to the improvement of theoverall health systems in the two countries.
Another important research area is connected to expanding the scaleand scope of the DHIS2 implementations in the region. As the District inDHIS implies, these systems focus on users at the district level, althoughit is also used at hospitals and facilities with the required infrastructure.Once a stable district-based system has been established, efforts should bemade to improve the systems by also integrating actors at the lowest levels,in rural facilities and out in the communities. One way in which this can bedone is through the use of mobile technologies, and this is an area wheremore research should be done.
Finally, more research should be done on how internet can be leveragedto improve IS and ICT implementations in developing countries. Forexample, comparing the DHIS2 implementations in Liberia and Ghanashow the important role internet can play. More research should be done
144

in this area to see to what extent Liberia and Ghana was a special cases, orif the internet can prove to be equally important elsewhere.
145

146

Bibliography
Adam, L and F Wood (Aug. 1999). “An investigation of the impact ofinformation and communication technologies in sub-Saharan Africa”.In: Journal of Information Science 25.4, 307–318.
Akrich, M. (1992). “The De-Scription of Technical Objects”. In: ed. by W. E.Bijker and J. Law. Cambridge, MA: MIT Press, pp. 205–224.
Auxila, P. and J. E. Rohde (1989). “Microcomputers as a means to introduceeffective management procedures in Primary Health Care: The Haitiexperience”. In: Information Technology for Development 4.4, pp. 769–778.
Avgerou, C. (June 2008). “Information systems in developing countries:a critical research review”. In: Journal of Information Technology 23.3,pp. 133–146.
Avison, D, F Lau and M. Myers (1999). “Action research”. In: Communica-tions of the ACM 42.1, pp. 94–97.
Baskerville, R. L. and J Pries-Heje (1999). “Grounded action research: amethod for understanding IT in practice”. In: Accounting, Managementand Information Technologies 9, pp. 1–23.
Bodart, C. and L. Shrestha (2000). “Identifying information needs andindicators”. In: Design and implementation of health information systems.Ed. by T. Lippeveld, R. Sauerborn and C. Bodart. Geneva: World HealthOrganization, pp. 49–72.
Bødker, S. (1996). “Creating Conditions for Participation: Conflicts andResources in Systems Development”. In: Human–Computer Interaction11.3, pp. 215–236.
Braa, J. and C. Hedberg (2002). “The Struggle for District-Based HealthInformation Systems in South Africa”. In: The Information Society 18,pp. 113–127.
Braa, J. and A. Heywood (2012). “Improving quality and use of datathrough data-use workshops: Zanzibar, United Republic of Tanzania”.In: Bulletin of the World Health . . .
Braa, J., E. Monteiro and S. Sahay (2004). “Networks of action: sustainablehealth information systems across developing countries”. In: Manage-ment Information Systems Quarterly 28.3, pp. 337–362.
Braa, J. and S. Sahay (2012). Integrated Health Information Architecture - Powerto the Users. Ed. by J. Braa and S. Sahay. New Dehli: Matrix.
— (forthcoming). “Participatory design within the HISP network”. In:Routledge International Handbook of Participatory Design. Ed. by J. Simon-sen and T. Robertson. New York: Routledge.
147

Braa, J., O. H. Titlestad and J. I. Sæbø (2004). “Participatory healthinformation systems development in Cuba: the challenge of addressingmultiple levels in a centralized setting”. In: Proceedings ParticipatoryDesign Conference 2004. Toronto: ACM Request Permissions.
Braa, J. et al. (Aug. 2007a). “Developing health information systems indeveloping countries: the flexible standards strategy”. In: ManagementInformation Systems Quarterly 31.Special Issues.
Braa, J. et al. (May 2007b). “Scaling Up Local Learning - Experiences FromSouth-South-North Networks of Shared Software Development”. In:Proceedings of the 9th International Conference on Social Implications ofComputers in Developing Countries. Sâo Paulo.
Braa, J. et al. (2010). “Comprehensive Yet Scalable Health InformationSystems for Low Resource Settings: A Collaborative Effort in SierraLeone”. In: American Medical Informatics Association Annual SymposiumProceedings, pp. 372–376.
Braa, J. et al. (May 2012). Situation Assessment of Health Information Systemsin the ECOWAS Region. Tech. rep. United States Agency for InternationalDevelopment, West African Health Orgnisation, Management Sciencesfor Health.
Calderon, C and L Serven (Apr. 2010). “Infrastructure and EconomicDevelopment in Sub-Saharan Africa”. In: Journal of African Economies19.AERC Supplement 1, pp. i13–i87.
Campbell, B., S. Adjei and A. Heywood (1996). From data to decisionmaking in health - The evolution of a health management information system.Amsterdam: Royal Tropical Institute.
Chatora, R and P Tumusiime (2004). Health sector reform and district healthsystems. Brazaville: World Health Organisation.
Checkland, P and S Holwell (2007). “Action Research: Its Nature andValidity”. In: Systemic Practive and Action Research 11.1, pp. 9–21.
Ciborra, C. (2000). “A critical review of the literature on the managementof corporate information infrastructure”. In: From control to drift:The dynamics of corporate information infrastructures. Oxford: OxfordUniversity Press, pp. 15–40.
Economist Intelligence Unit (2010). Democracy index 2010. Tech. rep.Encyclopaedia Britannica Online (n.d.[a]). Liberia. Available at: http :
//www.britannica.com/EBchecked/topic/339254/Liberia , accessed26/07/2012.
— (n.d.[b]). Western Africa. Available at: http://www.britannica.com/EBchecked/topic/640491/western-Africa , accessed 10/05/2012.
Flyvbjerg, B (2006). “Five misunderstandings about case-study research”.In: Qualitative inquiry 12, pp. 219–245.
Ghana Health Service (n.d.). About us. Available at: http://www.ghanahealthservice.org/aboutus.php?inf=Background , accessed 11/04/2012.
Hanseth, O. (n.d.). From systems and tools to networks and infrastructures -from design to cultivation. Towards a theory of ICT solutions and its designmethodology implications. Available at: http : / / heim . ifi . uio . no /~oleha / Publications / ib _ ISR _ 3rd _ resubm2 . html , accessed27/09/2010.
148

Hanseth, O. and K. Lyytinen (2004). “Theorizing about the design ofInformation Infrastructures: design kernel theories and principles”.In: Sprouts: Working Papers on Information Environments, Systems andOrganizations 4.4, pp. 207–241.
— (2010). “Design theory for dynamic complexity in information infra-structures: the case of building internet”. In: Journal of Information Tech-nology 25, pp. 1–19.
Hanseth, O. and E. Monteiro (Aug. 1998). Understanding informationinfrastructure. Available at: http : / / heim . ifi . uio . no / oleha /Publications/bok.pdf , accessed 21/09/2010.
Health Metrics Network (2008). Framework and Standards for CountryHealth Information Systems. Second Edition. Geneva: World HealthOrganisation.
Heeks, R. (2002). “Information Systems and Developing Countries: Failure,Success, and Local Improvisations”. In: The Information Society 18.2,pp. 101–112.
— (2008). “ICT4D 2.0: The Next Phase of Applying ICT for InternationalDevelopment”. In: Computer 41.6, pp. 26–33.
Hilbert, M. (2011). “The end justifies the definition: The manifold outlookson the digital divide and their practical usefulness for policy-making”.In: Telecommunications Policy 35.8, pp. 715–736.
James, J. (Sept. 2006). “An institutional critique of recent attempts tomeasure technological capabilities across countries”. In: Journal ofEconomic Issues 40.3, 743–766.
Kadt, E de (1989). “Making health policy management intersectoral: Issuesof information analysis and use in less developed countries”. In: SocialScience and Medicine 29.4, pp. 503–514.
Kanjo, C et al. (2009). “Towards Harmonisation of Health InformationSystems in Malawi: Challenges and Prospects”. In: IST-Africa 2009Conference Proceedings.
Kensing, F. and J. Blomberg (June 1998). “Participatory Design: Issues andConcerns”. In: Computer Supported Cooperative Work 7, pp. 167–185.
Lwanga, S. K., C.-Y. Tye and O Ayeni (1999). Teaching Health Statistics. WorldHealth Organisation. Geneva.
Ministry of Health (n.d.). About MOH. Available at: http://www.moh-ghana.org/pages.aspx?id=24 , accessed 10/05/2012.
Mutula, S. M. (2008). “Digital divide and economic development: casestudy of sub-Saharan Africa”. In: The Electronic Library 26.4, 468–489.
Myers, M. (2010). Qualitative research in information systems. Available at:http://www.qual.auckland.ac.nz/ , accessed 10/08/2010.
National Health Insurance Scheme (n.d.). The Benefits of the NationalHealth Insurance Scheme. Available at: http : / / www . nhis . gov . gh /?CategoryID=216 , accessed 13/04/2012.
Nyonator, F. K. et al. (2005). “The Ghana Community-based Health Plan-ning and Services Initiative for scaling up service delivery innovation”.In: Health Policy and Planning 20.1, pp. 25–34.
149

Osterwalder, A. (n.d.). ICT in developing countries. Available at: http :/ / www . hec . unil . ch / aosterwa / Documents / InternetInEmergingMarkets/Publications/ISGLOB03.pdf , accessed 18/08/2012.
Pandit, N. R. (Dec. 1996). “The Creation of Theory: A Recent Application ofthe Grounded Theory Method”. In: The Qualitative Report 2.4.
Parliamentary Office of Science and Technology (Mar. 2006). “ICT InDeveloping Countries”. In: postnote 261, pp. 1–4.
Rohde, J. E. et al. (Nov. 2008). “Information for Primary Health Care”. In:South African Health Review 2008. Ed. by J Roma-Reardon and P Barron.Durban: Health Systems Trust, pp. 195–210.
Sæbø, J. I. et al. (2009). “Integrating health information systems in SierraLeone”. In: ICTD 2009 Proceedings. Doha: IEEE, pp. 379–391.
Sæbø, J. I. et al. (2011a). “Comparing strategies to integrate healthinformation systems following a data warehouse approach in fourcountries”. In: Information Technology for Development 17.1, pp. 42–60.
Sæbø, J. I. et al. (May 2011b). “Networks of Networks - CollaborativeEffort To Develop Health Information Systems Across DevelopingCountries”. In: Proceedings of the 11th International Conference on SocialImplications of Computers in Developing Countries. UiO. Kathmandu.
Sauerborn, R. (2000). “Using information to make decisions”. In: Designand Implementation of Health Information Systems. Ed. by T. Lippeveld, R.Sauerborn and C. Bodart. Geneva: World Health Organisation, pp. 33–48.
Sauerborn, R. and T. Lippeveld (2000). “Introduction”. In: Design andImplementation of Health Information Systems. Ed. by T. Lippeveld, R.Sauerborn and C. Bodart. Geneva: World Health Organisation, pp. 1–14.
SDMX (n.d.). SDMX-HD (Health Domain). Available at: http://www.sdmx-hd.org/ , accessed 27/07/2012.
Sein, M. K. and G Harindranath (2004). “Conceptualizing the ICT Artifact:Toward Understanding the Role of ICT in National Development”. In:The Information Society 20.1, pp. 15–24.
Shaw, V. (2005). “Health information system reform in South Africa:developing an essential data set”. In: Bulletin of the World HealthOrganization 83.8, pp. 632–636.
Shrestha, L. and C. Bodart (2000). “Data Transmission, data processing, anddata quality”. In: Design and implementation of health information systems.Ed. by T. Lippeveld, R. Sauerborn and C. Bodart. Geneva: World HealthOrganisation, pp. 128–145.
Simwanza, A. and M. Church (2001). “Establishment of an InformationCulture: Achievements and Challenges in Zambia”. In: The RHINOWorkshop on Issues and Innovation in Routine Health Information inDeveloping Countries. Potomac, pp. 227–237.
Stake, R (2005). “Qualitative Case Studies”. In: The Sage handbook ofQualitative Research. Ed. by N. K. Denzin and Y. S. Lincoln. ThousandOaks: Sage Publications, pp. 443–466.
150

Staring, K. and O. H. Titlestad (2006). “Networks of Open Source HealthCare Action”. In: IFIP International Federation for Information Processing203, pp. 135–141.
The Economic Community of West African States (n.d.). ECOWAS in Brief.Available at: http://www.comm.ecowas.int/sec/index.php?id=about_a&lang=en , accessed 11/05/2012.
The World Bank (July 2011). Changes in Country Classifications. Available at:http://data.worldbank.org/news/2010-GNI-income-classifications , accessed 11/04/2012.
Tohouri, R. and I. Asangansi (2009). “The Sierra Leone HIS Case: Towardsan Integrated Health Information Infrastructure”. In: IST-Africa 2009Conference Proceedings.
Torero, M. and J. von Braun (2005). “ICTs: Information and CommunicationTechnologies for the Poor”. In: IFPRI Issue Brief.
United Nations Economic Commission for Africa (2010). Recent Economicand Social Developments in West Africa and Prospects for 2010. Tech. rep.
United Nations Statistics Division (May 2012). National Accounts MainAggregates Database. Available at: http://unstats.un.org/unsd/snaama/resQuery.asp , accessed 10/05/2012.
Valbø, B. (Nov. 2010). “Introducing a complex health information system ina developing country”. MA thesis. Oslo: University of Oslo.
Walsham, G (2006). “Doing interpretive research”. In: European Journal ofInformation Systems 15, pp. 320–330.
Walsham, G. and S. Sahay (Jan. 2006). “Research on information systemsin developing countries: Current landscape and future prospects”. In:Information Technology for Development 12.1, pp. 7–24.
West African Health Organisation (n.d.). About WAHO. Available at: http://www.wahooas.org/spip.php?page=rubriqueS&id_rubrique=24&lang=en , accessed 11/05/2012.
Williamson, L. and N. Stoops (2001). “Using Information for Health”. In:South African Health Review 2001. Ed. by A. Ntuli. Durban: HealthSystems Trust, pp. 101–116.
World Healh Organization (1988). “Hosehold surveys on health andnutrition”. In: Evaluating health care inforamtion systems: methods andapplications. Ed. by J. Anderson, C. Aydin and S. Jay. Thousand Oaks:Sage.
— (n.d.). World Health Organisation | What is HMN? Available at: http://www.WorldHealthOrganisation.int/healthmetrics/about/whatishmn/en/index.html , accessed 05/03/2012.
World of Maps (n.d.[a]). Map of Africa (West Africa). Available at: http ://www.worldofmaps.net/en/africa/africa/map-west-africa.htm ,accessed 21/06/2012.
— (n.d.[b]). Map of Ghana (Political Map). Available at: http://www.worldofmaps.net/en/africa/map- ghana/political- map- ghana.htm ,accessed 21/06/2012.
Yin, R (2002). Case Study Research: Design and Methods. 3rd ed. ThousandOaks: Sage Publications.
151

152

Appendix A
CHIM Training FeedbackSurvey
153

Center For Health Information, Accra Ghana September, 2011
Training Evaluation and Assessment
1. Please rate this training in terms of Trainer’s Expertise, Believe system of Participants,
Time Management, and Responsiveness to your educational needs. Provide any additional feedback in the Comments section. Circle the appropriate numbers.
RATING SCALE: 1 = LOW 3 = MEDIUM 5 = HIGH
Trainer Name(s) Trainer’s Expertise Believe System Time
Management Responsiveness
1 2 3 4 5 1 2 3 4 5 1 2 3 4 5 1 2 3 4 5
1 2 3 4 5 1 2 3 4 5 1 2 3 4 5 1 2 3 4 5
Comments:

Center For Health Information, Accra Ghana September, 2011
OVERALL EVALUATION OF PRESENTATION
2. Please take a moment to answer the following questions. Your comments are an important contribution as we design learning experiences to meet your professional needs.
What will you do differently in your practice/service setting as a result of this training?
What do you feel were the strengths of this presentation?
What do you feel were the weaknesses of this presentation?
How can we improve this presentation?
What additional training-development education do you require?
3. Please rate the following statements using a 1 through 5 scale where: 1 = Disagree Strongly 3 = Neither 1 nor 5 5 = Agree Strongly
____ The Training Program was well organized.
____ I can apply the knowledge acquired at my facility with ease.
____ The presentation met my professional needs.
____The trainer actively involved me in the learning process.
____ As a result of this training, I feel more confident in my capacity to retrain my colleagues
at work.

156

Appendix B
DHIS2 Academy Survey
157

DHIS Implementers workshop Accra – 7th to 16th November 2011
Post-Workshop Questionnaire !Dear!participant,!!This! questionnaire! is! intended! to! obtain! a! feedback! from! the! participants! of! the! DHIS! implementers’!workshop! in! the! areas! of! workshop! content,! its! presentations,! organization,! and! its! usefulness.! We!sincerely! expect! that! you! will! be! able! to! provide! us! with! a! constructive! feedback! which! will! help! us!improve!this!programme!further!and!address!any!deficiencies!on!our!part!in!future!workshops!as!well!as!to! improve! on! our! strengths.! Please! be! kind! enough! to! fillEin! this! questionnaire! and! insert! it! into! the!feedback!box!kept!at!the!workshop!premises.!!Thank!you!!!The!workshop!organizers!!!Participant*details!!**!1. What!is!your!country!of!participation?! ! ! ! ………….……………………….!
!2. What!is!your!designation!(e.g!Medical!Officer,!Health!manager,!Technical!officer…etc)?!!
!We* had* a* mix* of* technical* officers,* bio* statistics* officers,* programme* officers,* monitoring* and*evaluation*advisors,*health*information*officers,*medical*officers*and*biostatisticians.!!
3. What!is!your!role!in!relation!to!DHIS!in!your!country!(e.g.!user,!implementer,!developer…)?!!About*75%*were*implementers*while*rest*mentioned*their*role*as*user,*developer*or*coordinator.*!
4. Have!you!used!DHIS!before!participating!in!this!workshop?! Only*58%*had*prior*exposure*to*DHIS!!5. How!do!you!grade!your!knowledge!in!DHIS!before!the!workshop?!(please!underline)!!
Out*of*those*who*have*been*exposed*to*DHIS*previously,*50%*graded*their*knowledge*as*‘average’*and*30%*as*‘good’.*
!6. What!is!your!intention!in!participating!at!this!workshop?!
!Improving* the* self* knowledge* about* DHIS* was* cited* as* the* main* intention* while* setting* up* a*database,* troubleshooting,* setting* up* the* server* and*managing* hospital* data*were* some* of* the*other*intentions.*!
7. Would!you!like!to!train!others!in!DHIS!in!your!country?! ! Almost*all*have*mentioned*‘Yes’!!

!Workshop*content!!***Please*answer*all*the*questions*by*placing*a*(√ ) mark*at*the*appropriate*place.**!!
! Very*satisfied* Satisfied* Indifferent* Dissatisfied**********Very*dissatisfied*
8. How!satisfied!are!you!with!the!workshop!content?!
30%! 70%! ! ! !
9. How!satisfied!are!you!with!the!presentations?!
23%! 65%! ! 12%! !
10. How!satisfied!are!you!with!the!handsEon!activities?!
23%! 41%! 18%! 18%! !
11. How!satisfied!are!you!with!the!group!work?!
47%! 47%! ! 6%! !
12. How!satisfied!are!you!with!the!need!to!submit!assignments?!
12%! 64%! 18%! 6%! !
13. How!satisfied!are!you!with!the!training!material?!
18%! 64%! 6%! 6%! 6%!
14. How!satisfied!are!you!with!having!parallel!sessions?!
30%! 46%! 6%! 6%! 12%!
!15. What!additional!topics!do!you!think!that!the!DHIS!workshop!should!have!covered?!
!Suggestions* were* made* to* include* a* more* detailed* session* on* pivot* tables* and* server*configurations.*A*session*to*create*forms*and*troubleshooting*DHIS*was*also*suggested.*!!
!Usefulness!!**!
Please* indicate* your* level* of* familiarity* in* each* of* these* instances* by* placing* a* (√ ) mark* at* the*appropriate*place.**
!! Fully* To*a*good*
extent* Somewhat* Very*little* Not*at*all*
16. 16.!The!usefulness!of!DHIS! 50%! 50%! ! ! !
1. 17.!Setting!up!a!new!database! 12%! 35%! 30%! 18%! 6%!
2. 18.!Defining!the!organizational!hierarchy! 53%! 35%! 6%! 6%! !
3. 19.!Defining!data!elements!and!groups! 59%! 35%! 6%! ! !
4. 20.!Defining!indicators! 47%! 35%! 18%! ! !
5. 21.!Datasets!and!forms! 41%! 47%! 6%! 6%! !
6. 22.!Data!entry!and!validation! 41%! 47%! 12%! ! !
7. 23.!Reporting! 24%! 58%! 18%! ! !
8. 24.!GIS! 12%! 52%! 12%! 24%! !
9. 25.!End!user!training! 18%! 52%! 30%! ! !
10. 26.!Users!role!and!management! 24%! 46%! 30%! ! !
*Please* indicate* your* level* of* satisfaction* in* each* of* these* instances* by* placing* a* (√ ) mark* at* the*appropriate*place.**

! Fully*
satisfied* Satisfied* Indifferent* Dissatisfied* Very*dissatisfied*
27. How! satisfied! are! you! with! your!ability! to! teach! a! colleague! on! the!above!topics?!!
24%! 70%! 6%! ! !
28. How!satisfied!are!you!with!your!knowledge!in!DHIS!after!the!workshop?!
18%! 70%! 6%! 6%! !
29. How!satisfied!are!you!regarding!the!applicability!of!the!knowledge!that!you!gained!from!the!workshop?!
30%! 64%! 6%! ! !
!Organization!!**
Please* indicate* your* level* of* satisfaction* in* each* of* these* instances* by* placing* a* (√ ) mark* at* the*appropriate*place.**
! Fully*
satisfied* Satisfied* Indifferent* Dissatisfied* Very*dissatisfied*
30. How! satisfied! are! you! with! the!information! received! before! the!workshop?!
18%! 46%! 24%! 12%! !
31. How!satisfied!are!you!with!the!support!and!services!during!the!training?!
30%! 40%! 12%! 12%! 6%!
32. How!satisfied!are!you!with!the!facilities!available!at!the!workshop?!
30%! 34%! 18%! 12%! 6%!
33. Do!you!have!any!additional!comments!or!suggestions?!
!Many*have*suggested*to*opt*for*better*internet*access*and*conference*facility*(e.g*sound*system,*power…etc).*Few*have*mentioned*that*the*translation*in*French*was*not*enough*for*them*and*that*they*should*have*got*a*separate*workshop,*only*in*French.*Some*have*pointed*out*the*amount*of*extra*time*spent*when*it*is*done*in*two*languages.*Few*have*suggested*separate*workshops*for*beginner,*intermediate*and*expert*groups*rather*than*mixing*people*with*different*competencies.***Several*participants*also*have*suggested*holding*the*workshop*again*for*the*same*group*as*a*review*workshop*and*several*were*willing*to*participate*in*follow!up*workshops.*Some*countries*pointed*out*that*they*did*not*gain*adequate*attention*individually*while*certain*countries*have*suggested*having*workshops*in*their*own*country*as*they*will*benefit*in*their*implementation*process.**Some*participants*were*not*given*pre!workshop*instructions*or*were*not*communicated*in*advance*and*have*suggested*informing*them*of*a*detailed*work*plan*relatively*early.*One*participant*suggested*informing*them*of*the*need*to*bring*their*own*data*to*the*workshop*which*might*not*have*been*communicated*to*him*as*we*planned.*

Appendix C
Some Example DHIMS2Messages
161

challenges
Sylvester Asmah 2012-05-231. is difficult to enter data anonymous (inpatient morbidity & Moralities and returns on delivery. west with poor network suggest that, ways to import from dhims 1 to dhims 2 2. with bed state statistics, one have to change format of capturing data, no problem with that. but one also must consider physical change of ward. say general adult ward to male medical, female medical and so on. management will not buy such idea 3. make ways easier to print instead of downloading to pdf and excel.
Olav Poppe 2012-05-241) We are working on improving data entry with line lists in areas with poor network connectivity. 3) What do you want to print, the dataset reports? That is being worked on, and will be available in an update soon.
standard reports
Asaah Kofi 2012-04-16My population distributions are not appearing in the standard reports ie the RCH reports, kindly help me out.
Olav Poppe 2012-04-16What type of organisation unit is not showing population data - facilities, sub-districts or districts?
Asaah Kofi 2012-04-16It is the district which is not showing the population data
Olav Poppe 2012-04-17And you have filled the population dataset for all your sub-districts? I just tested running the RCH 2.1 report now, and all populations are showing. The problem might be that data for reports are generated every night - so if you entered the population data yesterday, it was not available in reports until today.
Asaah Kofi 2012-04-17thanks very much, is appearing now
Nutrition reporting format
Thomas Sarfo 2012-04-20there are series of auto generated figures in this reporting format eg. Fielmuo Sub-district February 2012 reports, there were figures already in the fields of the anaemia in pregnancy, Viatmin A supplementation fields, exclusive breastfeeding, birth weights, and growth monitoring and promotion fields respectively. so please if you can update me on that.
Olav Poppe 2012-04-20Hi, the nutrition form picks data such as Vit A, growth monitoring etc from RCH Form A and C, and from the monthly vaccination report.
Real time data issues
livingstone asem 2012-06-27Please am receiving the above feedback from my district and facilities that data entered take days and some times weeks to appear. But we were made to believe that data will be in real time thus data will appear for your reports immediatly you upload. As an IT person I want to be sure it is true and it was confirm from Worawora Hospital when I had to go online to check the bed Utilization data on the data entry end you see the data it is complete and was uploaded. On the reporting rate summary sometimes you can see the data appearing but on the dataset reporting no data was appearing all the field was black. Report was seen after 5 days. Can some body help me explain this; if it is the case how long will it take between the date of entry and date of appearing in the Reporting end of the System. Thanks
Olav Poppe 2012-06-28Data is stored on the server in real time. However, the data entered is only aggregated every night - so reports will be available the next day. As for the reporting rate summary, did you run based on "complete dataset registration" or "data elements"? If running or complete dataset registration, it will be zero unless the "complete button" is clicked.
livingstone asem 2012-06-28based on complete data set registration
Olav Poppe 2012-07-02And are you sure the "complete" button had been used during data entry?

In- patient morbidity data set and Report Rate Summary
Obed Nuobe 2012-05-02Please with the In-patient dataset: 1. In offline mode or when you disconnect the modem you cannot create new event unless it is connected during offline mode and it cannot be saved. 2. There is a regular interference of data from different districts or Regions. eg. date of admission and discharge, etc with exception of cost, insured and surgical procedures eg. Adress, (TAIFA) is in Accra but appears in the Adress column when the patient number is entered 3. The report Rate summary for first three quarters reads actuals as zeros meanwhile aggregate months have data entered and completed. please can you have a look at the above for me
Olav Poppe 2012-05-22Sorry for the late reply. 1) In-patient data entry does not currently work when offline. 2) Are you making sure you always click "create new event" before you start on a new patient?. 3) Did not quite get what you mean with this, can you elaborate?
Obed Nuobe 2012-07-24Olave Poppe Am preparing the half year report for 2012 and making reference to 2010 and and 2011. I can't get the top 20 cases of my org. unit for half year 2010 and 2011. Can you help me out?
Olav Poppe 2012-07-24Are you thinking of the inpatient data for 2010 and 2011? That has not been imported into DHIMS2 yet, so you will have to look in DHIMS1. For the routine data, it should be there.
Olav Poppe 2012-07-24If the data was in DHIMS1 that is, and the organisation units between DHIMS1 and DHIMS2 matched.
Inpatient morbidity and mortality
Yaw Darko Boateng 2012-06-25the following facilities cannnot access the inpatient morbidity and mortality and delivery forms at the data entry point. 1.Obuasi Govt hospital 2.St Jude hospital Obuasi
GEEGEE KWAME ADU 2012-06-25They can access both forms by following the following procedure 1.Select services 2.Select Name-Based data records 3.Select Anonymous Events 4.Select the organisational unit 5.Select program and the report period to access the forms

Appendix D
Terms of Reference fromLiberia
165


168
Appendix E
TALI Tool from Regional HISAssesment
169

Tool 1: TALI tool to assess levels of information usage: This tool was developed by HISP South Africa in early 2000 that helped to identify three levels of information usage, and the detailed criteria by which a facility or a district system could be assessed and placed into level 1, 2 or 3. Assessment can be done using a qualitative assessment supported by a checklist containing the different criteria of each level (See bellow). Level Broad description Detailed description of criteria Level 1 The information system is
working technically according to its specification: timely and accurate data is submitted to the district; district manages data in database, reports to region and feedback to facility. Similar at regional and central levels.
Clearly defined Essential datasets for all compulsory reporting have been defined? Has an information manager been identified? Have all the expected routine reports been submitted? Have feedback reports been issued? User friendly guideline including information handling at that level is available?
Level 2 Data is analyzed, disseminated and used: Summary reports of data produced and disseminated regularly Indicators are being assessed against performance / targets on a regular basis.
Are summary reports available Are indicators graphed? Are indicators discussed in management meetings?
Level 3 Information from the system used for planning and evaluation of achievements: Indicators and information are used by managers to inform their action plans. Indicators and information used to document performance in all written reports
Are indicators interpreted and understood? Are problems identified based on available information? Have any problems been addressed, and can these steps be documented, and an improvement shown using indicators and data?
Copyright © 2022 FDOKUMEN