The evolution of financial services: Harnessing disruption in FSI
Upload
khangminh22Category
view
0download
0
Harnessing the science of social marketing in communication materials development
and behaviour change for improved water quality in the GBR
Best Practice GUIDE for Development and Modification of Programme Communication Material
Rachel Hay, Lynne Eagle and Jacqueline Chan
Final Report

Harnessing the science of social marketing
in communication materials development
and behaviour change for improved
water quality in the GBR
Best Practice GUIDE for Development and Modification of Program
Communication Material
Rachel Hay1, Lynne Eagle, and Jacqueline Chan2
1 College of Business, Law and Governance, James Cook University 2 University of Pennsylvania
Supported by the Australian Government’s National Environmental Science Program
Project 3.1.3: Harnessing the science of social marketing and behaviour change for improved water quality in the Great Barrier Reef: an action research project

© James Cook University, 2018
Creative Commons Attribution
Harnessing the science of social marketing in communication materials development and behaviour change for
improved water quality in the GBR: Final Report Best Practice GUIDE for Development and Modification of
Program Communication Material is licensed by the James Cook University for use under a Creative Commons
Attribution 4.0 Australia licence. For licence conditions see: https://creativecommons.org/licenses/by/4.0/
National Library of Australia Cataloguing-in-Publication entry:
978-1-925514-09-4
This report should be cited as:
Hay, R., Eagle, L., & Chan, J., (2018) Harnessing the science of social marketing and behaviour change for
improved water quality in the Great Barrier Reef: Final report best practice guide for development and
modification of program communication material. Report to the National Environmental Science Program. Reef
and Rainforest Research Centre Limited, Cairns (69pp.).
Published by the Reef and Rainforest Research Centre on behalf of the Australian Government’s National
Environmental Science Program (NESP) Tropical Water Quality (TWQ) Hub.
The Tropical Water Quality Hub is part of the Australian Government’s National Environmental Science Program
and is administered by the Reef and Rainforest Research Centre Limited (RRRC). The NESP TWQ Hub
addresses water quality and coastal management in the World Heritage listed Great Barrier Reef, its catchments
and other tropical waters, through the generation and transfer of world-class research and shared knowledge.
This publication is copyright. The Copyright Act 1968 permits fair dealing for study, research, information or
educational purposes subject to inclusion of a sufficient acknowledgement of the source.
The views and opinions expressed in this publication are those of the authors and do not necessarily reflect those
of the Australian Government.
While reasonable effort has been made to ensure that the contents of this publication are factually correct, the
Commonwealth does not accept responsibility for the accuracy or completeness of the contents, and shall not be
liable for any loss or damage that may be occasioned directly or indirectly through the use of, or reliance on, the
contents of this publication.
Cover photographs: Lynne Eagle
This report is available for download from the NESP Tropical Water Quality Hub website:
http://www.nesptropical.edu.au

Best Practice Guide for Development and Modification of Communications Materials
i
CONTENTS
List of Tables .......................................................................................................................... ii
List of Figures ......................................................................................................................... ii
Acronyms .............................................................................................................................. iii
Acknowledgements ............................................................................................................... iv
Executive summary ............................................................................................................... 1
1.0 Introduction ................................................................................................................. 2
2.0 Purpose of the Best Practice Guide ............................................................................ 3
3.0 Communication ........................................................................................................... 4
4.0 Current writing guidelines for government ................................................................... 6
5.0 Communication Design Process ................................................................................. 8
5.1 Set your objectives .................................................................................................. 8
5.2 Social Marketing Benchmarks (refer to Section 2.5 Eagle et al. (2016)) .................. 9
5.3 Readability Tools ....................................................................................................12
5.3.1 Readability: Simple Measure of Gobbledygook (SMOG) .................................12
5.3.2 Norms .............................................................................................................14
5.3.3 Message Framing ...........................................................................................16
5.3.4 Message Appeals (including fear appeals) ......................................................20
5.3.5 Message Tone and Language .........................................................................22
5.3.6 Format ............................................................................................................24
5.4 Design Principles ...................................................................................................25
5.4.1 Target Audience ..............................................................................................25
5.4.2 Content ...........................................................................................................25
5.4.3 Organisation ....................................................................................................26
5.4.4 Credibility ........................................................................................................26
5.4.5 Design .............................................................................................................27
5.4.6 Visual Imagery ................................................................................................29
6.0 Methodology ..............................................................................................................32
6.1 SMOG Index (McLaughlin, 1969) ...........................................................................32
6.2 Norms and Message Framing ................................................................................33
7.0 Recommendations and Conclusion............................................................................34
References ...........................................................................................................................36
Appendix 1: Readability Communication Planning Checklist ................................................42
Appendix 2: Examples of email exchange in relation to readability assessment of live
documents ............................................................................................................................66

Hay, et al
ii
LIST OF TABLES
Table 1: Examples of positively framed messages and their effectiveness ..................19
Table 2: The key used in the analysis of message framing (including appeals), norms,
tone and message format ..............................................................................24
Table 3: Effect of Source Credibility on Message Persuasiveness (adapted from
Pornpitakpan, 2004. The Persuasiveness of Source Credibility: A Critical
Review of Five Decades' Evidence) ...............................................................27
Table 4: SMOG Conversion Tables (Kemp & Eagle, 2008; McGraw, n.d.) ..................33
Table 5: The key used in the analysis of message framing (including appeals), norms,
tone and message format ..............................................................................33
LIST OF FIGURES
Figure 1: The Communication Model (Shannon and Weaver, 1949) Image Source:
Google Images ............................................................................................... 4
Figure 2: Integrative Model of Behavioural Prediction and Change (adapted from
Fishbein & Ajzen, 2011) .................................................................................10
Figure 3: Example of injunctive norms i.e. using behaviours perceived as being
approved by others ........................................................................................15
Figure 4: Example of descriptive norms i.e. the perception of how others are behaving ..
......................................................................................................................15
Figure 5: Image of fertiliser bulk bags ready for recycling (Burdekin Region) ................16
Figure 6: Image showing the concept of the Rainfall Simulator taken from an information
sheet explaining the system ...........................................................................25
Figure 7: Image used in a case study on variable fertiliser application rates using
satellite data ..................................................................................................30

Best Practice Guide for Development and Modification of Communications Materials
iii
ACRONYMS
DAF ............... Department of Agriculture and Fisheries
DEHP ............ Department of Environment and Heritage Protection
DOEE ............ Department Environment and Energy
GBR .............. Great Barrier Reef
GBRMPA ...... Great Barrier Reef Marine Park Authority
NESP ............ National Environmental Science Program
NQDT ............ NQ Dry Tropics
NRM .............. Natural Resource Management
OECD ............ Organisation for Economic Cooperation and Development
SRA .............. Sugar Research Australia
TWQ .............. Tropical Water Quality

Hay, et al
iv
ACKNOWLEDGEMENTS
This project, supported through funding from the Australian Government’s National
Environmental Science Program (NESP) Tropical Water Quality (TWQ) Hub, would not have
been possible without the kind support and help of many individuals and organisations.
We sincerely acknowledge contributions towards the project from Sugar Research Australia,
Reef Catchments (Mackay, Whitsunday, Isaac) Limited, the Department of Environment and
Heritage Protection, the Department of Agriculture and Fisheries, NQ Dry Tropics, and
Terrain Natural Resource Management groups.
Project 3.1.3 supports Reef Trust investments, behaviour change programs (funded by
Australian and Queensland Governments and industry), the Paddock to Reef Program,
emerging reef projects to address the GBR Water Science Task Force recommendations the
Reef Water Quality Plan and the Scientific Consensus Statement.

Best Practice Guide for Development and Modification of Communications Materials
1
1.0 EXECUTIVE SUMMARY
This document is intended to provide guidelines for the development and modification of
communication material in the agricultural-environmental sector and incudes examples from
material supplied by stakeholders (insider’s view) to NESP Tropical Water Quality Hub
Project 3.1.3 Harnessing the science of social marketing and behaviour change for improved
water quality in the GBR: A Readability Desktop Review. NESP Project 3.1.3 is an extension
of NESP Tropical Water Quality Hub Project 2.1.3 Harnessing the science of social
marketing and behaviour change for improved water quality in the GBR: A documentary
analysis of Reef Trust Tender (Burdekin) and Reef Programme (Hay & Eagle, 2016) which
assessed readability of marketing material surrounding water quality from an outsider’s view.
The Great Barrier Reef (GBR) Water Science Taskforce indicated that “poor communication
and engagement” represents one of the barriers to effective program delivery, highlighting a
need to further strengthen the understanding of the impact that communication and visuals
have in the agricultural-environmental context.
Project 3.1.3 Harnessing the science of social marketing in communication materials
development and behaviour change for improved water quality in the GBR: Readability
Desktop Review, draws on learnings from Project 2.1.3 and from other past research to
conduct a readability, message tone and visual imagery analysis of communications material
from a selection of program documents supplied by Australian and Queensland
Governments and other program managers as well as extension service providers with the
aim of increasing uptake of water quality improvement programs in the Great Barrier Reef
Basin.
The findings confirmed results found in the Project 2.1.3 (Hay & Eagle, 2016). The material
supplied for analysis by stakeholders for both projects was found to be written in too complex
language. Further, the message tone used in some material may be a barrier to
communication and visual imagery may have unintended effects on communication.
Improved communication within marketing material for water quality programs will help to
achieve consistency in approach and message clarity, amongst the gamut of communication
materials produced for projects that support the Reef 2050 Plan and wider Reef
communication materials. Improving the way projects communicate and get buy-in from land
managers can help to ensure greater project uptake, associated positive results and lasting
behaviour change.

Hay, et al
2
2.0 INTRODUCTION
The NESP Tropical Water Quality Hub Project 2.1.3 (and Project 3.1.3), seeks to encourage
best practice land management uptake amongst land managers who have not previously
done so by taking a social marketing approach to influencing behaviour change.
The complexity of factors that affect land management practices means that no single policy
instrument is likely to be universally effective (Greiner, 2014; Rolfe & Gregg, 2015).
Encouraging best practice land management uptake amongst land managers who have not
done so previously requires the encouragement of participation in projects based on an
understanding of the multiple pressures and influences on farmer behaviour (Blackstock,
Ingram, Burton, Brown, & Slee, 2010; Feola, Lerner, Jain, Montefrio, & Nicholas, 2015) and
the specific factors that will lead to potential engagement (Rolfe & Gregg, 2015).
A social marketing approach captures deep and actionable insights into the factors that
enable or inhibit sustained behaviour change, including social acceptance, perceived social
norms, forms of social capital and social identity (Colvin et al., 2015; Compton & Beeton,
2012; Crane & Ruebottom, 2011; Fisher, 2013).
Coupled with tools for readability and communication this best practice guide will help the
writer to develop effective social marketing based interventions.
IMPORTANT: Some example texts included in this guide are taken out of context to
demonstrate the discussion surrounding the communication, this does not mean that they
have scored badly on readability (measured via the SMOG resource) or are not good
examples of readability when considered in the context of the complete document that
they were extracted from.

Best Practice Guide for Development and Modification of Communications Materials
3
3.0 PURPOSE OF THE BEST PRACTICE GUIDE
The Best Practice Guide for Development and Modification of Communication Material was
developed as a resource resulting from feedback received on the readability study performed
as part of Project 2.1.3 Harnessing the science of social marketing and behaviour change for
improved water quality in the GBR: A documentary analysis of Reef Trust Tender (Burdekin)
and Reef Programme (Hay & Eagle, 2016).
The readability analysis in Project 2.1.3 identified that:
1. Material is written in too complex language;
2. Message tone may be a barrier; and
3. Visual imagery may have unintended effects.
These findings have implications across wider programs. Therefore, Project 2.1.3
recommended that further research be completed to produce guidelines, templates and
readability assessment tools and message framing guidelines to support the fine tuning of
existing materials and the rollout of future communication material. As such, the project
reported in this document fulfils the recommendations of Project 2.1.3.
The Best Practice Guide for Development and Modification of Communication Material is
intended as a guide to the design of information material, particularly printed material such as
brochures and posters, but also for web pages. The guide uses de-identified examples from
material supplied by stakeholders for readability evaluation to illustrate concepts discussed in
relevant sections. This Guide is supported by a Readability Communication Planning
Checklist (Hay & Eagle, 2018), which is supplied as Appendix 1.
It is not intended to provide an exhaustive range of checks, but rather as a guide to
improving the readability of published materials.

Hay, et al
4
4.0 COMMUNICATION
The most useful definition of functional literacy provided by the Organisation for Economic
Cooperation and Development (OECD) (Nutbeam, 2008) is based on determining whether a
person is able to understand and employ printed information in daily life, at home, at work
and in the community. The multiple literacy definitions used in a range of studies make cross-
study comparisons difficult. In spite of this, there is agreement that some 20% of the
population of most developed countries have severe literacy problems and a further 20%
have limited literacy (Adkins & Ozanne, 2005; Office for National Statistics, 2000).
Good communication involves two-way communication. “Human communication is the
action of people talking, listening, seeing, feeling and reacting to each other, their
experiences and their environment” (Sigband & Bell, 1994). “Communication does not exist
in a vacuum. It is not something you do in the absence of other information… It is a process
that oils the gears that turns the machinery of business” (Penrose, Rasberry & Myers, 1993).
Supporting communication using good processes increases readability allowing users to
efficiently read and take in the information contained in the text.
Shannon and Weaver's (1949) Mathematical Theory of Communication shows that for
communication to occur, there must be a sender, a receiver and a channel (print, digital,
static or web) for the message to travel through (Figure 1). Messages must be encoded by
the source, pass through a channel and then be decoded in the way the message was
intended by the receiver.
Figure 1: The Communication Model (Shannon and Weaver, 1949) Image Source: Google Images
The message may be interrupted by noise surrounding the message, which may include
complex noise from the receiver’s field of experience, expert opinion, distrust or lack of
respect of the sender, fear, family and other reference groups or less complex noise such as
advertising, media, badly expressed messages, information overload and disinterest or a
lack of awareness of the relevance of the message (Tymson, Lazar, & Lazar, 2006).

Best Practice Guide for Development and Modification of Communications Materials
5
Finally, once the message is received, there is a response feedback loop that tells the source
that their message was understood. Response to the communication comes via the
feedback loop and a successful exchange may be confirmed by a change in behaviour or a
raised awareness of the topic of the message.
Because we (the message sender) want the message receiver to do something as a result of
our communication, it is important that we have a good understanding of the receivers
needs. The following sections provide guidelines to understanding the receiver and
maximising readability of both print and online documents.

Hay, et al
6
5.0 CURRENT WRITING GUIDELINES FOR GOVERNMENT
While there are many guidelines available to the Australian and Queensland government, the
most publicly available guide, the “Guide to help Australian Government teams design
simple, clear and fast content” (referred to as “the guide” from this point forward) (Australian
Government, 2018) cites the “modern government tone as being direct, calm and
understated”. It should be noted that different communication circumstances call for different
message tones, and a one size fits all approach will not create successful communication
with land holders. While the guide is aimed at writing for web based content, the language
used within the site is directed at both written work and online content.
The guide states that “the tone of a conversation should be polite, and use language that is
positive, sensitive and respectful”, “the writer should be aware of their audience and be
conscious of what the user needs to do”. It also states that the communication should “TELL
the user what they need to know”. “Telling” users what they need to know implies that the
receiver of a message does not know anything about the message being sent. When
discussing issues such as water quality, it is likely that the audience has experience with the
topic. Messages that “tell” them (land managers) what to do may be decoded as patronising
or dictatorial, (see Section 6.3.5). If a dictatorial message tone is required (telling), it should
be coupled with collaboration (Section 6.3.5) and a positive message frame (Section 6.3.3),
to ensure effective and positive communication.
The Australian Government guide’s “readability” guidelines
(https://guides.service.gov.au/content-guide/writing-style/#readability) start with a good
overview of readability stating that “content with good readability levels helps users know
what to do” and that “plain English helps specialists and technical audiences too”. However,
the readability guidelines contradict the suggested reading levels associated with the SMOG
index (schooling year/grade 7-9, age 12-15), which has been described as “the gold standard
readability measure” (Fitzsimmons, Michael, Hulley, & Scott, 2010, p. 294) (see Section
6.3.1). The guide states that writers should “aim for schooling year/grade 3 or 4 (age 9)
reading level”, as can be seen in the quote below.
“It’s good to aim for age 9 reading level. Someone who is age 9 would be in
Australian Year 3 or Year 4.”
The guide then contradicts itself referring to the “Web Content Accessibility Guidelines1”
(WCAG, 2008) criteria. WCAG criteria 3.1.5 (Level AAA) recommends writing to a lower
secondary education level equivalent to year/grade 7-8 (age 12-14). The guide closes the
readability requirements statement by reiterating that the writer should achieve a year/grade
3 or 4 (age 9) reading level, see excerpt reproduced below.
1 “Web Content Accessibility Guidelines (WCAG) 2.0 covers a wide range of recommendations for making Web content more
accessible. Following these guidelines will make content accessible to a wider range of people with disabilities, including
blindness and low vision, deafness and hearing loss, learning disabilities, cognitive limitations, limited movement, speech
disabilities, photosensitivity and combinations of these. Following these guidelines will also often make your Web content more
usable to users in general.” The Guide is managed by the Australian Government Digital Transformation Agency (DTA),
Canberra Australia.

Best Practice Guide for Development and Modification of Communications Materials
7
“WCAG criteria 3.1.5 (Level AAA) recommends you write to lower secondary
education level. This is Year 7 to Year 8 in Australia, or between 12 to 14 years old.”
“Even if you aren’t able to achieve an age 9 reading level, the more readable you
can make content the better it is for everyone.”
Caution is required, as writing at age 9 reading level (schooling year/grade 3-4) may be
interpreted by audiences with an average reading level as patronising (see Section 6.3.5),
which in turn may alienate the target audience. It is strongly recommended that content
(online and offline) be written towards readers of schooling year/grade 7-9 (aged between 12
and 15) as recommended by McLaughlin’s (1969) ‘gold standard’ SMOG index which is
supported by a substantial body of literature validating both the SMOG itself and the
recommended target reading level. The SMOG index is discussed in detail in Section 7.1.

Hay, et al
8
6.0 COMMUNICATION DESIGN PROCESS
This guide refers to excerpts reproduced from the NESP 2.1.3 Project and for best
outcomes, the guide should be used in conjunction with the NESP Project 2.1.3
Interim Report 1 (Eagle, Hay, & Farr, 2016) and the NESP Project 3.1.3 Readability
Communication Planning Checklist (Hay & Eagle, 2018), as found in Appendix 1.
The design process starts with the commission of the project including the budget (for this
report, it is assumed that this step is completed prior to project design, and as such not
discussed here). Next the design process collects information about the audience, and it
considers how the project information will be organised, analysed and interpreted. During
this process, the objectives of the intervention are explored as are the social marketing
benchmarks. This is followed by decisions about presentation and distribution of the
communication material (online, in print or both). The final step includes evaluating the
intervention based on the objectives and making adjustments toward the next intervention.
The next section helps you to set your objectives.
6.1 Set your objectives
Objectives are a specific result that a person or system aims to achieve within a time frame
and with available resources. At this point the objectives do not need to be precise and
measurable. They need only to respond to the call for action i.e., what is the overall strategic
outcome required. Use the following objectives drawn from the National Social Marketing
Centre Planning Guide and Toolkit (2016) and the New Australian and New Zealand Public
Relations Manual (Tymson et al., 2006) as a guide before you start to prepare your material.
Who Who is affected or involved. Include different segments, i.e. who is the audience for
this communication, who will read/view it? Is there more than one?
What What is the problem? What is your strategy? What do you want to achieve?
(Keeping this in scope of what is realistic and feasible)
When What time frame will your intervention use? Is it ongoing or timed for a particular
event for example a funding release, wet season, fertiliser application?
Where Where will the communication be used? Will it be paper or web based? How will
your audience access it? How will you approach each audience (face-to-face,
online, in groups, individually)?
Why Why are you doing this? Why should anyone care about what you have to say? Is
your reason compelling, does it engage interest (talking to, not at the audience)?
Can you provide quotes from trusted sources to gain interest (see Section 1.3.2
Implications of Source Credibility and Trust in Eagle et al., 2016)?

Best Practice Guide for Development and Modification of Communications Materials
9
6.2 Social Marketing Benchmarks (refer to Section 2.5 Eagle et al. (2016))
Social Marketing is a systematic and planned process that is used to influence behaviour in a
sustainable and cost-effective way. It helps you to decide who to work with, what behaviour
to influence and how to go about it. The rationale for, and expected outcomes of behaviour
change, must be made explicit: a general attitude about an issue has been proven in
numerous studies to not lead to specific behaviours (Ham, 2009). This underpins the need
to focus on the identification of factors influencing specific land management practices.
Consider the following social marketing benchmarks, which are a synthesis of two sets of
widely used benchmarks developed by the UK National Social Marketing Centre (NSMC
Benchmarks, 2006) and by Doug McKenzie Mohr (Community Based Social Marketing
Benchmarks) (McKenzie-Mohr, 2000). Apply them to your target market and the problem
you are trying to solve.
Benchmark 1: Identify the behaviour your intervention addresses
• Identify the specific behaviour that your intervention targets for change i.e. fertiliser
rates, erosion control
Benchmark 2: Focus on the audience to understand the drivers of current behaviour
and to identify barriers and benefits to behaviour change
• Identify the benefits that the intervention/outcome will make to the behaviour change
• Identify the barriers to the behaviour change (internal and external)
• Use a range of research from different sources to gain stakeholder understanding.
• Involve the target audience rather than treating them as research subjects
Benchmark 3: Use theory to understand your target audience (reproduced from
Section 2.6 in Eagle et al., 2016)
Theory can be used to identify the complex combination of factors that underlie specific
behaviours and which need to be considered in planning an intervention. These theories can
guide both the development and implementation of an intervention through identification of
the key beliefs on which to focus. Theory-driven approaches have been found to lead to
more persuasive messages across the range of socio-economic groups (Schneider, 2006)
and there is substantial evidence that, when theories are used to inform the development of
interventions in practice, the interventions have proven more success than interventions
based on “practical experience” alone (Fishbein, Hall-Jamieson, Zimmer, Haeften, & Nabi,
2002; Fishbein, von Haeften, & Appleyard, 2001).
The latest iteration of the Theory of Planned Behaviour (TPB) (Fishbein & Ajzen, 2011) is
recommended, see a full discussion of theories in Section 2.3.1 in Farr, Eagle, and Hay
(2017) for rationale. The TPB helps guide the identification of relevant attitudes and beliefs
that may underpin behaviours; for different segments of the target, behaviour may be more
strongly influenced by social norms in one segment compared to another.

Hay, et al
10
The TPB model asks you to consider the following information (this section is expanded in
the associated Readability Communication Planning Checklist (Hay & Eagle, 2018) :
• Background factors – individual, social, informational (see Figure 2)
• Beliefs:
o Behavioural - that an object has an attribute. Consider the behaviour that
you are trying to change. For example adding twice the amount of fertiliser
creates twice the amount of output.
o Normative - beliefs about the extent to which other people who are important
to them think they should or should not perform particular behaviours
o Control - the perceived presence of factors that may facilitate or impede
performance of a behaviour. If an individual feels that he/she can perform a
behaviour and can overcome the barriers that can impede the performance,
then they will be more likely to try it (Kreijns et al., 2013).
• Current attitude towards the behaviour – how strongly he or she believes that the
action will lead to a specific outcome (either favourable or unfavourable).
• Perceived subjective norms - the perceived social pressure to perform or not to
perform the behaviour.
• Perceived behavioural control - the perception of the ease or difficulty of the
particular behaviour.
• Behaviour intention – the person's perceived likelihood or subjective probability that
he or she will engage in a given behaviour based on their own assessment of the
perceived benefits versus costs (not necessarily just financial costs, but also social or
personal costs – see also Benchmark 5).
• Actual control – consider environmental factors (e.g. drought, rainfall, cyclones,
floods), actual knowledge, capital, opportunities, constraints. Do they have the
resources, skills and ability – what effect will these have on the behavioural intention /
actual behaviour.
Figure 2: Integrative Model of Behavioural Prediction and Change (adapted from Fishbein & Ajzen, 2011)
BACKGROUND FACTORS
IndividualPersonalityMood/EmotionValues/StereotypesGeneral attitudesPerceived riskPast behaviour
SocialEducationAgeGenderIncomeReligionRace/EthnicityCulture
InformationKnowledgeMediaIntervention
Behavioral Beliefs (BB) &
outcome evaluation
Attitude toward the Behavior
(ATB)
Perceived Behavioural
Control (PBC)/ Self
Efficacy
BehaviouralIntention
(BI)Behaviour (B)
ACTUAL CONTROL (AC)
Skills/AbilitiesEnvironmental factors
Perceived/ Subjective Norm (SN)
Normative Beliefs (NB)
& motivation to comply
Control Beliefs (CB)
Theory of Planned Behaviour /Integrative Model of BehaviouralPrediction & Change
(Fishbein & Ajzen, 2011)

Best Practice Guide for Development and Modification of Communications Materials
11
Benchmark 4: Identify actionable insights – pieces of understanding that will lead to
intervention development
• Use Benchmark 2 to generate insights including willingness to change behaviours
and individual versus community factors that influence behaviours, positively or
negatively
• Identify emotional (fear, anxiety, reluctance to undertake a behaviour that others are
not adopting) and physical barriers (lack of equipment or resources)
• Use insight to develop an attractive exchange. For example what can I ask my target
audience to do to implement the behaviour change? What are the perceived benefits
for them?
• Develop a strategy and pre-test the intervention. The results can be used as a
baseline, or a control group. Randomly select participants for the pre-test and gain
input from those participants regarding the planned intervention.
Benchmark 5: Exchange – considers benefits and costs of adopting and maintaining
the behaviour. Maximises benefits/minimises costs to create an attractive offer
• Clear and comprehensive analysis of perceived/actual costs vs perceived/actual
benefits
• Consider target audience’s values, offers incentives and rewards based on insights
(Benchmark 2 and 4)
• Replaces the benefits the target market derives from the problem behaviour
(Benchmark 6)
• What are the social propositions?
• What is the cost of involvement? This may not be financial, i.e. there may be social
or personal costs.
• Accessibility
• Social communication
Benchmark 6: Competition – identify strategies that address the battle for attention,
including the impact of commercial counter-marketing, social encouragement and/or
discouragement to change behaviours
• Develop ways of overcoming apathy and disinclination to change
• Seeks to understand what competes for the audience’s time, attention and inclination
to behave in a particular way.
• Addresses direct and external factors that compete for the audience’s time and
attention
• Forms alliances with or learns from the competing factors to develop the methods mix
Benchmark 7: Segmentation – identification of population segments, including
decision makers and influencers and their key characteristics
• Develop segmentation strategies
• Determine what interventions are most likely to be successful in encouraging
adoption of specific sustainable behaviours
Benchmark 8: Methods mix – uses a mix of methods to bring about behaviour change
• Should include co-creation with a range of stakeholders
• Considers the social and economic benefits of behaviour change and the
management of relationships by organisations and their clients

Hay, et al
12
• May include a range of materials depending on what works for whom (print, web,
face-to-face, focus groups, meetings, training etc.).
6.3 Readability Tools
Readability is important to how a user processes information as the content of a document or
online page. If the content is too difficult to understand, then it is likely the user will discard
the information before finishing reading. “Readability is the quality of being legible or
decipherable” (Oxford Dictionary, 2017). Readability is important to communicating,
especially to those with limited reading ability. As stated earlier, approximately 20% of the
population of most developed countries have severe literacy problems and a further 20%
have limited literacy (Adkins & Ozanne, 2005; Office for National Statistics, 2000). In
addition a high percentage of 15-74 year old Australian people fail to meet the minimum level
of functional literacy (Eagle et al., 2016, p. 65). Appropriate levels of readability
(approximately year 7 to year 9 school level) allow users to efficiently read and understand
the information that is in text form. Section 6.3 provides tools to test and manage readability
including the SMOG index, norms, message framing, message appeals, language and tone,
design principles and the use of visuals.
6.3.1 Readability: Simple Measure of Gobbledygook (SMOG)
Background to SMOG reproduced from Hay & Eagle, 2016, Section 3.1: To investigate
the supplied documents and links, we analysed for readability using the Simple Measure of
Gobbledygook (SMOG) readability index. The SMOG index has been described as “the gold
standard readability measure” (Fitzsimmons et al., 2010, p. 294), see Section 7.0
Methodology for SMOG index calculations. The originator (McLaughlin, 1969) of the SMOG
formula teamed up with JAVA programming expert Alain Trottier to provide an (undated)
internet-based version of the calculator at Trottier’s Words Count Website
(http://wordscount.info/index.html). There are other programs that claim to provide
readability statistics such as https://wordcounttools.com/ and https://readable.io/, but neither
have been tested for reliability (as confirmed by the authors in direct communication with the
suppliers). In previous research, Eagle et al., have compared the manually calculated results
of the SMOG formula with those derived from the Trottier’s version and found no difference
between them (Eagle & Dahl, 2016; Kemp & Eagle, 2008).
The SMOG index was selected because it has been repeatedly validated, and because of its
proven accuracy, correlation with other readability formulae and subsequent widespread use
in the academic literature, primarily in the health field (Mumford, 1997; Wallace & Lemon,
2004). More recently, it has also been used in environmental contexts such as renewable
energy reports (Biddinika et al., 2016), drinking water reports (Roy et al., 2015) and online
crisis communication (Temnikova, Vieweg, & Castillo, 2015).
Intervention managers should use the tools contained in this check list to produce their
communication material and then apply the SMOG calculator. If the score is above
year/grade 7-9, then the wording and structure used should be addressed and the calculator
applied again.

Best Practice Guide for Development and Modification of Communications Materials
13
It is important to remember that three and four syllable words such as government,
management, facilitate, contamination and resistance, among others including scientific
words, are hard to avoid and therefore will present a document with a high SMOG score.
In such cases, using other design principles supplied in this check list may help to overcome
a high SMOG score. In all cases, three and four syllable words should be used with caution
or if possible not at all.
The SMOG calculation measures only the likely reading level required for comprehension of
the material and no other aspects such as readability and suitability, which could be
assessed using other tools such as the Readability Assessment Instrument (RAIN) (Adkins,
Elkins, & Singh, 2001) or the Suitability Assessment of Materials measurement (SAM) (Doak,
Doak, & Root, 1985).
If the SMOG reading level is beyond year 7-9 then in addition to other design principles
included in this report, start by reworking the text to reduce three syllable or technical words,
long sentences, and text that uses passive voice. If complex or technical words must be
used, then follow them with a short descriptive sentence to assist the readers’ understanding,
for example “phytotoxicity (a toxic effect by a compound on plant growth)”.
The following worked example shows text from a brochure from 2016, with a SMOG grade of
16.25, which requires a reading level beyond secondary school (see Table 4, p. 33). Around
30% of the brochure was made up of very long sentences and 33% of the document was
made up of long sentences, which is hard for the average reader to comprehend.
The sentences also use passive voice and adverbs, which changed the context of the
sentence resulting in poor readability. An example of the text as written in the brochure and
of how it may be improved is below. The SMOG score for each paragraph is given to
demonstrate the change in reading level.
From
“Grower groups will look at practices such as banding and spot spraying of residual
herbicides, use of PSII herbicide alternatives and best practice use of canegrub
control products. Growers involved will also (adverb) be invited (passive voice) to
put forward (adverb) their own ideas on how chemical run-off from cane farms can
be reduced (passive voice) and weed management can be optimised (passive
voice).” (SMOG Score 16.7)
To
“Grower groups will look at practices such as banding and spot spraying of residual
herbicides, use of PSII herbicide alternatives and best practice use of cane grub
control products. Growers involved are invited (passive voice) to share (active
voice) their own ideas on how to reduce (active voice) chemical run-off from cane
farms and to optimise (active voice) weed management.” (SMOG Score 14.6)
The changes to this one paragraph reduced the SMOG score year level to 14.6, the
remainder of the brochure may be changed to reduce the SMOG score further. The re-
written option is still a long sentence (23 words), however, it is now written in an active voice
increasing readability. It is recommended that sentences are reduced to less than 20 words

Hay, et al
14
per sentence where possible and that an active voice be used in communications to assist
users with limited reading skills.
The target audience of the documents in all cases was farmers, who in the target area were
older (median age 52 years) than the median age of the Australian population (37 years). In
the wet tropics, 27.5% of cane growers completed year 10 and 6.9% completed a university
degree. In the dry tropics 34.2% of cane growers completed year 10 and 21% completed a
university degree, and 20.7% of graziers completed year 10 and 35.8% of graziers
completed a university degree (Farr, Eagle, & Hay, 2016).
All documents presented were above the average reading level of year 7-9. While
approximately one third of the readers in the target area are educated beyond year 10, if
reading skills are not used regularly, then the adult reading level will fall by 3 – 5 grades
below the level expected at the completion of formal education (Kemp & Eagle, 2008; Shea
et al., 2004). Therefore, attention needs to be paid to the whole target audience’s
knowledge, experience and most importantly their reading levels. Care must be taken to
respect their values, customs, beliefs and prior knowledge when providing information (see
Hay and Eagle (2016), Harnessing the science of social marketing and behaviour change for
improved water quality in the GBR: A documentary analysis of Reef Trust Tender (Burdekin)
and Reef Programme.).
6.3.2 Norms
Background reproduced from Hay & Eagle, 2016, Section 3.2.1: Norms revolve around
standards of proper or acceptable behaviour. While some researchers treat norms as a
single concept (Barnes et al., 2013, p. 449), others distinguish between injunctive norms
(portrayal of what people ought to do) and descriptive norms (what people actually do)
(Cialdini, 2007).
Identifying norms that might be followed by the audience of your campaign may help you to
choose which voice your communication will use:
Using injunctive norms i.e., behaviours that are perceived as being approved by others,
may help to promote acceptable behaviours, for example in a brochure about planting
damaged sugar cane (see Figure 3), text and images are used to show what the damage
looks like and the approved practice for using or not using the cane.

Best Practice Guide for Development and Modification of Communications Materials
15
Figure 3: Example of injunctive norms i.e. using behaviours perceived as being approved by others
Using descriptive norms i.e., the perception of how others are actually behaving, can also
promote accepted behaviours. The use of descriptive norms can be boosted by using
examples from trusted sources, these may be people (other farmers whose opinions are
valued or trusted service providers) or research bodies (depending on the topic in question).
Examples may include using images to demonstrate the success of a new process or
practice, see Figure 4 below.
Figure 4: Example of descriptive norms i.e. the perception of how others are behaving
Reproduced from Hay & Eagle, 2016, Section 3.2.1: It has been recognized for more than
two decades that, when there is a perceived conflict between actual or perceived norms and
attempts to change behaviours in a way that would conflict with those norms, message

Hay, et al
16
effectiveness will be hampered (Cialdini & Goldstein, 2004). Cialdini (2004) also cautions
against depicting behaviour that is problematic and thus targeted for change as being
widespread as this may result in the perception of behaviour change being seen as contrary
to prevailing social norms or that changing one’s own behaviour will be futile. An example of
this is the American ‘Crying Indian’ anti-littering campaign in which an indigenous American
is shown paddling down an increasingly polluted river. While the campaign received
numerous awards and was hailed as powerful (Searles, 2010), subsequent research
revealed that it reinforced descriptive norms, i.e. the perception that it was normal to litter
rather than the injunctive norm that people should not litter (Maio et al., 2007).
Both injunctive and descriptive norms can be used to promote avoiding a bad behaviour or a
poor practice. However, care must be taken to ensure that the practice is not perceived as
being an accepted practice, otherwise the wrong message may be communicated (see
Figure 5) below, which could be perceived as image a) “it’s ok to use lots of fertiliser” or
image b) as a “drop off point for recycling bulk fertiliser bags”.
Figure 5: Image of fertiliser bulk bags ready for recycling (Burdekin Region)
6.3.3 Message Framing
Reproduced from Hay & Eagle, 2016, Section 3.2.2: Message framing derives from
prospect theory (Gerend & Cullen, 2008; Rothman & Salovey, 1997; Tversky and
Kahneman, 1974). Prospect theory itself developed from extensive research into responses
to people’s perceptions of the prospect of positive (gain) or negative (loss) outcomes
resulting from a range of specific behaviours. This research confirmed that people tend to be
loss averse, being prepared to take risks to avoid losses but avoiding risk if there is potential
gain from an action (Van de Velde, Verbeke, Popp, & Van Huylenbroeck, 2010).
In terms of framing, a message can either emphasise the advantages of doing a certain
action (e.g., in relation to health, losing weight as a result of regular exercise) or it can
emphasise the negative consequences of not taking a certain action (again an example from
the health sector e.g. having a higher likelihood of cardiovascular disease as a result of not
taking regular exercise). In the agricultural-environmental sector, the gains in terms of
Image a)
Image b)
It’s ok to use
lots of Fertiliser!

Best Practice Guide for Development and Modification of Communications Materials
17
positive outcomes of best land management practices would be emphasised versus the
potential losses in terms of negative outcomes from not taking action. In the example text
below the negative outcomes are implied while a positive frame is used to convey the
message.
“As the climate changes and extreme weather events are projected to occur
more frequently; protection and re-instatement where possible of coastal
ecosystems is becoming more important to ensure maintenance of services to
humans, the environment, carbon storage and ultimately water quality to the
Great Barrier Reef”
Both approaches have been used successfully in various campaigns. However, research that
has explored the effects of either positive or negative message framing has led to conflicting
results (Homer & Yoon, 1992; Maheswaran & Meyers-Levy, 1990). It is now usually
recognised that no one single framing approach is applicable across all intervention types
(Block & Keller, 1995; Alexander J. Rothman & Salovey, 1997).

Hay, et al
18
Positive framing
Positively framed messages appear to be stronger for preventative behaviour and health
affirming messages (i.e. no risk in undertaking the behaviour), such as stopping smoking
before the onset of ill-health related to smoking. However, reviews of previously published
studies suggest that this may not apply in all situations (van Assema, Martens, Ruiter, &
Brug, 2001). For example positively framed messages may not be effective if the recipient is
unsure about behavioural norms (the manner of behaving or conducting one’s self under
normal circumstances) (Blanton, Köblitz, & McCaul, 2008; Stuart & Blanton, 2003) or if it
conflicts with existing knowledge, attitudes and beliefs (Cox & Cox, 2001). For example, if
reduced fertiliser application rates are not considered a behavioural norm, then a positively
framed message about the subject may be confusing. The recipient may question, if the
solution to the problem is simple, then why is it not applied all the time by others in the
industry. The example text below shows a positively framed message about Best
Management Practice (BMP), but if the audience has a negative belief or behavioural norm
associated with industry, government or the best management practice criteria - v’s their own
criteria - the message may not be effective.
“The Smartcane Best Management Practice (BMP) Program is an industry led,
government-supported best practice system for cane growing across
Queensland, aiming to support business productivity, profitability and
stewardship”
Additional factors that may impact on potential intervention effectiveness include whether
new behaviour is being promoted or whether ceasing current behaviour is targeted (Snyder
et al., 2004). Additionally, it has been argued that positive framing fosters a greater self-
efficacy (one's belief in one's ability to succeed in specific situations or accomplish a task),
which in turn is a major factor in compliance behaviour (Jayanti & Burns, 1998) and therefore
long-term behaviour change. The following paragraph gives an example of the impact of the
potential intervention aimed at long term behaviour change by targeting current behaviour,
promoting new behaviour and by fostering self-efficacy.
“It is acknowledged that current BMP alone is not enough to meet water
quality targets (current behaviour targeted) so the Government is supporting
farmers to trial new innovations that may help the industry meet these targets
(new behaviour promoted). Sugarcane growers are already proven to be
creative problem solvers and this program is designed to support the
flourishing of new ideas that are of benefit to farmers as well as the
environment (aimed at increasing self-efficacy)”
The level of personal involvement in a message topic also affects the type of framing that is
more effective. Evidence suggests (Donovan & Jalleh, 1999) that in low involvement
conditions positive messages are more effective, whereas the reverse is true for high-
involvement conditions. Again, this may support why positive framing appears to have been
effective in the past, for example (Table 1):

Best Practice Guide for Development and Modification of Communications Materials
19
Table 1: Examples of positively framed messages and their effectiveness
Effective Not-Effective
Sunscreen “Using sunscreen decreases your risk for skin cancer and prematurely aged skin”
“Not using sunscreen increases your risk for skin cancer and prematurely aged skin” (Detweiler, Bedell, Salovey, Pronin, & Rothman, 1999)
Water Conservation “By conserving water through installing low-flow irrigation heads, you will decrease the cost of your water bills in the future”
“By wasting water through installing high power irrigation heads, you will increase the cost of your water bill in the future” (Owens, Warner, Rumble, Lamm, & Cantrell, 2015)
Agri-environment “Farmers who manage runoff are reducing pollutants into the Great Barrier Reef protecting our reef for its future”
“Farmers who do not manage runoff are harming the Great Barrier Reef, risking harm to corals, sea life and water quality”
Negative framing
Negative message framing may be more effective where there is uncertainty about the
outcome of the behaviour, but there is awareness of the danger of not identifying a problem
early. A good example in the health sector is screening programmes that prevent a more
serious outcome e.g. mammograms (where if you don’t’ have a mammogram you might get
cancer, but if you have one it can be detected early) or cholesterol checks (if you get your
cholesterol levels checked, it might prevent you from having a heart attack if your cholesterol
levels are high). The following paragraph gives an example of a negatively framed message
in the sugar cane industry:
“If a successful applicant does not meet the industry standard within any of
the three required modules (uncertainty), they may work with a Smartcane
BMP Facilitator to develop an action plan to assist them in meeting that
standard (awareness)”
However, there is also evidence of significant barriers to these types of messages among
adolescents and young adults (Miller, Lane, Deatrick, Young & Potts, 2007), reactance
effects, where direct, potential or perceived threats to personal freedom cause resistance
(see Eagle et al., 2016, p. 22 for more discussion on the reactance effect). There appears
also to be cultural (Orth, Koenig, & Firbasova, 2007), context and situation variations.
Additionally, personality types may also have an influence: the potential ‘pain’ of not
undertaking a recommended behaviour may be a stronger motivator for those who are
focussed on safety and security, whereas the potential ‘pleasures’ from adhering to
recommended behaviours may be more motivating for those seeking personal growth
(Cesario, Corker, & Jelinek, 2013). Confounding factors include the degree of risk involved
in changing behaviours (Chang & Wu, 2015). Communicating uncertainty of outcomes
requires consideration, as people are reluctant to change behaviours if uncertainty is high,
and if potential outcomes are seen as threatening, denial may be triggered, resulting in a
refusal to make any meaningful behaviour changes (Morton, Bretschneider, Coley, &
Kershaw, 2011). The following paragraph identifies perceived or potential threats and
perceived risk in changing behaviour, which may lead to a resistance to change.

Hay, et al
20
“The GBR Water Science Taskforce (the Taskforce) is currently considering
mechanisms such as regulations (may be perceived as a direct or
potential threat), market-based trading, incentives and on-ground support to
find the best approach to meet our water quality targets (perceived risk).
While we await the Taskforce recommendations, we are urging all cane
farmers in the Wet Tropics, Burdekin and Mackay-Whitsunday regions to
adopt regulated standards and improve reef water quality outcomes”
(potential or perceived threats; perceived risk)
6.3.4 Message Appeals (including fear appeals)
Message appeals are the connection between the emotion or the cognition and the
consumer’s response to the message (Sheth, 2011). Appeals can be rational or emotional
and can include fear appeals.
“We recognise and applaud the many sugarcane producers who are
managing their farms sustainably, and who have adopted best management
practices. We also know that others could do better” (emotional appeal)
Fear appeals should be used with caution as, while early studies suggest that fear appeals
have the potential to influence attitude change and subsequent behaviour, there are
numerous examples of interventions based on fear appeals not achieving their objectives
(Donovan, Jalleh, Fielder & Ouschan, 2009). Most studies that claim fear appeals to be
effective have been laboratory-based, often with methodological shortcomings, and have
measured only short-term effects.
Strong fear appeals are more likely to be regarded as unethical if the target populations do
not believe they can readily undertake the recommended behaviour or that the
behaviour will not be effective in minimising the perceived threat (Snipes, LaTour &
Bliss, 1999) such as ultimately improving the water quality of the Great Barrier Reef. The
following paragraph is demonstrative of this type of fear appeal and should be used with
caution.
“The science about the state of the Great Barrier Reef is clear. The
Queensland Government is focusing its attention on increasing the uptake of
key farming practices that directly reduce the likelihood of nutrients and
pesticide runoff (may be disbelief that this can happen). Additional officers
are on the ground in reef regulated catchments to encourage faster uptake of
regulated standards (may disbelieve that they can readily adopt the
changes) through awareness, extension and targeted compliance activities
(may fear intervention). We are focusing on catchments and critical sub-
catchments where science is showing us there is a problem (may believe
this to be ineffective; respond with complacency)”

Best Practice Guide for Development and Modification of Communications Materials
21
Fear appeals appear to be effective and appropriate only in situations where the solution to a
fairly critical problem is relatively easy and effective solutions are available (Buller, Borland, &
Burgon, 1998). An additional factor appears to be a lessening of the effectiveness of fear
appeals over time. The ongoing usage of fear appeals can in fact lead to complacency as
people start to no longer respond with fear, but rather with indifference to the messages, if
not ‘switching off’ entirely (Brennan & Binney, 2010). In addition, threats of stronger
government legislation and regulation may be interpreted as a form of fear-based
messaging; the use of law generally is thought of as “coercive and punishing” (Rothschild,
1999, p. 25). An example text from the agricultural-environment below gives an example of
fear based messaging. While the text has a positive sentiment and a professional tone, the
use of government regulation to coerce the farmers into adopting a voluntary Smartcane
BMP may be perceived as a threat by farmers.
“You are encouraged to adopt best management practices, through the
voluntary Smartcane BMP. In 2010 reef protection requirements were
brought in under the Environmental Protection Act 1994 and the Chemical
Usage (Agricultural and Veterinary) Control Act 1988 and associated
regulations (coercive/punishing). The regulations require all cane
farmers…” SMOG Score 16.5
One solution may be to separate the government requirement from the farmers
requirements.
“Farmers are encouraged to adopt best management practices to meet new
reef protection requirements. The 2010 regulations are guided by the
Environmental Protection Act 1994 and the Chemical Usage Control Act
1988. Best management practice requires farmers to….” SMOG Score 13.6
To find necessary and appropriate behaviour change solutions to water quality challenges, it
is important to develop ways of communicating the need for effective ‘buy in’. It is important
to frame the overarching problem in a way that will not alienate target groups and that
will provide evidence of the need for action on the part of landholders that focuses on
landholders beliefs about the consequences of performing the behaviour (Greiner, 2016;
Hurlbert, 2014; Maio et al., 2007). The below paragraph gives a good example of not
alienating target groups.
“Cane farmers from across North Queensland are working hard to put in
place irrigation and nutrient management practices that reduce nitrogen
runoff – and urban communities are also making an effort to minimise their
water quality impacts. Here’s an update on some of the work councils do to
help keep our waterways clean.”

Hay, et al
22
In summary, message framing can be used to emphasise advantages of a certain action
and/or negative consequences of not doing a certain action identified for behaviour change.
Either positive or both negative and positive message framing should be used to align with
the message to frame messages for successful communication. While positively framed
messages appear to be stronger, they may not be effective if they go against the norms of
the target audience. Acceptance (decoding) of the message will be dependent on the level
of personal involvement that the landholder has with the message topic, therefore messages
should closely follow outcomes from Section 6.1 and 6.2 to align with audience norms. Fear
appeals may be viewed as unethical and should be used with caution. Using a fear appeal
will depend on the degree of risk involved in changing behaviours. Ultimately,
communicating effective ‘buy in’ solutions is most important to developing effective
communication.
6.3.5 Message Tone and Language
Background reproduced from Hay & Eagle, 2016, Section 3.3: Readability and message
framing have been identified in past research as impacting significantly on the way that
messages are processed (if at all) and whether the messages are ultimately influential in
encouraging the behaviours desired, whereas message tone effects have received less
attention (Clark, 2014). The tone of a message affects the way messages are processed
and how influential they are or are not. Messages can work with or against prevailing norms
and they can be subject to resistance or defiance. It is important to ensure that
communications work with rather than against prevailing social norms. If threats to
autonomy and identity are perceived, resistance and even defiant behaviour may occur (Mols
et al., 2015), particularly when there are some land manager groups who are unwilling or
unable to accept that they are contributing directly or indirectly to water quality problems.
Tone is essential to any communication, it impacts how the reader interprets the message
and it is a reflection of the message being sent. Tone can be measured as being dictatorial
(controlling or overbearing), collaborative (to co-operate, work together willingly), patronising
(superior attitude towards others) or adversarial (opposing sides).
The following text gives examples of message tones used in supplied documents (from) and
how they can be changed for better impact (to).
Dictatorial (controlling or overbearing):
From: To:
“Our team’s actions will be guided by the
reef protection requirements under the
Environmental Protection Act 1994 and the
Chemical Usage (Agricultural and
Veterinary) Control Act 1988 and
associated regulations”
“Our team will be guided by the
Environmental Protection Act 1994 and the
Chemical Usage Control Act 1988 to assist
landholders with reef protection
requirements”

Best Practice Guide for Development and Modification of Communications Materials
23
Collaborative (to co-operate, work together willingly):
From: To:
“By working one-on-one with growers to
develop their nutrient management plans,
our Extension Officers are making it easier
for growers to adopt the SIX EASY STEPS
guidelines across their farms and realise
improved yields and profits”
“Growers and extension officers will work
together to develop nutrient management
plans to improve yields and profits, as they
move towards adopting the Six Easy Steps
guidelines”
Patronising (superior attitude towards others):
From: To:
“A rainfall simulator is a tool that simulates a
rainfall event, with a pre-determined ‘rainfall’
intensity over a given time. Simulators are
often used to measure losses of sediment,
nutrients and pesticides and the amount of
rainfall runoff under different conditions”
“The rainfall simulator produces a pre-
determined rainfall intensity over time to
measure losses of sediment, nutrients and
pesticide runoff under different conditions” Note: Over explaining the procedure may imply that
the sender thinks they have more knowledge than the
receiver
Adversarial (opposing sides):
There were no examples of adversarial tone used in the supplied documents. However,
opposing sides are often used in media associated with the health of the Great Barrier
Reef which can negatively and/or positively affect the audience’s acceptance of intended
messages. See for example an excerpt from an article published in the Townsville Bulletin
on June 15 2016 “Farmers tired of reef claims”
“ONE of the North’s largest sugarcane producers says he is tired of farmers
being painted the villains in the reef damage debate.
Geoff Cox, who with brother David produces about 500,000 tonnes of cane in
the Burdekin, said activist groups had hijacked the debate with exaggerated
claims about the state of the reef and the impact of farm run-off….”
It is recommended that a collaborative tone be used when communicating with landholders.
However, ultimately the tone will depend on the message within the communication. If a
dictatorial tone is required (telling), it should be coupled with collaboration and a positive
message frame, to ensure effective and positive communication occurs.
Language: Use active voice
Text written in an active voice helps to bring the reader into the moment, it creates a stronger
connection to the action and it makes it easier for reader for whom English is a second
language or who read at an average reading level. Writing in an active voice is direct,
simpler and shorter in structure and uses subject (the person or thing that is doing the
action), verb (the action or thing that is being done) and an object (the person, place or thing
that is receiving the action) (Fowler & Aaron, 2016). The example text below, demonstrates
how to change text from passive voice to active voice.

Hay, et al
24
“Growers involved will also be invited (passive voice) to put forward their own
ideas on how chemical run-off from cane farms can be reduced (passive
voice) and weed management can be optimised (passive voice).”
“Growers involved are invited (passive voice) to share (active voice) their
own ideas on how to reduce (active voice) chemical run-off from cane farms
and to optimise (active voice) weed management.”
6.3.6 Format
The message format can be written scientifically using technical evidence to support its
claims i.e., the Scientific/technical format gives reference to studies that have shown a
particular positive outcome (e.g. X strategy achieved a 10% higher yield). The testimonial
format uses endorsement from landholders, usually featuring a specific landholder who is
quoted as saying that they used a recommended practice and achieved positive outcomes
(e.g. higher yields, reduction in fertilizer or pesticide applications).
Table 2 below contains the key used in the analysis of the message framing, norms, tone
and format of supplied documents, which may be used by the sender to rate communications
messages prior to distribution.
Table 2: The key used in the analysis of message framing (including appeals), norms, tone and message
format
Key: Framing: Po Positive, N Negative / R Rational E Emotional G Guilt F fear Norms: D Descriptive: perceptions of how other people are actually behaving, whether or not these are approved of; I Injunctive: behaviors perceived as being approved of by others Tone: DT Dictatorial, C Collaborative, Pa Patronising, A Adversarial Format: S Scientific / technical evidence T Testimonial / endorsement from landholders
Name of Stakeholder Framing Norms Tone format
Name and date of document, web link P D/I C T
Name and date of document, web link

Best Practice Guide for Development and Modification of Communications Materials
25
6.4 Design Principles
There are no firm rules regarding design. Pettersson (2010, p. 169) suggests that all
information materials must be legible and readable. They should be worth reading by
members of the intended audience and the communication should not be viewed as
complete until the receiver has understood the message. The sender must decide on the
communication channel (audio, text or visuals) and then decide on the text, sound and
imagery to be used. Next the sender must select the target audience, collect relevant
information (See Section 6.2) and include feedback from previous communication. Then the
sender must consider basic design principles. The following defines a list of elements to
assist with legibility for print based communications.
6.4.1 Target Audience
See Section 6.2. In addition, use the preferred language appropriate to audience,
appropriate for age and gender, respect for values, customs, beliefs and prior knowledge.
6.4.2 Content
Provide up to date information and focus on the most necessary information. Include a
maximum of three important points in any one communication. Use examples to illustrate
ideas and concepts. Include a call to action in the communication. Consider the audiences
culture and circumstances.
Figure 6: Image showing the concept of the Rainfall Simulator taken from an information sheet explaining
the system

Hay, et al
26
6.4.3 Organisation
Readers typically read in an F-shaped pattern. Firstly, in a horizontal movement, then down
and across again and then they follow down the page (Pernice, 2017). Reading in an F-
pattern means that focus is concentrated on the left hand side of a page. To assist the
reader to take in all of the information provided in the communication prioritise and format the
readers to what you want them to see. The following guidelines from Pernice (2017) have
been adapted to help organise the text for readers.
• Include the most important points in the first two paragraphs on the page.
• Use headings and subheadings. Ensure they look more important, and are more
visible, than normal text so users may distinguish them quickly.
• Start headings and subheadings with the words carrying most information: if users
see only the first 2 words, they should still get the gist of the following section.
• Visually group small amounts of related content — for instance, by surrounding them
with a border or using a different background.
• Bold important words and phrases.
• Use bullets and numbers to call out items in a list or process.
• Cut unnecessary content, such as welcomes to the communication, reduce
introductions to one sentence where possible.
6.4.4 Credibility
The credibility of the author or organisation is important to the belief of the topic of
communication. Source credibility is dependent upon expertise (the extent to which a
speaker is perceived to be capable of making correct assertions) and trustworthiness (the
degree to which an audience perceives the assertions made by a communicator to be ones
that the speaker considers valid) (Hovland, Janis, & Kelley, 1953). The extent of opinion
change is influenced by learning and acceptance of the audience, therefore will be less
trustworthy if the credibility of the author/spokesperson does not meet the audience’s
expectation (e.g., I know what he/she is saying but I don’t believe it) (Hovland & Weiss, 1951,
p. 647). Highly credible sources are more persuasive than others provided the message
being sent is perceived as trustworthy by the audience. However, being an expert in the
message topic does not automatically equate to trustworthiness (Pornpitakpan, 2004).
Trustworthiness may emanate from an action (variable) outside of the topic being discussed
and hence reflect on credibility (Pornpitakpan, 2004). Trustworthiness of the sources is best
described in terms of the situation. When investigated against a set of variables (see Table
3) the results show that when using the variable of evidence, the persuasiveness of the
message is increased if the source of the message has low to high credibility. By contrast,
persuasiveness will depend on the source’s self-interest when the variable of supporting
arguments is used. When threat or refutation are used the credibility of the source will affect
the weight the receivers give to the positive or negative information in the message. The
results indicate that highly credible sources need not be used in every situation and that the
level of source credibility used in a message will depend on the timing and type of message
being distributed.

Best Practice Guide for Development and Modification of Communications Materials
27
Table 3: Effect of Source Credibility on Message Persuasiveness (adapted from Pornpitakpan, 2004. The
Persuasiveness of Source Credibility: A Critical Review of Five Decades' Evidence)
Variable Effect on Persuasiveness
Source Credibility
Context
Evidence Increases Low-high Evidence seems to increase the persuasiveness of a low- but not a high-credibility source
Supporting Arguments
Increases Low Independent effects on persuasion, while presenting a message incongruous with the source’s self-interests
Message discrepancy high but note extreme
Highly increases High Highly credible source is more influential than is a low credibility source when message discrepancy is high but not too extreme
Message discrepancy low
Minimal increase Low Fewer source credibility effects when discrepancy is low
Threats and refutation
Increases/ decreases
Highly credible
Source credibility affects the weight receivers give to the positive and negative information in the message
Note: Message variables include timing, evidence, supporting arguments, argument quality, message congruity with the source’s self-interests, message discrepancy, extremity of the claims, threat level, message style, language intensity, quantitativeness of the message, and inclusion of refutation
A receiver’s response to credibility will be determined by their behaviour. If the “receivers
behaviour is salient, a low-credibility source tends to be more influential than a high-
credibility source” (Pornpitakpan, 2004).
6.4.5 Design
Text
Use a clear, direct, simple and transparent typography – use a single sans serif font style
(like Arial or Helvetica) sized between 10 and 12 points. While serif fonts are usually used in
print and sans serif used online, sans serif fonts have been found to increase readability for
users with average reading ability. Avoid using multiple fonts as too many fonts can cause
confusion and reduce readability. Use contrasting colours i.e. black text on a white or yellow
background (white on cream/yellow is the most readable background for people with dyslexia
and for reading from a distance). AVOID the use of CAPTIAL LETTERS, it makes words
difficult to read and it looks as though you are shouting. Use bullet points to define lists.
Layout
Use a simple and clear layout, with left aligned text. The ragged edges make it easier for the
eye to follow the lines when reading. Use bold text and white space to highlight information.
Use captions for illustrations.
Image Source 1: http://www.plainenglish.co.uk/files/designguide.pdf

Hay, et al
28
Harmony
Create harmony within groups of communications. Develop a standard template for graphic
design for each communication situation.
Attention
Use words relevant to the topic that will gain the attention of the receiver. Use colour coding
to draw attention to elements of the communication. Including white space in your
communication can improve legibility, comprehension and increase attention (Boag, 2011).
Short clearly separated chunks of text helps readers to follow the information, it helps them
to know when to stop and to not give up reading. White space is can be any colour but
defines the space between the elements of your design. The image below uses a good
combination of relevant words, colour contrast and white space (dark grey) to emphaise the
design.
Image Source 2: A good example of word and colour use from a supplied case study
The correct colour contrast can improve readability. The colour wheel below gives examples
of colours that are complimentary to each other. Avoid using fluorescent colours in charts
and graphs. Eight percent of males and 0.5% of females people are colour blind and cannot
see green and red (National Eye Institute, 2015). However, there are also other forms of
colour blindness for example blue/yellow and complete colour blindness. It is hard for many
readers to see combinations of green/brown, blue/purple, light green/yellow, blue/grey, and
green/grey (National Eye Institute, 2015). To ensure that information is accessible to all
readers’ authors should use different shades of the same colour (monochrome colours).
Colours that are opposite each
other on the colour wheel are
considered to be
complementary colours
(example: red and green)
Analogous colour schemes use
colours that are next to each
other on the colour wheel. They
usually match well and create
serene and comfortable
designs.
A triadic colour scheme uses
colours that are evenly spaced
around the colour wheel.
Image Source 3: http://www.tigercolor.com/color-lab/color-theory/color-theory-intro.htm#color_harmonies
The WCAG 2.0 level AA requires a contrast ratio of at least 4.5:1 for normal text. Level AAA
requires a contrast ratio of at least 7:1 for normal text. There are several free online colour
contrast checkers, the contrast example below is from WebAIM (web accessibility in mind).
Simply click on the foreground colour and select the colour you would like to use, then do the
same for the background. Check the score is above the AA level of 4.5:1 for normal text.

Best Practice Guide for Development and Modification of Communications Materials
29
Image Source 4: https://webaim.org/resources/contrastchecker/
Avoid using reverse types (white text on a dark background) they might look creative, but
they are less easy to read than dark type on light backgrounds and can be compromised
when being reproduced. For example, thin and serif texts can break up, small spaces can fill
in and a busy background or weak colour can make it hard to read, see below for more on
colour selection.
6.4.6 Visual Imagery
Critical to communication is the role of the comprehension of messages including the
inclusion of appropriate visual elements. Pettersson (2010) cites that a user’s “memory for
pictures is superior to memory for words” and that “visuals can strengthen language fluency
by enhancing memory and recall, as well as providing a visual schema in which information
can be organized and studied” (p. 180). If a communication is poorly designed then it will
have less chance of being understood, less attention will be paid to its content resulting in
less uptake of its product or topic. Balance and proximity (J6 Design, 2015) of images help to
build connections between verbal and visual representation and synthesize complex
information when text and illustrations are actively held in memory at the same time
(Pettersson, 2010; Thomsen, 2015). Balance provides stability and structure to the design,
whereas proximity creates relationships between the included elements. The use of visual
aids should be considered for three reasons.
• They may help in gaining attention and interest in a message, in order for time and
effort to be allocated to the remainder of the material (Lazard & Atkinson, 2014).
• The use of appropriate visuals can help those who struggle to understand text-based
information (Dowse, 2004) or abstract concepts (Altinay, 2015).
• They can “amplify the verbal portion of a persuasive message” (Seo, Dillard, & Shen,
2013, p. 565), or make specific elements within a specific communication stand out
(Altinay, 2015).
There is evidence that images can communicate more effectively than words alone (Lazard
& Atkinson, 2014).

Hay, et al
30
The following image (Figure 7) is an example from a case study that was used to discuss
innovation in SugarCane. The communication surrounded the successful use of variable
rates of applications of nitrogen in different zones using satellite yield data. When
assessed against the criteria for norms and message framing, the case study was rated
as positively framed (using active voice, talking about innovation and success), based on
descriptive norms (using examples from a landholder) using a scientific format (rates of
fertiliser application, spatial discussion), and it was identified as being perceived as
possibly dictatorial. This was not due to a substantial amount of wording that held a
dictatorial tone, but rather implied by the body language of the people depicted in the
main image used in the case study (see below). While the image is associated with
applying fertilizer it may not be taken in that context. In isolation the image would have
been intended to demonstrate communication between subjects. However, when taken in
the context of the case study, it appears that there was disagreement between the two
subjects in the photograph and hence the dictatorial rating. While the other images used
in the communication were appropriate to the topic and in good proximity to the
associated text, this image seemed out of place. We do not, of course have access to the
rationale for its selection. There were two other images depicting the landholder in the
case study, which may have been less distracting it terms of communication.
Figure 7: Image used in a case study on variable fertiliser application rates using satellite data
The “Guide to help Australian Government teams design simple, clear and fast content”
(referred to as “the guide” from this point forward) (Australian Government, 2018) states that
the sender needs to “choose relevant and clear images”, “use words rather than images” and
to “only use images that usefully add to the text content”. In addition, the guide states to
“make sure the images are not culturally insensitive to any audience” and to “make sure
there is sufficient contrast between any text and the background in images”.

Best Practice Guide for Development and Modification of Communications Materials
31
While Lazard and Atkinson (2014) highlight that “images can communicate more effectively
than words”, we reiterate the importance of choosing relevant visuals to convey the related
message and we add caution that just as images can add relevancy to the topic they can
also be misinterpreted when receivers have sufficient experience and time to generate their
own mental images as they read the text (Pettersson, 2010). As such we recommend that
imagery be used minimally (maximum 3 images), that the images chosen provide meaningful
content and that they are presented in close proximity to the text that explains them.
Reproduced from Hay & Eagle, 2016, Section 3.3.5 In the context of environmental
impacts (including the impact of climate change), the use of iconic images that are not
personally relevant and focused on local impacts or which are based on model simulations is
discouraged (Thomsen, 2015). Conversely, the use of local images in climate change
communication has been shown to be effective in gaining acceptance of the need for local
action, and consideration of alternative courses of action (Scannell & Gifford, 2013). A caveat
is that the visuals should be pre-tested to ensure that the message intended to be conveyed
is that actually received rather than having the potential for miscommunication (Dowse,
2004). Visually demonstrating the link between environmental pollution causes and impact is
noted as being challenging (Hansen & Machin, 2013). However, visuals can be a powerful
tool for demonstrating that positive actions are possible and achievable (Altinay, 2015).
Graphs, Charts, Statistics
Use graphs charts and statistics sparingly. Ensure that when they are used, that they are
meaningul and easy to read. Use graphs rather than figures when reporting statistics. A
guide for how to report statistical information is available from Queensland Treasury here
http://www.qgso.qld.gov.au/about-statistics/presentation/presenting-stat-info-graphs.pdf

Hay, et al
32
7.0 METHODOLOGY
The project assessed marketing material provided by the Sugar Research Australia (SRA),
Reef Catchments (Mackay, Whitsunday, Isaac) Limited, the Department of Environment and
Heritage Protection (DEHP), the Department of Agriculture and Fisheries (DAF), NQ Dry
Tropics (NQDT), and Terrain Natural Resource Management groups. The findings were then
used to create this “best practice guide”.
The documents were analysed for readability using the SMOG index calculator (See Section
7.1) and by measuring norms, message framing, appeal, tone and language and format (See
Section 6.3). In addition, the documents were measured against basic design principles
(See Section 6.4)
While SRA, Reef Catchments, and DEHP provided static documents to be assessed during
the course of the project, Terrain and NQDT supplied live documents, during project to be
assessed throughout the project, allowing them real time analysis of marketing material
before it was made available to their publics (all audiences who consumes the material).
Some examples of email exchanges between stakeholders and the analysis team are
contained in Appendix 2.
Each of the departments has received an individual report containing the results of the
analysis of their material. The results showed that all of the material provided was above the
recommended reading level of year 9. Individual feedback was provided with examples of
how the reading level may have been improved. In addition comments were made on the
design principles used. The feedback and comments were then de-identified to be used in
this guide as examples for the wider audience.
7.1 SMOG Index (McLaughlin, 1969)
The method used for the Manual calculation of SMOG levels is well documented in the
literature (see, for example, Aldridge, 2004). The manual calculation is performed by taking
three groups of 10 consecutive sentences at the beginning, middle, and end of a document,
giving a total of 30 sentences. Following this, all words with three or more syllables within
these selected sentences are counted and the square root of the total is then calculated and
rounded to the nearest integer. Finally, the number 3 is added to the integer to obtain the
grade level of the document. Table 4 shows the how the scores convert to grade levels.
Text that has 30 sentences or less are converted using the conversion rate listed below
(McGraw, n.d.).

Best Practice Guide for Development and Modification of Communications Materials
33
Table 4: SMOG Conversion Tables (Kemp & Eagle, 2008; McGraw, n.d.)
30 or more sentences Conversion for less than 30 Sentences
Word Count
Approximate Grade Level +/- 1.5 grades
Number of Sentences
Conversion # multiplier
Number of Sentences
Conversion # multiplier
0-2 4
Nursery, Junior/ Primary School
29 1.03 14 2.14
3-6 5 28 1.07 13 2.3
7-12 6 27 1.1 12 2.5
13-20 7 26 1.15 11 2.7
21-30 8 25 1.2 10 30
31-42 9 24 1.25
43-56 10 23 1.3
57-72 11
Secondary School
22 1.36
73-90 12 21 1.43
91-110 13 20 1.5
111-132 14 19 1.58
133-156 15 18 1.67
157-182 16 Further Education
17 1.76
183-210 17 16 1.87
211-240 18+ Higher Education College/University
15 2.0
7.2 Norms and Message Framing
Table 5 below contains the key used in the analysis of the message framing, norms, tone
and format of supplied documents. The supplied material was read and assessed separately
by two different coders. The results were checked for inter-coder reliability (Lombard,
Snyder-Duch, & Bracken, 2002), where the independent coders swapped materials and re-
evaluated the characteristics to ensure they reached the same conclusion.
Table 5: The key used in the analysis of message framing (including appeals), norms, tone and message
format
Key: Framing: Po Positive, N Negative / R Rational E Emotional G Guilt F fear Norms: D Descriptive: perceptions of how other people are actually behaving, whether or not these are approved of; I Injunctive: behaviors perceived as being approved of by others Tone: DT Dictatorial, C Collaborative, Pa Patronising, A Adversarial Format: S Scientific / technical evidence T Testimonial / endorsement from landholders
Name of Stakeholder Framing Norms Tone format
Name and date of document, web link P D/I C T
Name and date of document, web link

Hay, et al
34
8.0 RECOMMENDATIONS AND CONCLUSION
The readability analyses of material supplied to Project 3.1.3 confirmed findings from Project
2.1.3 (Hay & Eagle, 2016). The documentary analysis confirmed that material supplied was
written in too complex language, the message tone may be a barrier to communication and
visual imagery may have unintended effects on communication.
As stated earlier, good communication takes leadership and involves two-way (at least)
communication. Two-way communication allows for a message to be sent from a sender to
a receiver and is complete when the receiver acknowledges that they have understood the
message correctly. Therefore at least a two-way communication strategy is recommended to
convey best practice land management messages.
It is recommended that senders of communication materials use these guidelines to assist in
the development and modification of communication material. The best practice guide calls
on communication design processes to set objectives, to set social marketing benchmarks,
and to write for and to measure readability and it provides a set of design principles to guide
written communications.
Social Marketing is a systematic and planned process that is used to influence behaviour in a
sustainable and cost effective way. It assists with decision about who to work with, what
behaviour to influence and how to go about it. Taking a social marketing approach to
influencing behaviour change will assist in communicating within the complexity of factors
that affect land management practices. It is recommended that a social marketing approach
be taken to produce communication materials that focus on specific factors that influence
land management practices.
It is recommended that material be written at no more than grade / year 9 school level to
enable the majority of the general population to understand it (Carbone & Zoellner, 2012).
This recommendation is based on the findings of multiple studies validating readability
analysis techniques and does not match the advice found in The Guide which states that
writers should “aim for grade 3 or 4 reading level (age 9)”
(https://guides.service.gov.au/content-guide/writing-style/#readability). It is further
recommended that “The Guide” be updated to reflect the appropriate reading level of year 9
to reduce confusion amongst government and other writers.
It is recommended to identify and work with and around prevailing social norms. If threats to
autonomy and identity are perceived, resistance and even defiant behaviour may occur
(Mols, Haslam, Jetten, & Steffens, 2015), particularly when there are some land manager
groups who are unwilling or unable to accept that they are contributing directly or indirectly to
water quality problems.
It is recommended that messages frame and tone should closely follow outcomes from
Section 3.1 and 3.2 to align with prevailing audience norms. Different communication
circumstances call for different message framing and tone, and a one size fits all approach
will not create successful communication with land holders. The effects of message framing
highlights the importance of ensuring that the most effective framing strategies are used,
acknowledging that different frames and messages may be warranted for different segments.

Best Practice Guide for Development and Modification of Communications Materials
35
It is recommended that the following principles of design be followed:
• Ensure that the content provided is the most up to date and necessary information
• The document is organised in a way that encourages all of the information be
consumed
• That the credibility of the spokesperson be closely aligned with the message that is
being distributed
• That text, layout and colour are used to meet the WCAG 2.0 level of contrast to a AA
or AAA standard
• Visual imagery used must usefully add to the content
• When including graphs and charts the Queensland Treasury guidelines will be used
http://www.qgso.qld.gov.au/about-statistics/presentation/presenting-stat-info-
graphs.pdf
To find necessary and appropriate behaviour change solutions to water quality challenges, it
is important to develop ways of communicating the need for effective ‘buy in’. Improving the
way projects communicate and get buy in from producers will ensure greater project uptake,
associated results and lasting behaviour change.

Hay, et al
36
REFERENCES
Adkins, A., Elkins, E., & Singh, N. (2001). Readability of NIHM East-to-read Patient
Education Materials. Journal of Child and Family Studies, 10(3), 279 - 285.
Aldridge, M. (2004). Writing and Designing Readable Patient Education Materials.
Nephrology Nursing Journal, 31(4), 373 - 377.
Altinay, Z. M. (2015). Communicating Sustainability with Visuals: Issue Perception and Issue
Engagement. (PhD), Louisiana State University.
Anil, B., Tonts, M., & Siddique, K. (2015). Grower Groups and the Transformation of
Agricultural Research and Extension in Australia. Agroecology and Sustainable
Food Systems, 39(10), 1104-1123.
Australian Government. (2018). Gov.AU Content Guide. Retrieved from
https://guides.service.gov.au/content-guide/writing-style/#readability
Biddinika, M. K., Lestari, R. P., Indrawan, B., Yoshikawa, K., Tokimatsu, K., & Takahashi, F.
(2016). Measuring the readability of Indonesian biomass websites: The ease of
understanding biomass energy information on websites in the Indonesian language.
Renewable and Sustainable Energy Reviews, 59, 1349-1357.
Blackstock, K. L., Ingram, J., Burton, R., Brown, K. M., & Slee, B. (2010). Understanding and
influencing behaviour change by farmers to improve water quality. Science of the
Total Environment, 408(23), 5631-5638. doi:10.1016/j.scitotenv.2009.04.029
Blanton, H., Köblitz, A., & McCaul, K. D. (2008). Misperceptions about norm misperceptions:
Descriptive, injunctive, and affective ‘social norming’efforts to change health
behaviors. Social and Personality Psychology Compass, 2(3), 1379-1399.
Block, L. G., & Keller, P. A. (1995). When to Accentuate the Negative: The Effects of
Perceived Efficacy and Message Framing on Intentions to Perform a Health-Related
Behavior. Journal of Marketing Research, 32(2), 192 - 203.Boag, P. (2011, 15
February 2011). Why White Space Matters.
Brennan, L., & Binney, W. (2010). Fear, guilt, and shame appeals in social marketing.
Journal of Business Research, 63(2), 140-146.
Buller, D. B., Borland, R., & Burgon, M. (1998). Impact of Behavioral Intention on
Effectiveness of Message Features: Evidence from the Family Sun Safety Project.
Human Communication Research, 24(3), 433 - 453.
Carbone, E. T., & Zoellner, J. M. (2012). Nutrition and health literacy: a systematic review to
inform nutrition research and practice. Journal of the Academy of Nutrition and
Dietetics, 112(2), 254-265.
Cesario, J., Corker, K. S., & Jelinek, S. (2013). A self-regulatory framework for message
framing. Journal of Experimental Social Psychology, 49(2), 238-249.
Chang, M.-C., & Wu, C.-C. (2015). The effect of message framing on pro-environmental
behavior intentions: An information processing view. British Food Journal, 117(1),
339-357.
Cialdini, R. (2007). Descriptive Social Norms as Underappreciated Sources of Social Control.
Psychometrika, 72(2), 263-268. doi:10.1007/s11336-006-1560-6
Cialdini, R. B., & Goldstein, N. J. (2004). Social Influence: Compliance and Conformity.
Annual Review of Psychology, 55(1), 591-621.
Colvin, R., Witt, G. B., & Lacey, J. (2015). The social identity approach to understanding
socio-political conflict in environmental and natural resources management. Global
Environmental Change, 34, 237-246.

Best Practice Guide for Development and Modification of Communications Materials
37
Compton, E., & Beeton, R. B. (2012). An accidental outcome: Social capital and its
implications for Landcare and the “status quo”. Journal of Rural Studies, 28(2), 149-
160.
Cox, D., & Cox, A. D. (2001). Communicating the Consequences of Early Detection: The
Role of Evidence and Framing. Journal of Marketing, 65(3), 91-103.
Crane, A., & Ruebottom, T. (2011). Stakeholder theory and social identity: Rethinking
stakeholder identification. Journal of Business Ethics, 102(1), 77-87.
Detweiler, J. B., Bedell, B. T., Salovey, P., Pronin, E., & Rothman, A. J. (1999). Message
framing and sunscreen use: gain-framed messages motivate beach-goers. Health
Psychology: Official Journal Of The Division Of Health Psychology, American
Psychological Association, 18(2), 189-196.
Doak, C., Doak, L., & Root, J. (1985). Teaching Patients with Low Literacy Skills.
Philadelphia, Pa.: Lippincott.
Donovan, R. J., & Jalleh, G. (1999). Positively versus Negatively Framed Product Attributes:
The Influence of Involvement. Psychology & Marketing, 16(7), 613-630.
Donovan, R. J., Jalleh, G., Fielder, L., & Ouschan, R. (2009). Ethical issues in pro-social
advertising: the Australian 2006 White Ribbon Day campaign. Journal of Public
Affairs, 9(1), 5-19.
Dowse, R. (2004). Using visuals to communicate medicine information to patients with low
literacy. Adult learning, 15(1-2), 22.
Eagle, L., & Dahl, S. (2016). Empowering or misleading? Online Health Information
Provision Challenges. Marketing Intelligence & Planning, forthocoming.
Eagle, L., Hay, R., & Farr, M. (2016). Harnessing the science of social marketing and
behaviour change for improved water quality in the GBR: Background review of
literature. Retrieved from http://www.nesptropical.edu.au:
Farr, M., Eagle, L., & Hay, R. (2016). Harnessing the science of social marketing and
behaviour change for improved water quality in the GBR: Interim Report. Preliminary
Findings - Comparison of the results of the 2016 data collection from the Burdekin
and the Wet Tropics Region. Retrieved from
Farr, M., Eagle, L., & Hay, R. (2017). Key Determinants of pro-environmental behaviour of
land managers in the agricultural sector: Literature Review. NESP Project 2.1.3
Supplementary review. Report to the National Environmental Science Programme.
Reef and Rainforest Research Centre Limited, Cairns (97 pp.).
Feola, G., & Binder, C. R. (2010). Towards in improved understanding of farmers' behaviur:
The integrative agent-centred (IAC) approach. Ecological Economics, 69(12), 2323 -
2333.
Fishbein, M., & Ajzen, I. (2011). Predicting and changing behavior: The reasoned action
approach. Unites States: Taylor & Francis.
Fishbein, M., Hall-Jamieson, D., Zimmer, E., Haeften, I. v., & Nabi, R. (2002). Avoiding the
Boomerang: Testing the Relative Effectiveness of Antidrug Public Service
Announcements Before a National Campaign. American Journal of Public Health,
92(2), 238-245.
Fishbein, M., von Haeften, I., & Appleyard, J. (2001). The Role of Theory in Developing
Effective Interventions: Implications from Project Safer. Psychology, Health &
Medicine, 6(2), 223 -238.
Fisher, R. (2013). ‘A gentleman's handshake’: the role of social capital and trust in
transforming information into usable knowledge. Journal of Rural Studies, 31, 13-22.

Hay, et al
38
Fitzsimmons, P., Michael, B., Hulley, J., & Scott, G. (2010). A readability assessment of
online Parkinson's disease information. The journal of the Royal College of
Physicians of Edinburgh, 40(4), 292.
Fowler, R., & Aaron, J. (2016). The Little Brown Handbook. Essex, England: Pearson
Education Limited.
Gerend, M. A., & Cullen, M. (2008). Effects of message framing and temporal context on
college student drinking behavior. Journal of Experimental Social Psychology, 44(4),
1167-1173.
Greiner, R. (2014). Environmental duty of care: from ethical principle towards a code of
practice for the grazing industry in Queensland (Australia). Journal of agricultural
and environmental ethics, 27(4), 527-547.
Greiner, R. (2016). Factors influencing farmers’ participation in contractual biodiversity
conservation: a choice experiment with northern Australian pastoralists. Australian
Journal of Agricultural and Resource Economics, 60(1), 1-21.
Ham, S. H. (2009). From interpretation to protection: Is there a theoretical basis? Journal of
Interpretation Research, 14(2), 49-57.
Hansen, A., & Machin, D. (2013). Researching visual environmental communication.
Environmental Communication, 7(2), 151 - 168.
Hay, R., & Eagle, L. (2016). Harnessing the science of social marketing and behaviour
change for improved water quality in the GBR: A documentary analysis of Reef
Trust Tender (Burdekin) and Reef Programme. Retrieved from
http://www.nesptropical.edu.au:
Hay, R., Eagle, L., & Chan, J. (2018). Harnessing the science of social marketing in
communication materials development and behaviour change for improved water
quality in the GBR: Final Report Best Practice GUIDE for Development and
Modification of Programme Communication Material. Retrieved from
http://www.nesptropical.edu.au
Hay, R., & Eagle, L. (2018). Harnessing the science of social marketing in communication
materials development and behaviour change for improved water quality in the
GBR: Readability Communication Planning Checklist. Retrieved from
http://www.nesptropical.edu.au:
Homer, P. M., & Yoon, S.-G. (1992). Message Framing and the Interrelationships Among Ad-
Based Feelings, Affect, and Cognition. Journal of Advertising, XXI(1), 19-31.
Hurlbert, M. (2014). Adaptive institutional design in agri-environmental programs.
International Journal of Climate Change Strategies and Management, 6(2), 145-165.
Hovland, C., Janis, I., & Kelley, H. (1953). Communication andpersuasion. New Haven, CT:
Yale University Press.
Hovland, C. I., & Weiss, W. (1951). The Influence of Source Credibility on Communication
Effectiveness. The Public Opinion Quarterly, 15(4), 635-650.
J6 Design. (2015). The principles of design. Retrieved from http://www.j6design.com.au/6-
principles-of-design/
Kemp, G., & Eagle, L. (2008). Shared meanings or missed opportunities? The implications of
functional health literacy for social marketing interventions. International Review on
Public and Nonprofit Marketing, 5(2), 117-128.
Jayanti, R. K., & Burns, A. C. (1998). The Antecedents of Preventive Health Care Behavior:
An Empirical Study. Journal of the Academy of Marketing Science, 26(1), 6-15.
Lazard, A., & Atkinson, L. (2014). Putting Environmental Infographics Center Stage The Role
of Visuals at the Elaboration Likelihood Model’s Critical Point of Persuasion. Science
Communication, 83, 726 - 735.Lombard, M., Snyder-Duch, J., & Bracken, C. C.

Best Practice Guide for Development and Modification of Communications Materials
39
(2002). Content Analysis in Mass Communication: Assessment and Reporting of
Intercoder Reliability. Human Communication Research, 28(4), 587-604.
Maio, G. R., Verplanken, B., Manstead, A. S., Stroebe, W., Abraham, C., Sheeran, P., &
Conner, M. (2007). Social psychological factors in lifestyle change and their
relevance to policy. Social Issues and Policy Review, 1(1), 99-137.
McGraw, H. C. (n.d.). The Smog Readability Formula. Patient Education Workshop.
Retrieved from
http://library.med.utah.edu/Patient_Ed/workshop/handouts/smog_formula.pdf
McKenzie-Mohr, D. (2000). Fostering Sustainable Behavior Through Community-Based
Social Marketing. American Psychologist, 55(5), 531-537.
McLaughlin, G. H. (1969). SMOG Grading: A new Readability Formula. Journal of Reading,
12(8), 639 - 646.
Miller, C. H., Lane, L. T., Deatrick, L. M., Young, A. M., & Potts, K. A. (2007). Psychological
Reactance and Promotional Health Messages: The Effecrs of Controlling
Language, Lexical Concretenes, and the Restoration of Freedom. Human
Communication Research, 33(2), 219 - 240.
Mols, F., Haslam, S. A., Jetten, J., & Steffens, N. K. (2015). Why a nudge is not enough: A
social identity critique of governance by stealth. European Journal of Political
Research, 54(1), 81-98.
Morton, T. A., Bretschneider, P., Coley, D., & Kershaw, T. (2011). Building a better future: An
exploration of beliefs about climate change and perceived need for adaptation within
the building industry. Building and Environment, 46(5), 1151-1158.
doi:10.1016/j.buildenv.2010.12.007
Mumford, M. E. (1997). A Descriptive Study of the Readability of Patient Information Leaflets
Designed By Nurses. Journal of advanced nursing, 26(5), 985-991.
National Eye Institute. (2015). Facts about color blindness. Eye Health Information.
National Social Marketing Centre. (2016). NSMC Planning Guide and Toolkit,. Retrieved
from http://www.thensmc.com/toolkit
Nutbeam, D. (2008). The evolving concept of health literacy. Social Science & Medicine,
67(12), 2072-2078. doi:10.1016/j.socscimed.2008.09.050
Office for National Statistics. (2000). International Adult Literacy Survey Retrieved from
http://www.statistics.gov.uk/ssd/surveys/european_adult_literacy_review_survey.asp
Oxford Dictionary. (2017). Definition. English Oxford Living Dictionary.
Orth, U. R., Koenig, H. F., & Firbasova, Z. (2007). Cross-national Differences in Consumer
Response to the Framing of Advertising Messages. European journal of marketing,
41(3/4), 327-348.
Owens, C., Warner, L., Rumble, J., Lamm, A., & Cantrell, R. (2015). Encouraging Landscape
Water-Conservation Behaviors# 3: Developing Extension and Outreach Messages
That Encourage Landscape Water Conservation Practice Adoption. Agricultural
Education and Communication Department
Penrose, J. M., Rasberry, R. W., & Myers, R. J. (1993). Advanced Business Communication.
California: Wadsworth.
Pernice, K. (2017). F-Shaped Pattern of Reading on the Web: Misunderstood, But Still
Relevant (Even on Mobile).
Pettersson, R. (2010). Information Design - Principles and Guidelines. Journal of Visual
Literacy, 29(2), 167-182.
Pornpitakpan, C. (2004). The Persuasiveness of Source Credibility: A Critical Review of Five
Decades' Evidence. Journal of Applied Social Psychology, 34(2), 243-281.
Hay, et al
40
Rolfe, J., & Gregg, D. (2015). Factors affecting adoption of improved management practices
in the pastoral industry in Great Barrier Reef catchments. Journal of Environmental
Management, 157, 182-193.
Rothman, A. J., & Salovey, P. (1997). Shaping Perceptions to Motivate Healthy Behavior:
The Role of Message Framing. Psychological Bulletin, 121(1), 3 - 19.
Rothschild, M. (1999). Carrots, Sticks, and Promises: A Conceptual Framework for the
Management of Public Health and Social Issue Behaviors. Journal of Marketing,
63(4), 24-37.
Roy, S., Phetxumphou, K., Dietrich, A. M., Estabrooks, P. A., You, W., & Davy, B. M. (2015).
An evaluation of the readability of drinking water quality reports: a national
assessment. Journal of water and health, 13(3), 645-653.
Scannell, L., & Gifford, R. (2013). Personally Relevant Climate Change The Role of Place
Attachment and Local Versus Global Message Framing in Engagement.
Environment and Behavior, 45(1), 60-85.
Schneider, T. R. (2006). Getting the Biggest Bang for Your Health Education Buck. Message
Framing and Reducing Health Disparities. American Behavioural Scientist, 49(6),
812 - 822.
Searles, K. (2010). Feeling good and doing good for the environment: The use of emotional
appeals in pro-environmental public service announcements. Applied environmental
education and communication, 9(3), 173-184.
Seo, K., Dillard, J. P., & Shen, F. (2013). The effects of message framing and visual image
on persuasion. Communication Quarterly, 61(5), 564-583.
Shea, J., Beers, B., McDonald, V., Quistberg, D. A., Ravenell, K., Asch, D., & al., e. (2004).
Assessing Health Literacy in African American and Caucasian Adults: Disparities in
Rapid Estimate of Adult Literacy in Medicine (REALM) Scores. Family Medicine,
36(8), 575 - 581.
Shannon, C., & Weaver, W. (1949). The Mathematical Theory of Communication. Urbanna:
University of Illinois Press.
Sigband, N. B., & Bell, A. H. (1994). Communication for Managers. Ohio: South Western
Publishing.
Snipes, R. L., LaTour, M. S., & Bliss, S. J. (1999). A Model of the Effects of Self-efficacy on
the Perceived Ethicality and Performance of Fear Appeals in Advertising. Journal of
Business Ethics, 19(3), 273-285.
Stuart, A. E., & Blanton, H. (2003). The Effects of Message Framing on Behavioral
Prevalence Assumptions. European Journal of Social Psychology, 33, 93 - 102.
Temnikova, I., Vieweg, S., & Castillo, C. (2015). The Case for Readability of Crisis
Communications in Social Media. Paper presented at the Proceedings of the 24th
International Conference on World Wide Web Companion.
Thomsen, D. C. (2015). Seeing is questioning: prompting sustainability discourses through
an evocative visual agenda. Ecology and Society, 20(4), 9.
Tymson, C., Lazar, P., & Lazar, R. (2006). The Australian and New Zealand Public Relations
Manual. Manly, Australia: Millenium Books.
van Assema, P., Martens, M., Ruiter, R. A. C., & Brug, J. (2001). Framing of Nutrition
Education Messages in Persuading Consumers of the Advantages of a Healthy Diet.
Journal of Human Nutrition and Dietetics, 14(6), 435 - 442.
Van de Velde, L., Verbeke, W., Popp, M., & Van Huylenbroeck, G. (2010). The importance of
message framing for providing information about sustainability and environmental
aspects of energy. Energy Policy, 38(10), 5541-5549.
doi:10.1016/j.enpol.2010.04.053

Best Practice Guide for Development and Modification of Communications Materials
41
Wallace, L., & Lemon, E. (2004). American Academy of Family Physicians Patient Education
Materials: Can Patients Read Them? Family Medicine Journal, 36(8), 571 -575.
WCAG. (2008). Web Content Accessibility Guidelines (WCAG) 2.0. Retrieved from
http://www.w3.org/TR/WCAG20/

Hay, et al
42
APPENDIX 1: READABILITY COMMUNICATION PLANNING
CHECKLIST

Communication Planning Checklist To be used in conjunction with Hay, R., & Eagle, L., (2018), Harnessing the science of social
marketing in communication materials development and behaviour change for improved water quality
in the GBR: Final Report Best Practice for Development and Modification of Programme
Communication Material
43
1. START BY SUMMARISING YOUR COMMUNICATION
Summarise your problem and intervention, give it some context using the following table (this
can be as formal or informal as you need, you can come back and fill in the gaps later):
2. OBJECTIVES
1.1. Set your objectives? (Hay, Eagle, & Chan, 2018, p. 4)
Who _________________________________________________________________ ☐
Audience 1 ________________________________________________________
Audience 2 ________________________________________________________
Audience 3 ________________________________________________________
What ________________________________________________________________ ☐
_____________________________________________________________________
When ________________________________________________________________ ☐
_____________________________________________________________________
Where ________________________________________________________________ ☐
_____________________________________________________________________
Why _________________________________________________________________ ☐
_____________________________________________________________________

44
3. SOCIAL MARKETING BENCHMARKS
3.1. Check your social marketing benchmarks (Hay et al., 2018, pp. 8-11)
Benchmark 1: identify the behaviour your intervention addresses
Both the Benchmarks and the CBSM Steps acknowledge the centrality of focussing on
specific behaviours. There is a need to identify the specific behaviours that should be
targeted for change. There is an implicit assumption that a general attitude about an issue
such as the need to improve water quality will lead to behaviour change among those who
may be able to take individual or collective action. This is incorrect (Ham, 2009; Ham &
Sandberg, 2012). Behaviour change will not occur “unless a specific behaviour is explicitly
targeted and communication is designed to address attitudes relevant to that
behaviour” (Stern & Powell, 2013, p. 35). A gap between reported attitudes towards
environmental issues and actual behaviours is well documented in the literature (Ockwell,
Whitmarsh, & O'Neill, 2009). See also Benchmark 3.
_____________________________________________________________________ ☐
_____________________________________________________________________
Problem Definition and Context
1. What is the specific problem or issue you are trying to address?
2. What resources (financial and personnel) are available for this programme?

Communication Planning Checklist To be used in conjunction with Hay, R., & Eagle, L., (2018), Harnessing the science of social
marketing in communication materials development and behaviour change for improved water quality
in the GBR: Final Report Best Practice for Development and Modification of Programme
Communication Material
45
3. How significant is the problem or issue? What sectors of the population does the
problem affect the most? What data is available? What are the trends? How does the
incidence of the problem vary on an international, national, regional or local basis?
4. What are the consequences / costs of not addressing the problem?
5. What initiatives and programmes have been used in the past? How successful were
they? What problems were encountered with them?
6. What ‘upstream’ factors (environmental, social, economic, political or policy factors)
might hinder your programme? What can be done to resolve them?
7. Which other sectors or agencies might be involved in implementing this programme?
Are they supportive? If any barriers exist, how might these be overcome?

46
8. How does this fit in with other programmes in this area (national, regional, local). Are
messages consistent; do the programmes complement or compete with each other? If the
latter, what can be done?
9. Will the managers of these other programmes support or oppose your intervention?
What can be done to gain their support or to at least minimise their opposition?
10. Are there any third-party organisations that might be able to assist with the delivery of
the programme? What are the advantages and disadvantages of their involvement?
11. How will you achieve effective coordination and control of the various sector and third
party organisations?

Communication Planning Checklist To be used in conjunction with Hay, R., & Eagle, L., (2018), Harnessing the science of social
marketing in communication materials development and behaviour change for improved water quality
in the GBR: Final Report Best Practice for Development and Modification of Programme
Communication Material
47
Benchmark 2: Focus on the audience to understand the drivers of current behaviour
and to identify barriers and benefits to behaviour change
Identify barriers and benefits? (pg.8) Also links to Benchmark 4 (pg. 10)
Barriers & Benefits
1. Are there case studies or examples of best practice that may give you ideas on how
similar problems have been addressed elsewhere? Caution: do not assume that
interventions that have been successful in one area can automatically be transferred to
another
2. What research exists regarding the target groups already? What research is needed to
guide the development of the programme?
3. Does your organisation have the skills and ability to conduct any necessary research?
If not, what action is required?
4. What types of research will be undertaken?
5. How will you identify and recruit participants for any research that is needed? What
ethical issues may arise in this work?

48
Barriers (p.8) __________________________________________________________ ☐
Benefits (p.8) __________________________________________________________ ☐
Factors to consider
1. What barriers do they perceive will prevent them from undertaking the behaviours
a. How might these barriers be overcome?
2. What benefits do they perceive will prevent them from undertaking the behaviours
a. How might these barriers be overcome?

Communication Planning Checklist To be used in conjunction with Hay, R., & Eagle, L., (2018), Harnessing the science of social
marketing in communication materials development and behaviour change for improved water quality
in the GBR: Final Report Best Practice for Development and Modification of Programme
Communication Material
49
Benchmark 3: Use theory to understand your target audience
We now use the Theory of Planned Behaviour to illustrate how theory can be applied
Identify factors from the Theory of Planned Behaviour
1. If theories have been used in past interventions:
a. What theories have been used in the past, and with what success?
b. What can be learned from other interventions targeting similar population segments?
2. If theories have not been used in the past to help design interventions
a. How strongly do members of each segment believe that they are susceptible to the
problem, or engaging in behaviour that may lead to future problems?
b. How severe do members of each segment believe the consequences of the problem
are?
c. How strongly do members of each segment believe that adopting your recommended
behaviour will lower the risk of the problem?

50
Background Factors ☐
Individual (pg. 9) ________________________________________________________
Social (pg. 9) __________________________________________________________
Informational (pg. 9) _____________________________________________________
Beliefs ☐
Behavioural (pg. 9) ______________________________________________________
Normative (pg. 9) _______________________________________________________
Control (pg. 9) _________________________________________________________
Current attitude toward behaviour (pg. 9) _____________________________________ ☐
_____________________________________________________________________
Perceived subjective norms (pg. 9) _________________________________________ ☐
_____________________________________________________________________
Perceived behavioural control (pg. 9) ________________________________________ ☐
_____________________________________________________________________
Behaviour intention (pg. 9) _______________________________________________ ☐
_____________________________________________________________________
Actual control (pg. 9) ____________________________________________________ ☐
1. How strongly do members of each segment believe they can perform the desired
behaviour and continue to perform it over time (i.e. self-efficacy)? See also Benchmark 7
2. What normative beliefs exist in each segment regarding performing the desired
behaviour? How strong are these beliefs? How compatible is the intended behaviour with
each segment’s self-image?

Communication Planning Checklist To be used in conjunction with Hay, R., & Eagle, L., (2018), Harnessing the science of social
marketing in communication materials development and behaviour change for improved water quality
in the GBR: Final Report Best Practice for Development and Modification of Programme
Communication Material
51
Benchmark 4: Identify actionable insights
Willingness to change (pg. 10) _____________________________________________ ☐
_____________________________________________________________________
What will be exchanged (pg. 10) ___________________________________________ ☐
_____________________________________________________________________
What is the strategy? (pg. 10) _____________________________________________ ☐
_____________________________________________________________________
Benchmark 5: Exchange
Perceived/actual cost (cost may not be just financial) (pg. 8) _____________________ ☐
Target Audience Values (pg. 10) ___________________________________________ ☐
_____________________________________________________________________
Incentives/rewards (pg. 10) _______________________________________________ ☐
_____________________________________________________________________
Does the exchange replace the benefits the target market derives Yes ☐ No ☐
from the problem behaviour
If not, what is the exchange strategy? (pg. 10) ________________________________
_____________________________________________________________________
1. What level of risk (financial, social, and emotional) does each segment believe
exists in adopting the desired behaviour? What can be done to reduce their
perceived risk levels?
2. Clarify the exchange process: What do you want each segment to believe they
will need to give / invest / give up in return for what specific benefits?

52
Benchmark 6: Identify any competition to the behaviour
Ways to overcome apathy/disinclination (pg. 10) _______________________________ ☐
_____________________________________________________________________
Identify competition for audience’s attention (pg. 10) ____________________________ ☐
_____________________________________________________________________
1. What does each segment see as competition to your programme?
2. What can you offer to persuade them to accept your programme over competing options?
3. What advantages does each segment see in adopting the desired behaviour vs competing behaviour?
4. What disadvantages does each segment see in adopting the desired behaviour vs competing behaviour?

Communication Planning Checklist To be used in conjunction with Hay, R., & Eagle, L., (2018), Harnessing the science of social
marketing in communication materials development and behaviour change for improved water quality
in the GBR: Final Report Best Practice for Development and Modification of Programme
Communication Material
53
Benchmark 7: Segmentation
Identify segments (pg. 10) ________________________________________________
Who are the decision makers/influencers? (pg. 10) _____________________________
Key Characteristics _____________________________________________________
Initial Scoping Re Target Insights
1. Who are the intended primary target segments for this programme (these may not be
the same as those most affected)? Who are secondary target segments?
Refining Target Insights and Developing Segmentation
1. Can the target group be segmented on the basis of demographics (geographic,
education, income, age, gender, social class etc.?) Describe each segment according to
the factors that make them different from each other.
2. Can the target group be segmented on the basis of psychographics (different
knowledge, attitudes, beliefs etc) or behaviours? Describe each segment according to the
factors that make them different from each other.

54
3. How does the problem prevalence or vulnerability to the problem (highest incidence,
potential severity of the problem) vary across segments?
4. Have the segments had past experience with attempting this type of behaviour? What
can be learned regarding success / failure?
5. Where do you plan the target groups will gain information, support etc? Note: this may
be different to where they may perform the desired behaviours. What external factors
might make it easier to adopt / maintain behaviours (skills, demonstrations, endorsement,
support etc)?
6. How might resources be spread across the different segments? Are there any ethical
implications (for example, not targeting hard to reach groups)?

Communication Planning Checklist To be used in conjunction with Hay, R., & Eagle, L., (2018), Harnessing the science of social
marketing in communication materials development and behaviour change for improved water quality
in the GBR: Final Report Best Practice for Development and Modification of Programme
Communication Material
55
7. For each segment, what are their preferred information sources? What level of trust do
they have in information from these sources?
8. Are some segments more difficult to reach / communicate with than others? What are
the implications of this?
9. What role models, credible spokespeople or opinion leaders might be available? How
could they be involved?
10. What external organisations need to be made aware of this programme? What do you
want / need from them? If you cannot gain their support, what impact will this have on
your programme?

56
11. What people within your own organisation need to be involved in this programme?
What do you want / need from them? How will you communicate with them? If you cannot
gain their support, what impact will this have on the programme?
12. Can you plan (using Gantt charts or similar) what involvement and inputs are needed,
by when and who will have the responsibility of organising, coordinating, checking etc?
Notes: ___________________________________________________________________
________________________________________________________________________
________________________________________________________________________
________________________________________________________________________
________________________________________________________________________
________________________________________________________________________
________________________________________________________________________
________________________________________________________________________
________________________________________________________________________
________________________________________________________________________

Communication Planning Checklist To be used in conjunction with Hay, R., & Eagle, L., (2018), Harnessing the science of social
marketing in communication materials development and behaviour change for improved water quality
in the GBR: Final Report Best Practice for Development and Modification of Programme
Communication Material
57
Benchmark 8: Methods mix
Co-creation stakeholders (pg. 8) ___________________________________________
How will you distribute your behaviour change strategy? (pg. 8) ___________________
_____________________________________________________________________
Reaching and Communicating With Segments
1. What exactly do you want to communicate? How will the message differ across the
various segments?
2. What channels are available by which you can communicate to the various segments
and other stakeholders? Which should be selected and why?
3. How will you schedule activity across the various channels (amount of exposure /
timing)? Can you convert this into a Gantt chart? Who will have responsibility for ensuring
material is produced? What are the consequences of delays to any part of the schedule?

58
4. What is the image you want to project? What tone should be used (serious, dramatic,
humorous etc)? Should positive or negative message framing be used? Should the
message be presented in rational or emotional terms? Note: use fear appeals with
caution
5. How can you make the message credible for each of the segments?
6. How will you pre-test the material you intend to use? Who will you pre-test with
(experts / gatekeepers/ other stakeholders / target groups)
7. Have you checked for readability of printed material? Have you checked for any
relevant media regulations regarding the acceptability of any advertising material? (see
Section 4)

Communication Planning Checklist To be used in conjunction with Hay, R., & Eagle, L., (2018), Harnessing the science of social
marketing in communication materials development and behaviour change for improved water quality
in the GBR: Final Report Best Practice for Development and Modification of Programme
Communication Material
59
4. READABILITY TOOLS
4.1. Readability (Hay et al., 2018, p. 11 & 31)
Copy and paste text (10 consecutive sentences from beginning middle and end of the text to
the SMOG calculator at http://wordscount.info/index.html
Is the grade/year at level 7-9? ______________________________________ Yes ☐ No ☐
If no, use the guide in Hay & Eagle (2018) to rework the text to reduce the complexity of the
writing.
4.2. Norms (Hay et al., 2018, pp. 13-15)
Which perceived norm will you use?
Injunctive Norm (behaviours perceived to be approved by others) (pg. 9) ______ Yes ☐ No ☐
Descriptive Norm (perception of how others are actually behaving) (pg. 10) ____ Yes ☐ No ☐
Describe the context of the norm you are using: __________________________________
________________________________________________________________________
________________________________________________________________________
Can it be perceived as the opposite of your intention? (pg. 10) ______________ Yes ☐ No ☐
If yes, re-write the context here _______________________________________________
________________________________________________________________________
Do you have appropriate imagery to support your objective (see Section 5.4.6 in Hay & Eagle
(2018)) _________________________________________________________ Yes ☐ No ☐
4.3. Message Framing (Hay et al., 2018, pp. 15-18 & 32)
Does your target audience believe they can undertake the behaviour? ________________
________________________________________________________________________
Positive framing? (pg. 12) __________________________________________ Yes ☐ No ☐
Negative framing? (pg. 13) __________________________________________ Yes ☐ No ☐

60
4.4. Message Appeal (Hay et al., 2018, pp. 19-21)
Emotional appeal? (pg. 14) _________________________________________ Yes ☐ No ☐
Fear appeal? (pg. 14-16) ___________________________________________ Yes ☐ No ☐
Justify your use of fear appeal, is it necessary? ___________________________________
________________________________________________________________________
________________________________________________________________________
Does your message frame include many target groups or just one? _______ Many ☐ One ☐
If only one target group, what is your justification? (pg.16) __________________________
________________________________________________________________________
4.5. Message Tone and Language (Hay et al., 2018, pp. 21-23)
Is your message?
Dictatorial (controlling or overbearing)? _______________________________ Yes ☐ No ☐
If yes, re-write it here _______________________________________________________
________________________________________________________________________
Collaborative (to co-operate, work together willingly)? ____________________ Yes ☐ No ☐
If yes, great, don’t change anything! ___________________________________________
If no, re-write it here ________________________________________________________
________________________________________________________________________
Patronising (superior attitude towards others)? _________________________ Yes ☐ No ☐
If yes, re-write it here _______________________________________________________
________________________________________________________________________
Adversarial (opposing sides)? ______________________________________ Yes ☐ No ☐
If yes, is it written with a positive message frame? ________________________________
4.6. Message Format (Hay et al., 2018, p. 23)
Does your message use testimonials? ________________________________ Yes ☐ No ☐
Does your message use scientific/technical evidence? ___________________ Yes ☐ No ☐
If yes, is it supported by appropriate explanatory information? _____________ Yes ☐ No ☐

Communication Planning Checklist To be used in conjunction with Hay, R., & Eagle, L., (2018), Harnessing the science of social
marketing in communication materials development and behaviour change for improved water quality
in the GBR: Final Report Best Practice for Development and Modification of Programme
Communication Material
61
5. DESIGN PRINCIPLES
5.1. Target Audience (Hay et al., 2018, p. 24)
Is the appropriate language used? __________________________________ Yes ☐ No ☐
Is the language appropriate for the audience (year 7-9 level?) _____________ Yes ☐ No ☐
Have you met the requirements for Benchmark 2? ______________________ Yes ☐ No ☐
5.2 Content (Hay et al., 2018, p. 24)
Is the information accurate and up-to-date? ___________________________ Yes ☐ No ☐
Does it focus on the key, most necessary information? (And avoid extraneous information?)
________________________________________________________________________
______________________________________________________________ Yes ☐ No ☐
Have any important points been left out? _____________________________ Yes ☐ No ☐
If yes, what are they? _______________________________________________________
Where possible, are concrete examples given to illustrate general ideas? ____ Yes ☐ No ☐
Does the content take the audience's culture and circumstances into account? Yes ☐ No ☐
Does the material call on the reader to take some specific, appropriate action? Yes ☐ No ☐
5.3 Organisation (Hay et al., 2018, p. 25)
Is there a clear core message, supported by a few (3-4) main points? _______ Yes ☐ No ☐
Is the information presented in easy-to-understand "chunks" or sections? ____ Yes ☐ No ☐
Are the main points presented in a logical order that will make sense to the audience? Yes ☐
No ☐
Are headers used to direct the reader to the main points? ________________ Yes ☐ No ☐
Is there a summary of key points? ___________________________________ Yes ☐ No ☐

62
5.4 Credibility (Hay et al., 2018, p. 25)
Does the material's author/producer have credibility with the target audience? Yes ☐ No ☐
Does the spokesperson or other source shown in the material have credibility with the target
audience? _____________________________________________________ Yes ☐ No ☐
5.5 Design (Hay et al., 2018, p. 26)
Do design elements (like headers, bullets, and boxes) help draw attention to the main
points? Does the material have an accessible, open look with plenty of white space? Yes ☐
No ☐
Is the font (typeface) clear and clean, and large enough (10 points or larger)? Yes ☐ No ☐
Are confusing graphs, charts, and statistics avoided? ___________________ Yes ☐ No ☐
Is there good contrast between background and foreground? _____________ Yes ☐ No ☐
Is the material visually attractive? __________________________________________ Yes ☐ No ☐
5.6 Visual Imagery (Hay et al., 2018, pp. 29-30)
Do visuals support the text and are they placed close to the text they relate to? Yes ☐ No ☐
Do visuals show the correct way to do something? _____________________ Yes ☐ No ☐
Do the visuals add usefully to the text? _______________________________ Yes ☐ No ☐

Communication Planning Checklist To be used in conjunction with Hay, R., & Eagle, L., (2018), Harnessing the science of social
marketing in communication materials development and behaviour change for improved water quality
in the GBR: Final Report Best Practice for Development and Modification of Programme
Communication Material
63
6. OTHER CONSIDERATIONS
6.1 Public relations and publicity
1. Do you intend briefing the media? If so, what is their likely attitude towards the issue?
Is your story really newsworthy?
2. Who will deal with media contacts? How will you try to ensure that editorial is
consistent with the message you are trying to coordinate?
3. How will you monitor media coverage?
6.2 Contingency Planning and Crisis Management
1. What contingency and crisis management plans need to be considered for dealing with
adverse publicity via the media? Who will have direct contact with the media?
2. What contingency and crisis management plans need to be considered for the
programme in its entirety? How will you handle cost overruns, delays to the production of
material or failure to deliver any part of your programme?

64
6.3 Evaluation and Control
1. If parts of, or the entire programme do not appear to be working as intended, what can
you do to rectify things?
2. How will you evaluate the programme as it is implemented (when, how often)?
3. What measures will be used to assess effectiveness and efficiency of individual parts of
the programme and of the programme as a whole?
4. How will this information be used to aid future planning?
6.4 Ethical Issues Review (if you answer yes to any of these points, consider
the implications for your intervention)
Is it legal?
Is it contrary to society’s generally accepted moral obligations?
Is it contrary to moral obligations or codes of ethics that are specific to your particular
organisation?
Will it infringe on the rights of the organisation’s stakeholder?
Does the intervention give assistance where it is needed?
Is the autonomy of the target audience recognised?
Does the intervention allow those who need help the freedom to exercise their
entitlements?
Are all parties treated equally and fairly?
Will the choices made produce the greatest good for the greatest number of people?
Can you ensure that the intervention will not cause physical or psychological harm to
the target group (s) or to groups that are not part of the target?
Will it leave any person or group poorer?
Will it especially reduce the wellbeing of an already underprivileged group?

Communication Planning Checklist To be used in conjunction with Hay, R., & Eagle, L., (2018), Harnessing the science of social
marketing in communication materials development and behaviour change for improved water quality
in the GBR: Final Report Best Practice for Development and Modification of Programme
Communication Material
65
Is there an alternative action that produces equal or better benefits, and by
implications, will cause fewer negative consequences?
7. USEFUL RESOURCES
https://www.w3.org/TR/WCAG20/ https://guides.service.gov.au/content-guide/ https://www.johnlovett.com/elements-and-principles-of-design
8. REFERENCE
Hay, R., Eagle, L., & Chan, J. (2018). Harnessing the science of social marketing in communication materials development and behaviour change for improved water quality in the GBR: Final Report Best Practice GUIDE for Development and Modification of Programme Communication Material. Retrieved from http://www.nesptropical.edu.au:
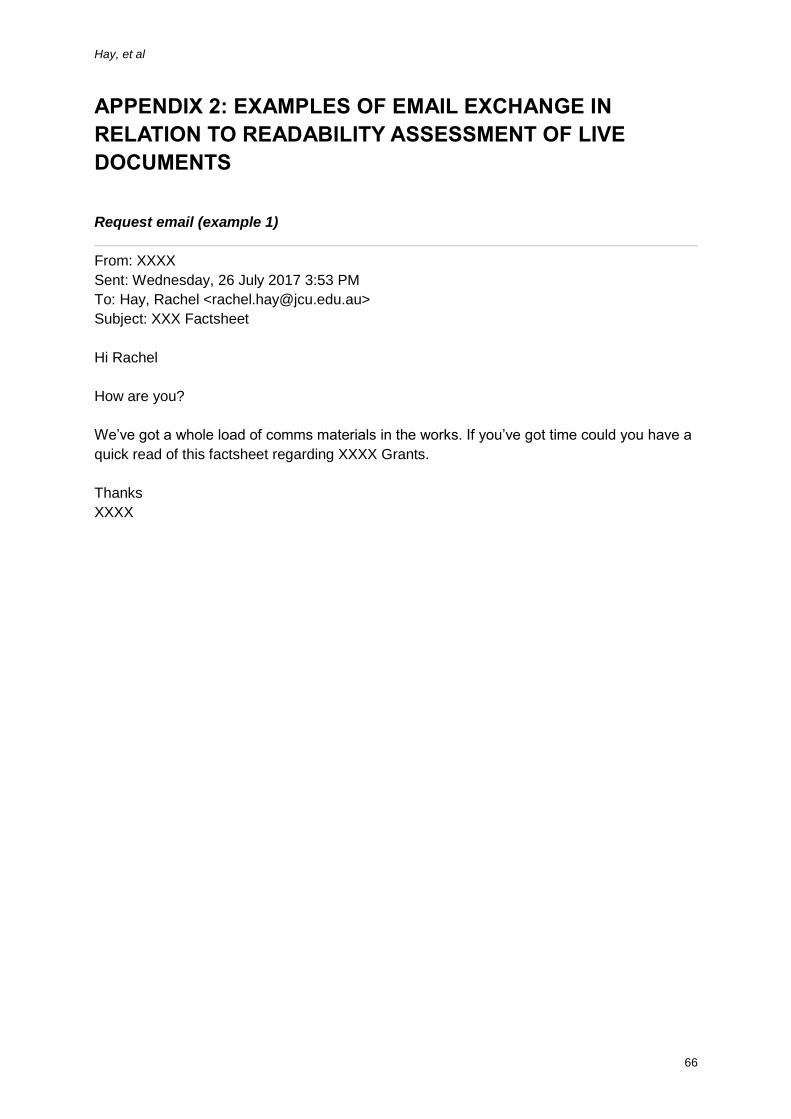
Hay, et al
66
APPENDIX 2: EXAMPLES OF EMAIL EXCHANGE IN
RELATION TO READABILITY ASSESSMENT OF LIVE
DOCUMENTS
Request email (example 1)
From: XXXX
Sent: Wednesday, 26 July 2017 3:53 PM
To: Hay, Rachel <[email protected]>
Subject: XXX Factsheet
Hi Rachel
How are you?
We’ve got a whole load of comms materials in the works. If you’ve got time could you have a
quick read of this factsheet regarding XXXX Grants.
Thanks
XXXX
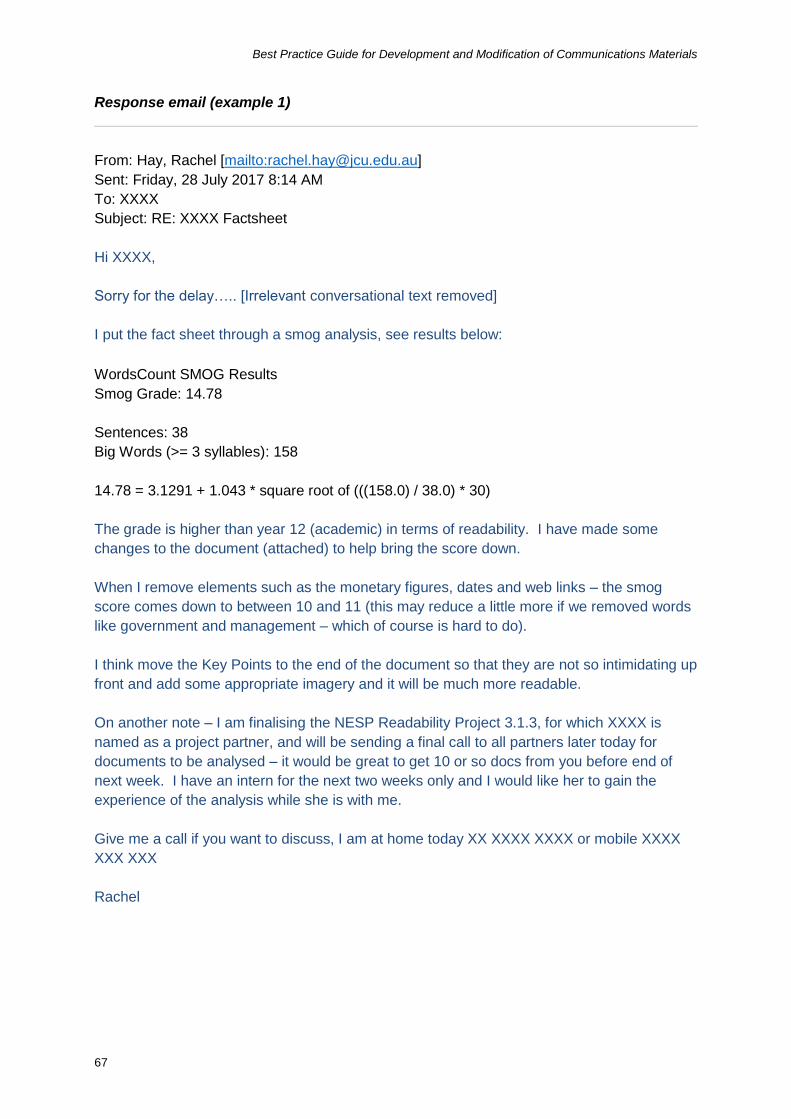
Best Practice Guide for Development and Modification of Communications Materials
67
Response email (example 1)
From: Hay, Rachel [mailto:[email protected]]
Sent: Friday, 28 July 2017 8:14 AM
To: XXXX
Subject: RE: XXXX Factsheet
Hi XXXX,
Sorry for the delay….. [Irrelevant conversational text removed]
I put the fact sheet through a smog analysis, see results below:
WordsCount SMOG Results
Smog Grade: 14.78
Sentences: 38
Big Words (>= 3 syllables): 158
14.78 = 3.1291 + 1.043 * square root of (((158.0) / 38.0) * 30)
The grade is higher than year 12 (academic) in terms of readability. I have made some
changes to the document (attached) to help bring the score down.
When I remove elements such as the monetary figures, dates and web links – the smog
score comes down to between 10 and 11 (this may reduce a little more if we removed words
like government and management – which of course is hard to do).
I think move the Key Points to the end of the document so that they are not so intimidating up
front and add some appropriate imagery and it will be much more readable.
On another note – I am finalising the NESP Readability Project 3.1.3, for which XXXX is
named as a project partner, and will be sending a final call to all partners later today for
documents to be analysed – it would be great to get 10 or so docs from you before end of
next week. I have an intern for the next two weeks only and I would like her to gain the
experience of the analysis while she is with me.
Give me a call if you want to discuss, I am at home today XX XXXX XXXX or mobile XXXX
XXX XXX
Rachel

Hay, et al
68
Request email (example 2)
From: XXXX
Sent: Friday, 27 October 2017 11:31 AM
To: CONTACTS REMOVED FOR PRIVACY (18 Recipients)
Subject: XXXX - draft communication tools for input
Hi everyone,
I hope you have been well.
XXXX and XXXX have been implementing the project's engagement strategy including
extension and communication activities over the past few months with our 14 participants at
XXXX.
As part of the strategy, two communication tools have been drafted and are attached for your
review. These have also been sent to a cane farmer and his wife (participants in other XXXX
projects), to provide their thoughts and opinions.
These tools were developed from the results of the social study of barriers and benefits of
practice change. The first is addressing the question from cane farmers 'whats happening in
the urban areas about water quality?' The second is a collection of good news stories from all
over the Great Barrier Reef to show participants that they are part of the 'bigger picture' and
part of a large community working together to improve the quality of water flowing from the
land to the sea.
As always, your input, comments and questions are greatly appreciated. Please provide
them by Friday next week 3 November if possible.
Thank you.

Best Practice Guide for Development and Modification of Communications Materials
69
Response email (example 2)
From: Hay, Rachel
Sent: Sunday, 29 October 2017 9:19 PM
To: CONTACTS REMOVED FOR PRIVACY (18 Recipients)
Subject: RE: XXXX - draft communication tools for input
Hi XXXX,
Well done! The information contained on both is clear.
The readability of the XXXX is at an acceptable level of 10.5. While year 7-9 is preferable,
this target is hard to reach using three syllable words like partnership, environments,
improvement and management, which are hard to avoid. One area that seems to get stuck
when I read it is in the sugarcane runoff paragraph “About 80 per cent of the total regional
load, sugarcane is the highest contributor of DIN” it just doesn’t run off the tongue for some
reason. The other is the image with the litter – can the river be named??
The second factsheet, XXXX, has scored slightly lower at 9.8 (so still around grade 10
reading level). It suffers the same effects from the three syllable words that are unavoidable,
but it is quite readable. On page 2nd paragraph, you could use the word ‘changed’ rather
than ‘tightened’. The figures under positive results – are they how much the loads have
reduced or how much is still flowing, if they represent the reduction, this needs to be made
clearer for example pesticides – 28% less… in the 2nd para in ‘XXXX’ maybe try ‘The’ Lower
Burdekin Landcare ‘group’ (LBLCA) is in the Lower Burdekin area, undertaking on ground
projects including water and soil testing, weed control and native tree propagation and
planting (Lower Burdekin Landcare 2017). It operates a local nursery, and hold’s’ regular
workshops and education sessions.
In both documents the language is mostly positive and rational using descriptive norms
(examples of what people have done). There is a mix of dictatorial, collaborative and
patronising language used appropriately. The imagery used are appropriate and enhance
the message.
Overall both are informative and interesting…
I hope that this is the type of feedback that you were requesting – again well done!
Rachel
The recommendations were adopted and the updated version is available on the stakeholder
website.

www.nesptropical.edu.au
Copyright © 2022 FDOKUMEN