Analysis of Business Intelligence on Strategic Decision Making

by Swain Scheps
BusinessIntelligence
FOR
DUMmIES‰
01_127230 ffirs.qxp 12/4/07 12:25 AM Page iii

01_127230 ffirs.qxp 12/4/07 12:25 AM Page ii

BusinessIntelligence
FOR
DUMmIES‰
01_127230 ffirs.qxp 12/4/07 12:25 AM Page i

01_127230 ffirs.qxp 12/4/07 12:25 AM Page ii

by Swain Scheps
BusinessIntelligence
FOR
DUMmIES‰
01_127230 ffirs.qxp 12/4/07 12:25 AM Page iii

Business Intelligence For Dummies®
Published byWiley Publishing, Inc.111 River StreetHoboken, NJ 07030-5774www.wiley.com
Copyright © 2008 by Wiley Publishing, Inc., Indianapolis, Indiana
Published by Wiley Publishing, Inc., Indianapolis, Indiana
Published simultaneously in Canada
No part of this publication may be reproduced, stored in a retrieval system or transmitted in any form orby any means, electronic, mechanical, photocopying, recording, scanning or otherwise, except as permit-ted under Sections 107 or 108 of the 1976 United States Copyright Act, without either the prior writtenpermission of the Publisher, or authorization through payment of the appropriate per-copy fee to theCopyright Clearance Center, 222 Rosewood Drive, Danvers, MA 01923, (978) 750-8400, fax (978) 646-8600.Requests to the Publisher for permission should be addressed to the Legal Department, Wiley Publishing,Inc., 10475 Crosspoint Blvd., Indianapolis, IN 46256, (317) 572-3447, fax (317) 572-4355, or online athttp://www.wiley.com/go/permissions.
Trademarks: Wiley, the Wiley Publishing logo, For Dummies, the Dummies Man logo, A Reference for theRest of Us!, The Dummies Way, Dummies Daily, The Fun and Easy Way, Dummies.com, and related tradedress are trademarks or registered trademarks of John Wiley & Sons, Inc. and/or its affiliates in the UnitedStates and other countries, and may not be used without written permission. All other trademarks are theproperty of their respective owners. Wiley Publishing, Inc., is not associated with any product or vendormentioned in this book.
LIMIT OF LIABILITY/DISCLAIMER OF WARRANTY: THE PUBLISHER AND THE AUTHOR MAKE NO REP-RESENTATIONS OR WARRANTIES WITH RESPECT TO THE ACCURACY OR COMPLETENESS OF THECONTENTS OF THIS WORK AND SPECIFICALLY DISCLAIM ALL WARRANTIES, INCLUDING WITHOUTLIMITATION WARRANTIES OF FITNESS FOR A PARTICULAR PURPOSE. NO WARRANTY MAY BE CRE-ATED OR EXTENDED BY SALES OR PROMOTIONAL MATERIALS. THE ADVICE AND STRATEGIES CON-TAINED HEREIN MAY NOT BE SUITABLE FOR EVERY SITUATION. THIS WORK IS SOLD WITH THEUNDERSTANDING THAT THE PUBLISHER IS NOT ENGAGED IN RENDERING LEGAL, ACCOUNTING, OROTHER PROFESSIONAL SERVICES. IF PROFESSIONAL ASSISTANCE IS REQUIRED, THE SERVICES OF ACOMPETENT PROFESSIONAL PERSON SHOULD BE SOUGHT. NEITHER THE PUBLISHER NOR THEAUTHOR SHALL BE LIABLE FOR DAMAGES ARISING HEREFROM. THE FACT THAT AN ORGANIZATIONOR WEBSITE IS REFERRED TO IN THIS WORK AS A CITATION AND/OR A POTENTIAL SOURCE OF FUR-THER INFORMATION DOES NOT MEAN THAT THE AUTHOR OR THE PUBLISHER ENDORSES THEINFORMATION THE ORGANIZATION OR WEBSITE MAY PROVIDE OR RECOMMENDATIONS IT MAYMAKE. FURTHER, READERS SHOULD BE AWARE THAT INTERNET WEBSITES LISTED IN THIS WORKMAY HAVE CHANGED OR DISAPPEARED BETWEEN WHEN THIS WORK WAS WRITTEN AND WHEN ITIS READ.
For general information on our other products and services, please contact our Customer CareDepartment within the U.S. at 800-762-2974, outside the U.S. at 317-572-3993, or fax 317-572-4002.
For technical support, please visit www.wiley.com/techsupport.
Wiley also publishes its books in a variety of electronic formats. Some content that appears in print maynot be available in electronic books.
Library of Congress Control Number: 2007938873
ISBN: 978-0-470-12723-0
Manufactured in the United States of America
10 9 8 7 6 5 4 3 2 1
01_127230 ffirs.qxp 12/4/07 12:25 AM Page iv

About the AuthorSwain Scheps is Manager of Business Analysis at Brierley + Partners, Inc. anda technology veteran making his first foray into the world of book authoring.He wrote the masterpiece resting in your hands with a great deal of input andinspiration from BI guru and fellow For Dummies author Alan R. Simon.
In the late 1990’s Swain, along with most people reading this book, had his dot-com boom-to-bust experience with a company called. . .well, that’s notreally important now is it. (Anyone interested in buying some slightly under-water stock options should contact the publisher immediately.) After thatthere were consulting stints at Compaq, Hewlett-Packard, and Best Crossmarkdeveloping sales support applications and reporting tools. As of this writing,Swain basks under the fluorescent lights of Brierley, a technology companywhose specialty is building customer relationship and loyalty managementsystems for retailers. The author has had the opportunity to learn from thevery best as Brierley also provides unparalleled business intelligence and analytics services for its clients.
Swain lives in Dallas, Texas with wife Nancy and a mere four dogs. He writes about more than just technology; his work has appeared in Fodor’stravel guide books, military history magazines, and even another ForDummies book.
01_127230 ffirs.qxp 12/4/07 12:25 AM Page v

01_127230 ffirs.qxp 12/4/07 12:25 AM Page vi

DedicationsFor Nancy and Marion M. “Turk” Turner and the rest of the crew of the sub-marine USS Perch (SS-176)
01_127230 ffirs.qxp 12/4/07 12:25 AM Page vii

01_127230 ffirs.qxp 12/4/07 12:25 AM Page viii

Author’s AcknowledgmentsBI belongs to the world, but this book, its concepts and arrangement, belongin spirit to technology author and BI guru Alan R. Simon. His ideas formBusiness Intelligence For Dummies’ foundation, and his initiative led ultimatelyto its creation and publication. I was fortunate enough to have Mr. Simon’sinput and guidance throughout the writing process.
As is the case with any book, the creation of this one was an extended collab-orative effort. It’s a collection of ideas, definitions, anecdotes, examples, andpractices from various points in the technology field. To write a book on BIrequires putting a lot of thumbtacks into the virtual map; I cover a lot ofground in a number of subjects. Aiding that journey were Meg Dussault atCognos and Steve Robinson at Autotrader.com.
I also owe a debt of gratitude for the BI team at Brierley + Partners, Inc thatcontributed advice and material for this book: Dominick Burley, Craig Nelson,Tim Lepple, and Jason Canada offered guidance on a number of topics.Others who helped and supported along the way were Jennifer Jaynes,Robert Owen, Pete Davies, and Bill Swift.
My friends and family have encouraged me throughout the process, offeringinspiration, guidance, and support as I assembled this book. Mad props alsogo to Christopher Shope who donated his laptop, among other things, to thiscause.
My agent Matthew Wagner has been a rock of stability in this occasionallytumultuous process. And I would be remiss if I did not mention my friend,mentor, and fellow For Dummies author Kevin Blackwood. He’s helped ininnumerable ways to get my writing habit pointed in the right direction. Theextraordinarily patient team at Wiley also deserves a shout-out: Greg Croy,Pat O’Brien, Leah Cameron, Barry Childs-Helton, and others who toil behindthe scenes to ensure there’s plenty of black-on-yellow on everybody’s bookshelf.
And finally a thank you goes to my beloved wife Nancy, who endured thebetter part of a year listening to the click-clicking of the keyboard and fieldingmy complaints and worries. Without her, this book — and all wonderfulthings in my life — would not exist.
01_127230 ffirs.qxp 12/4/07 12:25 AM Page ix

Publisher’s AcknowledgmentsWe’re proud of this book; please send us your comments through our online registration formlocated at www.dummies.com/register/.
Some of the people who helped bring this book to market include the following:
Acquisitions, Editorial, and Media Development
Project Editor: Pat O’Brien
Acquisitions Editor: Greg Croy
Senior Copy Editor: Barry Childs-Helton
Technical Editor: Rick Sherman
Editorial Manager: Kevin Kirschner
Media Development Manager: Laura VanWinkle
Editorial Assistant: Amanda Foxworth
Sr. Editorial Assistant: Cherie Case
Cartoons: Rich Tennant (www.the5thwave.com)
Composition Services
Project Coordinator: Erin Smith
Layout and Graphics: Reuben W. Davis, Alissa D. Ellet, Melissa K. Jester, Shane Johnson
Proofreaders: Joni Heredia, Jessica Kramer
Indexer: Galen Schroeder
Publishing and Editorial for Technology Dummies
Richard Swadley, Vice President and Executive Group Publisher
Andy Cummings, Vice President and Publisher
Mary Bednarek, Executive Acquisitions Director
Mary C. Corder, Editorial Director
Publishing for Consumer Dummies
Diane Graves Steele, Vice President and Publisher
Joyce Pepple, Acquisitions Director
Composition Services
Gerry Fahey, Vice President of Production Services
Debbie Stailey, Director of Composition Services
01_127230 ffirs.qxp 12/4/07 12:25 AM Page x
Contents at a GlanceIntroduction .................................................................1
Part I: Introduction and Basics ......................................7Chapter 1: Understanding Business Intelligence............................................................9Chapter 2: Fitting BI with Other Technology Disciplines ............................................23Chapter 3: Meeting the BI Challenge..............................................................................37
Part II: Business Intelligence User Models....................49Chapter 4: Basic Reporting and Querying.....................................................................51Chapter 5: OLAP: Online Analytical Processing ...........................................................67Chapter 6: Dashboards and Briefing Books ..................................................................89Chapter 7: Advanced / Emerging BI Technologies .....................................................101
Part III: The BI Lifecycle...........................................115Chapter 8: The BI Big Picture........................................................................................117Chapter 9: Human Factors in BI Implementations .....................................................131Chapter 10: Taking a Closer Look at BI Strategy ........................................................143Chapter 11: Building a Solid BI Architecture and Roadmap .....................................163
Part IV: Implementing BI ..........................................183Chapter 12: Building the BI Project Plan .....................................................................185Chapter 13: Collecting User Requirements .................................................................205Chapter 14: BI Design and Development .....................................................................223Chapter 15: The Day After: Maintenance and Enhancement ....................................243
Part V: BI and Technology.........................................259Chapter 16: BI Target Databases: Data Warehouses, Marts, and Stores .................261Chapter 17: BI Products and Vendors..........................................................................283
Part VI: The Part of Tens ...........................................301Chapter 18: Ten Keys to BI Success .............................................................................303Chapter 19: Ten BI Risks (and How to Overcome Them)..........................................309Chapter 20: Ten Keys to Gathering Good BI Requirements ......................................315Chapter 21: Ten Secrets to a Successful BI Deployment ...........................................323Chapter 22: Ten Secrets to a Healthy BI Environment...............................................331Chapter 23: Ten Signs That Your BI Environment Is at Risk .....................................339
Index .......................................................................345
02_127230 ftoc.qxp 12/4/07 12:24 AM Page xi

02_127230 ftoc.qxp 12/4/07 12:24 AM Page xii

Table of ContentsIntroduction..................................................................1
About This Book...............................................................................................2How to Use This Book .....................................................................................2How This Book Is Organized...........................................................................3
Part I: Introduction and Basics .............................................................3Part II: Business Intelligence User Models ..........................................3Part III: The BI Lifecycle.........................................................................4Part IV: Implementing BI........................................................................4Part V: BI and Technology.....................................................................4Part VI: The Part of Tens .......................................................................4
Icons Used in This Book..................................................................................5Time to Get Down to Business . . . Intelligence ............................................5
Part I: Introduction and Basics.......................................7
Chapter 1: Understanding Business Intelligence . . . . . . . . . . . . . . . . . .9Limited Resources, Limitless Decisions......................................................10Business Intelligence Defined: No CIA Experience Required ...................11
Pouring out the alphabet soup...........................................................12A better definition is in sight ..............................................................13BI’s Big Four ..........................................................................................14
The BI Value Proposition...............................................................................17A Brief History of BI .......................................................................................18
Data collection from stone tablets to databases..............................18BI’s Split Personality: Business and Technology........................................21
BI: The people perspective .................................................................22So, Are You BI Curious? .................................................................................22
Chapter 2: Fitting BI with Other Technology Disciplines . . . . . . . . . . .23Best Friends for Life: BI and Data Warehousing .........................................23
The data warehouse: no forklift required..........................................24Data warehouses resolve differences ................................................26All paths lead to the data warehouse ................................................27
ERP and BI: Taking the Enterprise to Warp Speed.....................................28From mainframe to client/server .......................................................28The great migration..............................................................................29Like it’s 1999: the Y2K catalyst ...........................................................30Cold war reporting ...............................................................................31ERP leads to the foundations of BI.....................................................31
02_127230 ftoc.qxp 12/4/07 12:24 AM Page xiii

Customer’s Always Right ..............................................................................32CRM joins ERP ......................................................................................32Core CRM...............................................................................................32Customer decisions .............................................................................33
BI-BUY! E-Commerce Takes BI Online..........................................................34E-commerce’s early days (daze?) .......................................................34E-commerce gets smart .......................................................................35Real-time business intelligence ..........................................................35
The Finance Function and BI ........................................................................36
Chapter 3: Meeting the BI Challenge . . . . . . . . . . . . . . . . . . . . . . . . . . . .37What’s Your Problem? ...................................................................................37
What can go wrong...............................................................................38The BI Spectrum — Where Do You Want It? ...............................................40
Enterprise versus departmental BI ....................................................40Strategic versus tactical business intelligence.................................43Power versus usability in BI tools......................................................44Reporting versus predictive analytics...............................................45BI that’s juuuuust right ........................................................................45
First Glance at Best (and Worst) Practices.................................................46Why BI is as much an art as a science...............................................46Avoiding all-too-common BI traps......................................................46One more continuum: hope versus hype..........................................47
Part II: Business Intelligence User Models ....................49
Chapter 4: Basic Reporting and Querying . . . . . . . . . . . . . . . . . . . . . . . .51Power to the People!......................................................................................51
Querying and reporting in context ....................................................52Reporting and querying puts BI over the hump ..............................54Reporting and querying toolkit characteristics ...............................55So who’s using this stuff? ....................................................................56
Basic BI: Self-Service Reporting and Querying...........................................58Building and using ad-hoc queries.....................................................59Building simple on-demand self-service reports..............................59Adding capabilities through managed querying/reporting ............61
Data Access — BI’s Push-Pull Tug-of-War ...................................................63Classical BI: pull-oriented information access .................................64Emerging BI: pushing critical insights to users ................................64
Chapter 5: OLAP: Online Analytical Processing . . . . . . . . . . . . . . . . . .67OLAP in Context .............................................................................................68OLAP Application Functionality...................................................................68Multidimensional Analysis............................................................................70
Lonely numbers....................................................................................70One-dimensional data ..........................................................................70Setting the table....................................................................................72
Business Intelligence For Dummies xiv
02_127230 ftoc.qxp 12/4/07 12:24 AM Page xiv

Seeing in 3-D ..........................................................................................73Beyond the third dimension ...............................................................74
OLAP Architecture .........................................................................................75The OLAP Cube.....................................................................................76OLAP access tools................................................................................78
What OLAP Can Really Do.............................................................................78Members only .......................................................................................79Remember the Big Four BI criteria.....................................................81
Drill team: Working with Multidimensional Data .......................................81Gaining insight through drill-down analysis .....................................82Going in the other direction: drill-up analysis..................................83Getting to the source: drill-through ...................................................84
OLAP versus OLTP .........................................................................................85Looking at Different OLAP Styles and Architecture...................................85
MOLAP: multidimensional OLAP........................................................86ROLAP: relational OLAP through “normal” databases ....................87HOLAP: Can’t we all get along?...........................................................87
Chapter 6: Dashboards and Briefing Books . . . . . . . . . . . . . . . . . . . . . .89Dashboards’ Origins ......................................................................................90
EIS: information gold for the top brass .............................................90EIS: Everybody’s Information System................................................91EIS gets left behind...............................................................................92
The Metric System .........................................................................................93Defining KPIs .........................................................................................93Business KPIs........................................................................................94
Looking at BI Dashboards .............................................................................95Mission control to the desktop ..........................................................95Dashboard best practices ...................................................................97
Briefing Books and Other Gadgetry.............................................................98
Chapter 7: Advanced / Emerging BI Technologies . . . . . . . . . . . . . . .101Catching a Glimpse of Visualization ..........................................................102
Basic visualization..............................................................................103Worth a thousand words ...................................................................103Off the charts ......................................................................................104Visualizing tomorrow.........................................................................104
Steering the Way with Guided Analysis.....................................................106Dancing the BI two-step.....................................................................107Old idea, new moves ..........................................................................108Guiding lights ......................................................................................109
Data Mining: Hype or Reality? ....................................................................109Digging through data mining’s past .................................................110Digging for data gold..........................................................................111Data mining today ..............................................................................111
Other Trends in BI........................................................................................113BI for one and all ................................................................................113Unstructured data ..............................................................................113
xvTable of Contents
02_127230 ftoc.qxp 12/4/07 12:24 AM Page xv
Part III: The BI Lifecycle ...........................................115
Chapter 8: The BI Big Picture . . . . . . . . . . . . . . . . . . . . . . . . . . . . . . . . .117So Many Methodologies, So Little Time....................................................117
Starting at the beginning ...................................................................118The exception to the rule: Micro-BI .................................................118
Customizing BI for Your Needs...................................................................120Your not-so-clean slate ......................................................................120Initial activities ...................................................................................121Could-be versus should-be alternatives ..........................................124Selecting BI products and technologies ..........................................124
Implementing BI: Get ’er Done....................................................................125Zeroing in on a technical design.......................................................126Putting together the BI project plan ................................................127Finishing the job .................................................................................128
Chapter 9: Human Factors in BI Implementations . . . . . . . . . . . . . . . .131Star Techie: Skills Profile of a Core BI Team .............................................132
Key performers...................................................................................132Your other techies..............................................................................134
Overruling Objections from the Court of User Opinion..........................136Ch-ch-ch-ch-changes ..........................................................................136Turn and face the strange .................................................................137
Major in Competence ..................................................................................139Find your center .................................................................................139A BI center that’s juuuuust right ......................................................141Raising standards ...............................................................................141
Chapter 10: Taking a Closer Look at BI Strategy . . . . . . . . . . . . . . . . .143The Big Picture .............................................................................................143Your Current BI Capabilities (or Lack Thereof) .......................................144
Assessing your business infrastructure ..........................................144Assessing the technology stack, top to bottom .............................147Keep the good stuff ............................................................................149Throw out the bad stuff.....................................................................151
Exploring “Should-Be” BI Alternatives.......................................................152Utopian BI............................................................................................153Coming back to reality: examining barriers
to achieving your desired future state.........................................154Deciding “Could-Be” Alternatives ..............................................................155
Judging viability..................................................................................155Identifying risks . . . and also how to mitigate those risks ............156Gauging business value .....................................................................156Aligning your alternatives with your organizational
structure and culture .....................................................................157Making your choice......................................................................................158
Considering everything .....................................................................158
Business Intelligence For Dummies xvi
02_127230 ftoc.qxp 12/4/07 12:24 AM Page xvi

Deciding on your strategy.................................................................159Getting the necessary buy-in ............................................................159
Chapter 11: Building a Solid BI Architecture and Roadmap . . . . . . .163What a Roadmap Is (and Isn’t) ...................................................................164Centralized Versus Decentralized Architecture .......................................165
A couple question ..............................................................................166How to choose ....................................................................................166
BI Architecture Alternatives .......................................................................168Starting an architecture evaluation .................................................168So many choices.................................................................................170So little time ........................................................................................170The short list.......................................................................................171Taking a second look at your short list ...........................................172Examining costs for each alternative...............................................173Looking at technology risks ..............................................................174Making your decision.........................................................................175
Developing a Phased, Incremental BI Roadmap.......................................175Deciding where to start .....................................................................176Keeping score .....................................................................................177Deciding what comes next ................................................................178Deciding what comes next, and next, and next . . . ........................178Planning for contingencies................................................................178Dealing with moving targets .............................................................180Leaving time for periodic “architectural tune-ups” .......................180
Part IV: Implementing BI...........................................183
Chapter 12: Building the BI Project Plan . . . . . . . . . . . . . . . . . . . . . . . .185Planning the Plan .........................................................................................186
Revisiting the vision...........................................................................186Project plan format ............................................................................187
Project Resources ........................................................................................187Roles versus Resources.....................................................................188BI project roles ...................................................................................189
Project Tasks.................................................................................................191First pass: Project milestones...........................................................192Second pass: High-level tasks ...........................................................193Linkages and Constraints ..................................................................195Third pass: Break it down .................................................................195Roles and skills ...................................................................................196
Risk Management and Mitigation...............................................................198Contingency planning ........................................................................198Checkpoints ........................................................................................199
Keeping Your BI Project Plan Up to Date ..................................................199Managing to the plan .........................................................................200Working through issues .....................................................................200
xviiTable of Contents
02_127230 ftoc.qxp 12/4/07 12:24 AM Page xvii
Daily updates ......................................................................................200Keeping task data up-to-date ............................................................201
Back to the Ol’ Drawing Board ...................................................................201
Chapter 13: Collecting User Requirements . . . . . . . . . . . . . . . . . . . . . .205It’s Business, Not Technical ........................................................................206
Documenting business requirements ..............................................206Document size and structure............................................................207A little help from your friends (and enemies) ................................208
Requirements-Gathering Techniques ........................................................208The data difference ............................................................................209User focus............................................................................................209Requirements-gathering activities ...................................................210
What, Exactly, Is a Requirement? ...............................................................213Reporting and analytical functionality ............................................214Data needed to support your desired functionality ......................215Matchup maker...................................................................................216The “look and feel” for how information
should be delivered to users.........................................................217Validating BI Requirements You’ve Collected ..........................................218
Conducting the initial double-checking...........................................218Prioritizing Your BI Requirements .............................................................218
Identifying “must-have-or-else” requirements................................219Getting the final buy-in ......................................................................220Stepping on the baseline ...................................................................220
Changing Requirements ..............................................................................221
Chapter 14: BI Design and Development . . . . . . . . . . . . . . . . . . . . . . . .223Successful BI .................................................................................................223
Be realistic...........................................................................................224Follow demand ...................................................................................224Act now, but think ahead...................................................................224
Design with Users in Mind ..........................................................................225Power users.........................................................................................225Business users ....................................................................................226The middle class.................................................................................226
Best Practices for BI Design........................................................................227Designing the data environment ......................................................228Designing the front-end environment ..............................................231
Getting Users On Board...............................................................................239Reporting review ................................................................................239Testing, 1-2-3 . . . ................................................................................240Pilot projects.......................................................................................242Proof of concept .................................................................................242
Business Intelligence For Dummies xviii
02_127230 ftoc.qxp 12/4/07 12:24 AM Page xviii

Chapter 15: The Day After: Maintenance and Enhancement . . . . . . .243BI = Constant Improvement ........................................................................244Post-Implementation Evaluations ..............................................................244
Overall project review .......................................................................245Technology review .............................................................................245Business-impact review.....................................................................246
Maintaining Your BI Environment ..............................................................247System health .....................................................................................248System relevance — Keeping up with business changes..............250Maintaining lines of communication................................................250
Extending Your Capabilities........................................................................252Expanding existing applications.......................................................252Installing advanced upgrades ...........................................................255
The Olympic Approach ...............................................................................256Thinking long term with a roadmap.................................................257Evolvability .........................................................................................257
Part V: BI and Technology .........................................259
Chapter 16: BI Target Databases: Data Warehouses, Marts, and Stores . . . . . . . . . . . . . . . . . . . . . . . . . . . . . . .261
Data Warehouses and BI..............................................................................262An extended example ........................................................................263Consolidating information across silos ...........................................267Structuring data to enable BI ............................................................270
Data Models ..................................................................................................274Dimensional data model....................................................................274Other kinds of data models...............................................................278
Data Marts.....................................................................................................279Operational Data Stores ..............................................................................280
Chapter 17: BI Products and Vendors . . . . . . . . . . . . . . . . . . . . . . . . . . .283Overview of BI Software ..............................................................................284
The dimensional model .....................................................................284Working together................................................................................285
The BI Software Marketplace......................................................................286A little history .....................................................................................286Mergers and acquisitions ..................................................................287
Major Software Companies in BI ................................................................289Oracle...................................................................................................290Microsoft .............................................................................................291SAP .......................................................................................................293IBM .......................................................................................................293
xixTable of Contents
02_127230 ftoc.qxp 12/4/07 12:24 AM Page xix

Pure-Play BI Vendors ...................................................................................293Indispensable qualities......................................................................294Vendors by strong suit.......................................................................295The sales pitch....................................................................................300
Part VI: The Part of Tens............................................301
Chapter 18: Ten Keys to BI Success . . . . . . . . . . . . . . . . . . . . . . . . . . . .303Picking Good Key Performance Indicators (KPIs) ...................................303Adjusting the Recipe....................................................................................304Coming to Terms with Complexity ............................................................304Thinking (and Working) Outside the Box .................................................304Picking a Winning Team ..............................................................................305Doing Your Homework.................................................................................305Remembrance of Things Past (Especially Mistakes)...............................305Considering Corporate Culture Completely .............................................306Just Going Through a Phase .......................................................................306Adopting a Bigwig ........................................................................................307
Chapter 19: Ten BI Risks (and How to Overcome Them) . . . . . . . . . .309Resistance Movement..................................................................................309Moving Targets .............................................................................................310Tool Letdown................................................................................................310Being a User Loser .......................................................................................311Mister Data Needs a Bath............................................................................312Dough a No-Go? ............................................................................................312Scope Creep ..................................................................................................313Rigidity ..........................................................................................................314Environmental Crisis ...................................................................................314
Chapter 20: Ten Keys to Gathering Good BI Requirements . . . . . . . .315All the Right People .....................................................................................316The Vision Thing ..........................................................................................317Connecting BI to the Business Themes.....................................................317Make Sure the Insights Are Within Sight ...................................................318Greatest Hits from Yesterday and Today ..................................................319Consequences of Going Without................................................................319What’s the Big Idea?.....................................................................................320Going Straight to the Source.......................................................................320Adjunct Benefits ...........................................................................................321What’s First and Why...................................................................................322
Business Intelligence For Dummies xx
02_127230 ftoc.qxp 12/4/07 12:24 AM Page xx

Chapter 21: Ten Secrets to a Successful BI Deployment . . . . . . . . . .323Start Early!.....................................................................................................323Get What You Paid For.................................................................................324Only Losers Ignore Users ............................................................................324Name-Dropping.............................................................................................325Testing 1-2-3 . . . 4-5-6 . . . and So On ..........................................................325Go to Battle from a War Room....................................................................326Project Management Management ............................................................326Deal with Any Foot-dragging Immediately! ...............................................327Prove That Concept! ....................................................................................328The Devil Is in the Details ...........................................................................328We’ve Got a Live One ...................................................................................329
Chapter 22: Ten Secrets to a Healthy BI Environment . . . . . . . . . . . .331Data TLC........................................................................................................331Hitting Budget Targets.................................................................................332Hitting Schedule Targets .............................................................................333Rinse and Repeat..........................................................................................333Rinse and Don’t Repeat ...............................................................................334Maintain Team Knowledge..........................................................................334Remember What You Forgot the First Time .............................................335Regular Updates ...........................................................................................335Staying in Touch and in Tune .....................................................................336Communicating Changes.............................................................................336Stay on the Train ..........................................................................................337Maintenance as a Process...........................................................................337
Chapter 23: Ten Signs That Your BI Environment Is at Risk . . . . . . . .339The Spreadsheets Just Won’t Die...............................................................339Everybody Asks for Help.............................................................................340Nobody Asks for Help..................................................................................340Water-Cooler Grumbles About Usability...................................................341Good-Old-Day Syndrome.............................................................................341Usage Numbers Decline Over Time ...........................................................342BI Tools Aren’t Part of Strategy Discussions ............................................342Executive Sponsors Lose Enthusiasm.......................................................343Executive Sponsors Lose their Jobs ..........................................................343Resistance to Upgrades and Expansion ....................................................344
Index........................................................................345
xxiTable of Contents
02_127230 ftoc.qxp 12/4/07 12:24 AM Page xxi

Business Intelligence For Dummies xxii
02_127230 ftoc.qxp 12/4/07 12:24 AM Page xxii

Introduction
Let’s get this joke out of the way right now. Business intelligence is indeedan oxymoron at many companies.
You’ve worked for that company before, or maybe you work there now. Thatcompany is a boat on top of an ocean of data that they’re unable to dip theircups into and drink. And because they’re so out of tune with the data flowingthrough their systems, they base their decisions on gut feel rather than factsand history. The most common analysis tool is a spreadsheet. They take wildstabs in the dark at what the long-term trends look like for sales, or profit, orsome other measurement. And speaking of measurement, they often measurethe wrong things entirely; they look at numbers that have little or no relation-ship to the long-term success of the business.
Welcome to Business Intelligence For Dummies, a book written for people inorganizations that want to break the cycle of business stupidity. If you pickedthis book up off the shelf, you’ve probably heard of BI but aren’t sure what itmeans. Sure, it’s got the feel of another one of those techno-buzzwords thatwill fade out of fashion in a few years.
But BI is here to stay. And this book is for executives and managers dying tolearn more about the technologies, tools, processes, and trends that make upbusiness intelligence. It’s for business people who need a way to derive busi-ness insights that are accurate, valuable, timely, and can be acted upon topositively influence the enterprise.
Maybe you’ve heard talk of BI in the hallways and want to learn more aboutit. Maybe you’ve come to the realization that more and more jobs requiresome knowledge of BI. Maybe somebody gave you this book for Christmasand you don’t have the heart to ask for a gift receipt. No matter how youcame by it, you’ll learn a lot by reading it; there’s a lot to know.
Be aware that if you’re looking into how to spy on the company next door, ifyou want to talk into a shoe phone at the office, or you’re looking for adviceon how to dig through dumpsters to find clues about your competition, you’llwant to move on down the shelf. We’re not talking about that kind of businessintelligence.
03_127230 intro.qxp 12/4/07 12:24 AM Page 1

About This BookThis is a business book. Sure it’s a book about technology, but it’s not a highlytechnical book. It’s not supposed to be. The whole idea is to make some fairly confusing topics accessible to the non pocket-protector set. If you’re aMicrosoft SQL Server administrator and you think this book is going to showyou how to extend UDM with SSAS stored procedures, you’re bound to bedisappointed.
But that’s what’s so great about this book. It separates out the eye-crossing,head-scratching technical jargon and puts important technology conceptsinto terms most business people with a modicum of technical knowledge can understand.
How to Use This BookIf you don’t know how to use a book, you’re a long way from needing businessintelligence, buddy. It’s like other books; it’s got a cover, chapters, pages,words, and an extraordinarily handsome and well-regarded author.
But I guess there are a few reading strategies that will suit you best depend-ing on what you’re looking to get out of Business Intelligence For Dummies.Consider these two pathways to BI enlightenment with this book:
� If you want to see a specific topic that’s come up in conversation aroundthe water cooler, or perhaps in a meeting, you can jump right to the chap-ter that covers it and start reading. For example, maybe there’s been a lotof chatter about OLAP or Dashboards in the office and you’ve been nod-ding your head acting like you know what those words mean. I’d adviseyou to move quickly to the chapters covering those topics before some-one learns your secret.
� If your agenda has more to do with getting the big picture, and you wantto see BI’s origins and context before moving through the topics, thatworks too. The chapters are self-contained vehicles of knowledge, butthey are ordered in such a way that one BI topic blends nicely into thenext. On the other hand, if you start reading about something that putsyou to sleep or makes you mad, by all means write your Congressman astrongly-worded note, then skip ahead to the next chapter. Hey, you didit in high school when you had to read A Tale of Two Cities, so nothing’sgoing to stop you from doing it here.
I would not, however, advise that you skip ahead to the last few chapters tosee how the story turns out. Although the end of the book is riveting and tiesup a few loose ends, it’s not really that kind of book.
2 Business Intelligence For Dummies
03_127230 intro.qxp 12/4/07 12:24 AM Page 2

There are a few important related books that expand on some of the topicscontained in this book. If you find the need for additional information, DataWarehousing For Dummies, (Wiley) is a few years old but provides a solidfoundation of knowledge for data integration topics. Then there are the prod-uct specific books that touch on technical topics related to BI like MarkRobinson’s Microsoft SQL Server 2005 Reporting Services For Dummies.
How This Book Is OrganizedThe information presented in this book is arranged into six self-containedparts, each of which comprises several self-contained chapters. It’s like oneof those Russian dolls, except painted yellow and black, and made out ofpaper instead of . . . well . . . whatever they make those dolls out of.
For most of the book, you’ll be able to consume a chapter whole; I do my bestto tell you everything you need to know inside each chapter without forcingyou to save places throughout the book with various fingers and ad-hocbookmarks. But I admit, on occasion I’ll refer you to another area in the bookbecause it’s really important you understand where to get more informationabout a subject; but if you don’t feel like being re-directed, just say no tocross-referencing.
Part I: Introduction and BasicsThese early chapters are a primer on business intelligence. They lay the BIgroundwork and will keep get you covered if you need a quick knowledgeinjection before you run to a meeting or an interview where the topic willcome up. You’ll see the one true definition of BI, at least according to me anda few thousand BI gurus. You’ll also get to know BI’s family tree, where it allbegan, and what related technologies you should get to know.
You’ll be especially pleased at the easy-going language and tone of thesechapters. Not much bits-and-bytes talk is necessary because, as you’ll see inPart I, business intelligence is about business first, technology second.
Part II: Business Intelligence User ModelsUnfortunately, you’ll find out in Part II that a business intelligence environ-ment doesn’t just hum along quietly in the background like an air conditioner,spitting out business insights and cool air. BI joins powerful tools to the fin-gertips and eyeballs of people just like you, who go to work every day andneed to make better business decisions, regardless of the scale or scope ofthose decisions.
3Introduction
03_127230 intro.qxp 12/4/07 12:24 AM Page 3

Each of the main user application classes gets its own chapter here, from basicreporting and querying up to new-fangled technologies just now emerging intothe market place.
Part III: The BI LifecycleMore than anything, business intelligence is a process. It’s about creating aculture that makes evidence-based rational decisions, that seeks out a clearerpicture of its past and present. In this part we’ll talk about what makes thatprocess work well inside organizations, how a business intelligence culturegets planned, hatched, and how it grows and develops over time. You’ll seewhat substrate works best for BI to take hold, and how to develop a soundbusiness intelligence strategy. In the last chapter in this part, you’ll get famil-iar with a BI roadmap, which sets you up nicely for the next part . . . read on!
Part IV: Implementing BIThis is how we do it. If you’re a project manager or analyst of some kind, thispart will warm the cockles of your heart. We’re talking about building a soundproject plan for your upcoming BI implementation and gathering — and managing — the functional and business requirements. If that sounds like any other IT project to you, you’re half-right. BI projects share characteristicswith other big technology efforts, but BI has its own special set of challengesfor a project team to face down, and we’ll talk about them here. Designing andbuilding a BI environment is no easy task, but following up your initial successwith ongoing victories is even harder.
Part V: BI and TechnologyThis is a special topics part, where we delve into areas that every budding BIguru should know about, but for the dabblers and dilettantes, they’re on aneed-to-know basis only. The BI universe tracks closely with that of datawarehousing, and that topic gets covered in depth in this part of the book.It’s also here that we start naming names, talking about who the big BI ven-dors are, what you should know about their products and services, and whatthey have to offer the market place.
Part VI: The Part of TensIf you’ve never read a book in the For Dummies series, this will be a nice sur-prise. If you have read another book in the series, this part will be like seeingan old friend again . . . one who doesn’t owe you money that is.
4 Business Intelligence For Dummies
03_127230 intro.qxp 12/4/07 12:24 AM Page 4

The Part of Tens, as always, is a collection of interesting BI topics, challenges,and warnings broken out into ten easy-to-digest chunks. There are ten keys toBI success, ten secrets to gathering good BI requirements and the like. Thesechapters are a good chance to test your knowledge after you’ve read the restof the book, or a way to get a jolt of BI know-how if you haven’t.
Icons Used in This BookLook for those familiar For Dummies icons to offer visual clues about the kindof material you’re about to read:
The best advice in the book is listed next to this icon. If you’re thinking abouta foray into BI, you’re going to need it.
I can’t quite recall what this icon means, but I think it has something to dowith quickly revisiting an important BI concept. Don’t forget to rememberthese things.
If BI was easy, every company out there would have implemented it long ago.This icon is the equivalent to a flashing red light on your dashboard. Ignore itat your own peril.
Every now and then I’m forced into some techie banter to add some colorand background to a topic. You should try to read it one time, but don’t getupset if it floats over your noggin at high altitude.
Time to Get Down to Business . . . Intelligence
If you feel the need for speed — getting up to speed on BI that is — you’re offto a good start, so let’s light this candle.
Now I’d like you to take a moment and go back and review the table of contentsone more time. Just kidding! March onward. Start with the first page of Part I orflip to a random page and start reading to see if it makes the slightest bit ofsense to you. I’ll endorse whatever reading strategy you have in mind, justhave fun. Oh what heights you’ll hit, so on with the show, this is it. Drumroll. . . .
5Introduction
03_127230 intro.qxp 12/4/07 12:24 AM Page 5

6 Business Intelligence For Dummies
03_127230 intro.qxp 12/4/07 12:24 AM Page 6

Part IIntroduction and Basics
04_127230 pt01.qxp 12/4/07 12:24 AM Page 7

In this part . . .You’ve been running your lemonade stand for several
years, and success has been an occasional visitor.This being the high-tech age, you’ve dutifully recordedbusiness data of every kind since you started mixingsugar and water together; the daily sales, the employeeswho have come and gone, the customers who frequentyour street corner, the supplies you buy once a week tomix your elixir.
So how can you put all that information to work for you?Some of the data’s on your laptop, some of it’s on yourdesktop at home, and a little bit of it is on your handheld.It would be nice to be able to look into the past and findmeaningful insights about what’s made your lemonadestand successful in the past, and what might make it moresuccessful in the future. That might help make decisionseasier.
You need a business intelligence solution. The chapters inthis part will show you what BI is, how it’s related to othertechnology areas, and how it can work for lemonade standsjust like yours.
04_127230 pt01.qxp 12/4/07 12:24 AM Page 8

Chapter 1
Understanding BusinessIntelligence
In This Chapter� Getting comfortable with the basics
� Understanding the business intelligence value proposition
� Seeing where BI came from and where it’s going
� Previewing what works (and what doesn’t)
From the CEO down to the lowest levels of any organization, every minuteof the day someone is making a decision that has an impact on the
company’s performance. Sometimes a decision is at a very high strategiclevel that affects the fate of the entire organization, and other times a deci-sion might be narrowly defined and tactical, affecting a single person ordepartment for a very short window of time. When taken together, these decisions make up a significant portion of the “day in the life” at any givenorganization, be it a company, governmental agency, or nonprofit organization.
In spite of the dramatic advances in technology and tools that aid in the deci-sion-making process, however, far too many people still make decisions theold-fashioned way: by blending a gumbo of tidbits of current information,best recollections of the past, advice from others, and a whole lot of “gutinstinct,” and then assessing which path is likely to give the best possibleoutcome for the decision at hand.
Decisions drive organizations. Making a good decision at a critical momentmay lead to a more efficient operation, a more profitable enterprise, or per-haps a more satisfied customer. So it only makes sense that the companiesthat make better decisions are more successful in the long run.
That’s where business intelligence comes in.
Business intelligence is defined in various ways (our chosen definition is inthe next section). For the moment, though, think of BI as using data aboutyesterday and today to make better decisions about tomorrow. Whether it’sselecting the right criteria to judge success, locating and transforming the
05_127230 ch01.qxp 12/4/07 12:23 AM Page 9

appropriate data to draw conclusions, or arranging information in a mannerthat best shines a light on the way forward, business intelligence makes com-panies smarter. It allows managers to see things more clearly, and permitsthem a glimpse of how things will likely be in the future.
Limited Resources, Limitless DecisionsAll organizations, whether business, government, charitable, or otherwise,have limited resources for performing their missions. Companies are forcedto make do with what they have — all the time. You can’t put a Nobel laureatein every position, and you can’t pour unlimited dollars into an endless questto make all your factories and offices more efficient.
The most precious resource is time. The marketplace is in constant motion,and companies must not only move correctly, they must move quickly. Other-wise competitors will fill any available vacuum in the market, resources willget used up, and your organization will inexorably wither away.
Business intelligence’s entire raison d’être (that’s French for “shade of lipstick” — just kidding) is as an ally at those inflection points throughout the life of a business where a decision is required. Business intelligence is aflexible resource that can work at various organizational levels and varioustimes — these, for example:
� A sales manager is deliberating over which prospects the account execu-tives should focus on in the final-quarter profitability push
� An automotive firm’s research-and-development team is deciding whichfeatures to include in next year’s sedan
10 Part I: Introduction and Basics
The Name GameBusiness intelligence is commonly knownsimply as BI. That’s pronounced “Bee Eye,” not“Buy.” We’ll go back and forth in this bookbetween the full phrase and the abbreviatedname. And if you’re wondering why there aren’tany periods in the acronym (as in, “B.I.”) it’sbecause of a custom in the technology world:Once a concept has gained widespread accep-tance and becomes known by its initials alone,the punctuation disappears.
Extracting periods from techno-acronyms (CPU,GB, ICBM, whatever) is the mission of theInternational Punctuation Review Board, agroup of Internet billionaires, former ambas-sadors, and high school football coaches whomeet in Geneva every four years to reviewwhich new buzzwords qualify for punctuation-free status. (Just kidding. Everything aboutacronyms in the previous paragraph is true butthe Board doesn’t really exist. Yet.)
05_127230 ch01.qxp 12/4/07 12:23 AM Page 10

� The fraud department is deciding on changes to customer loyalty pro-grams that will root out fraud without sacrificing customer satisfaction
The decisions can be strategic or tactical, grand or humble. But they representtwo roads diverging in a yellow wood: Considered in the aggregate, the roadstaken and those not taken represent the separation between successful andunsuccessful companies. Better decisions, with the help of business intelli-gence, can make all the difference.
Business Intelligence Defined: No CIA Experience Required
So what the heck is business intelligence, anyway? In essence, BI is any activ-ity, tool, or process used to obtain the best information to support theprocess of making decisions.
Right now you’re scratching your head and wondering, “Does he really meananything?” And the answer is a qualified yes. Whether you’re calling thePsychic Hotline, using an army of consultants, or have banks of computerschurning your data; if it helps you get a better handle on your company’s cur-rent situation, and provides insight into what to do in the future, it’s BI.
But by popular demand (and so I don’t have to write a chapter called “Usinga Magic 8-Ball for Improved Portfolio Risk Management”) we’ll narrow the def-inition just a tad. For our purposes, BI revolves around putting computingpower (highly specialized software in concert with other more common tech-nology assets) to work, to help make the best choices for your organization.Okay, there’s a little more to it than that. But before digging into specifics, itis (as the Magic 8-ball would say) decidedly so that you should understandsome context about how BI is defined, and who’s defining it.
The more you learn about BI, the more likely you are to encounter a wideswath of definitions for the term. Sometimes it seems as if nearly every newarticle on BI characterizes it in a new way. BI invariably gets unceremoni-ously tagged with an array of newfangled labels and connected with a wholecatalog of different technologies that can leave your head spinning as you tryto peg which elements are included in the definition and which ones aren’t.
And it’s no mystery why there is no single definition for business intelligence.Vendors and consultants define the phrase in a way that conveniently skewstoward their particular specialty. Academics, authors, and consultants alsohave their own pet definitions of BI; one may barely resemble the next.
11Chapter 1: Understanding Business Intelligence
05_127230 ch01.qxp 12/4/07 12:23 AM Page 11

Don’t get knocked off course. Regardless of who’s saying it, when you put BIon a stove, turn the heat up, and boil it down to its constituent elements,you’ll always find the same thing left in the pot: technology and tools to sup-port decision-making.
For the purposes of this book, and for your needs beyond this book, you’llonly need to know this one single definition (drum roll, please):
Business intelligence is essentially timely, accurate, high-value, and actionable business insights, and the work processes and technologies used to obtain them.
If you look up actionable in the dictionary, you see it actually means any deedthat might cause you to get sued; here action refers to legal action. But feelfree to use this specialized meaning of “actionable” with BI-savvy pros suchas techies and finance folks. Just don’t use it when you’re talking to an attorney(unless, of course, you’re a partner in the same law firm).
Contrary to what you may have been led to believe, there are no stone tabletswith a single list of processes, protocols or hardware/software combinationsthat define BI once and for all. In technology, those things are always evolv-ing. And they are often different from company to company, and differentdepending on the situation. Today’s common definitions of the essential BIcomponents are markedly different from the definitions bandied about in the1990s. What remains constant, though, is that BI’s purpose has always beento produce timely, accurate, high-value, and actionable information.
Pouring out the alphabet soupIf you think BI’s definition sounds a little familiar, it’s not just a case of déjà vu(that’s French for “I’ve had this head cold before”). The concept of BI is notnecessarily new; companies have been trying for years to press their systemsinto service to produce better strategic insights. You might have come acrosssome of these acronyms in your past.
� DSS: Once upon a time, a company was in need of systems that wouldsupport the decision-making process. The IT crew got together andcame up with Decision Support Systems. Pretty clever, eh? DSSs gainedpopularity by helping managers apply computing power and historicaldata to structured problems, such as production scheduling and othertypes of recurring planning decisions.
� EIS: The corner-office gang took notice of the success of DSS anddecided that just like executive bathrooms, they deserved their owndecision-management tools, and Executive Information Systems (EIS)technology was born.
12 Part I: Introduction and Basics
05_127230 ch01.qxp 12/4/07 12:23 AM Page 12

� MIS, MDS, AIS, and so on: Plenty of other BI predecessors came andwent — Management Information Systems, Management DecisionSystems, Analysis Information Systems, and so on, and each one laidclaim to some new style of supporting companies’ decision-makingprocesses.
Business intelligence has a big family tree. All of these technologies con-tributed to today’s incarnation of BI, some more than others. And some of the disciplines and movements that warranted their own acronyms stillexist today — in some cases calling themselves “next-generation BI” or, at the very least, “extenders” of BI.
There are several forces driving the multiple incarnations of what is basicallythe same idea. First, there is a motivation among vendors and IT consultantsto mint a phrase that catches on in the technology world. Doing so helps setthem apart from the competition (as if they’ve invented a better mousetrap).
Perhaps more important — and more cynical — is the tendency within thetechnology world to sheepishly leave behind heavily hyped initiatives thatdon’t quite live up to the buzz in their initial go-around. For example, earliergenerations of DSS and EIS often suffered from the same shortcomings thataffected all types of technology implementations in that era. The unknownsof cutting-edge technology, the unpredictability of organizational politics, andother deficiencies sabotaged early implementations. The ideas were sound,but the failures gave the specific concept being adopted a bad reputation.
But the underlying concepts would always survive. After all, who could arguewith the value of using high-power computing to support decisions? Whatexecutive wouldn’t want to put IT resources to work delivering valuable infor-mation to the office every day? And so, as memories of past failures faded,new ways of thinking evolved — and more advanced technologies came along— those same vendors and consultants would leave behind the now-taintedlabel, coin a new term, and begin selling the “new and improved” solution.
A better definition is in sightIt might be useful to take a quick second look at the term insight. Insights arethe ultimate destination for the many roads that all those authors, consultants,vendors, and various other nerds will send you down when you embark on a BIproject. “Insight” does a good job of encompassing the deliverables that flowforth from a good BI project. Imagine those as the glowing light bulbs thatappear over your head about some aspect of your business. Insights are anew way to look at things, a moment of clarity, a way forward. When BI deliv-ers a business insight, you’ve divined some fact or hypothesis about someaspect of your organization that was previously hidden or unknowable.
13Chapter 1: Understanding Business Intelligence
05_127230 ch01.qxp 12/4/07 12:23 AM Page 13

Insights is actually a more intelligent word than . . . well . . . intelligence. Afterall, “intelligence” can mean so many different things, depending on the con-text. So the next time you think about BI and an instant of confusion obscuresits definition from you, it helps to mentally substitute the word insights forintelligence and just attach BI to the phrase business insights.
But the good news is, with the kind of BI we’re describing here, you don’t haveto play James Bond to improve your market position. With the real businessintelligence, there are no double agents, no foreign sports cars, and the word“detonator” will never be relevant (unless your project goes very poorly.) BIis kind of like spying — but only if spying on yourself counts.
If your BI project goes well, you can ask your boss to start calling you “Q”.
BI’s Big FourSo what do we mean when we talk about insights that are accurate, valuable,timely, and (benignly) actionable? As you dig into BI’s main characteristics,you’ll see why each is so important to the process. In fact, if the knowledgegained from BI fails to meet any of the four criteria, the process has failed.
Accurate answersWhen decisions are taken in your organization they are inevitably informedwith conclusions drawn by a range of experts using important pieces of infor-mation about the enterprise’s current state. For BI to be of any value in thedecision making process, it must correctly reflect the objective reality of theorganization, and adhere to rigid standards of correctness. As such, the firsthallmark of insights produced from BI processes is their accuracy.
As with any technology-related tool or process, the GIGO rule is in full effectwith BI — that’s Garbage In, Garbage Out. GIGO says that if the BI insights arenot accurate, the decisions made are less likely to be the correct ones foryour enterprise. Imagine a sample BI report that shows one of the company’ssales territories lagging woefully behind the others. When folded into thedecision-making process, that piece of knowledge might well lead executivesto adjust the sales process (or perhaps the personnel). But if the picture iswrong — say the offices and departments were incorrectly aligned to the var-ious territories, so sales dollars weren’t correctly allocated — then the con-clusions (and the resulting actions taken) not only fail to help the company,they might actually make things worse.
Getting it right is important from a political perspective as well. For BI to havean impact, company stakeholders (those key employees whose businessdomains affect, and are affected by, BI) must trust it. Nothing’s more frustrat-ing in the world of business intelligence than a development team toiling formonths to produce a report that an executive looks at and, within 30 sec-onds, dismisses it by saying, “Those numbers aren’t correct.”
14 Part I: Introduction and Basics
05_127230 ch01.qxp 12/4/07 12:23 AM Page 14

But such things are common. After all, BI insights are often surprising, coun-terintuitive, and even sometimes threatening to groups within an organization.The sales manager who is shown numbers that indicate her team is laggingbehind will be motivated to find ways to challenge the validity of the report.Any errors, no matter how small, will call into question the veracity of theconclusions drawn from the data.
BI must represent the absolute closest thing to the truth that’s possible, notonly to produce results, but to protect its reputation among the skeptics!Without accuracy, insights that are the product of BI are worse than worth-less. They can be harmful to the company. And once that happens, nobodywill ever trust BI again.
Valuable insightsNot all insights are created equal. Imagine, for example, that after a multimillion-dollar BI-driven probe of sales-history data, a grocery store chainfinds that customers who bought peanut butter were also likely to buy jelly.
Duh.
BI insights like this are certainly accurate, but they are of limited value to thedecision makers (who probably know that most supermarkets place thosetwo items close together already). Part of what distinguishes BI is that itsgoal is not only to produce correct information, but to produce informationthat has a material impact on the organization — either in the form of signifi-cantly reduced costs, improved operations, enhanced sales, or some otherpositive factor. Further, high-value insights usually aren’t easily deduced —even if data-driven analysis weren’t readily available.
Every company has smart people working for it who can connect the obviousdots. BI insights aren’t always obvious, but their impact can be huge.
On-time informationHave you ever had a heated discussion with someone and thought of the per-fect retort to their witless argument exactly five minutes after you walk awayfrom them?
The French call this phenomenon “esprit d’escalier —”(the spirit of the stair-case). You never think of your best comeback until you’ve left a person’sapartment or office and are walking down the stairs in defeat.
The lesson is simple: What makes people effective in a debate is that they can not only deliver sound information, they can do it at the precise time it’sneeded. Without timeliness, great verbal pugilists like Oscar Wilde or Cicerowould have gone down in history as nothing more than good (but obscure)writers full of esprit d’escalier.
15Chapter 1: Understanding Business Intelligence
05_127230 ch01.qxp 12/4/07 12:23 AM Page 15

In business, information delays can make just as big a difference — and theycan come in many forms:
� Sometimes it’s a technology problem where the hardware or softwarecan’t compute fast enough to deliver information to users.
� Sometimes the problems relate strictly to workflow and logistics; thedata isn’t fed into the systems often enough.
� Logistics problems can pop up from time to time — for instance, what ifa report has to be translated into a different language?
Every step in the process takes time, whether it involves microchips orhumans. In the aggregate, those time intervals must be small enough to make the output of a BI process still relevant, useful, and valuable to a decision maker.
Timeliness is as important a quality in your business insight as any other.The best decision support processes involve up to the minute informationand analysis made available to decision makers in plenty of time to considerall the courses of action. Stock traders at hedge funds use massive spread-sheets full of constantly updated data. The data streams in and is manipu-lated in a series of processes that makes it usable to the trader. He or shebuys and sells stocks and bonds using the results of those calculations,making money for the firm and its clients. If the trader’s applications wereslower in producing translated data, they would miss opportunities to exe-cute the most profitable trades and their portfolios would start to look likeones the rest of us have.
Actionable conclusionsAccurate is one thing, actionable is another. Imagine if the conclusions reachedat the end of the BI cycle were that the company would be better off if a com-petitor would go out of business, or if one of its factories were 10 years oldinstead of 30 years old.
Those ideas might be accurate — and it’s no stretch to believe that if eitherscenario came to pass, it would be valuable to the company. But what, exactly,are the bosses supposed to do about them? You can’t wish a competing com-pany out of business. You can’t snap your fingers and de-age a factory. Theseare exaggerated examples but one of the biggest weaknesses of decision sup-port tools is that they build conclusions that are not actionable. To be action-able, there has to be a feasible course that takes advantage of the situation. Ithas to be possible to move from conclusion to action.
Ideally, the BI team at your company would produce a report that wouldguide future actions. The executives would conclude that a price should belowered, or perhaps that two items should be sold as a package. These aresimple actions that can be taken — supported by BI — to improve the posi-tion of the company. In BI-speak, that means insights must be actionable.
16 Part I: Introduction and Basics
05_127230 ch01.qxp 12/4/07 12:23 AM Page 16

The BI Value PropositionBI links information with action inside an organization. But because of theconfusion over defining BI, it’s not always clear where the value of a BI solu-tion lies. What exactly do businesses get from a BI implementation? If you’rethinking about BI, you’re naturally wondering “What’s in it for me?”
The answer is that when companies utilize BI, they don’t just have a swell newtoy for the IT team to deploy, or a snazzy new report or data store. Sure, itcan be all of those things, but more than anything, the BI value comes frompromoting good decision-making habits.
Encompassing BI is a rational approach to a continuous improvement loop:
1. Gathering data
2. Making decisions and taking action based on that data
3. Measuring the results according to predetermined metrics (a fancy wordfor measurements) for success
4. Feeding the lessons from one decision into the next
By using a continuous cycle of evidence-based actions, organizations adopt arational approach to their decision-making process — and BI can supportthat cycle. Figure 1-1 shows how this continuous loop can work. Throughbusiness intelligence concepts and tools, companies glean meaningful insightsfrom their operational data. If the insights fit the four criteria of BI (remem-ber: timely, accurate, high-value, and actionable) the company can apply themto its regular decision-making process. Those decisions, now informed withBI insights, lead to actions — and, if all goes well, improved operational results.(Don’t lose sight of the fact that improved results are what this is all about).And so the cycle begins anew; the first round of results becomes part of thehistorical data record, and the related BI insights are refined even further.
The process of using data to make better decisions can involve just aboutany piece of an organization. If there are lessons to be learned from opera-tional data, be it customer behavior, financial information, or another cate-gory, BI can play a part. By using BI practices to transform raw data intomeaningful conclusions, a team makes better decisions. The actions taken asa result of those decisions produce a new round of results — which can befed back into the system as new empirical evidence to draw the next round ofconclusions.
BI can improve any decision by supplying it with (everybody, now!) timely,accurate, valuable, and actionable insights.
17Chapter 1: Understanding Business Intelligence
05_127230 ch01.qxp 12/4/07 12:23 AM Page 17
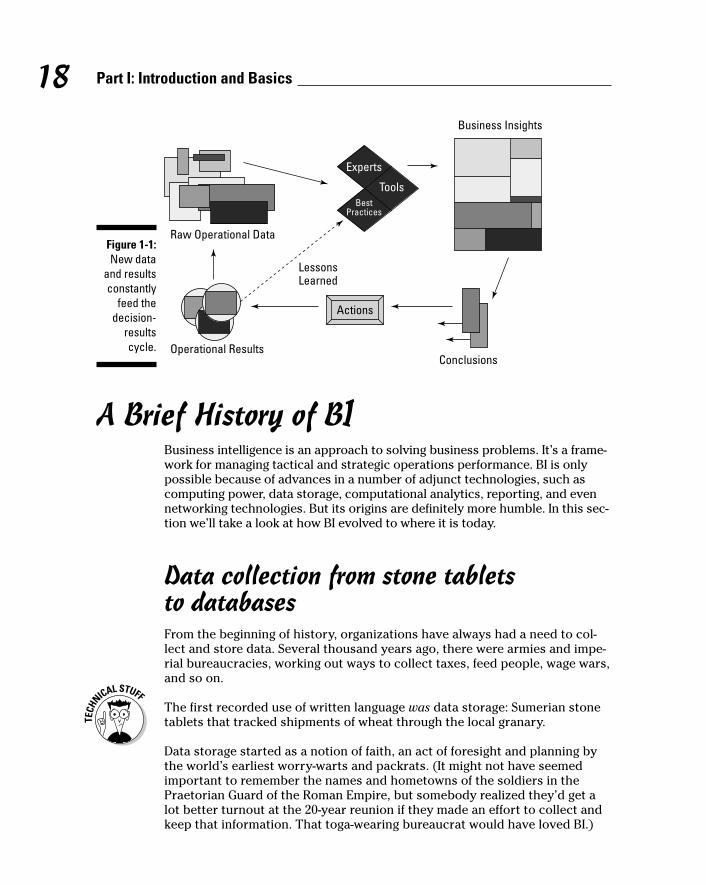
A Brief History of BIBusiness intelligence is an approach to solving business problems. It’s a frame-work for managing tactical and strategic operations performance. BI is onlypossible because of advances in a number of adjunct technologies, such ascomputing power, data storage, computational analytics, reporting, and evennetworking technologies. But its origins are definitely more humble. In this sec-tion we’ll take a look at how BI evolved to where it is today.
Data collection from stone tablets to databasesFrom the beginning of history, organizations have always had a need to col-lect and store data. Several thousand years ago, there were armies and impe-rial bureaucracies, working out ways to collect taxes, feed people, wage wars,and so on.
The first recorded use of written language was data storage: Sumerian stonetablets that tracked shipments of wheat through the local granary.
Data storage started as a notion of faith, an act of foresight and planning bythe world’s earliest worry-warts and packrats. (It might not have seemedimportant to remember the names and hometowns of the soldiers in thePraetorian Guard of the Roman Empire, but somebody realized they’d get alot better turnout at the 20-year reunion if they made an effort to collect andkeep that information. That toga-wearing bureaucrat would have loved BI.)
Raw Operational Data
Conclusions
Business Insights
Actions
LessonsLearned
Operational Results
Experts
ToolsBest
Practices
Figure 1-1:New data
and resultsconstantly
feed thedecision-
resultscycle.
18 Part I: Introduction and Basics
05_127230 ch01.qxp 12/4/07 12:23 AM Page 18

Record-keeping really came into its own as better forms of paper wereinvented. It allowed for more information to be stored and accessed in a smaller space.
Reading a book written on stone tablets is a real pain in the neck.
From silicon in stone to silicon in microchips, that challenge continues to thisday: storing more and more information in smaller and smaller space. Themodern organization makes use of computer power for its data storage.
The growth of computing power and data storageThe first computers were tabulating machines, designed and built to performone-off calculations. But scientists and inventors developed information-storage capability almost neck and neck with the growth of computing power.After the 1940s, both technologies exploded.
Mass storage began to take form when the properties of magnetic tape wereused to store analog patterns of information. That turned to disk drives, adecades-old technology that is still in use today in a form that would be rec-ognizable to its inventors, but on a scale that would blow their minds.
To manage the growing mountains of stored data, programmers developedDatabase Management Systems (DBMSs) of growing power and complexity.Relational database technology came about as a response to the increasinginformation-storage demands. This was a revolutionary way to maintain datathat dramatically sped up transaction time by splitting data elements intotheir component pieces and storing those pieces separately.
Transactional systemsAs computing systems became more powerful and ubiquitous, businessesbegan taking advantage of them to manage their daily transactions.
19Chapter 1: Understanding Business Intelligence
Available research on BIYou can look up all kinds of research and whitepapers on the Internet to check out the impactof BI on business. But don’t just skim throughthe study looking for the return-on-investment(ROI) number without understanding the con-text. Numerous important peer-reviewed stud-ies show that BI projects have a positive ROI,provided they are done correctly, and with the
proper goal in mind. When BI produces timely,accurate, high-value, actionable conclusions,and those conclusions are applied correctly, theROI will be positive. But lots of things can gowrong along the way. For every BI successstory, there are horror stories, just as you findwith any other technology. So how do you do itright? How can you maximize ROI? Read on . . . .
05_127230 ch01.qxp 12/4/07 12:23 AM Page 19

Point-of-sale (POS) systems are the classic example of a transactional system.A POS system has one main purpose: to allow sales reps to quickly enter salestransactions, collect payment, and issue a receipt to the customer for thatpurchase. Handily enough, if the POS is some kind of computer (rather thanjust a cash register that goes cha-ching) it can be connected with accountingsystems that gather and organize sales information for later use.
Companies normally have many transactional systems, each one a source ofits own unique kind of data, each one designed to perform one primary busi-ness role. Transactional systems help with the day-to-day operations of thecompany — for example, a system that tracks shipments between warehousesor handles customer billing.
The emergence of decision supportWith so many disparate transactional systems, a company stores an enormousamount of data. It didn’t take long before CEOs wanted to take a peek. After all,if they could see summaries of all that stored transactional data, they couldgain insight on certain aspects of their business (say, how often shipmentsmove between Warehouse A and Warehouse B, or what day of the week theircustomers are more likely to buy dessert). Examining transactional records in the aggregate seemed to offer a wellspring of good business insights. But no sooner did companies try it than a horde of problems sprang up — forexample, these:
� The systems were often separated, not only physically, but perhaps alsoby separate storage protocols, naming conventions, or even politicalbarriers within a company. That meant the analysis had to take placeindividually for each set of transactional records.
� Transactional systems such as the point-of-sale database were designedfor speeding transactions along — not for doing research. Diggingthrough the data to learn which products appealed enough to certaindemographics to purchase at certain times of the year (or to unearthother such business insights) was undeniably useful, but a transactionalsystem by itself was the wrong tool for that job. More powerful informa-tion systems were necessary to get the most out of the data.
In the late 1980s, companies began to recognize the potential value that thedata represented. In response, they became motivated to build systems toextract the knowledge buried in their files. And so BI was born.
Business intelligence came to encompass the wide range of technologies, pro-tocols, and practices that is required to produce valuable business insights.What BI actually means to one company may be different from what it meansto another because every company represents a different situation, with dif-ferent installed technology, and different needs. That’s why business intelli-gence doesn’t fit into a perfect definition you may have read on a vendor’swebsite. BI means timely, accurate, high-value, and actionable insights . . .and whatever it takes to produce those insights.
20 Part I: Introduction and Basics
05_127230 ch01.qxp 12/4/07 12:23 AM Page 20
BI in the by-and-byAs computing gets more powerful and software more useful, it seems BI —whether operating under its current name, or dressed up yet again as a “new”undertaking — will continue to increase in importance to large organizations.But look for it to take root in ever-smaller enterprises as well, as small busi-nesses realize they can finally take advantage of the advancing technology.
The BI concept is a flexible organism that will undoubtedly grow and evolvein response to whatever direction the advancing technology may take it. Somenear-term trends seem apparent:
� Origins in various business units: BI started as IT pet projects. After all,who else knew what was possible? But as executives and decision makersget used to thinking in terms of business intelligence, more (and bigger)BI initiatives will be driven by departments other than IT.
� Analytics delivered to the desktop: Vendors have created powerful add-ins to go with already-flexible and potent desktop tools (such asMicrosoft Excel). Starting with MS Office 2003, continuing with Office2007, advanced analytical tools will be available to just about everyonein the company who has a computer.
� Following the data: BI has traditionally been associated with data-warehousing technology (which we discuss in depth in the coming chapters). But future BI technology will be able, with increasing efficiency, to reach out into the source systems, grab data, and transform what it finds into what it needs to perform its analysis.
BI’s Split Personality: Business and Technology
BI is built on the massive computing power available to today’s enterprises.But it isn’t just about bits and bytes. Business intelligence requires a com-pany culture dedicated to the principles and practices that make high-quality,usable insights possible. Simply installing software and flipping a switchwon’t get a company to the promised land.
The commitment to BI has to come from both the business and technologysides of a business:
� Business managers must engender a rational, measurement-basedapproach to setting strategy and running operations.
� IT must be prepared to support the BI culture to the extent that busi-ness managers are prepared to push it into all levels of the company.
21Chapter 1: Understanding Business Intelligence
05_127230 ch01.qxp 12/4/07 12:23 AM Page 21

BI: The people perspectiveBusiness intelligence is about giving people new tools and perspectives; it’sdesigned to let decision makers ponder what-if questions. That only works ifthose decision makers are not only able to use the BI tools but are also pre-pared to ask the right questions.
That’s where BI truly straddles the world between business and technology —it’s both an art and a science. There is no set formula for determining the“right” reports and analytics for a particular company. No book explains every single possibility to consider in your analysis cycle.
What’s required is putting the right kind of people in positions where BI is toplay a role. Or the BI attitude must be spread by the company’s leadership. BI is about a commitment to a rational approach to making decisions — andthat approach must be supported at all levels of the organization, by IT exec-utives and business executives.
So, Are You BI Curious?Would your organization benefit from a business intelligence solution? Thereis no automatic answer to that question, but nearly every company can seeimprovement from adding some rigor to the decision-making processes. Thefollowing list of questions you might ask about your organization could indi-cate whether a BI approach makes sense:
� Can you view sales data in more than one view simultaneously? For exam-ple, if you wanted to see quarterly sales data by sales manager, productline, and customer type, how long would it take to produce the report?
� Is there data locked in transactional systems about your customers thatyou’d like to see but can’t because the system just isn’t designed to viewthe data the way you want?
� When your company makes strategic decisions, are you relying on harddata before you proceed or is it coin-toss time? Do you base your actionsaround evidence of the past and verifiable conclusions about the future?Do you consider statistical correlations between causes and effects? Oris it a seat-of-the-pants maneuver?
� You know what items your customers buy the most, but do you knowwhat items your customers buy in pairs?
� Do you know what your company does best? How do you know it? Is it agut feeling or do you have metrics to back up your conclusions?
22 Part I: Introduction and Basics
05_127230 ch01.qxp 12/4/07 12:23 AM Page 22

Chapter 2
Fitting BI with Other Technology Disciplines
In This Chapter� Walking hand in hand: BI and data warehousing
� Connecting BI to the enterprise with ERP
� Utilizing customer data with CRM systems
� Using BI to plan for the future
� Making e-commerce smarter through BI
In this section, we look at the most prominent technologies commonly asso-ciated with BI. Because these other classes of software are common in so
many companies, it’s important to understand how business intelligence isrelated to them. The associations — some casual, some arrangements of convenience — are of interest and importance to anyone considering a BIimplementation.
These disciplines exist outside the immediate realm of BI — but in each case,business intelligence concepts and approaches have had a dramatic effectand helped the underlying technology round itself out into full form. The rela-tionship between BI and each of these technologies is a two-way street. Eachtechnology area has benefited from the BI process, and BI has grown and inresponse to the widespread adoption and evolution of these technologies —especially data warehousing, Customer Relationship Management, Point-of-Sale systems, and Enterprise Resource Planning.
Best Friends for Life: BI and Data Warehousing
Maybe you remember the old Reese’s Peanut Butter Cup commercials featur-ing the inevitable collision between the person carrying peanut butter andthe person carrying chocolate. “You got chocolate in my peanut butter!” the
06_127230 ch02.qxp 12/4/07 12:23 AM Page 23

former would exclaim, followed by the other proclaiming “You got peanutbutter on my chocolate!” After a moment of consternation they realized thewonder they had created by mixing those two essential substances of the universe together at last.
The collision of data-warehousing technologies with BI practices was a Eureka!moment for companies:
� Executives needed better access to the company’s day-to-day data so theycould evaluate conditions more accurately and make better decisions.
� The IT department was developing protocols and systems to bringwidely dispersed and variable databases under one roof in order to run companywide statistical analysis and basic reporting.
When the two concurrent goals came together it was a chocolaty-peanut butterdelight. (From a business perspective, anyway.)
Like Batman and Robin, BI and data warehousing are inextricably linked. Theproduct of the two technology areas is more beneficial to companies than thesum of their parts. While each discipline is important in its own right, togetherthey enable businesses to go beyond organizing operational data. BI and datawarehousing make a transcendent combination — a powerful competitiveweapon that can actually guide the business in ways previously consideredimpossible.
The data warehouse: no forklift requiredThe whole purpose of a BI implementation is to turn operational data intomeaningful knowledge. That means BI must be connected with an organiza-tion’s data to be effective. With data spilling out the doors and windows ofany enterprise, the challenge is to put all the necessary data in one place, inone common format. Data warehouses are the perfect architecture to meetthat challenge head on.
A data warehouse is a single logical (but not necessarily physical) repositoryfor a company’s transactional or operational data. The data warehouse itselfdoes not create data; it’s not a transactional system. Every byte of data insidethe data warehouse has its origins elsewhere in the company.
So what data are we talking about then? Most enterprises produce data in avariety of different departments or domains; there might be transactional salesinformation coming directly in from a point-of-sale system (POS), customerdata from a Customer Relationship Management System (CRM), and an endlessvariety of operational systems that help the run. The data dispersed through-out all these different applications is likely saved in a variety of formats, on arange of hardware — say, a dedicated storage network, a mainframe, a data-base server on the Web, or even on various desktops. It could be anywhere.
24 Part I: Introduction and Basics
06_127230 ch02.qxp 12/4/07 12:23 AM Page 24

Data warehouses are different from standard transaction-based data-management systems. A data warehouse aggregates information about asingle subject area — and management then uses that resource in one of two ways:
� to create focused reports on one aspect of the enterprise
� to query in order to gain insights on that subject
Both activities are read-only. That makes sense because typically no data isdeleted from a data warehouse. Transactional systems, on the other hand,add, delete, and update the data they store.
Turning “apples-to-celery” into “apples-to-apples”A data warehouse is a collection of data from different systems, focusing onone subject area. But because the data originates from a multitude of sources,it’s going to be in different formats. Part of a data warehouse implementationinvolves manipulation — or transformation — of the data prior to storage sothat it resides in a single common format.
Imagine you’re merging phone lists from two different Excel spreadsheets. Onelists names as “Smith, Jason E.” and the other spreadsheet lists names in theformat “Jason E. Smith”. There are some names that appear on both lists, butsome are unique to one list or the other.
After merging the two lists, you alphabetize them and look at a sample of thecombined list:
Jacob Rogers 214-555-5406
Jacobs, Jeff Z. 972-555-9044
Jeff Z. Jacobs 972-555-9044
John A. Smith 214-743-0000
Johnson, Albert S. 817-342-4971
If you’ve merged the lists without transforming the data into a single format,the result is a unified — but confusing — list. First, how would you looksomeone up if you didn’t know whether they are listed by their first or lastname? Then there’s the problems caused by duplicate entries. If one personis listed twice (once in each format), then you’ll have problems if you need to update the person’s information, to say nothing of the ambiguity in doinglookups. On top of that, you’ll have trouble creating a simple summary reportof this data; you know how many list entries there are, but how many uniquepeople are there?
25Chapter 2: Fitting BI with Other Technology Disciplines
06_127230 ch02.qxp 12/4/07 12:23 AM Page 25

Data warehouses resolve differencesIn the real world, data differences can go well beyond name-formatting on an Excel spreadsheet. Related data might be stored on completely differentapplications, in different storage media. Data might be missing or completelycorrupted. Warehousing data can be an enormous task — you have to dothree things to all that data from disparate sources:
� Put the information in a single format.
� Check for systemic data errors.
� Translate the data into useful units of knowledge.
In addition, your company may have organizational and geographical bound-aries that separate information and prevent it from being used in concert withother key insights. So data warehousing technology must not only aggregatedata of all flavors, it must also work with software and protocols that trans-form that data into common formats so information from one data source canbe logically related to information from other data sources. Figure 2-1 showsa simple system where three different systems that collect similar data feedinformation into a data warehouse, which offers a single view of reality.
Say your company, Acme Lemonade Stands, keeps a central record of all cus-tomers who phone in delivery orders — including their full contact informa-tion and some basic data about their lemonade-buying habits. Out in the fieldat the sidewalk lemonade stands themselves, the cash register and the Point-of-Sale applications track each individual sales transaction at the counter.Then there’s a billing system that handles invoicing to customers on account.
Data Source 1(e.g. CRM System)
Data Source 2(e.g. Cash Register Data)
Data Source 3(e.g. Billing System)
Data Warehouse(Common view of relatablecustomer, sales, and AP data)
Figure 2-1:A commondata ware-
housingarchitecture,
greatlysimplified.
26 Part I: Introduction and Basics
06_127230 ch02.qxp 12/4/07 12:23 AM Page 26

Each of those databases is kept separate from the others in different parts of the company, on different platforms and systems, with different kinds ofusers and patterns of usage. What’s more, those data storage systems aredesigned to fit their mission — to store transactional data quickly. That cancause a problem because those systems (and their attendant data structures)may not lend themselves to producing reports on performance metrics suchas profitability by lemonade stand.
If your title starts with a capital letter C, you’re probably going to want to viewall that data together. After all, executives make strategic decisions about thedirection of the company by getting an accurate picture of business perfor-mance in many areas. For example, the CEO of Acme Lemonade might like toknow about the relationship between daily cash flow and invoicing, then tie itback to specific customers and customer types and adjust marketing strategyaccordingly. Building a unified report like that would be difficult because thedata resides in three different places. Without a data warehouse the CEO isout of luck.
If it sounds like we’re edging closer to BI (high-value, accurate and timely busi-ness insights that we can use as the basis for an action), you’re right, we are.Business intelligence and data warehousing are closely related because it isthe single data store (the aggregation of disparate data sources) that allowsBI processes to take place. When BI produces insights for a CEO about howthe company is performing, it’s because the technology under the hood hasallowed all that different data to sit together in the same place and be manip-ulable (subject to being jiggered, tinkered with, and looked at).
All paths lead to the data warehouseCompanies store an incredible amount of operational data: sales transactiondetails, operational reports, personnel information, and accounting data, justto name a few. What used to involve rows of filing cabinets and enormousvaults of physical storage space can now be stored digitally. Just like thatcrazy great-aunt you have who hasn’t come to terms with the fact that theGreat Depression is over, companies are packrats about data, keeping every-thing they can think of.
For BI to work, it requires wide-open roads between the places where the datalives. There can’t be barricades, checkpoints, or washed out bridges. Whenall of an organization’s information is present, correct, and relatable to itself,BI can function at the highest level.
Data warehousing is a key technology for enabling BI. When you implement adata-warehousing solution, you’ve taken a significant step toward businessintelligence. That’s not to say you can’t do data warehousing without BI —
27Chapter 2: Fitting BI with Other Technology Disciplines
06_127230 ch02.qxp 12/4/07 12:23 AM Page 27

many organizations do. For example, many companies utilize data- warehousingtechnologies and approaches to create Operational Data Stores — ODSs (okay,some purists argue that data warehouses and ODSs are very different — butwe can let them argue). Where DW and BI are focused largely on managementreporting for executives, the same aggregation of data can also be extremelyuseful for mid-level managers who keep track of operations.
Imagine a manager who wants to keep an eye on operations at the call center.The key to making this happen is data-warehousing technology that does itswork in this sequence:
1. Brings in external data from different sources.
2. Transforms the data into a common format.
3. Cleans the data for any incorrect or missing data.
4. Correlates the calls and call durations with operational and transac-tional information from other parts of the company.
5. Produces regular daily reports that show the correlation.
Data warehousing really pays off if it’s a prelude to enabling a business intelli-gence solution. After the data is collected and the barriers between the islandsof information are broken down, the next logical step is to build bridgesbetween those islands that create meaningful corporate insights (yep —accurate, timely, material, and actionable).
ERP and BI: Taking the Enterprise to Warp Speed
From the advent of business computers, up through the late 1980s and early1990s, the systems that drove and supported the enterprise were designed —and run — mostly independently of each other. Even systems that would naturally fit together — say, finance and accounting or supply chain andinventory — were built and operated as separate entities. In the early 1990s,companies began to see computing power as a way to integrate vast anddiverse transactional systems. As a result, Enterprise Resource Planning(ERP) systems were born.
From mainframe to client/serverThe computing power that originated most legacy software was centered onmainframe computers — gargantuan machines that existed in big rooms, oreven took up entire floors of buildings. Their cousins, the minicomputers,
28 Part I: Introduction and Basics
06_127230 ch02.qxp 12/4/07 12:23 AM Page 28

had a similar role as centralized points for all of a company’s processing. Inthose days, the IT staff consisted of as many electrical engineers as it didcomputer programmers — because the mainframes and minis were at leastas much electromechanical machines as they were computers — and some-times reprogramming meant rewiring.
By the late 1980s, microcomputers (which we know now as personal comput-ers) were getting small and powerful enough to place on workers’ desktops,bringing about the rise of the client/server model. That led to pulling tasksaway from the legacy systems and pushing them to workers’ desktops. It alsomeant great advances in networking protocols and practices, linking peopleand data together for the first time. This had some fantastic advantages interms of individual productivity, flexibility, and scalability.
The term legacy application most commonly refers to older, mainframe-oriented data-processing software. IT managers who cut their teeth on thenewer client/server architecture came to view older mainframe applicationsas dinosaurs, an inherited burden that had to be upgraded or replaced ASAP.But today, legacy has become a catchall pejorative that refers to any last-generation technology.
ERP came about as companies saw the need to integrate the core businesscomputing systems to fit with their new client/server architecture. The battlecry arose: mainframe computing, with its magnetic tapes, punch cards, andoutrageous electric bills, was dead. Why do data processing in one centralplace, they asked, when the work can be done on computers distributedthroughout the business?
The great migrationThe advantages of running ERP systems were clear. Workers could produceand consume data as never before. The old centralized data processing appli-cations could now become more interactive, and customized to fit the com-pany’s needs. And yet the client/server architecture still provided centralizedstorage of information, which meant ERP applications could run and haveeveryone in a company looking at the same data.
SAP was first on the scene, but others quickly followed. PeopleSoft, Baan,Oracle, Lawson, and JD Edwards were all pioneers in client/server ERP.Salesmen from these companies fanned out across the country, into ITdepartments, all with the same promise on their lips: “You can do away withyour big expensive mainframe computer systems.” And the IT departmentswere listening.
29Chapter 2: Fitting BI with Other Technology Disciplines
06_127230 ch02.qxp 12/4/07 12:23 AM Page 29

Like it’s 1999: the Y2K catalystIn the mid-1990s, computer nerds everywhere became aware of a problembrewing in the chips of companies everywhere around the world. No, theMaster Control Program from Tron wasn’t about to take over the world. It was much worse . . . .
The famous Y2K BugThe legacy systems (old data-processing software that was still running oncorporate mainframes and minicomputers) weren’t designed to understandthat the year after 1999 was 2000, not 1900. That’s because these systemswere only capable of tracking years in terms of two digits, so 1971 was repre-sented as 71, 1999 as 99 — and when 99 turned to 00 in all those computers,would disastrous amounts of data disappear? Nobody knew.
When the legacy systems were developed in the 1960s (and 1970s in somecases), the new millennium seemed so far in the future that nobody thoughtthe systems they were building would still be relevant and operating onDecember 31, 1999. Surprise: Much of the software written back then wouldbecome the basis for future generations of code. Programs would be reused,repurposed, and generally expanded upon with each successive release.There, lurking in the heart of every system that used that code — at the coreof thousands of businesses across the world — was a simple and powerfulbug that could bring factories, plants, and networks to a halt.
ERP saves the dayOne solution to the Y2K problem was to have programmers dig through theold code and fix it. But this was time-consuming, expensive, and not guaran-teed to work.
30 Part I: Introduction and Basics
SAP slurps up the ERP marketThe company that is considered the founder ofEnterprise Resource Planning software is theGerman firm SAP, founded in 1971. In 1973 theyintroduced R/1, an application that did some-thing quite revolutionary for the day: It handledreal-time processing of finance and accountingbusiness functions. (In fact, the R stood for real-time). R/1 became R/2 in the early 1980s, whichwas the first true ERP suite. R/2 expanded itsfinance and accounting functions along with
human resources and operations packages. Forthe first time, multiple departments (and physi-cal locations) had a single view of companydata. And SAP isn’t just a pioneer from the olddays. The company continues to be the marketleader in ERP — having released R/3 in the early1990s and building on the product from there —developing over 30,000 clients all around theworld.
06_127230 ch02.qxp 12/4/07 12:23 AM Page 30

ERP companies offered a more complete solution to the problem: By com-pletely replacing legacy systems with a unified set of ERP applications, companies could remove all doubt about Y2K. Not only that, but the new systems offered upgraded capabilities over the legacy systems.
The sales pitch (essentially “upgrade now or else”) worked. The Y2K problemwas a boon for ERP companies as organizations installed products from SAP,PeopleSoft, and the others at a record pace. Indeed, 1996 through 1998proved record years for ERP vendors. (In case you’re wondering, by 1999sales had dropped off because companies had run out of time to begin newimplementations.)
Cold war reportingLegacy systems were designed for data processing — crunching numbers. Assuch, the reporting capabilities were minimal. Summoning information fromdata storage beyond the standard basic diagnostic and status reports pro-duced after batch processes were complete required a Herculean effort byanalysts and programmers.
In the early days of ERP, the focus was on merely replicating the core func-tionality of the legacy systems, so ERP software was relatively light on report-ing capabilities. The systems may have been unified, but there usually wasstill a need to call in armies of programmers to hard-code custom reportsagainst the transactional databases — just like before.
ERP leads to the foundations of BIThe weaknesses of hard-coding reports was apparent — as were the problemsassociated with trying to use data from live transactional and operational systems in queries and reports. These challenges led ERP companies to beginincorporating some basic data-warehousing approaches into the new unifiedsuites of applications — in conjunction with some advanced reporting capabilities.
Now companies could truly have their cake and eat it too with their ERP systems:
� Their legacy systems all spoke the same language.
� The data warehouse aggregated the data.
� The new reporting tools made it easy to put the company’s data under amicroscope.
31Chapter 2: Fitting BI with Other Technology Disciplines
06_127230 ch02.qxp 12/4/07 12:23 AM Page 31

The foundation for BI was laid. Forward-thinking ERP vendors started addingpowerful reporting and analytic packages to their application suites to addfurther value for their customers.
SAP was a trendsetter, introducing SAP BW in 1997. BW stands for Business(Information) Warehouse, a set of applications that offered customersadvanced reporting and trend-spotting capabilities. And because BW wasmelded with the rest of the SAP application suite, clients could run the powerful BI tools against any set of data in the entire system — from manu-facturing to sales. Business Warehouse was a sales success for SAP; otherERP vendors followed suit.
Customer’s Always RightToo bad the customer data isn’t! (Well, at least some of the time.) And thatchallenge is why CRM was born.
CRM stands for Customer Relationship Management. It refers to software thathandles all aspects of an organization’s interactions with its customers. Thatmay include the entire sales cycle, from winning new customers, to servicingand tracking existing customers, to providing post-sales services.
CRM joins ERPCRM applications can touch lots of pieces of a business. Of course, the salesforce itself relies heavily on robust CRM applications that can track leads,perform customer analysis, handle transactions and so forth. But beyond thesales force, CRM’s tentacles reach into product management, inventory andprocurement, accounting and finance, and others. Imagine using all that dataabout customer relationships to plan the use of enterprise resources. SomeERP vendors did. So, in the late 1990s, they began including CRM applicationsin their enterprise suites. PeopleSoft made its CRM play through acquisitionwhen they acquired a CRM company called Vantive in 1999. Vantive was apure-play CRM vendor; that’s the only class of software they sold. Other ERPvendors, such as Oracle, built their application in-house.
Core CRMEarly CRM was always transactional in its approach, rather than analytical.The idea was to use technology to automate and facilitate the sales cycle asmuch as possible. So early incarnations of CRM would include features thattracked leads, scheduled sales operations, and recorded purchase history(along with other operational functions). But as CRM evolved, companies
32 Part I: Introduction and Basics
06_127230 ch02.qxp 12/4/07 12:23 AM Page 32

began to put greater demands on it to do more. Rather than just keep track ofyesterday, CRM customers wanted the software to participate in the process —and help predict what customers were going to do.
Companies began to see the potential for expanding CRM’s role as they lookedat all their contact points with customers. Call centers were foremost amongthese contact points; there hundreds of customer-service representativeswould work phone banks while sitting in front of the custom-built applica-tions they used to perform order entry or trouble-ticket functions on behalfof customers.
Customer decisionsIn the late 1990s, data-crunching capabilities were on the rise in other partsof the company, it was only natural that CRM systems would become moreinvolved in decision-support processes.
E-commerce was also exploding in the late 1990s; the competitive feverrequired companies to wring every dollar they could from their online mar-kets. That’s when companies such as e.piphany came into being by mergingtraditional core CRM functions with BI-like analytical features and reportingcapabilities.
Campaign management and moreMarketing was also transformed. Campaign management companies such ase.piphany guided their clients’ marketing practices to make them more customer-centric. Yes, of course that’s a silly tautological buzzword — customer-centric marketing . . . as if there’s any other kind. But there is agerm of truth to it. Products from this new generation of CRM companiesallowed analysis and integration of customer data in a way that companieshad never done before.
That gave companies a new capability to create precision-guided campaigns,to tweak their sales cycles to fit perfectly with the kinds of customers theyattracted. Companies could suddenly measure the effectiveness of their salesforce in ways never before imagined, and it spawned entire new marketingpractices like customer loyalty management, churn management (a.k.a.harassing existing customers to buy more), and customer reacquisitionprocesses to help bring straying former customers back into the fold.
CRM with a scoop of BI on topNow that CRM had gone beyond merely keeping track of what a sales forcewas doing — now that it was more than a fancy rolodex with customer namesstored within — the applications sprouted wings and began delivering customer-focused analysis and reporting that created a new science of working with customers. Some of the new features included
33Chapter 2: Fitting BI with Other Technology Disciplines
06_127230 ch02.qxp 12/4/07 12:23 AM Page 33

� Campaign management
� E-mail marketing
� Real-time personalization
� Demand-chain and collaborative marketing
Of course, all was not perfect. Many of the new-generation CRM companieswould die the same death as the most frivolous of dotcom companies. Buteven though the profits weren’t always there, the value had been demon-strated. BI was here to stay in the realm of managing customer relationships.
BI-BUY! E-Commerce Takes BI OnlineLike the early CRM software, the original e-commerce applications were simple.Their one-dimensional functionality was good for facilitating fairly rudimen-tary business transactions over the Internet — at that time, almost entirelybusiness-to-consumer sales. But in the early 1990s, the general public wasjust getting used to the idea of the Internet’s existence; buying goods onlinerepresented a great leap forward.
When the Internet first began popping up in homes, CRM software displayedlittle more than the same content you might find in sales brochures. There was little if any interaction with the company sites; it was strictly billboard ware.
E-commerce’s early days (daze?)A few visionary companies started to change all that by actually selling prod-ucts and interacting with customers on their Web sites. One of the first wasCyberian Outpost, who sold computers and peripherals off their site.
34 Part I: Introduction and Basics
Siebel comes full circleIn 1993, a former Oracle executive named TomSiebel made a highly public (and sometimesacrimonious) break from Oracle to found SiebelSystems, which would go on to become thestandard-bearer for CRM companies for yearsto come. After Siebel dominated that market fornearly a decade, other companies began to
duplicate Siebel’s CRM success — not onlymajor industry players such as SAP andMicrosoft, but also upstarts like e.piphany andSalesforce.com (a hosted CRM application).After several soap-operatic twists and turns,Oracle acquired Siebel for $5.8 billion. (Lookslike you can go home again after all.)
06_127230 ch02.qxp 12/4/07 12:23 AM Page 34

As retailers stumbled through e-commerce’s growing pains, they had severalkey tasks to accomplish: They had to develop the software itself (catalogs,shopping carts, credit card processing) plus develop data-capture and report-ing systems to match the transaction processing. As was the case with CRMand ERP systems, these functions had to be built from scratch, hard-coded bya mix of Web and traditional developers. At first the back-end analysis sys-tems added little intelligence to the e-commerce process itself, it was littlemore than ex post facto reporting and analysis.
E-commerce gets smartAmazon founder Jeffrey Bezos and his apparent fascination with analytics werelargely responsible for pushing BI into the e-commerce realm — and driving his company to billion-dollar heights in the process. Early on, Bezos operated a company that lived, ate, and breathed data. Managers pulled metrics andreporting data from every conceivable piece of the Amazon operation. Itstarted with a motivation to make the fulfillment and inventory systems as leanand efficient as possible — something Bezos knew could only be achieved byusing hard data to drive management decisions. Then Bezos applied the sameanalysis-heavy mindset to the storefront too, where he tracked every movecustomers made — and had the Web application respond to those moves.
The results of Amazon’s BI culture manifest themselves today in the com-pany’s marketplace hegemony as well as in the user features you encounterwhen you shop online. When you log in, you see the last products you lookedat, along with products judged to fit your tastes (according to your browsingand buying history). When you add books to your shopping cart, the systemperforms real-time analysis to recommend other books to you. BI actuallyhelps shape customer behavior in real time.
Real-time business intelligenceAmazon’s ability to influence customers is only possible because it collects amountain of customer data. As you shop, sophisticated analytics are runningin the background — comparing your habits and online activities with thoseof millions of customers who came before you. This customer-facing systemcan then react to you in real time (the industry calls it shopping time) andpresent you with options that make you more likely to spend more, returnagain and again, and be happy with the experience.
That instantaneous reaction — BI capabilities shaping a Web site’s behavioron the fly — represents a level of complexity and utility that isn’t commonlyseen in the other technology disciplines we’ve discussed in this chapter. ERP,CRM, and planning systems are most useful for looking at past data and doingone-time analysis to guide decision-making. But e-commerce brought BI intothe present tense.
35Chapter 2: Fitting BI with Other Technology Disciplines
06_127230 ch02.qxp 12/4/07 12:23 AM Page 35

The Finance Function and BIOne more area of software functionality has been touched by business intelli-gence: financial reporting and analysis. The finance departments of compa-nies of all shapes and sizes go through the process of assembling budgets,corporate planning initiatives, and performance forecasts. BI can help outthere in unprecedented ways.
The budgeting and planning process for organizations has always beenintensely manual — low-level analysts and staff members would crunch numbers and create individual spreadsheets that then had to be merged and summarized before becoming part of the next level. Team budgets would roll up into departmental budgets, from there up into divisional bud-gets, and eventually up into the overall corporate budget.
This process left very little room for analysis. Any changes to the planningprocess would have to be cascaded up and down throughout the company to really understand its full effects — a process that’s simply not feasible inmost companies.
As with ERP, CRM, and e-commerce, business intelligence found fertile soil in the global finance functions. CFO’s were desperate to move beyond thepencil-and-paper processes and Excel spreadsheets that had dominated the area for so long.
Business intelligence technology allows planners to perform what-if analyses,run budgets through predictive and profitability analyses, and create score-cards and dashboards to aid in corporate performance- management practices . . . for openers. BI not only speeds up these processes, it also givesthe finance department far more confidence in the numbers themselves.
36 Part I: Introduction and Basics
06_127230 ch02.qxp 12/4/07 12:23 AM Page 36

Chapter 3
Meeting the BI ChallengeIn This Chapter� Identifying your BI needs
� Looking at the BI continuums
� Using best and worst practices
� Avoiding vendor hype
Just about everybody agrees that having timely, accurate, high-value, andactionable insights available before making critical business decisions
would be extremely helpful. What marketing executive wouldn’t want a reportthat clearly shows the optimum mix of products to send to the marketplaceas a package? What V.P. of Sales wouldn’t like reliable figures on which territo-ries and accounts are the most profitable? But wanting something doesn’tmake it a reality.
While good business intelligence is within virtually any company’s grasp,many obstacles can get in the way. There are technology landmines, projecthurdles, and even political challenges. As you prepare for a BI implementa-tion, you need to be ready to answer some tough questions about how yourcompany operates. You have to make some decisions about what exactly youwant out of your BI solution. And you should brush up on your diplomaticskills to lay the groundwork for unifying your team behind a common goal.
This chapter is about identifying all the things that can go wrong with BI. Ifyou know in advance which problems lie in wait for you, they’re much easierto solve (or avoid altogether). If you charge ahead without considering whatcan go wrong, you’ll join the ranks of companies whose BI implementationseither never got off the ground or foundered once they were launched.
What’s Your Problem?A typical business intelligence solution has many moving parts — includingan array of software and hardware that must work together in concert. WithBI’s heavy reliance on IT, it’s no surprise that many companies squander the
07_127230 ch03.qxp 12/4/07 12:23 AM Page 37

bulk of their planning process on technology. This tech focus is a misconcep-tion that will get you into trouble.
Hardware and software selection is not actually the most difficult part of a BI implementation. A company that focuses on choosing server vendors,designing architectures, and the like is missing the real problem: identifyingaccurately what the business actually needs.
The real challenge of BI is coming up with a workable answer to the question“What’s our problem?” For business intelligence solutions to go to work foryou delivering important business insights, your organization must deter-mine the purpose of the implementation. Okay, that may sound all pie-in-the-sky and a little bit meta, but you do need to ask some preliminary questionsto identify the kinds of business questions you want BI to answer.
Some of these questions are obvious, some require in-depth research, somemight bring a range of responses depending on whom you ask within yourcompany, and some may have no single answer — just an educated guess will have to do. Here’s a sampling of those questions:
� What data is currently available to be measured and analyzed?
� What measurements can we monitor that indicate success in one ormore areas of the business?
These are the key performance indicators (KPIs); we talk about themmore in Chapter 6.
� When do we need the answers? Do we need them all at once?
� How will we take action if certain insights demand it?
� How prepared is the company culture to effect change once we get ouranswers?
And there are more of these — many more — to answer before you startthinking about technology. Some range from mundane project and logisticsquestions, but many are darn near philosophical questions that cut straightto the heart of the way your organization is run, and approaches change.Taken together, answering these questions shines light on the entire purposeof your business intelligence implementation. And best of all, you’ve madegood progress toward BI success without spending a dime on softwarelicenses or consultants’ time (yet).
What can go wrongIf you move ahead with a BI solution but fail to properly or completely iden-tify the problem you want it to solve, you don’t get much benefit from BI. In
38 Part I: Introduction and Basics
07_127230 ch03.qxp 12/4/07 12:23 AM Page 38

fact, a BI implementation can be a disruptive force to your organization inmany ways. Consider the following areas of impact.
CostIf you had an unlimited budget you could try everything and keep only whatworks. But BI can be an expensive proposition — and it doesn’t stop withnew software licenses or consultant bills. There’s always a need for extrahardware and infrastructure. Then you have to factor in maintenance costs,training costs, and all sorts of hidden expenses (such as a temporary declinein worker productivity as they adapt to a new paradigm, training classes forusers and project team members, opportunity costs, and so on).
BI is not for the faint of heart, nor is it for the faint of wallet.
TimeSure time is money, but sometimes time is just . . . well . . . time. Workingthrough a fruitless BI implementation means you aren’t doing something elsethat could be useful to the company. Waiting on a BI implementation to bakecan cause delays in tackling strategic problems. The resources dedicated tothe task could be repurposed to other tasks with immediate payoffs like get-ting a product ready for market or improving your internal processes.
CredibilityNot all high-level executives are convinced that BI is more than just an emptybuzzword. If one of the doubters sees your project fail, you’ll just confirm theirpre-conceived notions. Worst of all, it makes it that much harder to gain sup-port the next time around. And it’s not just about the corner-office folks; agood BI implementation depends on people at all levels making a commit-ment to the process. Skepticism is a self-fulfilling prophesy, so you shouldtake steps to ensure you get it right the first time.
Bad adviceThe worst consequence of all is that you may think you’re getting what youneed from your BI solution, only to find out the analysis has produced recom-mendations that lead in the direction precisely opposite to success.
Most BI wounds are self-inflicted. When BI projects go wrong, it’s not becausesoftware breaks or consultant teams lie. It’s because companies either don’tdo adequate preparation or don’t think through their goals and capabilitieswell enough (or both). And with this kind of self-inflicted wound, you don’tget out of combat. You’re back in your office on Monday morning with a ban-dage on your toe and an ice pack on your forehead trying to salvage whatyou can of your disastrous implementation.
39Chapter 3: Meeting the BI Challenge
07_127230 ch03.qxp 12/4/07 12:23 AM Page 39

The BI Spectrum — Where Do You Want It?
If you consider the Big Four characteristics of business insights produced byBI projects (timely, accurate, high-value, and actionable) you’ll note that theyare all abstract notions. Notice that nowhere in there does the definitioninclude insights that save you money, or help long-range planning. The fourcharacteristics of BI insights are intentionally left a safe distance from yourcompany’s particular success criteria.
That’s because BI projects come in all shapes and sizes. The CFO might bedirecting a massive BI project to look at the global finance functions and howthey affect the entire enterprise. Or a regional sales manager could be the“customer” of your company’s business intelligence system, and have a muchnarrower outlook. That person is not interested in enterprise-level financialinsights — and isn’t particularly concerned with building knowledge aboutthe entire company. For the regional sales chief, a successful BI implementa-tion offers insights on the sales process alone. Any insights beyond thataren’t actionable at the regional-sales level.
What makes BI insights good is not the breadth of their application in a com-pany, it’s whether they’re answering the questions they were designed toanswer — and producing information that is timely, accurate, high-value, andactionable.
Good BI insights can look different depending on the shape and scope of yourimplementation. It’s for you to decide what scope makes sense. Companiesare different, as are their internal processes and organizational structures.Part of the challenge of implementing a sensible business intelligence solu-tion is managing the scope so it applies exactly where it’s needed. Sometimesthat means finding the place where BI insights can have the biggest impact;sometimes it’s about delivering a usable solution on time.
Whatever it is, determining your project’s scope — how far the implementa-tion will reach, what areas it will touch — is paramount to its success. In thenext sections, we talk about some of the dimensions you should considerwhen you’re specifying the scope for your BI project.
Enterprise versus departmental BIFor most companies, the scale of the BI implementation is predetermined bythe team that originated the idea, the size of the project’s budget, and thelevel of buy-in from the company’s leadership:
40 Part I: Introduction and Basics
07_127230 ch03.qxp 12/4/07 12:23 AM Page 40

� For smaller implementations, the focus rests on a single department.
� Larger projects are an entire enterprise solution that affects the entirecompany.
As a best practice, your company’s first BI implementation should be at thedepartmental level. Keeping it narrowly focused affords you the chance tolearn and make mistakes, to see what does and doesn’t work. Then, whenyou’re ready for the big time, you can widen the scope for the second genera-tion of the BI project. If you must implement an enterprise-wide BI project, atleast make sure you keep the scope focused on a single function or geographicregion. Trying to do it all right off the bat (multifunctional, enterprise-scale) isa challenge that has stymied even the best BI gurus.
Characteristics of enterprise BIEnterprise BI projects are, naturally, broad in scope. They affect multiplefunctional areas of a business; typically they involve taking a unified view ofthe entire company (or of an entire self-contained business unit). Often heavyon analytics and forecasting, these projects produce insights that affect long-term decisions.
Enterprise-wide business intelligence is operated and sponsored by “C-level”people whose titles start with Chief — primarily CEOs and CFOs. That makessense because they’re the only ones who have the juice to force all businessunits to cooperate. Why wouldn’t they cooperate? Read on.
Some CEOs run Darwinian businesses where their departments or businessunits compete against each other for survival. In this environment, bonusesand stock options are doled out only to the most successful pieces of thebusiness. That’s a problem because BI requires cooperation. BI projectsinvolve — first and foremost — sharing potentially sensitive data betweenteams. It also requires buy-in of technology and business resources from allsides. While the surface may appear calm before work begins, internecineconflicts tend to bubble to the surface during a BI implementation. In big projects — say, installing enterprise-level BI systems — sooner or later everyone has to put their cards on the table. At that point, usually you findthat someone is bluffing.
Characteristics of departmental BIUnlike enterprise-level business intelligence projects, departmental BI existsat the operational level; where the rubber meets the road in an organization.Projects at this level are built to produce insights that fine-tune dailyprocesses and improve short-term decisions. With this type of project, you’relooking for insights in one narrowly defined piece of your business, such asmarketing, sales, or finance.
41Chapter 3: Meeting the BI Challenge
07_127230 ch03.qxp 12/4/07 12:23 AM Page 41

Departmental itself is an abstract term that in essence means “anything that’snot enterprise-wide.” There are all levels of departmental BI, from single-teamto multi-department. The word department itself could describe a traditionalbusiness team, or business functions that share a common geographic regionor mission. There is no universally accepted definition, so when you discussimplementing a “departmental” BI solution with others, make sure you allagree on what the term means.
Enterprise versus departmental: Choose wiselyOften a BI initiative starts off with an enterprise scope in mind, along withgrand dreams for producing business insights that will affect the strategicdirection of the whole company. But over time, as the challenges of the pro-ject are faced and dealt with, it often becomes clear that the initial scope wasfar too ambitious and the BI toolset — along with the lofty expectations —has to be scaled down.
Adjusting the scope of a project downward is a natural step to take when yourealize you’ve bitten off more than you can chew. But beware! A BI tool for asingle division or functional unit can still provide excellent value to the com-pany, as long as the solution itself hasn’t been denuded to the point wherethe insights themselves no longer live up to BI standards. (Perish the thought!)Remember, if they don’t match the Big Four characteristics, they aren’t BI.
Managing expectations is absolutely essential in any discussion concerningscope. It’s far easier, cheaper, and faster to do departmental BI, but you getwhat you pay for and nothing more. If your audience was expecting a com-pany-wide solution, they’ll be disappointed when the curtain goes up.
Smart organizations build a scalable solution — a departmental applicationthat can be expanded and linked in with other data sources in the event suc-cess is encountered and the bigwigs deem it necessary to expand the com-pany’s BI out to the enterprise.
Mind the (operational) gapDepartmental and enterprise BI solutions can be a challenge mainly becausetraditionally there’s been no smooth continuum of solutions that can handlethe whole range — small-scale departmental BI, medium-sized business unitBI, and the largest enterprise-wide BI. Vendors normally produced softwarethat covered only one specific level of an organization — perhaps even asingle specialty, such as accounting, travel services, human resources, or e-commerce.
This operational gap — which separates BI into different scales of activity inone company — is one of the main challenges the industry faces today. Howdo you build a bridge between BI user groups at different levels of the com-pany? The essence of the problem is that when strategic insights occur at thetop of the company, there’s not always an easy method of translating thosechanges into the company’s day-to-day operations.
42 Part I: Introduction and Basics
07_127230 ch03.qxp 12/4/07 12:23 AM Page 42

That task is so important, it’s earned its own buzzword: operationalizing busi-ness intelligence. Enterprise BI tools may produce valuable strategic insightsor reveal a long-term destination for the company. But that doesn’t mean theway forward is always clear for individual workers or departments. To opera-tionalize BI is to create an action plan of achievable day-to-day improvementsthat moves the company toward its strategic goals.
If your aim is to change the way workers do specific departmental tasks, butthe scope of your BI is enterprise-wide, you may be asking for trouble. Youhave to find a way to translate those strategic insights into a tactical format.A good BI solution will account for this operational gap and take steps toaccommodate the inevitable “translation” problems between BI insights andtheir target audience.
Strategic versus tactical business intelligenceIn addition to the operational scale of BI that differentiates between depart-mental and enterprise-wide solutions, there’s also a range of differences inthe scope of the decisions that BI insights indicate. Strategic BI deals with thebig picture and the long view; tactical BI handles today’s immediate decision-making process and other details of getting the job done, day in and day out.
Strategic decisionsThis kind of BI involves gaining business insights for long-term corporatedecisions, whose arc covers the broad direction of the company or businessunit as a whole. Imagine a question such as, “What is the optimal product mixfor the New England sales region in Q1 2009?” The insights that can be gainedfrom questions like that may not affect the day-to-day operation of the com-pany: the receptionist will still answer the phone, the sales team will continueto make calls on customers, the factory will continue to run the same way. Atsome point, however, such questions may prompt a strategic shift that leadsto a long-term change in how the company operates.
Tactical and operational decisionsThese decisions guide how a company operates on a day-to-day basis; they’reusually peculiar to a given department or business sub-unit — for example, adecision on the size of the discount that certain customer affinities mightreceive, or setting the price a business pays for a certain commodity. Theseare choices that affect day-to-day operations, and as such may change fromday to day. It’s difficult to fully automate these decisions; reporting and othercomputational tools can play a support role, but at some point in the chain,carbon-based neurons have to wrestle with them.
43Chapter 3: Meeting the BI Challenge
07_127230 ch03.qxp 12/4/07 12:23 AM Page 43

If transactions are like traffic, then operational decisions are like high-volumestoplights at your company. They’re the yes/no gates that might approve ordecline credit to a customer, kick off a coupon-awarding routine (or fraudalert), or perhaps initiate a late charge in a billing system.
The BI processes that touch these decisions — tactical BI — involve insightsthat might affect a business on a day-to-day or week-to-week basis. Theinsights might lead to immediate changes or adjustments to previous deci-sions. Imagine a BI application that could give you the answer to a specificquestion such as, “Who are the bottom three sales representatives in thePacific sales region, year-to-date?” The answer to that might prompt anadjustment in pricing, product mix, or approach to the sales process. Thedecisions taken from tactical BI usually don’t involve the entire business unit; they just touch a department or single functional area.
There are two scales to think about: Enterprise versus Departmental BI, andStrategic versus Tactical BI. While they often go together, there is no auto-matic correlation between enterprise/strategic and departmental/tactical. Sobe careful that the solution you design answers the most important questionsfor your organization.
Power versus usability in BI toolsThis is really a question of your users. Are you likely to have a large popula-tion of limited-ability users? Or is your BI implementation going to be oper-ated exclusively by a small group of experts?
BI used to be the exclusive domain of highly experienced users — IT experts,sent to expensive training classes, would then operate on behalf of the busi-ness community to draw information from the BI application. This was themodel that BI vendors counted upon, and they focused all their attention onmaking more powerful analytic and forecasting tools.
But as BI has spread throughout the organization, non-expert business users —such as CEOs — need to be able to harness the power of the applications sothey can tap into the insights. As a result, more vendors are at least payinglip service to usability, creating self-service applications, and allowing thenon-experts a degree of independence from the über-nerds.
Nevertheless there is a tension between tools that focus on ease of use andthose with greater power, complexity, and flexibility. Suppose you anticipateyour users to ask questions like, “What are the profit margins in the firstquarter of this year for the 10 least profitable products of the last five years?” Fair enough — a good SQL query writer could build that query towork against a standard database, but not all BI tools can handle a questionof that complexity.
44 Part I: Introduction and Basics
07_127230 ch03.qxp 12/4/07 12:23 AM Page 44

A good way to gauge your needs along the two primary BI continuums (enter-prise/strategic and operational/tactical) is to anticipate what kinds of ques-tions your users will want to ask — and then compare the complexity of thosequestions with the likely ability of those same users to operate the BI tools.
Even the easiest BI applications are complex. Sure, the vendors have made iteasy to drag and drop dimensions and metrics into tables, but many userswill be stumped by such a simple move. Some folks are going to be so set intheir ways; they won’t be willing to run even the most basic of reports. Betterto sniff out that problem ahead of time rather than after you’re deep intoyour implementation. If your BI system is unusable to the people you’redesigning it for, it puts the entire project in jeopardy.
Reporting versus predictive analyticsBI gives companies the ability to peer into the past, slicing and dicing histori-cal data in revealing ways. But applications are available that dig through yes-terday’s information to form predictions about what the future will be like.
Coupled with data warehouses, BI tools give users access to snapshots ofinformation from the organization’s operational and transaction-based sys-tems. The capability to do complex drill-downs into this historical record iswhere the system provides its unique value for reporting purposes.
On the other hand, some BI vendors focus on predictive-analysis tools. Thissoftware uses advanced statistical techniques to create tomorrow’s forecastsbased on yesterday’s data. Not a crystal ball, but the next best thing.
BI that’s juuuuust rightInstalling a business intelligence solution requires some “TBA,” or ThreeBears Analysis, by the planners. The solution has to be relevant to the busi-ness audience you’re trying to reach; if that’s the executive management,then you need to measure the performance of entire business units. If, on theother hand, your users do their work at lower levels in the company, the toolwill have to involve departmental metrics and operational data. In addition,the project team must gauge the kinds of insights needed; the level of sophis-tication required; whether the BI will do predictive analysis; and whether itlooks backward, forward, or both.
None of these are simple Yes/No, Either/Or answers. They occupy a wide rangeof possible answers that require the BI project sponsors, project managers andbusiness analysts to toss aside any porridge that’s too cold or too hot, and toonly wield a spoon when the temperature is judged to be just right.
45Chapter 3: Meeting the BI Challenge
07_127230 ch03.qxp 12/4/07 12:23 AM Page 45

First Glance at Best (and Worst) Practices
In case you’re feeling a little lost, you can take heart in knowing that the pathbefore you is well traveled. BI is an evolving field that often features cutting-edge technology, but that doesn’t mean you can’t learn from the successesand failures of those who came before you. In this section, you’ll find a quicklook at some common insiders’ advice.
Why BI is as much an art as a scienceFortunately, if you’re on the Goldilocks mission to attain the just-right BI, it’snot like you’re completely on your own. The technology is mature enoughthat best practices are available — and (as we mentioned) BI architectureand software are only moderately complicated. So why do so many imple-mentations fail?
The answer is that there is an art form to juggling all the competing prioritiesand coming up with the right temperature for the porridge. Beyond findingthe right place on the continuum, there are political considerations, budgetconsiderations, and a host of other concerns. There are process questionsthat must be answered that nobody ever thinks about: How do you deal withhistorical data? How do you handle different levels of user expertise? How doyou validate requirements? How do you prioritize them? When you’re aboutto miss a deadline, how can you tide over the key players who were promiseda solution? How do you ensure that something else doesn’t go wrong becauseof your BI project?
It would be nice to have a salty BI project manager always handy — someonewho knows (a) the answers to these questions, (b) when to draw the line inthe sand, (c) when to avoid eye contact with the rabid CFO, and (d) when toback away from the keyboard and hide under a pile of old coats in the closet.But they aren’t always available, and there’s no chapter in this book on intu-ition. Hopefully by the time you finish you’ll be staked with enough knowledgeand understanding of the process that your gut instinct will be adequate.
Avoiding all-too-common BI trapsStatistics support that notion that more BI implementations fail than suc-ceed. That’s not meant to scare you off; it’s a reality check. In some cases itjust wasn’t meant to be. But more often than not it was one of the well-knownquicksand traps below that brought the expedition to an untimely end.
46 Part I: Introduction and Basics
07_127230 ch03.qxp 12/4/07 12:23 AM Page 46

Thinking technology alone can cover itSheer wishful thinking. Even if you’re prepared to spend millions on softwarelicenses, it’s impossible to do a plug-and-play BI implementation without getting buy-in from the data consumers — and, to some extent, the data producers.
They may be silent and invisible, but you can’t spell Business Intelligencewithout the letters T-E-A-M. Even modest BI rollouts require collaborationamong many disciplines. “If you build it, they will come,” is not a valid mantra for anything other than a cornfield in Iowa.
Thinking people alone can handle itNot to impugn the talent on your company’s IT team, but there is no reasonnot to buy some components off the shelf (so to speak) instead of taking thetotal do-it-yourself route. The vendors may be full of themselves, but there isa kernel of truth in their hype. Business intelligence solutions aren’t vastlymore complicated than other software rollouts — but they are complex enoughthat building the entire package from scratch usually isn’t worth your while.
Loving your data just the way it isData is hard to love if it’s useless. One common BI failure is not paying enoughattention to the quality of the data that’s feeding the system. Bringing thedata under one roof in the data warehouse is not (by itself) enough to ensuresuccess. It has to be examined for a host of common problems — from formatincompatibility to missing data — and then processed and integrated to makeit useful.
Remember that data warehouses are typically one-way streets. Transformingthe data once it gets to the warehouse doesn’t put your original data at risk.You shouldn’t be afraid to twist, tweak, edit, or delete the information that’sflowing into the data warehouse.
Confusing causality and coincidenceAlthough it’s true that analyses and reports are only as good as the data in thedata warehouse, it’s also true that the untrained shouldn’t draw conclusions.It’s easy to misread reports, and see things that aren’t actually there. As MarkTwain famously said, “there are lies, damn lies, and statistics.” What he meantwas that statistics and metrics can be made to tell a story that’s more fictionthan non-fiction. And Huck Finn has no place in a finance department.
One more continuum: hope versus hypeThat BI vendors often oversell their products shouldn’t come as a surprise toyou; in fact, it makes BI just like every other technology. What’s a little differ-ent about business intelligence is the way it’s changed monikers over the
47Chapter 3: Meeting the BI Challenge
07_127230 ch03.qxp 12/4/07 12:23 AM Page 47

years. The different acronyms make it difficult to keep track of what’s what inthe industry — and that, combined with other factors, means the vendorsmay try to talk you in circles.
No matter which part of their pitch you listen to, there’s an awful lot of noise.And to add more confusion to the mix, the industry can change month bymonth as companies acquire each other and go out of business. Just keepthat in mind at your next product evaluation. Many of the total BI packagesare really just hodgepodge collections of products built by different compa-nies and acquired one-at-a-time over the years by the company that’s pitching its wares to you right now. That doesn’t mean the packages won’twork — but as always, caveat emptor.
Remember, BI vendors are there to wow you, to make you think your busi-ness will transform itself overnight if only you would buy their products. Justremember that for every survivor in the BI marketplace, there is a companythat fell by the wayside — and they said exactly the same thing to theirclients right up until the paychecks started bouncing.
In fact, it’s almost guaranteed the vendor you’re talking to right this momentwill claim to have a perfect solution for you, no matter where you are in theBI life cycle. (Isn’t that easy?) If you’re in the midst of a failed implementation,they’ll tell you their product is the missing piece of the puzzle that will stabi-lize the system and make it start spitting out amazing organizational insights.If you know very little about BI and are just starting down that road, the vendorwill take the role of the wise doctor — and the prescription they give you willjust happen to include a healthy dose of their products and services.
As with medical doctors, when in doubt, get a second opinion, and a third,and a fourth.
48 Part I: Introduction and Basics
07_127230 ch03.qxp 12/4/07 12:23 AM Page 48

Part IIBusiness
Intelligence User Models
08_127230 pt02.qxp 12/4/07 12:22 AM Page 49

In this part . . .
Okay, now you know the basics. You’ve seen that busi-ness intelligence solutions can harness all that data
you’ve kept over the years on your lemonade stand, bringit together, and turn them into something useful. But how?
The answer is you’ll have to make those BI tools work foryou. And in order to do that, you’d better understand whatthey are, and what they can and can’t do.
First is the obvious stuff: reports. Pulling interesting dataout and re-assembling it in ways you hadn’t thought of.Like working out how the profit margin per cup of lemon-ade sold varies with the high temperature. Then you’lllearn about other tools that help you get the most out ofthat data, like dashboards and scorecards that let youknow how your stand is doing at a glance, calculatingreams of data behind the scenes to give you a simplethumbs-up or thumbs-down.
08_127230 pt02.qxp 12/4/07 12:22 AM Page 50

Chapter 4
Basic Reporting and QueryingIn This Chapter� Fitting querying and reporting in with the rest of the BI stack
� Getting to know the query and reports user
� Understanding how query tools work
� Seeing how managed reporting affects business
Up to now we’ve talked about business intelligence as an abstract notion;it’s the tools, technologies, and practices that produce critical business
insights. But how exactly does a BI system accomplish such an ambitiousmission?
Where does the intelligence come from? How does it happen?
You might have visions of a bunch of IT geeks huddled around a hummingsupercomputer, waiting for it to spit out the answer to all of life’s great ques-tions that they can then rush straight to the CEO. Or perhaps you’re picturinga golden dot-matrix printer sitting on a raised dais in the boardroom thatoccasionally belches out pronouncements like “Betamax will beat out VHS” to the wonderment of the leadership council.
If only it were that simple.
In this chapter we talk about querying and reporting, where the rubber reallyhits the road on the sports car called business intelligence. Querying andreporting represents the face of a BI implementation, where all the work thatgoes into the back end — from the gathering and transformation of company-wide data, to its creation and storage inside a data warehouse — emerges ascritical knowledge, ready to be acted upon by the team.
Power to the People!Data warehousing and its connected functions are the exclusive domain ofthe pocket protector set, but querying and reporting represent pure ITdemocracy-in-action. These are the tools that allow individual contributors
09_127230 ch04.qxp 12/4/07 12:22 AM Page 51

and knowledge workers to access the aggregated information inside a datawarehouse, ask questions, poke and prod the answers, and finally mold theminto timely, accurate, important, and actionable insights.
Querying and reporting tools aren’t locked away in the server room, nor dothey rest on a shiny dais in the boardroom. They are designed to go ondepartmental PCs and laptops. They’re meant to be accessed by individualsin the middle tiers of management and lower throughout the company. Vendorsdesign them with ease of use and flexibility in mind so they can be utilized byvirtually any department — so they can handle data tasks of any stripe, fromaccounting and finance to sales and marketing, and everything in between.
The traditional way to look at querying and reporting applications was alwaysto draw a solid line between the two. Querying applications were focused onenabling users to take point-in-time snapshots of a particular set of data.Reporting was always focused on the output — the presentation of the data. Today, software vendors have virtually merged the two functions. Thebroken record plays on, stuck on the notion that querying is forever dividedfrom reporting; don’t get caught up in semantics.
Querying and reporting in contextWhat you need to understand about querying and reporting tools is that theyprovide users with the main pathways to the data itself. To do that, they have to be designed to work closely with the data warehouse or other datasources through common communication protocols, and then interpret anddisplay their results. And they have to do it all fast.
A query is nothing more than an electronic request for specific informationfrom a database. Queries hold an important place in the world of databasetechnology, data warehousing, and (therefore) business intelligence, becausethey are the most basic link between a user and the insights contained in thedatabase. The great dramatist Eugene Ionesco wrote, “It is not the answerthat enlightens, it is the question.” He could have been a BI consultant; creat-ing the correct query to get the information you’re after is half the battle.
ToolsAlthough they’re usually wrapped up in one package, here’s a brief descriptionof the important aspects of querying and reporting applications.
Querying toolsBecause a query itself is a request for information from a database, queryingtools are designed to help a user create that request. Common querying toolsprovide a graphical interface to make it easy to see what data fields are avail-able and to give the user an insight into the metadata — how the fields are
52 Part II: Business Intelligence User Models
09_127230 ch04.qxp 12/4/07 12:22 AM Page 52

related, table structure, and so forth. The latest-generation tools also offereasy-to-use drag-and-drop capabilities that allow users to adjust their querieson the fly as they drill down into the results that are returned. (That’s anadvanced data-manipulation technique; more about those later, particularlywhen we get to online analytical processing in Chapter 6.)
Reporting toolsRetrieving the right information from the database is one thing; presenting itin a meaningful, understandable way is quite another. That’s where dedicatedreporting applications come in. They’re usually either bundled with, or one inthe same as the query tools. Like the query tools, modern reporting toolsoffer an intuitive, graphical interface that allows the user to perform calcula-tions on the data retrieved through a query, such as averages and sums.Beyond simple presentation, reporting software helps organize and distributequery results in the form of reports.
Querying and reporting in the BI architectureIt might be helpful to take a snapshot from 20,000-feet of the entire BI archi-tecture so you can see how querying and reporting applications fit with therest of the components of a BI solution.
Starting at the bottom, you see the disparate data sources that may be spreadthroughout the company — across departments and ranging across geograph-ical and functional divisions. The data sources are operational databases, inuse by each department to record regular transactions and store data that isfrequently accessed and changed.
The data sources connect into the data warehouse through a set of processescommonly referred to as ETL, or Extract, Transform, and Load. Theseprocesses do exactly what they say; first they grab relevant data from theoperational databases, then they change it into a single, unified format so all data is apples-to-apples. After the data is clean, it’s loaded into the datawarehouse.
Querying and reporting tools sit astride the data warehouse. They act as theabstraction layer between the user and the really confusing, complex codethat pulls just the right data from the database and puts it on somebody’sdesktop in a readable format.
Figure 4-1 shows how the users of the query and reporting tools — like theoriginal data itself — can come from different departments representingdiverse business functions. They can use the same query and reportingengine because that software is built to accommodate virtually any type ofdata, and can present it as a report that suits the needs of whichever usershappen to be viewing the information.
53Chapter 4: Basic Reporting and Querying
09_127230 ch04.qxp 12/4/07 12:22 AM Page 53

Reporting and querying puts BI over the humpIn the old days, creating attractive and usable reports was a ridiculouslytime-consuming and expensive process that often required the services of a developer. That meant the process of requesting reports had to be tightlycontrolled by a company, lest the reporting budget get out of hand.
This bottled-up information circulated only among the upper levels of man-agement. For the average knowledge worker, there was no choice but to utilize standard reports, make futile requests for additional information, or perhaps to try to see the same information in a different way and hope for the best.
Inventory
Data Source #1
Sales
Data Source #2
Accounting
LANAccess
User
Tool
sVPN Access
Querying
Data Warehouse
TransformationProcesses
WebAccess
Depa
rtmen
tal U
sers
Reporting
Procurement
Data Source #3
Supply Chain Finance
Figure 4-1:Business
intelligencearchitecture
overview.
54 Part II: Business Intelligence User Models
09_127230 ch04.qxp 12/4/07 12:22 AM Page 54

Even as corporate computing moved away from the mainframe and towardclient/server, reporting was still a challenge. What few reporting tools existedrequired a high level of expertise to use. Anything beyond the standard func-tions meant calling in a developer — just like before — except perhaps theunderlying language was improved, making the reporting cycle a little shorter.
BI’s rise to prominence in business can largely be traced to the advent ofinteractive query- and report-design tools. This allowed the information toflow outward to all levels of an enterprise, to workers without one iota of pro-gramming experience. Trendsetting tools like Cognos Impromptu and CrystalReports allowed non-programmers to get a one-way (read-only!) look at thedata in a database or data warehouse — and share the insights they gainedwith others — all with minimal training.
It’s easy to lose sight of the value of BI querying and reporting tools becausein the abstract, they look similar to any other GUI-based application sittingon a database. So what makes BI different from a plain old Access databasewith some slick controls and pre-designed reports? The power and flexibilityof BI solutions. Business intelligence combines several key technologies in away that can’t be mimicked by a one-off application or simple database. Forone thing, it provides a unified look at potentially very different data residingon multiple databases. The data warehouse is a snapshot of operational andtransactional data that users can slice and dice in ways that aren’t possiblewith traditional systems. And finally, all that’s made possible by the advancedquerying and reporting tools described in this chapter.
Reporting and querying toolkit characteristicsHere’s a look at the latest generation of querying and reporting tools, evalu-ated on several key features that (naturally) vary from vendor to vendor.
Easy to useThe democratization of BI starts with making the tools user-friendly. Becausethese applications are no longer the exclusive domain of IT experts or pro-grammers, they need to be usable by the masses. That means
� Making help available in the software
� Providing an intuitive and logical interface
� Making some common decisions on behalf of the user
The trade-off you make to get ease of use is a reduction in the overall capabil-ities of the product.
55Chapter 4: Basic Reporting and Querying
09_127230 ch04.qxp 12/4/07 12:22 AM Page 55

Web-basedNewer querying and reporting tools offer a Web interface that allows users to access the tool as a service through a common Web browser. While thisarrangement places some natural limits on the capabilities of the software —and raises availability and security concerns — often the overall benefits outweigh the costs:
� Workers don’t have to fuss with bulky client software, or deal with theusual headaches of software upgrades.
� It makes support a breeze for the IT organization.
SpeedyOne of the biggest challenges in any data-heavy application is providingenough horsepower to manipulate millions of rows of data at a time, or to runcomplex queries without crashing the system. While much of the speed is dic-tated by the data-warehouse implementation itself, the querying-and-reportingapplication can drastically affect the responsiveness of the system. As the oldIT-support saying goes, “Fast, cheap, reliable: You may pick any two.”
InteroperableNot only is it important for querying and reporting tools to be able to inter-pret data from multiple data stores, but it’s also important that the output ofthe system can be used across different platforms like Excel.
Drill down capabilityWhat makes a BI system so powerful is that users can dig through the dataquickly — peeling layers off, rearranging the information in different formats,pivoting it to look at the data by one dimension instead of another, and focus-ing on the returned information with ever-increasing precision.
Versatile in communicationsSharing data between users, across departments, and up and down the levelsof a company is a key factor for BI practitioners. Querying and reportingtools can facilitate that process by providing standardized and scheduledreports, as well as custom alerts that kick off predetermined querying and reporting processes when specified conditions are met.
So who’s using this stuff?Three main classes of BI users work with querying and reporting tools. Eachhas different needs and skills, and they’re probably consuming differenttypes of data. There are two competing goals for classifying users:
56 Part II: Business Intelligence User Models
09_127230 ch04.qxp 12/4/07 12:22 AM Page 56

� Considering the users as one homogenous group creates a lowest-common-denominator effect for the BI implementation. That’s a good baseline for your design but might limit your thinking.
� Recognizing where users differ provides an indicator for where the application(s) need to provide specialty services and interfaces.
Information consumersPure information consumers view preexisting standard reports (or perhapsreceive them by way of a distribution tool), and then use the data to performsome task.
These folks aren’t creating their own queries or reports, although they mayuse the basic functions of the reporting tools to access the standard reports.
The BI middle classThese basic users can create their own queries and reports using the graphi-cal interface, but they don’t know any code, and couldn’t fix a SQL string inthe event their queries needed tweaking.
Basic users rely on the GUI-based applications, the pre-set reports, and thesimplest functions available in the tools.
Power usersPower users include developers and administrators. These folks make deci-sions about what information other knowledge workers need to see; theycreate reports and set access and distribution rights. Power users can bedevelopers or simply experts at the particular querying and reporting tool inuse by the enterprise.
Level of authority within a company plays absolutely no role in determiningwho’s who in the user food chain. A CEO is just as likely to be a simple con-sumer of data as a lower-level worker is to be a power user.
Most BI users are mid-level managers and below. They’re individual knowl-edge workers who contribute across a wide array of departments. More thanever BI is an essential tool up and down the corporate hierarchy.
One of the enabling factors of the power of data-driven solutions like BI isthat SQL as a computer language has proven remarkably stable; the versionin use today is much like the original. Vendors produce their own flavors thatfit with the precise features of their applications, but the core of SQL is thesame across all platforms. SQL is not without its disadvantages and detrac-tors, but the language has become so ubiquitous that it has become an openstandard set by the American National Standards Institute (ANSI) as well asthe International Standards Organization (ISO).
57Chapter 4: Basic Reporting and Querying
09_127230 ch04.qxp 12/4/07 12:22 AM Page 57
Basic BI: Self-Service Reporting and Querying
Because writing queries and accessing the database used to be such a heav-ily restricted process, the average knowledge worker had to make requests of the IT department, await approval, and then have the results sent to them.Today the concept of self-service is ubiquitous. Knowledge workers utilizinga BI tool will interface with the data by creating their own queries, using anapplication that sits on the desktop or Web browser. The results of the query are returned immediately to the user, who is then free to format thoseresults in an endless variety of report styles.
From beginning to end, the IT team never has to be involved beyond settingup the system. The power and usability of the tools themselves ensure thatprogrammers never have to touch the reports. This naturally results in effi-ciency gains for the workers, as well as cost savings for the IT team.
58 Part II: Business Intelligence User Models
Databases and SQLWith any application that touches a database,there’s inevitable use of the term SQL (pro-nounced as the letters S-Q-L or like the wordsequel.) SQL stands for Structured QueryLanguage — and is exactly that: It provides astandardized methodology for asking questionsof databases.
SQL grew in importance in the 1970s as therelational database model became the stan-dard. With flat-file databases, queries could benothing more than simple filters on the datafields. But relational systems are more complexand require a semantic model to match in orderto access the advanced table structures.
The most basis of SQL queries are SELECTstatements, like this one:
SELECT * FROM tblSTUDENTSWHEREtblSTUDENTS.BIRTHDATE >=
“01/01/1980”
The star (*) in this query represents the wordeverything, so this query asks the database toreturn all the information stored in the tablecalled tblSTUDENTS. So if that table con-tained the student’s first name, last name,middle initial, and birthdate, the results wouldinclude all four fields. If we were only interestedin the student’s name, we could replace thatstar with specific field names.
The WHERE statement indicates that we onlywant certain students returned. In this case, astudent’s information is included in the resultsonly if his or her year of birth is 1980 or later. Thephrase tblSTUDENTS.BIRTHDATEmeansthe BIRTHDATE is the name of the field in thetable called tblSTUDENTS that contains eachstudent’s birthday.
SQL is a remarkably flexible language thatallows users to perform a variety of databasefunctions beyond just creating queries. In factyou can create, load, and maintain a databaseusing only SQL commands.
09_127230 ch04.qxp 12/4/07 12:22 AM Page 58
Building and using ad-hoc queriesFor BI users, it’s not merely about being able to create queries and reports onyour own; the second half of the equation is having access to the data in realtime. In other words, workers can interact with the database as they need it,without delaying. This is the ad-hoc nature of BI; like many self-service capa-bilities, it provides extraordinary value for the company that enables itsteams in this way.
The people in the organization who create ad-hoc queries, then, are special-ists in other areas who use data from the BI system in their everyday jobs.These folks may be accountants or HR specialists or business analysts.
BI tools meet the companies’ needs because these knowledge workers caneasily design and deploy queries and reports using existing tools. They cando it with minimal knowledge of SQL (or other programming languages), inthe same way most employees in a business can operate an Excel spread-sheet. Creating ad-hoc queries and reports is simply another arrow in theirquiver that they use to get their jobs done.
Common application featuresWorkers will use tools to different degrees of confidence and effectiveness. Themost common features called for in modern querying and reporting tools are
� SQL-free query building
� Drag-and-drop creation of queries and reports
� Basic data-analysis features (such as creating a calculation on a report)
� Graphical features that allow users to easily build charts and graphs
� Easy publication of information — e-mail, Internet, intranet, wherevercolleagues might need to see it
� Export features
� Calendar and scheduler to help organize reporting functions
� Security that protects sensitive data
Building simple on-demand self-service reportsThe roots of business intelligence lie in reporting. The original impetus for cre-ating the entire system came from the need to take a closer look at transac-tional data to draw conclusions about the business. As the appetite for betterand more powerful reports grew, so did the demand for more capable systems.
59Chapter 4: Basic Reporting and Querying
09_127230 ch04.qxp 12/4/07 12:22 AM Page 59

The long history of BI and its precursors means reporting tools are now well-baked inside BI packages. The best practices were devised long ago; the mostpopular and usable feature sets are already built into reporting environments.The next subsection provides a fast overview of these features in action.
Concealing your sourcesGood reporting packages allow users to build their reports regardless ofwhere the underlying data comes from. That means the data source may be a relational database, a dedicated analytical processing database, a datawarehouse or data mart, or even another report or query.
Building your queryThe front-end tool will help you build your query by sorting through the datasources you’ve selected — revealing usable data fields. Query tools oftenhave wizards available to guide you through a commonly used process. Afterthe users select the data fields that correspond to the subject they’re tryingto gather information on, it’s time to set conditions to filter the results.
For example, you might want to see a list of history teachers at your school,along with their office hours. You’d need to access the tables that contain theteachers’ names, subjects, office hours, and probably office locations too. For the fields corresponding to the teaching subjects, you’d want to set acondition so the teacher’s record is returned only if it’s equal to history.After all, the whole purpose of the query is to get exactly the information you need, and none of the information you don’t.
Normally querying tools put a layer of abstraction between the user and thecomplex mechanics that happen behind the scenes to get your data to you.But sometimes an advanced user (or a user who thinks he’s advanced) likesto open up the hood and access the SQL that drives the query process. It’ssimilar to a Web-authoring tool that gives the user access to the underlyingHTML that gets created from the graphical interface. Most querying andreporting tools offer a way to let users get their hands dirty if they so choose.
Perfecting the reportOnce the query is run, the user should then be able to adjust the arrange-ment of the data, for example, looking at the revenue figures by quarterrather than by region. The software should allow the user to do this with afew simple clicks, dragging and dropping data fields. Every change the usermakes will result in cosmetic changes only; it’s a different perspective on thesame underlying information.
One common feature of reporting tools is called adaptive authoring wherebythe software is designed to make certain aesthetic choices on behalf of theuser, for example, resizing fonts and shapes to optimal levels depending onhow it fits in with the rest of the report.
60 Part II: Business Intelligence User Models
09_127230 ch04.qxp 12/4/07 12:22 AM Page 60

Publishing the dataBecause sensitive data exists throughout the enterprise, it may be necessaryto set viewing privileges to ensure that only the appropriate pairs of eyes seethe data contained in the report. A report’s author should be able to rely onthe administrative features in the reporting tool to limit distribution of thereport to only those users authorized to view the data.
Most halfway-decent report distribution applications can publish that infor-mation in whatever form is appropriate — such as HTML, Excel spreadsheets,CSV files, PDF or Word documents, and even XML output.
If it’s not presented in the right way, key insights can remain hidden insidereports. Sometimes the most effective way to present information is notsimply as a collection of numbers, or with rows of raw data. A picture can beworth a thousand words. That’s why most reporting packages have advancedgraphical capabilities that allow non-expert users to create stunning graphi-cal displays to drive their point home.
At this point, most good BI software will also allow the report to remain up to date, long after the original creator has moved on to other projects. Theoutput of the report can be tied to another program, or perhaps a pivot tablein an Excel spreadsheet. Every time a consumer of that report goes to look atit, the data will be refreshed with the most up-to-date revenue, shipping,accounting, or other information.
Web reportingOne of the latest innovations in reporting is publishing live reports to theWeb for better access and ensured compatibility. Users simply call up the report using a common Web browser — perhaps entering a passwordalong the way (as set and distributed by the original creator of the report).
The state of the art in reporting tools is to allow basic users to push complexinformation to the Internet without knowing a word of the underlying ASP,HTML, or other Web-enabled languages. As Web protocols grow more secure,more and more companies are becoming comfortable using this paradigm.
Adding capabilities through managed querying/reportingFor users unable (or unwilling) to operate the querying and reporting software — or for businesses that are unwilling to give their workers fullaccess to the data sources — there is managed reporting. Managed reportingtakes the Wild West of a completely self-service-oriented data environment,and adds a sheriff to the town.
61Chapter 4: Basic Reporting and Querying
09_127230 ch04.qxp 12/4/07 12:22 AM Page 61

Many BI consumers have no need to create complex reports, or to writeByzantine database queries to get what they need. They have little need touse the advanced features of the report-writing software. They just need therelevant data handed to them in a timely fashion so they can do their jobs.
Managed reporting is a bridge between simple consumption of reports andself-service report creation, where employees are responsible for getting theirown information from the database. In this situation, the users are given stan-dard reports authored by others, and are given some freedom to explore, sort,filter, graph, and drill down into the detailed data — under the watchful eyeof a team of data managers who control permissions, restrict when queriescan be run, specify what data is available, and so forth, all from a centralizedorganization.
The data managers are also there to prevent problems that can arise from acompletely open environment, and make sure that help is available whenneeded. (Chapter 13 details how environments like this are governed.)
Accessing and using standard reportsThe hallmark of managed reporting environments is a library of standardreports created by a centralized IT team. These are the most common reportsused by the various functions accessing the BI solution. A user would simplygo to a shared location on the company intranet to access the report, orwould perhaps look at the report through the Web.
Standard reports certainly make life easier for many data consumers and BIusers. There’s no thought involved in creating the query or building the pre-sentation of data; the user simply points and clicks and the report appears.The hard part’s all done by someone much more interested in it than (say)Marge in accounting, who just needs to see that her numbers match withthose on the monthly revenue report.
But just because your environment provides standard reports doesn’t meanyour company’s users don’t need at least some knowledge and training onthe software. The snazziest reports in the world are worthless if your teamdoesn’t know how to access them, read them, or interpret them.
Interactive reporting is a key feature of business intelligence software. Whenyou think of normal reports, you ask the database a question by sendingalong a query. The database software then finds data that matches yourquery and returns a report, organized and presented in a predetermined way, sometimes showing every row of returned data, sometimes showingsummary information.
With interactive reporting, it’s possible to manipulate the results of yourdatabase query until you get just the data you need. The first time you run aquery, you may not find what you’re looking for. But the answer to that initial
62 Part II: Business Intelligence User Models
09_127230 ch04.qxp 12/4/07 12:22 AM Page 62

question — the data contained in the report — may provide you with a clueof where to look next, or how to structure your next query. Interactive report-ing makes it easy to zero in on the data you were looking for in the first place.If all goes well, after refining your query several times, your insight appears.
We get more into drilling down (as well as up and across) — in particular,with OLAP tools — in Chapter 5. These are analytical tools that are closelyrelated to reports, and in fact share many common features with the front-end tools common to most BI platforms. But in the BI world, there is a cleardividing line between common querying and reporting tools and OLAP tools;we’ll save that discussion for the next chapter.
Data Access — BI’s Push-Pull Tug-of-War
A natural tension exists between two basic philosophies of data access, and ifyou’ve read this chapter carefully (and why wouldn’t you have?), then you’vepicked up on it. The common challenge is connecting the right people withthe right data. In some cases, businesses rely on their employees to go outand seek the data they need; in others, IT managers have determined it’s bestto take that potential variable out of the equation, and push the data straightto the appropriate users.
63Chapter 4: Basic Reporting and Querying
Keeping controlAs BI gets closer to the strategic core of manybusinesses, it becomes more important that itbe kept up-and-running and in good health. Thepieces of a business intelligence system areextraordinarily powerful, but they have anAchilles heel in that they are built on databases,which can be brought down by careless users.So with the increased role of BI, and with the increasing pressure to push more dataaccess to end-users, vendors have developedmore complex administration tools and querygovernors.
If you’re thinking a query governor sounds likesome kind of a statehouse scandal, you’ll bepleased to know that it’s nothing more than anapplication feature designed to protect the datasystems from harmful requests. Database pro-cessing power is a finite resource — and aquery governor acts to prevent poorly-writtenqueries from executing, or from running pastcertain time limits. That helps keep system per-formance from degrading or crashing alto-gether. Administrators can tune their governorsto balance the user community’s needs and thesystem’s resources.
09_127230 ch04.qxp 12/4/07 12:22 AM Page 63

Classical BI: pull-oriented information accessIn its traditional role, BI relied on a pull environment. In this situation, it’s upto the users to go out and create queries, build reports, or view the standardreports created by someone else. Users need data to do their jobs, and it’s upto them to navigate through the query and reporting systems to get what theyneed. It’s not all that different from getting up from your desk and “pulling” afile from the cabinet. Wouldn’t it be nice if somebody — perhaps a helpfulrobot that makes coffee, too — went to the filing cabinet for you?
One of the key tenets of BI is that the data-fueled insights must be timely. Youneed critical insights — that the market is going to turn, or that inventorieshave reached a critical level — in plenty of time to act. But in a classic pullenvironment, you run the risk that your workers may not gather the neededdata in time. And without timely data, you don’t have business intelligence,you have stale bread.
Emerging BI: pushing critical insights to usersThe latest generation of business intelligence tools is moving more decisivelyto a push environment. With push technology, a power user assembles dataon behalf of the user community and delivers it at critical moments. Theunderlying data is the same as in a pull environment, but the data “pusher”decides what data is important, the people it’s important to, how it should be presented, and when that information should flow into the hands of theenterprise’s critical teams.
Push environments also rely on some kind of directory service to contain allthe important information about the data and user environment. It trackswho has permission to see what, keeps tabs on which reports they’re receiv-ing and when, and provides a mechanism for making changes in how the datais pushed to users as needed.
Don’t underestimate how complex reporting environments can be. Two peoplewith the same job title may be able to see the exact same standard report,but because they roll up to different business units, the users’ informationpermissions are different. Or perhaps two people have access to the samedata, but one person is not allowed to publish it while the other can distrib-ute at will.
64 Part II: Business Intelligence User Models
09_127230 ch04.qxp 12/4/07 12:22 AM Page 64

Add to that the sheer variety of ways to push information to users, and set-ting up a good reporting system becomes a potentially mind-blowing challenge. Too many companies fail to account for the importance (and thelevel) of the expertise required to manage a push reporting environment.
65Chapter 4: Basic Reporting and Querying
Red alert, red alert: different models of alertsAlert services represent a relatively newadvance in BI front-end tools that allow usersmore organization in a self-service environ-ment. Users or managers can set their systemsto warn them when new data is available, or simply to let them know that it’s time toupdate their standard stable of reports. With
communication options so dispersed, a goodalert system can send you messages on yourphone, through your e-mail, or as a message on an intranet or portal. Users can set their preferences to receive a note about the report,or get the entire report itself.
09_127230 ch04.qxp 12/4/07 12:22 AM Page 65

66 Part II: Business Intelligence User Models
09_127230 ch04.qxp 12/4/07 12:22 AM Page 66

Chapter 5
OLAP: Online AnalyticalProcessing
In this Chapter� Understanding OLAP basics
� Drilling into data
� Looking at OLAP on different platforms
� Seeing the benefits of a hybrid approach
If you ever watched Star Trek, you’re probably familiar with the way thecharacters would interact with the Starship Enterprise computer when
they had a problem. Mr. Scott, the ship’s chief engineer would say, “Computer,please isolate why the propulsion system is only operating at 40 percent.”The computer would respond (in a mellifluous, calming voice), “Fuel leakdetected.” After several rounds of back-and-forth, the computer might give a full diagnosis: “Broken Fetzer valve in compartment 28b causing dilithiumplasma buildup. Calculations indicate a 30% chance of detonation in the nexthour unless the valve is repaired, and an 84.3% likelihood that the cause ofthe broken valve is Klingon sabotage.”
You see? The twenty-third century’s not so different from today after all! Mr.Scott had what was essentially a business problem: performance in his areaof responsibility was lagging and he needed answers. And since starships areridiculously complex machines, he did what anyone would do in his position:He used computing power to examine operational metrics, find anomaloustrends, and identify a solution. Presto!
The great thing about those starship computers and HAL 9000 (from 2001: ASpace Odyssey) is their real-time interactive capability. Querying and reportingare clearly powerful tools; they provide priceless services to organizations ofall kinds. But what’s missing from that process is a true on-the-fly back-and-forth, where an operator can massage the query and the data itself to get precisely the result that’s required.
That’s what OLAP can provide, and it’s why OLAP is business intelligence’skiller app.
10_127230 ch05.qxp 12/4/07 12:22 AM Page 67
OLAP in ContextUp until now, our focus has been on the technology foundations of a BI solu-tion. First, you identify the important data in your company; that is, the trans-actional information that resides on ERP, CRM and other operational systems.Next you gather the data together into a single place, and in a single format;that’s the job of the ETL processes, the data warehouse and related compo-nents. Finally, you provide access to that mountain of data in the form ofquerying and reporting tools.
We could stop here and the solution described would be valuable to anyorganization. Producing unified reports against companywide operationaldata is likely to increase the managers’ visibility into how all the pieces inter-act, and make it more likely that valuable insights might come to light.
But years ago some clever programmers and database engineers realized thatthey could get more from company transactional data by conceptualizing itdifferently than was traditionally called for. The concept was multi dimensionaldata rather than relational data — manifested as online analytical processing,or OLAP (pronounced “OH-lap”).
Instead of just aggregating and summarizing your data, OLAP tools give BIsystems the ability to look at it in a truly new way. Add the increased comput-ing horsepower and innovative software tools available at the time, and awhole new paradigm was born.
OLAP Application FunctionalityAn OLAP application is software designed to allow users to navigate, retrieve,and present business data. Rather than taking data from a relational system,writing complex queries to retrieve it, then manually inserting it into a reportto analyze, OLAP tools cut out the middle steps by actually storing the datain a report-ready format.
Traditional data processing was like plumbing: Your query would get flusheddown into the system. You’d wait a while, and hope that what came out of thepipes on the other end was what you wanted.
That’s not the case with OLAP. While it’s true you have to make choicesabout the kind of data you want to get a look at initially, it’s possible to twistand cut the results immediately. There’s no need to work through confusingquery logic or write long SQL strings. With a little drag-and-drop action,you’re looking at the data in a whole new way.
68 Part II: Business Intelligence User Models
10_127230 ch05.qxp 12/4/07 12:22 AM Page 68
If you’re thinking this is just a snazzy way to create the same old weekly TPSreports for your boss, you’re missing the point. The O and the A in OnlineAnalytical Processing aren’t just there for looks: the online and analyticalaspects of OLAP add up to a key difference. Consider: Rather than a set-in-concrete report, OLAP allows for fully interactive sessions between users andsoftware. If it used to take you a week to build the report of your dreams tohand in to your boss, you’re in luck: OLAP can take you through the processin a matter or minutes and leave enough time to do the analysis yourself.
Okay, the P isn’t all that important in OLAP; it’s no surprise that Processing isgoing on here. But a nice consonant makes an otherwise-forgettable acronymsound more like a real word.
69Chapter 5: OLAP: Online Analytical Processing
How to get “online” without the InternetBoth OLAP and OLTP (online transaction pro-cessing) use online, yet both were invented wellbefore the Internet came into widespread use.As a point of reference, online used to meansomething completely different.
In the early days of computing, the systemswere used strictly to store data and to run spe-cific programs thought out and coded wellahead of time. Programmers and engineerswould feed code into the system, wait for it toexecute, and see what the results were on the other side (as the vacuum tubes and tran-sistors cooled in preparation for another roundof processing).
OLTP and OLAP include the term online to indicate a revolutionary shift in the actualprocess of working with computers. Instead ofworking with reports and figures offline, andthen feeding the results into the computer forprocessing, users could now work directly withthe stored data.
For OLTP systems, that meant a user in theaccounting department could change aninvoice status from unpaid to paid by sitting at a terminal, accessing the invoice’s datarecord, and changing the record in real time.We take such an action for granted today, but it
wasn’t always like that. Accounting clerks usedto have to aggregate transactions, and thenhave them fed into the computer in batches byprogrammers.
OLAP changed things on the other side of thedata path. Knowledge workers would requestgrouped data in the form of reports that wouldthen be processed at sparse intervals. If a userlooked through the paper printout and discov-ered a need to see things in a different way —say, sorting the data by date rather than byamount — the programmers would have tobuild a brand new report. Moving theseprocesses online meant the report’s consumerscould see the data on a computer or terminalfirst, make changes to the report as needed, andthen print the report.
OLAP actually takes that process a step fartherthan merely playing with reports online. Itallows the users to get their hands directly onthe data — changing queries on the fly, alteringperspectives, adjusting the scope of the data.Before OLAP, analysis was something that hap-pened away from the computer. Taking all thoseintermediate steps out of the process savedtime and money, and (best of all) people thoughtit was really cool.
10_127230 ch05.qxp 12/4/07 12:22 AM Page 69

Multidimensional AnalysisAn OLAP data-and-reporting environment is different from a traditional data-base environment — mainly because of the way data is conceptualized andstored. And we aren’t talking about putting it on magnetic tapes instead offloppy disks (how twentieth-century). In an OLAP system, users work withdata in dimensional form rather than relational form. OLAP’s bread andbutter is multidimensional data.
Don’t worry about geometry right now (or how you would fit such data into atable). Some people freak out at the word dimension because they think itmeans they have to understand Einstein’s Theory of Special Relativity andthe space-time continuum. For now, just remember that a dimension is noth-ing more than a way to categorize data.
The A in OLAP is not just any old kind of analysis — it’s specifically quantitative — based on good old number crunching — rather than qualita-tive. OLAP software is designed to work with numeric data. That’s why mostof the examples you’ll see are accounting, finance, or some other calculation-heavy subject.
Lonely numbersAt their core, financial records and sales data are really just numbers — prices,costs, margins, quantities ordered, and time periods. A list of numbers meansnothing unless you know something about what those numbers represent.What makes numbers meaningful (and available for analysis) is the details:their descriptions and qualifiers.
If you see a number in a vast table, it will mean little to you without the con-text provided by the title of the table (or chart or graph) and the names andelements of the axes.
One-dimensional dataConsider a table whose title is “Sales Data” with the vertical axis labeled“Region” — and you can begin to draw some business conclusions rightaway, as in the Table 5-1.
70 Part II: Business Intelligence User Models
10_127230 ch05.qxp 12/4/07 12:22 AM Page 70

Table 5-1 A One-dimensional TableAnnual Sales Data
Region Amount
Northeast $45,091
Southeast $73,792
Central $88,122
West $63,054
TOTAL: $270,059
Although the data is (of course) displayed in two dimensions (horizontal andvertical), in OLAP terms this is considered one dimensional data. In otherwords, we’re looking at sales data from one particular perspective (or dimen-sion): in this case, by region.
Since companies usually record lots of information about each individualsales transaction, you could probably look at the same batch of transactionsin a different way. Table 5-2 shows the same underlying sales data in a differ-ent dimension: by product type. The total sales amount is identical with thetotal in the sales table by region because the exact same transactions areused to calculate both. We’re just looking at it broken out by product typesrather than by regions.
Table 5-2 The Same Data from a Slightly Different DirectionAnnual Sales Data
Product Amount
Gizmo $88,697
Widget $181,362
TOTAL: $270,059
Another important factor in OLAP analysis is time, so let’s take a look at whatthe sales figures look like through the time dimension. Table 5-3 shows thesame underlying transactions broken out by calendar quarters:
71Chapter 5: OLAP: Online Analytical Processing
10_127230 ch05.qxp 12/4/07 12:22 AM Page 71

Table 5-3 Yet Another View of the Sales DataAnnual Sales Data
Quarter Amount
Q1 $55,887
Q2 $87,659
Q3 $23,598
Q4 $102,915
TOTAL: $270,059
Setting the tableBy running reports that show a breakdown of annual sales figures by region,product, and quarter, we know what the total sales figure is — and we canrecognize which of those dimensions shows sales strength and weakness. Butwhere we go from there is a different story.
One option is to combine two of the dimensions into a table like Table 5-4.
Table 5-4 Two Dimensions of Data CombinedAnnual Sales Data
Product Totals
Quarter Gizmo Widget
Q1 $23,199 $32,688 $55,887
Q2 $24,798 $62,861 $87,659
Q3 $14,555 $9,043 $23,598
Q4 $26,145 $76,770 $102,915
TOTALS $88,697 $181,362 $270,059
With two-dimensional data, you can begin to think of dimensions as a kind ofcoordinate system. With quarters listed down the vertical axis and producttype listed across the horizontal axis, each unique pair of values of these twodimensions corresponds to a single point of data. For example, we know thatQuarter 2’s Widget sales were $24,798.
72 Part II: Business Intelligence User Models
10_127230 ch05.qxp 12/4/07 12:22 AM Page 72

Okay, let’s not dislocate our shoulders patting ourselves on the back for this“breakthrough” — tables date back to the Stone Age as a way to store two-dimensional data. Any spreadsheet application can handle table datawith ease.
But remember: We also have regional data as well, so how can we incorporatethat information here? One way would be to create a series of two-dimensionaltables. We could map regional sales figures by quarter, and we could mapregional sales figures by product type.
But that doesn’t necessarily get us where we ultimately want to go.
Seeing in 3-DAn analyst or a manager would find it especially helpful to be able to see allthe dimensions — regional, quarterly, and by product type — on the sametable at the same time.
But since spreadsheets and tables render all information in two spatial dimen-sions, we have to rig our table to handle the extra complexity. In Table 5-5,we’ve drilled deeper into the sales data. The individual data points from ouroriginal three one-dimensional tables are now the subtotals on the edges ofthis lone three-dimensional table.
Table 5-5 All Three Dimensions in One TableAnnual Sales Data
Region
Northeast Southeast Central West Total
GIZMOS
Q1 $1,543 $14,098 $1,991 $5,567 $23,199
Q2 $6,811 $2,822 $13,300 $1,865 $24,798
Q3 $5,190 $5,050 $2,106 $2,209 $14,555
Q4 $2,347 $8,005 $5,900 $9,893 $26,145
WIDGETS
Q1 $3,555 $5,520 $6,828 $16,785 $32,688
Q2 $9,158 $15,999 $18,096 $19,608 $62,861
Q3 $2,486 $1,297 $4,247 $1,013 $9,043
(continued)
73Chapter 5: OLAP: Online Analytical Processing
10_127230 ch05.qxp 12/4/07 12:22 AM Page 73

Table 5-5 (continued)Annual Sales Data
Region
Northeast Southeast Central West Total
Q4 $14,001 $21,001 $35,654 $6,114 $76,770
TOTALS $45,091 $73,792 $88,122 $63,054 $270,059
With this table, you begin to see the value of multidimensional analysis. Thetotals and subtotals are the same, but with all three dimensions representedtogether, you begin to see how these factors interact with each other in anoperational sense.
As an example of some analysis you might do, notice how the Northeast andCentral regional sales figures are disproportionately lower in the first quarterfor Gizmos, relative to those of the other regions and the other products.
Taking note of that anomaly might spur a call to the regional managers, whowould then explain to you that Gizmos don’t work well in the snow, makingthem hard to sell in Q1 because it’s wintertime.
Beyond the third dimensionThere’s (theoretically) no limit to the number of dimensions you can use todescribe your data. It all depends on what information your operational andtransactional systems capture — and how finely detailed you want the pictureto be. For example, your company’s CRM system might also have data on spe-cific sales reps. The accounting system could probably break down the timedimension further into months, weeks, and days.
There are practical limits on the software you use. Storing and manipulatingmultidimensional data is resource-intensive; it takes a lot of number crunch-ing. So you should make sure the OLAP application you work with matcheswith your data model.
Even though multi means more than one, multidimensional in the OLAP worldtypically refers to data that can be described in three or more dimensions (asin our earlier example where you have sales data by time, by product, and byregion). OLAP applications can certainly handle two-dimensional data, butone of the main reasons you’d use it is to handle information you can’t easilygenerate with a table.
The output or results of an interactive session with OLAP data is often just aone- or two-dimensional data view. OLAP gives the analyst the freedom to
74 Part II: Business Intelligence User Models
10_127230 ch05.qxp 12/4/07 12:22 AM Page 74

view information from different vantage points and in different ways. Aftercleaving and rearranging the multidimensional data, the analyst will find orcalculate the essential data and put it into tabular form.
OLAP ArchitectureOLAP systems are fundamentally different from other forms of data conceptu-alizations because it handles data in the same way people do when they’recreating reports.
These systems are designed to work in concert with the other tools in thebusiness intelligence architecture. The OLAP system typically comprises twodistinct categories of software:
� The OLAP cube houses the multidimensional data (Figure 5-1 shows howit relates to the rest of your BI implementation).
� The access tools allow users to build and massage information into formsappropriate for analysis.
75Chapter 5: OLAP: Online Analytical Processing
Data hierarchyOLAP data is viewed in terms of dimensions, butsome dimensions are related to others in theform of hierarchies. When you look at annualfigures for how many products were shipped,it’s the same as taking the quarterly figures andadding them together; the annual figures justoccupy a “higher” level in the hierarchy ofabstraction — they provide more of a bird’s-eyeview. Both quarterly and yearly data representthe time dimension of the shipping data — theyjust do so at different levels of granularity (acommon term in OLAP circles meaning detail).
Multidimensional data almost always has a log-ical hierarchy with multiple levels. Successfulanalysis can only occur if the OLAP user isviewing the data at the hierarchical level that’sappropriate for the job in hand.
For example, if a team of analysts wanted tolook for fluctuations in store sales based on theweather outside, they’d need to see information
at a certain level of granularity or the analysiswould be impossible. If they had sales figuresby year, for example, they’d be out of luck; if theyhad daily sales figures and were looking only atnational sales numbers, they couldn’t do muchanalysis either (since, presumably, the weatheris different across the country). But if they hadper-sales-rep sales figures by the hour, the datawould be too granular; it would be difficult tospot the larger trends they were looking for.
Data hierarchies spawn several other importantconcepts. If your company has two differentsystems to track Web sales and in-store sales,those two figures in the OLAP system wouldrepresent child dimensions of overall sales, theparent dimension. Good OLAP tools let youmove easily up and down the hierarchies ofdimensions to the level that suits the scope ofthe analysis you’re doing.
10_127230 ch05.qxp 12/4/07 12:22 AM Page 75

Figure 5-1 shows a traditional view of OLAP architecture. The operationalapplications store their data in disparate database systems strewn aroundthe company. That information is brought together into the common datawarehouse environment. The OLAP system extracts information from thedata warehouse and stores it in an easily changeable, multidimensional, hierarchical database called a cube. The OLAP access tools then link users to the data in the OLAP cube to help them produce multidimensional reportsand analyses.
The OLAP CubeThe table is the most common representation of numeric data because it’s ahighly useful and easily recognizable structure. It also lends itself to the two-dimensional world of paper and computer screens. But tables are, well, flat.
Company data is intricate and multifaceted, which makes tables of limitedvalue in storing and representing information. We know that the table’s nat-ural state is to show data in one or two dimensions — as either a one-column
OperationalDatabase
OLAP Access Tools Query & Reporting Tools
OperationalDatabase
Extract TransformLoading Process
OLAPCube Data Warehouse
OperationalDatabase
Figure 5-1:OLAP tools
in the BIarchitecture.
76 Part II: Business Intelligence User Models
10_127230 ch05.qxp 12/4/07 12:22 AM Page 76

tabular list or a row-and-column matrix that uses the vertical and horizontal torepresent the key characteristics. So when it comes time to add more complex-ity — in the form of extra data dimensions — tables quickly lose their utility.
It’s a data structureTo store multidimensional data, we conceptualize it as a cube, where each ofthe three axes represents a different dimension of the same information. Acube version of the previous example would look like Figure 5-2.
The cube has 32 cells of data, just like the three-dimensional table we drew.Another way to think about it is that we’re taking two 2D reports and stackingthem on top of each other — in this case Gizmo sales by region and by quar-ter, atop Widget sales by region and quarter.
That’s the concept of a cube — but how does it work in real life?
In an OLAP environment, a cube is a specialized data store designed specifi-cally to handle multidimensional summary data. But rather than being held inrelational tables (which are built to process transactions rapidly), cube datais stored in cells; its structure is like a 3D spreadsheet.
You say “dimension,” I say . . .In OLAP-speak, a dimension refers only to a characteristic of the data, not adirection in space. So when you hear talk about a cube with 25 dimensions,don’t give yourself a headache trying to picture the thing. In reality, it’s just a list of sales figures that can be jockeyed in many different ways. Likewise,cube is a convenient proxy term for any multidimensional data structure. Afterall, if you add a dimension to a flat two-dimensional table, you’ve made a cube.And since we don’t have words for any shape beyond three-dimensions, cubeis the closest we can get.
Sales by Region
West Cen SE NE Q1Q2
Q3Q4
Sale
s by
Pro
duct
Wid
gets
Gizm
os
Sales by QuarterFigure 5-2:
The cubefull of
sales data.
77Chapter 5: OLAP: Online Analytical Processing
10_127230 ch05.qxp 12/4/07 12:22 AM Page 77

Some vendors use the term cube as a general term to describe all multidimen-sional data in an OLAP environment; others say their software employs manycubes at once, one for each general data subject. For example, one vendormay describe an OLAP system where the tools access several different salescubes, inventory cubes, and so forth. But another vendor may simply saythat all tools access the cube. There’s no difference beyond semantics.
OLAP access toolsThe OLAP access tools are the client environments that allow users to twistand turn the cube’s data and ultimately produce meaningful business intelligence.
The goal of the OLAP access tool is to present large quantities of informationto the user in a way that lets them produce business insights without losingsight of the larger context of what they’re doing. That means the tools needto have the following characteristics:
� Easy: The coin of the realm with OLAP end-user software is its ease ofuse. That means not only its ability to quickly and intuitively navigatewhat can be extremely complicated data arrangements, but also drag-and-drop controls, and simple administration of the data views and files.
� Beautiful: Spotting anomalies can be a matter of turning a river of num-bers into just the right kind of visualization. The best tools will also havelots of charting, graphing, and reporting options.
� Smart: Users need to be able to tune the OLAP access tool to the rightkinds of tasks. That means intelligent searching functions and robustanalysis capabilities to help the user identify trends or create forecasts.
In the early days of OLAP, vendors packaged their cubes and access toolsinto a single pseudo-client-server package; there were two distinct applica-tions that had to be deployed together. That approach is still common today,but plenty of companies specialize in one application or the other, buildingtheir software to work with that of other companies.
What OLAP Can Really DoAsk someone what you can do with an OLAP cube and they’ll likely immedi-ately revert to the tired old slice-and-dice cliché; they might even throw theVeg-o-Matic joke at you if they’re past a certain age (and remember those oldtelevision commercials from long ago). Okay, cheap jokes aside, you can takespecific actions with data in an OLAP system that you can’t do in other environments:
78 Part II: Business Intelligence User Models
10_127230 ch05.qxp 12/4/07 12:22 AM Page 78

� Consolidation: This is another word for rolling up data into the nexthigher level of abstraction. For example, sales offices can be rolled upinto districts, and districts rolled up into regions or complex expres-sions that connect interrelated data.
� Drilling into the data: With OLAP applications, you aren’t just looking ata static report. Nor are you forced to thumb through 1000 differentreports covering different areas of the business. OLAP lets you workthrough the data in a natural, intuitive way. See a data point on whichyou need more information? Click it — the software will re-orient theview around that piece of information. Consider our three-dimensionalsales report showing subtotals by quarter, product type, and region.Clicking on one of the sales figures might take you to a view of the indi-vidual transactions. Clicking on a product category might open updetailed sales information on that category. OLAP drilling lets you gostraight to the information you need.
� Computation: The formal word for number crunching. Because OLAP’sfocus is typically vast amounts of numeric data, the applications havebuilt-in mathematical functions to help users turn more raw data intoless raw data. For example, if your data warehouse contains sales andproduction-cost numbers, you can include the derived data in your final report that shows profit margins.
� Pivoting: If you’ve worked with a pivot table in Excel, you know thevalue of being able to view your data or report from different perspec-tives. If you aren’t familiar with pivot tables, read on.
Members onlyOLAP has its own peculiar lexicon that you need to become familiar with ifyou do any work with multidimensional analysis and reporting. Different ven-dors or consultants complicate matters by using their own proprietary glos-saries that may not correspond to everyone else’s. Nevertheless, here aresome common terms for the OLAP concepts you’ll encounter most frequently:
� Attribute: A descriptive detail, or a way to subdivide or categorize dimen-sions. In a way, attributes are members of dimensions. For example, if youare storing sales in a multidimensional environment, your dimensionsmight be time, product, and location. Each of the three dimensions hasattributes that describe it; product’s attributes might be “product name”,“product type”, “product family” and “product ID#”. Attributes often havemeaningful hierarchies too; you could create your multidimensional tableso that certain product families combine to make a single product type.The time dimension is made up of “month”, “quarter”, and “year” whichare all related to one another in ways familiar to everyone.
79Chapter 5: OLAP: Online Analytical Processing
10_127230 ch05.qxp 12/4/07 12:22 AM Page 79

� Cell: A single data point — like $5439 — identifiable by a coordinatesystem. A table is made up of axes and a lot of cells.
� Measure: Think of the title of your report as the long version of yourmeasure — the general description of what’s going on in the table. Themeasure usually corresponds to a description of what is represented by the cells (data points). In our example, the data points were dollar figures representing daily sales by store; the measure would be simply“sales.”
You sometimes see the word “measure” used to mean much the same as“fact.” Technically there are some subtle distinctions between a measureand a fact, but to get a handle on the basics of OLAP, it’s usually okay toconsider the two terms synonymous.
� Member: One discrete element within a dimension. In the precedingexample, we listed out stores by number along the horizontal axis of thetable; any individual store (like Store #49) as a member of the “location”dimension.
80 Part II: Business Intelligence User Models
A word about pivot tablesThe example in the previous section shows thatit’s fairly easy to represent three dimensions ona table — but then, that was a relatively simpleexample. Imagine if there were 18 regionsinstead of 4, or if you wanted to look at sales ineach day of the year rather than by the fourquarters.
And for every new dimension you add to thetable, you must add as many new embeddedcells in the table as there are elements in thatdimension. For example, suppose you wanted toexplore the dimension of sales channels — anddivide the regional, product, and quarterly salesdata according to whether the product sales gothrough corporate-owned stores or franchisestores. You’d need to add two cells for every onethat exists in the table right now — one for cor-porate stores and one for franchises.
Microsoft Excel offers a good analysis tool fordoing fairly routine multidimensional analysis in
the form of pivot tables. Pivot tables are builtfrom raw dimensional data (as opposed to rela-tional data); users can design and alter theirtables by dragging and dropping particulardimensions onto the two axes of the tables.
Suppose, in our previous example, that youthought it made more sense to place the timedimension across the horizontal axis instead ofon the vertical axis. You would simply click adesign screen that allowed you to drag a repre-sentation of the time dimension to the horizon-tal axis. Excel would then recalculate all thefields to fit the new perspective of the data.
Users often find pivot tables handy for workingwith OLAP data. That’s because a pivot table isa consistent way to picture the overall multidi-mensional nature of OLAP, and the two play welltogether, even if a pivot table is not the samething as an OLAP cube.
10_127230 ch05.qxp 12/4/07 12:22 AM Page 80
Remember the Big Four BI criteriaThink for a moment about the essential characteristics of business intelli-gence. Regardless of how you get them, what applications are used, and whatacronyms are involved, you need insights that are timely, accurate, high-value,and actionable. Here’s how those criteria look from an OLAP perspective:
� Timely: Manipulating data in a modern OLAP system is a much fasterway of producing relevant business data and presenting it in an intuitive,intelligent way than querying and assembling data from a relational database.
� Accurate: Multidimensional data doesn’t just provide mere accuracy;you can trace it. You can dig into any cell instantly and find out what itsconstituent data elements are. In an OLAP report that shows quarterlysales data (for example), you can drill down and see monthly, weeklyand daily information as needed to make your point.
� High-value: Even though an OLAP system deals in multidimensionaldata, it’s still the same information that’s housed in the transactionalsystems. Using OLAP, you can perform advanced data manipulation andanalysis on just about any data stored in your enterprise. That meansyou can move quickly through data that doesn’t matter to get to thedata that does matter. And when high-value data is easier to get, goodvaluable insights are likely to appear.
� Actionable: This is where your OLAP system really earns its keep. YourOLAP system is especially good at aiding in analysis, allowing precisetrends to be plotted and activities to be monitored. That means analystscan recommend immediate action to take advantage of a situation — orprevent a problem from growing worse.
Drill team: Working withMultidimensional Data
Users get more utility from reporting-and-analysis applications when they canexplore the data on the fly. A typical dumb report is just a list of numbers, atable, or a series of tables. OLAP links all the data together at various levelsin the system, then gives users access to it.
If all you’re after is to taste the soup, you can stop there. But OLAP allowsyou to see the recipe and taste each ingredient. Going the other metaphoricaldirection, if you like the soup and want to see it in the context of the fullmeal, OLAP will set the table and serve you salad and a nice steak.
81Chapter 5: OLAP: Online Analytical Processing
10_127230 ch05.qxp 12/4/07 12:22 AM Page 81

Because OLAP data dimensions are usually arranged in terms of hierarchies,it’s important that the users be allowed to navigate up or down the differentlevels as their jobs require. That lets ’em get granular and settle on the rightlevel of detail for performing a mandated analysis.
OLAP terms this maneuverability drill capabilities. Viewing a data point’s con-stituent parts is called drilling down. This allows you to see business insightsin greater detail. If you’re examining how a data point aggregates into broaderfigures and calculations, you’re drilling up. And viewing related data is calleddrilling through — a metaphor of moving sideways instead of vertically.
Gaining insight through drill-down analysisMost users start their analysis with figures that are broad in scope, and fromthere they move into finer levels of detail as they see anomalous data orinteresting trends. This is the drill-down process, an essential tool in theOLAP user environment.
Specifically, drilling down is the action of moving through the data hierarchyto the next (more specific) level of detail. As an example, a user might take aninitial look at the OLAP cube and see quarterly production data, as shown inTable 5-6.
Table 5-6 A Drill-Down Example2007 Production Data
Quarter ➪ Q1 Q2 Q3 Q4
Factory A 577 529 499 442
Factory B 301 306 299 280
Factory C 753 731 819 648
The user might notice that each of the three factories were down in thefourth quarter of production — and double click the Q4 cell to open a newtable that looks like Table 5-7.
82 Part II: Business Intelligence User Models
10_127230 ch05.qxp 12/4/07 12:22 AM Page 82

Table 5-7 The Drill-Down Destination2007 Production Data
Month Oct Nov Dec
Factory A 122 116 104
Factory B 93 107 80
Factory C 220 227 201
Okay, here’s the user’s action translated into OLAP-speak: Looking at the“2007 Production Data”, the user double-clicked one of the dimension mem-bers (Q4) and drilled down by one level, opening a new table that displaysthe next level “down” in the hierarchy. This table shows more granularity —finer details of the fourth quarter. The user is still looking at factory produc-tion data — but can now look at each factory’s production for the three specific months that make up the fourth quarter.
Okay, this is a simplistic example, but it gives you an idea of how useful anOLAP access tool can be. Instead of having to rewrite a report, the user cansimply drill into the data to reach the desired level of detail.
Going in the other direction: drill-up analysisAs with drill-down analysis, the user can also take advantage of multidimen-sional data’s hierarchical nature by looking at larger groupings of data — alsowith a single click. This is called drilling up in a report. Drilling up effectivelytelescopes the more detailed levels of the data hierarchy into the next levelup, and consolidates (rolls up) their data totals.
If the user in the previous example wanted more of a bird’s-eye view of thedata, he or she could drill up from the quarterly table and view (say) theannual production total (that is, the quarterly totals combined). The tablewould provide a context across other years of output numbers, as in Table 5-8.
83Chapter 5: OLAP: Online Analytical Processing
10_127230 ch05.qxp 12/4/07 12:22 AM Page 83

Table 5-8 A Drill-Up ExampleProduction Data
Year ➪ 2007 2008 2009 2010
Factory A 2047 1998 2166 2141
Factory B 1186 1094 1101 1136
Factory C 2951 2795 2788 2993
Again, the rest of the table remains the same, as it was in the drill-down analy-sis. We’re still looking at production data over time, but now we’re seeingyearly data with less granularity (detail). You’ll be comforted to know thetotals for 2007 by each factory are the same as before — and why not? It’sexactly the same underlying production data.
Getting to the source: drill-throughLying behind any item of multidimensional data are the many — sometimesmillions — of rows of source information. The OLAP cube aggregates thisdata and transforms it into the multidimensional form you see in your OLAPfront-end tools. But what if you need to go back and look at the originalsource data? If you’ve ever daydreamed about being able to walk throughwalls, here’s your chance: drill-through capabilities.
Drill-through allows analysts to move between the OLAP table view and thesource data. For example, suppose an auto dealership has an OLAP cube inplace to provide instant analysis and reporting — but in the process of pro-ducing the annual sales report to the ownership group, the lot managernotices that the margins on a certain car model are far lower than they arefor other models.
In this case, drilling down into more granular levels of the data hierarchy won’thelp. The information that’s really needed is the individual transactionsthemselves — and that data is stored on the relational databases of the oper-ational systems. OLAP access tools that can drill through to those databases(on the same level of detail) give the user quick and seamless access to thesource transactions that make up the aggregations shown in the OLAP cube.
So why not just keep all your multidimensional data in a relational database?Well, there are some really good reasons not to — and they have to do withthe difference between OLAP and OLTP, detailed in the next section.
84 Part II: Business Intelligence User Models
10_127230 ch05.qxp 12/4/07 12:22 AM Page 84
OLAP versus OLTPThe reason behind building an OLAP database is because it excels where reg-ular relational databases don’t do such a good job. It might be useful toremember what’s involved in an OLTP system.
For day-to-day operations such as running the accounting department or callcenter, almost every company relies on transactional databases. Transactionalsystems are built to perform data actions in a few fundamental ways:
� Rapidly: Transactional systems must allow their users to read, write,and delete data quickly. For example, picture a point-of-sale (POS)system of a large retailer where the back-end database must allow rapid,simultaneous processing of cash-register-like transactions. Every time acustomer buys a stick of gum, the cashier scans the gum’s bar code,accesses the database, and retrieves the price and product information.Then the system adds a record of the final purchase — all fast enough toget the customer out the door with minimum wait time.
� In vast numbers: In addition to working rapidly, transactional systemsmust be able to address billions of rows of data. Imagine an inventorysystem for a multinational enterprise with hundreds of warehouses allover the planet. Every addition, deletion, and change to a warehouse’scontents must be recorded in a database.
� In real time: Transactional systems operate on a more or less continu-ous basis, reacting to user actions immediately and processing transac-tions on demand.
Transactional systems that support a company’s basic operations are calledOnline Transaction Processing systems or OLTP. Even though ERP softwareprovides some unity in the back-office applications and data, most big com-panies must run a variety of OLTP systems to support day-to-day operations.
Looking at Different OLAP Styles and Architecture
A multidimensional approach to data can be useful in different kinds of archi-tectures. Unfortunately it involves another helping of alphabet soup (as if youaren’t full enough already).
85Chapter 5: OLAP: Online Analytical Processing
10_127230 ch05.qxp 12/4/07 12:22 AM Page 85

MOLAP: multidimensional OLAPMOLAP — Multidimensional Online Analytical Processing — is the architecturebased on cubes. It’s a version of OLAP that’s built for speed: MOLAP storesdata in logical structures uniquely constructed to accelerate retrieval; theseare separate from the relational database system (RDBMS).
In spite of its unappealing acronym, this is the traditional cube architecturedescribed so far. The M for multidimensional simply indicates that in a MOLAPenvironment, a cube structure sits as a layer between the OLAP access toolsand the relational database.
Old days of MOLAPOLAP can trace its origins to the 1970s, when the relational database modelwas starting to gain a foothold in the programming community. An IBM engi-neer named Ken Tomlinson developed a high-level language called APL (youmight expect it to stand for something technical and important, but APL wasreally just A Programming Language.) APL was radical because it includedbuilt-in functions to handle multidimensional data.
APL was as much mathematics as computer science. The old saying “It’sGreek to me” applied (literally and figuratively) to APL; many of its program-matic operators were letters from the Greek alphabet, making it difficult tocode on a standard keyboard and ASCII-based system.
APL did, however, spark some interest in the multidimensional approach.Although relational databases became far more prevalent, the ancestor ofOLAP continued to evolve in the shadows through products such as TM1, anearly spreadsheet application. There were also analysis and reporting compa-nies such as Comshare and Information Resources (IRI) that produced data-bases with many multidimensional characteristics.
MOLAP in modern timesMOLAP-based systems began to hit the mainstream in 1992 with the releaseof the Arbor Software (later Hyperion) product Essbase, which IBM later inte-grated with its DB/2 relational-database product. Then Oracle (the 800-poundgorilla of the database world) bought IRI’s product with the intention of turn-ing it into a packaged layer of their traditional relational product. About thattime, the term OLAP came into being, often attributed to Dr. E.F. Codd, bestknown as the father of the relational database.
Other OLAP products came on the market in the 1990s — Cognos Powerplay,SAP BW, and early versions of Microsoft Analysis Services — each of whichstill holds an important position in the market today.
86 Part II: Business Intelligence User Models
10_127230 ch05.qxp 12/4/07 12:22 AM Page 86

If there is a downside to a MOLAP environment (versus other analysis-and-reporting architectures), it is that MOLAP necessarily involves an extra layer — the cube — and the architecture is already complex. It requires spe-cific expertise beyond what the average database administrator can offer.
ROLAP: relational OLAP through “normal” databasesRDBMSs didn’t get along well with OLAP at first; they were designed for trans-action processing and efficient storage of data, not for analysis and reporting.
Nevertheless (to the shock and consternation of many OLAP traditionalists), abreed of OLAP that goes completely cubeless — ROLAP (Relational OLAP) —emerged, and is still alive and well.
Instead of proprietary multidimensional databases, ROLAP emulates a cubelayer, inserting a semantic layer between the database and the end-user toolthat mimics the data cube’s actions. The OLAP access tools access thesemantic layer as if they were speaking to OLAP cube.
The downside here, of course, is that relational databases weren’t tradition-ally structured to deal with data in a dimensional format. When the informa-tion takes on more dimensions and increased hierarchical complexity,performance lags. A decade ago, there simply was not enough computinghorsepower to handle such a load — but today’s relational databases aremore capable.
On the other hand, using ROLAP allows companies to use the relational data-base they’ve already installed (say, Oracle or DB2). What’s more, they don’thave to hire experts in building and maintaining multidimensional cubes andintegrating all that stuff with the relational system.
HOLAP: Can’t we all get along?There are strong arguments on both sides of the ROLAP-versus-MOLAPdebate. And the acronym-slinging doesn’t end there. HOLAP (Hybrid OLAP) isan attempt to combine the best of both worlds.
In the early 1990s, it was necessary to make a firm commitment to one tech-nology or the other, but these days vendors have taken serious steps to inte-grate the most useful functions of both worlds. Products like Microsoft SQLServer, with its integrated Analysis Services package, mean that organizationsdon’t have to choose either ROLAP or MOLAP.
87Chapter 5: OLAP: Online Analytical Processing
10_127230 ch05.qxp 12/4/07 12:22 AM Page 87

It’s a lot like the hybrid automobiles on the market today. After all the ques-tions about whether to buy an electric car, the manufacturers ended the debateby building a hybrid. When the driver needs power, the good old gas-guzzling,exhaust-spitting, V-8 internal combustion engine roars to life and boosts thecar onto the freeway. But when the car is cruising, the gasoline-powered motorshuts off and gives way to the more efficient electric motor.
HOLAP systems perform the same kind of behind-the-curtains tricks as hybridautomobiles, switching modalities back and forth outside the view of the user.The cube structure is in place to handle large numbers of dimensions span-ning many levels of hierarchy. They offer rapid performance and fast refreshtimes for workers performing analysis and creating complex reports.
Meanwhile, the hybrid systems can rely upon the space-saving ROLAP archi-tecture to store larger volumes of raw data, funneling only the necessarysummary information to the cube. And when the user needs drill-throughcapabilities to dig into the source transactions, the OLAP access tools canwork directly with the relational system without a hitch.
And they do all that without contributing to global warming.
88 Part II: Business Intelligence User Models
10_127230 ch05.qxp 12/4/07 12:22 AM Page 88

Chapter 6
Dashboards and Briefing BooksIn This Chapter� Viewing summary data
� Understanding EIS and DSS
� Measuring business performance with KPIs
� Building the perfect dashboard
� Tracking objectives with scorecards
� Putting it all together in a briefing book
Some executives like to describe businesses in nautical terms. Start-upsare like speedboats they say, able to change direction on a dime as called
for by market conditions. The huge multinational conglomerates on the otherhand, are the supertankers, lumbering and powerful hulks, which take lots ofplanning and foresight before they make the slightest move.
Well, consider the supertanker Knock Nevis, the world’s largest ship. It tipsthe scales at nearly 600,000 tons (eight times the weight of the biggest battle-ship ever constructed), and is about 1500 feet long. In spite of this enormousand complex mass, the many systems of the Nevis can be controlled from asmall room in the superstructure by just a handful of sailors.
Every business, like every ship, has to have someone at the helm, readingconditions, navigating a course, and making the big decisions. But executivesdon’t have the benefit of a ship’s bridge, a single place where every operationcan be monitored and controlled at the flip of a switch.
The closest a CEO can come to that kind of command are IT tools powered bybusiness intelligence systems. For example, business dashboards providewhat is essentially a control panel for monitoring the vital functions of thebusiness. They supply immediate information and indicate when and whereperformance is lagging. With the help of the dashboard, its user might be able to keep the ship afloat.
11_127230 ch06.qxp 12/4/07 12:21 AM Page 89

Dashboards’ OriginsIn the 1980s, as virtually every company was adding to its technology infra-structure, managers and executives began to demand — and get — somebenefit for all that computing power. Blossoming technologies were makinglife easier for everyone else in the company; whether you were a secretary,an accountant, or a salesman, computers and networks were encroaching onyour day-to-day job functions, allowing for more informed decisions, andmaking you more productive. But it took a new class of software — even awhole new technology paradigm — for the suits upstairs to begin to reap therewards of all that silicon muscle.
EIS: information gold for the top brassThe normal decision process for company leaders involved analyzing reamsof data and combining that with subordinates’ interpretation of that data.Executive Information Systems (EISs) changed all that. In the early 1980s com-panies began working with their IT departments to funnel key company infor-mation into the corner offices and boardrooms. These programs — typicallybuilt internally — harvested operational data from around the companymainframe and minicomputer systems. They brought all that data together,combined it, manipulated it, and presented it in easy-to-read summaries.Instead of raw numbers, executives now had some context, analysis, andintelligence to go with it. They got more than just data, they were now beingfed information.
The foundation for the EIS concept was the Decision Support System (DSS) —early software that quantified how business decisions were made, and usedcomputing power to support that process. For companies that had dabbledin DSSs throughout the 1970s, the EIS was the logical next step. It applieddecision calculus to a wider array of business problems — and it got theattention of senior executives.
In the beginning, DSS and EIS software packages were mostly built in-houseby corporate technology teams. In the mid-1980s, vendors started gettinginto the act. Pilot Executive Software started installing its Command Centerapplication in 1984 and was quickly followed by others like Comshare,Metapraxis, and Execucom. Most packages cost in the neighborhood of aquarter of a million dollars; by the early 1990s, EIS was a $100 million business.
Most old-style EIS software was built with a fourth-generation (4GL) program-ming language, using pre-written queries and predefined parameters tosummon the needed data from operational or transactional systems.
90 Part II: Business Intelligence User Models
11_127230 ch06.qxp 12/4/07 12:21 AM Page 90

EIS: Everybody’s Information SystemAlthough EIS was originally designed to supply only the top levels of the com-pany with operational data, the rest of the organization quickly became inter-ested in the same capabilities. After all, EIS software’s job was to grab datafrom relevant data stores, summarize it, and present it to the user. Whycouldn’t it help mid-level managers make decisions about their particulardomain, just as it did for executives making decisions about the entire enterprise?
The only difference between executive-level EIS and mid-level EIS is the scopeof data that feeds the system. A COO might view sales metrics from all 250stores around the country — checking status, looking for trends in productcategory sales and inventory cycles, perhaps comparing the figures with pre-vious quarters and years. The regional manager would be interested in thesame kinds of information — if only for that particular region’s 32 locations. If the boss cares about it, the lower levels should care about it too.
EIS and dashboards can also have a unifying effect on a business that wasn’tpart of their original mandate. When the vendor or IT team is customizing thesystem to suit the company during the installation, the executives have todefine their criteria for success and failure. Formulas based on those criteriamust be attached to the key metrics that get scrutinized. Knowing how the
91Chapter 6: Dashboards and Briefing Books
EIS versus classic reportingThe value of having an EIS package installedwas that it allowed decision makers to avoid thedifficult and time-consuming process of siftingthrough reams of reports for key information,and they short-circuited the upward-cascadingfeedback loop in which field personnel reportedresults to their managers — who in turn sum-marized local results for their managers, and soon until the information finally found its wayback to the company leaders.
The user interface of an EIS program could be set up to show the most important informa-tion, metrics, and trends. The programmer oradministrator could set ranges and parametersthat defined when items needed attention and
triggered visual alert messages. That way big-wigs with limited time to spare could quickly flipthrough the pertinent information, only pausingto dig into the nuts and bolts when they saw theflashing red light.
From the executive’s point of view, it was per-fect: No Byzantine queries to be written, nomountain of data to be scaled. The softwaretook advantage of emerging database stan-dards and could be hooked into any of the lead-ing database and mainframe systems of the day. The information could be controlled andgiven out on a need-to-know basis only. Thescreens were all menu-driven; the graphicswere beautiful.
11_127230 ch06.qxp 12/4/07 12:21 AM Page 91

boss judges the company’s performance can help focus the efforts of the sub-ordinates on hitting those target metrics. That gets the entire team pointed inthe same direction, working to meet that unified goal.
EIS gets left behindAs revolutionary as the Executive Information Systems were, there were cer-tain limitations that pushed the approach out of style by the mid-1990s. EISbegan to be associated with a primitive, static display of data — if you wantedto customize the data or change the questions that the system asked, a pro-grammer still had to adjust the code.
But several key concepts came to light during the EIS era; they evolved andwere woven into the business intelligence systems that companies use today:
� The dashboard: Presenting a user with an interactive GUI (graphical userinterface) as a way to summarize information was a notion that stuck. Inan airplane cockpit or on the dashboard of a car you find gauges andindicators for the most important elements of the system — but not allthe information that exists. A 777 cockpit (for example) doesn’t need adisplay showing whether the passenger in seat 17F had the chicken orthe fish for dinner; it’s not important to the pilot’s job (except in themovie Airplane). The captain and first officer see things that matter toflying the plane — such as altitude, attitude, and heading. The key to adashboard’s utility is the presentation and position of the gauges: All thenecessary information should be conveyed with a glance. Depending onthe metric, that might mean using a graphic such as a red light/greenlight indicator, a chart, a graph, or a table. That technique — boilingdown and expressing information in its essential form — has become an important business intelligence tool.
� Interactive controls: Most EIS software that flourished in the late 1980sand early 1990s was good at following a prearranged process with adataset laid out well in advance. But it was not so good at tacklingunforeseen problems, looking at data outside the expected domain ofthe EIS, or creating advanced projections, calculations, and what-ifanalyses. As the systems evolved in the 1990s, it became clear that theproducts would need some new features:
• A customizable interface to match the level and function of the user
• Adaptability to work with any data source in the network
• The capability to present the data in a variety of ways
This increased level of flexibility and on-the-fly interactivity was part ofthe foundation for today’s BI.
92 Part II: Business Intelligence User Models
11_127230 ch06.qxp 12/4/07 12:21 AM Page 92

The Metric SystemWhat exactly are users looking at when they turn on their dashboards?Businesses are complex animals, and they can be measured in a thousand dif-ferent ways. But every enterprise has just a handful of metrics that reveal theessence of how the business is performing — its Key Performance Indicators(KPIs for short). It’s one of the most important concepts in the realm of busi-ness intelligence.
Defining KPIsKPIs go beyond simple financial measures and get at the heart of a company’soperations. But KPIs have to be carefully selected, regardless of whether theyappear in a dashboard application, a standard report, or some other tool. Theymust measure what’s important to a company’s success — and do so in away that summarizes other, more granular measurements to provide a larger,more general measurement. A KPI occupies a middle ground between specificand general:
� Specific enough to indicate where to find the source of a problem if oneexists
� General enough to keep the reader or user from getting lost in the minu-tiae and complexities of a large organization
A good analog to KPIs is a grammar school report card. For starters, eventhough a kid could be measured against many different criteria, report cardsshowed only items of importance. For instance, your report cards didn’tinclude a grade for your posture or how well you tied your shoelaces. Theywere restricted to subject areas the school board deemed academicallyimportant (such as math, English, and social studies).
But there was no specific indication on the report card for how well you coulddiagram a sentence or do long division, even though those skills were criticalto academic success. That’s because report cards show composite metrics —they blend all of your test and homework scores in certain related areasunder more general headings. Your math grade, for example, is a broad mea-surement that reflects your ability to do long division, convert fractions intodecimals, complete word problems (ugh), and so on.
Why not list every single test and homework score on a report card? Becauseit’s much easier to gauge a student’s overall academic performance by show-ing a few general marks, rather than by displaying every single grade receivedduring a semester. So, in effect, your grades were your childhood KPIs.
93Chapter 6: Dashboards and Briefing Books
11_127230 ch06.qxp 12/4/07 12:21 AM Page 93

Business KPIsCompanies are complex beasts. The marketplaces in which they operate havea vast array of moving parts. How can you tell whether a complex organismlike a corporation is moving in the right direction? There are the obviousmeasures — for example, those that deal with sales and profitability — butare they telling the whole story?
Financial metrics may indicate the overall health of the business, but theycan do no more than hint at what’s happening behind the curtain. It’s likemeasuring the health of your car by the speed it’s traveling down the road.You may be going 65 mph, but that doesn’t help the fact that you’re leakingoil and that there’s a mailbox tangled up in your front bumper.
To get a better look at what’s really happening inside their organizations,business chiefs turn to KPIs. Business KPIs help measure success — not ofthe company as a whole, but of individual processes. They are the bench-marks that encompass nearly every operational aspect of the business, andthey allow companies to manage their overall success.
BI grows in popularity every day because it puts better KPIs in the hands ofmanagers — developed through business intelligence processes, designedfrom the get-go to be accurate, meaningful, and timelier. On top of that, theKPIs themselves are precise enough to point at the actions required to makethem better.
Consider the following example KPIs:
� Average waiting time in a customer call center queue
� Number of times inventory turns over in a year
� Percentage of defective units manufactured
� Average sales-cycle time
� Sales per square foot of retail floor space
There are endless permutations of key performance indicators; this list isonly the lightest smattering. They cover a wide variety of operational disci-plines, from customer service to sales to manufacturing.
While the success of any business always boils down to money, notice thatthat the preceding measurements don’t necessarily include a direct dollarmeasurement. Through business intelligence processes, operational data iscollected and evaluated that shows (for example) that call center wait timerises and falls at specific times of the day. With this information, a call centermanager can then act to change staffing levels. A few weeks later, the BIsystem presents the manager with a follow-up report that demonstrates theresults of the staffing changes.
94 Part II: Business Intelligence User Models
11_127230 ch06.qxp 12/4/07 12:21 AM Page 94

It goes without saying (but we’re going to say it anyway) that every organiza-tion is a little bit different. Even companies selling the exact same productsor peddling identical services have their own peculiar strengths and weak-nesses. Each company’s position in the marketplace is unique; each one hasa certain admixture of talent and skill that no other organization has. Andmost of all, corporate philosophies vary throughout a market. As a result,KPIs vary from company to company.
Looking at BI DashboardsToday’s dashboards are direct descendants of the old EIS and DSS systems —with greatly improved functionality and appearance. That’s because they’relinked to today’s powerful data systems (the backbone of modern businessintelligence solutions) and utilize tightly focused KPIs.
Mission control to the desktopAs with the BI query-and-reporting tools or OLAP drill-down reports, the latestgeneration of dashboards can be made widely available to people throughoutthe company — at all levels and in nearly all job types. The shipping depart-ment might have a system that keys into the production, inventory, and logis-tics databases, in addition to hooks that lead into the road and rail companies’systems. Their dashboard might show the status of shipments, collated dailyand weekly delivery statistics, damage and late arrival rates, and other met-rics understandable and relevant only to shipping department personnel.
The fact is, 80 to 90 percent of individual contributors perform analysis ofsome kind. Not all those workers have the skill or training to write complexqueries or direct an intricate application to produce the desired results. Awell-designed dashboard can make a marked difference in workers’ produc-tivity because it allows them to make immediate decisions based on real-timeinformation.
Dashboards are flexible tools that can be bent into as many different shapesas the users call for. They can be customized for all levels of an organizationand can be set up to be backward-looking or focused on the present situation,depending on the users’ needs. Administrators may populate a dashboardwith historical data to show a general strategic situation or they can feed low-latency (that is, almost real-time) data to act as an up-to-the-minute statusreport on current operations.
Each screen and control on a single dashboard should represent informationthat’s relevant to the user’s office domain. A call center rep’s dashboard (forexample) might display a running graphic of call volume, average hold timesand call times, calls handled per employee, and other metrics peculiar to that
95Chapter 6: Dashboards and Briefing Books
11_127230 ch06.qxp 12/4/07 12:21 AM Page 95
environment. The accounts-receivable clerk might have other metrics suchas late payers, weekly and daily revenue received trends, and outstandingcollection notices.
Dashboards might show high-level abstract data about the company (say,aggregate financial measurements), but they are equally effective — if notmore effective — if they show real live operational information that relatesdirectly to tasks that teams and individuals perform every day.
Dozens of dashboard vendors exist in the marketplace. Some offer generalpackages to sit atop a BI solution; others provide specialized controls thatfocus on certain areas of the business. But most dashboards share a set ofcommon features:
� Navigable layout: Computer screens are only so big, so dashboardsallow for multiple, easily accessible screens. Whether it’s tabs, bread-crumb trails, or some kind of menu-based system, most dashboardshave a global navigation feature that allows for more information to bedisplayed than a single screen can handle. That means there’s a lot ofinformation at the users’ fingertips.
� Appealing and differing graphics: Conveying information on complexsubjects is not always easy or intuitive. A good dashboard allows for thepresentation of metrics in a variety of ways, such as charts, graphs,tables, and speedometers.
� Interactivity: When a user sees an important measure that needs atten-tion, the dashboard presents a pathway to deeper layers of information.For example, if the speedometer control dips from the green into the redsection, a user might want to see the component measurements thatmake up the larger measure in an effort to get to the source of the prob-lem. Clicking a dashboard control might do something simple (say, sortor expand a list or pivot a table around a more relevant dimension), or itmight lead to another application, or even automatically produce anOLAP report that can then be drilled into and analyzed.
� Customizable interface: Users should be able not only to navigate to dif-ferent subject areas, but also to set up their dashboards in a way thatgives them the ideal mix of information relevant to their jobs. Except forspecialty packages, dashboards offer customization and personalization.
� Embedded content: This feature allows administrators and users to mixin external content with the application-fed indicators and graphics. Itmight be appropriate for a financial analyst to have a dashboard windowthat had a stock ticker crawl. Or the accounting team might need tohave an interactive calendar available.
� Browser-based capabilities: Dashboards can be standalone applica-tions, or they can be made available over standard browser software.This makes distribution and control of the information easier.
96 Part II: Business Intelligence User Models
11_127230 ch06.qxp 12/4/07 12:21 AM Page 96

Dashboard best practicesThe old cliché about a picture being worth a thousand words rings true whenit comes to dashboards. Rather than working through a mass of reports andhours of meetings and briefings, knowledge workers can take a quick glanceat their dashboards and understand in an instant whether or not their team,department, or division is performing up to snuff.
Picking the right kind of dashboardWe’ve talked about the different business areas that can be modeled with adashboard approach, from accounting to shipping to human resources. Butthe other dimension is just as important: What level of the company needsthe dashboard? It’s worth asking; the approach to installing dashboards isactually quite different depending on the view required.
In Performance Dashboards: Measuring, Monitoring, and Managing Your Business(Wiley Publishing, Inc., 2005), dashboard expert Wayne W. Eckerson definesthree main breeds of dashboards: tactical, operational, and strategic. Here’show those differ:
� Tactical dashboards measure short-term productivity and effectiveness;their output is often used by an individual contributor. As an example, anetwork engineer might have a tactical dashboard that actively monitorsreal-time IT infrastructure statistics and trends — say, a Web site’s hitsand dropped packets. Such metrics would give the engineer an immedi-ate tip-off when something is wrong — and a pretty good notion ofwhether it’s with the servers, the software, or the connectivity.
� Operational dashboards quantify the short- and medium-term effective-ness of a specific business function (or family of business functions) atthe team or business-unit level. This level of dashboard could poten-tially be deployed for an individual knowledge worker or a local teammanager. The trends and metrics displayed will have an impact on short-term decisions. Call center managers might watch customer-satisfactionmetrics on their operational dashboards, looking out for negative trendsthat would spur them to take immediate action and make changes to theway the reps handle certain kinds of complaints.
� Strategic dashboards are built for the policy-setting levels of the organi-zation (such as the chief-level executives or business-unit directors).These dashboards display metrics that represent corporate strategy anddirection. They correspond to large-scale business activities, and usuallyhave designated teams responsible for monitoring them, interpretingthem, assessing their status, and making recommendations for the indi-cated course corrections (if necessary).
97Chapter 6: Dashboards and Briefing Books
11_127230 ch06.qxp 12/4/07 12:21 AM Page 97

Building the best dashboard for youAs useful as dashboards can be, there are still ways to mess it up. Dashboardsare designed to offer a first indicator when something is amiss, but theyaren’t meant to completely replace all other decision processes. Fortunatelymore than two decades of best practices are available to offer aid and com-fort to the project manager facing the dashboard wilderness.
� It all starts with two simple questions. What is the scope of what you’remeasuring? What kind of data will you be displaying? Answer those, andyou can move on to even more “best practices.”
� Select your KPIs wisely. Start with your business objectives, then lookat the available operational data to find appropriate metrics — not theother way around. Some companies have a tendency to let the tail wagthe dog and slap any old measurement on the dashboard. If your goal isto monitor manufacturing performance, the factory manager’s dash-board doesn’t need to display the company stock price.
� Don’t succumb to dashboard overload. It’s possible to cram so muchdata — so many gauges and widgets — into a dashboard that the clutternullifies the advantages of having at-a-glance summary information.Remember: Dashboards should show essential information only.
� Watch the dashboard, but check the oil occasionally, too. Dashboardscan be incredibly useful on their own, but they’re at their best whenused in concert with other BI components, such as OLAP-driven query-ing and reporting.
� Take dashboard design seriously. That means considering the placementand type of gauges, simple user interface best practices, and carefulmanagement of the depth to which users can dive into the data so theydon’t get tangled in the weeds of too much detail. A dashboard, like anyother application, is only as good as it is usable. If the user communityhas trouble navigating or interpreting the data, then your dashboardwon’t offer much of an advantage over standard representations of information.
Briefing Books and Other GadgetryDashboards are excellent at delivering real-time information, but they’re onlya part of the overall business intelligence equation. What if, as a knowledgeworker, you need regular access to reports and other application outputbeyond your customized dashboard screens? Or what if you want to sharespecific BI insights with others in your company? To collaborate on dash-board metrics or other complex reporting, many BI application suites offer abriefing-book tool. A briefing book gives the user the capability to save andcollect dashboard screens, scorecards, and reports to create a book of relatedinformation. But briefing books aren’t just screen shots or Power Point slides.
98 Part II: Business Intelligence User Models
11_127230 ch06.qxp 12/4/07 12:21 AM Page 98

99Chapter 6: Dashboards and Briefing Books
ScorecardsIn discussions of BI end-user tools, scorecardsare usually lumped in with dashboards — butthey have different functions: Scorecards aredesigned to measure progress toward meetingstrategic business goals; dashboards are onlydesigned for ongoing monitoring of specificactivities. Dashboards are not meant to conveyinformation about how close operations matchthe intent of the business and associated targets.
A scorecard usually appears as a graphical listof specific, attainable strategic milestones,combined with metrics that serve as bench-marks. Measurements of how well the companyactually executes specified activities are linkedto the scorecard; the resulting display is thestatus of each goal, often with some kind ofgraphic indicator.
For example, a scorecard might display greenwhen a given profit margin is meeting orexceeding company expectations. But once thebloom is off the rose and profits sag, the score-card fill color turns to red — indicating thatattention is needed to shore up the business.Like a dashboard, the scorecard gives a con-solidated at-a-glance view of key information.
Scorecards are designed to help managers andexecutives quickly identify company initiativesthat need extra attention. They’re also an excel-lent way to distribute accountability to mid-levelmanagers — if you have to explain to the bosswhy the goal associated with your name isblinking bright red, it’s a motivator!
This figure is an example of one of Hyperion’s BIstrategic scorecard screens. The strategicobjectives have status lights that indicatewhether the company is on target. Anotherimportant aspect of this product is that theobjectives are linked directly to subordinateobjectives — and (later) to specific activitiesthat must be accomplished to meet the objec-tives. In this example, the objective “ProfitableGrowth” links to sub-objectives “IncreaseRevenues” and “Reduce Costs” — which are in turn connected to specific actions that thecompany must undertake successfully to hitthose component objectives. The overall effectis a traceable story arc about the current busi-ness situation that a manager could quicklytransform into actions to correct any strategicshortcomings.
11_127230 ch06.qxp 12/4/07 12:21 AM Page 99

Users can actually create and organize a dynamic, interactive collection of datafrom a number of sources — and tightly control its presentation. For exam-ple, in your briefing book you might assign a certain dashboard control to thefirst page, but have it appear only if it falls into a certain range of values. Ifyou have a project scorecard, for example, you might set your briefing bookto display only those phases and steps that are overdue and appear as flash-ing red lights on your dashboard.
Other tools exist to help users manage the volume of information available to them. Tickers can be set to crawl across the users’ desktops, constantlyupdating the metrics of their choice. BI vendors are also increasing theircapacity to display KPIs as interrelated measurements through cause-effectdiagrams and process maps. In essence, though, all these tools are attempt-ing to accomplish the same basic task: inform the user with timely, accurate,important, and actionable insights.
100 Part II: Business Intelligence User Models
11_127230 ch06.qxp 12/4/07 12:21 AM Page 100

Chapter 7
Advanced / Emerging BI Technologies
In This Chapter� Making choices with guided analysis
� Shafting the competition with data mining
� Seeing visualization clearly
F rom its humble beginnings, business intelligence continues to evolvetoday as vendors offer more powerful and innovative solutions. With all
those changes, the purpose of BI systems remains the same — timely, accu-rate, high-value, and actionable insights. The new capabilities all serve thosesimple goals in one way or another.
Some of the advances happening today are taking current capabilities andmaking them better, such as more powerful graphic representations of data.But BI innovation goes beyond simply adding bells and whistles to existingapplications. The evolution of BI is happening along a broad front with thetechnology growing more powerful, more meaningful, and capable of puttingbusiness insights into the hands of more people.
Transforming data from raw facts into meaningful observations and rulesabout business operations is not so different from scientific research; everyyear sees incremental advances, not just in the conclusions reached, but inthe research methodologies, tools, and technologies that the researchers relyon. The pace of change in BI is steady; occasional minor breakthroughs inhow environments are built and used become next year’s best practices andtop-selling tools.
Of course, in a BI environment, innovative, imaginative, and powerful are allrelative terms. Vendors are always rolling out new tools, but there’s no guar-antee that the newest thing can help you with your business problems; that’sfor you to evaluate, and for your team to make a reality.
12_127230 ch07.qxp 12/4/07 12:26 AM Page 101

Some of the areas where research is expanding rapidly include the followinggeneral categories:
� Visualization: using advanced graphics to make critical business insightsclearer and more meaningful
� Guided analysis: interactive, goal-oriented BI that answers a specific setof questions in a structured way, prescribing certain actions based on theuser’s input and analysis
� Data mining: finding the needle you really need . . . in a huge stack ofneedles
� Unstructured data tools: turning irregular data into business insightswith search and indexing capabilities for hard-to-quantify informationformats
Does that mean you can install these things today? In some form or another,the answer is usually yes. Implementations tend to lag BI innovations. That’sa nice way of saying that companies rarely want to be the first on their blockto try an untested technology. A new tool that blows away the current para-digm will take time to find its way into immediate widespread use — and ittakes even longer to make everyone’s “best practices” list.
Of course, a tool or feature that is so common in today’s BI environmentsstarted as little more than a gleam in the collective eye of a team of softwareengineers in the design shop of a particularly innovative vendor. When itgained popularity in the marketplace other vendors would have copied thatsuccess by building their own version of that feature. Before long, it wouldbecome a must-have for any BI system. That process is still going on today as vendors continually seek to gain market share by building a better mousetrap; it’s a continuing cycle of development in the BI world.
Catching a Glimpse of VisualizationThe mission of any business intelligence program is to get information topeople when and where they need it. But as a secondary task, a BI systemalso has to make that information usable once it reaches its destination. Oneof the ways BI software can make information more usable is through visual-ization techniques.
Visualization means presenting numbers, statistics, metrics, and other factsin a graphical format that makes them easier to understand and interpret.Representing poll results as a pie chart is a simple example of visualization.As the old saying goes, “what the eye sees, the mind knows.”
102 Part II: Business Intelligence User Models
12_127230 ch07.qxp 12/4/07 12:26 AM Page 102

Basic visualizationAs data-warehousing and querying software grew more powerful and wide-spread, so did the need for ever-more-complex ways to present the outputdata. The result was stand-alone reporting software — either separate fromor packaged with basic query tools — that could help the user arrange, transform, and present data to audiences in a variety of formats. Reportingsoftware made the information as easy to understand as possible.
As BI was applied throughout the organization, the insights it provided grewin strategic value. Presenting data in a compelling format was no longer aluxury; in fact it became a top priority. Companies turned to tools that couldtransform their numbers into charts, graphs, and other accessible and under-standable representations. The lesson was clear: as important as standardrow-and-column reporting is, presenting data graphically can make the com-munication of complex data more efficient and more powerful.
Worth a thousand wordsData has to be understood as having an impact on business. And representingdata with charts, graphs, and other images is a powerful way to communicateinsights to team members, managers, partners and customers. A concept ortrend that may not be dramatic, or even clear, in tabular form, often comesalive in the right graphical format.
But this bit of everyday magic is easy to dismiss as insignificant. By creatinga bar graph, all we’ve done is represent numbers from the table as propor-tionally sized bars on a graph. But that simple change is powerful: Instead ofseeing numerals sitting in a table or on a page — thinking to ourselves, “Self,that number sure is bigger than that other number,” and then analyzing theresults of our assigning relative sizes to each data point — we can actuallysee those relationships. The bar graph allows us to skip a cognitive obstaclebetween us and the meaning of the numbers.
It’s true that in such a simple example, you might well have spotted the salespattern just by focusing on the 12 numbers in the table. But imagine a tablewith a thousand points of data, or a million. In those cases visualization isn’tjust a bonus or a shortcut; it’s a necessary step to performing meaningfulanalysis and obtaining business insights.
Just as Excel grew beyond mere grid-style representation to include its well-known charts and graphs toolset, BI reporting tools have grown to includebasic visualization techniques, similar to those you find in spreadsheets.
103Chapter 7: Advanced / Emerging BI Technologies
12_127230 ch07.qxp 12/4/07 12:26 AM Page 103
Off the chartsThe charting tool is the core of a visualization tool set. At the most basic level,that means static representations of data points like pie charts where the sizeof a given “slice” of a disc shows its relative share of the total amount.
BI reporting tools available today include visualization packages — but mostof those are still fairly simple. Analysts who need to translate their visuallybarren reports into compelling stories do have some special tools availablethat can help them with that job. Just as reporting tools ride atop the rest ofthe BI stack, visualization tools plug into reporting engines — and can trans-late data into cool pictures that convey the message about the data muchmore immediately than the data itself can.
Turning large complex data sets into meaningful images is the domain ofadvanced visualization tools. Instead of simple charts and graphs, graphicspackages allow users to render data into complicated geometric shapes andvector graphics, all in vibrant colors. The goal is to make that informationeasy to interpret; instead of poring over tables to find profitability hot spotsin a company’s product line, a visualization tool can create an image that willbring the full profitability picture to life, and put it into context with otherbusiness factors.
Visualizing tomorrowVendors have to grapple with an unavoidable challenge inherent in visualiza-tion techniques: A graphical representation of data must be compellingenough to look at, informative and truthful in its portrayal of the data — without giving the user a severe case of visual overload.
This balancing act is no mean task. As visualization software expands toinclude charts with multiple layers, drill-through capabilities, and navigationlinks, they risk becoming just as challenging to comprehend as the reportthey’re attempting to simplify! BI administrators and visualization tool usersmust be vigilant that users and information consumers aren’t getting buriedin too much detail.
Nevertheless, graphical representation has given BI a jolt of life by makingbusiness insights compelling and convincing. In addition, users in many dif-ferent jobs are used to graphics-based interfaces — and high-end visualiza-tion is the next logical step. Dashboards have become permanent tools for BIfamily; vendors such as Microstrategy are taking advantage of dashboardspace as a place to represent data with visualization.
104 Part II: Business Intelligence User Models
12_127230 ch07.qxp 12/4/07 12:26 AM Page 104

The newest visualization tools offer some fairly jazzy features, especiallywhen you think of BI and processing truckloads of numerical data:
� Aesthetic appeal: Vendors have realized that rendering data in a visualformat is only useful if the audience is willing to read, view, and digestthe information — and to do that, they have to look at it first. Making acontrol on a dashboard beautiful, rather than just giving it bare-bonesfunctionality, helps attract the user’s attention in the same way a memoor position paper can do if it’s engaging, reader-friendly, and suited to its audience.
Most knowledge workers with dashboards on their desktops aren’t pilots,engineers, or mathematicians; accuracy by itself isn’t enough to make agraphical representation of data useful.
� Interactivity: The original dashboard model relied on graphical controlsto be read just like any other static report; the data was translated into achart or graph that could then be interpreted by the reader. The nextgeneration, however, takes advantage of greater computing power andspeedier data transformation — and turns a static report into more of adialogue.
This goes beyond simply clicking a dashboard control to see a second,deeper-level control. Imagine putting the mouse pointer over one wordon the report and having all the other graphical controls transform orpivot in reaction — can do. The newest controls also allow for rapid tog-gling and tabbing.
� Customizable tools: Vendors can’t anticipate everything, so they buildprogrammatic hooks into their tools to allow developers on your teamto dip into the toolbox and make the dashboards and controls just rightto fit with your system. This approach also allows developers to importand use a wide range of third-party tools.
Really cool, next-generation visualizationQuality visualization goes beyond just more slippery sliders and tastier-lookingpie charts. BI vendors are trying to incorporate enough visual tools to allowdesign professionals to turn data into meaningful presentation material. We’renot quite to the point where you can surround yourself with a hologram ofyour BI data (as in the movie Minority Report), but anything that helps audi-ences understand data better is fair game.
These days most tools present complex, three-dimensional geometric render-ings of data, overlaid with traditional visualizations such as bar graphs or piecharts. For example, a tool might render the data points of a simple two-dimensional table into elevation points on a smooth 3-D terrain; on top theterrain would be a bar that corresponded to each elevation point and couldshow another dimension of the data.
105Chapter 7: Advanced / Emerging BI Technologies
12_127230 ch07.qxp 12/4/07 12:26 AM Page 105

Advanced visualization tools are only worthwhile when there is an expertthere to create the graphics. That means a BI manager needs analysts whocan not only build queries and reports, but also pilot the tools that create the advanced representations. Vendors make every attempt to make the toolseasy to use, but to take full advantage of the latest tools that create scientific-grade charts, advanced geometric representations, and other next-generationvisualizations, you’d better have somebody on the team who can both
� Understand what’s going on with the underlying BI process.
� Use the visualization tools that present the information most effectivelyto a specific audience.
On top of that, visualization requires good data-management practices.Companies typically need visualization tools when they’re dealing with mas-sive data sets that resist interpretation by other methods. If you’ve reached a point where visualization tools make sense, then your BI environment as awhole must be able to move and manipulate gargantuan volumes of informa-tion. If it can’t do that, it won’t be able to support the kind of visualizationtools you need.
Spatial visualizationOne of the hottest trends (and latest buzzwords) in business intelligence ispresenting data by way of spatial visualization. This approach takes advan-tage of today’s mapping technologies to weave business information intomaps and other geospatial representations. What you get is an immediateimpression of (say) where business processes are taking place and how theycompare with each other, as in Figure 7-1. Of course, using space as a datadimension is nothing new. (After all, where else do you visualize somethingbut in space?) But its burgeoning integration with business intelligence is asymbiosis that allows companies to represent information about customers,vendors, shipping points, or any other entities that reside in the real world,and whose locations are an important business consideration.
These tools have grown with the advent of ever-more-accurate GPS technol-ogy that can create data with a coordinate system in much the same way thattransactional data might be stamped with date, marking its “location” in thetime dimension.
Steering the Way with Guided AnalysisPart of the challenge of business intelligence is that powerful tools create somany possibilities. It can all be overwhelming to an analyst. Capabilities keepproliferating — usually way too many for the limited range of problems thatneed to be solved immediately. Wouldn’t it be nice if someone could justshow you what to do with all these buttons and options and toolbars?
106 Part II: Business Intelligence User Models
12_127230 ch07.qxp 12/4/07 12:26 AM Page 106

That’s where guided analysis can help. It’s an application that sits atop otherBI tools and literally directs the user to take certain follow-on steps thatdepend on initial results. It’s like having a BI tutor sitting next to you saying,“Okay, now you’ll want to rerun that same query, except expand it to includethe Northwest region.”
Having trouble visualizing what guided analysis is like? Think of a piece ofwell-designed tax software. The goal is to complete an overall tax return, butthe software helps break up the task into manageable chunks. The applicationguides the user through a series of steps that build to an ultimate solution.
Dancing the BI two-stepThe typical BI process is still very much a two-step sequence:
1. The user poses a query of some kind to the system, or perhaps signs upto receive a certain array of information on a regular basis. Then, when
345Miles
125Miles
108Miles
178Miles
573Miles
209Miles
El Paso23,876
Customers
Amarillo25,273
Customers
AbileneFactory
Austin34,188
Customers
San Antonio17,012
Customers
Ft Worth14,251
Customers
Houston15,291
CustomersFigure 7-1:Simple
example of spatial
visualization:mapping
data points by
geographiccoordinates.
107Chapter 7: Advanced / Emerging BI Technologies
12_127230 ch07.qxp 12/4/07 12:26 AM Page 107

the system delivers that information to the user, the second step begins: analysis.
2. The user takes the information set and performs whatever manipulationsand data gymnastics might be needed to draw a useful conclusion. For many complex business tasks, this involves performing a series ofqueries, followed by intermediate steps of data manipulation, and finallyproducing the necessary answer.
Guided analysis is a process that helps users get from point A to point B moreefficiently and effectively.
Old idea, new movesThe more BI spreads to the masses of a company, the more important it isthat the end users have some form of guidance as they manipulate data tomake decisions. This is particularly true when a department or team makesregular decisions where the variables are well understood, even if those deci-sion processes are long and complicated. Guided analysis is an element of BIwhere developers configure decision-support tools to offer users direct helpduring their regular processes.
For example, a bank employee processing a mortgage application might haveto enter hundreds of pieces of information about the customer and the loan.That process likely has dozens of branches that are taken depending on whatdata gets entered. On top of that, the employee might need to access BI sys-tems to view market reports, credit profiles, and other information on the fly.Guided analysis wraps this complex process into a single “skin”, prompting theuser from one screen to the next, delivering contextual information as needed.
The basic idea of guided analysis is nothing new; software vendors have alwayssought to combine computing tasks into sequences to create applicationswith broader reach. And since BI systems are built to support the decision-making process, you’d think guided-analysis techniques would be a natural fitwith BI-driven tasks. But because BI tools were built to be strictly functional,users were expected to design their own workflow to solve their specific prob-lems. Designers rarely considered wrapping tools into a consistent packagethat could link insight-gathering processes together for users.
With so much data being stored and analyzed in so many different corners ofthe today’s business world, it only makes sense that vendors embrace theguided analysis paradigm. Users in any discipline can combine transactionaltasks with analysis tasks — two actions that were traditionally separate.Teams can build playbooks and end-to-end processes around BI tools, makingan already-strategic function that much more powerful.
108 Part II: Business Intelligence User Models
12_127230 ch07.qxp 12/4/07 12:26 AM Page 108

Guiding lightsGuided-analysis systems do more than simply add a few help icons to areporting tool. BI tools with guided-analysis features might have (for exam-ple) process wizards that walk users from step to step, or set up event alertsthat monitor the system — or the user’s activity — and only offer help whenit’s needed.
When certain trigger conditions are met, the user is alerted and the guided-analysis tools step in to direct the user on how to proceed. The trigger maycause any of the following to happen:
� The user is alerted to a problem and given advice on how to resolve it.
� The system automatically runs processes or queries that the user mightneed to perform the task that’s been identified.
� The system leads the user down a known best-practices path, presentingscreens and tasks that have been pre-scripted.
Using complex, multistep processes, the guided-analysis engine serves several functions:
� Helps keep users on track and ensures that they’ve supplied completeinformation
� Keeps track of the progress of branch tasks that might need to be revisited later
� Gives contextual help about progress made toward the solution
Result: users don’t just work in a vacuum of numbers and spreadsheets; theywork in the context of broader business goals. Tight process managementcombined with established best practices to help with users’ workflow andcollaboration make guided analysis a useful manifestation of business intelli-gence capabilities.
Data Mining: Hype or Reality?The amount of information maintained by companies has reached levels thatare truly astonishing. Most of the corporate packrat habit can be traced tothe rapid advances in storage technologies. Data that used to require anentire storage room full of documents can now be digitally rendered and puton a few square millimeters of magnetic tape or a hard drive platter. There’salso a just-in-case attitude that many corporations take: Hang on to your databecause in a more litigious society, you never know when you’ll need it.
109Chapter 7: Advanced / Emerging BI Technologies
12_127230 ch07.qxp 12/4/07 12:26 AM Page 109

But it’s probable that hope drives some of the trend in data storage. Thereare people who dedicate their lives to finding hidden trends in stock pricesand economic indicators in the hope that they can transform that informa-tion into profit. Top-level executives take the same attitude: All that companydata must be harboring secrets and trends that, if harnessed, could helpmake the business more successful than ever before.
That’s what data mining is all about — examining oceans of past business datato find useful insights about the past that can act as a guide to the future. Thetwin trends of increased information storage and the steady advance of pro-cessing power means that dream may not be out of reach.
Digging through data mining’s pastThe concept of data mining has been around since the 1950s when the firstcomputers were moving out of entire floors of buildings and into singlerooms. As scientists’ eyes were being opened to the possibilities of machinesthat could resolve math problems, they also dreamt about far more complexproblems, and even of machines that could find their own problems to solve.
The term artificial intelligence was coined in 1956 at Dartmouth. But whatthey had in mind wasn’t the brand of AI that involves a robot mowing yourlawn while deftly avoiding your begonias. Computer scientists originally sawAI as a way to tackle evolving problems by including feedback loops in code.The idea is simple: When an AI application attempts to solve a problem, it“learns” from its incorrect guesses by noting what variables change — and is programmed to look for why they change.
AI gave birth to so-called expert systems (a trend that peaked in the late1980s) — computer programs that accept inputs and apply to them a set of heuristics (a fancy term that computer scientists use to refer to formulasand rules) to produce a result. Programmers typically fed the system a vastamount of past data and worked in a randomness that the system would useas a model for its predictions of future results.
In theory, you turn the power of the computer loose on the data and wait fora solution to emerge. In practice though, it was hard to implement. If theyweren’t set up correctly, or if they weren’t fed the correct data, expert sys-tems turned out to be not so smart.
But the idea was sound, and as other information technologies around themimproved, the expert systems of the 1980s evolved into ever-more powerfulpattern-matching software of the 1990’s and the twenty-first century. Datamining came into its own.
110 Part II: Business Intelligence User Models
12_127230 ch07.qxp 12/4/07 12:26 AM Page 110
Digging for data goldLike “business intelligence,” data mining is a catchall phrase; it refers to anycomputational technique that attempts to transform reams of raw data intomeaningful business insights. Data mining software often includes advancedpattern-matching algorithms and high-end statistical analyses — anything tohelp the user draw useful links between the past and the future.
No matter what it’s called, these are the questions that get answered:
� What really happened in the past? This is where the mountain of datapoints comes in. We’re not just talking about showing you reports of yes-terday’s sales. Data mining tools use advanced mathematical models tofind patterns and themes in historical data that wouldn’t otherwise beevident.
� Why did it happen? Knowing what happened is valuable — but it’s evenbetter if you know what the root causes were. Data mining comparesmany different variables and looks for subtle correlations over long periods of time.
� What is likely to happen in the future? If you can apply the patterns ofthe past to the current conditions of the company, it might be possibleto predict the outcome of certain business activities.
Those three questions lie at the heart of all doctrine, whether it’s business,medicine, warfare, or any other discipline. If you can recognize that you’recurrently following a specific chain of events that has happened before andled to a certain outcome, it gives you the opportunity to act to improve thatoutcome this time around.
It’s worth saying again in the context of data mining: Don’t confuse causalitywith coincidence. Just because two things happen at roughly the same timedoesn’t mean that one event caused the other.
Data mining todayData mining has been successfully applied to business problems, especiallyover the last decade. Some industries (for example, banking and insurance)use it to attach likely outcomes to certain behavioral patterns — which helpsdetermine major business variables such as financial risk.
As data mining techniques have become more refined, it’s become a main-stream tool for non-financial businesses as well. More software vendors nowview data mining as an essential BI component, and are starting to include itin their core DBMS (database management system) products. For example,
111Chapter 7: Advanced / Emerging BI Technologies
12_127230 ch07.qxp 12/4/07 12:26 AM Page 111

Microsoft installed data mining tools in the latest version of SQL Server 2005,allowing you to work all kinds of cool statistical wizardry upon your data. Ifyou know how to take advantage of things like multiple regression and non-parametric analysis, data mining is for you.
If you’re using data mining, make sure you don’t become the sorcerer’sapprentice and unleash magic you can’t control. Advanced data-mining andstatistical tools are like weapons: Only those well trained in their use andapplication should be allowed near them. The problem is simple: It’s bothhard to create meaningful results and (unfortunately) easy to turn perfectlygood data into total highfalutin garbage through the miracle of statistics.
In spite of the challenges, data mining should be on every BI project manager’sroadmap as a critical part of the overall toolkit. Used wisely, it can addtremendous value to the business.
112 Part II: Business Intelligence User Models
BI 2.0 and the world of tomorrowTechnology buyers are enamored with versionnumbers, and no number is more significant interms of hype than 2.0. You see it associated anyso-called “next generation” technology. (Ofcourse, when that generation actually arrives,they’ll probably just think of a new buzzword forit, and then they’ll apply “2.0” to the follow-ongeneration. And so it goes.)
As BI has matured in the marketplace andbecome widely accepted, executives far andwide are authorizing BI installations in theircompanies. But the fact is, BI is already a littlelong in the tooth; the term has been aroundsince the first George Bush was president. Soit’s only natural that vendors are competing toclaim more mental real estate as the provider of next-generation BI. No wonder BI 2.0 hasentered the lexicon as a common buzzword for“emerging business intelligence tools.”
Of course, BI 2.0 means different things to dif-ferent vendors and experts:
� For some vendors and experts, 2.0 involvesspecific capabilities we’ve listed in this
chapter, such as advanced visualizationtechniques.
� For others, it’s about architecture — suchas the very stylish service-oriented archi-tecture (essentially building business intel-ligence tools without a data warehouse,and using other methods of collecting andaggregating data before funneling it to theBI tools).
From a more general perspective, BI 2.0 encom-passes broad improvements in existing BItrends — a shorter time from analysis to action,a wider user base as BI spreads throughout theorganization, and potent encounters with otherIT products and processes such as ERP (enter-prise resource planning).
Okay, nobody has the one true definition of BI2.0. But rest assured that you’ll continue to seethe term pop up in articles and in the literatureof vendors. For now, you won’t go wrong if youthink of it as a general acceleration of existingBI trends.
12_127230 ch07.qxp 12/4/07 12:26 AM Page 112

Other Trends in BIThe business intelligence universe is in constant flux. Read an article in oneof the many magazines or Web sites covering the field, and you’ll likely learnabout another hot topic on the minds of BI professionals. Whether it’s how toorganize a team, the latest in applications and architectures, or manage ongo-ing BI processes, keeping up with trends can be a full-time job. Below are afew examples of other broad directions in business intelligence.
BI for one and allThe consistent trend in business intelligence is to offer the ability to retrieveand identify useful insights “down” the corporate food chain from the greatwhite sharks to plankton. Whether it’s high-level executives, senior man-agers, mid-level managers, or individual contributors, if an employee makesbetter decisions, it’s a good thing for the organization.
Unstructured dataOceans of corporate data reside in non-standard formats. Imagine the wealthof information stored in documents, Web pages, or even video. And up untilnow, that information has been untamed — difficult (if not impossible) tosearch, sort, and report on.
That’s why there’s a veritable gold rush to develop tools that reach into abusiness’s nooks and crannies to ferret out hard-to-reach information. Thisgrowing element of the BI space is centered on new search technologies thatallow a user to find — and make use of — information that doesn’t fit into aknown pattern.
The problem with unstructured data that exists in documents — or other formats — is that there’s no context to explain how that data is arranged and what it means. As a result, the tools have to be extremely complex to be able to interpret what they’re looking at.
For example, Business Objects has a technology called Data Feed as aUniverse that accepts information from just about anywhere — includingExcel files, Web-service feeds, RSS feeds, and any other source for externaldata. The idea is that users can combine information from varied sourceswith data warehouse data to create a richer environment for analysis andpresentation.
113Chapter 7: Advanced / Emerging BI Technologies
12_127230 ch07.qxp 12/4/07 12:26 AM Page 113

114 Part II: Business Intelligence User Models
12_127230 ch07.qxp 12/4/07 12:26 AM Page 114

Part IIIThe BI Lifecycle
13_127230 pt03.qxp 12/4/07 12:27 AM Page 115

In this part . . .
So you’ve figured out the concepts of BI, and youunderstand how users work with the tools to obtain
business insights. Now you’re ready to make that lemon-ade stand hum.
In this part, you’ll learn about how BI solutions are assem-bled. Where do you start? What goals are you workingtoward? How does the structure of your company play intothese tasks? What factors are important to your lemonadestand that may not be important to your competitors?
Before you know it, you’ll be hammering out a BI strategyfor yourself.
13_127230 pt03.qxp 12/4/07 12:27 AM Page 116

Chapter 8
The BI Big PictureIn this chapter� Choosing the best BI software vendor for you
� Judging which methodology is correct for your situation
� Knowing when to throw out the recipe
� Weighing all the options
� Taking that first critical step
If you’re waiting for that chapter where we talk about the one-and-only BImethodology that will bring about world peace in addition to guaranteeing
your project’s success, you’re in for a disappointment: Such a thing does not exist.
As anxious as you may be to get started, making careful first steps is one ofthe best things you can do for your project. You’re faced with a thousanddecisions early on — including selecting a scope for your initial implementa-tion, which vendor(s) to choose, and how to staff your team.
But the consequences of rushing headlong into the project are too far-reachingand expensive to do anything but the best planning beforehand. In this chap-ter, we talk about just what kind of mousetrap you want to build, some of thekey choices you have in front of you, and some tips on making good decisionsin the early stages.
So Many Methodologies, So Little TimeThere is no shortage of pathways to the end of your BI project, but there may be only a few that will truly lead you to BI nirvana. Because while theymay look nice on paper, it’s likely that only a few of these “secret recipes” will actually fit your project’s particular needs.
So open up a magazine, crack a book, or fire up a Web page, and you’ll likelycome face to face with yet another methodology for installing a business-intelligence solution.
14_127230 ch08..qxp 12/4/07 12:27 AM Page 117
When you take on the challenge of selecting a BI methodology, you’re evaluat-ing not only what you can afford to do with the technology budget; you’realso thinking about what your company can actually do within the allottedtimeframe, and why you’re doing BI in the first place.
Starting at the beginningWhat’s your BI implementation going to accomplish? Have you settled on aprecise scope and timeline for the project yet? If you haven’t, then youshould consider doing so before looking any farther down the road.
Once the strategy for the project’s been laid down, consider some roadmap-ping exercises where you match the project goals with some concrete stepson how to achieve them. A roadmap is like a Gantt chart on a project plan;the results and ending of one phase become the inputs and starting whistlefor the next phase. Working through the critical stages of the project givesyou early perspective on the challenges of timing and coordinating activities,availability of interconnected resources, and the kinds of decisions that haveto be made — now and in the future.
Every methodology you see will probably look easy on paper. And not justeasy to do, but easy on the eyes as well, what with all the richly colored dia-grams of technology stacks and process flows where circles and boxes getmagically connected by big, thick arrows that virtually scream “progress!”
If only it were that easy.
It’s unlikely that a single, out-of-the box methodology pitched by one vendoror consultant will suit all your needs. There will inevitably be unexpectedtwists and turns in the implementation, and your organization will havenooks and crannies that won’t be covered by a canned solution.
That’s actually okay. It’s to be expected that no one methodology will beexactly what you need. In the end, the best BI implementations are hodge-podges of ideas, best practices, and even vendors. In the end, your technol-ogy solution will likely be a collage of software and processes that attachperfectly to each piece of your problem.
The exception to the rule: Micro-BIIt’s possible to get away with a single-vendor, single-methodology BI solutionif the scope of your project is narrow enough, and the needs are perfectlydefined. A good example is when your BI problem concerns a single area ofthe business, like Shipping or Human Resources. Single-facet BI challenges
118 Part III: The BI Lifestyle
14_127230 ch08..qxp 12/4/07 12:27 AM Page 118

can often be met with an off-the-shelf solution from an established vendor. Inthe case of HR, you’ll find capable tools like the one from Knowledge WorkersInc. that can be installed and used right out of the box. Knowledge Workers isa specialty vendor that’s been around for a long time providing a tightly-defined solution with a well-established methodology to match. Companiesshouldn’t feel obligated to make their solution any more complicated than itneeds to be.
For situations like this, where you are using a single vendor to solve a problemof limited scope, it’s advisable to not seek out ways to custom fit the method-ology to your company’s contours. In fact, in these situations your best bet isto follow the vendor’s step-by-step instructions as closely as possible.
If your BI installation involves creating a solution for a single department anda minimal collection of data, it’s possible to follow the recipe exactly. Butsometimes things get more complicated than you originally planned — andyou have to consider customizing or expanding your BI solution. Here are afew telltale signs that an off-the-shelf solution won’t cut it:
� It goes beyond the one department you had in mind.
� It requires anything beyond static reports or light OLAP.
� It uses resources shared by other systems.
At this point, it’s good to know when to throw the single methodology out thewindow and light out on your own path.
119Chapter 8: The BI Big Picture
Wait, what’s a “methodology” again?The word methodology is one of those overusedbuzzwords that makes an appearance in justabout every high-tech arena. In the context ofBI, the methodology refers, in broad terms, tohow you are going to build and deliver yourbusiness intelligence solution.
Different experts or vendors may have differentdefinitions of what exactly a BI methodologycovers, depending on their perspective (and onwhat they’re selling!) One dimension to con-sider is how you’re going to import the expertiseto install the BI software solution; valid answersmight be a vendor-driven, consultant-driven, or
internal-focused methodology. In other cases,the methodology refers to how you divide up themany tasks at hand — for example, splitting upstrategy tasks from development and support,or splitting individual tasks into phases similarto those in standard project-management steps.
So don’t fear the word. BI methodology justmeans what strategy or approach you’re takingto meeting your goals. If you want to includewhat kind of beer to serve at the launch party aspart of your own . . . er . . . proprietary BImethodology, hey, nobody’s stopping you.
14_127230 ch08..qxp 12/4/07 12:27 AM Page 119

How does the old saying go? “A project plan does not a methodology make,”or something like that. There is a difference between a BI methodology and acanned project plan. There’s a temptation to confuse the two, but they encom-pass divergent ideas. A project plan only discusses steps and resources, whilea methodology encompasses motives, vendors, and a strategic outlook. Youmight be able to get by with just a project plan on a small-scale project. Butfor true BI solutions, you have to consider full methodologies if you want thejob done right.
Customizing BI for Your NeedsNo two BI implementations are the same, but how your company’s systemdiffers from the one at the company down the street is a mystery that youneed to unravel one step at a time. As Glinda the Good Witch told Dorothy:“It’s always best to start at the beginning.” So you should begin by taking alook at what you’re company’s doing already to develop business insights.Then you can move on to more formal reviews of existing resources, softwareand hardware components, and needs. And if you do a good job, you mightjust find yourself on the yellow brick road.
Your not-so-clean slateThe ideal situation for any BI project team would be to build a solution fromthe ground up. The landscape would consist only of operational data sources,with no tradition of information aggregation, few established reporting stan-dards, and no analytics to speak of. With no preexisting conditions to distortyour design, each system component and process could be built to meet thebusiness needs to a tee.
In the real world, there’s no such thing as a clean slate. Every company hasdeveloped some form of decision-support apparatus, whether it’s a Ouijaboard in the snack room or a full-fledged technology-based system. And likeit or not, you’ll have to consider what’s there today before you can thinkabout tomorrow.
Even if the words business intelligence have never crossed the minds of any of the managers or executives, it’s a sure bet that reports get created androuted to an established schedule and with agreed-upon standards. There are processes for applying lessons learned and operational information todecision-making. Whatever it may be, someone at every company is attempt-ing to find, use, and distribute business insights, and you must account for it in your process.
120 Part III: The BI Lifestyle
14_127230 ch08..qxp 12/4/07 12:27 AM Page 120

� What is it? Make an inventory of existing methods being used to deliverbusiness insights — whether it’s spreadsheets on desktops, old main-frame applications, or departmental data marts.
� How does it overlap with your planned BI scope? Concern yourselfwith how your planned system will either use or replace existingresources, but don’t stop there. Think ahead, too — about what mighthappen when you make future upgrades to your BI implementation.
� How effective is it? This is the most challenging part: assessing whetheranything in your current process is really worth keeping.
Some elements of the existing system probably are worth keeping. Justbecause a technology is old doesn’t automatically mean it’s bad. Your job isto search for kernels of good, reusable business intelligence, if they exist.There may be reports or processes that are perfectly fine the way they existtoday. If that’s the case, be careful before you mess with them. Taking a stepbackward won’t win you many friends in the user community, and it will takeup precious time.
Initial activitiesThe early phases of the BI project consist of a set of evaluations on the orga-nization’s needs and an assessment of the company’s current BI readiness,both in terms of technology and culture. With this information in hand, you’reready to start developing more concrete plans that will drive your projectthrough to its conclusion.
Assessing your current BI stateDoes your company have a good solution in place that supports decision-making? If so, what’s it made of and how effective is it? You’ll find parts of it(or maybe the whole thing) to be good, bad, or just plain ugly.
If you understand the general information needs that are driving the BI solu-tion, then assessing the current systems’ effectiveness is really just a processof comparing what’s supposed to be delivered with what actually is beingdelivered. In most cases, the company’s information needs are not being met.(Otherwise, why would you be installing a BI system in the first place, right?)To mitigate the problems, you need to understand their sources.
We get into evaluation of asset capabilities in Chapter 10, but for now it’s bestto start at the natural flow of data and work your way toward the user.
121Chapter 8: The BI Big Picture
14_127230 ch08..qxp 12/4/07 12:27 AM Page 121

After you identify the operational data sources, you need to evaluate theirreadiness to be integrated in a BI solution. Is the data entered accurately tobegin with? Is it structured in such a way that makes it accessible down the line?
If your organization is merging data in a central repository, you need toassess how well that process is working. Does the quality of the end datameet the standards you need for your reporting and analysis systems? Youshould judge whether the current data-warehousing environment — if itexists — can handle the tasks you have in store for it.
Finally, there’s the reporting environment. It’s safe to say that just about everycompany has an existing reporting environment. During the assessment phase,you need to evaluate whether that system can create the kinds of reports thatwill be commonplace in the BI solution — and whether the system can distrib-ute the information in a way that meets the new standards.
Developing a sound BI strategyIt’s best to develop your BI strategy in parallel with — or directly after —your assessment of the current BI state. Once you’ve figured out what yourcompany can do now, it’s time to really begin locking in the specific reportsand functions that you expect the BI solution to handle.
This is the time to begin talking about who will be using the reports andother applications — why they’ll be using them, and what they hope to getfrom them. You also have to make judgments about who will be setting therules, where the administrative responsibilities fall, and how you expect tokeep the data secure.
There’s a tendency to go straight from the assessment of current BI capabili-ties into evaluating software vendors, specific technology approaches, andproducts. But be cautious. Selecting a vendor inevitably narrows your solu-tion options. One common pitfall in BI projects is a tendency to lock the pro-ject mindset in to one solution or another too early in the overall process. It’stempting to do because it gives the team a tangible starting point and somespecific direction, but it also invests you in certain applications and proto-cols that may not (in the final analysis) be best for your organization.
Developing your BI architectureAt this point, you’ve got an idea of your ultimate destination, you’ve got amap to tell you where to go, and now it’s time to plan the vehicle that will get you there. How well you assemble this plan will have a grave effect on the success or failure of the project.
Piecing together the components of the solution is where you begin to seeyour BI vision start to take on a real form. When you’re confident that youunderstand who needs what information and in what form, you can beginthinking about the kinds of systems that will meet those requirements.
122 Part III: The BI Lifestyle
14_127230 ch08..qxp 12/4/07 12:27 AM Page 122

The end result of this stage is a document (or set of documents) spelling out the specific requirements of the project — from an overall business perspective and in terms of a project-specific technology. Whether you labelthat document “Architecture” or “Systems Requirements” doesn’t reallymatter. The point is what’s in it:
� An itemized list of the components and major sub-components of yoursystem
� Detailed functional requirements for system components
� Information about the data that flows through the system
A good architecture document usually includes information on the followingareas:
� Source data: You should inventory the general domains of informationthat will be handled by the BI system, such as finance, human resources,or sales data. There’s also the matter of assessing the current state of thatinformation, as well as the databases and storage systems that house it.
� Extraction, Transformation, and Loading (ETL): With the sources ofdata identified, a huge part of the architecture document will be devotedto how that data is moved to the central repository and made availablefor queries and reports. The architecture document will also cover datacleansing, and lay out thresholds for minimum data quality.
� Data warehouse: The architecture document will include decisions aboutthe final makeup of the dimensions and metrics tables, the metadata, thenormalization mix in each table, and the business rules.
� User tools: This will be a description of the functions available to theend users and administrators in the form of queries, reports, and analy-sis tools. Include descriptions of how precisely users will be able tomanipulate the information they find, whether it’s (say) drill-throughcapabilities or more advanced analysis.
Other sections of the architecture document will cover logistical concernssuch as governance, administration, security. It’s imperative to know whereand how decisions get made during the ongoing use of the BI tool.
Architecture documents are typically long on narrative and short on convo-luted diagrams. But there should be some basic boxes-and-arrows artworkincluded to help readers picture the end results.
In the end, the architecture documentation is not just about the componentsand logistics of the system, but it will tell you how everything actually fitstogether. In complex systems such as business intelligence application suites,the individual pieces are also complicated; how those pieces should intercon-nect and interact isn’t always intuitive.
123Chapter 8: The BI Big Picture
14_127230 ch08..qxp 12/4/07 12:27 AM Page 123

Could-be versus should-be alternativesLike any complex system, a business intelligence implementation boils downto making some key choices (read: “a whole lot of” key choices). Your teamwill have to make calls on some tough decisions throughout the design phase;your best bet is to look at more than just the first alternative that surfaces.These multiple choices are the could-be alternatives.
What makes it harder is the fact that no single prescription can meet all ofyour enterprise’s BI needs.
But the good news is that there’s almost always more than one way to get toPoughkeepsie. So don’t feel as though you must find the single perfect path;in most cases it doesn’t exist. There certainly may be a solution that’s prefer-able to the others, but as long as you have examined several could-bechoices, you can just make your best call and move forward.
A perfect example of many could-be solutions is in selecting your overarchingBI business and technical architecture. If you want to do an enterprise-scaleimplementation, you have at least two ways to go about it:
� You could make your system highly centralized around a hub data warehouse.
� You could create a more distributed architecture, setting up departmen-tal data marts.
Either alternative is a viable choice, but one or the other will make moresense for your company — depending on your available resources, the com-pany culture, and how the business is organized. But it’s up to you to weighthose factors and make the best possible call.
Seek outside expertise when you’re confronted with a tough call that youworry might come back to haunt you down the road. Even better, you don’thave to call a consultant or a vendor to get in touch with somebody who’sbeen there before: There are multiple user communities open to BI profes-sionals (and dabblers); there you can get in touch with people who mighthave just the right piece of advice.
Selecting BI products and technologiesWith the strategy in place and the architecture plotted, it’s finally time to beginspeaking to vendors. Because you’re fully prepared — with your assessments,documentation, and general knowledge about how you expect to integrate theBI application into the company — you’re in great shape to evaluate alterna-tives among applications.
124 Part III: The BI Lifestyle
14_127230 ch08..qxp 12/4/07 12:27 AM Page 124

Picking the right vendorOne approach to selecting the right product for your system is to focus firston finding a vendor the matches what you need, and then digging into theirofferings to decide which pieces you need. If you want to evaluate vendors,you’d first assemble a list of companies that offer everything your BI projectneeds in general — and then narrow the list by examining criteria such as thefollowing:
� Approach to license pricing: site (where use is limited to locations orservers) versus seat (where use is restricted to a certain number ofpeople), and concurrent versus individual users (which concernswhether licenses are interchangeable between people).
� Availability of technical support and willingness to answer questionsbefore you’ve issued a purchase order for a million bucks worth oflicenses.
� Vendor stability and longevity.
� Product maturity and reputation in the marketplace.
Picking the right productIf you’re simply going to go product by product and make evaluations, thequestions get more granular, and focus on the specific capabilities of the tools each vendor offers:
� Suitable cost of ownership, including initial license costs as well as feesfor ongoing support, training, and upgrades
� Compatibility with existing systems
� Response time and processing speeds
� Usability and ease of use that matches the profile of the user communityin your organization
� Data-handling capabilities that fit with your variety of source-data platforms
� Customization capabilities so your BI developers can create tailor-madeapplications and reporting
Implementing BI: Get ’er DoneWe’ve taken a high-level look at all of the preparatory steps necessary in anybusiness intelligence project. Your team has done assessments, made adetailed plan, and selected vendors and software platforms. Now it’s time to put your money where your mouth is and start installing the system.
125Chapter 8: The BI Big Picture
14_127230 ch08..qxp 12/4/07 12:27 AM Page 125

For the professional who’s comfortable with managing standard software-implementation projects, the analysis phases are complete at this point —now you’re ready for the detailed design of the main components that willmake up the system:
� the database design of the software infrastructure that will power thedata warehouse
� the metadata repository
� the ETL process design that will wrangle the herds of data from the pastures and drive ’em home to the corral
When you get to this point, the theorizing is over. Now it’s time to turn thegeneral principles into specifics and start powering up pieces of the systemone at a time until the BI solution is up and running. (Translation: It’s time forthis choo-choo train to hit the rails and start getting somewhere.)
Zeroing in on a technical designThe assessments and high-level strategy and architecture documents willpoint the way to the technical design itself. This is the heart of the system,where there are no more abstractions, no more generalities. The technicaldesign includes precise data definitions and user-interface designs.
The central decisions surrounding the design of the data warehouse and datamarts include the level of data granularity, working out how the fact tablesand metrics will be constructed, the level of summarization of the data, whichtables get normalized (and to what degree), and so forth.
This same technical design process continues for all pieces of the BI solution.That includes the user facing-tools — in most cases the querying and report-ing applications plus any analytics software. Standard UI design processesapply here, just as they would with any application.
User interface design is a key factor in whether a BI solution is a success ornot. That means it’s a good idea to use tried and true methods for assessingusability — these, for example:
� Mock-ups and wireframes to ensure basic form-by-form or screen-by-screen usability
� Cases and other UML tools to ensure that the system’s navigation andactivity flow makes sense in the context of the system’s business purposes
126 Part III: The BI Lifestyle
14_127230 ch08..qxp 12/4/07 12:27 AM Page 126

UML is a great overall modeling tool for any kind of software system. Ifit’s a standard your team plans on using, check out UML 2 For Dummiesby Michael Jesse Chonoles and James A. Schardt (Wiley Publishing, Inc.).
For companies that buy packaged solutions, much of this work is alreadydone; standard forms can be customized to suit specific needs. For compa-nies building their own front-end applications, this is the moment when it’stime to work out how information is presented to the user and which con-trols are in place.
In other words, the BI implementation team already knew what needed to bedone; now it’s actually working through the process of how to accomplishthese tasks.
This stage in the implementation will be dominated by the developers, dataarchitects, database administrators, and other techies. But make sure the teamisn’t stuck on a virtual technology island, with no connection to the business“mainland”. It’s always important to maintain buy-in from every business orga-nization affected by the technical design. This is where it becomes importantto identify power users in the key business functions who can help the techteam stay grounded in the business strategy as they make technology sidedecisions.
Putting together the BI project planThe project plan ties the many tasks of the technical design together, account-ing for resources and dependencies. The project plan is at once the schedulefor the BI implementation as well as a detailed inventory of the remainingsteps, and a running assessment of the resources that are available to the BI team.
Standard tools are fineThere’s nothing special about a BI project plan relative to other technologyimplementation project plans. Any software that offers the standard projectplanning, reporting, and display tools for tasks and resources will usually befine. Microsoft Project is the most commonly used application for buildingand maintaining project plans, but there are certainly other capable offeringson the market.
To learn about the capabilities of Project, check out Nancy C. Muir’s MicrosoftOffice Project 2007 For Dummies (Wiley Publishing, Inc.).
127Chapter 8: The BI Big Picture
14_127230 ch08..qxp 12/4/07 12:27 AM Page 127

Policing the processAs with any large-scale implementation, you need to maintain an adequatelevel of control over the quality of the technical development. It’s best tobuild in such features as inspections, walk-through sequences, and a thorough quality-assurance and testing program to ferret out any bugs and defects.
Finishing the jobAt the end of the line, when all the plans have been made and adhered to,when the development is complete, and the processes have all passed awhite-glove inspection (and survived every QA scenario you could possiblydream up), the project is finally done. Or is it?
There’s more to it than just building the solution and flipping the switch.Once the BI system is working the company has to be ready to actually use it — and benefit from the results.
As you get closer to the end of a long implementation, it’s not uncommon forthe troops to start grumbling. With the light at the end of the tunnel growingbrighter, it’s tempting to speed up, take shortcuts, or deviate from the plan.Without warning quality drops on the final phases of development. And evenif you keep your team motivated and on target, sometimes the late-gamepressure comes from the outside. Prospective users, managers, and othersbegin agitating to see the fruits of your labor. They’ll grow more and moreanxious to finally light the fuse and start taking advantage of the systembefore it’s completely ready. They figure, just because the dashboard applica-tion hasn’t gotten out of the quality-assurance testing phase doesn’t mean wecan’t start querying the data warehouse, right? Wrong. There’s nothing wrongwith planning a phased rollout, but once the plan is set, stick to it. Hold theline at all costs. If you roll out the BI soufflé half baked, you risk it falling flatbefore anyone’s been able to enjoy it.
Part of the project plan should include time for training classes for the usercommunity. The training strategy deserves just as much attention as otherparts of the high-level plan, because it is one more area that can make orbreak the BI project. Here’s a sample of the issues you have to wrestle to the ground:
� Will you have technical people train the user groups? Or will you holdtrain-the-trainer sessions and trust that the first round of learners canpass on the right information to their teams?
� How much material will you provide for the training? Will it be differentfor different user groups of varying skill levels?
� Will there be ongoing education as the system evolves?
128 Part III: The BI Lifestyle
14_127230 ch08..qxp 12/4/07 12:27 AM Page 128

These are not trivial questions. And they’ll crop up again from time to time.
Do yourself a favor and have a ribbon-cutting ceremony — and associatedparty! — once the implementation is complete. Invite as many people in theorganization as you can. There are several purposes to this pleasant ritual(beyond getting the company to pay for the beer):
� It rewards the BI team for a job well done and marks a milestone on theproject plan — a phase shift from building the tool to supporting the tool(which will be a challenge in its own right).
� The ribbon cutting is an opportunity to show off the full capabilities ofthe new system — and to build support and goodwill in the early going.(If something goes wrong, you may need it.)
129Chapter 8: The BI Big Picture
14_127230 ch08..qxp 12/4/07 12:27 AM Page 129

130 Part III: The BI Lifestyle
14_127230 ch08..qxp 12/4/07 12:27 AM Page 130

Chapter 9
Human Factors in BIImplementations
In This Chapter� Finding the right skills for your team
� Winning over reluctant users
� Overcoming resistance to change
� Running a BI competency center
E very successful business intelligence implementation, no matter the sizeand scope, must address how the project is affected by human factors.
You can assemble the best possible plans and purchase high-grade softwareand infrastructure components, but when it comes down to it, you’d betterhave the right people in place, or the whole thing could come crashing downaround you.
You can’t just have brainiacs and geeks in your team. You need some peopleskills. That means you need internal salesmen, facilitators, negotiators, anddiplomats. And in some cases, you need many of those skills packaged in onesingle person.
Companies are microcosmic societies, where egos, rivalries, and prejudgmentsare in constant motion — usually in the form of individuals and groups unitedfor one cause or another. The business intelligence system will be a two-waystreet. It will have to draw on the resources of the community of experts,users, allies, and champions, and it will need to provide benefits, direct andindirect, to those same groups.
This chapter dives into the people elements of your project. They are easilyas important as the technology factors, so take heed.
15_127230 ch09.qxp 12/4/07 12:28 AM Page 131

Star Techie: Skills Profile of a Core BI Team
Business intelligence projects are bridge-building exercises like no other. Toguarantee success, the implementation team must develop linkages betweenthe business goals and operations of the company and the elements of the ITinfrastructure.
Key performersSome members of the team will work on the BI project full time, while otherswill be on loan from other teams, or will supply expertise on an as-neededbasis when the implementation touches their particular area.
� Project manager (PM): This person will be the linchpin role for the entireimplementation. The PM is tasked with oversight of the project, meaningthey will establish the initial plan of attack, coordinate the necessaryresources, and do whatever it takes to adhere to the schedule.
A BI project manager should have the requisite skills inherent in goodPMs; they should have a good grasp of both the business and technologyside of things. They must understand how the BI project dovetails withthe company’s business objectives. The PM must be able to exercise all the key “soft” skills such as negotiation, mediation, and mentoring.
It’s often said that a good business intelligence PM has a sixth sense: ableto see project dead-ends and pitfalls in time to avoid them, and able tofeel when it’s time to deviate from the plan to keep the project moving.
� Business Analyst (BA): The BI business analyst shares the same basicqualities as counterparts working in other technology fields, with a fewnotable exceptions. All BAs are (in effect) translators who move betweenthe technical staff and the business teams, enabling communication inboth directions.
Because they must create a common platform for communication, BAs,like PMs, must have a good understanding of the underlying BI technol-ogy as well as a solid grasp of the business goals. BAs operating in a BIenvironment must have a particular handle on how data moves — notonly within a company’s operational systems but between those samesystems — to succeed. Armed with that knowledge, their main objectiveis to help the user community get the reports and application functional-ity they need. For later phases of the project, they must also be able tograsp the complexity of analytical tools, especially when the require-ments aren’t as cut-and-dried as those that apply to simple transactionsand reporting.
132 Part III: The BI Lifestyle
15_127230 ch09.qxp 12/4/07 12:28 AM Page 132

� Data architects and designers (DAs): These folks work at the lowestlevels of the data itself — designing data models, database structure,and information flows through the various elements of a BI solution.They also make decisions about which methods to use for key processes.For instance, ETL (extract, transform, load — the essential processes ofdata warehousing that are responsible for moving data from source data-bases into the warehouse) can be performed in multiple combinations ofpre-built tools and home-grown code; the DAs must recommend a com-bination that works best for the project. They must also work with therest of the team on how and when to make new data available in the datawarehouse. The developers may have designed the front-end tool basedon (say) 30-minute data-refresh intervals, but the architect may deter-mine that such a requirement is impossible to meet.
This is one position where the BI version of the role is quite differentfrom the normal version. Unlike a transactional data architect, the BIdata architect must understand dimensional modeling (which you’llrecall from Chapter 5 on OLAP), and be able to design a platform formultidimensional analysis.
133Chapter 9: Human Factors in BI Implementations
BI BA, Private EyeDocumenting a BI implementation is an incred-ibly important task. . The business-analyst rolesits closest to the users, whose participationwill ultimately determine the success or failureof the project. That makes the role of businessanalyst (BA) as important as any other role onthe team.
Documenting business requirements has a cas-cading effect on a project because it drives somany other branches of the process — testing,support, and troubleshooting, for openers.Creating that initial set of requirements usuallyrequires investigative skills much like those of areporter or a detective. The BA must be able tointerview business users and any area’s sub-ject-matter experts to find out where the BIcapabilities are needed the most, and how thetools are going to be used in the final solution.It’s then necessary to filter those businessrequirements through the projected capabilitiesof the project and distill them down into a core
business requirements document (BRD) thatspawns further documentation of the functionalspecifications — which the development teamwill use to actually build the solution.
A talented team of BAs can make the differencein a difficult implementation. Like project man-agers, business analysts have to have a sixthsense — to be able to elicit definitive informa-tion from people who may not know or under-stand what’s on the line, or from people whohave trouble articulating what they need. TheBA must be able to weigh requirements that areat cross purposes, and make supportable deci-sions that settle whose #1 priority is #1a andwhose is #1b. And finally, the BA must be a talented writer who can create crisp, well-organized documents. In the end, a solidrequirements-gathering and documentationprocess helps a good technology solution graduate become a good all-around businesssolution.
15_127230 ch09.qxp 12/4/07 12:28 AM Page 133

The data architect must be prepared to work closely with the businessanalysts to keep the data model in synch with the business model. Aswith many positions in the BI world, the DAs have to know just when tobreak certain rules, deviate from best practices, and mix in their ownbrands of solutions as they design the data model.
� Data-quality analyst (DQA): When a system relies on a data warehouse,a data-quality analyst in the project is a must. The DQA is there to assessthe fitness of the data that courses through the operational and transac-tional systems for use in the data warehouse. The DQA has a stronghand in the ETL process, making the call on which cleansing routinesmust be used on data from each source before it’s transferred into thewarehouse.
The rules about how and when to implement the multidimensional datamodel (as opposed to a relational data model) are no longer as hard and fast as they used to be. Some experts will carry a copy of their favorite database-design textbook around and refer to it reverently as if it containsthose missing Five Commandments (the ones Moses dropped in Mel Brooks’sHistory of the World Part II). Most database designs follow one of two tradi-tional directions:
� Relational databases are built for storing and accessing information.
� Multidimensional models are tailor-made for analysis.
But the lines are blurring; more systems aspire to do both these days.
Your other techiesThe following folks don’t have lead roles, but their support is important tothe project nonetheless.
Front-line IT folksThis is the crew that actually wrestles the machines, programs, and data intosubmission:
� BI infrastructure architect: The person in this role oversees the techni-cal foundation of the project, ensures that all the software parts worktogether, and ensures that the hardware is in place to handle the load.
� Application lead developer: This is a programmer who is responsiblefor assembling the front end tools. They are likely tasked with cobblingtogether the various querying, reporting, and analytics environmentsinto a smooth, usable application.
134 Part III: The BI Lifestyle
15_127230 ch09.qxp 12/4/07 12:28 AM Page 134

� Database administrator (DBA): The database administrator’s job is totake the logical model handed down by the data architect and turn itinto an efficient physical model — selecting database hardware and software, and assembling the foundations of the data-handling softwarethat will be accessed by other areas of the application.
� Quality-assurance analyst: In any technology environment, the testingphase is the first of many moments of truth. In a BI implementation,you’re looking not just for classic script-testers and bug-finders, but also(in fact, especially) for people who will work to actively challenge theenvironment you’ve created. Once it’s gone through the paces set by anexperienced BI testing team, you can be confident that the system isrugged enough to handle any level of user and abuser.
Getting help from the IT-freePeople in the organization who aren’t necessarily technology professionalsstill have an important role to play in your BI implementation:
� Users: Yes, these people are effectively part of your team (even if theydon’t always want to be!). You need to identify and classify them in orderto build the application to suit their needs. Remember how very differ-ent users can be across different business units and functions — andyet, if you can find the common aspects of what they need from the BItool, your job is that much easier.
� Subject-matter experts (SMEs): It’s important not just to get informationand opinion from the end-users, but also to identify experts in the fieldsyou’re touching directly. For example, say you’re building a BI tool thatwill serve the supply-chain team. Just because you speak with a few indi-vidual users doesn’t necessarily mean you’re getting the big picture. Infact, you can be led astray if you don’t identify SMEs who can show youthe 30,000-foot view of the company’s supply-chain operations, the datathat gets exchanged with the manufacturers and suppliers, what metricsare used to judge success inside the organization, and so on.
Your team will inevitably develop a small army of SMEs to rely on againand again to resolve development dilemmas such as selecting from twocompeting business priorities. An SME can be anyone with full knowl-edge of that specific business function and how it fits into the overallbusiness model.
Ideally your SMEs will be people of considerable experience, but youdon’t necessarily want to aim for the most senior people; they’re proneto mix opinion in with fact. Instead of a snapshot of reality from 30,000feet, you could easily get an oil-on-canvas picture of how your SMEwould like it to be.
135Chapter 9: Human Factors in BI Implementations
15_127230 ch09.qxp 12/4/07 12:28 AM Page 135
Overruling Objections from the Court of User Opinion
Who knew that a company is filled with tollbooths and drawbridges? You don’tsee them, of course, but they’re out there — in human form: Team leaders,mid-level managers, and people of all levels will seek to exact a toll of somekind from you in exchange for their cooperation in the BI implementation.
Okay, we’re not talking direct bribes here, but you need to be prepared tobend the project plan to meet the wishes of certain key people who controlresources you need to make the project work. Whether you’re paying a sym-bolic toll or paying homage, you should be prepared to do whatever it takesto get across that bridge or through that gate.
After winning the fight to get the BI solution implemented, after duking it outover budget and resources, the final test awaits you: the user community.Even if you do a superior job in every other respect, there will always bepeople who touch your implementation that will express mild doubt, skepti-cism, or downright antagonism.
The “other” half of the people battle is winning over the user community, aswell as areas of the business that you must pass through
Ch-ch-ch-ch-changesDid we mention that the BI project management team has to be part psychol-ogist as well? It’s obvious why there are so many doubters, gainsayers,negaters, and resisters: People naturally fear change because change means . . . well . . . that things change.
For worker bees in a department that’s about to get a shiny new BI applica-tion, it means learning a new skill. It opens them up to someone being “better”than they are — that is, losing their place in the pecking order. They mightfall out of line for that promotion they were bucking for.
Just lay off, okay?Worst of all, people will often fear for their jobs. So as you lead a BI implemen-tation, you need to be able to reassure all those affected by the implementationthat their jobs are absolutely, positively, not on the line. Except there’s onelittle problem: Sometimes they’re right. Their jobs may be on the line. Knowingthat better decisions will result from the BI implementation is cold comfort
136 Part III: The BI Lifestyle
15_127230 ch09.qxp 12/4/07 12:28 AM Page 136

for those who lose their jobs in the process; they won’t be around to experi-ence the fruits of those better decisions. It’s an unfortunate side effect ofworking with any program that has the power to transform a company.
At the risk of sounding melodramatic, companies who don’t adapt get leftbehind and eventually go out of business. Your company must be as efficientand smart as its competitors or everyone is out of a job. So (if you’re lookingfor a little rationalization) think of BI as a way of saving jobs, not choppingthem.
Cut through the buzzBusiness intelligence is a powerful and far-reaching technology concept (itsstarry-eyed adherents call it a “paradigm”) that has the power to transformorganizations, both in action and in structure — in ways that can frighten therank and file. BI solutions are often implemented right along with organiza-tional restructuring initiatives. Frequently those involve putting processesunder a microscope through programs such as TQM, ISO 9000, or Six Sigma —all of which are beyond the scope of this book but will produce millions ofhits when run through your favorite search engine. Such efforts often gohand in hand with re-jiggering teams, moving employees around on the orga-nizational chart, and (yes) downsizing.
Turn and face the strangeBeing aware of the ramifications of a BI implementation is an important firststep in combating the problems that can arise. Fear, uncertainty, and doubtwill spawn resistance to the program through the ranks of the teams touchedby the BI implementation. But there are some proven techniques and actionsthat can mitigate the drag-effect on your BI project:
� Get sponsored: Here’s where top-down clout comes in handy. A BIimplementation is far more likely to succeed if it carries the weight of acorner-office mandate with it. Anyone whose title starts with Chief andends in Officer will do, because when they say something will happen,one of the main effects is that critics are immediately silenced.
Your company’s Chief Executive Officer is a case in point; you need thatperson’s buy-in from the beginning. So show the CXO how the BI projectwill have an impact on things he or she cares about. Then keep thatperson in the loop — invitations to the kickoff meeting, the launch party,and as many points in-between as a busy exec is willing to attend. Runbig decisions by the higher-ups you get on your side — both to get thebenefit their expertise and to reinforce buy-in as they contribute whatthey know. Best of all, if you can generate enough enthusiasm for yourproject that your exec allies chat about it in the executive washrooms,you gain momentum.
137Chapter 9: Human Factors in BI Implementations
15_127230 ch09.qxp 12/4/07 12:28 AM Page 137

� Employ champions: No, don’t hire Tiger Woods or Garry Kasparov to doyour data cleansing. In this case, champions are any managers or influen-tial users who are willing not merely to set aside their antagonismtoward the project, but to sing its praises.
Long-time employees are especially good in this role because they notonly hold the respect of their coworkers, but they also operate withinnetworks of friends and colleagues that extend far and wide throughoutthe company. A few well-placed champions can generate more positivebuzz about your BI implementation than a full-fledged marketing campaign.
� Convert heretics: Is there a particular user group or team whose partici-pation is essential to the functioning of the entire program? Then focusyour best sales effort on them — especially potential doubters — andbring them into the tent. If you involve skeptics early on in the process,ask their advice, and take their suggestions whenever possible, you’remore likely to tamp down their negativity.
� Accentuate the positive: Simple positive reinforcement goes a long wayfor the implementation team, the extended technology resources, andthe user community as well. While you don’t want to oversell BI capabili-ties, it’s important to remind the relevant players of the end result, themagnitude of the anticipated improvement, and the level of value it willcreate within the company. It’s what politicians sometimes refer to as the vision thing: where you give voice to a version of future events thatpeople in the trenches sometimes lose sight of while dodging everydaybullets. When they’re reminded of how great it’s going to be (rather than being threatened or cajoled), they’re more motivated to do theirpart to create that positive outcome for the company.
� Do what works: The wheel’s been invented already, so there’s no needto sit down at a drafting table with a picture of a manhole cover and apencil. The biggest favor a BI project leader can do is simply to adhereto best practices. In almost every area of BI — from data managementand integration to application design, training, and support — a standardhas already been set. The lessons are all there: incremental rollouts,highest-value-first, and so on. Lean on that combined wisdom providedby the myriad experts who have gone before you down this path.
� Archive knowledge: BI implementations are not one-shot deals; they’redesigned to be a long-term transformative force inside companies. Thesystems will inevitably evolve over time as business priorities change,new technologies become available, and the people involved in the pro-ject rotate off or out of the company altogether. Preserving the lessonsand institutional knowledge that accumulates over the life of a BI imple-mentation is essential to keeping it efficient and relevant. Whether youcreate a competency center, invest in knowledge management software,or find some other solution, responsible stewardship over the BIarchives ensures the project’s survival.
138 Part III: The BI Lifestyle
15_127230 ch09.qxp 12/4/07 12:28 AM Page 138

Major in CompetenceJust building the BI solution can often be a multimillion-dollar enterprise thattakes dozens of months to accomplish. But the enormity of that challenge isnothing compared to what it takes to actually maintain the BI system overseveral years.
Setting and maintaining the ongoing business intelligence strategy is a rolethat often has no obvious home within an organization. And yet, it’s a mustfor companies that want to protect their BI investment and get the most fromthat complicated system moving forward. A common trend in the BI world isto set up a permanent organization tasked with maintaining the company’s BI effort.
Enter the BI Center of Excellence (BICOE) — or (as it’s also known) theBusiness Intelligence Competency Center (BICC).
The two terms essentially mean the same thing. While there are no hard andfast statistics to prove it, BICC seems more commonly used so we use thathere to talk about the organization in general — but if you have a choice, go with BICOE over BICC. The word competence has a connotation of bare-minimum proficiency, giving the feeling of being damned by faint praise. Even though a BI Competency Center will go well beyond mere proficiency, itsounds so average. It’s like advertising your restaurant with a billboard thatsays “Eat at Tedd’s Hamburger Joint, Where Our Food Won’t Make You Sick!”But if you put excellence in the title, right away you have something everyonewants to identify with.
Find your centerThe purpose of the BICOE/BICC — okay, the BI center by whichever name —is to act as a permanent body whose sole focus is to address every aspect ofBI throughout the organization, from establishing standards and priorities, todriving the overall BI strategy.
BICCs don’t issue orders or hand down mandates that must be followed. Theymake formal recommendations to the appropriate executive and managementteams that actually govern the company. Even so, that advice — coming froma team of experts and representative users — typically carries a lot of weight.Their evaluation of a vendor (for example) can make or break the relationship.If the BICC center deems one project a success or failure, it can impact thefuture of the individuals involved. And the BICC will give a thumbs-up orthumbs-down to every major BI activity being considered — from new installa-tions to upgrades to changes in the architecture. And it’s all accomplishedfrom one central organizational node.
139Chapter 9: Human Factors in BI Implementations
15_127230 ch09.qxp 12/4/07 12:28 AM Page 139

If you think that a BI center might be overkill in your organization, keep inmind that part of its purpose is coordination. BI activities often involve somany different players and teams that it’s almost impossible to make a movewithout a central committee that gathers everyone into one place to hashthrough issues. And remember: There may be more than one BI effort goingon at once. A BICC ensures that the multiple data warehouses and dozens ofdata-mart environments all follow the same standards and protocols.
Organization-based competency centersIn this model, the BICC acts as a cross-functional committee, filled with repre-sentatives from every relevant business unit and division that has a hand inthe BI process. The committee members manage tasks like managing relation-ships, both internal and external, such as establishing lines of communica-tion with the legal department and bodies that govern the company as wellas vendors and BI organizations. There are also sub-groups concerned withestablishing common protocols and standard processes in the technologyenvironment, as well as guiding principles for how projects are run.
Like competency, the word committee also has some negative connotationsand/or bureaucratic baggage (think Committee for Public Safety during theFrench Revolution). But the BICC doesn’t have to fall into the standard com-mittee traps of doing too much or too little. As long as the mission and agendaof the BICC is clear, and all key players are required to participate, it has agood chance for success.
Competency centers — budgetingA common sin committed by companies is to create a BI center without adjust-ing the mix between primary job responsibilities and committee responsibili-ties. If representatives from around the company are to take an active role inthe BI center, it must have people who can take the time to participate withoutjeopardizing their jobs. But at the same time, the BICC can’t become a home tofull-time committee members with no other responsibilities.
In the former case — the “PTA model” — the Competency Center is made upof BI specialists who are essentially volunteers. Management doesn’t officiallymake their work on the BICC a part of their performance plan. That leavesthe BI center devoid of a steady source of energy and influence as membersdrift in and out of the organization.
On the other hand, creating a fully budgeted BI center — where membershave no primary responsibility other than the work of the committee — creates another set of problems altogether. When members have no tasks inthe day-to-day functioning of the BI system, they’re likely to become divorcedfrom the truth of what’s working, what isn’t, and where the company’s BI ini-tiative should go from there.
140 Part III: The BI Lifestyle
15_127230 ch09.qxp 12/4/07 12:28 AM Page 140

A BI center that’s juuuuust rightYou guessed it — the Three Bears are right again: The middle ground is thesafest place to be when it comes to forming a BI center, somewhere betweenthe two extremes mentioned earlier. Membership should be mostly voluntary,but those who serve on the committee should be compensated for doing soby their originating organization. That allows the members to stay in touchwith the BI strategy without becoming so far removed from their primaryjobs that they lose unique professional perspective on BI’s direction in thecompany.
It’s also beneficial because there is no question of member loyalty. Everyoneon the committee has a known dual allegiance: to their primary organizationas well as to the company’s BI strategy. This balance provides a natural andpositive tension that means actions won’t be rash or hasty, and BI conclu-sions will only be reached by active compromise where the company’s needsare placed ahead of all others.
Raising standardsThe simple act of setting standards in a business intelligence environment canbe daunting when you consider the number of source databases that the effortmay have to draw from — and the sheer volume of reports that may be
141Chapter 9: Human Factors in BI Implementations
The spreadmart phenomenonAlmost every company in the world faces aproblem with spreadmarts. Yep, another buzz-word (in this case, mashing up spreadsheetwith data mart) — but it describes a potentialobstacle to integrating data in companieswhere important operational data resides ondesktop spreadsheets.
Part of the problem is that spreadsheet pro-grams are so powerful these days. Back whenit was just a young pup, the spreadsheet was atrue killer app, forcing the abacus, slide rule,and pocket calculator off people’s desks andchanging the way individual workers handleddata — particularly figures — for good. Today’sspreadsheet applications are so powerful that
employees can emulate fairly advanced data-base and analytical applications if they knowthe right tricks.
The problem is that spreadsheets remain mostlyisolated from the central population of companydata. What’s more, a spreadmart environment isthe Wild West when it comes to standards,security, access, and other basic governancefunctions.
As long as the data remains out of reach ofstandards committees — and as long as theindividuals maintain their own micro-BI spread-sheets — there will be a roadblock to integrat-ing all operational data, and there will beresistance to implementing a full BI solution.
15_127230 ch09.qxp 12/4/07 12:28 AM Page 141

created. Sure, decisions can be made in the field, but that makes coordinationand integration harder. Competency centers step in and apply best practiceswhen it’s time to set standards throughout the company. Even something asmundane as column widths or report layout spacing isn’t out of reach for a BICompetency Center, although such niggling attention to detail is rare. Butwhen it comes to big-picture decisions — such as deciding on ETL timing anddata-refresh rates for data warehouses throughout the company — standardsare necessary to making the system run. The BI Competency Center providesa mechanism for making such decisions.
142 Part III: The BI Lifestyle
15_127230 ch09.qxp 12/4/07 12:28 AM Page 142

Chapter 10
Taking a Closer Look at BI Strategy
In This Chapter� Considering the way it is
� Looking at potential “should be” states
� Dreaming about the “could be” possibilities
� Deciding on your BI strategy . . .
� . . . without looking back . . .
This chapter drills farther into business intelligence strategy. Before youstart making specific plans for your solution, however, take a quick, hard
look at certain realities that will become very important during the imple-mentation. (This chapter helps with that step, too.)
The Big PictureThe first part of your second look at BI strategy (as shown in Figure 10-1)includes a more detailed examination of the BI capabilities you already have(versus desired capabilities). The goal here is to collect information aboutyour organization’s current BI capabilities, assess its current BI needs, andchart a way forward to the next step: creating a roadmap, project plan, andrequirements documentation. From there, you can begin building the project.
16_127230 ch10.qxp 12/4/07 12:29 AM Page 143

Your Current BI Capabilities (or Lack Thereof)
Traditional strategic planning begins with a (usually long) analysis-and-planning phase: Leadership assesses a company’s current situation, definesthe finish line far over the horizon, and then goes through the long laboriousprocess of developing the route to get from here to there.
A BI implementation is no different: To know what’s needed, you have tounderstand what’s currently in place.
How you approach this assessment depends largely on the shape of the orga-nization, and the scope of your planned offering:
� If the focus is going to be on a single business function (for example,customer-relationship management), you might look at how that func-tion affects the entire organization: How does the sales department trackcustomer data versus the service delivery group? How does the billingdepartment use customer information, and which pieces of data do theyuse? You’ll need to understand the ramifications of a focused BI solutioneverywhere it plays a role in the company.
� If your BI project is going to involve a comprehensive overhaul of asingle business unit or department’s processes, you’ll start with thatdepartment or division, and then move outward to all the connectionpoints throughout the organization.
Assessing your business infrastructureBefore you move into an assessment of the technology that’s currently in placethroughout the company that supports business intelligence capabilities, you’llwant to understand the existing processes that govern the operation of yourbusiness.
CapabilitiesReview
Future StaleVision
Strategy Phase Planning Phase RequirementsPhase
BusinessRequirements
Documentation
Architecture
CandidateArchitectures
BillStrategy
ProjectPlanRoadmap
Figure 10-1:BI strategy:
gatheringideas and
informationto shape
implementa-tion
decisions.
144 Part III: The BI Lifestyle
16_127230 ch10.qxp 12/4/07 12:29 AM Page 144

You’re not yet at the point of gathering data on specific requirements. This isstill preliminary discovery work to give you a good view of how a BI solutionwould fit. By stepping back to look at the big picture, you can work out theright questions to ask while you’re identifying requirements. For now, it’sabout listening to individual contributors, middle management, and execu-tives as they tell you how they go about normal work processes — as oftoday. Here’s an overview of what to look for:
� Business functions: These are the broad categories of an organization’soperational activities. When you make a map of them, what you get is a cousin of the organizational chart, which diagrams the divisions andteams of the company in a hierarchy of activity. For example, your com-pany might subdivide the business into divisions based on the marketsthey serve, or perhaps base the divisions on different product lines.Within each of those divisions there might be a sales team, a sales sup-port staff, a marketing arm, and a shared-services entity (further subdi-vided into accounting, finance, human resources, and so on).
Chances are the company’s functional breakdown has already been doc-umented in some form; most people who’ve worked in an organizationhave a general understanding of how the company’s large pieces fittogether. For areas of the company that might be affected by the BIimplementation, you’ll want to create a pretty granular functional map.Don’t just list (for example) “Human Resources”; you’ll want to do somedetective work on how the HR department is assembled, and then list itsmajor parts (such as the Benefits, Recruiting, Training, and EmployeeRelations teams).
� Operational processes: This category describes how things actually getdone within each business function listed on the map you created ear-lier. This is a specific, step-by-step map of the major activities performedevery day by each team. For example, in the payroll team under theaccounting department, you’ll build a list of the basic steps, roles, andinteractions for the day-to-day functions like adding and deleting anemployee from payroll, or changing employee withholding information.
You’re not looking to map out every single step the workers on a teamtake; there should be no entries in your notes that say, “Employee pullsout chair. Employee sits in chair. Employee sips coffee. Employee opensReportWizz application by clicking the Run ReportWizz button. Employeewaits 8 seconds.” You want detail, but don’t go overboard. You’re trying toget down to the point where you understand at a high level only what dataindividuals use to perform their key everyday tasks, how those employeesare using data to make their critical decisions, where they get their datafrom. You don’t need to a play-by-play of every second of their day.
The questions you’ll ask will cover the following broad areas:
� What are your current pain points? In other words, what processes orapplications don’t serve your function well, and seem to be without anobvious or easy fix?
145Chapter 10: Taking a Closer Look at BI Strategy
16_127230 ch10.qxp 12/4/07 12:29 AM Page 145

� Are there any opportunities being missed because the data, reporting,or analysis infrastructure aren’t working well? What would be neededto take full advantage of those opportunities?
� What are the positive and negative aspects of the tools and processesyou work with every day to perform your job? Does everyone in thedepartment feel this way? Can that view be backed up with specificinstances or evidence?
Business intelligence has to produce insights that are timely, accurate, high-value, and actionable. Anything less than that and you’re probably talkingabout a failed process or a tool that’s not doing its job. That definition shouldnever be far from you at any time during your evaluation process. It shouldinform your detective work and guide you as you gather information aboutquality of the business processes and their specific contributions to how thebusiness functions. In most cases, when employees deem a process or tool tobe inadequate, they can identify the absence of at least one of the four keycharacteristics of BI.
As you discover more about how your company’s current processes work,you also build an understanding of general policies and business rules. You’relearning what people are doing, but along the way you also build a picture ofwhy they’re doing it that way. You figure out cause-and-effect relationshipsbetween the elements of the processes, along with business rules and teampolicies that affect business operations.
Mid-level managers are perfectly capable of expounding on the processeswithin their team and how their team interrelates with other teams. You’llwant to understand how things are supposed to work as well as how thingsactually work. But ask a fundamental question about a business issue as awhole, and the answers start to vary widely. For example, you might ask abasic question like, “How do you calculate the profitability of a particularsales account?” or “Who are our main competitors?” and two different man-agers might have perspectives that are completely at odds with each other.
Part of the task ahead of you, as you assess current capabilities, is to find“the truth” about how the business actually functions. That means findingagreement across divisions and teams about business rules and procedures,and sometimes even forcing agreement between opposing parties who havebeen doing things differently. It may actually come down to putting two man-agers into one room and letting them hash it out. That means you’re going tointerview lots of people, including representatives from the current end-usercommunity, those performing analysis work, those making decisions basedon the analysis, and just about everyone in-between. (It can be a longprocess. But you knew that.)
146 Part III: The BI Lifestyle
16_127230 ch10.qxp 12/4/07 12:29 AM Page 146

You may uncover some uncomfortable facts about business operations —say, a disagreement between managers over what constitutes the correctbusiness process, or the correct data definition or rule. This is where yourexecutive sponsor can go to work for you. Businesses are like families. Whenthere’s a dispute among siblings, it’s up to a parent to resolve it. And whenthere’s a dispute among managers at a company over how the businessworks, your task is to move up the organizational chart until you find theappropriate executive with enough power over all parties to get (read: force)an agreement.
Don’t look at disputes about business rules as a bad thing necessarily; it’s anopportunity for business intelligence to add value.
Now that your team has a clear picture of business policies and processes, aswell as a solid understanding of how information is used within and betweendepartments, you can move on to the technology assessment, another impor-tant step on your way to developing a sound BI strategy. During this phase,you’re attaching the processes described to you earlier by the managers andindividual workers, and associating them with the technology tools currentlyin place.
Assessing the technology stack, top to bottomThe technology assessment proceeds similar to the non-technology assess-ment. At first you’re involved in a simple discovery process where you gathervital statistics and basic information without pausing to perform a lot ofanalysis. Later you’ll want to align what you found out with the project goals.
Looking at the technology stack, here are the key points for each level:
� Infrastructure: This category starts with hardware; we’re talking mostlyabout PCs, servers, and networking gear. But it goes beyond that andincludes some low-level foundation software as well. The key variablesto nail down are these:
• What hardware platforms are currently in place in the departmentsin question — what is their life-cycle and are there any plannedupgrades or changes to the company’s approach to hardware?
• What type of network are we using? Is the proper network in placeto carry an adequate quantity of data between the appropriatebusiness units? Are all departments connected in the way(s) theyneed to be?
147Chapter 10: Taking a Closer Look at BI Strategy
16_127230 ch10.qxp 12/4/07 12:29 AM Page 147
• Is enough server horsepower available to handle the kind of report-ing, analysis, visualization, or advanced statistical tools that we’relooking to install?
• Are all potential end-users properly equipped to run the BI toolsand applications? For example, if you’re building a supply chainand inventory application — designed for your managers to accessas they walk the warehouse floor — it is essential to know whetheryour managers carry personal mobile devices or tablet PCs thatcan run the application.
� Security: Because a BI initiative often involves moving large quantities ofdata (whether in raw form or as reports), you need to feel comfortablethat the network and PCs are properly protected. That means under-standing everything from data encryption on the network backbones tobasic user management.
� Information management: Any software that has to do with the storageand manipulation of data is covered in this technology layer. For a BIproject, this layer gets as much scrutiny during your current-stateassessment as any other:
• Is the company standardized on one database-management system(DBMS) or one single vendor? If not, what’s each division using?
• Are there any compatibility limitations with the DBMS usedthroughout the company?
• Where does the relevant operational and transactional data resideright now?
• How many different versions or views of each key data dimensionare in use?
For example, if you’re planning to implement enterprise BI for thefield sales team, it’s important to know whether every entity in thecompany defines customer data in the same way, or whether you’redealing with islands of data, each with its own definition.
• Is there a unified data-stewardship council that maintains theenterprise data model for companywide applications?
� Application and user interface layer: Applications can include middle-ware and other software that constitutes the foundation of the businesstechnology environment, housing business logic, security, and communi-cation functions. The user interface consists of any tools that standbetween knowledge workers and the company’s computing environment.
• Is there an Enterprise Resource Planning system in place? For thatmatter, are there any other enterprise-wide tools that handle datathat may be important to the BI implementation?
148 Part III: The BI Lifestyle
16_127230 ch10.qxp 12/4/07 12:29 AM Page 148

• What software tools does the prospective user community cur-rently use to perform its analysis tasks? How are queries built?
• What is the current state of reporting in the organization? How arethey produced and distributed, and when does that happen?
In the same way that you mapped out the business functions and operationalprocesses, you’re going to want to do an application inventory. This is essen-tially a list of all the major software being used by the teams that can poten-tially be affected by the BI implementation. A good application inventoryshould include
� a high-level view of the role each application plays in the delivery andmanipulation of information
� an understanding of the users’ subjective view of its effectiveness
� the relationship with the software vendor, sales and service points-of-contact, and an overview of any contractual agreement (such as thelicense status)
Keep the good stuffIt’s always possible that you’re starting from a pure-green-fields situation,where nothing in the way of business intelligence is happening in your organization yet. But that’s not likely. In most situations, companies havesome existing elements that should be accounted for. You’ll eventually haveto evaluate whether it’s best to use them in the BI implementation or simplyleave them alone.
You’re looking at both processes and software. And it’s important you keepthem separate in your evaluation. Sometimes the software tool being used isnot adequate and you’ll want to replace it. But that doesn’t automaticallymean the underlying process (or set of business rules) surrounding that BIfunction is no good. And the opposite may be true — good tools, bad rules.
The goal is to put an effective BI solution into place, but in all likelihoodyou’ve got a limited budget and limited time. So if you have software orprocesses in place that cover functions you’ve targeted for change duringyour business intelligence initiative, take advantage of it.
Improvement projectsAs you assess the efficacy of a specific BI element, pay attention to the conver-sations you’ve had with the managers and workers in each department. Theiropinion of what’s working well and what isn’t is your starting point — but itshouldn’t be the final word. Evaluate their opinions in light of the overall goalsof the project, keeping the future state (and your BI goals) firmly in mind.
149Chapter 10: Taking a Closer Look at BI Strategy
16_127230 ch10.qxp 12/4/07 12:29 AM Page 149
In many cases, employees are so focused on their daily tasks that they missthe forest for the trees. In the case of a BI infrastructure assessment, it meansthey don’t recognize that their current process could either be drasticallyimproved with a new system (likely to a degree they can’t envision), or thattheir current process will be inadequate for the future state of the team. Inthese cases, the user gives the tool, report, or process a thumbs-up, but theBI project team decides it must go anyway. To make sure that team stays onboard with the implementation, be prepared to make your case to the folkswho really like the old tools.
Beware the sacred cow. Some applications, protocols, or processes may beinextricably ingrained into the company’s operational framework, not becauseit’s the best-in-class, but because of politics. It happens all the time. Maybethe CEO’s brother works for a software vendor whose product is doing a poorjob supporting the call center reps. Good luck upgrading your call center inthat situation! You know that cluster of little old ladies in the accounting officewho perform the audit that could be done in half the time by a simple pieceof software? Forget it; they’re a corporate institution. Make your recommen-dation, but do so knowing you may have to back down. Before you take onany sacred cow, be aware that there will be plenty of battles ahead, so pickthe ones that count, and make sure the brouhaha is well worth it.
Hidden technology gemsAt this stage, there’s another task your team can do: Keep an eye open forfunctionality that already exists in the company’s technology infrastructure,but which (for whatever reason) hasn’t been utilized to its fullest.
This can happen in several different ways. Sometimes an application that’sbeen rolled out across the organization has a feature set that employeeshaven’t been trained on. Rather than buying new software and installing it,you might be able to get by with developing a training class and getting yourpeople to take full advantage of assets that are already in place.
In other cases, there is an application being used by one team or departmentthat can be extended across the company. For example, if the company islooking at rolling out an advanced dashboard tool to all mid-level managersand above, it may be possible to take advantage of the fact that the vice pres-idents in the Finance organization have been using a dashboard for years. Ifthe tool has been successful in its limited role, maybe it’s time to make it thestar of the show. Of course, if it’s no good, and the veeps are ready to pulltheir hair out over its limitations, then you needn’t go any farther with it. But think of the advantages of expanding an existing installation:
� The IT guys are already familiar with supporting it.
� You have a history with the vendor.
� You have some record or the software’s performance.
150 Part III: The BI Lifestyle
16_127230 ch10.qxp 12/4/07 12:29 AM Page 150

Don’t assume that an old or ugly process should be chucked out just becausethere’s a replacement technology that’s slicker and newer. Sometimes whiz-bang new technology isn’t the answer to every single problem in the world.(What a concept.) In some cases, the $100,000 application simply doesn’t addenough value to a manual process to make it worthwhile.
Throw out the bad stuffOf course, there’s plenty of technology that can’t be redeemed, no matterhow hard you try. Since your organization is considering a BI initiative tobegin with, in all likelihood there’s a good deal of it that’s either ineffective ordoesn’t exist at all. Figure 10-2 shows a typical relationship of processes tokeep, remove, and add.
151Chapter 10: Taking a Closer Look at BI Strategy
The anti-incumbency biasExperts in their fields (or, for that matter, prod-uct specialists) have a certain affection for thatwhich represents their livelihood. A worker at aFord factory can talk for hours about why aMustang is better than a Camaro. And the sameis true of the growing ranks of BI specialists;they probably got involved in business intelli-gence technologies because they found thesolution compelling, and would probably comedown on the side of BI should a debate startwith a BI skeptic.
That enthusiasm is an important trait to have onyour project team. New implementations beingrolled out to a cautious (or downright skeptical)user community need to be evangelized, not justexplained. Just be careful that enthusiasmdoesn’t turn into jingoism.
Often BI professionals have to deal with BI-by-spreadsheet: A lot of folks still do data stor-age, manipulation, and analysis on spreadsheettools such as Microsoft Excel. Your instinctsmight tell you to press to have such simple and
generalized tools replaced with dedicated, spe-cialized BI reporting-and-analytics software.But before you jerk that knee, consider: In somecases, the Excel-based solution might be betterthan what your project will offer. It’s a questionof which technology is appropriate to your organization, your project, your people, andyour situation.
Excel has some huge inherent advantages thatredound to your benefit. First and foremost, it’severywhere. And we’re not just talking aboutthe installed user base; it’s pervasive inside theminds of your potential user base. They arealready comfortable using it; many are expertsat the intermediate and advanced features.
So take stock of existing BI functions being per-formed already. But don’t just assume that allthe tools being used currently must be plowedunder to make way for the shiny new businessintelligence software. Such a move could back-fire with the user base, and cost you a very realopportunity to make the most of an existing tool.
16_127230 ch10.qxp 12/4/07 12:29 AM Page 151

The process of doing an infrastructure assessment is to evaluate how muchof what you currently have is getting the job done. The future state of your BItools and processes will be a combination of elements from the old days —whether used as-is, expanded from their original limited roles, or found to beunderutilized — and (of course) lots of brand new elements.
Exploring “Should-Be” BI AlternativesLots of folks you encounter during this process will have ideas about what ittakes to fix BI-related processes. And at the same time, you’ll be developingopinions of your own about where the company has gone wrong, and whattools are needed to make it right. These ideas are your should-be states; they’reroughhewn ideas about the direction BI should follow. They may involvechanging processes, changing tools, altering corporate standards or policies,adjusting the way departments interact, tweaking data definitions, and any of a hundred other ways complex processes can be taken apart and put backtogether.
Our goal is to find the best path between the way it is today, and the way itcould be. The best path might be the shortest path, but often it isn’t.Sometimes it’s best to walk downstream until you find a bridge to cross; youmay be tempted to wade right in, but you never know whether there aregators lurking.
Throw Out Retain Build or Buy
Current Processesand Tools Future State
Expa
ndFi
nd
Figure 10-2:An infra-structure
assessment’sgoal is toevaluate
what’sworking and
what isn’t.
152 Part III: The BI Lifestyle
16_127230 ch10.qxp 12/4/07 12:29 AM Page 152

Utopian BIAfter the assessment process is complete, an excellent exercise is to suspendreality for a moment. Remove the Earthly time and budget constraints andbuild the perfect imaginary team to go along with the highly cooperative user base.
So, what’s it going to look like? Think of these areas and what your dreamscenario entails:
� Changes to the technology infrastructure
• Hardware
• Networking
• Storage
• Personal computing devices
� Data management
• Transactional database systems
• Reporting systems
• Changes to data definition
� Changes to the business infrastructure
• Re-arrange organizational chart
• Adjust corporate policies
• New business processes
This is an important exercise because it gives you a baseline of sorts. Havinga far shore to aim for is a good way to instill your team — and the rest of thestakeholders in the BI project — with a sense of common purpose. Plus, ithelps to start thinking about what you want and why you want it. That’s thefirst step to doing some real quantitative analysis on what needs to beincluded in the BI release, and what can be left out.
Don’t skim over this step. While you certainly don’t want to linger in la-la landforever, there are some genuinely important lessons that come from this exer-cise that you can really take advantage of down the road. So don’t just thinkabout what you want in an ideal world; think about why you want it, what the direct benefits would be, and what successes would be spawned by itsimplementation.
153Chapter 10: Taking a Closer Look at BI Strategy
16_127230 ch10.qxp 12/4/07 12:29 AM Page 153

Coming back to reality: examining barriersto achieving your desired future stateOkay, fun’s over. You caught a glimpse of what your BI dream-state is, but nowit’s time to come back to Earth. Hopefully you’ll descend filled with optimismand a sense of wonder at what might be. Truth to tell, most of us mere mor-tals aren’t likely ever to reach that far shore. The utopian dream will neverbe, but, as Hemingway asked, “. . . isn’t it pretty to think so?” Sometimes it’seven useful.
With the utopian BI vision planted firmly in your still dream-fogged head,slowly come out of your trance and begin thinking about what standsbetween you and that alternate BI universe.
Set money and time aside for the moment and address other factors that playa role in technology implementations. What are the barriers that prevent youfrom getting to each item on the list? For starters, take a look at these thornyfactors . . .
� Human: The company doesn’t have the right people in place to makethe necessary changes.
� Methodology: The company doesn’t foster an appropriate amount ofcooperation, communication, or some other quality that’s necessary tomake it work.
� Process: The company doesn’t follow sound or universal processes toachieve its strategic objectives.
� Technology: The company’s technology environment is woefully inade-quate to handle the load of such a system.
� Political: There are too many forces resistant to changes to think thatsuch a system would even be possible.
After utopia, of course, this exercise can get a little depressing. But whatmakes it useful is that you’ll start to identify potential obstacles to the BI initiative. You’ll want to determine what the biggest barriers are, as well aswhich ones can be overcome, and what effort will need to be expended to do so.
From this stage of the analysis comes the diagnosis that can get you past thebarriers — a game plan for dealing with negative forces while you try to buildthe system.
154 Part III: The BI Lifestyle
16_127230 ch10.qxp 12/4/07 12:29 AM Page 154

Deciding “Could-Be” AlternativesIn case you were wondering, the “correct” solution isn’t likely to jump out atyou. It’s rarely the case that a single, obvious path presents itself (or evenexists). For now, it’s your job to winnow the choices that don’t fit for what-ever reason, keeping those that do for later consideration.
After you’ve gone from Utopia down to Hades and lived to tell the tale, youshould be able to step component-by-component through your strategy andfor each, build a short list of combinations that would work and what wouldn’t.
Judging viabilityIn this stage of the process, you want to ask yourself if the alternatives swirlingaround your mind are even possible. Focus on the current state of the com-pany; don’t factor in your pipedreams about how the business might evolve to become a more appropriate vessel to carry all of your BI hopes and aspira-tions. Here’s a quick list of questions:
� Does the company have the technical capability to build, integrate, andsupport this approach?
� Does the user base have the appropriate skills to take full advantage ofthe tools that would be offered to them?
� Does sufficient budget exist to make this level of investment?
� Does this element or solution conform to existing corporate standardsand policies?
If the answer to any of these questions is “no,” you’ve identified an optionthat should be set aside. The hour is getting late, and this is the time to con-sider only those options that could actually get past all the usual hurdles andbe implemented.
If every one of your alternatives produced a “no” answer, it’s time to go backto the drawing board and create a smaller, less invasive set of BI options.Consider this to have been your feasibility study and the final verdict camedown that your initial approach was infeasible.
155Chapter 10: Taking a Closer Look at BI Strategy
16_127230 ch10.qxp 12/4/07 12:29 AM Page 155

Identifying risks . . . and also how to mitigate those risksSlowly but surely, you’re eliminating the impossible strategy elements fromyour list of candidates. What’s left are the possible solutions (and pieces ofsolutions). That doesn’t mean every choice remaining is practical or a versionof the right choice, but you’re getting warmer.
The next step is to identify potential risks with the remaining choices. Beforeyou go too far down the road with one of the alternatives, it’s important tounderstand what risk exposure — and how much — you’d be subjecting yourteam and the company to.
Risks to BI projects come in all shapes and sizes. Some can be identified;others are latent, and won’t show themselves until they’ve damaged your ini-tiative. The first step to mitigating risk is to identify as many possible (realis-tic) risks as you can. Start with general categories and work your way tomore precision as you go:
� Data risks: How stable is the data? How much clean up will be required?
� Application risks: Are we familiar with the tools? Are they reliable andeasily integrated?
� Organizational risks: Are the users ready to accept this initiative? Willother teams cooperate with the implementation?
� Financial: Is this project fully funded? What could cause it to break thebudget?
It’s impossible to overcome every possible risk. Shoot, a human being (even atalented one such as yourself) won’t even be able to identify all of them. Butby choosing one alternative over another, you might be able to reduce thelikelihood that the identifiable risks will cause a problem. You might evenreduce their impact if the worst does occur.
Gauging business valueJust as every strategy alternative has risks, each one also comes with rewards.The question is, how much of each? In the same way you identified the thingsthat could go wrong, now it’s time to talk about what could go right. Twoprinciples help here:
� Remember the Big Four. The whole purpose of the BI initiative is todeliver a solution that provides business value in the form of insightsthat are timely, accurate, high-value, and actionable. But each will deliverits own unique combination of benefits and business value. As you did
156 Part III: The BI Lifestyle
16_127230 ch10.qxp 12/4/07 12:29 AM Page 156

with risk, you have to create a matrix or list of business value attachedto each potential strategy, along with some means of quantifying. And aswith risk, you’ll need to consider how likely the benefits are to be deliv-ered, and how significant those benefits really are to the business.
� Business value is not always tangible. Improving a familiar metric — likewait time in a call center, or profit margins — shows compelling value.But it’s not the whole story; sometimes business value is indirect, hardto measure, or both. It’s hard to quantify, but make sure you’re consider-ing more than just easily-measured benefits. For example, the BI initiativeincludes finally doing away with that clunky old application in the ship-ping department. Presumably there will be some tangible value producedin the form of improved departmental efficiency, but there’s also theimproved morale at the loading dock and the warehouse where the teamis better managed, and doesn’t have to wrestle with the old software.That could have cascading benefits throughout the entire supply chain.
The balanced-scorecard approach can be very helpful at this stage, as youattempt to measure the impact of the business value of certain strategy alternatives.
Aligning your alternatives with your organizational structure and cultureThis process involves more than merely identifying costs, benefits, and risksthat go along with each alternative. You have to consider the political chal-lenges you might face as well. You must consider how any potential solutionmight align with the corporate culture. If it doesn’t, even the utopian solutionis destined to fail.
Any business intelligence strategy should work in concert with the powerstructure of the company. A decentralized organization, for example, lendsitself to more entrepreneurial strategies. That’s because decisions are madein the divisions rather than in a central control unit; the target users havemore control over their experience, and are relied upon more to get the mostvalue from the business insights they develop and find.
The power structure goes beyond centralized versus decentralized, how-ever. The planning team must consider other aspects of the culture that mayview certain solutions in an unfavorable light. For example, imagine a BI strat-egy that involved an aggressive fraud-detection system. It might be low-riskand provide tremendous business value in the form of reducing abuse. But ifthe corporate culture isn’t accepting of intrusive technologies, installing theapplication might cause more trouble than it’s ultimately worth.
157Chapter 10: Taking a Closer Look at BI Strategy
16_127230 ch10.qxp 12/4/07 12:29 AM Page 157

If one choice seems to keep popping up as the right way to go, don’t settle forless. Don’t short-circuit the process just because there’s an easy way to skip all those planning meetings you have on your calendar. This decision isimportant; it takes time for all the possible ramifications to bubble to the sur-face. Let the process run its course so there’s no doubt you’ve made the rightchoice when all is said and done.
Making Your ChoiceDeciding on the BI strategy is the first step of the rest of your project. So takecare in how you approach it.
Considering everythingAn inevitable chicken-and-egg feel infuses this process: One decision affectsanother, which affects another, so it’s hard to know where to start. You’llneed to channel your school days — in particular, algebra class, when youhad to solve simultaneous equations.
The way to solve simultaneous equations is simple: You find a way to holdone variable constant, and then adjust the other variable until it fits. In the BIworld, that translates to making an assumption about what one or two impor-tant elements of your company’s strategy will look like, and then seeing howthat assumption affects the other pieces of the equation.
Don’t just think about the technology. This process requires a holisticapproach to your business intelligence strategy and thinking about everypossible variable — these, for example:
� Technology versus work processes
� Operational needs versus long-term goals
� Scope versus schedule
� Budget versus time
� Governance and control versus user flexibility
� Data integration versus performance
� Needs versus wants
Imagine you’ve identified the ideal reporting tool that suits the needs of yourtarget users perfectly. But if you go with that tool, you likely cost yourself amonth in implementation time because it doesn’t integrate well with the
158 Part III: The BI Lifestyle
16_127230 ch10.qxp 12/4/07 12:29 AM Page 158
existing applications you have in place. Optimizing one variable will cost yousomewhere else, so the trick is finding that safe place where the high-priorityneeds are met, but the rest of the project doesn’t pay an excessive price for it.
Deciding on your strategyYou have enough evidence to make a decision now. No really, you do. So juststep off that cliff any time you’re ready.
What if there isn’t a standout? If there’s time, you can revisit the best avail-able options, but more than likely, you need to make a choice and move on.At this point in the game, the reason you have two choices is because bothare viable, so don’t drive yourself bananas trying to make it perfect.
Several good techniques exist for picking two equal finalists. One way is to“game out” the next steps of the project, talking through likely scenarios thatpre-suppose one of the two choices have been made. You’ve selected yourpath, so what happens next? At each fork in the hypothetical road, you’ll talkthrough the likely impact on the core business processes, and assess theoptions available from that point forward. Most important as you walk throughthe imaginary architecture planning steps is to take note of any obvious road-blocks or problems that emerge by taking one path versus the other. It involvesmaking a lot of assumptions, but talking through a deployment path is awindow into what the future just might hold.
Another way to choose between two seemingly even paths is to select a defaultchoice and continue the debate. Pick one single fallback position that you’lltake if no clear winner emerges. Then continue the discussion with a hard-stop time limit. After time’s up, if you haven’t reached a different conclusion,move forward with the default selection and don’t look back. If the differencesbetween the two approaches are so minimal that you can’t reach a definitiveconclusion about which one’s best after a full-throated debate, it’s unlikelythat some unrecognized disaster is lurking behind one of them. Flip a coin.
With that decision made, it’s time to get approval. If you don’t, the projectplan you’re about to write won’t be worth the paper it’s not yet printed on.
Getting the necessary buy-inJust because your planning team thinks you’ve made the right call doesn’tmean the rest of the company will. It’s imperative that you get some outsideperspective. A business intelligence initiative isn’t just a technology installa-tion; it precipitates real business changes in the way processes flow and deci-sions are made. Making such grand decisions in a vacuum is a sure path tofailure.
159Chapter 10: Taking a Closer Look at BI Strategy
16_127230 ch10.qxp 12/4/07 12:29 AM Page 159

You’ll need some level of buy-in from the teams that will be affected by thenew systems. That means the folks who will be supporting the technology,contributing data, reaping the insights, and dealing with those systems atevery point in between. And the best way to make that happen is to get every-one in the same place, and give them a single version of how it’s going to go.
Conducting the stakeholders’ summit meetingOne important option in making the solution choice is holding a stakeholders’summit. This meeting will introduce many of the key solution concepts andpresent some of the outstanding choices still to be made — to the peoplewho will have to deal with their effects.
The breadth of the company should be represented at the summit, with theattendees being as high-level as possible. But this isn’t a conference for big-wigs only; invite some mid-level managers and director-level folks who canprovide solid expertise in their operational areas. Invite ambassadors fromthe user community as well; they’ll be able to comment on what’s likely tohappen where the BI rubber hits the road. Finally, make sure there are a fewpeople from the technology team as well, who can speak to the constraintsand impact on the rest of the IT infrastructure.
The goal of the summit is to increase the participants’ understanding andsense of ownership in the initiative. You’ll be getting a lot of vital input thatwill help you determine the strategy to use, but more important is the buy-infrom critical personalities inside the company.
Don’t underestimate the importance of a good facilitator at a stakeholdersummit. There will be a lot of strong, loud voices in the room, each thinkingwhat they have to say is more important than what everybody else has to say.
During the meeting (or series of meetings) you’ll be presenting the mainapproach you’re planning on taking, and how it affects each department,both good and bad. Listen to the stakeholders’ concerns and do your best to address them. At the end of the stakeholders’ summit, there should be ageneral agreement on the company’s BI strategy.
Locking in your decision and moving aheadWith any luck, you’ll reach a point where one strategy stands out above therest. At that moment, it’s time to lock the decision into place and move on tothe next phase without looking back.
Different camps might emerge within and outside the BI planning team, andinevitably one will be miffed when their first choice isn’t your first choice.Take it all in stride. Criticism is part of the process. Stay positive, don’t reen-act the same debate over and over. When the course is set, quickly move tothe next phase of the project.
160 Part III: The BI Lifestyle
16_127230 ch10.qxp 12/4/07 12:29 AM Page 160

161Chapter 10: Taking a Closer Look at BI Strategy
Knowing when to revisit your BI strategyThe Hudson Bay Company was founded as atrading firm in 1670, and survives today as one of the largest department store retailers inCanada. Zildjian Cymbals was founded in theseventeenth century as well, and still suppliesinstruments to the world’s musicians.
While some companies are rocks of stability,most foster an environment in which changeoccurs rapidly. And when conditions force acompany to evolve, even in a tiny way, it mightindicate a second-look at the business intelli-gence strategy that is needed.
Certain conditions are obvious red flags: Whena serious economic event rattles the market, thecompany may shift into survival mode, necessi-tating a downsizing or refocusing of BI efforts. If the company is in an acquisitive phase, or ifthe company is a buyout target, it may makesense to plan for rapid-fire small releases so
that when a change occurs, the BI initiative willbe ready to turn on a dime in concert with thecompany.
Even smaller events can prompt BI project man-agers to re-examine the direction they’re going.Say one of the program’s key executive spon-sors leaves the company, or the companylaunches or re-tools one of its leading products,or enters a new market. Any of those develop-ments can affect your BI project.
Changes aren’t permanent, but change itselfcertainly is. A good BI organization is one thatcan roll with the punches. So never assume that the BI strategy you develop is a permanentfixture. It should provide a guiding light for thecurrent project phase, as well as the next fewin the planning stages. But after that, rememberthat anything can happen.
16_127230 ch10.qxp 12/4/07 12:29 AM Page 161

162 Part III: The BI Lifestyle
16_127230 ch10.qxp 12/4/07 12:29 AM Page 162

Chapter 11
Building a Solid BI Architectureand Roadmap
In This Chapter� Getting the most out of your roadmap
� Selecting the degree of centralization
� Getting a laser-focused plan
� Analyzing your solution’s degree of coupling
G ood news! The Chief Operations Officer has accepted your BI strategyrecommendations, and the Chief Financial Officer is prepared to fund
the project.
Bad news: Now you actually have to figure out how you’re going to make ithappen.
Right up to this point, a lot of the focus has been on theoretical issues —defining tools and technologies, and assessing how one piece fits togetherwith another piece. But now it’s time to put that knowledge into action andbegin to build the project roadmap.
As with any map that helps you on a journey, your BI roadmap is just a gen-eral guide to help you get from point A to point B. Defining those two pointsis the whole point of the content in the first half of this book. Now you haveto find the best route between them. Plan well; the road may get rough.
Notice that we’re looking for the best route between where you are now andwhere you want to be, not simply the fastest or the cheapest route. As is thecase with any IT project, the “impossible triangle” (Figure 11-1) is in effect forBI implementations. The concept is simple: You may strive to create a projectthat’s cheap, good, and fast, but you can’t have them all. For example, if youwant an inexpensive system that works well, you’ll have to sacrifice time. On the other hand, if you’re looking to install something immediately on alimited budget, it’s not going to be very good.
17_127230 ch11.qxp 12/4/07 12:40 AM Page 163

What a Roadmap Is (and Isn’t)A business intelligence roadmap is one or more documents that lays out theformal objectives, high-level requirements, and specific activities of the pro-ject. It is, in effect, a founding charter that the project team will use as a guid-ing North star to set schedules, allocate resources, and even to market theproject internally. Your roadmap should tell you what you’re trying to accom-plish, what tools you’re going to use to get the job done, how you plan to doit, and (to some extent) the justification for the approach you’re taking. Hereare some examples of sections of what to include in your roadmap:
� Statement of overall business problem(s) and the specific scope of thesolution.
� Business perspective of the solution — for example, what informationneeds your system will meet that it wasn’t meeting before.
� Initial financial analysis, including ROI projections.
� Current condition of the organization’s information infrastructure —including a discussion of where all the relevant data is being housed and what condition it’s in.
� High-level review of hardware requirements, emphasizing any new plat-forms you may need to implement.
� Discussion of existing and new software that will be utilized for the BIsolution.
� General make-up of project team and division of responsibilities.
� A section on risks, constraints, and assumptions that lays out wherethings can go wrong, as well as the known limits of the BI implementa-tion. (It’s always good to be explicit about what the project will notdeliver.)
What you won’t see anywhere on your roadmap is a detailed work plan. Aroadmap is not a comprehensive task-level project plan (though if you useMicrosoft Project as one of the tools to represent your high-level sequencing
Pick AnyTwo
Good
Chea
p
Fast
Figure 11-1:The well-
knownImpossibleTriangle of
IT projects.
164 Part III: The BI Lifestyle
17_127230 ch11.qxp 12/4/07 12:40 AM Page 164

of activities and milestones, you can build your project plan starting fromyour roadmap). It’s a strategic-level document that outlines the major deci-sions about how the business intelligence solution is to be implemented.Unlike a project plan — which lays out every step — a set of major choicestransforms the goals and requirements of the system.
Before you can finish your roadmap, you’ll be forced to make some big deci-sions about the architecture of your BI solution. Those initial decisions willdetermine what kind of tools you’ll need, and what kind of talent you’ll needon your team to get the job done.
As President Dwight D. Eisenhower famously noted, plans are nothing; plan-ning is everything. Ike wasn’t encouraging you to wing it, nor was he givingyou (and every other project planner) an excuse to toss aside detailed pro-ject plans and roadmaps. The point is that the process of planning is just asimportant as the artifacts that it spawns.
As you build the roadmap, you’ll have to take a microscope to your needsand abilities, think through more than a few ideas and possibilities (to makesure you haven’t “group-thought” yourself into one solution when anothermight be better for you), and make contact with people who can help you —both within your organization and without. Don’t short-circuit the planningprocess by thinking that the roadmap document itself is the goal.
While you want to make your roadmap as complete as it can be, don’t getstuck in the mud if you don’t know with absolute certainty all the answersand have to leave some stub headings that have no attached content beneaththem for the time being. That’s an inevitable part of the planning process. Forexample, if you work for the International Widget Corporation and you knowthere’s a chance the unprofitable Micro-Widget division will be sold, you mayneed to account for that variable in your roadmap by inserting an assump-tion stating how different outcomes could lead to different planning deci-sions. Above all, don’t bring the project planning process to a halt whilewaiting to nail down every possible loose end.
Centralized Versus DecentralizedArchitecture
The roadmap’s shape and form will hinge on the overall shape of the solu-tion. And one of the biggest drivers of that is the question of whether to buildout a centralized or decentralized system. The two architectures involve verydifferent approaches to the implementation process. In this section we’ll takea look at why the question is so important, and talk about ways to approachthe answer. It’s considered the biggest decision because it’s the first.Everything you do in your BI implementation will be affected.
165Chapter 11: Building a Solid BI Architecture and Roadmap
17_127230 ch11.qxp 12/4/07 12:40 AM Page 165

A couple questionSome BI specialists use the term coupling to describe the degree to which a BIsystem is centralized and consistently applied. A highly centralized systemmight make a common set of tools available to the entire company, share themost effective practices across the organization, and (usually) give a singleentity or team the responsibility for making key BI decisions that affect every-one. In a system like that, one department’s BI system is coupled to the cen-tral BI regime — both technologically and procedurally. It makes for easymanagement, but can stifle the effectiveness of a BI solution if the businesssituation calls for more versatility; everyone has to use one-size-fits-all tools.
On the other hand, a decentralized system allows some variations of policyand practice across different BI domains and functional areas. Departmentsand business units might use the same tools, but they aren’t obligated to doso as they would be in a centralized system. This kind of system, where toolsand practices are built up independently and de-coupled from a central deci-sion-making power, is often appealing because it can put ideally suited BItools in the everyone’s hands. (Of course, it can also be a tad inefficient andhard to manage, what with everyone doing their own thing.)
Chapter 5 discusses departmental and enterprise BI arrangements, but that’sa matter of scope. A BI system’s scope isn’t the same as how coupled it is. It’spossible to have a highly decentralized departmental implementation of BI.For example, imagine an international conglomerate that wants to introduceBI for its sales team, but the sales team has sub-units that work on differentproducts with wildly different sales dynamics. Perhaps they’re in differentcountries and don’t even speak the same language. In that case, a one-size-fits-all solution wouldn’t work; you’d have to allow those sub-units to cus-tomize the BI solution as needed.
How to chooseSo which one do you need? A centralized or decentralized architecture? Well,that depends on a handful of variables that can be summed up under twoheadings:
� Organizational culture. Most companies have one of two basic cultures:
• Autocratic: Decisions are made from the top down, with little roomfor interpretation. Autocratic cultures lend themselves to central-ized BI; the apparatus is already in place for centrally controlledstrategy and application administration, and usually that’s whattheir people are used to.
166 Part III: The BI Lifestyle
17_127230 ch11.qxp 12/4/07 12:40 AM Page 166

• Entrepreneurial: Business decisions are made throughout the com-pany and innovation is encouraged. Where departments and teamshave the authority to dictate the terms of how their supporting toolsare built, decentralized BI systems are more likely to flourish.
� Organizational structure. In most cases, but not all, the organizationalstructure aligns with the company’s culture. For example, if decisionsare made at the top, the structure of power and communication radiatefrom a handful of top executives down to the rest of the organization in a rigid way, while entrepreneurial companies are likely to be matrix-managed rather than hierarchical.
It’s important to be aware of organizational factors because they will dictatehow data moves between business units and teams, and that will ultimatelyguide your centralized versus decentralized decision. Since BI typically needsto bring lots of disparate data together, a company where teams are not inthe habit of sharing data or working together for the greater good could makeit difficult to install a centralized BI solution.
You’ll want to understand how the business units work together to performcommon functions, as well as where they are geographically.
It’s probable the answer lies somewhere in between centralized and decen-tralized BI architecture. That may seem contradictory, but the reality is thatwhile large chunks of the organization may require tools and practices incommon — and a rigid control system — pockets of decentralization maypersist as well. For example, a company might install an enterprise-wide, centralized, homogeneous BI system, but allow one key team with a uniquefunction — say, the corporate-strategy group or the sales-operations crew —to build their BI solution as they see fit.
Here the first key decision is setting policy to specify how coupled your BIenvironment should be; it’s arguably as important as any decision you’ll makethroughout the life of your project. Answering it forces you to look closely atmany aspects of your existing systems — and of your company as well. It’snot a question you can expect to answer in one sitting.
When you answer this how-coupled-is-it question, you set the direction forthe entire BI implementation. The degree of centralization you specify willcascade to the other steps in the plan; when you’ve decided on a couplingscheme, you’re ready to move on to other major choices — such as whatkind of tools you’re going to use and how the data will be handled. And noneof those questions can be tackled without answering the first question.
Bringing disparate data under a common umbrella in the form of a data ware-house (a dedicated repository for historical operational data) is a commonchoice made during the roadmap phase — but it may not be right for everysituation. Integrating data into one big centralized melting pot is far easier
167Chapter 11: Building a Solid BI Architecture and Roadmap
17_127230 ch11.qxp 12/4/07 12:40 AM Page 167

said than done — and will inevitably occupy an enormous chunk of your pro-ject resources. A data warehouse may well be the answer you’re looking for,but it’s certainly not the only solution out there. Often alternatives are avail-able that work just as well and spare you some heartburn along the way. We’lldiscuss data warehouses and other ways to bring information together inChapter 16.
BI Architecture AlternativesOnce you’ve developed either a centralized or decentralized model, you canmake the other general architecture choices. You’ll need to consider anumber of vital factors, such as these:
� How and where will the data be maintained?
� What will the integration schedule be?
� What tools will sit on which desktops — throughout the organization?
You won’t lay out every single detail of all possible solutions until you get intodetailed requirements and design (as discussed in the following chapters),but you’ll want to get a broad perspective on the solutions available in themarketplace. In the beginning, you have a lot of questions and few answers,so you’ll have to start by working through a list of all possible alternatives.After that, you narrow it down to a few good candidates.
Starting an architecture evaluationSo what factors are important when you’re looking into possible solutions?You’ll want to stick with the basics and view every alternative through theprism of your main business needs.
For BI implementations, your architecture choices will almost always startwith three major categories of technology:
� Hardware
� Data management
� End-user tools
Of course, each of those main categories can be broken down into sub-categories (even sub-sub-categories), but start with the big three.
168 Part III: The BI Lifestyle
17_127230 ch11.qxp 12/4/07 12:40 AM Page 168

Sure, there’s more to an enterprise-wide BI solution than just hardware, data-bases, and front-end tools. For example, you’ll probably have to consider thenetwork infrastructure that acts as the conduit between system components,as well as a vast collection of middleware (software that acts as the connec-tive tissue between network components, data sources, and applications). BIcan affect all of it.
As you examine each architecture alternative, be sure to address each of themain three components. For example, you may be starting your evaluationwith the constraint that the hardware environment can’t be changed. Thatcould happen for any number of reasons — budgetary, political, or other-wise. In that case, you’ll be forced to use what’s available; the project teamwill have to find data-handling and tools software that can be placed on exist-ing infrastructure without affecting performance any more than absolutelynecessary.
In general, every architecture solution involves three general componentsthat mirror the “big three” technology categories:
� Hardware: A discussion of what, if any, hardware changes are required(for example, will you have to increase server processing horsepower tohandle the complexity of the transactions expected?).
� Data management: A small list of data-management options (such ashow the data will be transported and transformed, and what the targetdatabase will need to be able to do.)
� End-user tools: Recommendations of one or more tools that meet thesystem’s general business needs directly (such as an advanced statisti-cal package, or a managed reporting solution to meet the needs of theprospective user groups.)
Start with the end-user tools. If you have a rough idea of the requirements,then the tools are a good brass-tacks place to start. You can develop a list ofavailable software that will meet your querying, reporting, and analysisneeds, then work backward to expand the evaluation to identify compatibledata handling technology that can support the tools. Then you’ll look forwhat hardware is required to run it.
169Chapter 11: Building a Solid BI Architecture and Roadmap
Proven techniques for narrowing down optionsYou’re not the first person to have to make asolid choice from a complex array of options,but if you’re the one ultimately on the hook for the decision, it can be a lonely position.Fortunately there are some tried and true
techniques to narrowing down your architec-ture choices. Can any selection methodologyguarantee you won’t make a monumental error?Unfortunately no, but read on and you’ll findthere are some ways to approach the task.
17_127230 ch11.qxp 12/4/07 12:40 AM Page 169

So many choicesLaying out all plausible alternatives — and giving each its day in court — is a step in the process skipped by far too many organizations. This phasedoesn’t have to last long, but it’s an important step because it opens you(and the team) up to technologies and techniques that may not be in thestandard recipe.
You want to work through a wide variety of choices while keeping your pro-ject’s basic constraints and objectives in mind. But feel free, at this stage, tobe a little more open with your ideas; allow your team some latitude duringyour planning sessions.
You’ll want to look at solution elements like these:
� Operating systems
� Network protocols
� Server hardware
� Primary database vendor
� Data Warehouse and Extract,Transform, and Load (ETL) processes
� The kinds of front-end BI tools you absolutely must have
� The kinds of front-end BI tools that would be nice to have
So little timeAt the beginning of the project, the slate is almost completely clean. The pos-sibilities stretch out before you — the software tools, hardware platforms,protocols, and processes that will comprise your BI implementation. The skiesare blue, the fields are green; whatever you envision can become a reality.
Get real.
While you certainly want to have a free-flowing discussion about the possibil-ities and endless alternatives, you’ll need to narrow down your options to afew main candidates pretty quickly.
The company’s installed technology and on-the-record future direction willbe a primary factor in deciding architecture. Are there internal standards thatlimit your choice of tools both today and in the future? For example, does yourorganization rely on one main vendor for its database-management system? Ifso, does that mean the BI system is similarly limited? Keeping such basic con-straints in mind should yield a general idea of what your options really are.
170 Part III: The BI Lifestyle
17_127230 ch11.qxp 12/4/07 12:40 AM Page 170

The planning process is a notorious quicksand zone, where projects getbogged down as team leaders agonize over the initial choices, knowing theirimportance. You’re not going to make the right call every time. Sometimesidentified “best practices” aren’t “best” for your organization. But don’t getparalyzed by the fear of making a misstep. You have no choice but to getmoving, and surround yourself with vendors, consultants, and team membersyou trust. Keep a close eye on what they’re doing, but put your faith in theirability to perform due diligence and meet the priorities you’ve laid out. Asthe old saying goes, trust but verify.
During the planning phase you look at the architecture as a whole, as well asthe individual pieces. The categories of questions you’ll need to ask at thispoint:
� Which solution components work well together? And which don’t?
� What infrastructure is currently in place and does it have spare capacity?
� Does the company have existing relationships with some of the targetvendors?
During this phase, you’ll also start to get a handle on which pieces of thepuzzle have higher priority than others. That’s important information; you’llneed to put it to use very soon.
The short listThe goal is to produce a short list of architecture alternatives that satisfy allof your bare minimum requirements, and hopefully supply some nice-to-havefeatures as well. The vetting process is far from over; you’ll want to turn overthe short list of alternatives to some key stakeholders and analysts on yourteam to pick apart and find reasons to narrow down the list.
Each short list will include the querying, reporting, analysis, and other front-end tools that the end-users throughout the company will be using. Therewill also be the underlying database technology — not just software, but con-figuration options and architectural considerations as well. Finally, be sure toput any hardware requirements on the short list. For example, if the short listincludes a solution that involves creating a new centralized data-warehouseenvironment, the entry on the short list should include
� A basic analysis of existing processing and storage capacity (relative tothe minimum amount needed)
� An ideal hardware configuration for maximum performance
171Chapter 11: Building a Solid BI Architecture and Roadmap
17_127230 ch11.qxp 12/4/07 12:40 AM Page 171

Taking a second look at your short listYou’re going to have to get your hands dirty now; it’s time to stop looking atsolutions in a vacuum. You’ll want to judge their capabilities and constraintsin the context of your infrastructure.
You may have already analyzed the gap between your existing systems’ capa-bilities and the business requirements for the BI system; now it’s necessaryto put the solutions in context. You can do that by examining your short listsolutions and visualizing how they’ll actually work when they’re installed inyour company’s environment. You’re looking to identify compatibility issues,integration problems, and other potential roadblocks that might arise whenyou start introducing new hardware and software to your existing technologyenvironment. Eventually you’re going to have to chop the architecture alter-natives that don’t play well with the other kids in the sandbox.
At this point it makes sense to begin in-depth discussions with candidate ven-dors and consultants so you can get detailed information on their productcapabilities, plus a full menu of their support options to go along with theirwares. Invite them in for a discussion of your situation and take careful noteof how they would approach the challenges you face.
This is a great time to have software vendors do live demonstrations of theirproducts. You can put an application through the paces and see how it holdsup. If it’s an end-user tool, invite a few key end-users to the demo, and ask fortheir input on how appealing, usable, and useful the software actually is.
It helps if the vendors have an idea of what you’re trying to do, so you shouldbe prepared to share a little information with them about your project. Projectdetails will help the third parties tailor their pitch toward what you actuallyneed. Check with your legal team and see whether there is a standard Non-Disclosure Agreement that you should use.
For gigantic implementations, you might have a vendor do an extensive Proofof Concept (POC) implementation as a way to test a product’s ability to meetyour specific needs. For a business intelligence solution, POCs are particu-larly useful to demonstrate whether different brands of software work togetherin your environment without building out the entire solution. POCs movebeyond the theoretical realm of PowerPoint presentations, white papers, andeven canned product demonstrations and reveal something of the true natureof the software.
172 Part III: The BI Lifestyle
17_127230 ch11.qxp 12/4/07 12:40 AM Page 172

Examining costs for each alternativeSo far, cost has not been a factor in the conversation — but that big greendollar sign is always lurking in the background (unless, of course, you’re inanother country and working in their currency). Bottom line: software licensescost money. Servers and networking gear cost money, as does integrationvendors’ time. Evaluating possible solutions without considering your budgetaffords you a certain amount of freedom to isolate the best alternatives, andidentify the most important components without constraint. But sooner orlater the piper must be paid.
Costs can sneak into IT projects in a lot of ways. Keep your eyes open for thefollowing expenses:
� Software licenses: Don’t be haphazard in your approach to buyinglicenses. Many vendors have complex and confusing schemes that canlead you to pay for more seats than you end up needing. A software part-ner with simple and flexible licensing can be worth its weight in gold.
� Hardware-acquisition costs: Buying new gear for your BI solution can bean expensive proposition, especially where it concerns high-performanceservers and networking gear. Having a scalable solution is a good way to save money; you can start small and work your way up to the hard-ware capacity you need, but not until you actually need it.
� Service and maintenance costs: Many vendors make their money notfrom the initial purchase of their product, but from ongoing fees exactedfrom customers for supporting their products. Make sure you accountfor all outlays over the life of the products you’re buying for your BIsystem, not just the big check at the beginning.
� Training and support costs: Complex software means the end-users ofyour business-intelligence system will need help before they get full useout of it. It’s important that quality education be made available for theuser community, and that costs money.
Always remember the business in business intelligence. Your organization istrying to make money, and that can only happen if you increase revenues orreduce expenses. In most cases, a BI implementation is already a big invest-ment for a company — but don’t confuse executive approval of your projectwith license to go crazy with the company checkbook. With limitedresources, you’ll want to stretch your budget resources as far as you can.
As you examine the costs of each solution alternative, keep in mind that themost expensive solution isn’t always the best. It’s a common trap that hassnared many a project manager. Price is clearly an important component, butmake sure that money don’t enter into your qualitative evaluation of productsto meet your needs.
173Chapter 11: Building a Solid BI Architecture and Roadmap
17_127230 ch11.qxp 12/4/07 12:40 AM Page 173

Looking at technology risksTo this point, you’ve taken your short list through the paces. You’ve per-formed an analysis of each solution’s viability as a way to meet your businessneeds. You’ve examined the associated cost of each element of your solutionas well. Now it’s time to look at risk.
We’re not talking about the risk that a huge meteorite could crash into theEarth and end all life as we know it. We’re talking about specific risks that gohand-in-hand with technology — say, a medium meteorite that crashes intoyour data center but leaves the rest of the planet intact.
It’s a scary word, but in essence, technology risk is nothing more than a vari-able expense that you don’t see coming. It’s impossible to predict with anycertainty, but if you do your best to see it coming, it’s possible to minimize itsimpact.
Fortunately, there are some common guidelines you can look to if you wantto understand risk in an IT environment better because it can have a hugeimpact on your BI rollout. Every large, complex IT implementation hascommon risks associated with it — these, for example:
� Software has unknown bugs that pupate and hatch at inopportune times.
� Software doesn’t perform as promised by the vendor.
� Products don’t work together as well as projected.
Included in your architecture and solution assessment should be a risk analy-sis of each choice on your short-list. You should include a list of the mostlikely things that could go wrong with each solution. It’s always a good ideato quantify the likelihood of a risk scenario coming to pass, and include a projected damage toll — including how it would affect your BI initiative.
Suppose, for example, you find that Application A has a large chance of causing minor performance issues with the system while the alternative,Application B, has a tiny chance of bringing the entire BI implementation to ahalt. Depending on the values you assign for the likelihood of each outcome,you might actually decide Application B makes the most sense from a riskperspective.
When in doubt, go with proven solutions. And while you want to look at ven-dors with a track record of stability, you should avoid version 1.0 of justabout any species of software. First-generation applications often have kinksthat still need to be worked out, and they’re a risky bet to build your environ-ment around unless you’re getting major concessions from the vendor to pro-tect and compensate your company for any problems that might arise.
174 Part III: The BI Lifestyle
17_127230 ch11.qxp 12/4/07 12:40 AM Page 174

Making your decisionIt’s a great feeling when a single solution emerges as a winner. Your project ispractically laid out before you on a silver platter when one candidate solu-tion is the only choice that fits your needs and your constraints.
Unfortunately, that’s a rarity. More often than not, a few solutions score veryclose to one another and you end up with a dead heat.
In spite of the temptation to flip a coin or end your planning meeting with around of eenie-meanie-miny-moe, you should take this opportunity to do a fresh analysis of your candidate solutions. That will usually lead to finding adeeper set of criteria from which to judge each candidate solution, with theaim of selecting a winner.
These three steps can help you break any ties:
1. Verify your information. Make sure all your existing information is cor-rect. That means re-working pricing numbers, compatibility issues, andfunctional capabilities. Go over the features of each product step bystep; make sure the analysis you’re reading is fair and unbiased (not tomention up-to-date, since software features can come and go fromrelease to release).
2. Revisit your criteria. After you’ve verified your research data, makesure you haven’t missed anything in terms of judging criteria. Are youbasing your judgment on the complete set of business drivers? Or arethere some considerations you initially left out because they seemedirrelevant to a particular architecture choice?
3. Get a new perspective. It’s a great idea to get a fresh set of eyes on eachsolution. Sometimes you’ll find if you stare at something long enoughyou lose all objectivity and perspective. An outside resource, evensomeone who has no direct expertise in the kind of system your build-ing, might have an angle that you hadn’t considered on why one solutionis better or worse than another.
Developing a Phased, Incremental BI Roadmap
Like the project itself, the roadmap is something you build one iteration at atime. You take a first pass at the document with candidate solutions, thennarrow those down to a few, and finally a winning architecture emerges. Ateach step of the way, the roadmap changes, becoming more focused, and providing a deeper level of detail.
175Chapter 11: Building a Solid BI Architecture and Roadmap
17_127230 ch11.qxp 12/4/07 12:40 AM Page 175

With the architecture selection made, and the solution coming into tighterfocus, it’s time to start working through how you’re going to make your visiona reality.
The goal is not to create a full project plan with step-by-step instructions;instead, the roadmap must include what you’re going to deliver and when.The roadmap is where you lay out a strategy for building your business intelligence solution in a way that keeps momentum up, maintains supportthroughout the organization, doesn’t use up resources too quickly, and toler-ates occasional failures.
And oh, by the way, it’s a good thing if it delivers on its promised businessvalue as well. (But you knew that.)
Deciding where to startInstead of starting with the first single step, you’ll want to define what theentire first phase is going to look like.
It’s almost always to your benefit to start with a limited solution that growsinto a full BI implementation after several subsequent phases. Doing thatensures that any early failures are small and can be overcome quickly. If youspend several years on a comprehensive, enterprise-wide BI implementation,the audience anticipation grows with each passing month. When the big daycomes and the spotlight is on you as it’s time to hit the switch, you’ll be inbig trouble if the Christmas tree doesn’t light up as planned.
So instead of shooting for the moon, you should look for objectives within yourgrasp for the early phases of the project. No IT book would be complete with-out the low-hanging fruit metaphor, so here it goes:
Your Phase I implementation should pluck the lowest-hanging, ripest, best-tasting fruit from the tree. That is, the initial goal should be to start building asolution at the intersection of the highest-value, least risky functions that arealso the easiest to deliver:
� Highest value: If you have a system in place now that’s already working,only at a level that requires eventual change, then skip that functionalarea for one where the user community is clamoring for anything to maketheir lives easier.
� Least risky: Don’t roll out executive dashboards first, or any other func-tion whose failure might lead to the bigwigs pulling the plug on the wholeshebang. And we’re not just talking about political risk; it’s wise to avoidimplementations that might interfere with systems that are functioningperfectly well.
176 Part III: The BI Lifestyle
17_127230 ch11.qxp 12/4/07 12:40 AM Page 176

� Easy to deliver: You should also avoid implementations that are highlytechnically complex as well. A simple solution establishes your team,lets you develop your internal processes, and build a tradition of suc-cess with the company.
Out of those three qualities, chances are you may only find two, but it can’thurt to be optimistic.
It’s always best to do improvements to existing systems, rather than brandnew systems. If (for example) you already have a sales analytics module upand running, it probably makes sense to make the early phases of your pro-ject include an upgrade to advanced sales analytics before building the HRfunction from the ground up.
Keeping scoreIt’s easy to decide to go after the low-hanging fruit, but what if the fruit onebranch up is extra-tasty? And what about the fruit that just fell off the treeand doesn’t even require a ladder?
It’s not always easy to decide where your priorities should be. A back-of-the-napkin scorecard system might make sense early on — where you lay out thekey variables listed in the previous section, along with a few that are peculiarto your situation. Work through the possible first steps and grade them outbased on how they fall in each category. From that scorecard, you’ll get theoptimal combination of functions for Phase I.
If you do a rough-and-ready scorecard of categories to evaluate, be sure youscore each category the same way — even if that seems a little counterintu-itive. Figure 11-2 shows a list of four possible Phase I initiatives for your BIsystem. On this scorecard, a higher score simply means “more advantageousto the company,” so under Value a score of 4 means more valuable and a scoreof 1 means less valuable. For the Risk category a score of 4 means safer —that is, less risky (since less risk is more advantageous to the company, right?)and a score of 1 means the most risky. When all the individual scores areadded, we find that the best Phase I solution is the upgrade to the reportingtool, whose score totaled 9. Sure, it’s the least valuable — but because it’sgoing to be easy and virtually risk-free to install, it makes the most sense.
The scorecard example in Figure 11-2 assumes all three criteria matter equally.You can always adjust the scorecard differently depending on what you’retrying to accomplish, or if there are any special circumstances surroundingthe choice you have to make. For example, if your company is especially risk-averse, you can rig the scorecard to be more sensitive to the risk category bymultiplying each Risk score by 2 prior to totaling the sores for each choice.Just remember: A perfectly balanced and fair scorecard is not the goal here;it’s just a tool to help illuminate your options.
177Chapter 11: Building a Solid BI Architecture and Roadmap
17_127230 ch11.qxp 12/4/07 12:40 AM Page 177

Deciding what comes nextThe decisions you make about Phase I will determine how to proceed. IfPhase I includes a Sales analytics implementation, you’ll proceed like youwould with any other IT project, beginning with an informational or discov-ery phase, followed by an architect phase where you design the solution, and on into a build and test phase.
Deciding what comes next, and next, and next . . .Now you’re on your way. You’ve got your roadmap in place with Phase I’sdeliverables. Rinse, lather, and repeat with Phase II. If you want, you cansimply look at the next best item on your scorecard and pencil that in as thenext priority on your roadmap. Or you might consider adjusting the score-card and adding the scores again; priorities may change after you have thefirst success under your belt.
Planning for contingenciesYou know what they say about the best laid plans of mice and men. Whetheryou’re rodent or human (or somewhere in between, like your boss), you’llneed to get familiar with the practice of contingency planning, and buildsome emergency scenarios and decision points into your roadmap.
A contingency plan is little more than a carefully designed set of alternativebranches in a project roadmap. Under certain conditions, the contingencyplan gets activated. For the purposes of your roadmap, you’ll need to flush
Sales Dashboard
Finance OLAP Conversion
Productivity Analytics
Reporting Upgrade
3
Easy
2
4
1
7
Overall
697
2
Risk
1
4
2
2
ValueProject
Phase I Solution Choices Scorecard
3
1
4
Figure 11-2:A sample
score-card for
determiningsensible
initial stepsfor your
BI project.
178 Part III: The BI Lifestyle
17_127230 ch11.qxp 12/4/07 12:40 AM Page 178

out specific project risks that could hamper development, delay the release,or put the entire initiative in jeopardy. The simplest contingency plans arethose that reduce the scope of the project in case something goes wrong. Orif a part of the release fails, your contingency plan could be as simple aspreparing a pre-assembled trouble-shooting team that swings into action.
We’ll talk more about identifying risks in Chapter 12, but for now, understandthat like any large complex high-visibility project, a business intelligenceimplementation has dozens of inflection points where problems can appearand derail your initiative.
Some examples of project risks include these:
� Higher-than-expected project staff turnover
� Loss of project champion or sponsor
� Higher-than-expected — or unexpected — expenses that cause you toblow through your budget
� Technology-specific risks such as these:
• Integration problems with existing software and hardware
• Over-promised (or under-delivered) software functionality
A good contingency-planning process identifies risks like these and createsalternate pathways into the roadmap, and later, the project plan itself. Insome cases, best practices can show you the way to a safe harbor in theevent of a storm. But for certain problems — including those unique to yourteam, your implementation, or your company — you’ll need to be ready totoss out the book and improvise.
If you read the transcript of the radio chatter between the spacecraft andMission Control during the failed Apollo XIII lunar-landing mission, you’dthink they were dealing with a backed-up space toilet rather than the graveproblems the astronauts actually faced. That’s because NASA emphasizedcontingency planning in the early days of the space program, and does soeven today. The transcript shows only the slightest hints of concern from theastronauts and Mission Control — even after discovering the crew’s oxygenwas leaking into space.
Your BI project is like a space mission — a large, complex system wherepieces can fail unexpectedly. The better you can anticipate problems — andwork out solutions and plans ahead of time to deal with them — the morelikely your project won’t be lost in space when something goes wrong.
179Chapter 11: Building a Solid BI Architecture and Roadmap
17_127230 ch11.qxp 12/4/07 12:40 AM Page 179

Dealing with moving targetsIt would be nice if you could freeze the world in place as you build out yourBI system. That way you wouldn’t have to worry that while you were off solv-ing one problem, another problem on the other side of the company changedshape without you knowing about it.
Unfortunately, BI implementations don’t happen in a vacuum; there are allkinds of dependencies and vital connections with resources in various partsof your organization. Given the fact that planning and design takes time, it’salways possible that things will change in an unexpected way.
It’s not always easy to do, but as you build your roadmap, it’s incumbentupon you and your team to account and plan for as many external variablesas possible. Suppose, for example, your data-warehouse system is designedto use a state-of-the-art storage network that you’ve been told will be launchedonly a month before the data warehouse comes online. It’s probably a goodidea to have a contingency plan available in case the new storage system isn’tavailable.
And it’s not just major IT systems that can change, either. Tiny changes to thedata schema that feeds your data warehouse (or perhaps an adjustment tothe network addressing scheme) may happen without you being any the wiser.Seemingly insignificant updates can have a big impact on your project.
Open a line of communication with other project managers in your companywho are working on IT-related initiatives parallel to yours. Be aware of theirroadmaps; work with them to coordinate the dates on your project plan withtheirs. Reach out to technology-governance boards wherever possible toensure you’re up to date on scheduled system and process changes. Andmost of all (again), do some good contingency planning.
Leaving time for periodic “architectural tune-ups”In spite of what you might have heard about the Pyramids in Egypt, not allarchitectures are designed to last forever. And the time to face your BI archi-tecture’s mortality is now, rather than after it becomes obsolete, useless, orjust aggravating to the users and administrators.
A BI system is a constantly-evolving organism; there will be regular upgradesand tweaks to functionality. The applications might be rolled out to a newteam one month, and a software patch might be rolled out the next month. In such an environment, it’s easy for changes to pile up without paying atten-tion to their combined effect on system performance.
180 Part III: The BI Lifestyle
17_127230 ch11.qxp 12/4/07 12:40 AM Page 180
One way to avoid problems is to plan for occasional code freezes in your pro-ject plan. During these periods (a good standard is one quarter out of everytwo years), the system gets tuned from time to time, but that’s about theextent of the changes. The code freeze gives you an opportunity to replaceservers, tune your databases, upgrade your front-end user tools, and performother tasks necessary to keep your system in shape. It’s also a good time tomake an honest evaluation of the state of the system.
As you examine the various elements of your system for how effectively they’reperforming their tasks, you’ll want to ask yourself some key questions notjust about raw quantitative performance issues, but also about softer, morequalitative issues — for example, how user-friendly the system is, whetherit’s time to upgrade the training program, and so forth.
It makes sense to have some “meta-metrics” (metrics that keep track of themetrics) for your BI architecture; they’re essentially performance indicatorsfor the system itself. Build some universal benchmark tasks that you can exe-cute every so often to get a glimpse of the system’s health and allow you tocompare performance over time. Keep track of system uptime and through-put. And it’s always important to have a standard user-satisfaction surveythat gets distributed on a regular basis. This will provide you a good heads-up when issues start to crop up.
It can’t hurt to stay in touch with the state of the marketplace for the maincogs in your system — the data warehouse, the ETL software, the queryingand reporting tools, and so on. The goal is not to create a killer case of buyer’sremorse for you, but rather to keep an eye open for new pieces to your puzzlethat might improve your performance, extend your existing functionality, orallow you to extend BI’s reach to a new set of users within your organization.
181Chapter 11: Building a Solid BI Architecture and Roadmap
17_127230 ch11.qxp 12/4/07 12:40 AM Page 181

182 Part III: The BI Lifestyle
17_127230 ch11.qxp 12/4/07 12:40 AM Page 182

Part IVImplementing BI
18_127230 pt04.qxp 12/4/07 12:40 AM Page 183

In this part . . .
Okay, Mr. or Ms. Lemonade maker. You’ve dreamedthe impossible dream for too long now. It’s time
to turn those dreams into reality, to put those plans intoeffect.
This is where the BI rubber hits the BI road. You’ll start off with a chapter about the project plan you’ll need toassemble that takes the best parts of your strategy andarchitecture ideas and codifies them, breaking them intotasks assigned to resources.
Is there a business analyst in the house? You’re going toneed a good one to manage the requirements elicitationprocess for your BI project. That means working throughthe users to find out what they really want, then analyzingit to discover if it’s what they really need.
Then you have no choice but to put it into a pot, mix ittogether and come up with a reasonable design that fitsinto the constraints of your business while meeting all ofyour goals. After that it’s the glory of a successful launch,followed by long days of maintaining and enhancing thesystem you so successfully installed.
18_127230 pt04.qxp 12/4/07 12:40 AM Page 184

Chapter 12
Building the BI Project PlanIn This Chapter� Getting your plan started
� Entering tasks into the plan
� Setting milestones
� Listing resources on your project
� Keeping the plan up-to-date
� Working out contingency plans
The BI project plan is the primary tracking and control mechanism for yourbusiness intelligence implementation. It’s where you list and organize
every single task required to make your BI project a reality. That doesn’t necessarily mean you list “reading this book”, or other early-stage day-dreaming . . . er . . . research tasks.
The project plan is there to help you choreograph every move the projectteam members will have to make. All the tasks, milestones, and deliverablesare there so that each moment of implementation planning, designing, coding,and testing is accounted for and scheduled properly. But project plans aremore than mere task lists; they include resources, constraints, risks, andbudget issues; wrapping it all around a calendar (or multiple calendars) toshow the impact of changing the resources working on the project or deviat-ing from the schedule.
The project plan is really a dual-purpose document:
� It’s the high-level blueprint that maps, ahead of time, which tasks haveto be done, in what order, and by whom.
� It’s the central organizing tool for the project team — and for many ofthe stakeholders as well. The plan keeps everybody marching to thebeat of the same drum.
Prior to beginning work on the project, the approved project plan communi-cated throughout the organization is a kind of promise to stakeholders. It saysthe BI implementation team will do these specific tasks in this specific way.
19_127230 ch12.qxp 12/4/07 12:41 AM Page 185

After the project kicks off, the plan’s tracking function comes into play. As thedays roll by, tasks are begun and completed, issues arise, resources comeand go, and these events ultimately affect the project delivery date. The pro-ject manager monitors everything that happens on the project and updatesthe plan so resources are utilized efficiently and the rest of the organizationknows the expected completion date.
The project plan is a full-fledged communication tool that project managersuse to set expectations both inside and outside the team. It offers everyone aglimpse of how each piece fits into the big picture, so it’s bound to fosterteamwork and cooperation.
A project plan is never really complete in the traditional sense of the word.It’s a snapshot of the current state of the project, combined with your bestestimate about what’s going to happen in the future. As the renowned man-agement guru Alan Lakein once said, “Planning is bringing the future into the present so that you can do something about it now.” The project plan —including the process of building it — shows one possible future scenario forthe business intelligence initiative.
If you wait until you know every little detail about the project plan, you’llnever get your BI venture off the ground. Be thorough when you’re creatingyour project plan, but not so much so that it brings the entire process to ahalt. It’s true that the finer a level of detail you can define in the project plan,the more likely you are to spot potential bottlenecks and risks to the imple-mentation. But at some point you have to actually get to work.
Planning the PlanWhen you’re ready to build a project plan, start with an inventory of theinformation you’re already working with, which many not be all that much.Chances are you have done some research and have produced a project mis-sion statement. Then there will be official communiqués from executive spon-sors. It doesn’t seem like much, but you should be able to glean someimportant information from these items. Then it’s time to think about howyou’re going to record it in a project plan.
Revisiting the visionStart the process of developing your project plan with the basic goals of theproject:
� Why is the organization undertaking this venture?
� What are they expecting to get from it?
186 Part IV: Implementing BI
19_127230 ch12.qxp 12/4/07 12:41 AM Page 186

� Who needs to know the project plan?
Most of these answers should be available to you in the project artifacts you’vealready created.
� Project vision and roadmap: An approved description of the overallpurpose and direction of the BI initiative. The roadmap will list sets offeatures and group them together into releases.
� Project architecture: The architecture is the overall technology approachyou’re going to take, as well as specifics about what hardware and soft-ware you’re shooting for with this release. It’s also the guide for whichapplication delivers which functionality.
Project plan formatThe plan can take whatever form is appropriate for your company. Most pro-ject managers build their project plans with a mainstream tool like MicrosoftProject.
Dedicated project-management tools like MS Project are helpful because theylink related tasks so that changing one task or date will result in other appro-priate changes being reflected through the rest of the project plan.
Project ResourcesWith a technology architecture in mind and a list of major applications tobuild, the project manager works with his project team to begin working outthe major tasks of the project. A list of required skills must accompany eachstep so the project manager can assign a role (or roles) to cover the task.Eventually the generic role will become a specific resource.
Early on you should assemble a general list of roles required for the project.A role is a standard combination of abilities and sets of skills that commonlygo together.
Think of a role as a job associated with a single verb — say, “tester” or “docu-menter” or “network analyzer.” It describes someone who has all the skillsnecessary to perform that one more general function in a project environ-ment. Of course, some of those titles sound a little silly, so use the commonlyaccepted industry terminology — in the case of the roles listed in this para-graph, that would be (respectively) “Quality-Assurance Analyst,” “TechnicalWriter,” and “Network Engineer”.
187Chapter 12: Building the BI Project Plan
19_127230 ch12.qxp 12/4/07 12:41 AM Page 187

Roles versus resourcesOnce the project-management team determines all the roles, it’s time to matchthem up with your available resources. Figure 12-1 represents a typical chartthat matches roles with resources; in this case, the role-to-resource relation-ship is (in database terms) many-to-many. That’s because you may find thatsome team members can play more than one role — and in some cases, youmust have multiple people playing a single role.
188 Part IV: Implementing BI
Project management softwareMicrosoft Project is the most common inte-grated project-management software on themarket, but hundreds of project-support appli-cations are available to project managers. Theyrange from general project-planning-and-man-agement systems to time and expense soft-ware, business-graphics packages, and otherapplications. Many of these are designed for specific types of projects or have specificfeatures.
Every organization has its own standards for —and approach to — project management. Thosedifferences vary by company, and mean more(or less) analysis and rigor at particular stagesof the process. What’s customary for your shopwill probably determine the kind of software youuse in your process.
For example, you might be required to under-take in-depth risk assessments at every phaseof the project, both quantitative and qualitative.Specialty project-management software canhelp you produce a comprehensive list of riskevents and plan a response in light of these twoelements:
� Pre-defined risk-assessment templatesadjusted to match your project’s circum-stances
� Your company’s aversion to certain kinds of risk
Such functions might be covered in your inte-grated application. Along with risk assessment,your project package should be able to cover —at a minimum — the following activities:
� Hierarchical organization of project activi-ties and tasks
� Task calendar that includes basic schedul-ing information, as well as dependenciesamong tasks and appropriate constraintcalculations
� Progress tracking — such as percentage-completed dates for specific tasks
� Lists and descriptions of resources you canassign to tasks (eventually)
� Basic budgeting functionality that tracksthe cost of resources and overhead for theproject
� Multiple project views (such as pert chartsand Gantt charts), as well as reports andvarious ways to summarize information
If the BI project is integrated with other IT pro-jects, you may be asked to use a portfolio-management solution. That helps you track mul-tiple projects that share a single resource pool.
19_127230 ch12.qxp 12/4/07 12:41 AM Page 188

If you’re tempted to start with people and fill in the roles underneath them,beware: Don’t count on stretching a person’s abilities to cover a role they’renot equipped to handle.
If you start with project roles instead, and then do your best to match themto the people available in the resource pool, you have a better chance of fit-ting the right person to the job, as well as identifying skills missing from yourteam. It’s best to understand exactly what you need first — without consider-ing what resources you have available. Only when the roles are definedshould you start adding real live people into your plans.
The project budget and timetable both play a big role during this process. Inan ideal world, you’d put seasoned experts at in every role, but in reality, youmay have to make some sacrifices to meet the demands of the schedule andstill come in under budget. If you can’t spend the money it takes to hire a sea-soned BI/ETL developer (for example), your regular application developersmay have to play that part and just do the best they can.
Roles are not people. A role is not necessarily equivalent to a specificresource. Think of a role as a part that has to be played in your little BIdrama. It can usually be summed up as a set of skills and a series of tasks,and will eventually be quantified into an amount of work required.
BI project rolesThe roles on a BI team are as diverse as the applications and tools that makeup your solution.
Billy Ray LangeData Quality Analyst
Data Quality Analyst
Todd MacleodSenior Analyst
RequirementsAnalyst
DatabaseAdministrator -
Oracle
LeadApplicationDeveloper
Kelly BajecData Administrator
Zach MeyersProgrammer
Technical Writer MetadataAdministrator
Lead ApplicationDeveloper
MetadataDesigner
ETL Developer -Java
Figure 12-1:A roles and
resourceschart.
189Chapter 12: Building the BI Project Plan
19_127230 ch12.qxp 12/4/07 12:41 AM Page 189

Team membersMost business intelligence projects include the following professionals whoare each experts in one or another key area of the project. You should getfamiliar with the titles and responsibilities of these roles:
� Project manager: This person coordinates and manages all projectactivities.
� Business analysts: This person is tasked with working closely with allstakeholders to codify the requirements for the project. BA’s also managethe requirements documentation and oversee the change control process.
� BI developers: Often these are experts in particular domains of technol-ogy. They manage the end-user environment — whether in terms ofreporting, analysis, visualization, or some other tool. This group mightinclude application developers, data-mining experts, or report developers.
� Database administrator: This person designs and maintains the targetdata repository that is the destination for operational data feeds.
� Data administrator: The person in this role plays an important part in anyBI project: identifying and analyzing operational data sources throughoutan organization, and developing a process to bring the data together.
� ETL developers: Various people can fill this role (unique to BI projects):extracting, transforming, and loading data. This domain of responsibilityincludes all processes that affect the data as it moves from the opera-tional sources to one of two destinations:
• The BI data repository
• The end-user environment
� Testers: With so many diverse elements in a BI application environment,there could be a considerable variety of quality-assurance roles.
For example, some projects may require all of these specialty testers:
• Front-end testers for the user-facing software
• A data-quality analyst who can monitor the data itself to ensurethat it’s performing as advertised
• Integration testers who will make sure that applications are work-ing together properly, and that all the pieces have come togetheras designed
If you’re on a budget, or even if you’re not, a jack-of-all-trades can be a revela-tion to any project manager. In this day and age, it’s not unusual for profes-sionals to have a second (or third) skill set — say, some one filling theBusiness Analyst role who also has a Q/A background, or someone serving asETL Developer who has a DBA background. It can save you some money, andit always helps to have human resources who can take a broad perspectiveon the project.
190 Part IV: Implementing BI
19_127230 ch12.qxp 12/4/07 12:41 AM Page 190

Other playersWhen you’re developing the project plan you’ll need to account for peoplewho serve as quasi-resources — folks outside the project team who aren’tunder your control, but whose time is required to complete the project. Someexamples of these roles are
� End-users: These people will ultimately be relying on the BI environmentto perform their daily tasks. Their perspective should guide the require-ments process early on in the project; they should have a role in evaluat-ing the tools at various points in the development cycle.
� Network infrastructure: Because all that BI data will flow over the cor-porate network, and the data repository and applications will probablyreside in the company data center, you’ll need the cooperation of theinfrastructure team to get the environment’s hardware and connectivityin place.
� Risk-management and security experts: These people help your teamcomply with corporate standards for handling data and recording yourorganization’s processes.
� Subject-matter experts: Interpreting the data (and the kinds of insightsthe users are seeking) may require an outside expert who understandsthe nature of the business. For example, a large retailer might invite astore manager or the point-of-sale application administrator to consulton building a BI tool — even though they won’t be using it, nor will theyhave a direct stake in the outcome of the project. Nevertheless, withouttheir expertise, the BI data administrator might not fully understand theinformation that the systems are storing.
Project TasksAfter you have the BI project’s roles developed and its resources designated,you can begin listing the major tasks in the project plan. Creating a projectplan is a naturally a process of iterations; it’s common to start out at a highlevel, jotting down the major components, go through the plan again to addmore detail . . . and go through it again to add even more detail. After severalpasses, the project plan will contain a list of specific tasks broken down intosub-tasks and sub-sub-tasks.
The project plan is a navigation aid — both a map that helps you plan priorto embarking and a compass that lets you know when you’ve lost your way.Take care with how you insert tasks and milestones.
During the project-construction phase, every task must be accounted for interms of its current state, the availability of resources associated with it, andother diagnostic snapshots that help measure the health of the project. Fornow, however, the goal is just to list and connect the tasks in a logical order.
191Chapter 12: Building the BI Project Plan
19_127230 ch12.qxp 12/4/07 12:41 AM Page 191

First pass: Project milestonesWhen you have your broad project outline in place, the development leads,senior architects, and most experienced analysts will play a major role inpopulating the project plan with details. But the first thing the project man-ager must do is to insert milestones.
Milestones are broad targets that large swathes of the project team worktowards. In a large, multi-faceted project like a BI initiative, reaching eachmilestone indicates the completion of a discrete goal or task.
A milestone event is like a state of being, usually described in such a way tomake sure the length of time listed is 0. It’s an intermediate goal, not a set ofsteps to reach the goal. A milestone indicates an important step in the pro-ject, like the start or finish of a phase.
For example, some amount of time and effort has to go into completing thetasks “mix dough,” “put dough balls onto baking sheet,” and “put bakingsheet in the oven.” “Cookies done!” is, however, a milestone — a checkpointthat tells you a particular phase of activity has drawn to a close. You couldadd any number of descriptive milestones to this project, but normallythey’re just used as summary descriptions of the status of a project.
The first iteration of the project plan will include major project milestonesthat indicate the completion of the various phases of the project. For example, the following milestones are common in a BI project (go ahead —capitalize ’em, they’re important):
� Stakeholder Interviews Complete
� Begin BI Pilot Project Design
� BI Pilot Design Complete
� Begin Pilot Development
� Pilot Development Complete
� Begin Pilot Test Phase
� Pilot Testing Complete
� Pilot Launch
� National Rollout Go/No-Go Decision
� Begin BI National Rollout Phase I
� National Rollout Phase II Complete
� Begin BI Project Phase II
� End Project Phase II
192 Part IV: Implementing BI
19_127230 ch12.qxp 12/4/07 12:41 AM Page 192

The preceding list includes no actual tasks. You put specific tasks and activitiesunder such headings as “Testing Complete,” but the headings themselves arestatus markers only. Milestones don’t describe what you’re doing, theydescribe where you are on the road to completion of the project.
The milestones should be aligned with the overall strategy and architectureof the project. That means they aren’t always technology-focused. Often theimportant milestones for a project include business decisions and anythingelse that might affect the project schedule. Think of milestones as inflectionpoints on the calendar, watershed moments, or important forks in the roadthat show progress toward the strategic goals.
Sometimes it’s not always clear what the specific project activities will be wellinto the future, but milestones are a different story. They can be anticipatedmonths, even years, in advance. Even if you don’t know how you’re going toget to a given destination, you know that’s where you’ve got to go.
Next to those milestones put in any hard dates that you know have to be met.For example, if your pilot implementation has to be up and running by the endof the fiscal year, insert that date next to that milestone. Those milestone list-ings become the immovable bedrock on which you build your project plan.From there, when you go through and start adding tasks (in the next sectionof this chapter), they will all be bound to the hard dates of the milestones.
Don’t force dates into a project plan unless you absolutely have to. Projectsoftware is designed to calculate realistic completion dates for you based onthe amount of estimated combined effort for all the tasks.
Second pass: High-level tasksAfter the project manager consults with the team about the milestones, you’llneed to start in on the second iteration of your project plan creation. In thisloop, it’s time to start adding the high-level tasks required to reach each mile-stone. Don’t panic if you don’t know them all now, or if you aren’t sure aboutthe order they should be accomplished in. Just enter them in to the best ofyour ability.
Figure 12-2 shows how indentation works in project-management software.
Microsoft Project organizes tasks automatically by creating a hierarchy basedon how the user indents entries. A good place to start a project plan is thefirst entry at indentation level 1 (i.e. all the way to the left) which usually con-tains the overall name of the project. Then task 2 would be one indentationlevel to the right and would be the first major activity area of the main event,such as “Project Research” or, if the project is to happen in multiple releases,“Release 1: This or That Function” or something similar.
193Chapter 12: Building the BI Project Plan
19_127230 ch12.qxp 12/4/07 12:41 AM Page 193

If you maintain all milestones on the same indentation level — and put onlythe milestones at that level — you can always roll up the outline at will whenyou want to reduce your project plan to a simple, straightforward list of milestones.
Regardless of whether it’s a task or a milestone, all entries directly below andindented to the right of a given task will be considered its child tasks. So thetask that says “Database Development” might show five or six activitiesbeneath it (and indented one level to the right) that represent the core tasksof developing the database. By using a hierarchy in the central task list, Projectshow the user exactly which sub-tasks are grouped together into broaderactivity categories.
As you fill in high-level development tasks, you rely on your technical leadsmuch more than you did with the milestones. After all, the project managerisn’t expected to know exactly what the technology effort will be (otherwisethe project manager would be a developer or database administrator!) Butit’s important to record the most important system development activitiesand their larger subtasks, even if you aren’t sure what it all means. When itcomes time to actually manage the project, you can reference those high-level technical activities — such as writing code modules, installing softwarepackages, performing necessary analyses, regression testing — to assess thedevelopment team’s progress..
The original project roadmap should provide a number of major tasks. Forexample, the roadmap may produce high-level goals like these:
� Gather requirements for querying and reporting software
� Design solution
� Identify data sources
� Develop ETL processes
1 Milestone: Begin Project Phase 7/31/2007 8/27/2007
ID Task Name Start Finish
2 Major Task 1 7/31/2007 8/10/2007
3 Sub-task A 7/31/2007 8/6/2007
4 Sub-task B 8/7/2007 8/10/2007
5 Major Task 2 8/13/2007 8/27/2007
6 Sub-task C 8/13/2007 8/17/2007
7 Sub-task D 8/20/2007 8/27/2007
8 Milestone: End Project Phase 8/28/2007 8/28/2007
Figure 12-2:Project
plansdisplay
hierarchiesof tasksthrough
indentation.
194 Part IV: Implementing BI
19_127230 ch12.qxp 12/4/07 12:41 AM Page 194

� Build data warehouse
� Feed live data into the data warehouse
� Test the solution with live data, using dummy queries
� Perform user-acceptance testing
It won’t be a perfect match, but you can take advantage of the technologyroadmap to fill in the initial project plan.
Linkages and constraintsFor larger tasks, you’ll need to begin thinking about linkages and constraints.These two factors, when combined with other information, will eventuallylead to milestone dates:
� Linkages: This is one of the most important concepts in the entire pro-ject plan. When tasks are linked, it means they can be completed only ina given order. Usually that means a first task must be completed beforestarting a second task — for example, the code must be complete beforeintegration testing can begin. However, there are other types of linkagesas well, such as start/start linkages where a second task can’t begin until a first task begins also.
Defining linkages is also called creating predecessor and successor tasks.These task-level dependencies will ultimately determine the completionpath for your project — that is, what order things get worked on.
� Constraints: These are external factors that affect the completion datesof certain tasks. For example, maybe a system you’ve planned on updat-ing for the BI project is on a code freeze until a certain date. That meansyour development work on that system can’t begin sooner than thatdate. Or perhaps a key resource has a vacation planned a few monthsafter the project begins. Constraints usually come in the form of dates,but can include any external factor that will impede work on your project.
Don’t languish over linkages just yet. Determining predecessor events is notalways an obvious or easy task. Just insert those that you know. The key iscontinuing your iteration through the project plan and assembling the majortasks and task groups.
Third pass: Break it downFor each main task, you’ll need to begin listing the more detailed sub-tasksthat lead up to it and draw the same conclusions about dependencies andconstraints as you did before.
195Chapter 12: Building the BI Project Plan
19_127230 ch12.qxp 12/4/07 12:41 AM Page 195

Task dependencies depend on whether you can work in parallel. If you can,no linkage exists. If, however, you have to wait for one task to reach a certainpoint before you can begin another, you should insert a dependency intoyour project plan at that point.
Gantt ChartsThe main type of visual for a project plan is the Gantt Chart. These usefulcharts contain a lot of information about a project.
First and foremost, it’s a list of tasks. But beyond that, it shows how tasks linktogether in dependencies and extend over a calendar.
Figure 12-3 is an example of a task list with an associated Gantt Chart out tothe side. When the task list is populated with major and minor tasks, the pro-ject manager fills in task durations and dependencies. The idea is to representwhether effort can be done in parallel; here each bar on the Gantt chart rep-resents a discrete task.
Duration estimatesAfter the sub-tasks are listed and as many dependencies as possible listed,you must add duration estimates to each sub-task. Your resource teamshould be able to provide rough estimates in either hours or days for howlong the individual tasks will take.
Other than the start date for the project — and any constrained dates —you should not enter specific dates into your project plan. The combinationof task durations and dependencies will get processed by the project-management software to produce start and end dates next to each task.
Make each iteration of the project plan as complete as possible. Don’t assumethat you can break it into functional pieces and assess any one section com-pletely before you move on to the other sections. The best route is to startwith high-level tasks for the entire project, then move down to mid-level tasksfor each area of the project. Then you can dig into the details. With each itera-tion, your plan gains visibility into successively finer points into the project.
Once the project begins, you’ll continue to revise the list of tasks, the depen-dencies, the time estimates, and just about everything else. There’s no suchthing as a completed project plan; it’s always just a snapshot of your bestguess about what the project looks like now and how it will look in the future.
Roles and skillsBy the time you get to this point, you’ll have a general idea of the team rolesrequired for the project. Only after you build the detailed plan will you under-stand the precise level of effort required from each participant.
196 Part IV: Implementing BI
19_127230 ch12.qxp 12/4/07 12:41 AM Page 196

After the tasks are broken down into their component elements, you’ll needto assign project team members to them.
1ET
L Re
quire
men
t Fin
aliza
tion
7/15
/200
97/
16/2
009
IDTa
sk N
ame
Star
tFi
nish
2Tr
ansf
orm
atio
n Pr
oces
s Co
de7/
17/2
009
7/20
/200
9
3In
itial
Cod
e7/
17/2
009
7/17
/200
9
4Tr
ansf
orm
atio
n Te
stin
g7/
21/2
009
7/22
/200
9
5Hi
stor
ical
Loa
d7/
24/2
009
7/24
/200
9
6Fi
nal T
estin
g7/
27/2
009
7/28
/200
9
7ET
L D
evel
opm
ent C
ompl
ete
7/28
/200
97/
28/2
009
2d
1516
1718
1920
21Jul 2
009
2223
2425
2627
28Du
ratio
n
2d 1d 1d 4
h
1d 1d 4
h
0d
Figure 12-3:Task list with
associatedGantt Chart.
197Chapter 12: Building the BI Project Plan
19_127230 ch12.qxp 12/4/07 12:41 AM Page 197

Most project-planning software allows the project manager to add resourcesto tasks, reducing the duration of each task in proportion. For example, if youestimate it will take 40 hours to code a certain piece of the ETL process, theproject manager will need to decide whether to assign one developer to thattask for 5 days, or to assign 5 developers for one day. You probably see aproblem with this right away: Project software often assumes an hour of workis an hour of the same work, but the reality is it’s not always so easy to stackmore people on a task to get it finished faster.
As a general rule, beware of how your project software handles extra workerson the same task. If the second worker won’t perform at the same level of effi-ciency as the first, you’ll need to account for that. For your 40-hour project,one programmer may be able to do it in 5 days, but adding 4 programmersmay only shave off a day or two because of reduced efficiency.
There are literally thousands of project plan formats that offer general modelsfor running all kinds of IT projects, including BI implementations. Don’t try tore-invent the wheel; use a template for one that’s worked successfully for youor someone else in your company, then change only the elements you need to.
Risk Management and MitigationDuring the planning phases of a project, the scenario that inevitably gets themost attention is the happy path — what happens when everything goes rightand all deliverables are completed on time.
It’s only natural that this course gets most of the project detail. But whenthings go wrong, a well-planned project can turn into the Wild West if no contingency plans are in place.
Contingency planningThere’s plenty of good advice for running a project when everything is goingwell. Fewer project management professionals want to talk about it whenthings go wrong.
Contingency planning is a lost art in some organizations, but its value is unmis-takable. When a project gets derailed, it can turn into the Wild West veryquickly. A contingency plan is a branch off the main sequence of tasks andevents, designed to get the project back on track and performing as it should.
198 Part IV: Implementing BI
19_127230 ch12.qxp 12/4/07 12:41 AM Page 198

Treat a contingency plan as you would any other piece of the project plan:List major milestones, tasks, and sub-tasks. Work out details and timelineswith your lead technology team, and then define what conditions must existfor you to implement that plan.
CheckpointsA good project manager stays abreast of the general health of the project, butit’s easy to get lost in the day-to-day tasks. That’s why it’s important to insertpre-arranged status-checking tasks into the plan ahead of time at regularintervals. No matter how busy it gets, you and your project leaders will pauseto take a breath and evaluate how things are going. It helps to have a pre-setlist of metrics that indicate the wellness of a project — for example, how manyman-days of work you’re either ahead or behind, or the current budget status.
If you reach a checkpoint and everything seems fine, good for you; continueas you were. And if there are a few items that seem a little off-balance or outof whack, you can quickly work to correct them before they become biggerheadaches.
But what if all indications are red lights? The best project managers have mit-igation strategies worked out ahead of time in case specific problems emergefor the project. Prepare a mitigation module for your project plan — a remedyfor fixing whatever the problem is — and be ready to activate it if necessary.For example, if all the code checks out and is functioning properly, but thesystem performance is inadequate, be prepared to lead the team down a spe-cific fork in the project plan that focuses on repairing any damage done.
Keeping Your BI Project Plan Up to DateA project plan is designed to be a living, breathing document. It’s not meantto be an unchanging blueprint to be hung on a wall in a frame.
Project plans are management tools as well as planning tools. Even if every-thing goes as expected on a project, the project managers have to be able totrack the progress of tasks, assign new tasks, manage resources, and so on.Not only that, but the project plan acts as a de facto reporting mechanismbecause it lays out milestones and dependencies, resource lists, utilizationrates, on-time metrics, and a pile of other information — all in a way thatmakes it easy for people inside and outside the project to understand.
199Chapter 12: Building the BI Project Plan
19_127230 ch12.qxp 12/4/07 12:41 AM Page 199
Managing to the planEnsuring that the project as a whole is delivered on time involves making sureindividual tasks are completed on time.
Project management is an ongoing activity, day by day and hour by hour, fromthe beginning of a project to the very end. A good project manager spendsmost of his or her time working between the resources and the plan, relyingon each resource to provide updates on progress (and expected completiondates) for the tasks. In addition, individual contributors to the project haveto inform the project manager of any changes in the list of activities, theschedule, or the order of tasks.
The project manager then compiles the resulting information into a list ofchanges for the project plan. For example, if the team identifies a new activityor deliverable, the project manager must undertake a thorough assessmentof what’s being called for. That entails breaking the target into its componenttasks, assigning each task an owner from the resource pool, gathering esti-mate data for level of effort and duration, and (finally) easing that set of tasks into the project plan in a way that minimizes disruption on the rest of the project.
Working through issuesA common problem on projects is task delays or other changes in the sched-ule. When tasks are completed late, the effect cascades to any subsequenttask. The first order effect is that any secondary or subsequent tasks thatcan’t begin until the primary task is completed becomes late as well. Butthere are other effects: resources may be tightly scheduled to move betweentasks at specific times. So if a task is late, not only can you not begin depen-dent tasks, you also have to delay any tasks that expect to have use of theresource assigned to the first task.
Sound confusing? Try expanding that to dozens of simultaneous activities,resources, and milestones, all interconnected and interdependent in waysthat make your project plan look like a jigsaw puzzle. On a BI initiative, pro-ject managers earn their money.
Daily updatesThe moral of the story is that the project plan must be updated every singleday. BI projects are notoriously complex because they often touch so manydifferent departments and teams of all disciplines across the company, evenextending to third parties. A plan that doesn’t get updated with the latest
200 Part IV: Implementing BI
19_127230 ch12.qxp 12/4/07 12:41 AM Page 200

realistic outlook for the project ceases to be a useful central managementtool for a fast-moving effort. Worse, an obsolete project plan causes tasks andresources to fall out of alignment, leading to waste and confusion among dif-ferent groups.
Maintaining the project plan is an entire project unto itself. The project man-ager will often hire a project controller or project administrator who handlesthe administrative functions of the project, and that includes being masterand commander of the project plan. A good rule is that for projects involvingat least ten full-time technology professionals, the project manager shouldfocus on actually managing the project — interacting with the resources, solv-ing problems, making contingency plans, and communicating with the stake-holders and sponsors — and not the project plan.
Keeping task data up-to-dateRegardless of who does it, updating the project plan boils down to maintain-ing the list of tasks — keeping the tasks up-to-date relative to each other, andthe information associated with each task current.
For each task, the project manager should monitor
� Percentage complete: This is necessary for resource planning, schedul-ing, and internal reporting and progress reports to stakeholders.
The percentage complete affects the task’s completion date, and thatcan have ramifications on subsequent activities. It will also affect theestimated delivery dates displayed for all dependent tasks.
� Resources associated with the task: Are the same members of the teamworking on the task that were originally slated to do so? Is the politicalmix correct between groups working together? If we need to complete atask sooner, what resources could we call in to help in a pinch?
Microsoft Project includes financial tracking information for project managersto maintain. In the Advanced tab for every individual task’s Informationdialog box, you’ll find so-called Earned Value information. This data keepsyou on track to ensure you’ve actually earned what you’re billing the client(whether internal or external).
Back to the Ol’ Drawing BoardNobody wants to have to do it, but sometimes no matter how well you’veplanned, no matter how well you’ve kept your project documentation up todate, and no matter what level of detail and forethought you’ve put into the
201Chapter 12: Building the BI Project Plan
19_127230 ch12.qxp 12/4/07 12:41 AM Page 201

project, sometimes situations arise that force you to completely reevaluatethe plan. If several factors conspire to throw your current working plan out of whack, it may be too complicated to try to simply repair it.
At those moments, some project managers have invoked the dreaded “nuclearoption” of project planning: They throw out the current plan, go back to thedrawing board, start from scratch, and rebuild the project plan from theground up.
The potential reasons for such drastic measures are manifold. Here are sometypical examples:
� A key source application you were counting on had a delayed release orwas canceled at the last minute.
� The company is going through layoffs or some other major economicevent, forcing you to change the shape of your team and re-evaluate whowill be left to use your application.
� A new executive enters the picture and dramatically alters the scope ofyour BI project.
Tectonic shifts don’t have to doom the project, but you have to be realisticabout the validity of your existing plan. If any of the following elementschange, invoking the nuclear option might make sense:
� Project budget: When funds get slashed, it’s your job to rework the planin an attempt to achieve the same goals with a reduced resource pool orwith a different (read: less expensive) set of tools.
� Project goals: The broad strategic objectives of the project exist indepen-dent of the implementation, and they can shift over time as the companyevolves. A change in direction often forces a change in implementation;if that’s what you’re facing, it might be time to build a new project planthat supports the new goals.
� Technology constraints: Having to conform to external systems or stan-dards can shape your project in profound ways. If these requirementschange, they could affect the entire BI initiative.
� Team resources: Layoffs are not uncommon in the IT industry, and youwouldn’t be the first project manager asked to do more with less. But ifthe shape of your team changes today, don’t expect yesterday’s projectplan to continue to work.
BI initiatives are best designed as incremental implementations, and if that’sthe case, they are also funded that way as well. There are often stoplightmilestones along the way, where the executive sponsor or technology com-mittee will evaluate progress and make one of three decisions:
202 Part IV: Implementing BI
19_127230 ch12.qxp 12/4/07 12:41 AM Page 202

� Green-light (Go): Progress justifies “full speed ahead.”
� Red-light (No-Go): The project comes to a screeching halt.
� Yellow-light (Slow Down): The team is directed to proceed, but withreduced or changed objectives, or down an adjusted path.
To make this decision-making process smoother, the project plan shouldinclude evaluation-and-approval tasks as well as decision points for funding.
203Chapter 12: Building the BI Project Plan
Project plans aren’t just for technology tasksMost project plans are focused squarely on thetechnology tasks and milestones that must becompleted in order to meet the goals of the project. Hardware staging, setup, and configu-ration time — as well as troubleshooting, appli-cation installs, and testing — are all commontasks that appear in the plan.
But while the technology tasks may representthe critical path of the project, there are alwaysas many administrative tasks that must be con-sidered as well. They may not be a part of theimplementation itself, but if they aren’t com-pleted, the project will fail.
Remember, the goal of the project plan is toidentify every task that has to be completed,define how its completion affects other tasks,and then assign resources and deadlines tothose tasks. That means weaving an adminis-trative thread into the plan in addition to yourcore technology tasks and milestones.
The first thing you should consider is budgetingmilestones and tasks. Money makes the worldgo around, as they say, and it is the fuel thatdrives your BI project. The BI project managermay need to make a case in front of the financecommittee for the budgetary needs of the project.
Even if you personally don’t have anything to dowith the money-related tasks, they still have tobe completed before the BI project can begin.You probably won’t have direct control over the
completion of the tasks. But because the entireproject depends on their completion, be surefinancial tasks appear in the project plan.
The administrative thread goes beyond the dol-lars and cents of the project. There are alwayspersonnel tasks to deal with — such as devel-oping a staffing plan and allowing interviewtime for the developers and other resources forthe project. If the project is to take longer thana few months, plan on periodic one-on-one performance reviews for your key team mem-bers — to say nothing of the time you’ll spendworking through unforeseen human resourcesissues. (Of course, unforeseen issues are bydefinition difficult to quantify for the sake of aproject plan, but estimate some time for themanyway).
There’s more: What about working with thefacilities department to make sure there’s aworkspace for your team? It’s a bit recursive but bears repeating: You’ll need to include timeon the project plan for basic planning functions,and those include updating the project planitself.
It’s easy to dismiss these activities, but if youstop to consider all the work that goes into acomplex project, you’ll find that there’s muchmore to it than its core technical tasks. Themore comprehensive your project plan is, thebetter prepared you’ll be to tackle the unknown.
19_127230 ch12.qxp 12/4/07 12:41 AM Page 203

Creating a project plan happens in iterations. You can’t know everythingabout everything during the first pass through the plan, so it’s advisable tostart with the high-level items first, and then work your way into the details.List the things you know first; you can dig into the shadows for the details alittle bit deeper with each pass.
204 Part IV: Implementing BI
19_127230 ch12.qxp 12/4/07 12:41 AM Page 204

Chapter 13
Collecting User RequirementsIn This Chapter� Figuring out whom to invite to your requirements session
� Making an agenda for your requirements session
� Knowing how to run a requirements session
� Working with requirements once you’ve collected them
When all the software has been installed, when all the cable has been laid,the servers have been slid into their racks, and the switch is flipped
for your BI solution, one group above all will determine the success of failureof your project: the users. And if they haven’t been involved from the get-go,more often than not the project will end in failure.
The users are what it’s all about. Whether your business intelligence tools aredesigned for corner-office folks who haven’t flown on a commercial flight inyears, or whether it’s clerks in the accounting or shipping department, theirsatisfaction with how well the tools work is going to define the outcome.
For that reason, the user community has to be involved in the developmentprocess. Now, of course the accounting clerk or CFO who logs in to work withyour BI tools may not be able to tell you one thing about whether to use aservice-oriented architecture or how often to refresh the metadata. But whatthey can tell you is how things are supposed to work, what features wouldmake their life easier, and how the BI tools fit into their daily processes.
Users tell designers what they need the software to do, and how it needs tolook to support their activities. This role can’t be thrown out for the sake ofconvenience. When developers or database administrators are left to divinehow the applications are supposed to perform, they are more likely than notto get it wrong. That’s why gathering business requirements directly fromusers deserves its own chapter in this book; it’s often overlooked or doneincorrectly, and the end result for the BI project can be catastrophic.
In this chapter, we take a look at the process of gathering requirements fromtop to bottom. It’s primarily a people process where two or more profession-als directly interact to solve a problem; you’ll have to get the right people on
20_127230 ch13.qxp 12/4/07 12:42 AM Page 205

your team, and you’ll need to identify the right people to engage in the usercommunity. Another important focus of this chapter is the documentationprocess. The requirements document is your blueprint moving forward, soyou’d better get it right.
It’s Business, Not TechnicalThe user community needs to be involved in the early phases of the specifi-cation of any business intelligence implementation and can best determinethe overall needs of the system. Users have a great vantage point on whatconstitutes a solution to a particular business problem — and what doesn’t.They know how to prioritize different functions and sub-functions in a busi-ness system.
Documenting business requirementsDifferent companies — even different teams in the same company — have dif-ferent names for this process. But whether you call it a Business RequirementsDocument (BRD), a System Requirements Specification (SRS), Needs Analysis(NA), or any one of what seems like a million other stuffy names with two- or three-letter acronyms, you need a master document that tracks all thefunctional information about your system. And your BI team has to build it.
There are entire books written on how to best capture application require-ments. Whether your master repository of requirements is a document,spreadsheet, report, or searchable database doesn’t really matter, so long asyou have one. Whether you use a requirements-management tool such asRational RequisitePro or create your own format and process isn’t terriblyimportant either, so long as it works. What matters is that the requirementsdocument must have all the information the developers need to build theirtechnical solution.
Specifically, a requirements document should contain some or all of the follow-ing general features:
� Project assumptions: Elements either fully or partially outside your control that must be in place for the project to succeed.
� Project features: A quick overview of the main deliverables.
� Requirements: The meat of the document — a numbered, organized listof specifications to be built into the system.
� Process flows: How the main components of the project will interact,and how the users will work with the system.
206 Part IV: Implementing BI
20_127230 ch13.qxp 12/4/07 12:42 AM Page 206

� Requirement priority: The subjective level of importance assigned to arequirement or group of requirements.
� Traceability and change information: Links that show requirements’origins and interdependencies.
� Prototypes and screen shots: Mock-ups of key user interfaces.
� Use cases: Step-by-step narratives outlining how actors (users or externalsystems) interact with the system in question.
As long as the resulting document addresses these two main concerns,you’re in good shape:
� Specifies the functional requirements of the application being designed
� Describes the business processes that the application will address
Most project artifacts (that is, documents, spreadsheets, templates, and any-thing else that describes some part of the project) are in a constant state offlux as information is added, removed or edited. You’ll hear team membersdescribe them as “living and breathing” documents in that they are con-stantly evolving throughout the life of the project. A requirements documentcan’t afford to be so flexible. Instead, it needs a well-defined lifespan duringwhich it can be in flux — but after which it’s frozen into final form. At thatpoint, any other changes must go through a predefined, tightly controlledchange-management process.
Document size and structureAs a general rule, the structure of the requirements document should mirrorthe application itself. Every system function should have its own sections orsub-documents. The more extensive and complex the business function, thelonger the section of the requirements document, and the more detail isrequired.
There’s no way around it: The requirements document is likely to grow — andbecome more complex as it gets bigger. That’s natural; the requirements docu-ment is to become the central repository for all functional specifications. Afterall, BI implementations usually address a variety of different business prob-lems and touch multiple entities within the organization. The system willaffect many pre-existing processes and will (of course) create new ones aswell. Every feature will have to be accounted for in the document. Don’t betoo shocked if it goes through several revisions and eventually fills severalhundred (or even thousand) pages.
207Chapter 13: Collecting User Requirements
20_127230 ch13.qxp 12/4/07 12:42 AM Page 207

This and subsequent steps in the design process spotlight the need for arequirements elicitation and capture process. Why? Because (more than likely)you’ll need to have a look at existing documentation to get a handle on the cur-rent functions of the systems you expect to interface with your BI implementa-tion. Often you’ll need to know the exact capabilities and limitations of theexisting software before you move forward with new features or extensions.
A little help from your friends (and enemies)You’ll need to hone your political skills; this phase of the implementationrequires the services of many people in your company, most of them comingfrom outside the project team. Two groups in particular can offer key per-spectives on how the application has to work, and on how business problemsshould be resolved:
� Stakeholders: This broad term refers to just about anyone in your com-pany who will be affected by the BI implementation. Specifically, stake-holders include managers and decision-makers from teams that rely onthe particular business process your BI implementation addresses. Theycan also be interested executives looking out for an entire business unit,or the whole company. A stakeholder naturally views decisions about theimplementation through the lens of his or her particular team and area ofresponsibility, and they usually have the power to influence others eitherfor or (hopefully not) against your project. Getting key stakeholdersinvolved and on-board is one of the toughest challenges you’ll face.
� Users: This group comprises the individual workers who will actually beusing the applications that sit on the front end of the BI implementation.The user community must be heavily represented in the requirementsgathering process to offer their perspectives on the underlying businessprocess being improved, how the applications can best suit their needs,and how they’d like to see the front-end applications assembled.
Notice who’s missing from this list of essential personnel: technology folks.The focus during this phase is on the people who actually have to use andrely on the BI system. Database administrators, data designers, and develop-ers will have to take a back seat (at least for a day or two).
Requirements-Gathering TechniquesThe task before you is simple: Get the best ideas that currently reside in theminds of dozens (maybe hundreds) of employees out into the open, thenmanipulate and prioritize those ideas to reach a consensus design that main-tains the integrity of the project plan, and meets the budget and timeline.
208 Part IV: Implementing BI
20_127230 ch13.qxp 12/4/07 12:42 AM Page 208

Got all that? Good. Now, before you charge right into it, you should under-stand that there are some tried-and-true methods that can help you get themost out of the requirements phase of the project. The usual methodsinclude the following:
� Group meetings: Get a bunch of stakeholders in a room and hash outthe requirements.
� Individual interviews: Talk one-on-one with representatives from theuser community.
� Questionnaires: Ask stakeholders what their needs are via e-mail.
� Prototypes and pilot storyboarding: Show folks the possible scenariosof how the application might look — and ask for feedback.
Just keep in mind that (as with every other hard-and-fast rule in the world of BI) there are no hard-and-fast rules. You can’t expect an approach thatworked for the company down the street (or even another department inyour company) to work for you. Nor can you expect to copy the techniquesthat worked for previous teams when they gathered requirements for a bigtechnology implementation; those approaches might not work for the currentproject. That’s just the way it works; you’ll have to find the best methods towork into your circumstances.
The data differenceRequirements-gathering activities for a BI implementation is different fromthat of other technology implementations in one key respect: the data. Withbusiness intelligence projects, you’re not conducting any transactions thatcreate new data; you’re simply using data that already exists in the system.That means you have to work with the user groups to determine what datathey need to do their jobs well, what data they’d like to have to do their jobsbetter, and how best BI tools can deliver that data to them.
On the flip side of that, you’ll be working with data providers — teams whocontrol historical data in various databases throughout the organization — todetermine what information your BI tools can access and make available forthe users. Your team will need to carefully research and specify both datasupply and data demand in the project requirements; how you match the twowill determine the success or failure of your project.
User focusThe people who actually operate the application (and consume the informa-tion it produces) are at the core of any requirements-gathering process. More
209Chapter 13: Collecting User Requirements
20_127230 ch13.qxp 12/4/07 12:42 AM Page 209
than likely they have experience with the existing business problems you’retrying to solve, so their contributions should be taken seriously.
For example, if your company is building an advanced customer-relationshipmanagement (CRM) and sales-data system, your user community will consistof several groups — say, account managers, inside sales staff, and supportpersonnel. But you should also include other stakeholders (such as the wholeSales Management hierarchy) who make strategic decisions around the busi-ness insights produced by the BI implementation. Users may be able to tellyou how they’d like to use the BI system, but their managers set policy andare the ultimate arbiters of the project’s functional needs.
Any project that fails to include the end-users in the process is almost certainto fail. It’s tempting to try a shortcut and let BI techies act as proxies to theuser community — and infer requirements from their general knowledge ofbusiness processes and report layouts — but don’t do it! Reach out to thepeople who really know what the business problems are, even if the require-ments seem obvious. That detail you miss could mean the difference betweensuccess and failure for your project.
Requirements-gathering activitiesNo way around it: Gathering requirements means holding meetings — but notjust any old meeting. This section offers a closer look at your main optionsfor gathering BI requirements: group sessions, JADs, one-on-one meetings,small-group meetings and virtual design sessions.
Group sessionsBy far the most common requirements-gathering technique is the group ses-sion. Sometimes it’s called a design session; if you want to get really fancy,your Business Analyst might talk you into calling it a Joint ApplicationDevelopment (JAD) session. The Joint in that name means you get all thestakeholders into one room (instead of interviewing individuals separately)and develop a consensus about the final application function and form.
So who should attend a group session? Anyone with a vested interest in theoutcome of the application. That doesn’t mean you have to (or should) invitehundreds of people to a single meeting, but it does mean your attendeesshould represent the diversity of the user community. For example, if you’rebuilding a big BI financial suite, you’ll want to get representation from anyonewho’ll be running reports off the system, as well as folks who are actuallymaking decisions based on those reports (where possible).
Sometimes it’s hard to tell the difference between someone with a businessinterest in the application and someone with a technology perspective. Whenin doubt, invite them all. And if the meeting grows too big, divide the groupand schedule a second meeting, a third, a fourth . . . whatever it takes to get
210 Part IV: Implementing BI
20_127230 ch13.qxp 12/4/07 12:42 AM Page 210
everyone involved while limiting the meeting to a reasonable size. Usuallyyou want no more than 10 to 15 people in a single meeting, with a durationfor each “chunk” lasting anywhere from 90 minutes to about three quarters ofa workday. You certainly can — and should — schedule multiple “chunks”over multiple days for the same group if you have a lot to cover. If you needto bring folks in from out of town to hold a single marathon session, justmake sure you schedule plenty of breaks to keep participants sharp.
The Complete MBA For Dummies by Kathleen Allen and Peter Economy laysout the following universal rules for a meeting:
Be prepared
Use an agenda
Fewer meetings, better results
Include more people
Maintain focus
Assign action items
Get feedback
JAD sessionsNo, a JAD isn’t a military acronym or an ancient throwing weapon. The JointApplication Development meeting evolved from best practices for elicitingand documenting software requirements.
The hallmark of a JAD session is that everyone in the room plays specific roles.And the roles themselves have fun, gimmicky names. For example, instead ofeveryone taking notes, there is a designated Scribe. People aren’t just atten-dees; they are specialists and experts. At the core of the JAD session is one ormore facilitators to act as the emcee of the event, as well as the arbiter and inter-viewer. Typically the facilitator is a senior-level business analyst with a knackfor asking probing questions (and not putting meeting attendees to sleep).
JAD sessions usually follow a very strict agenda, developed from extensivepre-session work done by the project team and business analyst. The busi-ness analyst assembles and presents any prior decisions and existing knowl-edge about the project — as well as what the constraints and assumptionsare. With those facts in mind, the BA forms an agenda that roughly mirrorsthe main application features relevant to the attendees for that session.
At the beginning of the JAD session, the goals are laid out for the attendees.In most meetings, that means the facilitator explains what’s known about theproject up to this point, introduces the room, and defines the scope of theday’s work for this meeting. Depending on how the sessions are divided up,that might mean tackling only one or two business problems — or it might
211Chapter 13: Collecting User Requirements
20_127230 ch13.qxp 12/4/07 12:42 AM Page 211

mean taking on the entire application in one session. Either way, the entireroom should be aware that nobody gets out alive until the agenda is com-plete and the deliverables for the day have been created.
During the actual meat of the meeting, the facilitator encourages participa-tion from everyone in the room — and urges wallflowers out of their silence.There’s a good reason for that; you don’t want the most vocal people todecide every feature. The quiet types should be heard from too; their ideasare likely just as good. Once ideas start getting tossed around, it’s not thefacilitator’s job to decide which is the best, but rather, to guide the meetingparticipants to a consensus on the best approach.
By the end of the JAD session, there should be pages full of notes on themeeting, and all the decisions taken therein. An array of to-dos and next-steps should be distributed to the participants of the meeting in case therewere any issues that couldn’t be resolved due to lack of information.
In the end, the combined notes from the JADs are the foundation on whichyou build the formal requirements document — and from there, the technicaldesign and build can begin.
Individual meetingsSometimes it makes sense to meet one-on-one with certain stakeholdersinvolved in your project for logistical reasons (say, scheduling conflicts) oreven because of office politics. For example, if the C-level executives (theChiefs of This and That) want to be involved in the requirements-gatheringprocess for your new Sales Information System, they may have very specificideas about how they want to contribute. And since their titles start withChief, you don’t have much choice but to accommodate them.
With only one other person in the room, consensus should be easy to find (forthe moment, at least). But what happens if you go to your next one-on-one ses-sion and find the second stakeholder disagrees with the first? People who don’thave to face each other in a meeting are far less likely to be agreeable, and farmore willing to place blame and point fingers. Keep in mind that individualmeetings have limits in terms of producing good requirements information.
In a one-on-one meeting, make sure you add some rigor to the reasoningprocess. You’ll need to play the role of devil’s advocate during an individualsession, essentially representing the possible range of opinions you’d get in afull group-design meeting. The people you plan on meeting with one-on-oneshould be warned in advance that you’re not going to just accept opinionswithout question; you’ll offer counterpoints and opposing views and askthem to defend themselves. That process ultimately helps build a morerobust, well-thought-out system.
212 Part IV: Implementing BI
20_127230 ch13.qxp 12/4/07 12:42 AM Page 212

Small-group meetingsSometimes it’s not necessary to have a full-blown JAD session with 10 to 20people in it — sometimes it doesn’t even make sense to. When the subjectmatter is complex it might make sense to have fewer people in the room. Thatmight seem counterintuitive, but it’s not uncommon for people to tune out inlarger meetings, or to lose touch with the course of a complicated discussionand get left behind. That’s especially true when you’re working through minu-tiae of a complicated application and only a few attendees have sufficientexpertise to hammer out specifications. If there’s not a lot of downstreamimplications in the problem you’re solving, spare the rest of the crowd theboring detour; invite the two or three experts to join you in an offline discus-sion, and move on to the next agenda item to keep the meeting flowing along.
Contentious subject matter also lends itself to smaller settings. Sometimeshaving too many people in a design session can expose hidden political riftsthat can cause a meeting to spiral out of control in a hurry. Smaller meetings —with fewer attendees — are a good way to avoid any extra drama.
Virtual design sessionsWhile face-to-face is the ideal format, sometimes it’s simply not possible.Technology exists today to get folks in the same virtual room, either by tele-conference or by audio conference call. If you’re pressed for time or in abudget crunch, these solutions can make a lot of sense. But be aware: Virtualmeetings can fall prey to the same logistics hassles as real meetings.
If there’s no other way, of course, the business-analysis team can distributee-mails to stakeholders and users to get their feedback — but this should bea fallback position only. Outside the group setting, there’s no interplay for ane-mail respondent to work with — and without a live interview it’s impossibleto have a dynamic, reactive conversation. Even if the e-mail, questionnaire, or other content is very well done, it’s always hard-put to hold its readers’attention.
What, Exactly, Is a Requirement?Retaining skillful business analysts and data modelers who are experts ateliciting requirements saves you from extreme heartburn later on in theprocess. Most basic application issues have poorly written or marginallyunderstood requirements at their source.
At this stage in the process, you’re going to capture the essential functionaland data needs of your end-users. That starts with some basic questions tothe users about what business functions they’re trying to perform, and whatquestions they need to be able to answer in order to do their jobs.
213Chapter 13: Collecting User Requirements
20_127230 ch13.qxp 12/4/07 12:42 AM Page 213

Along the way you’ll encounter adjunct requirements that aren’t at the heartof the business functions but are, nevertheless, important to explore andrecord. For example, you’ll need to understand the security and complianceconstraints that govern the processes and data handling. It’s important tounderstand what historical data must be kept, and who the ultimate decision-makers are that can change such policies.
Reporting and analytical functionalityMost business intelligence systems revolve around reporting in some form oranother, so it’s a good place to start gathering requirements.
Start with a list of standard, regular reports that the user community’s knownto need. For example, in a sales system, an array of broad-based, general-information reports gets distributed among the management team — such as weekly and monthly performance reports, client roles, pipeline reports,and so on.
For a sales department, those standard reports are the low-hanging fruit —after all, every sales department from every business in the world looks atthe same basic information. The challenge is to move beyond the easy stuffand to get the business users and stakeholders to start talking about require-ments for reports they’d like to see, the high-value data that’s been unavail-able prior to the BI implementation. As you gather requirements, part of thatprocess is opening users’ eyes to the enormous possibilities a business intel-ligence solution can provide.
For example, suppose a networking-gear manufacturer has several hundredenterprise customers who, combined, make hundreds of purchases everyday of the year, all around the world. The sales force is fragmented; each ofits units operates with a lot of autonomy, and the cost structure is Byzantine.Up until now, the only perspective on profitability has been in the aggregate,along product lines and sales regions. The new BI implementation will make itpossible to see up-to-the-second profitability reports for each customer. So,as you gather requirements, ask users what they want to be able to do, notjust what they’re currently able to do.
At this stage, you’re not actually designing the full reports yet. The goal is notto get an exact view of what heading appears over every column; it’s to get ageneral idea of the major classes of information that will be needed. You’reworking with buckets at this point, understanding general data requirementsand categories of analytical features. The precision work of designing reportscomes later during the design process.
214 Part IV: Implementing BI
20_127230 ch13.qxp 12/4/07 12:42 AM Page 214

Gathering requirements for the reporting process should always be informedwith the high standards of business intelligence. So if you’ve forgotten themagic words, it’s time for a refresher: The reports should reflect informationthat’s timely, accurate, high-value, and actionable.
Data needed to support your desired functionalityAt the heart of the business intelligence process is the information stored byyour system (or systems) that will ultimately feed the applications and leadto insights. When it comes to data, you have a few basic questions to ask:
� What data do we need to work with?
� Where is it currently stored?
� How important is it to the users (that is, how often is it used)?
The answers to those questions, taken in aggregate over the entire system,will point to several fundamental choices you’ll need to make in the technicaldesign process, covered in subsequent chapters.
Unlike transactional applications, business intelligence systems never actuallycreate data. Your system will read information from existing systems, manipu-late it, and perhaps even derive some temporary data to work with, but it’s a one-way street; your BI system won’t create data that will be permanentlystored. That means all the data you’re going to work with already existssomewhere in your company. One of the big challenges of BI is decidingwhether to pull the data into a data warehouse, or access it where it sits.
Know-it-allsGathering data requirements can be one of the more overwhelming tasks in aBI implementation, especially when you’re talking about an enterprise-widesolution that may cover several different functional areas.
Fortunately, there are some requirements-gathering strategies that can be uti-lized to make the process a little bit simpler. After all, if you just ask users whatdata they need, they’ll inevitably answer, “Everything.”
Investigative reportsIn addition to looking at the business processes, another good way to analyzethe data needs of a department or team is to look at their existing reportingprocesses and the reports themselves. You’ll want to see how data is used,how often it appears, and — most important — how information gets groupedtogether.
215Chapter 13: Collecting User Requirements
20_127230 ch13.qxp 12/4/07 12:42 AM Page 215

Reports are the most common end-point for data, but the reality is you wantto look at any existing systems that play a role in one of the key businessfunctions that will be touched by the BI implementation.
Break it down — divide and conquerIn a complex system, analysts should break down larger functions into theircomponent elements before querying users about business requirements. Forexample, if the BI implementation is going to include a human resources (HR)module, a good place to start would be to separate the main HR disciplines —such as recruiting and retention, payroll, benefits, performance measurement,and so on. Each of those functions contains elemental business processes andreports that make the company go.
Breaking down the requirements into more manageable functional groups willreveal some data elements common to all the company’s processes; keep aneye out for data that’s repeated. Of course, repetition isn’t always obvious;sometimes data appears in different forms. In the HR example just given (for example), the payroll system might handle employee salaries as a bi-weekly figure while the other systems store essentially the same data in itsannual form.
Matchup makerYou’ll need to go into your requirements session(s) fully understanding whereall the data lives — and where it’s going to live when the implementation iscomplete. For example, will a data warehouse change the kind of data that’saccessible? Will it improve performance to such an extent that it makesadvanced functionality possible that wasn’t before?
The matchup process is where you outline relationships between the functionalneeds of the user community and the data that currently exists in the system.This happens in two general stages:
1. Get the data requirements from individual users. You’re not just askingwhether you’ll need the data, you’re also asking users how important itis, how often they’ll need to access it, what the security requirementsare, and so forth.
2. Link everybody’s data needs together. This is where you draw the big picture of the combined data needs of the entire company. It will give you a broader perspective on the data requirements for the entiresystem.
216 Part IV: Implementing BI
20_127230 ch13.qxp 12/4/07 12:42 AM Page 216

The “look and feel” for how informationshould be delivered to usersThe requirements sessions are a good opportunity for you to go beyond plain-grid reports and start taking requests for the best presentation format to applyto the data being accessed by the users. Typically the available formats includethese types:
� Reports: This means, primarily, tabular and grid reports. Through therequirements process you’ll learn how dynamic these reports need tobe, whether they need to be accessible via the web, what the securitydemands are, and so on.
� Visualizations: Do your users need to go beyond the numbers and seedata represented in charts, graphs, or more complex graphics? Use therequirements-gathering time to find out what visualization techniqueswork best for users, which graphical elements are required, and the pri-orities attached to each.
� Dashboards: Depending on your audience, a dashboard solution mightmake sense. The key question is what kinds of decisions and actions arebeing made from the dashboard tool? In addition, you need to know whothe primary users are. Is it being built for executives to monitor corpo-rate key performance indicators (KPIs)? Is it being used by managers tomake daily decisions? That will determine what kind of data needs to bedisplayed, how it should be displayed, how often it should be refreshed,and what backup information should be made available to the user.
� Custom formats: Users might well need a hybrid solution or a customizedfront end that presents data in a unique — and unforeseen — way.
Finally the BA will want to gather look-and-feel requirements from the stake-holders and users. There are a lot of different options depending on the toolthe team is going to be using. This might seem a bit much, but don’t befooled; stylistic concerns can mean the difference between a satisfied usergroup and a dissatisfied one. Doing it right and at least giving the appearanceof concern for the users’ desires can go a long way in terms of goodwill.
Users know best when it comes to how they need their data presented. Ifthey’re clamoring for a dashboard approach, don’t stick them with someboring tabular report. Asking questions can bring to light some surprises, somake every attempt to keep an open mind as you start eliciting requirements.
217Chapter 13: Collecting User Requirements
20_127230 ch13.qxp 12/4/07 12:42 AM Page 217

Validating BI Requirements You’ve Collected
It’s not uncommon to wrap up a series of JADs (or other requirements ses-sions) and realize that one or more features are working at cross purposes.The purpose of the next step — validating your requirements — is to ensurethat the requirements all make sense when viewed together, and in the con-text of the underlying business processes. This stage is about laying out allrequirements, finding commonalities, building a list of unknowns and ques-tions (and ultimately seeking answers for them), and mapping out the dataneeds of the project to make sure they’re feasible.
Conducting the initial double-checkingWhen requirements don’t agree with each other, or don’t appear to corre-spond correctly to the reality of existing business processes, it’s an issue thatwill have to be flagged and noted. After the initial double-checking is com-plete, it’s the business analyst’s job to return to the original stakeholders andresearch the issue. Sometimes it’s simply that a requirement needs furtherexplanation, or perhaps the notes are incorrect. If there’s a legitimate disputethough, the BA will have to explain the circumstances of the conflicting notes,and (if necessary) make a recommendation about how to move forward basedon the project constraints.
In a large BI implementation you might (for example) run across two groupsthat claim to use two different canned reports for an identical process. Therequirements were recorded correctly, but when this business function is represented in the design, only one version will represent the truth about theprocess. Who’s right? And if they’re both right, should one report win outwhile the other one goes away?
The validation step can easily take as long as gathering the initial require-ments. Don’t skimp, and don’t take shortcuts. You must document all dis-putes and questions very thoroughly, along with any resolution that wasdecided on. No requirements are correct or final until they’ve been validated.
Prioritizing Your BI RequirementsIn the process of collecting business requirements, the focus will always beon the details of the project itself — but don’t let that distract you from anequally important concern: requirement priorities.
218 Part IV: Implementing BI
20_127230 ch13.qxp 12/4/07 12:42 AM Page 218

There’s always a chance you won’t be able to fit everything into a singlerelease. Too many features, too few resources, or too little time means some-thing has to give — and that usually means you’ll have to go with a phasedapproach, releasing one set of features first, then following it up with a secondrelease of additional functions and tools. The inevitable question is: what getspushed to later releases? Easy: the less important requirements!
Judging how important requirements are relative to each other is the task ofprioritization, and it’s a part of the overall requirements management processto be performed by analysts with input from stakeholders. Even if you’re notplanning on a phased approach, you should still take the time to assign prior-ities that make sense to major requirements and functions. You never knowwhen you’ll be asked to cut the scope of the project; it happens more oftenthan anyone would like.
Identifying “must-have-or-else” requirementsIf you don’t prioritize the requirements now, it’s inevitable that you’ll have tocircle back later and gauge their relative importance after the fact. That’s badbecause decisions made in requirements sessions are probably the most validway of coming to a consensus; everyone’s in the room, you’re working throughthe flow of the system, all the information is on the table. Suffice to say, the par-ticipants are well-informed about the topic at hand. Going back to them latermeans you’ve lost that moment and the decisions may not be as good.
The most common technique for prioritizing requirements is to divide theminto categories ranked by how necessary they are to the project. Sometimesit’s as simple as a binary question, where each feature or function is judgedto be a nice-to-have or a must-have. More commonly there are three classifications:
� Must: These features are deal-killers — if they’re not in there, the solu-tion doesn’t work. The application should not be rolled out unless thesefeatures are present and working.
� Should: Requirements listed as Shoulds should have a solid business casefor including them in the system. However, if circumstances change andyou have to leave out one or two, it shouldn’t hold up the scheduledrelease of the application suite.
� Could: These requirements are nice-to-haves. If the development teamcan fit them in, all the better. But under no circumstances should theproject be delayed just to include a Could feature.
219Chapter 13: Collecting User Requirements
20_127230 ch13.qxp 12/4/07 12:42 AM Page 219

Some Must features have nothing to do with what the users want or what the stakeholders may think makes sense. Every application has external constraints — such as regulatory requirements or companywide standards —that shackle them with a few extra features that normally wouldn’t be consid-ered essential. Make sure you do your due diligence and get input from theappropriate governance boards and central planning bodies within your orga-nization before you assume the application is yours to do with as you please.
Getting the final buy-inAfter the requirements are vetted, it always pays to run the completedrequirements documentation by the group of high-level stakeholders. Thegoal of this step is to take one final look at the business needs to make surethat what came out of the requirements elicitation sessions were what yousaid you needed going in. Were all the areas covered? Do the requirementsactually represent a solution to the original problem? Have the needs beenprioritized?
Don’t get caught in an analysis-paralysis loop where you can’t stop refiningthe requirements. Sooner or later, you have to stop analyzing and take thenext step: The design process, where you take the requirements and actuallybegin making technical decisions on how to implement them. Sometimes it’sbest just to move forward and let the questions be answered down the roadrather than halting the process in its tracks.
Stepping on the baselineThe final critical step in the requirements-gathering cycle is to get final sign-off on the requirements document from the client organizations, stakehold-ers, or project sponsors. It may be a symbolic “signature” but it has a veryreal meaning: from this point forward the project requirements cease being a moving target. Even if a stakeholder dreams up a new feature for the BIenvironment, the requirements document cannot be altered.
The goal is to create a requirements baseline, just as you would a projectplan, so the entire team has a single point of reference for what the project issupposed to entail and how it’s supposed to be built. Once baselined, therequirements documentation can be distributed to the development teamsand they can begin work in earnest on the design and construction, comfort-able in the knowledge that the requirements are now stable.
220 Part IV: Implementing BI
20_127230 ch13.qxp 12/4/07 12:42 AM Page 220

Changing RequirementsIn an ideal world, system requirements would be fully defined during the earlystages of the implementation and would never change. But the reality is thatchange is inevitable with requirements. First of all, BI projects can go on formonths or even years, so it’s possible (often likely) that a company’s busi-ness needs will change during that time. But most likely the cause of changesin the requirements is a part of the design process: As the design matures,certain needs are flushed out that weren’t obvious during the requirementssessions.
A certain amount of change is to be expected. In fact, some project managerssay that changing requirements are actually a good sign because they showthat your stakeholders are actively engaged.
221Chapter 13: Collecting User Requirements
Using requirements scorecardsIt’s not always easy to decide what goes into aproject and what gets left out, at least during thefirst phase. Sometimes things are a little bitmore complicated than Must, Should, and Could.
If the choice is still not clear after validating anddoing an initial prioritization of requirements, ascorecard could help alleviate a lot of the stressof choosing features. Scorecards at least offerthe appearance of impartiality by comparingchoices with a set of pre-selected criteria.Scorecards also invite engagement from thestakeholders, force the debate forward, andultimately help flush out a function’s true prior-ity that much faster.
Considering features in a BI implementation witha scorecard is simple. You build a spreadsheetthat lists all the potential choices down the page.In corresponding columns, you score each func-tion according to a list of pre-determined priori-ties. In some cases, you might be judging twofeatures to determine which one is really necessary for the project — and even if theyboth scored highly, it wouldn’t be necessary to
implement them both. For scoring criteria, usefactors that are important to your particular pro-ject. For example, you might list “ease of inte-gration” or “level of technology risk” or even“cost” as scoring factors.
Evaluating features with a scorecard in the con-text of a group meeting can actually be anenlightening and engaging experience for theteam. People can act as advocates for one ormore features and stand up and state theircase. It gets the project team thinking aboutthings with a broader perspective, and it canturn your meetings into something like a gameshow, which is always more fun than a lecture.
The downside of scorecards is that they areonly as impartial as you make them. If you’re theone deciding on the criteria, you could slantthem so that your own priorities are served, oryou could leave certain criteria out altogether.But in the end, the goal of the scorecard is to notto create a final decision per se; it’s simply tospur healthy debate and provide a basis forcomparison.
20_127230 ch13.qxp 12/4/07 12:42 AM Page 221

But don’t let your guard down. Shifting sands under a project have causedmany well-conceived and perfectly planned projects to fail. It’s absolutelyessential that you have a plan to deal with changes in requirements.Specifically, you’ll need a process to manage change requests so they can be tracked and prioritized. Additionally, you’ll have to do an impact assess-ment to see how the suggested (or demanded) change affects the rest of theproject requirements and, ultimately, the overall implementation schedule.Changing requirements during development is expensive, and a good changemanagement process quantifies just how high that bill will run. After that, thestakeholder can judge whether their change is worth throwing the projectplan off track, or if it’s a requirement that can wait for the next release.
222 Part IV: Implementing BI
20_127230 ch13.qxp 12/4/07 12:42 AM Page 222

Chapter 14
BI Design and DevelopmentIn This Chapter� Thinking about your users first
� Designing a sound data environment
� Assembling quality front-end systems
� Testing the BI application
� Getting feedback from the users
Even the best-laid plans can (and often will) go awry, so the developmentprocess is an interactive phase where your most talented team members
reveal themselves — where the true problem-solvers and can-do typesbubble to the surface. The development process requires almost constantinteraction between the technology team and the business-facing team.
Between design and deployment comes an intense testing phase that chal-lenges all the ideas of the previous months. That leads into the deploymentcircus, where your new systems go into production, the old ones are phasedout, users are trained, and the rubber hits the road.
Successful BIThere’s no guarantee that flipping the switch will bring success and accoladesfor your business intelligence solution. In fact, rave reviews shouldn’t neces-sarily even be a goal when you’re starting out. The best BI deployments arecompact, well-conceived, and work as expected. That gives your team anearly success and a platform to build upon.
At the risk of sounding ridiculously tautological, a successful BI solution isone that . . . well . . . succeeds. If the system meets its business objectives —whatever those may be in your company’s situation — that’s all that matters.And there are certain things you can do to increase your chances of success.In fact, most successful BI projects usually share similar characteristics.
21_127230 ch14.qxp 12/4/07 12:42 AM Page 223

Be realisticThat means shoot for reachable goals, such as a finite domain of reports, or a single analysis tool. Realism means grounded in reality, but it also implieswell-defined. The business headaches you’re addressing may not be sexy, but you know exactly what they are and what their negative impact is on theorganization.
Think in terms of six-month timelines. The first six months may include thetask of assembling a data-collection point — say, a data warehouse with some simple reporting tools on top of it. But after the six-month iterationsthat follow, your solutions should all be bite-sized chunks. Don’t get greedyfor results until you’ve got some skins on the wall.
Follow demandThere’s nothing worse than an IT team forcing a solution on a team that’s sat-isfied with the applications they’re already using. Wherever possible, your BIsolution should aim to solve a problem that’s dying to be solved — one that’sbeen neglected for years, really important to the company, or both.
Sometimes the sorest tooth has the hardest cavity to fill. Rule #1 — set realis-tic goals — has priority. Don’t get yourself in over your head; you’ll find thatthe hot potato isn’t so easy to pass along once it’s in your hands.
On the other hand, you’ll often get a lot of help if you’re trying to crack atough nut. And you’ll need that cooperation from the business groups you’re working with.
Act now, but think aheadYour implementation strategy is built to solve an existing problem, but thesteps should be additive; each piece of the solution contributing to the suc-cess of the next.
A perfect example is building related data marts that cover related subjectmatter while keeping an eye on creating a grand solution down the road;that’s a holistic, data-centric view of the truth about your sales organization.In the interim, you’re solving an important problem such as determining thesuccess of marketing campaigns, or defining characteristics about your cus-tomers. Those short-term, small-scale successes fuel the team to do biggerand better things. And the tools they build — along with the experience theygain — from those data-mart implementations will make later success thatmuch more likely.
224 Part IV: Implementing BI
21_127230 ch14.qxp 12/4/07 12:42 AM Page 224

Design with Users in MindBusiness intelligence is about getting the right information into the hands ofthe right people. No doubt you’ve spent a lot of time worrying about what theright information is. But what about the people?
A successful BI design is akin to any good product-marketing effort. You defineand segment your customers according to what they know about your prod-uct, what motivates them to buy (or use) it, and what onboard conditions arepresent that will affect how they use it, such as any preconceived notionsabout the information they’re receiving, experience with similar products,and broad-based skills they can apply to using it.
Not every knowledge worker can take advantage of the advanced featuresyou roll out. Some can slice and dice the data; others shouldn’t be allowednear sharp objects.
The best design treats the users of business intelligence tools as customers.And because customers of the same product might have very different needs,designers should prepare for varying usage patterns among user groups suchas these. . . .
Power usersThese are the analysts who will utilize your tools to their fullest capabilities,taking advantage of advanced features that even the manufacturers forgotabout long ago. The following is often true of power users:
� They study the data architecture and know where to find key nuggets ofdata. That might be because they’ve worked with it before, or simplybecause they’re motivated to take full advantage of the integrated infor-mation and blaze their own path through the database until they getwhat they need.
� They go beyond simply reading reports; they develop and administertheir own, using report-design tools fed by advanced queries. They usereports for analysis — to make decisions — not just as a way to trans-port data from one set of eyes to another.
� They can be more demanding, in some ways, because they have highexpectations about the BI solution’s robustness, thoroughness, andusability. On the other hand, making this group happy is what oftenleads to the greatest positive impact on the business; they’re the oneswho find innovative approaches to finding BI insights and applying themto business problems.
225Chapter 14: BI Design and Development
21_127230 ch14.qxp 12/4/07 12:42 AM Page 225

Take advantage of power users’ expertise by getting their input on advancedfeatures during design. In all likelihood, they have a mental wish list of high-end BI functionality they’d like to be able to use when the system is complete.Ask them what kind of tools they’d like to see for exploring the data and build-ing their own reporting-and-analysis tools. And get a clear understanding ofeach feature’s importance; that will help you prioritize the development effortaccording to what the experts really want.
Business usersThis crowd toils at the opposite end of the user spectrum from the powerusers. Business users are a broad class of information consumers — up totwo thirds of the user base in most companies — who are using the BI toolsas a means to an end. They’re unlikely to create custom queries or reports, or use the advanced features of front-end tools.
In case you get the wrong idea, the business users’ lack of expertise is notindicative of their importance to the success of the BI initiative, or in theirability to create business value from BI insights. Most of the time, they’reviewing reports and using the data they find there to make decisions, butthey’re less likely to be digging through the minutiae of the metadata model.
� They work in the business units and teams that you’re designing the BIsolution for in the first place; they’re accountants, salesmen, or perhapsmarketing analysts who need data to make regular decisions.
� They rely on canned output. Business users expect the scheduledreports to take care of their needs
� They’re not tasked with building new ways to look at the data, or findingnew insights in the data model; they’re simply going to retrieve whatthey already know to be there. If they find they need different informa-tion than what the pre-fabricated reports provide, they’ll have to rely onsomebody else to retrieve it for them.
During design, use the input from your business users to help you create yourstandard reports. It’s what they know best, and what the broad spectrum ofusers will be handling from day to day. Don’t focus on technical details; askabout accessibility, appearance, and seek advice on how to make the basicfeatures more user-friendly.
The middle classIn addition to power users and business users, there’s a middle class of knowl-edge workers who (under normal circumstances) behave like business users,consuming standard reports and utilizing only the standard features of the
226 Part IV: Implementing BI
21_127230 ch14.qxp 12/4/07 12:42 AM Page 226

front-end tools. If they take advantage of parameterized reports, for example,they rarely go beyond adding some basic inputs to customize the finalresults.
Occasionally, however, middle-class types may surprise you — designingqueries and reports or doing analyses beyond their comfort zone. This iswhere good, flexible design can make an enormous impact.
The middle class are the hardest to design for, because normally they don’tventure beyond the skills of business users. But this crowd has latent BI user skills that can be brought to the surface by applying good applicationrequirements-gathering and design principles. When advanced features aremore accessible and user-friendly, they fall within the comfort zone of awider audience of users — to the company’s advantage.
During design time, run some “What would it take for you to use this . . . ?”types of questions by your user representatives to get information on how tomake expert features easier for non-experts to master. If clever design andpackaging can transform a basic report consumer into a user comfortablewith complex guided-analysis pathways and drill-down exploration of data,you’ve created a more powerful user.
Best Practices for BI DesignThere’s no need to reinvent the wheel in the design phase of your BI project.Although BI is a relatively new discipline, the principles of good, sound ITdesign remain the same. The most important steps will be blueprinting andbuilding a target data environment with the appropriate structure, horse-power, and quality control.
One dirty little secret of designing a BI environment is that you can’t alwaysfollow an established methodology. The book you bought may tell you tostart with business needs, then do a technology assessment, followed bydata modeling — but that book doesn’t work at your company. Often the only option is to start with what you know and work outward from there onyour plan.
That’s easier said than done. With so many undefined variables, a BI projecthas precious little solid ground in its early stages. It’s natural to gravitate tothose few pieces that are nailed down and build from there, even though youhad planned on starting somewhere else.. For example, if your company iscommitted to a certain software vendor, causing the procurement team tobalk at buying the competing BI software you want, that’s your starting point(such as it is). Hey, at least you know something about what your environmentwill look like. Sure, the tool that you’re stuck with will have certain featuresand limitations you weren’t counting on, but you have to press forward. Yourpath through the maze is governed by where the walls are.
227Chapter 14: BI Design and Development
21_127230 ch14.qxp 12/4/07 12:42 AM Page 227

Designing the data environmentThe business intelligence front-end system has to feed on the collected,aggregated operational data you prepare and assemble for it. For most BIenvironments, this collection of data to be used by the front-end tools is adata warehouse or a data mart (which we discuss further in Chapter 16).
Business intelligence is the delivery of insights that are timely, accurate, high-value, and actionable. As long as those business revelations have those characteristics, you’ve got yourself a BI environment, whether it’s operatingagainst a data warehouse, a data mart, or something else entirely.
The target databaseFor purposes of this discussion, we’ll simply call the data environment thetarget database, and its conception and design will be largely a function ofseveral factors:
� Data sources: What information do they contain and what condition isthat data in? How accessible is it to the BI system?
� Query requirements: What kind of questions are your users expectingto be able to start with to begin their analysis? Are there specific report-ing patterns that need to be considered?
� Performance requirements: How fast will your users expect theiranswers?
The answers to those questions will determine how the data analysts on yourteam will decide the data environment that best suits the needs of the BI tools.
Database tradeoffsGetting to a BI-friendly data environment means balancing the needs of twodistinct but related functions: the ETL design (which determines how andwhen the source data moves) and how the users of the target database actu-ally interact with that data.
ETL designThe ETL (Extract, Transform, and Load) processes are the steps that the systemtakes to move information from the source data systems to the target data-base. That may seem like grunt-work; it may not be glamorous, but the designof your ETL process is one of the most important factors (if not the mostimportant) in the making your BI environment function successfully.
Database design has a longer history (and a large literature built up around it),but as BI becomes more important, ETL has grown in stature. Its challengeshave attracted some of the most talented minds in the industry over the last10 years.
228 Part IV: Implementing BI
21_127230 ch14.qxp 12/4/07 12:42 AM Page 228

Extracting and loading are simply moving data, but transforming it is wherethe complexity lies — and where the magic happens.
Transforming in this sense means effecting any change on the individual dataelements required to create a single, useful, correct body of data to be usedby the BI front-end applications. For example: your ETL software may berequired to convert several tables from avoirdupois measurement units (youknow: feet, pounds, or gallons) to metric measurements (meters, grams, orliters). The ETL software will be responsible for reading the original avoirdu-pois data element from the source database, performing the calculation tochange the number into a metric unit, and finally writing the metric conversionnumber to the correct location of the target database.
Source databases are the Wild West of your company; there’s no telling howeach local Sherriff is storing and treating the operational data you’ll need foryour BI system. A lot can be wrong with the data, and a lot can go wrong withthe transformation process. The ‘Transformation’ part of ETL is what makesthat data usable. If data fields need to be validated against complex businesslogic, then changed or erased, it’s the ETL software that makes that happen.And if multiple data sources feed the same target database, the ETL productmust recognize overlapping data and pick the correct value in case they’redifferent.
Your business insights are a function of how reliable and useful the informa-tion in your BI target database is. And your target database is a function ofhow well the ETL package has performed on the data sources. If data getsloaded in an unrecognized format, or if the values themselves are inaccurate,then that data is worthless to the user.
Figure 14-1 shows a simplified rendition of what an ETL process might do.Phone lists in the systems data sources have been maintained with no univer-sal formatting or information standards. In order for the lists to be combinedand used together, useless data must be stripped out, duplicate entries haveto be removed, and the information put into a common format.
It’s easy to think of ETL as a magic wand of transformation that cures data ofall its ills as it passes through a wonderful cleansing doorway. The reality isit’s a multilayered, complicated process that involves several steps:
1. Harvesting the data from the source systems. The tools must be able tooperate on a specific schedule, and be prepared to interact with manydifferent types of source databases and communications protocols.Extraction also sometimes involves gigantic swathes of data movingaround the company network, so the ETL tool should be able to dealwith high volumes efficiently.
2. Moving the data to a staging area where it can be cleansed and rearrangedaccording to the business rules of the ETL process.
229Chapter 14: BI Design and Development
21_127230 ch14.qxp 12/4/07 12:42 AM Page 229

3. Reordering and rebuilding the data, slowly and carefully, so its newshape fits the model of the target BI database.
The state of the data sources will ultimately determine the design of the ETL(Extract, Transform, and Load) process that harvests the data on a set sched-ule, cleanses it, transforms it into a single format the front-end systems canuse, and loads it into the final data environment. There are scores of ETLtools on the market today to help your data developers create an processthat feeds your target database what it needs.
Put your team’s top talent on the task of designing sound ETL processes —for now and for the future. It’s too important to leave to people who don’tknow or aren’t sure how to approach the problem, how to deal with commonpitfalls, and how to test their work.
Target tradeoffsWhen the data gets to its target environment, your BI system faces anotherbalancing act: What the user base does with your data will ultimately deter-mine the kind of data environment that gets built.
Best practices dictate that your users’ needs must influence the design of thedata environment at least as heavily as ETL technicalities do. Here are twotypical scenarios:
Data Source 1
BI Target Database
ETLProcess
John Smith, 555-1244John V. Smith, 555-1244Jason Smith, 555-8386
Data Source 2
Mr. Tom Stewart (212)-555-3922Ms. Tina Stuart 212-455-1937Dr. Tim Stuys 212.444.1411
JohnJasonTomTinaTim
SmithSmithStewartStuartStuys
212-555-1244212-555-8386212-555-3922212-455-1937212-444-1411
Figure 14-1:A conceptual
view of the ETL
process.
230 Part IV: Implementing BI
21_127230 ch14.qxp 12/4/07 12:42 AM Page 230

� If your users are looking for the flexibility to create queries on any pieceof the data in any way, shape, or form, then your target database willhave to be a relatively normalized environment. That means less redun-dancy and only limited summary data. Queries in such an environmenttake a long time to run, but your users will get what they want.
� If users follow some standard patterns of viewing data — for example,looking at reports along thematic lines like sales or product information — then the target database is likely to be a multidimensionaldesign. This type of database is perfect for slice-and-dice activities thathighlight various aspects of the data, but you also get more redundancyand a less efficient use of space.
Designing the front-end environmentThere’s no rest for the weary after your basic design work on the back-endenvironment is complete. The ETL process ensures the source data flows intothe target data environment, but once it’s there you’ll need to design ways foryour users to access the stored data. In most BI environments the front-endsystems include the reporting, querying, and all levels of general and customanalysis packages.
ReportsFor any business intelligence solution, the core of the front end is the report-ing environment.
Standard report designYour developers will design and develop a family of standard, pre-fabricatedreports for the BI front end. These reports form the backbone of the businessintelligence environment. They usually consist of core business information,divided into lines of business (or subject areas) and presented in a tabularformat. The idea is to help the reader grasp what’s happening with the business — as quickly as possible.
Reports require data, and it takes one or more queries to populate a reportwith data. So the first step in the creation of any standard report is to definethe set of queries that request the appropriate data from the target database.
In some cases, the report may require multiple datasets. For example, youmay have revenue data in one fact table and costs in another. To show prod-uct contribution, you may need two separate queries to combine these twosources. Your front-end tool will have to join the two result sets that comeback from the queries so you can calculate revenue minus costs.
231Chapter 14: BI Design and Development
21_127230 ch14.qxp 12/4/07 12:42 AM Page 231

Your development process for that report will include coding the queries toretrieve the two datasets, manipulating the information to create the productcontribution figures, and the code that assembles the viewable report. Thatmeans deciding what goes into the rows and columns, what calculations takeplace in the report, and how the report should be formatted.
Additionally, the development team might have to work out other details forthis report, like figuring out the best data source and managing administra-tion details (such as how the report may be accessed and altered).
Central to the creation of effective report formatting is the idea that theyshould be as easily understood as possible with no need for outside explana-tion or reference documentation. BI teams commonly face the challenge ofstriking the correct balance between report clarity and the relative utility of displaying data in more complex patterns.
Although many people are competent at creating reports, doing it well requiresa combination of talents well-grounded in information architecture, businessunderstanding, and even graphic design. Report writers are specialists; agood one can add a great deal of value to the BI process. This is especiallytrue when you’re building the basic templates on which all future standard-ized reports will be based. If you short-change that effort now, it will comeback to haunt you.
232 Part IV: Implementing BI
The metadata layerDatabase developers and BI architects willlikely spend a good deal of time developing themetadata: the set of definitions and relation-ships that describe the information stored inevery component in the system. Metadata isfield- and table-level information that allows alldata-handling applications to interact with eachother including the source and target databasesystems, the ETL toolkit, online analytical pro-cessing (OLAP) applications, and even data-administration tools.
In the old days metadata was called a data dic-tionary, a resource used by developers andusers alike when they took any action thattouched the data. Rather than leaving dataproperties and associations open for interpre-tation, metadata gives a single reference point
for everyone: users, analysts, developers, andadministrators. Because the actual schema ofthe target database is likely to be very confusing(and unlikely to supply much useful contextabout the data), users turn to the metadata.
How metadata is stored and accessed is a hottopic among designers these days. Metadata is often brought together in a centralized re-pository, either custom-built or purchased from a vendor. This repository can be a singlefacility that provides universal metadata to allapplications in the company, or it can be decen-tralized to serve the unique needs of individualapplications. Each approach has its advantagesand disadvantages, but a centralized approachis more common.
21_127230 ch14.qxp 12/4/07 12:42 AM Page 232

Effective communication via reporting requires that you produce a solid setof standard templates to house information. In addition, those templatesshould adhere to a set of information standards that make the reports morevaluable and user-friendly.
Standard reports have a fixed (or mostly fixed) format, driven by well-understood standardized parameters (such as time periods or product lines). Whether template-driven or not, every report should contain standard data such as the following elements:
� Report name
� Report category or family
� Date and time the report was created
� Source system name
� Reference source or help desk
In addition, the following standard features should be set and adhered to forall reports:
� Legal disclaimers and privacy policies
� Font type and size for headings and data fields
� Justification details for columns
� Color and corporate logo information
� Number formatting for currency, dates, and so on, including level of precision
� Inclusion or exclusion of data sources and query names (or entire querystrings) in the report
Figure 14-2 represents a standard report template that might be created andpublished for use by the information consumers in your BI environment. Itcontains a set of standardized elements that reflect the list just given.
In all likelihood, your team will look at the most common reports currentlyproduced, and create a family of report templates to be shared by the com-munity. In addition, basic reports will also be built and scheduled to be runon a regular basis, or as needed by the user community.
The standard reporting system consists of several technology components:
� A tool for defining and building reports, which the report designer(either someone in IT or a skilled business user) uses.
� Management services for report storage, execution, and security.
� A portal through which end-users can select and view the reports (oftena browser-based system).
233Chapter 14: BI Design and Development
21_127230 ch14.qxp 12/4/07 12:42 AM Page 233
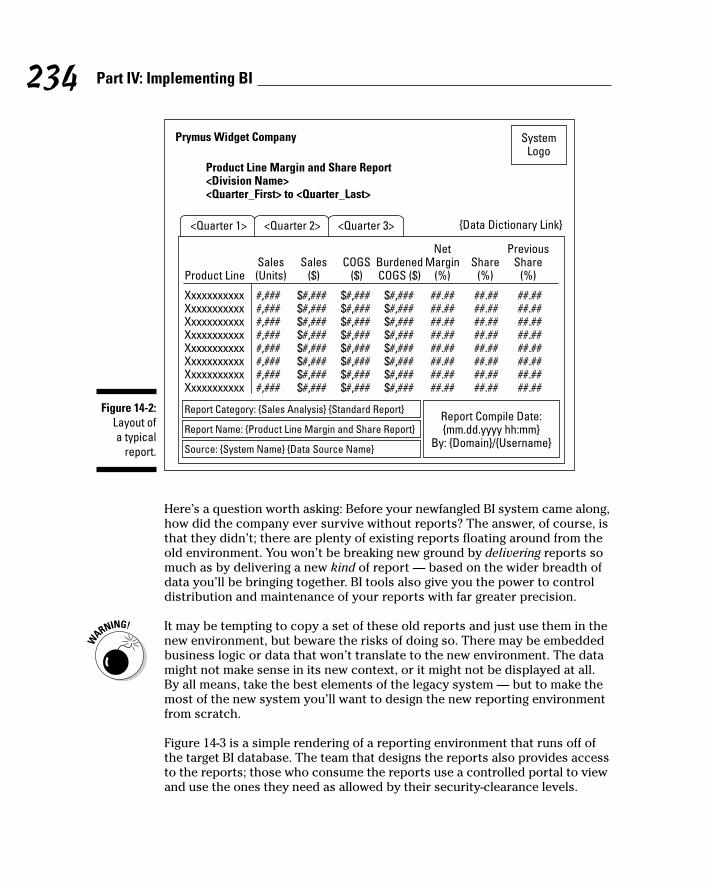
Here’s a question worth asking: Before your newfangled BI system came along,how did the company ever survive without reports? The answer, of course, isthat they didn’t; there are plenty of existing reports floating around from theold environment. You won’t be breaking new ground by delivering reports somuch as by delivering a new kind of report — based on the wider breadth ofdata you’ll be bringing together. BI tools also give you the power to controldistribution and maintenance of your reports with far greater precision.
It may be tempting to copy a set of these old reports and just use them in thenew environment, but beware the risks of doing so. There may be embeddedbusiness logic or data that won’t translate to the new environment. The datamight not make sense in its new context, or it might not be displayed at all.By all means, take the best elements of the legacy system — but to make themost of the new system you’ll want to design the new reporting environmentfrom scratch.
Figure 14-3 is a simple rendering of a reporting environment that runs off ofthe target BI database. The team that designs the reports also provides accessto the reports; those who consume the reports use a controlled portal to viewand use the ones they need as allowed by their security-clearance levels.
Prymus Widget Company
Product Line Margin and Share Report<Division Name><Quarter_First> to <Quarter_Last>
<Quarter 1>
Product Line
Report Category: {Sales Analysis} {Standard Report}
Xxxxxxxxxxx $#,### $#,### $#,####,### ##.## ##.## ##.##Xxxxxxxxxxx $#,### $#,### $#,####,### ##.## ##.## ##.##Xxxxxxxxxxx $#,### $#,### $#,####,### ##.## ##.## ##.##Xxxxxxxxxxx $#,### $#,### $#,####,### ##.## ##.## ##.##Xxxxxxxxxxx $#,### $#,### $#,####,### ##.## ##.## ##.##Xxxxxxxxxxx $#,### $#,### $#,####,### ##.## ##.## ##.##Xxxxxxxxxxx $#,### $#,### $#,####,### ##.## ##.## ##.##Xxxxxxxxxxx $#,### $#,### $#,####,### ##.## ##.## ##.##
Sales(Units)
COGS($)
Sales($)
BurdenedCOGS ($)
NetMargin
(%)Share
(%)
PreviousShare
(%)
<Quarter 2> <Quarter 3>
SystemLogo
{Data Dictionary Link}
Report Compile Date:{mm.dd.yyyy hh:mm}
By: {Domain}/{Username}Report Name: {Product Line Margin and Share Report}
Source: {System Name} {Data Source Name}
Figure 14-2:Layout of a typical
report.
234 Part IV: Implementing BI
21_127230 ch14.qxp 12/4/07 12:42 AM Page 234

As a best practice for BI implementation, the report developers are responsiblefor using the business requirements gathered from users and stakeholders tocreate a prioritized list of reports. The reports on that list will be released withthe first launch of the system.
The best way to create the prioritized list of reports is to start with a full listof candidates created while you were eliciting requirements. Each reportshould be scored in terms of its business value and how difficult it is to build.Then your team will need to decide which reports can be built for this release,and which reports will have to wait until later.
Many reporting environments have several components — including developertools, report viewers, an administrator tool, and a report server. Installationand configuration of a front-end reporting tool can take more work than youmight expect.
Ad-hoc information access designIf your environment is to support users who want more than standard reports,you’ll need to create a robust ad-hoc reporting environment.
Ad-hoc reports are extremely valuable for information consumers; they allowworkers to operate outside the information contained in standard, cannedreports. An ad-hoc reporting environment exposes the key entities of thedatabase to the user, who can then pick and choose among them to create a custom report.
ReportViewer/Portal
ReportConsumer
ReportDesign
Tool
DesignCreate
RunDisplayAdjust
ScheduleSecurityExecute
Store
ReportDesigner
ReportManagement
Tool
Administrator
BI Target Database
Reports
Figure 14-3:Diagram of
a typicalreporting
environment.
235Chapter 14: BI Design and Development
21_127230 ch14.qxp 12/4/07 12:42 AM Page 235

To be an effective report creator, a user must understand the underlying datamodel in the BI target database. Therefore a company that relies on ad-hocreporting tools must design a logical data model that makes sense to its information consumers. That means the entities should match real businesselements; the hierarchies used to describe the data should add up, both figu-ratively and literally. For example, a user should be able to write one queryfor the total sales for October, November, and December and get the sametotal as if the report were run against the Fourth Quarter of the same year.
There are a number of BI front-end tools that specialize in ad-hoc reporting —for example, Microsoft’s Report Builder product (which comes with SQLServer).
For users who like standard reports, but need the flexibility to make changes,some ad-hoc reporting tools offer an “in-between” solution. The user startswith a standard report template, then fills in the data variables they need tosee. In more flexible and abstract environments, the user starts from a blankslate, literally able to design a report from scratch.
OLAP designOnline analytical processing (OLAP) is a highly specialized implementation ofthe ad-hoc reporting environment. Instead of static reports, an OLAP front-endtool gives users a multidimensional view of the underlying data, where infor-mation can be rearranged on the fly to support fast-moving business needs.
In an OLAP environment, data is stored along central facts, such as individualsales transactions, and can be queried along any combination of dimensionsconnected to those facts. Instead of re-writing complex queries and waitingfor the system to return the dataset, users can manipulate the dataset instan-taneously, re-ordering, navigating through different dimensions, and using“drilling” methods (drill-down, drill-up, drill-through) to find just the informa-tion angle they’re looking for .
OLAP front-end tools offer flexible analysis and reporting that can feed manydifferent areas of the business — from the strategies in the corner office totactical decision support. There are a number of OLAP tools on the market,and the specific implementations can vary from one product to the next.
In general, designing an OLAP front-end solution involves four main steps:
1. Identify the variables to be tracked, measured, or described.
2. Group the variables together in logical domains of association.
3. Define the relationships between the major entities.
Consulting an OLAP expert can help your team define the dimensionmembers, hierarchies, measures, and attributes.
4. Define the formulas and derivations that serve to aggregate and combinethe measures in a useful way for the end-users.
236 Part IV: Implementing BI
21_127230 ch14.qxp 12/4/07 12:42 AM Page 236
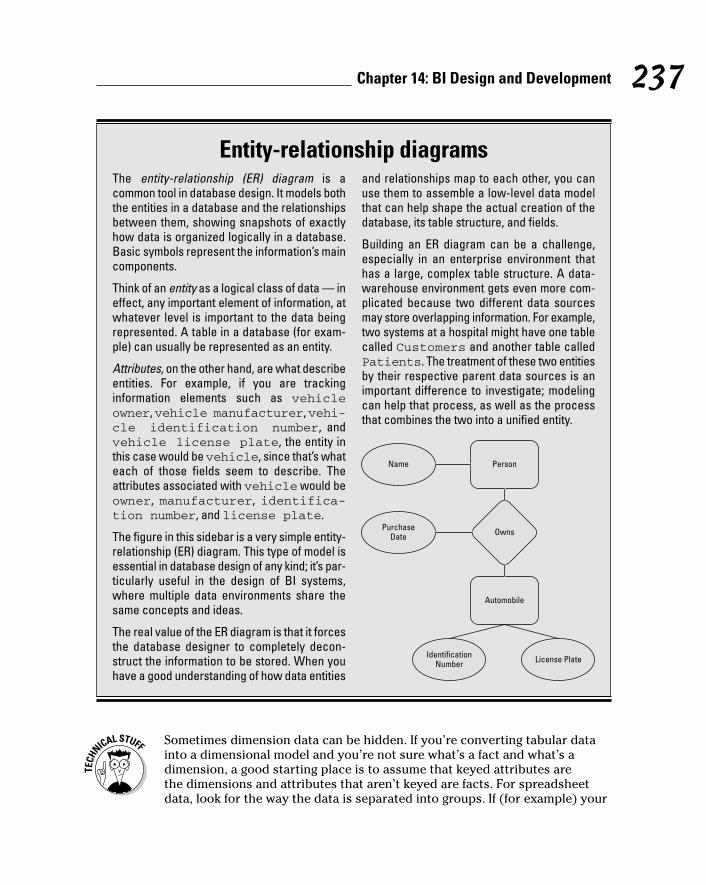
Sometimes dimension data can be hidden. If you’re converting tabular datainto a dimensional model and you’re not sure what’s a fact and what’s adimension, a good starting place is to assume that keyed attributes are the dimensions and attributes that aren’t keyed are facts. For spreadsheetdata, look for the way the data is separated into groups. If (for example) your
237Chapter 14: BI Design and Development
Entity-relationship diagramsThe entity-relationship (ER) diagram is acommon tool in database design. It models boththe entities in a database and the relationshipsbetween them, showing snapshots of exactlyhow data is organized logically in a database.Basic symbols represent the information’s maincomponents.
Think of an entity as a logical class of data — ineffect, any important element of information, atwhatever level is important to the data beingrepresented. A table in a database (for exam-ple) can usually be represented as an entity.
Attributes, on the other hand, are what describeentities. For example, if you are tracking information elements such as vehicleowner, vehicle manufacturer, vehi-cle identification number, andvehicle license plate, the entity inthis case would be vehicle, since that’s whateach of those fields seem to describe. Theattributes associated with vehicle would beowner, manufacturer, identifica-tion number, and license plate.
The figure in this sidebar is a very simple entity-relationship (ER) diagram. This type of model isessential in database design of any kind; it’s par-ticularly useful in the design of BI systems,where multiple data environments share thesame concepts and ideas.
The real value of the ER diagram is that it forcesthe database designer to completely decon-struct the information to be stored. When youhave a good understanding of how data entities
and relationships map to each other, you canuse them to assemble a low-level data modelthat can help shape the actual creation of thedatabase, its table structure, and fields.
Building an ER diagram can be a challenge,especially in an enterprise environment that has a large, complex table structure. A data-warehouse environment gets even more com-plicated because two different data sourcesmay store overlapping information. For example,two systems at a hospital might have one tablecalled Customers and another table calledPatients. The treatment of these two entitiesby their respective parent data sources is animportant difference to investigate; modelingcan help that process, as well as the processthat combines the two into a unified entity.
Name Person
Owns
Automobile
IdentificationNumber License Plate
PurchaseDate
21_127230 ch14.qxp 12/4/07 12:42 AM Page 237

master product sales performance spreadsheet has 15 different worksheetsrepresenting the 15 divisions of the company, then division is an importantdimension that users will want to differentiate when they’re analyzing reports.
Analytics and data-mining applicationsThese applications are at the top of the complexity ladder — but in essence,they serve the same purpose as any other BI front-end system: to supplybusiness insights to users in whatever form is most useful to them. Some ofthe most advanced analytics applications are designed to predict rather thanmerely describe, building a model of the past that can be used to envisionfuture events, project available choices, and allow analysts to game out (as in “game theory”, not as in Monopoly) the possibilities.
Analytics applications focus on a particular aspect of the business process —such as sales, inventory, or manufacturing — and attempt to spot useful trendsby using pre-loaded algorithms. Analytics software is built not only to spottrends from the past, but to forecast the future. For example, if you collect ahuge volume of customer sales data for a large retail chain, an analytics appli-cation can create a complex model of your market’s buying behavior. Theapplication spots trends that would take human eyes eons to recognize. Bestof all, you can use that customer model to predict how customers mightreact to price changes or promotions.
In terms of design and development, the approach is largely the same. Startingwith the overall business goals, the analysts and designers should derivewhat-if scenarios and questions that can’t be answered simply by looking at a summary of yesterday’s data. The patterns being sought are codified intobroader analytic goals.
In the pursuit of those goals, however, analytics applications suffer from thecommon pitfalls of all front-end BI applications:
� Analytics programs are only as good as the data that feeds them. Thatmeans data sources must be checked and monitored for data qualityand consistency. It’s not unusual for companies to spend a fortune onhigh-end analysis tools, only to find that the conclusions and forecastsproduced are worthless for the simple reason that the underlying data isunsound or inaccessible.
� High-intelligence reporting and forecasting software is only as goodas the data model used to populate the analysis engines. If the realworld doesn’t match up to what the software thinks is the real world, theforecast and analysis will be off. Analytics applications built by the majorsoftware companies normally ride atop the same target database thatother BI applications use. Provided that model is sound, the insightsgained from the analytics applications should at least be quantifiablycorrect. Whether you have the right people to interpret that informationis another matter.
238 Part IV: Implementing BI
21_127230 ch14.qxp 12/4/07 12:42 AM Page 238
� For analytics to work, the reports must be usable and relevant to thebusiness. That means you need individual contributors who can get themost out of the analytics applications to produce regular insights. Butmore than that, the business must be ready to react to what the data-mining and analytics applications have to say. That’s more likely tohappen if the application is correctly interlocked with the other systemsin the BI environment. The analysis engine must be synced up with thedata model, and it must take full advantage of the reporting environmentto present and distribute findings.
Getting Users On BoardThe best way to ensure that the user community is happy with the workyou’re doing is to keep them involved in the design process. That’s easiersaid than done for brand-new applications for which users have little or noframe of reference.
Reporting reviewBut for a reporting environment, you’re dealing with familiar ground for theusers. They’re used to seeing information in a certain format at certain times.Your new reporting environment should be rolled out to a select group ofexpert users who are open to the new system, but who are also willing to giveyou honest feedback.
Have the user group review and validate the following information:
� Review your list of high-priority standard reports; make sure any gapscan be filled in with the ad-hoc environment or by tweaking one of theexisting templates.
• Review the reports to ensure they are displaying data correctly.
• Ensure that the reports are readable and that the titles, headings,and extra information (like instructions) are correct.
� Work with the report developers on the run-and-release calendar; theschedule should ensure that the data is getting to the necessary targetson time.
� Show the user community how to navigate the reporting tool. The wayyou’ve organized the standard reports and explanatory informationshould make sense to everyday consumers of that information.
239Chapter 14: BI Design and Development
21_127230 ch14.qxp 12/4/07 12:42 AM Page 239

� Give a walk-through demonstration of the new environment’s capabilities — particularly new features that differentiate it from thelegacy system (say, a slick new browser-based interface or advancedtools that are available for the first time).
� Try out any drill-down or drill-through reports to ensure that the infor-mation is linking correctly, and that the drill links are logically placedand visible.
� Distribute the library of report templates and ensure that the informationdisplayed on every report adheres to company and project standards.
Testing, 1-2-3 . . . The quality-assurance process in a BI environment will probably resemblethat of other major technology projects: Unfortunately, that implies that it’soften done haphazardly, without any kind of real plan, if it’s even done at all.You can’t afford the usual testing chaos in a BI project.
Testing is an essential part of the design-and-deployment process for BIbecause mistakes caught at this point are far cheaper and easier to fix thanthey would be after the systems are in production. Testing comes in severaldifferent phases and flavors:
� Unit testing: This is the lowest level of testing that the developers com-plete. Do the code libraries compile into binaries? Do the applicationsload successfully?
� Integration testing: At this stage, you’re testing to see whether the com-ponents are speaking to each other. Can the ETL application communicatewith the source data systems? Are the front-end applications workingtogether as designed?
� Quality-assurance (QA) testing: This is the point where professionaltesters get involved. If all goes as planned, your QA analysts write testscripts that check the function of every component in the systemagainst the original specifications. That means testing everything fromthe quality of the data in the reports to the appearance of the reportsthemselves — along with any qualitative measures of performance suchas return time, error rates, or latency.
� User-acceptance testing: Here the end-user group finally gets its handson the application, puts it through its paces, and reports back issues.
Maintain tight control of user acceptance testing or it can spiral out of controlquickly. Choreograph the testing process for the guinea pig users by supplyingthem with test scripts, expected results, and a firm schedule for reportingissues and comments. It’s common for users to have a change of heart aboutan application specification (or to simply not remember what they asked
240 Part IV: Implementing BI
21_127230 ch14.qxp 12/4/07 12:42 AM Page 240

for) and report it as an issue. And it’s possible some of the testers weren’tinvolved in the requirements process to begin with, and will ask for extrafunctionality to be added to the project at this late date.
Document your testing just as you would document system specifications.Have QA professionals create a test plan and test cases while the developersare still building and coding the system. Document the outcome of every testand log the results for future reference. The reason for that is simple: whenyou upgrade the system later on, you’ll need to do regression testing toensure that the improvement or upgrade hasn’t broken anything. Withoutdocumentation from the original testing phase, you’ll have to re-invent whatcould be a fairly complex wheel.
ETL testingTesting the extract-transform-load process is one of the most critical QAefforts of the BI project, because mistakes can lie hidden like needles inhaystacks. There may be an error in your transformation process that onlymanifests itself once in every thousand records processed.
Testing the ETL process is a matter of deconstructing each step of the flowthrough the system. As the data moves from one state to the next, yourtesters are there to ensure every validation step and manipulation is workingcorrectly. Once you’re sure every step works by itself, it’s time to do integra-tion testing with the ETL process; making sure that every step leadssmoothly into the next.
It’s not necessary to employ end-users for testing the entire ETL process, butyou must find experts in the appropriate business subject matter to validatethe data cleansing and transformation processes. Business users and stake-holders will have been a part of specifying the requirements when the ETLprocess was designed, and they must play a part here, too: ensuring that thedata that comes out of the ETL chain is correct.
Front-end testingAfter the ETL process has been through a full QA cycle, you have to focus onthe front end. Make sure the queries are populating the reports as expected,and that the analysis tools are being fed the appropriate data.
To test your reports and front-end tools, start with the presentation of thereport itself. Does it appear correct? Are the calculations producing accurateresults?
Then the QA testers turn their attention to the parameterized data in thereports. They will likely throw various permutations and combinations ofparameters — legal and illegal — at the reporting tool to ensure that itresponds properly.
241Chapter 14: BI Design and Development
21_127230 ch14.qxp 12/4/07 12:42 AM Page 241

Now in limited releaseDoing a full release without any interim steps comes with significant risk. Forone thing, you’re committed to a certain direction without knowing if thetechnology you’re interested in using is even feasible, or if the opportunityarea makes sense for applying BI concepts.
Pilot projectsFor business intelligence applications, a pilot project is more than a dry run;it’s essentially a small-scale demonstration designed to show that BI can addvalue in a certain domain of the business. A pilot focuses on one functionalsilo, such as supply chain management or human resources, and builds a limited-capability system that includes only the core functions of all the mainBI components. Some characteristics of a pilot project:
� Time to launch is measured in months.
� Software is not licensed for permanent use.
� Budget is significantly lower than it would be for a full iteration of theproject.
� BI functionality is limited.
Pilot projects have limitations, to be sure. But they put the main concepts ofa BI initiative to the test, just with limited complexity and scale. The pilotproject would include identifying source data, constructing an ETL process(including developing capabilities for standardizing and cleansing data), anddeveloping a target database environment.
You will connect front-end tools to the target data environment, but advancedfunctionality will be kept to a minimum. The goal here is not to produce high-impact insights immediately, but rather show that all the moving parts canwork together. The lessons learned (and, potentially, internal allies gained)from a successful pilot program can be parlayed into a full project cycle witha permanent release.
Proof of conceptA proof of concept is different from a pilot project in terms of its goal: to applya particular solution to a business problem to see how well the proposedsystem can withstand the accompanying demands.
A common use of the proof-of-concept project is to build a prototype, using anuntested BI component (such as a front-end analysis and reporting tool or an OLAP engine). The results of the test (which could last for as little as a fewweeks) determine which direction the project team will go concerning a par-ticular technology.
242 Part IV: Implementing BI
21_127230 ch14.qxp 12/4/07 12:42 AM Page 242

Chapter 15
The Day After: Maintenance and Enhancement
In This Chapter� Waking up to your post-launch reality
� Keeping that bucket of bolts in the air
� Planning for the future of your BI environment
� Maximizing BI’s value within the organization
� BI Darwinism: evolving to meet the needs of your business
Research data say that most business intelligence projects don’t live upto their expectations. That means they’re not meeting their return-on-
investment (ROI) goals — and the users don’t think they’re worth much, either.
Avoiding that fate is easier said than done. Hopefully you went through acareful planning process and kept the business goals front-and-center whileyou developed your BI platform. And if all went well, you listened to the usercommunity, gathered good requirements, and designed a sound system.
After the team has successfully launched the first iteration of the platform,the real work begins. Before you fluff up the bed of laurels to rest upon, how-ever, it’s time to start thinking about how you’re going to keep this environ-ment running smoothly — and how you can make it even better.
It’s a common misconception that says businesses need only install BI soft-ware, and then they’re “finished” with the job; they can check it off the listand move on to the next IT project. The reality is that BI is not a project —it’s a process that’s driven by the business and supported by technology pro-fessionals. BI is a way of thinking about and utilizing information in the day-to-day and year-to-year processes that guide organizations.
22_127230 ch15.qxp 12/4/07 12:43 AM Page 243

BI = Constant ImprovementThe BI process manifests itself in two main forms: software implementationprojects and the accompanying business process changes that work in con-cert with the software.
An extended example demonstrates this point: imagine a company installs acomprehensive BI solution connecting detailed financial information withsales activity. The system brings a previously-unheard-of level of insight intothe sales process. With the new system, sales managers can attach precisemargin data with individual sales transactions and sales representatives.
Suddenly the sales management team can hold both the field and inside salesteams accountable for the deals they make — and demand that each transac-tion meet certain margin requirements. To ensure the sales teams can meetthe new margin thresholds, the business might implement a change to thesales process; adding a BI system-guided approval process when creatingquotes for deals. Without the new system, there would be no mechanismavailable to add this step, leaving the sales teams in the dark about margins.But in this case, BI is driving the business process — enabling the sales teamto improve how it handles its core functions.
BI creates a cascading evolutionary process within organizations, where tech-nology not only demands process changes, but permits new ways of thinkingand encourages better, more innovative methods for tackling problems.
That’s why BI practitioners have to be prepared to think about systemenhancements. A business intelligence system should be built to solve prob-lems and offer insights, but it should also entail a certain amount of planningfor the future.
Post-Implementation EvaluationsFirst things first after launch: You need to understand how you did. An often-overlooked — but extremely important — part of any business intelligenceproject comes after the applications have been put into production and it’stime to pause and look back at how well the project was executed. At thesame time, you should survey the landscape to see what impact the newtools are having on the business.
Make sure your evaluation isn’t perceived as just another testing period whereusers expect their feedback to be registered and acted upon — from this pointon, they’re going to have to do some adapting. Users don’t always know what they want until Day 2 (that is, the day after you’ve delivered their newreporting-and-analysis application.) They finally get a look at the new systemand only then they realize what their needs are. That’s what phase 2 is for.
244 Part IV: Implementing BI
22_127230 ch15.qxp 12/4/07 12:43 AM Page 244
Overall project reviewAfter it’s been put into the production environment and the end-users are get-ting full use from it (as designed), it’s time for a post-implementation review.Call it a post-mortem, a health-check, or whatever you want, but the purposeis always the same:
� Recap: Review the highlights of the entire development narrative, fromthe idea stage all the way to launch.
� Qualitative analysis: Identify which business goals were met or exceeded,and which ones, if any, the effort fell short of attaining.
� Quantitative analysis: Evaluate the project against standard performancemetrics: Did we meet the budget and schedule requirements?
� Lessons learned: These should cover both the good and the bad. Whatwent well? What areas of the development process needed smoothingover?
Technology reviewThe overall project review brings into clear relief the elements of your BIenvironment that are working as expected — and those that aren’t. Duringthe technology review, your team should take a closer look at the root causeof certain successes and failures. The examination shouldn’t stop at the appli-cation level; it should get as detailed as necessary: Why haven’t certain application features worked as expected? In most cases, the problem can be correlated with the main steps of the implementation process:
� Was the software installed and configured correctly?
� If it’s working as planned, was there a flaw in the requirements process?Was there an unanticipated problem that should have been identified inthe design phase?
� If it the application was specified properly, maybe the problem is broader:Did the feature, element, or report in question align with the businessgoals of the BI program?
These questions are valuable not only for fixing current deficiencies with theBI system as it is today, but also in planning for enhancements and the nextrelease. The technology review should provide a reference for requirementsor specific functionality considerations that must be accounted for in thesubsequent release.
245Chapter 15: The Day After: Maintenance and Enhancement
22_127230 ch15.qxp 12/4/07 12:43 AM Page 245

Document what you find; technology lessons learned are only worthwhile ifyou can remember them. A common problem with BI projects is that mis-takes are repeated. A poorly conceived user interface or a poorly designedreport shouldn’t be allowed to serve as the model for subsequent releasesand enhancements.
Business-impact reviewWhile it’s certainly important to examine how well the implementation went,if BI is to become woven into the fabric of the business, you’ll need to look at more than the efficiency of your project team. You’re going to have tounderstand — and, if possible, quantify — the actual business value of thenew BI tools, and the contribution the new applications are making to the functioning of the enterprise.
That’s easier said than done, of course. Not only is a meaningful assessment atime-consuming process to conduct, it can’t even begin until the new processesand tools have taken root. Start looking for results too early and you may notget a representative sample of data.
To conduct a business-impact review, return to the planning artifacts youcreated early on in the project (Chapters 10 and 11 cover the early steps in aproject). In all likelihood, you and your team conducted extensive research —put together roadmaps, strategy briefs and papers, as well as capabilityassessments and gap analyses. That documentation adds up to your baselinebusiness case — the original justification for creating (or, later, extending)the BI program.
In some cases, you may have created metrics early on in the program. Notjust broad goals for what the organization was hoping to achieve, but specificmeasurements that indicated organizational improvements, along with pre-cise methodologies for taking those readings. It’s a good idea to stick with theoriginal metrics built into the program — say, reducing processing time forreports or improving access to information. Filling in the blanks on measure-ments like these is a good way to close the loop in a BI project.
After that, it’s necessary to investigate the impact on the users. You’ll want to collect and analyze information from the knowledge workers who come incontact with the new BI tools. Typically the improvements will fall into one ofseveral standard categories, which the next subsections describe.
Reducing the time per taskThis measurement might apply to how long it takes to produce a given report,develop a specific analysis, or complete some other activity assigned to yourknowledge workers. Reductions in the amount of time incurred by the com-pany can be measured by multiplying the amount of time saved by a standard-ized hourly rate for the personnel involved.
246 Part IV: Implementing BI
22_127230 ch15.qxp 12/4/07 12:43 AM Page 246

Another way to approach this measurement is to attach a specific value tothe completion of a given task, and then multiply the extra tasks that can becompleted thanks to the BI implementation by that rate.
Reducing the cost per taskA BI end-user tool is likely to reduce the number of people involved in theresearch-and-analysis process — and that means cost savings for the company.
These reductions don’t necessarily mean laying off all the people no longernecessary to the task; it just means their time is freed up for different, poten-tially more valuable tasks.
Improving core competenciesThe core goal of many BI systems is more than just making the reportingprocess more efficient. It’s about the insights that come from those reports —the ideas and information that, in the right hands, actually have a positiveimpact on how the business is run.
A BI environment might enable a business to identify efficiencies throughoutthe core business activities, whether it’s the supply chain, manufacturingprocess, marketing and sales efforts, or any other main task performed bythe company with the aim of making money. For example, BI might make pos-sible better, more efficient use of direct mail by identifying customer buyingpatterns and connecting those patterns with geographic regions. That con-nection might allow the same direct-mail budget to be used to reach a morereceptive audience and improve the ROI for each campaign.
Refining business directionUltimately, the insights gained from integrating a BI environment, and theentire business intelligence mindset, into its strategic planning process maypay dividends in the long term by leading the company into new, more fruit-ful markets and activities.
Maintaining Your BI EnvironmentNo system can really run itself. In exchange for the advantages BI brings, theorganization has to pony up with ongoing maintenance — in particular, thesethree activities:
� Assessing the health of your BI system (how well it performs itsdesigned functions).
� Evaluating how relevant the system is to your evolving business needs.
� Checking the extent to which the system improves communicationwithin the organization.
247Chapter 15: The Day After: Maintenance and Enhancement
22_127230 ch15.qxp 12/4/07 12:43 AM Page 247

System healthThe most basic (though not at all simple) BI maintenance tasks revolve aroundkeeping the core systems up and running for your users.
Data healthIn theory, if you test adequately, your data should remain in good health as itmoves between the source systems, through the ETL process, and into thetarget database. A disruption in the chain of events that feeds information toyour users could be disastrous to the organization. If people use informationthat doesn’t actually reflect reality, reports will be inaccurate, decisions willbe off-kilter, and forecasts will have no relationship to the actual future. That’swhy constantly monitoring the data flowing into your BI environment is ofthe utmost importance.
One way to ensure good data is with a discovery-and-profiling process: Theproject team gets access to statistical analyses on the information flowingthrough your system. This can be a manual process — data experts on theteam can create their own queries to check on the data’s characteristicsbefore and after it’s loaded into the target system. Better yet is an automatedtool that analyzes the range and distribution of field values, relationshipsbetween tables, and other facts that can provide a complete profile on theinformation in your BI environment.
Don’t wait till you hear complaints from users to check to see whether yourdata’s in good shape. The outward symptoms of this disease won’t appearuntil the patient is already on life-support. Keep an eye on incomplete or cor-rupted data as part of your normal maintenance process.
Response timeMonitoring data load and query-response times is essential to maintaining auseful and usable BI environment. And success has its own price for a BIsystem: A more useful tool means more users will want access to the data; inthe long run, more business domains will be included in the BI system.
As the number of users grows, the strain on the system will naturally increase.
It’s equally true that the target data systems will fill with more data over time,and the nature of the queries and usage patterns will evolve (often in thedirection of more complexity), slowly but surely eroding performance. Add tothat the possibility that sometimes things just break, and you have the mak-ings of trouble right here in River City. It’s imperative to have one eye on BIsystem performance at all times.
Most database applications have built-in diagnostic tools for monitoring per-formance, and BI vendors often have add-on utilities that provide more visi-bility into how the system handles complex queries and peak loads. High-end
248 Part IV: Implementing BI
22_127230 ch15.qxp 12/4/07 12:43 AM Page 248
monitoring tools can even detect slowdowns by sniffing out increases inresponse times, and then triggering diagnostic processes to isolate thesource of the problem.
In a BI environment, recognizing and fixing a performance problem are usuallytwo relatively simple tasks sandwiched around a much more difficult one:identifying the root cause. With so many systems intertwined in a digital tangothat may stretch across the company, isolating the weak link in the chain canbe a real challenge. That’s what makes active performance monitoring so critical; it buys you more time to locate and fix the problem.
Waiting until users complain about response times is a recipe for trouble.Chances are, by the time word gets back to the project team, lots of peoplehave been affected by the reduced performance.
By measuring elapsed times for regular processes and requests, and thenwatching the trend lines for those response times, you can anticipate whenit’s time to upgrade the system to handle more capacity. You’ll be able tospot trouble before it arrives.
During the design process, define the response time needed for every pieceof data — keeping in mind that not all of it has to be refreshed in real time.For example, if you’re monitoring sales performance for a growing chain ofcoffee bars, you’ll want to refresh the actual sales data as often as possible.But reference information (such as store locations and employee data) doesn’tchange all that often; you only need refresh it once a week or once a month.Reloading that relatively static data once an hour would only bog down thesystem unnecessarily.
Tuning the target databaseAll databases require regular tuning to maintain performance, and BI targetdata systems are no different. The database administrator will need to per-form regular diagnostics and tuning procedures to ensure that the database-management system (DBMS) remains optimized for the kinds of queries it’srequired to do, that it’s making the best use of storage, and that the databaseis staying aligned with the applications it supports.
Updating the applicationAs is the case with any complex application, vendors are constantly releasingbug-fixes and updates to address users’ complaints and demands for improve-ments. A good BI team will have a systematic way to keep track of theseupgrades and to apply them to the environment efficiently and with minimumdisruption.
249Chapter 15: The Day After: Maintenance and Enhancement
22_127230 ch15.qxp 12/4/07 12:43 AM Page 249

System relevance — Keeping up with business changesA successful BI system will constantly acquire more data. That’s inherent in adata-warehousing environment where the information being stored is basedon historical operations. But it’s also true that as more detailed business datais stored and more subject areas are tracked than before; the demands on thesystem increase and become more complex. The BI system must constantlybe tweaked to ensure that it’s capturing relevant information, in the righttimeframe, and at the right level of detail.
Lots of factors can affect the health of a business intelligence system. The fol-lowing tasks highlight the challenge of keeping up a BI system in a dynamicbusiness environment:
� New information: Whether it’s a new category of data, a new businessunit, or a new source system, the environment must be flexible enoughto be able to take in and process new data.
� Source data changes or goes away: The opposite of the preceding con-cern is true as well: Source data systems won’t stay the same forever.They’ll upgrade, get rolled up into consolidated systems, or sometimesgo away altogether.
� New leadership and sponsor changes: The strategic importance of thesystem is a function of how the leadership views it. Be aware that changesin the corner offices or changes in the organization of the company canaffect how the system is used, both on a day-to-day level and as a long-term strategy tool.
Maintaining lines of communicationCommunication is the key to supporting the business intelligence environment.Keeping users trained, informed, and in touch with helpful resources goes along way toward maintaining a healthy system and happy user community.
Figure 15-1 shows the communication links, both direct and indirect, that mustexist between the project team and the various stakeholders in the company.
The project team is tasked with keeping several different channels of communi-cation open after they launch the system, each with its own predefined needs:
� Providing immediate support: This is helpdesk support that providesbasic aid for users who run into trouble with operating the applicationsor performing basic tasks. Larger companies often create a shared help-center function; in smaller organizations, the project team is responsiblefor this Level-1 support.
250 Part IV: Implementing BI
22_127230 ch15.qxp 12/4/07 12:43 AM Page 250

� Providing a feedback mechanism: It’s not all about fixing bugs and get-ting users online. You’ll also want to provide the stakeholders and appli-cation users with a way to offer complaints, comments, and criticism.And in case you were thinking about routing those comment cardsstraight to the trash can, take a moment and consider that the user isgolden in the BI environment. As is the case with BI as a whole, the infor-mation in your users’ comments provides the basis for your rationaldecisions about the system’s future. (Who knows? Somebody may evensay something nice.)
� Ongoing training for users: This isn’t just helping users get throughbasic tasks over the phone via live chat; this communication pathway isdesigned to upgrade user skills. One of the biggest problems in BI systemsis that he applications are often complex, and the project team assumesthe users can pick up on how to use them right away. Establishing a train-ing program is a great way to ensure that users get what they need fromthe system.
� Participation in standards and governance committees: The BI projectteam should stay directly involved in any corporate-wide oversight com-mittees. When the data stewards act, the BI team needs to know about itright away to apply the appropriate system updates. Not only that, butby maintaining a presence in governance committees, the BI projectteam has an opportunity to spread the word about the proper role ofbusiness intelligence in a company like yours.
ExecutiveSponsor
Project Team
• Regular Updates
• Information• Input
• Technical Support• User Feeback• Training
User Community
Governance
Figure 15-1:The project
team’s com-munication
channels.
251Chapter 15: The Day After: Maintenance and Enhancement
22_127230 ch15.qxp 12/4/07 12:43 AM Page 251

� Regular contact with executive sponsors: These people went out on alimb for you, so the least you can do is keep the bigwigs apprised of thesystem’s status. Share good news, bad news, and everything in between.They’ll hear it all anyway.
Extending Your CapabilitiesWith business intelligence touching more and more areas of the enterprisethese days, there are expansion opportunities everywhere. It’s important tomaintain your system, but the glory is in expanding it — bringing new featuresand applications to your user community to make the system work betterthan it did before.
As always, the business users and stakeholders should be driving the BI pro-ject. And the project team must always keep in mind the underlying businessobjectives so they remain lined up with the technology activities.
Follow the same basic procedures as your original installation — except inminiature, and from a slightly different perspective. With a particular busi-ness need in hand, decide the best technology path to support it.
Expanding existing applicationsThe first — and easiest — enhancements to make are those where you takewhat you already have and make it marginally better. It’s not uncommon forBI vendors to ship BI tools with a limited feature set turned on (often under aparticular licensing scheme). And because those features are already there inyour system, turning them on is minimally disruptive to the environment.
Start simple. During the first few enhancement and expansion phases, don’tbite off more than you can chew until you get a feel for the strategic andoperational challenges of upgrading the system.
Picking up leftoversHere’s where you revisit the prioritization exercise used during the requirements-elicitation phase of the project (see Chapter 13). That exercise reflects the reality that you rarely have time to do everything you plan to do during the initial implementation of the BI system. So the high-priority items got installed and the lower-priority items had to wait.
The first system enhancement is the perfect opportunity to revisit those ini-tial drafts of the project plan and requirement documentation. See whether
252 Part IV: Implementing BI
22_127230 ch15.qxp 12/4/07 12:43 AM Page 252

you have any leftover old priorities you can deal with right away. The require-ments you didn’t get to in your last BI implementation often are the simplestto complete.
The beauty of the initial-implementation rejects is that their specs are usuallyalready defined and vetted for business validity. You’ve already talked themover with the users and determined they were important in an absolutesense. They just didn’t make the cut.
Moving up the complexity chainSometimes it makes sense to upgrade users from simpler software to morecomplex applications. If users have mastered the basic features of an interface,they may become more productive if you expose advanced functionality tothem, or install new applications that naturally build on the existing features.
A typical BI system evolves in certain predictable ways because of the way fea-tures of one application are similar to, or build towards, features of a differentapplication. Figure 15-2 shows an initial BI installation on the left, connected to a few potential evolutionary paths on the right. For example, experts at themanaged reporting tools may want to expand their capabilities and move intoreport authoring and building their own ad-hoc queries. Others from that usergroup may ask for visualization software to turn their reports into graphics-laden masterpieces.
ManagedReporting
Dashboard
Data Mining
Ad Hoc Queryingand Reporting,
Report Authoring
AdvancedVisualizationTechniques
BusinessEvent
Management
Online AnalyticalProcessing
(OLAP)
GuidedAnalysis
Figure 15-2:Upgrade
paths for aBI system.
253Chapter 15: The Day After: Maintenance and Enhancement
22_127230 ch15.qxp 12/4/07 12:43 AM Page 253

As your system grows in capability and reach, it’s likely you’ll follow thesecommon growth patterns:
� Cater to power users: Create opportunities for power users to do evenmore detailed and in-depth analysis than before.
� Move BI toward real-time decision support: Your initial BI implementa-tion was aimed at helping you do a slow-motion analysis of businessproblems. With your first enhancement project, consider applicationsthat can support users making day-to-day decisions based on the analy-ses they do.
� Move BI into the realm of the strategic: Applications that support broadstrategic planning are at the end of a long BI software continuum. Yourenhancements should be pushing in that general direction — to make BIpart of the forecasting and planning function.
� Expand from ad-hoc to managed environments and back again: Boththese types of reporting environments can be extraordinarily valuable ifdeployed to the right people with the right training. Move to a managedenvironment if you have more users with limited ability and there’s aneed to author custom reports. Introduce an ad-hoc environment if folksare asking for more flexibility in running queries.
Don’t do it just because you can. It may be technically possible to deliver real-time cash register data to the sales analytics application, but come on, doyou really need that kind of information overload? If all the analysis is beingdone with week-to-date reports, you don’t need to invest the time and hasslein establishing a real-time data feed. That’s a common pitfall in BI; there areso many little ways to improve at the margins, you’d better pick and choosewhere to dedicate effort — carefully — or you’ll wind up with features youdon’t actually need.
More advanced work within existing versionsThis kind of BI expansion doesn’t require any new licenses. Enhancementsdon’t have to involve applications, and they don’t necessarily mean addinggobs of computing or storage capacity. Sometimes it’s about pausing to makea report better, or to improve the usability of a component.
Usability is an important aspect of your BI environment — as is the look andfeel of the day-to-day tools. Take these factors into account when you’re con-sidering system enhancements. Applications that are hard to use or unpleas-ant to deal with will eventually fall into disuse. And the visual, aestheticqualities of the software are often the first things a user notices — and complains about.
Adding new users to your BI environmentSometimes an enhancement is less about adding new functionality and moreabout adding a new user group. Adjust the system to handle more users by
254 Part IV: Implementing BI
22_127230 ch15.qxp 12/4/07 12:43 AM Page 254

upgrading for capacity. The goal is to allow the new users to access the datawithout imposing any noticeable lag in application performance, query lag-time, and the like.
If the new user group has a different skill level (or comes from a different partof the business), you may also have to deploy a different application aproposthe new, wider target audience. Giving the sales management team access tothe BI system, for example, may mean providing a tightly controlled, managedreporting environment in place of the ad-hoc environment that used to workfine for a smaller, more skilled user group.
Installing advanced upgradesOn certain occasions, you really can’t do any more with what you have. Youcan’t expand or enhance the existing BI tools. All the low-hanging fruit hasbeen eaten. Now it’s time to branch out and expand into tools that aren’talready in place.
Is your new enhancement going to endanger your existing system in any way?Will it make it harder to use? Will it be slower? Make sure you don’t breaksomething in the process. To protect your system from potential bugs anupgrade may bring, any good QA professional would tell you to make sureyou engage in full-system regression testing as you add new enhancements.
Here’s the short list of key questions to ask for any system upgrade:
� Who will implement the enhancements? Is it the same team that did thefirst project, or a whole new team?
� Do you have executive support for the upgrade?
� Have you fully specified the requirements for the new system — accordingto the same methodology as before?
� Which current BI users will use this application? What training will they need?
� Does the new functionality distract from or disrupt existing functionality?
Business intelligence projects in particular have special concerns that theproject team should take into account. Because BI is a transformativeapproach to business and technology, there is always the concern that busi-ness processes haven’t had a chance to catch up with the technology. In otherwords, the technology tools are indeed supplying insights to the users — butthey’re not being adequately used. Stacking shiny new applications on top ofexisting applications can lead to trouble. If the users aren’t making the mostof the simpler BI install, what makes you think they’ll get the most from thenew software? They might, but there’s no guarantee.
255Chapter 15: The Day After: Maintenance and Enhancement
22_127230 ch15.qxp 12/4/07 12:43 AM Page 255

Also, because there are so many puzzle pieces that have to fit together, com-patibility is always an issue. Most vendors today offer a standards-basedapproach. But sometimes two pieces of software simply don’t work (or atleast don’t work well) together.
With any enhancement or expansion, it’s critical to keep expectations in line.Are we fixing something? If so, what was broken, and how do we know forsure? Is this a new tool with new functionality? If so, what is its purpose andwhere is it documented?
The Olympic ApproachEvery 18 to 24 months, review the entire business intelligence system, soupto nuts, top to bottom. Set sacred cows aside. Subject every piece of yourenvironment to scrutiny as if you were buying a used automobile.
The squeakiest wheel gets the grease first. That’s why a complete review isimperative. It gives you a chance to cast a critical eye at the pieces of theenvironment that may not be causing acute headaches, but are acting as asilent drag on the system.
In your evaluation, consider what’s working well for users of all stripes — fromexecutive skimmers to power users to peon information consumers stuck inthe corporate dungeons. Do the same kind of analysis discussed when develop-ing the initial BI approach. Think about these five levels of questions:
1. Are people using the tools they’re supposed to be using?
2. Are they using the tools correctly?
3. Are the tools performing as expected?
4. Do the users perceive that the tools are adding value to their process?
5. Do the users have any needs that aren’t being met?
The answers you get may or may not point you in the direction of an over-haul. It’s possible you just need a round of retraining, or to refocus the com-pany culture on the BI process. But don’t ignore legitimate complaints fromthe user community, and don’t interpret their commentary as trashing yourinitial design. Remember, change is inevitable. It’s the sign of a healthy,dynamic system.
Don’t stop at the users. Ask administrators and BI support personnel to par-ticipate in a subjective evaluation of the environment as well. It’s not uncom-mon to have a system that’s humming along for the user community but is a major resource drain backstage. An upgrade or overhaul may not mattermuch to users, but it can be a godsend for the BI team.
256 Part IV: Implementing BI
22_127230 ch15.qxp 12/4/07 12:43 AM Page 256

Thinking long term with a roadmapThe Olympic approach, or planning major upgrades every few years, meansdeveloping a keen sense of where the BI environment is going. That productvision and calendar should be codified, documented, and kept up-to-date.
The product vision should list approximate release dates and functionalitygroups or application types. For example, your goal may be to deliver a data-mining-and-forecasting tool to the sales team in a year’s time. That goalshould be recorded, along with the specific need it will meet. The projectteam can then use the product vision to guide the planning process.
Not sure where to start on your product vision? For BI projects, the bestpractice is to deliver basic functionality with the first release, then with thesecond release wrap up the loose ends of the first release. Only later, whenthe target data system is stable and the kinks are long gone do you go backand add new user groups and the exciting enhancements and new tools.
Remember, things change. Do some basic contingency planning, even forunlikely future events, provided they could have a big impact on the BI envi-ronment. For example, say there’s talk of reorganizing the company from ashared services model into a divisional model — how will that affect yourplans? Have two different branches of the long-term roadmap if necessary.
What’s the difference between an enhancement and a planned release?Nothing, really, except the name — any time you change the configuration ofyour BI environment, it’s an enhancement. Just remember that enhancementsare not the same as maintenance. You don’t have to do enhancements to keepyour system humming. But maintenance activities, hardware, software, net-work, storage, and even process updates will keep your system healthyregardless of the enhancement schedule.
EvolvabilityBusiness intelligence is more than a set of applications working together, it’sa way of life for the company, and the tools you put in place to serve that waywill inevitably change over time. In some domains this is known as plannedobsolescence, but I prefer to call it planned evolution.
You’ll likely have several integrated tools working in concert to deliver busi-ness insights to your BI users. Just as the pieces of a car give out or need tobe replaced over time, you’ll have to plan on swapping out or upgrading indi-vidual BI components. You have to weigh the advantages and disadvantagesof the smaller disruptions involved in swapping out parts piecemeal versusdoing a top-to-bottom overhaul of the entire system all at once.
257Chapter 15: The Day After: Maintenance and Enhancement
22_127230 ch15.qxp 12/4/07 12:43 AM Page 257

There might be any number of reasons it’s time for a change with one of yoursystem components:
� User needs change. This is the obvious one. Your system can’t do whatyou need it to do. Maybe there’s a new product on the market that haspiqued your interest, or maybe performance requirements have changed.Either way, it’s time to upgrade.
� Software standards change. In this case, it’s not that what you’re usingdoesn’t work, it’s simply incompatible with the future state of the system.
� External compliance needs change. Perhaps there’s an outside vendor?
� An upgrade is available.
� Functionality can be combined. There’s always the chance that efficien-cies can be gained by unifying applications. Remember, every piece ofsoftware that handles information is a potential weak link in the chain —and the same is true of the handshakes between components. Bringingtwo or more functions under one roof can make administration easierand improve performance.
The One QuestionWhether a piece of software, or a given function fits into your long-term plansor not is certainly a question to ponder. But at the core, you have to ask your-self the one basic question:
Is it providing value today?
Some pieces of your architecture may be dead ends, planned obsolescencemay be kicking in, or the long-term usefulness of the component may beobscured by a weird, hazy future. That’s okay — as long as the piece is pro-viding value right now.
Off-roadingAssemble your system according to the long-term plan. That means enhance-ments and upgrades should happen on schedule as you planned them, and asthey appear on the roadmap. But sometimes it’s clear that external eventsare going to lead to a change in business conditions — and that leads to achange in the needs of the BI system.
For large corporate events — such as reorganizations, buyouts, or changes at the top of the company — you have to know when it’s time to take a turnoff the pavement and leave your roadmap behind.
258 Part IV: Implementing BI
22_127230 ch15.qxp 12/4/07 12:43 AM Page 258

Part VBI and Technology
23_127230 pt05.qxp 12/4/07 12:43 AM Page 259

In this part . . .
Since you’re learning about business intelligence, youmight as well learn about data warehouses, data
marts, and other kinds of target databases that act as acentral repository for your operational data. What a coin-cidence! That’s what’s covered in this part of the book.
In addition, it’s time you started learning about the BImarketplace, and the vendors that peddle their wares to lemonade stand owners and managers just like you.
23_127230 pt05.qxp 12/4/07 12:43 AM Page 260

Chapter 16
BI Target Databases: Data Warehouses, Marts, and Stores
In This Chapter� Relating data warehouses to the BI initiative
� Bringing together operational data sources
� Thinking about data integration
� Getting information at a discount at the data mart
� Other places to store data
Data — the information that quantifies and describes your organization’sactivities — is the wellspring of any business insights that come from
your BI environment. Developing a sound strategy to seek it out, clean it,marshal it, corral it, and move it into a useful posture is one of the mostimportant steps in the entire process.
In order for users — by way of the software they use — to have easy accessto your data, you’ll need to place it into a target data environment. Once inthis setting (which may take on a number of different forms), the data is avail-able to BI user applications that can harvest and use it to produce the keystrategic and operational insights that make the entire BI effort worthwhile.
The BI target database, no matter what form it takes, must be optimized for“data out” procedures — queries that feed reporting-and-analysis tools.
The target database must be built to withstand the pressures peculiar to BIusage. Normally the BI target database is geared to storing massive amountsof historical data, at all levels of summarization and aggregation. In addition,the BI target database may be designed to feed a diverse array of large, com-plex queries and reports — in addition to feeding high-end analysis tools.
This chapter discusses the most common BI target data environments: datawarehouses, data marts, operational data stores, and hybrid models. As wego along, we consider these important questions:
24_127230 ch16.qxp 12/4/07 12:44 AM Page 261

� Where does the data that we need currently reside?
� How in the world are we going to collect it all?
� What efforts must go into its maintenance and cleansing?
� How can we make sure the data is standardized so we’re dealing withapples-to-apples comparisons?
� How should we arrange the data to best serve the particular array ofuser-facing applications we’ve deployed?
� Where and how are we going to store the data? We need to make decisionson the storage architecture, protocols, and standards.
There are implementation strategies to fit every kind of environment. Ifyou’re involved in a BI implementation, what you’re looking for is prettyfamiliar: timely, accurate, high-value, actionable insights. Answering thesequestions will help determine which data architecture is the best way toreach that goal.
Data Warehouses and BIBI is built on the premise that the important operational data — the stuff youreally need to look at — is stored in varying platforms and locations aroundthe company. Bringing that information together under one umbrella is usu-ally known as data warehousing.
Specific definitions may vary across vendors and experts, but in general, adata warehouse is a data-storage system designed and built to gather histori-cal operational data together — for the purpose of creating reports andanalyses based on it. Performing those tasks on your operational databaseswould be complicated and costly, to say nothing of the fact that it might slowyour business down to a crawl. Data warehousing is a way to separate opera-tions from reporting and analysis.
A data warehouse doesn’t necessarily mean one single database full of dataready to be reported on and analyzed. Sometimes it makes more sense tobring data together in several related systems rather than one big system.
Data warehouses are often designed to bridge the gap across multiple func-tional areas of an organization, bringing related historical data together in auseful way. The finance and accounting departments (for example) may useone data storage system, while the HR and sales teams use their own data-collection mechanisms. Many of the objects and information nuggets con-tained in these different systems will be the same. The data warehouseprovides the logical — and, in most cases, physical — link that connectsthose objects together across departmental (or even state) lines.
262 Part V: BI and Technology
24_127230 ch16.qxp 12/4/07 12:44 AM Page 262

Part of the reason to create a data warehouse is because it creates a flexibleenvironment from which you can perform enterprise analysis on your busi-ness as a whole. Developers, database analysts, and managers can buildmore complex queries, reports, and perform higher value analysis when allthe company information is under one roof than they would be able to if itremained isolated within each business unit or team. When somebody asks anew question about the business, the information needed to answer it isalready available in the warehouse; there’s no need to find and integrate thedata all over again. With all the data sitting in one place, the developers arefreed to do higher-value work rather than create one-use tables for everybusiness query that comes down the pike.
A note about terminology is probably warranted here. Some authorities givethe term data repository more specific meaning than we have in this book;here it’s been used as generic term for any place that stores data. In some cir-cles, a data repository is considered an active operational system but a datawarehouse is a storehouse of historical business information (that’s the morestable and common definition). So the usual distinction looks like this:
� A data warehouse represents all the transactional events that make upthe past, on which the parent company performs read-only activitiessuch as running reports and statistical analyses.
� A data repository is a snapshot of the present (and perhaps the recentpast); the company’s transactional systems regularly update the data inthe repository for specific tactical decision-support tasks.
An extended exampleSometimes a full example can help bring a business situation into sharperrelief.
Wheels Automotive, Inc.Imagine that Wheels Automotive is a car dealership that sells new and usedcars to the public. You’re the General Manager of Wheels; you need a betterunderstanding of customer behavior, with the hope that you can identifyyour most profitable customers, and come up with some new sales and mar-keting strategies. You ask your IT department for a list of customers — andwhen they respond by asking you, “which list?”
With several parallel systems at Wheels containing customer and sales data,seemingly simple questions are hard to answer.
Let’s imagine that the fictional dealership, like most companies in the realworld, has evolved quite a bit in its 20-year history — first only offering newcar sales, but eventually expanding into used cars, parts, service, and auto-motive financing. With the addition of each new line of business, the company
263Chapter 16: BI Target Databases: Data Warehouses, Marts, and Stores
24_127230 ch16.qxp 12/4/07 12:44 AM Page 263

added new information systems to support it. In addition to that, the sales-men use a shared Microsoft Access database to track sales prospects as they walk into the showroom or call to express interest in purchasing anautomobile.
Figure 16-1 shows the multiple overlapping operational databases that trackcustomer and/or sales information. They operate independently of oneanother, on a variety of platforms. A lot of the same information appears inmore than one system; for example, nearly every database maintains infor-mation on customers for that line of business. But no single database has acomplete view of the customer. If you wanted to see a list of a customer’sentire transaction history with Wheels, you’d have to run several differentreports (one or more in each system), then combine the results manually.
Implementing a data warehouse at Wheels would take the operational infor-mation maintained on the dealership’s six operational systems, and store it inone place, in a unified format, building a single historical record of the com-pany’s business history. That would give Wheels employees a single view ofthe activities across the entire company to work from in order to performreporting and analysis tasks.
Figure 16-2 shows the desired configuration of the Wheels Automotive datawarehouse: Each separate database feeds its relevant customer and salesinformation into a central data warehouse.
By moving the data from its different homes into a single repository we’veachieved one single view of the customer base. Now, rather than making usscour through six different systems, the data warehouse shows every interac-tion with a particular customer by executing one query or compiling one report.
Now, if you look up a given customer of Wheels Automotive, the applicationwould access the data warehouse to display the customer’s profile
FinancingCustomers
Oracle
Active SalesProspects
MS Access
Automotive ServiceCustomers
SQL Server
Parts DepartmentCustomers
LegacyMainframe
New Car SalesCustomers
SQL Server
Used Car SalesCustomers
SQL Server
Figure 16-1:The
variety ofoperationaldatabasesat Wheels
Automotive.
264 Part V: BI and Technology
24_127230 ch16.qxp 12/4/07 12:44 AM Page 264

information along with a list of every sales transaction involving that cus-tomer regardless of the department.
What you see in Figure 16-3 is a simplified version of the real data that wouldappear, and be stored, in a data warehouse. To keep complexity at bay whileexplaining the concepts, I’ve had to distill the customer and sales informationinto a basic format. A real car dealership would track detailed customer infor-mation (as would any business) — for example, e-mail, phone, census data,preferences, and other details, in addition to a mailing address. The salestransactions would also contain a far greater level of detail. But even withoutall the detail, the utility of a consolidated view of the customer should be clear:
� It allows for better operational decisions by the sales people when a cus-tomer walks in the door.
� Storing it in a data warehouse that’s customized for reporting purposes,managers can build meaningful customer and sales reports in a fractionof the time it would take if anyone attempted to bridge the six opera-tional systems for the same purpose.
Sales Project12/02/2004
New Car Sale01/16/2005
Service01/16/2005
Parts04/01/2006
Service09/21/2007
Used Car Service
N/A
$31,788.40
$1,125.00
$19.94
$299.99
$9,705.93
2005 Ultimo LS
2005 Ultimo LS
Ultimo-Extended Warranty
Wiper Blades
30,000 Mile Checkup
2007 Slider GT09/21/2009
909 Axton Ct.Eric Smith
Cust
omer
Sal
es T
rans
actio
ns
Texas 75022Dallas
Figure 16-3:A Wheelscustomerrecord inthe data
warehouse.
FinancingCustomers
Oracle
DataWarehouse
Active SalesProspects
MS Access
AutomotiveService
Customers
SQL Server
PartsDepartmentCustomers
LegacyMainframe New Car Sales
Customers
SQL ServerUsed Car
SalesCustomers
SQL Server
Figure 16-2:The
Wheels datawarehouse
architecture.
265Chapter 16: BI Target Databases: Data Warehouses, Marts, and Stores
24_127230 ch16.qxp 12/4/07 12:44 AM Page 265

The challenge of unifying dataThe data warehouse sounds good in theory, but in practice it’s a little harder.For every live person who has ever transacted with Wheels Automotive, youwant to eliminate duplication and store a single customer record. So part ofbuilding the data warehouse involves identifying situations where that singleperson is stored in more than one operational system.
To accomplish unification in the Wheels data warehouse, you have to com-pare the customer records in each database, combining those where you’resure the duplicate data relates to a single person. To start with, you have tosort the records into categories:
� Two or more identical records, where each of the data fields are exactlyalike and likely relate to a single customer.
� Records where you can make an educated guess (or apply certain rulesto come to a conclusion) that they relate to the same customer.
� Records that share a few characteristics and might be the same, but youcan’t be sure without further investigation.
Figure 16-4 shows the challenges of trying to match up information from dis-parate data sources to get to one version of the truth. Identical records canbe treated as one person, but business rules must be thought through andthen implemented on how to handle records that are not perfect matches.
This exercise is an example of what a data warehouse project team must dowhen it implements a single repository of customer data. If there are 100,000duplicated names, your IT team will need to program the system with ruleson how to combine them, since it would be too time-consuming to join therecords manually. Note there are two records in the same database thatappear to refer to the same customer: Gerald Z. Juarez. The person’s name isunique enough to draw that conclusion, but how would you program a com-puter to make that judgment? The different addresses could simply mean thecustomer moved between visits to Wheels Automotive, that Mr. Juarez hastwo valid addresses, or that there are indeed two customers, each namedGerald Z. Juarez.
How does data get so confused in one small car dealership? It can happen ina number of ways. Wheels Automotive might have purchased the used-carbusiness down the street and inherited their sales system. As business needsevolved over time and new systems were installed or upgraded, it’s likely thatthe developers simply redefined data for each successive system. For exam-ple, when Wheels branched into the automotive-finance business, they had avendor come in and build the supporting system from scratch, ignoring theexisting database. Before long, the systems are completely fragmented andimpossible to bring together. When you consider how a large enterprise facessimilar choices with even greater volumes of data, you begin to see the valueof the data-warehouse concept — and the challenges in implementing it.
266 Part V: BI and Technology
24_127230 ch16.qxp 12/4/07 12:44 AM Page 266
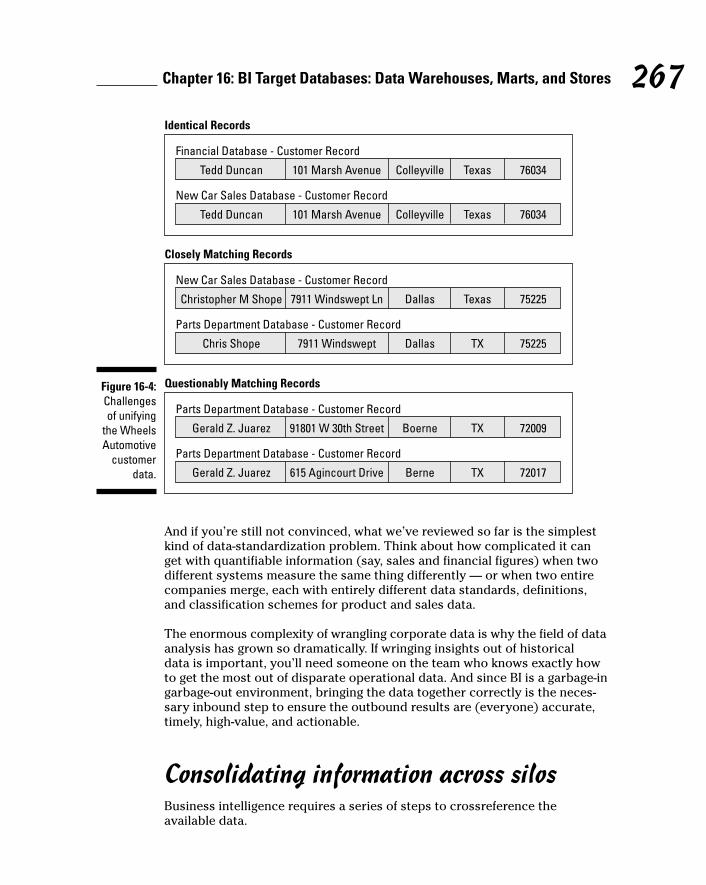
And if you’re still not convinced, what we’ve reviewed so far is the simplestkind of data-standardization problem. Think about how complicated it canget with quantifiable information (say, sales and financial figures) when twodifferent systems measure the same thing differently — or when two entirecompanies merge, each with entirely different data standards, definitions,and classification schemes for product and sales data.
The enormous complexity of wrangling corporate data is why the field of dataanalysis has grown so dramatically. If wringing insights out of historical data is important, you’ll need someone on the team who knows exactly howto get the most out of disparate operational data. And since BI is a garbage-ingarbage-out environment, bringing the data together correctly is the neces-sary inbound step to ensure the outbound results are (everyone) accurate,timely, high-value, and actionable.
Consolidating information across silosBusiness intelligence requires a series of steps to crossreference the available data.
101 Marsh AvenueTedd Duncan
Identical Records
Financial Database - Customer Record
Texas 76034Colleyville
101 Marsh AvenueTedd Duncan
New Car Sales Database - Customer Record
Texas 76034Colleyville
7911 Windswept LnChristopher M Shope
Closely Matching Records
New Car Sales Database - Customer Record
Texas 75225Dallas
7911 WindsweptChris Shope
Parts Department Database - Customer Record
TX 75225Dallas
91801 W 30th StreetGerald Z. Juarez
Questionably Matching Records
Parts Department Database - Customer Record
TX 72009Boerne
615 Agincourt DriveGerald Z. Juarez
Parts Department Database - Customer Record
TX 72017Berne
Figure 16-4:Challengesof unifying
the WheelsAutomotive
customerdata.
267Chapter 16: BI Target Databases: Data Warehouses, Marts, and Stores
24_127230 ch16.qxp 12/4/07 12:44 AM Page 267

Data-analysis activitiesDigging through the data from each individual source system to try to under-stand what information it contains and how it’s stored and presented is themajor design task associated with building a data warehouse. This is not thekind of analysis you’ll do at the end of the BI chain, where the valuable insightsstart issuing forth from the front-end software. This analysis is the step thatprecedes data integration — standardizing and integrating data from differentsource systems.
In any scheme that involves a central collection point for data, you alwaysrun the risk that the owners of the source data will feel an acute loss of control and may offer resistance to scrutiny, if not outright hostility at thethought of changes to their system. That’s where it helps to have strong datagovernance in an organization — a central authority that acts (in theory, atleast) as a central data steward. With data governance in place, everyone inthe company has to submit to the wishes of a central authority, a group (orperson or set of standards) watching out for best interests of the company asa whole, and not one team or business unit.
To perform data integration, your analysts and architects have to reconciledata from across different operational silos of the business, make businessdecisions on how best to merge that data, then codify those decisions intohard and fast rules that can be applied to the data warehouse to deliver a uni-fied view of the important objects of the business, such as sales transactions,customers, vendors, and just about anything else under the sun.
Integration of a company’s master data often involves hub technologies thatcan access, cleanse, standardize, match, integrate, and propagate masterdata. Knowledge of master data management, the vendor options, and thearchitectures that support them are essential to enabling customer data integration (CDI).
The goal here is to develop a data-management strategy that gets the rightknowledge into the hands of the right people. It has to be done securely andin a timely fashion. Oh, and the people who receive that data have to knowwhat to do with it when they get their hands on it. In theory, their decisionswill be better with a more complete vision of “the truth” (whatever that may be).
Data profilingBefore designing a consolidation plan, assemble a data profile of each sourcesystem. This usually involves a description of the relevant table structures,definitions of each field, and some statistical properties of the data (such as the record counts, the range of values found in each field, and other metricsthe designers of the data warehouse use to develop a standardizationprocess).
268 Part V: BI and Technology
24_127230 ch16.qxp 12/4/07 12:44 AM Page 268

Common data-profile information includes the following characteristics as astarting point to cataloguing data:
� Name and description: Every element in every table should have a uniquename in your data profile that relates to the specific field name used insystem code. The data profile will also include a definition of the data’sfunction and role — in non-technical language if possible and applicable.
� Data type and validation rules: Every value of a field must follow certainpatterns and belong to a general domain of information. For example,the field NAME_F, which contains the first name of a person, will be atext field with a specific character limit.
� Ownership and origin: All data fields belong to a certain hierarchy thatleads up through the table structure, the database, and application oforigin. The key information here is understanding who sets policy onhow the data is handled at the operational level — whether single man-ager or governance committee.
� Relationships and business rules: This important information compriseshow the data fields and tables relate to one another in a business con-text, and what policies affect their values.
There’s more information that can be captured, such as physical location ofthe data, security policies surrounding the information, usage details, andothers that can be listed about source data. But there’s no guarantee all orany of it will be available, so the data analyst is charged with doing the besthe or she can.
For a large system with several operational data sources, profiling and ana-lyzing the data can be a huge job. But it’s an important one for a successfuldata-warehouse effort. This knowledge about existing operational data willprovide guidance to the designers of the transformation and loadingprocesses that come later.
The data analysts have to bridge the gap between the technical and the busi-ness worlds when they go through the integration process. They’ll be connect-ing the two domains together with every decision they make. For example,when two customer records are being integrated, the data analyst mustresearch and understand how company employees have input customer datahistorically. What process did they follow? Were there business rules thataffected what information they recorded? Once they have a full understand-ing of the real-world processes, they can make a determination about thetechnical specifics for integrating the records.
These questions aren’t as easy as they may first appear. What constitutes acustomer anyway? If you restrict it to visitors to your store or website whohave made at least one purchase over their lifetime, what happens to people
269Chapter 16: BI Target Databases: Data Warehouses, Marts, and Stores
24_127230 ch16.qxp 12/4/07 12:44 AM Page 269

that are listed as prospects but who’ve never actually consummated a pur-chase? What if two otherwise identical records have different phone numbers?In that case, the data analyst must make a determination about which one“survives” (in that case the analyst would probably set up a rule to take thephone number of the record that was edited most recently, assuming thatinformation exists in the system.) These are important questions and canhave far-reaching consequences for the business.
Structuring data to enable BIIf your data analysts do a good job for you, the data profile will provide acomplete picture of the state of your system’s origin data. Now it’s time to get that data into a format that’s usable for BI user applications.
You can’t dump all the data you’ve just profiled into a data warehouse willy-nilly. Once you know what you’re dealing with in terms of source data, it’stime to work through the steps of cleansing and arranging it, then workingout how and where to store it, and in what form.
The user-facing systems that rely on the target data system will likely use somecombination of high-impact querying and reporting applications, statisticalpackages, and possibly analysis and visualization software. The intendeduses for the data will actually go a long way to determining how you shouldorganize the data. You know where the data is coming from, and have a goodidea of the kinds of applications that will access it on the front end. Theseapplications will all have slightly different data-consumption needs, but there are some standard parameters to keep in mind, as outlined in theupcoming subsections.
The BI target dataThe BI target database will have to be built for one-way performance — notfor storage efficiency. While operational databases work to normalize recordsfor rapid read/write operations, the data warehouse is there to feed queriesfrom front-end tools. Other than when operational data gets fed into it, thedata warehouse is a data provider, not a data consumer.
BI users will request information in formats that make sense to them, logi-cally modeled on the business itself. So, rather than storing data in a way thatrequires complicated queries for access, a data warehouse stores companyinformation in the same way knowledge workers actually think about thebusiness.
To perform advanced analyses, users will be thinking in terms of the familiarbusiness events and objects they’re comfortable with: sales, products, cus-tomers, and stores. Users won’t be thinking about confusing database
270 Part V: BI and Technology
24_127230 ch16.qxp 12/4/07 12:44 AM Page 270

terminology like primary keys, cross-references, or the complicated JOINstatements required in SQL queries. Data must be made accessible to peoplewho aren’t database experts.
Designing an information hierarchyWhen you think about the most important measurements to evaluate withyour front-end systems, you’ll probably focus on a series of simple facts andmeasurements. Good examples might be financial metrics — such as sales orgross margin — or utilization rates for resources, length of wait time for acustomer-service center, or some other quantifiable metric that your com-pany is trying to optimize.
Storing data in terms of dimensions makes it easier to retrieve for rapidquerying and analysis for BI purposes; it allows users to search for factsaccording to their dimensions. For example, you can query the system for allsales transactions (facts) that included a certain product type (dimension) ina certain zip code (dimension). Storing data by dimensions is actually acloser approximation of the way people usually think about company data.
Each dimension is an aspect of an individual business event that describes orcategorizes it in some way. Dimensions give events context and meaning.Combining facts with dimensions tells you what happened in the companyunder the exact conditions you specify.
As an example, consider a hypothetical railroad: passenger-carrying busi-nesses typically measure their efficiency through a metric unique to theirindustry, known as passenger-miles (P/M). One P/M is a single paying passen-ger traveling one mile aboard a train operated by the company. So a trainwith 100 people on board that traveled 50 miles gets entered into the systemas 5000 P/M. Normally the railroad would then use that figure as a denomina-tor for some other measurement, such as revenue for the trip, the cost ofoperating the train, or the amount of fuel used. Each calculation gives someinsight into the operating efficiency of the railroad.
At the most granular level, the railroad would look at a particular train tripbetween two cities, take the number of paying passengers, and multiply it bythe number of miles to come up with the P/M for that trip.
The railroad might then want to measure P/M by several different aspects ofits operations, starting with that same level of detail — these, for example:
� By time: Total P/M for the day, which adds up to P/M for the week, andon up to the month and the year.
� By geography: P/M between any two cities within a region, all combina-tions of which add up to the regional P/M figure. All regional P/M figuresadd up to the national P/M measurement.
271Chapter 16: BI Target Databases: Data Warehouses, Marts, and Stores
24_127230 ch16.qxp 12/4/07 12:44 AM Page 271

� By locomotive type: P/M for a specific locomotive, PM for locomotivesof the same type, PM for locomotives of the same family: electric versusdiesel or, perhaps, steam (just for fun).
The list of “By” measurements is only limited by the number of dimensionsyou store. And any dimension could have a hierarchical quality to it — likethe three dimensions shown here, where individual measurements can begrouped into successively more general ones.
Arranging data hierarchically in the data-storage environment makes it muchfaster and easier to get more meaningful chunks of information for users. Inan operational environment, these hierarchies have to be calculated manu-ally, and put through complex, costly (in terms of processing speed) data-base commands.
Aggregation is the general term that describes how data can be summarizedat different levels of hierarchical detail. A data warehouse should support“rolled-up” calculations for a hierarchy of values for every dimension. In thepreceding example, that capability would allow the user to query the datawarehouse for broad swathes of data, such as the P/M in the East Region, forthe entire month of June. Even though the you could see P/M measurementsin much finer detail if you wanted to, aggregation and summarization capabil-ities provide quick response time for more general queries.
272 Part V: BI and Technology
A word about Master Data ManagementA host of buzzwords float around the concept ofenterprise-wide data-management practices.One of the more common ones you’ll see isMaster Data Management (MDM).
MDM is a concept that involves an enterprise-wide approach to ensuring consistency ofmeaning and quality of all company data. Whilethat idea is consonant with data warehousingand BI target databases, it goes beyond simplyintegrating a few domains of data for reportingand analysis. MDM efforts are aimed at creatingone version of “the truth” across all systems —not just in the data warehouse, but also in the operational environments, the EnterpriseResource Planning (ERP) modules, and any-where else in the company where informationis being handled.
MDM is meant to touch systems and environ-ments that have nothing to do with your BI pro-ject, or the data warehouse you’re creating tosupport it. What happens, in many cases, is theBI team adopts the MDM cause because BIprojects require a level of data standardizationacross the enterprise. Once the team has gonethrough the various obstacles and created asingle picture of company information for thedata warehouse, other entities in the companybegin asking about going through the samestandardization process in their areas. Theassumption is that the mantle of responsibilityfor MDM rests with the BI or data warehousingteam. In theory, though, MDM should come firstas a broad company goal, the achievement of which would make data warehousing — andBI — much easier.
24_127230 ch16.qxp 12/4/07 12:44 AM Page 272

Data derivation is another feature of data warehouses. It’s certainly not aunique concept to BI target systems, but it’s still an important one. A derivedfact is an atomic (indivisible, highly specific) piece of data that doesn’t existper se in the source data. The data warehouse creates it with a prearrangedformula based on a combination of original data elements.
As an example, a large computer-hardware manufacturer may not track grossmargin on every component transaction in any of its individual source sys-tems. But a developer may be able to derive that important measurement fromexisting data. The developer might create a formula based on figures from two different systems:
� sale price from the CRM system
� cost-of-goods-sold figures from the supply-chain database
Subtracting one from the other yields the required margin-by-componentmeasurement. The data warehouse would be programmed to perform the cal-culation to derive that margin figure and store it in a pre-arranged table,where it would then be available for analysts to see in reports and analyses.
If the BI target database were a rock group, it would play nothing but covertunes. No original songs would be on the set list. The BI target database is arepository for information that exists in other systems. Sure, there may bederived data, and some fields might be transformed to make the underlyinginformation easier to understand or more accessible. But at the most basiclevel, there should be no new facts or events recorded in a BI target systemthat aren’t already in an operational database somewhere else.
Data qualityPoor data quality undermines the value of information and causes users andstakeholders to distrust the applications that rely on it. Part of preparing thedata for use by a BI application is going through checks to ensure the data’squality.
It’s logical to demand stringent data-entry standards as protection againstpoor data quality. For example, if customers are being entered into the systemwithout Zip codes, you could implement an application update that woulddisallow the entry unless a full five digit Zip was entered. While it soundsgood in theory, the reality is that it could cause unintended consequences.Harried data-entry clerks (for example) could circumvent the rules by enter-ing in 00000 as a Zip code, or put in some other nonsense 5-digit number, tomake it easier on themselves. Data-entry standards should certainly play apart, but they should be carefully designed — and they’re no substitute for aback-end data-quality process.
273Chapter 16: BI Target Databases: Data Warehouses, Marts, and Stores
24_127230 ch16.qxp 12/4/07 12:44 AM Page 273

Data ModelsAfter the source data has been analyzed, categorized, and profiled, it’s time tomove on to designing the BI target database. The first step in the constructionof any database is choosing a data model: the set of rules and constraints forhow information will be organized and filed away in a database. We’re talkingabout logical storage here, not physical storage — the database-managementsystem handles most of that without you having to worry about it.
A model helps us understand the real world by presenting a fat-free versionof it. The model represents the data — which in turn represents the businessentities and relationships that populate the real world. But since the real worldis a complicated place, the data can sometimes be exceptionally complicated.To be effective, your model must share enough characteristics with the realthing to acts as an accurate representation while at the same time boil downits essential qualities so steam doesn’t come out of your ears when you thinkabout it.
The data model will guide how your target database will store and arrangeinformation. That means it’s a good idea to put the model through the pacesduring design so that it can handle all the information needs that could arise.
In designing your data model — and therefore your data itself — you’re con-stantly making trade-offs between reality and usability. If you make the datamodel too simple, you may be hiding important complexities of the real busi-ness operations. But if you make the data model too complex, your userswon’t understand it, and as a result won’t be able to use the front-end appli-cations to their fullest extent — and then you can wave bye-bye to all thosegreat business insights you dreamed of.
Dimensional data modelA dimensional data model represents business processes and events, such assales, or shipments, or factory output.
Fact tables and dimensionsMost data warehouses use the dimensional model in the preceding railroadexample, where information orbits around measurable facts like sales num-bers. Those important facts occupy the central position in the database,occupying a table from which the rest of the information radiates.
The database stores those central facts in a table known (curiously enough)as a fact table. Each row in a fact table is a basic, atomic unit in the database.Database designers are charged with deciding not only what the key factsare, but also with deciding how granular they want to make the fact table. For
274 Part V: BI and Technology
24_127230 ch16.qxp 12/4/07 12:44 AM Page 274

example, if you’re measuring financial performance, make some measure ofsales serve as your fact. The designers will then decide whether each row inthe table represents a single line-item from a transaction, a single transaction,a daily total of transactions for each store location, or some other aggrega-tion of sales information.
The second key pillar of a dimensional model is how dimensions (particularaspects of a fact) are chosen, categorized, and stored. Dimensions are the dif-ferent ways you can filter facts, such as sales by sales person, sales by producttype, or sales by time period. If sales are the core measures in the fact table, adimension would tell you something about that dollar amount. For example,you might run the following query:
Show total sales by state
Here geography is the dimension, since you’ve queried the system to breakthe sales down by state. If you queried the system to show you total sales byzip code, you would still be querying along the geographical dimension, butyou’d be slicing the same sales data along slightly different lines. The corefacts would be the same, but the dimensional model allows you to break itinto pieces in whatever way is useful to you.
Benefits of the dimensional modelThe great thing about the dimensional model is that data is stored the waypeople think. The fact tables are the key measurement of the company’s per-formance that we’re trying to measure — whether it’s sales, seat-miles, orminutes on hold. And the dimensions are all possible influences on thosemeasures.
Normalized data, on the other hand, is not arranged in a way that reflects howpeople usually think. That’s what makes dimensional data so useful; it doesn’thave to be stored in some arcane, secret, programmers-only code. Regularpeople can query the database and feel comfortable that the results will bejust what they asked for in the first place. That’s not a trivial benefit; it boostsuser satisfaction with the front-end tools, and it brings workers closer tothose all-important BI insights.
There are other benefits as well:
� Not only is the data more intuitive for users who will create queries andreports, but it also makes the data warehouse easy to understand fordevelopers. That’s good for the construction time and helps with main-tenance as well.
� Intuitive dimensional data is important to the BI architect too, becausereporting tools and advanced analytics and statistical packages are pre-wired to work in that kind of environment, making new tool integra-tion easier.
275Chapter 16: BI Target Databases: Data Warehouses, Marts, and Stores
24_127230 ch16.qxp 12/4/07 12:44 AM Page 275

� Unifying the data from the operational data sources into a single modellends itself to a dimensional model if each system is focused around thesame function.
� Query speed can be improved. Rather than requiring extremely complextable joins, the dimensional model allows simpler, more direct operationsto filter out only the rows required by the requester.
� The dimensional model has a flexible schema — although it’s not neces-sarily easy to do, you can add more facts and dimensions without havingto rebuild the database.
Downside of the dimensional modelData normalization reduces redundancy in databases as a way to improvestorage efficiency and reduce the potential for data inconsistency and errors.Those negatives can potentially come into play with the dimensional model.Many of the data-integrity enforcement rules inherent in a relational datamodel are thrown out the window in a dimensional model. Result: A whole lotof data ends up getting stored.
Multidimensional star warsThere are two primary models for storing dimensional data: star schemasand snowflake schemas. Each has its good points and bad points. Data pro-fessionals inevitably have a strong opinion as to which is best for the datawarehouse they’re administering.
Star schemaThe star schema is the basic manifestation of the dimensional data model. Ithas two levels of data and two levels only — facts and dimensions. It’s calleda star schema because the central fact table has any number of dimensionsradiating out from it that offer aspects of the information described in thefact table.
Figure 16-5 is a simple representation of the tables in a star schema. The cen-tral event being measured is the sales information stored in the SALE FACTtable. The information in the four attached dimension tables is there todescribe the most specific sales transactions.
The star schema allows analysts to measure facts from a variety of perspec-tives limited only to the number of dimensions stored along with them. It’s apopular way to store data in a data warehouse because it mimics the wayusers often think of business information.
For example, if analysts are looking for insight on the performance of differ-ent retail stores in a given region, they would essentially be asking to see all the individual sales transactions that met the criteria of their query — calculated together. The fact tables in a star schema represent just that — along list of individual transactions (whatever they might be) that can be fil-tered and brought together according to the information that describes them.
276 Part V: BI and Technology
24_127230 ch16.qxp 12/4/07 12:44 AM Page 276

This data model is the most popular in use in data warehouses that feed BIapplications. It’s easy for developers and end-users to comprehend, whichmakes databases built with a star schema easy to create, maintain, and use.
One dimension you almost always find in a star schema is time; data ware-houses are built to provide insight into historical performance of companyevents. Inevitably, one of the standard ways that analysts look at data is bylooking at it across defined time periods. That’s important because it showshistorical trends, and allows you to make inferences about the past and itseffects on the future.
Snowflake schemaThe snowflake schema is closely related to the star schema in that the datamodel is centered on a central fact table. But it handles dimensions a little bit differently; some dimensions are normalized to save space and reduceredundancy.
The snowflake schema has become popular because it is said to use the bestof both worlds. The core information is dimensional, making the data modeleasier to understand and access; but rather than storing certain detail infor-mation over and over again, it takes advantage of normalized tables in someparts of the database.
What the snowflake schema gains in data redundancy and flexibility, it losesin terms of complexity. That means it’s harder for data analysts and adminis-trators to maintain and tune than a snowflake structure.
Product NameModel #Engine Size
Product Dimension
PK Product ID
Time ZoneHoursMinutesSecondsDateMonthYearDay of the Week
Time Dimension
PK Time Stamp
Company NameContact NamePhone NumberLoyalty Number
Customer Dimension
PK Customer ID
Associate NameEmployee NamePhone NumberCommission Percentage
Sales Associate Dimension
PK Associate ID
Product IDCustomer IDTime StampAssociate IDUnits SoldFull PriceDiscount AmountNet Sales Amount
FK1FK2FK3FK4
Sale Fact
PK Sale ID
Figure 16-5:Table
structure in a starschema.
277Chapter 16: BI Target Databases: Data Warehouses, Marts, and Stores
24_127230 ch16.qxp 12/4/07 12:44 AM Page 277

Figure 16-6 shows the table structure of a snowflake schema. Like a starschema, it’s organized around a central fact table that contains some essen-tial piece of information about the company. And it’s also surrounded bydimensions. The difference is that the dimensions of a star schema arebroken into normalized hierarchies to save space and reduce redundancy.
Other kinds of data modelsIn data warehouses, dimensional models are the name of the game. But thereare approaches other than the star and snowflake schema.
Normalized schemaRelational databases use normalized schema, where every effort is made tostore information once only.
Operator NameOperator ShiftExperience LevelLanguage IDFK1
Operator Dimension
PK Product ID
Center NamePostal CodeFK1
Center Dimension
PK Center ID
CityTime ZoneDistrict IDFK1
FK1FK2
Location Dimension
PK Postal Code
Language NameAlphabet
Language Dimension
PK Language ID
District NameRegion IDLanguage ID
Market District Dimension
PK District ID
FK1FK2
Customer NamePostal CodeLanguage ID
Customer Dimension
PK Customer ID
Region NameState/ProvinceCounty
Market Region Dimension
PK Region ID
Call StartCall EndCall LengthOperator IDCustomer IDCenter ID
FK1FK2FK3
Call Length Fact
PK Call ID
Figure 16-6:Table
structure ofa snowflake
schema
278 Part V: BI and Technology
24_127230 ch16.qxp 12/4/07 12:44 AM Page 278

This makes good sense when you’re trying to maintain tight data integrityand use minimum storage space. It’s also the right way to go for transactionalsystems where programs need quick response times when accessing, modify-ing, and writing records.
Hybrid modelsAlthough data-storage systems usually go one way or the other, sometimes it makes sense to use a blended approach — a normalized schema for onedomain of data, and a dimensional model for another domain.
Whether this approach works depends on the nature of the queries you planto run against the data warehouse. A combination of normalized and dimen-sional constructs must be perfectly compatible with the kinds of queries youplan to run for your schema to work well. Most experts agree that’s a rareoccurrence. You have to ask the questions a certain way, and the data mustbe related in the real world just so. Let your data architects guide you in thisdecision; just make sure you supply them with enough information to think itthrough. In addition to determining the structure of the data and the queriesyou’re planning to run, ask these questions:
� What’s more important — system performance or ease of use and maintenance?
� How flexible does the system need to be?
� Can the software to be connected to the data warehouse support a hybriddata model?
� Is anything changing in the future that might force us to run differentqueries than we anticipated?
There’s no sure-fire right answer with data models. Don’t squeeze your datainto a dimensional model if it’s a square peg in a round hole. If the data you’remodeling is too complex (whether from the source system, the processes, ora combination of the two), it may be impossible to apply a dimensional modelto the business objects and measures. Start with what you have and work outwhich model works best. Don’t start with a model in mind and work backward.
Data MartsImagine your company implemented a data warehouse that collected cus-tomer and sale transaction information from every division and subsidiary in the business. That should be very useful; throughout the entire enterprise,the data warehouse offers a unified, integrated view of information. But say themarket research department wants to access that data and run a specifickind of predictive-analytics application against the information stored in thedata warehouse. The company might institute a data mart for the marketing
279Chapter 16: BI Target Databases: Data Warehouses, Marts, and Stores
24_127230 ch16.qxp 12/4/07 12:44 AM Page 279

team. Several definitions for data marts exist in the BI landscape, but themost commonly accepted one is a single-domain data aggregation used forreporting, analysis, or decision-support. Data marts vary in their architec-ture; they may receive data from data warehouses, or directly from transac-tional systems. They may perform transformations and calculations on thedata similar to data warehouses. But data marts are always limited in theirscope and business purpose.
For example, you might have a data mart that services the point-of-sale systemin your business. The fact tables in your data mart that you’d want to queryand report from would be sales transaction information, such as the amountof each sale, the line items (such as SKU number), and if any discount wasapplied to the sale. Those basic facts could be connected to a number ofdimensions stored along with the transaction data. The dimensions for trans-action data might be time information, store information, and which cashiercompleted the sale.
Data marts can be great for more casual users without the same level ofexpertise as a regular or power user of advanced tools. Merge high-levelinformation on a single functional topic into a data mart environment andleave out the detail that you might offer to more experienced users. Forexample, the CEO might want high-level views of sales information withouthaving to operate a complicated reporting tool or write complex queries.
One danger of modeling every business process/event is that you could endup with many disparate, unrelated data marts. Each data mart will functioneffectively and answer specific business questions in its domain. Each datamart’s value to the organization, however, will be restricted; questions can’tbe answered across different functions of the business.
Operational Data StoresThis may surprise you, but an operational data store (ODS) is designed tointegrate and store . . . wait for it . . . operational data for reporting and analy-sis purposes. Your organization may have need to take snapshots of currentoperational data that can be made available and examined to support tacticalfunctions such as decision-support processes or reporting of some kind.Because data warehouses are designed as keepers of the historical record,they may not be able to respond fast enough to meet tactical needs. If that’sthe case, an ODS may be for you.
Business intelligence is about delivering insights that are, among other things,timely. An ODS can help ensure that insights are delivered in time to act onthem by delivering up-to-the second views of operational data.
280 Part V: BI and Technology
24_127230 ch16.qxp 12/4/07 12:44 AM Page 280

An ODS functions like a data warehouse: different systems around the com-pany feed it operational information which it processes into a homogenousform so analysts and report-writers can get one single view of the information.
Unlike a data warehouse, however, the ODS is not meant to maintain a vasthistorical record of information. The information in an ODS is meant to be acurrent (or at least very recent) view of the company’s operations. That givesbusinesses a chance to do instant analysis to react to a given situation.
Many companies use the ODS as a staging area for the data warehouse. Theintegration logic and processes reside on the operational data store. That waythe incoming data is transformed properly for smooth integration. Then, on aregular basis, the data warehouse takes the current batch of data from theODS and adds it to the existing historical data already in the system.
281Chapter 16: BI Target Databases: Data Warehouses, Marts, and Stores
24_127230 ch16.qxp 12/4/07 12:44 AM Page 281

282 Part V: BI and Technology
24_127230 ch16.qxp 12/4/07 12:44 AM Page 282
Chapter 17
BI Products and VendorsIn This Chapter� Evaluating the pure-play vendors
� Dabbling in BI with the big software firms
� Considering what makes a good vendor
� Checking out the open-source movement
� Taking stock of the minor players
For project managers and BI project sponsors planning a new businessintelligence initiative, selecting the software to power the environment
is one of the biggest choices of the implementation.
The good news is the industry has matured; a host of powerful, capablechoices await the application evaluator. There are general-purpose applica-tions, specialty applications, all-in-one packages, and cafeteria-style plans.The software industry has risen to the demand for good BI tools that can digup those business insights that are (you know the mantra) accurate, timely,high-value, and actionable.
All those choices can be a little overwhelming, so this chapter surveys thecurrent state of the software industry as it relates to business intelligence.That state is always changing, and not always easy to define.
This book is accurate as of the completion of the manuscript. But if the pastis any indication, several major acquisitions will take place the moment thebook goes to print, and the entire industry landscape will change overnight.
The BI software market is notoriously dynamic. There are niche players whopop into existence and make a name for themselves in one specialty. Pure-playvendors specialize in creating products for a single business purpose — inthis case, BI. Then there are the large software vendors who made their markoutside of BI. As they try to get in on the lucrative business intelligence soft-ware market, they often buy up smaller players to complete their BI productportfolio. Complicating it all is the shifting landscape of product features andcorporate needs. Important functionality currently packaged in a larger appli-cation suite may be spun off tomorrow as a standalone product. What I’msaying is caveat lector — reader beware!
25_127230 ch17.qxp 12/4/07 12:45 AM Page 283

Overview of BI SoftwareEveryone defines the boundaries of the marketplace a little bit differently. Forthe purposes of this book, we define the BI market as an aspect of everythingin the technology stack — from the operational data to the user-facing toolsthat spit out those valuable insights:
� Database-management systems (DBMS)
� Data-integration tools
• ETL (extract, transform, load) tools
• Data warehouse tools
� Querying, Reporting-and-analysis tools
• Ad-hoc queries
• Enterprise report management
• Notification and messenger services
• OLAP and other analysis
� Other front-end tools
• Data-mining and analytics
• Visualization tools (dashboards, scorecards, graphics)
� Access tools (portals, mobile access)
It’s been said many times many ways in this book, but it’s worth saying again:There is no such thing as a one-size-fits-all solution in BI software. Some com-panies try to touch every space, but there is no one company whose productdoes everything well.
Don’t become too enamored with these labels. Ask different BI experts andthey’ll give you a different family tree for business intelligence-related soft-ware. But you have to start somewhere, right?
The dimensional modelAmong every main BI group, the software BI software can be thought of alongfive major qualitative (or semi-qualitative) dimensions. I haven’t includedprice because it’s a given that you must evaluate every resource for your pro-ject along the lines of how the dollars and cents fit into the project budget.
284 Part V: BI and Technology
25_127230 ch17.qxp 12/4/07 12:45 AM Page 284
� Feature set: Can this application do precisely what I need it to do wheninstalled in my environment? Different software vendors focus on differ-ent functionality, so just because you’re looking at two different OLAPtools doesn’t mean you’re getting exactly the same thing.
� Compatibility: Will this application work with others? BI tools up anddown the technology stack by their very nature must interact well withthe other kids who already live on the block. But that doesn’t meanthey’re all best friends. This is extremely important because most com-panies already have a data environment of some kind that their BI toolsmust conform to.
� Packaging: What does the software vendor put into a single release of their BI software? You might get everything you need with one set oflicenses; then again, you may be purchasing off the á la carte menu.
� Performance: How fast can it handle the volumes of data I’ll be throwingat it? And if that number goes up dramatically in the future, will the soft-ware be able to grow with it?
� Ease of use: Closely related to how much training and support you’ll getfrom the software vendor. Some companies are out to make money ontheir software licenses, others on their support. Make sure you accountfor both when you select your software.
What makes choosing software a little bit easier for most folks involved in BIprojects is the fact that they often don’t have a lot of choices. It’s not thatthere aren’t a wide range of products on the market; quite the contrary infact. The problem, or rather the reality, of most projects and companies isthat they dictate a certain set of features by their very nature.
Working togetherThe compatibility dimension is the first thing that BI professionals think ofwhen considering a new installation or an upgrade; the software you installmust work with the data currently in the system, and it must speak to thesystem.
The last ten years have seen a lot of progress in standards, which has openedup the market. Almost all products can speak some form of the standardknown as Open Database Connectivity (ODBC), which translates requests andresponses to a database system into a kind of lingua franca available to all.Vendors are publishing application programming interfaces (APIs) that allowdevelopers to access a product’s functions in code. The Extensible MarkupLanguage (XML) standard has been important — and the continued prolifera-tion of the World Wide Web itself (along with the advent of the browser as aproductivity tool) has spurred this process along.
285Chapter 17: BI Products and Vendors
25_127230 ch17.qxp 12/4/07 12:45 AM Page 285

Even though these standards are established, nothing is universally compati-ble. And the concept of compatibility is far from attaining the checklist-likesimplicity that we all wish for it. In practice (for example), applications thatstore data in XML may not work with another XML-based system.
Mixing vendors to get just the right set of features — or to create an overallsolution that’s in the right price range for your budget — is a good plan. But you’d better have the experts on hand to make all those supposedly-compatible components work together.
Even when you find the right product or vendor that sits at the perfect inter-section of price and your required qualitative dimensions, you may have tonarrow down the field still more. Companies often mandate certain standards,or may have pre-existing relationships with certain vendors; if yours does,then there’s another set of restrictions that your project team has to adhere to.
The BI Software MarketplaceThe BI software marketplace is populated by companies of all shapes andsizes. Among the market leaders are familiar names such as Microsoft and Oracle, but also smaller pure-play BI companies such as Business Objects.Additionally, there are niche players who perform a single function very well,along with vertical specialists: companies that focus on BI for a particularindustry.
A little historyThe origins of today’s multibillion-dollar business intelligence software marketare humble and scattered. The disciplines that came, went, metamorphosed,changed names, and came back again almost always began with niches ofinnovators inside companies looking to squeeze some knowledge from allthat data. No wonder the companies that formed the early BI marketplacewere, like their adopters and champions, niche players.
The early days of BI — in its various forms — evolved with smaller companiescreating islands of technology; their number-one concern was winning in acompetitive niche. That meant offering high-performance and feature-richproducts (as defined by their market) rather than being flexible. Instead ofoffering universal compatibility, the small BI vendors would build their pack-ages to work well with one core database system.
That all changed as client-server networks grew in popularity, and eventuallygave way to the Internet and World Wide Web. Software became more modu-lar. As companies began to mix-and-match their BI components, interactivityand compatibility became more important.
286 Part V: BI and Technology
25_127230 ch17.qxp 12/4/07 12:45 AM Page 286

Mergers and acquisitionsThe BI software marketplace is like a shark tank, with small fish swimming fortheir lives and eventually doing one thing well enough (ironically) to get themeaten by a larger fish. That larger fish then gets eaten by an even larger fish,and so on until there are fewer competitors in the market.
Big fish, small fishIn recent years, the shape of the market has been set by the acquisitive natureof the big business software vendors: Microsoft, Oracle, IBM, and SAP. At thesame time, the pure-play BI vendors have not rested on their laurels; theycontinue to buy up competitors and complementary players to improve theirstanding in the market.
The acquisitions cascade upward. In the BI arena, often the mid-sized compa-nies (such as Hyperion, Cognos, and Business Objects) have been the marketleaders up and down the BI technology stack. With the exception of the data-base arena, the major software companies have played only a minor, butincreasing, role in the marketplace. The mid-market companies have takenaim at the other medium-size and small players in the market, buying themup to round out their BI portfolios. In recent years the software giants havegotten into the game, entering the BI market in one fell swoop with the acqui-sition of a mid-size player.
Build versus buyThe generic decision for any company, in any domain, is build versus buy. If thecompany recognizes a feature or function that it needs for one of its products,or for use internally, it has a choice to make: either take the time to write thecode, or purchase an existing product from another company. There are prosand cons to each:
� Build: If a vendor creates a homegrown solution, you can rest easy know-ing that the new feature will usually be perfectly compatible with its existing portfolio of products and solutions. The downside, of course, is that the solution you get won’t be as evolved as a mature BI product.That’s because it takes time to gain the expertise and experience requiredto produce a great product. It takes years of hard work, innovation, multi-ple releases, and (sometimes) costly mistakes for software to evolve andimprove before it’s acceptable to the market.
� Buy: If a vendor spots a hole in its portfolio, or if its people believe theirown product is at a disadvantage in the market, they can just buy anexisting player to catch up quickly. A perfect example came in 2003 whenBusiness Objects bought Crystal Decisions, then a leading provider ofreporting applications (something B.O. didn’t do at the time). The down-side to this approach is that you can’t automatically assume that yourcompany’s products will work well together with those of the acquired
287Chapter 17: BI Products and Vendors
25_127230 ch17.qxp 12/4/07 12:45 AM Page 287

company. Oracle (for example) has gone through ravenous phases in itsBI growth — but all that gobbling-up has sometimes left the companywith a confusing set of products with overlapping functionality.
� Kill: Oops, there’s always this third option available to software vendors:Buy your competitor and then shutter the company, leaving your ownproduct to dominate the market. Often a competitor’s product has a fewredeeming features worth cannibalizing. Oracle has used this approachmultiple times in the enterprise resource-planning (ERP) realm — buyingcompetitors, absorbing their products’ features, and then slowly transi-tioning their customer base to Oracle products. From the perspective ofa BI software purchaser, you have to be aware that this is always a possi-bility for the product you buy.
As an interim solution, many vendors will partner with a complementaryvendor as a way to please their customer base. Microsoft, lacking an analyt-ics package of its own, did this for years with Comshare and a few other ven-dors of powerful analytical reporting packages. Partnering can mean a simplemarketing relationship where the two companies cooperate on acquiring cus-tomers, or building a technical relationship to ensure that code from eachapplication is well integrated, or some form of co-operation between thosetwo extremes.
You shouldn’t have to do it, but it’s a reality of the BI marketplace: When youdecide to go with a particular BI vendor, it’s a good idea to do both a productanalysis and a market analysis. Make sure no red flags are flapping in thebreeze on either front. Is the company trying to sell you products it recentlyacquired? (If so, how well does it know its new products?) Is the company acandidate for a takeover? (If so, are they in a position to guarantee ongoingsupport for their product?)
Sure, you should do this with all major purchases . . . heck, before you buythat vacuum cleaner, you might as well check the company history. But the BImarket is especially quixotic, so keep the eyes peeled for warning signs. Just ataste of recent acquisitions in and around the BI world in the past few years:
� Hyperion bought Brio
� Oracle bought Hyperion
� Oracle bought IRI
� Business Objects bought Crystal Decisions
� Business Objects bought Cartesis
� Microsoft bought ProClarity
� Actuate bought EII
288 Part V: BI and Technology
25_127230 ch17.qxp 12/4/07 12:45 AM Page 288

� Ascential bought Mercator
� IBM bought Alphablox
� SAP bought Pilot
� SAP bought Outlooksoft
Figure 17-1 shows how the BI software market breaks down. Nobody doeseverything well, not even Microsoft and Oracle.
Major Software Companies in BIAs business intelligence and its related disciplines have become moreengrained in the processes of corporations, major software companies thatalready supply productivity and data tools have reacted by offering BI toolsof their own.
The result is that platform vendors like Microsoft and SAP have becomemajor players on the BI scene. In some cases, their applications have beenorganically grown — planned and produced by the company’s own develop-ment team. In other cases, the major company fills out its toolbox by buyingthe company that created the product it needs.
Microsoft, Oracle
Sybase SAP, Cognos, Business Objects, SAS
IBM Oracle, Cognos, SAP(Business Function-Specialized
BI and Market Vertical-Specialized BI)Netezza, NCR Teradata (High Volume DBMS)
Informatica, ETI Microstrategy
Mysql
Back-End
Pentaho (Open Source) Jaspersoft
DatabaseManagement
Systems
ETL, DataIntegration
OLAP,Data
Warehousing
Reporting,Ad Hoc
Querying
BI Functions
AnalysisAnalytics,
Visualization,Mining
Front-End
Figure 17-1:Overview of the BIsoftware
marketplace(valid for
today only!)
289Chapter 17: BI Products and Vendors
25_127230 ch17.qxp 12/4/07 12:45 AM Page 289

OracleOracle, already a heavy player in the core database and enterprise resourceplanning (ERP) space, is a formidable presence on the BI market landscape.Oracle offers integrated BI with its transactional and ERP applications — forexample, the balanced scorecards and analytics built into its Supply Chainpackage.
Oracle, like Microsoft, has a presence up and down the BI technology stack.Oracle CEO Larry Ellison follows the same philosophy with BI as with othersoftware niches: convince customers that integration is a headache and thatgetting a unified, single-vendor platform (and perhaps sacrificing a little insome areas) is superior to taking a best-of-breed approach that might requireextensive integration.
Oracle’s dedicated data-warehouse solutions include Warehouse Builder andthe Oracle BI Enterprise Edition (essentially the old Siebel analytics platform,swallowed in an acquisition), plus platforms for building and integrating cus-tomer BI solutions. Then there’s the PeopleSoft performance-managementapplication and Hyperion’s Essbase OLAP solutions that have been integrated.
If that sounds like a lot of moving parts, it is. One of the chief complaints aboutOracle’s approach to BI is that they’ve been so acquisitive over the years —and have so many parallel and specialty offerings — that it’s difficult to navi-gate through their entire menu of offers without losing your way. Each new
290 Part V: BI and Technology
Bundles of joyMajor software companies operate a bit differ-ently in how they deliver BI to the marketplacethan do the pure-play vendors.
A company like Microsoft or Oracle has agigantic existing install base of customers usingother pieces of its business software. The twocompanies, along with a handful of others, dom-inate the enterprise database market. Thatgives them leverage when it comes to marketsthey are not traditionally strong in. And that wasthe case with BI just a few years ago.
BI vendors strategically bundle components oftheir software together depending on how theysee the needs of the marketplace. That’s good
news for many project owners because itmeans they often have software licensesalready in-house. For example, if your IT depart-ment owns Microsoft SQL Server licenses,some of the most important BI tools areincluded with that product. No need to buy any-thing extra; you have it already.
The only downside is that this approach canmake it difficult to evaluate products side byside. And if the budget winds are blowing justso, it means you might end up having to use aproduct simply because it’s already in-house,instead of purchasing a different product thathas the capabilities you actually need.
25_127230 ch17.qxp 12/4/07 12:45 AM Page 290

acquisition means the software giant has to undertake an integration effortthat can take years.
Oracle plans to join all these moving parts together in 2008 in a product suitecalled Oracle Fusion, which will merge the enterprise applications, databasetechnology, BI features, and other goodies underneath an umbrella of unifiedmiddleware.
The Business Intelligence Suite will feature the following sub-products in various states of bundling:
� Dashboard
� Answers (querying, reporting, analysis)
� Delivers (messaging and alerts)
� Publisher (reporting distribution and routing)
� Essbase Analytics (universal OLAP)
� Disconnected Analytics
� Warehouse Builder (ETL, data quality, metadata management)
Oracle products are expensive, and their BI wares are no exception. The BISuite Enterprise Edition costs $1,500 per named user or $225,000 per serverprocessor. The good news is that it works with other data sources; if youdon’t have enough scratch left over to build your solution over an Oracledatabase, you can use something cheaper and still expect it to work.
The next generation of Oracle’s products will be called 11g, will feature a moreevent-driven architecture, and will be out in late 2008. BI professionals will bekeeping an eye on it for further integration of the multiple platforms — andclarity on some of the dueling technology tracks (for example, there are twoOLAP platforms and two data-warehouse approaches). In addition, Oraclewill be making a major upgrade to its scorecard application. Of course, all ofthat is subject to change.
MicrosoftBill Gates’s little Washington-based outfit has a habit of being disruptive whenit enters a new market. At first Microsoft plays nice with the competition as itbuilds its comfort level; then it stretches out on the couch and starts makingitself at home.
Gates’s vision includes managing information better (whether starting withtoo much or too little) — and that’s just what his company is doing. Afterstarting slowly, Microsoft is now one of the biggest players in the BI market-place, thanks to its popular enterprise database product, SQL Server.
291Chapter 17: BI Products and Vendors
25_127230 ch17.qxp 12/4/07 12:45 AM Page 291

Microsoft OfficeOffice sits on most business personal computers in the world — providing anatural environment for front-end BI. Specifically, Microsoft has built Excelinto a powerful BI tool; in particular, these features are very BI-friendly:
� Excel acts as a query-and-analysis engine through advanced pivot tablefeatures.
� Excel offers an attractive reporting and visualization engine for nearlyany kind of data environment.
� Worksheet functionality can now be embedded in other places outsideExcel, through the increasingly important SharePoint middleware package.
Pivot tables have been helping knowledge workers perform BI functions foryears, and they’re better than ever in Office 2007. Even Microsoft’s new con-ditional formatting options can add significant value to BI activities: when pivottables are more easily understood, they’re more likely to produce businessinsights.
SQL ServerMicrosoft is scheduled to unveil its next-generation database product SQLServer 2008, sometime in mid-to-late (well, yeah) 2008. Microsoft’s flagshipDBMS has been under intense development to improve business intelligencecapabilities in some key areas:
� Unstructured data management: This is one of the many “next frontiers”of information integration and exploitation. It’s easy to add up sales fig-ures and make the most use of them, but how can companies gain keyinsights from non-numerical data?
� Visualization: Microsoft enhanced visualization capabilities in its report-ing package by licensing code from a reporting-visualization specialtyfirm (Dundas Data Visualization), which contributes mapping and chart-ing capabilities to the next generation.
Those features are in addition to the standard SQL Server BI fare:
� Integration Services: Known for years as Data Transformation Services(DTS), this is Microsoft’s ETL tool.
� Analysis Services: Offering OLAP and data mining services, taking advan-tage of Microsoft’s so-called Unified Data Model.
� Reporting Services: A robust reporting creation and communicationtool offered for the first time with SQL Server 2005
� Presentation Tools: Microsoft’s use of ProClarity dashboard and visual-ization software give Bill Gates & Co. an enterprise-class front-end toolkitfor the first time.
292 Part V: BI and Technology
25_127230 ch17.qxp 12/4/07 12:45 AM Page 292

Did Mr. Gates mention he wanted to be your one-stop business intelligencevendor? If he didn’t yet, he will soon.
SAPSAP is the world’s leading Enterprise Resource Platform (ERP) vendor, andbecause of that it takes a bit of a different perspective on BI.
SAP offers its Business Warehouse and other BI-related tools as part of largertechnology bundles, rather than as stand-alone products. The only compa-nies using SAP BI tools are the ones already using their ERP software.
IBMUnlike Oracle and Microsoft, Big Blue is more into the partner game than any-thing else, focusing on its core DB2 database management platform andWebsphere application server as the platform from which to stack BI offer-ings. Rather than taking competitors on in head-on collisions like the otherbig vendors occasionally do, IBM has nurtured relationships with softwarecompanies in better position to immediately help their customers.
DB2 is IBM’s core DBMS. It can be purchased in a data-warehouse setup calledDB2 Warehouse Edition (9.1 is the most recent version). This offers develop-ers tools for creating integrated data flows, data mining, and analytics — allthrough its Alphablox and Cubeviews packages (both products of formeracquisitions).
IBM had a long-standing relationship with Hyperion and its Essbase OLAPproduct, giving it a solid partner in the multidimensional analytics marketspace. But that partnership petered out in 2005, which left IBM seeming alittle rudderless. Since then, they’ve taken more aggressive moves in themiddle of the BI stack, including the purchase of data-integration vendorDataMirror Technology in mid-2007.
Pure-Play BI VendorsIn the business intelligence kingdom, specialist companies, who built only BIproducts, were sovereign for a long time. Although their reign is giving way tothe major powers, it’s also true that pure-play vendors still have a major partto play in the evolution of BI. They continue to be at the edge of innovation,being more nimble and less risk-averse.
293Chapter 17: BI Products and Vendors
25_127230 ch17.qxp 12/4/07 12:45 AM Page 293

In terms of investment protection, going with a pure-play vendor can offersome comfort, provided the company is in good shape financially. If it’s not,you run the risk of your vendor going bankrupt. On the other hand, if the com-pany is marginally healthy, and the product is a good match for your needs,you’re probably safe. If the company is acquired by a competitor or a platformvendor, chances are your favorite application will survive in some form.
Indispensable qualitiesThe goal of integrating a pure-play vendor is to have it behave as if it’s a per-fectly molded part of your system; as powerful as it needs to be to handlewhatever your volume of data, but giving a richness of features that’s oftennot available from larger packaged software. Here’s a checklist to start with:
� Compatibility with major databases: This above all: to thy database betrue. And for that matter, the pure-play application should be able tospeak with OLAP services, major applications, and Web services.
� Platform flexibility: Does it work in a Windows, Linux, or Unix environment?
� Output options: Do their products take advantage of common browsers?Or do they function best as desktop applications for a data-rich, interac-tive experience?
� Application scalability: To play in the mid-sized and enterprise market,the niche players have to be able to handle reams of data, and do sowith speed and grace.
� Support: The vendor should be prepared to support the application withtraining hours, consulting hours, classes, certification, and/or a body ofliterature if necessary. If not, it had better be very easy to install andmaintain.
So before buying, ask yourself these questions:
� Start with the product above all — is it superior to the competition?Don’t limit yourself to the big boys.
� What is the industry whispering about it in trade magazines and at conferences?
� Is the product an essential part of their technology stack? Or is it dupli-cated somewhere along the way, making it potentially unnecessary?
� Do the vendor’s sales team talk about the product at length? Are theyknowledgeable and willing to answer your questions? Or do they nudgeyou onto some other topic?
� Is the vendor financially healthy?
294 Part V: BI and Technology
25_127230 ch17.qxp 12/4/07 12:45 AM Page 294

� Are you comfortable with the vendor’s BI roadmap over the next 18months to two years?
This is a big decision. Get help as you need it, both inside and outside theteam. A bad decision now could cascade for years and years . . . like a water-fall of shame.
Vendors by strong suitThe following pure-play BI vendors are described according to each one’sstrongest play in the three main subject areas moving from back to front:database, ETL, and all front-end players lumped together.
Other database and data-warehouse playersSome of the smaller vendors have come up with some impressive databaseand data-warehouse products. Here’s a taste of what they offer.
NCR TeradataNCR Teradata — Teradata actually has a fairly comprehensive BI stack andcould be squeezed in anywhere, but it’s placed in the database players listbecause of its reputation as a handler of gigantic amounts — terabytes andpetabytes and femtobytes (nah . . . that doesn’t sound right) — of data.
This is offered through its Enterprise Data Warehouse product, and it is usedprimarily by companies that have massive amounts of transactional data flowdaily through their networks — such as large banks, telecommunications, ortravel-services firms. Teradata’s competitive advantage is that it can offerwarehousing, querying, reporting, analysis, and in-situ data mining, as well as predictive analytics on a large scale.
Teradata has partnerships with DBMS and BI providers of all kinds.
NetezzaDatabase-software providers are making another attempt at pushing the“appliance” concept — essentially the database software comes preconfig-ured atop a stripped-down operating system and other support software, andthe whole shebang is loaded onto a purpose-built server. The idea is that youcan plug your analytics appliance or reporting appliance into your networkwith minimal fuss.
Oracle tried this in 2000 with its 9i database appliance, but the product neversold well. Still the idea lives on; one of the new names to pop up in thismarket is Netezza. This company offers high-end data appliances: dedicateddata-warehouse servers that use ready-made hardware and software compo-nents tuned and scaled for installation in an enterprise system.
295Chapter 17: BI Products and Vendors
25_127230 ch17.qxp 12/4/07 12:45 AM Page 295

Even IBM is now dabbling in the BI data-warehouse appliance under themoniker of Balanced Configuration Unit — no small validation of that busi-ness model. IBM also competes directly with Teradata in solutions tailored to high-volume transactional data warehouses — a market that grew at ahealthy clip last year, despite some skepticism that it hasn’t much room formore players.
MySQLSure, it’s a product rather than a vendor, but there’s nothing wrong withselecting a product you know you like rather than starting from scratch with a vendor.
Free or not, MySQL is a powerful and robust database platform, and becauseit adheres to most data standards, it’s a player in the BI market.
ETL ProductsExtract, Transform, and Load (ETL) tools are at the heart of any BI system.They are increasingly involved in other data-transformation tasks, regardlessof where the actual code exists and executes. Think of the ETL module as adata-retrieval-and-management system. Its job is to communicate with everysource of operational data, extract the right pieces of information, transformall that data into the right format, and then load it into the target system.
For example, you might be building a data warehouse that includes a field inwhich you want all entries to be in all capital letters with no spaces. Your ETLdevelopers would build scripts to speak to the varying source databases in
296 Part V: BI and Technology
The growing open-source BI movementAs was the case for operating systems (such asLinux and Unix) and software infrastructure(MySQL database), the open-source phenome-non has come to the BI world as well.
Pentaho (it’s supposed to be pronounced as ifyou’ve put a thumbtack into a map of north-western Nevada: “Pin Tahoe”) brings togetherseveral different open-source BI projects —notably an ETL tool and a reporting tool.Jaspersoft is another open-source BI player,specializing in reporting. And they aren’t theonly ones.
The models these two companies are usingfollow in the footsteps of Red Hat Linux before it
became a power in the operating-systemmarket. The company’s value in the equation ispackaging the software with other key compo-nents and support of all kinds — from installa-tion help to troubleshooting to training.
The approach is to deliver a capable product ata low cost of ownership, which is possiblebecause of the negligible cost for developingthe software. What buyers are paying for —and what the vendors are angling to sell moreof — are the so called ‘value-added’ services(such as training and consulting hours).
25_127230 ch17.qxp 12/4/07 12:45 AM Page 296

a way that they understand. Then the scripts would run a transformationprocess that would remove all spaces and capitalize all letters. That processwould ensure a certain level of uniformity in the data before it’s loaded into a central data repository such as a data warehouse.
In the real world, of course, the extractions and transformations can be quitecomplex and can involve billions of rows of data.
In the late 1990s and early 2000s, the ETL market was like the Soviet Union inthe late 1980s: large and fragmented. A number of specialty ETL vendorsserved the BI marketplace; vendors offering database products (such asMicrosoft, Oracle, and IBM) had versions of ETL — of varying abilities.
In recent years, the ETL marketplace has consolidated, impinged upon fromboth sides of the BI information stream:
� The primary database vendors have made more inroads into the market,bundling an ETL product in with their DBMS offering, as was the casewhen Sybase purchased a pure-play ETL product called Solande.
� In some cases the makers of BI end-user tools have spread themselvesinto the ETL market, as well, to become more “vertically integrated” inthe BI market. Following is a list of the main ETL vendors along with afew words about the product they offer.
Many BI project managers focus on ETL but lose sight of data quality. Althoughyou certainly have to get the data into place and get it normalized, if it’s notcleaned up, you won’t get good-quality insights. A good question to ask anyETL vendor is whether their product includes a data-quality module thatincludes tools to recognize “unclean” data and whip it into shape.
InformaticaMention ETL and Informatica is the name that inevitably is the first to roll off the tongues of BI experts. They are the leading pure-play ETL vendor inthe market, and have been for several years by remaining neutral in the software wars.
The Informatica data-integration tool is called Power Center; its success canbe credited to its quality and interoperability with every kind of platform.That’s the key to successful ETL, for obvious reasons: Transactional data cancome from any type of system — an SAP supply-chain application, an OracleHR package, several SQL Server or DB2 databases, and who knows what else.Informatica can speak to them all, and doesn’t rely only on open standards to do it.
IBMIBM made a big splash in the ETL market by purchasing Ascential, a leadingprovider of ETL and one of Informatica’s main competitors. There are questions about how well Ascential can be integrated into IBM’s software
297Chapter 17: BI Products and Vendors
25_127230 ch17.qxp 12/4/07 12:45 AM Page 297

ecosystem, but the move was popular with many analysts, who saw it asstrengthening IBM’s data-integration capabilities.
OracleAs is the case with IBM, Oracle offers a comprehensive suite of BI products.And like IBM, Oracle didn’t stick with its own integration product; in late 2006Oracle announced it was buying Sunopsis, another leading pure-play in theETL space. Until that product is fully integrated, Oracle’s ETL tools reside inits Warehouse Builder package; there are also embedded ETL features in thecore Oracle database. The problem with Warehouse Builder is that it can onlyput integrated data into an Oracle data warehouse.
Business ObjectsBO made a name for itself originally with a suite of analysis and reportingtools. But the company has expanded into the ETL market with a productcalled DataIntegrator.
MicrosoftFormerly packaged with its SQL Server database offering as DTS (DataTransformation Services), Microsoft’s ETL tool changed its name toIntegration Services in 2005 (it’s also known as SSIS). This tool is more robust and powerful than the old DTS application, and it comes pre-bundled with most SQL Server 2005 versions.
Other playersThe preceding vendors own the lion’s share of the ETL market, but there areseveral other notable players worth mentioning, including SAS, a leader inanalytics tools. SAS has an ETL offering suited for companies that need com-plex transformations.
There are also other pure-play vendors such as Ab Initio, iWAY, and Kalindo,each with its own niche in the ETL world.
If you have strong developers, enough time, and the right kind of project needs,you may end up doing what many companies have chosen to do: buildingyour own ETL software. This allows you to customize your data integrationroutines more precisely to fit your environment. A potential benefit is theimmediate cost savings of not having to drop a large chunk of change onthird-party software licenses. Just make sure you calculate the resource costof maintaining that homegrown ETL package over time.
Analytics and other front-end vendorsThe line between querying, reporting, and analysis is becoming harder todraw as queries become basic reports, which are then massaged to becomemanaged and distributed reports, which can then be analyzed in OLAP toolsand other analysis programs.
298 Part V: BI and Technology
25_127230 ch17.qxp 12/4/07 12:45 AM Page 298

SASSAS is a well-known player for the high-end analytics tools it attaches to itsenterprise-class data warehouse, built on top of one or more of the main-stream DBMS platforms.
From a competitive standpoint, no other vendors offer the experience andpedigree of SAS in sending data through the gymnastics of complex statisticalanalysis. SAS allows its users to generate consolidations and reports on largevolumes of data with highly complex statistical functions.
SAS is one of the leading front-end vendors because its products cover somuch real estate — including reporting, scorecards, metrics, and data miningthat feeds tools for predictive-modeling and decision-support.
CognosThis key pure-play vendor offers a large, robust set of BI products. Cognos wasalways known for Impromptu and Powerplay, its querying and reporting tools.But these days Cognos emphasizes an architecture based on Web services.
Business ObjectsBy some standards, Business Objects is the number-one overall BI vendor,but to make that case you’d have to include an awful lot of caveats aboutMicrosoft. To be sure, BO is a pure-play vendor that’s still standing after allthese years — no mean feat.
BO is based in France and offers its products and services under the umbrellaBI tool called Web Intelligence. The company has recently inked a partner-ship agreement with IBM.
Business Objects solidified its position at or near the top of the BI market byits acquisition of Crystal Decisions, an already-profitable company with alarge population of existing customers for its BI reporting products. In 2007,BO reintroduced Crystal Reports as a Web service — a hot trend across allsoftware markets.
MicrostrategyMicrostrategy is a public company that was once a larger player in the BIworld. The company relies on its consulting services as much as on its software licenses these days; it appears to be getting squeezed slowly out of the market by the competition.
Microstrategy is traditionally known as a data-warehouse and data-martvendor, but in recent years it has placed increased emphasis on a sophisti-cated dashboard and visualization platform.
299Chapter 17: BI Products and Vendors
25_127230 ch17.qxp 12/4/07 12:45 AM Page 299

SPSSThis specialty shop has become an important player on the BI scene,offering advanced statistical-analysis packages to go along with its reportingsolutions. SPSS is playing catch-up with SAS in the number-crunching space,partly because it was late to the usability game, reluctantly moving awayfrom mainframe formatting.
The sales pitchThe goal of almost every BI vendor is to dazzle your company’s marketingdepartment, or some other area that is unable to spot the drawbacks andtechnical pitfalls in a slick sales pitch. The vendors’ solutions are inevitablysimple: Buy this one single tool, install it, turn it on, and watch the insights flow.
The reality is far different from what the pitch seems to promise. Usually BIvendors have an entry tool that gets your company hooked on the productline, but to get the most from it you have to buy further add-ons, includingother modules and platforms.
Not only that, but the installation is never quite as easy as advertised. It’salways a good idea to have a central governance board to vet software-acquisition proposals by various departments and teams in the company.That’s especially true when those teams will be turning to the IT team toinstall — and then support — the BI application.
300 Part V: BI and Technology
BI made simple: AccessIt’s possible to create a BI environment with themost rudimentary of technology tools. MicrosoftAccess has shown itself to be a remarkably ver-satile and powerful database tool. MicrosoftExcel can act as a potent alternative to a fistfulof expensive querying, reporting, and analyticstools — especially with the new BI functional-ity built into MS Excel 2007.
You can, in fact, create an entire BI environmentwith nothing but Office tools. Using VBA andscripts, you can write your own ETL tools thattake advantage of ODBC and other commonprotocols to converse with data sourcesthroughout the company. Then Access canhouse the data itself, acting as a “warehouse.”Access has a built-in reporting tool, or it can
feed data into Excel, which can handle ever-more-complex pivot tables.
Of course, this approach has its limitations.Access is limited in the amount of data it canhandle, and the speed with which it canprocess queries, among other things.
But the lesson is clear: a high-value, timely,actionable insight doesn’t care who its motherand father are. Its value is inherent, regardlessof whether it came from a fancy million-dollarsystem or a homegrown program cobbledtogether with rubber bands and bubblegum.Don’t assume that BI has to be your company’sversion of an Apollo program. Start small andsee how it goes before you aim for the moon.
25_127230 ch17.qxp 12/4/07 12:45 AM Page 300

Part VIThe Part of Tens
26_127230 pt06.qxp 12/4/07 12:45 AM Page 301

In this part . . .
As if you don’t know already.
This part is a cornucopia of helpful info-gems that willmake your life much easier, in one capacity or another, if you get involved with a BI project.
26_127230 pt06.qxp 12/4/07 12:45 AM Page 302

Chapter 18
Ten Keys to BI SuccessIn This Chapter� Using sound business principles in a technology-centric project
� Being ready to adjust the plan and your approach
� Having realistic expectations about the project
No book on business intelligence would be complete without a list of thetop elements that have to be present in your BI initiative to make it a
success. Consultants and pundits make their own lists — just as every vendor,academic, and anyone else who’s ever been around a BI implementationmakes his or hers. Of course, every situation is different; companies, marketconditions, and personalities involved all conspire to make a complicatedsituation downright confusing. But if you combine the ideas in this list withyour own knowledge of your company’s unique qualities, you’ll be on your wayto a successful implementation and a valuable business intelligence program.
Picking Good Key PerformanceIndicators (KPIs)
How does your organization measure success? It seems an innocuous question — but an astounding number of executives can’t answer it.
Measuring and managing key performance indicators (KPIs) is the ultimategoal of any business intelligence solution. KPIs are metrics and measure-ments that indicate at a glance whether the company is living or dying. Theinsights gained through BI should lead to better decisions — followed (pre-sumably) by better performance that will show up later in the KPIs. The ideais that if you’ve picked your KPIs wisely, the business will prosper over thelong term.
Choose KPIs that line up with your business goals. If you run a call center (forexample), your BI solution should feed on KPIs like Average Hold Time andAverage Handling Time. If you’re the Chief Operations Officer (COO) of an air-line, you know your KPIs will be specialty measurements such as Revenue
27_127230 ch18.qxp 12/4/07 12:46 AM Page 303

Passenger Miles, Available Seat Miles, Available Seat Miles per Employee, andother industry-specific indicators. These metrics may mean little to anyoneoutside your line of business, but to the executives at your company, theymake the world go around.
Adjusting the RecipeThere’s plenty of good advice out there, from best practices to full solutions.Every element of the bedrock of technology and business practices on whichyou build your solution is covered in a manual somewhere. But (here’s afamiliar mantra) there’s no such thing as a one-size-fits-all solution. Companiesare too complex for that; two seemingly similar technology and business prob-lems rarely look the same up close.
Look at lots of options and take a combination of the best ideas and answersthat fit your business. Bottom line is, use what works for you.
Coming to Terms with ComplexityVendors and consultants make it all sound so easy: install this, configure thatand presto, you have a BI solution that will send your business through thestratosphere. If only it were that easy. As straightforward as the diagram maylook on paper, when you actually start descending into the details, you’ll finda rat warren of complexity.
Planning for complexity is the best way to protect yourself from its negativeeffects. Assume that problems will take longer to solve in a BI project. Giveyourself more time than you might in more familiar. And most of all, adoptand enforce core processes that can be adapted to suit all kinds of problems.That way, if you find that a given challenge is different from the way you ini-tially diagnosed it, your team will be flexible enough to switch gears withoutcoming to a complete stop.
Thinking (and Working) Outside the BoxIt’s an excruciating cliché but an important point. To find success in your BIproject, there are times when you have to throw away the book (metaphori-cally speaking, of course — and not this one) and think about things in a dif-ferent light. You have to set your ideas free from their cardboard prison.
The complexity of the technology isn’t always a bad thing; it gives you alter-natives when you’ve hit an apparent roadblock. Don’t assume you have to
304 Part VI: The Part of Tens
27_127230 ch18.qxp 12/4/07 12:46 AM Page 304

follow every step of the path laid out by the vendor or the consultant; if youcan get your team to think outside the . . . well, you know . . . if you can dothat, you’re likely to build a solution that takes best advantage of the uniquestrengths of your company and your team.
Picking a Winning TeamYour BI implementation will only be as good as the team of people that design,build and support it. And because business intelligence systems are interwo-ven into the fabric of the company, you need to have project members thatunderstand both the technology and the business aspects of the task at hand.
And it goes beyond simply finding experts in their fields; you want to findpeople with the right attitude. Things don’t always go perfectly on a BI pro-ject; it can be a roller coaster. Will your developers and business analysts and data architects be screaming with their hands in the air and big smiles on their faces? Or will they be turning green with every dip and turn?
Doing Your HomeworkBusiness intelligence is a rapidly evolving discipline (like pretty much every-thing else in the technology world), and there’s lots of knowledge out there —in books, white papers, blogs, marketing material, and a whole lot of otherformats.
Never assume that you know enough. It can only work to your benefit if youbecome a subject-matter expert in the areas of BI most relevant to yourimplementation — and urge your team to do the same. Professional organiza-tions such as The Data Warehousing Institute (TDWI), and expert trade publi-cations such as DMReview, are great places to start.
Remembrance of Things Past (Especially Mistakes)
There are pitfalls and bumps in the road that simply can’t be avoided. Thetrick is to remember what you did, make note of how the mistake could havebeen avoided in the first place, and figure out the best way to mitigate the sit-uation should it happen again. Incorrigible optimists would tell you to thinkof every error as an opportunity to learn a little something.
305Chapter 18: Ten Keys to BI Success
27_127230 ch18.qxp 12/4/07 12:46 AM Page 305

BI project teams succeed because they take full advantage of their experience.And we’re not just talking about business intelligence know-how; it’s aboutother core skills such as project management and coding. Company-specificexperience also helps seasoned staffers navigate confusing organizationalcharts, identify helpful resources and potential problems, and take full advantage of the corporate culture.
Considering Corporate CultureCompletely
Every organization has a character all its own, and before setting out on yourbig BI adventure, you should give yours a quick one-question personality test.The way the company operates, how it’s organized, where the power is, andhow decisions are made, should all be a part of your planning process.
Successful business intelligence projects always include corporate culture inthe early information gathering and design phases. At the heart of the corpo-rate culture issue is the question of where the power rests in the company:
� Centralized: In centralized enterprises, the subsidiaries and outlyingteams are operationally subordinate to a central core of executives.
� De-Centralized: A decentralized culture means that decisions made atthe top of the organization are merely starting points for negotiation.
Design your BI team, project plan, and the system itself to merit the approba-tion of those holding the power, wherever they are in the company (up thereor all around). That way your project is aligned with the culture; you’ll getbuy-in and cooperation from the people who hold sway.
Just Going Through a PhaseThe possibilities for your BI project are virtually limitless. You could connectevery operational data source in the company though data warehouses, andthen route it to departmental data marts that would feed an array of query-ing, reporting, and analytics tools — customized to each department, withsweet visualization technology to boot. And when it’s ready to launch (some-time in the next decade), you could have the Rolling Stones play at your sta-dium launch party.
Right.
306 Part VI: The Part of Tens
27_127230 ch18.qxp 12/4/07 12:46 AM Page 306

It’s great that you’re dreaming big and in color, but executive leadershiprarely has patience for such massive projects. Most companies prefer tomove cautiously when money is being spent; they like it when projects canshow small-scale successes along the way as opposed to making a big splash.And technology projects are notoriously tightly scrutinized by the boondog-gle police, so don’t book the Stones just yet.
Take your BI vision and divide it into manageable phases. Each phase should have
� Well-defined scope
� Tangible deliverables
� Benefits that can be demonstrated to one and all
� Modest time-horizons
If more than one Olympics is scheduled to occur before you’re scheduled todeliver anything, you really need to consider breaking your plan into smallerpieces.
Adopting a BigwigEvery project needs a high-level project sponsor who’s wise, well-liked, even-handed, and ready to roll up his or her sleeves and get things done. (Whenthey aren’t available, a C-level executive will do just fine, too.)
Business intelligence projects are especially vulnerable to internal skepticismbecause they’re often not well understood. And because the projects can touchso many pieces of an organization — that’s the very nature of BI — it’s impor-tant that you have friends in high places. Whether they are directly involvedin the project is not nearly as important as just having their genuine moralsupport. A person with hire and fire power for huge swathes of the companyhas an amazing capacity to evangelize to and convert the skeptics, andthey’re pretty good at knocking down roadblocks too.
307Chapter 18: Ten Keys to BI Success
27_127230 ch18.qxp 12/4/07 12:46 AM Page 307

308 Part VI: The Part of Tens
27_127230 ch18.qxp 12/4/07 12:46 AM Page 308

Chapter 19
Ten BI Risks (and How to Overcome Them)
In This Chapter� Planning for the worst
� Convincing the company to climb on board the BI bandwagon
� Dealing with data disasters
� Spotting problems before they’re problems
Transforming your company into a BI-friendly environment is fraught withperil; it’s a task that shouldn’t be entered into lightly. Plenty can, and
often will, go wrong. Here are some problems to look out for that can strikeyour business intelligence initiative. Included are some ideas about how toovercome them.
Resistance MovementA BI initiative can put your organization into a state of flux — and nothing givespeople the heebie-jeebies like change. Regardless of the scope of change, it’salways likely that you’ll encounter some level of resistance to the install, de-install, or upgrade procedures you’re trying to do.
Regardless of where and when it strikes, resistance to change must be man-aged by the BI project team and associated employees, all singing the samesong. What starts as minor friction can quickly turn into full-blown negativity,leaving your movement toward BI de-legitimized and in tatters. Adherence toa change-control program is a good start, but the real key is communication.
Building lasting, institutionalized relationships with IT and data-managementfolks throughout the company is a great way to extend your network of allies.Setting up a central BI Committee or a Center of Excellence (COE) gives you
28_127230 ch19.qxp 12/4/07 12:29 AM Page 309

an ideal company organ to exchange ideas, and it creates an umbrella ofexpertise over ongoing BI projects. Before you alter the company-widereporting standards, talk it over at a monthly COE meeting. Not only will you get invaluable input, but it’s also a step toward buy-in .
Moving TargetsOne thing is sure in a large BI implementation: The data source, application,or process you’re working on will change sometime between the moment youfinalize the project requirements and the time you go to implement it.
Companies are in a constant state of flux; so are their data entities. That cancreate big headaches. For example, if you update a reporting tool to work withthe latest customer-data definition, what will happen when you need to lookat historical records that follow the old data model? Nothing can wreck a BIprocess faster than failing to account for the volatility of data.
Planning for and maintaining visibility in your master set of data hierarchiesand relationships can help mitigate this problem. It’s also wise to integrateyour project plan with other plans in progress within the company. Is there(say) a planned upgrade to a new version of supporting software? Arechanges in the works to make the ERP metadata reflect the latest corporateacquisition? Planning for changes like that ahead of time beats cleaning upmesses after the fact.
Tool LetdownThere’s enough hot air coming from BI vendors to put a fleet of blimps in thesky. Many a project manager has been burned by an application that fails tolive up to its billing.
Putting the right tools in place is critical to the success of most BI implemen-tations. Even with well-known vendors, the software-evaluation cycle is by nomeans a pro-forma activity, so don’t skimp on it. Two principles apply here:
� You should establish a baseline process so you can give third parties afair shake during their day in court.
� The level of scrutiny you give to a tool (or, for that matter, a vendor pro-viding services) should increase along with its level of importance inyour system.
310 Part VI: The Part of Tens
28_127230 ch19.qxp 12/4/07 12:29 AM Page 310

After determining the scope and architecture of your BI system, go throughthe following steps:
1. Research and develop a list of candidate vendors that at least claim tooffer a solution for the function in question. Referrals from professionalorganizations are a good place to start.
2. Pay close attention to the vendor’s sales effort. Do they call you whenthey say they’re going to? Are they willing to give you bad news aboutlimitations to their product? An honest and forthright sales effort is agood indicator of a healthy company.
3. Demand a comprehensive demo.
4. Watch the comprehensive demo. But don’t get lulled to sleep by theflashing lights and nifty graphics. Ask a lot of questions. For example,you could ask about whether every demonstrated product is includedwith the standard license scheme. Ask the sales team to explain commonproblems their customers encounter. A demonstration is not a presenta-tion, it should be the start of a long dialogue between your team and thevendor’s sales team.
Don’t skimp on the software-evaluation cycle. Use multiple criteria to judgethe software; don’t just settle for the crowd with the nicest sales people orthe slickest demonstration. Dig deep; it’ll pay off in spades later on.
Being a User LoserWhat if you built the system and nobody showed up to use it? The users arewhat will make your system a success or failure. There are lots of reasonswhy users may not flock to the tools you roll out. First and foremost, if the BI environment doesn’t add value to their mission, they won’t use it; it’s assimple as that. Ensure that it does add that value by including end-users earlyin your process.
Too many techies think they know what the users want, and so they leave theaverage user out of the concept-and-design process. Get the end-users involvedearly in the process of gathering requirements; make sure you address thoseconcerns and do your best to fulfill their needs.
Then, when the BI program is launched, support the user community well.Offer training and helpdesk services to pull more folks into the fold. And ifthe worst case does come to pass, where you build it and they don’t come,find out why quickly. Don’t sit back and wait for complaints and feedback to roll in
311Chapter 19: Ten BI Risks (and How to Overcome Them)
28_127230 ch19.qxp 12/4/07 12:29 AM Page 311

To spot problems well ahead of time, monitor usage trends in your BI domainsas a standard policy. Whether the problem is simple or complex, the sooneryou understand it and address it, the better your chances of righting the shipbefore it sinks.
Mister Data Needs a BathIf there were ever a poster child for a Garbage-In-Garbage-Out system, it’s therealm of business intelligence tools. If you have questionable source datafeeding into your reporting, dashboard, analytics, and other user-facing appli-cations, then their output won’t be worth a ream of dot matrix printer paper.Questionable information can turn into bad information — and have anadverse impact on every one of its consumers downstream.
Data quality is an ongoing problem in BI, especially when there’s a data ware-house involved. Different source systems have varying layers of controls andbusiness-rule consistency. Include time to audit, analyze, and (if necessary)fix the data at the source if at all possible.
Source data is not a fix-it-and-forget element. Consider: Can you even recog-nize when you’re getting bad results? And if you do recognize a problem, canyou trace it to its source? Imagine what could happen if one of the operationaldata sources feeding your data warehouse just went through a business-rulechange (which nobody told you about, of course) that allows users to changeactive account numbers — a field that your ETL process uses as a primarykey. (Yikes.) Suddenly there’s a chance that historical transaction informationmay have nothing to do with future transactions for the accounts that havechanged. You’ll have no way of knowing that this problem is lurking . . . unlessyou’ve put some careful auditing and data-change-management procedures inplace throughout your system.
Dough a No-Go?If your project suffers a budget reduction of some kind, don’t feel bad, youaren’t the first and you won’t be the last. Whether it makes sense to continueany project depends on the circumstances. But one thing is certain: If thefinancial resource allocation isn’t done honestly, then the project is doomedto fail.
Don’t let enthusiasm for a project get in the way of making a rational decisionabout what can be realistically delivered. A natural tendency exists to say,“Well, I know half the budget’s been wiped out, so we can deliver the follow-ing limited scope . . . .” Whoa. Slow down — think long and hard before youdo that. For openers, try answering these questions:
312 Part VI: The Part of Tens
28_127230 ch19.qxp 12/4/07 12:29 AM Page 312

� Are you considering all the transition costs associated with adjustingthe direction of the project team to accommodate the smaller scope?
� Does the limited release still provide enough business value to make itworth it?
� Is there yet another budget cut lurking out there, a few months fartherdown the road?
Be blunt about the financial realities you face. BI implementations can providetremendous value, but they are expensive. And if the company isn’t willing tomake the investment in a proper implementation, perhaps it’s time to rethinkthe project altogether.
Scope CreepCertain elemental forces are at work in a BI environment; there will always bepressure on the budget from unexpected costs or overruns, and of coursethere will always be pressure to do just a little more than you originally setout to do. That phenomenon is known affectionately as scope creep.
BI projects have a notoriously high incidence of scope creep because BIcrosses into so many departments and often touches many different pre-existing systems. Before you know it, you’re getting requests from mid-levelmanagers you’ve never heard of before, and cleaning up data you hadn’tplanned on touching.
Avoiding scope creep is an active responsibility for you and the rest of yourteam. For starters, remember these basic principles:
� Don’t hurry through the original scope; make sure everything isaddressed.
� Anticipate change; build flexibility into your project plan. Assume therewill be some last-minute tweaks by the Chief Financial Officer (or some-one else you can’t refuse).
� Hire great Business Analysts to deliver excellent business requirements,to put them into flawless documentation, and manage them throughoutthe life of the implementation.
� Respect your processes; remember that detailed change-managementprocess you worked out so carefully back in the planning stages of your project? It wasn’t just for show. Use it.
Scopes naturally creep. It’s what they do. Vigilance is the watchword.
313Chapter 19: Ten BI Risks (and How to Overcome Them)
28_127230 ch19.qxp 12/4/07 12:29 AM Page 313

RigidityOkay, I just finished lecturing you about being too rigid when it comes toscope — but as with all things, there’s a flipside: sometimes flexibility isadvantageous.
During the development process, there is a tendency to think bottom-up — tomake decisions on specific details (such as report layouts) without taking thebroader context of the BI environment into consideration. That can lock youin to key decisions too early in the process.
Don’t assume you know what the users are going to want and need. Here aresome ways to prepare for their changing wants:
� Build some flexibility into your project plan that allows easy adjustmentsto front-end elements.
� Install self-service tools that allow users (with a little bit of training) tocontrol their own experiences with the tool — running queries, buildingand formatting reports, whatever fits in with their work and the project’sdesign.
Environmental CrisisAn initial BI initiative might call for different front-end tools to meet the diverseneeds of different teams throughout the company. In addition, companiesoften install and add onto their basic BI infrastructure over time, creatingmultiple data environments that feed different customers throughout thecompany. This fragmentation of environments can lead to confusion overhow to access certain information.
No wonder some vendors offer portals (or similar integration packages) thatbring together multiple information sub-domains in a company’s BI constella-tion. Portals work by presenting a user with a single interface that accessesseveral different BI environments, such as reporting or analysis tools. Usuallytwo steps are involved:
1. A user enters a query for data.
2. The portal seeks out the system that can speak the same language andthen does one of two things:
• Returns the request
• Moves the user directly into that specific BI tool
314 Part VI: The Part of Tens
28_127230 ch19.qxp 12/4/07 12:29 AM Page 314

Chapter 20
Ten Keys to Gathering Good BI Requirements
In This Chapter� Starting from high altitude
� Recognizing the true voice of the customer
� Getting granular with the gritty details
� Getting your priorities straight
Requirements are the bridge between nebulous ideas of what a businessintelligence application or application suite might accomplish, and the
completed, fully functional software and processes. They are the blueprintfor the technical teams that will assemble the pieces of the BI initiative.
Requirements represent fully formed, clearly demarcated definitions of exactlywhat a piece of software will and won’t do — and how it can accomplish thegoals of the program.
Don’t lump requirements management in with the project’s other preparatorysteps. The first priority of the requirements phase is to work out what func-tionality is required of the application(s). Any other design activity that takesplace before that step is complete can jeopardize the entire program.
Managing requirements includes eliciting, organizing, communicating, andmanaging the specifications of the software and processes. Although all ofthese are important, eliciting requirements is first among equals.
But it’s not always as simple as asking a question, and writing down theanswer. Most analysts like the term elicitation rather than merely gathering —possibly because it’s fancier, but more likely because it implies making theeffort to draw out the requirements and business rules from the minds of theusers and stakeholders; they won’t just be lying around waiting to be pickedup. You must shake the tree a little bit to get them to fall. And sometimes youmight even have to climb the tree to get at them.
29_127230 ch20.qxp 12/4/07 12:30 AM Page 315

The following ideas are the best ways to make the most of the requirementsphase; getting the stakeholders to admit to what they really want — and thendistilling what they tell you into a list of what they and the project stakehold-ers actually need.
All the Right PeopleConstructing a good initial requirements document is only possible if theright people are there to help. And it’s not just about being invited; the folkswho show up for the meetings have to be ready to participate.
Facilitating a requirements session is as much art as science. Some of thesmartest, best-organized technology brains in the world can’t stand up in aroom full of people and provide direction for a meeting. So the first person onyour attendee list should be a skilled meeting facilitator. That may be anexperienced business analyst on your team, or it could be a hired gun fromoutside the project team. Whomever you choose, a good facilitator will turnthose meandering, unfocused meetings we all dread into productive require-ments sessions.
When you schedule requirements sessions, make sure you plan two thingsvery carefully: the agenda and the attendee list. After you determine the topicsto be covered for each session or interview — well beforehand, please —don’t just leave it to the representatives of each department to staff yourmeeting. Ask exactly why each person needs to be there.
For a BI solution, consider inviting attendees with these three distinct perspectives:
� Representatives of the user base for the business area you’re covering.
� Subject-matter experts (people who know the business area, but whomay not actually be prospective end-users for your BI applications).
� Technology representatives who can provide guidance for the conversa-tion in terms of what’s feasible and what isn’t for the solution being discussed.
Techies also benefit from requirements meetings by gleaning key facts fromof the negotiations that may not be addressed as agenda items, or even saidout loud. The user-interface team (in particular) can get a jump start byabsorbing what’s said about the user community’s usability tastes. As anadded benefit, the meetings will steep the data analysts in the importance ofcertain data elements, possibly generating some early ideas about the logicaldesign of the database.
316 Part VI: The Part of Tens
29_127230 ch20.qxp 12/4/07 12:30 AM Page 316

Don’t expect all the salient points of the meeting to be absorbed by osmosisinto all the attendees’ heads. You need someone there who can (and will)take excellent notes. It sounds mundane, but a good scribe can help delivergreat results from a requirements-elicitation meeting — following the arc ofdeliberations, recording why one alternative was chosen over another, andtracking the action items that come out of the meeting.
The Vision ThingBefore holding a requirements session to dig into the specifics of a project, agood BI project manager puts every stakeholder on the same page in terms ofthe product’s overall direction, vision, and calendar.
Doing so puts the details of the project into their proper context — somethingthat’s often overlooked. How can you possibly make a decision about (say)which graphical tools will display your data if you don’t know the larger busi-ness purpose of the application? Sure, you can take a stab at such details, butusually the solution you get won’t be congruent with the grand strategy ofthe BI implementation.
Don’t just have a frank discussion with the stakeholders about the overallproject goals and vision. Tie it directly into the requirements-gatheringprocess. Explain how the activities undertaken during the requirements dis-cussions aren’t just idle chatter; they quite literally fill in the blanks for theapplication design.
When it’s time to host a design session with your internal clients, remindthem of where the BI application is headed, what problems it must solve, andwhat the important constraints are. Keep that vision at the forefront through-out the requirements-gathering phase — and throughout the entire project.
Connecting BI to the Business ThemesEvery business has themes: What’s the company trying to do? How are itspeople trying to do that job? Such themes represent the major imperatives of the organization. Here are some typical examples:
� Provide excellent customer service
� Grow revenues without giving up profit
� Offer products that are perfect for the marketplace
� Seek innovative ways to reduce costs while maintaining service levels
317Chapter 20: Ten Keys to Gathering Good BI Requirements
29_127230 ch20.qxp 12/4/07 12:30 AM Page 317

More often than not, these themes drive every major initiative undertaken bythe company, either directly or indirectly — including its BI projects.
During the early phases of eliciting requirements, be sure you talk not justabout the overall BI strategy for the company, but also about tying that strat-egy back to those same themes; your stakeholders should already be familiarwith them.
Make Sure the Insights Are Within SightFor a business intelligence project, be sure to define all requirements withinthe context of a specific insight you’re trying to achieve or discover.
Each insight should fit into one of the major themes of the business.
As an example of how this works, imagine a large networking gear manufac-turer that offers several different product lines. Their consultants sell solutions that involve a mix of components, all manufactured by their differ-ent divisions. Some components are even built by ex-competitors who wereacquired and now operate as subsidiaries. Because sales and accounting sys-tems vary across so many organizations, and because the terms negotiatedvary from client to client, it’s hard to get a profitability snapshot of any singleclient or solution.
Knowing the contribution of each division’s profitability would be an insightof enormous value to the company. It would allow the sales management teamto improve the company’s performance by tightly managing the product mixfor all future deals.
The BI project team should approach gathering requirements with that insightplanted firmly in their mind. What data do they need to gather to achieve thatinsight? How does it need to be manipulated? What tools will the sales man-agement team require to use to best take advantage of this particular insight?You may not know all the problems you’re trying to solve, but it always helpsto start with a handful of business challenges that everyone agrees desper-ately need solutions — that list becomes a central rallying point for therequirements process.
Business analysts are often tempted to gather requirements in a vacuum,keeping a tight focus on the agenda, and therefore the business processesthat must be defined. Although filtering out noise of larger discussions allowsthe team to concentrate on each step in the process, don’t filter everythingout. As long as the insights you’re after are well-defined and the stakeholdersperceive them as immutable, they can catalyze the requirements process andkeep it aligned with the broader business goals.
318 Part VI: The Part of Tens
29_127230 ch20.qxp 12/4/07 12:30 AM Page 318
Greatest Hits from Yesterday and TodayPart of eliciting requirements is understanding the terrain on which the com-pany is currently standing. That way, when you decide where to go, it helpsyou draw a line on the map to get there.
The requirements-elicitation phase is a good opportunity to talk to the stake-holders and prospective users of the application about how they’re wrestlingwith the business problems now — before the first piece of the BI solution isup and running.
It’s just possible that the way problems are being approached today can offerclues to how the developers should approach the BI solution. Seeing step-by-step examples of how a team currently uses information to achieve a certaininsight is often more useful than merely cataloging information needs withoutany context.
In many cases, the user groups and stakeholders clamor for a change (or atleast an upgrade of some kind) — but not always. When you go through theways your departments are handling data and harvesting insights, you maydecide that some of those steps — or even an end-to-end process — shouldbe preserved. It could happen. Even though the software on the market nowis more powerful and flexible than ever before, you shouldn’t feel obligated to make a change where none is needed. Think long and hard before you rockthe boat.
Consequences of Going WithoutDuring the requirements-definition phase, it’s useful to talk about the realbusiness value of the insights you’re seeking. It’s not always easy to define,but a good starting point is asking the user community a simple question: Ifthe project didn’t go forward and you were unable to get these insights, howwould it affect the company?
This is an important road to travel; it helps the project team prioritize therequirements in a way you can’t always get by simply asking, “What priorityshould this effort take?” Asking what would happen without the solution alsogets the group talking about qualities of the solution — such as responsetime, usability, scalability, and other similar specific factors that give thedesign team insight into what’s lacking from the current solution.
In addition, does the pursuit of multiple business insights result in one processworking at cross-purposes to another? In those situations, you have to do morethan simply decide which one wins; it’s just as important to think about why.All this discussion and discovery helps frame the project priorities, and makesgathering requirements more fruitful.
319Chapter 20: Ten Keys to Gathering Good BI Requirements
29_127230 ch20.qxp 12/4/07 12:30 AM Page 319

What’s the Big Idea?Gathering requirements is an exercise in understanding your company’sinformation needs at the conceptual level. The best approach is to postponeall those high-detail discussions such as how the tables will be formatted,which data fields are required for each interface, and other specifics. Reviewthe main themes of your business, and answer general questions first —these, for example:
� What information do you need and why do you need it?
� What (in general) are you going to do with the information once youhave it?
� How will the information be processed or transformed?
� What insights will come from it?
� What preliminary steps are needed to derive the insights you’re seeking?
� What information domains must be covered?
Such broad interrogation also helps the requirements discussions move along.It’s easy to bog down in detail and bring the session to a screeching halt astwo or three parties argue about which font to use in the standard report, orwhether a display should include a pie graph or a bar chart. Such details canbe hashed out later. Get the big ideas first.
Going Straight to the SourceAfter the general information needs are outlined, you must dive deeply intothe source data. This task may require meetings with an entirely different setof experts, but it’s still part of the broader requirements process. Initial ques-tions at this stage include these:
� Where is the data housed?
� How can you get to the data?
� What state is the data in?
� What are the ramifications of manipulating the data?
Things aren’t always as they seem. Different departments may have differentdefinitions and thresholds for data quality. Standards and definitions varyfrom one team to the next; use the process of eliciting requirements to flushout any differences.
320 Part VI: The Part of Tens
29_127230 ch20.qxp 12/4/07 12:30 AM Page 320
During this step, your analysts may locate multiple potential sources for theinformation you’re trying to harvest. For example, the same data on dailysales could be held in different systems. The core information is the same, butthere may be subtle differences in accessibility or format. As you evaluatedata sources, decide which one is the best for the needs of your BI project.
Understanding regulatory and compliance issues is part of what this phase isabout. For example, if your system is taking custody of personal-contactinformation, you may have to follow certain rules for storage and access,meet security standards laid down by a central data-stewardship body insideyour company, or even toe the line with an external regulatory agency.
Adjunct BenefitsAs important as focus is, peripheral vision can be equally valuable.
Building an application that takes advantage of and utilizes so much informa-tion opens up possibilities. With all this data, what else can the users do?Does the application add unforeseen value to other preexisting processes?The requirements sessions must meet their intended goals of flushing outbusiness rules and requirements, but you should also use it as a discoverysession, to get the stakeholders thinking about the possibilities before them.
The risk, of course, is scope creep — where your project gets weighed downby extra requirements. A good requirements-gathering process — run bywell-trained and experienced business analysts — will be your best bulwarkagainst the scope-creep scourge. . Ideally you can protect the boundaries ofyour project without stifling ideas and discussion. Stay on target but takenote of the possibilities that open up by introducing your BI application.
The BI requirements session is a little different from that of more common ITapplications: The solutions often cross organizational boundaries, bringingtogether lots of different teams that normally only interface with each otheras necessary to perform their own specific tasks. A BI application must servethe needs of several groups at once. Teams may not be used to doing thingsfor the common good.
If you have the data and you’re joining it together, stay aware of all the possi-bilities. You might just discover a pathway to insights you never thought possible.
321Chapter 20: Ten Keys to Gathering Good BI Requirements
29_127230 ch20.qxp 12/4/07 12:30 AM Page 321

What’s First and WhyPrioritizing requirements is just as important as listing them completely andattaching complete definitions to them. But it can be a painful process for thestakeholders who might feel they are being forced to choose between features.
Nevertheless, a good requirements session includes defining how importanteach major feature of the application is. And, in turn, good requirements doc-umentation includes some kind of explanation of where the user and busi-ness stakeholders’ priorities lie.
You have a number of possible ways to work out priorities for features andfunctionality; an experienced business analyst can run the requirements ses-sion through a number of exercises (such as weighted voting and cohesionanalysis) to open the discussion.
While your BI project is still in the planning process, define in advance howprioritization disputes will be resolved. Coming up with a method on the flycould come across as biased one way or another. So devise a scheme thatsuits both the project and the client, get the blessing of the project sponsor,and then — most important of all — tell the stakeholders about it before therequirements session begins.
322 Part VI: The Part of Tens
29_127230 ch20.qxp 12/4/07 12:30 AM Page 322

Chapter 21
Ten Secrets to a Successful BI Deployment
In This Chapter� Designing a solid solution
� Resolving issues today rather than tomorrow
� Keeping the team focused on what’s important
� Getting ready for liftoff (before launch day)
The first installation of BI tools is the trickiest, because not only are therethe common technology hurdles facing you, but there are cultural hur-
dles and engrained habits that must be dealt with as well.
Because the environment is full of moving parts, it’s easy to lose focus onwhat really matters. And this is no time to lose focus! When the curtain riseson your BI applications, the company will form a lasting judgment about yourteam’s ability to perform, and about the usefulness of a business intelligencesolution. In short, the first release will presage things to come, so it’s vitallyimportant to get it right the first time.
Start Early!A BI project is like a big operations management problem, where the timingand quantity of raw materials deliveries affect how quickly and efficiently thefactory can manufacture its products. BI requires specific decisions early onthat affect the overall process down the road.
Among the first lists a BI project manager should make is of any critical deliv-erables (that’s project-speak for discrete items that somebody has to completeor present to the project team, like a document, a project task, or a chunk ofapplication code.) It’s important to stay on top of all delivery deadlines —especially those where the lead time could balloon out of control. For exam-ple, if the process of procuring and installing extra network hardware in your
30_127230 ch21.qxp 12/4/07 12:31 AM Page 323

company’s data center is long and involved, start now. If your companyrequires a lengthy evaluation process for vendors before a purchase ordercan be issued for your core analytics software, start now. If there is a shortageof professionals with a particular skill you’ll need, start the recruiting processsooner rather than later.
The more potential chokepoints you can identify early on for the assembly ofthe BI solution, the less likely they are to choke your project down the road.
Get What You Paid ForAfter you write a big check to your vendors, they should be on the hook forsupporting you throughout the process. (You did negotiate that up front,right?)
Because a BI solution often involves multiple applications working seamlesslytogether, you’ll need to get full support from your vendors. Good projectmanagers know what was negotiated in the contract so they can demand theservice and support promised. That means knowing and enforcing thevendor’s service-level agreement (SLA) — the level of service, response time,and performance they’ve agreed (in writing) to deliver. If the software youbought is not performing as promised — or if anything you paid for isn’t upto snuff — call the vendor on it and demand a remedy. Most BI implementa-tions don’t have the luxury of time, so if there’s any doubt about the SLA,solve the problem as early as you can.
Software deals sometimes include such added value as training and supporthours built in to the standard seat licenses. Take advantage of them early onin the build process. Demand exactly the service and support you werepromised. Hold vendors to their SLAs. Don’t save up vendor goodwill untilrelease 2.0; there may not be a release 2.0 if your 1.0 version fails.
Only Losers Ignore UsersUsers give context to the project; they help you fit the tools and processesinto the specific business situation. They help define the problems you’resolving, and they give you essential clues to how those problems will besolved. So get the user community involved early on. Earn their respect, askfor their help, and get their support throughout the life of the BI project.
Users will help guide the requirements process, but user representativesshould provide consultation every step of the way — including during toolevaluation, testing, data analysis, and governance.
324 Part VI: The Part of Tens
30_127230 ch21.qxp 12/4/07 12:31 AM Page 324

For example, during the coding process, an ambiguous requirement mightprompt the development team to make assumptions about how the systemshould work. Stop right there. Your team actually doesn’t know the require-ments better than the users, so they shouldn’t act as if they do. A healthyproject team has regular interaction with the users, and can call on them forinput from the real world as needed.
Name-DroppingYou’d think everyone would understand how wonderful and important the BIinitiative is to the company, right? Well, even if they don’t, it still affects them.
Your BI solution will likely spread across several teams and even businessunits, affecting a variety of different people. It’s hard to keep them all on thesame page because there’s such a flock of them, and they have differentneeds and priorities. Even your own team-members can lose sight of the project’s goals.
That’s why it’s a good idea to send notes periodically to everyone, giving themupdates on the project’s status, reinforcing the importance of the initiative,and reviewing the benefits of completing the mission on time. Hold rah-rahmeetings if you must. And when you communicate with the outlying corpo-rate units, if you mention the names of the executive sponsors, you’re all butguaranteed to maintain your audience’s attention.
People can ignore the wants and needs of a project manager or a databaseadministrator, but drop the CEO’s name into the e-mail as someone who’sclosely watching the outcome of the project, and they tend to take heed.
Testing 1-2-3 . . . 4-5-6 . . . and So OnDon’t skimp on testing. No matter what.
The quality-assurance process has always gotten short shrift in IT projects;testing times get squeezed to accommodate the launch date in the face ofproject changes or delays. Unfortunately the same phenomenon occurs inthe BI realm; testing gets cut where the projects can least afford it.
By the time you get to the testing phase the broad questions have beenanswered. You should have a good understanding of whether the array of applications you’ve designed suits the general needs of the users. But well-designed systems can still fail if they’ve been executed poorly.
325Chapter 21: Ten Secrets to a Successful BI Deployment
30_127230 ch21.qxp 12/4/07 12:31 AM Page 325

If the system takes forever to respond to simple requests, or if the data ware-house in unstable, the users will avoid your system like quicksand. And it’sonly during the quality assurance process that you can identify problemswith the implementation.
Testing shines a light on any problems with your original design. They couldbe issues with the database schema, connectivity, or even hardware. Or itcould be a matter of usability. The more comprehensive the testing phase is,the more likely your first roll-out will be a success.
Go to Battle from a War RoomEvery army needs a headquarters. And the best HQs are far enough awayfrom the battlefield that upcoming movements can be planned and objectivesassigned without interruption — but close enough to the action that commu-nication with field commanders is easy, and there are clear sight lines towhat’s happening at the front.
Many BI managers advocate a “war room” for the first BI release. It’s a greatway to focus all project command-and-control functions and activities for thefinal important phases leading up to the release.
A “war room” is pretty much what it sounds like: putting all the key managersand architects in the same room during the final coding and testing steps. Itsaves time and heartache by simplifying the communication of changes,problem resolution, and testing issues. The war room means problems aren’tsolved in isolation (a phenomenon that can spawn other problems such asduplication of effort or confusion about deadlines). It also provides a rallyingpoint for the team, creating a bonding atmosphere and unifying the sense ofpurpose among the group.
A cohesive team is usually an effective team. And since BI initiatives usuallyinvolve a complicated technology environment, getting the IT and businesstalent as close together as possible can boost performance in the final, criti-cal phases of any project.
Project Management ManagementProject management often involves a good deal of administrative activities,such as maintaining and communicating the project plan. For larger projects,it often makes sense to designate a project controller or project administratorwho does nothing but manage the project plan and work through administra-tive tasks in the war room.
326 Part VI: The Part of Tens
30_127230 ch21.qxp 12/4/07 12:31 AM Page 326

If you’re well into a BI implementation that you’re overseeing, the latest itera-tion of the project plan may have very little resemblance to the original ver-sion. That’s not a sign of poor planning; it’s a reality of building a complextechnology solution. When you first create a project plan, it’s a best guessabout how things will go and what will be important to the project’s success;after you get down to work, however, the project evolves rapidly from itsoriginal form. Some tasks you thought would be easy turn out to take muchmore time and energy; some tasks you expected to consume a ton of resourcesget done in a snap, or turn out to be unnecessary altogether. It’s a naturalprocess; don’t let it break your stride.
Deal with Any Foot-draggingImmediately!
The environment — heck, the build itself — is a massive amalgam of movingparts, many of them critical to the function of the entire program. That’s whyyou absolutely, positively must take nothing for granted when it comes tocooperation from external sources — whether it’s a team within your com-pany, a consultant, a vendor, or someone in-between. If somebody has whatyou need for your project to succeed, you’d better stay on them until theydeliver.
The number-one source of delays for BI initiatives is in getting cooperationfrom the owners of the data sources which will feed your system. BI environ-ments typically draw operational data from many different sources through-out an organization. Getting that data flowing for the first time can be a majorheadache. After all, you’re the one getting the immediate benefit from thedata movement — it makes your application(s) work! — so the folks who ownthe data don’t always have a huge incentive to work with you.
If you sense any hesitation where it concerns access to data, tread carefullybut decisively. At the first missed deadline, go immediately to the source andmakes sure all loose ends are tied up. Make sure there are no security concernsor other hidden reasons why the flow hasn’t begun. Have things changed sinceyou first negotiated the file transfer? Has the political landscape morphed?Has the leadership changed?
You never can be sure of the data’s exact structure and quality until you actu-ally see it. Sure, you could design an ETL process based on a set of specs, butif anything is certain in the world, it’s that data storage can be uncertain. Foropeners, different groups have different definitions and different standards.You just won’t know what you’re dealing with until you get your hands onthose files for the first time.
327Chapter 21: Ten Secrets to a Successful BI Deployment
30_127230 ch21.qxp 12/4/07 12:31 AM Page 327

Prove That Concept!There’s nothing worse than the curtain being raised on the big day and find-ing that your cast and crew needed one more dress-rehearsal.
A proof-of-concept (POC) is a great way to model the difficulties involved in a full-scale implementation, to flush out uncertainties, and to prepare yourteam for what’s ahead. A POC is a subset of the total solution you have inmind. The scope is narrowed down to a few of the most important elementsand functions. At its core, a business intelligence POC usually consists of alimited data-harvesting solution combined with a stripped-down version ofone or more user tools. In most cases, a POC sets aside the detailed work ofgetting the user interfaces just right at the outset, and may even use morerudimentary tools and protocols than would be used in the full solution.
What you’re interested in here is whether it works.
The POC system isn’t meant to be the core of what will become the full system.It’s usually made of pieces that can be quickly mashed together to demonstratethat the basic assumptions of the BI initiative are valid — for example, that it ispossible to retrieve sales-transaction data from the regional branches, that anETL process could be built to normalize the information, that it could be ware-housed and used for end-user applications to gain business insights. The goalhere is not to check off every system goal on the list, it’s just to work throughenough of the major obstacles to facilitate a go/no-go decision.
The Devil Is in the DetailsOr perhaps he’s hiding in that box you’re always trying to think outside of.Sure, the glory is in finding the stunning business insights, or rolling out thegraphical renderings, but don’t lose sight of the day-to-day elements thatmake your system truly valuable to your enterprise.
Your initial roll-out should be easy to use — and fast. It should be accessible,intuitive, and reliable. When users mix the BI system with other applicationsthey’re already using, it should happen seamlessly. Those qualities are thefoundation of a good overall solution. So whatever the scope of the initialroll-out, the system should be infused with quality; it should do its job well. Ifyou don’t think you’ll have time to do that, you should consider reducing thescope of the project.
A business intelligence solution is often a patchwork of varying applicationsand a palimpsest (remember that word for your next Scrabble game) of ITsolutions built in bygone eras. Some components will work better than others.Some pieces will be released before they’re fully baked. Communicate those
328 Part VI: The Part of Tens
30_127230 ch21.qxp 12/4/07 12:31 AM Page 328

shortcomings — even minor ones — to your user community and stakehold-ers before they appear in an error report or an email from an annoyed analyst.Those folks are more likely be patient with a weakness here and there if theyknow you’re aware of the need for improvements.
We’ve Got a Live OneFor BI applications, the flow of data irrigates the applications, allowing themto spring to life. While you’re building the front end, you’ll probably usedummy data just to make sure the software is working properly.
But while the front end may change, in both appearance and in functionality,the data flow must be rock solid. If that doesn’t work, nothing will work.Because of its importance, it’s a good idea to graduate from mocked-up datato the real thing as soon as possible.
“Going live” isn’t about whether the user-facing applications work (after allthat testing, they’d better); it really means getting actual operational data infrom all the outlying feeder systems. Getting the data feeds fully up and run-ning is a huge milestone; throw a party and celebrate.
You always have to be careful in a project where you’re altering source data.Fortunately, BI systems usually only read data from external sources; thatmeans there’s little risk of damaging source data. That’s good news for yourproject team because it means you should be able to start taking delivery onthe data regardless of whether your system is working correctly yet.
Going live also means receiving that operational data in the actual timeframeyou’ve designed the BI system for — in the same format you expect to seewhen the applications are operational. Sure, you’ll start by getting it in batchesas you test. But the sooner you can shift to full-speed-ahead, the easier youcan judge whether your toolset is up to snuff.
Work back-to-front; turn on the data sources as early as possible, then perfectthe front end. Once the core data-handling components of your applicationare functional, then you can turn on the data spigot for the final stages ofdevelopment. That will simulate the way the system will actually operatewhen you go live, allowing your developers to complete the full system usingreal-world data conditions. If you’re forced to wait until the very end beforeturning on the full data-flow, your application may behave in surprising ways.
329Chapter 21: Ten Secrets to a Successful BI Deployment
30_127230 ch21.qxp 12/4/07 12:31 AM Page 329

330 Part VI: The Part of Tens
30_127230 ch21.qxp 12/4/07 12:31 AM Page 330

Chapter 22
Ten Secrets to a Healthy BI Environment
In This Chapter� Watching carefully
� Listening to users
� Evolving with the business itself
You flipped the switch, turned on your BI applications, and everythingworked like a charm. I hope you didn’t overdo it at the launch party
because there’s still a lot of work to be done. (But you knew that.)
Building on the initial success of your business intelligence deploymentrequires planning and resource consumption that will rival the initial imple-mentation. That’s because BI is ultimately there to offer a glimpse into theinner workings of the company — and some of those insights will provokechanges that you’ll have to help implement.
As the company changes its approach over time, BI must be prepared toevolve with it.
The following basic habits will mean the difference between a BI system that’sfully utilized, and one that withers and dies on the vine. These ten ideas willhelp keep your BI environment healthy.
Data TLCA comprehensive business intelligence environment often involves data thatgoes through an extensive and confusing chain of virtual custody and transformations.
Pay careful attention to every link in that chain. You never know when a changecould occur elsewhere in the company that renders a formerly reliable streamof information completely unrecognizable.
31_127230 ch22.qxp 12/4/07 12:31 AM Page 331

Data is the lifeblood of BI. When it gets lost, transposed, or transformed tothe point where it no longer adequately represents the operational reality ofthe company, the system can no longer deliver valuable insights. Think ofdata along these lines:
� Data quality: Is the data usable and complete?
Imagine you’re trying to do a geographical analysis of customers andyou find a large percentage of customer records are missing Zip codes.In a similar situation, customer-service representatives at your companymay be entering phone numbers into the CRM system in a variety of formats — some with parentheses, some with dashes, and some withjust digits. Part of caring for your data is being prepared to clean it upand ensure that it’s all in a uniform, usable format.
� Data integrity: Is the information correct? Does it represent what every-one believes it does?
For example, data quality degrades when one company entity measuresthings one way, and another entity measures it another way. Two divisionsmay be sending you sales data, but if one is sending you a daily summaryand the other is sending you a mass of individual transactions, you’dbetter be prepared to do some work on that data before you combine it.
Hitting Budget TargetsThe only thing worse than spending a lot of money on a BI initiative is spend-ing a whole lot more than you promised the project’s executive sponsors you’dspend. The significant cash outlays aren’t restricted to the beginning of theproject; there will be maintenance costs for the BI systems too. So you’ll needto take great care in estimating them at the outset.
Data may be the lifeblood of BI, but money is the fuel that makes the projectgo. And your ability to secure funding in the future will depend largely onyour ability to be a responsible steward of the company’s greenbacks thefirst time around and after the system is switched on.
The final product may be different from the original design. So the mainte-nance costs may be quite different from what you’d originally estimated.
The best bulwark against blown budgets is a comprehensive and accuratescoping process. You need to understand all the major system components(that is, budget items) before you promise the bigwigs that it’s going to cost a certain amount. Consider the following possible domains during the scopephase:
� The number and nature of the functions performed by the system. Didyou implement more functions than you had planned?
332 Part VI: The Part of Tens
31_127230 ch22.qxp 12/4/07 12:31 AM Page 332

� The number of third-party software vendors involved. If it’s more thanyou anticipated, you might have different license payment structuresthan you had originally planned for. And if you ended up building sometools yourself, don’t think that’s all free when it comes to maintenance.Your team’s time will have to be accounted for to keep your homegrowntools humming along.
� The number of different data sources and the quantity of data to beprocessed within a given time period. Are you handling the amount ofdata originally estimated? If it’s more, you might be on the hook for morestorage, connectivity, and security fees.
Your budget can only be as accurate as your initial scope estimates.
Sometimes, in addition to missing budget targets, you get the all-too-commonbudget surprise. If disaster is a possibility on the project, seriously considersending up a red flag well in advance. Hey, it happens sometimes: Vendors failto deliver, one aspect of the environment turns out way more complicatedthan you figured, or the solution — for many reasons — just doesn’t cometogether the way you expected. You might buy yourself some time by delay-ing the bad news, but doing so reflects poorly on your approach to the pro-ject; it indicates — justifiably or not — a fundamental lack of concern for thecompany’s investment.
Hitting Schedule TargetsThe project schedule is another constraint that has to be managed carefully.Because BI projects are often a jigsaw puzzle of events and resources, whenyou miss one deadline, the effect can cascade across other milestones andthrowing your project off the rails permanently.
Hit your schedule targets for upgrades and enhancements. After you powerup the BI environment and evangelize its uses, you’ll find that folks startcounting on you.
But it’s not just the software calendar that you should adhere to. Provide ade-quate room on your planner for training, reviews, governance meetings, andhumdrum maintenance tasks.
Rinse and RepeatInsert one or two of those standard clichés here: Don’t reinvent the wheel asyou’re building a better mousetrap. If you had a process or a technology thatworked brilliantly the first time through, use it again.
333Chapter 22: Ten Secrets to a Healthy BI Environment
31_127230 ch22.qxp 12/4/07 12:31 AM Page 333

You probably learned a lot from your initial implementation about any rangeof topics. Maybe it’s as simple as the way you structured the project team, orthe person who taught the training class to the employees. Or maybe it’ssome large aspect of how the technology works.
Regardless of the scope of the success story from the first round, try to reliveit as you maintain the environment. There are no points for originality in theBI world, only for success. So go with what you know works well . . . until it’sno longer working well. Then, and only then, you should find an alternate plan.
Rinse and Don’t RepeatYou’ve undoubtedly collected some bumps and bruises along the way in developing your BI environment. With any luck there’s no permanentdamage. But you can turn all those mistakes into valuable lessons that willhelp refine your process going forward. After all, life is for learning, right?
Business intelligence will provide insights into critical processes and functionsin your organization, and the net result will be that the company changes theway it operates. It’s the same with the BI implementation team itself. The expe-rience of building the system will provide many valuable lessons that can beemployed in the next go-round.
The key to learning from your mistakes is to have a process for tracking anddisseminating the lessons. Maybe it’s as simple as doing regular reviews andpost-mortems, or you may want a more formal tracking system. No matterwhat you decide, just make sure that you go beyond identifying mistakes andmissteps to creating resolutions. “Lessons learned” don’t count for muchunless you adjust your process accordingly the next time.
Maintain Team KnowledgeRepeating what works and avoiding past mistakes are part of an overallknowledge-preservation effort on your team. To make business intelligencepart of a long-term movement in the company, the more expertise you canpreserve inside the project team, the better you can serve the organization.
Some of the ways you can capture and maintain a continuum of team knowl-edge include these:
� Write down what you do. Create comprehensive process documenta-tion including descriptions and flow diagrams for every aspect of thesystem including all data sources, the entire ETL process, the datarepository, and all the user applications.
334 Part VI: The Part of Tens
31_127230 ch22.qxp 12/4/07 12:31 AM Page 334

� Document your code. Have developers comment their code so that ifone programmer leaves, others can understand the work he or she’s left behind.
� Develop and enforce a mentoring system. See to it that the junior mem-bers of the team work hand-in-hand with the old salts, so all the secretsget passed down.
Remember What You Forgot the First Time
It’s inevitable that the initial rollout will only include a subset of all of thosefeatures and items that you actually wanted to put into place. On top of thatthere will be suggestions and needs from the user community and stakeholdergroups; they may be new functionality, or perhaps tweaks to the user inter-face or some other aspect of the BI environment.
Just because you can’t do them all at once doesn’t mean you shouldn’tendeavor to do them all eventually.
Track those items that got squeezed out of your initial implementation so theycan be added during the maintenance and upgrade process. It gives the userswhat they want and need in a very straightforward way, and helps the BI teamportray itself in a positive light, by appearing responsive and organized.
Regular UpdatesA business intelligence environment is like an infant: It can’t operate unat-tended for very long without starting to smell funny.
If you let your system go for too long without monitoring and upgrading itscomponents, it will spiral out of control. Your tech guys will be the first onesto tell you that the systems in a BI environment need regular bug-fixes,upgrades, patches, and all kinds of general attention to keep everything ship-shape. Believe them; they know what they’re talking about.
It’s normal for software companies to release upgrades for their applications;the makers of end-user applications in a BI environment are no exception. Theupgrades and patches take care of minor problems, inefficiencies, and securityproblems, some of which may affect you directly, some of which may not. Thesame regular patches exist for all the supporting infrastructure such as thedatabase tools, the ETL applications, and other middleware in your system.
335Chapter 22: Ten Secrets to a Healthy BI Environment
31_127230 ch22.qxp 12/4/07 12:31 AM Page 335

In addition to responding to updates from vendors, there may be changeswithin your company (at the source-data level, for example) that requireattention from your tech team.
With so many moving parts, a good BI environment schedules time andresources for the simple act of maintaining the systems.
Staying in Touch and in TuneMonitoring how your application suite is behaving will help identify problemmountains when they’re still mere molehills.
To maintain a healthy environment, you’ll need to invest in good diagnosticapplications and devise a process for monitoring application health — andquickly reacting to any problems that appear. That means more than simplytracking whether software is running. You need to monitor performance —how well it’s running — to truly measure the health of the system.
Usage statistics tell you whether your targeted user community is adoptingthe BI programs. In your research you should have a baseline idea of whatusage stats might look like. Compare those over time and follow the trends.
Communicating ChangesYour system is only a success if people are actually using it to achieve busi-ness goals and to seek and locate business insights. They can only do that ifthey know what functions are available and how to use them. So as a practice,your team should let users know when you’ve made upgrades and changesthat may affect how they use the system. Did you add a server that’s going tocut response time in half for queries? Send a note to the user community andtell them about the upgrade.
If there’s a new application or function available, you’ll want folks using it assoon as possible. Communicating in general lets the organization know thatyour team is active and that the system is evolving to meet their needs. Italso spurs feedback from the company, which can never hurt.
Don’t just talk to your user base; your communications reach should extendthroughout the organization. A comprehensive communications plan meanskeeping the executive team informed of the latest enhancements to the system.The wider your communication reach is, the better.
336 Part VI: The Part of Tens
31_127230 ch22.qxp 12/4/07 12:31 AM Page 336

Stay on the TrainWhen you buy software licenses, they’ll normally come with a training pack-age, or a set number of classes that your developers and other resources canattend in order to learn how best to install and utilize the software. But what’sin the package is rarely enough training for the level of expertise you reallyneed.
BI vendors usually understate the amount of training required to successfullyutilize their products. They want to make you believe that you just plug in thenew application, flip the switch, and watch it go. But it never works that way;you have to maintain an appropriate level of expertise on your team to getthe most out of the systems you’ve bought and built.
Make ongoing training a regular component of the maintenance process as away to keep the experience and expertise on the team at healthy levels. As anadjunct benefit, professional development keeps the BI team satisfied andlowers the likelihood of their departure for greener pastures.
Maintenance as a ProcessIn a typical application implementation, the maintenance phase begins afterthe software has been launched successfully. Unfortunately, a BI environmentis different than a traditional IT implementation for a number of reasons.
Sure, there are standard software updates and tuning that have to happen ona regular basis. New people must be trained on how to use and administerthe system. But the larger difference is that the very nature of business intel-ligence projects demands that the system is not really meant to be stable. It’sactually supposed to evolve over time. Your team should be set up and pre-pared to deal with an evolving system.
BI is about transformation. Think about what business intelligence reallymeans to the business: the BI environment, once installed and activated,should begin to produce insights about the business for its users. Thoseinsights will (slowly but surely) make their way into the strategic planningprocess. They will put pressure on those original processes to change —which will in turn lead to new and expanded needs for the BI system.
For example, if a user community is suddenly given access to detailed client-profitability data, they may identify better business processes for (say) structuring contracts. But it’s also likely they’ll identify new dimensions ofcustomer and profitability information that could be used to discover even
337Chapter 22: Ten Secrets to a Healthy BI Environment
31_127230 ch22.qxp 12/4/07 12:31 AM Page 337

more business insights. In this case, BI is not merely a catalyst for businesschange; the business intelligence system actually feeds the demand for itsown evolution. Once users have access to BI insights, they’ll get a taste forthe power of information, and they’ll demand more data and more dimen-sions of that data. It’s a cycle of change that never really ends.
Maintaining a healthy BI environment means being ready to react to thechanges BI produces in the business as best as possible. It’s not always easyto anticipate those changes, but if the team and the maintenance philosophyare structured right, it’s at least possible to respond appropriately.
338 Part VI: The Part of Tens
31_127230 ch22.qxp 12/4/07 12:31 AM Page 338

Chapter 23
Ten Signs That Your BIEnvironment Is at Risk
In This Chapter� Starting from high altitude
� Getting granular
� Getting your priorities straight
Let’s hope all that planning pays off and your BI systems work flawlessly. Iwish you nothing but green lights and happy users in your future. But the
bad news is, if it’s not all smiles and handshakes in the user community, youwon’t always know it. It’s not always obvious to the project team when sys-tems aren’t doing their job, or when people are dissatisfied.
Here are some symptoms you should keep a watchful eye for that may indi-cate your BI environment is at risk of failure.
If these things happen it doesn’t mean all that planning — or your whole BIinitiative — was for naught. It just means it’s time to shore up the technology,the support, and the company processes.
The Spreadsheets Just Won’t DieIf a report gets generated automatically, but nobody sees that report, does itreally exist?
Your BI initiative may have taken shape exactly as you specified; it could beperfect in its conception and implementation. But if people aren’t using it, allof that counts for nada.
One of the easiest ways to tell whether people are getting the most from yourBI system is to monitor the transition between the old-style reporting-and-analysis tools and the new BI approach to the same problem. If folks still
32_127230 ch23.qxp 12/4/07 12:32 AM Page 339

show up at meetings with the same old spreadsheets and the same oldreports they used before the BI implementation, it might indicate that youstill have a ways to go to make your product more useful and user-friendly.
Don’t take it personally. Ask why people haven’t migrated, and listen to thereasons. It’s possible they haven’t been trained adequately, or it’s sometimesthe case that the manager hasn’t mandated the switch. Those hurdles caneasily be overcome. But if the truth is that the spreadsheet is just better, youmay need to revisit your project and find where you got off track.
Everybody Asks for HelpRight after your initial implementation, you should receive a torrent of requestsfor assistance with using the applications. But after the initial transition, folksshould begin to get used to the new systems; the calls to the helpdesk shouldbegin to trail off.
Of course, there’s a big difference in the kind of calls you’re getting, so youshould always monitor the problems being encountered. If the systems arebreaking, or if response times are unacceptable, those are problems you’llhave to fix yourself. But if everything is functioning as expected, the calls willbe questions about how to do something, or about where a feature can nowbe found.
First impressions can be valuable. Track the usability complaints from yourend-users and incorporate fixes for the major flaws in subsequent releases.
Nobody Asks for HelpAs Oscar Wilde famously quipped, “the only thing worse than being talkedabout is not being talked about.” And so it goes with your BI environment.The only thing worse than getting a bunch of helpdesk calls is getting almostno helpdesk calls.
If you kick off your program and you hear nothing but crickets at your help-desk phone bank, get out among the user community and find out what’s happening. Maybe you put together a lucky one-in-a-million application withno flaws, but more than likely a more sinister force is at work.
The first question to ask is, do people know about the new BI environment?And if so, are they using it? If they’re using it and not encountering any prob-lems, are they using all its functions, and are they using each function to its
340 Part VI: The Part of Tens
32_127230 ch23.qxp 12/4/07 12:32 AM Page 340

fullest capabilities? On another tangent, if you don’t get much feedback, maybeusers aren’t sure where to go for help.
Water-Cooler Grumbles About UsabilityThe best software in the world exists at the intersection of Useful and Usablestreets. If you find one without the other, you’re nowhere.
The two qualities are equally important, and yet so much more effort goesinto the former characteristic relative to the latter. More often than not,developers and architects focus all their energy on making the products func-tional, worrying little about whether the user can easily get done what theyneed to get done.
For these problems, you won’t necessarily get calls into the helpdesk. Theywill manifest themselves in the banter around the water cooler, and at the company picnic, and in low-level team meetings.
Never underestimate the role of usability in software. Make usability a prior-ity during the design process.
And we’re not just talking about user interfaces. Sure it’s important that thetab order is correct, that the buttons are big enough, and that the font isreadable. But the process has to be usable as well. A great interface is worth-less if the database round-trip supporting it takes 5 minutes. Usability encom-passes a lot of areas; and it must be on your mind when you design everyelement of your BI environment.
Good-Old-Day SyndromeA relative of the water-cooler grumbling about usability is the chatter you’lloccasionally hear about the way things used to be at the company. Maybe itconcerns discomfort over a new process, or maybe it’s a specific applicationthat’s being fondly remembered.
But if people are talking about it, it means the current BI suite isn’t doing itsjob as well as it should.
Separate out transition talk from meaningful opinion on the quality and utilityof the BI environment. Introducing a new application produces instant good-old-days syndrome. The indication of the problem occurs when that syn-drome never seems to go away.
341Chapter 23: Ten Signs That Your BI Environment Is at Risk
32_127230 ch23.qxp 12/4/07 12:32 AM Page 341

Usage Numbers Decline Over TimeYour usage statistics should steadily rise as more and more people turn on tothe usefulness of the BI application suite.
Don’t worry about occasional dips in usage numbers; there will be inevitablefluctuations as user teams get up to speed. But if you notice a steady declinein usage statistics, beware of some underlying problems in your environment:
� The most obvious source of the problem is that people aren’t yet com-fortable with the new reporting or analytics tool.
That’s hard to diagnose because those complaints often stay hidden. Butit’s easy to fix; give some enhanced training classes, or have your execu-tive sponsors remind the team of the new standards.
� Maybe your application is simply not delivering value to the user com-munity. The insights that you promised aren’t being produced.
That problem’s easier to diagnose, but harder to fix. You’ll need to checkback in with all your stakeholders and do an assessment of where theshortcomings are, then make some tough choices about whether totweak the environment, or (in the worst case) to pull the plug entirely.
BI Tools Aren’t Part of Strategy Discussions
In a healthy BI environment, particularly as it concerns IT, the data-collectionand aggregation tools should become part of the strategic landscape of thecompany.
Business intelligence is as much an ongoing management philosophy as it is a set of tools and processes. BI, if done right, should produce changes in theway things are done at your company. If it’s successful in delivering insightsabout the profit margins of each product line, the corporate bigwigs will want to transplant the successful approach to other data-heavy areas of thebusiness.
If you find that’s not happening, there may be a problem with what you’vedelivered. A BI-centric approach to strategy will spread only as far as yourexisting environment is successful.
The same holds true no matter the size of your BI environment. If you have alow-level implementation that only serves a department or two, then the plan-ning process for that limited area should include BI. Moving up the ladder, if
342 Part VI: The Part of Tens
32_127230 ch23.qxp 12/4/07 12:32 AM Page 342

BI is used in one functional silo of the business, BI should begin creeping intothe long-range business strategy discussions for that area.
Executive Sponsors Lose EnthusiasmNothing stays the same in business. While you are reading this sentence, somefactor has probably changed dramatically without your even knowing it. Sowatch your step in the BI arena; the Big Kahuna championing your projecttoday could be badmouthing it tomorrow.
Don’t take the support of your executive sponsors for granted. Their situa-tion may change, or the circumstances surrounding the business can easilyevolve out from under you. Stay in close touch with the sponsor’s needs; beas responsive as possible to his or her concerns.
One of your priorities is to make sponsors look good. It might feel like it’syour project, but their name is on it. So you need to create a workable prod-uct in a way that suits your executive sponsor’s wishes.
Executive Sponsors Lose their JobsThere’s always the possibility that your corner-office champions change jobsor leave the company. That leaves any pet projects they left behind at risk;often the replacement exec starts by evaluating his or her portfolio for weaklinks.
Even if the project is sound and the business utility is high, it’s always possi-ble the new executive won’t see it or understand. So be prepared to makeyour case early. Don’t wait till he or she contacts you; make a pre-emptivestrike before any hint of negativity has had a chance to take root. The salespitch you made to the original sponsor was successful, so why not deliver anencore performance? Just make sure you recognize what the factors were inyour original sponsor’s departure; if they had anything to do with your pro-ject or with BI in general, be prepared to address them head-on. A great wayto do that is to demonstrate examples of your early successes. And if thereare any manager-level folks who’ve benefited from your project, have themput in a good word for you as well.
From a political perspective, it’s important to be aware of the circumstancessurrounding the departure of your project’s benefactor. If that executive leftunder a cloud of controversy, you might change your approach in a way thatminimizes your connection to the previous regime.
343Chapter 23: Ten Signs That Your BI Environment Is at Risk
32_127230 ch23.qxp 12/4/07 12:32 AM Page 343

If your pitch fails and the new executive doesn’t take the bait, look elsewherefor a champion. Perhaps the progress you’ve made has changed some mindsin other areas of the company, or in other corner offices.
Resistance to Upgrades and ExpansionMoney talks when it comes to IT projects. Projects that have the faith of thecompany and the confidence of the executives are the ones that appear onnext year’s budget.
After the initial implementation, you probably have lots of plans aboutupgrades and expansion features. You may want to build on to current appli-cations or add brand new ones — say, add capacity to the database or putsome cutting-edge protocols in place.
But if you’re having trouble getting budget approval for such ventures, youshould probably take a hard look at the environment you’re currently operat-ing. Is it doing what you promised it would do? You’ll need to establish a track record before going to the well again — and if that’s not possible withthe technology and tools you have in place now, you’d better find a way tojustify pouring more money into the project.
344 Part VI: The Part of Tens
32_127230 ch23.qxp 12/4/07 12:32 AM Page 344

• A •Ab Initio, 298accuracy/accurate answers, 14–15acquisitions, software marketplace,
287–289acronyms, 10, 12–13actionable insights, 15–17ad-hoc queries and reports, 59–61,
235–236, 254aggregation, 271–273AI (artificial intelligence), 110AIS (analysis information systems), 13Allen, Kathleen, 211alternatives
corporate culture and, 157–158“could-be” alternatives, 155–158making the choice of, 158–161project planning, 124“should-be” alternatives, 152–154
Amazon, 35analog data storage, 19analytical systems/tools
desktop software, 21e-commerce and CRM, 34–35financial reporting, 36
ANSI (American National StandardsInstitute), 57
API (application programming interface),285
APL (“a programing language”), 86application inventory, 149application lead developer, 134applications
capabilities review, 148–149diagnostic tools & utilities, 248–249documenting requirements, 206–208
keep the good stuff, 149–151, 319, 333–334portals, 314staying within budget, 332–333throw out the bad stuff, 151–152upgrades & extensions, 252–256, 335–336
architectureBI overview, 54centralized versus decentralized, 165–168costs, 173data warehouse, 265developing your own, 122–123evaluating alternatives, 168–172OLAP, 75–78technology risks, 174
archives/artifacts, 138, 165, 187, 207, 246,317, 336–337
Ascential, 297assessment
current infrastructure, 144–147current technology, 147–149keep the good stuff, 149–151, 333–334throw out the bad stuff, 151–152
autocratic culture, 166
• B •Baan, 29bad advice, 39baseline/final sign-off, 220basic users, 57, 226–227best practices, 45, 97–98Bezos, Jeffrey, 35BI (business intelligence)
architecture overview, 54best & worst practices, 45brief history of, 18–21defined, 10–12
Index
33_127230 bindex.qxp 12/4/07 12:33 AM Page 345

BI (business intelligence) (continued)keys to healthy, 331–338keys to requirements management,
315–322keys to success, 303–307overcoming risks, 309–314as oxymoron, 1as “paradigm shift,” 137predecessor systems, 12–13process versus project, 243–244using this book for, 2–5
BI technologies. See also technologyacronyms and past systems, 12–13advances in, 101–102buzz of “next generation,” 112data mining, 109–112guided analysis, 106–109for unstructured data, 113visualization, 102–106
BICOE (BI Center of Excellence), 139–142,309–310
bonuses and stock options, 41BRD (business requirements document).
See requirementsbriefing books, 98–100budgeting and planning
BI technology, 36competency center, 140contingency planning, 179, 312–313implementation, 117–120, 203limited resources, 10–11“nuclear option,” 202querying and reporting, 54staying within target for, 332–333
business analyst (BA), 132–133, 190business insights
Big Four criteria for, 12–17, 40data as the source of, 261–262decision-results cycle, 18KPI as source of, 94–95, 303–304“next generation” trends, 113process versus project, 243–244role in project planning, 120–121
Three Bears Analysis (TBA), 45vision and goals, 317–320visualization as tool for, 102–106
Business Objects, 113, 298–299business requirements. See requirementsbusiness stupidity, 1business value, 156–157, 176, 246–247buy-in
business requirements, 220dealing with resistance, 309–310management, 40–45, 306–307, 343–344for strategy choices, 158–160technical design, 127
• C •call centers, 33campaign management, CRM, 33–34capabilities review
assessing infrastructure, 144–147, 152assessing technology, 147–149keeping the good stuff, 149–151throw out the bad stuff, 151–152
causality versus coincidence, 47, 111CDI (customer data integration), 268celebrations
“going live,” 329kickoff meeting/launch party, 137ribbon-cutting ceremony, 129
centralized architecture, 165–168champions, project, 137, 179, 307, 325,
343–344change
avoiding scope creep, 313avoiding unnecessary, 319, 333–334communicating, 336–337continuing resistance to, 339–342fear of, 136–138, 309–310inevitability of, 221–222overcoming foot-dragging, 327planned obsolescence, 257–258process versus project, 243–244upgrades & extensions, 344
346 Business Intelligences For Dummies
33_127230 bindex.qxp 12/4/07 12:33 AM Page 346

checkpoints, 199Chonoles, Michael Jesse, 127churn management, 33client/server ERP, 29–30Codd, E. F. (Dr.), 86code freezes, 180–181Cognos, 55, 86, 299coincidence versus causality, 47, 111collaborative marketing, 34–35compatibility, application, 284–286competency center, 139–142Complete MBA For Dummies (Allen &
Economy), 211computers. See hardware; softwareComshare, 86, 90concurrent versus individual licensing, 125constraints, task, 195contingency planning
budgeting, 312–313implementation, 178–181risk management, 198–199
corporate culture, 157, 166–168, 306costs. See also licensing pricing/costs
BI implementation, 39of change, 222open-source software, 293Oracle products, 291
“could have” requirements, 219–220“could-be” alternatives, 124, 155–158coupling, 166credibility, creating BI, 39CRMS (customer relationship management
system), 23–24, 32–34Crystal Decisions, 55, 299custom formats, 217customer-centric marketing, 33–34
• D •dashboards. See also visualization
EIS origins, 90–92evolution of, 92features & functionality, 95–96key performance indicators, 93–95
picking the right type, 97–98presentation formats, 217scorecard comparison to, 99
data, cleaning-up. See ETL (extract,transform, and load)
data architects & designers (DAs), 133–134,190
data derivation, 273data dictionary, 232data hierarchy, 75data management
architecture, 168–171avoiding foot-dragging, 327maintaining quality & integrity, 331–332optimizing procedures for, 261–262post-launch review, 248staying within budget, 332–333users versus providers, 209–210, 270–271
data mart, 141, 279–280data mining
concepts and systems of, 109–110defined, 111today and the future, 111–113
data modelchoosing the, 274dimensional, 274–276hybrid, 279normalized schema, 278–279snowflake schema, 277–278star schema, 276–277
data profiling, 268–270data quality, 273. See also ETL (extract,
transform, and load); GIGO rule(garbage in, garbage out)
data quality analyst (DQA), 134data repository, 263data standardization/integration, 266–270data storage
in BI history, 18–21choosing a model for, 274–279just-in-case attitude, 109–110RDBMSs, 87regulatory & compliance issues, 320–321
347Index
33_127230 bindex.qxp 12/4/07 12:33 AM Page 347

data transformationcommon problems, 47for data warehousing, 25data-standardization, 266–270ETL connections, 53–54research methodologies and, 101–102
data warehouse, 312assessing your current, 121–122case study/example, 263–267common problems, 47connecting BI to a, 23–25, 167–168, 305data transformations to, 25–27defined, 262–263new system installation, 126–127operational applications, 27–28profiling, 268–270queries & reporting access, 52–54standardization/integration, 266–268structuring target data, 270–273system architecture, 123unstructured data, 113
database administrator (DBA), 135, 190databases
access philosophies, 63–65accessibility, 58–62in the design process, 228–231discovery-and-profiling, 248maintaining control, 63querying/reporting tools, 51–56querying/reporting users, 56–57SQL, 57–58
DataMirror Technology, 293DB/2 (relational database application),
86–87, 293DBMS (database management systems),
19, 111–112decentralized architecture, 165–168decision-making
assessing your current state of, 121–122Big Four criteria for, 14–17business intelligence for, 9–11CRM in, 32–34
early systems of, 12–13ERP in, 28–32JAD sessions, 211–213making strategy choices, 158–161“nuclear option,” 202–203strategic versus tactical, 44–45
decision-results cycle, 18de-coupling, 166demand-chain marketing, 34–35departmental BI, 40–43design process
best practices, 227creating a strategy, 223–224data environment, 228–231data mining & analytics, 238–239OLAP tools, 236–238pilot projects, 242proof of concept, 242reports environment, 231–236, 239–240testing, 239–242user groups in the, 225–227, 239
diagnostic tools & utilities, 248–249dimensional data model, 274–278dimensional software model, 284–285disk drives, 19DMReview, 305documentation
architecture, 122–123archives, 138, 334–335artifacts as resources, 165, 187, 207business requirements, 133post-launch review, 246
do-it-yourself route, BI, 47downsizing, 136–137drill-down/drill-through
analytical systems, 45dashboards, 95–96OLAP, 79, 81–84, 88querying/reporting, 53, 56, 62–63, 240visualization software, 104
DSS (decision support systems), 12–13, 90
348 Business Intelligences For Dummies
33_127230 bindex.qxp 12/4/07 12:33 AM Page 348

• E •Eckerson, Wayne W., 97e-commerce, 33–36, 42Economy, Peter, 211EIS (executive information systems), 12–13,
90–92Eisenhower, Dwight D., 165end users. See also user interface
categories of, 56–57data requirements, 209–210licensing pricing/costs, 125overcoming objections of, 136–138,
306–307, 319post-launch communications, 250–252,
336, 340–342push-pull access for, 64querying and reporting tools, 51–52role in design process, 210–213, 239–242,
311–312, 316–317role in implementation, 135, 191, 205–208,
324–325training plan, 128–129, 337
enterprise BI, 40–45entrepreneurial culture, 167e.piphany, 33–34ER diagram (entity-relationship), 237ERP (enterprise resource planning), 28–32,
85, 272, 293“esprit d’escalier” (spirit of the staircase),
15ETL (extract, transform, and load)
cleaning & storing data, 53–54, 312database design and, 228–231development role, 190system architecture for, 123testing, 241, 325–326
Execucom, 90expert systems, 110, 227
• F •fact tables, 274–275feedback, 250–252financial reporting, 36, 94–95flat-file databases, 58forecasting, 36, 41, 44–45, 78, 238, 248, 254,
257front-end testing, 241, 325–326, 329
• G •Gantt Charts, 118, 196–197geospatial visualization, 106–107GIGO rule (garbage in, garbage out), 14–15,
112, 312governance, data, 123, 251, 268GPS (global positioning system), 106–107group sessions/design sessions, 210–212guided analysis, 106–109“gut instinct,” decision-making, 9
• H •hardware
architecture selection and, 168–171in BI history, 19–21legacy systems, 28–29
helpdesk support, 250–251, 340–341heuristics, 110hierarchy, information, 271–273history
early BI, 18–21e-commerce browsing/buying, 34–35software marketplace, 286–289
HOLAP (Hybrid OLAP), 87–88Hyperion, 86, 290, 293
• I •IBM, 293, 297–298icons, 5
349Index
33_127230 bindex.qxp 12/4/07 12:33 AM Page 349

impact assessments, 222implementation. See also project plan;
project plan, launching theaddressing the people factor of, 131–135avoiding foot-dragging, 327BI process versus project, 243–244celebrating completion of, 129choosing the level for, 40–43contingency planning, 178–179examining barriers to, 154“going live,” 329identifying the problem, 37–39, 117–120is a moving target, 180–181, 310“nuclear option,” 202overcoming resistance, 309–310Phase I, 176–177Phase II, 178practices of (best & worst), 46–48,
137–138scope, 43–44, 124scorecard, 177–178secrets to success, 323–329software-evaluation cycle, 310–311system architecture, 123testing phase, 325–326tools, 44–45
implementation team. See also champions;project management; sponsors
address the people factor, 131, 305in-house IT, 134–135roles versus resources, 187–189staff turnover, 179team members, 132–134, 189–191, 201use of meeting facilitator, 316users & in-house experts, 135utopian BI exercise, 153–154
“impossible triangle” of IT, 164Informatica, 297information consumers, 57information hierarchy, 271–273information management, 148Information Resources (IRI), 86
infrastructurecapabilities review, 147–149, 152role in implementation, 191
infrastructure architect, 134integration testing, 240interactive reporting, 62–63interface design, 126–127Internet
querying and reporting tools, 56user communities, 124
IPRB (International Punctuation ReviewBoard), 10
ISO (International StandardsOrganization), 57
ISO 9000, 137iWay, 298
• J •JAD (joint application development),
210–212Jaspersoft, 296JD Edwards, 29
• K •Kalindo, 298keys to BI success, 303–307keys to failure
end user acceptance, 340–341exclusion from strategic planning,
342–343loss of management support, 343–344reports that are not used, 339–340resistance to change, 344usability problems, 341–342
keys to good BIavoiding scope creep, 321business insights, 318–319business themes, 317–318prioritizing, 322seeing the big picture, 320
350 Business Intelligences For Dummies
33_127230 bindex.qxp 12/4/07 12:33 AM Page 350

source data, 320–321vision and goals, 317your implementation team, 316–317
Knowledge Workers, Inc., 119KPI (key performance indicators)
defined, 93identifying, 38, 303–304measuring, 94–95
• L •Lawson, 29legacy systems, 28–32lessons learned, 245licensing pricing/costs. See also costs
á la carte versus packaged, 285, 290build your own to save, 298cost factor, 39, 173pilot project, 242SQL server, 292system expansion, 252, 254vendor selection, 125, 149
limited release, 241linkages, task, 195Linux operating system, 296long-range planning, 40, 257–258loyalty, customer, 33
• M •Magic 8-Ball decisions, 11magnetic tape, 19, 28–29mainframe computers, 28–29maintenance
documentation is part of, 334–336feedback & user training, 250–252is a continuing process, 337–338keeps the system healthy, 247–249keeps the system relevant, 250post-implementation, 244–247process versus project, 243–244system on-going review, 256–258
upgrades & extensions, 252–256, 335–336versus enhancements, 257
managed reporting, 61–63management buy-in
address corporate culture for, 306–307business requirements, 220champions & sponsors for, 137–138, 179,
250, 252, 307, 325company versus department, 40–42loss of, 343–344power versus usability, 44–45strategic versus tactical, 43–44for strategy choices, 158–160technical design, 127
marketing campaign management, 33–34MDM (master data management), 268, 272MDS (management decision systems), 13meetings. See also celebrations
group sessions/design sessions, 210–211JAD sessions, 211–212one-on-one, 212rah-rah & name-dropping, 325small-group, 213use of meeting facilitator, 316–317virtual design sessions, 213
mergers, software marketplace, 287–289metadata, 52–53, 232meta-metrics, 181Metapraxis, 90methodology
challenge of selecting, 117–119defined, 119–120design process, 227examining barriers in, 154
microcomputers, 28–29Microsoft, 291–293, 298
Access, 300CRM systems, 34Excel, 80, 151, 300MS Office, 292MS Project, 164–165, 188, 193–194, 201SQL Server, 86–87, 112, 292
351Index
33_127230 bindex.qxp 12/4/07 12:33 AM Page 351

Microsoft Office Project 2007 For Dummies(Muir), 127
Microstrategy, 104, 299milestones, 192–193, 202–203MIS (management information systems), 13Muir, Nancy C., 127multidimensional data analysis, 70–75, 134multidimensional data model, 276–278multidimensional OLAP (MOLAP), 86–87multiple regression, 112“must have” requirements, 219–220MySQL, 296
• N •NA (needs analysis). See requirementsNCR Teradata, 295Netezza, 295–296“nice to have” requirements, 219–220non-parametric analysis, 112non-standard formats, 113. See also
unstructured datanormalized data, 275–279“nuclear option,” project planning, 202
• O •obsolescence, planned, 257–258ODBC (open database connectivity), 285ODS (operational data stores), 28, 280–281OLAP (online analytical processing)
applications & access tools, 78–79Big Four criteria for, 81concepts and terms, 79–80data hierarchy, 75defined, 68–69multidimensional data, 70–74, 81–85querying and reporting versus, 63system architecture, 75–78types and styles of, 85–88
OLTP (online transaction processing),69, 85
on-demand reports, 59–61
one-on-one meetings, 212operational dashboards, 97operational systems
assessing your current, 121–122characteristics of, 40–44data warehousing, 23–28power versus usability, 44–45
Oracle, 29, 32, 34, 86–87, 290–291, 298organizational culture, 166–168
• P •paradigm shifts, 39, 61, 68, 90, 102, 108, 137pattern-matching, 110–111, 268–269Pentaho, 296PeopleSoft, 29, 31–32, 290Performance Dashboards: Measuring,
Monitoring, and Managing YourBusiness (Eckerson), 97
Phase I/II implementation, 176–178phased roll-out, 128–129Pilot Executive Software, 90pilot projects, 242pivot tables, 80, 292planned obsolescence, 257–258planned release, 241, 257planning process, 165, 171. See also
implementation; project planPOC (proof of concept), 172, 242, 328politics
beware the sacred cows, 150, 213BI and organizational, 13–14, 20, 37, 46,
170of change, 154of corporate culture, 157implementation, 208of project manager tasks, 201
portals, 314portfolio risk management, 11POS system (point-of sale), 20, 23–24, 85,
191, 280post-implementation review, 244–247power users, 57, 225–226, 254
352 Business Intelligences For Dummies
33_127230 bindex.qxp 12/4/07 12:33 AM Page 352

predictive-analysis tools, 45prioritizing
business requirements, 206–208, 218–221is a continuing process, 46, 221–222reports, 235resolving disputes, 322scorecards, 221system expansion, 252–255user needs, 225–227
project administrator/controller, 201,326–327
project management. See alsoimplementation team
administrative tasks, 326–327requires a war room, 326
project manager (PA), 132, 190project plan. See also implementation;
maintenanceassessing your needs, 120–123baseline/final sign-off, 220business requirements document, 133,
206–208creating the, 127–128dealing with complexity, 304–305determining the vision, 317documentation/archiving, 138, 165, 207,
246, 336–337evaluating alternatives, 124“nuclear option,” 202overcoming objections, 136–138, 307overcoming risks, 309–314selecting the methodology, 117–120selecting the vendor/product, 124–125staying within budget, 332–333system installation, 125–127training is part of the, 128vision and goals, 186–187, 317–320
project plan, building thearchitecture selection, 165–171developing a short list, 171–172examining costs, 173making the roadmap, 163–165, 175–181requirement gathering, 210–213, 315–322
requirement reevaluation, 201–204requirement updating, 199–201risk management, 174, 198–199roles & resources, 187–191
project plan, launching theanalyze & review the, 244–245, 256–258business-impact review, 246–247initial roll-out, 328–329limited/planned, 241, 257maintenance tasks, 247–252as a phased process, 243–244, 306–307secrets to success, 323–329system expansion, 252–255system upgrades, 255–256, 335–336technology review, 245–246
project scopearchitecture selection, 166avoiding scope creep, 313, 321Big Four criteria and, 40contingency planning, 178–179, 202,
218–219data hierarchy, 75determining project, 117–121, 144, 158,
306–307enterprise versus departmental, 40–43power versus usability, 44–45reporting versus predictive, 45roadmap states the, 164–165staying within budget, 332–333strategic versus tactical, 43–44Three Bears Analysis, 45
project taskscontingency planning, 198–199developing, 191high-level tasks, 193–195identifying milestones, 192–193linkages & constraints, 195management, 326–327stoplight milestones, 202–203sub-tasks, 195–196team roles & skills, 196–198updating and revising, 199–204
pure-play vendors, 293–300
353Index
33_127230 bindex.qxp 12/4/07 12:33 AM Page 353

• Q •quality-assurance analyst, 135quality-assurance testing, 240–241, 325–326queries and reporting
alert services, 65in the BI architecture, 54data accessibility, 54–55, 58–61defined, 52graphic display in, 103–106maintaining control of, 61–63portals, 314push-pull philosophies of, 63–65resistance to change, 339–340response time, 248–249SQL, 58tools for, 52–53, 55–56users, 51–52, 56–57using ad-hoc information, 59
query governors, 63
• R •Rational RequisitePro, 206RDBMS (relational DBMS), 86–87reacquisition, customer, 33real-time applications
dashboards, 95–98e-commerce & CRM, 34–35OLAP interactivity, 67SAP software functions, 30system evolution to, 254
Red Hat Linux, 296regulatory & compliance issues, 320–321relational databases
development, 19modeling, 134OLAP approach to, 85–87SQL, 58
reports/reporting environment, 235. Seealso queries and reporting
ad-hoc information, 59–61, 235–236, 254alert services, 65
assessing your current, 121–122design process review, 239–240gathering requirements from, 214–216OLAP, 67–69, 236–238on-demand, 59–61presentation formats, 217standard design, 61–63, 231–232templates, 233–235Web-based, 61
requirementsdata environment design, 228–231defining, 213–217documenting, 133, 205–208gathering, 210–213, 315–322inevitability of change, 221–222post-launch expansion, 252–256prioritizing, 218–220, 322scorecards, 221users versus providers, 208–210validating, 218
resistance. See changeribbon-cutting ceremony, 129risks/risk management
checkpoints, 199contingency planning for, 178–179,
198–199identifying, 156–158implementation, 191overcoming, 309–314problems in, 339–344project plan, 155–156roadmap, 164technology, 174
roadmapdefined, 164–165goals, 175–176identifying project tasks, 191–195implementation phases, 176–178planning for contingencies, 178–179responding to changes, 180–181, 257–258for upgrades & extensions, 257, 335–336
ROI (return-on-investment), 19, 243
354 Business Intelligences For Dummies
33_127230 bindex.qxp 12/4/07 12:33 AM Page 354

ROLAP (relational OLAP), 87roll-out plan, 128–129. See also project
plan, launching the
• S •Salesforce.com, 34SAP, 29–32, 34, 86, 293SAS, 298–299Schardt, James A., 127scope creep, 313, 321. See also project
scopescorecards, 99, 221. See also visualizationsecrets to success
champions & sponsors, 325communications, 336data quality & integrity, 331–332deal with foot-dragging, 327documentation, 334–335hitting target deadlines, 323–324, 333keep what works, 333–334learning from mistakes, 334listening to the users, 324–325maintenance, 337–338project management, 326–327proof of concept, 328quality-assurance testing, 325–326staying within budget, 332–333take care of details, 328–329upgrades & extensions, 335–336vendor support, 334, 337
securitydata storage & access, 320–321query governors, 63role in implementation, 191system architecture, 123technology assessment, 148Web-based querying & reporting, 56, 61
“should have” requirements, 219–220“should-be” alternatives, 124, 152–154Siebel Systems, 34, 290site versus seat licensing, 125
Six Sigma, 137SLA (service-level agreement), 324small-group meetings, 213snowflake schema, 277–278software
application choices, 283applications overview, 284–286component bundling, 290diagnostic tools & utilities, 248–249do-it-yourself route, 47EIS & DSS, 90evaluation cycle, 310–311hope versus hype of, 47–48inventory, 148–149major companies, 289–293marketplace history, 286–289middleware, 169open-source, 296project management, 188pure-play vendors, 293–300selecting the right, 37–38, 124–126service-level agreements, 324staying within budget, 332–333upgrades & extensions, 252–256, 335–336Web-based querying & reporting, 56
source data, 123spatial visualization, 106–107sponsors, project, 137, 179, 250, 252, 307,
325, 343–344spreadmarts, 141spreadsheets
as analytical tool, 1, 151data transformation, 25financial reporting and analysis, 36resistance to change, 339–340visualization tools, 103
SPSS, 300SQL (structured query language), 57–58.
See also MicrosoftSRS (system requirements specification).
See requirements
355Index
33_127230 bindex.qxp 12/4/07 12:33 AM Page 355

stakeholders. See also end usersBI use by, 14–15buy-in, 160determining requirements of, 208,
316–317standardization, unifying data for, 266–270standards, setting/maintaining
archiving and, 138competency center role in, 141–142“nuclear option,” 202post-launch, 250–252software, 285–286
star schema, 276–277statistical analysis, 47, 111–112stock options and bonuses, 41stoplight milestones, 202–203strategic BI, 42–45, 121–122strategic dashboards, 97strategic planning
capabilities review, 144–152could-be alternatives, 155–158incorporating BI into, 342–343role of a roadmap in, 176should-be alternatives, 152–154steps for making the choice, 158–160system expansion to, 254when to revisit, 161
subject-matter experts (SMEs), 135, 191,305
Sybase, 297system requirements. See architecture
• T •tactical BI, 43–45tactical dashboards, 97tasks to accomplish. See project tasksTBA (three bears analysis), 45, 141TDWI (The Data Warehousing Institute),
305team. See implementation team
technical supportavailability of, 125implementation team, 134–135post-launch, 250–251vendor, 285, 294, 296
technology. See also BI technologiesas aid in decision process, 9architecture evaluation, 168–171in BI history, 18–21contingency planning, 179–181hardware & software selection, 37–38hope versus hype of, 47–48“impossible triangle,” 164infrastructure assessment, 147–149overcoming barriers, 154, 304–305post-launch review, 245–246use of acronyms, 10
testing phasedesign process, 240–242“going live,” 329implementation team, 135, 187, 190usability, 325–326
time/timelinessBI implementation, 39BI requires, 15–17decision-making, 10–11delivery deadlines, 323–324
TM1 (spreadsheet application), 86Tomlinson, Ken, 86TQM (total quality management), 137training
cost factor, 39, 44, 173implementation includes, 128–129,
311–312is a continuing process, 337post-launch feedback and, 250–252software, 62, 150upgrading, 181, 255–256, 335–336vendor support, 125, 285, 294, 296, 324
transactional systemscomputers in, 19–20CRM and, 32–33
356 Business Intelligences For Dummies
33_127230 bindex.qxp 12/4/07 12:33 AM Page 356

data warehousing, 23–28OLTP and, 85RDBMSs, 87
transformations. See data transformationtrend-setting software, 32, 55, 299trends/trend-spotting
BI advances in, 1, 21, 112–113, 139data mining for, 109–110, 238EIS, 91graphic display, 97, 103identifying problems with, 249OLAP, 75, 78, 81
• U •UML (unified modeling language), 126–127UML 2 For Dummies (Chonoles & Schardt),
127unifying data records (data integration),
266–270unit testing, 240Unix operating system, 296unstructured data, 102, 113, 292upgrades & extensions
expanding the system, 252–256keep systems healthy, 335–336resistance to change, 344
usability, 274BI tools, power versus, 44–45design process for, 125–127end user problems with, 341–342queries and reporting, 58–61upgrades & extensions, 252–255
user community. See buy-in; end users;stakeholders
user interface. See also end usersdashboard, 90–92, 98“going live,” 329portals, 314system architecture for, 123, 168–171technology assessment, 148–149technology design, 126–127, 246
user-acceptance testing, 240–241
• V •validation, 218, 241, 269Vantive, 32vendors
a brief history of, 286–289finding & selecting, 122, 125, 310–311marketplace overview, 289role in planning process, 172sales pitch, 300service-level agreements, 324, 337software bundling, 290
vendors (past & present)Ab Initio, 298Ascential, 297Baan, 29Business Objects, 113, 298–299Cognos, 55, 86, 299Comshare, 86, 90Crystal Decisions, 55, 299DataMirror Technology, 293e.piphany, 33–34Execucom, 90Hyperion, 86, 290, 293IBM, 293, 297–298Informatica, 297Information Resources (IRI), 86iWay, 298Jaspersoft, 296JD Edwards, 29Kalindo, 298Knowledge Workers, Inc., 119Lawson, 29Metapraxis, 90Microsoft, 34, 80, 86–87, 291–293, 298, 300Microstrategy, 104, 299MySQL, 296NCR Teradata, 295Netezza, 295–296Oracle, 29, 32, 34, 86–87, 290–291, 298Pentaho, 296PeopleSoft, 29, 31–32, 290Pilot Executive Software, 90
357Index
33_127230 bindex.qxp 12/4/07 12:33 AM Page 357

vendors (continued)Salesforce.com, 34SAP, 29–32, 34, 86, 293SAS, 298–299Siebel Systems, 34, 290SPSS, 300Sybase, 297Vantive, 32
virtual design sessions, 213visualization. See also dashboards;
scorecardsdefined, 102features & tools, 103–106new trends in, 106presentation formats, 217spatial/mapping, 107user needs, 253, 270utopian BI exercise, 153–154
• W •Wiley Publishing
Complete MBA For Dummies (Allen &Economy), 211
Microsoft Office Project 2007 For Dummies(Muir), 127
Performance Dashboards: Measuring,Monitoring, and Managing YourBusiness (Eckerson), 97
UML 2 For Dummies (Chonoles &Schardt), 127
• X •XML (extensible markup language),
285–286
• Y •Y2K, 30–31
358 Business Intelligences For Dummies
33_127230 bindex.qxp 12/4/07 12:33 AM Page 358

BUSINESS, CAREERS & PERSONAL FINANCE
Also available:Business Plans Kit For Dummies 0-7645-9794-9Economics For Dummies 0-7645-5726-2Grant Writing For Dummies0-7645-8416-2Home Buying For Dummies 0-7645-5331-3Managing For Dummies 0-7645-1771-6Marketing For Dummies 0-7645-5600-2
Personal Finance For Dummies 0-7645-2590-5*Resumes For Dummies 0-7645-5471-9Selling For Dummies 0-7645-5363-1Six Sigma For Dummies 0-7645-6798-5Small Business Kit For Dummies 0-7645-5984-2Starting an eBay Business For Dummies 0-7645-6924-4Your Dream Career For Dummies 0-7645-9795-7
0-7645-9847-3 0-7645-2431-3
Also available:Candy Making For Dummies0-7645-9734-5Card Games For Dummies 0-7645-9910-0Crocheting For Dummies 0-7645-4151-XDog Training For Dummies 0-7645-8418-9Healthy Carb Cookbook For Dummies 0-7645-8476-6Home Maintenance For Dummies 0-7645-5215-5
Horses For Dummies 0-7645-9797-3Jewelry Making & Beading For Dummies 0-7645-2571-9Orchids For Dummies 0-7645-6759-4Puppies For Dummies 0-7645-5255-4Rock Guitar For Dummies 0-7645-5356-9Sewing For Dummies 0-7645-6847-7Singing For Dummies 0-7645-2475-5
FOOD, HOME, GARDEN, HOBBIES, MUSIC & PETS
0-7645-8404-9 0-7645-9904-6
Available wherever books are sold. For more information or to order direct: U.S. customers visit www.dummies.com or call 1-877-762-2974. U.K. customers visit www.wileyeurope.com or call 0800 243407. Canadian customers visit www.wiley.ca or call 1-800-567-4797.
HOME & BUSINESS COMPUTER BASICS
Also available:Cleaning Windows Vista For Dummies 0-471-78293-9Excel 2007 For Dummies0-470-03737-7Mac OS X Tiger For Dummies 0-7645-7675-5MacBook For Dummies 0-470-04859-XMacs For Dummies 0-470-04849-2Office 2007 For Dummies0-470-00923-3
Outlook 2007 For Dummies0-470-03830-6PCs For Dummies 0-7645-8958-XSalesforce.com For Dummies 0-470-04893-XUpgrading & Fixing Laptops For Dummies 0-7645-8959-8Word 2007 For Dummies 0-470-03658-3Quicken 2007 For Dummies 0-470-04600-7
0-470-05432-8 0-471-75421-8
Also available:Blogging For Dummies 0-471-77084-1Digital Photography For Dummies0-7645-9802-3Digital Photography All-in-One Desk Reference For Dummies0-470-03743-1Digital SLR Cameras and Photography For Dummies0-7645-9803-1eBay Business All-in-One Desk Reference For Dummies0-7645-8438-3HDTV For Dummies 0-470-09673-X
Home Entertainment PCs For Dummies 0-470-05523-5MySpace For Dummies 0-470-09529-6Search Engine Optimization For Dummies0-471-97998-8Skype For Dummies 0-470-04891-3The Internet For Dummies 0-7645-8996-2Wiring Your Digital Home For Dummies 0-471-91830-X
INTERNET & DIGITAL MEDIA
0-470-04529-9 0-470-04894-8
* Separate Canadian edition also available† Separate U.K. edition also available
34_127230 bob.1.qxp 12/4/07 12:33 AM Page 359

Also available:3D Game Animation For Dummies 0-7645-8789-7AutoCAD 2006 For Dummies 0-7645-8925-3Building a Web Site For Dummies 0-7645-7144-3Creating Web Pages For Dummies 0-470-08030-2Creating Web Pages All-in-One Desk Reference For Dummies 0-7645-4345-8Dreamweaver 8 For Dummies 0-7645-9649-7
InDesign CS2 For Dummies 0-7645-9572-5Macromedia Flash 8 For Dummies 0-7645-9691-8Photoshop CS2 and Digital Photography For Dummies 0-7645-9580-6Photoshop Elements 4 For Dummies 0-471-77483-9Syndicating Web Sites with RSS Feeds For Dummies 0-7645-8848-6Yahoo! SiteBuilder For Dummies 0-7645-9800-7
SPORTS, FITNESS, PARENTING, RELIGION & SPIRITUALITY
Also available:Catholicism For Dummies 0-7645-5391-7Exercise Balls For Dummies 0-7645-5623-1Fitness For Dummies 0-7645-7851-0Football For Dummies 0-7645-3936-1Judaism For Dummies 0-7645-5299-6Potty Training For Dummies 0-7645-5417-4Buddhism For Dummies 0-7645-5359-3
Pregnancy For Dummies 0-7645-4483-7 †Ten Minute Tone-Ups For Dummies 0-7645-7207-5NASCAR For Dummies 0-7645-7681-XReligion For Dummies 0-7645-5264-3Soccer For Dummies 0-7645-5229-5Women in the Bible For Dummies 0-7645-8475-8
Also available:Alaska For Dummies 0-7645-7746-8Cruise Vacations For Dummies 0-7645-6941-4England For Dummies 0-7645-4276-1Europe For Dummies 0-7645-7529-5Germany For Dummies 0-7645-7823-5Hawaii For Dummies 0-7645-7402-7
Italy For Dummies 0-7645-7386-1Las Vegas For Dummies 0-7645-7382-9London For Dummies 0-7645-4277-XParis For Dummies 0-7645-7630-5RV Vacations For Dummies 0-7645-4442-XWalt Disney World & Orlando For Dummies 0-7645-9660-8
TRAVEL
GRAPHICS, DESIGN & WEB DEVELOPMENT
0-471-76871-5 0-7645-7841-3
0-7645-7749-2 0-7645-6945-7
0-7645-8815-X 0-7645-9571-7
Also available:Access 2007 For Dummies 0-470-04612-0ASP.NET 2 For Dummies 0-7645-7907-XC# 2005 For Dummies 0-7645-9704-3Hacking For Dummies 0-470-05235-XHacking Wireless Networks For Dummies 0-7645-9730-2Java For Dummies 0-470-08716-1
Microsoft SQL Server 2005 For Dummies 0-7645-7755-7Networking All-in-One Desk Reference For Dummies 0-7645-9939-9Preventing Identity Theft For Dummies 0-7645-7336-5Telecom For Dummies 0-471-77085-XVisual Studio 2005 All-in-One Desk Reference For Dummies 0-7645-9775-2XML For Dummies 0-7645-8845-1
NETWORKING, SECURITY, PROGRAMMING & DATABASES
0-7645-7728-X 0-471-74940-0
34_127230 bob.1.qxp 12/4/07 12:33 AM Page 360

Available wherever books are sold. For more information or to order direct: U.S. customers visit www.dummies.com or call 1-877-762-2974. U.K. customers visit www.wileyeurope.com or call 0800 243407. Canadian customers visit www.wiley.ca or call 1-800-567-4797.
Get smart @ dummies.com®• Find a full list of Dummies titles
• Look into loads of FREE on-site articles
• Sign up for FREE eTips e-mailed to you weekly
• See what other products carry the Dummies name
• Shop directly from the Dummies bookstore
• Enter to win new prizes every month!
Also available:Bipolar Disorder For Dummies 0-7645-8451-0Chemotherapy and Radiation For Dummies 0-7645-7832-4Controlling Cholesterol For Dummies 0-7645-5440-9Diabetes For Dummies 0-7645-6820-5* † Divorce For Dummies 0-7645-8417-0 †
Fibromyalgia For Dummies 0-7645-5441-7Low-Calorie Dieting For Dummies 0-7645-9905-4Meditation For Dummies 0-471-77774-9Osteoporosis For Dummies 0-7645-7621-6Overcoming Anxiety For Dummies 0-7645-5447-6Reiki For Dummies 0-7645-9907-0Stress Management For Dummies 0-7645-5144-2
HEALTH & SELF-HELP
0-7645-8450-2 0-7645-4149-8
Also available:The ACT For Dummies 0-7645-9652-7Algebra For Dummies 0-7645-5325-9Algebra Workbook For Dummies 0-7645-8467-7Astronomy For Dummies 0-7645-8465-0Calculus For Dummies 0-7645-2498-4Chemistry For Dummies 0-7645-5430-1Forensics For Dummies 0-7645-5580-4
Freemasons For Dummies 0-7645-9796-5French For Dummies 0-7645-5193-0Geometry For Dummies 0-7645-5324-0Organic Chemistry I For Dummies 0-7645-6902-3The SAT I For Dummies 0-7645-7193-1Spanish For Dummies 0-7645-5194-9Statistics For Dummies 0-7645-5423-9
EDUCATION, HISTORY, REFERENCE & TEST PREPARATION
0-7645-8381-6 0-7645-9554-7
* Separate Canadian edition also available† Separate U.K. edition also available
34_127230 bob.1.qxp 12/4/07 12:33 AM Page 361

Check out the Dummies Specialty Shop at www.dummies.com for more information!
Do More with Dummies
Instructional DVDs • Music Compilations Games & Novelties • Culinary Kits Crafts & Sewing PatternsHome Improvement/DIY Kits • and more!
34_127230 bob.1.qxp 12/4/07 12:34 AM Page 362
Copyright © 2022 FDOKUMEN