Confronting the issue of guns in America - Cedar Crest College
Upload
khangminh22Category
view
1download
0


GUNS IN AMERICA

GUNS IN AMERICA
Results of a Comprehensive National Survey on
Firearms Ownership and Use
Summary Report
Philip J. Cook Jens Ludwig
Police Foundation Washington, DC
The Police Foundation is a privately funded, independent, nonprofit organization established by The Ford Foundation in 1970 and dedicated to supporting innovation and improvement in polic- ing. T l ~ e Police Foundation's research findings are published as an information service.
The research findings in this publication were supported under award number 93-IJ-CX-0017 from the National Institute of Justice, Office of Justice Programs, U.S. Department of Justice.
Points of view in this document are those of the authors and do not necessarily represent the official position of the U.S. Department of Justice or the Police Foundation.
This is a summary report of The National Survey of Private Ownership of Firearms in the United States. The full technical report is available from the Police Foundation, 1001 22nd Street, N.W., Washington, D.C. 20037, telephone (202) 833-1460.
01996 by the Police Foundation
All rights, including translation into other languages, reserved uncter the Universal Copyright Con- vention, the Berne Convention for the Protection of Literary and Artistic Works and the Interna- tional and Pan American Copyright Conventions. Permission to quote readily granted.
ISBN 1-88461414-0
Library of Congress Catalog Card Number: 9746573
List of Tables ....................................................................................................... vii
Acknowledgments ................................................................................................. x
Foreword .............................................................................................................. xi
.................................................................................................. I . Introduction 1
................................................................................................. . 11 Methodology 5
.................................................................................................. Introduction 5
.............................................................................................. Survey Method 5
............................................................................................. Response Rates 5
.................................................... Characteristics of the NSPOF Population 8
.................................................................................. Gun Ownership Rates 9
111 . Stocks and Flows of Guns in Private Hands .............................................. 13
Introduction ................................................................................................. 13
Distribution and Characteristics of the Private Gun Stock ........................ 13
Storage .......................................................................................................... 19
Acquisitions .................................................................................................. 23
Disposals ...................................................................................................... 28
IV . Gun Ownership ........................................................................................... 31
Introduction ................................................................................................. 31
Patterns of Gun Ownership ........................................................................ 32
Reasons for Ownership ............................................................................... 36
Feelings of Safety with a Gun
in the Home ............................................................................................. 43
V . Gun Uses and Misuses ................................................................................ 45
................................................................................................. Introduction 45
......................................................................................... Firearms Training 45
Recreational Uses of Firearms ..................................................................... 46
Gun Accidents ............................................................................................. 49
Gun Carrying ............................................................................................... 53
VI . Defensive Gun Uses .................................................................................... 57
................................................................................................. Introduction 57
How Many Defensive Gun Uses? .................................................................................... Previous Findings 58
How Many Defensive Gun Uses? .......................................................................... NSPOF-Based Estimates 61
Resolving the NCVS-NSPOF Discrepancy .................................................. 68
......................................... Interpretation of Defensive Gun Use Estimates 75
.................................................................... VII . Attitudes Toward Gun Control 77
Support for Handgun Control Measures: How Much and from Whom? ................................................................. 77
............................... Gun Involvement and Support for Handgun Control 80
Support for Handgun Control and Concern about Crime ....................................................................... 82
................................................................................................... VIII . Conclusion 85
............................................................................................................ References 89
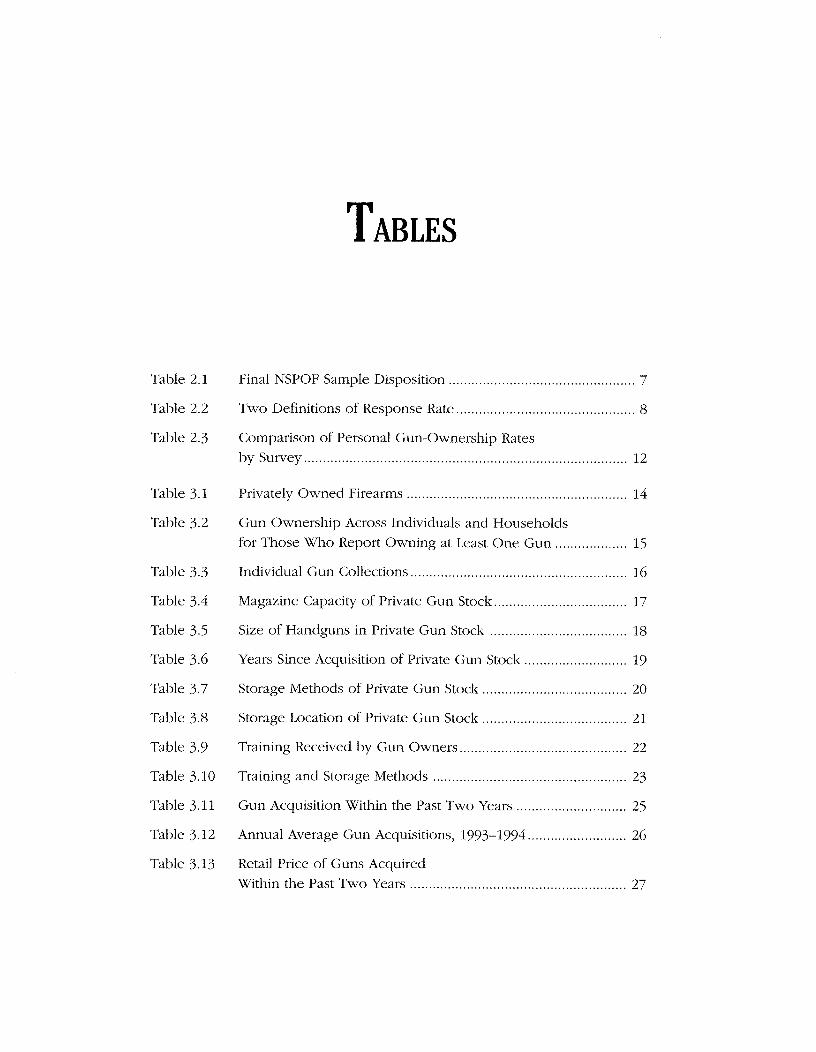
Table 2.1
Table 2.2
Table 2.3
Table 3.1
Table 3.2
Table 3.3
Table 3.4
Table 3.5
Table 3.6
Table 3.7
Table 3.8
Table 3.9
Table 3.10
Table 3.11
Table 3.12
Table 3.13
................................................. Final NSPOF Sample Disposition 7
Two Definitions of Response Rate ............................................... 8
Comparison of Personal Gun-Ownership Rates by Survey ..................................................................................... 12
.......................................................... Privately Owned Firearms 14
Gun Ownership Across Individuals and Households
................... for Those Who Report Owning at Least One Gun 15
Individual Gun Collections ........................................................ 16
Magazine Capacity of Private Gun Stock ................................... 17
Size of Handguns in Private Gun Stock .................................... 18
Years Since Acquisition of Private Gun Stock ........................... 19
Storage Methods of Private Gun Stock ...................................... 20
Storage Location of Private Gun Stock ...................................... 21
Training Received by Gun Owners ............................................ 22
................................................... Training and Storage Methods 23
Gun Acquisition Within the Past Two Years ............................. 25
Annual Average Gun Acquisitions. 1993-1994 .......................... 26
Retail Price of Guns Acquired ......................................................... Within the Past Two Years 27
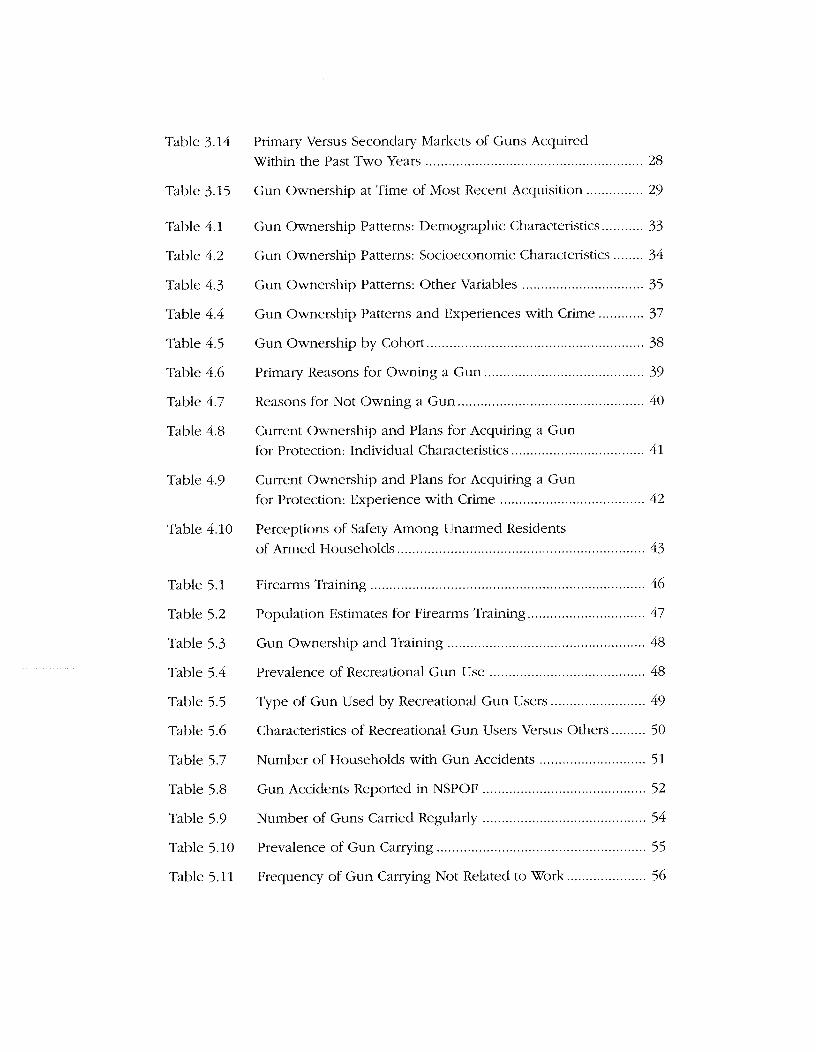
Table 3.14
Table 3.15
Table 4.1
Table 4.2
Table 4.3
Table 4.4
Table 4.5
Table 4.6
Table 4.7
Table 4.8
Table 4.9
Table 4.10
Table 5.1
Table 5.2
Table 5.3
Table 5.4
Table 5.5
Table 5.6
Table 5.7
Table 5.8
Table 5.9
Table 5.10
Table 5.11
Primary Versus Secondary Markets of Guns Acquired Within the Past Two Years ........................................................ 28
Gun Ownership at Time of Most Recent Acquisition ............... 29
Gun Ownership Patterns: Demographic Characteristics ........... 33
Gun Ownership Patterns: Socioeconomic Characteristics ........ 34
Gun Ownership Patterns: Other Variables ................................ 35
Gun Ownership Patterns and Experiences with Crime ............ 37
Gun Ownership by Cohort ......................................................... 38
Primary Reasons for Owning a Gun .......................................... 39
Reasons for Not Owning a Gun ............................................... 40
Current Ownership and Plans for Acquiring a Gun for Protection: Individual Characteristics ................................... 41
Current Ownership and Plans for Acquiring a Gun for Protection: Experience with Crime ...................................... 42
Perceptions of Safety Among Unarmed Residents of Armed Households ................................................................ 43
........................................................................ Firearms Training 46
Population Estimates for Firearms Training ............................... 47
Gun Ownership and Training .................................................... 48
Prevalence of Recreational Gun Use ......................................... 48
Type of Gun Used by Recreational Gun Users ......................... 49
Characteristics of Recreational Gun Users Versus Others ......... 50
Number of Households with Gun Accidents ............................ 51
Gun Accidents Reported in NSPOF .......................................... 52
Number of Guns Carried Regularly ........................................... 54
Prevalence of Gun Carrying ...................................................... 55
Frequency of Gun Carrying Not Related to Work ..................... 56
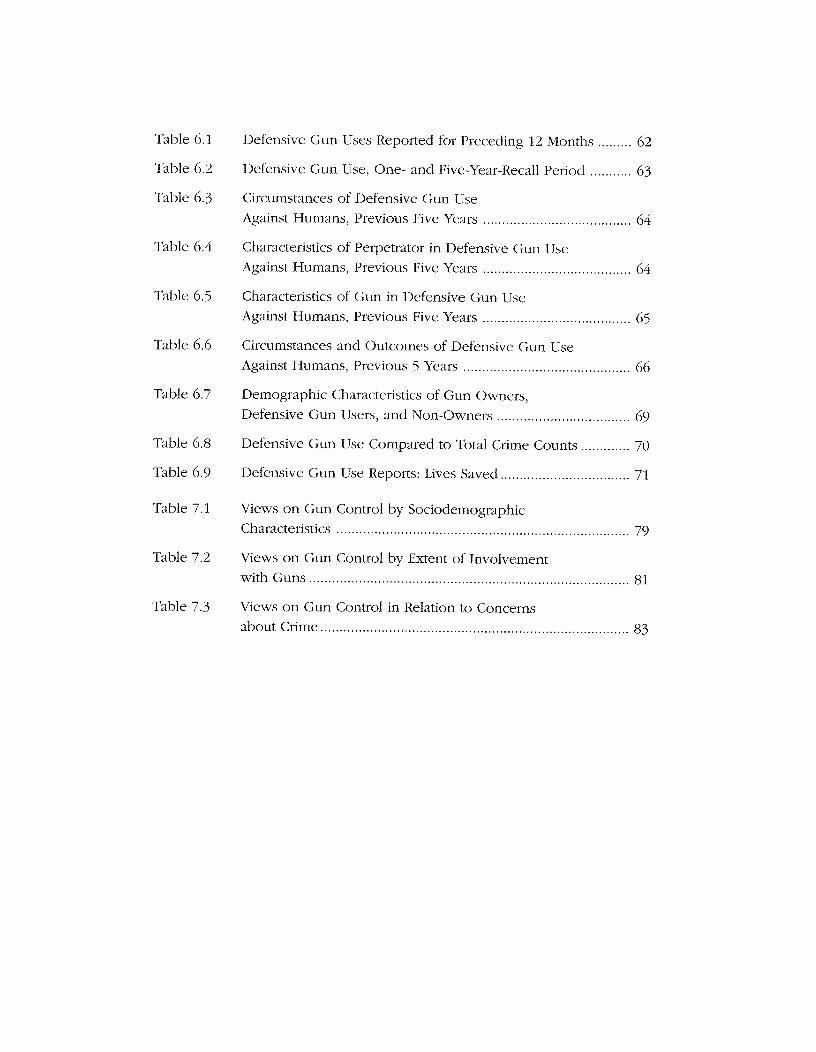
Table 6.1
Table 6.2
Table 6.3
Table 6.4
Table 6.5
Table 6.6
Table 6.7
Table 6.8
Table 6.9
Table 7.1
Table 7.3
Defensive Gun Uses Reported for Preceding 12 Months . . . . . . . . . 62
Defensive Gun Use, One- and Five-Year-Recall Period ........... 63
Circurnstances of Defensive Gun Use Against Humans, Previous Five Years ....................................... 64
Characteristics of Perpetrator in Defensive Gun Use Against Humans, Previous Five Years ....................................... 64
Characteristics of Gun in Defensive Gun Use Against Humans, Previous Five Years ....................................... 65
Circumstances and Outcomes of Defensive Gun Use Against Humans, Previous 5 Years ......................................... 66
Demographic Characteristics of Gun Owners, Defensive Gun Users, and Non-Owners ................................... 69
Defensive Gun Use Compared to Total Crime Counts ............. 70
Defensive Gun Use Reports: Lives Saved .................................. 71
Views on Gun Control by Sociodemographic Characteristics ............................................................................. 79
Views on Gun Control by Extent of Involvement with Guns .................................................................................... 81
Views on Gun Control in Relation to Concerns about Crime ................................................................................. 83
Acknowledgments
The authors thank Lois Mock at the National Institute of Justice and Earl Hamilton at the Police Foundation for their advice and support in completing this project, and to President Hubert Williams for providing Police Foundation support for publication of this report. Garen Wintemute provided helpful comments on an earlier draft. We also thank David Hemenway and the peer reviewers for their helpful comments on an earlier draft. We especially want to acknowledge the skilled assistance of Karen Price and Robin Turner at Duke, and Brian Komar and Ruth Almeida at Georgetown.
Guns in America
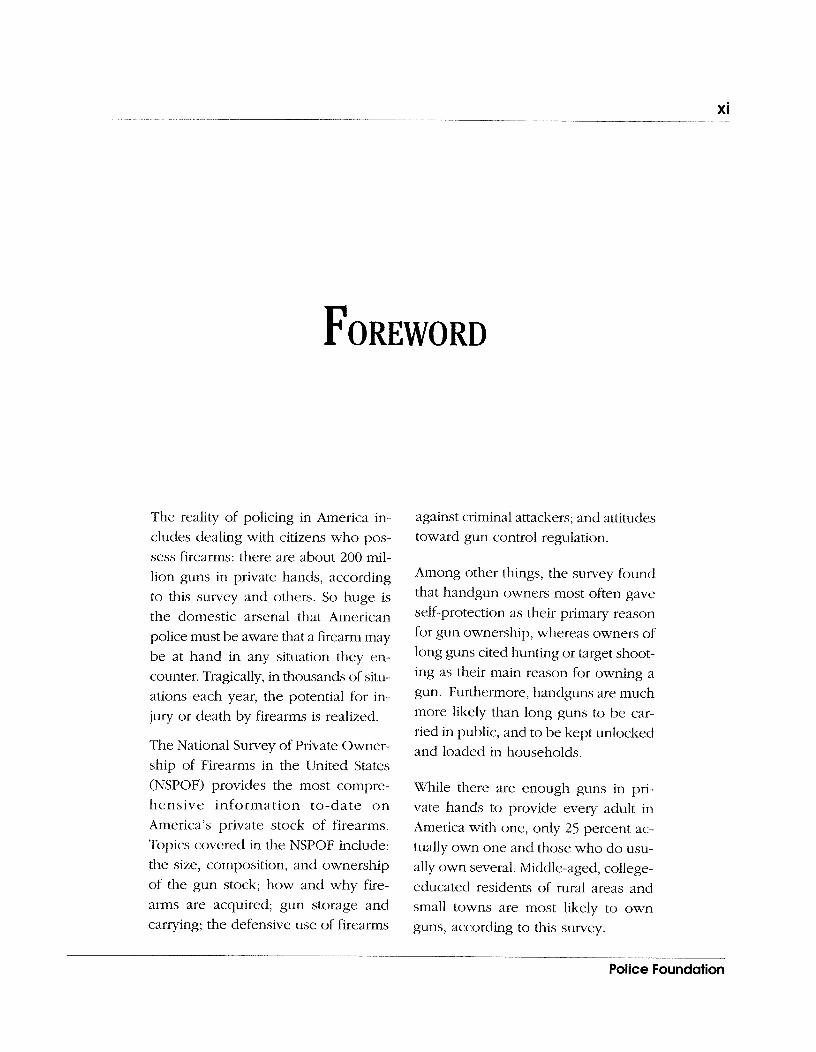
The reality of policing in America in- cludes dealing with citizens who pos- sess firearms: there are about 200 mil- lion guns in private hands, according to this survey and others. So huge is the domestic arsenal that American police must be aware that a firearm may be at hand in any situation they en- counter. Tragically, in thousands of situ- ations each year, the potential for in- jury or death by firearms is realized.
The National Survey of Private Owner- ship of Firearms in the United States (NSPOF) provides the most compre- hensive information to-date o n America's private stock of firearms. Topics covered in the NSPOF include: the size, composition, and ownership of the gun stock; how and why fire- arms are acquired; gun storage and carrying; the defensive use of firearms
against criminal attackers; and attitudes toward gun control regulation.
Among other things, the survey found that handgun owners most often gave self-protection as their primary reason for gun ownership, whereas owners of long guns cited hunting or target shoot- ing as their main reason for owning a gun. Furthermore, handguns are much more likely than long guns to be car- ried in public, and to be kept unlocked and loaded in households.
While there are enough guns in pri- vate hands to provide every adult in America with one, only 25 percent ac- tually own one and those who do usu- ally own several. Middle-aged, college- educated residents of rural areas and small towns are most likely to own guns, according to this survey.
--
Police Foundation
By the year 2003, according to the Centers for Disease Control (CDC), the leading cause of death by injury in the U.S. will be from gunshots. The prevalence of firearm ownership and use is of concern to law enforcement personnel, health officials, educators, policymakers, families, and commu- nities all across America. The impact that guns have on our lives contin- ues to generate passionate debate. Americans a re ambivalent about guns: they fear them and at the same time they feel safer possessing them, as reflected by the growing number of states that have or are considering c o n c e a l e d weapons-"right-to- carryn-laws.
For the nation's police, the nexus of drugs and guns creates daily and deadly challenges to tlieir ability to con- trol crime and ensure public safety. Civil debate and rational policy about guns require that we arm ourselves with the facts about the extent and na- ture of gun ownership and use in America. As with all of the work which the Police Foundation has conducted for over a quarter century, the results of The National Survey of Private Owner- ship of Firearms presented in this report are an effort toward informing the debate.
Hubert Williams President
February 1997
Guns in America
The United States is unique among wealthy nations in its vast private arse- nal of firearms. The 200 million guns in private hands provide a sense of secu- rity for many of their owners. Yet they also make a lethal contribution to an- other uniquely lavish feature of Ameri- can life, criminal violence. In the debate over the proper regulation of gun com- merce and use, it is concern about crime that holds center stage. One side touts guns as an important deterrent and source of protection; the other de- nounces them for the damage they do. It is clear that America's vast stock of firearms has impact on our lives in a variety of ways and that it behooves us to learn what we can about it.
The 1994 National Survey of the Pri- vate Ownership of Firearms (NSPOF) was designed and implemented with
these concerns in mind. This nationally representative telephone survey was conducted by Chilton Research Services during November and December 1994 for the Police Foundation under the sponsorship of the National Institute of Justice (NIJ). It consisted of telephone interviews with a probability sample of over 2,500 adults, who were asked ques- tions about gun ownership, training, transactions, uses, and related attitudes. To an extent the NSPOF visits familiar territory, well mapped by previous sur- veys; this redundancy helps provide a check on its validity. But the NSPOF sur- passes other surveys in its comprehen- siveness. As a result, we now have a sta- tistical description of the private gun stock by size, caliber, value, how the fire- arms were obtained, and when and how they are stored and used.
... we now have a statistical description of the private gun stock by
size, caliber, value, bow the firearms were obtained, and when and bow they are stored and used.
... handgun ownersbip
follows pretty much the
same pattern as long gun ownersbip despite the
weapons' very different uses: handguns are predominantly
kept for self- defense, and
long guns for sport.
The NSPOF does less well in providing reliable information on two vital events involving guns: defense against crime and accidental wounding. Both of these are rare occurrences, at least proportion- ately, but figure prominently in the pub- lic debate over the costs and benefits of gun ownership. As we shall discuss in this report, the estimated incidence of these occurrences from this and similar
surveys is subject to a large positive bias and should not be taken serio~~sly.
This summary report is presented in chapters, beginning with an assessment of the quality of the survey. The NSPOF was conducted in a fashion that meets the norms for an academic-quality, ran- dom-digit-dial telephone survey. Initially we were concerned that the NSPOF- based estimate of household gun preva- lence was just 35 percent, when the conventional wisdom suggests that some- thing closer to 50 percent is correct. But the conventional wisdom may be out of date; our estimate is not far out of line with other recent surveys. And the NSPOF estimate of 192 million guns in private hands is close to other careful estimates. In our investigation, a new version of the gender gap became evi- dent: inat-ried women are considerably less likely to report a gun in the house- hold than married men. Apparently, wives are either ignorant of the firearins' presence or uncomfortable in discuss- ing them. We solved this problem by re- stricting most of our analysis to the data on self-ownership.
Chapter 3 presents results that are unique to the NSPOF. Thanks to detailed inquir-
ies about each respondent's gun collec- tion, this survey provides the basis for a detailed portrait of the U.S. gun stock. This report includes information not just on the types of guns, but also on how they were acquired. Previous specula- tion on the importance of the "second- ary" market in gun tsansactions may have been exaggerated; we find that a major- ity of transactions involve federally li- censed dealers. Our analysis of how guns are stored documents an all-too-preva- lent practice of keeping at least one gun loaded and unlocked. Strangely, train- ing does not appear to promote safer storage. However, when we disaggre- gate formal training by source we find that some training programs (such as those offered by the National Safety Council) are effective in reducing the prevalence of unsafe storage practices.
Chapter 4 switches focus from the guns to their owners, documenting the pat- terns and motivations for gun owner- ship. The most evident division is be- tween the sexes: men own most of the guns. About two-thirds of adult men have owned a gun at some time in their lives, and over 40 percent do so cur- rently. The corresponding numbers for woinen are far smaller. In other re- spects as well, gun ownership follows patterns of military service and rural sporting traditions. One interesting fea- ture is that handgun ownership follows pretty much the same pattern as long gun ownership despite the weapons' very different uses: handguns are pre- dominantly kept for self-defense, and long guns for sport. The woinen who
Guns in America
do own guns are far more likely than male owners to report protection as their primary motive. Adults who have been arrested for nontraffic offenses are more likely to own firearms than others.
Chapter 5 analyzes the uses of guns, beginning with the extent to which the public (gun owning or not) has been trained in the proper handling of guns. The primary sporting uses of guns are hunting and target shooting, with about 15 million people involved in each. We estimate that 4 million people carry guns for protection on tlie job and an- other 10 million people carry guns, at least occasionally, for protection out- side of their work. All of this activity produces some accidental shootings, but so rarely as to preclude accurate estimation in this type of survey.
The dangers of relying upon telephone surveys to estimate rare events are also highlighted in our attempts to estimate the number of defensive gun uses (DGUs), reported at some length in chapter 6 The NSPOF data offer the first opportunity to replicate the recent well-publicized survey finding that 2.5 million citizens use a gun defensively each year. Since many defensive gun uses may go unreported to law enforce- ment, these estimates cannot be veri- fied by official records.
However, the DGU estimate from the NSPOF-which is not inconsistent with the 2.5 million figure--can be compared to well-known facts about the number of firearms injuries, homicides, and vio-
lent crimes in the United States. These comparisons reveal gross inconsistencies. The filndamental problem here is inher- ent to the task of estimating a rare event; false positives tend to outnumber false negatives, producing a positive bias. Consistent with this explanation, a sub- stantial proportion of the defensive gun use reports are in some way internally inconsistent, or otherwise don't make sense. We also note that respondents' descriptions of their "defensive" gun uses do not allow us to properly determine whether the incident, if accurately re- ported, was legal or appropriate, nor can we determine the respondent's culpa- bility, if any, in the incident.
Finally, in chapter 7 we explore the views of the respondents with respect to hand- gun regulation. As has been the case since pollsters started asking the ques- tion, the great majority of the American public would like to see somewhat more stringent controls on gun commerce and use than currently exist in most jurisdic- tions. On the other hand, only a minor- ity is willing to express support for actu- ally banning handgun possession. Tlie gender gap is again much in evidence on these matters and so is the respon- dents' concern about crime.
This collection of findings does not add up to any specific conclusion about appropriate regulation of guns, but policy concerns influence our choice of topics throughout. The result, we hope, is better understanding of the causes and consequences of America's extensive involvement with guns.
... the American public would like to see somewhat
more stringent controls on gun commerce and use than currently exist in most jurisdictions.
Police Foundation

Guns in America
Introduction The NSPOF is a nationally representa- tive telephone survey. The methods employed by Chilton generally follow the norms of good practice for tele- phone surveys (Frey 1989). The main cause for concern is the low response rate-more than 40 percent of the con- tacts with "eligible" telephone numbers could not be completed, or resulted in a refusal. Hence the completed sample may be somewhat unrepresentative of the U.S. population. However, for bet- ter or worse this response rate is not unusually low for surveys of this sort.
Survey Method The NSPOF employs a list-assisted ran- dom-digit-dial sampling method, as discussed in Brick et al. (1995). House- holds with unlisted telephone numbers
are eligible under this method, and each telephone household in the U.S. essentially has equal likelihood of be- ing selected. Each selected household was scheduled for an original call and up to five follow-ups (Chilton 1995, 2-
4). When a call was completed, the Chilton interviewer asked to speak with the adult in the household who had the most recent birthday. Since this method randomizes the choice of re- spondent from the adults living in the household, the NSPOF is able to pro- duce a probability sample of English- or Spanish-speaking adults in the United States (Waksberg 1978).
Response Rates The survey response rate1 is relevant to judging the accuracy of survey esti- mates. The sample of completed inter-
views will be somewhat unrepresenta- tive if those who refuse to cooperate tend to be different in relevant ways than those who are successfully inter- viewed. While we d o not know whether those who refused to partici- pate in the NSPOF are more or less likely than the national average to, say, own a gun, we cannot rule out that possibility. The larger the group of refusers in comparison with coopera- tors, the larger is the likely magnitude
mi le we of "nonresponse bias." The response rate was quite low in the NSPOF, and do not know hence a matter of concern.
whether those The final sample disposition is pre-
refused sented in Table 2.1. Of the 29,917 tele-
to participate phone numbers tliat were randomly
in the NSPOF
are more or
less likely than the national
average to ... own a gun,
we cannot rule out that
possibility.
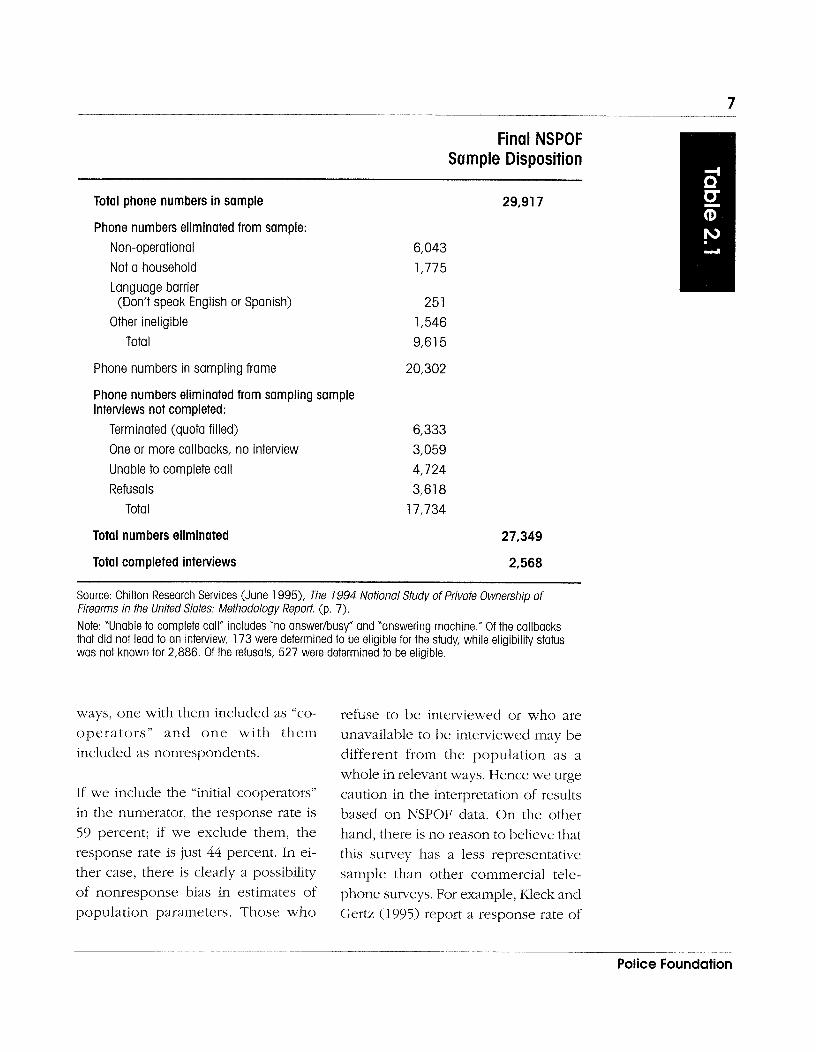
selected, 32 percent were ineligible (not working or not residential). Of the 20,302 telephone numbers in the sam- pling frame, 6,333 contacts were ter- minated by Chilton before conducting the interview because tlie initial re- sponses indicated that the household was not needed to complete pre-es- tablished sampling quotas. These quo- tas were defined for the NSPOF with respect to race and gun-ownership sta- tus (Chilton 1995, 16). What remains after netting out these cases is 13,969 telephone numbers of households that are either known to be eligible for in- clusion or at least not known to be in- eligible. Of these, 2,568 interviews were
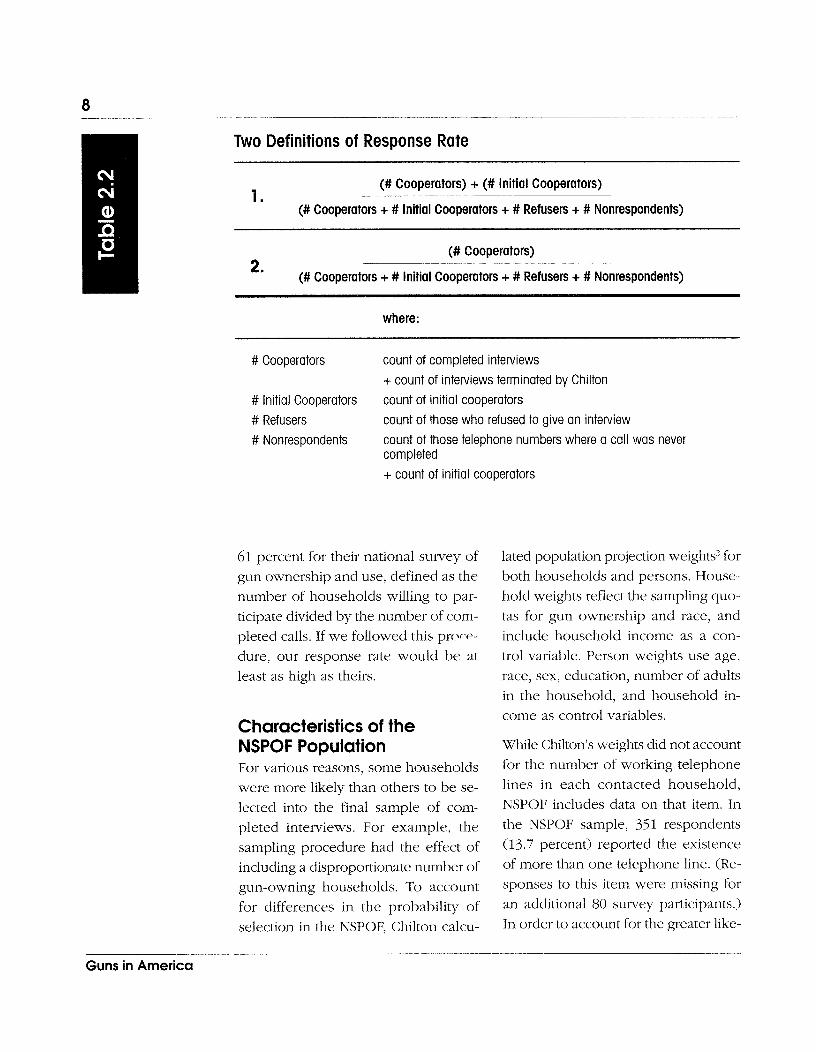
about the representativeness of the completed sample) is the number of households that provided interviews or were willing to do so-that is, com- pleted interviews plus those terminated because the sample quota had been filled. Response-rate measures differ with respect to what is included in the denominator. At a minimum, the de- nominator includes, in addition to tlie count of willing participants (the nu- merator), the count of refusals (3,618 in the case of NSPOF). We believe it appropriate to include also the count of telephone numbers in which a call was never completed (4,724), since this form of nonresponse may also produce an unrepresentative sample.
Less clear-cut is what to do about the other type of nonresponse-those cases (3,059 in all) in which some member of the ho~lsehold had been contacted and been cooperative, but no interview had actually been completed by the time the survey ended despite one or more fol- low up calls. These cases can be viewed as "cooperators" (because the fact that there was a successful initial contact sug- gests at least the willingness to cooper- ate), in which case they would be in- cluded in both the numerator and tlie denominator. Or they could be viewed as non-respondents, since the chosen adult in the household proved some- what difficult to contact. in which case
completed. they should be included in the denomi-
There is no single definition for "re- nator but not the numerator. We des-
sponse rate" (Frey 1989). The appro- ignate them as "initial cooperators,"
priate numerator (given our concern and calculate the response rate in two
Guns in America
Final NSPOF Sample Disposition
Total phone numbers in sample
Phone numbers eliminated from sample: Non-operational Not a household Language barrier (~on'tspeak English or Spanish)
Other ineligible Total
Phone numbers in sampling frame 20,302
Phone numbers eliminated from sampling sample Interviews not completed:
Terminated (quota filled) 6,333 One or more callbacks, no interview 3,059 Unable to complete call 4,724 Refusals 3,618
Total 17,734
Total numbers eliminated 27,349
Total completed interviews 2,568
Source: Chilton Research Services (June 1 995), The 1994 National Study of Privote Ownership of Firearms in the United States: Methodology Report. (p, 7) . Note: "Unable to complete call" includes "no answerlbusy" and "answering machine." Of the callbacks that did not lead to an interview, 173 were determined to be eligible for the study, while eligibility status was not known for 2,886. Of the refusals, 527 were determined to be eligible,
ways, one with them included as "co- operators" a n d o n e with them included as nonrespondents.
If we include the "initial cooperators" in the numerator, the response rate is 59 percent; if we exclude them, the response rate is just 44 percent. In ei- ther case, there is clearly a possibility of nonresponse bias in estimates of population parameters. Those who
refuse to be interviewed or who are unavailable to be interviewed may be different from the population as a whole in relevant ways. Hence we urge caution in the interpretation of results based on NSPOF data. On the other hand, there is no reason to believe that this survey has a less representative sa~lnple than other commercial tele- phone surveys. For example, Heck and Gertz (1995) report a response rate of
Police Foundation
Two Definitions of Response Rate
(# Cooperators) + (# lnitial Cooperators) 1.
(# Cooperators + # lnitial Cooperators + # Refusers + # Nonrespondents)
(# Cooperators) *' (# Cooperators + # Initial Cooperators + # Refusers + # Nonrespondents)
where:
# Cooperators count of completed interviews
+ count of interviews terminated by Chilton # lnitial Cooperators count of initial cooperators
# Refusers count of those who refused to give an interview
# Nonrespondents count of those telephone numbers where a call was never completed + count of initial cooperators
61 percent for their national survey of gun ownership and use, defined as the number of households willing to par- ticipate divided by the number of com- pleted calls. If we followed this prorp- dure, our response rate would be at least as high as theirs.
Characteristics of the NSPOF Population For various reasons, some households were more likely than others to be se- lected into the final sample of com- pleted interviews. For example, the sampling procedure had the effect of including a disproportionate number of gun-owning households. To account for differences in the probability of selection in the NSPOF. Chilton calcu-
lated population projection weights2 for both households and persons. House- hold weights reflect the sampling quo- tas for gun ownersliip and race, and include household income as a con- trol variable. Person weights use age, race, sex, education, number of adults in the household, and household in- come as control variables.
While Chilton's weights did not account for the number of working telephone lines in each contacted household, NSPOF includes data on that item. In the NSPOF sample, 351 respondents (13.7 percent) reported the existence of more than one telephone line. (Re- sponses to this item were missing for an additional 80 survey participants.) In order to account for the greater like-
Guns in America
lihood that a household with two or more telephone lines would be selected to participate, we adjusted the Chilton weights by dividing through by the number of working telephone lines in the respondent's household. Thus, a household with two working telephone numbers would receive one-half the weight of an equivalent household that had one telephone line, as suggested by Sud~lnan (1976). We made an addi- tional modification to ensure that the sample projects to the entire U.S. adult population.
Gun Ownership Rates
Estimates for Household Gun Ownership The December 1993 Gallup Poll esti- mated that 49 percent of households possess a gun, a result that affirms one of the seeming constants in American life: the fraction of American house- holds owning a gun has remained at about half since polling on the subject began in 1959 (Kleck 1991). Given this conventional wisdom, it is of consid- erable concern that the NSPOF data in- dicate that just 35 percent (plus or mi- nus l .3 percent) of households owned a (working) gun in 1994. We believe that this estimate may be somewhat off the mark, but not by much. The con- ventional wisdom appears out of date.
The best of the available series on gun ownership is the General Social Sur- vey (GSS), conducted by the National Opinion Research Center. Its estimates have been in the range of 40-43 per-
cent during the 199Os, several points lower than during the 1970s and much lower than the Gallup Poll estimate. In particular, the GSS estimate for 1994 was just 41 percent. The Kleck-Gertz survey, conducted in 1993, produced a still-lower estimate of gun ownership, 38 percent of households. Our best guess, then, is that the NSPOF estimate understates the "truth," but only by about five percentage points, rather than the 15-point deficit implied by the conventional wisdom.
What is the cause of this apparent un- derestimate? One possibility is that the net effect of the various distortions in the NSPOF sample is to underrepresent gun owners. Alternatively, we offer three observations concerning the spe- cifics of how gun ownership is deter- mined in the NSPOF, any one of which may lead to a small negative bias in the gun ownership estimate:
The NSPOF focuses on guns owned by household members aged 18 and older. A l~ousehold that in- cludes a gun-owning adolescent but no gun-owning adult is counted as a "no gun" household. However, such households are apparently very rare. An NSPOF follow-up of 200 households in which the first- round respondent had indicated that no adult owned a gun found no cases in which a minor in the household owned a gun. Hence we doubt that the focus on adults ac- counts for the low estimate of gun ownership.
NSPOF data indicate that just 35 percent. .. of bousebolds owned a... gun in 1994.
Police Foundation
II The NSPOF was conducted by tele- phone, whereas in the GSS respon- dents are interviewed face-to-face. The 6 percent of U.S. households that lack telephone service will be excluded from the NSPOF sampling frame; that only matters if phoneless households are more likely to own a gun, which we doubt. More important may be the effect of the interview mode (tele- phone versus face-to-face) on the
m e tendency for the respondent to re- port gun ownership. While there
indZvldual might be some difference in this -
who actually regard, we can only speculate as
owns the to what it would be.
gun appears The gun ownership question is more complex in the NSPOF than rnore willing in the GSS. The GSS asks, "Do vou
(or able) happen to have in your home (IF
than other HOUSE: or garage) any guns or
adults in the revolvers?" The NSPOF asks re- spondents, "Do you or any mern-
household to bers of your household 18 years of
report that the age or older currently have any -
household firearms in your home, car, or else- where around vour home? Do not
includes include airguns, toys, models, or
a gum starter pistols." Some NSPOF re- spondents may become confused by the complexity of this question, and end u p giving the wrong answer.
We have rnore direct evidence on yet another possible explanation for the NSPOF "undercount." Whether a household is reported to have a work- ing gun depends in part on which adult
in the household is chosen as the re- spondent. The individual who actually owns the gun appears more willing (or able) than other adults in the house- hold to report that the household includes a gun. We document that in- teresting phenomenon below, and pro- vide evidence that using the data on individual, rather than household, ownership has the effect of reducing the negative bias.
Self-Ownership Versus Household Ownership Surveys typically interview only one randomly selected adult from each sample household in order to minimize surveying costs. As Smith (1985, 2)
notes:
Interviewing each adult in a house- hold is usually considered unnec- essary when the information being sought is either 1) household level information accessible to any adult Family member.. .2) a joint behavior shared with the informant ... or 3) a basic demographic or observed be- havior that is commonly known by household members.
But gun ownership is typically not a "joint behavior" and in some house- holds it may not even be "commonly known" or "accessible."
Evidence on this issue comes from comparing responses by men and women. Given the NSPOF's method for selecting respondents, husbands and wives should be equally likely to re-
Guns in America
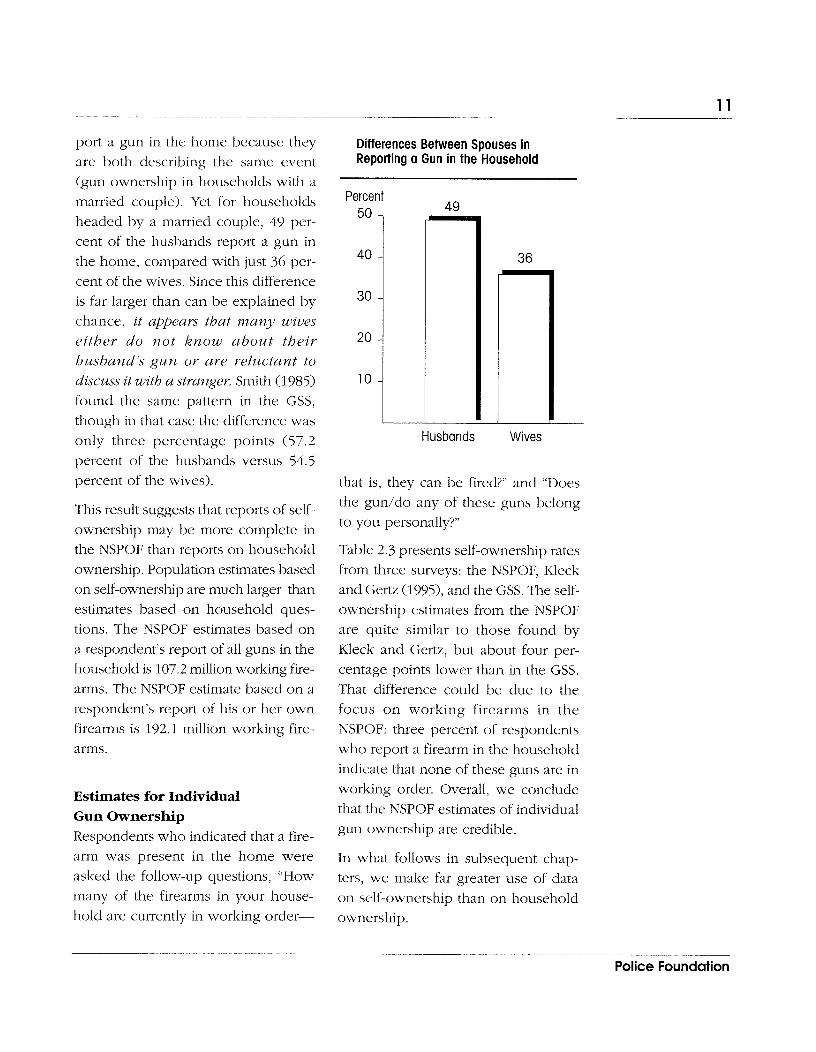
port a gun in the home because they are both describing the same event (gun ownership in households with a married couple). Yet for households headed by a married couple, 49 per- cent of the husbands report a gun in the home, compared with just 36 per- cent of the wives. Since this difference is far larger than can be explained by chance, it appears that many wives either do not know about their husband's g u ~ z or are reluctant to discuss it with a stranger. Smith (1985) found the same pattern in the GSS, though in that case the difference was only three percentage points (57.2 percent of the husbands versus 54.5 percent of the wives).
This result suggests that reports of self- ownership may be more complete in the NSPOF than reports on household ownership. Population estimates based on self-ownership are much larger than estimates based on household ques- tions. The NSPOF estimates based on a respondent's report of all guns in the household is 107.2 million working fire- arms. The NSPOF estimate based on a respondent's report of his or her own firearms is 192.1 inillion working fire- arms.
Estimates for Individual Gun Ownership Respondents who indicated that a fire- arm was present in the home were asked the follow-up questions, "How many of the firearms in your house- hold are currently in working order-
Differences Between Spouses in Repofling a Gun in the Household
that is, they can be fired?" and "Does the gun/do any of these guns belong to you personally?"
Percent 50 - 49
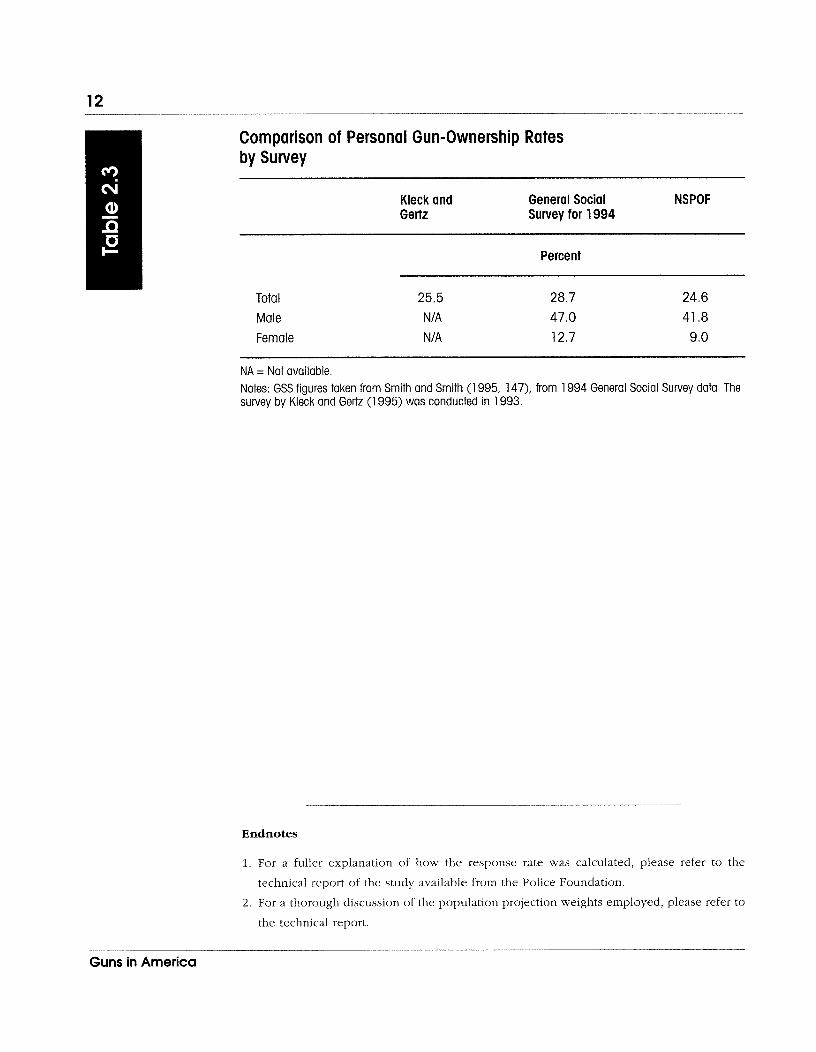
Table 2.3 presents self-ownership rates from three surveys: the NSPOF, Kleck and Gertz (1995), and the GSS. The self- ownership estimates from the NSPOF are quite similar to those found by Kleck and Gertz, but about four per- centage points lower than in the GSS. That difference could be due to the
4 0 -
3 0 -
20 -
10 -
focus on working firearms in the NSPOF: three percent of respondents who report a firearm in the household indicate that none of these guns are in working order. Overall, we conclude that the NSPOF estimates of individual gun ownership are credible.
In what follows in subsequent chap-
Husbands Wives
A
ters, we make far greater use of data on self-ownership than on household
ownership.
3 6
Police Foundation
Comparison of Personal Gun-Ownership Rates by Survey
Kleck and General Social NSPOF Gertz Survey for 1994
Percent
Total 25.5 28.7 24.6
Male NIA 47 .O 41.8
Female NIA 12.7 9.0
NA = Not available. Notes: GSS figures taken from Smith and Smith (1 995, 147), from 1994 General Social Survey data. The survey by Kleck and Gertz (1 995) was conducted in 1993.
Endnotes
1. For a fuller explanation of how the response rate was calculated, please refer to the
technical report of the study available from the Police Foundation.
2 . For a thorough discussion of the population projection weights employed, please refer to
the technical report.
Guns in America
Introduction The NSPOF was designed to gather detailed information on the stock of privately held guns in the United States, including:
what types of guns are in circulation, who owns them, how they were acquired, and how they are stored.
This information helps fill a major gap in our knowledge.
Distribution and Characteristics of the Private Gun Stock Concentration of Ownership The NSPOF-based estimate for the to- tal number of privately owned firearms is 192 million, of which 65 million
(about one third) are handguns, 70 million are rifles, and 49 million are shotguns (Table 3.1). About 40 percent of handguns and long guns are semi- automatics. These estimates are reason- ably close to other survey-based estimates and only about 15 percent less than the cumulative total of known additions (imports and domestic manu- factures minus exports) since 1899 (Zawitz 1995). While that is not much attrition over nearly a century, the ex- planation is not so much the dura- bility of guns as in the great upsurge of gun sales in recent decades: NSPOF estimates suggest that 80 percent of all firearms in private hands were acquired since 1974.
While there are enough guns to pro- vide every adult in the United States with one, only one-quarter of adults
NSPOF
estimates suggest that 80 percent of all firearms in private bands were acquired since 1974.

Privately Owned Firearms
NSPOF Estimate
Guns Entering Circulation, 1899-1 993*
Handguns Revolvers Semi-automatics Other
Rifles Semi-automatics Other
Shotguns
Millions
*From Zawitz (1 995) ** Includes "other long gun" and 'other gun" categories not ~ncluded above
... the owners actually own a gun. Those who have
of four or one gun usually have several. Sev- enty-four percent have two or more.
guns As shown in Table 3.2, the owners
(about 10 of four or more guns (about 10 per-
percent of cent of the nation's adults) are in possession of 77 percent of the total
the nation's stock of firearms.
are in It is also of interest to consider the
Gun ownership is quite concentrated, but not more so than for other durable goods. In marketing circles, the "80/ 20 rule" suggests that the top fifth of
all consumers of a product typically ac- count for four-fifths of all purchases by value (Clotfelter and Cook 1989, 93, 279). NSPOF data indicate that the top
20 percent of gun owners have just 55
possession of concentration of ownership among Percent of the tota1 quantity (It is Pos-
households, since some households sible that if we could adjust for the 77percent of
include more than one gun owner. value of guns, the degree of concen- the total stock Accordinn to the NSPOF results, 35 tration would be still greater and would -
of firearms. percent of households include at least better fit the rule.) The bottom line is
one gun, and the relative distribution this: 9.7 million individuals own 105.5
of guns across households is very million guns, while the remaining 86.6
similar to the distribution among million guns are dispersed among 34.4
individuals. million individuals.
Guns in America
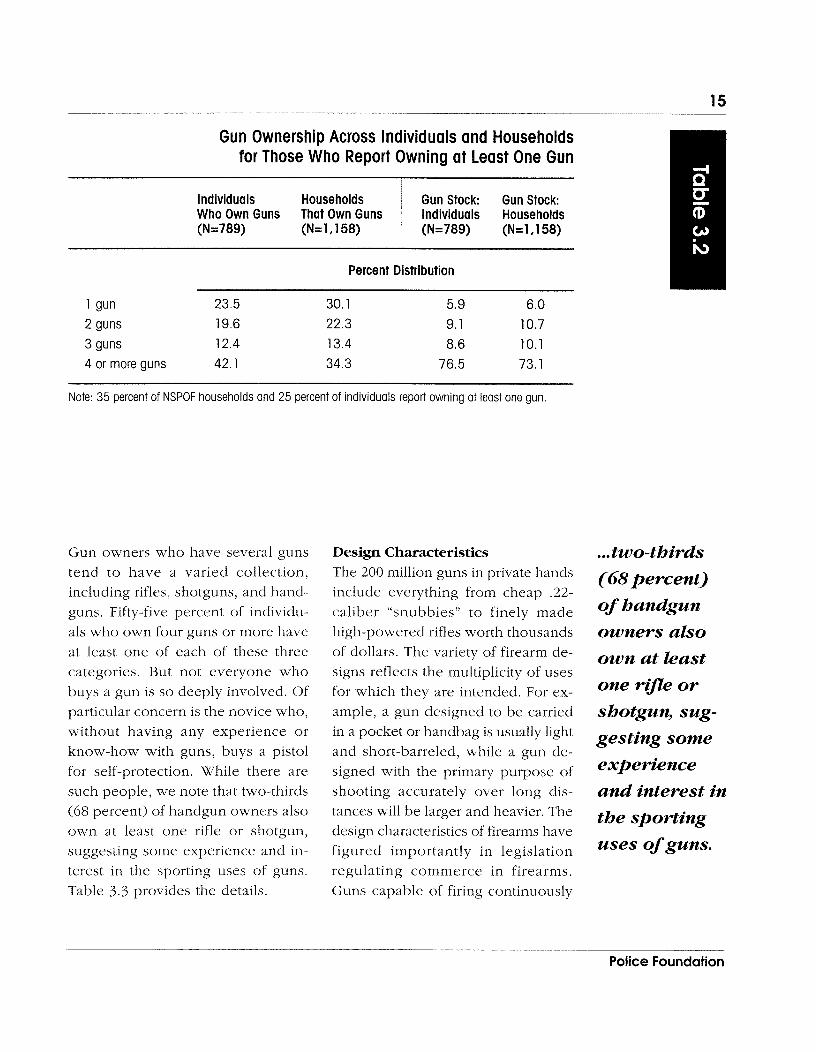
Gun Ownership Across Individuals and Households for Those Who Report Owning at Least One Gun
Percent Distribution
Individuals Households Who Own Guns That Own Guns (N=789) (N=1,158)
1 gun 23.5 30.1
2 guns 19.6 22.3
3 guns 12.4 13.4 4 or more guns 42.1 34.3
Gun Stock: Gun Stock: Individuals Households (N=789) (N=1,158)
Note: 35 percent of NSPOF households and 25 percent of individuals report owning at least one gun.
Gun owners who have several guns tend to have a varied collection, including rifles, shotguns, and hand- guns. Fifty-five percent of individu- als who own four guns or more have at least one of each of these three categories. But not everyone who buys a gun is so deeply involved. Of particular concern is the novice who, without having any experience or know-how with guns, buys a pistol for self-protection. While there are such people, we note that two-thirds (68 percent) of handgun owners also own at least one rifle or shotgun, suggesting some experience and in- terest in the sporting uses of guns. Table 3.3 provides the details.
Design Characteristics The 200 million guns in private hands include everything from cheap .22- caliber "snubbies" to finely made high-powered rifles worth thousands of dollars. The variety of firearm de- signs reflects the multiplicity of uses for which they are intended. For ex- ample, a gun designed to be carried in a pocket or handbag is usually light and short-barreled, while a gun de- signed with the primary purpose of shooting accurately over long dis- tances will be larger and heavier. The design characteristics of firearms have figured importantly in legislation regulating commerce in firearms. Guns capable of firing continuously
... two-thirds (68 percent) of handgun owners also own at least one ripe or shotgun, sug- gesting some experience and interest in the sporting uses of guns.
Police Foundation
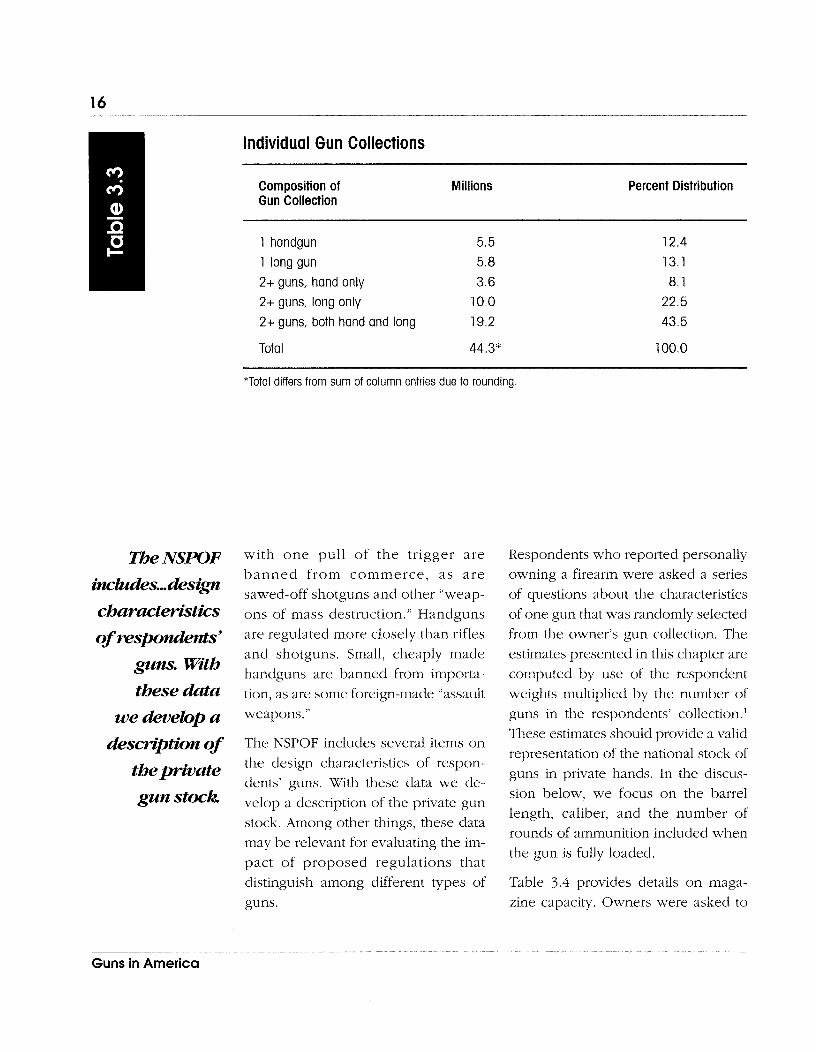
Individual Gun Collections
m e N S .
i1~3ludes. ..design characteristics of respcmdmzs'
guns. With these data
we develop a desm.ptiun of
the p'vate gun stock:
Composition of Gun Collection
Millions Percent Distribution
1 handgun 1 long gun 2+ guns, hand only 2+ guns, long only 10.0 2+ guns, both hand and long 19.2
Total 44.3*
*Total differs from sum of column entries due to rounding,
with one pull of the trigger are banned from commerce, as are sawed-off shotguns and other "weap- ons of mass destruction." Handguns are regulated more closely than rifles and shotguns. Small, cheaply made handguns are banned from importa- tion, as are some foreign-made "assault weapons."
The NSPOF includes several items on the design characteristics of respon- dents' guns. With these data we de- velop a description of the private gun stock. Among other things, these data may be relevant for evaluating the im- pact of proposed regulations that distinguish among different types of guns.
Respondents who reported personally owning a firearm were asked a series of questions about the characteristics of one gun that was randomly selected from the owner's gun collection. The estimates presented in this chapter are computed by use of the respondent weights multiplied by the number of guns in the respondents' collection.' These estimates should provide a valid representation of the national stock of guns in private hands. In the discus- sion below, we focus on the barrel length, caliber, and the number of rounds of ammunition included when the gun is fully loaded.
Table 3.4 provides details on maga- zine capacity. Owners were asked to
Guns in A m e r i c a
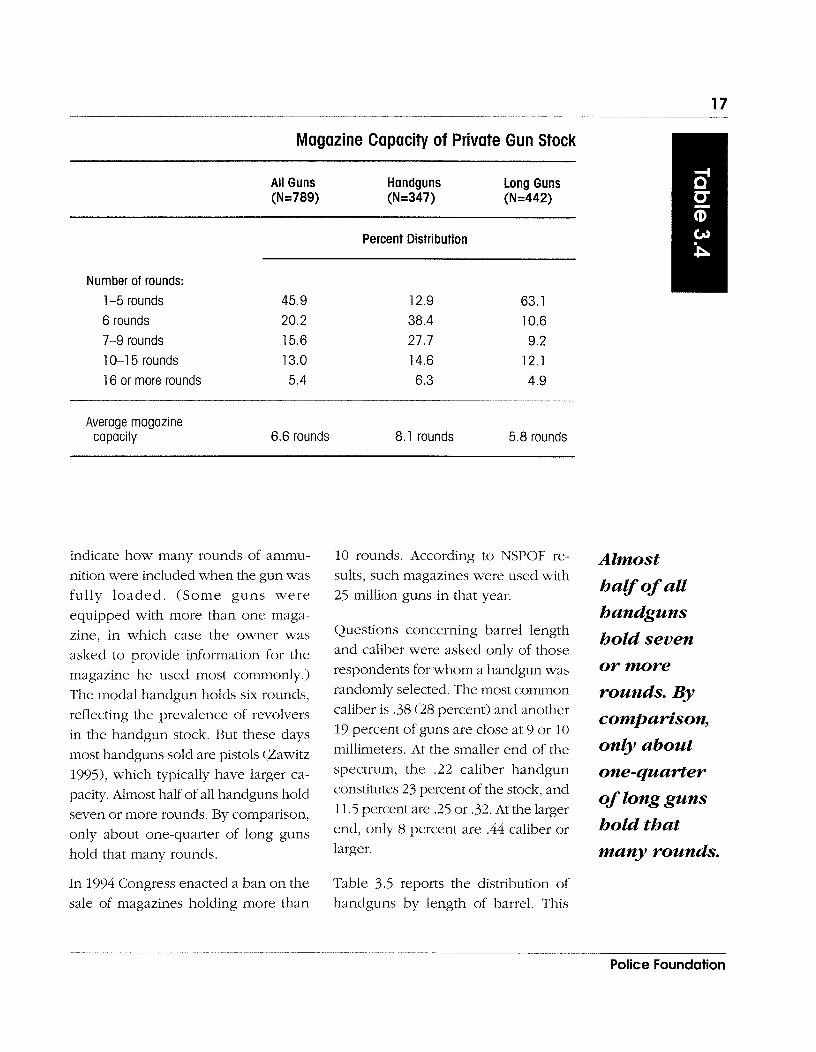
Magazine Capacity of Private Gun Stock
All Guns Handguns Long Guns (N=789) (N=347) (N=442)
Percent Distribution
Number of rounds: 1-5 rounds 45.9 12.9 63.1
6 rounds 20.2 38.4 10.6
7-9 rounds 15.6 27.7 9.2
10-1 5 rounds 13.0 14.6 12.1
16 or more rounds 5.4 6.3 4.9
Average magazine capacity 6.6 rounds 8.1 rounds 5.8 rounds
indicate how many rounds of ammu- nition were included when the gun was fully loaded. (Some guns were equipped with more than one maga- zine, in which case the owner was asked to provide information for the magazine he used most commonly.) The modal handgun holds six rounds, reflecting the prevalence of revolvers in the handgun stock. But these days most handguns sold are pistols (Zawitz 1995), which typically have larger ca- pacity. Almost half of all handguns hold seven or more rounds. By comparison, only about one-quarter of long guns hold that many rounds.
In 1994 Congress enacted a ban on the sale of magazines holding more than
10 rounds. According to NSPOF re- sults, such magazines were used with 25 million guns in that year.
Questions concerning barrel length and caliber were asked only of those respondents for whom a handgun was randomly selected. The most common caliber is .38 (28 percent) and another 19 percent of guns are close at 9 or 10 millimeters. At the smaller end of the spectrum, the .22 caliber handgun constitutes 23 percent of the stock, and 11.5 percent are .25 or .32. At the larger end, only 8 percent are .44 caliber or larger.
Table 3.5 reports the distribution of handguns by length of barrel. This
Almost halfof all handguns hold seven or more rounds. By comparison, only about one-quarter of long guns bold that many rounds.
Pol ice Foundation

Size of Handguns in Private Gun Stock
Length of Barrel
Percent with Percent Distribution Small Caliber of Handgun Stock
1-3 inches (N=86) 36.9
4-5 inches (N=129) 30.7 6 or more inches (N=132) 37.5
Note: "Small Caliber" is defined here as .32 or less.
...the characteristic of handguns has been legislative efforts to extend the ban particularly important in the debate to domestic manufacture.
majority over appropriate regulation, because
As shown in Table 3.5, only about one of short short-barreled handguns are well in six handguns have a barrel length
handguns adapted to street crime in the sense of three inches or less-1 1 million guns
that they are conveniently carried concealed. This, however, is the only
in all. The median length of the hand- gun stock is five inches. In this table l a ~ e caliber, advantage of a short barrel; since a we also report the percentage of hand-
in excess short barrel reduces the accuracy and guns in each of the length categories
power of the gun, someone who did of 32. that have small caliber (32 or less).
not want to carry it concealed would ordinarily prefer a longer gun. (In The important news here is that the most states carrying a concealed fire- majority of short handguns have fairly arm is banned outright or is restricted large caliber, in excess of .32. One to those who have a special license.) implication is that definitions of "Sat- The 1968 Gun Control Act restricted urday night specials" specifying small the importation of short-barreled caliber do not apply to the majority of guns, and there have been recurrent short-barreled handguns in the nation's
Guns in America
Years Since Acquisition of Private Gun Stock
All Guns Handguns Long Guns (N=789) (N=352) (N=437)
Percent Distribution
0-1 year 2 years 3-5 years 6 or more years
Average years since gun was acquired 12.8 10.9 13.9
firearms stock. It should be kept in were acquired by their current owners mind that caliber has no effect on one within the past two years. of the problematic dimensions of these guns, their concealability (Cook 1981, Storage 1740)' Indeed' it appears In 1993. there were 1.740 accidental studies that have a preference deaths caused by fire=,rms, including
for handguns with and 170 involving children fourteen years
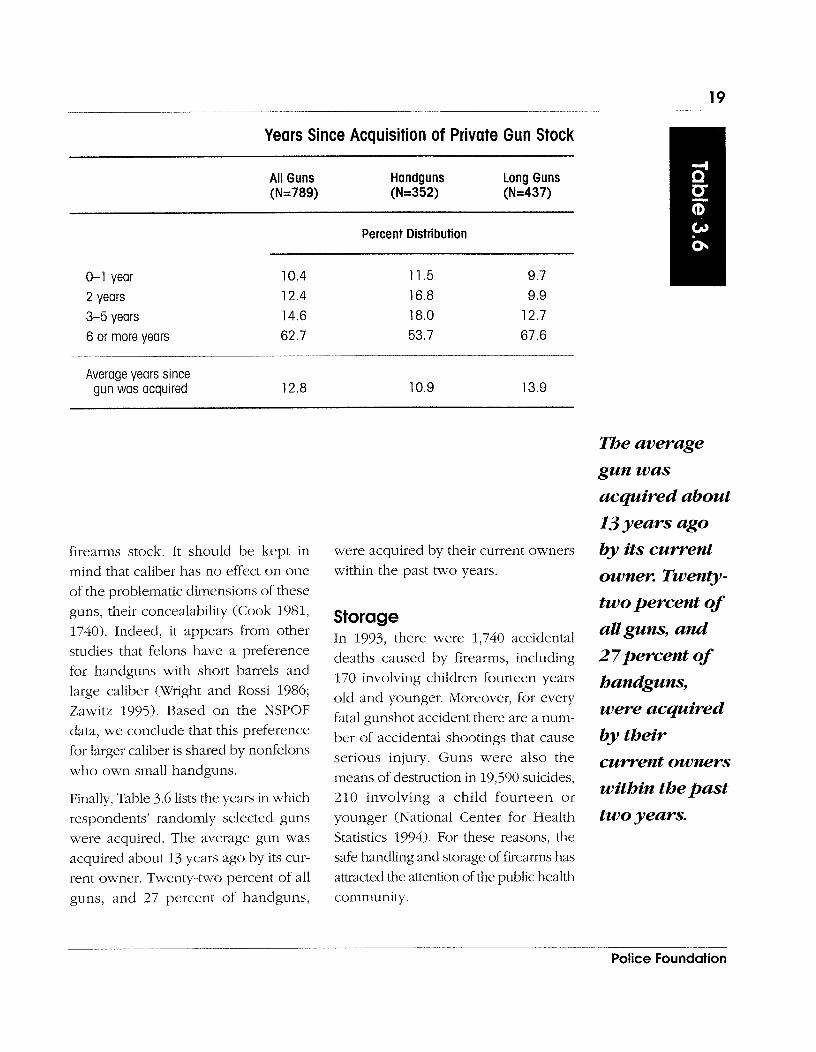
Zawitz 1995) Based On the NSPoF fatal gunshot accident there are a num- " data, we that this preference her of accidental shootings that cause for larger caliber is shared by nonfelons serious injury, Guns were also the who own small handguns. means of destruction in 19,590 suicides, Finally, Table 3.6 lists the years in which 2 10 involving a child fourteen or respondents' randomly selected guns younger (National Center for Health were acquired. The average gun was Statistics 1994). For these reasons, the acquired about 13 years ago by its cur- safe handling and storage of firearms has rent owner. Twenty-two percent of all attmcted the attention of the public health guns, and 27 percent of handguns, community.
m e average gun was acquired about 13 years ago by its current owner. Twenty- two percent of all guns, and 27percent of handguns, were acquired by their current owners within the past two years.
Police Foundation
Storage Methods of Private Gun Stock
... 20 percent of all
gun-owning households
had a loaded and unlocked
gun in the home. ..
All Guns Handguns Long Guns (N=789) (N=352) (N=437)
Percent
Gun locked up, secured with trigger lock etc. 45.6
Gun loaded 26.2
Gun loaded and unlocked 16.4
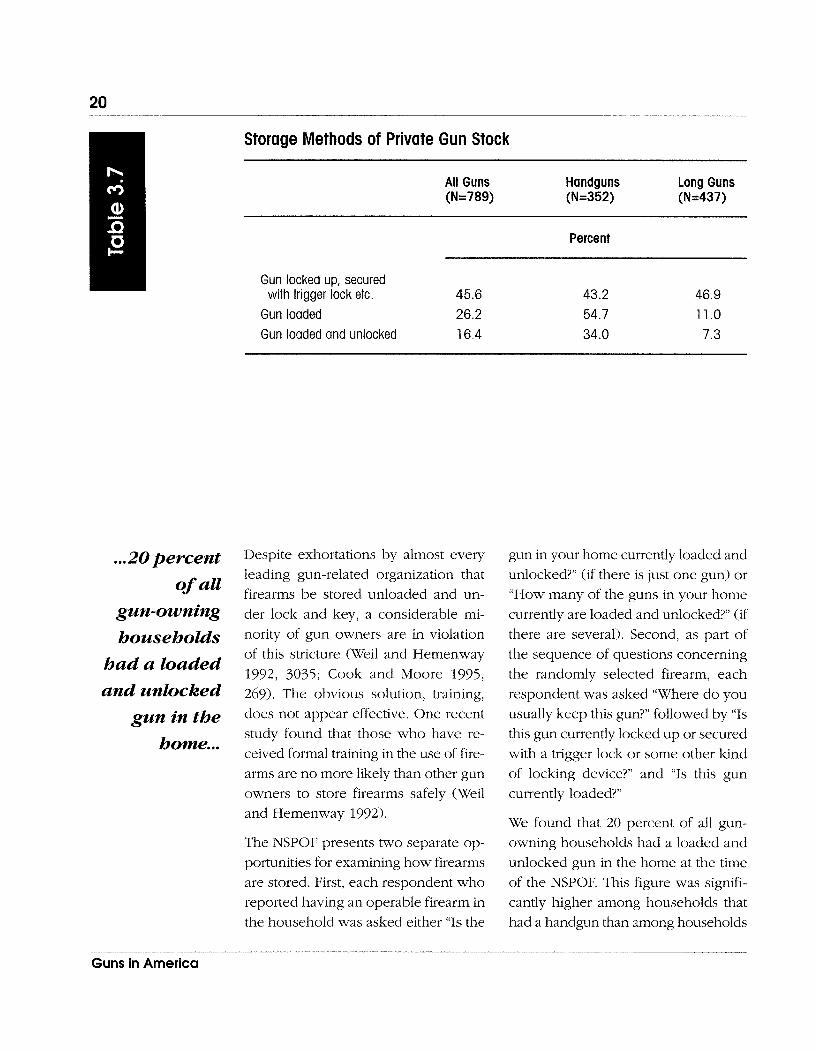
Despite exhortations by almost every leading gun-related organization that firearms be stored unloaded and un- der lock and key, a considerable mi- nority of gun owners are in violation of this stricture (Weil and Hemenway 1992, 3035; Cook and Moore 1995, 269). The obvious solution, training, does not appear effective. One recent study found that those who have re- ceived formal training in the use of fire- arms are no more likely than other gun owners to store firearms safely (Weil and Hemenway 1992).
The NSPOF presents two separate op- portunities for examining how firearms are stored. First, each respondent who reported having an operable firearm in the household was asked either "Is the
gun in your home currently loaded and unlocked?" (if there is just one gun) or "How many of the guns in your home currently are loaded and unlocked?" (if there are several). Second, as part of the sequence of questions concerning the randomly selected firearm, each respondent was asked "Where do you usually keep this gun?" followed by "Is this gun currently locked up or secured with a trigger lock or some other kind of locking device?" and "Is this gun currently loaded?"
We found that 20 percent of all gun- owning households had a loaded and unlocked gun in the home at the time of the NSPOF. This figure was signifi- cantly higher among households that had a handgun than among households
Guns in America
Storage Location of Private Gun Stock
All Guns Handguns Long Guns (N=789) (N=352) (N=437)
Percent Distribution
Bedroom Gun closet 44.1 26.5 53.3
Other closet 16.6 11.5 19.2
With or on respondent 3.3 8.7 0.5
In car or truck 2.6 7.7 0.1
Other 9.7 8.5 10.2
with long guns only (30 versus 7 per- cent). In Table 3.7 we present the re- sults for the other questionnaire items on storage, those concerning how the randomly selected firearm was stored. We found that 53 percent of long guns and 57 percent of handguns are usu- ally kept unlocked. Further, 26 percent of all guns, and 55 percent of all hand- guns, are usually kept loaded. Loaded guns of either type are a bit more likely to be unlocked than are unloaded guns. The result is that one in three hand- guns, and one in six long guns, is kept loaded and unlocked.
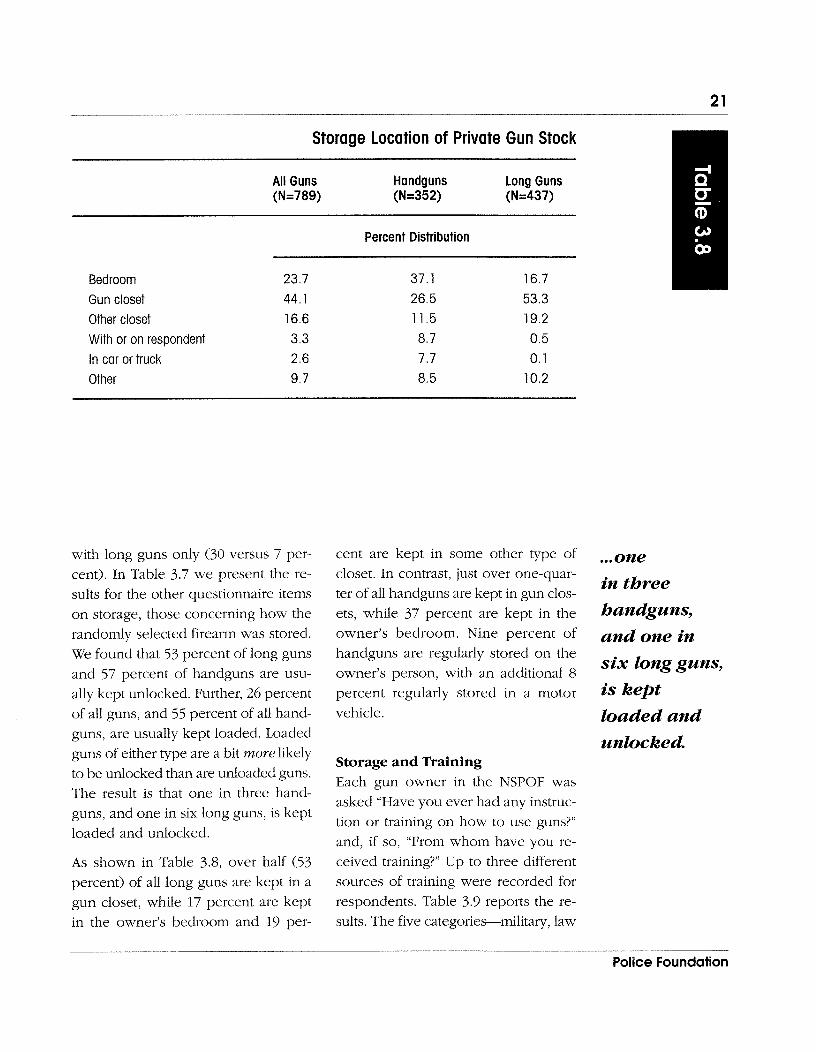
As shown in Table 3.8, over half (53 percent) of all long guns are kept in a gun closet, while 17 percent are kept in the owner's bedroom and 19 per-
cent are kept in some other type of closet. In contrast, just over one-quar- ter of all handguns are kept in gun clos- ets, while 37 percent are kept in the owner's bedroom. Nine percent of handguns are regularly stored on the owner's person, with an additional 8 percent regularly stored in a motor vehicle.
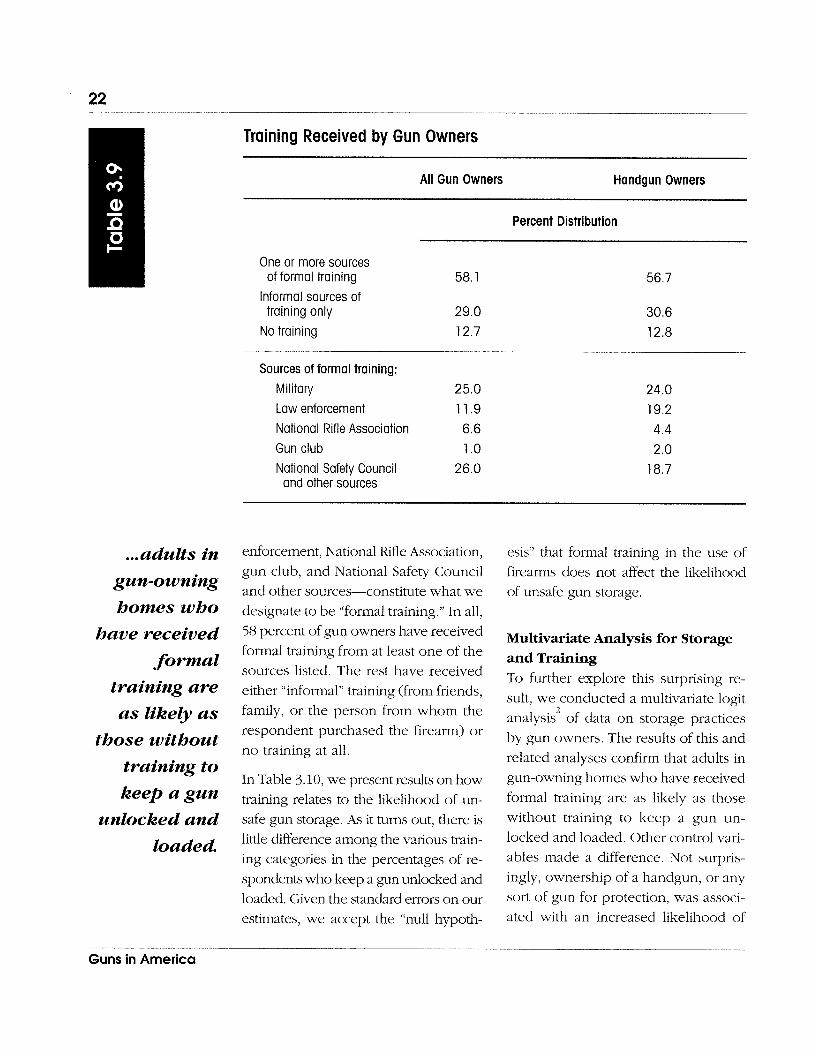
Storage and Training Each gun owner in the NSPOF was asked "Have you ever had any instruc- tion or training on how to use guns?" and, if so, "From whom have you re- ceived training?" Up to three different sources of training were recorded for respondents. Table 3.9 reports the re- sults. The five categories-military, law
... one in three handguns, and one in six long guns, is kept loaded and unlocked.
Police Foundation
Training Received by Gun Owners
All Gun Owners Handgun Owners
One or more sources of formal training
Informal sources of training only
No training
Percent Distribution
Sources of formal training: Military 25.0 Law enforcement 11.9 National Rifle Association 6.6 Gun club 1 .O National Safety Council 26.0
and other sources
... adults in gun-owning homes who
have received formal
training are as likely as
those without training to keep a gun
unlocked and loaded.
enforcement, National Rifle Association, esis" that formal training in the use of gun club, and National Safety Council firearms does not affect the likelihood and other sources-constitute what we of unsafe gun storage. designate to be "formal training." In all, 58 percent of gun owners have received Analysis for Storage formal training from at least one of the and Trahhg sources listed. The rest have received To further explore this surprising re- either ''informal" training (from friends, sult, we conducted a multivariate logit
2 Or the person from the analysis of data on storage practices purchased the firearm) Or by gun owners. The results of this and
no training at all. related analyses confirm that adults in
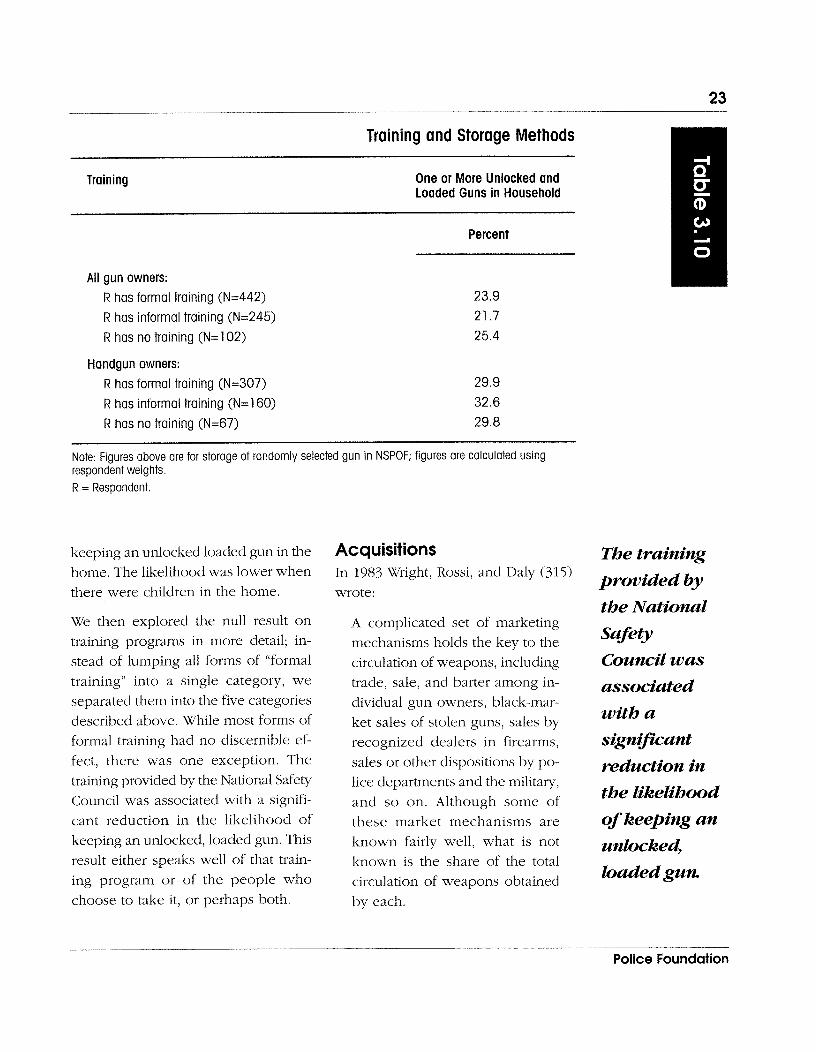
In Table 3.10, we present results on how training relates to the likelihood of un- safe gun storage. As it turns out, there is little difference among the various train- ing categories in the percentages of re- spondents who keep a gun unlocked and loaded. Given the standard errors on our estimates, we accept the "null hypoth-
gun-owning homes who have received formal training are as likely as those without training to keep a gun un- locked and loaded. Other control vari- ables made a difference. Not surpris- ingly, ownership of a handgun, or any sort of gun for protection, was associ- ated with an increased likelihood of
Guns in America
Training and Storage Methods
Training One or More Unlocked and Loaded Guns in Household
All gun owners: R has formal training (N=442)
R has informal training (N=245) R has no training (N=102)
Handgun owners: R has formal training (N=307) R has informal training (N=160)
R has no training (N=67)
Percent
Note: Figures above are for storage of randomly selected gun in NSPOF; figures are calculated using respondent weights. R = Resgondent.
keeping an unlocked loaded gun in the home. The likelihood was lower when there were children in the home.
We then explored the null result on training programs in more detail; in- stead of lumping all forms of "formal training" into a single category, we separated them into the five categories described above. While most forms of formal training had no discernible ef- fect, there was one exception. The training provided by the National Safety Council was associated with a signifi- cant reduction in the likelihood of keeping an unlocked, loaded gun. This result either speaks well of that train- ing program or of the people who choose to take it, or perhaps both.
Acquisitions In 1983 Wight, Rossi, and Daly (315) wrote:
A complicated set of marketing mechanisms holds the key to the circulation of weapons, including trade, sale, and barter among in- dividual gun owners, black-mar- ket sales of stolen guns, sales by recognized dealers in firearms, sales or other dispositions by po- lice departments and the military-, and so on. Although some of these market mechanisms are known fairly well, what is not known is t l ~ e share of the total circulation of weapons obtained by each.
TIje training provided by the National Safety Council was associated with a signzjkant reduction in the likelihood of keeping an unlocked loaded gun.
Pol ice Foundation
Almost all guns
acquired in the previous
two years were either
purchased by the respondent ... or received
as a gz3 ....
Not much has been learned about gun flows in the 13 years since the publica- tion of that report. The potential im- portance of this information is in evalu- ating regulations on firearms corn- merce. For example, some regulations apply only to transfers that involve a federally licensed firearms dealer (FFL) (Cook, Molliconi, and Cole 1995, 68- 91, so it would be useful to know the volume of informal transfers that do not involve FFLs. But heretofore there has been no survey or other data-gath- ering mechanism designed to measure the relative importance of primary and secondary flows of guns.
The NSPOF provides a sound basis for making such estimates. The results, developed below, suggest that the sec- ondary market is somewhat less impor- tant than previously thought.
In the NSPOF, the sequence of questions concerning the respondent's randomly selected gun concluded with the ques- tion "About how many years ago did J T ~ I 1
acquire this gun?" followed by the ques- tion you acquired any other gun since you obtained the one we just fin- ished talking about?" If yes, the inter- viewer established some basic charac- teristics of this more recently acquired gun (type and how long ago it was ac- quired) and then proceeded to a se- quence of questions for all gun owners concerning details of the most recent fire- arm acquisition. Thus, we have the date of acquisition for one or two guns per gun owner, as well as detailed data on each gun owner's most recent acquisition.
Sources and Means of Acquisition Our objective is to characterize the flow of guns for a defined period of time. The choice of how long a period to use entailed a trade-off. A longer pe- riod, such as the five years preceding the survey, would give us a larger sample size (more acquisitions) than a shorter one, but at the cost of greater recall error and a greater under- representation of those who were most active in the market. In what follows we focus on the results for the two- year period before the survey. Table 3.11 provides some results.
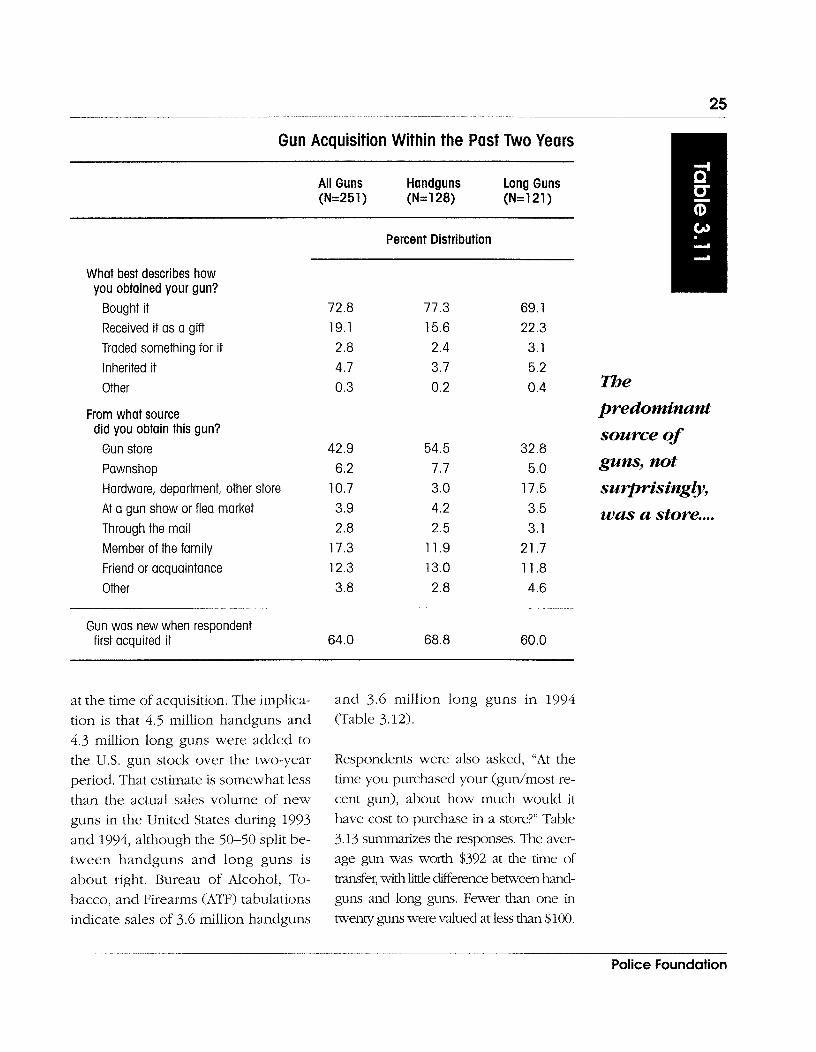
Almost all guns acquired in the previ- ous two years were either purchased by the respondent (73 percent) or re- ceived as a gift (19 percent). The re- maining 8 percent were obtained through inheritance, a swap of some kind, or other means. The predomi- nant source of guns, not surprisingly, was a store (60 percent). Other impor- tant sources included family members (17 percent) and acquaintances (12 per- cent). The 3 percent of respondents who indicated that they obtained the gun "through the mail" (which is ille- gal for all but FFLs) may have mis- remembered or may be referring to a mail-order purchase arranged through an FFL.
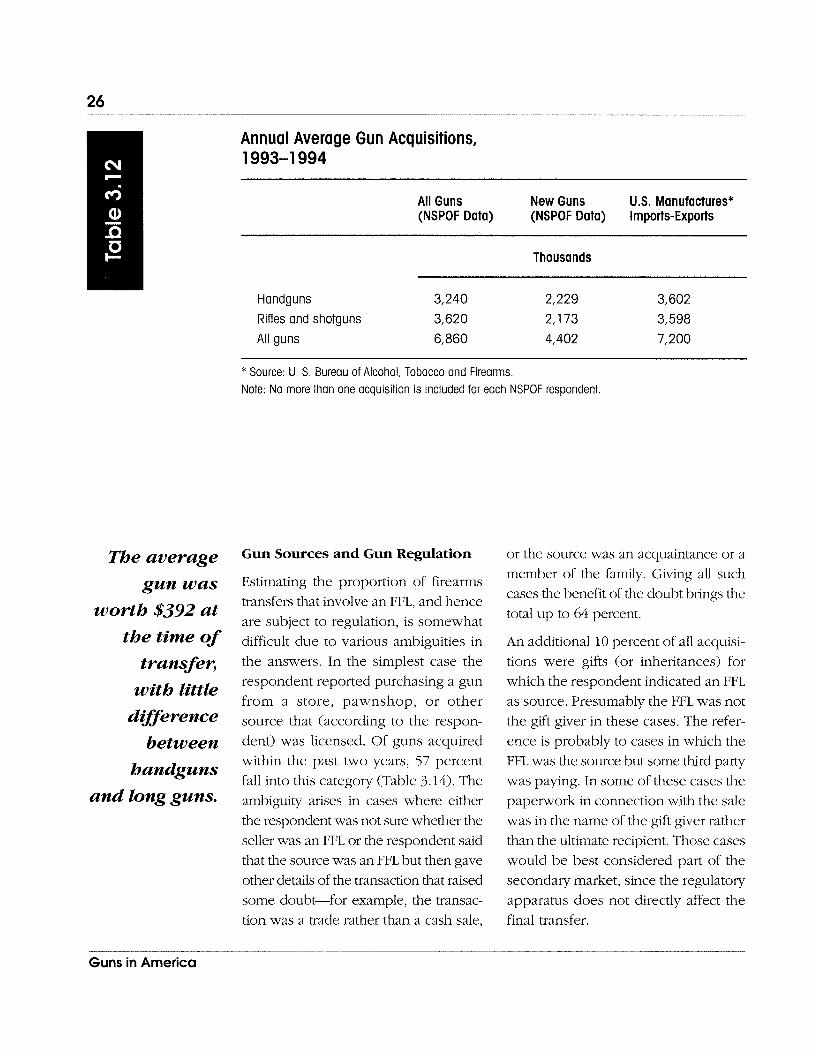
The volume of gun acquisitions im- plied by the 251 NSPOF cases (Table 3.12) is 13.7 million; 6.5 million of these transactions involved a handgun. Note that 60 percent of the long guns and 68 percent of the handguns were new
Guns in America
Gun Acquisition Within the Past Two Years
All Guns Handguns Long Guns (N=251) (N=128) (N=121)
What best describes how you obtained your gun?
Bought it Received it as a gift Traded something for it Inherited it Other
From what source did you obtain this gun?
Gun store Pawnshop Hardware, department, other store At a gun show or flea market Through the mail Member of the family Friend or acquaintance Other
Percent Distribution
m e predominant source of guns, not
surprisingly, was a store....
Gun was new when respondent first acquired it 64.0 68.8 60.0
at the time of acquisition. The implica- tion is that 4.5 million handguns and 4.3 million long guns were added to the U.S. gun stock over the two-year period. That estimate is somewhat less than the actual sales volume of new guns in the United States during 1993 and 1994, although the 50-50 split be- tween handguns and long guns is about right. Bureau of Alcohol, To- bacco, and Firearms (ATF) tabulations indicate sales of 3.6 million handguns
and 3.6 million long guns in 1994 (Table 3.12).
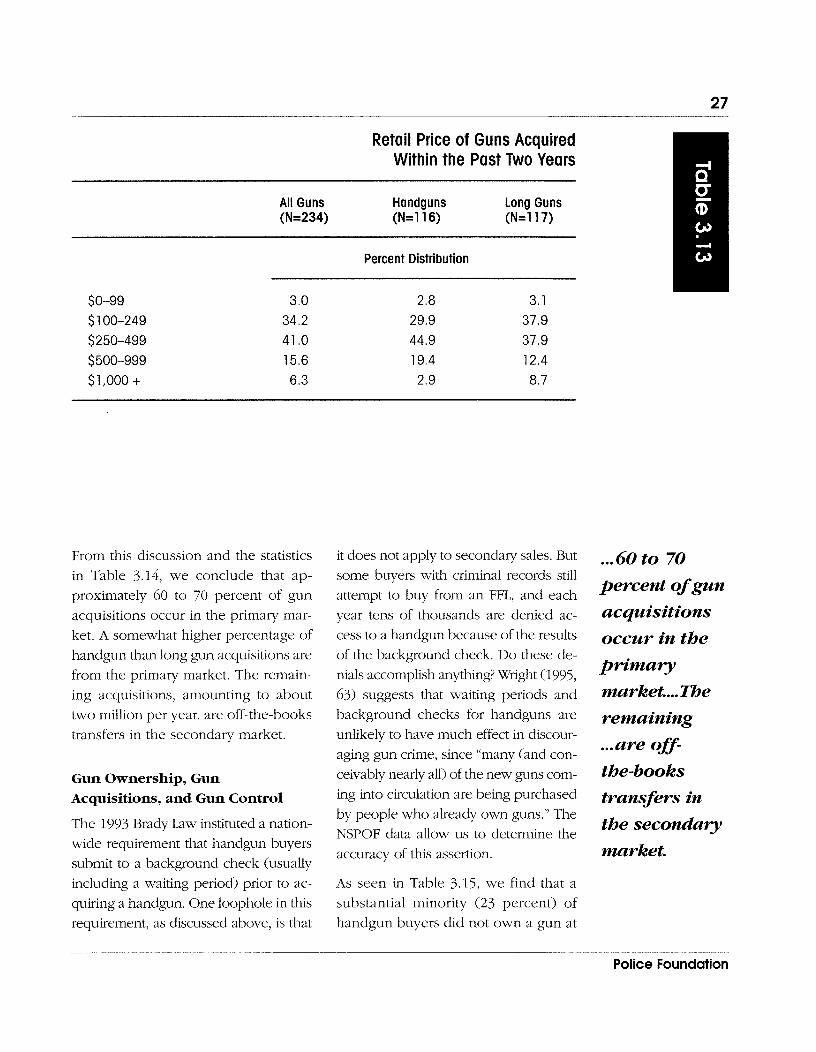
Respondents were also asked, "At the time you purchased your (gun/most re- cent gun), about how much would it have cost to purchase in a store?" Table 3.13 summarizes the responses. The aver- age gun was worth $392 at the time of transfer, with little difference between hand- guns and long guns. Fewer than one in twenty guns were valued at less than $100.
Police Foundation
Theaverage gun was
worth $39.2 at the time of
transfer, with little
difference between
handguns and long guns.
Annual Average Gun Acquisitions, 1993-1 994
All Guns New Guns U.S. Manufactures* (NSPOF Data) (NSPOF Data) Imports-Exports
Thousands
Handguns 3,240 2,229 3,602 Rifles and shotguns 3,620 2,173 3,598 All guns 6,860 4,402 7,200
* Source: U. S. Bureau of Alcohol, Tobacco and Firearms. Note: No more than one acquisition is included for each NSPOF respondent.
Gun Sources and Gun Regulation
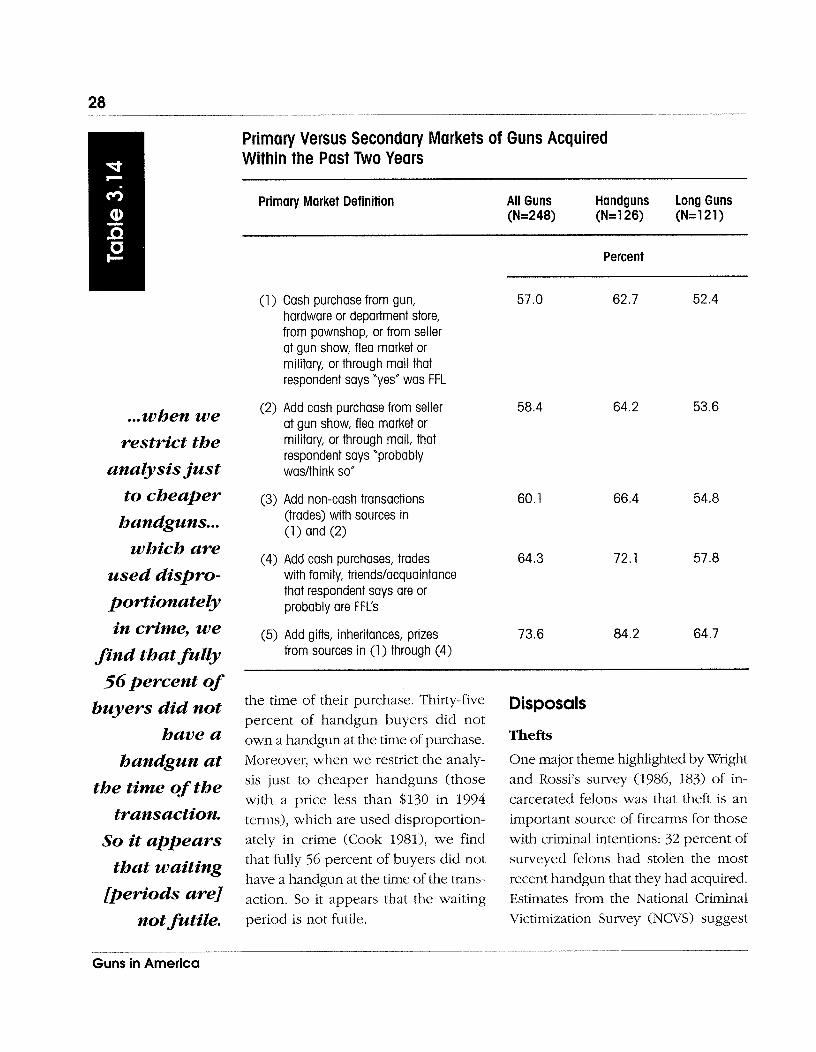
Estimating the proportion of firearms transfers that involve an FFL, and hence are subject to regulation, is somewhat difficult due to various ambiguities in the answers. In the simplest case the respondent reported purchasing a gun from a store, pawnshop, or other source that (according to the respon- dent) was licensed. Of guns acquired within the past two years, 57 percent fall into this category (Table 3.14). The ambiguity arises in cases where either the respondent was not sure whether the seller was an FFL or the respondent said that the source was an FFL but then gave other details of the transaction that raised some doubt-for example, the transac- tion was a trade rather than a cash sale,
or the source was an acquaintance or a member of the family. Giving all such cases the benefit of the doubt brings the total up to 64 percent.
An additional 10 percent of all acquisi- tions were gifts (or inheritances) for which the respondent indicated an FFL as source. Presumably the FFL was not the gift giver in these cases. The refer- ence is probably to cases in which the FFL was the source but some third party was paying. In some of these cases the paperwork in connection with the sale was in the name of the gift giver rather than the ultimate recipient. Those cases would be best considered part of the secondary market, since the regulatory apparatus does not directly affect the final transfer.
Guns in America
Retail Price of Guns Acquired Within the Past Two Years
All Guns Handguns Long Guns (N=234) (N=116) (N=117)
Percent Distribution
From this discussion and the statistics in Table 3.14, we conclude that ap- proximately 60 to 70 percent of gun acquisitions occur in the primary mar- ket. A somewhat higher percentage of handgun than long gun acquisitions are from the primary market. The remain- ing acquisitions, amounting to about two million per year, are off-the-books transfers in the secondary market.
Gun Ownership, Gun Acquisitions, and Gun Control
The 1993 Brady Law instituted a nation- wide requirement that handgun buyers submit to a background check (usually including a waiting period) prior to ac- quiring a handgun. One loophole in this requirement, as discussed above, is that
it does not apply to secondary sales. But some buyers with criminal records still attempt to buy from an FFL, and each year tens of thousands are denied ac- cess to a handgun because of the results of the background check. Do these de- nials accomplish anything? Wright (1995, 63) suggests that waiting periods and background checks for handguns are unlikely to l~ztve much effect in discour- aging gun crime, since "many (and con- ceivably nearly all) of the new guns corn- ing into circulation are being purchased by people who already own guns." The NSPOF data allow us to determine the accuracy of this assertion.
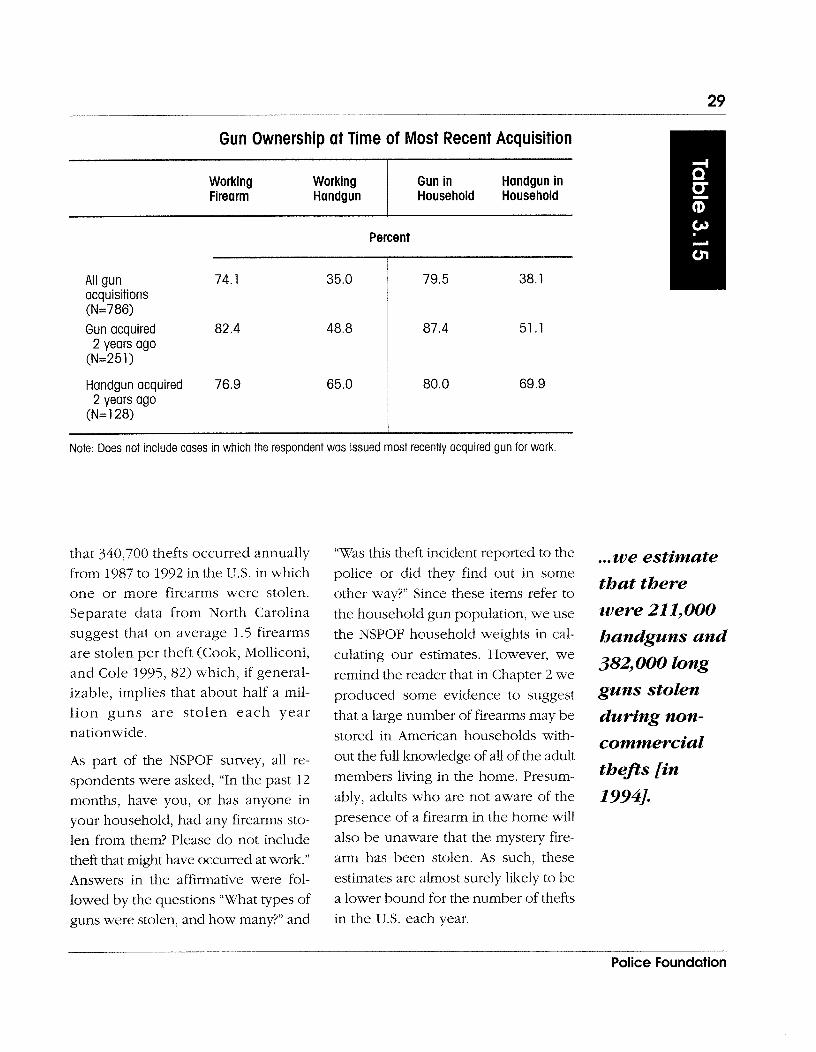
As seen in Table 3.15, we find that a substantial minority (23 percent) of handgun buyers did not own a gun at
... 60 to 70 percent of gun acquisitions
occur in the primary market. ... The remaining ... are off- the-books transfers in
the secondary market.
Pol ice Foundation
... when we restrict the
analysis just to cheaper handguns ...
which are used dispro- portionately in crime, we
find that fully 56percent of
buyers did not have a
handgun at the time of the
transaction. So it appears
that waiting [periods are]
not futile.
Primary Versus Secondary Markets of Guns Acquired Within the Past Two Years
Primary Market Definition All Guns Handguns Long Guns (N=248) (N=126) (N=121)
(1 ) Cash purchase from gun, hardware or department store, from pawnshop, or from seller at gun show, flea market or military, or through mail that respondent says "yes" was FFL
(2) Add cash purchase from seller at gun show, flea market or military, or through mail, that respondent says "probably waslthink so"
Percent
(3) Add non-cash transactions 60.1 (trades) with sources in (1 and (2)
(4) Add cash purchases, trades 64.3 with family, friendslacquaintance that respondent says are or probably are FFCs
(5) Add gifts, inheritances, prizes 73.6 84.2 64.7 from sources in (1) through (4)
the time of their purchase. Thirty-five percent of handgun buyers did not own a handgun at the time of purchase. Moreover, when we restrict the analy- sis just to cheaper handguns (those with a price less than $130 in 1994 terms), which are used disproportion- ately in crime (Cook 1981), we find that fully 56 percent of buyers did not have a handgun at the time of the trans- action. So it appears that the waiting period is not futile.
Disposals
Thefts
One major theme highlighted by Wright and Rossi's survey (1986, 183) of in- carcerated felons was that theft is an important source of firearms for those with criminal intentions: 32 percent of surveyed felons had stolen the most recent handgun that they had acquired. Estimates from the National Criminal Victimization Survey (NCVS) suggest
Guns in America
Gun Ownership at Time of Most Recent Acquisition
Working Working Firearm Handgun
Gun in Handgun in Household Household
Percent
All gun 74.1 35.0 acquisitions (N=786) Gun acquired 82.4 48.8
2 years ago (N=251)
Handgun acquired 76.9 65.0 2 years ago
(N=128)
Note: Does not include cases in which the respondent was issued most recently acquired gun for work.
that 340,700 thefts occurred annually from 1987 to 1992 in the U.S. in which one or more firearms were stolen. Separate data from North Carolina suggest that on average 1.5 firearms are stolen per theft (Cook, Molliconi, and Cole 1995, 82) which, if general- izable, implies that about half a mil- l ion guns are s tolen each year nationwide.
As part of the NSPOF survey, all re- spondents were asked, "In the past 12 months, have you, or has anyone in your household, had any firearms sto- len from them? Please do not include theft that might have occurred at work." Answers in the affirmative were fol- lowed by the questions "What types of guns were stolen, and how many?" and
"Was this theft incident reported to the police or did they find out in some other way?" Since these items refer to the household gun population, we use the NSPOF household weights in cal- culating our estimates. However, we remind the reader that in Chapter 2 we produced some evidence to suggest that a large number of firearms may be stored in American households with- out the full knowledge of all of the adult members living in the home. Presum- ably, adults who are not aware of the presence of a firearm in the home will also be unaware that the mystery fire- arm has been stolen. As such, these estimates are almost surely likely to be a lower bound for the number of thefts in the U.S. each year.
... we estimate
that there were 21 1,000
handguns and 382,000 long
guns stolen during non- commercial theJts [in
19941.
Police Foundation
. . .600,000 used
handguns and 3 70,000
used long guns changed owners
during the past year
through ...p rivate
transactions.
Based on the NSPOF, we estimate that 0.9 percent of all gun-owning house- holds (269,000) experienced during the previous year a theft in which a fire- arm was stolen. Using the information on the number of firearms that were taken from theft victims, we estimate that there were 21 1,000 handguns and 382,000 long guns stolen during non- commercial thefts during the past year, for a total of 593,000 stolen guns. These estimates are subject to considerable sampling error, and are not inconsis- tent with the 511,000 per year figure estimated by Cook, Molliconi, and Cole (1995,82) from NCVS data for the years 1987 to 1992.
Disposing of Guns Earlier we examined transactions in sec- ond-hand guns from the purchasers' re- ports. Data from the NSPOF also allow us to estimate used-gun sales from the sellers' reports. Each respondent was asked "In the past 12 months, other than by theft, have you or anyone in your household gotten rid of or otherwise lost a gun you or they owned?" Respondents who indicated that they or someone else had transferred a handgun were then asked, "Please think of the gun you most recently got rid of. How did you get rid of this gun?" [emphasis in original] and "What type of gun did you discard of or lose recently?'
Based on NSPOF responses, we estimate that 3.4 percent of gun-owning house- holds (about 1 million) disposed of a gun in the previous year. Most reported selling the gun or giving it as a gift. Since respondents were not asked to provide the number of guns that were disposed of during the past 12 months, the most we can do is produce a lower bound for the number of used guns that circu- lated. Our lower-bound figures suggest that half a million guns were sold, an- other quarter-million were bartered for something else, and 160,000 were given away. Of the firearms that were kept in circulation (transferred to another owner in some way), over 60 percent were handguns. We estimate that 600,000 used handguns and 370,000 used long guns changed owners during the past year through these private transactions.
NSPOF figures indicate that 6,000 fire- arms were confiscated during the past year by police or other authorities, dra- matically lower than previous estimates of up to 200,000 confiscated guns per year (Cook 1993). The underestimate may be due either to under- representation of criminals in the sample or reluctance on the part of the respondents to admit to criminal in- volvement (see Cook 1985). We also estimate that 36,000 guns were thrown away by their owners.
Endnotes
1. For a full discussion of this formula, please see the technical report.
2. For a fuller description of this analysis, please see the technical report.
Guns in America
Introduction
A number of surveys have documented the patterns and motivations for gun ownership in the United States. The results from the NSPOF tend to rein- force previous findings. Most long gun owners enjoy the sporting uses of guns, such as hunting and target shooting. For those who own handguns, self-pro- tection is the primary motivation. The people who keep guns for self-protec- tion are for the most part those who also make use of them in recreation. As a result, the patterns of handgun ownership closely parallel patterns of gun ownership overall: gun ownership rates are highest among men, people living in rural areas, and people of middle age and higher income. Almost everyone who currently owns a gun had some experience with guns as a
youth, either in military service or (more commonly) from growing up with guns in the home.
In addition to information on current gun ownership, the NSPOF includes items on previous ownership. From these we find that while 42 percent of men own guns now, another 24 per- cent owned them previously and then gave them up. Thus two-thirds of men have been gun owners. The cohorts who are currently middle aged (40 through 64) have had the greatest life- time involvement with guns.
About 5 percent of the nonowners were planning to acquire a gun during the year following the survey for self-de- fense purposes. Blacks and youths were especially likely to indicate ac- quisition plans, as were those who had been robbed or attacked recently.
Almost every- one who currently owns a gun bad some experience with guns as a youth, either in military service or (more commonly) from growing up with guns in the home.
...g un ownership
is much more prevalent in rural areas
and small towns than in cities .... Those
aged 40
through 64
have a substantially
higher rate than the other
age groups.
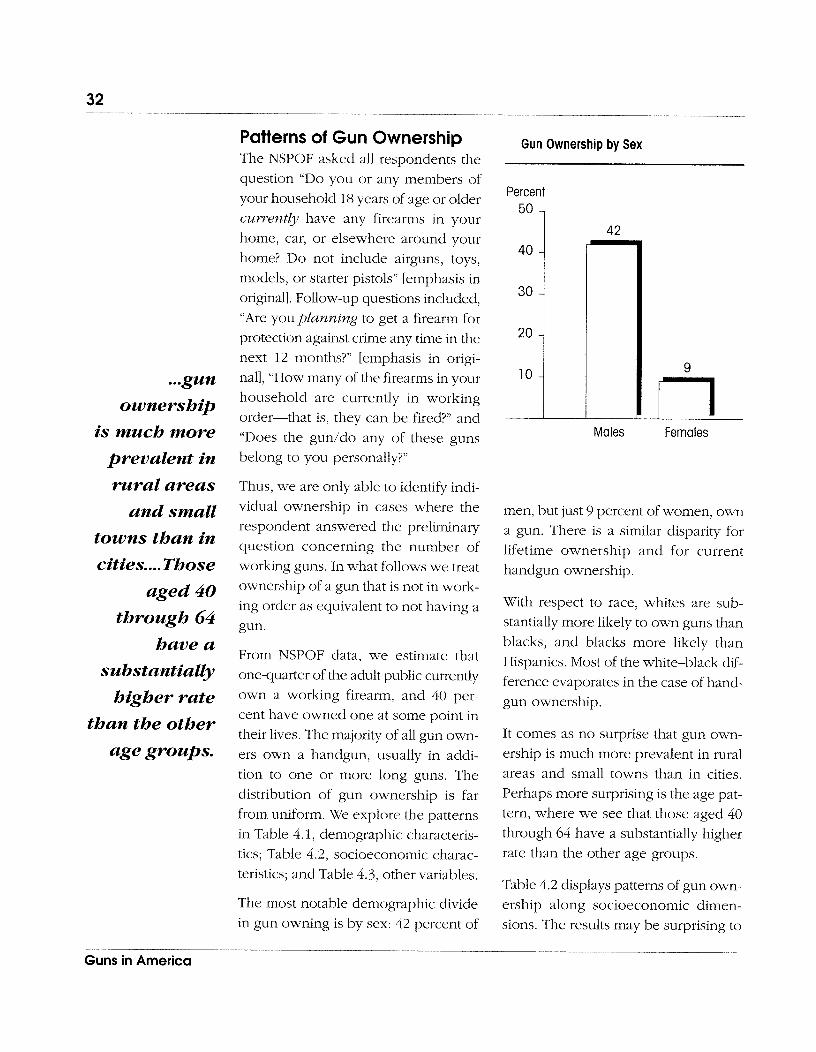
Patterns of Gun Ownership The NSPOF asked all respondents the question "Do you or any members of your household 18 years of age or older currently have any firearms in your home, car, or elsewhere around your home? Do not include airguns, toys, models, or starter pistols" [emphasis in original]. Follow-up questions included, "Are you planning to get a firearm for protection against crime any time in the next 12 months?" [emphasis in origi- nal], "How many of the firearms in your household are currently in working order-that is, they can be fired?" and "Does the gun/do any of these guns belong to you personally?"
Thus, we are only able to identify indi- vidual ownership in cases where the respondent answered the preliminary question concerning the number of working guns. In what follows we treat ownership of a gun that is not in work- ing order as equivalent to not having a gun.
From NSPOF data, we estimate that one-quarter of the adult public currently own a working firearm, and 40 per- cent have owned one at some point in their lives. The majority of all gun own- ers own a handgun, usually in addi- tion to one or more long guns. The distribution of gun ownership is far from uniform. We explore the patterns in Table 4.1, demographic characteris- tics; Table 4.2, socioeconomic charac- teristics; and Table 4.3, other variables.
The most notable demographic divide in gun owning is by sex: 42 percent of
Gun Ownership by S e x
Percent
50 1 42
Males Females
men, but just 9 percent of women, own a gun. There is a similar disparity for lifetime ownership and for current handgun ownership.
With respect to race, whites are sub- stantially more likely to own guns than blacks, and blacks more likely than Hispanics. Most of the white-black dif- ference evaporates in the case of hand- gun ownership.
It comes as no surprise that gun own- ership is much more prevalent in rural areas and srnall towns than in cities. Perhaps more surprising is the age pat- tern, where we see that those aged 40 through 64 have a substantially higher rate than the other age groups.
Table 4.2 displays patterns of gun own- ership along socioeconomic dimen- sions. The results may be surprising to
Guns in America
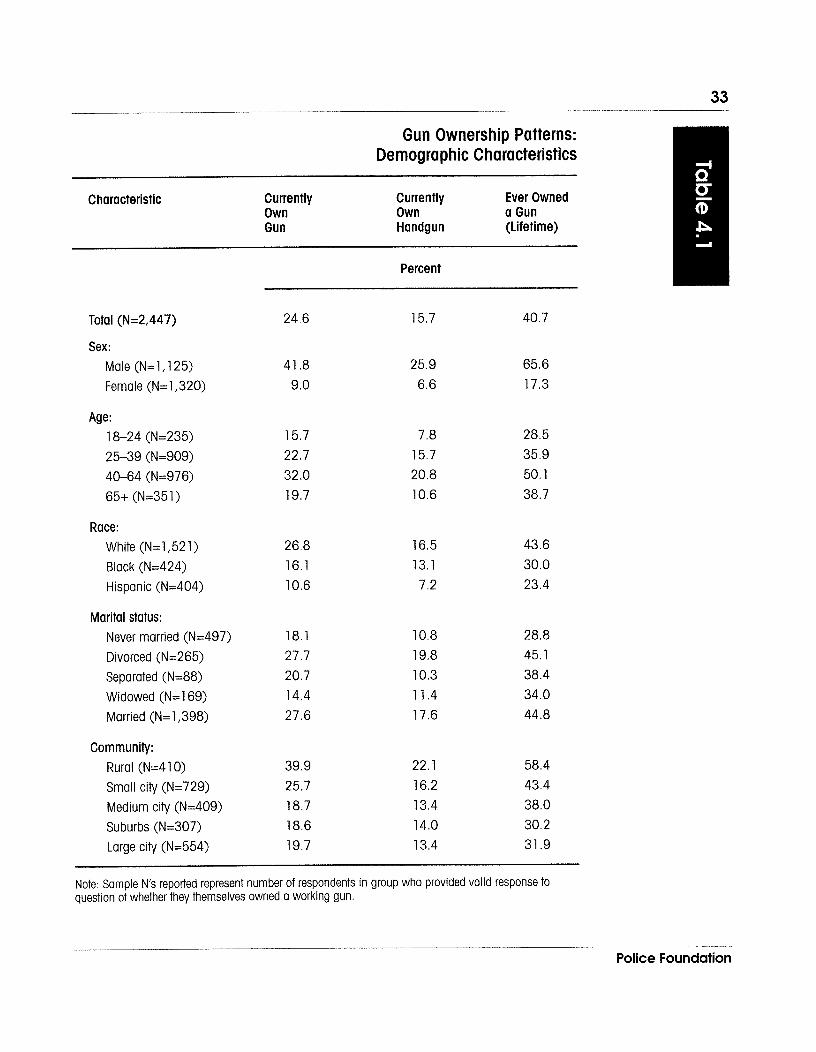
Gun Ownership Patterns: Demographic Characteristics
Characteristic Currently Currently Ever Owned Own Own a Gun Gun Handgun (Lifetime)
Total (N=2,447)
Sex: Male (N=l, 125) Female (N=1,320)
Age: 18-24 (N=235) 25-39 (N=909) 40-64 (N=976) 65+ (N=351)
Race: White (N=1,521) Black (N=424) Hispanic (N=404)
Marital status: Never married (N=497) Divorced (N=265) Separated (N=88) Widowed (N=169) Married (N=1,398)
Community: Rural (N=4 1 0)
Small city (N=729) Medium city (N=409) Suburbs (N=307) Large city (N=554)
Percent
Note: Sample N's reported represent number of respondents in group who provided valid response to question of whether they themselves owned a working gun.
Police Foundation
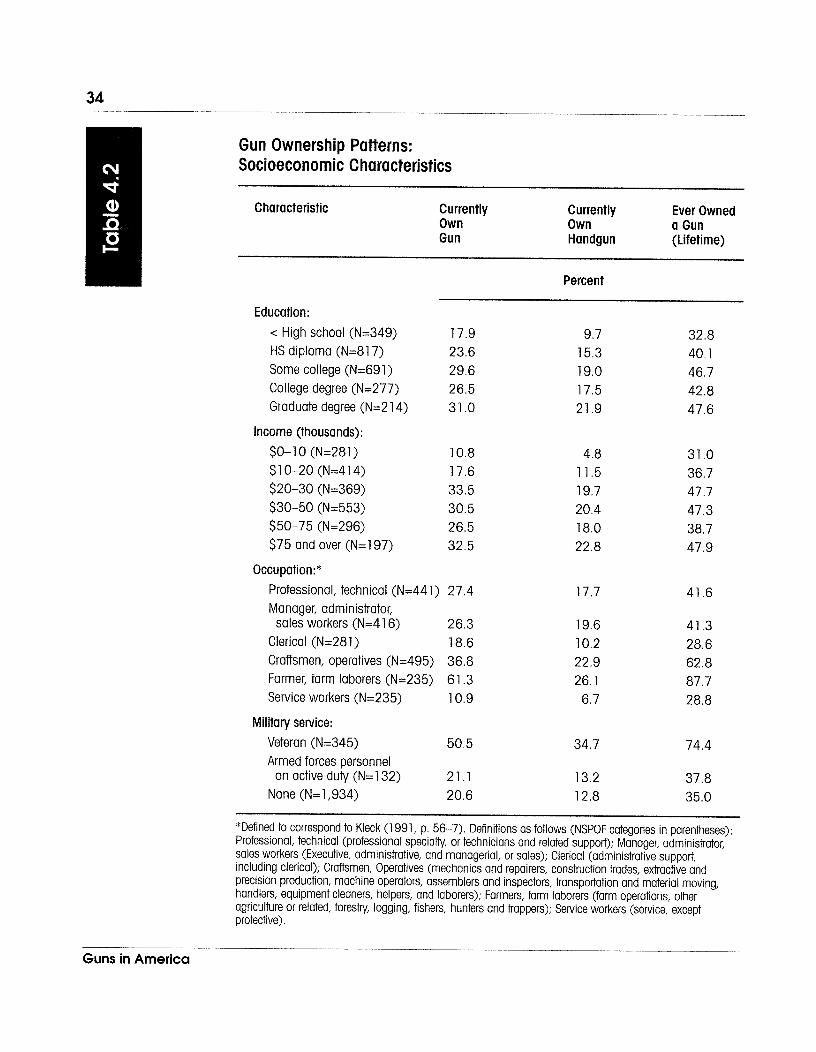
Gun Ownership Patterns: Socioeconomic Characteristics
Characteristic Currently Currently Ever Owned Own Own a Gun Gun Handgun (Lifetime)
Education: < High school (N=349) 17.9 HS diploma (N=817) 23.6 Some college (N=691) 29.6 College degree (N=277) 26.5 Graduate degree (N=2 1 4) 31 .O
Income (thousands):
Percent
$0-1 0 (N=281) 10.8 $1 0-20 (N=414) 17.6 $20-30 (N=369) 33.5 $30-50 (N=553) 30.5 $50-75 (N=296) 26.5 $75 and over (N=197) 32.5
Professional, technical (N=44 1 ) 27.4 Manager, administrator,
sales workers (N=416) 26.3 Clerical (N=281) 18.6 Craftsmen, operatives (N=495) 36.8 Farmer, farm laborers (N=235) 61.3 Service workers (N=235) 10.9
Military service: Veteran (N=345) 50.5 Armed forces personnel
on active duty (N=132) 21.1 None (N= 1,934) 20.6
*Defined to correspond to Kleck (1 991, p. 56-7). Definitions os follows (NSPOF categories in parentheses): Professional, technical (professional specialty, or technicians and related support); Manager, administrator, sales workers (Executive, administrative, and managerial, or sales); Clerical (administrative support, including clerical); Craftsmen, Operatives (mechanics and repairers, construction trades, extractive and precision production, machine operators, assemblers and inspectors, transportation and material moving, handlers, equipment cleaners, helpers, and laborers); Farmers, farm laborers (farm operations, other agriculture or related, forestry, logging, fishers, hunters and trappers); Service workers (service, except protective).
Guns in America
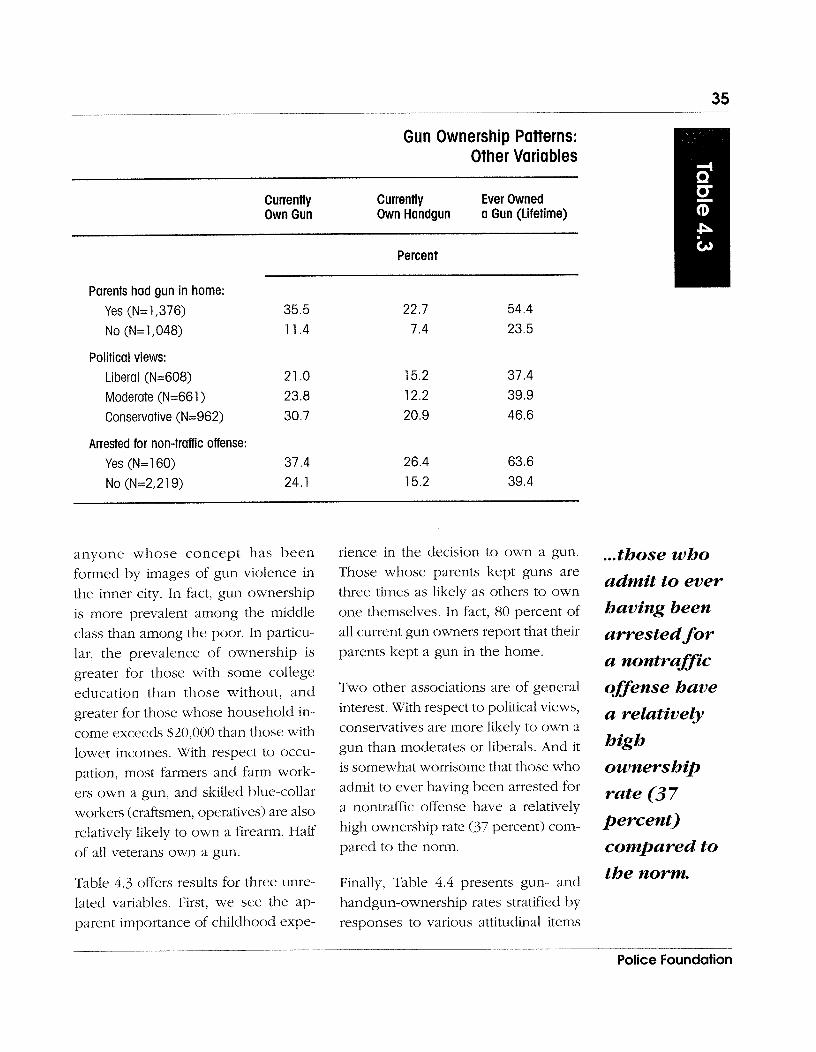
Gun Ownership Patterns: Other Variables
Currently Currently Ever Owned Own Gun Own Handgun a Gun (Lifetime)
Parents had gun in home: Yes (N=1,376) No (N= 1,048)
Political views: Liberal (N=608) Moderate (N=66 1 ) Conservative (N=962)
Arrested for non-traffic offense: Yes (N=160) No (N=2,2 1 9)
Percent
anyone whose concept has been formed by images of gun violence in the inner city. In fact, gun ownership is more prevalent among the middle class than among the poor. In particu- lar, the prevalence of ownership is greater for those with some college education than those without, and greater for those whose household in- come exceeds $20,000 than those with lower incomes. With respect to occu- pation, most farmers and farm work- ers own a gun, and skilled blue-collar workers (craftsmen, operatives) are also relatively likely to own a firearnl. Half of all veterans own a gun.
Table 4.3 offers results for three unre- lated variables. First, we see the ap- parent importance of childhood expe-
rience in the decision to own a gun. Those whose parents kept guns are three times as likely as others to own one themselves. In fact, 80 percent of all current gun owners report that their parents kept a gun in the home.
Two other associations are of general interest. With respect to political views, conservatives are more likely to own a gun than moderates or liberals. And it is somewhat worrisome that those who admit to ever having been arrested for a nontraffic offense have a relatively high ownership rate (37 percent) com- pared to the norm.
Finally, Table 4.4 presents gun- and handgun-ownership rates stratified by responses to various attitudinal items
... those who
admit to ever having been
arrested for a nontraffic
offense have a relatively high
ownership
rate (3 7 percent) compared to the norm.
Police Foundation
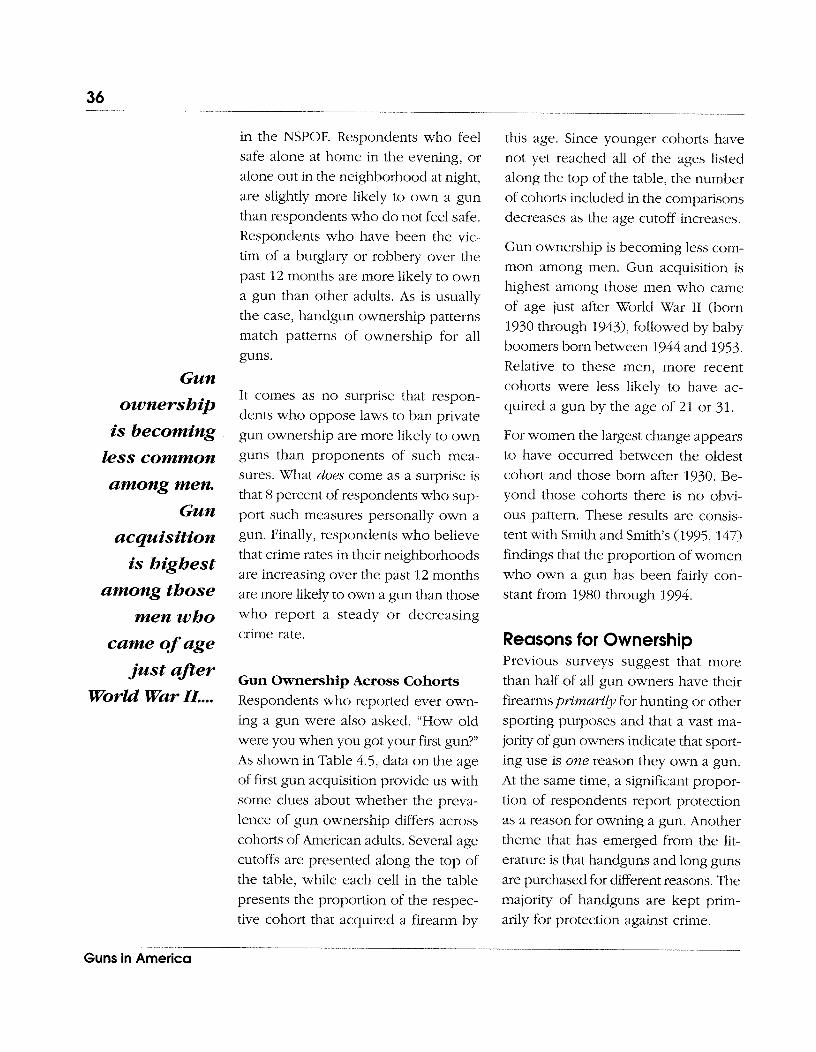
Gun ownership
is becoming less common among men.
Gun acquisition
is bigbest among those
men who came of age
just aJter World War I%;...
in the NSPOF. Respondents who feel safe alone at home in the evening, or alone out in the neighborhood at night, are slightly more likely to own a gun than respondents who do not feel safe. Respondents who have been the vic- tim of a burglary or robbery over the past 12 months are more likely to own a gun than other adults. As is usually the case, handgun ownership patterns match patterns of ownership for all guns.
It comes as no surprise that respon- dents who oppose laws to ban private gun ownership are more likely to own guns than proponents of such mea- sures. What does come as a surprise is that 8 percent of respondents who sup- port such measures personally own a gun. Finally, respondents who believe that crime rates in their neighborhoods are increasing over the past 12 months are more likely to own a gun than those who report a steady or decreasing crime rate.
Gun Ownership Across Cohorts Respondents who reported ever own- ing a gun were also asked, "How old were you when you got your first gun?" As shown in Table 4.5, data on the age of first gun acquisition provide us with some clues about whether the preva- lence of gun ownership differs across cohorts of American adults. Several age cutoffs are presented along the top of the table, while each cell in the table presents the proportion of the respec- tive cohort that acquired a firearm by
this age. Since younger cohorts have not yet reached all of the ages listed along the top of the table, the number of cohorts included in the comparisons decreases as the age cutoff increases.
Gun ownership is becoming less com- mon among men. Gun acquisition is highest among those men who came of age just after World War I1 (born 1930 through 1943), followed by baby boomers born between 1944 and 1953. Relative to these men, more recent cohorts were less likely to have ac- quired a gun by the age of 21 or 31.
For women the largest change appears to have occurred between the oldest cohort and those born after 1930. Be- yond those cohorts there is no obvi- ous pattern. These results are consis- tent with Smith and Smith's (1995, 147) findings that the proportion of women who own a gun has been fairly con- stant from 1980 through 1994.
Reasons for Ownership Previous surveys suggest that more than half of all gun owners have their firearms pm'mam'ly for hunting or other sporting purposes and that a vast ma- jority of gun owners indicate that sport- ing use is one reason they own a gun. At the same time, a significant propor- tion of respondents report protection as a reason for owning a gun. Another theme that has emerged from the lit- erature is that handguns and long guns are purchased for different reasons. The majority of handguns are kept prim- arily for protection against crime.
Guns in America
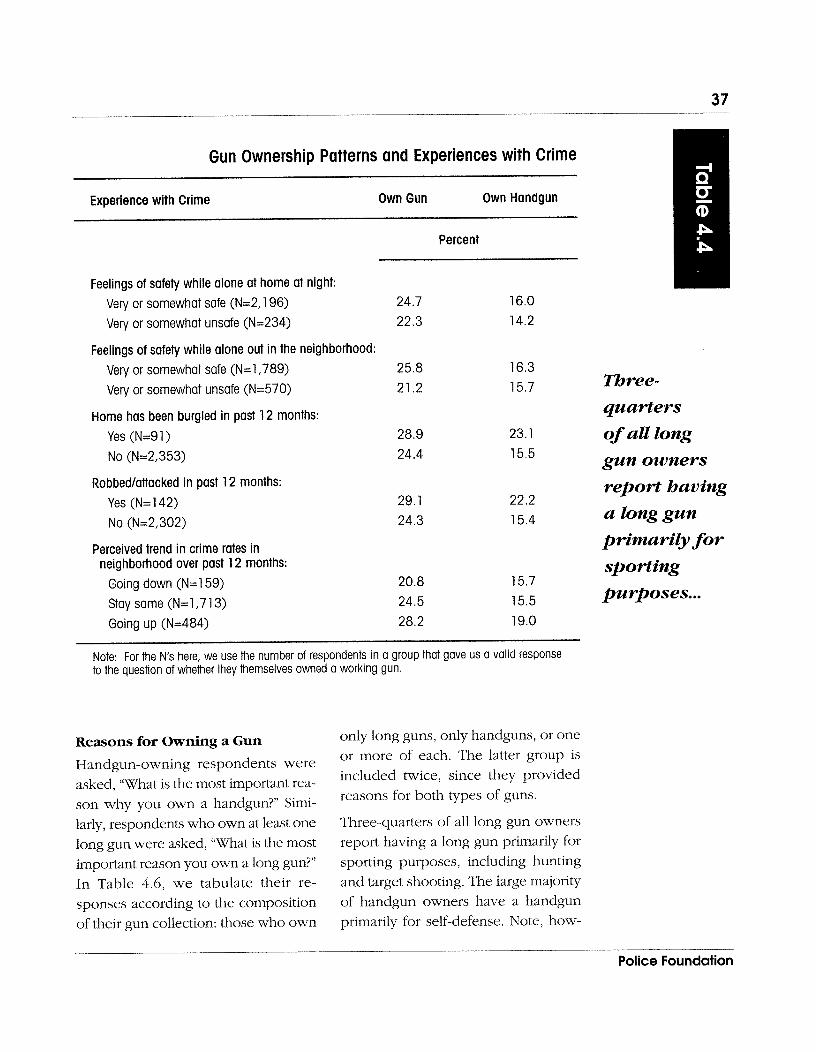
Gun Ownership Patterns and Experiences with Crime
Experience with Crime Own Gun Own Handgun
Feelings of safety while alone at home at night: Very or somewhat safe (N=2,196) Very or somewhat unsafe (N=234)
Feelings of safety while alone out in the neighborhood: Very or somewhat safe (N=1,789) Very or somewhat unsafe (N=570)
Home has been burgled in past 12 months: Yes (N=9 1 ) No (N=2,353)
Robbedlattacked in past 12 months: Yes (N= 1 42) No (N=2,302)
Perceived trend in crime rates in neighborhood over past 12 months:
Going down (N=159) Stay same (N=1,7 13) Going up (N=484)
Percent
Note: For the N's here, we use the number of respondents in a group that gave us a valid response to the question of whether they themselves owned a working gun.
Reasons for Owning a Gun only long guns, only handguns, or one - Handgun-owning respondents were or more of each. The latter group is
asked, "What is the most important rea- included twice, since they provided
son why you own a handgun?" Simi- reasons for both types of guns.
larly, respondents who own at least one Three-quarters of a11 Iong gun owners long gun were asked, "What is the most report having a long gun primarily for important reason you own a long gun?" sporting purposes, including hunting In Table 4.6, we tabulate their re- and target shooting. The large majority sponses according to the composition of handgun owners have a handgun of their gun collection: those who own primarily for self-defense. Note, how-
Three- quarters of all long gun owners report having a long gun primarily for sporting purposes ...
Police Foundation
Gun Ownership by Cohort
Focusing on handgun
owners ..., 63 percent own a gun
primarily for protection
against crime.
Sex and Age Owned Gun Owned Gun Owned Gun Owned Gun (in 1994) Before Age 21 Before Age 31 Before Age 41 Before Age 51
Percent Distribution
Males, 2 1-30 48.3
Males, 31-40 44.1 54.5 Males, 4 1-50 51.9 62.7 69.1 Males, 51 -64 59.3 72.8 76.4 78.1
Males, 65 + 47.9 60.9 66.0 69.3
Females, 2 1-30 5.2 Females, 3 1-40 5.2 16.4 Females, 4 1-50 4.2 10.9 17.1
Females, 5 1-64 9.4 13.2 17.6 22.4 Females, 65 + 2.8 5.4 7.1 8.9
Note: All respondents who have ever owned a firearm were asked, "How old were you when you got your first gun?"
ever, that for a few respondents hunt- ing or target shooting is the most im- portant reason. Note also that in the "handgun only" group, for whom hand- gun ownership is mostly utilitarian, 40 percent are women, compared to their lower than 15 percent representation in the other two groups.
Overall, 46 percent of gun owners own some kind of gun primarily for protec- tion against crime. The figure is 41 percent for males, and 67 percent for females. (Respondents were not asked about secondary reasons for owning a gun.) Focusing on handgun owners (irrespective of whether or not a long gun is also owned), 63 percent own a gun primarily for protection against crime. The proportion is much higher
for female handgun owners than for males (84 versus 57 percent).
Reasons for Not Owning a Gun Respondents who did not personally own a gun at the time of the NSPOF interview were asked, "Why don't you personally own a gun now?" Chilton interviewers were instructed to probe for additional reasons, using the fol- low up question "Why else don't you own a gun?" Up to five reasons were recorded for each respondent.
We have grouped their reasons into seven categories, as presented in Table 4.7. The most prevalent reason for not owning a firearm was affordability; 27 percent of respondents listed this as the most important reason for not own-
Guns in America
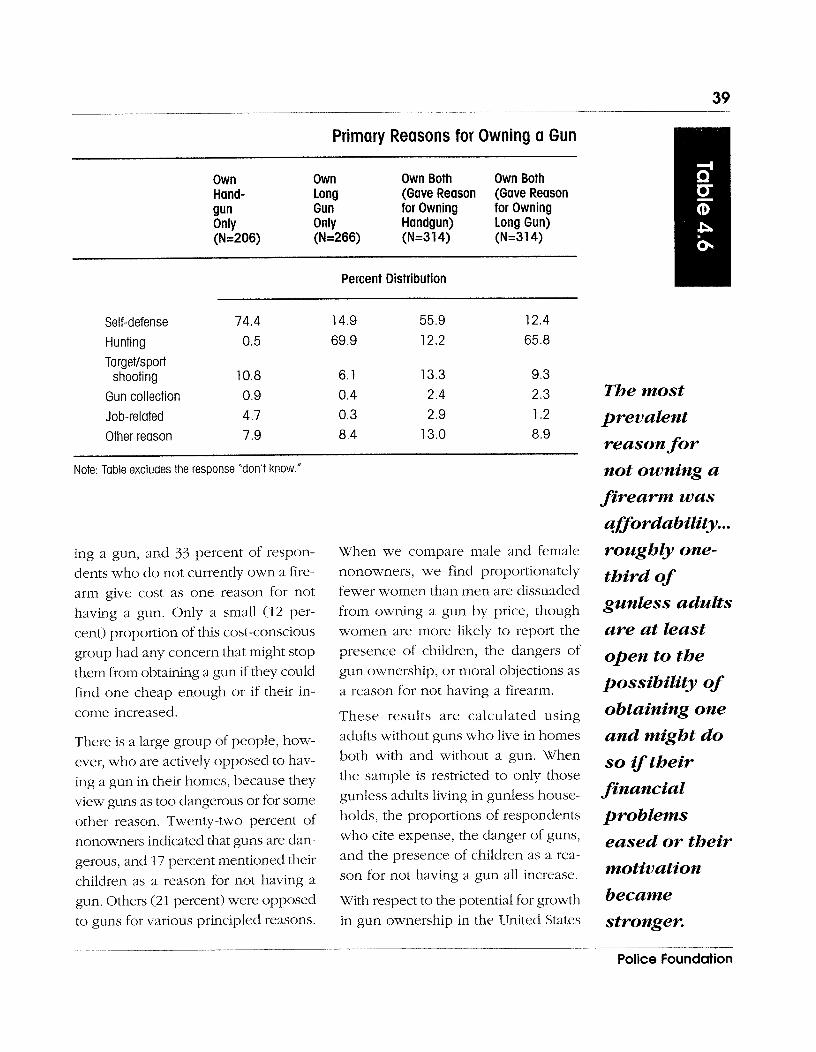
Primary Reasons for Owning a Gun
Own Own Own Both Own Both Hand- Long (Gave Reason (Gave Reason gun Gun for Owning for Owning Only Only Handgun) Long Gun) (N=206) (N=266) (N=3 1 4) (N=314)
Percent Distribution
Self-defense 74.4 14.9 55.9 12.4
Hunting 0.5 69.9 12.2 65.8
Targetlsport shooting 10.8 6.1 13.3 9.3
Gun collection 0.9 0.4 2.4 2.3
Job-related 4.7 0.3 2.9 1.2
Other reason 7.9 8.4 13.0 8.9
Note: Table excludes the response "don't know."
ing a gun, and 33 percent of respon- dents who do not currently own a fire- arm give cost as one reason for not having a gun. Only a small (12 per- cent) proportion of this cost-conscious group had any concern that might stop them from obtaining a gun if they could find one cheap enough or if their in- come increased.
There is a large group of people, how- ever, who are actively opposed to hav- ing a gun in their homes, because they view guns as too dangerous or for some other reason. Twenty-two percent of nonowners indicated that guns are dan- gerous, and 17 percent mentioned their children as a reason for not having a gun. Others (21 percent) were opposed to guns for various principled reasons.
When we compare male and female nonowners, we find proportionately fewer women than men are dissuaded from owning a gun by price, though women are more likely to report the presence of children, tlie dangers of gun ownership, or moral objections as a reason for not having a firearm.
These results are calculated using adults without guns who live in homes both with and without a gun. When the sample is restricted to only those gunless adults living in gunless house- holds, the proportions of respondents who cite expense, the danger of guns, and the presence of children as a rea- son for not having a gun all increase.
With respect to the potential for growth in gun ownership in the United States
The most prevalent reason for not owning a firearm was a ffordability ... roughly one- third of gunless adults are at least open to the possibility of obtaining one and might d o so if their financial problems eased or their motivation became stronger.
Police Foundation
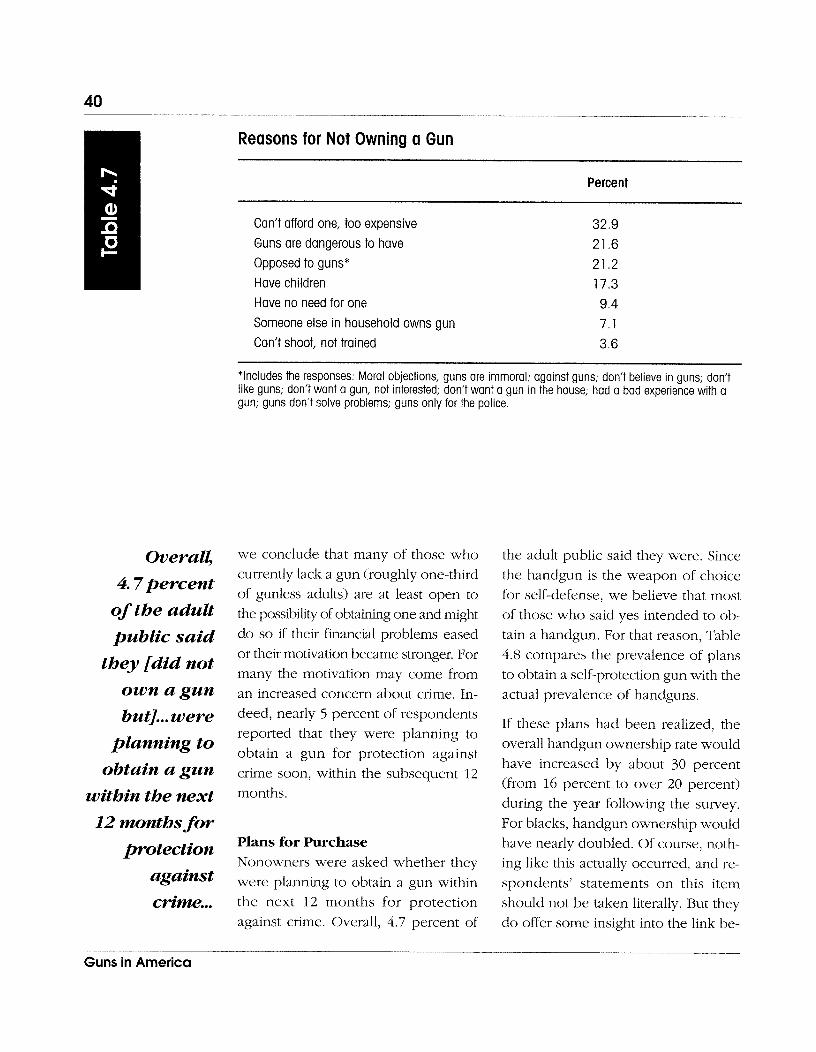
Overal& 4.7percent
of the adult public said
they [did not own a gun but]. .. were
planning to obtain a gun
within the next 12 months for
protection against crime. ..
Reasons for Not Owning a Gun
Percent
Can't afford one, too expensive Guns are dangerous to have Opposed to guns* Have children Have no need for one 9.4 Someone else in household owns gun Can't shoot, not trained
*Includes the responses: Moral objections, guns are immoral; against guns; don't believe in guns; don't like guns; don't want a gun, not interested; don't want a gun in the house; had a bad experience with a gun; guns don't solve problems; guns only for the police,
we conclude that many of those who currently lack a gun (roughly one-third of gunless adults) are at least open to the possibility of obtaining one and might do so if their financial problems eased or their motivation became stronger. For many the motivation may come from an increased concern about crime. In- deed, nearly 5 percent of respondents reported that they were planning to obtain a gun for protection against crime soon, within the subsequent 12 months.
Plans for Purchase Nonowners were asked whether they were planning to obtain a gun within the next 12 months for protection against crime. Overall, 4.7 percent of
the adult public said they were. Since the handgun is the weapon of choice for self-defense, we believe that most of those who said yes intended to ob- tain a handgun. For that reason, Table 4.8 compares the prevalence of plans to obtain a self-protection gun with the actual prevalence of handguns.
If these plans had been realized, the overall handgun ownership rate would have increased by about 30 percent (from 16 percent to over 20 percent) during the year following the survey. For blacks, handgun ownership would have nearly doubled. Of course, noth- ing like this actually occurred, and re- spondents' statements on this item should not be taken literally. But they do offer some insight into the link be-
Guns in America
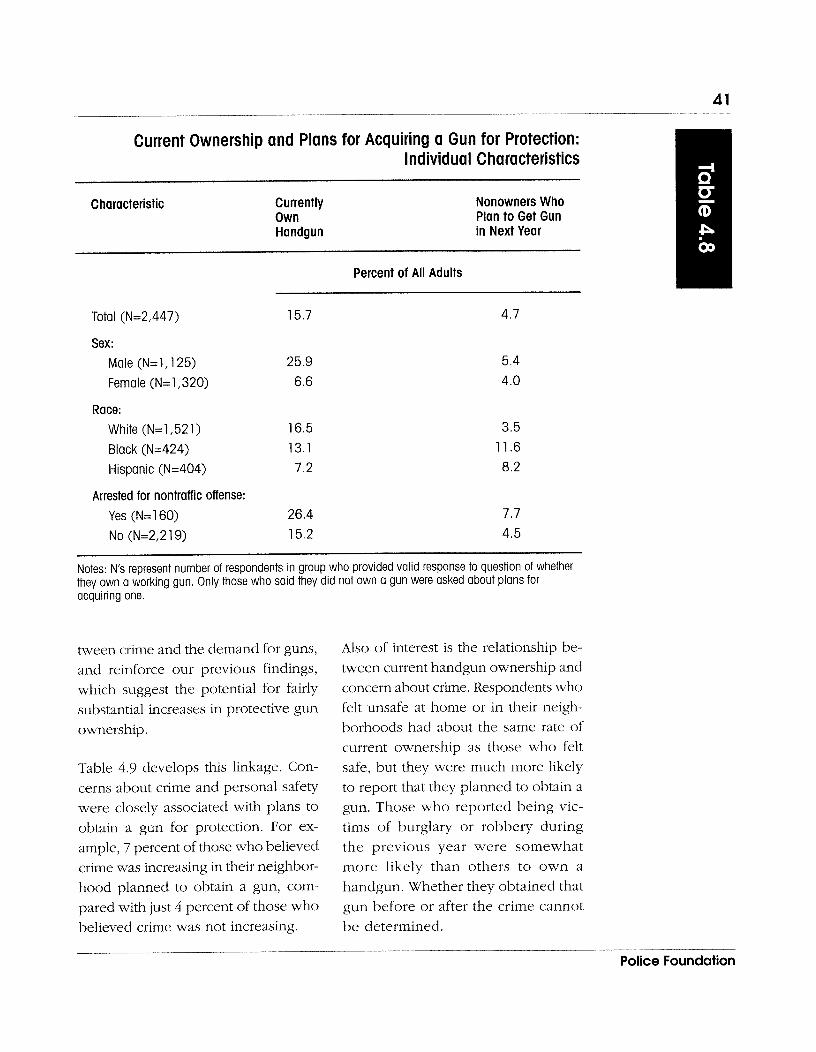
Current Ownership and Plans for Acquiring a Gun for Protection: Individual Characteristics
Characteristic Currently Own Handgun
Nonowners Who Plan to Get Gun in Next Year
Percent of All Adults
Total (N=2,447)
Sex: Male (N=l, 125)
Female (N=1,320)
Race: White (N=1,521) Black (N=424)
Hispanic (N=404)
Arrested for nontraffic offense: Yes (N= 1 60) No (N=2,2 1 9)
Notes: N's represent number of respondents in group who provided valid response to question of whether they own a working gun. Only those who said they did not own a gun were asked about plans for acquiring one.
tween crime and the demand for guns, and reinforce our previous findings, which suggest the potential for fairly substantial increases in protective gun ownership.
Table 4.9 develops this linkage. Con- cerns about crime and personal safety were closely associated with plans to obtain a gun for protection. For ex- ample, 7 percent of those who believed crime was increasing in their neighbor- hood planned to obtain a gun, com- pared with just 4 percent of those who believed crime was not increasing.
Also of interest is the relationship be- tween current handgun ownership and concern about crime. Respondents who felt unsafe at home or in their neigh- borhoods had about the same rate of current ownership as those who felt safe, but they were much more likely to report that they planned to obtain a gun. Those who reported being vic- tims of burglary or robbery during the previous year were somewhat more likely than others to own a handgun. Whether they obtained that gun before or after the crime cannot be determined.
Pol ice Foundation
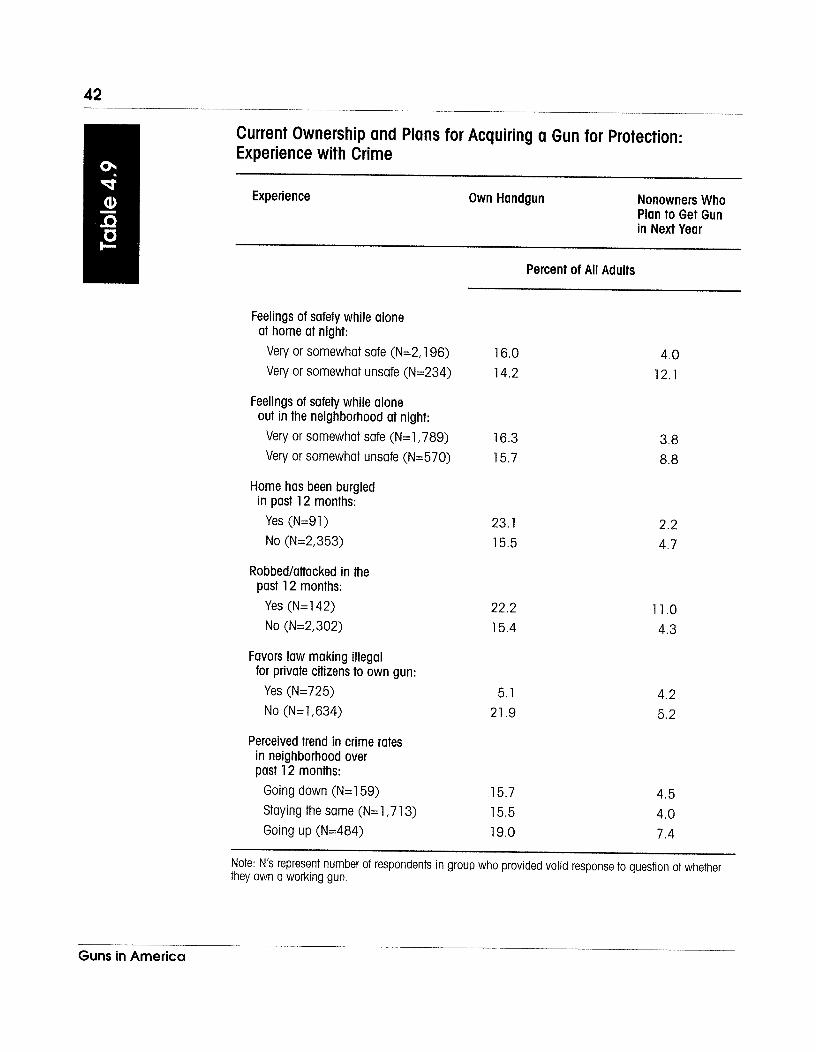
Current Ownership and Plans for Acquiring a Gun for Protection: Experience with Crime
Experience Own Handgun Nonowners Who Plan to Get Gun in Next Year
Feelings of safety while alone at home at night:
Very or somewhat safe (N=2,196) Very or somewhat unsafe (N=234)
Feelings of safety while alone out in the neighborhood at night:
Very or somewhat safe (N=1,789) Very or somewhat unsafe (N=570)
Home has been burgled in past 12 months:
Yes (N=91) No (N=2,353)
Robbedlattacked in the past 12 months:
Yes (N= 1 42) NO (N=2,302)
Favors law making illegal for private citizens to own gun:
Yes (N=725) NO (N=1,634)
Perceived trend in crime rates in neighborhood over past 12 months:
Going down (N=159) Staying the same (N=1,7 13) Going up (N=484)
Percent of All Adults
Note: N's represent number of respondents in group who provided valid response to question of whether they own a working gun,
Guns in America
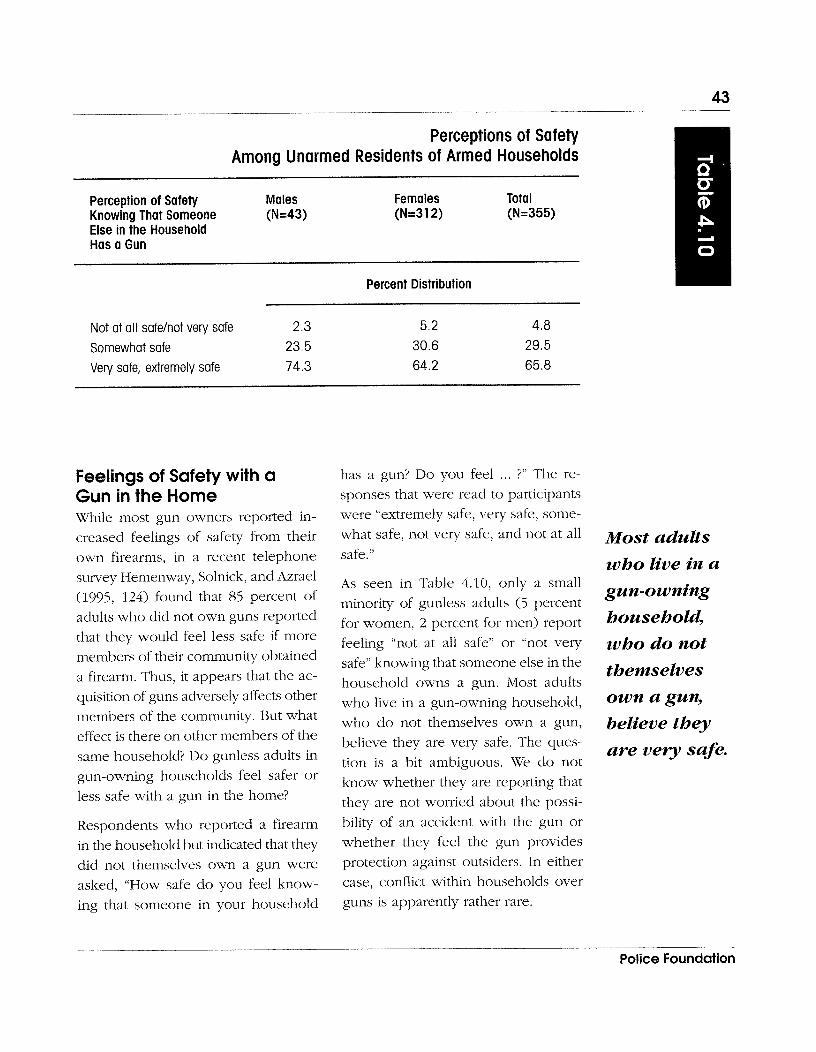
Perceptions of Safety Among Unarmed Residents of Armed Households
Perception of Safety Males Females Total Knowing That Someone (N=43) (N=3 1 2) (N=355) Else in the Household Has a Gun
Percent Distribution
Not at all safelnot very safe 2.3
Somewhat safe 23.5 Very safe, extremely safe 74.3
Feelings of Safety with a Gun in the Home While most gun owners reported in- creased feelings of safety from their own firearms, in a recent telephone survey Hemenway, Solnick, and Azrael (1995, 124) found that 85 percent of adults who did not own guns reported that they would feel less safe if more members of their community obtained a firearm. Thus, it appears that the ac- quisition of guns adversely affects other members of the community. But what effect is there on other members of the same household? Do gunless adults in gun-owning households feel safer or less safe with a gun in the home?
Respondents who reported a firearm in the household but indicated that they did not themselves own a gun were asked, "How safe do you feel know- ing that someone in your household
has a gun? Do you feel ... ?" The re- sponses that were read to participants were "extremely safe, very safe, some- what safe, not very safe, and not at all
safe."
As seen in Table 4.10, only a small minority of gunless adults (5 percent for women, 2 percent for men) report feeling "not at all safe" or "not very safe" knowing that someone else in the household owns a gun. Most adults who live in a gun-owning household, who do not themselves own a gun, believe they are very safe. The ques- tion is a bit ambiguous. We do not know whether they are reporting that they are not worried about the possi- bility of an accident with the gun or whether they feel the gun provides protection against outsiders. In either case, conflict within households over guns is apparently rather rare.
Most adults who live in a gun-owning household, who do not themselves own a gun, believe they are very safe.
Police Foundation

Guns in America
Introduction In this chapter, we examine a collec- tion of topics related to the use and misuse of firearms:
.I the prevalence of firearms training among the adult population in the United States, and in particular for gun owners and those living with guns in the home;
the recreational uses of guns, in particular hunting and sport or tar- get shooting;
II firearm accidents; and
.I gun carrying.
Firearms Training The following question was asked of all respondents in the NSPOF: "Have you ever had any instruction or train- ing on how to use guns?" Respondents
who said yes were then asked about the sources from which training was received. Chapter 3 presented some results from these items on training in connection with our analysis of gun- storage practices. We now develop a more comprehensive picture of how Americans learn the skills necessary to handle guns safely.
As indicated in Tables 5.1 and 5.2, about three-quarters of American men and over one-third of women have re- ceived some instruction or training in how to use a gun. Over half of all men have received "formal" training-that is, training from a professional instruc- tor provided by law enforcement or other security agencies, the National Rifle Association, gun clubs, the Scouts, the National Safety Council, or (most commonly) the armed forces. Most
... tbree- quarters of American men and over one-third of women have received some instruction or training in bow to use a gun.
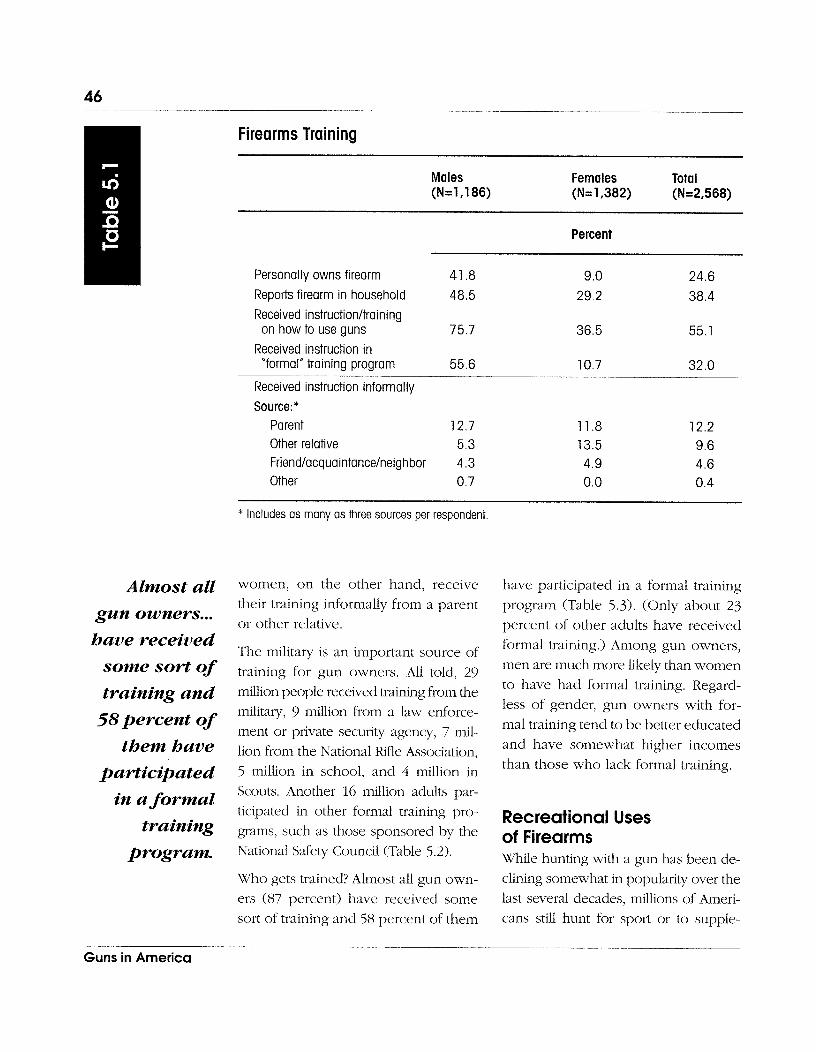
Firearms Training
Almost all gun owners... have received
some sort of training and
58percent of them have
participated in a formal
training program.
Males Females Total (N=1,186) (N=1,382) (N=2,568)
Percent
Personally owns firearm 41.8 9.0 24.6
Reports firearm in household 48.5 Received instructionltraining
on how to use guns 75.7 Received instruction in
"formal" training program 55.6
Received instruction informally Source:*
Parent 12.7 11.8 12.2 Other relative 5.3 13.5 9.6 Friendlacquaintance/neighbor 4.3 4.9 4.6 Other 0.7 0.0 0.4
* Includes as many as three sources per respondent.
women, on the other hand, receive their training informally from a parent or other relative.
The military is an important source of training for gun owners. All told, 29 million people received training from the military, 9 million from a law enforce- ment or private security agency, 7 mil- lion from the National Rifle Association, 5 million in school, and 4 million in Scouts. Another 16 million adults par- ticipated in other formal training pro- grams, such as those sponsored by the National Safety Council (Table 5.2).
Who gets trained? Almost all gun own- ers (87 percent) have received some sort of training and 58 percent of them
have participated in a formal training program (Table 5.3). (Only about 23
percent of other adults have received formal training.) Among gun owners, men are much more likely than women to have had formal training. Regard- less of gender, gun owners with for- mal training tend to be better educated and have solnewhat higher incomes than those who lack formal training.
Recreational Uses of Firearms While hunting with a gun has been de- clining somewhat in popularity over the last several decades, rnillions of Ameri- cans still hunt for sport or to supple-
Guns in America
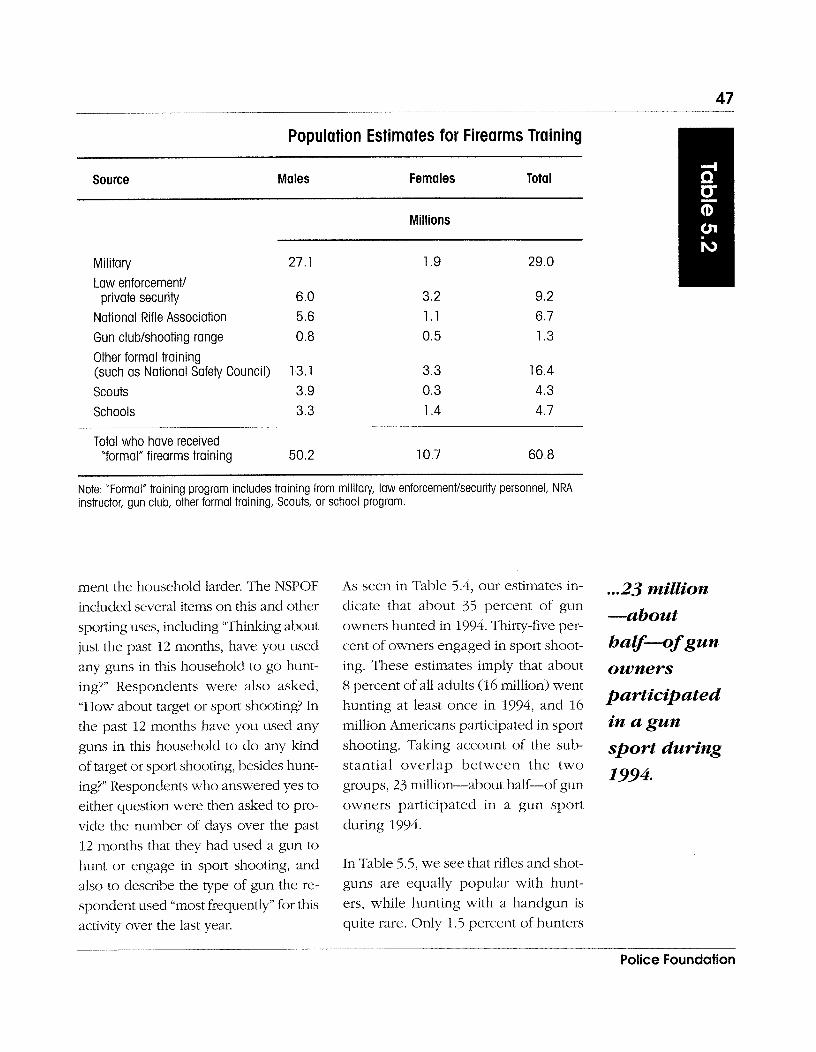
Population Estimates for Firearms Training
Source Males Females Total
Military Law enforcement1
private security
Millions
27.1 1.9 29.0
National Rifle Association 5.6
Gun clublshooting range 0.8 Other formal training (such as National Safety Council) 13.1
Scouts 3.9
Schools 3.3
Total who have received "formal" firearms training 50.2 10.7 60.8
Note: "Formal" training program includes training from military, law enforcement/security personnel, NRA instructor, gun club, other formal training, Scouts, or school program.
ment the household larder. The NSPOF
included several items on this and other sporting uses, including "Thinking about just the past 12 months, have you used any guns in this household to go hunt- ing?" Respondents were also asked, "How about target or sport shooting? In the past 12 months have you used any guns in this household to do any kind of target or sport shooting, besides hunt- ing?" Respondents who answered yes to either question were then asked to pro- vide the number of days over the past 12 months that they had used a gun to hunt or engage in sport shooting, and also to describe the type of gun the re- spondent used "most frequently" for this activity over the last year.
As seen in Table 5.4, our estimates in- dicate that about 35 percent of gun owners hunted in 1994. Thirty-five per- cent of owners engaged in sport shoot- ing. These estimates imply that about 8 percent of all adults (16 million) went hunting at least once in 1994, and 16 million Americans participated in sport shooting. Taking account of the sub- stantial overlap between the two groups, 23 million-about half-of gun owners participated in a gun sport during 1994.
In Table 5.5, we see that rifles and shot- guns are equally popular with hunt- ers, while hunting with a handgun is quite rare. Only 1.5 percent of hunters
. .. 23 million a b o u t half-f gun owners participated in a gun sport during
1994.
Police Foundation
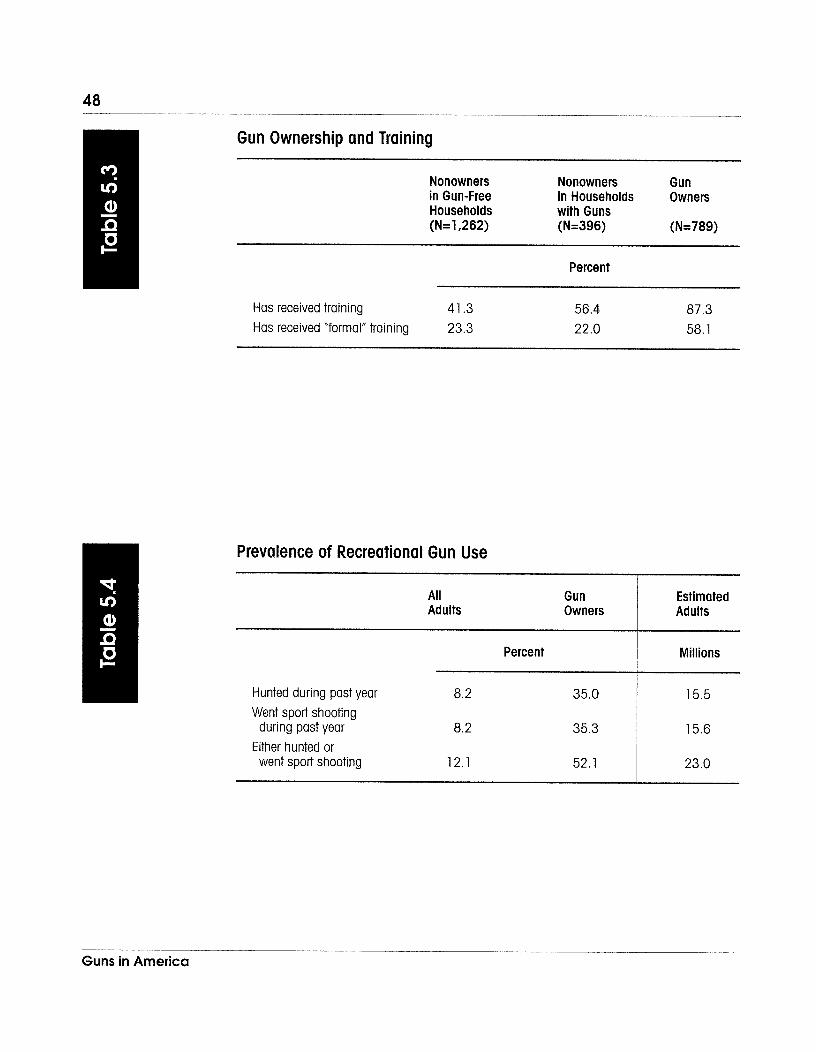
Gun Ownership and Training
Nonowners Nonowners Gun in Gun-Free in Households Owners Households with Guns (N= 1,262) (N=396) (N=789)
Percent
Has received training 41.3 56.4 87.3 Has received 'formal" training 23.3 22.0 58.1
Prevalence of Recreational Gun Use
All Gun Adults Owners
Estimated Adults
Percent Millions
Hunted during past year Went sport shooting
during past year Either hunted or went sport shooting
Guns in A m e r i c a
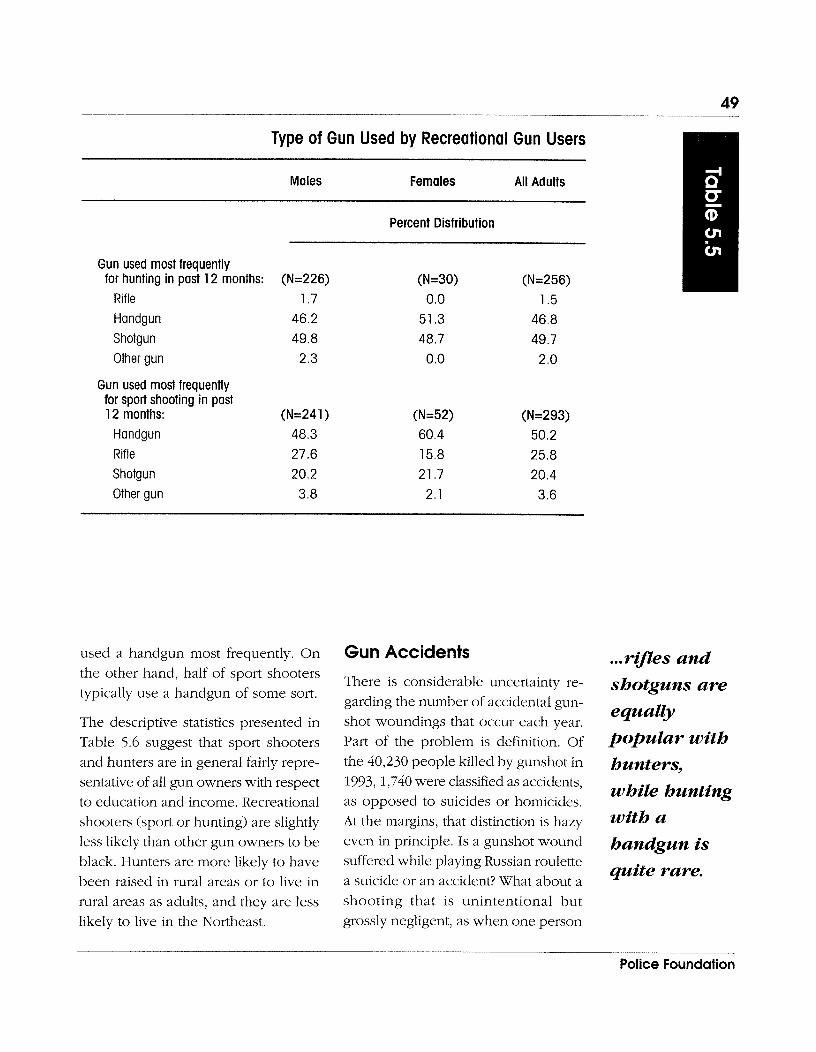
Type of Gun Used by Recreational Gun Users
Males Females All Adults
Percent Distribution
Gun used most frequently for hunting in past 12 months: (N=226) (N=30) (N=256)
Rifle 1.7 0.0 1.5 Handgun Shotgun
Other gun
Gun used most frequently for sport shooting in pasf 12 months:
Handgun Rifle
Shotgun Other gun
used a handgun most frequently. On the other hand, half of sport shooters typically use a handgun of some sort.
The descriptive statistics presented in Table 5.6 suggest that sport shooters and hunters are in general fairly repre- sentative of all gun owners with respect to education and income. Recreational shooters (sport or hunting) are slightly less likely than other gun owners to be black. Hunters are more likely to have been raised in rural areas or to live in rural areas as adults, and they are less likely to live in the Northeast.
Gun Accidents
There is considerable uncertainty re- garding the number of accidental gun- shot woundings that occur each year. Part of the problem is definition. Of the 40,230 people killed by gunshot in 1993, 1,740 were classified as accidents, as opposed to suicides or homicides. At the margins, that distinction is hazy even in principle. Is a gunshot wound suffered while playing Russian roulette a suicide or an accident? What about a shooting that is unintentional but grossly negligent, as when one person
... rijles and shotguns are equally popular with hunters, while bunting with a handgun is quite rare.
Police Foundation
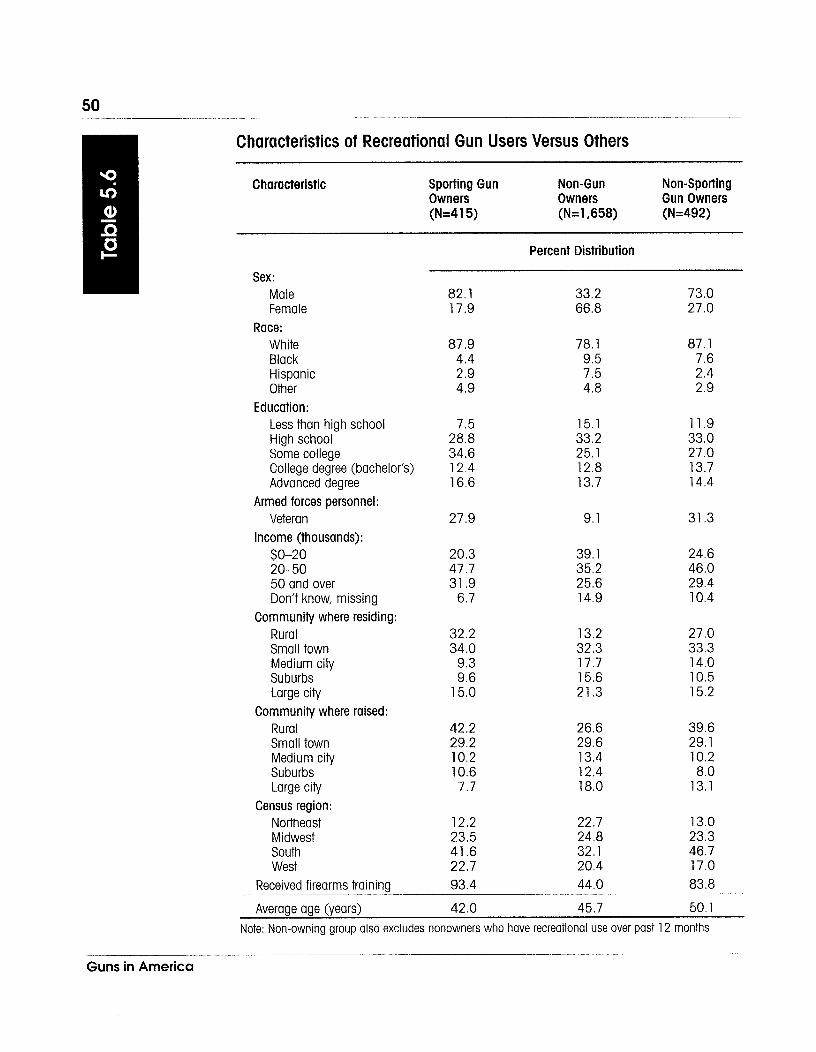
Characteristics of Recreational Gun Users Versus Others
Characteristic Sporting Gun Non-Gun Non-Sporting Owners Owners Gun Owners (N=4 1 5) (N=1,658) (N=492)
Sex: Male
- Percent Distribution
Female 17.9 Race:
White 87.9 Black 4.4 Hispanic 2.9 Other 4.9
Education: Less than high school 7.5 High school 28.8 Some college 34.6 College degree (bachelor's) 12.4 Advanced degree 16.6
Armed forces personnel: Veteran 27.9
Income (thousands): $0-20 20.3 20-50 47.7 50 and over 31.9 Don't know, missing 6.7
Community where residing: Rural 32.2 Small town 34.0 Medium city 9.3 Suburbs 9.6 Large city 15.0
Community where raised: Rural 42.2 Small town 29.2 Medium city 10.2 Suburbs 10.6 Large city 7.7
Census region: Northeast 12.2 Midwest 23.5 South 41.6 West 22.7
Received firearms training 93.4
Average age (years) 42.0 45.7 50.1 Note: Non-owning group also excludes nonowners who have recreational use over past 12 months
Guns in America
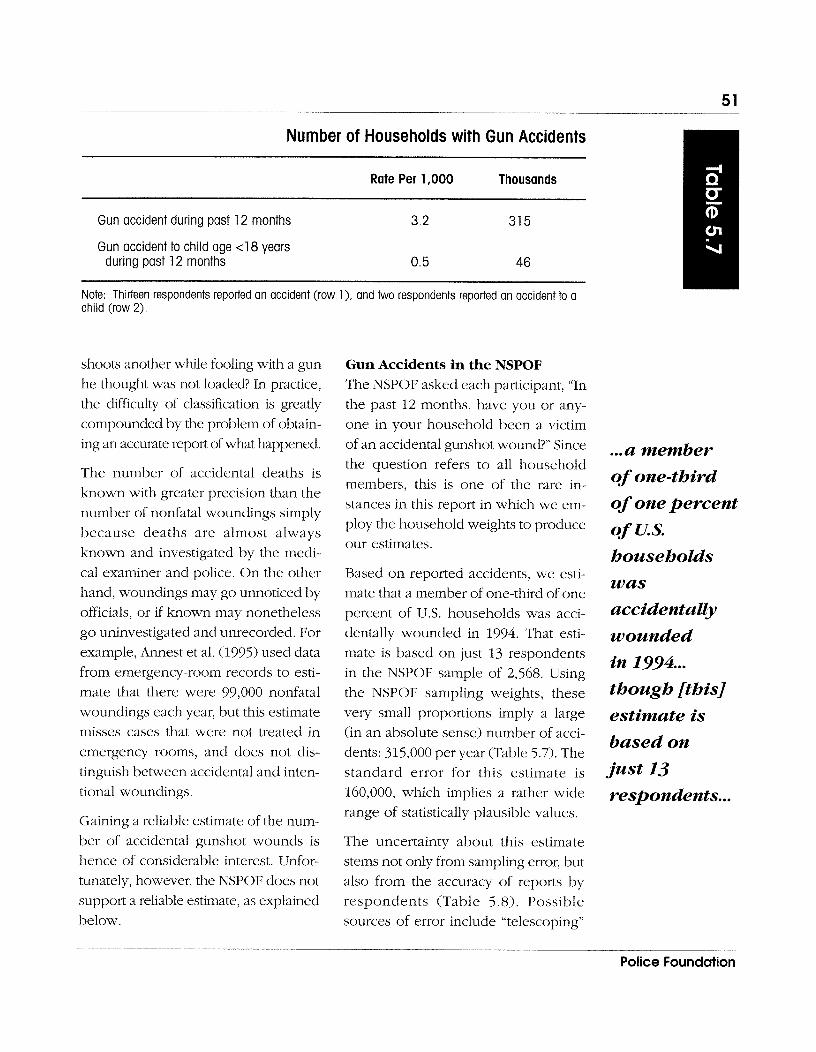
Number of Households with Gun Accidents
Rate Per 1,000 Thousands
Gun accident during past 12 months
Gun accident to child age <18 years during past 12 months
Note: Thirteen respondents reported an accident (row I ) , and two respondents reported an accident to a child (row 2).
shoots another while fooling with a gun Gun Accidents in the NSPOF he thought was not loaded? In practice, The NSPOF asked each participant, "In the difficulty of classification is greatly the past 12 months, have you or any- compounded by the problem of obtain- one in your household been a victim ing an accurate report of what happened.
The number of accidental deaths is known with greater precision than the number of nonfatal woundings simply because deaths are almost always known and investigated by the medi- cal examiner and police. On the other hand, woundings may go unnoticed by officials, or if known may nonetheless go uninvestigated and unrecorded. For example, Annest et al. (1995) used data from emergency-room records to esti- mate that there were 99,000 nonfatal woundings each year, but this estimate misses cases that were not treated in emergency rooms, and does not dis- tinguish between accidental and inten- tional woundings.
Gaining a reliable estimate of the num- ber of accidental gunshot wounds is hence of considerable interest. Unfor- tunately, however, the NSPOF does not support a reliable estimate, as explained below.
of an accidental gunshot wound?" Since the question refers to all household members, this is one of the rare in- stances in this report in which we em- ploy the household weights to produce our estimates.
Based on reported accidents, we esti- mate that a member of one-third of one percent of U.S. households was acci- dentally wounded in 1994. That esti- mate is based on just 13 respondents in the NSPOF sample of 2,568. Using the NSPOF sampling weights, these very small proportions imply a large (in an absolute sense) number of acci- dents: 315,000 per year (Table 5.7). The standard error for this estimate is 160,000, which implies a rather wide range of statistically plausible values.
The uncertainty about this estimate stems not only from sampling error, but also from the accuracy of reports by respondents (Table 5.8). Possible sources of error include "telescoping"
... a member
of one-third of one percent of us. households
was accidentally
wounded in 1974 ... though [this] estimate is based on
just 13 respondents ...
Police Foundation
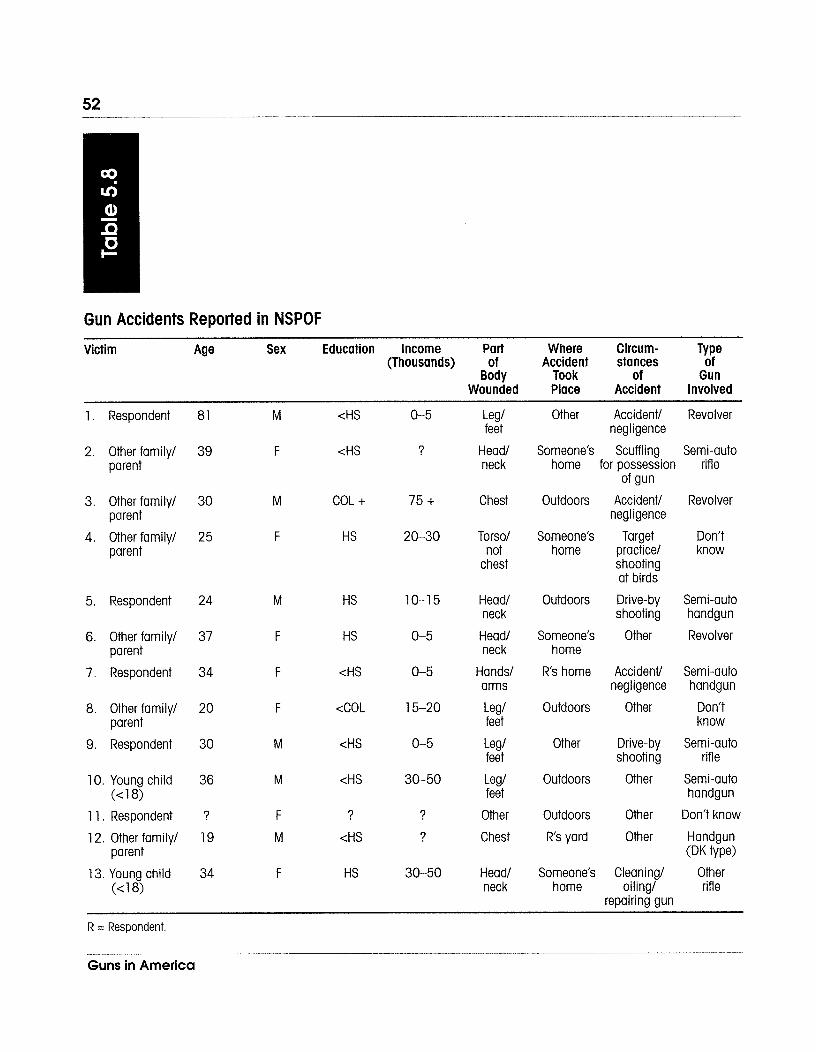
Gun Accidents Reported in NSPOF
Victim Age Sex Education Income Part Where Circum- TY pe (Thousands) of Accident stances of
Body Took of Gun Wounded Place Accident Involved
1. Respondent
2. Other family1 parent
3. Other family1 parent
4. Otherfamilyl parent
5. Respondent
6. Other family1 parent
7. Respondent
8. Other family/ parent
9. Respondent
10. Young child (< 1 8)
1 1. Respondent
1 2. Other family1 parent
13. Young child (< 1 8)
<HS
<HS
COL +
HS
HS
HS
<HS
<COL
<HS
<HS
?
<HS
HS
Leg1 feet
Head1 neck
Chest
Tors01 not
chest
Head1 neck
Head1 neck
Hands1 arms
Leg1 feet
Leg1 feet
Leg1 feet
Other
Chest
Head1 neck
Other Accident1 Revolver negligence
Someone's Scuff ling Semi-auto home for possession rifle
of gun
Outdoors Accidentl Revolver negligence
Someone's Target Don't home practice/ know
shooting at birds
Outdoors Drive-by Semi-auto shooting handgun
Someone's Other Revolver home
R's home Accidentl Semi-auto negligence handgun
Outdoors Other Don't know
Other Drive-by Semi-auto shooting rifle
Outdoors Other Semi-auto handgun
Outdoors Other Don't know
R's yard Other Handgun (DK type)
Someone's Cleaning/ Other home oiling1 rifle
repairing gun
R = Respondent.
Guns in America
(reporting an event that occurred more than a year ago), and failure to report an accident that did occur in the year- long window (perhaps due to the respondent's unwillingness to divulge an event in which he was implicated). Respondents may also misclassify as unintentional incidents that would be considered intentional by law enforce- ment authorities (for example, 2 of the 13 events were drive-by shootings). In general a survey of this sort is a prob- lematic device for measuring a rare event. We return to this matter in greater detail in the next chapter's discussion of defensive gun uses.
For what it is worth, we note that the 13 respondents who reported accidents do not represent a cross section of gun- owning households. Of these 13, 11 are either black or Hispanic, and most are of less-than-average income and education. With only one clear excep- tion, the accidents did not result from hunting or target shooting. Seven of the 10 guns that respondents could iden- tify by type were handguns. Most of the accidents did not occur in the respondent's home.
Gun Carrying Carrying a gun away from home, es- pecially in an urban area, is problem- atic because it places the public at risk if the carrier is reckless or criminal. For that reason, carrying a gun in a vehicle or especially on one's person is sub- jected to a variety of state and local regulations. In particular, carrying a concealed gun is generally prohibited
by state laws except in the case of law enforcement officers and (in many states) those who have obtained a spe- cial license. The effects (positive and negative) of legislation that increases the ability of citizens to carry concealed firearms are the topic of ongoing de- bate (McDowall, Loftin, and Wiersema 1995; Polsby 1995), but a number of states have enacted such legislation within the last few years.
Gun Carrying in the NSPOF The NSPOF data provide two separate opportunities to examine gun-carrying behavior among the adult population. First, as discussed earlier in the report, the NSPOF survey explores the char- acteristics, acquisition, and uses of one gun that is randomly selected from among each gun-owning respondent's stock. One of the questions asked of each respondent is "Where do you usu- ally keep this gun?" with two of the possible response categories given by "with you, on you" and "in car, truck." Thus, analysis of NPSOF data allows us to estimate the proportion of the gun stock (and separately of the hand- gun stock) that is "usually" carried, and to distinguish between guns that are carried directly on the owners from those that are stored in motor vehicles. Second, the NSPOF also contains a se- ries of questions directly concerning gun carrying for protection. Respon- dents are asked whether the gun car- rying was in connection with their work, how many days during the past year they carried a gun, whether they
Carrying a gun away from home, especially in an urban area, is problematic because it places the public at risk if the carrier is reckless or criminal.
Police Foundation
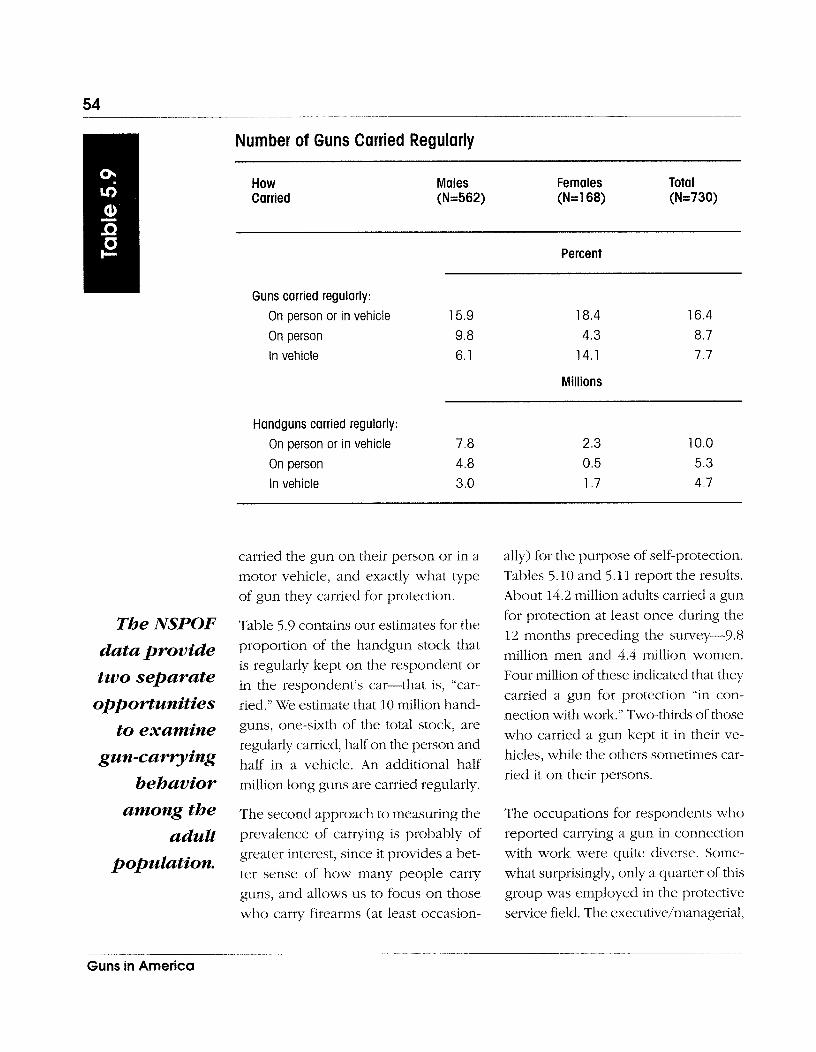
The NSPOF
data provide two separate opportunities
to examine gun-carrying
behavior
Number of Guns Carried Regularly
How Carried
Males Females Total (N=562) (N=168) (N=730)
Percent
Guns carried regularly: On person or in vehicle 15.9 18.4 16.4
On person 9.8 4.3 8.7
In vehicle 6.1 14.1 7.7
Millions
Handguns carried regularly: On person or in vehicle 7.8
On person 4.8 In vehicle 3.0
carried the gun on their person or in a ally) for the purpose of self-protection.
motor vehicle, and exactly what type Tables 5.10 and 5.1 1 report the results.
of gun they carried for protection. About 14.2 million adults carried a gun
Table 5.9 contains our estimates for the proportion of tlie handgun stock that is regularly kept on the respondent or in the respondent's car-that is, "car- ried." We estimate that 10 million hand- guns, one-sixth of the total stock, are regularly carried, lialf on the person and half in a vehicle. An additional half million long guns are carried regularly.
for protection at least once during the 12 months preceding the survey-9.8 million men and 4.4 million women. Four million of these indicated that they carried a gun for protection "in con- nection with work." Two-thirds of those who carried a gun kept it in their ve- hicles, while the others sometimes car- ried it on their persons.
among the The second approach to measuring the The occupations for respondents who
adult prevalence of carrying is probably of reported carrying a gun in connection
greater interest, since it provides a bet- with work were quite diverse. Some- population.
ter sense of how many people carry what surprisingly, only a quarter of this
guns, and allows us to focus on those group was employed in the protective
who carry firearms (at least occasion- service field. The executive/manageriaI,
Guns in America
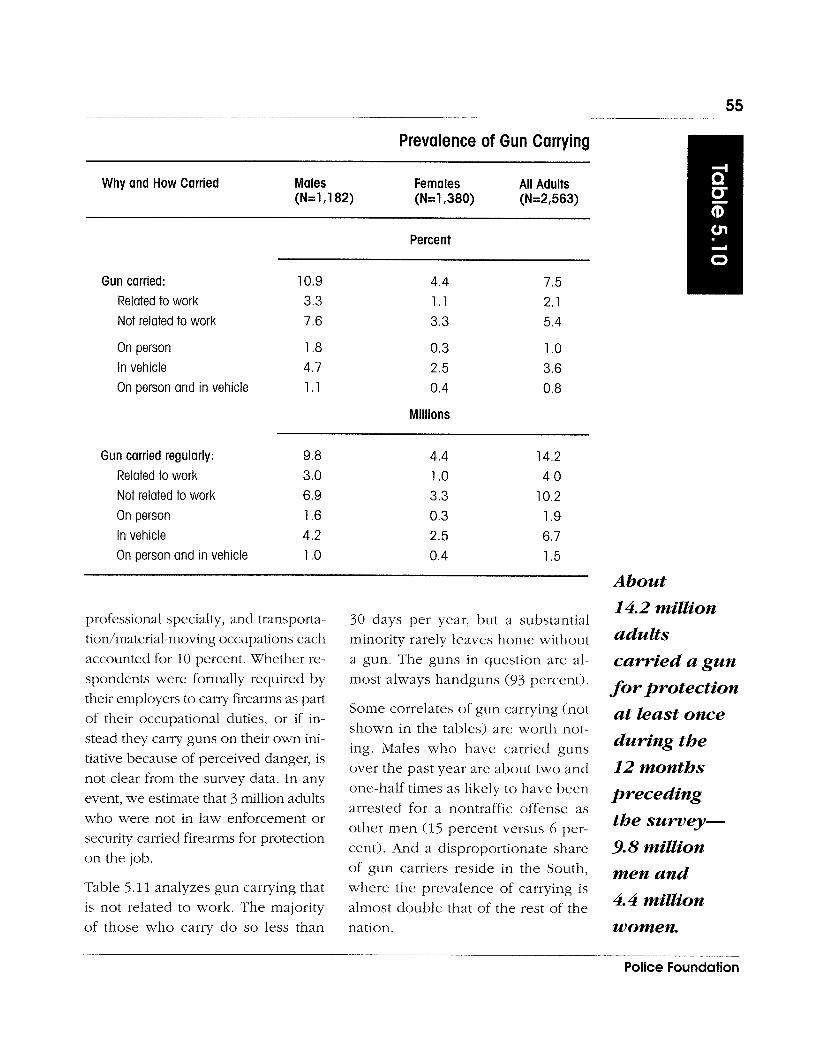
Prevalence of Gun Carrying
Why and How Carried Males Females All Adults (N=1 , I 82) (N=1,380) (N=2,563)
Percent
Gun carried: 10.9 Related to work 3.3 Not related to work 7.6
On person 1.8 In vehicle 4.7 On person and in vehicle 1.1
Millions
Gun carried regularly: 9.8
Related to work 3 .0 Not related to work 6.9 On person 1.6 In vehicle 4.2 On person and in vehicle 1 .O
professional specialty, and transposta- 30 days per year, but a substantial tiodmaterial-moving occupations each minority rarely leaves home without accounted for 10 percent. Whether re- a gun. The guns in question are al- spondents were formally required by most always handguns (93 percent). their employers to carry firearms as past of their occupational duties, or if in- stead they carry guns on their own ini- tiative because of perceived danger, is not clear from the survey data. In any event, we estimate that 3 million adults who were not in law enforcement or security carried firearms for protection on the job.
Table 5.11 analyzes gun carrying that is not related to work. The majority of those who carry do so less than
Some correlates of gun carrying (not shown in the tables) are worth not- ing. Males who have carried guns over the past year are about two and one-half times as likely to have been arrested for a nontraffic offense as other men (15 percent versus 6 per- cent). And a disproportionate share of gun carriers reside in the South, where the prevalence of carrying is almost double that of the rest of the nation.
About 14.2 million
adults
carried a gun for protection
at least once during the
12 months preceding
the survey- 9.8 million men and
4.4 million women.
Pol ice Foundat ion
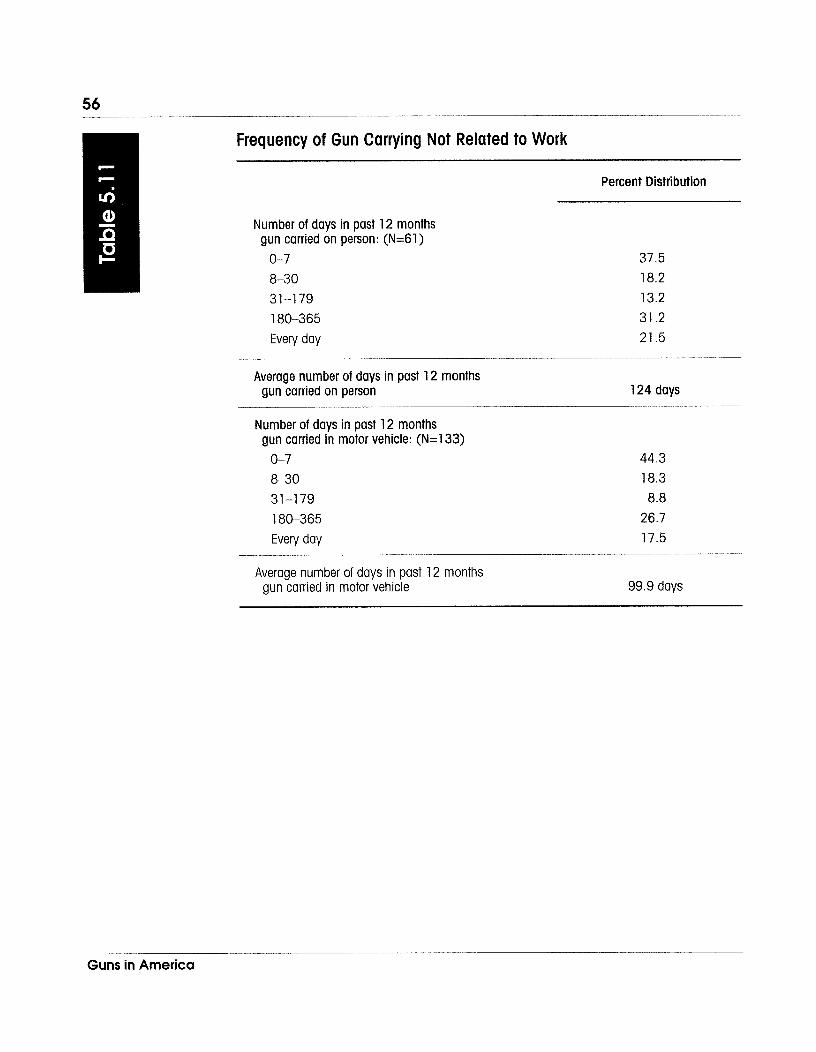
Frequency of Gun Carrying Not Related to Work
Percent Distribution
Number of days in past 12 months gun carried on person: (N=61)
0-7 8-30 31-179
1 80-365 Every day
Average number of days in past 12 months gun carried on person 124 days
Number of days in past 12 months gun carried in motor vehicle: (N=133)
0-7 8-30 31-1 79
180-365
Every day
Average number of days in past 12 months gun carried in motor vehicle 99.9 days
Guns in America
Introduction
The annual number of defensive gun uses (DGUs) is frequently invoked as a measure of the benefits of private gun ownership. It is typically compared to the costs as measured by the number of violent crimes committed with a fire- arm each year. The National Crime Vic- timization Survey (NCVS) provides a relatively uncontroversial estimate of the number of gun crimes-1.3 million in 1994 (BJS 1996). The NCVS also pro- vides estimates of the number of DGUs, recently averaging about 65,000 per year (McDowall and Wiersema 1994). But other surveys provide a basis for far-higher estimates (Kleck 1988). The most recent and noteworthy estimate of the number of DGUs is 2.5 million per year, based on data from a nation- ally representative telephone survey
conducted explicitly for this purpose (Kleck and Gertz 1995). The 2.5 mil- lion figure has been picked up by the press and now appears regularly in newspaper articles, letters to the edi- tor, and editorials, and even in Con- gressional Research Service briefs for public policymakers.
The NSPOF survey is quite similar to that conducted by Kleck and Gertz (1995), and provides a basis for repli- cating their estimate. The NSPOF data indicate that in 1994 at least 1.5 mil- lion adults used a gun defensively against another person, a figure that is much closer to Kleck and Gertz's 2.5 million figure than to the NCVS-based estimates. Further, many of the NSPOF respondents who indicated a DGU in the preceding year said that they had also used their gun defensively on one
The NSPOF
data indicate that in 1994
at least 1.5
million adults used a gun de fensiuely against
another person ...
Most commentators have assumed
that. .. [defensive
gun uses] are actions that
would be endorsed by an impartial
observer who knew all the
facts.
or more other occasions. Taking ac- count of these multiple reporters, the NSPOF data suggest that from 4 to 23 million DGUs occurred in 1994 (de- pending on which definition of a DGU is used).
Our discussion of these results focuses on two issues. The first is whether they are credible. Respondents who re- ported a DGU were asked a number of questions about the circumstances and results of their action. That infor- mation provides the basis for estirnat- ing a number of statistics for which the true values are known with some de- gree of accuracy. For example, the NSPOF data imply that there were over 100,000 criminals shot by their victims in 1994. That figure can be compared with estimates from other sources about the number of people treated annually for gunshot wo~ tnds in the United States. This and other such compari- sons, as well as puzzling inconsisten- cies in several DGU reports, suggest that the NSPOF data on DGUs is grossly in error.
The second issue we explore is the value of these estimates for the ongo- ing debate over the public value of private gun ownership. Most comtnen- tators have assumed that the DGUs reported by survey respondents are actions that would be endorsed by an impartial observer who knew all the facts. Yet the sketchy and unverified accounts available from surveys leave considerable uncertainty about what actually happened, whether the respon-
dent was the victim or the perpetrator, and whether the respondent's actions were otherwise legal, reasonable, and in the public interest.
We begin by reviewing the previous literature on defensive gun uses in the U.S. The third section presents esti- mates of DGU incidents based on data from the NSPOF, following the meth- ods used in earlier analyses based on surveys of this sort. The fourth section provides a discussion of the results.
How Many Defensive Gun Uses? Previous Findings Previous estimates of the number of DGUs come from surveys of nation- ally representative samples. Here we review the results from the National Crime Victimization Survey (NCVS), and then from several telephone sur- veys conducted by private polling firms.
NCVS-Based Estirnates The NCVS is conducted by the Census Bureau for the U.S. Bureau of Justice Statistics, and involves in-person inter- views with every person age 12 and above in a nationally representative sample of 56,000 households. Each household is interviewed once every six months, and households are re- tained in the sample for seven inter- views over the course of three years. The NCVS asks respondents who have been the victim of a crime in the pre- ceding six months whether they "did or tried to do [anything] about the in-
Guns in America
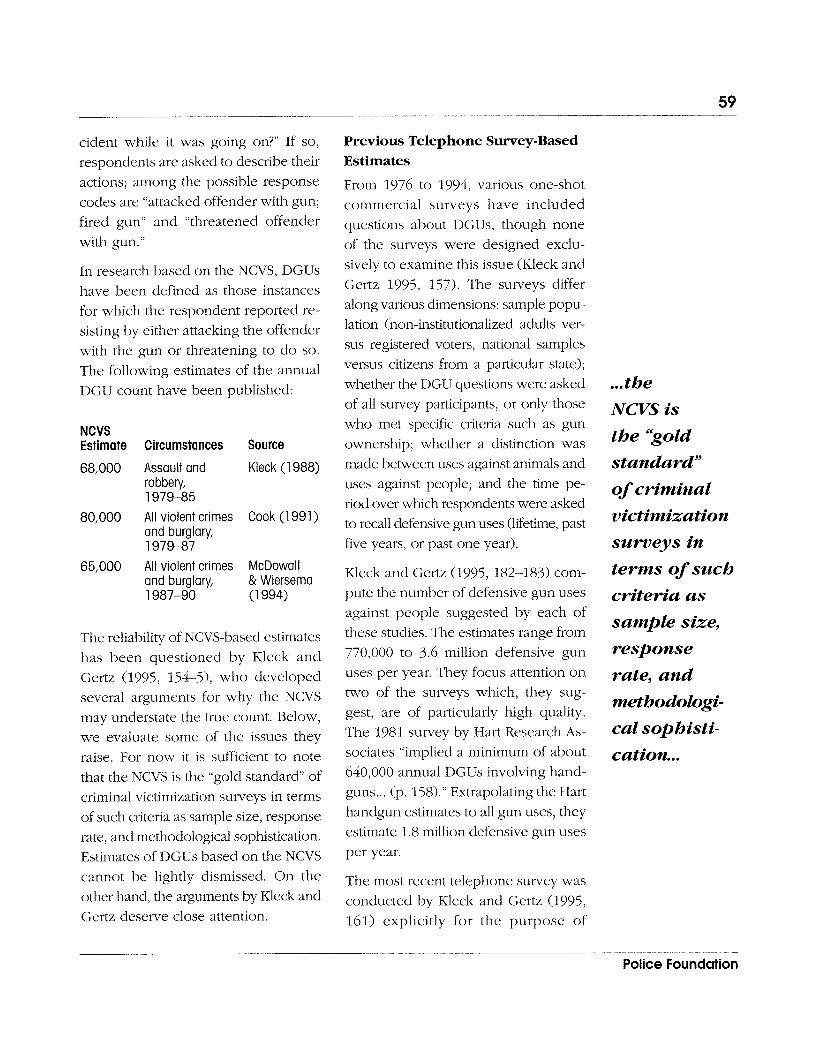
cident while it was going on?" If so, respondents are asked to describe their actions; among the possible response codes are "attacked offender with gun; fired gun" and "threatened offender with gun."
In research based on the NCVS, DGUs have been defined as those instances for which the respondent reported re- sisting by either attacking the offender with the gun or threatening to do so. The following estimates of the annual DGU count have been published:
NCVS Estimate Circumstances Source
68,000 Assault and Kleck (1 988) robbery, 1979-85
80,000 All violent crimes Cook (1 991) and burglary, 1 979-87
65,000 All violent crimes McDowall and burglary, & Wiersema 1987-90 (1 994)
The reliability of NCVS-based estimates has been questioned by Kleck and Gertz (1995, 154-5), who developed several arguments for why the NCVS may understate the true count. Below, we evaluate some of the issues they raise. For now it is sufficient to note that the NCVS is the "gold standard" of criminal victimization surveys in terms of such criteria as sample size, response rate, and methodological sophistication. Estimates of DGUs based on the NCVS cannot be lightly dismissed. On the other hand, the arguments by Kleck and Gertz deserve close attention.
Previous Telephone Survey-Based Estimates
From 1976 to 1994, various one-shot commercial surveys have included questions about DGUs, though none of the surveys were designed exclu- sively to examine this issue (Kleck and Gertz 1995, 157). The surveys differ along various dimensions: sample popu- lation (non-institutionalized adults ver- sus registered voters, national samples versus citizens from a particular state); whether the DGU questions were asked of all survey participants, or only those who met specific criteria such as gun ownership; whether a distinction was made between uses against animals and uses against people; and the time pe- riod over which respondents were asked to recall defensive gun uses (lifetime, past five years, or past one year).
Kleck and Gertz (1995, 182-183) com- pute the number of defensive gun uses against people suggested by each of these studies. The estimates range from 770,000 to 3.6 million defensive gun uses per year. They focus attention on two of the surveys which, they sug- gest, are of particularly high quality. The 1981 survey by Hart Research As- sociates "implied a minimum of about 640,000 annual DGUs involving hand- guns. .. (p. 158)." Extrapolating the Hart handgun estimates to all gun uses, they estimate 1.8 million defensive gun uses per year.
The most recent telephone survey was conducted by Kleck and Gertz (1995, 161) explicitly for the purpose of
... the
NCVS is the 'kold standard" of crinzinal victimization
surveys in terms of such criteria as
sample size, response
rate, and methodologi- cal sophisti-
cation. ..
Police Foundation
... a series of one-shot
commercial telephone
surveys o$.. [defensive gun
uses] have produced
estimates that are one or
two orders of magnitude
larger than those
produced using ...
National Crime
Victimization Survey data.
estimating the annual incidence of de- fensive gun uses. Kleck and Gertz oversampled males in the South and West regions in order to produce an acceptably large number of DGUs, and weighted the data to generate nation- ally representative population estimates (161). A total of 4,977 households were contacted in the Kleck and Gertz sur- vey, of which 1,832 cases completed the full questionnaire-all respondents reporting a DGU plus a randomly se- lected third of respondents who did not report a DGU. An additional 3,145 were terminated by Kleck and Gertz's inter- viewers once it was determined that they had not participated in a DGU.
Kleck and Gertz's DGU question reads as follows (p. 161): "Within the past five years, have you yourself or another member of your household used a gun, even if it was not fired, for self-protec- tion or for the protection of property at home, work, or elsewhere? Please do not include military service, police work, or work as a security guard" [em- phasis in original]. Respondents an- swering in the affirmative were then asked whether the DGU was used to protect against an animal or person, and also to provide the number of DGUs in which the respondent was involved over the past five years.
From the sample of almost 5,000 adults, 244 respondents indicated some kind of defensive gun use over the past five years. Of this group, 22 (9 percent) indicated the most recent defensive gun use was against an animal.
The DGU estimates were standardized to show the estimated number of DGUs against humans that did not involve actions by police, military, or protec- tive service personnel acting in the line of duty. Kleck and Gertz (1995,162-63) applied additional, more stringent, cri- teria in producing their own estimates for the annual number of "genuine" DGUs, as follows:
(1) The defensive use "involved actual contact with a person, rather than merely investigating suspicious cir- cumstances";
(2) "The defender could state a spe- cific crime which he thought was being committed at the time of the incident";
(3) The respondent "used" the gun ("at a minimum it had to be used as part of a threat against a person, either by verbally referring to the gun ... or by pointing it at an ad- versary").
Incidents that met all these criteria were used to calculate what they termed A-
type estimates for one- and five-year prevalence. Kleck and Gertz also pro- duced more conservative B estimates that apply the additional restriction:
(4) The respondent was not employed by the police, military, or protec- tive service industry (regardless of whether the most recent DGU oc- curred at work), and the record from the interview was complete in all relevant respects.
Guns in America
Kleck and Gertz's A-type estimate for the number of adults involved in a DGU during the previous year is the well-known 2.5 million. Their B-type estimate is 2.2 million.
In sum, a series of one-shot commercial telephone surveys of DGUs have pro- duced estimates that are one or two or- ders of magnitude larger than those pro- duced using the NCVS data. In the next section, we use the NSPOF to develop estimates for the number of defensive gun uses and users as a first step in at- tempting to resolve this discrepancy.
How Many Defensive Gun Uses? NSPOF-Based Estimates
DGU Questions in the NSPOF Each of the 2,568 respondents in the NSPOF were asked the question: "Within the past 12 months, have you yourself used a gun, even if it was not fired, to protect yourself or someone else, or for the protection of property at home, work, or elsewhere?" Answers in the affirmative were followed with "How many different times did you use a gun, even if it was not fired, to pro- tect yourself or property in the past 12
months?" [emphasis in original]. Nega- tive answers to the first DGU question were followed by "Have you ever used a gun to defend yourself or someone else?" Respondents who answered yes to either of these DGU questions were then asked a sequence of 30 additional questions concerning the most recent DGU in which the respondent was
involved, including the respondent's ac- tions with the gun, the location and other circumstances of the incident, and the respondent's relationship to the perpetrator.
The Chilton interviewers were also asked to provide their own assessment of whether the respondent was invent- ing the most recent DGU incident.
NSPOF Estimates Given that the NSPOF is quite similar to the survey reported in Kleck and Gertz with respect to the instrument, sampling procedure, and interviewing method, we would expect similar re- sults on the number of defensive gun users each year. As it turns out, we find that NSPOF-based estimates of the number of defensive gun users (DGUers) are lower but compatible (in a statistical sense) to those produced by Kleck and Gertz. The NSPOF has an advantage over the Kleck and Gertz survey in that it includes an item on the number of DGUs during the pre- ceding year by those respondents who had at least one; thus we are able to estimate the number of defensive gun uses, which is several times as large as the number of users.
Table 6.1 contains results from the NSPOF on the number of defensive gun users each year. We exclude from our calculations those respondents whom the Chilton interviewers suspected of fabricating the most recent DGU inci- dent. As shown in the table, 54 respon- dents reported a defensive gun use during the past 12 months, which
The NSPOP. .. includes ... the number of ...[d efensiue gun uses] during the preceding year by those respondents who had at least one...
Police Foundation
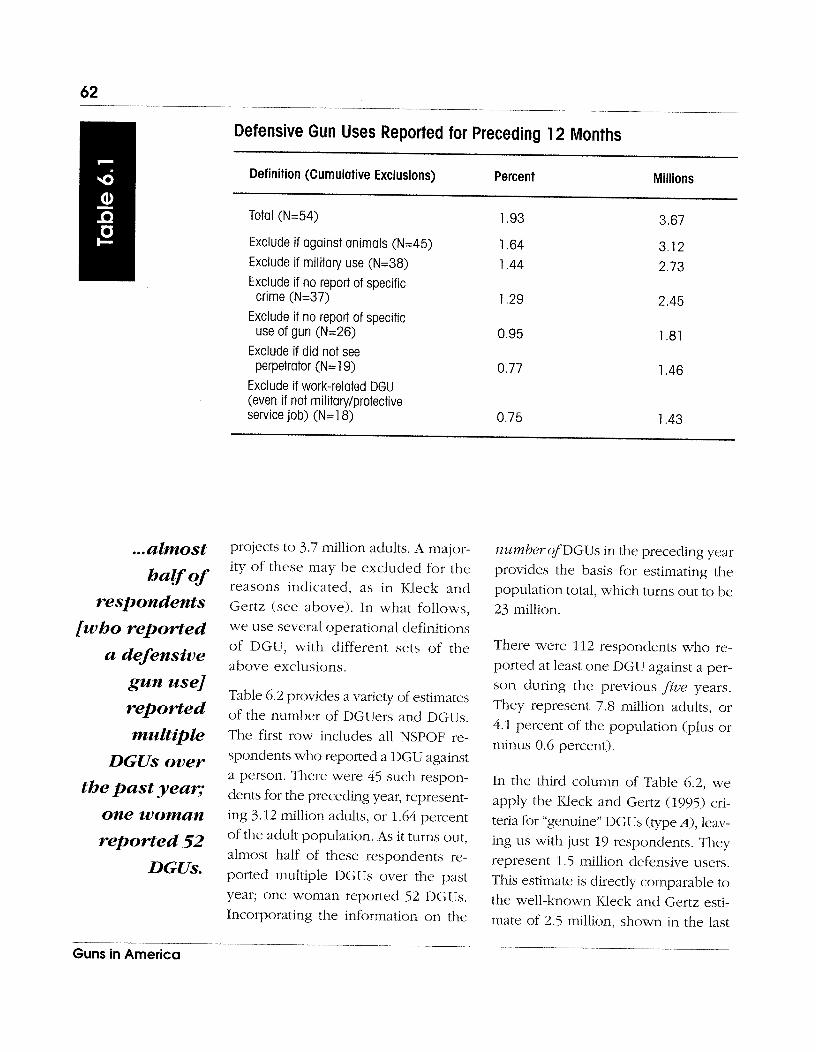
Defensive Gun Uses Reported for Preceding 12 Months
Definition (Cumulative Exclusions) Percent Millions
Total (N=54) 1.93
Exclude if against animals (N=45) 1.64 Exclude if military use (N=38) 1.44
Exclude if no report of specific crime (N=37) 1.29
Exclude if no report of specific use of gun (N=26)
Exclude if did not see perpetrator (N=19) 0.77
Exclude if work-related DGU (even if not militarylprotective service job) (N=l8) 0.75
... almost halfof
respondents [who reported
a defensive gun use] reported multiple
DGUs over the past year;
one woman reported 52
DGUs.
projects to 3.7 million adults. A major- ity of these may be excluded for the reasons indicated, as in Kleck and Gertz (see above). In what follows, we use several operational definitions of DGU, with different sets of the above exclusions.
Table 6.2 provides a variety of estimates of the number of DGUers and DGUs. The first row includes all NSPOF re- spondents who reported a DGU against a person. There were 45 such respon- dents for the preceding year, represent- ing 3.12 million adults, or 1.64 percent of the adult population. As it turns out, almost half of these respondents re- ported multiple DGUs over the past year; one woman reported 52 DGUs. Incorporating the information on the
number of DGUs in the preceding year provides the basis for estimating the population total, which turns out to be 23 million.
There were 112 respondents who re- ported at least one DGU against a per- son during the previous five years. They represent 7.8 million adults, or 4.1 percent of the population (plus or minus 0.6 percent).
In the third column of Table 6.2, we apply the Kleck and Gertz (1995) cri- teria for "genuine" DGUs (type A), leav- ing us with just 19 respondents. They represent 1.5 million defensive users. This estimate is directly comparable to the well-known Kleck and Gertz esti- mate of 2.5 million, shown in the last
Guns in America
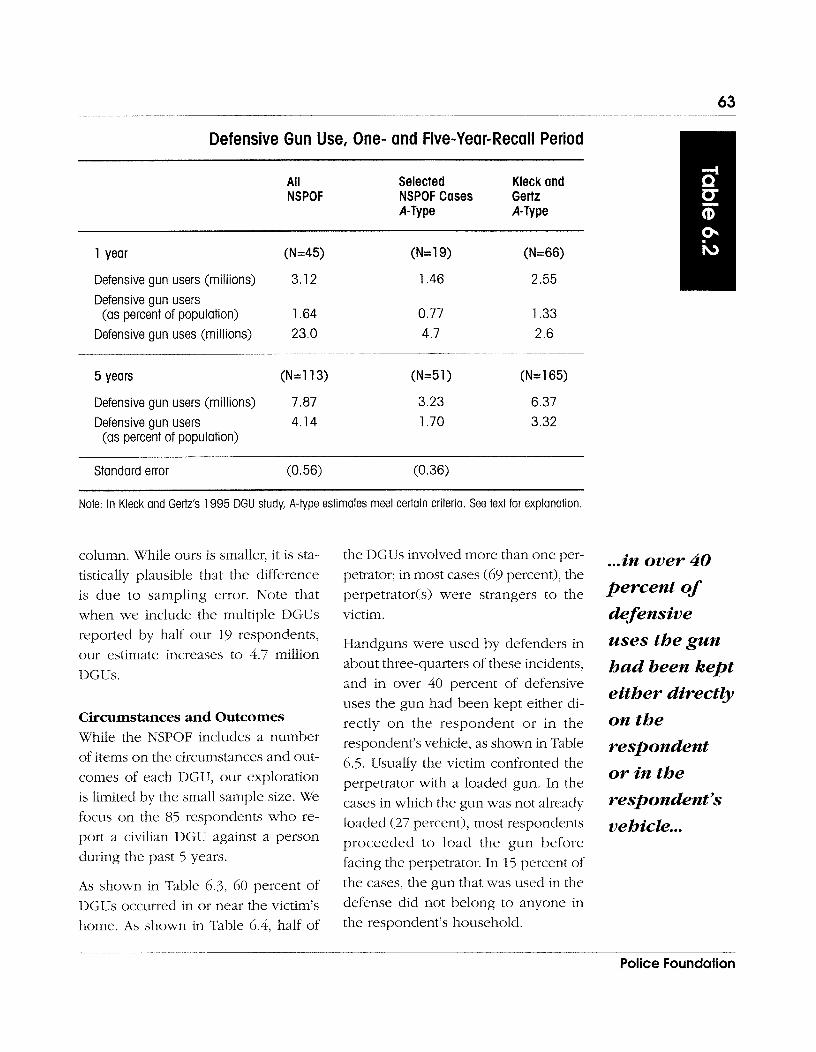
Defensive Gun Use, One- and Five-Year-Recall Period
All Selected Kleck and NSPOF NSPOF Cases Gertz
A-Type A-Type
1 year (N=45) (N=19) (N=66)
Defensive gun users (millions) 3.12 1.46 2.55
Defensive gun users (as percent of population) 1.64 0.77 1.33
Defensive gun uses (millions) 23.0 4.7 2.6
5 years (N=113) (N=5 1 ) (N= 1 65)
Defensive gun users (millions) 7.87 3.23 6.37
Defensive gun users 4.14 1.70 3.32 (as percent of population)
Standard error (0.56) (0.36)
Note: In Kleck and Gertz's 1995 DGU study, A-type estimates meet certain criteria. See text for explanation
column. While ours is smaller, it is sta- the DGUs involved more than one per- ,,.in over 40 tistically plausible that the difference petrator; in most cases (69 percent), the is due to sampling error. Note that perpetrator(s) were strangers to the percent of when we include the multiple DGUs victim. defensive reported by half our 19 respondents, our estimate increases to 4.7 million DGUs.
Circumstances and Outcomes While the NSPOF includes a number of items on the circumstances and out- comes of each DGU, our exploration is limited by the small sample size. We focus on the 85 respondents who re- port a civilian DGU against a person during the past 5 years.
As shown in Table 6.3, 60 percent of DGUs occurred in or near the victim's home. As shown in Table 6.4, half of
Handguns were used by defenders in about three-quarters of these incidents, and in over 40 percent of defensive uses the gun had been kept either di- rectly on the respondent or in the respondent's vehicle, as shown in Table 6.5. Usually the victim confronted the perpetrator with a loaded gun. In the cases in which the gun was not already loaded (27 percent), most respondents proceeded to load the gun before facing the perpetrator. In 15 percent of the cases, the gun that was used in the defense did not belong to anyone in the respondent's household.
uses the gun had been kept either directly on the respondent or in the respondent's vehicle. ..
Police Foundation
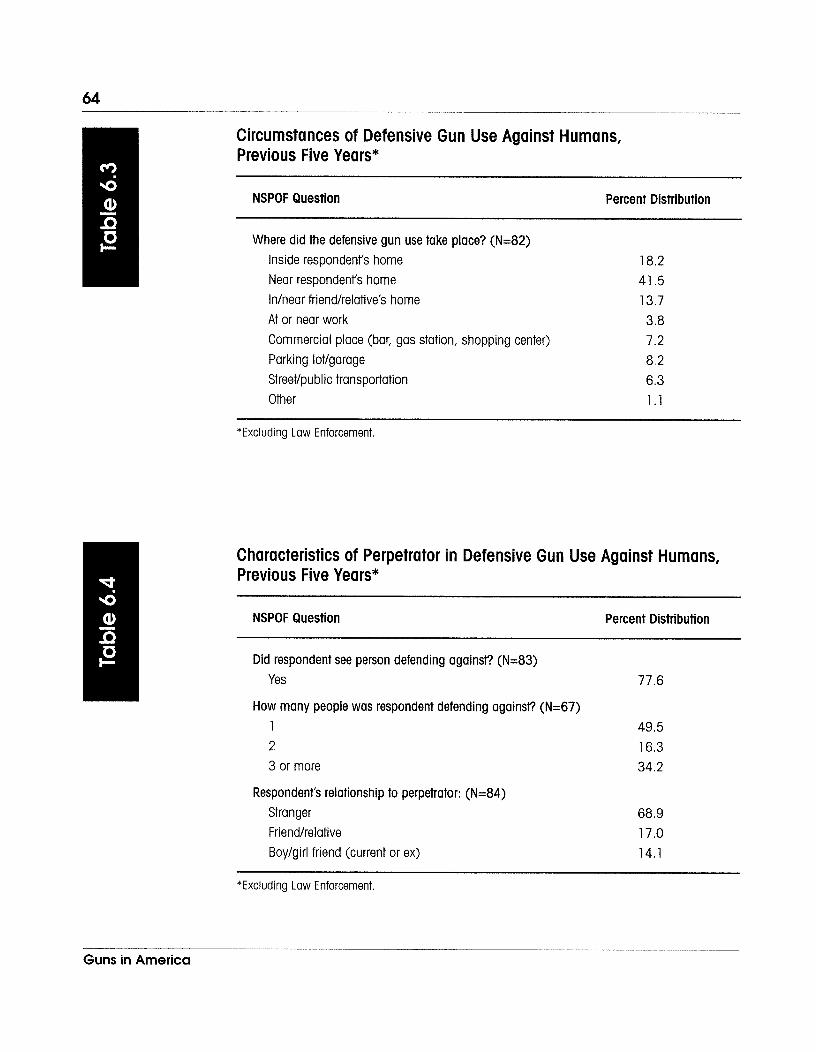
Circumstances of Defensive Gun Use Against Humans, Previous Five Years*
NSPOF Question Percent Distribution
Where did the defensive gun use take place? (N=82) Inside respondent's home Near respondent's home Inlnear friendlrelative's home 13.7 At or near work 3.8 Commercial place (bar, gas station, shopping center) 7.2
Parking lotlgarage 8.2 Streetlpublic transportation 6.3
Other 1.1
*Excluding Law Enforcement
Characteristics of Perpetrator in Defensive Gun Use Against Humans, Previous Five Years*
NSPOF Question Percent Distribution
Did respondent see person defending against? (N=83)
Yes 77.6
How many people was respondent defending against? (N=67) 1 49.5 2 16.3 3 or more 34.2
Respondent's relationship to perpetrator: (N=84) Stranger Friendlrelative Boylgirl friend (current or ex)
*Excluding Law Enforcement.
G u n s in A m e r i c a
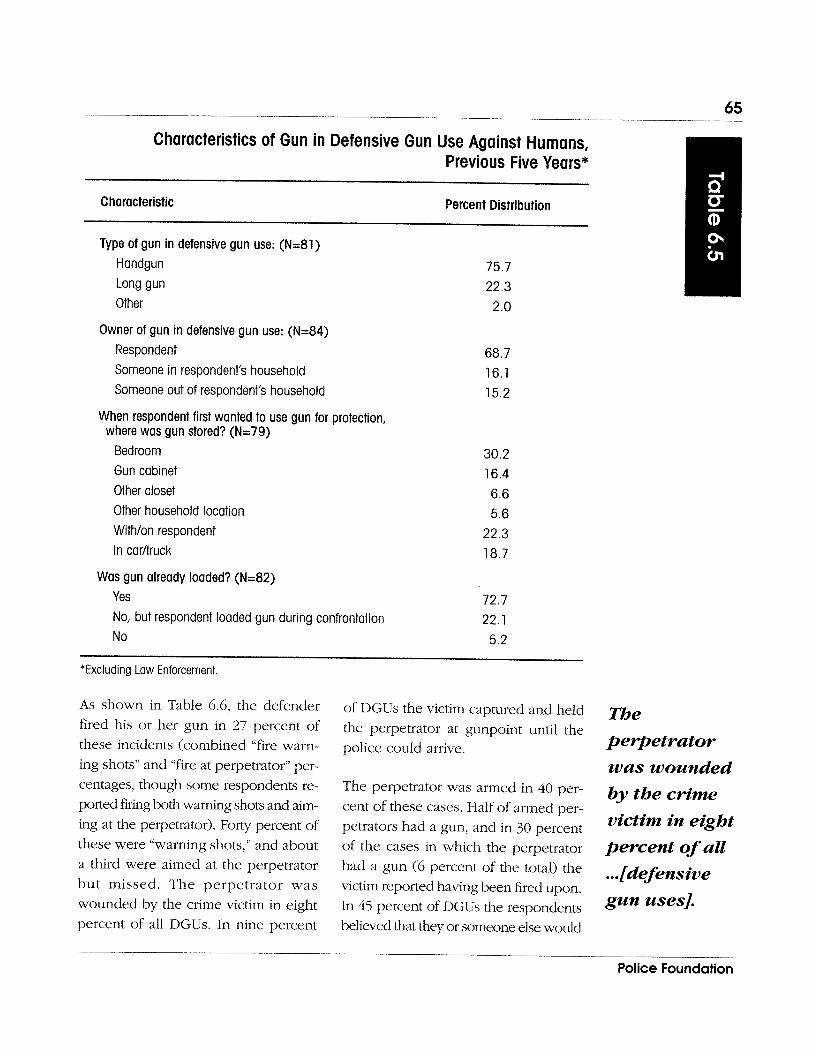
Characteristics of Gun in Defensive Gun Use Against Humans, Previous Five Years*
Characteristic Percent Distribution
Type of gun in defensive gun use: (N=81) Handgun Long gun Other
Owner of gun in defensive gun use: (N=84) Respondent Someone in respondenrs household Someone out of respondent's household
When respondent first wanted to use gun for protection, where was gun stored? (N=79)
Bedroom Gun cabinet Other closet Other household location Withlon respondent In carltruck
Was gun already loaded? (N=82) Yes No, but respondent loaded gun during confrontation No
*Excluding Law Enforcement.
As shown in Table 6.6, the defender fired his or her gun in 27 percent of these incidents (combined "fire warn- ing shots" and "fire at perpetrator" per- centages, though some respondents re- ported firing both warning shots and airn- ing at the perpetrator). Forty percent of these were "warning shots," and about a third were aimed at the perpetrator but missed. The perpetrator was wounded by the crime victim in eight percent of all DGUs. In nine percent
of DGUs the victim captured and held the perpetrator at gunpoint until the police could arrive.
The perpetrator was armed in 40 per- cent of these cases. Half of armed per- petrators had a gun, and in 30 percent of the cases in which the perpetrator had a gun (6 percent of the total) the victim reported having been fired upon. In 45 percent of DGUs the respondents believed that they or someone else would
The perpetrator was wounded by the crime victim in eight
percent of all ...[d efensiue gun uses].
Pol ice Foundat ion
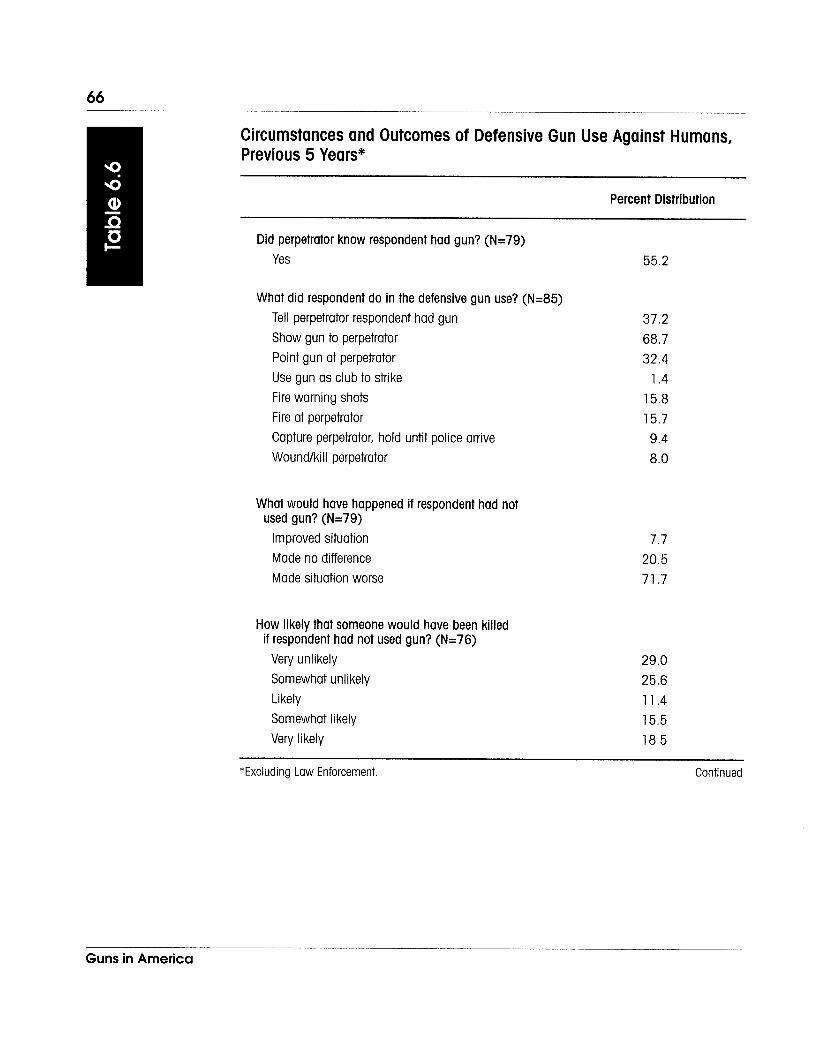
Circumstances and Outcomes of Defensive Gun Use Against Humans, Previous 5 Years*
Percent Distribution
Did perpetrator know respondent had gun? (N=79) Yes
What did respondent do in the defensive gun use? (N=85) Tell perpetrator respondent had gun Show gun to perpetrator Point gun at perpetrator Use gun as club to strike Fire warning shots Fire at perpetrator Capture perpetrator, hold until police arrive Woundlkill perpetrator
What would have happened if respondent had no1 used gun? (N=79)
Improved situation Made no difference Made situation worse
How likely that someone would have been killed if respondent had not used gun? (N=76)
Very unlikely Somewhat unlikely Likely Somewhat likely Very likely
*Excluding Law Enforcement, Continued
Guns in America
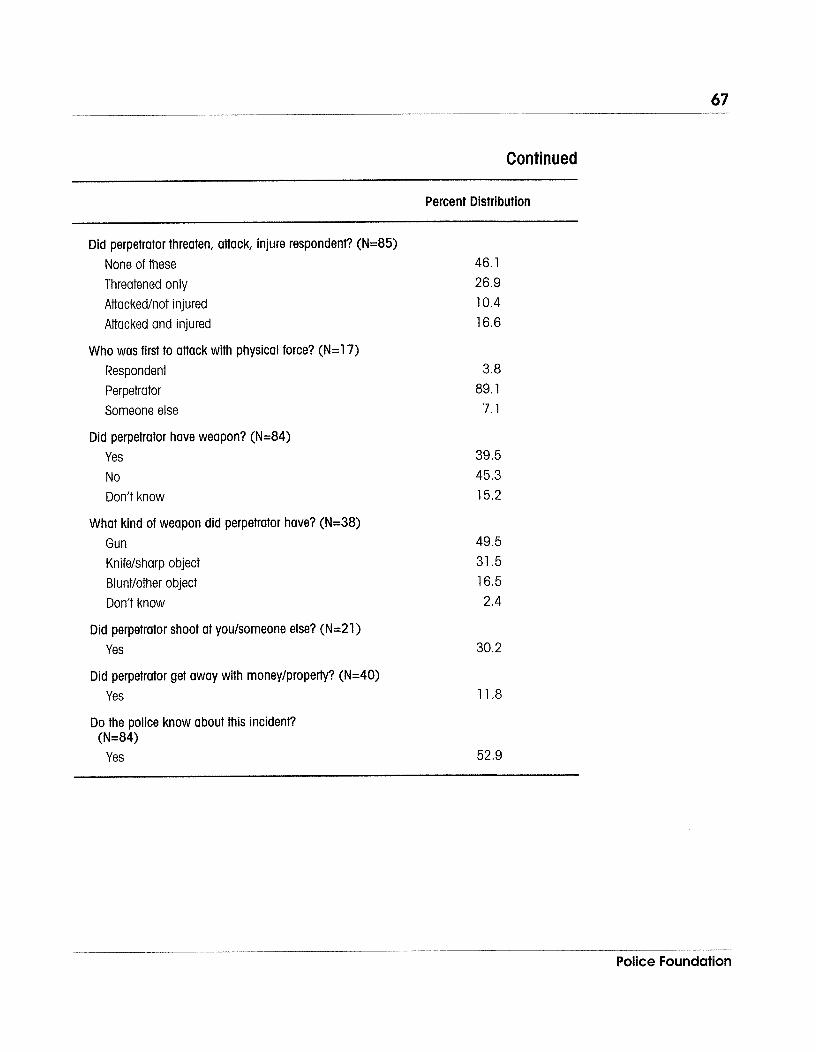
Continued
Percent Distribution
Did perpetrator threaten, attack, injure respondent? (N=85) None of these
Threatened only Attackedlnot injured Attacked and injured
Who was first to attack with physical force? (N=17) Respondent
Perpetrator Someone else
Did perpetrator have weapon? (N=84) Yes No Don't know
What kind of weapon did perpetrator have? (N=38) Gun Knifelsharp object
Bluntlother object Don't know
Did perpetrator shoot at you/someone else? (N=21) Yes
Did perpetrator get away with moneylproperty? (N=40) Yes
Do the police know about this incident? (N=84)
Yes
Police Foundation
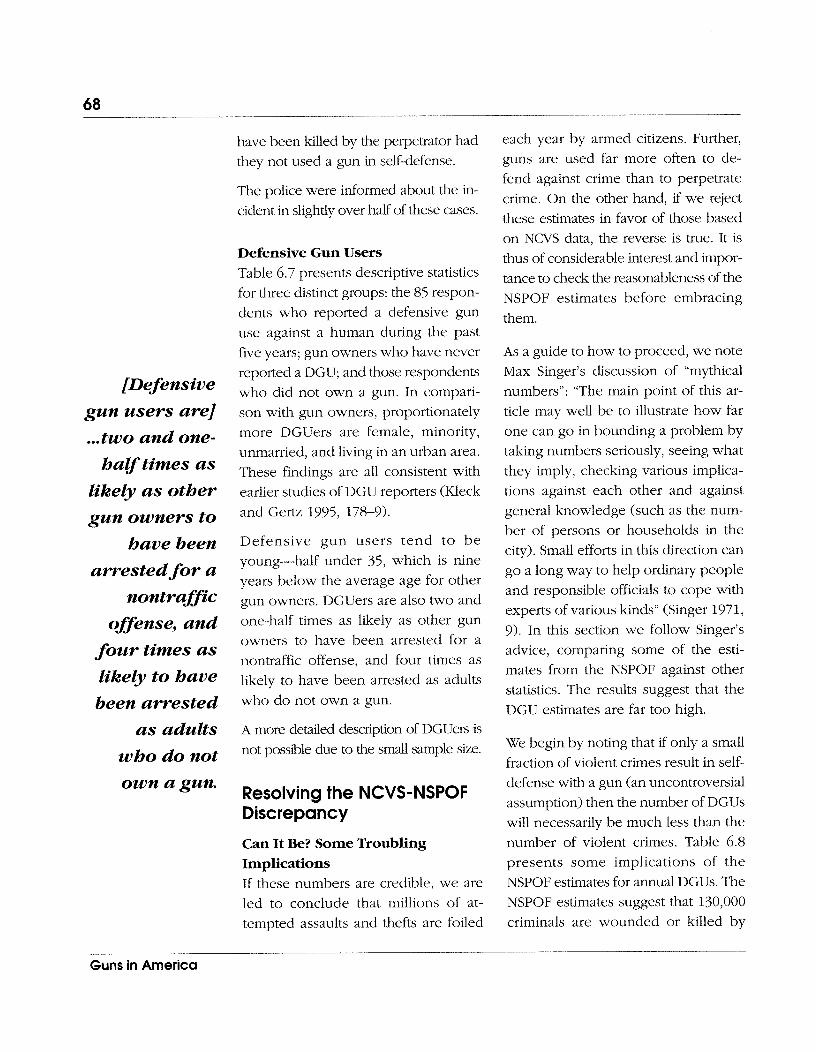
[Defensive gun users are] ... two and one-
halftimes as likely as other gun owners to
bave been arrested for a
nontra ff ic offense, and
four times as likely to bave been arrested
as adults who do not own a gun.
have been killed by the perpetrator had they not used a gun in self-defense.
The police were informed about the in- cident in slightly over half of these cases.
Defensive Gun Users Table 6.7 presents descriptive statistics for three distinct groups: the 85 respon- dents who reported a defensive gun use against a human during the past five years; gun owners who have never reported a DGU; and those respondents who did not own a gun. In compari- son with gun owners, proportionately more DGUers are female, minority, unmarried, and living in an urban area. These findings are all consistent with earlier studies of DGU reporters (Kleck and Gertz 1995, 178-9).
Defensive gun users tend to be young-half under 35, which is nine years below the average age for other gun owners. DGUers are also two and one-half times as likely as other gun owners to have been arrested for a nontraffic offense, and four times as likely to have been arrested as adults who do not own a gun.
A more detailed description of DGUers is not possible due to the small sample size.
Resolving the NCVS-NSPOF Discrepancy
Can It Be? Some Troubling Implications If these numbers are credible, we are led to conclude that millions of at- tempted assaults and thefts are foiled
each year by armed citizens. Further, guns are used far more often to de- fend against crime than to perpetrate crime. On the other hand, if we reject these estimates in favor of those based on NCVS data, the reverse is true. It is thus of considerable interest and impor- tance to check the reasonableness of the NSPOF estimates before embracing them.
As a guide to how to proceed, we note Max Singer's discussion of "mythical numbers": "The main point of this ar- ticle may well be to illustrate how far one can go in bounding a problem by taking numbers seriously, seeing what they imply, checking various implica- tions against each other and against general knowledge (such as the num- ber of persons or households in the city). Small efforts in this direction can go a long way to help ordinary people and responsible officials to cope with experts of various kinds" (Singer 1971, 9). In this section we follow Singer's advice, comparing some of the esti- mates from the NSPOF against other statistics. The results suggest that the DGU estimates are far too high.
We begin by noting that if only a small fraction of violent crimes result in self- defense with a gun (an uncontroversial assumption) then the number of DGUs will necessarily be much less than the number of violent crimes. Table 6.8 presents some implications of the NSPOF estimates for annual DGUs. The NSPOF estimates suggest that 130,000 criminals are wounded or killed by
Guns in America
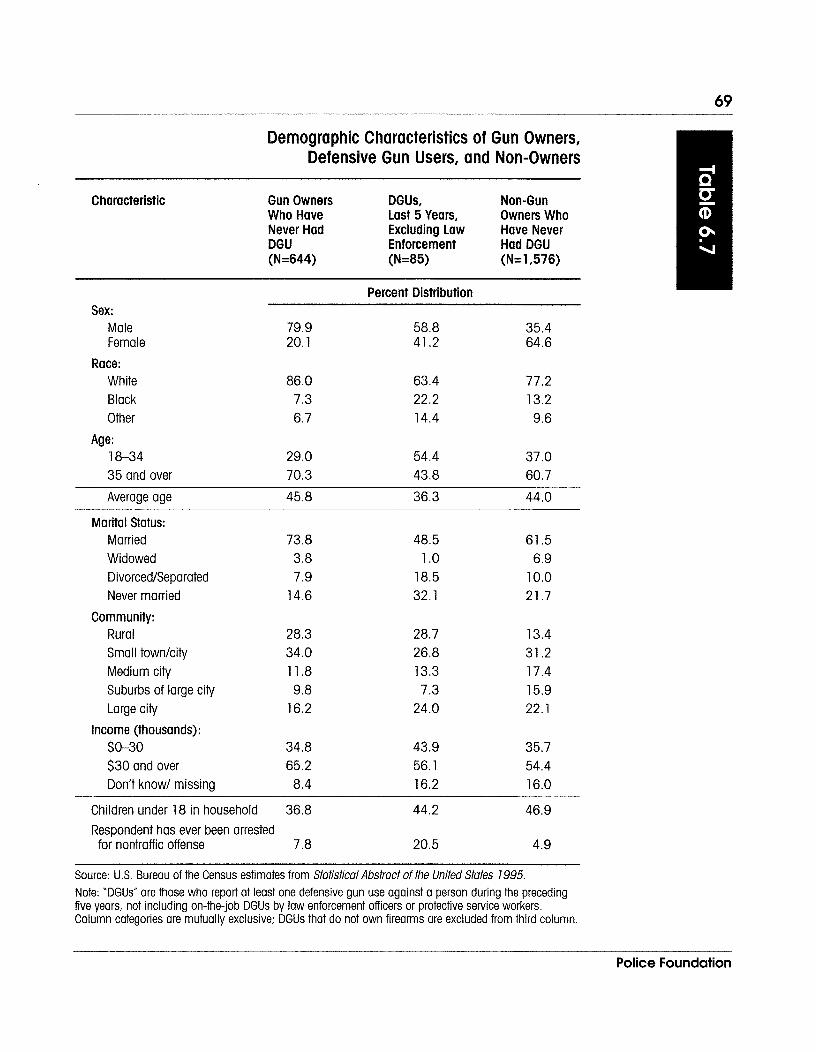
Demographic Characteristics of Gun Owners, Defensive Gun Users, and Non-Owners
Characteristic Gun Owners DGUs, Non-Gun Who Have Last 5 Years, Owners Who Never Had Excluding Law Have Never DGU Enforcement Had DGU (N=644) (N=85) (N=1,576)
Percent Distribution Sex:
Male Female
Race: White Black Other
Age: 18-34 29.0 54.4 37.0 35 and over 70.3 43.8 60.7
Average age 45.8 36.3 44.0
Marital Status: Married Widowed Divorced/Separated Never married
Community: Rural Small town/city Medium city Suburbs of large city Large city
Income (thousands): $0-30 $30 and over Don't know/ missing
Children under 18 in household 36.8 44.2 46.9 Respondent has ever been arrested for nontraffic offense 7.8 20.5 4.9
Source: U.S. Bureau of the Census estimates from Statistical Abstract of the United States 1995. Note: "DGUs" are those who report at least one defensive gun use against a person during the preceding five years, not including on-the-job DGUs by law enforcement officers or protective service workers. Column categories are mutually exclusive; DGUs that do not own firearms are excluded from third column.
Police Foundation
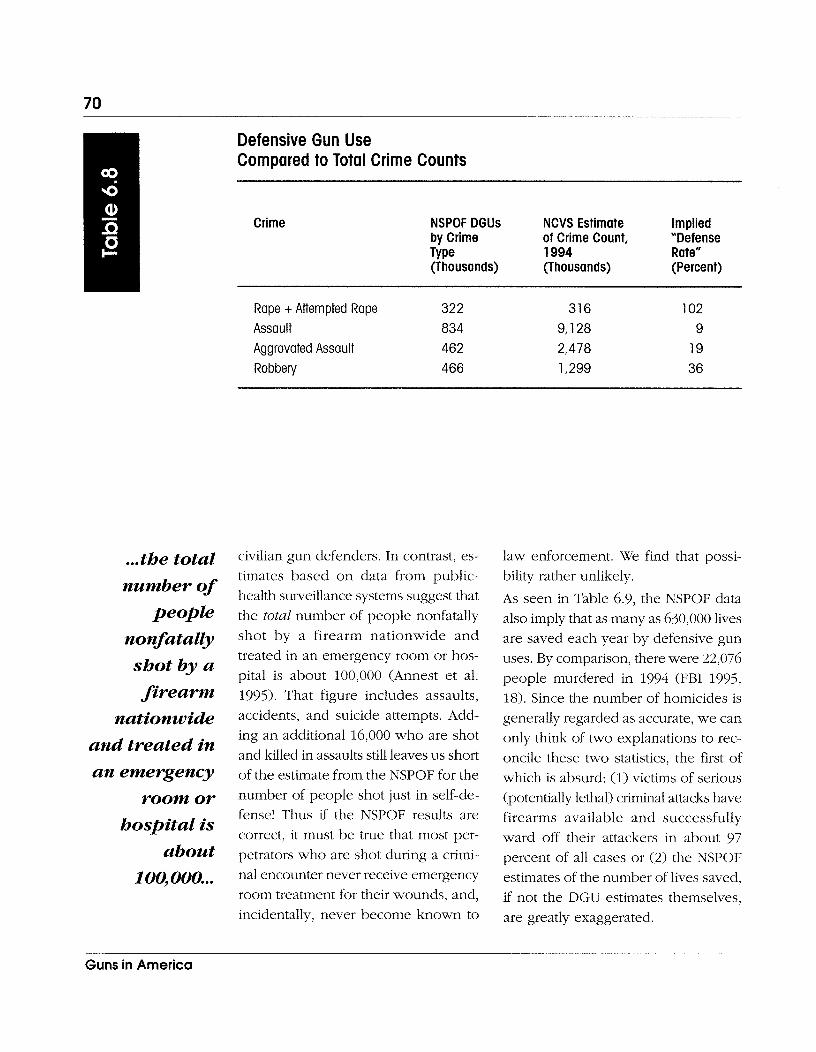
Defensive Gun Use Compared to Total Crime Counts
... the total number of
people nonfatally shot by a firearm
nationwide and treated in an emergency
room or hospital is
about 100, 000. ..
Crime NSPOF DGUs NCVS Estimate Implied by Crime of Crime Count, "Defense TY Pe 1994 Rate" (Thousands) (Thousands) (Percent)
Rape + Attempted Rape 322 31 6 102 Assault 834 9,128 9 Aggravated Assault 462 2,478 19 Robbery 466 1,299 36
civilian gun defenders. In contrast, es- timates based on data from public- health surveillance systems suggest that the total number of people nonfatally shot by a firearm nationwide and treated in an emergency room or hos- pital is about 100,000 (Annest et al. 1995). That figure includes assaults, accidents, and suicide attempts. Add- ing an additional 16,000 who are shot and killed in assaults still leaves us short of the estimate from the NSPOF for the number of people shot just in self-de- fense! Thus if the NSPOF results are correct, it must be true that most per- petrators who are shot during a crimi- nal encounter never receive emergency room treatment for their wounds, and, incidentally, never become known to
law enforcement. We find that possi- bility rather unlikely.
As seen in Table 6.9, the NSPOF data also imply that as many as 630,000 lives are saved each year by defensive gun uses. By comparison, there were 22,076 people murdered in 1994 (FBI 1995, 18). Since the number of homicides is generally regarded as accurate, we can only think of two explanations to rec- oncile these two statistics, the first of which is absurd: (1) victims of serious (potentially lethal) criminal attacks have firearms available and successfully ward off their attackers in about 97 percent of all cases or (2) the NSPOF estimates of the number of lives saved, if not the DGU estimates themselves, are greatly exaggerated.
Guns in A m e r i c a
Defensive Gun Use Reports: Lives Saved
How likely that someone would have been killed had gun not been used defensively?
"Very likely" 'Somewhat likely" "Likely"
Total number of lives saved Total number of homicides saved (1 994)*
Thousands
Implied successful defense rate** 97%
*Homicide estimates for 1994 taken from FBI's Uniform Crime Reports (1 995, 18). **Implied successful defense rate represents percent of all potentially lethal attacks that are successfully defended by armed victim. Calculated as ( A / A + B ), with A = number of successful gun defenses by victim in potentially lethal attack (NSPOF estimate), and B = number of homicides (FBI count).
The evidence of positive bias in the DGU estimates is still stronger when we recall that the DGU estimates are calculated using only the most recently reported DGU incidents of NSPOF re- spondents. As we have seen, about half of the respondents who reported a DGU indicated that there had been two or more in the preceding year. While we have no details on the circum- stances of those additional DGUs, pre- sumably if the respondents had been asked they would have reported addi- tional violent crimes, wounded perpe- trators, and lethal attacks foiled. The already improbable figures for the num- ber of crimes defended against with a gun could be magnified still farther.
Some Explanations With a sample size of 2,568, each NSPOF respondent represents from 70,000 to 80,000 citizens on average using the projection weights discussed earlier. As we have seen, the most re- cent NCVS-based estimates suggest 65,000 defensive gun uses by citizens against crime each year (McDowall and Wiersema 1995); on the basis of the NCVS figures, we would have expected one respondent from the entire NSPOF sample to have reported a defensive gun use during the past year. Instead, 19 reported at least one DGU that meets our stringent criteria. In this section, we explore possible explanations for these differences.
Police Foundation
In the NSPOF.. . all
respondents are asked whether a
gun bas been used
defensively during the indicated period of
time.
Sequence of Questions. The NCVS asks respondents whether they have been victims of a crime during a speci- fied time, and, if so, whether and what defensive actions were taken during the crime. As a result, the opportunity to discuss a defensive gun use is only made available to NCVS participants if a crime has first been reported. In the NSPOF (as with most telephone surveys), all respondents are asked whether a gun has been used defensively during the indicated period of time.
By construction of our selection crite- ria, each of the 19 NSPOF respondents indicate that some form of crime was involved in their most recent DGU. A small portion of the discrepancy be- tween the NSPOF and NCVS estimates may be accounted for by the fact that in three cases the most serious crime reported is "trespass," a crime which is not included in the NCVS.
Some of the DGU reporters provide a contradictory account of what happened. In question 72 they are asked "Which of the following best describes what was happening when you used the gun de- fensively?" They are given nine options, and are permitted to answer "yes" to any number of them. Three responded "yes" to several categories of serious crime (rape, robbery) but also said "yes" to the category "no crime was involved." Another apparent inconsistency ap- pears when we compare the responses to this question with the responses to question 75, "Did the perpetrator
threaten, attack, or injure you?" A total of six respondents who indicated that the circumstance of the DGU was rape, robbery, or attack (question 72) responded "no" to question 75.
The NCVS has a more systematic ap- proach to inquiring about victimization, and some of these DGUers would not have been classified as victims in the NCVS interview. While the NCVS pro- cedures will eliminate some faulty re- ports of victimization, it may also be true that some respondents will choose not to report crimes that actually occurred.
Survey Environment. The NCVS in- terviewing environment is different in potentially important ways from that of the one-shot telephone-survey in- terviews like those of the NSPOF. The NCVS is conducted face-to-face in the respondents' homes. The interviewers identify themselves as federal employ- ees (working for the U.S. Bureau of the Census), and promise that all an- swers will be kept confidential. In con- trast, the NSPOF interviewers identified themselves as from "Chilton Research Services" and conducted all interviews over the telephone without any prom- ise of confidentiality. Which type of in- terview would respondents trust more?
Our presumption is that some respon- dents would feel more comfortable speaking with someone in person, es- pecially with the guarantee, but that oth- ers would feel more comfortable on the telephone. Kleck and Gertz's (pp. 154-
Guns in America
6) intuition is quite different than ours. They assert that respondents will be far less likely to disclose sensitive in- formation to the NCVS interviewer than to a telephone interviewer who says she is working for a private firm. Kleck and Gertz assert that the commercial telephone surveys produce a much higher prevalence of DGUs than the NCVS precisely because there are many respondents who are unwilling to dis- cuss legally dubious actions with gov- ernment workers, but are willing to discuss them with a stranger on the telephone. We know of no evidence that would test this conjecture.
In some respects the NCVS is inarguably superior. While the NSPOF has a sample of 2,568, with a response rate of 44 or 59 percent, the NCVS has a sample size of 120,000 in 56,000 housing units, and re- ceived responses from residents in 96 percent of targeted households (BJS 1996). Thus, not only is the NCVS ex- pected to provide more reliable estimates due to the sheer size of the sample (that is, NCVS-based estimates are less sensi- tive to a few aberrant responses), but the differences in response rates also suggest that the NCVS is closer to a truly representative sample of U.S. adults than are telephone surveys.
Telescoping. Following the conven- tion in the literature, our estimates fo- cus on the number of defensive gun users and uses during the past year. However, as seen in Table 6.2, divid- ing the estimates for DGUs and DGUers
using the five-year-recall period pro- duces annual estimates that are dramati- cally smaller than annual DGU esti- mates derived from the one-year-recall period (1.46 million versus 648,000, using the conservative count for our most stringent criteria). As seen in the table, this phenomenon is common to other telephone gun surveys (Kleck and Gertz 1995, 165). We would not, of course, expect the five-year-recall pe- riod to produce estimates of defensive gun users that are five times as large as the one-year-recall period, given that higher-risk individuals may be victim- ized several times. At the same time, the observation that the one-year-re- call period estimates are twice as large as the annual estimates produced by the five-year recall suggests a problem with respondents' memories. It may be that respondents in the NSPOF include DGUs that occurred more than a year ago in the 12-month-recall question (a phenomenon known as "telescoping"). To the extent to which this occurs, the one-year-recall period will produce overestimates of the number of DGUs each year.
The NCVS guards against this phenom- enon by re-interviewing respondents every six months, and using the previ- ous NCVS interview as a benchmark for respondents for the six-month-recall pe- riod. The first interview with each NCVS participant is "unbounded," and has been found to produce far larger estimates for the six-month recall than subsequent (bounded) interviews (Cantor 1989).
Our presumption is that some respondents would feel more comfortable speaking with someone in person, especially with the guarantee [of
c0q-J but that others would feel more comfortable on the telep hone.
Police Foundation
m e possibility that some
respondents may be
confused by the question
or about their own
experiences is suggested
by the rather high incidence of
mental illness and substance
abuse in the United States.
False Positives. Prevalence estimates based on interview data are subject to both false negatives (a respondent fails to report a relevant instance) and false positives (where a respondent reports a relevant instance that did not actu- ally occur, or did not occur in the rel- evant time frame). If the true preva- lence is low, as in the case of DGUs, then in a sense there is much greater scope for false positives than false nega- tives--only a relatively few respondents are logically capable of giving a false negative, whereas anyone who did not use a gun defensively can give a false positive. If the true prevalence is 1/1,000, and the false-positive rate is 2/1,000, then the estimated DGU rate will be at least twice the true level even if none of the true DGUers choose to rqort their e q e - rience (Hemenway 1996).
Is there any reason to believe that some respondents will report DGUs that did not occur? In addition to the telescop- ing problem discussed above, respon- dents may falsely report because they are confused, have a distorted memory, or are simply having fun with the in- terviewer.
Research on survey methodology sug- gests that respondents have a desire to make themselves "look good" in the eyes of the interviewer (Sudman and Bradburn 1974,40). Fighting off a crimi- nal attack is (in most circumstances) a heroic act. There may be a temptation for some respondents either to make something up or else to change the details of an actual event. For example,
a survey respondent who had recently heard a bump in the night and checked it out, gun in hand, may report having scared off a trespasser even though in fact he or she did not see anyone at the time.
The possibility that some respondents may be confused by the question or about their own experiences is sug- gested by the rather high incidence of mental illness and substance abuse in the United States. Recent estimates from the National Institute for Mental Health suggest that 5 1.3 million American adults aged 18 and over have "one or more mental or addictive disorders" (Bounrdon et al. 1994, 23). Thus, at any point in time a large proportion of American adults are either under the influence of some intoxicant or suffer- ing from a mental disorder, and in ei- ther case may be unreliable reporters in a survey. A representative sample of American adults will include these individuals.
An additional source of false positives is strategic behavior by gun advocates. Those who are well informed about the gun-control debate will know that the number of DGUs is relevant and may be tempted to enhance that estimate through their own response to the survey.
The purpose of this discussion is not to claim that every citizen reporting a DGU is mentally impaired or invent- ing the incident for whatever reason. Rather, our intention is to note that a
Guns in America
representative survey of 2,568 Arneri- cans that asks questions about any topic will include at least a handful of people who are drunk, have an erratic memory or an axe to grind, or who are just hav- ing fun. Given that our estimate of over 4 million defensive gun uses rests on just 19 responses, a handful of false positives would make a big difference.
Of course it is possible that there are also one or more false negatives in this survey. We focus on the problem of false positives because of the logic of estimating rare events, and because we have been persuaded by the evidence offered earlier that the NSPOF estimates overstate the true incidence by a very wide margin.
Finally, while the NSPOF estimate ap- pears too high, that does not imply that the far lower NCVS estimate is correct. The fact that the NCVS only asks DGU questions for those who report a crime eliminates the false-positive problem, but may cause the NCVS to miss DGUers who do not remember or choose not to report the crime. The rather frustrating conclusion is that the available survey data leave consider- able uncertainty about the "true" num- ber of DGUs.
Interpretation of Defensive Gun Use Estimates The controversy over the frequency with which guns are used in self- defense is animated by the notion that such uses are vital and virtuous: that
is, they have public merit in ways that other private uses of guns (target shoot- ing, hunting) do not (Cook and Moore 1995). The cost of any regulation that will deprive some law-abiding citizens of guns must be reckoned accordingly. If, as suggested by the NSPOF data, it is quite likely that a law-abiding gun owner will have occasion to use the gun in self-defense against a robber or burglar, then the social cost of restrict- ing ownership and use may be sub- stantial. On the other hand, if the likeli- hood of virtuous self-defense is minute, as suggested by the NCVS data, then we reach quite a different conclusion.
The discussion above has focused on demonstrating that despite a number of surveys that seem relevant, includ- ing the NSPOF, we remain highly un- certain about the actual number of genuine DGUs that occur each year. The number that is in wide circulation, 2.5 million, is lower than our best esti- mate based on a literal interpretation of NSPOF data. But there are numer- ous reasons, both empirical and con- ceptual, to believe that this NSPOF es- timate is far higher than the underly- ing reality. The tmth eludes this method of measurement, because even a hand- ful of false reports are sufficient to greatly distort the conclusion.
But there is a more fundamental prob- lem here. Even if we could design a questionnaire so cleverly as to weed out misinformation, there would remain a problem in interpreting the results. Does the number of DGUs serve as a
The controversy over the frequency with which guns are used in self-defense is animated by the notion that such uses are vital and virtuous.
Police Foundation
... surveys are a decidedly
flawed method for
learning about the
frequency with which
innocent victims of
crirne use a gun to defend
themselves.
measure of the public benefit of pri- vate gun possession, even in principle? When it comes to DGUs, is more bet- ter? We note several problems:
1. Gun use may take the place of other means of avoiding trouble. Someone who has a gun handy will be inclined to use it when there is a perceived threat to person or property. But other means of defense, such as calling for help or leaving the scene, may be just as effective. Access to a firearm may encourage some people to be less pru- dent about avoiding confrontations and may enable or embolden others to es- calate confrontations. The logic here extends to preventive activities as well. Gun possession may encourage some people to invest less in other means of self-protection or to be less vigilant in avoiding unsafe situations. The NSPOF, as with other surveys, does not pro- vide sufficient information about what alternative courses of action were avail- able to its respondents. Without this information, it is not possible to deter- mine whether many of these gun uses were beneficial to society.
2. Readiness to use guns in self-defense may lead to fatal m&takes. Someone who keeps a gun handy for dealing with in- truders and other predators may end up shooting the wrong person. We refer here
not only to the tragic cases in which someone shoots a member of their fam- ily after hearing a noise in the night, but also those cases in which the intruder is perhaps trespassing but poses no physi- cal threat to the household.
3. 7%e number of DGUs tells us little about the most important effects on crime of widespread gun ownership. When a large percentage of households and even people on the street are armed, that circumstance presumably has an important effect on the behav- ior of predatory criminals. Some may be deterred or diverted to other types of crime. Others may change their tac- tics, acquiring a gun themselves or in some other way seeking to preempt gun use by the intended victim (Cook 1991). Such consequences presumably have an important effect on criminal victimization rates, but are in no way reflected in the DGU count.
To sum up, surveys are a decidedly flawed method for learning about the frequency with which innocent victims of crime use a gun to defend them- selves. On the other hand, even if we could develop a reliable estimate of this frequency, it would only be of mar- ginal relevance to the ongoing debate over the appropriate regulation of fire- arms commerce, possession, and use.
Guns in America
VII
"One of the few constants in American public opinion over the last two de- cades has been that three-fourths of the population supports gun control," wrote Tom W. Smith in 1980. Now, years later, this consistently high level of support remains. In the 1994 Gen- eral Social Survey, 78 percent favored a law that would require a person to obtain a police permit before buying a gun (BJS 1995, 193). But there are lim- its to how far this majority has been willing to go. Registration and police background checks have long been in favor, but an outright ban on handgun ownership has been opposed by a clear majority (BJS 1995, 191). The NSPOF includes two items on attitudes toward gun-control measures, and the results
Support for Handgun Control Measures: How Much and from Whom?
Each respondent in the NSPOF was asked the following questions: "Wbuld you favor or oppose a law which re- quired private citizens to register hand- guns they own?" "Would you favor or oppose a law which made it illegal for any private citizen, other than law en- forcement officers and licensed secu- rity guards, to own a handgun?" Simi- lar items have been included in a vari- ety of national surveys over the years (Kleck 1991).
The Gallup Monthly Poll from time to time has asked, "V170uld you favor or oppose the registration of all hand-
Registration and police background checks have long been in favor, but an outright ban on handgun ownership has been opposed by a clear majority ....
conform with this general pattern. guns?" During the 1980s support in-
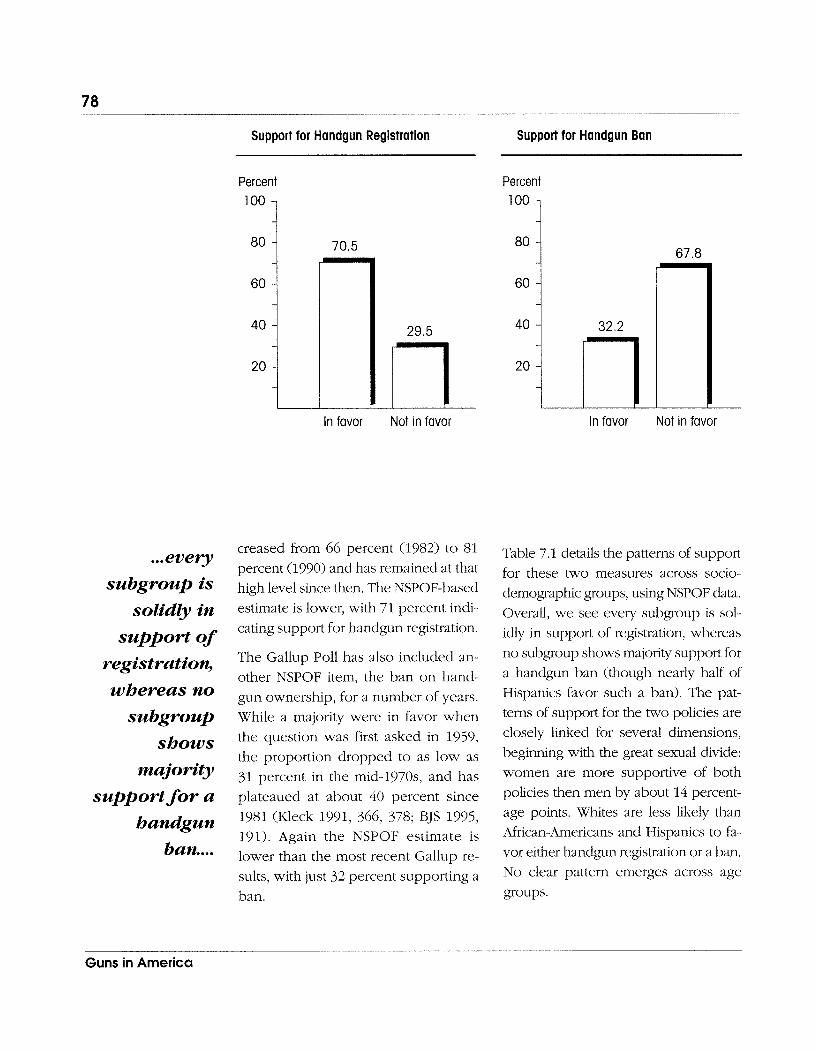
... every subgroup is
solidly in support of
registration, whereas no
subgroup shows
majority support for a
handgun ban ....
Support for Handgun Registration Support for Handgun Ban
Percent
loo 1 Percent
loo 1
In favor Not in favor in favor Not in favor
creased from 66 percent (1982) to 81 percent (1990) and has remained at that high level since then. The NSPOF-based estimate is lower, with 71 percent indi- cating support for handgun registration.
The Gallup Poll has also included an- other NSPOF item, the ban on hand- gun ownership, for a number of years. While a majority were in favor when the question was first asked in 1959, the proportion dropped to as low as 31 percent in the mid-1970s, and has plateaued at about 40 percent since 1981 (Kleck 1991, 366, 378; BJS 1995, 191). Again the NSPOF estimate is lower than the most recent Gallup re- sults, with just 32 percent supporting a ban.
Table 7.1 details the patterns of support for these two measures across socio- demographic groups, using NSPOF data. Overall, we see every subgroup is sol- idly in support of registration, whereas no subgroup shows majority support for a handgun ban (though nearly half of Hispanics favor such a ban). The pat- terns of support for the two policies are closely linked for several dimensions, beginning with the great sexual divide: women are more supportive of both policies then men by about 14 percent- age points. Whites are less likely than African-Americans and Hispanics to fa- vor either handgun registration or a ban. No clear pattern emerges across age groups.
Guns in America
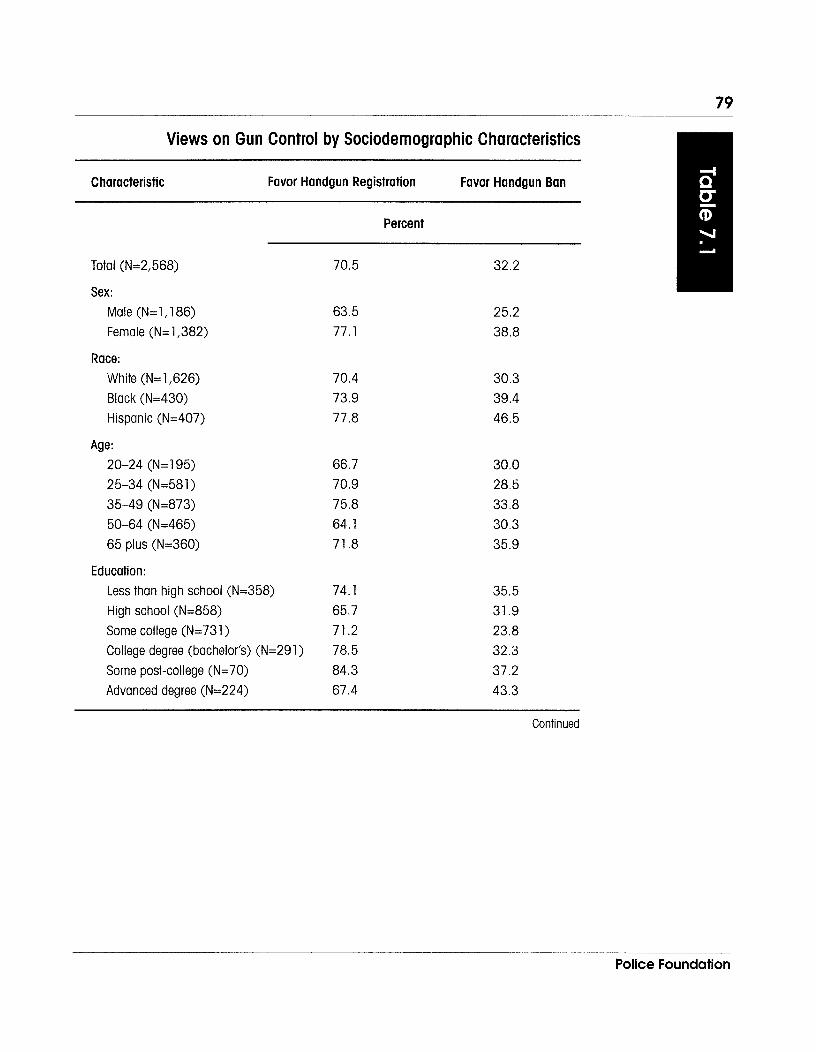
Views on Gun Control by Sociodemographic Characteristics
Characteristic Favor Handgun Registration Favor Handgun Ban
Total (N=2,568) 70.5
Sex: Male (N=l, 186) Female (N=1,382)
Race: White (N=1,626) Black (N=430) Hispanic (N=407)
Age: 20-24 (N=195) 25-34 (N=581) 35-49 (N=873) 50-64 (N=465) 65 plus (N=360)
Percent
Education: Less than high school (N=358) 74.1 High school (N=858) 65.7 Some college (N=73 1 ) 71.2
College degree (bachelor's) (N=291) 78.5 Some post-college (N=70) 84.3 Advanced degree (N=224) 67.4
Continued
Pol ice Foundat ion
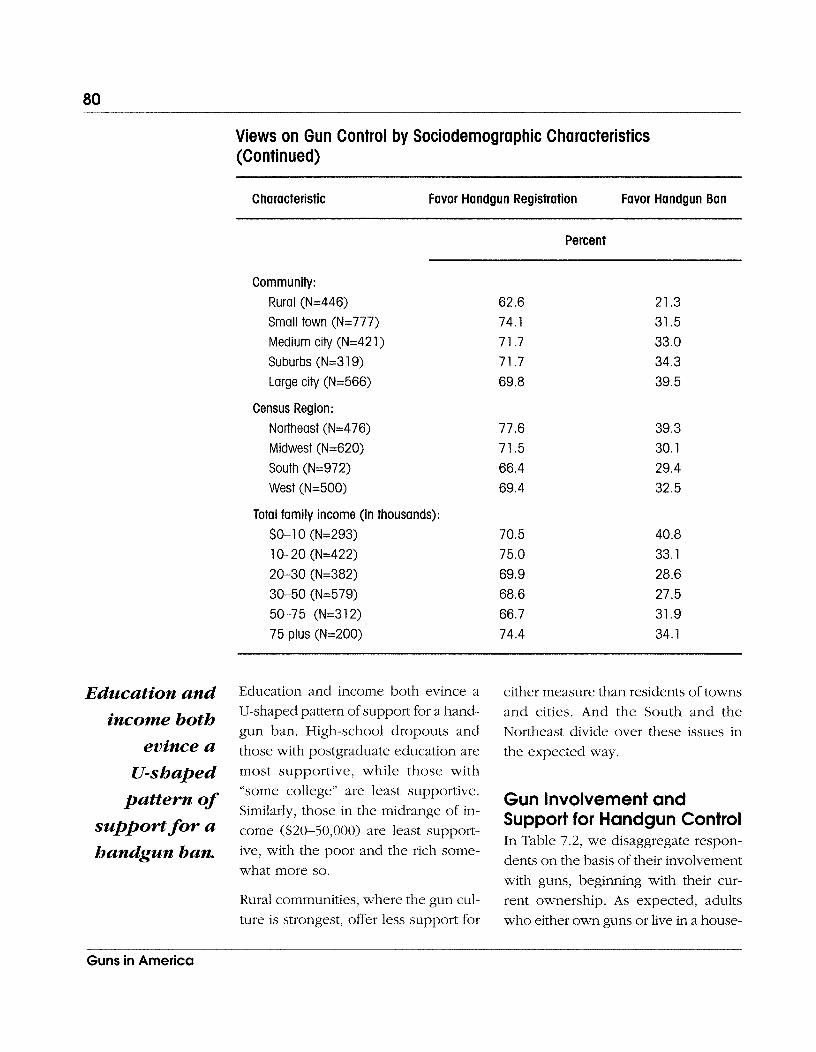
Education and income both
evince a U-s haped
pattern of support for a handgun ban.
Views on Gun Control by Sociodemographic Characteristics (Continued)
Characteristic Favor Handgun Registration Favor Handgun Ban
Community: Rural (N=446) Small town (N=777)
Medium city (N=42 1 ) Suburbs (N=3 1 9)
Large city (N=566)
Census Region: Northeast (N=476)
Midwest (N=620) South (N=972)
West (N=500)
Percent
Total family income (in thousands): $0-1 0 (N=293) 10-20 (N=422)
20-30 (N=382) 30-50 (N=579)
50-75 (N=3 1 2) 75 plus (N=200)
Education and income both evince a either measure than residents of towns U-shaped pattern of support for a hand- and cities. And the South and the gun ban. High-school dropouts and Northeast divide over these issues in those with postgraduate education are the expected way. most supportive, while those with "some college" are least supportive. Similarly, those in the midrange of in-
Gun Involvement and
come ($20-50,000) are least support- Support for Handgun Control In Table 7.2, we disaggregate respon-
ive, with the poor and the rich some- dents on the basis of their involvement
what more so. with guns, beginning with their cur-
Rural communities, where the gun cul- rent ownership. As expected, adults ture is strongest, offer less support for who either own guns or live in a house-
Guns in America
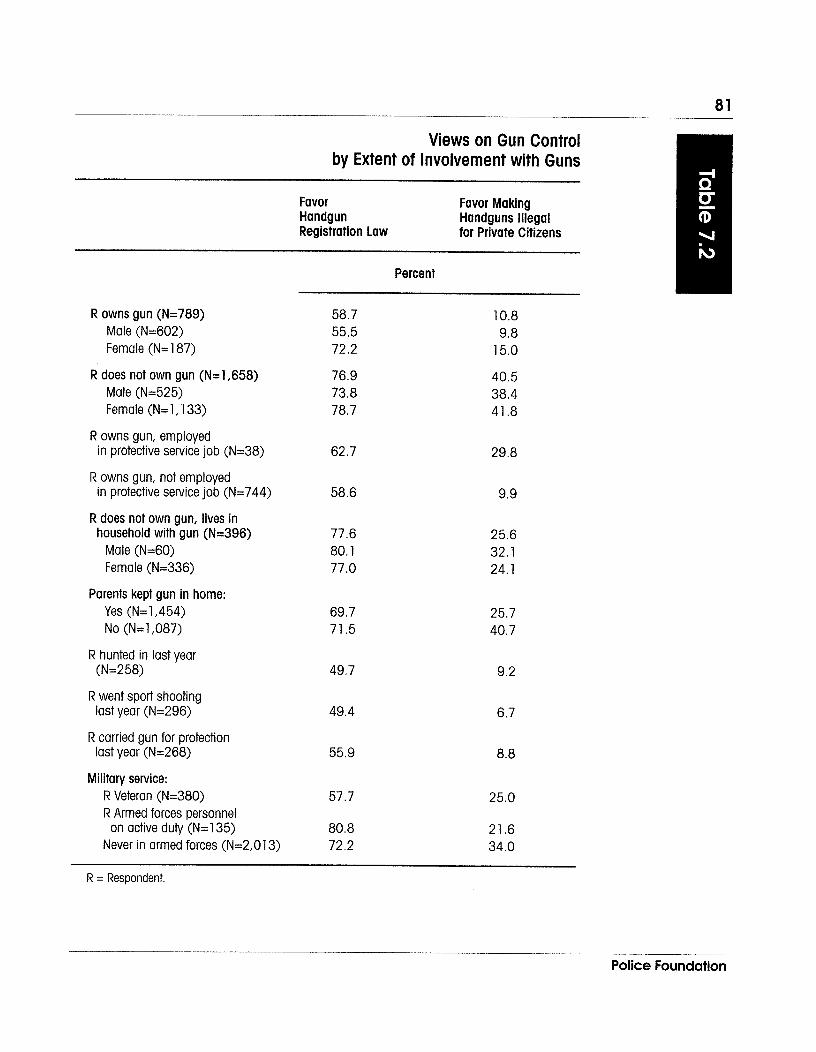
Views on Gun Control by Extent of Involvement with Guns
Favor Favor Making Handgun Handguns Illegal Registration Law for Private Citizens
Percent
R owns gun (N=789) Male (N=602) Female (N=187)
R does not own gun (N=1,658) Male (N=525) Female (N=1 ,133)
R owns gun, employed in protective service job (N=38)
R owns gun, not employed in protective service job (N=744)
R does not own gun, lives in household with gun (N=396)
Male (N=60) Female (N=336)
Parents kept gun in home: Yes (N=1,454) NO (N=1,087)
R hunted in last year (N=258)
R went sport shooting last year (N=296)
R carried gun for protection last year (N=268)
Military service: R Veteran (N=380) R Armed forces personnel
on active duty (N=135) Never in armed forces (N=2,013)
R = Respondent
Police Foundation
... over half of all
gun-owning
hold with a gun are less likely to sup- or carry a gun for protection. The low port either handgun control measure level of support among veterans may than other adults. Yet note that over reflect their active involvement with half of all gun-owning men and nearly guns, as documented earlier. three-quarters of gun-owning women support handgun registration. And it is surely intriguing that 11 percent of gun owners and 26 percent of nonowners who live with an owner favor a ban on handguns. In fact, 10 percent of handgun owners favor a ban. Support for handgun registration and a hand- gun ban are highest among those gun owners employed in protective service occupations, though the sample size for this group is somewhat small.
Support for Handgun Control and Concern about Crime Do concerns about crime, or actual vic- timization experiences, increase or de- crease a respondent's support for hand- gun control? Handguns are the pre- ferred gun both for perpetrating crime and for defending against it, and in that sense restrictions on handguns cut both ways. What we actually find in tlie NSPOF results is an interesting differ-
men and How can we explain why a subset of ence between popular views of the two
neap-2~ three- handgun owners would actually en- control measures. +
quarters of gun-owning
women support
handgun registration.
dorse an outright ban on handguns? They may have been confused about the question. Or they may have been indicating a genuine willingness to ex- change their own handgun for the chance to live in a handgun-free community.
Tliose respondents who are most ac- tively involved with guns are less likely than other gun owners to support ei- ther control measure. In Table 7.2 we see the relatively low levels of support by those who hunt, go sport shooting,
In Table 7.3, concern about crime is related to support for the handgun con- trol measures. In comparison to those with a more sanguine view, those who believe that crime is going up in their neighborhood are more likely to sup- port handgun registration but less likely to support a handgun ban. This pat- tern may reflect a belief that registra- tion would give an advantage to law- abiding citizens over the criminal ele- ment but that an outright ban would have the opposite effect.
Guns in America
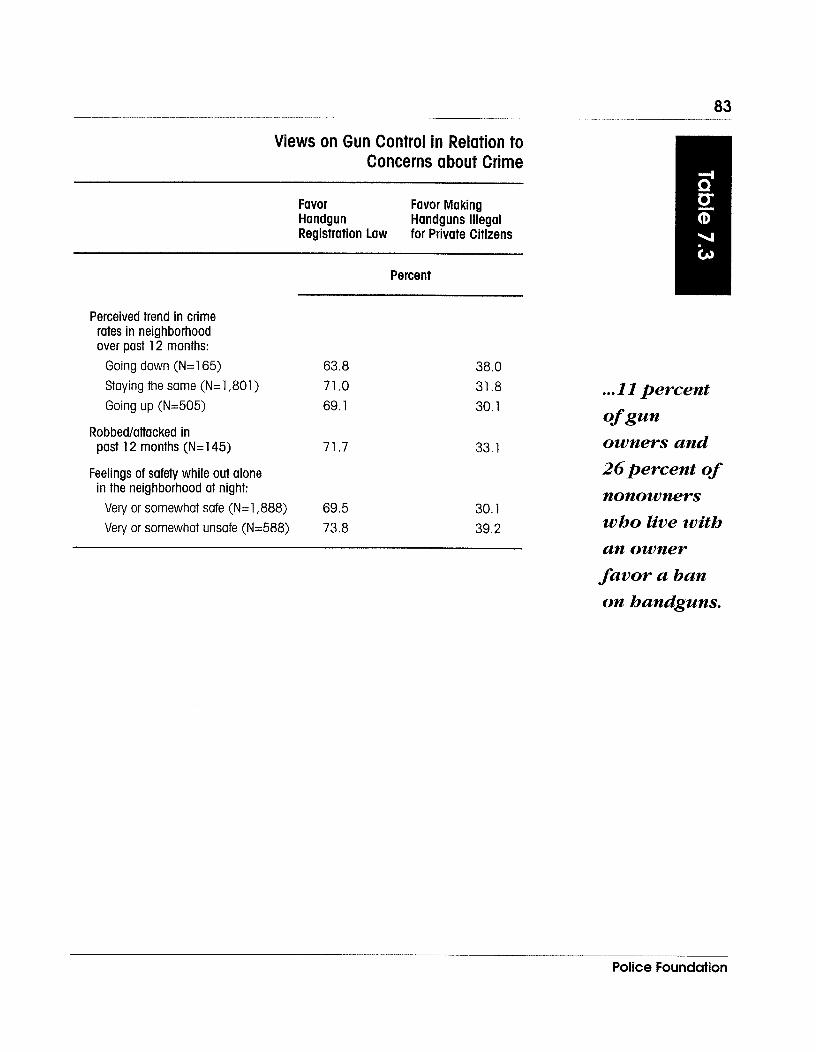
Views on Gun Control in Relation to Concerns about Crime
Favor Favor Making Handgun Handguns Illegal Registration Law for Private Citizens
Percent
Perceived trend in crime rates in neighborhood over past 12 months:
Going down (N=165) 63.8 Staying the same (N=1,801) 71 .O Going up (N=505) 69.1
Robbedlattacked in past 12 months (N=145)
Feelings of safety while out alone in the neighborhood at night:
Very or somewhat safe (N=1,888) 69.5 Very or somewhat unsafe (N=588) 73.8
... 11 percent
of sun owners and %percent of nonowners who live with an owner favor a ban on handguns.
Police Foundation

Guns in America
VIII
The NSPOF provides uniquely detailed data on the stock of firearms in private hands, the uses and misuses of these firearms, and the recent transactions in which firearms have changed hands. These survey data are not without flaws. We have taken care to document the methods used in gathering these data and point out potential problems. The response rate is uncomfortably low, although in line with other tele- phone surveys of this sort. More no- table for students of survey design, we find that female respondents are sub- stantially less likely to report their husband's guns than are the male own- ers themselves. As a result, we limit most of our analysis to respondents' reports concerning their own guns, which appear accurate.
The most important methodological problem explored in this report is the likelihood of a large positive bias in estimates of the incidence of rare events. We have offered evidence that the NSPOF-based estimates of the num- ber of defensive gun uses and of the number of firearm accidents are too high by an order of magnitude or more, and that many of the DGU reports con- tain puzzling internal contradictions or otherwise don't make sense. The prob- lem comes down to a matter of arith- metic. If the true incidence is 1 in 1,000, say, then even a small false-positive rate among the other 999 will result in an estimate that is far too high. False posi- tives may originate from telescoping, confusion, a desire to impress the in- terviewer, and other causes. This
The most important ...p roblem explored in this report is the likelihood of a large positive bias in estimates of the incidence of rare events ...[s uch as] defensive gun uses.
... do not place faith in
estimates of ... defensive
gun uses-or indeed, in any survey-based
estimate of the incidence
of a rare event-unless
there is a credible
mechanism for screening
out false
problem is generic to any method of measurement but has not been ad- equately acknowledged or dealt with in the field of survey research. Thus, one of our most important conclusions is negative: do not place faith in esti- mates of the number of defensive gun uses-or indeed, in any survey-based estimate of the incidence of a rare event-unless there is a credible mechanism for screening out false re- ports. Note that the NCVS deals with the false-positive problem by preempt- ing it: only respondents who say they were the victim of a crime are asked about self-defense measures, so the vast majority of respondents never have a chance to offer a report, false or other- wise, on defensive gun uses.
For measuring other characteristics of gun ownership and use, we do find the NSPOF credible. Among the more notable findings:
II While there are enough guns in private hands to provide every adult with one, in fact the pattern of ownership is quite concentrated. Only a quarter of adults own a gun, and on the average owners have about four guns each. Just 10 mil- lion adults own over half of the 200 million guns.
much more likely than long guns to be kept unlocked and ready for use in the home as well as to be carried in public, but they are much less likely to be used in sporting activities. Despite this difference in purpose, the demographic and so- cioeconomic patterns of ownership are very similar for handguns and long guns. In fact, most handgun owners also own one or more long guns. It seems fair to conclude that the more fundamental divide among people is not with respect to their felt needs (sports or self-protection) but rather with respect to their level of comfort and experience with guns. Those who like guns, have experience with them, and have the means to buy them tend to keep a number of them for various pur- poses. Most of the adult public turns elsewhere for recreation and self- protection.
Over time, the self-protection and sporting uses have been changing in relative importance in motivating gun acquisition and use. Perhaps as a result of the increasing urbaniza- tion of the United States, the overall prevalence of ownership of guns appears to be declining, as is par- ticipation in hunting. Proportionately
reports. II When asked, handgun owners usu- fewer households own guns now ally give self-protection as their than in the 1960s and 1970s, and the primary motive, while long gun younger cohorts are entering into owners mention hunting or target gun ownership at slower rates than shooting. Other findings support previous cohorts. When people do this basic division: handguns are acquire guns now, it is more likely
Guns in America
to be motivated by self-defense than in the past. The mix of new guns sold is now equally divided between handguns and long guns, whereas 25 years ago there were twice as many long guns sold (Cook 1993). The NSPOF findings suggest that about 5 percent of adults are plan- ning to acquire a gun for self-pro- tection even though they do not own a gun now.
The concern for self-protection helps account for the unsafe stor- age methods and the widespread practice of carrying guns in public. Of particular interest is the fact that those owners who have received formal firearms training are no less likely than others to store their guns unsafely, unlocked and loaded.
erally-licensed firearm dealer, a fig- ure that is higher than previously thought. The remaining gun trans-
actions are of special concern be- Our cause they are less subject to extraordinary regulatory scrutiny. collective
These and a number of other findings involvement serve as a useful reference for those With - who wish to understand the current roles played by guns in the day-to-day
reflects and
life of America's households, and to ascertain some of the trends. The data may also be useful in judging the im- pact of proposed changes in how gov- ernment regulates gun transactions and use. Our extraordinary collective in- volvement with guns reflects and has a large influence o n life-and-death matters, including crime, suicide, and accidents. Data of the sort collected by
has a large influence on life-and-death matters, including
crime, suicide, and accidents.
We find that 60 to 70 percent of all the NSPOF provide a basis for informed firearm acquisitions involve a fed- action in this area of public concern.
Police Foundation

Guns in America
Adams, Kenneth. 1996. Guns and gun control. In Americans' view of crime and justice, ed. Timothy J. Flanagan and Dennis R. Longmire. Newberry Park, CA: Sage.
Annest, Joseph L., James A. Mercy, Delinda R. Gibson, and George W. Ryan. 1995. National estimates of nonfatal firearm-related injuries: Beyond the tip of the iceberg. Journal of the American Medical Association 273(22).
Bea, Keith. 1994. Gun control. Congressional Research Service Issue Brief (Sep- tember 19).
Bourndon, Karen, Donald Rae, William Narrow, Ronald Manderscheid, and Darrel Regier. 1994. National prevalence and treatment of mental and addictive disorders. In Mental Health, United States, 1994, 22-35. Wash- ington, DC: U.S. Department of Health and Human Services, Center for Mental Health Services.
Brick, J. Michael, Joseph Waksberg, Dale Kulp, and Amy Starer. 1995. Bias in list-assisted telephone samples. Public Opinion Quarterly 59:21&35.
Cantor, David. 1989. Substantive implications of longitudinal design features: The National Crime Survey as a case study. In Panel Sum/eys, ed. D. Kasprzyk et al. New York: John Wiley.
Chilton Research Services. 1995. National Study of Private Ownership of Fire- arms in the United States: Methodology report. Radnor, PA: Chilton Research Services.
Clotfelter, Charles T., and Philip J. Cook. 1989. Selling hope: State lotteries in America. Harvard University Press: Cambridge, MA.
Colombotos, J. 1969. Personal versus telephone interviews: Effect on responses. Public Health Reports 84:773-82.
Cook, Philip J. 1981. The "Saturday Night Special": An assessment of alternative definitions from a policy perspective. Journal of Criminal Law and Crimi- nology 72(4): 1735-45.
-. 1985. The case of the missing victims: Gunshot woundings in the National Crime Survey. Journal of Quantitative Criminologyl(l):91-102.
-. 1991. The technology of personal violence. In Crime and Justice: An Annual Review of Research 14:l-71. Chicago: University of Chicago Press.
-. 1993. Notes on the availability and prevalence of firearms. American Journal of Preventive Medicine 9(3).
Cook, Philip J., Stephanie Molliconi, and Thomas B. Cole. 1995. Regulating gun markets. n e Journal of Criminal Law and Criminology 86(1):59-92.
Cooper, Sanford. 1964. Random sampling by telephone-an improved method. Journal of Marketing Research 1:45-8.
Deming, W. Edwards. El9441 1978. On errors in surveys. In Sociological meth- ods: A sourcebook, ed. Norman K. Denzin, 233-47. New York: McGraw-Hill.
Freeman, Howard, Jill Kiecolt, William Nicholls, and Merrill Shanks. 1982. Telephone sampling bias in surveying disability. Public Opinion Quarterly 46:392-407.
Frey, James H. 1989. Survey Research by Telephone. 2nd ed. Newbury Park, CA: Sage Publications.
Groves, R.M. and R.L. Kahn. 1979. Surveys by telephone: A national comparison with personal interviews. New York: Academic Press.
Hemenway, David. 1995. Guns, public health, and public safety. In Guns and the Constitution: The myth of Second Amendment protection for firearms in America, ed. Dennis Henigan, E. Bruce Nicholson, and David Hemenway, 49-82. Northampton, MA: Alethia Press.
-. 1996. Survey research and self-defense gun use: An explanation of ex- treme overestimates. Harvard University working paper.
Hemenway, David, and Deborah Azrael. 1995. Use of guns in self-defense: Results of a national telephone survey. Harvard University working paper.
Hemenway, David, and Elizabeth Richardson. 1995. Who owns semi-automatic firearms? Harvard University working paper.
Hemenway, David, Sara J. Solnick, and Deborah Azrael. 1995. Firearm training and storage. Journal of the American Medical Association 273(1):46-50.
Guns in America
Hochstim, J.R. 1962. Comparison of three information-gathering strategies in a popu- lation study of sociomedical variables. Proceedings of the American Statistical Association, Social Statistics Section 154-9.
-. 1967. A critical comparison of three strategies of collecting data from households. Journal of the American Statistical Association 62:976-89.
Jones, Edward. 1981. The District of Columbia's Firearms Control Regulations Act of 1975: The toughest handgun control law in the United States-or is it? Annals of the AAPSS 455:138-49.
Jordan, L.A., A.C. Marcus, and L.G. Reeder. 1980. Response styles in telephone and household interviewing: A field experiment. Public Opinion Quarterly 44:210-22.
Kellermann, A.L., F. P. Rivara, J. Banton, D. Reay, and C.L. Flinger. 1991. Validat- ing survey responses to questions about gun ownership among owners of registered handguns. American Journal of Epidemiology 131 : 1080-4.
Kleck, Gary. 1988. Crime control through the private use of armed force. Social
Problems 35(1):1-21.
-. 1991. Point blank: Guns and violence in America. New York: Aldine De Gsuyter.
-. 1993. Bad data and the "Evil Empire": Interpreting poll data on gun con- trol. Vzolence and Victims 8(4): 367-376.
Kleck, Gary, and Mark Gertz. 1995. Armed resistance to crime: The prevalence and nature of self-defense with a gun. The Journal of Criminal Law and Criminology 86(1): 150-87.
Kopel, David. 1993. Hold your fire: Gun control won't stop rising violence. Policy Review 58-65.
Kviz, F. J. 1977. Toward a standard definition of response rate. Public Opinion Quarterly 41 :265-7.
Leuthold, David, and Raymond Scheele. 1971. Patterns of bias in samples based on telephone directories. Public Opinion Quarterly 3 5:249-57.
Lizotte, Alan, David Bordua, and Carolyn White. 1981. Firearms ownership for sport and protection: Two not so divergent models. American Sociological Review 46:499-503.
Police Foundation
Mayer, Jane, and Doyle McManus. 1988. Landslide: The unmaking of the Presi- dent, 29841988. Boston: Houghton-Mifflin.
McDowall, David, and Brian Wiersema. 1994. The incidence of defensive fire- arm use by U.S. crime victims, 1987 through 1990. American Journal of Public Health 1982-4.
Nelson, David, Joyce Grant-Worley, Kenneth Powell, James Mercy, and Deborah Holtzman. 1996. Population estimates of firearm storage practices and fire- arm carrying in Oregon. Journal of the American Medical Association 275(22): 1744-8.
O'Higgins, Niall. 1994. YTS, employment and sample selection bias. Oxford Economic Papers 46(4):605-28.
Orwin, Robert, and Robert Boruch. 1982. RRT meets RRD: Statistical strategies for assuring response privacy in telephone surveys. Public Opinion Quar- terly 46560-71.
Palmer, Gladys. 1943. Factors in the variability of response in enumerative stud- ies. Journal of the American Statistical Association 38: 143-52.
Potthoff, Richard, Kenneth Manton, and Max Woodbury. 1993. Correcting for nonavailability bias in surveys by weighting based on number of callbacks. Journal of the American Statistical Association 88 (424):1197-207.
Salmon, Charles, and John Spicer Nichols. 1983. The next-birthday method of respondent selection. Public Opinion Quarterly 47:270-6.
Sims, Barbara. Forthcoming. The National Opinion Survey of Crime and Justice, 1995: Development and methods. In Americans view crime andjustice, ed. Timothy J. Flanagan and Dennis R. Longmire. Newberry Park, CA: Sage.
Singer, Max. 1971. The vitality of mythical numbers. The Public Interest 23:3-9.
Slansky, Paul. 1989. i%e clothes have no emperor: A chronicle of the American 80s. New York: Simon and Schuster.
Smith, Tom W. 1980. The 75% solution: An analysis of the structure of attitudes on gun control, 1959-1977. The Journal of Criminal Law and Criminology 71(3):3OO-16.
-. 1985. An analysis of the accuracy of spousal reports. National Opinion Research Center: General Social Science Survey Methodological Report Num- ber 35. Chicago: University of Chicago.
Guns in America
Smith, Tom W., and Robert J. Smith. 1995. Changes in firearms ownership among women, 1980-1994. TheJournal of Criminal Law and Criminology 86(1): 133-49.
Sudman, Seymour. 1966. Probability sampling with quotas. Journal of the Ameri- can Statistical Association 749-71.
-. 1976. Applied sampling. New York: Academic Press.
Sudman, Seymour, and Norman M. Bradburn. 1974. Response effects in surveys: A review and synthesis. Chicago: Aldine.
Troldahl, V., and R. Carter. 1964. Random selection of respondents within house- holds in phone surveys. Journal of Marketing Research 1 :71-6.
U.S. Bureau of the Census. 1995. Statistical abstract of the United States: 1995. 115th ed. Washington, DC.
-. 1994. Monthly Vital Statistics Report (October) 42(13):4.
U.S. Department of Education. 1994. Working with NCES's NELS:88 Data Sets- Potential Problems and Answers. Paper prepared for the 1994 AERA Annual Meeting, New Orleans, LA.
U.S. Department of Justice. 1994. Criminal victimization in the United States, 1992: A national crime victimization survey report. Government Printing Office: Washington, DC.
- 1995. Criminal victimization 1993. Bureau of Justice Statistics Bulletin. Government Printing Office: Washington, DC.
U.S. Department of Justice. Federal Bureau of Investigation. 1994. Uniform crime reports for the United States, 1994. Washington, DC: Government Printing Office.
Waksberg, Joseph. 1978. Sampling methods for random digit dialing. Journal of the American Statistical Association 73:40-6.
Weil, Douglas S., and David Hemenway. 1992. Loaded guns in the home: Analysis of a national random survey of gun owners. Journal of the American Medi- cal Association 267(22):3033-7.
Wolfgang, Marvin E. 1958. Patterns in criminal homicide. New York, NY: Wiley.
Wright, James. 1979. Public opinion and gun control: A comparison of results from two national surveys. Arnherst: University of Massachusetts.
Police Foundation
-. 1984. The ownership of firearms for reasons of self defense. In Firearms and violence: Issues ofpublicpolicy, ed. Donald Kates, 301-27. Cambridge, MA: Ballinger.
-. 1988. Second thoughts about gun control. B e Public Interest 23-39.
-. 1995. Ten essential observations on guns in America. Society 63-8.
Wright, James, and Peter Rossi. 1986. Armed and considered dangerous: A Sur- vey of felons and theirfirearms. New York: Aldine De Gruyter.
Wright, James, Peter Rossi and Kathleen Daly. 1983. Under the gun: Weapons, crime, and violence in America. New York: Aldine Publishing Company.
Wright, James, Joseph Sheley, and M. Dwayne Smith. 1992. Kids, guns, and killing fields. Society 85-9.
Zawitz, Marianne W. 1995. Firearms, crime and criminal justice: Guns used in crime. Bureau of Jz~stice Statistics Selected Findings (July).
Zimring, Franklin E. 1972. The medium is the message: Firearm calibre as a determinant of death from assault. Journal of Legal Studies 1:97-124.
-. 1991. Firearms, violence and public policy. Scientific American (Novem- ber) 48-54.
Guns in America
About the Authors
Philip J. Cook is ITTlSanford Professor of Public Policy Studies at Duke Univer- sity. The "technology" of personal violence has been a major concern of his research for the past 20 years. He has studied and written extensively on two basic scientific issues that arise in any debate over gun control: What difference does the type of weapon make in (potentially) violent encounters, and what difference does gun availability make in the choices of violent criminals.
Jens Ludwig is Assistant Professor of Public Policy at Georgetown University. His primary interest is in evaluating the effects of government policy on crime, education, and poverty. His recent projects include re-examining the relation- ship between permissive gun carrying laws and homicide.


Copyright © 2022 FDOKUMEN