Guideline for apicultural citizen science to apply the honey ...
89
Guideline for apicultural citizen science to apply the honey bee colony for bio-monitoring of the environment INSIGNIA Consortium 2018 – 2021
-
Upload
khangminh22 -
Category
Documents
-
view
0 -
download
0
Transcript of Guideline for apicultural citizen science to apply the honey ...

Guideline for apicultural citizen science to apply the honey bee colony for bio-monitoring of the environment
INSIGNIA Consortium 2018 – 2021
INSIGNIA Consortium 2018-2021
Edition 1, June 2021 Page 1 of 88
Guideline for Apicultural citizen science to apply the
honey bee colony for bio-monitoring of the environment
Authors
Jozef van der Steen1, Flemming Vejsnæs12, Hans Baveco7, David Biron14, Robert
Brodschneider2, Valters Brusbardis15, Bas Buddendorf7, Norman Carreck4, Leonidas
Charistos3, Mary F. Coffey13, Caroline Eulderink11, Giovanni Formato8, Dirk de Graaf11,
Kristina Gratzer2, Alison Gray5, Fani Hatjina3, Konstantinos Kasiotis9, Ole Kilpinen12, Dries
Laget16, Maria Murcia10, Marco Pietropaoli8, M. Alice Pinto6, Andreia Queresma6, Ivo
Roessink7, Effrosyni Zafeiraki9, Amadeo Fernandez-Alba10
Corresponding author
Jozef van der Steen,
Kerkstraat 96
5061 EL Oisterwijk
Netherlands
Email: [email protected]
Affiliations
1. AlveusAB Consultancy, Oisterwijk, NL
2. Institute of Biology, University of Graz, Graz, AT
3. Hellenic Agricultural Organization ‘DEMETER’ Nea Moudania, GR
4. Carreck Consultancy Ltd, Shipley, West Sussex, UK
5. University of Strathclyde, Glasgow, Scotland, UK
6. CIMO, Instituto Politécnico de Bragança, PT
7. Team Environmental Risk Assessment, Wageningen Environmental Research,
Wageningen, NL
8. Istituto Zooprofilattico Sperimentale delle Regioni Lazio e Toscana "M.Aleandri",
Rome, IT
9. Benaki Phytopathological Institute, Athens, GR
10. University of Almeria, Almeria, ES
11. HKH Kwaliteit & Certificering, Veldhoven, NL
12. Danmarks Biavlerforening, Sorø, DK
13. Mary F Coffey, Department of Agriculture, Food and Marine, Celbridge, Kildare, IE
14. Institute on Ecology and Environment CNRS, Clermont Ferrand, FR
15. Latvian Beekeepers Association, Jelgava, LV
16. Gent University, Gent, BE
This guideline is the outcome of the INSIGNIA study "Environmental monitoring of
pesticide use through honeybees", concerning the scientific development of a
substantiated Apicultural Citizen Scientist protocol, including data analysis, non-invasive
sampling for the honey bee colony, in-hive pesticide passive sampler development,
molecular detection of pollen origin, pesticide risk exposure modelling for honey bee
colonies, and modelling of pollen availability and diversity for bees.
INSIGNIA Consortium 2018-2021
Edition 1, June 2021 Page 2 of 88
This study was granted by the European Commission, Directorate General for health and
food safety: Number SANTE/E4/SI2.788418-SI2.788452 - INSIGNIA.
The content of this guideline represents the views of the author only and is his/her sole
responsibility; it cannot be considered to reflect the views of the European Commission
or any other body of the European Union. The European Commission does not accept any
responsibility for use that may be made of the information it contains.
Content
1. Rationale
2. Study set-up
3. Protocols
4. Methods
Accounting
This guideline is a general guideline for the application of honey bee colonies for bio-
monitoring and how to organise an Apicultural citizen science study. The study objective
determines the toolbox for the beekeepers. This guideline has been designed and tested
for its practical and scientific merits in the INSIGNIA study 2018-2021. This resulted in a
best practice guide for Apicultural citizen science studies for bio-monitoring with honey
bee colonies.
The supporting INSIGNIA studies, reports, and publications are available on the
INSIGNIA website (https://www.insignia-bee.eu) - publications. This website will be
maintained for seven (7) years after the end of the INSIGNIA study 2018-2021.
Reading guide
This guideline consists of:
1. Rationale with the background of the application of the honey bee colony as a
monitoring tool, and the key outcomes of the INSIGNIA study.
2. Study set-up. This chapter describes the outline of the study, linking relationships,
research integrity, data integrity, and communication processes.
3. Protocols for the beekeeper in the role of Apiculturalist Citizen Scientist. In this
edition 1, April 2021, of the guideline, the protocols for bio-monitoring for
pesticides and bio-monitoring for pollen diversity, with their specific toolboxes, are
presented. The format of the protocols for different subjects is identical, to
facilitate combining protocols for specific monitoring subjects in a study plan.
4. Methods applied in the laboratories for pesticide residue analysis, pollen ITS2
metabarcoding, the statistical methods, and the description of the exposure risk
and pollen availability models.
Acknowledgement
The INSIGNIA Consortium thanks Steven Laan of AI-catcher, The Netherlands, for his
critical evaluation of improvements of the flowcharts, icon drawings in the protocol and
general layout of the Guideline.

1 - Rationale
1 - Rationale
Edition 1, June 2021 Page 4 of 88
Content
1 Honey bees for bio-monitoring .......................................................................... 5
2 In-hive processes ............................................................................................ 5
2.1 Nectar route .............................................................................................. 5
2.2 Pollen route .............................................................................................. 6
2.3 Water route .............................................................................................. 6
2.4 Wax route ................................................................................................. 7
2.5 Propolis route ............................................................................................ 7
2.6 Loose particles’ route ................................................................................. 7
3 Bee-monitoring matrices .................................................................................. 7
3.1 Bee matrices’ efficacy for monitoring of pesticides ......................................... 8
4 Non-biological passive samplers ........................................................................ 9
5 Invasive and non-invasive honey bee colony sampling ........................................10
5.1 Apiary sampling, colony sampling, sample pooling ........................................10
6 Apicultural citizen science ................................................................................10
7 The INSIGNIA study .......................................................................................11
7.1 Objective of the INSIGNIA study .................................................................11
7.2 Important links .........................................................................................12
7.2.1 Deliverable 1.2 .................................................................................12
7.2.2 Deliverable 3.2 .................................................................................12
7.2.3 Report year 1 ...................................................................................12
7.2.4 Scientific publications ........................................................................13
7.3 The set-up and testing ..............................................................................14
7.4 Non-invasive sampling ..............................................................................14
7.5 Pesticide residue analysis and pollen ITS2 metabarcoding ..............................15
7.5.1 The pesticide residue analyses ............................................................15
7.5.2 Botanical identification of mixed-pollen samples by ITS2 metabarcoding ..15
7.5.3 Pesticide exposure risk mapping .........................................................17
7.5.4 The Apiculturalist Citizen Scientist (CS), sociological study and profile .....17
7.6 Communications .......................................................................................18
7.6.1 In-consortium ..................................................................................18
7.6.2 Beekeeper Instruction - tutorials and other means of instruction .............18
7.6.3 AMA sessions (Ask Me Anything) .........................................................19
7.6.4 Communication with stakeholders by means of social media and journals 19
8 References ....................................................................................................21
1 - Rationale
Edition 1, June 2021 Page 5 of 88
1 Honey bees for bio-monitoring
The link between the honey bee colony and bio-monitoring is the comprehensive
interaction between the colony and the environment. Bees depend entirely for their food
and in-hive resistance on the nectar, pollen, water, and propolis available in an
approximately three to six kilometre radius (28 to 113 km2) around the colony. A smaller
radius of about 1 to 1.5 km (3 to 7 km2) is preferred and longer foraging distances have
also been recorded (Garbuzov et al., 2015; Beekman & Ratnieks, 2000). Along with this
collection, and due to the bees’ behaviour on the flowers, contaminants, both solid in
small and ultra-small particles and as a liquid, are inadvertently collected and brought
into the hive. In the foraging season of the colony, about a quarter of the colony forages
on average ten times a day and visits multiple flowers (Steen, et al, 2012; Winston,
1991). This is the power of the big numbers that the honey bee colony offers with its
large forager cohort and the accumulation of what is collected in a central spot, the hive.
As a result, the colony reflects both the nutrient availability as well as the environmental
pollution status of the foraging area (Chauzat et al., 2006; Conti & Botrè, 2001;
Bromenshenk et al., 1985; Steen, et al., 2016). The pollutants collected are not
restricted to pollutants in nectar, pollen, water and propolis taken from the soil by the
plants themselves, but also include pollutants deposited on the flowers, leaves, buds, and
surface water by airborne processes, soil dusting, dust deposition and by human
activities such as the application of plant protection products. To give an impression of
what is deposited daily, an example is the dust on cars and their windscreens. This is the
visible part of the deposits, which is only a fraction of the total deposition.
2 In-hive processes
The many thousands of foraging bees from one honey bee colony transport mainly nectar
and pollen to a single location, the hive. Annually, a colony collects on average of 100 to
125 kg of nectar and 25 to 30 kg of pollen. Both nectar and pollen are collected in
portions of 20 to 30 mg. This requires four to five times more nectar foragers than pollen
foragers in the hive. Inside the hive, nectar, pollen, xenobiotics and plant pathogens are
exchanged among the in-hive bees via trophallaxis, auto-, and allogrooming, and
physical contact, and they are accumulated over time in the different bee hive
compartments (DeGrandi-Hoffman et al., 1986; Paalhaar et al., 2007; Eyer et al., 2016;
Steen et al., 2018). In the hive, the incoming food follows the nectar route or the pollen
route for storage, consumption and application, and the contaminants attached to or
dissolved in the food follow the same routes. The water route is different, as water is not
stored. The wax route is not exactly a route, as beeswax can bind pesticides and
immobilise the contamination as does propolis. Finally, the loose particles route follows a
maximal 2-weeks route on the bees in the hive. As each route has its typical circulation
inside the hive and final storage, this must be taken into consideration when planning
sampling strategies for assessment of contaminants in the hive.
2.1 Nectar route
Incoming nectar is handed over by trophallaxis (food sharing) to in-hive nectar-
transporting bees. Part of this fresh nectar is fed directly to the foraging bees to fuel new
flights, part is distributed throughout the in-hive bees and larvae and the remainder is
stored in the cells (Brandstetter et al., 1988; DeGrandi- Hoffmann & Hagler, 2000;
Brodschneider et al., 2007). Part of the stored nectar is not or only slightly concentrated
and is the daily fuel of the colony. Due to the trophallaxis of freshly collected nectar,
within hours this nectar circulates throughout the colony. Another part is concentrated
into honey which has about 80% sugar content for winter stores (Eyer et al., 2016). The
1 - Rationale
Edition 1, June 2021 Page 6 of 88
honey is processed by exposing nectar on the tongue to air currents produced by wing
fanning. This evaporation process is repeated many times before the nectar reaches its
final sugar concentration. Each time the partially processed nectar is returned into a cell
until the final sugar concentration is reached. Consequently, nectar collected on different
days becomes mixed, and the honey in the capped cells, with about 80% sugar content,
is the result of this mixing process.
2.2 Pollen route
Pollen is stored straight away by the pollen foragers, as beebread. The pollen is mainly
consumed by the nurse bees. Bees prefer freshly collected pollen and therefore the time
for which beebread is stored is short. Within one week about three-quarters of these
stores are consumed, and in 2 weeks the major part is consumed during the reproduction
periods of the colony (Anderson et al., 2014; Carroll et al., 2017; Roessink & van der
Steen, 2021). In the process of collecting pollen, executed during foraging and the home
flight of the forager honey bee, besides pollen, other particles are brushed into the
corbicula (pollen basket) as well.
2.3 Water route
Honey bee colonies collect about 25 kg water per year to dilute larval food and cool the
brood nest (Nicolson, 2009; Kühnholz & Seeley, 1997). This water is collected as surface
water from ditches, puddles, ponds, mud, rivers and lakes. The link between water,
pesticides and honey bees is the contamination of this surface water, direct by
contamination deposition, run off from sprayed fields, drift deposition and indirect via
livestock farming and companion animals. Biocides are applied to these animals to
control endo- and ectoparasites. This goes via feed and direct application on the skin/
coat of the animals to control fleas and ticks. Parent pesticides and their metabolites of
pesticides applied via the feed are excreted with the urine and faeces. Slurry, containing
these excretions containing biocides or metabolites, is distributed in large amounts on
the soil for fertilisation. Part of these substances will run off to surface water. Another
part will be immobilized. Some biocides show very low mobility in the soil (high Koc) and
will remain in the soil, bound to the clay particles, while others like Amitraz are very
mobile (low Koc) and rinse off to the surface water (UNAF, 2018). Perkins et al. (2020)
studied Fipronil and its metabolites and Imidacloprid from pet treatments in English
rivers. These substances were found in up to 99% and 66% of the samples tested,
respectively. The chronic risk quotient, the ratio of the amounts exposed to and the
toxicity, indicates a high risk to the aquatic ecosystem. This also indicates a significant
risk that bees pick up these substances by water collection. Although not stored and
partially consumed, the biocides will be among the xenobiotic molecules circulating in the
colony. The importance of this route of exposure for pesticides and biocides is also a
topic in the expert groups working on the bee guidance (EFSA) and pollinator guidance
(ECHA) and is potentially part of the guidances. The definitions of pesticide and biocide
overlap. A 'pesticide' is something that prevents, destroys, or controls a harmful
organism ('pest') or disease, or protects plants or plant products during production,
storage and transport. The term includes, amongst others: herbicides, fungicides,
insecticides, acaricides, nematicides, molluscicides, rodenticides, growth regulators,
repellents, rodenticides and biocides (https://ec.europa.eu/food/plant/pesticides).
Biocides, which are intended for non-plant issues to control pests and disease carriers
such as insects, rats and mice do not fall within the remits of EFSA. This is an ECHA
topic.

1 - Rationale
Edition 1, June 2021 Page 7 of 88
2.4 Wax route
Beeswax is a lipophilic matrix that binds non-polar substances. The vast majority of
pesticides and other organic pollutants have a lipophilic nature, and therefore they are
susceptible to migrating to the wax inside the bee hive and hence accumulate. A large
number of pesticide residues can be accumulated and retained in wax for long periods of
time due to a lack of elimination, reaching concentration values up to mg kg-1 (Lozano et
al., 2019). However, the physicochemical properties and chemical stability of each
substance influence the extent to which it accumulates, with significant variations among
different contaminants.
2.5 Propolis route
Propolis is a lipophilic, resin-like material which bees collect from plant exudate and is
used mainly for sealing the bee hive. Although it contains some wax, it behaves
differently and is used differently in the bee hive. The value of propolis to medicine and
human health has long been recognized in that it is an antimicrobial, antioxidant, anti-
inflammatory and antitumour product (Burdock, 1998; Bankova et al., 2000). Due to its
lipophilic capacity, stickiness and its exposure to the atmosphere while on the plants as
well as inside the honey bee colony, propolis accumulates higher amounts of acaricides,
pesticides and heavy metals when compared to honey or pollen or even wax (Pareja et
al., 2011; Maragou et al., 2016, 2017; Gérez et al., 2017), a fact that makes propolis a
very good matrix for environmental monitoring studies. Honey bees collect propolis
almost all year round, but higher quantities are collected when the colony is in need and
there are particular plants or flowering buds available. Special plastic sheets are available
in the market for collecting propolis, where the bees collect high amounts of propolis
which are clean from wax and other hive debris. The amounts of propolis collected are
strongly colony and region dependent.
2.6 Loose particles’ route
Another group of contaminants and micro-organisms, although not bound to the food,
find their way throughout the colony. These contaminants, like particulate matter (fine
dust), plant pathogens and molecules that remain on the bee’s body after direct contact
with flowers during food collection, or along with water collection, will circulate in the
colony through trophallaxis and auto- or allogrooming. Whereas pollen collectors brush
the pollen and particles actively into the corbiculae during foraging, nectar foragers do
not do that (Westerkamp, 1991). Based on pollen distribution studies, within a few hours
all of the in-hive bees carry the collected particles to a greater or lesser extent (Paalhaar
et al., 2007; Free & Williams, 1972; DeGrandi Hoffman et al., 1986). The residence time
in the colony is not known for all these materials. It is known that the residence time
vital of Erwinia bacteria on honey bees is some days (de Wael, 1988; Alexandrova et al.,
2002). The residence time of pollen on the bees in the hive is at least 10 days
(Michielsen, 2017). This 10-days period is an indication of the in-hive residence time of
loose particles. Taking this residence time into account, the sampling frequency in a bee-
monitoring program must therefore be at least bi-weekly.
3 Bee-monitoring matrices
A matrix is a substance that carries e.g. xenobiotics or plant pathogens and is not altered
by these xenobiotics or micro-organisms. For example, nectar is a matrix of systemic
pesticides and pesticide molecules deposited directly in the flower during spraying or as a
result of drift. Pollen is a matrix of particles and molecules that are physically or
chemically bound to its surface as a result of direct spraying or airborne deposition.
Beeswax is a matrix of lipophilic molecules that enter the colony via nectar, pollen, or
1 - Rationale
Edition 1, June 2021 Page 8 of 88
directly via contaminated bees. The honey bee itself is a matrix of pollen grains, plant
pathogens, and non-biological particulate matter stuck to the branched hairs and food
collecting parts of the bee. The pollen forager is focused on combing as much pollen as
possible into the corbiculae, and exhibits frequent auto-grooming during foraging,
whereas the nectar forager exhibits non-frequent auto-grooming.
3.1 Bee matrices’ efficacy for monitoring of pesticides
In a review by Johnson et al. (2010) it is clearly shown that pollen is by far the most
important vehicle for pesticides to enter the colony. Pooling together all data in this
paper, the median amount of pesticides in wax, pollen, bees and honey was 36, 61, 2
and 0.1 ppb respectively. In the studies where wax and pollen were analysed
simultaneously (from the same colony), the median amount of pesticides in wax was 31
and in pollen 108 ppb. This difference in efficacy can be explained by the routes
described. Honey is obviously a poor matrix because of the quick dilution of nectar in the
sprayed flowers, the in-hive dilution with non-contaminated nectars and the temporal in-
hive mixing of the nectars during honey processing (Schatz & Wallner, 2009). Also, bees
themselves are not the most efficient matrices for bio-monitoring because of
autogrooming during the collection flight, in-hive auto- and allogrooming, detoxification
in the alimentary tract of the bees and the in-hive trophallaxis.
The practice and nature of sampling by the different matrices differs significantly. Every
in-hive bee sample is by definition a mixture of all age cohorts of bees, which all have
different levels of exposure (Steen et al., 2012). Forager bees are directly and the in-hive
bees indirectly exposed by trophallaxis and physical contact. Also, hive entrance samples
comprise bees that have visited different locations (Visscher & Seeley, 1982; Waddington
et al., 1994). Wax is a rather efficient matrix. However, it has the disadvantage that it is
selective in its binding capacity and it is, because of strong binding and the long in-hive
residence time of months to years, an archive from which it is impossible to distinguish
between recent and older pesticide influxes.
Pollen is the most efficient bee matrix. Working with trapped pollen, there is a tension
between the duration of trapping and the impact this has on the colony; trapping for too
long may have negative impact on the colony, whereas short activation of the pollen trap
will result in snapshot data as the flowering period of most flowers varies from only days
to some weeks. Because of non-invasive sampling considerations and of aiming to affect
the bio-monitoring tool “honey bee colony” as little as possible, activation of the pollen
trap should be limited to a maximum of four days, if weather conditions are such that no
pollen is collected in a single day of collection. On the other hand, beebread is the
accumulation of collected pollen. As most beebread is consumed in a 2-week period, it
mostly holds recent information. However, beebread consumption depends strongly on
the colony’s condition, particularly the brood status (Crailsheim et al., 1992). As
beebread storage is randomly distributed in the colony over the edges of the brood nest,
it is very time consuming to collect this material, and it also has a disturbing impact on
the colony. Furthermore it is much more invasive and time-consuming to collect
compared to pollen trapping.

1 - Rationale
Edition 1, June 2021 Page 9 of 88
4 Non-biological passive samplers
Besides these biological matrices, non-biological samplers have been developed. The
Beehold tube, a tube lined with sticky polyethylene glycol (PEG) on the inside through
which bees enter the hive, is a matrix of particles found on the exterior of the entering
bees (Steen et al., 2018). The APIStrip is an in-hive sampler. It is a polystyrene strip
covered with Tenax (a porous absorbent polymer), which is placed between two combs in
the centre of the colony. The Tenax is very firmly bound to the plastic strip, and binds
pesticide molecules that circulate inside the colony on the bees’ exterior, as loose
particles and in gas form. In environmental research, these types of non-biological
matrices are referred to as “passive samplers”. The fabrication, and preparation for
analysis of the APIStrip is described in Murcia-Morales et al. (2020). The mode of
application is presented in this guideline in chapter 3 Protocols, subchapter 3.2 Protocol
for the Apiculturalist Citizen Scientist for honey bee colony monitoring for pesticides. The
fabrication, mode of application and preparation for analysis for pollen and bacteria of the
Beehold tube is described in Steen et al. (2018). The preparation for analysis of
pesticides from the Beehold tube and from the APIStrip is presented in Report year 1
(2019) of the INSIGNIA pilot study on environmental monitoring of pesticide use through
honeybees, p 38-39.
In Table 1.1, the in-hive storage times/ archive periods, in-hive routes, matrices and
their suitability as a bee-monitoring matrix are summarised.
Table 1.1. Storage periods and consequences for sampling
In-hive
archive
period
In-hive route Matrix for bio-monitoring of
contaminants or pollen availability
Nectar 0 to X days Trophallaxis, physical
exchange, temporal cell
storage
Research for direct exposure to
pesticides, not for bio-monitoring1
Honey ∞ days No in-hive route, cell storage
Pollen/
Beebread
5 days Mouthparts, physical
exchange, cell storage
Pesticides
Pollen diversity
Water
0 Trophallaxis, physical
exchange
Not a matrix because of no storage
Wax ∞ days Some of the pesticides, depending on
chemical characteristics2
Propolis ∞ days Some of the pesticides, depending on
chemical characteristics and amounts
collected3
Loose Particles up to 10 days Physical exchange Particulate matter, heavy metals, bee
parasites, bee pathogens, micro
plastics 1 Due to pesticide degradation and dilution, pesticide levels decrease rapidly in temporally stored nectar storage
(Schatz & Wallner, 2009). Honey stomach sampling shows direct exposure to this source. 2 Wax is considered as a non-reliable pesticide matrix for bee-monitoring because of selective binding capacity to
pesticides and dilution by new wax. 3 Propolis is considered as a non-reliable pesticide matrix for bee-monitoring because of its colony- season and
regional differences in availability.

1 - Rationale
Edition 1, June 2021 Page 10 of 88
5 Invasive and non-invasive honey bee colony sampling
Sampling the honey bee colony can be done by various means, either invasively (at the
expense of the colony) or non-invasively (without affecting the colony). As pollutants/
xenobiotics bio-sampled by the honey bee colony form an intrinsic part of the bee food
and the in-hive routes by trophallaxis and allo- or autogrooming, the xenobiotics are
present in the food matrix and bee matrix. Invasive sampling involves taking bees or
food to an extent that the colony itself is negatively affected. Non-invasive sampling does
not negatively impact on the colony. Impact on the colony should be balanced with
efficacy of the sampling. There are no established standards for taking bees from a
colony without negatively affecting this superorganism, however recommended sampling
is a maximum of 3% of a certain cohort in order to consider sampling as non-invasive if
using a 3-weekly sampling frequency. Trapping pollen is to a certain extent invasive, but
the colony can compensate for this loss of pollen. Furthermore, there is a huge difference
in trapping efficacy of different designs of pollen traps, ranging from 10% (Free, 1967) to
54% (Vassiere et al., 1996).
5.1 Apiary sampling, colony sampling, sample pooling
Colonies in an apiary divide themselves over the surroundings with only partly
overlapping foraging areas (Waddington et al., 1994). Consequently, it takes more than
one colony to cover an area and the pooled apiary samples are thereby, by definition, a
spatial sample.
Focusing on the environmental study of pesticides or other pollutants, the worldwide
network of honey bee colonies provides the ultimate means to apply these colonies for
bio-sampling, both for large-scale overview monitoring and also for detailed small-scale
monitoring. Bio-monitoring means structured repeated bio-sampling. Focusing on large-
scale studies, the land use and colony density determine the “region” and not the
national borders. For example, it makes more sense to combine the Northern European
plains of Denmark, the Netherlands, Flanders, and Northern Germany as one region;
likewise for Alpine regions, and Mediterranean countries could be another region.
Sampling points should be spread evenly over the region, depending on the study
objective.
6 Apicultural citizen science
Citizen science is research, conducted partly or completely by citizens and non-
professional scientists, often in collaboration with and under the direction of professional
scientists and scientific institutions (WUR, Wikipedia). Apicultural citizen science is citizen
science focused on beekeepers, who sample their colonies or make regular recordings of
hive parameters such as the number of bees, colony weight, foraging periods etc. The
main conditions for successful citizen science in general must be clear, unambiguously
interpretable instructions about sampling, storage, and shipping etc. For Apicultural
citizen science, colony conditions and beekeeping practices are additions to the general
main conditions. Commitment of the beekeeper and support for the beekeeper are also
essential.
1 - Rationale
Edition 1, June 2021 Page 11 of 88
7 The INSIGNIA study
7.1 Objective of the INSIGNIA study
The INSIGNIA study was a proposal submitted to an European Commission call on
“Environmental monitoring of pesticides use through honey bees”. The aim of the study
was to develop a best practice protocol for Apicultural citizen science and to conduct “A
pilot study on the best practices for a European wide monitoring program with honey bee
colonies in an Apicultural citizen science (CS) setting to study pesticide use and exposure
of honey bees and investigation of pollen sources”.
The INSIGNIA consortium formulated the following goals:
To develop and test the Apicultural citizen science protocol for applying honey bee
colonies for bio-monitoring of pesticides and pollen in a citizen science study;
To set-up and test the organisation of an Apicultural citizen science study;
To develop non-invasive sampling and therefore to develop and test (in-hive)
passive sampler(s);
To test and optimise ITS2 metabarcoding for pollen identification;
To model pesticide exposure and undertake risk mapping / risk modelling;
To evaluate the CORINE database for its applicability to bees;
To list pesticides detected in this study;
To list bee-collected pollen origin;
To make a list of applied non-legislated pesticides detected in this study.
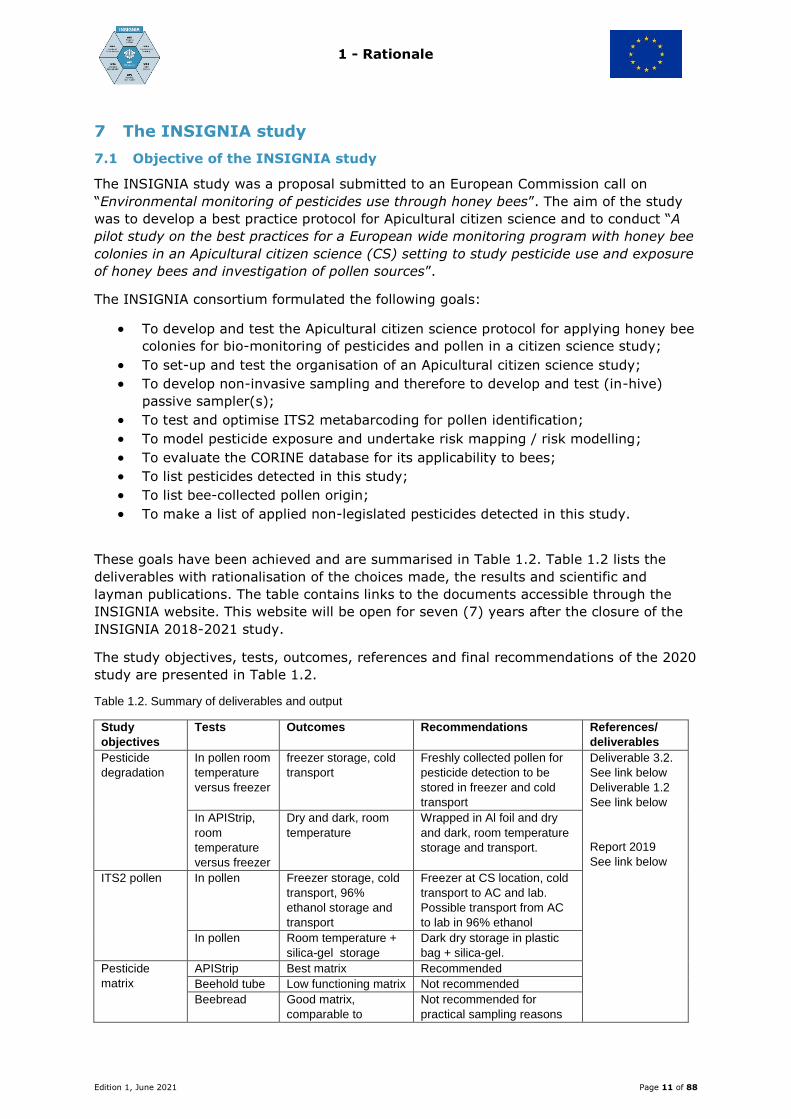
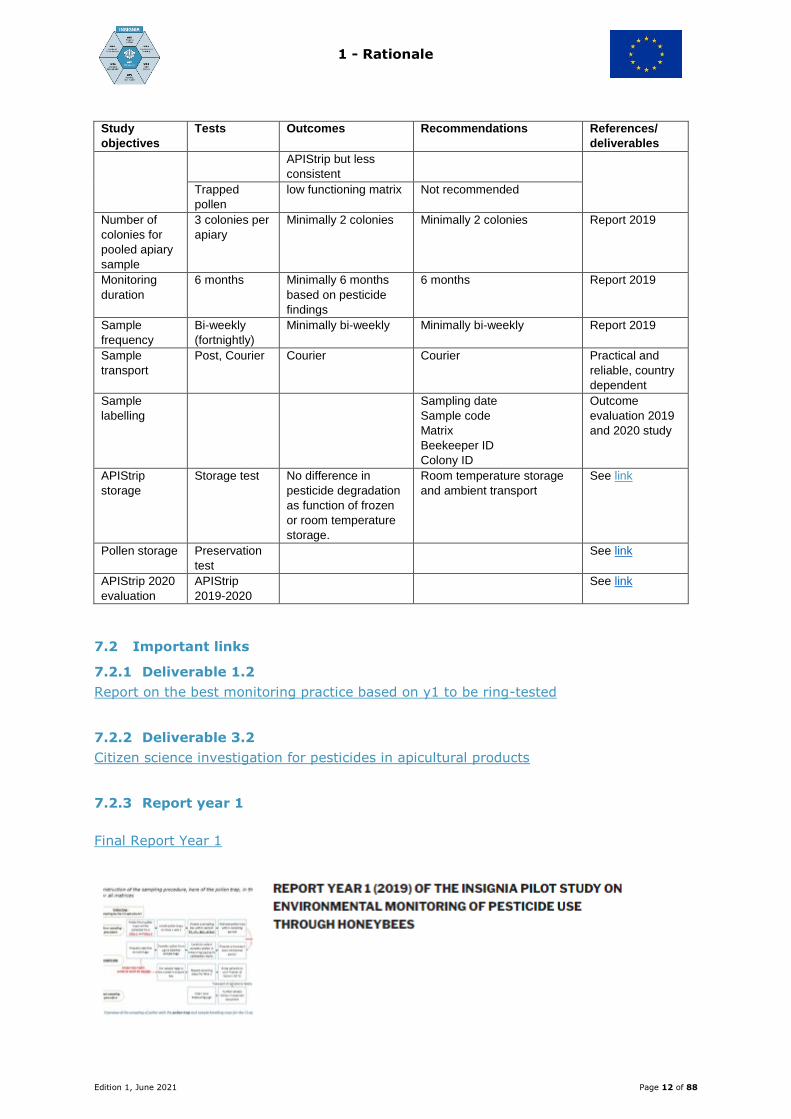
These goals have been achieved and are summarised in Table 1.2. Table 1.2 lists the
deliverables with rationalisation of the choices made, the results and scientific and
layman publications. The table contains links to the documents accessible through the
INSIGNIA website. This website will be open for seven (7) years after the closure of the
INSIGNIA 2018-2021 study.
The study objectives, tests, outcomes, references and final recommendations of the 2020
study are presented in Table 1.2.
Table 1.2. Summary of deliverables and output
Study
objectives
Tests Outcomes Recommendations References/
deliverables
Pesticide
degradation
In pollen room
temperature
versus freezer
freezer storage, cold
transport
Freshly collected pollen for
pesticide detection to be
stored in freezer and cold
transport
Deliverable 3.2.
See link below
Deliverable 1.2
See link below
Report 2019
See link below
In APIStrip,
room
temperature
versus freezer
Dry and dark, room
temperature
Wrapped in Al foil and dry
and dark, room temperature
storage and transport.
ITS2 pollen In pollen Freezer storage, cold
transport, 96%
ethanol storage and
transport
Freezer at CS location, cold
transport to AC and lab.
Possible transport from AC
to lab in 96% ethanol
In pollen Room temperature +
silica-gel storage
Dark dry storage in plastic
bag + silica-gel.
Pesticide
matrix
APIStrip Best matrix Recommended
Beehold tube Low functioning matrix Not recommended
Beebread Good matrix,
comparable to
Not recommended for
practical sampling reasons
1 - Rationale
Edition 1, June 2021 Page 12 of 88
Study
objectives
Tests Outcomes Recommendations References/
deliverables
APIStrip but less
consistent
Trapped
pollen
low functioning matrix Not recommended
Number of
colonies for
pooled apiary
sample
3 colonies per
apiary
Minimally 2 colonies Minimally 2 colonies Report 2019
Monitoring
duration
6 months Minimally 6 months
based on pesticide
findings
6 months Report 2019
Sample
frequency
Bi-weekly
(fortnightly)
Minimally bi-weekly Minimally bi-weekly Report 2019
Sample
transport
Post, Courier Courier Courier Practical and
reliable, country
dependent
Sample
labelling
Sampling date
Sample code
Matrix
Beekeeper ID
Colony ID
Outcome
evaluation 2019
and 2020 study
APIStrip
storage
Storage test No difference in
pesticide degradation
as function of frozen
or room temperature
storage.
Room temperature storage
and ambient transport
See link
Pollen storage Preservation
test
See link
APIStrip 2020
evaluation
APIStrip
2019-2020
See link
7.2 Important links
7.2.1 Deliverable 1.2
Report on the best monitoring practice based on y1 to be ring-tested
7.2.2 Deliverable 3.2
Citizen science investigation for pesticides in apicultural products
7.2.3 Report year 1
Final Report Year 1
1 - Rationale
Edition 1, June 2021 Page 13 of 88
7.2.4 Scientific publications
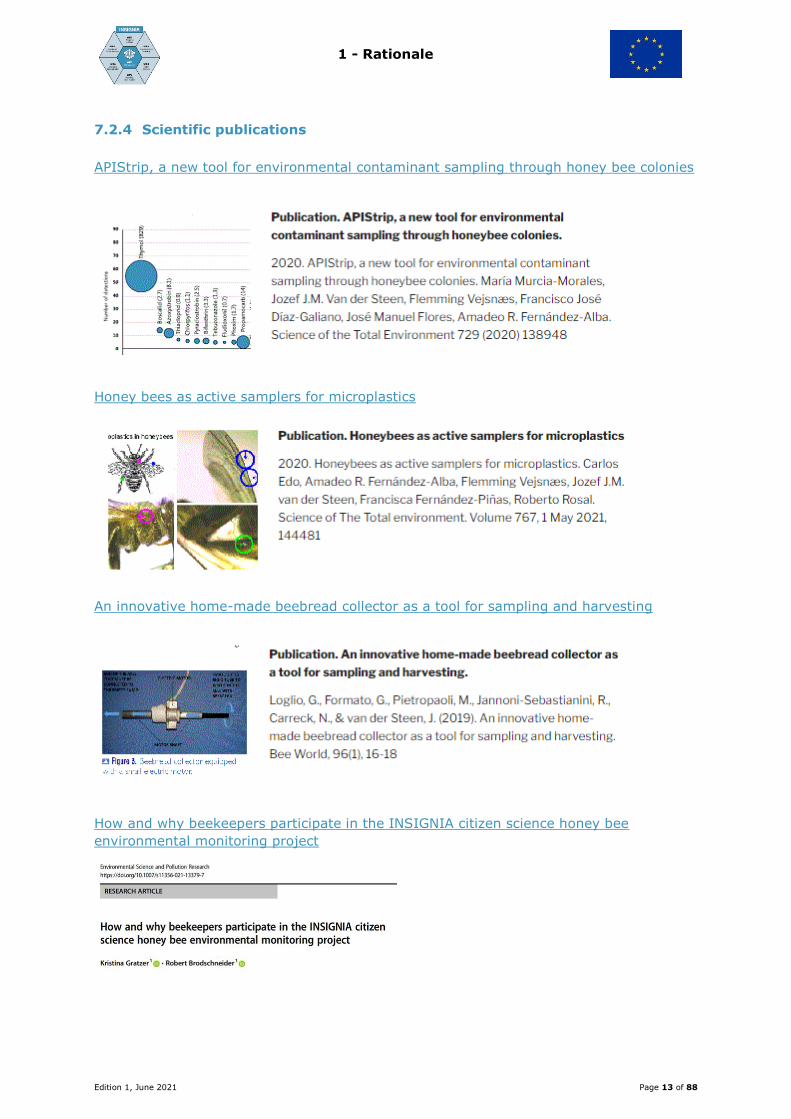
APIStrip, a new tool for environmental contaminant sampling through honey bee colonies
Honey bees as active samplers for microplastics
An innovative home-made beebread collector as a tool for sampling and harvesting
How and why beekeepers participate in the INSIGNIA citizen science honey bee
environmental monitoring project
1 - Rationale
Edition 1, June 2021 Page 14 of 88
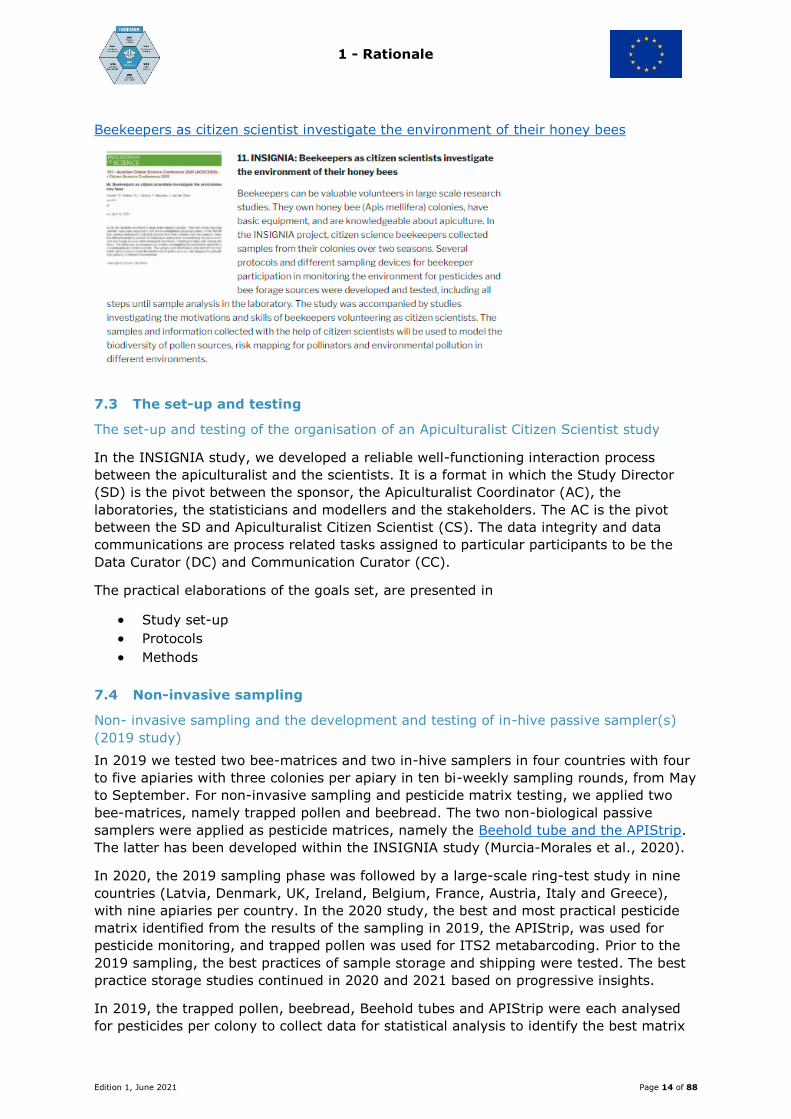
Beekeepers as citizen scientist investigate the environment of their honey bees
7.3 The set-up and testing
The set-up and testing of the organisation of an Apiculturalist Citizen Scientist study
In the INSIGNIA study, we developed a reliable well-functioning interaction process
between the apiculturalist and the scientists. It is a format in which the Study Director
(SD) is the pivot between the sponsor, the Apiculturalist Coordinator (AC), the
laboratories, the statisticians and modellers and the stakeholders. The AC is the pivot
between the SD and Apiculturalist Citizen Scientist (CS). The data integrity and data
communications are process related tasks assigned to particular participants to be the
Data Curator (DC) and Communication Curator (CC).
The practical elaborations of the goals set, are presented in
Study set-up
Protocols
Methods
7.4 Non-invasive sampling
Non- invasive sampling and the development and testing of in-hive passive sampler(s)
(2019 study)
In 2019 we tested two bee-matrices and two in-hive samplers in four countries with four
to five apiaries with three colonies per apiary in ten bi-weekly sampling rounds, from May
to September. For non-invasive sampling and pesticide matrix testing, we applied two
bee-matrices, namely trapped pollen and beebread. The two non-biological passive
samplers were applied as pesticide matrices, namely the Beehold tube and the APIStrip.
The latter has been developed within the INSIGNIA study (Murcia-Morales et al., 2020).
In 2020, the 2019 sampling phase was followed by a large-scale ring-test study in nine
countries (Latvia, Denmark, UK, Ireland, Belgium, France, Austria, Italy and Greece),
with nine apiaries per country. In the 2020 study, the best and most practical pesticide
matrix identified from the results of the sampling in 2019, the APIStrip, was used for
pesticide monitoring, and trapped pollen was used for ITS2 metabarcoding. Prior to the
2019 sampling, the best practices of sample storage and shipping were tested. The best
practice storage studies continued in 2020 and 2021 based on progressive insights.
In 2019, the trapped pollen, beebread, Beehold tubes and APIStrip were each analysed
for pesticides per colony to collect data for statistical analysis to identify the best matrix

1 - Rationale
Edition 1, June 2021 Page 15 of 88
for pesticide detection and for identification of botanical origin of pollen via ITS2
metabarcoding.
According to the proposal in the Grant Agreement, in 2020 we applied pooling of the
samples from different colonies within the apiary. The rationale behind this apiary-
pooling was that the focus of this bio-monitoring study is on the environment, and as
honey bee colonies in an apiary each cover different foraging areas, the apiary provides
more comprehensive and accurate information about the environment than a single
colony.
The number of colonies, sampling frequency and best matrices were chosen based on the
individual colony data of the statistical analyses for 2019. Based on the individual colony
data, we decided to sample 2 colonies per apiary in a bi-weekly sampling scheme for
pesticides with the APIStrip in-hive exposure, and for pollen with a one-day pollen
trapping every two weeks. In the 2020 sampling, the pollen samples of both colonies
were pooled per sampling date. The details of pooling and shipping to the labs are
described in chapter 2-Study set-up and 3-Protocols.
7.5 Pesticide residue analysis and pollen ITS2 metabarcoding
7.5.1 The pesticide residue analyses
In both laboratories of the Benaki Phytopathological Institute (Greece) and the University
of Almeria (Spain), the residue extractions and analyses were performed identically on all
samples. The division of samples between laboratories was agreed prior to the beginning
of the sampling rounds. The extraction of the APIStrip was performed in acetonitrile
according to the established procedure (Murcia-Morales et al., 2020). For the vast
majority of compounds, the limits of quantification were set as 0.5 nanograms per gram
of Tenax (parts per billion, ppb). When a pesticide residue was detected, but the
calculated concentration was below 0.5 ppb, it was reported as “< LOQ”, meaning that it
was present in the sample at trace levels. The analysis list comprises 272 pesticides,
included in the multiresidue methods of both laboratories. The details/ analysis protocols
are presented in chapter 4-Methods.
7.5.2 Botanical identification of mixed-pollen samples by ITS2 metabarcoding
Molecular identification of the botanical origin of pollen, in mixed bee-collected pollen
pellets, beebread and in the non-biological matrix Beehold tube, was performed by DNA
metabarcoding using high-throughput sequencing (HTS) with the nuclear barcoding
marker ITS2 (internal transcribed spacer 2 regions of nuclear ribosomal DNA). To that
end, first, DNA was extracted from pollen using the NucleoSpin Food kit of Macherey-
Nagel with an in-house-made combination of zirconia beads of varying sizes to assure
exine rupture of pollen grains of varying sizes. The DNA extracts were then analysed
using the ITS2 metabarcoding protocol. Briefly, DNA extracts were PCR-amplified with
the universal primers ITS-S2F (Chen et al., 2010) and ITS-S4R (White et al., 1990), as
part of an oligo scaffold that incorporates the MiSeq-specific adapters and the unique
indexes for multiplexing. PCRs were run in triplicate to account for PCR bias. Library
preparation for HTS was performed using a dual-indexing approach. The mixed pollen
samples were sequenced on the Illumina MiSeq platform using 2×250 cycles v2
chemistry for pools by approximately 380 samples. Analysis of sequence reads and taxa
assignments were performed using an improved and updated ITS2 reference database
and a bioinformatics pipeline modified from Sickel et al. (2015). The reference database
includes ITS2 sequences representing bee plants collected by the INSIGNIA consortium.
Prior to large-scale implementation of this metabarcoding protocol to samples collected

1 - Rationale
Edition 1, June 2021 Page 16 of 88
by citizen scientists in 2019 and 2020, sample storage / transportation, DNA extraction,
PCR conditions and primers were assessed and the protocols were optimised accordingly.
The protocols are presented in chapter 4-Methods.
The ITS2 reference library
The ITS2 sequence reads generated in the Illumina MiSeq platform for each mixed-pollen
sample were aligned with the sequences of the reference library, and taxonomic
classification was performed using the UTAX and RDP classifiers embedded in the
bioinformatics pipeline (Sickel et al., 2015). The success and accuracy of taxonomic
identification depends, to a large extent, on the quality and breadth of the reference
library; ideally, accurately curated sequences of every single plant species visited by the
colonies under study would be represented in the reference library. Additionally, the
more geographically suited that the reference library is, the more accurate can be the
classification at the species level; ideally, the library would only include ITS2 sequences
for the plant taxa occurring in the area visited by the colonies under study. To address
these issues, first the ITS2 reference library assembled by Sickel et al. (2015) was
updated with ITS2 sequences recently deposited in GenBank. Due to higher plant
diversity, and possibly to lower sequencing efforts, Mediterranean species are probably
underrepresented in GenBank. Although a greater breadth of the ITS2 database is
expected for northern Europe, not all species are represented in GenBank. Therefore, in
an attempt to improve taxonomic classification of the mixed-pollen samples, bee plants
(list prepared by INSIGNIA) identified to the species level were gathered from across
Europe by ACs and shipped dried to IPB for Sanger-sequencing of ITS2. The newly
developed sequences were added to the ITS2 reference library. Secondly, the
GBIF (https://www.gbif.org/) and the EurMed Plant
(https://www.emplantbase.org/home.html) databases were used for generating the lists
of plant taxa occurring in the INSIGNIA countries.
1 - Rationale
Edition 1, June 2021 Page 17 of 88
7.5.3 Pesticide exposure risk mapping
Risk modelling / evaluation of the CORINE database for its applicability to bees
In order to process the acquired monitoring data into risk maps, two modelling
approaches were tested. Firstly, an approach applying mechanistic modelling of
landscape-level pollen foraging of honey bees was used. This was based on the CORINE
database, and an assessment was made of how well landscape-level exposure risk
modelling can be performed using CORINE data. An adapted version of the nectar
foraging model of Baveco et al. (2016) was used to analyse the landscape around the
hive location for the distance-weighted amount of CORINE landcover classes that were
potential sources of pollen or pesticides returned to a hive, as indicated by the results of
the monitoring campaign. Secondly, a statistical / machine-learning based approach was
used where the relationships between CORINE landscape characteristics and exposure
risk and pollen diversity were directly obtained from the data collected in INSIGNIA. With
the model, predictions can be made for a new location at the country-scale. Both
modelling approaches provide the means to produce risk maps of honey bee pesticide
exposure, as well as maps of pollen diversity. In addition, within the application of these
two modelling approaches the potential of the CORINE data set for use in such detailed
spatial modelling was evaluated.
7.5.4 The Apiculturalist Citizen Scientist (CS), sociological study and profile
The mission and definition of citizen science is vividly debated, but normally, mainly
scientists and policy stakeholders have voice in this debate. In contrast, in INSIGNIA we
drew attention to how the citizen scientists themselves actively construct their own roles
within the project, in relation to both their histories and the project’s scientists. Drawing
on a set of in-depth interviews with participating Austrian beekeepers in the 2019 study
season, we showed that even within a small, relatively homogeneous sample of
participants there is considerable diversity in how the citizen scientists conceptualise their
roles.
In the 2020 study season several traits and attitudes of 69 volunteering beekeepers from
ten countries were surveyed. Beekeepers volunteering to participate in the INSIGNIA
study were mostly male and older than 55 years. Participants can be rated as
experienced in beekeeping, as shown by the number of colonies they manage (on
average 70) and a mean of circa 20 years of beekeeping experience. Knowing the target
group and their motivation will help in designing successful citizen science studies and
recruiting volunteers. We found that the motivation of beekeepers was similar to that of
other studies on environmental volunteer motivations, with helping the environment and
contributing to scientific knowledge being strong motivators. Our results suggest that
receiving laboratory analysis results of the samples from colonies is the most meaningful
way of appreciation for beekeepers, but not their primary reason for participation. Citizen
scientists ranked environment, beekeeping and science as the areas where they expected
the study to be most impactful. A citizen scientist beekeeper in this study on average
spent circa 12 working hours on sampling throughout the season. After the study, most
volunteers would participate in similar studies or recommend participation to other
beekeepers. We suggest that beekeepers have a great potential to help research in many
ways. The next steps for citizen science in honey bee research would be to create more
collaborative or co-created research projects, where beekeepers are also involved in
higher-level tasks like identifying research questions or study design.
1 - Rationale
Edition 1, June 2021 Page 18 of 88
7.6 Communications
7.6.1 In-consortium
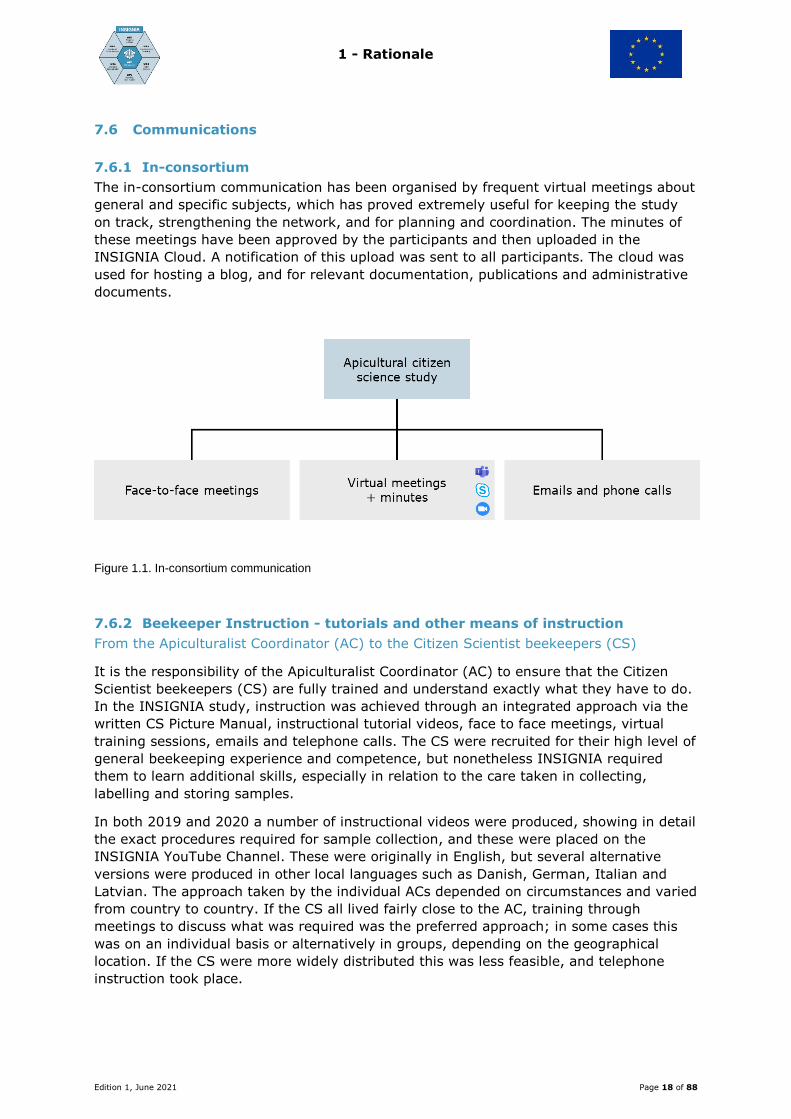
The in-consortium communication has been organised by frequent virtual meetings about
general and specific subjects, which has proved extremely useful for keeping the study
on track, strengthening the network, and for planning and coordination. The minutes of
these meetings have been approved by the participants and then uploaded in the
INSIGNIA Cloud. A notification of this upload was sent to all participants. The cloud was
used for hosting a blog, and for relevant documentation, publications and administrative
documents.
Figure 1.1. In-consortium communication
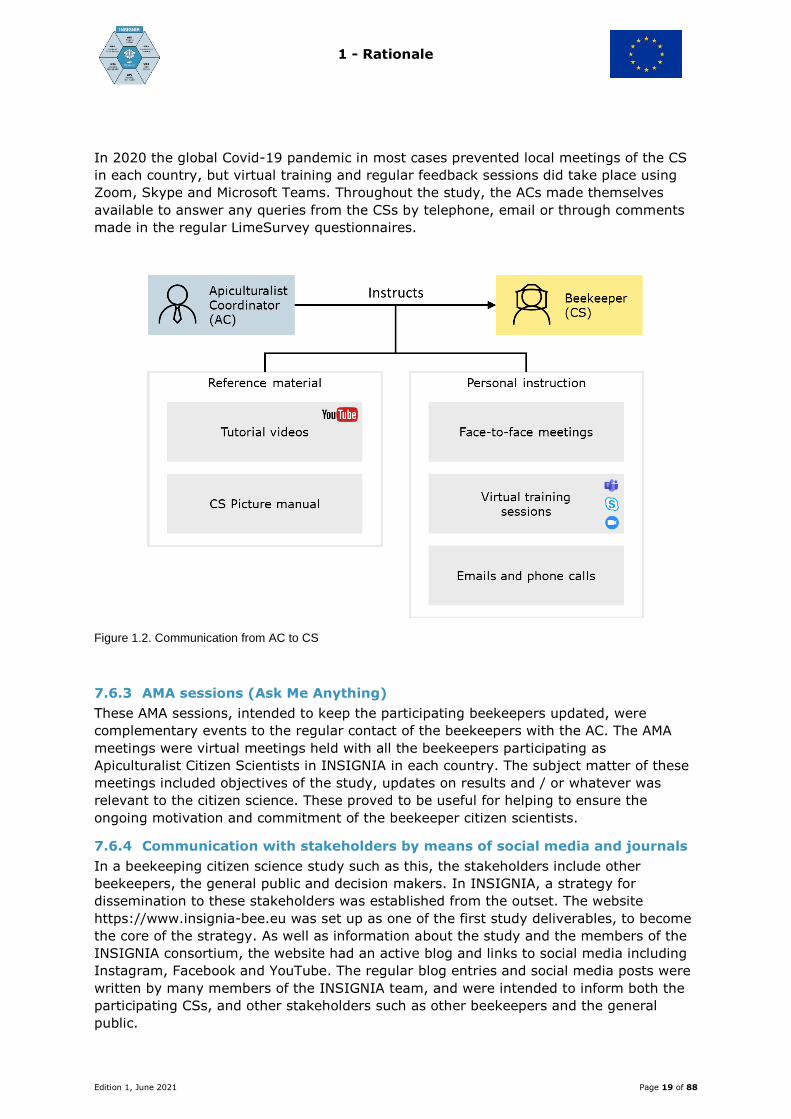
7.6.2 Beekeeper Instruction - tutorials and other means of instruction
From the Apiculturalist Coordinator (AC) to the Citizen Scientist beekeepers (CS)
It is the responsibility of the Apiculturalist Coordinator (AC) to ensure that the Citizen
Scientist beekeepers (CS) are fully trained and understand exactly what they have to do.
In the INSIGNIA study, instruction was achieved through an integrated approach via the
written CS Picture Manual, instructional tutorial videos, face to face meetings, virtual
training sessions, emails and telephone calls. The CS were recruited for their high level of
general beekeeping experience and competence, but nonetheless INSIGNIA required
them to learn additional skills, especially in relation to the care taken in collecting,
labelling and storing samples.
In both 2019 and 2020 a number of instructional videos were produced, showing in detail
the exact procedures required for sample collection, and these were placed on the
INSIGNIA YouTube Channel. These were originally in English, but several alternative
versions were produced in other local languages such as Danish, German, Italian and
Latvian. The approach taken by the individual ACs depended on circumstances and varied
from country to country. If the CS all lived fairly close to the AC, training through
meetings to discuss what was required was the preferred approach; in some cases this
was on an individual basis or alternatively in groups, depending on the geographical
location. If the CS were more widely distributed this was less feasible, and telephone
instruction took place.
1 - Rationale
Edition 1, June 2021 Page 19 of 88
In 2020 the global Covid-19 pandemic in most cases prevented local meetings of the CS
in each country, but virtual training and regular feedback sessions did take place using
Zoom, Skype and Microsoft Teams. Throughout the study, the ACs made themselves
available to answer any queries from the CSs by telephone, email or through comments
made in the regular LimeSurvey questionnaires.
Figure 1.2. Communication from AC to CS
7.6.3 AMA sessions (Ask Me Anything)
These AMA sessions, intended to keep the participating beekeepers updated, were
complementary events to the regular contact of the beekeepers with the AC. The AMA
meetings were virtual meetings held with all the beekeepers participating as
Apiculturalist Citizen Scientists in INSIGNIA in each country. The subject matter of these
meetings included objectives of the study, updates on results and / or whatever was
relevant to the citizen science. These proved to be useful for helping to ensure the
ongoing motivation and commitment of the beekeeper citizen scientists.
7.6.4 Communication with stakeholders by means of social media and journals
In a beekeeping citizen science study such as this, the stakeholders include other
beekeepers, the general public and decision makers. In INSIGNIA, a strategy for
dissemination to these stakeholders was established from the outset. The website
https://www.insignia-bee.eu was set up as one of the first study deliverables, to become
the core of the strategy. As well as information about the study and the members of the
INSIGNIA consortium, the website had an active blog and links to social media including
Instagram, Facebook and YouTube. The regular blog entries and social media posts were
written by many members of the INSIGNIA team, and were intended to inform both the
participating CSs, and other stakeholders such as other beekeepers and the general
public.

1 - Rationale
Edition 1, June 2021 Page 20 of 88
Lectures, presentations and talks about the study have been given by various team
members at a range of meetings, from international platforms such as the Apimondia
International Apicultural Congress in Canada, the Apimondia Bee Health Symposium in
Italy and the COLOSS Asia Conferences in Thailand and Japan, through national and
regional beekeepers meetings to local meetings of individual beekeepers’ associations.
Several articles arising from the study have been written and then translated into many
local languages for publication in many local beekeeping journals.
A regular series of “Notes for stakeholders” have also been produced on a range of
topics, and were distributed via a mailing list comprising beekeeping associations,
environmental journalists, editors of beekeeping magazines, relevant government
ministries, and relevant non-governmental organisations.
Figure 1.3. Consortium outward communication
1 - Rationale
Edition 1, June 2021 Page 21 of 88
8 References
Alexandrova, M., Porrini, C., Bazzi, C., Carpana, E., Bigliardi, M. & Sabatini, A.G.
(2002). Erwinia amylovora longevity in beehives, beehive products and honeybees. Acta
Hortic. 590, 201-205. DOI: 10.17660/ActaHortic.2002.590.29
Anderson, K. E., Carroll, M. J., Sheehan, T. I. M., Mott, B. M., Maes, P., & Corby‐Harris,
V. (2014). Hive‐stored pollen of honey bees: many lines of evidence are consistent with
pollen preservation, not nutrient conversion. Molecular Ecology, 23(23), 5904-5917.
Bankova, V. S., de Castro, S. L., & Marcucci, M. C. (2000). Propolis: recent advances in
chemistry and plant origin. Apidologie, 31(1), 3-15.
Beekman, M., & Ratnieks, F. L. W. (2000). Long‐range foraging by the honey‐bee, Apis
mellifera L. Functional Ecology, 14(4), 490-496.
Burdock, G. A. (1998). Review of the biological properties and toxicity of bee propolis
(propolis). Food and Chemical Toxicology, 36(4), 347-363.
Brandstetter, M., Crailsheim, K., Heran, H. 1988. Provision of food in the honey bee before
foraging. In BIONA report 6, Akas. Wiss. U. Lit. Mainz. Fischer Stuttgard, pp 129-148.
Brodschneider, R., Hrassnigg, N., Vollmann, J., Petz, M., Riessberger-Gallé, U., &
Crailsheim, K. (2007). Liquid nutrition within a honeybee colony–who feeds.
Apidologie, 38, 492.
Bromenshenk, J. J., Carlson, S. R., Simpson, J. C., & Thomas, J. M. (1985). Pollution
monitoring of Puget Sound with honey bees. Science, 227(4687), 632-634.
Carroll, M. J., Brown, N., Goodall, C., Downs, A. M., Sheenan, T. H., & Anderson, K. E.
(2017). Honey bees preferentially consume freshly-stored pollen. PLoS One, 12(4).
e0175933.
Chauzat, M. P., Faucon, J. P., Martel, A. C., Lachaize, J., Cougoule, N., & Aubert, M.
(2006). A survey of pesticide residues in pollen loads collected by honey bees in
France. Journal of Economic Entomology, 99(2), 253-262.
Chen S, Yao H, Han J, Liu C, Song J, Shi L et al (2010) Validation of the ITS2 region as a
novel DNA barcode for identifying medicinal plant species. PLoS One, 5:e8613.
Conti, M. E., & Botrè, F. (2001). Honeybees and their products as potential bioindicators
of heavy metals contamination. Environmental Monitoring and Assessment, 69(3), 267-
282.
Crailsheim, K., Schneider, L. H. W., Hrassnigg, N., Bühlmann, G., Brosch, U.,
Gmeinbauer, R., & Schöffmann, B. (1992). Pollen consumption and utilization in worker
honeybees (Apis mellifera carnica): dependence on individual age and function. Journal
of Insect Physiology, 38(6), 409-419.
Degrandi-Hoffman, G., Hoopingarner, R., & Klomparens, K. (1986). Influence of honey
bee (Hymenoptera: Apidae) in-hive pollen transfer on cross-pollination and fruit set in
apple. Environmental Entomology, 15(3), 723-725.
1 - Rationale
Edition 1, June 2021 Page 22 of 88
DeGrandi-Hoffman, G., & Hagler, J. (2000). The flow of incoming nectar through a honey
bee (Apis mellifera L.) colony as revealed by a protein marker. Insectes Sociaux, 47(4),
302-306.
Eyer, M., Neumann, P., & Dietemann, V. (2016). A look into the cell: honey storage in
honey bees, Apis mellifera. PLoS One, 11(8), e0161059.
Free, J. B., & Williams, I. H. (1972). The transport of pollen on the body hairs of
honeybees (Apis mellifera L.) and bumblebees (Bombus spp. L.). Journal of Applied
Ecology, 609-615.
Free, J.,B. Factors determining the collection of pollen by honeybee foragers. Animal
Behaviour, 15(1), 134-144.
Johnson, R. M., Ellis, M. D., Mullin, C. A., & Frazier, M. (2010). Pesticides and honey bee
toxicity–USA. Apidologie, 41(3), 312-331.
Garbuzov, M., Schürch, R., & Ratnieks, F. L. (2015). Eating locally: dance decoding
demonstrates that urban honey bees in Brighton, UK, forage mainly in the surrounding
urban area. Urban Ecosystems, 18(2), 411-418.
Gérez, N., Pérez-Parada, A., Cesio, M. V., & Heinzen, H. (2017). Occurrence of pesticide
residues in candies containing bee products. Food Control, 72, 293-299.
Kühnholz, S., & Seeley, T. D. (1997). The control of water collection in honey bee
colonies. Behavioral Ecology and Sociobiology, 41(6), 407-422.
Lozano, A., Hernando, M. D., Uclés, S., Hakme, E., & Fernández-Alba, A. R. (2019).
Identification and measurement of veterinary drug residues in beehive products. Food
Chemistry, 274, 61-70.
Maragou, N. C., Pavlidis, G., Karasali, H., & Hatjina, F. (2016). Cold vapor atomic
absorption and microwave digestion for the determination of mercury in honey, pollen,
propolis and bees of Greek origin. Global NEST Journal, 18(4), 690-696.
Maragou, N. C., Pavlidis, G., Karasali, H., & Hatjina, F. (2017). Major and minor element
levels in Greek apicultural products. Global Nest J, 19, 423-429.
Michielsen, M.C. 2017. The in-hive pollen distribution and beebread residence time. BSc
thesis, University of Amsterdam.
Murcia-Morales, M., Van der Steen, J. J., Vejsnæs, F., Díaz-Galiano, F. J., Flores, J. M., &
Fernández-Alba, A. R. (2020). APIStrip, a new tool for environmental contaminant
sampling through honeybee colonies. Science of The Total Environment, 729, 138948.
Nicolson, S. W. (2009). Water homeostasis in bees, with the emphasis on
sociality. Journal of Experimental Biology, 212(3), 429-434.
Paalhaar, J., Boot, W. J., Van Der Steen, J. J. M., & Calis, J. N. M. (2007). In-hive pollen
transfer between bees enhances cross-pollination of plants. ENT-80430 in Dept. of
Entomology., Wageningen University and Research, Wageningen.
Pareja, L., Colazzo, M., Pérez-Parada, A., Niell, S., Carrasco-Letelier, L., Besil, N., Cesia,
M.V. & Heinzen, H. (2011). Detection of pesticides in active and depopulated beehives in
1 - Rationale
Edition 1, June 2021 Page 23 of 88
Uruguay. International Journal of Environmental Research and Public Health, 8(10),
3844-3858.
Perkins, R., Whitehead, M., Civil, W., & Goulson, D. (2020). Potential role of veterinary
flea products in widespread pesticide contamination of English rivers. Science of the Total
Environment, 143560.
Roessink, I., & van der Steen, J.J.M. (2021) Beebread consumption by honey bees is
fast: results of a six-weeks field-study. Journal of Apicultural Research. Accepted 18 Feb
2021.
Schatz, F., & Wallner, K. (2009). Pflanzenschutzmittelapplikation in blühenden raps
(Brassica napus) und deren auswirkungen auf die rückstandssituation in honig, nektar
und pollen der honigbiene (Apis mellifera L.) Doctoral dissertation, Thesis (Diploma),
Universität Hohenheim, Hohenheim, Germany.
Sickel, W. et al. (2015). Increased efficiency in identifying mixed pollen samples by
meta-barcodingwith a dual-indexing approach. BMC Ecology, 15(1), p 20.
Steen, J. J.M van der, Cornelissen, B., Donders, J., Blacquière, T., & van Dooremalen, C.
(2012). How honey bees of successive age classes are distributed over a one storey, ten
frames hive. Journal of Apicultural Research, 51(2), 174-178.
Steen, J. J. M. van der, Cornelissen, B., Blacquière, T., Pijnenburg, J. E. M. L., &
Severijnen, M. (2016). Think regionally, act locally: metals in honeybee workers in the
Netherlands (surveillance study 2008). Environmental Monitoring and Assessment,
188(8), 463.
Steen, J. J. M., van der (2016). Beehold: the colony of the honeybee (Apis mellifera L) as
a bio-sampler for pollutants and plant pathogens. PhD thesis, Wageningen University and
Research. http://edepot.wur.nl/375348
Steen, J. J. M. van der, Bergsma-Vlami, M., & Wenneker, M. (2018). The Perfect Match:
Simultaneous Strawberry Pollination and Bio-Sampling of the Plant Pathogenic Bacterium
Erwinia pyrifoliae by Honey Bees Apis mellifera. Sustainable Agriculture Research, 7(526-
2020-417), 25-32.
Vaissiére, B. E., Rodet, G., Cousin, M., Botella, L., & TorrÉ Grossa, J. P. (1996).
Pollination effectiveness of honey bees (Hymenoptera: Apidae) in a kiwifruit
orchard. Journal of Economic Entomology, 89(2), 453-461.
Visscher, P. K., & Seeley, T. D. (1982). Foraging strategy of honeybee colonies in a
temperate deciduous forest. Ecology, 63(6), 1790-1801.
Waddington, K. D., Herbert, T. J., Visscher, P. K., & Richter, M. R. (1994). Comparisons
of forager distributions from matched honey bee colonies in suburban
environments. Behavioral Ecology and Sociobiology, 35(6), 423-429.
Wael, L. de. (1988). De honingbij als mogelijke vector fan, Erwinia amylovora (Burr)
Winslow et al. Proefschrift Faculteit van de Landbouwwetenschappen Gent.
Westerkamp, C. (1991). Honeybees are poor pollinators—why?. Plant Systematics and
Evolution, 177(1-2), 71-75.
1 - Rationale
Edition 1, June 2021 Page 24 of 88
White, T.J., Bruns, T., Lee, S., Taylor, J.W. (1990). Amplification and direct sequencing
of fungal ribosomal RNA genes for phylogenetics. In: Innis MA, Gelfand DH, Sninsky JJ,
White TJ (eds) PCR protocols: a guide to methods and applications. Academic Press, New
York, pp 315–322.
WUR. https://www.wur.nl/nl/Dossiers/dossier/Citizen-science-burgerwetenschap.htm
Wikipedia. https://en.wikipedia.org/wiki/Citizen_science
Winston, M. L. (1991). The Biology of The Honey bee. Harvard University Press.
UNAF 2018. How pesticides used in livestock farming threaten bees veterinary
treatments, biocidal products & pollinating insects. A UNAF report
8e8ea4_467b544292764eb695ff0d14c86eeb86.pdf (filesusr.com)
2 - Study set-up
Edition 1, June 2021 Page 25 of 88
2 - Study set-up
Tasks - responsibilities - workflows of the Study Director, Apiculturalist Coordinator, Data
Curator and Communication Curator

2 - Study set-up
Edition 1, June 2021 Page 26 of 88
Content
Introduction .........................................................................................................27
List of abbreviations...........................................................................................27
1 Study Plan .....................................................................................................28
2 Research integrity* .........................................................................................28
3 Study process ................................................................................................29
4 Study Director - tasks and responsibilities .........................................................30
5 Apiculturalist Coordinator - tasks and responsibilities ..........................................31
5.1 Apiculturalist Coordinator and Apiculturalist Citizen Scientist (AC and CS) .......32
5.1.1 Recruitment .....................................................................................32
5.1.2 Citizen scientist number for sample- and data warehouse recordings ......32
5.1.3 Information and contact ....................................................................32
5.1.4 Instruction of the CS .........................................................................33
5.1.5 Toolbox ...........................................................................................33
5.1.6 Instructions for sample labelling .........................................................33
5.1.7 Samples from the CS to the AC ..........................................................35
5.2 Sample handling by the AC after arrival from the CS .....................................35
5.2.1 Label check ......................................................................................35
5.2.2 AC journal ........................................................................................35
5.3 Pooling ....................................................................................................36
5.4 Sample storage till shipment to the laboratories ...........................................37
5.5 Shipping samples from the AC to the laboratories .........................................37
5.6 Laboratory sample identification .................................................................37
6 Data integrity and communication ....................................................................37
6.1 Online questionnaire survey program and data warehouse .............................38
6.1.1 Automated communication .................................................................39
6.1.2 The online survey questionnaire .........................................................39
6.1.3 Summary sample flow .......................................................................40
6.1.4 Flowchart of communication with the Apiculturalist Citizen Scientist (CS) .40
2 - Study set-up
Edition 1, June 2021 Page 27 of 88
Introduction
The Study Director (SD) has the responsibility for the study in all its aspects. The SD
coordinates and participates in writing the study plan with the Apiculturalist Coordinator
(AC), the laboratory specialists, statisticians and modellers involved, according to
scientific standards. He / she is the pivot between the sponsor, the AC, the analytical
laboratories, the statisticians and modellers and the stakeholders. This function
comprises responsibilities for study coordination, study progress, study quality,
coordination of CS instruction, data integrity, data storage, reporting to the sponsor
about study content and finances, organising the communication routes, both internal
and external, and the final study report.
The Apiculturalist Coordinator (AC) is responsible for the practical implementation and
the course of the citizen science study in a particular country or region. He / she is the
pivot between the SD and the Apiculturalist Citizen Scientist (CS). The function
responsibilities comprise the recruitment of the apiculturalist CS, the content and
assembly of the toolbox, the sample quality in terms of labelling, storage, transfer from
CS to AC and subsequently from the AC to the laboratories, the sample flow recording
and layman reporting to the participating CS.
Data integrity and communication, both internal and external, are key processes in the
Apicultural citizen science study. Although the SD is responsible for these processes and
the AC for the practical implementation, these processes have such a comprehensive
range that specific tasks should be delegated to control the process. The Data Curator
and Communication Curator tasks and processes are described in a separate paragraph
“Data integrity and communication“.
The study plan process is worked out in the paragraph “Study Plan”. The role of the SD
and AC is depicted in a flow chart and process descriptions are shown in the paragraphs
“Study Director” and “Apiculturalist Coordinator”. Data integrity and communication
processes are presented in the paragraph “Data integrity and communication”.
List of abbreviations
SD: Study Director
AC: Apiculturalist Coordinator
DC: Data Curator
CC: Communication Curator
CS: Apiculturalist Citizen Scientist
2 - Study set-up
Edition 1, June 2021 Page 28 of 88
1 Study Plan
Every research study starts with a question or hypothesis, formulated in a study
proposal. A key process to turn a study proposal into a study plan is the question
articulation, in other words, what exactly is the question or hypothesis? Next, this
defined research question must be translated into a study plan.
In practice, a sponsor formulates a research question and an institute or consortium will,
after verification of the definite study question, make the study plan.
In Apicultural citizen science, the study plan process is an interplay between a SD, an AC,
and the scientific specialists (e.g. chemists, geneticists, molecular biologists, statisticians,
modellers, environmentalists) involved in the study. The AC is the beekeeping specialist.
In this interplay the practical possibility, scientific standards, financial and manpower
possibilities are weighed, in order to come to a balanced study plan with timelines,
responsibilities and processes. This study plan is submitted to the sponsor who posed the
research question.
In an Apicultural citizen science study plan, the key process is the collaboration and
interactions between the SD and the AC, a strict sampling or recording timeline, a well-
defined protocol for the beekeepers, the actual citizen scientists, and an adequate
toolbox for the beekeepers to do the job. The study plan comprises the layout of the
study, the study course, the responsibilities on all levels - from beekeeper, via the AC
through to the SD - and the processes like the instructions, communication, recordings
and reporting, research integrity and overall data integrity.
2 Research integrity*
Research integrity means conducting research in a way which allows others to have trust
and confidence in the methods used and the findings that result from this. Researchers
are expected to abide by the standards of research integrity:
Honesty in all aspects of research including
o Presentation of research goals, intentions and findings;
o Reporting on research methods and procedures;
o Gathering data;
o Using and acknowledging the work of other researchers;
o Conveying valid interpretations and making justifiable claims based on
research findings.
Scrupulous care, thoroughness and excellence in research practice
o In performing research and using appropriate methods;
o In adhering to an agreed protocol where appropriate;
o In drawing interpretations and conclusions from the research;
o In communicating the results.
Transparency and open communications
o In declaring conflicts of interest;
o In reporting of research data collection methods, including the re-use of data
collected for other purposes;
o In analysis and interpretation of data;
o In making research findings widely available, including sharing negative
results as appropriate;
o In presenting the work to other researchers and to the general public.
2 - Study set-up
Edition 1, June 2021 Page 29 of 88
Care and respect for
o All participants in and subjects of research, including humans, animals, the
environment and cultural objects;
o The stewardship of research and scholarship for future generations.
* The definition of research integrity presented is quoted from the University of Bath,
UK (Definition of research integrity (bath.ac.uk))
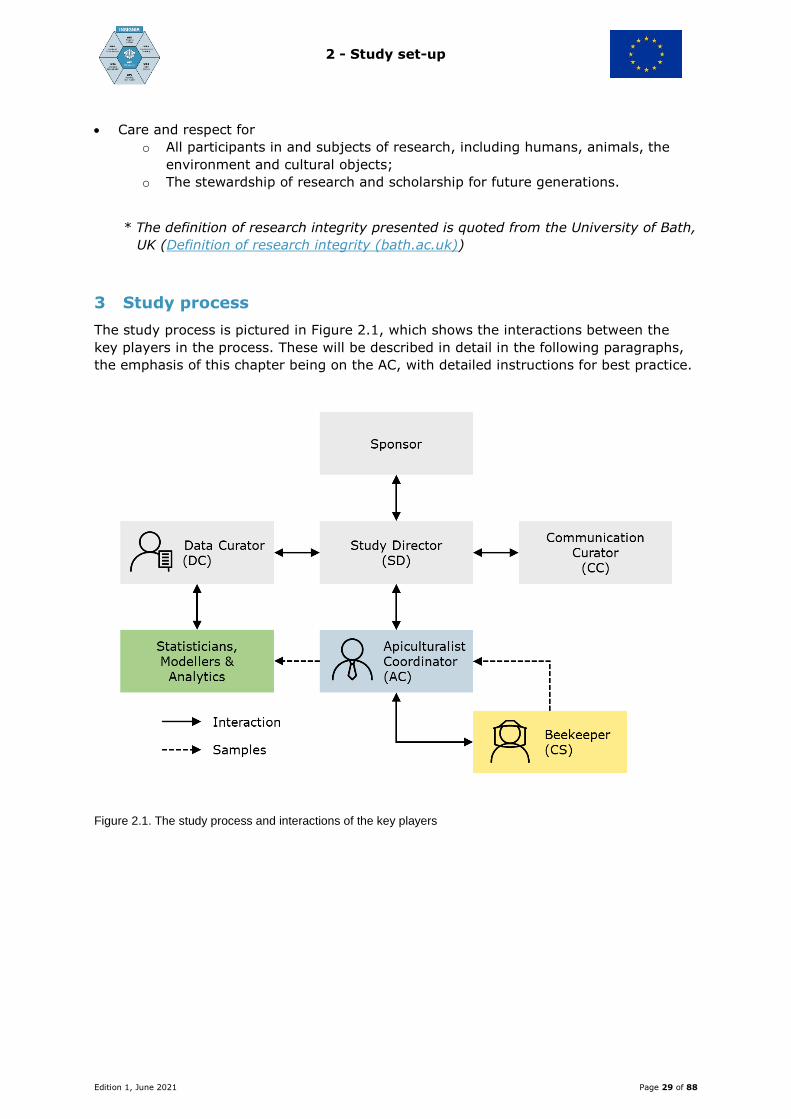
3 Study process
The study process is pictured in Figure 2.1, which shows the interactions between the
key players in the process. These will be described in detail in the following paragraphs,
the emphasis of this chapter being on the AC, with detailed instructions for best practice.
Figure 2.1. The study process and interactions of the key players
2 - Study set-up
Edition 1, June 2021 Page 30 of 88
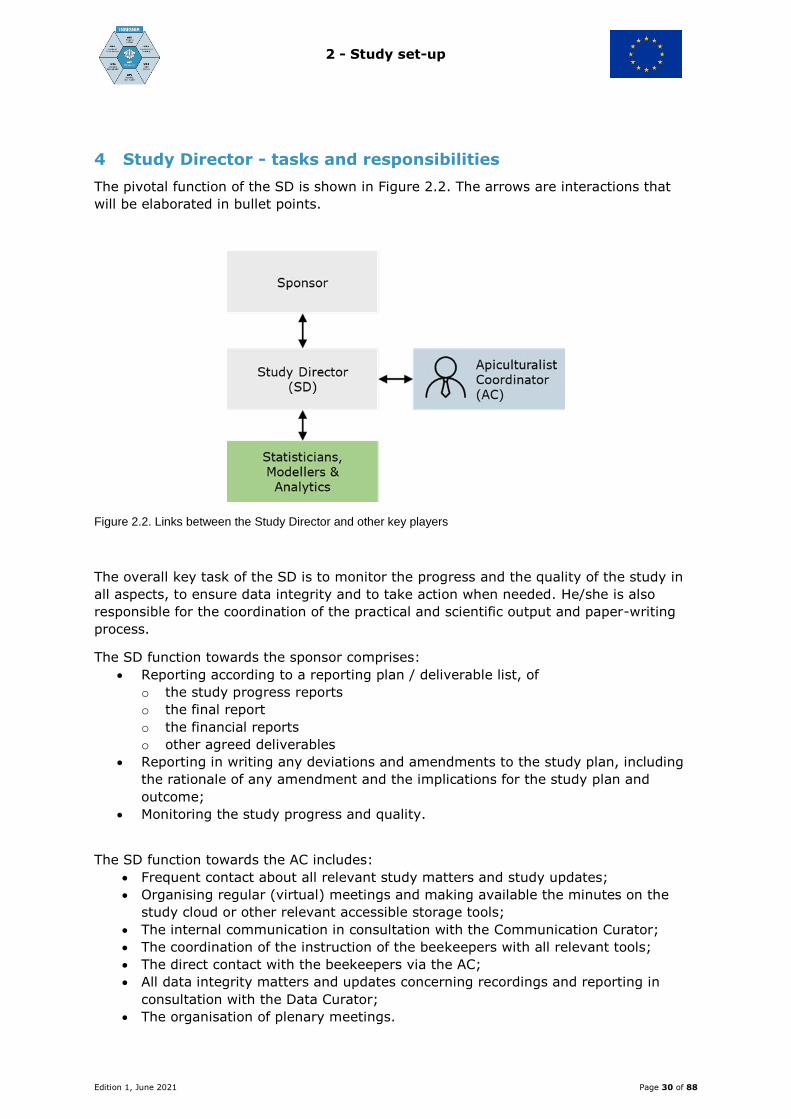
4 Study Director - tasks and responsibilities
The pivotal function of the SD is shown in Figure 2.2. The arrows are interactions that
will be elaborated in bullet points.
Figure 2.2. Links between the Study Director and other key players
The overall key task of the SD is to monitor the progress and the quality of the study in
all aspects, to ensure data integrity and to take action when needed. He/she is also
responsible for the coordination of the practical and scientific output and paper-writing
process.
The SD function towards the sponsor comprises:
Reporting according to a reporting plan / deliverable list, of
o the study progress reports
o the final report
o the financial reports
o other agreed deliverables
Reporting in writing any deviations and amendments to the study plan, including
the rationale of any amendment and the implications for the study plan and
outcome;
Monitoring the study progress and quality.
The SD function towards the AC includes:
Frequent contact about all relevant study matters and study updates;
Organising regular (virtual) meetings and making available the minutes on the
study cloud or other relevant accessible storage tools;
The internal communication in consultation with the Communication Curator;
The coordination of the instruction of the beekeepers with all relevant tools;
The direct contact with the beekeepers via the AC;
All data integrity matters and updates concerning recordings and reporting in
consultation with the Data Curator;
The organisation of plenary meetings.
2 - Study set-up
Edition 1, June 2021 Page 31 of 88
The SD function towards the analytical laboratories, statisticians and modellers
comprises:
Frequent contact about the analytical process;
Clarifying and resolving through discussion any issues that arise;
The organisation and checks of the uniformity of the sample identifications;
Providing the statisticians and modellers with the relevant data files, being entries
of the data warehouse, in collaboration with the Data Curator;
The organisation of the plenary meetings.
The SD function towards the stakeholders comprises:
Organising the communication with the stakeholders, in consultation with the
Communication Curator, via e.g. notes and bee journal articles;
Being the addressee for the stakeholders.
5 Apiculturalist Coordinator - tasks and responsibilities
The AC is responsible for the practical implementation of the study plan and is the pivot
in the Apicultural citizen science study, as shown in the flow chart in the section “Study
process“. In practice, the AC organises the local part of the study, that is the actual
sampling in a particular area / region / country and all requirements for adequate
sampling. The AC is a co-operator with the Data Curator and co-operator with the
Communication Curator (paragraph "Data integrity and communication").
The AC interaction with the SD is shown in the SD paragraph.
The AC function towards the beekeeper comprises:
Recruitment of the beekeepers;
Assigning a CS number to each beekeeper;
Providing the beekeepers with all information of the "why and how" of the study
and its specific goals;
Instruction about the study protocol with all appropriate tools;
Providing the beekeepers with the toolbox to conduct the sampling and
recordings;
Being the contact person for the beekeepers;
Informing the beekeepers about the study progress and results.
The specific AC tasks are elaborated in the subparagraphs below.
The AC function towards the laboratories comprises the following:
During the study, the AC receives the samples taken by the beekeepers in pre-
appointed time slots and under pre-appointed conditions (protocols). The AC
checks the samples and labels and makes sure that the samples that will be sent
to the laboratories have the correct label information;
Sending of the samples, in conjunction with the analytical laboratories. The AC
makes sure that the transport is carried out with a reliable postal service and /or
courier, with tracking / tracing to follow the shipment;
The AC keeps records of the sample materials sent, sample returns and transport
to the laboratories, in the AC journal (record-keeping file);
According to Good Laboratory Practice (GLP) the original label follows the sample
to the laboratories, and these labels are stored by the laboratories along with the
analytical results for a minimum duration of seven (7) years or other time period
specified in the study plan;
2 - Study set-up
Edition 1, June 2021 Page 32 of 88
The AC takes care of correct sample labelling and sample pooling if necessary;
The AC is the intermediary between the laboratories and beekeepers in case of
specific issues arising;
The AC keeps correct recordings in the AC journal of the sample identification and
sample flow.
The AC function towards the statisticians and modellers is:
The analytical results are sent to the SD. Before sending the results to the
statisticians and modellers, the SD will be in contact with the AC for a label/coding
check;
During the statistical analyses and modelling processes, the AC will provide the
statisticians and modellers with any specific information needed, and will be
available to answer any queries relevant to the data and /or analyses.
5.1 Apiculturalist Coordinator and Apiculturalist Citizen Scientist (AC and CS)
5.1.1 Recruitment
The beekeepers who will participate in the study as citizen scientists (CS) are selected
and invited by the AC.
The basic conditions for a CS to participate are:
Internet access and an email address;
Having a minimum of 2 non-migrating honey bee colonies (well overwintered and
of average strength as generally accepted in the particular region);
Having time within the pre-determined sampling rounds to do the appointed pre-,
post-, and actual sampling activities;
Having an awareness of the environmental surroundings;
Being reliable in sticking to the agreements and appointments;
Being a skilled beekeeper;
Having an affinity to science, as a pre-condition for involvement as a CS.
5.1.2 Citizen scientist number for sample- and data warehouse recordings
In consultation with the Data Curator, the CS data and CS number are stored in the data
warehouse.
To the selected beekeepers a unique citizen scientist number (e.g. AT001, DK002,
GB003, LV001,…) is assigned, as agreed in the study plan.
5.1.3 Information and contact
The quality and reliability of the data / results concerning pesticides, pollen or anything
else sampled depends on the quality of the sampling. This constitutes the basis of any
monitoring study. Therefore, the CS must be well informed about the "why and how" of
the study set-up, its specific goals, the study progress and study results. It is up to the
AC to inform the CS about these and to place the role of the CS in perspective as a key
participant in the citizen scientist study. The basic condition for the relationship between
the AC and CS to be successful is open and clear communication. All communication
channels available in the study are at the disposal of the AC, including AMA (“ask me
anything”) meetings, WhatsApp groups, Signal groups, Facebook groups, or whatever is
applicable to keep in touch with the CS. These will assist if questions arise from the CS,
and will help to ensure the smooth running of the study and the continued and essential
engagement of the CS.
2 - Study set-up
Edition 1, June 2021 Page 33 of 88
5.1.4 Instruction of the CS
The importance of correct sampling, sample storage and sample transport is explained in
the previous subparagraph. This can only be achieved by crystal clear instructions.
Therefore instruction tools must be made, which are:
An instruction picture manual;
Links to tutorial and instruction movies;
Demonstrations or whatever is required for good instruction under the local
conditions, ideally on-site education near to the beekeeper;
These instructions comprise:
Strict (not to be misinterpretable) instruction for sample labelling / completion of
pre-printed labels;
Strict procedures for the actual sampling;
Strict instructions for sample storage at the beekeeper‘s premises;
Clear instructions plus adequate mailing boxes / envelopes for sample shipping to
the AC.
The instructions and procedures are subject-specific and will be elaborated in the
protocols in the Chapter “Protocols”. Examples are available on the INSIGNIA website
https://www.insignia-bee.eu.
5.1.5 Toolbox
Including sample tools, pre-printed labels and return-transport boxes/ envelopes.
The content of the “toolbox” is subject-specific and is specified in the “Protocols “. The AC
assembles the toolbox for the CS. This toolbox contains all materials needed for adequate
sampling, sample storage, sample labelling and sample shipping.
A toolbox for bee-monitoring by the honey bee colony, designed for the CS contains:
Tubes, bags and pencils. The pencil is mandatory because all ink-based pen
writing can be erased by alcohol, water or other solvents;
Non-biological passive samplers / matrices;
Supporting material for storage;
Pre-printed sample labels. This key aspect is elaborated in a sub-paragraph
“Instruction for sample labelling”;
Envelopes / boxes for sending back to the AC by the CS. This key aspect is
elaborated in a sub-paragraph “Samples from the CS to the AC“.
5.1.6 Instructions for sample labelling
All efforts in the recruitment, sampling, analytics, statistics, modelling and reports are
useless if there is not a solid, clear and unambiguous sample label that cannot be
misinterpreted.
It is mandatory for all AC involved in the study to use the same coding system for the
samples.
Any label should have the following information:
A country or region abbreviation;
Sampling subject / matrix;
CS ID;
Sampling date;
Sampling round.
All this information is additionally summarised in the sample ID on the label.

2 - Study set-up
Edition 1, June 2021 Page 34 of 88
The example below, applied in the INSIGNIA pesticide and pollen bee-monitoring study in
2020, meets these conditions. Also, for uniformity, the recommended practice is to
provide agreed templates on the study platform.
The label consists of five different elements (figure below):
The country code (e.g. Austria AT)
The CS ID name and number (example: Name of beekeeper with CS ID 001)
The sampling round (SR)
The colony number
The sample matrix
The sample ID completes the sample in the combination of the details: Country code –
CS ID Number - SR - Colony Number - sample matrix abbreviation.
Figure 2.3. Pollen label
Figure 2.4. APIStrip label
In the INSIGNIA study
The templates for the labels were available on the study platform (study cloud);
An online tool was available through the study platform;
o The labels must be in the correct language, therefore they need to be
translated (to make sure the citizen scientists understand the label) and
adapted for the particular country (country code, citizen scientist code,
sampling round).
o The labels need to be printed.
o The printed labels need to be placed inside the sample bags rather than
stuck on the outside. See the instruction / template in the box below.
The CS beekeepers were asked to make a (cell phone) photo of the labelled
sample before storing the samples. These photos were sent to their AC. The AC
checks the labels and contacts the CS in case of missing or incorrect parts of the
label.
The instructions must make it crystal clear what the CS must add to the labels, because
the samples will be processed by the AC (e.g. pollen will be split and sent to the
laboratory in ethanol; the other part will be stored in the AC’s freezer). The CS
instruction is elaborated in chapter 3-Protocols.
2 - Study set-up
Edition 1, June 2021 Page 35 of 88
5.1.7 Samples from the CS to the AC
The AC will pre-organise the transport from the CS to the AC by providing adequate free-
post package material and contact with a courier or postal service. This transport time
must be short, preferably within 3 days, to avoid degradation of samples. A simple data
logger can be added to record the transport conditions (Temperature (T) and Relative
Humidity (RH)).
5.2 Sample handling by the AC after arrival from the CS
5.2.1 Label check
The samples need to be checked for damage and for missing labels:
Has the CS filled in the sample ID? If yes, compare it to the other information on
the label and check whether it was assigned correctly. If not, the sample ID needs
to be allocated.
5.2.2 AC journal
The AC journal (e.g. offline Excel sheet, notebook) is kept by each AC, and combines the
original information from the beekeepers and the information for the labs. It gives the
opportunity to track the samples and every working step and has to be archived for the
required time period (7 years) by the AC or otherwise if required in the study plan.
The requirements are:
Correct recording of the pre-labels to be sent to the beekeepers and recording of
the sending dates;
Correct recording of arrival of samples from the beekeepers after sampling;
Correct recording of the samples and sample handling after return from the
beekeepers, as, for example:
NL001-SR01-P = Netherlands, beekeeper 1; sampling round 1; pollen sample
If samples (from a given apiary) are pooled, this can be recorded in several ways. For
example, for recording the pooling process of a pollen sample:
NL001-SR01-P = NL001-SR1-1-P + NL 001-SR1-2-P
or
NL001-SR01-P = NL001-SR1-1-P (not pooled because not enough pollen for
pooling)
or
NL001-SR01-P = NL 001-SR1-2-P (not pooled because not enough pollen for
pooling)
or
NO NL001-SR01-P sample because of holidays, private circumstances, etc.
Correct recording of samples and sample IDs and dates sent to the laboratories;
Recording of appointments and comments of the participants related to sampling;
Recording of shipment to the laboratories.
The Data Curator (DC) will export the data of an Online Survey of the AC’s country into
that country-specific spreadsheet (=journal).
The AC is responsible for his/her own study journal. It is used to check the samples, the
labs use it to add the day of sample arrival, to add notes and to add the lab code (if it
differs from the original sample ID).
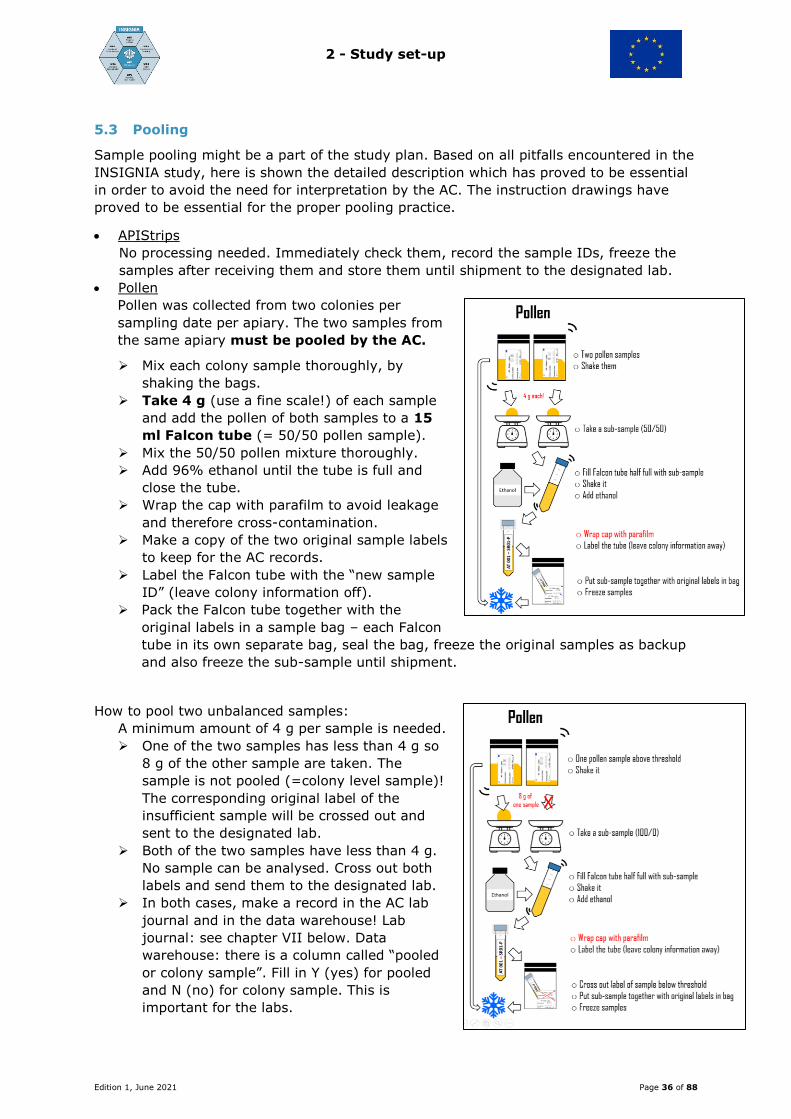
2 - Study set-up
Edition 1, June 2021 Page 36 of 88
5.3 Pooling
Sample pooling might be a part of the study plan. Based on all pitfalls encountered in the
INSIGNIA study, here is shown the detailed description which has proved to be essential
in order to avoid the need for interpretation by the AC. The instruction drawings have
proved to be essential for the proper pooling practice.
APIStrips
No processing needed. Immediately check them, record the sample IDs, freeze the
samples after receiving them and store them until shipment to the designated lab.
Pollen
Pollen was collected from two colonies per
sampling date per apiary. The two samples from
the same apiary must be pooled by the AC.
Mix each colony sample thoroughly, by
shaking the bags.
Take 4 g (use a fine scale!) of each sample
and add the pollen of both samples to a 15
ml Falcon tube (= 50/50 pollen sample).
Mix the 50/50 pollen mixture thoroughly.
Add 96% ethanol until the tube is full and
close the tube.
Wrap the cap with parafilm to avoid leakage
and therefore cross-contamination.
Make a copy of the two original sample labels
to keep for the AC records.
Label the Falcon tube with the “new sample
ID” (leave colony information off).
Pack the Falcon tube together with the
original labels in a sample bag – each Falcon
tube in its own separate bag, seal the bag, freeze the original samples as backup
and also freeze the sub-sample until shipment.
How to pool two unbalanced samples:
A minimum amount of 4 g per sample is needed.
One of the two samples has less than 4 g so
8 g of the other sample are taken. The
sample is not pooled (=colony level sample)!
The corresponding original label of the
insufficient sample will be crossed out and
sent to the designated lab.
Both of the two samples have less than 4 g.
No sample can be analysed. Cross out both
labels and send them to the designated lab.
In both cases, make a record in the AC lab
journal and in the data warehouse! Lab
journal: see chapter VII below. Data
warehouse: there is a column called “pooled
or colony sample”. Fill in Y (yes) for pooled
and N (no) for colony sample. This is
important for the labs.
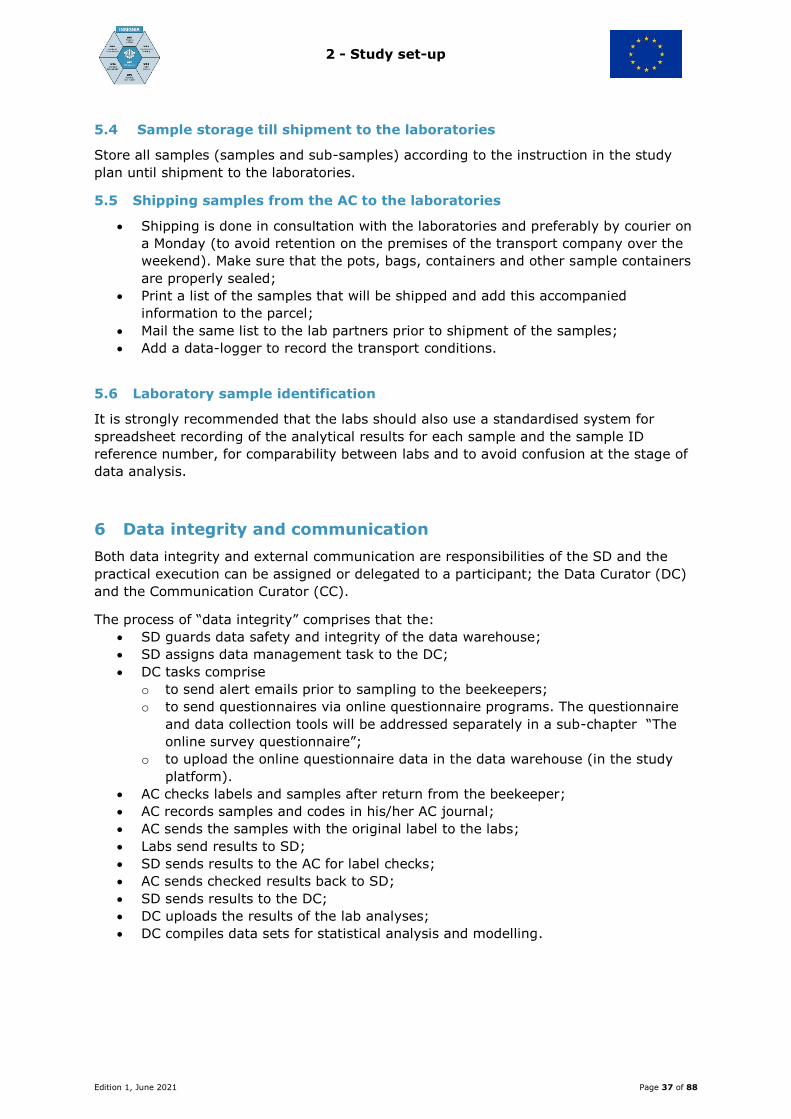
2 - Study set-up
Edition 1, June 2021 Page 37 of 88
5.4 Sample storage till shipment to the laboratories
Store all samples (samples and sub-samples) according to the instruction in the study
plan until shipment to the laboratories.
5.5 Shipping samples from the AC to the laboratories
Shipping is done in consultation with the laboratories and preferably by courier on
a Monday (to avoid retention on the premises of the transport company over the
weekend). Make sure that the pots, bags, containers and other sample containers
are properly sealed;
Print a list of the samples that will be shipped and add this accompanied
information to the parcel;
Mail the same list to the lab partners prior to shipment of the samples;
Add a data-logger to record the transport conditions.
5.6 Laboratory sample identification
It is strongly recommended that the labs should also use a standardised system for
spreadsheet recording of the analytical results for each sample and the sample ID
reference number, for comparability between labs and to avoid confusion at the stage of
data analysis.
6 Data integrity and communication
Both data integrity and external communication are responsibilities of the SD and the
practical execution can be assigned or delegated to a participant; the Data Curator (DC)
and the Communication Curator (CC).
The process of “data integrity” comprises that the:
SD guards data safety and integrity of the data warehouse;
SD assigns data management task to the DC;
DC tasks comprise
o to send alert emails prior to sampling to the beekeepers;
o to send questionnaires via online questionnaire programs. The questionnaire
and data collection tools will be addressed separately in a sub-chapter “The
online survey questionnaire”;
o to upload the online questionnaire data in the data warehouse (in the study
platform).
AC checks labels and samples after return from the beekeeper;
AC records samples and codes in his/her AC journal;
AC sends the samples with the original label to the labs;
Labs send results to SD;
SD sends results to the AC for label checks;
AC sends checked results back to SD;
SD sends results to the DC;
DC uploads the results of the lab analyses;
DC compiles data sets for statistical analysis and modelling.
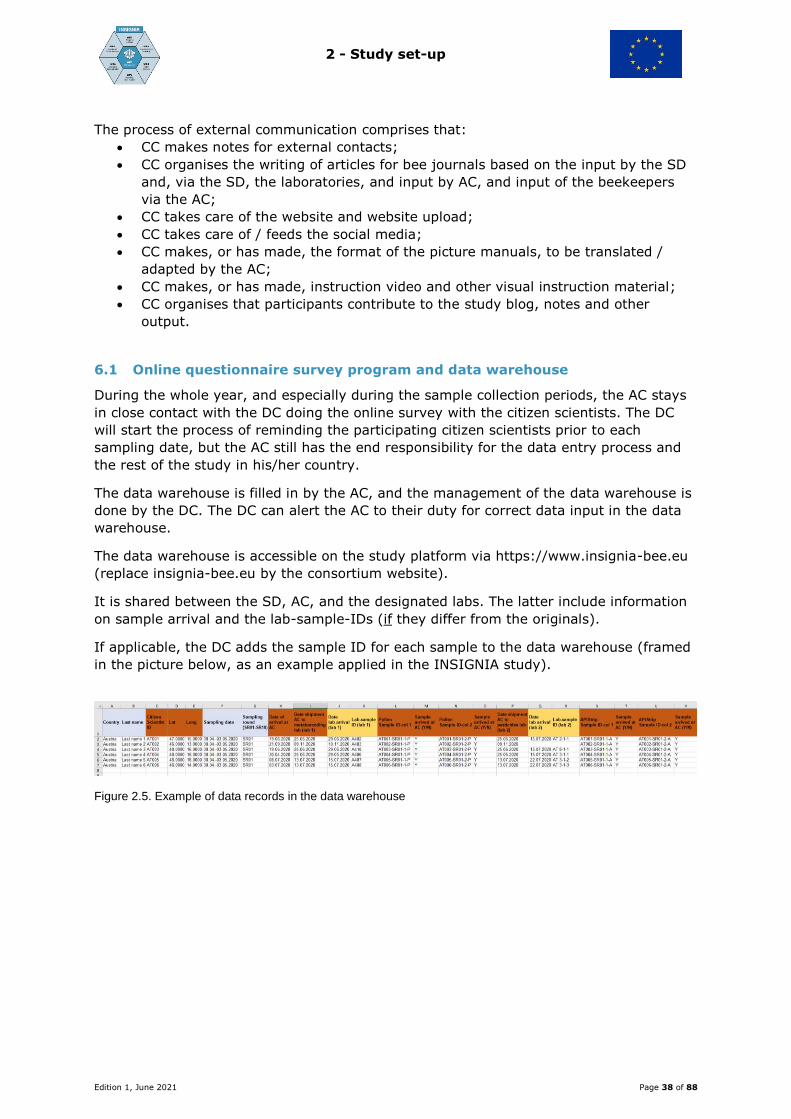
2 - Study set-up
Edition 1, June 2021 Page 38 of 88
The process of external communication comprises that:
CC makes notes for external contacts;
CC organises the writing of articles for bee journals based on the input by the SD
and, via the SD, the laboratories, and input by AC, and input of the beekeepers
via the AC;
CC takes care of the website and website upload;
CC takes care of / feeds the social media;
CC makes, or has made, the format of the picture manuals, to be translated /
adapted by the AC;
CC makes, or has made, instruction video and other visual instruction material;
CC organises that participants contribute to the study blog, notes and other
output.
6.1 Online questionnaire survey program and data warehouse
During the whole year, and especially during the sample collection periods, the AC stays
in close contact with the DC doing the online survey with the citizen scientists. The DC
will start the process of reminding the participating citizen scientists prior to each
sampling date, but the AC still has the end responsibility for the data entry process and
the rest of the study in his/her country.
The data warehouse is filled in by the AC, and the management of the data warehouse is
done by the DC. The DC can alert the AC to their duty for correct data input in the data
warehouse.
The data warehouse is accessible on the study platform via https://www.insignia-bee.eu
(replace insignia-bee.eu by the consortium website).
It is shared between the SD, AC, and the designated labs. The latter include information
on sample arrival and the lab-sample-IDs (if they differ from the originals).
If applicable, the DC adds the sample ID for each sample to the data warehouse (framed
in the picture below, as an example applied in the INSIGNIA study).
Figure 2.5. Example of data records in the data warehouse
2 - Study set-up
Edition 1, June 2021 Page 39 of 88
6.1.1 Automated communication
The texts for automated communication with CSs will be translated into the required
languages, depending on the participants in the study, by the AC. The online survey
setup allows addition of other languages as needed. The AC makes sure that every
participant in their country receives an online survey link for each sampling round. The
AC is responsible for the process of data provision by the participants in consultation with
the DC. Within the study platform there is a document containing all online survey
questions /content that has to be translated into the languages by the AC.
6.1.2 The online survey questionnaire
The online survey questionnaire serves two purposes. Firstly it confirms which dates the
CSs have collected samples, and secondly, it is a way to collect additional data about the
conditions in the apiaries over the sampling season.
There are various systems available for making questionnaires. In the INSIGNIA project,
the online LimeSurvey survey software was used, but there are other systems such as
Google Formula and Survey Monkey. It is the responsibility of the DC to set up the
questionnaire and send out emails to all CSs for each sampling round. Only if individual
CSs fail to answer the questionnaire will the AC be involved, and they will then make
direct contact to the relevant CS to ensure that the questionnaire will be answered.
The online survey tool LimeSurvey was a good choice for the INSIGNIA project since it
can issue individual invitations with a "token". This means that during the whole process
it is possible to keep track of all the responses from the beekeepers, issue reminders,
and to notify the AC to contact non-respondents. LimeSurvey also has a very good
mapping facility, for determining the GPS position of each participating apiary.
Information to be collected includes:
Which samples have been collected in the sampling rounds, and the exact dates
for the start and end of the subsequent sampling rounds.
Information about the size of the colonies based on frame size and number of
occupied bee lanes. This is important, as larger colonies will be expected to collect
more food, nectar, and pollen, and consequently also pollutants.
Finally, the questionnaire gives the CS the opportunity to report (chemical) varroa
treatments and other relevant information.
The DC collects the answers and adds information to the data warehouse. The DC also
ensures that sampling dates from the questionnaire and the physical samples are
consistent.

2 - Study set-up
Edition 1, June 2021 Page 40 of 88
6.1.3 Summary sample flow
Figure 2.6. Workflow describing crucial interaction steps of CSs with AC and DC, and showing their
responsibilities
6.1.4 Flowchart of communication with the Apiculturalist Citizen Scientist (CS)
Figure 2.7. Typical communication routine with the citizen scientist
3 - Protocols
Edition 1, June 2021 Page 41 of 88
3 - Protocols
Introduction
This chapter consists of protocols. Each protocol is about a specific subject such as
pesticides or pollen. The rationale behind this design is that each monitoring subject
demands its specific toolbox, sampling techniques, recording, storage and shipping. The
format of the protocols is identical in order to facilitate the combination of protocols if the
honey bee colony is to be used for bee-monitoring with passive samplers for more than
one subject. Because of having identical formats, there is some textual overlap in each
protocol. We consider this a minor issue in relation to the complexity of combined
protocols, with the chances of inherent errors. In practice, the protocol for specific
monitoring subjects can be combined in one study plan – the study-specific Apicultural
citizen science protocol.
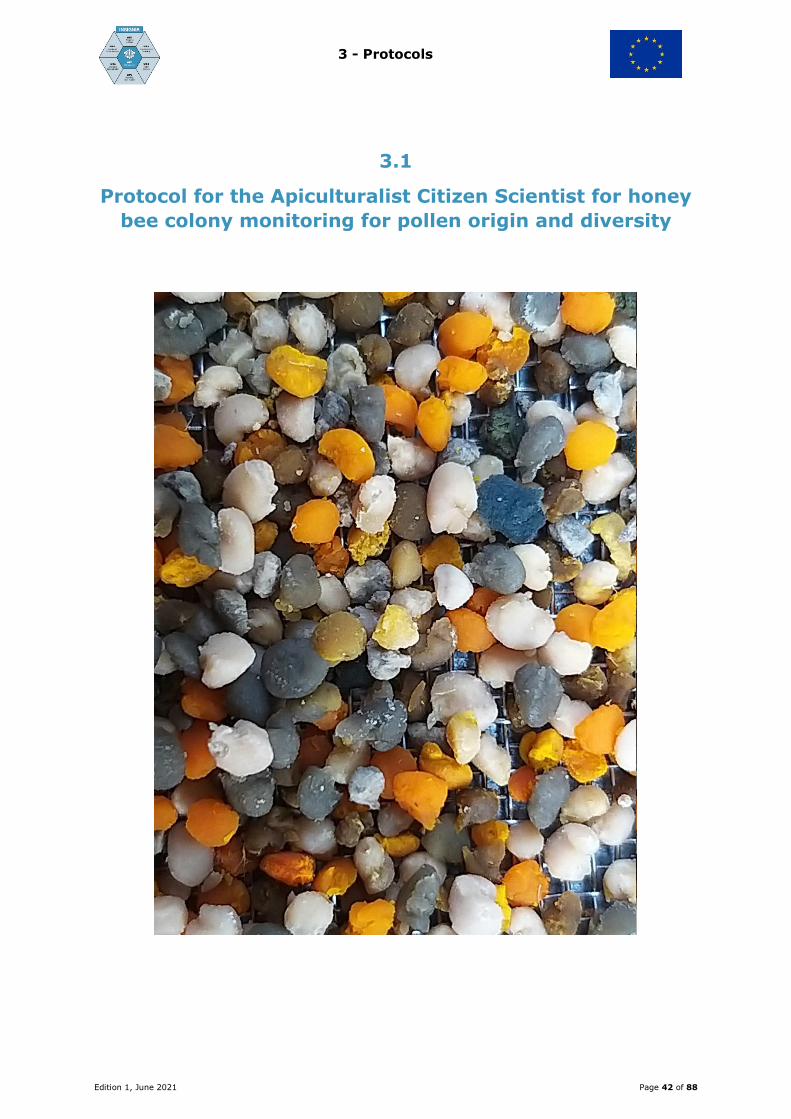
3 - Protocols
Edition 1, June 2021 Page 42 of 88
3.1
Protocol for the Apiculturalist Citizen Scientist for honey
bee colony monitoring for pollen origin and diversity
3 - Protocols
Edition 1, June 2021 Page 43 of 88
Content 1 Study design ..................................................................................................44
1.1 Objective .................................................................................................44
1.2 Lay-out of the study ..................................................................................44
2 Sampling scheme ...........................................................................................45
3 Alerts/ questionnaires for the data warehouse ....................................................45
4 The toolbox ...................................................................................................46
5 Picture manual and other instruction tools .........................................................47
5.1 Prior to study start ....................................................................................47
5.2 Preparations for sampling ..........................................................................47
5.3 Sampling procedure ..................................................................................48
5.4 Storage at the beekeeper’s premises ...........................................................51
5.5 Quality control ..........................................................................................51
5.6 The transport to the Apiculturalist Coordinator (AC) ......................................51
5.7 Data entry ...............................................................................................52
5.8 Support/Video Manual (example from the INSIGNIA Study) ...........................52
6 Background information for ITS2 metabarcoding ................................................53
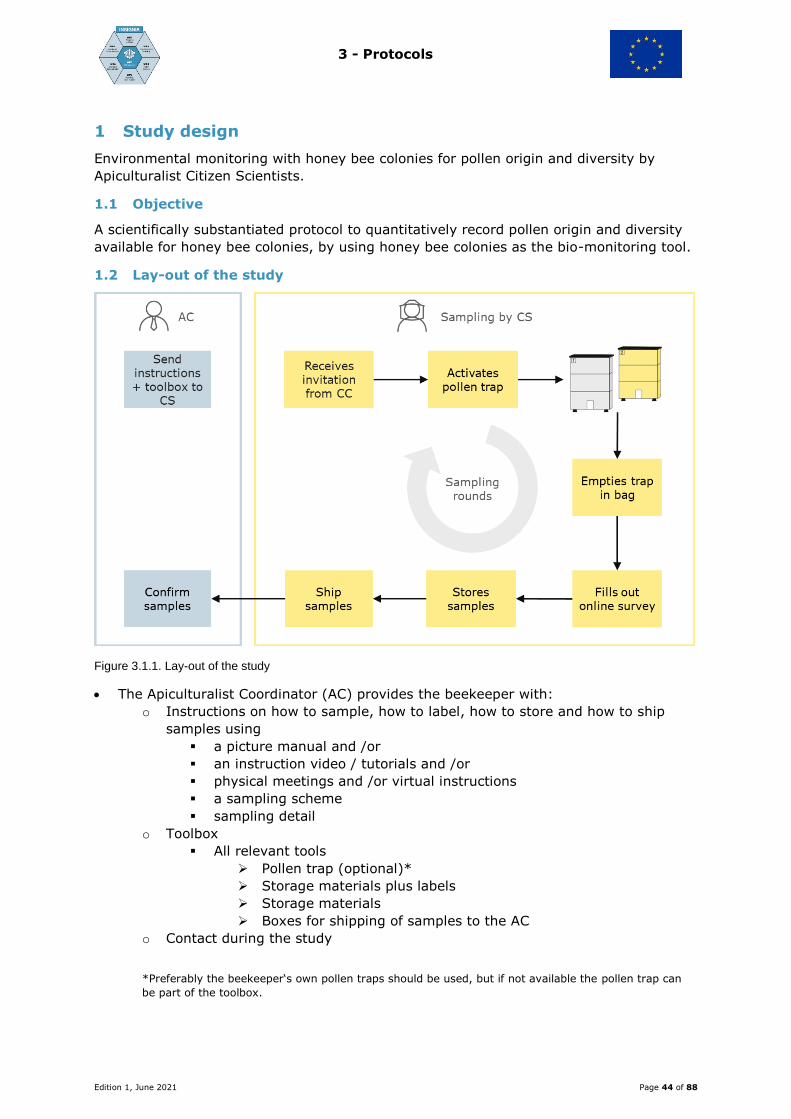
3 - Protocols
Edition 1, June 2021 Page 44 of 88
1 Study design
Environmental monitoring with honey bee colonies for pollen origin and diversity by
Apiculturalist Citizen Scientists.
1.1 Objective
A scientifically substantiated protocol to quantitatively record pollen origin and diversity
available for honey bee colonies, by using honey bee colonies as the bio-monitoring tool.
1.2 Lay-out of the study
Figure 3.1.1. Lay-out of the study
The Apiculturalist Coordinator (AC) provides the beekeeper with:
o Instructions on how to sample, how to label, how to store and how to ship
samples using
a picture manual and /or
an instruction video / tutorials and /or
physical meetings and /or virtual instructions
a sampling scheme
sampling detail
o Toolbox
All relevant tools
Pollen trap (optional)*
Storage materials plus labels
Storage materials
Boxes for shipping of samples to the AC
o Contact during the study
*Preferably the beekeeper‘s own pollen traps should be used, but if not available the pollen trap can
be part of the toolbox.
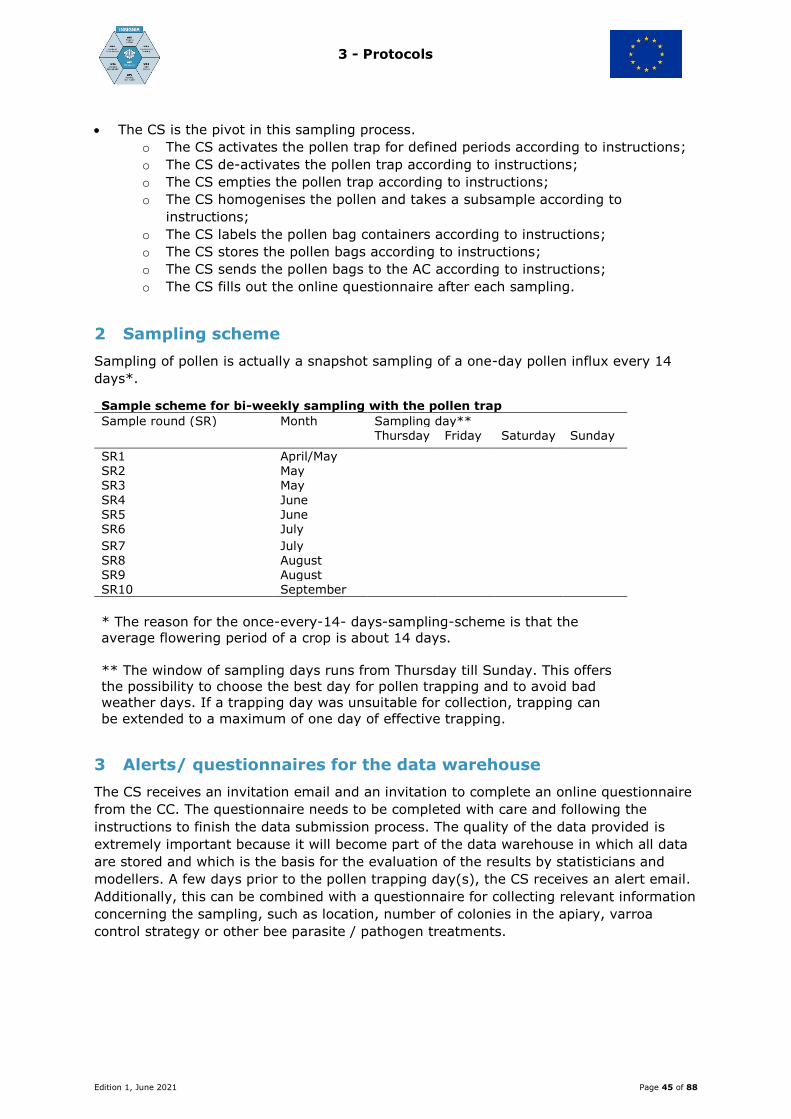
3 - Protocols
Edition 1, June 2021 Page 45 of 88
The CS is the pivot in this sampling process.
o The CS activates the pollen trap for defined periods according to instructions;
o The CS de-activates the pollen trap according to instructions;
o The CS empties the pollen trap according to instructions;
o The CS homogenises the pollen and takes a subsample according to
instructions;
o The CS labels the pollen bag containers according to instructions;
o The CS stores the pollen bags according to instructions;
o The CS sends the pollen bags to the AC according to instructions;
o The CS fills out the online questionnaire after each sampling.
2 Sampling scheme
Sampling of pollen is actually a snapshot sampling of a one-day pollen influx every 14
days*.
Sample scheme for bi-weekly sampling with the pollen trap
Sample round (SR) Month Sampling day** Thursday Friday Saturday Sunday
SR1 April/May SR2 May SR3 May
SR4 June SR5 June SR6 July
SR7 July SR8 August SR9 August
SR10 September
* The reason for the once-every-14- days-sampling-scheme is that the
average flowering period of a crop is about 14 days.
** The window of sampling days runs from Thursday till Sunday. This offers
the possibility to choose the best day for pollen trapping and to avoid bad
weather days. If a trapping day was unsuitable for collection, trapping can
be extended to a maximum of one day of effective trapping.
3 Alerts/ questionnaires for the data warehouse
The CS receives an invitation email and an invitation to complete an online questionnaire
from the CC. The questionnaire needs to be completed with care and following the
instructions to finish the data submission process. The quality of the data provided is
extremely important because it will become part of the data warehouse in which all data
are stored and which is the basis for the evaluation of the results by statisticians and
modellers. A few days prior to the pollen trapping day(s), the CS receives an alert email.
Additionally, this can be combined with a questionnaire for collecting relevant information
concerning the sampling, such as location, number of colonies in the apiary, varroa
control strategy or other bee parasite / pathogen treatments.

3 - Protocols
Edition 1, June 2021 Page 46 of 88
4 The toolbox
The toolbox provided by the AC includes all equipment needed by every CS for pollen
monitoring. It contains materials for 10 sampling rounds with 2 bee colonies. The CS
should check the materials for completeness.
Materials Amount Checklist
Picture manual (including sample scheme) 1 ☐
Graphite pencils 1 ☐
Larger bag (1 per sampling round, 1l zip lock bag) 10 ☐
For pollen sampling and storage, two (2) options are provided
Option 1: per hive and sampling round a 20 gram sample is taken, stored in freezer and
transported in cold chain transport
Option 2: per hive and sampling round 4 x 5 gram pollen is taken, per 5 gram samplers,
dried with silica gel at room temperature - room temperature storage and room temperature
transport.
Option 1. measurement tool 20 gram 2 (1 per hive) ☐
Option 2. measurement tool 5 gram 2 (1 per hive) ☐
Option 1. sample bag: airtight plastic zip lock bags 20 ☐
Option 2. sample bag: airtight plastic zip lock bags 80 ☐
Option 1. pre-printed labels (one per hive) 20 ☐
Option 2. pre-printed labels (one per hive) 80 ☐
Option 2. storage: silica bags sachets of 5 to 6 gram 80 ☐
Option 2. storage: 80 paper tea filters 80 ☐
Option 1. transport: Styrofoam boxes 2 ☐
Option 1. transport: cool blocks 2 ☐
Option 2. transport: cardboard postal boxes 2 ☐
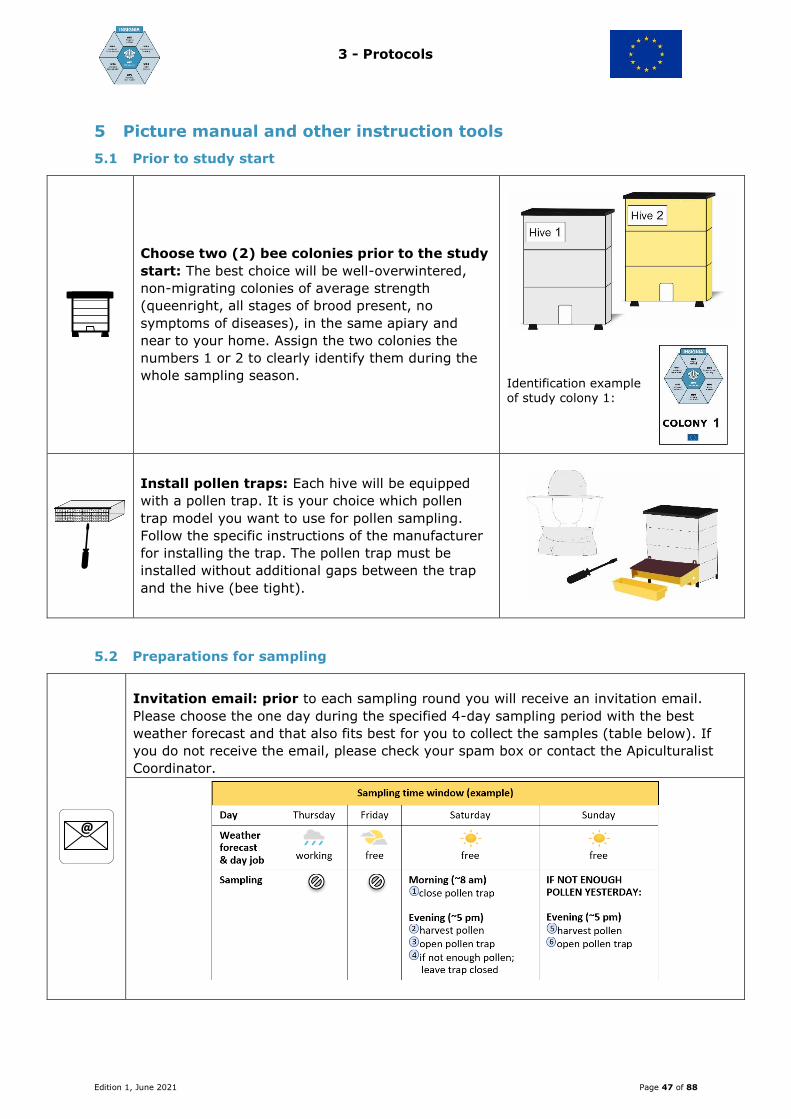
3 - Protocols
Edition 1, June 2021 Page 47 of 88
5 Picture manual and other instruction tools
5.1 Prior to study start
Choose two (2) bee colonies prior to the study
start: The best choice will be well-overwintered,
non-migrating colonies of average strength
(queenright, all stages of brood present, no
symptoms of diseases), in the same apiary and
near to your home. Assign the two colonies the
numbers 1 or 2 to clearly identify them during the
whole sampling season.
Identification example
of study colony 1:
Install pollen traps: Each hive will be equipped
with a pollen trap. It is your choice which pollen
trap model you want to use for pollen sampling.
Follow the specific instructions of the manufacturer
for installing the trap. The pollen trap must be
installed without additional gaps between the trap
and the hive (bee tight).
5.2 Preparations for sampling
Invitation email: prior to each sampling round you will receive an invitation email.
Please choose the one day during the specified 4-day sampling period with the best
weather forecast and that also fits best for you to collect the samples (table below). If
you do not receive the email, please check your spam box or contact the Apiculturalist
Coordinator.
@
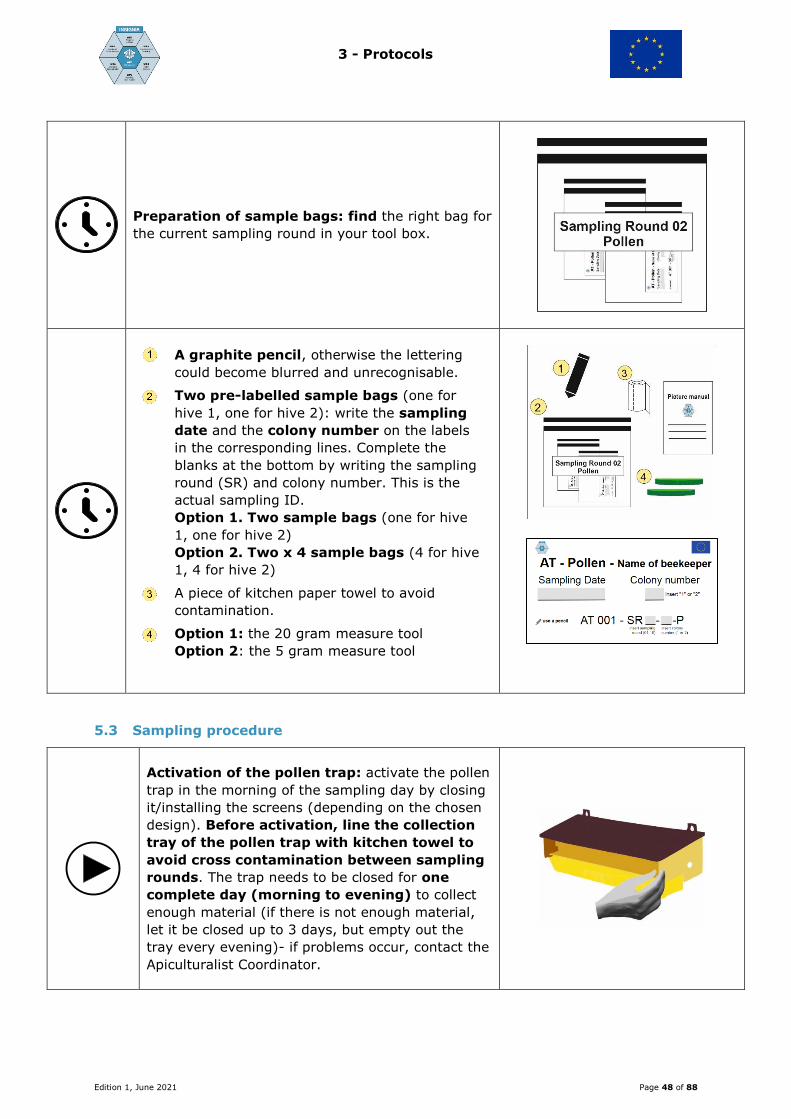
3 - Protocols
Edition 1, June 2021 Page 48 of 88
Preparation of sample bags: find the right bag for
the current sampling round in your tool box.
A graphite pencil, otherwise the lettering
could become blurred and unrecognisable.
Two pre-labelled sample bags (one for
hive 1, one for hive 2): write the sampling
date and the colony number on the labels
in the corresponding lines. Complete the
blanks at the bottom by writing the sampling
round (SR) and colony number. This is the
actual sampling ID.
Option 1. Two sample bags (one for hive
1, one for hive 2)
Option 2. Two x 4 sample bags (4 for hive
1, 4 for hive 2)
A piece of kitchen paper towel to avoid
contamination.
Option 1: the 20 gram measure tool
Option 2: the 5 gram measure tool
5.3 Sampling procedure
Activation of the pollen trap: activate the pollen
trap in the morning of the sampling day by closing
it/installing the screens (depending on the chosen
design). Before activation, line the collection
tray of the pollen trap with kitchen towel to
avoid cross contamination between sampling
rounds. The trap needs to be closed for one
complete day (morning to evening) to collect
enough material (if there is not enough material,
let it be closed up to 3 days, but empty out the
tray every evening)- if problems occur, contact the
Apiculturalist Coordinator.
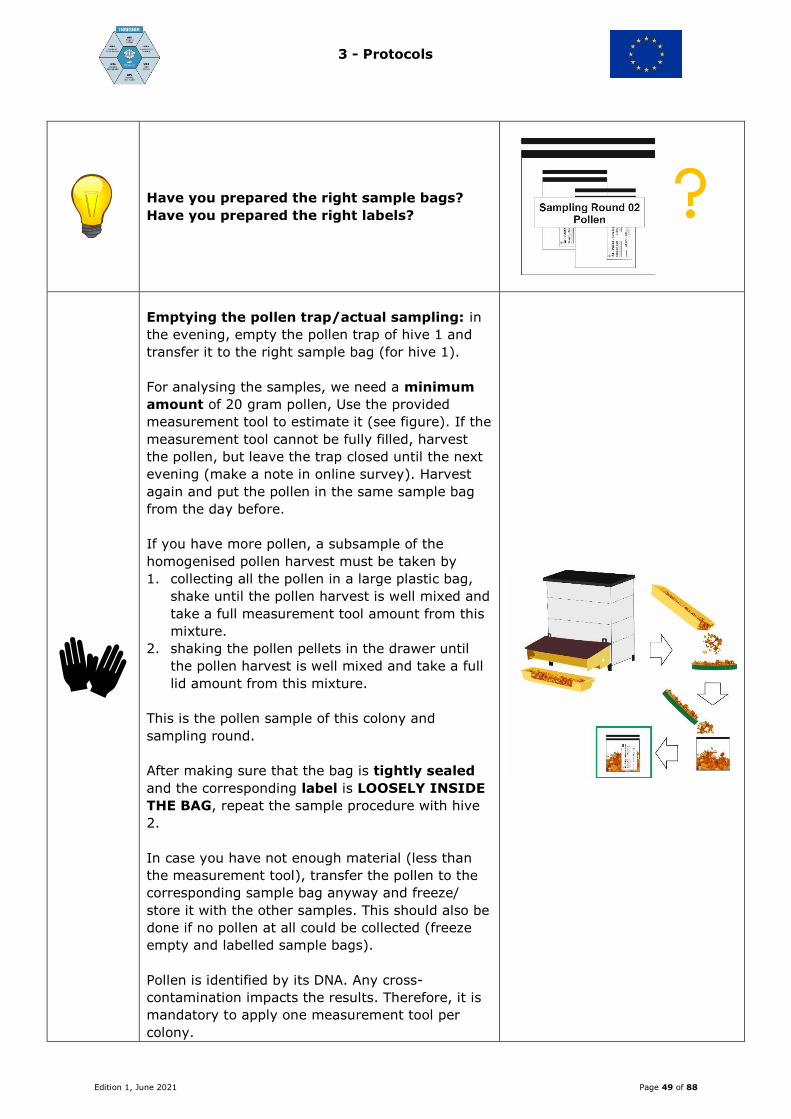
3 - Protocols
Edition 1, June 2021 Page 49 of 88
Have you prepared the right sample bags?
Have you prepared the right labels?
Emptying the pollen trap/actual sampling: in
the evening, empty the pollen trap of hive 1 and
transfer it to the right sample bag (for hive 1).
For analysing the samples, we need a minimum
amount of 20 gram pollen, Use the provided
measurement tool to estimate it (see figure). If the
measurement tool cannot be fully filled, harvest
the pollen, but leave the trap closed until the next
evening (make a note in online survey). Harvest
again and put the pollen in the same sample bag
from the day before.
If you have more pollen, a subsample of the
homogenised pollen harvest must be taken by
1. collecting all the pollen in a large plastic bag,
shake until the pollen harvest is well mixed and
take a full measurement tool amount from this
mixture.
2. shaking the pollen pellets in the drawer until
the pollen harvest is well mixed and take a full
lid amount from this mixture.
This is the pollen sample of this colony and
sampling round.
After making sure that the bag is tightly sealed
and the corresponding label is LOOSELY INSIDE
THE BAG, repeat the sample procedure with hive
2.
In case you have not enough material (less than
the measurement tool), transfer the pollen to the
corresponding sample bag anyway and freeze/
store it with the other samples. This should also be
done if no pollen at all could be collected (freeze
empty and labelled sample bags).
Pollen is identified by its DNA. Any cross-
contamination impacts the results. Therefore, it is
mandatory to apply one measurement tool per
colony.
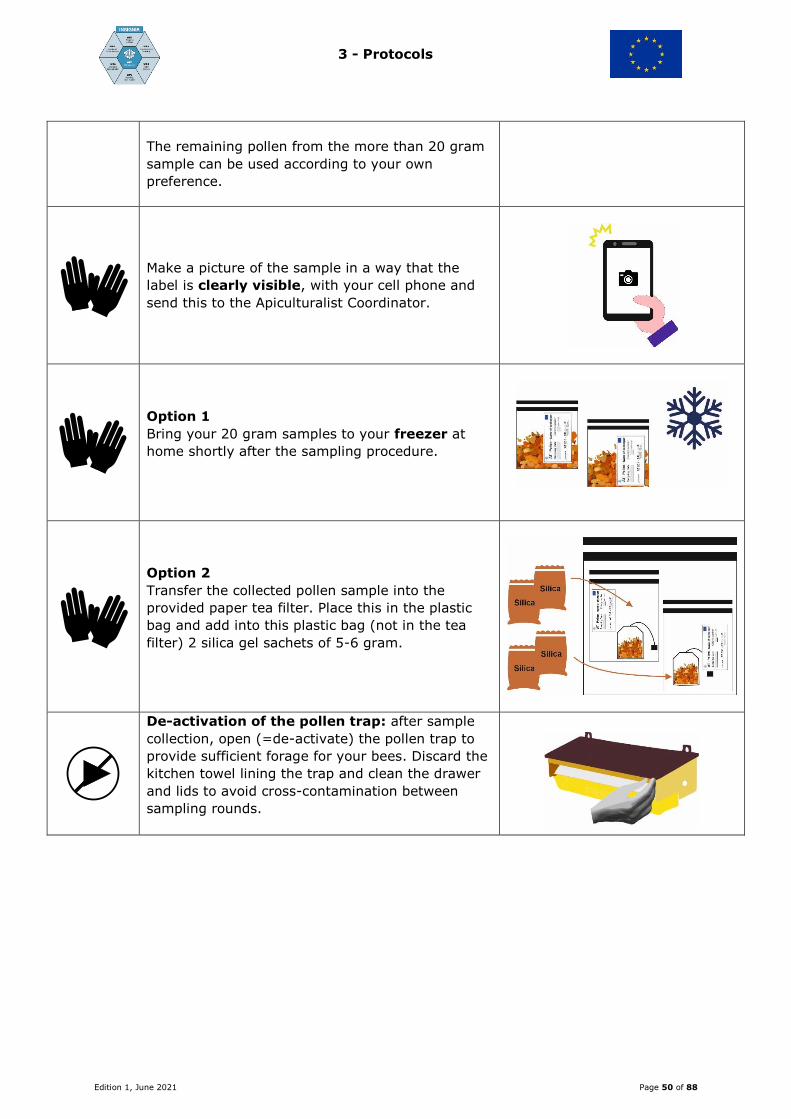
3 - Protocols
Edition 1, June 2021 Page 50 of 88
The remaining pollen from the more than 20 gram
sample can be used according to your own
preference.
Make a picture of the sample in a way that the
label is clearly visible, with your cell phone and
send this to the Apiculturalist Coordinator.
Option 1
Bring your 20 gram samples to your freezer at
home shortly after the sampling procedure.
Option 2
Transfer the collected pollen sample into the
provided paper tea filter. Place this in the plastic
bag and add into this plastic bag (not in the tea
filter) 2 silica gel sachets of 5-6 gram.
De-activation of the pollen trap: after sample
collection, open (=de-activate) the pollen trap to
provide sufficient forage for your bees. Discard the
kitchen towel lining the trap and clean the drawer
and lids to avoid cross-contamination between
sampling rounds.
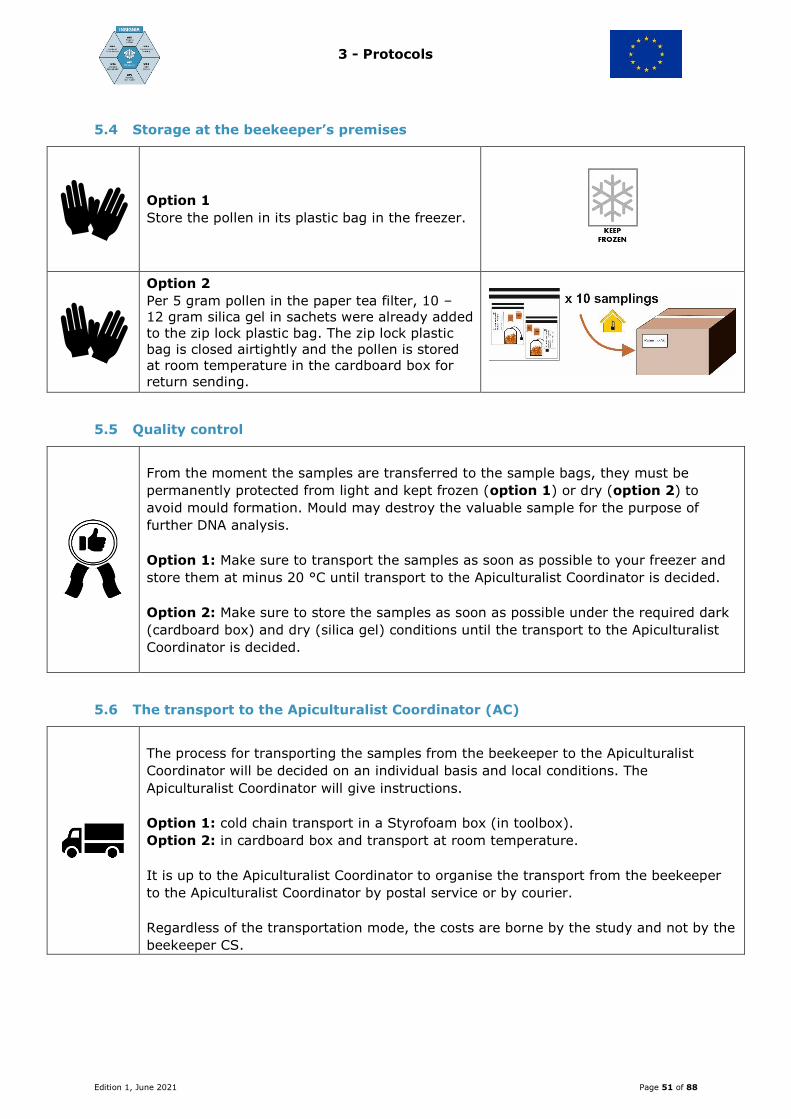
3 - Protocols
Edition 1, June 2021 Page 51 of 88
5.4 Storage at the beekeeper’s premises
Option 1
Store the pollen in its plastic bag in the freezer.
Option 2
Per 5 gram pollen in the paper tea filter, 10 –
12 gram silica gel in sachets were already added
to the zip lock plastic bag. The zip lock plastic
bag is closed airtightly and the pollen is stored
at room temperature in the cardboard box for
return sending.
5.5 Quality control
From the moment the samples are transferred to the sample bags, they must be
permanently protected from light and kept frozen (option 1) or dry (option 2) to
avoid mould formation. Mould may destroy the valuable sample for the purpose of
further DNA analysis.
Option 1: Make sure to transport the samples as soon as possible to your freezer and
store them at minus 20 °C until transport to the Apiculturalist Coordinator is decided.
Option 2: Make sure to store the samples as soon as possible under the required dark
(cardboard box) and dry (silica gel) conditions until the transport to the Apiculturalist
Coordinator is decided.
5.6 The transport to the Apiculturalist Coordinator (AC)
The process for transporting the samples from the beekeeper to the Apiculturalist
Coordinator will be decided on an individual basis and local conditions. The
Apiculturalist Coordinator will give instructions.
Option 1: cold chain transport in a Styrofoam box (in toolbox).
Option 2: in cardboard box and transport at room temperature.
It is up to the Apiculturalist Coordinator to organise the transport from the beekeeper
to the Apiculturalist Coordinator by postal service or by courier.
Regardless of the transportation mode, the costs are borne by the study and not by the
beekeeper CS.
3 - Protocols
Edition 1, June 2021 Page 52 of 88
5.7 Data entry
Last but not least, sample information is crucial. Therefore, it is necessary to answer
the online questionnaire after each sampling round. Prior to each sampling round,
you will receive a unique invitation email with a personalised link to your online
questionnaire. The link allows the automatic recording of your answers/data entries
from the present sampling round. If you have difficulties reaching the website or if you
do not receive the invitation email, please check your spam box or contact the
Apiculturalist Coordinator. Note any derogations of the sampling scheme or
irregularities, using the comment section of the questionnaire.
Successful data transmission
If you miss the data entry, you will receive a reminder email. If you have successfully
submitted your data, within a few minutes you will receive a confirmation email. After
data submission, the link will be de-activated and cannot be used again. If you made
some mistakes during data entry, no problem - please immediately contact your
Apiculturalist Coordinator.
Thank you for your valuable contribution!
Apiculturalist Coordinator
Email: _____________________
Phone number: _____________ (contactable during sampling periods - Thursday to
Sunday from 9 am to 5 pm)
(Messenger group: __________)
Website:
5.8 Support/Video Manual (example from the INSIGNIA Study)
You will find accompanying instruction videos and constantly updated blog entries on
our INSIGNIA YouTube channel and on our website, respectively.
During the active sampling periods, the Apiculturalist Coordinator is available via the
above-mentioned phone number and social media. If you have any questions or other
requests outside of the sampling periods, please write an email to the Apiculturalist
Coordinator. Further, you are also invited to the national messenger group to exchange
your experiences with the other citizen scientists of your country.
Video manual pollen: www.youtube.com/watch?v=97josWrHu-A
Blog: https://www.insignia-bee.eu/blog/
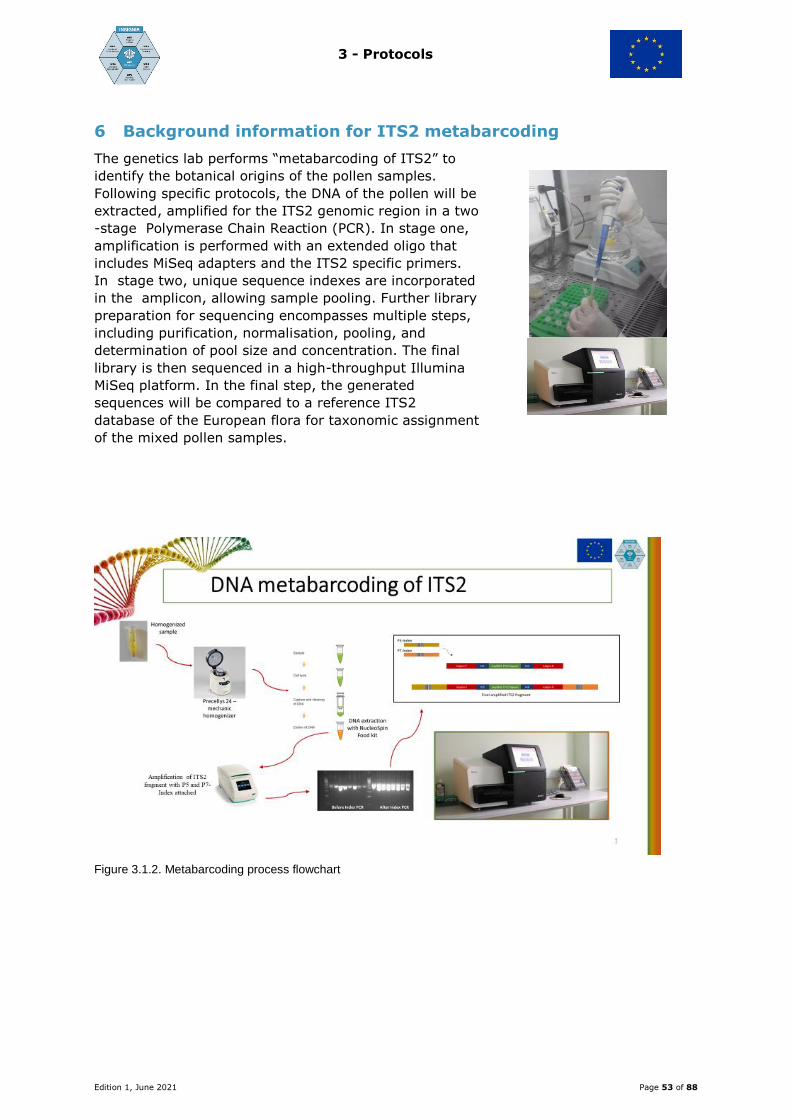
3 - Protocols
Edition 1, June 2021 Page 53 of 88
6 Background information for ITS2 metabarcoding
The genetics lab performs “metabarcoding of ITS2” to
identify the botanical origins of the pollen samples.
Following specific protocols, the DNA of the pollen will be
extracted, amplified for the ITS2 genomic region in a two
-stage Polymerase Chain Reaction (PCR). In stage one,
amplification is performed with an extended oligo that
includes MiSeq adapters and the ITS2 specific primers.
In stage two, unique sequence indexes are incorporated
in the amplicon, allowing sample pooling. Further library
preparation for sequencing encompasses multiple steps,
including purification, normalisation, pooling, and
determination of pool size and concentration. The final
library is then sequenced in a high-throughput Illumina
MiSeq platform. In the final step, the generated
sequences will be compared to a reference ITS2
database of the European flora for taxonomic assignment
of the mixed pollen samples.
Figure 3.1.2. Metabarcoding process flowchart

3 - Protocols
Edition 1, June 2021 Page 54 of 88
3.2
Protocol for the Apiculturalist Citizen Scientist for honey
bee colony monitoring for pesticides

3 - Protocols
Edition 1, June 2021 Page 55 of 88
Content
1 Study design ..................................................................................................56
1.1 Objective .................................................................................................56
1.2 Lay-out of the study ..................................................................................56
2 Sampling scheme ...........................................................................................57
3 Alerts/ questionnaires for the data warehouse ....................................................57
4 The toolbox ...................................................................................................58
5 Picture manual and other instruction tools .........................................................58
5.1 Prior to study start ....................................................................................58
5.2 Two weeks before first sampling .................................................................59
5.3 Preparations for sampling ..........................................................................59
5.4 Sampling procedure ..................................................................................60
5.5 Storage at the beekeeper’s premises ...........................................................62
5.6 Quality control ..........................................................................................62
5.7 The transport to the Apiculturalist Coordinator (AC) ......................................62
5.8 Data entry ...............................................................................................63
5.9 Support/Video Manual (example from the INSIGNIA Study) ...........................63
6 Background information on the APIStrip ............................................................64
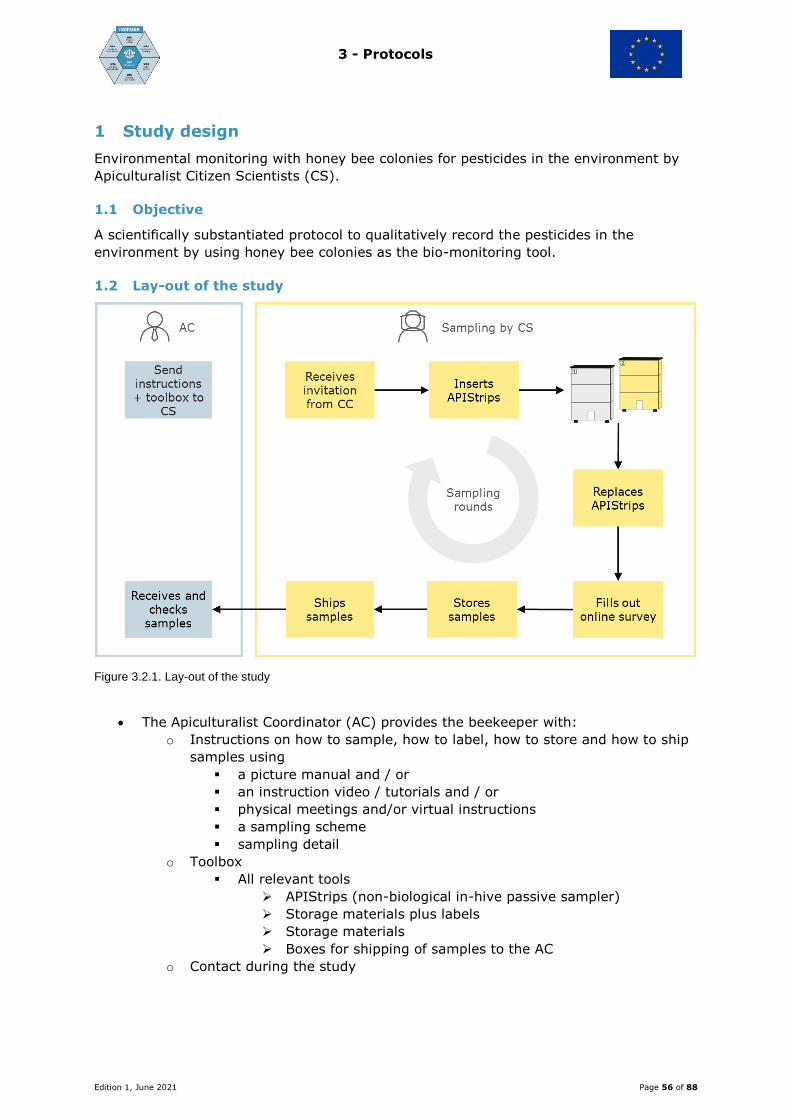
3 - Protocols
Edition 1, June 2021 Page 56 of 88
1 Study design
Environmental monitoring with honey bee colonies for pesticides in the environment by
Apiculturalist Citizen Scientists (CS).
1.1 Objective
A scientifically substantiated protocol to qualitatively record the pesticides in the
environment by using honey bee colonies as the bio-monitoring tool.
1.2 Lay-out of the study
Figure 3.2.1. Lay-out of the study
The Apiculturalist Coordinator (AC) provides the beekeeper with:
o Instructions on how to sample, how to label, how to store and how to ship
samples using
a picture manual and / or
an instruction video / tutorials and / or
physical meetings and/or virtual instructions
a sampling scheme
sampling detail
o Toolbox
All relevant tools
APIStrips (non-biological in-hive passive sampler)
Storage materials plus labels
Storage materials
Boxes for shipping of samples to the AC
o Contact during the study
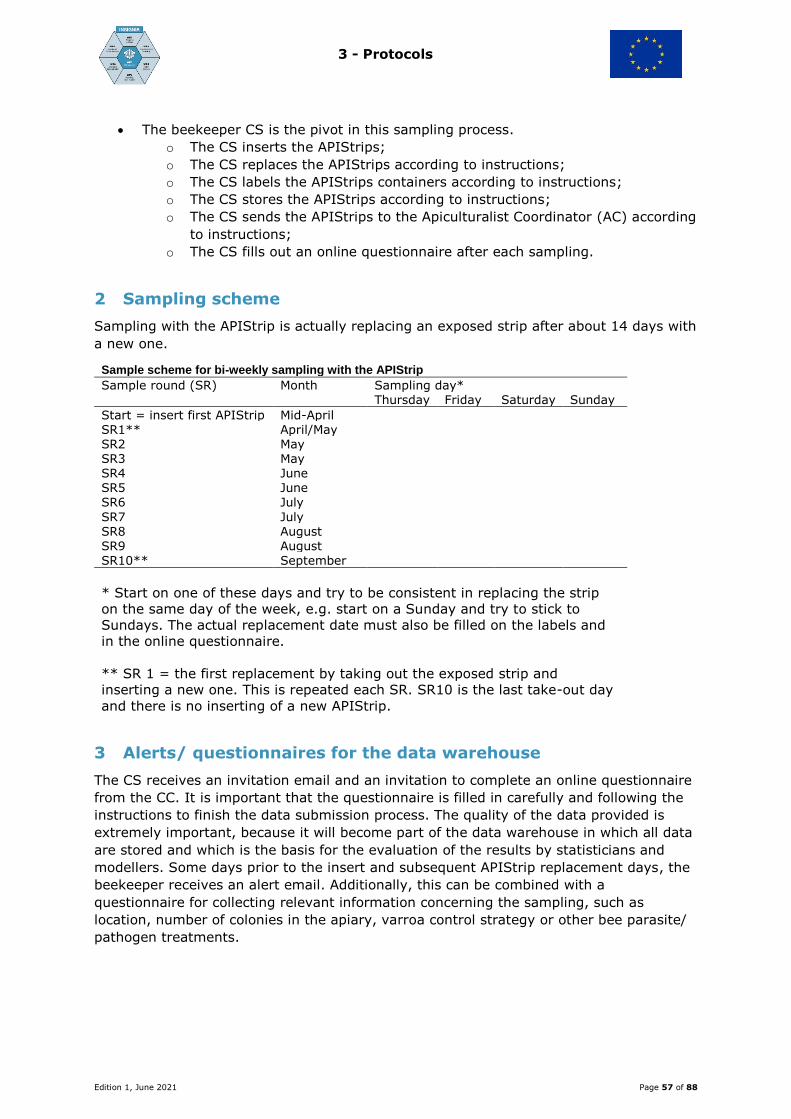
3 - Protocols
Edition 1, June 2021 Page 57 of 88
The beekeeper CS is the pivot in this sampling process.
o The CS inserts the APIStrips;
o The CS replaces the APIStrips according to instructions;
o The CS labels the APIStrips containers according to instructions;
o The CS stores the APIStrips according to instructions;
o The CS sends the APIStrips to the Apiculturalist Coordinator (AC) according
to instructions;
o The CS fills out an online questionnaire after each sampling.
2 Sampling scheme
Sampling with the APIStrip is actually replacing an exposed strip after about 14 days with
a new one.
Sample scheme for bi-weekly sampling with the APIStrip
Sample round (SR) Month Sampling day* Thursday Friday Saturday Sunday
Start = insert first APIStrip Mid-April SR1** April/May SR2 May SR3 May SR4 June SR5 June SR6 July
SR7 July SR8 August SR9 August SR10** September
* Start on one of these days and try to be consistent in replacing the strip
on the same day of the week, e.g. start on a Sunday and try to stick to
Sundays. The actual replacement date must also be filled on the labels and
in the online questionnaire.
** SR 1 = the first replacement by taking out the exposed strip and
inserting a new one. This is repeated each SR. SR10 is the last take-out day
and there is no inserting of a new APIStrip.
3 Alerts/ questionnaires for the data warehouse
The CS receives an invitation email and an invitation to complete an online questionnaire
from the CC. It is important that the questionnaire is filled in carefully and following the
instructions to finish the data submission process. The quality of the data provided is
extremely important, because it will become part of the data warehouse in which all data
are stored and which is the basis for the evaluation of the results by statisticians and
modellers. Some days prior to the insert and subsequent APIStrip replacement days, the
beekeeper receives an alert email. Additionally, this can be combined with a
questionnaire for collecting relevant information concerning the sampling, such as
location, number of colonies in the apiary, varroa control strategy or other bee parasite/
pathogen treatments.
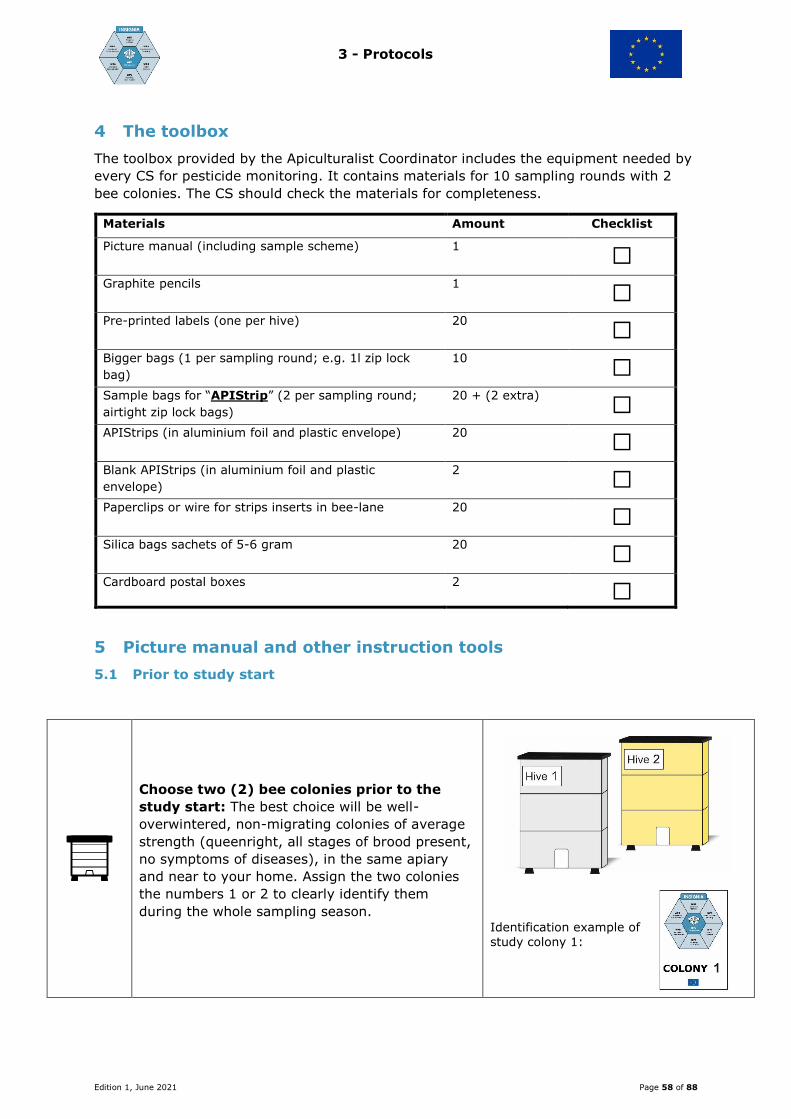
3 - Protocols
Edition 1, June 2021 Page 58 of 88
4 The toolbox
The toolbox provided by the Apiculturalist Coordinator includes the equipment needed by
every CS for pesticide monitoring. It contains materials for 10 sampling rounds with 2
bee colonies. The CS should check the materials for completeness.
Materials Amount Checklist
Picture manual (including sample scheme) 1 ☐
Graphite pencils 1 ☐
Pre-printed labels (one per hive) 20 ☐
Bigger bags (1 per sampling round; e.g. 1l zip lock
bag)
10 ☐
Sample bags for “APIStrip” (2 per sampling round;
airtight zip lock bags)
20 + (2 extra) ☐
APIStrips (in aluminium foil and plastic envelope) 20 ☐
Blank APIStrips (in aluminium foil and plastic
envelope)
2 ☐
Paperclips or wire for strips inserts in bee-lane 20 ☐
Silica bags sachets of 5-6 gram 20 ☐
Cardboard postal boxes 2 ☐
5 Picture manual and other instruction tools
5.1 Prior to study start
Choose two (2) bee colonies prior to the
study start: The best choice will be well-
overwintered, non-migrating colonies of average
strength (queenright, all stages of brood present,
no symptoms of diseases), in the same apiary
and near to your home. Assign the two colonies
the numbers 1 or 2 to clearly identify them
during the whole sampling season.
Identification example of
study colony 1:
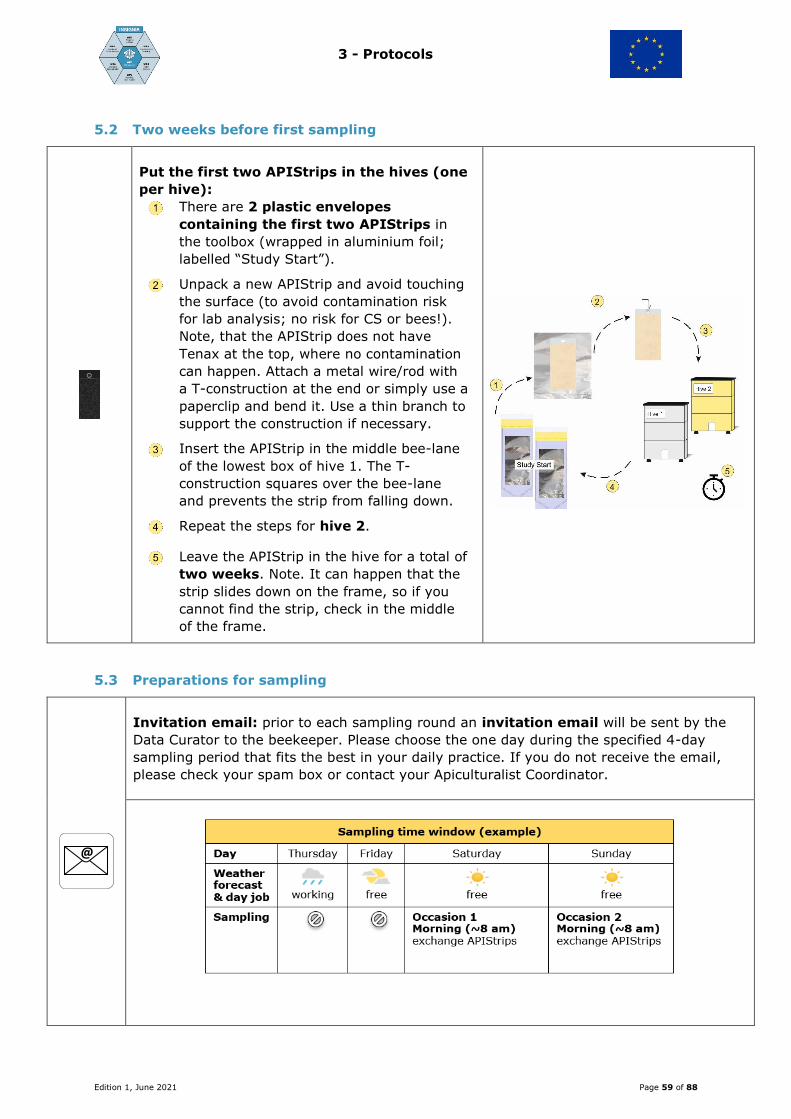
3 - Protocols
Edition 1, June 2021 Page 59 of 88
5.2 Two weeks before first sampling
Put the first two APIStrips in the hives (one
per hive):
There are 2 plastic envelopes
containing the first two APIStrips in
the toolbox (wrapped in aluminium foil;
labelled “Study Start”).
Unpack a new APIStrip and avoid touching
the surface (to avoid contamination risk
for lab analysis; no risk for CS or bees!).
Note, that the APIStrip does not have
Tenax at the top, where no contamination
can happen. Attach a metal wire/rod with
a T-construction at the end or simply use a
paperclip and bend it. Use a thin branch to
support the construction if necessary.
Insert the APIStrip in the middle bee-lane
of the lowest box of hive 1. The T-
construction squares over the bee-lane
and prevents the strip from falling down.
Repeat the steps for hive 2.
Leave the APIStrip in the hive for a total of
two weeks. Note. It can happen that the
strip slides down on the frame, so if you
cannot find the strip, check in the middle
of the frame.
5.3 Preparations for sampling
Invitation email: prior to each sampling round an invitation email will be sent by the
Data Curator to the beekeeper. Please choose the one day during the specified 4-day
sampling period that fits the best in your daily practice. If you do not receive the email,
please check your spam box or contact your Apiculturalist Coordinator.
@
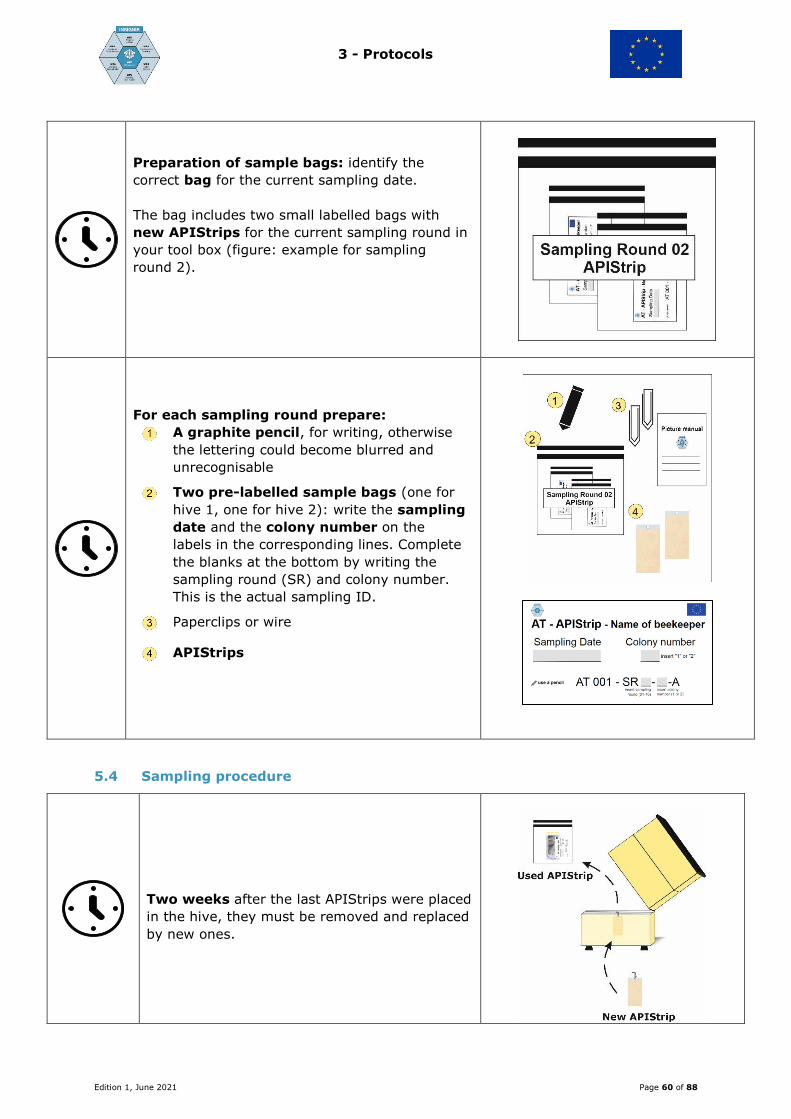
3 - Protocols
Edition 1, June 2021 Page 60 of 88
Preparation of sample bags: identify the
correct bag for the current sampling date.
The bag includes two small labelled bags with
new APIStrips for the current sampling round in
your tool box (figure: example for sampling
round 2).
For each sampling round prepare:
A graphite pencil, for writing, otherwise
the lettering could become blurred and
unrecognisable
Two pre-labelled sample bags (one for
hive 1, one for hive 2): write the sampling
date and the colony number on the
labels in the corresponding lines. Complete
the blanks at the bottom by writing the
sampling round (SR) and colony number.
This is the actual sampling ID.
Paperclips or wire
APIStrips
5.4 Sampling procedure
Two weeks after the last APIStrips were placed
in the hive, they must be removed and replaced
by new ones.
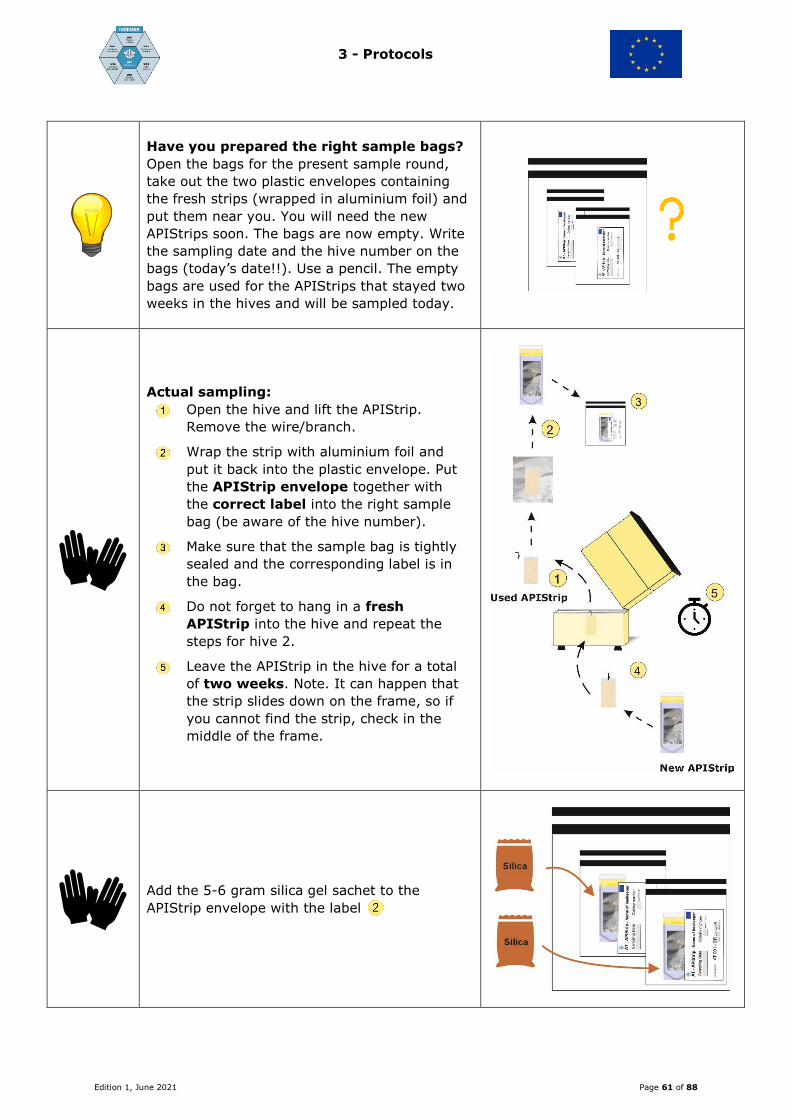
3 - Protocols
Edition 1, June 2021 Page 61 of 88
Have you prepared the right sample bags?
Open the bags for the present sample round,
take out the two plastic envelopes containing
the fresh strips (wrapped in aluminium foil) and
put them near you. You will need the new
APIStrips soon. The bags are now empty. Write
the sampling date and the hive number on the
bags (today’s date!!). Use a pencil. The empty
bags are used for the APIStrips that stayed two
weeks in the hives and will be sampled today.
Actual sampling:
Open the hive and lift the APIStrip.
Remove the wire/branch.
Wrap the strip with aluminium foil and
put it back into the plastic envelope. Put
the APIStrip envelope together with
the correct label into the right sample
bag (be aware of the hive number).
Make sure that the sample bag is tightly
sealed and the corresponding label is in
the bag.
Do not forget to hang in a fresh
APIStrip into the hive and repeat the
steps for hive 2.
Leave the APIStrip in the hive for a total
of two weeks. Note. It can happen that
the strip slides down on the frame, so if
you cannot find the strip, check in the
middle of the frame.
Add the 5-6 gram silica gel sachet to the
APIStrip envelope with the label
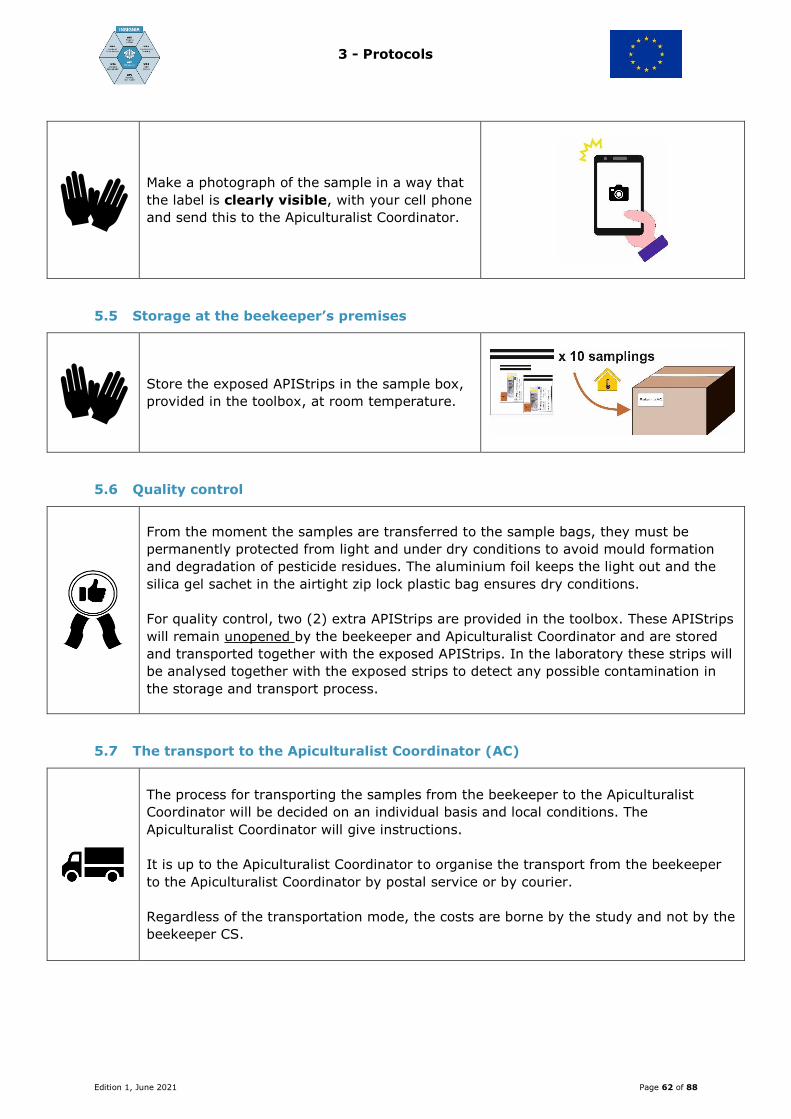
3 - Protocols
Edition 1, June 2021 Page 62 of 88
Make a photograph of the sample in a way that
the label is clearly visible, with your cell phone
and send this to the Apiculturalist Coordinator.
5.5 Storage at the beekeeper’s premises
Store the exposed APIStrips in the sample box,
provided in the toolbox, at room temperature.
5.6 Quality control
From the moment the samples are transferred to the sample bags, they must be
permanently protected from light and under dry conditions to avoid mould formation
and degradation of pesticide residues. The aluminium foil keeps the light out and the
silica gel sachet in the airtight zip lock plastic bag ensures dry conditions.
For quality control, two (2) extra APIStrips are provided in the toolbox. These APIStrips
will remain unopened by the beekeeper and Apiculturalist Coordinator and are stored
and transported together with the exposed APIStrips. In the laboratory these strips will
be analysed together with the exposed strips to detect any possible contamination in
the storage and transport process.
5.7 The transport to the Apiculturalist Coordinator (AC)
The process for transporting the samples from the beekeeper to the Apiculturalist
Coordinator will be decided on an individual basis and local conditions. The
Apiculturalist Coordinator will give instructions.
It is up to the Apiculturalist Coordinator to organise the transport from the beekeeper
to the Apiculturalist Coordinator by postal service or by courier.
Regardless of the transportation mode, the costs are borne by the study and not by the
beekeeper CS.
3 - Protocols
Edition 1, June 2021 Page 63 of 88
5.8 Data entry
Last but not least, sample information is crucial. Therefore, it is necessary to answer
the online questionnaire after each sampling round. Prior to each sampling round,
you will receive a unique invitation email with a personalised link to your online
questionnaire. The link allows the automatic recording of your answers/data entries
from the present sampling round. If you have difficulties reaching the website or if you
do not receive the invitation email, please check your spam box or contact the
Apiculturalist Coordinator. Note any derogations of the sampling scheme or
irregularities, using the comment section of the questionnaire.
Successful data transmission
If you miss the data entry, you will receive a reminder email. If you have successfully
submitted your data, within a few minutes you will receive a confirmation email. After
data submission, the link will be de-activated and cannot be used again. If you made
some mistakes during data entry, no problem - please immediately contact your
Apiculturalist Coordinator.
Thank you for your valuable contribution!
Apiculturalist Coordinator
Email: _____________________
Phone number: _____________ (contactable during sampling periods - Thursday to
Sunday from 9 am to 5 pm)
(Messenger group: __________)
Website:
5.9 Support/Video Manual (example from the INSIGNIA Study)
You will find accompanying instruction videos and constantly updated blog entries on
our INSIGNIA YouTube channel and on our website, respectively.
During the active sampling periods, the Apiculturalist Coordinator is available via the
above-mentioned phone number and social media. If you have any questions or other
requests outside of the sampling periods, please write an email to the Apiculturalist
Coordinator. Further, you are also invited to the national messenger group to exchange
your experiences with the other citizen scientists of your country.
Video manual APIStrip: www.youtube.com/watch?v=97josWrHu-A
Blog: https://www.insignia-bee.eu/blog/
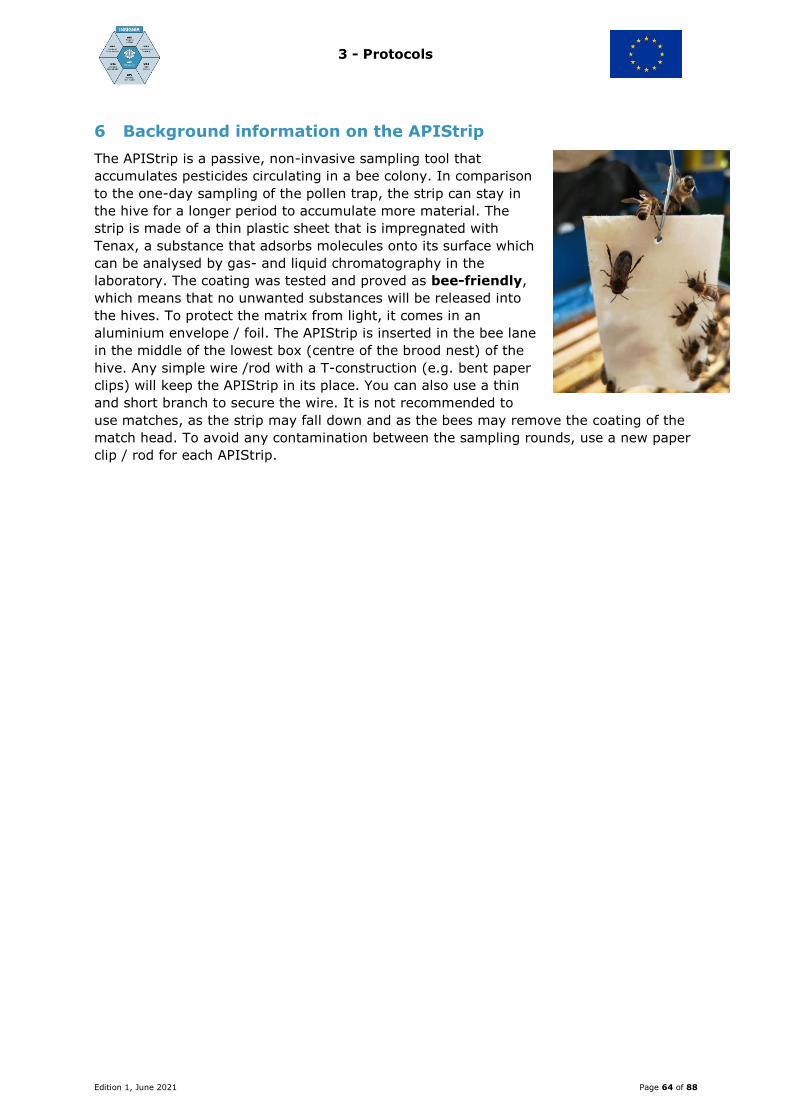
3 - Protocols
Edition 1, June 2021 Page 64 of 88
6 Background information on the APIStrip
The APIStrip is a passive, non-invasive sampling tool that
accumulates pesticides circulating in a bee colony. In comparison
to the one-day sampling of the pollen trap, the strip can stay in
the hive for a longer period to accumulate more material. The
strip is made of a thin plastic sheet that is impregnated with
Tenax, a substance that adsorbs molecules onto its surface which
can be analysed by gas- and liquid chromatography in the
laboratory. The coating was tested and proved as bee-friendly,
which means that no unwanted substances will be released into
the hives. To protect the matrix from light, it comes in an
aluminium envelope / foil. The APIStrip is inserted in the bee lane
in the middle of the lowest box (centre of the brood nest) of the
hive. Any simple wire /rod with a T-construction (e.g. bent paper
clips) will keep the APIStrip in its place. You can also use a thin
and short branch to secure the wire. It is not recommended to
use matches, as the strip may fall down and as the bees may remove the coating of the
match head. To avoid any contamination between the sampling rounds, use a new paper
clip / rod for each APIStrip.

4 - Methods
Edition 1, June 2021 Page 65 of 88
4 - Methods
4 - Methods
Edition 1, June 2021 Page 66 of 88
Content
1 APIStrip extraction procedure ..........................................................................67
1.1 GC-QqQ-MS/MS analysis ...........................................................................67
1.2 LC-QqQ-MS/MS analysis ............................................................................68
2 Metabarcoding procedure ................................................................................69
2.1 Pollen homogenisation ...............................................................................69
2.2 DNA extraction .........................................................................................69
2.3 Library preparation ...................................................................................69
2.4 Library normalisation, pool size and quantification ........................................72
2.5 Library sequencing ....................................................................................72
3 Statistical procedures for analysis of numbers of pesticides .................................74
3.1 The aim ...................................................................................................74
3.2 Data processing ........................................................................................74
3.3 Descriptive statistics .................................................................................74
3.4 Statistical tests .........................................................................................75
3.5 Statistical modelling ..................................................................................75
4 Modelling .......................................................................................................76
4.1 Occurrence of pollen and pesticides in the INSIGNIA landscape ......................76
4.2 Spatial and temporal geodata .....................................................................78
4.2.1 CORINE Land Use and Land Cover data ...............................................78
4.2.2 Pan-European weather data ...............................................................78
4.3 Mechanistic pollen foraging model ...............................................................80
4.3.1 Kernel model ....................................................................................80
4.3.2 Plant phenology ................................................................................81
4.3.3 Pollen resources ...............................................................................81
4.3.4 Exposure landscape ..........................................................................82
4.3.5 Pollen foraging .................................................................................83
4.4 Pollen and pesticide classification model ......................................................85
4.4.1 Random forests for classification .........................................................85
4.4.2 Fitting models to INSIGNIA pollen and pesticide data ............................86
4.4.3 Test of variable importance ................................................................87
4.4.4 Country-scale prediction of pollen and pesticides to produce maps ..........87
5 References ....................................................................................................88

4 - Methods
Edition 1, June 2021 Page 67 of 88
1 APIStrip extraction procedure
The desorption procedure of the pesticides from the Tenax surface is carried out as
follows: first, the APIStrips are cut in small pieces and placed inside 50 mL PTFE
centrifuge tubes. Then, 10 mL of acetonitrile are added and the samples are
automatically shaken at 1250 rpm (Geno/Grinder 2010, SPEX) for 3.5 minutes and
centrifuged at 4000 rpm for 5 minutes.
Procedural internal standards are used as surrogate standards to control the extraction
performance: dichlorvos-D6, malathion-D10, carbendazim-D3 and triphenyl phosphate
(TPP). The recovery of dichlorvos-D6, malathion-D10 and carbendazim-D3 is checked by
LC and the recovery of malathion-D10 and triphenyl phosphate is tested by GC.
For the preparation of the injection vials, different procedures are followed according to
the analytical technique. For liquid chromatography vials, 1 mL of extract is evaporated
under a gentle nitrogen stream and reconstituted with 100 µL of acetonitrile; afterwards,
400 µL of ultrapure water are added. For gas chromatography, 500 µL of extract are
evaporated and reconstituted with 50 µL of ethyl acetate. In both cases, the vial
preparation entails a 10-fold concentration. Injection internal standards (dimethoate-d6
for LC, lindane-d6 for GC) are employed to check the variations in the injection volume.
Calibration curves are prepared as follows: a blank APIStrip extract (500 µL for GC-
MS/MS, 1 mL for LC-MS/MS) is evaporated and reconstituted with an organic solvent (50
L ethyl acetate for GC-MS/MS, 100 L acetonitrile for LC-MS/MS) containing a mixture
of pesticides at 0.5, 1, 5, 10, 50, 100 or 200 µg/L. For the LC vials, 400 µL of ultrapure
water are added.
1.1 GC-QqQ-MS/MS analysis
The analyses by gas chromatography is performed in an Agilent Intuvo 9000 GC system
equipped with an Agilent 7693 autosampler and an Agilent 7010 GC-MS/MS triple
quadrupole. Data acquisition and processing is developed by Agilent MassHunter QQQ
Acquisition and Quantitative Analysis software version 10.0. The samples are injected
using a multimode injector inlet in splitless mode, through an Agilent ultra-inert inlet
liner with a glass wool frit. The injection volume is 1 µL. The injector temperature is kept
at 80 °C during the solvent evaporation stage (0.1 min) and then ramped up to 300 °C
at 600 °C/min for 5 min and up to 250 ºC at 100 °C/min . Two planar columns (Agilent),
HP-5MS UI 15 m long × 0.25 mm i.d. × 0.25 µm film thickness are used.
The oven temperature program is as follows: 60 °C for 0.5 min, up to 170 °C at
80 °C/min and finally up to 310 °C at 20 °C/min. The total run time is 12.4 min with 2.1
additional min for backflushing at 310 °C. The instrument works at a constant flow (1.28
mL/min column 1, 1.48 mL/min column 2). The system works in dynamic MRM, acquiring
the transition in a ± 0.2 min window from the retention time of the analyte.
Helium (99.999% purity) is used as the carrier and quenching gas, and nitrogen
(99.999% purity) as the collision gas. The collision and quenching gas flows are
1.5 mL/min and 2.25 mL/min, respectively. Both the transfer line and the ion source -
operated in electron ionisation- are maintained at 280 °C. The quadrupole analyzer
temperature is fixed at 150 °C. The solvent delay is 2.6 min.
4 - Methods
Edition 1, June 2021 Page 68 of 88
For the optimisation of the MS parameters, all pesticides are monitored in full-scan mode
in the 50–550 m/z range. The first step is the selection of the precursor/s ion/s for each
analyte and the retention time, injecting individual solutions for each pesticide at 1 mg
kg−1 in full-scan mode. The ion with the highest intensity and m/z relationship is selected
as the precursor ion. Precursor ion fragmentation is performed by collision-induced
dissociation with nitrogen, from which the best fragment ions are chosen. Once the
fragment ions are selected, the adequate CE for each transition is assayed in the 3–40 eV
range.
1.2 LC-QqQ-MS/MS analysis
An Agilent UPLC 1290 Series (Agilent Technologies, Palo Alto, CA, USA) coupled to an
Agilent Technologies 6490 Triple Quad LC/MS is used for this study. Data acquisition and
processing is developed by Agilent MassHunter QQQ Acquisition and Quantitative Analysis
software version 10.0, using dynamic MRM software features with a retention time
window of 0.8 min. The injection volume is 5 μL, and the chromatographic separation is
carried out with a Zorbax Eclipse Plus C8 column (Agilent), 2.1 mm × 100 mm × 1.8 μm.
The system employs 0.1 % formic acid in milliQ water (mobile phase A),and 0.1 %
formic acid and 5 % water in acetonitrile (mobile phase B) with the following gradient:
20 % of B for 2 min, a linear gradient up to 100 % of B in 13 min and finally an isocratic
mode at 100 % of B for 2 min. Subsequently, an equilibration step coming back to 20%
of B (2.5 min) is performed. The system is provided with a JetStream electrospray ion
source, employing nitrogen as the nebulizer gas. This ion source is configured as follows:
120 °C for the drying gas temperature, 13 L/min for the drying gas flow rate, 45 psi for
the nebulizer pressure, 375 °C for the sheath gas temperature and 10 L/min for the
sheath gas flow rate. The MS uses nitrogen as the collision gas (99.999 % purity), 380 V
for the fragmentor and 3,000 V for the capillary voltage, both in positive and negative
mode.
For the optimisation of the MS parameters, all pesticides at 0.1 mg/L (acetonitrile:water,
1:1, v/v) are injected directly into the MS system in full-scan mode within the 50–800
m/z range. From this injection, the precursor ion is selected. Then, one more injection in
product ion mode is needed to choose two fragment ions and the optimum collision
energy (CE) for each transition. The most intense transition is selected as the quantifier
transition (SRM1), while the second most intense is chosen as the qualifier transition
(SRM2).
4 - Methods
Edition 1, June 2021 Page 69 of 88
2 Metabarcoding procedure
All steps, from pollen homogenisation, DNA extraction, to sample preparation for PCR,
should be carried out in a safety cabinet to prevent any contamination from airborne
pollen. Additionally, before starting, all equipment and materials (e.g. SC, micropipettes,
magnetic stirrer, centrifuge) should be carefully cleaned with 10% bleach and 70%
ethanol and autoclaved (e.g. beakers, magnets, racks). The UV light of the safety cabinet
(and of the room, if exists) should be turned on for 1 hour. Negative controls should be
included in every batch of DNA extraction and PCR plate, for monitoring potential
contamination.
2.1 Pollen homogenisation
Pollen homogenisation is carried out by weighing 2 g of pollen pellets into a 50 mL
beaker, followed by adding 4 mL of sterile ultrapure water. This solution is homogenised
using a magnetic stirrer until the pollen pellets are totally dissolved. A volume of 200 μL
of the homogenised solution (~50 mg of pollen) is placed in a 1.5 mL microcentrifuge
tube and then centrifuged at maximum speed for 3 minutes. After centrifugation, the
supernatant is discarded and 1 mL of absolute ethanol is added to the tube, which is then
stored at -20°C until DNA extraction.
2.2 DNA extraction
DNA is extracted from the ~50 mg pollen using the NucleoSpin Food Kit (Macherey-
Nagel, Düren, Germany), according to manufacturer’s instructions, with minor
modifications as follows:
a) The ethanol-stored pollen samples are centrifuged at maximum speed for 3
minutes, and the supernatant (ethanol) is discarded;
b) The pollen is transferred to a 2.0 mL screwcap tube containing a mix of zirconia
beads of varying sizes (100 µm, 200 µm, 400 µm, 800 µm, 3 mm) to target all
pollen grains;
c) A volume of 550 μL of the NucleoSpin lysis buffer is added to the 2.0 mL tube and
the mixture is ground in a powerful tissue homogeniser (e.g. Precellys, Bertin) to
assure exine rupture of all pollen grains;
d) The next DNA extraction steps strictly follow manufacturer’s instructions.
After extraction, the quality and yield are measured in a SPECTROstar® Nano (BMG
Labtech, Ortenberg, Germany) and the DNA extracts are diluted to 10 ng/μL before PCR.
2.3 Library preparation
ITS2 library preparation follows a dual indexing strategy (Kozich et al., 2013) and starts
with a two-stage PCR: amplicon and indexing. PCR products are sequenced in the
Illumina MiSeq platform using a paired-end protocol to generate millions of overlapping
reads.
a) Amplicon PCR
In stage-one PCR, the ITS2 nuclear region is amplified using the universal primers ITS-
S2F (Chen et al., 2010) and ITS-S4R (White et al., 1990), which have been expanded to
include the Illumina sequence adaptors for the stage-two PCR (Figure 4.1; Table 4.1).
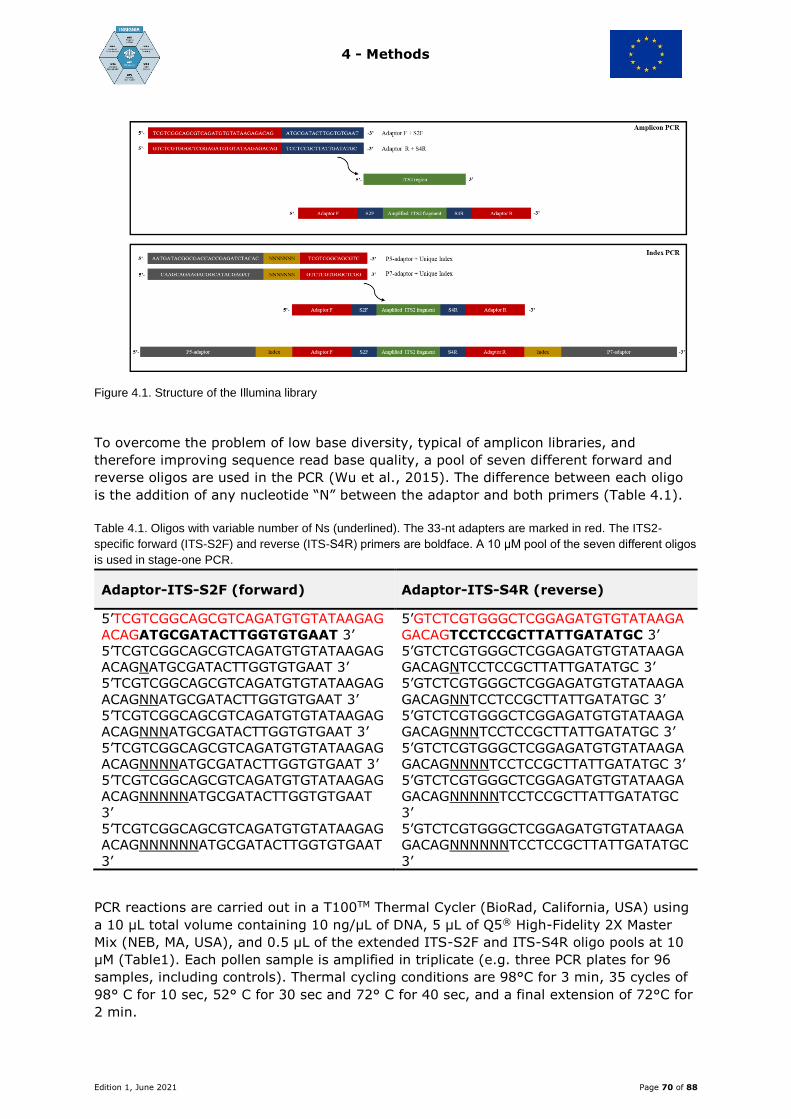
4 - Methods
Edition 1, June 2021 Page 70 of 88
Figure 4.1. Structure of the Illumina library
To overcome the problem of low base diversity, typical of amplicon libraries, and
therefore improving sequence read base quality, a pool of seven different forward and
reverse oligos are used in the PCR (Wu et al., 2015). The difference between each oligo
is the addition of any nucleotide “N” between the adaptor and both primers (Table 4.1).
Table 4.1. Oligos with variable number of Ns (underlined). The 33-nt adapters are marked in red. The ITS2-
specific forward (ITS-S2F) and reverse (ITS-S4R) primers are boldface. A 10 μM pool of the seven different oligos
is used in stage-one PCR.
Adaptor-ITS-S2F (forward) Adaptor-ITS-S4R (reverse)
5’TCGTCGGCAGCGTCAGATGTGTATAAGAG
ACAGATGCGATACTTGGTGTGAAT 3’
5’GTCTCGTGGGCTCGGAGATGTGTATAAGA
GACAGTCCTCCGCTTATTGATATGC 3’
5’TCGTCGGCAGCGTCAGATGTGTATAAGAG
ACAGNATGCGATACTTGGTGTGAAT 3’
5’GTCTCGTGGGCTCGGAGATGTGTATAAGA
GACAGNTCCTCCGCTTATTGATATGC 3’
5’TCGTCGGCAGCGTCAGATGTGTATAAGAG
ACAGNNATGCGATACTTGGTGTGAAT 3’
5’GTCTCGTGGGCTCGGAGATGTGTATAAGA
GACAGNNTCCTCCGCTTATTGATATGC 3’
5’TCGTCGGCAGCGTCAGATGTGTATAAGAG
ACAGNNNATGCGATACTTGGTGTGAAT 3’
5’GTCTCGTGGGCTCGGAGATGTGTATAAGA
GACAGNNNTCCTCCGCTTATTGATATGC 3’
5’TCGTCGGCAGCGTCAGATGTGTATAAGAG
ACAGNNNNATGCGATACTTGGTGTGAAT 3’
5’GTCTCGTGGGCTCGGAGATGTGTATAAGA
GACAGNNNNTCCTCCGCTTATTGATATGC 3’
5’TCGTCGGCAGCGTCAGATGTGTATAAGAG
ACAGNNNNNATGCGATACTTGGTGTGAAT
3’
5’GTCTCGTGGGCTCGGAGATGTGTATAAGA
GACAGNNNNNTCCTCCGCTTATTGATATGC
3’
5’TCGTCGGCAGCGTCAGATGTGTATAAGAG
ACAGNNNNNNATGCGATACTTGGTGTGAAT
3’
5’GTCTCGTGGGCTCGGAGATGTGTATAAGA
GACAGNNNNNNTCCTCCGCTTATTGATATGC
3’
PCR reactions are carried out in a T100TM Thermal Cycler (BioRad, California, USA) using
a 10 μL total volume containing 10 ng/μL of DNA, 5 μL of Q5® High-Fidelity 2X Master
Mix (NEB, MA, USA), and 0.5 μL of the extended ITS-S2F and ITS-S4R oligo pools at 10
μM (Table1). Each pollen sample is amplified in triplicate (e.g. three PCR plates for 96
samples, including controls). Thermal cycling conditions are 98°C for 3 min, 35 cycles of
98° C for 10 sec, 52° C for 30 sec and 72° C for 40 sec, and a final extension of 72°C for
2 min.

4 - Methods
Edition 1, June 2021 Page 71 of 88
For checking amplification success, 2 μL per sample of PCR products are loaded on a 1%
agarose gel and run at 95V. The remaining ~8 μL of the amplicons are purified from
unincorporated reaction components by using reversible immobilisation (SPRI)
paramagnetic beads (Agencourt AMPure XP, Beckman Coulter, CA, USA) with 0.8X of
beads per μL of PCR product.
b) Indexing PCR
In the stage-two indexing PCR, unique 7-nt sequence indexes are incorporated into the
amplicons. These unique sequences allow pooling of hundreds of samples in the
sequencing library. The indexing PCR is prepared individually for each replicate using 2.0
μL of 1:10 dilution of the previously purified amplicon, 5 μL of KAPA HiFi HotStart
ReadyMixPCR Kit (Kapa Biosystems, MA, USA), 0.5 μL of 1 μM of forward and reverse
oligos, in a total volume of 10 μL. The oligo scaffold includes the MiSeq-specific sequence
(forward: P5, reverse: P7), to attach to the sequencing flow cell, a 7-nt unique index, to
allow multiplexing, and the 14-15 nt adapters to attach to the stage-one amplicon
(Figure 4.1, Table 4.2). Thermal cycling conditions are 95°C for 3 min, followed by 10
cycles of 95°C for 30 sec, 55°C for 30 sec, 72°C for 30 sec, and a final extension of 72
°C for 5 min. Products are purified with the paramagnetic bead protocol used before and
then run on a 1% agarose, for quality checking of the indexing reaction.
Table 4.2. Oligos used in the indexing PCR. The sequences in yellow and blue are the MiSeq-specific adapters
P5 and P7, respectively, read by the MiSeq flow cell. The 7-nt underlined sequences are examples of unique
indexes, which allow sample pooling. The size of the pool depends on the number of unique indexes used. The
remaining 14-15 nt adaptors will attach to the amplicon of stage-one PCR.
P5-index (forward) P7-index (reverse)
5’AATGATACGGCGACCACCGAGATCTACACAC
CAACT TCGTCGGCAGCGTC 3’
5’CAAGCAGAAGACGGCATACGAGATAGG
TATT GTCTCGTGGGCTCGG 3’
5’AATGATACGGCGACCACCGAGATCTACACCG
AATGC TCGTCGGCAGCGTC 3’
5’CAAGCAGAAGACGGCATACGAGATCCT
ATCT GTCTCGTGGGCTCGG 3’
5’AATGATACGGCGACCACCGAGATCTACACGA
TCTCG TCGTCGGCAGCGTC 3’
5’CAAGCAGAAGACGGCATACGAGATCCT
GCGA GTCTCGTGGGCTCGG 3’
4 - Methods
Edition 1, June 2021 Page 72 of 88
2.4 Library normalisation, pool size and quantification
Purified indexed amplicons are quantified on an Epoch Spectrophotometer and then
normalised to a final concentration of 10 nM. After normalisation, all the samples from
each PCR plate are combined into one pool. For further confirmation that the correct ITS2
fragment has been amplified, the size distribution of the amplicons is determined for
each pool on a TapeStation 2200 using the HS D1000 kit (Agilent Technologies, CA,
USA). Next, each pool is quantified by a SYBR green quantitative PCR (qPCR) assay using
the KAPA Library Quantification kit (Kapa Biosystems, MA, USA) and the BIORAD C1000
Real Time Thermo cycler (BioRad, California, USA). After quantification, pools are
combined equimolarly into one final pool for sequencing (sequencing library).
2.5 Library sequencing
The sequencing library is diluted to 2 nM, spiked with 10% Illumina-generated PhiX
control library and then sequenced on MiSeq (Illumina, CA, USA) using the MiSeq
Reagent Kit v2 (500 cycles) with paired-end reads, according to manufacturer’s
instructions. Once the sequencing run is completed (after ~39 hours), the pools are de-
multiplexed into the original samples, based on the unique 7-nt index, and the primers
are trimmed using the BaseSpaceTM platform. The sequence reads generated for each
sample for the ITS2 fragment are imported into a bioinformatics pipeline (modified from
Sickel et al., 2015) for analysis. Briefly, the reads are merged, quality filtered and then
classified to the species level using an updated ITS2 reference database that includes
sequences representing bee plants collected by the INSIGNIA consortium. The entire
work flow for ITS2 metabarcoding of mixed pollen samples is shown in Figure 4.2.
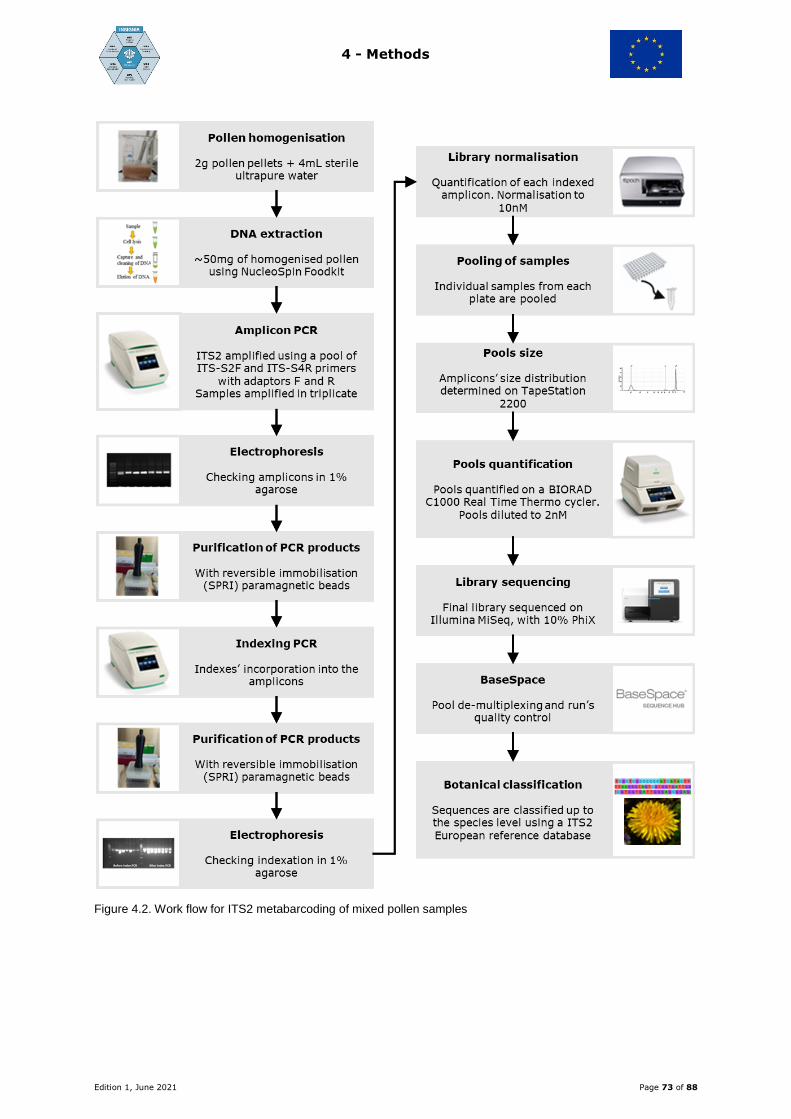
4 - Methods
Edition 1, June 2021 Page 73 of 88
Figure 4.2. Work flow for ITS2 metabarcoding of mixed pollen samples
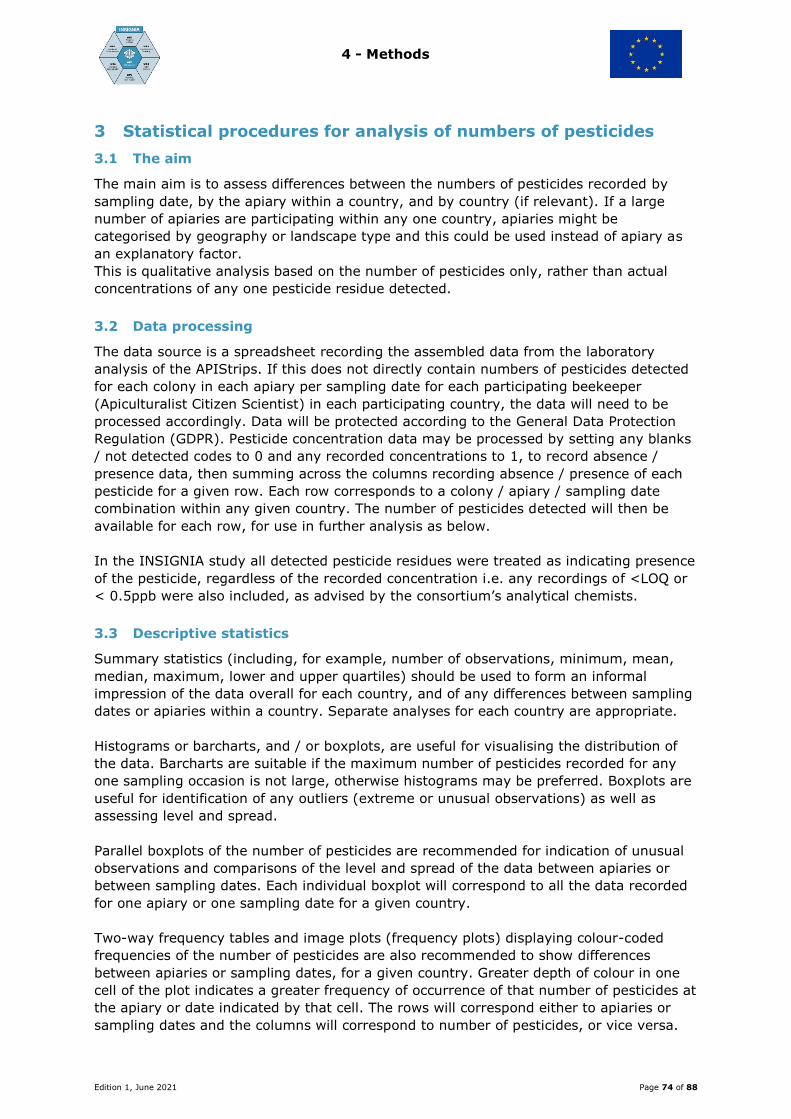
4 - Methods
Edition 1, June 2021 Page 74 of 88
3 Statistical procedures for analysis of numbers of pesticides
3.1 The aim
The main aim is to assess differences between the numbers of pesticides recorded by
sampling date, by the apiary within a country, and by country (if relevant). If a large
number of apiaries are participating within any one country, apiaries might be
categorised by geography or landscape type and this could be used instead of apiary as
an explanatory factor.
This is qualitative analysis based on the number of pesticides only, rather than actual
concentrations of any one pesticide residue detected.
3.2 Data processing
The data source is a spreadsheet recording the assembled data from the laboratory
analysis of the APIStrips. If this does not directly contain numbers of pesticides detected
for each colony in each apiary per sampling date for each participating beekeeper
(Apiculturalist Citizen Scientist) in each participating country, the data will need to be
processed accordingly. Data will be protected according to the General Data Protection
Regulation (GDPR). Pesticide concentration data may be processed by setting any blanks
/ not detected codes to 0 and any recorded concentrations to 1, to record absence /
presence data, then summing across the columns recording absence / presence of each
pesticide for a given row. Each row corresponds to a colony / apiary / sampling date
combination within any given country. The number of pesticides detected will then be
available for each row, for use in further analysis as below.
In the INSIGNIA study all detected pesticide residues were treated as indicating presence
of the pesticide, regardless of the recorded concentration i.e. any recordings of <LOQ or
< 0.5ppb were also included, as advised by the consortium’s analytical chemists.
3.3 Descriptive statistics
Summary statistics (including, for example, number of observations, minimum, mean,
median, maximum, lower and upper quartiles) should be used to form an informal
impression of the data overall for each country, and of any differences between sampling
dates or apiaries within a country. Separate analyses for each country are appropriate.
Histograms or barcharts, and / or boxplots, are useful for visualising the distribution of
the data. Barcharts are suitable if the maximum number of pesticides recorded for any
one sampling occasion is not large, otherwise histograms may be preferred. Boxplots are
useful for identification of any outliers (extreme or unusual observations) as well as
assessing level and spread.
Parallel boxplots of the number of pesticides are recommended for indication of unusual
observations and comparisons of the level and spread of the data between apiaries or
between sampling dates. Each individual boxplot will correspond to all the data recorded
for one apiary or one sampling date for a given country.
Two-way frequency tables and image plots (frequency plots) displaying colour-coded
frequencies of the number of pesticides are also recommended to show differences
between apiaries or sampling dates, for a given country. Greater depth of colour in one
cell of the plot indicates a greater frequency of occurrence of that number of pesticides at
the apiary or date indicated by that cell. The rows will correspond either to apiaries or
sampling dates and the columns will correspond to number of pesticides, or vice versa.
4 - Methods
Edition 1, June 2021 Page 75 of 88
The image plots make visual identification of any patterns straightforward and also allow
comparison of the corresponding plots for each country.
For a given country, the number of times or proportion of times any pesticides were
detected at all across the sampling dates may be compared between the apiaries. If a
large number of apiaries are participating, the number of times or proportion of times
any pesticides were detected in any apiaries could be compared between sampling dates.
3.4 Statistical tests
Tests will be used to formally assess for differences in recorded numbers of pesticides
between apiaries or sampling dates for a given country. As the number of pesticides is
likely to have a skewed distribution and is count data, likely to have a limited range, a
Kruskal-Wallis test of difference in distribution in number of pesticides for different
sampling dates or different apiaries is appropriate. If this indicates significant differences,
this is followed by multiple comparisons of apiaries or sampling dates, for example using
pairwise Wilcoxon rank sum tests corrected for multiple testing. Many options are
available for such correction. In the INSIGNIA study, this approach was used with a
Benjamini-Hochberg correction for multiple testing.
For a given country, to test the significance of any differences in the proportions of times
pesticides were detected at all for different apiaries or for different sampling dates, a
Pearson’s Chi-squared test can be used on the frequencies of detection and non-
detection, or alternatively, if the observed frequencies of detection are low, a Fisher’s
exact test is appropriate.
3.5 Statistical modelling
As the aim is to relate the number of pesticides to sampling date and apiary for any one
country, study of the statistical significance of the effects on number of pesticides of
sampling date and apiary, individually or simultaneously, can be accomplished through
fitting generalised linear models (GLMs). Poisson, quasi-Poisson or Negative Binomial
GLMs are suitable, using a log link function, depending on the variability present in the
data. Sampling date and apiary should be treated as factors. Generalised linear mixed
models (GLMMs) are also appropriate, including fixed effects for sampling date and
apiary, with colony (within apiary) as a random effect.
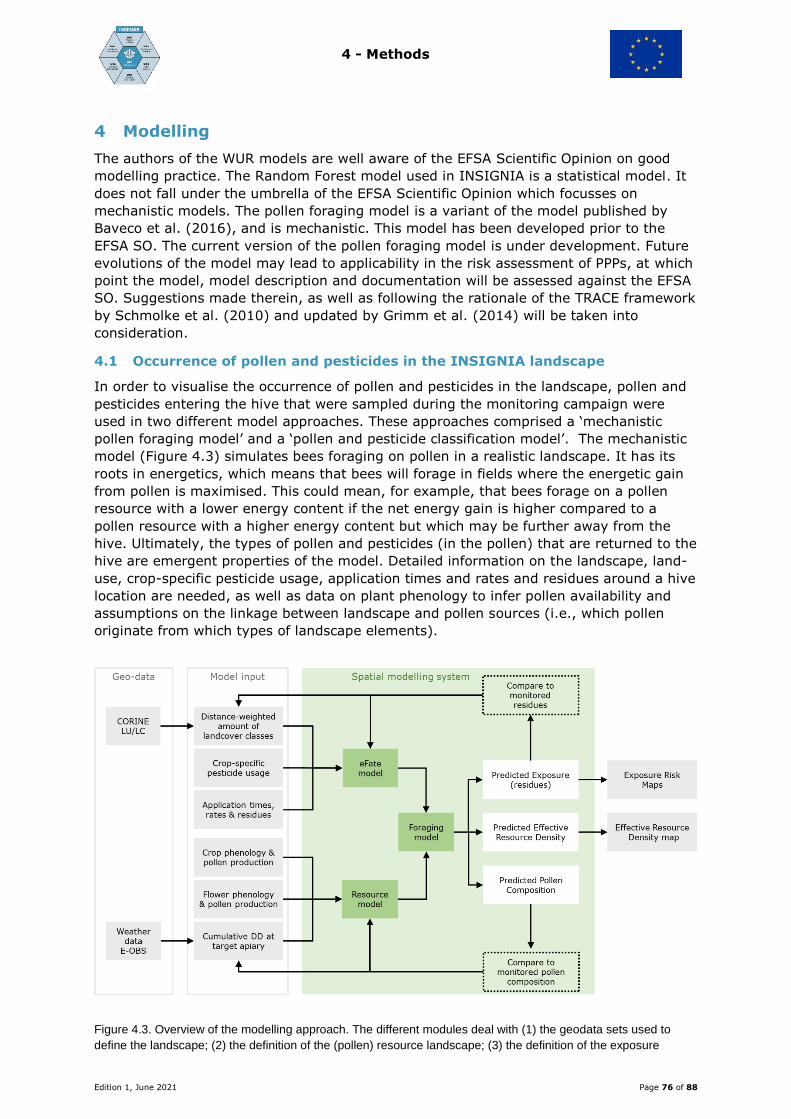
4 - Methods
Edition 1, June 2021 Page 76 of 88
4 Modelling
The authors of the WUR models are well aware of the EFSA Scientific Opinion on good
modelling practice. The Random Forest model used in INSIGNIA is a statistical model. It
does not fall under the umbrella of the EFSA Scientific Opinion which focusses on
mechanistic models. The pollen foraging model is a variant of the model published by
Baveco et al. (2016), and is mechanistic. This model has been developed prior to the
EFSA SO. The current version of the pollen foraging model is under development. Future
evolutions of the model may lead to applicability in the risk assessment of PPPs, at which
point the model, model description and documentation will be assessed against the EFSA
SO. Suggestions made therein, as well as following the rationale of the TRACE framework
by Schmolke et al. (2010) and updated by Grimm et al. (2014) will be taken into
consideration.
4.1 Occurrence of pollen and pesticides in the INSIGNIA landscape
In order to visualise the occurrence of pollen and pesticides in the landscape, pollen and
pesticides entering the hive that were sampled during the monitoring campaign were
used in two different model approaches. These approaches comprised a ‘mechanistic
pollen foraging model’ and a ‘pollen and pesticide classification model’. The mechanistic
model (Figure 4.3) simulates bees foraging on pollen in a realistic landscape. It has its
roots in energetics, which means that bees will forage in fields where the energetic gain
from pollen is maximised. This could mean, for example, that bees forage on a pollen
resource with a lower energy content if the net energy gain is higher compared to a
pollen resource with a higher energy content but which may be further away from the
hive. Ultimately, the types of pollen and pesticides (in the pollen) that are returned to the
hive are emergent properties of the model. Detailed information on the landscape, land-
use, crop-specific pesticide usage, application times and rates and residues around a hive
location are needed, as well as data on plant phenology to infer pollen availability and
assumptions on the linkage between landscape and pollen sources (i.e., which pollen
originate from which types of landscape elements).
Figure 4.3. Overview of the modelling approach. The different modules deal with (1) the geodata sets used to
define the landscape; (2) the definition of the (pollen) resource landscape; (3) the definition of the exposure
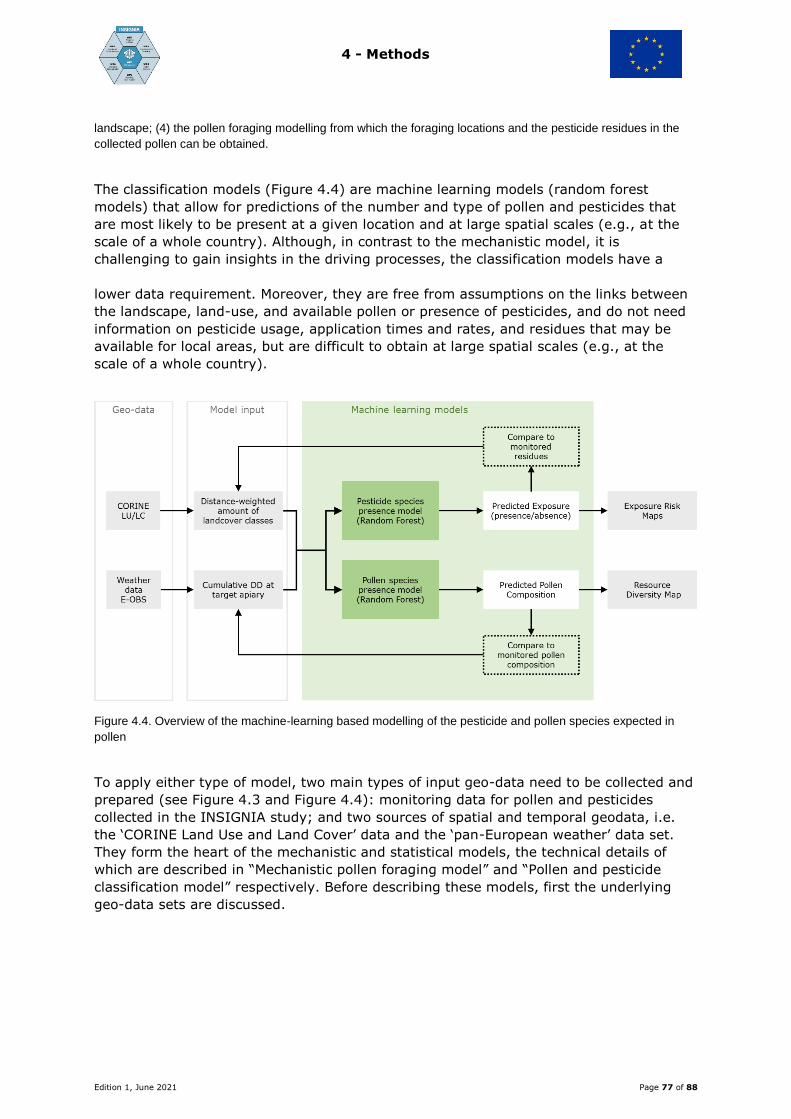
4 - Methods
Edition 1, June 2021 Page 77 of 88
landscape; (4) the pollen foraging modelling from which the foraging locations and the pesticide residues in the
collected pollen can be obtained.
The classification models (Figure 4.4) are machine learning models (random forest
models) that allow for predictions of the number and type of pollen and pesticides that
are most likely to be present at a given location and at large spatial scales (e.g., at the
scale of a whole country). Although, in contrast to the mechanistic model, it is
challenging to gain insights in the driving processes, the classification models have a
lower data requirement. Moreover, they are free from assumptions on the links between
the landscape, land-use, and available pollen or presence of pesticides, and do not need
information on pesticide usage, application times and rates, and residues that may be
available for local areas, but are difficult to obtain at large spatial scales (e.g., at the
scale of a whole country).
Figure 4.4. Overview of the machine-learning based modelling of the pesticide and pollen species expected in
pollen
To apply either type of model, two main types of input geo-data need to be collected and
prepared (see Figure 4.3 and Figure 4.4): monitoring data for pollen and pesticides
collected in the INSIGNIA study; and two sources of spatial and temporal geodata, i.e.
the ‘CORINE Land Use and Land Cover’ data and the ‘pan-European weather’ data set.
They form the heart of the mechanistic and statistical models, the technical details of
which are described in “Mechanistic pollen foraging model” and “Pollen and pesticide
classification model” respectively. Before describing these models, first the underlying
geo-data sets are discussed.

4 - Methods
Edition 1, June 2021 Page 78 of 88
4.2 Spatial and temporal geodata
4.2.1 CORINE Land Use and Land Cover data
The first step in preparing the necessary data for the mechanistic and classification
models is the geo-data (see box ‘Geo-data’ in Figure 4.3 and Figure 4.4). After the first
processing step, which is described in the section “Kernel model”, the data can be used
as input to the models (see box ‘Input data’ in Figure 4.3 and Figure 4.4). The data
describe the landscape around the locations of hives used in this study and are used to
form a link between the physical landscape and the presence of pollen and pesticides.
The data set used is the CORINE Land Cover (CLC) dataset, which is based on satellite
imagery. It was first developed in the 1980s with the aim to standardise data collection
on land and land-use in Europe and to support environmental research and policy. The
dataset contains information on the land use and land cover over the whole of Europe at
a relatively coarse 100m resolution. In other words, the whole of Europe is divided into 1
hectare grids, and each grid cell is placed into a category describing the land-use. In total
44 different land-use classes are recognised. They are sub-divided into five main
categories: artificial surfaces (e.g., roads, built up areas), agricultural areas (e.g.,
pastures, arable fields), forests and semi-natural areas (e.g., rough pastures), wetlands
(e.g., bogs, marshes), and waterbodies (e.g., rivers and lakes). The most recent CORINE
raster version (coordinate reference system EPSG:3035 - ETRS89-extended / LAEA
Europe – Projected; 2018) was downloaded from https://land.copernicus.eu/pan-
european/corine-land-cover/clc2018?tab=download and used for this study. Obviously,
there is no need to use the entire data set for the whole of Europe for each hive.
Therefore, in order to extract the relevant information from the CORINE database (i.e.,
within the vicinity of a hive) Python scripts are used to obtain so-called clipped maps that
contain information on the type of CORINE CLCs in the local area. Pre-processing steps of
the models expect maps in ascii-grid format. In the INSIGNIA study, two spatial scales
are used to extract CLC data. Firstly, bee foraging is assumed to be limited to the
landscape within a 3.25 km radius of the hive. With this distance in mind, for pollen
resources a hive location is defined by a clip of 65 by 65 cells with the hive coordinates in
the centre. In other words, the hive is at the centre of a ‘patch’ with an area of 6.5 by
6.5km. Secondly, the foraging landscape that is used by bees can be influenced by
pesticides coming from within this area but also from outside this area by, for example,
drift deposition. Therefore, for the landscape that determines the potential sources of
exposure to pesticides, a larger clip area is used, i.e., 513 by 513 cells.
4.2.2 Pan-European weather data
The second primary source of input geo-data required by both models is on temperature
patterns (see Weather data E-OBS in the box ‘Geo-data’ in Figure 4.3 and Figure 4.4).
The reason is that the phenology of plant species determines when that species starts
flowering and thus when pollen is available. It is, however, impossible to obtain
information on plant phenology for individual plant species from geo-data directly. The
number of cumulative degree days (CDD10) above a threshold value (10 °C in this
report) is generally considered to be an important species-specific requirement. Indeed,
species-specific thresholds in CDD10 for first bloom and / or full bloom can be found in
phenology calendars such as: https://www.oardc.ohio-state.edu/CDD10/. For maximum
generality, for each pollen resource the flowering period is defined as a distribution over
CDD10 values with a base temperature of 10 °C. To apply the models for specific location
and time of the year, the CDD10 up to this date for this location will be needed. The
CDD10 can be calculated from temperature time-series by summing the difference
between the daily average temperature (geometric mean between minimum and
maximum) and the threshold temperature.
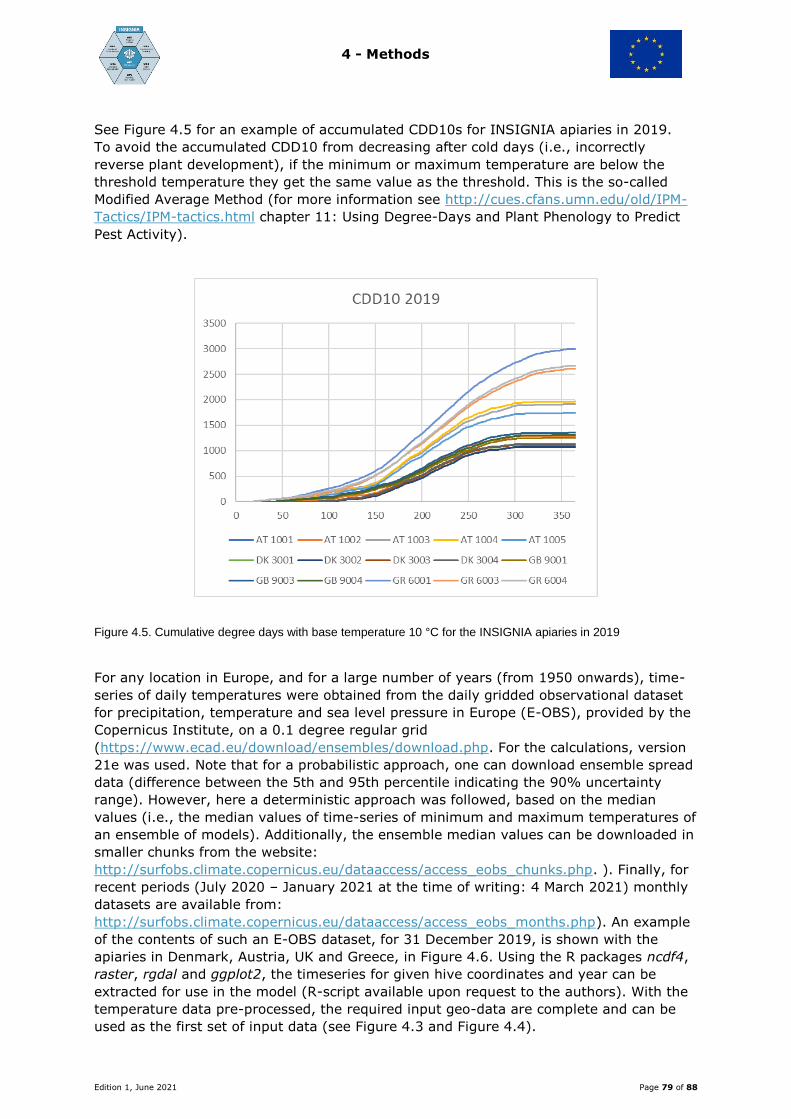
4 - Methods
Edition 1, June 2021 Page 79 of 88
See Figure 4.5 for an example of accumulated CDD10s for INSIGNIA apiaries in 2019.
To avoid the accumulated CDD10 from decreasing after cold days (i.e., incorrectly
reverse plant development), if the minimum or maximum temperature are below the
threshold temperature they get the same value as the threshold. This is the so-called
Modified Average Method (for more information see http://cues.cfans.umn.edu/old/IPM-
Tactics/IPM-tactics.html chapter 11: Using Degree-Days and Plant Phenology to Predict
Pest Activity).
Figure 4.5. Cumulative degree days with base temperature 10 °C for the INSIGNIA apiaries in 2019
For any location in Europe, and for a large number of years (from 1950 onwards), time-
series of daily temperatures were obtained from the daily gridded observational dataset
for precipitation, temperature and sea level pressure in Europe (E-OBS), provided by the
Copernicus Institute, on a 0.1 degree regular grid
(https://www.ecad.eu/download/ensembles/download.php. For the calculations, version
21e was used. Note that for a probabilistic approach, one can download ensemble spread
data (difference between the 5th and 95th percentile indicating the 90% uncertainty
range). However, here a deterministic approach was followed, based on the median
values (i.e., the median values of time-series of minimum and maximum temperatures of
an ensemble of models). Additionally, the ensemble median values can be downloaded in
smaller chunks from the website:
http://surfobs.climate.copernicus.eu/dataaccess/access_eobs_chunks.php. ). Finally, for
recent periods (July 2020 – January 2021 at the time of writing: 4 March 2021) monthly
datasets are available from:
http://surfobs.climate.copernicus.eu/dataaccess/access_eobs_months.php). An example
of the contents of such an E-OBS dataset, for 31 December 2019, is shown with the
apiaries in Denmark, Austria, UK and Greece, in Figure 4.6. Using the R packages ncdf4,
raster, rgdal and ggplot2, the timeseries for given hive coordinates and year can be
extracted for use in the model (R-script available upon request to the authors). With the
temperature data pre-processed, the required input geo-data are complete and can be
used as the first set of input data (see Figure 4.3 and Figure 4.4).
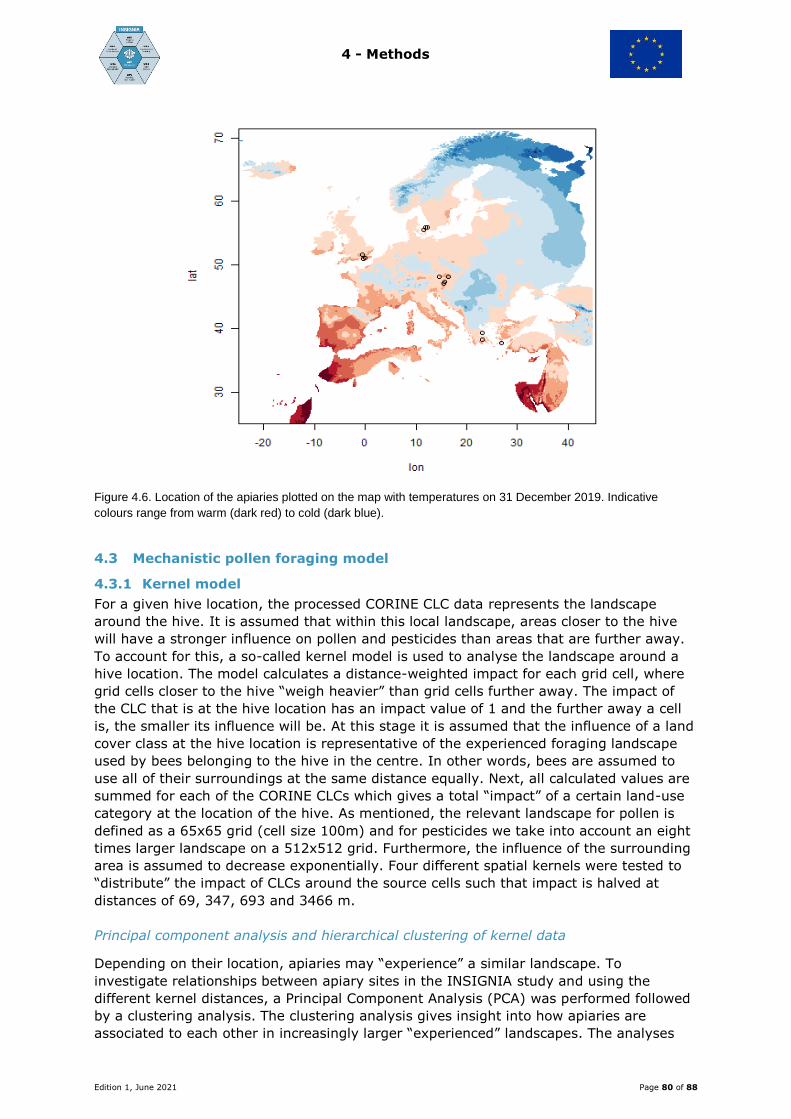
4 - Methods
Edition 1, June 2021 Page 80 of 88
Figure 4.6. Location of the apiaries plotted on the map with temperatures on 31 December 2019. Indicative
colours range from warm (dark red) to cold (dark blue).
4.3 Mechanistic pollen foraging model
4.3.1 Kernel model
For a given hive location, the processed CORINE CLC data represents the landscape
around the hive. It is assumed that within this local landscape, areas closer to the hive
will have a stronger influence on pollen and pesticides than areas that are further away.
To account for this, a so-called kernel model is used to analyse the landscape around a
hive location. The model calculates a distance-weighted impact for each grid cell, where
grid cells closer to the hive “weigh heavier” than grid cells further away. The impact of
the CLC that is at the hive location has an impact value of 1 and the further away a cell
is, the smaller its influence will be. At this stage it is assumed that the influence of a land
cover class at the hive location is representative of the experienced foraging landscape
used by bees belonging to the hive in the centre. In other words, bees are assumed to
use all of their surroundings at the same distance equally. Next, all calculated values are
summed for each of the CORINE CLCs which gives a total “impact” of a certain land-use
category at the location of the hive. As mentioned, the relevant landscape for pollen is
defined as a 65x65 grid (cell size 100m) and for pesticides we take into account an eight
times larger landscape on a 512x512 grid. Furthermore, the influence of the surrounding
area is assumed to decrease exponentially. Four different spatial kernels were tested to
“distribute” the impact of CLCs around the source cells such that impact is halved at
distances of 69, 347, 693 and 3466 m.
Principal component analysis and hierarchical clustering of kernel data
Depending on their location, apiaries may “experience” a similar landscape. To
investigate relationships between apiary sites in the INSIGNIA study and using the
different kernel distances, a Principal Component Analysis (PCA) was performed followed
by a clustering analysis. The clustering analysis gives insight into how apiaries are
associated to each other in increasingly larger “experienced” landscapes. The analyses
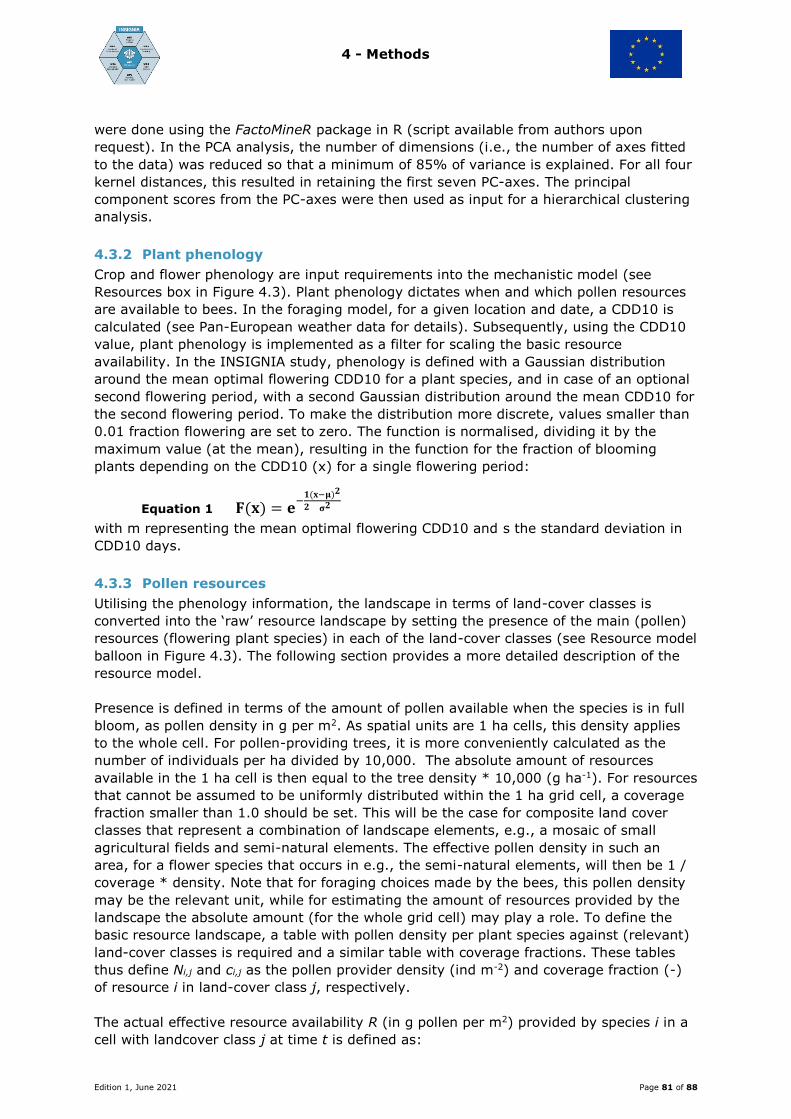
4 - Methods
Edition 1, June 2021 Page 81 of 88
were done using the FactoMineR package in R (script available from authors upon
request). In the PCA analysis, the number of dimensions (i.e., the number of axes fitted
to the data) was reduced so that a minimum of 85% of variance is explained. For all four
kernel distances, this resulted in retaining the first seven PC-axes. The principal
component scores from the PC-axes were then used as input for a hierarchical clustering
analysis.
4.3.2 Plant phenology
Crop and flower phenology are input requirements into the mechanistic model (see
Resources box in Figure 4.3). Plant phenology dictates when and which pollen resources
are available to bees. In the foraging model, for a given location and date, a CDD10 is
calculated (see Pan-European weather data for details). Subsequently, using the CDD10
value, plant phenology is implemented as a filter for scaling the basic resource
availability. In the INSIGNIA study, phenology is defined with a Gaussian distribution
around the mean optimal flowering CDD10 for a plant species, and in case of an optional
second flowering period, with a second Gaussian distribution around the mean CDD10 for
the second flowering period. To make the distribution more discrete, values smaller than
0.01 fraction flowering are set to zero. The function is normalised, dividing it by the
maximum value (at the mean), resulting in the function for the fraction of blooming
plants depending on the CDD10 (x) for a single flowering period:
Equation 1 𝐅(𝐱) = 𝐞−
𝟏
𝟐
(𝐱−𝛍)𝟐
𝛔𝟐
with m representing the mean optimal flowering CDD10 and s the standard deviation in
CDD10 days.
4.3.3 Pollen resources
Utilising the phenology information, the landscape in terms of land-cover classes is
converted into the ‘raw’ resource landscape by setting the presence of the main (pollen)
resources (flowering plant species) in each of the land-cover classes (see Resource model
balloon in Figure 4.3). The following section provides a more detailed description of the
resource model.
Presence is defined in terms of the amount of pollen available when the species is in full
bloom, as pollen density in g per m2. As spatial units are 1 ha cells, this density applies
to the whole cell. For pollen-providing trees, it is more conveniently calculated as the
number of individuals per ha divided by 10,000. The absolute amount of resources
available in the 1 ha cell is then equal to the tree density * 10,000 (g ha-1). For resources
that cannot be assumed to be uniformly distributed within the 1 ha grid cell, a coverage
fraction smaller than 1.0 should be set. This will be the case for composite land cover
classes that represent a combination of landscape elements, e.g., a mosaic of small
agricultural fields and semi-natural elements. The effective pollen density in such an
area, for a flower species that occurs in e.g., the semi-natural elements, will then be 1 /
coverage * density. Note that for foraging choices made by the bees, this pollen density
may be the relevant unit, while for estimating the amount of resources provided by the
landscape the absolute amount (for the whole grid cell) may play a role. To define the
basic resource landscape, a table with pollen density per plant species against (relevant)
land-cover classes is required and a similar table with coverage fractions. These tables
thus define Ni,j and ci,j as the pollen provider density (ind m-2) and coverage fraction (-)
of resource i in land-cover class j, respectively.
The actual effective resource availability R (in g pollen per m2) provided by species i in a
cell with landcover class j at time t is defined as:
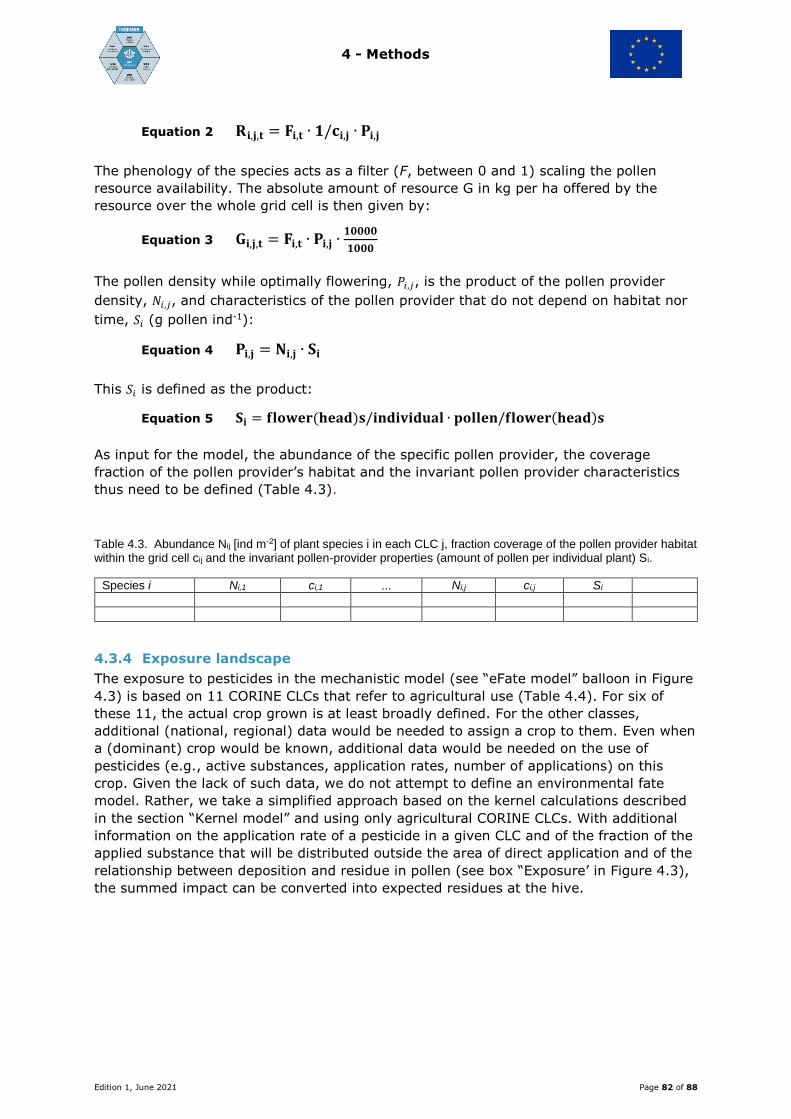
4 - Methods
Edition 1, June 2021 Page 82 of 88
Equation 2 𝐑𝐢,𝐣,𝐭 = 𝐅𝐢,𝐭 ∙ 𝟏/𝐜𝐢,𝐣 ∙ 𝐏𝐢,𝐣
The phenology of the species acts as a filter (F, between 0 and 1) scaling the pollen
resource availability. The absolute amount of resource G in kg per ha offered by the
resource over the whole grid cell is then given by:
Equation 3 𝐆𝐢,𝐣,𝐭 = 𝐅𝐢,𝐭 ∙ 𝐏𝐢,𝐣 ∙𝟏𝟎𝟎𝟎𝟎
𝟏𝟎𝟎𝟎
The pollen density while optimally flowering, 𝑃𝑖,𝑗, is the product of the pollen provider
density, 𝑁𝑖,𝑗, and characteristics of the pollen provider that do not depend on habitat nor
time, 𝑆𝑖 (g pollen ind-1):
Equation 4 𝐏𝐢,𝐣 = 𝐍𝐢,𝐣 ∙ 𝐒𝐢
This 𝑆𝑖 is defined as the product:
Equation 5 𝐒𝐢 = 𝐟𝐥𝐨𝐰𝐞𝐫(𝐡𝐞𝐚𝐝)𝐬/𝐢𝐧𝐝𝐢𝐯𝐢𝐝𝐮𝐚𝐥 ∙ 𝐩𝐨𝐥𝐥𝐞𝐧/𝐟𝐥𝐨𝐰𝐞𝐫(𝐡𝐞𝐚𝐝)𝐬
As input for the model, the abundance of the specific pollen provider, the coverage
fraction of the pollen provider’s habitat and the invariant pollen provider characteristics
thus need to be defined (Table 4.3).
Table 4.3. Abundance Nij [ind m-2] of plant species i in each CLC j, fraction coverage of the pollen provider habitat within the grid cell cij and the invariant pollen-provider properties (amount of pollen per individual plant) Si.
Species i Ni,1 ci,1 ... Ni,j ci,j Si
4.3.4 Exposure landscape
The exposure to pesticides in the mechanistic model (see “eFate model” balloon in Figure
4.3) is based on 11 CORINE CLCs that refer to agricultural use (Table 4.4). For six of
these 11, the actual crop grown is at least broadly defined. For the other classes,
additional (national, regional) data would be needed to assign a crop to them. Even when
a (dominant) crop would be known, additional data would be needed on the use of
pesticides (e.g., active substances, application rates, number of applications) on this
crop. Given the lack of such data, we do not attempt to define an environmental fate
model. Rather, we take a simplified approach based on the kernel calculations described
in the section “Kernel model” and using only agricultural CORINE CLCs. With additional
information on the application rate of a pesticide in a given CLC and of the fraction of the
applied substance that will be distributed outside the area of direct application and of the
relationship between deposition and residue in pollen (see box “Exposure’ in Figure 4.3),
the summed impact can be converted into expected residues at the hive.

4 - Methods
Edition 1, June 2021 Page 83 of 88
Table 4.4. Land-cover classes in the CORINE database referring to agricultural use
Land-cover class Agricultural use
211 Non-irrigated arable land
212 Permanently irrigated land
213 Rice fields
221 Vineyards
222 Fruit trees and berry plantations
223 Olive groves
231 Pastures
241 Annual crops associated with permanent crops
242 Complex cultivation patterns
243 Land principally occupied by agriculture with significant areas of natural vegetation
244 Agro-forestry areas
4.3.5 Pollen foraging
With the outputs from the “Resource” and “eFate” models, the “foraging model” can be
run (see Figure 4.3). The outputs from the foraging model are: predicted exposure
(residues); predicted mixture risk; predicted pollen composition; and the predicted
effective resource density (Figure 4.3). The outputs can be compared against the
monitoring data, and the model can be iteratively refined. Once a best-performing model
has been established, the outputs can be used to produce exposure and risk maps, as
well as effective resource density maps (Figure 4.3). The following provides an overview
of the foraging model.
For honey bee pollen foragers, we assume it is the amount of pollen protein that can be
obtained from a pollen resource that determines its attractiveness (Liolios et al., 2016).
This amount is determined by both the protein content of the pollen and the presence of
the resource in the surrounding landscape. Gain of the pollen foraging is the amount of
protein collected. To be able to deal with it in a framework balancing gains and costs of
collecting the pollen protein, gains and costs need to be expressed in a common
currency, for which we use energy (in J). Energy gain is thus the amount of pollen
collected, multiplied by its protein content and the conversion factor of protein to energy
(17 kJ/g). Energetic costs are the transport costs (unloaded flight from hive to foraging
location and loaded flight back to the hive) and the foraging itself. For the latter we apply
a single coefficient, lumping the outcome of the processes of movement from flower to
flower and from plant to plant, and the actual extraction of the pollen from each flower.
The rate with which pollen is collected (f, in mg s-1) depends also on the resource density
(g m-2), following a functional response function that puts an upper limit on the rate of
collection:
Equation 6 𝐟 =𝐚𝐑∗𝟏𝟎𝟎𝟎
𝟏+𝐚𝐡𝐑∗𝟏𝟎𝟎𝟎
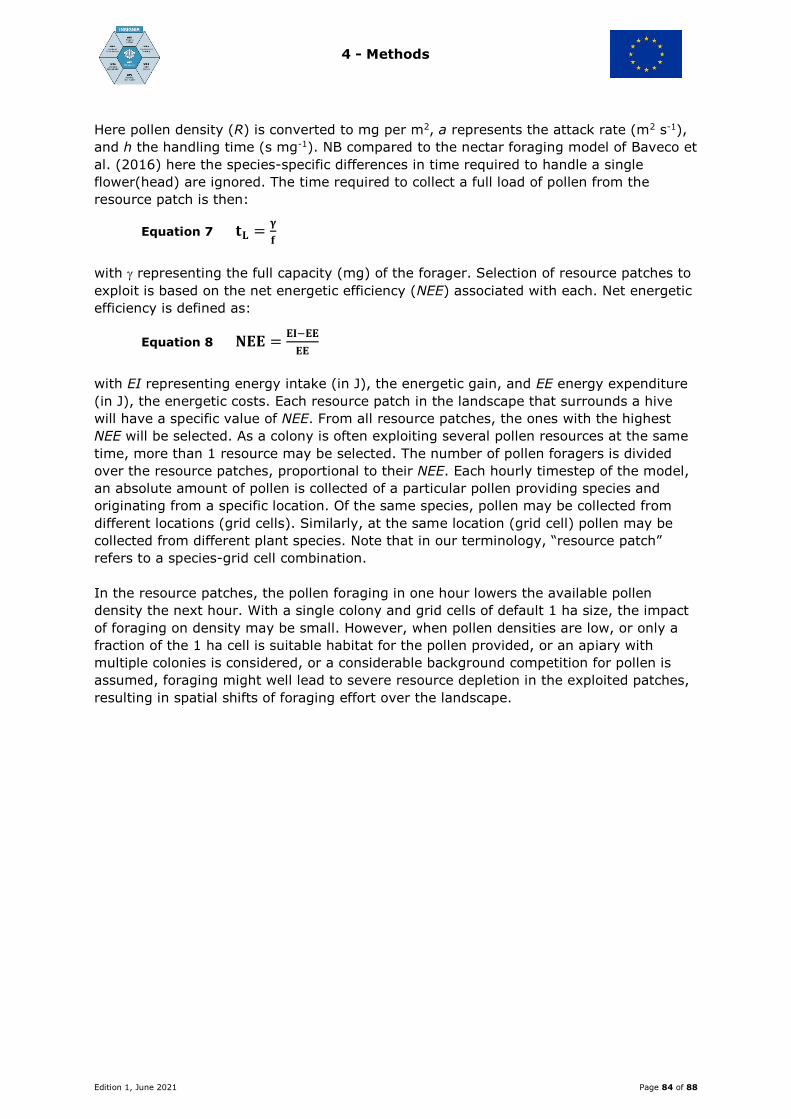
4 - Methods
Edition 1, June 2021 Page 84 of 88
Here pollen density (R) is converted to mg per m2, a represents the attack rate (m2 s-1),
and h the handling time (s mg-1). NB compared to the nectar foraging model of Baveco et
al. (2016) here the species-specific differences in time required to handle a single
flower(head) are ignored. The time required to collect a full load of pollen from the
resource patch is then:
Equation 7 𝐭𝐋 =𝛄
𝐟
with representing the full capacity (mg) of the forager. Selection of resource patches to
exploit is based on the net energetic efficiency (NEE) associated with each. Net energetic
efficiency is defined as:
Equation 8 𝐍𝐄𝐄 =𝐄𝐈−𝐄𝐄
𝐄𝐄
with EI representing energy intake (in J), the energetic gain, and EE energy expenditure
(in J), the energetic costs. Each resource patch in the landscape that surrounds a hive
will have a specific value of NEE. From all resource patches, the ones with the highest
NEE will be selected. As a colony is often exploiting several pollen resources at the same
time, more than 1 resource may be selected. The number of pollen foragers is divided
over the resource patches, proportional to their NEE. Each hourly timestep of the model,
an absolute amount of pollen is collected of a particular pollen providing species and
originating from a specific location. Of the same species, pollen may be collected from
different locations (grid cells). Similarly, at the same location (grid cell) pollen may be
collected from different plant species. Note that in our terminology, “resource patch”
refers to a species-grid cell combination.
In the resource patches, the pollen foraging in one hour lowers the available pollen
density the next hour. With a single colony and grid cells of default 1 ha size, the impact
of foraging on density may be small. However, when pollen densities are low, or only a
fraction of the 1 ha cell is suitable habitat for the pollen provided, or an apiary with
multiple colonies is considered, or a considerable background competition for pollen is
assumed, foraging might well lead to severe resource depletion in the exploited patches,
resulting in spatial shifts of foraging effort over the landscape.
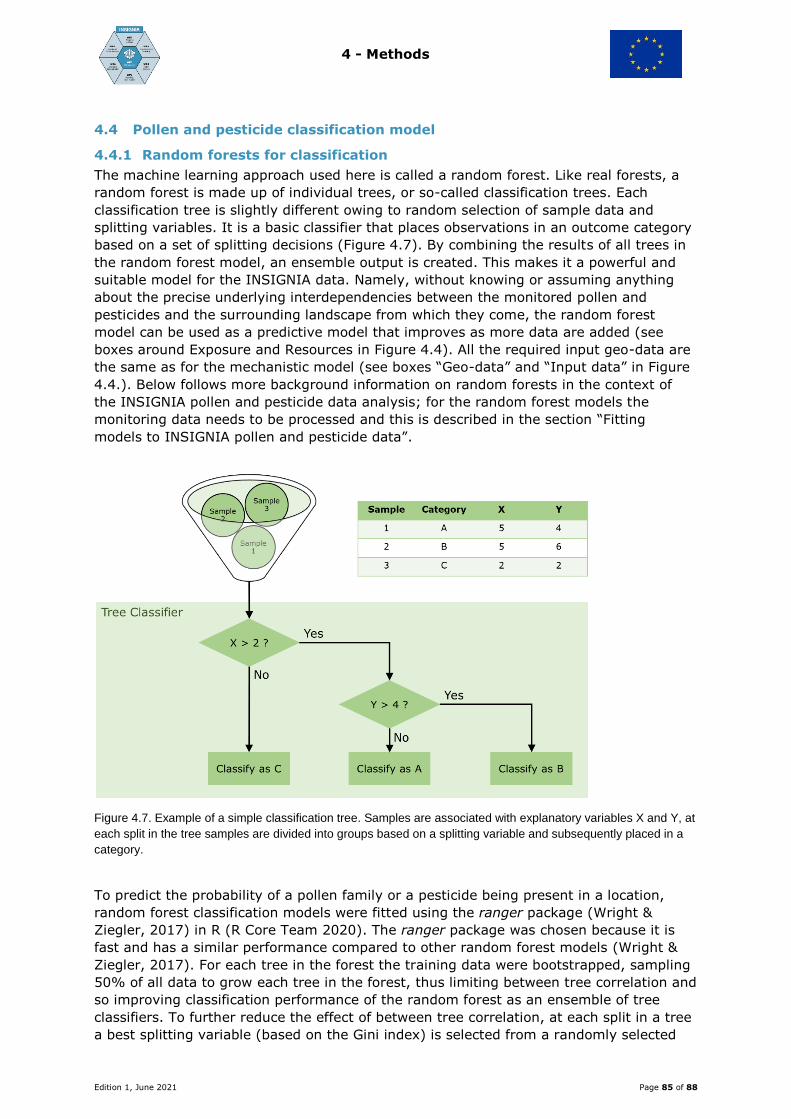
4 - Methods
Edition 1, June 2021 Page 85 of 88
4.4 Pollen and pesticide classification model
4.4.1 Random forests for classification
The machine learning approach used here is called a random forest. Like real forests, a
random forest is made up of individual trees, or so-called classification trees. Each
classification tree is slightly different owing to random selection of sample data and
splitting variables. It is a basic classifier that places observations in an outcome category
based on a set of splitting decisions (Figure 4.7). By combining the results of all trees in
the random forest model, an ensemble output is created. This makes it a powerful and
suitable model for the INSIGNIA data. Namely, without knowing or assuming anything
about the precise underlying interdependencies between the monitored pollen and
pesticides and the surrounding landscape from which they come, the random forest
model can be used as a predictive model that improves as more data are added (see
boxes around Exposure and Resources in Figure 4.4). All the required input geo-data are
the same as for the mechanistic model (see boxes “Geo-data” and “Input data” in Figure
4.4.). Below follows more background information on random forests in the context of
the INSIGNIA pollen and pesticide data analysis; for the random forest models the
monitoring data needs to be processed and this is described in the section “Fitting
models to INSIGNIA pollen and pesticide data”.
Figure 4.7. Example of a simple classification tree. Samples are associated with explanatory variables X and Y, at
each split in the tree samples are divided into groups based on a splitting variable and subsequently placed in a
category.
To predict the probability of a pollen family or a pesticide being present in a location,
random forest classification models were fitted using the ranger package (Wright &
Ziegler, 2017) in R (R Core Team 2020). The ranger package was chosen because it is
fast and has a similar performance compared to other random forest models (Wright &
Ziegler, 2017). For each tree in the forest the training data were bootstrapped, sampling
50% of all data to grow each tree in the forest, thus limiting between tree correlation and
so improving classification performance of the random forest as an ensemble of tree
classifiers. To further reduce the effect of between tree correlation, at each split in a tree
a best splitting variable (based on the Gini index) is selected from a randomly selected

4 - Methods
Edition 1, June 2021 Page 86 of 88
subset of the predictor variables (Breiman, 2001). Each time an observation in the
training data is passed through the classifier, it is placed into a certain outcome category
(predicted outcome); each tree can lead to a different outcome for a sample. Next, from
the ensemble of classifiers (i.e., the collection of all trees) a probability estimate is given
for the membership of a sample to a certain category based on the proportion of all the
trees that predict that category for the sample (observation).
There are a number of parameters that can be adapted in the tree fitting procedure(see
Wright & Ziegler, 2017 for details), and the four most important parameters (and their
chosen values) that were adapted here are: the sample fraction (0.5), the number of
trees (2000), the number of randomly selected predictor variables (11), and the
minimum size of a terminal node (1, i.e., the number of observations that reach a
terminal node in a tree).
4.4.2 Fitting models to INSIGNIA pollen and pesticide data
Pollen and APIStrip samples were split to individual observations. Distance weighted
CORINE CLC data and CDD10 data (see Figure 4.4) were collected and linked to
individual observations, so that each observation is associated with the landscape around
the respective hives, and cumulative temperature and month information for pollen and
APIStrip samples, respectively. The long distance kernel (see section “Kernel model”)
was deemed most suitable to describe the surrounding landscape of a hive. Based on the
long-distance kernel, CORINE CLC impact was calculated for each apiary (see section
“Kernel model”). Note that, in contrast to the mechanistic model, no assumptions on the
likely sources of pollen and/or pesticides are made with respect to the different landcover
classes, and therefore here all 44 CORINE CLCs are used. CDD10 information was
extracted for the observation’s location and date (see section “Pan-European weather
data”) for pollen and month information was assigned as temporal information for
pesticides.
Owing to the fact that most pollen and APIStrip samples had more than one pollen family
or pesticide present, the classifier for individual samples is not accurate (i.e., the out-of-
bag error is large). Instead, using the probability estimates of class membership for each
sample and applying a cut-off value, we obtain a most likely set of pollen or pesticides in
the same sample. A range of cut-off values was tested from 0.01 to 0.1. If the probability
of class membership is equal or larger than the cut-off value, it is accepted in the set of
most likely pollen or pesticides. Lower cut-off values thus result in a less strict classifier.
Separate models were created for Austria and Denmark, for both pollen and pesticides
(i.e., four classification models).
From all random forest models created, the performance was checked against 30 random
subsets of 20% of the available pollen or pesticide data. For each sample, all classes with
a probability above the cut-off value were accepted as likely to be present and were
stored. Each predicted sample set was compared against the observed pollen or
pesticides in the sample (see Figure 4.4). Next, two ratios were calculated: 1) the ratio of
accepted classes present in the sample versus actual classes in the sample (true
positives, range: [0,1]); 2) the ratio of accepted classes not present in the sample
versus the actual classes in the sample (false positives, there are 61 unique pesticides in
the data used for the classification model, in the most extreme case there is only one
pesticide in a sample and 61 (i.e., all) pesticides are accepted in the prediction giving the
following range: [0,60]).
4 - Methods
Edition 1, June 2021 Page 87 of 88
Mean true positive and false positive ratios (n = 30) were computed and used to select
the cut-off value that maximises the true positives and minimises the false positives.
Note here that the implication of having false positives is not the same for the pollen and
pesticide models. For the pollen, a false positive would falsely suggest a more diverse
foraging landscape. For the pesticides, a false positive would falsely suggest a landscape
with a higher presence of pesticides. However, from an environmental risk assessment
point of view, which aims to be conservative, this means a false positive for pollen is less
conservative, whereas a false positive for pesticides would be more conservative. Hence,
for the pollen model, we may accept a slightly lower ratio of true positives if this results
in a substantially lower ratio of false positives. Conversely, for the pesticide model, we
may accept a slightly higher ratio of false positives if this comes with a substantially
higher ratio of true positives.
4.4.3 Test of variable importance
A final classification model was fitted to the pollen and pesticide data for each country.
These models are ready to be used for prediction at large spatial scales. It would still be
of interest to get some insights into the role of the different explanatory variables.
Although it is difficult to directly relate model responses to input variables (as one would
normally do with, for example, a generalised linear model), it is possible to infer how
important a variable is. To test the influence of each of the variables on the classification
results of the model, predictions were made by iteratively permuting one predictor
variable and logging the change in the ratio of true positives and false positives, based
on 50 permutations. For important variables, a large change in both ratios is expected,
whereas for variables that carry less information, smaller changes are expected.
4.4.4 Country-scale prediction of pollen and pesticides to produce maps
The objective of the final model objects is to make pesticide predictions for five months
of the year (i.e. May – September) and for Austria and Denmark. For pollen, the same
was done but using CDD10 values, calculated for the middle of the month for each
date/location combination. For this the required data (see Figure 4.4) was collected
based on a 10km spacing of points for which CORINE CLC kernel impacts were extracted
using the long distance kernel.
For every 10km grid cell the model predicts the pollen families and pesticide types
present. For simplicity and visualisation the results are reported as the number of
predicted pesticides and pollen, though for each prediction the actual accepted pollen
families and pesticides are also produced.
4 - Methods
Edition 1, June 2021 Page 88 of 88
5 References
Baveco, J. M., A. Focks, D. Belgers, J. J. M. van der Steen, J. J. T. I. Boesten, &
I. Roessink. 2016. An energetics-based honeybee nectar-foraging model used to assess
the potential for landscape-level pesticide exposure dilution. PeerJ 4:e2293.
Breiman, L. 2001. Random Forests. Machine Learning 45:5-32.
Grimm, V., Augusiak, J., Focks, A., Frank, B. M., Gabsi, F., Johnston, A. S., ... &
Railsback, S. F. (2014). Towards better modelling and decision support: Documenting
model development, testing, and analysis using TRACE. Ecological modelling, 280, 129-
139.
Kozich JJ, Westcott SL, Baxter NT, Highlander SK, Schloss PD (2013) Development of a
dual-index sequencing strategy and curation pipeline for analyzing amplicon sequence
data on the MiSeq Illumina sequencing platform. Appl Environ Microbiol 79: 5112–5120.
Liolios, V., C. Tananaki, M. Dimou, D. Kanelis, G. Goras, E. Karazafiris, & A.
Thrasyvoulou. 2016. Ranking pollen from bee plants according to their protein
contribution to honey bees. Journal of Apicultural Research 54:1-11.
R Core Team. 2020. R: A language and environment for statistical computing. R
Foundation for Statistical Computing, Vienna, Austria.
Schmolke, A., Thorbek, P., DeAngelis, D. L., & Grimm, V. (2010). Ecological models
supporting environmental decision making: a strategy for the future. Trends in ecology &
evolution, 25(8), 479-486.
Wright, M. N., & A. Ziegler. 2017. ranger: A Fast Implementation of Random Forests for
High Dimensional Data in C++ and R. 2017 77:17.
Wu, L., Wen, C., Qin, Y. et al. Phasing amplicon sequencing on Illumina Miseq for robust
environmental microbial community analysis. BMC Microbiol 15, 125 (2015).
https://doi.org/10.1186/s12866-015-0450-4