Guide to the Income and Expenditure Accounts - the United ...
297
Guide to the Income and Expenditure Accounts Catalogue no. 13-017-X Statistics Canada Statistique Canada Canada
-
Upload
khangminh22 -
Category
Documents
-
view
1 -
download
0
Transcript of Guide to the Income and Expenditure Accounts - the United ...
Guide to the Income and Expenditure Accounts
Catalogue no. 13-017-X
StatisticsCanada
StatistiqueCanada Canada
Symbols
The following standard symbols are used in Statistics Canada publications:
. not available for any reference period
.. not available for a specific reference period
... not applicable0 true zero or a value rounded to zero0s value rounded to 0 (zero) where there is a meaningful distinction between true zero and the value that was rounded p preliminaryr revisedx suppressed to meet the confidentiality requirements of the Statistics ActE use with cautionF too unreliable to be published
How to obtain more information
For information about this product or the wide range of services and data available from Statistics Canada, visit our website at www.statcan.ca, e-mail us at [email protected], or telephone us, Monday to Friday from 8:30 a.m. to 4:30 p.m., at the following numbers:
To access this productThis product, Catalogue no. 13-017-XIE, is available for free in electronic format. To obtain a single issue, visit our website at www.statcan.ca and select “Publications” > “Free Internet publications.”
Standards of service to the publicStatistics Canada is committed to serving its clients in a prompt, reliable and courteous manner. To this end, Statistics Canada has developed standards of service that its employees observe. To obtain a copy of these service standards, please contact Statistics Canada toll-free at 1-800-263-1136. The service standards are also published on www.statcan.ca under “About us” > “Providing services to Canadians.”
Statistics Canada’s National Contact CentreToll-free telephone (Canada and the United States):
Inquiries line 1-800-263-1136
National telecommunications device for the hearing impaired 1-800-363-7629Fax line 1-877-287-4369
Local or international calls:Inquiries line 1-613-951-8116Fax line 1-613-951-0581
Depository Services ProgramInquiries line 1-800-635-7943Fax line 1-800-565-7757
Statistics CanadaSystem of National Accounts
Guide to the Income and Expenditure Accounts
Published by authority of the Minister responsible for Statistics Canada
© Minister of Industry, 2008
All rights reserved. The content of this electronic publication may be reproduced, in whole or in part,and by any means, without further permission from Statistics Canada, subject to the followingconditions: that it be done solely for the purposes of private study, research, criticism, review ornewspaper summary, and/or for non-commercial purposes; and that Statistics Canada be fullyacknowledged as follows: Source (or “Adapted from”, if appropriate): Statistics Canada, year ofpublication, name of product, catalogue number, volume and issue numbers, reference period andpage(s). Otherwise, no part of this publication may be reproduced, stored in a retrieval system ortransmitted in any form, by any means—electronic, mechanical or photocopy—or for any purposeswithout prior written permission of Licensing Services, Client Services Division, Statistics Canada,Ottawa, Ontario, Canada K1A 0T6.
June 2008
Catalogue no. 13-017-XIE
ISSN 1715-7145
Ottawa
La version française de cette publication est disponible sur demande (no 13-017-XIF au catalogue).
Note of Appreciation
Canada owes the success of its statistical system to a long-standing partnership between Statistics Canada, the citizens of Canada, its businesses, governments and other institutions. Accurate and timely statistical information could not be produced without their continued cooperation and goodwill.
Table of contents
Statistics Canada’s National Contact Centre. . . . . . . . . . . . . . . . . . . . . . . . . . . . . . . . . . . . . . . . . . . . . . . . . . . 2Depository Services Program . . . . . . . . . . . . . . . . . . . . . . . . . . . . . . . . . . . . . . . . . . . . . . . . . . . . . . . . . . . . . . 2
Chapter 1 Introduction . . . . . . . . . . . . . . . . . . . . . . . . . . . . . . . . . . . . . . . . . . . . . . . . . . . . . . . . . . . . . . . . . . . . 12
The purpose of the guide . . . . . . . . . . . . . . . . . . . . . . . . . . . . . . . . . . . . . . . . . . . . . . . . . . . . . . . . . . . . . . . . . . . . 12
Background . . . . . . . . . . . . . . . . . . . . . . . . . . . . . . . . . . . . . . . . . . . . . . . . . . . . . . . . . . . . . . . . . . . . . . . . . . . . . . 12
Perspective on the use of the Income and Expenditure Accounts . . . . . . . . . . . . . . . . . . . . . . . . . . . . . . . . . 13
The Income and Expenditure Accounts within the Canadian System of National Accounts . . . . . . . . . . . . . . . . . 13
Architecture of the system . . . . . . . . . . . . . . . . . . . . . . . . . . . . . . . . . . . . . . . . . . . . . . . . . . . . . . . . . . . . . . . 13
Industry-based statistics . . . . . . . . . . . . . . . . . . . . . . . . . . . . . . . . . . . . . . . . . . . . . . . . . . . . . . . . . . . . . . . . . 14
Sector-based statistics . . . . . . . . . . . . . . . . . . . . . . . . . . . . . . . . . . . . . . . . . . . . . . . . . . . . . . . . . . . . . . . . . . 14
Income and Expenditure Accounts . . . . . . . . . . . . . . . . . . . . . . . . . . . . . . . . . . . . . . . . . . . . . . . . . . . . . 14Financial and Wealth Accounts . . . . . . . . . . . . . . . . . . . . . . . . . . . . . . . . . . . . . . . . . . . . . . . . . . . . . . . . 15Sector detail . . . . . . . . . . . . . . . . . . . . . . . . . . . . . . . . . . . . . . . . . . . . . . . . . . . . . . . . . . . . . . . . . . . . . . . 16Links to the international accounts . . . . . . . . . . . . . . . . . . . . . . . . . . . . . . . . . . . . . . . . . . . . . . . . . . . . . . 17
Significant revisions to the Income and Expenditure Accounts . . . . . . . . . . . . . . . . . . . . . . . . . . . . . . . . . . . . . . . 17
The historical revision of 1997. . . . . . . . . . . . . . . . . . . . . . . . . . . . . . . . . . . . . . . . . . . . . . . . . . . . . . . . . . . . . 17
Mini-revision of 2000 . . . . . . . . . . . . . . . . . . . . . . . . . . . . . . . . . . . . . . . . . . . . . . . . . . . . . . . . . . . . . . . . . . . . 17
Mini-revision of 2001 . . . . . . . . . . . . . . . . . . . . . . . . . . . . . . . . . . . . . . . . . . . . . . . . . . . . . . . . . . . . . . . . . . . . 18
Adoption of a Fisher-type chain index . . . . . . . . . . . . . . . . . . . . . . . . . . . . . . . . . . . . . . . . . . . . . . . . . . . 18Capitalization of software . . . . . . . . . . . . . . . . . . . . . . . . . . . . . . . . . . . . . . . . . . . . . . . . . . . . . . . . . . . . . 18
Re-referencing of the Chain Fisher index . . . . . . . . . . . . . . . . . . . . . . . . . . . . . . . . . . . . . . . . . . . . . . . . . . . . 18
Next historical revision. . . . . . . . . . . . . . . . . . . . . . . . . . . . . . . . . . . . . . . . . . . . . . . . . . . . . . . . . . . . . . . . . . . 18
Chapter 2 Concepts and definitions . . . . . . . . . . . . . . . . . . . . . . . . . . . . . . . . . . . . . . . . . . . . . . . . . . . . . . . . . 19
Production and aggregate economic activity . . . . . . . . . . . . . . . . . . . . . . . . . . . . . . . . . . . . . . . . . . . . . . . . . . . . . 19
Production, output and product . . . . . . . . . . . . . . . . . . . . . . . . . . . . . . . . . . . . . . . . . . . . . . . . . . . . . . . . . . . . 19
Basic concepts . . . . . . . . . . . . . . . . . . . . . . . . . . . . . . . . . . . . . . . . . . . . . . . . . . . . . . . . . . . . . . . . . . . . . 19Classification of productive activities . . . . . . . . . . . . . . . . . . . . . . . . . . . . . . . . . . . . . . . . . . . . . . . . . . . . 19CSNA production boundary . . . . . . . . . . . . . . . . . . . . . . . . . . . . . . . . . . . . . . . . . . . . . . . . . . . . . . . . . . . 22
Analytical definitions applied to GDP. . . . . . . . . . . . . . . . . . . . . . . . . . . . . . . . . . . . . . . . . . . . . . . . . . . . . . . . 22
Net or gross GDP . . . . . . . . . . . . . . . . . . . . . . . . . . . . . . . . . . . . . . . . . . . . . . . . . . . . . . . . . . . . . . . . . . . 22National or domestic product . . . . . . . . . . . . . . . . . . . . . . . . . . . . . . . . . . . . . . . . . . . . . . . . . . . . . . . . . . 23GDP at market price or at basic price . . . . . . . . . . . . . . . . . . . . . . . . . . . . . . . . . . . . . . . . . . . . . . . . . . . 23
Alternative approaches to calculating aggregate GDP . . . . . . . . . . . . . . . . . . . . . . . . . . . . . . . . . . . . . . . . . . 24
A hypothetical economy with no government and no capital . . . . . . . . . . . . . . . . . . . . . . . . . . . . . . . . . . 25
Institutional sectors dimension of the CSNA – The Income and Expenditure Accounts . . . . . . . . . . . . . . . . . . . . 27
The institutional sectors. . . . . . . . . . . . . . . . . . . . . . . . . . . . . . . . . . . . . . . . . . . . . . . . . . . . . . . . . . . . . . . . . . 27
The persons and unincorporated business sector . . . . . . . . . . . . . . . . . . . . . . . . . . . . . . . . . . . . . . . . . . 28The corporate and government business enterprise sector . . . . . . . . . . . . . . . . . . . . . . . . . . . . . . . . . . . 28The government sector . . . . . . . . . . . . . . . . . . . . . . . . . . . . . . . . . . . . . . . . . . . . . . . . . . . . . . . . . . . . . . 29
4 Statistics Canada - Catalogue no. 13-017 Guide to the Income and Expenditure Accounts
Table of contents (continued)
The non-resident sector . . . . . . . . . . . . . . . . . . . . . . . . . . . . . . . . . . . . . . . . . . . . . . . . . . . . . . . . . . . . . . 29The sequence of the institutional sector accounts. . . . . . . . . . . . . . . . . . . . . . . . . . . . . . . . . . . . . . . . . . . . . . 29
Gross domestic product measured by income and expenditure . . . . . . . . . . . . . . . . . . . . . . . . . . . . . . . . . . . 31
Statistical discrepancy . . . . . . . . . . . . . . . . . . . . . . . . . . . . . . . . . . . . . . . . . . . . . . . . . . . . . . . . . . . . . . . 31Income-based GDP aggregates . . . . . . . . . . . . . . . . . . . . . . . . . . . . . . . . . . . . . . . . . . . . . . . . . . . . . . . . 32Expenditure-based GDP aggregates . . . . . . . . . . . . . . . . . . . . . . . . . . . . . . . . . . . . . . . . . . . . . . . . . . . . 33
The income and outlay account. . . . . . . . . . . . . . . . . . . . . . . . . . . . . . . . . . . . . . . . . . . . . . . . . . . . . . . . . . . . 34
The income and outlay account for persons and unincorporated businesses . . . . . . . . . . . . . . . . . . . . . 35The income and outlay account for corporations and government business enterprises . . . . . . . . . . . . 36The income and outlay account for governments . . . . . . . . . . . . . . . . . . . . . . . . . . . . . . . . . . . . . . . . . . 38The income and outlay account for non-residents . . . . . . . . . . . . . . . . . . . . . . . . . . . . . . . . . . . . . . . . . . 39Saving: the balancing item in the current accounts . . . . . . . . . . . . . . . . . . . . . . . . . . . . . . . . . . . . . . . . . 39
The capital account . . . . . . . . . . . . . . . . . . . . . . . . . . . . . . . . . . . . . . . . . . . . . . . . . . . . . . . . . . . . . . . . . . . . . 40
Gross saving and capital transfers . . . . . . . . . . . . . . . . . . . . . . . . . . . . . . . . . . . . . . . . . . . . . . . . . . . . . . 40Non-financial capital acquisition . . . . . . . . . . . . . . . . . . . . . . . . . . . . . . . . . . . . . . . . . . . . . . . . . . . . . . . . 40
The financial account (the financing of economic activity) . . . . . . . . . . . . . . . . . . . . . . . . . . . . . . . . . . . . . . . 41
Types of transactions on financial assets and liabilities . . . . . . . . . . . . . . . . . . . . . . . . . . . . . . . . . . . . . . 41
The Balance Sheet Account (the result of economic activity and gains/losses) . . . . . . . . . . . . . . . . . . . . . . . 42
Other aspects of the Income and Expenditure Accounts data . . . . . . . . . . . . . . . . . . . . . . . . . . . . . . . . . . . . . . . . 42
Measures of volume and prices in the Income and Expenditure Accounts . . . . . . . . . . . . . . . . . . . . . . . . . . . 42
Chain Fisher volume indexes . . . . . . . . . . . . . . . . . . . . . . . . . . . . . . . . . . . . . . . . . . . . . . . . . . . . . . . . . . 44
Building an index and chaining . . . . . . . . . . . . . . . . . . . . . . . . . . . . . . . . . . . . . . . . . . . . . . . . . . . . . . . . . . . . 44
Choice of index – Towards the chain fisher index . . . . . . . . . . . . . . . . . . . . . . . . . . . . . . . . . . . . . . . . . . 47Application to the Income and Expenditure Accounts . . . . . . . . . . . . . . . . . . . . . . . . . . . . . . . . . . . . . . . 48
The Provincial Economic Accounts . . . . . . . . . . . . . . . . . . . . . . . . . . . . . . . . . . . . . . . . . . . . . . . . . . . . . . . . . 55
The satellite accounts . . . . . . . . . . . . . . . . . . . . . . . . . . . . . . . . . . . . . . . . . . . . . . . . . . . . . . . . . . . . . . . . . . . 55
The tourism satellite account and tourism economic indicators . . . . . . . . . . . . . . . . . . . . . . . . . . . . . . . . 55The satellite account of non-profit institutions and volunteering . . . . . . . . . . . . . . . . . . . . . . . . . . . . . . . 55Pension satellite account . . . . . . . . . . . . . . . . . . . . . . . . . . . . . . . . . . . . . . . . . . . . . . . . . . . . . . . . . . . . . 56
Appendix 2A The presentation of product and output in the Canadian System of National Accounts Input-Output Tables . . . . . . . . . . . . . . . . . . . . . . . . . . . . . . . . . . . . . . . . . . . . . . . . . . . . . . . . . . . . . . . . . . . . . . . . . . . . . . . . . . 57
Appendix 2B. Interest and miscellaneous investment income in the income and outlay accounts of the institutional sectors . . . . . . . . . . . . . . . . . . . . . . . . . . . . . . . . . . . . . . . . . . . . . . . . . . . . . . . . . . . . . . . . . . . . . . . . . . . . . . . . . . 64
Chapter 3 Wages, salaries and supplementary labour income . . . . . . . . . . . . . . . . . . . . . . . . . . . . . . . . . . . 66
Introduction . . . . . . . . . . . . . . . . . . . . . . . . . . . . . . . . . . . . . . . . . . . . . . . . . . . . . . . . . . . . . . . . . . . . . . . . . . . . . . 66
Concepts and definitions . . . . . . . . . . . . . . . . . . . . . . . . . . . . . . . . . . . . . . . . . . . . . . . . . . . . . . . . . . . . . . . . . . . . 67
Wages and salaries . . . . . . . . . . . . . . . . . . . . . . . . . . . . . . . . . . . . . . . . . . . . . . . . . . . . . . . . . . . . . . . . . . . . . 67
Supplementary labour income. . . . . . . . . . . . . . . . . . . . . . . . . . . . . . . . . . . . . . . . . . . . . . . . . . . . . . . . . . . . . 68
Annual estimation methods and data sources . . . . . . . . . . . . . . . . . . . . . . . . . . . . . . . . . . . . . . . . . . . . . . . . . . . . 68
Wages and salaries . . . . . . . . . . . . . . . . . . . . . . . . . . . . . . . . . . . . . . . . . . . . . . . . . . . . . . . . . . . . . . . . . . . . . 68
Supplementary labour income. . . . . . . . . . . . . . . . . . . . . . . . . . . . . . . . . . . . . . . . . . . . . . . . . . . . . . . . . . . . . 69
Statistics Canada - Catalogue no. 13-017 Guide to the Income and Expenditure Accounts 5
Table of contents (continued)
Registered pension plans . . . . . . . . . . . . . . . . . . . . . . . . . . . . . . . . . . . . . . . . . . . . . . . . . . . . . . . . . . . . . 70Canada and Quebec pension plans . . . . . . . . . . . . . . . . . . . . . . . . . . . . . . . . . . . . . . . . . . . . . . . . . . . . . 70Employment insurance . . . . . . . . . . . . . . . . . . . . . . . . . . . . . . . . . . . . . . . . . . . . . . . . . . . . . . . . . . . . . . . 70Workers’ compensation . . . . . . . . . . . . . . . . . . . . . . . . . . . . . . . . . . . . . . . . . . . . . . . . . . . . . . . . . . . . . . 71Welfare . . . . . . . . . . . . . . . . . . . . . . . . . . . . . . . . . . . . . . . . . . . . . . . . . . . . . . . . . . . . . . . . . . . . . . . . . . . 71Retirement allowances . . . . . . . . . . . . . . . . . . . . . . . . . . . . . . . . . . . . . . . . . . . . . . . . . . . . . . . . . . . . . . . 71The quarterly and monthly estimates of labour income . . . . . . . . . . . . . . . . . . . . . . . . . . . . . . . . . . . . . . . . . . . . . 71
Wages and salaries . . . . . . . . . . . . . . . . . . . . . . . . . . . . . . . . . . . . . . . . . . . . . . . . . . . . . . . . . . . . . . . . . . . . . 72
Supplementary labour income. . . . . . . . . . . . . . . . . . . . . . . . . . . . . . . . . . . . . . . . . . . . . . . . . . . . . . . . . . . . . 73
Labour income by sector . . . . . . . . . . . . . . . . . . . . . . . . . . . . . . . . . . . . . . . . . . . . . . . . . . . . . . . . . . . . . . . . . 73
Provincial, territorial, industrial and sectoral estimation methods and data sources . . . . . . . . . . . . . . . . . . . . . . . 74
Wages and salaries . . . . . . . . . . . . . . . . . . . . . . . . . . . . . . . . . . . . . . . . . . . . . . . . . . . . . . . . . . . . . . . . . . . . . 74
Province or territory of employment . . . . . . . . . . . . . . . . . . . . . . . . . . . . . . . . . . . . . . . . . . . . . . . . . . . . . 74Province or territory of residence . . . . . . . . . . . . . . . . . . . . . . . . . . . . . . . . . . . . . . . . . . . . . . . . . . . . . . . 74Industries . . . . . . . . . . . . . . . . . . . . . . . . . . . . . . . . . . . . . . . . . . . . . . . . . . . . . . . . . . . . . . . . . . . . . . . . . 74Sectors . . . . . . . . . . . . . . . . . . . . . . . . . . . . . . . . . . . . . . . . . . . . . . . . . . . . . . . . . . . . . . . . . . . . . . . . . . . 75Business . . . . . . . . . . . . . . . . . . . . . . . . . . . . . . . . . . . . . . . . . . . . . . . . . . . . . . . . . . . . . . . . . . . . . . . . . . 75Government . . . . . . . . . . . . . . . . . . . . . . . . . . . . . . . . . . . . . . . . . . . . . . . . . . . . . . . . . . . . . . . . . . . . . . . 75Personal . . . . . . . . . . . . . . . . . . . . . . . . . . . . . . . . . . . . . . . . . . . . . . . . . . . . . . . . . . . . . . . . . . . . . . . . . . 75
Supplementary labour income. . . . . . . . . . . . . . . . . . . . . . . . . . . . . . . . . . . . . . . . . . . . . . . . . . . . . . . . . . . . . 76
Registered pension plans . . . . . . . . . . . . . . . . . . . . . . . . . . . . . . . . . . . . . . . . . . . . . . . . . . . . . . . . . . . . . 76Canada and Quebec pension plans . . . . . . . . . . . . . . . . . . . . . . . . . . . . . . . . . . . . . . . . . . . . . . . . . . . . . 76Employment insurance . . . . . . . . . . . . . . . . . . . . . . . . . . . . . . . . . . . . . . . . . . . . . . . . . . . . . . . . . . . . . . . 76Workers’ compensation . . . . . . . . . . . . . . . . . . . . . . . . . . . . . . . . . . . . . . . . . . . . . . . . . . . . . . . . . . . . . . 77Welfare . . . . . . . . . . . . . . . . . . . . . . . . . . . . . . . . . . . . . . . . . . . . . . . . . . . . . . . . . . . . . . . . . . . . . . . . . . . 77Retirement allowances . . . . . . . . . . . . . . . . . . . . . . . . . . . . . . . . . . . . . . . . . . . . . . . . . . . . . . . . . . . . . . . 77
Chapter 4 Entrepreneurial income: Operating surplus . . . . . . . . . . . . . . . . . . . . . . . . . . . . . . . . . . . . . . . . . . 78
Introduction . . . . . . . . . . . . . . . . . . . . . . . . . . . . . . . . . . . . . . . . . . . . . . . . . . . . . . . . . . . . . . . . . . . . . . . . . . . . . . 78
Basic concepts . . . . . . . . . . . . . . . . . . . . . . . . . . . . . . . . . . . . . . . . . . . . . . . . . . . . . . . . . . . . . . . . . . . . . . . . 78
Statistical details and presentation of operating surplus . . . . . . . . . . . . . . . . . . . . . . . . . . . . . . . . . . . . . . . . . 78
Chapter 5 Entrepreneurial income: Mixed income . . . . . . . . . . . . . . . . . . . . . . . . . . . . . . . . . . . . . . . . . . . . . 80
Introduction . . . . . . . . . . . . . . . . . . . . . . . . . . . . . . . . . . . . . . . . . . . . . . . . . . . . . . . . . . . . . . . . . . . . . . . . . . . . . . 80
Statistical details of mixed income . . . . . . . . . . . . . . . . . . . . . . . . . . . . . . . . . . . . . . . . . . . . . . . . . . . . . . . . . . . . . 80
Accrued net income of farm operators from farm production . . . . . . . . . . . . . . . . . . . . . . . . . . . . . . . . . . . . 82
Concepts and definitions . . . . . . . . . . . . . . . . . . . . . . . . . . . . . . . . . . . . . . . . . . . . . . . . . . . . . . . . . . . . . . . . . . . . 82
Annual estimation methods and data sources . . . . . . . . . . . . . . . . . . . . . . . . . . . . . . . . . . . . . . . . . . . . . . . . . . . . 83
Quarterly estimation methods and data sources . . . . . . . . . . . . . . . . . . . . . . . . . . . . . . . . . . . . . . . . . . . . . . . . . . 84
Farm cash receipts . . . . . . . . . . . . . . . . . . . . . . . . . . . . . . . . . . . . . . . . . . . . . . . . . . . . . . . . . . . . . . . . . . . . . 84
Farm income in kind . . . . . . . . . . . . . . . . . . . . . . . . . . . . . . . . . . . . . . . . . . . . . . . . . . . . . . . . . . . . . . . . . . . . 85
Investment in farm-held inventories. . . . . . . . . . . . . . . . . . . . . . . . . . . . . . . . . . . . . . . . . . . . . . . . . . . . . . . . . 86
Farm operating expenses and depreciation . . . . . . . . . . . . . . . . . . . . . . . . . . . . . . . . . . . . . . . . . . . . . . . . . . 86
6 Statistics Canada - Catalogue no. 13-017 Guide to the Income and Expenditure Accounts
Table of contents (continued)
Farm corporate profits before taxes . . . . . . . . . . . . . . . . . . . . . . . . . . . . . . . . . . . . . . . . . . . . . . . . . . . . . . . . 87Adjustment of Canadian Wheat Board profits and government program payments . . . . . . . . . . . . . . . . . . . . 88
Provincial and territorial estimation methods and data sources. . . . . . . . . . . . . . . . . . . . . . . . . . . . . . . . . . . . . . . 88
Relationship with other parts of the Income and Expenditure Accounts . . . . . . . . . . . . . . . . . . . . . . . . . . . . . 88
Reconciliation of estimates with the Agriculture Division. . . . . . . . . . . . . . . . . . . . . . . . . . . . . . . . . . . . . . . . . 88
Net income of non-farm unincorporated business, excluding net rental income . . . . . . . . . . . . . . . . . . . . . 89
Concepts and definitions . . . . . . . . . . . . . . . . . . . . . . . . . . . . . . . . . . . . . . . . . . . . . . . . . . . . . . . . . . . . . . . . . . . . 89
Annual estimation methods and data sources . . . . . . . . . . . . . . . . . . . . . . . . . . . . . . . . . . . . . . . . . . . . . . . . . . . . 89
Quarterly estimation methods and data sources . . . . . . . . . . . . . . . . . . . . . . . . . . . . . . . . . . . . . . . . . . . . . . . . . . 94
Provincial and territorial estimation methods and data sources. . . . . . . . . . . . . . . . . . . . . . . . . . . . . . . . . . . . . . . 96
Net rental income of non-farm unincorporated business . . . . . . . . . . . . . . . . . . . . . . . . . . . . . . . . . . . . . . . . 96
Concepts and definitions . . . . . . . . . . . . . . . . . . . . . . . . . . . . . . . . . . . . . . . . . . . . . . . . . . . . . . . . . . . . . . . . . . . . 96
Annual estimation methods and data sources . . . . . . . . . . . . . . . . . . . . . . . . . . . . . . . . . . . . . . . . . . . . . . . . . . . . 97
Rent, paid and imputed . . . . . . . . . . . . . . . . . . . . . . . . . . . . . . . . . . . . . . . . . . . . . . . . . . . . . . . . . . . . . . . . . . 97
Rent paid to landlords . . . . . . . . . . . . . . . . . . . . . . . . . . . . . . . . . . . . . . . . . . . . . . . . . . . . . . . . . . . . . . . 97Rent imputed to owner-occupants . . . . . . . . . . . . . . . . . . . . . . . . . . . . . . . . . . . . . . . . . . . . . . . . . . . . . . 98
Net income of non-farm unincorporated business from rent . . . . . . . . . . . . . . . . . . . . . . . . . . . . . . . . . . . . . . 98
Net residential rental income imputed to owner-occupants . . . . . . . . . . . . . . . . . . . . . . . . . . . . . . . . . . . 98Net residential rental income of unincorporated businesses . . . . . . . . . . . . . . . . . . . . . . . . . . . . . . . . . . 99Net non-residential rental income of unincorporated businesses . . . . . . . . . . . . . . . . . . . . . . . . . . . . . 100
Quarterly estimation methods and data sources . . . . . . . . . . . . . . . . . . . . . . . . . . . . . . . . . . . . . . . . . . . . . . . . . 101
Rent . . . . . . . . . . . . . . . . . . . . . . . . . . . . . . . . . . . . . . . . . . . . . . . . . . . . . . . . . . . . . . . . . . . . . . . . . . . . . . . . 101
Net rent . . . . . . . . . . . . . . . . . . . . . . . . . . . . . . . . . . . . . . . . . . . . . . . . . . . . . . . . . . . . . . . . . . . . . . . . . . . . . 101
Provincial and territorial estimation methods and data sources. . . . . . . . . . . . . . . . . . . . . . . . . . . . . . . . . . . . . . 101
Chapter 6 Taxes less subsidies. . . . . . . . . . . . . . . . . . . . . . . . . . . . . . . . . . . . . . . . . . . . . . . . . . . . . . . . . . . . 103
Introduction . . . . . . . . . . . . . . . . . . . . . . . . . . . . . . . . . . . . . . . . . . . . . . . . . . . . . . . . . . . . . . . . . . . . . . . . . . . . . 103
Concepts and definitions . . . . . . . . . . . . . . . . . . . . . . . . . . . . . . . . . . . . . . . . . . . . . . . . . . . . . . . . . . . . . . . . . . . 103
Taxes on products . . . . . . . . . . . . . . . . . . . . . . . . . . . . . . . . . . . . . . . . . . . . . . . . . . . . . . . . . . . . . . . . . . . . . 103
Taxes on factors of production . . . . . . . . . . . . . . . . . . . . . . . . . . . . . . . . . . . . . . . . . . . . . . . . . . . . . . . . . . . 105
Subsidies on products and on factors of production . . . . . . . . . . . . . . . . . . . . . . . . . . . . . . . . . . . . . . . . . . . 105
Annual estimation methods and data sources . . . . . . . . . . . . . . . . . . . . . . . . . . . . . . . . . . . . . . . . . . . . . . . . . . . 106
Federal government . . . . . . . . . . . . . . . . . . . . . . . . . . . . . . . . . . . . . . . . . . . . . . . . . . . . . . . . . . . . . . . . . . . 106
Provincial and territorial governments . . . . . . . . . . . . . . . . . . . . . . . . . . . . . . . . . . . . . . . . . . . . . . . . . . . . . . 107
Local government . . . . . . . . . . . . . . . . . . . . . . . . . . . . . . . . . . . . . . . . . . . . . . . . . . . . . . . . . . . . . . . . . . . . . 108
Quarterly estimation methods and data sources . . . . . . . . . . . . . . . . . . . . . . . . . . . . . . . . . . . . . . . . . . . . . . . . . 108
Estimation methods – Provincial and territorial estimates . . . . . . . . . . . . . . . . . . . . . . . . . . . . . . . . . . . . . . . . . . 108
Chapter 7 Personal expenditure on consumer goods and services . . . . . . . . . . . . . . . . . . . . . . . . . . . . . . 110
Introduction . . . . . . . . . . . . . . . . . . . . . . . . . . . . . . . . . . . . . . . . . . . . . . . . . . . . . . . . . . . . . . . . . . . . . . . . . . . . . 110
Statistics Canada - Catalogue no. 13-017 Guide to the Income and Expenditure Accounts 7
Table of contents (continued)
Classification, measurement and concepts . . . . . . . . . . . . . . . . . . . . . . . . . . . . . . . . . . . . . . . . . . . . . . . . . . . . . 110Presentation of estimates . . . . . . . . . . . . . . . . . . . . . . . . . . . . . . . . . . . . . . . . . . . . . . . . . . . . . . . . . . . . . . . . . . 113
Data sources and estimation methods. . . . . . . . . . . . . . . . . . . . . . . . . . . . . . . . . . . . . . . . . . . . . . . . . . . . . . . . . 115
Overview . . . . . . . . . . . . . . . . . . . . . . . . . . . . . . . . . . . . . . . . . . . . . . . . . . . . . . . . . . . . . . . . . . . . . . . . . . . . 115
Personal expenditure at current prices . . . . . . . . . . . . . . . . . . . . . . . . . . . . . . . . . . . . . . . . . . . . . . . . . . . . . 117
National estimates at current prices . . . . . . . . . . . . . . . . . . . . . . . . . . . . . . . . . . . . . . . . . . . . . . . . . . . . 121Provincial and territorial estimates at current prices . . . . . . . . . . . . . . . . . . . . . . . . . . . . . . . . . . . . . . . 131Estimates of sales taxes . . . . . . . . . . . . . . . . . . . . . . . . . . . . . . . . . . . . . . . . . . . . . . . . . . . . . . . . . . . . 132
Personal expenditure at constant prices . . . . . . . . . . . . . . . . . . . . . . . . . . . . . . . . . . . . . . . . . . . . . . . . . . . . 133
Appendix 7A Principal methodology for computing estimators of personal expenditure on consumer goods . . 178
Chapter 8 Government current expenditure on goods and services. . . . . . . . . . . . . . . . . . . . . . . . . . . . . . 185
Introduction . . . . . . . . . . . . . . . . . . . . . . . . . . . . . . . . . . . . . . . . . . . . . . . . . . . . . . . . . . . . . . . . . . . . . . . . . . . . . 185
Concepts and definitions . . . . . . . . . . . . . . . . . . . . . . . . . . . . . . . . . . . . . . . . . . . . . . . . . . . . . . . . . . . . . . . . . . . 185
Who is included in the government institutional sector? . . . . . . . . . . . . . . . . . . . . . . . . . . . . . . . . . . . . . . . . 186
Annual estimation methods and data sources . . . . . . . . . . . . . . . . . . . . . . . . . . . . . . . . . . . . . . . . . . . . . . . . . . . 188
Federal government . . . . . . . . . . . . . . . . . . . . . . . . . . . . . . . . . . . . . . . . . . . . . . . . . . . . . . . . . . . . . . . . . . . 189
Provincial and territorial government . . . . . . . . . . . . . . . . . . . . . . . . . . . . . . . . . . . . . . . . . . . . . . . . . . . . . . . 190
Local government . . . . . . . . . . . . . . . . . . . . . . . . . . . . . . . . . . . . . . . . . . . . . . . . . . . . . . . . . . . . . . . . . . . . . 190
Canada and Quebec pension plans . . . . . . . . . . . . . . . . . . . . . . . . . . . . . . . . . . . . . . . . . . . . . . . . . . . . . . . 191
Quarterly estimation methods and data sources . . . . . . . . . . . . . . . . . . . . . . . . . . . . . . . . . . . . . . . . . . . . . . . . . 191
Federal government . . . . . . . . . . . . . . . . . . . . . . . . . . . . . . . . . . . . . . . . . . . . . . . . . . . . . . . . . . . . . . . . . . . 191
Provincial and territorial government . . . . . . . . . . . . . . . . . . . . . . . . . . . . . . . . . . . . . . . . . . . . . . . . . . . . . . . 191
Local government . . . . . . . . . . . . . . . . . . . . . . . . . . . . . . . . . . . . . . . . . . . . . . . . . . . . . . . . . . . . . . . . . . . . . 191
Canada and Quebec pension plans . . . . . . . . . . . . . . . . . . . . . . . . . . . . . . . . . . . . . . . . . . . . . . . . . . . . . . . 191
Deflation – Estimates in real terms . . . . . . . . . . . . . . . . . . . . . . . . . . . . . . . . . . . . . . . . . . . . . . . . . . . . . . . . . . . 193
Chapter 9 Gross fixed capital formation. . . . . . . . . . . . . . . . . . . . . . . . . . . . . . . . . . . . . . . . . . . . . . . . . . . . . 196
Introduction . . . . . . . . . . . . . . . . . . . . . . . . . . . . . . . . . . . . . . . . . . . . . . . . . . . . . . . . . . . . . . . . . . . . . . . . . . . . . 196
Concepts and definitions . . . . . . . . . . . . . . . . . . . . . . . . . . . . . . . . . . . . . . . . . . . . . . . . . . . . . . . . . . . . . . . . . . . 196
Gross fixed capital formation in residential structures . . . . . . . . . . . . . . . . . . . . . . . . . . . . . . . . . . . . . . . . . 199
General concepts. . . . . . . . . . . . . . . . . . . . . . . . . . . . . . . . . . . . . . . . . . . . . . . . . . . . . . . . . . . . . . . . . . . . . . . . . 199
New residential construction . . . . . . . . . . . . . . . . . . . . . . . . . . . . . . . . . . . . . . . . . . . . . . . . . . . . . . . . . . . . . 199
Renovations. . . . . . . . . . . . . . . . . . . . . . . . . . . . . . . . . . . . . . . . . . . . . . . . . . . . . . . . . . . . . . . . . . . . . . . . . . 200
Ownership transfer costs. . . . . . . . . . . . . . . . . . . . . . . . . . . . . . . . . . . . . . . . . . . . . . . . . . . . . . . . . . . . . . . . 201
Annual estimation methods and data sources . . . . . . . . . . . . . . . . . . . . . . . . . . . . . . . . . . . . . . . . . . . . . . . . . . . 202
New residential construction . . . . . . . . . . . . . . . . . . . . . . . . . . . . . . . . . . . . . . . . . . . . . . . . . . . . . . . . . . . . . 202
Renovations. . . . . . . . . . . . . . . . . . . . . . . . . . . . . . . . . . . . . . . . . . . . . . . . . . . . . . . . . . . . . . . . . . . . . . . . . . 203
Ownership transfer costs. . . . . . . . . . . . . . . . . . . . . . . . . . . . . . . . . . . . . . . . . . . . . . . . . . . . . . . . . . . . . . . . 203
8 Statistics Canada - Catalogue no. 13-017 Guide to the Income and Expenditure Accounts
Table of contents (continued)
Quarterly estimation methods and data sources . . . . . . . . . . . . . . . . . . . . . . . . . . . . . . . . . . . . . . . . . . . . . . . . . 204Provincial and territorial estimation methods and data sources. . . . . . . . . . . . . . . . . . . . . . . . . . . . . . . . . . . . . . 204
Deflation – Estimates in real terms . . . . . . . . . . . . . . . . . . . . . . . . . . . . . . . . . . . . . . . . . . . . . . . . . . . . . . . . . . . 204
Gross fixed capital formation in non-residential structures . . . . . . . . . . . . . . . . . . . . . . . . . . . . . . . . . . . . . 206
General concepts. . . . . . . . . . . . . . . . . . . . . . . . . . . . . . . . . . . . . . . . . . . . . . . . . . . . . . . . . . . . . . . . . . . . . . . . . 206
Annual estimation methods and data sources . . . . . . . . . . . . . . . . . . . . . . . . . . . . . . . . . . . . . . . . . . . . . . . . . . . 207
Quarterly estimation methods and data sources . . . . . . . . . . . . . . . . . . . . . . . . . . . . . . . . . . . . . . . . . . . . . . . . . 207
The detailed approach. . . . . . . . . . . . . . . . . . . . . . . . . . . . . . . . . . . . . . . . . . . . . . . . . . . . . . . . . . . . . . . . . . 207
Government sector . . . . . . . . . . . . . . . . . . . . . . . . . . . . . . . . . . . . . . . . . . . . . . . . . . . . . . . . . . . . . . . . . 208Business sector . . . . . . . . . . . . . . . . . . . . . . . . . . . . . . . . . . . . . . . . . . . . . . . . . . . . . . . . . . . . . . . . . . . 208
The global approach . . . . . . . . . . . . . . . . . . . . . . . . . . . . . . . . . . . . . . . . . . . . . . . . . . . . . . . . . . . . . . . . . . . 208
Provincial and territorial estimation methods and data sources. . . . . . . . . . . . . . . . . . . . . . . . . . . . . . . . . . . . . . 209
Deflation – Estimates in real terms . . . . . . . . . . . . . . . . . . . . . . . . . . . . . . . . . . . . . . . . . . . . . . . . . . . . . . . . . . . 209
Gross fixed capital formation in machinery and equipment . . . . . . . . . . . . . . . . . . . . . . . . . . . . . . . . . . . . . 210
General concepts. . . . . . . . . . . . . . . . . . . . . . . . . . . . . . . . . . . . . . . . . . . . . . . . . . . . . . . . . . . . . . . . . . . . . . . . . 210
Annual estimation methods and data sources . . . . . . . . . . . . . . . . . . . . . . . . . . . . . . . . . . . . . . . . . . . . . . . . . . . 211
Quarterly estimation methods and data sources . . . . . . . . . . . . . . . . . . . . . . . . . . . . . . . . . . . . . . . . . . . . . . . . . 213
The supply-disposition model . . . . . . . . . . . . . . . . . . . . . . . . . . . . . . . . . . . . . . . . . . . . . . . . . . . . . . . . . . . . 213
Passenger cars and trucks . . . . . . . . . . . . . . . . . . . . . . . . . . . . . . . . . . . . . . . . . . . . . . . . . . . . . . . . . . . . . . 216
Software . . . . . . . . . . . . . . . . . . . . . . . . . . . . . . . . . . . . . . . . . . . . . . . . . . . . . . . . . . . . . . . . . . . . . . . . . . . . 216
Provincial and territorial estimation methods and data sources. . . . . . . . . . . . . . . . . . . . . . . . . . . . . . . . . . . . . . 216
Deflation – Estimates in real terms . . . . . . . . . . . . . . . . . . . . . . . . . . . . . . . . . . . . . . . . . . . . . . . . . . . . . . . . . . . 216
Appendix 9A A brief description of the Capital Expenditure Survey . . . . . . . . . . . . . . . . . . . . . . . . . . . . . . . . . . 219
Chapter 10 Investment in inventories . . . . . . . . . . . . . . . . . . . . . . . . . . . . . . . . . . . . . . . . . . . . . . . . . . . . . . . 220
Introduction . . . . . . . . . . . . . . . . . . . . . . . . . . . . . . . . . . . . . . . . . . . . . . . . . . . . . . . . . . . . . . . . . . . . . . . . . . . . . 220
Concepts and definitions . . . . . . . . . . . . . . . . . . . . . . . . . . . . . . . . . . . . . . . . . . . . . . . . . . . . . . . . . . . . . . . . . . . 220
Presentation: Income and Expenditure Accounts and Input-Output Tables . . . . . . . . . . . . . . . . . . . . . . . . . . . . 221
Business investment in non-farm inventories . . . . . . . . . . . . . . . . . . . . . . . . . . . . . . . . . . . . . . . . . . . . . . . . . . . 222
Estimation methods, benchmark years and non-benchmark years. . . . . . . . . . . . . . . . . . . . . . . . . . . . . . . . 222
Estimation methods, monthly and quarterly . . . . . . . . . . . . . . . . . . . . . . . . . . . . . . . . . . . . . . . . . . . . . . . . . 222
Estimation methods, provinces and territories. . . . . . . . . . . . . . . . . . . . . . . . . . . . . . . . . . . . . . . . . . . . . . . . 230
Business investment in farm inventories . . . . . . . . . . . . . . . . . . . . . . . . . . . . . . . . . . . . . . . . . . . . . . . . . . . . . . . 230
Estimation methods, non-benchmark years . . . . . . . . . . . . . . . . . . . . . . . . . . . . . . . . . . . . . . . . . . . . . . . . . 231
Estimation methods, quarterly estimates . . . . . . . . . . . . . . . . . . . . . . . . . . . . . . . . . . . . . . . . . . . . . . . . . . . 231
Estimation methods, provincial estimates . . . . . . . . . . . . . . . . . . . . . . . . . . . . . . . . . . . . . . . . . . . . . . . . . . . 231
Government investment in inventories. . . . . . . . . . . . . . . . . . . . . . . . . . . . . . . . . . . . . . . . . . . . . . . . . . . . . . . . . 232
Calculating volume aggregates with the chain Fisher formula for investment in inventories . . . . . . . . . . . . . . . . 232
Calculation formulas . . . . . . . . . . . . . . . . . . . . . . . . . . . . . . . . . . . . . . . . . . . . . . . . . . . . . . . . . . . . . . . 233Components of the calculation of investment in non-farm inventories . . . . . . . . . . . . . . . . . . . . . . . . . . 234Components of the calculation of investment in farm inventories . . . . . . . . . . . . . . . . . . . . . . . . . . . . . 234
Statistics Canada - Catalogue no. 13-017 Guide to the Income and Expenditure Accounts 9
Table of contents (continued)
Investment in inventories, level of aggregation . . . . . . . . . . . . . . . . . . . . . . . . . . . . . . . . . . . . . . . . . . . 235Chapter 11 International and inter-provincial trade in goods and services . . . . . . . . . . . . . . . . . . . . . . . . 236
Introduction . . . . . . . . . . . . . . . . . . . . . . . . . . . . . . . . . . . . . . . . . . . . . . . . . . . . . . . . . . . . . . . . . . . . . . . . . . . . . 236
International trade . . . . . . . . . . . . . . . . . . . . . . . . . . . . . . . . . . . . . . . . . . . . . . . . . . . . . . . . . . . . . . . . . . . . . 236
Inter-provincial trade . . . . . . . . . . . . . . . . . . . . . . . . . . . . . . . . . . . . . . . . . . . . . . . . . . . . . . . . . . . . . . . . . . . 236
Concepts and definitions . . . . . . . . . . . . . . . . . . . . . . . . . . . . . . . . . . . . . . . . . . . . . . . . . . . . . . . . . . . . . . . . 236
Trade in goods . . . . . . . . . . . . . . . . . . . . . . . . . . . . . . . . . . . . . . . . . . . . . . . . . . . . . . . . . . . . . . . . . . . . . . . . . . . 237
Adjustments to customs data . . . . . . . . . . . . . . . . . . . . . . . . . . . . . . . . . . . . . . . . . . . . . . . . . . . . . . . . . . . . 238
Trade in services . . . . . . . . . . . . . . . . . . . . . . . . . . . . . . . . . . . . . . . . . . . . . . . . . . . . . . . . . . . . . . . . . . . . . . . . . 240
Travel services . . . . . . . . . . . . . . . . . . . . . . . . . . . . . . . . . . . . . . . . . . . . . . . . . . . . . . . . . . . . . . . . . . . . . . . 240
Transportation services . . . . . . . . . . . . . . . . . . . . . . . . . . . . . . . . . . . . . . . . . . . . . . . . . . . . . . . . . . . . . . . . . 240
Commercial services . . . . . . . . . . . . . . . . . . . . . . . . . . . . . . . . . . . . . . . . . . . . . . . . . . . . . . . . . . . . . . . . . . . 241
Government services. . . . . . . . . . . . . . . . . . . . . . . . . . . . . . . . . . . . . . . . . . . . . . . . . . . . . . . . . . . . . . . . . . . 242
Financial services indirectly measured (FSIM) . . . . . . . . . . . . . . . . . . . . . . . . . . . . . . . . . . . . . . . . . . . . . . . 242
Link between the Balance of Payments and the Income and Expenditure Accounts . . . . . . . . . . . . . . . . . . . . . 244
Treatment of FSIM. . . . . . . . . . . . . . . . . . . . . . . . . . . . . . . . . . . . . . . . . . . . . . . . . . . . . . . . . . . . . . . . . . . . . 244
Treatment of reinvested earnings on direct investment. . . . . . . . . . . . . . . . . . . . . . . . . . . . . . . . . . . . . . . . . 245
Estimation methods and data sources–International imports and exports. . . . . . . . . . . . . . . . . . . . . . . . . . . . . . 246
Presentation of estimates within the Income and Expenditure Accounts. . . . . . . . . . . . . . . . . . . . . . . . . . . . . . . 246
Revision cycle . . . . . . . . . . . . . . . . . . . . . . . . . . . . . . . . . . . . . . . . . . . . . . . . . . . . . . . . . . . . . . . . . . . . . . . . . . . 248
Annual and quarterly estimation methods and data sources—Trade in goods . . . . . . . . . . . . . . . . . . . . . . . . . . 248
Annual and quarterly estimation methods and data sources—Trade in services . . . . . . . . . . . . . . . . . . . . . . . . 248
Deflation. . . . . . . . . . . . . . . . . . . . . . . . . . . . . . . . . . . . . . . . . . . . . . . . . . . . . . . . . . . . . . . . . . . . . . . . . . . . . . . . 255
Deflation—Estimates of international trade in goods in real terms . . . . . . . . . . . . . . . . . . . . . . . . . . . . . . . . 255
Deflation—Estimates of international trade in services in real terms . . . . . . . . . . . . . . . . . . . . . . . . . . . . . . 255
Provincial and territorial estimation methods and sources. . . . . . . . . . . . . . . . . . . . . . . . . . . . . . . . . . . . . . . . . . 257
Presentation of provincial and territorial estimates . . . . . . . . . . . . . . . . . . . . . . . . . . . . . . . . . . . . . . . . . . . . 258
Estimation methodology—International and interprovincial trade . . . . . . . . . . . . . . . . . . . . . . . . . . . . . . . . . 259
Deflation of regional estimates . . . . . . . . . . . . . . . . . . . . . . . . . . . . . . . . . . . . . . . . . . . . . . . . . . . . . . . . . . . 262
Appendix 11A Reconciliation between the Balance of Payments current account and the Income and Expenditure Accounts’ non-residents sector . . . . . . . . . . . . . . . . . . . . . . . . . . . . . . . . . . . . . . . . . . . . . . . . . . . . . . . . . . . . . . 264
Appendix 11B Data sources for commercial services. . . . . . . . . . . . . . . . . . . . . . . . . . . . . . . . . . . . . . . . . . . . . 266
Appendix 11C Level of detail for the trade in goods . . . . . . . . . . . . . . . . . . . . . . . . . . . . . . . . . . . . . . . . . . . . . . 268
Appendix 11D Balancing of provincial trade flows . . . . . . . . . . . . . . . . . . . . . . . . . . . . . . . . . . . . . . . . . . . . . . . 270
Chapter 12 Data quality . . . . . . . . . . . . . . . . . . . . . . . . . . . . . . . . . . . . . . . . . . . . . . . . . . . . . . . . . . . . . . . . . . 272
National Income and Expenditure Accounts . . . . . . . . . . . . . . . . . . . . . . . . . . . . . . . . . . . . . . . . . . . . . . . . . . . . 272
Description. . . . . . . . . . . . . . . . . . . . . . . . . . . . . . . . . . . . . . . . . . . . . . . . . . . . . . . . . . . . . . . . . . . . . . . . . . . 272
10 Statistics Canada - Catalogue no. 13-017 Guide to the Income and Expenditure Accounts
Table of contents (concluded)
Data sources and methodology. . . . . . . . . . . . . . . . . . . . . . . . . . . . . . . . . . . . . . . . . . . . . . . . . . . . . . . . . . . 272Target population . . . . . . . . . . . . . . . . . . . . . . . . . . . . . . . . . . . . . . . . . . . . . . . . . . . . . . . . . . . . . . . . . . 272Data sources . . . . . . . . . . . . . . . . . . . . . . . . . . . . . . . . . . . . . . . . . . . . . . . . . . . . . . . . . . . . . . . . . . . . . 272Estimation . . . . . . . . . . . . . . . . . . . . . . . . . . . . . . . . . . . . . . . . . . . . . . . . . . . . . . . . . . . . . . . . . . . . . . . 272Quality evaluation . . . . . . . . . . . . . . . . . . . . . . . . . . . . . . . . . . . . . . . . . . . . . . . . . . . . . . . . . . . . . . . . . . 273Disclosure control . . . . . . . . . . . . . . . . . . . . . . . . . . . . . . . . . . . . . . . . . . . . . . . . . . . . . . . . . . . . . . . . . . 273Revisions and seasonal adjustment . . . . . . . . . . . . . . . . . . . . . . . . . . . . . . . . . . . . . . . . . . . . . . . . . . . . 274
Data accuracy . . . . . . . . . . . . . . . . . . . . . . . . . . . . . . . . . . . . . . . . . . . . . . . . . . . . . . . . . . . . . . . . . . . . . . . . 274
Documentation . . . . . . . . . . . . . . . . . . . . . . . . . . . . . . . . . . . . . . . . . . . . . . . . . . . . . . . . . . . . . . . . . . . . . . . 274
Provincial Economic Accounts. . . . . . . . . . . . . . . . . . . . . . . . . . . . . . . . . . . . . . . . . . . . . . . . . . . . . . . . . . . . . . . 274
Description. . . . . . . . . . . . . . . . . . . . . . . . . . . . . . . . . . . . . . . . . . . . . . . . . . . . . . . . . . . . . . . . . . . . . . . . . . . 274
Data sources and methodology. . . . . . . . . . . . . . . . . . . . . . . . . . . . . . . . . . . . . . . . . . . . . . . . . . . . . . . . . . . 275
Target population . . . . . . . . . . . . . . . . . . . . . . . . . . . . . . . . . . . . . . . . . . . . . . . . . . . . . . . . . . . . . . . . . . 275Data sources . . . . . . . . . . . . . . . . . . . . . . . . . . . . . . . . . . . . . . . . . . . . . . . . . . . . . . . . . . . . . . . . . . . . . 275Estimation . . . . . . . . . . . . . . . . . . . . . . . . . . . . . . . . . . . . . . . . . . . . . . . . . . . . . . . . . . . . . . . . . . . . . . . 275Quality evaluation . . . . . . . . . . . . . . . . . . . . . . . . . . . . . . . . . . . . . . . . . . . . . . . . . . . . . . . . . . . . . . . . . . 275Disclosure control . . . . . . . . . . . . . . . . . . . . . . . . . . . . . . . . . . . . . . . . . . . . . . . . . . . . . . . . . . . . . . . . . . 276Revisions and seasonal adjustment . . . . . . . . . . . . . . . . . . . . . . . . . . . . . . . . . . . . . . . . . . . . . . . . . . . . 276
Data accuracy . . . . . . . . . . . . . . . . . . . . . . . . . . . . . . . . . . . . . . . . . . . . . . . . . . . . . . . . . . . . . . . . . . . . . . . . 276
Documentation . . . . . . . . . . . . . . . . . . . . . . . . . . . . . . . . . . . . . . . . . . . . . . . . . . . . . . . . . . . . . . . . . . . . . . . 276
Chapter 13 Glossary . . . . . . . . . . . . . . . . . . . . . . . . . . . . . . . . . . . . . . . . . . . . . . . . . . . . . . . . . . . . . . . . . . . . . 277
Chapter 14 Surveys and statistical programs . . . . . . . . . . . . . . . . . . . . . . . . . . . . . . . . . . . . . . . . . . . . . . . . 289
Chapter 15 Reference list . . . . . . . . . . . . . . . . . . . . . . . . . . . . . . . . . . . . . . . . . . . . . . . . . . . . . . . . . . . . . . . . . 292
Statistics Canada publications and products . . . . . . . . . . . . . . . . . . . . . . . . . . . . . . . . . . . . . . . . . . . . . 292Other publications . . . . . . . . . . . . . . . . . . . . . . . . . . . . . . . . . . . . . . . . . . . . . . . . . . . . . . . . . . . . . . . . . 294
Chapter 16 Acronyms and initialisms. . . . . . . . . . . . . . . . . . . . . . . . . . . . . . . . . . . . . . . . . . . . . . . . . . . . . . . 295
Statistics Canada - Catalogue no. 13-017 Guide to the Income and Expenditure Accounts 11
Introduction
Chapter 1 Introduction
The purpose of the guide
1.1 This guide is the fourth of its type in the 60-year history of the Income and Expenditure Accounts (IEA). It isalso the latest addition to the methodological documents on the Canadian System of National Accounts. It aims atimproving users’ understanding of national accounting, in particular of the sources and methods of the IEA. Itundertakes the detailed task of explaining the how’s and the why’s of gross domestic product and its components,as a means of strengthening macroeconomic analysis. This guide also gives analysts a sense of how the IEA fitinto the national accounts as a whole, with reference to related accounts and data throughout the document.Further, the guide enables readers to bridge the gap between Canadian and international terminology, withreferences to international standards, terms and conceptual treatments.
1.2 This guide is structured logically around the concepts, sources and methods used in the sum of incomes andsum of expenditures approaches to deriving gross domestic product (GDP). Chapter 2 supplies an overview ofGDP measurement, in both the production and income-expenditure frameworks, as well as a discussion of aspectsof component accounts. Chapters 3 to 5 provide the basic elements of income arising from production—essentially,the returns to labour and capital; while Chapter 6 describes the income-side adjustment to get to GDP at marketprices. The guide then switches to articulating the measurement of final spending on production. Chapters 7, 8 and9, cover the main components of final domestic demand—personal expenditure, government current expenditureand capital formation. Chapter 10 presents investment in inventories. Chapter 11 discusses estimates ofinternational trade as well as inter-provincial trade flows. The remaining reference chapters provide a glossary, alist of acronyms and initialisms used, a list of Statistics Canada surveys referenced throughout the chapters and abrief discussion of the elements of quality.
1.3 An important feature of this guide is that it is a living document that will be updated and extended as required,in order to best serve the user community. This feature is made more useful with international System of NationalAccounts (SNA) standards undergoing review, and with a subsequent historical revision on the horizon. New users,who may not be as familiar with the SNA as established IEA clients, now have background information toaccompany the time series data available electronically.
Background
1.4 The Income and Expenditure Accounts (IEA) are a major component of the Canadian System of National
Accounts. They are published on both an annual and a quarterly basis.1 The annual series date from 1926 whilethe quarterly series date from 1947. The annual Provincial Economic Accounts have been published from thereference year 1961.
1.5 Understanding economy-wide activity emerged as a key interest following the Great Depression of the 1930s.This event is viewed as a catalyst for the development of macroeconomics in which a key principle, advanced byKeynes in his framework for analysis, was that economic downturns were generally characterized by insufficientaggregate demand. Subsequent research in this area, in turn, spawned a need for new information on the macro-economy—in particular, more data on aggregate measures of activity. The emergence of national accounting as adiscipline, including the development of the Income and Expenditure Accounts in Canada, was in direct responseto this need.
1.6 Since its first regular appearance in 1952,2 the IEA—featuring gross national product (GNP) and, morerecently, gross domestic product (GDP) as the central aggregates—has become indispensable for macroeconomicanalysis in Canada. As the name suggests, the focus of the IEA is income arising from production and final
1. National Income and Expenditure Accounts, catalogue no. 13-001.2. Annual IEA estimates were first published in the latter half of the 1940’s, while the quarterly accounts were first published in the fall
of 1953.
12 Statistics Canada - Catalogue no. 13-017 Guide to the Income and Expenditure Accounts
Introduction
expenditure on that production. As the principal indicator of economic performance, GDP and its related detail(e.g., consumption, investment, saving and the detailed transactions of institutional sectors) are key tounderstanding macro-economic activity.
Perspective on the use of the Income and Expenditure Accounts
1.7 Two main uses of the Income and Expenditure Accounts (IEA) are for analysis of economic trends and ofbusiness cycles. These accounts are designed to help analysts understand the elements that drive the economy,the factors underlying its growth, as well as to make short-term and long-term forecasts of macroeconomic activityfor various purposes. The supporting detail in the IEA gives users the capacity to analyse the distribution ofnational income and the composition of the final expenditures on production, as well as to examine the contributionand evolution of the main participant groups in the economy. They can then link economic performance withnational events (changes in social programs, tax reforms, etc.), changes in key prices (interest rates, commodityprices, exchange rates, etc.) or with international developments (economic cycles in the United States,international energy prices, free trade agreements, international financial crises, etc.). The findings that emergefrom studies have an impact on the monetary policy of the central bank, government fiscal and other policies,activities of financial institutions, businesses’ investment decisions, as well as on the evolution of economic theory.The quarterly IEA estimates have a long history of being available approximately 60 days after the end of the
reference period3 in order to meet user needs for timely macroeconomic data.
1.8 While the focus is on aggregate activity for the economy as a whole, there is also a regional dimension to theIEA in the form of the annual Provincial Economic Accounts.These data are in high demand by government andother analysts in each of the Canadian provinces and territories. Preliminary estimates of the PEA are availableapproximately 120 days after the end of the reference year.
1.9 Analysis of the economy is further enhanced with extensions to the main sector accounts of the IEA—inparticular, in the form of the Financial Flow Accounts (FFA) and the National Balance Sheet Accounts (NBSA).Together these integrated accounts present economic activity and its financing, as well as wealth generation in astock-flow framework.
1.10 The conceptual framework of the national accounts is based on international conventions such that GDP andrelated variables can be used to make international comparisons of economic performance.
1.11 The national accounts in Canada are not static, and have an established history of adaptation and expansionto account for changes in the economy, emerging issues, as well as evolving international standards. Theseaccounts will continue to evolve in order to meet new policy and/or analytic needs. This is particularly evident in theaddition of a number of satellite accounts in recent years, including the Tourism Satellite Account and theassociated National Tourism Indicators; the Satellite Account of Non-profit Institutions and Volunteering; and, thePension Satellite Account (under development).
The Income and Expenditure Accounts within the Canadian System of National Accounts
Architecture of the system
1.12 The Canadian System of National Accounts (CSNA) publishes a full set of accounts which is a slightlymodified version of the international standard—the System of National Accounts 1993 (SNA 1993). Reduced to itssimplest terms, the CSNA is a sequence of economic accounts. The system largely articulates the majortransactions through the production and use of incomes as well as the accumulation of non-financial and financialassets. The integration of the data and accounts in the CSNA means that analysts can construct consistenthistories linking wealth, production activity and income and expenditures, including those resulting from the
3. Actual release days for key statistical products, including the IEA, are set and publicized one year in advance. See www.statcan.ca/nea.
Statistics Canada - Catalogue no. 13-017 Guide to the Income and Expenditure Accounts 13
Introduction
redistribution of wealth and the formation and financing of capital by economic agents. The information contained inthe CSNA is presented in the form of economic accounts that parallel, to some extent, the statements used inbusiness accounting. The economic series’ estimates that appear in a number of accounts are identical and/orconsistent, because common definitions, classifications and valuations are used across the entire CSNA.
1.13 GDP lies at the centre of the two main architectures of the CSNA—the industry-based and sector-basedstatistics. It is the most monitored measure in the national accounts. GDP is the unduplicated value of goods andservices produced during a period that is available for final domestic consumption, investment or export. Theincome and expenditure account records the value of GDP, as income arising from production and as final
expenditure on goods and services produced.4 In real terms (that is, adjusted for price change), GDP isrepresentative of the volume of economic activity in a given period.
Industry-based statistics
1.14 In the Input-Output Tables (IOT), production activity is articulated at a very detailed level. The supply and usetables focus on the productive structure of the economy. It traces production of commodities by domestic industriescombined with imports through their use as intermediate inputs or as final use including exports. The systemprovides a measure of value added by industry—total output (or sales) less intermediate inputs. These tables canbe used to calculate economy-wide GDP either directly, by summing value added over the industries, or indirectly,by either summing to the economy-wide cost of primary inputs (GDP income) or computing the grand total of theflow of commodities into final demand categories (GDP expenditure)—the link to the Income and ExpenditureAccounts.
1.15 The annual IOT for Canada and the regions are released 2 1/2 years after the reference period.Nevertheless, they are central to the system in that they provide a set of reference data for the rest of the CSNA,and figure into the annual revision and benchmarking process. Current monthly GDP figures are produced, as ameans of providing more up-to-date industry information to users for current analysis. The monthly measures usea set of indicators to project the GDP by industry benchmarks from the IOT. These estimates are linked to theIncome and Expenditure Accounts on a quarterly basis.
Sector-based statistics
Income and Expenditure Accounts
1.16 The Income and Expenditure Accounts (IEA) are the subject of this guide. These are comprised of theaggregate income-based GDP and expenditure-based GDP tables, as well as the sector accounts—Income andOutlay Account and Capital Account. GDP can be derived from the consolidation of income and expenditure flowsof the four main institutional sectors—persons and unincorporated businesses (including non-profit institutions
serving households),5 corporations and government business enterprises; governments; and non-residents(see Table 1.1).
4. This is a combination of production account and generation of income accounts in SNA 1993.5. This is broader than the household sector used in SNA 1993.
14 Statistics Canada - Catalogue no. 13-017 Guide to the Income and Expenditure Accounts
Introduction
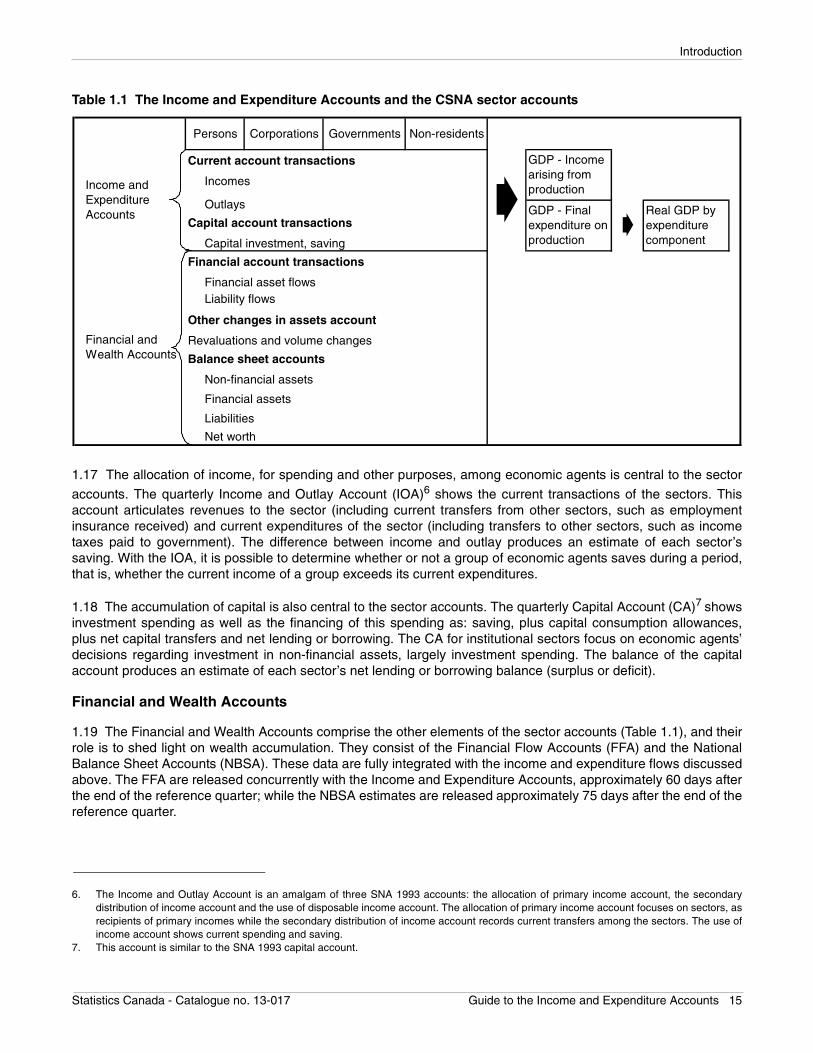
Table 1.1 The Income and Expenditure Accounts and the CSNA sector accounts
1.17 The allocation of income, for spending and other purposes, among economic agents is central to the sector
accounts. The quarterly Income and Outlay Account (IOA)6 shows the current transactions of the sectors. Thisaccount articulates revenues to the sector (including current transfers from other sectors, such as employmentinsurance received) and current expenditures of the sector (including transfers to other sectors, such as incometaxes paid to government). The difference between income and outlay produces an estimate of each sector’ssaving. With the IOA, it is possible to determine whether or not a group of economic agents saves during a period,that is, whether the current income of a group exceeds its current expenditures.
1.18 The accumulation of capital is also central to the sector accounts. The quarterly Capital Account (CA)7 showsinvestment spending as well as the financing of this spending as: saving, plus capital consumption allowances,plus net capital transfers and net lending or borrowing. The CA for institutional sectors focus on economic agents’decisions regarding investment in non-financial assets, largely investment spending. The balance of the capitalaccount produces an estimate of each sector’s net lending or borrowing balance (surplus or deficit).
Financial and Wealth Accounts
1.19 The Financial and Wealth Accounts comprise the other elements of the sector accounts (Table 1.1), and theirrole is to shed light on wealth accumulation. They consist of the Financial Flow Accounts (FFA) and the NationalBalance Sheet Accounts (NBSA). These data are fully integrated with the income and expenditure flows discussedabove. The FFA are released concurrently with the Income and Expenditure Accounts, approximately 60 days afterthe end of the reference quarter; while the NBSA estimates are released approximately 75 days after the end of thereference quarter.
6. The Income and Outlay Account is an amalgam of three SNA 1993 accounts: the allocation of primary income account, the secondarydistribution of income account and the use of disposable income account. The allocation of primary income account focuses on sectors, asrecipients of primary incomes while the secondary distribution of income account records current transfers among the sectors. The use ofincome account shows current spending and saving.
7. This account is similar to the SNA 1993 capital account.
Persons Corporations Governments Non-residents
Income and Expenditure Accounts
Current account transactions
Incomes
Capital account transactions
Capital investment, saving
Other changes in assets account
Liabilities
Net worth
Revaluations and volume changes
Balance sheet accounts
Non-financial assets
Financial assets
Real GDP by expenditure component
Financial and Wealth Accounts
Outlays
GDP - Income arising from production
GDP - Final expenditure on production
Financial account transactions
Financial asset flows Liability flows
Statistics Canada - Catalogue no. 13-017 Guide to the Income and Expenditure Accounts 15
Introduction
1.20 The quarterly Financial Flow Accounts (FFA) combine the Capital Account and the Financial Account.8 TheCapital and Financial Account, as the FFA is referred to in the aggregated sectors of the IEA release, makes for acomplete accounting of sources and uses of funds by institutional sector as well as an articulation of transaction-
driven changes to sector net worth positions and national wealth.9 The financial account portion of the FFA focuseson the financial activity underlying, or incidental, to economic activity in the sectors of the economy. As such, thisaccount shows net acquisition (purchases less sales) of financial assets and net incurrence of liabilities (borrowingless repayment). The balance in the financial account provides a second estimate of each sector’s net lending orborrowing.
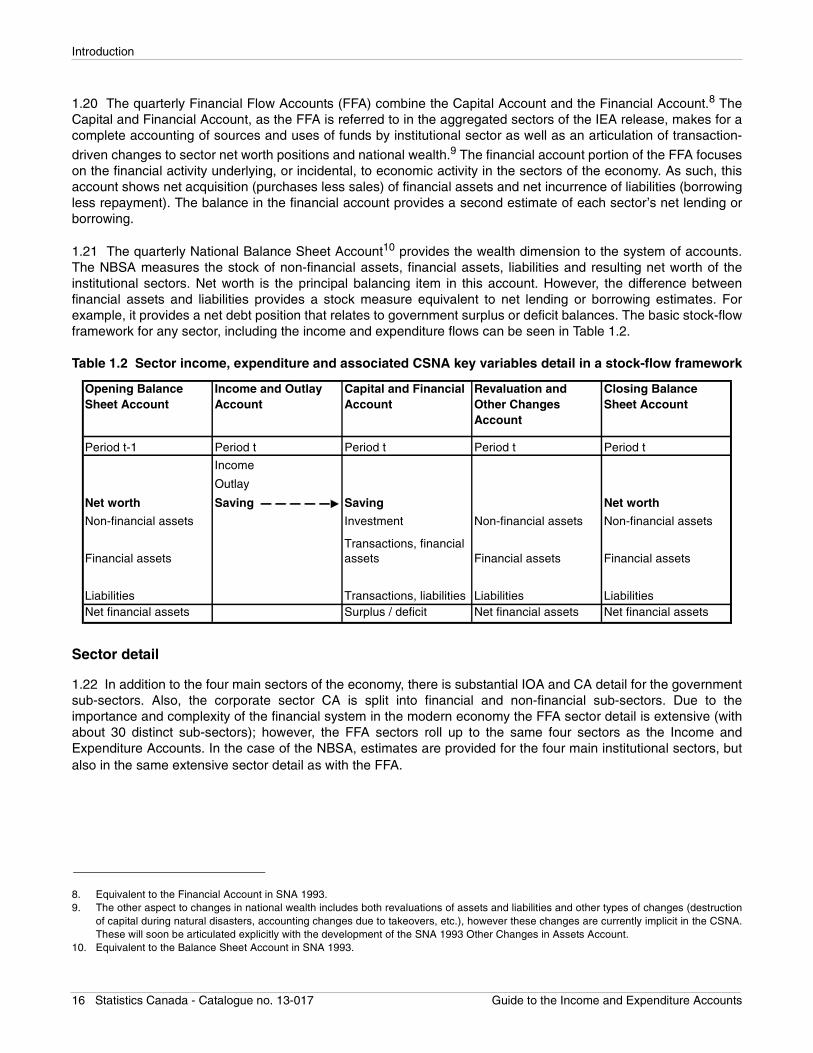
1.21 The quarterly National Balance Sheet Account10 provides the wealth dimension to the system of accounts.The NBSA measures the stock of non-financial assets, financial assets, liabilities and resulting net worth of theinstitutional sectors. Net worth is the principal balancing item in this account. However, the difference betweenfinancial assets and liabilities provides a stock measure equivalent to net lending or borrowing estimates. Forexample, it provides a net debt position that relates to government surplus or deficit balances. The basic stock-flowframework for any sector, including the income and expenditure flows can be seen in Table 1.2.
Table 1.2 Sector income, expenditure and associated CSNA key variables detail in a stock-flow framework
Sector detail
1.22 In addition to the four main sectors of the economy, there is substantial IOA and CA detail for the governmentsub-sectors. Also, the corporate sector CA is split into financial and non-financial sub-sectors. Due to theimportance and complexity of the financial system in the modern economy the FFA sector detail is extensive (withabout 30 distinct sub-sectors); however, the FFA sectors roll up to the same four sectors as the Income andExpenditure Accounts. In the case of the NBSA, estimates are provided for the four main institutional sectors, butalso in the same extensive sector detail as with the FFA.
8. Equivalent to the Financial Account in SNA 1993.9. The other aspect to changes in national wealth includes both revaluations of assets and liabilities and other types of changes (destruction
of capital during natural disasters, accounting changes due to takeovers, etc.), however these changes are currently implicit in the CSNA.These will soon be articulated explicitly with the development of the SNA 1993 Other Changes in Assets Account.
10. Equivalent to the Balance Sheet Account in SNA 1993.
Opening Balance Sheet Account
Income and Outlay Account
Capital and Financial Account
Revaluation and Other Changes Account
Closing Balance Sheet Account
Period t-1 Period t Period t Period t Period t
Income
Outlay
Net worth Saving Saving Net worth
Non-financial assets Investment Non-financial assets Non-financial assets
Financial assetsTransactions, financial assets Financial assets Financial assets
Liabilities Transactions, liabilities Liabilities LiabilitiesNet financial assets Surplus / deficit Net financial assets Net financial assets
16 Statistics Canada - Catalogue no. 13-017 Guide to the Income and Expenditure Accounts
Introduction
Links to the international accounts
1.23 In the IOA, the non-resident sector is a representation of the Canadian Balance of International Payments’Current Account. In the FFA, the non-resident sector represents the Canadian Balance of International Payments’Financial Account. The non-resident sector of the NBSA is a representation of Canada’s International InvestmentPosition.
Significant revisions to the Income and Expenditure Accounts
1.24 Since the publication of the last sources and methods document in 1990 (13-603E), there have been somenotable changes to the Canadian national accounts, which are outlined directly below. The national accounts arenot static, and the next historical revision is in the planning phase.
The historical revision of 1997
1.25 Every 10 years or so, an historical revision to the Canadian System of National Accounts (CSNA) isundertaken. The CSNA was updated and improved in a number of ways in the 1997 historical revision. Therevisions provided the opportunity to implement new international standards, to the extent required, and toharmonize government sector concepts. In addition this revision also permitted the introduction of changes in thepresentation of the accounts, incorporation of revised and new data into the estimates, the adoption of improvedestimation methods, the elimination of statistical breaks and further increases in the degree of integration amongthe component parts of the CSNA. The revisions were only applied to the 1961 to 1997 period, both quarterly andannually. As such, the older annual (1926 to 1960) and quarterly (1947 to 1960) data are no longer compatible. Forthe Provincial Economic Accounts, revisions were applied to the 1981 to 1997 period.
1.26 The major changes included:• The implementation of the System of National Accounts 1993 (SNA 1993) and of the revised Balance of
Payments Manual 5th edition, 1993 (BPM5)• The harmonization of the standards used for compiling public sector statistics in two separate systems:
The CSNA and the Canadian Financial Management System (FMS)• The rebasing of the constant price series from the previous base of 1986 to the base of 1992• The re-formatting of the sector accounts in the Income and Expenditure Accounts (IEA) including adding
a condensed and seasonally-adjusted version of the financial account, so as to be able to identify allsources and uses of funds
• The introduction of a series of changes to the income and expenditure components of the IEA
1.27 Revisions are detailed in the publication: Latest Developments in the Canadian Economic Accounts (13-605).For more detail on the historical revision of 1997 the issue “Historical revision of the National Economic andFinancial Accounts” should be consulted.
Mini-revision of 2000
1.28 In 2000, at the time of the annual revision, it was decided to open up the accounts historically (back to 1961)to incorporate a major change in the treatment of government unfunded pension plans. Essentially, this revisionincluded these liabilities as part of government debt and as part of household assets. The main purpose of therevision was to align these with other employer-sponsored plans and to substantially improve measures ofpersonal saving, assets and wealth as well as of government surplus/deficit and debt.
1.29 This change had been under study for some time, and amounted to an extension of the 1997 historicalrevisions’ project on the harmonization of government statistics. In addition, given the importance of Canada-U.S.comparisons, this change brought the treatment in line with that of the U.S. Income and Product Accounts andFlow of Funds Statistics.
Statistics Canada - Catalogue no. 13-017 Guide to the Income and Expenditure Accounts 17
Introduction
Mini-revision of 2001
1.30 Two further historical changes were introduced at the time of the annual revision in 2001: The adoption of theChain Fisher index for real GDP in the Income and Expenditure Accounts (IEA); and, the broadening of investmentspending to include the capitalization of software in the Canadian System of National Accounts (CSNA).
Adoption of a Fisher-type chain index
1.31 The quarterly IEA adopted the Fisher index formula, chained quarterly, as the official measure of realexpenditure-based gross domestic product (GDP) in 2001. The measure of real GDP and related aggregates wasreplaced by estimates based on chain Fisher volume indexes referenced to 1997 dollars (chained (1997) dollarestimates).
1.32 The reason for the adoption of this particular formula was twofold: it produces the most accurate measure ofquarter-to-quarter growth in GDP and its components; and, the change brought the Canadian measure in line withthe U.S. quarterly Income and Product Accounts which also use the chain Fisher formula to measure real GDP.
1.33 Please refer to the “Chain Fisher volume index” issue of the Latest Developments in the Canadian EconomicAccounts (13-605).
Capitalization of software
1.34 A new treatment for software as investment was implemented in the CSNA, and was reflected in the IEA in2001. This revision brought Canada in line with a number of countries, including the U.S. and other G-7 nations,which had expanded their GDP concept to include software as capital. This change also brought Canada in linewith the SNA 1993 recommendation that business and government acquisition of software be treated in thenational accounts as investment spending as opposed to a current expense.
1.35 Software is now treated like any other capital input that is used repeatedly in the production process over ayear or more. Software includes three types: pre-packaged, custom-designed and own-account.
1.36 Please refer to the “Capitalization of Software in the National Accounts” issue of the Latest Developments inthe Canadian Economic Accounts (13-605).
Re-referencing of the Chain Fisher index
1.37 Re-referencing of the Chain Fisher took place at the time of the annual revision in 2007, during the firstquarter production cycle. At this time, the reference year was updated to 2002.
Next historical revision
1.38 With the review and update process for the SNA 1993 international standard complete, the next historicalrevision to the CSNA is on the way. No date for this comprehensive revision has been set yet. However, a CSNAreview and feasibility assessment of the agreed upon international SNA issues is currently underway.
1.39 Two important proposed changes to the international standard for national accounting are the capitalization ofresearch and development and the inclusion of unfunded pension liabilities in government debt (and consequentlyin household assets). With respect to the former, the CSNA has initiated a project to develop initial estimates of thevalue of research and development capital. With respect to the latter, the CSNA has already implemented (in 2000)the major portions of the recommendation.
18 Statistics Canada - Catalogue no. 13-017 Guide to the Income and Expenditure Accounts
Concepts and definitions
Chapter 2 Concepts and definitions
Production and aggregate economic activity
Production, output and product
Basic concepts
2.1 Gross domestic product (GDP) is the key measure in the Canadian System of National Accounts. GDP lies atthe centre of the two architectures of the Canadian System of National Accounts (CSNA) — the industry-basedInput-Output Tables that provide a value added measure, and the sector-based Income and Expenditure Accountsthat provide both income-based and expenditure-based measures. GDP reflects the aggregate production of aneconomy. Production is an activity which uses inputs (labour, capital, goods and services) to produce outputs(goods and services). It excludes purely natural processes without any human involvement or direction, such asthe unmanaged growth of fish stocks (whereas fish farming is production).
2.2 Output consists of those goods or services that are produced within an establishment1 that become available
for use outside that establishment.2 The output includes work in progress whenever a process of productionextends over two or more accounting periods as well as any goods or services produced for its own final use. Thegross value added is defined as the value of total output less the value of all goods and services used in theproduction process (intermediate consumption). GDP (at basic prices) for the economy is equivalent to the sum ofthe value added by all resident producers. GDP at market prices is the aggregate GDP plus taxes, less subsidies,on products.
2.3 The relationship between output and value added gives an idea of the extent of transformations taking place inthe economy. Product or GDP, regardless of how it is measured in the CSNA, is the end result of productiveactivities.
Classification of productive activities
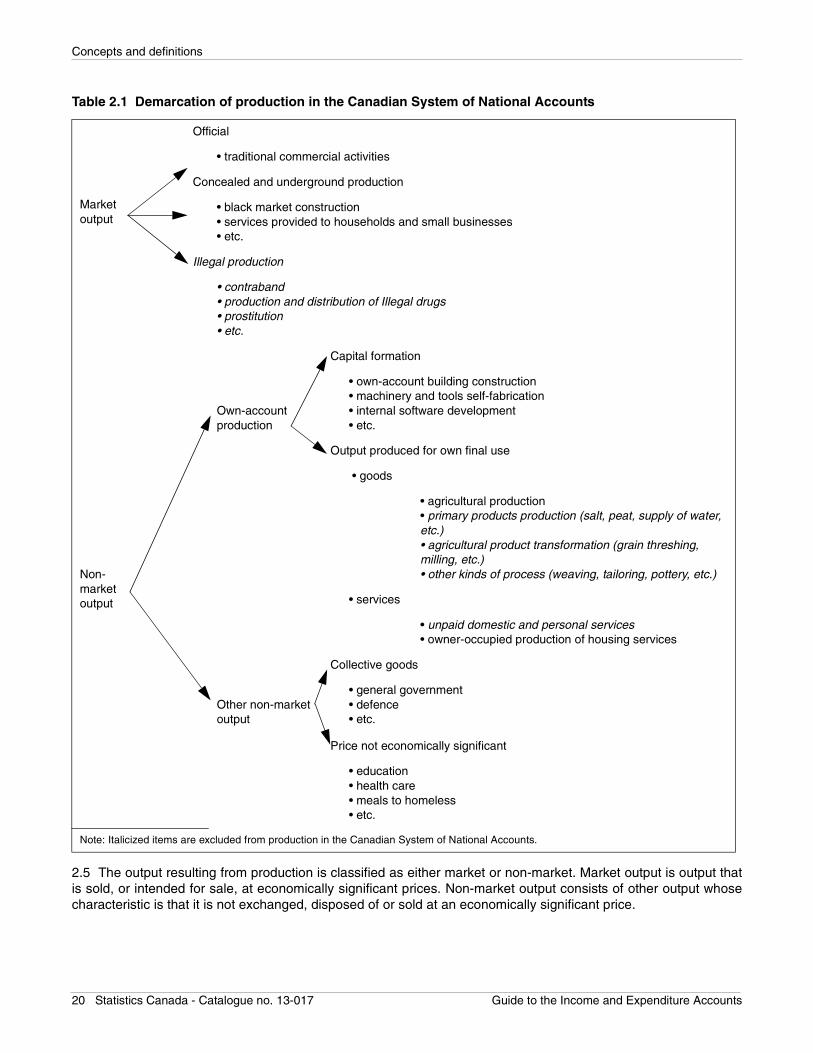
2.4 Understanding the production boundary is central to measuring gross domestic product as the level of GDP isaffected where the boundary is drawn. Table 2.1 presents a diagram demarcating production.
1. An establishment is an enterprise or part of an enterprise, that is situated in a single location and in which only a single (non-ancillary)productive activity is carried out or in which the principal productive activity accounts for most of the value added, according to paragraphs5.21 and 6.80 of System of National Accounts 1993. Establishments are grouped into industries.
2. See paragraph 6.38 of System of National Accounts 1993.
Statistics Canada - Catalogue no. 13-017 Guide to the Income and Expenditure Accounts 19
Concepts and definitions
Table 2.1 Demarcation of production in the Canadian System of National Accounts
2.5 The output resulting from production is classified as either market or non-market. Market output is output thatis sold, or intended for sale, at economically significant prices. Non-market output consists of other output whosecharacteristic is that it is not exchanged, disposed of or sold at an economically significant price.
Marketoutput
Official
• traditional commercial activities
Concealed and underground production
• black market construction• services provided to households and small businesses• etc.
Illegal production
• contraband• production and distribution of Illegal drugs• prostitution• etc.
Capital formation
Own-accountproduction
• own-account building construction• machinery and tools self-fabrication• internal software development• etc.
Output produced for own final use
• goods
Non-market output
• agricultural production• primary products production (salt, peat, supply of water, etc.)• agricultural product transformation (grain threshing, milling, etc.)• other kinds of process (weaving, tailoring, pottery, etc.)
• services
• unpaid domestic and personal services• owner-occupied production of housing services
Collective goods
Other non-marketoutput
• general government• defence• etc.
Price not economically significant
• education• health care• meals to homeless• etc.
Note: Italicized items are excluded from production in the Canadian System of National Accounts.
20 Statistics Canada - Catalogue no. 13-017 Guide to the Income and Expenditure Accounts
Concepts and definitions
2.6 Market output is generally sold at an economically significant price, that is, a price that has a significantinfluence on the amounts that producers are willing to supply and the amounts that purchasers wish to buy.Transactions are settled in cash or cash substitutes (that is trade payables or receivables) by barter or in kind.Market output includes:
• the total value of goods and services sold or marketed (at an economically significant price);• the total value of goods and services bartered;• the total value of goods and services used for payments in kind, including remuneration in kind;• the total value of goods and services provided to another establishment within the same enterprise; and,• the value of changes in inventories of finished goods and work in progress intended for one or another of
the above uses.
2.7 The productive activity that results in market output is sometimes unreported or concealed.3 Economic activitywhere the scale is small enough that traditional sources of information may not pick it up is referred to as theinformal economy. Informal activity is relatively insignificant in Canada. Concealed production includes productiveactivities that are authorized by law but are not reported, for various reasons, such as to avoid paying income taxesor other taxes, or to avoid particular legal obligations, etc. Lastly, illegal production is also concealed activity. Itconsists of the production of goods and services whose sale, distribution or possession is forbidden by law but iscarried out, by mutual agreement between the parties. Examples of such activities include the manufacture anddistribution of narcotics, smuggling of goods and prostitution. The different aspects of market production are shownin the upper part of Table 2.1. It should be noted that even though no explicit adjustment is made to include illegalactivity some illegal activity may enter the market economy through money laundering.
2.8 Non-market output consists of other types of output whose common characteristic is that they are notmarketed, exchanged, disposed of or sold at an economically significant price. There are two types of non-marketoutput: own account output and other non-market output.
2.9 The own-account output consists of goods retained by institutional units for their own final consumption or theirown capital formation. For business and governments, own-account production takes the form of gross fixedcapital formation. For example, the manufacture of specialized tools by an engineering firm when the tools willsubsequently be used in the production process.
2.10 The other non-market output includes individual or collective goods and services to which the pricemechanism cannot apply. It also includes goods and services that a producing institutional unit has decided tosupply to other institutional units either for free or for prices that are not economically significant. Generalgovernment administration and national defence are examples of output for which the price mechanism does notfunction freely. The different aspects of non-market production are shown in the lower part of Table 2.1.
2.11 In the case of households, own-account production corresponds to final consumption. For example, somecrops produced by farmers may be used for final consumption by the farmer’s household. Clothing or pottery maybe produced by households for own-consumption.
2.12 Unpaid personal and domestic services are excluded from the production boundary, but occasional estimates
are available.4 Examples of these are:• Cleaning, decorating and maintenance of the dwelling occupied by the household, including minor
repairs usually done by renters or owners;• Cleaning, maintenance and repair of durable consumer goods or other goods, including vehicles used
for the needs of the household;
3. This is often referred to as the underground economy, but the more recent and broader term is the unmeasured economy. Two separatestudies have been published on the underground economy: “Assessing the Size of the Underground Economy: The Statistics CanadaPerspective”, Income and Expenditure Accounts Technical Series no. 28, May 1994; and, “The Size of the Underground Economy inCanada”, Studies in National Accounting, June 1994, catalogue no. 13-603, no 2.
4. “The Value of Household Work in Canada, 1992”, Income and Expenditure Accounts Technical Series no. 27, March 1994.
Statistics Canada - Catalogue no. 13-017 Guide to the Income and Expenditure Accounts 21
Concepts and definitions
• Meal preparation and table service;• The care, education and training of children;• The care of ill, disabled or elderly persons;• Transportation of household members or their goods.
CSNA production boundary
2.13 As can be seen from Table 2.1 the production boundary in the CSNA is very close to the System of NationalAccounts 1993 (SNA 1993). In the domain of market output, the CSNA currently excludes illegal production exceptsmuggling activity, where significant. Smuggling of cigarettes is an example of where the CSNA includes anestimate.
2.14 Among the own-account production, the excluded items are: the production and processing of agriculturaland related products; other kinds of processing, such as production and alteration of clothes, semi-durable ordurable goods such as furniture. The production of these goods can easily be sold on the market. The rationale forexclusion of household and personal services produced by households for their own consumption follows thatprovided in paragraphs 6.19 to 6.21 of the System of National Accounts 1993:
• These are “self-contained activity with limited repercussions on the rest of the economy”;• As “there are typically no suitable market prices that can be used to value such services”;• “Imputed values have a different economic significance from monetary values... if the incomes were to
be available in cash, the resulting expenditures might be quite different”;
2.15 However, it is worth noting that paid household and personal services (performed by domestic staff) areincluded in production, since this is a form of market output.
2.16 The own-account housing services produced and consumed by owner-occupants is included. The housingservices of owner-occupants are similar to rental housing services, which are included in market output. For thehousing services produced and consumed by owner-occupants, the System of National Accounts 1993 providesthis explanation to justify inclusion:
“The ratio of owner-occupied to rented dwellings can vary significantly between countries and even overshort periods of time within a single country, so that both international and inter-temporal comparisons of theproduction and consumption of housing services could be distorted if no imputation were made for the valueof own-account housing services. The imputed value of the income generated by such production is taxed in
some countries.”5
Analytical definitions applied to GDP
Net or gross GDP
2.17 Economic production involves the using up of productive capital assets–the “consumption” of capital.Because capital assets are highly durable, this using up is a gradual process, typically occurring over many years.Fixed capital consumption, often called depreciation, represents the reduction in the value of fixed assets used inproduction during the accounting period, resulting from physical deterioration or normal obsolescence. Thisconvention parallels financial accounting, as businesses customarily allocate to each period’s operating expensesa depreciation charge designed to cover the wearing out of capital assets during the period in question.Depreciation is therefore both an economic and a business cost, which is included in the market price of goods andservices sold to final users.
5. System of National Accounts 1993, paragraph 6.29.
22 Statistics Canada - Catalogue no. 13-017 Guide to the Income and Expenditure Accounts
Concepts and definitions
2.18 GDP therefore includes capital consumption allowances. The term gross is used to indicate that the
consumption of fixed capital,6 is part of the measure. The term net signifies that the consumption of fixed capital isexcluded from the definition of production, yielding net domestic product (NDP). Some analysts contend that thegross measure is more useful for some analyses, because in the short term the replacement of capital can bepostponed. Consequently, it is gross product that is used for final consumption. However, the continuousconsumption of gross product, without replacement of the assets used, would gradually reduce the country’swealth. Other analysts are focused on net net national product (NNP), arguing that it provides a better picture ofthe nation’s economic progress since it measures the amount of output that is left after providing for maintenanceof the stock of productive capital.
National or domestic product
2.19 In national accounting, an economy is defined by the entire set of resident institutional units. An institutionalunit is resident in a country when it has a centre of economic interest in that country’s economic territory. A centreof economic interest is a location—a dwelling, place of production or office—from which it engages, and intends tocontinue to engage, in economic activities and transactions on a significant scale either indefinitely or over a finite
but long period of time.7 It includes production within diplomatic enclaves.
2.20 Gross domestic product (GDP) is the sum of gross value added across all resident units— industries orinstitutions regardless of the ownership (Canadian or foreign) of the factors of production. The GDP measure, asthe key macroeconomic aggregate, allows for better correspondence to domestic employment and domesticprices.
2.21 Gross national product (GNP) or gross national income (GNI) is a measure of the total unduplicated value ofproduction of goods and services of Canadian residents at market prices (it excludes the activity related to non-resident factors of production). The concept of national refers to the economic activities of the resident economicunits, in their capacity as owners of the factors of production within a country or region. Otherwise stated, GNP(GNI) represents the income received by resident economic units due to their ownership of the factors ofproduction, regardless of where the production takes place. GNP (GNI) is more closely associated with the IEAsector-based accounts of the CSNA. It is equivalent to GDP plus compensation of employees and investmentincome received from non-residents minus compensation of employees and investment income paid to non-residents.
2.22 Until 1986, the central concept of the Canadian System of National Accounts was gross national product.Since then, gross domestic product has supplanted it. This change was introduced in order to facilitate analysis ofthe economic situation and statistical integration of the components of the national accounts. The advantages ofthe domestic measure over the national measure are as follows: GDP is more closely related to employment anddomestic prices than is GNI; it is easier to reconcile the components of the Canadian System of National Accounts;regional and national measures are better integrated; and, most countries emphasize GDP as the primarymeasure of product. That being said, GNI is making a comeback as a main indicator in recent times, whereglobalization and other current events are causing analysts to look more closely at the ownership of factors ofproduction.
GDP at market price or at basic price
2.23 GDP is valued at both basic price8 and at market price. Aggregates expressed at market prices are valued atthe prices actually paid by purchasers, meaning that they include all taxes less subsidies on products, such as:
6. Fixed capital consumption represents the reduction in the value of the fixed assets used in production during the accounting period,resulting from physical deterioration, normal obsolescence or normal accidental damage. See paragraph 10.27 of SNA 1993. Fixed capitalconsumption is the term recognized in international accounting. In Canada, the term capital consumption allowance or depreciation is alsoused.
7. The concept of residence in national accounting is identical to the concept described in the Balance of Payments Manual of theInternational Monetary Fund (IMF). It is explained in that manual and also in paragraphs 4.15 and 4.16 and Chapter XIV of System ofNational Accounts 1993.
Statistics Canada - Catalogue no. 13-017 Guide to the Income and Expenditure Accounts 23
Concepts and definitions
• the Goods and Services Tax (GST) and the Harmonized Sales Tax (HST);• sales taxes;• fuel taxes;• import duties and taxes;• excise taxes on tobacco and alcoholic beverages;• subsidies paid on agricultural products;• subsidies paid on transportation services and energy.
2.24 They also include taxes less subsidies on factors of production, such as:• property taxes;• capital taxes;• payroll taxes;• subsidies for job creation and training.
2.25 Estimates at basic prices are obtained by leaving out taxes less subsidies on products.
2.26 The two concepts meet different analytical needs. Valuation at market prices is better suited to analysing finaldemand, where the focus is more on the price that purchasers actually pay. Valuation at basic prices is bettersuited to analysing the content of the resources incorporated into different goods or services or resource allocation.It represents the sum of the incomes from the factors of production as measured by the cost of the labour andcapital factors, including net taxes on the factors of production, used in the production process. In economic terms,the concept of basic prices is considered the most useful concept for analysing the production and relativedistribution of primary resources between industries.
Alternative approaches to calculating aggregate GDP
2.27 Gross domestic product can be measured in three ways. The first and most intuitive method is called theproduction or value added approach. It consists of summing the gross value added of all industries (resident
sectors).9 For each industry, this involves subtracting intermediate consumption from the industry output. The GDP
at market price is obtained by adding taxes less subsidies10 on products to the sum total of value added. In oursimplified hypothetical example that follows, we assume that there is no government and therefore taxes do notexist.
2.28 The second method, the income approach, consists in summing all the factor incomes generated in theproduction process plus net taxes on products and on production. In our simplified example that follows, workersare compensated by wages and the owners of capital are compensated by profits.
2.29 The third approach, the final expenditure approach, consists of summing the expenditures of thosepurchasing final goods and services. In the example, this includes final consumption expenditures, and exportsminus imports, assuming no capital formation. Table 2.3 shows that the three approaches yield the same value forfinal output in the economy.
8. Canadian basic prices in the Input-Output Tables do not correspond exactly to international basic prices. In the Canadian System ofNational Accounts, the concept of modified basic prices is used. It refers to the price at the factory gate of the producing establishment,excluding sales and excise taxes collected after the final processing stage. The modified basic price of a product is equal to the pricereceivable from the purchaser minus any transport margins and trade margins at the time of delivery of the product to the purchaser andany taxes on products. In Canada, the modified basic price is the subsidized price on products, while in the System of National Accounts1993, it is the real price plus subsidies.
9. Resident units are grouped in homogenous sectors.10. The net taxes are added because they are not included in the values of the outputs and value added of resident producers.
24 Statistics Canada - Catalogue no. 13-017 Guide to the Income and Expenditure Accounts
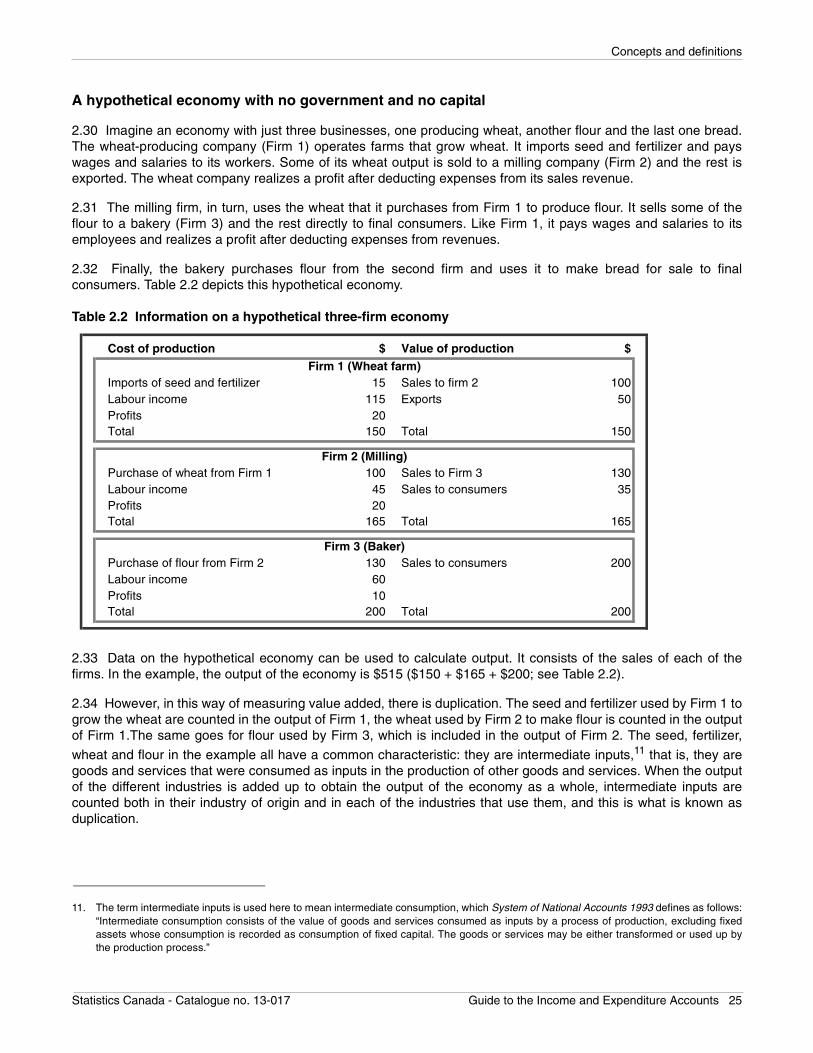
Concepts and definitions
A hypothetical economy with no government and no capital
2.30 Imagine an economy with just three businesses, one producing wheat, another flour and the last one bread.The wheat-producing company (Firm 1) operates farms that grow wheat. It imports seed and fertilizer and payswages and salaries to its workers. Some of its wheat output is sold to a milling company (Firm 2) and the rest isexported. The wheat company realizes a profit after deducting expenses from its sales revenue.
2.31 The milling firm, in turn, uses the wheat that it purchases from Firm 1 to produce flour. It sells some of theflour to a bakery (Firm 3) and the rest directly to final consumers. Like Firm 1, it pays wages and salaries to itsemployees and realizes a profit after deducting expenses from revenues.
2.32 Finally, the bakery purchases flour from the second firm and uses it to make bread for sale to finalconsumers. Table 2.2 depicts this hypothetical economy.
Table 2.2 Information on a hypothetical three-firm economy
2.33 Data on the hypothetical economy can be used to calculate output. It consists of the sales of each of thefirms. In the example, the output of the economy is $515 ($150 + $165 + $200; see Table 2.2).
2.34 However, in this way of measuring value added, there is duplication. The seed and fertilizer used by Firm 1 togrow the wheat are counted in the output of Firm 1, the wheat used by Firm 2 to make flour is counted in the outputof Firm 1.The same goes for flour used by Firm 3, which is included in the output of Firm 2. The seed, fertilizer,
wheat and flour in the example all have a common characteristic: they are intermediate inputs,11 that is, they aregoods and services that were consumed as inputs in the production of other goods and services. When the outputof the different industries is added up to obtain the output of the economy as a whole, intermediate inputs arecounted both in their industry of origin and in each of the industries that use them, and this is what is known asduplication.
11. The term intermediate inputs is used here to mean intermediate consumption, which System of National Accounts 1993 defines as follows:“Intermediate consumption consists of the value of goods and services consumed as inputs by a process of production, excluding fixedassets whose consumption is recorded as consumption of fixed capital. The goods or services may be either transformed or used up bythe production process.”
Cost of production $ Value of production $
Imports of seed and fertilizer 15 Sales to firm 2 100Labour income 115 Exports 50Profits 20Total 150 Total 150
Purchase of wheat from Firm 1 100 Sales to Firm 3 130Labour income 45 Sales to consumers 35Profits 20Total 165 Total 165
Purchase of flour from Firm 2 130 Sales to consumers 200Labour income 60Profits 10Total 200 Total 200
Firm 3 (Baker)
Firm 1 (Wheat farm)
Firm 2 (Milling)
Statistics Canada - Catalogue no. 13-017 Guide to the Income and Expenditure Accounts 25
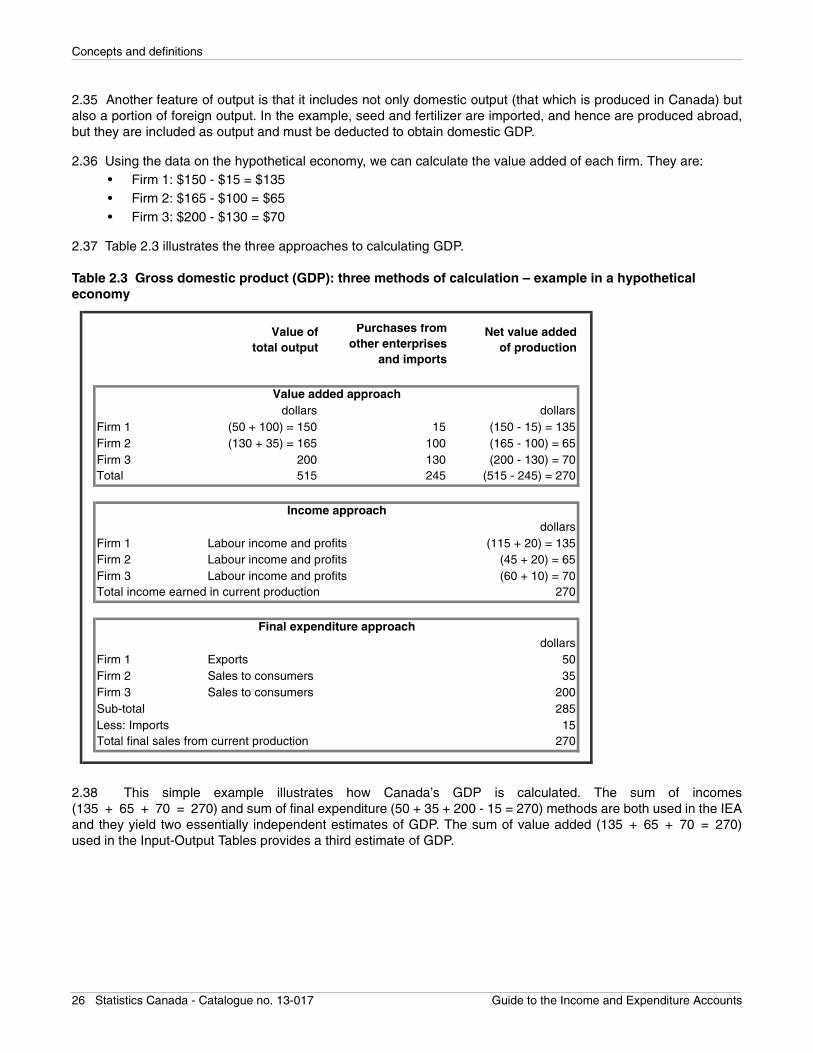
Concepts and definitions
2.35 Another feature of output is that it includes not only domestic output (that which is produced in Canada) butalso a portion of foreign output. In the example, seed and fertilizer are imported, and hence are produced abroad,but they are included as output and must be deducted to obtain domestic GDP.
2.36 Using the data on the hypothetical economy, we can calculate the value added of each firm. They are:• Firm 1: $150 - $15 = $135• Firm 2: $165 - $100 = $65• Firm 3: $200 - $130 = $70
2.37 Table 2.3 illustrates the three approaches to calculating GDP.
Table 2.3 Gross domestic product (GDP): three methods of calculation – example in a hypothetical economy
2.38 This simple example illustrates how Canada’s GDP is calculated. The sum of incomes(135 + 65 + 70 = 270) and sum of final expenditure (50 + 35 + 200 - 15 = 270) methods are both used in the IEAand they yield two essentially independent estimates of GDP. The sum of value added (135 + 65 + 70 = 270)used in the Input-Output Tables provides a third estimate of GDP.
Value oftotal output
Purchases fromother enterprises
and imports
Net value added of production
Value added approachdollars dollars
Firm 1 (50 + 100) = 150 15 (150 - 15) = 135Firm 2 (130 + 35) = 165 100 (165 - 100) = 65Firm 3 200 130 (200 - 130) = 70Total 515 245 (515 - 245) = 270
Income approachdollars
Firm 1 Labour income and profits (115 + 20) = 135Firm 2 Labour income and profits (45 + 20) = 65Firm 3 Labour income and profits (60 + 10) = 70Total income earned in current production 270
Final expenditure approachdollars
Firm 1 Exports 50Firm 2 Sales to consumers 35Firm 3 Sales to consumers 200Sub-total 285Less: Imports 15Total final sales from current production 270
26 Statistics Canada - Catalogue no. 13-017 Guide to the Income and Expenditure Accounts
Concepts and definitions
Institutional sectors dimension of the CSNA – The Income and Expenditure Accounts
2.39 Economists use the circular flow of income diagram as a tool to illustrate the interactions among the differenteconomic agents in the economy. One of the fundamental characteristics of such a representation of the economyis that it condenses information on markets and economic agents into an ordered framework.
2.40 The underlying idea of this representation is to group together economic agents (institutional units) that havesimilar behaviour and motivation. Households consume and supply the labour input. Companies sell the goods thatthey produce in order to make a profit. Governments provide public goods and attend to the redistribution ofincome within society. Non-residents sell goods and services to residents of the country and purchase goods andservices from them in order to benefit from the comparative advantages related to trade.
2.41 National accounting uses a similar approach. In the SNA, groups of economic agents are called institutionalsectors. The creation of institutional sectors in the compilation of national accounting statistics provides analystswith “ordered and usable” statistics for analysing the functioning of the economy and identifying relationshipsamong its various components.
2.42 The System of National Accounts 1993 (SNA 1993) defines an institutional unit as “an economic entity that iscapable, in its own right, of owning assets, incurring liabilities and engaging in economic activities and intransactions with other entities”. Institutional units may either be physical persons (or groups of persons) or legal orsocial entities. Households belong to the first class, while non-profit institutions (NPIs), governments andcorporations (businesses) belong to the second. The two classes are mutually exclusive, and institutional sectorsare mutually exclusive.
2.43 The Canadian System of National Accounts identifies three resident institutional sectors and a non-residentsector. The different accounts in the system are articulated for each of these four sectors. Each sector has sub-sectors.
The institutional sectors
2.44 The Income and Expenditure Accounts (IEA) presents a full sequence of accounts for the sectors shown inTable 2.4. As may be seen, there are minor difference in sectoring between the CSNA and the SNA 1993. InCanada, the household sector is more precisely called the persons and unincorporated business sector as itincludes non-profit institutions serving households (NPISHs).The financial corporation and non-financialcorporation sectors are called the corporate and government business enterprise sector. Lastly, the rest of theworld sector is called the non-resident sector.
2.45 In the CSNA, non-profit institutions serving households (NPISH) are included in the persons andunincorporated business sector. However, since 2004, Canadian statisticians in the Income and Expenditure
Accounts Division have set up a satellite account12 covering all non-profit institutions, whether they servehouseholds or they are classified in the government sector or in the corporate sector. This more comprehensiveapproach to the treatment of non-profit institutions is more desirable from an analytical standpoint, and indeed it isan approach that is being examined by international statistical organizations.
12. Satellite Account of Nonprofit Institutions and Volunteering, catalogue no. 13-015.
Statistics Canada - Catalogue no. 13-017 Guide to the Income and Expenditure Accounts 27
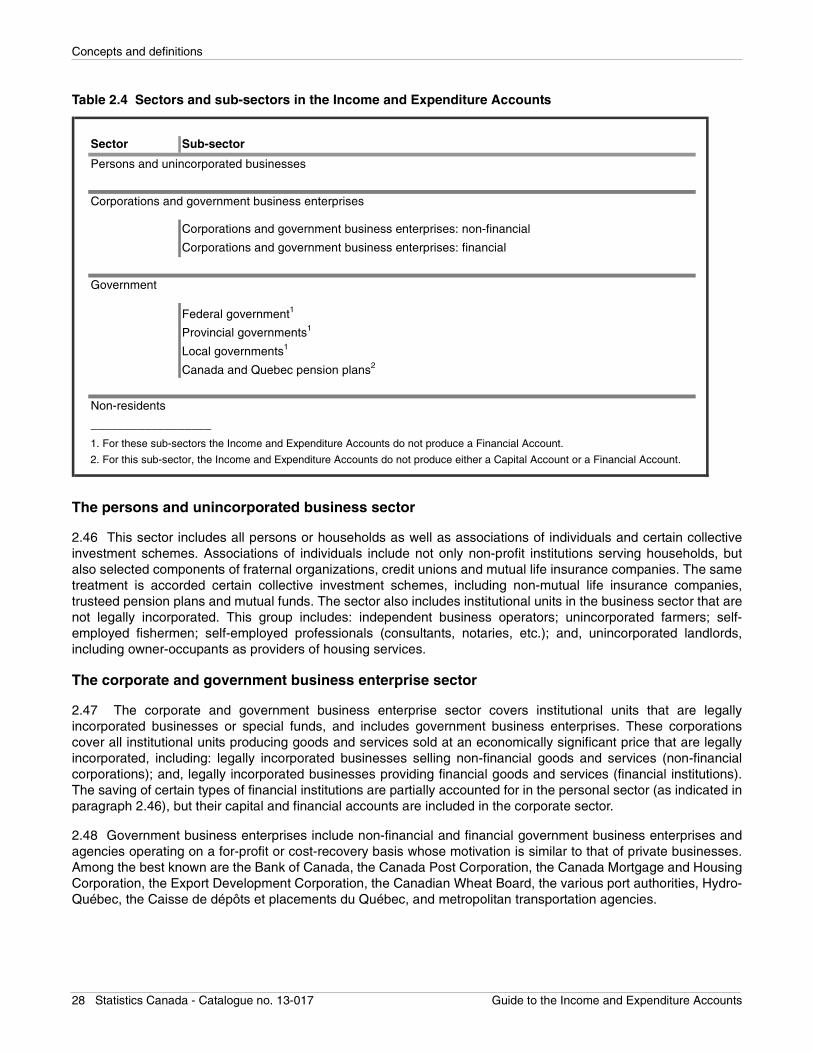
Concepts and definitions
Table 2.4 Sectors and sub-sectors in the Income and Expenditure Accounts
The persons and unincorporated business sector
2.46 This sector includes all persons or households as well as associations of individuals and certain collectiveinvestment schemes. Associations of individuals include not only non-profit institutions serving households, butalso selected components of fraternal organizations, credit unions and mutual life insurance companies. The sametreatment is accorded certain collective investment schemes, including non-mutual life insurance companies,trusteed pension plans and mutual funds. The sector also includes institutional units in the business sector that arenot legally incorporated. This group includes: independent business operators; unincorporated farmers; self-employed fishermen; self-employed professionals (consultants, notaries, etc.); and, unincorporated landlords,including owner-occupants as providers of housing services.
The corporate and government business enterprise sector
2.47 The corporate and government business enterprise sector covers institutional units that are legallyincorporated businesses or special funds, and includes government business enterprises. These corporationscover all institutional units producing goods and services sold at an economically significant price that are legallyincorporated, including: legally incorporated businesses selling non-financial goods and services (non-financialcorporations); and, legally incorporated businesses providing financial goods and services (financial institutions).The saving of certain types of financial institutions are partially accounted for in the personal sector (as indicated inparagraph 2.46), but their capital and financial accounts are included in the corporate sector.
2.48 Government business enterprises include non-financial and financial government business enterprises andagencies operating on a for-profit or cost-recovery basis whose motivation is similar to that of private businesses.Among the best known are the Bank of Canada, the Canada Post Corporation, the Canada Mortgage and HousingCorporation, the Export Development Corporation, the Canadian Wheat Board, the various port authorities, Hydro-Québec, the Caisse de dépôts et placements du Québec, and metropolitan transportation agencies.
Sector Sub-sector
Persons and unincorporated businesses
Corporations and government business enterprises
Corporations and government business enterprises: non-financial
Corporations and government business enterprises: financial
Government
Federal government1
Provincial governments1
Local governments1
Canada and Quebec pension plans2
Non-residents
__________________
1. For these sub-sectors the Income and Expenditure Accounts do not produce a Financial Account.
2. For this sub-sector, the Income and Expenditure Accounts do not produce either a Capital Account or a Financial Account.
28 Statistics Canada - Catalogue no. 13-017 Guide to the Income and Expenditure Accounts
Concepts and definitions
The government sector
2.49 The government sector includes all departments, agencies and funds (budgetary and non-budgetary) of thefederal, provincial, territorial and local levels of government, as well as crown corporations that receive more than50% of their revenues in grants from their parent government. This sector is divided into the following sub-sectors:
• Federal government• Government administration
• Departments and agencies• Independent agencies, councils, commissions and funds• Non-autonomous employer-sponsored pension plans
• Provincial and territorial governments• Government administration
• Departments and agencies• Independent agencies, councils, commissions and funds • Non-autonomous employer-sponsored pension plans • Universities and colleges• Universities• Colleges, vocational training institutes and trade schools
• Health services and social services institutions• Public hospitals• Other health and social services institutions
• Local governments• Government administration
• Municipalities• Independent agencies, councils, commissions and funds
• School boards• Canada and Quebec pension plans
2.50 The publication Financial Management System (FMS), provides a complete description of the governmentsector in Canada.
The non-resident sector
2.51 Unlike the other sectors, the non-resident sector is not made up of homogeneous institutional units, since itincludes all non-resident institutional units that carry out transactions with resident units. In practice, the non-resident sector includes all institutional units that have no centre of economic interest (dwelling or place ofbusiness) within Canada’s economic territory. By definition, non-residents engage in financial investment only. Anyagent engaging in non-financial investment is considered resident.
2.52 This sector also includes some institutional units that are physically located within a country’s geographicterritory. The following are considered non-resident: embassies, consulates, military bases and internationalorganizations.
The sequence of the institutional sector accounts
2.53 The System of National Accounts 1993 recommends that the following sector accounts be produced:
(a) The production account – Records the value of production and the intermediate expenses by industry yielding gross value added, or GDP for the economy.
Statistics Canada - Catalogue no. 13-017 Guide to the Income and Expenditure Accounts 29
Concepts and definitions
(b) The primary distribution of income account – Records the generation of income into its various income components: wages and salaries, supplementary labour income, net taxes on production, mixed income and operating surplus.
(c) The secondary distribution of income account – Records, in addition to the income from the allocation of primary income accounts, the transfers between the sectors.
(d) The use of income account – Focuses on how resident institutional sectors allocate their disposable income between current expenditure and saving.
(e) The capital account – Comprises the second accumulation account that focuses on non-financial assets.
(f) The financial account – Comprises the second accumulation account that focuses on financial transactions.
(g) Other changes in assets account – Comprises the third accumulation account that articulates capital gains and losses and other volume changes e.g., resource discoveries, destruction of assets due to catastrophic events.
(h) The balance sheet account – Is the wealth statement, detailing assets, liabilities and net worth.
2.54 The CSNA-IEA provides a slightly modified version of the international standard, as follows:
(a) The gross domestic product account. The Income and Expenditure Accounts does not produce a production account by sector or by industry (GDP by industry is available from the Input-Output Tables). At an aggregate level for the economy (without sectoring), the Income and Expenditure Accounts presents GDP by types of income and by types of expenditure. The income details correspond to the primary distribution of income account (see Table 2.5).
(b) The income and outlay account of each of the sectors traces current incomes and outlays related to the production process and current transfers between sectors. The difference between incomes and outlays constitutes the saving of the sector. This item balances the account. This account combines allocation of income account and secondary distribution of income account, as well as use of income account. It is produced for the four main institutional sectors described in Table 2.4.
(c) The capital account of each sector traces, on the one hand, the resources available for acquiring non- financial capital (saving, capital consumption allowance and net transfers of capital) and on the other hand, the acquisition of non-financial capital. This account is produced for five sectors where corporations are disaggregated into financial and non-financial corporations. The gap between resources and acquisitions is called the net lending of the sector. This item balances the account.
(d) The financial account of each of the sectors traces both the transactions on financial assets and the transactions on financial liabilities taking place during a given period. This account is recorded for the
five sectors of the economy in the National Income and Expenditure Accounts.13 In addition, financial accounts are published for 35 detailed sub-sectors in the Financial Flow Accounts. The balance between financial asset and liability flows consists of the net financial investment of the sector. In theory, net financial investment from this account and net lending from the capital account are equal, with each measuring a different side of the same coin. In practice, statistical imperfections generate a gap between the two measures.
2.55 The balance sheet reflects the result of accumulation of wealth in the economy, by recording the assets,liabilities and net worth of the sectors. As such, it is inclusive of the other changes in assets. It is published as theNational Balance Sheet Accounts, at both the 5 sector and 35 sector level.
13. In fact, the National Income and Expenditure Accounts presents a combined Capital and Financial Account.
30 Statistics Canada - Catalogue no. 13-017 Guide to the Income and Expenditure Accounts
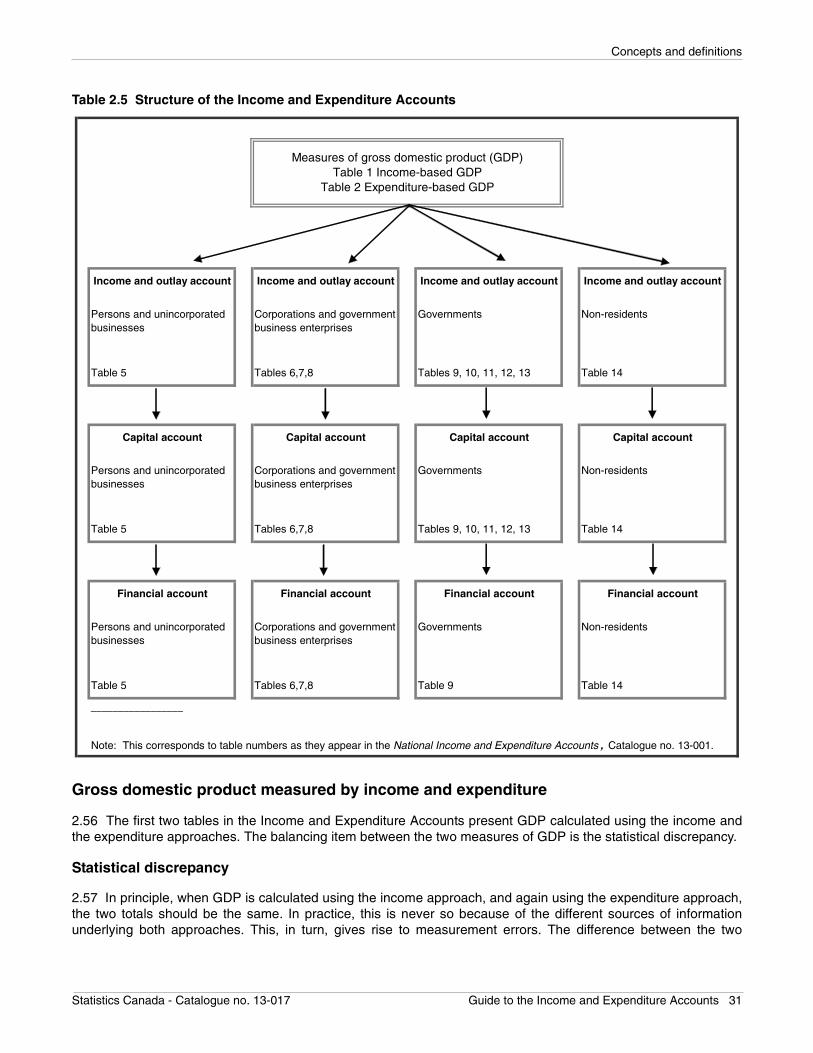
Concepts and definitions
Table 2.5 Structure of the Income and Expenditure Accounts
Gross domestic product measured by income and expenditure
2.56 The first two tables in the Income and Expenditure Accounts present GDP calculated using the income andthe expenditure approaches. The balancing item between the two measures of GDP is the statistical discrepancy.
Statistical discrepancy
2.57 In principle, when GDP is calculated using the income approach, and again using the expenditure approach,the two totals should be the same. In practice, this is never so because of the different sources of informationunderlying both approaches. This, in turn, gives rise to measurement errors. The difference between the two
Persons and unincorporated businesses
Corporations and government business enterprises
Governments Non-residents
Table 5 Tables 6,7,8 Tables 9, 10, 11, 12, 13 Table 14
Persons and unincorporated businesses
Corporations and government business enterprises
Governments Non-residents
Table 5 Tables 6,7,8 Tables 9, 10, 11, 12, 13 Table 14
Persons and unincorporated businesses
Corporations and government business enterprises
Governments Non-residents
Table 5 Tables 6,7,8 Table 9 Table 14
_________________
Measures of gross domestic product (GDP)Table 1 Income-based GDP
Table 2 Expenditure-based GDP
Note: This corresponds to table numbers as they appear in the National Income and Expenditure Accounts , Catalogue no. 13-001.
Income and outlay account Income and outlay account Income and outlay account Income and outlay account
Capital account Capital account Capital account Capital account
Financial account Financial account Financial account Financial account
Statistics Canada - Catalogue no. 13-017 Guide to the Income and Expenditure Accounts 31
Concepts and definitions
methods of measuring GDP is divided in two, with one half subtracted from the highest estimate and one halfadded to the lowest estimate. This amount is shown in tables 1 and 2 of the publication National Income andExpenditure Accounts under the name of statistical discrepancy.
2.58 A small statistical discrepancy is a desired result, since it implies that the two estimates of GDP derivedindependently, have turned out almost the same.
Income-based GDP aggregates
2.59 GDP measured by the income approach is shown in Table 1 of National Income and Expenditure Accounts.The methods of estimating income categories are described in detail in the following chapters. The paragraphsbelow provide a brief description of these aggregates.
2.60 The first category is wages, salaries and supplementary labour income. Wages and salaries are the totalcompensation, in cash or in kind, paid to workers for work performed. This item is entered before any deduction forincome tax, pensions, employment insurance or other social insurance plans. Wages and salaries also includecommissions, tips, performance premiums, directors’ fees, and vacation and sick leave allowances, as well asmilitary pay and allowances. Supplementary labour income includes employers’ social contributions. The followingare examples of supplementary labour income: retiring allowances, employment insurance contributions, andcontributions to the Canada and Quebec pension plans, contributions to other pension plans, occupational healthand safety funds, health insurance, dental care plans, etc. Wages, salaries and supplementary labour income ispresented in tables 1 and 5 of National Income and Expenditure Accounts. Monthly estimates, by province and byindustry, are also available in Estimates of Labour Income.
2.61 Corporation profits before taxes and government business enterprise profits before taxes represent net
earnings resulting from the economic activity of private and select14 public corporations, respectively. Net earningsare measured after deduction of capital consumption allowances. Corporation profits before taxes and governmentbusiness enterprise profits before taxes are analyzed in tables 1 and 6 of National Income and ExpenditureAccounts. Table 32 of the same publication reconciles corporation profits before taxes with undistributedcorporation profits.
2.62 Interest and miscellaneous investment income comprise the interest paid by businesses to households15,
governments and non-residents to compensate them for the loan or rental of financial or non-financial assets16 foruse in production. Information on interest and miscellaneous investment income is presented in Table 1 and inmore sector detail in tables 5, 6, 9, 10, 11, 12, 13 and 14 of National Income and Expenditure Accounts. Appendix2B explains the link between the aggregate and its distribution in the incomes and outlays of the institutionalsectors.
2.63 Accrued net income received by farm operators from farm production refers to the net farm proceeds that goto unincorporated farm operators. The estimate is obtained by deducting expenditures from receipts. Receiptsinclude gross sales of farm products, the imputed value of farm output consumed by farming households,investment in farm inventories and the distributed and undistributed portions of earnings arising out of theoperations of the Canadian Wheat Board. Expenditures include farm operating expenditures and capitalconsumption allowances. Accrued net income received by farm operators from farm production is presented intables 1 and 5 of National Income and Expenditure Accounts.
2.64 Net income of non-farm unincorporated business, including rent, consists of the earnings of unincorporatedproprietors, except farm operators, from their own business. It also includes the net income of independentmembers of professions, such as physicians, dentists, lawyers and engineers. Lastly, it includes the net rentalincome of persons (but not corporations). This includes rents paid or imputed, after deduction of expenses, on
14. This covers public corporations not consolidated within the government sector, which are referred to as government business enterprises.15. This includes collective investment schemes.16. Land is included in non-financial assets.
32 Statistics Canada - Catalogue no. 13-017 Guide to the Income and Expenditure Accounts
Concepts and definitions
residential properties and net rents paid on non-residential properties. Imputation for rents is explained by the factthat in national accounting, owner-occupants are considered as producers of housing services who rent a dwellingto themselves (more fully discussed in Chapter 5). Net income of non-farm unincorporated business, includingrent, is presented in tables 1 and 5 of National Income and Expenditure Accounts.
2.65 The inventory valuation adjustment represents the net holding gain or loss incurred by businesses as a resultof price changes. This is an adjustment to profits, since gains or losses on inventories are included in thecorporation profits before taxes. This gain (or loss) must be removed in order to measure current output. Theinventory valuation adjustment is available in tables 1 and 6 of National Income and Expenditure Accounts.
2.66 Taxes less subsidies, on factors of production refer to taxes received and subsidies paid by government.These taxes and subsidies are payable or paid regardless of the quantity or value of the goods and servicesproduced or sold. Capital taxes, licences and permits, property taxes and payroll taxes are examples of taxesincluded in this aggregate. Information on taxes less subsidies, on factors of production is presented in tables 1and 9 to 12 of National Income and Expenditure Accounts.
2.67 Taxes less subsidies on products, refer to taxes received and subsidies paid by government. These taxes andsubsidies are payable or paid, based on the quantity or value of goods and services produced or sold. Thisaggregate includes sales taxes, fuel taxes, import duties and taxes, and excise taxes on tobacco and alcoholicproducts. Taxes less subsidies, on products, is presented in tables 1 and 9 to 12 of National Income andExpenditure Accounts.
2.68 Capital consumption allowances are allowances for the using up of buildings, machinery and equipment andother assets in the productive process. This item also includes miscellaneous valuation adjustments bringingbusiness accounting records into conformity with national accounting definitions. Capital consumption allowancesis presented in tables 1 and 5 to 12 of National Income and Expenditure Accounts.
Expenditure-based GDP aggregates
2.69 GDP measured on the basis of final expenditures in current dollars is shown in Table 2 of National Incomeand Expenditure Accounts. Volume-based estimates for the same components appear in Table 3. The methods ofestimating expenditure aggregates are described in later chapters. The following paragraphs provide a briefdescription of these aggregates.
2.70 Personal expenditure on consumer goods and services measure household expenditures on durable, semi-durable and non-durable goods as well as services. The aggregate also includes the operating expenses of non-profit organizations serving households. Personal expenditure on consumer goods and services is presented at ahighly aggregated level in tables 2, 3, 4 and 5 of National Income and Expenditure Accounts. Tables 16, 17 and 18show the aggregate in more detail.
2.71 Government current expenditure on goods and services includes current expenditure on goods and services(including military spending for strictly military purposes), compensation paid to government employees, and otherpurchases of goods and services, except capital goods. The aggregate also includes an imputation for capitalconsumption allowances. This aggregate is presented net of sales to avoid duplication. Government currentexpenditure on goods and services is presented at a highly aggregated level in tables 2, 3 and 4 of NationalIncome and Expenditure Accounts. Detailed data also appears on a gross basis in tables 9, 10, 11 and 12, theinstitutional sector accounts.
2.72 Government and business gross fixed capital formation includes the expenditures of the business andgovernment sectors on goods with an expected economic life of one year or more, and on buildings andengineering construction of any kind. This item also includes residential construction, alterations andimprovements made to the building stock and transfer costs associated with the sale of existing assets.Government and business gross fixed capital formation is presented at a highly aggregated level in tables 2, 3 and4 of National Income and Expenditure Accounts. Tables 19 to 24 of the same publication provide more detail onthese aggregates. The data also appears in tables 5 to 13 of the institutional sector accounts.
Statistics Canada - Catalogue no. 13-017 Guide to the Income and Expenditure Accounts 33
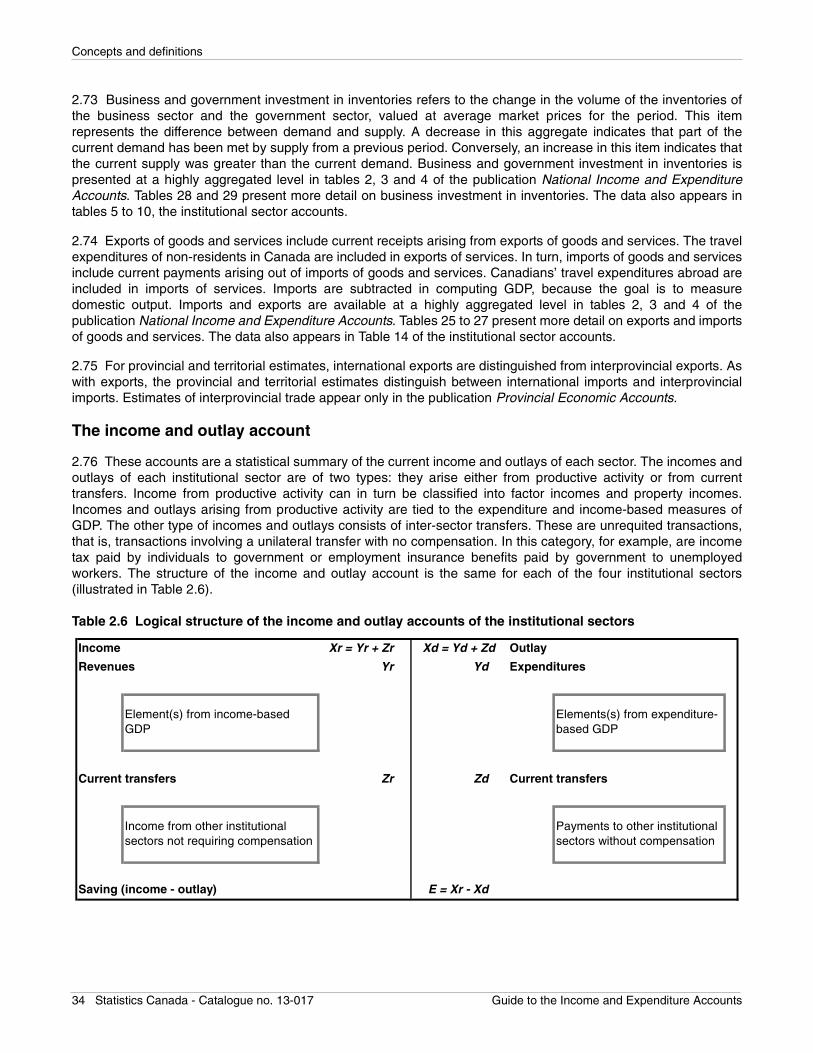
Concepts and definitions
2.73 Business and government investment in inventories refers to the change in the volume of the inventories ofthe business sector and the government sector, valued at average market prices for the period. This itemrepresents the difference between demand and supply. A decrease in this aggregate indicates that part of thecurrent demand has been met by supply from a previous period. Conversely, an increase in this item indicates thatthe current supply was greater than the current demand. Business and government investment in inventories ispresented at a highly aggregated level in tables 2, 3 and 4 of the publication National Income and ExpenditureAccounts. Tables 28 and 29 present more detail on business investment in inventories. The data also appears intables 5 to 10, the institutional sector accounts.
2.74 Exports of goods and services include current receipts arising from exports of goods and services. The travelexpenditures of non-residents in Canada are included in exports of services. In turn, imports of goods and servicesinclude current payments arising out of imports of goods and services. Canadians’ travel expenditures abroad areincluded in imports of services. Imports are subtracted in computing GDP, because the goal is to measuredomestic output. Imports and exports are available at a highly aggregated level in tables 2, 3 and 4 of thepublication National Income and Expenditure Accounts. Tables 25 to 27 present more detail on exports and importsof goods and services. The data also appears in Table 14 of the institutional sector accounts.
2.75 For provincial and territorial estimates, international exports are distinguished from interprovincial exports. Aswith exports, the provincial and territorial estimates distinguish between international imports and interprovincialimports. Estimates of interprovincial trade appear only in the publication Provincial Economic Accounts.
The income and outlay account
2.76 These accounts are a statistical summary of the current income and outlays of each sector. The incomes andoutlays of each institutional sector are of two types: they arise either from productive activity or from currenttransfers. Income from productive activity can in turn be classified into factor incomes and property incomes.Incomes and outlays arising from productive activity are tied to the expenditure and income-based measures ofGDP. The other type of incomes and outlays consists of inter-sector transfers. These are unrequited transactions,that is, transactions involving a unilateral transfer with no compensation. In this category, for example, are incometax paid by individuals to government or employment insurance benefits paid by government to unemployedworkers. The structure of the income and outlay account is the same for each of the four institutional sectors(illustrated in Table 2.6).
Table 2.6 Logical structure of the income and outlay accounts of the institutional sectors
Income Xr = Yr + Zr Xd = Yd + Zd Outlay
Revenues Yr Yd Expenditures
Current transfers Zr Zd Current transfers
Saving (income - outlay) E = Xr - Xd
Element(s) from income-based GDP
Income from other institutional sectors not requiring compensation
Elements(s) from expenditure-based GDP
Payments to other institutional sectors without compensation
34 Statistics Canada - Catalogue no. 13-017 Guide to the Income and Expenditure Accounts
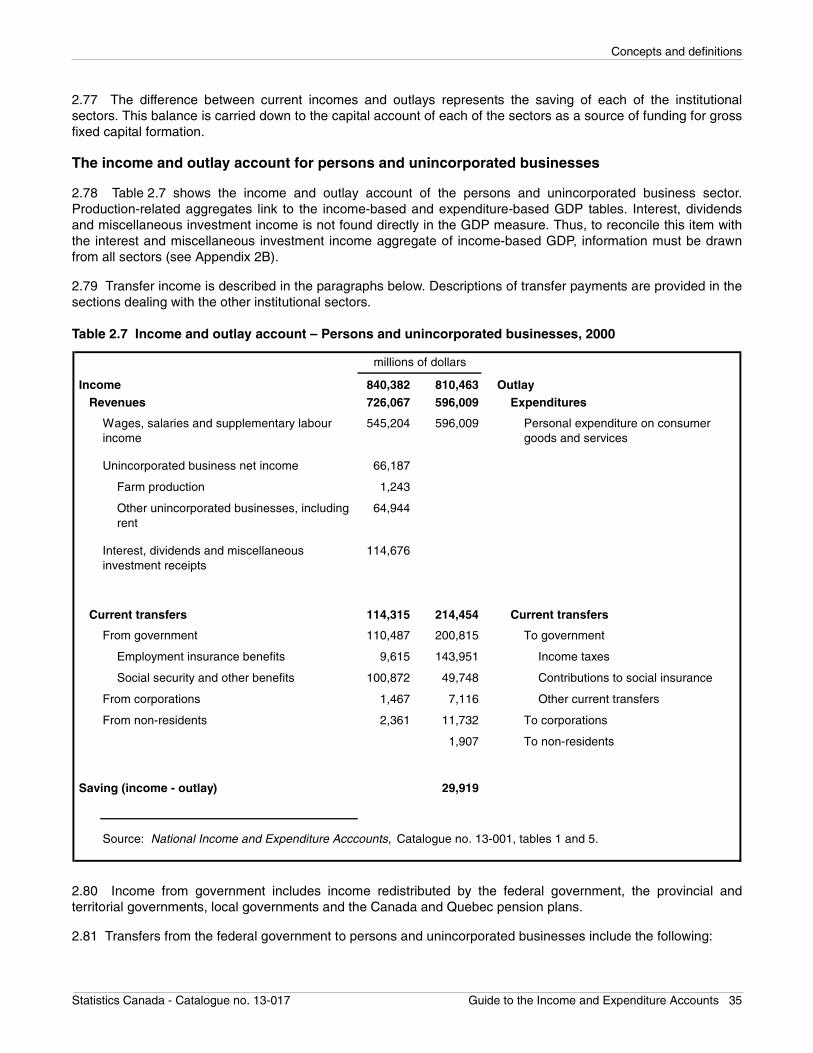
Concepts and definitions
2.77 The difference between current incomes and outlays represents the saving of each of the institutionalsectors. This balance is carried down to the capital account of each of the sectors as a source of funding for grossfixed capital formation.
The income and outlay account for persons and unincorporated businesses
2.78 Table 2.7 shows the income and outlay account of the persons and unincorporated business sector.Production-related aggregates link to the income-based and expenditure-based GDP tables. Interest, dividendsand miscellaneous investment income is not found directly in the GDP measure. Thus, to reconcile this item withthe interest and miscellaneous investment income aggregate of income-based GDP, information must be drawnfrom all sectors (see Appendix 2B).
2.79 Transfer income is described in the paragraphs below. Descriptions of transfer payments are provided in thesections dealing with the other institutional sectors.
Table 2.7 Income and outlay account – Persons and unincorporated businesses, 2000
2.80 Income from government includes income redistributed by the federal government, the provincial andterritorial governments, local governments and the Canada and Quebec pension plans.
2.81 Transfers from the federal government to persons and unincorporated businesses include the following:
840,382 810,463 Outlay726,067 596,009 Expenditures
Unincorporated business net income 66,187
Farm production 1,243
114,315 214,454 Current transfers
From government 110,487 200,815 To government
Employment insurance benefits 9,615 143,951 Income taxes
Social security and other benefits 100,872 49,748 Contributions to social insurance
From corporations 1,467 7,116 Other current transfers
From non-residents 2,361 11,732 To corporations
1,907 To non-residents
29,919
Revenues
545,204 596,009 Personal expenditure on consumer goods and services
millions of dollars
Source: National Income and Expenditure Acccounts, Catalogue no. 13-001, tables 1 and 5.
Wages, salaries and supplementary labour income
Other unincorporated businesses, including rent
Interest, dividends and miscellaneous investment receipts
114,676
Current transfers
Income
64,944
Saving (income - outlay)
Statistics Canada - Catalogue no. 13-017 Guide to the Income and Expenditure Accounts 35
Concepts and definitions
• family and youth allowances;• child tax benefit;• child tax credit;• employment insurance benefits;• payments from the Old Age Security Fund;• grants to aboriginal people and their organizations;• goods and services tax credit;• pensions, World Wars I and II;• veterans’ allowances;• national associations;• Canada Council for the Arts;• adult vocational training;• scholarships and research grants; and• miscellaneous other transfer payments to persons, such as athletes and athletic associations,
community organizations and arts and culture organizations.
2.82 Transfers from provincial and territorial governments to persons and unincorporated businesses include thefollowing:
• social assistance–income maintenance;• social assistance–other;• workers’ compensation benefits;• payments to non-profit organizations; and• other transfers to persons.
2.83 Transfers from local governments to persons and unincorporated businesses include the following: • social assistance;• payments to non-profit organizations; and • other current transfers to persons.
2.84 Transfers from corporations and government business enterprises include the following:• charitable gifts; • miscellaneous other contributions; and• write-off of bad debts.
2.85 Lastly, transfers from non-residents include: • retirement benefits paid by foreign governments to residents of Canada;• institutional payments for assistance, research or other (wartime compensation payments, other
transfers from non-residents to residents of Canada, etc.); and• other transfers from non-residents to Canadian residents, such as personal gifts.
2.86 Transfers to other sectors are dominated by income tax and social contributions and appear in the sectionsthat follow (refer to 2.94, 2.96 to 2.98).
The income and outlay account for corporations and government business enterprises
2.87 Table 2.8 shows the income and outlay account for the corporations and government business enterprisesector. Production-related aggregates link to the income-based and expenditure-based GDP tables. Interest,dividends and direct receipts and interest on public debt are not found directly in the GDP measure. Thus, toreconcile these items with the interest and miscellaneous investment income aggregate of GDP by incomeapproach, information must be drawn from all sectors (see Appendix 2B).
36 Statistics Canada - Catalogue no. 13-017 Guide to the Income and Expenditure Accounts
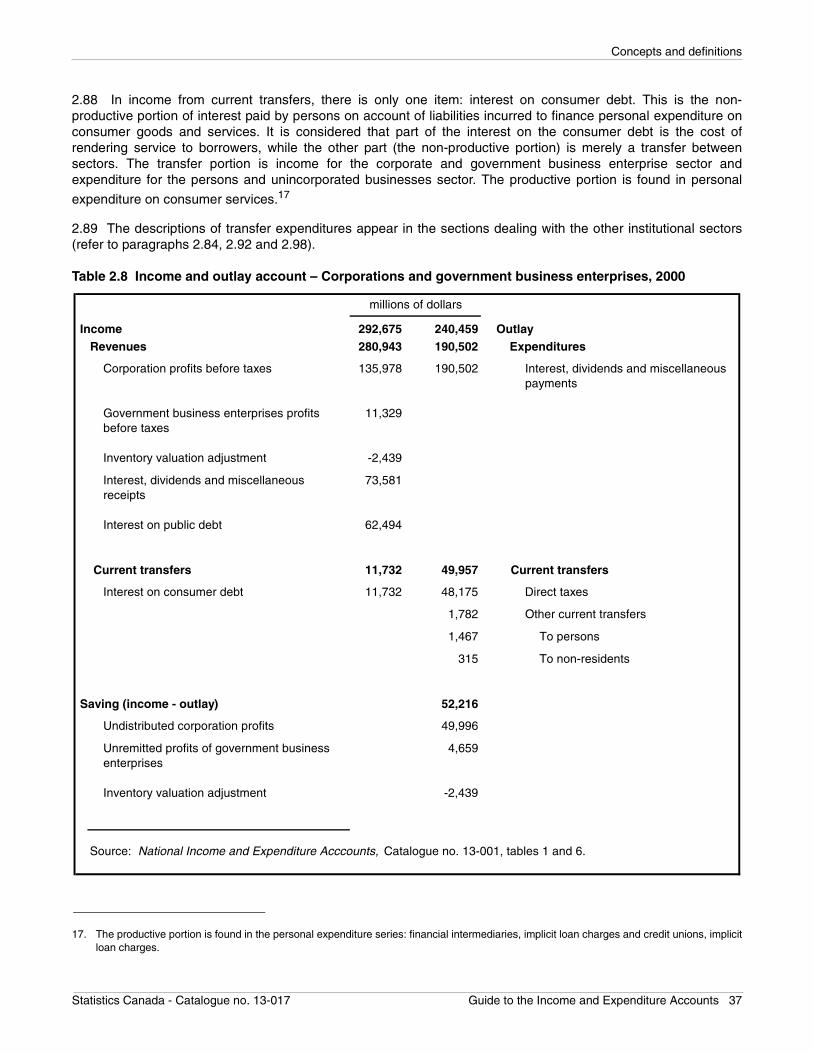
Concepts and definitions
2.88 In income from current transfers, there is only one item: interest on consumer debt. This is the non-productive portion of interest paid by persons on account of liabilities incurred to finance personal expenditure onconsumer goods and services. It is considered that part of the interest on the consumer debt is the cost ofrendering service to borrowers, while the other part (the non-productive portion) is merely a transfer betweensectors. The transfer portion is income for the corporate and government business enterprise sector andexpenditure for the persons and unincorporated businesses sector. The productive portion is found in personal
expenditure on consumer services.17
2.89 The descriptions of transfer expenditures appear in the sections dealing with the other institutional sectors(refer to paragraphs 2.84, 2.92 and 2.98).
Table 2.8 Income and outlay account – Corporations and government business enterprises, 2000
17. The productive portion is found in the personal expenditure series: financial intermediaries, implicit loan charges and credit unions, implicitloan charges.
292,675 240,459 Outlay280,943 190,502 Expenditures
Inventory valuation adjustment -2,439
Interest on public debt 62,494
11,732 49,957 Current transfers
Interest on consumer debt 11,732 48,175 Direct taxes
1,782 Other current transfers
1,467 To persons
315 To non-residents
52,216
Undistributed corporation profits 49,996
Inventory valuation adjustment -2,439
135,978 Corporation profits before taxes
11,329
millions of dollars
Income Revenues
Interest, dividends and miscellaneous payments
Source: National Income and Expenditure Acccounts, Catalogue no. 13-001, tables 1 and 6.
Government business enterprises profits before taxes
Interest, dividends and miscellaneous receipts
Unremitted profits of government business enterprises
Current transfers
Saving (income - outlay)
190,502
73,581
4,659
Statistics Canada - Catalogue no. 13-017 Guide to the Income and Expenditure Accounts 37
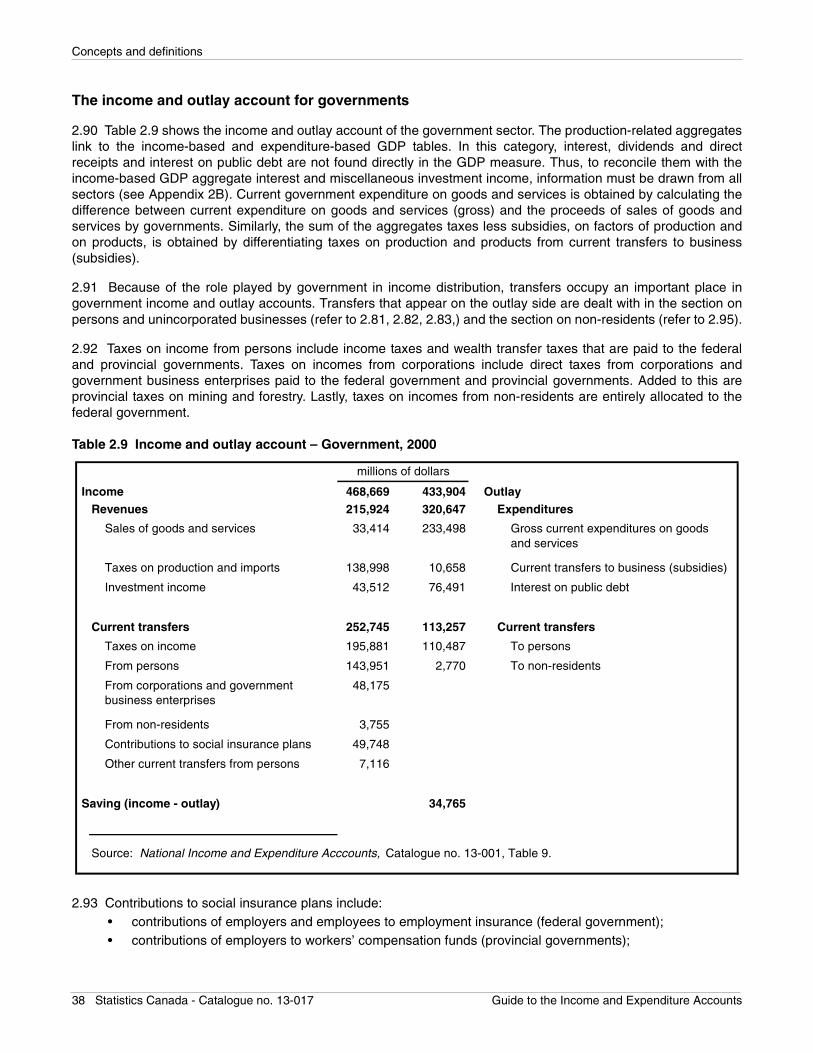
Concepts and definitions
The income and outlay account for governments
2.90 Table 2.9 shows the income and outlay account of the government sector. The production-related aggregateslink to the income-based and expenditure-based GDP tables. In this category, interest, dividends and directreceipts and interest on public debt are not found directly in the GDP measure. Thus, to reconcile them with theincome-based GDP aggregate interest and miscellaneous investment income, information must be drawn from allsectors (see Appendix 2B). Current government expenditure on goods and services is obtained by calculating thedifference between current expenditure on goods and services (gross) and the proceeds of sales of goods andservices by governments. Similarly, the sum of the aggregates taxes less subsidies, on factors of production andon products, is obtained by differentiating taxes on production and products from current transfers to business(subsidies).
2.91 Because of the role played by government in income distribution, transfers occupy an important place ingovernment income and outlay accounts. Transfers that appear on the outlay side are dealt with in the section onpersons and unincorporated businesses (refer to 2.81, 2.82, 2.83,) and the section on non-residents (refer to 2.95).
2.92 Taxes on income from persons include income taxes and wealth transfer taxes that are paid to the federaland provincial governments. Taxes on incomes from corporations include direct taxes from corporations andgovernment business enterprises paid to the federal government and provincial governments. Added to this areprovincial taxes on mining and forestry. Lastly, taxes on incomes from non-residents are entirely allocated to thefederal government.
Table 2.9 Income and outlay account – Government, 2000
2.93 Contributions to social insurance plans include: • contributions of employers and employees to employment insurance (federal government);• contributions of employers to workers’ compensation funds (provincial governments);
468,669 433,904 OutlayRevenues 215,924 320,647 Expenditures
Taxes on production and imports 138,998 10,658 Current transfers to business (subsidies)
Investment income 43,512 76,491 Interest on public debt
Current transfers 252,745 113,257 Current transfers
Taxes on income 195,881 110,487 To persons
From persons 143,951 2,770 To non-residents
From non-residents 3,755
Contributions to social insurance plans 49,748
Other current transfers from persons 7,116
34,765
From corporations and government business enterprises
Gross current expenditures on goods and services
Source: National Income and Expenditure Acccounts, Catalogue no. 13-001, Table 9.
millions of dollars
Income
233,49833,414 Sales of goods and services
Saving (income - outlay)
48,175
38 Statistics Canada - Catalogue no. 13-017 Guide to the Income and Expenditure Accounts
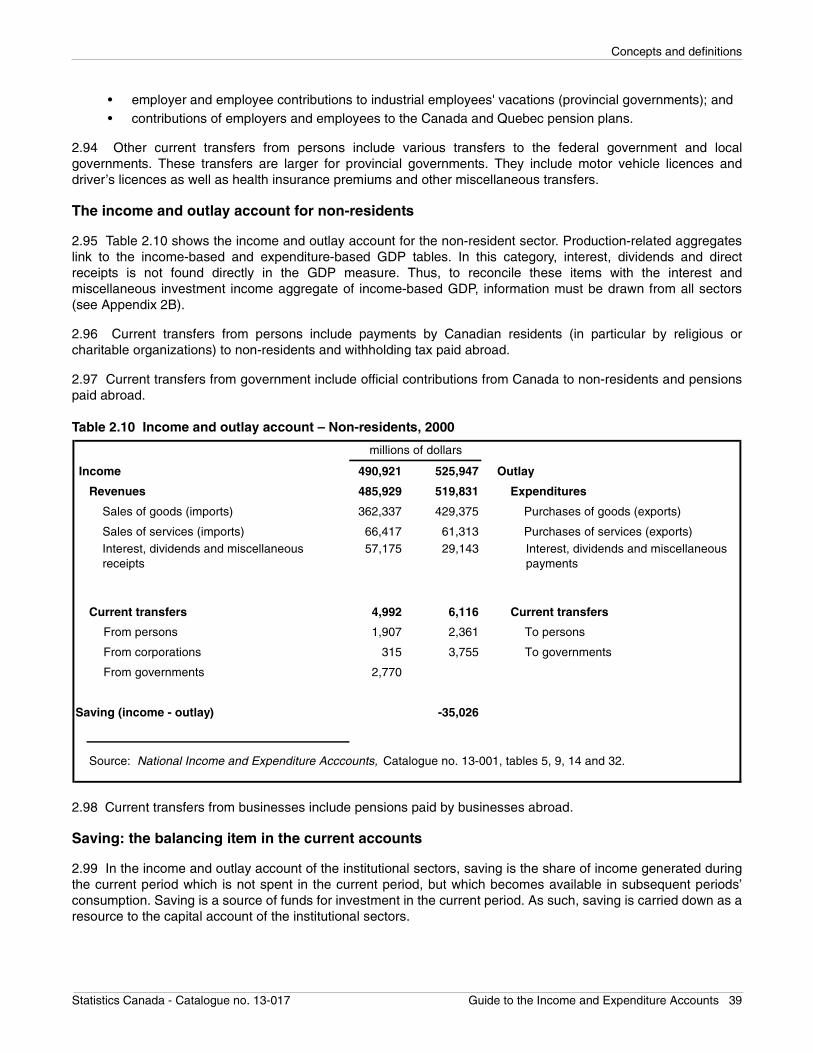
Concepts and definitions
• employer and employee contributions to industrial employees' vacations (provincial governments); and • contributions of employers and employees to the Canada and Quebec pension plans.
2.94 Other current transfers from persons include various transfers to the federal government and localgovernments. These transfers are larger for provincial governments. They include motor vehicle licences anddriver’s licences as well as health insurance premiums and other miscellaneous transfers.
The income and outlay account for non-residents
2.95 Table 2.10 shows the income and outlay account for the non-resident sector. Production-related aggregateslink to the income-based and expenditure-based GDP tables. In this category, interest, dividends and directreceipts is not found directly in the GDP measure. Thus, to reconcile these items with the interest andmiscellaneous investment income aggregate of income-based GDP, information must be drawn from all sectors(see Appendix 2B).
2.96 Current transfers from persons include payments by Canadian residents (in particular by religious orcharitable organizations) to non-residents and withholding tax paid abroad.
2.97 Current transfers from government include official contributions from Canada to non-residents and pensionspaid abroad.
Table 2.10 Income and outlay account – Non-residents, 2000
2.98 Current transfers from businesses include pensions paid by businesses abroad.
Saving: the balancing item in the current accounts
2.99 In the income and outlay account of the institutional sectors, saving is the share of income generated duringthe current period which is not spent in the current period, but which becomes available in subsequent periods’consumption. Saving is a source of funds for investment in the current period. As such, saving is carried down as aresource to the capital account of the institutional sectors.
490,921 525,947 Outlay
Revenues 485,929 519,831 Expenditures
Sales of goods (imports) 362,337 429,375 Purchases of goods (exports)
Sales of services (imports) 66,417 61,313 Purchases of services (exports)
Current transfers 4,992 6,116 Current transfers
From persons 1,907 2,361 To persons
From corporations 315 3,755 To governments
From governments 2,770
Saving (income - outlay) -35,026
Source: National Income and Expenditure Acccounts, Catalogue no. 13-001, tables 5, 9, 14 and 32.
Interest, dividends and miscellaneous receipts
Interest, dividends and miscellaneous payments
millions of dollars
Income
29,14357,175
Statistics Canada - Catalogue no. 13-017 Guide to the Income and Expenditure Accounts 39
Concepts and definitions
The capital account
2.100 There is a capital account for each institutional sector and sub-sector. This account presents resources andthe uses to which they are put. The resources are gross saving and capital transfers. The uses consist ofacquisitions of non-financial capital. Net lending (or borrowing) is the balancing item for this account. It records thedifference between sources of funds internal to a sector and expenditures on non-financial capital. A positivedifference is lent to other institutional sectors via financial transactions. Conversely, a negative difference indicatesthat the sector must borrow funds from other sectors through financial transactions.
2.101 For the economy as a whole (the sum of all institutional sectors), gross saving and capital transfers is equalto acquisitions of non-financial capital. Net lending for the economy as a whole is therefore zero.
Gross saving and capital transfers
2.102 The gross saving and capital transfers aggregate includes all resources available for the acquisition of non-financial assets. It includes, firstly, the saving made available by each sector—that is, the share of incomegenerated during the current period which is not spent in the current period. Saving is derived from the precedingIEA account, namely the income and outlay accounts of each of the different institutional sectors. Added to thisitem are capital consumption allowances (CCA). The latter are a cost reflecting the reduction in the value of fixedassets used up in production during the period (i.e., depreciation). Even so, they constitute available resources,since in practice, CCA is merely an accounting entry. CCA also includes miscellaneous valuation adjustments, ofwhich the most significant is the claim portion of business and residential insurance. And lastly, net capital transfersare also considered to be available resources.
2.103 Capital transfers consist of either a transfer of funds from one unit to another (cash transfer for the purposesof acquiring an asset); or, a transfer of ownership of a good or non-cash asset, the cancellation of a liability bymutual agreement, or the provision of a service without a counter part transaction. In all cases, this amounts to atransfer of wealth from one sector to another. Net capital transfers between the non-resident sector and thepersons and unincorporated business sector consist mainly of net amounts paid or received abroad on migrants’estates and capital. Other capital transfers could be a gift of land to developers as an incentive to create a businessor undertake construction, or debt forgiveness of parent governments towards their government businessenterprises.
Non-financial capital acquisition
2.104 Acquisitions of non-financial capital may take three forms: acquisition of fixed capital; investment ininventory; and, acquisition of existing assets. Acquisition of fixed capital corresponds to new gross fixed capitalformation in the GDP by expenditure tables and are included in final domestic demand. Investment in inventoryalso appears in the tables on expenditure-based GDP. These two components were defined in the section onmeasuring GDP (refer to 2.72, 2.73).
2.105 In order to fully reflect the acquisition of fixed capital by any institutional sector, expenditures on both newand existing capital as well as on both produced and non-produced assets in a period must be taken into account.Net acquisition of existing assets corresponds to purchases and sales among institutional sectors of existingresidential and non-residential structures, machinery and equipment and/or land. Expenditures on existing capitalassets or land are not included in that period’s macro-economic activity, or GDP.
2.106 The acquisition of non-financial capital applies only to domestic institutional sectors. By definition, the non-resident sector makes only financial investments, since non-residents do not have a centre of economic interestwithin the country’s economic territory.
40 Statistics Canada - Catalogue no. 13-017 Guide to the Income and Expenditure Accounts
Concepts and definitions
The financial account (the financing of economic activity)
2.107 The sector accounts of the National Income and Expenditure Accounts extend the capital account with apicture of financial activity, thus producing a capital and financial account for each sector–a sources and uses offunds statement. These two accounts, sometimes referred to as accumulation accounts, comprise the transaction-driven changes to sector net worth. This section describes the financial account.
2.108 The two measures of GDP, as well as the underlying detail in both the income and outlay account and thecapital account of the institutional sectors, describe economic activity in terms of transactions on goods andservices. It is also possible to track the economy by observing the financial transactions associated with economicactivity. The financial account of the institutional sectors provides this perspective.
2.109 From a financial standpoint, the difference between transactions in financial assets and liabilities for anysector is the amount that sector puts at the disposal of other institutional sectors (lending) or the amount that itrequires from other institutional sectors (borrowing). This is the same concept as the net lending-borrowingdescribed with respect to the capital account, but in this case it is applied to the financial aspect of the economy. Todistinguish it from net lending, this balancing item in the financial account is referred to as net financial investment.
2.110 The financial account of the different institutional sectors are a condensed version of the Financial FlowAccounts, which record the financial transactions of the economy (in conjunction with capital transactions) in greatasset-liability and sector detail. The information on this account and on the resulting wealth positions can be foundin the publication Guide to the Financial Flow and Balance Sheet Accounts. The paragraphs that follow provide abrief description of asset and liability categories in the financial account.
Types of transactions on financial assets and liabilities
2.111 The financial accounts of the institutional sectors, presented in tables 5, 6, 7, 8, 9 and 14 and SupplementaryTable 1 of the publication National Income and Expenditure Accounts include several categories of financial assets
and liabilities. These items are briefly described in the following paragraphs.18
2.112 Official reserves cover a number of different components. Official holdings of gold and foreign exchange,includes gold, U.S. dollar, sterling and other foreign convertible currency denominated deposits and securities heldas assets by the monetary authorities. The International Monetary Fund (IMF) general account, encompassesloans by Canada to the IMF. Special drawing rights (SDRs) include both the allocation of new SDRs and themovement of existing rights between Canada and the rest of the world.
2.113 Currency and deposits includes three main sub-components: Canadian currency and deposits in charteredbanks, deposits in other institutions and foreign currency and deposits. Checking and saving accounts of differenttypes and terms are included in deposits.
2.114 Consumer credit includes personal loans, for the purposes of acquiring consumer goods and services,made by chartered banks and near-banks. Also included are policy loans advanced by life insurance companies,as well as loans to persons advanced by sales finance and consumer loan companies. Loans for other purposescover bank and other loans and include negotiated loans, advances and overdrafts booked in Canada by Canadianchartered banks and other lending institutions. Mortgage loans include loans and agreements of sale secured byreal property, mostly residential buildings.
2.115 Life insurance and pensions is a broad category that covers the liability of life insurance companies to itspolicy-holders as well as the liabilities of employer-sponsored pension schemes towards members of the plan.
18. The following definitions are a condensed version of those that appear in the Guide to the Financial Flow and National Balance SheetAccounts – Definitions, Concepts, Sources, Methods, catalogue no. 13-585.
Statistics Canada - Catalogue no. 13-017 Guide to the Income and Expenditure Accounts 41
Concepts and definitions
2.116 Debt instruments comprise short-term paper and bonds. Bonds cover federal, provincial and municipalbonds, as well as corporate bonds and debentures (including guaranteed bonds of government businessenterprises), and other bonds (e.g., non-profit institutions) as well as asset-backed securities. Bonds are typicallymarketable, with an original term to maturity in excess of one year. Money market instruments include federalshort-term paper and other marketable short-term notes issued by a variety of financial and non-financialcorporations and sectors. Short-term paper can be described as negotiable bearer promissory notes with anoriginal term to maturity of less than one year, issued at a discount without coupons.
2.117 Shares include marketable and non-marketable common and preferred shares, plus investment fund units.Foreign investments are defined as all marketable financial instruments that are liabilities of non-resident entities.
2.118 Trade accounts (payables/receivables) include short-term credit granted or received in the ordinary courseof business by suppliers or purchasers of goods and services. Other financial assets/liabilities comprise a variety ofitems not included in the other components of financial flows.
The Balance Sheet Account (the result of economic activity and gains/losses)
2.119 The opening and closing positions in the CSNA sequence of accounts are articulated (by institutional sectorand for the economy as a whole) in the National Balance Sheet Account (NBSA). The NBSA is the final componentof the CSNA sequence of accounts. Unlike the accounts described previously, which measure the flow of activitiesover a given period, the balance sheet account measures the impact of those activities on the stock of assets andliabilities and net worth at the end of a given period. It provides a snapshot of the state of the nation’s economic-financial position. The balance sheet account evolves as the result of capital and financial transactions on the onehand, and capital gains/losses on assets-liabilities on the other.
2.120 In the balance sheet account, sector estimates of net worth are calculated as the value of financial and non-financial assets minus liabilities. The NBSA also provides an important aggregate: the nation’s wealth, or nationalnet worth. National wealth is the sum of the nation’s non-financial assets (both produced and non-produced).National net worth is equal to national wealth adjusted for the nation’s net international investment position (if oneexists), alternatively, national net worth can be derived as the sum of resident sector net worth.
2.121 The NBSA has the same overall structure and sector detail as the Financial Flow Accounts.
Other aspects of the Income and Expenditure Accounts data
Measures of volume and prices in the Income and Expenditure Accounts
2.122 Growth in the current dollar gross domestic product (GDP) or any other nominal value aggregate can bedecomposed into two elements: a price element, or the part of the growth linked to inflation, and a volume element,which covers the change in quantities and quality of the aggregate. The volume element is presented in theSystem of National Accounts by what is referred to as the real economic activity series (such as the real GDP).Real GDP is the key economic indicator, on the trend-cycle growth pattern of the economy. Calculating real GDPand its expenditure components is, therefore, an important undertaking.
2.123 The volume element is measured to a very large extent by deflating the nominal value of a given series by
an appropriate price index.19 This is referred to as the deflation method.
2.124 Within the Canadian System of National Accounts the deflation of a series (such as exports of machineryand equipment) occurs at the lowest possible level for which a representative price index can be found. Thedeflated series can then be aggregated together to derive various totals. For example, 435 series are deflated andthen aggregated together in order to calculate real quarterly GDP.
19. Exceptions to the deflation approach in the estimation of volume measures will be noted where relevant in the chapters dealing withexpenditure side GDP components (refer also to 2.140).
42 Statistics Canada - Catalogue no. 13-017 Guide to the Income and Expenditure Accounts

Concepts and definitions
2.125 There are several ways to aggregate deflated series in order to calculate the volume aggregate. Indexnumber theory offers a wide range of tools to this end. Since the spring of 2001, the Canadian System of NationalAccounts (CSNA) has adopted the chain Fisher index. This measure is theoretically superior to the formerfixed-base Laspeyres measure and also makes the Canadian data comparable with the U.S. official measure ofreal economic activity. Furthermore, it offers compliance with the recommendations of the System of NationalAccounts 1993 (SNA 1993).
2.126 The following paragraphs provide a simplified explanation of the methods used by the CSNA to measure thecountry’s real economic activity.
2.127 The level of detail—that is, the number of components used in each of the aggregates—is determined bythe availability of data and by certain determinants of overall quality (such as the stability of seasonality). At thenational level, 435 series in current dollars and the same number of corresponding price series, are used tocalculate real GDP using the chain Fisher index. Table 2.11 shows how these series are distributed between thevarious aggregates presented in Table 3 of the publication National Income and Expenditure Accounts.
Table 2.11 Level of detail at the national level
number of series
Personal expenditure on consumer goods and services 130
Durable goods 22
Semi-durable goods 15
Non-durable goods 14
Services 79
Government current expenditure on goods and services 24
Government gross fixed capital formation 14
Government investment in inventory 1
Business gross fixed capital formation 18
Residential structures 4
Non-residential structures and equipment 14
Non-residential structures 4
Machinery and equipment 10
Business investment in inventory 110
Non-farm 76
Farm 34
Exports of goods and services 69
Goods 64
Services 5
Imports of goods and services 68
Goods 63
Services 5
Statistical discrepancy 1
Gross domestic product at market prices 435
Final domestic demand 186
Statistics Canada - Catalogue no. 13-017 Guide to the Income and Expenditure Accounts 43
Concepts and definitions
2.128 Real gross domestic product (GDP) is estimated from 435 series. The values in those series are derivedfrom surveys and administrative sources (see the chapters on sources and methods). The price indexesassociated with each of the 435 series are taken from various sources, primarily consumer price indexes, industryproduct price indexes, raw materials price indexes, farm price indexes, export price indexes, import price indexes,foreign price indexes, and wage rates.
2.129 Personal consumption expenditure on goods and services includes 130 categories of goods and services.In most cases, consumer price indexes are associated with those goods and services.
2.130 There are 24 series for government current expenditure on consumer goods and services (see Chapter 8 forinformation on the deflation of government data). Volume estimates for the 10 labour income series are derivedfrom hours worked, and the price indexes for the series are implicit. The 10 series for government capitalconsumption allowances are deflated with indexes based on information from the Investment and Capital StockDivision, while a number of sources are used to construct the other 4 price indexes.
2.131 The 32 series that make up gross fixed capital formation are mainly based on industry product priceindexes, raw materials price indexes, machinery and equipment price indexes and import price indexes.
2.132 Business investment in inventories includes 55 components,20 whereas government investment ininventories is based on just one series. The price indexes are mainly industry price indexes and farm price indexes.
2.133 International imports consists of 68 import price indexes, while 69 different price indexes are used to deflateinternational exports.
2.134 The price index associated with the value of the statistical discrepancy is the aggregate implicit expenditure-side GDP price index (constructed by excluding the statistical discrepancy).
Chain Fisher volume indexes
2.135 The quarterly Income and Expenditure Accounts adopted the Fisher index formula, chained quarterly, as theofficial measure of expenditure based real gross domestic product in May 2001. This formula was also adopted forthe Provincial Economic Accounts, chained annually, in October 2002.
2.136 There were two reasons for adopting this formula: to provide users with a more accurate measure of realgrowth for GDP and its components between two consecutive periods and to make the Canadian measurecomparable with the National Income and Product Accounts (NIPA) of the United States, which has used the chainFisher index formula to measure real GDP since 1996.
Building an index and chaining
2.137 A given nominal aggregate (GDP or other) represents a summation of quantities evaluated in the samemonetary unit, at the prices of the current period. Note: When we refer to quantities we are implicitly including anyquality change as well. To use GDP as an example, this summation can be expressed as GDP = Σpq which is the
sum of all quantities of goods and services transacted in the economy, multiplied by their respective prices. The
change or variation in nominal GDP, between a period 0 and a period t, can therefore be expressed in index21 formby:
20. Each component is used twice in computing the aggregates, once as beginning-of-period inventory and a second time as end-of-periodinventory.
21. That is, by establishing a ratio between the value of the current period and the value of a preceding period.
44 Statistics Canada - Catalogue no. 13-017 Guide to the Income and Expenditure Accounts
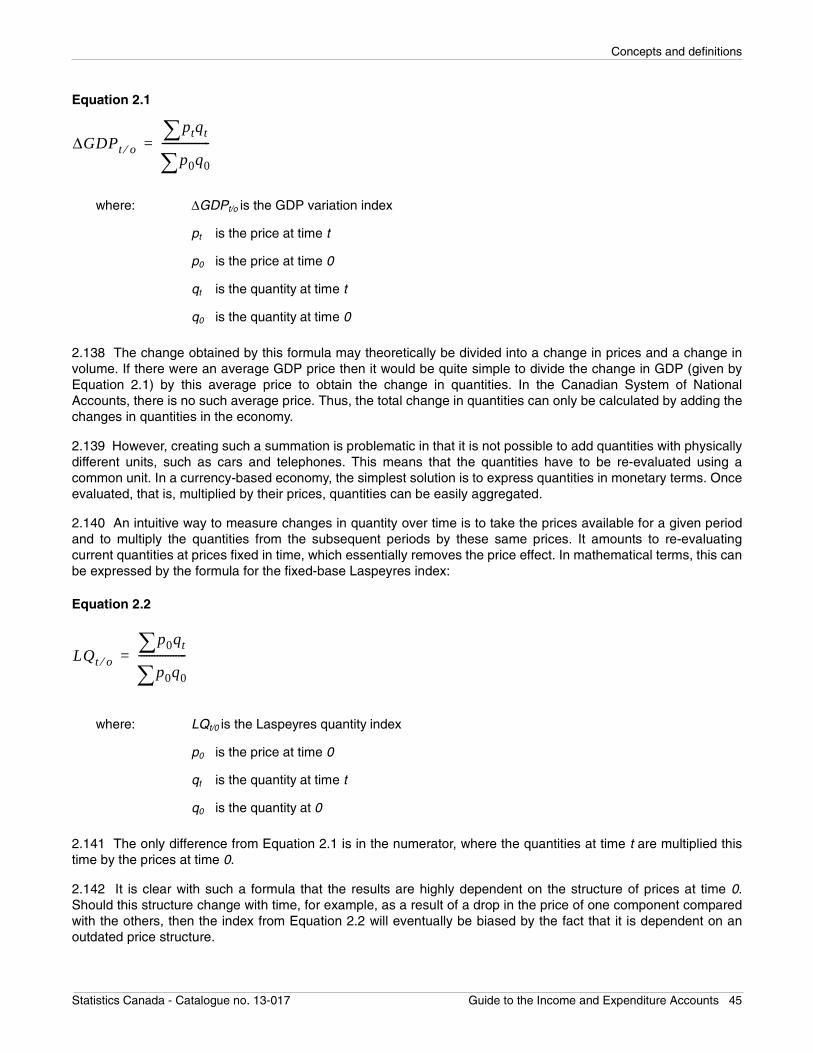
Concepts and definitions
Equation 2.1
2.138 The change obtained by this formula may theoretically be divided into a change in prices and a change involume. If there were an average GDP price then it would be quite simple to divide the change in GDP (given byEquation 2.1) by this average price to obtain the change in quantities. In the Canadian System of NationalAccounts, there is no such average price. Thus, the total change in quantities can only be calculated by adding thechanges in quantities in the economy.
2.139 However, creating such a summation is problematic in that it is not possible to add quantities with physicallydifferent units, such as cars and telephones. This means that the quantities have to be re-evaluated using acommon unit. In a currency-based economy, the simplest solution is to express quantities in monetary terms. Onceevaluated, that is, multiplied by their prices, quantities can be easily aggregated.
2.140 An intuitive way to measure changes in quantity over time is to take the prices available for a given periodand to multiply the quantities from the subsequent periods by these same prices. It amounts to re-evaluatingcurrent quantities at prices fixed in time, which essentially removes the price effect. In mathematical terms, this canbe expressed by the formula for the fixed-base Laspeyres index:
Equation 2.2
2.141 The only difference from Equation 2.1 is in the numerator, where the quantities at time t are multiplied thistime by the prices at time 0.
2.142 It is clear with such a formula that the results are highly dependent on the structure of prices at time 0.Should this structure change with time, for example, as a result of a drop in the price of one component comparedwith the others, then the index from Equation 2.2 will eventually be biased by the fact that it is dependent on anoutdated price structure.
∆GDPt o⁄
ptqt∑p0q0∑
------------------=
where: ∆GDPt/o is the GDP variation index
pt is the price at time t
p0 is the price at time 0
qt is the quantity at time t
q0 is the quantity at time 0
LQt o⁄
p0qt∑p0q0∑
------------------=
where: LQt/0 is the Laspeyres quantity index
p0 is the price at time 0
qt is the quantity at time t
q0 is the quantity at 0
Statistics Canada - Catalogue no. 13-017 Guide to the Income and Expenditure Accounts 45
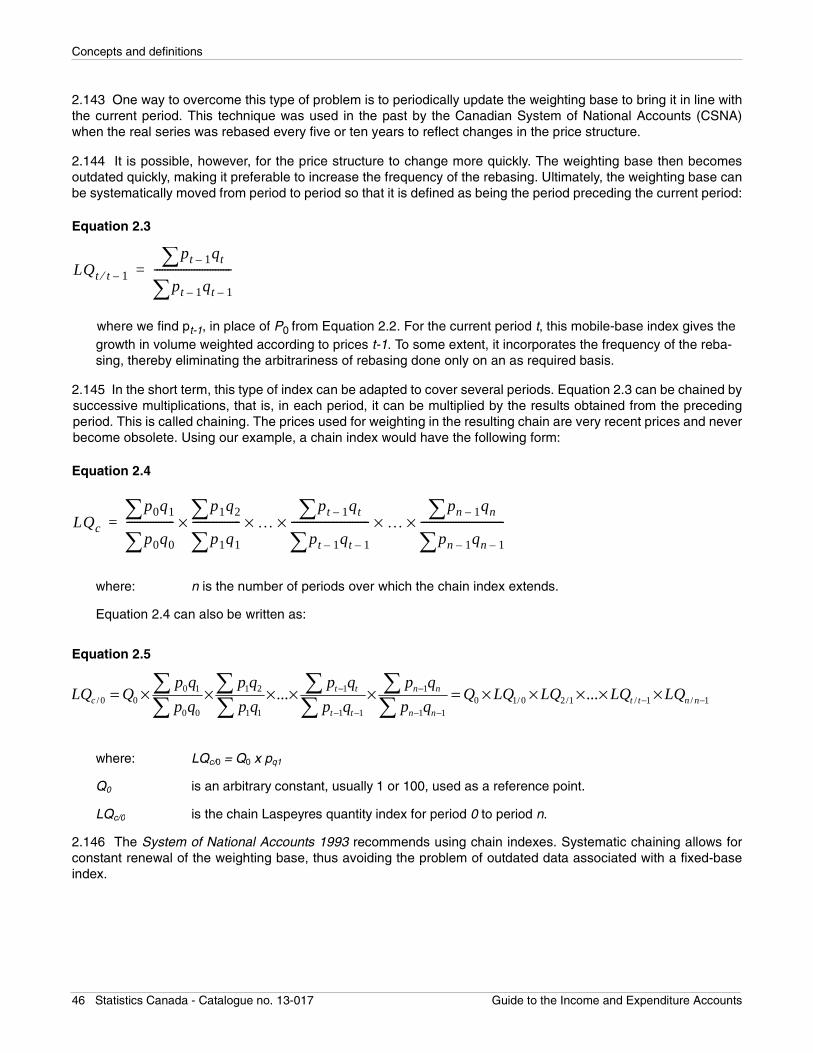
Concepts and definitions
2.143 One way to overcome this type of problem is to periodically update the weighting base to bring it in line withthe current period. This technique was used in the past by the Canadian System of National Accounts (CSNA)when the real series was rebased every five or ten years to reflect changes in the price structure.
2.144 It is possible, however, for the price structure to change more quickly. The weighting base then becomesoutdated quickly, making it preferable to increase the frequency of the rebasing. Ultimately, the weighting base canbe systematically moved from period to period so that it is defined as being the period preceding the current period:
Equation 2.3
where we find pt-1, in place of P0 from Equation 2.2. For the current period t, this mobile-base index gives the growth in volume weighted according to prices t-1. To some extent, it incorporates the frequency of the reba-sing, thereby eliminating the arbitrariness of rebasing done only on an as required basis.
2.145 In the short term, this type of index can be adapted to cover several periods. Equation 2.3 can be chained bysuccessive multiplications, that is, in each period, it can be multiplied by the results obtained from the precedingperiod. This is called chaining. The prices used for weighting in the resulting chain are very recent prices and neverbecome obsolete. Using our example, a chain index would have the following form:
Equation 2.4
Equation 2.5
2.146 The System of National Accounts 1993 recommends using chain indexes. Systematic chaining allows forconstant renewal of the weighting base, thus avoiding the problem of outdated data associated with a fixed-baseindex.
LQt t⁄ 1–
pt 1– qt∑pt 1– qt 1–∑
-----------------------------=
where: n is the number of periods over which the chain index extends.
Equation 2.4 can also be written as:
LQc
p0q1∑p0q0∑
------------------p1q2∑p1q1∑
------------------× …pt 1– qt∑
pt 1– qt 1–∑-----------------------------×× …
pn 1– qn∑pn 1– qn 1–∑
-------------------------------××=
0 1 1 2 1 1/ 0 0 0 1/ 0 2/1 / 1 / 1
0 0 1 1 1 1 1 1
... ...t t n nc t t n n
t t n n
p q p q p q p qLQ Q Q LQ LQ LQ LQ
p q p q p q p q− −
− −− − − −
= × × × × × = × × × × ×∑ ∑ ∑ ∑∑ ∑ ∑ ∑
where: LQc/0 = Q0 x pq1
Q0 is an arbitrary constant, usually 1 or 100, used as a reference point.
LQc/0 is the chain Laspeyres quantity index for period 0 to period n.
46 Statistics Canada - Catalogue no. 13-017 Guide to the Income and Expenditure Accounts
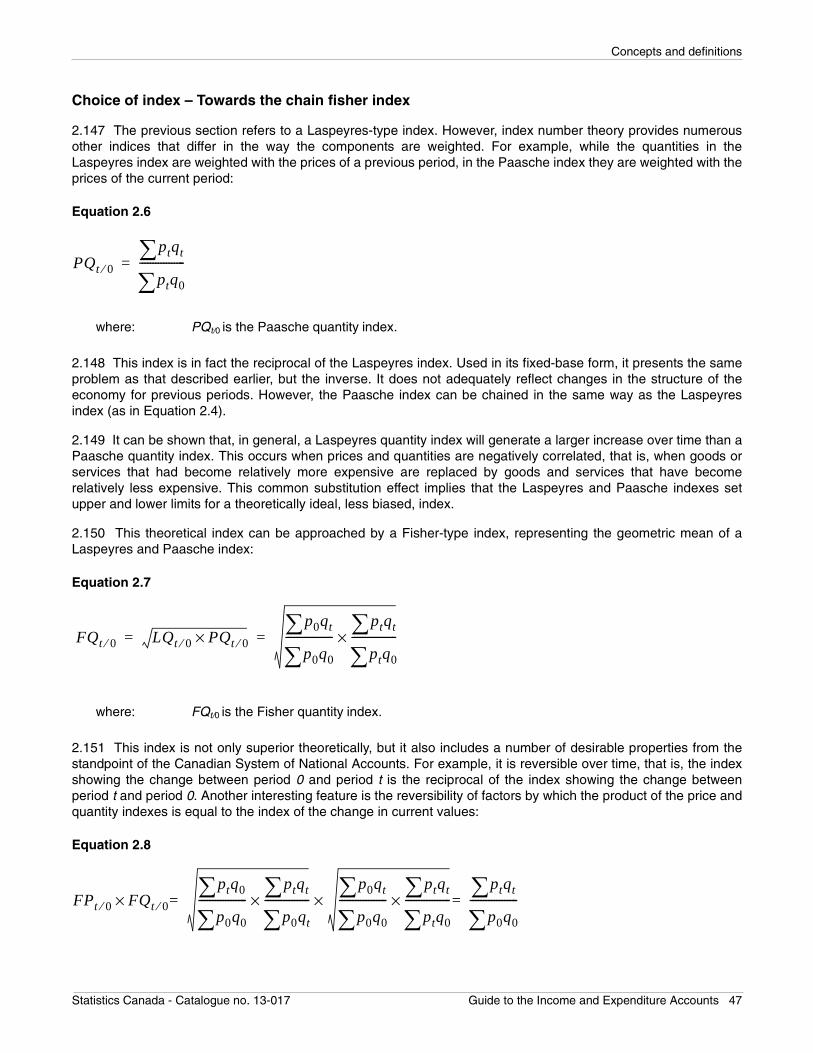
Concepts and definitions
Choice of index – Towards the chain fisher index
2.147 The previous section refers to a Laspeyres-type index. However, index number theory provides numerousother indices that differ in the way the components are weighted. For example, while the quantities in theLaspeyres index are weighted with the prices of a previous period, in the Paasche index they are weighted with theprices of the current period:
Equation 2.6
2.148 This index is in fact the reciprocal of the Laspeyres index. Used in its fixed-base form, it presents the sameproblem as that described earlier, but the inverse. It does not adequately reflect changes in the structure of theeconomy for previous periods. However, the Paasche index can be chained in the same way as the Laspeyresindex (as in Equation 2.4).
2.149 It can be shown that, in general, a Laspeyres quantity index will generate a larger increase over time than aPaasche quantity index. This occurs when prices and quantities are negatively correlated, that is, when goods orservices that had become relatively more expensive are replaced by goods and services that have becomerelatively less expensive. This common substitution effect implies that the Laspeyres and Paasche indexes setupper and lower limits for a theoretically ideal, less biased, index.
2.150 This theoretical index can be approached by a Fisher-type index, representing the geometric mean of aLaspeyres and Paasche index:
Equation 2.7
2.151 This index is not only superior theoretically, but it also includes a number of desirable properties from thestandpoint of the Canadian System of National Accounts. For example, it is reversible over time, that is, the indexshowing the change between period 0 and period t is the reciprocal of the index showing the change betweenperiod t and period 0. Another interesting feature is the reversibility of factors by which the product of the price andquantity indexes is equal to the index of the change in current values:
Equation 2.8
PQt 0⁄
ptqt∑ptq0∑
-----------------=
where: PQt/0 is the Paasche quantity index.
FQt 0⁄ LQt 0⁄ PQt 0⁄×p0qt∑p0q0∑
------------------ptqt∑ptq0∑
-----------------×= =
where: FQt/0 is the Fisher quantity index.
FPt 0⁄ FQt 0⁄
ptq0∑p0q0∑
------------------ptqt∑p0qt∑
-----------------×p0qt∑p0q0∑
------------------ptqt∑ptq0∑
-----------------×ptqt∑p0q0∑
------------------=×=×
Statistics Canada - Catalogue no. 13-017 Guide to the Income and Expenditure Accounts 47
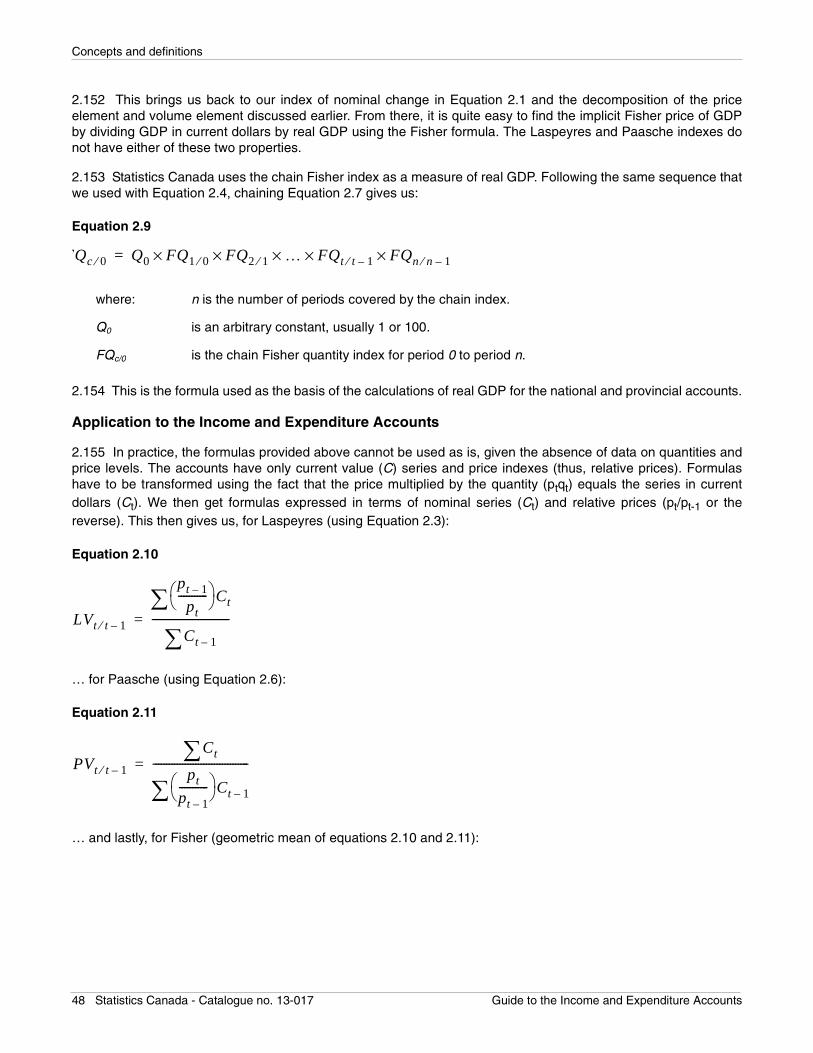
Concepts and definitions
2.152 This brings us back to our index of nominal change in Equation 2.1 and the decomposition of the priceelement and volume element discussed earlier. From there, it is quite easy to find the implicit Fisher price of GDPby dividing GDP in current dollars by real GDP using the Fisher formula. The Laspeyres and Paasche indexes donot have either of these two properties.
2.153 Statistics Canada uses the chain Fisher index as a measure of real GDP. Following the same sequence thatwe used with Equation 2.4, chaining Equation 2.7 gives us:
Equation 2.9
2.154 This is the formula used as the basis of the calculations of real GDP for the national and provincial accounts.
Application to the Income and Expenditure Accounts
2.155 In practice, the formulas provided above cannot be used as is, given the absence of data on quantities andprice levels. The accounts have only current value (C) series and price indexes (thus, relative prices). Formulashave to be transformed using the fact that the price multiplied by the quantity (ptqt) equals the series in currentdollars (Ct). We then get formulas expressed in terms of nominal series (Ct) and relative prices (pt/pt-1 or thereverse). This then gives us, for Laspeyres (using Equation 2.3):
Equation 2.10
… for Paasche (using Equation 2.6):
Equation 2.11
… and lastly, for Fisher (geometric mean of equations 2.10 and 2.11):
FQc 0⁄ Q0 FQ1 0⁄ FQ2 1⁄ … FQt t⁄ 1–× FQn n⁄ 1–××××=
where: n is the number of periods covered by the chain index.
Q0 is an arbitrary constant, usually 1 or 100.
FQc/0 is the chain Fisher quantity index for period 0 to period n.
LVt t⁄ 1–
pt 1–
pt-----------⎝ ⎠⎛ ⎞Ct∑
Ct 1–∑-----------------------------=
PVt t⁄ 1–
Ct∑pt
pt 1–-----------⎝ ⎠⎛ ⎞Ct 1–∑
------------------------------------=
48 Statistics Canada - Catalogue no. 13-017 Guide to the Income and Expenditure Accounts
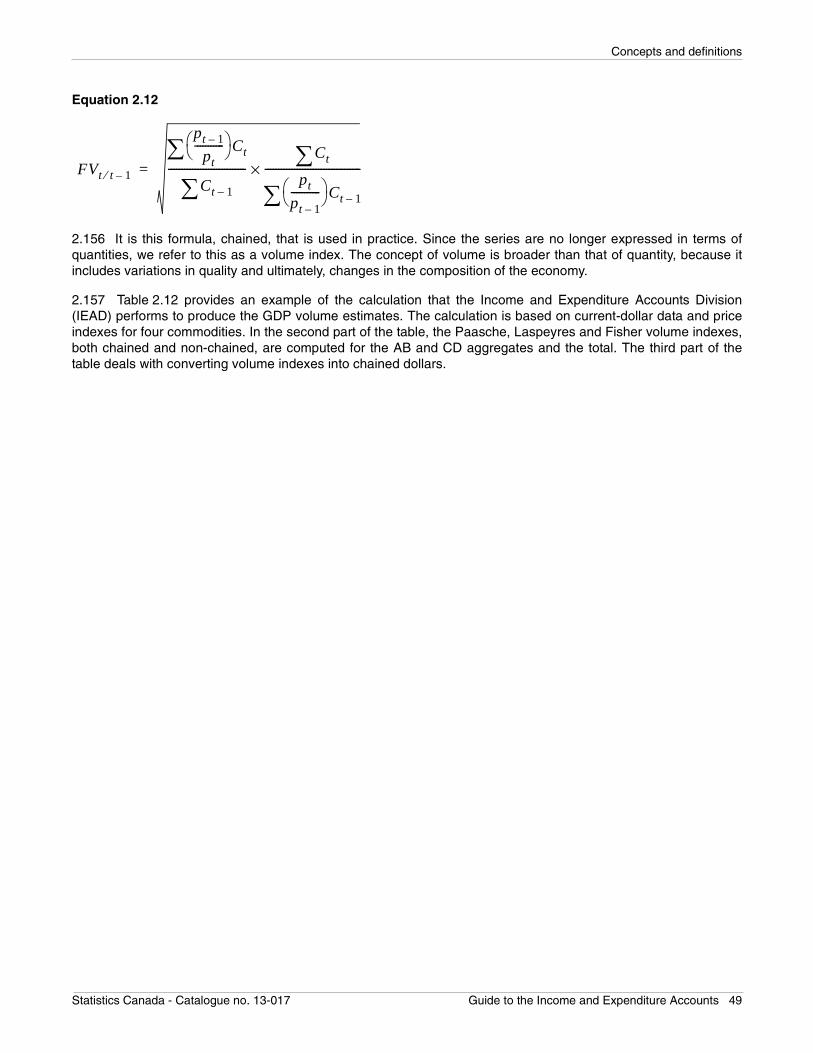
Concepts and definitions
Equation 2.12
2.156 It is this formula, chained, that is used in practice. Since the series are no longer expressed in terms ofquantities, we refer to this as a volume index. The concept of volume is broader than that of quantity, because itincludes variations in quality and ultimately, changes in the composition of the economy.
2.157 Table 2.12 provides an example of the calculation that the Income and Expenditure Accounts Division(IEAD) performs to produce the GDP volume estimates. The calculation is based on current-dollar data and priceindexes for four commodities. In the second part of the table, the Paasche, Laspeyres and Fisher volume indexes,both chained and non-chained, are computed for the AB and CD aggregates and the total. The third part of thetable deals with converting volume indexes into chained dollars.
FVt t⁄ 1–
pt 1–
pt-----------⎝ ⎠⎛ ⎞Ct∑
Ct 1–∑-----------------------------
Ct∑pt
pt 1–-----------⎝ ⎠⎛ ⎞Ct 1–∑
------------------------------------×=
Statistics Canada - Catalogue no. 13-017 Guide to the Income and Expenditure Accounts 49
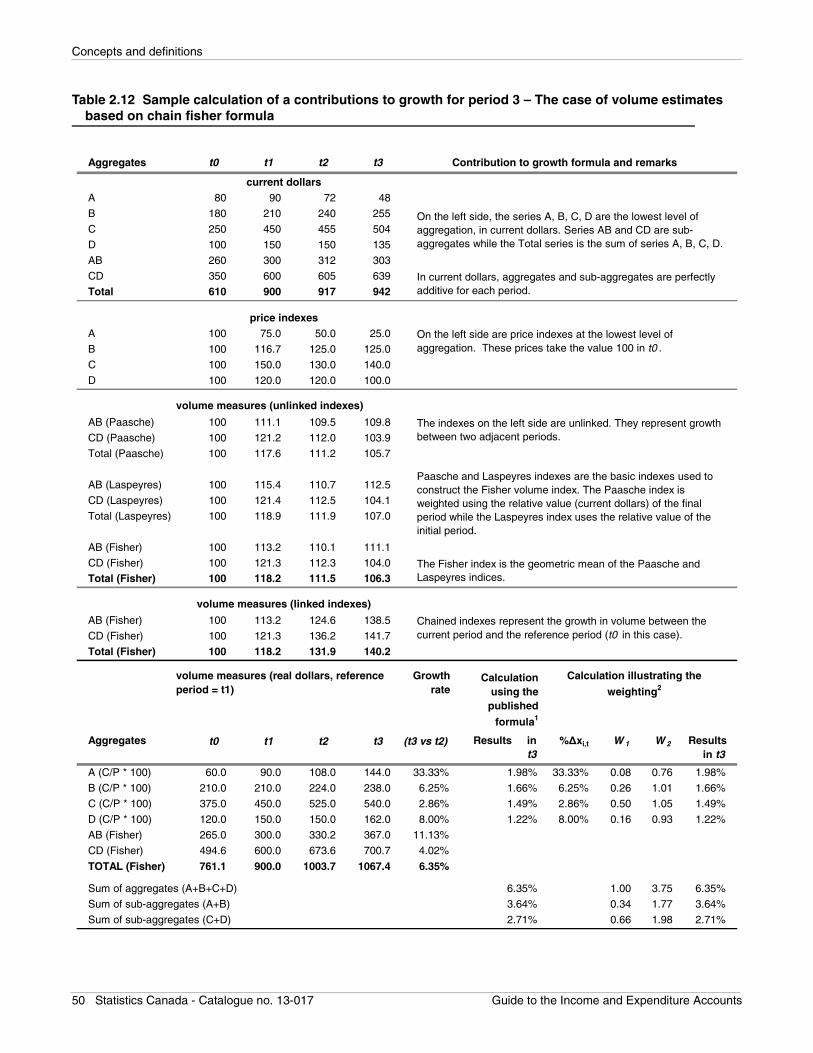
Concepts and definitions
Table 2.12 Sample calculation of a contributions to growth for period 3 – The case of volume estimates based on chain fisher formula
Aggregates t0 t1 t2 t3
A 80 90 72 48
B 180 210 240 255
C 250 450 455 504
D 100 150 150 135
AB 260 300 312 303
CD 350 600 605 639
Total 610 900 917 942
A 100 75.0 50.0 25.0
B 100 116.7 125.0 125.0
C 100 150.0 130.0 140.0
D 100 120.0 120.0 100.0
AB (Paasche) 100 111.1 109.5 109.8
CD (Paasche) 100 121.2 112.0 103.9
Total (Paasche) 100 117.6 111.2 105.7
AB (Laspeyres) 100 115.4 110.7 112.5
CD (Laspeyres) 100 121.4 112.5 104.1
Total (Laspeyres) 100 118.9 111.9 107.0
AB (Fisher) 100 113.2 110.1 111.1
CD (Fisher) 100 121.3 112.3 104.0
Total (Fisher) 100 118.2 111.5 106.3
AB (Fisher) 100 113.2 124.6 138.5
CD (Fisher) 100 121.3 136.2 141.7
Total (Fisher) 100 118.2 131.9 140.2
Growthrate
Calculation using the
published
formula1
Aggregates t0 t1 t2 t3 (t3 vs t2) %∆xi,t W 1 W 2
A (C/P * 100) 60.0 90.0 108.0 144.0 33.33% 1.98% 33.33% 0.08 0.76 1.98%
B (C/P * 100) 210.0 210.0 224.0 238.0 6.25% 1.66% 6.25% 0.26 1.01 1.66%
C (C/P * 100) 375.0 450.0 525.0 540.0 2.86% 1.49% 2.86% 0.50 1.05 1.49%
D (C/P * 100) 120.0 150.0 150.0 162.0 8.00% 1.22% 8.00% 0.16 0.93 1.22%
AB (Fisher) 265.0 300.0 330.2 367.0 11.13%
CD (Fisher) 494.6 600.0 673.6 700.7 4.02%
TOTAL (Fisher) 761.1 900.0 1003.7 1067.4 6.35%
Sum of aggregates (A+B+C+D) 6.35% 1.00 3.75 6.35%
Sum of sub-aggregates (A+B) 3.64% 0.34 1.77 3.64%
Sum of sub-aggregates (C+D) 2.71% 0.66 1.98 2.71%
volume measures (unlinked indexes)
Results in t3
Results in t3
On the left side, the series A, B, C, D are the lowest level of aggregation, in current dollars. Series AB and CD are sub-aggregates while the Total series is the sum of series A, B, C, D.
In current dollars, aggregates and sub-aggregates are perfectly additive for each period.
Paasche and Laspeyres indexes are the basic indexes used to construct the Fisher volume index. The Paasche index is weighted using the relative value (current dollars) of the final period while the Laspeyres index uses the relative value of the initial period.
The Fisher index is the geometric mean of the Paasche and Laspeyres indices.
On the left side are price indexes at the lowest level of aggregation. These prices take the value 100 in t0 .
current dollars
price indexes
Contribution to growth formula and remarks
The indexes on the left side are unlinked. They represent growth between two adjacent periods.
Chained indexes represent the growth in volume between the current period and the reference period (t0 in this case).
volume measures (real dollars, reference period = t1)
volume measures (linked indexes)
Calculation illustrating the
weighting2
50 Statistics Canada - Catalogue no. 13-017 Guide to the Income and Expenditure Accounts
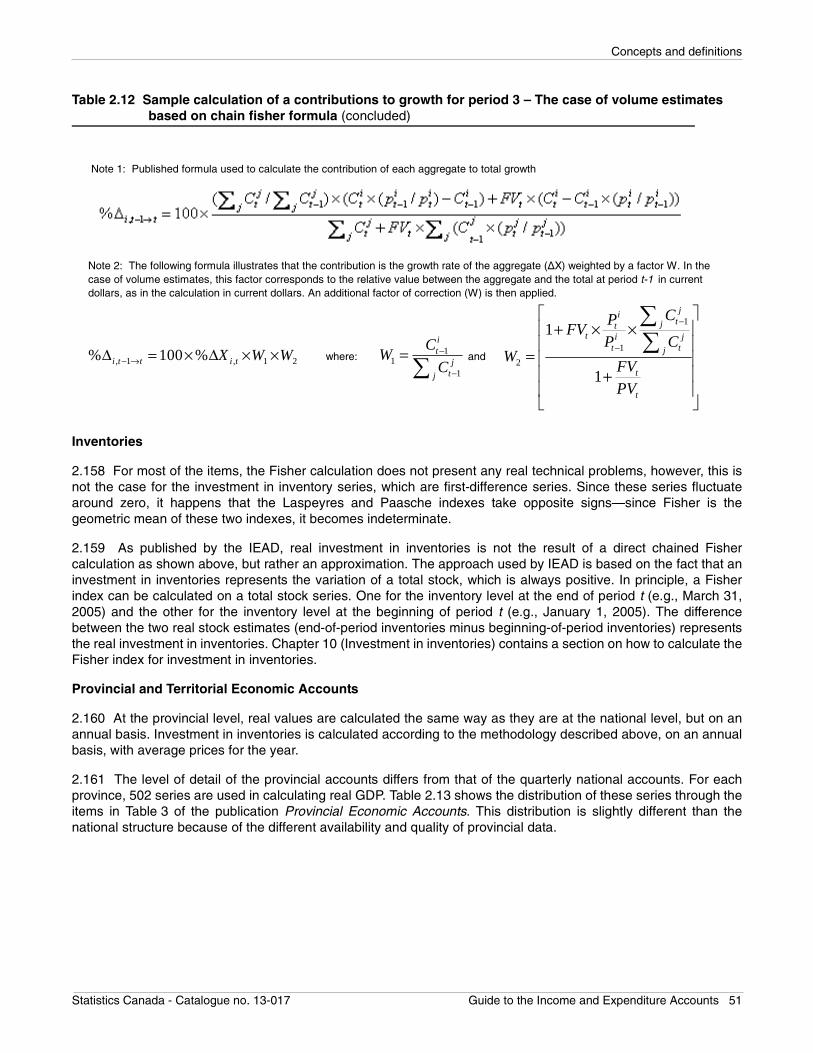
Concepts and definitions
Table 2.12 Sample calculation of a contributions to growth for period 3 – The case of volume estimates based on chain fisher formula (concluded)
Inventories
2.158 For most of the items, the Fisher calculation does not present any real technical problems, however, this isnot the case for the investment in inventory series, which are first-difference series. Since these series fluctuatearound zero, it happens that the Laspeyres and Paasche indexes take opposite signs—since Fisher is thegeometric mean of these two indexes, it becomes indeterminate.
2.159 As published by the IEAD, real investment in inventories is not the result of a direct chained Fishercalculation as shown above, but rather an approximation. The approach used by IEAD is based on the fact that aninvestment in inventories represents the variation of a total stock, which is always positive. In principle, a Fisherindex can be calculated on a total stock series. One for the inventory level at the end of period t (e.g., March 31,2005) and the other for the inventory level at the beginning of period t (e.g., January 1, 2005). The differencebetween the two real stock estimates (end-of-period inventories minus beginning-of-period inventories) representsthe real investment in inventories. Chapter 10 (Investment in inventories) contains a section on how to calculate theFisher index for investment in inventories.
Provincial and Territorial Economic Accounts
2.160 At the provincial level, real values are calculated the same way as they are at the national level, but on anannual basis. Investment in inventories is calculated according to the methodology described above, on an annualbasis, with average prices for the year.
2.161 The level of detail of the provincial accounts differs from that of the quarterly national accounts. For eachprovince, 502 series are used in calculating real GDP. Table 2.13 shows the distribution of these series through theitems in Table 3 of the publication Provincial Economic Accounts. This distribution is slightly different than thenational structure because of the different availability and quality of provincial data.
Note 1: Published formula used to calculate the contribution of each aggregate to total growth
and where:
Note 2: The following formula illustrates that the contribution is the growth rate of the aggregate (∆X) weighted by a factor W. In the case of volume estimates, this factor corresponds to the relative value between the aggregate and the total at period t-1 in current dollars, as in the calculation in current dollars. An additional factor of correction (W) is then applied.
, 1 , 1 2% 100 %i t t i tX W W− →∆ = × ∆ × ×
1
1
2
1
1
jitjt
t i jt tj
t
t
CPFV
P CW
FV
PV
−
−
⎡ ⎤⎢ + × × ⎥⎢ ⎥
= ⎢ ⎥⎢ ⎥+⎢ ⎥⎣ ⎦
∑∑1
11
it
jtj
CW
C−
−
=∑
Statistics Canada - Catalogue no. 13-017 Guide to the Income and Expenditure Accounts 51
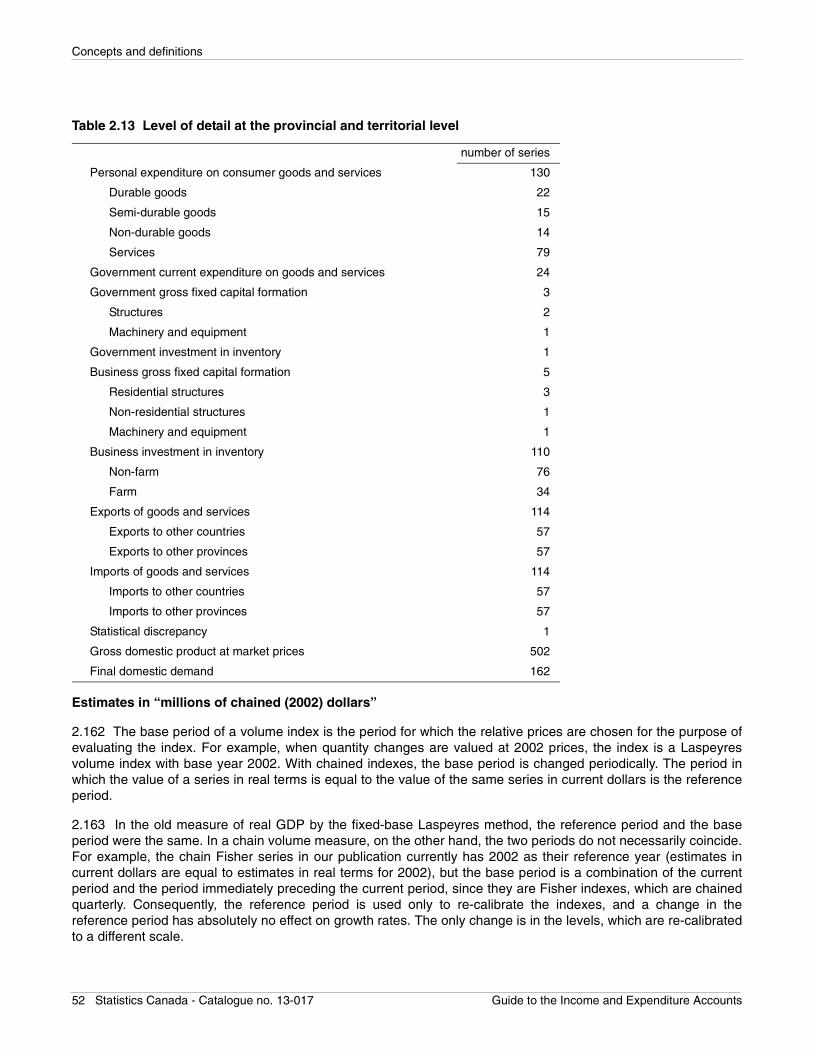
Concepts and definitions
Table 2.13 Level of detail at the provincial and territorial level
Estimates in “millions of chained (2002) dollars”
2.162 The base period of a volume index is the period for which the relative prices are chosen for the purpose ofevaluating the index. For example, when quantity changes are valued at 2002 prices, the index is a Laspeyresvolume index with base year 2002. With chained indexes, the base period is changed periodically. The period inwhich the value of a series in real terms is equal to the value of the same series in current dollars is the referenceperiod.
2.163 In the old measure of real GDP by the fixed-base Laspeyres method, the reference period and the baseperiod were the same. In a chain volume measure, on the other hand, the two periods do not necessarily coincide.For example, the chain Fisher series in our publication currently has 2002 as their reference year (estimates incurrent dollars are equal to estimates in real terms for 2002), but the base period is a combination of the currentperiod and the period immediately preceding the current period, since they are Fisher indexes, which are chainedquarterly. Consequently, the reference period is used only to re-calibrate the indexes, and a change in thereference period has absolutely no effect on growth rates. The only change is in the levels, which are re-calibratedto a different scale.
number of series
Personal expenditure on consumer goods and services 130
Durable goods 22
Semi-durable goods 15
Non-durable goods 14
Services 79
Government current expenditure on goods and services 24
Government gross fixed capital formation 3
Structures 2
Machinery and equipment 1
Government investment in inventory 1
Business gross fixed capital formation 5
Residential structures 3
Non-residential structures 1
Machinery and equipment 1
Business investment in inventory 110
Non-farm 76
Farm 34
Exports of goods and services 114
Exports to other countries 57
Exports to other provinces 57
Imports of goods and services 114
Imports to other countries 57
Imports to other provinces 57
Statistical discrepancy 1
Gross domestic product at market prices 502
Final domestic demand 162
52 Statistics Canada - Catalogue no. 13-017 Guide to the Income and Expenditure Accounts
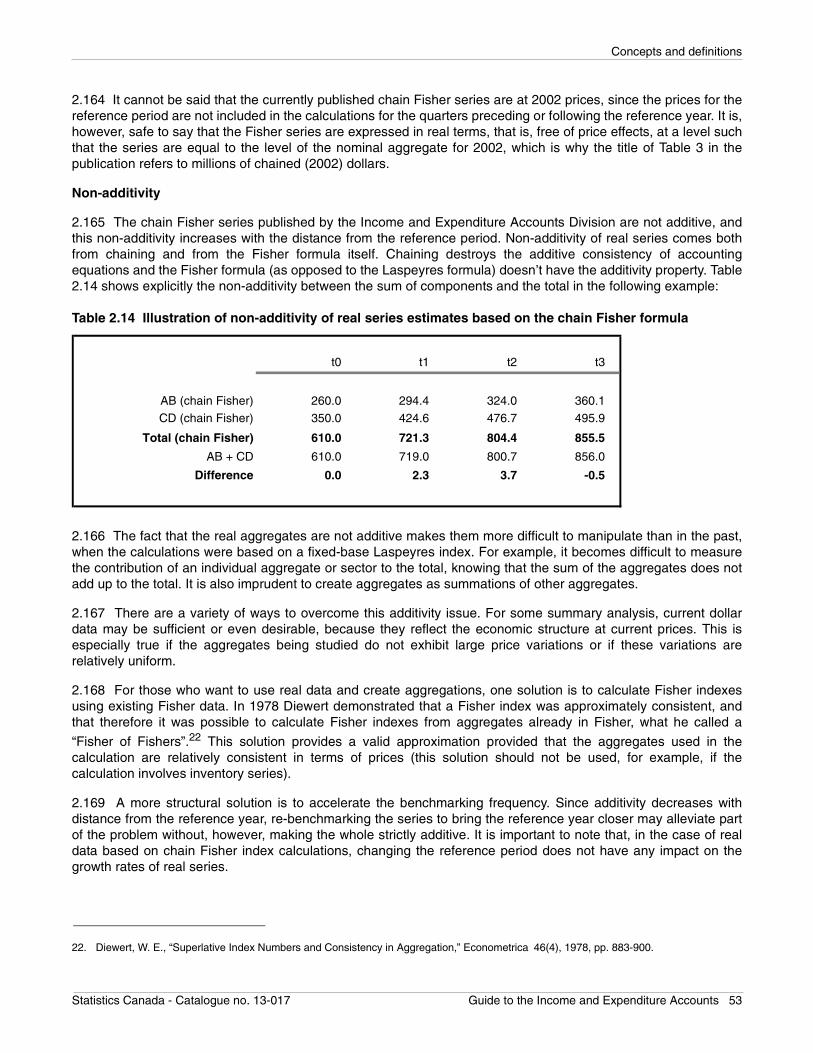
Concepts and definitions
2.164 It cannot be said that the currently published chain Fisher series are at 2002 prices, since the prices for thereference period are not included in the calculations for the quarters preceding or following the reference year. It is,however, safe to say that the Fisher series are expressed in real terms, that is, free of price effects, at a level suchthat the series are equal to the level of the nominal aggregate for 2002, which is why the title of Table 3 in thepublication refers to millions of chained (2002) dollars.
Non-additivity
2.165 The chain Fisher series published by the Income and Expenditure Accounts Division are not additive, andthis non-additivity increases with the distance from the reference period. Non-additivity of real series comes bothfrom chaining and from the Fisher formula itself. Chaining destroys the additive consistency of accountingequations and the Fisher formula (as opposed to the Laspeyres formula) doesn’t have the additivity property. Table2.14 shows explicitly the non-additivity between the sum of components and the total in the following example:
Table 2.14 Illustration of non-additivity of real series estimates based on the chain Fisher formula
2.166 The fact that the real aggregates are not additive makes them more difficult to manipulate than in the past,when the calculations were based on a fixed-base Laspeyres index. For example, it becomes difficult to measurethe contribution of an individual aggregate or sector to the total, knowing that the sum of the aggregates does notadd up to the total. It is also imprudent to create aggregates as summations of other aggregates.
2.167 There are a variety of ways to overcome this additivity issue. For some summary analysis, current dollardata may be sufficient or even desirable, because they reflect the economic structure at current prices. This isespecially true if the aggregates being studied do not exhibit large price variations or if these variations arerelatively uniform.
2.168 For those who want to use real data and create aggregations, one solution is to calculate Fisher indexesusing existing Fisher data. In 1978 Diewert demonstrated that a Fisher index was approximately consistent, andthat therefore it was possible to calculate Fisher indexes from aggregates already in Fisher, what he called a
“Fisher of Fishers”.22 This solution provides a valid approximation provided that the aggregates used in thecalculation are relatively consistent in terms of prices (this solution should not be used, for example, if thecalculation involves inventory series).
2.169 A more structural solution is to accelerate the benchmarking frequency. Since additivity decreases withdistance from the reference year, re-benchmarking the series to bring the reference year closer may alleviate partof the problem without, however, making the whole strictly additive. It is important to note that, in the case of realdata based on chain Fisher index calculations, changing the reference period does not have any impact on thegrowth rates of real series.
22. Diewert, W. E., “Superlative Index Numbers and Consistency in Aggregation,” Econometrica 46(4), 1978, pp. 883-900.
t0 t1 t2 t3
AB (chain Fisher) 260.0 294.4 324.0 360.1
CD (chain Fisher) 350.0 424.6 476.7 495.9
Total (chain Fisher) 610.0 721.3 804.4 855.5
AB + CD 610.0 719.0 800.7 856.0
Difference 0.0 2.3 3.7 -0.5
Statistics Canada - Catalogue no. 13-017 Guide to the Income and Expenditure Accounts 53
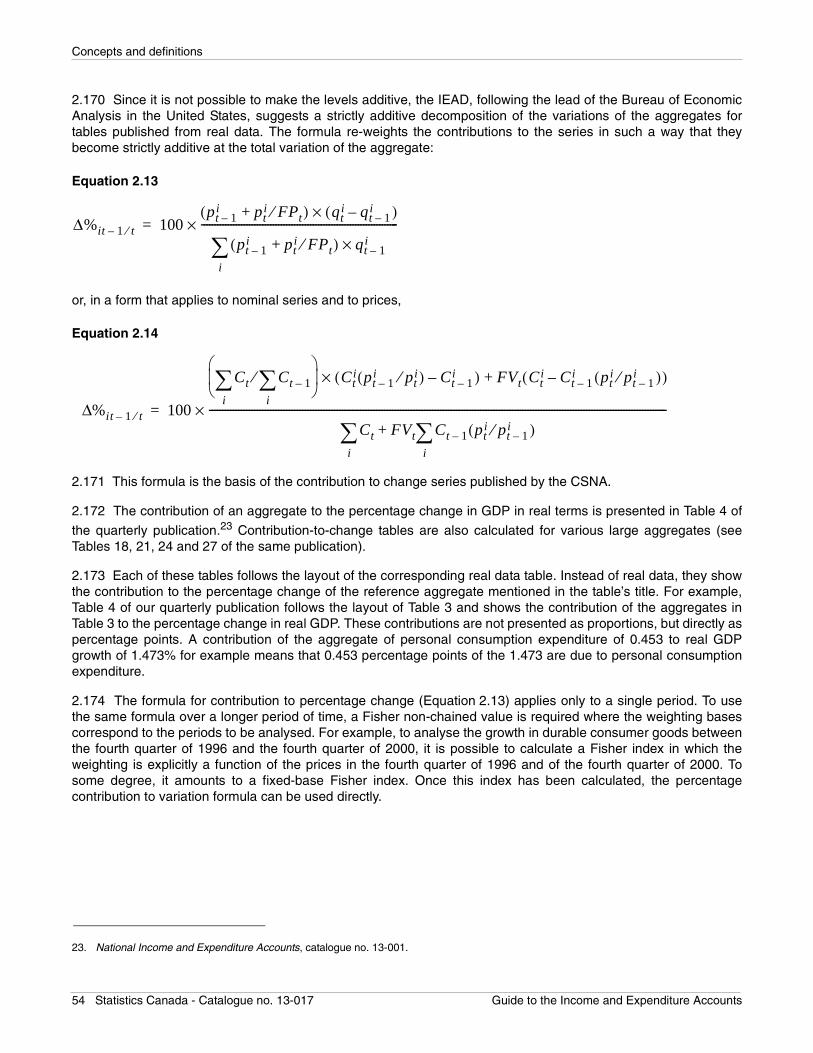
Concepts and definitions
2.170 Since it is not possible to make the levels additive, the IEAD, following the lead of the Bureau of EconomicAnalysis in the United States, suggests a strictly additive decomposition of the variations of the aggregates fortables published from real data. The formula re-weights the contributions to the series in such a way that theybecome strictly additive at the total variation of the aggregate:
Equation 2.13
or, in a form that applies to nominal series and to prices,
Equation 2.14
2.171 This formula is the basis of the contribution to change series published by the CSNA.
2.172 The contribution of an aggregate to the percentage change in GDP in real terms is presented in Table 4 of
the quarterly publication.23 Contribution-to-change tables are also calculated for various large aggregates (seeTables 18, 21, 24 and 27 of the same publication).
2.173 Each of these tables follows the layout of the corresponding real data table. Instead of real data, they showthe contribution to the percentage change of the reference aggregate mentioned in the table’s title. For example,Table 4 of our quarterly publication follows the layout of Table 3 and shows the contribution of the aggregates inTable 3 to the percentage change in real GDP. These contributions are not presented as proportions, but directly aspercentage points. A contribution of the aggregate of personal consumption expenditure of 0.453 to real GDPgrowth of 1.473% for example means that 0.453 percentage points of the 1.473 are due to personal consumptionexpenditure.
2.174 The formula for contribution to percentage change (Equation 2.13) applies only to a single period. To usethe same formula over a longer period of time, a Fisher non-chained value is required where the weighting basescorrespond to the periods to be analysed. For example, to analyse the growth in durable consumer goods betweenthe fourth quarter of 1996 and the fourth quarter of 2000, it is possible to calculate a Fisher index in which theweighting is explicitly a function of the prices in the fourth quarter of 1996 and of the fourth quarter of 2000. Tosome degree, it amounts to a fixed-base Fisher index. Once this index has been calculated, the percentagecontribution to variation formula can be used directly.
23. National Income and Expenditure Accounts, catalogue no. 13-001.
∆%it 1 t⁄– 100pt 1–
i pti FPt⁄+( ) qt
i qt 1–i–( )×
pt 1–i pt
i FPt⁄+( ) qt 1–i×
i∑
--------------------------------------------------------------------------×=
%∆ it 1 t⁄– 100
Ct
i∑ Ct 1–
i∑⁄⎝ ⎠
⎜ ⎟⎛ ⎞
Cti pt 1–
i pti⁄( ) Ct 1–
i–( ) FVt Cti Ct 1–
i pti pt 1–
i⁄( )–( )+×
Ct FVt Ct 1–
i∑ pt
i pt 1–i⁄( )+
i∑
----------------------------------------------------------------------------------------------------------------------------------------------------------------------------×=
54 Statistics Canada - Catalogue no. 13-017 Guide to the Income and Expenditure Accounts
Concepts and definitions
The Provincial Economic Accounts
2.175 Statistics Canada produces an annual provincial and territorial counterpart to the National Income andExpenditure Accounts. The estimates appear in the publication Provincial Economic Accounts, which providesmeasures of income-based and expenditure-based GDP for the ten provinces and three territories. The ProvincialEconomic Accounts also provide a detailed revenue and expenditure account for the government sector. Apersonal sector table is also provided.
2.176 While the conceptual framework of the Provincial Economic Accounts is similar to that of the nationalaccounts, there are conceptual and statistical issues of measurement and allocation that are specific to theprovincial accounts, notably with respect to the federal government, corporation profits and inter-provincial trade.
2.177 Estimates are produced for the ten provinces and three territories. Provincial estimates go back to 1981,whereas territorial estimates go back to 1981 for Yukon and the combined Northwest Territories and Nunavut andto 1999 for the new Northwest Territories and Nunavut.
2.178 It is important to note that the sum of the output of the provinces and territories is somewhat less than theoutput for Canada. This is because the GDP of Canada includes, on the income side, the income of Canadianstemporarily posted abroad (diplomatic and military personnel and employees in the private sector) and on theexpenditure side, current public expenditure abroad. There is thus a portion of Canada’s domestic output that is notproduced within the borders of a province or territory. This portion is simply omitted from the provincial accountsrather than being allocated arbitrarily to one region or another. More specifically, the foreign portion of income andexpenditures is omitted from the GDP tables, and in the case of wages, salaries and supplementary labour income,it is also omitted from the table on personal income. However, governments’ receipts and expenditures abroad areshown separately under the region Outside Canada in the supplementary tables on government. There they serveas a balancing item, for the aggregates involved, between Canada and the sum of provinces and territories.
The satellite accounts
2.179 The satellite accounts exist because of the need to flexibly extend the analytical capabilities of the nationalaccounts core components in particular areas. These accounts are related to the other accounts in the CanadianSystem of National Accounts and through them, to integrated economic statistics in general. Furthermore, theyrelate to a particular field (tourism) or theme (non-profit organizations) and are also linked to the information systemspecific to it. Since they are closely linked to the Canadian System of National Accounts, they facilitate the analysisof some subjects in the context of macroeconomic accounts and analyses. In short, the satellite accounts play adouble role, as instruments of analysis and means of statistical co-ordination.
The tourism satellite account and tourism economic indicators
2.180 The Income and Expenditure Accounts Division produces a tourism satellite account both for Canada andfor the provinces and territories. The satellite account explicitly defines the tourism industry within the statisticalsystem of the national accounts and measures its contribution to the economy. Because it is based on the Systemof Canadian National Accounts framework, the satellite account makes it possible to compare tourism with otherindustries. It provides benchmark data used to estimate quarterly indicators of tourism activity in Canada. Thisquarterly product is called the National Tourism Indicators.
The satellite account of non-profit institutions and volunteering
2.181 This satellite account is primarily intended to account explicitly for the economic activities of the non-profitsector and shed more light on its interaction with other areas of the economy within a macroeconomic framework.
2.182 The satellite account includes a standard set of economic accounts for the non-profit sector, along with anon-market component used to determine the value of volunteer work. These accounts provide information on anumber of economic characteristics of the non-profit sector, including income and outlays. They serve to establishthe economic profile of Canada’s non-profit sector and answer major questions such as: what percentage of GDP
Statistics Canada - Catalogue no. 13-017 Guide to the Income and Expenditure Accounts 55

Concepts and definitions
does the non-profit sector represent in Canada? In what fields do non-profit organizations contribute to the well-being of Canadian society? How financially stable or vulnerable is the non-profit sector? How much does thissector depend on paid work rather than the contribution of volunteers?
Pension satellite account
2.183 The pension satellite account is currently under development. It will allow for enhanced analysis of theeconomic impact(s) of an aging population.
56 Statistics Canada - Catalogue no. 13-017 Guide to the Income and Expenditure Accounts
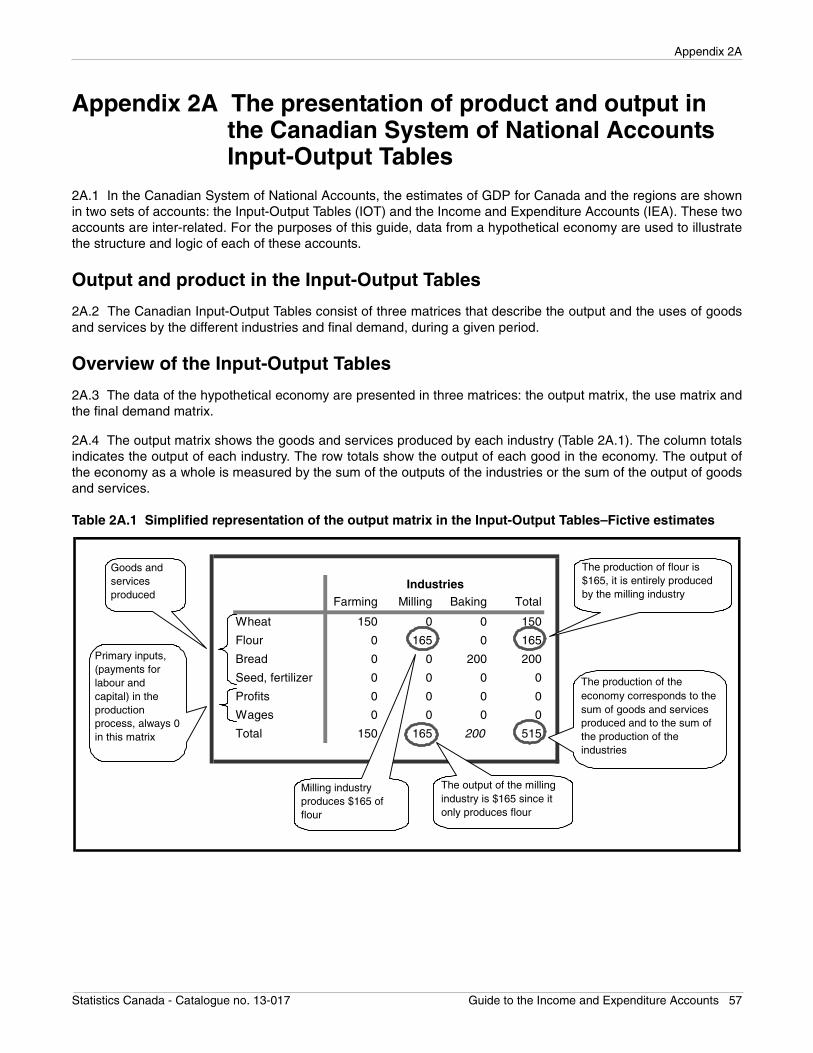
Appendix 2A
Appendix 2A The presentation of product and output in the Canadian System of National Accounts Input-Output Tables
2A.1 In the Canadian System of National Accounts, the estimates of GDP for Canada and the regions are shownin two sets of accounts: the Input-Output Tables (IOT) and the Income and Expenditure Accounts (IEA). These twoaccounts are inter-related. For the purposes of this guide, data from a hypothetical economy are used to illustratethe structure and logic of each of these accounts.
Output and product in the Input-Output Tables
2A.2 The Canadian Input-Output Tables consist of three matrices that describe the output and the uses of goodsand services by the different industries and final demand, during a given period.
Overview of the Input-Output Tables
2A.3 The data of the hypothetical economy are presented in three matrices: the output matrix, the use matrix andthe final demand matrix.
2A.4 The output matrix shows the goods and services produced by each industry (Table 2A.1). The column totalsindicates the output of each industry. The row totals show the output of each good in the economy. The output ofthe economy as a whole is measured by the sum of the outputs of the industries or the sum of the output of goodsand services.
Table 2A.1 Simplified representation of the output matrix in the Input-Output Tables–Fictive estimates
IndustriesFarming Milling Baking Total
Wheat 150 0 0 150
Flour 0 165 0 165
Bread 0 0 200 200
Seed, fertilizer 0 0 0 0
Profits 0 0 0 0
Wages 0 0 0 0
Total 150 165 200 515
Goods and services produced
Primary inputs, (payments for labour and capital) in the production process, always 0 in this matrix
Milling industry produces $165 of flour
The output of the milling industry is $165 since it only produces flour
The production of flour is $165, it is entirely produced by the milling industry
The production of the economy corresponds to the sum of goods and services produced and to the sum of the production of the industries
Statistics Canada - Catalogue no. 13-017 Guide to the Income and Expenditure Accounts 57
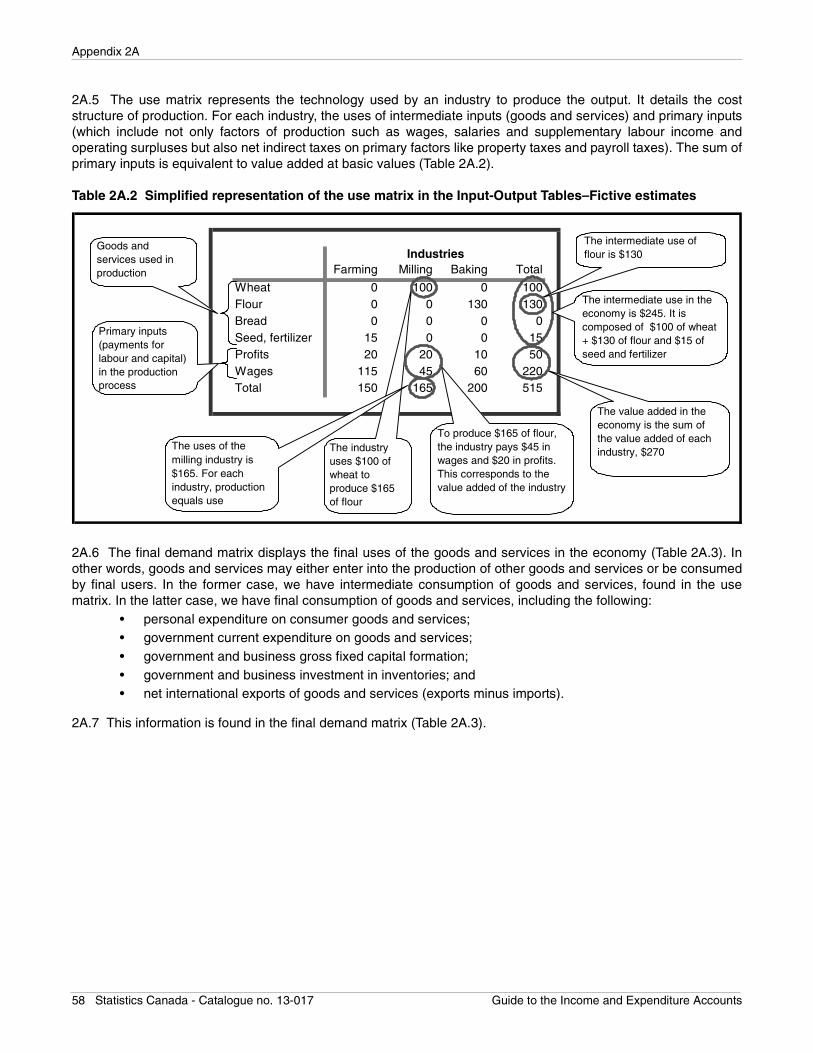
Appendix 2A
2A.5 The use matrix represents the technology used by an industry to produce the output. It details the coststructure of production. For each industry, the uses of intermediate inputs (goods and services) and primary inputs(which include not only factors of production such as wages, salaries and supplementary labour income andoperating surpluses but also net indirect taxes on primary factors like property taxes and payroll taxes). The sum ofprimary inputs is equivalent to value added at basic values (Table 2A.2).
Table 2A.2 Simplified representation of the use matrix in the Input-Output Tables–Fictive estimates
2A.6 The final demand matrix displays the final uses of the goods and services in the economy (Table 2A.3). Inother words, goods and services may either enter into the production of other goods and services or be consumedby final users. In the former case, we have intermediate consumption of goods and services, found in the usematrix. In the latter case, we have final consumption of goods and services, including the following:
• personal expenditure on consumer goods and services;• government current expenditure on goods and services;• government and business gross fixed capital formation;• government and business investment in inventories; and• net international exports of goods and services (exports minus imports).
2A.7 This information is found in the final demand matrix (Table 2A.3).
IndustriesFarming Milling Baking Total
Wheat 0 100 0 100Flour 0 0 130 130Bread 0 0 0 0Seed, fertilizer 15 0 0 15Profits 20 20 10 50Wages 115 45 60 220Total 150 165 200 515
The industry uses $100 of wheat to produce $165 of flour
The value added in the economy is the sum of the value added of each industry, $270
Goods and services used in production
Primary inputs (payments for labour and capital) in the production process
The intermediate use of flour is $130
The intermediate use in the economy is $245. It is composed of $100 of wheat + $130 of flour and $15 of seed and fertilizer
To produce $165 of flour, the industry pays $45 in wages and $20 in profits. This corresponds to the value added of the industry
The uses of the milling industry is $165. For each industry, production equals use
58 Statistics Canada - Catalogue no. 13-017 Guide to the Income and Expenditure Accounts
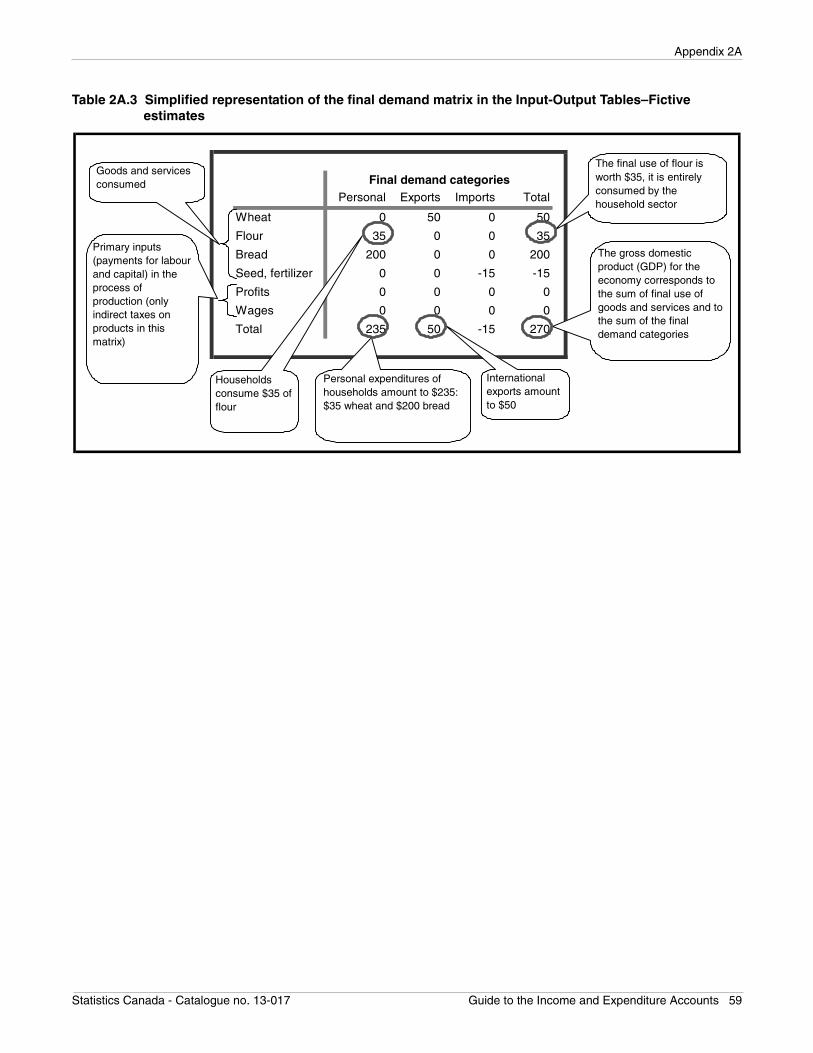
Appendix 2A
Table 2A.3 Simplified representation of the final demand matrix in the Input-Output Tables–Fictive estimates
Final demand categoriesPersonal Exports Imports Total
Wheat 0 50 0 50
Flour 35 0 0 35
Bread 200 0 0 200
Seed, fertilizer 0 0 -15 -15
Profits 0 0 0 0
Wages 0 0 0 0
Total 235 50 -15 270
Households consume $35 of flour
The gross domestic product (GDP) for the economy corresponds to the sum of final use of goods and services and to the sum of the final demand categories
Goods and services consumed
Primary inputs (payments for labour and capital) in the process of production (only indirect taxes on products in this matrix)
The final use of flour is worth $35, it is entirely consumed by the household sector
Personal expenditures of households amount to $235: $35 wheat and $200 bread
International exports amount to $50
Statistics Canada - Catalogue no. 13-017 Guide to the Income and Expenditure Accounts 59
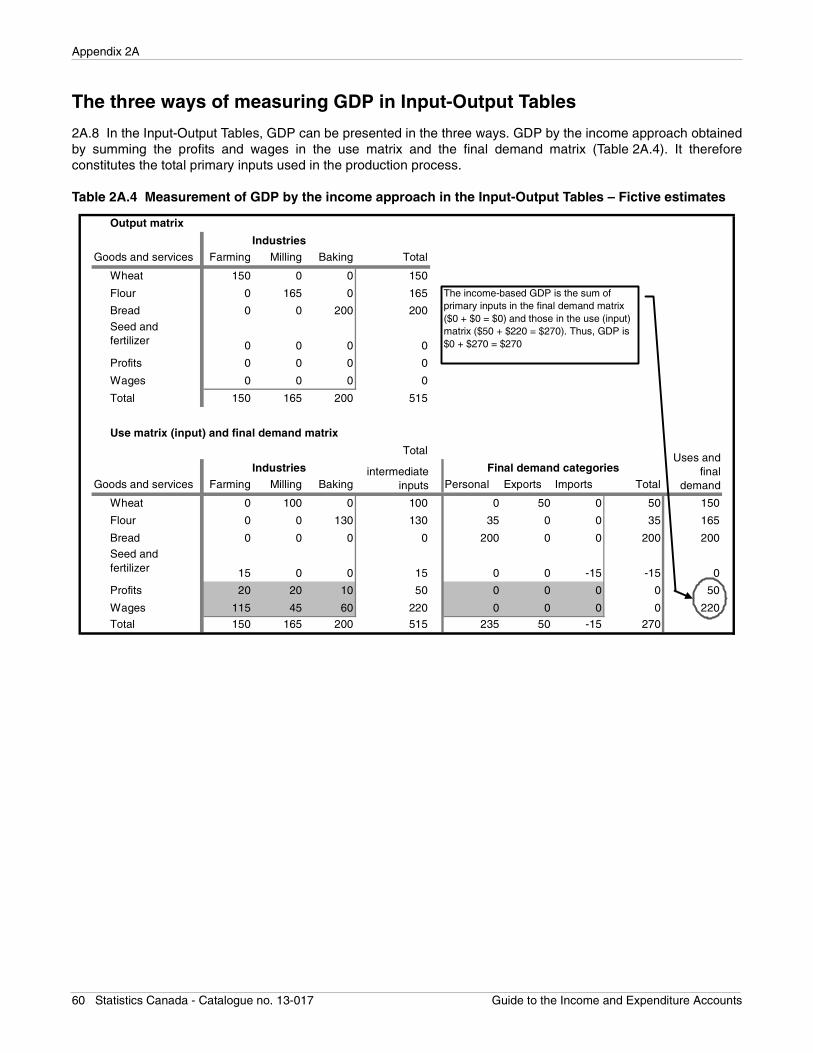
Appendix 2A
The three ways of measuring GDP in Input-Output Tables
2A.8 In the Input-Output Tables, GDP can be presented in the three ways. GDP by the income approach obtainedby summing the profits and wages in the use matrix and the final demand matrix (Table 2A.4). It thereforeconstitutes the total primary inputs used in the production process.
Table 2A.4 Measurement of GDP by the income approach in the Input-Output Tables – Fictive estimates
Output matrix
Goods and services Farming Milling Baking Total
Wheat 150 0 0 150
Flour 0 165 0 165
Bread 0 0 200 200
0 0 0 0
Profits 0 0 0 0
Wages 0 0 0 0
Total 150 165 200 515
Use matrix (input) and final demand matrix
Total
Industries Final demand categoriesGoods and services Farming Milling Baking Personal Exports Imports Total
Wheat 0 100 0 100 0 50 0 50 150
Flour 0 0 130 130 35 0 0 35 165
Bread 0 0 0 0 200 0 0 200 200
15 0 0 15 0 0 -15 -15 0
Profits 20 20 10 50 0 0 0 0 50
Wages 115 45 60 220 0 0 0 0 220
Total 150 165 200 515 235 50 -15 270
Industries
intermediate inputs
Uses and final
demand
Seed and fertilizer
Seed and fertilizer
The income-based GDP is the sum of primary inputs in the final demand matrix ($0 + $0 = $0) and those in the use (input) matrix ($50 + $220 = $270). Thus, GDP is $0 + $270 = $270
60 Statistics Canada - Catalogue no. 13-017 Guide to the Income and Expenditure Accounts
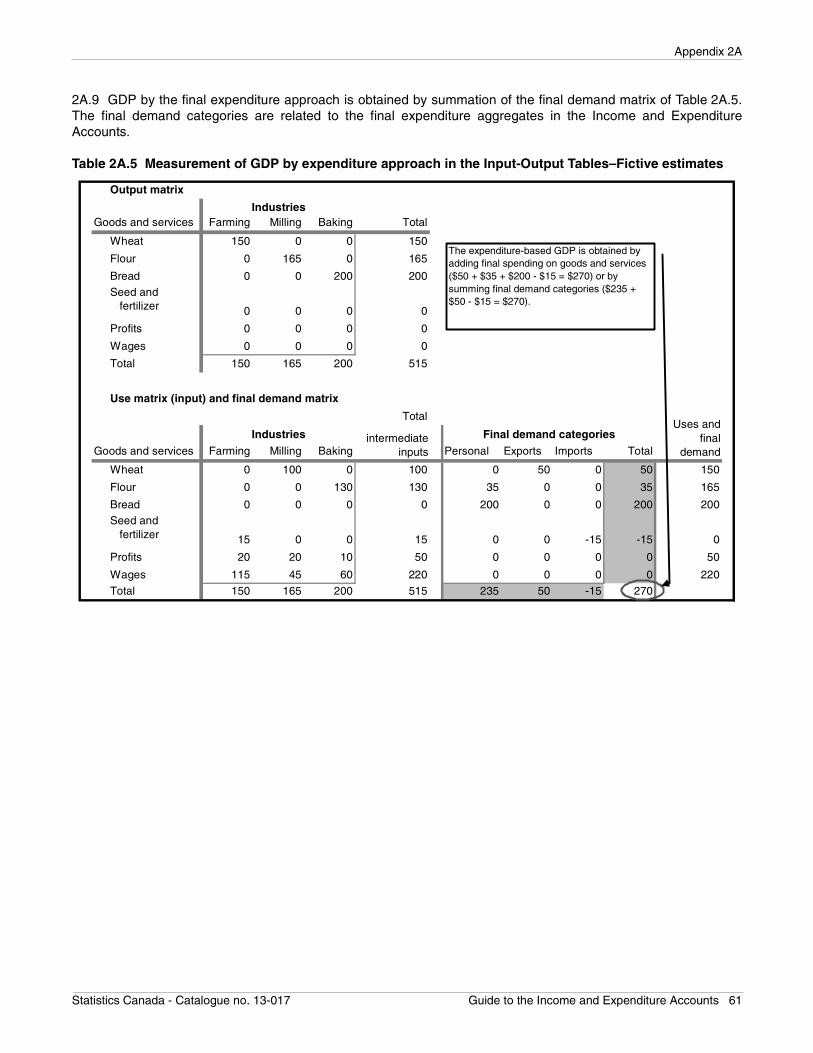
Appendix 2A
2A.9 GDP by the final expenditure approach is obtained by summation of the final demand matrix of Table 2A.5.The final demand categories are related to the final expenditure aggregates in the Income and ExpenditureAccounts.
Table 2A.5 Measurement of GDP by expenditure approach in the Input-Output Tables–Fictive estimates
Output matrix
Goods and services Farming Milling Baking Total
Wheat 150 0 0 150
Flour 0 165 0 165
Bread 0 0 200 200Seed and fertilizer 0 0 0 0
Profits 0 0 0 0
Wages 0 0 0 0
Total 150 165 200 515
Use matrix (input) and final demand matrix
Total
Industries Final demand categoriesGoods and services Farming Milling Baking Personal Exports Imports Total
Wheat 0 100 0 100 0 50 0 50 150
Flour 0 0 130 130 35 0 0 35 165
Bread 0 0 0 0 200 0 0 200 200Seed and fertilizer 15 0 0 15 0 0 -15 -15 0
Profits 20 20 10 50 0 0 0 0 50
Wages 115 45 60 220 0 0 0 0 220
Total 150 165 200 515 235 50 -15 270
Industries
Uses and final
demandintermediate
inputs
The expenditure-based GDP is obtained by adding final spending on goods and services ($50 + $35 + $200 - $15 = $270) or by summing final demand categories ($235 + $50 - $15 = $270).
Statistics Canada - Catalogue no. 13-017 Guide to the Income and Expenditure Accounts 61
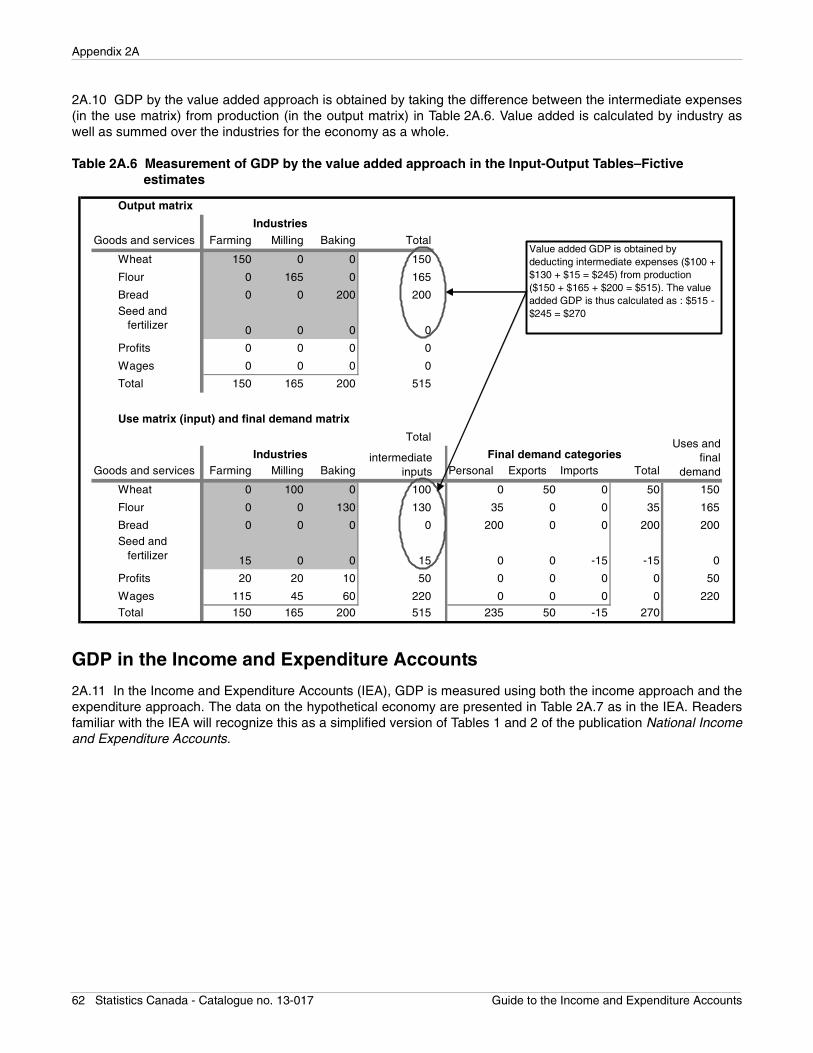
Appendix 2A
2A.10 GDP by the value added approach is obtained by taking the difference between the intermediate expenses(in the use matrix) from production (in the output matrix) in Table 2A.6. Value added is calculated by industry aswell as summed over the industries for the economy as a whole.
Table 2A.6 Measurement of GDP by the value added approach in the Input-Output Tables–Fictive estimates
GDP in the Income and Expenditure Accounts
2A.11 In the Income and Expenditure Accounts (IEA), GDP is measured using both the income approach and theexpenditure approach. The data on the hypothetical economy are presented in Table 2A.7 as in the IEA. Readersfamiliar with the IEA will recognize this as a simplified version of Tables 1 and 2 of the publication National Incomeand Expenditure Accounts.
Output matrix
Goods and services Farming Milling Baking Total
Wheat 150 0 0 150
Flour 0 165 0 165
Bread 0 0 200 200Seed and fertilizer 0 0 0 0
Profits 0 0 0 0
Wages 0 0 0 0
Total 150 165 200 515
Use matrix (input) and final demand matrix
Total
Industries Final demand categoriesGoods and services Farming Milling Baking Personal Exports Imports Total
Wheat 0 100 0 100 0 50 0 50 150
Flour 0 0 130 130 35 0 0 35 165
Bread 0 0 0 0 200 0 0 200 200Seed and fertilizer 15 0 0 15 0 0 -15 -15 0
Profits 20 20 10 50 0 0 0 0 50
Wages 115 45 60 220 0 0 0 0 220
Total 150 165 200 515 235 50 -15 270
Industries
Uses and final
demandintermediate
inputs
Value added GDP is obtained by deducting intermediate expenses ($100 + $130 + $15 = $245) from production ($150 + $165 + $200 = $515). The value added GDP is thus calculated as : $515 - $245 = $270
62 Statistics Canada - Catalogue no. 13-017 Guide to the Income and Expenditure Accounts
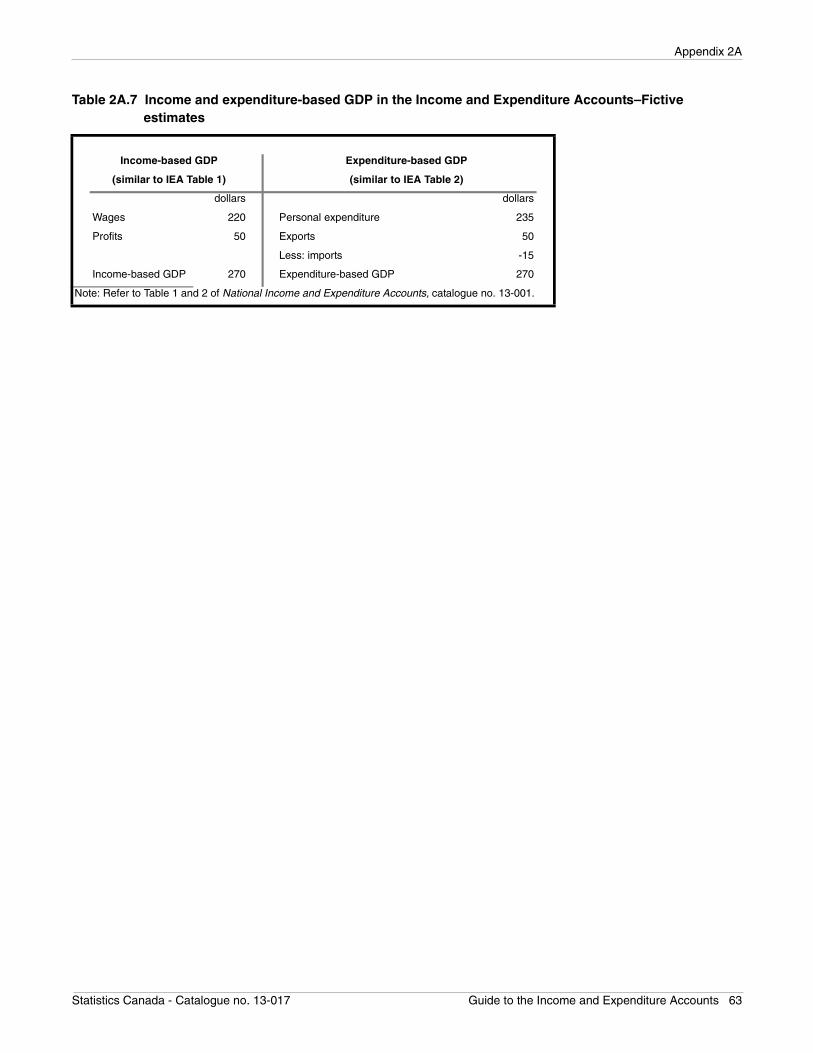
Appendix 2A
Table 2A.7 Income and expenditure-based GDP in the Income and Expenditure Accounts–Fictive estimates
Income-based GDP Expenditure-based GDP
(similar to IEA Table 1) (similar to IEA Table 2)
dollars dollars
Wages 220 Personal expenditure 235
Profits 50 Exports 50
Less: imports -15
Income-based GDP 270 Expenditure-based GDP 270
Note: Refer to Table 1 and 2 of National Income and Expenditure Accounts, catalogue no. 13-001.
Statistics Canada - Catalogue no. 13-017 Guide to the Income and Expenditure Accounts 63
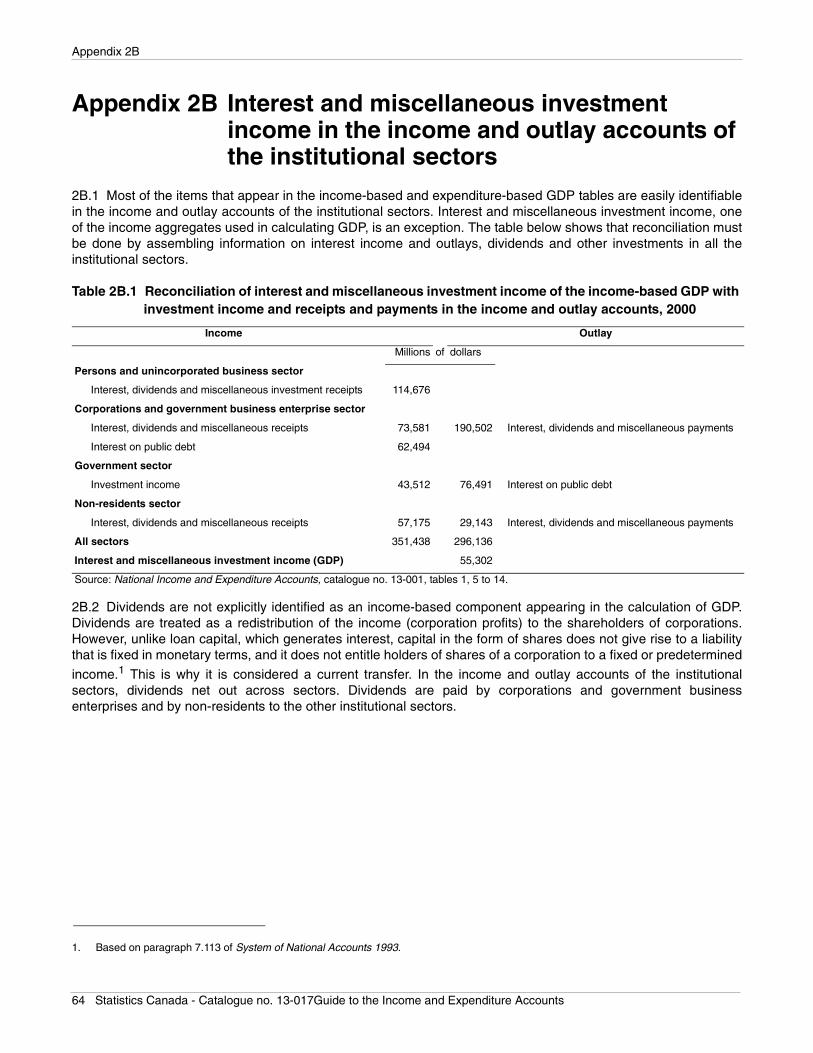
Appendix 2B
Appendix 2B Interest and miscellaneous investment income in the income and outlay accounts of the institutional sectors
2B.1 Most of the items that appear in the income-based and expenditure-based GDP tables are easily identifiablein the income and outlay accounts of the institutional sectors. Interest and miscellaneous investment income, oneof the income aggregates used in calculating GDP, is an exception. The table below shows that reconciliation mustbe done by assembling information on interest income and outlays, dividends and other investments in all theinstitutional sectors.
Table 2B.1 Reconciliation of interest and miscellaneous investment income of the income-based GDP with investment income and receipts and payments in the income and outlay accounts, 2000
2B.2 Dividends are not explicitly identified as an income-based component appearing in the calculation of GDP.Dividends are treated as a redistribution of the income (corporation profits) to the shareholders of corporations.However, unlike loan capital, which generates interest, capital in the form of shares does not give rise to a liabilitythat is fixed in monetary terms, and it does not entitle holders of shares of a corporation to a fixed or predetermined
income.1 This is why it is considered a current transfer. In the income and outlay accounts of the institutionalsectors, dividends net out across sectors. Dividends are paid by corporations and government businessenterprises and by non-residents to the other institutional sectors.
Income Outlay
Millions of dollars
Persons and unincorporated business sector
Interest, dividends and miscellaneous investment receipts 114,676
Corporations and government business enterprise sector
Interest, dividends and miscellaneous receipts 73,581 190,502 Interest, dividends and miscellaneous payments
Interest on public debt 62,494
Government sector
Investment income 43,512 76,491 Interest on public debt
Non-residents sector
Interest, dividends and miscellaneous receipts 57,175 29,143 Interest, dividends and miscellaneous payments
All sectors 351,438 296,136
Interest and miscellaneous investment income (GDP) 55,302
Source: National Income and Expenditure Accounts, catalogue no. 13-001, tables 1, 5 to 14.
1. Based on paragraph 7.113 of System of National Accounts 1993.
64 Statistics Canada - Catalogue no. 13-017Guide to the Income and Expenditure Accounts
Appendix 2B
2B.3 Interest on public debt appears twice. This item, which represents the commitments of the governmentsector, constitutes a government expenditure ($76,491 million in 2000). The same item appears as income of thecorporations and government business enterprise sector but the amount is lower, corresponding to thedomestically paid portion of interest on the public debt. The non-domestic portion is included in the income of non-residents as interest, dividends and miscellaneous receipts. The equality between the expenditures and incomerelated to interest on public debt shows that the latter is considered a current transfer. This treatment differs fromthe treatment of other interest payments in the economy, which are considered productive. There are two reasonsfor the special treatment reserved for interest on public debt. First, government borrowings are mainly used tofinance current spending rather than capital. Second, the shifting financing policies of governments should notaffect GDP. If service of the public debt were considered productive (and were hence included in GDP),governments could then increase or reduce GDP at will by switching between financing through income taxes
(which is a transfer) and financing through borrowing.2
2. On this subject, see the articles of Crozier, Robert B., The treatment of Interest on the Public Debt in the National Accounts, Canadian Journal of Economics and Political Science, Volume 25, November 1959, pp. 501-503 (1959) and Sunga, P. (1967, 1984) and Sunga, P., An Alternative to the Current Treatment of Interest as a Transfer in the United Nations and Canadian System of National Accounts, Review of Income and Wealth, Volume 30, December 1984, pp. 385-402, and The Treatment of Interest and Net Rents in the National Accounts Framework, Review of Income and Wealth, Volume 13, March 1967, pp. 26-35.
Statistics Canada - Catalogue no. 13-017 Guide to the Income and Expenditure Accounts 65
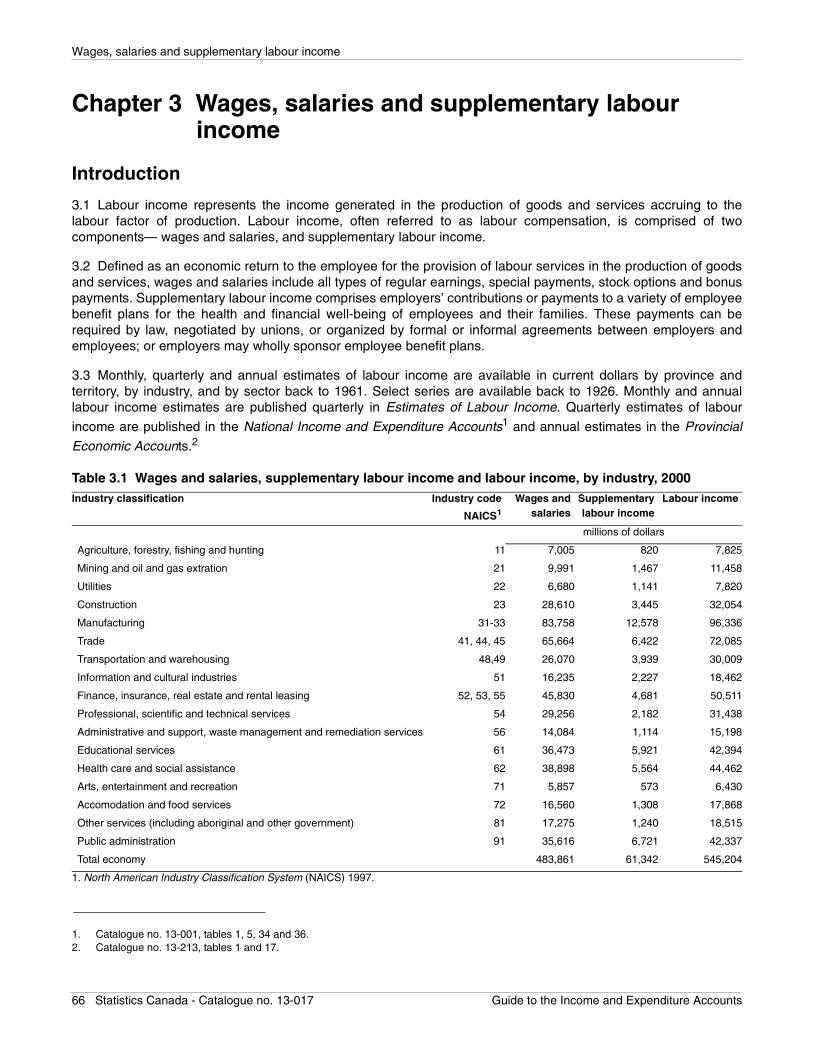
Wages, salaries and supplementary labour income
Chapter 3 Wages, salaries and supplementary labour income
Introduction
3.1 Labour income represents the income generated in the production of goods and services accruing to thelabour factor of production. Labour income, often referred to as labour compensation, is comprised of twocomponents— wages and salaries, and supplementary labour income.
3.2 Defined as an economic return to the employee for the provision of labour services in the production of goodsand services, wages and salaries include all types of regular earnings, special payments, stock options and bonuspayments. Supplementary labour income comprises employers’ contributions or payments to a variety of employeebenefit plans for the health and financial well-being of employees and their families. These payments can berequired by law, negotiated by unions, or organized by formal or informal agreements between employers andemployees; or employers may wholly sponsor employee benefit plans.
3.3 Monthly, quarterly and annual estimates of labour income are available in current dollars by province andterritory, by industry, and by sector back to 1961. Select series are available back to 1926. Monthly and annuallabour income estimates are published quarterly in Estimates of Labour Income. Quarterly estimates of labour
income are published in the National Income and Expenditure Accounts1 and annual estimates in the ProvincialEconomic Accounts.2
1. Catalogue no. 13-001, tables 1, 5, 34 and 36.2. Catalogue no. 13-213, tables 1 and 17.
Table 3.1 Wages and salaries, supplementary labour income and labour income, by industry, 2000Industry classification Industry code
NAICS1
Wages andsalaries
Supplementarylabour income
Labour income
millions of dollars
Agriculture, forestry, fishing and hunting 11 7,005 820 7,825
Mining and oil and gas extration 21 9,991 1,467 11,458
Utilities 22 6,680 1,141 7,820
Construction 23 28,610 3,445 32,054
Manufacturing 31-33 83,758 12,578 96,336
Trade 41, 44, 45 65,664 6,422 72,085
Transportation and warehousing 48,49 26,070 3,939 30,009
Information and cultural industries 51 16,235 2,227 18,462
Finance, insurance, real estate and rental leasing 52, 53, 55 45,830 4,681 50,511
Professional, scientific and technical services 54 29,256 2,182 31,438
Administrative and support, waste management and remediation services 56 14,084 1,114 15,198
Educational services 61 36,473 5,921 42,394
Health care and social assistance 62 38,898 5,564 44,462
Arts, entertainment and recreation 71 5,857 573 6,430
Accomodation and food services 72 16,560 1,308 17,868
Other services (including aboriginal and other government) 81 17,275 1,240 18,515
Public administration 91 35,616 6,721 42,337
Total economy 483,861 61,342 545,204
1. North American Industry Classification System (NAICS) 1997.
66 Statistics Canada - Catalogue no. 13-017 Guide to the Income and Expenditure Accounts
Wages, salaries and supplementary labour income
3.4 Labour income represents roughly 50% of gross domestic product (GDP), and comprises almost two thirds ofpersonal income. Over 70% of labour income is paid by businesses operating in Canada, while approximately 20%
is paid by various levels of government. The remainder is paid by personal sector organizations.3
3.5 Not included in labour income are incomes of self-employed individuals, such as sub-contractors,management consultants, lawyers, doctors, dentists, working owners of unincorporated businesses, soleproprietors involved in joint ventures or partnerships, and unincorporated farmers, all of whose incomes areincluded in the farm and non-farm unincorporated net income components of income-based gross domesticproduct.
Concepts and definitions
Wages and salaries
3.6 Broadly defined, wages and salaries4 comprise the gross pay before tax that is paid to employees in cash or inkind, for work performed under the general direction of an employer. Fundamental to this definition is an inherentemployer-employee relationship or contract of service, where the employer defines the time and place of work, thenature of the work, and the compensation provided for work done. Also implied in this employer-employee
relationship is a certain level of direct or indirect control5 where the employer is ultimately responsible for the hiringof employees and the termination of their employment. The compensation given to employees can be as varied asthe jobs themselves. Wages and salaries represent the many types of payments given to all employees regardlessof their occupation, method of payment, or duration of employment. Employees can be full-time, part-time, casual,or seasonal workers. In addition, employees can be paid on either an hourly, weekly, monthly or annual basis, aswell as receive special or irregular payments. Included in the compensation package can be a variety of base
salary plus commission arrangements, special payments,6 and performance bonuses, as well as taxable
allowances and benefits.7
3.7 The wages and salaries of all persons working for resident Canadian or foreign-owned companies areincluded in the estimate of total wages and salaries, whether they are Canadian citizens, landed immigrants, or
non-permanent residents.8 Military personnel and federal government employees working outside the country arealso included in labour income, as military bases, external affairs embassies and consulates are deemed Canadian
territory.9 On the other hand, Canadian residents working for Canadian or foreign-owned companies located
outside the country are not included in labour income.10
3. Business, government and personal sector wages and salaries are each shown in the persons and unincorporated businesses sectoraccount of the Income and Expenditure Accounts. The criteria used to select the organizations falling within each sector are identical tothat used throughout the Canadian System of National Accounts to identify the corporations and government business enterprises sectorand the government sector. The personal sector consists of organizations which are not operating for a profit, and are serving households.
4. See the international definition of wages and salaries, paragraph 7.32 in the System of National Accounts 1993.5. Certain athletes and artists may be considered employees depending on the nature of their contract. Certain construction workers may
also be considered employees rather than sub-contractors. Employee or Self-employed? (RC 4110), published by the Canada RevenueAgency, provides a checklist of questions to determine the existence of an employer-employee relationship.
6. Bonuses and retroactive pay increases, overtime pay, and directors’ fees are examples of special payments. A full list can be found in theSpecial Payments Chart in chapter 7 of the Canada Revenue Agency’s Employers’ Guide, Payroll Deductions and Remittances (T4001).This chart lists special payments for which employers must withhold Canada Pension Plan, Employment Insurance, or income tax.
7. Automobile allowances, board and lodging, and gifts are examples of taxable allowances and benefits. See the Benefits Chart, at the endof the Canada Revenue Agency’s Employers’ Guide, Taxable Benefits (T4130). This chart lists the taxable allowances and benefits forwhich employers must withhold Canada Pension Plan, Employment Insurance, or income tax. The chart also indicates whether the taxablebenefit is included as Goods and Services Tax (GST) or Harmonized Sales Tax (HST).
8. Any individual working in Canada requires a Social Insurance Number. Temporary social insurance numbers are given to non-permanentresidents and these are referred to as TTNs (Temporary Taxation Numbers).
9. Residents of countries other than Canada or locally engaged residents working for Canadian military bases or Canadian consulateslocated in foreign countries are excluded from labour income.
10. These include cross-border workers, such as Canadian nurses working in hospitals located in the United States.
Statistics Canada - Catalogue no. 13-017 Guide to the Income and Expenditure Accounts 67
Wages, salaries and supplementary labour income
Supplementary labour income
3.8 Supplementary labour income11 includes employers’ contributions to private and public sector pension plans,Canada and Quebec pension plans, employment insurance, workers’ compensation, health and life insuranceplans, and retirement allowances.
3.9 Supplementary labour income is defined as payments or contributions made by employers, out of their ownrevenue funds, and are therefore considered to be an employers’ labour cost. These payments or contributions canbe placed into private or government managed funds for the future benefit of employees and their families.Payments, such as retirement allowances, may also be made directly to employees upon termination of work.Many of these payments or contributions are required by law, such as the employers’ contributions to Canada andQuebec pension plans, the Employment Insurance Fund, and provincial and territorial workers compensationfunds. Some employers’ payments or contributions are unique to certain provinces, such as payments to specificprovincial medical plans in Alberta and British Columbia, while others are determined by provincial and territoriallabour legislation, such as retirement allowance payments. Employers’ payments or contributions can also bemade obligatory through union contracts or agreements between employers and employees, such as employers’contributions to private and public sector pension plans, and contributions to group health, life and dental insuranceplans.
Annual estimation methods and data sources
3.10 The annual and monthly estimates of labour income are closely intertwined. The annual estimates set thelevel of wages and salaries and supplementary labour income by industry and by province and territory, while themonthly estimates project the last annual estimate of labour income up to the most recent month.
3.11 Labour income estimates follow the Canadian System of National Accounts four year revision cycle. The firsttwo years of the revision cycle, known as benchmark years (t-4 and t-3), are reconciled with the Input-OutputTables. The third revision year (t-2) levels are built with the latest taxation statistics and survey information. Monthlypatterns, already established from the monthly projection process, are then adjusted to annual levels using astatistical technique called quadratic minimization. Both benchmark and third year estimates are built from a top-down approach, where the province and territory totals are established first and industry detail is allocated withinthese totals. For the last revision year (t-1) and most current period (t), monthly estimates of labour income arederived using a bottom-up approach, where estimates are derived first by industry within each province andterritory, and then aggregated to obtain totals by provinces and territories.
3.12 Similar data sources are used for wages and salaries and supplementary labour income in both thebenchmark and third year annual revision estimates. However, data sources are more varied for industry estimatesin the benchmark years as the Industry Accounts Division builds industry estimates of wages and salaries andsupplementary labour income using a wide range of published and unpublished survey data at very detailed NorthAmerican Industry Classification System (NAICS) levels.
3.13 The third non-benchmarked revision year, built solely by the Income and Expenditure Accounts Division, isbased on a smaller group of data sources and industry groups with heavy reliance on tax data as described below.
Wages and salaries
3.14 Wages and salaries are available for all provinces and territories as well as for outside Canada. In addition,wages and salaries estimates are produced for most industries at the two-digit NAICS level. Estimates are brokendown into three groups, wages and salaries paid by businesses, governments, and persons.
11. See the international definition of supplementary labour income, known as employers’ social contributions, paragraphs 7.43 to 7.47 and8.67 to 8.74 in the System of National Accounts 1993.
68 Statistics Canada - Catalogue no. 13-017 Guide to the Income and Expenditure Accounts
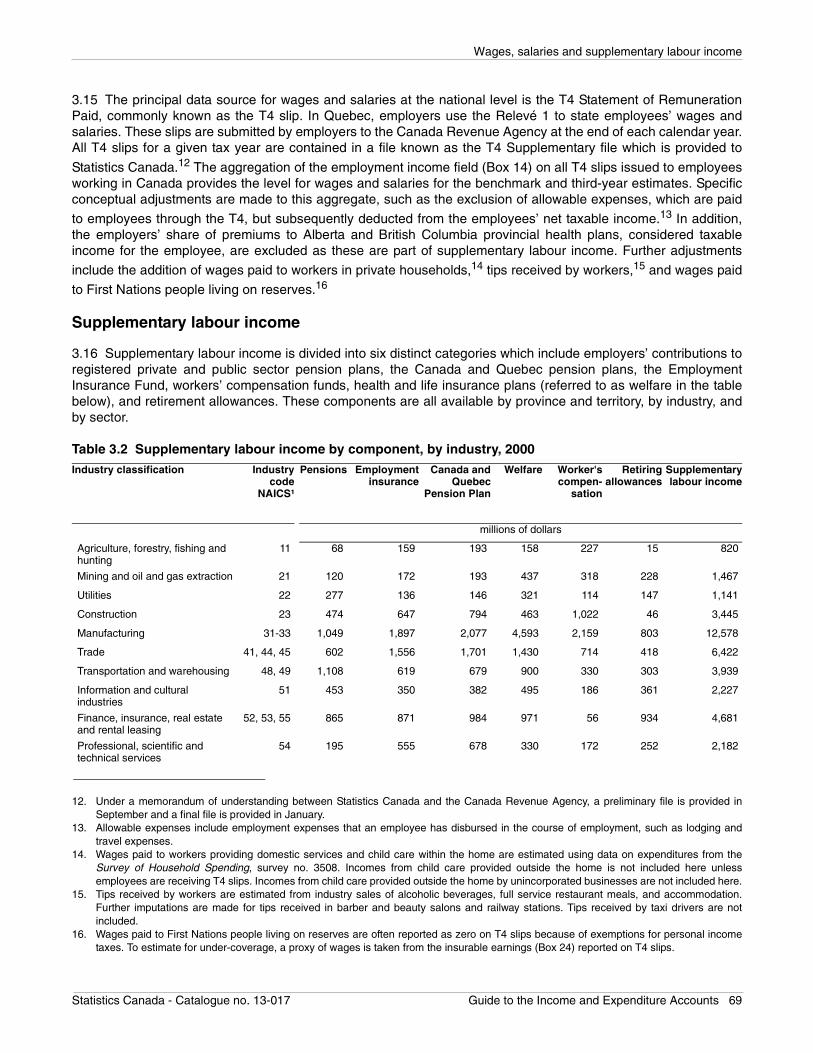
Wages, salaries and supplementary labour income
3.15 The principal data source for wages and salaries at the national level is the T4 Statement of RemunerationPaid, commonly known as the T4 slip. In Quebec, employers use the Relevé 1 to state employees’ wages andsalaries. These slips are submitted by employers to the Canada Revenue Agency at the end of each calendar year.All T4 slips for a given tax year are contained in a file known as the T4 Supplementary file which is provided to
Statistics Canada.12 The aggregation of the employment income field (Box 14) on all T4 slips issued to employeesworking in Canada provides the level for wages and salaries for the benchmark and third-year estimates. Specificconceptual adjustments are made to this aggregate, such as the exclusion of allowable expenses, which are paid
to employees through the T4, but subsequently deducted from the employees’ net taxable income.13 In addition,the employers’ share of premiums to Alberta and British Columbia provincial health plans, considered taxableincome for the employee, are excluded as these are part of supplementary labour income. Further adjustments
include the addition of wages paid to workers in private households,14 tips received by workers,15 and wages paid
to First Nations people living on reserves.16
Supplementary labour income
3.16 Supplementary labour income is divided into six distinct categories which include employers’ contributions toregistered private and public sector pension plans, the Canada and Quebec pension plans, the EmploymentInsurance Fund, workers’ compensation funds, health and life insurance plans (referred to as welfare in the tablebelow), and retirement allowances. These components are all available by province and territory, by industry, andby sector.
12. Under a memorandum of understanding between Statistics Canada and the Canada Revenue Agency, a preliminary file is provided inSeptember and a final file is provided in January.
13. Allowable expenses include employment expenses that an employee has disbursed in the course of employment, such as lodging andtravel expenses.
14. Wages paid to workers providing domestic services and child care within the home are estimated using data on expenditures from theSurvey of Household Spending, survey no. 3508. Incomes from child care provided outside the home is not included here unlessemployees are receiving T4 slips. Incomes from child care provided outside the home by unincorporated businesses are not included here.
15. Tips received by workers are estimated from industry sales of alcoholic beverages, full service restaurant meals, and accommodation.Further imputations are made for tips received in barber and beauty salons and railway stations. Tips received by taxi drivers are notincluded.
16. Wages paid to First Nations people living on reserves are often reported as zero on T4 slips because of exemptions for personal incometaxes. To estimate for under-coverage, a proxy of wages is taken from the insurable earnings (Box 24) reported on T4 slips.
Table 3.2 Supplementary labour income by component, by industry, 2000Industry classification Industry
codeNAICS¹
Pensions Employmentinsurance
Canada andQuebec
Pension Plan
Welfare Worker'scompen-
sation
Retiringallowances
Supplementarylabour income
millions of dollars
Agriculture, forestry, fishing and hunting
11 68 159 193 158 227 15 820
Mining and oil and gas extraction 21 120 172 193 437 318 228 1,467
Utilities 22 277 136 146 321 114 147 1,141
Construction 23 474 647 794 463 1,022 46 3,445
Manufacturing 31-33 1,049 1,897 2,077 4,593 2,159 803 12,578
Trade 41, 44, 45 602 1,556 1,701 1,430 714 418 6,422
Transportation and warehousing 48, 49 1,108 619 679 900 330 303 3,939
Information and cultural industries
51 453 350 382 495 186 361 2,227
Finance, insurance, real estate and rental leasing
52, 53, 55 865 871 984 971 56 934 4,681
Professional, scientific and technical services
54 195 555 678 330 172 252 2,182
Statistics Canada - Catalogue no. 13-017 Guide to the Income and Expenditure Accounts 69
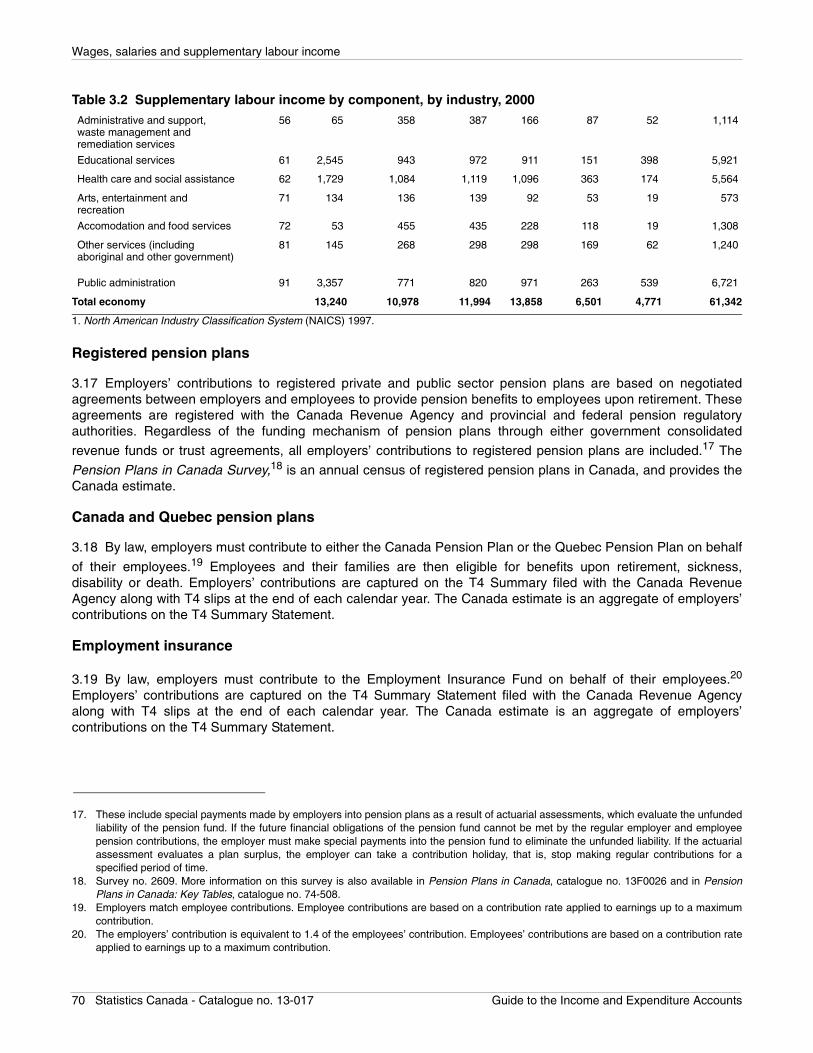
Wages, salaries and supplementary labour income
Registered pension plans
3.17 Employers’ contributions to registered private and public sector pension plans are based on negotiatedagreements between employers and employees to provide pension benefits to employees upon retirement. Theseagreements are registered with the Canada Revenue Agency and provincial and federal pension regulatoryauthorities. Regardless of the funding mechanism of pension plans through either government consolidated
revenue funds or trust agreements, all employers’ contributions to registered pension plans are included.17 The
Pension Plans in Canada Survey,18 is an annual census of registered pension plans in Canada, and provides theCanada estimate.
Canada and Quebec pension plans
3.18 By law, employers must contribute to either the Canada Pension Plan or the Quebec Pension Plan on behalf
of their employees.19 Employees and their families are then eligible for benefits upon retirement, sickness,disability or death. Employers’ contributions are captured on the T4 Summary filed with the Canada RevenueAgency along with T4 slips at the end of each calendar year. The Canada estimate is an aggregate of employers’contributions on the T4 Summary Statement.
Employment insurance
3.19 By law, employers must contribute to the Employment Insurance Fund on behalf of their employees.20
Employers’ contributions are captured on the T4 Summary Statement filed with the Canada Revenue Agencyalong with T4 slips at the end of each calendar year. The Canada estimate is an aggregate of employers’contributions on the T4 Summary Statement.
Administrative and support, waste management and remediation services
56 65 358 387 166 87 52 1,114
Educational services 61 2,545 943 972 911 151 398 5,921
Health care and social assistance 62 1,729 1,084 1,119 1,096 363 174 5,564
Arts, entertainment and recreation
71 134 136 139 92 53 19 573
Accomodation and food services 72 53 455 435 228 118 19 1,308
Other services (including aboriginal and other government)
81 145 268 298 298 169 62 1,240
Public administration 91 3,357 771 820 971 263 539 6,721
Total economy 13,240 10,978 11,994 13,858 6,501 4,771 61,342
1. North American Industry Classification System (NAICS) 1997.
17. These include special payments made by employers into pension plans as a result of actuarial assessments, which evaluate the unfundedliability of the pension fund. If the future financial obligations of the pension fund cannot be met by the regular employer and employeepension contributions, the employer must make special payments into the pension fund to eliminate the unfunded liability. If the actuarialassessment evaluates a plan surplus, the employer can take a contribution holiday, that is, stop making regular contributions for aspecified period of time.
18. Survey no. 2609. More information on this survey is also available in Pension Plans in Canada, catalogue no. 13F0026 and in PensionPlans in Canada: Key Tables, catalogue no. 74-508.
19. Employers match employee contributions. Employee contributions are based on a contribution rate applied to earnings up to a maximumcontribution.
20. The employers’ contribution is equivalent to 1.4 of the employees’ contribution. Employees’ contributions are based on a contribution rateapplied to earnings up to a maximum contribution.
Table 3.2 Supplementary labour income by component, by industry, 2000
70 Statistics Canada - Catalogue no. 13-017 Guide to the Income and Expenditure Accounts
Wages, salaries and supplementary labour income
Workers’ compensation
3.20 By law, employers must contribute to employee work injury insurance plans operated and administered byprovincial and territorial workers’ compensation boards. Employers must contribute to workers’ compensationfunds based on their industry’s injury rate applied to their payrolls. In the event of an accident or injury, theemployer is not held liable and the employee or their family is eligible for a range of services and benefits. Self-insurers, who pay administration fees for the application of the insurance program to their employees, and who paythe full amount of the benefits administered by the provincial and territorial boards, are also included.
Welfare
3.21 Employers’ contributions to a variety of public21 and non-profit health, dental, accident, sickness and lifeinsurance benefit plans fall under this group. Five sub-groups are represented in the welfare component ofsupplementary labour income, which are:
• employers’ contributions to accident and sickness insurance plans;• group term life insurance plans;
• administrative service contracts;22
• premiums to provincial health plans in Alberta and British Columbia; and• non-profit health plans.
3.22 These plans offer a wide variety of life and health insurance coverage—from basic physician, hospital anddrug expenses to specialized health care services, such as eye and dental care, mental health services, andspecialized physical treatment services, such as podiatric and chiropractic services. Employers’ contributions tothese plans may depend on formal or informal agreements between employers and their employees.
Retirement allowances
3.23 Upon retirement, layoff or termination, employees may be eligible for retirement allowances depending on thecontractual obligations of employers, and jurisdictional labour legislation. Retirement allowances or severance pay
is an amount paid by employers to an employee in recognition of long service or loss of employment.23 The datasource for retiring allowances is the T4A Supplementary file, which includes all statements of pension, retirement,annuity, and other income filed with the Canada Revenue Agency at the end of each calendar year. The
aggregation of all T4A slips24 issued by employers provides the annual estimate of retiring allowances.
The quarterly and monthly estimates of labour income
3.24 Monthly estimates of wages and salaries are produced by industry and by province and territory.Supplementary labour income is also produced on a monthly basis by province and territory. Estimates of labourincome paid by the business, government and personal sectors are produced on a quarterly basis only at theCanada level.
21. Only employers’ contributions to both Alberta and British Columbia provincial health insurance plans are included in supplementary labourincome. Employer payroll taxes are not included in supplementary labour income but are included as indirect taxes on production.
22. Administrative service contracts are arrangements between employers and insurance companies where employers pay for the healthbenefits of employees on a pay-as-required basis. Claims are approved and administered by an insurance company or third party for anadministrative fee. Insurance companies administer these contracts under which employers pay for benefits to employees outside of groupinsurance plans. Short-term and long-term disability income protection, extended health care coverage, and dental care expenses can allbe provided in this way.
23. This does not include unused sick leave credits or vacation leave credits which are part of wages and salaries. However, it does includegolden handshakes, cash-outs, or wrongful dismissal payments.
24. Box 26 includes the amount eligible for transfer to Registered Retirement Savings Plans (RRSP), and Box 27 includes the amount noteligible for transfer.
Statistics Canada - Catalogue no. 13-017 Guide to the Income and Expenditure Accounts 71
Wages, salaries and supplementary labour income
Wages and salaries
3.25 The estimation of wages and salaries is derived through a complex series of steps, which involves not onlythe projection of monthly trends in wages and salaries by industry, and by province and territory, but also therevision of monthly patterns for both current and benchmark years. The monthly estimates of wages and salaries
are produced by broad industry groups25 for each province and territory, using monthly trend indicators ofearnings, average weekly earnings, and employment. The data are then seasonally adjusted using StatisticsCanada’s X-11 ARIMA program.
3.26 The Survey of Employment, Payroll and Hours26 (SEPH) provides the most detailed trend indicator of
unadjusted earnings, hours and employment by industry,27 and by province and territory.28 These indicatorscharacterize the composition of earnings by highlighting increases in average weekly earnings, employment, andhours worked.
3.27 The Survey of Employment, Payroll and Hours also provides the only comprehensive estimate of irregular orspecial payments. While these payments form only a small percentage of the total wages and salaries, they canhave enormous impacts on some provinces and territories, as well as on industries. Therefore, it is important that
these special payments be disaggregated from the overall estimates so that their impact can be analyzed.29
3.28 Data on special payments is supplemented with information on retroactive special payments gathered from
collective bargaining bulletins30 issued by Human Resources and Skills Development Canada on recent collectivebargaining settlements by unions. This source identifies major wage developments in collective bargaining inCanada, reporting the number of employees affected, as well as the increases in rate of pay. All special paymentsincluding retroactive payments are treated on a cash-basis rather than an accrual-basis.
3.29 Data on work stoppages in effect during the month are also used to estimate trends in wages and salaries.Weekly reports are available from Human Resources and Skills Development Canada on major work stoppagesthat affect 500 or more workers. These reports identify the employer, location and union affected, the number ofworkers involved, and the start and end dates of work stoppages. Monthly work stoppages are calculated byindustry for each province and territory using average weekly earnings multiplied by the number of employeesaffected. An estimate of “money lost” is used to adjust wages and salaries prior to seasonal adjustment.
3.30 Information gleaned from media articles is also an important source in identifying recent labour disputes,strikes, layoffs, and the impact of wage settlements.
3.31 Employment and earnings data from the Labour Force Survey also provide monthly indicators of trends in
wages and salaries of paid workers by province and territory,31 and by industry.32 These data provide an additionaltrend perspective, since they are based on information supplied by workers living in the household, rather thandata supplied by employers.
25. Due to the complexity of preparing monthly projections, by industry and by province and territory, some industry estimates are combined.For example, the professional and personal services group includes: professional, scientific and technical services; administrative andsupport, waste management and remediation services; arts, entertainment and recreation; accommodation and food services; and otherservices.
26. Survey no. 2612. Monthly estimates derived from the payroll deductions administrative data received from Canada Revenue Agency arecombined with the results of the Business Payroll Survey (no. 2614) to produce estimates for the full range of SEPH variables.
27. Employers in agriculture, fishing and trapping, private household services, religious organizations and military personnel are excluded.28. The province of establishment derived from the Business Register is used by SEPH.29. Special payments include items such as overtime payments, retroactive pay and bonus payments. As an example, overtime payments
during the 1998 ice storm were significant.30. See Collective Bargaining, Workplace Information Directorate, Labour Program, Human Resources and Skills Development Canada at
www.labour.gc.ca.31. The Labour Force Survey excludes the Yukon, Northwest Territories, Nunavut, persons living on Indian Reserves, and inmates.32. The Labour Force Survey excludes defence services and aboriginal public administration.
72 Statistics Canada - Catalogue no. 13-017 Guide to the Income and Expenditure Accounts
Wages, salaries and supplementary labour income
3.32 The Public Institutions Division (PID) provides the sole timely source of employment and payroll data for thepublic administration industry. PID supplies monthly employment and gross payroll data for the federal governmentand the military, as well as provincial governments. PID also supplies a breakdown of gross payroll into regular pay
and special payments33 for both federal and provincial employees.
3.33 Other ad hoc information may be obtained from a variety of sources. Trends in employers’ provincial payrolltaxes, or assessed employers’ payrolls compiled by workers compensation boards, may be provided by provincialand territorial contacts. Data on current remittances of personal income taxes may also provide ad hoc trendinformation. Status reports received from the Canada Revenue Agency on the processing of individual tax formsfor the current tax year, although less timely, are also useful in confirming published trends in wages and salaries
by province and territory. Lastly, the Canadian Payroll Manual34 monthly bulletins on changes in tax legislationaffecting employers’ payrolls are consulted.
Supplementary labour income
3.34 Few data sources are available on a monthly basis to estimate supplementary labour income by province andterritory. Employers’ contributions to the Employment Insurance Fund and the Canada and Quebec pension plansare projected on the basis of trends in employment as well as rate increases, if any, throughout the year.
3.35 The remaining components of supplementary labour income are combined and estimated as a group usingthe trends in wages and salaries, due to the scarcity of indicators. Newspaper articles may provide someinformation on retiring allowances, if a large number of people are affected as a result of downsizing or businessclosures. National adjustments may be made for retiring allowances, workers compensation, or welfare, whenlarge significant payments or changes in employers’ contributions have been substantiated. In addition, quarterlyestimates of employers’ contributions to pensions obtained from the Quarterly Survey of Trusteed Pension Fundsare monitored and adjustments may be made for upcoming unfunded liability payments, or for contributionholidays, if known.
3.36 The supplementary labour income estimates are seasonally adjusted for each province and territory using
the X-11 ARIMA program.35
Labour income by sector
3.37 Labour income paid by the business, government, and personal sectors is estimated by quarter for Canadaonly. Labour income paid by the government sector is estimated using the trend in public administration wages andsalaries. Labour income paid by the business and personal sectors is estimated by quarter using the trend in thetotal economy, as well as information gleaned from ad hoc sources.
3.38 Although great care is taken on a monthly basis to accurately estimate the current data, revisions are oftenmade in the preparation of the quarterly Income and Expenditure Accounts, and must be reworked through theindustry detail within each province and territory because of the monthly bottom-up approach used in estimatingwages and salaries. Generally, revisions occur because of additional information received from other componentsof the accounts.
33. Data on special payments are provided for retroactive payment, overtime, extra duty, bonuses, and taxable allowances and benefits.34. The Canadian Payroll Manual (Thomson-Carswell, Toronto, Ontario).35. The X-11ARIMA program can seasonally adjust complete or partial time series stored in the FAME database. The major features of the
X-11 ARIMA are detection of seasonal trends; adjustment of raw data; and calculation of seasonal factors.
Statistics Canada - Catalogue no. 13-017 Guide to the Income and Expenditure Accounts 73

Wages, salaries and supplementary labour income
Provincial, territorial, industrial and sectoral estimation methods and data sources
3.39 Two geographic measures of wages and salaries and supplementary labour income are published. The firstis by province and territory of employment, or place of work, which is used in the calculation of provincial income-based gross domestic product. The second is by province and territory of residence, which is used in thecalculation of personal disposable income and saving.
Wages and salaries
Province or territory of employment
3.40 Provincial and territorial estimates of wages and salaries are derived using the province of employment code
(Box 29) on the T4 slip.36 The province of employment code reflects the province or territory where the workactually takes place. Employers are required to issue T4 slips identifying the province or territory in which the
employee is currently working when the employee reports to an establishment within that province or territory.37 Ifan employee is transferred from one province or territory to another over the course of the year, multiple T4 slipswill be issued to the employee.
Province or territory of residence
3.41 The distribution of labour income38 on a province of residence basis is primarily estimated by applying thegeographical shares of employment income obtained from the province of residence code of the T1 Personal
Master File to the national total of labour income. The T1 Personal Master File39 includes all individual income taxreturns required by law to be completed by Canadian residents. Employment income as reported on the federalincome tax return (line 101) is used to calculate the provincial and territorial shares of employment income on aprovince of residence basis.
Industries
3.42 The calculation of wages and salaries by industry involves a number of different steps. First, all T4 slips40
issued by an employer are aggregated under the employer’s business number.41 This information is then linked to
Statistics Canada’s Business Register42 which provides the industrial activities43 of over two million businessesoperating in Canada. The aggregated income of all T4 slips issued by individual businesses is then distributedamong the specific industries under which the business operates using the number of employees in each unique
industry. This initial matrix of wages and salaries by province and territory and by industry44 is the starting point forthe annual industry estimates. Throughout this chapter this process will be referred to as the T4 allocation process.
36. The use of the province of employment code (Box 29) on the T4 slip was first published with the 1981-1991 historical revision of theProvincial Economic Accounts in April 1993. Prior to 1981, there was only one regional distribution of wages and salaries that wasconstructed by industry using annual censuses and monthly sample surveys from Statistics Canada, data from the Public Accounts, aswell as administrative data obtained from Revenue Canada (now the Canada Revenue Agency).
37. A typical example would be federal government employees living in Gatineau, Quebec but working in Ottawa, Ontario. These employeeswould have T4 slips showing Ontario as the province of employment.
38. Province of residence estimates are produced for labour income only.39. A Canada Revenue Agency (CRA) file.40. Information on all T4 slips is found on the Canada Revenue Agency T4 Supplementary file. 41. Business numbers are issued by Canada Revenue Agency to identify business payroll accounts under which businesses remit various
payments.42. The Business Register is a central repository of information on businesses in Canada, used as the principal frame for economic statistics
programs.43. The industrial activities of enterprises on the Business Register are classified according to the North American Industrial Classification
System (NAICS).44. Six-digit NAICS is the most detailed industrial classification used at Statistics Canada.
74 Statistics Canada - Catalogue no. 13-017 Guide to the Income and Expenditure Accounts
Wages, salaries and supplementary labour income
3.43 Industry estimates for public sector organizations, such as hospitals, elementary and secondary schools,colleges, universities, and residential care facilities are supplied by various Statistics Canada divisions. Federal,provincial and municipal government estimates are obtained from public accounts data and taxation statistics.
3.44 For the benchmarked years, reconciliation of wages and salaries by industry with the Industry Accounts
Division (IAD)45 is conducted for business, government and personal sectors. The result is a final matrix of wagesand salaries by industry at the two-digit NAICS level, calculated using a combination of administrative and surveydata sources.
Sectors
Business
3.45 Wages and salaries paid by business sector organizations comprise all privately controlled or ownedenterprises together with government business enterprises, all of whose primary motivation is profit making. Usinga wide range of survey and T4 data sources, the business sector estimates by industry are derived in conjunction
with Industry Accounts Division for the benchmark years.46 The third-year business sector estimates are derivedusing T4 levels and trend estimates applied to benchmark levels. For the benchmark and third-year estimates (t-4,t-3, and t-2), the top down approach requires that control totals are first established by province and territory, andthen by sector. Estimates of the government and personal sector by industry are then removed leaving a controltotal for the business sector.
3.46 Due to the size of the business sector, and the various sources used, minor adjustments to industries areoften necessary to balance the business sector to provincial and territorial control totals.
Government
3.47 Wages and salaries paid by the government sector include all wages and salaries paid by federal, provincial,and municipal governments, as well as public hospitals, municipal school boards, colleges, universities andresidential care facilities. All government units are identified and classified by Public Institutions Division, usingspecific classification criteria. The government sector estimates are produced by industry from a number ofsources, including public accounts, budgetary estimates, information obtained from detailed expenditure filesreceived directly from provincial and territorial governments, T4 data, and data obtained from other StatisticsCanada subject matter divisions.
Personal
3.48 Wages and salaries paid by personal sector organizations include organizations serving households thatprovide services free of charge or at less than economically significant prices. These organizations include childand family social services, charitable organizations, non-profit organizations serving households, labour unions,political organizations, social advocacy groups, civic and fraternal societies, and religious organizations. Theuniverse of personal sector organizations is principally derived from charitable organizations reporting on theRegistered Charity Information Return, and non-profit organizations reporting on the Non-Profit Organization
(NPO) Information Return.47 Considerable effort is made to remove entities classified to the government sectorand the business sector, by using a selection of business numbers and industry classifications. The remainingorganizations are then linked to the T4 file to obtain wages and salaries. Personal sector organizations which donot report on the charities or non-profit files but are providing similar services to households are added to the
45. Own-account construction derived by the Industry Accounts Division is added back to each industry to reconcile with the Income andExpenditure Accounts Division’s labour income estimates. The Industry Accounts Division excludes own-account estimates from allindustries and combines own-account and regular construction activity together to form the construction industry.
46. The Industry Accounts Division produces detailed industry estimates for about 300 industry groups (roughly corresponding to four-digitNAICS), whereas the Income and Expenditures Accounts Division produces industry estimates at aggregate industry levels (two-digitNAICS).
47. Canada Revenue Agency T3010A and T1044 forms, respectively.
Statistics Canada - Catalogue no. 13-017 Guide to the Income and Expenditure Accounts 75
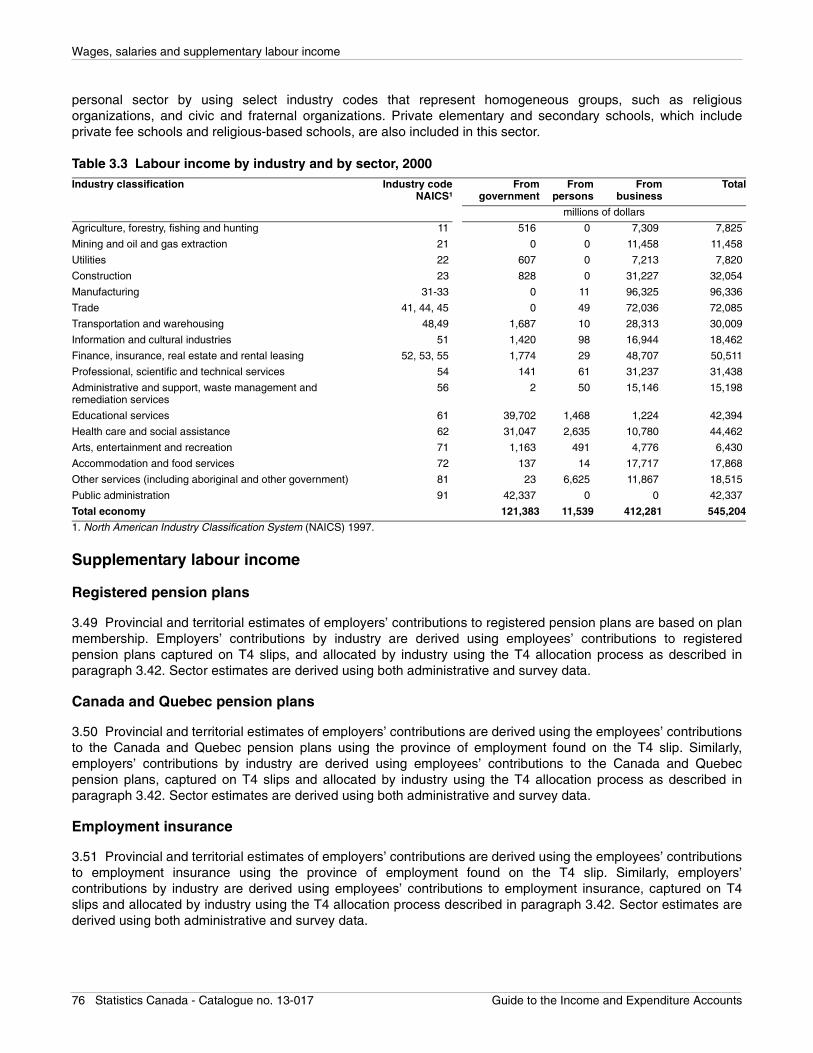
Wages, salaries and supplementary labour income
personal sector by using select industry codes that represent homogeneous groups, such as religiousorganizations, and civic and fraternal organizations. Private elementary and secondary schools, which includeprivate fee schools and religious-based schools, are also included in this sector.
Supplementary labour income
Registered pension plans
3.49 Provincial and territorial estimates of employers’ contributions to registered pension plans are based on planmembership. Employers’ contributions by industry are derived using employees’ contributions to registeredpension plans captured on T4 slips, and allocated by industry using the T4 allocation process as described inparagraph 3.42. Sector estimates are derived using both administrative and survey data.
Canada and Quebec pension plans
3.50 Provincial and territorial estimates of employers’ contributions are derived using the employees’ contributionsto the Canada and Quebec pension plans using the province of employment found on the T4 slip. Similarly,employers’ contributions by industry are derived using employees’ contributions to the Canada and Quebecpension plans, captured on T4 slips and allocated by industry using the T4 allocation process as described inparagraph 3.42. Sector estimates are derived using both administrative and survey data.
Employment insurance
3.51 Provincial and territorial estimates of employers’ contributions are derived using the employees’ contributionsto employment insurance using the province of employment found on the T4 slip. Similarly, employers’contributions by industry are derived using employees’ contributions to employment insurance, captured on T4slips and allocated by industry using the T4 allocation process described in paragraph 3.42. Sector estimates arederived using both administrative and survey data.
Table 3.3 Labour income by industry and by sector, 2000Industry classification Industry code
NAICS¹From
governmentFrom
personsFrom
businessTotal
millions of dollars
Agriculture, forestry, fishing and hunting 11 516 0 7,309 7,825
Mining and oil and gas extraction 21 0 0 11,458 11,458
Utilities 22 607 0 7,213 7,820
Construction 23 828 0 31,227 32,054
Manufacturing 31-33 0 11 96,325 96,336
Trade 41, 44, 45 0 49 72,036 72,085
Transportation and warehousing 48,49 1,687 10 28,313 30,009
Information and cultural industries 51 1,420 98 16,944 18,462
Finance, insurance, real estate and rental leasing 52, 53, 55 1,774 29 48,707 50,511
Professional, scientific and technical services 54 141 61 31,237 31,438
Administrative and support, waste management and remediation services
56 2 50 15,146 15,198
Educational services 61 39,702 1,468 1,224 42,394
Health care and social assistance 62 31,047 2,635 10,780 44,462
Arts, entertainment and recreation 71 1,163 491 4,776 6,430
Accommodation and food services 72 137 14 17,717 17,868
Other services (including aboriginal and other government) 81 23 6,625 11,867 18,515
Public administration 91 42,337 0 0 42,337
Total economy 121,383 11,539 412,281 545,204
1. North American Industry Classification System (NAICS) 1997.
76 Statistics Canada - Catalogue no. 13-017 Guide to the Income and Expenditure Accounts

Wages, salaries and supplementary labour income
Workers’ compensation
3.52 Provincial and territorial estimates are derived from premium revenues received by workers compensationboards. The amount that employers contribute to workers’ compensation varies by province and territory,depending on assessment rates by industry, applied to gross payrolls. The industry estimates are derived from a
historical set of industry by province and territory ratios.48 Sector estimates are derived using both administrativeand survey data.
Welfare
3.53 Provincial and territorial estimates of employers’ contributions to welfare are derived from the Canadian
Health and Life Insurance Association,49 Alberta and British Columbia government health plan premiums, andpremium revenue received by non-profit health insurance organizations. The industry estimates are derived from ahistorical set of industry by province and territory ratios. Sector estimates are derived using both administrative andsurvey data.
Retirement allowances
3.54 Provincial and territorial estimates are derived using the province of employment on the T4 slip to obtain theemployees’ last place of work. Retirement allowances are allocated by industry using Statistics Canada’s BusinessRegister, as well as the distribution of wages and salaries by industry from the T4 allocation process as describedin paragraph 3.42. Sector estimates are derived using administrative and survey data.
48. These historical ratios by industry and by province and territory were based on Labour Costs in Canada, catalogue no. 72-618, which laterbecame Employee Compensation in Canada, catalogue no. 72-619, which in turn was discontinued in the early 1980s.
49. Information obtained from Canadian Life and Health Insurance Association Inc., Toronto, Ontario.
Statistics Canada - Catalogue no. 13-017 Guide to the Income and Expenditure Accounts 77
Entrepreneurial income: Operating surplus
Chapter 4 Entrepreneurial income: Operating surplus
Introduction
Basic concepts
4.1 Operating surplus represents the income of corporations and government business enterprises accruing to thecapital factor of production from the production of goods and services. The international System of NationalAccounts (SNA 1993) labels operating surplus, often referred to as capital income, as a component ofentrepreneurial income. In Canada, operating surplus is the largest component of entrepreneurial income, with theincome generated from production by unincorporated businesses making up the balance. However,
unincorporated business income is described as mixed income1 because it contains remuneration for work doneby the owner(s), which cannot be separated from the return to the owner as entrepreneur (see Chapter 5).
4.2 In the Canadian System of National Accounts (CSNA), estimates of operating surplus by industry are shownexplicitly in the Input-Output Tables (IOT). However, the aggregate operating surplus generated in the Canadianeconomy is decomposed into the five components in the National Income and Expenditure Accounts (NIEA) and in
the provincial and territorial economic accounts (PTEA). The income-based estimates of GDP2 present the fivecomponents of gross operating surplus separately:
• Corporation profits before taxes• Government business enterprises profits before taxes• Interest and miscellaneous investment income• Inventory valuation adjustment• Capital consumption allowances
4.3 The integration of the IOT and the Income and Expenditure Accounts (IEA), accomplished through an annualreconciliation exercise referred to as benchmarking, results in a single unambiguous measure of operating
surplus.3 This measure is published in the IOT, but only its components are published in the IEA.
4.4 This chapter will be completed at a later date. It will first discuss operating surplus followed by a discussion ofits components, as they are presented in the IEA.
Statistical details and presentation of operating surplus
4.5 The SNA 1993 generation of income account shows the sectors or industries in which the primary incomesoriginate, as distinct from the sectors destined to receive such income, hence reflecting earnings before transfershave a redistributive effect. The operating surplus or deficit is derived as the balancing item in the generation ofincome account as follows:
Value added at basic prices-Compensation of employees payable-Taxes on production payable+Subsidies on production receivable
1. The income generated by owner-occupiers in their capacity as producers of housing services is included with the mixedincome component in the Canadian SNA as it represents all income generated by unincorporated businesses. That incomeis included with operating surplus in the generation of income account presented in the SNA 1993.
2. For the provincial and territorial economic accounts, the government business enterprises profits before taxes are includedwith the interest and miscellaneous investment income component.
3. The statistical discrepancy shown in the derivation of income-based GDP has to be added to the sum of the fivecomponents to equal the operating surplus in the IOT.
78 Statistics Canada - Catalogue no. 13-017 Guide to the Income and Expenditure Accounts
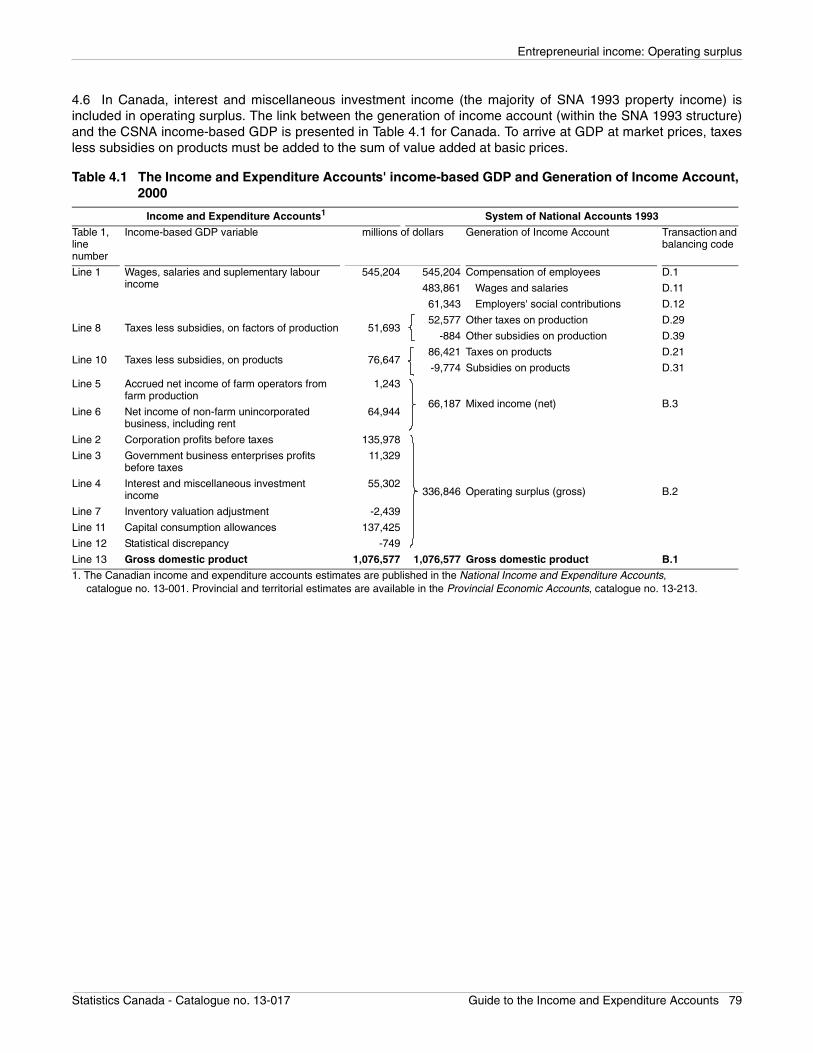
Entrepreneurial income: Operating surplus
4.6 In Canada, interest and miscellaneous investment income (the majority of SNA 1993 property income) isincluded in operating surplus. The link between the generation of income account (within the SNA 1993 structure)and the CSNA income-based GDP is presented in Table 4.1 for Canada. To arrive at GDP at market prices, taxesless subsidies on products must be added to the sum of value added at basic prices.
Table 4.1 The Income and Expenditure Accounts' income-based GDP and Generation of Income Account, 2000
Income and Expenditure Accounts1 System of National Accounts 1993
Table 1, line number
Income-based GDP variable millions of dollars Generation of Income Account Transaction and balancing code
Line 1 Wages, salaries and suplementary labour income
545,204 545,204 Compensation of employees D.1
483,861 Wages and salaries D.11
61,343 Employers' social contributions D.12
Line 8 Taxes less subsidies, on factors of production 51,69352,577 Other taxes on production D.29
-884 Other subsidies on production D.39
Line 10 Taxes less subsidies, on products 76,64786,421 Taxes on products D.21
-9,774 Subsidies on products D.31
Line 5 Accrued net income of farm operators from farm production
1,243
66,187 Mixed income (net) B.3Line 6 Net income of non-farm unincorporated
business, including rent64,944
Line 2 Corporation profits before taxes 135,978
336,846 Operating surplus (gross) B.2
Line 3 Government business enterprises profits before taxes
11,329
Line 4 Interest and miscellaneous investment income
55,302
Line 7 Inventory valuation adjustment -2,439
Line 11 Capital consumption allowances 137,425
Line 12 Statistical discrepancy -749
Line 13 Gross domestic product 1,076,577 1,076,577 Gross domestic product B.1
1. The Canadian income and expenditure accounts estimates are published in the National Income and Expenditure Accounts, catalogue no. 13-001. Provincial and territorial estimates are available in the Provincial Economic Accounts, catalogue no. 13-213.
Statistics Canada - Catalogue no. 13-017 Guide to the Income and Expenditure Accounts 79

Entrepreneurial income: Mixed income
Chapter 5 Entrepreneurial income: Mixed income
Introduction
5.1 Mixed income represents the entrepreneurial income, generated in the production of goods and services, ofunincorporated business. This income accrues to the capital factors of production, in the same way that operatingsurplus does for corporations and government business enterprises (see Chapter 4). However, unincorporated
business income is described as mixed income1 because it contains remuneration for work undertaken by theowner(s) that cannot be separated from the return to the owner(s) as entrepreneur(s).
5.2 Mixed income (proprietors' revenue) captures a class of income that is difficult to classify—essentially fallingbetween labour income and business profits. It is the amount that independent owners who are in business forthemselves, but who have not incorporated their businesses, earn. The amount that the owner of anunincorporated business earns in a year is typically considered by the owner to be profit, yet a significant amountends up as remuneration to the owner for his labour services.
5.3 The SNA 1993 defines mixed income as follows:
“Mixed income is the surplus or deficit accruing from production by unincorporated business owned byhouseholds; it implicitly contains an element of remuneration for work done by the owner, or othermembers of the household, that cannot be separately identified from the return to the owner as
entrepreneur but it excludes the surplus coming from owner-occupied dwellings”.2 (System of NationalAccounts 1993 paragraphs 7.4, 4.134 and 7.81)
5.4 In the Canadian System of National Accounts (CSNA), the net imputed rent generated by owner-occupieddwellings is added to mixed income. The income generated by owner-occupiers in their capacity as producers ofhousing services is included in mixed income, as it represents all income generated by unincorporated business.
5.5 Mixed income specifically refers to the net income of both farm and non-farm unincorporated business andrepresents approximately 6% of income-based gross domestic product (GDP). Within the Income and ExpenditureAccounts (IEA), mixed income is broken into two main components: accrued net income of farm operators fromfarm production; and, net income of non-farm unincorporated business. The latter is broken down into two sub-components: net income excluding rental income and net rental income, both paid and imputed.
Statistical details of mixed income
5.6 This chapter presents sources and methods used to estimate these components of income-based GDP. Onepractical distinction between the Income and Expenditure Accounts (IEA) and the generation of income account(as presented in Table 4.1) relates to the treatment of capital consumption allowances (CCA) and the net propertyincome payable from production activities for unincorporated businesses. In the IEA, the mixed income componentis presented on a net basis, after deducting CCA and the net property income payable of unincorporatedbusinesses while the operating surplus includes them along with the estimates for the other sectors of theeconomy. On the other hand, the generation of income account presents mixed income before allowances forthose two components. For this reason, the mixed income shown under the generation income account in Table4.1 is described as net while the operating surplus is on a gross basis. It would be preferable to include the CCAand the net property income payable of unincorporated businesses in the mixed income component asrecommended by the SNA 1993, but statistical and methodological difficulties obviate this presentation in the IEA.
1. The income generated by owner-occupiers in their capacity as producers of housing services is included with the mixed incomecomponent in the Canadian SNA as it represents all income generated by unincorporated businesses. In the SNA 1993 it is included withoperating surplus in the generation of income account.
2. The rationale for excluding imputed rent from mixed income in SNA 1993 is that there is no labour input into the production of theseservices.
80 Statistics Canada - Catalogue no. 13-017 Guide to the Income and Expenditure Accounts
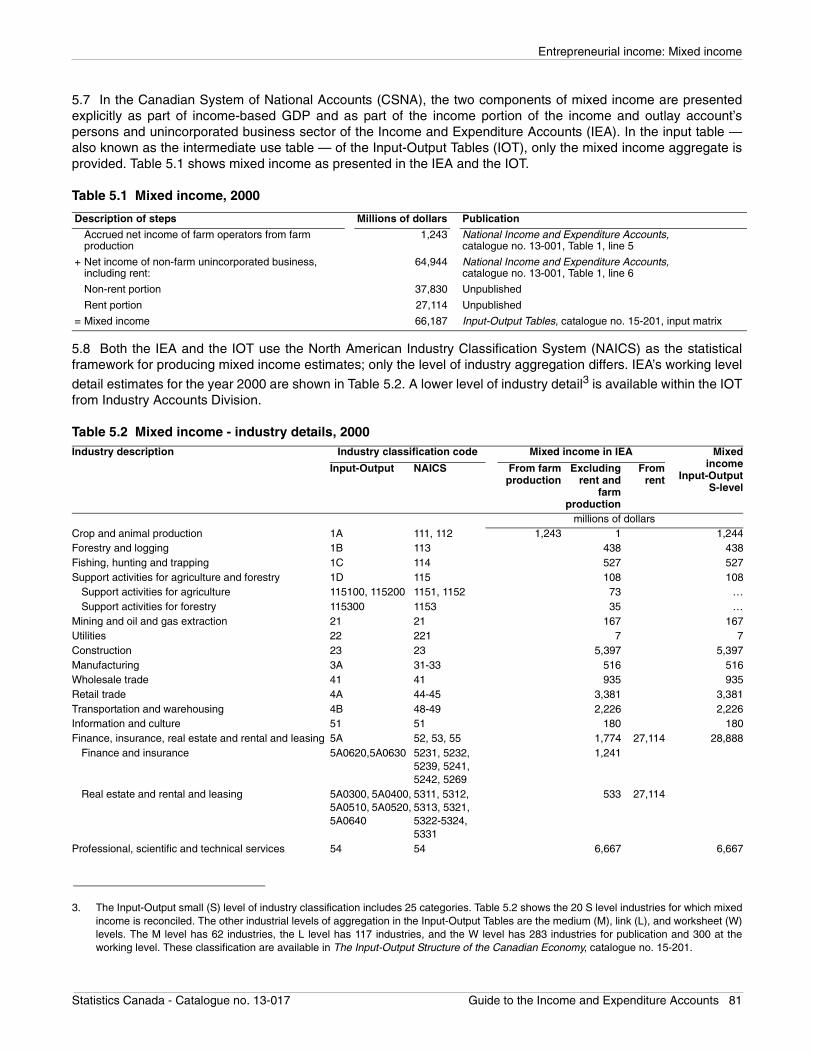
Entrepreneurial income: Mixed income
5.7 In the Canadian System of National Accounts (CSNA), the two components of mixed income are presentedexplicitly as part of income-based GDP and as part of the income portion of the income and outlay account’spersons and unincorporated business sector of the Income and Expenditure Accounts (IEA). In the input table —also known as the intermediate use table — of the Input-Output Tables (IOT), only the mixed income aggregate isprovided. Table 5.1 shows mixed income as presented in the IEA and the IOT.
5.8 Both the IEA and the IOT use the North American Industry Classification System (NAICS) as the statisticalframework for producing mixed income estimates; only the level of industry aggregation differs. IEA’s working level
detail estimates for the year 2000 are shown in Table 5.2. A lower level of industry detail3 is available within the IOTfrom Industry Accounts Division.
Table 5.1 Mixed income, 2000
Description of steps Millions of dollars Publication
Accrued net income of farm operators from farm production
1,243 National Income and Expenditure Accounts, catalogue no. 13-001, Table 1, line 5
+ Net income of non-farm unincorporated business, including rent:
64,944 National Income and Expenditure Accounts, catalogue no. 13-001, Table 1, line 6
Non-rent portion 37,830 Unpublished
Rent portion 27,114 Unpublished
= Mixed income 66,187 Input-Output Tables, catalogue no. 15-201, input matrix
3. The Input-Output small (S) level of industry classification includes 25 categories. Table 5.2 shows the 20 S level industries for which mixedincome is reconciled. The other industrial levels of aggregation in the Input-Output Tables are the medium (M), link (L), and worksheet (W)levels. The M level has 62 industries, the L level has 117 industries, and the W level has 283 industries for publication and 300 at theworking level. These classification are available in The Input-Output Structure of the Canadian Economy, catalogue no. 15-201.
Table 5.2 Mixed income - industry details, 2000Industry description Industry classification code Mixed income in IEA Mixed
incomeInput-Output
S-level
Input-Output NAICS From farmproduction
Excludingrent and
farmproduction
Fromrent
millions of dollarsCrop and animal production 1A 111, 112 1,243 1 1,244Forestry and logging 1B 113 438 438Fishing, hunting and trapping 1C 114 527 527Support activities for agriculture and forestry 1D 115 108 108
Support activities for agriculture 115100, 115200 1151, 1152 73 …Support activities for forestry 115300 1153 35 …
Mining and oil and gas extraction 21 21 167 167Utilities 22 221 7 7Construction 23 23 5,397 5,397Manufacturing 3A 31-33 516 516Wholesale trade 41 41 935 935Retail trade 4A 44-45 3,381 3,381Transportation and warehousing 4B 48-49 2,226 2,226Information and culture 51 51 180 180Finance, insurance, real estate and rental and leasing 5A 52, 53, 55 1,774 27,114 28,888
Finance and insurance 5A0620,5A0630 5231, 5232, 5239, 5241, 5242, 5269
1,241
Real estate and rental and leasing 5A0300, 5A0400, 5A0510, 5A0520, 5A0640
5311, 5312, 5313, 5321, 5322-5324, 5331
533 27,114
Professional, scientific and technical services 54 54 6,667 6,667
Statistics Canada - Catalogue no. 13-017 Guide to the Income and Expenditure Accounts 81
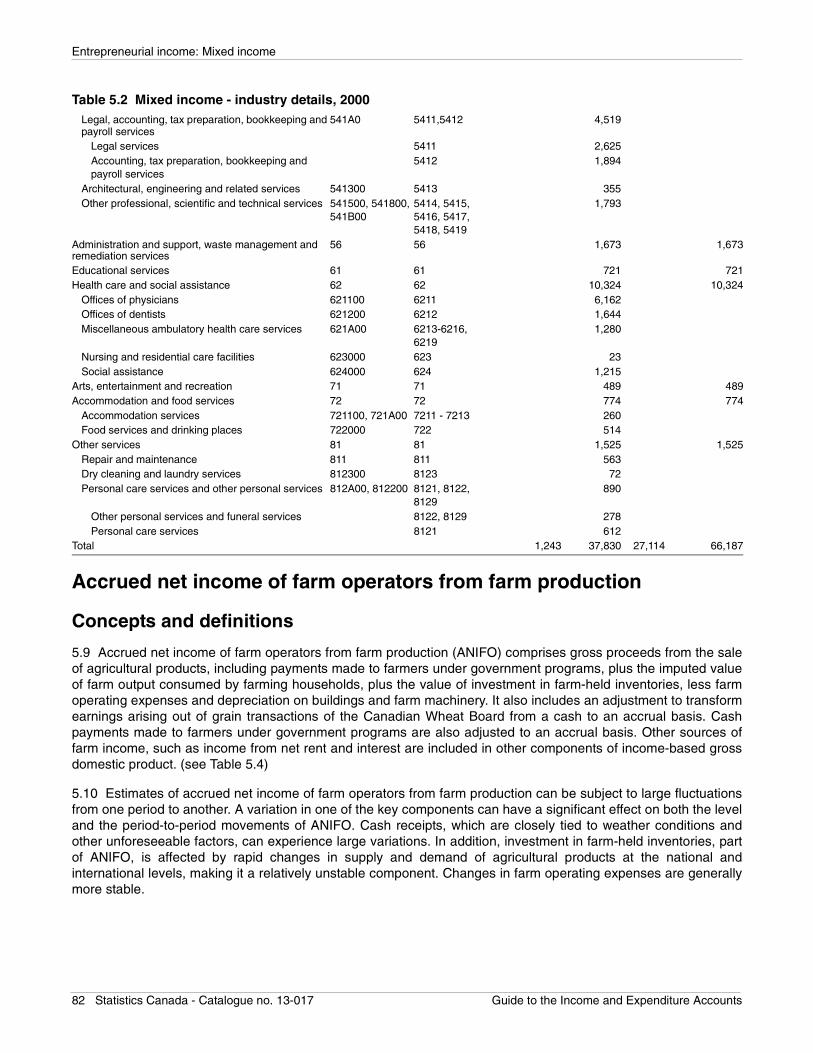
Entrepreneurial income: Mixed income
Accrued net income of farm operators from farm production
Concepts and definitions
5.9 Accrued net income of farm operators from farm production (ANIFO) comprises gross proceeds from the saleof agricultural products, including payments made to farmers under government programs, plus the imputed valueof farm output consumed by farming households, plus the value of investment in farm-held inventories, less farmoperating expenses and depreciation on buildings and farm machinery. It also includes an adjustment to transformearnings arising out of grain transactions of the Canadian Wheat Board from a cash to an accrual basis. Cashpayments made to farmers under government programs are also adjusted to an accrual basis. Other sources offarm income, such as income from net rent and interest are included in other components of income-based grossdomestic product. (see Table 5.4)
5.10 Estimates of accrued net income of farm operators from farm production can be subject to large fluctuationsfrom one period to another. A variation in one of the key components can have a significant effect on both the leveland the period-to-period movements of ANIFO. Cash receipts, which are closely tied to weather conditions andother unforeseeable factors, can experience large variations. In addition, investment in farm-held inventories, partof ANIFO, is affected by rapid changes in supply and demand of agricultural products at the national andinternational levels, making it a relatively unstable component. Changes in farm operating expenses are generallymore stable.
Legal, accounting, tax preparation, bookkeeping and payroll services
541A0 5411,5412 4,519
Legal services 5411 2,625Accounting, tax preparation, bookkeeping and payroll services
5412 1,894
Architectural, engineering and related services 541300 5413 355Other professional, scientific and technical services 541500, 541800,
541B005414, 5415, 5416, 5417, 5418, 5419
1,793
Administration and support, waste management and remediation services
56 56 1,673 1,673
Educational services 61 61 721 721Health care and social assistance 62 62 10,324 10,324
Offices of physicians 621100 6211 6,162Offices of dentists 621200 6212 1,644Miscellaneous ambulatory health care services 621A00 6213-6216,
62191,280
Nursing and residential care facilities 623000 623 23Social assistance 624000 624 1,215
Arts, entertainment and recreation 71 71 489 489Accommodation and food services 72 72 774 774
Accommodation services 721100, 721A00 7211 - 7213 260Food services and drinking places 722000 722 514
Other services 81 81 1,525 1,525Repair and maintenance 811 811 563Dry cleaning and laundry services 812300 8123 72Personal care services and other personal services 812A00, 812200 8121, 8122,
8129890
Other personal services and funeral services 8122, 8129 278Personal care services 8121 612
Total 1,243 37,830 27,114 66,187
Table 5.2 Mixed income - industry details, 2000
82 Statistics Canada - Catalogue no. 13-017 Guide to the Income and Expenditure Accounts
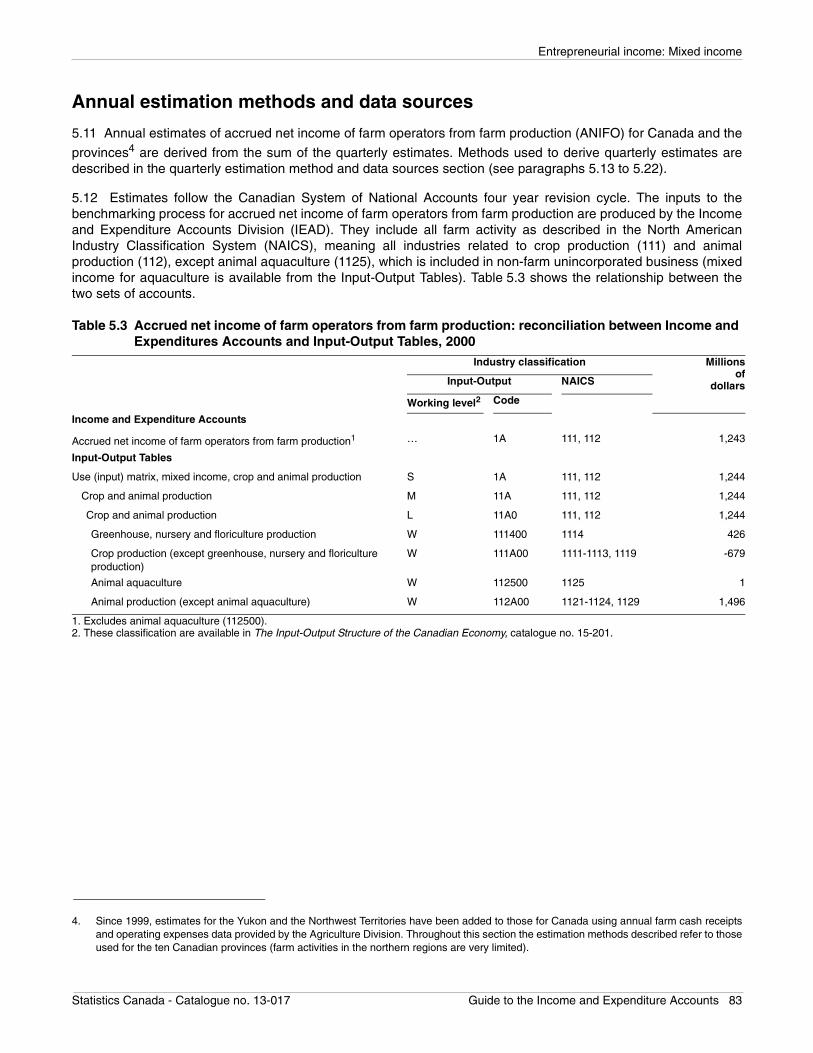
Entrepreneurial income: Mixed income
Annual estimation methods and data sources
5.11 Annual estimates of accrued net income of farm operators from farm production (ANIFO) for Canada and the
provinces4 are derived from the sum of the quarterly estimates. Methods used to derive quarterly estimates aredescribed in the quarterly estimation method and data sources section (see paragraphs 5.13 to 5.22).
5.12 Estimates follow the Canadian System of National Accounts four year revision cycle. The inputs to thebenchmarking process for accrued net income of farm operators from farm production are produced by the Incomeand Expenditure Accounts Division (IEAD). They include all farm activity as described in the North AmericanIndustry Classification System (NAICS), meaning all industries related to crop production (111) and animalproduction (112), except animal aquaculture (1125), which is included in non-farm unincorporated business (mixedincome for aquaculture is available from the Input-Output Tables). Table 5.3 shows the relationship between thetwo sets of accounts.
4. Since 1999, estimates for the Yukon and the Northwest Territories have been added to those for Canada using annual farm cash receiptsand operating expenses data provided by the Agriculture Division. Throughout this section the estimation methods described refer to thoseused for the ten Canadian provinces (farm activities in the northern regions are very limited).
Table 5.3 Accrued net income of farm operators from farm production: reconciliation between Income and Expenditures Accounts and Input-Output Tables, 2000
Industry classification Millionsof
dollarsInput-Output NAICS
Working level2 Code
Income and Expenditure Accounts
Accrued net income of farm operators from farm production1 … 1A 111, 112 1,243
Input-Output Tables
Use (input) matrix, mixed income, crop and animal production S 1A 111, 112 1,244
Crop and animal production M 11A 111, 112 1,244
Crop and animal production L 11A0 111, 112 1,244
Greenhouse, nursery and floriculture production W 111400 1114 426
Crop production (except greenhouse, nursery and floriculture production)
W 111A00 1111-1113, 1119 -679
Animal aquaculture W 112500 1125 1
Animal production (except animal aquaculture) W 112A00 1121-1124, 1129 1,496
1. Excludes animal aquaculture (112500).2. These classification are available in The Input-Output Structure of the Canadian Economy, catalogue no. 15-201.
Statistics Canada - Catalogue no. 13-017 Guide to the Income and Expenditure Accounts 83
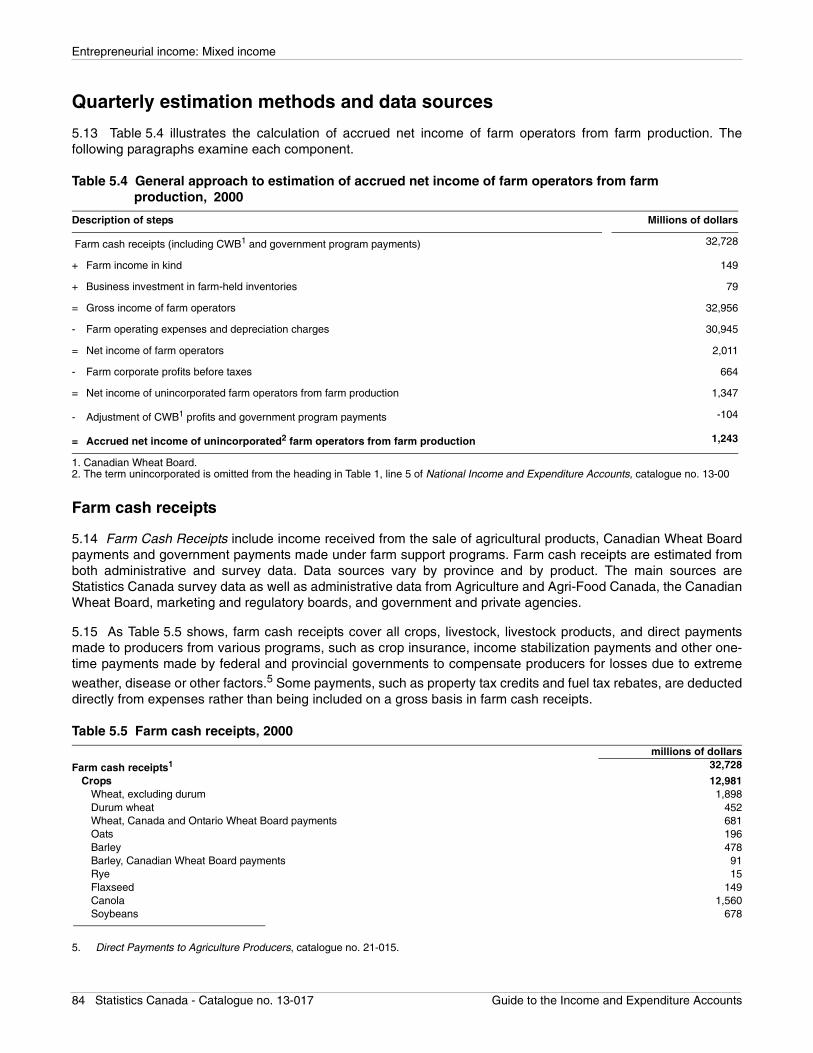
Entrepreneurial income: Mixed income
Quarterly estimation methods and data sources
5.13 Table 5.4 illustrates the calculation of accrued net income of farm operators from farm production. Thefollowing paragraphs examine each component.
Farm cash receipts
5.14 Farm Cash Receipts include income received from the sale of agricultural products, Canadian Wheat Boardpayments and government payments made under farm support programs. Farm cash receipts are estimated fromboth administrative and survey data. Data sources vary by province and by product. The main sources areStatistics Canada survey data as well as administrative data from Agriculture and Agri-Food Canada, the CanadianWheat Board, marketing and regulatory boards, and government and private agencies.
5.15 As Table 5.5 shows, farm cash receipts cover all crops, livestock, livestock products, and direct paymentsmade to producers from various programs, such as crop insurance, income stabilization payments and other one-time payments made by federal and provincial governments to compensate producers for losses due to extreme
weather, disease or other factors.5 Some payments, such as property tax credits and fuel tax rebates, are deducteddirectly from expenses rather than being included on a gross basis in farm cash receipts.
Table 5.4 General approach to estimation of accrued net income of farm operators from farm production, 2000
Description of steps Millions of dollars
Farm cash receipts (including CWB1 and government program payments) 32,728
+ Farm income in kind 149
+ Business investment in farm-held inventories 79
= Gross income of farm operators 32,956
- Farm operating expenses and depreciation charges 30,945
= Net income of farm operators 2,011
- Farm corporate profits before taxes 664
= Net income of unincorporated farm operators from farm production 1,347
- Adjustment of CWB1 profits and government program payments -104
= Accrued net income of unincorporated2 farm operators from farm production 1,243
1. Canadian Wheat Board.2. The term unincorporated is omitted from the heading in Table 1, line 5 of National Income and Expenditure Accounts, catalogue no. 13-00
5. Direct Payments to Agriculture Producers, catalogue no. 21-015.
Table 5.5 Farm cash receipts, 2000millions of dollars
Farm cash receipts1 32,728
Crops 12,981Wheat, excluding durum 1,898Durum wheat 452Wheat, Canada and Ontario Wheat Board payments 681Oats 196Barley 478Barley, Canadian Wheat Board payments 91Rye 15Flaxseed 149Canola 1,560Soybeans 678
84 Statistics Canada - Catalogue no. 13-017 Guide to the Income and Expenditure Accounts
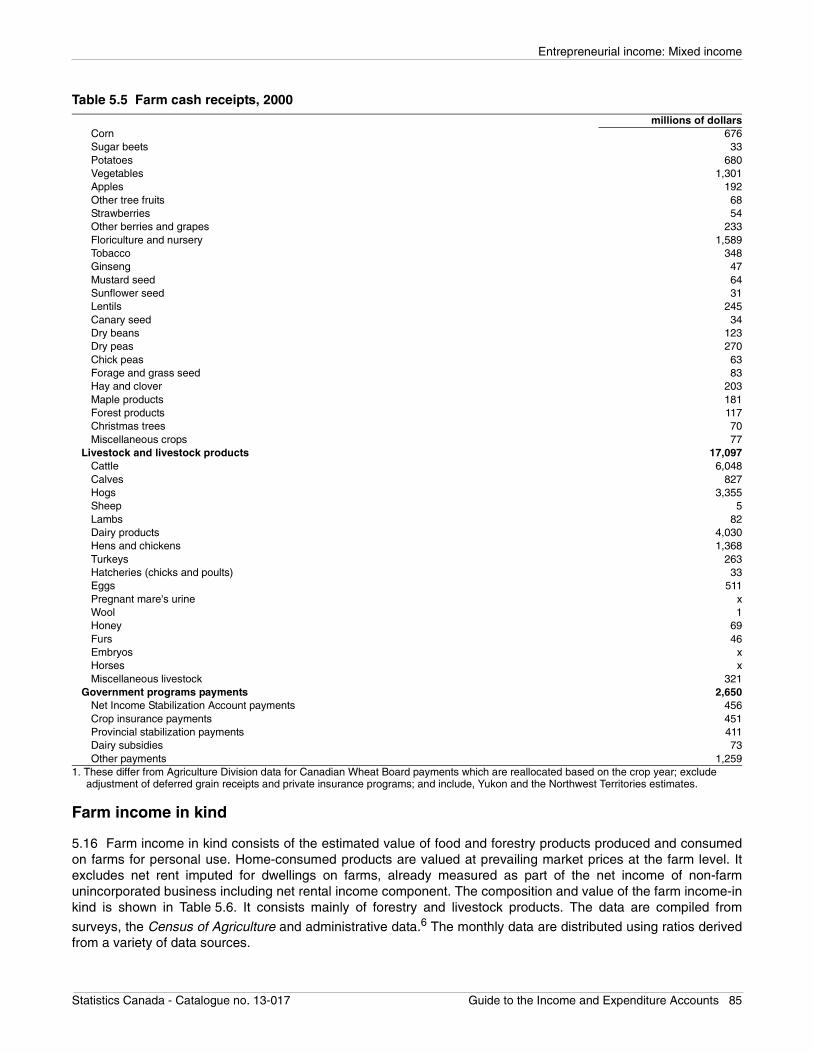
Entrepreneurial income: Mixed income
Farm income in kind
5.16 Farm income in kind consists of the estimated value of food and forestry products produced and consumedon farms for personal use. Home-consumed products are valued at prevailing market prices at the farm level. Itexcludes net rent imputed for dwellings on farms, already measured as part of the net income of non-farmunincorporated business including net rental income component. The composition and value of the farm income-inkind is shown in Table 5.6. It consists mainly of forestry and livestock products. The data are compiled from
surveys, the Census of Agriculture and administrative data.6 The monthly data are distributed using ratios derivedfrom a variety of data sources.
Corn 676Sugar beets 33Potatoes 680Vegetables 1,301Apples 192Other tree fruits 68Strawberries 54Other berries and grapes 233Floriculture and nursery 1,589Tobacco 348Ginseng 47Mustard seed 64Sunflower seed 31Lentils 245Canary seed 34Dry beans 123Dry peas 270Chick peas 63Forage and grass seed 83Hay and clover 203Maple products 181Forest products 117Christmas trees 70Miscellaneous crops 77
Livestock and livestock products 17,097Cattle 6,048Calves 827Hogs 3,355Sheep 5Lambs 82Dairy products 4,030Hens and chickens 1,368Turkeys 263Hatcheries (chicks and poults) 33Eggs 511Pregnant mare's urine xWool 1Honey 69Furs 46Embryos xHorses xMiscellaneous livestock 321
Government programs payments 2,650Net Income Stabilization Account payments 456Crop insurance payments 451Provincial stabilization payments 411Dairy subsidies 73Other payments 1,259
1. These differ from Agriculture Division data for Canadian Wheat Board payments which are reallocated based on the crop year; exclude adjustment of deferred grain receipts and private insurance programs; and include, Yukon and the Northwest Territories estimates.
Table 5.5 Farm cash receipts, 2000millions of dollars
Statistics Canada - Catalogue no. 13-017 Guide to the Income and Expenditure Accounts 85
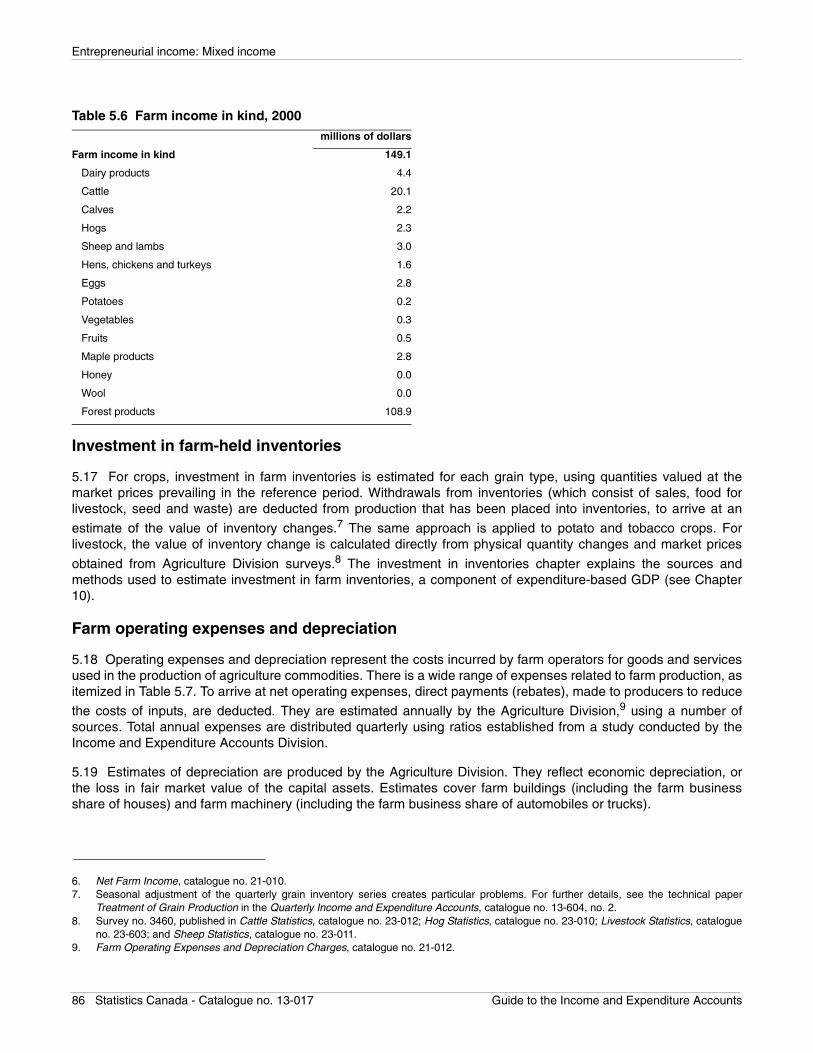
Entrepreneurial income: Mixed income
Investment in farm-held inventories
5.17 For crops, investment in farm inventories is estimated for each grain type, using quantities valued at themarket prices prevailing in the reference period. Withdrawals from inventories (which consist of sales, food forlivestock, seed and waste) are deducted from production that has been placed into inventories, to arrive at an
estimate of the value of inventory changes.7 The same approach is applied to potato and tobacco crops. Forlivestock, the value of inventory change is calculated directly from physical quantity changes and market prices
obtained from Agriculture Division surveys.8 The investment in inventories chapter explains the sources andmethods used to estimate investment in farm inventories, a component of expenditure-based GDP (see Chapter10).
Farm operating expenses and depreciation
5.18 Operating expenses and depreciation represent the costs incurred by farm operators for goods and servicesused in the production of agriculture commodities. There is a wide range of expenses related to farm production, asitemized in Table 5.7. To arrive at net operating expenses, direct payments (rebates), made to producers to reduce
the costs of inputs, are deducted. They are estimated annually by the Agriculture Division,9 using a number ofsources. Total annual expenses are distributed quarterly using ratios established from a study conducted by theIncome and Expenditure Accounts Division.
5.19 Estimates of depreciation are produced by the Agriculture Division. They reflect economic depreciation, orthe loss in fair market value of the capital assets. Estimates cover farm buildings (including the farm businessshare of houses) and farm machinery (including the farm business share of automobiles or trucks).
6. Net Farm Income, catalogue no. 21-010.
Table 5.6 Farm income in kind, 2000millions of dollars
Farm income in kind 149.1
Dairy products 4.4
Cattle 20.1
Calves 2.2
Hogs 2.3
Sheep and lambs 3.0
Hens, chickens and turkeys 1.6
Eggs 2.8
Potatoes 0.2
Vegetables 0.3
Fruits 0.5
Maple products 2.8
Honey 0.0
Wool 0.0
Forest products 108.9
7. Seasonal adjustment of the quarterly grain inventory series creates particular problems. For further details, see the technical paperTreatment of Grain Production in the Quarterly Income and Expenditure Accounts, catalogue no. 13-604, no. 2.
8. Survey no. 3460, published in Cattle Statistics, catalogue no. 23-012; Hog Statistics, catalogue no. 23-010; Livestock Statistics, catalogueno. 23-603; and Sheep Statistics, catalogue no. 23-011.
9. Farm Operating Expenses and Depreciation Charges, catalogue no. 21-012.
86 Statistics Canada - Catalogue no. 13-017 Guide to the Income and Expenditure Accounts
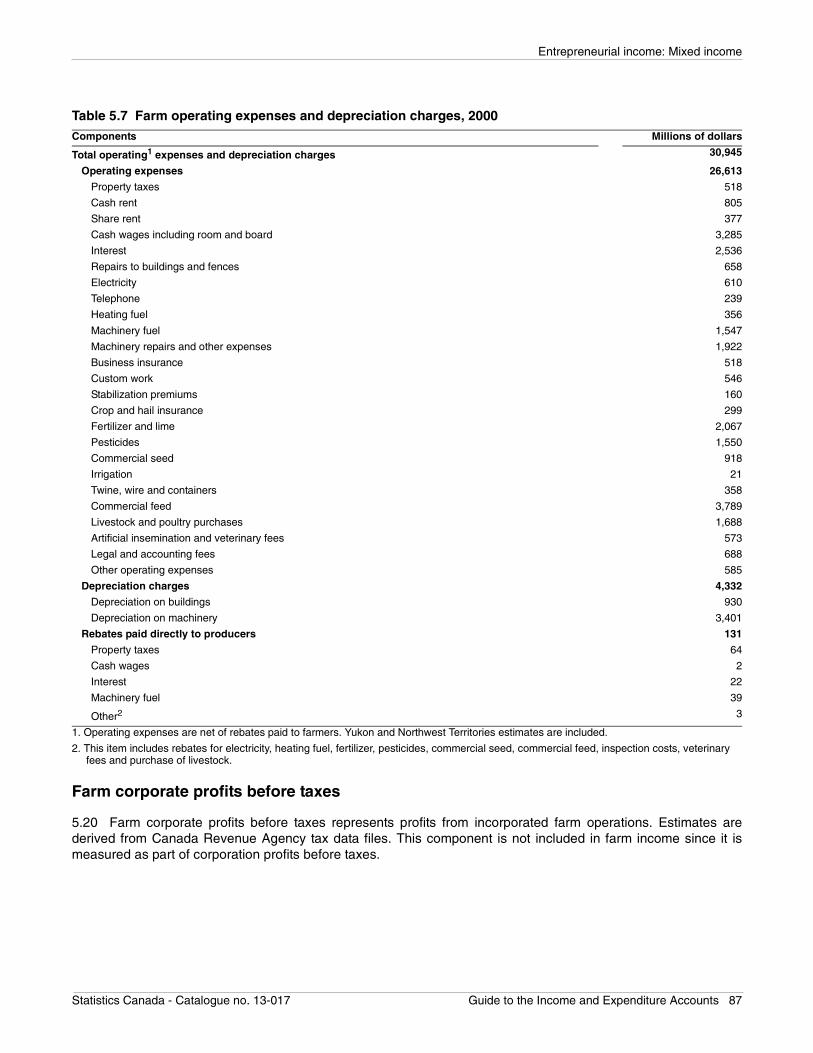
Entrepreneurial income: Mixed income
Farm corporate profits before taxes
5.20 Farm corporate profits before taxes represents profits from incorporated farm operations. Estimates arederived from Canada Revenue Agency tax data files. This component is not included in farm income since it ismeasured as part of corporation profits before taxes.
Table 5.7 Farm operating expenses and depreciation charges, 2000Components Millions of dollars
Total operating1 expenses and depreciation charges 30,945
Operating expenses 26,613
Property taxes 518
Cash rent 805
Share rent 377
Cash wages including room and board 3,285
Interest 2,536
Repairs to buildings and fences 658
Electricity 610
Telephone 239
Heating fuel 356
Machinery fuel 1,547
Machinery repairs and other expenses 1,922
Business insurance 518
Custom work 546
Stabilization premiums 160
Crop and hail insurance 299
Fertilizer and lime 2,067
Pesticides 1,550
Commercial seed 918
Irrigation 21
Twine, wire and containers 358
Commercial feed 3,789
Livestock and poultry purchases 1,688
Artificial insemination and veterinary fees 573
Legal and accounting fees 688
Other operating expenses 585
Depreciation charges 4,332
Depreciation on buildings 930
Depreciation on machinery 3,401
Rebates paid directly to producers 131
Property taxes 64
Cash wages 2
Interest 22
Machinery fuel 39
Other2 3
1. Operating expenses are net of rebates paid to farmers. Yukon and Northwest Territories estimates are included.
2. This item includes rebates for electricity, heating fuel, fertilizer, pesticides, commercial seed, commercial feed, inspection costs, veterinary fees and purchase of livestock.
Statistics Canada - Catalogue no. 13-017 Guide to the Income and Expenditure Accounts 87
Entrepreneurial income: Mixed income
Adjustment of Canadian Wheat Board profits and government program payments
5.21 This adjustment is necessary because gross domestic product measures income arising from currentproduction and not current receipts. Consequently, profits arising out of the operations of the Canadian Wheat
Board10 (CWB) are allocated to farm operators when they are earned regardless of when they are actually paid tofarmers. As well, an inventory valuation adjustment is calculated to eliminate any holding gains or losses from theinitial CWB earnings reported.
5.22 Similarly, government program payments to farmers are adjusted from a cash basis to an accrual basis toreflect current agricultural production.
Provincial and territorial estimation methods and data sources
5.23 Provincial estimates are established from the quarterly estimates, which are estimated by province.
Relationship with other parts of the Income and Expenditure Accounts
5.24 A number of the components of accrued net income of farm operators from farm production are also includedin other variables of gross domestic product. Investment in farm-held inventories appears directly on theexpenditure side of the Income and Expenditure Accounts. Income-in kind for food is included as part of farm-consumption and other imputed food expenses, appearing under personal expenditure on consumer goods andservices. All taxes and subsidies, whether part of income or expenses of farm operators, are included in eithertaxes less subsidies on factors of production or taxes less subsidies on products. Finally, depreciation, which is partof farm operating expenses, is included in capital consumption allowance, an income-based GDP component.
5.25 Accrued net income of farm operators from farm production is part of the unincorporated business net incomein the persons and unincorporated businesses sector.
5.26 Investment in farm-held inventories is divided between the unincorporated sector and the incorporatedsector, using a ratio derived from the Census of Agriculture data on farm cash receipts.
Reconciliation of estimates with the Agriculture Division
5.27 Agriculture Division produces a number of economic statistics on farming.11 Most of them are included in theestimation of accrued net income of farm operators from farm production. Table 5.8 shows the reconciliationbetween the two estimates.
10. The CWB buys wheat and barley from farm operators and sells the grain on various markets, notably the export market, on their behalf.11. Agriculture Division’s series Agriculture Economic Statistics includes: Net Farm Income, catalogue no. 21-010, Farm Cash Receipts,
catalogue no. 21-011, Farm Operating Expenses and Depreciation Charges, catalogue no. 21-012, Value of Farm Capital, catalogue no.21-013, Farm Debt Outstanding, catalogue no. 21-014, Direct Payments to Agriculture Producers, catalogue no. 21-015, Balance Sheet ofthe Agricultural Sector, catalogue no. 21-016, Agriculture Value Added Account, catalogue no. 21-017, and Farm Business Cash Flows,catalogue no. 21-018. Agriculture Division also offers additional statistics on various agricultural outputs.
88 Statistics Canada - Catalogue no. 13-017 Guide to the Income and Expenditure Accounts
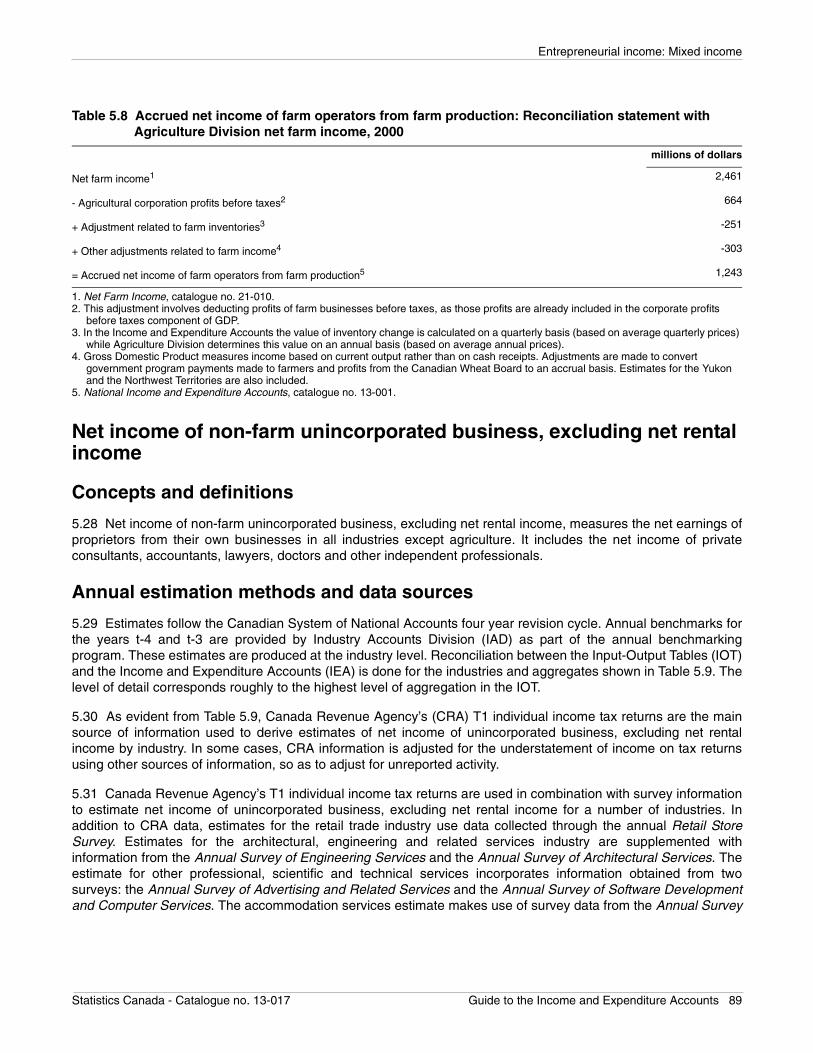
Entrepreneurial income: Mixed income
Net income of non-farm unincorporated business, excluding net rental income
Concepts and definitions
5.28 Net income of non-farm unincorporated business, excluding net rental income, measures the net earnings ofproprietors from their own businesses in all industries except agriculture. It includes the net income of privateconsultants, accountants, lawyers, doctors and other independent professionals.
Annual estimation methods and data sources
5.29 Estimates follow the Canadian System of National Accounts four year revision cycle. Annual benchmarks forthe years t-4 and t-3 are provided by Industry Accounts Division (IAD) as part of the annual benchmarkingprogram. These estimates are produced at the industry level. Reconciliation between the Input-Output Tables (IOT)and the Income and Expenditure Accounts (IEA) is done for the industries and aggregates shown in Table 5.9. Thelevel of detail corresponds roughly to the highest level of aggregation in the IOT.
5.30 As evident from Table 5.9, Canada Revenue Agency’s (CRA) T1 individual income tax returns are the mainsource of information used to derive estimates of net income of unincorporated business, excluding net rentalincome by industry. In some cases, CRA information is adjusted for the understatement of income on tax returnsusing other sources of information, so as to adjust for unreported activity.
5.31 Canada Revenue Agency’s T1 individual income tax returns are used in combination with survey informationto estimate net income of unincorporated business, excluding net rental income for a number of industries. Inaddition to CRA data, estimates for the retail trade industry use data collected through the annual Retail StoreSurvey. Estimates for the architectural, engineering and related services industry are supplemented withinformation from the Annual Survey of Engineering Services and the Annual Survey of Architectural Services. Theestimate for other professional, scientific and technical services incorporates information obtained from twosurveys: the Annual Survey of Advertising and Related Services and the Annual Survey of Software Developmentand Computer Services. The accommodation services estimate makes use of survey data from the Annual Survey
Table 5.8 Accrued net income of farm operators from farm production: Reconciliation statement with Agriculture Division net farm income, 2000
millions of dollars
Net farm income1 2,461
- Agricultural corporation profits before taxes2 664
+ Adjustment related to farm inventories3 -251
+ Other adjustments related to farm income4 -303
= Accrued net income of farm operators from farm production5 1,243
1. Net Farm Income, catalogue no. 21-010.2. This adjustment involves deducting profits of farm businesses before taxes, as those profits are already included in the corporate profits
before taxes component of GDP.3. In the Income and Expenditure Accounts the value of inventory change is calculated on a quarterly basis (based on average quarterly prices)
while Agriculture Division determines this value on an annual basis (based on average annual prices).4. Gross Domestic Product measures income based on current output rather than on cash receipts. Adjustments are made to convert
government program payments made to farmers and profits from the Canadian Wheat Board to an accrual basis. Estimates for the Yukon and the Northwest Territories are also included.
5. National Income and Expenditure Accounts, catalogue no. 13-001.
Statistics Canada - Catalogue no. 13-017 Guide to the Income and Expenditure Accounts 89
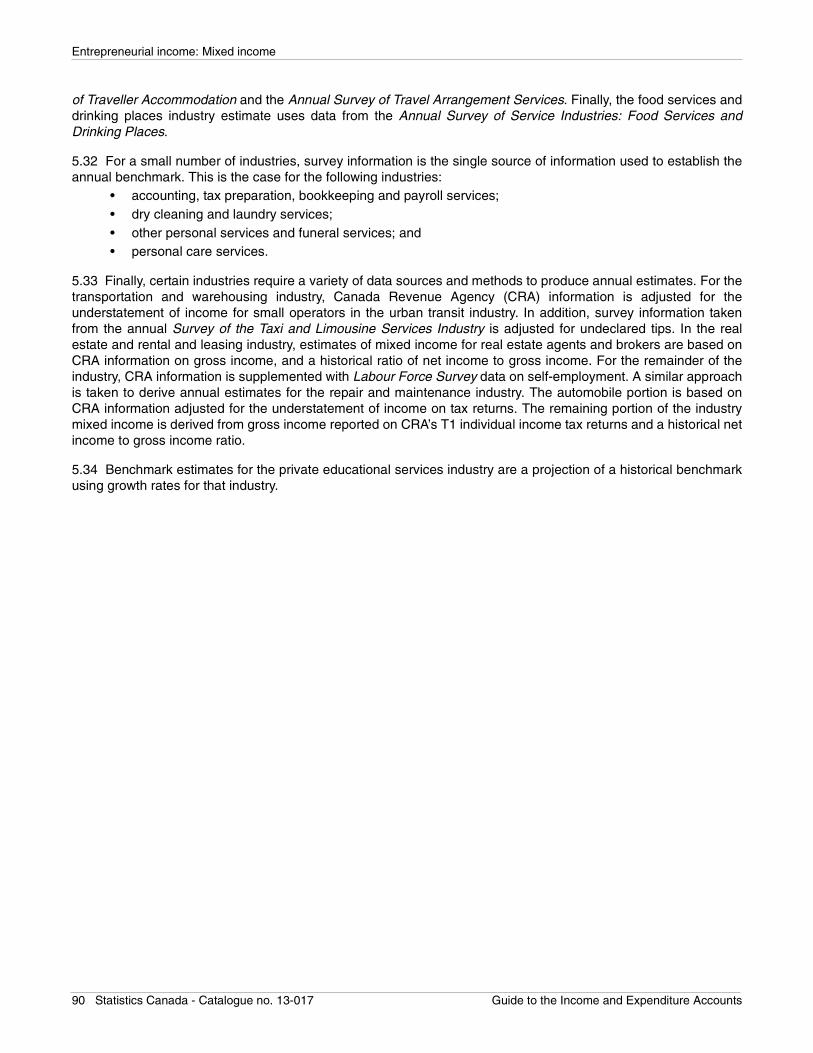
Entrepreneurial income: Mixed income
of Traveller Accommodation and the Annual Survey of Travel Arrangement Services. Finally, the food services anddrinking places industry estimate uses data from the Annual Survey of Service Industries: Food Services andDrinking Places.
5.32 For a small number of industries, survey information is the single source of information used to establish theannual benchmark. This is the case for the following industries:
• accounting, tax preparation, bookkeeping and payroll services; • dry cleaning and laundry services; • other personal services and funeral services; and• personal care services.
5.33 Finally, certain industries require a variety of data sources and methods to produce annual estimates. For thetransportation and warehousing industry, Canada Revenue Agency (CRA) information is adjusted for theunderstatement of income for small operators in the urban transit industry. In addition, survey information takenfrom the annual Survey of the Taxi and Limousine Services Industry is adjusted for undeclared tips. In the realestate and rental and leasing industry, estimates of mixed income for real estate agents and brokers are based onCRA information on gross income, and a historical ratio of net income to gross income. For the remainder of theindustry, CRA information is supplemented with Labour Force Survey data on self-employment. A similar approachis taken to derive annual estimates for the repair and maintenance industry. The automobile portion is based onCRA information adjusted for the understatement of income on tax returns. The remaining portion of the industrymixed income is derived from gross income reported on CRA’s T1 individual income tax returns and a historical netincome to gross income ratio.
5.34 Benchmark estimates for the private educational services industry are a projection of a historical benchmarkusing growth rates for that industry.
90 Statistics Canada - Catalogue no. 13-017 Guide to the Income and Expenditure Accounts
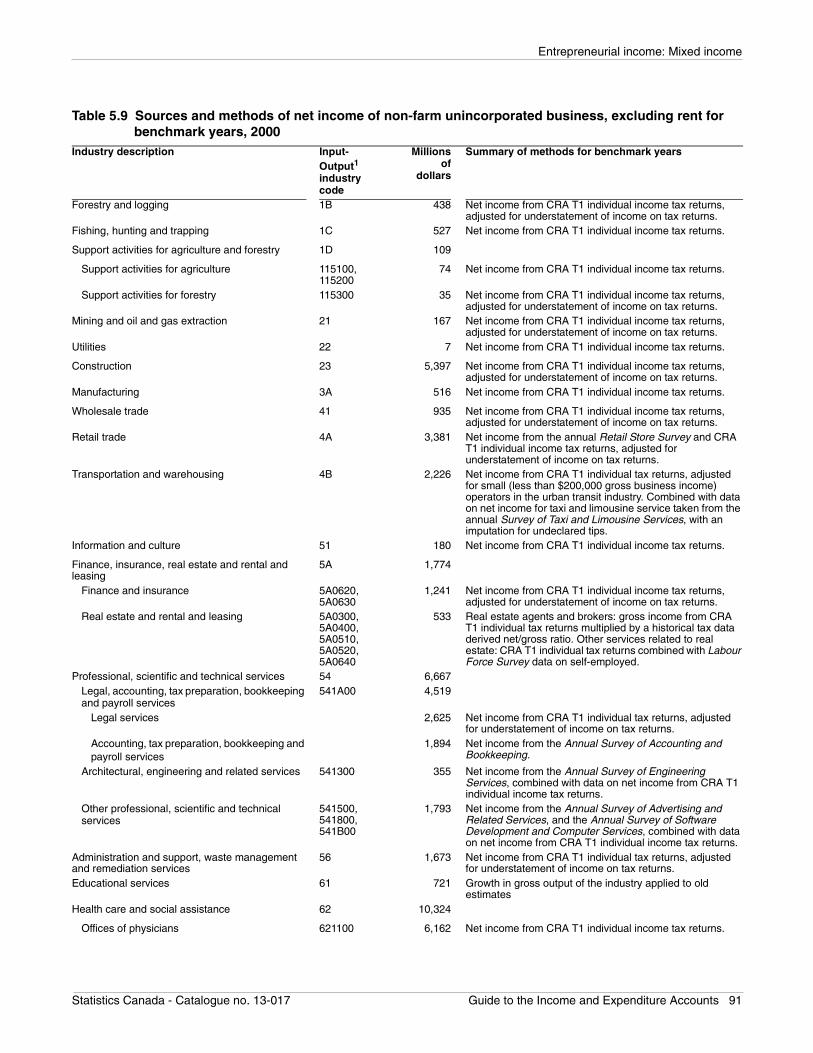
Entrepreneurial income: Mixed income
Table 5.9 Sources and methods of net income of non-farm unincorporated business, excluding rent for benchmark years, 2000
Industry description Input-Output1
industry code
Millionsof
dollars
Summary of methods for benchmark years
Forestry and logging 1B 438 Net income from CRA T1 individual income tax returns, adjusted for understatement of income on tax returns.
Fishing, hunting and trapping 1C 527 Net income from CRA T1 individual income tax returns.
Support activities for agriculture and forestry 1D 109
Support activities for agriculture 115100, 115200
74 Net income from CRA T1 individual income tax returns.
Support activities for forestry 115300 35 Net income from CRA T1 individual income tax returns, adjusted for understatement of income on tax returns.
Mining and oil and gas extraction 21 167 Net income from CRA T1 individual income tax returns, adjusted for understatement of income on tax returns.
Utilities 22 7 Net income from CRA T1 individual income tax returns.
Construction 23 5,397 Net income from CRA T1 individual income tax returns, adjusted for understatement of income on tax returns.
Manufacturing 3A 516 Net income from CRA T1 individual income tax returns.
Wholesale trade 41 935 Net income from CRA T1 individual income tax returns, adjusted for understatement of income on tax returns.
Retail trade 4A 3,381 Net income from the annual Retail Store Survey and CRA T1 individual income tax returns, adjusted for understatement of income on tax returns.
Transportation and warehousing 4B 2,226 Net income from CRA T1 individual tax returns, adjusted for small (less than $200,000 gross business income) operators in the urban transit industry. Combined with data on net income for taxi and limousine service taken from the annual Survey of Taxi and Limousine Services, with an imputation for undeclared tips.
Information and culture 51 180 Net income from CRA T1 individual income tax returns.
Finance, insurance, real estate and rental and leasing
5A 1,774
Finance and insurance 5A0620, 5A0630
1,241 Net income from CRA T1 individual income tax returns, adjusted for understatement of income on tax returns.
Real estate and rental and leasing 5A0300, 5A0400, 5A0510, 5A0520, 5A0640
533 Real estate agents and brokers: gross income from CRA T1 individual tax returns multiplied by a historical tax data derived net/gross ratio. Other services related to real estate: CRA T1 individual tax returns combined with Labour Force Survey data on self-employed.
Professional, scientific and technical services 54 6,667Legal, accounting, tax preparation, bookkeeping and payroll services
541A00 4,519
Legal services 2,625 Net income from CRA T1 individual tax returns, adjusted for understatement of income on tax returns.
Accounting, tax preparation, bookkeeping and payroll services
1,894 Net income from the Annual Survey of Accounting and Bookkeeping.
Architectural, engineering and related services 541300 355 Net income from the Annual Survey of Engineering Services, combined with data on net income from CRA T1 individual income tax returns.
Other professional, scientific and technical services
541500, 541800, 541B00
1,793 Net income from the Annual Survey of Advertising and Related Services, and the Annual Survey of Software Development and Computer Services, combined with data on net income from CRA T1 individual income tax returns.
Administration and support, waste management and remediation services
56 1,673 Net income from CRA T1 individual tax returns, adjusted for understatement of income on tax returns.
Educational services 61 721 Growth in gross output of the industry applied to old estimates
Health care and social assistance 62 10,324
Offices of physicians 621100 6,162 Net income from CRA T1 individual income tax returns.
Statistics Canada - Catalogue no. 13-017 Guide to the Income and Expenditure Accounts 91
Entrepreneurial income: Mixed income
5.35 Data sources and methods used for the non-benchmark years are dependent on the availability ofbenchmark data. Canada Revenue Agency’s (CRA) T1, along with some survey information, is used in forestimating t-2. Sources of data that are used for the first three years of the revision cycle are not usually availableto assist in preparing estimates for the year t-1. In this case, annual estimates are obtained by using the sum of thequarterly estimates (t-1) as a projector.
5.36 Table 5.10 presents the method of estimation used for the non-benchmark years, by industry. The t-2estimates are an extension of the benchmark period. Most of the estimates are derived using net income fromCanada Revenue Agency’s (CRA) T1. For retail and wholesale trade industries, survey information is the solesource of information used to produce the t-2 estimates.
5.37 With the exception of the physicians, dentists and the other health industry, t-1 estimates by industry areobtained by using the corresponding industry’s sum of its quarterly estimates as a projector. For offices ofphysicians and dentists, provincial government expenditures on medicare and personal expenditures on medicaland dental services are used respectively as the projectors. Finally, net income of the other health industry isprojected using earnings information from the Survey of Employment, Payrolls and Hours on health care and socialassistance.
Offices of dentists 621200 1,644 Net income from CRA T1 individual income tax returns.
Miscellaneous ambulatory health care services 621A00 1,280 Net income from CRA T1 individual income tax returns.
Nursing and residential care facilities 623000 23 Net income from CRA T1 individual income tax returns.
Social assistance 624000 1,215 Net income from CRA T1 individual tax returns, adjusted for understatement of income on tax returns.
Arts, entertainment and recreation 71 489 Net income from CRA T1 individual income tax returns.
Accommodation and food services 72 774
Accommodation services 721100, 721A00
260 Net income from CRA T1 individual income tax returns, combined with net income data from Annual Survey of Traveller Accommodation and Annual Survey of Travel Arrangement Services.
Food services and drinking places 722000 514 Net income from Annual Survey of Food Services and Drinking Places, adjusted for understatement of net income.
Other services 81 1,525
Repair and maintenance 811 563 Auto repair and maintenance: net income from CRA T1 individual income tax returns, adjusted for understatement of income on tax returns. Other repair and maintenance industries: based on current production and historical data available from Input-Output Tables.
Dry cleaning and laundry services 812300 72 Net income from Annual Survey of Personal Services.
Personal care services and other personal services
812A00, 812200
890
Other personal services and funeral services 278 Net income from Annual Survey of Personal Services for combined industries 8121 and 8129. Split between 8121 and 8129 using personal expenditures information.
Personal care services 612 Net income from Annual Survey of Personal Services for combined industries 8121 and 8129. Split between 8121 and 8129 using personal expenditures information.
Total 37,830
1. Input-Output industry classification and its relationship to the NAICS classification is presented in the publication The Input-Output Structure of the Canadian Economy, catalogue no. 15-201.
Table 5.9 Sources and methods of net income of non-farm unincorporated business, excluding rent for benchmark years, 2000
Industry description Input-Output1
industry code
Millionsof
dollars
Summary of methods for benchmark years
92 Statistics Canada - Catalogue no. 13-017 Guide to the Income and Expenditure Accounts
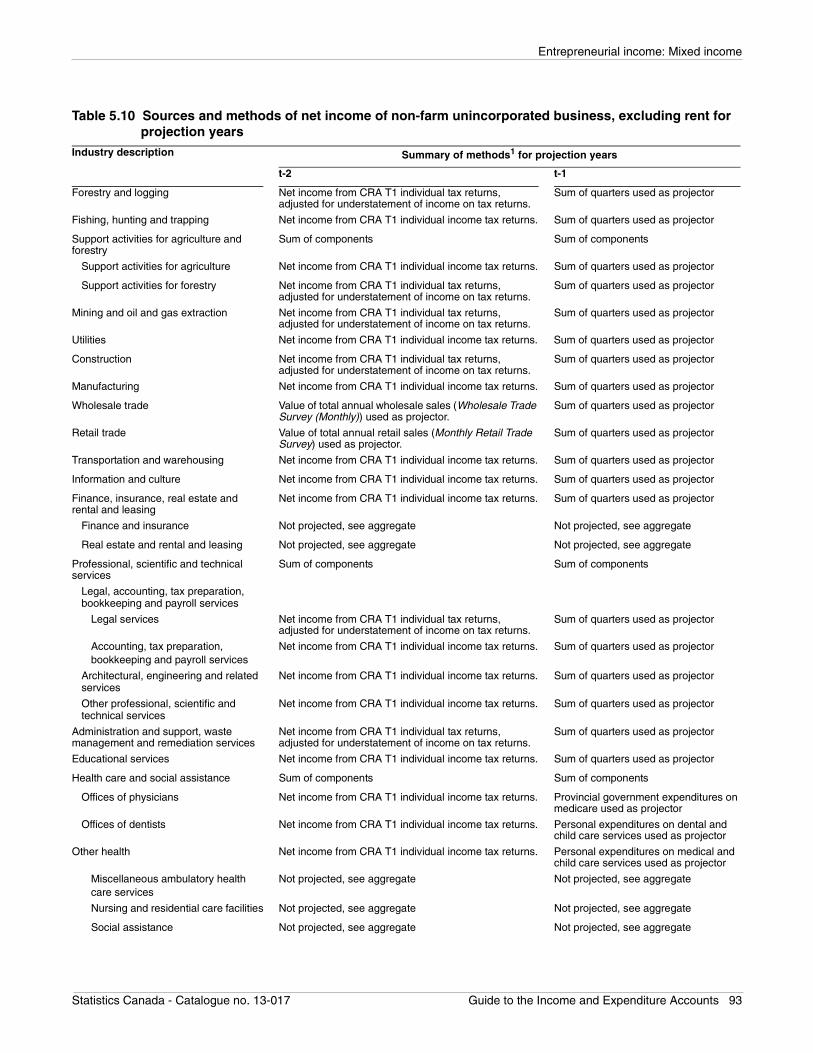
Entrepreneurial income: Mixed income
Table 5.10 Sources and methods of net income of non-farm unincorporated business, excluding rent for projection years
Industry description Summary of methods1 for projection years
t-2 t-1
Forestry and logging Net income from CRA T1 individual tax returns, adjusted for understatement of income on tax returns.
Sum of quarters used as projector
Fishing, hunting and trapping Net income from CRA T1 individual income tax returns. Sum of quarters used as projector
Support activities for agriculture and forestry
Sum of components Sum of components
Support activities for agriculture Net income from CRA T1 individual income tax returns. Sum of quarters used as projector
Support activities for forestry Net income from CRA T1 individual tax returns, adjusted for understatement of income on tax returns.
Sum of quarters used as projector
Mining and oil and gas extraction Net income from CRA T1 individual tax returns, adjusted for understatement of income on tax returns.
Sum of quarters used as projector
Utilities Net income from CRA T1 individual income tax returns. Sum of quarters used as projector
Construction Net income from CRA T1 individual tax returns, adjusted for understatement of income on tax returns.
Sum of quarters used as projector
Manufacturing Net income from CRA T1 individual income tax returns. Sum of quarters used as projector
Wholesale trade Value of total annual wholesale sales (Wholesale Trade Survey (Monthly)) used as projector.
Sum of quarters used as projector
Retail trade Value of total annual retail sales (Monthly Retail Trade Survey) used as projector.
Sum of quarters used as projector
Transportation and warehousing Net income from CRA T1 individual income tax returns. Sum of quarters used as projector
Information and culture Net income from CRA T1 individual income tax returns. Sum of quarters used as projector
Finance, insurance, real estate and rental and leasing
Net income from CRA T1 individual income tax returns. Sum of quarters used as projector
Finance and insurance Not projected, see aggregate Not projected, see aggregate
Real estate and rental and leasing Not projected, see aggregate Not projected, see aggregate
Professional, scientific and technical services
Sum of components Sum of components
Legal, accounting, tax preparation, bookkeeping and payroll services
Legal services Net income from CRA T1 individual tax returns, adjusted for understatement of income on tax returns.
Sum of quarters used as projector
Accounting, tax preparation, bookkeeping and payroll services
Net income from CRA T1 individual income tax returns. Sum of quarters used as projector
Architectural, engineering and related services
Net income from CRA T1 individual income tax returns. Sum of quarters used as projector
Other professional, scientific and technical services
Net income from CRA T1 individual income tax returns. Sum of quarters used as projector
Administration and support, waste management and remediation services
Net income from CRA T1 individual tax returns, adjusted for understatement of income on tax returns.
Sum of quarters used as projector
Educational services Net income from CRA T1 individual income tax returns. Sum of quarters used as projector
Health care and social assistance Sum of components Sum of components
Offices of physicians Net income from CRA T1 individual income tax returns. Provincial government expenditures on medicare used as projector
Offices of dentists Net income from CRA T1 individual income tax returns. Personal expenditures on dental and child care services used as projector
Other health Net income from CRA T1 individual income tax returns. Personal expenditures on medical and child care services used as projector
Miscellaneous ambulatory health care services
Not projected, see aggregate Not projected, see aggregate
Nursing and residential care facilities Not projected, see aggregate Not projected, see aggregate
Social assistance Not projected, see aggregate Not projected, see aggregate
Statistics Canada - Catalogue no. 13-017 Guide to the Income and Expenditure Accounts 93
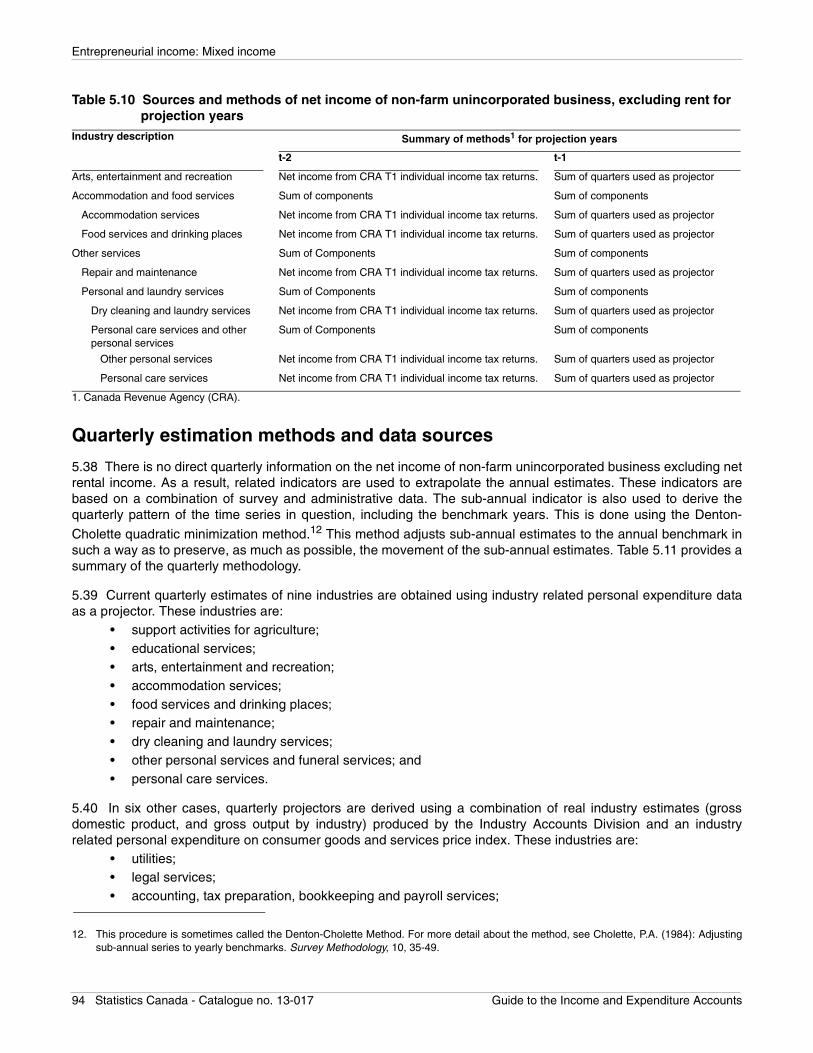
Entrepreneurial income: Mixed income
Quarterly estimation methods and data sources
5.38 There is no direct quarterly information on the net income of non-farm unincorporated business excluding netrental income. As a result, related indicators are used to extrapolate the annual estimates. These indicators arebased on a combination of survey and administrative data. The sub-annual indicator is also used to derive thequarterly pattern of the time series in question, including the benchmark years. This is done using the Denton-
Cholette quadratic minimization method.12 This method adjusts sub-annual estimates to the annual benchmark insuch a way as to preserve, as much as possible, the movement of the sub-annual estimates. Table 5.11 provides asummary of the quarterly methodology.
5.39 Current quarterly estimates of nine industries are obtained using industry related personal expenditure dataas a projector. These industries are:
• support activities for agriculture; • educational services; • arts, entertainment and recreation; • accommodation services; • food services and drinking places; • repair and maintenance; • dry cleaning and laundry services; • other personal services and funeral services; and • personal care services.
5.40 In six other cases, quarterly projectors are derived using a combination of real industry estimates (grossdomestic product, and gross output by industry) produced by the Industry Accounts Division and an industryrelated personal expenditure on consumer goods and services price index. These industries are:
• utilities; • legal services; • accounting, tax preparation, bookkeeping and payroll services;
Arts, entertainment and recreation Net income from CRA T1 individual income tax returns. Sum of quarters used as projector
Accommodation and food services Sum of components Sum of components
Accommodation services Net income from CRA T1 individual income tax returns. Sum of quarters used as projector
Food services and drinking places Net income from CRA T1 individual income tax returns. Sum of quarters used as projector
Other services Sum of Components Sum of components
Repair and maintenance Net income from CRA T1 individual income tax returns. Sum of quarters used as projector
Personal and laundry services Sum of Components Sum of components
Dry cleaning and laundry services Net income from CRA T1 individual income tax returns. Sum of quarters used as projector
Personal care services and other personal services
Sum of Components Sum of components
Other personal services Net income from CRA T1 individual income tax returns. Sum of quarters used as projector
Personal care services Net income from CRA T1 individual income tax returns. Sum of quarters used as projector
1. Canada Revenue Agency (CRA).
12. This procedure is sometimes called the Denton-Cholette Method. For more detail about the method, see Cholette, P.A. (1984): Adjustingsub-annual series to yearly benchmarks. Survey Methodology, 10, 35-49.
Table 5.10 Sources and methods of net income of non-farm unincorporated business, excluding rent for projection years
Industry description Summary of methods1 for projection years
t-2 t-1
94 Statistics Canada - Catalogue no. 13-017 Guide to the Income and Expenditure Accounts
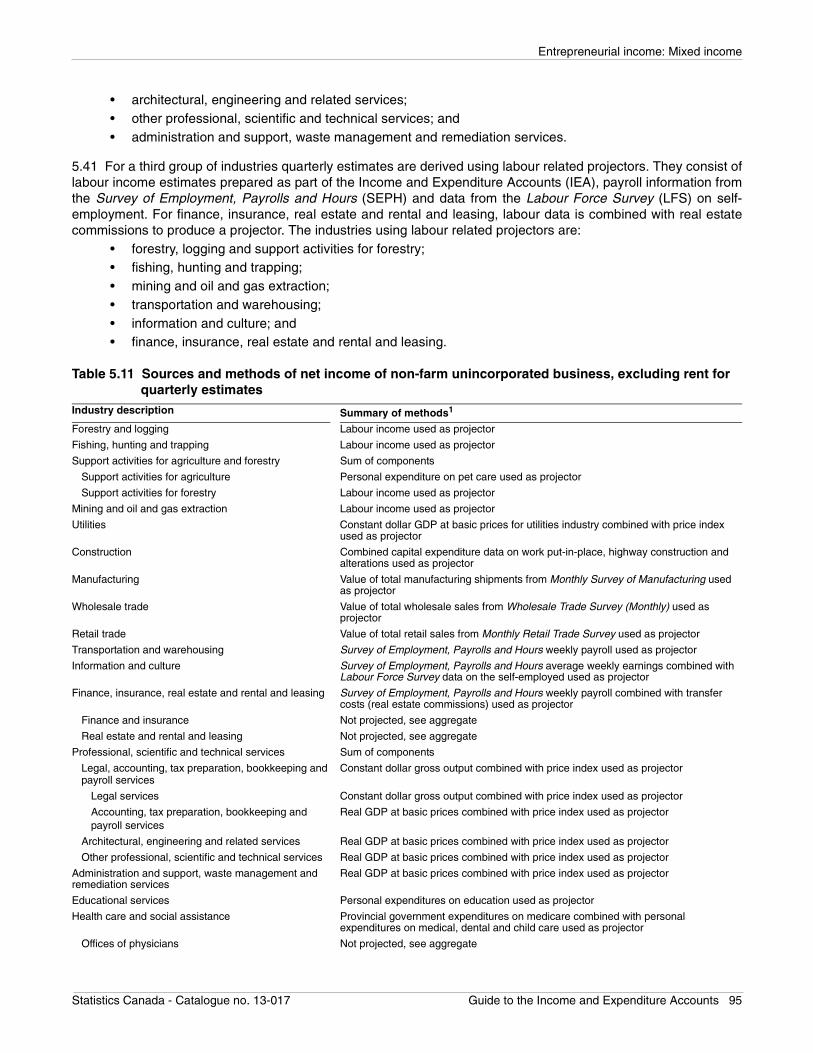
Entrepreneurial income: Mixed income
• architectural, engineering and related services; • other professional, scientific and technical services; and • administration and support, waste management and remediation services.
5.41 For a third group of industries quarterly estimates are derived using labour related projectors. They consist oflabour income estimates prepared as part of the Income and Expenditure Accounts (IEA), payroll information fromthe Survey of Employment, Payrolls and Hours (SEPH) and data from the Labour Force Survey (LFS) on self-employment. For finance, insurance, real estate and rental and leasing, labour data is combined with real estatecommissions to produce a projector. The industries using labour related projectors are:
• forestry, logging and support activities for forestry; • fishing, hunting and trapping; • mining and oil and gas extraction; • transportation and warehousing; • information and culture; and • finance, insurance, real estate and rental and leasing.
Table 5.11 Sources and methods of net income of non-farm unincorporated business, excluding rent for quarterly estimates
Industry description Summary of methods1
Forestry and logging Labour income used as projector
Fishing, hunting and trapping Labour income used as projector
Support activities for agriculture and forestry Sum of components
Support activities for agriculture Personal expenditure on pet care used as projector
Support activities for forestry Labour income used as projector
Mining and oil and gas extraction Labour income used as projector
Utilities Constant dollar GDP at basic prices for utilities industry combined with price index used as projector
Construction Combined capital expenditure data on work put-in-place, highway construction and alterations used as projector
Manufacturing Value of total manufacturing shipments from Monthly Survey of Manufacturing used as projector
Wholesale trade Value of total wholesale sales from Wholesale Trade Survey (Monthly) used as projector
Retail trade Value of total retail sales from Monthly Retail Trade Survey used as projector
Transportation and warehousing Survey of Employment, Payrolls and Hours weekly payroll used as projector
Information and culture Survey of Employment, Payrolls and Hours average weekly earnings combined with Labour Force Survey data on the self-employed used as projector
Finance, insurance, real estate and rental and leasing Survey of Employment, Payrolls and Hours weekly payroll combined with transfer costs (real estate commissions) used as projector
Finance and insurance Not projected, see aggregate
Real estate and rental and leasing Not projected, see aggregate
Professional, scientific and technical services Sum of components
Legal, accounting, tax preparation, bookkeeping and payroll services
Constant dollar gross output combined with price index used as projector
Legal services Constant dollar gross output combined with price index used as projector
Accounting, tax preparation, bookkeeping and payroll services
Real GDP at basic prices combined with price index used as projector
Architectural, engineering and related services Real GDP at basic prices combined with price index used as projector
Other professional, scientific and technical services Real GDP at basic prices combined with price index used as projector
Administration and support, waste management and remediation services
Real GDP at basic prices combined with price index used as projector
Educational services Personal expenditures on education used as projector
Health care and social assistance Provincial government expenditures on medicare combined with personal expenditures on medical, dental and child care used as projector
Offices of physicians Not projected, see aggregate
Statistics Canada - Catalogue no. 13-017 Guide to the Income and Expenditure Accounts 95
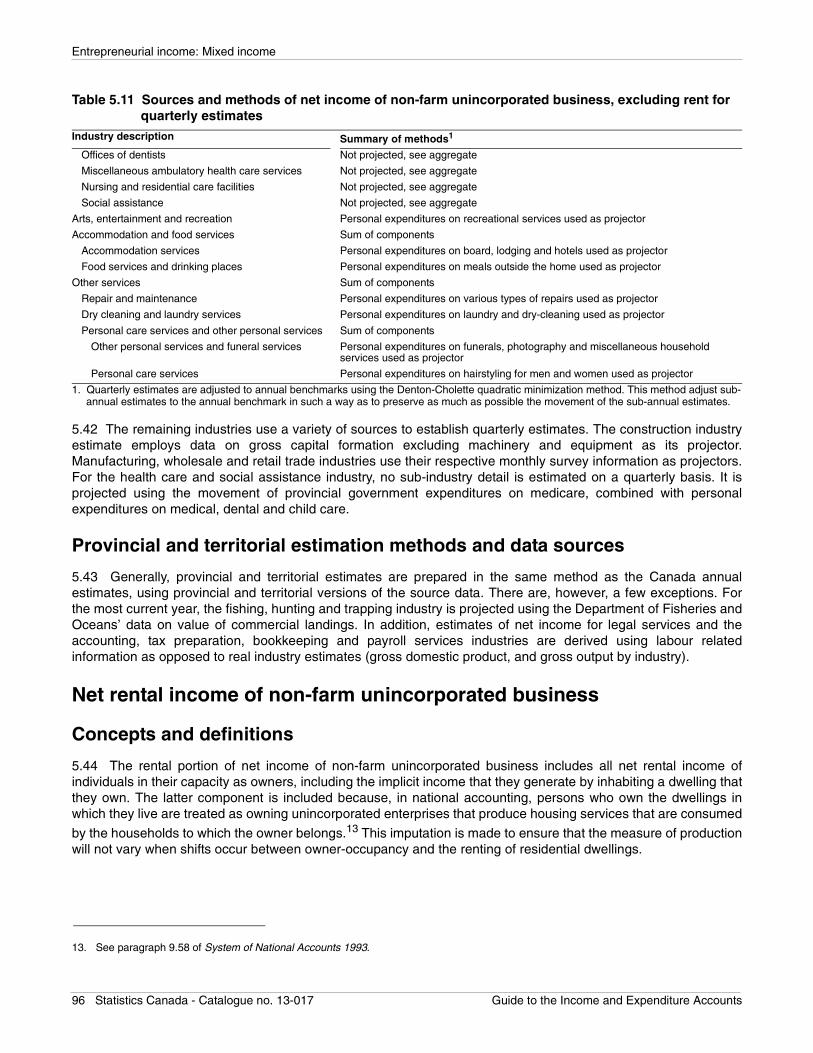
Entrepreneurial income: Mixed income
5.42 The remaining industries use a variety of sources to establish quarterly estimates. The construction industryestimate employs data on gross capital formation excluding machinery and equipment as its projector.Manufacturing, wholesale and retail trade industries use their respective monthly survey information as projectors.For the health care and social assistance industry, no sub-industry detail is estimated on a quarterly basis. It isprojected using the movement of provincial government expenditures on medicare, combined with personalexpenditures on medical, dental and child care.
Provincial and territorial estimation methods and data sources
5.43 Generally, provincial and territorial estimates are prepared in the same method as the Canada annualestimates, using provincial and territorial versions of the source data. There are, however, a few exceptions. Forthe most current year, the fishing, hunting and trapping industry is projected using the Department of Fisheries andOceans’ data on value of commercial landings. In addition, estimates of net income for legal services and theaccounting, tax preparation, bookkeeping and payroll services industries are derived using labour relatedinformation as opposed to real industry estimates (gross domestic product, and gross output by industry).
Net rental income of non-farm unincorporated business
Concepts and definitions
5.44 The rental portion of net income of non-farm unincorporated business includes all net rental income ofindividuals in their capacity as owners, including the implicit income that they generate by inhabiting a dwelling thatthey own. The latter component is included because, in national accounting, persons who own the dwellings inwhich they live are treated as owning unincorporated enterprises that produce housing services that are consumed
by the households to which the owner belongs.13 This imputation is made to ensure that the measure of productionwill not vary when shifts occur between owner-occupancy and the renting of residential dwellings.
Offices of dentists Not projected, see aggregate
Miscellaneous ambulatory health care services Not projected, see aggregate
Nursing and residential care facilities Not projected, see aggregate
Social assistance Not projected, see aggregate
Arts, entertainment and recreation Personal expenditures on recreational services used as projector
Accommodation and food services Sum of components
Accommodation services Personal expenditures on board, lodging and hotels used as projector
Food services and drinking places Personal expenditures on meals outside the home used as projector
Other services Sum of components
Repair and maintenance Personal expenditures on various types of repairs used as projector
Dry cleaning and laundry services Personal expenditures on laundry and dry-cleaning used as projector
Personal care services and other personal services Sum of components
Other personal services and funeral services Personal expenditures on funerals, photography and miscellaneous household services used as projector
Personal care services Personal expenditures on hairstyling for men and women used as projector
1. Quarterly estimates are adjusted to annual benchmarks using the Denton-Cholette quadratic minimization method. This method adjust sub-annual estimates to the annual benchmark in such a way as to preserve as much as possible the movement of the sub-annual estimates.
13. See paragraph 9.58 of System of National Accounts 1993.
Table 5.11 Sources and methods of net income of non-farm unincorporated business, excluding rent for quarterly estimates
Industry description Summary of methods1
96 Statistics Canada - Catalogue no. 13-017 Guide to the Income and Expenditure Accounts
Entrepreneurial income: Mixed income
Annual estimation methods and data sources
5.45 For net residential rental income of non-farm unincorporated business, the data for the benchmarkingprocess are estimated by the Income and Expenditure Accounts Division.
5.46 The overall approach is to first estimate the residential rent that is paid to landlords, or imputed to owner-
occupants.14 Rent, paid and imputed, is published in personal expenditure. Next, the rent paid to corporations andgovernments is subtracted. Then, the expenses incurred by owners (repair costs, property and school taxes,insurance, mortgage interest, depreciation and miscellaneous expenses) are deducted to obtain the net income ofnon-farm unincorporated business from paid and imputed residential rent, to which Industry Accounts Division’s net
income of non-farm unincorporated business from non-residential rent is added.15 (Table 5.14)
Rent, paid and imputed
Rent paid to landlords
5.47 The estimate of paid rent begins with the housing stock, as measured by the Census of Population. Thehousing stock is divided into single-family dwellings, multiple dwellings, mobile homes, cottages, garages andfarms. The Census figures on these stocks are extrapolated annually by the Investment and Capital Stock Division,
which uses the number of new dwellings completed, plus conversions,16 less demolitions from the survey of theCanada Mortgage and Housing Corporation (CMHC) and the Building Permits Survey. The housing stock is alsodivided between rented or owned dwellings and occupied or vacant dwellings, using fixed ratios based on thecensus.
5.48 The average rent is defined as the average price paid by renters for the use of a dwelling (single-familydwellings, multiple dwellings and mobile homes). This average rent is estimated using data drawn from the sampleof respondents to the Labour Force Survey. The housing component of the Consumer Price Index is also based onthese same data.
5.49 The number of rented and occupied dwelling units (single-family dwellings, multiple dwellings and mobilehomes) is multiplied by the average rent to obtain contract rent. The portion of contract rent that is not related to thedwelling space, that is, expenditures relating to facilities and services provided by landlords, is subtracted to obtain
paid rent.17 These expenditures include depreciation of furniture, stoves, refrigerators and washing machines aswell as costs related to water, electricity, heating, parking and maintenance services. Since the average rent is notavailable for cottages and farms, stocks and estimates of rent for other types of dwellings are used in order to
obtain an approximation.18 For garages, the average rent comes from the Survey of Household Spending. Finally,an adjustment is made to remove the portion related to offices in the dwelling.
5.50 Several sources are used to estimate expenditures relating to facilities and services provided by landlords,including the Survey of Household Spending, personal expenditure data on furniture and household appliancesand on energy, and the Survey of Employment, Payrolls and Hours for maintenance services.
5.51 Data provided by the Prices Division indicate that approximately 2% of workers use their dwelling as aworkplace. The Income and Expenditure Accounts Division hypothesizes that 25% of rent should be attributed tothe business portion. The calculation is as follows:
14. Residential rent that is paid to landlords is referred to as paid rent in the rest of this chapter; residential rent imputed to owner-occupants isreferred to as imputed rent.
15. The non-residential portion of net rental income of non-farm unincorporated business represents about 3% of the total.16. These are additional dwelling units created from formerly non-residential buildings or from other types of residential buildings.17. Paid rent is often referred to as gross space paid rent or gross paid rent for space, emphasizing that this estimate measures only the cost
of the space occupied.18. Paid rent for cottages, garages and farms accounts for less than 3% of the total.
Statistics Canada - Catalogue no. 13-017 Guide to the Income and Expenditure Accounts 97
Entrepreneurial income: Mixed income
Paid rent
x Ratio of rent used for office space (25%)
x Ratio of individuals using their dwelling as a workplace (2%)
= Adjustment for offices in the dwelling
5.52 Paid rent is the starting point for estimating rent imputed to owner-occupants.
Rent imputed to owner-occupants
5.53 Dividing paid rent by the rented and occupied housing stock, results in an estimate of the average rent. Thisestimate is adjusted using a coefficient of quality, since a dwelling that is owned is generally larger and of betterquality than a rented dwelling. This coefficient is based on the average number of rooms in owned dwellings
compared to that of rented dwellings, according to the Census of Population. Imputed rent19 is obtained bymultiplying the number of dwelling units owned and occupied (single-family dwellings, multiple dwellings andmobile homes) by the average rent paid adjusted by a quality coefficient. The calculation is as follows:
Paid rent
÷ Rented and occupied housing stock
= Average rent paid
x Coefficient of quality related to a dwelling that is owner-occupied
x Owned and occupied housing stock
= Imputed rent
5.54 To obtain imputed residential rent for garages, cottages and farms, the procedure is the same as for rentedand occupied dwellings (see paragraph 5.49).
5.55 An adjustment is made for offices in the dwelling in the same way as in rented and occupied dwellings (seeparagraphs 5.49 and 5.51).
5.56 Imputed rent, like paid rent, is the starting point for estimating the net rental income of non-farm
unincorporated businesses. It is published in personal expenditure as imputed rent.20
Net income of non-farm unincorporated business from rent
5.57 Table 5.12, Table 5.13 and Table 5.15 illustrate the calculation of net rental income of non-farmunincorporated business. The calculation is done in three parts: first, net residential rental income imputed toowner-occupants; then net residential rental income of unincorporated businesses; and lastly, net non-residentialrental income of unincorporated businesses. Table 5.14 displays estimates for 2000.
Net residential rental income imputed to owner-occupants
5.58 As shown in Table 5.12, the calculation of net residential rental income imputed to owner-occupants beginswith imputed rent. From this, owner-occupants’ expenditures related to the dwelling are subtracted. These includerepair costs, property and school taxes, insurance, mortgage interest, depreciation and miscellaneousexpenditures.
19. Imputed rent is often referred to as gross space imputed rent or gross imputed rent for space, emphasizing that this estimate measuresonly the costs of the space occupied.
20. National Income and Expenditure Accounts, catalogue no. 13-001, Table 16, line 10.
98 Statistics Canada - Catalogue no. 13-017 Guide to the Income and Expenditure Accounts
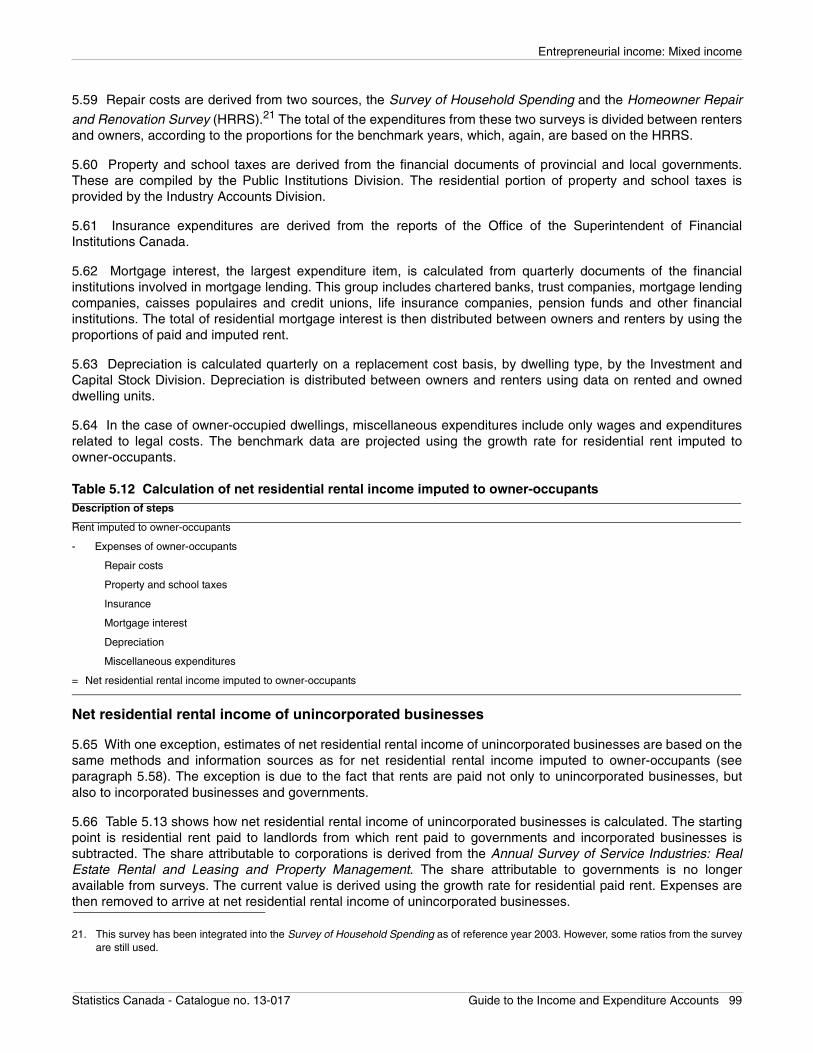
Entrepreneurial income: Mixed income
5.59 Repair costs are derived from two sources, the Survey of Household Spending and the Homeowner Repair
and Renovation Survey (HRRS).21 The total of the expenditures from these two surveys is divided between rentersand owners, according to the proportions for the benchmark years, which, again, are based on the HRRS.
5.60 Property and school taxes are derived from the financial documents of provincial and local governments.These are compiled by the Public Institutions Division. The residential portion of property and school taxes isprovided by the Industry Accounts Division.
5.61 Insurance expenditures are derived from the reports of the Office of the Superintendent of FinancialInstitutions Canada.
5.62 Mortgage interest, the largest expenditure item, is calculated from quarterly documents of the financialinstitutions involved in mortgage lending. This group includes chartered banks, trust companies, mortgage lendingcompanies, caisses populaires and credit unions, life insurance companies, pension funds and other financialinstitutions. The total of residential mortgage interest is then distributed between owners and renters by using theproportions of paid and imputed rent.
5.63 Depreciation is calculated quarterly on a replacement cost basis, by dwelling type, by the Investment andCapital Stock Division. Depreciation is distributed between owners and renters using data on rented and owneddwelling units.
5.64 In the case of owner-occupied dwellings, miscellaneous expenditures include only wages and expendituresrelated to legal costs. The benchmark data are projected using the growth rate for residential rent imputed toowner-occupants.
Net residential rental income of unincorporated businesses
5.65 With one exception, estimates of net residential rental income of unincorporated businesses are based on thesame methods and information sources as for net residential rental income imputed to owner-occupants (seeparagraph 5.58). The exception is due to the fact that rents are paid not only to unincorporated businesses, butalso to incorporated businesses and governments.
5.66 Table 5.13 shows how net residential rental income of unincorporated businesses is calculated. The startingpoint is residential rent paid to landlords from which rent paid to governments and incorporated businesses issubtracted. The share attributable to corporations is derived from the Annual Survey of Service Industries: RealEstate Rental and Leasing and Property Management. The share attributable to governments is no longeravailable from surveys. The current value is derived using the growth rate for residential paid rent. Expenses arethen removed to arrive at net residential rental income of unincorporated businesses.
21. This survey has been integrated into the Survey of Household Spending as of reference year 2003. However, some ratios from the surveyare still used.
Table 5.12 Calculation of net residential rental income imputed to owner-occupantsDescription of steps
Rent imputed to owner-occupants
- Expenses of owner-occupants
Repair costs
Property and school taxes
Insurance
Mortgage interest
Depreciation
Miscellaneous expenditures
= Net residential rental income imputed to owner-occupants
Statistics Canada - Catalogue no. 13-017 Guide to the Income and Expenditure Accounts 99
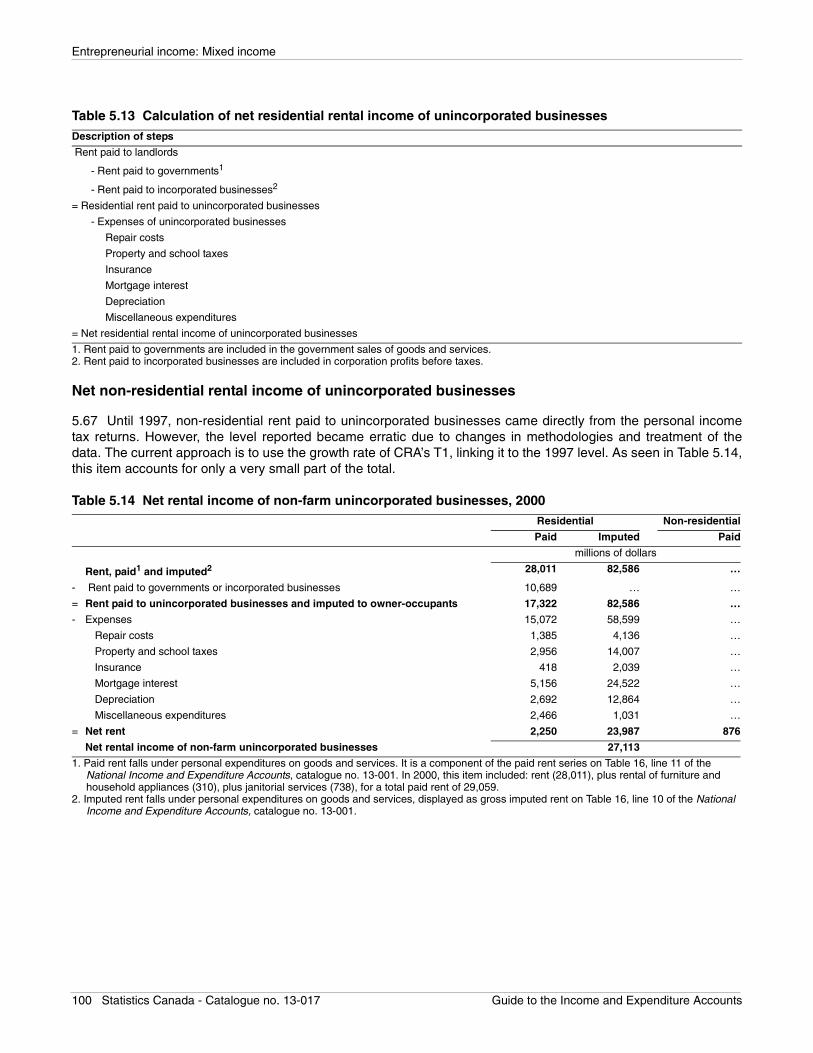
Entrepreneurial income: Mixed income
Net non-residential rental income of unincorporated businesses
5.67 Until 1997, non-residential rent paid to unincorporated businesses came directly from the personal incometax returns. However, the level reported became erratic due to changes in methodologies and treatment of thedata. The current approach is to use the growth rate of CRA’s T1, linking it to the 1997 level. As seen in Table 5.14,this item accounts for only a very small part of the total.
Table 5.13 Calculation of net residential rental income of unincorporated businessesDescription of steps
Rent paid to landlords
- Rent paid to governments1
- Rent paid to incorporated businesses2
= Residential rent paid to unincorporated businesses
- Expenses of unincorporated businesses
Repair costs
Property and school taxes
Insurance
Mortgage interest
Depreciation
Miscellaneous expenditures
= Net residential rental income of unincorporated businesses
1. Rent paid to governments are included in the government sales of goods and services.2. Rent paid to incorporated businesses are included in corporation profits before taxes.
Table 5.14 Net rental income of non-farm unincorporated businesses, 2000Residential Non-residential
Paid Imputed Paid
millions of dollars
Rent, paid1 and imputed2 28,011 82,586 …
- Rent paid to governments or incorporated businesses 10,689 … …
= Rent paid to unincorporated businesses and imputed to owner-occupants 17,322 82,586 …
- Expenses 15,072 58,599 …
Repair costs 1,385 4,136 …
Property and school taxes 2,956 14,007 …
Insurance 418 2,039 …
Mortgage interest 5,156 24,522 …
Depreciation 2,692 12,864 …
Miscellaneous expenditures 2,466 1,031 …
= Net rent 2,250 23,987 876
Net rental income of non-farm unincorporated businesses 27,113
1. Paid rent falls under personal expenditures on goods and services. It is a component of the paid rent series on Table 16, line 11 of the National Income and Expenditure Accounts, catalogue no. 13-001. In 2000, this item included: rent (28,011), plus rental of furniture and household appliances (310), plus janitorial services (738), for a total paid rent of 29,059.
2. Imputed rent falls under personal expenditures on goods and services, displayed as gross imputed rent on Table 16, line 10 of the National Income and Expenditure Accounts, catalogue no. 13-001.
100 Statistics Canada - Catalogue no. 13-017 Guide to the Income and Expenditure Accounts
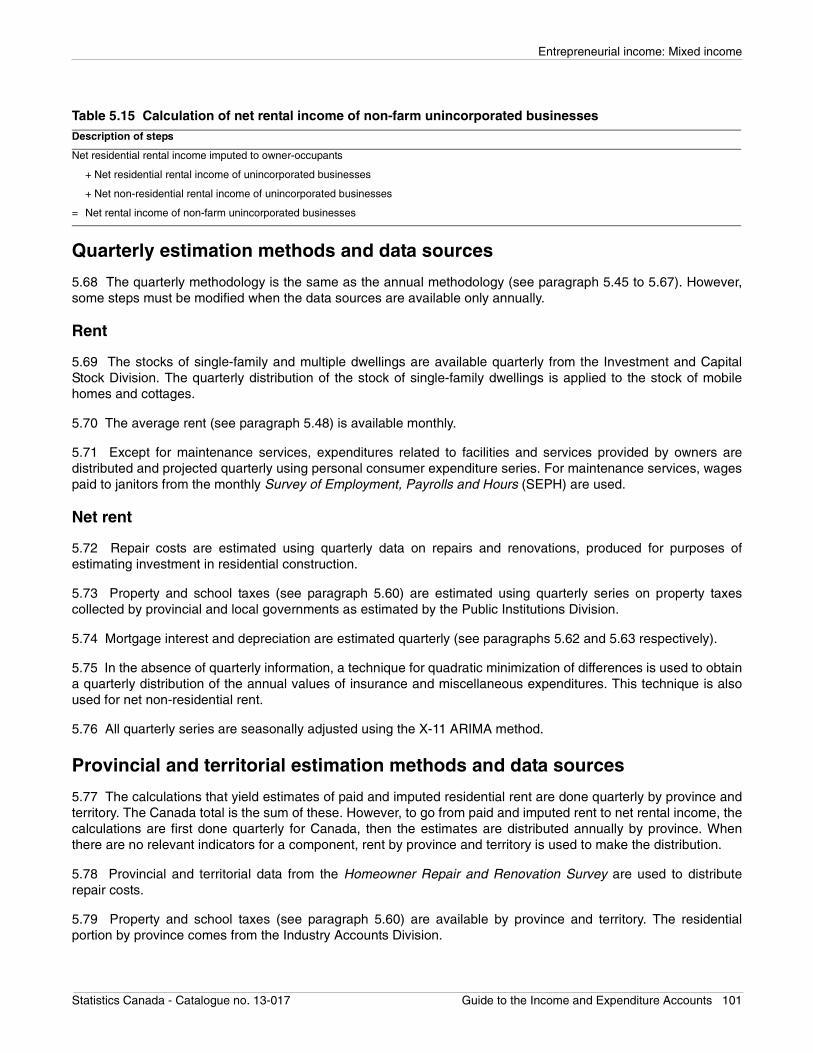
Entrepreneurial income: Mixed income
Quarterly estimation methods and data sources
5.68 The quarterly methodology is the same as the annual methodology (see paragraph 5.45 to 5.67). However,some steps must be modified when the data sources are available only annually.
Rent
5.69 The stocks of single-family and multiple dwellings are available quarterly from the Investment and CapitalStock Division. The quarterly distribution of the stock of single-family dwellings is applied to the stock of mobilehomes and cottages.
5.70 The average rent (see paragraph 5.48) is available monthly.
5.71 Except for maintenance services, expenditures related to facilities and services provided by owners aredistributed and projected quarterly using personal consumer expenditure series. For maintenance services, wagespaid to janitors from the monthly Survey of Employment, Payrolls and Hours (SEPH) are used.
Net rent
5.72 Repair costs are estimated using quarterly data on repairs and renovations, produced for purposes ofestimating investment in residential construction.
5.73 Property and school taxes (see paragraph 5.60) are estimated using quarterly series on property taxescollected by provincial and local governments as estimated by the Public Institutions Division.
5.74 Mortgage interest and depreciation are estimated quarterly (see paragraphs 5.62 and 5.63 respectively).
5.75 In the absence of quarterly information, a technique for quadratic minimization of differences is used to obtaina quarterly distribution of the annual values of insurance and miscellaneous expenditures. This technique is alsoused for net non-residential rent.
5.76 All quarterly series are seasonally adjusted using the X-11 ARIMA method.
Provincial and territorial estimation methods and data sources
5.77 The calculations that yield estimates of paid and imputed residential rent are done quarterly by province andterritory. The Canada total is the sum of these. However, to go from paid and imputed rent to net rental income, thecalculations are first done quarterly for Canada, then the estimates are distributed annually by province. Whenthere are no relevant indicators for a component, rent by province and territory is used to make the distribution.
5.78 Provincial and territorial data from the Homeowner Repair and Renovation Survey are used to distributerepair costs.
5.79 Property and school taxes (see paragraph 5.60) are available by province and territory. The residentialportion by province comes from the Industry Accounts Division.
Table 5.15 Calculation of net rental income of non-farm unincorporated businessesDescription of steps
Net residential rental income imputed to owner-occupants
+ Net residential rental income of unincorporated businesses
+ Net non-residential rental income of unincorporated businesses
= Net rental income of non-farm unincorporated businesses
Statistics Canada - Catalogue no. 13-017 Guide to the Income and Expenditure Accounts 101
Entrepreneurial income: Mixed income
5.80 Property insurance premiums paid by province and territory, compiled by the Office of the Superintendent ofFinancial Institutions Canada, are used to distribute insurance expenditures.
5.81 For mortgage interest, there is no provincial or territorial indicator. The Canada growth rate is applied to eachprovince and territory.
5.82 Depreciation (see paragraph no. 5.63), which is supplied by the Investment and Capital Stock Division, isavailable quarterly by province and territory.
102 Statistics Canada - Catalogue no. 13-017 Guide to the Income and Expenditure Accounts
Taxes less subsidies
Chapter 6 Taxes less subsidies
Introduction
6.1 In the Canadian System of National Accounts, the aggregate gross domestic product (GDP) is measured atmarket prices – that is, at prices faced by purchasers. These market prices include the effects of governmentintervention in the market, specifically: taxes levied on production of goods and services; taxes on the goods andservices themselves; subsidies paid to producers to influence the costs of production; and, subsidies paid todirectly change the price of goods and services or the incomes arising from their production and sale.
6.2 Taxes on production include property taxes, taxes on payrolls and capital, and the costs of business licences,permits and fees. These taxes are levied regardless of the current level of production of goods and services.
6.3 Taxes on products, on goods and services themselves, include the Goods and Services Tax, provincial salestaxes, federal and provincial taxes on sales volumes of gasoline and other motive fuel taxes, tobacco and alcohol,etc. These taxes only arise as a result of the actual production or sale of goods and services.
6.4 Subsidies are unrequited payments made to business sector entities by governments to affect the currentcosts of production or the final prices of the goods and services produced or the incomes arising from thatproduction.
6.5 Subsidies on production include payments made to business to influence the mix of factors of production usedin their operations. They include assistance for training and other payments to reduce the cost of labour as well aspayments to compensate producers for the interest costs of capital, property and other taxes, etc.
6.6 Subsidies on products directly affect either the price of those goods and services or the incomes arising fromtheir production and sale. These subsidies include payments to reduce the price of, for example, passenger railtravel and other transportation services such as ferries and electricity, natural gas and other home-heating fuels.Also included in subsidies on products are payments to farmers to compensate them for low market prices for theirproducts and to enhance their incomes from that production.
6.7 Whenever possible, taxes and subsidies are estimated on an accrual basis of accounting rather than a cashbasis of accounting so that output reflects as accurately as possible the costs related to it.
6.8 In the income-based GDP table, two items relate to taxes and subsidies: taxes less subsidies on factors ofproduction, and taxes less subsidies on products.
Concepts and definitions
Taxes on products
6.9 Taxes on products1 are taxes payable per unit of some good or service sold. The tax may be a specific amountof money per unit or it may be calculated as a specified percentage of the goods and services sold. Taxes on
products include:2
• general sales taxes such as the Goods and Services Tax (GST) and provincial retail sales taxes;• taxes on alcoholic beverages and on tobacco, which include special taxes, excise taxes and duties
collected on the production and sale of alcoholic beverages and tobacco products;
1. In the System of National Accounts 1993 (SNA 1993), this aggregate appears under “Taxes on products” in the Primary Distribution ofIncome Account and is described in paragraphs 7.62 to 7.69.
2. The descriptions of the types of taxes on products are based on the descriptions in section 6.07 of the Financial Management System(FMS), catalogue no. 68F0023.
Statistics Canada - Catalogue no. 13-017 Guide to the Income and Expenditure Accounts 103
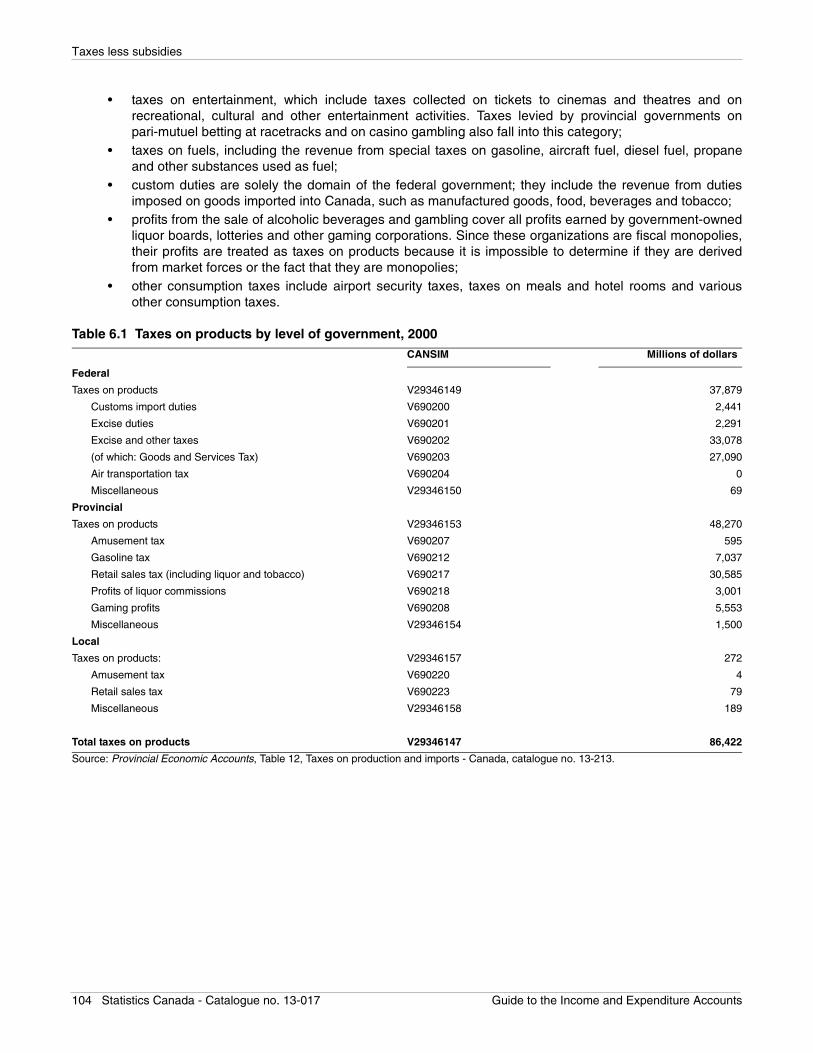
Taxes less subsidies
• taxes on entertainment, which include taxes collected on tickets to cinemas and theatres and onrecreational, cultural and other entertainment activities. Taxes levied by provincial governments onpari-mutuel betting at racetracks and on casino gambling also fall into this category;
• taxes on fuels, including the revenue from special taxes on gasoline, aircraft fuel, diesel fuel, propaneand other substances used as fuel;
• custom duties are solely the domain of the federal government; they include the revenue from dutiesimposed on goods imported into Canada, such as manufactured goods, food, beverages and tobacco;
• profits from the sale of alcoholic beverages and gambling cover all profits earned by government-ownedliquor boards, lotteries and other gaming corporations. Since these organizations are fiscal monopolies,their profits are treated as taxes on products because it is impossible to determine if they are derivedfrom market forces or the fact that they are monopolies;
• other consumption taxes include airport security taxes, taxes on meals and hotel rooms and variousother consumption taxes.
Table 6.1 Taxes on products by level of government, 2000CANSIM Millions of dollars
Federal
Taxes on products V29346149 37,879
Customs import duties V690200 2,441
Excise duties V690201 2,291
Excise and other taxes V690202 33,078
(of which: Goods and Services Tax) V690203 27,090
Air transportation tax V690204 0
Miscellaneous V29346150 69
Provincial
Taxes on products V29346153 48,270
Amusement tax V690207 595
Gasoline tax V690212 7,037
Retail sales tax (including liquor and tobacco) V690217 30,585
Profits of liquor commissions V690218 3,001
Gaming profits V690208 5,553
Miscellaneous V29346154 1,500
Local
Taxes on products: V29346157 272
Amusement tax V690220 4
Retail sales tax V690223 79
Miscellaneous V29346158 189
Total taxes on products V29346147 86,422
Source: Provincial Economic Accounts, Table 12, Taxes on production and imports - Canada, catalogue no. 13-213.
104 Statistics Canada - Catalogue no. 13-017 Guide to the Income and Expenditure Accounts
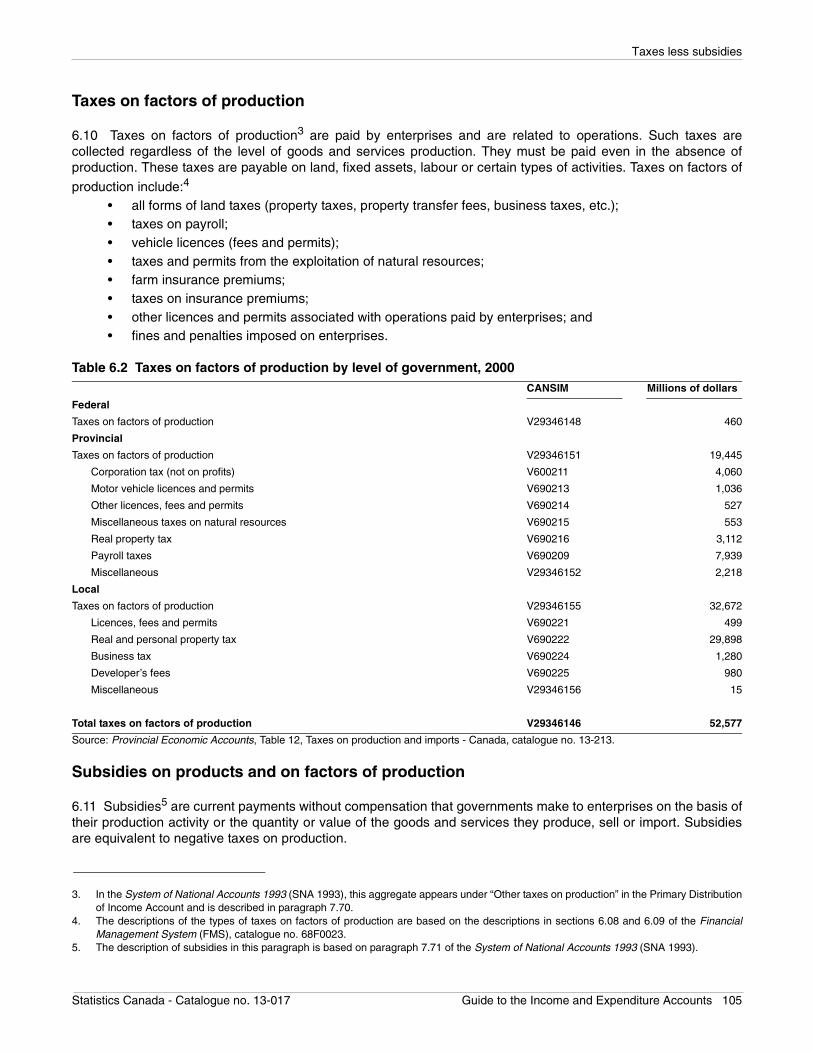
Taxes less subsidies
Taxes on factors of production
6.10 Taxes on factors of production3 are paid by enterprises and are related to operations. Such taxes arecollected regardless of the level of goods and services production. They must be paid even in the absence ofproduction. These taxes are payable on land, fixed assets, labour or certain types of activities. Taxes on factors of
production include:4 • all forms of land taxes (property taxes, property transfer fees, business taxes, etc.);• taxes on payroll;• vehicle licences (fees and permits);• taxes and permits from the exploitation of natural resources;• farm insurance premiums;• taxes on insurance premiums;• other licences and permits associated with operations paid by enterprises; and• fines and penalties imposed on enterprises.
Subsidies on products and on factors of production
6.11 Subsidies5 are current payments without compensation that governments make to enterprises on the basis oftheir production activity or the quantity or value of the goods and services they produce, sell or import. Subsidiesare equivalent to negative taxes on production.
3. In the System of National Accounts 1993 (SNA 1993), this aggregate appears under “Other taxes on production” in the Primary Distributionof Income Account and is described in paragraph 7.70.
4. The descriptions of the types of taxes on factors of production are based on the descriptions in sections 6.08 and 6.09 of the FinancialManagement System (FMS), catalogue no. 68F0023.
Table 6.2 Taxes on factors of production by level of government, 2000CANSIM Millions of dollars
Federal
Taxes on factors of production V29346148 460
Provincial
Taxes on factors of production V29346151 19,445
Corporation tax (not on profits) V600211 4,060
Motor vehicle licences and permits V690213 1,036
Other licences, fees and permits V690214 527
Miscellaneous taxes on natural resources V690215 553
Real property tax V690216 3,112
Payroll taxes V690209 7,939
Miscellaneous V29346152 2,218
Local
Taxes on factors of production V29346155 32,672
Licences, fees and permits V690221 499
Real and personal property tax V690222 29,898
Business tax V690224 1,280
Developer’s fees V690225 980
Miscellaneous V29346156 15
Total taxes on factors of production V29346146 52,577
Source: Provincial Economic Accounts, Table 12, Taxes on production and imports - Canada, catalogue no. 13-213.
5. The description of subsidies in this paragraph is based on paragraph 7.71 of the System of National Accounts 1993 (SNA 1993).
Statistics Canada - Catalogue no. 13-017 Guide to the Income and Expenditure Accounts 105
Taxes less subsidies
6.12 Subsidies on products6 are payable per unit of a good or service sold. They may be a specific amount ofmoney per unit or may be calculated as a specified percentage of the goods and services sold. A subsidy may alsobe calculated as the difference between a specified target price and the market price actually paid by a buyer.
6.13 Subsidies on factors of production7 are paid to enterprises based on their production activities. Thesesubsidies include, for example, subsidies on payroll or workforce or subsidies to reduce pollution.
Annual estimation methods and data sources
6.14 Taxes less subsidies, either on products or on factors of production, are estimated from the same sources,using the same methodologies.
6.15 For this discussion of sources and methods, the three stages of the production-revision cycle will beconsidered starting from the benchmark years (first two years of the four year revision cycle, t-4 and t-3) to the non-benchmark years (last two years, t-2 and t-1) and progressing to the current quarter estimates. This order worksbetter because the benchmark year estimates which are based on information from public accounts, auditedfinancial statements and censuses of universe entities, provide a solid ground for understanding the governmentinstitutional sector and its activities.
6.16 The benchmark years estimates also benefit from the commodity and industry balancing of the Input-OutputTables (IOT) and are the product of an integrated effort by statisticians of the Industry Accounts Division, theIncome and Expenditure Accounts Division and the Public Institutions Division. These estimates are used inestablishing the level of the non-benchmark years.
6.17 Non-benchmark year estimates are based on similar source information – financial reports and statements,budget estimates and survey responses–but final versions are often not yet available and the information is stillsubject to revision.
6.18 Current quarter estimates are based on sub-annual administrative or financial reports, budget estimates andrelated indicators.
Federal government
6.19 The federal government sub-sector is divided into two parts for purposes of estimation, as the underlying data
sources are different. These two parts are called budgetary8 and extra-budgetary.
6.20 Information for the budgetary part of the sub-sector comes from the Government of Canada Banking andAccounting System of Public Works and Government Services Canada (PWGSC), specifically the Public Accounts
of Canada9 and from monthly statements provided by PWGSC and by Canada Revenue Agency (CRA). Budgetarytaxes include customs duties, excise duties (on alcohol and tobacco), excise taxes on motive fuel and otherproducts and the Air Travellers Security Charge. For the last year of the four-year revision cycle, no publicaccounts are available and the estimates are based on the monthly CRA and PWGSC information.
6. In the international system, this aggregate appears under “Subsidies on products” in the Primary distribution of Income account. This itemis described in paragraphs 7.73 to 7.78 of the System of National Accounts 1993.
7. In the international system, this aggregate appears under “2. Other subsidies on production” in the Primary Distribution of Income Account.This item is described in paragraph 7.79 of the System of National Accounts 1993.
8. Budgetary entities is the terminology used in Canadian public finance to describe the ministries, departments and agencies of thegovernment. Similarly, extra-budgetary entities is used to describe what the public sector universe refers to as autonomous organizations,boards, commissions and funds, that is, entities that the Canadian System of National Accounts includes in the federal sub-sector butwhich are not included in the Government of Canada’s budgetary universe, for example, the Canadian Broadcasting Corporation (CBC).
9. The federal, provincial, territorial and Canada and Quebec pension plans public accounts benchmark data are all on a fiscal-year basis.Since estimates for these entities in the IEA were all originally made for a specific quarter, based on monthly or quarterly information, it is arelatively simple matter to convert the benchmark data from a fiscal-year to a calendar-year basis using the appropriate componentquarters.
106 Statistics Canada - Catalogue no. 13-017 Guide to the Income and Expenditure Accounts
Taxes less subsidies
6.21 Data sources for the extra-budgetary part include annual and sub-annual financial reports and statements ofthe extra-budgetary entities or other information obtained directly from them. If the information is not forthcomingfor the most recent year(s), estimates are calculated using data from earlier periods. Extra-budgetary taxes includethe Canadian Dairy Commission Levy, premiums charged by the Canada Deposit Insurance Corporation andlicence fees paid into the Canadian Television Fund.
6.22 The Goods and Services Tax (GST), while a part of budgetary revenue for the Government of Canada, is notestimated from information contained in the Public Accounts of Canada. For the benchmark years (and the firstnon-benchmark year), the annual estimate for GST revenue comes from the GST/HST Revenue Pool establishedby the Government of Canada and those provinces that have harmonized their sales taxes with the GST (NewBrunswick, Nova Scotia and Newfoundland). This estimate is then reconciled with the estimate of GST embeddedin the components of the final demand matrix of the Input-Output Tables (IOT) to produce annual control totals.
6.23 For the most recent year, the Goods and Services Tax (GST) is estimated using an aggregate indicator andprojector calculated from the estimates of GST embedded in the final domestic demand components of GDP.Through the IOT reconciliation and integration process, control estimates are established for the GST embedded ineach GDP final demand component. As these final demand components are estimated for non-benchmark years(and, indeed, for current year quarters) they yield an estimate of related GST. An aggregation of these estimates ofembedded GST yields the estimator used to produce the GST for the second non-benchmark year, andsubsequent periods. Available quarterly, this estimator is also used to distribute the annual GST data for use in thequarterly IEA.
6.24 Agricultural subsidies10 are estimated as part of accrued net income of farm operators from farm production(Chapter 5). The main sources are Agriculture Division surveys, Agriculture and Agri-Food Canada, the CanadianGrain Commission and various marketing and regulatory agencies in Canada and the provinces.
6.25 Non-agricultural subsidies paid by the federal administration are derived from the Public Accounts of Canadaand financial statements of government business enterprises receiving subsidies for the benchmark years. Non-benchmark years are estimated from monthly PWGSC information and information obtained from federalgovernment business enterprises. All non-agricultural subsidies are part of the budgetary accounts.
Provincial and territorial governments
6.26 For benchmark years, source documents used to estimate provincial and territorial taxes and non-agriculturalsubsidies include the public accounts of each province and territory for budgetary components, and auditedfinancial statements and annual reports of extra-budgetary entities. Non-benchmark year estimates are preparedfrom information published, annually and quarterly, by provincial governments in budgets, public accounts andother financial statements. In the case of component entities for which financial statements are not available for themost recent year(s), information from the most currently available year is substituted.
6.27 An exception is the provincial share of the Harmonized Sales Tax (HST) which is derived from the same GST/HST Revenue Pool used to establish the federal GST control. Three provinces, Newfoundland, New Brunswickand Nova Scotia, harmonize their provincial sales taxes with the federal sales taxes. The reported HST figures inthe provincial government public accounts are not used because they may contain adjustments for prior periods.
6.28 Agricultural subsidies paid by provinces and territories are part of the estimation of accrued net income offarm operators from farm production (see paragraph 6.24 and Chapter 5).
10. Government program payments to farmer and government payments made under farm support programs are used as alternateterminology for agricultural subsidies in Chapter 5.
Statistics Canada - Catalogue no. 13-017 Guide to the Income and Expenditure Accounts 107
Taxes less subsidies
Local government
6.29 Taxes and subsidies received or paid by municipal governments are derived from annual reports of provincialand territorial government departments of municipal affairs, which summarize information for all municipalities intheir jurisdiction, and from financial statements of municipalities and other local government entities.
6.30 Estimates for school boards are based on provincial and territorial department of education informationrepresenting a census of local schools. This information is gathered from surveys conducted by Culture, Tourismand the Centre for Education Statistics.
6.31 For non-benchmark years, local administration taxes and subsidies are estimated using: a sample surveycollecting municipal budget estimates information, conducted by Public Institutions Division; and, a sample surveycollecting financial information for local schools conducted by Culture, Tourism and the Centre for EducationStatistics.
Quarterly estimation methods and data sources
6.32 Current quarter estimates of federal taxes, subsidies and Goods and Services Tax (GST) are calculated fromthe same information used for the last year of the four year revision cycle. The only difference being an increasingdifficulty in obtaining information for extra-budgetary entities for current quarters and hence an increasing relianceon prior-period information.
6.33 Provincial and territorial tax revenue estimates are developed from a variety of source information varyingwidely across jurisdictions. L’Institut de la Statistique du Québec provides estimates based on Government ofQuebec internal information. Other provinces provide monthly and quarterly information from their governmentaccounting systems while estimates of some series for some jurisdictions have to be calculated using budgetestimates distributed across quarters, using related indicators.
6.34 Current-quarter estimates of taxes less subsidies for the local sub-sector are derived using estimates ofannual values and a variety of quarterly distribution methodologies.
6.35 The bulk of local sub-sector taxes, consisting mainly of realy property taxes, are levied on an annual or semi-annual basis. Since the stream of services produced by real property is, for national accounts’ purposes,continuous throughout the year, these annual taxes are divided evenly over the component quarters of the year.
6.36 A small sub-set of local taxes is levied on current, observable activity and these are estimated quarterly usingrelated indicators. An example is the Deed Transfer Tax series, estimated on the volume of real estatetransactions.
Estimation methods – Provincial and territorial estimates
6.37 Estimates of provincial and local taxes on products and on factors of production as well as provincial andlocal subsidies are built up by province in the course of preparing national estimates, and pose no problem forprovincial accounts.
6.38 Federal government taxes and subsidies on products and on factors of production, on the other hand, mustbe allocated across provinces and territories.
6.39 Federal taxes less subsidies on factors of production are allocated by province based on the location ofproduction of the industry being taxed or subsidized. For example, employment development subsidies are firstallocated across receiving industries and then geographically, using information on the location of production byeach industry.
108 Statistics Canada - Catalogue no. 13-017 Guide to the Income and Expenditure Accounts
Taxes less subsidies
6.40 Taxes less subsidies on products are allocated by province according to the location of production in the caseof subsidies and according to the location of final sale in the case of taxes. Therefore, passenger rail subsidies areallocated by passenger-mile travelled and tobacco excise taxes on sales of tobacco products are allocated byprovince.
6.41 By-province allocation of the Goods and Services Tax is a special case. As discussed previously, calculationof the GST for non-benchmark years and current year quarters is done using a composite indicator and estimatorcalculated by aggregating the embedded GST included in the value of GDP final demand components. This sameprocedure is used to allocate the GST by province and territory. Through the benchmarking of GDP components tothe provincial IOT, control totals are established for each GDP final demand component by province. For non-benchmark years, the by-province estimation of each final demand component includes a value for embeddedGST. Aggregating these estimates of embedded GST produces a composite by-province allocator, which is appliedto the national total for GST.
Statistics Canada - Catalogue no. 13-017 Guide to the Income and Expenditure Accounts 109
Personal expenditure on consumer goods and services
Chapter 7 Personal expenditure on consumer goods and services
Introduction
7.1 Personal expenditure on consumer goods and services includes outlays of transactors of the persons andunincorporated business sector on durable, semi-durable and non-durable goods, and on services.
7.2 Transactors of the persons and unincorporated business sector include all households as well as associations
of individuals serving households and certain collective investment schemes.1 Associations of individuals include
non-profit institutions serving households2 (NPISHs) such as charitable institutions, labour unions, professionalorganizations and religious organizations, as well as fraternal organizations, credit unions and mutual lifeinsurance companies. Collective investment schemes, such as trusteed pension funds and mutual funds, areincluded since they act collectively for the benefit of individuals. Note that unincorporated businesses are alsoincluded in this sector because of difficulties in separating their income between the portion which is withdrawn forpersonal use and the portion which is retained in the business. However, for households owning an unincorporatedbusiness, only the expenditures for personal needs are included. The current expenses related to the business areexcluded from personal expenditure and from final demand as they are treated as intermediate inputs, while theircapital expenditures are classified as business gross fixed capital formation in the Canadian System of NationalAccounts (CSNA).
7.3 In the CSNA, personal expenditure on consumer goods and services presently covers the value ofhouseholds’ expenditure as well as the value of the expenditures incurred by NPISHs on individual consumption ofgoods and services provided to households as a social transfer in kind. A project is underway to decomposegovernment consumption expenditure by function, according to the classification of the functions of government(COFOG). Once this project is completed, it will be possible to calculate household actual final consumption, whichconsists of the consumption of goods and services acquired by individual households, by expenditures or throughsocial transfers in kind received from government units or NPISHs.
Classification, measurement and concepts
7.4 The classification of personal expenditure on consumer goods and services is based on the internationalclassification of individual consumption by purpose (COICOP). “Purpose” and “function” are used interchangeablyand refer to the socio-economic objectives that economic agents aim to achieve through various kinds of outlayssuch as food, clothing, housing, health and education. COICOP also groups expenditures into four classes:
durable goods, semi-durable goods, non-durable goods and services. Goods are tangible products3 that can bestored or inventoried, while services are products that cannot be stored and are consumed at the place and time oftheir delivery. The distinction between non-durable goods and durable goods is based on whether the goods canbe used only once or whether they can be used repeatedly or continuously over a period of considerably more thanone year. Semi-durable goods, such as clothing and footwear, differ from durable goods in that their expectedlifetime of use, though more than one year, is often significantly shorter.
1. This document refers to the “persons” and unincorporated business sector instead of the “households” and unincorporated business sectorbecause of the inclusion of associations of individuals and of certain collective investment schemes.
2. NPISHs are not currently considered as a separate sector in the Canadian System of National Accounts, although Statistics Canada is inthe process of developing it.
3. Although durable goods are more typically viewed as an asset, the only way in which the repeated use of durables by households could berecognized would be to extend the production boundary by postulating that the durables are gradually used up in hypothetical productionprocesses whose outputs consist of services. These services could then be recorded as being acquired by households over a successionof time periods (System of National Accounts 1993, paragraph 9.40). However, by SNA convention, household consumption is measuredonly by expenditures and acquisitions.
110 Statistics Canada - Catalogue no. 13-017 Guide to the Income and Expenditure Accounts
Personal expenditure on consumer goods and services
7.5 Most commodities can be easily assigned to one of the four classes mentioned previously, but some goodsand services could be classified to more than one. Multi-purpose commodities are classified according to theirpredominant purpose. For example, sports shoes suitable for everyday or leisure wear would be classified asfootwear and not as recreational equipment. Other commodities are mixed, such as meals consumed outside thehome, which include non-durable goods (food and non-alcoholic beverages) and a service. In this case, the fullvalue of the meals is shown as a service. The classification of personal expenditure on consumer goods andservices used in the CSNA is presented in 7.6.
7.6 Expenditure on goods is recorded at the time the ownership changes whether paid with cash, cheques, creditcards or by redeeming a gift card. On the other hand, expenditure on a service is recorded when the delivery of theservice is completed; for example, prepaid airline tickets will only be recorded when the trips are taken.
7.7 Expenditures are measured at market prices, i.e. they include the provincial and federal sales taxes. Note thatthey also include all taxes embedded in the price before sales taxes, such as excise taxes and environmentaltaxes. All gratuities paid for the delivery of a service are also included, but the expenditures are net of subsidies onproducts.
7.8 Personal expenditure includes spending by Canadian residents at home or when they are temporarily abroad,either as tourists (but not for business purposes), as members of the armed forces or as diplomats. Allexpenditures by foreign residents temporarily in Canada are excluded from personal expenditure but are included
in exports of services.4
7.9 Not all outlays by transactors of the persons and unincorporated business sector are included in personalexpenditure. As mentioned in paragraph 7.2, business expenditures of unincorporated businesses are excluded.Similarly, in the CSNA, non-profit institutions and other associations of individuals are treated as businesses withrespect to their capital expenditure, but as households with respect to their current expenditure. Therefore, theirspending on goods and services is measured by their current expenditure net of revenues from the sale of goodsand services, which are mostly food, and alcoholic and non-alcoholic beverages.
7.10 The purchase of a house by a household is considered as an acquisition of an asset,5 as if the purchaserwere an unincorporated business. However, the distinction between personal expenditure and capital expenditureis often difficult to make for expenditures pertaining to a house. Improvements such as major renovations,reconstruction or enlargement, which bring about significant changes in some of the characteristics of an existinghouse and therefore extends the previously expected service life well beyond ordinary maintenance and repairs,are also considered as capital expenditure. On the other hand, ordinary repairs and maintenance that must beundertaken regularly in order to maintain a house in working order over its expected service life are considered aspersonal expenditure, for example, replacing defective parts with new parts of the same kind.
7.11 Hospital and medical care premiums and the purchase of marriage licenses, motor vehicle licenses andpermits and other miscellaneous licenses and permits such as hunting and fishing permits, as well as various finesand penalties are treated as transfer payments to the government sector and therefore not personal expenditure.The above noted household payments are de facto taxes since no good or service is received in return.
7.12 Fees paid directly by households for certain services provided by government, mostly related to educationand health, are included in personal expenditure. Current expenditure incurred by government units on individualconsumption of goods and services provided to households as a social transfer in kind is included in householdactual final consumption.
4. Although many data sources underlying the estimates of personal expenditure series include expenditures in Canada by non-residents,these transactions are excluded in the aggregate by means of the travel receipts from non-residents, series J218 (see paragraph 7.26).
5. The full value of a new house and the ownership transfer costs associated with the purchase of an existing house are considered ascapital expenditure.
Statistics Canada - Catalogue no. 13-017 Guide to the Income and Expenditure Accounts 111

Personal expenditure on consumer goods and services
7.13 For some services, the value of the purchases included in personal expenditure does not always equal thefull value of the outlay, but rather an amount reflecting the value of the service consumed by households. Forexample, the value of the service “games of chance” purchased by households is assumed to be equal to theamounts wagered less the prizes awarded.
7.14 Similarly, the premiums paid for automobile, property, accident and sickness, and life insurance are notconsidered to be personal expenditure. Only the cost of the service provided is taken into account for personal
expenditure. The cost of service is measured by the premiums earned plus the premium supplements6 minusclaims due. It is net of claims due in order to avoid double-counting of personal expenditure since expendituresreimbursed by insurance companies are accounted for separately in selected goods and services, such asautomobile repair and electronic equipment. The automobile, property, accident and sickness, and life insurance
net premiums7 are treated as current transfers from corporations to households. See paragraphs 7.83 to 7.88 forthe data sources and estimation methods of personal expenditure on automobile, on property, on accident andsickness, and on life insurance.
7.15 Personal expenditure is net of sales of used goods by households. Hence, interpersonal transactions of usedgoods, excluding sales taxes, cancel out. For transactions between households through the intermediation of aretailer, only the components which represent new production are included; that is, the cost of parts used to repairand/or refurbish the good plus the value added (profit margin and labour charges). However, the value of usedgoods purchased by households is included in its entirety if the previous owner belonged to corporations,government business enterprises, unincorporated businesses, governments or non-residents. Sales taxes arealways included in full, regardless of the previous owner. The estimation method for used motor vehicles is outlinedin paragraphs 7.57 to 7.67.
7.16 Selected non-market transactions are included in personal expenditure. Imputations are made to place amarket value on some transactions in order to keep personal expenditure invariant to the way certain activities arecarried out. Such is the case for rent of owner-occupied dwellings, for financial services indirectly measured whenno explicit charges are recorded (such as the portion of bank interest and deposit charges that representadministration costs), for own-account production of food consumed by farmers and for the special treatment offinancial leasing of motor vehicles.
7.17 As mentioned in paragraph 7.10, purchases of dwelling units are considered as investment in fixed capital.This capitalization of dwellings requires that personal expenditure include an imputed rent estimate for owner-occupied housing, representing the service yielded by the dwelling. The housing services produced are deemed tobe equal in value to the rentals that would be paid on the market for accommodation of the same size, quality andtype. Without this imputation, the measure of housing services and of gross domestic product (GDP) would not beinvariant to shifts between the owner-occupied dwellings and the renting of residential dwellings. The estimationmethod for rents is outlined in paragraphs 7.75 to 7.82.
7.18 Financial services provided by banks and other financial institutions such as service charges for deposits andloans are paid for indirectly through variations in deposit and borrowing rates. A practical approach in imputing avalue for these services is by taking the difference between the property income receipts of financial institutionsand the property income paid by them, and adjusting the net interest received for the use of the financialinstitution’s own funds. Note that in the calculation of financial services indirectly measured (FSIM), propertyincome includes only interest. Other financial services such as currency exchange and advice about investmentsare explicitly charged and can be measured directly. See paragraphs 7.89 to 7.95 for the data sources andestimation methods pertaining to personal expenditure on financial service indirectly measured.
6. Premium supplements represent the income from investments of the insurance technical reserves. Technical reserves are defined as pre-paid premiums and reserves against outstanding claims, both being a form of credit extended by the policyholder to the insurer.
7. Net premiums (or claims) are equal to premiums paid minus the cost of service.
112 Statistics Canada - Catalogue no. 13-017 Guide to the Income and Expenditure Accounts
Personal expenditure on consumer goods and services
7.19 An imputation is also made to personal expenditure for the value of food grown, manufactured and consumedby farmers and the value of goods or services consumed out of income in kind provided to employees in lieu ofwages and salaries.
7.20 Finally, rather than consider the periodic payments made for financial leasing of motor vehicles as thepurchase of a service, the full value of the vehicle before sales taxes is recorded as personal expenditure ondurable goods, as the vehicle is deemed to be purchased and owned by households. However, only the salestaxes applicable to the lease payments are included for the duration of the lease. See paragraphs 7.50 to 7.56 formore details.
Presentation of estimates
7.21 Personal expenditure on consumer goods and services are estimated quarterly at the national level andannually at the provincial and territorial level. These estimates are available at both current and constant prices.
7.22 National estimates of personal expenditure, which become available approximately 60 days after thereference period, are presented in tables 2, 3 and 4 of the National Income and Expenditure Accounts (NIEA) forthe four classes: durable goods, semi-durable goods, non-durable goods and services. Seasonally adjustedestimates are presented at current prices in Table 2, at constant prices in Table 3, and the contributions to percentchange in real gross domestic product in Table 4. Seasonally adjusted estimates for aggregates of personalexpenditure at current and constant prices and their contribution to percent change in real personal expenditure onconsumer goods and services are shown in tables 16, 17 and 18, respectively. These aggregates—9 major groups(PSG), 38 groups (PS) and the four classes—are calculated from the 130 series (J) of personal expenditure, whichare also available to the public on demand. Table 7.6 describes these 130 series of goods and services andpresents them according to the groupings published in tables 16 to 18. It should be noted that tables 17 and 18have been based on the chain Fisher volume indexes since the release of the NIEA for the first quarter of 2001.Prior to that release, the aggregates were derived by summing the individual personal expenditure series,reflecting a fixed-base Laspeyres measure. For more information, refer to the section on chain Fisher volumeindexes presented in Chapter 2.
7.23 At the national level, the annual and quarterly series are available dating back to 1926 and 1947 respectively,but the statistics for the period prior to 1961 do not include the conceptual, methodological and statistical changesmade at the time of the 1997 historical revision. Monthly national series have been available for personalexpenditure on consumer goods since January 1986.
7.24 Provincial and territorial estimates of personal expenditure are based on the same classification of goods andservices as at the national level. These expenditures, which are published in the Provincial Economic Accounts(PEA) approximately four months after the reference year, are grouped as consumer durables, semi-durables andnon-durables goods and consumer services. In the PEA, the estimates at current prices are found in Table 2, atconstant prices in Table 3, and their contribution to percent change in real gross domestic product, expenditure-based for the classes of personal expenditure in Table 4. It should be noted that tables 3 and 4 have been basedon the chain Fisher volume indexes since the October 2002 release of the PEA covering the period up to 2001 (seeChapter 2 for more details). Although not published, most of the 130 series of goods and services and their
groupings are available to the public.8
7.25 At the provincial and territorial level, series that incorporate the conceptual, methodological and statisticalchanges introduced in the 1997 historical revision are available back to 1981. However, unrevised data, coveringthe period 1961 to 1980, are accessible at current prices, as are statistics at constant prices for the period 1971to 1980.
8. For confidentiality reasons, some series are grouped at the provincial and territorial level.
Statistics Canada - Catalogue no. 13-017 Guide to the Income and Expenditure Accounts 113
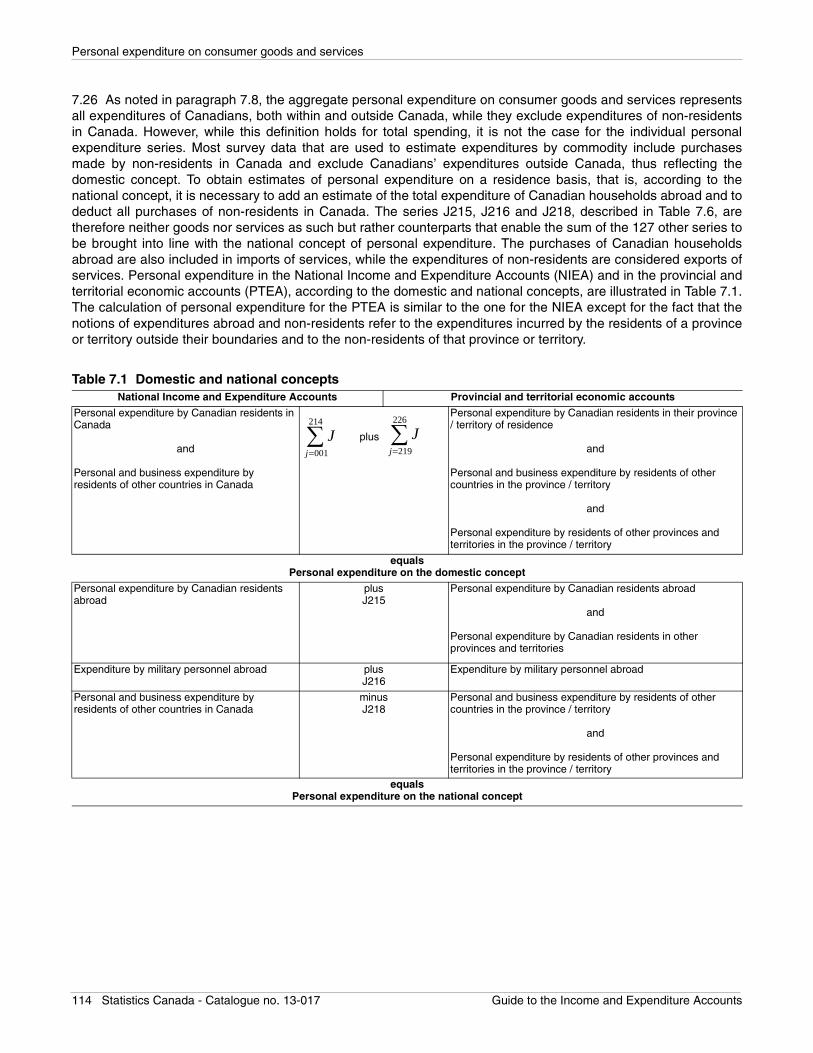
Personal expenditure on consumer goods and services
7.26 As noted in paragraph 7.8, the aggregate personal expenditure on consumer goods and services representsall expenditures of Canadians, both within and outside Canada, while they exclude expenditures of non-residentsin Canada. However, while this definition holds for total spending, it is not the case for the individual personalexpenditure series. Most survey data that are used to estimate expenditures by commodity include purchasesmade by non-residents in Canada and exclude Canadians’ expenditures outside Canada, thus reflecting thedomestic concept. To obtain estimates of personal expenditure on a residence basis, that is, according to thenational concept, it is necessary to add an estimate of the total expenditure of Canadian households abroad and todeduct all purchases of non-residents in Canada. The series J215, J216 and J218, described in Table 7.6, aretherefore neither goods nor services as such but rather counterparts that enable the sum of the 127 other series tobe brought into line with the national concept of personal expenditure. The purchases of Canadian householdsabroad are also included in imports of services, while the expenditures of non-residents are considered exports ofservices. Personal expenditure in the National Income and Expenditure Accounts (NIEA) and in the provincial andterritorial economic accounts (PTEA), according to the domestic and national concepts, are illustrated in Table 7.1.The calculation of personal expenditure for the PTEA is similar to the one for the NIEA except for the fact that thenotions of expenditures abroad and non-residents refer to the expenditures incurred by the residents of a provinceor territory outside their boundaries and to the non-residents of that province or territory.
Table 7.1 Domestic and national conceptsNational Income and Expenditure Accounts Provincial and territorial economic accounts
Personal expenditure by Canadian residents in Canada
and
Personal and business expenditure by residents of other countries in Canada
plus
Personal expenditure by Canadian residents in their province / territory of residence
and
Personal and business expenditure by residents of other countries in the province / territory
and
Personal expenditure by residents of other provinces and territories in the province / territory
equalsPersonal expenditure on the domestic concept
Personal expenditure by Canadian residents abroad
plusJ215
Personal expenditure by Canadian residents abroad
and
Personal expenditure by Canadian residents in other provinces and territories
Expenditure by military personnel abroad plusJ216
Expenditure by military personnel abroad
Personal and business expenditure by residents of other countries in Canada
minusJ218
Personal and business expenditure by residents of other countries in the province / territory
and
Personal expenditure by residents of other provinces and territories in the province / territory
equalsPersonal expenditure on the national concept
∑=
214
001j
J ∑=
226
219j
J
114 Statistics Canada - Catalogue no. 13-017 Guide to the Income and Expenditure Accounts
Personal expenditure on consumer goods and services
Data sources and estimation methods
Overview
7.27 As noted in Chapter 2, the Canadian System of National Accounts (CSNA) is an integrated conceptualframework, presented in the form of economic accounts. In this framework, personal expenditure on consumergoods and services are integrated with other statistics from the Income and Expenditure Accounts, in addition tobeing harmonized with the various components of the CSNA, especially with the Input-Output Tables for the 130series of goods and services.
7.28 It is important to note that like the other components of gross domestic product (GDP), the estimation ofpersonal expenditure operates within a four-year revision cycle. This cycle ensures that any new information drawnfrom Statistics Canada surveys and data from administrative and other data sources are incorporated into thesystem. For the first two estimation years of the cycle, benchmark data or annual benchmarks at current prices,with and without sales tax, are derived by balancing supply and demand by commodity. These benchmarks areincorporated into the Input-Output Tables and the Income and Expenditure Accounts.
7.29 Since the Input-Output Tables cover only the first two of the four years annually subject to revision, theIncome and Expenditure Accounts Division (IEAD) is responsible for producing national, provincial and territorialestimates of personal expenditure at current prices for the two most recent reference years. Also, the IEADproduces, for the four-year period, quarterly national estimates at current and constant prices as well as annualconstant price estimates by province and territory. All these estimates require various operations or processes,which are described in the following paragraphs.
7.30 The first operation consists of projecting benchmark estimates at current prices without sales tax for the twomost recent reference years. The operations that follow differ depending on whether they are carried out at thenational or at the provincial/territorial level. In the case of national estimates, it is first necessary to distribute theannual series into quarterly series for the four years subject to revision and then to project them to obtain quarterly
values for the current reference year.9 In the case of projected provincial and territorial estimates, they must beadjusted by distributing any difference that might exist between their sum and the national estimate. One reason forthis difference could be that the provincial and territorial series are estimated independently of each other (that is,without the prior constraint of additivity to the national estimate) and that the national estimate previously publishedwas not calculated from provincial/territorial data. Another reason could be that revised or more up-to-date sourcedata have since become available.
7.31 The three operations mentioned above, namely projection (annual or quarterly), quarterly distribution andprovincial/territorial distribution, are carried out using data series that are called “estimators”. Projection consists ofcalculating the rate of change of the estimator observed from one period to the next and applying it to theestimation of personal expenditure for the previous period. Quarterly distribution consists of distributing annualvalues into quarterly values while trying to reflect the quarterly rates of change observed for the estimator, usingquadratic minimization techniques. Lastly, the provincial/territorial distribution consists of allocating the differencebetween the sum of the provincial and territorial estimates and the national estimate, while minimizing the relativeimpact on the rate of change of each of the provincial and territorial series. The methods used to calculate theestimators for the national estimates at current prices are presented in paragraphs 7.49 to 7.100 while those for theprovincial and territorial estimates at current prices are shown in paragraphs 7.101 to 7.108.
9. This applies only when the estimates resulting from the annual revision cycle are published, that is, usually when the estimates for the firstquarter of a reference year are published. When the estimates for the second, third and fourth quarters are published, the estimates for theperiods preceding the current reference year are not revisable. Only the projection step is carried out for the quarters of the currentreference year.
Statistics Canada - Catalogue no. 13-017 Guide to the Income and Expenditure Accounts 115
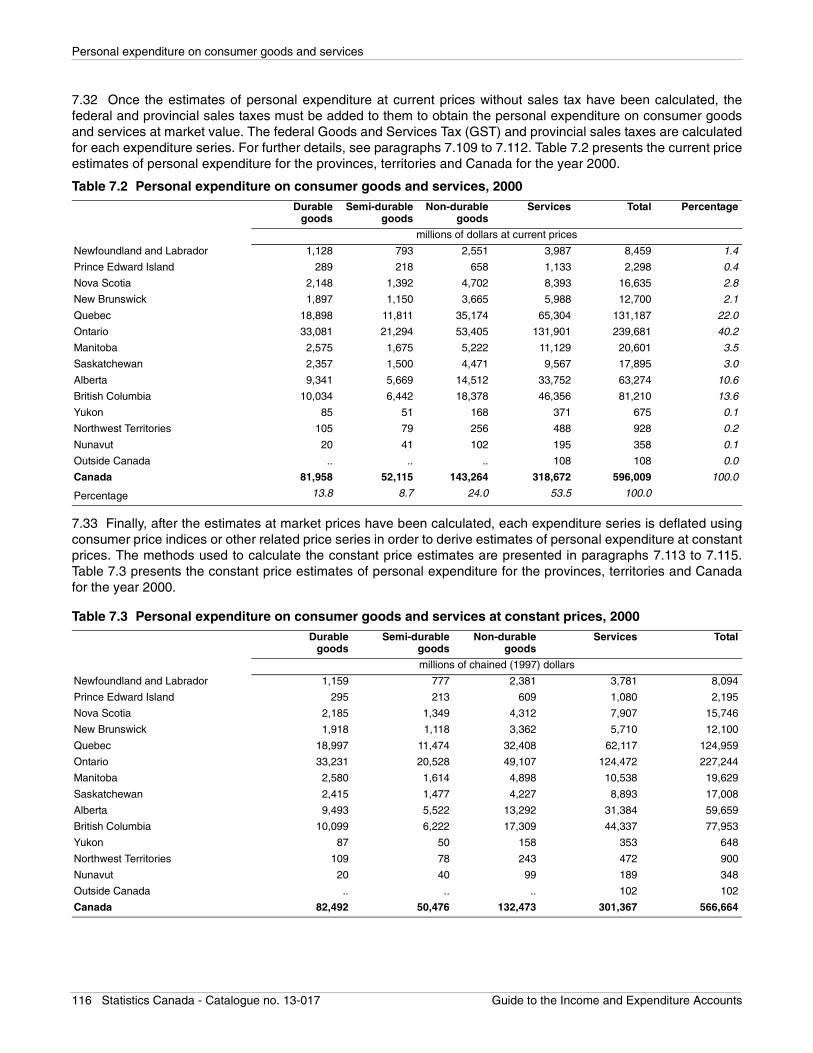
Personal expenditure on consumer goods and services
7.32 Once the estimates of personal expenditure at current prices without sales tax have been calculated, thefederal and provincial sales taxes must be added to them to obtain the personal expenditure on consumer goodsand services at market value. The federal Goods and Services Tax (GST) and provincial sales taxes are calculatedfor each expenditure series. For further details, see paragraphs 7.109 to 7.112. Table 7.2 presents the current priceestimates of personal expenditure for the provinces, territories and Canada for the year 2000.
7.33 Finally, after the estimates at market prices have been calculated, each expenditure series is deflated usingconsumer price indices or other related price series in order to derive estimates of personal expenditure at constantprices. The methods used to calculate the constant price estimates are presented in paragraphs 7.113 to 7.115.Table 7.3 presents the constant price estimates of personal expenditure for the provinces, territories and Canadafor the year 2000.
Table 7.2 Personal expenditure on consumer goods and services, 2000Durable
goodsSemi-durable
goodsNon-durable
goodsServices Total Percentage
millions of dollars at current prices
Newfoundland and Labrador 1,128 793 2,551 3,987 8,459 1.4
Prince Edward Island 289 218 658 1,133 2,298 0.4
Nova Scotia 2,148 1,392 4,702 8,393 16,635 2.8
New Brunswick 1,897 1,150 3,665 5,988 12,700 2.1
Quebec 18,898 11,811 35,174 65,304 131,187 22.0
Ontario 33,081 21,294 53,405 131,901 239,681 40.2
Manitoba 2,575 1,675 5,222 11,129 20,601 3.5
Saskatchewan 2,357 1,500 4,471 9,567 17,895 3.0
Alberta 9,341 5,669 14,512 33,752 63,274 10.6
British Columbia 10,034 6,442 18,378 46,356 81,210 13.6
Yukon 85 51 168 371 675 0.1
Northwest Territories 105 79 256 488 928 0.2
Nunavut 20 41 102 195 358 0.1
Outside Canada .. .. .. 108 108 0.0
Canada 81,958 52,115 143,264 318,672 596,009 100.0
Percentage 13.8 8.7 24.0 53.5 100.0
Table 7.3 Personal expenditure on consumer goods and services at constant prices, 2000Durable
goodsSemi-durable
goodsNon-durable
goodsServices Total
millions of chained (1997) dollars
Newfoundland and Labrador 1,159 777 2,381 3,781 8,094
Prince Edward Island 295 213 609 1,080 2,195
Nova Scotia 2,185 1,349 4,312 7,907 15,746
New Brunswick 1,918 1,118 3,362 5,710 12,100
Quebec 18,997 11,474 32,408 62,117 124,959
Ontario 33,231 20,528 49,107 124,472 227,244
Manitoba 2,580 1,614 4,898 10,538 19,629
Saskatchewan 2,415 1,477 4,227 8,893 17,008
Alberta 9,493 5,522 13,292 31,384 59,659
British Columbia 10,099 6,222 17,309 44,337 77,953
Yukon 87 50 158 353 648
Northwest Territories 109 78 243 472 900
Nunavut 20 40 99 189 348
Outside Canada .. .. .. 102 102
Canada 82,492 50,476 132,473 301,367 566,664
116 Statistics Canada - Catalogue no. 13-017 Guide to the Income and Expenditure Accounts
Personal expenditure on consumer goods and services
Personal expenditure at current prices
7.34 The purpose of this guide is not so much to describe in detail the methodologies currently used as to give thereader an overview of them. This section, which deals with current price estimates, is divided in three parts: the firsttwo parts present the data sources and methods of the national and provincial/territorial estimators using summarytables while the third discusses the sales tax estimates. The next section deals with personal expenditure atconstant prices.
7.35 Estimates of personal expenditure at current prices are derived using national and provincial/territorialestimators, as described in paragraphs 7.30 and 7.31. The data sources and estimation methods usually used tocalculate the estimators for the 130 series of goods and services are presented in paragraphs 7.49 to 7.108. Wesay “usually used” because the source data used for calculating some personal expenditure estimators areoccasionally inconsistent, making it necessary to resort to alternative calculation methods. These statisticalinconsistencies are identified in the analysis that is conducted in part to confront the different statistical signalsavailable, in order to assess their quality.
7.36 It should be noted that it is difficult to systematically present the methods of calculating estimators for each ofthe 130 series of consumer goods and services in a unique and standardized format while avoiding duplication.Conversely, it is also difficult to group them into a limited set of identical methods that would each cover a largenumber of series. However, it is possible to define two general calculation approaches, which can themselves bedivided into six methods. The first approach consists of calculating estimators for expenditure series on the basis ofdirect indicators, that is, indicators that are very closely related to the series to be estimated. By contrast, thesecond approach consists of using indirect indicators, which do not in themselves represent a purchase ofconsumer goods or services. By its nature, the second approach tends to produce estimates of lesser quality. Thecalculation methods for estimators resulting from these two approaches are as follows:
• The direct “current prices” method [M1] consists of using an estimator that is an expenditure on goods orservices. This estimator could differ from the series to be estimated because, for example, it includes notonly the expenditures of households but also those of businesses and governments. The estimator forspending on furniture, derived from the Quarterly Retail Commodity Survey, represents an example ofthis method.
• The direct “quantity times price” method [M2] applies to goods and services series for which there aredirect indicators of quantities. Expenditure estimators are calculated based on a quantity indicator that isconverted to nominal values using consumer prices. This method is used for personal expenditureestimators such as those for certain types of transportation as well as energy consumption.
• The indirect “current prices” method [M3] applies primarily to series for which there is no currentinformation on households’ purchases, but which are nevertheless closely linked to a related series or agiven industry through its revenues and/or its payroll. In particular, this method is used to calculateestimators for expenditure on shoe or clothing repair.
• The indirect “quantity times price” method [M4] is used when there is no direct or indirect source ofinformation at current prices and no direct indicator of quantities. It consists of converting an indirectindicator of volume into an estimator of expenditures by applying a consumer price index to it. Quarterlyestimators of expenditure on taxi services, among others, are calculated using this method.
• The “time trends” method [M5] is used as a last resort, when no reliable estimator is available. In suchcases, the volume indicator will be based on recent or historical trends at constant prices, and a relatedprice index will be applied to it. This method is used for quarterly estimators of expenditure on hairstylingservices, among others.
• The specific methods [M6] are used for selected series which usually represent a major expenditure byhouseholds and require a complex or specific analysis. The complexity of these methods is due to thefact that they consist, in most cases, of using several types of indicators and/or a combination of themethods described above. This is the case, for example, with estimators of personal expenditure on newand used motor vehicles, on tobacco products, on paid rent, on imputed rent, on insurance services, onfinancial services indirectly measured and on travel expenditures.
Statistics Canada - Catalogue no. 13-017 Guide to the Income and Expenditure Accounts 117
Personal expenditure on consumer goods and services
7.37 The use of one method rather than another is based primarily on the availability of specific data when theestimators are being calculated. Since the calculation of a large number of estimators for consumer goods andservices is based on two main data sources, namely the Survey of Household Spending and the Quarterly RetailCommodity Survey, the following paragraphs will provide an overview of these surveys and how they are used.
Survey of Household Spending
7.38 The Survey of Household Spending10 (SHS) is an annual survey conducted since 1997.11 Its main purpose isto obtain detailed information on the spending habits of Canadian households for a variety of goods and services,extending from food to shelter and including expenditure on education and health care. Estimates derived from thissurvey are published for different aggregates, including those based on household type, household income andgeographic region. The data reflect the value at market prices and are reported annually by province, whereasterritorial statistics are available from 1997 to 1999 and every two years starting in 2001. The SHS covers allprivate households in Canada, although certain groups are excluded, such as persons living in residences forsenior citizens or in long-term care facilities, members of the Canadian armed forces living in military camps,Canadian residents posted abroad and persons living on Indian reserves. The above-mentioned groups are,however, covered under personal expenditure.
7.39 Conceptually, household expenditures are very similar to personal expenditure on consumer goods andservices, despite some differences between them. The SHS data also include various outlays such as personalincome taxes, vehicle registration fees, premiums paid to a public health insurance plan and donations to non-profitorganizations, which are excluded from personal expenditure because they are considered transfers. The SHSalso includes the value of all purchases of second-hand goods, while personal expenditure represents the value of
purchases less sales of used goods.12 On the other hand, certain expenditures such as imputed rents ofhomeowners are part of personal expenditure but are either not captured by the SHS, or are treated differently byit.
7.40 The SHS is a primary data source used to project personal expenditure on selected commodities for the yearfollowing the last benchmark year. The SHS classification of expenditures is therefore adapted to the one used inthe CSNA. For most personal expenditure series, a direct mapping exists, while for others, data from other surveysor from the Input-Output Tables are used to allocate various consumer expenditures from the SHS. No mapping isestablished when the concepts differ significantly.
7.41 Annual estimators for the following goods and services are derived from the SHS:J101 - Food and non-alcoholic beverages;J158 - Domestic services;J159 - Child care, in the home;J160 - Child care, outside home;J161 - Laundry and dry cleaning;J163 - Pet care;J178 - Interurban bus;J181 - Taxis;J183 - Telecommunications;J184 - Postal and courier services;J187 - Other recreational services;J189 - Fees for education and training, other than university;
10. For more information on the SHS, see the User Guide for the Survey of Household Spending, 2005 (62F0026MIE), available on theStatistics Canada website.
11. Prior to 1997, an occasional annual survey, Survey of Family Expenditures (FAMEX) collected information on household spending.12. For more information on used goods, refer to paragraph 7.15 and to paragraphs 7.57 to 7.67 which deal specifically with used motor
vehicles.
118 Statistics Canada - Catalogue no. 13-017 Guide to the Income and Expenditure Accounts
Personal expenditure on consumer goods and services
J191 - Hairstyling for men and women;J192 - Other personal care;J209 - Legal, accounting and other services;J211 - Miscellaneous household services;J219 - Cable television and pay television;J221 - Parking;J222 - Driving lessons and membership in automobile associations;J223 - Motor vehicle renting;J224 - Cinemas;J225 - Photographic services.
7.42 Depending on the personal expenditure series, either the value of the estimator, its rate of change, its trend orits provincial/territorial distribution is used. To project estimates for the second year following benchmark years andto distribute estimates on a quarterly basis, other data sources and/or methods of calculating estimators are used.These are described in Table 7.7 and Table 7.8.
Quarterly Retail Commodity Survey
7.43 Estimators derived from the SHS are primarily used to project personal expenditure on services. However,they are also used for some goods, but only as a secondary indicator since they have certain deficiencies. Forexample, since purchases of durable goods are by definition infrequent, it is possible that the sample drawn mightnot be sufficiently representative and hence the estimates of expenditure on these goods may have a highervariance. This is one of the reasons why the estimators for approximately 40 series of personal expenditure onconsumer goods are calculated using data from the Quarterly Retail Commodity Survey (QRCS). Moreover,business surveys have the advantage of covering a major portion of the consumer activities of a country or a givenregion with a limited sample. This is not generally possible with household surveys, due to respondent burdenconsiderations and other constraints.
7.44 It should be noted that the use of QRCS results as estimators for personal expenditure on consumer goodsalso has some deficiencies. These commodity sales represent not only the purchases of individuals but also thoseof businesses (including other retailers) and governments. Moreover, retailers are not the only sources of supply forconsumers. For example, consumers may also make purchases from wholesalers or buy goods via the Internet.Because of these deficiencies, the use of estimators derived from the QRCS implies that household purchases ofspecific goods grow at a rate similar to the retail sales of those goods. This assumption is acceptable for manygoods, such as food and non-alcoholic beverages. However, for other commodities, such as hardware goodswhich are bought in larger proportions by businesses, this assumption may result in less reliable estimators.
7.45 Since the first quarter of 1998, the QRCS has collected information on the sales of approximately 120
detailed series of goods and services for 19 types of retail outlets (trade groups) in Canada.13 The survey isconducted as a supplement to the Monthly Retail Trade Survey (MRTS), which collects data on total retail sales.
7.46 As a first step, the QRCS commodity classification is adapted to the one used in the CSNA. The concordancebetween the two classifications is often direct, but some QRCS commodities must nevertheless be distributedamong several CSNA series of goods. When QRCS results are not available to calculate estimators for a given
period,14 the sales of each commodity from a previous period for a given trade group are then expressed in theform of a ratio representing them as a proportion of total sales. These ratios are then applied to the total of monthlyretail sales from the MRTS for the same trade group for the period to be estimated. The estimators are thencalculated by simply summing the sales of each good for all the trade groups. An example is provided inAppendix 7A.
13. Previously, the distribution by commodity of sales by type of trade was based on the annual results of the retail commodity surveys of 1974and 1989.
14. The data are usually available with a lag of one quarter.
Statistics Canada - Catalogue no. 13-017 Guide to the Income and Expenditure Accounts 119
Personal expenditure on consumer goods and services
7.47 Quarterly and annual estimators for the following products are derived from the QRCS:J001 - Furniture;J002 - Floor coverings;J004 - Refrigerators and freezers;J005 - Washers and dryers;J006 - Stoves, ranges and microwave ovens;J007 - Other major appliances;J008 - Small electrical appliances;J010 - Garden tools and equipment for outdoor maintenance;J012 - Used motor vehicles;J014 - Road and off-road recreational vehicles;J015 - Motor vehicle maintenance and repairs;J016 - Motor vehicle parts and accessories;J017 - Radios, sound systems and accessories;J018 - TV sets, video equipment and accessories;J019 - Boats, aircraft and accessories;J020 - Photographic and optical equipment;J021 - Sporting and camping equipment;J023 - Musical instruments and supplies;J024 - Trailers;J026 - Recreation equipment rentals;J027 - Watches and jewellery;J051 - Men's and boys' clothing;J052 - Women's, girls’ and infant's clothing;J053 - Thread, yarn and sewing accessories;J054 - Piece goods;J056 - Footwear;J058 - Luggage, leather goods and other personal effects;J059 - Toys, games and hobby supplies;J060 - Films and other photographic supplies;J061 - Household textiles and furnishings;J062 - China, glassware and kitchenware;J063 - Lamps, lighting equipment and accessories;J064 - Flatware;J065 - Hardware;J066 - Newspapers, books, magazines and stationery;J068 - Pets and supplies;
J101 - Food and non-alcoholic beverages;15
J103 - Pet food;J109 - Soaps and other cleaning supplies;J110 - Other household supplies;J111 - Pharmaceutical products and medical goods;J113 - Flowers, plants and other horticultural supplies;J114 - Cosmetics and toiletries.
15. As noted in paragraph 7.43, the SHS is the main source used when available, while for other periods the QRCS is used.
120 Statistics Canada - Catalogue no. 13-017 Guide to the Income and Expenditure Accounts
Personal expenditure on consumer goods and services
Other data sources
7.48 While the SHS and the QRCS are the main information sources for most personal expenditure series, severalother data sources are also used to estimate selected series. These other sources include a great number ofStatistics Canada surveys collecting information on the operating revenues of companies doing business in sectorsas varied as transportation, accommodation, food services, recreational services and personal care. Othersurveys, directly focusing on households, are also an extremely important source of information for measuringexpenditure on other types of goods and services. These include the International Travel Survey and the TravelSurvey of Residents of Canada. Information on prices, primarily drawn from the Consumer Price Index, is alsoused when the only data available are physical quantities. Lastly, a sizable number of statistics obtained fromoutside Statistics Canada, more specifically from administrative data sources and from various governmentagencies, provide valuable information.
National estimates at current prices
7.49 Table 7.7 provides a summary of the data sources and estimation methods usually used to calculate each ofthe national estimators at current prices, on an annual as well as on a quarterly basis. The majority of theestimators of personal expenditure are calculated using one of the first five methods presented in paragraph 7.36.These methods are referred to in this table as M1 for the first method, M2 for the second, etc. The table presents,under three columns, the estimation methods and data sources of the annual estimators for the two most recentyears as well as those for the quarterly estimators. Because the calculation methods for some estimators are morecomplex than others (method M6), special attention is given to most of them in the following paragraphs.
New cars, vans and trucks
Annual method16
7.50 Personal expenditure on new cars, vans and trucks17 are estimated using monthly data from StatisticsCanada’s New Motor Vehicle Sales Survey (NMVSS) along with the monthly reports of the Canadian VehicleManufacturers’ Association (CVMA). The survey presents the value and number of new motor vehicles sold byeach manufacturer, while the reports provide the number of vehicles sold in Canada by model, in addition toidentifying fleet sales. In the Canadian System of National Accounts (CSNA), the personal expenditures on newmotor vehicles are expressed in terms of the full value of the vehicles that are purchased or leased by households;in other words, there is no consideration of trade-ins and of the tax savings resulting from trading used vehicles in
the expenditure series on new motor vehicles.18 It should be noted that financial leases are treated as sales,19
although the applicable taxes are mostly distributed over the duration of the leasing contract on the basis of thelessee’s periodic payments.
7.51 The data reported in the NMVSS are matched and confronted with those in the CVMA report. Thisreconciliation consists of applying the manufacturer’s suggested retail price (MSRP) to the number of units of eachmodel that are sold, after adjusting the MSRP to reflect rebates offered by dealers and manufacturers,
transportation costs and the accessories commonly purchased as options.20 The values thus obtained by modelare then aggregated by manufacturer so that they can be confronted with the NMVSS data.
16. This methodology is also used to derive the annual benchmark estimates.17. Includes pickup trucks and sport-utility vehicles.18. Trade-ins and their tax implications are reflected in the personal expenditure series on used motor vehicles (net value). See paragraphs
7.57 to 7.67 for more details.19. This treatment is similar to the practice followed by manufacturers.20. Data on prices by model and data on the cost of options are drawn from the Canadian Red Book (ISSN 0045-527X) and the Guide
d’évaluation Hebdo (ISBN 1488-3821).
Statistics Canada - Catalogue no. 13-017 Guide to the Income and Expenditure Accounts 121
Personal expenditure on consumer goods and services
7.52 Once this reconciliation is carried out, the personal portion of new motor vehicle sales is calculated in two
stages.21 The first stage consists of classifying vehicles sold according to their main use, i.e., for personal orcommercial use. Based on provincial and territorial vehicle registration data and CVMA statistics, this stageconsists of subtracting from total sales of new vehicles all those clearly intended for commercial use, such asheavy-duty trucks and fleet sales, as well as all other new vehicles registered by businesses and governments.Although this stage serves to identify the purchases of individuals, it is not necessarily an estimator of personalexpenditure, since some individuals, such as a number of self-employed workers, use their vehicle partly forcommercial purposes. Conversely, some vehicles purchased by the business and government sectors are partiallyused for personal purposes. Since personal expenditure must represent the personal use that will be made of newmotor vehicles purchased, the second stage will consist of subtracting from sales to individuals that portionrepresenting the commercial use that will be made of the vehicles sold and adding a value reflecting the personaluse that will be made of vehicles sold to businesses and governments. In practice, reflecting the personal use of allvehicle sales is a difficult task. Nevertheless, adjustments are derived on the basis of commercial use ratios drawnfrom the Survey of Household Spending (SHS) as well as data from the T4 Supplementary file of the CanadaRevenue Agency, reflecting the personal use of purchases by businesses and governments. According to all ofthese calculations, personal expenditure generally accounts for approximately 70 percent of the value of new carsales and 50 percent of the value of new van and truck sales.
7.53 Apart from financial leases, where taxes are based on periodic payments, the calculation of federal andprovincial sales taxes is based on the price of new vehicles, not accounting for trades that are made. The effect ofthese trades on taxes is discussed in paragraph 7.65.
Quarterly method
7.54 As in the case of the annual method, quarterly estimates of personal expenditure on new cars, vans andtrucks are calculated using monthly New Motor Vehicle Sales Survey (NMVSS) data and the monthly CanadianVehicle Manufacturers’ Association (CVMA) reports. However, unlike with the annual method, the calculations usedata by vehicle model aggregated into selected groupings.
7.55 The first operation in deriving the estimator of personal expenditure on new cars consists of calculating theproportion of car sales that are not fleet sales in relation to the total number of units sold and applying thisproportion to the value of total sales (that is, without distinction as to the model or manufacturer) reported in theNMVSS. This estimated value of new cars purchased by individuals is then adjusted to reflect the personal usebased on information derived from the annual methodology. The value representing the commercial use is includedunder business gross fixed capital formation on machinery and equipment.
7.56 The method of calculating the estimator of personal expenditure on new vans and trucks is similar to theannual method, except that sales by model are grouped into sales by vehicle category. Seven categories havebeen identified: light, standard, sport-utility, van, medium-duty, heavy-duty and bus. The first operation consists ofapplying average prices to the number of units sold, by category. A reconciliation between the values thusestimated and the official estimate from the NMVSS is then performed by manufacturer, and an adjustment ismade to the average price per vehicle category for each manufacturer so that the difference can be allocated tothem proportionally. The next operation is to subtract from the value of total sales of new vans and trucks allvehicles intended for commercial purposes, such as medium-duty trucks, heavy-duty trucks and buses as well asthe value of fleet sales in the other four categories. This estimated value of new vans and trucks purchased byindividuals is then adjusted to reflect the personal use based on information derived from the annual methodology.The value representing the commercial use is included under business gross fixed capital formation on machineryand equipment.
21. The “non-personal” portion appears under gross fixed capital formation in machinery and equipment (see Chapter 9).
122 Statistics Canada - Catalogue no. 13-017 Guide to the Income and Expenditure Accounts
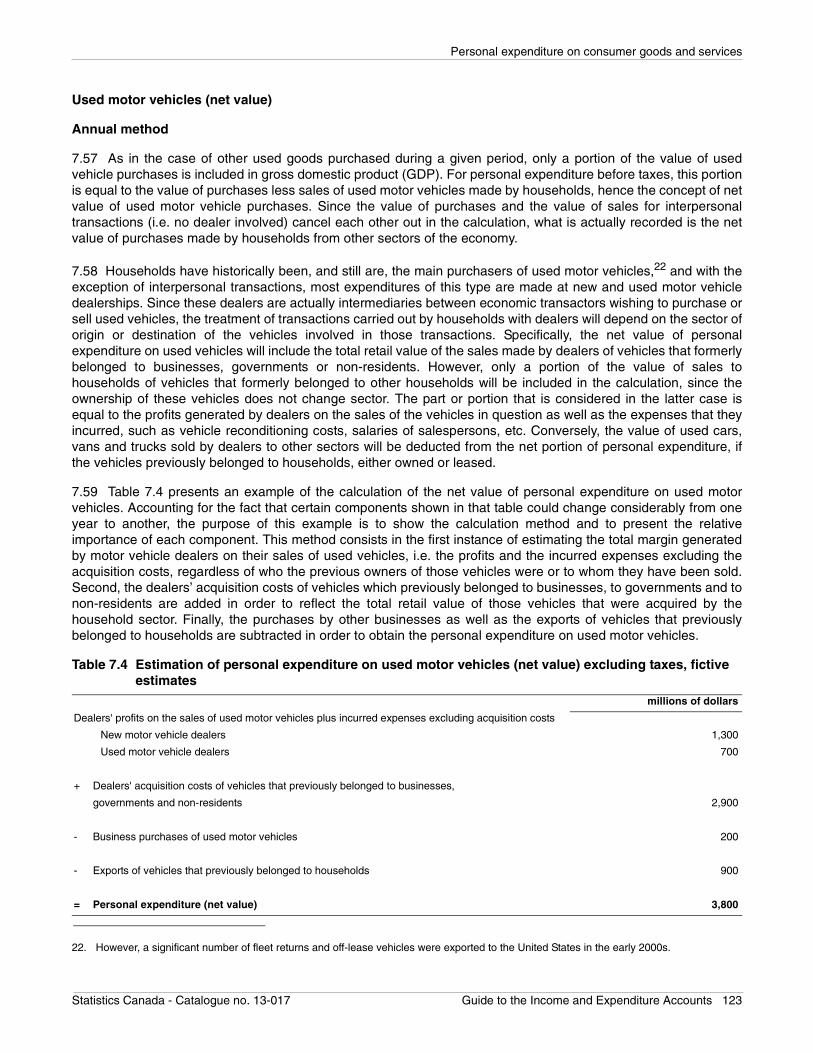
Personal expenditure on consumer goods and services
Used motor vehicles (net value)
Annual method
7.57 As in the case of other used goods purchased during a given period, only a portion of the value of usedvehicle purchases is included in gross domestic product (GDP). For personal expenditure before taxes, this portionis equal to the value of purchases less sales of used motor vehicles made by households, hence the concept of netvalue of used motor vehicle purchases. Since the value of purchases and the value of sales for interpersonaltransactions (i.e. no dealer involved) cancel each other out in the calculation, what is actually recorded is the netvalue of purchases made by households from other sectors of the economy.
7.58 Households have historically been, and still are, the main purchasers of used motor vehicles,22 and with theexception of interpersonal transactions, most expenditures of this type are made at new and used motor vehicledealerships. Since these dealers are actually intermediaries between economic transactors wishing to purchase orsell used vehicles, the treatment of transactions carried out by households with dealers will depend on the sector oforigin or destination of the vehicles involved in those transactions. Specifically, the net value of personalexpenditure on used vehicles will include the total retail value of the sales made by dealers of vehicles that formerlybelonged to businesses, governments or non-residents. However, only a portion of the value of sales tohouseholds of vehicles that formerly belonged to other households will be included in the calculation, since theownership of these vehicles does not change sector. The part or portion that is considered in the latter case isequal to the profits generated by dealers on the sales of the vehicles in question as well as the expenses that theyincurred, such as vehicle reconditioning costs, salaries of salespersons, etc. Conversely, the value of used cars,vans and trucks sold by dealers to other sectors will be deducted from the net portion of personal expenditure, ifthe vehicles previously belonged to households, either owned or leased.
7.59 Table 7.4 presents an example of the calculation of the net value of personal expenditure on used motorvehicles. Accounting for the fact that certain components shown in that table could change considerably from oneyear to another, the purpose of this example is to show the calculation method and to present the relativeimportance of each component. This method consists in the first instance of estimating the total margin generatedby motor vehicle dealers on their sales of used vehicles, i.e. the profits and the incurred expenses excluding theacquisition costs, regardless of who the previous owners of those vehicles were or to whom they have been sold.Second, the dealers’ acquisition costs of vehicles which previously belonged to businesses, to governments and tonon-residents are added in order to reflect the total retail value of those vehicles that were acquired by thehousehold sector. Finally, the purchases by other businesses as well as the exports of vehicles that previouslybelonged to households are subtracted in order to obtain the personal expenditure on used motor vehicles.
22. However, a significant number of fleet returns and off-lease vehicles were exported to the United States in the early 2000s.
Table 7.4 Estimation of personal expenditure on used motor vehicles (net value) excluding taxes, fictive estimates
millions of dollars
Dealers' profits on the sales of used motor vehicles plus incurred expenses excluding acquisition costs
New motor vehicle dealers 1,300
Used motor vehicle dealers 700
+ Dealers' acquisition costs of vehicles that previously belonged to businesses,
governments and non-residents 2,900
- Business purchases of used motor vehicles 200
- Exports of vehicles that previously belonged to households 900
= Personal expenditure (net value) 3,800
Statistics Canada - Catalogue no. 13-017 Guide to the Income and Expenditure Accounts 123
Personal expenditure on consumer goods and services
7.60 The main data sources used to estimate the sales of used vehicles by motor vehicle dealers are the NewMotor Vehicle Dealer Commodity Survey (NMVDCS), the sales of the used and recreational motor vehicle andparts dealers reported in the Quarterly Retail Commodity Survey (QRCS), and the federal Goods and Services Tax(GST) file. Despite its name, the NMVDCS is in fact a census carried out among motor vehicle manufacturers whoanswer on behalf of all their dealers. For its part, the GST file is a databank that includes, among other items,statistics on the revenues of companies collecting the GST on behalf of the federal government. The NMVDCS isused to calculate used vehicle sales made by new vehicle dealers, while the used vehicle dealers’ market isestimated with data from the GST file and the QRCS.
7.61 Households’ purchases of used motor vehicles from dealers are estimated by deducting from the dealers’total used vehicle sales a notional adjustment reflecting the purchases made by the other sectors of the economy,mostly unincorporated businesses. Because vehicle purchases made by households are treated differentlydepending on whether or not the vehicles previously belonged to other households, domestic sales and exportsmust be distributed by sector of origin and destination. In making these distributions, data on new vehicleregistrations are used and various assumptions are made regarding the average duration of vehicle use beforeresale.
7.62 Profit margins realized by dealers on used vehicle sales are mainly based on data reported in the Guided’évaluation Hebdo or the Canadian Red Book, while expenditures related to vehicle reconditioning are drawn fromthe NMVDCS.
7.63 The following example illustrates how used motor vehicle transactions involving an auto dealer affectpersonal expenditure and gross domestic product (GDP), using typical scenarios.
Example of used motor vehicle transactions
Assume that a dealer, in order to sell a new car, van or truck to a given household, takes the household’s used vehicle intrade. As part of the transaction, the dealer assigns a value of $10,000 to the used vehicle, an amount that is deducted fromthe price of the new vehicle. The impact of this transaction on the net value of personal expenditure on used vehicles is-$10,000. Note that the full value of the new vehicle purchase prior to the trade-in is recorded for the personal expenditureon new cars, vans or trucks.
Now assume that after taking possession of the used vehicle, the dealer makes various standard repairs on the vehicle(valued at $500), before selling it to another household for the sum of $11,500 before taxes. Since the purchaser is ahousehold, $11,500 must be added to the net value of personal expenditure on used vehicles. The final effect on usedvehicle personal expenditure (and GDP) is +$1,500 when both transactions are considered (-$10,000 + $11,500). This effectis equal to the dealer’s costs of reconditioning and selling the used vehicle as well as his profit from these activities. In otherwords, we will include in personal expenditure on used vehicles only the impact of the dealer’s activities on GDP. This isconsistent with the fact that the residual value ($10,000) of the vehicle before repair and resale contributes no added valueto the economy as it was already recorded in GDP when the vehicle was sold the first time as a new car, van or truck.
It should be noted that the final effect on GDP would have been the same if the used vehicle had not been purchased by ahousehold, or if it had not been a household that traded it to the dealer for a new vehicle. For example, assume that theoriginal owner was a business that had leased the vehicle when it was new and returned it to the dealer when the leasingcontract expired. This transaction will be reported in the Canadian System of National Accounts (CSNA) as a disinvestmentin machinery and equipment (-$10,000). Assuming now that the dealer then sells the vehicle to a household for an amountof $11,500, then +$11,500 will be attributed to the net value of personal expenditure on used vehicles. The final effect onGDP is +$1,500 (-$10,000 + $11,500). However, in this case, personal expenditure increased $11,500 compared to only$1,500 in the previous case.
124 Statistics Canada - Catalogue no. 13-017 Guide to the Income and Expenditure Accounts
Personal expenditure on consumer goods and services
7.64 While this personal expenditure series records the net value of purchases made by households from othersectors of the economy, the taxes that are incorporated into those purchases are nevertheless calculated
according to the gross value of used motor vehicle sales, including interpersonal sales.23 In fact, in addition to thetaxes applicable to the gross value of used vehicles that are sold during a given period, two other components oftaxes are also part of the calculation of this series, namely:
• the tax differential on trade-ins, and• taxes paid on lease returns when purchased by lessees.
7.65 The tax differential on trade-ins consists of the sales taxes that a household does not have to pay on thepurchase of a new vehicle when they trade their vehicle to a dealer. For a given transaction, the amount of taxesthat a household will not have to pay is equal to the federal and provincial sales taxes applicable to the value of theused vehicle that will be traded in for a new vehicle. In the CSNA, the sales taxes on purchased vehicles reportedin the new cars, vans and trucks expenditure series are calculated according to their full value. Therefore, byconvention, the tax differential on trade-ins will be deducted from the net value of expenditure on used motorvehicles, in order to not overestimate the total value of sales taxes that is reported in the system.
7.66 It was previously noted that financial leases are treated in the CSNA as purchases of new vehicles, exceptthat the taxes are mostly distributed over the duration of the contract on the basis of the lessee’s periodicpayments. Should the lessee of a vehicle decide to purchase it at the end of the contract, that transaction will notbe recorded in the CSNA as a used vehicle sale, since this would amount to saying that the individual involved hadpurchased the same vehicle twice. This being said, in light of the convention that applies to the treatment of taxeson financial leases, the taxes applicable to the residual value of the vehicle the individual will pay at the end of thecontract in order to take legal possession of it must be recorded in this series.
Quarterly method
7.67 The quarterly estimator of personal expenditure on used motor vehicles (net value) is calculated using theresults of the Quarterly Retail Commodity Survey (QRCS) and the Monthly Retail Trade Survey (MRTS) asdescribed in paragraph 7.43 and in Appendix 7A. This estimator represents the total retail value of used motorvehicle sales made by dealers, and its use assumes that its rate of growth is identical to that of personalexpenditure on used vehicles.
Tobacco products
Annual method24
7.68 Personal expenditure on tobacco products requires a specific calculation methodology, which consists ofestimating the quantities consumed, to which consumer unit prices are applied. A specific method is used becauseseveral sources of information are available and because personal expenditure on cigarettes and other tobaccoproducts include not only legal purchases (that is, purchases for which all taxes were collected by manufacturers,distributors and merchants and were remitted to the administrative authorities concerned), but also expendituresattributable to contraband activities, making the estimation of this series relatively more complex.
7.69 The estimation of personal expenditure on tobacco products on an annual basis results from a reconciliationexercise between several data sources from both the supply side and the demand side. Among the main sourceson the demand side are the revenues from specific taxes imposed on the various tobacco products byadministrative authorities. These figures are drawn from the federal, provincial and territorial public accounts, aswell as corresponding tax rates legislated by governments. Also noteworthy are data from household surveysconducted to evaluate Canadians’ consumption habits: the Canadian Tobacco Use Monitoring Survey (CTUMS)
23. Although the federal Goods and Services Tax (GST) and provincial sales taxes apply to used vehicle sales made by dealers, interpersonaltransactions, on the other hand, are only subject to the provincial sales taxes.
24. This methodology is also used to derive the annual benchmark estimates.
Statistics Canada - Catalogue no. 13-017 Guide to the Income and Expenditure Accounts 125
Personal expenditure on consumer goods and services
and the Survey of Household Spending (SHS). On the supply side, the main data source consists of the domesticsales reported by the Production and Disposition of Tobacco Products survey, supplemented by declaredinternational imports, obtained from the International Trade Division.
7.70 The first step of the methodology is calculating the quantity or volume of cigarettes, cigars and fine cuttobacco for which specific taxes have been collected by the federal, provincial and territorial authorities. Thisvolume, which is expressed in terms of cigarettes and is obtained by dividing tax revenues by the specific rateslevied in each province and territory, is then compared to data from household surveys and to the domestic salesreported by manufacturers, supplemented by international imports. Respondents to household surveys tend tounderestimate their tobacco consumption, generally resulting in a marked difference between the volumescalculated from surveys and those derived from tax data. However, it has been found that in some provinces,especially those where specific taxes are the highest, the quantities obtained from tax data are below the reportedconsumption, a situation generally attributed to contraband. This would suggest that many smokers are turning tothe black market for their supply of cigarettes and fine cut tobacco. This would also explain the fact that domesticsales reported by manufacturers have declined more substantially than the trends reported in household surveyseach time major increases in specific tobacco taxation rates have been imposed in Canada.
7.71 The total volume of tobacco consumed in Canada (including contraband tobacco products) is calculatedannually based on trends observed in household survey data, on the level of prices and on the domestic salesreported by manufacturers. Up to the period 2001-2002, the domestic sales reported by the manufacturers weregenerally a good estimator of the total volume of tobacco consumed in Canada, since the products of contrabandwere to a great extent composed of cigarettes produced by major manufacturers and purchased by illegalwholesalers for resale on the black market. With the federal and provincial tobacco tax increases of 2001 and2002, this scheme was partly replaced as the wholesale prices of tobacco sold by the major manufacturersincreased in accordance with the taxes. Since the contraband of cigarettes produced in unlicensed manufacturesof tobacco products and the imports of illegal cigarettes from other countries took a greater share of the market, thedomestic sales reported by the legal manufacturers of tobacco could not be used as a reliable estimator ofdomestic consumption anymore. In order to determine the total volume of tobacco products consumed in thecountry, information from a number of data sources is now used, including the trends observed in data fromhousehold surveys as well as the price-elasticity of demand for tobacco products.
7.72 Once estimated, the total volume consumed in Canada is then distributed by province or territory, using data
drawn from the CTUMS, conducted by Statistics Canada for Health Canada since 1999.25 The consumption ofcontraband tobacco is then calculated residually for each province and territory by comparing, among other things,the total volume consumed to the quantity derived from tax sources on tobacco products.
7.73 Finally, consumer unit prices are applied to the volumes estimated by province and territory. The pricesretained for the volumes sold on the legal market are drawn from the related consumer price index coveringCanada’s main population centres, while the prices paid for contraband tobacco are obtained from varioussources, particularly media reports and press clippings.
Quarterly method
7.74 Since there is no sub-annual data source for the demand of tobacco products, the personal expenditure mustbe derived from the supply side. To approximate consumption, we use a moving average of the last four months ofthe volume of cigarettes sold in the country by Canadian manufacturers and by importers of tobacco products. Thedomestic sales of Canadian tobacco products are taken from the survey on the Production and Disposition ofTobacco Products by tobacco manufacturers with facilities in Canada. The import statistics are provided by theInternational Trade Division. Since taxes on tobacco products and prices vary from one province or territory toanother, the national consumption of tobacco products must then be allocated among the provinces and territoriesusing distributions from recent years as obtained by the annual method. Then, consumer unit prices are applied to
25. The provincial and territorial distribution of expenditures on tobacco products, derived from the CTUMS, yields results comparable to thedata reported by the SHS.
126 Statistics Canada - Catalogue no. 13-017 Guide to the Income and Expenditure Accounts
Personal expenditure on consumer goods and services
the volumes estimated by province and territory. An adjustment is made to take expenditures on fine cut tobaccointo account. Adjustments may also be made to reflect changing proportions sub-annually between consumption oflegal and contraband products.
Paid and imputed rents
7.75 The annual and quarterly estimates of personal expenditure on paid and imputed rents are both derived usingthe same methodology. Additional information on this method and the one used to calculate estimates of net rent ispresented in Chapter 5.
7.76 The estimation of paid and imputed rents begins with the housing stock, as measured by the Census ofPopulation. The housing stock is divided into single-family dwellings, multiple dwellings, mobile homes, cottages,garages and farms. The Census figures on these stocks are extrapolated annually by the Investment and Capital
Stock Division, which uses the number of new dwellings completed plus conversions26 less demolitions, from thesurvey of the Canada Mortgage and Housing Corporation (CMHC) and the Building Permits Survey. The housingstock is then divided between rented or owned dwellings and occupied or vacant dwellings.
7.77 The average rent is defined as the average price paid by renters for the use of a dwelling (single-familydwellings, multiple dwellings and mobile homes). This average rent is estimated using data drawn from part of thesample of respondents to the Labour Force Survey (LFS). The housing component of the Consumer Price Index(CPI) is also based on these same data.
7.78 The number of rented and occupied dwelling units (single-family dwellings, multiple dwellings and mobilehomes) is multiplied by the average rent to obtain contract rent. The portion of contract rent that is not related to thedwelling space, that is, expenditures relating to facilities and services provided by landlords, is subtracted to obtain
paid rent.27 These expenditures include depreciation of furniture, stoves, refrigerators and washing machines aswell as costs related to water, electricity, heating, parking and maintenance services. Since the average rent is notavailable for cottages and farms, stocks and estimates of paid rent for other types of dwellings are used in order to
obtain an approximation.28 For garages, the average rent comes from the Survey of Household Spending (SHS).For farms, data from the Census of Agriculture and from surveys conducted by Statistics Canada on farm operatorsare also used. Finally, an adjustment is made to eliminate the portion related to offices in the dwelling.
7.79 Several data sources are used to estimate expenditures relating to facilities and services provided bylandlords, including the SHS, the personal expenditure on furniture and household appliances and on energy, andthe Survey of Employment, Payrolls and Hours (SEPH) for maintenance services.
7.80 Data provided by Prices Division indicate that approximately 2% of workers use their dwelling as a workplace.The Income and Expenditure Accounts Division hypothesizes that 25% of rent should be attributed to the businessportion. The adjustment for offices in the dwelling is calculated as follows:
Paid rent (before adjustment)x Ratio of rent used for office space (25%)x Ratio of individuals using their dwelling as a workplace (2%)= Adjustment for offices in the dwelling.
7.81 Paid rent is the starting point for estimating rent imputed29 to owner-occupants. By dividing paid rent by therented and occupied housing stock, we obtain the average rent. This average rent is adjusted using a coefficient ofquality, since a dwelling that is owned is generally larger and of better quality than a rented dwelling. The quality
26. These are additional dwelling units created from formerly non-residential buildings or from other types of residential buildings.27. Paid rent is often referred to as gross space paid rent or gross paid rent for space, emphasizing that this estimate measures only the cost
of the space occupied. 28. Paid rent for cottages, garages and farms accounts for less than 3% of the total.29. Imputed rent is often referred to as gross space imputed rent or gross imputed rent for space, emphasizing that this estimate measures
only the cost of the space occupied.
Statistics Canada - Catalogue no. 13-017 Guide to the Income and Expenditure Accounts 127
Personal expenditure on consumer goods and services
coefficient is based on the average number of rooms in owned dwellings compared to that of rented dwellings,according to the Census of Population. Imputed rent is obtained by multiplying the number of dwelling units ownedand occupied (single-family dwellings, multiple dwellings and mobile homes) by the average rent paid and by thequality coefficient. The calculation is as follows:
Paid rent (J154)÷ Rented and occupied housing stock= Average rent paidx Coefficient of quality related to a dwelling that is owner-occupiedx Owned and occupied housing stock= Imputed rent (J153)
7.82 The imputed residential rent for garages, cottages and farms and the adjustment made for offices in thedwelling are derived similarly as those for rented and occupied dwellings.
Insurance services
7.83 The output of life and non-life insurance corporations represents the value of the service provided inarranging payments of claims and benefits in exchange for the receipts of premiums and contributions. Fourinsurance services are measured in personal expenditure: property insurance (J162), accident and sicknessinsurance (J171), auto insurance (J175) and life insurance (J202).
7.84 Personal expenditure for the first three insurance series is derived using the following formula: (Premiums earned - Claims due + Investment income on technical reserves)x Personal ratio
7.85 Premiums are earned by insurance companies on a continuous basis over a period, although it is common fora premium to be paid at the start of the period. Premiums collected from policyholders are invested in financial orother assets which are held to meet future claims arising from the occurrence of the events specified in theinsurance policies. These pre-paid premiums are a form of credit extended by the policyholder to the insurer andare part of the technical reserves. Similarly, claims become due for payment by the insurance company when thecontingency specified in the policy occurs, but they may not be payable until some time later, often because ofnegotiations regarding the settlement amounts. This is another form of credit described as reserves againstoutstanding claims and they are the other component of technical reserves. The investment income on thesetechnical reserves accrues to policyholders and represents a premium supplement paid by policyholders to theinsurer in the measurement of insurance output.
7.86 The measurement of life insurance output must also take into account the change in actuarial reserves. Theactuarial reserves for life insurance are reserve requirements stipulated by the Superintendent of FinancialInstitutions and represent amounts set aside for payments of future claims and benefits which exceed thepremiums and contributions received to the current date. For life insurance, the following calculation is made:
(Premiums/contributions earned- Claims/benefits due+ Investment income on technical reserves - Increases (+ decreases) in actuarial reserves)x Personal ratio
128 Statistics Canada - Catalogue no. 13-017 Guide to the Income and Expenditure Accounts
Personal expenditure on consumer goods and services
7.87 Data on premiums, claims and investment income for the provinces with a public automobile insurance plan30
are obtained from the Public Institutions Division (PID). For the other provinces and territories, automobileinsurance data are obtained from the Office of the Superintendent of Financial Institutions Canada (OSFI) and fromthe Quarterly Survey of Financial Statistics for Enterprises (QFS), compiled by the Industrial Organization andFinance Division (IOFD). For accident and sickness insurance and life insurance, data from the Canadian Life andHealth Insurance (CLHI), OSFI and IOFD are used, while property and casualty insurance is calculated usinginformation from IOFD and OSFI.
7.88 The personal proportions are based on historical data obtained from the OSFI. These ratios, used todetermine the proportion of insurance output purchased by households, are as follows:
• Property and casualty insurance 70%• Accident and sickness insurance 70%• Auto insurance 70%• Life insurance 95%
Financial services indirectly measured (FSIM)
7.89 In addition to explicit charges for selected services they provide, financial institutions also derive income fromthe interest rate spread between loans and deposits. This spread represents an implicit charge to borrowers anddepositors for services that are provided by financial institutions without explicit fees. The following four personalexpenditure series for financial services indirectly measured (FSIM) are calculated:
• Financial intermediaries, implicit loan charges (J200);• Credit unions, implicit deposit charges (J201);• Financial intermediaries, implicit deposit charges (J204) and• Credit unions, implicit loan charges (J207).
7.90 FSIM estimates are calculated as interest received minus interest paid plus adjustments for own funds for allfinancial institutions that offer lending and/or borrowing services to households, except for credit unions. Thecalculation for credit unions is slightly different because these institutions are considered to be associations ofindividuals. Therefore, their profits are not part of corporation profits but are treated as redistributions to thepersons and unincorporated business sector. The estimate of FSIM for credit unions is calculated as interestreceived minus interest paid plus adjustments for own funds minus profits of credit unions.
7.91 The FSIM estimates are roughly equal to the interest received by the financial institutions net of interest paidby them. The term roughly is used because the net interest received needs to be adjusted for the use of their ownfunds in carrying the lending and borrowing activities. The purpose of this adjustment is to insure that the netinterest received (i.e. FSIM) actually reflects the service level provided independently of the source of funds. Forexample, a client of a bank should receive the same amount of service when borrowing money whether it comesfrom the bank’s own funds or from its deposits. Similarly, the level of service received by a depositor should not bereduced when the bank pays interest on bonds issued. Basically, the own funds’ adjustment corresponds tointerest paid for non-deposit interest minus interest received for other interest bearing assets excluding mortgageand non-mortgage loans.
7.92 The FSIM estimates are then distributed into a depositors’ portion and a borrowers’ portion representing theservice provided to both types of transactors. This distribution is carried out by type of financial institution usingtheir assets and liabilities. For example, if a financial institution has $12 million in deposit liabilities and $8 million inloan assets, then 60% (i.e. (12/(12+8))) of the FSIM would be allocated to depositors while 40% would be allocatedto borrowers.
30. Quebec, Manitoba, Saskatchewan and British Columbia.
Statistics Canada - Catalogue no. 13-017 Guide to the Income and Expenditure Accounts 129
Personal expenditure on consumer goods and services
7.93 The depositors’ portion and the borrowers’ portion are further divided among persons, governments, non-residents and businesses (corporations, government business enterprises and unincorporated businesses). Thedepositors’ portion is broken down using the assets of each sector (or liabilities from the financial institution’sperspective). The borrowers’ portion is broken down using the liabilities of each sector (or assets from the financialinstitution's perspective).
7.94 Estimates of FSIM provided to persons appear in personal expenditure under the four series mentionedabove while those allocated to governments and to non-residents are also included on the expenditure side of theproduction account under government current expenditure on goods and services and exports of services,respectively. FSIM estimates allocated to corporations, government business enterprises and unincorporatedbusinesses are treated as intermediate expenses.
7.95 Source data for the chartered banks are obtained from the OSFI while data for the other institutions of thepersonal and commercial banking industry, for consumer lending and sales financing, and for credit unions areobtained from the Quarterly Survey of Financial Statistics for Enterprises and from other administrative datasources.
Net expenditure abroad
7.96 As noted in paragraphs 7.8 and 7.26, while personal expenditure on consumer goods and services is definedas spending by Canadian residents at home and when temporarily abroad, the individual series (J001 to J214 and
J219 to J226) do not reflect this concept.31 It is therefore necessary to add spending of Canadians abroad topersonal expenditure and remove spending by non-residents (personal and business) in Canada from it. This isdone through the aggregate net expenditure abroad, which adjusts the sum of the 127 individual series to reflectthe total purchases of goods and services by Canadian residents wherever they were produced. Conceptually,
travel payments abroad (J215)32 and spending of military personnel abroad (J216) are personal expenditure, butthey are not part of Canadian production. Offsetting entries are therefore made in imports in order to cancel theseexpenditures in the derivation of gross domestic product (GDP). Conversely, travel receipts from non-residents(J218) are subtracted in the aggregate from personal expenditure and are shown instead as exports, reflectingCanadian production.
7.97 The International Travel Survey (ITS) is the major data source for the calculation of net expenditure abroad. Itprovides data on travel spending and international transportation fares which are used to derive travel paymentsabroad and travel receipts from non-residents. Additional data on the education and health related travel spendingis obtained from Culture, Tourism and the Centre of Education Statistics in order to adequately calculate J215,J218 and the personal expenditure aggregate.
7.98 The travel payments abroad series (J215) is the sum of two components. The first is derived by removing thetravel spending of businesses as well as the spending of Canadians on education and health related travel fromthe total travel payments obtained from the ITS. The second component is the international transportation farespaid by households to foreign carriers which is calculated using a personal ratio of fares paid, derived from the ITS.The travel payments are recorded as imports of travel services, and the international fares as imports oftransportation services.
7.99 Travel receipts from non-residents (J218) is also the sum of two components: the receipts for both personaland business travel spending from which the expenditures of non-residents on education and health related travelare removed, and the international transportation fares paid by non-residents to Canadian carriers. Those fares are
31. A notable exception is the education and health related travel spending. The individual personal expenditure series already include suchexpenditures by Canadians abroad and exclude those of non-residents in Canada. For example, the university fees of Canadians studyingabroad are included with the series university fees (J188).
32. The term “travel” in the series travel payments abroad (J215) is not restricted to pleasure travelling, but refers to all non-business trips byCanadians outside Canada.
130 Statistics Canada - Catalogue no. 13-017 Guide to the Income and Expenditure Accounts
Personal expenditure on consumer goods and services
included in J218 since they are already part of the individual personal expenditure series such as air transport(J179). The travel receipts are recorded as exports of travel services, and the international fares as exports oftransportation services, both reflecting Canadian production.
7.100 The spending of military personnel abroad series (J216) is calculated by multiplying the salaries and wagespaid to members of the Canadian military abroad as reported by IEAD, with a ratio reflecting the spending ofmilitary personnel outside Canada.
Provincial and territorial estimates at current prices
7.101 Provincial and territorial estimates of personal expenditure are only available annually and are based on thesame classification of goods and services as are the national estimates (see ). Whenever possible, the same datasources and methods employed at the national level are used to calculate the provincial and territorial estimates.Interprovincial travel expenditure, which is discussed in paragraphs 7.105 to 7.108, represents a notable exception.
7.102 Generally, the provincial and territorial estimates are derived by distributing the national estimates byprovince and territory. However, for certain expenditure series, such as personal spending on electricity, on naturalgas, on paid rent and on imputed rent, the quality and timeliness of the statistical information make it possible tocalculate provincial and territorial estimates and summing them to obtain national estimates.
7.103 For most goods purchased at the retail level, the provincial and territorial estimates are obtained with themethod outlined in Appendix 7A: a provincial/territorial retail commodity breakdown is applied to the provincial andterritorial retail trade sales by trade group. The estimation of spending on services by province and territory relieson more varied data sources, such as the Survey of Household Spending, surveys on transportation,accommodation, food services, recreational services and personal care as well as on data from administrative datasources.
7.104 provides a summary of the data sources and estimation methods usually used to calculate each of theprovincial/territorial estimators at current prices for the two most recent years. Series of personal expenditurewithout sales tax are derived with these estimators. Depending on the personal expenditure series and the datasources available, the estimators are used either to directly distribute the national benchmarks or to project theprovincial and territorial benchmark data. In the latter case, the difference between the sum of the projectedprovincial and territorial estimates and the national estimate must be distributed by province and territory whileminimizing the relative impact on the rate of change of each of the provincial and territorial series. As with thenational estimators, the six methods presented in paragraph 7.36 are identified in the table.
Net expenditure abroad
7.105 In the provincial and territorial economic accounts, the aggregate net expenditure abroad includes aninternational component and an interprovincial component. The first corresponds exactly to the net expenditureabroad outlined in paragraphs 7.96 to 7.100, with the difference that the travel payments abroad are distributed byprovince or territory of residence and the travel receipts from non-residents are allocated to the province or territoryvisited. The second component is an estimate of interprovincial travel expenditure of Canadian residents. For thecountry as a whole, the net interprovincial travel expenditure is equal to zero because the sum of interprovincialtravel payments equals the sum of interprovincial travel receipts.
7.106 The international component of travel payments abroad (J215) and travel receipts from non-residents (J218)is calculated using the same data sources and methods as presented in paragraphs 7.96 to 7.100, that is mostlyfrom the International Travel Survey. The interprovincial component is derived using payments by residents of aprovince or territory while travelling in another province or territory for pleasure and other personal reasons. Datafor the latter component are obtained from the Travel Survey of Residents of Canada (TSRC). An adjustment isalso made to reflect other expenditures not covered by the TSRC such as outlays by residents of a province orterritory who work in another province or territory.
Statistics Canada - Catalogue no. 13-017 Guide to the Income and Expenditure Accounts 131
Personal expenditure on consumer goods and services
7.107 As is the case for the international component, spending on education and health related travel is notincluded with the interprovincial component of J215 and J218 since it is already included with the individualpersonal expenditure series. For example, the university fees of a resident of Yukon studying in British Columbiaare included with the series university fees (J188) and not with the series J215 of Yukon. Note that those fees areincluded with imports of services for Yukon and with exports of services for British Columbia.
7.108 By international convention, Canadian diplomatic and military personnel posted abroad are consideredresidents of Canada and their personal expenditure is shown under a region called “Outside Canada”.
Estimates of sales taxes
7.109 The estimators, for which the data sources and estimation methods were presented in the paragraphs 7.49to 7.108, are used to derive personal expenditure estimates at current prices excluding the federal and provincial
sales taxes.33 The federal Goods and Services Tax (GST) and the provincial sales taxes must be added to obtainpersonal expenditure at market prices.
7.110 When it replaced the manufacturers’ sales tax in January 1991, the GST had been set at a rate of 7 percentand remained at that level until July 1, 2006, when it was reduced to 6 percent. It was further reduced to 5 percenton January 1, 2008. The GST is charged on most goods and services that are sold and is similar to the valueadded taxes (VAT) that exist in many industrialized countries. However, because most businesses are allowed toclaim input tax credits or refunds for the GST paid on their intermediate expenses, it is to a large extent a tax onfinal consumption.
7.111 A general sales tax is also levied by all provincial governments except Alberta.34 A general sales tax isdefined as a tax which is legislated by a provincial act and which applies to most goods and selected servicespurchased. Historically, provincial sales taxes (PST) have been applicable mostly to the purchase of tangiblegoods, but the tax base has been expanded in many provinces in recent years. In 1992, the Quebec governmentharmonized most of its tax base to that of the GST. In 1997, the governments of Newfoundland and Labrador, Nova
Scotia and New Brunswick adhered to the Harmonized Sales Tax (HST) Agreement.35 More recently, otherprovincial governments have decided to apply the general sales tax to additional products.
7.112 In the Canadian System of National Accounts (CSNA), sales taxes are calculated by province and byterritory for each personal expenditure series. The tax rate in effect and a taxable proportion are applied to eachpersonal expenditure series at current prices without sales tax. For any series, the taxable proportion correspondsto the percentage of the personal spending for which the sales tax (GST or PST) is applicable. The use of taxableproportions is necessary because of various exemptions that apply to selected goods and services as well as tospecific purchasers. The method used to calculate the GST and PST is identical, except in Prince Edward Islandand Quebec where the provincial sales tax rate applies to the personal expenditure estimates including the GST.As in the case for the estimates of personal expenditure at current prices excluding sales tax, the sum of the salestax estimates by province and territory must correspond to the national estimates. An example of the calculation ofthe sales taxes applicable to furniture for Ontario is presented in Table 7.5 .
33. A certain number of taxes are already incorporated into the personal expenditure series at current prices without sales tax, such as thefederal excise duties on tobacco, the federal excise taxes applicable on the purchase of some new motor vehicles, the air travellers’security charge, and the excise taxes on gasoline, among others.
34. Although there is no general sales tax in Alberta or in the three territories, taxes are nevertheless levied on certain goods and services. Forinstance, the four governments levy tobacco taxes; there is a tax on accommodation services in Alberta; and the government of Yukoncharges a tax on alcoholic beverages bought in stores.
35. In accordance with the HST Agreement, the federal government collects a 13 percent tax on the retail sales subject to the GST in each ofthe three participating provinces; between July 1st 2006 and January 1st 2008, the HST rate was set at 14 percent while it was set at 15percent prior to July 1st 2006. From the amount collected, the federal government keeps the revenue attributed to the GST andredistributes the share corresponding to the 8 percent provincial tax to the participating provinces.
132 Statistics Canada - Catalogue no. 13-017 Guide to the Income and Expenditure Accounts
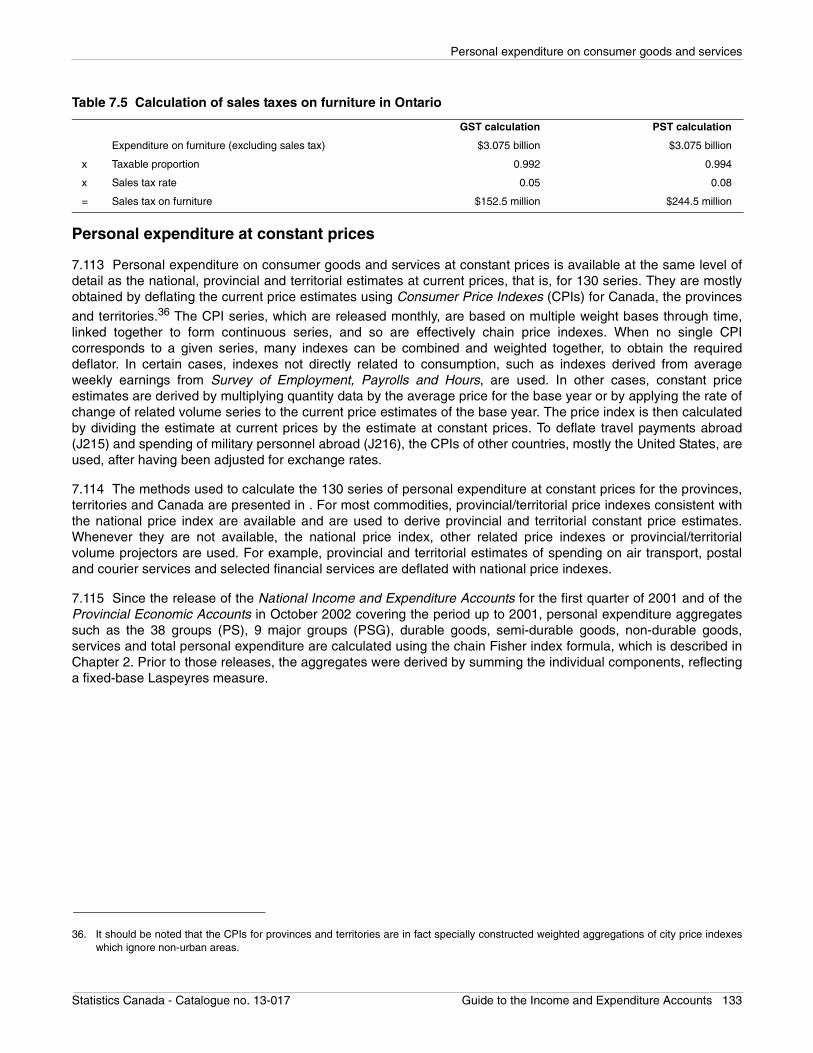
Personal expenditure on consumer goods and services
Personal expenditure at constant prices
7.113 Personal expenditure on consumer goods and services at constant prices is available at the same level ofdetail as the national, provincial and territorial estimates at current prices, that is, for 130 series. They are mostlyobtained by deflating the current price estimates using Consumer Price Indexes (CPIs) for Canada, the provinces
and territories.36 The CPI series, which are released monthly, are based on multiple weight bases through time,linked together to form continuous series, and so are effectively chain price indexes. When no single CPIcorresponds to a given series, many indexes can be combined and weighted together, to obtain the requireddeflator. In certain cases, indexes not directly related to consumption, such as indexes derived from averageweekly earnings from Survey of Employment, Payrolls and Hours, are used. In other cases, constant priceestimates are derived by multiplying quantity data by the average price for the base year or by applying the rate ofchange of related volume series to the current price estimates of the base year. The price index is then calculatedby dividing the estimate at current prices by the estimate at constant prices. To deflate travel payments abroad(J215) and spending of military personnel abroad (J216), the CPIs of other countries, mostly the United States, areused, after having been adjusted for exchange rates.
7.114 The methods used to calculate the 130 series of personal expenditure at constant prices for the provinces,territories and Canada are presented in . For most commodities, provincial/territorial price indexes consistent withthe national price index are available and are used to derive provincial and territorial constant price estimates.Whenever they are not available, the national price index, other related price indexes or provincial/territorialvolume projectors are used. For example, provincial and territorial estimates of spending on air transport, postaland courier services and selected financial services are deflated with national price indexes.
7.115 Since the release of the National Income and Expenditure Accounts for the first quarter of 2001 and of theProvincial Economic Accounts in October 2002 covering the period up to 2001, personal expenditure aggregatessuch as the 38 groups (PS), 9 major groups (PSG), durable goods, semi-durable goods, non-durable goods,services and total personal expenditure are calculated using the chain Fisher index formula, which is described inChapter 2. Prior to those releases, the aggregates were derived by summing the individual components, reflectinga fixed-base Laspeyres measure.
Table 7.5 Calculation of sales taxes on furniture in Ontario
GST calculation PST calculation
Expenditure on furniture (excluding sales tax) $3.075 billion $3.075 billion
x Taxable proportion 0.992 0.994
x Sales tax rate 0.05 0.08
= Sales tax on furniture $152.5 million $244.5 million
36. It should be noted that the CPIs for provinces and territories are in fact specially constructed weighted aggregations of city price indexeswhich ignore non-urban areas.
Statistics Canada - Catalogue no. 13-017 Guide to the Income and Expenditure Accounts 133
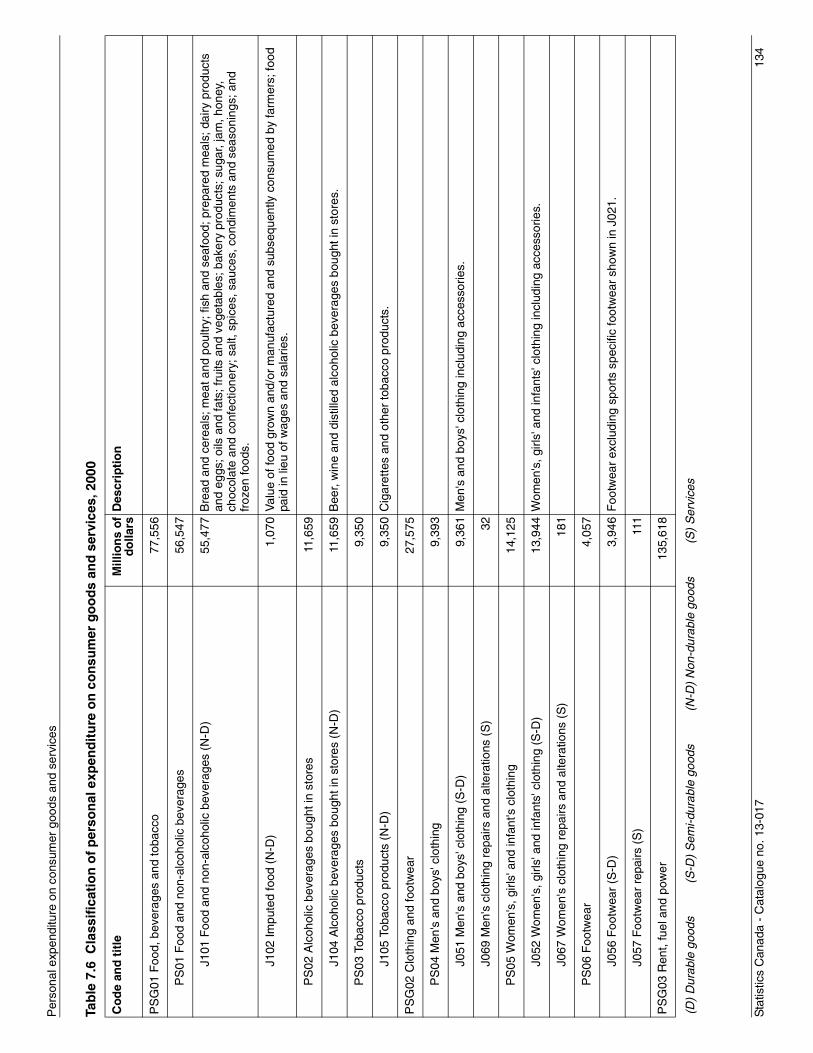
Sta
tistic
s C
anad
a -
Cat
alog
ue n
o. 1
3-01
713
4
Per
sona
l exp
endi
ture
on
cons
umer
goo
ds a
nd s
ervi
ces
Tab
le 7
.6 C
lass
ific
atio
n o
f p
erso
nal
exp
end
itu
re o
n c
on
sum
er g
oo
ds
and
ser
vice
s, 2
000
Co
de
and
tit
leM
illio
ns
of
do
llars
Des
crip
tio
n
PS
G01
Foo
d, b
ever
ages
and
toba
cco
77,
556
PS
01 F
ood
and
non-
alco
holic
bev
erag
es 5
6,54
7
J101
Foo
d an
d no
n-al
coho
lic b
ever
ages
(N
-D)
55,
477
Bre
ad a
nd c
erea
ls; m
eat a
nd p
oultr
y; fi
sh a
nd s
eafo
od; p
repa
red
mea
ls; d
airy
pro
duct
s an
d eg
gs; o
ils a
nd fa
ts; f
ruits
and
veg
etab
les;
bak
ery
prod
ucts
; sug
ar, j
am, h
oney
, ch
ocol
ate
and
conf
ectio
nery
; sal
t, sp
ices
, sau
ces,
con
dim
ents
and
sea
soni
ngs;
and
fr
ozen
food
s.
J102
Impu
ted
food
(N
-D)
1,07
0V
alue
of f
ood
grow
n an
d/or
man
ufac
ture
d an
d su
bseq
uent
ly c
onsu
med
by
farm
ers;
food
pa
id in
lieu
of w
ages
and
sal
arie
s.
PS
02 A
lcoh
olic
bev
erag
es b
ough
t in
stor
es 1
1,65
9
J104
Alc
ohol
ic b
ever
ages
bou
ght i
n st
ores
(N
-D)
11,
659
Bee
r, w
ine
and
dist
illed
alc
ohol
ic b
ever
ages
bou
ght i
n st
ores
.
PS
03 T
obac
co p
rodu
cts
9,35
0
J105
Tob
acco
pro
duct
s (N
-D)
9,35
0C
igar
ette
s an
d ot
her
toba
cco
prod
ucts
.
PS
G02
Clo
thin
g an
d fo
otw
ear
27,
575
PS
04 M
en's
and
boy
s' c
loth
ing
9,39
3
J051
Men
's a
nd b
oys'
clo
thin
g (S
-D)
9,36
1M
en's
and
boy
s' c
loth
ing
incl
udin
g ac
cess
orie
s.
J069
Men
's c
loth
ing
repa
irs a
nd a
ltera
tions
(S
) 3
2
PS
05 W
omen
's, g
irls'
and
infa
nt's
clo
thin
g 1
4,12
5
J052
Wom
en's
, girl
s' a
nd in
fant
s' c
loth
ing
(S-D
) 1
3,94
4W
omen
's, g
irls'
and
infa
nts'
clo
thin
g in
clud
ing
acce
ssor
ies.
J067
Wom
en's
clo
thin
g re
pairs
and
alte
ratio
ns (
S)
181
PS
06 F
ootw
ear
4,05
7
J056
Foo
twea
r (S
-D)
3,9
46F
ootw
ear
excl
udin
g sp
orts
spe
cific
foot
wea
r sh
own
in J
021.
J057
Foo
twea
r re
pairs
(S
) 1
11
PS
G03
Ren
t, fu
el a
nd p
ower
135
,618
(D)
Dur
able
goo
ds
(S
-D)
Sem
i-dur
able
goo
ds
(N
-D)
Non
-dur
able
goo
ds
(S
) S
ervi
ces
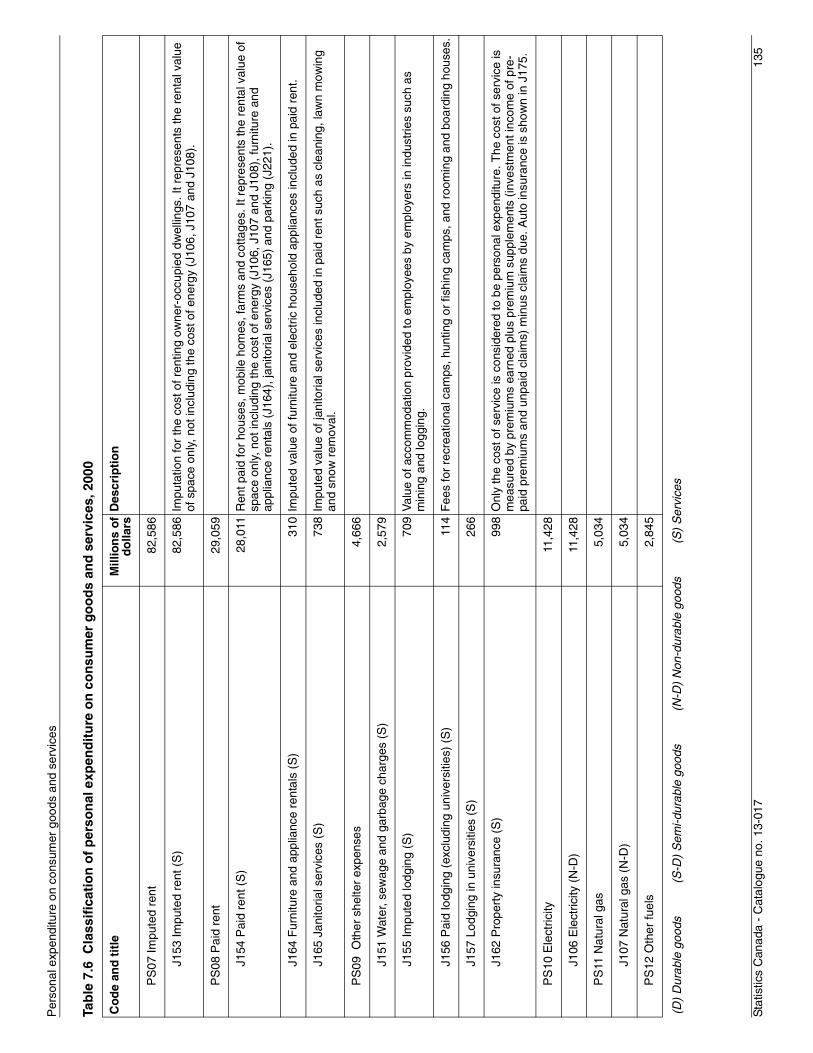
Sta
tistic
s C
anad
a -
Cat
alog
ue n
o. 1
3-01
713
5
Per
sona
l exp
endi
ture
on
cons
umer
goo
ds a
nd s
ervi
ces
PS
07 Im
pute
d re
nt
82,
586
J153
Impu
ted
rent
(S
) 8
2,58
6Im
puta
tion
for
the
cost
of r
entin
g ow
ner-
occu
pied
dw
ellin
gs. I
t rep
rese
nts
the
rent
al v
alue
of
spa
ce o
nly,
not
incl
udin
g th
e co
st o
f ene
rgy
(J10
6, J
107
and
J108
).
PS
08 P
aid
rent
29,
059
J154
Pai
d re
nt (
S)
28,
011
Ren
t pai
d fo
r ho
uses
, mob
ile h
omes
, far
ms
and
cotta
ges.
It r
epre
sent
s th
e re
ntal
val
ue o
f sp
ace
only
, not
incl
udin
g th
e co
st o
f ene
rgy
(J10
6, J
107
and
J108
), fu
rnitu
re a
nd
appl
ianc
e re
ntal
s (J
164)
, jan
itoria
l ser
vice
s (J
165)
and
par
king
(J2
21).
J164
Fur
nitu
re a
nd a
pplia
nce
rent
als
(S)
310
Impu
ted
valu
e of
furn
iture
and
ele
ctric
hou
seho
ld a
pplia
nces
incl
uded
in p
aid
rent
.
J165
Jan
itoria
l ser
vice
s (S
) 7
38Im
pute
d va
lue
of ja
nito
rial s
ervi
ces
incl
uded
in p
aid
rent
suc
h as
cle
anin
g, la
wn
mow
ing
and
snow
rem
oval
.
PS
09 O
ther
she
lter
expe
nses
4,6
66
J151
Wat
er, s
ewag
e an
d ga
rbag
e ch
arge
s (S
) 2
,579
J155
Impu
ted
lodg
ing
(S)
709
Val
ue o
f acc
omm
odat
ion
prov
ided
to e
mpl
oyee
s by
em
ploy
ers
in in
dust
ries
such
as
min
ing
and
logg
ing.
J156
Pai
d lo
dgin
g (e
xclu
ding
uni
vers
ities
) (S
) 1
14F
ees
for
recr
eatio
nal c
amps
, hun
ting
or fi
shin
g ca
mps
, and
roo
min
g an
d bo
ardi
ng h
ouse
s.
J157
Lod
ging
in u
nive
rsiti
es (
S)
266
J162
Pro
pert
y in
sura
nce
(S)
998
Onl
y th
e co
st o
f ser
vice
is c
onsi
dere
d to
be
pers
onal
exp
endi
ture
. The
cos
t of s
ervi
ce is
m
easu
red
by p
rem
ium
s ea
rned
plu
s pr
emiu
m s
uppl
emen
ts (
inve
stm
ent i
ncom
e of
pre
-pa
id p
rem
ium
s an
d un
paid
cla
ims)
min
us c
laim
s du
e. A
uto
insu
ranc
e is
sho
wn
in J
175.
PS
10 E
lect
ricity
11,
428
J106
Ele
ctric
ity (
N-D
) 1
1,42
8
PS
11 N
atur
al g
as 5
,034
J107
Nat
ural
gas
(N
-D)
5,0
34
PS
12 O
ther
fuel
s 2
,845
Tab
le 7
.6 C
lass
ific
atio
n o
f p
erso
nal
exp
end
itu
re o
n c
on
sum
er g
oo
ds
and
ser
vice
s, 2
000
Co
de
and
tit
leM
illio
ns
of
do
llars
Des
crip
tio
n
(D)
Dur
able
goo
ds
(S
-D)
Sem
i-dur
able
goo
ds
(N
-D)
Non
-dur
able
goo
ds
(S
) S
ervi
ces
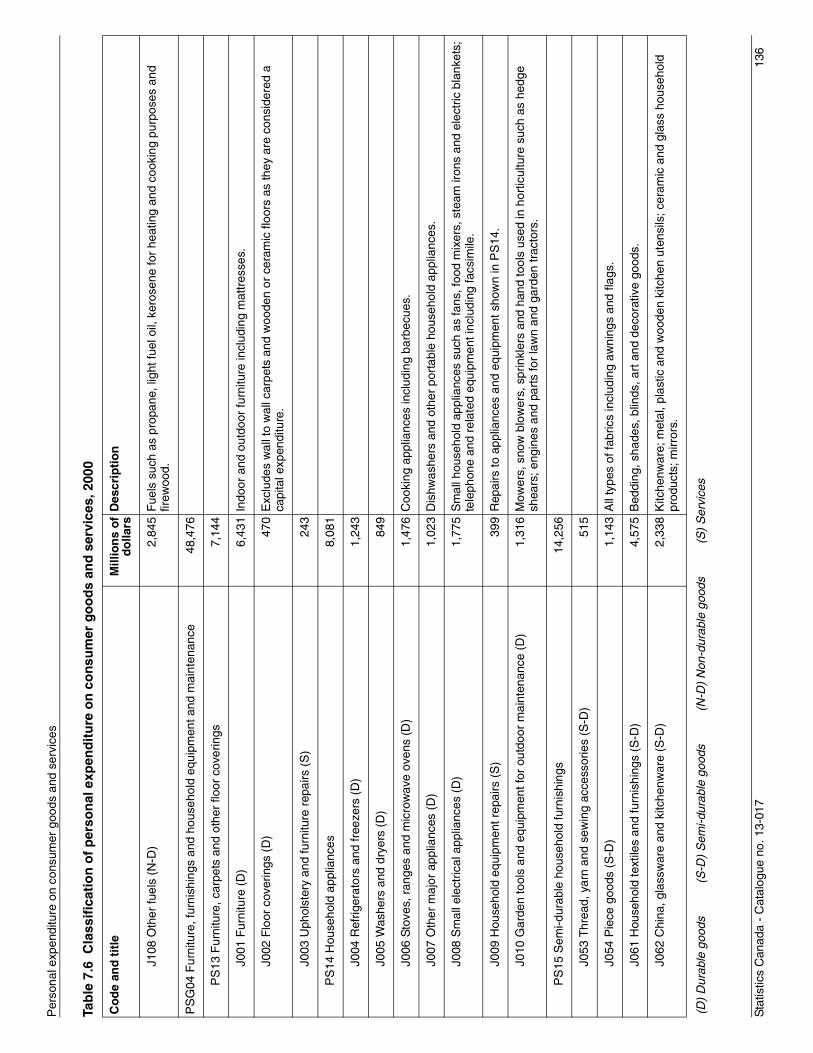
Sta
tistic
s C
anad
a -
Cat
alog
ue n
o. 1
3-01
713
6
Per
sona
l exp
endi
ture
on
cons
umer
goo
ds a
nd s
ervi
ces
J108
Oth
er fu
els
(N-D
) 2
,845
Fue
ls s
uch
as p
ropa
ne, l
ight
fuel
oil,
ker
osen
e fo
r he
atin
g an
d co
okin
g pu
rpos
es a
nd
firew
ood.
PS
G04
Fur
nitu
re, f
urni
shin
gs a
nd h
ouse
hold
equ
ipm
ent a
nd m
aint
enan
ce
48,4
76
PS
13 F
urni
ture
, car
pets
and
oth
er fl
oor
cove
rings
7,1
44
J001
Fur
nitu
re (
D)
6,4
31In
door
and
out
door
furn
iture
incl
udin
g m
attr
esse
s.
J002
Flo
or c
over
ings
(D
)
470
Exc
lude
s w
all t
o w
all c
arpe
ts a
nd w
oode
n or
cer
amic
floo
rs a
s th
ey a
re c
onsi
dere
d a
capi
tal e
xpen
ditu
re.
J003
Uph
olst
ery
and
furn
iture
rep
airs
(S
)
243
PS
14 H
ouse
hold
app
lianc
es 8
,081
J004
Ref
riger
ator
s an
d fr
eeze
rs (
D)
1,2
43
J005
Was
hers
and
dry
ers
(D)
84
9
J006
Sto
ves,
ran
ges
and
mic
row
ave
oven
s (D
) 1
,476
Coo
king
app
lianc
es in
clud
ing
barb
ecue
s.
J007
Oth
er m
ajor
app
lianc
es (
D)
1,0
23D
ishw
ashe
rs a
nd o
ther
por
tabl
e ho
useh
old
appl
ianc
es.
J008
Sm
all e
lect
rical
app
lianc
es (
D)
1,7
75S
mal
l hou
seho
ld a
pplia
nces
suc
h as
fans
, foo
d m
ixer
s, s
team
iron
s an
d el
ectr
ic b
lank
ets;
te
leph
one
and
rela
ted
equi
pmen
t inc
ludi
ng fa
csim
ile.
J009
Hou
seho
ld e
quip
men
t rep
airs
(S
)
399
Rep
airs
to a
pplia
nces
and
equ
ipm
ent s
how
n in
PS
14.
J010
Gar
den
tool
s an
d eq
uipm
ent f
or o
utdo
or m
aint
enan
ce (
D)
1,3
16M
ower
s, s
now
blo
wer
s, s
prin
kler
s an
d ha
nd to
ols
used
in h
ortic
ultu
re s
uch
as h
edge
sh
ears
; eng
ines
and
par
ts fo
r la
wn
and
gard
en tr
acto
rs.
PS
15 S
emi-d
urab
le h
ouse
hold
furn
ishi
ngs
14
,256
J053
Thr
ead,
yar
n an
d se
win
g ac
cess
orie
s (S
-D)
51
5
J054
Pie
ce g
oods
(S
-D)
1,1
43A
ll ty
pes
of fa
bric
s in
clud
ing
awni
ngs
and
flags
.
J061
Hou
seho
ld te
xtile
s an
d fu
rnis
hing
s (S
-D)
4,5
75B
eddi
ng, s
hade
s, b
linds
, art
and
dec
orat
ive
good
s.
J062
Chi
na, g
lass
war
e an
d ki
tche
nwar
e (S
-D)
2,3
38K
itche
nwar
e; m
etal
, pla
stic
and
woo
den
kitc
hen
uten
sils
; cer
amic
and
gla
ss h
ouse
hold
pr
oduc
ts; m
irror
s.
Tab
le 7
.6 C
lass
ific
atio
n o
f p
erso
nal
exp
end
itu
re o
n c
on
sum
er g
oo
ds
and
ser
vice
s, 2
000
Co
de
and
tit
leM
illio
ns
of
do
llars
Des
crip
tio
n
(D)
Dur
able
goo
ds
(S
-D)
Sem
i-dur
able
goo
ds
(N
-D)
Non
-dur
able
goo
ds
(S
) S
ervi
ces
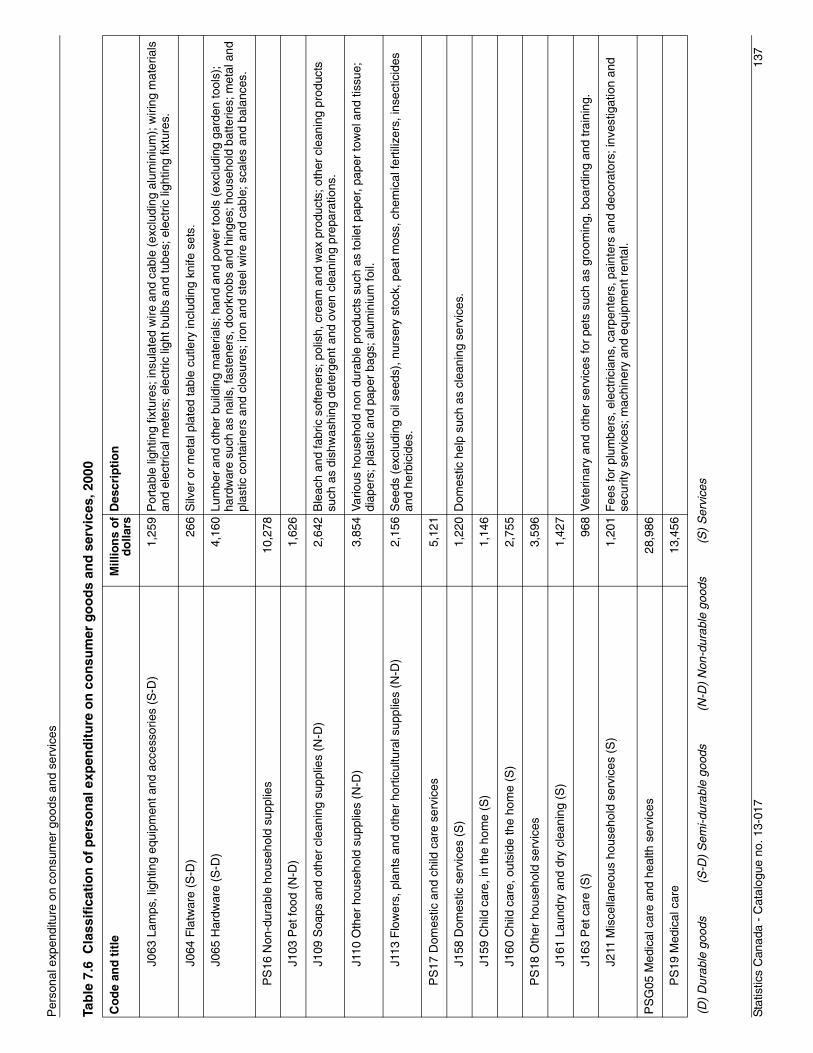
Sta
tistic
s C
anad
a -
Cat
alog
ue n
o. 1
3-01
713
7
Per
sona
l exp
endi
ture
on
cons
umer
goo
ds a
nd s
ervi
ces
J063
Lam
ps, l
ight
ing
equi
pmen
t and
acc
esso
ries
(S-D
) 1
,259
Por
tabl
e lig
htin
g fix
ture
s; in
sula
ted
wire
and
cab
le (
excl
udin
g al
umin
ium
); w
iring
mat
eria
ls
and
elec
tric
al m
eter
s; e
lect
ric li
ght b
ulbs
and
tube
s; e
lect
ric li
ghtin
g fix
ture
s.
J064
Fla
twar
e (S
-D)
26
6S
ilver
or
met
al p
late
d ta
ble
cutle
ry in
clud
ing
knife
set
s.
J065
Har
dwar
e (S
-D)
4,1
60Lu
mbe
r an
d ot
her
build
ing
mat
eria
ls; h
and
and
pow
er to
ols
(exc
ludi
ng g
arde
n to
ols)
; ha
rdw
are
such
as
nails
, fas
tene
rs, d
oork
nobs
and
hin
ges;
hou
seho
ld b
atte
ries;
met
al a
nd
plas
tic c
onta
iner
s an
d cl
osur
es; i
ron
and
stee
l wire
and
cab
le; s
cale
s an
d ba
lanc
es.
PS
16 N
on-d
urab
le h
ouse
hold
sup
plie
s
10,2
78
J103
Pet
food
(N
-D)
1,6
26
J109
Soa
ps a
nd o
ther
cle
anin
g su
pplie
s (N
-D)
2,6
42B
leac
h an
d fa
bric
sof
tene
rs; p
olis
h, c
ream
and
wax
pro
duct
s; o
ther
cle
anin
g pr
oduc
ts
such
as
dish
was
hing
det
erge
nt a
nd o
ven
clea
ning
pre
para
tions
.
J110
Oth
er h
ouse
hold
sup
plie
s (N
-D)
3,8
54V
ario
us h
ouse
hold
non
dur
able
pro
duct
s su
ch a
s to
ilet p
aper
, pap
er to
wel
and
tiss
ue;
diap
ers;
pla
stic
and
pap
er b
ags;
alu
min
ium
foil.
J113
Flo
wer
s, p
lant
s an
d ot
her
hort
icul
tura
l sup
plie
s (N
-D)
2,1
56S
eeds
(ex
clud
ing
oil s
eeds
), n
urse
ry s
tock
, pea
t mos
s, c
hem
ical
fert
ilize
rs, i
nsec
ticid
es
and
herb
icid
es.
PS
17 D
omes
tic a
nd c
hild
car
e se
rvic
es 5
,121
J158
Dom
estic
ser
vice
s (S
) 1
,220
Dom
estic
hel
p su
ch a
s cl
eani
ng s
ervi
ces.
J159
Chi
ld c
are,
in th
e ho
me
(S)
1,1
46
J160
Chi
ld c
are,
out
side
the
hom
e (S
) 2
,755
PS
18 O
ther
hou
seho
ld s
ervi
ces
3,5
96
J161
Lau
ndry
and
dry
cle
anin
g (S
) 1
,427
J163
Pet
car
e (S
)
968
Vet
erin
ary
and
othe
r se
rvic
es fo
r pe
ts s
uch
as g
room
ing,
boa
rdin
g an
d tr
aini
ng.
J211
Mis
cella
neou
s ho
useh
old
serv
ices
(S
) 1
,201
Fee
s fo
r pl
umbe
rs, e
lect
ricia
ns, c
arpe
nter
s, p
aint
ers
and
deco
rato
rs; i
nves
tigat
ion
and
secu
rity
serv
ices
; mac
hine
ry a
nd e
quip
men
t ren
tal.
PS
G05
Med
ical
car
e an
d he
alth
ser
vice
s
28,9
86
PS
19 M
edic
al c
are
13
,456
Tab
le 7
.6 C
lass
ific
atio
n o
f p
erso
nal
exp
end
itu
re o
n c
on
sum
er g
oo
ds
and
ser
vice
s, 2
000
Co
de
and
tit
leM
illio
ns
of
do
llars
Des
crip
tio
n
(D)
Dur
able
goo
ds
(S
-D)
Sem
i-dur
able
goo
ds
(N
-D)
Non
-dur
able
goo
ds
(S
) S
ervi
ces
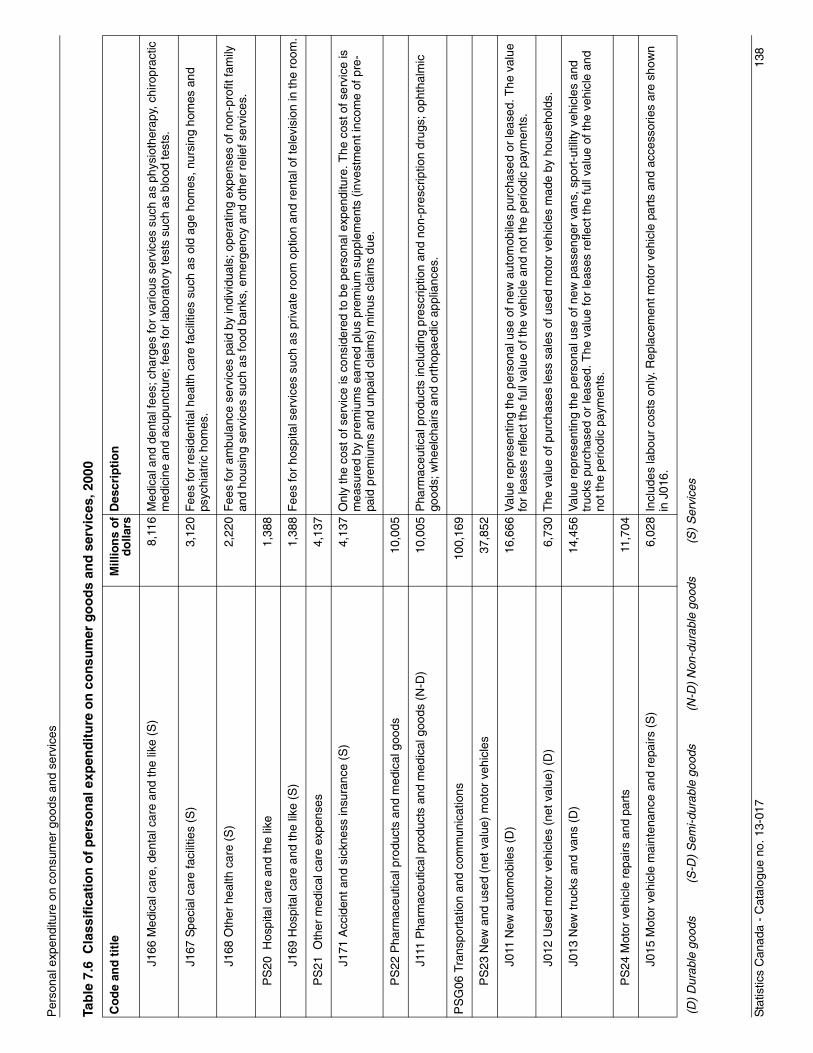
Sta
tistic
s C
anad
a -
Cat
alog
ue n
o. 1
3-01
713
8
Per
sona
l exp
endi
ture
on
cons
umer
goo
ds a
nd s
ervi
ces
J166
Med
ical
car
e, d
enta
l car
e an
d th
e lik
e (S
) 8
,116
Med
ical
and
den
tal f
ees;
cha
rges
for
vario
us s
ervi
ces
such
as
phys
ioth
erap
y, c
hiro
prac
tic
med
icin
e an
d ac
upun
ctur
e; fe
es fo
r la
bora
tory
test
s su
ch a
s bl
ood
test
s.
J167
Spe
cial
car
e fa
cilit
ies
(S)
3,1
20F
ees
for
resi
dent
ial h
ealth
car
e fa
cilit
ies
such
as
old
age
hom
es, n
ursi
ng h
omes
and
ps
ychi
atric
hom
es.
J168
Oth
er h
ealth
car
e (S
) 2
,220
Fee
s fo
r am
bula
nce
serv
ices
pai
d by
indi
vidu
als;
ope
ratin
g ex
pens
es o
f non
-pro
fit fa
mily
an
d ho
usin
g se
rvic
es s
uch
as fo
od b
anks
, em
erge
ncy
and
othe
r re
lief s
ervi
ces.
PS
20 H
ospi
tal c
are
and
the
like
1,3
88
J169
Hos
pita
l car
e an
d th
e lik
e (S
) 1
,388
Fee
s fo
r ho
spita
l ser
vice
s su
ch a
s pr
ivat
e ro
om o
ptio
n an
d re
ntal
of t
elev
isio
n in
the
room
.
PS
21 O
ther
med
ical
car
e ex
pens
es 4
,137
J171
Acc
iden
t and
sic
knes
s in
sura
nce
(S)
4,1
37O
nly
the
cost
of s
ervi
ce is
con
side
red
to b
e pe
rson
al e
xpen
ditu
re. T
he c
ost o
f ser
vice
is
mea
sure
d by
pre
miu
ms
earn
ed p
lus
prem
ium
sup
plem
ents
(in
vest
men
t inc
ome
of p
re-
paid
pre
miu
ms
and
unpa
id c
laim
s) m
inus
cla
ims
due.
PS
22 P
harm
aceu
tical
pro
duct
s an
d m
edic
al g
oods
10
,005
J111
Pha
rmac
eutic
al p
rodu
cts
and
med
ical
goo
ds (
N-D
)
10,0
05P
harm
aceu
tical
pro
duct
s in
clud
ing
pres
crip
tion
and
non-
pres
crip
tion
drug
s; o
phth
alm
ic
good
s; w
heel
chai
rs a
nd o
rtho
paed
ic a
pplia
nces
.
PS
G06
Tra
nspo
rtat
ion
and
com
mun
icat
ions
100
,169
PS
23 N
ew a
nd u
sed
(net
val
ue)
mot
or v
ehic
les
37
,852
J011
New
aut
omob
iles
(D)
16
,666
Val
ue r
epre
sent
ing
the
pers
onal
use
of n
ew a
utom
obile
s pu
rcha
sed
or le
ased
. The
val
ue
for
leas
es r
efle
ct th
e fu
ll va
lue
of th
e ve
hicl
e an
d no
t the
per
iodi
c pa
ymen
ts.
J012
Use
d m
otor
veh
icle
s (n
et v
alue
) (D
) 6
,730
The
val
ue o
f pur
chas
es le
ss s
ales
of u
sed
mot
or v
ehic
les
mad
e by
hou
seho
lds.
J013
New
truc
ks a
nd v
ans
(D)
14
,456
Val
ue r
epre
sent
ing
the
pers
onal
use
of n
ew p
asse
nger
van
s, s
port
-util
ity v
ehic
les
and
truc
ks p
urch
ased
or
leas
ed. T
he v
alue
for
leas
es r
efle
ct th
e fu
ll va
lue
of th
e ve
hicl
e an
d no
t the
per
iodi
c pa
ymen
ts.
PS
24 M
otor
veh
icle
rep
airs
and
par
ts
11,7
04
J015
Mot
or v
ehic
le m
aint
enan
ce a
nd r
epai
rs (
S)
6,0
28In
clud
es la
bour
cos
ts o
nly.
Rep
lace
men
t mot
or v
ehic
le p
arts
and
acc
esso
ries
are
show
n in
J01
6.
Tab
le 7
.6 C
lass
ific
atio
n o
f p
erso
nal
exp
end
itu
re o
n c
on
sum
er g
oo
ds
and
ser
vice
s, 2
000
Co
de
and
tit
leM
illio
ns
of
do
llars
Des
crip
tio
n
(D)
Dur
able
goo
ds
(S
-D)
Sem
i-dur
able
goo
ds
(N
-D)
Non
-dur
able
goo
ds
(S
) S
ervi
ces
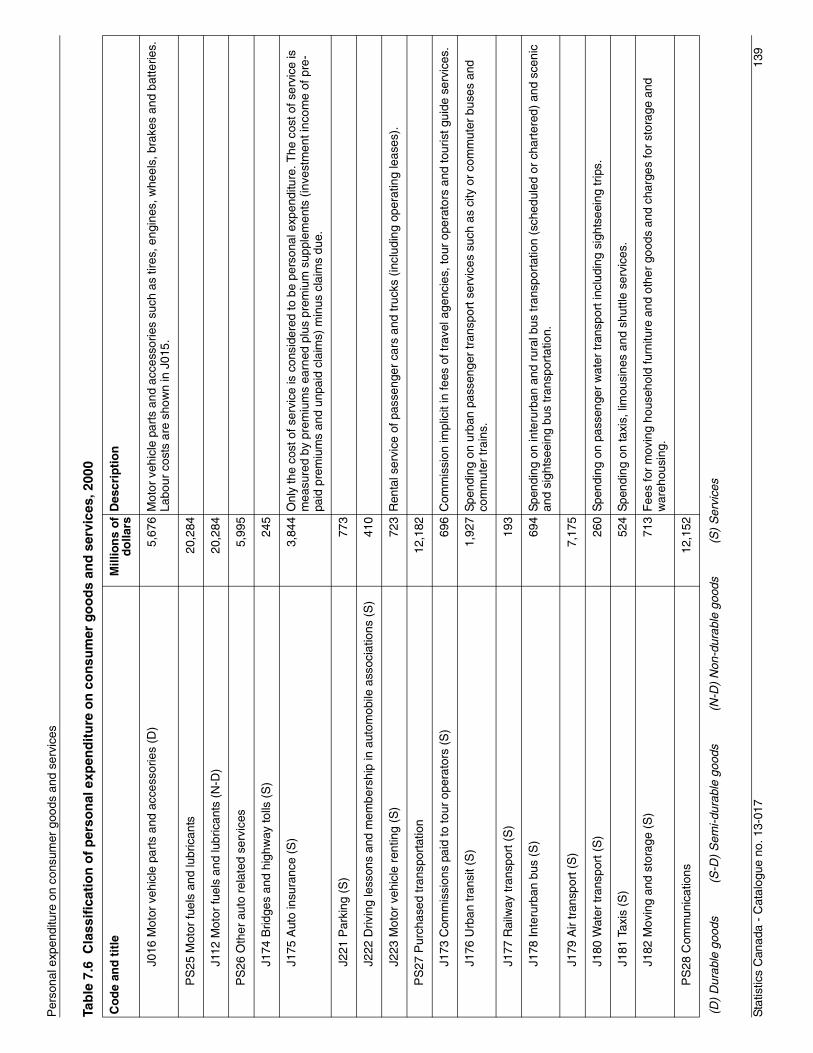
Sta
tistic
s C
anad
a -
Cat
alog
ue n
o. 1
3-01
713
9
Per
sona
l exp
endi
ture
on
cons
umer
goo
ds a
nd s
ervi
ces
J016
Mot
or v
ehic
le p
arts
and
acc
esso
ries
(D)
5,6
76M
otor
veh
icle
par
ts a
nd a
cces
sorie
s su
ch a
s tir
es, e
ngin
es, w
heel
s, b
rake
s an
d ba
tterie
s.
Labo
ur c
osts
are
sho
wn
in J
015.
PS
25 M
otor
fuel
s an
d lu
bric
ants
20
,284
J112
Mot
or fu
els
and
lubr
ican
ts (
N-D
)
20,2
84
PS
26 O
ther
aut
o re
late
d se
rvic
es 5
,995
J174
Brid
ges
and
high
way
tolls
(S
)
245
J175
Aut
o in
sura
nce
(S)
3,8
44O
nly
the
cost
of s
ervi
ce is
con
side
red
to b
e pe
rson
al e
xpen
ditu
re. T
he c
ost o
f ser
vice
is
mea
sure
d by
pre
miu
ms
earn
ed p
lus
prem
ium
sup
plem
ents
(in
vest
men
t inc
ome
of p
re-
paid
pre
miu
ms
and
unpa
id c
laim
s) m
inus
cla
ims
due.
J221
Par
king
(S
)
773
J222
Driv
ing
less
ons
and
mem
bers
hip
in a
utom
obile
ass
ocia
tions
(S
)
410
J223
Mot
or v
ehic
le r
entin
g (S
)
723
Ren
tal s
ervi
ce o
f pas
seng
er c
ars
and
truc
ks (
incl
udin
g op
erat
ing
leas
es).
PS
27 P
urch
ased
tran
spor
tatio
n
12,1
82
J173
Com
mis
sion
s pa
id to
tour
ope
rato
rs (
S)
69
6C
omm
issi
on im
plic
it in
fees
of t
rave
l age
ncie
s, to
ur o
pera
tors
and
tour
ist g
uide
ser
vice
s.
J176
Urb
an tr
ansi
t (S
) 1
,927
Spe
ndin
g on
urb
an p
asse
nger
tran
spor
t ser
vice
s su
ch a
s ci
ty o
r co
mm
uter
bus
es a
nd
com
mut
er tr
ains
.
J177
Rai
lway
tran
spor
t (S
)
193
J178
Inte
rurb
an b
us (
S)
69
4S
pend
ing
on in
teru
rban
and
rur
al b
us tr
ansp
orta
tion
(sch
edul
ed o
r ch
arte
red)
and
sce
nic
and
sigh
tsee
ing
bus
tran
spor
tatio
n.
J179
Air
tran
spor
t (S
) 7
,175
J180
Wat
er tr
ansp
ort (
S)
26
0S
pend
ing
on p
asse
nger
wat
er tr
ansp
ort i
nclu
ding
sig
htse
eing
trip
s.
J181
Tax
is (
S)
52
4S
pend
ing
on ta
xis,
lim
ousi
nes
and
shut
tle s
ervi
ces.
J182
Mov
ing
and
stor
age
(S)
71
3F
ees
for
mov
ing
hous
ehol
d fu
rnitu
re a
nd o
ther
goo
ds a
nd c
harg
es fo
r st
orag
e an
d w
areh
ousi
ng.
PS
28 C
omm
unic
atio
ns
12,1
52
Tab
le 7
.6 C
lass
ific
atio
n o
f p
erso
nal
exp
end
itu
re o
n c
on
sum
er g
oo
ds
and
ser
vice
s, 2
000
Co
de
and
tit
leM
illio
ns
of
do
llars
Des
crip
tio
n
(D)
Dur
able
goo
ds
(S
-D)
Sem
i-dur
able
goo
ds
(N
-D)
Non
-dur
able
goo
ds
(S
) S
ervi
ces
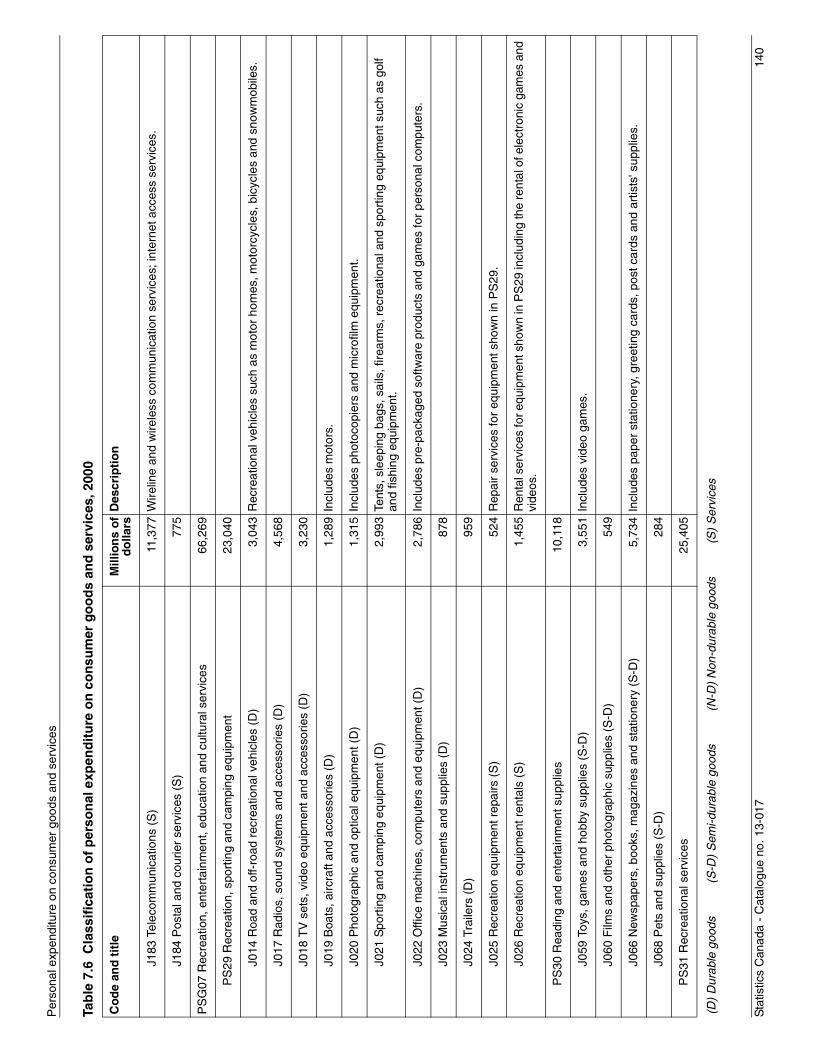
Sta
tistic
s C
anad
a -
Cat
alog
ue n
o. 1
3-01
714
0
Per
sona
l exp
endi
ture
on
cons
umer
goo
ds a
nd s
ervi
ces
J183
Tel
ecom
mun
icat
ions
(S
)
11,3
77W
irelin
e an
d w
irele
ss c
omm
unic
atio
n se
rvic
es; i
nter
net a
cces
s se
rvic
es.
J184
Pos
tal a
nd c
ourie
r se
rvic
es (
S)
77
5
PS
G07
Rec
reat
ion,
ent
erta
inm
ent,
educ
atio
n an
d cu
ltura
l ser
vice
s
66,2
69
PS
29 R
ecre
atio
n, s
port
ing
and
cam
ping
equ
ipm
ent
23
,040
J014
Roa
d an
d of
f-ro
ad r
ecre
atio
nal v
ehic
les
(D)
3,0
43R
ecre
atio
nal v
ehic
les
such
as
mot
or h
omes
, mot
orcy
cles
, bic
ycle
s an
d sn
owm
obile
s.
J017
Rad
ios,
sou
nd s
yste
ms
and
acce
ssor
ies
(D)
4,5
68
J018
TV
set
s, v
ideo
equ
ipm
ent a
nd a
cces
sorie
s (D
) 3
,230
J019
Boa
ts, a
ircra
ft an
d ac
cess
orie
s (D
) 1
,289
Incl
udes
mot
ors.
J020
Pho
togr
aphi
c an
d op
tical
equ
ipm
ent (
D)
1,3
15In
clud
es p
hoto
copi
ers
and
mic
rofil
m e
quip
men
t.
J021
Spo
rtin
g an
d ca
mpi
ng e
quip
men
t (D
) 2
,993
Tent
s, s
leep
ing
bags
, sai
ls, f
irear
ms,
rec
reat
iona
l and
spo
rtin
g eq
uipm
ent s
uch
as g
olf
and
fishi
ng e
quip
men
t.
J022
Offi
ce m
achi
nes,
com
pute
rs a
nd e
quip
men
t (D
) 2
,786
Incl
udes
pre
-pac
kage
d so
ftwar
e pr
oduc
ts a
nd g
ames
for
pers
onal
com
pute
rs.
J023
Mus
ical
inst
rum
ents
and
sup
plie
s (D
)
878
J024
Tra
ilers
(D
)
959
J025
Rec
reat
ion
equi
pmen
t rep
airs
(S
)
524
Rep
air
serv
ices
for
equi
pmen
t sho
wn
in P
S29
.
J026
Rec
reat
ion
equi
pmen
t ren
tals
(S
) 1
,455
Ren
tal s
ervi
ces
for e
quip
men
t sho
wn
in P
S29
incl
udin
g th
e re
ntal
of e
lect
roni
c ga
mes
and
vi
deos
.
PS
30 R
eadi
ng a
nd e
nter
tain
men
t sup
plie
s
10,1
18
J059
Toy
s, g
ames
and
hob
by s
uppl
ies
(S-D
) 3
,551
Incl
udes
vid
eo g
ames
.
J060
Film
s an
d ot
her
phot
ogra
phic
sup
plie
s (S
-D)
549
J066
New
spap
ers,
boo
ks, m
agaz
ines
and
sta
tione
ry (
S-D
) 5
,734
Incl
udes
pap
er s
tatio
nery
, gre
etin
g ca
rds,
pos
t car
ds a
nd a
rtis
ts' s
uppl
ies.
J068
Pet
s an
d su
pplie
s (S
-D)
284
PS
31 R
ecre
atio
nal s
ervi
ces
25,
405
Tab
le 7
.6 C
lass
ific
atio
n o
f p
erso
nal
exp
end
itu
re o
n c
on
sum
er g
oo
ds
and
ser
vice
s, 2
000
Co
de
and
tit
leM
illio
ns
of
do
llars
Des
crip
tio
n
(D)
Dur
able
goo
ds
(S
-D)
Sem
i-dur
able
goo
ds
(N
-D)
Non
-dur
able
goo
ds
(S
) S
ervi
ces
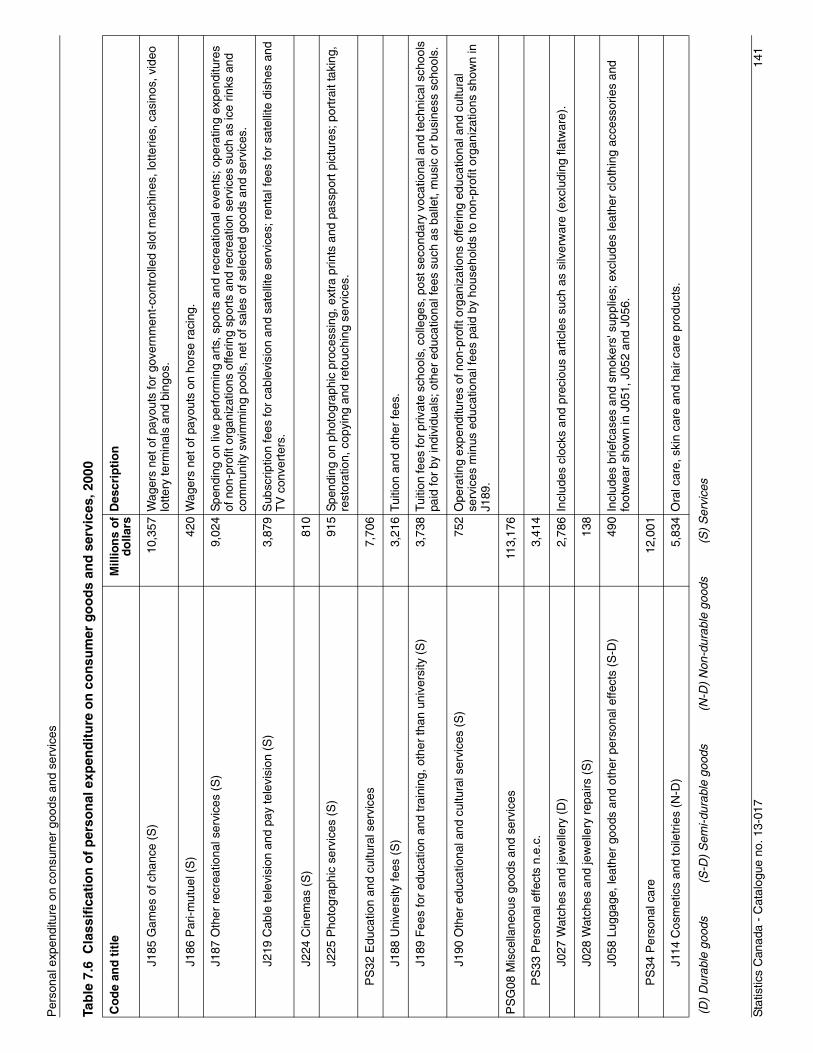
Sta
tistic
s C
anad
a -
Cat
alog
ue n
o. 1
3-01
714
1
Per
sona
l exp
endi
ture
on
cons
umer
goo
ds a
nd s
ervi
ces
J185
Gam
es o
f cha
nce
(S)
10,
357
Wag
ers
net o
f pay
outs
for
gove
rnm
ent-
cont
rolle
d sl
ot m
achi
nes,
lotte
ries,
cas
inos
, vid
eo
lotte
ry te
rmin
als
and
bing
os.
J186
Par
i-mut
uel (
S)
420
Wag
ers
net o
f pay
outs
on
hors
e ra
cing
.
J187
Oth
er r
ecre
atio
nal s
ervi
ces
(S)
9,0
24S
pend
ing
on li
ve p
erfo
rmin
g ar
ts, s
port
s an
d re
crea
tiona
l eve
nts;
ope
ratin
g ex
pend
iture
s of
non
-pro
fit o
rgan
izat
ions
offe
ring
spor
ts a
nd r
ecre
atio
n se
rvic
es s
uch
as ic
e rin
ks a
nd
com
mun
ity s
wim
min
g po
ols,
net
of s
ales
of s
elec
ted
good
s an
d se
rvic
es.
J219
Cab
le te
levi
sion
and
pay
tele
visi
on (
S)
3,8
79S
ubsc
riptio
n fe
es fo
r ca
blev
isio
n an
d sa
telli
te s
ervi
ces;
ren
tal f
ees
for
sate
llite
dis
hes
and
TV
con
vert
ers.
J224
Cin
emas
(S
) 8
10
J225
Pho
togr
aphi
c se
rvic
es (
S)
915
Spe
ndin
g on
pho
togr
aphi
c pr
oces
sing
, ext
ra p
rints
and
pas
spor
t pic
ture
s; p
ortr
ait t
akin
g,
rest
orat
ion,
cop
ying
and
ret
ouch
ing
serv
ices
.
PS
32 E
duca
tion
and
cultu
ral s
ervi
ces
7,7
06
J188
Uni
vers
ity fe
es (
S)
3,2
16Tu
ition
and
oth
er fe
es.
J189
Fee
s fo
r ed
ucat
ion
and
trai
ning
, oth
er th
an u
nive
rsity
(S
) 3
,738
Tuiti
on fe
es fo
r priv
ate
scho
ols,
col
lege
s, p
ost s
econ
dary
voc
atio
nal a
nd te
chni
cal s
choo
ls
paid
for
by in
divi
dual
s; o
ther
edu
catio
nal f
ees
such
as
balle
t, m
usic
or
busi
ness
sch
ools
.
J190
Oth
er e
duca
tiona
l and
cul
tura
l ser
vice
s (S
) 7
52O
pera
ting
expe
nditu
res
of n
on-p
rofit
org
aniz
atio
ns o
fferin
g ed
ucat
iona
l and
cul
tura
l se
rvic
es m
inus
edu
catio
nal f
ees
paid
by
hous
ehol
ds to
non
-pro
fit o
rgan
izat
ions
sho
wn
in
J189
.
PS
G08
Mis
cella
neou
s go
ods
and
serv
ices
113
,176
PS
33 P
erso
nal e
ffect
s n.
e.c.
3
,414
J027
Wat
ches
and
jew
elle
ry (
D)
2,7
86In
clud
es c
lock
s an
d pr
ecio
us a
rtic
les
such
as
silv
erw
are
(exc
ludi
ng fl
atw
are)
.
J028
Wat
ches
and
jew
elle
ry r
epai
rs (
S)
138
J058
Lug
gage
, lea
ther
goo
ds a
nd o
ther
per
sona
l effe
cts
(S-D
) 4
90In
clud
es b
riefc
ases
and
sm
oker
s' s
uppl
ies;
exc
lude
s le
athe
r cl
othi
ng a
cces
sorie
s an
d fo
otw
ear
show
n in
J05
1, J
052
and
J056
.
PS
34 P
erso
nal c
are
12,
001
J114
Cos
met
ics
and
toile
trie
s (N
-D)
5,8
34O
ral c
are,
ski
n ca
re a
nd h
air
care
pro
duct
s.
Tab
le 7
.6 C
lass
ific
atio
n o
f p
erso
nal
exp
end
itu
re o
n c
on
sum
er g
oo
ds
and
ser
vice
s, 2
000
Co
de
and
tit
leM
illio
ns
of
do
llars
Des
crip
tio
n
(D)
Dur
able
goo
ds
(S
-D)
Sem
i-dur
able
goo
ds
(N
-D)
Non
-dur
able
goo
ds
(S
) S
ervi
ces
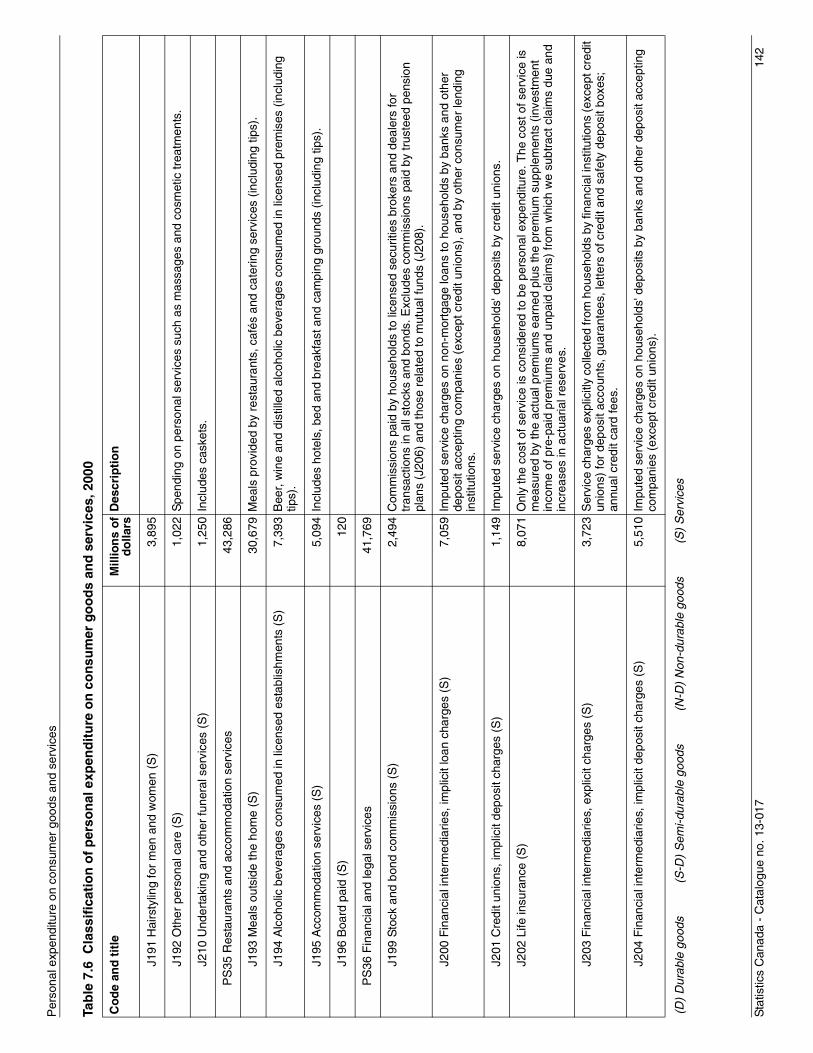
Sta
tistic
s C
anad
a -
Cat
alog
ue n
o. 1
3-01
714
2
Per
sona
l exp
endi
ture
on
cons
umer
goo
ds a
nd s
ervi
ces
J191
Hai
rsty
ling
for
men
and
wom
en (
S)
3,8
95
J192
Oth
er p
erso
nal c
are
(S)
1,0
22S
pend
ing
on p
erso
nal s
ervi
ces
such
as
mas
sage
s an
d co
smet
ic tr
eatm
ents
.
J210
Und
erta
king
and
oth
er fu
nera
l ser
vice
s (S
) 1
,250
Incl
udes
cas
kets
.
PS
35 R
esta
uran
ts a
nd a
ccom
mod
atio
n se
rvic
es 4
3,28
6
J193
Mea
ls o
utsi
de th
e ho
me
(S)
30,
679
Mea
ls p
rovi
ded
by r
esta
uran
ts, c
afés
and
cat
erin
g se
rvic
es (
incl
udin
g tip
s).
J194
Alc
ohol
ic b
ever
ages
con
sum
ed in
lice
nsed
est
ablis
hmen
ts (
S)
7,3
93B
eer,
win
e an
d di
still
ed a
lcoh
olic
bev
erag
es c
onsu
med
in li
cens
ed p
rem
ises
(in
clud
ing
tips)
.
J195
Acc
omm
odat
ion
serv
ices
(S
) 5
,094
Incl
udes
hot
els,
bed
and
bre
akfa
st a
nd c
ampi
ng g
roun
ds (
incl
udin
g tip
s).
J196
Boa
rd p
aid
(S)
120
PS
36 F
inan
cial
and
lega
l ser
vice
s 4
1,76
9
J199
Sto
ck a
nd b
ond
com
mis
sion
s (S
) 2
,494
Com
mis
sion
s pa
id b
y ho
useh
olds
to li
cens
ed s
ecur
ities
bro
kers
and
dea
lers
for
tran
sact
ions
in a
ll st
ocks
and
bon
ds. E
xclu
des
com
mis
sion
s pa
id b
y tr
uste
ed p
ensi
on
plan
s (J
206)
and
thos
e re
late
d to
mut
ual f
unds
(J2
08).
J200
Fin
anci
al in
term
edia
ries,
impl
icit
loan
cha
rges
(S
) 7
,059
Impu
ted
serv
ice
char
ges
on n
on-m
ortg
age
loan
s to
hou
seho
lds
by b
anks
and
oth
er
depo
sit a
ccep
ting
com
pani
es (
exce
pt c
redi
t uni
ons)
, and
by
othe
r co
nsum
er le
ndin
g in
stitu
tions
.
J201
Cre
dit u
nion
s, im
plic
it de
posi
t cha
rges
(S
) 1
,149
Impu
ted
serv
ice
char
ges
on h
ouse
hold
s' d
epos
its b
y cr
edit
unio
ns.
J202
Life
insu
ranc
e (S
) 8
,071
Onl
y th
e co
st o
f ser
vice
is c
onsi
dere
d to
be
pers
onal
exp
endi
ture
. The
cos
t of s
ervi
ce is
m
easu
red
by th
e ac
tual
pre
miu
ms
earn
ed p
lus
the
prem
ium
sup
plem
ents
(in
vest
men
t in
com
e of
pre
-pai
d pr
emiu
ms
and
unpa
id c
laim
s) fr
om w
hich
we
subt
ract
cla
ims
due
and
incr
ease
s in
act
uaria
l res
erve
s.
J203
Fin
anci
al in
term
edia
ries,
exp
licit
char
ges
(S)
3,7
23S
ervi
ce c
harg
es e
xplic
itly
colle
cted
from
hou
seho
lds
by fi
nanc
ial i
nstit
utio
ns (
exce
pt c
redi
t un
ions
) fo
r de
posi
t acc
ount
s, g
uara
ntee
s, le
tters
of c
redi
t and
saf
ety
depo
sit b
oxes
; an
nual
cre
dit c
ard
fees
.
J204
Fin
anci
al in
term
edia
ries,
impl
icit
depo
sit c
harg
es (
S)
5,5
10Im
pute
d se
rvic
e ch
arge
s on
hou
seho
lds'
dep
osits
by
bank
s an
d ot
her
depo
sit a
ccep
ting
com
pani
es (
exce
pt c
redi
t uni
ons)
.
Tab
le 7
.6 C
lass
ific
atio
n o
f p
erso
nal
exp
end
itu
re o
n c
on
sum
er g
oo
ds
and
ser
vice
s, 2
000
Co
de
and
tit
leM
illio
ns
of
do
llars
Des
crip
tio
n
(D)
Dur
able
goo
ds
(S
-D)
Sem
i-dur
able
goo
ds
(N
-D)
Non
-dur
able
goo
ds
(S
) S
ervi
ces
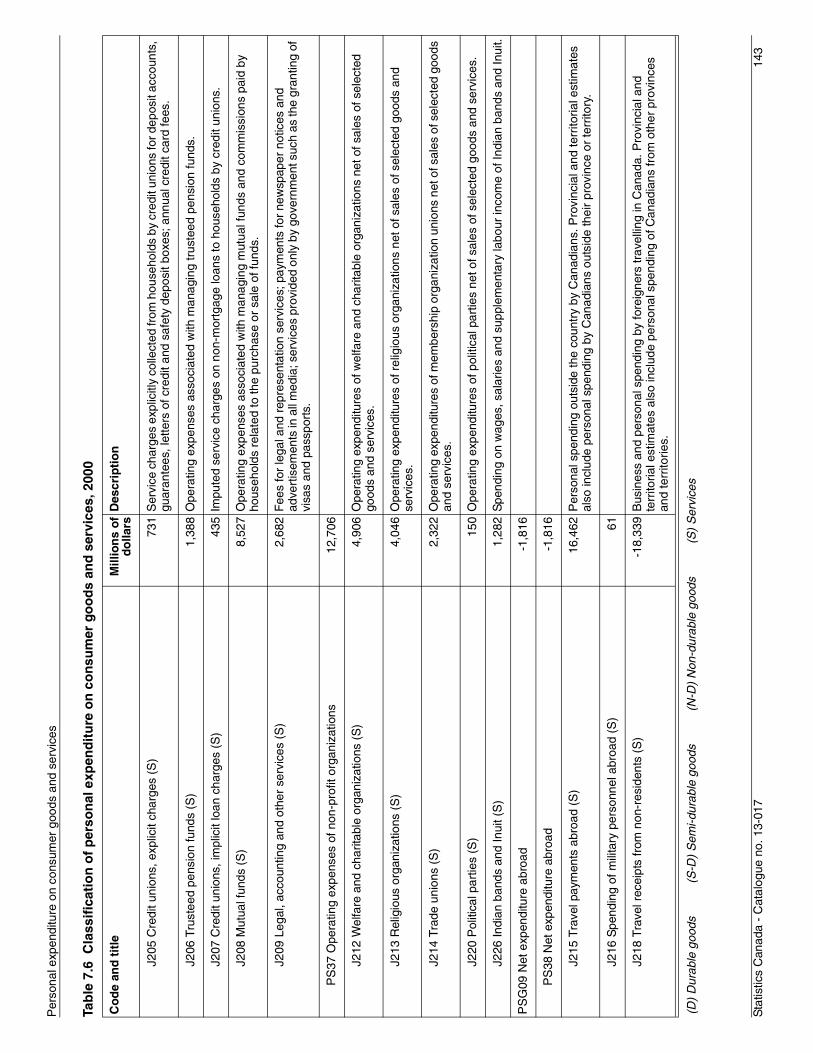
Sta
tistic
s C
anad
a -
Cat
alog
ue n
o. 1
3-01
714
3
Per
sona
l exp
endi
ture
on
cons
umer
goo
ds a
nd s
ervi
ces
J205
Cre
dit u
nion
s, e
xplic
it ch
arge
s (S
) 7
31S
ervi
ce c
harg
es e
xplic
itly
colle
cted
from
hou
seho
lds
by c
redi
t uni
ons
for d
epos
it ac
coun
ts,
guar
ante
es, l
ette
rs o
f cre
dit a
nd s
afet
y de
posi
t box
es; a
nnua
l cre
dit c
ard
fees
.
J206
Tru
stee
d pe
nsio
n fu
nds
(S)
1,3
88O
pera
ting
expe
nses
ass
ocia
ted
with
man
agin
g tr
uste
ed p
ensi
on fu
nds.
J207
Cre
dit u
nion
s, im
plic
it lo
an c
harg
es (
S)
435
Impu
ted
serv
ice
char
ges
on n
on-m
ortg
age
loan
s to
hou
seho
lds
by c
redi
t uni
ons.
J208
Mut
ual f
unds
(S
) 8
,527
Ope
ratin
g ex
pens
es a
ssoc
iate
d w
ith m
anag
ing
mut
ual f
unds
and
com
mis
sion
s pa
id b
y ho
useh
olds
rel
ated
to th
e pu
rcha
se o
r sa
le o
f fun
ds.
J209
Leg
al, a
ccou
ntin
g an
d ot
her
serv
ices
(S
) 2
,682
Fee
s fo
r le
gal a
nd r
epre
sent
atio
n se
rvic
es; p
aym
ents
for
new
spap
er n
otic
es a
nd
adve
rtis
emen
ts in
all
med
ia; s
ervi
ces
prov
ided
onl
y by
gov
ernm
ent s
uch
as th
e gr
antin
g of
vi
sas
and
pass
port
s.
PS
37 O
pera
ting
expe
nses
of n
on-p
rofit
org
aniz
atio
ns 1
2,70
6
J212
Wel
fare
and
cha
ritab
le o
rgan
izat
ions
(S
) 4
,906
Ope
ratin
g ex
pend
iture
s of
wel
fare
and
cha
ritab
le o
rgan
izat
ions
net
of s
ales
of s
elec
ted
good
s an
d se
rvic
es.
J213
Rel
igio
us o
rgan
izat
ions
(S
) 4
,046
Ope
ratin
g ex
pend
iture
s of
rel
igio
us o
rgan
izat
ions
net
of s
ales
of s
elec
ted
good
s an
d se
rvic
es.
J214
Tra
de u
nion
s (S
) 2
,322
Ope
ratin
g ex
pend
iture
s of
mem
bers
hip
orga
niza
tion
unio
ns n
et o
f sal
es o
f sel
ecte
d go
ods
and
serv
ices
.
J220
Pol
itica
l par
ties
(S)
150
Ope
ratin
g ex
pend
iture
s of
pol
itica
l par
ties
net o
f sal
es o
f sel
ecte
d go
ods
and
serv
ices
.
J226
Indi
an b
ands
and
Inui
t (S
) 1
,282
Spe
ndin
g on
wag
es, s
alar
ies
and
supp
lem
enta
ry la
bour
inco
me
of In
dian
ban
ds a
nd In
uit.
PS
G09
Net
exp
endi
ture
abr
oad
-1,
816
PS
38 N
et e
xpen
ditu
re a
broa
d -
1,81
6
J215
Tra
vel p
aym
ents
abr
oad
(S)
16,
462
Per
sona
l spe
ndin
g ou
tsid
e th
e co
untr
y by
Can
adia
ns. P
rovi
ncia
l and
terr
itoria
l est
imat
es
also
incl
ude
pers
onal
spe
ndin
g by
Can
adia
ns o
utsi
de th
eir
prov
ince
or
terr
itory
.
J216
Spe
ndin
g of
mili
tary
per
sonn
el a
broa
d (S
)
61
J218
Tra
vel r
ecei
pts
from
non
-res
iden
ts (
S)
-18
,339
Bus
ines
s an
d pe
rson
al s
pend
ing
by fo
reig
ners
trav
ellin
g in
Can
ada.
Pro
vinc
ial a
nd
terr
itoria
l est
imat
es a
lso
incl
ude
pers
onal
spe
ndin
g of
Can
adia
ns fr
om o
ther
pro
vinc
es
and
terr
itorie
s.
Tab
le 7
.6 C
lass
ific
atio
n o
f p
erso
nal
exp
end
itu
re o
n c
on
sum
er g
oo
ds
and
ser
vice
s, 2
000
Co
de
and
tit
leM
illio
ns
of
do
llars
Des
crip
tio
n
(D)
Dur
able
goo
ds
(S
-D)
Sem
i-dur
able
goo
ds
(N
-D)
Non
-dur
able
goo
ds
(S
) S
ervi
ces
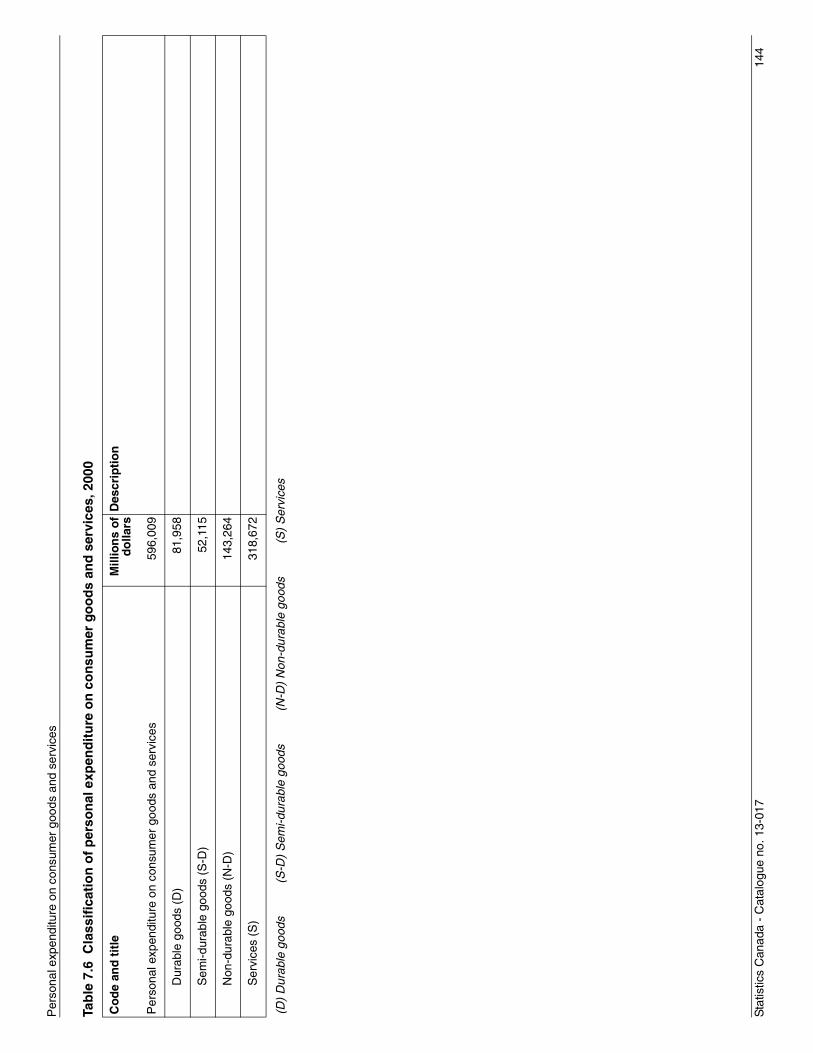
Sta
tistic
s C
anad
a -
Cat
alog
ue n
o. 1
3-01
714
4
Per
sona
l exp
endi
ture
on
cons
umer
goo
ds a
nd s
ervi
ces
Per
sona
l exp
endi
ture
on
cons
umer
goo
ds a
nd s
ervi
ces
596
,009
Dur
able
goo
ds (
D)
81,
958
Sem
i-dur
able
goo
ds (
S-D
) 5
2,11
5
Non
-dur
able
goo
ds (
N-D
) 1
43,2
64
Ser
vice
s (S
) 3
18,6
72
Tab
le 7
.6 C
lass
ific
atio
n o
f p
erso
nal
exp
end
itu
re o
n c
on
sum
er g
oo
ds
and
ser
vice
s, 2
000
Co
de
and
tit
leM
illio
ns
of
do
llars
Des
crip
tio
n
(D)
Dur
able
goo
ds
(S
-D)
Sem
i-dur
able
goo
ds
(N
-D)
Non
-dur
able
goo
ds
(S
) S
ervi
ces
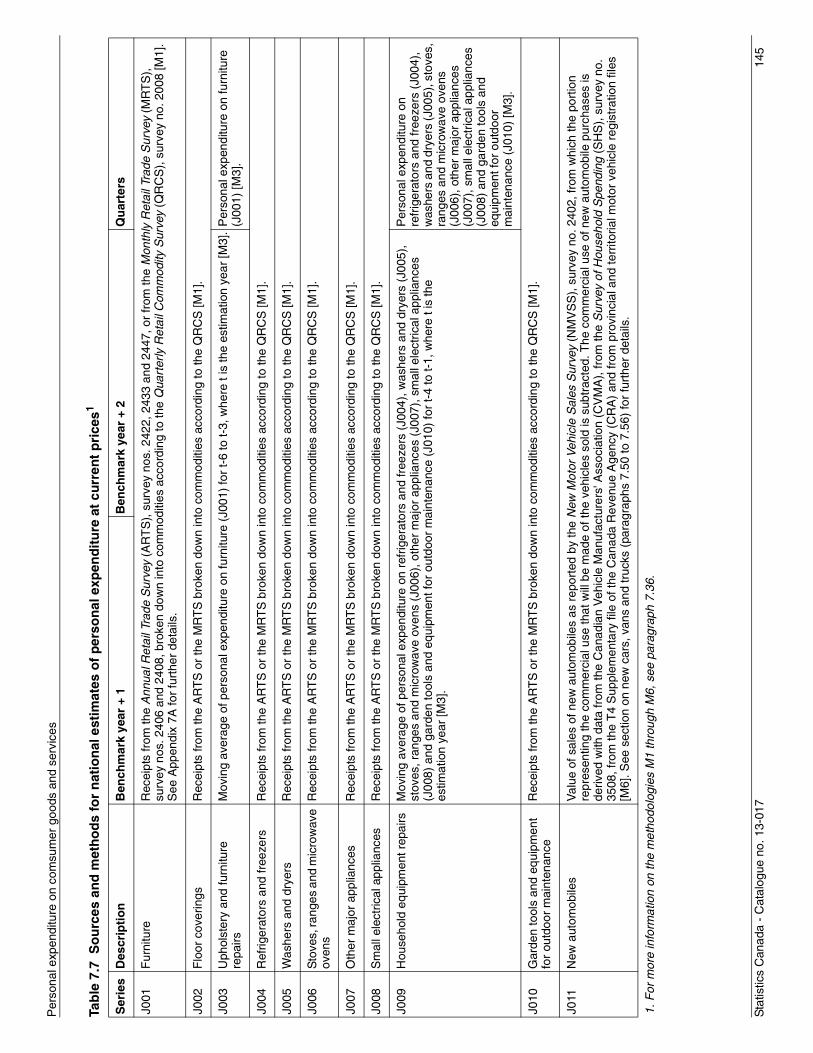
Sta
tistic
s C
anad
a -
Cat
alog
ue n
o. 1
3-01
714
5
Per
sona
l exp
endi
ture
on
com
sum
er g
oods
and
ser
vice
s
Tab
le 7
.7 S
ou
rces
an
d m
eth
od
s fo
r n
atio
nal
est
imat
es o
f p
erso
nal
exp
end
itu
re a
t cu
rren
t p
rice
s1
Ser
ies
Des
crip
tio
nB
ench
mar
k ye
ar +
1B
ench
mar
k ye
ar +
2Q
uar
ters
J001
Fur
nitu
reR
ecei
pts
from
the
Ann
ual R
etai
l Tra
de S
urve
y (A
RT
S),
sur
vey
nos.
242
2, 2
433
and
2447
, or
from
the
Mon
thly
Ret
ail T
rade
Sur
vey
(MR
TS
),
surv
ey n
os. 2
406
and
2408
, bro
ken
dow
n in
to c
omm
oditi
es a
ccor
ding
to th
e Q
uart
erly
Ret
ail C
omm
odity
Sur
vey
(QR
CS
), s
urve
y no
. 200
8 [M
1].
See
App
endi
x 7A
for
furt
her
deta
ils.
J002
Flo
or c
over
ings
Rec
eipt
s fr
om th
e A
RT
S o
r th
e M
RT
S b
roke
n do
wn
into
com
mod
ities
acc
ordi
ng to
the
QR
CS
[M1]
.
J003
Uph
olst
ery
and
furn
iture
re
pairs
Mov
ing
aver
age
of p
erso
nal e
xpen
ditu
re o
n fu
rnitu
re (
J001
) fo
r t-
6 to
t-3,
whe
re t
is th
e es
timat
ion
year
[M3]
.P
erso
nal e
xpen
ditu
re o
n fu
rnitu
re
(J00
1) [M
3].
J004
Ref
riger
ator
s an
d fr
eeze
rsR
ecei
pts
from
the
AR
TS
or
the
MR
TS
bro
ken
dow
n in
to c
omm
oditi
es a
ccor
ding
to th
e Q
RC
S [M
1].
J005
Was
hers
and
dry
ers
Rec
eipt
s fr
om th
e A
RT
S o
r th
e M
RT
S b
roke
n do
wn
into
com
mod
ities
acc
ordi
ng to
the
QR
CS
[M1]
.
J006
Sto
ves,
rang
es a
nd m
icro
wav
e ov
ens
Rec
eipt
s fr
om th
e A
RT
S o
r th
e M
RT
S b
roke
n do
wn
into
com
mod
ities
acc
ordi
ng to
the
QR
CS
[M1]
.
J007
O
ther
maj
or a
pplia
nces
Rec
eipt
s fr
om th
e A
RT
S o
r th
e M
RT
S b
roke
n do
wn
into
com
mod
ities
acc
ordi
ng to
the
QR
CS
[M1]
.
J008
Sm
all e
lect
rical
app
lianc
esR
ecei
pts
from
the
AR
TS
or
the
MR
TS
bro
ken
dow
n in
to c
omm
oditi
es a
ccor
ding
to th
e Q
RC
S [M
1].
J009
Hou
seho
ld e
quip
men
t rep
airs
Mov
ing
aver
age
of p
erso
nal e
xpen
ditu
re o
n re
frig
erat
ors
and
free
zers
(J0
04),
was
hers
and
dry
ers
(J00
5),
stov
es, r
ange
s an
d m
icro
wav
e ov
ens
(J00
6), o
ther
maj
or a
pplia
nces
(J0
07),
sm
all e
lect
rical
app
lianc
es
(J00
8) a
nd g
arde
n to
ols
and
equi
pmen
t for
out
door
mai
nten
ance
(J0
10)
for
t-4
to t-
1, w
here
t is
the
estim
atio
n ye
ar [M
3].
Per
sona
l exp
endi
ture
on
refr
iger
ator
s an
d fr
eeze
rs (
J004
),
was
hers
and
dry
ers
(J00
5), s
tove
s,
rang
es a
nd m
icro
wav
e ov
ens
(J00
6), o
ther
maj
or a
pplia
nces
(J
007)
, sm
all e
lect
rical
app
lianc
es
(J00
8) a
nd g
arde
n to
ols
and
equi
pmen
t for
out
door
m
aint
enan
ce (
J010
) [M
3].
J010
Gar
den
tool
s an
d eq
uipm
ent
for
outd
oor
mai
nten
ance
Rec
eipt
s fr
om th
e A
RT
S o
r th
e M
RT
S b
roke
n do
wn
into
com
mod
ities
acc
ordi
ng to
the
QR
CS
[M1]
.
J011
New
aut
omob
iles
Val
ue o
f sal
es o
f new
aut
omob
iles
as r
epor
ted
by th
e N
ew M
otor
Veh
icle
Sal
es S
urve
y (N
MV
SS
), s
urve
y no
. 240
2, fr
om w
hich
the
port
ion
repr
esen
ting
the
com
mer
cial
use
that
will
be
mad
e of
the
vehi
cles
sol
d is
sub
trac
ted.
The
com
mer
cial
use
of n
ew a
utom
obile
pur
chas
es is
de
rived
with
dat
a fr
om th
e C
anad
ian
Veh
icle
Man
ufac
ture
rs' A
ssoc
iatio
n (C
VM
A),
from
the
Sur
vey
of H
ouse
hold
Spe
ndin
g (S
HS
), s
urve
y no
. 35
08, f
rom
the
T4
Sup
plem
enta
ry fi
le o
f the
Can
ada
Rev
enue
Age
ncy
(CR
A)
and
from
pro
vinc
ial a
nd te
rrito
rial m
otor
veh
icle
reg
istr
atio
n fil
es
[M6]
. See
sec
tion
on n
ew c
ars,
van
s an
d tr
ucks
(pa
ragr
aphs
7.5
0 to
7.5
6) fo
r fu
rthe
r de
tails
.
1. F
or m
ore
info
rmat
ion
on th
e m
etho
dolo
gies
M1
thro
ugh
M6,
see
par
agra
ph 7
.36.
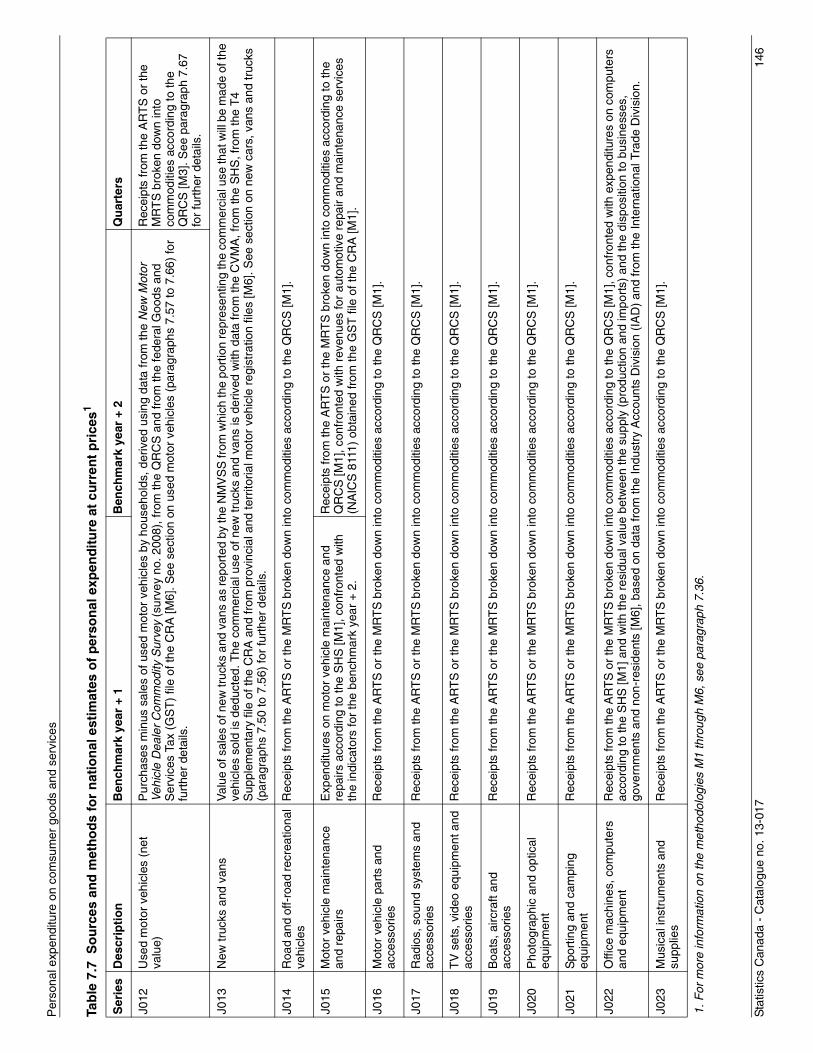
Sta
tistic
s C
anad
a -
Cat
alog
ue n
o. 1
3-01
714
6
Per
sona
l exp
endi
ture
on
com
sum
er g
oods
and
ser
vice
s
J012
Use
d m
otor
veh
icle
s (n
et
valu
e)P
urch
ases
min
us s
ales
of u
sed
mot
or v
ehic
les
by h
ouse
hold
s, d
eriv
ed u
sing
dat
a fr
om th
e N
ew M
otor
Ve
hicl
e D
eale
r C
omm
odity
Sur
vey
(sur
vey
no. 2
008)
, fro
m th
e Q
RC
S a
nd fr
om th
e fe
dera
l Goo
ds a
nd
Ser
vice
s Ta
x (G
ST
) fil
e of
the
CR
A [M
6]. S
ee s
ectio
n on
use
d m
otor
veh
icle
s (p
arag
raph
s 7.
57 to
7.6
6) fo
r fu
rthe
r de
tails
.
Rec
eipt
s fr
om th
e A
RT
S o
r th
e M
RT
S b
roke
n do
wn
into
co
mm
oditi
es a
ccor
ding
to th
e Q
RC
S [M
3]. S
ee p
arag
raph
7.6
7 fo
r fu
rthe
r de
tails
.
J013
New
truc
ks a
nd v
ans
Val
ue o
f sal
es o
f new
truc
ks a
nd v
ans
as re
port
ed b
y th
e N
MV
SS
from
whi
ch th
e po
rtio
n re
pres
entin
g th
e co
mm
erci
al u
se th
at w
ill b
e m
ade
of th
e ve
hicl
es s
old
is d
educ
ted.
The
com
mer
cial
use
of n
ew tr
ucks
and
van
s is
der
ived
with
dat
a fr
om th
e C
VM
A, f
rom
the
SH
S, f
rom
the
T4
Sup
plem
enta
ry fi
le o
f the
CR
A a
nd fr
om p
rovi
ncia
l and
terr
itoria
l mot
or v
ehic
le r
egis
trat
ion
files
[M6]
. See
sec
tion
on n
ew c
ars,
van
s an
d tr
ucks
(p
arag
raph
s 7.
50 to
7.5
6) fo
r fu
rthe
r de
tails
.
J014
Roa
d an
d of
f-ro
ad re
crea
tiona
l ve
hicl
esR
ecei
pts
from
the
AR
TS
or
the
MR
TS
bro
ken
dow
n in
to c
omm
oditi
es a
ccor
ding
to th
e Q
RC
S [M
1].
J015
Mot
or v
ehic
le m
aint
enan
ce
and
repa
irsE
xpen
ditu
res
on m
otor
veh
icle
mai
nten
ance
and
re
pairs
acc
ordi
ng to
the
SH
S [M
1], c
onfr
onte
d w
ith
the
indi
cato
rs fo
r th
e be
nchm
ark
year
+ 2
.
Rec
eipt
s fr
om th
e A
RT
S o
r th
e M
RT
S b
roke
n do
wn
into
com
mod
ities
acc
ordi
ng to
the
QR
CS
[M1]
, con
fron
ted
with
rev
enue
s fo
r au
tom
otiv
e re
pair
and
mai
nten
ance
ser
vice
s (N
AIC
S 8
111)
obt
aine
d fr
om th
e G
ST
file
of t
he C
RA
[M1]
.
J016
Mot
or v
ehic
le p
arts
and
ac
cess
orie
sR
ecei
pts
from
the
AR
TS
or
the
MR
TS
bro
ken
dow
n in
to c
omm
oditi
es a
ccor
ding
to th
e Q
RC
S [M
1].
J017
Rad
ios,
sou
nd s
yste
ms
and
acce
ssor
ies
Rec
eipt
s fr
om th
e A
RT
S o
r th
e M
RT
S b
roke
n do
wn
into
com
mod
ities
acc
ordi
ng to
the
QR
CS
[M1]
.
J018
TV
set
s, v
ideo
equ
ipm
ent a
nd
acce
ssor
ies
Rec
eipt
s fr
om th
e A
RT
S o
r th
e M
RT
S b
roke
n do
wn
into
com
mod
ities
acc
ordi
ng to
the
QR
CS
[M1]
.
J019
Boa
ts, a
ircra
ft an
d ac
cess
orie
sR
ecei
pts
from
the
AR
TS
or
the
MR
TS
bro
ken
dow
n in
to c
omm
oditi
es a
ccor
ding
to th
e Q
RC
S [M
1].
J020
Pho
togr
aphi
c an
d op
tical
eq
uipm
ent
Rec
eipt
s fr
om th
e A
RT
S o
r th
e M
RT
S b
roke
n do
wn
into
com
mod
ities
acc
ordi
ng to
the
QR
CS
[M1]
.
J021
Spo
rtin
g an
d ca
mpi
ng
equi
pmen
tR
ecei
pts
from
the
AR
TS
or
the
MR
TS
bro
ken
dow
n in
to c
omm
oditi
es a
ccor
ding
to th
e Q
RC
S [M
1].
J022
Offi
ce m
achi
nes,
com
pute
rs
and
equi
pmen
tR
ecei
pts
from
the
AR
TS
or
the
MR
TS
bro
ken
dow
n in
to c
omm
oditi
es a
ccor
ding
to th
e Q
RC
S [M
1], c
onfr
onte
d w
ith e
xpen
ditu
res
on c
ompu
ters
ac
cord
ing
to th
e S
HS
[M1]
and
with
the
resi
dual
val
ue b
etw
een
the
supp
ly (
prod
uctio
n an
d im
port
s) a
nd th
e di
spos
ition
to b
usin
esse
s,
gove
rnm
ents
and
non
-res
iden
ts [M
6], b
ased
on
data
from
the
Indu
stry
Acc
ount
s D
ivis
ion
(IA
D)
and
from
the
Inte
rnat
iona
l Tra
de D
ivis
ion.
J023
Mus
ical
inst
rum
ents
and
su
pplie
sR
ecei
pts
from
the
AR
TS
or
the
MR
TS
bro
ken
dow
n in
to c
omm
oditi
es a
ccor
ding
to th
e Q
RC
S [M
1].
Tab
le 7
.7 S
ou
rces
an
d m
eth
od
s fo
r n
atio
nal
est
imat
es o
f p
erso
nal
exp
end
itu
re a
t cu
rren
t p
rice
s1
Ser
ies
Des
crip
tio
nB
ench
mar
k ye
ar +
1B
ench
mar
k ye
ar +
2Q
uar
ters
1. F
or m
ore
info
rmat
ion
on th
e m
etho
dolo
gies
M1
thro
ugh
M6,
see
par
agra
ph 7
.36.
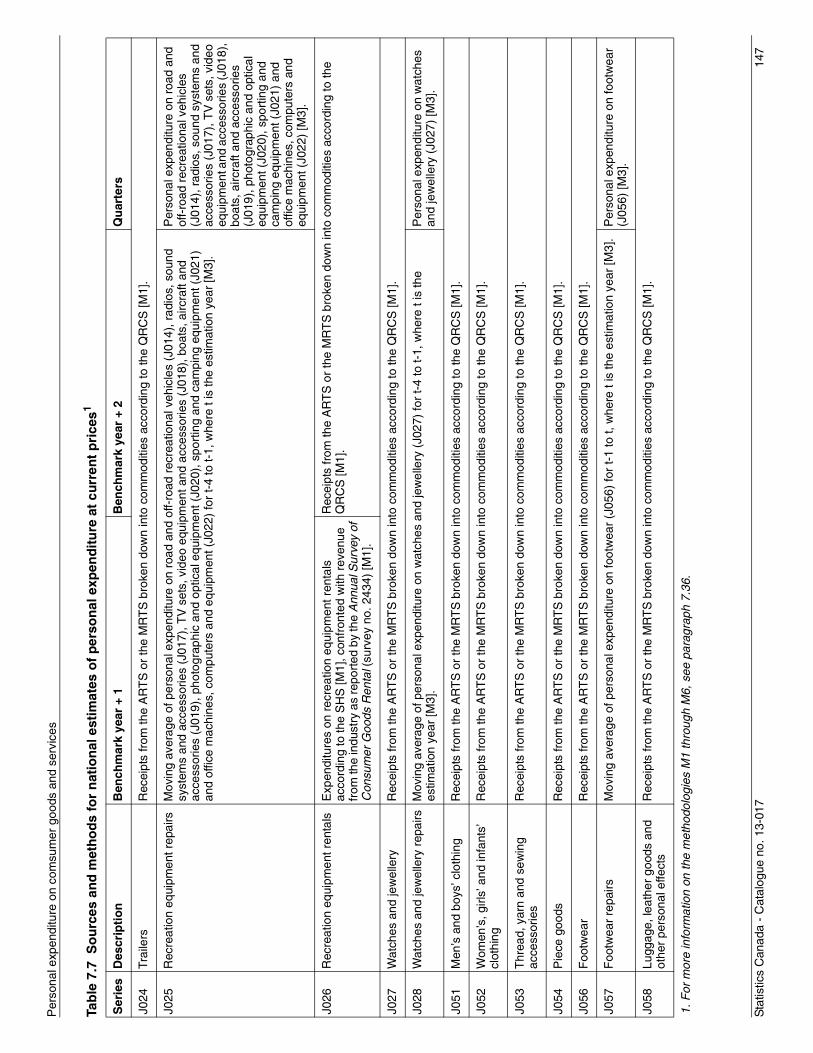
Sta
tistic
s C
anad
a -
Cat
alog
ue n
o. 1
3-01
714
7
Per
sona
l exp
endi
ture
on
com
sum
er g
oods
and
ser
vice
s
J024
Trai
lers
Rec
eipt
s fr
om th
e A
RT
S o
r th
e M
RT
S b
roke
n do
wn
into
com
mod
ities
acc
ordi
ng to
the
QR
CS
[M1]
.
J025
Rec
reat
ion
equi
pmen
t rep
airs
Mov
ing
aver
age
of p
erso
nal e
xpen
ditu
re o
n ro
ad a
nd o
ff-ro
ad r
ecre
atio
nal v
ehic
les
(J01
4), r
adio
s, s
ound
sy
stem
s an
d ac
cess
orie
s (J
017)
, TV
set
s, v
ideo
equ
ipm
ent a
nd a
cces
sorie
s (J
018)
, boa
ts, a
ircra
ft an
d ac
cess
orie
s (J
019)
, pho
togr
aphi
c an
d op
tical
equ
ipm
ent (
J020
), s
port
ing
and
cam
ping
equ
ipm
ent (
J021
) an
d of
fice
mac
hine
s, c
ompu
ters
and
equ
ipm
ent (
J022
) fo
r t-
4 to
t-1,
whe
re t
is th
e es
timat
ion
year
[M3]
.
Per
sona
l exp
endi
ture
on
road
and
of
f-ro
ad r
ecre
atio
nal v
ehic
les
(J01
4), r
adio
s, s
ound
sys
tem
s an
d ac
cess
orie
s (J
017)
, TV
set
s, v
ideo
eq
uipm
ent a
nd a
cces
sorie
s (J
018)
, bo
ats,
airc
raft
and
acce
ssor
ies
(J01
9), p
hoto
grap
hic
and
optic
al
equi
pmen
t (J0
20),
spo
rtin
g an
d ca
mpi
ng e
quip
men
t (J0
21)
and
offic
e m
achi
nes,
com
pute
rs a
nd
equi
pmen
t (J0
22)
[M3]
.
J026
Rec
reat
ion
equi
pmen
t ren
tals
Exp
endi
ture
s on
rec
reat
ion
equi
pmen
t ren
tals
ac
cord
ing
to th
e S
HS
[M1]
, con
fron
ted
with
rev
enue
fr
om th
e in
dust
ry a
s re
port
ed b
y th
e A
nnua
l Sur
vey
of
Con
sum
er G
oods
Ren
tal (
surv
ey n
o. 2
434)
[M1]
.
Rec
eipt
s fr
om th
e A
RT
S o
r th
e M
RT
S b
roke
n do
wn
into
com
mod
ities
acc
ordi
ng to
the
QR
CS
[M1]
.
J027
Wat
ches
and
jew
elle
ryR
ecei
pts
from
the
AR
TS
or
the
MR
TS
bro
ken
dow
n in
to c
omm
oditi
es a
ccor
ding
to th
e Q
RC
S [M
1].
J028
Wat
ches
and
jew
elle
ry r
epai
rsM
ovin
g av
erag
e of
per
sona
l exp
endi
ture
on
wat
ches
and
jew
elle
ry (
J027
) fo
r t-
4 to
t-1,
whe
re t
is th
e es
timat
ion
year
[M3]
.P
erso
nal e
xpen
ditu
re o
n w
atch
es
and
jew
elle
ry (
J027
) [M
3].
J051
Men
’s a
nd b
oys’
clo
thin
gR
ecei
pts
from
the
AR
TS
or
the
MR
TS
bro
ken
dow
n in
to c
omm
oditi
es a
ccor
ding
to th
e Q
RC
S [M
1].
J052
Wom
en’s
, girl
s’ a
nd in
fant
s’
clot
hing
Rec
eipt
s fr
om th
e A
RT
S o
r th
e M
RT
S b
roke
n do
wn
into
com
mod
ities
acc
ordi
ng to
the
QR
CS
[M1]
.
J053
Thr
ead,
yar
n an
d se
win
g ac
cess
orie
sR
ecei
pts
from
the
AR
TS
or
the
MR
TS
bro
ken
dow
n in
to c
omm
oditi
es a
ccor
ding
to th
e Q
RC
S [M
1].
J054
Pie
ce g
oods
Rec
eipt
s fr
om th
e A
RT
S o
r th
e M
RT
S b
roke
n do
wn
into
com
mod
ities
acc
ordi
ng to
the
QR
CS
[M1]
.
J056
F
ootw
ear
Rec
eipt
s fr
om th
e A
RT
S o
r th
e M
RT
S b
roke
n do
wn
into
com
mod
ities
acc
ordi
ng to
the
QR
CS
[M1]
.
J057
F
ootw
ear
repa
irsM
ovin
g av
erag
e of
per
sona
l exp
endi
ture
on
foot
wea
r (J
056)
for
t-1
to t,
whe
re t
is th
e es
timat
ion
year
[M3]
.P
erso
nal e
xpen
ditu
re o
n fo
otw
ear
(J05
6) [M
3].
J058
Lugg
age,
leat
her
good
s an
d ot
her
pers
onal
effe
cts
Rec
eipt
s fr
om th
e A
RT
S o
r th
e M
RT
S b
roke
n do
wn
into
com
mod
ities
acc
ordi
ng to
the
QR
CS
[M1]
.
Tab
le 7
.7 S
ou
rces
an
d m
eth
od
s fo
r n
atio
nal
est
imat
es o
f p
erso
nal
exp
end
itu
re a
t cu
rren
t p
rice
s1
Ser
ies
Des
crip
tio
nB
ench
mar
k ye
ar +
1B
ench
mar
k ye
ar +
2Q
uar
ters
1. F
or m
ore
info
rmat
ion
on th
e m
etho
dolo
gies
M1
thro
ugh
M6,
see
par
agra
ph 7
.36.
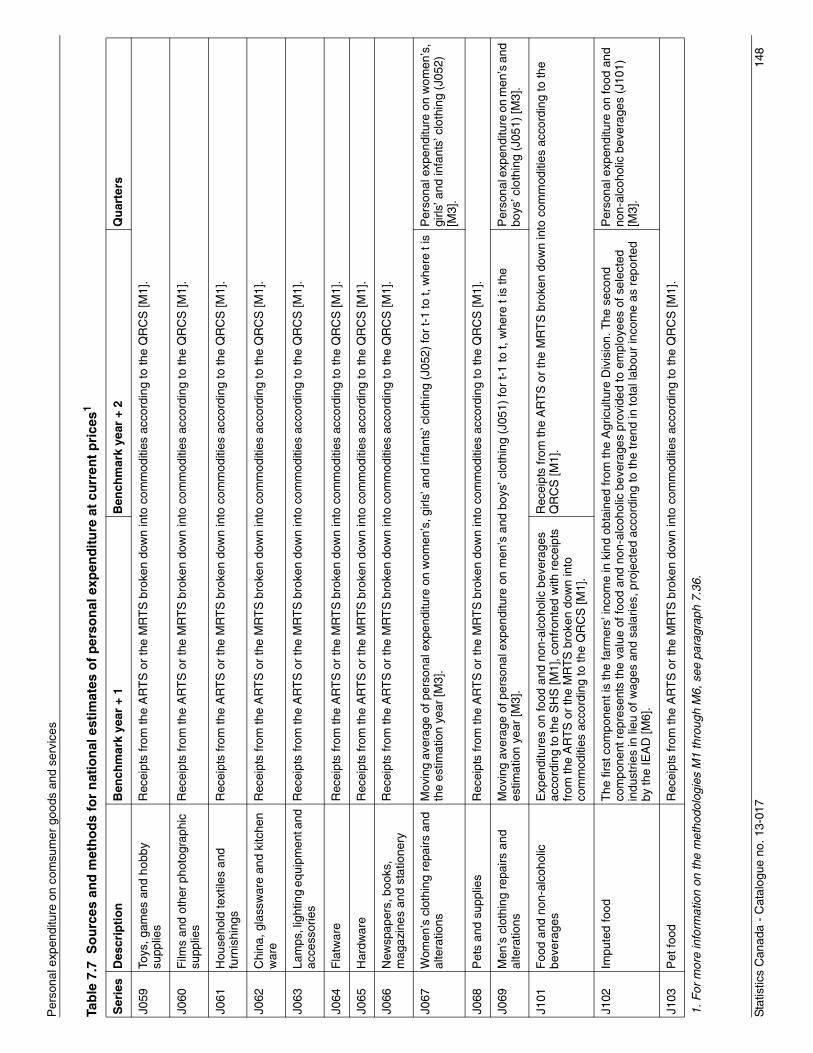
Sta
tistic
s C
anad
a -
Cat
alog
ue n
o. 1
3-01
714
8
Per
sona
l exp
endi
ture
on
com
sum
er g
oods
and
ser
vice
s
J059
Toys
, gam
es a
nd h
obby
su
pplie
sR
ecei
pts
from
the
AR
TS
or
the
MR
TS
bro
ken
dow
n in
to c
omm
oditi
es a
ccor
ding
to th
e Q
RC
S [M
1].
J060
Film
s an
d ot
her
phot
ogra
phic
su
pplie
sR
ecei
pts
from
the
AR
TS
or
the
MR
TS
bro
ken
dow
n in
to c
omm
oditi
es a
ccor
ding
to th
e Q
RC
S [M
1].
J061
Hou
seho
ld te
xtile
s an
d fu
rnis
hing
sR
ecei
pts
from
the
AR
TS
or
the
MR
TS
bro
ken
dow
n in
to c
omm
oditi
es a
ccor
ding
to th
e Q
RC
S [M
1].
J062
Chi
na, g
lass
war
e an
d ki
tche
n w
are
Rec
eipt
s fr
om th
e A
RT
S o
r th
e M
RT
S b
roke
n do
wn
into
com
mod
ities
acc
ordi
ng to
the
QR
CS
[M1]
.
J063
Lam
ps, l
ight
ing
equi
pmen
t and
ac
cess
orie
sR
ecei
pts
from
the
AR
TS
or
the
MR
TS
bro
ken
dow
n in
to c
omm
oditi
es a
ccor
ding
to th
e Q
RC
S [M
1].
J064
Fla
twar
eR
ecei
pts
from
the
AR
TS
or
the
MR
TS
bro
ken
dow
n in
to c
omm
oditi
es a
ccor
ding
to th
e Q
RC
S [M
1].
J065
Har
dwar
eR
ecei
pts
from
the
AR
TS
or
the
MR
TS
bro
ken
dow
n in
to c
omm
oditi
es a
ccor
ding
to th
e Q
RC
S [M
1].
J066
New
spap
ers,
boo
ks,
mag
azin
es a
nd s
tatio
nery
Rec
eipt
s fr
om th
e A
RT
S o
r th
e M
RT
S b
roke
n do
wn
into
com
mod
ities
acc
ordi
ng to
the
QR
CS
[M1]
.
J067
Wom
en’s
clo
thin
g re
pairs
and
al
tera
tions
Mov
ing
aver
age
of p
erso
nal e
xpen
ditu
re o
n w
omen
’s, g
irls’
and
infa
nts’
clo
thin
g (J
052)
for
t-1
to t,
whe
re t
is
the
estim
atio
n ye
ar [M
3].
Per
sona
l exp
endi
ture
on
wom
en’s
, gi
rls’ a
nd in
fant
s’ c
loth
ing
(J05
2)
[M3]
.
J068
Pet
s an
d su
pplie
sR
ecei
pts
from
the
AR
TS
or
the
MR
TS
bro
ken
dow
n in
to c
omm
oditi
es a
ccor
ding
to th
e Q
RC
S [M
1].
J069
Men
’s c
loth
ing
repa
irs a
nd
alte
ratio
nsM
ovin
g av
erag
e of
per
sona
l exp
endi
ture
on
men
’s a
nd b
oys’
clo
thin
g (J
051)
for
t-1
to t,
whe
re t
is th
e es
timat
ion
year
[M3]
.P
erso
nal e
xpen
ditu
re o
n m
en’s
and
bo
ys’ c
loth
ing
(J05
1) [M
3].
J101
Foo
d an
d no
n-al
coho
lic
beve
rage
sE
xpen
ditu
res
on fo
od a
nd n
on-a
lcoh
olic
bev
erag
es
acco
rdin
g to
the
SH
S [M
1], c
onfr
onte
d w
ith r
ecei
pts
from
the
AR
TS
or
the
MR
TS
bro
ken
dow
n in
to
com
mod
ities
acc
ordi
ng to
the
QR
CS
[M1]
.
Rec
eipt
s fr
om th
e A
RT
S o
r th
e M
RT
S b
roke
n do
wn
into
com
mod
ities
acc
ordi
ng to
the
QR
CS
[M1]
.
J102
Impu
ted
food
T
he fi
rst c
ompo
nent
is th
e fa
rmer
s' in
com
e in
kin
d ob
tain
ed fr
om th
e A
gric
ultu
re D
ivis
ion.
The
sec
ond
com
pone
nt r
epre
sent
s th
e va
lue
of fo
od a
nd n
on-a
lcoh
olic
bev
erag
es p
rovi
ded
to e
mpl
oyee
s of
sel
ecte
d in
dust
ries
in li
eu o
f wag
es a
nd s
alar
ies,
pro
ject
ed a
ccor
ding
to th
e tr
end
in to
tal l
abou
r in
com
e as
rep
orte
d by
the
IEA
D [M
6].
Per
sona
l exp
endi
ture
on
food
and
no
n-al
coho
lic b
ever
ages
(J1
01)
[M3]
.
J103
Pet
food
Rec
eipt
s fr
om th
e A
RT
S o
r th
e M
RT
S b
roke
n do
wn
into
com
mod
ities
acc
ordi
ng to
the
QR
CS
[M1]
.
Tab
le 7
.7 S
ou
rces
an
d m
eth
od
s fo
r n
atio
nal
est
imat
es o
f p
erso
nal
exp
end
itu
re a
t cu
rren
t p
rice
s1
Ser
ies
Des
crip
tio
nB
ench
mar
k ye
ar +
1B
ench
mar
k ye
ar +
2Q
uar
ters
1. F
or m
ore
info
rmat
ion
on th
e m
etho
dolo
gies
M1
thro
ugh
M6,
see
par
agra
ph 7
.36.
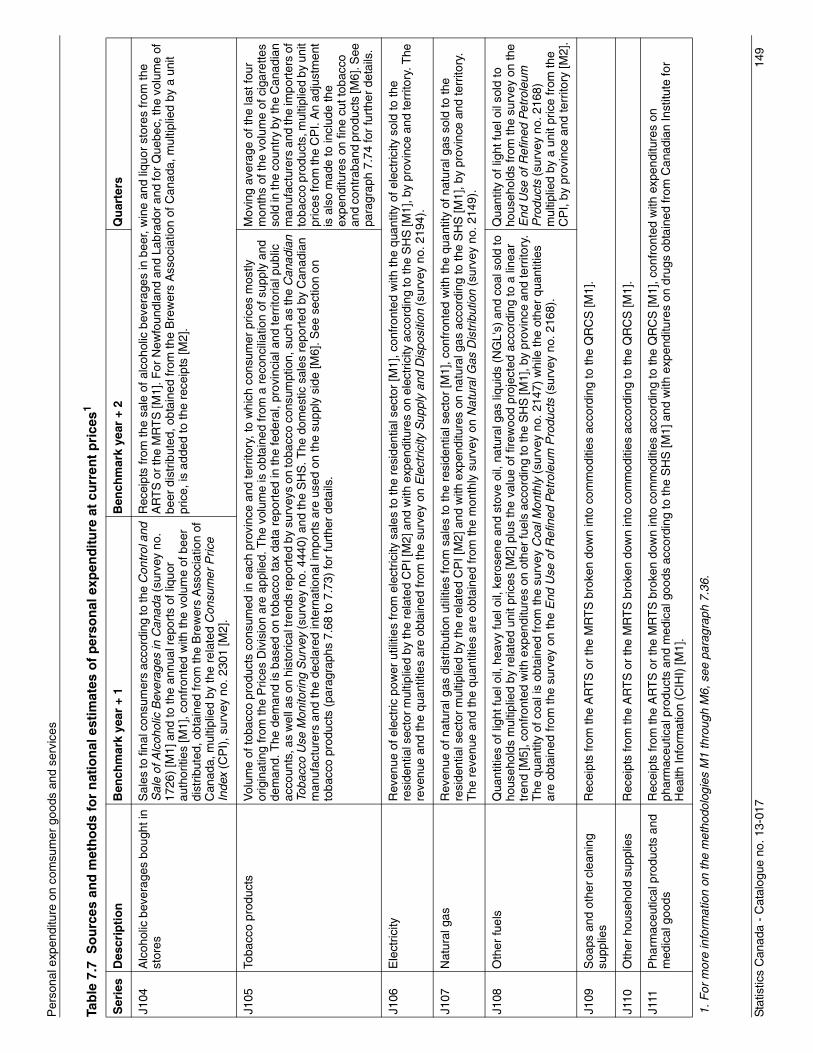
Sta
tistic
s C
anad
a -
Cat
alog
ue n
o. 1
3-01
714
9
Per
sona
l exp
endi
ture
on
com
sum
er g
oods
and
ser
vice
s
J104
Alc
ohol
ic b
ever
ages
bou
ght i
n st
ores
Sal
es to
fina
l con
sum
ers
acco
rdin
g to
the
Con
trol
and
S
ale
of A
lcoh
olic
Bev
erag
es in
Can
ada
(sur
vey
no.
1726
) [M
1] a
nd to
the
annu
al r
epor
ts o
f liq
uor
auth
oriti
es [M
1], c
onfr
onte
d w
ith th
e vo
lum
e of
bee
r di
strib
uted
, obt
aine
d fr
om th
e B
rew
ers
Ass
ocia
tion
of
Can
ada,
mul
tiplie
d by
the
rela
ted
Con
sum
er P
rice
Inde
x (C
PI)
, sur
vey
no. 2
301
[M2]
.
Rec
eipt
s fr
om th
e sa
le o
f alc
ohol
ic b
ever
ages
in b
eer,
win
e an
d liq
uor
stor
es fr
om th
e A
RT
S o
r th
e M
RT
S [M
1]. F
or N
ewfo
undl
and
and
Labr
ador
and
for
Que
bec,
the
volu
me
of
beer
dis
trib
uted
, obt
aine
d fr
om th
e B
rew
ers
Ass
ocia
tion
of C
anad
a, m
ultip
lied
by a
uni
t pr
ice,
is a
dded
to th
e re
ceip
ts [M
2].
J105
Toba
cco
prod
ucts
Vol
ume
of to
bacc
o pr
oduc
ts c
onsu
med
in e
ach
prov
ince
and
terr
itory
, to
whi
ch c
onsu
mer
pric
es m
ostly
or
igin
atin
g fr
om th
e P
rices
Div
isio
n ar
e ap
plie
d. T
he v
olum
e is
obt
aine
d fr
om a
rec
onci
liatio
n of
sup
ply
and
dem
and.
The
dem
and
is b
ased
on
toba
cco
tax
data
rep
orte
d in
the
fede
ral,
prov
inci
al a
nd te
rrito
rial p
ublic
ac
coun
ts, a
s w
ell a
s on
his
toric
al tr
ends
repo
rted
by
surv
eys
on to
bacc
o co
nsum
ptio
n, s
uch
as th
e C
anad
ian
Toba
cco
Use
Mon
itorin
g S
urve
y (s
urve
y no
. 444
0) a
nd th
e S
HS
. The
dom
estic
sal
es r
epor
ted
by C
anad
ian
man
ufac
ture
rs a
nd th
e de
clar
ed in
tern
atio
nal i
mpo
rts
are
used
on
the
supp
ly s
ide
[M6]
. See
sec
tion
on
toba
cco
prod
ucts
(pa
ragr
aphs
7.6
8 to
7.7
3) fo
r fu
rthe
r de
tails
.
Mov
ing
aver
age
of th
e la
st fo
ur
mon
ths
of th
e vo
lum
e of
cig
aret
tes
sold
in th
e co
untr
y by
the
Can
adia
n m
anuf
actu
rers
and
the
impo
rter
s of
to
bacc
o pr
oduc
ts, m
ultip
lied
by u
nit
pric
es fr
om th
e C
PI.
An
adju
stm
ent
is a
lso
mad
e to
incl
ude
the
expe
nditu
res
on fi
ne c
ut to
bacc
o an
d co
ntra
band
pro
duct
s [M
6]. S
ee
para
grap
h 7.
74 fo
r fu
rthe
r de
tails
.
J106
Ele
ctric
ityR
even
ue o
f ele
ctric
pow
er u
tiliti
es fr
om e
lect
ricity
sal
es to
the
resi
dent
ial s
ecto
r [M
1], c
onfr
onte
d w
ith th
e qu
antit
y of
ele
ctric
ity s
old
to th
e re
side
ntia
l sec
tor
mul
tiplie
d by
the
rela
ted
CP
I [M
2] a
nd w
ith e
xpen
ditu
res
on e
lect
ricity
acc
ordi
ng to
the
SH
S [M
1], b
y pr
ovin
ce a
nd te
rrito
ry. T
he
reve
nue
and
the
quan
titie
s ar
e ob
tain
ed fr
om th
e su
rvey
on
Ele
ctric
ity S
uppl
y an
d D
ispo
sitio
n (s
urve
y no
. 219
4).
J107
Nat
ural
gas
Rev
enue
of n
atur
al g
as d
istr
ibut
ion
utili
ties
from
sal
es to
the
resi
dent
ial s
ecto
r [M
1], c
onfr
onte
d w
ith th
e qu
antit
y of
nat
ural
gas
sol
d to
the
resi
dent
ial s
ecto
r m
ultip
lied
by th
e re
late
d C
PI [
M2]
and
with
exp
endi
ture
s on
nat
ural
gas
acc
ordi
ng to
the
SH
S [M
1], b
y pr
ovin
ce a
nd te
rrito
ry.
The
rev
enue
and
the
quan
titie
s ar
e ob
tain
ed fr
om th
e m
onth
ly s
urve
y on
Nat
ural
Gas
Dis
trib
utio
n (s
urve
y no
. 214
9).
J108
Oth
er fu
els
Qua
ntiti
es o
f lig
ht fu
el o
il, h
eavy
fuel
oil,
ker
osen
e an
d st
ove
oil,
natu
ral g
as li
quid
s (N
GL'
s) a
nd c
oal s
old
to
hous
ehol
ds m
ultip
lied
by r
elat
ed u
nit p
rices
[M2]
plu
s th
e va
lue
of fi
rew
ood
proj
ecte
d ac
cord
ing
to a
line
ar
tren
d [M
5], c
onfr
onte
d w
ith e
xpen
ditu
res
on o
ther
fuel
s ac
cord
ing
to th
e S
HS
[M1]
, by
prov
ince
and
terr
itory
. T
he q
uant
ity o
f coa
l is
obta
ined
from
the
surv
ey C
oal M
onth
ly (
surv
ey n
o. 2
147)
whi
le th
e ot
her
quan
titie
s ar
e ob
tain
ed fr
om th
e su
rvey
on
the
End
Use
of R
efin
ed P
etro
leum
Pro
duct
s (s
urve
y no
. 216
8).
Qua
ntity
of l
ight
fuel
oil
sold
to
hous
ehol
ds fr
om th
e su
rvey
on
the
End
Use
of R
efin
ed P
etro
leum
P
rodu
cts
(sur
vey
no. 2
168)
m
ultip
lied
by a
uni
t pric
e fr
om th
e C
PI,
by p
rovi
nce
and
terr
itory
[M2]
.
J109
Soa
ps a
nd o
ther
cle
anin
g su
pplie
sR
ecei
pts
from
the
AR
TS
or
the
MR
TS
bro
ken
dow
n in
to c
omm
oditi
es a
ccor
ding
to th
e Q
RC
S [M
1].
J110
Oth
er h
ouse
hold
sup
plie
sR
ecei
pts
from
the
AR
TS
or
the
MR
TS
bro
ken
dow
n in
to c
omm
oditi
es a
ccor
ding
to th
e Q
RC
S [M
1].
J111
Pha
rmac
eutic
al p
rodu
cts
and
med
ical
goo
dsR
ecei
pts
from
the
AR
TS
or
the
MR
TS
bro
ken
dow
n in
to c
omm
oditi
es a
ccor
ding
to th
e Q
RC
S [M
1], c
onfr
onte
d w
ith e
xpen
ditu
res
on
phar
mac
eutic
al p
rodu
cts
and
med
ical
goo
ds a
ccor
ding
to th
e S
HS
[M1]
and
with
exp
endi
ture
s on
dru
gs o
btai
ned
from
Can
adia
n In
stitu
te fo
r H
ealth
Info
rmat
ion
(CIH
I) [M
1].
Tab
le 7
.7 S
ou
rces
an
d m
eth
od
s fo
r n
atio
nal
est
imat
es o
f p
erso
nal
exp
end
itu
re a
t cu
rren
t p
rice
s1
Ser
ies
Des
crip
tio
nB
ench
mar
k ye
ar +
1B
ench
mar
k ye
ar +
2Q
uar
ters
1. F
or m
ore
info
rmat
ion
on th
e m
etho
dolo
gies
M1
thro
ugh
M6,
see
par
agra
ph 7
.36.
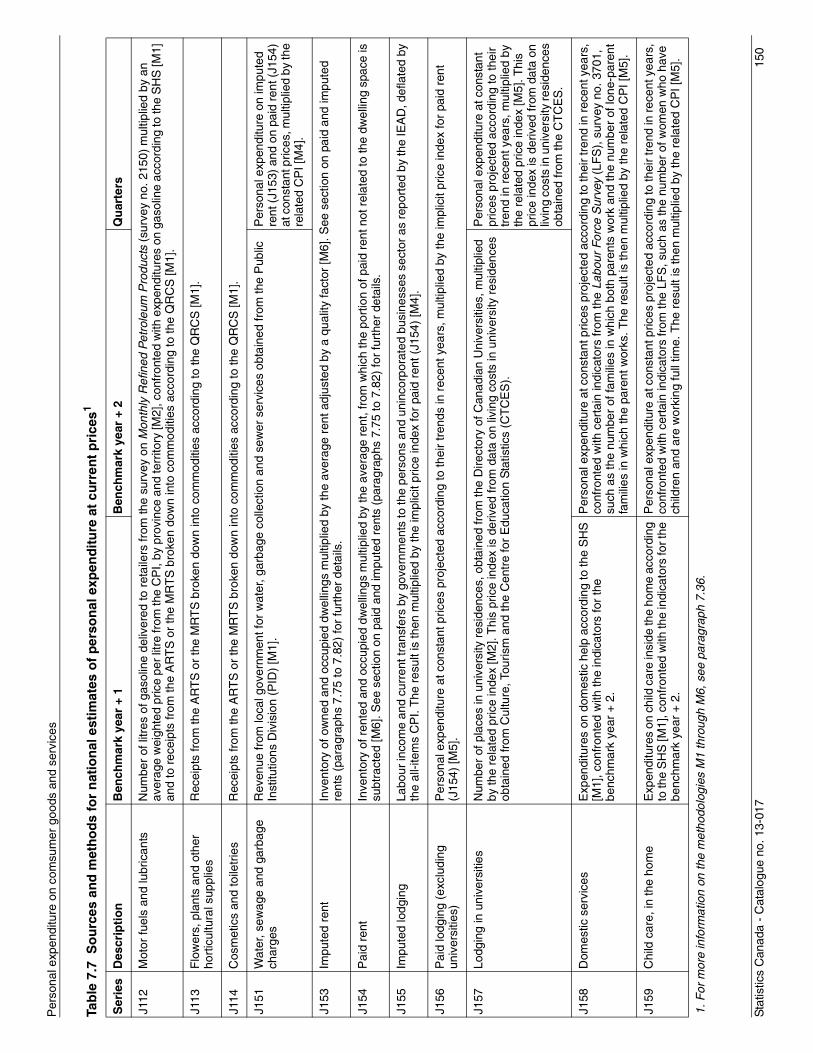
Sta
tistic
s C
anad
a -
Cat
alog
ue n
o. 1
3-01
715
0
Per
sona
l exp
endi
ture
on
com
sum
er g
oods
and
ser
vice
s
J112
Mot
or fu
els
and
lubr
ican
tsN
umbe
r of
litr
es o
f gas
olin
e de
liver
ed to
ret
aile
rs fr
om th
e su
rvey
on
Mon
thly
Ref
ined
Pet
role
um P
rodu
cts
(sur
vey
no. 2
150)
mul
tiplie
d by
an
aver
age
wei
ghte
d pr
ice
per
litre
from
the
CP
I, by
pro
vinc
e an
d te
rrito
ry [M
2], c
onfr
onte
d w
ith e
xpen
ditu
res
on g
asol
ine
acco
rdin
g to
the
SH
S [M
1]
and
to r
ecei
pts
from
the
AR
TS
or
the
MR
TS
bro
ken
dow
n in
to c
omm
oditi
es a
ccor
ding
to th
e Q
RC
S [M
1].
J113
Flo
wer
s, p
lant
s an
d ot
her
hort
icul
tura
l sup
plie
sR
ecei
pts
from
the
AR
TS
or
the
MR
TS
bro
ken
dow
n in
to c
omm
oditi
es a
ccor
ding
to th
e Q
RC
S [M
1].
J114
Cos
met
ics
and
toile
trie
sR
ecei
pts
from
the
AR
TS
or
the
MR
TS
bro
ken
dow
n in
to c
omm
oditi
es a
ccor
ding
to th
e Q
RC
S [M
1].
J151
Wat
er, s
ewag
e an
d ga
rbag
e ch
arge
sR
even
ue fr
om lo
cal g
over
nmen
t for
wat
er, g
arba
ge c
olle
ctio
n an
d se
wer
ser
vice
s ob
tain
ed fr
om th
e P
ublic
In
stitu
tions
Div
isio
n (P
ID)
[M1]
.P
erso
nal e
xpen
ditu
re o
n im
pute
d re
nt (
J153
) an
d on
pai
d re
nt (
J154
) at
con
stan
t pric
es, m
ultip
lied
by th
e re
late
d C
PI [
M4]
.
J153
Im
pute
d re
ntIn
vent
ory
of o
wne
d an
d oc
cupi
ed d
wel
lings
mul
tiplie
d by
the
aver
age
rent
adj
uste
d by
a q
ualit
y fa
ctor
[M6]
. See
sec
tion
on p
aid
and
impu
ted
rent
s (p
arag
raph
s 7.
75 to
7.8
2) fo
r fu
rthe
r de
tails
.
J154
P
aid
rent
Inve
ntor
y of
ren
ted
and
occu
pied
dw
ellin
gs m
ultip
lied
by th
e av
erag
e re
nt, f
rom
whi
ch th
e po
rtio
n of
pai
d re
nt n
ot r
elat
ed to
the
dwel
ling
spac
e is
su
btra
cted
[M6]
. See
sec
tion
on p
aid
and
impu
ted
rent
s (p
arag
raph
s 7.
75 to
7.8
2) fo
r fu
rthe
r de
tails
.
J155
Impu
ted
lodg
ing
Labo
ur in
com
e an
d cu
rren
t tra
nsfe
rs b
y go
vern
men
ts to
the
pers
ons
and
unin
corp
orat
ed b
usin
esse
s se
ctor
as
repo
rted
by
the
IEA
D, d
efla
ted
by
the
all-i
tem
s C
PI.
The
res
ult i
s th
en m
ultip
lied
by th
e im
plic
it pr
ice
inde
x fo
r pa
id r
ent (
J154
) [M
4].
J156
Pai
d lo
dgin
g (e
xclu
ding
un
iver
sitie
s)P
erso
nal e
xpen
ditu
re a
t con
stan
t pric
es p
roje
cted
acc
ordi
ng to
thei
r tr
ends
in r
ecen
t yea
rs, m
ultip
lied
by th
e im
plic
it pr
ice
inde
x fo
r pa
id r
ent
(J15
4) [M
5].
J157
Lodg
ing
in u
nive
rsiti
esN
umbe
r of
pla
ces
in u
nive
rsity
res
iden
ces,
obt
aine
d fr
om th
e D
irect
ory
of C
anad
ian
Uni
vers
ities
, mul
tiplie
d by
the
rela
ted
pric
e in
dex
[M2]
. Thi
s pr
ice
inde
x is
der
ived
from
dat
a on
livi
ng c
osts
in u
nive
rsity
res
iden
ces
obta
ined
from
Cul
ture
, Tou
rism
and
the
Cen
tre
for
Edu
catio
n S
tatis
tics
(CT
CE
S).
Per
sona
l exp
endi
ture
at c
onst
ant
pric
es p
roje
cted
acc
ordi
ng to
thei
r tr
end
in r
ecen
t yea
rs, m
ultip
lied
by
the
rela
ted
pric
e in
dex
[M5]
. Thi
s pr
ice
inde
x is
der
ived
from
dat
a on
liv
ing
cost
s in
uni
vers
ity re
side
nces
ob
tain
ed fr
om th
e C
TC
ES
.
J158
Dom
estic
ser
vice
sE
xpen
ditu
res
on d
omes
tic h
elp
acco
rdin
g to
the
SH
S
[M1]
, con
fron
ted
with
the
indi
cato
rs fo
r th
e be
nchm
ark
year
+ 2
.
Per
sona
l exp
endi
ture
at c
onst
ant p
rices
pro
ject
ed a
ccor
ding
to th
eir
tren
d in
rec
ent y
ears
, co
nfro
nted
with
cer
tain
indi
cato
rs fr
om th
e La
bour
For
ce S
urve
y (L
FS
), s
urve
y no
. 370
1,
such
as
the
num
ber
of fa
mili
es in
whi
ch b
oth
pare
nts
wor
k an
d th
e nu
mbe
r of
lone
-par
ent
fam
ilies
in w
hich
the
pare
nt w
orks
. The
res
ult i
s th
en m
ultip
lied
by th
e re
late
d C
PI [
M5]
.
J159
Chi
ld c
are,
in th
e ho
me
Exp
endi
ture
s on
chi
ld c
are
insi
de th
e ho
me
acco
rdin
g to
the
SH
S [M
1], c
onfr
onte
d w
ith th
e in
dica
tors
for t
he
benc
hmar
k ye
ar +
2.
Per
sona
l exp
endi
ture
at c
onst
ant p
rices
pro
ject
ed a
ccor
ding
to th
eir
tren
d in
rec
ent y
ears
, co
nfro
nted
with
cer
tain
indi
cato
rs fr
om th
e LF
S, s
uch
as th
e nu
mbe
r of
wom
en w
ho h
ave
child
ren
and
are
wor
king
full
time.
The
res
ult i
s th
en m
ultip
lied
by th
e re
late
d C
PI [
M5]
.
Tab
le 7
.7 S
ou
rces
an
d m
eth
od
s fo
r n
atio
nal
est
imat
es o
f p
erso
nal
exp
end
itu
re a
t cu
rren
t p
rice
s1
Ser
ies
Des
crip
tio
nB
ench
mar
k ye
ar +
1B
ench
mar
k ye
ar +
2Q
uar
ters
1. F
or m
ore
info
rmat
ion
on th
e m
etho
dolo
gies
M1
thro
ugh
M6,
see
par
agra
ph 7
.36.
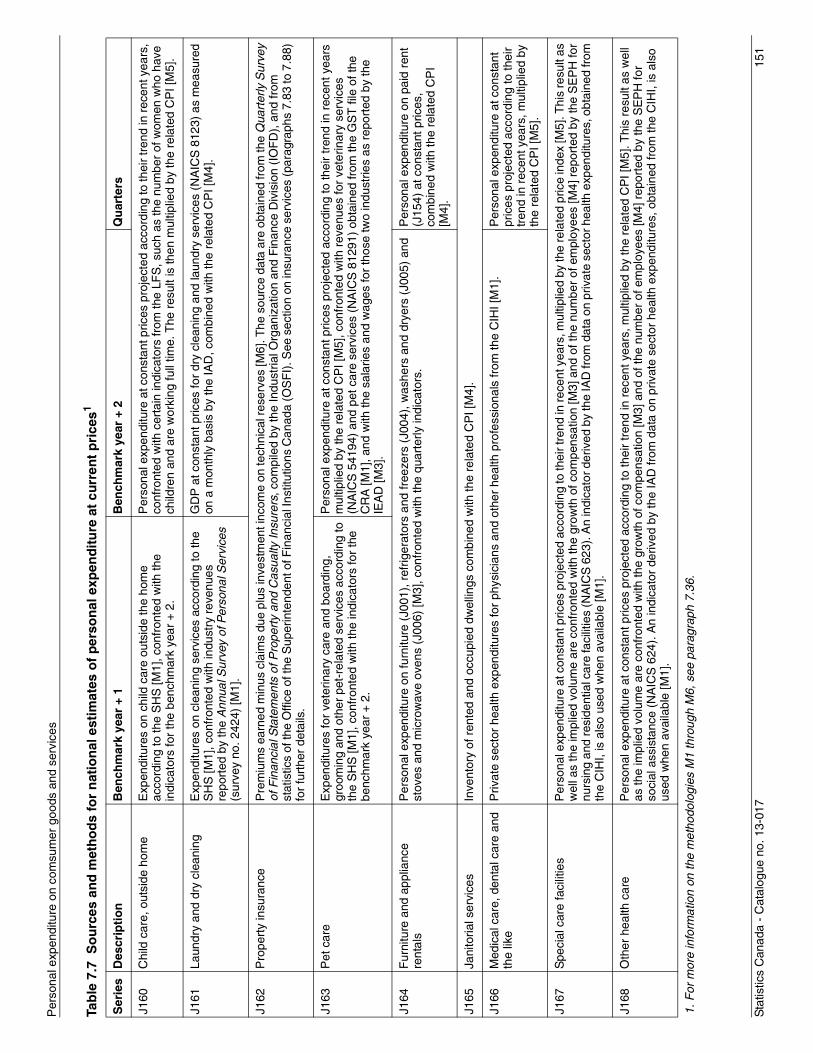
Sta
tistic
s C
anad
a -
Cat
alog
ue n
o. 1
3-01
715
1
Per
sona
l exp
endi
ture
on
com
sum
er g
oods
and
ser
vice
s
J160
Chi
ld c
are,
out
side
hom
eE
xpen
ditu
res
on c
hild
car
e ou
tsid
e th
e ho
me
acco
rdin
g to
the
SH
S [M
1], c
onfr
onte
d w
ith th
e in
dica
tors
for
the
benc
hmar
k ye
ar +
2.
Per
sona
l exp
endi
ture
at c
onst
ant p
rices
pro
ject
ed a
ccor
ding
to th
eir
tren
d in
rec
ent y
ears
, co
nfro
nted
with
cer
tain
indi
cato
rs fr
om th
e LF
S, s
uch
as th
e nu
mbe
r of
wom
en w
ho h
ave
child
ren
and
are
wor
king
full
time.
The
res
ult i
s th
en m
ultip
lied
by th
e re
late
d C
PI [
M5]
.
J161
Laun
dry
and
dry
clea
ning
Exp
endi
ture
s on
cle
anin
g se
rvic
es a
ccor
ding
to th
e S
HS
[M1]
, con
fron
ted
with
indu
stry
rev
enue
s re
port
ed b
y th
e A
nnua
l Sur
vey
of P
erso
nal S
ervi
ces
(sur
vey
no. 2
424)
[M1]
.
GD
P a
t con
stan
t pric
es fo
r dr
y cl
eani
ng a
nd la
undr
y se
rvic
es (
NA
ICS
812
3) a
s m
easu
red
on a
mon
thly
bas
is b
y th
e IA
D, c
ombi
ned
with
the
rela
ted
CP
I [M
4].
J162
Pro
pert
y in
sura
nce
Pre
miu
ms
earn
ed m
inus
cla
ims
due
plus
inve
stm
ent i
ncom
e on
tech
nica
l res
erve
s [M
6]. T
he s
ourc
e da
ta a
re o
btai
ned
from
the
Qua
rter
ly S
urve
y of
Fin
anci
al S
tate
men
ts o
f Pro
pert
y an
d C
asua
lty In
sure
rs, c
ompi
led
by th
e In
dust
rial O
rgan
izat
ion
and
Fin
ance
Div
isio
n (I
OF
D),
and
from
st
atis
tics
of th
e O
ffice
of t
he S
uper
inte
nden
t of F
inan
cial
Inst
itutio
ns C
anad
a (O
SF
I). S
ee s
ectio
n on
insu
ranc
e se
rvic
es (p
arag
raph
s 7.
83 to
7.8
8)
for
furt
her
deta
ils.
J163
Pet
car
eE
xpen
ditu
res
for
vete
rinar
y ca
re a
nd b
oard
ing,
gr
oom
ing
and
othe
r pe
t-re
late
d se
rvic
es a
ccor
ding
to
the
SH
S [M
1], c
onfr
onte
d w
ith th
e in
dica
tors
for
the
benc
hmar
k ye
ar +
2.
Per
sona
l exp
endi
ture
at c
onst
ant p
rices
pro
ject
ed a
ccor
ding
to th
eir
tren
d in
rec
ent y
ears
m
ultip
lied
by th
e re
late
d C
PI [
M5]
, con
fron
ted
with
rev
enue
s fo
r ve
terin
ary
serv
ices
(N
AIC
S 5
4194
) an
d pe
t car
e se
rvic
es (
NA
ICS
812
91)
obta
ined
from
the
GS
T fi
le o
f the
C
RA
[M1]
, and
with
the
sala
ries
and
wag
es fo
r th
ose
two
indu
strie
s as
rep
orte
d by
the
IEA
D [M
3].
J164
F
urni
ture
and
app
lianc
e re
ntal
sP
erso
nal e
xpen
ditu
re o
n fu
rnitu
re (
J001
), r
efrig
erat
ors
and
free
zers
(J0
04),
was
hers
and
dry
ers
(J00
5) a
nd
stov
es a
nd m
icro
wav
e ov
ens
(J00
6) [M
3], c
onfr
onte
d w
ith th
e qu
arte
rly in
dica
tors
. P
erso
nal e
xpen
ditu
re o
n pa
id r
ent
(J15
4) a
t con
stan
t pric
es,
com
bine
d w
ith th
e re
late
d C
PI
[M4]
.
J165
Ja
nito
rial s
ervi
ces
Inve
ntor
y of
ren
ted
and
occu
pied
dw
ellin
gs c
ombi
ned
with
the
rela
ted
CP
I [M
4].
J166
Med
ical
car
e, d
enta
l car
e an
d th
e lik
eP
rivat
e se
ctor
hea
lth e
xpen
ditu
res
for
phys
icia
ns a
nd o
ther
hea
lth p
rofe
ssio
nals
from
the
CIH
I [M
1].
Per
sona
l exp
endi
ture
at c
onst
ant
pric
es p
roje
cted
acc
ordi
ng to
thei
r tr
end
in r
ecen
t yea
rs, m
ultip
lied
by
the
rela
ted
CP
I [M
5].
J167
Spe
cial
car
e fa
cilit
ies
Per
sona
l exp
endi
ture
at c
onst
ant p
rices
pro
ject
ed a
ccor
ding
to th
eir t
rend
in re
cent
yea
rs, m
ultip
lied
by th
e re
late
d pr
ice
inde
x [M
5]. T
his
resu
lt as
w
ell a
s th
e im
plie
d vo
lum
e ar
e co
nfro
nted
with
the
grow
th o
f com
pens
atio
n [M
3] a
nd o
f the
num
ber
of e
mpl
oyee
s [M
4] r
epor
ted
by th
e S
EP
H fo
r nu
rsin
g an
d re
side
ntia
l car
e fa
cilit
ies
(NA
ICS
623
). A
n in
dica
tor d
eriv
ed b
y th
e IA
D fr
om d
ata
on p
rivat
e se
ctor
hea
lth e
xpen
ditu
res,
obt
aine
d fr
om
the
CIH
I, is
als
o us
ed w
hen
avai
labl
e [M
1].
J168
Oth
er h
ealth
car
eP
erso
nal e
xpen
ditu
re a
t con
stan
t pric
es p
roje
cted
acc
ordi
ng to
thei
r tr
end
in r
ecen
t yea
rs, m
ultip
lied
by th
e re
late
d C
PI [
M5]
. Thi
s re
sult
as w
ell
as th
e im
plie
d vo
lum
e ar
e co
nfro
nted
with
the
grow
th o
f com
pens
atio
n [M
3] a
nd o
f the
num
ber
of e
mpl
oyee
s [M
4] r
epor
ted
by th
e S
EP
H fo
r so
cial
ass
ista
nce
(NA
ICS
624
). A
n in
dica
tor
deriv
ed b
y th
e IA
D fr
om d
ata
on p
rivat
e se
ctor
hea
lth e
xpen
ditu
res,
obt
aine
d fr
om th
e C
IHI,
is a
lso
used
whe
n av
aila
ble
[M1]
.
Tab
le 7
.7 S
ou
rces
an
d m
eth
od
s fo
r n
atio
nal
est
imat
es o
f p
erso
nal
exp
end
itu
re a
t cu
rren
t p
rice
s1
Ser
ies
Des
crip
tio
nB
ench
mar
k ye
ar +
1B
ench
mar
k ye
ar +
2Q
uar
ters
1. F
or m
ore
info
rmat
ion
on th
e m
etho
dolo
gies
M1
thro
ugh
M6,
see
par
agra
ph 7
.36.
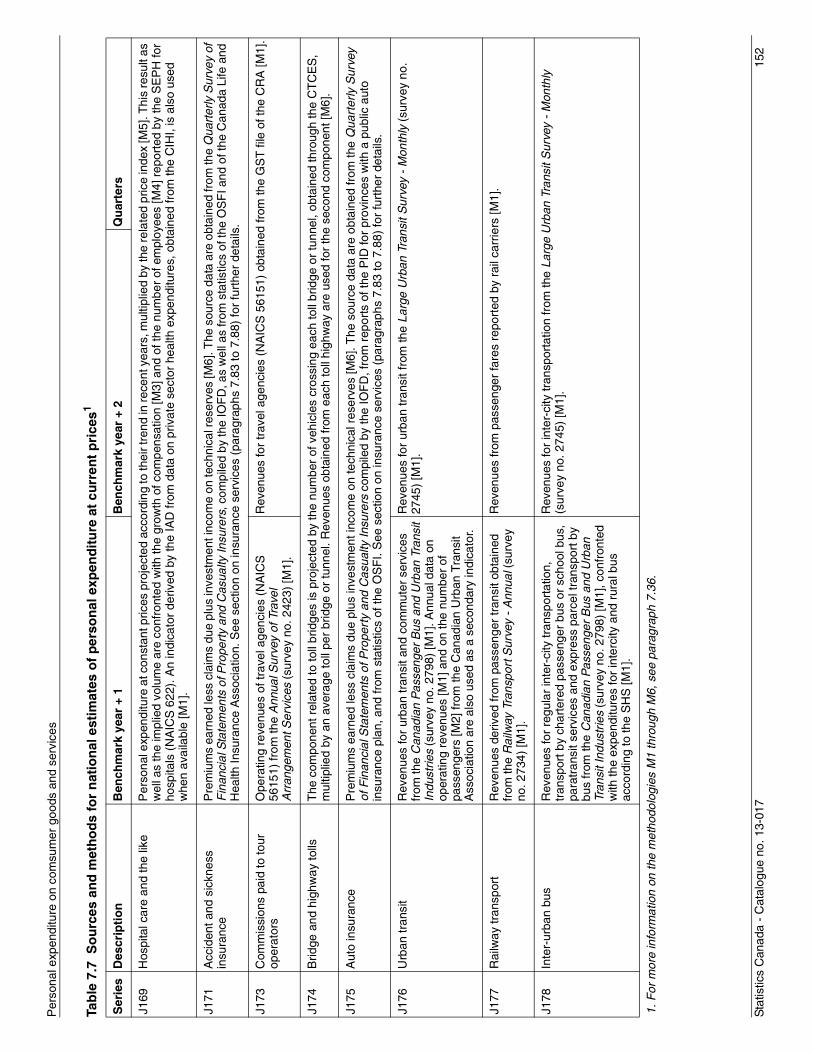
Sta
tistic
s C
anad
a -
Cat
alog
ue n
o. 1
3-01
715
2
Per
sona
l exp
endi
ture
on
com
sum
er g
oods
and
ser
vice
s
J169
Hos
pita
l car
e an
d th
e lik
eP
erso
nal e
xpen
ditu
re a
t con
stan
t pric
es p
roje
cted
acc
ordi
ng to
thei
r tre
nd in
rece
nt y
ears
, mul
tiplie
d by
the
rela
ted
pric
e in
dex
[M5]
. Thi
s re
sult
as
wel
l as
the
impl
ied
volu
me
are
conf
ront
ed w
ith th
e gr
owth
of c
ompe
nsat
ion
[M3]
and
of t
he n
umbe
r of
em
ploy
ees
[M4]
rep
orte
d by
the
SE
PH
for
hosp
itals
(N
AIC
S 6
22).
An
indi
cato
r de
rived
by
the
IAD
from
dat
a on
priv
ate
sect
or h
ealth
exp
endi
ture
s, o
btai
ned
from
the
CIH
I, is
als
o us
ed
whe
n av
aila
ble
[M1]
.
J171
Acc
iden
t and
sic
knes
s in
sura
nce
Pre
miu
ms
earn
ed le
ss c
laim
s du
e pl
us in
vest
men
t inc
ome
on te
chni
cal r
eser
ves
[M6]
. The
sou
rce
data
are
obt
aine
d fr
om th
e Q
uart
erly
Sur
vey
of
Fin
anci
al S
tate
men
ts o
f Pro
pert
y an
d C
asua
lty In
sure
rs, c
ompi
led
by th
e IO
FD
, as
wel
l as
from
sta
tistic
s of
the
OS
FI a
nd o
f the
Can
ada
Life
and
H
ealth
Insu
ranc
e A
ssoc
iatio
n. S
ee s
ectio
n on
insu
ranc
e se
rvic
es (
para
grap
hs 7
.83
to 7
.88)
for
furt
her
deta
ils.
J173
Com
mis
sion
s pa
id to
tour
op
erat
ors
Ope
ratin
g re
venu
es o
f tra
vel a
genc
ies
(NA
ICS
56
151)
from
the
Ann
ual S
urve
y of
Tra
vel
Arr
ange
men
t Ser
vice
s (s
urve
y no
. 242
3) [M
1].
Rev
enue
s fo
r tr
avel
age
ncie
s (N
AIC
S 5
6151
) ob
tain
ed fr
om th
e G
ST
file
of t
he C
RA
[M1]
.
J174
Brid
ge a
nd h
ighw
ay to
llsT
he c
ompo
nent
rel
ated
to to
ll br
idge
s is
pro
ject
ed b
y th
e nu
mbe
r of
veh
icle
s cr
ossi
ng e
ach
toll
brid
ge o
r tu
nnel
, obt
aine
d th
roug
h th
e C
TC
ES
, m
ultip
lied
by a
n av
erag
e to
ll pe
r br
idge
or
tunn
el. R
even
ues
obta
ined
from
eac
h to
ll hi
ghw
ay a
re u
sed
for
the
seco
nd c
ompo
nent
[M6]
.
J175
Aut
o in
sura
nce
Pre
miu
ms
earn
ed le
ss c
laim
s du
e pl
us in
vest
men
t inc
ome
on te
chni
cal r
eser
ves
[M6]
. The
sou
rce
data
are
obt
aine
d fr
om th
e Q
uart
erly
Sur
vey
of F
inan
cial
Sta
tem
ents
of P
rope
rty
and
Cas
ualty
Insu
rers
com
pile
d by
the
IOF
D, f
rom
rep
orts
of t
he P
ID fo
r pr
ovin
ces
with
a p
ublic
aut
o in
sura
nce
plan
, and
from
sta
tistic
s of
the
OS
FI.
See
sec
tion
on in
sura
nce
serv
ices
(pa
ragr
aphs
7.8
3 to
7.8
8) fo
r fu
rthe
r de
tails
.
J176
Urb
an tr
ansi
tR
even
ues
for
urba
n tr
ansi
t and
com
mut
er s
ervi
ces
from
the
Can
adia
n P
asse
nger
Bus
and
Urb
an T
rans
it In
dust
ries
(sur
vey
no. 2
798)
[M1]
. Ann
ual d
ata
on
oper
atin
g re
venu
es [M
1] a
nd o
n th
e nu
mbe
r of
pa
ssen
gers
[M2]
from
the
Can
adia
n U
rban
Tra
nsit
Ass
ocia
tion
are
also
use
d as
a s
econ
dary
indi
cato
r.
Rev
enue
s fo
r ur
ban
tran
sit f
rom
the
Larg
e U
rban
Tra
nsit
Sur
vey
- M
onth
ly (
surv
ey n
o.
2745
) [M
1].
J177
Rai
lway
tran
spor
tR
even
ues
deriv
ed fr
om p
asse
nger
tran
sit o
btai
ned
from
the
Rai
lway
Tra
nspo
rt S
urve
y -
Ann
ual (
surv
ey
no. 2
734)
[M1]
.
Rev
enue
s fr
om p
asse
nger
fare
s re
port
ed b
y ra
il ca
rrie
rs [M
1].
J178
Inte
r-ur
ban
bus
Rev
enue
s fo
r re
gula
r in
ter-
city
tran
spor
tatio
n,
tran
spor
t by
char
tere
d pa
ssen
ger
bus
or s
choo
l bus
, pa
ratr
ansi
t ser
vice
s an
d ex
pres
s pa
rcel
tran
spor
t by
bus
from
the
Can
adia
n P
asse
nger
Bus
and
Urb
an
Tran
sit I
ndus
trie
s (s
urve
y no
. 279
8) [M
1], c
onfr
onte
d w
ith th
e ex
pend
iture
s fo
r in
terc
ity a
nd r
ural
bus
ac
cord
ing
to th
e S
HS
[M1]
.
Rev
enue
s fo
r in
ter-
city
tran
spor
tatio
n fr
om th
e La
rge
Urb
an T
rans
it S
urve
y -
Mon
thly
(s
urve
y no
. 274
5) [M
1].
Tab
le 7
.7 S
ou
rces
an
d m
eth
od
s fo
r n
atio
nal
est
imat
es o
f p
erso
nal
exp
end
itu
re a
t cu
rren
t p
rice
s1
Ser
ies
Des
crip
tio
nB
ench
mar
k ye
ar +
1B
ench
mar
k ye
ar +
2Q
uar
ters
1. F
or m
ore
info
rmat
ion
on th
e m
etho
dolo
gies
M1
thro
ugh
M6,
see
par
agra
ph 7
.36.
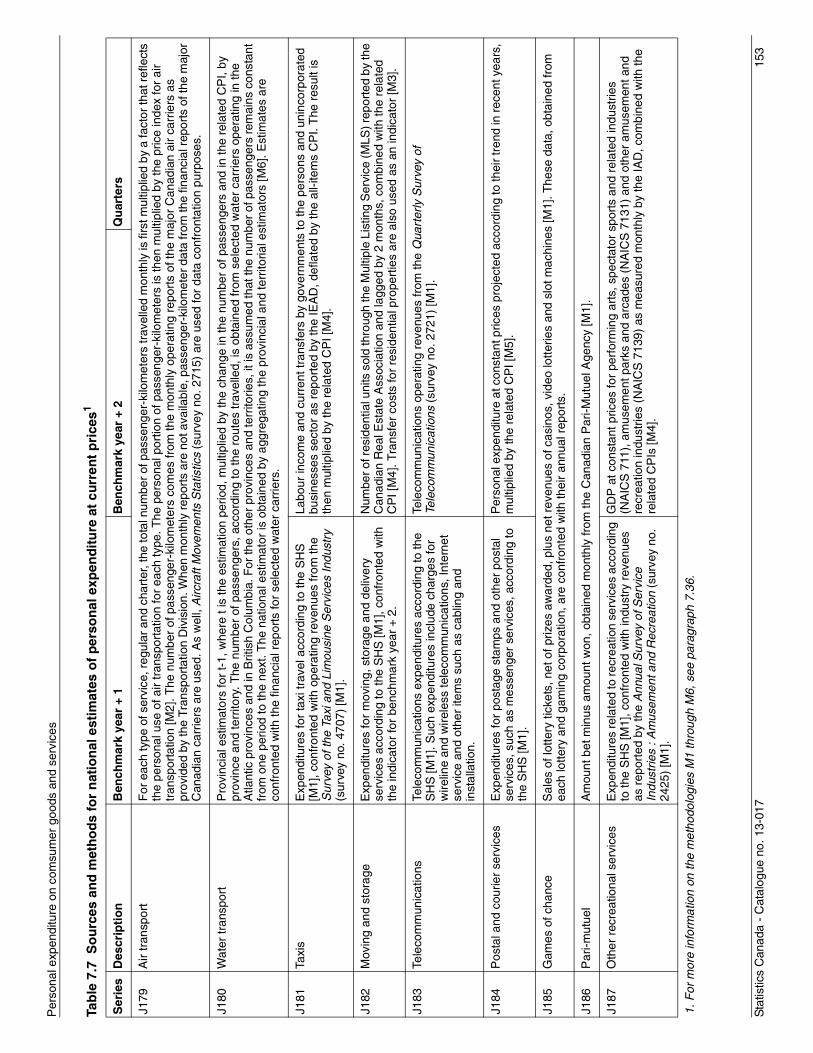
Sta
tistic
s C
anad
a -
Cat
alog
ue n
o. 1
3-01
715
3
Per
sona
l exp
endi
ture
on
com
sum
er g
oods
and
ser
vice
s
J179
Air
tran
spor
tF
or e
ach
type
of s
ervi
ce, r
egul
ar a
nd c
hart
er, t
he to
tal n
umbe
r of
pas
seng
er-k
ilom
eter
s tr
avel
led
mon
thly
is fi
rst m
ultip
lied
by a
fact
or th
at r
efle
cts
the
pers
onal
use
of a
ir tr
ansp
orta
tion
for
each
type
. The
per
sona
l por
tion
of p
asse
nger
-kilo
met
ers
is th
en m
ultip
lied
by th
e pr
ice
inde
x fo
r ai
r tr
ansp
orta
tion
[M2]
. The
num
ber
of p
asse
nger
-kilo
met
ers
com
es fr
om th
e m
onth
ly o
pera
ting
repo
rts
of th
e m
ajor
Can
adia
n ai
r ca
rrie
rs a
s pr
ovid
ed b
y th
e Tr
ansp
orta
tion
Div
isio
n. W
hen
mon
thly
repo
rts
are
not a
vaila
ble,
pas
seng
er-k
ilom
eter
dat
a fr
om th
e fin
anci
al r
epor
ts o
f the
maj
or
Can
adia
n ca
rrie
rs a
re u
sed.
As
wel
l, A
ircra
ft M
ovem
ents
Sta
tistic
s (s
urve
y no
. 271
5) a
re u
sed
for
data
con
fron
tatio
n pu
rpos
es.
J180
Wat
er tr
ansp
ort
Pro
vinc
ial e
stim
ator
s fo
r t-
1, w
here
t is
the
estim
atio
n pe
riod,
mul
tiplie
d by
the
chan
ge in
the
num
ber
of p
asse
nger
s an
d in
the
rela
ted
CP
I, by
pr
ovin
ce a
nd te
rrito
ry. T
he n
umbe
r of
pas
seng
ers,
acc
ordi
ng to
the
rout
es tr
avel
led,
is o
btai
ned
from
sel
ecte
d w
ater
car
riers
ope
ratin
g in
the
Atla
ntic
pro
vinc
es a
nd in
Brit
ish
Col
umbi
a. F
or th
e ot
her
prov
ince
s an
d te
rrito
ries,
it is
ass
umed
that
the
num
ber
of p
asse
nger
s re
mai
ns c
onst
ant
from
one
per
iod
to th
e ne
xt. T
he n
atio
nal e
stim
ator
is o
btai
ned
by a
ggre
gatin
g th
e pr
ovin
cial
and
terr
itoria
l est
imat
ors
[M6]
. Est
imat
es a
re
conf
ront
ed w
ith th
e fin
anci
al r
epor
ts fo
r se
lect
ed w
ater
car
riers
.
J181
Taxi
sE
xpen
ditu
res
for
taxi
trav
el a
ccor
ding
to th
e S
HS
[M
1], c
onfr
onte
d w
ith o
pera
ting
reve
nues
from
the
Sur
vey
of th
e Ta
xi a
nd L
imou
sine
Ser
vice
s In
dust
ry
(sur
vey
no. 4
707)
[M1]
.
Labo
ur in
com
e an
d cu
rren
t tra
nsfe
rs b
y go
vern
men
ts to
the
pers
ons
and
unin
corp
orat
ed
busi
ness
es s
ecto
r as
rep
orte
d by
the
IEA
D, d
efla
ted
by th
e al
l-ite
ms
CP
I. T
he r
esul
t is
then
mul
tiplie
d by
the
rela
ted
CP
I [M
4].
J182
Mov
ing
and
stor
age
Exp
endi
ture
s fo
r m
ovin
g, s
tora
ge a
nd d
eliv
ery
serv
ices
acc
ordi
ng to
the
SH
S [M
1], c
onfr
onte
d w
ith
the
indi
cato
r fo
r be
nchm
ark
year
+ 2
.
Num
ber o
f res
iden
tial u
nits
sol
d th
roug
h th
e M
ultip
le L
istin
g S
ervi
ce (M
LS) r
epor
ted
by th
e C
anad
ian
Rea
l Est
ate
Ass
ocia
tion
and
lagg
ed b
y 2
mon
ths,
com
bine
d w
ith th
e re
late
d C
PI [
M4]
. Tra
nsfe
r co
sts
for
resi
dent
ial p
rope
rtie
s ar
e al
so u
sed
as a
n in
dica
tor
[M3]
.
J183
Tele
com
mun
icat
ions
Tele
com
mun
icat
ions
exp
endi
ture
s ac
cord
ing
to th
e S
HS
[M1]
. Suc
h ex
pend
iture
s in
clud
e ch
arge
s fo
r w
irelin
e an
d w
irele
ss te
leco
mm
unic
atio
ns, I
nter
net
serv
ice
and
othe
r ite
ms
such
as
cabl
ing
and
inst
alla
tion.
Tele
com
mun
icat
ions
ope
ratin
g re
venu
es fr
om th
e Q
uart
erly
Sur
vey
of
Tele
com
mun
icat
ions
(su
rvey
no.
272
1) [M
1].
J184
Pos
tal a
nd c
ourie
r se
rvic
esE
xpen
ditu
res
for
post
age
stam
ps a
nd o
ther
pos
tal
serv
ices
, suc
h as
mes
seng
er s
ervi
ces,
acc
ordi
ng to
th
e S
HS
[M1]
.
Per
sona
l exp
endi
ture
at c
onst
ant p
rices
pro
ject
ed a
ccor
ding
to th
eir
tren
d in
rec
ent y
ears
, m
ultip
lied
by th
e re
late
d C
PI [
M5]
.
J185
Gam
es o
f cha
nce
Sal
es o
f lot
tery
tick
ets,
net
of p
rizes
aw
arde
d, p
lus
net r
even
ues
of c
asin
os, v
ideo
lotte
ries
and
slot
mac
hine
s [M
1]. T
hese
dat
a, o
btai
ned
from
ea
ch lo
ttery
and
gam
ing
corp
orat
ion,
are
con
fron
ted
with
thei
r an
nual
rep
orts
.
J186
Par
i-mut
uel
Am
ount
bet
min
us a
mou
nt w
on, o
btai
ned
mon
thly
from
the
Can
adia
n P
ari-M
utue
l Age
ncy
[M1]
.
J187
Oth
er r
ecre
atio
nal s
ervi
ces
Exp
endi
ture
s re
late
d to
recr
eatio
n se
rvic
es a
ccor
ding
to
the
SH
S [M
1], c
onfr
onte
d w
ith in
dust
ry r
even
ues
as r
epor
ted
by th
e A
nnua
l Sur
vey
of S
ervi
ce
Indu
strie
s : A
mus
emen
t and
Rec
reat
ion
(sur
vey
no.
2425
) [M
1].
GD
P a
t con
stan
t pric
es fo
r pe
rfor
min
g ar
ts, s
pect
ator
spo
rts
and
rela
ted
indu
strie
s (N
AIC
S 7
11),
am
usem
ent p
arks
and
arc
ades
(N
AIC
S 7
131)
and
oth
er a
mus
emen
t and
re
crea
tion
indu
strie
s (N
AIC
S 7
139)
as
mea
sure
d m
onth
ly b
y th
e IA
D, c
ombi
ned
with
the
rela
ted
CP
Is [M
4].
Tab
le 7
.7 S
ou
rces
an
d m
eth
od
s fo
r n
atio
nal
est
imat
es o
f p
erso
nal
exp
end
itu
re a
t cu
rren
t p
rice
s1
Ser
ies
Des
crip
tio
nB
ench
mar
k ye
ar +
1B
ench
mar
k ye
ar +
2Q
uar
ters
1. F
or m
ore
info
rmat
ion
on th
e m
etho
dolo
gies
M1
thro
ugh
M6,
see
par
agra
ph 7
.36.
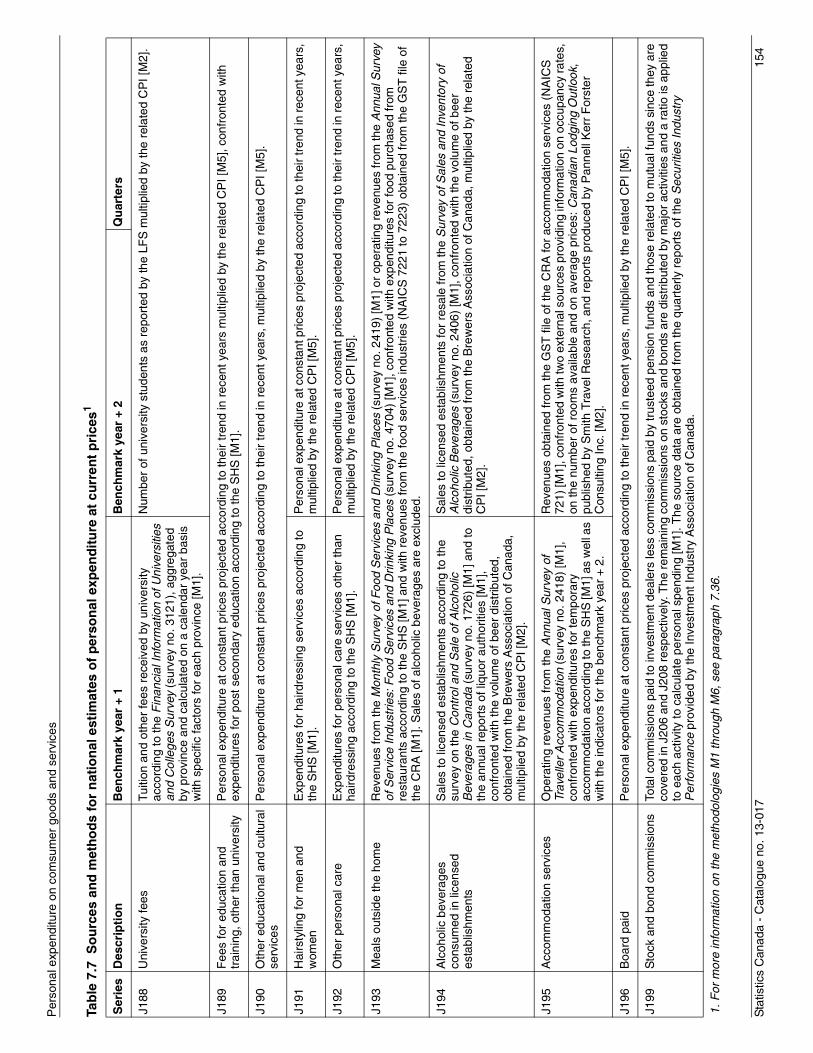
Sta
tistic
s C
anad
a -
Cat
alog
ue n
o. 1
3-01
715
4
Per
sona
l exp
endi
ture
on
com
sum
er g
oods
and
ser
vice
s
J188
Uni
vers
ity fe
esTu
ition
and
oth
er fe
es r
ecei
ved
by u
nive
rsity
ac
cord
ing
to th
e F
inan
cial
Info
rmat
ion
of U
nive
rsiti
es
and
Col
lege
s S
urve
y (s
urve
y no
. 312
1), a
ggre
gate
d by
pro
vinc
e an
d ca
lcul
ated
on
a ca
lend
ar y
ear
basi
s w
ith s
peci
fic fa
ctor
s fo
r ea
ch p
rovi
nce
[M1]
.
Num
ber
of u
nive
rsity
stu
dent
s as
rep
orte
d by
the
LFS
mul
tiplie
d by
the
rela
ted
CP
I [M
2].
J189
Fee
s fo
r ed
ucat
ion
and
trai
ning
, oth
er th
an u
nive
rsity
Per
sona
l exp
endi
ture
at c
onst
ant p
rices
pro
ject
ed a
ccor
ding
to th
eir
tren
d in
rec
ent y
ears
mul
tiplie
d by
the
rela
ted
CP
I [M
5], c
onfr
onte
d w
ith
expe
nditu
res
for
post
sec
onda
ry e
duca
tion
acco
rdin
g to
the
SH
S [M
1].
J190
Oth
er e
duca
tiona
l and
cul
tura
l se
rvic
esP
erso
nal e
xpen
ditu
re a
t con
stan
t pric
es p
roje
cted
acc
ordi
ng to
thei
r tr
end
in r
ecen
t yea
rs, m
ultip
lied
by th
e re
late
d C
PI [
M5]
.
J191
Hai
rsty
ling
for
men
and
w
omen
Exp
endi
ture
s fo
r ha
irdre
ssin
g se
rvic
es a
ccor
ding
to
the
SH
S [M
1].
Per
sona
l exp
endi
ture
at c
onst
ant p
rices
pro
ject
ed a
ccor
ding
to th
eir
tren
d in
rec
ent y
ears
, m
ultip
lied
by th
e re
late
d C
PI [
M5]
.
J192
Oth
er p
erso
nal c
are
Exp
endi
ture
s fo
r pe
rson
al c
are
serv
ices
oth
er th
an
haird
ress
ing
acco
rdin
g to
the
SH
S [M
1].
Per
sona
l exp
endi
ture
at c
onst
ant p
rices
pro
ject
ed a
ccor
ding
to th
eir
tren
d in
rec
ent y
ears
, m
ultip
lied
by th
e re
late
d C
PI [
M5]
.
J193
Mea
ls o
utsi
de th
e ho
me
Rev
enue
s fr
om th
e M
onth
ly S
urve
y of
Foo
d S
ervi
ces
and
Drin
king
Pla
ces
(sur
vey
no. 2
419)
[M1]
or
oper
atin
g re
venu
es fr
om th
e A
nnua
l Sur
vey
of S
ervi
ce In
dust
ries:
Foo
d S
ervi
ces
and
Drin
king
Pla
ces
(sur
vey
no. 4
704)
[M1]
, con
fron
ted
with
exp
endi
ture
s fo
r fo
od p
urch
ased
from
re
stau
rant
s ac
cord
ing
to th
e S
HS
[M1]
and
with
rev
enue
s fr
om th
e fo
od s
ervi
ces
indu
strie
s (N
AIC
S 7
221
to 7
223)
obt
aine
d fr
om th
e G
ST
file
of
the
CR
A [M
1]. S
ales
of a
lcoh
olic
bev
erag
es a
re e
xclu
ded.
J194
Alc
ohol
ic b
ever
ages
co
nsum
ed in
lice
nsed
es
tabl
ishm
ents
Sal
es to
lice
nsed
est
ablis
hmen
ts a
ccor
ding
to th
e su
rvey
on
the
Con
trol
and
Sal
e of
Alc
ohol
ic
Bev
erag
es in
Can
ada
(sur
vey
no. 1
726)
[M1]
and
to
the
annu
al r
epor
ts o
f liq
uor
auth
oriti
es [M
1],
conf
ront
ed w
ith th
e vo
lum
e of
bee
r di
strib
uted
, ob
tain
ed fr
om th
e B
rew
ers
Ass
ocia
tion
of C
anad
a,
mul
tiplie
d by
the
rela
ted
CP
I [M
2].
Sal
es to
lice
nsed
est
ablis
hmen
ts fo
r re
sale
from
the
Sur
vey
of S
ales
and
Inve
ntor
y of
A
lcoh
olic
Bev
erag
es (
surv
ey n
o. 2
406)
[M1]
, con
fron
ted
with
the
volu
me
of b
eer
dist
ribut
ed, o
btai
ned
from
the
Bre
wer
s A
ssoc
iatio
n of
Can
ada,
mul
tiplie
d by
the
rela
ted
CP
I [M
2].
J195
Acc
omm
odat
ion
serv
ices
Ope
ratin
g re
venu
es fr
om th
e A
nnua
l Sur
vey
of
Trav
elle
r A
ccom
mod
atio
n (s
urve
y no
. 241
8) [M
1],
conf
ront
ed w
ith e
xpen
ditu
res
for
tem
pora
ry
acco
mm
odat
ion
acco
rdin
g to
the
SH
S [M
1] a
s w
ell a
s w
ith th
e in
dica
tors
for
the
benc
hmar
k ye
ar +
2.
Rev
enue
s ob
tain
ed fr
om th
e G
ST
file
of t
he C
RA
for
acco
mm
odat
ion
serv
ices
(N
AIC
S
721)
[M1]
, con
fron
ted
with
two
exte
rnal
sou
rces
pro
vidi
ng in
form
atio
n on
occ
upan
cy ra
tes,
on
the
num
ber
of r
oom
s av
aila
ble
and
on a
vera
ge p
rices
: Can
adia
n Lo
dgin
g O
utlo
ok,
publ
ishe
d by
Sm
ith T
rave
l Res
earc
h, a
nd r
epor
ts p
rodu
ced
by P
anne
ll K
err
For
ster
C
onsu
lting
Inc.
[M2]
.
J196
Boa
rd p
aid
Per
sona
l exp
endi
ture
at c
onst
ant p
rices
pro
ject
ed a
ccor
ding
to th
eir
tren
d in
rec
ent y
ears
, mul
tiplie
d by
the
rela
ted
CP
I [M
5].
J199
Sto
ck a
nd b
ond
com
mis
sion
sTo
tal c
omm
issi
ons
paid
to in
vest
men
t dea
lers
less
com
mis
sion
s pa
id b
y tr
uste
ed p
ensi
on fu
nds
and
thos
e re
late
d to
mut
ual f
unds
sin
ce th
ey a
re
cove
red
in J
206
and
J208
res
pect
ivel
y. T
he r
emai
ning
com
mis
sion
s on
sto
cks
and
bond
s ar
e di
strib
uted
by
maj
or a
ctiv
ities
and
a ra
tio is
app
lied
to e
ach
activ
ity to
cal
cula
te p
erso
nal s
pend
ing
[M1]
. The
sou
rce
data
are
obt
aine
d fr
om th
e qu
arte
rly r
epor
ts o
f the
Sec
uriti
es In
dust
ry
Per
form
ance
pro
vide
d by
the
Inve
stm
ent I
ndus
try
Ass
ocia
tion
of C
anad
a.
Tab
le 7
.7 S
ou
rces
an
d m
eth
od
s fo
r n
atio
nal
est
imat
es o
f p
erso
nal
exp
end
itu
re a
t cu
rren
t p
rice
s1
Ser
ies
Des
crip
tio
nB
ench
mar
k ye
ar +
1B
ench
mar
k ye
ar +
2Q
uar
ters
1. F
or m
ore
info
rmat
ion
on th
e m
etho
dolo
gies
M1
thro
ugh
M6,
see
par
agra
ph 7
.36.
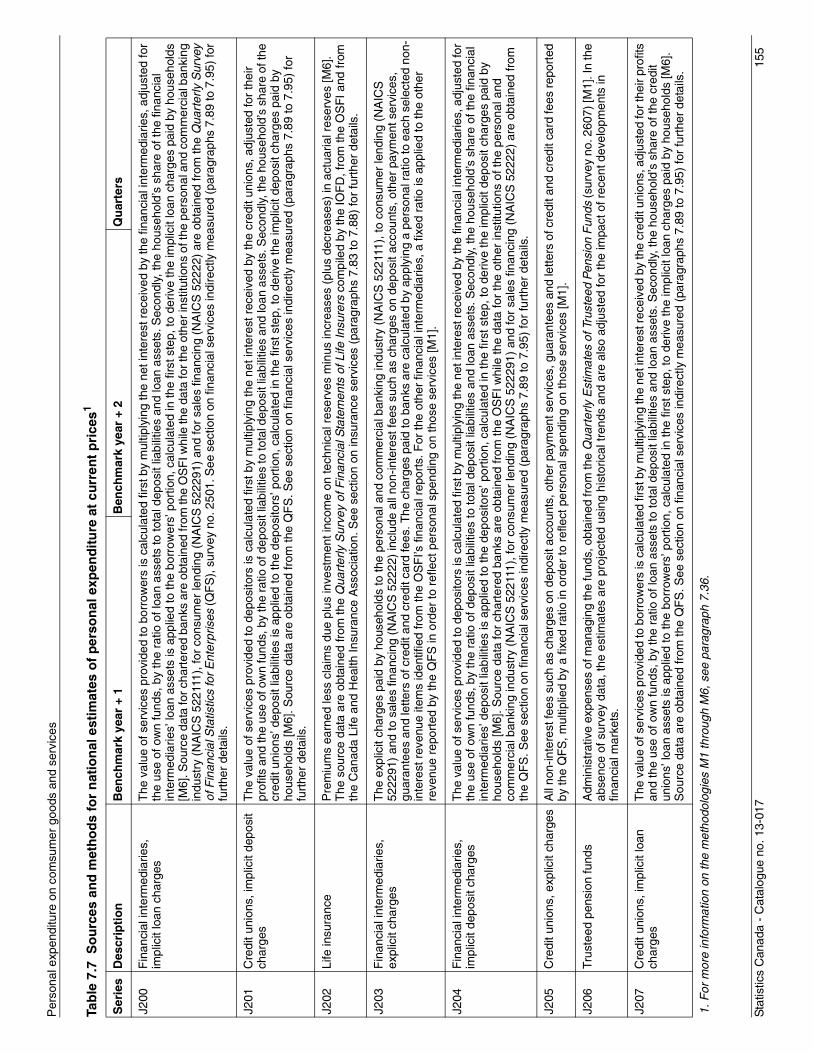
Sta
tistic
s C
anad
a -
Cat
alog
ue n
o. 1
3-01
715
5
Per
sona
l exp
endi
ture
on
com
sum
er g
oods
and
ser
vice
s
J200
Fin
anci
al in
term
edia
ries,
im
plic
it lo
an c
harg
esT
he v
alue
of s
ervi
ces
prov
ided
to b
orro
wer
s is
cal
cula
ted
first
by
mul
tiply
ing
the
net i
nter
est r
ecei
ved
by th
e fin
anci
al in
term
edia
ries,
adj
uste
d fo
r th
e us
e of
ow
n fu
nds,
by
the
ratio
of l
oan
asse
ts to
tota
l dep
osit
liabi
litie
s an
d lo
an a
sset
s. S
econ
dly,
the
hous
ehol
d’s
shar
e of
the
finan
cial
in
term
edia
ries’
loan
ass
ets
is a
pplie
d to
the
borr
ower
s’ p
ortio
n, c
alcu
late
d in
the
first
ste
p, to
der
ive
the
impl
icit
loan
cha
rges
pai
d by
hou
seho
lds
[M6]
. Sou
rce
data
for c
hart
ered
ban
ks a
re o
btai
ned
from
the
OS
FI w
hile
the
data
for t
he o
ther
inst
itutio
ns o
f the
per
sona
l and
com
mer
cial
ban
king
in
dust
ry (
NA
ICS
522
111)
, for
con
sum
er le
ndin
g (N
AIC
S 5
2229
1) a
nd fo
r sa
les
finan
cing
(N
AIC
S 5
2222
) ar
e ob
tain
ed fr
om th
e Q
uart
erly
Sur
vey
of F
inan
cial
Sta
tistic
s fo
r Ent
erpr
ises
(Q
FS
), s
urve
y no
. 250
1. S
ee s
ectio
n on
fina
ncia
l ser
vice
s in
dire
ctly
mea
sure
d (p
arag
raph
s 7.
89 to
7.9
5) fo
r fu
rthe
r de
tails
.
J201
Cre
dit u
nion
s, im
plic
it de
posi
t ch
arge
sT
he v
alue
of s
ervi
ces
prov
ided
to d
epos
itors
is c
alcu
late
d fir
st b
y m
ultip
lyin
g th
e ne
t int
eres
t rec
eive
d by
the
cred
it un
ions
, adj
uste
d fo
r th
eir
prof
its a
nd th
e us
e of
ow
n fu
nds,
by
the
ratio
of d
epos
it lia
bilit
ies
to to
tal d
epos
it lia
bilit
ies
and
loan
ass
ets.
Sec
ondl
y, th
e ho
useh
old’
s sh
are
of th
e cr
edit
unio
ns’ d
epos
it lia
bilit
ies
is a
pplie
d to
the
depo
sito
rs’ p
ortio
n, c
alcu
late
d in
the
first
ste
p, to
der
ive
the
impl
icit
depo
sit c
harg
es p
aid
by
hous
ehol
ds [M
6]. S
ourc
e da
ta a
re o
btai
ned
from
the
QF
S. S
ee s
ectio
n on
fina
ncia
l ser
vice
s in
dire
ctly
mea
sure
d (p
arag
raph
s 7.
89 to
7.9
5) fo
r fu
rthe
r de
tails
.
J202
Life
insu
ranc
eP
rem
ium
s ea
rned
less
cla
ims
due
plus
inve
stm
ent i
ncom
e on
tech
nica
l res
erve
s m
inus
incr
ease
s (p
lus
decr
ease
s) in
act
uaria
l res
erve
s [M
6].
The
sou
rce
data
are
obt
aine
d fr
om th
e Q
uart
erly
Sur
vey
of F
inan
cial
Sta
tem
ents
of L
ife In
sure
rs c
ompi
led
by th
e IO
FD
, fro
m th
e O
SF
I and
from
th
e C
anad
a Li
fe a
nd H
ealth
Insu
ranc
e A
ssoc
iatio
n. S
ee s
ectio
n on
insu
ranc
e se
rvic
es (
para
grap
hs 7
.83
to 7
.88)
for
furt
her
deta
ils.
J203
Fin
anci
al in
term
edia
ries,
ex
plic
it ch
arge
sT
he e
xplic
it ch
arge
s pa
id b
y ho
useh
olds
to th
e pe
rson
al a
nd c
omm
erci
al b
anki
ng in
dust
ry (
NA
ICS
522
111)
, to
cons
umer
lend
ing
(NA
ICS
52
2291
) an
d to
sal
es fi
nanc
ing
(NA
ICS
522
22)
incl
ude
all n
on-in
tere
st fe
es s
uch
as c
harg
es o
n de
posi
t acc
ount
s, o
ther
pay
men
t ser
vice
s,
guar
ante
es a
nd le
tters
of c
redi
t and
cre
dit c
ard
fees
. The
cha
rges
pai
d to
ban
ks a
re c
alcu
late
d by
app
lyin
g a
pers
onal
rat
io to
eac
h se
lect
ed n
on-
inte
rest
rev
enue
item
s id
entif
ied
from
the
OS
FI’s
fina
ncia
l rep
orts
. For
the
othe
r fin
anci
al in
term
edia
ries,
a fi
xed
ratio
is a
pplie
d to
the
othe
r re
venu
e re
port
ed b
y th
e Q
FS
in o
rder
to r
efle
ct p
erso
nal s
pend
ing
on th
ose
serv
ices
[M1]
.
J204
Fin
anci
al in
term
edia
ries,
im
plic
it de
posi
t cha
rges
The
val
ue o
f ser
vice
s pr
ovid
ed to
dep
osito
rs is
cal
cula
ted
first
by
mul
tiply
ing
the
net i
nter
est r
ecei
ved
by th
e fin
anci
al in
term
edia
ries,
adj
uste
d fo
r th
e us
e of
ow
n fu
nds,
by
the
ratio
of d
epos
it lia
bilit
ies
to to
tal d
epos
it lia
bilit
ies
and
loan
ass
ets.
Sec
ondl
y, th
e ho
useh
old’
s sh
are
of th
e fin
anci
al
inte
rmed
iarie
s’ d
epos
it lia
bilit
ies
is a
pplie
d to
the
depo
sito
rs’ p
ortio
n, c
alcu
late
d in
the
first
ste
p, to
der
ive
the
impl
icit
depo
sit c
harg
es p
aid
by
hous
ehol
ds [M
6]. S
ourc
e da
ta fo
r ch
arte
red
bank
s ar
e ob
tain
ed fr
om th
e O
SF
I whi
le th
e da
ta fo
r th
e ot
her
inst
itutio
ns o
f the
per
sona
l and
co
mm
erci
al b
anki
ng in
dust
ry (
NA
ICS
522
111)
, for
con
sum
er le
ndin
g (N
AIC
S 5
2229
1) a
nd fo
r sa
les
finan
cing
(N
AIC
S 5
2222
) ar
e ob
tain
ed fr
om
the
QF
S. S
ee s
ectio
n on
fina
ncia
l ser
vice
s in
dire
ctly
mea
sure
d (p
arag
raph
s 7.
89 to
7.9
5) fo
r fu
rthe
r de
tails
.
J205
Cre
dit u
nion
s, e
xplic
it ch
arge
sA
ll no
n-in
tere
st fe
es s
uch
as c
harg
es o
n de
posi
t acc
ount
s, o
ther
pay
men
t ser
vice
s, g
uara
ntee
s an
d le
tters
of c
redi
t and
cre
dit c
ard
fees
rep
orte
d by
the
QF
S, m
ultip
lied
by a
fixe
d ra
tio in
ord
er to
ref
lect
per
sona
l spe
ndin
g on
thos
e se
rvic
es [M
1].
J206
Trus
teed
pen
sion
fund
sA
dmin
istr
ativ
e ex
pens
es o
f man
agin
g th
e fu
nds,
obt
aine
d fr
om th
e Q
uart
erly
Est
imat
es o
f Tru
stee
d P
ensi
on F
unds
(su
rvey
no.
260
7) [M
1]. I
n th
e ab
senc
e of
sur
vey
data
, the
est
imat
es a
re p
roje
cted
usi
ng h
isto
rical
tren
ds a
nd a
re a
lso
adju
sted
for
the
impa
ct o
f rec
ent d
evel
opm
ents
in
finan
cial
mar
kets
.
J207
Cre
dit u
nion
s, im
plic
it lo
an
char
ges
The
val
ue o
f ser
vice
s pr
ovid
ed to
bor
row
ers
is c
alcu
late
d fir
st b
y m
ultip
lyin
g th
e ne
t int
eres
t rec
eive
d by
the
cred
it un
ions
, adj
uste
d fo
r the
ir pr
ofits
an
d th
e us
e of
ow
n fu
nds,
by
the
ratio
of l
oan
asse
ts to
tota
l dep
osit
liabi
litie
s an
d lo
an a
sset
s. S
econ
dly,
the
hous
ehol
d’s
shar
e of
the
cred
it un
ions
’ loa
n as
sets
is a
pplie
d to
the
borr
ower
s’ p
ortio
n, c
alcu
late
d in
the
first
ste
p, to
der
ive
the
impl
icit
loan
cha
rges
pai
d by
hou
seho
lds
[M6]
. S
ourc
e da
ta a
re o
btai
ned
from
the
QF
S. S
ee s
ectio
n on
fina
ncia
l ser
vice
s in
dire
ctly
mea
sure
d (p
arag
raph
s 7.
89 to
7.9
5) fo
r fu
rthe
r de
tails
.
Tab
le 7
.7 S
ou
rces
an
d m
eth
od
s fo
r n
atio
nal
est
imat
es o
f p
erso
nal
exp
end
itu
re a
t cu
rren
t p
rice
s1
Ser
ies
Des
crip
tio
nB
ench
mar
k ye
ar +
1B
ench
mar
k ye
ar +
2Q
uar
ters
1. F
or m
ore
info
rmat
ion
on th
e m
etho
dolo
gies
M1
thro
ugh
M6,
see
par
agra
ph 7
.36.
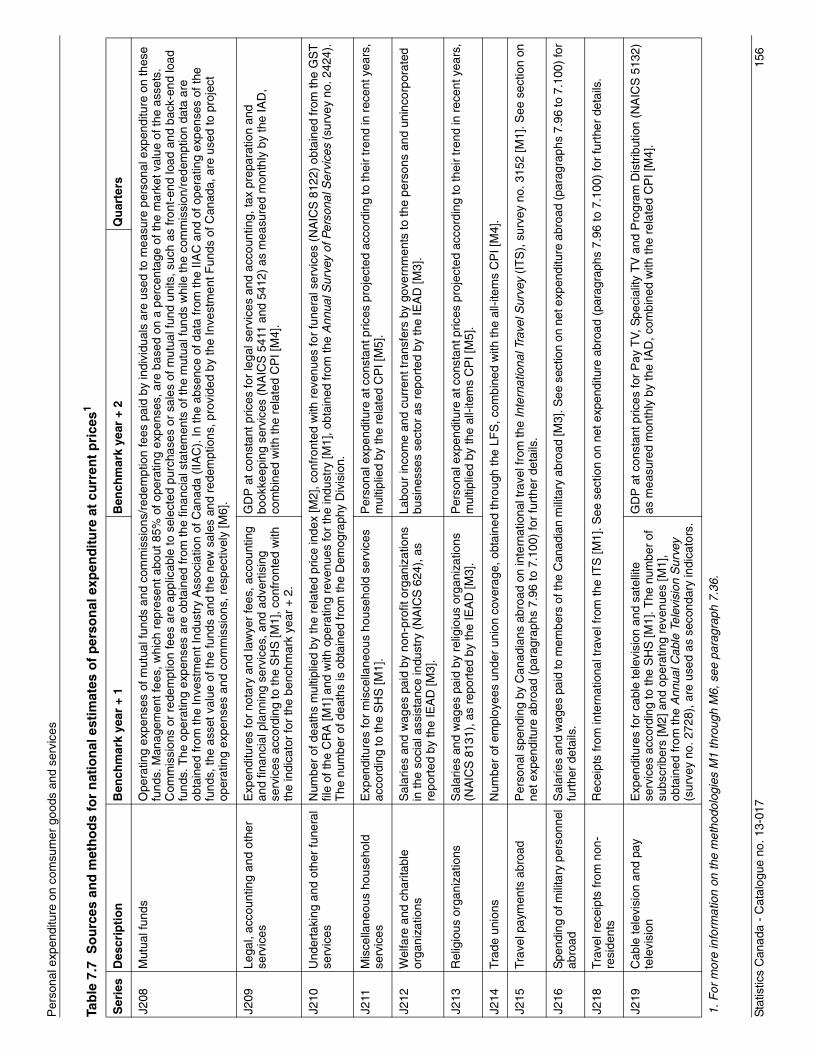
Sta
tistic
s C
anad
a -
Cat
alog
ue n
o. 1
3-01
715
6
Per
sona
l exp
endi
ture
on
com
sum
er g
oods
and
ser
vice
s
J208
Mut
ual f
unds
Ope
ratin
g ex
pens
es o
f mut
ual f
unds
and
com
mis
sion
s/re
dem
ptio
n fe
es p
aid
by in
divi
dual
s ar
e us
ed to
mea
sure
per
sona
l exp
endi
ture
on
thes
e fu
nds.
Man
agem
ent f
ees,
whi
ch r
epre
sent
abo
ut 8
5% o
f ope
ratin
g ex
pens
es, a
re b
ased
on
a pe
rcen
tage
of t
he m
arke
t val
ue o
f the
ass
ets.
C
omm
issi
ons
or r
edem
ptio
n fe
es a
re a
pplic
able
to s
elec
ted
purc
hase
s or
sal
es o
f mut
ual f
und
units
, suc
h as
fron
t-en
d lo
ad a
nd b
ack-
end
load
fu
nds.
The
ope
ratin
g ex
pens
es a
re o
btai
ned
from
the
finan
cial
sta
tem
ents
of t
he m
utua
l fun
ds w
hile
the
com
mis
sion
/red
empt
ion
data
are
ob
tain
ed fr
om th
e In
vest
men
t Ind
ustr
y A
ssoc
iatio
n of
Can
ada
(IIA
C).
In th
e ab
senc
e of
dat
a fr
om th
e IIA
C a
nd o
f ope
ratin
g ex
pens
es o
f the
fu
nds,
the
asse
t val
ue o
f the
fund
s an
d th
e ne
w s
ales
and
red
empt
ions
, pro
vide
d by
the
Inve
stm
ent F
unds
of C
anad
a, a
re u
sed
to p
roje
ct
oper
atin
g ex
pens
es a
nd c
omm
issi
ons,
res
pect
ivel
y [M
6].
J209
Lega
l, ac
coun
ting
and
othe
r se
rvic
esE
xpen
ditu
res
for
nota
ry a
nd la
wye
r fe
es, a
ccou
ntin
g an
d fin
anci
al p
lann
ing
serv
ices
, and
adv
ertis
ing
serv
ices
acc
ordi
ng to
the
SH
S [M
1], c
onfr
onte
d w
ith
the
indi
cato
r fo
r th
e be
nchm
ark
year
+ 2
.
GD
P a
t con
stan
t pric
es fo
r le
gal s
ervi
ces
and
acco
untin
g, ta
x pr
epar
atio
n an
d bo
okke
epin
g se
rvic
es (
NA
ICS
541
1 an
d 54
12)
as m
easu
red
mon
thly
by
the
IAD
, co
mbi
ned
with
the
rela
ted
CP
I [M
4].
J210
Und
erta
king
and
oth
er fu
nera
l se
rvic
esN
umbe
r of
dea
ths
mul
tiplie
d by
the
rela
ted
pric
e in
dex
[M2]
, con
fron
ted
with
rev
enue
s fo
r fu
nera
l ser
vice
s (N
AIC
S 8
122)
obt
aine
d fr
om th
e G
ST
fil
e of
the
CR
A [M
1] a
nd w
ith o
pera
ting
reve
nues
for
the
indu
stry
[M1]
, obt
aine
d fr
om th
e A
nnua
l Sur
vey
of P
erso
nal S
ervi
ces
(sur
vey
no. 2
424)
. T
he n
umbe
r of
dea
ths
is o
btai
ned
from
the
Dem
ogra
phy
Div
isio
n.
J211
Mis
cella
neou
s ho
useh
old
serv
ices
Exp
endi
ture
s fo
r m
isce
llane
ous
hous
ehol
d se
rvic
es
acco
rdin
g to
the
SH
S [M
1].
Per
sona
l exp
endi
ture
at c
onst
ant p
rices
pro
ject
ed a
ccor
ding
to th
eir
tren
d in
rec
ent y
ears
, m
ultip
lied
by th
e re
late
d C
PI [
M5]
.
J212
Wel
fare
and
cha
ritab
le
orga
niza
tions
Sal
arie
s an
d w
ages
pai
d by
non
-pro
fit o
rgan
izat
ions
in
the
soci
al a
ssis
tanc
e in
dust
ry (
NA
ICS
624
), a
s re
port
ed b
y th
e IE
AD
[M3]
.
Labo
ur in
com
e an
d cu
rren
t tra
nsfe
rs b
y go
vern
men
ts to
the
pers
ons
and
unin
corp
orat
ed
busi
ness
es s
ecto
r as
rep
orte
d by
the
IEA
D [M
3].
J213
Rel
igio
us o
rgan
izat
ions
Sal
arie
s an
d w
ages
pai
d by
rel
igio
us o
rgan
izat
ions
(N
AIC
S 8
131)
, as
repo
rted
by
the
IEA
D [M
3].
Per
sona
l exp
endi
ture
at c
onst
ant p
rices
pro
ject
ed a
ccor
ding
to th
eir
tren
d in
rec
ent y
ears
, m
ultip
lied
by th
e al
l-ite
ms
CP
I [M
5].
J214
Trad
e un
ions
Num
ber
of e
mpl
oyee
s un
der
unio
n co
vera
ge, o
btai
ned
thro
ugh
the
LFS
, com
bine
d w
ith th
e al
l-ite
ms
CP
I [M
4].
J215
Trav
el p
aym
ents
abr
oad
Per
sona
l spe
ndin
g by
Can
adia
ns a
broa
d on
inte
rnat
iona
l tra
vel f
rom
the
Inte
rnat
iona
l Tra
vel S
urve
y (I
TS
), s
urve
y no
. 315
2 [M
1]. S
ee s
ectio
n on
ne
t exp
endi
ture
abr
oad
(par
agra
phs
7.96
to 7
.100
) fo
r fu
rthe
r de
tails
.
J216
Spe
ndin
g of
mili
tary
per
sonn
el
abro
adS
alar
ies
and
wag
es p
aid
to m
embe
rs o
f the
Can
adia
n m
ilita
ry a
broa
d [M
3]. S
ee s
ectio
n on
net
exp
endi
ture
abr
oad
(par
agra
phs
7.96
to 7
.100
) fo
r fu
rthe
r de
tails
.
J218
Trav
el r
ecei
pts
from
non
-re
side
nts
Rec
eipt
s fr
om in
tern
atio
nal t
rave
l fro
m th
e IT
S [M
1]. S
ee s
ectio
n on
net
exp
endi
ture
abr
oad
(par
agra
phs
7.96
to 7
.100
) fo
r fu
rthe
r de
tails
.
J219
Cab
le te
levi
sion
and
pay
te
levi
sion
Exp
endi
ture
s fo
r ca
ble
tele
visi
on a
nd s
atel
lite
serv
ices
acc
ordi
ng to
the
SH
S [M
1]. T
he n
umbe
r of
su
bscr
iber
s [M
2] a
nd o
pera
ting
reve
nues
[M1]
, ob
tain
ed fr
om th
e A
nnua
l Cab
le T
elev
isio
n S
urve
y (s
urve
y no
. 272
8), a
re u
sed
as s
econ
dary
indi
cato
rs.
GD
P a
t con
stan
t pric
es fo
r P
ay T
V, S
peci
ality
TV
and
Pro
gram
Dis
trib
utio
n (N
AIC
S 5
132)
as
mea
sure
d m
onth
ly b
y th
e IA
D, c
ombi
ned
with
the
rela
ted
CP
I [M
4].
Tab
le 7
.7 S
ou
rces
an
d m
eth
od
s fo
r n
atio
nal
est
imat
es o
f p
erso
nal
exp
end
itu
re a
t cu
rren
t p
rice
s1
Ser
ies
Des
crip
tio
nB
ench
mar
k ye
ar +
1B
ench
mar
k ye
ar +
2Q
uar
ters
1. F
or m
ore
info
rmat
ion
on th
e m
etho
dolo
gies
M1
thro
ugh
M6,
see
par
agra
ph 7
.36.
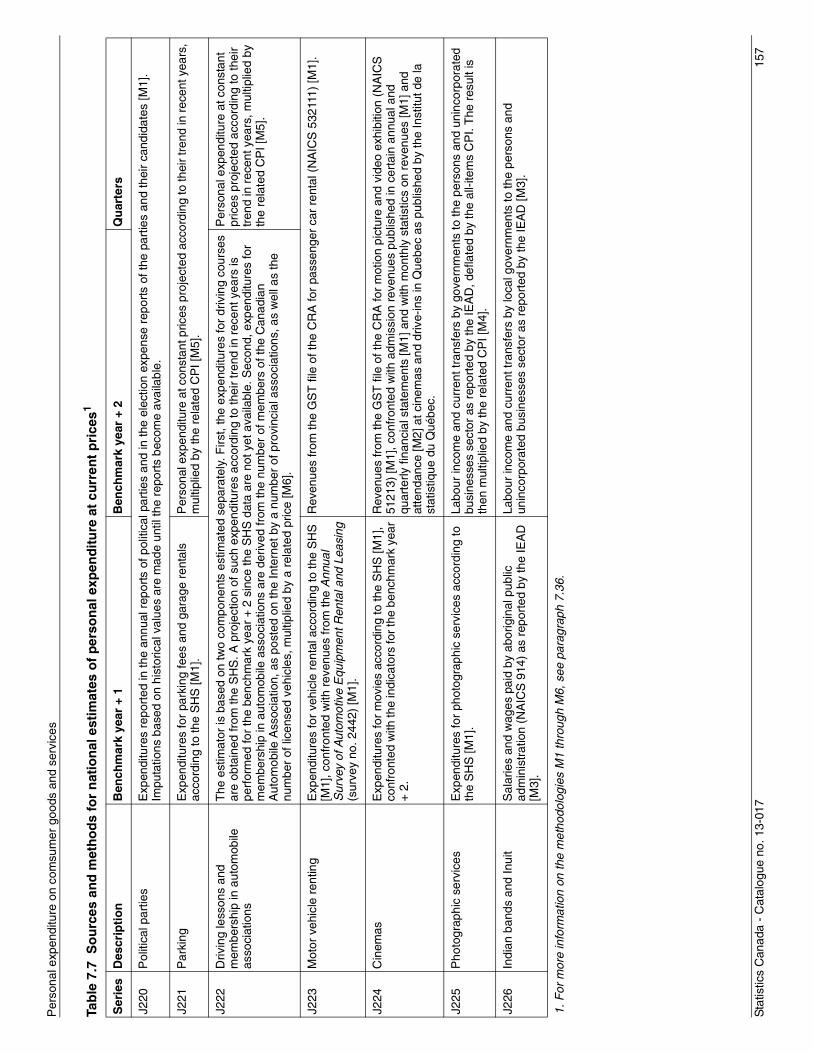
Sta
tistic
s C
anad
a -
Cat
alog
ue n
o. 1
3-01
715
7
Per
sona
l exp
endi
ture
on
com
sum
er g
oods
and
ser
vice
s
J220
Pol
itica
l par
ties
Exp
endi
ture
s re
port
ed in
the
annu
al r
epor
ts o
f pol
itica
l par
ties
and
in th
e el
ectio
n ex
pens
e re
port
s of
the
part
ies
and
thei
r ca
ndid
ates
[M1]
. Im
puta
tions
bas
ed o
n hi
stor
ical
val
ues
are
mad
e un
til th
e re
port
s be
com
e av
aila
ble.
J221
Par
king
Exp
endi
ture
s fo
r pa
rkin
g fe
es a
nd g
arag
e re
ntal
s ac
cord
ing
to th
e S
HS
[M1]
.P
erso
nal e
xpen
ditu
re a
t con
stan
t pric
es p
roje
cted
acc
ordi
ng to
thei
r tr
end
in r
ecen
t yea
rs,
mul
tiplie
d by
the
rela
ted
CP
I [M
5].
J222
Driv
ing
less
ons
and
mem
bers
hip
in a
utom
obile
as
soci
atio
ns
The
est
imat
or is
bas
ed o
n tw
o co
mpo
nent
s es
timat
ed s
epar
atel
y. F
irst,
the
expe
nditu
res
for
driv
ing
cour
ses
are
obta
ined
from
the
SH
S. A
pro
ject
ion
of s
uch
expe
nditu
res
acco
rdin
g to
thei
r tr
end
in r
ecen
t yea
rs is
pe
rfor
med
for
the
benc
hmar
k ye
ar +
2 s
ince
the
SH
S d
ata
are
not y
et a
vaila
ble.
Sec
ond,
exp
endi
ture
s fo
r m
embe
rshi
p in
aut
omob
ile a
ssoc
iatio
ns a
re d
eriv
ed fr
om th
e nu
mbe
r of
mem
bers
of t
he C
anad
ian
Aut
omob
ile A
ssoc
iatio
n, a
s po
sted
on
the
Inte
rnet
by
a nu
mbe
r of
pro
vinc
ial a
ssoc
iatio
ns, a
s w
ell a
s th
e nu
mbe
r of
lice
nsed
veh
icle
s, m
ultip
lied
by a
rel
ated
pric
e [M
6].
Per
sona
l exp
endi
ture
at c
onst
ant
pric
es p
roje
cted
acc
ordi
ng to
thei
r tr
end
in r
ecen
t yea
rs, m
ultip
lied
by
the
rela
ted
CP
I [M
5].
J223
Mot
or v
ehic
le r
entin
gE
xpen
ditu
res
for
vehi
cle
rent
al a
ccor
ding
to th
e S
HS
[M
1], c
onfr
onte
d w
ith r
even
ues
from
the
Ann
ual
Sur
vey
of A
utom
otiv
e E
quip
men
t Ren
tal a
nd L
easi
ng
(sur
vey
no. 2
442)
[M1]
.
Rev
enue
s fr
om th
e G
ST
file
of t
he C
RA
for
pass
enge
r ca
r re
ntal
(N
AIC
S 5
3211
1) [M
1].
J224
Cin
emas
Exp
endi
ture
s fo
r m
ovie
s ac
cord
ing
to th
e S
HS
[M1]
, co
nfro
nted
with
the
indi
cato
rs fo
r th
e be
nchm
ark
year
+
2.
Rev
enue
s fr
om th
e G
ST
file
of t
he C
RA
for
mot
ion
pict
ure
and
vide
o ex
hibi
tion
(NA
ICS
51
213)
[M1]
, con
fron
ted
with
adm
issi
on r
even
ues
publ
ishe
d in
cer
tain
ann
ual a
nd
quar
terly
fina
ncia
l sta
tem
ents
[M1]
and
with
mon
thly
sta
tistic
s on
rev
enue
s [M
1] a
nd
atte
ndan
ce [M
2] a
t cin
emas
and
driv
e-in
s in
Que
bec
as p
ublis
hed
by th
e In
stitu
t de
la
stat
istiq
ue d
u Q
uébe
c.
J225
Pho
togr
aphi
c se
rvic
esE
xpen
ditu
res
for
phot
ogra
phic
ser
vice
s ac
cord
ing
to
the
SH
S [M
1].
Labo
ur in
com
e an
d cu
rren
t tra
nsfe
rs b
y go
vern
men
ts to
the
pers
ons
and
unin
corp
orat
ed
busi
ness
es s
ecto
r as
rep
orte
d by
the
IEA
D, d
efla
ted
by th
e al
l-ite
ms
CP
I. T
he r
esul
t is
then
mul
tiplie
d by
the
rela
ted
CP
I [M
4].
J226
Indi
an b
ands
and
Inui
tS
alar
ies
and
wag
es p
aid
by a
borig
inal
pub
lic
adm
inis
trat
ion
(NA
ICS
914
) as
rep
orte
d by
the
IEA
D
[M3]
.
Labo
ur in
com
e an
d cu
rren
t tra
nsfe
rs b
y lo
cal g
over
nmen
ts to
the
pers
ons
and
unin
corp
orat
ed b
usin
esse
s se
ctor
as
repo
rted
by
the
IEA
D [M
3].
Tab
le 7
.7 S
ou
rces
an
d m
eth
od
s fo
r n
atio
nal
est
imat
es o
f p
erso
nal
exp
end
itu
re a
t cu
rren
t p
rice
s1
Ser
ies
Des
crip
tio
nB
ench
mar
k ye
ar +
1B
ench
mar
k ye
ar +
2Q
uar
ters
1. F
or m
ore
info
rmat
ion
on th
e m
etho
dolo
gies
M1
thro
ugh
M6,
see
par
agra
ph 7
.36.
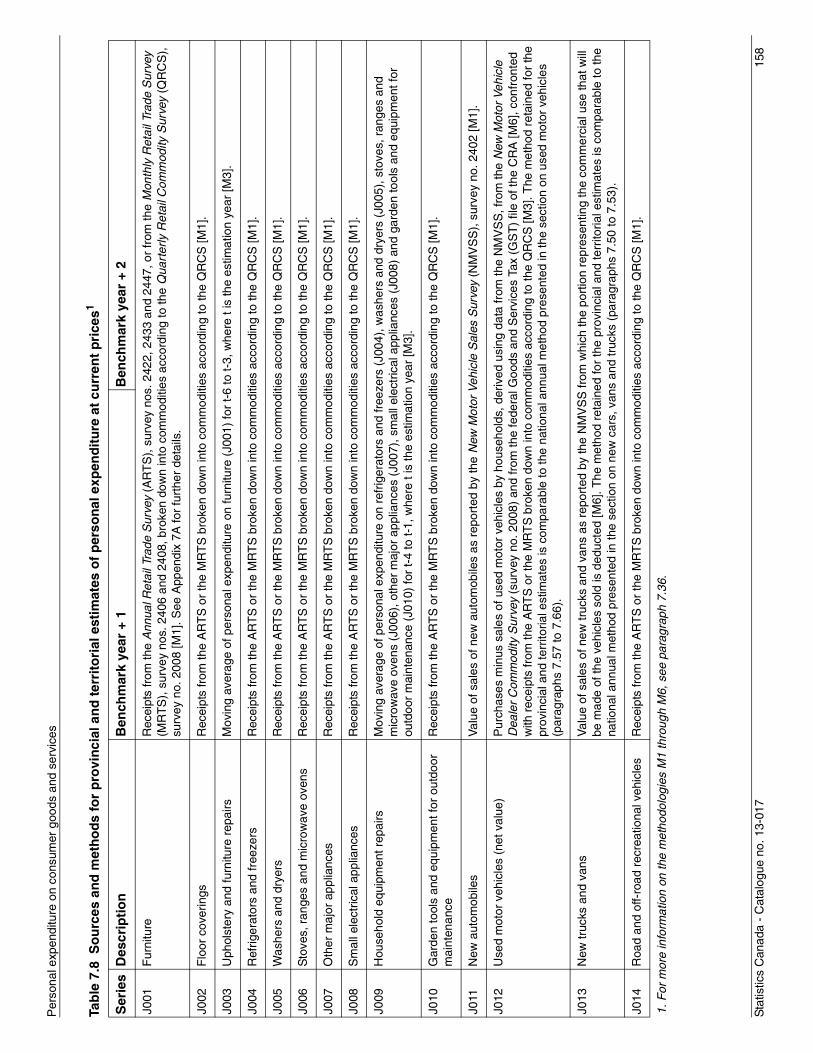
Sta
tistic
s C
anad
a -
Cat
alog
ue n
o. 1
3-01
715
8
Per
sona
l exp
endi
ture
on
cons
umer
goo
ds a
nd s
ervi
ces
Tab
le 7
.8 S
ou
rces
an
d m
eth
od
s fo
r p
rovi
nci
al a
nd
ter
rito
rial
est
imat
es o
f p
erso
nal
exp
end
itu
re a
t cu
rren
t p
rice
s1
Ser
ies
Des
crip
tio
nB
ench
mar
k ye
ar +
1B
ench
mar
k ye
ar +
2
J001
Fur
nitu
reR
ecei
pts
from
the
Ann
ual R
etai
l Tra
de S
urve
y (A
RT
S),
sur
vey
nos.
242
2, 2
433
and
2447
, or
from
the
Mon
thly
Ret
ail T
rade
Sur
vey
(MR
TS
), s
urve
y no
s. 2
406
and
2408
, bro
ken
dow
n in
to c
omm
oditi
es a
ccor
ding
to th
e Q
uart
erly
Ret
ail C
omm
odity
Sur
vey
(QR
CS
),
surv
ey n
o. 2
008
[M1]
. See
App
endi
x 7A
for
furt
her
deta
ils.
J002
Flo
or c
over
ings
Rec
eipt
s fr
om th
e A
RT
S o
r th
e M
RT
S b
roke
n do
wn
into
com
mod
ities
acc
ordi
ng to
the
QR
CS
[M1]
.
J003
Uph
olst
ery
and
furn
iture
rep
airs
Mov
ing
aver
age
of p
erso
nal e
xpen
ditu
re o
n fu
rnitu
re (
J001
) fo
r t-
6 to
t-3,
whe
re t
is th
e es
timat
ion
year
[M3]
.
J004
Ref
riger
ator
s an
d fr
eeze
rsR
ecei
pts
from
the
AR
TS
or
the
MR
TS
bro
ken
dow
n in
to c
omm
oditi
es a
ccor
ding
to th
e Q
RC
S [M
1].
J005
Was
hers
and
dry
ers
Rec
eipt
s fr
om th
e A
RT
S o
r th
e M
RT
S b
roke
n do
wn
into
com
mod
ities
acc
ordi
ng to
the
QR
CS
[M1]
.
J006
Sto
ves,
ran
ges
and
mic
row
ave
oven
sR
ecei
pts
from
the
AR
TS
or
the
MR
TS
bro
ken
dow
n in
to c
omm
oditi
es a
ccor
ding
to th
e Q
RC
S [M
1].
J007
O
ther
maj
or a
pplia
nces
Rec
eipt
s fr
om th
e A
RT
S o
r th
e M
RT
S b
roke
n do
wn
into
com
mod
ities
acc
ordi
ng to
the
QR
CS
[M1]
.
J008
Sm
all e
lect
rical
app
lianc
esR
ecei
pts
from
the
AR
TS
or
the
MR
TS
bro
ken
dow
n in
to c
omm
oditi
es a
ccor
ding
to th
e Q
RC
S [M
1].
J009
Hou
seho
ld e
quip
men
t rep
airs
Mov
ing
aver
age
of p
erso
nal e
xpen
ditu
re o
n re
frig
erat
ors
and
free
zers
(J0
04),
was
hers
and
dry
ers
(J00
5), s
tove
s, r
ange
s an
d m
icro
wav
e ov
ens
(J00
6), o
ther
maj
or a
pplia
nces
(J0
07),
sm
all e
lect
rical
app
lianc
es (
J008
) an
d ga
rden
tool
s an
d eq
uipm
ent f
or
outd
oor
mai
nten
ance
(J0
10)
for
t-4
to t-
1, w
here
t is
the
estim
atio
n ye
ar [M
3].
J010
Gar
den
tool
s an
d eq
uipm
ent f
or o
utdo
or
mai
nten
ance
Rec
eipt
s fr
om th
e A
RT
S o
r th
e M
RT
S b
roke
n do
wn
into
com
mod
ities
acc
ordi
ng to
the
QR
CS
[M1]
.
J011
New
aut
omob
iles
Val
ue o
f sal
es o
f new
aut
omob
iles
as r
epor
ted
by th
e N
ew M
otor
Veh
icle
Sal
es S
urve
y (N
MV
SS
), s
urve
y no
. 240
2 [M
1].
J012
Use
d m
otor
veh
icle
s (n
et v
alue
)P
urch
ases
min
us s
ales
of u
sed
mot
or v
ehic
les
by h
ouse
hold
s, d
eriv
ed u
sing
dat
a fr
om th
e N
MV
SS
, fro
m th
e N
ew M
otor
Veh
icle
D
eale
r C
omm
odity
Sur
vey
(sur
vey
no. 2
008)
and
from
the
fede
ral G
oods
and
Ser
vice
s Ta
x (G
ST
) fil
e of
the
CR
A [M
6], c
onfr
onte
d w
ith r
ecei
pts
from
the
AR
TS
or
the
MR
TS
bro
ken
dow
n in
to c
omm
oditi
es a
ccor
ding
to th
e Q
RC
S [M
3]. T
he m
etho
d re
tain
ed fo
r th
e pr
ovin
cial
and
terr
itoria
l est
imat
es is
com
para
ble
to th
e na
tiona
l ann
ual m
etho
d pr
esen
ted
in th
e se
ctio
n on
use
d m
otor
veh
icle
s (p
arag
raph
s 7.
57 to
7.6
6).
J013
New
truc
ks a
nd v
ans
Val
ue o
f sal
es o
f new
truc
ks a
nd v
ans
as r
epor
ted
by th
e N
MV
SS
from
whi
ch th
e po
rtio
n re
pres
entin
g th
e co
mm
erci
al u
se th
at w
ill
be m
ade
of th
e ve
hicl
es s
old
is d
educ
ted
[M6]
. The
met
hod
reta
ined
for
the
prov
inci
al a
nd te
rrito
rial e
stim
ates
is c
ompa
rabl
e to
the
natio
nal a
nnua
l met
hod
pres
ente
d in
the
sect
ion
on n
ew c
ars,
van
s an
d tr
ucks
(pa
ragr
aphs
7.5
0 to
7.5
3).
J014
Roa
d an
d of
f-ro
ad r
ecre
atio
nal v
ehic
les
Rec
eipt
s fr
om th
e A
RT
S o
r th
e M
RT
S b
roke
n do
wn
into
com
mod
ities
acc
ordi
ng to
the
QR
CS
[M1]
.
1. F
or m
ore
info
rmat
ion
on th
e m
etho
dolo
gies
M1
thro
ugh
M6,
see
par
agra
ph 7
.36.
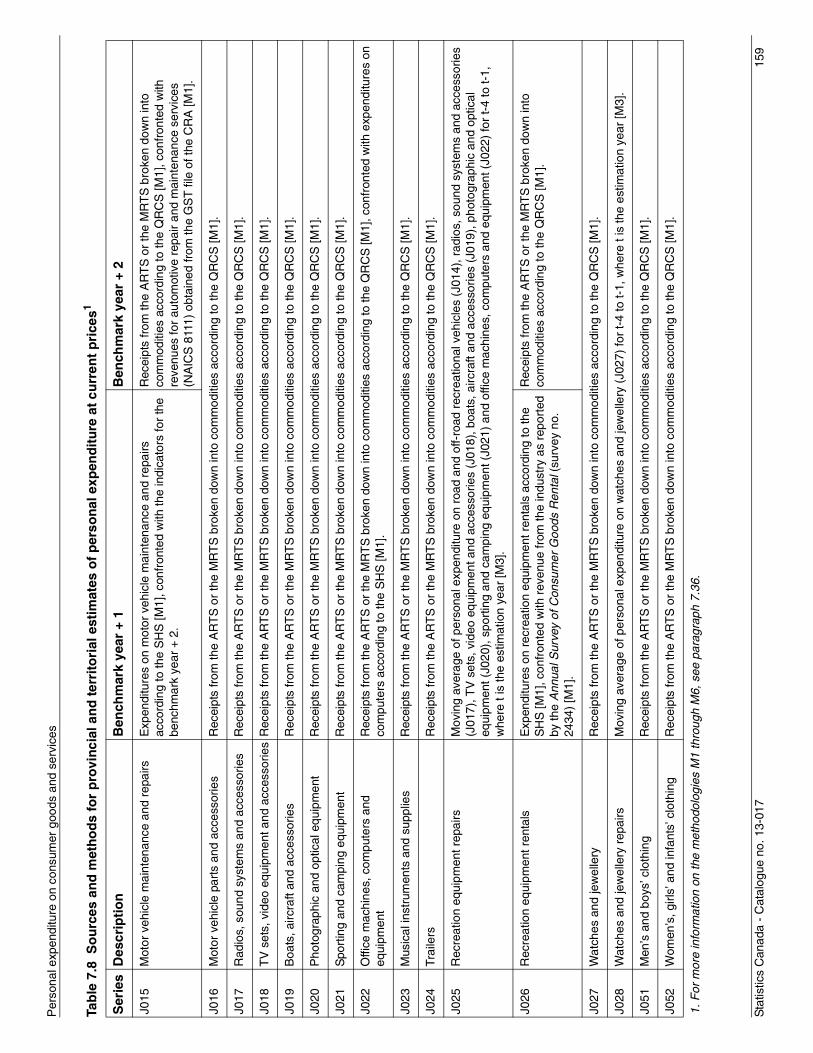
Sta
tistic
s C
anad
a -
Cat
alog
ue n
o. 1
3-01
715
9
Per
sona
l exp
endi
ture
on
cons
umer
goo
ds a
nd s
ervi
ces
J015
Mot
or v
ehic
le m
aint
enan
ce a
nd r
epai
rsE
xpen
ditu
res
on m
otor
veh
icle
mai
nten
ance
and
rep
airs
ac
cord
ing
to th
e S
HS
[M1]
, con
fron
ted
with
the
indi
cato
rs fo
r th
e be
nchm
ark
year
+ 2
.
Rec
eipt
s fr
om th
e A
RT
S o
r th
e M
RT
S b
roke
n do
wn
into
co
mm
oditi
es a
ccor
ding
to th
e Q
RC
S [M
1], c
onfr
onte
d w
ith
reve
nues
for
auto
mot
ive
repa
ir an
d m
aint
enan
ce s
ervi
ces
(NA
ICS
811
1) o
btai
ned
from
the
GS
T fi
le o
f the
CR
A [M
1].
J016
Mot
or v
ehic
le p
arts
and
acc
esso
ries
Rec
eipt
s fr
om th
e A
RT
S o
r th
e M
RT
S b
roke
n do
wn
into
com
mod
ities
acc
ordi
ng to
the
QR
CS
[M1]
.
J017
Rad
ios,
sou
nd s
yste
ms
and
acce
ssor
ies
Rec
eipt
s fr
om th
e A
RT
S o
r th
e M
RT
S b
roke
n do
wn
into
com
mod
ities
acc
ordi
ng to
the
QR
CS
[M1]
.
J018
TV
set
s, v
ideo
equ
ipm
ent a
nd a
cces
sorie
sR
ecei
pts
from
the
AR
TS
or
the
MR
TS
bro
ken
dow
n in
to c
omm
oditi
es a
ccor
ding
to th
e Q
RC
S [M
1].
J019
Boa
ts, a
ircra
ft an
d ac
cess
orie
sR
ecei
pts
from
the
AR
TS
or
the
MR
TS
bro
ken
dow
n in
to c
omm
oditi
es a
ccor
ding
to th
e Q
RC
S [M
1].
J020
Pho
togr
aphi
c an
d op
tical
equ
ipm
ent
Rec
eipt
s fr
om th
e A
RT
S o
r th
e M
RT
S b
roke
n do
wn
into
com
mod
ities
acc
ordi
ng to
the
QR
CS
[M1]
.
J021
Spo
rtin
g an
d ca
mpi
ng e
quip
men
tR
ecei
pts
from
the
AR
TS
or
the
MR
TS
bro
ken
dow
n in
to c
omm
oditi
es a
ccor
ding
to th
e Q
RC
S [M
1].
J022
Offi
ce m
achi
nes,
com
pute
rs a
nd
equi
pmen
tR
ecei
pts
from
the
AR
TS
or
the
MR
TS
bro
ken
dow
n in
to c
omm
oditi
es a
ccor
ding
to th
e Q
RC
S [M
1], c
onfr
onte
d w
ith e
xpen
ditu
res
on
com
pute
rs a
ccor
ding
to th
e S
HS
[M1]
.
J023
Mus
ical
inst
rum
ents
and
sup
plie
sR
ecei
pts
from
the
AR
TS
or
the
MR
TS
bro
ken
dow
n in
to c
omm
oditi
es a
ccor
ding
to th
e Q
RC
S [M
1].
J024
Trai
lers
Rec
eipt
s fr
om th
e A
RT
S o
r th
e M
RT
S b
roke
n do
wn
into
com
mod
ities
acc
ordi
ng to
the
QR
CS
[M1]
.
J025
Rec
reat
ion
equi
pmen
t rep
airs
Mov
ing
aver
age
of p
erso
nal e
xpen
ditu
re o
n ro
ad a
nd o
ff-ro
ad r
ecre
atio
nal v
ehic
les
(J01
4), r
adio
s, s
ound
sys
tem
s an
d ac
cess
orie
s (J
017)
, TV
set
s, v
ideo
equ
ipm
ent a
nd a
cces
sorie
s (J
018)
, boa
ts, a
ircra
ft an
d ac
cess
orie
s (J
019)
, pho
togr
aphi
c an
d op
tical
eq
uipm
ent (
J020
), s
port
ing
and
cam
ping
equ
ipm
ent (
J021
) an
d of
fice
mac
hine
s, c
ompu
ters
and
equ
ipm
ent (
J022
) fo
r t-
4 to
t-1,
w
here
t is
the
estim
atio
n ye
ar [M
3].
J026
Rec
reat
ion
equi
pmen
t ren
tals
Exp
endi
ture
s on
rec
reat
ion
equi
pmen
t ren
tals
acc
ordi
ng to
the
SH
S [M
1], c
onfr
onte
d w
ith r
even
ue fr
om th
e in
dust
ry a
s re
port
ed
by th
e A
nnua
l Sur
vey
of C
onsu
mer
Goo
ds R
enta
l (su
rvey
no.
24
34)
[M1]
.
Rec
eipt
s fr
om th
e A
RT
S o
r th
e M
RT
S b
roke
n do
wn
into
co
mm
oditi
es a
ccor
ding
to th
e Q
RC
S [M
1].
J027
Wat
ches
and
jew
elle
ryR
ecei
pts
from
the
AR
TS
or
the
MR
TS
bro
ken
dow
n in
to c
omm
oditi
es a
ccor
ding
to th
e Q
RC
S [M
1].
J028
Wat
ches
and
jew
elle
ry r
epai
rsM
ovin
g av
erag
e of
per
sona
l exp
endi
ture
on
wat
ches
and
jew
elle
ry (
J027
) fo
r t-
4 to
t-1,
whe
re t
is th
e es
timat
ion
year
[M3]
.
J051
Men
’s a
nd b
oys’
clo
thin
gR
ecei
pts
from
the
AR
TS
or
the
MR
TS
bro
ken
dow
n in
to c
omm
oditi
es a
ccor
ding
to th
e Q
RC
S [M
1].
J052
Wom
en’s
, girl
s’ a
nd in
fant
s’ c
loth
ing
Rec
eipt
s fr
om th
e A
RT
S o
r th
e M
RT
S b
roke
n do
wn
into
com
mod
ities
acc
ordi
ng to
the
QR
CS
[M1]
.
Tab
le 7
.8 S
ou
rces
an
d m
eth
od
s fo
r p
rovi
nci
al a
nd
ter
rito
rial
est
imat
es o
f p
erso
nal
exp
end
itu
re a
t cu
rren
t p
rice
s1
Ser
ies
Des
crip
tio
nB
ench
mar
k ye
ar +
1B
ench
mar
k ye
ar +
2
1. F
or m
ore
info
rmat
ion
on th
e m
etho
dolo
gies
M1
thro
ugh
M6,
see
par
agra
ph 7
.36.
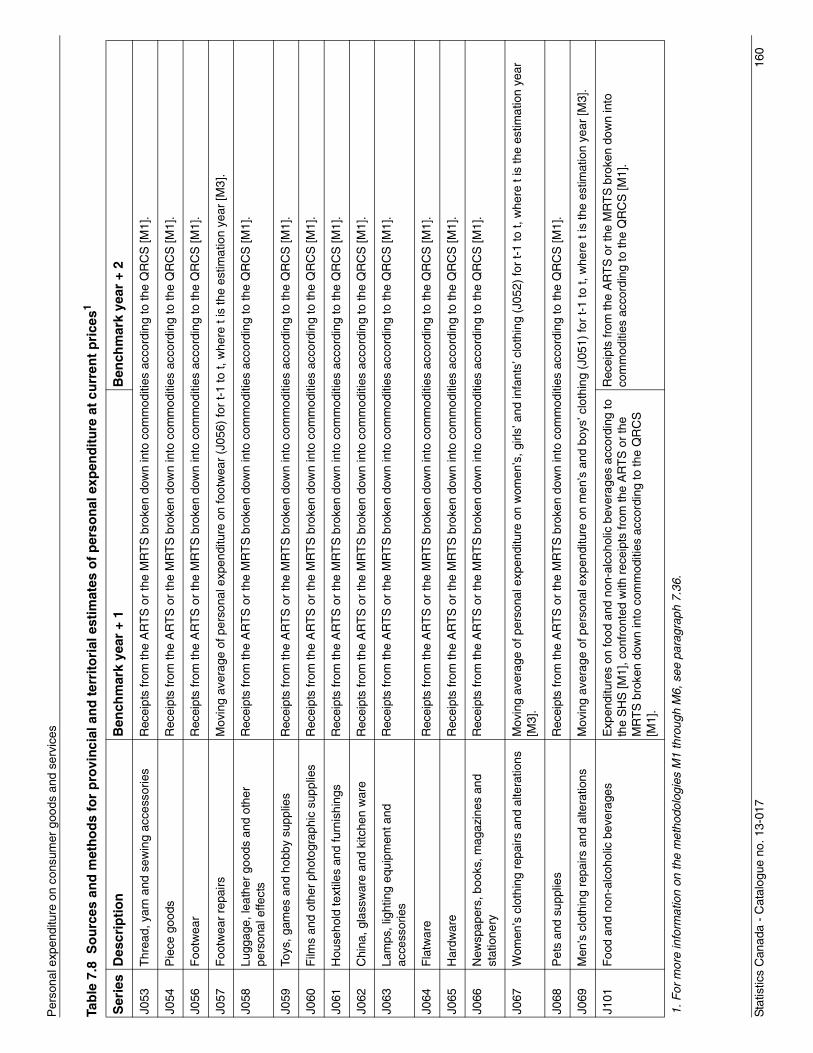
Sta
tistic
s C
anad
a -
Cat
alog
ue n
o. 1
3-01
716
0
Per
sona
l exp
endi
ture
on
cons
umer
goo
ds a
nd s
ervi
ces
J053
Thr
ead,
yar
n an
d se
win
g ac
cess
orie
sR
ecei
pts
from
the
AR
TS
or
the
MR
TS
bro
ken
dow
n in
to c
omm
oditi
es a
ccor
ding
to th
e Q
RC
S [M
1].
J054
Pie
ce g
oods
Rec
eipt
s fr
om th
e A
RT
S o
r th
e M
RT
S b
roke
n do
wn
into
com
mod
ities
acc
ordi
ng to
the
QR
CS
[M1]
.
J056
F
ootw
ear
Rec
eipt
s fr
om th
e A
RT
S o
r th
e M
RT
S b
roke
n do
wn
into
com
mod
ities
acc
ordi
ng to
the
QR
CS
[M1]
.
J057
F
ootw
ear
repa
irsM
ovin
g av
erag
e of
per
sona
l exp
endi
ture
on
foot
wea
r (J
056)
for
t-1
to t,
whe
re t
is th
e es
timat
ion
year
[M3]
.
J058
Lugg
age,
leat
her
good
s an
d ot
her
pers
onal
effe
cts
Rec
eipt
s fr
om th
e A
RT
S o
r th
e M
RT
S b
roke
n do
wn
into
com
mod
ities
acc
ordi
ng to
the
QR
CS
[M1]
.
J059
Toys
, gam
es a
nd h
obby
sup
plie
sR
ecei
pts
from
the
AR
TS
or
the
MR
TS
bro
ken
dow
n in
to c
omm
oditi
es a
ccor
ding
to th
e Q
RC
S [M
1].
J060
Film
s an
d ot
her
phot
ogra
phic
sup
plie
sR
ecei
pts
from
the
AR
TS
or
the
MR
TS
bro
ken
dow
n in
to c
omm
oditi
es a
ccor
ding
to th
e Q
RC
S [M
1].
J061
Hou
seho
ld te
xtile
s an
d fu
rnis
hing
sR
ecei
pts
from
the
AR
TS
or
the
MR
TS
bro
ken
dow
n in
to c
omm
oditi
es a
ccor
ding
to th
e Q
RC
S [M
1].
J062
Chi
na, g
lass
war
e an
d ki
tche
n w
are
Rec
eipt
s fr
om th
e A
RT
S o
r th
e M
RT
S b
roke
n do
wn
into
com
mod
ities
acc
ordi
ng to
the
QR
CS
[M1]
.
J063
Lam
ps, l
ight
ing
equi
pmen
t and
ac
cess
orie
sR
ecei
pts
from
the
AR
TS
or
the
MR
TS
bro
ken
dow
n in
to c
omm
oditi
es a
ccor
ding
to th
e Q
RC
S [M
1].
J064
Fla
twar
eR
ecei
pts
from
the
AR
TS
or
the
MR
TS
bro
ken
dow
n in
to c
omm
oditi
es a
ccor
ding
to th
e Q
RC
S [M
1].
J065
Har
dwar
eR
ecei
pts
from
the
AR
TS
or
the
MR
TS
bro
ken
dow
n in
to c
omm
oditi
es a
ccor
ding
to th
e Q
RC
S [M
1].
J066
New
spap
ers,
boo
ks, m
agaz
ines
and
st
atio
nery
Rec
eipt
s fr
om th
e A
RT
S o
r th
e M
RT
S b
roke
n do
wn
into
com
mod
ities
acc
ordi
ng to
the
QR
CS
[M1]
.
J067
Wom
en’s
clo
thin
g re
pairs
and
alte
ratio
nsM
ovin
g av
erag
e of
per
sona
l exp
endi
ture
on
wom
en’s
, girl
s’ a
nd in
fant
s’ c
loth
ing
(J05
2) fo
r t-
1 to
t, w
here
t is
the
estim
atio
n ye
ar
[M3]
.
J068
Pet
s an
d su
pplie
sR
ecei
pts
from
the
AR
TS
or
the
MR
TS
bro
ken
dow
n in
to c
omm
oditi
es a
ccor
ding
to th
e Q
RC
S [M
1].
J069
Men
’s c
loth
ing
repa
irs a
nd a
ltera
tions
Mov
ing
aver
age
of p
erso
nal e
xpen
ditu
re o
n m
en’s
and
boy
s’ c
loth
ing
(J05
1) fo
r t-
1 to
t, w
here
t is
the
estim
atio
n ye
ar [M
3].
J101
Foo
d an
d no
n-al
coho
lic b
ever
ages
Exp
endi
ture
s on
food
and
non
-alc
ohol
ic b
ever
ages
acc
ordi
ng to
th
e S
HS
[M1]
, con
fron
ted
with
rec
eipt
s fr
om th
e A
RT
S o
r th
e M
RT
S b
roke
n do
wn
into
com
mod
ities
acc
ordi
ng to
the
QR
CS
[M
1].
Rec
eipt
s fr
om th
e A
RT
S o
r th
e M
RT
S b
roke
n do
wn
into
co
mm
oditi
es a
ccor
ding
to th
e Q
RC
S [M
1].
Tab
le 7
.8 S
ou
rces
an
d m
eth
od
s fo
r p
rovi
nci
al a
nd
ter
rito
rial
est
imat
es o
f p
erso
nal
exp
end
itu
re a
t cu
rren
t p
rice
s1
Ser
ies
Des
crip
tio
nB
ench
mar
k ye
ar +
1B
ench
mar
k ye
ar +
2
1. F
or m
ore
info
rmat
ion
on th
e m
etho
dolo
gies
M1
thro
ugh
M6,
see
par
agra
ph 7
.36.
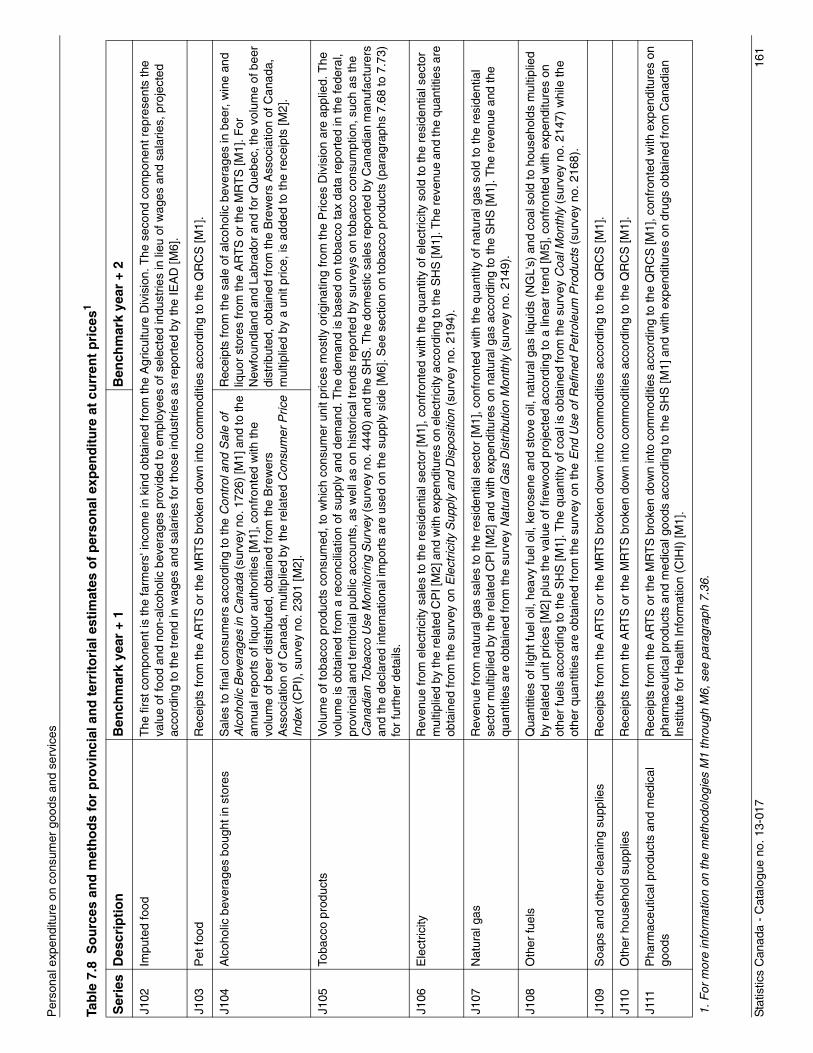
Sta
tistic
s C
anad
a -
Cat
alog
ue n
o. 1
3-01
716
1
Per
sona
l exp
endi
ture
on
cons
umer
goo
ds a
nd s
ervi
ces
J102
Impu
ted
food
T
he fi
rst c
ompo
nent
is th
e fa
rmer
s' in
com
e in
kin
d ob
tain
ed fr
om th
e A
gric
ultu
re D
ivis
ion.
The
sec
ond
com
pone
nt r
epre
sent
s th
e va
lue
of fo
od a
nd n
on-a
lcoh
olic
bev
erag
es p
rovi
ded
to e
mpl
oyee
s of
sel
ecte
d in
dust
ries
in li
eu o
f wag
es a
nd s
alar
ies,
pro
ject
ed
acco
rdin
g to
the
tren
d in
wag
es a
nd s
alar
ies
for
thos
e in
dust
ries
as r
epor
ted
by th
e IE
AD
[M6]
.
J103
Pet
food
Rec
eipt
s fr
om th
e A
RT
S o
r th
e M
RT
S b
roke
n do
wn
into
com
mod
ities
acc
ordi
ng to
the
QR
CS
[M1]
.
J104
Alc
ohol
ic b
ever
ages
bou
ght i
n st
ores
Sal
es to
fina
l con
sum
ers
acco
rdin
g to
the
Con
trol
and
Sal
e of
A
lcoh
olic
Bev
erag
es in
Can
ada
(sur
vey
no. 1
726)
[M1]
and
to th
e an
nual
rep
orts
of l
iquo
r au
thor
ities
[M1]
, con
fron
ted
with
the
volu
me
of b
eer
dist
ribut
ed, o
btai
ned
from
the
Bre
wer
s A
ssoc
iatio
n of
Can
ada,
mul
tiplie
d by
the
rela
ted
Con
sum
er P
rice
Inde
x (C
PI)
, sur
vey
no. 2
301
[M2]
.
Rec
eipt
s fr
om th
e sa
le o
f alc
ohol
ic b
ever
ages
in b
eer,
win
e an
d liq
uor
stor
es fr
om th
e A
RT
S o
r th
e M
RT
S [M
1]. F
or
New
foun
dlan
d an
d La
brad
or a
nd fo
r Q
uebe
c, th
e vo
lum
e of
bee
r di
strib
uted
, obt
aine
d fr
om th
e B
rew
ers
Ass
ocia
tion
of C
anad
a,
mul
tiplie
d by
a u
nit p
rice,
is a
dded
to th
e re
ceip
ts [M
2].
J105
Toba
cco
prod
ucts
Vol
ume
of to
bacc
o pr
oduc
ts c
onsu
med
, to
whi
ch c
onsu
mer
uni
t pric
es m
ostly
orig
inat
ing
from
the
Pric
es D
ivis
ion
are
appl
ied.
The
vo
lum
e is
obt
aine
d fr
om a
rec
onci
liatio
n of
sup
ply
and
dem
and.
The
dem
and
is b
ased
on
toba
cco
tax
data
rep
orte
d in
the
fede
ral,
prov
inci
al a
nd te
rrito
rial p
ublic
acc
ount
s, a
s w
ell a
s on
his
toric
al tr
ends
rep
orte
d by
sur
veys
on
toba
cco
cons
umpt
ion,
suc
h as
the
Can
adia
n To
bacc
o U
se M
onito
ring
Sur
vey
(sur
vey
no. 4
440)
and
the
SH
S. T
he d
omes
tic s
ales
rep
orte
d by
Can
adia
n m
anuf
actu
rers
an
d th
e de
clar
ed in
tern
atio
nal i
mpo
rts
are
used
on
the
supp
ly s
ide
[M6]
. See
sec
tion
on to
bacc
o pr
oduc
ts (
para
grap
hs 7
.68
to 7
.73)
fo
r fu
rthe
r de
tails
.
J106
Ele
ctric
ityR
even
ue fr
om e
lect
ricity
sal
es to
the
resi
dent
ial s
ecto
r [M
1], c
onfr
onte
d w
ith th
e qu
antit
y of
ele
ctric
ity s
old
to th
e re
side
ntia
l sec
tor
mul
tiplie
d by
the
rela
ted
CP
I [M
2] a
nd w
ith e
xpen
ditu
res
on e
lect
ricity
acc
ordi
ng to
the
SH
S [M
1]. T
he re
venu
e an
d th
e qu
antit
ies
are
obta
ined
from
the
surv
ey o
n E
lect
ricity
Sup
ply
and
Dis
posi
tion
(sur
vey
no. 2
194)
.
J107
Nat
ural
gas
Rev
enue
from
nat
ural
gas
sal
es to
the
resi
dent
ial s
ecto
r [M
1], c
onfr
onte
d w
ith th
e qu
antit
y of
nat
ural
gas
sol
d to
the
resi
dent
ial
sect
or m
ultip
lied
by th
e re
late
d C
PI [
M2]
and
with
exp
endi
ture
s on
nat
ural
gas
acc
ordi
ng to
the
SH
S [M
1]. T
he r
even
ue a
nd th
e qu
antit
ies
are
obta
ined
from
the
surv
ey N
atur
al G
as D
istr
ibut
ion
Mon
thly
(su
rvey
no.
214
9).
J108
Oth
er fu
els
Qua
ntiti
es o
f lig
ht fu
el o
il, h
eavy
fuel
oil,
ker
osen
e an
d st
ove
oil,
natu
ral g
as li
quid
s (N
GL'
s) a
nd c
oal s
old
to h
ouse
hold
s m
ultip
lied
by r
elat
ed u
nit p
rices
[M2]
plu
s th
e va
lue
of fi
rew
ood
proj
ecte
d ac
cord
ing
to a
line
ar tr
end
[M5]
, con
fron
ted
with
exp
endi
ture
s on
ot
her
fuel
s ac
cord
ing
to th
e S
HS
[M1]
. The
qua
ntity
of c
oal i
s ob
tain
ed fr
om th
e su
rvey
Coa
l Mon
thly
(su
rvey
no.
214
7) w
hile
the
othe
r qu
antit
ies
are
obta
ined
from
the
surv
ey o
n th
e E
nd U
se o
f Ref
ined
Pet
role
um P
rodu
cts
(sur
vey
no. 2
168)
.
J109
Soa
ps a
nd o
ther
cle
anin
g su
pplie
sR
ecei
pts
from
the
AR
TS
or
the
MR
TS
bro
ken
dow
n in
to c
omm
oditi
es a
ccor
ding
to th
e Q
RC
S [M
1].
J110
Oth
er h
ouse
hold
sup
plie
sR
ecei
pts
from
the
AR
TS
or
the
MR
TS
bro
ken
dow
n in
to c
omm
oditi
es a
ccor
ding
to th
e Q
RC
S [M
1].
J111
Pha
rmac
eutic
al p
rodu
cts
and
med
ical
go
ods
Rec
eipt
s fr
om th
e A
RT
S o
r th
e M
RT
S b
roke
n do
wn
into
com
mod
ities
acc
ordi
ng to
the
QR
CS
[M1]
, con
fron
ted
with
exp
endi
ture
s on
ph
arm
aceu
tical
pro
duct
s an
d m
edic
al g
oods
acc
ordi
ng to
the
SH
S [M
1] a
nd w
ith e
xpen
ditu
res
on d
rugs
obt
aine
d fr
om C
anad
ian
Inst
itute
for
Hea
lth In
form
atio
n (C
IHI)
[M1]
.
Tab
le 7
.8 S
ou
rces
an
d m
eth
od
s fo
r p
rovi
nci
al a
nd
ter
rito
rial
est
imat
es o
f p
erso
nal
exp
end
itu
re a
t cu
rren
t p
rice
s1
Ser
ies
Des
crip
tio
nB
ench
mar
k ye
ar +
1B
ench
mar
k ye
ar +
2
1. F
or m
ore
info
rmat
ion
on th
e m
etho
dolo
gies
M1
thro
ugh
M6,
see
par
agra
ph 7
.36.
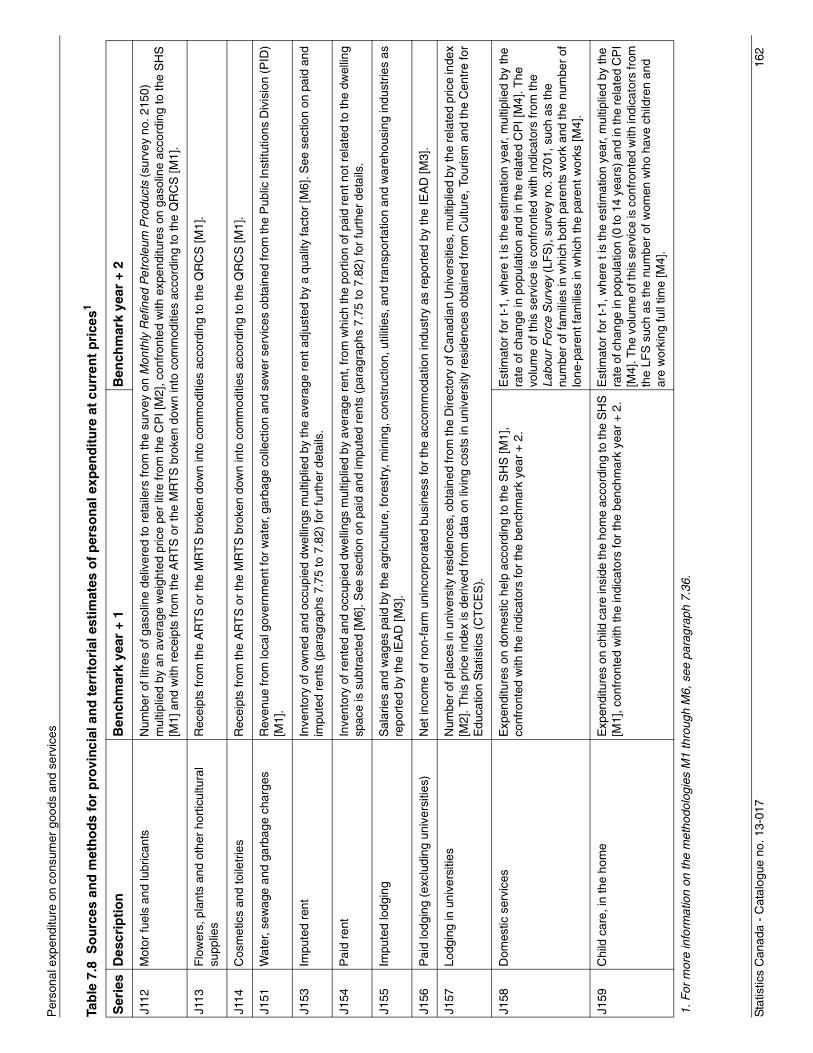
Sta
tistic
s C
anad
a -
Cat
alog
ue n
o. 1
3-01
716
2
Per
sona
l exp
endi
ture
on
cons
umer
goo
ds a
nd s
ervi
ces
J112
Mot
or fu
els
and
lubr
ican
tsN
umbe
r of
litr
es o
f gas
olin
e de
liver
ed to
ret
aile
rs fr
om th
e su
rvey
on
Mon
thly
Ref
ined
Pet
role
um P
rodu
cts
(sur
vey
no. 2
150)
m
ultip
lied
by a
n av
erag
e w
eigh
ted
pric
e pe
r lit
re fr
om th
e C
PI [
M2]
, con
fron
ted
with
exp
endi
ture
s on
gas
olin
e ac
cord
ing
to th
e S
HS
[M
1] a
nd w
ith r
ecei
pts
from
the
AR
TS
or
the
MR
TS
bro
ken
dow
n in
to c
omm
oditi
es a
ccor
ding
to th
e Q
RC
S [M
1].
J113
Flo
wer
s, p
lant
s an
d ot
her
hort
icul
tura
l su
pplie
sR
ecei
pts
from
the
AR
TS
or
the
MR
TS
bro
ken
dow
n in
to c
omm
oditi
es a
ccor
ding
to th
e Q
RC
S [M
1].
J114
Cos
met
ics
and
toile
trie
sR
ecei
pts
from
the
AR
TS
or
the
MR
TS
bro
ken
dow
n in
to c
omm
oditi
es a
ccor
ding
to th
e Q
RC
S [M
1].
J151
Wat
er, s
ewag
e an
d ga
rbag
e ch
arge
sR
even
ue fr
om lo
cal g
over
nmen
t for
wat
er, g
arba
ge c
olle
ctio
n an
d se
wer
ser
vice
s ob
tain
ed fr
om th
e P
ublic
Inst
itutio
ns D
ivis
ion
(PID
) [M
1].
J153
Im
pute
d re
ntIn
vent
ory
of o
wne
d an
d oc
cupi
ed d
wel
lings
mul
tiplie
d by
the
aver
age
rent
adj
uste
d by
a q
ualit
y fa
ctor
[M6]
. See
sec
tion
on p
aid
and
impu
ted
rent
s (p
arag
raph
s 7.
75 to
7.8
2) fo
r fu
rthe
r de
tails
.
J154
P
aid
rent
Inve
ntor
y of
ren
ted
and
occu
pied
dw
ellin
gs m
ultip
lied
by a
vera
ge r
ent,
from
whi
ch th
e po
rtio
n of
pai
d re
nt n
ot r
elat
ed to
the
dwel
ling
spac
e is
sub
trac
ted
[M6]
. See
sec
tion
on p
aid
and
impu
ted
rent
s (p
arag
raph
s 7.
75 to
7.8
2) fo
r fu
rthe
r de
tails
.
J155
Impu
ted
lodg
ing
Sal
arie
s an
d w
ages
pai
d by
the
agric
ultu
re, f
ores
try,
min
ing,
con
stru
ctio
n, u
tiliti
es, a
nd tr
ansp
orta
tion
and
war
ehou
sing
indu
strie
s as
re
port
ed b
y th
e IE
AD
[M3]
.
J156
Pai
d lo
dgin
g (e
xclu
ding
uni
vers
ities
)N
et in
com
e of
non
-far
m u
ninc
orpo
rate
d bu
sine
ss fo
r th
e ac
com
mod
atio
n in
dust
ry a
s re
port
ed b
y th
e IE
AD
[M3]
.
J157
Lodg
ing
in u
nive
rsiti
esN
umbe
r of p
lace
s in
uni
vers
ity re
side
nces
, obt
aine
d fr
om th
e D
irect
ory
of C
anad
ian
Uni
vers
ities
, mul
tiplie
d by
the
rela
ted
pric
e in
dex
[M2]
. Thi
s pr
ice
inde
x is
der
ived
from
dat
a on
livi
ng c
osts
in u
nive
rsity
res
iden
ces
obta
ined
from
Cul
ture
, Tou
rism
and
the
Cen
tre
for
Edu
catio
n S
tatis
tics
(CT
CE
S).
J158
Dom
estic
ser
vice
sE
xpen
ditu
res
on d
omes
tic h
elp
acco
rdin
g to
the
SH
S [M
1],
conf
ront
ed w
ith th
e in
dica
tors
for
the
benc
hmar
k ye
ar +
2.
Est
imat
or fo
r t-
1, w
here
t is
the
estim
atio
n ye
ar, m
ultip
lied
by th
e ra
te o
f cha
nge
in p
opul
atio
n an
d in
the
rela
ted
CP
I [M
4]. T
he
volu
me
of th
is s
ervi
ce is
con
fron
ted
with
indi
cato
rs fr
om th
e La
bour
For
ce S
urve
y (L
FS
), s
urve
y no
. 370
1, s
uch
as th
e nu
mbe
r of
fam
ilies
in w
hich
bot
h pa
rent
s w
ork
and
the
num
ber
of
lone
-par
ent f
amili
es in
whi
ch th
e pa
rent
wor
ks [M
4].
J159
Chi
ld c
are,
in th
e ho
me
Exp
endi
ture
s on
chi
ld c
are
insi
de th
e ho
me
acco
rdin
g to
the
SH
S
[M1]
, con
fron
ted
with
the
indi
cato
rs fo
r th
e be
nchm
ark
year
+ 2
.E
stim
ator
for
t-1,
whe
re t
is th
e es
timat
ion
year
, mul
tiplie
d by
the
rate
of c
hang
e in
pop
ulat
ion
(0 to
14
year
s) a
nd in
the
rela
ted
CP
I [M
4]. T
he v
olum
e of
this
ser
vice
is c
onfr
onte
d w
ith in
dica
tors
from
th
e LF
S s
uch
as th
e nu
mbe
r of
wom
en w
ho h
ave
child
ren
and
are
wor
king
full
time
[M4]
.
Tab
le 7
.8 S
ou
rces
an
d m
eth
od
s fo
r p
rovi
nci
al a
nd
ter
rito
rial
est
imat
es o
f p
erso
nal
exp
end
itu
re a
t cu
rren
t p
rice
s1
Ser
ies
Des
crip
tio
nB
ench
mar
k ye
ar +
1B
ench
mar
k ye
ar +
2
1. F
or m
ore
info
rmat
ion
on th
e m
etho
dolo
gies
M1
thro
ugh
M6,
see
par
agra
ph 7
.36.
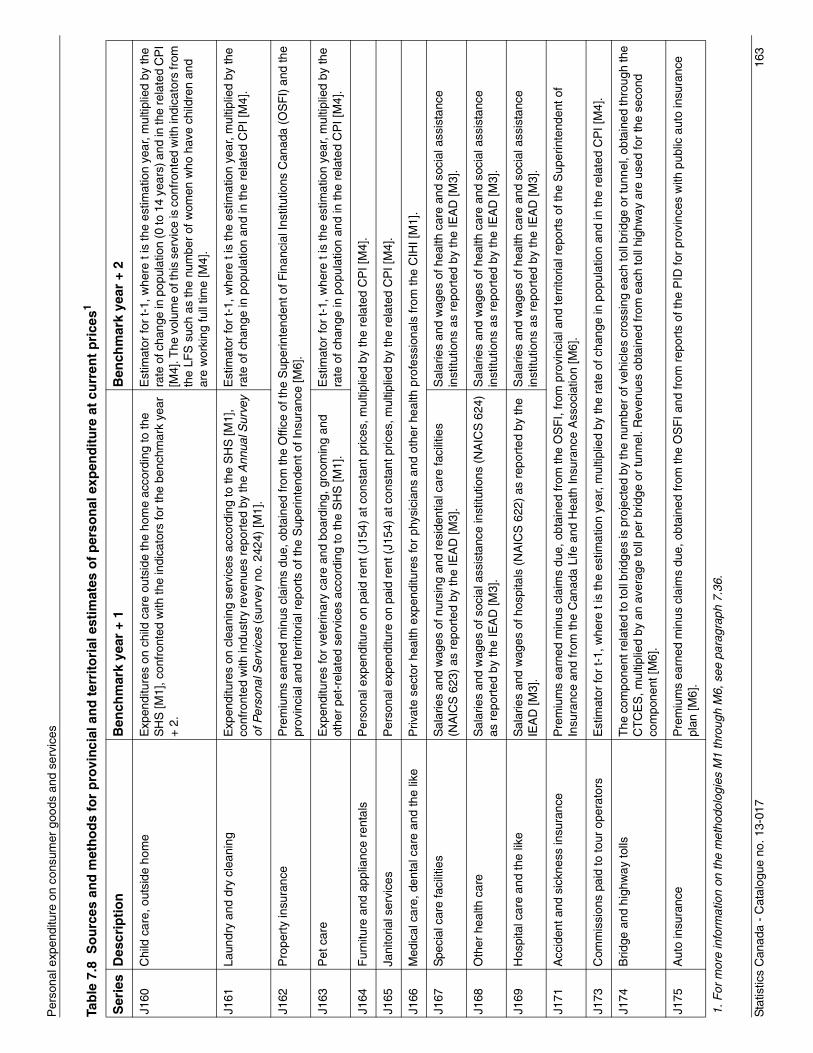
Sta
tistic
s C
anad
a -
Cat
alog
ue n
o. 1
3-01
716
3
Per
sona
l exp
endi
ture
on
cons
umer
goo
ds a
nd s
ervi
ces
J160
Chi
ld c
are,
out
side
hom
eE
xpen
ditu
res
on c
hild
car
e ou
tsid
e th
e ho
me
acco
rdin
g to
the
SH
S [M
1], c
onfr
onte
d w
ith th
e in
dica
tors
for
the
benc
hmar
k ye
ar
+ 2.
Est
imat
or fo
r t-
1, w
here
t is
the
estim
atio
n ye
ar, m
ultip
lied
by th
e ra
te o
f cha
nge
in p
opul
atio
n (0
to 1
4 ye
ars)
and
in th
e re
late
d C
PI
[M4]
. The
vol
ume
of th
is s
ervi
ce is
con
fron
ted
with
indi
cato
rs fr
om
the
LFS
suc
h as
the
num
ber
of w
omen
who
hav
e ch
ildre
n an
d ar
e w
orki
ng fu
ll tim
e [M
4].
J161
Laun
dry
and
dry
clea
ning
Exp
endi
ture
s on
cle
anin
g se
rvic
es a
ccor
ding
to th
e S
HS
[M1]
, co
nfro
nted
with
indu
stry
rev
enue
s re
port
ed b
y th
e A
nnua
l Sur
vey
of P
erso
nal S
ervi
ces
(sur
vey
no. 2
424)
[M1]
.
Est
imat
or fo
r t-
1, w
here
t is
the
estim
atio
n ye
ar, m
ultip
lied
by th
e ra
te o
f cha
nge
in p
opul
atio
n an
d in
the
rela
ted
CP
I [M
4].
J162
Pro
pert
y in
sura
nce
Pre
miu
ms
earn
ed m
inus
cla
ims
due,
obt
aine
d fr
om th
e O
ffice
of t
he S
uper
inte
nden
t of F
inan
cial
Inst
itutio
ns C
anad
a (O
SF
I) a
nd th
e pr
ovin
cial
and
terr
itoria
l rep
orts
of t
he S
uper
inte
nden
t of I
nsur
ance
[M6]
.
J163
Pet
car
eE
xpen
ditu
res
for
vete
rinar
y ca
re a
nd b
oard
ing,
gro
omin
g an
d ot
her
pet-
rela
ted
serv
ices
acc
ordi
ng to
the
SH
S [M
1].
Est
imat
or fo
r t-
1, w
here
t is
the
estim
atio
n ye
ar, m
ultip
lied
by th
e ra
te o
f cha
nge
in p
opul
atio
n an
d in
the
rela
ted
CP
I [M
4].
J164
F
urni
ture
and
app
lianc
e re
ntal
sP
erso
nal e
xpen
ditu
re o
n pa
id r
ent (
J154
) at
con
stan
t pric
es, m
ultip
lied
by th
e re
late
d C
PI [
M4]
.
J165
Ja
nito
rial s
ervi
ces
Per
sona
l exp
endi
ture
on
paid
ren
t (J1
54)
at c
onst
ant p
rices
, mul
tiplie
d by
the
rela
ted
CP
I [M
4].
J166
Med
ical
car
e, d
enta
l car
e an
d th
e lik
eP
rivat
e se
ctor
hea
lth e
xpen
ditu
res
for
phys
icia
ns a
nd o
ther
hea
lth p
rofe
ssio
nals
from
the
CIH
I [M
1].
J167
Spe
cial
car
e fa
cilit
ies
Sal
arie
s an
d w
ages
of n
ursi
ng a
nd r
esid
entia
l car
e fa
cilit
ies
(NA
ICS
623
) as
rep
orte
d by
the
IEA
D [M
3].
Sal
arie
s an
d w
ages
of h
ealth
car
e an
d so
cial
ass
ista
nce
inst
itutio
ns a
s re
port
ed b
y th
e IE
AD
[M3]
.
J168
Oth
er h
ealth
car
eS
alar
ies
and
wag
es o
f soc
ial a
ssis
tanc
e in
stitu
tions
(N
AIC
S 6
24)
as r
epor
ted
by th
e IE
AD
[M3]
.S
alar
ies
and
wag
es o
f hea
lth c
are
and
soci
al a
ssis
tanc
e in
stitu
tions
as
repo
rted
by
the
IEA
D [M
3].
J169
Hos
pita
l car
e an
d th
e lik
eS
alar
ies
and
wag
es o
f hos
pita
ls (
NA
ICS
622
) as
rep
orte
d by
the
IEA
D [M
3].
Sal
arie
s an
d w
ages
of h
ealth
car
e an
d so
cial
ass
ista
nce
inst
itutio
ns a
s re
port
ed b
y th
e IE
AD
[M3]
.
J171
Acc
iden
t and
sic
knes
s in
sura
nce
Pre
miu
ms
earn
ed m
inus
cla
ims
due,
obt
aine
d fr
om th
e O
SF
I, fr
om p
rovi
ncia
l and
terr
itoria
l rep
orts
of t
he S
uper
inte
nden
t of
Insu
ranc
e an
d fr
om th
e C
anad
a Li
fe a
nd H
eath
Insu
ranc
e A
ssoc
iatio
n [M
6].
J173
Com
mis
sion
s pa
id to
tour
ope
rato
rsE
stim
ator
for
t-1,
whe
re t
is th
e es
timat
ion
year
, mul
tiplie
d by
the
rate
of c
hang
e in
pop
ulat
ion
and
in th
e re
late
d C
PI [
M4]
.
J174
Brid
ge a
nd h
ighw
ay to
llsT
he c
ompo
nent
rel
ated
to to
ll br
idge
s is
pro
ject
ed b
y th
e nu
mbe
r of v
ehic
les
cros
sing
eac
h to
ll br
idge
or t
unne
l, ob
tain
ed th
roug
h th
e C
TC
ES
, mul
tiplie
d by
an
aver
age
toll
per
brid
ge o
r tu
nnel
. Rev
enue
s ob
tain
ed fr
om e
ach
toll
high
way
are
use
d fo
r th
e se
cond
co
mpo
nent
[M6]
.
J175
Aut
o in
sura
nce
Pre
miu
ms
earn
ed m
inus
cla
ims
due,
obt
aine
d fr
om th
e O
SF
I and
from
rep
orts
of t
he P
ID fo
r pr
ovin
ces
with
pub
lic a
uto
insu
ranc
e pl
an [M
6].
Tab
le 7
.8 S
ou
rces
an
d m
eth
od
s fo
r p
rovi
nci
al a
nd
ter
rito
rial
est
imat
es o
f p
erso
nal
exp
end
itu
re a
t cu
rren
t p
rice
s1
Ser
ies
Des
crip
tio
nB
ench
mar
k ye
ar +
1B
ench
mar
k ye
ar +
2
1. F
or m
ore
info
rmat
ion
on th
e m
etho
dolo
gies
M1
thro
ugh
M6,
see
par
agra
ph 7
.36.
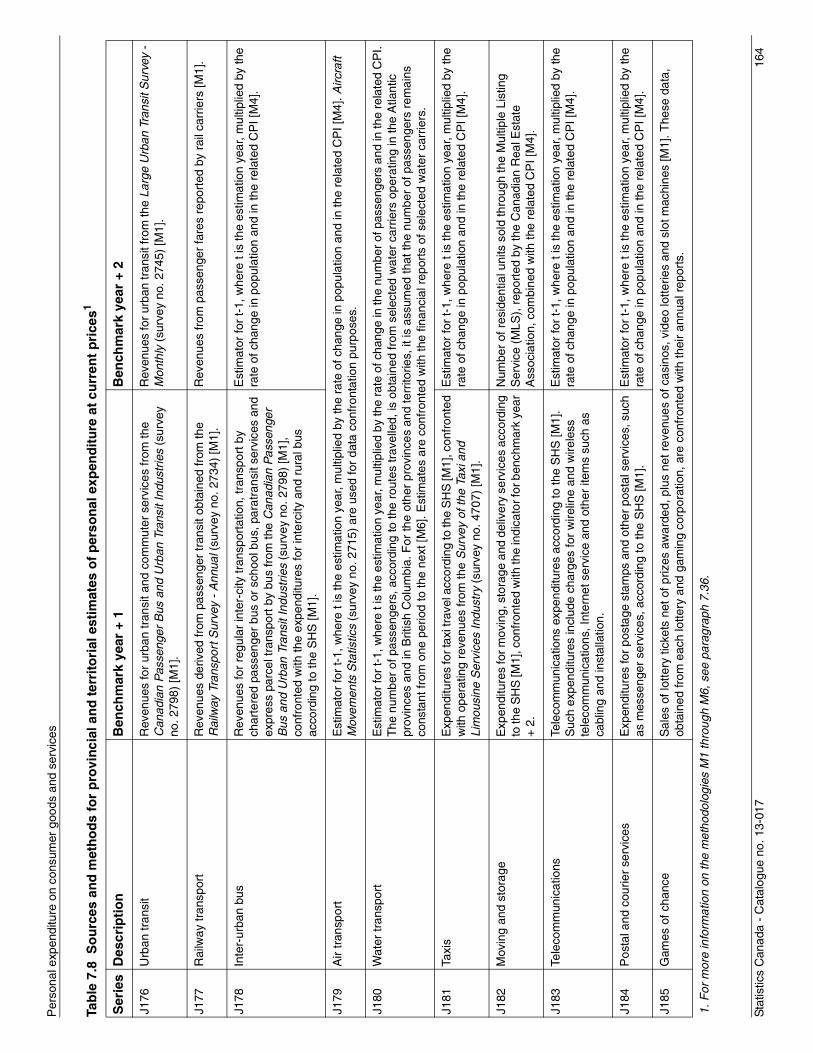
Sta
tistic
s C
anad
a -
Cat
alog
ue n
o. 1
3-01
716
4
Per
sona
l exp
endi
ture
on
cons
umer
goo
ds a
nd s
ervi
ces
J176
Urb
an tr
ansi
tR
even
ues
for
urba
n tr
ansi
t and
com
mut
er s
ervi
ces
from
the
Can
adia
n P
asse
nger
Bus
and
Urb
an T
rans
it In
dust
ries
(sur
vey
no. 2
798)
[M1]
.
Rev
enue
s fo
r ur
ban
tran
sit f
rom
the
Larg
e U
rban
Tra
nsit
Sur
vey
- M
onth
ly (
surv
ey n
o. 2
745)
[M1]
.
J177
Rai
lway
tran
spor
tR
even
ues
deriv
ed fr
om p
asse
nger
tran
sit o
btai
ned
from
the
Rai
lway
Tra
nspo
rt S
urve
y -
Ann
ual (
surv
ey n
o. 2
734)
[M1]
.R
even
ues
from
pas
seng
er fa
res
repo
rted
by
rail
carr
iers
[M1]
.
J178
Inte
r-ur
ban
bus
Rev
enue
s fo
r re
gula
r in
ter-
city
tran
spor
tatio
n, tr
ansp
ort b
y ch
arte
red
pass
enge
r bu
s or
sch
ool b
us, p
arat
rans
it se
rvic
es a
nd
expr
ess
parc
el tr
ansp
ort b
y bu
s fr
om th
e C
anad
ian
Pas
seng
er
Bus
and
Urb
an T
rans
it In
dust
ries
(sur
vey
no. 2
798)
[M1]
, co
nfro
nted
with
the
expe
nditu
res
for
inte
rcity
and
rur
al b
us
acco
rdin
g to
the
SH
S [M
1].
Est
imat
or fo
r t-
1, w
here
t is
the
estim
atio
n ye
ar, m
ultip
lied
by th
e ra
te o
f cha
nge
in p
opul
atio
n an
d in
the
rela
ted
CP
I [M
4].
J179
Air
tran
spor
tE
stim
ator
for
t-1,
whe
re t
is th
e es
timat
ion
year
, mul
tiplie
d by
the
rate
of c
hang
e in
pop
ulat
ion
and
in th
e re
late
d C
PI [
M4]
. Airc
raft
Mov
emen
ts S
tatis
tics
(sur
vey
no. 2
715)
are
use
d fo
r da
ta c
onfr
onta
tion
purp
oses
.
J180
Wat
er tr
ansp
ort
Est
imat
or fo
r t-
1, w
here
t is
the
estim
atio
n ye
ar, m
ultip
lied
by th
e ra
te o
f cha
nge
in th
e nu
mbe
r of
pas
seng
ers
and
in th
e re
late
d C
PI.
The
num
ber
of p
asse
nger
s, a
ccor
ding
to th
e ro
utes
trav
elle
d, is
obt
aine
d fr
om s
elec
ted
wat
er c
arrie
rs o
pera
ting
in th
e A
tlant
ic
prov
ince
s an
d in
Brit
ish
Col
umbi
a. F
or th
e ot
her
prov
ince
s an
d te
rrito
ries,
it is
ass
umed
that
the
num
ber
of p
asse
nger
s re
mai
ns
cons
tant
from
one
per
iod
to th
e ne
xt [M
6]. E
stim
ates
are
con
fron
ted
with
the
finan
cial
rep
orts
of s
elec
ted
wat
er c
arrie
rs.
J181
Taxi
sE
xpen
ditu
res
for t
axi t
rave
l acc
ordi
ng to
the
SH
S [M
1], c
onfr
onte
d w
ith o
pera
ting
reve
nues
from
the
Sur
vey
of th
e Ta
xi a
nd
Lim
ousi
ne S
ervi
ces
Indu
stry
(su
rvey
no.
470
7) [M
1].
Est
imat
or fo
r t-
1, w
here
t is
the
estim
atio
n ye
ar, m
ultip
lied
by th
e ra
te o
f cha
nge
in p
opul
atio
n an
d in
the
rela
ted
CP
I [M
4].
J182
Mov
ing
and
stor
age
Exp
endi
ture
s fo
r mov
ing,
sto
rage
and
del
iver
y se
rvic
es a
ccor
ding
to
the
SH
S [M
1], c
onfr
onte
d w
ith th
e in
dica
tor f
or b
ench
mar
k ye
ar
+ 2.
Num
ber
of r
esid
entia
l uni
ts s
old
thro
ugh
the
Mul
tiple
Lis
ting
Ser
vice
(M
LS),
rep
orte
d by
the
Can
adia
n R
eal E
stat
e A
ssoc
iatio
n, c
ombi
ned
with
the
rela
ted
CP
I [M
4].
J183
Tele
com
mun
icat
ions
Tele
com
mun
icat
ions
exp
endi
ture
s ac
cord
ing
to th
e S
HS
[M1]
. S
uch
expe
nditu
res
incl
ude
char
ges
for
wire
line
and
wire
less
te
leco
mm
unic
atio
ns, I
nter
net s
ervi
ce a
nd o
ther
item
s su
ch a
s ca
blin
g an
d in
stal
latio
n.
Est
imat
or fo
r t-
1, w
here
t is
the
estim
atio
n ye
ar, m
ultip
lied
by th
e ra
te o
f cha
nge
in p
opul
atio
n an
d in
the
rela
ted
CP
I [M
4].
J184
Pos
tal a
nd c
ourie
r se
rvic
esE
xpen
ditu
res
for
post
age
stam
ps a
nd o
ther
pos
tal s
ervi
ces,
suc
h as
mes
seng
er s
ervi
ces,
acc
ordi
ng to
the
SH
S [M
1].
Est
imat
or fo
r t-
1, w
here
t is
the
estim
atio
n ye
ar, m
ultip
lied
by th
e ra
te o
f cha
nge
in p
opul
atio
n an
d in
the
rela
ted
CP
I [M
4].
J185
Gam
es o
f cha
nce
Sal
es o
f lot
tery
tick
ets
net o
f priz
es a
war
ded,
plu
s ne
t rev
enue
s of
cas
inos
, vid
eo lo
tterie
s an
d sl
ot m
achi
nes
[M1]
. The
se d
ata,
ob
tain
ed fr
om e
ach
lotte
ry a
nd g
amin
g co
rpor
atio
n, a
re c
onfr
onte
d w
ith th
eir
annu
al r
epor
ts.
Tab
le 7
.8 S
ou
rces
an
d m
eth
od
s fo
r p
rovi
nci
al a
nd
ter
rito
rial
est
imat
es o
f p
erso
nal
exp
end
itu
re a
t cu
rren
t p
rice
s1
Ser
ies
Des
crip
tio
nB
ench
mar
k ye
ar +
1B
ench
mar
k ye
ar +
2
1. F
or m
ore
info
rmat
ion
on th
e m
etho
dolo
gies
M1
thro
ugh
M6,
see
par
agra
ph 7
.36.
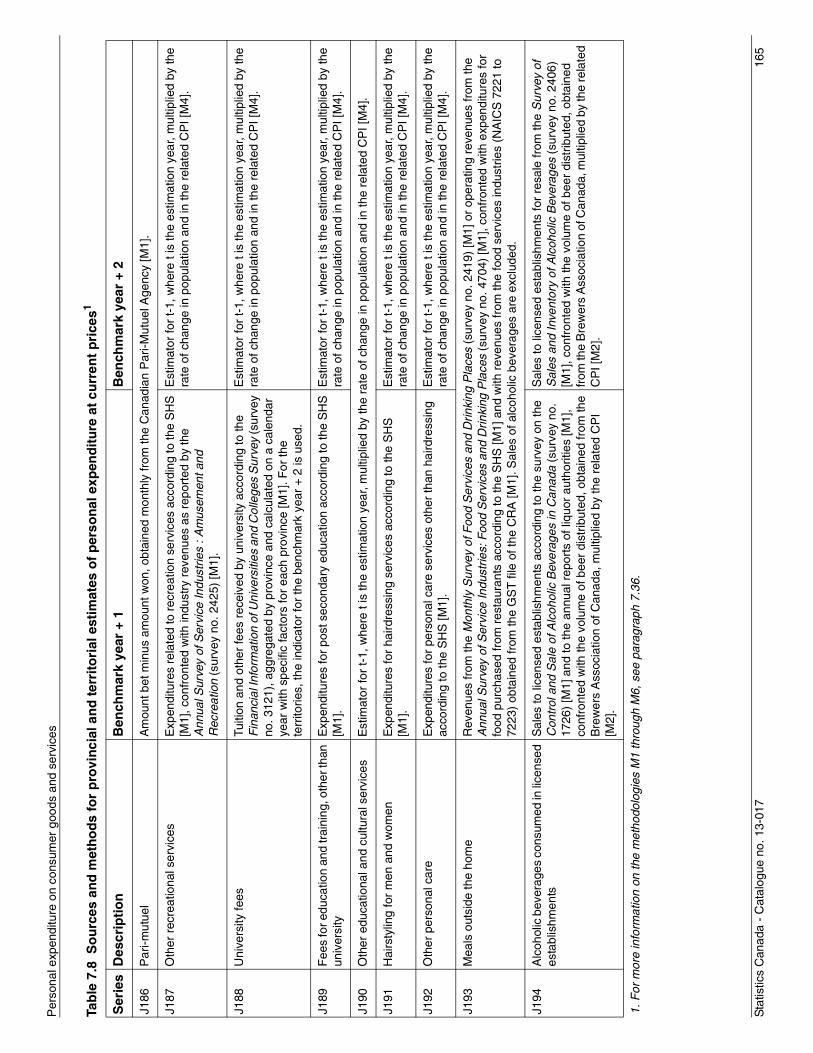
Sta
tistic
s C
anad
a -
Cat
alog
ue n
o. 1
3-01
716
5
Per
sona
l exp
endi
ture
on
cons
umer
goo
ds a
nd s
ervi
ces
J186
Par
i-mut
uel
Am
ount
bet
min
us a
mou
nt w
on, o
btai
ned
mon
thly
from
the
Can
adia
n P
ari-M
utue
l Age
ncy
[M1]
.
J187
Oth
er r
ecre
atio
nal s
ervi
ces
Exp
endi
ture
s re
late
d to
rec
reat
ion
serv
ices
acc
ordi
ng to
the
SH
S
[M1]
, con
fron
ted
with
indu
stry
rev
enue
s as
rep
orte
d by
the
Ann
ual S
urve
y of
Ser
vice
Indu
strie
s : A
mus
emen
t and
R
ecre
atio
n (s
urve
y no
. 242
5) [M
1].
Est
imat
or fo
r t-
1, w
here
t is
the
estim
atio
n ye
ar, m
ultip
lied
by th
e ra
te o
f cha
nge
in p
opul
atio
n an
d in
the
rela
ted
CP
I [M
4].
J188
Uni
vers
ity fe
esTu
ition
and
oth
er fe
es r
ecei
ved
by u
nive
rsity
acc
ordi
ng to
the
Fin
anci
al In
form
atio
n of
Uni
vers
ities
and
Col
lege
s S
urve
y (s
urve
y no
. 312
1), a
ggre
gate
d by
pro
vinc
e an
d ca
lcul
ated
on
a ca
lend
ar
year
with
spe
cific
fact
ors
for
each
pro
vinc
e [M
1]. F
or th
e te
rrito
ries,
the
indi
cato
r fo
r th
e be
nchm
ark
year
+ 2
is u
sed.
Est
imat
or fo
r t-
1, w
here
t is
the
estim
atio
n ye
ar, m
ultip
lied
by th
e ra
te o
f cha
nge
in p
opul
atio
n an
d in
the
rela
ted
CP
I [M
4].
J189
Fee
s fo
r edu
catio
n an
d tr
aini
ng, o
ther
than
un
iver
sity
Exp
endi
ture
s fo
r po
st s
econ
dary
edu
catio
n ac
cord
ing
to th
e S
HS
[M
1].
Est
imat
or fo
r t-
1, w
here
t is
the
estim
atio
n ye
ar, m
ultip
lied
by th
e ra
te o
f cha
nge
in p
opul
atio
n an
d in
the
rela
ted
CP
I [M
4].
J190
Oth
er e
duca
tiona
l and
cul
tura
l ser
vice
sE
stim
ator
for
t-1,
whe
re t
is th
e es
timat
ion
year
, mul
tiplie
d by
the
rate
of c
hang
e in
pop
ulat
ion
and
in th
e re
late
d C
PI [
M4]
.
J191
Hai
rsty
ling
for
men
and
wom
enE
xpen
ditu
res
for
haird
ress
ing
serv
ices
acc
ordi
ng to
the
SH
S
[M1]
.E
stim
ator
for
t-1,
whe
re t
is th
e es
timat
ion
year
, mul
tiplie
d by
the
rate
of c
hang
e in
pop
ulat
ion
and
in th
e re
late
d C
PI [
M4]
.
J192
Oth
er p
erso
nal c
are
Exp
endi
ture
s fo
r pe
rson
al c
are
serv
ices
oth
er th
an h
aird
ress
ing
acco
rdin
g to
the
SH
S [M
1].
Est
imat
or fo
r t-
1, w
here
t is
the
estim
atio
n ye
ar, m
ultip
lied
by th
e ra
te o
f cha
nge
in p
opul
atio
n an
d in
the
rela
ted
CP
I [M
4].
J193
Mea
ls o
utsi
de th
e ho
me
Rev
enue
s fr
om th
e M
onth
ly S
urve
y of
Foo
d S
ervi
ces
and
Drin
king
Pla
ces
(sur
vey
no. 2
419)
[M1]
or
oper
atin
g re
venu
es fr
om th
e A
nnua
l Sur
vey
of S
ervi
ce In
dust
ries:
Foo
d S
ervi
ces
and
Drin
king
Pla
ces
(sur
vey
no. 4
704)
[M1]
, con
fron
ted
with
exp
endi
ture
s fo
r fo
od p
urch
ased
from
res
taur
ants
acc
ordi
ng to
the
SH
S [M
1] a
nd w
ith r
even
ues
from
the
food
ser
vice
s in
dust
ries
(NA
ICS
722
1 to
72
23)
obta
ined
from
the
GS
T fi
le o
f the
CR
A [M
1]. S
ales
of a
lcoh
olic
bev
erag
es a
re e
xclu
ded.
J194
Alc
ohol
ic b
ever
ages
con
sum
ed in
lice
nsed
es
tabl
ishm
ents
Sal
es to
lice
nsed
est
ablis
hmen
ts a
ccor
ding
to th
e su
rvey
on
the
Con
trol
and
Sal
e of
Alc
ohol
ic B
ever
ages
in C
anad
a (s
urve
y no
. 17
26)
[M1]
and
to th
e an
nual
rep
orts
of l
iquo
r au
thor
ities
[M1]
, co
nfro
nted
with
the
volu
me
of b
eer
dist
ribut
ed, o
btai
ned
from
the
Bre
wer
s A
ssoc
iatio
n of
Can
ada,
mul
tiplie
d by
the
rela
ted
CP
I [M
2].
Sal
es to
lice
nsed
est
ablis
hmen
ts fo
r re
sale
from
the
Sur
vey
of
Sal
es a
nd In
vent
ory
of A
lcoh
olic
Bev
erag
es (
surv
ey n
o. 2
406)
[M
1], c
onfr
onte
d w
ith th
e vo
lum
e of
bee
r di
strib
uted
, obt
aine
d fr
om th
e B
rew
ers
Ass
ocia
tion
of C
anad
a, m
ultip
lied
by th
e re
late
d C
PI [
M2]
.
Tab
le 7
.8 S
ou
rces
an
d m
eth
od
s fo
r p
rovi
nci
al a
nd
ter
rito
rial
est
imat
es o
f p
erso
nal
exp
end
itu
re a
t cu
rren
t p
rice
s1
Ser
ies
Des
crip
tio
nB
ench
mar
k ye
ar +
1B
ench
mar
k ye
ar +
2
1. F
or m
ore
info
rmat
ion
on th
e m
etho
dolo
gies
M1
thro
ugh
M6,
see
par
agra
ph 7
.36.
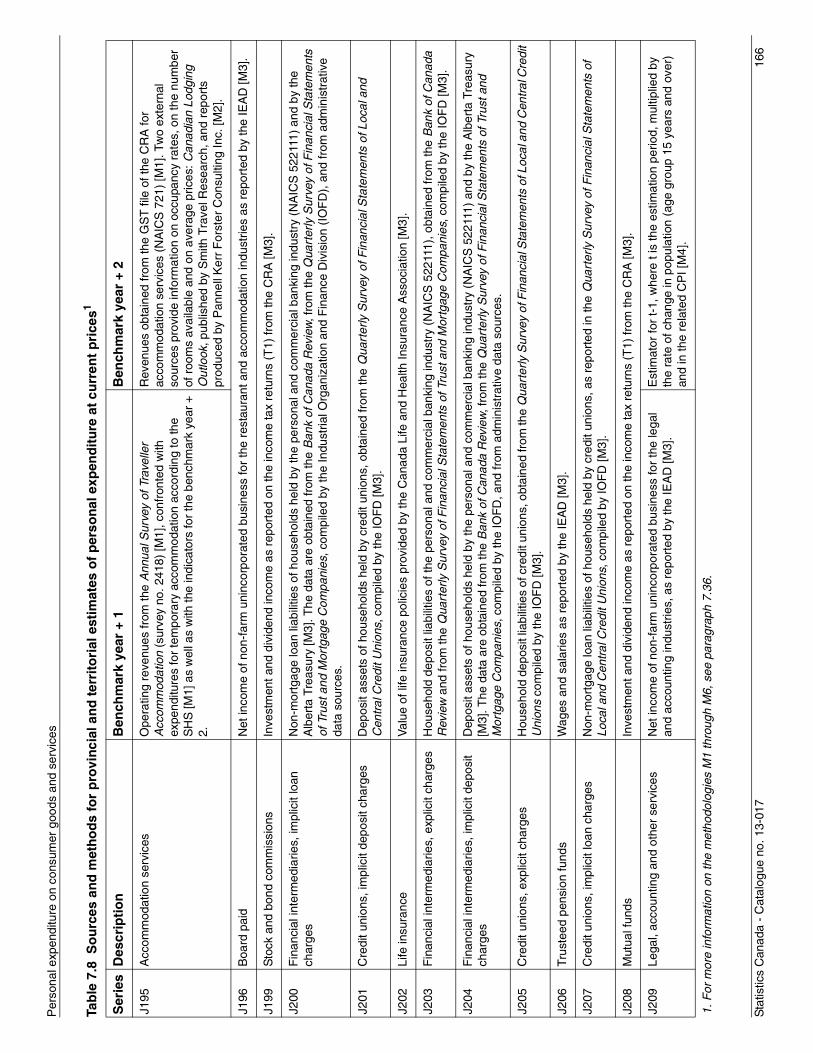
Sta
tistic
s C
anad
a -
Cat
alog
ue n
o. 1
3-01
716
6
Per
sona
l exp
endi
ture
on
cons
umer
goo
ds a
nd s
ervi
ces
J195
Acc
omm
odat
ion
serv
ices
Ope
ratin
g re
venu
es fr
om th
e A
nnua
l Sur
vey
of T
rave
ller
Acc
omm
odat
ion
(sur
vey
no. 2
418)
[M1]
, con
fron
ted
with
ex
pend
iture
s fo
r te
mpo
rary
acc
omm
odat
ion
acco
rdin
g to
the
SH
S [M
1] a
s w
ell a
s w
ith th
e in
dica
tors
for
the
benc
hmar
k ye
ar +
2.
Rev
enue
s ob
tain
ed fr
om th
e G
ST
file
of t
he C
RA
for
acco
mm
odat
ion
serv
ices
(N
AIC
S 7
21)
[M1]
. Tw
o ex
tern
al
sour
ces
prov
ide
info
rmat
ion
on o
ccup
ancy
rat
es, o
n th
e nu
mbe
r of
roo
ms
avai
labl
e an
d on
ave
rage
pric
es: C
anad
ian
Lodg
ing
Out
look
, pub
lishe
d by
Sm
ith T
rave
l Res
earc
h, a
nd r
epor
ts
prod
uced
by
Pan
nell
Ker
r F
orst
er C
onsu
lting
Inc.
[M2]
.
J196
Boa
rd p
aid
Net
inco
me
of n
on-f
arm
uni
ncor
pora
ted
busi
ness
for
the
rest
aura
nt a
nd a
ccom
mod
atio
n in
dust
ries
as r
epor
ted
by th
e IE
AD
[M3]
.
J199
Sto
ck a
nd b
ond
com
mis
sion
sIn
vest
men
t and
div
iden
d in
com
e as
rep
orte
d on
the
inco
me
tax
retu
rns
(T1)
from
the
CR
A [M
3].
J200
Fin
anci
al in
term
edia
ries,
impl
icit
loan
ch
arge
sN
on-m
ortg
age
loan
liab
ilitie
s of
hou
seho
lds
held
by
the
pers
onal
and
com
mer
cial
ban
king
indu
stry
(N
AIC
S 5
2211
1) a
nd b
y th
e A
lber
ta T
reas
ury
[M3]
. The
dat
a ar
e ob
tain
ed fr
om th
e B
ank
of C
anad
a R
evie
w, f
rom
the
Qua
rter
ly S
urve
y of
Fin
anci
al S
tate
men
ts
of T
rust
and
Mor
tgag
e C
ompa
nies
, com
pile
d by
the
Indu
stria
l Org
aniz
atio
n an
d F
inan
ce D
ivis
ion
(IO
FD
), a
nd fr
om a
dmin
istr
ativ
e da
ta s
ourc
es.
J201
Cre
dit u
nion
s, im
plic
it de
posi
t cha
rges
Dep
osit
asse
ts o
f hou
seho
lds
held
by
cred
it un
ions
, obt
aine
d fr
om th
e Q
uart
erly
Sur
vey
of F
inan
cial
Sta
tem
ents
of L
ocal
and
C
entr
al C
redi
t Uni
ons,
com
pile
d by
the
IOF
D [M
3].
J202
Life
insu
ranc
eV
alue
of l
ife in
sura
nce
polic
ies
prov
ided
by
the
Can
ada
Life
and
Hea
lth In
sura
nce
Ass
ocia
tion
[M3]
.
J203
Fin
anci
al in
term
edia
ries,
exp
licit
char
ges
Hou
seho
ld d
epos
it lia
bilit
ies
of th
e pe
rson
al a
nd c
omm
erci
al b
anki
ng in
dust
ry (
NA
ICS
522
111)
, obt
aine
d fr
om th
e B
ank
of C
anad
a R
evie
w a
nd fr
om th
e Q
uart
erly
Sur
vey
of F
inan
cial
Sta
tem
ents
of T
rust
and
Mor
tgag
e C
ompa
nies
, com
pile
d by
the
IOF
D [M
3].
J204
Fin
anci
al in
term
edia
ries,
impl
icit
depo
sit
char
ges
Dep
osit
asse
ts o
f hou
seho
lds
held
by
the
pers
onal
and
com
mer
cial
ban
king
indu
stry
(N
AIC
S 5
2211
1) a
nd b
y th
e A
lber
ta T
reas
ury
[M3]
. The
dat
a ar
e ob
tain
ed fr
om th
e B
ank
of C
anad
a R
evie
w, f
rom
the
Qua
rter
ly S
urve
y of
Fin
anci
al S
tate
men
ts o
f Tru
st a
nd
Mor
tgag
e C
ompa
nies
, com
pile
d by
the
IOF
D, a
nd fr
om a
dmin
istr
ativ
e da
ta s
ourc
es.
J205
Cre
dit u
nion
s, e
xplic
it ch
arge
sH
ouse
hold
dep
osit
liabi
litie
s of
cre
dit u
nion
s, o
btai
ned
from
the
Qua
rter
ly S
urve
y of
Fin
anci
al S
tate
men
ts o
f Loc
al a
nd C
entr
al C
redi
t U
nion
s co
mpi
led
by th
e IO
FD
[M3]
.
J206
Trus
teed
pen
sion
fund
sW
ages
and
sal
arie
s as
rep
orte
d by
the
IEA
D [M
3].
J207
Cre
dit u
nion
s, im
plic
it lo
an c
harg
esN
on-m
ortg
age
loan
liab
ilitie
s of
hou
seho
lds
held
by
cred
it un
ions
, as
repo
rted
in th
e Q
uart
erly
Sur
vey
of F
inan
cial
Sta
tem
ents
of
Loca
l and
Cen
tral
Cre
dit U
nion
s , c
ompi
led
by IO
FD
[M3]
.
J208
Mut
ual f
unds
Inve
stm
ent a
nd d
ivid
end
inco
me
as r
epor
ted
on th
e in
com
e ta
x re
turn
s (T
1) fr
om th
e C
RA
[M3]
.
J209
Lega
l, ac
coun
ting
and
othe
r se
rvic
esN
et in
com
e of
non
-far
m u
ninc
orpo
rate
d bu
sine
ss fo
r th
e le
gal
and
acco
untin
g in
dust
ries,
as
repo
rted
by
the
IEA
D [M
3].
Est
imat
or fo
r t-
1, w
here
t is
the
estim
atio
n pe
riod,
mul
tiplie
d by
th
e ra
te o
f cha
nge
in p
opul
atio
n (a
ge g
roup
15
year
s an
d ov
er)
and
in th
e re
late
d C
PI [
M4]
.
Tab
le 7
.8 S
ou
rces
an
d m
eth
od
s fo
r p
rovi
nci
al a
nd
ter
rito
rial
est
imat
es o
f p
erso
nal
exp
end
itu
re a
t cu
rren
t p
rice
s1
Ser
ies
Des
crip
tio
nB
ench
mar
k ye
ar +
1B
ench
mar
k ye
ar +
2
1. F
or m
ore
info
rmat
ion
on th
e m
etho
dolo
gies
M1
thro
ugh
M6,
see
par
agra
ph 7
.36.
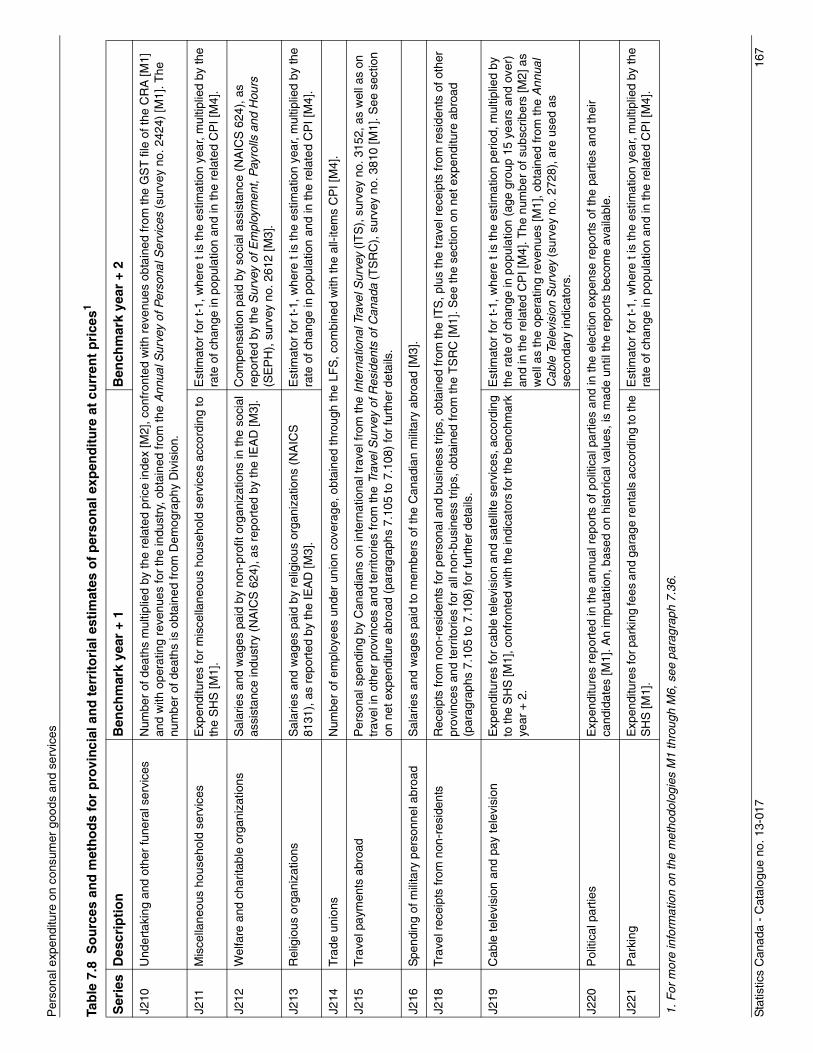
Sta
tistic
s C
anad
a -
Cat
alog
ue n
o. 1
3-01
716
7
Per
sona
l exp
endi
ture
on
cons
umer
goo
ds a
nd s
ervi
ces
J210
Und
erta
king
and
oth
er fu
nera
l ser
vice
sN
umbe
r of
dea
ths
mul
tiplie
d by
the
rela
ted
pric
e in
dex
[M2]
, con
fron
ted
with
rev
enue
s ob
tain
ed fr
om th
e G
ST
file
of t
he C
RA
[M1]
an
d w
ith o
pera
ting
reve
nues
for
the
indu
stry
, obt
aine
d fr
om th
e A
nnua
l Sur
vey
of P
erso
nal S
ervi
ces
(sur
vey
no. 2
424)
[M1]
. The
nu
mbe
r of
dea
ths
is o
btai
ned
from
Dem
ogra
phy
Div
isio
n.
J211
Mis
cella
neou
s ho
useh
old
serv
ices
Exp
endi
ture
s fo
r m
isce
llane
ous
hous
ehol
d se
rvic
es a
ccor
ding
to
the
SH
S [M
1].
Est
imat
or fo
r t-
1, w
here
t is
the
estim
atio
n ye
ar, m
ultip
lied
by th
e ra
te o
f cha
nge
in p
opul
atio
n an
d in
the
rela
ted
CP
I [M
4].
J212
Wel
fare
and
cha
ritab
le o
rgan
izat
ions
Sal
arie
s an
d w
ages
pai
d by
non
-pro
fit o
rgan
izat
ions
in th
e so
cial
as
sist
ance
indu
stry
(N
AIC
S 6
24),
as
repo
rted
by
the
IEA
D [M
3].
Com
pens
atio
n pa
id b
y so
cial
ass
ista
nce
(NA
ICS
624
), a
s re
port
ed b
y th
e S
urve
y of
Em
ploy
men
t, P
ayro
lls a
nd H
ours
(S
EP
H),
sur
vey
no. 2
612
[M3]
.
J213
Rel
igio
us o
rgan
izat
ions
Sal
arie
s an
d w
ages
pai
d by
rel
igio
us o
rgan
izat
ions
(N
AIC
S
8131
), a
s re
port
ed b
y th
e IE
AD
[M3]
.E
stim
ator
for
t-1,
whe
re t
is th
e es
timat
ion
year
, mul
tiplie
d by
the
rate
of c
hang
e in
pop
ulat
ion
and
in th
e re
late
d C
PI [
M4]
.
J214
Trad
e un
ions
Num
ber
of e
mpl
oyee
s un
der
unio
n co
vera
ge, o
btai
ned
thro
ugh
the
LFS
, com
bine
d w
ith th
e al
l-ite
ms
CP
I [M
4].
J215
Trav
el p
aym
ents
abr
oad
Per
sona
l spe
ndin
g by
Can
adia
ns o
n in
tern
atio
nal t
rave
l fro
m th
e In
tern
atio
nal T
rave
l Sur
vey
(IT
S),
sur
vey
no. 3
152,
as
wel
l as
on
trav
el in
oth
er p
rovi
nces
and
terr
itorie
s fr
om th
e Tr
avel
Sur
vey
of R
esid
ents
of C
anad
a (T
SR
C),
sur
vey
no. 3
810
[M1]
. See
sec
tion
on n
et e
xpen
ditu
re a
broa
d (p
arag
raph
s 7.
105
to 7
.108
) fo
r fu
rthe
r de
tails
.
J216
Spe
ndin
g of
mili
tary
per
sonn
el a
broa
dS
alar
ies
and
wag
es p
aid
to m
embe
rs o
f the
Can
adia
n m
ilita
ry a
broa
d [M
3].
J218
Trav
el r
ecei
pts
from
non
-res
iden
tsR
ecei
pts
from
non
-res
iden
ts fo
r pe
rson
al a
nd b
usin
ess
trip
s, o
btai
ned
from
the
ITS
, plu
s th
e tr
avel
rec
eipt
s fr
om r
esid
ents
of o
ther
pr
ovin
ces
and
terr
itorie
s fo
r al
l non
-bus
ines
s tr
ips,
obt
aine
d fr
om th
e T
SR
C [M
1]. S
ee th
e se
ctio
n on
net
exp
endi
ture
abr
oad
(par
agra
phs
7.10
5 to
7.1
08)
for
furt
her
deta
ils.
J219
Cab
le te
levi
sion
and
pay
tele
visi
onE
xpen
ditu
res
for c
able
tele
visi
on a
nd s
atel
lite
serv
ices
, acc
ordi
ng
to th
e S
HS
[M1]
, con
fron
ted
with
the
indi
cato
rs fo
r the
ben
chm
ark
year
+ 2
.
Est
imat
or fo
r t-
1, w
here
t is
the
estim
atio
n pe
riod,
mul
tiplie
d by
th
e ra
te o
f cha
nge
in p
opul
atio
n (a
ge g
roup
15
year
s an
d ov
er)
and
in th
e re
late
d C
PI [
M4]
. The
num
ber
of s
ubsc
riber
s [M
2] a
s w
ell a
s th
e op
erat
ing
reve
nues
[M1]
, obt
aine
d fr
om th
e A
nnua
l C
able
Tel
evis
ion
Sur
vey
(sur
vey
no. 2
728)
, are
use
d as
se
cond
ary
indi
cato
rs.
J220
Pol
itica
l par
ties
Exp
endi
ture
s re
port
ed in
the
annu
al r
epor
ts o
f pol
itica
l par
ties
and
in th
e el
ectio
n ex
pens
e re
port
s of
the
part
ies
and
thei
r ca
ndid
ates
[M1]
. An
impu
tatio
n, b
ased
on
hist
oric
al v
alue
s, is
mad
e un
til th
e re
port
s be
com
e av
aila
ble.
J221
Par
king
Exp
endi
ture
s fo
r par
king
fees
and
gar
age
rent
als
acco
rdin
g to
the
SH
S [M
1].
Est
imat
or fo
r t-
1, w
here
t is
the
estim
atio
n ye
ar, m
ultip
lied
by th
e ra
te o
f cha
nge
in p
opul
atio
n an
d in
the
rela
ted
CP
I [M
4].
Tab
le 7
.8 S
ou
rces
an
d m
eth
od
s fo
r p
rovi
nci
al a
nd
ter
rito
rial
est
imat
es o
f p
erso
nal
exp
end
itu
re a
t cu
rren
t p
rice
s1
Ser
ies
Des
crip
tio
nB
ench
mar
k ye
ar +
1B
ench
mar
k ye
ar +
2
1. F
or m
ore
info
rmat
ion
on th
e m
etho
dolo
gies
M1
thro
ugh
M6,
see
par
agra
ph 7
.36.
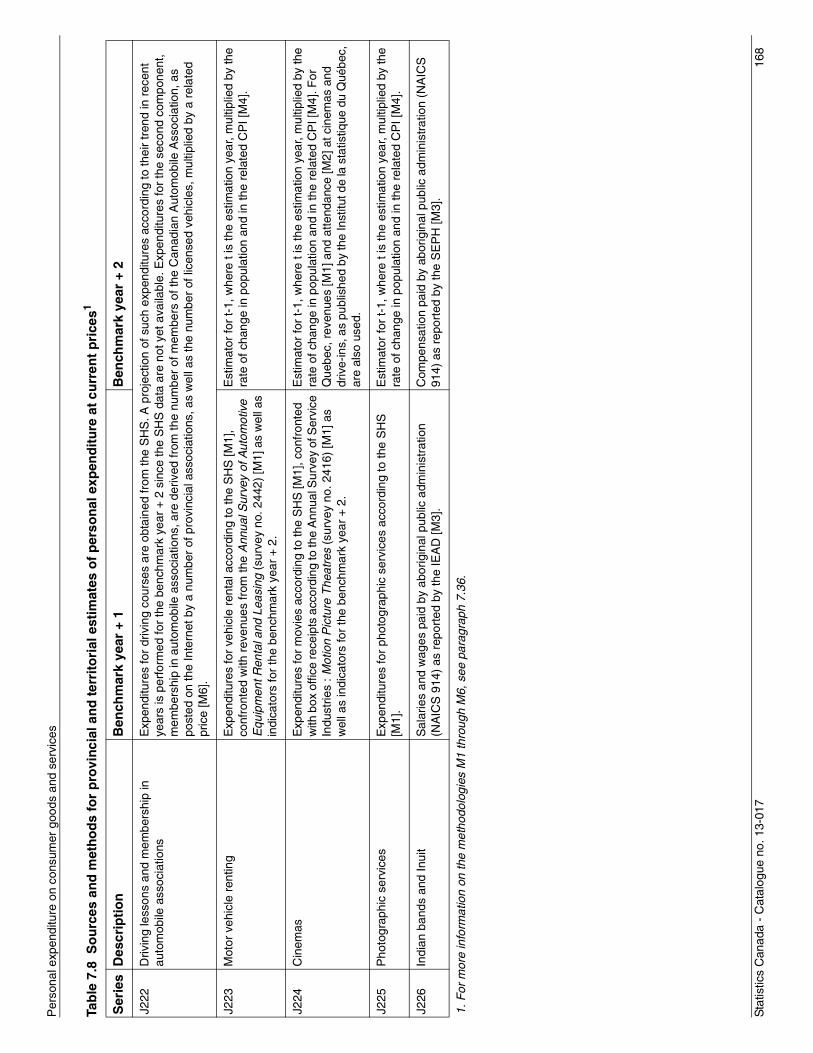
Sta
tistic
s C
anad
a -
Cat
alog
ue n
o. 1
3-01
716
8
Per
sona
l exp
endi
ture
on
cons
umer
goo
ds a
nd s
ervi
ces
J222
Driv
ing
less
ons
and
mem
bers
hip
in
auto
mob
ile a
ssoc
iatio
nsE
xpen
ditu
res
for
driv
ing
cour
ses
are
obta
ined
from
the
SH
S. A
pro
ject
ion
of s
uch
expe
nditu
res
acco
rdin
g to
thei
r tr
end
in r
ecen
t ye
ars
is p
erfo
rmed
for
the
benc
hmar
k ye
ar +
2 s
ince
the
SH
S d
ata
are
not y
et a
vaila
ble.
Exp
endi
ture
s fo
r th
e se
cond
com
pone
nt,
mem
bers
hip
in a
utom
obile
ass
ocia
tions
, are
der
ived
from
the
num
ber
of m
embe
rs o
f the
Can
adia
n A
utom
obile
Ass
ocia
tion,
as
post
ed o
n th
e In
tern
et b
y a
num
ber
of p
rovi
ncia
l ass
ocia
tions
, as
wel
l as
the
num
ber
of li
cens
ed v
ehic
les,
mul
tiplie
d by
a r
elat
ed
pric
e [M
6].
J223
Mot
or v
ehic
le r
entin
gE
xpen
ditu
res
for
vehi
cle
rent
al a
ccor
ding
to th
e S
HS
[M1]
, co
nfro
nted
with
rev
enue
s fr
om th
e A
nnua
l Sur
vey
of A
utom
otiv
e E
quip
men
t Ren
tal a
nd L
easi
ng (
surv
ey n
o. 2
442)
[M1]
as
wel
l as
indi
cato
rs fo
r th
e be
nchm
ark
year
+ 2
.
Est
imat
or fo
r t-
1, w
here
t is
the
estim
atio
n ye
ar, m
ultip
lied
by th
e ra
te o
f cha
nge
in p
opul
atio
n an
d in
the
rela
ted
CP
I [M
4].
J224
Cin
emas
Exp
endi
ture
s fo
r m
ovie
s ac
cord
ing
to th
e S
HS
[M1]
, con
fron
ted
with
box
offi
ce re
ceip
ts a
ccor
ding
to th
e A
nnua
l Sur
vey
of S
ervi
ce
Indu
strie
s : M
otio
n P
ictu
re T
heat
res
(sur
vey
no. 2
416)
[M1]
as
wel
l as
indi
cato
rs fo
r th
e be
nchm
ark
year
+ 2
.
Est
imat
or fo
r t-
1, w
here
t is
the
estim
atio
n ye
ar, m
ultip
lied
by th
e ra
te o
f cha
nge
in p
opul
atio
n an
d in
the
rela
ted
CP
I [M
4]. F
or
Que
bec,
rev
enue
s [M
1] a
nd a
ttend
ance
[M2]
at c
inem
as a
nd
driv
e-in
s, a
s pu
blis
hed
by th
e In
stitu
t de
la s
tatis
tique
du
Qué
bec,
ar
e al
so u
sed.
J225
Pho
togr
aphi
c se
rvic
esE
xpen
ditu
res
for
phot
ogra
phic
ser
vice
s ac
cord
ing
to th
e S
HS
[M
1].
Est
imat
or fo
r t-
1, w
here
t is
the
estim
atio
n ye
ar, m
ultip
lied
by th
e ra
te o
f cha
nge
in p
opul
atio
n an
d in
the
rela
ted
CP
I [M
4].
J226
Indi
an b
ands
and
Inui
tS
alar
ies
and
wag
es p
aid
by a
borig
inal
pub
lic a
dmin
istr
atio
n (N
AIC
S 9
14)
as r
epor
ted
by th
e IE
AD
[M3]
.C
ompe
nsat
ion
paid
by
abor
igin
al p
ublic
adm
inis
trat
ion
(NA
ICS
91
4) a
s re
port
ed b
y th
e S
EP
H [M
3].
Tab
le 7
.8 S
ou
rces
an
d m
eth
od
s fo
r p
rovi
nci
al a
nd
ter
rito
rial
est
imat
es o
f p
erso
nal
exp
end
itu
re a
t cu
rren
t p
rice
s1
Ser
ies
Des
crip
tio
nB
ench
mar
k ye
ar +
1B
ench
mar
k ye
ar +
2
1. F
or m
ore
info
rmat
ion
on th
e m
etho
dolo
gies
M1
thro
ugh
M6,
see
par
agra
ph 7
.36.
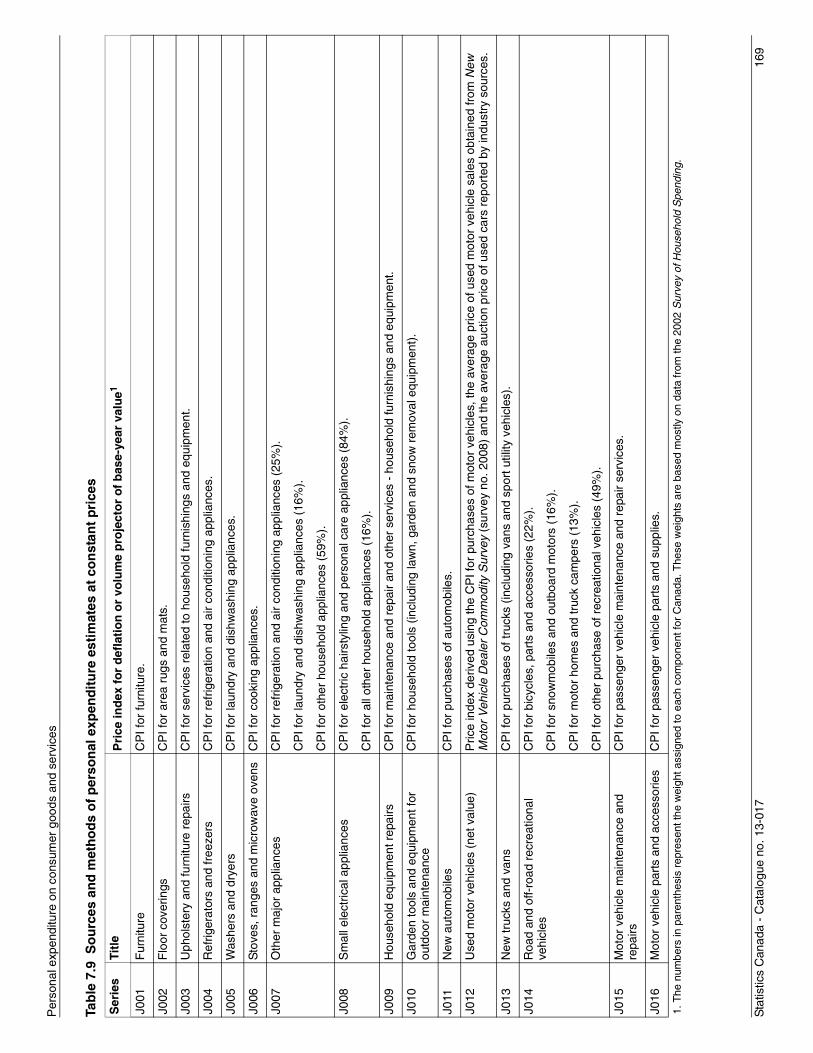
Sta
tistic
s C
anad
a -
Cat
alog
ue n
o. 1
3-01
716
9
Per
sona
l exp
endi
ture
on
cons
umer
goo
ds a
nd s
ervi
ces
Tab
le 7
.9 S
ou
rces
an
d m
eth
od
s o
f p
erso
nal
exp
end
itu
re e
stim
ates
at
con
stan
t p
rice
s
Ser
ies
Titl
eP
rice
ind
ex f
or
def
lati
on
or
volu
me
pro
ject
or
of
bas
e-ye
ar v
alu
e1
J001
Fur
nitu
reC
PI f
or fu
rnitu
re.
J002
Flo
or c
over
ings
CP
I for
are
a ru
gs a
nd m
ats.
J003
Uph
olst
ery
and
furn
iture
rep
airs
CP
I for
ser
vice
s re
late
d to
hou
seho
ld fu
rnis
hing
s an
d eq
uipm
ent.
J004
Ref
riger
ator
s an
d fr
eeze
rsC
PI f
or r
efrig
erat
ion
and
air
cond
ition
ing
appl
ianc
es.
J005
Was
hers
and
dry
ers
CP
I for
laun
dry
and
dish
was
hing
app
lianc
es.
J006
Sto
ves,
ran
ges
and
mic
row
ave
oven
sC
PI f
or c
ooki
ng a
pplia
nces
.
J007
O
ther
maj
or a
pplia
nces
CP
I for
ref
riger
atio
n an
d ai
r co
nditi
onin
g ap
plia
nces
(25
%).
CP
I for
laun
dry
and
dish
was
hing
app
lianc
es (
16%
).
CP
I for
oth
er h
ouse
hold
app
lianc
es (
59%
).
J008
Sm
all e
lect
rical
app
lianc
esC
PI f
or e
lect
ric h
airs
tylin
g an
d pe
rson
al c
are
appl
ianc
es (
84%
).
CP
I for
all
othe
r ho
useh
old
appl
ianc
es (
16%
).
J009
Hou
seho
ld e
quip
men
t rep
airs
CP
I for
mai
nten
ance
and
rep
air
and
othe
r se
rvic
es -
hou
seho
ld fu
rnis
hing
s an
d eq
uipm
ent.
J010
Gar
den
tool
s an
d eq
uipm
ent f
or
outd
oor
mai
nten
ance
CP
I for
hou
seho
ld to
ols
(incl
udin
g la
wn,
gar
den
and
snow
rem
oval
equ
ipm
ent)
.
J011
New
aut
omob
iles
CP
I for
pur
chas
es o
f aut
omob
iles.
J012
Use
d m
otor
veh
icle
s (n
et v
alue
)P
rice
inde
x de
rived
usi
ng th
e C
PI f
or p
urch
ases
of m
otor
veh
icle
s, th
e av
erag
e pr
ice
of u
sed
mot
or v
ehic
le s
ales
obt
aine
d fr
om N
ew
Mot
or V
ehic
le D
eale
r C
omm
odity
Sur
vey
(sur
vey
no. 2
008)
and
the
aver
age
auct
ion
pric
e of
use
d ca
rs r
epor
ted
by in
dust
ry s
ourc
es.
J013
New
truc
ks a
nd v
ans
CP
I for
pur
chas
es o
f tru
cks
(incl
udin
g va
ns a
nd s
port
util
ity v
ehic
les)
.
J014
Roa
d an
d of
f-ro
ad r
ecre
atio
nal
vehi
cles
CP
I for
bic
ycle
s, p
arts
and
acc
esso
ries
(22%
).
CP
I for
sno
wm
obile
s an
d ou
tboa
rd m
otor
s (1
6%).
CP
I for
mot
or h
omes
and
truc
k ca
mpe
rs (
13%
).
CP
I for
oth
er p
urch
ase
of r
ecre
atio
nal v
ehic
les
(49%
).
J015
Mot
or v
ehic
le m
aint
enan
ce a
nd
repa
irsC
PI f
or p
asse
nger
veh
icle
mai
nten
ance
and
rep
air
serv
ices
.
J016
Mot
or v
ehic
le p
arts
and
acc
esso
ries
CP
I for
pas
seng
er v
ehic
le p
arts
and
sup
plie
s.
1. T
he n
umbe
rs in
par
enth
esis
rep
rese
nt th
e w
eigh
t ass
igne
d to
eac
h co
mpo
nent
for
Can
ada.
The
se w
eigh
ts a
re b
ased
mos
tly o
n da
ta fr
om th
e 20
02 S
urve
y of
Hou
seho
ld S
pend
ing.
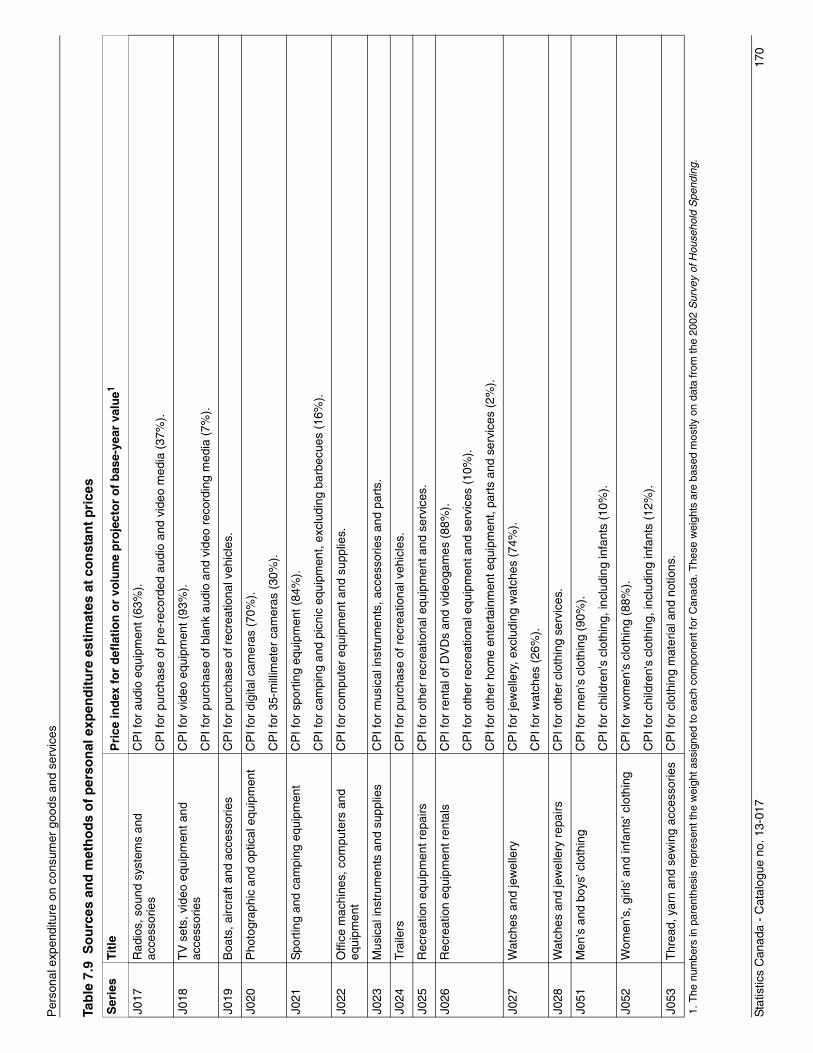
Sta
tistic
s C
anad
a -
Cat
alog
ue n
o. 1
3-01
717
0
Per
sona
l exp
endi
ture
on
cons
umer
goo
ds a
nd s
ervi
ces
J017
Rad
ios,
sou
nd s
yste
ms
and
acce
ssor
ies
CP
I for
aud
io e
quip
men
t (63
%).
CP
I for
pur
chas
e of
pre
-rec
orde
d au
dio
and
vide
o m
edia
(37
%).
J018
TV
set
s, v
ideo
equ
ipm
ent a
nd
acce
ssor
ies
CP
I for
vid
eo e
quip
men
t (93
%).
CP
I for
pur
chas
e of
bla
nk a
udio
and
vid
eo r
ecor
ding
med
ia (
7%).
J019
Boa
ts, a
ircra
ft an
d ac
cess
orie
sC
PI f
or p
urch
ase
of r
ecre
atio
nal v
ehic
les.
J020
Pho
togr
aphi
c an
d op
tical
equ
ipm
ent
CP
I for
dig
ital c
amer
as (
70%
).
CP
I for
35-
mill
imet
er c
amer
as (
30%
).
J021
Spo
rtin
g an
d ca
mpi
ng e
quip
men
tC
PI f
or s
port
ing
equi
pmen
t (84
%).
CP
I for
cam
ping
and
pic
nic
equi
pmen
t, ex
clud
ing
barb
ecue
s (1
6%).
J022
Offi
ce m
achi
nes,
com
pute
rs a
nd
equi
pmen
tC
PI f
or c
ompu
ter
equi
pmen
t and
sup
plie
s.
J023
Mus
ical
inst
rum
ents
and
sup
plie
sC
PI f
or m
usic
al in
stru
men
ts, a
cces
sorie
s an
d pa
rts.
J024
Trai
lers
CP
I for
pur
chas
e of
rec
reat
iona
l veh
icle
s.
J025
Rec
reat
ion
equi
pmen
t rep
airs
CP
I for
oth
er r
ecre
atio
nal e
quip
men
t and
ser
vice
s.
J026
Rec
reat
ion
equi
pmen
t ren
tals
CP
I for
ren
tal o
f DV
Ds
and
vide
ogam
es (
88%
).
CP
I for
oth
er r
ecre
atio
nal e
quip
men
t and
ser
vice
s (1
0%).
CP
I for
oth
er h
ome
ente
rtai
nmen
t equ
ipm
ent,
part
s an
d se
rvic
es (
2%).
J027
Wat
ches
and
jew
elle
ryC
PI f
or je
wel
lery
, exc
ludi
ng w
atch
es (
74%
).
CP
I for
wat
ches
(26
%).
J028
Wat
ches
and
jew
elle
ry r
epai
rsC
PI f
or o
ther
clo
thin
g se
rvic
es.
J051
Men
’s a
nd b
oys’
clo
thin
gC
PI f
or m
en's
clo
thin
g (9
0%).
CP
I for
chi
ldre
n's
clot
hing
, inc
ludi
ng in
fant
s (1
0%).
J052
Wom
en’s
, girl
s' a
nd in
fant
s' c
loth
ing
CP
I for
wom
en's
clo
thin
g (8
8%).
CP
I for
chi
ldre
n's
clot
hing
, inc
ludi
ng in
fant
s (1
2%).
J053
Thr
ead,
yar
n an
d se
win
g ac
cess
orie
sC
PI f
or c
loth
ing
mat
eria
l and
not
ions
.
Tab
le 7
.9 S
ou
rces
an
d m
eth
od
s o
f p
erso
nal
exp
end
itu
re e
stim
ates
at
con
stan
t p
rice
s
Ser
ies
Titl
eP
rice
ind
ex f
or
def
lati
on
or
volu
me
pro
ject
or
of
bas
e-ye
ar v
alu
e1
1. T
he n
umbe
rs in
par
enth
esis
rep
rese
nt th
e w
eigh
t ass
igne
d to
eac
h co
mpo
nent
for
Can
ada.
The
se w
eigh
ts a
re b
ased
mos
tly o
n da
ta fr
om th
e 20
02 S
urve
y of
Hou
seho
ld S
pend
ing.
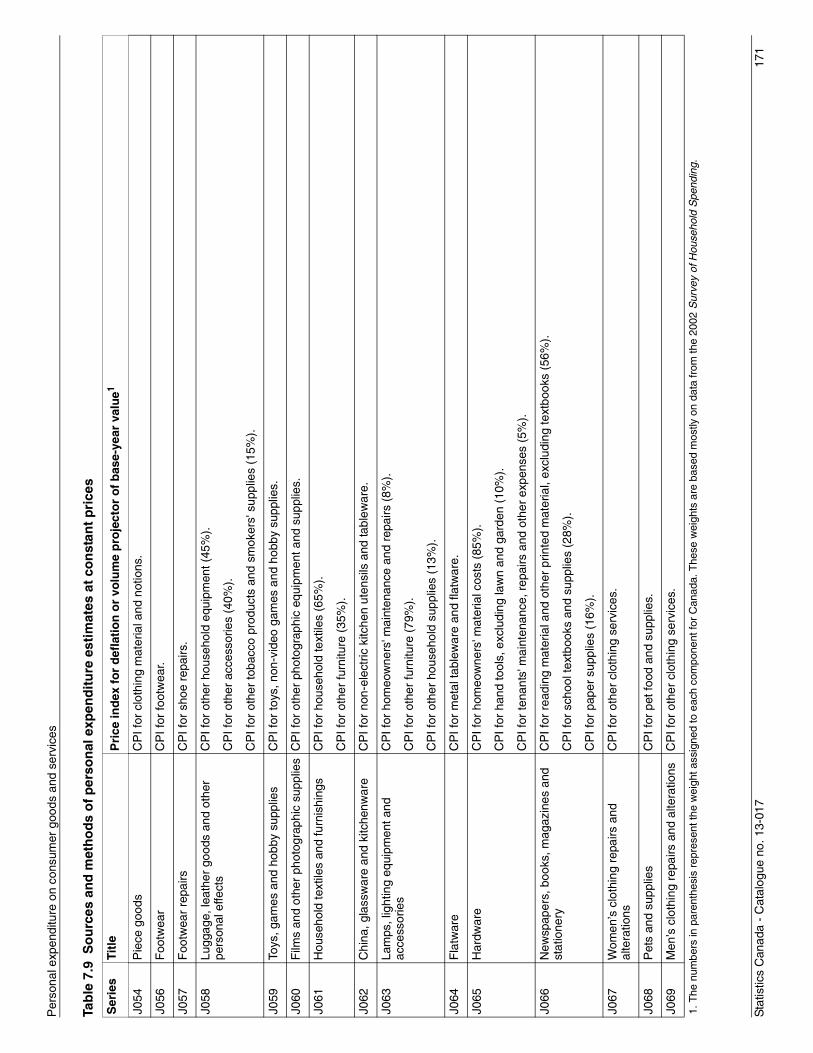
Sta
tistic
s C
anad
a -
Cat
alog
ue n
o. 1
3-01
717
1
Per
sona
l exp
endi
ture
on
cons
umer
goo
ds a
nd s
ervi
ces
J054
Pie
ce g
oods
CP
I for
clo
thin
g m
ater
ial a
nd n
otio
ns.
J056
F
ootw
ear
CP
I for
foot
wea
r.
J057
F
ootw
ear
repa
irsC
PI f
or s
hoe
repa
irs.
J058
Lugg
age,
leat
her
good
s an
d ot
her
pers
onal
effe
cts
CP
I for
oth
er h
ouse
hold
equ
ipm
ent (
45%
).
CP
I for
oth
er a
cces
sorie
s (4
0%).
CP
I for
oth
er to
bacc
o pr
oduc
ts a
nd s
mok
ers'
sup
plie
s (1
5%).
J059
Toys
, gam
es a
nd h
obby
sup
plie
sC
PI f
or to
ys, n
on-v
ideo
gam
es a
nd h
obby
sup
plie
s.
J060
Film
s an
d ot
her
phot
ogra
phic
sup
plie
sC
PI f
or o
ther
pho
togr
aphi
c eq
uipm
ent a
nd s
uppl
ies.
J061
Hou
seho
ld te
xtile
s an
d fu
rnis
hing
sC
PI f
or h
ouse
hold
text
iles
(65%
).
CP
I for
oth
er fu
rnitu
re (
35%
).
J062
Chi
na, g
lass
war
e an
d ki
tche
nwar
eC
PI f
or n
on-e
lect
ric k
itche
n ut
ensi
ls a
nd ta
blew
are.
J063
Lam
ps, l
ight
ing
equi
pmen
t and
ac
cess
orie
sC
PI f
or h
omeo
wne
rs' m
aint
enan
ce a
nd r
epai
rs (
8%).
CP
I for
oth
er fu
rnitu
re (
79%
).
CP
I for
oth
er h
ouse
hold
sup
plie
s (1
3%).
J064
Fla
twar
eC
PI f
or m
etal
tabl
ewar
e an
d fla
twar
e.
J065
Har
dwar
eC
PI f
or h
omeo
wne
rs' m
ater
ial c
osts
(85
%).
CP
I for
han
d to
ols,
exc
ludi
ng la
wn
and
gard
en (
10%
).
CP
I for
tena
nts'
mai
nten
ance
, rep
airs
and
oth
er e
xpen
ses
(5%
).
J066
New
spap
ers,
boo
ks, m
agaz
ines
and
st
atio
nery
CP
I for
rea
ding
mat
eria
l and
oth
er p
rinte
d m
ater
ial,
excl
udin
g te
xtbo
oks
(56%
).
CP
I for
sch
ool t
extb
ooks
and
sup
plie
s (2
8%).
CP
I for
pap
er s
uppl
ies
(16%
).
J067
Wom
en’s
clo
thin
g re
pairs
and
al
tera
tions
CP
I for
oth
er c
loth
ing
serv
ices
.
J068
Pet
s an
d su
pplie
sC
PI f
or p
et fo
od a
nd s
uppl
ies.
J069
Men
’s c
loth
ing
repa
irs a
nd a
ltera
tions
CP
I for
oth
er c
loth
ing
serv
ices
.
Tab
le 7
.9 S
ou
rces
an
d m
eth
od
s o
f p
erso
nal
exp
end
itu
re e
stim
ates
at
con
stan
t p
rice
s
Ser
ies
Titl
eP
rice
ind
ex f
or
def
lati
on
or
volu
me
pro
ject
or
of
bas
e-ye
ar v
alu
e1
1. T
he n
umbe
rs in
par
enth
esis
rep
rese
nt th
e w
eigh
t ass
igne
d to
eac
h co
mpo
nent
for
Can
ada.
The
se w
eigh
ts a
re b
ased
mos
tly o
n da
ta fr
om th
e 20
02 S
urve
y of
Hou
seho
ld S
pend
ing.
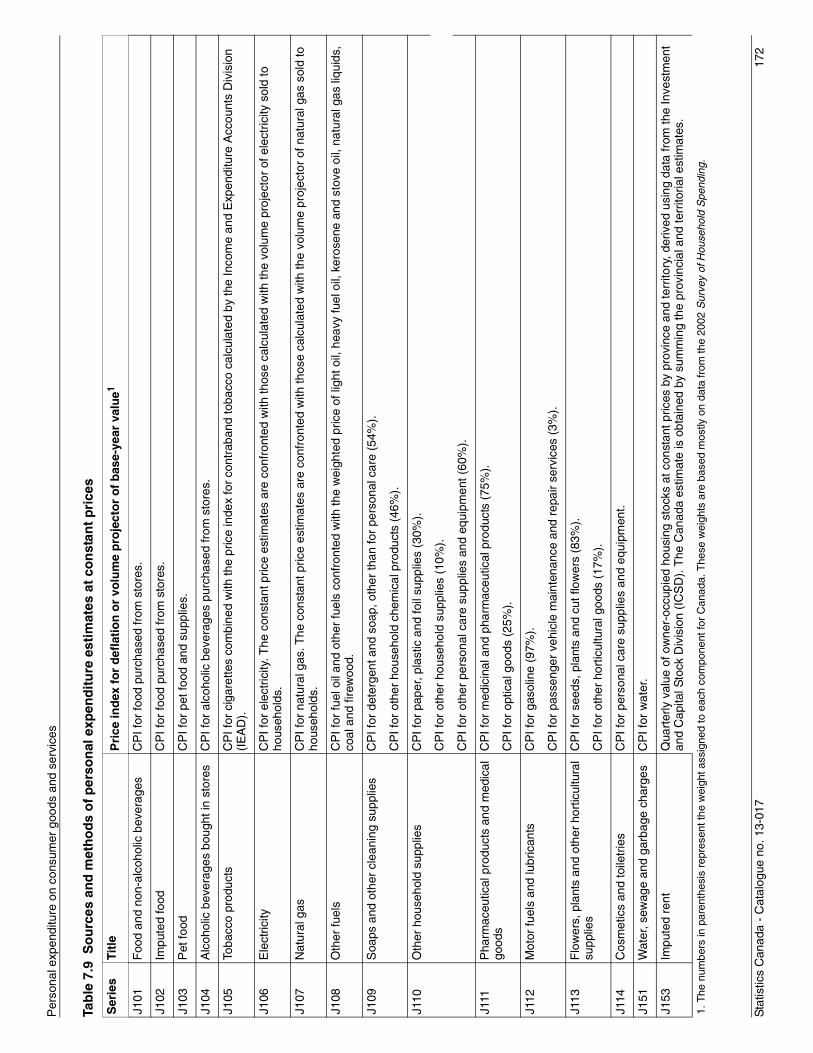
Sta
tistic
s C
anad
a -
Cat
alog
ue n
o. 1
3-01
717
2
Per
sona
l exp
endi
ture
on
cons
umer
goo
ds a
nd s
ervi
ces
J101
Foo
d an
d no
n-al
coho
lic b
ever
ages
CP
I for
food
pur
chas
ed fr
om s
tore
s.
J102
Impu
ted
food
C
PI f
or fo
od p
urch
ased
from
sto
res.
J103
Pet
food
CP
I for
pet
food
and
sup
plie
s.
J104
Alc
ohol
ic b
ever
ages
bou
ght i
n st
ores
CP
I for
alc
ohol
ic b
ever
ages
pur
chas
ed fr
om s
tore
s.
J105
Toba
cco
prod
ucts
CP
I for
cig
aret
tes
com
bine
d w
ith th
e pr
ice
inde
x fo
r co
ntra
band
toba
cco
calc
ulat
ed b
y th
e In
com
e an
d E
xpen
ditu
re A
ccou
nts
Div
isio
n (I
EA
D).
J106
Ele
ctric
ityC
PI f
or e
lect
ricity
. The
con
stan
t pric
e es
timat
es a
re c
onfr
onte
d w
ith th
ose
calc
ulat
ed w
ith th
e vo
lum
e pr
ojec
tor
of e
lect
ricity
sol
d to
ho
useh
olds
.
J107
Nat
ural
gas
CP
I for
nat
ural
gas
. The
con
stan
t pric
e es
timat
es a
re c
onfr
onte
d w
ith th
ose
calc
ulat
ed w
ith th
e vo
lum
e pr
ojec
tor
of n
atur
al g
as s
old
to
hous
ehol
ds.
J108
Oth
er fu
els
CP
I for
fuel
oil
and
othe
r fu
els
conf
ront
ed w
ith th
e w
eigh
ted
pric
e of
ligh
t oil,
hea
vy fu
el o
il, k
eros
ene
and
stov
e oi
l, na
tura
l gas
liqu
ids,
co
al a
nd fi
rew
ood.
J109
Soa
ps a
nd o
ther
cle
anin
g su
pplie
sC
PI f
or d
eter
gent
and
soa
p, o
ther
than
for
pers
onal
car
e (5
4%).
CP
I for
oth
er h
ouse
hold
che
mic
al p
rodu
cts
(46%
).
J110
Oth
er h
ouse
hold
sup
plie
sC
PI f
or p
aper
, pla
stic
and
foil
supp
lies
(30%
).
CP
I for
oth
er h
ouse
hold
sup
plie
s (1
0%).
CP
I for
oth
er p
erso
nal c
are
supp
lies
and
equi
pmen
t (60
%).
J111
Pha
rmac
eutic
al p
rodu
cts
and
med
ical
go
ods
CP
I for
med
icin
al a
nd p
harm
aceu
tical
pro
duct
s (7
5%).
CP
I for
opt
ical
goo
ds (
25%
).
J112
Mot
or fu
els
and
lubr
ican
tsC
PI f
or g
asol
ine
(97%
).
CP
I for
pas
seng
er v
ehic
le m
aint
enan
ce a
nd r
epai
r se
rvic
es (
3%).
J113
Flo
wer
s, p
lant
s an
d ot
her
hort
icul
tura
l su
pplie
sC
PI f
or s
eeds
, pla
nts
and
cut f
low
ers
(83%
).
CP
I for
oth
er h
ortic
ultu
ral g
oods
(17
%).
J114
Cos
met
ics
and
toile
trie
sC
PI f
or p
erso
nal c
are
supp
lies
and
equi
pmen
t.
J151
Wat
er, s
ewag
e an
d ga
rbag
e ch
arge
s C
PI f
or w
ater
.
J153
Im
pute
d re
ntQ
uart
erly
val
ue o
f ow
ner-
occu
pied
hou
sing
sto
cks
at c
onst
ant p
rices
by
prov
ince
and
terr
itory
, der
ived
usi
ng d
ata
from
the
Inve
stm
ent
and
Cap
ital S
tock
Div
isio
n (I
CS
D).
The
Can
ada
estim
ate
is o
btai
ned
by s
umm
ing
the
prov
inci
al a
nd te
rrito
rial e
stim
ates
.
Tab
le 7
.9 S
ou
rces
an
d m
eth
od
s o
f p
erso
nal
exp
end
itu
re e
stim
ates
at
con
stan
t p
rice
s
Ser
ies
Titl
eP
rice
ind
ex f
or
def
lati
on
or
volu
me
pro
ject
or
of
bas
e-ye
ar v
alu
e1
1. T
he n
umbe
rs in
par
enth
esis
rep
rese
nt th
e w
eigh
t ass
igne
d to
eac
h co
mpo
nent
for
Can
ada.
The
se w
eigh
ts a
re b
ased
mos
tly o
n da
ta fr
om th
e 20
02 S
urve
y of
Hou
seho
ld S
pend
ing.
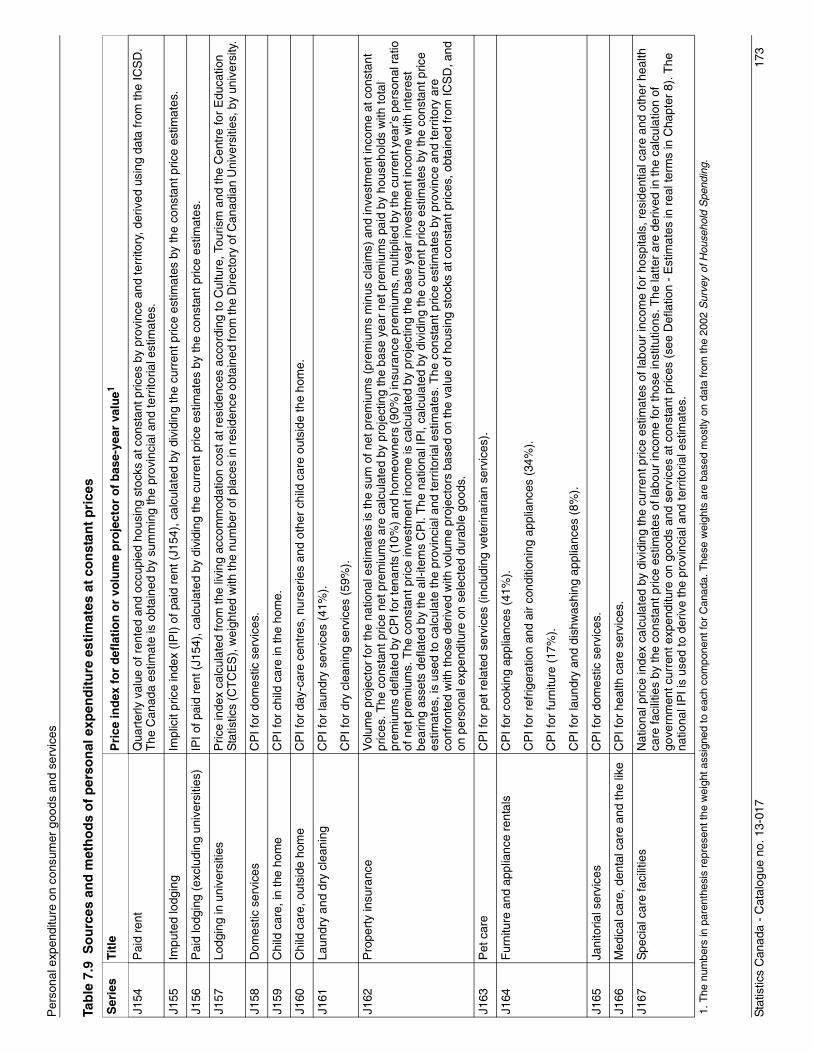
Sta
tistic
s C
anad
a -
Cat
alog
ue n
o. 1
3-01
717
3
Per
sona
l exp
endi
ture
on
cons
umer
goo
ds a
nd s
ervi
ces
J154
P
aid
rent
Qua
rter
ly v
alue
of r
ente
d an
d oc
cupi
ed h
ousi
ng s
tock
s at
con
stan
t pric
es b
y pr
ovin
ce a
nd te
rrito
ry, d
eriv
ed u
sing
dat
a fr
om th
e IC
SD
. T
he C
anad
a es
timat
e is
obt
aine
d by
sum
min
g th
e pr
ovin
cial
and
terr
itoria
l est
imat
es.
J155
Impu
ted
lodg
ing
Impl
icit
pric
e in
dex
(IP
I) o
f pai
d re
nt (
J154
), c
alcu
late
d by
div
idin
g th
e cu
rren
t pric
e es
timat
es b
y th
e co
nsta
nt p
rice
estim
ates
.
J156
Pai
d lo
dgin
g (e
xclu
ding
uni
vers
ities
)IP
I of p
aid
rent
(J1
54),
cal
cula
ted
by d
ivid
ing
the
curr
ent p
rice
estim
ates
by
the
cons
tant
pric
e es
timat
es.
J157
Lodg
ing
in u
nive
rsiti
esP
rice
inde
x ca
lcul
ated
from
the
livin
g ac
com
mod
atio
n co
st a
t res
iden
ces
acco
rdin
g to
Cul
ture
, Tou
rism
and
the
Cen
tre
for
Edu
catio
n S
tatis
tics
(CT
CE
S),
wei
ghte
d w
ith th
e nu
mbe
r of
pla
ces
in r
esid
ence
obt
aine
d fr
om th
e D
irect
ory
of C
anad
ian
Uni
vers
ities
, by
univ
ersi
ty.
J158
Dom
estic
ser
vice
sC
PI f
or d
omes
tic s
ervi
ces.
J159
Chi
ld c
are,
in th
e ho
me
CP
I for
chi
ld c
are
in th
e ho
me.
J160
Chi
ld c
are,
out
side
hom
eC
PI f
or d
ay-c
are
cent
res,
nur
serie
s an
d ot
her
child
car
e ou
tsid
e th
e ho
me.
J161
Laun
dry
and
dry
clea
ning
CP
I for
laun
dry
serv
ices
(41
%).
CP
I for
dry
cle
anin
g se
rvic
es (
59%
).
J162
Pro
pert
y in
sura
nce
Vol
ume
proj
ecto
r fo
r th
e na
tiona
l est
imat
es is
the
sum
of n
et p
rem
ium
s (p
rem
ium
s m
inus
cla
ims)
and
inve
stm
ent i
ncom
e at
con
stan
t pr
ices
. The
con
stan
t pric
e ne
t pre
miu
ms
are
calc
ulat
ed b
y pr
ojec
ting
the
base
yea
r ne
t pre
miu
ms
paid
by
hous
ehol
ds w
ith to
tal
prem
ium
s de
flate
d by
CP
I for
tena
nts
(10%
) and
hom
eow
ners
(90%
) ins
uran
ce p
rem
ium
s, m
ultip
lied
by th
e cu
rren
t yea
r’s p
erso
nal r
atio
of
net
pre
miu
ms.
The
con
stan
t pric
e in
vest
men
t inc
ome
is c
alcu
late
d by
pro
ject
ing
the
base
yea
r in
vest
men
t inc
ome
with
inte
rest
be
arin
g as
sets
def
late
d by
the
all-i
tem
s C
PI.
The
nat
iona
l IP
I, ca
lcul
ated
by
divi
ding
the
curr
ent p
rice
estim
ates
by
the
cons
tant
pric
e es
timat
es, i
s us
ed to
cal
cula
te th
e pr
ovin
cial
and
terr
itoria
l est
imat
es. T
he c
onst
ant p
rice
estim
ates
by
prov
ince
and
terr
itory
are
co
nfro
nted
with
thos
e de
rived
with
vol
ume
proj
ecto
rs b
ased
on
the
valu
e of
hou
sing
sto
cks
at c
onst
ant p
rices
, obt
aine
d fr
om IC
SD
, and
on
per
sona
l exp
endi
ture
on
sele
cted
dur
able
goo
ds.
J163
Pet
car
eC
PI f
or p
et r
elat
ed s
ervi
ces
(incl
udin
g ve
terin
aria
n se
rvic
es).
J164
F
urni
ture
and
app
lianc
e re
ntal
sC
PI f
or c
ooki
ng a
pplia
nces
(41
%).
CP
I for
ref
riger
atio
n an
d ai
r co
nditi
onin
g ap
plia
nces
(34
%).
CP
I for
furn
iture
(17
%).
CP
I for
laun
dry
and
dish
was
hing
app
lianc
es (
8%).
J165
Ja
nito
rial s
ervi
ces
CP
I for
dom
estic
ser
vice
s.
J166
Med
ical
car
e, d
enta
l car
e an
d th
e lik
eC
PI f
or h
ealth
car
e se
rvic
es.
J167
Spe
cial
car
e fa
cilit
ies
Nat
iona
l pric
e in
dex
calc
ulat
ed b
y di
vidi
ng th
e cu
rren
t pric
e es
timat
es o
f lab
our
inco
me
for
hosp
itals
, res
iden
tial c
are
and
othe
r he
alth
ca
re fa
cilit
ies
by th
e co
nsta
nt p
rice
estim
ates
of l
abou
r in
com
e fo
r th
ose
inst
itutio
ns. T
he la
tter
are
deriv
ed in
the
calc
ulat
ion
of
gove
rnm
ent c
urre
nt e
xpen
ditu
re o
n go
ods
and
serv
ices
at c
onst
ant p
rices
(se
e D
efla
tion
- E
stim
ates
in r
eal t
erm
s in
Cha
pter
8).
The
na
tiona
l IP
I is
used
to d
eriv
e th
e pr
ovin
cial
and
terr
itoria
l est
imat
es.
Tab
le 7
.9 S
ou
rces
an
d m
eth
od
s o
f p
erso
nal
exp
end
itu
re e
stim
ates
at
con
stan
t p
rice
s
Ser
ies
Titl
eP
rice
ind
ex f
or
def
lati
on
or
volu
me
pro
ject
or
of
bas
e-ye
ar v
alu
e1
1. T
he n
umbe
rs in
par
enth
esis
rep
rese
nt th
e w
eigh
t ass
igne
d to
eac
h co
mpo
nent
for
Can
ada.
The
se w
eigh
ts a
re b
ased
mos
tly o
n da
ta fr
om th
e 20
02 S
urve
y of
Hou
seho
ld S
pend
ing.
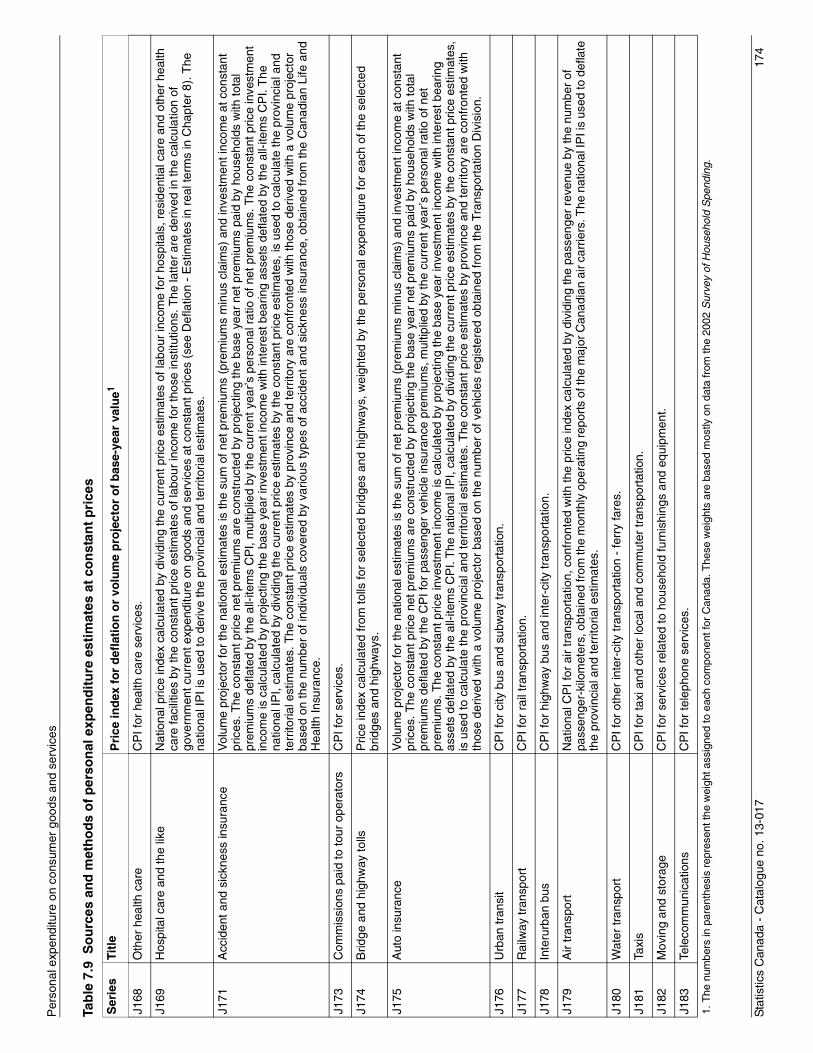
Sta
tistic
s C
anad
a -
Cat
alog
ue n
o. 1
3-01
717
4
Per
sona
l exp
endi
ture
on
cons
umer
goo
ds a
nd s
ervi
ces
J168
Oth
er h
ealth
car
eC
PI f
or h
ealth
car
e se
rvic
es.
J169
Hos
pita
l car
e an
d th
e lik
eN
atio
nal p
rice
inde
x ca
lcul
ated
by
divi
ding
the
curr
ent p
rice
estim
ates
of l
abou
r in
com
e fo
r ho
spita
ls, r
esid
entia
l car
e an
d ot
her
heal
th
care
faci
litie
s by
the
cons
tant
pric
e es
timat
es o
f lab
our
inco
me
for
thos
e in
stitu
tions
. The
latte
r ar
e de
rived
in th
e ca
lcul
atio
n of
go
vern
men
t cur
rent
exp
endi
ture
on
good
s an
d se
rvic
es a
t con
stan
t pric
es (
see
Def
latio
n -
Est
imat
es in
rea
l ter
ms
in C
hapt
er 8
). T
he
natio
nal I
PI i
s us
ed to
der
ive
the
prov
inci
al a
nd te
rrito
rial e
stim
ates
.
J171
Acc
iden
t and
sic
knes
s in
sura
nce
Vol
ume
proj
ecto
r fo
r th
e na
tiona
l est
imat
es is
the
sum
of n
et p
rem
ium
s (p
rem
ium
s m
inus
cla
ims)
and
inve
stm
ent i
ncom
e at
con
stan
t pr
ices
. The
con
stan
t pric
e ne
t pre
miu
ms
are
cons
truc
ted
by p
roje
ctin
g th
e ba
se y
ear
net p
rem
ium
s pa
id b
y ho
useh
olds
with
tota
l pr
emiu
ms
defla
ted
by th
e al
l-ite
ms
CP
I, m
ultip
lied
by th
e cu
rren
t yea
r’s p
erso
nal r
atio
of n
et p
rem
ium
s. T
he c
onst
ant p
rice
inve
stm
ent
inco
me
is c
alcu
late
d by
pro
ject
ing
the
base
yea
r in
vest
men
t inc
ome
with
inte
rest
bea
ring
asse
ts d
efla
ted
by th
e al
l-ite
ms
CP
I. T
he
natio
nal I
PI,
calc
ulat
ed b
y di
vidi
ng th
e cu
rren
t pric
e es
timat
es b
y th
e co
nsta
nt p
rice
estim
ates
, is
used
to c
alcu
late
the
prov
inci
al a
nd
terr
itoria
l est
imat
es. T
he c
onst
ant p
rice
estim
ates
by
prov
ince
and
terr
itory
are
con
fron
ted
with
thos
e de
rived
with
a v
olum
e pr
ojec
tor
base
d on
the
num
ber
of in
divi
dual
s co
vere
d by
var
ious
type
s of
acc
iden
t and
sic
knes
s in
sura
nce,
obt
aine
d fr
om th
e C
anad
ian
Life
and
H
ealth
Insu
ranc
e.
J173
Com
mis
sion
s pa
id to
tour
ope
rato
rsC
PI f
or s
ervi
ces.
J174
Brid
ge a
nd h
ighw
ay to
llsP
rice
inde
x ca
lcul
ated
from
tolls
for
sele
cted
brid
ges
and
high
way
s, w
eigh
ted
by th
e pe
rson
al e
xpen
ditu
re fo
r ea
ch o
f the
sel
ecte
d br
idge
s an
d hi
ghw
ays.
J175
Aut
o in
sura
nce
Vol
ume
proj
ecto
r fo
r th
e na
tiona
l est
imat
es is
the
sum
of n
et p
rem
ium
s (p
rem
ium
s m
inus
cla
ims)
and
inve
stm
ent i
ncom
e at
con
stan
t pr
ices
. The
con
stan
t pric
e ne
t pre
miu
ms
are
cons
truc
ted
by p
roje
ctin
g th
e ba
se y
ear
net p
rem
ium
s pa
id b
y ho
useh
olds
with
tota
l pr
emiu
ms
defla
ted
by th
e C
PI f
or p
asse
nger
veh
icle
insu
ranc
e pr
emiu
ms,
mul
tiplie
d by
the
curr
ent y
ear’s
per
sona
l rat
io o
f net
pr
emiu
ms.
The
con
stan
t pric
e in
vest
men
t inc
ome
is c
alcu
late
d by
pro
ject
ing
the
base
yea
r in
vest
men
t inc
ome
with
inte
rest
bea
ring
asse
ts d
efla
ted
by th
e al
l-ite
ms
CP
I. T
he n
atio
nal I
PI,
calc
ulat
ed b
y di
vidi
ng th
e cu
rren
t pric
e es
timat
es b
y th
e co
nsta
nt p
rice
estim
ates
, is
use
d to
cal
cula
te th
e pr
ovin
cial
and
terr
itoria
l est
imat
es. T
he c
onst
ant p
rice
estim
ates
by
prov
ince
and
terr
itory
are
con
fron
ted
with
th
ose
deriv
ed w
ith a
vol
ume
proj
ecto
r ba
sed
on th
e nu
mbe
r of
veh
icle
s re
gist
ered
obt
aine
d fr
om th
e Tr
ansp
orta
tion
Div
isio
n.
J176
Urb
an tr
ansi
tC
PI f
or c
ity b
us a
nd s
ubw
ay tr
ansp
orta
tion.
J177
Rai
lway
tran
spor
tC
PI f
or r
ail t
rans
port
atio
n.
J178
Inte
rurb
an b
usC
PI f
or h
ighw
ay b
us a
nd in
ter-
city
tran
spor
tatio
n.
J179
Air
tran
spor
tN
atio
nal C
PI f
or a
ir tr
ansp
orta
tion,
con
fron
ted
with
the
pric
e in
dex
calc
ulat
ed b
y di
vidi
ng th
e pa
ssen
ger
reve
nue
by th
e nu
mbe
r of
pa
ssen
ger-
kilo
met
ers,
obt
aine
d fr
om th
e m
onth
ly o
pera
ting
repo
rts
of th
e m
ajor
Can
adia
n ai
r car
riers
. The
nat
iona
l IP
I is
used
to d
efla
te
the
prov
inci
al a
nd te
rrito
rial e
stim
ates
.
J180
Wat
er tr
ansp
ort
CP
I for
oth
er in
ter-
city
tran
spor
tatio
n -
ferr
y fa
res.
J181
Taxi
sC
PI f
or ta
xi a
nd o
ther
loca
l and
com
mut
er tr
ansp
orta
tion.
J182
Mov
ing
and
stor
age
CP
I for
ser
vice
s re
late
d to
hou
seho
ld fu
rnis
hing
s an
d eq
uipm
ent.
J183
Tele
com
mun
icat
ions
CP
I for
tele
phon
e se
rvic
es.
Tab
le 7
.9 S
ou
rces
an
d m
eth
od
s o
f p
erso
nal
exp
end
itu
re e
stim
ates
at
con
stan
t p
rice
s
Ser
ies
Titl
eP
rice
ind
ex f
or
def
lati
on
or
volu
me
pro
ject
or
of
bas
e-ye
ar v
alu
e1
1. T
he n
umbe
rs in
par
enth
esis
rep
rese
nt th
e w
eigh
t ass
igne
d to
eac
h co
mpo
nent
for
Can
ada.
The
se w
eigh
ts a
re b
ased
mos
tly o
n da
ta fr
om th
e 20
02 S
urve
y of
Hou
seho
ld S
pend
ing.
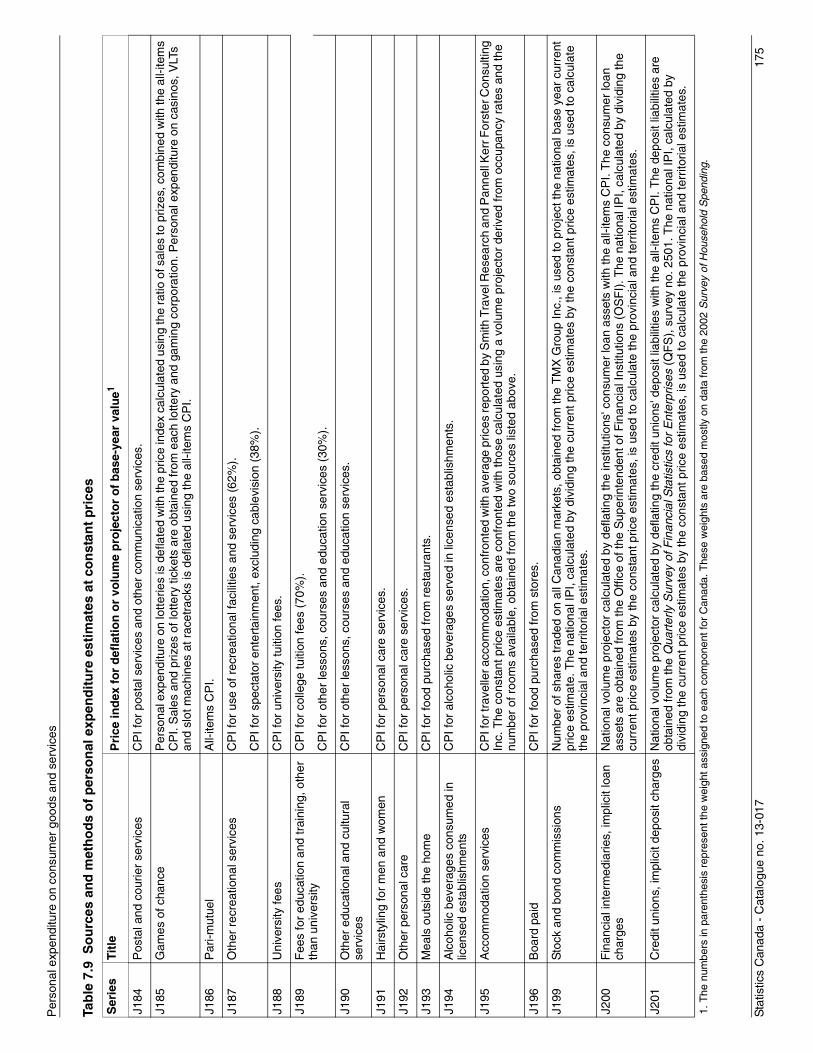
Sta
tistic
s C
anad
a -
Cat
alog
ue n
o. 1
3-01
717
5
Per
sona
l exp
endi
ture
on
cons
umer
goo
ds a
nd s
ervi
ces
J184
Pos
tal a
nd c
ourie
r se
rvic
esC
PI f
or p
osta
l ser
vice
s an
d ot
her
com
mun
icat
ion
serv
ices
.
J185
Gam
es o
f cha
nce
Per
sona
l exp
endi
ture
on
lotte
ries
is d
efla
ted
with
the
pric
e in
dex
calc
ulat
ed u
sing
the
ratio
of s
ales
to p
rizes
, com
bine
d w
ith th
e al
l-ite
ms
CP
I. S
ales
and
priz
es o
f lot
tery
tick
ets
are
obta
ined
from
eac
h lo
ttery
and
gam
ing
corp
orat
ion.
Per
sona
l exp
endi
ture
on
casi
nos,
VLT
s an
d sl
ot m
achi
nes
at r
acet
rack
s is
def
late
d us
ing
the
all-i
tem
s C
PI.
J186
Par
i-mut
uel
All-
item
s C
PI.
J187
Oth
er r
ecre
atio
nal s
ervi
ces
CP
I for
use
of r
ecre
atio
nal f
acili
ties
and
serv
ices
(62
%).
CP
I for
spe
ctat
or e
nter
tain
men
t, ex
clud
ing
cabl
evis
ion
(38%
).
J188
Uni
vers
ity fe
esC
PI f
or u
nive
rsity
tuiti
on fe
es.
J189
Fee
s fo
r ed
ucat
ion
and
trai
ning
, oth
er
than
uni
vers
ityC
PI f
or c
olle
ge tu
ition
fees
(70
%).
CP
I for
oth
er le
sson
s, c
ours
es a
nd e
duca
tion
serv
ices
(30
%).
J190
Oth
er e
duca
tiona
l and
cul
tura
l se
rvic
esC
PI f
or o
ther
less
ons,
cou
rses
and
edu
catio
n se
rvic
es.
J191
Hai
rsty
ling
for
men
and
wom
enC
PI f
or p
erso
nal c
are
serv
ices
.
J192
Oth
er p
erso
nal c
are
CP
I for
per
sona
l car
e se
rvic
es.
J193
Mea
ls o
utsi
de th
e ho
me
CP
I for
food
pur
chas
ed fr
om r
esta
uran
ts.
J194
Alc
ohol
ic b
ever
ages
con
sum
ed in
lic
ense
d es
tabl
ishm
ents
CP
I for
alc
ohol
ic b
ever
ages
ser
ved
in li
cens
ed e
stab
lishm
ents
.
J195
Acc
omm
odat
ion
serv
ices
CP
I for
trav
elle
r acc
omm
odat
ion,
con
fron
ted
with
ave
rage
pric
es re
port
ed b
y S
mith
Tra
vel R
esea
rch
and
Pan
nell
Ker
r For
ster
Con
sulti
ng
Inc.
The
con
stan
t pric
e es
timat
es a
re c
onfr
onte
d w
ith th
ose
calc
ulat
ed u
sing
a v
olum
e pr
ojec
tor
deriv
ed fr
om o
ccup
ancy
rat
es a
nd th
e nu
mbe
r of
roo
ms
avai
labl
e, o
btai
ned
from
the
two
sour
ces
liste
d ab
ove.
J196
Boa
rd p
aid
CP
I for
food
pur
chas
ed fr
om s
tore
s.
J199
Sto
ck a
nd b
ond
com
mis
sion
sN
umbe
r of
sha
res
trad
ed o
n al
l Can
adia
n m
arke
ts, o
btai
ned
from
the
TM
X G
roup
Inc.
, is
used
to p
roje
ct th
e na
tiona
l bas
e ye
ar c
urre
nt
pric
e es
timat
e. T
he n
atio
nal I
PI,
calc
ulat
ed b
y di
vidi
ng th
e cu
rren
t pric
e es
timat
es b
y th
e co
nsta
nt p
rice
estim
ates
, is
used
to c
alcu
late
th
e pr
ovin
cial
and
terr
itoria
l est
imat
es.
J200
Fin
anci
al in
term
edia
ries,
impl
icit
loan
ch
arge
sN
atio
nal v
olum
e pr
ojec
tor
calc
ulat
ed b
y de
flatin
g th
e in
stitu
tions
' con
sum
er lo
an a
sset
s w
ith th
e al
l-ite
ms
CP
I. T
he c
onsu
mer
loan
as
sets
are
obt
aine
d fr
om th
e O
ffice
of t
he S
uper
inte
nden
t of F
inan
cial
Inst
itutio
ns (
OS
FI)
. The
nat
iona
l IP
I, ca
lcul
ated
by
divi
ding
the
curr
ent p
rice
estim
ates
by
the
cons
tant
pric
e es
timat
es, i
s us
ed to
cal
cula
te th
e pr
ovin
cial
and
terr
itoria
l est
imat
es.
J201
Cre
dit u
nion
s, im
plic
it de
posi
t cha
rges
Nat
iona
l vol
ume
proj
ecto
r ca
lcul
ated
by
defla
ting
the
cred
it un
ions
' dep
osit
liabi
litie
s w
ith th
e al
l-ite
ms
CP
I. T
he d
epos
it lia
bilit
ies
are
obta
ined
from
the
Qua
rter
ly S
urve
y of
Fin
anci
al S
tatis
tics
for
Ent
erpr
ises
(Q
FS
), s
urve
y no
. 250
1. T
he n
atio
nal I
PI,
calc
ulat
ed b
y di
vidi
ng th
e cu
rren
t pric
e es
timat
es b
y th
e co
nsta
nt p
rice
estim
ates
, is
used
to c
alcu
late
the
prov
inci
al a
nd te
rrito
rial e
stim
ates
.
Tab
le 7
.9 S
ou
rces
an
d m
eth
od
s o
f p
erso
nal
exp
end
itu
re e
stim
ates
at
con
stan
t p
rice
s
Ser
ies
Titl
eP
rice
ind
ex f
or
def
lati
on
or
volu
me
pro
ject
or
of
bas
e-ye
ar v
alu
e1
1. T
he n
umbe
rs in
par
enth
esis
rep
rese
nt th
e w
eigh
t ass
igne
d to
eac
h co
mpo
nent
for
Can
ada.
The
se w
eigh
ts a
re b
ased
mos
tly o
n da
ta fr
om th
e 20
02 S
urve
y of
Hou
seho
ld S
pend
ing.
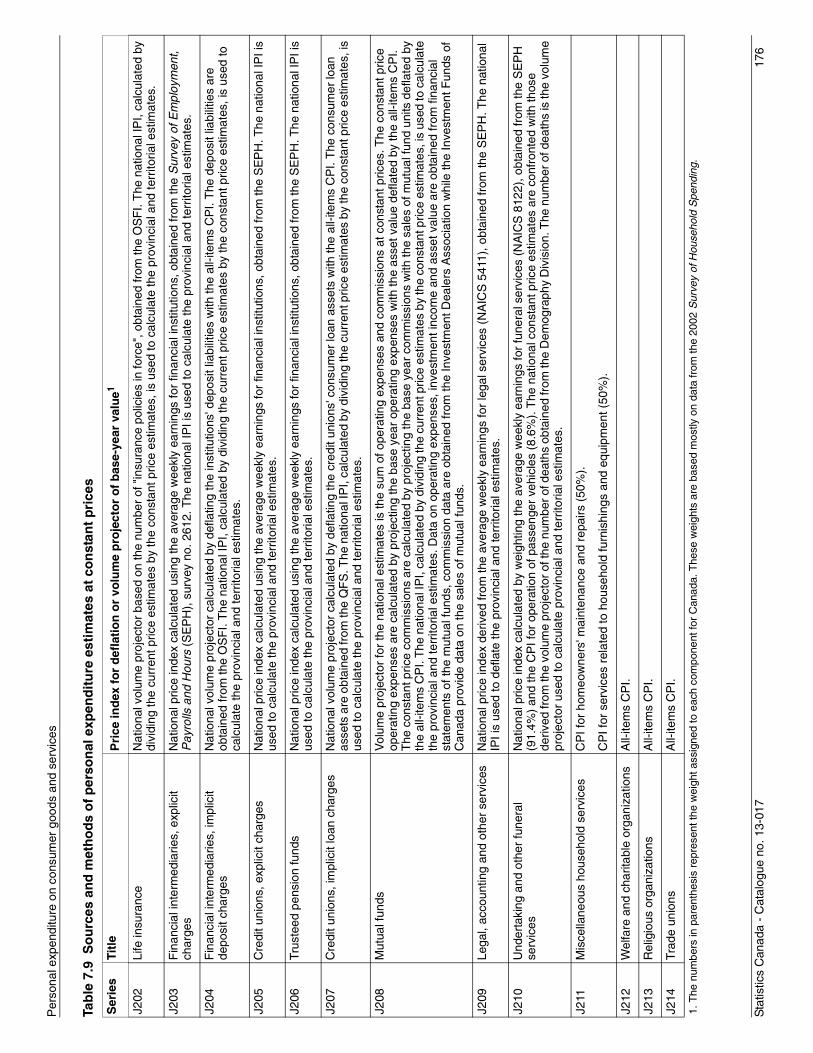
Sta
tistic
s C
anad
a -
Cat
alog
ue n
o. 1
3-01
717
6
Per
sona
l exp
endi
ture
on
cons
umer
goo
ds a
nd s
ervi
ces
J202
Life
insu
ranc
eN
atio
nal v
olum
e pr
ojec
tor
base
d on
the
num
ber
of "
insu
ranc
e po
licie
s in
forc
e", o
btai
ned
from
the
OS
FI.
The
nat
iona
l IP
I, ca
lcul
ated
by
divi
ding
the
curr
ent p
rice
estim
ates
by
the
cons
tant
pric
e es
timat
es, i
s us
ed to
cal
cula
te th
e pr
ovin
cial
and
terr
itoria
l est
imat
es.
J203
Fin
anci
al in
term
edia
ries,
exp
licit
char
ges
Nat
iona
l pric
e in
dex
calc
ulat
ed u
sing
the
aver
age
wee
kly
earn
ings
for
finan
cial
inst
itutio
ns, o
btai
ned
from
the
Sur
vey
of E
mpl
oym
ent,
Pay
rolls
and
Hou
rs (
SE
PH
), s
urve
y no
. 261
2. T
he n
atio
nal I
PI i
s us
ed to
cal
cula
te th
e pr
ovin
cial
and
terr
itoria
l est
imat
es.
J204
Fin
anci
al in
term
edia
ries,
impl
icit
depo
sit c
harg
esN
atio
nal v
olum
e pr
ojec
tor
calc
ulat
ed b
y de
flatin
g th
e in
stitu
tions
' dep
osit
liabi
litie
s w
ith th
e al
l-ite
ms
CP
I. T
he d
epos
it lia
bilit
ies
are
obta
ined
from
the
OS
FI.
The
nat
iona
l IP
I, ca
lcul
ated
by
divi
ding
the
curr
ent p
rice
estim
ates
by
the
cons
tant
pric
e es
timat
es, i
s us
ed to
ca
lcul
ate
the
prov
inci
al a
nd te
rrito
rial e
stim
ates
.
J205
Cre
dit u
nion
s, e
xplic
it ch
arge
sN
atio
nal p
rice
inde
x ca
lcul
ated
usi
ng th
e av
erag
e w
eekl
y ea
rnin
gs fo
r fin
anci
al in
stitu
tions
, obt
aine
d fr
om th
e S
EP
H. T
he n
atio
nal I
PI i
s us
ed to
cal
cula
te th
e pr
ovin
cial
and
terr
itoria
l est
imat
es.
J206
Trus
teed
pen
sion
fund
sN
atio
nal p
rice
inde
x ca
lcul
ated
usi
ng th
e av
erag
e w
eekl
y ea
rnin
gs fo
r fin
anci
al in
stitu
tions
, obt
aine
d fr
om th
e S
EP
H. T
he n
atio
nal I
PI i
s us
ed to
cal
cula
te th
e pr
ovin
cial
and
terr
itoria
l est
imat
es.
J207
Cre
dit u
nion
s, im
plic
it lo
an c
harg
esN
atio
nal v
olum
e pr
ojec
tor
calc
ulat
ed b
y de
flatin
g th
e cr
edit
unio
ns' c
onsu
mer
loan
ass
ets
with
the
all-i
tem
s C
PI.
The
con
sum
er lo
an
asse
ts a
re o
btai
ned
from
the
QF
S. T
he n
atio
nal I
PI,
calc
ulat
ed b
y di
vidi
ng th
e cu
rren
t pric
e es
timat
es b
y th
e co
nsta
nt p
rice
estim
ates
, is
used
to c
alcu
late
the
prov
inci
al a
nd te
rrito
rial e
stim
ates
.
J208
Mut
ual f
unds
Vol
ume
proj
ecto
r fo
r th
e na
tiona
l est
imat
es is
the
sum
of o
pera
ting
expe
nses
and
com
mis
sion
s at
con
stan
t pric
es. T
he c
onst
ant p
rice
oper
atin
g ex
pens
es a
re c
alcu
late
d by
pro
ject
ing
the
base
yea
r op
erat
ing
expe
nses
with
the
asse
t val
ue d
efla
ted
by th
e al
l-ite
ms
CP
I. T
he c
onst
ant p
rice
com
mis
sion
s ar
e ca
lcul
ated
by
proj
ectin
g th
e ba
se y
ear
com
mis
sion
s w
ith th
e sa
les
of m
utua
l fun
d un
its d
efla
ted
by
the
all-i
tem
s C
PI.
The
nat
iona
l IP
I, ca
lcul
ated
by
divi
ding
the
curr
ent p
rice
estim
ates
by
the
cons
tant
pric
e es
timat
es, i
s us
ed to
cal
cula
te
the
prov
inci
al a
nd te
rrito
rial e
stim
ates
. Dat
a on
ope
ratin
g ex
pens
es, i
nves
tmen
t inc
ome
and
asse
t val
ue a
re o
btai
ned
from
fina
ncia
l st
atem
ents
of t
he m
utua
l fun
ds, c
omm
issi
on d
ata
are
obta
ined
from
the
Inve
stm
ent D
eale
rs A
ssoc
iatio
n w
hile
the
Inve
stm
ent F
unds
of
Can
ada
prov
ide
data
on
the
sale
s of
mut
ual f
unds
.
J209
Lega
l, ac
coun
ting
and
othe
r se
rvic
esN
atio
nal p
rice
inde
x de
rived
from
the
aver
age
wee
kly
earn
ings
for
lega
l ser
vice
s (N
AIC
S 5
411)
, obt
aine
d fr
om th
e S
EP
H. T
he n
atio
nal
IPI i
s us
ed to
def
late
the
prov
inci
al a
nd te
rrito
rial e
stim
ates
.
J210
Und
erta
king
and
oth
er fu
nera
l se
rvic
esN
atio
nal p
rice
inde
x ca
lcul
ated
by
wei
ghtin
g th
e av
erag
e w
eekl
y ea
rnin
gs fo
r fu
nera
l ser
vice
s (N
AIC
S 8
122)
, obt
aine
d fr
om th
e S
EP
H
(91.
4%)
and
the
CP
I for
ope
ratio
n of
pas
seng
er v
ehic
les
(8.6
%).
The
nat
iona
l con
stan
t pric
e es
timat
es a
re c
onfr
onte
d w
ith th
ose
deriv
ed fr
om th
e vo
lum
e pr
ojec
tor
of th
e nu
mbe
r of
dea
ths
obta
ined
from
the
Dem
ogra
phy
Div
isio
n. T
he n
umbe
r of
dea
ths
is th
e vo
lum
e pr
ojec
tor
used
to c
alcu
late
pro
vinc
ial a
nd te
rrito
rial e
stim
ates
.
J211
Mis
cella
neou
s ho
useh
old
serv
ices
CP
I for
hom
eow
ners
' mai
nten
ance
and
rep
airs
(50
%).
CP
I for
ser
vice
s re
late
d to
hou
seho
ld fu
rnis
hing
s an
d eq
uipm
ent (
50%
).
J212
Wel
fare
and
cha
ritab
le o
rgan
izat
ions
All-
item
s C
PI.
J213
Rel
igio
us o
rgan
izat
ions
All-
item
s C
PI.
J214
Trad
e un
ions
All-
item
s C
PI.
Tab
le 7
.9 S
ou
rces
an
d m
eth
od
s o
f p
erso
nal
exp
end
itu
re e
stim
ates
at
con
stan
t p
rice
s
Ser
ies
Titl
eP
rice
ind
ex f
or
def
lati
on
or
volu
me
pro
ject
or
of
bas
e-ye
ar v
alu
e1
1. T
he n
umbe
rs in
par
enth
esis
rep
rese
nt th
e w
eigh
t ass
igne
d to
eac
h co
mpo
nent
for
Can
ada.
The
se w
eigh
ts a
re b
ased
mos
tly o
n da
ta fr
om th
e 20
02 S
urve
y of
Hou
seho
ld S
pend
ing.
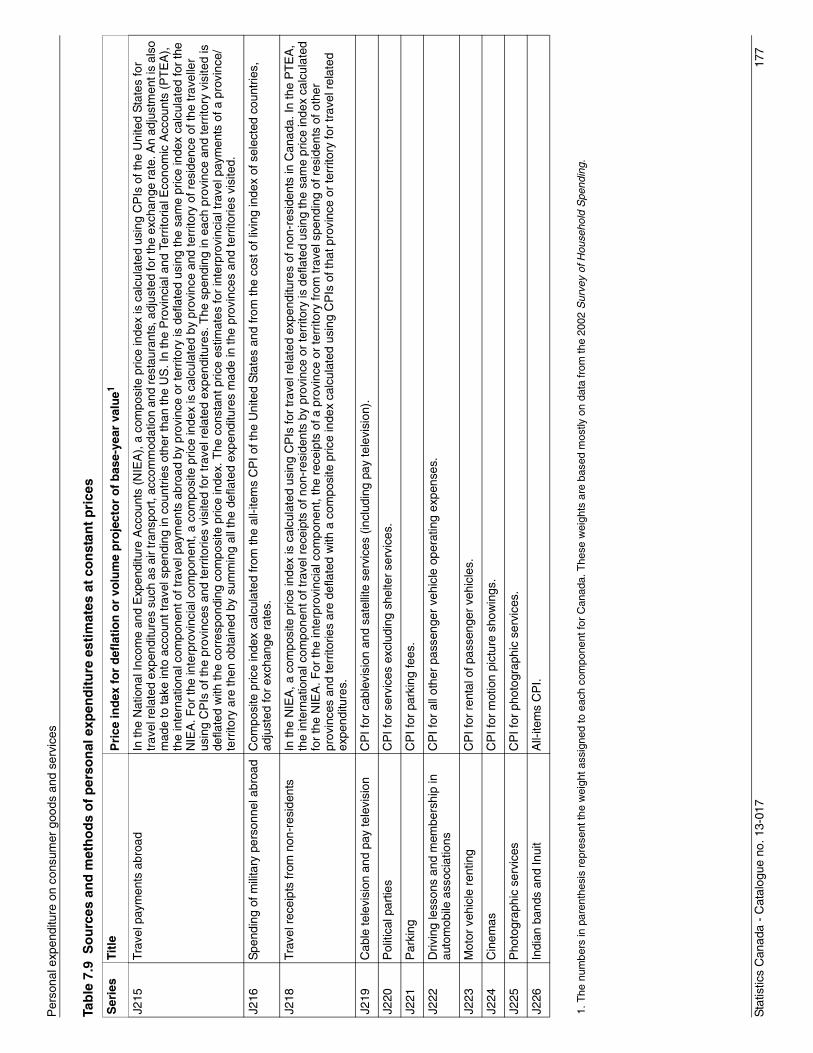
Sta
tistic
s C
anad
a -
Cat
alog
ue n
o. 1
3-01
717
7
Per
sona
l exp
endi
ture
on
cons
umer
goo
ds a
nd s
ervi
ces
J215
Trav
el p
aym
ents
abr
oad
In th
e N
atio
nal I
ncom
e an
d E
xpen
ditu
re A
ccou
nts
(NIE
A),
a c
ompo
site
pric
e in
dex
is c
alcu
late
d us
ing
CP
Is o
f the
Uni
ted
Sta
tes
for
trav
el re
late
d ex
pend
iture
s su
ch a
s ai
r tra
nspo
rt, a
ccom
mod
atio
n an
d re
stau
rant
s, a
djus
ted
for t
he e
xcha
nge
rate
. An
adju
stm
ent i
s al
so
mad
e to
take
into
acc
ount
trav
el s
pend
ing
in c
ount
ries
othe
r th
an th
e U
S. I
n th
e P
rovi
ncia
l and
Ter
ritor
ial E
cono
mic
Acc
ount
s (P
TE
A),
th
e in
tern
atio
nal c
ompo
nent
of t
rave
l pay
men
ts a
broa
d by
pro
vinc
e or
terr
itory
is d
efla
ted
usin
g th
e sa
me
pric
e in
dex
calc
ulat
ed fo
r th
e N
IEA
. For
the
inte
rpro
vinc
ial c
ompo
nent
, a c
ompo
site
pric
e in
dex
is c
alcu
late
d by
pro
vinc
e an
d te
rrito
ry o
f res
iden
ce o
f the
trav
elle
r us
ing
CP
Is o
f the
pro
vinc
es a
nd te
rrito
ries
visi
ted
for
trav
el r
elat
ed e
xpen
ditu
res.
The
spe
ndin
g in
eac
h pr
ovin
ce a
nd te
rrito
ry v
isite
d is
de
flate
d w
ith th
e co
rres
pond
ing
com
posi
te p
rice
inde
x. T
he c
onst
ant p
rice
estim
ates
for
inte
rpro
vinc
ial t
rave
l pay
men
ts o
f a p
rovi
nce/
terr
itory
are
then
obt
aine
d by
sum
min
g al
l the
def
late
d ex
pend
iture
s m
ade
in th
e pr
ovin
ces
and
terr
itorie
s vi
site
d.
J216
Spe
ndin
g of
mili
tary
per
sonn
el a
broa
dC
ompo
site
pric
e in
dex
calc
ulat
ed fr
om th
e al
l-ite
ms
CP
I of t
he U
nite
d S
tate
s an
d fr
om th
e co
st o
f liv
ing
inde
x of
sel
ecte
d co
untr
ies,
ad
just
ed fo
r ex
chan
ge r
ates
.
J218
Trav
el r
ecei
pts
from
non
-res
iden
tsIn
the
NIE
A, a
com
posi
te p
rice
inde
x is
cal
cula
ted
usin
g C
PIs
for
trav
el r
elat
ed e
xpen
ditu
res
of n
on-r
esid
ents
in C
anad
a. In
the
PT
EA
, th
e in
tern
atio
nal c
ompo
nent
of t
rave
l rec
eipt
s of
non
-res
iden
ts b
y pr
ovin
ce o
r te
rrito
ry is
def
late
d us
ing
the
sam
e pr
ice
inde
x ca
lcul
ated
fo
r th
e N
IEA
. For
the
inte
rpro
vinc
ial c
ompo
nent
, the
rec
eipt
s of
a p
rovi
nce
or te
rrito
ry fr
om tr
avel
spe
ndin
g of
res
iden
ts o
f oth
er
prov
ince
s an
d te
rrito
ries
are
defla
ted
with
a c
ompo
site
pric
e in
dex
calc
ulat
ed u
sing
CP
Is o
f tha
t pro
vinc
e or
terr
itory
for
trav
el r
elat
ed
expe
nditu
res.
J219
Cab
le te
levi
sion
and
pay
tele
visi
onC
PI f
or c
able
visi
on a
nd s
atel
lite
serv
ices
(in
clud
ing
pay
tele
visi
on).
J220
Pol
itica
l par
ties
CP
I for
ser
vice
s ex
clud
ing
shel
ter
serv
ices
.
J221
Par
king
CP
I for
par
king
fees
.
J222
Driv
ing
less
ons
and
mem
bers
hip
in
auto
mob
ile a
ssoc
iatio
nsC
PI f
or a
ll ot
her
pass
enge
r ve
hicl
e op
erat
ing
expe
nses
.
J223
Mot
or v
ehic
le r
entin
gC
PI f
or r
enta
l of p
asse
nger
veh
icle
s.
J224
Cin
emas
CP
I for
mot
ion
pict
ure
show
ings
.
J225
Pho
togr
aphi
c se
rvic
esC
PI f
or p
hoto
grap
hic
serv
ices
.
J226
Indi
an b
ands
and
Inui
tA
ll-ite
ms
CP
I.
Tab
le 7
.9 S
ou
rces
an
d m
eth
od
s o
f p
erso
nal
exp
end
itu
re e
stim
ates
at
con
stan
t p
rice
s
Ser
ies
Titl
eP
rice
ind
ex f
or
def
lati
on
or
volu
me
pro
ject
or
of
bas
e-ye
ar v
alu
e1
1. T
he n
umbe
rs in
par
enth
esis
rep
rese
nt th
e w
eigh
t ass
igne
d to
eac
h co
mpo
nent
for
Can
ada.
The
se w
eigh
ts a
re b
ased
mos
tly o
n da
ta fr
om th
e 20
02 S
urve
y of
Hou
seho
ld S
pend
ing.
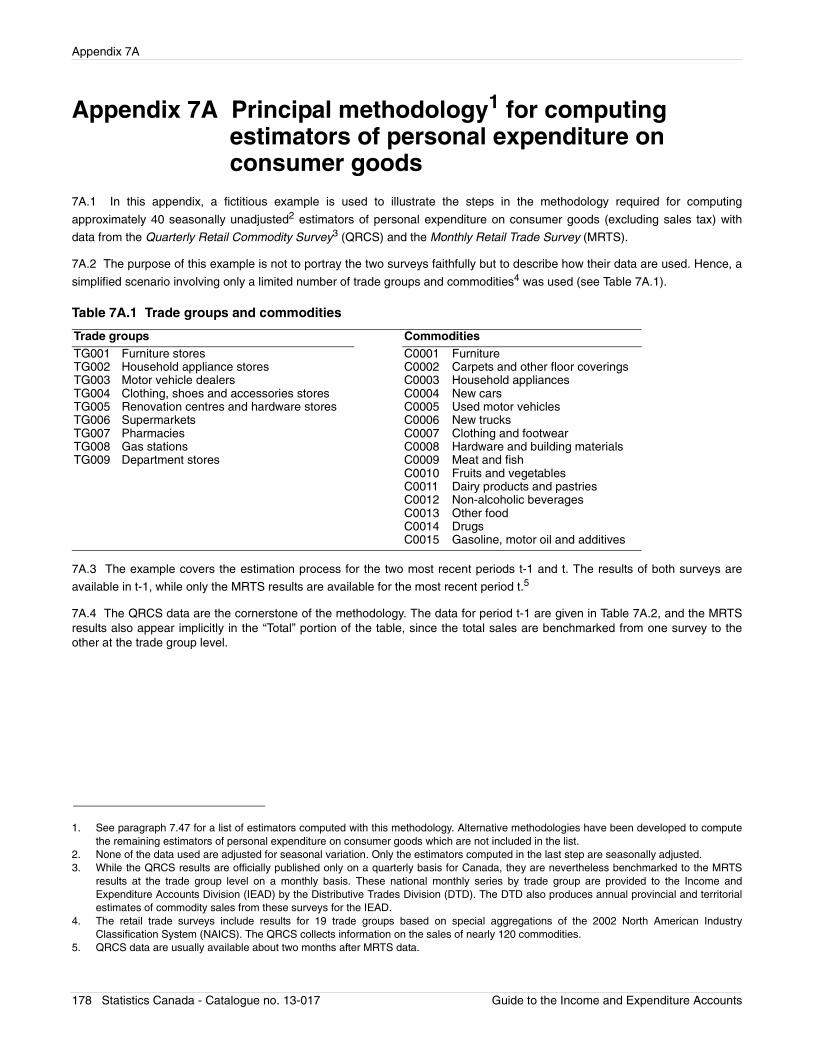
Appendix 7A
Appendix 7A Principal methodology1 for computing estimators of personal expenditure on consumer goods
7A.1 In this appendix, a fictitious example is used to illustrate the steps in the methodology required for computing
approximately 40 seasonally unadjusted2 estimators of personal expenditure on consumer goods (excluding sales tax) with
data from the Quarterly Retail Commodity Survey3 (QRCS) and the Monthly Retail Trade Survey (MRTS).
7A.2 The purpose of this example is not to portray the two surveys faithfully but to describe how their data are used. Hence, a
simplified scenario involving only a limited number of trade groups and commodities4 was used (see Table 7A.1).
Table 7A.1 Trade groups and commodities
7A.3 The example covers the estimation process for the two most recent periods t-1 and t. The results of both surveys are
available in t-1, while only the MRTS results are available for the most recent period t.5
7A.4 The QRCS data are the cornerstone of the methodology. The data for period t-1 are given in Table 7A.2, and the MRTSresults also appear implicitly in the “Total” portion of the table, since the total sales are benchmarked from one survey to theother at the trade group level.
1. See paragraph 7.47 for a list of estimators computed with this methodology. Alternative methodologies have been developed to computethe remaining estimators of personal expenditure on consumer goods which are not included in the list.
2. None of the data used are adjusted for seasonal variation. Only the estimators computed in the last step are seasonally adjusted.3. While the QRCS results are officially published only on a quarterly basis for Canada, they are nevertheless benchmarked to the MRTS
results at the trade group level on a monthly basis. These national monthly series by trade group are provided to the Income andExpenditure Accounts Division (IEAD) by the Distributive Trades Division (DTD). The DTD also produces annual provincial and territorialestimates of commodity sales from these surveys for the IEAD.
4. The retail trade surveys include results for 19 trade groups based on special aggregations of the 2002 North American IndustryClassification System (NAICS). The QRCS collects information on the sales of nearly 120 commodities.
Trade groups CommoditiesTG001TG002TG003TG004TG005TG006TG007TG008TG009
Furniture storesHousehold appliance storesMotor vehicle dealersClothing, shoes and accessories storesRenovation centres and hardware storesSupermarketsPharmaciesGas stationsDepartment stores
C0001C0002C0003C0004C0005C0006C0007C0008C0009C0010C0011C0012C0013C0014C0015
FurnitureCarpets and other floor coveringsHousehold appliancesNew carsUsed motor vehiclesNew trucksClothing and footwearHardware and building materialsMeat and fishFruits and vegetablesDairy products and pastriesNon-alcoholic beveragesOther foodDrugsGasoline, motor oil and additives
5. QRCS data are usually available about two months after MRTS data.
178 Statistics Canada - Catalogue no. 13-017 Guide to the Income and Expenditure Accounts
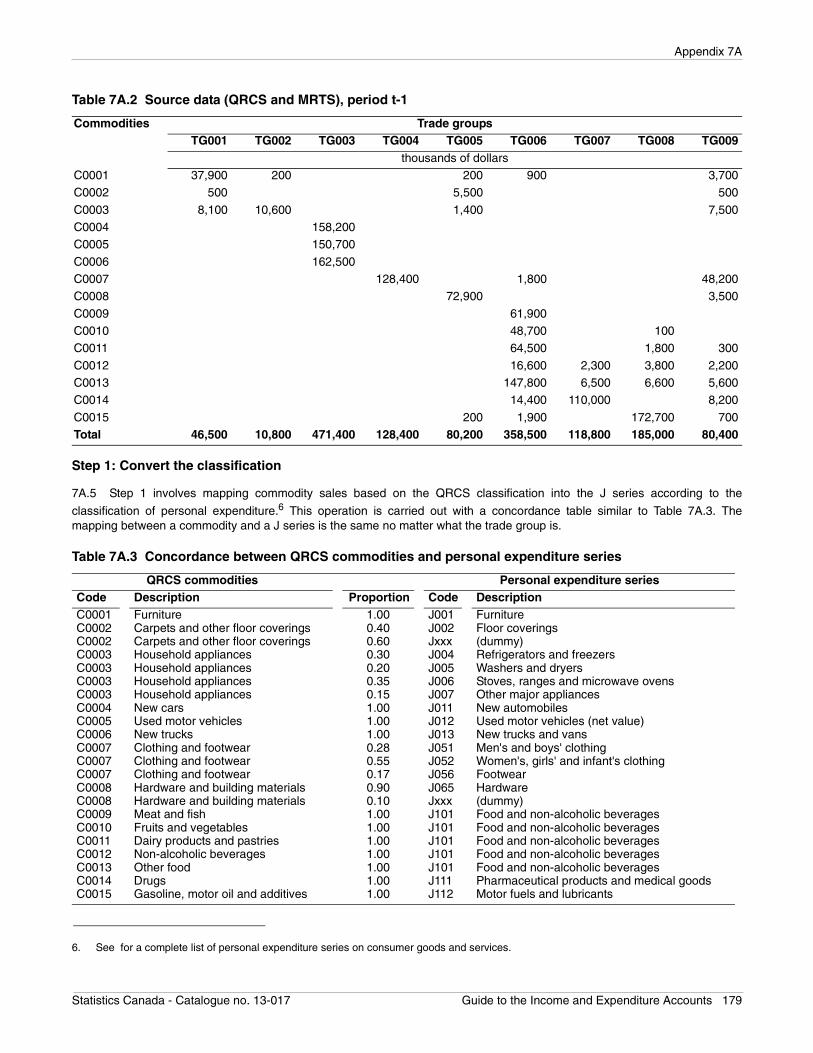
Appendix 7A
Table 7A.2 Source data (QRCS and MRTS), period t-1
Step 1: Convert the classification
7A.5 Step 1 involves mapping commodity sales based on the QRCS classification into the J series according to the
classification of personal expenditure.6 This operation is carried out with a concordance table similar to Table 7A.3. Themapping between a commodity and a J series is the same no matter what the trade group is.
Table 7A.3 Concordance between QRCS commodities and personal expenditure series
Commodities Trade groupsTG001 TG002 TG003 TG004 TG005 TG006 TG007 TG008 TG009
thousands of dollarsC0001 37,900 200 200 900 3,700C0002 500 5,500 500
C0003 8,100 10,600 1,400 7,500C0004 158,200C0005 150,700
C0006 162,500C0007 128,400 1,800 48,200C0008 72,900 3,500
C0009 61,900C0010 48,700 100C0011 64,500 1,800 300
C0012 16,600 2,300 3,800 2,200C0013 147,800 6,500 6,600 5,600C0014 14,400 110,000 8,200
C0015 200 1,900 172,700 700Total 46,500 10,800 471,400 128,400 80,200 358,500 118,800 185,000 80,400
6. See for a complete list of personal expenditure series on consumer goods and services.
QRCS commodities Personal expenditure seriesCode Description Proportion Code DescriptionC0001C0002C0002C0003C0003C0003C0003C0004C0005C0006C0007C0007C0007C0008C0008C0009C0010C0011C0012C0013C0014C0015
FurnitureCarpets and other floor coveringsCarpets and other floor coveringsHousehold appliancesHousehold appliancesHousehold appliancesHousehold appliancesNew carsUsed motor vehiclesNew trucksClothing and footwearClothing and footwearClothing and footwearHardware and building materialsHardware and building materialsMeat and fishFruits and vegetablesDairy products and pastriesNon-alcoholic beveragesOther foodDrugsGasoline, motor oil and additives
1.000.400.600.300.200.350.151.001.001.000.280.550.170.900.101.001.001.001.001.001.001.00
J001J002JxxxJ004J005J006J007J011J012J013J051J052J056J065JxxxJ101J101J101J101J101J111J112
FurnitureFloor coverings(dummy)Refrigerators and freezersWashers and dryersStoves, ranges and microwave ovensOther major appliancesNew automobilesUsed motor vehicles (net value)New trucks and vansMen's and boys' clothingWomen's, girls' and infant's clothingFootwearHardware(dummy)Food and non-alcoholic beveragesFood and non-alcoholic beveragesFood and non-alcoholic beveragesFood and non-alcoholic beveragesFood and non-alcoholic beveragesPharmaceutical products and medical goodsMotor fuels and lubricants
Statistics Canada - Catalogue no. 13-017 Guide to the Income and Expenditure Accounts 179
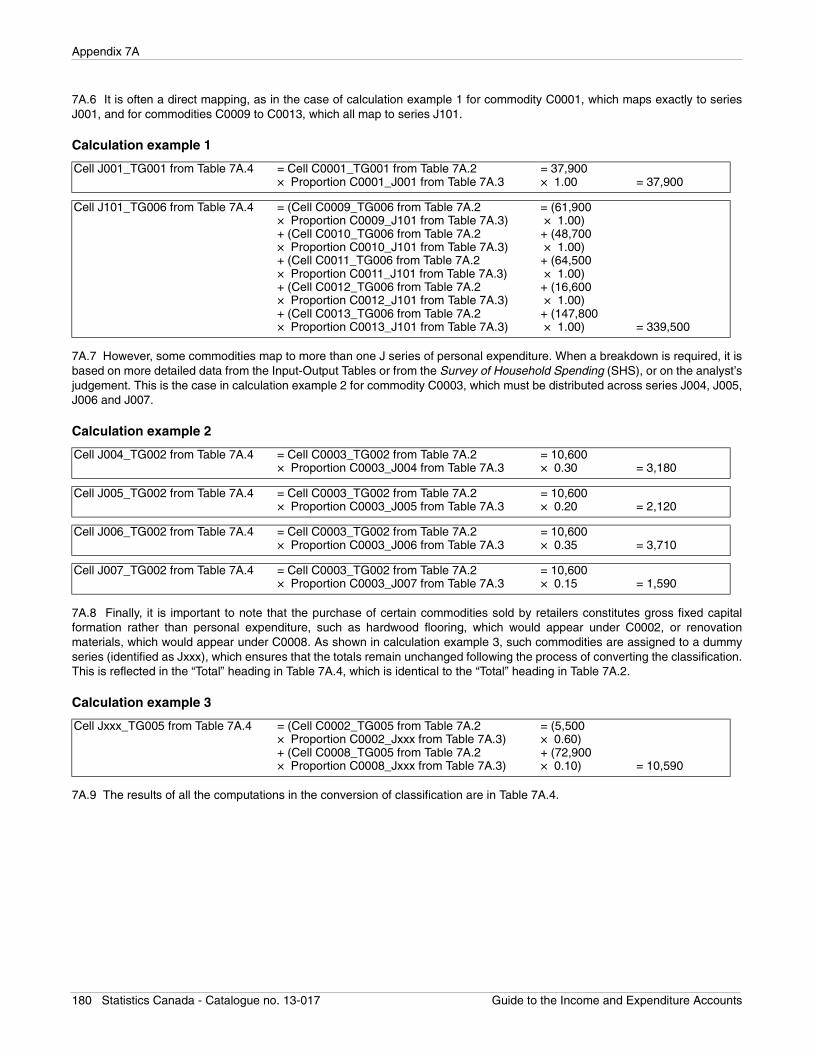
Appendix 7A
7A.6 It is often a direct mapping, as in the case of calculation example 1 for commodity C0001, which maps exactly to seriesJ001, and for commodities C0009 to C0013, which all map to series J101.
Calculation example 1
7A.7 However, some commodities map to more than one J series of personal expenditure. When a breakdown is required, it isbased on more detailed data from the Input-Output Tables or from the Survey of Household Spending (SHS), or on the analyst’sjudgement. This is the case in calculation example 2 for commodity C0003, which must be distributed across series J004, J005,J006 and J007.
Calculation example 2
7A.8 Finally, it is important to note that the purchase of certain commodities sold by retailers constitutes gross fixed capitalformation rather than personal expenditure, such as hardwood flooring, which would appear under C0002, or renovationmaterials, which would appear under C0008. As shown in calculation example 3, such commodities are assigned to a dummyseries (identified as Jxxx), which ensures that the totals remain unchanged following the process of converting the classification.This is reflected in the “Total” heading in Table 7A.4, which is identical to the “Total” heading in Table 7A.2.
Calculation example 3
7A.9 The results of all the computations in the conversion of classification are in Table 7A.4.
Cell J001_TG001 from Table 7A.4 = Cell C0001_TG001 from Table 7A.2× Proportion C0001_J001 from Table 7A.3
= 37,900× 1.00 = 37,900
Cell J101_TG006 from Table 7A.4 = (Cell C0009_TG006 from Table 7A.2× Proportion C0009_J101 from Table 7A.3)+ (Cell C0010_TG006 from Table 7A.2× Proportion C0010_J101 from Table 7A.3)+ (Cell C0011_TG006 from Table 7A.2× Proportion C0011_J101 from Table 7A.3)+ (Cell C0012_TG006 from Table 7A.2× Proportion C0012_J101 from Table 7A.3)+ (Cell C0013_TG006 from Table 7A.2× Proportion C0013_J101 from Table 7A.3)
= (61,900 × 1.00)+ (48,700 × 1.00)+ (64,500 × 1.00)+ (16,600 × 1.00)+ (147,800 × 1.00) = 339,500
Cell J004_TG002 from Table 7A.4 = Cell C0003_TG002 from Table 7A.2× Proportion C0003_J004 from Table 7A.3
= 10,600× 0.30 = 3,180
Cell J005_TG002 from Table 7A.4 = Cell C0003_TG002 from Table 7A.2× Proportion C0003_J005 from Table 7A.3
= 10,600× 0.20 = 2,120
Cell J006_TG002 from Table 7A.4 = Cell C0003_TG002 from Table 7A.2× Proportion C0003_J006 from Table 7A.3
= 10,600× 0.35 = 3,710
Cell J007_TG002 from Table 7A.4 = Cell C0003_TG002 from Table 7A.2× Proportion C0003_J007 from Table 7A.3
= 10,600× 0.15 = 1,590
Cell Jxxx_TG005 from Table 7A.4 = (Cell C0002_TG005 from Table 7A.2× Proportion C0002_Jxxx from Table 7A.3)+ (Cell C0008_TG005 from Table 7A.2× Proportion C0008_Jxxx from Table 7A.3)
= (5,500× 0.60)+ (72,900× 0.10) = 10,590
180 Statistics Canada - Catalogue no. 13-017 Guide to the Income and Expenditure Accounts
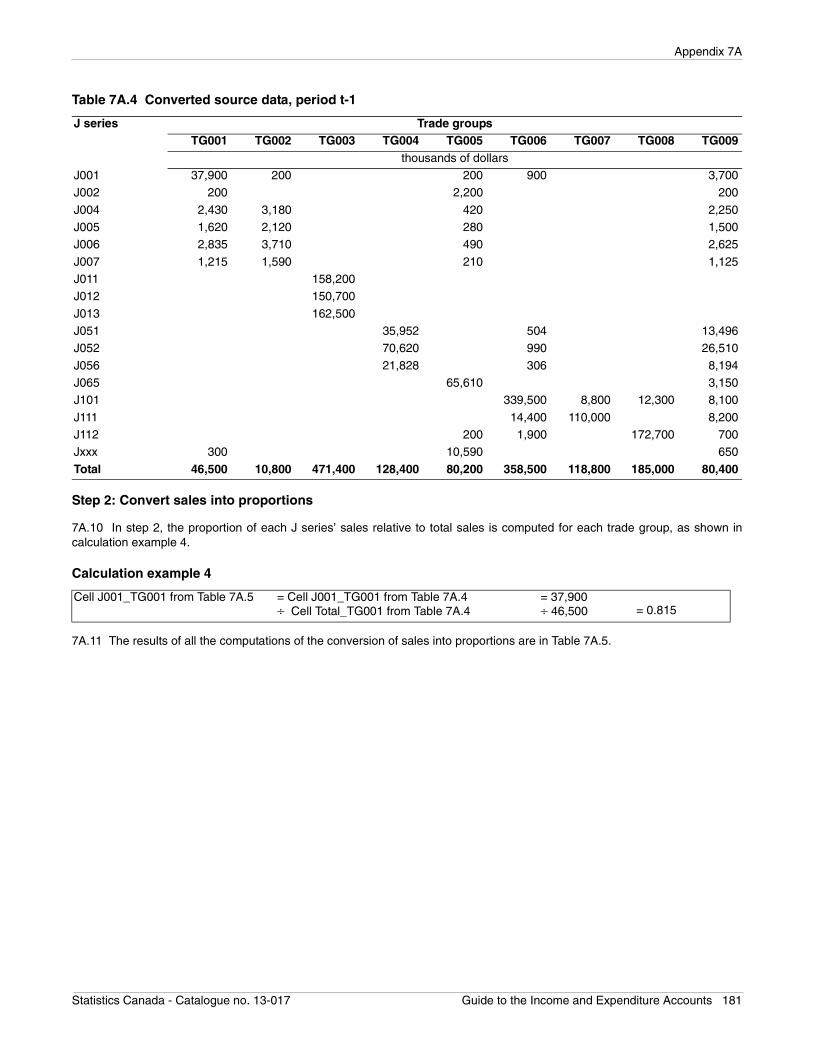
Appendix 7A
Table 7A.4 Converted source data, period t-1
Step 2: Convert sales into proportions
7A.10 In step 2, the proportion of each J series’ sales relative to total sales is computed for each trade group, as shown incalculation example 4.
Calculation example 4
7A.11 The results of all the computations of the conversion of sales into proportions are in Table 7A.5.
J series Trade groupsTG001 TG002 TG003 TG004 TG005 TG006 TG007 TG008 TG009
thousands of dollarsJ001 37,900 200 200 900 3,700J002 200 2,200 200
J004 2,430 3,180 420 2,250J005 1,620 2,120 280 1,500J006 2,835 3,710 490 2,625
J007 1,215 1,590 210 1,125J011 158,200J012 150,700
J013 162,500J051 35,952 504 13,496J052 70,620 990 26,510
J056 21,828 306 8,194J065 65,610 3,150J101 339,500 8,800 12,300 8,100
J111 14,400 110,000 8,200J112 200 1,900 172,700 700Jxxx 300 10,590 650
Total 46,500 10,800 471,400 128,400 80,200 358,500 118,800 185,000 80,400
Cell J001_TG001 from Table 7A.5 = Cell J001_TG001 from Table 7A.4÷ Cell Total_TG001 from Table 7A.4
= 37,900÷ 46,500 = 0.815
Statistics Canada - Catalogue no. 13-017 Guide to the Income and Expenditure Accounts 181
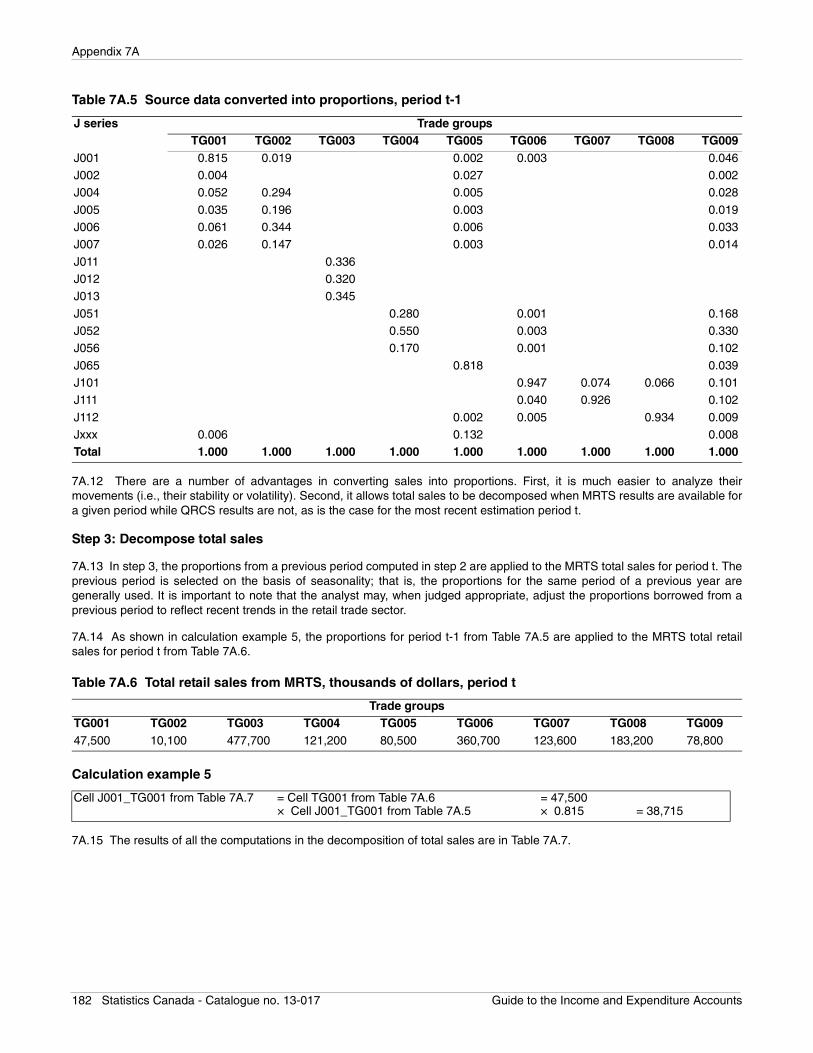
Appendix 7A
Table 7A.5 Source data converted into proportions, period t-1
7A.12 There are a number of advantages in converting sales into proportions. First, it is much easier to analyze theirmovements (i.e., their stability or volatility). Second, it allows total sales to be decomposed when MRTS results are available fora given period while QRCS results are not, as is the case for the most recent estimation period t.
Step 3: Decompose total sales
7A.13 In step 3, the proportions from a previous period computed in step 2 are applied to the MRTS total sales for period t. Theprevious period is selected on the basis of seasonality; that is, the proportions for the same period of a previous year aregenerally used. It is important to note that the analyst may, when judged appropriate, adjust the proportions borrowed from aprevious period to reflect recent trends in the retail trade sector.
7A.14 As shown in calculation example 5, the proportions for period t-1 from Table 7A.5 are applied to the MRTS total retailsales for period t from Table 7A.6.
Table 7A.6 Total retail sales from MRTS, thousands of dollars, period t
Calculation example 5
7A.15 The results of all the computations in the decomposition of total sales are in Table 7A.7.
J series Trade groupsTG001 TG002 TG003 TG004 TG005 TG006 TG007 TG008 TG009
J001 0.815 0.019 0.002 0.003 0.046J002 0.004 0.027 0.002J004 0.052 0.294 0.005 0.028
J005 0.035 0.196 0.003 0.019J006 0.061 0.344 0.006 0.033J007 0.026 0.147 0.003 0.014
J011 0.336J012 0.320J013 0.345
J051 0.280 0.001 0.168J052 0.550 0.003 0.330J056 0.170 0.001 0.102
J065 0.818 0.039J101 0.947 0.074 0.066 0.101J111 0.040 0.926 0.102
J112 0.002 0.005 0.934 0.009Jxxx 0.006 0.132 0.008Total 1.000 1.000 1.000 1.000 1.000 1.000 1.000 1.000 1.000
Trade groupsTG001 TG002 TG003 TG004 TG005 TG006 TG007 TG008 TG00947,500 10,100 477,700 121,200 80,500 360,700 123,600 183,200 78,800
Cell J001_TG001 from Table 7A.7 = Cell TG001 from Table 7A.6× Cell J001_TG001 from Table 7A.5
= 47,500× 0.815 = 38,715
182 Statistics Canada - Catalogue no. 13-017 Guide to the Income and Expenditure Accounts
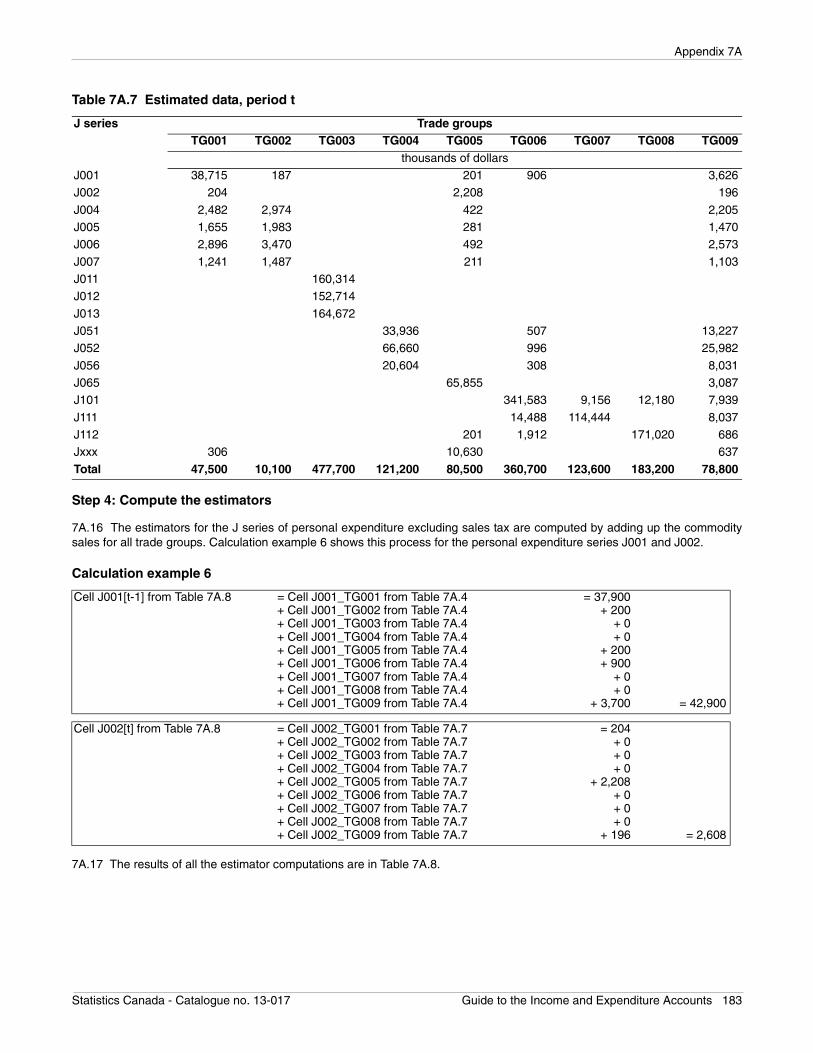
Appendix 7A
Table 7A.7 Estimated data, period t
Step 4: Compute the estimators
7A.16 The estimators for the J series of personal expenditure excluding sales tax are computed by adding up the commoditysales for all trade groups. Calculation example 6 shows this process for the personal expenditure series J001 and J002.
Calculation example 6
7A.17 The results of all the estimator computations are in Table 7A.8.
J series Trade groupsTG001 TG002 TG003 TG004 TG005 TG006 TG007 TG008 TG009
thousands of dollarsJ001 38,715 187 201 906 3,626J002 204 2,208 196
J004 2,482 2,974 422 2,205J005 1,655 1,983 281 1,470J006 2,896 3,470 492 2,573
J007 1,241 1,487 211 1,103J011 160,314J012 152,714
J013 164,672J051 33,936 507 13,227J052 66,660 996 25,982
J056 20,604 308 8,031J065 65,855 3,087J101 341,583 9,156 12,180 7,939
J111 14,488 114,444 8,037J112 201 1,912 171,020 686Jxxx 306 10,630 637
Total 47,500 10,100 477,700 121,200 80,500 360,700 123,600 183,200 78,800
Cell J001[t-1] from Table 7A.8 = Cell J001_TG001 from Table 7A.4+ Cell J001_TG002 from Table 7A.4+ Cell J001_TG003 from Table 7A.4+ Cell J001_TG004 from Table 7A.4+ Cell J001_TG005 from Table 7A.4+ Cell J001_TG006 from Table 7A.4+ Cell J001_TG007 from Table 7A.4+ Cell J001_TG008 from Table 7A.4+ Cell J001_TG009 from Table 7A.4
= 37,900+ 200
+ 0+ 0
+ 200+ 900
+ 0+ 0
+ 3,700 = 42,900
Cell J002[t] from Table 7A.8 = Cell J002_TG001 from Table 7A.7+ Cell J002_TG002 from Table 7A.7+ Cell J002_TG003 from Table 7A.7+ Cell J002_TG004 from Table 7A.7+ Cell J002_TG005 from Table 7A.7+ Cell J002_TG006 from Table 7A.7+ Cell J002_TG007 from Table 7A.7+ Cell J002_TG008 from Table 7A.7+ Cell J002_TG009 from Table 7A.7
= 204+ 0+ 0+ 0
+ 2,208+ 0+ 0+ 0
+ 196 = 2,608
Statistics Canada - Catalogue no. 13-017 Guide to the Income and Expenditure Accounts 183
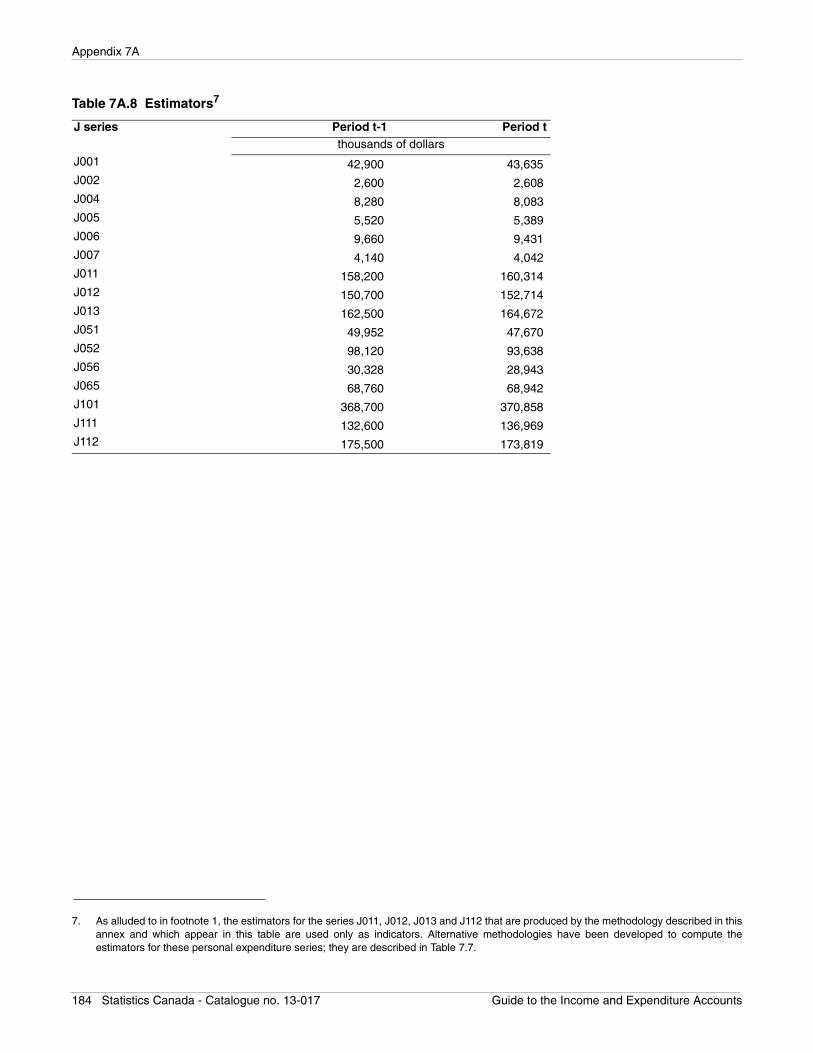
Appendix 7A
Table 7A.8 Estimators7
J series Period t-1 Period tthousands of dollars
J001 42,900 43,635J002 2,600 2,608J004 8,280 8,083J005 5,520 5,389J006 9,660 9,431J007 4,140 4,042J011 158,200 160,314J012 150,700 152,714J013 162,500 164,672J051 49,952 47,670J052 98,120 93,638J056 30,328 28,943J065 68,760 68,942J101 368,700 370,858J111 132,600 136,969J112 175,500 173,819
7. As alluded to in footnote 1, the estimators for the series J011, J012, J013 and J112 that are produced by the methodology described in thisannex and which appear in this table are used only as indicators. Alternative methodologies have been developed to compute theestimators for these personal expenditure series; they are described in Table 7.7.
184 Statistics Canada - Catalogue no. 13-017 Guide to the Income and Expenditure Accounts
Government current expenditure on goods and services
Chapter 8 Government current expenditure on goods and services
Introduction
8.1 Canadian governments play an important role in the national economy. One way in which this role is evident isas a producer of public goods and services. Some government-produced goods and services cannot be providedby non-government producers, such as the administration of justice or military defence. Canadians prefer othergoods and services to be provided by their governments, such as most education and health-care services. Thevalue of the goods and services produced by Canadian governments must be included in gross domestic productfor that measure to accurately describe the economy.
8.2 The value of the goods and services produced by government is estimated in two places in the Income andExpenditure Accounts (IEA): government current expenditure on goods and services and government gross fixedcapital formation. These aggregates are two of the components of expenditure-based gross domestic product(GDP) and, as such, represent the direct contribution of the government sector to aggregate economic activity.
8.3 Canadian governments also redistribute income and provide economic incentives to influence behaviour. Acomprehensive depiction of government economic activity is presented in the IEA government sector accounts(see Chapter 1 and Chapter 2). In these accounts government income is disaggregated into various taxes andtransfers, investment income and sales of goods and services. Government outlay components include purchasesof goods and services, transfers to persons, to businesses, to non-residents and interest on the public debt.
8.4 While this chapter is devoted to the sources and methods used in estimating government current expenditureon goods and services, it should be kept in mind that an analysis of the role of governments in the nationaleconomy should include statistical information presented in other aggregates of the IEA and in other parts of theCanadian System of National Accounts (CSNA) such as the Financial Flow Accounts and the National BalanceSheet Accounts, produced by the Income and Expenditure Accounts Division (IEAD), the Public Sector Statistics,produced by the Public Institutions Division and Canada’s International Investment Position, produced by theBalance of Payments Division.
Concepts and definitions
8.5 In national accounting, goods and services are usually valued using the prices buyers pay for them. Mostgovernment production, however, is not sold but is delivered without charge and consumed either individually byCanadians—education or health care, for instance—or collectively by all Canadians, like military defence or theadministration of justice. The absence of market transactions and selling prices for most government-producedgoods and services creates difficulties for national accountants, in Canada and around the world, in estimating thevalue of this production. The method adopted as the international national accounting standard is to assume thatthe value of the goods and services produced by government is equal to the cost of producing those goods andservices. That is to say, the value of government-produced goods and services is equal to government currentexpenditure on goods and services.
8.6 Government current expenditure on goods and services1 appearing in the IEA as a component of expenditure-based GDP does not include the value of those goods and services produced by government that are sold to otherinstitutional sectors. The value of these sales is netted from total purchases of goods and services by government,to estimate the value of government final consumption—Canadian society’s final consumption of governmentgoods and services.
1. In the System of National Accounts 1993 (SNA 1993), the government current expenditure on goods and services is named government final consumption expenditure. The definition in this section is derived from paragraph 9.94b of SNA 1993. The examples for individual and collective consumption were added to the SNA 1993 definition.
Statistics Canada - Catalogue no. 13-017 Guide to the Income and Expenditure Accounts 185
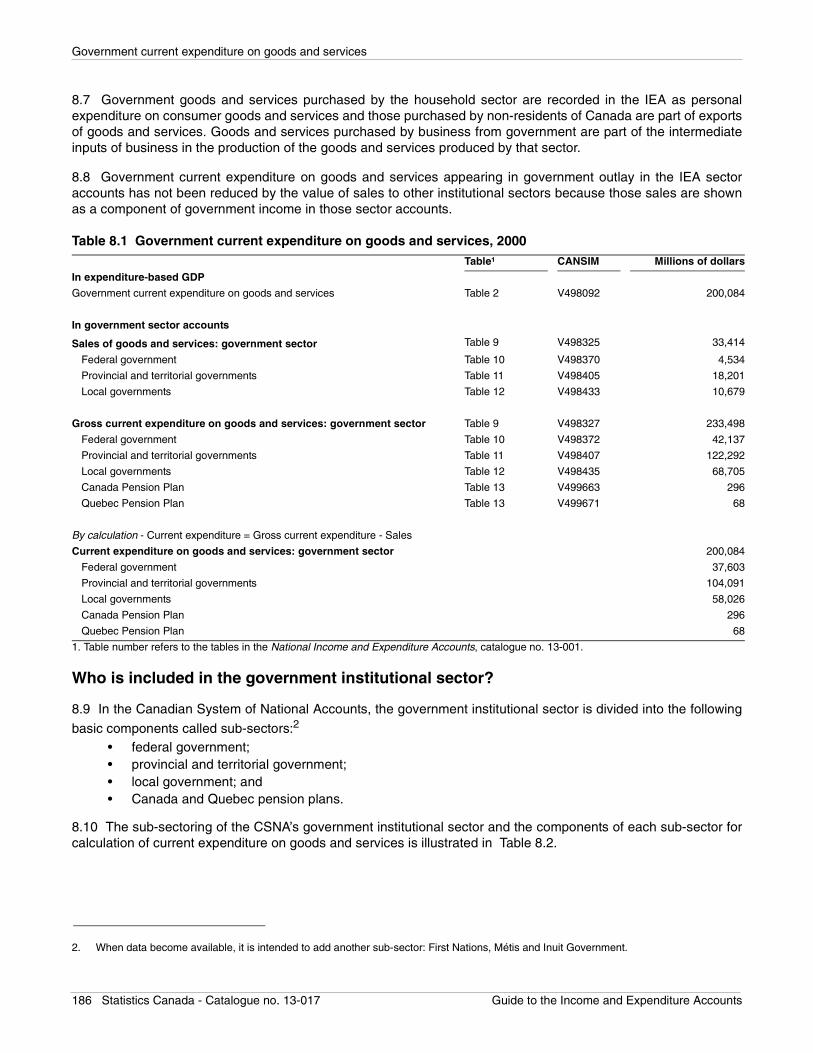
Government current expenditure on goods and services
8.7 Government goods and services purchased by the household sector are recorded in the IEA as personalexpenditure on consumer goods and services and those purchased by non-residents of Canada are part of exportsof goods and services. Goods and services purchased by business from government are part of the intermediateinputs of business in the production of the goods and services produced by that sector.
8.8 Government current expenditure on goods and services appearing in government outlay in the IEA sectoraccounts has not been reduced by the value of sales to other institutional sectors because those sales are shownas a component of government income in those sector accounts.
Who is included in the government institutional sector?
8.9 In the Canadian System of National Accounts, the government institutional sector is divided into the following
basic components called sub-sectors:2
• federal government; • provincial and territorial government; • local government; and • Canada and Quebec pension plans.
8.10 The sub-sectoring of the CSNA’s government institutional sector and the components of each sub-sector forcalculation of current expenditure on goods and services is illustrated in Table 8.2.
Table 8.1 Government current expenditure on goods and services, 2000Table¹ CANSIM Millions of dollars
In expenditure-based GDP
Government current expenditure on goods and services Table 2 V498092 200,084
In government sector accounts
Sales of goods and services: government sector Table 9 V498325 33,414
Federal government Table 10 V498370 4,534
Provincial and territorial governments Table 11 V498405 18,201
Local governments Table 12 V498433 10,679
Gross current expenditure on goods and services: government sector Table 9 V498327 233,498
Federal government Table 10 V498372 42,137
Provincial and territorial governments Table 11 V498407 122,292
Local governments Table 12 V498435 68,705
Canada Pension Plan Table 13 V499663 296
Quebec Pension Plan Table 13 V499671 68
By calculation - Current expenditure = Gross current expenditure - Sales
Current expenditure on goods and services: government sector 200,084
Federal government 37,603
Provincial and territorial governments 104,091
Local governments 58,026
Canada Pension Plan 296
Quebec Pension Plan 68
1. Table number refers to the tables in the National Income and Expenditure Accounts, catalogue no. 13-001.
2. When data become available, it is intended to add another sub-sector: First Nations, Métis and Inuit Government.
186 Statistics Canada - Catalogue no. 13-017 Guide to the Income and Expenditure Accounts

Government current expenditure on goods and services
8.11 The government sector of the Canadian System of National Accounts is one part of a larger group of entitiescalled the public sector universe. The other component of the public sector universe is called government businessenterprises (GBE) which, in the CSNA, is classified to the corporate sector. The primary distinction betweengovernment controlled institutional units assigned to government and those assigned to government businessenterprises is the nature of their principal activity. Non-commercial institutional units, controlled by government, areclassified to the government institutional sector, while government controlled commercial entities are classified tothe GBE component. An institutional unit is considered to be commercial, and therefore a GBE, if it operates in the
marketplace, charging economically significant prices for its products.3 In the measurement of government currentexpenditure on goods and services, GBEs are not included.
Table 8.2 Components of current expenditure on goods and services by government sub-sector, 2000
CANSIM Millions of dollarsGovernment current expenditure on goods and services V498092 200,084
Federal government Gross current expenditure on goods and services V500017 42,137
Non-defence V500018 27,961Defence V500019 10,398
of which: military V500020 4,292Capital consumption allowances V500021 3,451Financial services indirectly measured (FSIM) V500022 327
Minus: Sales of goods and services V500015 4,534Current expenditures on goods and services 37,603
Provincial and territorial governmentsGeneral government and provincial non-autonomous pension plans
Gross current expenditure on goods and services V500137 58,370Operating expenditures V500138 52,723Capital consumption allowances V500139 5,506Financial services indirectly measured (FSIM) V500140 141
Minus: Sales of goods and services V500135 6,063Current expenditures on goods and services 52,307
Health and social services institutionsGross current expenditure on goods and services V500207 45,489
Operating expenditures V500208 43,652Capital consumption allowances V500209 1,807Financial services indirectly measured (FSIM) V500210 30
Minus: Sales of goods and services V500205 5,845Current expenditures on goods and services 39,644
Universities and collegesGross current expenditure on goods and services V500190 18,433
Operating expenditures V500191 17,211Capital consumption allowances and financial services indirectly measured (FSIM) V500192 1,222
Minus: Sales of goods and services V500188 6,293Current expenditures on goods and services 12,140
Local governmentsGross current expenditure on goods and services V500240 68,705
Operating expenditures V500241 60,340Municipalities V500242 28,520Schools V500243 31,820
Capital consumption allowances V500244 8,159Municipalities V500245 6,536Schools V500246 1,623
Financial services indirectly measured (FSIM) V500247 206Minus: Sales of goods and services V500238 10,679Current expenditures on goods and services 58,026
Canada and Quebec pension plansCanada Pension Plan V499663 296Quebec Pension Plan V499671 68
Statistics Canada - Catalogue no. 13-017 Guide to the Income and Expenditure Accounts 187
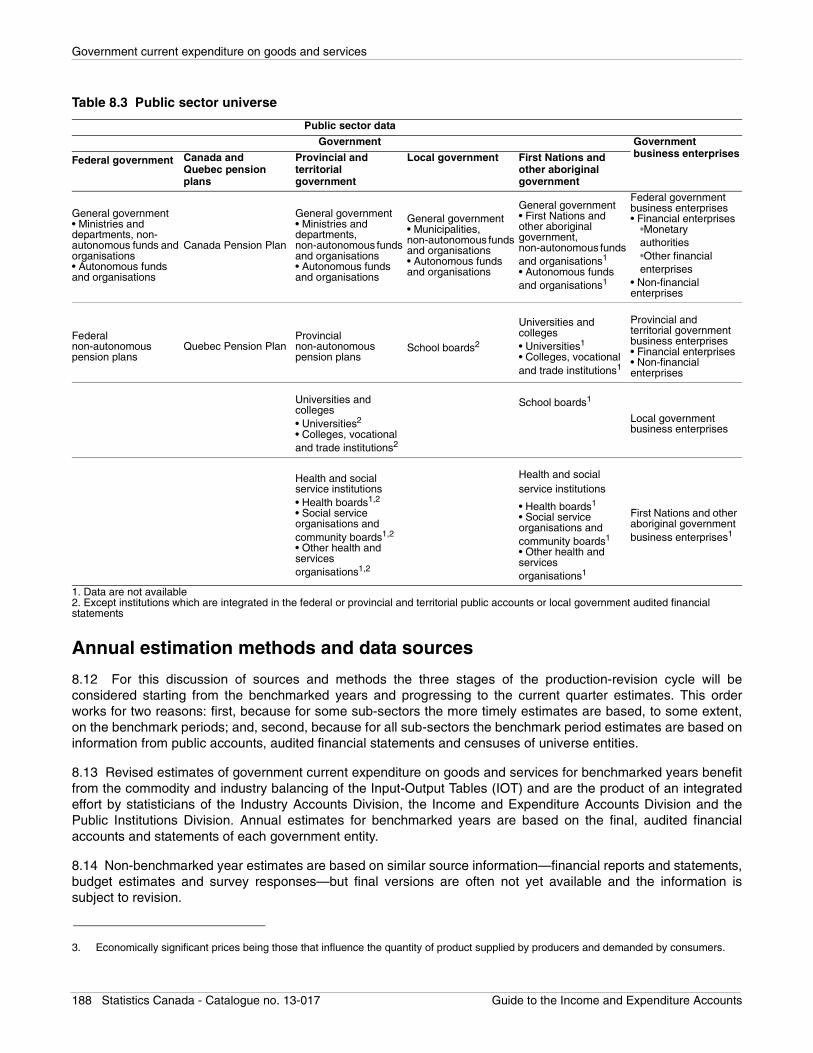
Government current expenditure on goods and services
Annual estimation methods and data sources
8.12 For this discussion of sources and methods the three stages of the production-revision cycle will beconsidered starting from the benchmarked years and progressing to the current quarter estimates. This orderworks for two reasons: first, because for some sub-sectors the more timely estimates are based, to some extent,on the benchmark periods; and, second, because for all sub-sectors the benchmark period estimates are based oninformation from public accounts, audited financial statements and censuses of universe entities.
8.13 Revised estimates of government current expenditure on goods and services for benchmarked years benefitfrom the commodity and industry balancing of the Input-Output Tables (IOT) and are the product of an integratedeffort by statisticians of the Industry Accounts Division, the Income and Expenditure Accounts Division and thePublic Institutions Division. Annual estimates for benchmarked years are based on the final, audited financialaccounts and statements of each government entity.
8.14 Non-benchmarked year estimates are based on similar source information—financial reports and statements,budget estimates and survey responses—but final versions are often not yet available and the information issubject to revision.
3. Economically significant prices being those that influence the quantity of product supplied by producers and demanded by consumers.
Table 8.3 Public sector universe
Public sector data
Government Government business enterprises
Federal government Canada and Quebec pension plans
Provincial and territorial government
Local government First Nations and other aboriginal government
General government• Ministries and departments, non-autonomous funds and organisations• Autonomous funds and organisations
Canada Pension Plan
General government• Ministries and departments, non-autonomous funds and organisations• Autonomous funds and organisations
General government• Municipalities, non-autonomous funds and organisations• Autonomous funds and organisations
General government• First Nations and other aboriginal government, non-autonomous funds and organisations1
• Autonomous funds and organisations1
Federal government business enterprises• Financial enterprises
•Monetary authorities•Other financial enterprises
• Non-financial enterprises
Federal non-autonomous pension plans
Quebec Pension PlanProvincial non-autonomous pension plans
School boards2
Universities and colleges• Universities1
• Colleges, vocational and trade institutions1
Provincial and territorial government business enterprises• Financial enterprises• Non-financial enterprises
Universities and colleges• Universities2
• Colleges, vocational and trade institutions2
School boards1
Local government business enterprises
Health and social service institutions• Health boards1,2
• Social service organisations and community boards1,2
• Other health and services organisations1,2
Health and social service institutions
• Health boards1
• Social service organisations and community boards1
• Other health and services organisations1
First Nations and other aboriginal government business enterprises1
1. Data are not available2. Except institutions which are integrated in the federal or provincial and territorial public accounts or local government audited financial statements
188 Statistics Canada - Catalogue no. 13-017 Guide to the Income and Expenditure Accounts
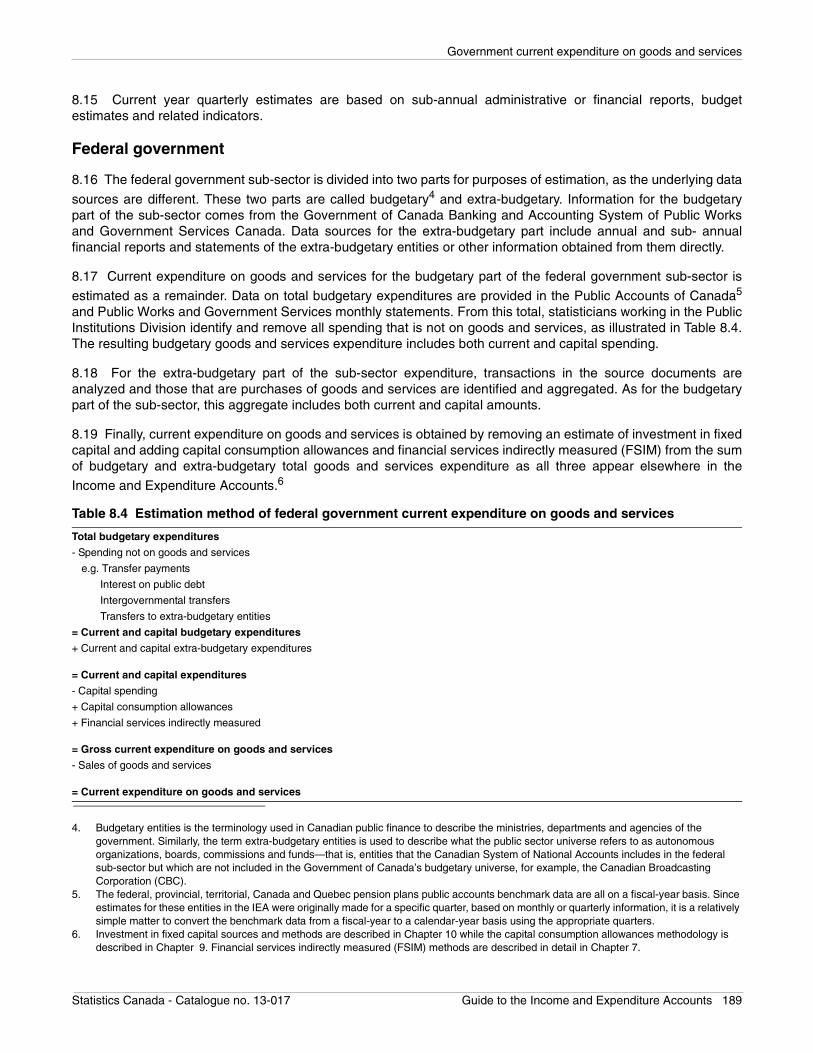
Government current expenditure on goods and services
8.15 Current year quarterly estimates are based on sub-annual administrative or financial reports, budgetestimates and related indicators.
Federal government
8.16 The federal government sub-sector is divided into two parts for purposes of estimation, as the underlying data
sources are different. These two parts are called budgetary4 and extra-budgetary. Information for the budgetarypart of the sub-sector comes from the Government of Canada Banking and Accounting System of Public Worksand Government Services Canada. Data sources for the extra-budgetary part include annual and sub- annualfinancial reports and statements of the extra-budgetary entities or other information obtained from them directly.
8.17 Current expenditure on goods and services for the budgetary part of the federal government sub-sector is
estimated as a remainder. Data on total budgetary expenditures are provided in the Public Accounts of Canada5
and Public Works and Government Services monthly statements. From this total, statisticians working in the PublicInstitutions Division identify and remove all spending that is not on goods and services, as illustrated in Table 8.4.The resulting budgetary goods and services expenditure includes both current and capital spending.
8.18 For the extra-budgetary part of the sub-sector expenditure, transactions in the source documents areanalyzed and those that are purchases of goods and services are identified and aggregated. As for the budgetarypart of the sub-sector, this aggregate includes both current and capital amounts.
8.19 Finally, current expenditure on goods and services is obtained by removing an estimate of investment in fixedcapital and adding capital consumption allowances and financial services indirectly measured (FSIM) from the sumof budgetary and extra-budgetary total goods and services expenditure as all three appear elsewhere in the
Income and Expenditure Accounts.6
4. Budgetary entities is the terminology used in Canadian public finance to describe the ministries, departments and agencies of the government. Similarly, the term extra-budgetary entities is used to describe what the public sector universe refers to as autonomous organizations, boards, commissions and funds—that is, entities that the Canadian System of National Accounts includes in the federal sub-sector but which are not included in the Government of Canada’s budgetary universe, for example, the Canadian Broadcasting Corporation (CBC).
5. The federal, provincial, territorial, Canada and Quebec pension plans public accounts benchmark data are all on a fiscal-year basis. Since estimates for these entities in the IEA were originally made for a specific quarter, based on monthly or quarterly information, it is a relatively simple matter to convert the benchmark data from a fiscal-year to a calendar-year basis using the appropriate quarters.
6. Investment in fixed capital sources and methods are described in Chapter 10 while the capital consumption allowances methodology is described in Chapter 9. Financial services indirectly measured (FSIM) methods are described in detail in Chapter 7.
Table 8.4 Estimation method of federal government current expenditure on goods and services
Total budgetary expenditures
- Spending not on goods and services
e.g. Transfer payments
Interest on public debt
Intergovernmental transfers
Transfers to extra-budgetary entities
= Current and capital budgetary expenditures
+ Current and capital extra-budgetary expenditures
= Current and capital expenditures
- Capital spending
+ Capital consumption allowances
+ Financial services indirectly measured
= Gross current expenditure on goods and services
- Sales of goods and services
= Current expenditure on goods and services
Statistics Canada - Catalogue no. 13-017 Guide to the Income and Expenditure Accounts 189
Government current expenditure on goods and services
8.20 Sales of goods and services are identified directly in source documents for both budgetary and extra-budgetary entities.
8.21 Federal government estimation is done in two parts for the non-benchmark years, just as for benchmarkyears. For the budgetary part, the same procedure is used for both benchmark and non-benchmark years, exceptthat since the Public Accounts of Canada is not usually available for the last non-benchmark year, only PublicWorks and Government Services Canada’s monthly reports are used.
8.22 Extra-budgetary estimates are also prepared in the same way as for benchmark years. Again, the maindifference with benchmark years is source-data availability; for some extra-budgetary entities, financial statementsare not available for the reference year and information for the most currently available year is used instead.
Provincial and territorial government
8.23 The provincial and territorial sub-sector has budgetary and extra-budgetary parts too, but unlike the federalsub-sector, the same methodology is used for both parts. Source documents are analyzed and transactions thatare purchases (or sales) of goods and services are identified and aggregated. Source documents used to estimateprovincial and territorial government current expenditure on goods and services include the public accounts ofeach province and territory for budgetary components and audited financial statements and annual reports of extra-budgetary entities.
8.24 The estimates derived from provincial and territorial sub-sector information, as for the federal sub-sector,include both current and capital spending. Current expenditure on goods and services is obtained by removing anestimate of investment in fixed capital and adding both capital consumption allowances and financial servicesindirectly measured (FSIM).
8.25 For the non-benchmark years, source information is much less uniform than for benchmark years andincludes budget estimates, quarterly and monthly financial reports and information obtained directly fromgovernments and their subordinate entities. As with the benchmark years, provincial and territorial governmentsexpenditure on (and sales of) goods and services are identified in source documents and aggregated—themethodology for both budgetary and extra-budgetary parts of the sub-sector being identical.
8.26 Current expenditure on goods and services of hospitals, residential care facilities and other health and socialservice entities is obtained by summing their operating expenditures, as reported in Canadian Institute for HealthInformation (CIHI), Health Statistics Division surveys and provincial health ministry records. These surveys andrecords also provide the information to estimate sales of goods and services.
8.27 Estimates of universities and colleges expenditures on, and sales of, goods and services are obtainedthrough surveys conducted by the Culture, Tourism and the Centre for Education Statistics.
8.28 For hospitals, residential care facilities, other health and social institutions, and universities and colleges,estimates for the more current years are projected from earlier benchmarks using various indicators, includinginformation on provincial and territorial funding transfers and related labour income time series.
Local government
8.29 Source documents are the annual reports of provincial and territorial governments’ departments of municipalaffairs, which summarize information for all municipalities in their jurisdiction, and financial statements ofmunicipalities and other local government entities. The current expenditure on goods and services of municipalitiesand other local government entities are calculated by summing all transactions identified as purchases of goodsand services. Sales of goods and services are also aggregated.
8.30 Estimates for school boards are based on provincial and territorial departments of education information,representing a census of local schools. This information is gathered from surveys conducted by the PublicInstitutions Division.
190 Statistics Canada - Catalogue no. 13-017 Guide to the Income and Expenditure Accounts
Government current expenditure on goods and services
8.31 For the non-benchmark years, estimates of transactions in goods and services of municipalities and otherlocal government entities are developed from information gathered through sample surveys conducted by the
Public Institution Division7 and then inflated to represent the universe of local government entities in Canada. Thesurveys collect information originally developed for budget estimates and financial statements.
8.32 Operating expenditures and sales of goods and services estimates of local schools boards are based oninformation from provincial departments of education, compiled by the Culture, Tourism and the Centre forEducation Statistics, for the non-benchmark years.
Canada and Quebec pension plans
8.33 Administrative expenditures of the Canada Pension Plan and Quebec Pension Plan are obtained from theaccounting statements of the plans for both the benchmark and non-benchmark years.
Quarterly estimation methods and data sources
8.34 When possible, quarterly estimates are built using monthly and quarterly information from governmentaccounting systems, reports, financial statements and surveys. When quarterly source information is not available,quarterly indicators are used to estimate the series from benchmark and non-benchmark years or to establishquarterly values from annual values.
Federal government
8.35 For benchmark and non-benchmark years, federal government estimation is done separately for thebudgetary and extra-budgetary parts of the sub-sector. For the budgetary part, the procedure and data sources areexactly the same. For the extra-budgetary part, estimates are also prepared in the same way as for benchmark andnon-benchmark years, the only difference being the increasing difficulty in obtaining source information for somecomponent entities. In these cases, values are estimated from the most currently available period.
Provincial and territorial government
8.36 Quarterly estimates for provincial and territorial governments expenditure on (and sales of) goods andservices are developed from a variety of source information, varying widely across jurisdictions: l’Institut de laStatistique du Québec provides estimates based on Government of Quebec accounting-system information, otherprovinces submit monthly and quarterly information from their government accounting systems while estimates forsome components and jurisdictions have to be compiled from official budget estimates and other published and un-published information.
8.37 For hospitals, residential care facilities, other health and social institutions, universities and colleges,quarterly data on operating expenditures and sales on goods and services are estimated from earlier periods,based on related labour income series.
Local government
8.38 Quarterly estimates are projected from earlier periods, based on related labour income series.
Canada and Quebec pension plans
8.39 Administrative expenditures of the Canada Pension Plan and Quebec Pension Plan are obtained from thequarterly accounting statements of the plans.
7. See Public Sector Statistics, catalogue no. 68-213 for the methodology and sample size of the surveys.
Statistics Canada - Catalogue no. 13-017 Guide to the Income and Expenditure Accounts 191
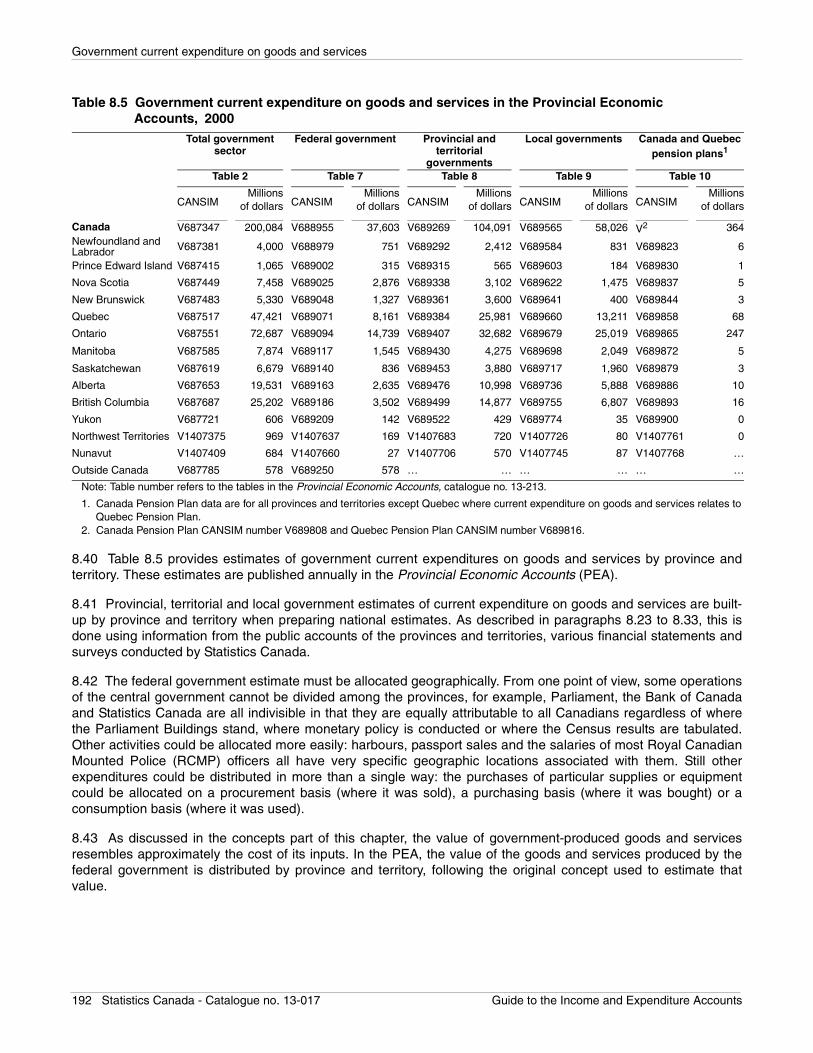
Government current expenditure on goods and services
8.40 Table 8.5 provides estimates of government current expenditures on goods and services by province andterritory. These estimates are published annually in the Provincial Economic Accounts (PEA).
8.41 Provincial, territorial and local government estimates of current expenditure on goods and services are built-up by province and territory when preparing national estimates. As described in paragraphs 8.23 to 8.33, this isdone using information from the public accounts of the provinces and territories, various financial statements andsurveys conducted by Statistics Canada.
8.42 The federal government estimate must be allocated geographically. From one point of view, some operationsof the central government cannot be divided among the provinces, for example, Parliament, the Bank of Canadaand Statistics Canada are all indivisible in that they are equally attributable to all Canadians regardless of wherethe Parliament Buildings stand, where monetary policy is conducted or where the Census results are tabulated.Other activities could be allocated more easily: harbours, passport sales and the salaries of most Royal CanadianMounted Police (RCMP) officers all have very specific geographic locations associated with them. Still otherexpenditures could be distributed in more than a single way: the purchases of particular supplies or equipmentcould be allocated on a procurement basis (where it was sold), a purchasing basis (where it was bought) or aconsumption basis (where it was used).
8.43 As discussed in the concepts part of this chapter, the value of government-produced goods and servicesresembles approximately the cost of its inputs. In the PEA, the value of the goods and services produced by thefederal government is distributed by province and territory, following the original concept used to estimate thatvalue.
Table 8.5 Government current expenditure on goods and services in the Provincial Economic Accounts, 2000
Total government sector
Federal government Provincial and territorial
governments
Local governments Canada and Quebec pension plans1
Table 2 Table 7 Table 8 Table 9 Table 10
CANSIMMillions
of dollars CANSIMMillions
of dollars CANSIMMillions
of dollars CANSIMMillions
of dollars CANSIMMillions
of dollars
Canada V687347 200,084 V688955 37,603 V689269 104,091 V689565 58,026 V2 364Newfoundland and Labrador V687381 4,000 V688979 751 V689292 2,412 V689584 831 V689823 6
Prince Edward Island V687415 1,065 V689002 315 V689315 565 V689603 184 V689830 1
Nova Scotia V687449 7,458 V689025 2,876 V689338 3,102 V689622 1,475 V689837 5
New Brunswick V687483 5,330 V689048 1,327 V689361 3,600 V689641 400 V689844 3
Quebec V687517 47,421 V689071 8,161 V689384 25,981 V689660 13,211 V689858 68
Ontario V687551 72,687 V689094 14,739 V689407 32,682 V689679 25,019 V689865 247
Manitoba V687585 7,874 V689117 1,545 V689430 4,275 V689698 2,049 V689872 5
Saskatchewan V687619 6,679 V689140 836 V689453 3,880 V689717 1,960 V689879 3
Alberta V687653 19,531 V689163 2,635 V689476 10,998 V689736 5,888 V689886 10
British Columbia V687687 25,202 V689186 3,502 V689499 14,877 V689755 6,807 V689893 16
Yukon V687721 606 V689209 142 V689522 429 V689774 35 V689900 0
Northwest Territories V1407375 969 V1407637 169 V1407683 720 V1407726 80 V1407761 0
Nunavut V1407409 684 V1407660 27 V1407706 570 V1407745 87 V1407768 …
Outside Canada V687785 578 V689250 578 … … … … … …
Note: Table number refers to the tables in the Provincial Economic Accounts, catalogue no. 13-213.
1. Canada Pension Plan data are for all provinces and territories except Quebec where current expenditure on goods and services relates to Quebec Pension Plan.
2. Canada Pension Plan CANSIM number V689808 and Quebec Pension Plan CANSIM number V689816.
192 Statistics Canada - Catalogue no. 13-017 Guide to the Income and Expenditure Accounts
Government current expenditure on goods and services
8.44 The current expenditure on goods and services of the federal government sub-sector can be broken downinto about 60% for wages, salaries and supplementary labour income, 10% for consumption of capital and 30% forother current goods and services. Each of these different types of expenditure is distributed geographically usingthe same concept but a different method.
8.45 Wages, salaries and supplementary labour income are distributed geographically on the basis ofemployment, for example, where employees work. However, the provincial distribution of capital consumptionallowances (CCA) is a function of the distribution of the capital stock of the federal government. The Investmentand Capital Stock Division estimates investment in fixed capital, the capital stock and the CCA for the federalgovernment on a provincial and territorial basis at replacement cost.
8.46 Other non-wage expenditure on goods and services is allocated by province and territory where the goodsand services were consumed in production. This distribution is based on information obtained by the IndustryAccounts Division for the various components of the federal government sub-sector. The following two examplesdemonstrate the allocation process used for non-wage goods and services:
• Suppose uniforms for all RCMP officers are produced in Ontario and purchased by the Government ofCanada. In the Provincial Economic Accounts the associated expenditure would be allocated not toOntario, where the uniforms were produced, but, instead, to the provinces where the uniforms were usedby RCMP officers in producing government goods and services (law enforcement).
• Another example is the acquisition of the submarine HMCS8 Victoria. The vessel was purchased fromnon-residents (the United Kingdom) and is based in British Columbia. Although the service produced bythe government (defence), is consumed by all Canadians, in the Provincial Economic Accounts, theexpenditure is allocated to British Columbia because that is where the submarine is used in production.
Deflation – Estimates in real terms
8.47 For deflation purposes, government current expenditure on goods and services is broken down into 24components. The deflation is carried out in three broad segments: wages, salaries and supplementary labourincome (called, broadly, labour income); capital consumption allowances; and, all other current expenditures.
Labour income
8.48 Labour income represents about 60% of total net government expenditure on goods and services and isconsidered separately for 11 sub-sectors. The associated hours worked in the period are used as an indicator ofvolume, and the price indexes are obtained implicitly, as the ratio of the current dollars estimate to the constantdollar estimate. Estimates of labour income in current dollars are produced by the Income and ExpenditureAccounts Division (IEAD) as part of the estimation of the wages, salaries and supplementary labour incomeaggregate. Data on hours worked in each sub-sector are also compiled by the IEAD, using public sectoremployment data from the Public Institutions Division and average hours worked per employee provided by theLabour Force Survey. The sub-sectors are:
• federal government • civilian defence • military pay • other civil servants
• provincial and territorial government • general government • universities • colleges • hospitals • residential care facilities
8. Her Majesty’s Canadian Ship.
Statistics Canada - Catalogue no. 13-017 Guide to the Income and Expenditure Accounts 193
Government current expenditure on goods and services
• other health and social services • local government
• general government • school boards
8.49 Over time, compositional changes occur in federal and provincial government sector employment thatamount to a quality change in the labour input to production. These changes need to be reflected in the estimatesin real terms, but cannot be captured through the total hours worked data. To reflect this type of change in theestimates in real terms, quality indexes are applied during the benchmarking revision cycle. On an annual basis,Industry Accounts Division provides quality indexes for federal civilian defence, military pay and allowances and allother civil servants, while the Income and Expenditure Accounts Division provides a quality index for provincialgovernment employment.
Capital consumption allowances
8.50 Capital consumption allowances (CCA) are estimated in current dollars for nine sub-sectors. As for otherestimates related to capital, the CCA estimates and their associated price indexes are produced by the Investmentand the Capital Stock Division. The sub-sectors are:
• federal government • civilian defence• other civil servants
• provincial and territorial government • general government • universities • colleges • hospitals • residential care facilities
• local government • general government • school boards
Other non-wage current expenditures
8.51 Other non-wage current government expenditure on goods and services is broken down into four parts:defence, medicare, hospitals, and a remainder for all other outlays. Combined, they represent about 30% of netgovernment expenditure on goods and services.
8.52 The deflation of defence expenditures presents unusually difficult problems. First, an object breakdown ofthese expenditures in the level of detail most appropriate for deflation is not available from the Department ofNational Defence. Second, the problem of pricing individual products or commodities within the availablebreakdown of defence expenditure is particularly troublesome. Changes in price can be measured readily if thenature of the priced object remains constant. For example, a bushel of Number 1 Northern Wheat in 2000 isessentially unchanged from a bushel of that commodity in 1990. But commodities such as aircraft are constantlyundergoing technological and structural changes so that an aircraft produced today is not easily comparable to anaircraft produced fifteen years earlier. Consequently, changes in the cost of these goods to the government cannotbe regarded wholly as changes in their price. Because of these difficulties, the present deflator for defenceexpenditure combines various material and average-hourly-earning indexes, with the implicit assumption thatthese prices move in the same way as do the prices of the final products.
8.53 Medicare expenditures are deflated using a fee-benefits index for physicians provided by the CanadianInstitute of Health Information (CIHI).
194 Statistics Canada - Catalogue no. 13-017 Guide to the Income and Expenditure Accounts
Government current expenditure on goods and services
8.54 Hospital expenditures are deflated with a fixed-weighted index of commodities used in hospitals.
8.55 The remaining portion of government current expenditure on goods and services is deflated using a base-weighted composite price index covering major operating expenditure categories: freight, postage, and telephones;utility expenses; office supplies and equipment; and building maintenance and repairs. The component priceindexes used to build this composite index for all other expenditures are largely final-purchase prices asincorporated in the Consumer Price Index (CPI) although some use is made of intermediate input prices in the formof Industry Price Indexes (IPI). The weights come from the latest Input-Output Tables.
Statistics Canada - Catalogue no. 13-017 Guide to the Income and Expenditure Accounts 195
Gross fixed capital formation
Chapter 9 Gross fixed capital formation
Introduction
9.1 In the Income and Expenditure Accounts (IEA), gross fixed capital formation is divided into three principaltypes of investment expenditure:
• residential structures;
• non-residential structures; and
• machinery and equipment.
9.2 Estimates of each type of investment are produced for the business1 and government sectors in the IEA. Thediscussion in this chapter is structured around these three major categories of gross fixed capital formation.
9.3 Fixed investment expenditure is a significant part of aggregate demand. This activity is tied to economicgrowth through its impact on the productive stock of capital, to social welfare in relation to governmentinfrastructure, and to business cycles in terms of the volatility of its components.
Concepts and definitions
9.4 Defining capital and capital expenditure is increasingly challenging, given the changing nature of production.Recently, the investment boundary has shifted, resulting in the re-classification of certain types of currentexpenditure to capital expenditure (e.g., software). In the simplest terms, any expenditure that gives rise to anasset could be considered investment; or, spending on an item whose expected life equals or exceeds one year
could be considered investment. However, investment spending must be linked to future use in production.2
9.5 Fixed capital covers tangible or intangible assets which are produced as outputs from production processesand which are themselves used repeatedly or continuously in other production processes for more than one year.Fixed assets exclude, by definition, certain non-produced intangible assets, such as non-cultivated biological
resources (e.g., virgin forests).3
9.6 Generally speaking, capital formation refers to additions to the stock of the nation’s non-financial assetsresulting from investment activities. The scope of this investment is described in detail in the capital accountchapter of System of National Accounts 1993 (SNA 1993). The IEA closely follows this international standard, witha few exceptions, as noted in this chapter.
9.7 Gross fixed capital formation4 is the total value of acquisitions, less disposals, of fixed assets during thereference period, plus the activity related to certain additions to the value of non-produced assets (such as mineral
deposits or major improvements to the quantity, quality or productivity of land)5 owing to the productive activity ofinstitutional units. The word gross preceding the term fixed capital formation denotes that investment is measuredbefore deduction of capital consumption allowances. Fixed capital formation includes many types of investment.
9.8 According to the SNA 1993, fixed capital formation includes:
1. Includes corporations, unincorporated businesses and non-profit institutions serving households.2. It is on this basis that expenditure on consumer durable goods is excluded from investment in the national accounts.3. However the value of major improvements to such assets is included.4. Correspond to paragraphs 10.33 and 10.34 of System of National Accounts 1993.5. Improvements to land consists of the following kinds of activities: reclamation of land from the sea by the construction of dykes, sea walls
or dams for this purpose; clearance of forests, rocks, etc., to enable land to be used in production for the first time; draining of marshes orthe irrigation of deserts by the construction of dykes, ditches or irrigation channels; prevention of flooding or erosion by the sea or by rivers,by construction of breakwaters, sea walls or flood barriers. Paragraphs 10.51 to 10.54 of System of National Accounts 1993 (SNA 1993).
196 Statistics Canada - Catalogue no. 13-017 Guide to the Income and Expenditure Accounts
Gross fixed capital formation
a) acquisitions, less disposals, of new or existing tangible fixed assets, sub-divided by type of asset into:
• dwellings;
• other buildings and structures;
• machinery and equipment; and
• cultivated assets – trees and livestock – that are used repeatedly or continuously to obtain products suchas fruit, rubber, milk, etc.
b) acquisitions, less disposals, of new or existing intangible fixed assets, sub-divided by type of asset into:
• mineral exploration;
• software;
• entertainment, literary or artistic originals; and
• other intangible fixed assets.
c) major improvements to non-produced tangible assets, including land; and
d) costs of transfers of ownership of non-produced assets.
9.9 It is recognized that the above list is not exhaustive and that capital assets should ideally include explicitly(under paragraph 9.8b) other research and development expenditure and goodwill and marketing assets, whichhave taken on increased importance in the modern economy. In the ongoing revision to the SNA 1993, it isproposed that the definition of non-financial assets or investment be expanded to include these increasinglyimportant forms of intangible capital. In anticipation of this proposed change, estimates of research anddevelopment investment flows and stocks are currently under development for Canada.
9.10 Business and government gross fixed capital formation in the IEA encompasses most of the SNA 1993recommended items. Investment in residential structures includes dwellings, structure and land improvements, aswell as costs of ownership transfers. Investment in non-residential structures covers buildings and structures,mineral exploration, structure and land improvements, as well as costs of ownership transfers. Investment inmachinery and equipment also covers software. Cultivated assets are largely excluded as are entertainment,literary or artistic originals which are considered negligible. Notably, the breakdown between tangible andintangible assets is not drawn in the estimates for Canada, though this distinction will likely be incorporated at thetime of the next historical revision.
9.11 According to the SNA 1993 gross fixed capital formation is recorded when the ownership of a fixed asset istransferred to the institutional units that will use them, except for own-account capital formation. Canada does notalways practice this convention, as with investment in residential structures. In the case of financial leasing, theSNA 1993 says that a change of ownership is imputed.
9.12 In the IEA, gross fixed capital formation is presented first as part of expenditure-based gross domesticproduct (GDP) and then again in the institutional sector accounts. It should be noted that, in the measurement ofexpenditure-based GDP, business gross fixed capital formation is the sum of investment spending for the personsand unincorporated businesses sector and the corporate and government business enterprises sector.
Statistics Canada - Catalogue no. 13-017 Guide to the Income and Expenditure Accounts 197
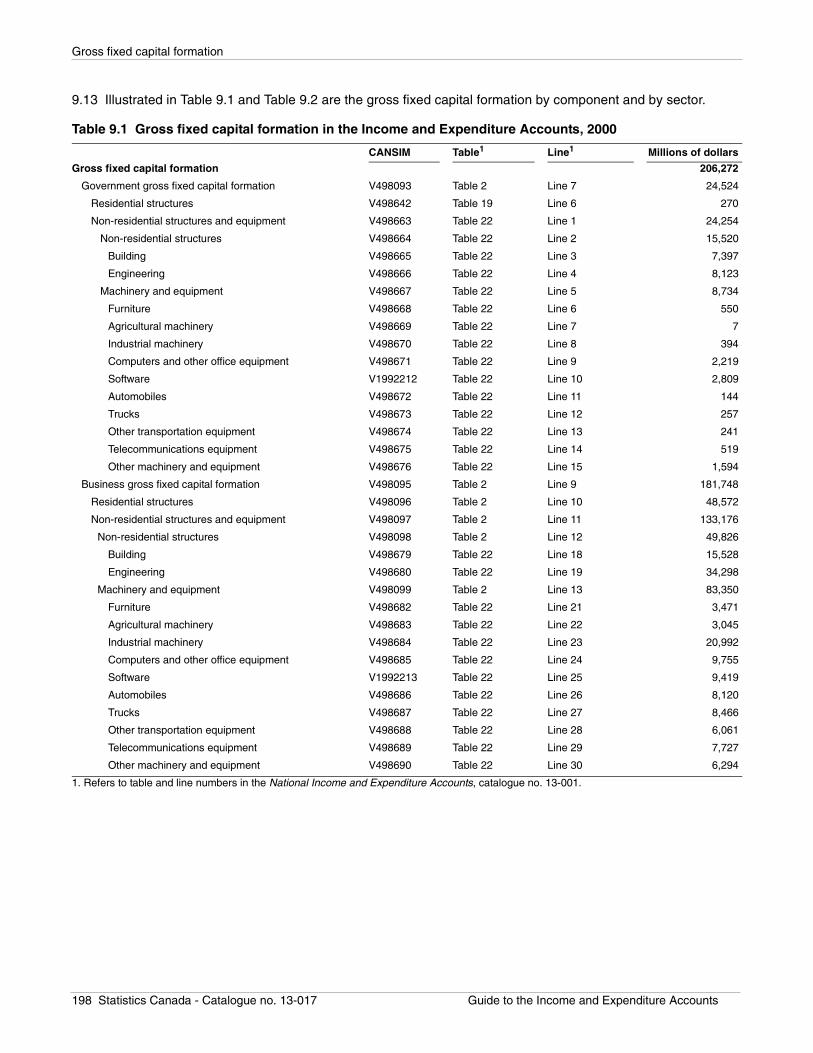
Gross fixed capital formation
9.13 Illustrated in Table 9.1 and Table 9.2 are the gross fixed capital formation by component and by sector.
Table 9.1 Gross fixed capital formation in the Income and Expenditure Accounts, 2000
CANSIM Table1 Line1 Millions of dollars
Gross fixed capital formation 206,272
Government gross fixed capital formation V498093 Table 2 Line 7 24,524
Residential structures V498642 Table 19 Line 6 270
Non-residential structures and equipment V498663 Table 22 Line 1 24,254
Non-residential structures V498664 Table 22 Line 2 15,520
Building V498665 Table 22 Line 3 7,397
Engineering V498666 Table 22 Line 4 8,123
Machinery and equipment V498667 Table 22 Line 5 8,734
Furniture V498668 Table 22 Line 6 550
Agricultural machinery V498669 Table 22 Line 7 7
Industrial machinery V498670 Table 22 Line 8 394
Computers and other office equipment V498671 Table 22 Line 9 2,219
Software V1992212 Table 22 Line 10 2,809
Automobiles V498672 Table 22 Line 11 144
Trucks V498673 Table 22 Line 12 257
Other transportation equipment V498674 Table 22 Line 13 241
Telecommunications equipment V498675 Table 22 Line 14 519
Other machinery and equipment V498676 Table 22 Line 15 1,594
Business gross fixed capital formation V498095 Table 2 Line 9 181,748
Residential structures V498096 Table 2 Line 10 48,572
Non-residential structures and equipment V498097 Table 2 Line 11 133,176
Non-residential structures V498098 Table 2 Line 12 49,826
Building V498679 Table 22 Line 18 15,528
Engineering V498680 Table 22 Line 19 34,298
Machinery and equipment V498099 Table 2 Line 13 83,350
Furniture V498682 Table 22 Line 21 3,471
Agricultural machinery V498683 Table 22 Line 22 3,045
Industrial machinery V498684 Table 22 Line 23 20,992
Computers and other office equipment V498685 Table 22 Line 24 9,755
Software V1992213 Table 22 Line 25 9,419
Automobiles V498686 Table 22 Line 26 8,120
Trucks V498687 Table 22 Line 27 8,466
Other transportation equipment V498688 Table 22 Line 28 6,061
Telecommunications equipment V498689 Table 22 Line 29 7,727
Other machinery and equipment V498690 Table 22 Line 30 6,294
1. Refers to table and line numbers in the National Income and Expenditure Accounts, catalogue no. 13-001.
198 Statistics Canada - Catalogue no. 13-017 Guide to the Income and Expenditure Accounts
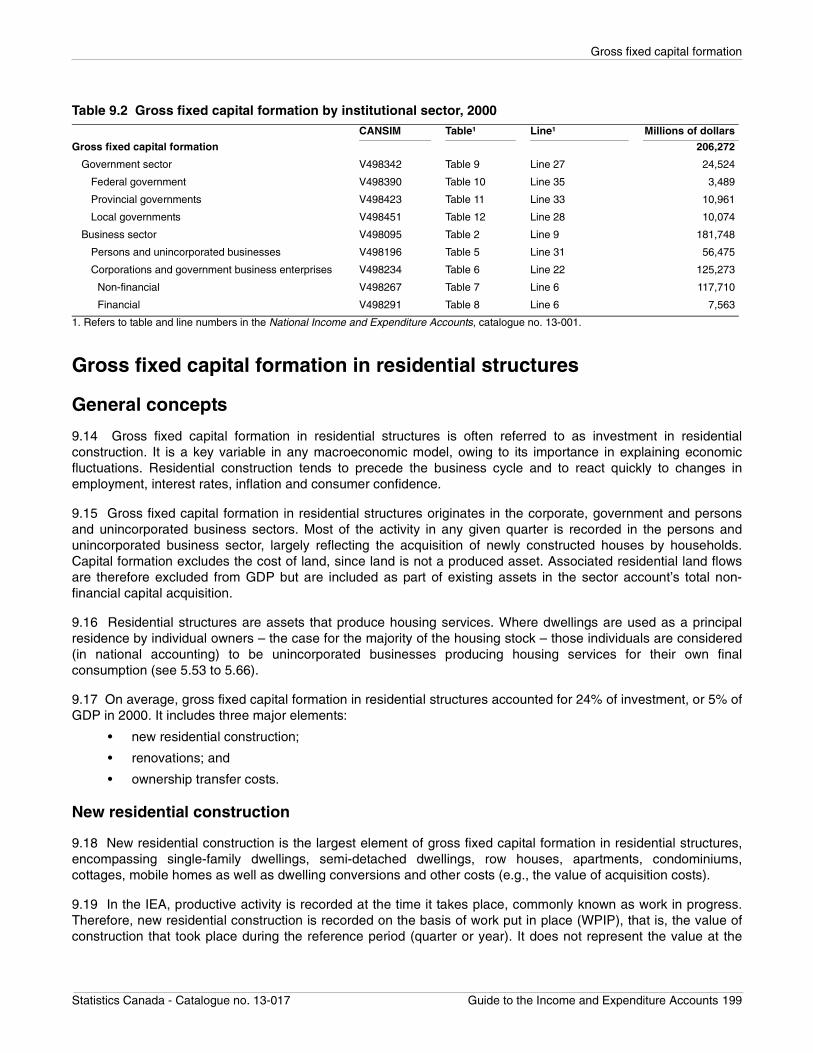
Gross fixed capital formation
Gross fixed capital formation in residential structures
General concepts
9.14 Gross fixed capital formation in residential structures is often referred to as investment in residentialconstruction. It is a key variable in any macroeconomic model, owing to its importance in explaining economicfluctuations. Residential construction tends to precede the business cycle and to react quickly to changes inemployment, interest rates, inflation and consumer confidence.
9.15 Gross fixed capital formation in residential structures originates in the corporate, government and personsand unincorporated business sectors. Most of the activity in any given quarter is recorded in the persons andunincorporated business sector, largely reflecting the acquisition of newly constructed houses by households.Capital formation excludes the cost of land, since land is not a produced asset. Associated residential land flowsare therefore excluded from GDP but are included as part of existing assets in the sector account’s total non-financial capital acquisition.
9.16 Residential structures are assets that produce housing services. Where dwellings are used as a principalresidence by individual owners – the case for the majority of the housing stock – those individuals are considered(in national accounting) to be unincorporated businesses producing housing services for their own finalconsumption (see 5.53 to 5.66).
9.17 On average, gross fixed capital formation in residential structures accounted for 24% of investment, or 5% ofGDP in 2000. It includes three major elements:
• new residential construction;
• renovations; and
• ownership transfer costs.
New residential construction
9.18 New residential construction is the largest element of gross fixed capital formation in residential structures,encompassing single-family dwellings, semi-detached dwellings, row houses, apartments, condominiums,cottages, mobile homes as well as dwelling conversions and other costs (e.g., the value of acquisition costs).
9.19 In the IEA, productive activity is recorded at the time it takes place, commonly known as work in progress.Therefore, new residential construction is recorded on the basis of work put in place (WPIP), that is, the value ofconstruction that took place during the reference period (quarter or year). It does not represent the value at the
Table 9.2 Gross fixed capital formation by institutional sector, 2000CANSIM Table¹ Line¹ Millions of dollars
Gross fixed capital formation 206,272
Government sector V498342 Table 9 Line 27 24,524
Federal government V498390 Table 10 Line 35 3,489
Provincial governments V498423 Table 11 Line 33 10,961
Local governments V498451 Table 12 Line 28 10,074
Business sector V498095 Table 2 Line 9 181,748
Persons and unincorporated businesses V498196 Table 5 Line 31 56,475
Corporations and government business enterprises V498234 Table 6 Line 22 125,273
Non-financial V498267 Table 7 Line 6 117,710
Financial V498291 Table 8 Line 6 7,563
1. Refers to table and line numbers in the National Income and Expenditure Accounts, catalogue no. 13-001.
Statistics Canada - Catalogue no. 13-017 Guide to the Income and Expenditure Accounts 199
Gross fixed capital formation
time of acquisition, but rather the volume of work completed during a given period, regardless of whether the finalproduct is purchased or not. This is important, as the construction of a residential structure may extend overseveral months.
9.20 In the SNA 1993 it is recommended that newly constructed dwellings for sale be recorded as capital onlywhen ownership is transferred, and prior to this point should be recorded as a work in progress inventory change.In the IEA the newly constructed dwellings for sale are classified to gross fixed capital formation in residentialstructures, under the sub-category change in work in progress inventory. In fact, the value of new housingconstruction item is categorized into three components: Change in work in progress inventory, change in inventoryof completed dwellings and sales of new dwellings excluding land. On this point IEA differs only in presentationfrom the SNA 1993. This treatment was deemed to be both more useful to the user community and moreconsistent with associated financing activity.
9.21 In addition to the construction of new buildings, dwelling conversions are also included in new residentialconstruction. Examples would be the conversion of a single-family dwelling into multiple dwellings, and additionalhousing units created from non-residential buildings or other types of residential structures.
9.22 New residential construction also includes all costs associated with the construction and sale or purchase ofa building. These costs are as follows:
• federal and provincial taxes on new buildings;
• land preparation and development costs;
• engineering, architectural and development fees;
• builders’ administration costs (including marketing and insurance costs) that are passed on to thepurchaser;
• mortgage costs assumed by the purchaser (for example, mortgage insurance costs); and
• other costs (including acquisition costs).
Renovations
9.23 Renovations to existing residential structures are the second largest element of gross fixed capital formationin residential structures. Renovations, also known as alterations and improvements, are made up of spending onadditions, renovations and alterations, new installations and replacement of equipment.
• Additions are structural extensions to property (such as rooms, decks, garages, car ports, garden sheds)and swimming pools, fences, patios, driveways and major landscaping;
• Renovations and alterations involve work intended to upgrade the property to acceptable buildingstandards, rearrange the interior space and modernize existing facilities without changing the type ofoccupancy such as remodelling rooms, adding or replacing doors and windows, renovating exteriorwalls, upgrading insulation and adding eaves trough;
• New installations involve the installation of equipment not previously in existence, for example, theinstallation of fixed electrical home appliances;
• Replacement of equipment is the installation of equipment that replaces an existing unit. It includesupgrading to a superior quality and conversion from one type to another (for example, the replacement ofa roof, carpet, heating system or air conditioning system).
9.24 All of these activities change the value of assets or extend their service life.
9.25 The value of renovations to residential structures encompasses all costs associated with the work, includingmargins and taxes.
200 Statistics Canada - Catalogue no. 13-017 Guide to the Income and Expenditure Accounts
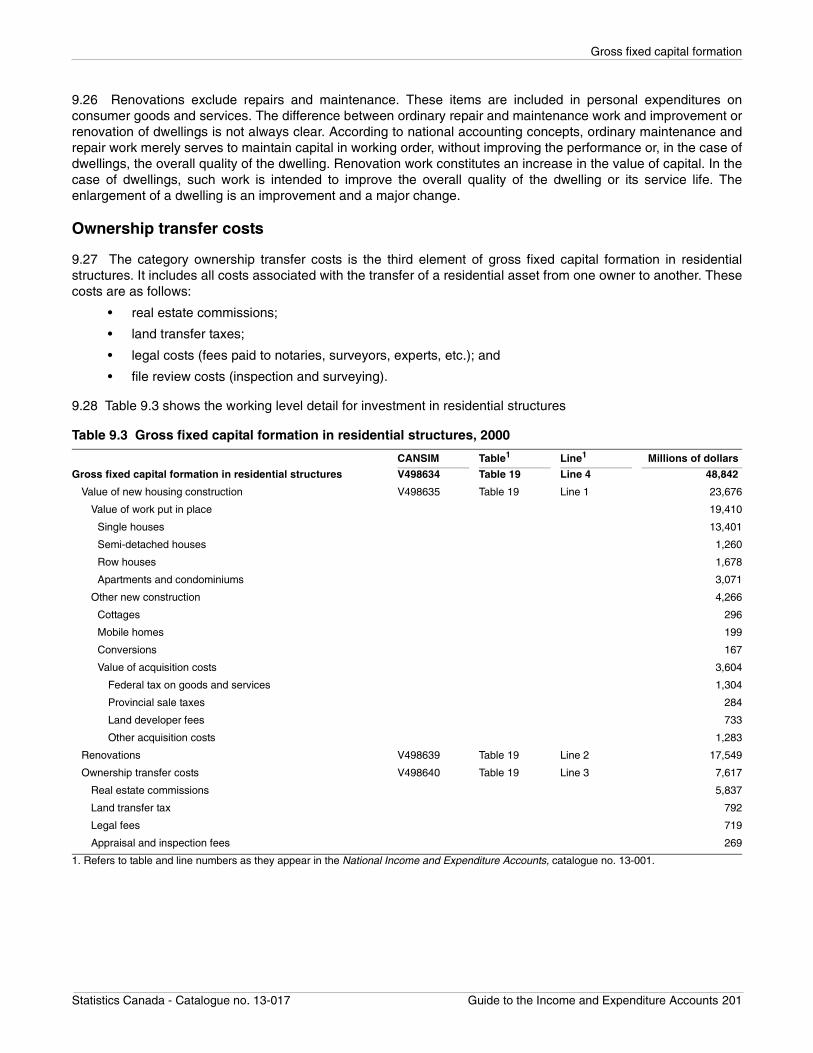
Gross fixed capital formation
9.26 Renovations exclude repairs and maintenance. These items are included in personal expenditures onconsumer goods and services. The difference between ordinary repair and maintenance work and improvement orrenovation of dwellings is not always clear. According to national accounting concepts, ordinary maintenance andrepair work merely serves to maintain capital in working order, without improving the performance or, in the case ofdwellings, the overall quality of the dwelling. Renovation work constitutes an increase in the value of capital. In thecase of dwellings, such work is intended to improve the overall quality of the dwelling or its service life. Theenlargement of a dwelling is an improvement and a major change.
Ownership transfer costs
9.27 The category ownership transfer costs is the third element of gross fixed capital formation in residentialstructures. It includes all costs associated with the transfer of a residential asset from one owner to another. Thesecosts are as follows:
• real estate commissions;
• land transfer taxes;
• legal costs (fees paid to notaries, surveyors, experts, etc.); and
• file review costs (inspection and surveying).
9.28 Table 9.3 shows the working level detail for investment in residential structures
Table 9.3 Gross fixed capital formation in residential structures, 2000
CANSIM Table1 Line1 Millions of dollars
Gross fixed capital formation in residential structures V498634 Table 19 Line 4 48,842
Value of new housing construction V498635 Table 19 Line 1 23,676
Value of work put in place 19,410
Single houses 13,401
Semi-detached houses 1,260
Row houses 1,678
Apartments and condominiums 3,071
Other new construction 4,266
Cottages 296
Mobile homes 199
Conversions 167
Value of acquisition costs 3,604
Federal tax on goods and services 1,304
Provincial sale taxes 284
Land developer fees 733
Other acquisition costs 1,283
Renovations V498639 Table 19 Line 2 17,549
Ownership transfer costs V498640 Table 19 Line 3 7,617
Real estate commissions 5,837
Land transfer tax 792
Legal fees 719
Appraisal and inspection fees 269
1. Refers to table and line numbers as they appear in the National Income and Expenditure Accounts, catalogue no. 13-001.
Statistics Canada - Catalogue no. 13-017 Guide to the Income and Expenditure Accounts 201
Gross fixed capital formation
Annual estimation methods and data sources
9.29 Estimates for benchmark years (t-4 and t-3) and non-benchmark years (t-2 and t-1) for gross fixed capitalformation in new residential construction are produced using the same methods and data sources. Onlyrenovations and ownership transfer costs (see paragraphs 9.32 through 9.36) use different sources of informationfor the two periods. It should also be noted that estimates for the current years (t-2 and t-1) are not subject to theInput–Output Tables balancing process.
9.30 Gross fixed capital formation in residential structures is estimated for both the business and governmentsectors. The government share accounted for less than 0.6% of the total in 2000. New residential construction isfirst estimated for the economy as a whole. The availability of detailed data on the government sector allows for thedirect estimation of new residential construction for government and the balance is allocated to the business
sector.6 Government data are taken directly from government financial statements obtained from the Public
Institutions Division. Included in this item are expenditures on non-profit housing.7
New residential construction
9.31 New residential construction consists of two sub-elements: work put in place (WPIP) and other newconstruction. Each item has its own estimation method. In 2000, the value of WPIP represented 82% of the valueof new residential construction and 40% of total gross fixed capital formation in residential structures. Other newconstruction consists of new residential construction of cottages, mobile homes, building conversions andacquisition costs such as taxes and land development costs.
9.32 WPIP corresponds to the value of construction of single-family dwellings, semi-detached dwellings, rowhouses, apartments and condominiums realized during a given period. The construction of those residentialbuildings may have started a month ago, six months ago or even two years ago (to a maximum of 21 months). Asan example, the estimation of WPIP in June 2005 included the value of construction realized in June 2005 for allresidential buildings for which the construction started between October 2003 and June 2005. However, not muchof the October 2003 vintage construction would be reflected in the data by June 2005, except in the case of largemultiple housing projects, (such as apartment buildings).
9.33 The Investment and Capital Stock Division (ICSD) is responsible for calculating WPIP based on housingstarts, the average value of building permits and WPIP coefficients. The value of starts in a given period isestimated by combining housing starts from the Starts and Completions Survey of the Canada Mortgage andHousing Corporation (CMHC) and the average value of starts using the reported value from the Building PermitsSurvey. The value of building permits includes material, labour and overhead costs. It excludes the cost of land butmay include some acquisition costs. This value is corrected to account for the fact that building permitssystematically underestimate the final value of the dwelling.
9.34 The value of starts does not only correspond to the construction activity in the current month, but also to theprogress of construction projects launched in previous months. The work may extend over a period of 21 months.The Investment and Capital Stock Division (ICSD) distributes the value of starts over these months. This operation
is made using a vector of WPIP coefficients which combines the number of months needed to complete each start8
with the percentage of construction added during the construction period.9
6. Expenditures other than those on new residential construction (e.g., renovations) are all drawn from the business sector, owing to the lackof data.
7. The construction of residences and dormitories for universities, houses and sleeping cabins in public parks and for coast guards, as wellas embassies, consulates, government properties and barracks are part of government non-residential construction.
8. For example, for starts of single-family dwellings in Ontario in June 2005, 4% of the work is completed in the first month, 8% of the work iscompleted in the second month, etc.
9. For example, for the construction of a single-family dwelling being built over three months, 35% of the value of construction is completed inthe first month, 37% in the second month and 28% in the third month. It is possible that the total construction period may extend over 21months.
202 Statistics Canada - Catalogue no. 13-017 Guide to the Income and Expenditure Accounts
Gross fixed capital formation
9.35 For the estimation of the vector of WPIP coefficients, information from CMHC on completed dwellings byconstruction duration is used. The distribution of work completed by construction duration is derived using a specialdata compilation from the CMHC (Flows and Stocks of Fixed Residential Capital).
9.36 Other new construction also has several sub-categories, all prepared monthly by province and territory byICSD. Estimates for cottages, conversions and mobile homes are calculated using data from the Building PermitsSurvey.
9.37 Acquisition costs include the federal tax on goods and services, provincial sales taxes, land developer feesand other acquisition costs.
9.38 The Goods and Services Tax (GST), applies to sales of dwellings, conversions, cottages and mobile homes.This federal tax on sales of new dwellings (single-family, semi-detached, row houses, apartments andcondominiums) is calculated using data from the Canada Mortgage and Housing Corporation (CMHC) and the taxrebate file (from the Canada Revenue Agency). The value of new home sales is the product of the number ofhouses sold and CMHC prices, adjusted to the fair market value from the GST rebate file. The federal tax onconversions, cottages and mobile homes is obtained by applying the GST rate to their respective values.
9.39 The second item in acquisition costs is the Provincial Sales Tax (PST), calculated in the same way as theGST for provinces, where a tax equivalent to the GST applies.
9.40 Thirdly, land development costs are associated with the development of infrastructures that make the landusable, such as new streets and electrical power, water and sewage systems. These data are obtained annually,by province or territory, from the Public Institutions Division, which obtains them from provincial and localgovernments.
9.41 Finally, other acquisition costs include a range of expenditures related to the construction of new dwellings.These include mortgage-related costs (such as the cost of mortgage insurance), promotion and marketing costsand other administrative costs incurred by the contractor (insurance, maintaining an office, etc.) as well asarchitectural and engineering fees. These data are supplied by ICSD on a monthly basis, and are based on theBuilding Permits Survey and the Starts and Completions Survey from CMHC.
Renovations
9.42 Renovations include expenditures on structural modifications which do not create a separate dwelling butwhich prolong the service life of a building or add to its quality. Renovation expenditures are calculated for owner-occupants, landlords, cottage owners and renters.
9.43 Until 2002, estimates of spending on renovations were drawn from the Homeowner Repair and RenovationSurvey (HRRS) results. This survey was discontinued and the Survey of Household Spending (SHS) is now themain source of information used to produce estimates for benchmark years and for the first projection year (t-2).The results from this survey are examined in light of other indicators such as renovation permits and sales ofbuilding materials. Finally, estimates for the last projection years (t-1) are obtained by summing quarterly estimates(see paragraph 9.47).
Ownership transfer costs
9.44 Ownership transfer costs include several sub-categories. The largest consists of real estate commissions,which are commissions paid to real estate brokers and agents. A value was established in 1992 by analysing theGST file obtained from the Tax Data Division. Since 2000, annual benchmarks have been established using theAnnual Survey of Service Industries: Real Estate Agents, Brokers, Appraisers and Other Real Estate Activities andthe Survey of Household Spending. Estimates of real estate commissions are also based on the monthly report oflistings through the Multiple Listing Service (MLS) of the Canadian Real Estate Association. This report providesmonthly data, by province, on the number of houses sold and their average selling price.
Statistics Canada - Catalogue no. 13-017 Guide to the Income and Expenditure Accounts 203
Gross fixed capital formation
9.45 Land transfer taxes which are real estate taxes levied by provincial or local governments, are produced on anannual basis by the Public Institutions Division, which obtains them from those governments.
9.46 Legal costs include professional fees or commissions paid by the dwelling purchaser (fees paid to notaries,surveyors, experts, etc.). File review costs are the inspection and surveying costs borne by the purchaser. In bothcases, these costs are calculated as a proportion of real estate commissions, the proportions being drawn from theSurvey of Household Spending.
Quarterly estimation methods and data sources
9.47 For most of the above categories, the quarterly methodology is identical to that for benchmark years, sincethe information sources are readily available on a monthly basis. However, there are some exceptions. Landdevelopment costs are estimated quarterly following the trend in housing starts. Renovations are based on sales ofbuilding supplies from the Quarterly Retail Commodity Survey (QRCS), building permits for alterations from theBuilding Permits Survey and building materials from the Wholesale Trade Survey (Monthly). Finally, quarterly landtransfer taxes are obtained by applying the rate of growth of real estate commissions to the last quarterlybenchmark.
Provincial and territorial estimation methods and data sources
9.48 Provincial and territorial estimates are produced at the same level of detail as the estimates for Canada as awhole. In fact, in most cases the national estimate is built up from provincial estimates. The exceptions arerenovation expenditures and ownership transfer costs.
9.49 For renovation expenditures, three sources of information are used to produce provincial and territorialestimates. These are the Survey of Household Spending, the Building Permits Survey and a provincial allocator ofrenovation expenditures produced by the Investment and the Capital Stock Division (ICSD). The advantage of theICSD allocator is that it allows for exceptional events such as the implementation of a government incentive. Itcombines two elements:
• the importance of the housing stock of each province and territory relative to the total; and
• the value of renovation permits in each province and territory coming from the Building Permits Survey.
9.50 As to ownership transfer costs, data from the Multiple Listing Service (MLS) of the Canadian Real EstateAssociation, the Survey of Household Spending and the Survey of Annual Real Estate Agents, Brokers, Appraisersand Other Real Estate Activities serve as provincial and territorial distributors.
Deflation – Estimates in real terms
9.51 The new construction series are deflated using price indexes reflecting the price paid by purchasers.Expenditures on renovations are deflated using an index of the cost of renovation work (price of materials andlabour costs). Ownership transfer costs are deflated using price indexes constructed from the average sale price ofexisting homes sold, based on data from the Multiple Listing Service (MLS) of the Canadian Real EstateAssociation. Table 9.4 provides details on the deflation method by category.
204 Statistics Canada - Catalogue no. 13-017 Guide to the Income and Expenditure Accounts
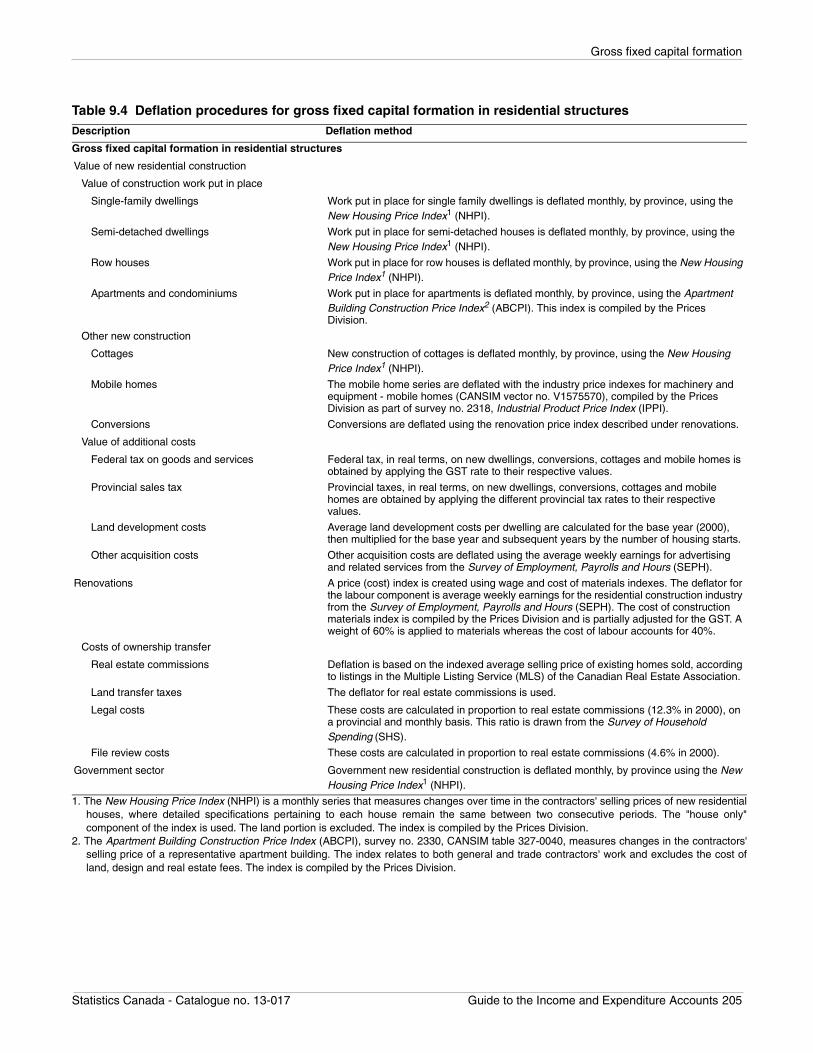
Gross fixed capital formation
Table 9.4 Deflation procedures for gross fixed capital formation in residential structuresDescription Deflation method
Gross fixed capital formation in residential structures
Value of new residential construction
Value of construction work put in place
Single-family dwellings Work put in place for single family dwellings is deflated monthly, by province, using the New Housing Price Index1 (NHPI).
Semi-detached dwellings Work put in place for semi-detached houses is deflated monthly, by province, using the New Housing Price Index1 (NHPI).
Row houses Work put in place for row houses is deflated monthly, by province, using the New Housing Price Index1 (NHPI).
Apartments and condominiums Work put in place for apartments is deflated monthly, by province, using the Apartment Building Construction Price Index2 (ABCPI). This index is compiled by the Prices Division.
Other new construction
Cottages New construction of cottages is deflated monthly, by province, using the New Housing Price Index1 (NHPI).
Mobile homes The mobile home series are deflated with the industry price indexes for machinery and equipment - mobile homes (CANSIM vector no. V1575570), compiled by the Prices Division as part of survey no. 2318, Industrial Product Price Index (IPPI).
Conversions Conversions are deflated using the renovation price index described under renovations.
Value of additional costs
Federal tax on goods and services Federal tax, in real terms, on new dwellings, conversions, cottages and mobile homes is obtained by applying the GST rate to their respective values.
Provincial sales tax Provincial taxes, in real terms, on new dwellings, conversions, cottages and mobile homes are obtained by applying the different provincial tax rates to their respective values.
Land development costs Average land development costs per dwelling are calculated for the base year (2000), then multiplied for the base year and subsequent years by the number of housing starts.
Other acquisition costs Other acquisition costs are deflated using the average weekly earnings for advertising and related services from the Survey of Employment, Payrolls and Hours (SEPH).
Renovations A price (cost) index is created using wage and cost of materials indexes. The deflator for the labour component is average weekly earnings for the residential construction industry from the Survey of Employment, Payrolls and Hours (SEPH). The cost of construction materials index is compiled by the Prices Division and is partially adjusted for the GST. A weight of 60% is applied to materials whereas the cost of labour accounts for 40%.
Costs of ownership transfer
Real estate commissions Deflation is based on the indexed average selling price of existing homes sold, according to listings in the Multiple Listing Service (MLS) of the Canadian Real Estate Association.
Land transfer taxes The deflator for real estate commissions is used.
Legal costs These costs are calculated in proportion to real estate commissions (12.3% in 2000), on a provincial and monthly basis. This ratio is drawn from the Survey of Household Spending (SHS).
File review costs These costs are calculated in proportion to real estate commissions (4.6% in 2000).
Government sector Government new residential construction is deflated monthly, by province using the New Housing Price Index1 (NHPI).
1. The New Housing Price Index (NHPI) is a monthly series that measures changes over time in the contractors' selling prices of new residentialhouses, where detailed specifications pertaining to each house remain the same between two consecutive periods. The "house only"component of the index is used. The land portion is excluded. The index is compiled by the Prices Division.
2. The Apartment Building Construction Price Index (ABCPI), survey no. 2330, CANSIM table 327-0040, measures changes in the contractors'selling price of a representative apartment building. The index relates to both general and trade contractors' work and excludes the cost ofland, design and real estate fees. The index is compiled by the Prices Division.
Statistics Canada - Catalogue no. 13-017 Guide to the Income and Expenditure Accounts 205
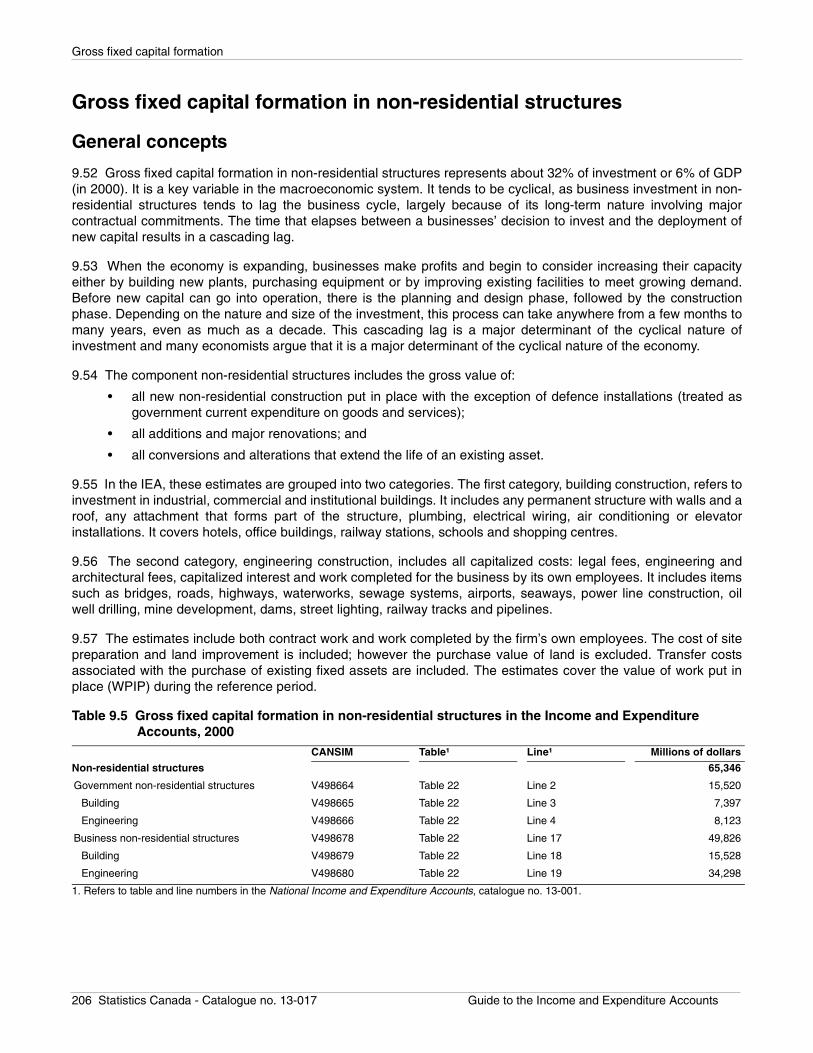
Gross fixed capital formation
Gross fixed capital formation in non-residential structures
General concepts
9.52 Gross fixed capital formation in non-residential structures represents about 32% of investment or 6% of GDP(in 2000). It is a key variable in the macroeconomic system. It tends to be cyclical, as business investment in non-residential structures tends to lag the business cycle, largely because of its long-term nature involving majorcontractual commitments. The time that elapses between a businesses’ decision to invest and the deployment ofnew capital results in a cascading lag.
9.53 When the economy is expanding, businesses make profits and begin to consider increasing their capacityeither by building new plants, purchasing equipment or by improving existing facilities to meet growing demand.Before new capital can go into operation, there is the planning and design phase, followed by the constructionphase. Depending on the nature and size of the investment, this process can take anywhere from a few months tomany years, even as much as a decade. This cascading lag is a major determinant of the cyclical nature ofinvestment and many economists argue that it is a major determinant of the cyclical nature of the economy.
9.54 The component non-residential structures includes the gross value of:
• all new non-residential construction put in place with the exception of defence installations (treated asgovernment current expenditure on goods and services);
• all additions and major renovations; and
• all conversions and alterations that extend the life of an existing asset.
9.55 In the IEA, these estimates are grouped into two categories. The first category, building construction, refers toinvestment in industrial, commercial and institutional buildings. It includes any permanent structure with walls and aroof, any attachment that forms part of the structure, plumbing, electrical wiring, air conditioning or elevatorinstallations. It covers hotels, office buildings, railway stations, schools and shopping centres.
9.56 The second category, engineering construction, includes all capitalized costs: legal fees, engineering andarchitectural fees, capitalized interest and work completed for the business by its own employees. It includes itemssuch as bridges, roads, highways, waterworks, sewage systems, airports, seaways, power line construction, oilwell drilling, mine development, dams, street lighting, railway tracks and pipelines.
9.57 The estimates include both contract work and work completed by the firm’s own employees. The cost of sitepreparation and land improvement is included; however the purchase value of land is excluded. Transfer costsassociated with the purchase of existing fixed assets are included. The estimates cover the value of work put inplace (WPIP) during the reference period.
Table 9.5 Gross fixed capital formation in non-residential structures in the Income and Expenditure Accounts, 2000
CANSIM Table¹ Line¹ Millions of dollars
Non-residential structures 65,346
Government non-residential structures V498664 Table 22 Line 2 15,520
Building V498665 Table 22 Line 3 7,397
Engineering V498666 Table 22 Line 4 8,123
Business non-residential structures V498678 Table 22 Line 17 49,826
Building V498679 Table 22 Line 18 15,528
Engineering V498680 Table 22 Line 19 34,298
1. Refers to table and line numbers in the National Income and Expenditure Accounts, catalogue no. 13-001.
206 Statistics Canada - Catalogue no. 13-017 Guide to the Income and Expenditure Accounts
Gross fixed capital formation
Annual estimation methods and data sources
9.58 The annual benchmark estimates (for t-4 and t-3 years) for gross fixed capital formation in non-residentialbuilding and engineering construction are reconciled to the final demand matrix of the Input-Output Tables (IOT).The Industry Accounts Division (IAD) primarily uses information from the Investment and Capital Stock Division’s
Capital Repair Expenditures Survey10 (CES) by asset type. This information is based on the North AmericanIndustry Classification System (NAICS). The data are produced on a January-December basis and are consistent(in most cases) with national accounts’ concepts.
9.59 The CES totals are not identical to IEA’s gross fixed capital formation measures because a number ofadjustments are made to ensure consistency with the CSNA definitions. One difference between the survey andIEA data is related to sectoring. The survey data are reclassified because the business and government sectorsare defined differently in the CSNA.
9.60 In addition, IEA totals are based on other sources of information, such as the Quarterly Survey of FinancialStatistics for Enterprises.11 This survey focuses on revenues, profits and assets, but also includes a number ofquestions on capital spending. It differs from the CES in coverage (based on enterprises rather thanestablishments) and content (e.g., includes the purchase price of land and used buildings).
9.61 Information is also taken from ICSD’s Investment in Non-residential Building Construction data based on theBuilding Permits Survey for comparison with CES data on the value of some investment projects.
9.62 The Input-Output supply-disposition framework, which is used to refine the estimates for the benchmarkyears, and the values for the various sub-items that are generated with the methodologies developed for theproduction of quarterly estimates, also contribute to the accuracy or completeness of the investment estimates.
9.63 As in the case of the annual benchmark estimates, the CES is the main source of information. For the t-2
period, actual data12 from the survey are used whereas for the t-1 period, the preliminary actual estimates are usedas the main indicator along with the quarterly estimates based on related indicators.
Quarterly estimation methods and data sources
9.64 In the absence of a quarterly capital expenditure survey, related indicators must be used. Non-residentialbuilding and engineering construction estimates are published separately on a quarterly basis. The methodologiesused to produce these aggregates are closely related.
9.65 There are essentially two approaches: a detailed approach and a global approach. The results of bothapproaches are carefully examined and analysed in order to arrive at an acceptable estimate. In this process, wealso take into consideration the annual forecasts of the Capital Expenditure Survey (CES) for the current year(spending intentions released each February).
The detailed approach
9.66 The detailed approach consists of multiplying the most recent quarterly estimate of capital spending for eachcomponent by the percentage change in a related indicator, and then summing the results to produce an overallestimate. This method is used for building and engineering construction expenditures for both the government andbusiness sectors.
10. Survey no. 2803. The data are published in Private and Public Investment in Canada, Intentions, catalogue no. 61-205. This survey isoften referred to as Private and Public Investment or PPI.
11. Survey no. 2501. The data are published in Quarterly Survey of Financial Statistics for Enterprises, catalogue no. 61-008.12. For more information on the CES concepts of intentions, preliminary actual and actual expenditures, see Appendix 1: A Brief Description of
the Capital Expenditure Survey.
Statistics Canada - Catalogue no. 13-017 Guide to the Income and Expenditure Accounts 207
Gross fixed capital formation
Government sector
9.67 For building construction, the quarterly indicator used is the investment in non-residential institutional buildingconstruction, produced by ICSD. It is based on the Building Permits Survey of municipalities, which providesinformation on construction intentions for this type of building. Work put in place (WPIP) patterns are assigned tothis category of structure. The patterns which are used to distribute the value of building permits according toproject length, differ by type and value of construction project— a project worth millions of dollars will usually takelonger to complete than a project worth $100,000.
9.68 Engineering construction expenditures are calculated for highways, bridges, railways and other engineering.Material costs (asphalt purchases in cubic metres multiplied by the Industrial Product Price Index (IPPI) price forasphalt) and labour costs based on earnings in the highway, streets and bridge industry, from the Survey ofEmployment, Payrolls and Hours (SEPH) make up the highways’ estimator. This same estimator is used toestimate expenditures on the other, less important, components.
Business sector
9.69 For the buildings category, the quarterly indicators are the investment in non-residential industrial andcommercial buildings, produced by ICSD.
9.70 The business sector’s engineering expenditures are made up of two categories: private roads and otherengineering. The private roads estimator is the same one used for public highways described in paragraph 9.68.One of the estimators used for other engineering is based on capital spending (reported in the Quarterly Survey ofFinancial Statistics for Enterprises) by large companies, in mining, telecommunications, railways, etc., which investmainly in engineering. Other information used includes such items as capital spending by provincial electric utilities
and the value added in drilling and rigging services13 in the oil and gas industry.
9.71 Finally, qualitative information on major construction projects is extracted from budget documents,newspapers articles, specialized publications and project inventories maintained by private consulting firms, etc.
The global approach
9.72 The global approach consists of constructing an overall indicator of capital spending on construction. Thisindicator or estimator is also used to derive quarterly estimates of investment in non-residential construction. Total
construction spending14 is estimated primarily by combining data on employment, wages and shipments of variousmaterials used in construction. Other variables, such as profits in the construction industry and inventories ofbuilding materials are also taken into account.
9.73 Employment in construction is taken from the Labour Force Survey (LFS). Average hourly earnings are pulledfrom the monthly Survey of Employment, Payroll and Hours (SEPH). Another key monthly indicator, the valueadded in drilling and rigging services, is obtained from provincial ministries in oil and gas producing provinces.These indicators are combined to obtain an overall level of construction activity for each quarter. The quarterlyestimate for residential construction (new construction, alterations and improvements) is then subtracted from thetotal, yielding an estimate of spending on non-residential construction. The resulting estimates are then comparedwith the annual estimates from the Capital Expenditure Survey. The allocation of expenditures between the
government and business sectors15 is based on Private and Public Investment Intentions.16
13. Drilling activity is measured in metres, while rigging is measured in rig operating days by depth (in metres).14. Includes both residential and non-residential expenditures.15. Some government enterprises are transferred from the government to the business sector to maintain consistency with the CSNA.16. Survey no. 2803. The data are published in Private and Public Investment in Canada, Intentions, catalogue no. 61-205. This survey is often
referred to as Private and Public Investment or PPI.
208 Statistics Canada - Catalogue no. 13-017 Guide to the Income and Expenditure Accounts
Gross fixed capital formation
9.74 Little information is available on the supply side, other than data on building materials from various monthlysurveys, such as the production of cement and asphalt, sales of lumber, and imports and exports of other buildingmaterials. Supply based estimates for the construction industry tend to be lower than the demand-side estimatesincorporated into the National Accounts.
9.75 Finally, the quarterly data are benchmarked to the annual levels at the time of the production of the annualestimates. These annual estimates reflect the most recent aggregates from the Input-Output Tables, data from the
Capital Expenditure Survey by Type of Asset17 and the latest Capital Expenditure Survey.
9.76 For the quarters of the current year, the series are built on the basis of the movement of the speciallyconstructed indicators discussed previously, of which inputs are all available up-to-date on a sub-annual basis.
Provincial and territorial estimation methods and data sources
9.77 The provincial distribution of non-residential construction investment comes from the Capital ExpenditureSurvey. Note that the provincial estimates are benchmarked to the most recent provincial Input-Output Tables (fort-4 and t-3 years).
Deflation – Estimates in real terms
9.78 Estimates are produced for each component at current prices and then deflated at the following levels ofdetail:
• Non-residential buildings
• Engineering
• Highways and roads • Railways • Other engineering
9.79 Both output and input price indexes are used. Output price indexes produced by the Prices Division are usedto deflate building investment, while input prices indexes, most of them produced within the IEA, are used to deflateengineering construction. The input price indexes are based on:
• average earnings for the labour component;
• IPPI for the materials; and
• a mix of average weekly earnings indexes and consumer price indexes for overhead costs.
9.80 These price indexes are then weighted together on the basis of detailed annual estimates from the Input-Output Tables.
9.81 The non-residential buildings deflator is based on non-residential building construction price indexes, withcontracted investment by industry having a weight of 90% and own-account work having a weight of 10%.
9.82 Output price indexes measure the variation in contractors’ selling prices for non-residential structures (i.e.,commercial, industrial and institutional buildings). These indexes relate to both general and trade contractors’ workand exclude land improvement costs and real estate fees. Prices for work put in place (WPIP) are provided by thePrices Division, which surveys subcontractors and general contractors whose bids are based on specifications andquantities set by real estate markets. The latter survey covers such items as overhead and profits that reflectmarket conditions. Prices for certain materials, labour rates, equipment rental costs, municipal charges and salestaxes are obtained from a variety of secondary sources.
17. This information is also produced by the Capital Expenditure Survey (CES). Previously published in Capital Expenditures by Type of Asset,catalogue no. 61-223, now available only on CANSIM.
Statistics Canada - Catalogue no. 13-017 Guide to the Income and Expenditure Accounts 209
Gross fixed capital formation
9.83 Prices for own-account work are obtained from a fixed-weighted composite index of average hourly earningsfor the construction sector, based on the Survey of Employment, Payrolls and Hours (SEPH) data; materials prices,based on the Industrial Product Price Index (IPPI); and overhead costs, based on various price indexes, such asaverage weekly earnings indexes and various consumer price indexes.
9.84 The highways and roads, railways and other engineering deflators are all input price indexes based on afixed-weighted composite of wages, materials and overhead costs. Table 9.6 shows the relative weights of thedeflators, derived from the 1997 Input-Output Tables. Indexed average weekly earnings from SEPH are used forthe wages portion. The materials component of the deflator is based on IPPIs. The overhead costs share is basedon a mix of average weekly earnings indexes and consumer price indexes.
Gross fixed capital formation in machinery and equipment
General concepts
9.85 Gross fixed capital formation in machinery and equipment, is a key component of investment, accounting for45% of gross fixed capital formation in 2000. It enhances productivity and potential output and contributes toeconomic growth. It is also one of the more cyclical components of GDP, as in an expansion and strong profitperiod when businesses consider modernizing or increasing their capacity either by purchasing equipment or byimproving existing machinery to meet growing demand. In addition, since a large proportion of investment goodsare imported, machinery and equipment has a substantial impact on the merchandise trade balance.
9.86 Table 9.7 presents the value of gross fixed capital formation in machinery and equipment for both thebusiness and government sectors for the year 2000.
Source: Guide to the Income and Expenditure Accounts, Statistics Canada, catalogue no. 13-017.
Table 9.6 Relative weights of engineering deflatorsWeights of indexes
Labour Materials Overhead costs Total
percent
Transportation 37 39 24 100
Other engineering 34 43 23 100
Table 9.7 Gross fixed capital formation in machinery and equipment, 2000
Business Government Total
millions of dollars
Gross fixed capital formation in machinery and equipment 83,350 8,734 92,084
Furniture 3,471 550 4,021
Agricultural machinery 3,045 7 3,052
Industrial machinery 20,992 394 21,386
Computers and other office equipment 9,755 2,219 11,974
Software 9,419 2,809 12,228
Automobiles 8,120 144 8,264
Trucks 8,466 257 8,723
Other transportation equipment 6,061 241 6,302
Telecommunications equipment 7,727 519 8,246
Other machinery and equipment 6,294 1,594 7,888
210 Statistics Canada - Catalogue no. 13-017 Guide to the Income and Expenditure Accounts
Gross fixed capital formation
9.87 In the Canadian System of National Accounts (CSNA), gross fixed capital formation in machinery andequipment comprises spending on produced durable goods that have a productive life of one year or more.Purchase, construction and installation costs are included for both the replacement and addition of assets. Assetsare recorded as gross fixed capital formation in machinery and equipment whether they are owned or leased. Thefollowing costs are capitalized:
• feasibility studies18
• exploration and development costs;
• tooling;
• progress payments;
• the net portion of purchases of used assets (vehicles, aircraft, other assets); and
• an adjustment for scrap and salvage.
9.88 By definition, investment in machinery and equipment can be moved without altering the structure in which itis housed. Otherwise, it is regarded as an integral part of the structure itself and is included in gross fixed capitalformation in non-residential structures.
9.89 Machinery and equipment investment is valued at purchaser prices (including taxes) and includes spendingon smaller goods such as hand tools and office furniture, even though firms often treat these as currentexpenditures. Non-military investment expenditures for national defence are included in gross fixed capitalformation in machinery and equipment, however strictly military expenditures such as tanks, are considered part ofgovernment current expenditure. In 2001, business and government investment in software was included in grossfixed capital formation in machinery and equipment, with estimates beginning in 1981.
9.90 Estimates published by the IEAD cover ten major groups for both the business and government sectors (seetables 22, 23 and 24 in the National Income and Expenditure Accounts). The categories for which data arepublished are as follows:
• Furniture: office furniture and special-purpose furniture;
• Agricultural machinery: tractors and other agricultural equipment;
• Industrial machinery: industrial machinery such as pumps, compressors, furnaces and electric turbines;
• Computers and other office equipment: computers and peripheral equipment and other office machines;
• Software: own-account, pre-packaged and custom design software;
• Automobiles: passenger cars;
• Trucks: trucks and tractor trailers;
• Other transportation equipment: locomotives, boxcars, ships, aircraft, buses, parts and equipment;
• Telecommunications equipment: radar and equipment related to telephone systems and radio andtelevision transmission systems;
• Other machinery and equipment: other investment goods such as hand tools and medical and electricequipment.
Annual estimation methods and data sources
9.91 The annual benchmark estimates for gross fixed capital formation in machinery and equipment are obtainedfrom the final demand matrix of the Input-Output Tables (IOT). The Industry Accounts Division (IAD) primarily usesinformation from the Investment and Capital Stock Division (ICSD) Capital Expenditure Survey (CES) by asset
type.19 Analysts also draw on various annual industry surveys to calibrate the information. A comparison of the
18. In theory, feasibility studies, exploration and development costs are all capitalized. In practice, some of these costs are recorded as currentexpenditure by businesses. They then become intermediate rather than final expenditure.
Statistics Canada - Catalogue no. 13-017 Guide to the Income and Expenditure Accounts 211
Gross fixed capital formation
main information sources with all secondary sources, both at the industry and commodity level (a process knownas balancing the Input-Output Tables), involves more than 100 investment goods. In the event of a significantimbalance between inputs or outputs, the source data and estimation methods are re-examined.
9.92 The CES and the most recent Input-Output Tables are the main sources of information for the non-benchmark (t-2, t-1) years. Table 9.8 displays a reconciliation of the CES machinery and equipment estimates andthose published by IEAD. The following adjustments are made:
• net additions;
• sectoring;
• software adjustments; and
• Canadian System of National Accounts adjustments.
9.93 Net additions refer to investment capital projects not captured by the CES. This small adjustment onlyaccounts for about 1% of the CES estimates.
9.94 The CES data are subject to sectoring adjustments to ensure consistency with the CSNA definitions. Theseadjustments involve a reclassification from the private to the public sector (for example, universities and hospitals).
9.95 Another adjustment is made for software expenditures. The CES provides a part of software investment – thealready reported portion – while Industry Accounts Division calculates the comprehensive estimate. Due todifferent production deadlines, the CES data need to be adjusted by the difference between IAD’s final and IEAD’spreliminary estimates.
9.96 Canada System of National Accounts adjustments are also made to CES data. One adjustment stems from acomparison of Public Accounts data for government investment estimates with the CES data, which leads tocorrections to the survey data. A second, more conceptual adjustment involves eliminating used machinery andequipment from the survey data, as these were already included in the GDP when first produced. Specifically, this
means removing business spending on scrap and salvage, used motor vehicles and used aircraft.20,21
9.97 Another modification is based on the comparison of the value of certain investment projects according to theCES and to other information sources. For passenger cars and trucks, for example, a more direct approach istaken in conjunction with personal expenditure estimation on motor vehicles.
9.98 An adjustment is also made to compensate for CES’s underestimation of investment in aircraft. Informationfrom the International Trade Division provides coverage of aircraft leasing contracts missed by the survey.
9.99 Lastly, on the basis of the Input-Output Tables, an adjustment is made to offset under coverage in a numberof commodities including agricultural machinery and motor vehicles.
19. A brief description of the survey is provided in Appendix 1: A Brief Description of the Capital Expenditure Survey.20. The value of capital formation is equal to acquisitions less disposals. As the data on disposals is not available by industry, the estimate is
made at the total level.21. Sales of used cars are included in personal expenditure and are therefore not deducted from capital.
212 Statistics Canada - Catalogue no. 13-017 Guide to the Income and Expenditure Accounts
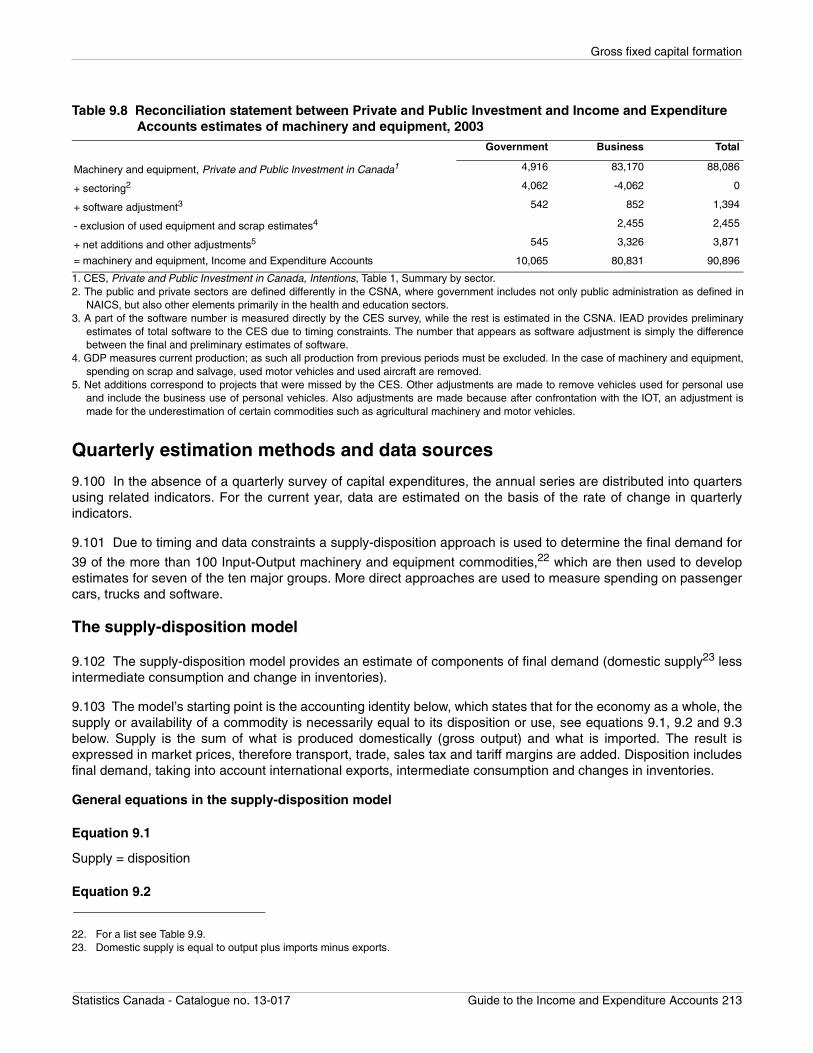
Gross fixed capital formation
Quarterly estimation methods and data sources
9.100 In the absence of a quarterly survey of capital expenditures, the annual series are distributed into quartersusing related indicators. For the current year, data are estimated on the basis of the rate of change in quarterlyindicators.
9.101 Due to timing and data constraints a supply-disposition approach is used to determine the final demand for
39 of the more than 100 Input-Output machinery and equipment commodities,22 which are then used to developestimates for seven of the ten major groups. More direct approaches are used to measure spending on passengercars, trucks and software.
The supply-disposition model
9.102 The supply-disposition model provides an estimate of components of final demand (domestic supply23 lessintermediate consumption and change in inventories).
9.103 The model’s starting point is the accounting identity below, which states that for the economy as a whole, thesupply or availability of a commodity is necessarily equal to its disposition or use, see equations 9.1, 9.2 and 9.3below. Supply is the sum of what is produced domestically (gross output) and what is imported. The result isexpressed in market prices, therefore transport, trade, sales tax and tariff margins are added. Disposition includesfinal demand, taking into account international exports, intermediate consumption and changes in inventories.
General equations in the supply-disposition model
Equation 9.1
Supply = disposition
Equation 9.2
Table 9.8 Reconciliation statement between Private and Public Investment and Income and Expenditure Accounts estimates of machinery and equipment, 2003
Government Business Total
Machinery and equipment, Private and Public Investment in Canada1 4,916 83,170 88,086
+ sectoring2 4,062 -4,062 0
+ software adjustment3 542 852 1,394
- exclusion of used equipment and scrap estimates4 2,455 2,455
+ net additions and other adjustments5 545 3,326 3,871
= machinery and equipment, Income and Expenditure Accounts 10,065 80,831 90,896
1. CES, Private and Public Investment in Canada, Intentions, Table 1, Summary by sector.2. The public and private sectors are defined differently in the CSNA, where government includes not only public administration as defined in
NAICS, but also other elements primarily in the health and education sectors.3. A part of the software number is measured directly by the CES survey, while the rest is estimated in the CSNA. IEAD provides preliminary
estimates of total software to the CES due to timing constraints. The number that appears as software adjustment is simply the differencebetween the final and preliminary estimates of software.
4. GDP measures current production; as such all production from previous periods must be excluded. In the case of machinery and equipment,spending on scrap and salvage, used motor vehicles and used aircraft are removed.
5. Net additions correspond to projects that were missed by the CES. Other adjustments are made to remove vehicles used for personal useand include the business use of personal vehicles. Also adjustments are made because after confrontation with the IOT, an adjustment ismade for the underestimation of certain commodities such as agricultural machinery and motor vehicles.
22. For a list see Table 9.9.23. Domestic supply is equal to output plus imports minus exports.
Statistics Canada - Catalogue no. 13-017 Guide to the Income and Expenditure Accounts 213
Gross fixed capital formation
GO + II + MA = FD + ID + ∆inv
and since
FD = FDD + IX = Final demand
Equation 9.3
GO + II + MA = (FDD + IX) + ID + ∆inv
where,GO = gross output,II = international imports,MA = transport, trade, sales tax and tariff margins,FD = FDD + IX = final demand,FDD = final domestic demand,IX = international exports,ID = intermediate demand,∆inv = change in inventories
9.104 This model is applied to machinery and equipment investment goods. Final domestic demand (FDD)corresponds to gross fixed capital formation in machinery and equipment (GFME) in the measurement ofexpenditure-based GDP.
General equations in machinery and equipment investment24
Equation 9.4
GO + II + MA = GFME + IX + ID + ∆inv
where,
GFME = gross fixed capital formation in machinery and equipment
Equation 9.5
GFME = GO + II + MA - IX - ID - ∆inv
9.105 To obtain a quarterly estimate of gross fixed capital formation in machinery and equipment with Equation9.5, the model uses several datasets.
9.106 Gross output (GO) is estimated using manufacturing shipments by industry, obtained from the MonthlySurvey of Manufacturing. This industry-based information is converted to a commodity classification using an
Input-Output matrix which shows the proportion25 of output attributable to each commodity group in each industry.
9.107 International exports (IX) and international imports (II) are obtained from the International Trade Division.The data, classified according to the Harmonized System, are converted to the Input-Output classification system.
9.108 Data from the most recent Input-Output Tables are used to calculate margin rates, which in turn, are used toconvert supply at basic prices to total supply. The margin rates are calculated from annual Input-Output data bytaking the ratio of total supply to supply at basic prices Equation 9.6.
24. Equation specification differs by commodity.25. Each component of the conversion matrix is calculated as follows: (Output of commodity i by industry j) / (Output of industry j).
214 Statistics Canada - Catalogue no. 13-017 Guide to the Income and Expenditure Accounts
Gross fixed capital formation
Equation 9.6
Margin rates = total supply at market rates ÷ total supply at basic prices = (output + imports + margins) ÷ (output + imports)
9.109 As shown in the following equations, total supply is obtained by multiplying output and imports by the marginrates.
Equation 9.7
Total supply at basic prices = GO + II
Equation 9.8
Total supply at market prices = (GO + II) x margin rate
9.110 The result of Equation 9.8 is the same as the first three terms of Equation 9.5.
9.111 The next step is to estimate domestic supply at market prices, that is, total supply at market prices Equation9.8 minus exports. This leads to Equation 9.9, which is the same as the first four terms of Equation 9.5.
Equation 9.9
Domestic supply at market prices = total supply at market prices - exports
9.112 Since there are no quarterly estimates of final demand for each commodity, the most recent data from theInput-Output Tables are used to compute final demand ratios. These ratios are obtained by dividing final demandfor machinery and equipment investment goods by domestic supply. Structural changes are taken into account viathe use of Capital Expenditure Survey (CES) data for non-benchmark years.
9.113 Final demand is then obtained by multiplying the domestic supply at market prices by the final demandratios, as shown in Equation 9.10.
Equation 9.10
Business GFME = business final demand ratio x domestic supply at market prices
9.114 The IAD produces monthly data on changes in inventories by industry. Changes in inventories, particularlyat the wholesale level, are also available by commodity and institutional sector in the estimate of the business andgovernment investment in inventories component of expenditure-based GDP.
9.115 The derived estimators are used to produce quarterly estimates from the annual Input-Output data, using a
quadratic minimization procedure known as the Denton-Cholette26 method. This procedure adjusts the sub-annualdata so that the annual totals (or averages) match the annual benchmarks while keeping the adjusted sub annualvariations as close as possible to the original sub-annual variations by minimizing the sum of the squares of thedifferences between them.
9.116 For the current quarters, the same supply-disposition model is used, as all the inputs are available on amonthly basis up to date. The 39 commodities are then regrouped into 7 major groups (i.e. furniture, agriculturalmachinery, industrial machinery, computers and other office equipment, other transportation equipment,telecommunications equipment and other machinery and equipment). Their movements are used to projectinvestment in these categories.
26. For more detail about the method, see Cholette, P.A. (1984): Adjusting sub-annual series to yearly benchmarks. Survey Methodology, 10,35-49.
Statistics Canada - Catalogue no. 13-017 Guide to the Income and Expenditure Accounts 215
Gross fixed capital formation
Passenger cars and trucks
9.117 For passenger cars and trucks, there are direct estimates of final demand made in conjunction with personalexpenditure estimates. Total sales by type of vehicle are provided by the New Motor Vehicle Sales Survey. Thegovernment and business sectors’ shares of passenger car sales are based on data from the Motor VehicleManufacturers Association (MVMA); for trucks, the shares are estimated on the basis of buyer profiles. Sales of caror truck fleets are treated separately and allocated entirely to the business and government sectors.
Software
9.118 Investment in software was incorporated into GDP and gross fixed capital formation in machinery andequipment in the first quarter of 2001 (backdated to 1981), in response to the SNA 1993 recommendation that
business and government acquisition of software be treated as investment instead of current expenditure.27
Investment in pre-packaged and custom design software is determined residually as the total supply of software(domestic production plus imports plus margins) less personal consumption less exports to non-residents.Estimates for own-account software (software developed by in-house employees to meet specific organization’sneeds) are based on the labour costs for computer programmers and systems analysts and other costs (non-
salary) of in-house software development.28
Provincial and territorial estimation methods and data sources
9.119 As in the case of non-residential structures, national totals for gross fixed capital formation in machinery andequipment are distributed among the provinces and territories using information from the Capital and RepairExpenditures Survey.
9.120 It should be noted that the provincial and territorial distribution of investment in mobile assets, such asaircraft, locomotives, trucks, ships and satellites, presents some difficulties. In principle, investment should bedistributed according to the place of consumption. In practice, the distribution is based on the limited amount ofdata available, and there is no guarantee that it is always consistent and uniform. The various distribution methodsused in the Capital Expenditure Survey are also employed in the Provincial Economic Accounts.
Deflation – Estimates in real terms
9.121 Gross fixed capital formation in machinery and equipment is deflated at the same level of detail as thecompilation of current-price estimates, using, for the most part, machinery and equipment price indexes from thePrices Division.
9.122 For computers and other office equipment, a weighted index is calculated using export and import priceindexes. For software, the Prices Division’s price index for pre-packaged software, average hourly earningsindexes for programmers and systems analysts, and non-labour input costs are used.
27. Statistics Canada, Capitalization of Software in the National Accounts, catalogue no. 13-604, issue no. 37.28. Quarterly sources of data include earnings of computer system designers from the Survey of Employment, Payrolls and Hours (SEPH) and
employment, and hourly earnings of software publishers, data processors and system designers from the Labour Force Survey (LFS).
216 Statistics Canada - Catalogue no. 13-017 Guide to the Income and Expenditure Accounts
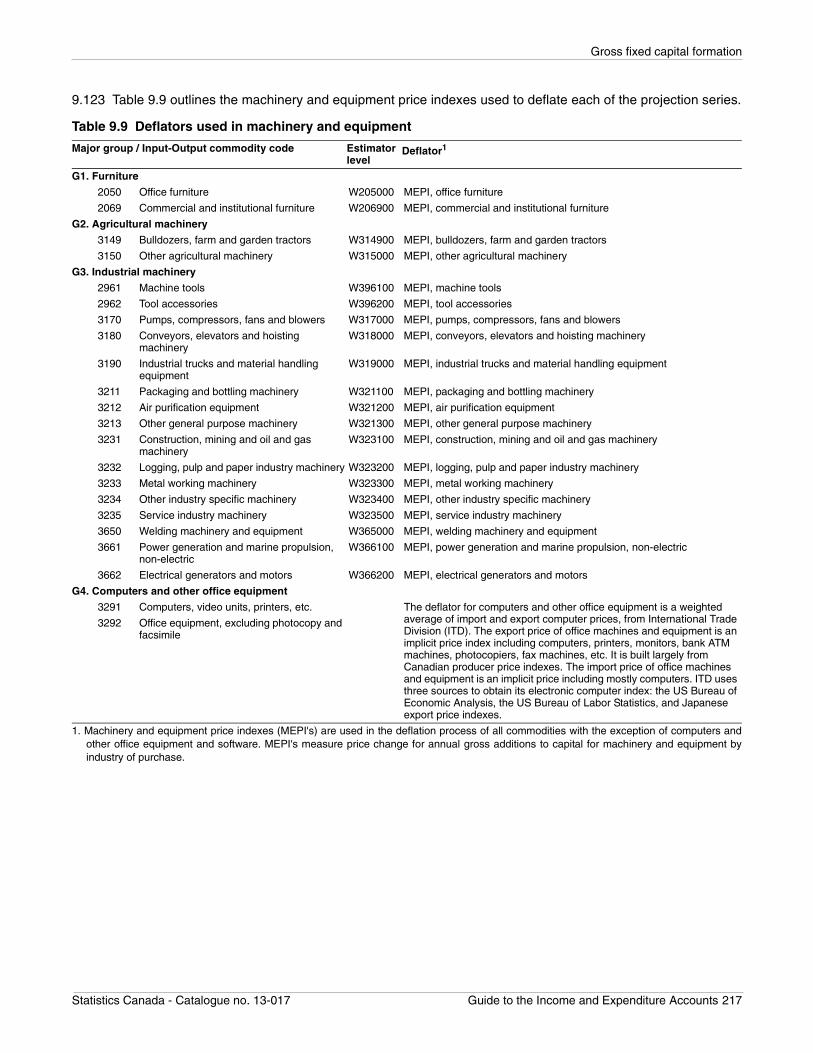
Gross fixed capital formation
9.123 Table 9.9 outlines the machinery and equipment price indexes used to deflate each of the projection series.
Table 9.9 Deflators used in machinery and equipment
Major group / Input-Output commodity code Estimator level
Deflator1
G1. Furniture
2050 Office furniture W205000 MEPI, office furniture
2069 Commercial and institutional furniture W206900 MEPI, commercial and institutional furniture
G2. Agricultural machinery
3149 Bulldozers, farm and garden tractors W314900 MEPI, bulldozers, farm and garden tractors
3150 Other agricultural machinery W315000 MEPI, other agricultural machinery
G3. Industrial machinery
2961 Machine tools W396100 MEPI, machine tools
2962 Tool accessories W396200 MEPI, tool accessories
3170 Pumps, compressors, fans and blowers W317000 MEPI, pumps, compressors, fans and blowers
3180 Conveyors, elevators and hoisting machinery
W318000 MEPI, conveyors, elevators and hoisting machinery
3190 Industrial trucks and material handling equipment
W319000 MEPI, industrial trucks and material handling equipment
3211 Packaging and bottling machinery W321100 MEPI, packaging and bottling machinery
3212 Air purification equipment W321200 MEPI, air purification equipment
3213 Other general purpose machinery W321300 MEPI, other general purpose machinery
3231 Construction, mining and oil and gas machinery
W323100 MEPI, construction, mining and oil and gas machinery
3232 Logging, pulp and paper industry machinery W323200 MEPI, logging, pulp and paper industry machinery
3233 Metal working machinery W323300 MEPI, metal working machinery
3234 Other industry specific machinery W323400 MEPI, other industry specific machinery
3235 Service industry machinery W323500 MEPI, service industry machinery
3650 Welding machinery and equipment W365000 MEPI, welding machinery and equipment
3661 Power generation and marine propulsion, non-electric
W366100 MEPI, power generation and marine propulsion, non-electric
3662 Electrical generators and motors W366200 MEPI, electrical generators and motors
G4. Computers and other office equipment
3291 Computers, video units, printers, etc. The deflator for computers and other office equipment is a weighted average of import and export computer prices, from International Trade Division (ITD). The export price of office machines and equipment is an implicit price index including computers, printers, monitors, bank ATM machines, photocopiers, fax machines, etc. It is built largely from Canadian producer price indexes. The import price of office machines and equipment is an implicit price including mostly computers. ITD uses three sources to obtain its electronic computer index: the US Bureau of Economic Analysis, the US Bureau of Labor Statistics, and Japanese export price indexes.
3292 Office equipment, excluding photocopy and facsimile
1. Machinery and equipment price indexes (MEPI's) are used in the deflation process of all commodities with the exception of computers andother office equipment and software. MEPI's measure price change for annual gross additions to capital for machinery and equipment byindustry of purchase.
Statistics Canada - Catalogue no. 13-017 Guide to the Income and Expenditure Accounts 217
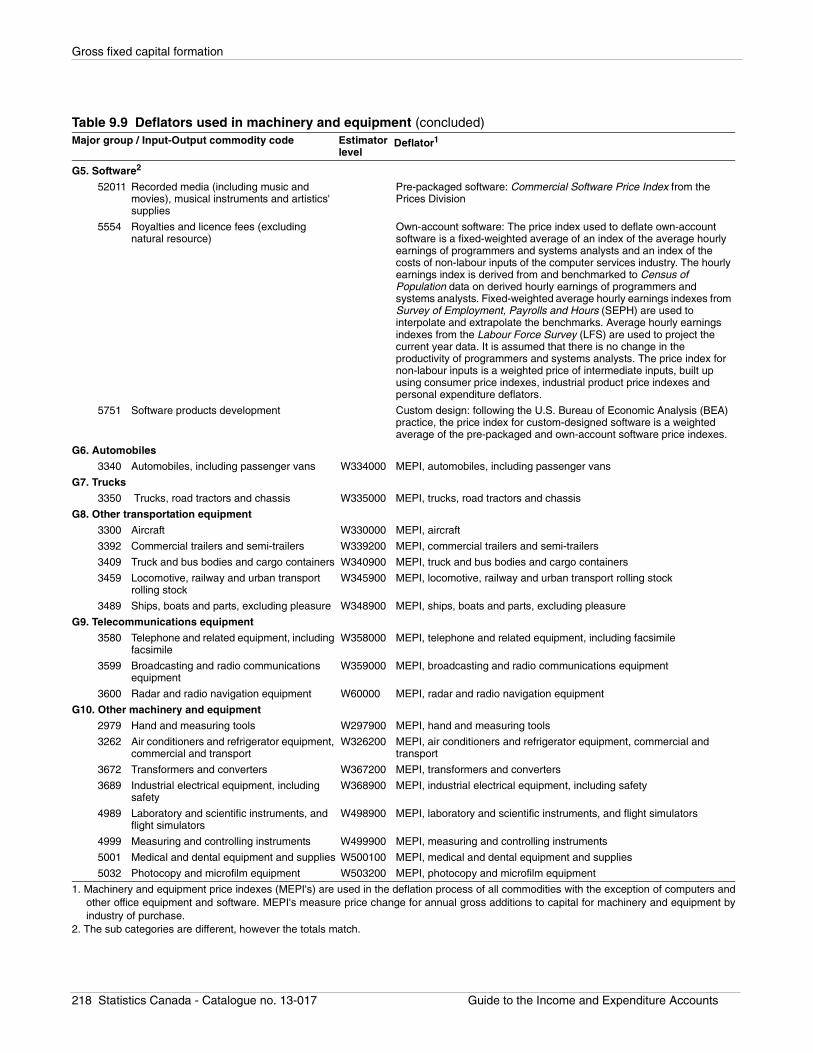
Gross fixed capital formation
Table 9.9 Deflators used in machinery and equipment (concluded)Major group / Input-Output commodity code Estimator
levelDeflator1
G5. Software2
52011 Recorded media (including music and movies), musical instruments and artistics' supplies
Pre-packaged software: Commercial Software Price Index from the Prices Division
5554 Royalties and licence fees (excluding natural resource)
Own-account software: The price index used to deflate own-account software is a fixed-weighted average of an index of the average hourly earnings of programmers and systems analysts and an index of the costs of non-labour inputs of the computer services industry. The hourly earnings index is derived from and benchmarked to Census of Population data on derived hourly earnings of programmers and systems analysts. Fixed-weighted average hourly earnings indexes from Survey of Employment, Payrolls and Hours (SEPH) are used to interpolate and extrapolate the benchmarks. Average hourly earnings indexes from the Labour Force Survey (LFS) are used to project the current year data. It is assumed that there is no change in the productivity of programmers and systems analysts. The price index for non-labour inputs is a weighted price of intermediate inputs, built up using consumer price indexes, industrial product price indexes and personal expenditure deflators.
5751 Software products development Custom design: following the U.S. Bureau of Economic Analysis (BEA) practice, the price index for custom-designed software is a weighted average of the pre-packaged and own-account software price indexes.
G6. Automobiles
3340 Automobiles, including passenger vans W334000 MEPI, automobiles, including passenger vans
G7. Trucks
3350 Trucks, road tractors and chassis W335000 MEPI, trucks, road tractors and chassis
G8. Other transportation equipment
3300 Aircraft W330000 MEPI, aircraft
3392 Commercial trailers and semi-trailers W339200 MEPI, commercial trailers and semi-trailers
3409 Truck and bus bodies and cargo containers W340900 MEPI, truck and bus bodies and cargo containers
3459 Locomotive, railway and urban transport rolling stock
W345900 MEPI, locomotive, railway and urban transport rolling stock
3489 Ships, boats and parts, excluding pleasure W348900 MEPI, ships, boats and parts, excluding pleasure
G9. Telecommunications equipment
3580 Telephone and related equipment, including facsimile
W358000 MEPI, telephone and related equipment, including facsimile
3599 Broadcasting and radio communications equipment
W359000 MEPI, broadcasting and radio communications equipment
3600 Radar and radio navigation equipment W60000 MEPI, radar and radio navigation equipment
G10. Other machinery and equipment
2979 Hand and measuring tools W297900 MEPI, hand and measuring tools
3262 Air conditioners and refrigerator equipment, commercial and transport
W326200 MEPI, air conditioners and refrigerator equipment, commercial and transport
3672 Transformers and converters W367200 MEPI, transformers and converters
3689 Industrial electrical equipment, including safety
W368900 MEPI, industrial electrical equipment, including safety
4989 Laboratory and scientific instruments, and flight simulators
W498900 MEPI, laboratory and scientific instruments, and flight simulators
4999 Measuring and controlling instruments W499900 MEPI, measuring and controlling instruments
5001 Medical and dental equipment and supplies W500100 MEPI, medical and dental equipment and supplies
5032 Photocopy and microfilm equipment W503200 MEPI, photocopy and microfilm equipment
1. Machinery and equipment price indexes (MEPI's) are used in the deflation process of all commodities with the exception of computers andother office equipment and software. MEPI's measure price change for annual gross additions to capital for machinery and equipment byindustry of purchase.
2. The sub categories are different, however the totals match.
218 Statistics Canada - Catalogue no. 13-017 Guide to the Income and Expenditure Accounts
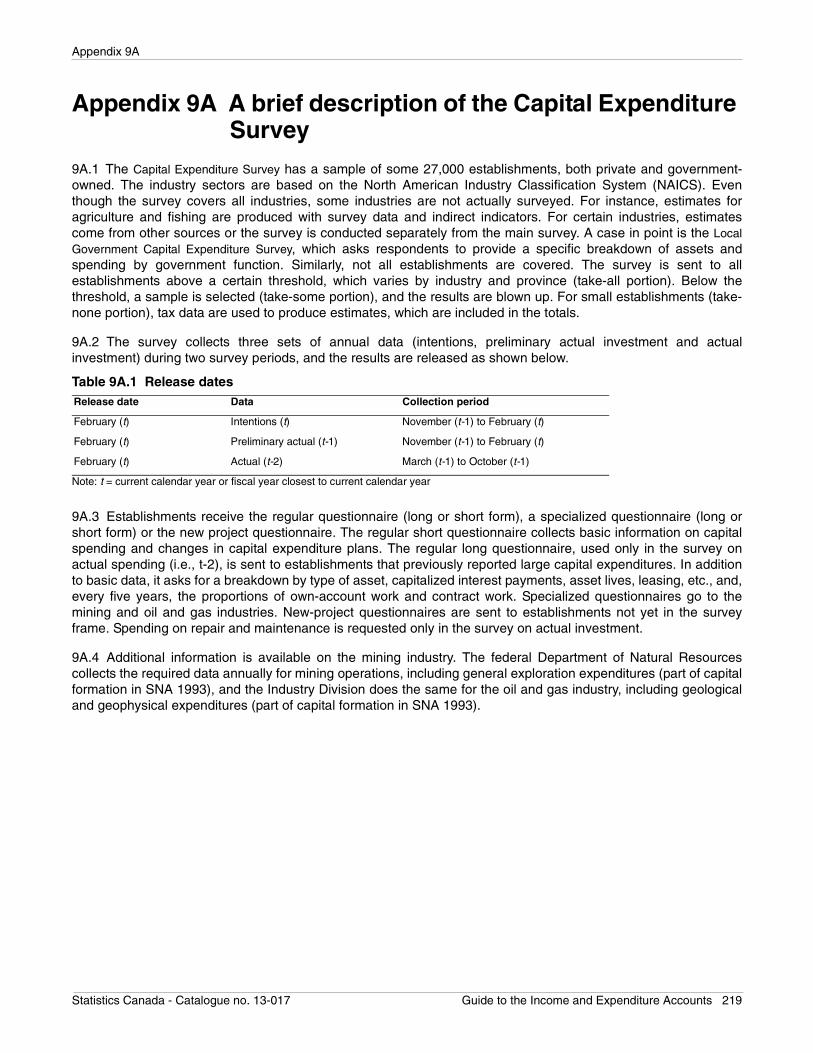
Appendix 9A
Statistics Canada - Catalogue no. 13-017 Guide to the Income and Expenditure Accounts 219
Appendix 9A A brief description of the Capital Expenditure Survey
9A.1 The Capital Expenditure Survey has a sample of some 27,000 establishments, both private and government-owned. The industry sectors are based on the North American Industry Classification System (NAICS). Eventhough the survey covers all industries, some industries are not actually surveyed. For instance, estimates foragriculture and fishing are produced with survey data and indirect indicators. For certain industries, estimatescome from other sources or the survey is conducted separately from the main survey. A case in point is the LocalGovernment Capital Expenditure Survey, which asks respondents to provide a specific breakdown of assets andspending by government function. Similarly, not all establishments are covered. The survey is sent to allestablishments above a certain threshold, which varies by industry and province (take-all portion). Below thethreshold, a sample is selected (take-some portion), and the results are blown up. For small establishments (take-none portion), tax data are used to produce estimates, which are included in the totals.
9A.2 The survey collects three sets of annual data (intentions, preliminary actual investment and actualinvestment) during two survey periods, and the results are released as shown below.
9A.3 Establishments receive the regular questionnaire (long or short form), a specialized questionnaire (long orshort form) or the new project questionnaire. The regular short questionnaire collects basic information on capitalspending and changes in capital expenditure plans. The regular long questionnaire, used only in the survey onactual spending (i.e., t-2), is sent to establishments that previously reported large capital expenditures. In additionto basic data, it asks for a breakdown by type of asset, capitalized interest payments, asset lives, leasing, etc., and,every five years, the proportions of own-account work and contract work. Specialized questionnaires go to themining and oil and gas industries. New-project questionnaires are sent to establishments not yet in the surveyframe. Spending on repair and maintenance is requested only in the survey on actual investment.
9A.4 Additional information is available on the mining industry. The federal Department of Natural Resourcescollects the required data annually for mining operations, including general exploration expenditures (part of capitalformation in SNA 1993), and the Industry Division does the same for the oil and gas industry, including geologicaland geophysical expenditures (part of capital formation in SNA 1993).
Table 9A.1 Release datesRelease date Data Collection period
February (t) Intentions (t) November (t-1) to February (t)
February (t) Preliminary actual (t-1) November (t-1) to February (t)
February (t) Actual (t-2) March (t-1) to October (t-1)
Note: t = current calendar year or fiscal year closest to current calendar year
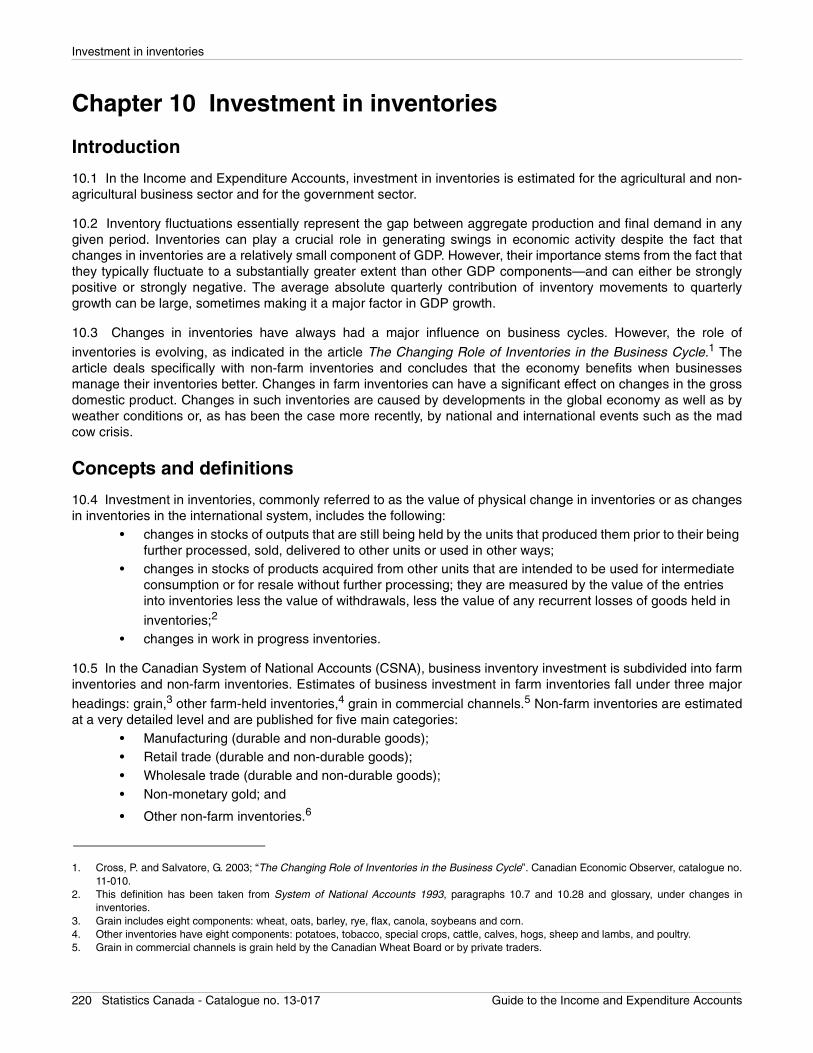
Investment in inventories
Chapter 10 Investment in inventories
Introduction
10.1 In the Income and Expenditure Accounts, investment in inventories is estimated for the agricultural and non-agricultural business sector and for the government sector.
10.2 Inventory fluctuations essentially represent the gap between aggregate production and final demand in anygiven period. Inventories can play a crucial role in generating swings in economic activity despite the fact thatchanges in inventories are a relatively small component of GDP. However, their importance stems from the fact thatthey typically fluctuate to a substantially greater extent than other GDP components—and can either be stronglypositive or strongly negative. The average absolute quarterly contribution of inventory movements to quarterlygrowth can be large, sometimes making it a major factor in GDP growth.
10.3 Changes in inventories have always had a major influence on business cycles. However, the role of
inventories is evolving, as indicated in the article The Changing Role of Inventories in the Business Cycle.1 Thearticle deals specifically with non-farm inventories and concludes that the economy benefits when businessesmanage their inventories better. Changes in farm inventories can have a significant effect on changes in the grossdomestic product. Changes in such inventories are caused by developments in the global economy as well as byweather conditions or, as has been the case more recently, by national and international events such as the madcow crisis.
Concepts and definitions
10.4 Investment in inventories, commonly referred to as the value of physical change in inventories or as changesin inventories in the international system, includes the following:
• changes in stocks of outputs that are still being held by the units that produced them prior to their being further processed, sold, delivered to other units or used in other ways;
• changes in stocks of products acquired from other units that are intended to be used for intermediate consumption or for resale without further processing; they are measured by the value of the entries into inventories less the value of withdrawals, less the value of any recurrent losses of goods held in
inventories;2 • changes in work in progress inventories.
10.5 In the Canadian System of National Accounts (CSNA), business inventory investment is subdivided into farminventories and non-farm inventories. Estimates of business investment in farm inventories fall under three major
headings: grain,3 other farm-held inventories,4 grain in commercial channels.5 Non-farm inventories are estimatedat a very detailed level and are published for five main categories:
• Manufacturing (durable and non-durable goods); • Retail trade (durable and non-durable goods); • Wholesale trade (durable and non-durable goods); • Non-monetary gold; and
• Other non-farm inventories.6
1. Cross, P. and Salvatore, G. 2003; “The Changing Role of Inventories in the Business Cycle”. Canadian Economic Observer, catalogue no.11-010.
2. This definition has been taken from System of National Accounts 1993, paragraphs 10.7 and 10.28 and glossary, under changes ininventories.
3. Grain includes eight components: wheat, oats, barley, rye, flax, canola, soybeans and corn.4. Other inventories have eight components: potatoes, tobacco, special crops, cattle, calves, hogs, sheep and lambs, and poultry. 5. Grain in commercial channels is grain held by the Canadian Wheat Board or by private traders.
220 Statistics Canada - Catalogue no. 13-017 Guide to the Income and Expenditure Accounts
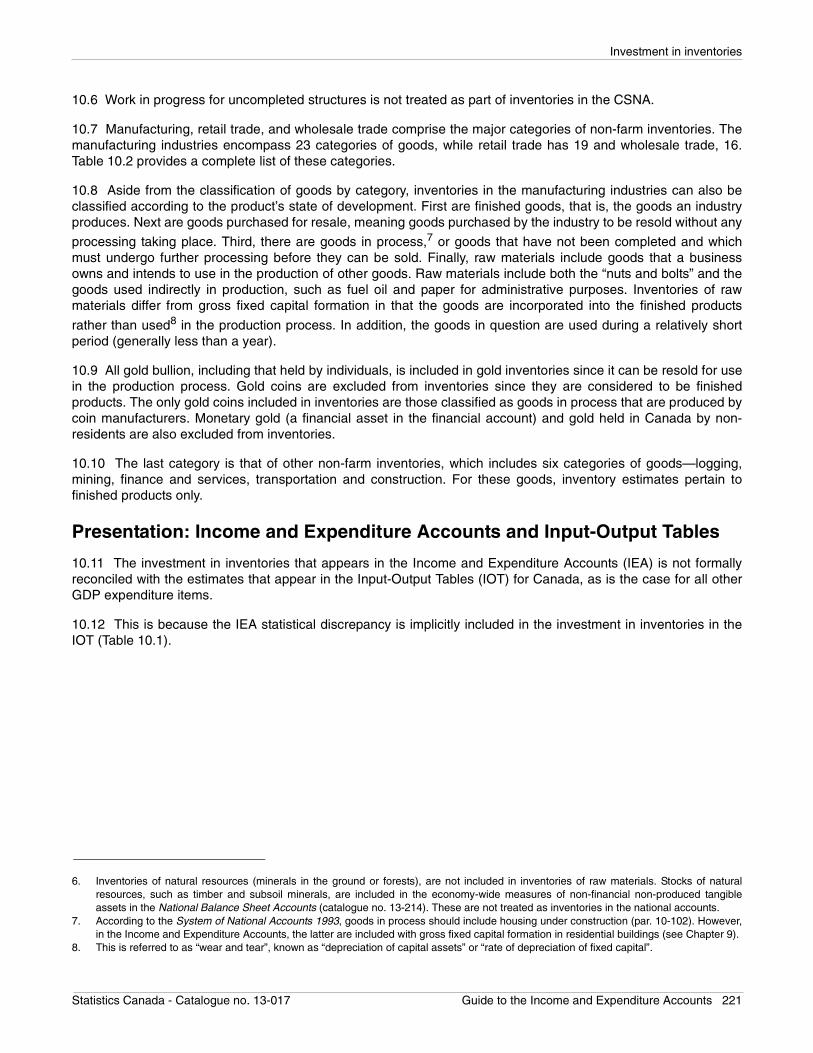
Investment in inventories
10.6 Work in progress for uncompleted structures is not treated as part of inventories in the CSNA.
10.7 Manufacturing, retail trade, and wholesale trade comprise the major categories of non-farm inventories. Themanufacturing industries encompass 23 categories of goods, while retail trade has 19 and wholesale trade, 16.Table 10.2 provides a complete list of these categories.
10.8 Aside from the classification of goods by category, inventories in the manufacturing industries can also beclassified according to the product’s state of development. First are finished goods, that is, the goods an industryproduces. Next are goods purchased for resale, meaning goods purchased by the industry to be resold without any
processing taking place. Third, there are goods in process,7 or goods that have not been completed and whichmust undergo further processing before they can be sold. Finally, raw materials include goods that a businessowns and intends to use in the production of other goods. Raw materials include both the “nuts and bolts” and thegoods used indirectly in production, such as fuel oil and paper for administrative purposes. Inventories of rawmaterials differ from gross fixed capital formation in that the goods are incorporated into the finished products
rather than used8 in the production process. In addition, the goods in question are used during a relatively shortperiod (generally less than a year).
10.9 All gold bullion, including that held by individuals, is included in gold inventories since it can be resold for usein the production process. Gold coins are excluded from inventories since they are considered to be finishedproducts. The only gold coins included in inventories are those classified as goods in process that are produced bycoin manufacturers. Monetary gold (a financial asset in the financial account) and gold held in Canada by non-residents are also excluded from inventories.
10.10 The last category is that of other non-farm inventories, which includes six categories of goods—logging,mining, finance and services, transportation and construction. For these goods, inventory estimates pertain tofinished products only.
Presentation: Income and Expenditure Accounts and Input-Output Tables
10.11 The investment in inventories that appears in the Income and Expenditure Accounts (IEA) is not formallyreconciled with the estimates that appear in the Input-Output Tables (IOT) for Canada, as is the case for all otherGDP expenditure items.
10.12 This is because the IEA statistical discrepancy is implicitly included in the investment in inventories in theIOT (Table 10.1).
6. Inventories of natural resources (minerals in the ground or forests), are not included in inventories of raw materials. Stocks of naturalresources, such as timber and subsoil minerals, are included in the economy-wide measures of non-financial non-produced tangibleassets in the National Balance Sheet Accounts (catalogue no. 13-214). These are not treated as inventories in the national accounts.
7. According to the System of National Accounts 1993, goods in process should include housing under construction (par. 10-102). However,in the Income and Expenditure Accounts, the latter are included with gross fixed capital formation in residential buildings (see Chapter 9).
8. This is referred to as “wear and tear”, known as “depreciation of capital assets” or “rate of depreciation of fixed capital”.
Statistics Canada - Catalogue no. 13-017 Guide to the Income and Expenditure Accounts 221
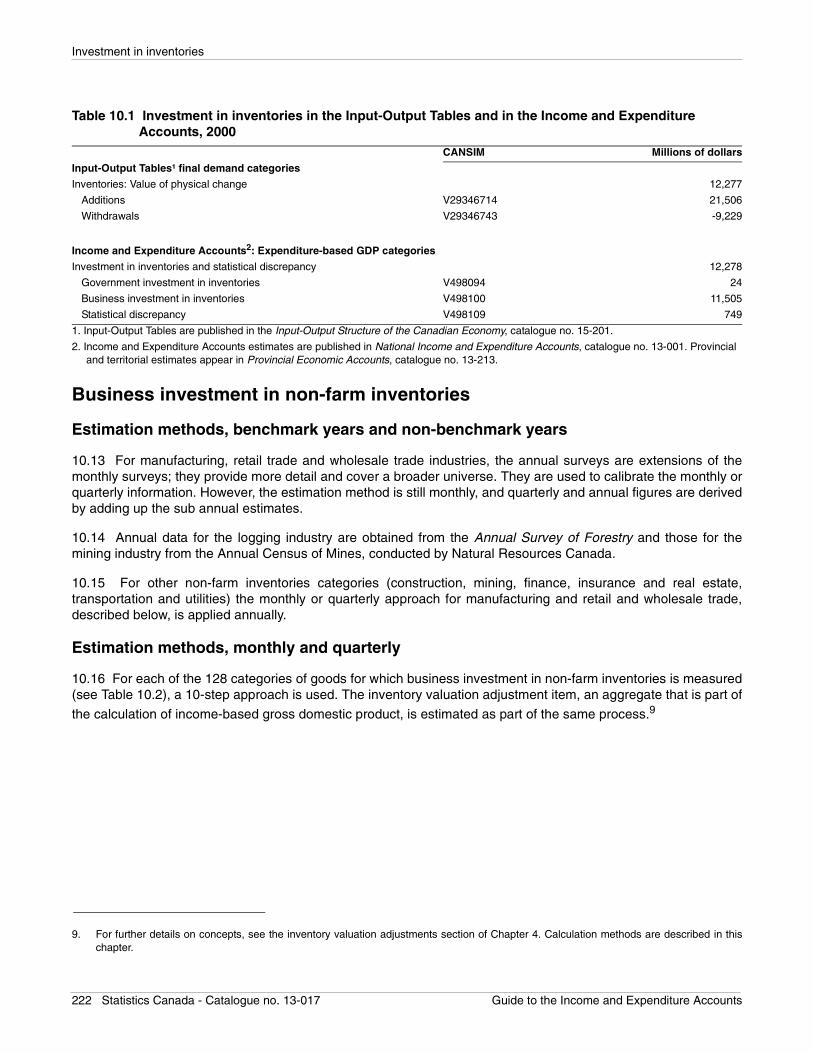
Investment in inventories
Business investment in non-farm inventories
Estimation methods, benchmark years and non-benchmark years
10.13 For manufacturing, retail trade and wholesale trade industries, the annual surveys are extensions of themonthly surveys; they provide more detail and cover a broader universe. They are used to calibrate the monthly orquarterly information. However, the estimation method is still monthly, and quarterly and annual figures are derivedby adding up the sub annual estimates.
10.14 Annual data for the logging industry are obtained from the Annual Survey of Forestry and those for themining industry from the Annual Census of Mines, conducted by Natural Resources Canada.
10.15 For other non-farm inventories categories (construction, mining, finance, insurance and real estate,transportation and utilities) the monthly or quarterly approach for manufacturing and retail and wholesale trade,described below, is applied annually.
Estimation methods, monthly and quarterly
10.16 For each of the 128 categories of goods for which business investment in non-farm inventories is measured(see Table 10.2), a 10-step approach is used. The inventory valuation adjustment item, an aggregate that is part of
the calculation of income-based gross domestic product, is estimated as part of the same process.9
Table 10.1 Investment in inventories in the Input-Output Tables and in the Income and Expenditure Accounts, 2000
CANSIM Millions of dollars
Input-Output Tables¹ final demand categories
Inventories: Value of physical change 12,277
Additions V29346714 21,506
Withdrawals V29346743 -9,229
Income and Expenditure Accounts2: Expenditure-based GDP categories
Investment in inventories and statistical discrepancy 12,278
Government investment in inventories V498094 24
Business investment in inventories V498100 11,505
Statistical discrepancy V498109 749
1. Input-Output Tables are published in the Input-Output Structure of the Canadian Economy, catalogue no. 15-201.
2. Income and Expenditure Accounts estimates are published in National Income and Expenditure Accounts, catalogue no. 13-001. Provincial and territorial estimates appear in Provincial Economic Accounts, catalogue no. 13-213.
9. For further details on concepts, see the inventory valuation adjustments section of Chapter 4. Calculation methods are described in thischapter.
222 Statistics Canada - Catalogue no. 13-017 Guide to the Income and Expenditure Accounts
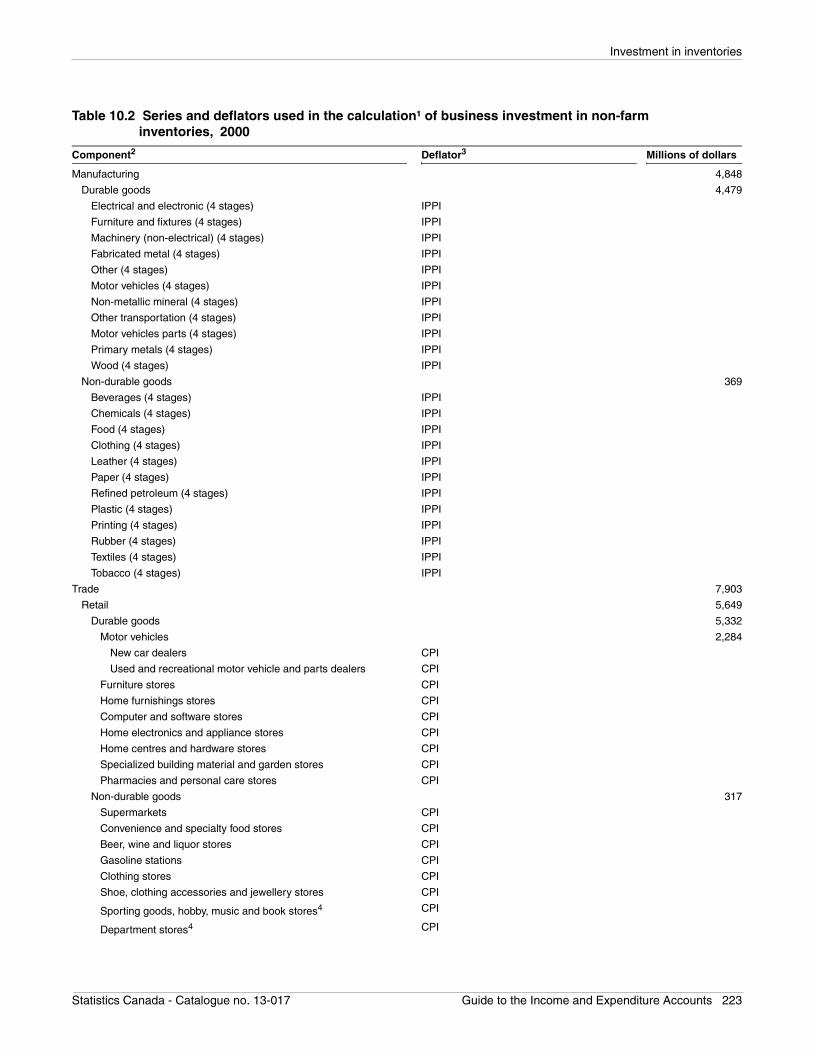
Investment in inventories
Table 10.2 Series and deflators used in the calculation¹ of business investment in non-farm inventories, 2000
Component2 Deflator3 Millions of dollars
Manufacturing 4,848
Durable goods 4,479
Electrical and electronic (4 stages) IPPI
Furniture and fixtures (4 stages) IPPI
Machinery (non-electrical) (4 stages) IPPI
Fabricated metal (4 stages) IPPI
Other (4 stages) IPPI
Motor vehicles (4 stages) IPPI
Non-metallic mineral (4 stages) IPPI
Other transportation (4 stages) IPPI
Motor vehicles parts (4 stages) IPPI
Primary metals (4 stages) IPPI
Wood (4 stages) IPPI
Non-durable goods 369
Beverages (4 stages) IPPI
Chemicals (4 stages) IPPI
Food (4 stages) IPPI
Clothing (4 stages) IPPI
Leather (4 stages) IPPI
Paper (4 stages) IPPI
Refined petroleum (4 stages) IPPI
Plastic (4 stages) IPPI
Printing (4 stages) IPPI
Rubber (4 stages) IPPI
Textiles (4 stages) IPPI
Tobacco (4 stages) IPPI
Trade 7,903
Retail 5,649
Durable goods 5,332
Motor vehicles 2,284
New car dealers CPI
Used and recreational motor vehicle and parts dealers CPI
Furniture stores CPI
Home furnishings stores CPI
Computer and software stores CPI
Home electronics and appliance stores CPI
Home centres and hardware stores CPI
Specialized building material and garden stores CPI
Pharmacies and personal care stores CPI
Non-durable goods 317
Supermarkets CPI
Convenience and specialty food stores CPI
Beer, wine and liquor stores CPI
Gasoline stations CPI
Clothing stores CPI
Shoe, clothing accessories and jewellery stores CPI
Sporting goods, hobby, music and book stores4 CPI
Department stores4 CPI
Statistics Canada - Catalogue no. 13-017 Guide to the Income and Expenditure Accounts 223
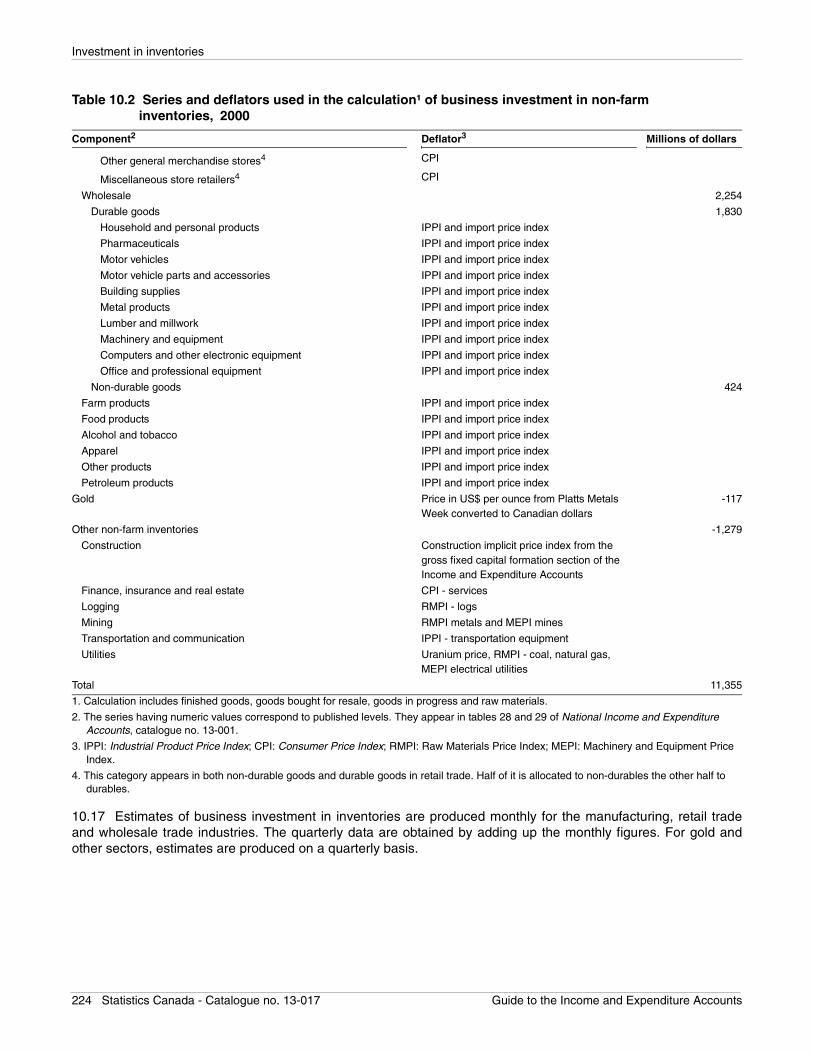
Investment in inventories
10.17 Estimates of business investment in inventories are produced monthly for the manufacturing, retail tradeand wholesale trade industries. The quarterly data are obtained by adding up the monthly figures. For gold andother sectors, estimates are produced on a quarterly basis.
Other general merchandise stores4 CPI
Miscellaneous store retailers4 CPI
Wholesale 2,254
Durable goods 1,830
Household and personal products IPPI and import price index
Pharmaceuticals IPPI and import price index
Motor vehicles IPPI and import price index
Motor vehicle parts and accessories IPPI and import price index
Building supplies IPPI and import price index
Metal products IPPI and import price index
Lumber and millwork IPPI and import price index
Machinery and equipment IPPI and import price index
Computers and other electronic equipment IPPI and import price index
Office and professional equipment IPPI and import price index
Non-durable goods 424
Farm products IPPI and import price index
Food products IPPI and import price index
Alcohol and tobacco IPPI and import price index
Apparel IPPI and import price index
Other products IPPI and import price index
Petroleum products IPPI and import price index
Gold Price in US$ per ounce from Platts Metals Week converted to Canadian dollars
-117
Other non-farm inventories -1,279
Construction Construction implicit price index from the gross fixed capital formation section of the Income and Expenditure Accounts
Finance, insurance and real estate CPI - services
Logging RMPI - logs
Mining RMPI metals and MEPI mines
Transportation and communication IPPI - transportation equipment
Utilities Uranium price, RMPI - coal, natural gas, MEPI electrical utilities
Total 11,355
1. Calculation includes finished goods, goods bought for resale, goods in progress and raw materials.
2. The series having numeric values correspond to published levels. They appear in tables 28 and 29 of National Income and Expenditure Accounts, catalogue no. 13-001.
3. IPPI: Industrial Product Price Index; CPI: Consumer Price Index; RMPI: Raw Materials Price Index; MEPI: Machinery and Equipment Price Index.
4. This category appears in both non-durable goods and durable goods in retail trade. Half of it is allocated to non-durables the other half to durables.
Table 10.2 Series and deflators used in the calculation¹ of business investment in non-farm inventories, 2000
Component2 Deflator3 Millions of dollars
224 Statistics Canada - Catalogue no. 13-017 Guide to the Income and Expenditure Accounts
Investment in inventories
10.18 The following data are needed for the calculations: • the value of sales and shipments; • the book value of inventories as reported by businesses; • the accounting method used by businesses to arrive at the book value; and • price indexes that, to the extent possible, reflect purchase costs rather than selling prices.
10.19 Each of these datasets is explored in the sections below. A description of the 10-step calculation methodfollows (paragraphs 10.38 to 10.50).
Sales and shipments
10.20 Sales and shipments for manufacturing are derived from the Monthly Survey of Manufacturing (MSM).10 Forthe wholesale industry, monthly sales and shipments data are provided by the Wholesale Trade Survey
(Monthly).11 For the retail industry, the data are taken from the Monthly Retail Trade Survey (Department StoreOrganizations) and the Retail Trade Survey (Monthly).12
10.21 For gold, a supply and demand model is used as a quarterly distributor of the annual benchmarks providedby the Input-Output Tables. The same model is used to produce the current estimates; it relies on the IndustryAccounts Division’s estimates of gold production, gold exports and imports from the International Trade Division,and the Balance of Payments Division’s surveys for the Bank of Canada’s activities in managing gold reserves andsales of gold coins.
10.22 For construction, the benchmark data are projected using information from the Survey of Employment,Payrolls and Hours13 and the Survey of Employment, Payrolls and Man-hours. The same approach is followed forfinancial services, except that the projectors are taken from personal expenditure on consumer financial services.
10.23 For the logging industry, a supply and demand model is used. The information is provided by the IndustryAccounts Division and the International Trade Division.
10.24 For the mining industry and the transportation and telecommunications industry, quarterly information is
available from the Quarterly Survey of Financial Statistics for Enterprises.14
10.25 For electric utilities, information is provided by the Public Institutions Division. For gas utilities, it is suppliedby the Manufacturing, Construction and Energy Division.
Book value stocks
10.26 The book values of inventory stocks for the manufacturing, wholesale, retail, gold and other industries arederived from the same sources as sales and shipments.
Accounting method
10.27 The accounting method refers to the LIFO (last in first out) and FIFO (first in first out) methods of bookinginventories. The FIFO assumes for costing purposes that the goods are charged to production or sales in order oftheir acquisition. The LIFO method assumes that the goods charged out first are the goods last acquired.
10. Survey no. 2101, published in Monthly Survey of Manufacturing, catalogue no. 31-001.11. Survey no. 2401, published in Wholesale Trade, catalogue no. 63-008.12. Survey no. 2406, published in Retail Trade, catalogue no. 63-005.13. Survey no. 2612, published in Employment, Earnings and Hours, catalogue no. 72-002.14. Survey no. 2501, published in Quarterly Financial Statistics for Enterprises, catalogue no. 61-008.
Statistics Canada - Catalogue no. 13-017 Guide to the Income and Expenditure Accounts 225
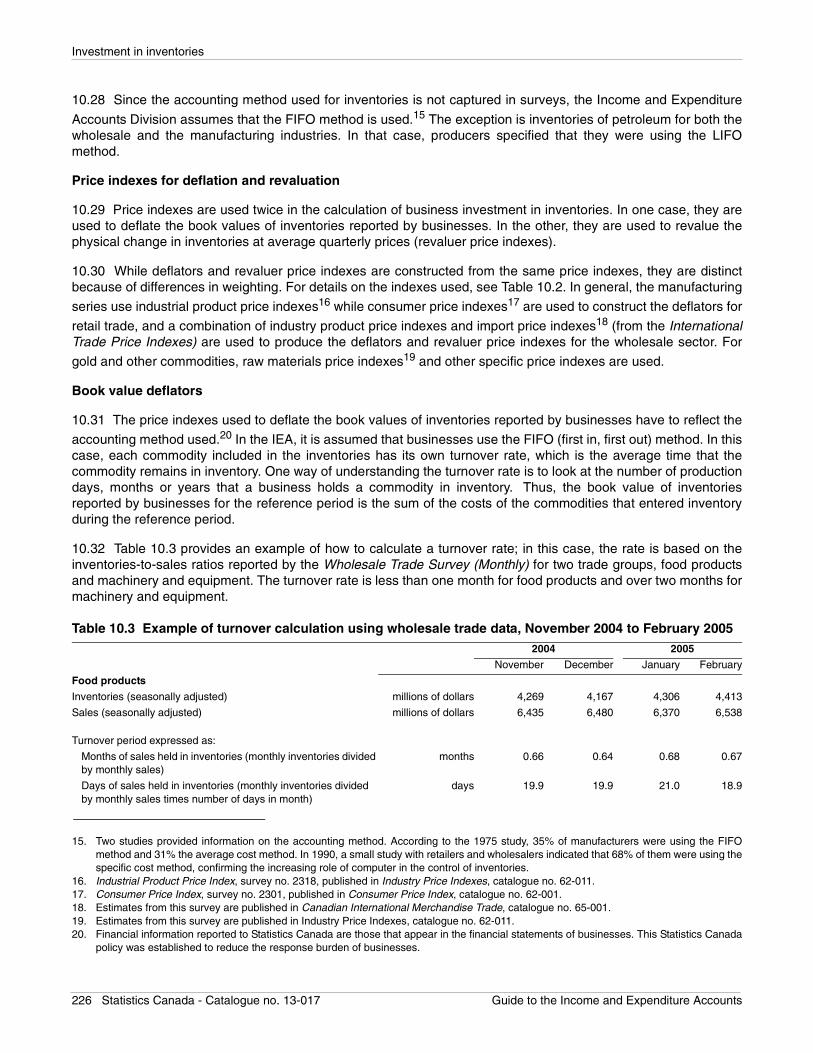
Investment in inventories
10.28 Since the accounting method used for inventories is not captured in surveys, the Income and Expenditure
Accounts Division assumes that the FIFO method is used.15 The exception is inventories of petroleum for both thewholesale and the manufacturing industries. In that case, producers specified that they were using the LIFOmethod.
Price indexes for deflation and revaluation
10.29 Price indexes are used twice in the calculation of business investment in inventories. In one case, they areused to deflate the book values of inventories reported by businesses. In the other, they are used to revalue thephysical change in inventories at average quarterly prices (revaluer price indexes).
10.30 While deflators and revaluer price indexes are constructed from the same price indexes, they are distinctbecause of differences in weighting. For details on the indexes used, see Table 10.2. In general, the manufacturing
series use industrial product price indexes16 while consumer price indexes17 are used to construct the deflators for
retail trade, and a combination of industry product price indexes and import price indexes18 (from the InternationalTrade Price Indexes) are used to produce the deflators and revaluer price indexes for the wholesale sector. For
gold and other commodities, raw materials price indexes19 and other specific price indexes are used.
Book value deflators
10.31 The price indexes used to deflate the book values of inventories reported by businesses have to reflect the
accounting method used.20 In the IEA, it is assumed that businesses use the FIFO (first in, first out) method. In thiscase, each commodity included in the inventories has its own turnover rate, which is the average time that thecommodity remains in inventory. One way of understanding the turnover rate is to look at the number of productiondays, months or years that a business holds a commodity in inventory. Thus, the book value of inventoriesreported by businesses for the reference period is the sum of the costs of the commodities that entered inventoryduring the reference period.
10.32 Table 10.3 provides an example of how to calculate a turnover rate; in this case, the rate is based on theinventories-to-sales ratios reported by the Wholesale Trade Survey (Monthly) for two trade groups, food productsand machinery and equipment. The turnover rate is less than one month for food products and over two months formachinery and equipment.
15. Two studies provided information on the accounting method. According to the 1975 study, 35% of manufacturers were using the FIFOmethod and 31% the average cost method. In 1990, a small study with retailers and wholesalers indicated that 68% of them were using thespecific cost method, confirming the increasing role of computer in the control of inventories.
16. Industrial Product Price Index, survey no. 2318, published in Industry Price Indexes, catalogue no. 62-011.17. Consumer Price Index, survey no. 2301, published in Consumer Price Index, catalogue no. 62-001.18. Estimates from this survey are published in Canadian International Merchandise Trade, catalogue no. 65-001.19. Estimates from this survey are published in Industry Price Indexes, catalogue no. 62-011.20. Financial information reported to Statistics Canada are those that appear in the financial statements of businesses. This Statistics Canada
policy was established to reduce the response burden of businesses.
Table 10.3 Example of turnover calculation using wholesale trade data, November 2004 to February 20052004 2005
November December January February
Food products
Inventories (seasonally adjusted) millions of dollars 4,269 4,167 4,306 4,413
Sales (seasonally adjusted) millions of dollars 6,435 6,480 6,370 6,538
Turnover period expressed as:
Months of sales held in inventories (monthly inventories divided by monthly sales)
months 0.66 0.64 0.68 0.67
Days of sales held in inventories (monthly inventories divided by monthly sales times number of days in month)
days 19.9 19.9 21.0 18.9
226 Statistics Canada - Catalogue no. 13-017 Guide to the Income and Expenditure Accounts
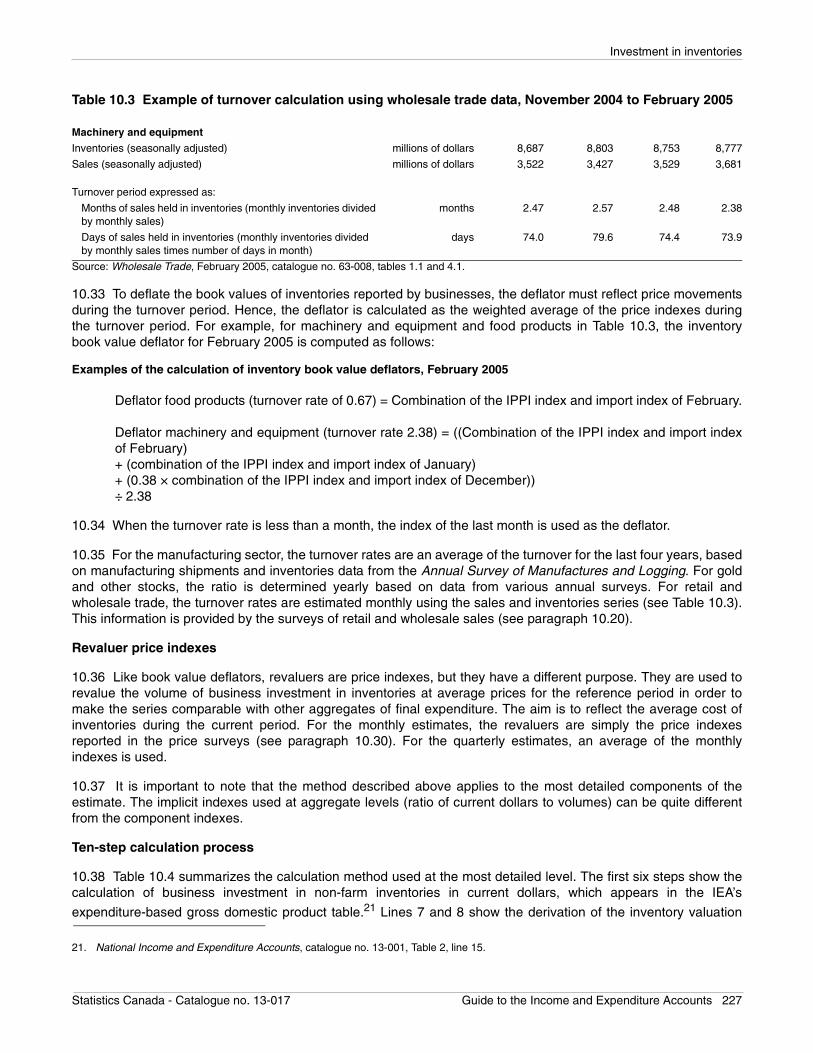
Investment in inventories
10.33 To deflate the book values of inventories reported by businesses, the deflator must reflect price movementsduring the turnover period. Hence, the deflator is calculated as the weighted average of the price indexes duringthe turnover period. For example, for machinery and equipment and food products in Table 10.3, the inventorybook value deflator for February 2005 is computed as follows:
Examples of the calculation of inventory book value deflators, February 2005
Deflator food products (turnover rate of 0.67) = Combination of the IPPI index and import index of February.
Deflator machinery and equipment (turnover rate 2.38) = ((Combination of the IPPI index and import indexof February)+ (combination of the IPPI index and import index of January)+ (0.38 × combination of the IPPI index and import index of December)) ÷ 2.38
10.34 When the turnover rate is less than a month, the index of the last month is used as the deflator.
10.35 For the manufacturing sector, the turnover rates are an average of the turnover for the last four years, basedon manufacturing shipments and inventories data from the Annual Survey of Manufactures and Logging. For goldand other stocks, the ratio is determined yearly based on data from various annual surveys. For retail andwholesale trade, the turnover rates are estimated monthly using the sales and inventories series (see Table 10.3).This information is provided by the surveys of retail and wholesale sales (see paragraph 10.20).
Revaluer price indexes
10.36 Like book value deflators, revaluers are price indexes, but they have a different purpose. They are used torevalue the volume of business investment in inventories at average prices for the reference period in order tomake the series comparable with other aggregates of final expenditure. The aim is to reflect the average cost ofinventories during the current period. For the monthly estimates, the revaluers are simply the price indexesreported in the price surveys (see paragraph 10.30). For the quarterly estimates, an average of the monthlyindexes is used.
10.37 It is important to note that the method described above applies to the most detailed components of theestimate. The implicit indexes used at aggregate levels (ratio of current dollars to volumes) can be quite differentfrom the component indexes.
Ten-step calculation process
10.38 Table 10.4 summarizes the calculation method used at the most detailed level. The first six steps show thecalculation of business investment in non-farm inventories in current dollars, which appears in the IEA’s
expenditure-based gross domestic product table.21 Lines 7 and 8 show the derivation of the inventory valuation
Machinery and equipment
Inventories (seasonally adjusted) millions of dollars 8,687 8,803 8,753 8,777
Sales (seasonally adjusted) millions of dollars 3,522 3,427 3,529 3,681
Turnover period expressed as:
Months of sales held in inventories (monthly inventories divided by monthly sales)
months 2.47 2.57 2.48 2.38
Days of sales held in inventories (monthly inventories divided by monthly sales times number of days in month)
days 74.0 79.6 74.4 73.9
Source: Wholesale Trade, February 2005, catalogue no. 63-008, tables 1.1 and 4.1.
21. National Income and Expenditure Accounts, catalogue no. 13-001, Table 2, line 15.
Table 10.3 Example of turnover calculation using wholesale trade data, November 2004 to February 2005
Statistics Canada - Catalogue no. 13-017 Guide to the Income and Expenditure Accounts 227
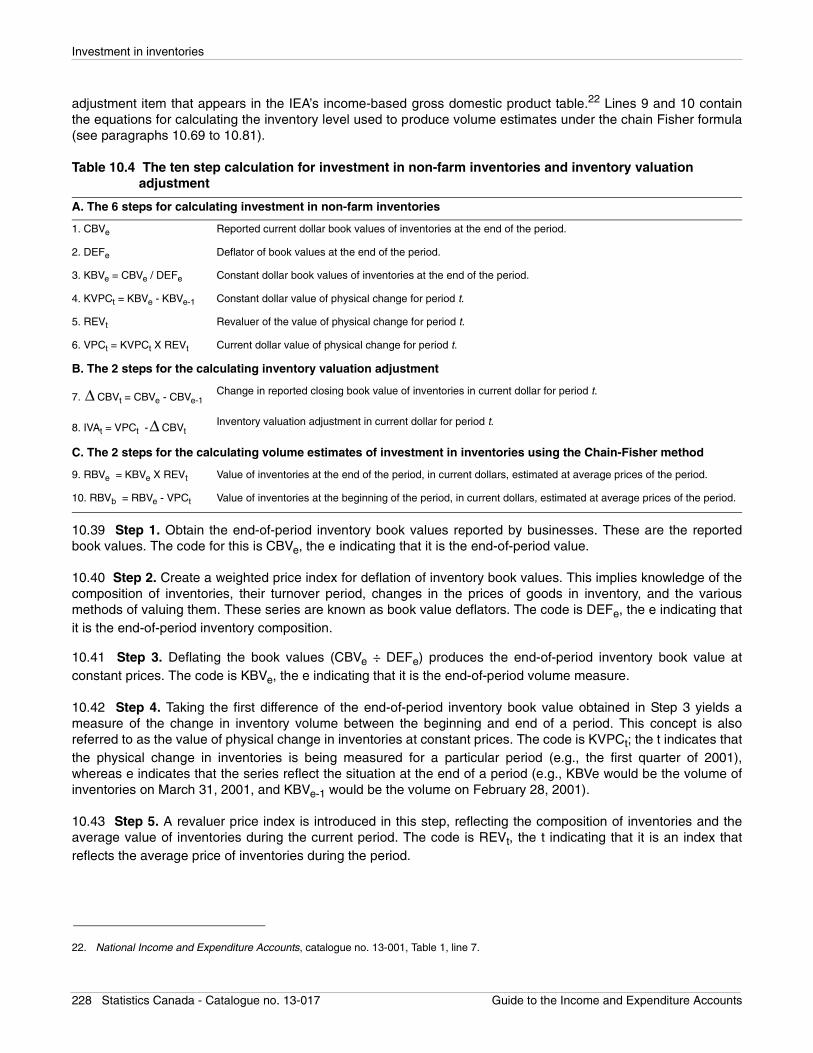
Investment in inventories
adjustment item that appears in the IEA’s income-based gross domestic product table.22 Lines 9 and 10 containthe equations for calculating the inventory level used to produce volume estimates under the chain Fisher formula(see paragraphs 10.69 to 10.81).
10.39 Step 1. Obtain the end-of-period inventory book values reported by businesses. These are the reportedbook values. The code for this is CBVe, the e indicating that it is the end-of-period value.
10.40 Step 2. Create a weighted price index for deflation of inventory book values. This implies knowledge of thecomposition of inventories, their turnover period, changes in the prices of goods in inventory, and the variousmethods of valuing them. These series are known as book value deflators. The code is DEFe, the e indicating thatit is the end-of-period inventory composition.
10.41 Step 3. Deflating the book values (CBVe ÷ DEFe) produces the end-of-period inventory book value atconstant prices. The code is KBVe, the e indicating that it is the end-of-period volume measure.
10.42 Step 4. Taking the first difference of the end-of-period inventory book value obtained in Step 3 yields ameasure of the change in inventory volume between the beginning and end of a period. This concept is alsoreferred to as the value of physical change in inventories at constant prices. The code is KVPCt; the t indicates thatthe physical change in inventories is being measured for a particular period (e.g., the first quarter of 2001),whereas e indicates that the series reflect the situation at the end of a period (e.g., KBVe would be the volume ofinventories on March 31, 2001, and KBVe-1 would be the volume on February 28, 2001).
10.43 Step 5. A revaluer price index is introduced in this step, reflecting the composition of inventories and theaverage value of inventories during the current period. The code is REVt, the t indicating that it is an index thatreflects the average price of inventories during the period.
22. National Income and Expenditure Accounts, catalogue no. 13-001, Table 1, line 7.
Table 10.4 The ten step calculation for investment in non-farm inventories and inventory valuation adjustment
A. The 6 steps for calculating investment in non-farm inventories
1. CBVe Reported current dollar book values of inventories at the end of the period.
2. DEFe Deflator of book values at the end of the period.
3. KBVe = CBVe / DEFe Constant dollar book values of inventories at the end of the period.
4. KVPCt = KBVe - KBVe-1 Constant dollar value of physical change for period t.
5. REVt Revaluer of the value of physical change for period t.
6. VPCt = KVPCt X REVt Current dollar value of physical change for period t.
B. The 2 steps for the calculating inventory valuation adjustment
7. CBVt = CBVe - CBVe-1Change in reported closing book value of inventories in current dollar for period t.
8. IVAt = VPCt - CBVtInventory valuation adjustment in current dollar for period t.
C. The 2 steps for the calculating volume estimates of investment in inventories using the Chain-Fisher method
9. RBVe = KBVe X REVt Value of inventories at the end of the period, in current dollars, estimated at average prices of the period.
10. RBVb = RBVe - VPCt Value of inventories at the beginning of the period, in current dollars, estimated at average prices of the period.
∆
∆
228 Statistics Canada - Catalogue no. 13-017 Guide to the Income and Expenditure Accounts
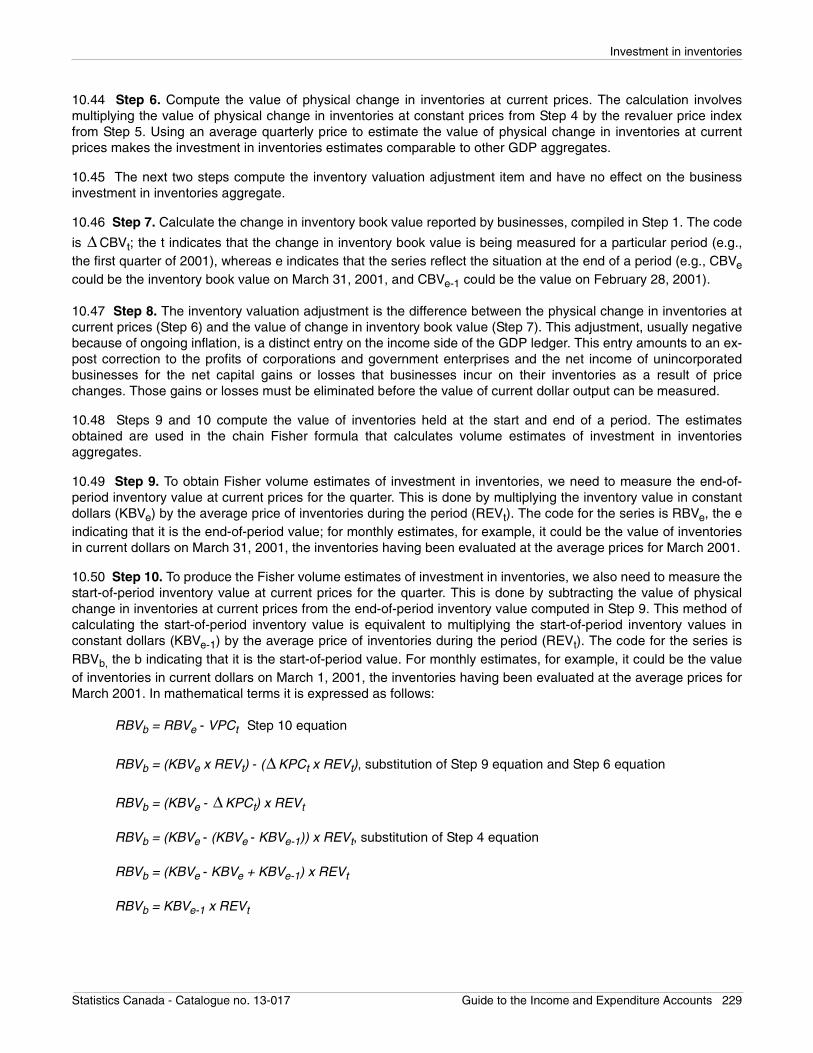
Investment in inventories
10.44 Step 6. Compute the value of physical change in inventories at current prices. The calculation involvesmultiplying the value of physical change in inventories at constant prices from Step 4 by the revaluer price indexfrom Step 5. Using an average quarterly price to estimate the value of physical change in inventories at currentprices makes the investment in inventories estimates comparable to other GDP aggregates.
10.45 The next two steps compute the inventory valuation adjustment item and have no effect on the businessinvestment in inventories aggregate.
10.46 Step 7. Calculate the change in inventory book value reported by businesses, compiled in Step 1. The code
is CBVt; the t indicates that the change in inventory book value is being measured for a particular period (e.g.,the first quarter of 2001), whereas e indicates that the series reflect the situation at the end of a period (e.g., CBVecould be the inventory book value on March 31, 2001, and CBVe-1 could be the value on February 28, 2001).
10.47 Step 8. The inventory valuation adjustment is the difference between the physical change in inventories atcurrent prices (Step 6) and the value of change in inventory book value (Step 7). This adjustment, usually negativebecause of ongoing inflation, is a distinct entry on the income side of the GDP ledger. This entry amounts to an ex-post correction to the profits of corporations and government enterprises and the net income of unincorporatedbusinesses for the net capital gains or losses that businesses incur on their inventories as a result of pricechanges. Those gains or losses must be eliminated before the value of current dollar output can be measured.
10.48 Steps 9 and 10 compute the value of inventories held at the start and end of a period. The estimatesobtained are used in the chain Fisher formula that calculates volume estimates of investment in inventoriesaggregates.
10.49 Step 9. To obtain Fisher volume estimates of investment in inventories, we need to measure the end-of-period inventory value at current prices for the quarter. This is done by multiplying the inventory value in constantdollars (KBVe) by the average price of inventories during the period (REVt). The code for the series is RBVe, the eindicating that it is the end-of-period value; for monthly estimates, for example, it could be the value of inventoriesin current dollars on March 31, 2001, the inventories having been evaluated at the average prices for March 2001.
10.50 Step 10. To produce the Fisher volume estimates of investment in inventories, we also need to measure thestart-of-period inventory value at current prices for the quarter. This is done by subtracting the value of physicalchange in inventories at current prices from the end-of-period inventory value computed in Step 9. This method ofcalculating the start-of-period inventory value is equivalent to multiplying the start-of-period inventory values inconstant dollars (KBVe-1) by the average price of inventories during the period (REVt). The code for the series isRBVb, the b indicating that it is the start-of-period value. For monthly estimates, for example, it could be the valueof inventories in current dollars on March 1, 2001, the inventories having been evaluated at the average prices forMarch 2001. In mathematical terms it is expressed as follows:
RBVb = RBVe - VPCt Step 10 equation
RBVb = (KBVe x REVt) - ( KPCt x REVt), substitution of Step 9 equation and Step 6 equation
RBVb = (KBVe - KPCt) x REVt
RBVb = (KBVe - (KBVe - KBVe-1)) x REVt, substitution of Step 4 equation
RBVb = (KBVe - KBVe + KBVe-1) x REVt
RBVb = KBVe-1 x REVt
∆
∆
∆
Statistics Canada - Catalogue no. 13-017 Guide to the Income and Expenditure Accounts 229
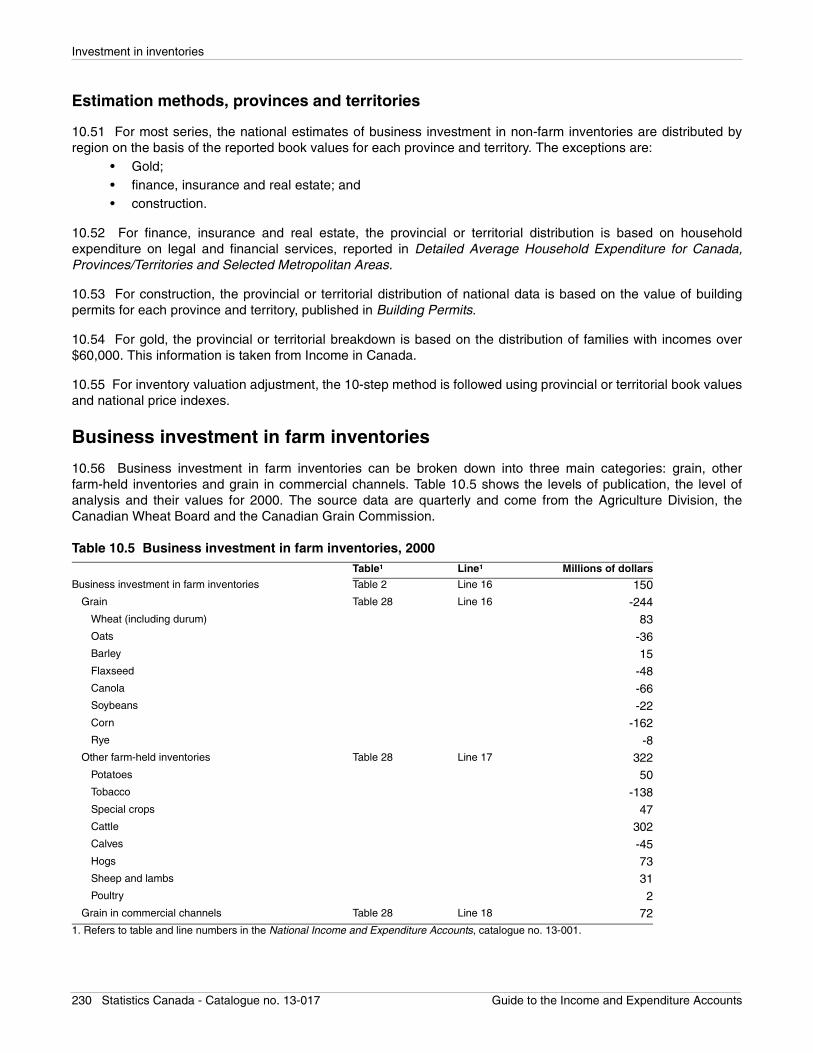
Investment in inventories
Estimation methods, provinces and territories
10.51 For most series, the national estimates of business investment in non-farm inventories are distributed byregion on the basis of the reported book values for each province and territory. The exceptions are:
• Gold;• finance, insurance and real estate; and • construction.
10.52 For finance, insurance and real estate, the provincial or territorial distribution is based on householdexpenditure on legal and financial services, reported in Detailed Average Household Expenditure for Canada,Provinces/Territories and Selected Metropolitan Areas.
10.53 For construction, the provincial or territorial distribution of national data is based on the value of buildingpermits for each province and territory, published in Building Permits.
10.54 For gold, the provincial or territorial breakdown is based on the distribution of families with incomes over$60,000. This information is taken from Income in Canada.
10.55 For inventory valuation adjustment, the 10-step method is followed using provincial or territorial book valuesand national price indexes.
Business investment in farm inventories
10.56 Business investment in farm inventories can be broken down into three main categories: grain, otherfarm-held inventories and grain in commercial channels. Table 10.5 shows the levels of publication, the level ofanalysis and their values for 2000. The source data are quarterly and come from the Agriculture Division, theCanadian Wheat Board and the Canadian Grain Commission.
Table 10.5 Business investment in farm inventories, 2000Table¹ Line¹ Millions of dollars
Business investment in farm inventories Table 2 Line 16 150Grain Table 28 Line 16 -244
Wheat (including durum) 83Oats -36Barley 15Flaxseed -48Canola -66Soybeans -22Corn -162Rye -8
Other farm-held inventories Table 28 Line 17 322Potatoes 50Tobacco -138Special crops 47Cattle 302Calves -45Hogs 73Sheep and lambs 31Poultry 2
Grain in commercial channels Table 28 Line 18 721. Refers to table and line numbers in the National Income and Expenditure Accounts, catalogue no. 13-001.
230 Statistics Canada - Catalogue no. 13-017 Guide to the Income and Expenditure Accounts
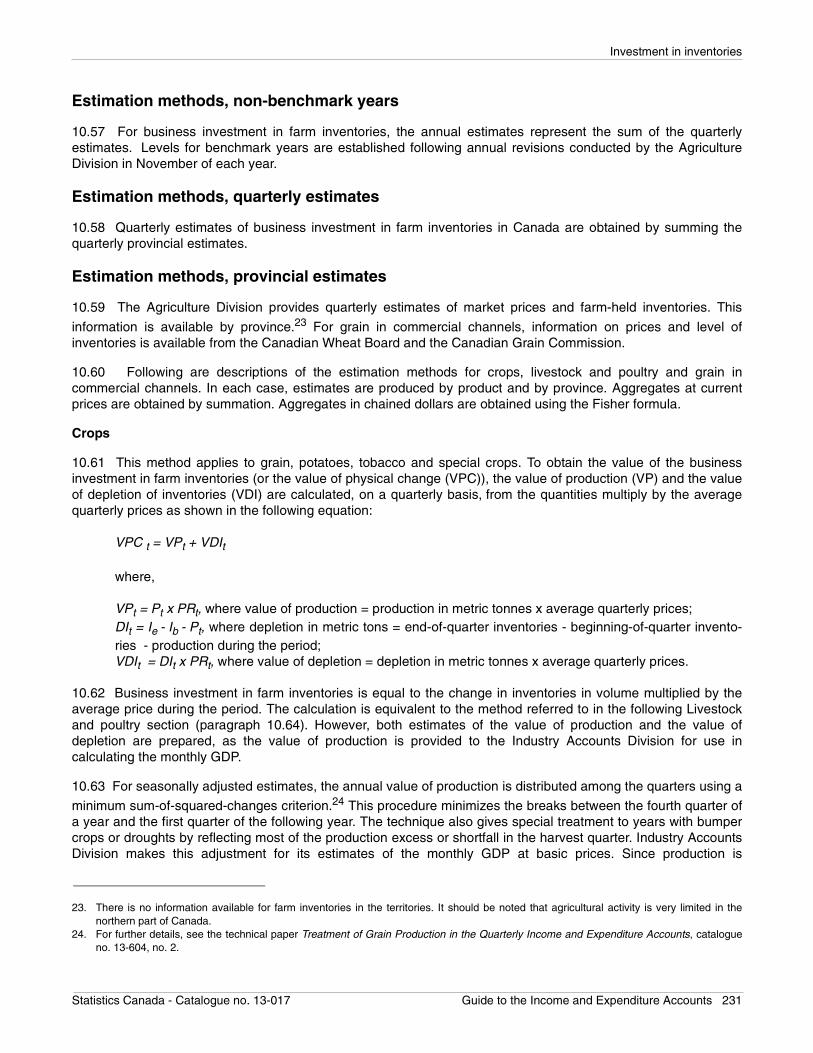
Investment in inventories
Estimation methods, non-benchmark years
10.57 For business investment in farm inventories, the annual estimates represent the sum of the quarterlyestimates. Levels for benchmark years are established following annual revisions conducted by the AgricultureDivision in November of each year.
Estimation methods, quarterly estimates
10.58 Quarterly estimates of business investment in farm inventories in Canada are obtained by summing thequarterly provincial estimates.
Estimation methods, provincial estimates
10.59 The Agriculture Division provides quarterly estimates of market prices and farm-held inventories. This
information is available by province.23 For grain in commercial channels, information on prices and level ofinventories is available from the Canadian Wheat Board and the Canadian Grain Commission.
10.60 Following are descriptions of the estimation methods for crops, livestock and poultry and grain incommercial channels. In each case, estimates are produced by product and by province. Aggregates at currentprices are obtained by summation. Aggregates in chained dollars are obtained using the Fisher formula.
Crops
10.61 This method applies to grain, potatoes, tobacco and special crops. To obtain the value of the businessinvestment in farm inventories (or the value of physical change (VPC)), the value of production (VP) and the valueof depletion of inventories (VDI) are calculated, on a quarterly basis, from the quantities multiply by the averagequarterly prices as shown in the following equation:
VPC t = VPt + VDIt
where,
VPt = Pt x PRt, where value of production = production in metric tonnes x average quarterly prices;DIt = Ie - Ib - Pt, where depletion in metric tons = end-of-quarter inventories - beginning-of-quarter invento-ries - production during the period;VDIt = DIt x PRt, where value of depletion = depletion in metric tonnes x average quarterly prices.
10.62 Business investment in farm inventories is equal to the change in inventories in volume multiplied by theaverage price during the period. The calculation is equivalent to the method referred to in the following Livestockand poultry section (paragraph 10.64). However, both estimates of the value of production and the value ofdepletion are prepared, as the value of production is provided to the Industry Accounts Division for use incalculating the monthly GDP.
10.63 For seasonally adjusted estimates, the annual value of production is distributed among the quarters using a
minimum sum-of-squared-changes criterion.24 This procedure minimizes the breaks between the fourth quarter ofa year and the first quarter of the following year. The technique also gives special treatment to years with bumpercrops or droughts by reflecting most of the production excess or shortfall in the harvest quarter. Industry AccountsDivision makes this adjustment for its estimates of the monthly GDP at basic prices. Since production is
23. There is no information available for farm inventories in the territories. It should be noted that agricultural activity is very limited in thenorthern part of Canada.
24. For further details, see the technical paper Treatment of Grain Production in the Quarterly Income and Expenditure Accounts, catalogueno. 13-604, no. 2.
Statistics Canada - Catalogue no. 13-017 Guide to the Income and Expenditure Accounts 231
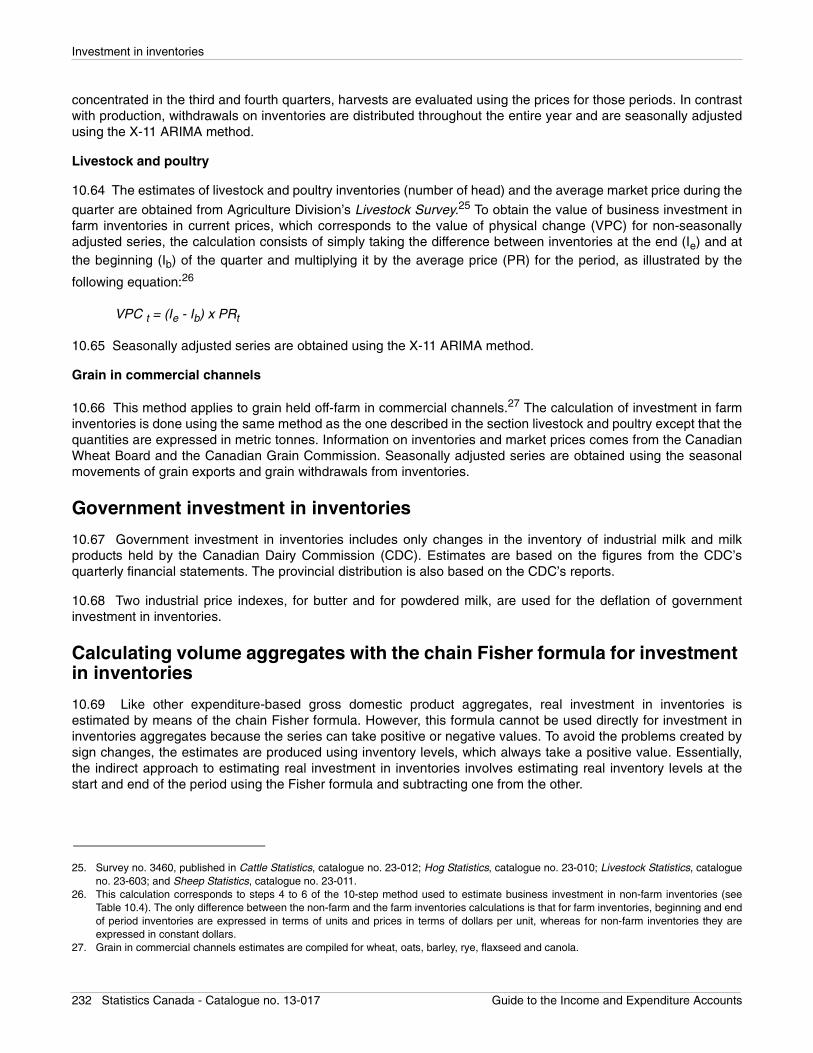
Investment in inventories
concentrated in the third and fourth quarters, harvests are evaluated using the prices for those periods. In contrastwith production, withdrawals on inventories are distributed throughout the entire year and are seasonally adjustedusing the X-11 ARIMA method.
Livestock and poultry
10.64 The estimates of livestock and poultry inventories (number of head) and the average market price during the
quarter are obtained from Agriculture Division’s Livestock Survey.25 To obtain the value of business investment infarm inventories in current prices, which corresponds to the value of physical change (VPC) for non-seasonallyadjusted series, the calculation consists of simply taking the difference between inventories at the end (Ie) and atthe beginning (Ib) of the quarter and multiplying it by the average price (PR) for the period, as illustrated by the
following equation:26
VPC t = (Ie - Ib) x PRt
10.65 Seasonally adjusted series are obtained using the X-11 ARIMA method.
Grain in commercial channels
10.66 This method applies to grain held off-farm in commercial channels.27 The calculation of investment in farminventories is done using the same method as the one described in the section livestock and poultry except that thequantities are expressed in metric tonnes. Information on inventories and market prices comes from the CanadianWheat Board and the Canadian Grain Commission. Seasonally adjusted series are obtained using the seasonalmovements of grain exports and grain withdrawals from inventories.
Government investment in inventories
10.67 Government investment in inventories includes only changes in the inventory of industrial milk and milkproducts held by the Canadian Dairy Commission (CDC). Estimates are based on the figures from the CDC’squarterly financial statements. The provincial distribution is also based on the CDC’s reports.
10.68 Two industrial price indexes, for butter and for powdered milk, are used for the deflation of governmentinvestment in inventories.
Calculating volume aggregates with the chain Fisher formula for investment in inventories
10.69 Like other expenditure-based gross domestic product aggregates, real investment in inventories isestimated by means of the chain Fisher formula. However, this formula cannot be used directly for investment ininventories aggregates because the series can take positive or negative values. To avoid the problems created bysign changes, the estimates are produced using inventory levels, which always take a positive value. Essentially,the indirect approach to estimating real investment in inventories involves estimating real inventory levels at thestart and end of the period using the Fisher formula and subtracting one from the other.
25. Survey no. 3460, published in Cattle Statistics, catalogue no. 23-012; Hog Statistics, catalogue no. 23-010; Livestock Statistics, catalogueno. 23-603; and Sheep Statistics, catalogue no. 23-011.
26. This calculation corresponds to steps 4 to 6 of the 10-step method used to estimate business investment in non-farm inventories (seeTable 10.4). The only difference between the non-farm and the farm inventories calculations is that for farm inventories, beginning and endof period inventories are expressed in terms of units and prices in terms of dollars per unit, whereas for non-farm inventories they areexpressed in constant dollars.
27. Grain in commercial channels estimates are compiled for wheat, oats, barley, rye, flaxseed and canola.
232 Statistics Canada - Catalogue no. 13-017 Guide to the Income and Expenditure Accounts
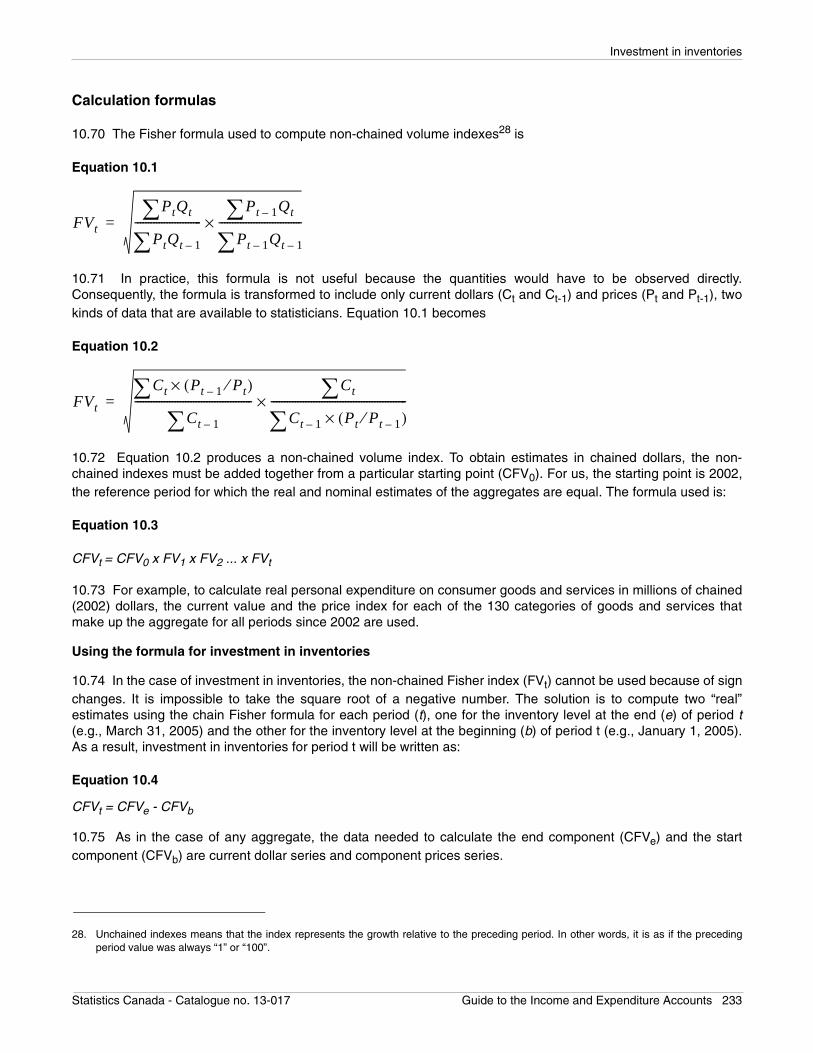
Investment in inventories
Calculation formulas
10.70 The Fisher formula used to compute non-chained volume indexes28 is
Equation 10.1
10.71 In practice, this formula is not useful because the quantities would have to be observed directly.Consequently, the formula is transformed to include only current dollars (Ct and Ct-1) and prices (Pt and Pt-1), twokinds of data that are available to statisticians. Equation 10.1 becomes
Equation 10.2
10.72 Equation 10.2 produces a non-chained volume index. To obtain estimates in chained dollars, the non-chained indexes must be added together from a particular starting point (CFV0). For us, the starting point is 2002,the reference period for which the real and nominal estimates of the aggregates are equal. The formula used is:
Equation 10.3
CFVt = CFV0 x FV1 x FV2 ... x FVt
10.73 For example, to calculate real personal expenditure on consumer goods and services in millions of chained(2002) dollars, the current value and the price index for each of the 130 categories of goods and services thatmake up the aggregate for all periods since 2002 are used.
Using the formula for investment in inventories
10.74 In the case of investment in inventories, the non-chained Fisher index (FVt) cannot be used because of signchanges. It is impossible to take the square root of a negative number. The solution is to compute two “real”estimates using the chain Fisher formula for each period (t), one for the inventory level at the end (e) of period t(e.g., March 31, 2005) and the other for the inventory level at the beginning (b) of period t (e.g., January 1, 2005).As a result, investment in inventories for period t will be written as:
Equation 10.4
CFVt = CFVe - CFVb
10.75 As in the case of any aggregate, the data needed to calculate the end component (CFVe) and the startcomponent (CFVb) are current dollar series and component prices series.
28. Unchained indexes means that the index represents the growth relative to the preceding period. In other words, it is as if the precedingperiod value was always “1” or “100”.
FVt
PtQt∑PtQt 1–∑
-------------------------Pt 1– Qt∑
Pt 1– Qt 1–∑-------------------------------×=
FVt
Ct Pt 1– Pt⁄( )×∑Ct 1–∑
--------------------------------------------Ct∑
Ct 1– Pt Pt 1–⁄( )×∑---------------------------------------------------×=
Statistics Canada - Catalogue no. 13-017 Guide to the Income and Expenditure Accounts 233
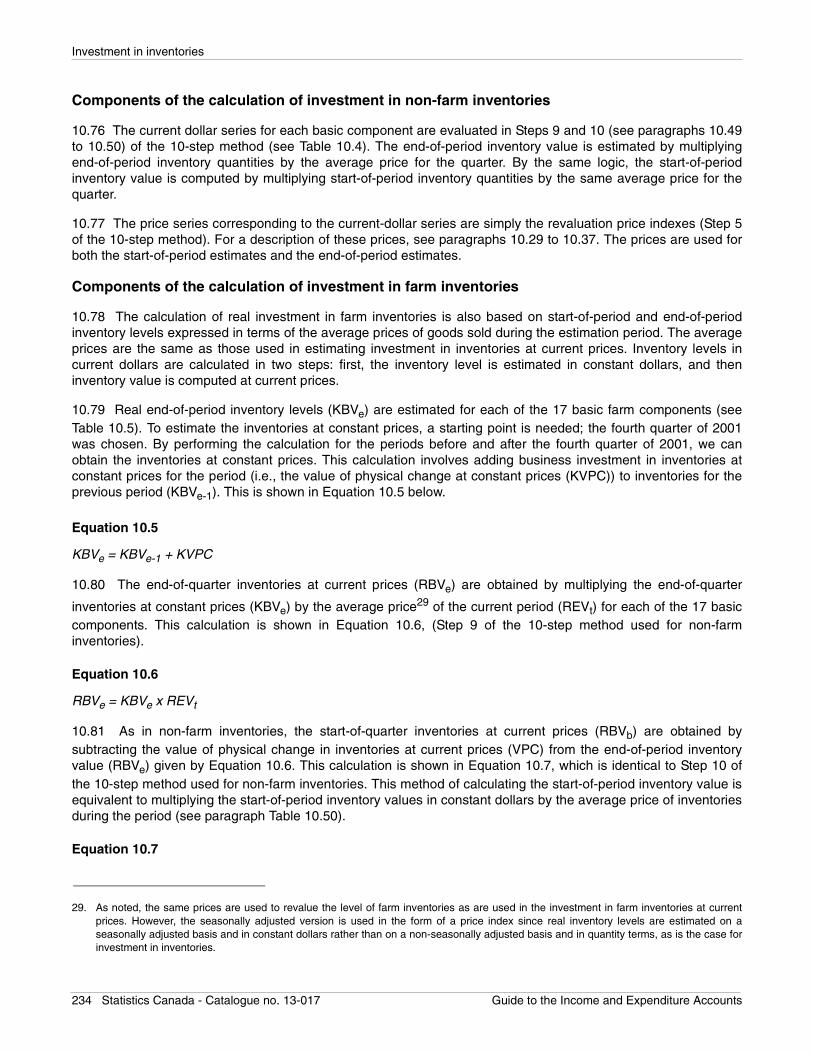
Investment in inventories
Components of the calculation of investment in non-farm inventories
10.76 The current dollar series for each basic component are evaluated in Steps 9 and 10 (see paragraphs 10.49to 10.50) of the 10-step method (see Table 10.4). The end-of-period inventory value is estimated by multiplyingend-of-period inventory quantities by the average price for the quarter. By the same logic, the start-of-periodinventory value is computed by multiplying start-of-period inventory quantities by the same average price for thequarter.
10.77 The price series corresponding to the current-dollar series are simply the revaluation price indexes (Step 5of the 10-step method). For a description of these prices, see paragraphs 10.29 to 10.37. The prices are used forboth the start-of-period estimates and the end-of-period estimates.
Components of the calculation of investment in farm inventories
10.78 The calculation of real investment in farm inventories is also based on start-of-period and end-of-periodinventory levels expressed in terms of the average prices of goods sold during the estimation period. The averageprices are the same as those used in estimating investment in inventories at current prices. Inventory levels incurrent dollars are calculated in two steps: first, the inventory level is estimated in constant dollars, and theninventory value is computed at current prices.
10.79 Real end-of-period inventory levels (KBVe) are estimated for each of the 17 basic farm components (seeTable 10.5). To estimate the inventories at constant prices, a starting point is needed; the fourth quarter of 2001was chosen. By performing the calculation for the periods before and after the fourth quarter of 2001, we canobtain the inventories at constant prices. This calculation involves adding business investment in inventories atconstant prices for the period (i.e., the value of physical change at constant prices (KVPC)) to inventories for theprevious period (KBVe-1). This is shown in Equation 10.5 below.
Equation 10.5
KBVe = KBVe-1 + KVPC
10.80 The end-of-quarter inventories at current prices (RBVe) are obtained by multiplying the end-of-quarter
inventories at constant prices (KBVe) by the average price29 of the current period (REVt) for each of the 17 basiccomponents. This calculation is shown in Equation 10.6, (Step 9 of the 10-step method used for non-farminventories).
Equation 10.6
RBVe = KBVe x REVt
10.81 As in non-farm inventories, the start-of-quarter inventories at current prices (RBVb) are obtained bysubtracting the value of physical change in inventories at current prices (VPC) from the end-of-period inventoryvalue (RBVe) given by Equation 10.6. This calculation is shown in Equation 10.7, which is identical to Step 10 ofthe 10-step method used for non-farm inventories. This method of calculating the start-of-period inventory value isequivalent to multiplying the start-of-period inventory values in constant dollars by the average price of inventoriesduring the period (see paragraph Table 10.50).
Equation 10.7
29. As noted, the same prices are used to revalue the level of farm inventories as are used in the investment in farm inventories at currentprices. However, the seasonally adjusted version is used in the form of a price index since real inventory levels are estimated on aseasonally adjusted basis and in constant dollars rather than on a non-seasonally adjusted basis and in quantity terms, as is the case forinvestment in inventories.
234 Statistics Canada - Catalogue no. 13-017 Guide to the Income and Expenditure Accounts
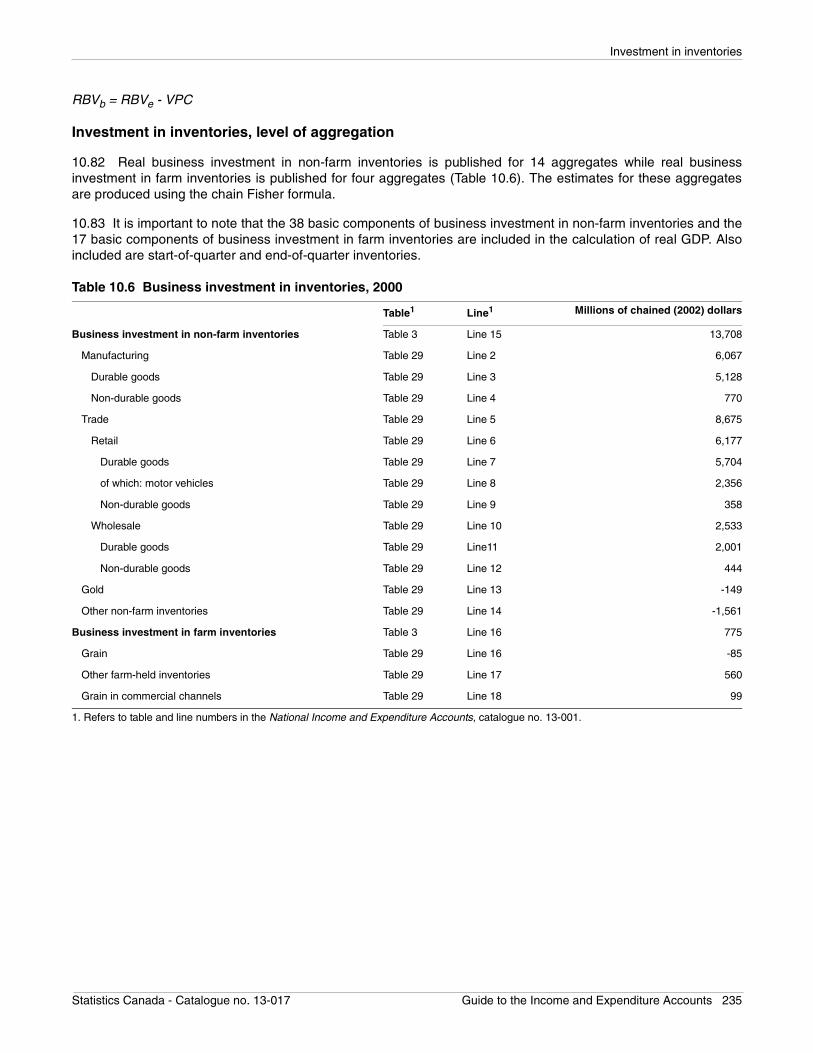
Investment in inventories
RBVb = RBVe - VPC
Investment in inventories, level of aggregation
10.82 Real business investment in non-farm inventories is published for 14 aggregates while real businessinvestment in farm inventories is published for four aggregates (Table 10.6). The estimates for these aggregatesare produced using the chain Fisher formula.
10.83 It is important to note that the 38 basic components of business investment in non-farm inventories and the17 basic components of business investment in farm inventories are included in the calculation of real GDP. Alsoincluded are start-of-quarter and end-of-quarter inventories.
Table 10.6 Business investment in inventories, 2000
Table1 Line1 Millions of chained (2002) dollars
Business investment in non-farm inventories Table 3 Line 15 13,708
Manufacturing Table 29 Line 2 6,067
Durable goods Table 29 Line 3 5,128
Non-durable goods Table 29 Line 4 770
Trade Table 29 Line 5 8,675
Retail Table 29 Line 6 6,177
Durable goods Table 29 Line 7 5,704
of which: motor vehicles Table 29 Line 8 2,356
Non-durable goods Table 29 Line 9 358
Wholesale Table 29 Line 10 2,533
Durable goods Table 29 Line11 2,001
Non-durable goods Table 29 Line 12 444
Gold Table 29 Line 13 -149
Other non-farm inventories Table 29 Line 14 -1,561
Business investment in farm inventories Table 3 Line 16 775
Grain Table 29 Line 16 -85
Other farm-held inventories Table 29 Line 17 560
Grain in commercial channels Table 29 Line 18 99
1. Refers to table and line numbers in the National Income and Expenditure Accounts, catalogue no. 13-001.
Statistics Canada - Catalogue no. 13-017 Guide to the Income and Expenditure Accounts 235
International and inter-provincial trade in goods and services
Chapter 11 International and inter-provincial trade in goods and services
Introduction
International trade
11.1 International trade is part of a vast system of statistics on Canada’s transactions with non-residents. Thesystem measures the flow of thousands of different goods and services across the border to and from countriesaround the world. The statistics on goods can be compiled on either a customs-basis or a Balance of Paymentsbasis. The Canadian System of National Accounts (CSNA) uses the latter interpretation. This chapter discussestrade in the income and expenditure-based gross domestic product (GDP) framework.
11.2 Statistics on international trade are compiled both nationally and provincially. Foreign trade is reflected in boththe quarterly economy-wide measures of GDP and the non-resident sector account (National Income andExpenditure Accounts) as well as the annual provincial measures of GDP (Provincial Economic Accounts).
11.3 International trade is essential to Canada’s open economy. In 2002, for example, exports accounted for 42%of Canada’s GDP and imports 37%. In other words, exports totalled $479 billion while imports totalled $428 billionrelative to a total GDP of $1,153 billion in 2002. Export demand is largely determined by foreign income and theratio of foreign to domestic prices; where import demand is largely determined by national income and therelationship of domestic prices to foreign prices. International trade flows are also affected by factors includingsharp fluctuations in exchange rates and international trade arrangements.
Inter-provincial trade
11.4 Inter-provincial trade flows by province are similarly significant. These sales or purchases of goods andservices among provinces and territories are largely determined by the regional levels of economic activity(income) and by the composition of economic activity in those regions of Canada. The Provincial EconomicAccounts provides this detail alongside the international trade detail for each province and territory.
Concepts and definitions1
11.5 In general terms, international trade statistics can be defined as the statistical compilation of flows of goodsand services between residents of an economy and non-residents over a given period. More broadly, internationaltransactions can also cover income flows as well as financial transactions. This chapter specifically deals withtrade in goods and services.
11.6 The Balance of Payments convention constitutes the conceptual framework for international trade withinCanadian System of National Accounts (CSNA). To the extent possible, this framework reflects the standards andconventions set out in the System of National Accounts 1993 and in the Balance of Payments Manual (1993), Fifthedition of the International Monetary Fund. These standards and conventions provide the means for developing arecord of transactions between residents and non-residents.
11.7 The conceptual framework of the Balance of Payments establishes the line between residents andnon-residents. Such delineation is important because the Balance of Payments records only transactions betweenthese units. Institutional units that reside, (e.g., produce, consume) in Canada are considered residents of Canada.Canadian residents may be legal entities (businesses) or persons. For individuals, this usually means that theymust have their principal residence in Canada. For businesses (unincorporated, corporations or public
1. For a more detailed description see Canada’s Balance of International Payments and International Investment Position: Concepts,Services, Methods and Products, catalogue no. 67-506.
236 Statistics Canada - Catalogue no. 13-017 Guide to the Income and Expenditure Accounts
International and inter-provincial trade in goods and services
enterprises), their residence is linked to their Canadian production activities. In other words, they are Canadianresidents if they carry out production in Canada through resident entities. These entities may be Canadian
corporations or a Canadian branch or subsidiary of a foreign corporation.2
11.8 International trade in goods and services is defined as follows in the System of National Accounts19933 (SNA 1993):
“Exports of goods and services consist of sales, barter, or gifts or grants, of goods and services fromresidents to non-residents, while imports consist of purchases, barter, or receipts of gifts or grants, of goods
and services by residents from non-residents.”4
11.9 The concepts associated with trade in goods and services are defined in detail in the next two sections.
11.10 The Income and Expenditure Accounts (IEA) make direct use of the data on flows of goods and services
from the Balance of Payments Division (BPD).5 The only exception is the addition in IEA of the category of financialservices indirectly measured (FSIM). These services represent an indirect measure of the value of certain financialservices – specifically, the income earned by financial institutions on services provided but for which financialinstitutions do not charge explicitly.
Trade in goods
11.11 As noted above, goods are considered imported or exported in the Balance of Payments when there is achange of ownership between residents and non-residents. By international convention, the cross-bordermovement of goods, as measured by customs data, represents a proxy for the change in ownership. Most goodsthat cross the border and appear in customs documents are therefore included in the Balance of Payments and, asa result, in the Income and Expenditure Accounts.
11.12 However, there are two general instances where customs data do not correspond to a change in ownership.First, there is the case of goods that change ownership but which are not recorded in customs documents. Thesegoods could include, for example, satellites or vessels (which do not necessarily cross a country’s economicterritory) or non-monetary gold traded with non-residents, but which remain in the country. In these cases, thecustoms data are amended with information from other administrative sources or Balance of Payments Divisionsurveys. Second, there are cases of goods recorded in the customs data that are clearly not subject to change ofownership. These include goods for processing, repair and financial leases of capital equipment. These, however,are still treated as goods by international standards.
11.13 In the Balance of Payments framework, goods are recorded at market prices at the border (customs frontier)of the exporting country. Generally, this matches the customs value of the goods. In the Canadian customsdocuments goods are valued at the transaction value – that is, at the point of exit for Canadian exports and at thepoint of last direct shipment for Canadian imports. For the most part, the transaction value corresponds to themarket price at the frontier of the exporting country. Canadian exports shipped to overseas countries are valued at
free on board prices (FOB),6 port of exit, inland freight included to the point of exit. Similarly, exports to the UnitedStates are valued at the point of exit from Canada. For imports, however, the transactions prices at the point of
2. Foreign businesses can produce in Canada through the establishment of foreign direct investment subsidiaries, which are Canadiancorporations, or through a Canadian branch of a foreign enterprise.
3. Commission of European Communities, International Monetary Fund, Organization for International Cooperation and Development, UnitedNations, and the World Bank. 1993 System of National Accounts, manual prepared under the auspices of the Inter-secretariat WorkingGroup on National Accounts, Brussels/Luxembourg, New York, Paris, Washington, D.C., 1993, 773 p.
4. SNA 1993, paragraph 14.88. 5. Balance of Payments statistics have historically preceded national accounts, in Canada and elsewhere.6. The FOB price can be regarded as the purchaser’s price that would be paid by an importer taking delivery of the goods after these have
been loaded onto his own carrier (or other carrier) at the exporter’s frontier after payment of any export taxes or the receipt of any rebates(SNA 1993, paragraph 14.37).
Statistics Canada - Catalogue no. 13-017 Guide to the Income and Expenditure Accounts 237
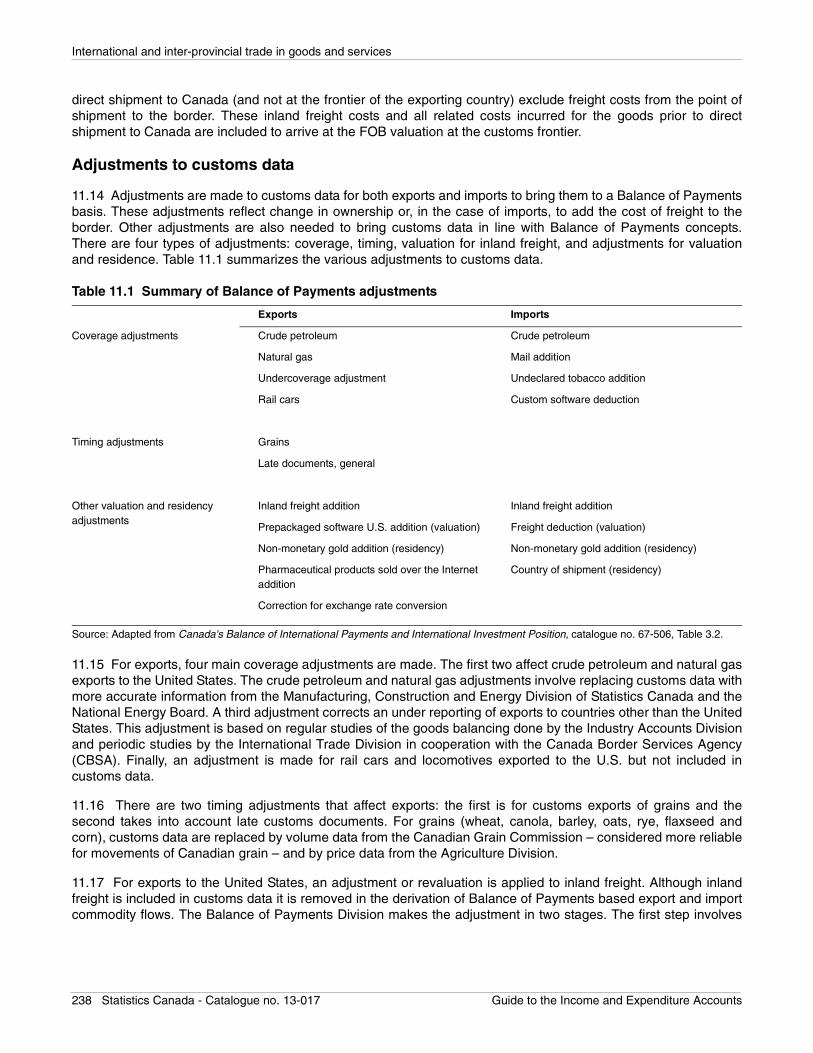
International and inter-provincial trade in goods and services
direct shipment to Canada (and not at the frontier of the exporting country) exclude freight costs from the point ofshipment to the border. These inland freight costs and all related costs incurred for the goods prior to directshipment to Canada are included to arrive at the FOB valuation at the customs frontier.
Adjustments to customs data
11.14 Adjustments are made to customs data for both exports and imports to bring them to a Balance of Paymentsbasis. These adjustments reflect change in ownership or, in the case of imports, to add the cost of freight to theborder. Other adjustments are also needed to bring customs data in line with Balance of Payments concepts.There are four types of adjustments: coverage, timing, valuation for inland freight, and adjustments for valuationand residence. Table 11.1 summarizes the various adjustments to customs data.
11.15 For exports, four main coverage adjustments are made. The first two affect crude petroleum and natural gasexports to the United States. The crude petroleum and natural gas adjustments involve replacing customs data withmore accurate information from the Manufacturing, Construction and Energy Division of Statistics Canada and theNational Energy Board. A third adjustment corrects an under reporting of exports to countries other than the UnitedStates. This adjustment is based on regular studies of the goods balancing done by the Industry Accounts Divisionand periodic studies by the International Trade Division in cooperation with the Canada Border Services Agency(CBSA). Finally, an adjustment is made for rail cars and locomotives exported to the U.S. but not included incustoms data.
11.16 There are two timing adjustments that affect exports: the first is for customs exports of grains and thesecond takes into account late customs documents. For grains (wheat, canola, barley, oats, rye, flaxseed andcorn), customs data are replaced by volume data from the Canadian Grain Commission – considered more reliablefor movements of Canadian grain – and by price data from the Agriculture Division.
11.17 For exports to the United States, an adjustment or revaluation is applied to inland freight. Although inlandfreight is included in customs data it is removed in the derivation of Balance of Payments based export and importcommodity flows. The Balance of Payments Division makes the adjustment in two stages. The first step involves
Table 11.1 Summary of Balance of Payments adjustments
Exports Imports
Coverage adjustments Crude petroleum Crude petroleum
Natural gas Mail addition
Undercoverage adjustment Undeclared tobacco addition
Rail cars Custom software deduction
Timing adjustments Grains
Late documents, general
Other valuation and residency adjustments
Inland freight addition Inland freight addition
Prepackaged software U.S. addition (valuation) Freight deduction (valuation)
Non-monetary gold addition (residency) Non-monetary gold addition (residency)
Pharmaceutical products sold over the Internet addition
Country of shipment (residency)
Correction for exchange rate conversion
Source: Adapted from Canada's Balance of International Payments and International Investment Position, catalogue no. 67-506, Table 3.2.
238 Statistics Canada - Catalogue no. 13-017 Guide to the Income and Expenditure Accounts
International and inter-provincial trade in goods and services
removing the inland freight valued by the International Trade Division. The second consists of calculating a newestimate, based on various sources, and recording it in a separate series, Other Balance of Payments
adjustments.7
11.18 Each of the following elements are calculated and included as part of inland freight for exports to the UnitedStates:
a) Freight by truck, as reported in U.S. customs data;
b) Rail freight of forestry products, as reported in U.S. customs data, adjusted on a cost, insurance andfreight beyond the border basis;
c) Movement of petroleum by pipeline, as calculated by the National Energy Board and the Manufacturing,Construction and Energy Division;
d) An amount added for miscellaneous freight in cases where no mode of transport is indicated in customsdata; and
e) An adjustment for double-counting of rail charges on exports transiting through the United States andalready estimated for goods to overseas destinations.
11.19 There are three final adjustments to export data on software, gold and pharmaceutical products.Pre-packaged software exports are undervalued because certain transactions of U.S. imports, the source of thesedata, are estimated at the value of the medium (CD, DVD) rather than the value of the content. The data used tocalculate the adjustment comes from the Bureau of Economic Analysis. The adjustment on non-monetary goldconsists of adding the gold sold to non-residents, but which is left in Canada. Data for these adjustments areobtained from surveys of Canadian banks and refiners. Also added to exports of non-monetary gold is the value of
monetary gold sold by Canadian monetary authorities to foreign residents other than foreign monetary authorities.8
Pharmaceutical products are adjusted to take into account Internet sales that may not be properly evaluated bycustoms data.
11.20 On the import side, there are four coverage adjustments made to customs data. The first pertains to crudepetroleum, where customs data are replaced by more accurate data from the Manufacturing, Construction andEnergy Division. A second coverage adjustment deals with data on imports by mail that are not recorded incustoms data. This adjustment is derived from internal surveys and administrative sources. The third adjustmentpertains to imports of undeclared tobacco products, which have been estimated from studies on production andtrade. Lastly, a fourth adjustment is compiled by the International Trade Division to subtract custom softwarealready covered in service statistics.
11.21 As noted previously, customs imports are valued at the point of last direct shipment to Canada, making itnecessary to add inland freight to the border of the exporting country in order to bring the customs data in line withBalance of Payments concepts – that is, valuation at the frontier of the exporting country. For imports from theUnited States, the adjustment for inland freight to the border of the United States is done by mode of transport(truck, rail) and by commodity. The International Trade Division uses direct imputation for trucking, while rail freightis compiled from Balance of Payments Division surveys among Canadian and American carriers. In the case ofimports from other countries, the freight is derived from freight rates applied to the value of imports.
11.22 Lastly, two residency adjustments are made to imports. The first adjustment deals with gold bought inCanada from non-residents, but which does not cross the border. Data drawn from a survey of banks and refinersare used for this adjustment. The second adjustment is aimed at showing imports according to country of lastshipment which is believed to be a better indicator of the change of ownership. This adjustment is made on thelevel of countries and cancels out on a global basis. In some respects, it amounts to a redistribution of imports bycountry.
7. Given its size and the methodology applied, this adjustment is not redistributed among commodities but presented en bloc in the itemOther Balance of Payments adjustments.
8. This is considered a normal export of non-monetary gold.
Statistics Canada - Catalogue no. 13-017 Guide to the Income and Expenditure Accounts 239
International and inter-provincial trade in goods and services
Trade in services
11.23 Services differ fundamentally from goods in that they are intangible in nature. In the past, trade in serviceswas referred to as the trade in invisibles. According to the SNA 1993, services are not separate entities over whichownership rights can be established. They cannot be traded separately from their production. By the time theirproduction is complete, they must have been provided to the consumer.
11.24 As covered in the Balance of Payments Guide,9 services transactions normally require the simultaneouspresence of both the producer and the consumer of the services. This simultaneity is not easily realized between
countries where distance and political boundaries separate the supplier and the client.10 This may explain the lowvolume of international services transactions relative to goods, where both the sellers and buyers of goods remainin their respective economies while the traded goods move across the border. This situation exists despite the factthat, in industrialized countries, services often represent close to three-quarters of the economy in value. However,there is ongoing interest in the trade in services, perhaps because a large part of international trade negotiations inrecent years has focused on services.
11.25 The Income and Expenditure Accounts (IEA) use the four main service categories of the Balance ofPayments, to which are added financial services indirectly measured (FSIM). The IEA categories are:
• travel;• transportation;• commercial services;• government services; and• financial services indirectly measured (FSIM).
Travel services
11.26 In conformity with international standards, travel covers purchases of goods and services by:• persons travelling in another country for less than a year; • persons travelling in another country for more than a year for medical or education reasons;• seasonal and border workers working in another country (cross-border workers); and • crews of airplanes, ships, trucks or trains stopping off or laying over in other countries.
11.27 Purchases of goods and services consist of expenditures for food, lodging, recreation, gifts, incidentals andlocal transportation purchased in the country of travel. Travel statistics exclude passenger fares for internationaltransportation (which are included in transportation services), as well as spending of diplomats and military
personnel posted for more than one year in their host country.11 No upper limit is spelled out for health andeducation travel. Travel imports represent the purchases of goods and services by Canadians when travellingabroad while travel exports represent the purchases of goods and services of foreigners while travelling in Canada.
Transportation services
11.28 Transportation12 services include revenues (receipts) and expenses (payments) at the international levelarising from transportation of goods and cross-border travellers, as well as from supporting services related totransportation.
9. Catalogue no. 67-506, 6.1.1.10. See page 41 of Canada’s Balance of International Payments and International Investment Position: Concepts, Sources, Methods and
Products, catalogue no. 67-506.11. These personnel remain residents of their home countries, and their spending in the host countries is included in trade in government
services; however, a visit in the interim, whether on leave or on official business, is considered part of travel.12. See chapter 5 of Canada’s Balance of International Payments and International Investment Position: Concepts, Sources, Methods and
Products, catalogue no. 67-506.
240 Statistics Canada - Catalogue no. 13-017 Guide to the Income and Expenditure Accounts
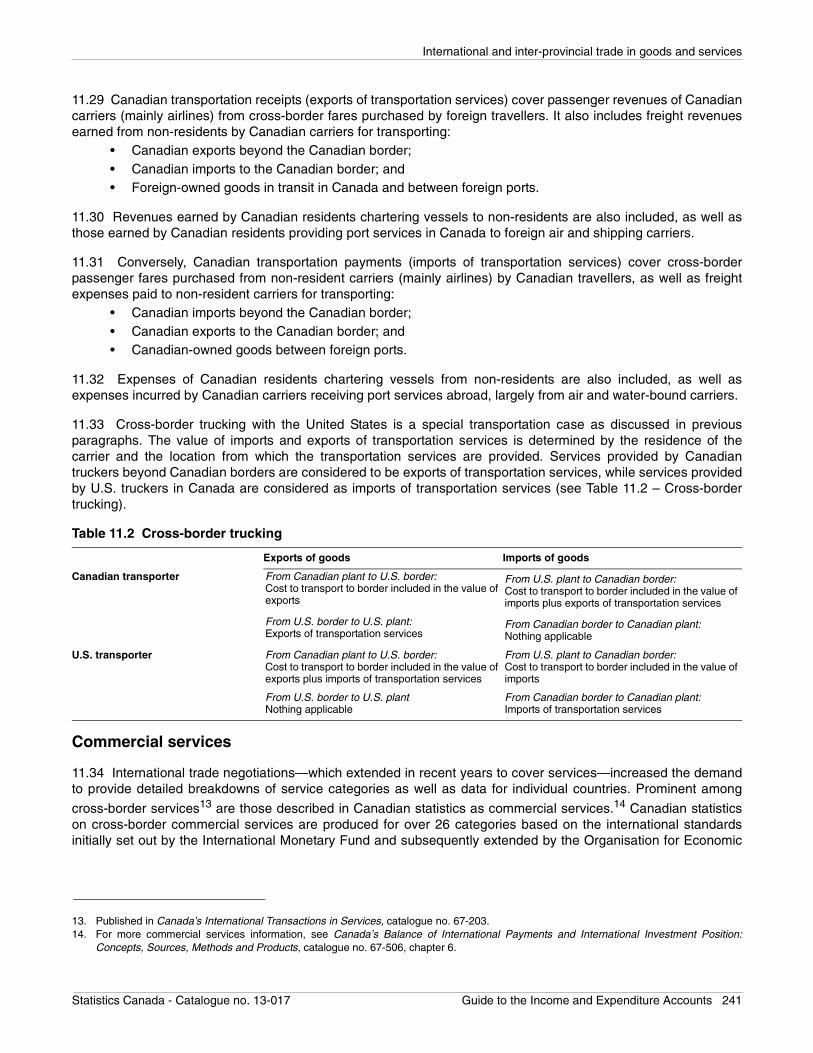
International and inter-provincial trade in goods and services
11.29 Canadian transportation receipts (exports of transportation services) cover passenger revenues of Canadiancarriers (mainly airlines) from cross-border fares purchased by foreign travellers. It also includes freight revenuesearned from non-residents by Canadian carriers for transporting:
• Canadian exports beyond the Canadian border;• Canadian imports to the Canadian border; and • Foreign-owned goods in transit in Canada and between foreign ports.
11.30 Revenues earned by Canadian residents chartering vessels to non-residents are also included, as well asthose earned by Canadian residents providing port services in Canada to foreign air and shipping carriers.
11.31 Conversely, Canadian transportation payments (imports of transportation services) cover cross-borderpassenger fares purchased from non-resident carriers (mainly airlines) by Canadian travellers, as well as freightexpenses paid to non-resident carriers for transporting:
• Canadian imports beyond the Canadian border;• Canadian exports to the Canadian border; and• Canadian-owned goods between foreign ports.
11.32 Expenses of Canadian residents chartering vessels from non-residents are also included, as well asexpenses incurred by Canadian carriers receiving port services abroad, largely from air and water-bound carriers.
11.33 Cross-border trucking with the United States is a special transportation case as discussed in previousparagraphs. The value of imports and exports of transportation services is determined by the residence of thecarrier and the location from which the transportation services are provided. Services provided by Canadiantruckers beyond Canadian borders are considered to be exports of transportation services, while services providedby U.S. truckers in Canada are considered as imports of transportation services (see Table 11.2 – Cross-bordertrucking).
Commercial services
11.34 International trade negotiations—which extended in recent years to cover services—increased the demandto provide detailed breakdowns of service categories as well as data for individual countries. Prominent among
cross-border services13 are those described in Canadian statistics as commercial services.14 Canadian statisticson cross-border commercial services are produced for over 26 categories based on the international standardsinitially set out by the International Monetary Fund and subsequently extended by the Organisation for Economic
Table 11.2 Cross-border trucking
Exports of goods Imports of goods
Canadian transporter From Canadian plant to U.S. border:Cost to transport to border included in the value of exports
From U.S. plant to Canadian border:Cost to transport to border included in the value of imports plus exports of transportation services
From U.S. border to U.S. plant:Exports of transportation services
From Canadian border to Canadian plant:Nothing applicable
U.S. transporter From Canadian plant to U.S. border:Cost to transport to border included in the value of exports plus imports of transportation services
From U.S. plant to Canadian border:Cost to transport to border included in the value of imports
From U.S. border to U.S. plantNothing applicable
From Canadian border to Canadian plant:Imports of transportation services
13. Published in Canada’s International Transactions in Services, catalogue no. 67-203.14. For more commercial services information, see Canada’s Balance of International Payments and International Investment Position:
Concepts, Sources, Methods and Products, catalogue no. 67-506, chapter 6.
Statistics Canada - Catalogue no. 13-017 Guide to the Income and Expenditure Accounts 241
International and inter-provincial trade in goods and services
Cooperation and Development (OECD) and Eurostat (the statistical arm of the European Union). This breakdown
is based on the Central Product Classification (CPC),15 whose main objective “is to provide a framework for
international comparison of various kinds of statistics dealing with goods, services and assets.”16
Government services
11.35 Government services17 cover international transactions arising largely from official representation andmilitary activities, as well as commercial activities of governments not covered in other accounts. They includeexpenses of staff at embassies and missions and of individuals stationed on military bases. Receipts (exports ofgovernment services) chiefly comprise expenditures in Canada by foreign governments and their staff recruitedabroad. Receipts also include overheads to administer official assistance. Payments (imports of governmentservices) cover expenditures abroad of both the Canadian federal and provincial governments and their staffrecruited in Canada. Beginning with the reference year 1996, separate information is available on construction,existing building and land transactions for both embassy and other use by the Government of Canada abroad.Construction is now included in imports of commercial services while purchases of existing buildings continue to betreated as imports of government services. In conformance with international standards, land transactions areclassified as non-produced non-financial assets in the capital account.
11.36 Outlays by the federal government for contributions to the operations of international organizations andprograms are excluded and shown in current transfers, as per international standards. For provincial governments,the data excludes receipts and payments by provinces for the promotion of tourism, which are included incommercial services. To the extent that the source data—official government records—are on a cash basis, theyare incorporated as such in the Balance of Payments Accounts and not on an accrual basis, as called for byinternational standards.
Financial services indirectly measured (FSIM)
11.37 Financial services indirectly measured arise when a financial institution such as a bank or finance companychannels funds to lenders and/or to borrowers. Most financial institutions do not charge explicitly for these services.Instead, they pay lower interest rates to their depositors than the rates they charge to their borrowers. The servicesthey provide to their depositors and borrowers have to be measured indirectly. These services are referred to as
financial services indirectly measured (FSIM).18
11.38 There is a notional reference rate of interest at which lending and borrowing can take place directly betweena lender and a borrower, satisfactory to both parties. This reference rate represents the pure cost of borrowingfunds—that is, a rate from which the risk premium has been eliminated to the greatest extent possible and whichdoes not include any financial services indirectly measured. In principle, it is the difference between the interestrate paid to depositors or paid by borrowers and the reference rate that enables the calculation of financial servicesindirectly measured (FSIM).
11.39 Table 11.3 shows the logic in the calculation of FSIM for imports. In this case, FSIM is paid by Canadianresidents to non-residents, related to a) deposits held by Canadians in other countries and b) loans contracted byCanadians in other countries’ financial institutions. Table 11.3 shows the case of a Canadian resident having adeposit of $600 in a Swiss bank paying an 8% interest rate on deposits. This person receives $48. But, aftermaking the calculation using a reference rate of 10%, it is apparent that this person should have received $60 ininterest and paid $12 of service charge. Borrowing is similar. The Canadian resident paid $60 in interest on a loan
15. Refer to United Nations, Central Product Classification (CPC) Version 1.0, Statistical Papers, (Series M, No. 77, 1998).16. International Monetary Fund, Balance of Payments Manual, (Fifth edition, IMF Publication Services, 700 19th Street NW, Washington DC
20431 USA, 1993), paragraph 521, p. 146.17. See Canada’s Balance of International Payments and International Investment Position: Concepts, Sources, Methods and Products,
catalogue no. 67-506, chapter 7.18. See paragraph 7.89 for further explanation.
242 Statistics Canada - Catalogue no. 13-017 Guide to the Income and Expenditure Accounts
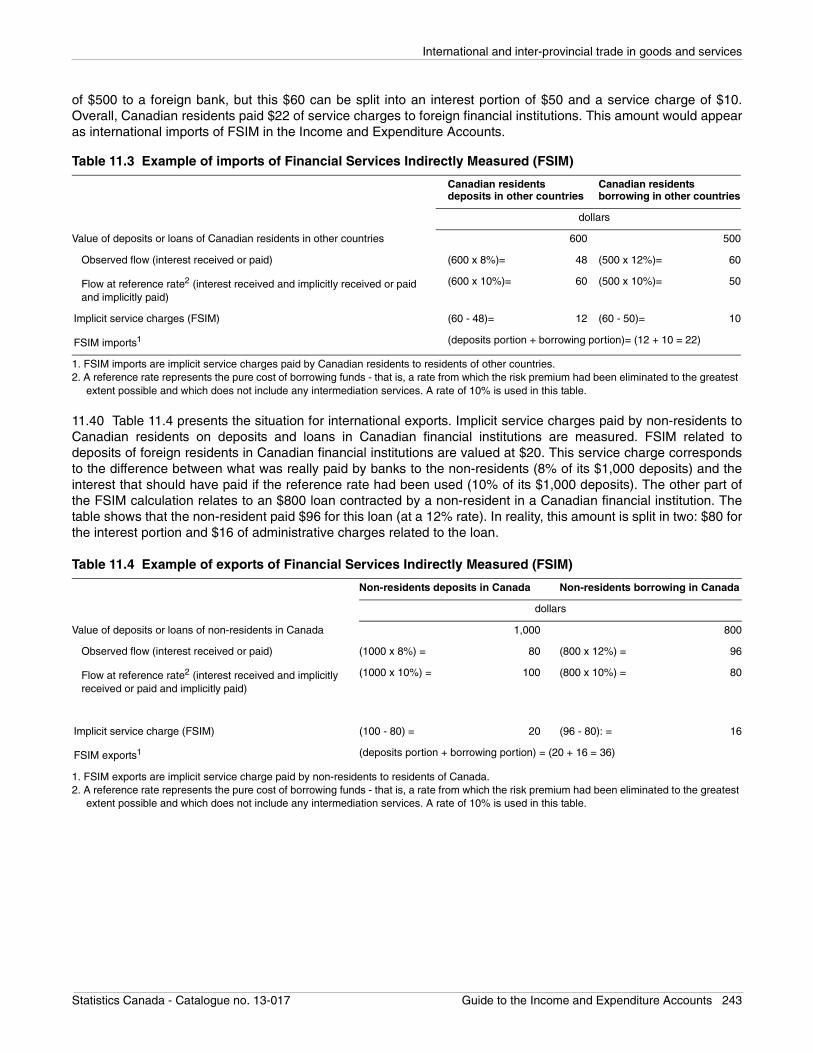
International and inter-provincial trade in goods and services
of $500 to a foreign bank, but this $60 can be split into an interest portion of $50 and a service charge of $10.Overall, Canadian residents paid $22 of service charges to foreign financial institutions. This amount would appearas international imports of FSIM in the Income and Expenditure Accounts.
11.40 Table 11.4 presents the situation for international exports. Implicit service charges paid by non-residents toCanadian residents on deposits and loans in Canadian financial institutions are measured. FSIM related todeposits of foreign residents in Canadian financial institutions are valued at $20. This service charge correspondsto the difference between what was really paid by banks to the non-residents (8% of its $1,000 deposits) and theinterest that should have paid if the reference rate had been used (10% of its $1,000 deposits). The other part ofthe FSIM calculation relates to an $800 loan contracted by a non-resident in a Canadian financial institution. Thetable shows that the non-resident paid $96 for this loan (at a 12% rate). In reality, this amount is split in two: $80 forthe interest portion and $16 of administrative charges related to the loan.
Table 11.3 Example of imports of Financial Services Indirectly Measured (FSIM)
Canadian residents deposits in other countries
Canadian residents borrowing in other countries
dollars
Value of deposits or loans of Canadian residents in other countries 600 500
Observed flow (interest received or paid) (600 x 8%)= 48 (500 x 12%)= 60
Flow at reference rate2 (interest received and implicitly received or paid and implicitly paid)
(600 x 10%)= 60 (500 x 10%)= 50
Implicit service charges (FSIM) (60 - 48)= 12 (60 - 50)= 10
FSIM imports1 (deposits portion + borrowing portion)= (12 + 10 = 22)
1. FSIM imports are implicit service charges paid by Canadian residents to residents of other countries.2. A reference rate represents the pure cost of borrowing funds - that is, a rate from which the risk premium had been eliminated to the greatest
extent possible and which does not include any intermediation services. A rate of 10% is used in this table.
Table 11.4 Example of exports of Financial Services Indirectly Measured (FSIM)
Non-residents deposits in Canada Non-residents borrowing in Canada
dollars
Value of deposits or loans of non-residents in Canada 1,000 800
Observed flow (interest received or paid) (1000 x 8%) = 80 (800 x 12%) = 96
Flow at reference rate2 (interest received and implicitly received or paid and implicitly paid)
(1000 x 10%) = 100 (800 x 10%) = 80
Implicit service charge (FSIM) (100 - 80) = 20 (96 - 80): = 16
FSIM exports1 (deposits portion + borrowing portion) = (20 + 16 = 36)
1. FSIM exports are implicit service charge paid by non-residents to residents of Canada.2. A reference rate represents the pure cost of borrowing funds - that is, a rate from which the risk premium had been eliminated to the greatest
extent possible and which does not include any intermediation services. A rate of 10% is used in this table.
Statistics Canada - Catalogue no. 13-017 Guide to the Income and Expenditure Accounts 243
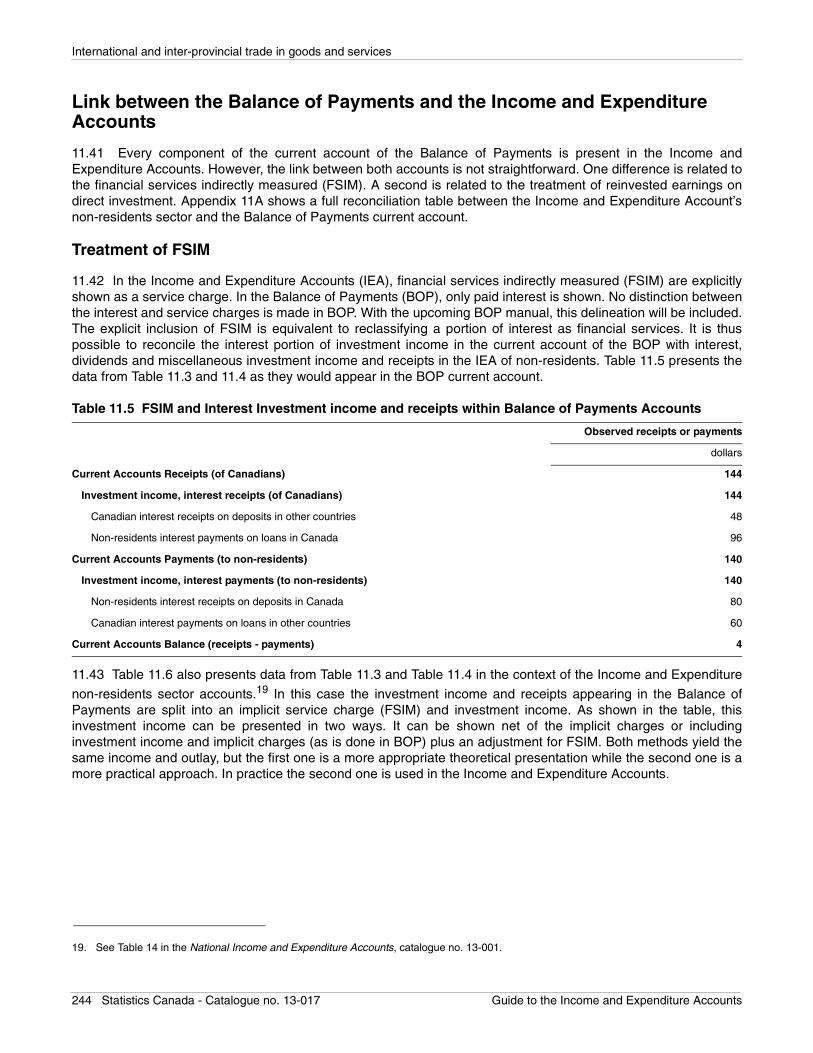
International and inter-provincial trade in goods and services
Link between the Balance of Payments and the Income and Expenditure Accounts
11.41 Every component of the current account of the Balance of Payments is present in the Income andExpenditure Accounts. However, the link between both accounts is not straightforward. One difference is related tothe financial services indirectly measured (FSIM). A second is related to the treatment of reinvested earnings ondirect investment. Appendix 11A shows a full reconciliation table between the Income and Expenditure Account’snon-residents sector and the Balance of Payments current account.
Treatment of FSIM
11.42 In the Income and Expenditure Accounts (IEA), financial services indirectly measured (FSIM) are explicitlyshown as a service charge. In the Balance of Payments (BOP), only paid interest is shown. No distinction betweenthe interest and service charges is made in BOP. With the upcoming BOP manual, this delineation will be included.The explicit inclusion of FSIM is equivalent to reclassifying a portion of interest as financial services. It is thuspossible to reconcile the interest portion of investment income in the current account of the BOP with interest,dividends and miscellaneous investment income and receipts in the IEA of non-residents. Table 11.5 presents thedata from Table 11.3 and 11.4 as they would appear in the BOP current account.
11.43 Table 11.6 also presents data from Table 11.3 and Table 11.4 in the context of the Income and Expenditure
non-residents sector accounts.19 In this case the investment income and receipts appearing in the Balance ofPayments are split into an implicit service charge (FSIM) and investment income. As shown in the table, thisinvestment income can be presented in two ways. It can be shown net of the implicit charges or includinginvestment income and implicit charges (as is done in BOP) plus an adjustment for FSIM. Both methods yield thesame income and outlay, but the first one is a more appropriate theoretical presentation while the second one is amore practical approach. In practice the second one is used in the Income and Expenditure Accounts.
Table 11.5 FSIM and Interest Investment income and receipts within Balance of Payments Accounts
Observed receipts or payments
dollars
Current Accounts Receipts (of Canadians) 144
Investment income, interest receipts (of Canadians) 144
Canadian interest receipts on deposits in other countries 48
Non-residents interest payments on loans in Canada 96
Current Accounts Payments (to non-residents) 140
Investment income, interest payments (to non-residents) 140
Non-residents interest receipts on deposits in Canada 80
Canadian interest payments on loans in other countries 60
Current Accounts Balance (receipts - payments) 4
19. See Table 14 in the National Income and Expenditure Accounts, catalogue no. 13-001.
244 Statistics Canada - Catalogue no. 13-017 Guide to the Income and Expenditure Accounts
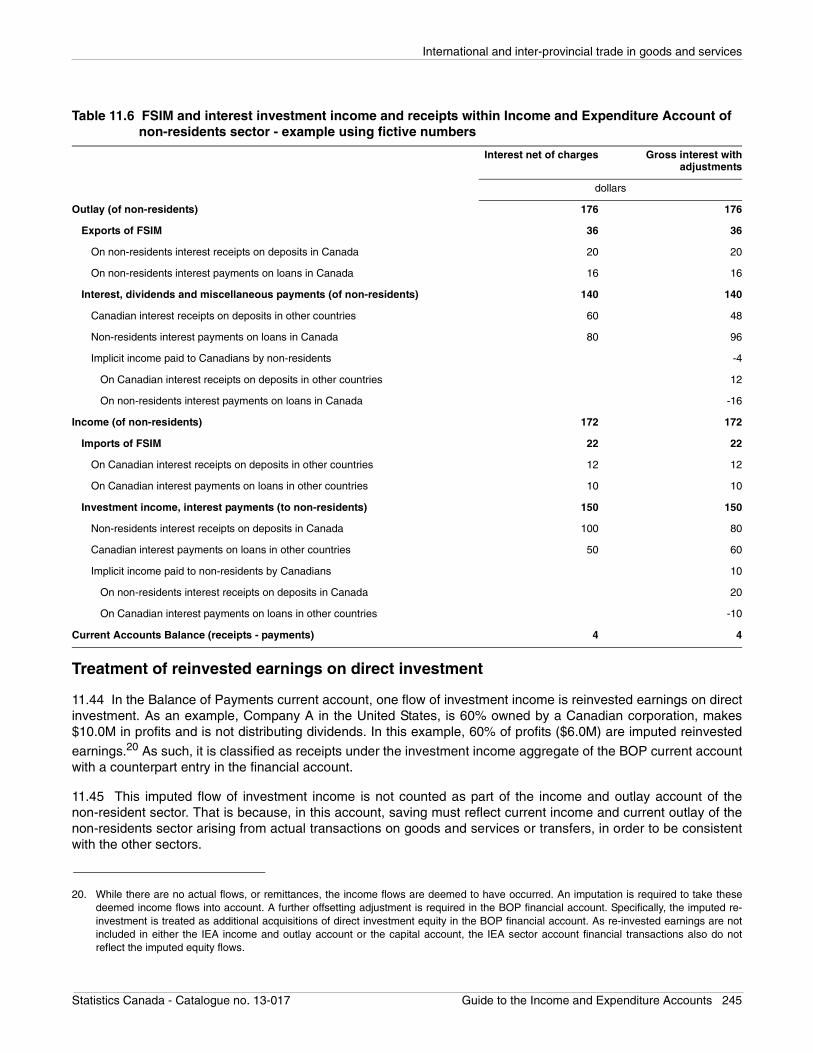
International and inter-provincial trade in goods and services
Treatment of reinvested earnings on direct investment
11.44 In the Balance of Payments current account, one flow of investment income is reinvested earnings on directinvestment. As an example, Company A in the United States, is 60% owned by a Canadian corporation, makes$10.0M in profits and is not distributing dividends. In this example, 60% of profits ($6.0M) are imputed reinvested
earnings.20 As such, it is classified as receipts under the investment income aggregate of the BOP current accountwith a counterpart entry in the financial account.
11.45 This imputed flow of investment income is not counted as part of the income and outlay account of thenon-resident sector. That is because, in this account, saving must reflect current income and current outlay of thenon-residents sector arising from actual transactions on goods and services or transfers, in order to be consistentwith the other sectors.
Table 11.6 FSIM and interest investment income and receipts within Income and Expenditure Account of non-residents sector - example using fictive numbers
Interest net of charges Gross interest withadjustments
dollars
Outlay (of non-residents) 176 176
Exports of FSIM 36 36
On non-residents interest receipts on deposits in Canada 20 20
On non-residents interest payments on loans in Canada 16 16
Interest, dividends and miscellaneous payments (of non-residents) 140 140
Canadian interest receipts on deposits in other countries 60 48
Non-residents interest payments on loans in Canada 80 96
Implicit income paid to Canadians by non-residents -4
On Canadian interest receipts on deposits in other countries 12
On non-residents interest payments on loans in Canada -16
Income (of non-residents) 172 172
Imports of FSIM 22 22
On Canadian interest receipts on deposits in other countries 12 12
On Canadian interest payments on loans in other countries 10 10
Investment income, interest payments (to non-residents) 150 150
Non-residents interest receipts on deposits in Canada 100 80
Canadian interest payments on loans in other countries 50 60
Implicit income paid to non-residents by Canadians 10
On non-residents interest receipts on deposits in Canada 20
On Canadian interest payments on loans in other countries -10
Current Accounts Balance (receipts - payments) 4 4
20. While there are no actual flows, or remittances, the income flows are deemed to have occurred. An imputation is required to take thesedeemed income flows into account. A further offsetting adjustment is required in the BOP financial account. Specifically, the imputed re-investment is treated as additional acquisitions of direct investment equity in the BOP financial account. As re-invested earnings are notincluded in either the IEA income and outlay account or the capital account, the IEA sector account financial transactions also do notreflect the imputed equity flows.
Statistics Canada - Catalogue no. 13-017 Guide to the Income and Expenditure Accounts 245

International and inter-provincial trade in goods and services
11.46 As such, the reconciliation of the Balance of Payments current account with the income and outlay accountof non-residents is done after the balancing item (net saving) is measured in the income and outlay account (seethe reconciliation table in Appendix 11A).
Estimation methods and data sources–International imports and exports
11.47 The International Trade Division (ITD) compiles and publishes customs administrative data. Customsdocuments are produced by the Canada Border Services Agency and are compiled by the ITD for all imports fromforeign countries and for exports to countries other than the United States. Since import data is usually consideredmore reliable than export data, the value of exports to the U.S. is gathered from U.S. customs documents onimports from Canada. In addition, Statistics Canada periodically conducts surveys of Canadian exporters and usesthe information gathered to supplement its administrative data.
11.48 Goods are recorded in conformity with the standards set out in the General System of Trade Statistics of theUnited Nations Statistics Division. Both exports and imports are classified and published in accordance with theHarmonized Commodity Description and Coding System (HS). HS coding is an international standard that wasdeveloped under the auspices of the World Customs Organization and is currently used by 167 countries, covering95% of all goods traded in the world.
11.49 Although trade estimates are collected at the very detailed HS level, the ITD subsequently aggregatescommodities into 64 major export groups and 63 major import groups, on a customs basis and on a Balance ofPayments basis. The Income and Expenditure Accounts Division uses the Balance of Payments framework to
present trade data.21
11.50 As previously mentioned, services differ from goods in terms of the link between their production and theirtrade. For goods, their trade can generally be separated in time from their production, because a good produced inone country can later be traded at any time, even years after production. That is not the case for services, wherethe production is closely linked to their trade. This has a major impact on the way in which they are measured.
11.51 The services categories are set out in the Balance of Payments Manual. The categories used by the Incomeand Expenditure Accounts Division (IEAD) are those of the Balance of Payments Division (BPD), the classificationof which represents in part a regrouping of the more detailed categories of the Balance of Payments Manual, plusFSIM. Trade in services is derived from a variety of sources (see paragraphs 11.63 to 11.106).
Presentation of estimates within the Income and Expenditure Accounts
11.52 Table 11.7 shows the level of detail at which international trade estimates are published in the NationalIncome and Expenditure Accounts, Table 25, for 2000. The goods categories represented correspond to thosepublished by the International Trade Division, the source division for commodity data. The services correspond tothe categories published by the Balance of Payments Division, except for the financial intermediation category,
which is calculated by IEAD.22
11.53 The eight goods categories set out in Table 11.7, which are called sectors, are aggregations of the 64 majorexport groups and 63 major import groups published and provided by ITD, as presented in Appendix 11C. UnlikeITD, IEAD does not publish at the level of the 64 major export groups and 63 major import groups, but uses themas the working level.
21. This framework of 64 export groups and 63 import groups is not a natural extension of the HS system or an official classification ofcommodities of Statistics Canada. Its origin goes back 60 years when it was born of the defunct MCC (Import Commodity Classification)and the XCC (Export Commodity Classification).
22. For goods published by ITD, see Canadian International Merchandise Trade, catalogue no. 65-001. Services are published in Canada’sInternational Balance of Payments, No. 67-001.
246 Statistics Canada - Catalogue no. 13-017 Guide to the Income and Expenditure Accounts
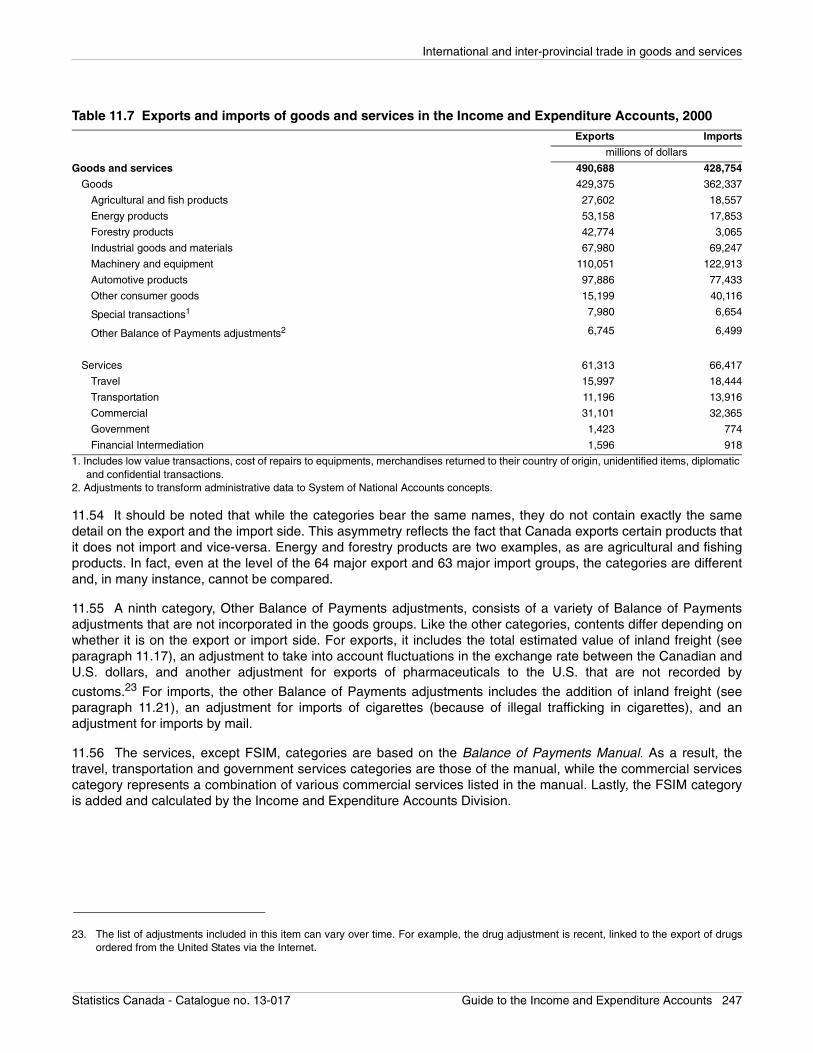
International and inter-provincial trade in goods and services
11.54 It should be noted that while the categories bear the same names, they do not contain exactly the samedetail on the export and the import side. This asymmetry reflects the fact that Canada exports certain products thatit does not import and vice-versa. Energy and forestry products are two examples, as are agricultural and fishingproducts. In fact, even at the level of the 64 major export and 63 major import groups, the categories are differentand, in many instance, cannot be compared.
11.55 A ninth category, Other Balance of Payments adjustments, consists of a variety of Balance of Paymentsadjustments that are not incorporated in the goods groups. Like the other categories, contents differ depending onwhether it is on the export or import side. For exports, it includes the total estimated value of inland freight (seeparagraph 11.17), an adjustment to take into account fluctuations in the exchange rate between the Canadian andU.S. dollars, and another adjustment for exports of pharmaceuticals to the U.S. that are not recorded by
customs.23 For imports, the other Balance of Payments adjustments includes the addition of inland freight (seeparagraph 11.21), an adjustment for imports of cigarettes (because of illegal trafficking in cigarettes), and anadjustment for imports by mail.
11.56 The services, except FSIM, categories are based on the Balance of Payments Manual. As a result, thetravel, transportation and government services categories are those of the manual, while the commercial servicescategory represents a combination of various commercial services listed in the manual. Lastly, the FSIM categoryis added and calculated by the Income and Expenditure Accounts Division.
Table 11.7 Exports and imports of goods and services in the Income and Expenditure Accounts, 2000Exports Imports
millions of dollars
Goods and services 490,688 428,754
Goods 429,375 362,337
Agricultural and fish products 27,602 18,557
Energy products 53,158 17,853
Forestry products 42,774 3,065
Industrial goods and materials 67,980 69,247
Machinery and equipment 110,051 122,913
Automotive products 97,886 77,433
Other consumer goods 15,199 40,116
Special transactions1 7,980 6,654
Other Balance of Payments adjustments2 6,745 6,499
Services 61,313 66,417
Travel 15,997 18,444
Transportation 11,196 13,916
Commercial 31,101 32,365
Government 1,423 774
Financial Intermediation 1,596 918
1. Includes low value transactions, cost of repairs to equipments, merchandises returned to their country of origin, unidentified items, diplomatic and confidential transactions.
2. Adjustments to transform administrative data to System of National Accounts concepts.
23. The list of adjustments included in this item can vary over time. For example, the drug adjustment is recent, linked to the export of drugsordered from the United States via the Internet.
Statistics Canada - Catalogue no. 13-017 Guide to the Income and Expenditure Accounts 247
International and inter-provincial trade in goods and services
Revision cycle
11.57 Estimates of international imports and exports follow the Canadian System of National Accounts four yearrevision cycle, such that, once a year, revisions are incorporated for all four years of annual and quarterly data. Thethree stages of the production-revision cycle are:
• current year quarterly estimates (t) • non-benchmarked years (t-1, t-2) • benchmarked years (t-3, t-4)
11.58 Non-benchmarked years international trade data are assembled by the International Trade Division (ITD) forgoods and by the Balance of Payments Division (BPD) for services. For goods, data are collected monthly andaggregated to obtain quarterly data. For services, the data are obtained from annual and quarterly surveys by BPD,other Statistics Canada surveys and other statistical sources.
11.59 For benchmark years, the Industry Accounts Division develops the estimates, based largely on the ITD andBPD estimates. These estimates consist of re-valuing the Balance of Payments adjustments in light of therebalancing of the economy by commodity. This rebalancing also makes it possible to provide a better valuation ofthe under reporting adjustment for overseas exports.
Annual and quarterly estimation methods and data sources—Trade in goods
11.60 The data for goods are assembled monthly, while annual estimates are the summation of months of trade.Trade in goods is largely based on customs documents. In Canada, the customs records are processed andpublished for statistical purposes by the International Trade Division of Statistics Canada. That division compilesCanadian imports from all foreign countries and Canadian exports to countries other than the United States fromthe Canadian customs documents filed with the Canada Border Services Agency.
11.61 Since January 1, 1990, Canadian exports to the United States have been based on U.S. customs’ importsfrom Canada documents. The data are compiled by the U.S. Census Bureau of the U.S. Department of Commerceand provided to the International Trade Division of Statistics Canada.
11.62 Although most categories of goods can be easily compiled by the recording of their crossing the border,Balance of Payments adjustments are needed to bring customs data to a Balance of Payments basis (Table 11.1).
Annual and quarterly estimation methods and data sources—Trade in services
11.63 Estimates for services use a variety of sources, some annual, others quarterly. They are described in thefollowing sections.
Travel services
11.64 The Culture, Tourism and Centre for Education Statistics Division of Statistics Canada compiles the basicCanadian travel statistics. These statistics are derived from a combination of census data and sample counts oftravellers crossing the border, coupled with sample surveys used to collect specific information from travellers,
including their expenditures and main purpose of visit (business or personal).24
24. For more information, see Canada’s Balance of International Payments and International Investment Position: Concepts, Sources,Methods and Products, catalogue no. 67-506, pages 32 and 33. A full description of methods and data sources is available from the samesource, Chapter 4.
248 Statistics Canada - Catalogue no. 13-017 Guide to the Income and Expenditure Accounts
International and inter-provincial trade in goods and services
11.65 The Canada Border Services Agency collects information on the number of crossings at frontier ports anddistributes the travel survey questionnaires. The frontier count is made by categories, based on mode oftransportation (including, in the case of highways and ferry points, cars, trucks, motorcycles and bicycles).Complete counts are taken at all but seven points of entry where automobile, motorcycle and bicycle flows areestimated from samples. The questionnaires that collect the travel expenditure data are distributed according topre-arranged schedules to non-resident travellers (exports of travel services) upon exit from Canada, or toresidents of Canada (imports of travel services) upon their return from travel abroad. Completion of thequestionnaires is voluntary and travellers are asked to mail their completed questionnaires directly to StatisticsCanada.
11.66 In business travel, estimates of spending by crews (of airplanes, ships, boats, trains and trucks) arecalculated by the Culture, Tourism and Centre for Education Statistics Division.
11.67 Personal travel includes travel for health, travel for education and travel for tourism. The receipts data(exports) for health consist of foreign spending for hospital services in Canada, as recorded from the annualhospital survey of the Canadian Institute for Health Information, with projections for recent years where surveyresults are not yet available. Recent estimates for physician services linked to U.S. data on the payments side wereintroduced with the 1995 reference year. The payments for health (imports) consist of Canadian residents spendingin other countries for hospital and physician charges paid under provincial and other private health plans. Otherexpenses related to health but not identified as such by the sources would be included under tourism.
11.68 On the receipt (export) side of the education series, the Culture, Tourism and Centre for Education StatisticsDivision produces the estimates by combining the time series on the number of students with average tuition feesand adding estimates of other expenditures. For payments (imports) of Canadian students in the United States, thedata have been supplied by the U.S. Bureau of Economic Analysis from 1981 onward and were linked withBalance of Payments data for prior years. Data on student expenditures overseas are estimated according to theUnited Nations Educational, Scientific and Cultural Organization (UNESCO) data on the number of Canadianstudents who study in various countries abroad. Account is taken of relative living cost indexes overseas,developed by the Prices Division of Statistics Canada.
11.69 Receipts and payments related to basic tourism spending are derived from the International Travel Survey.
Transportation services
11.70 Transport services are a combination of freight transport and passenger fares. In general, passenger faresare obtained from the Culture, Tourism and Centre for Education Statistics Division’s surveys. Freight information isderived from various Balance of Payments Division and Transportation Division surveys.
11.71 The Culture, Tourism and Centre for Education Statistics Division estimates passenger fare receipts andexpenditures. The monthly data on air travellers, provided by Canada Border Services Agency, are combined with
estimates of average passenger fares, obtained from the quarterly sample survey of travellers.25
11.72 Quarterly estimates of transportation of goods by truck26 beyond the exporting country are derived fromcustoms documentation compiled by the International Trade Division for payments (imports) and by the U.S.Census Bureau for receipts (exports). The earnings of Canadian truckers for the carriage of goods in the UnitedStates, as well as the expenses paid to U.S. truckers for transporting goods in Canada, are obtained from the U.S.Bureau of Economic Analysis (BEA). The BEA incorporates freight data from the customs data compiled by theInternational Trade Division of Statistics Canada.
25. Information on passenger fares is from Canada’s Balance of International Payments and International Investment Position: Concepts,Sources, Methods and Products, catalogue no. 67-506, p. 37.
26. For more information on transportation of goods by truck, see Canada’s Balance of International Payments and International InvestmentPosition: Concepts, Sources, Methods and Products, catalogue no. 67-506, p.37, and Canada’s International Trade in Services, catalogueno. 67-203, p. 53.
Statistics Canada - Catalogue no. 13-017 Guide to the Income and Expenditure Accounts 249
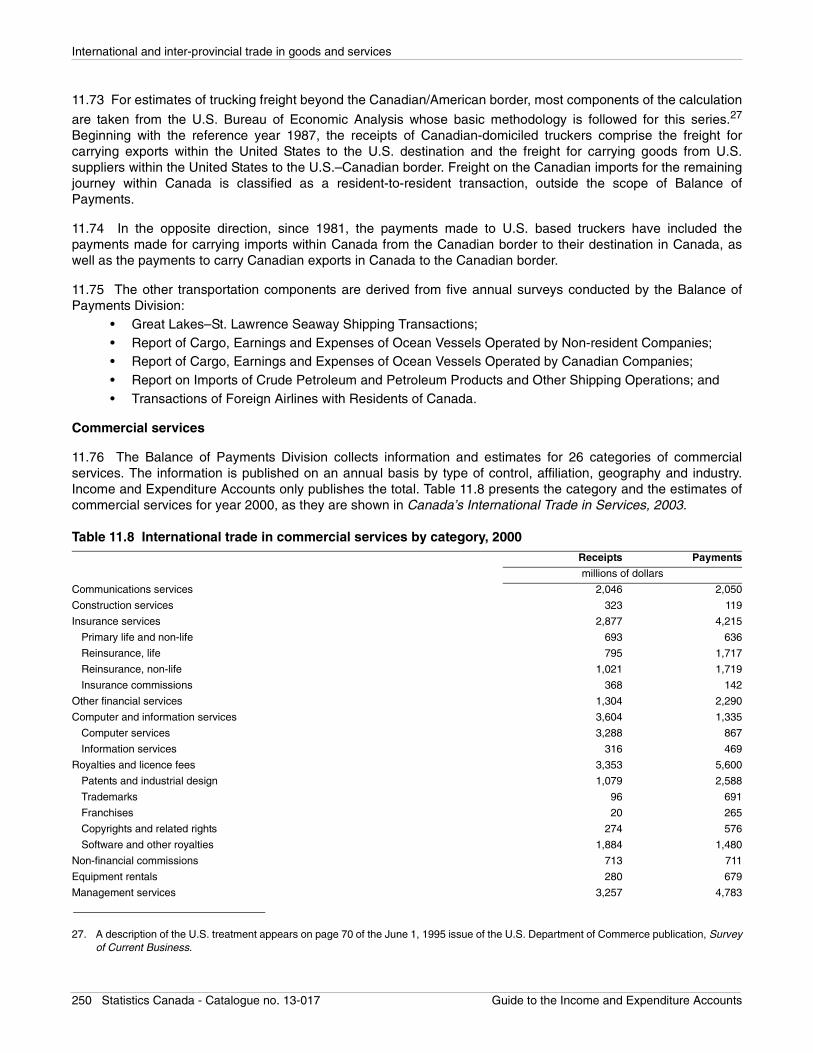
International and inter-provincial trade in goods and services
11.73 For estimates of trucking freight beyond the Canadian/American border, most components of the calculation
are taken from the U.S. Bureau of Economic Analysis whose basic methodology is followed for this series.27
Beginning with the reference year 1987, the receipts of Canadian-domiciled truckers comprise the freight forcarrying exports within the United States to the U.S. destination and the freight for carrying goods from U.S.suppliers within the United States to the U.S.–Canadian border. Freight on the Canadian imports for the remainingjourney within Canada is classified as a resident-to-resident transaction, outside the scope of Balance ofPayments.
11.74 In the opposite direction, since 1981, the payments made to U.S. based truckers have included thepayments made for carrying imports within Canada from the Canadian border to their destination in Canada, aswell as the payments to carry Canadian exports in Canada to the Canadian border.
11.75 The other transportation components are derived from five annual surveys conducted by the Balance ofPayments Division:
• Great Lakes–St. Lawrence Seaway Shipping Transactions;• Report of Cargo, Earnings and Expenses of Ocean Vessels Operated by Non-resident Companies;• Report of Cargo, Earnings and Expenses of Ocean Vessels Operated by Canadian Companies;• Report on Imports of Crude Petroleum and Petroleum Products and Other Shipping Operations; and • Transactions of Foreign Airlines with Residents of Canada.
Commercial services
11.76 The Balance of Payments Division collects information and estimates for 26 categories of commercialservices. The information is published on an annual basis by type of control, affiliation, geography and industry.Income and Expenditure Accounts only publishes the total. Table 11.8 presents the category and the estimates ofcommercial services for year 2000, as they are shown in Canada’s International Trade in Services, 2003.
27. A description of the U.S. treatment appears on page 70 of the June 1, 1995 issue of the U.S. Department of Commerce publication, Surveyof Current Business.
Table 11.8 International trade in commercial services by category, 2000Receipts Payments
millions of dollars
Communications services 2,046 2,050
Construction services 323 119
Insurance services 2,877 4,215
Primary life and non-life 693 636
Reinsurance, life 795 1,717
Reinsurance, non-life 1,021 1,719
Insurance commissions 368 142
Other financial services 1,304 2,290
Computer and information services 3,604 1,335
Computer services 3,288 867
Information services 316 469
Royalties and licence fees 3,353 5,600
Patents and industrial design 1,079 2,588
Trademarks 96 691
Franchises 20 265
Copyrights and related rights 274 576
Software and other royalties 1,884 1,480
Non-financial commissions 713 711
Equipment rentals 280 679
Management services 3,257 4,783
250 Statistics Canada - Catalogue no. 13-017 Guide to the Income and Expenditure Accounts
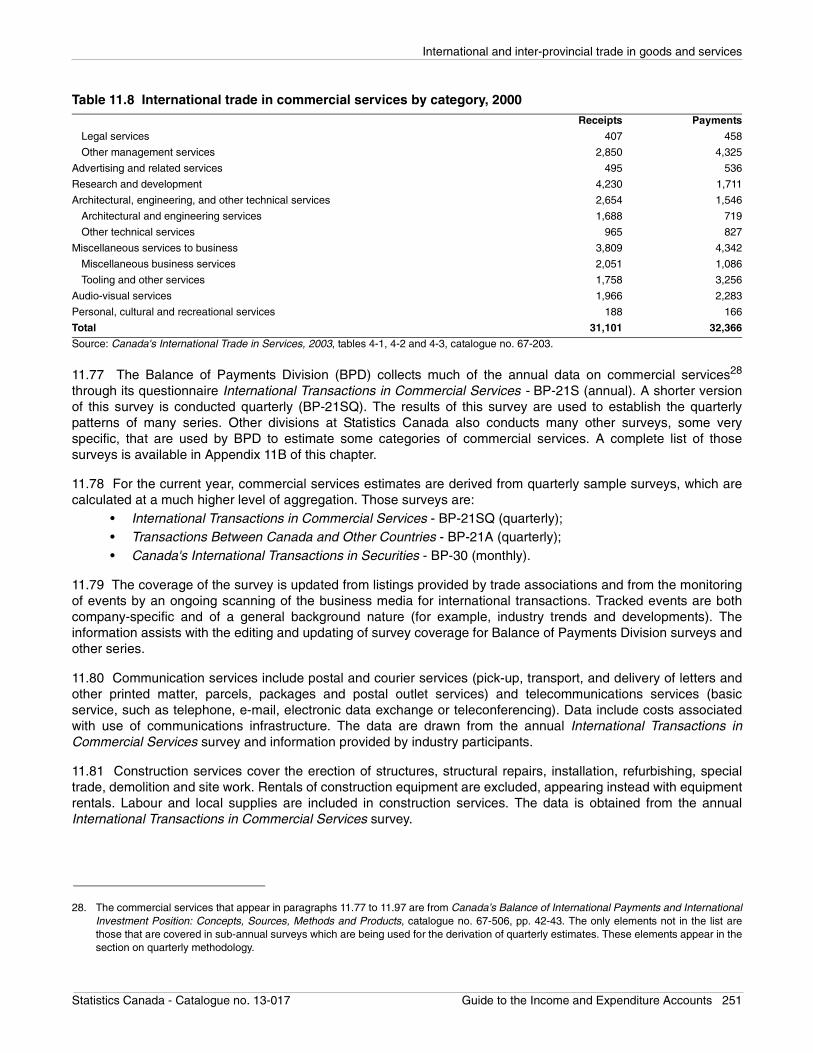
International and inter-provincial trade in goods and services
11.77 The Balance of Payments Division (BPD) collects much of the annual data on commercial services28
through its questionnaire International Transactions in Commercial Services - BP-21S (annual). A shorter versionof this survey is conducted quarterly (BP-21SQ). The results of this survey are used to establish the quarterlypatterns of many series. Other divisions at Statistics Canada also conducts many other surveys, some veryspecific, that are used by BPD to estimate some categories of commercial services. A complete list of thosesurveys is available in Appendix 11B of this chapter.
11.78 For the current year, commercial services estimates are derived from quarterly sample surveys, which arecalculated at a much higher level of aggregation. Those surveys are:
• International Transactions in Commercial Services - BP-21SQ (quarterly);• Transactions Between Canada and Other Countries - BP-21A (quarterly);• Canada's International Transactions in Securities - BP-30 (monthly).
11.79 The coverage of the survey is updated from listings provided by trade associations and from the monitoringof events by an ongoing scanning of the business media for international transactions. Tracked events are bothcompany-specific and of a general background nature (for example, industry trends and developments). Theinformation assists with the editing and updating of survey coverage for Balance of Payments Division surveys andother series.
11.80 Communication services include postal and courier services (pick-up, transport, and delivery of letters andother printed matter, parcels, packages and postal outlet services) and telecommunications services (basicservice, such as telephone, e-mail, electronic data exchange or teleconferencing). Data include costs associatedwith use of communications infrastructure. The data are drawn from the annual International Transactions inCommercial Services survey and information provided by industry participants.
11.81 Construction services cover the erection of structures, structural repairs, installation, refurbishing, specialtrade, demolition and site work. Rentals of construction equipment are excluded, appearing instead with equipmentrentals. Labour and local supplies are included in construction services. The data is obtained from the annualInternational Transactions in Commercial Services survey.
Legal services 407 458
Other management services 2,850 4,325
Advertising and related services 495 536
Research and development 4,230 1,711
Architectural, engineering, and other technical services 2,654 1,546
Architectural and engineering services 1,688 719
Other technical services 965 827
Miscellaneous services to business 3,809 4,342
Miscellaneous business services 2,051 1,086
Tooling and other services 1,758 3,256
Audio-visual services 1,966 2,283
Personal, cultural and recreational services 188 166
Total 31,101 32,366
Source: Canada's International Trade in Services, 2003, tables 4-1, 4-2 and 4-3, catalogue no. 67-203.
28. The commercial services that appear in paragraphs 11.77 to 11.97 are from Canada’s Balance of International Payments and InternationalInvestment Position: Concepts, Sources, Methods and Products, catalogue no. 67-506, pp. 42-43. The only elements not in the list arethose that are covered in sub-annual surveys which are being used for the derivation of quarterly estimates. These elements appear in thesection on quarterly methodology.
Table 11.8 International trade in commercial services by category, 2000Receipts Payments
Statistics Canada - Catalogue no. 13-017 Guide to the Income and Expenditure Accounts 251
International and inter-provincial trade in goods and services
11.82 Insurance services cover the provision of various types of insurance to non-residents by resident insurancecompanies and the provision of various types of insurance to Canadian residents by non-resident insurance
companies. Broker and agency commissions are included.29 Contrary to international standards, Canadianstatistics are established on the basis of gross premiums and claims. Exports of insurance services are calculatedas the sum of premiums received by Canadian residents abroad and claims paid to clients in Canada bynon-resident insurers. Imports are the sum of claims paid abroad by insurers resident in Canada and premiumspaid to outside insurers by policyholders in Canada.
11.83 The insurance series are divided into four categories: primary life and non-life, which includes premiums andclaims of insurance carriers for fire, accident, risk and miscellaneous insurance; reinsurance – life, subcontractedrisk on life insurance for a proportional share of the premium income; reinsurance – non-life, for othersubcontracted risks; and finally, insurance commissions, which covers commissions by brokers and agencies andcommissions identified by carriers.
11.84 Insurance data are drawn from surveys by the Balance of Payments Division of Canadian and foreign
insurers in Canada,30 to which are added data from the annual International Transactions in Commercial Servicessurvey. Data from the U.S. Bureau of Economic Analysis on cross-border insurance activity is also used, especiallyfor insurance of Canadian resident individuals with U.S. insurance companies.
11.85 Other financial services cover intermediary and auxiliary financial services between residents andnon-residents. It includes commissions and other fees related to transactions in securities (brokerage, placementof issues, underwriting, redemption and arrangement of swaps, options and other hedging instruments),commissions of commodity futures traders, as well as services related to asset management, financial marketoperational and regulatory services and lastly, intermediary service fees (fees associated with letters of credit,bankers’ acceptance, lines of credit and financial leasing). Note that financial services indirectly measured (FSIM)are excluded from this category and are posted separately under trade in services (see paragraph 11.23).
11.86 Commissions on new issues and fees related to securities transactions—which constitute the vast majorityof services in this category—are calculated by applying ratios. The commissions on new issues are largely derived
by applying a percentage against the proceeds from new issues,31 percentages that are checked from time to timeagainst prospectuses. Fees on securities transactions are derived from gross trading data coupled with certain ratefactors based on discussions with the industry. Other fees and commissions in this commercial services categoryare derived from corporate and regulatory sources, supplemented by the annual International Transactions inCommercial Services survey.
11.87 Within computer and information services, computer services include the design, manufacture andmanagement of computer systems (exclusive of the value of hardware). Also covered are the development andproduction of original software. Pre-packaged software for general commercial or personal use are excluded fromthis category and included in goods. Information services includes online information retrieval services, especiallydatabase services and computer-assisted document searches, and news agency services. Data on computerservices and on information services are derived from the annual International Transactions in CommercialServices survey. These data are supplemented by receipts of major computer industry firms surveyed by StatisticsCanada’s Services Industries Division.
29. Canada’s Balance of International Payments and International Investment Position: Concepts, Sources, Methods and Products, catalogueno. 67-506, p. 44.
30. The surveys used are: International Transactions between Insurance Brokers in Canada and their Foreign Affiliates, Agents and OtherCompanies or Persons Outside Canada (annual); Transactions between Canadian Incorporated Insurance Companies and their ForeignAffiliates, Agencies and Bank Accounts and Other Companies or Persons Outside Canada (annual); Transactions between CanadianBranches of Foreign Insurance Companies in Canada and Head or Other Offices, Companies or Persons Outside Canada (annual).
31. Canada’s Balance of International Payments and International Investment Position: Concepts, Sources, Methods and Products, catalogueno. 67-506, p. 45.
252 Statistics Canada - Catalogue no. 13-017 Guide to the Income and Expenditure Accounts
International and inter-provincial trade in goods and services
11.88 The royalties and licence fees category covers the use of intellectual property rights. It is broken down intofive subcategories: patents and industrial designs, which covers royalties or licence fees for use of patents,industrial designs, industrial know-how or manufacturing rights; trademarks, which includes royalties and fees foruse of trademarks; franchises, which covers contractual privileges granted by an individual or corporation toanother, permitting the sale of a product or service in a specified area or manner; copyrights and related rightscovers royalty and licence fees for use of original artistic, literary, dramatic or musical works, for example, to stageproductions or performances or make recordings or a film; and lastly, software and other royalties covers mainlycomputer-related royalties, notably, the right to replicate, distribute or use software, whether custom or pre-packaged, and to a lesser degree, fees for the exclusive use of natural resources. Most of the data is derived fromthe annual International Transactions in Commercial Services survey.
11.89 Non-financial commissions covers commissions on transactions of goods and services betweennon-residents and resident brokers, commodity traders, dealers, manufacturers’ sales branches and commissionagents. The data are derived from the annual International Transactions in Commercial Services survey andestimates from the application of fixed factors to merchandise exports and imports.
11.90 Equipment rentals cover rentals (without operator) of light and heavy equipment and tools, drilling rigs andsupply vessels, rail and road or off-road vehicles, and aircraft. It also includes the rental of containers, officemachinery and equipment, including computers, as well as rentals of household and personal goods. Estimates forequipment rentals are based on the annual International Transactions in Commercial Services survey and othersmaller surveys.
11.91 The management services category covers legal, accounting and business management services (whichinclude management and administrative overheads between related enterprises and business managementconsulting). Legal services cover legal advisory and representational services in any legal, judicial and statutoryprocedures, and the drawing up of legal instruments or documentation. Other management services coversaccounting (business and other accounts, including reviews and audits, bookkeeping and preparation of relatedstatements and tax returns), business management consulting (public relations services) and other managementservices (charges for managerial and administrative services rendered by an individual or corporation that cannotbe included in any other service category). The data are derived largely from the annual International Transactionsin Commercial Services survey.
11.92 Advertising and related services covers design, creation and marketing of advertisements by advertisingagencies, placement of advertisements in various media (print, electronic, various advertising spaces),participation in trade fairs and other promotional outlays (for example, exhibition services, telemarketing andpromotional material). The data are derived from the annual International Transactions in Commercial Servicessurvey. Tourism promotion outlays are obtained from provincial authorities on an annual basis.
11.93 Research and development covers charges related to systematic investigation through experiment oranalysis to achieve a scientific or commercial advance for, or through, the creation of new or significantly improved
products or processes.32 The statistics are derived from the annual International Transactions in CommercialServices survey and other surveys of the Science, Innovation and Electronic Information Division.
11.94 Architectural, engineering and other technical services includes a range of architectural and engineeringactivities, together with a diverse group of scientific and technical services and specific services related to mineralextraction, processing and the environment. More specifically, architectural and engineering services compriseconsulting, design and pre-design, as well as contract supervision services. Urban planning and landscapearchitectural services are covered, as are project management services. Other technical services covers scientificand technical services (geological and geophysical services, mineral exploration and prospecting work, surveying,mapping and weather services, services of testing, analysis, inspection or certification of materials or products),mining services (drilling and field services) and environmental services (sanitation services, waste storage,treatment and destruction, decontamination, clean-up, confinement and pollution control, environmental
32. Canada’s Balance of International Payments and International Investment Position: Concepts, Sources, Methods and Products, catalogueno. 67-506, p. 49.
Statistics Canada - Catalogue no. 13-017 Guide to the Income and Expenditure Accounts 253

International and inter-provincial trade in goods and services
consulting, environmental audits and site assessments). The statistics for this category are derived from the annualInternational Transactions in Commercial Services survey, which are supplemented by data from other surveys oftechnical, engineering and architectural services by the Services Division.
11.95 Miscellaneous services to business comprises tooling and other services (e.g., retooling for production ofnew models for automobile companies) and miscellaneous business services (transactions not allocatedelsewhere: real estate services, suits and settlements, medical and dental laboratories, education, training andstaff development). The data on tooling and other automotive charges are based on the annual InternationalTransactions in Commercial Services survey and customs data from the International Trade Division. Remainingdata are in part based on unspecified services reported by individual companies in the annual InternationalTransactions in Commercial Services survey and reported under other transactions. Compensation of non-residents employees (including commuter and seasonal worker’s remuneration) is included under miscellaneousservices to business since these employees are treated as self-employed service providers. This is a departurefrom international standards where such compensation should be included under income, not services.
11.96 Audiovisual services cover film and video production and distribution, performing arts and organized sports.Services related to the production of motion pictures, radio and television programs and sound recording areincluded in this category, as are rentals, the services of actors, directors, producers and other crew members forartistic productions. Most of the data are derived from annual surveys of the Science, Innovation and ElectronicInformation Division and the Culture, Tourism and Centre for Education Statistics Division.
11.97 Personal, cultural and recreational services are presently limited to international activities of trade unions.Figures, that until recently were estimated from annual returns filed with Statistics Canada under the formerCorporations and Labour Unions Returns Act, are now projected since the Act no longer covers labour unions.
11.98 The Balance of Payments Division also relies on other Statistics Canada surveys and on administrative datato produce estimates of commercial services. An exhaustive list of these sources and surveys is found inAppendix 11B.
Government services
11.99 Most of the data are collected from administrative sources; except for ad hoc surveys conducted to obtainestimates of spending by foreign embassies in Canada (the last such survey collected 1995 data). Federalgovernment administrative sources include the following:
• Public Accounts of Canada;• National Defence;• Canadian International Development Agency;• Department of Foreign Affairs and International Trade; and• International Development Research Centre.
11.100 Data for provincial and territorial governments come from the provincial Public Accounts while data forcrown corporations are taken from federal and provincial Public Accounts and supplementary data obtaineddirectly from selected corporations.
11.101 Most of the data on spending in Canada by U.S. government authorities are provided by the U.S. Bureau ofEconomic Analysis (BEA). Data on spending by country, other than the U.S., are obtained from Canadianadministrative records.
11.102 For Canadian expenditures by personnel posted abroad, two-thirds of their salary is assumed to beavailable for personal spending in the local economy. Payments for Canadian military personnel are calculated andprovided by the Government section of the Income and Expenditure Accounts Division.
11.103 Canadian expenditures abroad are based on quarterly estimates of salary paid to military and embassiespersonnel. Quarterly expenditures in Canada by the U.S. come from the BEA and expenditures of other countriesin Canada are obtained from Canadian administrative records.
254 Statistics Canada - Catalogue no. 13-017 Guide to the Income and Expenditure Accounts
International and inter-provincial trade in goods and services
Financial services indirectly measured (FSIM)
11.104 The estimation of FSIM is done on a quarterly basis; annual estimates are obtained by summing quarterlyestimates. Financial services indirectly measured (FSIM) are calculated as follows for all types of financialinstitutions except credit unions:
Interest received minus interest paid
- Adjustments for own funds used
= Net interest (Total FSIM)
11.105 The calculation for credit unions is slightly different, these institutions being considered associations ofindividuals. As such, the profits made are not part of corporate profits but considered as rebates and subtractedfrom the FSIM estimate. The calculation of FSIM is presented in paragraphs 11.39 and 11.40.
11.106 Source data are obtained from:• Chartered banks: Office of Superintendent of Financial Institutions (OSFI);• Trust companies, mortgage loan companies and consumer loan companies and credit unions; and
• Industrial Organization and Finance Division (IOFD).33
Deflation
Deflation—Estimates of international trade in goods in real terms
11.107 The goods series are deflated on a monthly basis by the International Trade Division. Deflation is done at avery detailed level and relies on various data sources for prices.
11.108 On the exports side, most of the goods are deflated by the price indexes of domestic industrial products, byunit values derived from customs data, and by price indexes for exported industrial products. In a few other specialcases, prices are drawn from alternative sources, such as the U.S. Bureau of Labor Statistics, the National EnergyBoard of Canada and the Manufacturing, Construction and Energy Division.
11.109 On the imports side, goods are deflated primarily by producer price indexes from the U.S. Bureau of LaborStatistics multiplied by the exchange rate. When applicable, unit values are drawn from customs data and exportprices of the Bank of Japan are used.
11.110 Once deflated, goods at the HS level are aggregated into 64 major export groups and 63 major import
groups. The groups, both in nominal and Laspeyres fixed-weight volume terms, are published monthly34 by theInternational Trade Division and sent as is to the Income and Expenditure Accounts Division (IEAD) for compilationof the quarterly gross domestic product (GDP).
11.111 IEAD uses the 64 major export groups and 63 major import groups, aggregated quarterly, as the startingpoint for calculating the chain Fisher indexes. In this case, the groups are considered as unit series, each with itsunit price (the implicit price for the group). Real Fisher aggregates are calculated for the nine sectors defined innominal value and for the totals of goods exports and imports.
Deflation—Estimates of international trade in services in real terms
11.112 Services are deflated by the Income and Expenditure Accounts Division (IEAD). Although the publishedlevel of services consists of five large groups, deflation is applied at a more detailed level, with the exception oftravel services. At this lower level of detail, the series are deflated individually by price indexes and aggregated to
33. Financial and Taxation Statistics for Enterprises, survey no. 2510, catalogue no. 61-219.34. Canadian International Merchandise Trade, catalogue no. 65-001.
Statistics Canada - Catalogue no. 13-017 Guide to the Income and Expenditure Accounts 255
International and inter-provincial trade in goods and services
the level of the five groups published, using the fixed-base Laspeyres index method. Once the real series havebeen aggregated to their published level, they are used, along with their nominal value counterparts, as the basisfor calculating the chain Fisher index of the aggregate of services and the aggregates of exports and imports.
Quarterly deflation of services exports
11.113 The unique deflator of travel services comes from the personal expenditure section of the Income andExpenditure Accounts Division (IEAD). It is unique because it is used both to deflate travel services for personalexpenditures and for exports. A detailed description of this deflator is provided in the chapter on personalexpenditures on consumer goods and services.
11.114 Transportation services are deflated in two distinct parts: passenger transport services and goods transportservices. The travel services deflator for fares (see paragraph 11.113) serves for deflation of the passengertransport services. Goods transport services, for their part, are divided into five categories: air, marine, rail, trucktransport services and pipeline services. A deflator is constructed for each of these categories, based on the indexof industrial product prices for all goods, indexes of industrial product prices for certain fuels and the index of
wages for the industry that is conceptually closest to the transportation category concerned.35 These indexes areweighted based on the structure of the inputs of the industry that, once again, most closely corresponds to thetransportation category concerned.
11.115 Commercial services are deflated for the 48 components provided by the Balance of Payments Division. Acombination of average weekly earnings from the Survey of Employment, Payrolls and Hours, personalexpenditure deflators, and consumer and industry price indexes are used for deflating the 48 commercial exportservices. The weights of these prices are based on the weights of inputs into these industries coming from theInput-Output Tables.
11.116 Government services, excluding immigration and work permits, are deflated using the Consumer PriceIndex of non-durable goods. Immigration and work permits are deflated by the price index of non-wageexpenditures of public administrations.
11.117 Exports of financial services indirectly measured (FSIM) are deflated using a current weighted price indexbased on the borrowing and deposits portion of FSIM. For the borrowings portion, the personal expendituredeflator of financial intermediation, implicit loan charges is used. For the deposits portion, the personal expendituredeflator for financial intermediation, implicit deposit charges is being used; a description of those deflators isavailable in the personal expenditure on consumer goods and services chapter of this guide.
Quarterly deflation of services imports
11.118 Prices to deflate imports of travel services are constructed by the personal expenditure area of Income andExpenditure Accounts Division. The deflator is based on a combination of foreign prices and exchange rates.
11.119 Transportation services are deflated according to two categories—passenger transportation services andtransportation services for goods. Passenger transportation services are deflated using the travel price index forimports. Goods transportation services are deflated according to five categories: transport by pipeline, air, marine,train and truck. The weighting used is based on the nominal values of transportation services for each category, asprovided by the Balance of Payments Division.
11.120 Similar to exports, deflation of imports of commercial services is done at a very detailed level. U.S. AverageWeekly Earnings (AWE), CPI’s, PPI’s and services price indexes from the Bureau of Labor Statistics (BLS) are theprincipal sources of information. Where applicable, the BLS series are supplemented by Canadian consumer priceindexes and industrial product price indexes.
35. These indexes are calculated from the results of the Survey of Employment, Payroll and Hours (SEPH).
256 Statistics Canada - Catalogue no. 13-017 Guide to the Income and Expenditure Accounts
International and inter-provincial trade in goods and services
11.121 Imports of government services are deflated in two parts: military pay and allowances abroad and otherexpenditures. The first part is deflated using a weighted average of indexes of the cost of living at bases abroad,adjusted to take into account exchange rates. The second part is deflated by the index of international travelservices. A description of these deflators is available in the chapter on personal expenditure on consumer goodsand services.
11.122 As is the case for exports, imports of financial services indirectly measured (FSIM) are deflated using acurrent weighted price index based on the borrowings and deposits portion of FSIM. For the borrowings portion,the personal expenditure price for financial intermediation, implicit loan charges is used. The personal expenditureprice for financial intermediation, implicit deposit charge is used for the deposits portion; a description of thesedeflators is available in the personal expenditure on consumer goods and services chapter of this guide.
Provincial and territorial estimation methods and sources
11.123 Inter-provincial trade flows measure the annual sales of goods and services among Canada’s provincesand territories while international trade by province reflects annual sales between individual provinces/territories
and the rest of the world.36
11.124 Estimating inter-provincial and international trade flows consists of determining the origin and destination ofgoods within and outside Canada. The point of origin represents the location where the goods and services areproduced or withdrawn from inventory, while destination represents the place where the goods and services aresold or entered into inventory.
11.125 Inter-provincial and international flows of goods and services are determined through a process ofbalancing the supply and demand for goods and services by province. Thus, for each province or territory and foreach product (whether a good or service), domestic demand must equal imports from the rest of the world(international trade), from other provinces (inter-provincial trade) and production (including changes in inventory) inthe same province. There is an additional constraint in the case of international trade, where the sum of theprovinces is benchmarked to the national totals published by the Income and Expenditure Accounts Division
(IEAD).37
11.126 This balancing of supply and demand by province is done in the framework of the provincial and territorialInput-Output Tables produced by the Industry Accounts Division (IAD). These tables summarize production, finaldemand and the estimate of trade flows, both international and inter-provincial. The estimates are produced by IADin current dollars only, for benchmark and non-benchmark years. Benchmark year data are fully balanced and arepart of the published Input-Output Tables, while the estimates for the non-benchmark years are derived frommodels developed by the IAD and integrated into the IEA.
11.127 International trade by the provinces is valued at market prices38 as required by the Balance of Paymentsconcepts. For international exports, trade margins and transportation margins are redistributed among the goods.Inter-provincial trade, however, is not tied to the Balance of Payments concept and is calculated at the producer’sprice rather than at market prices.
11.128 The International Trade Division (ITD) and the Balance of Payments Division (BPD), which are datasources of international trade at the national level, are considered important sources of data for the input-outputsystem, but not as suppliers of final estimates, as is the case in the national system. Although essential, the datarecorded by the ITD and the BPD are not sufficient in a provincial framework because they do not allow for a strongregional breakout of flows. This inadequacy is especially apparent with international imports of goods, wherecustoms data refer to the province of entry and not the province of final use. In the case of exports of goods,
36. For more information, see The Derivation of Provincial (Inter-regional) Trade Flows: The Canadian Experience, prepared for presentationat the 14th International Input-Output Techniques Conference, October 10 to 15, 2002, Montreal, 48 pp.
37. The accounting identities are described in greater detail in Appendix 11D: Balancing of provincial trade flows.38. These are often referred to as purchaser prices.
Statistics Canada - Catalogue no. 13-017 Guide to the Income and Expenditure Accounts 257
International and inter-provincial trade in goods and services
customs data do not always distinguish between the plant and the wholesaler or retailer, which distorts the data on
product origin.39 On the services side, the BPD only produces estimates at the national level and no provincial dataare available.
11.129 There are also significant differences between the quarterly national and annual provincial systems. Themost obvious one relates to classification: since the input-output classification is different from that used by theBalance of Payments Division at the national level, it is difficult to match products between the provincial andnational systems. This difference in classification is exacerbated during the deflation process where the chainFisher indexes are calculated from different levels of detail on different aggregates. A second difference exists inthe definition of certain services, such as travel services. At the national level, travel services include the purchaseof goods by foreign tourists in Canada or the reverse, by Canadians abroad. For input-output purposes, these
goods are placed in their corresponding categories.40 These two fundamental differences of classification anddefinition of goods and services mean that the goods and services totals of the provincial and national systems donot match, that is, the sum of the goods of the provinces does not equal the Canadian total published in thenational system, and the same applies to services.
Presentation of provincial and territorial estimates
11.130 As mentioned, international provincial and inter-provincial trade data are calculated by the IndustryAccounts Division, which uses its own system of goods classification for its calculations. The level of work of theIEAD (for deflation, in particular) and the presentation framework of the data are therefore substantially influencedby the IAD classification.
11.131 The Industry Accounts Division uses a classification consisting of 679 goods and services for bothinternational and inter-provincial trade. These 679 goods and services are remitted as is, in current dollars, to theIEAD. The IEAD uses the 679 groups as a working level, from which a first edit of the most important groups interms of nominal value and an initial deflation is made. These 679 goods and services are then aggregated into 57groups that serve as the basis for calculating the chain Fisher volume indexes. These groups have no direct link tothe 64 export groups and 63 import groups used on a national basis.
39. On the international exports side, the exporting province is recorded as the province of origin. There are, however, a number of problems:wholesalers and retailers are often confused with the producer; storage facilities and the routes used by carriers can create errors (forexample, iron from Labrador assigned to Quebec); international sales are sometimes managed by agents (for example, uranium fromSaskatchewan sold by an Ontario agent); the province of origin not recorded in customs documents; exports to the United States comefrom U.S. import customs documents, which are less accurate in terms of origin; the coding can contain errors. For international imports,the documents record only the province at which the goods cleared customs and not the final destination.
40. Travel services, commercial services, transportation services and government services are re-classified when they are moved into theinput-output balancing system.
258 Statistics Canada - Catalogue no. 13-017 Guide to the Income and Expenditure Accounts
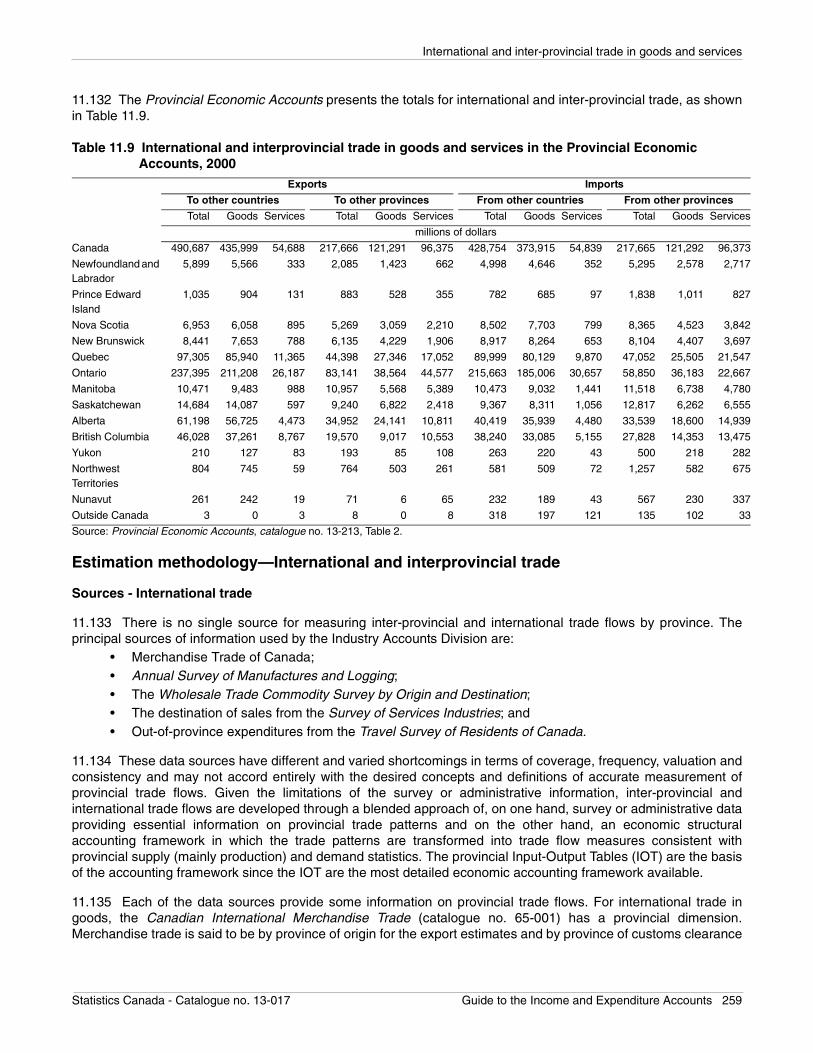
International and inter-provincial trade in goods and services
11.132 The Provincial Economic Accounts presents the totals for international and inter-provincial trade, as shownin Table 11.9.
Estimation methodology—International and interprovincial trade
Sources - International trade
11.133 There is no single source for measuring inter-provincial and international trade flows by province. Theprincipal sources of information used by the Industry Accounts Division are:
• Merchandise Trade of Canada;• Annual Survey of Manufactures and Logging;• The Wholesale Trade Commodity Survey by Origin and Destination;• The destination of sales from the Survey of Services Industries; and• Out-of-province expenditures from the Travel Survey of Residents of Canada.
11.134 These data sources have different and varied shortcomings in terms of coverage, frequency, valuation andconsistency and may not accord entirely with the desired concepts and definitions of accurate measurement ofprovincial trade flows. Given the limitations of the survey or administrative information, inter-provincial andinternational trade flows are developed through a blended approach of, on one hand, survey or administrative dataproviding essential information on provincial trade patterns and on the other hand, an economic structuralaccounting framework in which the trade patterns are transformed into trade flow measures consistent withprovincial supply (mainly production) and demand statistics. The provincial Input-Output Tables (IOT) are the basisof the accounting framework since the IOT are the most detailed economic accounting framework available.
11.135 Each of the data sources provide some information on provincial trade flows. For international trade ingoods, the Canadian International Merchandise Trade (catalogue no. 65-001) has a provincial dimension.Merchandise trade is said to be by province of origin for the export estimates and by province of customs clearance
Table 11.9 International and interprovincial trade in goods and services in the Provincial Economic Accounts, 2000
Exports Imports
To other countries To other provinces From other countries From other provinces
Total Goods Services Total Goods Services Total Goods Services Total Goods Services
millions of dollars
Canada 490,687 435,999 54,688 217,666 121,291 96,375 428,754 373,915 54,839 217,665 121,292 96,373
Newfoundland and Labrador
5,899 5,566 333 2,085 1,423 662 4,998 4,646 352 5,295 2,578 2,717
Prince Edward Island
1,035 904 131 883 528 355 782 685 97 1,838 1,011 827
Nova Scotia 6,953 6,058 895 5,269 3,059 2,210 8,502 7,703 799 8,365 4,523 3,842
New Brunswick 8,441 7,653 788 6,135 4,229 1,906 8,917 8,264 653 8,104 4,407 3,697
Quebec 97,305 85,940 11,365 44,398 27,346 17,052 89,999 80,129 9,870 47,052 25,505 21,547
Ontario 237,395 211,208 26,187 83,141 38,564 44,577 215,663 185,006 30,657 58,850 36,183 22,667
Manitoba 10,471 9,483 988 10,957 5,568 5,389 10,473 9,032 1,441 11,518 6,738 4,780
Saskatchewan 14,684 14,087 597 9,240 6,822 2,418 9,367 8,311 1,056 12,817 6,262 6,555
Alberta 61,198 56,725 4,473 34,952 24,141 10,811 40,419 35,939 4,480 33,539 18,600 14,939
British Columbia 46,028 37,261 8,767 19,570 9,017 10,553 38,240 33,085 5,155 27,828 14,353 13,475
Yukon 210 127 83 193 85 108 263 220 43 500 218 282
Northwest Territories
804 745 59 764 503 261 581 509 72 1,257 582 675
Nunavut 261 242 19 71 6 65 232 189 43 567 230 337
Outside Canada 3 0 3 8 0 8 318 197 121 135 102 33
Source: Provincial Economic Accounts, catalogue no. 13-213, Table 2.
Statistics Canada - Catalogue no. 13-017 Guide to the Income and Expenditure Accounts 259
International and inter-provincial trade in goods and services
for imports. For export data, the province of origin corresponds to the requirement of the trade flows program. Butsince the export estimates to U.S. are based on U.S. import data from Canada, the province of origin for the bulk ofour exports is in effect the last point of direct shipment to the U.S. The province of origin data from customsdocumentation is therefore not a reliable source for provincially allocating international exports. For this reason,trade in grains is corrected using Canadian Grain Commission information, energy commodities are provided bythe Manufacturing, Construction and Energy Division (MCED). Census of Mines is put to contribution to validateinternational merchandise exports of mining commodities. Finally, the Annual Surveys of Manufacturers and theWholesale Trade Commodity Survey by Origin and Destination provide key information about the origin ofinternational exports.
11.136 For international imports, the data from the Canadian International Merchandise Trade are by province ofcustoms clearance which is not consistent with the province of destination (consumption) concept required byinter-provincial and international trade flows program. Again, the Wholesale Trade Commodity Survey by Originand Destination and survey data which provides information on demand by province is used to reallocateinternational imports to the proper destination.
11.137 The Canadian Balance of Payments form the basis of the international trade in services measure in theCanadian System of National Accounts. However, they are not produced by province or territory as is required bythe provincial trade flows program. Since survey data is generally unavailable at the provincial or territorial level,the national data are allocated according to the province or territory in which the activity is estimated to take place.A wide range of distributors are used such as:
• Wages by province to allocate many of the commercial services;• Number of international students by host province to apportion education-related travel;• Cargo tonnage of foreign carriers by province to distribute freight payments; and• Number of foreign representatives by province to allocate foreign government spending in Canada.
11.138 The latest provincial allocation of BOP national estimates are for reference year 1996 and are used as astarting point for international trade in services by province for all years since that time. Additional and more currentsources are used to complement specific services in international trade. They are:
• Annual surveys of the business services industries occasionally include a question on the geographic residence of clients;
• Various annual transport surveys provide rail/truck/marine origin and destination transport data which are used in the derivation of both international transport imports and exports;
• The International Travel Survey is the basis for provincial allocation of specific travel-related commodities in deriving both international imports and exports; and
• Wholesale Trade Commodity Surveys by Origin and Destination provides a pattern to provincialize the wholesale margins for both international imports and exports. The latest results are for reference years 1998 and 2001.
Sources—Inter-provincial trade
11.139 The Industry Accounts Division (IAD) obtains measures of inter-provincial trade either by asking producerswhere goods and services are sold or by asking buyers where goods and services originated from. In general,inter-provincial trade in goods is based on the producers information, while retail, wholesale and travel relatedexpenditures is based on buyers information. For many other commodities, mainly services, only very proxyinformation is available to estimate trade patterns. In those cases the use of the IO framework fills the data gap.Table 11.10 presents the methods used by IAD for three groups of goods and four groups of services.
260 Statistics Canada - Catalogue no. 13-017 Guide to the Income and Expenditure Accounts

International and inter-provincial trade in goods and services
11.140 International trade by province and inter-provincial trade flows estimates for the non-benchmark years donot benefit from the full provincial Input-Output Tables (IOT). In other words, the supply/demand constraints of theaccounting framework are not available.
Table 11.10 Summary of interprovincial trade flows methods and sources
Goods Source
Primary goods Trade patterns are generally obtained by asking producers where goods and services are sold.
- Agricultural products (livestock, grains, dairy products): Surveys from Statistics Canada's Agriculture Division; Records from the Canadian Grain Commission, Records from Canadian Dairy Commission; Records from Agriculture Canada.
- Metallic and non-metallic ores and concentrates: Annual Census of Mines, Quarries and Sand Pits conducted by Natural Resources Canada.
- Energy commodities: Surveys of the Energy section of Statistics Canada. The trade patterns for crude oil is modified to correspond to the concept of the trade flow program. This is done based on trade movement of crude oil subject to domestic demand/supply constraints.
Manufactured goods The principal source is "destination of shipments" from Statistics Canada Annual Survey of Manufacturers and Logging. This information is combined with the results of the Wholesale Trade Commodity by Origin and Destination survey to bridge the gap between "first" and "final" destination of shipments.
Other goods Construction and Utilities related commodities are included in this category. By nature, the output of construction cannot be traded outside province where work is put in place. For utilities, electricity is the only commodity for which trade flows are measured. These flows are obtained from published electricity disposition table by Statistics Canada Energy section.
Services
Transportation and storage - Storage (grain): Based on flows of major grain commodities.
- Transport related to travel (Taxi, urban and interurban bus and air): Derived from Travel Survey of Residents of Canada and Air Transport Origin and Destination surveys of the Transport Division of Statistics Canada.
- Freight (trucking): Trucking Commodity Origin and Destination Survey.
- Freight (marine): Marine International Freight Origin and Destination Survey.
- Freight (rail): Rail Commodity Origin and Destination Statistics.
Communications Commodities included are "telephone and telecommunications", "postal services", radio and television broadcasting" and "cable and other subscription programs". For these commodities, source data are limited. Trade patterns are derived from provincial domestic demand of the Input-Output framework.
Business and computer services
Trade patterns derived from occasional information on destination of sales of Statistics Canada annual surveys of various industries. The latest years are (1998 and 2003).
Financial services No survey or administrative information on origin and destination of financial services is available. Trade flows fluctuate as a result of changes in domestic supply/demand constraints.
Wholesale and retail margins - Wholesale margins: Interprovincial trade distributions are derived from the Wholesale Trade Commodity Survey by Origin and Destination. The location of the wholesaler represents the province of origin of the wholesale margin, and the destination of wholesale sale represents the destination of the wholesale margin.
- Retail margins: Trade patterns are derived from 1994 survey of growing small and medium-sized enterprises. The survey provided the proportion of out-of-province sales of small to medium-sized retailers; see catalogue no. 61-523 Strategies for Success: A profile of Growing Small and Medium-sized Enterprises in Canada.
Personal and recreational services
Various recreation and personal services can be exported when consumed by non-residents (travel and tourism). Interprovincial trade in these services were derived from the Travel Survey of Residents of Canada which contains information on the province of origin of travelers and province of travel expenditures by broad categories of outlays such as transportation fares, vehicle operations, accommodations, restaurants and drinking places. These expenditure trade flows are allocated to appropriate commodities such as accommodation, meals, alcoholic beverages consumed on licensed premises, motor vehicle rentals as well as recreation and entertainment services.
Statistics Canada - Catalogue no. 13-017 Guide to the Income and Expenditure Accounts 261
International and inter-provincial trade in goods and services
11.141 With the objective of having a current set of supply and demand constraints, the Industry Accounts Divisionproduces synthetic or projected provincial Input-Output Tables based on data available in the current period. Thosesynthetic tables are, in essence, a projection of the most recent benchmarked provincial IOT and its associatedtrade matrix, using the following limited but current information:
• internally-produced current price provincial gross outputs from the provincial gross domestic product (GDP) by industry program;
• major components of the provincial expenditure-based gross domestic product from the Provincial Economic Accounts;
• industrial and provincial distributions of the private and public investment;• international merchandise trade by province;• national Balance of Payments estimates and their breakdown;• trade flows for agricultural and energy commodities (from Statistics Canada surveys);• miscellaneous heterogeneous information such as provincial employment and wages by industry; • economic intelligence gathered through press releases and provincial governments; and• final domestic demand estimates.
Deflation of regional estimates
11.142 The Income and Expenditure Accounts Division (IEAD) deflates inter-provincial and international trade flowseries at the detailed level of 679 products. As a general rule, for a given product, the same price will be applied inall provinces, by trade flow. Province specific prices may be used where province specific price or volume data isavailable.
11.143 Series are deflated at the most detailed level, then aggregated to the S level (57 groups). Implicit pricesused in calculating the chain Fisher index are then deduced from the 57 groups in current and constant dollars. Achain Fisher index is calculated for the totals of exports and imports, and for totals of flows to other provinces (inter-
provincial trade) and to other countries (international trade).41 Fisher indexes are also calculated for goods andservices of these flows.
11.144 Deflation of the series at the most detailed level uses prices from several sources. The various sourcesused for international trade and for flows in inter-provincial products are summarized in Table 11.11. For flows ofinter-provincial products, there is no differentiation in export and import prices by product because the flow ofexports from one province is the flow of imports to another.
11.145 International exports of goods are generally deflated by prices provided by the International Trade Division.They provide IEAD with a set of detailed prices (a more detail level than the major groups) to facilitate their
incorporation into the provincial system.42 As in the national deflation, for exports, these prices are mainly derivedfrom price indexes of domestic industrial products, produced by the Prices Division, and, to a lesser degree, fromunit values derived from customs data and price indexes of industrial export products. For some commodities, theimplicit prices of the major groups of the national system are also used for international exports of provinces. Thisis the case, in particular, for exports of automobiles, petroleum products and natural gas.
11.146 International exports of services are mainly deflated by prices from the national system, where weeklyaverage earnings, Industrial Product Price Index (IPPI), personal expenditure prices and CPIs largely serve as thebasis for calculating price indexes.
11.147 The Income and Expenditure Accounts Division (IEAD) sometimes receives province or commoditiesspecific information that can be taken into account and used to adjust some prices.
41. This index is subsequently benchmarked on current dollar values of a reference year, as is the case in the national system.42. The provincial system has 679 products while the national has 64. ITD is able to provide IEAD with a lower level of detail than the major
groups of the national system, which allows for some refinement of provincial deflation. These prices are also used as the basis fordeflation of the national system.
262 Statistics Canada - Catalogue no. 13-017 Guide to the Income and Expenditure Accounts
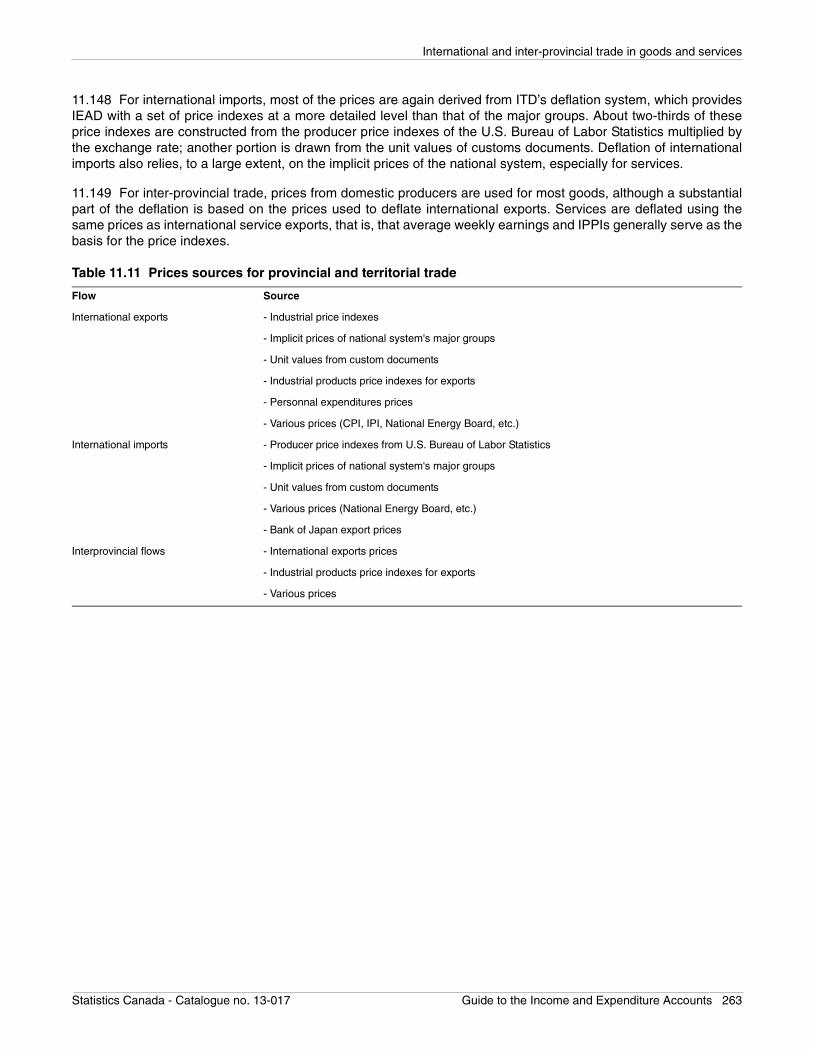
International and inter-provincial trade in goods and services
11.148 For international imports, most of the prices are again derived from ITD’s deflation system, which providesIEAD with a set of price indexes at a more detailed level than that of the major groups. About two-thirds of theseprice indexes are constructed from the producer price indexes of the U.S. Bureau of Labor Statistics multiplied bythe exchange rate; another portion is drawn from the unit values of customs documents. Deflation of internationalimports also relies, to a large extent, on the implicit prices of the national system, especially for services.
11.149 For inter-provincial trade, prices from domestic producers are used for most goods, although a substantialpart of the deflation is based on the prices used to deflate international exports. Services are deflated using thesame prices as international service exports, that is, that average weekly earnings and IPPIs generally serve as thebasis for the price indexes.
Table 11.11 Prices sources for provincial and territorial trade
Flow Source
International exports - Industrial price indexes
- Implicit prices of national system's major groups
- Unit values from custom documents
- Industrial products price indexes for exports
- Personnal expenditures prices
- Various prices (CPI, IPI, National Energy Board, etc.)
International imports - Producer price indexes from U.S. Bureau of Labor Statistics
- Implicit prices of national system's major groups
- Unit values from custom documents
- Various prices (National Energy Board, etc.)
- Bank of Japan export prices
Interprovincial flows - International exports prices
- Industrial products price indexes for exports
- Various prices
Statistics Canada - Catalogue no. 13-017 Guide to the Income and Expenditure Accounts 263
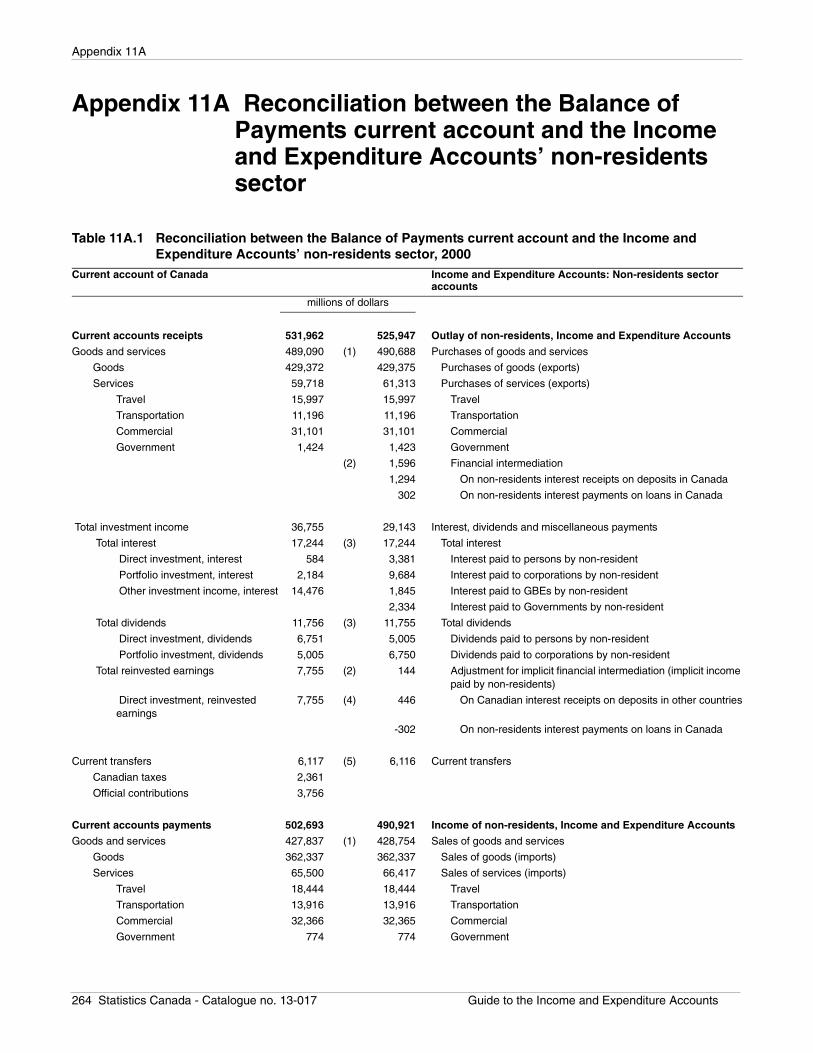
Appendix 11A
Appendix 11A Reconciliation between the Balance of Payments current account and the Income and Expenditure Accounts’ non-residents sector
Table 11A.1 Reconciliation between the Balance of Payments current account and the Income and Expenditure Accounts’ non-residents sector, 2000
Current account of Canada Income and Expenditure Accounts: Non-residents sector accounts
millions of dollars
Current accounts receipts 531,962 525,947 Outlay of non-residents, Income and Expenditure Accounts
Goods and services 489,090 (1) 490,688 Purchases of goods and services
Goods 429,372 429,375 Purchases of goods (exports)
Services 59,718 61,313 Purchases of services (exports)
Travel 15,997 15,997 Travel
Transportation 11,196 11,196 Transportation
Commercial 31,101 31,101 Commercial
Government 1,424 1,423 Government
(2) 1,596 Financial intermediation
1,294 On non-residents interest receipts on deposits in Canada
302 On non-residents interest payments on loans in Canada
Total investment income 36,755 29,143 Interest, dividends and miscellaneous payments
Total interest 17,244 (3) 17,244 Total interest
Direct investment, interest 584 3,381 Interest paid to persons by non-resident
Portfolio investment, interest 2,184 9,684 Interest paid to corporations by non-resident
Other investment income, interest 14,476 1,845 Interest paid to GBEs by non-resident
2,334 Interest paid to Governments by non-resident
Total dividends 11,756 (3) 11,755 Total dividends
Direct investment, dividends 6,751 5,005 Dividends paid to persons by non-resident
Portfolio investment, dividends 5,005 6,750 Dividends paid to corporations by non-resident
Total reinvested earnings 7,755 (2) 144 Adjustment for implicit financial intermediation (implicit income paid by non-residents)
Direct investment, reinvested earnings
7,755 (4) 446 On Canadian interest receipts on deposits in other countries
-302 On non-residents interest payments on loans in Canada
Current transfers 6,117 (5) 6,116 Current transfers
Canadian taxes 2,361
Official contributions 3,756
Current accounts payments 502,693 490,921 Income of non-residents, Income and Expenditure Accounts
Goods and services 427,837 (1) 428,754 Sales of goods and services
Goods 362,337 362,337 Sales of goods (imports)
Services 65,500 66,417 Sales of services (imports)
Travel 18,444 18,444 Travel
Transportation 13,916 13,916 Transportation
Commercial 32,366 32,365 Commercial
Government 774 774 Government
264 Statistics Canada - Catalogue no. 13-017 Guide to the Income and Expenditure Accounts
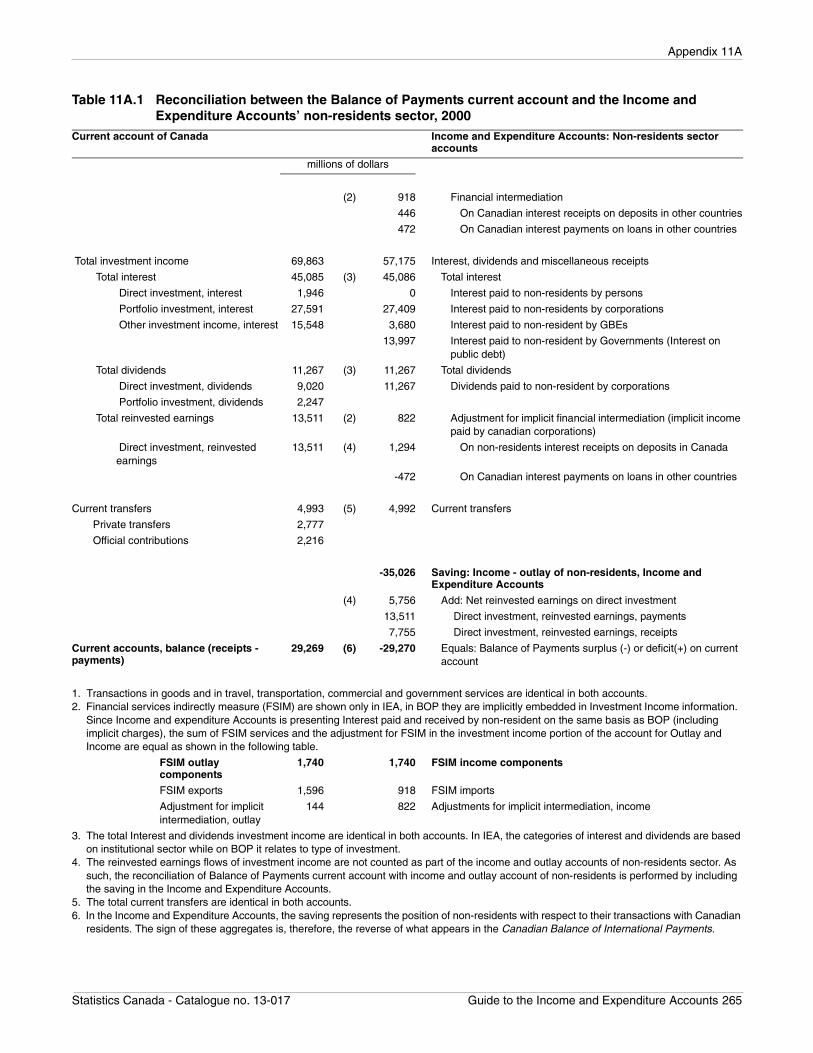
Appendix 11A
(2) 918 Financial intermediation
446 On Canadian interest receipts on deposits in other countries
472 On Canadian interest payments on loans in other countries
Total investment income 69,863 57,175 Interest, dividends and miscellaneous receipts
Total interest 45,085 (3) 45,086 Total interest
Direct investment, interest 1,946 0 Interest paid to non-residents by persons
Portfolio investment, interest 27,591 27,409 Interest paid to non-residents by corporations
Other investment income, interest 15,548 3,680 Interest paid to non-resident by GBEs
13,997 Interest paid to non-resident by Governments (Interest on public debt)
Total dividends 11,267 (3) 11,267 Total dividends
Direct investment, dividends 9,020 11,267 Dividends paid to non-resident by corporations
Portfolio investment, dividends 2,247
Total reinvested earnings 13,511 (2) 822 Adjustment for implicit financial intermediation (implicit income paid by canadian corporations)
Direct investment, reinvested earnings
13,511 (4) 1,294 On non-residents interest receipts on deposits in Canada
-472 On Canadian interest payments on loans in other countries
Current transfers 4,993 (5) 4,992 Current transfers
Private transfers 2,777
Official contributions 2,216
-35,026 Saving: Income - outlay of non-residents, Income and Expenditure Accounts
(4) 5,756 Add: Net reinvested earnings on direct investment
13,511 Direct investment, reinvested earnings, payments
7,755 Direct investment, reinvested earnings, receipts
Current accounts, balance (receipts - payments)
29,269 (6) -29,270 Equals: Balance of Payments surplus (-) or deficit(+) on current account
1. Transactions in goods and in travel, transportation, commercial and government services are identical in both accounts.2. Financial services indirectly measure (FSIM) are shown only in IEA, in BOP they are implicitly embedded in Investment Income information.
Since Income and expenditure Accounts is presenting Interest paid and received by non-resident on the same basis as BOP (including implicit charges), the sum of FSIM services and the adjustment for FSIM in the investment income portion of the account for Outlay and Income are equal as shown in the following table.
FSIM outlay components
1,740 1,740 FSIM income components
FSIM exports 1,596 918 FSIM imports
Adjustment for implicit intermediation, outlay
144 822 Adjustments for implicit intermediation, income
3. The total Interest and dividends investment income are identical in both accounts. In IEA, the categories of interest and dividends are based on institutional sector while on BOP it relates to type of investment.
4. The reinvested earnings flows of investment income are not counted as part of the income and outlay accounts of non-residents sector. As such, the reconciliation of Balance of Payments current account with income and outlay account of non-residents is performed by including the saving in the Income and Expenditure Accounts.
5. The total current transfers are identical in both accounts.6. In the Income and Expenditure Accounts, the saving represents the position of non-residents with respect to their transactions with Canadian
residents. The sign of these aggregates is, therefore, the reverse of what appears in the Canadian Balance of International Payments.
Table 11A.1 Reconciliation between the Balance of Payments current account and the Income and Expenditure Accounts’ non-residents sector, 2000
Current account of Canada Income and Expenditure Accounts: Non-residents sector accounts
millions of dollars
Statistics Canada - Catalogue no. 13-017 Guide to the Income and Expenditure Accounts 265
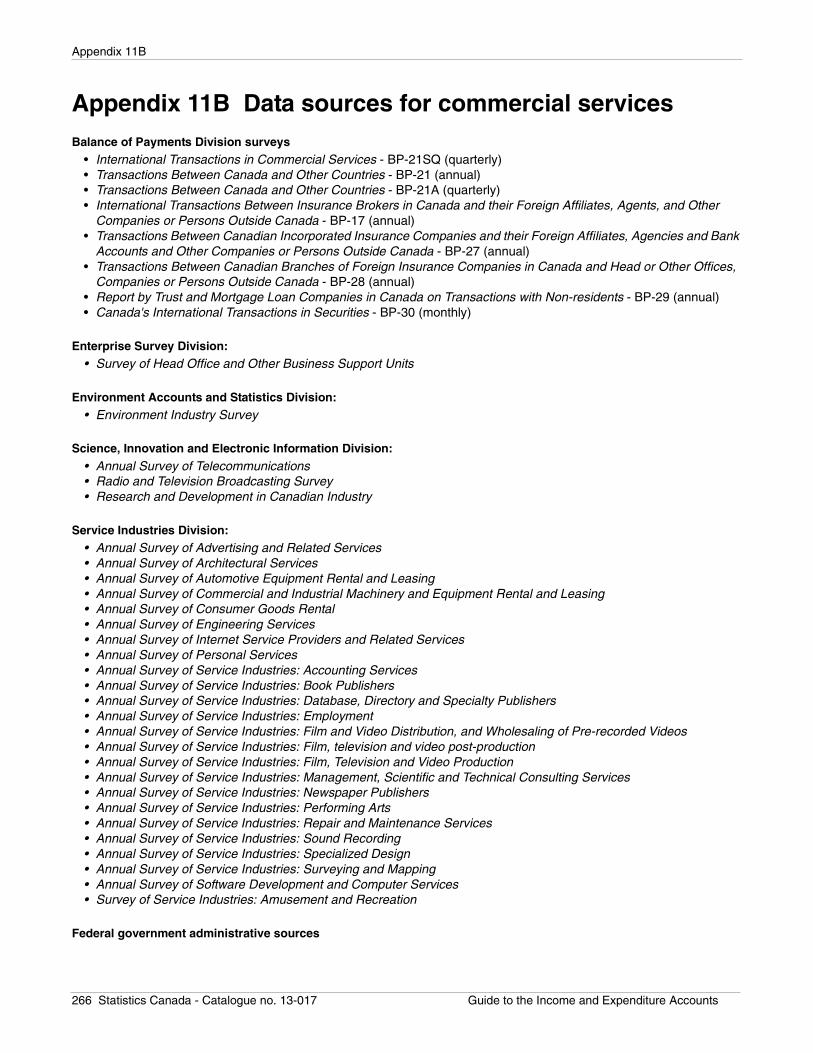
Appendix 11B
Appendix 11B Data sources for commercial servicesBalance of Payments Division surveys
• International Transactions in Commercial Services - BP-21SQ (quarterly)• Transactions Between Canada and Other Countries - BP-21 (annual)• Transactions Between Canada and Other Countries - BP-21A (quarterly)• International Transactions Between Insurance Brokers in Canada and their Foreign Affiliates, Agents, and Other
Companies or Persons Outside Canada - BP-17 (annual)• Transactions Between Canadian Incorporated Insurance Companies and their Foreign Affiliates, Agencies and Bank
Accounts and Other Companies or Persons Outside Canada - BP-27 (annual)• Transactions Between Canadian Branches of Foreign Insurance Companies in Canada and Head or Other Offices,
Companies or Persons Outside Canada - BP-28 (annual)• Report by Trust and Mortgage Loan Companies in Canada on Transactions with Non-residents - BP-29 (annual)• Canada's International Transactions in Securities - BP-30 (monthly)
Enterprise Survey Division:• Survey of Head Office and Other Business Support Units
Environment Accounts and Statistics Division:• Environment Industry Survey
Science, Innovation and Electronic Information Division:
• Annual Survey of Telecommunications• Radio and Television Broadcasting Survey• Research and Development in Canadian Industry
Service Industries Division:• Annual Survey of Advertising and Related Services• Annual Survey of Architectural Services• Annual Survey of Automotive Equipment Rental and Leasing• Annual Survey of Commercial and Industrial Machinery and Equipment Rental and Leasing• Annual Survey of Consumer Goods Rental• Annual Survey of Engineering Services• Annual Survey of Internet Service Providers and Related Services• Annual Survey of Personal Services• Annual Survey of Service Industries: Accounting Services• Annual Survey of Service Industries: Book Publishers• Annual Survey of Service Industries: Database, Directory and Specialty Publishers• Annual Survey of Service Industries: Employment• Annual Survey of Service Industries: Film and Video Distribution, and Wholesaling of Pre-recorded Videos• Annual Survey of Service Industries: Film, television and video post-production• Annual Survey of Service Industries: Film, Television and Video Production• Annual Survey of Service Industries: Management, Scientific and Technical Consulting Services• Annual Survey of Service Industries: Newspaper Publishers• Annual Survey of Service Industries: Performing Arts• Annual Survey of Service Industries: Repair and Maintenance Services• Annual Survey of Service Industries: Sound Recording• Annual Survey of Service Industries: Specialized Design• Annual Survey of Service Industries: Surveying and Mapping• Annual Survey of Software Development and Computer Services• Survey of Service Industries: Amusement and Recreation
Federal government administrative sources
266 Statistics Canada - Catalogue no. 13-017 Guide to the Income and Expenditure Accounts
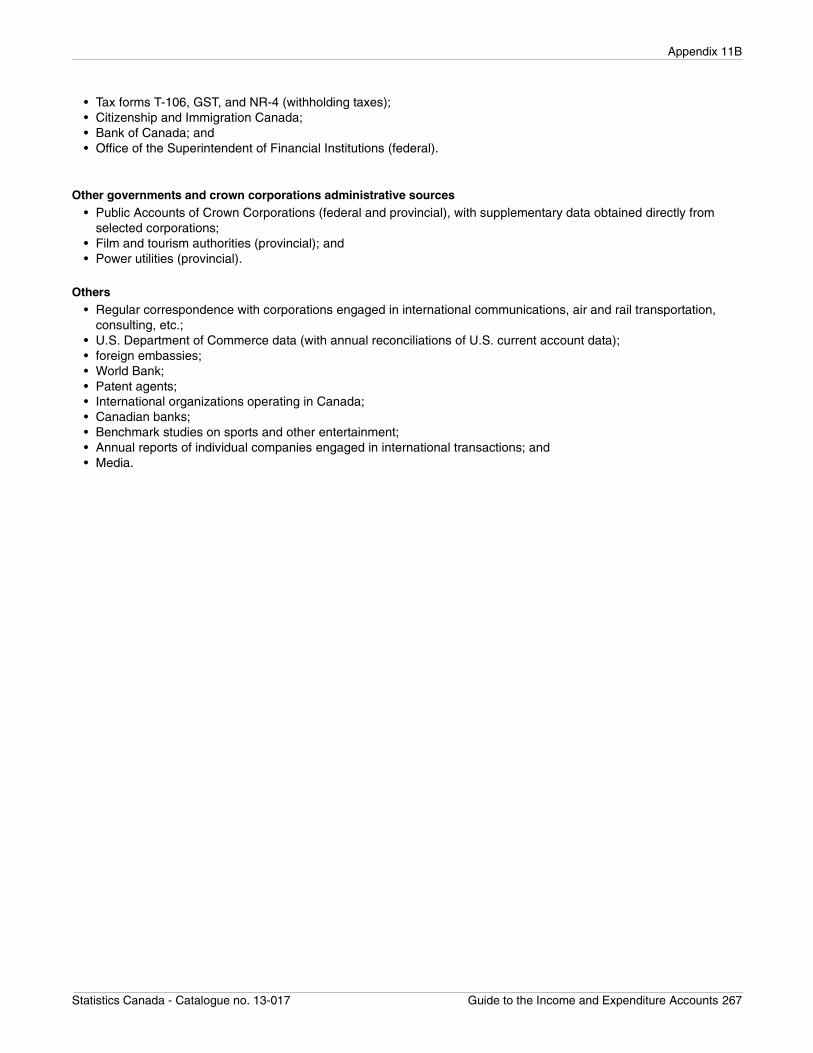
Appendix 11B
• Tax forms T-106, GST, and NR-4 (withholding taxes);• Citizenship and Immigration Canada;• Bank of Canada; and • Office of the Superintendent of Financial Institutions (federal).
Other governments and crown corporations administrative sources• Public Accounts of Crown Corporations (federal and provincial), with supplementary data obtained directly from
selected corporations;• Film and tourism authorities (provincial); and• Power utilities (provincial).
Others• Regular correspondence with corporations engaged in international communications, air and rail transportation,
consulting, etc.;• U.S. Department of Commerce data (with annual reconciliations of U.S. current account data);• foreign embassies;• World Bank;• Patent agents;• International organizations operating in Canada;• Canadian banks;• Benchmark studies on sports and other entertainment;• Annual reports of individual companies engaged in international transactions; and• Media.
Statistics Canada - Catalogue no. 13-017 Guide to the Income and Expenditure Accounts 267
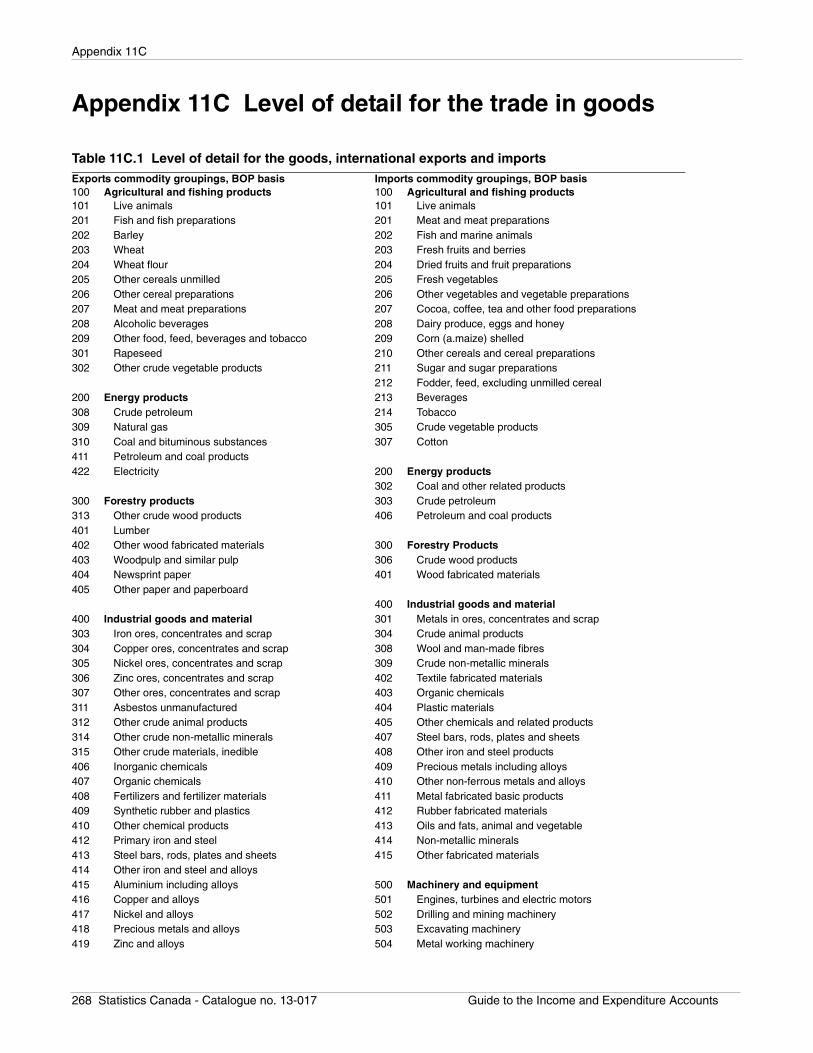
Appendix 11C
Appendix 11C Level of detail for the trade in goods
Table 11C.1 Level of detail for the goods, international exports and importsExports commodity groupings, BOP basis Imports commodity groupings, BOP basis100 Agricultural and fishing products 100 Agricultural and fishing products101 Live animals 101 Live animals201 Fish and fish preparations 201 Meat and meat preparations202 Barley 202 Fish and marine animals203 Wheat 203 Fresh fruits and berries204 Wheat flour 204 Dried fruits and fruit preparations205 Other cereals unmilled 205 Fresh vegetables206 Other cereal preparations 206 Other vegetables and vegetable preparations207 Meat and meat preparations 207 Cocoa, coffee, tea and other food preparations208 Alcoholic beverages 208 Dairy produce, eggs and honey209 Other food, feed, beverages and tobacco 209 Corn (a.maize) shelled301 Rapeseed 210 Other cereals and cereal preparations302 Other crude vegetable products 211 Sugar and sugar preparations
212 Fodder, feed, excluding unmilled cereal200 Energy products 213 Beverages308 Crude petroleum 214 Tobacco309 Natural gas 305 Crude vegetable products310 Coal and bituminous substances 307 Cotton411 Petroleum and coal products422 Electricity 200 Energy products
302 Coal and other related products300 Forestry products 303 Crude petroleum313 Other crude wood products 406 Petroleum and coal products401 Lumber402 Other wood fabricated materials 300 Forestry Products403 Woodpulp and similar pulp 306 Crude wood products404 Newsprint paper 401 Wood fabricated materials405 Other paper and paperboard
400 Industrial goods and material400 Industrial goods and material 301 Metals in ores, concentrates and scrap303 Iron ores, concentrates and scrap 304 Crude animal products304 Copper ores, concentrates and scrap 308 Wool and man-made fibres305 Nickel ores, concentrates and scrap 309 Crude non-metallic minerals306 Zinc ores, concentrates and scrap 402 Textile fabricated materials307 Other ores, concentrates and scrap 403 Organic chemicals311 Asbestos unmanufactured 404 Plastic materials312 Other crude animal products 405 Other chemicals and related products314 Other crude non-metallic minerals 407 Steel bars, rods, plates and sheets315 Other crude materials, inedible 408 Other iron and steel products406 Inorganic chemicals 409 Precious metals including alloys407 Organic chemicals 410 Other non-ferrous metals and alloys408 Fertilizers and fertilizer materials 411 Metal fabricated basic products409 Synthetic rubber and plastics 412 Rubber fabricated materials410 Other chemical products 413 Oils and fats, animal and vegetable412 Primary iron and steel 414 Non-metallic minerals413 Steel bars, rods, plates and sheets 415 Other fabricated materials414 Other iron and steel and alloys415 Aluminium including alloys 500 Machinery and equipment416 Copper and alloys 501 Engines, turbines and electric motors417 Nickel and alloys 502 Drilling and mining machinery418 Precious metals and alloys 503 Excavating machinery419 Zinc and alloys 504 Metal working machinery
268 Statistics Canada - Catalogue no. 13-017 Guide to the Income and Expenditure Accounts
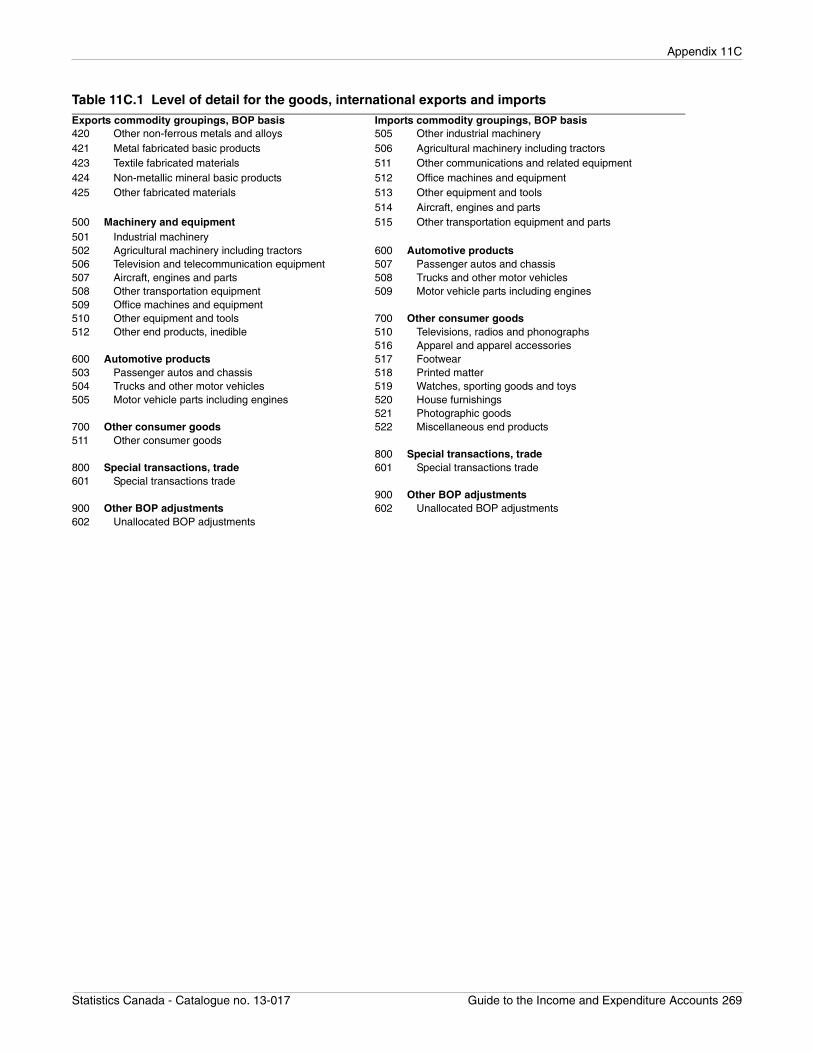
Appendix 11C
420 Other non-ferrous metals and alloys 505 Other industrial machinery421 Metal fabricated basic products 506 Agricultural machinery including tractors423 Textile fabricated materials 511 Other communications and related equipment424 Non-metallic mineral basic products 512 Office machines and equipment425 Other fabricated materials 513 Other equipment and tools
514 Aircraft, engines and parts500 Machinery and equipment 515 Other transportation equipment and parts501 Industrial machinery502 Agricultural machinery including tractors 600 Automotive products506 Television and telecommunication equipment 507 Passenger autos and chassis507 Aircraft, engines and parts 508 Trucks and other motor vehicles508 Other transportation equipment 509 Motor vehicle parts including engines509 Office machines and equipment510 Other equipment and tools 700 Other consumer goods512 Other end products, inedible 510 Televisions, radios and phonographs
516 Apparel and apparel accessories600 Automotive products 517 Footwear503 Passenger autos and chassis 518 Printed matter504 Trucks and other motor vehicles 519 Watches, sporting goods and toys505 Motor vehicle parts including engines 520 House furnishings
521 Photographic goods700 Other consumer goods 522 Miscellaneous end products511 Other consumer goods
800 Special transactions, trade800 Special transactions, trade 601 Special transactions trade601 Special transactions trade
900 Other BOP adjustments900 Other BOP adjustments 602 Unallocated BOP adjustments602 Unallocated BOP adjustments
Table 11C.1 Level of detail for the goods, international exports and importsExports commodity groupings, BOP basis Imports commodity groupings, BOP basis
Statistics Canada - Catalogue no. 13-017 Guide to the Income and Expenditure Accounts 269
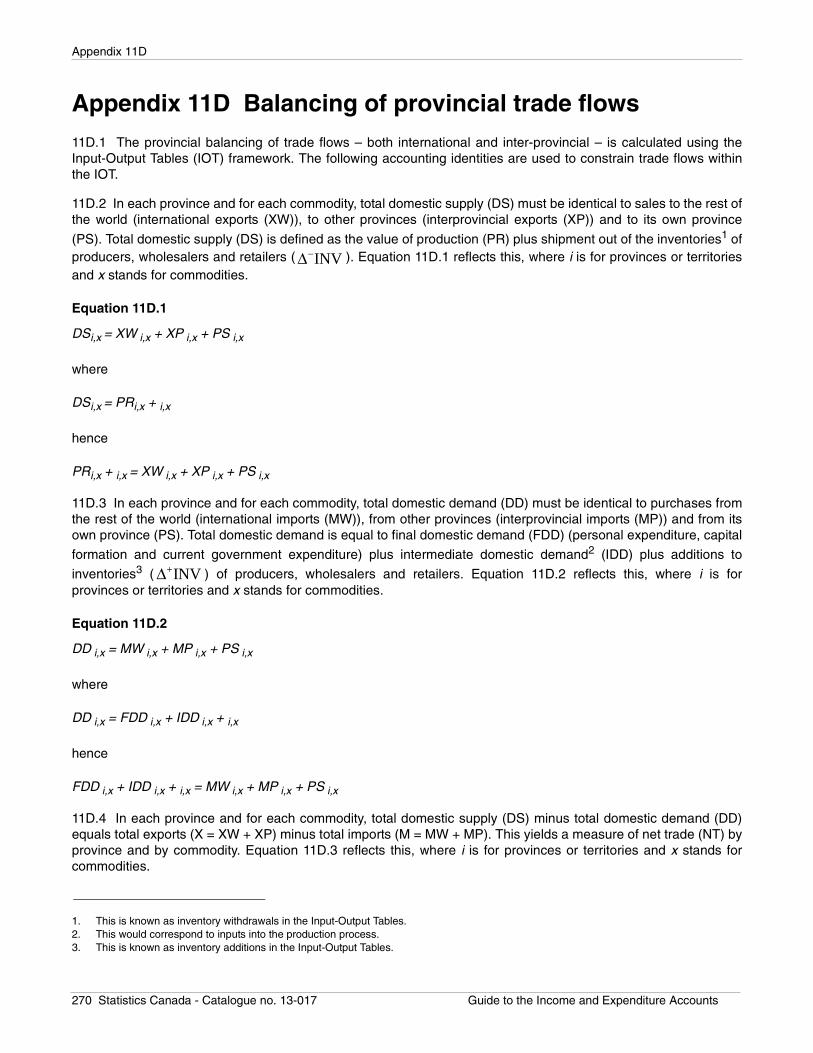
Appendix 11D
Appendix 11D Balancing of provincial trade flows11D.1 The provincial balancing of trade flows – both international and inter-provincial – is calculated using theInput-Output Tables (IOT) framework. The following accounting identities are used to constrain trade flows withinthe IOT.
11D.2 In each province and for each commodity, total domestic supply (DS) must be identical to sales to the rest ofthe world (international exports (XW)), to other provinces (interprovincial exports (XP)) and to its own province
(PS). Total domestic supply (DS) is defined as the value of production (PR) plus shipment out of the inventories1 ofproducers, wholesalers and retailers ( ). Equation 11D.1 reflects this, where i is for provinces or territoriesand x stands for commodities.
Equation 11D.1
DSi,x = XW i,x + XP i,x + PS i,x
where
DSi,x = PRi,x + i,x
hence
PRi,x + i,x = XW i,x + XP i,x + PS i,x
11D.3 In each province and for each commodity, total domestic demand (DD) must be identical to purchases fromthe rest of the world (international imports (MW)), from other provinces (interprovincial imports (MP)) and from itsown province (PS). Total domestic demand is equal to final domestic demand (FDD) (personal expenditure, capital
formation and current government expenditure) plus intermediate domestic demand2 (IDD) plus additions to
inventories3 ( ) of producers, wholesalers and retailers. Equation 11D.2 reflects this, where i is forprovinces or territories and x stands for commodities.
Equation 11D.2
DD i,x = MW i,x + MP i,x + PS i,x
where
DD i,x = FDD i,x + IDD i,x + i,x
hence
FDD i,x + IDD i,x + i,x = MW i,x + MP i,x + PS i,x
11D.4 In each province and for each commodity, total domestic supply (DS) minus total domestic demand (DD)equals total exports (X = XW + XP) minus total imports (M = MW + MP). This yields a measure of net trade (NT) byprovince and by commodity. Equation 11D.3 reflects this, where i is for provinces or territories and x stands forcommodities.
1. This is known as inventory withdrawals in the Input-Output Tables.2. This would correspond to inputs into the production process.3. This is known as inventory additions in the Input-Output Tables.
INV−∆
INV+∆
270 Statistics Canada - Catalogue no. 13-017 Guide to the Income and Expenditure Accounts
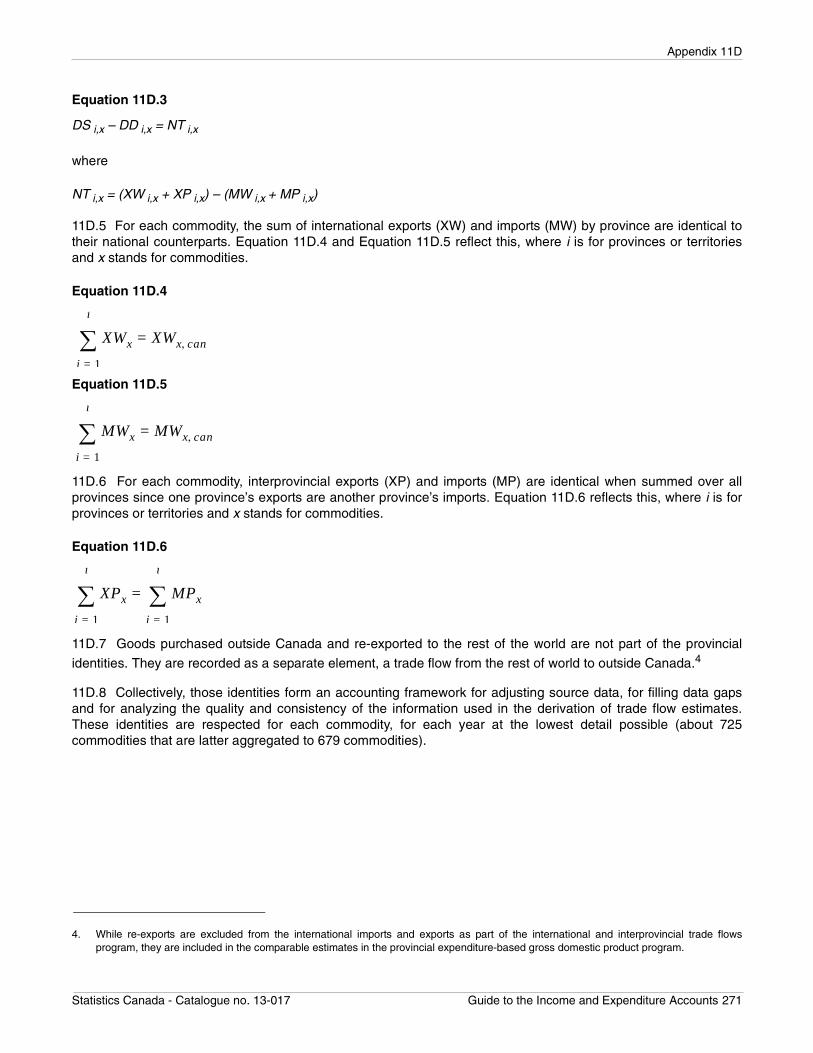
Appendix 11D
Equation 11D.3
DS i,x – DD i,x = NT i,x
where
NT i,x = (XW i,x + XP i,x) – (MW i,x + MP i,x)
11D.5 For each commodity, the sum of international exports (XW) and imports (MW) by province are identical totheir national counterparts. Equation 11D.4 and Equation 11D.5 reflect this, where i is for provinces or territoriesand x stands for commodities.
Equation 11D.4
Equation 11D.5
11D.6 For each commodity, interprovincial exports (XP) and imports (MP) are identical when summed over allprovinces since one province’s exports are another province’s imports. Equation 11D.6 reflects this, where i is forprovinces or territories and x stands for commodities.
Equation 11D.6
11D.7 Goods purchased outside Canada and re-exported to the rest of the world are not part of the provincial
identities. They are recorded as a separate element, a trade flow from the rest of world to outside Canada.4
11D.8 Collectively, those identities form an accounting framework for adjusting source data, for filling data gapsand for analyzing the quality and consistency of the information used in the derivation of trade flow estimates.These identities are respected for each commodity, for each year at the lowest detail possible (about 725commodities that are latter aggregated to 679 commodities).
4. While re-exports are excluded from the international imports and exports as part of the international and interprovincial trade flowsprogram, they are included in the comparable estimates in the provincial expenditure-based gross domestic product program.
XWx XWx can,=
i 1=
i
∑
MWx MWx can,=
i 1=
i
∑
XPx MPx
i 1=
i
∑=
i 1=
i
∑
Statistics Canada - Catalogue no. 13-017 Guide to the Income and Expenditure Accounts 271
Data quality
Chapter 12 Data quality
National Income and Expenditure Accounts
Description
12.1 The Income and Expenditure Accounts are the centre of macroeconomic analysis and policy-making inCanada. They are used in a broad assortment of applications by a wide range of persons and groups in society.They are a means by which Canadians can view and assess the performance of the national economy. Theaccounts provide both a planning framework for governments and a report card on the results of the plans thatgovernments carry out.
12.2 At the core of the Income and Expenditure Accounts (IEA) is the concept of gross domestic product (GDP)and its components. It is a measure of aggregate economic activity that represents the unduplicated value ofproduction in two ways: (i) incomes arising from production and (ii) final expenditures on production. The first is thesum of factor incomes generated by productive activity—that is, incomes representing the returns to the labour andcapital employed. The second is the sum of all sales to final users (consumers, governments, business on capitalaccount, exports less imports). The two measures of GDP may not be equal to each other, giving rise to a statisticaldiscrepancy.
12.3 The Canadian System of National Accounts (CSNA) provides a conceptually integrated framework ofstatistics and analysis for studying the state and behaviour of the Canadian economy. The accounts are centeredon the measurement of activities associated with production of goods and services, the sales of goods andservices in final markets, the supporting financial transactions, and the resulting wealth positions.
Data sources and methodology
Target population
12.4 The Canadian economy (persons and unincorporated business, corporations, governments and non-residents).
Data sources
12.5 Data are extracted from administrative files and derived from Statistics Canada surveys and/or other sources.
12.6 The IEA measure of macroeconomic activity, on a quarterly basis, as represented by income andexpenditure-based GDP, relies heavily on a wealth of information. A large amount of information from varioussurvey divisions within Statistics Canada, along with other data, is compiled, integrated and analysed as part of thecomplex process of arriving at GDP and its component categories and underlying sector accounts.
12.7 Major suppliers of data within Statistics Canada include: Agriculture Division, Distributive Trades Division,Income Statistics Division, Industrial Organization and Finance Division, International Trade Division, Investmentand Capital Stock Division, Labour Division, Manufacturing, Construction and Energy Division, Prices Division,Public Institutions Division, Service Industries Division, Tax Data Division and Transportation Division. Numerousexternal and administrative sources of data are also used.
Estimation
12.8 At the heart of the System of National Accounts is the concept of 'economic production'. Gross domesticproduct is designed explicitly to measure the value of the nation's total production of goods and services. But, inarriving at this total, the tables also provide a statistical picture of the structure and functioning of the economy - ofthe composition and use of the nation's production, and of the various types of income which are generated in theprocess. Going a stage further, the broad income and expenditure estimates are further broken down to show how
272 Statistics Canada - Catalogue no. 13-017 Guide to the Income and Expenditure Accounts
Data quality
the various sectors of the economy (businesses, persons, governments and non-residents) interact in theirtransactions with one another to produce this output. In other words, beginning from the basic concept ofproduction, it is possible to build up a major system of statistics which traces the flow of all income and expendituretransactions underlying the production and the distribution of the nation's total output. In the present system, boththe 'national' and 'domestic' concepts are in use. The gross national product measures the earnings of all Canadianfactors of production regardless of where located. The gross domestic product measures only the productionoriginating within the geographic boundaries of Canada, whether the factors of production are owned byCanadians or non-residents.
12.9 The National Income and Expenditure Accounts measure the unduplicated value of production in twoseparate ways. The first simply sums all of the factor incomes (wages and salaries, and profits) generated by thisproductive activity—incomes representing the returns to the labour and capital employed. The second approachsums all sales which firms have made to final users—to consumers, to governments, to business on capitalaccount, or in export markets. This approach also provides an unduplicated value of total production. Imports, ofcourse, have to be deducted from this summation since they are implicitly included in these final sales and shouldnot be counted as a part of Canadian production—they represent part of the production of a foreign country. Salesfrom one firm to another (intermediate production) are not counted since to do so would involve double counting, allintermediate production being embodied in final output sold to users. This 'sales to final users' (or 'sum ofexpenditures') approach yields the same value of production as the 'sum of incomes' approach. After the initialestimates income and expenditure—side GDP are produced, the discrepancy is assessed.
12.10 Real GDP is only calculated in terms of expenditure as the components of the income-based GDP cannotbe split between a quantity value and a price value. Therefore, there is no indicator enabling us to remove theeffect of inflation to calculate real values for the income-based GDP components. This is why only the componentsthat are part of the GDP by expenditure are calculated in real terms.
Quality evaluation
12.11 Data are analysed for time series consistency, links to current economic events, issues arising from thesource data, and with respect to coherence. As well, the discrepancy between the estimates of income andexpenditure-based GDP is assessed.
12.12 It is not possible to produce an equivalent to the income or expenditure accounts except at the aggregatelevel. At the level of GDP, the unduplicated value of production can also be measured by taking the gross value ofproduction of each firm and subtracting each firm's intermediate inputs in the form of its purchases from other firms(including imports) to yield the `net value added' to production by the firm. Estimates of this type are produced inthe annual Input-Output Tables, as well as in the monthly industry-based estimates of GDP. Real GDP estimatescan then be compared with the results of the monthly GDP by industry program. Annually, the income andexpenditure data are benchmarked to the Input-Output Accounts.
12.13 Certain components of income and expenditure-based GDP can be obtained from survey divisions, buttypically the data are not directly comparable. For example, the variable corporate profits is published in theQuarterly Financial Statistics release, but it differs from the income-based GDP measure due to certain nationalaccounts concept adjustments.
Disclosure control
12.14 Statistics Canada is prohibited by law from releasing any data that would divulge information obtained underthe Statistics Act that relates to any identifiable person, business or organization without the prior knowledge or theconsent in writing of that person, business or organization. Various confidentiality rules are applied to all data thatare released or published to prevent the publication or disclosure of any information deemed confidential. Ifnecessary, data are suppressed to prevent direct or residual disclosure of identifiable data.
Statistics Canada - Catalogue no. 13-017 Guide to the Income and Expenditure Accounts 273
Data quality
Revisions and seasonal adjustment
12.15 Revisions: Data are released within 60 days after the reference period. Estimates for each quarter arerevised when those for subsequent quarters of the same year are published. At the time of the first quarter of eachyear, revisions are made back four years. They are not normally revised again except when historical revisions arecarried out, usually once per decade. Statistical revisions are carried out in order to incorporate the most recentinformation from quarterly and annual surveys, taxation statistics, public accounts, censuses, etc., as well as fromthe annual benchmarking process of the Input-Output Accounts.
12.16 Seasonal adjustment: Almost all series of the quarterly IEA are seasonally adjusted. Seasonal adjustment isgenerally made at the lowest level of aggregation, and seasonally adjusted aggregates are obtained bysummation. Statistics Canada's X-11 ARIMA is used to seasonally adjust series.
Data accuracy
12.17 The accounts are designed as a double-entry system in which the income- and expenditure-based GDPtotals should, in principle, be identical. In fact, a difference virtually always arises between them due to errors in thesource data, imperfect estimation techniques, differing seasonal adjustment methods and discrepancies in the timeat which the incomes and expenditures are recorded.
12.18 The size of the discrepancy, which stems from the estimation procedure, is one gauge of the system'soverall reliability. However, it is a partial and quite insufficient gauge. Another quality measure is how well realexpenditure-side GDP compares to the real GDP by industry measure.
12.19 No direct measures of the margin of error in the estimates can be calculated. The quality of the estimatescan be inferred from analysis of revisions and from a subjective assessment of the data sources and methodologyused in the preparation of the estimates.
Documentation
12.20 Information on developments in the National Income and Expenditure Accounts are available in Latestdevelopments in the Canadian economic accounts. The side bar menu of that electronic publication includes:chronology of events, conceptual changes, classifications changes, and data revisions.
Provincial Economic Accounts
Description
12.21 The Provincial Economic Accounts program produces annual estimates of selected aggregates of theIncome and Expenditure Accounts by province and territory: gross domestic product, final domestic demand,personal income and government sector accounts.
12.22 The data are used in macroeconomic analysis and forecasting, for policy analysis and for econometricmodelling and hypothesis testing by federal and provincial government officials, business people, academiceconomists and international organizations.
12.23 The Canadian System of National Accounts (CSNA) provides a conceptually integrated framework ofstatistics and analysis for studying the state and behaviour of the Canadian economy. The accounts are centeredon the measurement of activities associated with production of goods and services, the sales of goods andservices in final markets, the supporting financial transactions, and the resulting wealth positions.
12.24 Provincial and territorial accounts - The System of National Economic Accounts disseminates a wide varietyof data at the provincial and territorial level on topics such as the environment, government finance, gross domesticproduct and its components, GDP by industry, tourism and labour productivity.
274 Statistics Canada - Catalogue no. 13-017 Guide to the Income and Expenditure Accounts
Data quality
Data sources and methodology
Target population
12.25 The Canadian economy (persons and unincorporated business, corporations, governments and non-residents).
Data sources
12.26 Data are extracted from administrative files and derived from other Statistics Canada surveys and/or othersources.
12.27 The Provincial Economic Accounts (PEA) provide a measure of macroeconomic activity on an annual basis,as represented by income and expenditure-based GDP, and rely heavily on a wealth of information from variousareas of Statistics Canada. A large amount of information from various survey divisions within the bureau, alongwith other data, is compiled, integrated and analysed as part of the complex process of arriving at provincial GDP'sand their component categories and underlying sector accounts.
12.28 Major suppliers of data within Statistics Canada include: Agriculture Division, Distributive Trades Division,Income Statistics Division, Industrial Organization and Finance Division, International Trade Division, Investmentand Capital Stock Division, Labour Division, Manufacturing, Construction and Energy Division, Prices Division,Public Institutions Division, Service Industries Division, Tax Data Division and Transportation Division. Numerousexternal and administrative sources of data are also used.
Estimation
12.29 The Provincial Economic Accounts measure the unduplicated value of production in two separate ways. Thefirst simply sums all of the factor incomes (wages and salaries, and profits) generated by this productive activity—incomes representing the returns to the labour and capital employed. The second approach sums all sales whichfirms have made to final users—to consumers, to governments, to business on capital account, or in exportmarkets. This approach also provides an unduplicated value of total production. Imports, of course, have to bededucted from this summation since they are implicitly included in these final sales and should not be counted as apart of indigenous production—they represent part of the exogenous production. Sales from one firm to another(intermediate production) are not counted since to do so would involve double counting, all intermediate productionbeing embodied in final output sold to users. This 'sales to final users' (or sum of expenditures) approach yields thesame value of production as the 'sum of incomes' approach. After the initial estimates income and expenditure—side GDP are produced, the discrepancy is assessed.
12.30 Real GDP is only calculated in terms of expenditure as the components of the income-based GDP cannotbe split between a quantity value and a price value. Therefore, there is no indicator enabling us to remove theeffect of inflation to calculate real values for the income-based GDP components. This is why only the componentsthat are part of the GDP by expenditure are calculated in real terms.
Quality evaluation
12.31 Data are analysed for time series consistency, links to current economic events, issues arising from thesource data, and with respect with coherence. As well, the discrepancy between the estimates of income andexpenditure-side GDP is assessed.
12.32 It is not possible to produce an equivalent to Provincial Economic Accounts, as measured in terms ofincome and expenditures except at the aggregate level. At the level of GDP, the unduplicated value of productioncan also be measured by taking the gross value of production of each firm and subtracting each firm's intermediateinputs in the form of its purchases from other firms (including imports) to yield the 'net value added' to production bythe firm. Estimates of this type are produced in the provincial Input-Output Tables, as well as in the industry-based
Statistics Canada - Catalogue no. 13-017 Guide to the Income and Expenditure Accounts 275
Data quality
estimates of GDP by province. Real GDP estimates can then be compared with the results of the provincial GDPby industry program. Annually, the provincial income and expenditure data are benchmarked to the Input-OutputAccounts.
12.33 Certain components of income and expenditure-based GDP can be obtained in survey divisions, buttypically the data are not directly comparable. For example, the variable ’corporate profits’ is published in theQuarterly Financial Statistics release, but it differs from the income-based GDP measure due to certain nationalaccounts' concept adjustments. Also, the national estimates have to be allocated by province and by territory toreflect where the activity took place rather than where the head office is located.
Disclosure control
12.34 Statistics Canada is prohibited by law from releasing any data that would divulge information obtained underthe Statistics Act that relates to any identifiable person, business or organization without the prior knowledge or theconsent in writing of that person, business or organization. Various confidentiality rules are applied to all data thatare released or published to prevent the publication or disclosure of any information deemed confidential. Ifnecessary, data are suppressed to prevent direct or residual disclosure of identifiable data.
Revisions and seasonal adjustment
12.35 Revisions: Preliminary estimates are released in the spring following the end of the reference period, andrevised in the fall of the same year. This latter release also comprises revisions to the three previous years.Estimates are not normally revised again except when historical revisions are carried out, usually once per decade.Statistical revisions are carried out in order to incorporate the most recent information from surveys, taxationstatistics, public accounts, censuses, etc., as well as from the annual benchmarking process of the Input-OutputAccounts.
12.36 Seasonal adjustment: Where quarterly PEA data are available, seasonal adjustment is generally made atthe lowest level of aggregation, and seasonally adjusted aggregates are obtained by summation. StatisticsCanada's X-11 ARIMA is used to seasonally adjust series.
Data accuracy
12.37 The accounts are designed as a double-entry system in which the income- and expenditure-based GDPtotals should, in principle, be identical. In fact, a difference virtually always arises between them due to errors in thesource data, imperfect estimation techniques, differing seasonal adjustment methods and discrepancies in the timeat which the incomes and expenditures are recorded.
12.38 The size of the discrepancy, which stems from the estimation procedure, is one gauge of the system'soverall reliability. However, it is a partial and quite insufficient gauge. Another quality measure is how well realexpenditure-side GDP compares to the real GDP by industry measure.
12.39 No direct measures of the margin of error in the estimates can be calculated. The quality of the estimatescan be inferred from analysis of revisions and from a subjective assessment of the data sources and methodologyused in the preparation of the estimates.
Documentation
12.40 Information on developments in the Provincial Economic Accounts are available in Latest developments inthe Canadian economic accounts. The side bar menu of that electronic publication includes: chronology of events,conceptual changes, classifications changes, and data revisions.
276 Statistics Canada - Catalogue no. 13-017 Guide to the Income and Expenditure Accounts
Glossary
Chapter 13 GlossaryAccrued net income of farm operators from farm production. Net income received by farm operators fromfarm production plus the undistributed portion of earnings arising out of the operations of the Canadian WheatBoard and the adjustment made to shift agricultural subsidies from a cash to an accrual basis.
Associations of individuals. Non-profit institutions serving households, such as churches, labour unions andcharitable organizations, plus credit unions, trusteed pension plans, life insurance companies, fraternal societiesand mutual non-life insurance companies. They are treated as businesses with respect to their capital outlays andtheir intermediation activities, but as persons with respect to their current expenses.
Base period. Reference period from which prices are taken to calculate an index.
Basic prices. A basic price valuation includes the costs of production factors (labour and capital) and indirecttaxes and subsidies on production factors. Income measures are estimated at basic prices or market prices.
Bonds. Marketable and non-marketable securities issued in Canadian or foreign currency with an original term tomaturity in excess of one year. Includes:
Canada bonds. Direct bonds of the federal government (of which, Canada Savings Bonds) and guaranteedfederal enterprise bonds.
Provincial bonds. Direct bonds of provincial governments (of which, provincial savings bonds) andguaranteed provincial enterprise bonds.
Municipal bonds. Direct bonds of municipalities and guaranteed municipal enterprise bonds.
Other bonds. Bonds issued by Canadian corporations, hospitals and non-profit institutions, as well as non-guaranteed bonds of government business enterprises. Also included are asset-backed securities.
Business gross fixed capital formation. This expression covers all expenditures on buildings, engineeringconstruction and machinery and equipment by the business sector, both corporations and unincorporatedbusinesses. Business gross fixed capital formation is divided into three major categories in production accounts:residential structures, non-residential structures and machinery and equipment.
Business investment in inventories. Business sector inventories consist of two categories: (a) non-farminventories and (b) farm inventories and grain in commercial channels. These two categories are presented indetailed tables in the Income and Expenditure Accounts. Business sector inventories are themselves subdividedinto those of the persons and unincorporated businesses sector and those of the corporations and governmentbusiness enterprises sector. These two estimates are shown in the respective sector accounts under theinventories heading.
Business sector. All transactors producing goods and services for sale at a price intended to cover costs ofproduction, namely corporations, government business enterprises, unincorporated businesses and independentprofessional practitioners. Also includes owners occupying their own dwelling, treated as businesses renting tothemselves, and associations of individuals, treated as businesses with respect to their capital outlays and theirintermediation activities.
Canada and Quebec pension plans. The part of the government sector which consists of the operations of theCanada and Quebec pension plans, established in 1966.
Canadian residents. Institutional units, such as persons, corporations and non-profit institutions, which have acentre of economic interest (a dwelling, a business location) in the economic territory of Canada.
Statistics Canada - Catalogue no. 13-017 Guide to the Income and Expenditure Accounts 277
Glossary
Capital and financial account. This account shows, for each major sector, a) the saving and acquisition of non-financial capital and the difference between them, called net lending; and b) transactions in financial assets,transactions in liabilities and the difference between them, called net financial investment. In theory, the twobalancing items, net lending and net financial investment, are equal; in practice, imperfections in the statistics leadto a difference between the two, shown as a statistical discrepancy.
Capital consumption allowances. Allowances for the using up of capital in the productive process. They arecalculated for business and government fixed assets as well as housing. They also include miscellaneousvaluation adjustments bringing business accounting records into conformity with national accounts definitions,such as the addition of claims paid by insurance companies to compensate for fire and other losses.
Capital transfers. Transfers in cash or in kind, out of the wealth of the donor (inheritances and migrants’ funds,transfer of ownership of an asset or cancellation of a liability), or transfers which the recipient is expected to usetowards the acquisition of an asset. Capital transfers have no effect on the saving of the donor or recipient.
Chain Fisher price index. See implicit price indexes.
Chain Fisher volume index. A measure of change in volume from period to period. It is calculated as thegeometric mean of a chain Paasche volume index and a chain Laspeyres volume index. In other words, it isthe mean of two distinct measures of change in volume: one calculated as if prices were constant in the first of twoconsecutive periods (Laspeyres volume) and the other calculated as if prices were constant in the second of thetwo consecutive periods (Paasche volume).
Chain index. An index which is rebased on a period to period basis, accumulated multiplicatively from a baseperiod value. For example, the chain Fisher volume index calculates the Fisher volume index in each pair ofconsecutive quarters, treating the earlier quarter as the base period.
Chain Laspeyres volume indexes. A measure of the change in volume from period to period. It is calculated as ifprices were constant in the first of two consecutive periods. The indexes of each of the periods are linked togetherin a chain to for an index. Chain Laspeyres volume indexes are one of the components of the chain Fishervolume indexes that are the official measure of the Income and Expenditure Accounts.
Chain Paasche volume indexes. A measure of the change in volume from period to period. It is calculated as ifprices were constant in the second of two consecutive periods. The indexes of each of the periods are linkedtogether in a chain to form an index. The chain Paasche volume indexes are one of the components of the chainFisher volume indexes that are the official measure of the Income and Expenditure Accounts.
Changing the base period. Changing the base period of a series involves redefining the base period on whichthe weightings are established.
Claims. Financial instrument comprising:
Corporate claims. Loans, advances and issues of debt between associated corporations; on the asset side,also includes investment in shares between associated corporations.
Government claims. Claims between governments, between related government business enterprises orbetween a parent government and its enterprises, in the form of shares, debt securities, loans and advances.
Consumer credit. Credit extended to persons for purchasing consumer goods and services.
Consumer goods. New goods acquired by households for their own consumption. Comprises three categories:
Durable goods, which can be used repeatedly or continuously for more than one year, such as motor vehiclesand major appliances;
278 Statistics Canada - Catalogue no. 13-017 Guide to the Income and Expenditure Accounts

Glossary
Semi-durable goods, which can be used on multiple occasions and have an expected lifetime of one year orsomewhat more, such as clothing, footwear and linens;
Non-durable goods, which can be used only once, such as food, gasoline, alcoholic beverages and tobacco;in practice, the latter also include a few goods of little value used more than once, such as household supplies.
Consumer services. Services consumed by households, such as rent (including the rent imputed on owner-occupied housing), transportation, education, medical care, child care, food and accommodation services as wellas travel expenditures of Canadians abroad, less travel expenditures of foreigners in Canada. Also includes thecurrent (operating) expenses of associations of individuals and unincorporated businesses.
Contributions to percent changes. These estimates show the contribution of a sub-aggregate to the percentchange in an aggregate. For example, if personal consumer spending increases 2% and the contribution to thepercent change by motor vehicle purchases is 1%, then motor vehicle purchases would be said to have accountedfor half of the increase in personal consumer spending.
Contributions to social insurance plans. Employer and employee contributions to employment insurance, theCanada and Quebec Pension Plans and workers’ compensation.
Corporate and government business enterprise sector. All business transactors whose legal form oforganization is the corporation, plus government business enterprises. This sector is divided into non-financial andfinancial enterprises. The latter are comprised of several sub-sectors (Bank of Canada, chartered banks, creditunions, life insurance companies, trusteed pension funds, mutual funds, etc.). The intermediation activities of creditunions, life insurance companies and trusteed pension funds shown as assets of these sub-sectors are balancedby claim liabilities which, in turn, are assets of the persons and unincorporated business sector.
Corporation profits before taxes. The net earnings from economic activity of privately-held corporations,measured after deduction of capital consumption allowances.
Currency and deposits. Financial instruments comprising:
Currency and bank deposits. Deposits denominated in Canadian dollars at chartered banks in Canada andat the Bank of Canada, plus Canadian currency and coin in circulation.
Other deposits. All deposits at other Canadian deposit-taking institutions, including shares in credit unions.
Foreign currency and deposits. Holdings of foreign currency and foreign currency denominated deposits atchartered banks in Canada, foreign branches and subsidiaries of Canadian chartered banks, foreign banks andother foreign deposit-taking institutions.
Current prices. A valuation at current prices is expressed at the prices prevailing during the period being referredto.
Current transactions with non-residents. Exports of goods and services less imports of goods and services,plus net investment income from non-residents and net current transfers from non-residents.
Current transfers. Transfers out of the income of the donor, reducing his saving and adding to that of the recipient.
Current transfers from corporations to persons. Charitable donations and other contributions.
Current transfers from government to business. Subsidies to the business sector.
Statistics Canada - Catalogue no. 13-017 Guide to the Income and Expenditure Accounts 279
Glossary
Current transfers from government to non-residents. Pensions paid to non-residents, contributions tointernational organizations and economic and technical assistance as well as food aid provided by the CanadianInternational Development Assistance Agency and other governmental agencies.
Current transfers from government to persons. Payments such as the Child Tax Benefit/Credit, EmploymentInsurance benefits, old age security benefits, welfare payments, scholarships and research grants, workers’compensation benefits, grants to aboriginal peoples and their organizations, pensions paid under the Canada andQuebec Pension Plans, and veterans’ allowances.
Current transfers from non-residents to government. Withholding taxes paid by non-residents to theGovernment of Canada.
Current transfers from non-residents to persons. Pensions paid by foreign governments to Canadian residentsplus remittances by non-residents to Canadian residents.
Current transfers from persons and unincorporated businesses to government. Income taxes, contributionsto social insurance plans and other current transfers.
Current transfers from persons to corporations. The transfer portion of interest on the consumer debt.
Current transfers from persons to non-residents. Remittances by Canadian residents (particularly religious andcharitable organizations) to non-residents and withholding taxes paid abroad.
Deflation. Process of eliminating price change from a specific time series.
Disposable income. See personal disposable income.
Dividends. Income payable and receivable in respect of corporate equities (cash dividends) and further equityparticipation in corporate enterprises (stock dividends).
Economic territory. The economic territory of a country encompasses the geographic territory, plus the air space,territorial waters and continental shelf, as well as its territorial enclaves abroad (embassies, consulates, militarybases, etc.).
Existing assets. See net acquisition of existing assets.
Exports and imports of goods and services. Current receipts and payments arising out of transactions inmoveable goods and services between residents and non-residents. Services include travel, freight and shipping,business services, government transactions, financial intermediation and other services.
Factor cost. A valuation reflecting the cost of production factors (labour and capital). It corresponds to the valueremaining after the deduction from market prices of all applicable taxes and subsidies.
Farm inventories. Farm output stored on farms; includes grains, tobacco, potatoes and livestock.
Final domestic demand. The sum of personal expenditure on consumer goods and services, net governmentcurrent expenditure on goods and services, government gross fixed capital formation and business gross fixedcapital formation.
Fisher index. Geometric mean of the Laspeyres index and the Paasche index.
Fisher volume index. Geometric mean of the Laspeyres volume index and the Paasche volume index.
Fixed capital. See gross fixed capital formation.
280 Statistics Canada - Catalogue no. 13-017 Guide to the Income and Expenditure Accounts
Glossary
Fixed-weighted price indexes. Also known as “Laspeyres” indexes, these are price indexes where a fixed patternof expenditure from some base period is used to aggregate the detailed price indexes in each period.
Foreign investments. All marketable financial instruments (bonds, short-term paper and shares) which areliabilities of the non-resident sector (foreign governments and corporations) and assets of domestic sectors.
Government business enterprise profits before taxes. Net earnings from the economic activity of governmentbusiness enterprises, measures after deduction of capial consumption allowances.
Government business enterprises. Government enterprises and agencies which operate on a profit or costrecovery basis and whose motivation is similar to that of private enterprises. Their total profits (net of losses) arerecorded in GDP, while only the profits remitted to government are recorded in the government income and outlayaccount, under government investment income. The difference between these two measures, retained earnings,forms part of business sector saving.
Government current expenditure on goods and services. All current outlays for goods and services by thegovernment sector, including wages and salaries of government employees. It also includes expenditure onweapons for defence and an imputation for the depreciation of government fixed assets. It is recorded beforededuction of revenues from sales of goods and services in the government income and outlay account, and afterdeduction of these revenues in GDP (net government current expenditure on goods and services).
Government gross fixed capital formation. This expression covers all expenditures on buildings, engineeringconstruction and machinery and equipment. Government gross fixed capital formation includes spending onnon-military defence buildings and equipment (airports, docks, roads, hospitals, transport aircraft, etc.).Abbreviated as fixed capital in the government capital and financial account.
Government investment in inventories. Government inventories include only uranium stocks, up to 1981, andthose held by federal government commodity agencies, such as the Canadian Dairy Commission. Abbreviated asinventories in the government sector account.
Government investment income. In GDP, includes interest income of public service pension plans, other interestand dividend income of governments and royalties. In the government income and outlay account, it also includesthe profits of government business enterprises remitted to government. See government business enterprises.
Government sales of goods and services. Revenues from the sale of goods and services, such as watercharges, landing fees and charges for government documents.
Government sector. All departments, agencies, and funds (budgetary and non-budgetary) of the federal,provincial and local levels of government, as well as crown corporations which receive more than 50% of theirrevenues in grants from their parent governments. Also included are school boards, universities, non-profitcolleges, hospitals, non-profit residential care facilities, as well as the Canada and Quebec Pension Plans.
Grain in commercial channels. Grain in the hands of the Canadian Wheat Board or private grain dealers.
Gross domestic product. The total unduplicated value of the goods and services produced in the economicterritory of a country or region during a given period. GDP can be measured three ways: as total incomes earned incurrent production (income approach), as total final sales of current production (expenditure approach), or as totalnet values added in current production (value added approach). It can be valued either at base price or at marketprices. In the Income and Expenditure Accounts, Gross Domestic Product is measured by the income andexpenditure approach.
Gross fixed capital formation. This expression covers all expenditures on buildings, engineering constructionand machinery and equipment. Gross capital formation in machinery and equipment includes imports of usedmachinery and equipment since the latter constitute additions to domestic capital stock. Gross fixed capital
Statistics Canada - Catalogue no. 13-017 Guide to the Income and Expenditure Accounts 281
Glossary
formation in buildings includes transfer costs on the sale of existing fixed assets (e.g., real estate commissions).Abbreviated as fixed capital in the capital and financial account. Synonym of investment in fixed capital.
Gross fixed capital formation, corporations and government business enterprises sector. This expressioncovers all expenditures on buildings, engineering construction and machinery and equipment in the corporationsand government business enterprises sector. It includes a large portion of the gross fixed capital formation innon-residential structures and machinery and equipment of the business sector. Abbreviated as fixed capital inthe corporations and government business enterprises sector account.
Gross fixed capital formation, persons and unincorporated businesses sector. This expression covers allexpenditures on buildings, engineering construction and machinery and equipment in the persons andunincorporated businesses sector. It includes mainly the gross fixed capital formation in residential structuresbut also includes a small portion of non-residential structures and machinery and equipment. Abbreviated as fixedcapital in the persons and unincorporated businesses sector account.
Gross national product. A measure of income equal to the Gross domestic product at market prices, plusinvestment income received from non-residents, less investment income paid to non-residents.
Gross saving. Net saving plus capital consumption allowances.
Holding gains and losses. Additions to or subtractions from income which result from selling an asset for more orless than its purchase price. As holding gains and losses are not related to current production, they are excludedfrom GDP through the inventory valuation adjustment.
Households. A group of persons who share the same living accommodation, pool some, or all of their income andwealth and consume certain goods and services collectively. They may engage in any other kind of economicactivity.
Implicit price indexes. These price indexes are a by-product of the deflation procedure, obtained by dividing anexpenditure series expressed at current prices by the corresponding series expressed in real terms. For all volumeaggregates published in the Income and Expenditure Accounts, the implicit price indexes are the chain Fisherprices indexes.
Imports of goods and services. See exports and imports of goods and services.
Income and outlay account. This account shows, for each major sector, all sources of current income(production, receipts of property income and other transfers) and all current outlays (expenditure on goods andservices, payments of property income and other transfers), as well as saving, equal to a sector’s income less itsoutlay.
Inheritances and migrants' funds. Capital brought to Canada by immigrants at the time of arrival or transferredoutside Canada by emigrants at time of departure, or intended to be transferred at a later date, plus bequests toCanadian residents from non-residents or vice-versa.
Interest and miscellaneous investment income. Investment income of persons, except dividends, plusgovernment investment income, less net investment income of persons and governments received from non-residents, less the transfer portion of interest on the consumer debt, less the interest on the public debt.
Interest, dividends and miscellaneous investment income of persons. Includes income of persons andunincorporated businesses as owners of financial or tangible non-produced assets in return for putting the assetsat the disposal of another institutional unit. Interest includes interest on Canadian bonds, mortgage interest paid topersons and interest on deposits. Miscellaneous investment income includes accrued interest in pension plans, lifeinsurance funds and interest on investments made by other “associations of individuals”.
282 Statistics Canada - Catalogue no. 13-017 Guide to the Income and Expenditure Accounts
Glossary
Interest on the consumer debt. Interest paid by persons on account of liabilities incurred to finance personalexpenditure on consumer goods and services. Consists of two parts: the administrative expenses, representing thecost of rendering services to borrowers, and the remaining “transfer portion”.
Interest on the public debt. Interest payments on liabilities of the government sector.
Inventories. See investment in inventories.
Inventory valuation adjustment. The difference between the change in inventory book values and the value ofphysical change in inventories, which is a measure of the net holding gain or loss realized by business as a resultof price changes. Holding gains and losses on inventories are present in corporation profits and other incomeaggregates, and must be removed in order to measure the value of current production.
Investment in fixed capital. Synonym of gross fixed capital formation.
Investment in inventories. Change in the physical volume of business and government inventories, valued at theaverage market prices of the period.
Investment in inventories, corporations and government business enterprises. Consists of most of theinvestment in inventories of the business sector except for a portion of non-farm inventories held by unincorporatedfarm businesses. Abbreviated as inventories in the corporations and government business enterprises sectoraccount.
Investment in inventories, persons and unincorporated businesses sector. Consists mainly of farminventories held by unincorporated farm businesses. Abbreviated as inventories in the persons and unincorporatedbusinesses sector account.
Investment income of persons. Interest on deposits, bonds, mortgages, etc., and royalties paid by corporations,governments and non-residents to persons, plus investment income accumulating on their behalf in trusteedpension plans and life insurance funds, or on behalf of other associations of individuals. Excludes dividends.
Investment income paid to non-residents. Investment income payments on Canadian liabilities to non-residents,inclusive of any applicable withholding taxes. Includes interest, dividends and other payments such as netexpenses of Canadian banks from foreign currency transactions and net revenues of foreign insurance companiesfrom insurance operations in Canada.
Investment income received from non-residents. Investment income earned by Canadian residents on theirassets abroad, inclusive of any applicable withholding taxes. Includes interest, dividends and other receipts suchas net earnings of Canadian banks from foreign currency transactions and net revenues of Canadian insurancecompanies from insurance operations abroad.
Labour income. The sum of wages and salaries plus supplementary labour income.
Laspeyres index. Index calculated by using prices or volumes from a predetermined base year as weights.
Life insurance and pensions. Liability of life insurance companies and trusteed pension plans to policyholders orbeneficiaries and federal government liability with respect to annuities sold under the Annuities Act, as well asgovernment employer-sponsored pension plans. Asset of policy holders or beneficiaries.
Loans. Financial instrument comprising bank loans and other loans. Negotiated loans made by chartered banksand other financial institutions.
Statistics Canada - Catalogue no. 13-017 Guide to the Income and Expenditure Accounts 283
Glossary
Machinery and equipment. Capital expenditures on durable, tangible goods with an expected service life of oneyear or more, such as furniture, motor vehicles, office machines and equipment not permanently installed(permanently built-in equipment belongs to non-residential construction). Includes installation and delivery costs.
Market prices. A valuation expressed in terms of the prices actually paid by the purchaser, that is, after allapplicable taxes and subsidies. See factor cost.
Military pay and allowances. The part of labour income consisting of payments to members of the Armed Forcesserving in Canada or abroad. Includes military pay, allowances and the employer’s social contributions. Excludesveterans' allowances, treated as transfer payments.
Mortgages. Negotiated loans and agreements of sale secured by real property, mostly residential buildings.Includes first, second and third mortgages. Mortgages are characterized by blended repayments, usually monthly,of principal and interest.
Net acquisition of existing assets. A sector’s purchases less sales of used fixed assets and land. Businesspurchases less sales of natural resources, resource rights and intangible assets are also included. Does not applyto the non-resident sector which, by definition, acquires only financial investments. Abbreviated as existing assetsin the capital and financial account.
Net capital transfers. Capital transfers from other sectors less capital transfers to other sectors.
Net domestic product at basic prices. The sum of all incomes arising from production, or ownership of assetsused in production, within the economic territory of a country or region. This income includes labour income,profits before taxes, interest and miscellaneous investment income, accrued net income of farm operatorsfrom farm production, net income of non-farm unincorporated business including rent, and the inventoryvaluation adjustment. Taxes and subsidies on factors of production are also included since the size of thesecomponents is directly linked to the production decisions of producers. Differs from GDP at basic prices in that itexcludes capital consumption allowances.
Net financial investment. The net lending (or borrowing) of a sector can be measured either through incomes andexpenditures or through financial transactions. Under the financial transactions approach, net lending is called netfinancial investment. It is equal to a sector’s transactions in financial assets less its transactions in liabilities. Seenet lending and capital and financial account.
Net income of non-farm unincorporated business, including rent. Earnings of unincorporated proprietors,except farm operators, from their own business. Includes the net income of unincorporated businesses and self-employed individuals, as well as the net rental income of persons.
Net income of unincorporated business. The sum of net accrued income received by farm operators fromfarm production and net income of non-farm unincorporated business, including rent.
Net income received by farm operators from farm production. Gross proceeds from the sale of farm products,plus subsidies on a cash basis, plus the imputed value of farm output consumed by farming households, plusinvestment in farm inventories, less farm operating expenses and depreciation on farm buildings and equipment.Excludes other types of income, such as net rent or interest receipts, and profits of incorporated farms. Seeaccrued net income of farm operators from farm production.
Net investment income from non-residents. Investment income received from, less investment income paid to,non-residents.
Net lending. The net lending (or borrowing) of a sector can be measured either through incomes and expendituresor through financial transactions. Under the income and expenditure approach, net lending is the differencebetween internally generated funds and outlays on non-financial capital. A sector’s net lending equals its saving,
284 Statistics Canada - Catalogue no. 13-017 Guide to the Income and Expenditure Accounts
Glossary
plus its capital consumption allowances and net capital transfers from non-residents, less its investment in fixedcapital and inventories. Net lending (or borrowing) is also referred to as sector surplus (or deficit). See netfinancial investment and capital and financial account.
Net national income at basic prices. Net domestic product at basic prices plus net investment income ofnon-residents.
Net reinvested earnings on direct investment. Reinvested earnings (REI) are profits earned on, less dividendsreceived from, direct foreign investment. From 1961, equity income from direct foreign investment is recorded onan accrual rather than cash basis in the Balance of International Payments. Net REI are defined as REI on foreigndirect investment in Canada less REI on Canadian direct investment abroad. Net REI gives rise to an additionalreconciliation item between the Canadian Balance of International Payments Accounts and the National Incomeand Expenditure Accounts, in which this change has not been incorporated.
Net rental income. Earnings of persons, after expenses, arising from the ownership of residential property,whether rented or owner-occupied, and from the rental of non-residential property.
Net saving. The current income of a sector, less its current expenditure. Includes current transfers but excludescapital consumption allowances and capital transfers. Synonym of saving.
Non-farm inventories. Inventories of raw materials, goods-in-process and finished products.
Non-financial capital acquisition. Includes the gross fixed capital formation of a sector (fixed capital), plus itsinvestment in inventories (inventories) and its net acquisition of existing assets (existing assets). Does not apply tothe non-resident sector which, by definition, can only engage in financial investment.
Non-resident sector. All transactors who do not have a centre of economic interest (a dwelling, a businesslocation) in the economic territory of Canada. By definition, non-residents can only engage in financial investment.Any transactor making non-financial investment is deemed to be a resident.
Non-residential structures. Construction of industrial, commercial and institutional buildings, such as plants,warehouses, shopping centres, office buildings, schools and hospitals, plus construction of highways, bridges,railway tracks, canals, waterworks, sewage systems, dams, hydro or thermal generating plants, telephone lines, oiland gas facilities, etc. Includes new construction, conversions resulting in a structural change, major renovations,permanently built-in equipment and site preparation.
Non-residential structures and equipment. The sum of business investment in non-residential structures and inmachinery and equipment.
Official reserves. The sum of a) official holdings of gold and foreign exchange (U.S. dollars and deposits in otherconvertible currencies), b) loans to or from the International Monetary Fund on general account, and c) specialdrawing rights.
Other current transfers from persons to government. Transfers not classified as direct taxes. Includes hospitaland medical care premiums, various licences and permits, (hunting and fishing licenses, marriage licenses, etc.)fines and penalties, the personal portion of motor vehicle licenses and permits, as well as donations to entitieswithin the government sector.
Other financial assets / Other liabilities. Various items not included under other financial instruments, such asaccrued interest, interest receivable or payable and prepaid expenses.
Outside Canada. Embassies and other Canadian government offices abroad which are part of the territory ofCanada.
Statistics Canada - Catalogue no. 13-017 Guide to the Income and Expenditure Accounts 285
Glossary
Paasche index. Index calculated by using prices or volumes from the current period as weights.
Personal disposable income. Personal income less current transfers to government.
Personal expenditure on consumer goods and services. Household spending on new consumer goods and onconsumer services, plus any mark-up on used goods. Operating expenses of associations of individuals servinghouseholds are also included, under consumer services.
Personal income. The sum of all incomes received by persons residing in Canada, whether factor earnings fromcurrent production or current transfers from other sectors, plus the investment income that associations ofindividuals accumulate on their own behalf or on behalf of persons.
Personal saving. Personal disposable income less personal expenditure on consumer goods and services, lesscurrent transfers from persons to corporations and to non-residents.
Personal sector. All persons, households and associations of individuals serving households.
Persons and unincorporated business sector. Transactors of the personal sector plus those of theunincorporated business sector. In the capital and financial account, transactions of these two sectors areconsolidated. In addition, in this account, although credit unions, life insurance companies and trusteed pensionplans appear as sub-sectors of the corporate and government business enterprise sector, their transactions infinancial assets are balanced by liabilities which, in turn, are recorded as assets of the persons and unincorporatedbusiness sector.
Price index. Measure of the change in prices in index form. There are several methods of measuring indexes. SeeLaspeyres index, Paasche index, Fisher index, chain index and implicit price indexes.
Production factors. Transactors which, when combined, result in economic production. In general, there are twoproduction factors: labour and capital.
Real. In the national accounts, real means the estimation of the aggregate in volume, possibly in the form of avolume index or an estimate in real dollars.
Real dollars. A dollar estimate of the volume of economic activity obtained by applying the growth in a volumeindex to the value of a specific series for a given reference period.
Rebase, to. See changing the base period.
Reference period. The period when the value of a series in constant dollars is equal to the value of the sameseries in current dollars. The current reference year is 1997 (current dollars are equal to constant dollars in 1997).
Residential structures. Construction of dwellings (includes single, semi-detached, row housing and apartments),garages, cottages and mobile homes. Includes new construction, conversions resulting in a structural change andmajor renovations (together referred to as “alterations and improvements”), permanently built-in equipment, sitepreparation and transfer costs such as real estate commissions.
Saving. See net saving.
Saving rate. The ratio between net saving of the persons and unincorporated businesses sector and personaldisposal income, expressed in percentage.
Sector accounts. The quarterly national accounts include the full sector accounts. They record the income, outlay,saving, non-financial and financial investment, borrowing and net lending for the four main sectors: (a) persons and
286 Statistics Canada - Catalogue no. 13-017 Guide to the Income and Expenditure Accounts
Glossary
unincorporated businesses; (b) corporations and government business enterprises; c) government; and d) non-residents. See income and outlay account and capital and financial account.
Semi-durable goods. See consumer goods.
Shares. Financial instrument consisting of common and preferred shares (including term preferred shares andmutual fund shares), plus contributed surplus. Stock issued by a government business enterprise to a parentgovernment is classified to government claims.
Short-term paper. Marketable financial instrument comprising:
Government of Canada short-term paper. Treasury bills, which are notes of original term to maturity of lessthan one year, issued at a discount and sold at auction every week; also includes Canada bills issued in foreigncurrency.
Other short-term paper. Notes of original term to maturity of one year or less, issued at a discount by a varietyof financial and non-financial institutions; includes provincial and municipal Treasury bills as well as asset-backedsecurities.
Statistical discrepancy. Double-entry bookkeeping is fundamental in national accounting and several aggregates,such as GDP and net lending, can be calculated in two or more ways. In principle, all the measures of anaggregate are equal. In practice, differences invariably arise between them due to imperfections in basic statisticsand estimation techniques. This difference is called a statistical discrepancy and serves as the balancing itembetween two theoretically equal aggregates. It can be recorded as is, like the discrepancy between the twoestimates of net lending or it can be divided in two, one half being subtracted from the higher estimate and theother, added to the lower one, like the discrepancy between income-based and expenditure-based GDP.
Subsidies. Transfers from government to the business sector toward current costs of production. These transfersrepresent additions to the income of producers from current production. Subsidies can be linked to productionfactors or products.
Subsidies on products. These subsidies are paid by unit of good or service. They can take the form of a specificmonetary amount paid by unit quantity of good or service or can be calculated ad valorem as a specific percentageof their unit price. Examples of product subsidies are those paid for agricultural products, transportation servicesand energy.
Subsidies on factors of production. Production subsidies are subsidies received by a unit that are unrelated tothe quantity or the value of goods produced or sold. They are primarily subsidies on wages and labour, pollutionreduction subsidies and interest subsidies. Investment assistance is not included.
Supplementary labour income. Employers’ social contributions, either compulsory or voluntary. Includesretirement allowances and contributions to employment insurance, the Canada and Quebec Pension Plans, otherpension plans, workers' compensation, medicare, dental plans, short- and long-term disability insurance, etc.
Surplus or deficit on current account in the “Canadian Balance of International Payments”. The surplus ordeficit of Canada on current transactions with non-residents plus net reinvested earnings on directinvestment.
Taxes less subsidies on factors of production. Difference between taxes on factors of production andsubsidies on factors of production. These taxes and subsidies are payable (received) regardless of the quantityor value of the goods and services produced or sold.
Statistics Canada - Catalogue no. 13-017 Guide to the Income and Expenditure Accounts 287
Glossary
Taxes less subsidies on products. Difference between taxes on products and subsidies on products. Thesetaxes and subsidies are payable (received) based on the quantity or value of the goods and services produced orsold.
Taxes on factors of production. These are mandatory payments without consideration, in cash or in kind,collected by government. They apply to production and the import of goods and services, employment of labourand ownership or use of land, structures and other assets used for production purposes. They are payableregardless of the quantity or value of the goods and services produced or sold.
Taxes on products. These are mandatory payments without consideration, collected by government on the sale ofgoods and services. These taxes include sales taxes, fuel taxes, import duties and taxes, excise taxes on tobaccoand alcohol.
Trade accounts receivable/payable. Short-term credit advanced or received in the ordinary course of businessby suppliers or buyers of business goods and services.
Transactors. Economic agents who engage in transactions involving the purchase and sale of goods and servicesand the payment and receipt of factor incomes and transfers.
Transfers. Cash, good, service, or asset other than cash transferred by one transactor to another withoutcounterpart, that is, without the donor receiving anything in return. See current transfers and capital transfers.Synonym of transfer payments.
Transfer payments. See Transfers.
Unincorporated business sector. All business transactors whose legal form of organization is not thecorporation. Includes independent business operators, self-employed farmers, fishermen and professionals andunincorporated landlords (including those renting to themselves).
Volume. Volume consists of the changes in quantities and qualities.
Volume index. A measure of growth with the effects of price removed, presented in index form. There are severalmethods of measuring indexes. See Laspeyres index, Paasche index, Fisher index, chain index. The Incomeand Expenditure Accounts use the chain Fisher volume index to calculate the real GDP.
Wages and salaries. Total remuneration, in cash or in kind, paid to employees in return for work done. It isrecorded on a gross basis, before any deduction for income taxes, pensions, unemployment insurance and othersocial insurance schemes. Also includes other forms of compensation, namely commissions, tips, bonuses,directors' fees and allowances such as those for holidays and sick leave, as well as military pay and allowances.Excludes employers’ social contributions, which are treated as supplementary labour income.
Withholding taxes. Taxes withheld by the Government of Canada on selected income and service payments tonon-residents, or withheld by foreign governments on selected income and service payments to Canadianresidents.
288 Statistics Canada - Catalogue no. 13-017 Guide to the Income and Expenditure Accounts
Surveys and statistical programs
Chapter 14 Surveys and statistical programs
Alphabetical list of surveys and statistical programs
A
2715: Aircraft Movement Statistics 2728: Annual Cable Television Survey 2433: Annual Retail and Wholesale Trade Survey 2422: Annual Retail Trade Survey 2437: Annual Survey of Advertising and Related Services 2420: Annual Survey of Architectural Services 2442: Annual Survey of Automotive Equipment Rental and Leasing 2434: Annual Survey of Consumer Goods Rental 2439: Annual Survey of Engineering Services 2107: Annual Survey of Forestry 2103: Annual Survey of Manufactures and Logging 2424: Annual Survey of Personal Services 4706: Annual Survey of Service Industries: Real Estate Agents, Brokers, Appraisers and Other Real Estate
Activities 4705: Annual Survey of Service Industries: Real Estate Rental and Leasing and Property Management 4704: Annual Survey of Service Industries: Food Services and Drinking Places 2416: Annual Survey of Service Industries: Motion Picture Theatres 2410: Annual Survey of Software Development and Computer Services 2423: Annual Survey of Travel Arrangement Services 2418: Annual Survey of Traveller Accommodation 2330: Apartment Building Construction Price Indexes
B
2802: Building Permits Survey
C
2798: Canadian Passenger Bus and Urban Transit Industries • Large Urban Transit Survey - Monthly
4440: Canadian Tobacco Use Monitoring Survey 2803: Capital and Repair Expenditures, Actual, Preliminary Actual and Intentions
• Survey on Capital and Repair Expenditures3438: Census of Agriculture 3901: Census of Population 2147: Coal Monthly 2301: Consumer Price Index 1726: Control and Sale of Alcoholic Beverages in Canada
E
2194: Electricity Supply and Disposition - Annual
F
2510: Financial and Taxation Statistics for Enterprises 3121: Financial Information of Universities and Colleges Survey
Statistics Canada - Catalogue no. 13-017 Guide to the Income and Expenditure Accounts 289
Surveys and statistical programs
Alphabetical list of surveys and statistical programs (continued)
G
2149: Gas Utilities/Transportation and Distribution Systems (Monthly)• Natural Gas Distribution
H
3886: Homeowner Repair and Renovation Survey
I
2318: Industrial Product Price Index 2203: International Trade Price Indexes 3152: International Travel Survey: Mail-back Questionnaires and Air Exit Survey of Overseas Travellers 5014: Investment in Non-residential Building Construction
L
3701: Labour Force Survey 2745: Large Urban Transit Survey - Monthly 3460: Livestock Survey
M
2791: Marine International Freight Origin and Destination Survey 2150: Monthly Refined Petroleum Products 2419: Monthly Restaurants, Caterers and Taverns Survey 2408: Monthly Retail Trade Survey (Department Store Organizations) 2101: Monthly Survey of Manufacturing
N
2402: New Motor Vehicle Sales Survey
P
2142: Production and Disposition of Tobacco Products 1902: Provincial Economic Accounts
Q
2607: Quarterly Estimates of Trusteed Pension Funds 2008: Quarterly Retail Commodity Survey
• New Motor Vehicle Dealer Commodity Survey2501: Quarterly Survey of Financial Statistics for Enterprises
• Quarterly Survey of Financial Statements - Central Credit Unions• Quarterly Survey of Financial Statements - Life Insurers• Quarterly Survey of Financial Statements - Local Credit Unions• Quarterly Survey of Financial Statements - Property and Casualty Insurers• Quarterly Survey of Financial Statements - Trust and Mortgage Companies
290 Statistics Canada - Catalogue no. 13-017 Guide to the Income and Expenditure Accounts
Surveys and statistical programs
Alphabetical list of surveys and statistical programs (concluded)
2168: Quarterly Survey of the End-Use of Refined Petroleum Products• End Use of Refined Petroleum Products
R
2736: Rail Commodity Origin and Destination Statistics 2734: Railway Transport Survey - Annual 2446: Retail Store Survey 2447: Retail Chain Survey 2406: Retail Trade Survey (Monthly)
• Survey of Sales and Inventory of Alcoholic Beverages
S
2612: Survey of Employment, Payrolls and Hours 2603: Survey of Employment, Payrolls and Man-hours 3504: Survey of Family Expenditures 3508: Survey of Household Spending 2425: Survey of Service Industries: Amusement and Recreation
• Annual Survey of Arts, Entertainment and Recreation4707: Survey of the Taxi and Limousine Services Industry
T
2721: Telecommunications Statistics - Quarterly • Quarterly Survey of Telecommunications
3810: Travel Survey of Residents of Canada 2741: Trucking Commodity Origin and Destination Survey
U
2307: Union Wage Rate Indexes for Major Construction Trades, 20-City Composite
W
5061: Wholesale Trade Commodity Survey by Origin and Destination 2401: Wholesale Trade Survey (Monthly)
Statistics Canada - Catalogue no. 13-017 Guide to the Income and Expenditure Accounts 291
Reference list
Chapter 15 Reference list
Statistics Canada publications and products
Lal, Kishori. 1994. The 1993 International System of National Accounts: Its Implementation in Canada. Statistics Canada Catalogue no. 13-604-MIB. Income and Expenditures Accounts Technical Series, no. 32. Ottawa.
Statistics Canada. 2003–. Agriculture Value Added Account - Agriculture Economic Statistics, Statistics Canada Catalogue no. 21-017. Ottawa.
Statistics Canada. 2003–. Balance Sheet of the Agricultural Sector - Agriculture Economic Statistics, Statistics Canada Catalogue no. 21-016. Ottawa.
Statistics Canada. 1923–. Building Permits. Statistics Canada Catalogue no. 64-001. Ottawa.
Statistics Canada. 1981–. Canada's Balance of International Payments and International Investment Position, Concepts, Sources, Methods and Products, Statistics Canada Catalogue no. 67-506. Ottawa.
Statistics Canada. 1997–. Canada's International Trade in Services, Statistics Canada Catalogue no. 67-203. Ottawa.
Statistics Canada. April 1990–. Canadian Economic Observer, Statistics Canada Catalogue no. 11-010. Ottawa.
Statistics Canada. 1992–. Canadian International Merchandise Trade. Statistics Canada Catalogue no. 65-001. Ottawa.
Statistics Canada. 1995–. Capital Expenditures by Type of Asset, Statistics Canada Catalogue no. 61-223. Ottawa.
Statistics Canada. 2002–. Cattle Statistics. Statistics Canada Catalogue no. 23-012. Ottawa.
Statistics Canada. 1997–. Detailed Average Household Expenditure for Canada, Provinces/Territories and Selected Metropolitan Areas. Statistics Canada Catalogue no. 62F0031. Ottawa.
Statistics Canada. 2002–. Direct Payments to Agriculture Producers. Statistics Canada Catalogue no. 21-015. Ottawa.
Statistics Canada. 1980. Employee Compensation in Canada, Statistics Canada Catalogue no. 72-619. Ottawa.
Statistics Canada. 1994–. Employment, Earnings and Hours, Statistics Canada Catalogue no. 72-002. Ottawa.
Statistics Canada. 1996–. Estimates of Labour Income. Statistics Canada Catalogue no. 13F0016. Ottawa.
Statistics Canada. 2003–. Farm Business Cash Flows - Agriculture Economic Statistics, Statistics Canada Catalogue no. 21-018. Ottawa.
Statistics Canada. 2000–. Farm Cash Receipts, Statistics Canada Catalogue no. 21-001. Ottawa.
Statistics Canada. 2002–. Farm Cash Receipts. Statistics Canada Catalogue no. 21-011. Ottawa.
Statistics Canada. 2003–. Farm Debt Outstanding - Agriculture Economic Statistics, Statistics Canada Catalogue no. 21-014. Ottawa.
292 Statistics Canada - Catalogue no. 13-017 Guide to the Income and Expenditure Accounts
Reference list
Statistics Canada. 2003–. Farm Operating Expenses and Depreciation Charges - Agriculture Economic Statistics, Statistics Canada Catalogue no. 21-012. Ottawa.
Statistics Canada. 1997–. Financial and Taxation Statistics for Enterprises, Statistics Canada Catalogue no. 61-219. Ottawa.
Statistics Canada. 1972–. Financial Flow Accounts. Statistics Canada Catalogue no. 13-014. Ottawa.
Statistics Canada. 2000–. Financial Management System (FMS). Statistics Canada Catalogue no. 68F0023. Ottawa.
Statistics Canada. 1989. Guide to the Financial Flow and Balance Sheet Accounts – Definitions, Concepts, Sources, Methods. Statistics Canada Catalogue no. 13-585. Ottawa.
Statistics Canada. ___–. Guide to the Income and Expenditure Accounts, Statistics Canada Catalogue no. 13-017. Ottawa.
Statistics Canada. 1990. Guide to the Income and Expenditure Accounts, Statistics Canada Catalogue no. 13-603 no. 1. Ottawa.
Statistics Canada. 2002–. Hog Statistics. Statistics Canada Catalogue no. 23-010. Ottawa.
Statistics Canada. 1990–. Households' Unpaid Work: Measurement and Valuation, Statistics Canada Catalogue no. 13-603 no. 3. Ottawa.
Statistics Canada. 1990–. Income and Expenditure Accounts Technical Series, Statistics Canada Catalogue no. 13-604. Ottawa.
Statistics Canada. 1998–. Income in Canada. Statistics Canada Catalogue no. 75-202. Ottawa.
Statistics Canada. 2001–. Industry Price Indexes, Statistics Canada Catalogue no. 62-011. Ottawa.
Statistics Canada. 1980. Labour Costs in Canada, Statistics Canada Catalogue no. 72-618. Ottawa.
Statistics Canada. 1997–. Latest Developments in the Canadian Economic Accounts. Statistics Canada Catalogue no. 13-605. Ottawa.
Statistics Canada. 1993-2002. Livestock Statistics. Statistics Canada Catalogue no. 23-603. Ottawa.
Statistics Canada. 1985–. National Balance Sheet Accounts. Statistics Canada Catalogue no. 13-214. Ottawa.
Statistics Canada. 1953–. National Income and Expenditure Accounts. Statistics Canada Catalogue no. 13-001. Ottawa.
Statistics Canada. 1996–. National Tourism Indicators. Statistics Canada Catalogue no. 13-009. Ottawa.
Statistics Canada. 2003–. Net Farm Income - Agriculture Economic Statistics, Statistics Canada Catalogue no. 21-010. Ottawa.
Statistics Canada. 1999–. Pension Plans in Canada, Statistics Canada Catalogue no. 74-401. Ottawa.
Statistics Canada. 2004–. Pension Plans in Canada: Key Tables, Statistics Canada Catalogue no. 74-508. Ottawa.
Statistics Canada - Catalogue no. 13-017 Guide to the Income and Expenditure Accounts 293
Reference list
Statistics Canada. 1999–. Private and Public Investment in Canada, Intentions, Statistics Canada Catalogue no. 61-205. Ottawa.
Statistics Canada. 1989–. Provincial Economic Accounts. Statistics Canada Catalogue no. 13-213. Ottawa.
Statistics Canada. 2000–. Public Sector Statistics, Statistics Canada Catalogue no. 68-213. Ottawa.
Statistics Canada. 1992–. Quarterly Financial Statistics for Enterprises, Statistics Canada Catalogue no. 61-008. Ottawa.
Statistics Canada. 1999–. Retail Trade, Statistics Canada Catalogue no. 63-005. Ottawa.
Statistics Canada. 2004–. Satellite Account of Nonprofit Institutions and Volunteering, Statistics Canada Catalogue no. 13-015. Ottawa.
Statistics Canada. 2002–. Sheep Statistics, Statistics, Canada Catalogue no. 23-011. Ottawa.
Statistics Canada. 2001–. The Input-Output Structure of the Canadian Economy, Statistics Canada Catalogue no. 15-201. Ottawa.
Statistics Canada. 2003–. Value of Farm Capital - Agriculture Economic Statistics, Statistics Canada Catalogue no. 21-013. Ottawa.
Statistics Canada. 1999–. Wholesale Trade, Statistics Canada Catalogue no. 63-008. Ottawa.
Other publications
Canada Revenue Agency, RC4110 Employee or Self-employed? Guide no. RC4110(E) Rev. 2006/12. www.cra-arc.gc.ca/E/pub/tg/rc4110/ (accessed September 11, 2007).
Canada Revenue Agency, T4001 Employers' Guide – Payroll Deductions and Remittances. Guide no. T4001(E) Rev. 2006/10 www.cra-arc.gc.ca/E/pub/tg/t4001/ (accessed September 17, 2007).
Canada Revenue Agency, T4130 Employers' Guide – Taxable Benefits. Guide no. T4130(E) Rev. 2006/11 www.cra-arc.gc.ca/E/pub/tg/t4130/ (accessed September 10, 2007).
Carswell Payroll Consulting Group,The Canadian Payroll Manual. Toronto: Carswell, 1993.
Commission of the European Communities, International Monetary Fund, Organisation for Economic Co-operation and Development, United Nations and World Bank. 1993. System of National Accounts 1993, Inter-Secretariat Working Group on National Accounts. Brussels, Luxembourg, New York, Paris, Washington.
Human Resources and Social Development Canada, Current Collective Bargaining Settlements. www.hrsdc.gc.caen/lp/wid/bulletin.shtml (accessed September 11, 2007).
294 Statistics Canada - Catalogue no. 13-017 Guide to the Income and Expenditure Accounts
Acronyms and initialisms
Chapter 16 Acronyms and initialismsAABCPI Apartment Building Construction Price Index ANIFO Accrued net income of farm operators from farm productionARTS Annual Retail Trade SurveyAWE Average Weekly Earnings
BBEA Bureau of Economic Analysis BGE Government Business EnterprisesBLS Bureau of Labor Statistics BOP Balance of Payments BPD Balance of Payments DivisionBPM5 Balance of Payments Manual 5
CCA Capital AccountsCBSA Canada Border Services AgencyCCA Capital Consumption AllowancesCDC Canadian Dairy CommissionCES Capital Expenditure SurveyCIHI Canadian Institute for Health InformationCLHI Canadian Life and Health InsuranceCMHC Canada Mortgage and Housing CorporationCOFOG Classification of the functions of governmentCOICOP Classification of individual consumption by purposeCPC Central Product Classification CPI Consumer Price IndexCRA Canada Revenue AgencyCSNA Canadian System of National AccountsCTUMS Canadian Tobacco Use Monitoring SurveyCVMA Canadian Vehicle Manufacturers' AssociationCWB Canadian Wheat Board
DDS Domestic supply
FFAMEX Survey of Family ExpendituresFDD Final Domestic DemandFFA Financial Flow AccountsFIFO First In First OutFMS Financial Management SystemFOB Free on boardFSIM Financial Services Indirectly MeasuredFV Non-Chained Fisher Index
Statistics Canada - Catalogue no. 13-017 Guide to the Income and Expenditure Accounts 295
Acronyms and initialisms
Chapter 16 Acronyms and initialisms (continued)
GGDP Gross Domestic ProductGFME Gross Fixed Capital Formation in Machinery and EquipmentGNI Gross National IncomeGNP Gross National ProductGO Gross OutputGST Goods and Services Tax
HHRRS Homeowner Repair and Renovation SurveyHS Harmonized Commodity Description and Coding System HST Harmonized Sales Tax
IIAD Industry Accounts DivisionICSD Investment and Capital Stock DivisionIEA Income and Expenditure Accounts IEAD Income and Expenditure Accounts DivisionII International ImportsIMF International Monetary FundIOA Income and Outlay AccountsIOFD Industrial Organization and Finance DivisionIOT Input-Output TablesIPI Industry Price IndexesIPPI Industrial Product Price IndexITD International Trade Division ITS International Travel SurveyIX International Exports
LLFS Labour Force SurveyLIFO Last In First Out
MMCED Manufacturing, Construction and Energy DivisionMLS Multiple Listing ServiceMRTS Monthly Retail Trade SurveyMSM Monthly Survey of ManufacturingMSRP Manufacturer's Suggested Retail PriceMVMA Motor Vehicle Manufacturers Association
NNAICS North American Industry Classification SystemNBSA National Balance Sheet AccountsNIEA National Income and Expenditure AccountsNIPA National Income and Product AccountsNIPO Non-Profit Organization
296 Statistics Canada - Catalogue no. 13-017 Guide to the Income and Expenditure Accounts
Acronyms and initialisms
Chapter 16 Acronyms and initialisms (concluded)
NMVDCS New Motor Vehicle Dealer Commodity SurveyNMVSS New Motor Vehicle Sales SurveyNNP Net Domestic ProductNPI Non-Profit InstitutionsNPISH Non-Profit Institutions Serving Households
OOECD Organisation for Economic Cooperation and DevelopmentOSFI Office of the Superintendent of Financial InstitutionsOSFI Office of the Superintendent of Financial Institutions Canada
PPEA Provincial Economic AccountsPID Public Institutions DivisionPSG Personal Spending PSG Personal Spending GroupsPST Provincial Sales TaxesPTEA Provincial and Territorial Economic AccountsPWGSC Public Works and Government Services Canada
QQFS Quarterly Survey of Financial Statistics for EnterprisesQRCS Quarterly Retail Commodity Survey
RRCMP Royal Canadian Mounted Police
SSDR Special drawing rightsSEPH Survey of Employment, Payroll and HoursSHS Survey of Household SpendingSNA System of National Accounts SNA 1993 System of National Accounts 1993
TTSRC Travel Survey of Residents of Canada
UU.K. United KingdomUNESCO United Nations Educational, Scientific and Cultural Organization
VVAT Value Added TaxesVDI Value of Depletion of InventoriesVP Value of ProductionVPC Value of Physical Change
WWPIP Work Put In Place
Statistics Canada - Catalogue no. 13-017 Guide to the Income and Expenditure Accounts 297