Guidance document for members - GIRT Scientific Divers
54
Guidance document for members VERSION 2.3 aligned with survey sheets Version 2.0 1
-
Upload
khangminh22 -
Category
Documents
-
view
3 -
download
0
Transcript of Guidance document for members - GIRT Scientific Divers

Guidance document for members
VERSION 2.3 aligned with survey sheets Version 2.0 1

2
TableofContents
PREFACE ............................................................................................................................................ 4
1 INTRODUCTION ........................................................................................................................... 4
2 INTRODUCTION TO THE GIRT 8 STEP METHOD ............................................................................. 5
2.1 STEP 1 – ABOVE WATER OBSERVATIONS .................................................................................... 5 2.1 A - DEBRIS ZONE PATTERN ..................................................................................................................................................... 6 2.2 STEP 2 – MAKE A SKETCH OF THE SITE (MUD MAP) ...................................................................... 8 2.3 STEP 3 - SITE AND ENVIRONMENT ............................................................................................. 10 2.4 STEP 4 – PHOTO CONDITION DOCUMENTATION ....................................................................... 11 2.4A - PLACE SCALE AND NOTE DEPTH ..................................................................................................................................... 11 2.4B - ORIENTATE YOURSELF .................................................................................................................................................... 11 2.4C - TAKE CONDITION PHOTO ............................................................................................................................................... 12 2.4 D - RECORD OBSERVATIONS ................................................................................................................................................ 12 2.5 STEP 4A – VIDEO TRANSECT ...................................................................................................... 13 2.6 STEP 4B – PHOTOGRAMMETRY ................................................................................................. 14 2.7 STEP 5 – MARINE ENVIRONMENTAL SURVEY ............................................................................ 15 2.8 STEP 6 – SAVE DATA ................................................................................................................. 16 2.9 STEP 7 – ESTIMATING THREAT AND RISK LEVEL ......................................................................... 17 2.9 A - ASSESSMENT OF CONDITION, THREAT AND RISK AFTER DIVE 1 ..................................................................... 19 2.10 STEP 8 – ENTER DATA INTO THE GIRT SURVEY REPORT PAGE ................................................... 19
3 - META DATA GUIDANCE ............................................................................................................ 20
3.1 SURFACE DATA SHEET ............................................................................................................................................ 20 3.2 UNDERWATER DATA SHEET ................................................................................................................................... 21 3.3 MUDMAP ............................................................................................................................................................... 27 3.4 PHOTO CONDITION SHEET ...................................................................................................................................... 28 3.5 VIDEO AND PHOTOGRAMMETRY SHEET ................................................................................................................. 29 3.6 MARINE SURVEY SHEET ......................................................................................................................................... 30 3.7 THREAT AND RISK LEVEL DATA ENTRY ................................................................................................................... 31
APPENDIX 1 - DATA COLLECTION EXAMPLE ...................................................................................... 32
APPENDIX 2 - 3D PROCEDURES FROM IAN MCCANN – MAAWA MEMBER ....................................... 33
PRACTICAL APPROACH TO 3D PHOTOGRAMMETRY ......................................................................................................... 33 EQUIPMENT REQUIREMENTS ............................................................................................................................................ 33 CAMERAS .................................................................................................................................................................................... 33 SETTINGS FOR THE CAMERAS ............................................................................................................................................ 34 SHUTTER SPEED .......................................................................................................................................................................... 34

3
APERTURE ................................................................................................................................................................................... 34 ISO ........................................................................................................................................................... 34 LENSES ........................................................................................................................................................................................ 34 QUALITY ...................................................................................................................................................................................... 34 EDITING IMAGES ............................................................................................................................................................... 34 ADDITIONAL LIGHT SOURCES ............................................................................................................................................ 35 SOFTWARE ........................................................................................................................................................................ 35 UNDERWATER .................................................................................................................................................................. 35 ON LAND .......................................................................................................................................................................... 37 GENERAL GUIDELINES ....................................................................................................................................................... 38 TARGETS FOR MEASUREMENT .......................................................................................................................................... 39 RECORDING ...................................................................................................................................................................... 40 EXERCISE 1 ......................................................................................................................................... 40 EXERCISE 2 ......................................................................................................................................... 42 GENERAL WORKFLOW ...................................................................................................................................................... 43 EXTRACTING STILLS FROM VIDEO .............................................................................................................................................. 43 PROCESSING THE DATA IN PHOTOSCAN .................................................................................................................................... 45 ADD PHOTOS OR FILES ............................................................................................................................................................... 45 ALIGN PHOTOS ........................................................................................................................................................................... 45 BUILD DENSE CLOUD ................................................................................................................................................................. 45 BUILD MESH ............................................................................................................................................................................... 45 BUILD TEXTURE .......................................................................................................................................................................... 45 ORIENTATION ............................................................................................................................................................................. 45 SCALING ...................................................................................................................................................................................... 46
APPENDIX 3 – PHOTOGRAMMETRY SOFTWARE ACCESS GUIDANCE ................................................. 49
INSTALLING AND ACTIVATING WRECK CHECK/GIRT PHOTOSCAN SOFTWARE ................................................................ 49 INSTALLING ................................................................................................................................................................................. 49 ACTIVATION ................................................................................................................................................................................ 50 DE-ACTIVATION ......................................................................................................................................................................... 50 ADDITIONAL INFORMATION ....................................................................................................................................................... 50
APPENDIX 4 – EXPORTING A 3D MODEL FROM AGISOFT PHOTOSCAN / ........................................... 51
METASHAPE .................................................................................................................................... 51
OVERVIEW ........................................................................................................................................................................ 51 THE PROBLEM ................................................................................................................................................................... 51 REDUCING THE FILE SIZE ................................................................................................................................................... 51 REDUCING THE TEXTURE TO “1” .............................................................................................................. 51 REDUCING THE MESH SIZE ................................................................................................................................................ 52 SOLUTION 1: UPLOAD THE MODEL TO THE SKETCHFAB.COM WEBSITE ............................................................................ 52 SOLUTION 2: CREATE A 3D.PDF ....................................................................................................................................... 53

4
PREFACE
The purpose of this document is to explain background to the project, the methodology and steps to collect and process information and to assist you to do 3D photogrammetry of your site or features. The document is also designed to assist you to use the GIRT website which is currently being developed.
1 INTRODUCTION
The destruction of underwater cultural heritage (UCH) has increased rapidly in the last two hundred years mainly driven by direct and indirect impacts from people. However, with climate change and increasingly violent storm events, a site’s equilibrium with its physical environment is under potentially greater or new threats from natural events.
Gathering Information via Recreational and Technical (GIRT) Scientific Divers is a conservation focused no-impact citizen-science project. It aims to train members to systematically document observable physical and natural features of historic shipwrecks, in an open sea water environment, to facilitate their ongoing protection and management. The focus of the GIRT citizen science project is to enable better understanding of the condition of shipwrecks and the factors driving their preservation or deterioration. It also aims to encourage interested people to have an active and positive public archaeology role.
GIRT members (individuals, groups and businesses) ‘adopt-a-wreck’ that is of interest to them and agree to monitor the site using the GIRT survey methodology at least once a year. Starting fully in the second year of observations, GIRT members compare their site data and allocate a ‘traffic light’ indication of threat to the site’s preservation (Green, Yellow, Orange, Red). GIRT member’s observations and threat assessments are shown on a map that can be located on the ADOPT WRECK page of the website at www.girtsd.org.
Once the website development is completed, all the records from a survey will be:
• linked to the names of the GIRT members who undertook the survey and their adopted site; and
• compressed and made available for GIRT members to add to their site’s formal record in a statutory database.
For people living in New Zealand, Papua New Guinea and Australia that statutory database is the Australasian Underwater Cultural Heritage Database (AUCHD). For people living in other countries you will be able to identify the relevant database under the heading ‘Other’.
By being able to add GIRT monitoring records to the AUCHD, or any other statutory database, annual observations of a site’s condition will never be lost and GIRT member contributions will be permanently recognised. Also, promoting the democratisation of information, GIRT member contributions will facilitate a greater understanding of what is happening in our marine coastal environment from climate change and its impact on our underwater cultural heritage. Potentially, with enough GIRT members adding their individual observations, the GIRT citizen science project may be able to assist conservation scientists to go beyond understanding a specific site's ‘equilibrium’ in the environment over time and obtain an understanding of what is happening more broadly

5
to underwater cultural heritage – locally and regionally. Through your participation in GIRT, you can assist others, to easily see the threats to your adopted site and if there are patterns to events occurring in the marine environment that may impact other nearby wrecks. Through these methods GIRT members can contribute directly to science-based decision making and potentially the prioritisation of activities by relevant authorities or appropriately qualified community groups to protect or undertake rescue archaeology of submerged sites.
In order to collect data on a site, members need access to a camera with an underwater housing, 30m tape, photography scales, slate and pencil and GIRT monitoring templates printed on waterproof paper (besides standard dive gear).
Once data has been collected, GIRT members will be encouraged to compare their results with other members, lead the analysis of aspects of research (i.e. marine life, correlation of storm data with observed sediment movements, modelling observed change to other proximal sites…..) and present the results of their surveys or broader analysis of data at conferences such as at the Australasian Institute for Maritime Archaeology (AIMA) annual conference.
GIRT Scientific Divers is part of a PhD research project that aims to: better understand the motivation of divers. GIRT members are also asked to complete an anonymous 15- minute online survey to enable better understanding of who is interested to participate as a volunteer in this citizen science project and whether their motivation changes throughout the course of their participation. A survey monkey request will be sent to your email address on completion of training and again approximately two years later. Completing this short online survey will significantly help improve GIRT as a citizen science project and is appreciated.
2 INTRODUCTION TO THE GIRT 8 STEP METHOD
There are eight steps in the GIRT Scientific Divers workflow. Steps two to five require diving. The number of dives required to safely collect all the information is not defined and will depend entirely on your adopted site, depth, your familiarity with the processes and the way you work with your dive buddy or buddies. Even in shallow water on a relatively small site, it is expected that more than one dive will be required to complete an entire survey. While it is ideal to complete all the survey sheets, GIRT is scalable. Complete as much as you can of each Survey Sheet within the limitations of conditions and dive time.
The order in the work flow given below is not rigid but is recommended for your first survey. An alternative scenario for collecting data underwater is given at APPENDIX 1. The latest version of this GUIDANCE Document and all five GIRT Survey Sheets are able to be downloaded from GIRT website JOIN page (http://www.girtsd.org/register).
2.1 Step 1 – ABOVE WATER OBSERVATIONS
Populate the form titled SURFACE DATA SHEET (Figure 1). This form does not need to be taken underwater and is largely self-explanatory. One panel that requires more background is
Tip - Several data fields in this form can be populated before you are on site. Two fields need to be completed after your dive of the site, the ‘Site Classification’ field and the 'Debris Zone Pattern'.

6
the panel titled Debris Zone Pattern.
In an attempt to further site formation knowledge the SURFACE SHEET includes two panel’s on site formation information. The first panel is the one termed 'Site Classification' which builds on seminal research published by Keith Muckelroy in 1976. This panel is largely self- explanatory and includes an ‘other’ category which was not in the initial design. The other category typically suits metal hulled sites that have been extensively salvaged, i.e. they have Extensive Structural Remains, Few to no Organic Remains, sometimes Many - Few Other Objects and the distribution can be Coherent to Scattered Ordered. The project also hopes to further observations recorded on deep water sites in the Gulf of Mexico by Daniel Warren, building on early work by Church et al. To assist you in correctly completing this panel some extra detail is outlined below.
Figure 1: Front and back page of GIRT Surface sheet version. NB: the most recent survey form version is currently labelled Version 2.0 in the bottom left corner of each sheet.
2.1 A - Debris Zone Pattern
Distribution Pattern A - 'is identified by debris extending out from around the central hull remains. The wreck debris is distributed over the site unevenly with denser concentrations near the hull structure and lighter scatters on the site's periphery. This type of distribution (Warren) attributed to a ship sinking near vertically to the seafloor and the impact dispersing materials around the impact area (Church et al. 2007)'. p 245

7
Distribution Pattern B - similar to a site distribution mechanism observed in shallow water. This pattern consists of a trail of wreckage leading to a site with denser concentrations near the core wreckage. On deepwater sites this pattern is attributed to materials continuing to move horizontally through the water column before reaching the seafloor. In this type of pattern, the field density is directly proportionate to the amount of material dislodged from the vessel as it sank (Church et al. 2007).' p245-247.
Distribution Pattern C - is characterised by separate debris scatters. One or more scatters are located away from the core wreckage, while the main scatter is directly related to the main wreckage. In between the scatters, the seafloor is relatively void of wreck-related artefacts. This type of distribution occurs when materials are dislodged from a vessel on the surface, such as by an explosion, then the ship drifts or moves a substantial distance away from this point without additional loss of ship components, before finally sinking (Church et al. 2007).' p247.

8
Other - This option is included as all the above models are based on deepwater wrecks and people may or may not be able to choose one of the above distribution patterns. If this option is chosen members should include on their site plan an outline of the distribution pattern.
Reference: Warren, D.J., 2016, Acoustic Positioning and Site Formation on Deep- Water World War II Shipwrecks' in Site Formation Processes of Submerged Shipwrecks, ed. Matthew E. Keith. University Press of Florida, 2016, pp- 235-248.
2.2 Step 2 – MAKE A SKETCH OF THE SITE (MUD MAP)
Make an approximately scaled sketch of the site and associated debris field (in meters) on the GIRT sheet title MUD MAP (Figure 2).
Include an indicative North arrow on the page and give a compass orientation of the wreck (stern to bow where possible).
Label identifying features of the site (i.e. bow, stern, engine, anchor, rudder or tail plane, propeller, wing)
On the Mud Map, number a maximum of 10 features that you intend to use for longitudinal monitoring of the site’s physical condition and sediment movement around the site. Your choice of the number of places to monitor annually with be based upon only factors you can consider, factors such as: the requirement for effective monitoring; the depth of your site; the size of the area being monitored; current or wave action; the number of distinct features; your accessibility to the site; and the movement of sediments around features.
Either create a legend near the Mud Map showing the monitoring location's number and name/description of the feature you have chosen to monitor or use the Mud Map fair copy template. It is best to finalise choice of locations for longitudinal survey after discussing the site with your dive buddy.
It is recommended that once you have a Mud Map sketch with numbered survey points and a corresponding legend - take a photo and make a second or third copy so you can write notes underwater without crowding your sketch with information. This will also help you make a fair copy of all your collected data for uploading into the SURVEY REPORT page of the website when you complete the survey.
Peter Holt’s website at 3H Consulting has a very good resource on sketching a Mud Map. Peter has a specific section on sketches/Mud Maps with good examples that reinforce the fact that everyone can sketch underwater.

9
Figure 2: GIRT Mud Map sheets and a completed example

10
2.3 Step 3 - SITE AND ENVIRONMENT
Using the UNDERWATER SHEET Record water temperature, visibility, current – strength and direction, area of site, maximum depth of wreck/ wreck debris, minimum depth of wreck (highest and lowest points of wreck), slope of seafloor over which wreck and debris field is located, record mobility of sediment surface on the seafloor – direction and frequency (Figure 3).
Where required take photos of particular features and record their depth and approximate position on the Mud Map.
In practice, the UNDERWATER SHEET can be largely populated by a diver while acting as dive buddy for the camera person recording for photogrammetry.
Figure 3: – UNDERWATER SHEET/S
Tip – Frequency of sediment waves can be calculated using your 30m tape. Lay 10m of tape down on the sea floor in the direction of the waves. Record the compass direction on your sheet and count the number of sediment waves. Divide the total number of waves by 10 and this is the spatial frequency, or cycles per meter (cpm).

11
2.4 Step 4 – PHOTO CONDITION DOCUMENTATION
Prior to entering the water you can partially populate your PHOTO CONDITION MONITORING SHEET (Figure 4).
2.4A - Place scale and note depth
Place a photo scale near the feature being photographed so that it will be easily visible when you take your condition imge of the feature (generally the photo scale is located flat on the ground near the feature or on the feature itself if required). Swim back slightly to be able to get the best general photo of the feature with your camera system. Check your depth measurement so that in following years you can relocated yourself approximately within 0.1 m of the same depth.
2.4B - Orientate yourself
To ensure that the observations will in the future be from a consistent direction, record the compass orientation (+/- 10 degrees) for the photo. Orientate yourself so that you face the survey point from the same direction each time.
Reading a scuba compass
Follow these steps to become more comfortable with your scuba compass.
Step 1: Note that most compasses have numbers marked every 30 degrees. Many substitute East for 90, South for 180, West for 270 and North for 0/360.
Step 2: Rotate the compass back and forth to make it level. The card, the only moving part, should remain stationary and aimed north. Then aim your lubber line toward your survey target.
Step 3: Count the tick marks from left or right of the closest cardinal point to your desired direction. The number it lands on is your heading. Repeat this step to be sure the card is still pointing north and accurate.
(https://www.sportdiver.com/how-to-use-a-compass-underwater-scuba-diving-tips)
Tip – make sure the date time stamp on your camera is correctly setup. This can help you sort photos.
Separate photos of survey locations by taking a photo of your hand or fin at the end of each survey location’s photo condition documentation. This will help you sort images later on.
If you cannot white balance your camera underwater, at that depth take an image that includes white in it and photos can be colour corrected later.
Tip - Discuss with your dive buddy what order you will do the documentation photos in. Tasks can be split between divers - scribe and photographer. Note that when setting up for the dive you will need your UW camera, photo scale/s, compass, depth gauge, slate with marked mud-map on one side to record data on.
Tip – Note the time you took the image of that feature on the survey sheet so you can easily match up images to locations later on.

12
2.4C - Take condition photo
Check that you have framed your photo to include the scale bar at the bottom of the image and the feature.
Remember that the intent of the image is to show the physical condition of the feature, the level of sand cover at the base and or biological growth, or the size and shape of a hole in the vessel. The resolution for the images and your position should enable you to observe the physical condition of the object, the level of sediment piled up to the object and marine growth on the feature. Take a number of images with the scale visible in the view finder so you can select the best image later.
Peter Holt -3H Consulting has a nice piece on taking photos for archaeological purposes. He also has many other useful tips and guides.
http://www.3hconsulting.com/techniques/TechRecordingPhotosOnSite.html
2.4 D - Record Observations
On the sheet, record the feature’s survey number from the Mud Map (if not already done pre- dive), the compass direction and depth at which you took the photo in to enable future consistent observations. Also, write a short observtaion of the feature’s condition. Select the best image when uploading data into the SURVEY REPORT page in the website.
Prior to moving to the next feature to document, ensure that you have updated the survey sheet.
Feature No
Depth of obs.
Orientation of obs.
Photos No taken
Observations
1 – exposed timbers
Original recorded depth 15.5 m
15.6
60 (E – NE) 5 07:30am
Three timbers with borer damage. Dark sand. Lots of seagrass.
2 - anchor Original recorded depth 6.2m
180 (S) 42 07:44am
Coarse sand, rocky outcrop nearby

13
Figure 4: PHOTO CONDITION SHEET.
2.5 Step 4a – VIDEO TRANSECT
Choose an area with a typical composition of the seafloor and marine growth for your site. Attempt to utilise already identified survey locations as either the starting and or finishing points of your 30 m transect. If this is not possible select other prominent features on your site. If you choose two points that are not one of the pre-selected survey locations you have chosen for photo condition documentation, record them as survey points 11 and 12 (or as relevant) on the Mud Map and into the legend.
Lay down your 30-meter tape between the two features recording the depth at the start and finish of the tape. Choose one direction in which you will always swim and video record. Note the compass direction of the swim and which two features you are using on your mud map. Swim slowly in the one direction at a height either 1.0m, 1m-2m, or >2m above the tape recording at a 60-900 angle (height selection is dependent on available visibility). The measuring tape should remain in the middle of the viewfinder with 1 – 3 meters of seabed visible each side of the tape. Record data on your Video Transect and Photogrammetry Sheet (Figure 5).

14
Figure 5: VIDEO TRANSECT AND PHOTOGRAMMETRY SHEET.
2.6 Step 4b – PHOTOGRAMMETRY
One of the most significant advancements in recent years has been the accessibility of photogrammetry to 3-D document features by simply taking overlapping images in a particular manner. Photogrammetry can be defined as both the collection of images in a particular manner and the conversion of those images into a point cloud and scaled 3D model that enables post diving visual analysis, identification of features, measurements and effective communication of the site to occur. Photogrammetry can greatly facilitate the archaeological process and site management by giving millimeter accuracy and by visually documenting change (termed site formation).
Photogrammetry often uses coded targets like those below. Coded targets help automate certain point measurement tasks and increase accuracy (Figure 6).
Figure 6: Coded targets used in conjunction with length and colour scale (Wreck Check Inc.) Photo on the right of a Late Bronze Age stone anchor off southern central Cyprus.

15
Dependant on available time and conditions, GIRT members may wish to do photogrammetry of a specific feature, up to 5 features or of the entire site. Using the VIDEO TRANSECT AND PHOTOGRAMMETRY SHEET, record the locations you are imaging for photogrammetry, the depth and unique number of each control point/ photogrammetry target.
As outlined in APPENDIX 2 Photo Condition reporting guide from Ian McCann (Maritime Archaeological Association of Western Australia (MAAWA) member) ‘it is necessary to set up controls that will allow you to scale and orientate the 3D model’. This document goes into detail about camera setup and data collection.
In addition, Wreck Check’s Andrew Hutchison prepared this video (https://youtu.be/Tbv6bFYyGWY) to assist the Norfolk Island Maritime Archaeology Association collect images for a research project on HMS Sirius. Agisoft also has an enormous range of supporting information on their website http://www.agisoft.com/.
Recognising that most members do not have access to a copy of AGISOFT Photoscan (now called Metashape), which is the standard software used to produce a 3D digital model of sites or features, GIRT has arranged to purchase a number of ‘standard edition’ copies that can be loaned, utilised and then returned. Instructions on how to load and unload the software is at APPENDIX 3. While access to the software will be via the SURVEY REPORT page in the GIRT website in the future, currently members are asked to contact Wreck Check and GIRT member Alex Moss who is acting as the GIRT digital librarian. Details to contact Alex are in APPENDIX 3.
Alternately, you can send your images to GIRT via dropbox and request member support to process them and convert those images into a 3D PDF file suitable for uploading. Simply email [email protected] to request support or send collected images via ‘wetransfer’ or another file sharing platform.
Once you have created a 3D model, follow the instructions in APPENDIX 4 to produce a 3D pdf. This guidance will be downloadable from the website on the SURVEY REPORT page.
As of June 2020, GIRT has a Sketchfab website (https://sketchfab.com/GIRT) set up to enable members to put their photogrammetry models up on the web so that everyone can see their site’s condition. Detailed guidance on how to post your file on Sketchfab will be developed and posted in the TRAINING pages of the website and attached to this document. In the interim please just contact [email protected] until the procedures have been developed.
2.7 Step 5 – MARINE ENVIRONMENTAL SURVEY
GIRT encourages members to use any existing non-intrusive marine environmental survey/citizen program to document the marine life around their adopted shipwreck.
If you have been trained in another citizen science project and can utilise that method on your adopted site, please do so. Any marine environmental data collected will be added to your site’s record as attached PDF documents when entering data in the SURVEY REPORT page of the GIRT website. GIRT member Alison Turner has agreed to help South Australian based members identify marine species on their site or connect members with other people knowledgeable of the marine environment in South Australia. A contact point for coordinating
Tip – Regardless of the controls or scales used it is important to record the depth of each control point/photogrammetry target to help you scale the site in space (X, Y and Z).

16
marine environmental surveys in New Zealand or in other Australian states is yet to be established. Any data collected by a GIRT member will be shared with the relevant citizen science project. Examples of citizen science projects that can be done in conjunction with GIRT include: Reefwatch (Figure 7), Coral Watch, Redmap, Reef Check and Eye on the Reef, though many others may be utilised. Information about these other citizen science projects is available at https://biocollect.ala.org.au/ala-cs or on their websites.
Figure 7: e.g. REEFWATCH SURVEY SHEETS.
2.8 Step 6 – SAVE DATA
A major step in the GIRT workflow is taking the data collected and as soon as possible after the dive, working that data up into a fair copy and entering the data as required in the SURVEY REPORT page of the GIRT website. Currently the SURVEY REPORT page is not live but is under development. It cannot be stressed highly enough the need to recognise the importance of post diving data management and to plan your dives to enable sufficient time and energy to do this vital step. When the website is working completely, your entered data will be linked via the relational database, to your site’s record and the name/s of the GIRT members involved in the survey.
Simultaneously a compressed file will be produced which can be downloaded by you and added to your site’s official record wherever that is held. For individuals in Papua New Guinea, New Zealand and Australia, the AUCHD (https://www.environment.gov.au/heritage/underwater-heritage/auchd) constitutes the national register for these countries.
In the interim an Excel spreadsheet has been created that facilitates members storing data in the right format so that it can be easily entered when the database reporting tool comes on line. This Excel form is available from the GIRT Dropbox or by request from [email protected]. Once a member has entered data into the template they are required to label attached files as outlined below. Please scan/or photograph completed template documents and save them using the file naming convention below:
Labelling for Excel, images, video, PDFs and 3D PDFs - save file as: Date (yyyymmdd format) underscore divers name underscore divers name underscore ANSDB Shipwreck ID number for your site underscore template sheet details
Tip - It is always best to take a photo of the GIRT populated template documents once you are out of the water. This need not be the final version but it backs up data that can be accidentally lost, blurred or rubbed away on the return trip.

17
20180728_ viduka_bullers _5748_1sds
[sds = Surface data Sheet] [Star of Greece is Shipwreck ID Number 5748 in the Australian National Shipwrecks Database]
20180728_ viduka_bullers _5748_2Mud Map
20180728_ viduka_bullers _5748_3uwsheet
[uw = Underwater]
Labelling condition images of features - save file as:
20180728_ viduka_bullers _5748_4sp1_image1
[sp1 = Survey Point (and number allocated from 1 – 10)]
20180728_viduka_bullers_5748_4sp1_image2
20180728_ viduka_bullers _5748_4sp2_image1
Labelling videos - save file as:
20180728_ viduka_bullers _5748_30mt
[30mt= 30 meter transect]
Labelling Marine Survey PDFs - save file as:
20180728_viduka_bullers_5748_MS_(name of type of marine survey) i.e.
20180728_viduka_bullers_5748_MS_Reefwatch
[MS = Marine Survey. Reefwatch, Coral Watch, Redmap, Reef Check and Eye on the Reef]
Photogrammetry 3D PDFs – create a file folder labelled as:
20180728_ viduka_bullers _5748_sp1_pg
[sp1_pg = Survey Point 1_ Photogrammetry]
Copy all images collected in the photogrammetry survey into that folder.
The entire folder can be shared with [email protected] using the free file sharing app we transfer (https://wetransfer.com/)
2.9 Step 7 – ESTIMATING THREAT AND RISK LEVEL
A key role of a GIRT Scientific Diver is to estimate the threats, likelihood and risks to your adopted site to determine a risk level to that heritage’s ongoing preservation. Sites are in a dynamic equilibrium, it will take time and experience to know what is normal for your site in its micro-environment and what is a significant change. Initial assessments of risk may be wrong, but these will enable us to learn. Experience will refine your assessment of condition, threat, risk and likelihood. As a regular systematic observer of the site’s physical condition you will be best placed to assess the extent of change in the physical condition and surrounding environment and will be able to support your assessments with observations, measurements,

18
photographic and photogrammetry evidence. Until that experience is established, your assessment of threat may be moderated in discusison with you, after being submitted through the SURVEY REPORTING web page. A site is threatened if there is evidence of cultural or natural activity that has negatively impacted the potential preservation of the site. While some actions are indications of threat the risk those activities pose to the site’s preservation vary considerably. Below are some examples of activities and their level of threat:
• The site has been totally or partially exposed by a major weather event [High –Critical];
• Timber appears newly exposed on the site [Moderate – Critical];
• Evidence of visible anchor damage (loss of concretion (the dense coral cover over an object’s surface), physical damage, furrows in sand near site, displaced coral) [Low – High];
• Anchors lost from other vessels are present on site [ Low – High];
• Other human debris around site (bottles, cans, fishing nets, fishing line ... indicating activity over site) [ Low to High];
• Evidence of marine borer damage on exposed timber [Low to Critical];
• The site has lost concretion cover [Low to Critical];
• There is visible evidence of significant active corrosion [ Low to Critical]; or
• Artefacts are easily observable around the site or have been placed for diver inspection [Low to Major].
To assist you in making an assessment of ‘low, medium, high or severe’ risk to your site’s preservation, members are required to use the ‘Likelihood of threat’ and ‘Threat to UCH’ matrix below (Figure 8).
Figure 8: Likelihood of threat’ and ‘Threat to UCH’ matrix below

19
a) - Write a list of identified observable threats
b) - Prioritise those threats in order of significant consequence or potential cumulative effect allocating (minor, moderate, high, major, critical) c) - Consider the likelihood of each threat
d) - Identify each threat’s risk level - as either low, medium, high or severe
e) - Record the site’s Threat and Risk level based on the threat with the most significant consequence and highest likelihood to the site’s overall preservation.
2.9 a - Assessment of condition, threat and risk after dive 1
After the first year’s survey a baseline of observations and images has been collected. Following the completion of the second survey you will be able to start comparing records for your adopted site (written and photographic) and assigning a score of change (between 1-10) against certain observations. This will help fine tune your assessment of threat, severity and likelihood. The refinement of this process both practically and methodologically is at the core of this research and is expected to be an iterative process subject to future refinement, building on your knowledge, experience and input as citizen scientists.
Major events that involve significant structural change to a site or loss of sediment cover over a substantial area will immediately cause sites to be at ‘severe risk’.
2.10 Step 8 – ENTER DATA INTO THE GIRT SURVEY REPORT PAGE
To assist members to add data easily, once the GIRT website is fully developed you will be able to enter your data through the SURVEY REPORT page directly transcribing from your completed survey sheets. The Online format for each sheet will look identical to your survey form. The page will guide you through entering data for each field of information in the correct format, adding images, video and other attachments with the correct meta-data labels. Once all the data is added a compressed file will be created that can be downloaded by you and attached by you as a Public Researcher, to the site’s official record in the AUCHD.
GIRT members can also add data into the AUCHD one of two ways. Firstly, members can simply attach their compressed site survey record to the email address below to be added to their site’s record. Alternately, GIRT members, like any member of the public, can apply to be a Public Researcher and directly add data or your complete zip file to relevant fields in the AUCHD.
To become a Public Researcher in the AUCHD you must make an email request [email protected]
In making your request address the following information:
Purpose of access: Public Researcher
Organisation: GIRT Scientific Divers
Position: Citizen Scientist
Brief outline of research interests or qualifications (if public researcher):
[Please populate this with a short synopsis explaining your interest to get access to the AUCHD, i.e. I am a member of GIRT and have adopted the site XXXXX. I am willing to submit

20
my yearly observations to the AUCHD so they can be added to the site’s permanent record as a statement of its condition on the day it was surveyed.
Once you are allocated access you can login and search the site for your adopted wreck. Observation data, once loaded, will be entered into a workflow within the AUCHD and submitted to the responsible heritage manager/s in a given jurisdiction for consideration and potential addition to the permanent database record for your adopted site.
3 - META DATA GUIDANCE
Meta data (a set of data that describes and gives information about other data) recommendations are aligned with a diver's standard equipment and use of a camera underwater. All values are recorded in a particular manner to ensure consistency, repeatability, robustness of method and to facilitate comparative analysis. Before diving, cameras need to be set for the correct date and time. Images can be collected in JPEG format, however if divers wish to use the RAW or TIFF/JPEG option. Please note that this may reduce shutter speed when doing photogrammetry.
3.1 Surface Data Sheet
What data is to be collected:
Metadata description:
Site – Name and year of sinking
i.e. SS Yongala (1911) (Use name in AUCHD. Shipwrecks should be identified by their registered or historically correct name).
Statutory database number
AUCHD Shipwreck ID number (https://dmzapp17p.ris.environment.gov.au/shipwreck/public/wreck/ search.do )
Which Statutory database
Dropdown option list auto populated with AUCHD, Needs a chance to type in a database name in another field:
Number of surveys conducted at this site
Number of surveys already completed by you at this site.
Divers name First name last name for each diver (i.e. Rick Bullers and Andy Viduka)
Divers name First name last name for each diver (i.e. Rick Bullers and Andy Viduka)
Date of Survey Format yyyymmdd (i.e. 20180728) Time of Survey Format 00:00 24 hour Location (Latitude) In degrees decimal minutes (for GPS). NB: AUCHD uses decimal
degrees e.g. Latitude – 19.7654 Longitude -143.1234. Location (Longitude) In degrees decimal minutes (for GPS). NB: AUCHD uses decimal
degrees e.g. Latitude – 19.7654 Longitude -143.1234. Members are required to enter the location data in Degrees and Decimal Minutes format)
Approximate location position recorded at
Select one: Stern, Amidships, Bow
Datum i.e. WGS84, other (free text field) datum
Tip - the AUCHD is a statutory database and the database manager will need to consider what you say prior to giving access. Access as a public researcher is not guaranteed by being a member of GIRT.

21
Position format Select one: Degrees and Decimal minutes (GIS), Decimal Degrees (GPS), Degrees, Minutes and Seconds (Charts)
Distance from Land/Reef
Select one: 0 - 1 nautical mile (nm), 1 -3 nm, 3 - 5 nm, 5 - 10 nm, > 10 nm
Current at surface (speed)
Surface sheet – “(1 knot = 1.85 km per hour)” or (1 knot = 30.1 metres per minutes)”
Ropes and lines are used by divers for various purposes including to determine the speed of a tidal flow. For example, if a 30-metre line fully extends to its full length in a minute, the speed of tidal flow would be about one knot.
Current at surface (direction)
Record compass direction North, North East, East, South East, South, South West, West, North West (i.e. Easterly current). (NB. The direction of ocean currents is the direction they’re headed for or where the current is flowing towards, and the direction of wind is named as the direction from where it’s blowing. So an easterly current and westerly wind is going the same way or has the same vector - from west to east)
Tide at survey Select one: High tide, Low tide, Ebb tide, Flood tide Freshwater/ Saltwater influence
Select one: Yes - River, Yes - Spring, Yes - Run Off, Yes - Sea Water, No (The preservation of sites can be influenced by a change in the salinity which can impact biological and chemical deterioration. Potential freshwater influence on your site should be noted).
Sediment plume visible in water
Select one: Yes or No. (Generally in tropical environments, large rainfalls cause significant sediment to be washed out to sea, this happens near SS Yongala in North Queensland. Generally the water is dirty with a very low visibility).
Sea State Select one: 0 metres = Calm (glassy), 0 to 0.1 metres = Calm (rippled), 0.1 to 0.5 metres = Smooth (wavelets), 0.5 to 1.25 metres = Slight, 1.25 to 2.5 metres = Moderate, 2.5 to 4.0 Rough (General condition of the surface of the water with respect to wind, waves and swell at a certain location and moment. Use the World meteorological Organizations sea state code).
Swell height Select one: 0-No swell, 1- Very Low, 2 - Low, 3-Light, 4-Moderate, 5-Moderate rough
Site Classification Select one: Class 1, Class 2, Class 3, Class 4, Class 5, Class 6 (Based on Muckelroy. Refer back of Surface sheet for guidance).
Debris Zone Pattern Select one: Pattern A, Pattern B, Pattern C, Other (from Warren 2016). (Most shipwrecks end up with a debris field associated either with the wrecking event or subsequent post depositional actions. If artefacts are visible around the site, note their approximate location on your mud map. As artefacts can be moved by natural and cultural activity, the location and distribution of artefacts indicate site formation processes occurring on site).
3.2 Underwater Data Sheet
What data is to be collected:
Metadata description:
Site – Name and year of sinking
i.e. SS Yongala (1911) (Use name in AUCHD. Shipwrecks should be identified by their registered or historically correct name).

22
Location (Latitude) In degrees decimal minutes (for GPS). NB: AUCHD uses decimal degrees e.g. Latitude – 19.7654 Longitude -143.1234.
Location (Longitude) In degrees decimal minutes (for GPS). NB: AUCHD uses decimal degrees e.g. Latitude – 19.7654 Longitude -143.1234.
Datum i.e. WGS84 datum
Divers name First name last name for each diver (i.e. Rick Bullers and Andy Viduka)
Divers name First name last name for each diver (i.e. Rick Bullers and Andy Viduka)
Date of Survey Format yyyymmdd (i.e. 20180728)
Time of Survey Format 00:00 24 hour
Water temperature at surface
(usually +/-0.1 in degree Celsius)
Visibility in water Select one: <5m, 5-10m, >10m (Through water visibility).
Current on site (direction) Record compass direction i.e. Easterly current. (NB. The direction of ocean currents is the direction they’re headed for or where the current is flowing towards, and the direction of wind is named as the direction from where it’s blowing. So an easterly current and westerly wind is going the same way or has the same vector - from west to east)
Current on site (speed) i.e 0.5 knots
Site Orientation Select one: Upright, upside down, lying on port side, lying on starboard side, listing to port, listing to starboard.
Site compass direction of wreck (stern to bow)
Use 000 degrees and 16 point compass term (i.e. 90 degrees E) (gives approximate direction of travel)
Evidence of structural collapse
Select one: Yes or No.
Evidence of structural collapse - image and depth
If yes, Depth is recorded in meters (00.0)

23
Evidence of structural collapse - image
Photograph and indicate where on the mud map. This informs the site classification question on the surface data sheet Attach PDF, JPEG or high resolution TIFF. Label condition images of features. Date (yyyymmdd format) underscore divers name underscore divers name underscore AUCHD Shipwreck ID number for your site underscore template sheet details. i.e. 20180728_ viduka_bullers _5748_4sp1_image1 ; 20180728_viduka_bullers_5748_4sp1_image2; 20180728_ viduka_bullers _5748_4sp2_image1 [sp1 = Survey Point (and number allocated from 1 – 10)]
Composition of dominant wreck material visible
Select one: Iron, aluminium, wood. (If other than these materials please list under other)
Location deepest point on wreck
Short description - 100 characters. Mark location on mudmap.
Depth at deepest point on wreck
Maximum depth is recorded at the deepest point on the site. Depth is recorded in meters (00.0) (To be determined by you with reference to depth gauge (typically depth gauges have a +/- 0.1m accuracy). Place hand with depth gauge on top of identified location).
Water temperature at deepest point on wreck
Degrees Celsius (usually +/-0.10C error in dive computers)
Site Dimensions - length In meters. To be used to calculate area: (Length (m)) x (Width (m)) = Area in m squared
Site Dimensions - width In meters. To be used to calculate area: (Length (m)) x (Width (m)) = Area in m squared
Mobility of Sediment Surface (rippling, direction)
Take a compass bearing on the direction of travel of ripples use 000 degrees and 16 point compass term (i.e. 90 degrees E). To assist calculating the frequency of a repeating event - determine the number of times that event occurs within a specific period, then dividing the count 30. For example, if 15 events occur within 30 m the frequency = 15/30 = 0.5 ripples per meter. To assist in determining this lay down the 30m tape measure and count the number of ripples over that distance.
General Seabed Topography near site
Select one: Flat, crest, slope
Sediment Colour Gradation (changes in colour over the area of the site)
Select one: Yes or No. (Changing colour of sand over the site may indicate different conditions for preservation or recent scouring or deposition).

24
Sediment Colour Gradation - image
Photograph with scale and indicate where on the mud map. This informs the site classification question on the surface data sheet Attach PDF, JPEG or high resolution TIFF. Label condition images of features. Date (yyyymmdd format) underscore divers name underscore divers name underscore AUCHD Shipwreck ID number for your site underscore template sheet details. i.e. 20180728_ viduka_bullers _5748_4sp1_image1 ; 20180728_viduka_bullers_5748_4sp1_image2; 20180728_ viduka_bullers _5748_4sp2_image1 [sp1 = Survey Point (and number allocated from 1 – 10)]
Sediment Slope near wreck (gradient)
Select one: Flat, slight incline, steep incline. (Swim length of site noting depth change from bow to stern, 1-2m flat, 2 - 4 meters slight incline, > 5 steep incline)
General composition seafloor (coral, limestone outcroppings, sand, boulders, pebbles, clay, seaweed, seagrass)
Select relevant: Cora, Limestone outcroppings, Sand, Pebbles, Boulders, Clay, Seaweed, Seagrass. (The preservation ability of sediment in the marine environment is linked to the size of the sand grains (larger particles allow more oxygen access into the sediment column), the amount of organic detritus included within the sediment column and the rate and extent of the physical agitation of the deposit. Lighter coloured and red/brown sands (containing iron ions) are typically oxygenated and include sessile marine organisms (bryozoans, sponges, ascidians and tunicates and marine borers (molluscs or crustaceans). Black sand is usually anaerobic (no oxygen) where sulphate reducing bacteria predominate as the mechanism for deterioration. These sands help preserve shipwrecks by significantly changing the rate of deterioration. Sand can range from very coarse (1.0 -2.0 mm) per grain, through medium sand ¼ - ½ mm to silt < 1/16 mm. Pebbles are approximately 4- 64 mm each, cobbles 64 -256 mm and boulders > 256 mm. Underwater it is impossible to gauge this by eye and sampling does not align with GIRT’s ‘no impact’ research approach. Members are asked to assess by eye whether the sediment over the site comprises of Coral, limestone outcroppings, boulders, cobbles, pebbles, sand, silt. More than one can be chosen and an approximate proportion can be indicated for each.)
Vegetation cover on seafloor
Select one: 0-20%, 21- 40%, 41 -60%, 61 - 80%, 81-100%
Percentage of concretion (fouling organisms) coverage on exposed wreck material
Of the visible portions of the wreck, approximately how much of the exposed material is covered in concretion or other marine growth. Give results as a percentage, i.e. 70%

25
Evidence of recent active corrosion
Select one: Yes or No. (Corrosion is indicated by the appearance of red active areas on iron. Sometimes gas can be evolving from cracks in concretion).
Evidence of recent active corrosion - depth
If yes, Depth is recorded in meters (00.0)
Evidence of active corrosion - image
Photograph with scale and indicate where the most active corrosion is ocuring on the mud map. Attach JPEG or high resolution TIFF. Label condition images of features. Date (yyyymmdd format) underscore divers name underscore divers name underscore AUCHD Shipwreck ID number for your site underscore template sheet details. i.e. 20180728-_ viduka_bullers _5748_4sp1_image1 20180728_viduka_bullers_5748_4sp1_image2; 20180728_ viduka_bullers _5748_4sp2_image1 [sp1 = Survey Point (and number allocated from 1 – 10)];
Evidence of Seasonal or storm/cyclone exposure
Select one: Yes or No.
Types of fouling organisms on wreck
Select one: Yes or No. (NB: fouling organisms are animal or plants attached to surface of the site)
Types of fouling organisms on wreck - image
Take a photo of the dominant looking type of marine fouling organisms. Label and attach up to 10 images with scale. Attach JPEG or high resolution TIFF. Label condition images of features.Date (yyyymmdd format) underscore divers name underscore divers name underscore AUCHD Shipwreck ID number for your site underscore template sheet details. i.e. 20180728_ viduka_bullers _5748_4sp1_image1 ; 20180728_viduka_bullers_5748_4sp1_image2; 20180728_ viduka_bullers _5748_4sp2_image1 [sp1 = Survey Point (and number allocated from 1 – 10)]
Evidence of timber Infestation by marine borers
Select one: Yes or No.
Evidence of timber Infestation by marine borers - image
Photograph with scale and indicate where the most active marine borer activity is occurring on the mud map. Attach JPEG or high resolution TIFF. Label condition images of features. Date (yyyymmdd format) underscore divers name underscore divers name underscore AUCHD Shipwreck ID number for your site underscore template sheet details. i.e. 20180728_ viduka_bullers _5748_4sp1_image1 ; 20180728_viduka_bullers_5748_4sp1_image2; 20180728_ viduka_bullers _5748_4sp2_image1 [sp1 = Survey Point (and number allocated from 1 – 10)]

26
Is contemporary rubbish present around the site (Yes, No) Indicate on mud map where image/s taken.
Select one: Yes or No. Indicate on mud map.
Is contemporary rubbish present around the site
Select relevant: Beer cans, glass bottles, fish nets, fishing line, tyres, plastic, rope, other (100 characters to type in what other is)
Approximate no. of pieces of rubbish around site
Select one: 0-20, 21-40,41-60,61-80,81-100, >100
Evidence of Human Disturbance
Select one: Yes or No. (If yes option to add more than one record) Indicate on mud map.
Evidence of Human Disturbance - description
Select relevant: Anchor damage, digging, objects moved, broken timbers, exposed artefacts, other (100 characters to type in what Other is)
Evidence of Human Disturbance - depth
If yes, Depth is recorded in meters (00.0)
Evidence of Human Disturbance - image
Photograph with scale and indicate where the evidence of human disturbance occurred on the mud map. Attach JPEG or high resolution TIFF. Label condition images of features. Date (yyyymmdd format) underscore divers name underscore divers name underscore AUCHD Shipwreck ID number for your site underscore template sheet details. i.e. 20180728_ viduka_bullers _5748_4sp1_image1 ; 20180728_viduka_bullers_5748_4sp1_image2; 20180728_ viduka_bullers _5748_4sp2_image1 [sp1 = Survey Point (and number allocated from 1 – 10)]
Sediment build up on site or around features
Select one: Yes or No. Indicate on mud map.
Sediment build up on site or around features - depth
If yes, Depth is recorded in meters (00.0)
Sediment build up on site or around features - image
Photograph with scale and indicate where the evidence of sediment build up occurred on the mud map. Attach JPEG or high resolution TIFF. Label condition images of features. Date (yyyymmdd format) underscore divers name underscore divers name underscore AUCHD Shipwreck ID number for your site underscore template sheet details. i.e. 20180728_ viduka_bullers _5748_4sp1_image1 ; 20180728_viduka_bullers_5748_4sp1_image2; 20180728_ viduka_bullers _5748_4sp2_image1 [sp1 = Survey Point (and number allocated from 1 – 10)]
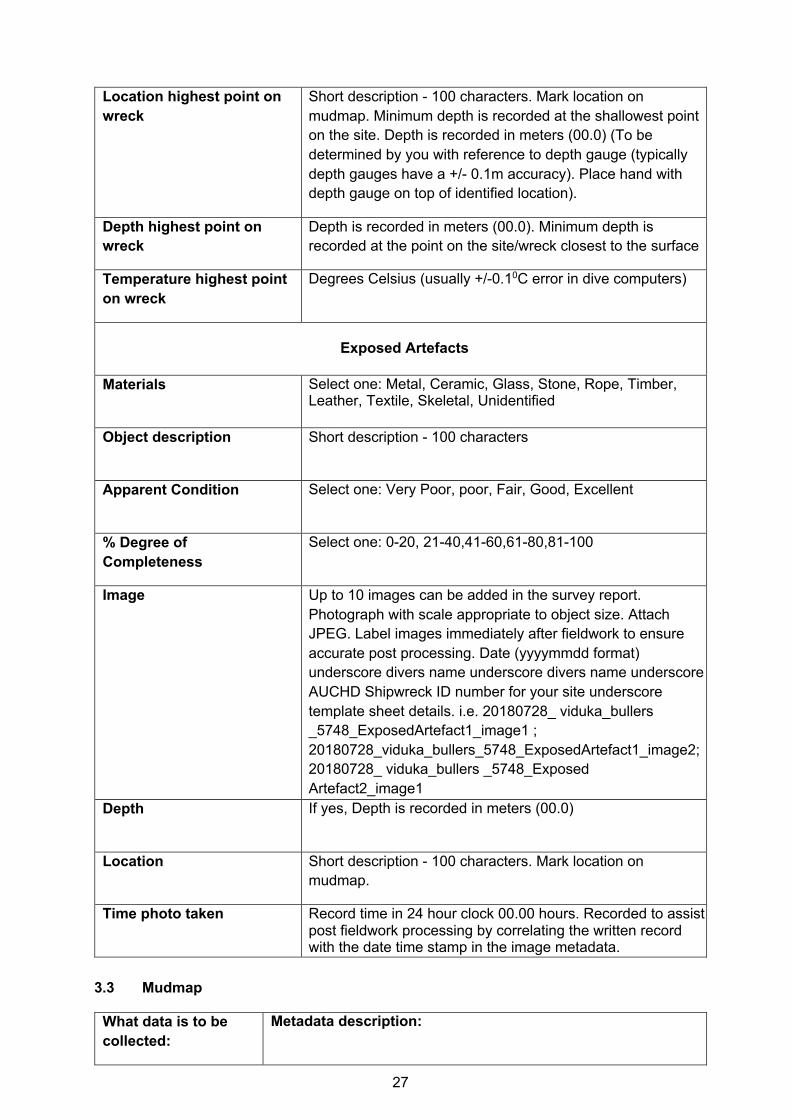
27
Location highest point on wreck
Short description - 100 characters. Mark location on mudmap. Minimum depth is recorded at the shallowest point on the site. Depth is recorded in meters (00.0) (To be determined by you with reference to depth gauge (typically depth gauges have a +/- 0.1m accuracy). Place hand with depth gauge on top of identified location).
Depth highest point on wreck
Depth is recorded in meters (00.0). Minimum depth is recorded at the point on the site/wreck closest to the surface
Temperature highest point on wreck
Degrees Celsius (usually +/-0.10C error in dive computers)
Exposed Artefacts
Materials Select one: Metal, Ceramic, Glass, Stone, Rope, Timber, Leather, Textile, Skeletal, Unidentified
Object description Short description - 100 characters
Apparent Condition Select one: Very Poor, poor, Fair, Good, Excellent
% Degree of Completeness
Select one: 0-20, 21-40,41-60,61-80,81-100
Image
Up to 10 images can be added in the survey report. Photograph with scale appropriate to object size. Attach JPEG. Label images immediately after fieldwork to ensure accurate post processing. Date (yyyymmdd format) underscore divers name underscore divers name underscore AUCHD Shipwreck ID number for your site underscore template sheet details. i.e. 20180728_ viduka_bullers _5748_ExposedArtefact1_image1 ; 20180728_viduka_bullers_5748_ExposedArtefact1_image2; 20180728_ viduka_bullers _5748_Exposed Artefact2_image1
Depth If yes, Depth is recorded in meters (00.0)
Location Short description - 100 characters. Mark location on mudmap.
Time photo taken Record time in 24 hour clock 00.00 hours. Recorded to assist post fieldwork processing by correlating the written record with the date time stamp in the image metadata.
3.3 Mudmap
What data is to be collected:
Metadata description:

28
Mud map 1 – Key Sheet
The Mud Map (or site sketch) sheet is a key visual aid for any other diver to replicate your survey. Draw a sketch of your site and number up to 10 locations where you will do longitudinal surevy. In the key features box write a short description of each location (i.e. anchor, engine or boiler..). Attach the Mud Map in the survey reporting page as either a PDF or high-resolution JPEG document. (Labelling files prior to entering results into the website: Date (yyyymmdd format) underscore divers name underscore divers name underscore AUCHD Shipwreck ID number for your site underscore template sheet details i.e. 20180728_ viduka_bullers _5748_2mudmap1 [Star of Greece is Shipwreck ID Number 5748 in the Australasian Underwater Cultural Heritage Database)
Mud map 2 – Working Copy Sheets (NB: Members can attach up to five PDFS in this section of the survey report. Each PDF can have more than one page if required)
To avoid a cluttered site sketch which is too busy with information you have collected, it is better and easier to make a second or more sketch of your site and add other details to those site sketches. Attach PDF or high resolution JPEG. (Labelling files: Date (yyyymmdd format) underscore divers name underscore divers name underscore AUCHD Shipwreck ID number for your site underscore template sheet details i.e. 20180728_ viduka_bullers _5748_2mudmap2 [Star of Greece is Shipwreck ID Number 5748 in the Australasian Underwater Cultural Heritage Database)
3.4 Photo condition sheet
What data is to be collected: Metadata description:
Site – Name and year of sinking i.e. SS Yongala (1911) (Use name in AUCHD. Shipwrecks should be identified by their registered or historically correct name).
Location (Latitude) In degrees decimal minutes (for GPS). NB: AUCHD uses decimal degrees e.g. Latitude – 19.7654 Longitude -143.1234.
Location (Longitude) In degrees decimal minutes (for GPS). NB: AUCHD uses decimal degrees e.g. Latitude – 19.7654 Longitude -143.1234.
Datum i.e. WGS84 datum
Divers name First name last name for each diver (i.e. Rick Bullers and Andy Viduka)
Divers name First name last name for each diver (i.e. Rick Bullers and Andy Viduka)
Date of Survey Format yyyymmdd (i.e. 20180728)
Mud Map Grid no. Select a letter: A - N and a number: 1 - 13

29
Feature/Location Number of Survey Point taken from mudmap (i.e. SP 1 -10)
Time photos were taken Format 00:00 24 hour
Depth of diver observation 000.0 meters. The relationship of the diver taking the image to the object is captured here to assist future photographers to be in the same space facing in the same direction.
Direction photo taken i.e. 60 (E – NE)
Number of photos taken This is to indicate if there are other photos that may be accessed later if required. Personally, I always take more than one photo so I can choose the best image. Between survey points I take a photo of my hand between survey points so when I am reviewing images of a survey I can easily differentiate between photo sequences.
Observation of exposed artefacts physical condition, biological growth and sediment cover
Max 500 characters
Attach best condition image* (*Up to 10 records can be entered)
Attach PDF, JPEG or high resolution TIFF. Label condition images of features. Date (yyyymmdd format) underscore divers name underscore divers name underscore AUCHD Shipwreck ID number for your site underscore template sheet details. i.e. 20180728_ viduka_bullers _5748_4sp1_image1 ; 20180728_viduka_bullers_5748_4sp1_image2; 20180728_ viduka_bullers _5748_4sp2_image1 [sp1 = Survey Point (and number allocated from 1 – 10)]
3.5 Video and Photogrammetry Sheet
What data is to be collected: Metadata description:
Site – Name and year of sinking i.e. SS Yongala (1911) (Use name in AUCHD. Shipwrecks should be identified by their registered or historically correct name).
Location (Latitude) In degrees decimal minutes (for GPS). NB: AUCHD uses decimal degrees e.g. Latitude – 19.7654 Longitude -143.1234.
Location (Longitude) In degrees decimal minutes (for GPS). NB: AUCHD uses decimal degrees e.g. Latitude – 19.7654 Longitude -143.1234.
Location (Datum) i.e. WGS84 datum

30
Divers name First name last name for each diver (i.e. Rick Bullers and Andy Viduka)
Date of Survey Format yyyymmdd (i.e. 20180728)
Camera system and lens Free text field 100 characters
Video format MP4, MOV, WMV or AVI. (Circle one)
Time – length of recording Recorded in minutes and seconds (i.e. 1min 50sec)
Mud Map Grid no. Select a letter: A - N and a number: 1 – 13 on the key Mud Map sheet to indicate where point A of the video transect survey is located.
Name / description of Location A Free text field 100 characters
Depth at Location A 000.0 meters
Compass bearing from A to B i.e. 60 (E – NE)
Height of swim over from A to B <1.0 m 1-2m, 3m, >3m (tick one)
Observation of exposed artefacts physical condition, biological growth and sediment cover
Max 500 characters
Photogrammetry
Unique scale number or description of scale
Describe the scale (i.e. 1m white, 0.5m white and black and 1m orange)
Depth of scale Regardless of the controls or scales used it is important to record the depth of each control point/photogrammetry target to help you scale the site in space (X, Y and Z).
Location of scale (i.e. Mud map grid number)
Indicate the approximate location of each unique scale and its depth on a site sketch.
Description of location being imaged and relevant survey point number if applicable
This is to indicate if there are other photos that may be accessed later if required
3.6 Marine Survey Sheet
What data is to be collected:
Metadata description:
What type of survey is this?
Dropdown options (i.e. Reef Check, Red Map, Eyes on the Reef…..) which can be initially populated by administrator. Need to have a list that includes the chance for members to select 'Other' and add free text.

31
Marine Survey Sheet 1* (*Maximum of five PDFs or images can be loaded under this field)
Attach PDF, JPEG or high resolution TIFF (Labelling Marine Survey PDFs - save file as: Date (yyyymmdd format) underscore divers name underscore divers name underscore AUCHD Shipwreck ID number for your site underscore template sheet details i.e. 20180728_viduka_bullers_5748_MS_(name of type of marine survey) i.e.20180728_viduka_bullers_5748_MS_Reefwatch [Star of Greece is Shipwreck ID Number 5748 in the Australasian Underwater Cultural Heritage Database; [MS = Marine Survey. Reefwatch, Coral Watch, Redmap, Reef Check and Eye on the Reef])
3.7 Threat and Risk Level Data Entry
What data is to be collected:
Metadata description:
Identify the threat* (*Up to 10 threats can be entered)
100 characters. (eg. The site been totally or partially exposed by a major weather event)
Identify the likelihood of the threat
Select one: 0-10%, 10-29%, 30-59%, 60-79%, 80-100%
Identify the threats consequence
Select one: minor, moderate, high, major, critical
Record the site's Threat and Risk level based on the threat with the most significant consequence and highest likelihood to the site's overall preservation
Select one: Low, Medium, High, Severe (NB. The selection of one of these variables changes the colour of the site on the ADOPT WRECK map page)
Low
Medium High
Severe

32 decompression limits.
APPENDIX 1 - DATA COLLECTION EXAMPLE
Your dive buddy and you have dived together regularly. You have a sense of the small aircraft wreck site below and know that it is largely intact and approximately 30 meters long and 30 meters wide and you have agreed on a dive plan that benefits from the 5m+ visibility. The site is only 15 meters deep and you are on your first dive so you know you have on air a maximum bottom time without deco of approximately 70 minutes according to your PADI dive tables. This is sufficient for two experienced divers to do either the bulk or all of the condition photography or photogrammetry and other underwater data. You agree on a scribe and camera person approach. With the SURFACE DATA SHEET mostly completed before getting to the site, a quick check of the environment is all that is required to ensure everything is accurate.
Because the weather may come up quickly you have decided to change the order of the in- water data collection. You have four slates set-up double-sided in a catch bag with a 30m tape and six photo scales. On dive 1 – diver A will have the underwater camera set up for continuous 12MB photos every 0.5 seconds and diver B will have the photogrammetry scales and slates prepared to draw a MUD MAP of the wreck and make observations about the site on the UNDERWATER SHEET while images for photogrammetry are being collected.
Diver B starts by pinning the catch bag just outside of the survey area but visible from the tailplane of the wreck. Swimming around the plane wreck, Diver B places four of the photogrammetry scales around the site, recording the approximate position and depth of each scale on the mud map sheet, without disturbing the silt. At an agreed location on the wreck Diver A starts collecting images for photogrammetry of the whole site. While Diver A is swimming narrow lanes slightly above the wreck, getting 60-70% overlap on images, Diver B, without getting in the view-finder’s way, draws a mud map of the plane wreck and starts thinking about the best observation locations for ongoing survey. These locations are numbered 1 up to 10 on the mud map with a corresponding legend numbering and naming the locations. Divers leave the site without recovering the photogrammetry scales so that any images captured in their next dive can be more easily added during processing.During their surface interval, the divers discuss and finalise a fair copy of the mud map with a legend. They eventually agree on six photo documentation survey locations, numbering 1 to 6 points around the mud map and labeling those six points in the legend. Divers then draft up two spare mud maps sticking them to a spare slate for extra notes. At this time they change the camera battery for dive 2.
Dive 2 – On this dive both Divers might start by completing the collection of images for the photogrammetry and observations for the UNDERWATER SHEET. Following this they work in tandem to lay out the 30m tape for the video tarnsect noting on the Mud Map the approximate start and finishing points, depths of both of those locations and the bearing and back bearing of the tape on the VIDEO TRANSECT AND PHOTOGRAMMETRY SHEET. Diver A then video records the environment either side of the tape by swimming very slowly 2-3 meters above the tape filming directly downwards. The direction diver A swam over the tape is also recorded by Diver A. Once this is finished Diver A winds the tape up and swims over to diver B who counted the frequency of sediment ripples over 10m of the tapes length and recorded their compass direction. Dive B puts down a scale in front of the first agreed observation point. Diver B has recorded on the PHOTO CONDITION SHEET the depth, angle and time at which the photo was taken by Diver A and may have made observations about the sediment near the feature, including the feature itself and marine life on the feature. Once the image is collected, Diver A picks up the scale and swims to the agreed second observation point and so on until the monitoring is concluded or bottom time is completed to stay within no

33
APPENDIX 2 - 3D PROCEDURES FROM IAN MCCANN – MAAWA MEMBER
Practical Approach to 3D Photogrammetry
The following techniques describe a low budget approach to 3D photogrammetry. This approach uses low cost or free software and rapid capture to produce a basic 3D model that is suitable for a simple site plan. Its simplicity and user friendly software means it can be used as a tool by most people, from the professional archaeologist to recreational divers. If the steps outlined are followed, models of high accuracy can be produced allowing precise measurements to be taken from them. Detailed site models and recordings of excavations are very important for post excavation study, and while currently this low cost approach will not replace traditional recording techniques, the rapid development of cameras, computers and programs means this may not be too far away.
An important facet of this technique is expectation, if you want a model with fine detail and all you have is; a single person, limited time and low end equipment, then you may well be disappointed.
So ask these questions: Why is the site being recorded? How is the model going to be used? What’s the budget? What level of skill is available?
If all that’s required is a rapid site survey for an initial assessment then this approach will become an essential tool for maritime archaeology.
Equipment Requirements
Cameras
Almost any camera will work, from a smartphone to a high end DSLR. What will vary is the quality of the 3D model produced from these different cameras. It’s not all about pixels, either: a 16 mega pixel smartphone, which has a small sensor, will not produce as good a picture as one taken by a 16 mega pixel camera with a large sensor. Putting more pixels on a small sensor doesn’t improve pixel resolution. As shown in the image to the right, the ‘full frame’ sensor has larger pixels than the others. The larger the pixel the more light is collected, and therefore produces a picture with superior dynamic range and less noise.
This is a bit of over simplification, there are a lot more factors involved with image quality but it’s one of the most misunderstood aspects of digital cameras. Video can also be used from which screen grabs or captured images can be generated, this data will produce acceptable models. GoPros have been particularly successful due to their ease of use, good depth of field and acceptable quality. Extracting data from video using Photoshop is shown further on in this procedure. Using a GoPro won’t give a detailed model, but it will produce a basic model suitable for an initial site assessment.
Using a camera underwater (unless waterproof) necessitates the use of an underwater housing which can cost more than the camera. However, there are a number of more affordable alternatives available that can be just as effective. I’ve been using a cheap housing for a Sony Nex camera for over three years to 40m with no leaks. Just remember: buyer beware.

34
Settings for the Cameras
Shutter Speed
A fast shutter speed is necessary to produce sharp images.
When taking a photo, it’s important to be as still as possible. However underwater this is more challenging, and a faster shutter speed will help compensate for any motion and minimize blur. This is desirable as motion blur reduces the amount of recognizable data for the program to analyse, and can result in a poor model.
Aperture
Depth of Field describes the portion of the image in focus, and therefor it’s ideal to get the greatest depth of field possible. F22 will give a better depth of field than F4.5. However, as long as the area you want to capture in that frame is in focus, then other frames can fill in the blurred data during processing.
ISO
With modern cameras the ISO can be pushed beyond 100,000. Doing so means a higher quality photograph in lower light conditions can be captured because a faster shutter speed and a higher aperture can be used.
Lenses
The better the lens optics the better the level of detail, which translates into better data for the software to process and fewer number of images that need to be taken overall.
Ultra-wide angle lenses cause more distortion in the image and this can cause problems in processing, however consistently good results can be obtained with wide angle lenses of 15mm and greater, with very good pair matching in processing. The advantage of the wide angle lens for the diver is that you can get closer to the subject, which results in fewer particles or backscatter in the picture, and can therefore produce better photographs.
Quality
This really comes down to the processing speed of your computer and the graphics card. It’s best to capture the highest quality image your camera can manage, as the size or resolution can always be changed later in a batch editing package, such as IM Batch (www.highmotionsoftware.com/products/imbatch).
Your computer may not be able to handle a large number of high quality images which may mean slow, or no, processing. Getting the best quality data also future proofs your work. As computers get faster and software more sophisticated, processing these high quality images in the future will become more manageable. Photoscan recommends 5mp and upwards to get good consistent results.
Editing images
If the information in this procedure is followed this step shouldn’t be needed. If editing is required then using the auto button on most packages will improve the photographs. If you are having trouble with the photographs aligning then adjusting the contrast can help.

35
Additional light sources
In a studio or controlled environment extra light sources may be manageable. Softboxes, reflectors or just bouncing light off the walls or ceilings can give an even spread of light. However without a bit of experience, the use of an additional light source in 3D photogrammetry will cause problems, the main one being an increase in shadows (also called caustics). Shadows will create blank spaces in the models because detail is hidden by these shadows.
Software
There are currently over forty software packages available for 3D photogrammetry ranging from Autodesk 123D Catch, a free phone App, www.123dapp.com/catch , through to Simactives Correlator3D designed to process satellite data. For this introduction to photogrammetry we’ll be using Agisoft Photoscan it has almost become the default programme for this technique due to its user-friendly workflow. Photoscan’s workflow is basically acquiring images, feature extraction, 3D surface generation, and texturing.
If you don’t have access to Agisoft Photoscan, either the standard or professional edition, then you can download a trial license for 30 days, http://www.agisoft.com/downloads/request-trial/.
The trial will let you try everything except exporting and saving your model.
The requirements to run this programme are:
Minimum Configuration � Windows XP or later (32 or 64 bit), Mac OS X Snow Leopard or later, Debian/Ubuntu (64 bit)
� Intel Core 2 Duo processor or equivalent � 2GB of RAM
Recommended configuration
� Windows XP or later (64 bit), Mac OS X Snow Leopard or later, Debian/Ubuntu (64 bit) � Intel Core i7 processor
� 12GB of RAM
At 10 MP per photo, 2GB RAM is sufficient to make a model based on 30 photos, 12GB RAM will process up to 300 photographs per model.
The practical outlined later will only take you up to producing a 3D model on your screen as you can’t export or save the model with the trial license.
The free program Meshlab is needed to scale the model if the standard version of Photoscan is being used.
https://sourceforge.net/projects/meshlab/files/meshlab/MeshLab%20v1.3.3/
Underwater
Many of the unique challenges posed by taking photographs or video underwater can be addressed by good dive planning and preparation. A site visit or using online resources prior to

36
a recoding run can be valuable. It’ll inform as to the nature of the site; in terms of depth, currents, tides, visibility, access/egress, and potential complications.
For example if the site is in shallow water then SCUBA may not be needed but the snorkelers may be exposed to increased water movement from tides, current, wind or swell. Shallow water sites, less than 3 metres, can have lighting problems due to wavelets causing light to be refracted through the surface of the water so that it illuminates the target with a constantly changing light pattern.
If these conditions are encountered then shoot early in the morning or late afternoon.
The size and complexity of the site will dictate the patterns of the recording runs and how many additional sections will need more detailed recording. If the vessel has collapsed and has a fairly low profile then, the recoding runs are fairly straightforward. If there are elevated features, such as engines, deck winches, a wheel-house or even anchors then separate recording runs will be needed and these processed with the main body of data. Wrecks with fairly intact hulls may need multiple recording runs at different times of the day when the natural light will illuminate different parts of the wreck, this will help reduce shadows which hide data. If there isn’t sufficient overlap of photos or the pattern is too simple, areas hidden by shadow or parts of the wreckage will result in voids in the model. In the figure below diver 1 will miss areas obscured by some of the wreckage (the red shaded section), with a second run diver 2, with the recommended overlap, will help cover most potential voids.

37
The diagram below is a suggested pattern to swim for capturing photos on wrecks, overlaying two swimming patterns will help capture areas that may be hidden by the wreckage it’s self.
Additional light sources can reduce or eliminate shadows but if not used correctly it can increase them. They can also cause backscatter, this is where the light reflects off particles in the water between the object and the lens, again hiding detail.
Using a wide angled lens or getting closer to the target can help manage low visibility or lack of available light during a heavily overcast day, depth or particles in the water. This will also add to the number of photographs and commensurately increase the site recording time. The diver will also have to move slower and allow for more overlap.
On Land
Strong light, shadows and anything moving in the area being scanned can reduce the ability of the program to process the captured data. As with diving, choose the early morning or afternoon to capture data when the light can be more even. If shooting a small object outdoors, a shady spot is the best. If shooting indoors, choose a place away from any direct sunlight or widows, look for a position where the light is nice and even.

38
General Guidelines
Almost any camera can be used as long as the basic recommendation for capturing images is followed. When recording a site it’s important to keep the camera, lens, and settings the same. To speed up processing time the resolution of the camera can be set as low as 5MP.
Lenses between 15-20mm work well for larger sites whilst a 50mm lens will work for a single item like a small pot.
If using a Gopro for photographs or video the ultra-wide setting, 170 degrees, causes too much distortion in the image and results in having a greater number of rejected images in the photo alignment.
Images captured using ultra-wide lenses can be adjusted for lens distortion but this just means more work.
For still images, a Gopro can be set on the time-lapse mode and 0.5 seconds per frame, this works well most sites.
Record the images in a set pattern ensuring an overlap of 50-75%, with a side overlap of 25- 50%. A feature that is recorded in multiple photo’s and can be identified by the software is essential for creating the geometry needed to create a 3D model.
If it’s a smaller target then get a few general shots of the item before shooting the closer ones for more detail.
The two figures below show a pattern used for a small pot. They indicate the camera position and angle. Starting with some general shots, to establish the form, move systematically around the pot allowing for the recommended overlap. This is repeated at different angles and heights until all details are captured.

39
This pattern is also used to capture individual features on a larger target. If the pot had a larger belly or was a bowl with a wide, low flare then more images are needed at a lower angle to record all areas of the pot.
For larger sites a “lawn mowing” pattern is often the best as in the diagram below. The closer to the site you are, the more runs will be needed to get the overlaps.
If insufficient photographs are taken or not enough points matched in processing due to shadows, reflective surfaces or motion blur then voids or distortions in the model will be visible, as in the images below.
Targets for Measurement
To enhance site recording beyond just a simple model for illustration, the use of scales for measurement is important. These may be anything of a known length, such as a scaling pole or simply a measurement between two significant fixed features on the site. Whatever is used should be of a non-reflective, matt surface and placed in a position where multiple photographs from different angles can ‘see’ them. Getting the correct orientation of the model

40
can be made easier by the ensuring the scale is level by using simple bubble levels, see photograph below.
Recording
Once the best capture method has been determined, and a scale has been included, then the data capture can commence. Following the image capture pattern, moving or swimming as decided will ensure a full coverage of the site. It is important to be moving at a steady rate, allowing for the overlaps while not over-imaging one area.
When shooting directly down, plan, keep a 5-degree angle ‘up’ this can help produce better results.
Keep the same distance away from the subject, if it’s on a slope follow the contour down. For example, if a 4-metre standoff from subject is being used try and maintain that at all times. For larger sites where most of the photographs are taken in plan, capture at least a couple of metres beyond its actual area. This will help in the processing, some models produce bends on their edges and these can be cropped if there are unwanted areas.
Once the “plan” run is done capture any features or parts of the site with any elevation. Try and get any overhangs or areas where data may be hidden and angle the camera so less of the unwanted background is captured.
The following exercises will break the process down into simple dot points and should produce suitable data for processing.
Exercise 1
Items needed:
Small ceramic pot
Piece of neutral coloured matt material
Scale
Small table or stand
A place with an even light

41
Camera
Method: � Place the material on a small table or something to raise it up off the floor, preferably the cloth will cover the surface of the stand.
� Place the pot on the cloth and the scale close to its base.
• Make sure you can walk around the pot and can keep a constant distance away from it. For a 30cm high pot try a 45cm standoff. This distance will vary according to the shape and volume of the item, there’s no correct distance. Too close and the program can’t build a model, too far away and the detail will be poor. Trying to scan a variety of items to get experience at to what standoff is best for different items.
� Use the auto setting on the camera. � Take four photographs from above the pot, plan shots, at even spaces whist moving around the pot. Remember to keep the camera steady when taking the photos.
� On the next pass move down the pot, shoot the photos with the camera at approximately 30 degrees to the pot, taking around eight pictures at even spaces.
� Move down again and have the camera at approximately 45 degrees, again taking eight photos.
� Lastly move down again with the camera at 90 degrees to the pot and again take eight photos.
The data can now be processed.
The following screen captures show an image capture pattern used to record a 1 metre section of timber.

42
Exercise 2
Items needed:
Scale
Camera
Choose a larger feature, part of a garden for example. � Walk around it and work out how it can be recorded efficiently and methodically.
� Place a scale.
• Take several establishing shots so the program can make sense of what’s there. These should try and cover the whole area per shot and be taken from different angles.
� Start from one point on the corner of the area to be recorded. � Take the photos with the camera at approximately 45 degrees to the ground.
� Take the first photo, step forward and take the next.
� Keep repeating this, possibly using the pattern shown below.
� Once the plan shots are completed assess if there are any features that could be added.
� Choose one and apply a capture pattern similar to the pattern used to capture the post in exercise 1. These Photos can be imported together by combining the files or as separate files or chunks.
Process the data.

43
General workflow � The general workflow for processing images is:
� Capture image / Stills / Process in Photoscan
� Capture image/ Video / Extract Stills / Process in Photoscan
Extracting Stills from Video
� Open Photoshop
� File > Open > Choose video file of subject > Open

44
File > Export > Render Video
Render Video Box:
Name > Name your file Select Folder > Select folder destination
Create New Subfolder> Do not tick
Photoshop Image Sequence > JPEG

45
Frame rate > Custom
FPS > 5FPS
Render
The files will now export. Finally check the files have been exported.
Processing the data in Photoscan
PhotoScans workflow is very easy to follow. At each stage a dialogue box will open informing you of the progress of each step.
Add photos or files
Open Photoscan > File > New
Workflow > Add photos or add folder > Choose photo’s or folder’s > Open
The photos will now be loaded and will be referred to as a Chunk, visible on the left hand side of you screen. It will also show the number of cameras, each camera is a photograph.
Align Photos
Workflow > Align Photo’s > Accuracy: Medium > Pair Selection: Generic > OK
Pixels will now compared to find matches, work out camera location and produce a sparse point cloud. At this point the form of the item can often be recognized.
Build Dense Cloud
Workflow > Build Dense Cloud > Quality > Medium > OK Significantly more points are produced to where the dense cloud appears as a solid model when zoomed out.
Build Mesh
Workflow > Build Mesh > Surface Type: Arbitrary > Source Data: Dense Cloud > Face Count: Medium
Faces are created over the model by connecting the points to make a continuous Mesh.
Build Texture
Workflow > Build Texture > Mapping Mode: Generic > Blending Mode: Mosaic (default) >Texture Size/Count: Use recommended, 4096 x 1 > OK
A texture map is wrapped around the model creating a photo realistic 3D model.
Orientation
When initially processed, the model is often upside down and needs to be correctly oriented.
To do this turn off the perspective view, this is shown in blue in the top left hand corner of the screen:
View > Perspective/Orthographic, select. The view you are now in will be shown in blue on the screen.

46
Next
View > Predefined Views > Top
Select “Rotate Object” in the toolbar.
By using the cursor, highlighting one of the coloured bands on the sphere, red, green or blue, the ball the model can now be rotated in any direction. If the scale used for the model has been levelled, using simple bubble levels, the model can be orientated to that level.
Orientate the model to match the view selected, then click on the Navigation icon to lock the change.
When that model is next opened in Photoscan it will be in that orientation.
Photoscan models can be exported to other program such as Blender for animation and rendering and Sketchfab for file sharing. Export formats include .stl that can be used for 3D printing.
Scaling
This can’t be done with the trial version of Photoscan. With the standard version the model needs to be exported to Meshlab. First the model needs to be exported in a different format, a PLY file.
File > Export Model > File Type > Stanford PLY > Save

47
Next open Meshlab and import the model.
File > Import Mesh > choose model file (*.ply).
With the cursor click the Tape Measure Tool
Use the Tape Measure Tool to measure a known distance.
An arbitrary distance will be shown, here it’s 2.72515.
Knowing the scales length, 1 metre, we divide 1m by 2.72515 so the scaling factor is 0.367.
To re-scale go to:
Filters > Normals, Curvatures and Orientation > Transform Scale > click

48
A Transform: Scale dialogue box will open. Input the figure 0.3670 into the boxes for the X, Y, and Z axis and check the Uniform Scaling box is ticked, then apply.
Using the Measuring Tool any part of the model can now be measured.
To save the model export it, remembering to give the file a new name so the original is not overwritten:
File > Export Mesh As > select Stanford Polygon File Format (*.PLY) > Save.
At any stage of the processing editing tools can be used to delete selected parts of the point cloud or sections of the model after building mesh or texture. This will reduce processing time as well as refining the model. The red square encloses the shaped selection tools, the green circle a standard crop tool and the yellow the delete button.
This is only a basic approach to 3-D photogrammetry using the free or standard edition of Photoscan. Many things can be done with 3-D models from printing them into physical models, creating orthographic plans to simple line drawings. It takes quite a bit of practice to make 3-D models from underwater photographs or video. Nothing beats practice, simply getting out there and recording sites and processing the data. There are online forums discussing different techniques and some detailed guides on how to accomplish some of the more complicated processes.

49
APPENDIX 3 – PHOTOGRAMMETRY SOFTWARE ACCESS GUIDANCE
To assist members to be able to process their images into 3D models, GIRT has purchased seven standard-edition stand-alone Agisoft Photoscan (Metashape) licenses. GIRT members can borrow a license (like a library book) simply by emailing GIRT member Alex Moss [email protected]. Below are instructions for loading and unloading the software.
Please download the software from the official website (if you haven't installed it yet): http://www.agisoft.com/downloads/installer/
You can find installation instructions in Agisoft Photoscan User Manual available for download at: http://www.agisoft.com/downloads/user-manuals/
Visit the Tutorials page http://www.agisoft.com/support/tutorials/ to learn some standard processing workflows.
Some useful tips on capturing scenarios can be found at http://www.agisoft.com/support/tips- tricks/
Installing and Activating Wreck Check/GIRT Photoscan software
Agisoft Photoscan is used for converting still images/video images into 3D reconstructions. It is a specialist surveying and visualisation tool and is quite expensive. The Professional version includes the capacity to make detailed linear measurements and calculate volumes. The Standard version is much cheaper and will fulfil most needs in Maritime Archaeology. 3D reconstructions produced in the Standard Version can then be imported into a Professional version to have distance and volumetric measurements made.
The software can be downloaded and installed for free but requires a purchased Activation Code to enable it to save any results.
Installing
Download the Agisoft Photoscan 1.4.5 “STANDARD EDITION” installer for your computer from….
https://www.agisoft.com/downloads/installer/
DO NOT install the Agisoft Metashape 1.5.0 installer. This is a major redevelopment and name change of Photoscan, just released in December 2018, but it has some major bugs in it. This will be fixed soon, but until then, use the tried and tested Agisoft Photoscan 1.4.5 “STANDARD EDITION”, which is still available for download further down the page.
Download and install Agisoft Photoscan 1.4.5 “STANDARD EDITION”. At the end of the installation process, the software will open a window asking you to choose to enter a licence code, continue with a trial version, or continue in “preview” mode, which will not allow you to save any results you create.
At this time, the software has already recorded the individual serial numbers of the CPU, motherboard and hard drive/s of your computer.

50
The 30-day trial option will allow you to save results, but you will not be able to get another 30 day trial on the same computer.
Activation
Use the Activation Code the Wreck Check/GIRT Administrator has provided to you. Enter this into the window and click “Activate”. If you have already moved past this installation stage before you received the code, then you can reopen this window by going to the menu bar at the top of the screen and choose HELP/ACTIVATE PRODUCT.
If you enter a code, and it is still active on another computer, an alert box will appear telling you that this code is already “locked” to another computer – even if that computer is not turned on, or not on a network. In this case, you will need to advise the Wreck Check/GIRT Administrator of this situation – someone who has previously had the Activation Code has not de-activated it from their computer as they were supposed to.
De-Activation
When the Wreck Check/GIRT Administrator requests that you de-activate the code on your computer, you need to go to the menu bar at the top of the screen and choose HELP/ACTIVATE PRODUCT.
A window will open telling you Photoscan is already activated, and next to that is a small button titled “Deactivate” you can click. It will then tell you your copy of Photoscan has been deactivated (assuming you were online at that time).
The code number you were using has now been “un-associated” with your computer, and you can advise the Wreck Check/GIRT administrator that the code can now be used by another computer.
You will still be able to use the software to import and align images, but you will not be able to save any of these results.
Additional Information
This is not related to the issue of Activation Codes, but it is important. When you install Agisoft you will also need to go into the menu bar at the top of the screen and choose Photoscan /Preferences/GPU/ and tick the boxes under “GPU devices” to tell Photoscan to use the GPU (Graphics Processing Units)/video cards your computer has. For some reason, these are not selected by default. This will dramatically speed up the processing of the images.

51
APPENDIX 4 – EXPORTING A 3D MODEL FROM AGISOFT PHOTOSCAN /
METASHAPE
Note: “Agisoft Photoscan” was renamed Agisoft Metashape” in 2019.
Andrew Hutchison, WreckCheck member – 08.05.2019.
Overview
Once you have processed a series of images into a 3D model in Photoscan, you then have the problem of getting it outside of Photoscan, so that it can be viewed on computers that do not have Agisoft.
This description does not include the process of importing and aligning images, or the process of creating point clouds and meshes, and then applying the photographic textures to them. The basic workflow is described in the Agisoft manual, available from:
https://www.agisoft.com/downloads/user-manuals/
This is the first draft of this document, so please do email me to let me know about problems, errors, suggestions.
mailto:[email protected]
The Problem
Agisoft is a very specialist software originally intended for reconstructing landscapes from aerial photography for surveying purposes. It assumes a lot of pre-existing knowledge about computer processing, data types, etc. It can export models in a very wide range of specialist file formats suitable for use in other specialist applications/industries. Exporting a “demo” model that can be simply viewed on a normal computer without specialist software is not something that Agisoft does very easily.
Reducing the File Size
If you have made your model from a high quality point cloud/mesh, and /or have chosen multiple textures, then when you export it, it may be very large in file size. This may be both a problem for emailing/uploading, and also may lag on the computer that it ends up on. So it is best to reduce the overall file size of the model.
The objective is to reduce the data size of both the mesh and the texture that make up the overall model, while retaining the “wow” factor. This will not provide a forensic level of detail in the mesh or texture, but it can be very powerful to show how well your model represents the object/scene you have captured.
You can reduce the model file size in the workflow order Mesh then Texture.
Reducing the Texture to “1”
Start with the mesh and texture model that you are happy with. Go to Main Menu/

52
Workflow and then “Build Texture”. Make sure to have only 1 texture in the option box. The default setting is “1” but in case you or someone else has changed this to increase the quality of the model’s appearance, you need to reset it to “1” by remaking it.
So now you have your original mesh, and are confident you are looking at only 1 texture, which will reduce the overall file size.
Now copy this original Chunk by selecting it, right clicking, and choosing
“Duplicate” from the drop down menu.
Reducing the Mesh size
Select the newly created Chunk, and then go to the Main Menu, and choose
“Tools/Mesh/Decimate Mesh”.
It will prompt you to “decimate” the existing mesh to some value, that you have to enter. Choose something like 10% of the existing value.
When it has finished, 90% of the data in the mesh will have been removed… with some level of loss of actual detail. You will also notice that the texture that was with the mesh has also been lost. Now go to Main Menu/Workflow” and then “Build Texture” again.
You will notice that the time to create this texture is much less than the time to create the original texture … Because the time to create the mesh is a multiplier of the number of images * the number of “faces"/vertices in the mesh. Less mesh = less texture time.
Once you have a texture on the new “90%”model, switch between the first chunk and the “90%” chunk to compare the way they look with the same texture on them. Probably, the much smaller mesh looks very much like the much bigger mesh. If it looks unacceptably squared/chunky, then you have reduced it too much.
If it looks okay, then save it out from Agisoft using one of the methods below, and see ifit works well. If it is slow to load or move, then you can go back and repeat the process… duplicate the original mesh, and then decimate it to only 50% of the original.
Then re-texture. And so on. At some point, you will get to a happy compromise of data size and appearance.
Of course, it is possible that you will find the first model works very well, in which case you could experiment with slowly increasing the quality detail. This would best be done first by increasing the number of textures, and then by increasing the size of the mesh.
Solution 1: Upload the model to the Sketchfab.com website
Agisoft has a menu option for uploading a model directly to the Sketchfab.com website. Go Main Menu/File/Upload Model.
Pros: � You can just email or text a url to the person you want to see it, and they can look at it on any computer or smart phone without installing any software or logging in. It will just work.
� The model usually looks much better quality than in some of the other options.

53
Cons: � You have to create a profile on sketchfab.com. However, it is free, and it takes only a couple of minutes to create the profile.
� You have to add in a passcode from Sketchfab each time you upload directly from Agisoft, but you can just follow the prompts that Agisoft provides to do this.
You can view the “Broken HMS Sirius” model made using this process here:
https://sketchfab.com/3d-models/broken-anchor-at-the-wreck-site-of-hms- siriusbf1b4d074143468c856cef35e115ff7d
Solution 2: Create a 3D.pdf
Agisoft can export an Adobe Portable Document (.pdf) format version of a 3D model.
Adobe Acrobat is free from the Adobe website, and is already pre-installed on most computers.
Pros:
• You can store your demo models on your own computer, which is good if you are somewhere you don’t have Internet access.
• You don’t have to use Sketchfab.com.
Cons: � The person you are sending it to may have to download Adobe Acrobat
� The same model usually looks worse in Acrobat than it does on Sketchfab.com.
� Acrobat may interrupt the loading of the 3D model into Acrobat, and so you have to send the email with instructions on how to overcome these (provided below).The person you are sending to may give up trying.
Highlight your Chunk, and then choose “Main Menu/File/Export Model”.
Once the “save” box opens, you will need to select the correct file format from the pop down menu (.PDF). You can type your own text description into the box where it currently says “made with Agisoft”. Save it to wherever you want on your computer.
Then double click on the .pdf to open the model in Adobe Acrobat Reader. If this all works, you can just then send this as an email attachment.
“How to View Notes” to include in your email when you send the model.
You need to double click on the .zip archive.
Then double click on the .pdf, which will open Adobe Acrobat Reader on your
computer, if you have it. If you don’t, then go to

54
https://get.adobe.com/reader/
It’s free.
The 3D model might open up right away, and you will be able to click on it and rotate it around.
But it MAY just look like an empty white box, with a text description written in the bottom right hand corner.
If so, you will need to look for a yellowish alert message at the top, and click
“allow this document…”
And then if you still don’t see anything, look for a small red icon, usually in the top left hand corner, and click on that, to tell Acrobat to “load the 3D
images”.
End of “How to View Notes”.
Please do advise me of mistakes/confusions in this first draft.
mailto:[email protected]