
GREATER JAKARTA: REAL ESTATE MARKET OUTLOOK
79
GREATER JAKARTA: REAL ESTATE MARKET OUTLOOK by Johanes Ribli Sarjana Teknik (Bachelor of Science) Bandung Institute of Technology, 1993 Submitted to the Department of Architecture in Partial Fulfillment of the Requirements for the Degree of Master of Science in Real Estate Development at the Massachusetts Institute of Technology September 1997 @1997 Johanes Ribli. All rights reserved. The author hereby grants to MIT permission to reproduce and to distribute publicly paper and electronic copies of this thesis document in whole or in part. Signature of Author Departmert f Architecture July 31, 1997 Certified by Blake Eagle Chairman, MIT Center for Real Estate Thesis Supervisor Accepted by William C. Wheaton Chairman Interdepartmental Degree Program in Real Estate Development .~ _ _
-
Upload
khangminh22 -
Category
Documents
-
view
0 -
download
0
Transcript of GREATER JAKARTA: REAL ESTATE MARKET OUTLOOK

GREATER JAKARTA:
REAL ESTATE MARKET OUTLOOK
by
Johanes Ribli
Sarjana Teknik (Bachelor of Science)
Bandung Institute of Technology, 1993
Submitted to the Department of Architecturein Partial Fulfillment of the Requirements for the Degree of
Master of Science in Real Estate Development
at the
Massachusetts Institute of Technology
September 1997
@1997 Johanes Ribli. All rights reserved.
The author hereby grants to MIT permission to reproduce and to distributepublicly paper and electronic copies of this thesis document in whole or in part.
Signature of AuthorDepartmert f Architecture
July 31, 1997
Certified byBlake Eagle
Chairman, MIT Center for Real EstateThesis Supervisor
Accepted byWilliam C. Wheaton
ChairmanInterdepartmental Degree Program in Real Estate Development
.~
_
_

GREATER JAKARTA:
REAL ESTATE MARKET OUTLOOK
by
Johanes Ribli
Submitted to the Department of Architectureon July 31, 1997 in Partial Fulfillment of the Requirements for the Degree of
Master of Science in Real Estate Development
ABSTRACT
Indonesia is well-endowed with land, natural resources and available labor. Because it isthe fourth most populous country in the world, it has huge market potential. Indonesia hasalso experienced rapid GDP growth, at an average rate of 7.26%, since 1992, and hasbenefited from a high level of domestic and foreign investment. As a result, it has becomeone of the most favorable locations in Asia for real estate investment.
Greater Jakarta is comprised of Jakarta itself, the capital city and center of economicdevelopment, and the supporting regions of Bogor, Tangerang, and Bekasi. The demandfor real estate in Greater Jakarta, either residential, retail, office, or industrial, is strong,supported as it is, by increased income and high investment.
Strong demand for real estate has also stimulated buyer and developer speculation, whichhas created problems, such as inflated demand, increasing land costs, delays, cancellation,defaults, sub-standard construction, and even fraudulent projects. All of which has led to anatmosphere of dishonesty and bad debt in the development field.
To create a healthier real estate market, the government has intervened directly with newregulations. In general, these interventions have been positive, but others seem biased,ineffectual, or at best poorly implemented. Moreover, government intervention has createda high level of government dependency and of uncertainty in the business environment.Even worse, some sectors are now dominated by the government.
The real estate market is also afflicted with problems of no legal assurance, an unfavorableagrarian system, illegal fees, and complicated permit processes. Since most of theseproblems are inherent in a developing country, immediate solutions to them are not going tobe found without a greater government commitment to them. More germane, however, isthe issue of political stability, a necessity for the country's well-being. Unfortunately, theIndonesian political system is vulnerable because the issue of presidential succession hasyet to be resolved.
Thesis Supervisor Blake EagleTitle : Chairman, MIT Center for Real Estate

ACKNOWLEDGMENTS
This thesis could not have been completed without an extraordinary amountof assistance from a wide variety of individuals and institutions.
I am most grateful to Stewart Forbes, President of Colliers International;Charles Grossman, Managing Director of Jones Lang Wootton Realty Advisors;Gary Barth, Managing Director of Jones Lang Wootton USA; Trevor J. Peach,Managing Director of Colliers Jardine Indonesia; Ian David, Consulting Director ofProcon Indah JLW; and Phil Simpson, Managing Director of Procon Indah JLW. Ireceived the extremely generous assistance and supports as well as deep insightsfrom them.
My deepest gratitude is to Jonathan Hubbard. I mostly appreciate hiswillingness to edit this thesis in a very short period. The writing of this thesis isheavily helped by him and would be totally different without his help.
I would like to thank John Konarski III of International Council of ShoppingCenters for his resources; Peter Salim, author of Standard Indonesian-EnglishDictionary, for his advice and input; Michael Jammen, my classmate, for hisreference; Rimba Handoyo for his computer; and my classmates and groupassociates for all of their supports.
I want especially to thank Blake Eagle, my thesis supervisor. His references,guidance, advice and kind encouragement throughout this thesis process make itpossible to finish this thesis on schedule.
I would also like to thank Sandra Inawaty, my fiancee. As an AssistantManaging Director of Duta Pertiwi, she has given countless sharp suggestions andviews. She accompanied me, supplied me with information, edited my thesis, andprovided encouragement and moral support throughout this effort. I simply could nothave done this thesis without her.
Finally, I would like to express my gratitude to my family, to whom this thesisis dedicated. They have encouraged me to study in U.S., and given me full andunconditional support to finish the program. I would like to thank Philip Ribli forsupporting me to study in U.S. as well as Sacek and Soicek for partially financing mystudy. I am most appreciative for all of their supports.

CONTENTS
1 INTRODUCTION.................................................................................----------.-------------------.---....................8
I. B A C KG RO U N D......................................................................--....... ---------------------------------------------............ 8
II. O BJECTIVE ......................................................................................................................................... 9
III. M ETHODOLO GY ........................................................................................ . --------------------......................... 9
2 INDONESIA ................................................................................----...--------..................................... 11
I. INTRO DUCTION .......................................................................... ................ - - - - - - - - --..............................-- - - - I III. G EOGRAPHY........................................................................- -. -- - - - --.......................................................... 11
III. DEMOGRAPHY....................................................-............---...........................................................-----II
IV . P O LITIC A L S Y STEM ...................................................................................---- . . . --------------- . 13
V. LAW ..............................................-.------.------------------------------.......................................................... 14V I. ECONOM Y .......................................................- ...... - - - - - - - - - - - - - - - - - - - - --.......................................................... 14
A . O verview ...................................................................---- ..... . --.. . --------............................. 14B . Infl a tio n ............................................................................................................................................. 1 6C . Interest R a tes..............................................................................................------........ ---............. 17D . Exchange R ate.... ........................................................................................ ...... .............. .. 17
V II. D OM ESTIC AND FOREIGN INVESTM ENT ........................................................................ . ........... 18
VIII. POLICY..................-.-----...--------.---------------------------................................................................................ 20
A . F isca l P o licy ...................................................................................................................................... 2 0B . M o n eta ry P o licy ................................................................................................................................ 2 0C . L a b o r P o licy ...................................................................................................................................... 2 1
IX . G REATER JAKARTA A REA .........................................................................--....-------.----------..................... 21
X . C O NCLU SIO N ...............................................................................................--...-------.--......................... 24
3 THE STRUCTURE OF THE INDONESIAN REAL ESTATE MARKET..................25
I. IN TR O D U C T IO N .................................................................................................. . ------ ...-- - - - -- - - - . 2 5
II. L A N D P LA N N IN G ....................................................................... 25.----.. ------... . -.. -------------................ 25
A . G en e ra l..............................................................................................................................................2 5B . U rban P lan for Jakaarta ..................................................................................................................... 25C . B asic A g ra rian L aw .......................................................................................................................... 2 6D . S tra ta -title L a w .................................................................................................................................. 2 6E. Regulation of Collateral Rights (UU No. 4 of 1996)....................................................................26F. Right-to-Use Titles (UU Nos. 40 and 41 of 1996) ................................... 27
III. SEVERAL PROBLEMS IN THE INDONESIAN REAL ESTATE MARKET..........................................................27
A . U nder-utilized L icenses ..................................................................................................................... 2 7B . Sp eculative D evelop m ent...................................................................................................................29
1 . G e n e ra l ............................................................................................................................................................... 2 92. O vergro w th P roperty L oans ............................................................................................................................... 293. Increasing Share of Property Loans....................................................................................................................294 . M is-allo catio n L o an s .......................................................................................................................................... 3 0
C. Government Efforts to Reduce Speculative Development ............................. 31D . Sp ecu la tive B uyers.............................................................................................................................3 1E. Complicated Permit Application Processes ................................................................................... 32F . H ouses W ithout D eeds.......................................................................................................................33
IV . C A PITA L STR U CTU RE .............................................................................................................................. 33
V . C O NCLUSIO N ...............................................................................--------- .............. . ............................. 34
4 GREATER JAKARTA: REAL ESTATE MARKET OUTLOOK ...................................................... 35
I. INTRO D UCTIO N .................................................................................. ... .................. . ........................ 35
II. HOUSING ................................................................................................-- - - - - ......... 35
A . D em a n d ............................................................................................................................................. 3 5

I. G en eral........................................................................................................- . . ----- ---- ----- ---- ----.................... ---..3 52 . A ffo rd ab ility ....................................................................................................................................................... 3 6
B . S up p ly ................................................................................................................................................ 3 91. G eneral ........................................................................................................-----.----....- . -- ---- -- - -- ------..................... 392 . D istrib u tio n .............................................................................. ...................... -. . ---- .-. --.......... 3 93 . R esid en tial E state .................................................. .......................................................- - - - ...... . ---............ 4 14. Low-Income Housing (RS/RSS) ........................................................................................................................ 425. Small Houses ...................... ............................................................................................--- 44
III. APARTMENTS AND CONDOMINIUMS...................................................................... ............................. 45
A . D em a n d ............................................................................................................................................. 4 5B . S up p ly ................................................................................................................................................ 4 6
1 . G e n e ra l ............................................................................................................................................................... 4 62. Supply Profile...............................................................................................---....-.. ---------------------..................... 47
C. Lower- to Middle-Income Condominiums........................................ 48
D. Low-Income Apartments.............................................................................................-...........----..----49E. Town Houses ..................................................................................................................................... 50
IV. OFFICE ..........................................................................-- ........-- ..... . ---. -------................................. 50A . G en e ra l............................................. .............................. ---......... . ---........................................... 5 0
1. Demand .................................................. ................................... ------------... ------............................................. 502 . S u p p ly ..................................................... ................ ---- ........ . . . . ------ ------............................................. 5 0
B. Central Business District (CBD) .................................................................................................. 511. Area .............................................................................................-------.. -----------------............................................ 512. Demand .....................................................................................--........-- . .. - - - - --............................................523. Supply...................................................................................-- ... .-.. -..... . - --............................................53
C. Non-CBD Office ............................................................................................................................... 551. Demand ...................................................................................................--- .... . -------.......................552. Supply....................................................... .................--- .........------ . . . - - --............................................56
V. RETAIL............................................................................................------... -----------------------........................ 58
A. Demand ......................................................................... ...............--............................................... 58B . S up p ly ................................................................................................................................................ 5 9
1. G en e ra l ....................................................................................------- . . . -----------------------------...------- ..5 92. Located in Housing Areas .................................................................................................................................. 603. Following the Global Retail Trend ..................................................................................................................... 614. Using Foreign Anchor Tenants...........................................................................................................................615. Developing M ixed-Use Sites in CBD Area.................................................................................................... 626. Protecting Traditional Retailers..........................................................................................................................62
VI. INDUSTRIAL ESTATE ................................................................................................--.....-.. -----......... 62
A . D e m a n d ............................................................................................................................................. 6 2B . S up p ly ................................................................................................................................................ 6 3
VII. CONCLUSION................................................................................----..........-----------..........................65
5 CONCLUSION..........................................................................................................................................67
APPENDIX A. COMPARISON BETWEEN RIGHT-TO-USE AND RIGHT-TO- BUILD TITLES ..... 71
APPENDIX B. SURVEY ABOUT HOUSING IN GREATER JAKARTA ................................................ 72
APPENDIX C. SHOPPING MALLS IN CENTRAL JAKARTA (UNTIL 2000) ................. 73
APPENDIX E. SURVEY ON THE RETAIL MARKET IN GREATER JAKARTA..............74
REFERENCES ................................................................................................................................................... 75
REFERENCES IN INDONESIAN....................................................................................................................78

LIST OF FIGURES
F IG U RE 2.1 M A P O F IN DO N ESIA ............................................................................................................................. 12
FIGURE 2.2 M AP OF GREATER JAKARTA AND SURROUNDING AREAS.................................................................... 12
F IG U RE 2.3 G D P G RO W TH ................................................................................................---.. --. . --.............. 15
FIGURE 2.4 M ORTGAGE, LENDING AND SBI 90-DAY RATES ............................................................................ 17
FIGURE 2.5 DOMESTIC INVESTMENT APPROVALS ........................................................................................... 19
FIGURE 2.6 FOREIGN DIRECT INVESTMENT APPROVALS ................................................................................ 19
FIGURE 2.7 THE DEMOGRAPHIC PROFILE OF GREATER JAKARTA...................................................................... 22
FIGURE 2.8 URBANIZATION TREND IN INDONESIA ............................................................................................. 24
FIGURE 3.1 RATIO OF PROPERTY LOANS TO NATIONAL LOANS .......................................................... 30
FIGURE 4.1 A FFORDABILITY BY CATEGORY..........................................................................................................37
FIGURE 4.2 EFFECTIVE LAND AND HOUSE PRICE INDEX WITH AFFORDABILITY INDEX......................................38
FIGURE 4.3 ADJUSTED AFFORDABILITY BY CATEGORY ........................................... ......... 38
FIGURE 4.4 SENSITIVITY ANALYSIS (MORTGAGE RATE VERSUS AFFORDABILITY) ............................................ 39
FIGURE 4.5 DISTRIBUTION OF RESIDENTIAL ESTATE AREA PLANNED FOR DEVELOPMENT ................................ 40
FIGURE 4.6 DISTRIBUTION BY INCOME SEGMENT ........ .......................................... ........ 40
FIGURE 4.7 D ISTRIBUTIO N BY SIZE ............................................................................. ........... . --................... 41
FIGURE 4.8 RS/RSS DEVELOPMENT IN INDONESIA...................................... ....... ..................... 44
FIGURE 4.9 HOUSE SALES IN GREATER JAKARTA AREA........................................................................................45
FIGURE 4.10 TREND OF SIZE AND PRICE PER UNIT ...................... ..................................................... 45
FIGURE 4.11 RENTAL APARTMENT CUMULATIVE SUPPLY, DEMAND AND OCCUPANCY RATE .......................... 46
FIGURE 4.12 EXISTING MULTIFAMILY HOUSE SUPPLY DISTRIBUTION ............................... ...... 47
FIGURE 4.13 EXISTING MULTIFAMILY HOUSE SUPPLY DISTRIBUTION BY DISTRICT ......................................... 48
FIGURE 4.14 PRIME APARTMENT AVERAGE RENTALS ............................................ ....... 48
FIGURE 4.15 CONDOM INIUM A VERAGE PRICE ...................................................................................................... 49
FIGURE 4.16 EXISTING CONDOMINIUM SUPPLY AND DEMAND BY PRICE SEGMENT..............................................49
FIGURE 4.17 JAKARTA OFFICE SUPPLY, TAKE UP AND VACANCY RATE..............................51
FIGURE 4.18 AVERAGE NET PRIME JAKARTA OFFICE RENT AND CAPITAL VALUE ........................................... 51
F IGURE 4.19 C B D O FFICE D ISTRIBUTION ............................................................................................................. 53
FIGURE 4.20 CBD OFFICE CUMULATIVE DEMAND PROFILE ............................................................................. 54
FIGURE 4.21 JAKARTA CBD OFFICE M ARKET ................................................................................................... 54
FIGURE 4.22 CBD OFFICE BASE RENTAL AND CAPITAL VALUE INDEX ............................................................. 54
FIGURE 4.23 JAKARTA CBD OFFICE YIELDS .................................................................................................... 55
FIGURE 4.24 GREATER JAKARTA AREA NON-CBD OFFICE BASE RENTAL RATE ...................... ........ 55
FIGURE 4.25 NON-CBD OFFICE SPACE DISTRIBUTION BY COMMERCIAL AREA .............................. 56
FIGURE 4.26 NON-CBD OFFICE TENANCY STATUS ............................................... 57
FIGURE 4.27 GREATER JAKARTA AREA NON-CBD OFFICE MARKET .................. .................... 57
FIGURE 4.28 BASE RETAIL RENTAL RATE IN GROUND FLOOR PRIME SPACE ................. .............. 58
FIGURE 4.29 JAKARTA RETAIL SUPPLY, DEMAND AND OCCUPANCY RATE ...... ................... ........ 59
FIGURE 4.30 GREATER JAKARTA AREA INDUSTRIAL M ARKET............................................................................63
FIGURE 4.31 INDUSTRIAL ESTATE AVERAGE LAND PRICE .................................................................................... 64
FIGURE 4.32 FUTURE INDUSTRIAL SUPPLY ........................................................................................................ 64

LIST OF TABLES
TABLE 2.1 INDONESIAN DEMOGRAPHY PROFILE............................................................................................... 13
TABLE 2.2 ORIGINS OF GROSS DOMESTIC PRODUCTS ....................................................................................... 16
TABLE 2.3 INFLATION R ATE IN INDONESIA ........................................................................................................ 16
T ABLE 2.4 E X CH A N G E R A TE ................................................................................................................................. 18TABLE 2.5 ESTIMATED POPULATION IN GREATER JAKARTA ............................................................................. 22
TABLE 2.6 LAND AREA, POPULATION AND DENSITY OF GREATER JAKARTA AREA ..................... ..... 23
TABLE 2.7 GROSS DOMESTIC REGIONAL PRODUCT BY CURRENT VALUE ........... .................. 23
T A BLE 3.1 P ERM ITS IN B O TABEK .......................................................................................................................... 27
T A BLE 3.2 P RO PERTY L O A N .................................................................................................................................. 30
TABLE 3.3 TAX REGULATIONS GOVERNING THE PROPERTY SECTOR ................................................................ 31
TABLE 3.4 LEGAL AND ILLEGAL COSTS FOR PERMIT APPLICATIONS.................................................................32
TABLE 4.1 ESTIMATED NUMBER OF NEW HOUSEHOLDS IN THE GREATER JAKARTA AREA ......................... 36TABLE 4.2 DEFINITION OF LANDED HOUSE CATEGORY .................................................... ........ 37
TABLE 4.3 LARGE-SCALE H OUSING PROJECTS ................................................................................................... 42
TABLE 4.4 INTEREST RATE ON BTN's HOME OWNERSHIP CREDITS (1991-96) ......... ......... ............ 43
TABLE 4.5 GREATER JAKARTA AREA SHOPPING MALL DISTRIBUTION PROFILE...................................................60
TABLE 4.6 SHOPPING M ALLS IN HOUSING A REAS.................................................................................................60
TABLE 4.7 FOREIGN A NCHOR TENANTS................................................................................................................61

INTRODUCTION1. Background
Indonesia has become a favorable location for real estate investment in Asia.'
That country is well-endowed with land, natural resources and available labor.
Because it is the fourth most populous country in the world, Indonesia with its
increasing number of affluent people, has a steadily growing market for housing and
retail development. With the support of enormous domestic and foreign investment,
the country is also experiencing rapid economic growth at an average rate of 7.26%
per annum (1992-96 figures).
Most of the foreign real estate investors in Indonesia are Asian investors,
notably from Japan, Hong Kong and Taiwan. 2 The main reason for this is a different
perception of risk between Asian and non-Asian investors. The risks in Asian
countries are more familiar to Asian investors than to non-Asian investors.
Since non-Asian investors are not familiar with such risks, they often demand
much higher returns as compensation for them. Moreover, because they feel
insecure in that environment, they normally prefer short-term investments and
anticipate high short-term capital gains.4 Asian investors tend to invest with a longer
view and greater confidence. 5
It is possible that non-Asian foreign investors in Indonesia could be
encouraged to expand their long-term investments if they became more familiar with
1 Interview with Trevor J. Peach, Managing Director of PT. Colliers Jardine Indonesia, Jakarta, June21,1997.2 "PMA Properti Asia Ekspansi ke Indonesia," Bisnis Indonesia, April 22, 1997.3 Interview with Ian David, Consulting Director of PT. Procon Indah JLW, Jakarta, June 27, 1997.4 Interview with C.Stewart Forbes, President of Colliers International, Boston, May 21, 1997.s Interview with Trevor J. Peach.

Introduction 9
the country and the true nature of its real estate market. Hopefully, such an
increased awareness would also lead to an adjustment in return demands.
I1. Ob-ective
Despite the attractiveness of Indonesian real estate, there has been little
research done in the West, especially in the U.S., to investigate that market. In his
thesis Analysis of Demand and Investment Outlook in the Office Market in Jakarta -
Indonesia, Chandra Makmoen of MIT analyzed only the office market in Jakarta.
Later, in 1997, the Urban Land Institute analyzed the total Jakarta real estate market
for the first time in ULI Asia Pacific Market Profiles, but only in very general terms.
The purpose of my thesis is to fill in the information gap in the area of
Indonesian real estate, by providing a comprehensive analysis of that market. This
thesis offers a specific analysis of the real estate in the Greater Jakarta Area, which
is comprised of Jakarta, Bogor, Tangerang, and Bekasi.
Ill. Methodolo.
In order to undertake this study, I have reviewed and evaluated market
research and analysis made by property consultants, research agencies, and mass
media analysts both in Indonesia and internationally.
As the leading property consultants in Indonesia, Procon Indah JLW and
Colliers Jardine Indonesia are the most reliable data sources for this purpose. Their
data are widely used by local and international agencies as well as newspapers and
magazines to analyze the market. Therefore, although there may be many other
data sources, the data for this thesis is mainly taken from analyses made by these
two property consultants. To gain a more accurate and up-to-date view of the
market, interviews with staff members of these companies were also conducted.
Additional data resources include:
* commercial research from international agencies such as Dresdner Kleinwort
Benson, Economist Intelligence Unit, First Boston Credit Suisse, Fuji Research
Institute, ING Barings, Jardine Fleming, Morgan Stanley, Schroders, SocGen-
Crosby, and W.I.Carr Far East;

Introduction 10
" commercial research from local agencies such as CAPRICON Indonesia
Consult, Data Consult Indonesia, First Pacific Davies Indonesian, Pusat Studi
Properti Indonesia, and Indonesian Business Data Centre;
* data from government agencies such as the Central Bureau of Statistics, the
Investment Coordinating Board, the Department of Public Housing, the National
Land Agency and the Department of Finance;
* articles from international and local magazines such as Asian Business, Far
Eastern Economic Review, Property Link Asia Pacific, Economic & Business
Review Indonesia, Kontan, Properti Indonesia and Swa; - and -
" articles from local newspapers such as Bisnis Indonesia, Media Indonesia,
Republika, and Suara Pembaruan.
I have divided the analysis in this thesis into three parts:
" Analysis of the main variables that have influenced and that will influence the
real estate market in Indonesia in general and in the Greater Jakarta Area in
particular. These main variables include: demography, the political system, the
legal system, foreign and domestic investment, economic growth, inflation,
interest rates, and government policy.
* Analysis of the structure of the Indonesian real estate market. This includes
the agrarian system as well as urban development planning in Jakarta.
Problems in the Indonesian real estate market and government solutions to these
problems are also discussed here along with the capital structure of Indonesian
real estate companies.
. Analysis of each sector of the Greater Jakarta real estate market: retail, office,
residential, and industrial. Included in this section are analyses of supply and
demand for each sector based on recent figures and other related variables.

INDONESIAI. Introduction
This chapter provides general information about Indonesia and about the
Greater Jakarta Area.
I1. Geo.raph
Indonesia is the largest archipelago in the world, consisting of 13,667 islands.
The main islands are Java, Kalimantan (Western Borneo), Sulawesi (Celebes), Irian
Jaya (Western New Guinea) and Sumatra (see Figure 2.1). Indonesia occupies an
area of 5 million km2, of which 2 million are land and the remainder are the sea
water dividing its islands. The country is divided into 27 provinces with a total of 246
regencies (Kabupatens), which in turn are divided into 3,539 sub-districts
(Kecamatans) and 67,534 villages.'
Ill. Demo.raph
As seen in Table 2.1, Indonesia had a population of 194 million people in
1995, making it the fourth most populous country in the world. Although the island of
Java accounts for only 7% of the total land area, almost 60% of the total population
resides on that island, and four of the five major cities in Indonesia are also located
there.
1 Tan Cheng Leong and Terence Lim, Indonesia: Business and Investment Opportunities (Singapore:Cassia Communications, 1992), 3.

Indonesia 12
Figure 2.1 Map of Indonesia
Figure 2.2 Map of Greater Jakarta and Surrounding Areas

Indonesia 13
There are over 300 ethnic groups living in Indonesia. Chief among these are
the Javanese (45%), the Sundanese (14%), the Madurese (8%), and the coastal
Malays (7.5%). The remaining ethnic groups are indigenous Malaysians or ethnic
non-indigenous Chinese (3%). About 85-90% of all Indonesians are Muslims and
only 7.5% are Christians. There are also small groups of Hindus, Buddhists and
animists. Although there are approximately 365 languages and dialects spoken
within the boundaries of Indonesia, most Indonesians understand Bahasa Indonesia,
which is the national language.
Table 2.1 Indonesian Demography Profile
Source: Central Bureau of Statistics
IV. Political System
Under the 1945 Constitution, the People's Consultative Assembly (MPR)
became the highest authority in the nation, and it now provides for the establishment
of 4 independent entities within the government: the President, the House of
People's Representatives (DPR), the Supreme Audit Board and the Supreme Court.
The MPR elects a President and a Vice President for a term of five-years and
establishes the Broad Outlines of State Policy (GBHN). Half of the MPR members
are from the DPR and the other half are nominated by the government in direct
proportion to the results of national elections.
The DPR has 460 members, 360 of whom are elected, while the other 100
are appointed from military and non-military groups. The DPR meets four times a
year and is responsible for drafting legislation and approving Presidential degrees
and budgets.
2 Price Waterhouse, Doing Business in Indonesia (Jakarta, 1993), 5.

Indonesia 14
Executive power lies in the hands of the President, who is also the Prime
Minister and the leader of the cabinet. Since 1945, Indonesia has had only two
presidents: Soekarno, who was the first, and Soeharto, who is the current
President. President Soeharto has been in office since 1968. As a result, the
presidential succession process has never really been tested, and there is no
obvious successor at this time. Because President Soeharto is now 76 years old,
presidential succession is now a key issue influencing the stability of the future
political environment in Indonesia.
Most Indonesian laws are based on Dutch law, except for a few more recent
ones which apply to companies with limited liability, foreign investments, taxation
and specialized industries. Law enforcement and litigation are often difficult
because they can be time-consuming and unpredictable. According to a decree
passed by the Provisional National Assembly (MPRS) in 1966, Indonesian law is
structured according to the following hierarchy:4
1. The 1945 Indonesian Constitution (UUD 1945).
2. A decree made by the National Assembly (TAP MPR).
3. A government regulation replacing a law (PERPU).
4. A government regulation (PP).
5. A presidential decree (KEPPRES).
6. A ministerial regulation.
7. A ministerial directive.
V. Economy
A. Overview
Indonesia has experienced serious economic problems in the past. Before
1966, the country was suffering from hyperinflation, a stagnant economy and
depleted foreign exchange reserves. Even in 1967, Indonesia was still one of the
3 "Shaking the Family Tree," Asian Business, February 1997, 32.4 Price Waterhouse, 6.

Indonesia 15
world's poorest countries, with a GDP per capita of US$70. When General Soeharto
took office in March 1966, top priority was given to economic rehabilitation and the
reduction of the rate of inflation, which at that time was almost 650%. With the
economy somewhat restored by 1969, it became possible to implement a plan with
new economic objectives. Five 5-year plans known as Repelita I-V were
successively implemented from April 1969 to March 1994. As a result of this
strategy, the country began to enjoy a GDP growth with an average rate of 7.2% per
annum throughout the 70s. When the price of oil fell in 1982, however, the GDP
growth rate fell to 2.3% but rose again to 7% and has fluctuated between 7% and
5% since that time (See Figure 2.3).
90 8
S 6 -
S 3-
0 - ..
co 00 co co cO o CO 0M 0) a) 0) 0) 0) r- 000 0) 0) 0) 0) 0) 0) ) 0 ) a0 ) 0) ) 0
Figure 2.3 GDP GrowthSource: Central Business of Statistics
Indonesia has a free-market economy which is dominated by its private sector
although the government does play a role through state-owned firms and the
imposition of price controls in selected industries. The public enterprise sector
represents an estimated 15% of the GDP and employs about 1.2 million people
(1.4% of the labor force). The government's share with its 181 state-owned firms
has declined gradually as a result of strong private sector growth.
Table 2.2 shows the origins of Indonesia's GDP. As seen in this table, the
construction industry is one of the fastest growing sectors. The rate of construction
growth was 12.89% in 1995, 12.37% in 1996. Other fast-growing sectors include the
electric industry, manufacturing, trade, finance and transportation.

Indonesia 16
Table 2.2 Origins of Gross Domestic Products(In Billion Runiah)
Source: Central Bureau of Statistics
B. Inflation
Inflation was a major problem in Indonesia in the 60s and 70s; as a result,
tight monetary measures and careful fiscal actions were taken to keep it down in the
1980s. As seen in Table 2.3, during the period 1986-96, the government
successfully maintained an inflation rate below 10%, and in 1996, inflation had
declined to 6.47%, approaching the targeted government rate of 5% or below.
Table 2.3 Inflation Rate in Indonesia
Source: Central Bureau of Statistics
Table 2.3 shows that the inflation rate in the housing sector has also been
fluctuating. This fluctuation has more or less followed the housing market itself:

Indonesia 17
when housing demand was strong in 1993, the inflation rate in the housing sector
rose to 15.48%, but when housing demand was weak in 1996, it fell to 4.72%.
C. Interest Rates
Interest rates are an important variable in any analysis of the Greater Jakarta
real estate market. From the perspective of supply, interest rates determine the
return of new projects. From the perspective of demand, interest rates determine
mortgage rates for new house loans. Since 70% of all middle- to high-income
housing sales in Indonesia are financed by mortgages5, the middle- to high-income
housing market is strongly effected by the fluctuation of interest rates.
As shown in Figure 2.4, during the period 1982-96, the average mortgage
rate in Indonesia was 22.2%; the average lending rate was 18.2%. In 1990, when
the government was implementing a tighter monetary policy by increasing the prime
money market rate, the mortgage rate rose to a high of 28%
28.0%26.0%24.0%22.0%
Mortgage Rates
16.0% Prime Lending Rates
14.0% ------ SBI-90 Day Rate
12.0%10.0%8.0% 1 I I I I
CN CO) 't LO (D N OD 0) 0 - C\1 C) It L)O ( LLU LLCD CO CD CO (O 0 0 0(0 0) 0) 0) 0Y) 0) 0) M) r_ W0M0M0M0M)CD0)D)0)0C) 0)0C )0) 0)0)0) 0)
Figure 2.4 Mortgage, Lending and SBI 90-Day RatesSource: ING Barings, Dresdner Klienwort Benson
D. Exchange Rate
The Indonesian currency unit is the rupiah. It is on a managed float,
depreciating slowly against a basket of trading partners' currencies. The policy of

Indonesia 18
Bank Indonesia (BI), the Central Bank, is to depreciate the currency slowly to
compensate for differences in the rates of inflation in Indonesia and in the currencies
of its major trading partners, and to maintain the competitiveness of Indonesian
exports. Rupiah are traded in an inter-bank market in Jakarta. Indonesia maintains
no capital controls, and foreign exchange may flow freely in and out of the country.
As shown in Table 2.4, the rupiah has steadily depreciated against the US dollar at
an average rate of 3.54% per year.
Table 2.4 Exchange Rate
Source: Capricon Indonesia Consult
VII. Domestic and Foreign Investment
One of the important sources of GDP growth is domestic and foreign
investment. As seen in Figure 2.5, the value of domestic investment approvals has
increased steadily since 1987. Figure 2.6 shows that since 1994, foreign direct
investment (FDI) approvals also increased significantly. During the period of 1990-
93, the average value of FDI approvals was around US$9 billion U.S., but the value
of FDI approvals increased to $30 billion U.S. in 1994 and US$40 billion U.S. in
1995. This high value of domestic and FDI approvals has supported the increasing
demand for office and industrial real estate.
s Schroders, Indonesian Property Market (Jakarta, January 15, 1997), 9.

Indonesia 19
Figure 2.5 Domestic Investment ApprovalsSource: Investment Coordinating Board (BKPM)
Figure 2.6 Foreign Direct Investment ApprovalsSource: Investment Coordinating Board (BKPM)
Both foreign and domestic capital investment, which are welcomed by the
Indonesian government, are managed by a government agency known as the
Investment Coordinating Board (BKPM). Every year, this agency reviews its
regulations in an effort to encourage new investment. The government recognizes
the importance of FDI to the continuous growth and development of the national
economy. Because of budgetary constraints and development requirements, the
120,000 14000
2100,000 1200
. 80,000 L.800 (
m 60,000 0y" 600
40,000
20,000 200 30 0
1987 1988 1989 1990 1991 1992 1993 1994 1995 1996
=Value -+- Number
45,000
40,000
35,000
30 000
S 25,000
> 620,000
$15,00010,000
5,000
01980 1981 1982 1983 1984 1985 1986 1987 1988 1989 1990 1991 1992 1993 1994 1995 1996

Indonesia 20
government hopes that foreign investment will provide new technology and technical
training for Indonesians. Over the past few years, there have been a significant
number of deregulation measures designed to facilitate international
competitiveness and stimulate the economy. Major deregulations for FDI include
the following:6
0 100 percent ownership in most businesses and 95 percent ownership in the
public sector.
0 No minimum requirement for investments.
. Easier divestment.
0 Elimination of duties on goods for re-export.
. Incentives for export-oriented investment.
. Streamlining of investment application procedures.
Vill. Polic
A. Fiscal Policy
The government has maintained a balanced budget policy which balances
expenses and the combined assets of domestic revenue and foreign assistance.
The chief governmental fiscal policy is to improve its non-oil-related tax collecting
and to reduce its dependence on foreign assistance.
B. Monetary Policy
From mid-1 990 to early 1992, the Central Bank had tightened its monetary
policy in order to help curb inflation and a widening current account deficit. The
government also asked private banks and businesses to limit offshore loans after a
rapid expansion of the private sector into foreign liability. As inflation pressures
abated, the government began to relax its monetary policy.
6 "Government Moderately Successful in Attracting Investors, Despite Drop in Value of ForeignInvestments," Indocommercial, January 13,1997, 15-17.
Indonesia 21
C. Labor Policy
Private sector workers have the freedom to form or join unions. However, a
union has to register with the Department of Home Affairs and meet the
requirements of the Department of Manpower if it wants to be able to bargain for
employees. This rule has effectively restricted the labor movement in Indonesia
because it gives the government control over most labor activities.
IX. Greater Jakarta Area
Jakarta is the capital of Indonesia and the center of the Indonesian
government. It is the only city in Indonesia with a population of over 9.5 million. It
covers approximately 650 km2 and includes the islands of Pulau Seribu in the Bay of
Jakarta.
The dynamics of Jakarta's economic development cannot be separated from
the economic development of the surrounding regions, Bogor, Bekasi and
Tangerang (See Figure 2.2), which comprise an area loosely known as Greater
Jakarta or Jabotabek.7 Greater Jakarta covers a total of 6,342 km2 and is located
in the provinces of DKI Jakarta and West Java. It is an important focus for
demographic growth in Western Java as well an indicator of overall economic growth
of Indonesia.
As seen in Table 2.5, the population of Greater Jakarta will be approximately
25 million in the year 2000, with an estimated annual growth of 4.01 %. This high
growth rate will undoubtedly support an increasing residential demand.
As shown in Figure 2.7, Greater Jakarta has a high concentration of young
people; 74% of the population is below the age of 34. Since most young people in
Indonesian do not have their own homes, they constitute a large potential housing
market.
7 Indonesian Business Data Centre. Real Estate Indonesia. (Jakarta, 1995), 125.

Indonesia 22
Table 2.5 Estimated Population in Greater Jakarta
Source: Procon Indah/JLW Research
Figure 2.7 The Demographic Profile of Greater JakartaSource: Procon Indah/JLW Research
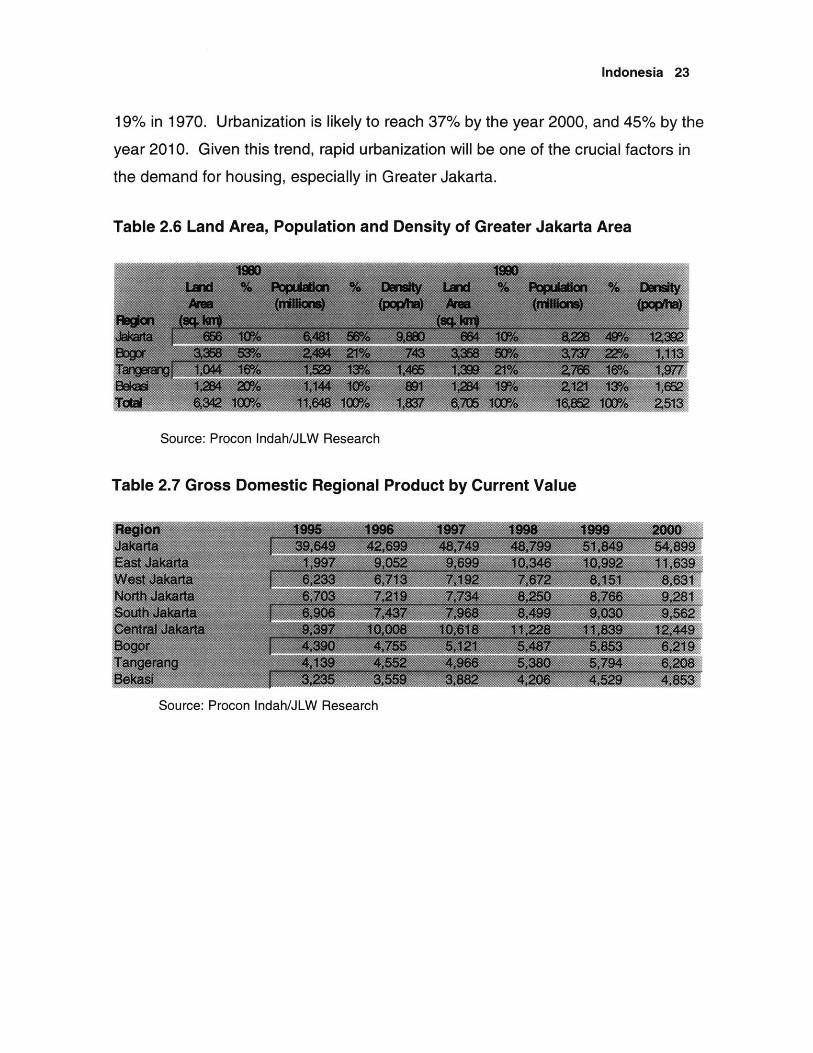
As seen in Table 2.6, the population density of Greater Jakarta has increased
from 1,837 per/ha in 1980 to 2,513 per/ha in 1990. This table also shows that
although metropolitan Jakarta represents only 10% of Greater Jakarta, its population
accounts for 49% of the total population. As a result, the population density of that
area, which was 12,392 per/ha in 1990, has remained greater than that of the
surrounding region. However, since the populations of Bogor, Tangerang and
Bekasi have been increasing more rapidly than that of metropolitan Jakarta, the
demographic distribution has begun to change.
Table 2.7 shows that significant increases in the Gross Domestic Regional
Product are projected for East Jakarta, Bogor and Tangerang.
As the focal point of economic development in Indonesia, Jakarta is the chief
area targeted for urbanization. As shown in Figure 2.8, in 1995, 33% of the total
Indonesian population was living in urban areas, as compared to 22% in 1980 and
<14
25-340>
45-54
>65
U FemaleE Male
2.5 3.0 3.50.5 1.0 1.5 2.0Million People
Indonesia 23
19% in 1970. Urbanization is likely to reach 37% by the year 2000, and 45% by the
year 2010. Given this trend, rapid urbanization will be one of the crucial factors in
the demand for housing, especially in Greater Jakarta.
Table 2.6 Land Area, Population and Density of Greater Jakarta Area
Source: Procon Indah/JLW Research
Table 2.7 Gross Domestic Regional Product by Current Value
Source: Procon Indah/JLW Research

Indonesia 24
Figure 2.8 Urbanization Trend in IndonesiaSource: Schroders, January 1997
X. Conclusion
Indonesia is geographically dispersed and has an uneven distribution of
income and ethnic affiliations among its 195 million people. Political stability is,therefore, very important for the country's well being. Nevertheless, the Indonesianpolitical system is vulnerable as long as the issue of presidential succession remains
unresolved, and this has cast a shadow on the country's future.
Because of its big market potential and rapid GDP growth, Indonesia has
become attractive for both domestic and foreign investment. Inflation, exchangerates and interest rates are carefully controlled by the government. Unfortunately,however, the Indonesian legal system remains weak and ineffectual.
Greater Jakarta is comprised of metropolitan Jakarta, the capital city and thecenter of economic development, as well as the supporting regions of Bogor,
Tangerang, and Bekasi. Greater Jakarta contains more than 21 million people; the
majority of these are under 34 years, and are therefore, potential first-time home-
owners. Furthermore, the population of Greater Jakarta is continuously growing,
and this has already created a strong demand for residential and retail development.
50%
0 40%
30%
- 20%
10%0.0
0 0%1970 1980 1990 1995 2000 2010
THE STRUCTURE OF THEINDONESIAN REAL ESTATE MARKETI. Introduction
This chapter discusses some important issues in the Indonesian real estate
market, including land planning and capital structure. Also discussed are problems
such as licensed undeveloped projects, speculative development, speculative
acquisition, bad debt, houses without deeds, and complicated permit processes.
Government efforts to solve these problems are also mentioned in connection with
each one.
Ill. Land Plannin
A. General
All land planning is handled at the municipal level. The government has
come under increasing pressure to liberalize its land laws, especially the Basic
Agrarian Law, which is the foundation of the country's agrarian system. This law is
felt to be at odds with the needs of foreign investors.1
B. Urban Plan for Jakarta
The general plan for Urban Jakarta for the period 1985-2005 prioritizes
residential development in the west and east parts of the city. These areas are
perceived as under-utilized, and land prices there are also lower than they are in the
Central Business District (CBD) and in the northern and southern parts of Jakarta,
and since July 1995, the government has stopped issuing new land permits for
1 Urban Land Institute, ULI Asia Pacific Market Profiles: 1997 (New York, 1997), 17.

The Structure of the Indonesian Real Estate Market 26
residential development in Greater Jakarta. On the other hand, the government is
encouraging residential development by those developers who have already
acquired permits and has given them the opportunity to build and manage their own
infrastructures. Furthermore, any large-scale residential development greater than
100 hectares has been accepted as a part of the national urban development
policy.
C. Basic Agrarian Law
The Basic Agrarian Law of 1960 defines four types of land ownership titles:2
1. Hak Milik (HM), ownership by Indonesian citizens and certain other legal entities;
2. Hak Guna Bangunan (HGB), the right to build, which can be granted to legal
entities according to the terms of the foreign investment law for 30, with a
possible 20 year extension (See Appendix A);
3. Hak Pakai, the right to use land for construction or for agricultural purposes,
rewritten in 1996;3
4. Hak Pengelolaan, the right to manage land, which can also be granted to foreign
companies or other legal entities.
D. Strata-title Law
The strata-title law was passed in 1985. It permits the sale of individual units
in high-rise buildings located on HGB land. A strata-title can be transferred or sold
after the HGB title to the land has been issued. Upon issuance of the strata-title,
developers can apply for separate deeds to common areas, properties and/or land.
Ownership of the new unit normally includes ownership of any common areas,
properties and/or land, which constitute an inseparable part of that unit.4
E. Regulation of Collateral Rights (UU No. 4 of 1996)
On April 9, 1996, the National Land Agency issued Regulation No. 4 to define
collateral rights. Lands used for collateral must be formally registered as such to
2 Schroders, Indonesian Property Sector (Jakarta, January 15, 1997), 20.3 Regulations Nos. 4, 40, and 41. See Appendix A for a comparison of HGB and Hak Pakai.4 Schroders, 20.

The Structure of the Indonesian Real Estate Market 27
give creditors the necessary legal rights. In the past, foreclosures were difficult
because rights to the original collateral were not always clear. With this new
regulation, the legal assurance of collateral rights became a necessary part of most
bank loans. Moreover, the regulation permits creditors to bypass court processes
and foreclose directly. Anything of value located on the land can be used as
collateral.
F. Right-to-Use Titles (UU Nos. 40 and 41 of 1996)
In June 1996, the government issued regulations Nos. 40 and 41 to increase
the value of right-to-use titles. Regulation No. 40 extends the term from 10 to 25
years, with an additional 20 year option followed by possible a renewal. Regulation
No. 41 allows qualifying foreigners5 to buy property in Indonesia as long as the
property is developed with a right-to-use title.6
|||. Several Problems in the Indonesian Real Estate Market
A. Under-utilized Licenses
Table 3.1 Permits in Botabek
Source: National Land Agency, August 1995
As shown in Table 3.1, only 16.35% of the licenses in Botabek (Greater
Jakarta excluding Jakarta itself) had been used for development by August 1995.
According to the National Land Agency, the unused licenses could provide
3,396,400 homes, enough to supply the needs of the entire Greater Jakarta Area
until 2018. Many of these unused licenses were taken out for the purpose of land
5 Defines as foreigners who own and maintain an economic interest in Indonesia; however, thedefinition is too wide and bias.6 "Sekitar Peluang dari PP 41/1996 Masih Perlu Tindak Lanjut," Media Indonesia, January 3,1997.
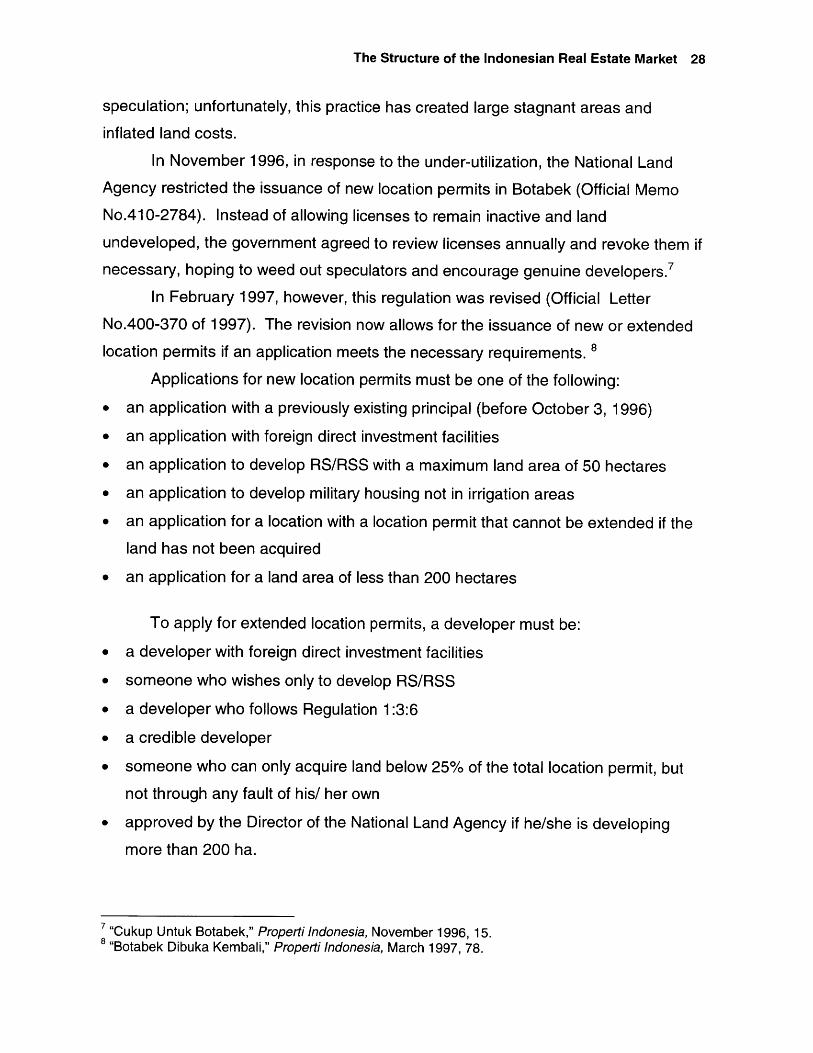
The Structure of the Indonesian Real Estate Market 28
speculation; unfortunately, this practice has created large stagnant areas and
inflated land costs.
In November 1996, in response to the under-utilization, the National Land
Agency restricted the issuance of new location permits in Botabek (Official Memo
No.410-2784). Instead of allowing licenses to remain inactive and land
undeveloped, the government agreed to review licenses annually and revoke them ifnecessary, hoping to weed out speculators and encourage genuine developers.7
In February 1997, however, this regulation was revised (Official Letter
No.400-370 of 1997). The revision now allows for the issuance of new or extended
location permits if an application meets the necessary requirements. 8
Applications for new location permits must be one of the following:
* an application with a previously existing principal (before October 3, 1996)
e an application with foreign direct investment facilities
e an application to develop RS/RSS with a maximum land area of 50 hectares
e an application to develop military housing not in irrigation areas
e an application for a location with a location permit that cannot be extended if the
land has not been acquired
e an application for a land area of less than 200 hectares
To apply for extended location permits, a developer must be:
* a developer with foreign direct investment facilities
" someone who wishes only to develop RS/RSS
" a developer who follows Regulation 1:3:6
e a credible developer
" someone who can only acquire land below 25% of the total location permit, butnot through any fault of his/ her own
e approved by the Director of the National Land Agency if he/she is developing
more than 200 ha.
"Cukup Untuk Botabek," Properti Indonesia, November 1996, 15.8 "Botabek Dibuka Kembali," Properti Indonesia, March 1997, 78.

The Structure of the Indonesian Real Estate Market 29
B. Speculative Development
1. General
From 1992-95, the real estate market was booming. This activity was related
to deregulation in October 1993, which made it easier to get development permits
and which encouraged banks to increase their loans. As a result, many new
developers entered the market with expectations of high returns. There was a flood
of new speculative development projects. The real estate market was oversupplied
and many developers could not sell. This, in turn, led to delays, defaults, under-
specification, and even fictional projects, and created an overall bad images for
developers in general. As of September 1996, speculative development had created
approximately 5.25 trillion rupiah in bad debts, a figure that represented more than
10% of all national property loans. 9
2. Overgrowth Property Loans
As seen in Table 3.2, property loans grew at an annual rate of 37% from
1993-96 while industry and trading loans grew only at rates of 19.4% and 16.1%,
respectively. Because the property sector normally supports or reflects other
sectors, especially industry and trading, property loans are clearly in a period of
overgrowth.10
3. Increasing Share of Property Loans
As seen in Figure 3.1, the share of property loans increased from 13.3% in
1993 to 19.0% in 1996. Although these figures are still below those of Hong Kong
(30%) and Malaysia (30%), they should be a warning sign to Indonesia where
property loans have a much higher debt equity ratio.
9 "Gelombang Proyek Bermasalah," Properti Indonesia, September 1996, 18.10 "Ada Apa Kredit Properti," Properti Indonesia, October 1996, 30-31.1 "Ada Apa Kredit Properti," 30-31.

The Structure of the Indonesian Real Estate Market 30
Table 3.2 Property Loan
Source: Bank Indonesia
20.00%
18.00%
16.00%14.00%
12.00%
10.000/0
8.00%
6.00%4.00%
2.00%0.00/a0 0
1993 1994 1995 1996F
-- Construction Loan: National Loan ------ Real Estate Loan: National LoanMortgage : National Loan - - - - Property Loan: National Loan
Figure 3.1 Ratio of Property Loans to National LoansSource: Properti Indonesia, Bank Indonesia
4. Mis-allocation Loans
Table 3.2 shows that only a small share of development loans are used for
low-income housing (simple house), the biggest housing demand. Such mis-
allocation can endanger the market because the supply is not responding to the right
demand and the demand for low-income hosing remains unfulfilled.12
12 "Ada Apa Kredit Properti," 32.

The Structure of the Indonesian Real Estate Market 31
C. Government Efforts to Reduce Speculative Development
To protect the public from irresponsible developers, the government has
tightened up its procedures and now requires building permits before any marketing
can be done.13
Moreover, in July, 1997, to respond to overgrowth property loans and the
increased share of such loans and to deal with the increase in bad debts, the
government prohibited domestic loans for land acquisition and middle- and high-
income housing developments.
D. Speculative Buyers
The 1992-95 boom attracted not only developers but also speculative buyers
to the market. As a result, demand was exaggerated and developers overestimated
it. Once the market was oversupplied, the speculators disappeared or even
increased the oversupply by selling their properties, and the situation became
critical.
In January 1995, to reduce further speculative acquisition, the government
introduced new tax regulations: luxury property taxes, which were 10% of the sale
price; and secondary sales taxes, which were 2% for low-income housing, 6% for
rental income from investment properties and 5% for all other housing (See Table
3.3). This secondary sales tax replaced the existing 30% capital gains tax.14
Table 3.3 Tax Regulations Governing the Property Sector
Source: Department of Finance
13 ING Barings, Property Sector Review (August 1996), 26.14 ING Barings, 22-24.

The Structure of the Indonesian Real Estate Market 32
E. Complicated Permit Application Processes
Permit application processes in Indonesia are very complicated. Developers
have to register for many types of permits, such as a principal permit (IP), a location
permit, a permit for advice planning, a block plan permit, a permit to develop (IMB),
a permit to use the building (IPB), and a principal certificate. Applications for these
involve numerous government agencies: the National Land Agency, the Department
of Public Works, the Department of Public Housing, the Department of
Transportation, and even the military. To make matters worse, there is very little
coordination among government agencies, and big projects have additional
problems. For these projects, developers usually need several years. Nonetheless,they must renew all permits annually, and new approvals are not guaranteed. As a
result, permits for big projects are often tenuous.15
Table 3.4 Legal and Illegal Costs for Permit Applications
.................. ' ..
Source: Properti Indonesia, November 1996
For obvious reasons, the permit application process has frequently frustrated
developers. Many of these prefer to solve the problem or accelerate the application
process by paying additional illegal costs, which can be 3-4 times higher than official
costs (See Table 3.4).
15 "Benang Kusut Perizinan," Properti Indonesia, November 1996, 20.

The Structure of the Indonesian Real Estate Market 33
F. Houses Without Deeds
Buyers often do not get their house deeds immediately even after paying off
their mortgage. The main reason for this is that developers usually wait to register
deeds until they can sell all of the houses in a single project. Moreover, they
sometimes use the whole project, including houses that have been paid for, as
collateral. In 1996, to curtail this abusive practice, the government passed
Regulation No. 4 which made this practice illegal, and required developers to
register deeds directly after the mortgages were fully paid.16
IV. Capital Structure
Traditionally, most of the financial sources for real estate development are
banks.17 Consequently, the fluctuation of interest rates and available funds have a
significant effect on the real estate market.
However, since July 1997, local banks have been prohibited by law from
financing land acquisitions and middle- and high-income housing developments.
Consequently, developers have to use their own equity or seek other sources for
funding.
Companies developing low-income housing can borrow from Bank Tabungan
Negara, a government agency established for that purpose. Another possible
source of funding is the stock market. In 1997, 20 real estate companies offered
equity shares on the Jakarta and Surabaya Stock Exchanges. Since only
established real estate companies with long-term experience can meet the
requirements of these markets, small companies are seldom able to raise funds in
this way. Other possible financial sources, such as secondary mortgages or workers'
savings, have also been considered18 , and several big developers have utilized
foreign loans and foreign equity. 19
16 "Kalau Sertifikat Tak Kunjung Datang," Properti Indonesia, October 1996, 116-117.1 Ada Apa Kredit Properti," 38-39.18 "KPR Model Baru dari Bakrie-REI," Properti Indonesia, January 1997, 88-89.19 "Tumpuan Baru Kala Kredit Makin Irit," Properti Indonesia, November 1996, 32-33.

The Structure of the Indonesian Real Estate Market 34
V. Conclusion
The Indonesian real estate market still has many problems: illegal costs, high
land costs, undeveloped licensed projects, an unfavorable agrarian system, a
complicated permit process, an excess of speculative development, and increasing
bad debt. Some of these problems are the usual problems of a developing country,
and therefore, immediate solutions to them are not possible. Greater government
commitment to such solutions is needed.
Other problems are clearly the result of speculative development, and the
government has actively intervened to solve these problems in an effort to create a
healthier real estate market. The deregulation of July 1997, represents a significant
intervention. It prohibits domestic loans for land acquisitions and development with
the exception of loans for low-income housing. This regulation is designed to reduce
speculative development as well as its negative effects. In general, government
interventions are positive efforts, but others seem biased, ineffectual, or poorly
implemented.
Traditionally, banks are the main financial sources for real estate
development. Big companies can raise funds through the stock market and foreign
investors; low-income housing developers can borrow funds from Bank Tabungan
Negara. The deregulation of July 1997, makes it illegal for other developers to
borrow from banks, so that these are now forced to find other sources. This
situation may be a good opportunity for foreign investors to enter the Indonesian real
estate market.
GREATER JAKARTA: REAL ESTATEMARKET OUTLOOK
1. Introduction
This chapter analyzes supply and demand in each sector of the Greater
Jakarta real estate market: housing, office, retail and industrial.
I1. Housin.
A. Demand
1. General
Rising incomes, increased population, a decline in household size, a growing
middle class and rapid urbanization are the main forces behind the strong demand
for housing in Greater Jakarta.
In 1996, Jakarta's GDP per capita was US$3,016 per annum, while the
National GDP was only US$1,100. As a result, affordability has increased as the
middle class continues to expand. Increased demand is also the result of growth in
the number of households (See Table 4.1) because of increased population (See
Table 2.5), rapid urbanization (See Figure 2.8) and the decline in household size.'
Landed house demand is strong because Indonesian people still prefer
detached one-level houses to apartments, condominiums, or townhouses. They
prefer to live further from the city in affordable and less congested communities.
1 The household size has decreased from 5.6 people in 1980 to 4.7 people in 1990, and is expectedto reach 3.8 by the year 2000 (Schroders, Indonesian Property Market, 6).

Greater Jakarta: Real Estate Market Outlook 36
First-time home-buyers dominate the market because 74% of the population
is still below the age of 34 (See Figure 2.6) and living with parents. Many of these
people will be potential buyers when they have saved enough money.
Table 4.1 Estimated Number of New Households in the Greater Jakarta Area
* Data from Procon Indah/JLW (Table 2.5)** Assuming that the average household size is 4.9 people
The demand for new houses will be concentrated in and around Greater
Jakarta for the next few years because Greater Jakarta has easy access to the
Jakarta-Merak toll road. Toll roads have become increasingly important because
traffic congestion in Greater Jakarta has become much worse.
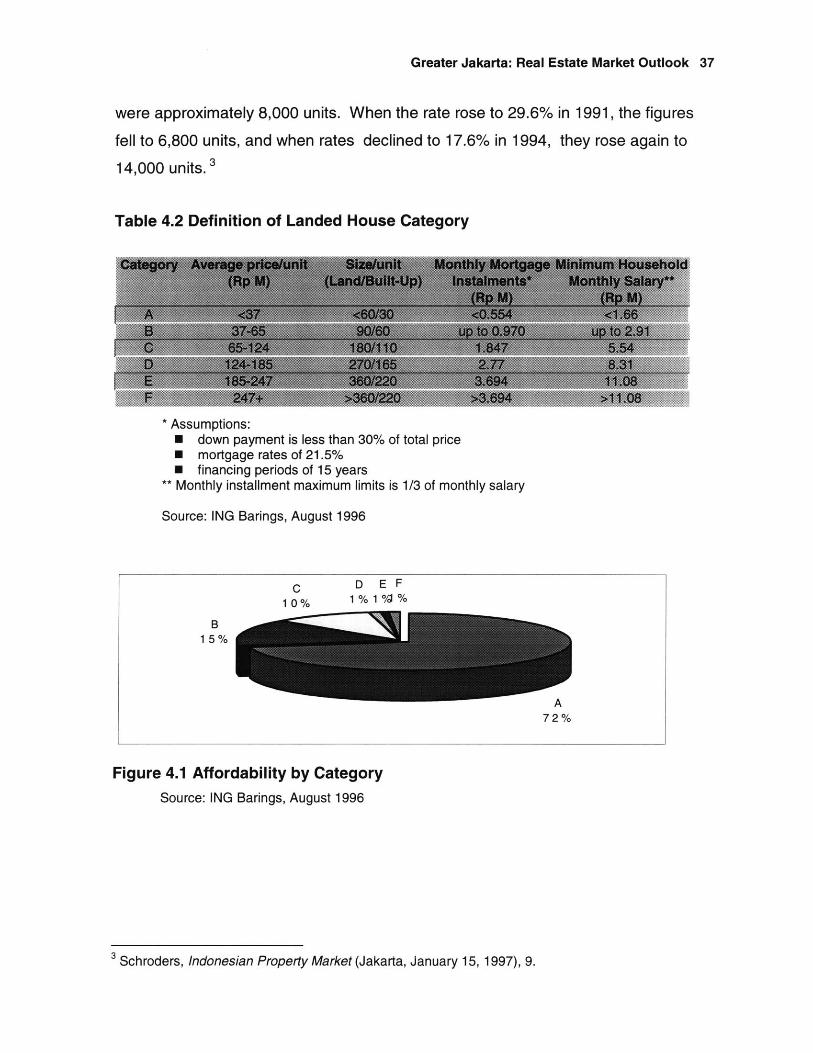
2. Affordability
Although demand is high, there is still a lack of affordable housing.2 Most
houses offered can be afforded by only 28% of the population (See Table 4.2 and
Figure 4.1). Affordability itself has increased (See Figure 4.2), but this is because
income levels are increasing while the increase of land and house cost is coming
down, a trend that began in 1994 (See Figure 4.2).
According to ING Barings Research, affordability could be improved by
lowering mortgage rates and increasing down-payments (See Figure 4.3).
Mortgage rates significantly effect the sales of high- to middle-income houses,
because 70% of those sales are financed by mortgages. Consequently, their sales
pattern is roughly correlated with the fluctuation of mortgage rates. When the base
lending rate was around 20% in 1988, total sales of middle- to high-income houses
2 Properti Indonesia, Rumah Untuk Anda (Jakarta, 1995), 31-32.
Greater Jakarta: Real Estate Market Outlook 37
were approximately 8,000 units. When the rate rose to 29.6% in 1991, the figures
fell to 6,800 units, and when rates declined to 17.6% in 1994, they rose again to
14,000 units. 3
Table 4.2 Definition of Landed House Category
* Assumptions:" down payment is less than 30% of total price* mortgage rates of 21.5%* financing periods of 15 years
** Monthly installment maximum limits is 1/3 of monthly salary
Source: ING Barings, August 1996
Figure 4.1 Affordability by CategorySource: ING Barings, August 1996
3 Schroders, Indonesian Property Market (Jakarta, January 15, 1997), 9.

Greater Jakarta: Real Estate Market Outlook 38
1000% 2.50X900%800% 2.00 *
700% -I 600% 1.50- 500%
ccJ 400% 1.00
.5 300%N 200% 0.50
100%0% -
N~ o It LO (D r- 00 0) 0 cmJ co It LO 1±. LL LL00 oo OD Go (0 (0 (D (0 (0 0) 0) 0) 0) 0) 0) (D N~ (D
0 0) ) 0) 0) 0) 0) 0) 0) 0) 0) 0) 0) 0) 0) 0) C) 0)0M 0) 0)
Year
Effective Land Price (left axis) Effective House Price (left axis) ------ Affordability Index (right axis)
Figure 4.2 Effective Land and House Price Index with Affordability Index* Affordability here is based on household income divided by mortgage payment.Affordability improves as the index increases
Source: ING Barings, February 1997
Figure 4.3 Adjusted Affordability by Category* Assumptions:
* down payment is less than 30% of total price* mortgage rates of 19.5%* financing periods of 15 years
Source: ING Barings, August 1996
A decrease in mortgage rates has a greater impact than an increase in
mortgage rates (See Figure 4.4) because a decreasing attracts not only homebuyers but also speculators. Conversely, increased mortgage rates drive out
speculators, but not necessary home buyers because most of them are first-time

Greater Jakarta: Real Estate Market Outlook 39
home buyers and their decisions to purchase a house are more based on their
affordability than profitability.4
15.0%
10.0%
& 5.0%.~0.0% 0
.) 0.0% Change of Mortgage Rateg -5.0% 0% Change of Affordability (in -
-10.0%
-15.0%17.5% 18.5% 19.5% 20.5% 21.5% 22.5%
Mortgage Rate
Figure 4.4 Sensitivity Analysis (Mortgage Rate versus Affordability)* In negative %: affordability decreases when mortgage rate increases
Source: ING Barings, February 1997
B. Supply
1. General
The public sector and the private sector have supplied 25% and 75% of the
housing demand, respectively. About 50% of the existing housing in Jakarta is
considered substandard, 40% fair and 10% good. Jakarta, therefore, needs large
investments for housing developments which will include social facilities and
infrastructure, and occupy about 600 hectares of land per year.5
2. Distribution
Population growth and the growth of commercial sector in Jakarta have
pushed new residential development farther out on the fringes of the city and into
Tangerang, Bogor and Bekasi, where land prices are lower. The majority of the
new housing development in Greater Jakarta are located in Tangerang, while a
smaller number are located in Bogor, Bekasi and Jakarta, respectively (See Figure
4 ING Barings, Asean Property Sector Review (Singapore, February 1997), 16.5 Urban Land Institute, ULI Asia Pacific Market Profiles: 1997 (New York, 1997), 17.

Greater Jakarta: Real Estate Market Outlook 40
4.5). Tangerang has become a new residential district while Bekasi is now largely
considered an industrial area. Another major development area is Bogor, but
primarily for resort-type houses.6
* 25,000
0
e 0 00_
-V 5,000
Bekasi Bogor Tangerang Jakarta
U Developed Area U Undeveloped Area
Figure 4.5 Distribution of Residential Estate Area Planned for DevelopmentSource: Procon Indah/JLW Research, March 1997
Figure 4.6 Distribution by Income SegmentSource: Procon Indah/JLW Research, March 1997
As seen in Figure 4.6, middle-income housing accounts for 37% of all houses
offered. This figure is followed by lower- to middle- and low-income housing at 30%
and 22%, respectively. Jakarta itself has a greater concentration of middle-income
6 ING Barings, Property Sector Review (Jakarta, August 1996), 38.
Supply120,000
100,000U Lower
80,000 U Lower Middle
0 000O MiddleM Upper Middle
040000 EUpper
20,000
0
Area
Take Up120,000
100,000 0 Lower. 80,000 U Lower Middle
0 Middle
C 600 Upper Middleo 40,000 UUpper
20,000
0
Area

I -
Greater Jakarta: Real Estate Market Outlook 41
housing, while Tangerang has more lower- to middle-income housing and Bekasi
has more low-income housing. Almost 81 % of the supplies in Botabek are small
houses, whereas in Jakarta, 42% of the total supply is medium-sized houses (See
Figure 4.7).
Figure 4.7 Distribution by SizeSource: Procon Indah/JLW Research, March 1997
3. Residential Estate
The high residential land prices in metropolitan Jakarta have stimulated the
development of self-contained cities outside of Jakarta (See Table 4.3). The
development of residential estates is still at an early stage, accounting for only 20%
of the total supply of new houses. 7 However, the desire to live in a large-scale self-
contained development in a satellite city is growing rapidly because of such
advantages as location, quality of access, quality of living environment, protection
from arbitrary zoning laws, and provision of social and recreational facilities within
the residential estate.8
7 Schroders, 9.8 Properti Indonesia (1995), 35-36.
Supply
Jakarta
Tangerang
Bogor
Bekasi
150,0000 50,000 100,000
House (Units)
ESmall EMedium OLarge
Take Up
Jakarta
Tangerang
Bogor
Bekasi
150,0000 50,000 100,000
House (Units)
ESmall EMedium OLarge

Greater Jakarta: Real Estate Market Outlook 42
Table 4.3 Large-scale Housing Projects
Source: Data Consult, 1996
4. Low-Income Housing (RS/RSS)
To supply enough low-income housing, the biggest housing demand, the
government has promoted the concept of "simple and very simple houses"
(RS/RSS). The government encourages the development of RS/RSS by subsidizing
RS/RSS mortgage rates and taxes as well as by creating a favorable investment
climate for RS/RSS development.9 The interest rates on RS/RSS mortgages are
subsidized, 11 % for RS and 8.5% for RSS (See Table 4.4); these are much lower
than market-rate mortgages at 20-22%. RS/RSS mortgages also do not require
sales tax. For RS/RSS development, the costs for certificate application has been
reduced.
9Target Repelita VI Insya Allah Terlampaui," Properti Indonesia, January 1997, 19.

Greater Jakarta: Real Estate Market Outlook 43
Table 4.4 Interest Rate on BTN's Home Ownership Credits (1991-96)
* RS is Simple House, RSS is Very Simple House and KSB is ready to build house
Source: Data Consult, June 1996
Some regulations have been issued to force development of RS/RSS.
Regulation 1:3:6 obliges developers who get permits for more than 200 ha of lands,
to build at least three middle-income houses and six units of RS/RSS for each high-
income house they construct. Moreover, new and extended location permits in
Botabek are prioritized for developers who implement Regulation 1:3:6 or who
develop RS/RSS (See 3.Ill.A).
Implementation of Regulation 1:3:6 at the present time is still far from what
might have been expected. The chief obstacles are the low profit margin for such
development, the high cost of land and the fluctuation cost of raw materials, as well
as time-consuming activities of land acquisition and bank loan approval. 10
As seen in Figure 4.8, during 1969-94, more than 950,000 units of RS/RSS
had been developed; 75% were built by REI, an association of Indonesian
developers, and the rest were built by Perumnas, a government agency whose
10 "RS/RSS: Menagih Janji Pengembang Besar," Properti Indonesia, February 1997, 54.

Greater Jakarta: Real Estate Market Outlook 44
chief purpose is to provide RS/RSS. It is estimated that the existing supply of low-
income housing will meet only 15% of the demand.'1
350,000
300,000250,000200,000
: 150,000100,00050,000
0
1969-74 1974-79 1979-84 1985-89 1989-94 1994-99*
UREI U Perumnas 0 Cooperation Agency Target
Figure 4.8 RS/RSS Development in IndonesiaSource: RE[
5. Small Houses
Since 1994, the sales of high-income houses have decreased chiefly because
of increasing mortgage rates (See Figure 2.3). On the other hand, sales of low-
income houses are unaffected and are increasing (See Figure 4.9). The main
reason for this is that the sales of these houses are based more on affordability than
on mortgage rates. Responding to this situation, developers have begun to offer
houses at lower prices either by reducing quality or by offering smaller houses (See
Figure 4.10).Small houses are more attractive than RS/RSS because they offer a better
profit margin for developers. As a trade off, these houses are better quality, and
have better designs and facilities than RS/RSS.12 Moreover, since most of them are
parts of large scale developments, they often have better urban designs, facilities
and infrastructures.13 Nonetheless, these large scale developments usually are
located far away from metropolitan Jakarta.
il"Real Estate Business Sluggish," Indonesian Commercial Newsletter (Jakarta, June 10, 1996), 3.12 "Rumah Munggil Yang Kian Menarik," Properti Indonesia, August 1996, 18-36.

Greater Jakarta: Real Estate Market Outlook 45
120
100
80
S60
40
20 094
0 095Low Middle Upper 096
Figure 4.9 House Sales in Greater Jakarta Area* Sales data is compiled from Ciputra, Dharmala Intiland, Duta Pertiwi, Jaya Real, KIJakabeka and Modernland
Source: ING Barings, February 1997
Figure 4.10 Trend of Size and Price per UnitSource: ING Barings, August 1996
III. Apartments and Condominiums
A. Demand
Most of the customers for these are foreigners who work in Indonesia.
Indonesian people still prefer detached one-level houses, in preference to
apartments and condominiums, because one-level houses provide more space and
are more suitable for large families. Moreover, almost all middle- to high-income
households have live-in domestic help such as nannies, housekeepers, etc.

Greater Jakarta: Real Estate Market Outlook 46
30000 1000/0
25000 9 00/
20000 80%
E 15000 7 0 %
10000 60%/6
5000 50/
0 -- " m 40%/
1985 1986 1987 1988 1989 1990 1991 1992 1993 1994 1995 1996 1997F1998F1999F
Cmuative Stgply (left ads) Oluative Demand (left ads) -*- Oocuancy Rate (rift ads)
Figure 4.11 Rental Apartment Cumulative Supply, Demand and OccupancyRate
Sources: ING Barings and JLW Research, March 1997
In 1985, the strata-title law clarified the ownership of strata-title for high-rise
buildings (See 3.Il.D). This clarification increased the demand for strata-title
buildings, including apartments or condominiums. The demand was primarily from
middle- to high-income people looking for ways to avoid traffic congestion and stay
near the CBD. As a result, the condominium market strengthened after 1992 (See
Figure 4.11), but the demand was also amplified by buyer speculators. 14
B. Supply
1. General
Before 1992, the supply of apartments was meant mainly to fulfill the demand
from foreigners. The increased demand from Indonesian people, triggered by the
strata-title law, has led to a boom in the condominium market, characterized byenormously successful pre-sale activities. However, the boom also attracted
speculative developers and buyers. Both of these created inflated demand and
triggered high supply (See Figure 4.11). Even worst, since projects that were
14 ING Barings, Property Sector Review (Jakarta, August 1996), 42.

Greater Jakarta: Real Estate Market Outlook 47
launched from 1993 to 1995 will be completed in the next few years, the market will
continue to be oversupplied and need a long time to recover; this long recovery
period is based on the fact that the demand is mainly from foreigners and that the
demand from Indonesian people is still relatively small.
The oversupply market has created many problems: late, canceled, defaulted
and below-specification projects, as well as defaulted loans.15 Some developers
convert their strata-title condominiums into service apartments while others have
asked for foreign assistance, hoping that foreigners can attract a greater foreign
demand or increase the project credibility.16
2. Supply Profile
Rental Townhouse Strata-title TownhouseServiced Apartment 7% 1%
8%
Rental Apartment14%
Strata-title Apartment70%
Figure 4.12 Existing Multifamily House Supply DistributionSource: Procon Indah/JLW Research, March 1997
Strata-title apartments or condominiums dominate the number of available
multifamily houses; rental and service apartments account for only 22% (See Figure
4.12). Most existing units are located in central Jakarta, CBD and south Jakarta
(See Figure 4.13). Despite the oversupply market, the average rent for an
apartment (See Figure 4.14) and the average price of a condominium in a prime
location (See Figure 4.15) are still high. This may be due to the fact that availability
in prime location is still proportional to demand.
15 "Gelombang Proyek Bermasalah," Properti Indonesia, September 1996, 18.16 "Berlindung di Bawah Bendera Asing," Properti Indonesia, August 1996, 96-97.

Greater Jakarta: Real Estate Market Outlook 48
East Bekasi & TangerangWest 1% 5%9%
North11% .
South22%
CBD28%
Central24%
Figure 4.13 Existing Multifamily House Supply Distribution by DistrictSource: Procon Indah/JLW Research, March 1997
Figure 4.14 Prime Apartment Average RentalsSource: Procon Indah/JLW Research, March 1997
C. Lower- to Middle-Income Condominiums
In 1996, lower- to middle-income condominiums performed well; about 80-
95% could be sold during the launching period. Although they usually were not in
prime locations, their prices were low; some even costing less than landed houses
3530
25C 20
E 15
Dec- Jun- Dec- Mar- Jun- Sep- Dec- Mar- Jun- Sep- Dec- Mar- Jun- Sep- Dec- Mar- Jun- Sep- Dec- Mar-91 92 92 93 93 93 93 94 94 94 94 95 95 95 95 96 96 96 96 97
*Based on selected basket of apartments 1 bedroom --- 2 bedroom ------ -3 bedroom

Greater Jakarta: Real Estate Market Outlook 49
in the same areas.17 The prospects of these condominiums may inspire further
development of a similar kind and change the distribution of condominium supply,which is still dominated by middle- to high-income developments (See Figure 4.16).
EFL2,000
1,500
1,000 ---- Prime LocationCBD
m 500
00 0
1992 1993 1994 1995 1996 Mar-97
*Based on selected basket condominiums
Figure 4.15 Condominium Average PriceSource: Procon Indah/JLW Research, March 1997
5,000 100%
4,000 90%
3,000 80%
: 2,000 70%
1,000 60%
0 50%
Lower Mddle Mddle Upper M~ddle Upper
Supply (left axis) Demand (left axis) -a-- Sales Rate (rght axis)
Figure 4.16 Existing Condominium Supply and Demand by Price SegmentSource: Procon Indah/JLW Research, March 1997
D. Low-Income Apartments
The character of low-income apartments is uniquely different. The main
market for them is middle- to low-income people or people who have relocated
17 "Apartemen Turun Kelas," Properti Indonesia, June 1997, 18-35.

Greater Jakarta: Real Estate Market Outlook 50
because of fire, illegally development, or neighborhood deterioration. 8 These
people usually have a mixed demography and can be, but not necessary, are low-
income people. As a result, crime and other community problems are common.
Combined with bad maintenance and poor facility, all this has created bad images
for these low-income apartments.19
E. Town Houses
Since 1996, town houses have become more popular because of their good
locations and low maintenance costs. Town houses can be built near prime
locations because the high cost of the land is distributed among the occupants. They
also have low maintenance cost, often the same as those of landed houses,
because town houses do not have luxurious lobbies, elevators or swimming pools. 20
IV. Office
A. General
1. Demand
High economic growth and strong investment have fueled office demand.
This demand comes mainly from financial, telecommunications, computer software,
manufacturing, trading and service companies.
2. Supply
22
In 1996, 84% of total supply was located in the CBD .2 As seen in Figure
4.17, since 1990, the market has been oversupplied. Vacant space increased from
19,475 m2 in 1990, to 526,800 m2 in 1996. As a result, average net prime office
rents and capital values have declined (See Figure 4.18). However, the pre-
18 "Hunian Vertikal Belum Menjadi Pilihan Utama," Suara Pembaruan, May 21, 1997.19 Pane, Libertus S., Membangun Rumah Susun Dengan Nalar Ganda, Suara Pembaruan, May 2,1997.20 "Rumah Bandar Strata Title," Properti Indonesia, February 1997, 52-53.21 Schroders, 1322 Urban Land Institute, 20.

Greater Jakarta: Real Estate Market Outlook
commitment level of supply (83% in 1996) was still high; this figure has encouraged
further office development despite the steady increase of vacant space.23
600,000 18.00%
500,000 114.00%400,000 12.00%
10.00%E 300,000 - 8.00%E 8.00%
200,000 6.00%-4.00%
100,000 2.00%0 0.00%
(~j 0e) 'c O D t 0 ) 0 C14 cr) 't I) to LL LLCD oo0 0 OD c 0 0 O 0) 0) 0) 0) 0) 0 0) r- CD0)M 0 ) 0) M ) M 0) 0) M) 0) 0) 0M 0) 0)M 0
Annual Supply (left axis) Annual Take Up (left axis) -A- Vacancy Rate (right axis)
Figure 4.17 Jakarta Office Supply, Take Up and Vacancy RateSources: Colliers Jardine Research and Procon Indah/JLW Research, March 1997
250 $3,500c4 200 - -$3,000 C
5$2,500 E$50 '2,000
69- 10-- -$1,500 cL(0$1,000 ch~ 50 $500
00 00 00 OD O( 0 (0 0) 0) 0) 0) 0) 0 ) 0
0) 0 ) 0 ) 0 ) 0) 0) 0) ) 0 0 )
- Rent (Left Axis) -K- Capital Value (Right Axis)
Figure 4.18 Average Net Prime Jakarta Office Rent and Capital ValueSource: Jones Lang Wootton Research, April 1997
B. Central Business District (CBD)
1. Area
The Central Business District (CBD) in Jakarta is well known as Jakarta's
Golden Triangle. It is bounded by M.H. Thamrin Ave. and Gen. Sudirman Ave. to its
west, Gen. Gatot Subroto Ave. to its South and H.R. Rasuna Said Ave. to its east
23 First Pacific Davies, Office: Jakarta Market Overview, (Jakarta, 2nd Quarter 1997), 2.

Greater Jakarta: Real Estate Market Outlook 52
On M.H. Thamrin Ave., the Jakarta's first high-rise building Gedung Sarinah
was built, and this was soon followed by other high-rise office developments in the
late 60s and 70s. A proliferation of major government office buildings was later
erected at the northern end of this through fare.
On North Gen. Sudirman Ave., in the 1980s, several office developments
went up. Financial deregulation in 1988 also resulted in several grade-A office
developments which responded to the growing needs of large local private and
international banks. A concentration of banking institutions has caused this street to
be known as Jakarta's financial strip.24
On South Gen. Sudirman Ave., many recent grade-A offices have also been
built. Since the Jakarta Stock Exchange Building is located here, many major
financial investment institutions and securities firms have relocated their offices in
the vicinity. The development of Sudirman Business District Center in this area has
gradually moved the center of the CBD from M.H. Thamrin Ave. to Gen. Sudirman
Ave.25
On H.R. Rasuna Said Ave., there are many embassies. Other mid-rise and
high-rise offices along this street were built in the 80s and early 90s. Many recent
strata-title office buildings have been built there.
Without any particular emphasis on trade, Gen. Gatot Subroto Ave. is not a
prime area for office development
As seen in Figure 4.19, most CBD offices are located on Gen. Sudirman Ave.;
others are located on H.R. Rasuna Said Ave. , Gen. Gatot Subroto Ave., and M.H.
Thamrin Ave. in diminishing numbers.
2. Demand
The majority of CBD tenants are financial service companies, banks,
telecommunication companies, construction companies, and real estate and
manufacturing companies (See Figure 4.20). Around 55% of these use their
24 "The Golden Triangle of Indonesia", Property Link Asia Pacific, July/Aug 1996.25 Urban Land Institute, 20.

Greater Jakarta: Real Estate Market Outlook 53
buildings as corporate headquarters, while 21%,13% and 6%, respectively, use
them for representative offices, regional offices and branch offices.26
M.H. Thamrin Ave. Others H.R. Rasuna Said Ave.7% 8% 20%
Gen. Gatot SubrotoAve.12%
Gen. Sudirman Ave.53%
Figure 4.19 CBD Office DistributionSource: Procon Indah/JLW Research, March 1997
3. Supply
Since 1990, the CBD office market has been oversupplied (See Figure 4.21).
Consequently, CBD office-base rentals, capital values (See Figure 4.22) and yields
(See Figure 4.23) have declined.
Of the total supply, 54% is grade-A buildings, 31 % grade-B, and 15% grade-
C.27 Most new buildings are premium and/or grade-A. This new supply has been
accompanied by a high pre-commitment rate, e.g. 76% in March 1997.28
The removal of the CBD height limit in 1994 triggered the development of 50-
story buildings with the latest in building and engineering technologies.
In the established areas of CBD, vacant lands are scarce. However, the
development of super-blocks has provided ample land for prime commercial use.
These super-blocks offer land with prices ranging from US$2,500 to US$5,000/m2
and construction costs from US$700 to US$900/m 2.
26 Schroders, 15.27 Procon Indah/JLW Research, Property Market Outlook, 4.28 Procon Indah/JLW Research, 5.

Greater Jakarta: Real Estate Market Outlook 54
Figure 4.20 CBD Office Cumulative Demand ProfileSource: Procon lndah/JLW Research, March 1997
Figure 4.21 Jakarta CBD Office MarketSource: Procon lndah/JLW Research, March 1997
700
600500
400300
200100
0
- Base Rental (Left Axis)Capital Value Index (Right Axis)
Figure 4.22 CBD Office Base Rental and Capital Value IndexSource: Procon lndah/JLW Research, March 1997
Others PharmaceuticalFinancial Service 11% 2% Gvrmn11% 2%Government
23% 5 Consultanta2%
Trading7%
Agriculture
Retari
Banks 4%
15% ManufacturingTelecommunication Construction and Real Estate 9%
9% 9% Oil and Mining2%
3,000 10
CJ 2,500 -95%
2,000 .: I X -1.X1,500851,000
500 -80%~UI hI
M M 0) 0M 0) 0) 0 0) 0) 0M 0) M) 0 0) 0) 0) 0) 0)
Cummulative Supply (left axis Cummuative Demand (left axis) --*Occupancy Rate (right axis)

Greater Jakarta: Real Estate Market Outlook 55
C. Non-CBD Office
1. Demand
Due to high rents in the CBD, some tenants who do not need a prime
location, relocate their offices. Their average rental rate is much lower than that of
CBD prime offices (See Figure 4.24). Secondary locations have become more
attractive because their accessibility has been improving.
15.0%14.0%13.0%12.0%
11.0%
>-9.0%
8.0%-7.0%6.0%
1988 1989 1990 1991 1992 1993 1994 1995 1996
Figure 4.23 Jakarta CBD Office YieldsSource: Procon Indah/JLW Research, March 1997
0 .
10.5-
9910. 19219-999519
E c
S E 9.5 -
6- 9.0 -
8.51991 1992 1993 1994 1995 1996
Figure 4.24 Greater Jakarta Area Non-CBD Office Base Rental RateSource: Procon Indah/JLW Research, March 1997
Some banks, insurance companies, and automobile manufactures have
relocated their supporting offices in these areas. It is predicted that manufacturing
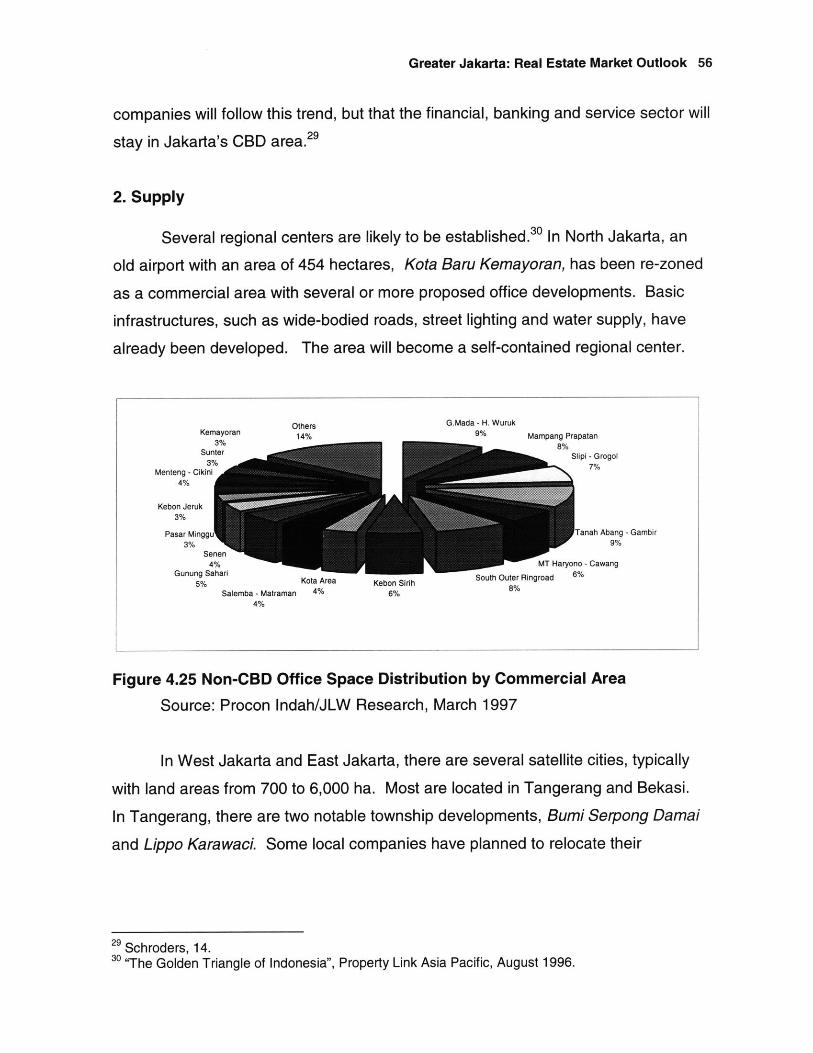
Greater Jakarta: Real Estate Market Outlook 56
companies will follow this trend, but that the financial, banking and service sector will
stay in Jakarta's CBD area.
2. Supply
Several regional centers are likely to be established. In North Jakarta, an
old airport with an area of 454 hectares, Kota Baru Kemayoran, has been re-zoned
as a commercial area with several or more proposed office developments. Basic
infrastructures, such as wide-bodied roads, street lighting and water supply, have
already been developed. The area will become a self-contained regional center.
OthersKemayoran 14%
Sunter
Menteng - Ciki4%
Kebon Jeruk3%
Pasar Minggu3%
Gunung Sahari5% Kota Area
Salemba - Matraman 4%4%
G.Mada - H. Wuruk9%
Kebon Sirith6%
Mampang Prapatan8%
Slipi -Grogol7%
Tanah Abang - Gambir9%aMT Haryono - Cawang
South Outer Ringroad 6%8%
Figure 4.25 Non-CBD Office Space Distribution by Commercial AreaSource: Procon Indah/JLW Research, March 1997
In West Jakarta and East Jakarta, there are several satellite cities, typically
with land areas from 700 to 6,000 ha. Most are located in Tangerang and Bekasi.
In Tangerang, there are two notable township developments, Bumi Serpong Damai
and Lippo Karawaci. Some local companies have planned to relocate their
29 Schroders, 14.30 "The Golden Triangle of Indonesia", Property Link Asia Pacific, August 1996.

Greater Jakarta: Real Estate Market Outlook 57
headquarters or supporting office operations there.3 In Bekasi, most offices support
the industrial located there.
In South Jakarta, the development of medium-size office projects has
emerged. This area is less congested than the CBD with good accessibility to the
outer ring roads and therefore, easy linkage to other parts of the city.
1,800,0001,600,0001,400,0001,200,000
1,000,000 3 Vacant800,000 UPublic Lease
....... 6 0 E Owner Occupation400,000
0
Central South West East North OverallArea
Figure 4.26 Non-CBD Office Tenancy StatusSource: Procon lndah/JLW Research, January 1997
Z000,000 100.0/oX,)
1,500,000 4.7/CM.
1,000,000 90.0/ ra.
500,00 85.P/ C
0 80./61991 1992 1993 1994 1995 1996
OnmratKe Sopy (Let Ads) OnmjaiveDerrad (Left Ms) --A- Octpany Fbte (Rft Axs)
Figure 4.27 Greater Jakarta Area Non-CBD Office MarketSource: Procon Indah/JLW Research, March 1997
31 Schroders, 14.

Greater Jakarta: Real Estate Market Outlook 58
The distribution of existing non-CBD offices is widely dispersed (See Figure
4.25). Of the total supply, 40% are occupied by owners (See Figure 4.26). After
1991, non-CBD offices performed better than CBD offices, but the attraction of non-
CBD offices created a big supply in 1996, and pushed the occupancy rate down
(See Figure 4.27).
A. Demand
The emerging middle class, new foreign retailers, rising income levels, strong
economic growth and changing lifestyles have fueled the increasing demand for
retail space.
In 1996, Jakarta's GDP reached US$3,016 while the national average GDP
was only US$1,100.32 The entry of foreign retailers and the evolution of lifestyles
have further energized this sector.
As seen in a survey on the retail market in Greater Jakarta (See Appendix D),people are accepting malls as place for recreation; only 29.6% people go there for
shopping and 76% go there at least three times a month. This will gradually change
the tradition; people traditionally look for recreation at the beach, on the islands, or
out of town.
2 800 70-
SE 60-C i 50 -
40--4
30 - Prime Centers
'CO 20 - Suburban Centers
10
LO (0 !l- 00 0) 0 N~ Cr) 1q LO co 1-
a) (D) C) (D(O)C
ao 0 0 0 0 0 0 0 0 0 0 0
Figure 4.28 Base Retail Rental Rate in Ground Floor Prime SpaceSource: Procon Indah/JLW Research, March 1997
32 Schroders, 15.

Greater Jakarta: Real Estate Market Outlook 59
Since 1989, the strong demand for retail has supported an increase in rental
rates (See Figure 4.28) and a high pre-commitment level for new supplies, 93% in
1997.33
B. Supply
1. General
Modern
of Ratu Plaza.
growth in retail
shopping centers in Jakarta first appeared in 1980 with the opening
Afterward, the supply grew very slowly. The largest incremental
space began in the early 1990s (See Figure 4.29).
1,200,000 96.0%1 -94.0%1,000,000 92.0%
C 6 V 800,000 90.0%4001 88.0%600,000 1 86.0%
-* 400,000 84.0%inli~ bfh~f 1 ul1182.0%
. ~ 200,000 80.....0%......0 T 78.0%
oo 0) 0) 0o 0M 0) 0) 0) 0) 0) 0) 00) 0) 0) 0)
Cummulative Supply (left axis) Cummulative Demand (left axis) -A-Occupancy Rate (right axis)
Figure 4.29 Jakarta Retail Supply, Demand and Occupancy RateSource: Procon Indah/JLW Research, March 1997
Existing retail space is unevenly distributed (See Table 4.5). Unlike shopping
malls in Singapore and Hong Kong which are centralized because they are
international shopping hubs with tourists for customers, the shopping malls in
Jakarta are designed to serve city dwellers.
Of the total supply, 74% targets middle- to upper-income people.34 As seen
in Table 4.5, the supply of shopping malls has increased more than 70% since 1993.
As a result, retail competition has become intense.
33 Procon Indah/JLW Research, Property Market Outlook, 12.3 Schroders, 16.
- INNOW40 - - - 11 - -__ --- - __ - - __1 - - . - - - __ - - - -

Greater Jakarta: Real Estate Market Outlook 60
Table 4.5 Greater Jakarta Area Shopping Mall Distribution Profile(In M2)
Source: Properti Indonesia, February 1997
2. Located in Housing Areas
To deal with the competition, in 1996 developers concentrated their retail
development in growing residential suburban areas (See Table 4.6), mainly at the
eastern and western ends of Greater Jakarta. These malls have their own captive
markets, and since they are usually located outside Jakarta, land costs for them are
low. They can occupy larger areas with fewer levels and therefore, they can function
as family recreation centers and even attract customers from outside the residential
areas.
Table 4.6 Shopping Malls in Housing Areas
Source: Properti Indonesia, February 1997

Greater Jakarta: Real Estate Market Outlook 61
3. Following the Global Retail Trend
New malls usually have more sophisticated designs and layouts. As we have
seen, they are also larger (See Appendix C) and offer a full range of shopping
facilities as well as recreation and entertainment. With these advantages, they can
outperform the old malls.
4. Using Foreign Anchor Tenants
Some new shopping malls also use foreign anchor tenants (See Table 4.7),to attract middle- to high-income people.35 The contribution of foreign retailers is
positive because they not only provide high-quality products and premium brands
but they also transfer technology and know-how to the Indonesian retail market.
Table 4.7 Foreign Anchor Tenants
Source: Properti Indonesia, February 1997
Nevertheless, the role of foreign retailers is restricted. To protect Indonesian
retailers, the government prohibits foreign direct investment in the retail sector.
Foreign retailers are allowed to enter the market only through franchises or technical
assistance agreements with Indonesian companies. 6 It is predicted that the
government will release this restriction by 2003, when the agreement on free trade
among Southeast Asian countries goes into effect.
35 "Asing Masuk, Lokal Tak Gentar," Properti Indonesia, September 1996, 82-83.36 Colliers Jardine Indonesia, 19.

Greater Jakarta: Real Estate Market Outlook 62
5. Developing Mixed-Use Sites in CBD Area
Since most retailers are located in the CBD area (See Table 4.5) and that
area is relatively small, the competition there is very intense. To deal with this,developers have shifted their new shopping malls in the CBD from stand-alone
shopping malls to malls with large mixed-use sites or "super-blocks", which also
include offices, hotels and apartments.
6. Protecting Traditional Retailers
The fast growth of retail has also pushed out traditional retailers, usually small
businesses owned by low- to middle-income people. To protect them, the
government, through regulations 38 has obliged big retailers to form partnerships with
small retailers. Moreover, big retailers who want to operate in sub-district must have
special permits from the government.39
V1. Industrial Estate
A. Demand
The demand here is mostly related to investment. While investment
approvals grew at a rate of 43.5% per annum between 1985 and 1990, the demand
for industrial land grew at a rate of 22% per annum. After 1991, a tighter
governmental monetary policy slowed investment down, and reduced demand.
When the rate of investment recovered (1993-1995), the demand also recovered
(See Figure 4.30).
Government policies has a strong influence. After the collapse of oil prices in
1980, the Indonesian government encouraged other kinds of development, and
many regulations were issued to attract new investment in the manufacturing sector
(See 2.VIl).40
3 Procon Indah/JLW, Property Market Outlook, 13.38 SKB Nos.145/MPP/Kep/5/1997 and 57/199739 "Serbuan Menjelang Pasar Bebas," Kontan, (Jakarta: July 7, 1997), 5.40 "Perkembangan dan Prospek Kawasan Industri di Indonesia," Indocommercial (Jakarta, April 26,1994), 21.

-r - - - -. -------- - _____
Greater Jakarta: Real Estate Market Outlook 63
Most domestic factories are located on the industry-zoned land because that
land is often lower than land in industrial estates.4' However, since November 1996,
the government has forced industries to relocate from the industry-zoned land to
designated industrial estates when their operation permits expire (Official Memo No.
462-3040).
4000 84%
3500 82%V 3000 80% ,. 2500 78% l
2000 -674%
1500 72% 2E 1000 70%
500 68%0 66%
1990 1991 1992 1993 1994 1995 1996 1997F
Cumulative Supply (left axis) Cumulative Demand (left axis) -h- Take Up Rate (right axis)
Figure 4.30 Greater Jakarta Area Industrial MarketSource: Procon Indah/JLW Research, March 1997
The government has also taken stringent steps to curb industrial activities in
Jakarta and Tangerang areas in order to encourage new development in other areas
where industrial estates and sound infrastructure facilities already exist.
Consequently, the demand for and price of industrial estates in other places,especially in Bekasi42 and Karawang, have increased (See Figure 4.31).
B. Supply
The supply entered a new stage when a Presidential Decree in 1989 allowed
developments by the private sector. Before 1989, state-owned companies had
developed only eight industrial areas, which totaled 2,870 hectares. Since that time,
however, 136 licenses have been issued for developing industrial estates covering
of 44,000 hectares of lands.4 3 Most of these are located in Tangerang, Bekasi and
41 "Kawasan Industri - Bisnis Mikro atau Makro," Informasi (Jakarta, August 1993).42 Bekasi has good infrastructure and good location, closed to Jakarta and to the harbor.43 Schroders, 18.

Greater Jakarta: Real Estate Market Outlook 64
Karawang (See Figure 4.32). The restriction of new developments in Tangerang
has made Bekasi a favored location. However, as land prices in Bekasi increase,
developers are being forced to find land in locations further to the east, e.g.,Karawang, etc."
100
I% Q
Figure 4.31 Industrial Estate Average Land PriceSource: Procon Indah/JLW Research, March 1997
K araw an g
Bekasi35
48%
Tang eran g17%
Figure 4.32 Future Industrial SupplySource: ING Barings and JLW Research, August 1996
ING Barings, Property Sector Review, 52.

Greater Jakarta: Real Estate Market Outlook 65
VlI. Conclusion
Rising incomes, increasing population, a decline in household size, a
booming middle class, and rapid urbanization are the main driving forces in the
demand for housing. Since traffic congestion has become much worse and easy
access to toll roads is increasingly important, the demand for new houses is now
concentrated in the Greater Jakarta Area.
This market is dominated by first-time home-buyers, who are beginning to
prefer residential estates. Mortgage rates significantly effect the sales of middle- to
high-income homes. There is a lack of affordability and an oversupply of middle- to
high-income housing, because the demand is largely from low-income buyers.
The main buyers for apartments and condominiums are foreigners.
Indonesian people still prefer detached one-level houses because they are more
spacious and, therefore, suitable for large families. The strata-title law of 1985
created a condominium boom in 1993. This boom also attracted buyer and
developer speculation. As a result, the condominium market has been oversupplied
ever since. It will need a long period of recovery because local demand is weak
and the market remains flooded with unwanted properties.
Since 1996, lower- and middle-income condominiums attracted buyers
because of their low price, even in comparison with that of landed houses located in
the same areas. This may trigger further development and alter the character of the
condominium and apartment market.
The demand for office space is supported by high economic growth and
strong investment. It comes mainly from financial, telecommunications, computer
software, manufacturing, trading and service companies. Since 1990, vacant space
has been increasing and rents have declined.
Most CBD tenants are financial service companies, banks,
telecommunications, construction, real estate and manufacturing companies, who
use their buildings for corporate headquarters. Grade-A buildings dominate the
market. The most recent buildings in the CBD usually have 50 stories and all the
latest technologies.

Greater Jakarta: Real Estate Market Outlook 66
Due to high rents in that area, tenants who do not need a prime location,
often relocate to secondary locations. Many of these locations have become
attractive because of their improved accessibility. Some banks, insurance
companies and automobile manufacturers have opened supporting offices in these
areas. It is predicted that manufacturing companies will follow this trend while the
financial, banking and service sectors will continue to prefer Jakarta's CBD area.
The emerging middle class, rising income levels, strong economic growth,
entering foreign retailers, and a changing lifestyle are all creating an increasing
demand for retail. The supply of retail space has grown rapidly since 1990, and
competition has become intense. To deal with this, retailers have resorted to
suburban locations, sophisticated designs and layouts, complete shopping facilities
with recreation and entertainment, foreign anchor tenants, and mixed-use sites.
To protect Indonesian retail, the government prohibits foreign retailers from
investing directly in the market, although they can enter it through franchises and/or
technical agreements. To protect small businesses, the government has obliged big
retailers to accept them as partners. Moreover, big retailers who want to operate in
a sub-district must get a special permit from the government.
The industrial sector has been significantly influenced by government policies.
The permission given to private entities to develop industrial estates has triggered a
boom in industrial estate development, and since 1980, many regulations have been
issued to attract new investment to the manufacturing sector. Since November 1996,
the government has forced industrialists to relocate to designated industrial estates
upon the expiration of their permits. The government has also taken drastic steps to
curb new industrial activities in residential Jakarta and Tangerang. This too has
increased the demand for industrial estates in Bekasi and Karawang.

CONCLUSION
As the fourth most populous country in the world, Indonesia has a huge
market and abundant labor. With 2 million km2 of land and 3 million km2 of sea,
Indonesia is also well-endowed with land and natural resources. It has experienced
rapid economic growth with an average yearly rate of 7.26% since 1992. The
Indonesian GDP per capita per annum reached US$1,100 in 1996, while Jakarta's
GDP per capita rose to US$3,016 in the same year. This increase in income has
created increased domestic affordability.
The new rapid economic growth is mainly the result of foreign and domestic
investment. To attract more investment, the Indonesian government is still making
efforts to improve the investment environment with deregulations. The value of
domestic investment approvals reached more than 100 trillion rupiah in 1996, and
the value of foreign direct investment (FDI) approvals jumped from US$ 8.1 billion in
1993, to more than US$ 28.6 billion in 1996. These high figures for investment
approvals have fueled the continuously strong demand for office and industrial real
estate.
The Indonesian government has also intervened in the real estate market to
reduce speculative buying and developing, and has influenced demand in several
sectors and promoted low-income housing. Furthermore, through direct
intervention, the government has also made efforts to protect domestic retailers,
notably small businesses. Some new regulations have had significant effects. The
newest and most important example of these is the July '97 deregulation which
prohibits local bank loans for land acquisition and/or development. In general, the
effects of government intervention are positive, but some efforts have been labeled
inconsistent, biased, or even useless.

Conclusion 68
There are severe problems with Indonesian real estate: weak legal
assurance; an unfavorable agrarian system; illegal fees; and unnecessarily
complicated permit processes. Since most of these problems are common problems
in developing countries, immediate solutions to them are unlikely, but there is a
visible government commitment to minimize them.
A more fundamental issue is the stability of the future political system. Since
the country has a significantly uneven distribution of wealth, population and ethnic
groups, political stability is crucial for continued economic development.
Unfortunately, the current political system is not stabile. President Soeharto has led
the country for more than 30 years and is now very old. A succession process,
which has never been tested will determine the future of Indonesia and its economic
growth.
Population growth and expanding commerce in Jakarta have pushed real
estate development toward the fringes of the city and even into other cities (Bogor,
Tangerang, and Bekasi) where land prices are lower. The combined areas of
Jakarta, Bogor, Tangerang, and Bekasi are now known as Greater Jakarta. Jakarta
is the capital city and the economic center of Indonesia, and Bogor, Tangerang, and
Bekasi have gradually become integral parts of Jakarta's development, which supply
additional real estate for industrial and residential development , secondary
locations, and malls. All of Greater Jakarta contain promising real estate, because
incomes there are rising and so is investment both foreign and domestic.
The demand for new housing in Greater Jakarta is strong because of the
rising incomes and increased population, and because of a decline in household
size. The entire area is characterized by a booming middle class and rapid
urbanization. Although most of the demand is for low-income housing, supply is still
far below demand, despite government efforts to promote such development. An
abundant supply of middle- and high-income homes is not responding to this need,
and at the same time, is flooding the market with housing that few can buy.
The main customers for apartments and condominiums are still foreigners.
Indonesian people tend to prefer detached one-level houses and like to live in
landed property which provides spacious living areas suitable for a large families

Conclusion 69
with domestic help (nannies, drivers, servants, etc.). From 1993-94, the strata-title
law stimulated a boom in condominiums, but this was overshadowed by speculative
developers and buyers, and since 1995, the condominium market has been
oversupplied.
In the office market, high economic growth as well as strong foreign and
domestic investments have supported the demand mainly from financial,
telecommunications, computer software, manufacturing, trading and service
companies. Most of the new offerings in the CBD are premium and/or grade-A
buildings with the latest building and engineering technologies. The supply of these
has also been accompanied by a high pre-commitment rate. High rents in the CBD
have encouraged some offices to move to secondary locations. It is predicted that
manufacturing companies will follow this trend but that the financial, banking and
service sectors will remain in Jakarta's CBD area.
In the retail sector, an emerging middle class, rising income levels, changing
lifestyles, foreign retailers, and strong economic growth have created an increasing
demand. The retail supply grew very slowly until the late 1980s, the largest
incremental growth taking place in the early 1990s. As a result, the retail sector too
has become oversupplied, and retail competition has become intense. To stay
competitive, new shopping malls have followed global retail trends with sophisticated
designs and layouts. Larger shopping malls offer a full range of facilities as well as
recreation and entertainment areas, and more recently, foreign anchor tenants.
Despite prohibition on direct investment in Indonesia, foreign retailers have entered
the market through franchises and technical assistance agreements with Indonesian
companies.
In the industrial sector, the government has a strong influence, and many new
regulations have been issued to attract investment in manufacturing. Furthermore,
in November 1996, the government forced industries to relocate in designated
industrial estates upon the expiration of their previous operation permits. To
encourage supply, the Presidential Decree of 1989 allowed the development of
industrial estates by private entities. In 1989, there were only eight areas in 1989,
but by 1995, 136 areas had been given licenses for development. A ban on further

Conclusion 70
industrial park development in Tangerang has made Bekasi a favored location for
new ones, because it is located near the port and near Jakarta and has a good
infrastructure. High economic growth, as well as new investment, supported by a
better investment environment made possible by the government, should continue to
fuel the demand for industrial estates.

APPENDIX A
COMPARISON BETWEEN RIGHT-TO-USE AND RIGHT-TO-BUILD TITLES
* Develop buildings* Aariculture
IndonesiansLegally Indonesian agenciesForeigners who stay in IndonesiaForeigner agencies who stay inIndonesiaGovernment agenciesReligious and social agenciesForeian renresentatives
e Build and own buildings on otherlands
* Indonesians" Legally Indonesian agencies
Sco e
Usage
Subjecte0
e0
e
' ^--'I- .-- "'L '-"--- --- ' '---- ' ^--'^ -- "' '- -"-"---^

APPENDIX B
SURVEY ABOUT HOUSING IN GREATER JAKARTA
Properti Indonesia, December 19966663.8% (Confidence Level of 95%)
SourceSampleSampling Error
Figure A.1 Choice of Price
Figure A.2 Location Preference
Depok North Jakarta Central Jakarta
Tangerang 8% 5% 2% South Jakarta8% 38%
West Jakarta6%
East Jakarta9% Bekasi Bogor
9% 15%

APPENDIX C
SHOPPING MALLS IN CENTRAL JAKARTA (UNTIL 2000)
Sources: Prolease and Properti Indonesia, February 1997

APPENDIX D
SURVEY ON THE RETAIL MARKET IN GREATER JAKARTA
SourceSampleSampling Error
Properti Indonesia, February 19979003.9% (Confidence Level of 95%)
Others
More than 4 Times 5%
22%
20%
1 Time15% 2 Times
e6%
3 Times32%
Figure D.1 Frequency Going to Shopping Malls
Figure D.2 Purpose Going to Shopping Malls
REFERENCESCane, Alan. Service Asia: How to Win and Keep Business in Asia. Melbourne: The Business
Library, 1993.
Chow, Lotte. "Property: Safe as Houses," Far Eastern Economic Review, January 9, 1997.
Colliers Jardine Research. Jakarta Residential Update 1996. Jakarta, 1996.
Colliers Jardine Research. Jakarta Property Market Review. Jakarta, February 1997.
Colliers Jardine Research. Asia Pacific Property Trends: Conditions and Forecasts. New SouthWales, January 1997.
Colliers Jardine Research. Jakarta Property Market: Press Release. Jakarta, March 1997.
Condon, Tim. Indonesia: Interest Rates Can Fall Further. Morgan Stanley Asia, April 4, 1997.
Credit Suisse First Boston. Indonesia: Monthly Review and Comment -April 1997. Hong Kong,April 1997.
Dresdner Kleinwort Benson. Asian Quarterly Outlook. New York, March 3, 1997.
"Economic Focus: Indonesia," Asian Business, February 1997.
Economist Intelligence Unit. Indonesia, Country Profile, Analysis of Economical and PoliticalTrends Every Quarter. London, 1995.
First Pacific Davies. Office: Jakarta Market Overview. Jakarta, 2 nd Quarter 1997.
"Government Moderately Successful in Attracting Investors, Despite Drop in Value of ForeignInvestments," Indonesian Commercial Newsletter, January 13, 1997, 15-17.
Habir, Manggir. "Property: Timing is the Key," Far Eastern Economic Review, April 28, 1994.
Hill, Hal. The Indonesian Economy Since 1966: Southeast Asia's Emerging Giant. New York:Cambridge University Press, 1996.
"Indonesia: De-Regulating The Residential Market," Property Link Asia Pacific, November-December 1996.
Indonesian Business Data Centre. Real Estate Indonesia. Jakarta, 1995.
Indonesian Business Data Centre. Property Indonesia. Jakarta, 1990.
"Indonesia: Commercial Sector Performs Well," Property Link Asia Pacific, May-June 1997, 26-28.
"Indonesia: Next Year Expected to Be Good," Property Link Asia Pacific, January-February1997, 24-26.
"Indonesia: Scaling New Height," Property Link Asia Pacific, March-April 1997, 32-58.
ING Barings. A SEAN Property Sector Review. Singapore, February 1997.

References 76
ING Barings. Property Sector Review. Jakarta, August 1996.
International Monetary Fund. International Financial Statistic. Washington D.C., March 1997.
Jakarta Statistical Office. Jakarta in Figure. Jakarta: Central Bureau of Statistics, 1996.
Jardine Fleming. Retail Shopping Centres in Jakarta. Jakarta, March 25, 1992.
Jones Lang Wootton Research. JLW Asia Property 1997. Jakarta, 1997.
Jones Lang Wootton Research. JLW Regional Property Investment Guide. Singapore, 1994.
"Law: Foreign Market Mission Impossible," Properti Indonesia, August 1996, 116.
Macpherson, Neil T. The Southeast Asian Investment Guide. Hong Kong: Longman Group FarEast, 1992.
Makmoen, B. Chandra. Analysis of Demand and Investment Outlook in Office Market in Jakarta -Indonesia. Thesis, MIT, Center for Real Estate, 1993.
Morgan Stanley. Asia/Pacific Property: Property in Picture. April 15, 1997.
"New Rules for Foreign Buyers of Indonesia High-End Residential Market," Property Link Asia,November 1996.
"Office Space: Strata Title Strong," Properti Indonesia, January 1997, 99.
"Permits: A Time to Freeze," Properti Indonesia, November 1996, 20.
"PP No. 41/1996: Look Who's Qualified Now", Properti Indonesia, November 1996, 108.
"Prospect of Construction Industry in Indonesia, 1996," Indocommercial, March 19, 1996, 3-25.
"Prospect of Construction Industry in Indonesia," Indocommercial, January 11, 1997, 3-28.
Price Waterhouse. Doing Business in Indonesia. Jakarta, 1993.
Procon Indah/JLW Research. Property Market Outlook: Jakarta - April 1997. Jakarta, March1997.
Procon \ndah/JLW Research. Property Market Outlook: Jakarta, Surabaya, Bali -January 1997.Jakarta, January 1997.
"Real Estate Business Sluggish," Indonesian Commercial Newsletter. Jakarta, June 10, 1996.
Sastrowardoyo, Sanyoto. "Indonesia: A Favourable Location for Foreign Direct Investment,"Economic & Business Review Indonesia, December 11, 1996.
Schroders. Indonesian Property Sector. Jakarta, January 15, 1997.
"Smaller Apartment, Bigger Demand," Properti Indonesia, January 1997, 96.
"Shaking the Family Tree," Asian Business, February 1997, 28-32.
SocGen-Crosby Research. Monthly Regional Overview. Hong Kong, May 1997.

References 77
Tan, Cheng Leong, and Terence Lim Indonesia: Business and Investment Opportunities.Singapore: Cassia Communications, 1992.
"The Golden Triangle of Indonesia," Property Link Asia Pacific, July/Aug 1996.
"The Race to Riches: Indonesia's Retail Renaissance," Economic & Business Review Indonesia,July 3, 1996.
Urban Land Institute. ULl Asia Pacific Market Profiles: 1997. New York, 1997.
W.I. Carr Far East. Indonesia Weekly. Jakarta, April 3-8, 1997.
Yanai, Akiko. Asian Quarterly Review: Indonesia. Fuji Research Institute Corporation, April1997.
"Yellow Light on Credit," Properti Indonesia, October 1996, 132.

REFERENCES IN INDONESIAN"Ada Apa Kredit Properti," Properti Indonesia, October 1996, 28-41.
"Apartemen Turun Kelas," Properti Indonesia, June 1997, 18-35.
"Asing Masuk, Lokal Tak Gentar," Properti Indonesia, September 1996, 82-83.
"Babak Baru Politik Pertanahan," Properti Indonesia, July 1996, 18-41.
"Benang Kusut Perizinan," Properti Indonesia, November 1996, 20-31.
"Bisnis Apartemen Ketika Mega Real Estate Marak," Swa, June 1995, 26-27
"Boom Pusat Belanja," Properti Indonesia, February 1997, 20-42.
"Botabek Dibuka Kembali," Properti Indonesia, March 1997, 78.
"Fenomena Mal dan Gaya Belanja Golongan Menengah," Properti Indonesia, April 1996, 3-24.
"Gelombang Proyek Bermasalah," Properti Indonesia, September 1996, 18-35.
"Hunian Vertikal Belum Menjadi Pilihan Utama," Suara Pembaruan, May 21, 1997.
"Jojoran Spekulasi Apartemen," Warta Ekonomi, September 27, 1993, 22-36.
"Jual Murah Proyek Macet," Properti Indonesia, May 1997, 22-36.
"Kalau Sertifikat Tak Kunjung Datang," Properti Indonesia, October 1996, 116-117.
"Kawasan Industri - Bisnis Mikro atau Makro," Informasi (Jakarta: August 1993).
"Kiat Pendanaan Saat Uang Ketat," Properti Indonesia, March 1997, 18-31.
"KPR Model Baru dari Bakrie-REI," Properti Indonesia, January 1997, 88-89.
"Mengebuk Spekulan Tanah," Properti Indonesia, April 1997, 20-31.
Pane, Libertus S. "Membangun Rumah Susun dengan Nalar Ganda," Suara Pembaruan, May 2,1997.
"Perekonomian Indonesian 1996 dan Prospek 1997," Indocommercial, December 26, 1996, 3-14.
"Perkembangan dan Prospek Kawasan Industri di Indonesia," Indocommercial, April 26, 1994, 3-26.
"PMA Properti Asia Ekspansi ke Indonesia," Bisnis Indonesia, April 22, 1997.
Properti Indonesia. Rumah UntukAnda. Jakarta, 1995.
Properti Indonesia. Rumah UntukAnda. Jakarta, 1996.
"Rodapun Berputar ke Bawah," Swasembada, March 27, 1996, 12.

References in Indonesian 79
"RS/RSS: Menagih Janji Pengembang Besar," Properti Indonesia, February 1997, 54.
"Rumah Bandar Strata Title," Properti Indonesia, February 1997, 52-53.
"Rumah Favorit '96," Properti Indonesia, December 1996, 20-33.
"Rumah Munggil Yang Kian Menarik," Properti Indonesia, August 1996, 18-36.
"Rumah Murah Lebih Banyak Dibangun," Properti Indonesia, January 1997, 16.
"Sekitar Peluang dari PP 41/1996 Masih Perlu Tindak Lanjut," Media Indonesia, January 3, 1997.
"Serbuan Menjelang Pasar Bebas," Kontan, July 7, 1997, 5.
"Target Pemerintah dan Peran Swasta dalam Pembangunan RS/RSS," Informasi, March 1997,10.
"Target Repelita VI Insya Allah Terlampaui," Properti Indonesia, January 1997, 19.
"Tumpuan Baru Kala Kredit Makin Irit," Properti Indonesia, November 1996, 32-33.
Wibisono, Christianto. "Kawasan Industri-Bisnis Mikro atau Makro," Informasi, August 31, 1993.