Good Carbs, Bad Carbs
10
1 © Conner Middelmann, Nutrition Coach @ Modern Mediterranean, LLC Good Carbs, Bad Carbs If you have diabetes, pre-diabetes, PCOS, Alzheimer’s disease, are trying to lose weight or balance your blood lipids, you probably know you should monitor your carbohydrate intake. Different carbohydrate- containing foods affect blood sugar differently, however. These effects can be quantified by measures known as the glycemic index (GI) and glycemic load (GL). What these numbers measure The glycemic index (GI) assigns a score to a food based on how sharply it makes your blood sugar rise. Foods are ranked on a scale of 0 to 100, with pure glucose given a value of 100. In general, the more cooked or processed a food, the higher its GI, and the more fiber or fat in a food, the lower its GI. But the glycemic index tells just part of the story. What it doesn't tell you is how high your blood sugar could go when you actually eat the food. To understand a food's complete effect on blood sugar, you need to know both how quickly it converts into blood glucose (this determines how much insulin your pancreas will secrete in response), and how much glucose it can deliver. A separate measure called the glycemic load (GL) does both — which means the GL gives you a more accurate picture of a food's real-life impact on your blood sugar. Therefore, I use GL rather than GI to select carbohydrate foods. Bear in mind, however, that these numbers are approximative; different individuals react differently to different foods, so if you experience a sharp rise in blood sugar from a low- or medium-glycemic food, it’s best to avoid or minimize it, regardless of its GI/GL ranking. Low, medium and high: Glycemic Load (GL) 0-10: This food is likely to have a modest effect on blood sugar and you can eat it liberally 10-20: This food has a more significant effect on blood sugar; enjoy in limited quantities ☹ 20+: This food has a strong glycemic impact and should be avoided (except for occasional treats) When you do eat a high-glycemic food (sometimes it’s inevitable), you can lower its glycemic impact by eating only a modest serving of it (½ cup cooked rice, 1 slice bread or ½ to 1 cup pasta cooked al dente) and accompanying it with: - Protein (e.g., meat, fish), - Fat (e.g., olive oil, Parmesan) - Fiber (e.g., a vegetable or side salad), and - Something acidic (e.g., lemon or vinegar in the salad dressing, lemon or vinegar water) Combining these with carb-rich foods slows the speed at which the food leaves your stomach and thus slows the conversion of starchy carbohydrates into blood glucose. This can protect you against sharp blood-sugar fluctuations and the secretion of large amounts of insulin. E.g.,
-
Upload
khangminh22 -
Category
Documents
-
view
1 -
download
0
Transcript of Good Carbs, Bad Carbs

1 © Conner Middelmann, Nutrition Coach @ Modern Mediterranean, LLC
Good Carbs, Bad Carbs
If you have diabetes, pre-diabetes, PCOS, Alzheimer’s disease, are trying to lose weight or balance your
blood lipids, you probably know you should monitor your carbohydrate intake. Different carbohydrate-
containing foods affect blood sugar differently, however. These effects can be quantified by measures
known as the glycemic index (GI) and glycemic load (GL).
What these numbers measure
The glycemic index (GI) assigns a score to a food based on how sharply it makes your blood sugar rise.
Foods are ranked on a scale of 0 to 100, with pure glucose given a value of 100. In general, the more
cooked or processed a food, the higher its GI, and the more fiber or fat in a food, the lower its GI.
But the glycemic index tells just part of the story. What it doesn't tell you is how high your blood sugar
could go when you actually eat the food. To understand a food's complete effect on blood sugar, you need
to know both how quickly it converts into blood glucose (this determines how much insulin your pancreas
will secrete in response), and how much glucose it can deliver. A separate measure called the glycemic
load (GL) does both — which means the GL gives you a more accurate picture of a food's real-life impact
on your blood sugar. Therefore, I use GL rather than GI to select carbohydrate foods.
Bear in mind, however, that these numbers are approximative; different individuals react differently to
different foods, so if you experience a sharp rise in blood sugar from a low- or medium-glycemic food, it’s
best to avoid or minimize it, regardless of its GI/GL ranking.
Low, medium and high: Glycemic Load (GL)
😊 😊 0-10: This food is likely to have a modest effect on blood sugar and you can eat it liberally
😊 10-20: This food has a more significant effect on blood sugar; enjoy in limited quantities
☹ 20+: This food has a strong glycemic impact and should be avoided (except for occasional treats)
When you do eat a high-glycemic food (sometimes it’s inevitable), you can lower its glycemic impact by
eating only a modest serving of it (½ cup cooked rice, 1 slice bread or ½ to 1 cup pasta cooked al dente)
and accompanying it with:
- Protein (e.g., meat, fish),
- Fat (e.g., olive oil, Parmesan)
- Fiber (e.g., a vegetable or side salad), and
- Something acidic (e.g., lemon or vinegar in the salad dressing, lemon or vinegar water)
Combining these with carb-rich foods slows the speed at which the food leaves your stomach and thus
slows the conversion of starchy carbohydrates into blood glucose. This can protect you against sharp
blood-sugar fluctuations and the secretion of large amounts of insulin. E.g.,

2 © Conner Middelmann, Nutrition Coach @ Modern Mediterranean, LLC
- Rice (carb) with chicken curry (protein, fat) and vegetables drizzled with lemon juice (fiber, acidity)
- Bagel (carb) with cream cheese (fat), lox (protein) and a side-salad (fiber, acidity)
- Oats (carb) with milk/yogurt (protein), nuts (fat) and berries (fiber, acidity)
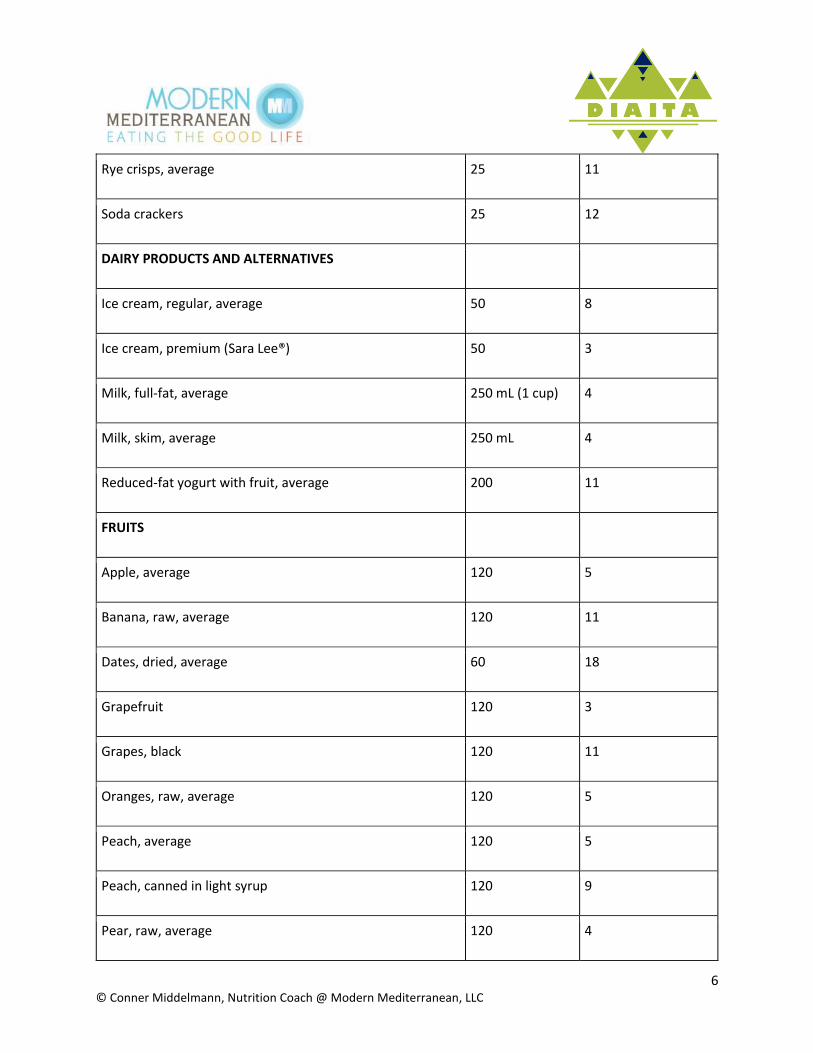
This table shows the GLs and GIs for more than 100 commonly eaten high-carbohydrate foods. Serving
sizes matter, and are indicated in the left-hand column; the larger the serving, the greater its glycemic
load.
FOOD Serving size (grams)
Glycemic load per serving
BAKERY PRODUCTS AND BREADS
Banana cake, made with sugar 60 14
Sponge cake, plain 63 17
Corn bread 60 (1 slice) 31
Vanilla cake made from packet mix with vanilla frosting (Betty Crocker)
111 24
Apple muffin, made with rolled oats and sugar 60 13
Apple muffin, made with rolled oats and without sugar 60 9
Waffles, Aunt Jemima® 35 10
Bagel, white, frozen 70 25
Baguette, white, plain 60 (1 piece) 29
Coarse barley bread, 80% kernels 30 7
Donut (large, glazed) 75 (1 donut) 24

3 © Conner Middelmann, Nutrition Coach @ Modern Mediterranean, LLC
Hamburger bun 30 9
Kaiser roll 30 12
Pumpernickel bread 30 7
50% cracked wheat kernel bread 30 12
White wheat flour bread, average 30 11
Wonder® bread, average 30 10
Whole wheat bread, average 30 9
Sourdough wheat bread 30 6
Pita bread, white 30 10
Corn tortilla 50 12
Wheat tortilla 50 8
BEVERAGES
Coca Cola® (US formula) 250 mL/1 cup 16
Fanta®, orange soft drink 250 mL/1 cup 23
Apple juice, unsweetened 250 mL/1 cup 12
Cranberry juice cocktail (Ocean Spray®) 250 mL/1 cup 24
Gatorade, orange flavor (US formula) 250 mL/1 cup 13
Orange juice, unsweetened, average 250 mL/1 cup 12

4 © Conner Middelmann, Nutrition Coach @ Modern Mediterranean, LLC
Tomato juice, canned, no sugar added 250 mL/1 cup 4
BREAKFAST CEREALS AND RELATED PRODUCTS
All-Bran®, average 30 9
Coco Pops®, average 30 20
Cheerios 30 (1 cup) 13
Cornflakes®, average 30 20
Cream of Wheat® 250 17
Cream of Wheat®, Instant 250 22
Grape-Nuts® 60 (1/2 cup) 31
Muesli, average 30 10
Oats (rolled, traditional), cooked 250 11
Oatmeal, average 250 13
Instant oatmeal, average 250 21
Puffed wheat cereal 30 17
Rice Krispies 30 23
Bran flakes 30 19
Raisin Bran 60 (1 cup) 24
Special K® (US formula) 30 21

5 © Conner Middelmann, Nutrition Coach @ Modern Mediterranean, LLC
GRAINS
Pearled barley, average 150 11
Sweet corn on the cob 60 14
Couscous 150 9
Quinoa 150 13
Sushi rice, cooked 150 33
White rice, boiled, type non-specified 150 29
Quick cooking white basmati 150 26
Brown rice, steamed 150 16
Parboiled Converted white rice (Uncle Ben's®) 150 14
Sweet corn 150 (1 scant cup) 20
Whole wheat kernels, average 50 15
Bulgur, average 150 12
COOKIES AND CRACKERS
Graham crackers 25 13
Vanilla wafers 25 14
Shortbread 25 10
Rice cakes, average 25 17
6 © Conner Middelmann, Nutrition Coach @ Modern Mediterranean, LLC
Rye crisps, average 25 11
Soda crackers 25 12
DAIRY PRODUCTS AND ALTERNATIVES
Ice cream, regular, average 50 8
Ice cream, premium (Sara Lee®) 50 3
Milk, full-fat, average 250 mL (1 cup) 4
Milk, skim, average 250 mL 4
Reduced-fat yogurt with fruit, average 200 11
FRUITS
Apple, average 120 5
Banana, raw, average 120 11
Dates, dried, average 60 18
Grapefruit 120 3
Grapes, black 120 11
Oranges, raw, average 120 5
Peach, average 120 5
Peach, canned in light syrup 120 9
Pear, raw, average 120 4

7 © Conner Middelmann, Nutrition Coach @ Modern Mediterranean, LLC
Pear, canned in pear juice 120 5
Prunes, pitted 60 10
Raisins 60 28
Watermelon 120 4
BEANS AND NUTS
Baked beans 150 6
Black-eyed peas 150 15
Black beans 150 7
Chickpeas 150 3
Chickpeas, canned in brine 150 9
Navy beans, average 150 12
Kidney beans, average 150 9
Lentils 150 5
Soy beans, average 150 1
Cashews, salted 50 3
Peanuts 50 1
PASTA and NOODLES
Fettucini 180 15

8 © Conner Middelmann, Nutrition Coach @ Modern Mediterranean, LLC
Macaroni, average 180 24
Macaroni and Cheese (Kraft®) 180 33
Spaghetti, white, boiled, average 180 22
Spaghetti, white, boiled 20 min 180 26
Spaghetti, whole-grain, boiled 180 17
Rice pasta (gluten free) 180 24
Corn pasta (gluten-free) 180 31
SNACK FOODS
Corn chips, plain, salted 50 11
Fruit Roll-Ups® 30 24
M & M's®, peanut 30 6
Microwave popcorn, plain, average 20 7
Potato chips, average 50 12
Pretzels, oven-baked 30 16
Snickers Bar®, average 60 18
VEGETABLES
Green peas 80 4
Carrots, average 80 2

9 © Conner Middelmann, Nutrition Coach @ Modern Mediterranean, LLC
Parsnips 80 4
Baked russet potato 150 33
Boiled white potato, average 150 21
Instant mashed potato, average 150 17
Sweet potato, average 150 22
Yam, average 150 20
MISCELLANEOUS
Hummus (chickpea salad dip) 30 0
Chicken nuggets, frozen, reheated in microwave oven 5 min 100 7
Pizza, plain baked dough, served with parmesan cheese and tomato sauce
100 22
Pizza, Super Supreme (Pizza Hut®) 100 9
Honey, average 25 13
Maple syrup 25 10
Sugar (sucrose – white) 25 6
The data shown here was obtained at www.glycemicindex.com and Dr. Sears’ Glycemic Guide.
The complete list of the glycemic index and glycemic load for more than 1,000 foods can be found in the article "International tables of glycemic index and glycemic load values: 2008" by Fiona S. Atkinson, Kaye Foster-Powell, and Jennie C. Brand-Miller in the December 2008 issue of Diabetes Care, Vol. 31, number 12, pages 2281-2283.

10 © Conner Middelmann, Nutrition Coach @ Modern Mediterranean, LLC