Global, regional, and national incidence and mortality for HIV, tuberculosis, and malaria during...
243
Supplementary appendix This appendix formed part of the original submission and has been peer reviewed. We post it as supplied by the authors. Supplement to: Murray CJL, Ortblad KF, Guinovart C, et al. Global, regional, and national incidence and mortality for HIV, tuberculosis, and malaria during 1990–2013: a systematic analysis for the Global Burden of Disease Study 2013. Lancet 2014; published online July 22. http://dx.doi.org/10.1016/S0140-6736(14)60844-8.
Transcript of Global, regional, and national incidence and mortality for HIV, tuberculosis, and malaria during...

Supplementary appendixThis appendix formed part of the original submission and has been peer reviewed. We post it as supplied by the authors.
Supplement to: Murray CJL, Ortblad KF, Guinovart C, et al. Global, regional, and national incidence and mortality for HIV, tuberculosis, and malaria during 1990–2013: a systematic analysis for the Global Burden of Disease Study 2013. Lancet 2014; published online July 22. http://dx.doi.org/10.1016/S0140-6736(14)60844-8.

1
Global, regional and national incidence and death for HIV, tuberculosis and malaria during 1990-2013: a systematic analysis for the Global Burden of Disease Study 2013
This appendix provides more methodological detail on the HIV, TB, and malaria morbidity and mortality estimation process,
Table of Contents 1. HIV ......................................................................................................................................................... 2
1.1 Additional methods for calculation mortality off ART .................................................................. 2
Data ....................................................................................................................................................... 2
Calculating HIV Relative Survival ........................................................................................................... 2
Statistical Model ................................................................................................................................... 2
Compartmental Model ......................................................................................................................... 2
1.2 Additional methods for calculating mortality on ART .................................................................. 3
Data ....................................................................................................................................................... 3
Modelling .............................................................................................................................................. 3
1.3 HIV mortality in countries with vital registration systems ........................................................... 4
Garbage code redistribution ................................................................................................................. 4
Misclassification paragraph .................................................................................................................. 4
Imputation of missing years for a complete time series of mortality .................................................. 5
2. Tuberculosis .......................................................................................................................................... 5
2.1 CODEm .......................................................................................................................................... 5
2.2 DisMod‐MR 2.0 data sources ....................................................................................................... 7
2.3 DisMod‐MR 2.0 description and implementation ........................................................................ 7
2.4 Incidence, Prevalence, and Mortality for TB with HIV ................................................................ 11
3. Malaria ................................................................................................................................................ 11
3.1 Explanation of malaria covariates .............................................................................................. 11
3.2 CODEm Results ........................................................................................................................... 11
3.3 Sensitivity analysis ...................................................................................................................... 12
3.4 Country groupings for malaria incidence data ........................................................................... 12
4. References .......................................................................................................................................... 12
5. Supplementary Tables and Figures ..................................................................................................... 14

2
1. HIV
1.1 Additional methods for calculation mortality off ART
Data
We reviewed the literature of HIV mortality in the absence of ART using the PubMed search terms
(((((HIV) AND (mortality OR survival OR death) AND (seroconverters OR seroconversion OR seropositive
OR seropositivity))) and also screened the references of articles discovered by the search. These terms
identified 2809 studies. These titles were screened and 145 abstracts were flagged for review. Studies
were considered if they contained all‐cause adult survival curves from time of sero‐conversion. In total,
we included 13 studies (Appendix Table 1). All pooled, age, and sex‐specific survival data was extracted
at one‐year intervals up to 12 years since sero‐conversion, after which data availability was sparse.
Calculating HIV Relative Survival
To estimate HIV relative mortality, we calculated conditional mortality rates and subtracted estimates of
age, sex, country, and year‐specific background mortality rates.1 Since this was calculated for each data
point, we set the conditional HIV relative mortality rate to zero when the background mortality
exceeded the all‐cause conditional mortality for that study‐year.
Statistical Model
We developed a regression model to estimate the range of survival curves extracted in our analysis.
Logit‐transformed one year conditional probabilities of death were regressed on age group and year
since sero‐conversion indicator variables with a study‐level random effect. To be consistent with
UNAIDS Spectrum compartmental model, we used four age groups: 15‐24, 25‐34, 35‐44, and 45+. The
model’s uncertainty was estimated using standard simulation methods by drawing 1000 times for each
age group from the variance‐covariance matrix of the regression coefficients and the standard deviation
of the study level random effect.
Compartmental Model
The AIDS Impact Model (AIM) component of Spectrum takes age and CD4‐specific mortality and progression probabilities as inputs for epidemic estimates. These parameters are determined by optimizing a compartmental model such that the output matches Weibull‐distribution fitted to survival data from three East African cohorts and a South African miners cohort.2 We programmed a version of the UNAIDS compartmental model into R in order to quickly cycle through survival curve draws from our statistical model.3 For each of these survival curves, we use the UNAIDS optimization framework, which assumes exponentially increasing mortality hazards and linearly increasing progression hazards across CD4 bins. We calculated loss as the sum of the squared errors between the predicted survival curve and the survival draw from the statistical model. This loss function was optimized using the optim package in R. Appendix Figure 1a, 1b, and 1c show 1000 survival curves for each age group that capture the systematic variation in survival across the available studies for ages 15 to 24, 35 to 45, and 45+.

3
1.2 Additional methods for calculating mortality on ART
Data
A PubMed search was conducted using the terms: ("hiv"[MeSH Terms] OR "hiv"[All Fields]) AND
("mortality"[Subheading] OR "mortality"[All Fields] OR "mortality"[MeSH Terms]) AND antiretroviral[All
Fields] AND ("therapy"[Subheading] OR "therapy"[All Fields] OR "therapeutics"[MeSH Terms] OR
"therapeutics"[All Fields]). The articles identified by this search were considered for inclusion in three
separate meta‐analyses: (1) probability of death by initial CD4 count; (2) age hazard ratios for mortality;
and (3) sex hazard ratios for mortality. Studies were eligible for inclusion in the probability of death
analysis if they reported data on both mortality and LTFU. Studies that traced patients through vital
registration or other efforts were assumed to have 0 LTFU. Age and sex hazard ratios were only eligible
if they were adjusted for the other factors of interest (age, sex and initial CD4, as applicable). Exclusion
criteria for all studies included non‐ART‐naïve populations, children, and special populations such as
hospitalized patients. For probability of death, 39 articles were included, contributing data for 80
distinct cohorts. For sex hazard ratios, 78 articles were included, contributing data for 86 cohorts. For
age hazard ratios, 40 articles and cohorts were included. Appendix Table 2 shows the data sources
included in these analyses.
Modelling
We identified 17 studies that identified the true outcomes of lost to follow‐up patients (LTFU) patients;
14 of which were included in a prior LTFU analysis4 as well as 3 recently published studies. The results
from these studies were used to adjust the extracted mortality estimates. Our methods built on
previous work,4–6 which exploits the observed relationship between total proportion LTFU in tracking
studies and the proportion of those that had died. The relationship was estimated using the following
equation:
1 1
Where MLTFU is the proportion dying among those LTFU and PLTFU is the proportion of the study LTFU.
A separate DisMod‐MR 2.0 model (see below in the section on tuberculosis for a more detailed
description of the parameterization of DisMod‐MR 2.0) was used to synthesize adjusted CD4‐specific
conditional probabilities of death (0‐6, 7‐12, 12‐24 months on ART) for each region. Age hazard ratios
were referenced to the youngest age group for that study before being synthesized by DisMod‐MR 2.0,
including a study‐level random effect. The posterior hazard ratio estimate for each age group was
referenced to the hazard for the average age from the mortality studies. A random effects meta‐analysis
was run on the natural log of the sex hazard ratios, using the metan command in Stata.
The mortality rate estimates were multiplied by the age hazard ratios to generate age‐specific estimates.
The sex hazard ratios were applied using the following equations:
∗ 1
∗

4
Where Mf is the female mortality rate, Mall is the overall mortality rate found in the mortality studies, HR
is the hazard for males compared to females, pm is the proportion male, and Mm is the male mortality
rate.
Background mortality rates excluding HIV were subtracted to obtain estimates of the excess mortality.
All steps of this process were conducted at the 1000‐draw level. Appendix Tables 3a, 3b and 3c show
1000 draws from the posterior distribution for each age, sex and CD4 category in sub‐Saharan African
sites (3a), low‐middle‐income countries outside of sub‐Saharan Africa (3b), and high income countries
(3c) for conditional mortality rates for 0‐6 months, 6‐12 months and 13‐24 months as inputs to
Spectrum.
1.3 HIV mortality in countries with vital registration systems
Garbage code redistribution
Garbage codes are causes of death that should not be identified as underlying causes of death but have been entered as the underlying cause of death on death certificates. Classic examples of garbage codes for HIV and malaria are Acute Febrile Illness, Fever with unknown origin, Septicemia and Kaposi’s sarcoma. We can see these type of garbage codes in different death registry system, verbal autopsy studies and surveillance data. For each garbage code, the potential underlying causes of death have been identified based on pathophysiology bases. For example, the target codes for Kaposi’s sarcoma include “other viral related cancer” and HIV or for Acute Febrile Illness target can be malaria, HIV, meningitis, respiratory infection and other different causes based on age and sex. As part of the GBD, different types of algorithms have been developed to redistribute garbage codes. Some redistribution is proportional, some is based on statistical methods, and some is based on evidence and studies we have found in the literature. In the main body of the paper, two examples are given the effect of redistribution on HIV deaths.
Misclassification
We used the method developed by Birnbaum et al7 to identify potentially misclassified HIV deaths. In principle, for each cause in each country, we compute the death rate at each age relative to the death rate at age 40. We also use all the pooled vital registration data in countries with HIV prevalence less than 0.1% to produce a standard relative age pattern of death. By computing the relative age pattern, differences in the level of mortality for a cause are removed from the comparison. For all diseases, the relative age pattern tends to be highly preserved. Injury relative age patterns are somewhat more variable across populations and overtime. We identify potentially misclassified deaths from HIV when the relative rates of death change over the time period during the HIV epidemic. Where the relative age pattern shows an increase in the age‐groups 15‐49 compared with the global standard relative age pattern and finally when there is no other explanation for the shift in the relative age pattern. All deaths that meet these criteria are transferred to HIV up until the relative age pattern reaches the global age pattern. Appendix Table 4 shows HIV vital registration sources that were corrected for garbage codes and
misclassified HIV deaths.

5
Imputation of missing years for a complete time series of mortality
To use the time series of causes of death from vital registration to adjust incidence curves for the modified Spectrum analysis, we needed a complete time series. We used spatio‐temporal Gaussian Process Regression (ST‐GPR) to generate a complete time series from countries data. ST‐GPR has been widely used for global health estimation studies.1,8–10 Gaussian Process Regression (GPR) was applied to data for each country‐age‐sex group to derive a complete time series for HIV death rate. GPR is a stochastic modeling technique that is designed to detect signals amidst noisy data. It also serves as a powerful tool for interpolating non‐linear trends.11,12 Unlike classical linear models that assume that the trend underlying data follows a definitive functional form, GPR assumes that the specific trend of interest follows a Gaussian Process, which is defined by a mean function ∙ and a Materne covariance function ∙ .
Random draws of 1,000 samples were obtained from the distributions above for every country, age, and sex group. The final estimated death rate for each country, age, and sex group was the mean of the draws. In addition, uncertainty intervals were obtained by taking the 2.5 and 97.5 percentiles of the samples. Note that the entire process was conducted in natural log scale, all values were back‐transformed to the original scale. The analysis was implemented using the PyMC package in Python.
2. Tuberculosis 2.1 CODEm
Following Lozano et al and the GBD 2010, we use CODEm to model tuberculosis mortality.13,14 The
Cause of Death Ensemble Model (CODEm) is based on five general principles: identifying all available
data, maximizing the comparability and quality of the dataset, developing a diverse set of plausible
models, assessing the predictive validity of each plausible individual model and of ensemble models, and
choosing the model or ensemble model with the best performance in out‐of‐sample predictive
analysis.14 Specifically, CODEm explores a large variety of possible models to estimate trends in causes of
death. Possible models are identified using a covariate selection algorithm that yields many plausible
combinations of covariates which are then run through four model classes. The model classes include
mixed effects linear models and spatiotemporal GPR models for cause fractions and death rates. All
models for each cause of death are then assessed using out‐of‐sample predictive validity and combined
into an ensemble with optimal out‐of‐sample predictive performance.
We first identified a range of plausible covariates for tuberculosis based on the published literature. We
divided these covariates into three groups based on the strength of epidemiological evidence: 1) class 1
covariates for which there is strong evidence and a biologically plausible pathway, 2) class 2 covariates
for which there is some evidence but with a less direct causal pathway, and 3) class 3 covariates where
there is general correlation evidence for a relationship as observed in previous time series or cross‐
sectional studies. Appendix Table 5 lists the candidate covariates, priors, and levels for the CODEm
model based on physician judgment and literature review of risk factors related to tuberculosis.
For a covariate to be included, we needed to have a comparable, complete time series for 1980‐2010.
Transformations were performed based on the observed relationship between rates or cause fractions

6
and the covariate of interest untransformed or transformed – if the relationship between the
transformed covariate and the rate or cause fraction was more linear than the relationship between the
untransformed covariate, the transformation was included. We used the natural log transformation of
lag distributed income (LDI) per capita, the logit transformation of malnutrition in children under 5
(proportion less than two standard deviations below mean weight for age),15 cumulative cigarettes (5
years), smoking prevalence,16 diabetes fasting plasma glucose (mmol/L),17 indoor air pollution (all
cooking fuels),18 alcohol (liters per capita),19 population density (500‐1,000 ppl/sqkm, proportion),
population density (over 1,000 ppl/sqkm, proportion), education (years per capita) and health system
access (an aggregate measure of hospital beds per capita, in‐facility deliveries, vaccination coverage, and
other health system indicators produced by IHME).20,21
In the first step, we ran regressions for all possible combinations of category 1 covariates. We ran
regressions for models where the dependent variable is the rate in logarithmic scale by age and models
where the dependent variable is logit cause fraction by age. For each type of model, we assessed a
possible universe of 64 combinations of level 1 covariates for males and females. All models, where the
signs for all covariates in that model are in the expected direction and the coefficient is significant at the
p<0∙05 level, are retained. At levels two or three, category two and three covariates are added to these
models using a forward stepwise technique which is not order dependent. This is achieved by starting
the forward stepwise evaluation for each base model over for each category two covariate. Models
which are subsets of other models at levels two or three were dropped. A total of 105 and 77 unique
combinations of covariates for males and females respectively were kept where the prediction was
significant at the p<0.05 level and in the predicted direction. Counting the covariates being run as both
simple mixed effects and spatiotemporal models, this resulted in a total pool of 420 and 308 component
models for males and females respectively.
As per Lozano et al, the ability of each of these models to make accurate predictions was formally
evaluated.22 We created 20 train‐test‐test splits. For each of these datasets, we randomly assign 70% of
the data to the train set, 15% to the test 1 set, and the last 15% to test 2. The assignment of the data to
train and test is implemented so that the pattern of holding out the data for the test datasets mimics
the pattern of missingness in the full dataset. For each train dataset, we re‐estimated each of the
proposed models including both the linear model and the spatial‐temporal model. We used the results
of the models estimated on the training data alone to predict for the first test set. The test data have
not been included in the model estimation; the performance of each model was therefore being
evaluated out‐of‐sample. In this way, the out‐of‐sample predictions for the test set are a fair test of how
each model will perform for tuberculosis mortality where the data are sparse or missing.
Predictive validity is evaluated using three metrics. First, we evaluate how well each model predicts age‐
specific death rates using the RMSE of the natural log of the death rate. Log death rates are comparable
across age groups so that we can pool results from model performance across age groups with quite
different underlying rates. Second, we also want models that predict accurate trends. To do this, for the
test data, we compared the predicted slope for every time interval from 1 to 7 years and compare it to
the slope from the held out data. We computed the RMSE for the predicted slope. Finally, we also
want models that generate plausible prediction intervals so we computed the percent of the data in the
test set included in the 95% data prediction interval. The prediction interval is based both on the
uncertainty in the predicted death rate and the data variance for each observation.

7
Following Lozano et al, the best overall results in terms of RMSE and trend were yielded by the
ensemble model with a Psi value of 1∙1.22 This value of Psi results in draws ranging from 91 for the top
performing model to 0 for the worst performer in both males and females, as detailed in Appendix
Tables 6a and 6b. For comparison it also shows the results for the best single model. The best
component model for males was a spatiotemporal model on the logit of the cause fractions, with health
system access, logit transformed malnutrition (proportion less than two standard deviations below
mean weight for age), indoor air pollution (all cooking fuels), smoking prevalence, alcohol (liters per
capita), education (years per capita), and log transformed lag distributed income (LDI) per capita. While
the best component model for females was a spatiotemporal model on the logit of the cause fractions,
with logit transformed malnutrition (proportion less than two standard deviations below mean weight
for age), indoor air pollution (all cooking fuels), smoking prevalence, alcohol (liters per capita) and
education (years per capita).
Appendix Table 7 shows TB mortality sources used in GBD 2013.
Appendix Table 8 shows CODEm covariates for both males and females.
2.2 Excess mortality estimates Predicted death to incidence ratios were transformed into excess mortality hazards using the following
logic. First, the relationship between incidence and prevalence is a function of remission and excess
mortality:
Second, the population death rate from tuberculosis occurs fully among prevalent cases and hence:
Third, using these two equations we can express remission as:
1 1
and excess mortality as:
1
where i is incidence, p is prevalence, r is the remission hazard, m the excess mortality hazard and d the
population mortality rate from tuberculosis.
2.3 DisMod‐MR 2.0 data sources Appendix Table 9 shows tuberculosis data sources used in DisMod‐MR 2.0
2.4 DisMod‐MR 2.0 description and implementation DisMod‐MR was developed for the GBD2010 study to deal with the many challenges in estimating the
prevalence of non‐fatal health outcomes and risk factor exposures. The information gathered by
systematic reviews of published studies, grey literature sources and survey data varied tremendously for

8
each outcome of interest in terms of the volume of data, methods used to collect the data, geographical
and temporal coverage, and the type of epidemiological parameter. The goal was to find the true
variation in the occurrence of diseases and risk factors for every country and over time.
Estimates of prevalence (or any of the other epidemiological parameters of interest: incidence,
remission, duration and risk of mortality) for the same populations often varied by much more than
would be expected based on sampling error. Differences in data collection methods such as sampling
design, case definitions, measurement instruments and implementation issues, contributed to large
non‐sampling error. There are two approaches to deal with this heterogeneity. One could set criteria for
the optimal measurement of each disease parameter of interest and include only those studies that
meet that high standard. This would make measurements comparable but would leave out the vast
majority of information available. In GBD, the preferred approach is to make use of all available data
that meets a minimum standard of acceptable quality and address major differences in measurement
methods by adjusting data for any systematic bias introduced by a study quality characteristic relative to
a chosen reference value. This was done by identifying for each disease or risk factor exposure the
important study characteristics that can help explain the variation in measurements and flag data points
that deviate from the chosen, optimal, reference value with a covariate. DisMod‐MR then estimated a
coefficient for each chosen study covariate and adjusted the data accordingly.
To help make estimates for countries and time periods for which little or no data were available,
DisMod‐MR would predict based on country characteristics and random effects on super‐region, region
and country. For this purpose a database of country covariates for 84 topic areas and 179 variants
thereof was created. Missing data were filled in using Gaussian process or space‐time regression
methods to ensure a complete set of values for each covariate for every country and every year from
1980 to present. If no country covariates were specified and no data were available, a country estimate
would revert to the average of a region, super‐region or the world.
DisMod‐MR dealt with any specification of age ranges by which data were available to produce
estimates by the 20 standard GBD age groups. It also allowed the user to add strong prior knowledge on
the age at onset or age pattern of prevalence or incidence such as restricting the occurrence of pre‐
menstrual syndrome to fertile ages or stipulating that there are no cases of Parkinson’s disease before
age 30. All these functions were new in DisMod‐MR compared to earlier DisMod version used in
previous GBD studies which required an analyst to choose one particular data source for a given disease
parameter rather than being able to evaluate all available data. Hence the tool was renamed DisMod‐
MR, the suffix indicating the important meta‐regression component. DisMod‐MR also accommodated
the main functionality of the earlier DisMod tools, i.e. confronting the data from different disease
parameters and forcing consistency between these based on differential equations that determine the
flow of cases in a stable population between those disease‐free and prevalent cases of disease (through
incidence or remission) and those in either category that die from other causes (other‐cause mortality)
and the disease of interest (cause‐specific mortality).
To accommodate all functions, DisMod‐MR was designed as a Bayesian meta‐regression tool using a
generalized negative binomial model with fixed effects on age, study and country level covariates as well

9
as random intercepts for country, region and super‐region. Greater detail on DisMod‐MR has been
published in a web‐appendix to the paper on non‐fatal health outcomes in GBD2010.24
While DisMod‐MR successfully addressed many of the major challenges in the estimation of non‐fatal
health outcomes and risk factor exposures it had a number of drawbacks which we have tried to solve
for GBD 2013 by creating an updated version of the tool, DisMod‐MR 2.0. The biggest drawback was the
computing time required. Each disease model needed to run between 4 and 24 hours on a large
computer cluster to produce results for all countries and three time periods (1990, 2005 and 2010).
Moreover because of computational constraints a decision had to be made to restrict the consistency
checks at the level of 21 regions only. To make country estimates, the relevant fixed effects on study
and country covariates and the random effects for each country were applied. While this produced
defensible estimates of prevalence it did not guarantee coherence between prevalence and other
disease parameters such as incidence and excess mortality rates at the country level.
The code for DisMod‐MR 2.0 was rewritten and optimized to run up to 50 times faster than DisMod‐MR.
A decision was also made to shift to an offset log‐normal rather than a negative binomial model as this is
easier to implement and because predictive validity tests carried out in DisMod‐MR indicated that the
statistical properties the two types of models were at least equivalent.
The much faster running time of the core computational engine in DisMod‐MR 2.0 allows us to better
evaluate all the data through a geographical cascade of four levels. At first, all the world’s data are
evaluated to estimate the fixed effects on age, sex, study level and country level covariates as well as a
first pass at estimating the random effects for countries, regions and super‐regions. The outputs of the
global level are then used as prior information for the next, super‐region level of the cascade. A single
age pattern for both sexes and all years of interest is created with uncertainty bounds. All data points
that are marked as pertaining to both sexes or flagged with a covariate for a study characteristic (e.g. a
less than optimal case definition or a low response rate) are adjusted at this stage to reflect what the
likely value would have been if the study had specified sex and/or used the reference study
characteristic. The data are also split up between super‐regions and, optionally, by time period and sex.
Using the global prior and the adjusted data values for each super‐region are re‐estimated using the
same core computational engine. While there is flexibility whether to re‐assess fixed effects on sex or
study level covariates at this level, the default option is to adjust the data by the sex and study‐level
covariates after the global level fit, only. At each successive level of the cascade the fixed effects on
country‐level covariates are re‐evaluated and centered on the average of values for the countries that
make up a super‐region or region. Similarly, random effects are re‐evaluated for just the countries in a
given geography. It logically follows that no fixed or random effects are re‐evaluated at country level.
After fitting the model to each of the super‐regions, the results are fed as priors to the region‐specific
fits and finally, region fits are used as a prior when modelling a country’s results for a particular time
period.
A new interface was created to draw relevant data for each disease, sequela or risk factor to be
modelled, to apply all the default and optional settings and to visualize results. The analyst has a lot of
choice to set model parameters to suit any given disease or risk factor of interest. There is a setting to

10
define the age mesh point at which DisMod‐MR 2.0 does its calculations. The default setting is to use 21
age mesh points that define the 20 GBD standard age groups. For each study‐level and country‐level
covariate the analyst can set a reference value and upper and lower values for the coefficients. The
inclusion of cause‐specific mortality rates by age and sex from GBD’s mortality estimates is optional. An
alternative method of informing a model with mortality data is by using the log of the age‐standardised
mortality rate as a country‐level covariate. Other examples of the basic settings include a value for the
parameter that determines the amount of smoothing over the age curve and is denoted by Greek letter
‘xi’ (ξ); the value of the offset for the lognormal (‘eta’ or η) for which the default setting is at one per
cent of the median of available data values for a parameter or 0.0001 in case there are no data for that
parameter; and a range of values for the parameter ‘zeta’ (ζ) that determines how much ‘noise’ the
analyst allows DisMod‐MR 2.0 to estimate for a parameter. The latter function is useful to the analyst.
When DisMod‐MR 2.0 estimates zeta close to the upper threshold it indicates there is a lot of noise in
the data or it may be an indication that there are data entry errors that deserve attention.
Analysts have the choice of using a Gaussian, log‐Gaussian, Laplace or Log‐Laplace likelihood function in
Dismod‐MR 2.0. The default log‐Gaussian equation for the data likelihood is:
log √2 log12
log log
where, yj is a ‘measurement value’ (i.e. data point); Φ denotes all model random variables; ηj is the
offset value, eta, for a particular ‘integrand’ (prevalence, incidence, remission, excess mortality rate,
with‐condition mortality rate, cause‐specific mortality rate, relative risk or standardized mortality ratio)
and aj is the adjusted measurement for data point j, defined by:
where uj is the total ‘area effect’ (i.e. the sum of the random effects at three levels of the cascade:
super‐region, region and country) and cj is the total covariate effect (i.e. the mean combined fixed
effects for sex, study level and country level covariates), defined by:
β, ,
with standard deviation
ζ, ,
where k denotes the mean value of each data point in relation to a covariate (also called x‐covariate); I(j)
denotes a data point for a particular integrand, j; βI(j),k is the multiplier of the kth x‐covariate for the ith
integrand; , is the covariate value corresponding to the data point j for covariate k; l denotes the
standard deviation of each data point in relation to a covariate (also called z‐covariate); ζI(j),k is the

11
multiplier of the lth z‐covariate for the ith integrand; and δj is the standard deviation for adjusted
measurement j, defined by:
Where mj denotes the model for the jth measurement, not counting effects or measurement noise and
defined by:
(a) da
where A(j) is the lower bound of the age range for a data point; B(j) is the upper bound of the age range
for a data point; and I(j) denotes the function of age corresponding to the integrand for data point j.
2.5 Incidence, Prevalence, and Mortality for TB with HIV Appendix Table 10 shows the age‐standardized incidence, prevalence, and mortality for TB with HIV.
3. Malaria Appendix Table 11 lists the malaria non‐fatal data sources used in DisMod‐MR 2.0 for the GBD 2013.
3.1 Explanation of malaria covariates We tested the following time‐series variables: rainfall, health‐system access, first‐line antimalarial drug resistance, insecticide‐treated bednet coverage, indoor residual spraying coverage, income per head, and educational attainment.24 First‐line antimalarial drug resistance is a weighted average by country and year of the treatment efficacy of chloroquine, sulfadoxinepyrimethamine, and artemisinin‐combination therapy with weights based on the frequency of drug use. Treatment efficacy was estimated with a spatio‐temporal model of in‐vivo efficacy studies and WHO antimalarial drug resistance database reports.25,26 Frequency of drug use was estimated with a spatio‐temporal model of survey data for antimalarial drug use in children with fever, which was supplemented by program data for supply of artemisinin‐combination therapy, correcting for bias with survey data as the benchmark. Updated estimates of household bednet coverage and estimates for outside of Africa were produced with a previously described Bayesian statistical model.27 Coverage of indoor residual spraying was based on a spatio‐temporal model of survey data for reported household spraying in the previous 12 months and program data reported to WHO, correcting for bias with survey data as the benchmark.
3.2 CODEm Results Appendix Table 12 lists the malaria mortality data sources used in the GBD 2013.
Appendix Table 13 lists the covariates used in CODEm
Appendix Tables 14a‐h show the ensemble performance, for males and females, over and under 5 years,
inside and outside Africa.

12
3.3 Sensitivity analysis We developed a method to adjust cause‐specific mortality fractions (CSMFs) to account for sensitivity
and specificity of verbal autopsy when diagnosing malaria. Using constrained non‐linear optimization
techniques,28 we back‐calculated the malaria and non‐malaria CSMFs subject to the constraints that
both CSMFs must sum to one, and that no CSMF can be negative. Back‐calculation was tested on both
the input verbal autopsy data and the modeled estimates. Because the estimated sensitivity in adults
and children was much lower than specificity, most malaria CSMFs were found to be higher after
adjustment than before. This is illustrated in the global number of deaths by category from 1990 to
2013 in Appendix Figure 3.
3.4 Country groupings for malaria incidence data Countries were divided into three categories based on the quality and availability of their malaria
incidence data. Within each of these categories, malaria incidence cases were estimated. Appendix
Table 15 shows the country groupings for each of the three categories.
4. References 1 Wang H, Dwyer‐Lindgren L, Lofgren KT, et al. Age‐specific and sex‐specific mortality in 187 countries,
1970–2010: a systematic analysis for the Global Burden of Disease Study 2010. The Lancet 2012; 380: 2071–94.
2 Futures Institute. AIM: A computer program for making HIV/AIDS projections and examining the demographic and social impacts of AIDS. , 2014https://spectrummodel.zendesk.com/attachments/token/6eixzeawlonxjg7/?name=AIM+2014+English.pdf.
3 R Core Team (2012). R: A language and environment for statistical computing. R Foundation for Statistical Computing. Vienna, Austria. ISBN 3‐900051‐07‐0.http://www.R‐project.org/ (accessed 29 Apr2014).
4 Brinkhof MWG, Spycher BD, Yiannoutsos C, et al. Adjusting Mortality for Loss to Follow‐Up: Analysis of Five ART Programmes in Sub‐Saharan Africa. PLoS ONE 2010; 5: e14149.
5 Egger M, Spycher BD, Sidle J, et al. Correcting Mortality for Loss to Follow‐Up: A Nomogram Applied to Antiretroviral Treatment Programmes in Sub‐Saharan Africa. PLoS Med 2011; 8: e1000390.
6 Verguet S, Lim SS, Murray CJL, Gakidou E, Salomon JA. Incorporating loss to follow‐up in estimates of survival among HIV‐infected individuals in sub‐Saharan Africa enrolled in antiretroviral therapy programs. J Infect Dis 2013; 207: 72–9.
7 Birnbaum JK, Murray CJ, Lozano R. Exposing misclassified HIV/AIDS deaths in South Africa. Bull World Health Organ 2011; 89: 278–85.
8 Murray CJL, Rosenfeld LC, Lim SS, et al. Global malaria mortality between 1980 and 2010: a systematic analysis. Lancet 2012; 379: 413–31.

13
9 Hogan MC, Foreman KJ, Naghavi M, et al. Maternal mortality for 181 countries, 1980–2008: a systematic analysis of progress towards Millennium Development Goal 5. The Lancet 2010; 375: 1609–23.
10 Rajaratnam JK, Marcus JR, Flaxman AD, et al. Neonatal, postneonatal, childhood, and under‐5 mortality for 187 countries, 1970–2010: a systematic analysis of progress towards Millennium Development Goal 4. The Lancet 2010; 375: 1988–2008.
11 Rasmussen CE. Gaussian processes for machine learning. , MIT Press, 2006.
12 Vasudevan S, Ramos F, Nettleton E, Durrant‐Whyte H. Heteroscedastic Gaussian processes for data fusion in large scale terrain modeling. In: 2010 IEEE International Conference on Robotics and Automation (ICRA). , 2010: 3452–9.
13 Lozano R, Naghavi M, Foreman K, et al. Global and regional mortality from 235 causes of death for 20 age groups in 1990 and 2010: a systematic analysis for the Global Burden of Disease Study 2010. The Lancet 2012; 380: 2095–128.
14 Foreman KJ, Lozano R, Lopez AD, Murray CJ. Modeling causes of death: an integrated approach using CODEm. Popul Health Metr 2012; 10: 1.
15 Cegielski JP, McMurray DN. The relationship between malnutrition and tuberculosis: evidence from studies in humans and experimental animals. Int J Tuberc Lung Dis Off J Int Union Tuberc Lung Dis 2004; 8: 286–98.
16 Lin H‐H, Ezzati M, Murray M. Tobacco Smoke, Indoor Air Pollution and Tuberculosis: A Systematic Review and Meta‐Analysis. PLoS Med 2007; 4: e20.
17 Stevenson CR, Critchley JA, Forouhi NG, et al. Diabetes and the risk of tuberculosis: a neglected threat to public health? Chronic Illn 2007; 3: 228–45.
18 Rehfuess E. Fuel for life: household energy and health. Geneva, World Health Organization, 2006http://www.who.int/indoorair/publications/.
19 Lönnroth K, Williams BG, Stadlin S, Jaramillo E, Dye C. Alcohol use as a risk factor for tuberculosis – a systematic review. BMC Public Health 2008; 8: 289.
20 Lönnroth K, Jaramillo E, Williams BG, Dye C, Raviglione M. Drivers of tuberculosis epidemics: the role of risk factors and social determinants. Soc Sci Med 1982 2009; 68: 2240–6.
21 Rieder H. Epidemiologic Basis of Tuberculosis Control. The Union. 1999.http://www.theunion.org/what‐we‐do/publications/technical/epidemiologic‐basis‐of‐tuberculosis‐control (accessed 10 Mar2014).
22 Lozano R, Wang H, Foreman KJ, et al. Progress towards Millennium Development Goals 4 and 5 on maternal and child mortality: an updated systematic analysis. The Lancet 2011; 378: 1139–65.

14
23 Vos T, Flaxman AD, Naghavi M, et al. Years lived with disability (YLDs) for 1160 sequelae of 289 diseases and injuries 1990‐2010: a systematic analysis for the Global Burden of Disease Study 2010. Lancet 2012; 380: 2163–96.
24 Gakidou E, Cowling K, Lozano R, Murray CJ. Increased educational attainment and its effect on child mortality in 175 countries between 1970 and 2009: a systematic analysis. The Lancet 2010; 376: 959–74.
25 WHO. Susceptibility of plasmodium falciparum to antimalarial drugs: Report on global monitoring 1996‐2004. , 2005http://www.who.int/malaria/publications/atoz/whohtmmal20051103/en/.
26 WHO. Global report on anitmalarial efficacy and drug resistance: 2000‐2010. , 2010http://www.who.int/malaria/publications/atoz/9789241500470/en/.
27 Flaxman AD, Fullman N, Otten MW Jr, et al. Rapid Scaling Up of Insecticide‐Treated Bed Net Coverage in Africa and Its Relationship with Development Assistance for Health: A Systematic Synthesis of Supply, Distribution, and Household Survey Data. PLoS Med 2010; 7: e1000328.
28 Zhu C, Byrd R, Lu P, Nocedal J. L‐BFGS‐B: A Limited Memory FORTRAN Code for Solving Bound Constrained Optimization Problems Tech. rep. NAM‐11. EECS Department, Northwestern University, 1994.
5. Supplementary Tables and Figures

0.0
0.1
0.2
0.3
0.4
0.5
0.6
0.7
0.8
0.9
1.0
0 1 2 3 4 5 6 7 8 9 10 11 12Years since seroconversion
HIV
rel
ativ
e su
rviv
al
Source GBD Compartmental Model UNAIDS Compartmental Model
Appendix Figure 1a. Comparison of HIV relative survival estimates: Age group 15−24

0.0
0.1
0.2
0.3
0.4
0.5
0.6
0.7
0.8
0.9
1.0
0 1 2 3 4 5 6 7 8 9 10 11 12Years since seroconversion
HIV
rel
ativ
e su
rviv
al
Source GBD Compartmental Model UNAIDS Compartmental Model
Appendix Figure 1b. Comparison of HIV relative survival estimates: Age group 35−44

0.0
0.1
0.2
0.3
0.4
0.5
0.6
0.7
0.8
0.9
1.0
0 1 2 3 4 5 6 7 8 9 10 11 12Years since seroconversion
HIV
rel
ativ
e su
rviv
al
Source GBD Compartmental Model UNAIDS Compartmental Model
Appendix Figure 1c. Comparison of HIV relative survival estimates: Age group 45+

0
50
100
150
1970 1980 1990 2000 2010Year
Dea
ths
(in th
ousa
nds)
1,000 Matched Full 10,000
Appendix Figure 2a. Adult HIV Mortality in Uganda

0
200
400
600
1970 1980 1990 2000 2010Year
Dea
ths
(in th
ousa
nds)
1,000 Matched Full 10,000
Appendix Figure 2b. Adult HIV Mortality in South Africa

0
10
20
30
1970 1980 1990 2000 2010Year
Dea
ths
(in th
ousa
nds)
1,000 Matched Full 10,000
Appendix Figure 2c. Adult HIV Mortality in Ghana

100
200
300
400
500
600
Dea
th C
ount
(10
00’s
)
1980 1990 2000 2010Year
Adjusted UnadjustedAfrica Over 5 Africa Under 5Outside Africa Over 5 Outside Africa Under 5
VR Countries Not Adjusted
Appendix Figure 3. Effect of back−calculation on estimated malaria deaths

<0.070.07−0.100.10−0.140.14−0.180.18−0.23
0.23−0.280.28−0.350.35−0.490.49−0.62>0.62
Appendix Figure 4. Ratio of years of life saved through intervention to prevalent cases in adults over 15 in 2013.
Caribbean LCA
DMA
ATG
TTO
GRD
VCT
TLS
MDV
BRB
SYC
MUS
COM
Persian Gulf
W Africa E Med.
MLT
SGP Balkan Peninsula TON
WSM
FSM
KIR
FJI
VUT
SLB
MHL

●
●
●
●
●
●
●
●
●
●
●
●
●
●
●
●
●
●
●
●
●
●
●
●
●
●
●
●
●
●
●
●
●
●
●
●
●
●
●
●
●
●
●
●
●
●
●
●
15−24 25−34
35−44 45+
−4
−3
−2
−4
−3
−2
>500 350−500 250−349 200−249 100−199 50−99 >500 350−500 250−349 200−249 100−199 50−99CD4 Bin
Nat
ural
log
risk
of p
rogr
essi
on in
0.1
yea
r in
terv
al
Source
●
●
IHME Model
UNAIDS
95% CIs for GBD CD4 progression parameters compared to UNAIDSAppendix Figure 5.

15−19 20−24 25−29 30−34 35−39 40−44 45−49
0
2
4
6
GBDSur
vey
UNAIDS
GBDSur
vey
UNAIDS
GBDSur
vey
UNAIDS
GBDSur
vey
UNAIDS
GBDSur
vey
UNAIDS
GBDSur
vey
UNAIDS
GBDSur
vey
UNAIDS
Pre
vale
nce
(%)
Source
GBD
Survey
UNAIDS
BDI 2010 Males
Appendix Figure 6. Comparison of national HIV prevalence survey estimates to GBD and UNAIDS estimates with 95% confidence intervals. Each graph represents age-specific estimates for a particular country, survey year, and sex.

15−19 20−24 25−29 30−34 35−39 40−44 45−49
0
2
4
6
GBDSur
vey
UNAIDS
GBDSur
vey
UNAIDS
GBDSur
vey
UNAIDS
GBDSur
vey
UNAIDS
GBDSur
vey
UNAIDS
GBDSur
vey
UNAIDS
GBDSur
vey
UNAIDS
Pre
vale
nce
(%)
Source
GBD
Survey
UNAIDS
HIV prevalence comparison to survey estimates by age−group wih 95% confidence intervalsBDI 2010 Females

15−19 20−24 25−29 30−34 35−39 40−44 45−49
0
1
2
3
4
GBDSur
vey
UNAIDS
GBDSur
vey
UNAIDS
GBDSur
vey
UNAIDS
GBDSur
vey
UNAIDS
GBDSur
vey
UNAIDS
GBDSur
vey
UNAIDS
GBDSur
vey
UNAIDS
Pre
vale
nce
(%)
Source
GBD
Survey
UNAIDS
HIV prevalence comparison to survey estimates by age−group wih 95% confidence intervalsBEN 2006 Males

15−19 20−24 25−29 30−34 35−39 40−44 45−49
0
1
2
3
4
GBDSur
vey
UNAIDS
GBDSur
vey
UNAIDS
GBDSur
vey
UNAIDS
GBDSur
vey
UNAIDS
GBDSur
vey
UNAIDS
GBDSur
vey
UNAIDS
GBDSur
vey
UNAIDS
Pre
vale
nce
(%)
Source
GBD
Survey
UNAIDS
HIV prevalence comparison to survey estimates by age−group wih 95% confidence intervalsBEN 2006 Females

15−19 20−24 25−29 30−34 35−39 40−44 45−49
0
1
2
3
GBDSur
vey
UNAIDS
GBDSur
vey
UNAIDS
GBDSur
vey
UNAIDS
GBDSur
vey
UNAIDS
GBDSur
vey
UNAIDS
GBDSur
vey
UNAIDS
GBDSur
vey
UNAIDS
Pre
vale
nce
(%)
Source
GBD
Survey
UNAIDS
HIV prevalence comparison to survey estimates by age−group wih 95% confidence intervalsBEN 2011−2012 Males

15−19 20−24 25−29 30−34 35−39 40−44 45−49
0
1
2
3
4
GBDSur
vey
UNAIDS
GBDSur
vey
UNAIDS
GBDSur
vey
UNAIDS
GBDSur
vey
UNAIDS
GBDSur
vey
UNAIDS
GBDSur
vey
UNAIDS
GBDSur
vey
UNAIDS
Pre
vale
nce
(%)
Source
GBD
Survey
UNAIDS
HIV prevalence comparison to survey estimates by age−group wih 95% confidence intervalsBEN 2011−2012 Females

15−19 20−24 25−29 30−34 35−39 40−44 45−49
0
2
4
6
8
GBDSur
vey
UNAIDS
GBDSur
vey
UNAIDS
GBDSur
vey
UNAIDS
GBDSur
vey
UNAIDS
GBDSur
vey
UNAIDS
GBDSur
vey
UNAIDS
GBDSur
vey
UNAIDS
Pre
vale
nce
(%)
Source
GBD
Survey
UNAIDS
HIV prevalence comparison to survey estimates by age−group wih 95% confidence intervalsBFA 2003 Males

15−19 20−24 25−29 30−34 35−39 40−44 45−49
0
2
4
6
GBDSur
vey
UNAIDS
GBDSur
vey
UNAIDS
GBDSur
vey
UNAIDS
GBDSur
vey
UNAIDS
GBDSur
vey
UNAIDS
GBDSur
vey
UNAIDS
GBDSur
vey
UNAIDS
Pre
vale
nce
(%)
Source
GBD
Survey
UNAIDS
HIV prevalence comparison to survey estimates by age−group wih 95% confidence intervalsBFA 2003 Females

15−19 20−24 25−29 30−34 35−39 40−44 45−49
0
1
2
3
GBDSur
vey
UNAIDS
GBDSur
vey
UNAIDS
GBDSur
vey
UNAIDS
GBDSur
vey
UNAIDS
GBDSur
vey
UNAIDS
GBDSur
vey
UNAIDS
GBDSur
vey
UNAIDS
Pre
vale
nce
(%)
Source
GBD
Survey
UNAIDS
HIV prevalence comparison to survey estimates by age−group wih 95% confidence intervalsBFA 2010 Males

15−19 20−24 25−29 30−34 35−39 40−44 45−49
0
1
2
3
GBDSur
vey
UNAIDS
GBDSur
vey
UNAIDS
GBDSur
vey
UNAIDS
GBDSur
vey
UNAIDS
GBDSur
vey
UNAIDS
GBDSur
vey
UNAIDS
GBDSur
vey
UNAIDS
Pre
vale
nce
(%)
Source
GBD
Survey
UNAIDS
HIV prevalence comparison to survey estimates by age−group wih 95% confidence intervalsBFA 2010 Females

15−19 20−24 25−29 30−34 35−39 40−44 45−49
0.0
2.5
5.0
7.5
10.0
12.5
GBDSur
vey
UNAIDS
GBDSur
vey
UNAIDS
GBDSur
vey
UNAIDS
GBDSur
vey
UNAIDS
GBDSur
vey
UNAIDS
GBDSur
vey
UNAIDS
GBDSur
vey
UNAIDS
Pre
vale
nce
(%)
Source
GBD
Survey
UNAIDS
HIV prevalence comparison to survey estimates by age−group wih 95% confidence intervalsCIV 2005 Males

15−19 20−24 25−29 30−34 35−39 40−44 45−49
0
5
10
15
20
GBDSur
vey
UNAIDS
GBDSur
vey
UNAIDS
GBDSur
vey
UNAIDS
GBDSur
vey
UNAIDS
GBDSur
vey
UNAIDS
GBDSur
vey
UNAIDS
GBDSur
vey
UNAIDS
Pre
vale
nce
(%)
Source
GBD
Survey
UNAIDS
HIV prevalence comparison to survey estimates by age−group wih 95% confidence intervalsCIV 2005 Females

15−19 20−24 25−29 30−34 35−39 40−44 45−49
0.0
2.5
5.0
7.5
10.0
12.5
GBDSur
vey
UNAIDS
GBDSur
vey
UNAIDS
GBDSur
vey
UNAIDS
GBDSur
vey
UNAIDS
GBDSur
vey
UNAIDS
GBDSur
vey
UNAIDS
GBDSur
vey
UNAIDS
Pre
vale
nce
(%)
Source
GBD
Survey
UNAIDS
HIV prevalence comparison to survey estimates by age−group wih 95% confidence intervalsCIV 2011−2012 Males

15−19 20−24 25−29 30−34 35−39 40−44 45−49
0.0
2.5
5.0
7.5
10.0
12.5
GBDSur
vey
UNAIDS
GBDSur
vey
UNAIDS
GBDSur
vey
UNAIDS
GBDSur
vey
UNAIDS
GBDSur
vey
UNAIDS
GBDSur
vey
UNAIDS
GBDSur
vey
UNAIDS
Pre
vale
nce
(%)
Source
GBD
Survey
UNAIDS
HIV prevalence comparison to survey estimates by age−group wih 95% confidence intervalsCIV 2011−2012 Females

15−19 20−24 25−29 30−34 35−39 40−44 45−49
0
3
6
9
12
GBDSur
vey
UNAIDS
GBDSur
vey
UNAIDS
GBDSur
vey
UNAIDS
GBDSur
vey
UNAIDS
GBDSur
vey
UNAIDS
GBDSur
vey
UNAIDS
GBDSur
vey
UNAIDS
Pre
vale
nce
(%)
Source
GBD
Survey
UNAIDS
HIV prevalence comparison to survey estimates by age−group wih 95% confidence intervalsCMR 2004 Males

15−19 20−24 25−29 30−34 35−39 40−44 45−49
0
5
10
GBDSur
vey
UNAIDS
GBDSur
vey
UNAIDS
GBDSur
vey
UNAIDS
GBDSur
vey
UNAIDS
GBDSur
vey
UNAIDS
GBDSur
vey
UNAIDS
GBDSur
vey
UNAIDS
Pre
vale
nce
(%)
Source
GBD
Survey
UNAIDS
HIV prevalence comparison to survey estimates by age−group wih 95% confidence intervalsCMR 2004 Females

15−19 20−24 25−29 30−34 35−39 40−44 45−49
0.0
2.5
5.0
7.5
GBDSur
vey
UNAIDS
GBDSur
vey
UNAIDS
GBDSur
vey
UNAIDS
GBDSur
vey
UNAIDS
GBDSur
vey
UNAIDS
GBDSur
vey
UNAIDS
GBDSur
vey
UNAIDS
Pre
vale
nce
(%)
Source
GBD
Survey
UNAIDS
HIV prevalence comparison to survey estimates by age−group wih 95% confidence intervalsCMR 2011 Males

15−19 20−24 25−29 30−34 35−39 40−44 45−49
0
5
10
GBDSur
vey
UNAIDS
GBDSur
vey
UNAIDS
GBDSur
vey
UNAIDS
GBDSur
vey
UNAIDS
GBDSur
vey
UNAIDS
GBDSur
vey
UNAIDS
GBDSur
vey
UNAIDS
Pre
vale
nce
(%)
Source
GBD
Survey
UNAIDS
HIV prevalence comparison to survey estimates by age−group wih 95% confidence intervalsCMR 2011 Females

15−19 20−24 25−29 30−34 35−39 40−44 45−49
0
1
2
3
GBDSur
vey
UNAIDS
GBDSur
vey
UNAIDS
GBDSur
vey
UNAIDS
GBDSur
vey
UNAIDS
GBDSur
vey
UNAIDS
GBDSur
vey
UNAIDS
GBDSur
vey
UNAIDS
Pre
vale
nce
(%)
Source
GBD
Survey
UNAIDS
HIV prevalence comparison to survey estimates by age−group wih 95% confidence intervalsCOD 2007 Males

15−19 20−24 25−29 30−34 35−39 40−44 45−49
0
2
4
6
GBDSur
vey
UNAIDS
GBDSur
vey
UNAIDS
GBDSur
vey
UNAIDS
GBDSur
vey
UNAIDS
GBDSur
vey
UNAIDS
GBDSur
vey
UNAIDS
GBDSur
vey
UNAIDS
Pre
vale
nce
(%)
Source
GBD
Survey
UNAIDS
HIV prevalence comparison to survey estimates by age−group wih 95% confidence intervalsCOD 2007 Females

15−19 20−24 25−29 30−34 35−39 40−44 45−49
0
2
4
6
8
GBDSur
vey
UNAIDS
GBDSur
vey
UNAIDS
GBDSur
vey
UNAIDS
GBDSur
vey
UNAIDS
GBDSur
vey
UNAIDS
GBDSur
vey
UNAIDS
GBDSur
vey
UNAIDS
Pre
vale
nce
(%)
Source
GBD
Survey
UNAIDS
HIV prevalence comparison to survey estimates by age−group wih 95% confidence intervalsCOG 2009 Males

15−19 20−24 25−29 30−34 35−39 40−44 45−49
0.0
2.5
5.0
7.5
GBDSur
vey
UNAIDS
GBDSur
vey
UNAIDS
GBDSur
vey
UNAIDS
GBDSur
vey
UNAIDS
GBDSur
vey
UNAIDS
GBDSur
vey
UNAIDS
GBDSur
vey
UNAIDS
Pre
vale
nce
(%)
Source
GBD
Survey
UNAIDS
HIV prevalence comparison to survey estimates by age−group wih 95% confidence intervalsCOG 2009 Females

15−19 20−24 25−29 30−34 35−39 40−44 45−49
0.0
2.5
5.0
7.5
10.0
GBDSur
vey
UNAIDS
GBDSur
vey
UNAIDS
GBDSur
vey
UNAIDS
GBDSur
vey
UNAIDS
GBDSur
vey
UNAIDS
GBDSur
vey
UNAIDS
GBDSur
vey
UNAIDS
Pre
vale
nce
(%)
Source
GBD
Survey
UNAIDS
HIV prevalence comparison to survey estimates by age−group wih 95% confidence intervalsCPV 2005 Males

15−19 20−24 25−29 30−34 35−39 40−44 45−49
0
1
2
3
GBDSur
vey
UNAIDS
GBDSur
vey
UNAIDS
GBDSur
vey
UNAIDS
GBDSur
vey
UNAIDS
GBDSur
vey
UNAIDS
GBDSur
vey
UNAIDS
GBDSur
vey
UNAIDS
Pre
vale
nce
(%)
Source
GBD
Survey
UNAIDS
HIV prevalence comparison to survey estimates by age−group wih 95% confidence intervalsCPV 2005 Females

15−19 20−24 25−29 30−34 35−39 40−44 45−49
0
1
2
3
4
GBDSur
vey
UNAIDS
GBDSur
vey
UNAIDS
GBDSur
vey
UNAIDS
GBDSur
vey
UNAIDS
GBDSur
vey
UNAIDS
GBDSur
vey
UNAIDS
GBDSur
vey
UNAIDS
Pre
vale
nce
(%)
Source
GBD
Survey
UNAIDS
HIV prevalence comparison to survey estimates by age−group wih 95% confidence intervalsDOM 2002 Males

15−19 20−24 25−29 30−34 35−39 40−44 45−49
0
1
2
GBDSur
vey
UNAIDS
GBDSur
vey
UNAIDS
GBDSur
vey
UNAIDS
GBDSur
vey
UNAIDS
GBDSur
vey
UNAIDS
GBDSur
vey
UNAIDS
GBDSur
vey
UNAIDS
Pre
vale
nce
(%)
Source
GBD
Survey
UNAIDS
HIV prevalence comparison to survey estimates by age−group wih 95% confidence intervalsDOM 2002 Females

15−19 20−24 25−29 30−34 35−39 40−44 45−49
0.0
0.5
1.0
1.5
2.0
GBDSur
vey
UNAIDS
GBDSur
vey
UNAIDS
GBDSur
vey
UNAIDS
GBDSur
vey
UNAIDS
GBDSur
vey
UNAIDS
GBDSur
vey
UNAIDS
GBDSur
vey
UNAIDS
Pre
vale
nce
(%)
Source
GBD
Survey
UNAIDS
HIV prevalence comparison to survey estimates by age−group wih 95% confidence intervalsDOM 2007 Males

15−19 20−24 25−29 30−34 35−39 40−44 45−49
0.0
0.5
1.0
1.5
2.0
GBDSur
vey
UNAIDS
GBDSur
vey
UNAIDS
GBDSur
vey
UNAIDS
GBDSur
vey
UNAIDS
GBDSur
vey
UNAIDS
GBDSur
vey
UNAIDS
GBDSur
vey
UNAIDS
Pre
vale
nce
(%)
Source
GBD
Survey
UNAIDS
HIV prevalence comparison to survey estimates by age−group wih 95% confidence intervalsDOM 2007 Females

15−19 20−24 25−29 30−34 35−39 40−44 45−49
0
2
4
6
GBDSur
vey
UNAIDS
GBDSur
vey
UNAIDS
GBDSur
vey
UNAIDS
GBDSur
vey
UNAIDS
GBDSur
vey
UNAIDS
GBDSur
vey
UNAIDS
GBDSur
vey
UNAIDS
Pre
vale
nce
(%)
Source
GBD
Survey
UNAIDS
HIV prevalence comparison to survey estimates by age−group wih 95% confidence intervalsETH 2005 Males

15−19 20−24 25−29 30−34 35−39 40−44 45−49
0
2
4
6
GBDSur
vey
UNAIDS
GBDSur
vey
UNAIDS
GBDSur
vey
UNAIDS
GBDSur
vey
UNAIDS
GBDSur
vey
UNAIDS
GBDSur
vey
UNAIDS
GBDSur
vey
UNAIDS
Pre
vale
nce
(%)
Source
GBD
Survey
UNAIDS
HIV prevalence comparison to survey estimates by age−group wih 95% confidence intervalsETH 2005 Females

15−19 20−24 25−29 30−34 35−39 40−44 45−49
0
1
2
3
4
5
GBDSur
vey
UNAIDS
GBDSur
vey
UNAIDS
GBDSur
vey
UNAIDS
GBDSur
vey
UNAIDS
GBDSur
vey
UNAIDS
GBDSur
vey
UNAIDS
GBDSur
vey
UNAIDS
Pre
vale
nce
(%)
Source
GBD
Survey
UNAIDS
HIV prevalence comparison to survey estimates by age−group wih 95% confidence intervalsETH 2011 Males

15−19 20−24 25−29 30−34 35−39 40−44 45−49
0
2
4
GBDSur
vey
UNAIDS
GBDSur
vey
UNAIDS
GBDSur
vey
UNAIDS
GBDSur
vey
UNAIDS
GBDSur
vey
UNAIDS
GBDSur
vey
UNAIDS
GBDSur
vey
UNAIDS
Pre
vale
nce
(%)
Source
GBD
Survey
UNAIDS
HIV prevalence comparison to survey estimates by age−group wih 95% confidence intervalsETH 2011 Females

15−19 20−24 25−29 30−34 35−39 40−44 45−49
0
5
10
15
GBDSur
vey
UNAIDS
GBDSur
vey
UNAIDS
GBDSur
vey
UNAIDS
GBDSur
vey
UNAIDS
GBDSur
vey
UNAIDS
GBDSur
vey
UNAIDS
GBDSur
vey
UNAIDS
Pre
vale
nce
(%)
Source
GBD
Survey
UNAIDS
HIV prevalence comparison to survey estimates by age−group wih 95% confidence intervalsGAB 2012 Males

15−19 20−24 25−29 30−34 35−39 40−44 45−49
0.0
2.5
5.0
7.5
10.0
12.5
GBDSur
vey
UNAIDS
GBDSur
vey
UNAIDS
GBDSur
vey
UNAIDS
GBDSur
vey
UNAIDS
GBDSur
vey
UNAIDS
GBDSur
vey
UNAIDS
GBDSur
vey
UNAIDS
Pre
vale
nce
(%)
Source
GBD
Survey
UNAIDS
HIV prevalence comparison to survey estimates by age−group wih 95% confidence intervalsGAB 2012 Females

15−19 25−29 30−34 35−39 40−44 45−49
0
2
4
6
GBDSur
vey
UNAIDS
GBDSur
vey
UNAIDS
GBDSur
vey
UNAIDS
GBDSur
vey
UNAIDS
GBDSur
vey
UNAIDS
GBDSur
vey
UNAIDS
Pre
vale
nce
(%)
Source
GBD
Survey
UNAIDS
HIV prevalence comparison to survey estimates by age−group wih 95% confidence intervalsGHA 2003 Males

15−19 20−24 25−29 30−34 35−39 40−44 45−49
0
2
4
6
GBDSur
vey
UNAIDS
GBDSur
vey
UNAIDS
GBDSur
vey
UNAIDS
GBDSur
vey
UNAIDS
GBDSur
vey
UNAIDS
GBDSur
vey
UNAIDS
GBDSur
vey
UNAIDS
Pre
vale
nce
(%)
Source
GBD
Survey
UNAIDS
HIV prevalence comparison to survey estimates by age−group wih 95% confidence intervalsGHA 2003 Females

15−19 20−24 25−29 30−34 35−39 40−44 45−49
0
2
4
6
GBDSur
vey
UNAIDS
GBDSur
vey
UNAIDS
GBDSur
vey
UNAIDS
GBDSur
vey
UNAIDS
GBDSur
vey
UNAIDS
GBDSur
vey
UNAIDS
GBDSur
vey
UNAIDS
Pre
vale
nce
(%)
Source
GBD
Survey
UNAIDS
HIV prevalence comparison to survey estimates by age−group wih 95% confidence intervalsGIN 2005 Males

15−19 20−24 25−29 30−34 35−39 40−44 45−49
0
2
4
6
GBDSur
vey
UNAIDS
GBDSur
vey
UNAIDS
GBDSur
vey
UNAIDS
GBDSur
vey
UNAIDS
GBDSur
vey
UNAIDS
GBDSur
vey
UNAIDS
GBDSur
vey
UNAIDS
Pre
vale
nce
(%)
Source
GBD
Survey
UNAIDS
HIV prevalence comparison to survey estimates by age−group wih 95% confidence intervalsGIN 2005 Females

15−19 20−24 25−29 30−34 35−39 40−44 45−49
0
1
2
3
4
5
GBDSur
vey
UNAIDS
GBDSur
vey
UNAIDS
GBDSur
vey
UNAIDS
GBDSur
vey
UNAIDS
GBDSur
vey
UNAIDS
GBDSur
vey
UNAIDS
GBDSur
vey
UNAIDS
Pre
vale
nce
(%)
Source
GBD
Survey
UNAIDS
HIV prevalence comparison to survey estimates by age−group wih 95% confidence intervalsGIN 2012 Males

15−19 20−24 25−29 30−34 35−39 40−44 45−49
0
2
4
GBDSur
vey
UNAIDS
GBDSur
vey
UNAIDS
GBDSur
vey
UNAIDS
GBDSur
vey
UNAIDS
GBDSur
vey
UNAIDS
GBDSur
vey
UNAIDS
GBDSur
vey
UNAIDS
Pre
vale
nce
(%)
Source
GBD
Survey
UNAIDS
HIV prevalence comparison to survey estimates by age−group wih 95% confidence intervalsGIN 2012 Females

15−19 20−24 25−29 30−34 35−39 40−44 45−49
0
5
10
15
GBDSur
vey
UNAIDS
GBDSur
vey
UNAIDS
GBDSur
vey
UNAIDS
GBDSur
vey
UNAIDS
GBDSur
vey
UNAIDS
GBDSur
vey
UNAIDS
GBDSur
vey
UNAIDS
Pre
vale
nce
(%)
Source
GBD
Survey
UNAIDS
HIV prevalence comparison to survey estimates by age−group wih 95% confidence intervalsGNQ 2011 Males

15−19 20−24 25−29 30−34 35−39 40−44 45−49
0
5
10
15
20
GBDSur
vey
UNAIDS
GBDSur
vey
UNAIDS
GBDSur
vey
UNAIDS
GBDSur
vey
UNAIDS
GBDSur
vey
UNAIDS
GBDSur
vey
UNAIDS
GBDSur
vey
UNAIDS
Pre
vale
nce
(%)
Source
GBD
Survey
UNAIDS
HIV prevalence comparison to survey estimates by age−group wih 95% confidence intervalsGNQ 2011 Females

15−19 20−24 25−29 30−34 35−39 40−44 45−49
0
2
4
6
GBDSur
vey
UNAIDS
GBDSur
vey
UNAIDS
GBDSur
vey
UNAIDS
GBDSur
vey
UNAIDS
GBDSur
vey
UNAIDS
GBDSur
vey
UNAIDS
GBDSur
vey
UNAIDS
Pre
vale
nce
(%)
Source
GBD
Survey
UNAIDS
HIV prevalence comparison to survey estimates by age−group wih 95% confidence intervalsHTI 2005−2006 Males

15−19 20−24 25−29 30−34 35−39 40−44 45−49
0
2
4
6
GBDSur
vey
UNAIDS
GBDSur
vey
UNAIDS
GBDSur
vey
UNAIDS
GBDSur
vey
UNAIDS
GBDSur
vey
UNAIDS
GBDSur
vey
UNAIDS
GBDSur
vey
UNAIDS
Pre
vale
nce
(%)
Source
GBD
Survey
UNAIDS
HIV prevalence comparison to survey estimates by age−group wih 95% confidence intervalsHTI 2005−2006 Females

15−19 20−24 25−29 30−34 35−39 40−44 45−49
0
2
4
6
GBDSur
vey
UNAIDS
GBDSur
vey
UNAIDS
GBDSur
vey
UNAIDS
GBDSur
vey
UNAIDS
GBDSur
vey
UNAIDS
GBDSur
vey
UNAIDS
GBDSur
vey
UNAIDS
Pre
vale
nce
(%)
Source
GBD
Survey
UNAIDS
HIV prevalence comparison to survey estimates by age−group wih 95% confidence intervalsHTI 2012 Males

15−19 20−24 25−29 30−34 35−39 40−44 45−49
0
2
4
6
GBDSur
vey
UNAIDS
GBDSur
vey
UNAIDS
GBDSur
vey
UNAIDS
GBDSur
vey
UNAIDS
GBDSur
vey
UNAIDS
GBDSur
vey
UNAIDS
GBDSur
vey
UNAIDS
Pre
vale
nce
(%)
Source
GBD
Survey
UNAIDS
HIV prevalence comparison to survey estimates by age−group wih 95% confidence intervalsHTI 2012 Females

15−19 20−24 25−29 30−34 35−39 40−44 45−49
0.00
0.25
0.50
0.75
GBDSur
vey
UNAIDS
GBDSur
vey
UNAIDS
GBDSur
vey
UNAIDS
GBDSur
vey
UNAIDS
GBDSur
vey
UNAIDS
GBDSur
vey
UNAIDS
GBDSur
vey
UNAIDS
Pre
vale
nce
(%)
Source
GBD
Survey
UNAIDS
HIV prevalence comparison to survey estimates by age−group wih 95% confidence intervalsIND 2005−2006 Males

15−19 20−24 25−29 30−34 35−39 40−44 45−49
0.0
0.2
0.4
0.6
GBDSur
vey
UNAIDS
GBDSur
vey
UNAIDS
GBDSur
vey
UNAIDS
GBDSur
vey
UNAIDS
GBDSur
vey
UNAIDS
GBDSur
vey
UNAIDS
GBDSur
vey
UNAIDS
Pre
vale
nce
(%)
Source
GBD
Survey
UNAIDS
HIV prevalence comparison to survey estimates by age−group wih 95% confidence intervalsIND 2005−2006 Females

15−19 20−24 25−29 30−34 35−39 40−44 45−49
0
5
10
15
GBDSur
vey
UNAIDS
GBDSur
vey
UNAIDS
GBDSur
vey
UNAIDS
GBDSur
vey
UNAIDS
GBDSur
vey
UNAIDS
GBDSur
vey
UNAIDS
GBDSur
vey
UNAIDS
Pre
vale
nce
(%)
Source
GBD
Survey
UNAIDS
HIV prevalence comparison to survey estimates by age−group wih 95% confidence intervalsKEN 2003 Males

15−19 20−24 25−29 30−34 35−39 40−44 45−49
0
5
10
15
GBDSur
vey
UNAIDS
GBDSur
vey
UNAIDS
GBDSur
vey
UNAIDS
GBDSur
vey
UNAIDS
GBDSur
vey
UNAIDS
GBDSur
vey
UNAIDS
GBDSur
vey
UNAIDS
Pre
vale
nce
(%)
Source
GBD
Survey
UNAIDS
HIV prevalence comparison to survey estimates by age−group wih 95% confidence intervalsKEN 2003 Females

15−19 20−24 25−29 30−34 35−39 40−44 45−49
0
5
10
15
GBDSur
vey
UNAIDS
GBDSur
vey
UNAIDS
GBDSur
vey
UNAIDS
GBDSur
vey
UNAIDS
GBDSur
vey
UNAIDS
GBDSur
vey
UNAIDS
GBDSur
vey
UNAIDS
Pre
vale
nce
(%)
Source
GBD
Survey
UNAIDS
HIV prevalence comparison to survey estimates by age−group wih 95% confidence intervalsKEN 2009 Males

15−19 20−24 25−29 30−34 35−39 40−44 45−49
0
5
10
15
20
GBDSur
vey
UNAIDS
GBDSur
vey
UNAIDS
GBDSur
vey
UNAIDS
GBDSur
vey
UNAIDS
GBDSur
vey
UNAIDS
GBDSur
vey
UNAIDS
GBDSur
vey
UNAIDS
Pre
vale
nce
(%)
Source
GBD
Survey
UNAIDS
HIV prevalence comparison to survey estimates by age−group wih 95% confidence intervalsKEN 2009 Females

15−19 20−24 25−29 30−34 35−39 40−44 45−49
0
2
4
6
GBDSur
vey
UNAIDS
GBDSur
vey
UNAIDS
GBDSur
vey
UNAIDS
GBDSur
vey
UNAIDS
GBDSur
vey
UNAIDS
GBDSur
vey
UNAIDS
GBDSur
vey
UNAIDS
Pre
vale
nce
(%)
Source
GBD
Survey
UNAIDS
HIV prevalence comparison to survey estimates by age−group wih 95% confidence intervalsKHM 2005 Males

15−19 20−24 25−29 30−34 35−39 40−44 45−49
0
2
4
6
8
GBDSur
vey
UNAIDS
GBDSur
vey
UNAIDS
GBDSur
vey
UNAIDS
GBDSur
vey
UNAIDS
GBDSur
vey
UNAIDS
GBDSur
vey
UNAIDS
GBDSur
vey
UNAIDS
Pre
vale
nce
(%)
Source
GBD
Survey
UNAIDS
HIV prevalence comparison to survey estimates by age−group wih 95% confidence intervalsKHM 2005 Females

15−19 20−24 25−29 30−34 35−39 40−44 45−49
0
1
2
3
GBDSur
vey
UNAIDS
GBDSur
vey
UNAIDS
GBDSur
vey
UNAIDS
GBDSur
vey
UNAIDS
GBDSur
vey
UNAIDS
GBDSur
vey
UNAIDS
GBDSur
vey
UNAIDS
Pre
vale
nce
(%)
Source
GBD
Survey
UNAIDS
HIV prevalence comparison to survey estimates by age−group wih 95% confidence intervalsLBR 2007 Males

15−19 20−24 25−29 30−34 35−39 40−44 45−49
0
1
2
3
4
GBDSur
vey
UNAIDS
GBDSur
vey
UNAIDS
GBDSur
vey
UNAIDS
GBDSur
vey
UNAIDS
GBDSur
vey
UNAIDS
GBDSur
vey
UNAIDS
GBDSur
vey
UNAIDS
Pre
vale
nce
(%)
Source
GBD
Survey
UNAIDS
HIV prevalence comparison to survey estimates by age−group wih 95% confidence intervalsLBR 2007 Females

15−19 20−24 25−29 30−34 35−39 40−44 45−49
0
10
20
30
40
50
GBDSur
vey
UNAIDS
GBDSur
vey
UNAIDS
GBDSur
vey
UNAIDS
GBDSur
vey
UNAIDS
GBDSur
vey
UNAIDS
GBDSur
vey
UNAIDS
GBDSur
vey
UNAIDS
Pre
vale
nce
(%)
Source
GBD
Survey
UNAIDS
HIV prevalence comparison to survey estimates by age−group wih 95% confidence intervalsLSO 2003 Males

15−19 20−24 25−29 30−34 35−39 40−44 45−49
0
20
40
60
GBDSur
vey
UNAIDS
GBDSur
vey
UNAIDS
GBDSur
vey
UNAIDS
GBDSur
vey
UNAIDS
GBDSur
vey
UNAIDS
GBDSur
vey
UNAIDS
GBDSur
vey
UNAIDS
Pre
vale
nce
(%)
Source
GBD
Survey
UNAIDS
HIV prevalence comparison to survey estimates by age−group wih 95% confidence intervalsLSO 2003 Females

15−19 20−24 25−29 30−34 35−39 40−44 45−49
0
20
40
GBDSur
vey
UNAIDS
GBDSur
vey
UNAIDS
GBDSur
vey
UNAIDS
GBDSur
vey
UNAIDS
GBDSur
vey
UNAIDS
GBDSur
vey
UNAIDS
GBDSur
vey
UNAIDS
Pre
vale
nce
(%)
Source
GBD
Survey
UNAIDS
HIV prevalence comparison to survey estimates by age−group wih 95% confidence intervalsLSO 2009 Males

15−19 20−24 25−29 30−34 35−39 40−44 45−49
0
20
40
60
GBDSur
vey
UNAIDS
GBDSur
vey
UNAIDS
GBDSur
vey
UNAIDS
GBDSur
vey
UNAIDS
GBDSur
vey
UNAIDS
GBDSur
vey
UNAIDS
GBDSur
vey
UNAIDS
Pre
vale
nce
(%)
Source
GBD
Survey
UNAIDS
HIV prevalence comparison to survey estimates by age−group wih 95% confidence intervalsLSO 2009 Females

15−19 20−24 25−29 30−34 35−39 40−44 45−49
0
2
4
6
GBDSur
vey
UNAIDS
GBDSur
vey
UNAIDS
GBDSur
vey
UNAIDS
GBDSur
vey
UNAIDS
GBDSur
vey
UNAIDS
GBDSur
vey
UNAIDS
GBDSur
vey
UNAIDS
Pre
vale
nce
(%)
Source
GBD
Survey
UNAIDS
HIV prevalence comparison to survey estimates by age−group wih 95% confidence intervalsMLI 2001 Males

15−19 20−24 25−29 30−34 35−39 40−44 45−49
0
2
4
GBDSur
vey
UNAIDS
GBDSur
vey
UNAIDS
GBDSur
vey
UNAIDS
GBDSur
vey
UNAIDS
GBDSur
vey
UNAIDS
GBDSur
vey
UNAIDS
GBDSur
vey
UNAIDS
Pre
vale
nce
(%)
Source
GBD
Survey
UNAIDS
HIV prevalence comparison to survey estimates by age−group wih 95% confidence intervalsMLI 2001 Females

15−19 20−24 25−29 30−34 35−39 40−44 45−49
0
2
4
GBDSur
vey
UNAIDS
GBDSur
vey
UNAIDS
GBDSur
vey
UNAIDS
GBDSur
vey
UNAIDS
GBDSur
vey
UNAIDS
GBDSur
vey
UNAIDS
GBDSur
vey
UNAIDS
Pre
vale
nce
(%)
Source
GBD
Survey
UNAIDS
HIV prevalence comparison to survey estimates by age−group wih 95% confidence intervalsMLI 2006 Males

15−19 20−24 25−29 30−34 35−39 40−44 45−49
0
1
2
3
4
GBDSur
vey
UNAIDS
GBDSur
vey
UNAIDS
GBDSur
vey
UNAIDS
GBDSur
vey
UNAIDS
GBDSur
vey
UNAIDS
GBDSur
vey
UNAIDS
GBDSur
vey
UNAIDS
Pre
vale
nce
(%)
Source
GBD
Survey
UNAIDS
HIV prevalence comparison to survey estimates by age−group wih 95% confidence intervalsMLI 2006 Females

15−19 20−24 25−29 30−34 35−39 40−44 45−49
0
5
10
15
20
GBDSur
vey
UNAIDS
GBDSur
vey
UNAIDS
GBDSur
vey
UNAIDS
GBDSur
vey
UNAIDS
GBDSur
vey
UNAIDS
GBDSur
vey
UNAIDS
GBDSur
vey
UNAIDS
Pre
vale
nce
(%)
Source
GBD
Survey
UNAIDS
HIV prevalence comparison to survey estimates by age−group wih 95% confidence intervalsMOZ 2009 Males

15−19 20−24 25−29 30−34 35−39 40−44 45−49
0
5
10
15
20
GBDSur
vey
UNAIDS
GBDSur
vey
UNAIDS
GBDSur
vey
UNAIDS
GBDSur
vey
UNAIDS
GBDSur
vey
UNAIDS
GBDSur
vey
UNAIDS
GBDSur
vey
UNAIDS
Pre
vale
nce
(%)
Source
GBD
Survey
UNAIDS
HIV prevalence comparison to survey estimates by age−group wih 95% confidence intervalsMOZ 2009 Females

15−19 20−24 25−29 30−34 35−39 40−44 45−49
0
10
20
30
GBDSur
vey
UNAIDS
GBDSur
vey
UNAIDS
GBDSur
vey
UNAIDS
GBDSur
vey
UNAIDS
GBDSur
vey
UNAIDS
GBDSur
vey
UNAIDS
GBDSur
vey
UNAIDS
Pre
vale
nce
(%)
Source
GBD
Survey
UNAIDS
HIV prevalence comparison to survey estimates by age−group wih 95% confidence intervalsMWI 2004 Males

15−19 20−24 25−29 30−34 35−39 40−44 45−49
0
10
20
30
GBDSur
vey
UNAIDS
GBDSur
vey
UNAIDS
GBDSur
vey
UNAIDS
GBDSur
vey
UNAIDS
GBDSur
vey
UNAIDS
GBDSur
vey
UNAIDS
GBDSur
vey
UNAIDS
Pre
vale
nce
(%)
Source
GBD
Survey
UNAIDS
HIV prevalence comparison to survey estimates by age−group wih 95% confidence intervalsMWI 2004 Females

15−19 20−24 25−29 30−34 35−39 40−44 45−49
0
10
20
GBDSur
vey
UNAIDS
GBDSur
vey
UNAIDS
GBDSur
vey
UNAIDS
GBDSur
vey
UNAIDS
GBDSur
vey
UNAIDS
GBDSur
vey
UNAIDS
GBDSur
vey
UNAIDS
Pre
vale
nce
(%)
Source
GBD
Survey
UNAIDS
HIV prevalence comparison to survey estimates by age−group wih 95% confidence intervalsMWI 2010 Males

15−19 20−24 25−29 30−34 35−39 40−44 45−49
0
10
20
30
GBDSur
vey
UNAIDS
GBDSur
vey
UNAIDS
GBDSur
vey
UNAIDS
GBDSur
vey
UNAIDS
GBDSur
vey
UNAIDS
GBDSur
vey
UNAIDS
GBDSur
vey
UNAIDS
Pre
vale
nce
(%)
Source
GBD
Survey
UNAIDS
HIV prevalence comparison to survey estimates by age−group wih 95% confidence intervalsMWI 2010 Females

20−24 25−29 30−34 35−39 40−44 45−49
0
2
4
GBDSur
vey
UNAIDS
GBDSur
vey
UNAIDS
GBDSur
vey
UNAIDS
GBDSur
vey
UNAIDS
GBDSur
vey
UNAIDS
GBDSur
vey
UNAIDS
Pre
vale
nce
(%)
Source
GBD
Survey
UNAIDS
HIV prevalence comparison to survey estimates by age−group wih 95% confidence intervalsNER 2006 Males

20−24 25−29 30−34 35−39 40−44 45−49
0
1
2
3
4
GBDSur
vey
UNAIDS
GBDSur
vey
UNAIDS
GBDSur
vey
UNAIDS
GBDSur
vey
UNAIDS
GBDSur
vey
UNAIDS
GBDSur
vey
UNAIDS
Pre
vale
nce
(%)
Source
GBD
Survey
UNAIDS
HIV prevalence comparison to survey estimates by age−group wih 95% confidence intervalsNER 2006 Females

15−19 20−24 25−29 30−34 35−39 40−44 45−49
0.0
0.5
1.0
1.5
2.0
2.5
GBDSur
vey
UNAIDS
GBDSur
vey
UNAIDS
GBDSur
vey
UNAIDS
GBDSur
vey
UNAIDS
GBDSur
vey
UNAIDS
GBDSur
vey
UNAIDS
GBDSur
vey
UNAIDS
Pre
vale
nce
(%)
Source
GBD
Survey
UNAIDS
HIV prevalence comparison to survey estimates by age−group wih 95% confidence intervalsNER 2012 Males

15−19 20−24 25−29 30−34 35−39 40−44 45−49
0.0
0.5
1.0
1.5
2.0
GBDSur
vey
UNAIDS
GBDSur
vey
UNAIDS
GBDSur
vey
UNAIDS
GBDSur
vey
UNAIDS
GBDSur
vey
UNAIDS
GBDSur
vey
UNAIDS
GBDSur
vey
UNAIDS
Pre
vale
nce
(%)
Source
GBD
Survey
UNAIDS
HIV prevalence comparison to survey estimates by age−group wih 95% confidence intervalsNER 2012 Females

15−19 20−24 25−29 30−34 35−39 40−44 45−49
0
3
6
9
GBDSur
vey
UNAIDS
GBDSur
vey
UNAIDS
GBDSur
vey
UNAIDS
GBDSur
vey
UNAIDS
GBDSur
vey
UNAIDS
GBDSur
vey
UNAIDS
GBDSur
vey
UNAIDS
Pre
vale
nce
(%)
Source
GBD
Survey
UNAIDS
HIV prevalence comparison to survey estimates by age−group wih 95% confidence intervalsRWA 2005 Males

15−19 20−24 25−29 30−34 35−39 40−44 45−49
0.0
2.5
5.0
7.5
10.0
GBDSur
vey
UNAIDS
GBDSur
vey
UNAIDS
GBDSur
vey
UNAIDS
GBDSur
vey
UNAIDS
GBDSur
vey
UNAIDS
GBDSur
vey
UNAIDS
GBDSur
vey
UNAIDS
Pre
vale
nce
(%)
Source
GBD
Survey
UNAIDS
HIV prevalence comparison to survey estimates by age−group wih 95% confidence intervalsRWA 2005 Females

15−19 20−24 25−29 30−34 35−39 40−44 45−49
0.0
2.5
5.0
7.5
10.0
GBDSur
vey
UNAIDS
GBDSur
vey
UNAIDS
GBDSur
vey
UNAIDS
GBDSur
vey
UNAIDS
GBDSur
vey
UNAIDS
GBDSur
vey
UNAIDS
GBDSur
vey
UNAIDS
Pre
vale
nce
(%)
Source
GBD
Survey
UNAIDS
HIV prevalence comparison to survey estimates by age−group wih 95% confidence intervalsRWA 2010 Males

15−19 20−24 25−29 30−34 35−39 40−44 45−49
0.0
2.5
5.0
7.5
10.0
GBDSur
vey
UNAIDS
GBDSur
vey
UNAIDS
GBDSur
vey
UNAIDS
GBDSur
vey
UNAIDS
GBDSur
vey
UNAIDS
GBDSur
vey
UNAIDS
GBDSur
vey
UNAIDS
Pre
vale
nce
(%)
Source
GBD
Survey
UNAIDS
HIV prevalence comparison to survey estimates by age−group wih 95% confidence intervalsRWA 2010 Females

20−24 30−34 35−39 40−44 45−49
0
2
4
6
GBDSur
vey
UNAIDS
GBDSur
vey
UNAIDS
GBDSur
vey
UNAIDS
GBDSur
vey
UNAIDS
GBDSur
vey
UNAIDS
Pre
vale
nce
(%)
Source
GBD
Survey
UNAIDS
HIV prevalence comparison to survey estimates by age−group wih 95% confidence intervalsSEN 2005 Males

15−19 20−24 25−29 30−34 35−39 40−44 45−49
0
1
2
3
4
GBDSur
vey
UNAIDS
GBDSur
vey
UNAIDS
GBDSur
vey
UNAIDS
GBDSur
vey
UNAIDS
GBDSur
vey
UNAIDS
GBDSur
vey
UNAIDS
GBDSur
vey
UNAIDS
Pre
vale
nce
(%)
Source
GBD
Survey
UNAIDS
HIV prevalence comparison to survey estimates by age−group wih 95% confidence intervalsSEN 2005 Females

20−24 25−29 30−34 35−39 40−44 45−49
0
2
4
6
GBDSur
vey
UNAIDS
GBDSur
vey
UNAIDS
GBDSur
vey
UNAIDS
GBDSur
vey
UNAIDS
GBDSur
vey
UNAIDS
GBDSur
vey
UNAIDS
Pre
vale
nce
(%)
Source
GBD
Survey
UNAIDS
HIV prevalence comparison to survey estimates by age−group wih 95% confidence intervalsSEN 2011 Males

15−19 20−24 25−29 30−34 35−39 40−44 45−49
0
1
2
3
4
GBDSur
vey
UNAIDS
GBDSur
vey
UNAIDS
GBDSur
vey
UNAIDS
GBDSur
vey
UNAIDS
GBDSur
vey
UNAIDS
GBDSur
vey
UNAIDS
GBDSur
vey
UNAIDS
Pre
vale
nce
(%)
Source
GBD
Survey
UNAIDS
HIV prevalence comparison to survey estimates by age−group wih 95% confidence intervalsSEN 2011 Females

20−24 25−29 30−34 35−39 40−44 45−49
0
2
4
GBDSur
vey
UNAIDS
GBDSur
vey
UNAIDS
GBDSur
vey
UNAIDS
GBDSur
vey
UNAIDS
GBDSur
vey
UNAIDS
GBDSur
vey
UNAIDS
Pre
vale
nce
(%)
Source
GBD
Survey
UNAIDS
HIV prevalence comparison to survey estimates by age−group wih 95% confidence intervalsSLE 2008 Males

15−19 20−24 25−29 30−34 35−39 40−44 45−49
0
2
4
6
GBDSur
vey
UNAIDS
GBDSur
vey
UNAIDS
GBDSur
vey
UNAIDS
GBDSur
vey
UNAIDS
GBDSur
vey
UNAIDS
GBDSur
vey
UNAIDS
GBDSur
vey
UNAIDS
Pre
vale
nce
(%)
Source
GBD
Survey
UNAIDS
HIV prevalence comparison to survey estimates by age−group wih 95% confidence intervalsSLE 2008 Females

15−19 20−24 25−29 30−34 35−39 40−44 45−49
0
3
6
9
GBDSur
vey
UNAIDS
GBDSur
vey
UNAIDS
GBDSur
vey
UNAIDS
GBDSur
vey
UNAIDS
GBDSur
vey
UNAIDS
GBDSur
vey
UNAIDS
GBDSur
vey
UNAIDS
Pre
vale
nce
(%)
Source
GBD
Survey
UNAIDS
HIV prevalence comparison to survey estimates by age−group wih 95% confidence intervalsSTP 2008−2009 Males

15−19 20−24 25−29 30−34 35−39 40−44 45−49
0
2
4
GBDSur
vey
UNAIDS
GBDSur
vey
UNAIDS
GBDSur
vey
UNAIDS
GBDSur
vey
UNAIDS
GBDSur
vey
UNAIDS
GBDSur
vey
UNAIDS
GBDSur
vey
UNAIDS
Pre
vale
nce
(%)
Source
GBD
Survey
UNAIDS
HIV prevalence comparison to survey estimates by age−group wih 95% confidence intervalsSTP 2008−2009 Females

15−19 20−24 25−29 30−34 35−39 40−44 45−49
0
10
20
30
40
50
GBDSur
vey
UNAIDS
GBDSur
vey
UNAIDS
GBDSur
vey
UNAIDS
GBDSur
vey
UNAIDS
GBDSur
vey
UNAIDS
GBDSur
vey
UNAIDS
GBDSur
vey
UNAIDS
Pre
vale
nce
(%)
Source
GBD
Survey
UNAIDS
HIV prevalence comparison to survey estimates by age−group wih 95% confidence intervalsSWZ 2007 Males

15−19 20−24 25−29 30−34 35−39 40−44 45−49
0
20
40
GBDSur
vey
UNAIDS
GBDSur
vey
UNAIDS
GBDSur
vey
UNAIDS
GBDSur
vey
UNAIDS
GBDSur
vey
UNAIDS
GBDSur
vey
UNAIDS
GBDSur
vey
UNAIDS
Pre
vale
nce
(%)
Source
GBD
Survey
UNAIDS
HIV prevalence comparison to survey estimates by age−group wih 95% confidence intervalsSWZ 2007 Females

15−19 20−24 25−29 30−34 35−39 40−44 45−49
0
5
10
15
GBDSur
vey
UNAIDS
GBDSur
vey
UNAIDS
GBDSur
vey
UNAIDS
GBDSur
vey
UNAIDS
GBDSur
vey
UNAIDS
GBDSur
vey
UNAIDS
GBDSur
vey
UNAIDS
Pre
vale
nce
(%)
Source
GBD
Survey
UNAIDS
HIV prevalence comparison to survey estimates by age−group wih 95% confidence intervalsTZA 2003−2004 Males

15−19 20−24 25−29 30−34 35−39 40−44 45−49
0
5
10
15
GBDSur
vey
UNAIDS
GBDSur
vey
UNAIDS
GBDSur
vey
UNAIDS
GBDSur
vey
UNAIDS
GBDSur
vey
UNAIDS
GBDSur
vey
UNAIDS
GBDSur
vey
UNAIDS
Pre
vale
nce
(%)
Source
GBD
Survey
UNAIDS
HIV prevalence comparison to survey estimates by age−group wih 95% confidence intervalsTZA 2003−2004 Females

15−19 20−24 25−29 30−34 35−39 40−44 45−49
0
5
10
GBDSur
vey
UNAIDS
GBDSur
vey
UNAIDS
GBDSur
vey
UNAIDS
GBDSur
vey
UNAIDS
GBDSur
vey
UNAIDS
GBDSur
vey
UNAIDS
GBDSur
vey
UNAIDS
Pre
vale
nce
(%)
Source
GBD
Survey
UNAIDS
HIV prevalence comparison to survey estimates by age−group wih 95% confidence intervalsTZA 2007−2008 Males

15−19 20−24 25−29 30−34 35−39 40−44 45−49
0
5
10
GBDSur
vey
UNAIDS
GBDSur
vey
UNAIDS
GBDSur
vey
UNAIDS
GBDSur
vey
UNAIDS
GBDSur
vey
UNAIDS
GBDSur
vey
UNAIDS
GBDSur
vey
UNAIDS
Pre
vale
nce
(%)
Source
GBD
Survey
UNAIDS
HIV prevalence comparison to survey estimates by age−group wih 95% confidence intervalsTZA 2007−2008 Females

15−19 20−24 25−29 30−34 35−39 40−44 45−49
0
3
6
9
GBDSur
vey
UNAIDS
GBDSur
vey
UNAIDS
GBDSur
vey
UNAIDS
GBDSur
vey
UNAIDS
GBDSur
vey
UNAIDS
GBDSur
vey
UNAIDS
GBDSur
vey
UNAIDS
Pre
vale
nce
(%)
Source
GBD
Survey
UNAIDS
HIV prevalence comparison to survey estimates by age−group wih 95% confidence intervalsTZA 2011−2012 Males

15−19 20−24 25−29 30−34 35−39 40−44 45−49
0
5
10
GBDSur
vey
UNAIDS
GBDSur
vey
UNAIDS
GBDSur
vey
UNAIDS
GBDSur
vey
UNAIDS
GBDSur
vey
UNAIDS
GBDSur
vey
UNAIDS
GBDSur
vey
UNAIDS
Pre
vale
nce
(%)
Source
GBD
Survey
UNAIDS
HIV prevalence comparison to survey estimates by age−group wih 95% confidence intervalsTZA 2011−2012 Females

15−19 20−24 25−29 30−34 35−39 40−44 45−49
0
5
10
15
GBDSur
vey
UNAIDS
GBDSur
vey
UNAIDS
GBDSur
vey
UNAIDS
GBDSur
vey
UNAIDS
GBDSur
vey
UNAIDS
GBDSur
vey
UNAIDS
GBDSur
vey
UNAIDS
Pre
vale
nce
(%)
Source
GBD
Survey
UNAIDS
HIV prevalence comparison to survey estimates by age−group wih 95% confidence intervalsUGA 2004−2005 Males

15−19 20−24 25−29 30−34 35−39 40−44 45−49
0
5
10
15
GBDSur
vey
UNAIDS
GBDSur
vey
UNAIDS
GBDSur
vey
UNAIDS
GBDSur
vey
UNAIDS
GBDSur
vey
UNAIDS
GBDSur
vey
UNAIDS
GBDSur
vey
UNAIDS
Pre
vale
nce
(%)
Source
GBD
Survey
UNAIDS
HIV prevalence comparison to survey estimates by age−group wih 95% confidence intervalsUGA 2004−2005 Females

15−19 20−24 25−29 30−34 35−39 40−44 45−49
0
5
10
GBDSur
vey
UNAIDS
GBDSur
vey
UNAIDS
GBDSur
vey
UNAIDS
GBDSur
vey
UNAIDS
GBDSur
vey
UNAIDS
GBDSur
vey
UNAIDS
GBDSur
vey
UNAIDS
Pre
vale
nce
(%)
Source
GBD
Survey
UNAIDS
HIV prevalence comparison to survey estimates by age−group wih 95% confidence intervalsUGA 2011 Males

15−19 20−24 25−29 30−34 35−39 40−44 45−49
0
5
10
15
GBDSur
vey
UNAIDS
GBDSur
vey
UNAIDS
GBDSur
vey
UNAIDS
GBDSur
vey
UNAIDS
GBDSur
vey
UNAIDS
GBDSur
vey
UNAIDS
GBDSur
vey
UNAIDS
Pre
vale
nce
(%)
Source
GBD
Survey
UNAIDS
HIV prevalence comparison to survey estimates by age−group wih 95% confidence intervalsUGA 2011 Females

15−19 20−24 25−29 30−34 35−39 40−44 45−49
0
10
20
30
GBDSur
vey
UNAIDS
GBDSur
vey
UNAIDS
GBDSur
vey
UNAIDS
GBDSur
vey
UNAIDS
GBDSur
vey
UNAIDS
GBDSur
vey
UNAIDS
GBDSur
vey
UNAIDS
Pre
vale
nce
(%)
Source
GBD
Survey
UNAIDS
HIV prevalence comparison to survey estimates by age−group wih 95% confidence intervalsZAF 2012 Males

15−19 20−24 25−29 30−34 35−39 40−44 45−49
0
10
20
30
40
GBDSur
vey
UNAIDS
GBDSur
vey
UNAIDS
GBDSur
vey
UNAIDS
GBDSur
vey
UNAIDS
GBDSur
vey
UNAIDS
GBDSur
vey
UNAIDS
GBDSur
vey
UNAIDS
Pre
vale
nce
(%)
Source
GBD
Survey
UNAIDS
HIV prevalence comparison to survey estimates by age−group wih 95% confidence intervalsZAF 2012 Females

15−19 20−24 25−29 30−34 35−39 40−44 45−49
0
10
20
30
GBDSur
vey
UNAIDS
GBDSur
vey
UNAIDS
GBDSur
vey
UNAIDS
GBDSur
vey
UNAIDS
GBDSur
vey
UNAIDS
GBDSur
vey
UNAIDS
GBDSur
vey
UNAIDS
Pre
vale
nce
(%)
Source
GBD
Survey
UNAIDS
HIV prevalence comparison to survey estimates by age−group wih 95% confidence intervalsZMB 2001−2002 Males

15−19 20−24 25−29 30−34 35−39 40−44 45−49
0
10
20
30
GBDSur
vey
UNAIDS
GBDSur
vey
UNAIDS
GBDSur
vey
UNAIDS
GBDSur
vey
UNAIDS
GBDSur
vey
UNAIDS
GBDSur
vey
UNAIDS
GBDSur
vey
UNAIDS
Pre
vale
nce
(%)
Source
GBD
Survey
UNAIDS
HIV prevalence comparison to survey estimates by age−group wih 95% confidence intervalsZMB 2001−2002 Females

15−19 20−24 25−29 30−34 35−39 40−44 45−49
0
10
20
30
GBDSur
vey
UNAIDS
GBDSur
vey
UNAIDS
GBDSur
vey
UNAIDS
GBDSur
vey
UNAIDS
GBDSur
vey
UNAIDS
GBDSur
vey
UNAIDS
GBDSur
vey
UNAIDS
Pre
vale
nce
(%)
Source
GBD
Survey
UNAIDS
HIV prevalence comparison to survey estimates by age−group wih 95% confidence intervalsZMB 2007 Males

15−19 20−24 25−29 30−34 35−39 40−44 45−49
0
10
20
30
GBDSur
vey
UNAIDS
GBDSur
vey
UNAIDS
GBDSur
vey
UNAIDS
GBDSur
vey
UNAIDS
GBDSur
vey
UNAIDS
GBDSur
vey
UNAIDS
GBDSur
vey
UNAIDS
Pre
vale
nce
(%)
Source
GBD
Survey
UNAIDS
HIV prevalence comparison to survey estimates by age−group wih 95% confidence intervalsZMB 2007 Females

15−19 20−24 25−29 30−34 35−39 40−44 45−49
0
10
20
30
40
50
GBDSur
vey
UNAIDS
GBDSur
vey
UNAIDS
GBDSur
vey
UNAIDS
GBDSur
vey
UNAIDS
GBDSur
vey
UNAIDS
GBDSur
vey
UNAIDS
GBDSur
vey
UNAIDS
Pre
vale
nce
(%)
Source
GBD
Survey
UNAIDS
HIV prevalence comparison to survey estimates by age−group wih 95% confidence intervalsZWE 2005 Males

15−19 20−24 25−29 30−34 35−39 40−44 45−49
0
10
20
30
40
50
GBDSur
vey
UNAIDS
GBDSur
vey
UNAIDS
GBDSur
vey
UNAIDS
GBDSur
vey
UNAIDS
GBDSur
vey
UNAIDS
GBDSur
vey
UNAIDS
GBDSur
vey
UNAIDS
Pre
vale
nce
(%)
Source
GBD
Survey
UNAIDS
HIV prevalence comparison to survey estimates by age−group wih 95% confidence intervalsZWE 2005 Females

15−19 20−24 25−29 30−34 35−39 40−44 45−49
0
10
20
30
40
GBDSur
vey
UNAIDS
GBDSur
vey
UNAIDS
GBDSur
vey
UNAIDS
GBDSur
vey
UNAIDS
GBDSur
vey
UNAIDS
GBDSur
vey
UNAIDS
GBDSur
vey
UNAIDS
Pre
vale
nce
(%)
Source
GBD
Survey
UNAIDS
HIV prevalence comparison to survey estimates by age−group wih 95% confidence intervalsZWE 2011 Males

15−19 20−24 25−29 30−34 35−39 40−44 45−49
0
10
20
30
40
GBDSur
vey
UNAIDS
GBDSur
vey
UNAIDS
GBDSur
vey
UNAIDS
GBDSur
vey
UNAIDS
GBDSur
vey
UNAIDS
GBDSur
vey
UNAIDS
GBDSur
vey
UNAIDS
Pre
vale
nce
(%)
Source
GBD
Survey
UNAIDS
HIV prevalence comparison to survey estimates by age−group wih 95% confidence intervalsZWE 2011 Females

Appendix Table 1. Data sources used in the mortality without ART analysis
Collaborative Group on AIDS Incubation and HIV Survival * including the CASCADE EU Concerted Action. Time from HIV-1 seroconversion to AIDS and death before widespread use of highly-active antiretroviral therapy: a collaborative re-analysis. Collaborative Group on AIDS Incubation and HIV Survival including the CASCADE EU Concerted Action. Concerted Action on SeroConversion to AIDS and Death in Europe. Lancet 2000; 355: 1131–7.Deschamps MM, Fitzgerald DW, Pape JW, Johnson WD Jr. HIV infection in Haiti: natural history and disease progression. AIDS 2000; 14: 2515–21.Glynn JR, Sonnenberg P, Nelson G, Bester A, Shearer S, Murray J. Survival from HIV-1 seroconversion in Southern Africa: a retrospective cohort study in nearly 2000 gold-miners over 10 years of follow-up. AIDS 2007; 21: 625–32.Isingo R, Zaba B, Marston M, et al. Survival after HIV infection in the pre-antiretroviral therapy era in a rural Tanzanian cohort. AIDS 2007; 21 Suppl 6: S5–S13.Kilmarx PH, Limpakarnjanarat K, Kaewkungwal J, et al. Disease progression and survival with human immunodeficiency virus type 1 subtype E infection among female sex workers in Thailand. J Infect Dis 2000; 181: 1598–606.Lutalo T, Gray RH, Wawer M, et al. Survival of HIV-infected treatment-naive individuals with documented dates of seroconversion in Rakai, Uganda. AIDS 2007; 21 Suppl 6: S15–19.Manaloto CR, Perrault JG, Caringal LT, et al. Natural history of HIV infection in Filipino female commercial sex workers. J Acquir Immune Defic Syndr 1994; 7: 1157–68.Minga A, Danel C, Abo Y, et al. Progression to WHO criteria for antiretroviral therapy in a 7-year cohort of adult HIV-1 seroconverters in Abidjan, Côte d’Ivoire. Bull World Health Organ 2007; 85: 116–23.Nelson KE, Costello C, Suriyanon V, Sennun S, Duerr A. Survival of blood donors and their spouses with HIV-1 subtype E (CRF01 A_E) infection in northern Thailand, 1992-2007. AIDS 2007; 21 Suppl 6: S47–54.Peters PJ, Karita E, Kayitenkore K, et al. HIV-infected Rwandan women have a high frequency of long-term survival. AIDS 2007; 21 Suppl 6: S31–37.Porter K, Zaba B. The empirical evidence for the impact of HIV on adult mortality in the developing world: data from serological studies. AIDS 2004; 18 Suppl 2: S9–S17.Rangsin R, Piyaraj P, Sirisanthana T, Sirisopana N, Short O, Nelson KE. The natural history of HIV-1 subtype E infection in young men in Thailand with up to 14 years of follow-up. AIDS 2007; 21 Suppl 6: S39–46.Van der Paal L, Shafer LA, Todd J, Mayanja BN, Whitworth JAG, Grosskurth H. HIV-1 disease progression and mortality before the introduction of highly active antiretroviral therapy in rural Uganda. AIDS 2007; 21 Suppl 6: S21–29.

Appendix Table 2. Data sources used in the mortality on ART analysisMortality and LTFU
rates
Sex hazard ratios
Age hazard ratios
Abaasa AM, Todd J, Ekoru K, et al. Good adherence to HAART and improved survival in a community HIV/AIDS treatment and care programme: the experience of The AIDS Support Organization (TASO), Kampala, Uganda. BMC Health Serv Res 2008; 8: 241.
x x
Alvarez-Uria G, Naik PK, Pakam R, Midde M. Factors associated with attrition, mortality, and loss to follow up after antiretroviral therapy initiation: data from an HIV cohort study in India. Glob Health Action 2013; 6: 21682. x x x
Amuron B, Levin J, Birunghi J, et al. Mortality in an antiretroviral therapy programme in Jinja, south-east Uganda: a prospective cohortstudy. AIDS Res Ther 2011; 8: 39. x
Antiretroviral Therapy Cohort Collaboration. Causes of death in HIV-1-infected patients treated with antiretroviral therapy, 1996-2006:collaborative analysis of 13 HIV cohort studies. Clin Infect Dis 2010; 50: 1387–96. x
Assefa Y, Kiflie A, Tesfaye D, et al. Outcomes of antiretroviral treatment program in Ethiopia: retention of patients in care is a majorchallenge and varies across health facilities. BMC Health Serv Res 2011; 11: 81. x
Badie BM, Nabaei G, Rasoolinejad M, Mirzazadeh A, McFarland W. Early loss to follow-up and mortality of HIV-infected patients diagnosed after the era of antiretroviral treatment scale up: a call for re-invigorating the response in Iran. Int J STD AIDS 2013; 24: 926–30.
x
Bakanda C, Birungi J, Mwesigwa R, et al. Survival of HIV-infected adolescents on antiretroviral therapy in Uganda: findings from anationally representative cohort in Uganda. PLoS ONE 2011; 6: e19261. x
Biadgilign S, Reda AA, Digaffe T. Predictors of mortality among HIV infected patients taking antiretroviral treatment in Ethiopia: aretrospective cohort study. AIDS Res Ther 2012; 9: 15. x
Bisson GP, Gaolathe T, Gross R, et al. Overestimates of survival after HAART: implications for global scale-up efforts. PLoS ONE 2008; 3: e1725. x
Boulle A, Van Cutsem G, Hilderbrand K, et al. Seven-year experience of a primary care antiretroviral treatment programme inKhayelitsha, South Africa. AIDS 2010; 24: 563–72. x x x
Boyles TH, Wilkinson LS, Leisegang R, Maartens G. Factors influencing retention in care after starting antiretroviral therapy in a ruraSouth African programme. PLoS ONE 2011; 6: e19201. x
Brennan AT, Maskew M, Sanne I, Fox MP. The interplay between CD4 cell count, viral load suppression and duration of antiretroviraltherapy on mortality in a resource-limited setting. Trop Med Int Health 2013; 18: 619–31. x x
Brinkhof MWG, Boulle A, Weigel R, et al. Mortality of HIV-infected patients starting antiretroviral therapy in sub-Saharan Africa:comparison with HIV-unrelated mortality. PLoS Med 2009; 6: e1000066. x x
Brinkhof MWG, Dabis F, Myer L, et al. Early loss of HIV-infected patients on potent antiretroviral therapy programmes in lower-income countries. Bull World Health Organ 2008; 86: 559–67. x x x
Chang LW, Alamo S, Guma S, et al. Two-year virologic outcomes of an alternative AIDS care model: evaluation of a peer health worker and nurse-staffed community-based program in Uganda. J Acquir Immune Defic Syndr 2009; 50: 276–82.
x
Chasombat S, McConnell MS, Siangphoe U, et al. National expansion of antiretroviral treatment in Thailand, 2000-2007: program scale-up and patient outcomes. J Acquir Immune Defic Syndr 2009; 50: 506–12. x x
Chen J, Yu B, Wang Y, et al. Expansion of HIV care and treatment in Yunnan Province, China: Treatment outcomes with scale up of combination antiretroviral therapy. AIDS Care 2014; 26: 633–41. x x
Chen SC-C, Yu JK-L, Harries AD, et al. Increased mortality of male adults with AIDS related to poor compliance to antiretroviraltherapy in Malawi. Trop Med Int Health 2008; 13: 513–9. x x
Chi BH, Mwango A, Giganti M, et al. Early clinical and programmatic outcomes with tenofovir-based antiretroviral therapy in Zambia.J Acquir Immune Defic Syndr 2010; 54: 63–70. x x
Chi BH, Mwango A, Giganti MJ, et al. Comparative outcomes of tenofovir-based and zidovudine-based antiretroviral therapy regimensin Lusaka, Zambia. J Acquir Immune Defic Syndr 2011; 58: 475–81. x
Corey DM, Kim HW, Salazar R, et al. Brief report: effectiveness of combination antiretroviral therapy on survival and opportunistic infections in a developing world setting: an observational cohort study. J Acquir Immune Defic Syndr 2007; 44: 451–5.
x
Cornell M, Grimsrud A, Fairall L, et al. Temporal changes in programme outcomes among adult patients initiating antiretroviraltherapy across South Africa, 2002-2007. AIDS 2010; 24: 2263–70. x
Cornell M, Myer L, Kaplan R, Bekker L-G, Wood R. The impact of gender and income on survival and retention in a South African antiretroviral therapy programme. Trop Med Int Health 2009; 14: 722–31. x
Cornell M, Schomaker M, Garone DB, et al. Gender differences in survival among adult patients starting antiretroviral therapy in SouthAfrica: a multicentre cohort study. PLoS Med 2012; 9: e1001304. x
DeSilva MB, Merry SP, Fischer PR, Rohrer JE, Isichei CO, Cha SS. Youth, unemployment, and male gender predict mortality in AIDSpatients started on HAART in Nigeria. AIDS Care 2009; 21: 70–7. x x
Egger M, May M, Chêne G, et al. Prognosis of HIV-1-infected patients starting highly active antiretroviral therapy: a collaborativeanalysis of prospective studies. Lancet 2002; 360: 119–29. x
Fatti G, Grimwood A, Bock P. Better antiretroviral therapy outcomes at primary healthcare facilities: an evaluation of three tiers ofART services in four South African provinces. PLoS ONE 2010; 5: e12888. x x
Ford N, Kranzer K, Hilderbrand K, et al. Early initiation of antiretroviral therapy and associated reduction in mortality, morbidity and defaulting in a nurse-managed, community cohort in Lesotho. AIDS 2010; 24: 2645–50. x x x
Fregonese F, Collins IJ, Jourdain G, et al. Predictors of 5-year mortality in HIV-infected adults starting highly active antiretroviraltherapy in Thailand. J Acquir Immune Defic Syndr 2012; 60: 91–8. x
García de Olalla P, Knobel H, Carmona A, Guelar A, López-Colomés JL, Caylà JA. Impact of adherence and highly active antiretroviral therapy on survival in HIV-infected patients. J Acquir Immune Defic Syndr 2002; 30: 105–10. x x
Geng EH, Emenyonu N, Bwana MB, Glidden DV, Martin JN. Sampling-based approach to determining outcomes of patients lost to follow-up in antiretroviral therapy scale-up programs in Africa. JAMA 2008; 300: 506–7. x
Greenbaum AH, Wilson LE, Keruly JC, Moore RD, Gebo KA. Effect of age and HAART regimen on clinical response in an urban cohort of HIV-infected individuals. AIDS 2008; 22: 2331–9. x x
Greig J, Casas EC, O’Brien DP, Mills EJ, Ford N. Association between older age and adverse outcomes on antiretroviral therapy: a cohort analysis of programme data from nine countries. AIDS 2012; 26 Suppl 1: S31–37. x x
Hambisa MT, Ali A, Dessie Y. Determinants of Mortality among HIV Positives after Initiating Antiretroviral Therapy in WesternEthiopia: A Hospital-Based Retrospective Cohort Study. ISRN AIDS 2013; 2013: 491601. x x

Hawkins C, Chalamilla G, Okuma J, et al. Sex differences in antiretroviral treatment outcomes among HIV-infected adults in an urbanTanzanian setting. AIDS 2011; 25: 1189–97. x
Hermans S, van Leth F, Manabe Y, Hoepelman A, Lange J, Kambugu A. Earlier initiation of antiretroviral therapy, increasedtuberculosis case finding and reduced mortality in a setting of improved HIV care: a retrospective cohort study. HIV Medicine 2012; 13: 337–44.
x
HIV-CAUSAL Collaboration, Ray M, Logan R, et al. The effect of combined antiretroviral therapy on the overall mortality of HIV-infected individuals. AIDS 2010; 24: 123–37. x
Hoffmann CJ, Fielding KL, Charalambous S, et al. Reducing mortality with cotrimoxazole preventive therapy at initiation of antiretroviral therapy in South Africa. AIDS 2010; 24: 1709–16. x x
Hoffmann CJ, Fielding KL, Johnston V, et al. Changing predictors of mortality over time from cART start: implications for care. J Acquir Immune Defic Syndr 2011; 58: 269–76. x
Hoffmann CJ, Schomaker M, Fox MP, et al. CD4 count slope and mortality in HIV-infected patients on antiretroviral therapy: multicohort analysis from South Africa. J Acquir Immune Defic Syndr 2013; 63: 34–41. x x
Jensen-Fangel S, Pedersen L, Pedersen C, et al. Low mortality in HIV-infected patients starting highly active antiretroviral therapy: acomparison with the general population. AIDS 2004; 18: 89–97. x x x
Johannessen A, Naman E, Ngowi BJ, et al. Predictors of mortality in HIV-infected patients starting antiretroviral therapy in a ruralhospital in Tanzania. BMC Infect Dis 2008; 8: 52. x
Kanters S, Nansubuga M, Mwehire D, et al. Increased mortality among HIV-positive men on antiretroviral therapy: survival differencesbetween sexes explained by late initiation in Uganda. HIV AIDS (Auckl) 2013; 5: 111–9. x
Karcher H, Omondi A, Odera J, Kunz A, Harms G. Risk factors for treatment denial and loss to follow-up in an antiretroviral treatment cohort in Kenya. Trop Med Int Health 2007; 12: 687–94. x
Keiser O, Chi BH, Gsponer T, et al. Outcomes of antiretroviral treatment in programmes with and without routine viral load monitoring in Southern Africa. AIDS 2011; 25: 1761–9. x
Kiboneka A, Nyatia RJ, Nabiryo C, et al. Combination antiretroviral therapy in population affected by conflict: outcomes from large cohort in northern Uganda. BMJ 2009; 338: b201. x
Koenig SP, Rodriguez LA, Bartholomew C, et al. Long-term antiretroviral treatment outcomes in seven countries in the Caribbean. JAcquir Immune Defic Syndr 2012; 59: e60–71. x x
Kouanda S, Meda IB, Nikiema L, et al. Determinants and causes of mortality in HIV-infected patients receiving antiretroviral therapyin Burkina Faso: a five-year retrospective cohort study. AIDS Care 2012; 24: 478–90. x x
Laurent C, Bourgeois A, Mpoudi-Ngolé E, et al. Tolerability and effectiveness of first-line regimens combining nevirapine andlamivudine plus zidovudine or stavudine in Cameroon. AIDS Res Hum Retroviruses 2008; 24: 393–9. x
Liao L, Xing H, Su B, et al. Impact of HIV drug resistance on virologic and immunologic failure and mortality in a cohort of patients on antiretroviral therapy in China. AIDS 2013; 27: 1815–24. x
Lima VD, Harrigan R, Bangsberg DR, et al. The combined effect of modern highly active antiretroviral therapy regimens andadherence on mortality over time. J Acquir Immune Defic Syndr 2009; 50: 529–36. x
Lima VD, Hogg RS, Harrigan PR, et al. Continued improvement in survival among HIV-infected individuals with newer forms of highly active antiretroviral therapy. AIDS 2007; 21: 685–92. x x
Lohse N, Ladefoged K, Pedersen L, Jensen-Fangel S, Sørensen HT, Obel N. Low effectiveness of highly active antiretroviral therapy and high mortality in the Greenland HIV-infected population. Scand J Infect Dis 2004; 36: 738–42.
x
Loubiere S, el Filal KM, Sodqi M, et al. When to initiate highly active antiretroviral therapy in low-resource settings: the Moroccanexperience. Antivir Ther (Lond) 2008; 13: 241–51. x
Lowrance D, Makombe S, Harries A, et al. Lower early mortality rates among patients receiving antiretroviral treatment at clinicsoffering cotrimoxazole prophylaxis in Malawi. J Acquir Immune Defic Syndr 2007; 46: 56–61. x
Lowrance DW, Ndamage F, Kayirangwa E, et al. Adult clinical and immunologic outcomes of the national antiretroviral treatmentprogram in Rwanda during 2004-2005. J Acquir Immune Defic Syndr 2009; 52: 49–55. x
MacPherson P, Moshabela M, Martinson N, Pronyk P. Mortality and loss to follow-up among HAART initiators in rural South Africa. Trans R Soc Trop Med Hyg 2009; 103: 588–93. x
Maman D, Pujades-Rodriguez M, Nicholas S, et al. Response to antiretroviral therapy: improved survival associated with CD4 above500 cells/μl. AIDS 2012; 26: 1393–8. x x
Marston BJ, Macharia DK, Nga’nga L, et al. A program to provide antiretroviral therapy to residents of an urban slum in nairobi, kenya. J Int Assoc Physicians AIDS Care (Chic) 2007; 6: 106–12. x
Martin LJ, Houston S, Yasui Y, Wild TC, Saunders LD. All-cause and HIV-related mortality rates among HIV-infected patients afterinitiating highly active antiretroviral therapy: the impact of Aboriginal ethnicity and injection drug use. Can J Public Health 2011; 102: 90–6.
x
Maskew M, Brennan AT, MacPhail AP, Sanne IM, Fox MP. Poorer ART outcomes with increasing age at a large public sector HIVclinic in Johannesburg, South Africa. J Int Assoc Physicians AIDS Care (Chic) 2012; 11: 57–65. x x
May M, Boulle A, Phiri S, et al. Prognosis of patients with HIV-1 infection starting antiretroviral therapy in sub-Saharan Africa: acollaborative analysis of scale-up programmes. Lancet 2010; 376: 449–57. x x
May M, Sterne JAC, Sabin C, et al. Prognosis of HIV-1-infected patients up to 5 years after initiation of HAART: collaborative analysis of prospective studies. AIDS 2007; 21: 1185–97. x x
May MT, Sterne JAC, Costagliola D, et al. HIV treatment response and prognosis in Europe and North America in the first decade of highly active antiretroviral therapy: a collaborative analysis. Lancet 2006; 368: 451–8. x
McManus H, O’Connor CC, Boyd M, et al. Long-term survival in HIV positive patients with up to 15 Years of antiretroviral therapy. PLoS ONE 2012; 7: e48839. x
Mills EJ, Bakanda C, Birungi J, et al. Life expectancy of persons receiving combination antiretroviral therapy in low-income countries:a cohort analysis from Uganda. Ann Intern Med 2011; 155: 209–16. x x
Mills EJ, Bakanda C, Birungi J, et al. Male gender predicts mortality in a large cohort of patients receiving antiretroviral therapy inUganda. J Int AIDS Soc 2011; 14: 52. x x
Mills EJ, Bakanda C, Birungi J, et al. Mortality by baseline CD4 cell count among HIV patients initiating antiretroviral therapy:evidence from a large cohort in Uganda. AIDS 2011; 25: 851–5. x x
Moore AL, Kirk O, Johnson AM, et al. Virologic, immunologic, and clinical response to highly active antiretroviral therapy: the genderissue revisited. J Acquir Immune Defic Syndr 2003; 32: 452–61. x x
Mugavero MJ, Napravnik S, Cole SR, et al. Viremia copy-years predicts mortality among treatment-naive HIV-infected patientsinitiating antiretroviral therapy. Clin Infect Dis 2011; 53: 927–35. x

Mugisha V, Teasdale CA, Wang C, et al. Determinants of Mortality and Loss to Follow-Up among Adults Enrolled in HIV Care Services in Rwanda. PLoS ONE 2014; 9: e85774. x
Mujugira A, Wester CW, Kim S, Bussmann H, Gaolathe T. Patients with advanced HIV type 1 infection initiating antiretroviral therapyin Botswana: treatment response and mortality. AIDS Res Hum Retroviruses 2009; 25: 127–33. x
Mulissa Z, Jerene D, Lindtjørn B. Patients present earlier and survival has improved, but pre-ART attrition is high in a six-year HIVcohort data from Ethiopia. PLoS ONE 2010; 5: e13268. x x
Mutevedzi PC, Lessells RJ, Heller T, Bärnighausen T, Cooke GS, Newell M-L. Scale-up of a decentralized HIV treatment programme in rural KwaZulu-Natal, South Africa: does rapid expansion affect patient outcomes? Bull World Health Organ 2010; 88: 593–600.
x
Nachega JB, Hislop M, Dowdy DW, et al. Adherence to highly active antiretroviral therapy assessed by pharmacy claims predictssurvival in HIV-infected South African adults. J Acquir Immune Defic Syndr 2006; 43: 78–84. x x
Nglazi MD, Lawn SD, Kaplan R, et al. Changes in programmatic outcomes during 7 years of scale-up at a community-based antiretroviral treatment service in South Africa. J Acquir Immune Defic Syndr 2011; 56: e1–8. x x x
Odafe S, Idoko O, Badru T, et al. Patients’ demographic and clinical characteristics and level of care associated with lost to follow-up and mortality in adult patients on first-line ART in Nigerian hospitals. J Int AIDS Soc 2012; 15: 17424.
x x
Palombi L, Dorrucci M, Zimba I, et al. Immunologic response to highly active antiretroviral therapy and mortality reduction in a cohort of human immunodeficiency virus-positive persons in Mozambique. Am J Trop Med Hyg 2010; 83: 1128–32.
x
Palombi L, Marazzi MC, Guidotti G, et al. Incidence and predictors of death, retention, and switch to second-line regimens in antiretroviral- treated patients in sub-Saharan African Sites with comprehensive monitoring availability. Clin Infect Dis 2009; 48: 115–22.
x
Peterson I, Togun O, de Silva T, et al. Mortality and immunovirological outcomes on antiretroviral therapy in HIV-1 and HIV-2infected individuals in the Gambia. AIDS 2011; 25: 2167–75. x
Poka-Mayap V, Pefura-Yone EW, Kengne AP, Kuaban C. Mortality and its determinants among patients infected with HIV-1 on antiretroviral therapy in a referral centre in Yaounde, Cameroon: a retrospective cohort study. BMJ Open 2013; 3. doi:10.1136/bmjopen-2013-003210.
x
Rai S, Mahapatra B, Sircar S, et al. Adherence to Antiretroviral Therapy and Its Effect on Survival of HIV-Infected Individuals inJharkhand, India. PLoS ONE 2013; 8: e66860. x x
Rasschaert F, Koole O, Zachariah R, Lynen L, Manzi M, Van Damme W. Short and long term retention in antiretroviral care in healthfacilities in rural Malawi and Zimbabwe. BMC Health Serv Res 2012; 12: 444. x
Russell EC, Charalambous S, Pemba L, Churchyard GJ, Grant AD, Fielding K. Low haemoglobin predicts early mortality among adults starting antiretroviral therapy in an HIV care programme in South Africa: a cohort study. BMC Public Health 2010; 10: 433.
x x
Sanne IM, Westreich D, Macphail AP, Rubel D, Majuba P, Van Rie A. Long term outcomes of antiretroviral therapy in a largeHIV/AIDS care clinic in urban South Africa: a prospective cohort study. J Int AIDS Soc 2009; 12: 38. x
Schöni-Affolter F, Keiser O, Mwango A, et al. Estimating loss to follow-up in HIV-infected patients on antiretroviral therapy: theeffect of the competing risk of death in Zambia and Switzerland. PLoS ONE 2011; 6: e27919. x
Seyler C, Anglaret X, Dakoury-Dogbo N, et al. Medium-term survival, morbidity and immunovirological evolution in HIV-infectedadults receiving antiretroviral therapy, Abidjan, Côte d’Ivoire. Antivir Ther (Lond) 2003; 8: 385–93. x
Silverberg MJ, Leyden W, Quesenberry CP Jr, Horberg MA. Race/ethnicity and risk of AIDS and death among HIV-infected patientswith access to care. J Gen Intern Med 2009; 24: 1065–72. x x
Somi G, Keogh SC, Todd J, et al. Low mortality risk but high loss to follow-up among patients in the Tanzanian national HIV care and treatment programme. Trop Med Int Health 2012; 17: 497–506. x x x
Stringer JSA, Zulu I, Levy J, et al. Rapid scale-up of antiretroviral therapy at primary care sites in Zambia: feasibility and earlyoutcomes. JAMA 2006; 296: 782–93. x x
Thai S, Koole O, Un P, et al. Five-year experience with scaling-up access to antiretroviral treatment in an HIV care programme inCambodia. Trop Med Int Health 2009; 14: 1048–58. x
Tsertsvadze T, Chkhartishvili N, Sharvadze L, et al. Outcomes of Universal Access to Antiretroviral Therapy (ART) in Georgia. AIDSRes Treat 2011; 2011: 621078. x
Tuboi SH, Schechter M, McGowan CC, et al. Mortality during the first year of potent antiretroviral therapy in HIV-1-infected patients in 7 sites throughout Latin America and the Caribbean. J Acquir Immune Defic Syndr 2009; 51: 615–23.
x x
Van der Borght SF, Clevenbergh P, Rijckborst H, et al. Mortality and morbidity among HIV type-1-infected patients during the first 5 years of a multicountry HIV workplace programme in Africa. Antivir Ther (Lond) 2009; 14: 63–74. x x
Van Griensven J, Thai S. Predictors of immune recovery and the association with late mortality while on antiretroviral treatment inCambodia. Trans R Soc Trop Med Hyg 2011; 105: 694–703. x x
Velen K, Lewis JJ, Charalambous S, Grant AD, Churchyard GJ, Hoffmann CJ. Comparison of tenofovir, zidovudine, or stavudine as part of first-line antiretroviral therapy in a resource-limited-setting: a cohort study. PLoS ONE 2013; 8: e64459.
x
Wandeler G, Keiser O, Pfeiffer K, et al. Outcomes of antiretroviral treatment programs in rural Southern Africa. J Acquir ImmuneDefic Syndr 2012; 59: e9–16. x x x
When To Start Consortium, Sterne JAC, May M, et al. Timing of initiation of antiretroviral therapy in AIDS-free HIV-1-infectedpatients: a collaborative analysis of 18 HIV cohort studies. Lancet 2009; 373: 1352–63. x
Willig JH, Westfall AO, Mugavero M, et al. Effect of persistency of first-line HIV antiretroviral therapy on clinical outcomes. AIDSRes Hum Retroviruses 2013; 29: 698–703. x
Wolff MJ, Cortés CP, Shepherd BE, Beltrán CJ, Chilean AIDS Cohort Study Group. Long-term outcomes of a national expanded access program to antiretroviral therapy: the Chilean AIDS cohort. J Acquir Immune Defic Syndr 2010; 55: 368–74.
x
Wubshet M, Berhane Y, Worku A, Kebede Y, Diro E. High loss to followup and early mortality create substantial reduction in patient retention at antiretroviral treatment program in north-west ethiopia. ISRN AIDS 2012; 2012: 721720.
x x
Zhu H, Napravnik S, Eron JJ, et al. Decreasing excess mortality of HIV-infected patients initiating antiretroviral therapy: comparison with mortality in general population in China, 2003-2009. J Acquir Immune Defic Syndr 2013; 63: e150–157.
x x

Time period
Initial CD4 15-24 25-34 35-44 45-54 55+ 15-24 25-34 35-44 45-54 55+
0-6 <5044·2
(22·7 - 79·0)40·6
(20·4 - 71·5)41·5
(21·2 - 74·6)40·4
(20·2 - 73·2)51·9
(24·8 - 94·7)57·8
(29·4 - 102·2)53·1
(26·5 - 93·5)54·4
(28·2 - 96·4)52·8
(26·6 - 95·6)68·8
(32·7 - 126·1)
0-6 50-9919·0
(13·6 - 27·7)17·4
(12·2 - 25·0)17·7
(12·9 - 25·1)16·9
(11·6 - 24·9)20·2
(13·4 - 30·2)24·8
(17·7 - 36·0)22·8
(16·2 - 32·4)23·2
(17·2 - 33·0)22·2
(15·1 - 33·0)27·4
(18·7 - 40·9)
0-6 100-19915·4
(11·5 - 20·3)14·1
(10·4 - 18·4)14·2
(10·9 - 18·1)13·6
(9·7 - 18·5)15·6
(10·7 - 21·5)20·1
(14·8 - 26·6)18·4
(13·6 - 24·2)18·7
(14·3 - 23·8)17·8
(12·6 - 24·2)21·4
(15·0 - 29·3)
0-6 200-24913·6
(9·8 - 18·1)12·5
(8·9 - 16·6)12·6
(9·3 - 16·3)11·9
(8·3 - 16·5)13·4
(8·6 - 19·0)17·8
(12·9 - 23·7)16·3
(11·6 - 21·7)16·5
(12·2 - 21·3)15·7
(10·8 - 21·4)18·5
(12·2 - 25·8)
0-6 250-34911·7
(7·7 - 16·3)10·7
(7·0 - 14·8)10·8
(7·3 - 14·7)10·2
(6·5 - 14·6)11·0
(5·9 - 16·5)15·3
(10·2 - 21·4)14·0
(9·3 - 19·4)14·2
(9·7 - 19·4)13·3
(8·6 - 19·1)15·4
(8·8 - 22·7)
0-6 350-4998·9
(5·1 - 13·5)8·1
(4·7 - 12·0)8·1
(4·6 - 12·0)7·5
(4·0 - 12·1)7·4
(2·7 - 13·3)11·6
(6·8 - 17·7)10·5
(6·0 - 15·8)10·6
(6·2 - 15·8)9·8
(5·4 - 15·8)10·7
(4·6 - 18·3)
0-6 500+7·0
(1·2 - 12·6)6·3
(0·9 - 11·0)6·3
(0·8 - 11·3)5·8
(0·4 - 11·0)5·2
(0·0 - 12·1)9·1
(1·5 - 16·5)8·2
(1·2 - 14·7)8·3
(1·1 - 14·8)7·6
(0·5 - 14·5)7·7
(0·0 - 16·8)
7-12 <509·8
(6·6 - 14·5)8·9
(6·0 - 13·4)8·9
(6·2 - 13·2)8·4
(5·4 - 13·0)8·6
(4·5 - 15·0)12·8
(8·5 - 19·0)11·6
(7·9 - 17·5)11·7
(8·0 - 17·4)11·0
(7·1 - 17·2)12·2
(7·0 - 20·3)
7-12 50-997·2
(5·5 - 9·5)6·5
(5·0 - 8·4)6·5
(5·1 - 8·4)6·0
(4·3 - 8·5)5·3
(3·2 - 8·0)9·4
(7·1 - 12·5)8·6
(6·5 - 11·2)8·6
(6·7 - 11·1)7·9
(5·6 - 11·4)8·0
(5·2 - 11·7)
7-12 100-1996·3
(4·9 - 7·9)5·7
(4·4 - 7·2)5·7
(4·6 - 6·8)5·1
(3·7 - 6·9)4·2
(2·4 - 6·1)8·2
(6·5 - 10·4)7·4
(5·8 - 9·5)7·4
(6·0 - 9·0)6·7
(4·9 - 9·2)6·5
(4·2 - 9·2)
7-12 200-2495·6
(4·2 - 7·3)5·1
(3·8 - 6·5)5·0
(3·9 - 6·3)4·5
(3·1 - 6·2)3·3
(1·7 - 5·3)7·4
(5·5 - 9·6)6·6
(4·9 - 8·6)6·6
(5·1 - 8·3)5·9
(4·1 - 8·2)5·4
(3·1 - 8·1)
7-12 350-3494·9
(3·4 - 6·5)4·4
(3·0 - 6·0)4·3
(3·0 - 5·6)3·8
(2·4 - 5·5)2·4
(0·5 - 4·4)6·3
(4·4 - 8·7)5·7
(3·9 - 7·8)5·6
(3·9 - 7·4)5·0
(3·1 - 7·2)4·1
(1·6 - 6·9)
7-12 350-4993·5
(2·2 - 5·1)3·1
(1·8 - 4·8)3·0
(1·8 - 4·5)2·5
(1·2 - 4·2)0·8
(0·0 - 2·7)4·6
(2·8 - 6·7)4·1
(2·4 - 6·2)4·0
(2·4 - 5·9)3·3
(1·6 - 5·5)1·9
(0·0 - 4·6)
7-12 500+2·6
(0·2 - 4·9)2·3
(0·1 - 4·4)2·2
(0·0 - 4·2)1·7
(0·0 - 3·8)0·4
(0·0 - 2·3)3·4
(0·3 - 6·3)3·0
(0·1 - 5·7)2·9
(0·0 - 5·5)2·3
(0·0 - 5·0)1·0
(0·0 - 3·9)
13-24 <504·5
(3·1 - 6·4)4·0
(2·7 - 5·7)3·9
(2·7 - 5·7)3·4
(2·1 - 5·3)1·9
(0·2 - 4·3)5·8
(4·0 - 8·4)5·2
(3·6 - 7·5)5·2
(3·6 - 7·5)4·5
(2·8 - 6·9)3·4
(1·2 - 6·7)
13-24 50-993·3
(2·5 - 4·4)3·0
(2·3 - 3·9)2·9
(2·3 - 3·7)2·4
(1·6 - 3·4)0·5
(0·0 - 1·7)4·4
(3·3 - 5·7)3·9
(3·0 - 5·1)3·8
(3·0 - 4·9)3·2
(2·1 - 4·4)1·6
(0·4 - 3·2)
13-24 100-1993·0
(2·3 - 3·7)2·6
(2·0 - 3·3)2·5
(2·0 - 3·0)2·0
(1·4 - 2·8)0·2
(0·0 - 0·8)3·9
(3·0 - 4·9)3·4
(2·6 - 4·3)3·3
(2·7 - 4·0)2·7
(1·8 - 3·7)1·0
(0·0 - 2·1)
13-24 200-2492·7
(2·1 - 3·5)2·4
(1·8 - 3·1)2·3
(1·7 - 2·8)1·8
(1·1 - 2·6)0·1
(0·0 - 0·6)3·5
(2·7 - 4·5)3·1
(2·3 - 4·0)3·0
(2·3 - 3·7)2·4
(1·5 - 3·4)0·6
(0·0 - 1·8)
13-24 250-3492·3
(1·7 - 3·1)2·0
(1·4 - 2·7)1·9
(1·3 - 2·5)1·4
(0·8 - 2·2)0·0
(0·0 - 0·2)3·0
(2·2 - 4·1)2·6
(1·8 - 3·6)2·5
(1·8 - 3·3)1·9
(1·0 - 2·9)0·2
(0·0 - 1·2)
13-24 350-4991·6
(0·9 - 2·5)1·4
(0·7 - 2·2)1·2
(0·5 - 2·0)0·8
(0·1 - 1·7)0·0
(0·0 - 0·0)2·1
(1·2 - 3·3)1·8
(1·0 - 2·8)1·6
(0·8 - 2·6)1·0
(0·1 - 2·3)0·0
(0·0 - 0·2)
13-24 500+1·1
(0·0 - 2·4)0·9
(0·0 - 2·0)0·8
(0·0 - 1·8)0·4
(0·0 - 1·6)0·0
(0·0 - 0·0)1·5
(0·0 - 3·1)1·2
(0·0 - 2·6)1·0
(0·0 - 2·4)0·6
(0·0 - 2·1)0·0
(0·0 - 0·0)
Appendix Table 3a. HIV-specific mortality rates for patients on ART in all sub-Saharan African sites by time since ART initiation, sex, initial CD4 and age (per 100 person-years)
Female Male

Time period
Initial CD4 15-24 25-34 35-44 45-54 55+ 15-24 25-34 35-44 45-54 55+
0-6 <5025·0
(11·1-51·3)23·1
(10·5-48·0)23·6
(10·9-49·3)23·0
(10·3-47·9)27·9
(11·3-63·5)42·3
(19·2-87·3)39·1
(18·1-79·9)40·1
(18·8-85·3)39·3
(17·5-80·8)49·4
(20·9-109·9)
0-6 50-9911·4
(6·6-18·5)10·5
(6·1-16·9)10·7
(6·3-17·1)10·3
(5·7-16·9)10·9
(5·0-19·3)19·4
(11·5-31·2)17·9
(10·6-28·2)18·3
(11·0-28·8)17·7
(9·9-28·4)20·8
(10·8-35·3)
0-6 100-1998·2
(5·1-12·6)7·5
(4·6-11·4)7·6
(4·6-11·6)7·2
(4·1-11·4)6·8
(2·9-12·3)13·9
(8·6-21·5)12·8
(8·0-19·4)13·0
(8·2-19·8)12·5
(7·5-19·7)13·9
(7·4-23·2)
0-6 200-2496·8
(3·9-11·1)6·3
(3·5-9·9)6·3
(3·6-9·9)5·9
(3·0-9·6)5·2
(1·5-10·3)11·6
(6·9-18·6)10·7
(6·1-17·2)10·8
(6·4-16·7)10·3
(5·7-16·8)11·0
(5·2-20·2)
0-6 250-3495·5
(2·9-9·3)5·0
(2·6-8·4)5·0
(2·7-8·4)4·6
(2·2-8·1)3·5
(0·3-8·1)9·3
(5·0-15·3)8·6
(4·4-14·6)8·7
(4·5-14·7)8·2
(4·1-13·8)8·2
(2·8-16·1)
0-6 350-4993·7
(1·5-6·9)3·3
(1·3-6·4)3·3
(1·2-6·3)2·9
(0·8-5·9)1·4
(0·0-5·2)6·2
(2·6-11·5)5·7
(2·3-10·9)5·7
(2·3-10·8)5·2
(1·8-10·1)4·3
(0·0-10·9)
0-6 500+2·5
(0·1-6·2)2·3
(0·0-5·8)2·2
(0·0-5·8)1·9
(0·0-5·4)0·7
(0·0-4·5)4·4
(0·2-10·4)4·0
(0·1-9·5)3·9
(0·0-9·4)3·5
(0·0-9·1)2·5
(0·0-9·7)
7-12 <506·6
(4·0-10·6)6·0
(3·8-9·8)6·1
(3·7-9·9)5·7
(3·2-9·5)4·8
(1·7-9·8)11·2
(6·8-17·2)10·3
(6·5-16·3)10·4
(6·6-16·3)9·9
(5·9-16·4)10·5
(5·2-18·6)
7-12 50-994·7
(3·2-6·7)4·3
(3·0-6·1)4·3
(3·0-6·0)3·9
(2·5-5·7)2·5
(0·7-4·9)8·0
(5·5-11·2)7·3
(5·2-10·2)7·4
(5·2-10·1)6·9
(4·5-9·8)6·5
(3·4-10·2)
7-12 100-1993·9
(2·8-5·4)3·6
(2·5-4·9)3·5
(2·5-4·8)3·2
(2·1-4·7)1·5
(0·0-3·4)6·7
(4·8-9·4)6·1
(4·4-8·3)6·2
(4·5-8·3)5·7
(3·8-8·1)4·9
(2·5-7·8)
7-12 200-2493·5
(2·4-5·0)3·2
(2·2-4·5)3·1
(2·1-4·5)2·8
(1·7-4·3)1·0
(0·0-2·8)6·0
(4·1-8·4)5·5
(3·8-7·6)5·5
(3·8-7·5)5·0
(3·2-7·4)4·0
(1·7-7·0)
7-12 350-3493·0
(2·0-4·4)2·7
(1·8-4·0)2·7
(1·8-3·9)2·3
(1·3-3·7)0·5
(0·0-2·1)5·2
(3·4-7·4)4·7
(3·1-6·7)4·7
(3·1-6·7)4·3
(2·6-6·5)3·0
(0·9-5·9)
7-12 350-4992·3
(1·2-3·6)2·0
(1·1-3·3)1·9
(1·0-3·2)1·6
(0·6-3·0)0·1
(0·0-1·1)3·9
(2·2-6·1)3·5
(1·9-5·6)3·5
(1·8-5·5)3·0
(1·3-5·3)1·4
(0·0-4·2)
7-12 500+1·7
(0·1-3·4)1·5
(0·0-3·0)1·5
(0·0-3·0)1·1
(0·0-2·7)0·1
(0·0-0·8)3·0
(0·3-5·7)2·7
(0·1-5·2)2·6
(0·0-5·2)2·2
(0·0-4·9)0·8
(0·0-3·6)
13-24 <504·3
(2·8-6·8)3·9
(2·6-6·0)3·9
(2·6-6·1)3·5
(2·1-5·7)2·0
(0·2-4·9)7·4
(4·9-11·3)6·7
(4·6-10·2)6·8
(4·6-10·3)6·3
(3·9-9·7)5·7
(2·6-10·2)
13-24 50-993·2
(2·2-4·7)2·9
(2·0-4·1)2·9
(2·0-4·1)2·5
(1·6-3·8)0·7
(0·0-2·3)5·5
(3·8-7·8)5·0
(3·5-7·1)5·0
(3·5-7·1)4·6
(2·9-6·8)3·4
(1·3-6·2)
13-24 100-1992·8
(1·9-4·3)2·6
(1·7-3·7)2·5
(1·7-3·6)2·1
(1·3-3·3)0·3
(0·0-1·7)4·9
(3·4-7·0)4·4
(3·1-6·2)4·4
(3·1-6·2)3·9
(2·5-5·8)2·6
(0·8-5·0)
13-24 200-2492·6
(1·8-3·9)2·4
(1·6-3·4)2·3
(1·5-3·4)1·9
(1·1-3·1)0·2
(0·0-1·4)4·5
(3·0-6·4)4·1
(2·8-5·8)4·0
(2·7-5·7)3·6
(2·3-5·3)2·1
(0·4-4·5)
13-24 250-3492·3
(1·5-3·4)2·1
(1·3-3·0)2·0
(1·2-3·0)1·6
(0·9-2·7)0·1
(0·0-0·8)4·0
(2·6-5·7)3·6
(2·3-5·1)3·5
(2·3-5·1)3·1
(1·8-4·8)1·5
(0·0-3·6)
13-24 350-4991·7
(0·9-2·6)1·5
(0·8-2·3)1·4
(0·7-2·3)1·1
(0·4-2·0)0·0
(0·0-0·0)2·9
(1·7-4·5)2·6
(1·5-3·9)2·5
(1·4-3·9)2·1
(0·9-3·6)0·4
(0·0-2·0)
13-24 500+1·2
(0·1-2·4)1·1
(0·0-2·1)1·0
(0·0-2·1)0·7
(0·0-1·8)0·0
(0·0-0·0)2·2
(0·2-4·2)1·9
(0·1-3·6)1·8
(0·0-3·6)1·4
(0·0-3·3)0·2
(0·0-1·5)
Appendix Table 3b. HIV-specific mortality rates for patients on ART in LMIC countries outside of sub-Saharan Africa by time since ART initiation, sex, initial CD4 and age (per 100 person-years)
Female Male

Time period
Initial CD4 15-24 25-34 35-44 45-54 55+ 15-24 25-34 35-44 45-54 55+
0-6 <505·5
(2·2-11·7)6·1
(2·9-12·3)7·5
(3·8-14·3)8·9
(3·7-18·7)6·6
(1·4-16·0)6·2
(2·4-13·2)6·8
(3·2-13·8)8·3
(4·1-15·8)9·8
(4·0-20·8)7·4
(1·6-17·9)
0-6 50-993·1
(1·2-6·2)3·4
(1·7-6·5)4·2
(2·2-7·4)4·9
(2·1-9·5)2·4
(0·0-7·2)3·4
(1·4-7·1)3·8
(1·8-7·2)4·6
(2·4-8·4)5·3
(2·2-10·7)2·7
(0·0-8·0)
0-6 100-1991·9
(0·8-3·6)2·0
(1·1-3·6)2·5
(1·5-4·0)2·8
(1·3-5·2)0·5
(0·0-2·6)2·0
(0·9-3·9)2·2
(1·2-3·9)2·7
(1·5-4·4)3·0
(1·3-5·6)0·6
(0·0-2·9)
0-6 200-2491·0
(0·4-1·9)1·1
(0·6-1·9)1·3
(0·8-2·1)1·4
(0·7-2·7)0·0
(0·0-0·0)1·1
(0·4-2·1)1·2
(0·6-2·1)1·4
(0·8-2·2)1·4
(0·6-2·8)0·0
(0·0-0·0)
0-6 250-3490·6
(0·3-1·2)0·7
(0·3-1·2)0·8
(0·5-1·3)0·8
(0·3-1·6)0·0
(0·0-0·0)0·7
(0·3-1·3)0·7
(0·3-1·3)0·8
(0·4-1·4)0·8
(0·2-1·7)0·0
(0·0-0·0)
0-6 350-4990·4
(0·2-0·8)0·5
(0·2-0·9)0·5
(0·2-0·9)0·5
(0·1-1·1)0·0
(0·0-0·0)0·4
(0·1-0·9)0·5
(0·2-0·9)0·5
(0·2-1·0)0·4
(0·0-1·0)0·0
(0·0-0·0)
0-6 500+0·3
(0·1-0·7)0·3
(0·1-0·7)0·3
(0·1-0·7)0·3
(0·0-0·8)0·0
(0·0-0·0)0·3
(0·0-0·7)0·3
(0·0-0·7)0·3
(0·0-0·7)0·2
(0·0-0·7)0·0
(0·0-0·0)
7-12 <504·4
(1·7-9·5)4·9
(2·3-10·0)5·9
(2·9-11·6)7·0
(2·9-14·8)4·7
(0·5-12·8)4·9
(1·8-10·6)5·4
(2·5-11·1)6·6
(3·2-13·2)7·7
(3·1-16·5)5·2
(0·5-14·5)
7-12 50-992·6
(1·1-5·5)2·9
(1·5-5·7)3·5
(1·9-6·3)4·1
(1·8-8·1)1·6
(0·0-5·7)2·9
(1·2-6·1)3·2
(1·6-6·3)3·8
(2·1-7·0)4·4
(1·9-9·1)1·7
(0·0-6·2)
7-12 100-1991·9
(0·8-3·7)2·1
(1·1-3·7)2·5
(1·4-4·2)2·9
(1·4-5·5)0·5
(0·0-2·8)2·1
(0·8-4·1)2·3
(1·2-4·0)2·7
(1·5-4·6)3·1
(1·3-5·9)0·6
(0·0-3·0)
7-12 200-2491·3
(0·6-2·5)1·4
(0·8-2·4)1·7
(1·0-2·7)1·9
(0·9-3·4)0·1
(0·0-0·8)1·4
(0·6-2·7)1·5
(0·8-2·6)1·8
(1·1-2·9)2·0
(0·8-3·6)0·1
(0·0-0·8)
7-12 350-3490·8
(0·3-1·6)0·9
(0·5-1·6)1·1
(0·6-1·7)1·2
(0·5-2·2)0·0
(0·0-0·0)0·9
(0·4-1·7)1·0
(0·5-1·7)1·1
(0·6-1·9)1·1
(0·4-2·2)0·0
(0·0-0·0)
7-12 350-4990·5
(0·2-1·0)0·5
(0·2-1·0)0·6
(0·3-1·1)0·6
(0·2-1·3)0·0
(0·0-0·0)0·5
(0·2-1·0)0·5
(0·2-1·0)0·6
(0·2-1·1)0·5
(0·0-1·2)0·0
(0·0-0·0)
7-12 500+0·3
(0·1-0·6)0·3
(0·1-0·6)0·3
(0·0-0·7)0·2
(0·0-0·8)0·0
(0·0-0·0)0·3
(0·0-0·7)0·3
(0·0-0·7)0·3
(0·0-0·7)0·1
(0·0-0·7)0·0
(0·0-0·0)
13-24 <503·4
(1·4-7·8)3·7
(1·7-7·7)4·5
(2·3-8·5)5·3
(2·3-10·6)2·8
(0·0-8·4)3·7
(1·5-8·8)4·1
(1·9-8·4)4·9
(2·5-9·4)5·7
(2·4-11·7)3·1
(0·0-9·5)
13-24 50-992·1
(0·9-4·1)2·3
(1·2-3·9)2·8
(1·6-4·5)3·2
(1·5-5·8)0·8
(0·0-3·4)2·3
(0·9-4·6)2·5
(1·3-4·3)3·0
(1·7-5·0)3·4
(1·6-6·4)0·9
(0·0-3·7)
13-24 100-1991·4
(0·6-2·7)1·6
(0·9-2·7)1·9
(1·2-3·0)2·1
(1·1-3·9)0·1
(0·0-1·3)1·6
(0·7-3·1)1·7
(0·9-3·0)2·0
(1·2-3·4)2·2
(1·0-4·2)0·1
(0·0-1·4)
13-24 200-2491·0
(0·4-1·9)1·1
(0·6-1·8)1·2
(0·8-2·0)1·4
(0·6-2·6)0·0
(0·0-0·0)1·0
(0·4-2·1)1·1
(0·6-2·0)1·3
(0·8-2·2)1·4
(0·5-2·7)0·0
(0·0-0·0)
13-24 250-3490·7
(0·3-1·3)0·7
(0·4-1·3)0·8
(0·5-1·4)0·9
(0·4-1·8)0·0
(0·0-0·0)0·7
(0·3-1·4)0·8
(0·4-1·4)0·9
(0·5-1·5)0·8
(0·3-1·8)0·0
(0·0-0·0)
13-24 350-4990·5
(0·2-0·9)0·5
(0·3-0·9)0·6
(0·3-1·0)0·6
(0·2-1·2)0·0
(0·0-0·0)0·5
(0·2-1·0)0·5
(0·2-0·9)0·6
(0·3-1·0)0·5
(0·0-1·2)0·0
(0·0-0·0)
13-24 500+0·3
(0·1-0·7)0·3
(0·1-0·6)0·3
(0·1-0·7)0·3
(0·0-0·8)0·0
(0·0-0·0)0·3
(0·1-0·7)0·3
(0·1-0·7)0·3
(0·1-0·7)0·2
(0·0-0·7)0·0
(0·0-0·0)
Appendix Table 3c. HIV-specific mortality rates for patients on ART in high income countries by time since ART initiation, sex, initial CD4 and age (per 100 person-years)
Female Male

Country Source number Source Surveillance Verbal AutopsyVital
Registration
Albania 01 - ALBWorld Health Organization (WHO). WHO Mortality Database Version February 2014. Geneva, Switzerland: World Health Organization (WHO), 2014. X
Antigua and Barbuda 01 - ATG
World Health Organization (WHO). WHO Mortality Database Version February 2014. Geneva, Switzerland: World Health Organization (WHO), 2014. X
Argentina 01 - ARGWorld Health Organization (WHO). WHO Mortality Database Version February 2014. Geneva, Switzerland: World Health Organization (WHO), 2014. X
Armenia 01 - ARMWorld Health Organization (WHO). WHO Mortality Database Version February 2014. Geneva, Switzerland: World Health Organization (WHO), 2014. X
Australia 01 - AUSWorld Health Organization (WHO). WHO Mortality Database Version February 2014. Geneva, Switzerland: World Health Organization (WHO), 2014. X
Austria 01 - AUTWorld Health Organization (WHO). WHO Mortality Database Version February 2014. Geneva, Switzerland: World Health Organization (WHO), 2014. X
Azerbaijan 01 - AZEWorld Health Organization (WHO). WHO Mortality Database Version February 2014. Geneva, Switzerland: World Health Organization (WHO), 2014. X
Bahrain 01 - BHRWorld Health Organization (WHO). WHO Mortality Database Version February 2014. Geneva, Switzerland: World Health Organization (WHO), 2014. X
Bangladesh 01 - BGD
INDEPTH, International Centre for Diarrhoeal Disease Research (Bangladesh). Bangladesh - Matlab Health and Demographic Surveillance System. Dhaka, Bangladesh: International Centre for Diarrhoeal Disease Research (Bangladesh). X
Bangladesh 02 - BGDINDEPTH. Bangladesh - AMK Health and Demographic Surveillance System.
X
Barbados 01 - BRBWorld Health Organization (WHO). WHO Mortality Database Version February 2014. Geneva, Switzerland: World Health Organization (WHO), 2014. X
Belarus 01 - BLRWorld Health Organization (WHO). WHO Mortality Database Version February 2014. Geneva, Switzerland: World Health Organization (WHO), 2014. X
Belgium 01 - BELWorld Health Organization (WHO). WHO Mortality Database Version February 2014. Geneva, Switzerland: World Health Organization (WHO), 2014. X
Belize 01 - BLZWorld Health Organization (WHO). WHO Mortality Database Version February 2014. Geneva, Switzerland: World Health Organization (WHO), 2014. X
Bermuda 01 - BMUWorld Health Organization (WHO). WHO Mortality Database Version February 2014. Geneva, Switzerland: World Health Organization (WHO), 2014. X
Bolivia 01 - BOLWorld Health Organization (WHO). WHO Mortality Database Version February 2014. Geneva, Switzerland: World Health Organization (WHO), 2014. X
Bosnia and Herzegovina 01 - BIH
World Health Organization (WHO). WHO Mortality Database Version February 2014. Geneva, Switzerland: World Health Organization (WHO), 2014. X
Brazil 01 - BRAWorld Health Organization (WHO). WHO Mortality Database Version February 2014. Geneva, Switzerland: World Health Organization (WHO), 2014. X
Brunei 01 - BRNWorld Health Organization (WHO). WHO Mortality Database Version February 2014. Geneva, Switzerland: World Health Organization (WHO), 2014. X
Bulgaria 01 - BGRWorld Health Organization (WHO). WHO Mortality Database Version February 2014. Geneva, Switzerland: World Health Organization (WHO), 2014. X
Appendix Table 4. HIV mortality data sources used in the GBD 2013.

Burkina Faso 01 - BFA
Bell JS, Ouédraogo M, Ganaba R, Sombié I, Byass P, Baggaley RF, Filippi V, Fitzmaurice AE, Graham WJ. The epidemiology of pregnancy outcomes in rural Burkina Faso. Trop Med Int Health. 2008; 13 Suppl 1: 31-43. X
Burkina Faso 02 - BFAINDEPTH, Nouna Health Research Center (Burkina Faso). Burkina Faso - Nouna Health and Demographic Surveillance System. X
Burkina Faso 03 - BFA
Ramroth H, Lorenz E, Rankin JC, Fottrell E, Yé M, Neuhann F, Ssennono M, Sié A, Byass P, Becher H. Causas de la distribución de muerte con el modelo InterVA y la codificación de médicos en un área rural de Burkina Faso. Trop Med Int Health. 2012; 17(7): 904-13.
X
Burkina Faso 04 - BFAWürthwein R, Gbangou A, Sauerborn R, Schmidt CM. Measuring the local burden of disease. A study of years of life lost in sub-Saharan Africa. Int J Epidemiol. 2001; 30(3): 501-8.
X
Burkina Faso 05 - BFA
Yé M, Diboulo E, Niamba L, Sié A, Coulibaly B, Bagagnan C, Dembélé J, Ramroth H. An improved method for physician-certified verbal autopsy reduces the rate of discrepancy: experiences in the Nouna Health and Demographic Surveillance Site (NHDSS), Burkina Faso. Popul Health Metr. 2011; 9: 34.
X
Canada 01 - CANWorld Health Organization (WHO). WHO Mortality Database Version February 2014. Geneva, Switzerland: World Health Organization (WHO), 2014. X
Cape Verde 01 - CPV
Wessel H, Reitmaier P, Dupret A, Rocha E, Cnattingius S, Bergström S. Deaths among women of reproductive age in Cape Verde: causes and avoidability. Acta Obstet Gynecol Scand. 1999; 78(3): 225-32. X
Chile 01 - CHLMinistry of Health (Chile), National Institute of Statistics (Chile). Chile Vital Registration - Deaths 1985. X
Chile 02 - CHLWorld Health Organization (WHO). WHO Mortality Database Version February 2014. Geneva, Switzerland: World Health Organization (WHO), 2014. X
China 01 - CHNChinese Center for Disease Control and Prevention (CCDC). China Disease Surveillance Points 1991 - China CDC. X
China 02 - CHNChinese Center for Disease Control and Prevention (CCDC). China Disease Surveillance Points 1993 - China CDC. X
China 03 - CHNChinese Center for Disease Control and Prevention (CCDC). China Disease Surveillance Points 1994 - China CDC. X
China 04 - CHNChinese Center for Disease Control and Prevention (CCDC). China Disease Surveillance Points 1995 - China CDC. X
China 05 - CHNChinese Center for Disease Control and Prevention (CCDC). China Disease Surveillance Points 1996 - China CDC. X
China 06 - CHNChinese Center for Disease Control and Prevention (CCDC). China Disease Surveillance Points 1997 - China CDC. X
China 07 - CHNChinese Center for Disease Control and Prevention (CCDC). China Disease Surveillance Points 1998 - China CDC. X
China 08 - CHNChinese Center for Disease Control and Prevention (CCDC). China Disease Surveillance Points 1999 - China CDC. X
China 09 - CHNChinese Center for Disease Control and Prevention (CCDC). China Disease Surveillance Points 2000 - China CDC. X
China 10 - CHNChinese Center for Disease Control and Prevention (CCDC). China Disease Surveillance Points 2001 - China CDC. X
China 11 - CHNChinese Center for Disease Control and Prevention (CCDC). China Disease Surveillance Points 2002 - China CDC. X
China 12 - CHNChinese Center for Disease Control and Prevention (CCDC). China Disease Surveillance Points 2004 - China CDC. X
China 13 - CHNChinese Center for Disease Control and Prevention (CCDC). China Disease Surveillance Points 2005 - China CDC. X
China 14 - CHNChinese Center for Disease Control and Prevention (CCDC). China Disease Surveillance Points 2006 - China CDC. X
China 15 - CHNChinese Center for Disease Control and Prevention (CCDC). China Disease Surveillance Points 2007 - China CDC. X
China 16 - CHNChinese Center for Disease Control and Prevention (CCDC). China Disease Surveillance Points 2008 - China CDC. X
China 17 - CHNChinese Center for Disease Control and Prevention (CCDC). China Disease Surveillance Points 2009 - China CDC. X

China 18 - CHNChinese Center for Disease Control and Prevention (CCDC). China Disease Surveillance Points 2010 - China CDC. X
China 19 - CHNChinese Center for Disease Control and Prevention (CCDC). China Disease Surveillance Points 2011 - China CDC. X
China 20 - CHNChinese Center for Disease Control and Prevention (CCDC). China Notifiable Infectious Diseases 2004. X
China 21 - CHNChinese Center for Disease Control and Prevention (CCDC). China Notifiable Infectious Diseases 2005. X
China 22 - CHNChinese Center for Disease Control and Prevention (CCDC). China Notifiable Infectious Diseases 2006. X
China 23 - CHNChinese Center for Disease Control and Prevention (CCDC). China Notifiable Infectious Diseases 2007. X
China 24 - CHNChinese Center for Disease Control and Prevention (CCDC). China Notifiable Infectious Diseases 2008. X
China 25 - CHNChinese Center for Disease Control and Prevention (CCDC). China Notifiable Infectious Diseases 2009. X
China 26 - CHNChinese Center for Disease Control and Prevention (CCDC). China Notifiable Infectious Diseases 2010. X
China 27 - CHNChinese Center for Disease Control and Prevention (CCDC). China Notifiable Infectious Diseases 2011. X
China 28 - CHNChinese Center for Disease Control and Prevention (CCDC). China Notifiable Infectious Diseases 2012. X
China 29 - CHNWorld Health Organization (WHO). WHO Mortality Database Version February 2014. Geneva, Switzerland: World Health Organization (WHO), 2014. X
Colombia 01 - COLNational Administrative Department of Statistics (Colombia). Colombia Vital Statistics - Deaths 2008. Bogotá, Colombia: National Administrative Department of Statistics (Colombia).
X
Colombia 02 - COLWorld Health Organization (WHO). WHO Mortality Database Version February 2014. Geneva, Switzerland: World Health Organization (WHO), 2014. X
Costa Rica 01 - CRIWorld Health Organization (WHO). WHO Mortality Database Version February 2014. Geneva, Switzerland: World Health Organization (WHO), 2014. X
Croatia 01 - HRVWorld Health Organization (WHO). WHO Mortality Database Version February 2014. Geneva, Switzerland: World Health Organization (WHO), 2014. X
Cuba 01 - CUBWorld Health Organization (WHO). WHO Mortality Database Version February 2014. Geneva, Switzerland: World Health Organization (WHO), 2014. X
Cyprus 01 - CYPWorld Health Organization (WHO). WHO Mortality Database Version February 2014. Geneva, Switzerland: World Health Organization (WHO), 2014. X
Czech Republic 01 - CZEWorld Health Organization (WHO). WHO Mortality Database Version February 2014. Geneva, Switzerland: World Health Organization (WHO), 2014. X
Democratic Republic of the Congo
01 - CODCoghlan B, Brennan RJ, Ngoy P, Dofara D, Otto B, Clements M, Stewart T. Mortality in the Democratic Republic of Congo: a nationwide survey. Lancet. 2006; 367(9504): 44-51.
X
Denmark 01 - DNKWorld Health Organization (WHO). WHO Mortality Database Version February 2014. Geneva, Switzerland: World Health Organization (WHO), 2014. X
Dominica 01 - DMAWorld Health Organization (WHO). WHO Mortality Database Version February 2014. Geneva, Switzerland: World Health Organization (WHO), 2014. X
Dominican Republic 01 - DOM
World Health Organization (WHO). WHO Mortality Database Version February 2014. Geneva, Switzerland: World Health Organization (WHO), 2014. X
Eastern Cape 01 - ZECDepartment of Home Affairs (South Africa), Statistics South Africa. South Africa Mortality and Causes of Death 1997-2005. Pretoria, South Africa: Statistics South Africa.
X
Ecuador 01 - ECUWorld Health Organization (WHO). WHO Mortality Database Version February 2014. Geneva, Switzerland: World Health Organization (WHO), 2014. X

Egypt 01 - EGYWorld Health Organization (WHO). WHO Mortality Database Version February 2014. Geneva, Switzerland: World Health Organization (WHO), 2014. X
El Salvador 01 - SLVWorld Health Organization (WHO). WHO Mortality Database Version February 2014. Geneva, Switzerland: World Health Organization (WHO), 2014. X
Estonia 01 - ESTWorld Health Organization (WHO). WHO Mortality Database Version February 2014. Geneva, Switzerland: World Health Organization (WHO), 2014. X
Ethiopia 01 - ETHAnteneh A, Araya T, Misganaw A. Factors associated with place of death in AddisAbaba, Ethiopia. BMC Palliat Care. 2013; 12(14): 14. X
Ethiopia 02 - ETH
Araya T, Tensou B, Davey G, Berhane Y. La vigilancia de entierros detectó una reducción significativa en las muertes relacionadas con el VIH en Addis Ababa, Etiopía. Trop Med Int Health. 2011; 16(12): 1483-9. X
Ethiopia 03 - ETHDeribew A, Tessema F, Girma B. Determinants of under-five mortality in Gilgel Gibe Field Research Center, Southwest Ethiopia. Ethiopian Journal of Health Development. 2007; 21(2): 117-24.
X
Ethiopia 04 - ETH
Fantahun M, Fottrell E, Berhane Y, Wall S, Högberg U, Byass P. Assessing a new approach to verbal autopsy interpretation in a rural Ethiopian community: the InterVA model. Bull World Health Organ. 2006; 84(3): 204-10. X
Ethiopia 05 - ETHINDEPTH. Ethiopia - Butajira Health and Demographic Surveillance System.
X
Ethiopia 06 - ETHLulu K, Berhane Y. The use of simplified verbal autopsy in identifying causes of adult death in a predominantly rural population in Ethiopia. BMC Public Health. 2005; 5: 58.
X
Ethiopia 07 - ETH
Weldearegawi B, Ashebir Y, Gebeye E, Gebregziabiher T, Yohannes M, Mussa S,Berhe H, Abebe Z. Emerging chronic non-communicable diseases in rural communities of Northern Ethiopia: evidence using population-based verbal autopsy method in Kilite Awlaelo surveillance site. Health Policy Plan. 2013. [Epub ahead of print]
X
Fiji 01 - FJIWorld Health Organization (WHO). WHO Mortality Database Version February 2014. Geneva, Switzerland: World Health Organization (WHO), 2014. X
Finland 01 - FINWorld Health Organization (WHO). WHO Mortality Database Version February 2014. Geneva, Switzerland: World Health Organization (WHO), 2014. X
France 01 - FRAWorld Health Organization (WHO). WHO Mortality Database Version February 2014. Geneva, Switzerland: World Health Organization (WHO), 2014. X
Free State 01 - ZFSDepartment of Home Affairs (South Africa), Statistics South Africa. South Africa Mortality and Causes of Death 1997-2005. Pretoria, South Africa: Statistics South Africa.
X
Gauteng 01 - ZGADepartment of Home Affairs (South Africa), Statistics South Africa. South Africa Mortality and Causes of Death 1997-2005. Pretoria, South Africa: Statistics South Africa.
X
Georgia 01 - GEOWorld Health Organization (WHO). WHO Mortality Database Version February 2014. Geneva, Switzerland: World Health Organization (WHO), 2014. X
Germany 01 - DEUWorld Health Organization (WHO). WHO Mortality Database Version February 2014. Geneva, Switzerland: World Health Organization (WHO), 2014. X
Ghana 01 - GHABirths and Deaths Registry (Ghana). Ghana - Accra Births and Deaths Registry - Deaths 2000-2007. X
Ghana 02 - GHA
Ghana Statistical Service, Ghana Health Service, Macro International, Inc. Ghana Special Demographic and Health Survey 2007-2008. Calverton, United States: Macro International, Inc., 2010. X

Ghana 03 - GHA
Hurt L, ten Asbroek A, Amenga-Etego S, Zandoh C, Danso S, Edmond K, Hurt C,Tawiah C, Hill Z, Fenty J, Owusu-Agyei S, Campbell OM, Kirkwood BR. Effect of vitamin A supplementation on cause-specific mortality in women of reproductive age in Ghana: a secondary analysis from the ObaapaVitA trial. Bull World Health Organ. 2013; 91(1): 19-27.
X
Ghana 04 - GHAINDEPTH. Ghana - Navrongo Health and Demographic Surveillance System.
X
Greece 01 - GRCWorld Health Organization (WHO). WHO Mortality Database Version February 2014. Geneva, Switzerland: World Health Organization (WHO), 2014. X
Grenada 01 - GRDWorld Health Organization (WHO). WHO Mortality Database Version February 2014. Geneva, Switzerland: World Health Organization (WHO), 2014. X
Guatemala 01 - GTMWorld Health Organization (WHO). WHO Mortality Database Version February 2014. Geneva, Switzerland: World Health Organization (WHO), 2014. X
Guyana 01 - GUYWorld Health Organization (WHO). WHO Mortality Database Version February 2014. Geneva, Switzerland: World Health Organization (WHO), 2014. X
Haiti 01 - HTI
Dowell SF, Davis HL, Holt EA, Ruff AJ, Kissinger PJ, Bijoux J, Boulos R, Boulos C, Halsey NA. The utility of verbal autopsies for identifying HIV-1-relateddeaths in Haitian children. AIDS. 1993; 7(9): 1255-9. X
Haiti 02 - HTIWorld Health Organization (WHO). WHO Mortality Database Version February 2014. Geneva, Switzerland: World Health Organization (WHO), 2014. X
Honduras 01 - HNDWorld Health Organization (WHO). WHO Mortality Database Version February 2014. Geneva, Switzerland: World Health Organization (WHO), 2014. X
Hungary 01 - HUNWorld Health Organization (WHO). WHO Mortality Database Version February 2014. Geneva, Switzerland: World Health Organization (WHO), 2014. X
Iceland 01 - ISLWorld Health Organization (WHO). WHO Mortality Database Version February 2014. Geneva, Switzerland: World Health Organization (WHO), 2014. X
India 01 - IND
Byrraju Foundation, Centre for Chronic Disease Control (India), Cooperative for Assistance and Relief Everywhere (CARE), School of Population Health, University of Queensland (Australia). India - Andhra Pradesh Rural Health Initiative.
X
India 02 - IND
Dongre A, Singh A, Deshmukh P, Garg B. A community based cross sectional study on feasibility of lay interviewers in ascertaining causes of adult deaths by using verbal autopsy in rural Wardha. Online Journal of Health and Allied Sciences. 2008; 7(4): 4.
X
India 03 - INDGajalakshmi V, Peto R, Kanaka S, Balasubramanian S. Verbal autopsy of 48 000 adult deaths attributable to medical causes in Chennai (formerly Madras), India. BMC Public Health. 2002; 2: 7.
X
India 04 - INDIndian Council of Medical Research (ICMR). India Study on Causes of Death by Verbal Autopsy 2003. X
India 05 - IND
Joshi R, Cardona M, Iyengar S, Sukumar A, Raju CR, Raju KR, Raju K, Reddy KS, Lopez A, Neal B. Chronic diseases now a leading cause of death in rural India– mortality data from the Andhra Pradesh Rural Health Initiative. Int J Epidemiol. 2006; 35(6): 1522-9.
X
India 06 - INDMinistry of Health and Family Welfare (India), Office of the Registrar General and Census Commissioner (India). India Special Survey of Deaths 2004. X
India 07 - INDOffice of the Registrar General and Census Commissioner (India). India MCCD Vital Statistics - Deaths 1999-2001. X
India 08 - IND
Office of the Registrar General and Census Commissioner (India). India Medical Certification of Cause of Death Report 2002. New Delhi, India: Office of the Registrar General and Census Commissioner (India), 2009. X

India 09 - IND
Office of the Registrar General and Census Commissioner (India). India Medical Certification of Cause of Death Report 2003. New Delhi, India: Office of the Registrar General and Census Commissioner (India), 2009. X
India 10 - IND
Office of the Registrar General and Census Commissioner (India). India Medical Certification of Cause of Death Report 2004. New Delhi, India: Office of the Registrar General and Census Commissioner (India), 2009. X
India 11 - IND
Office of the Registrar General and Census Commissioner (India). India Medical Certification of Cause of Death Report 2005. New Delhi, India: Office of the Registrar General and Census Commissioner (India), 2012. X
India 12 - IND
Office of the Registrar General and Census Commissioner (India). India Medical Certification of Cause of Death Report 2006. New Delhi, India: Office of the Registrar General and Census Commissioner (India), 2012. X
India 13 - IND
Office of the Registrar General and Census Commissioner (India). India Medical Certification of Cause of Death Report 2008. New Delhi, India: Office of the Registrar General and Census Commissioner (India), 2013. X
Indonesia 01 - IDN
National Institute of Health Research and Development (NIHRD), Ministry of Health (Indonesia). Indonesia Sample Registration System 2012, Indonesia Cause of Death Survey 2010-2011, Indonesia Mortality Registration System Strengthening Project (IMRSSP), and Indonesia Basic Health Research 2007-2008.
X
Iran 01 - IRNMinistry of Health and Medical Education (Iran). Iran Vital Registration - Deaths 2007. X
Iran 02 - IRNMinistry of Health and Medical Education (Iran). Iran Vital Registration - Deaths 2008. X
Iran 03 - IRNMinistry of Health and Medical Education (Iran). Iran Vital Registration - Deaths 2009. X
Iran 04 - IRNMinistry of Health and Medical Education (Iran). Iran Vital Registration - Deaths 2010. X
Iraq 01 - IRQWorld Health Organization (WHO). WHO Mortality Database Version February 2014. Geneva, Switzerland: World Health Organization (WHO), 2014. X
Ireland 01 - IRLWorld Health Organization (WHO). WHO Mortality Database Version February 2014. Geneva, Switzerland: World Health Organization (WHO), 2014. X
Israel 01 - ISRWorld Health Organization (WHO). WHO Mortality Database Version February 2014. Geneva, Switzerland: World Health Organization (WHO), 2014. X
Italy 01 - ITAWorld Health Organization (WHO). WHO Mortality Database Version February 2014. Geneva, Switzerland: World Health Organization (WHO), 2014. X
Jamaica 01 - JAMWorld Health Organization (WHO). WHO Mortality Database Version February 2014. Geneva, Switzerland: World Health Organization (WHO), 2014. X
Japan 01 - JPNWorld Health Organization (WHO). WHO Mortality Database Version February 2014. Geneva, Switzerland: World Health Organization (WHO), 2014. X
Jordan 01 - JORWorld Health Organization (WHO). WHO Mortality Database Version February 2014. Geneva, Switzerland: World Health Organization (WHO), 2014. X
Kazakhstan 01 - KAZWorld Health Organization (WHO). WHO Mortality Database Version February 2014. Geneva, Switzerland: World Health Organization (WHO), 2014. X
Kenya 01 - KENINDEPTH. Kenya - Kisumu Health and Demographic Surveillance System.
X
Kenya 02 - KENINDEPTH. Kenya - Nairobi Health and Demographic Surveillance System.
X
Kenya 03 - KEN
van Eijk AM, Adazu K, Ofware P, Vulule J, Hamel M, Slutsker L. Causes of deaths using verbal autopsy among adolescents and adults in rural western Kenya. Trop Med Int Health. 2008; 13(10): 1314-24. X

Kiribati 01 - KIRWorld Health Organization (WHO). WHO Mortality Database Version February 2014. Geneva, Switzerland: World Health Organization (WHO), 2014. X
Kuwait 01 - KWTWorld Health Organization (WHO). WHO Mortality Database Version February 2014. Geneva, Switzerland: World Health Organization (WHO), 2014. X
KwaZulu-Natal 01 - ZKNDepartment of Home Affairs (South Africa), Statistics South Africa. South Africa Mortality and Causes of Death 1997-2005. Pretoria, South Africa: Statistics South Africa.
X
Kyrgyzstan 01 - KGZWorld Health Organization (WHO). WHO Mortality Database Version February 2014. Geneva, Switzerland: World Health Organization (WHO), 2014. X
Latvia 01 - LVAWorld Health Organization (WHO). WHO Mortality Database Version February 2014. Geneva, Switzerland: World Health Organization (WHO), 2014. X
Limpopo 01 - ZLIDepartment of Home Affairs (South Africa), Statistics South Africa. South Africa Mortality and Causes of Death 1997-2005. Pretoria, South Africa: Statistics South Africa.
X
Lithuania 01 - LTUWorld Health Organization (WHO). WHO Mortality Database Version February 2014. Geneva, Switzerland: World Health Organization (WHO), 2014. X
Luxembourg 01 - LUXWorld Health Organization (WHO). WHO Mortality Database Version February 2014. Geneva, Switzerland: World Health Organization (WHO), 2014. X
Macedonia 01 - MKDWorld Health Organization (WHO). WHO Mortality Database Version February 2014. Geneva, Switzerland: World Health Organization (WHO), 2014. X
Malawi 01 - MWIChecchi F, Nyasulu P, Chandramohan D, Roberts B. Rates and causes of death in Chiradzulu District, Malawi, 2008: a key informant study. Trop Med Int Health. 2011; 16(3): 375-8.
X
Malawi 02 - MWI
Chihana M, Floyd S, Molesworth A, Crampin AC, Kayuni N, Price A, Zaba B, Jahn A, Mvula H, Dube A, Ngwira B, Glynn JR, French N. Adult mortality and probable cause of death in rural northern Malawi in the era of HIV treatment. TropMed Int Health. 2012; 17(8): E74-83.
X
Malawi 03 - MWIDoctor HV, Weinreb AA. Estimation of AIDS adult mortality by verbal autopsy inrural Malawi. AIDS. 2003; 17(17): 2509-13. X
Malawi 04 - MWI
Jahn A, Floyd S, Crampin AC, Mvula H, Mwinuka V, Mwaiyeghele E, McGrath N, Zaba B, Fine PEM, Glynn JR. Declining child mortality in northern Malawi despite high rates of infection with HIV. Bull World Health Organ. 2010; 88: 746-53.
X
Malaysia 01 - MYSWorld Health Organization (WHO). WHO Mortality Database Version February 2014. Geneva, Switzerland: World Health Organization (WHO), 2014. X
Maldives 01 - MDVWorld Health Organization (WHO). WHO Mortality Database Version February 2014. Geneva, Switzerland: World Health Organization (WHO), 2014. X
Malta 01 - MLTWorld Health Organization (WHO). WHO Mortality Database Version February 2014. Geneva, Switzerland: World Health Organization (WHO), 2014. X
Mauritius 01 - MUSWorld Health Organization (WHO). WHO Mortality Database Version February 2014. Geneva, Switzerland: World Health Organization (WHO), 2014. X
Mexico 01 - MEXMinistry of Health (Mexico), National Institute of Statistics and Geography (Mexico). Mexico Vital Registration - Deaths 1980 . X
Mexico 02 - MEXMinistry of Health (Mexico), National Institute of Statistics and Geography (Mexico). Mexico Vital Registration - Deaths 1981 . X
Mexico 03 - MEXMinistry of Health (Mexico), National Institute of Statistics and Geography (Mexico). Mexico Vital Registration - Deaths 1982. X
Mexico 04 - MEXMinistry of Health (Mexico), National Institute of Statistics and Geography (Mexico). Mexico Vital Registration - Deaths 1983. X
Mexico 05 - MEXMinistry of Health (Mexico), National Institute of Statistics and Geography (Mexico). Mexico Vital Registration - Deaths 1984. X
Mexico 06 - MEXMinistry of Health (Mexico), National Institute of Statistics and Geography (Mexico). Mexico Vital Registration - Deaths 1985. X

Mexico 07 - MEXMinistry of Health (Mexico), National Institute of Statistics and Geography (Mexico). Mexico Vital Registration - Deaths 1986. X
Mexico 08 - MEXMinistry of Health (Mexico), National Institute of Statistics and Geography (Mexico). Mexico Vital Registration - Deaths 1987. X
Mexico 09 - MEXMinistry of Health (Mexico), National Institute of Statistics and Geography (Mexico). Mexico Vital Registration - Deaths 1988. X
Mexico 10 - MEXMinistry of Health (Mexico), National Institute of Statistics and Geography (Mexico). Mexico Vital Registration - Deaths 1989. X
Mexico 11 - MEXMinistry of Health (Mexico), National Institute of Statistics and Geography (Mexico). Mexico Vital Registration - Deaths 1990. X
Mexico 12 - MEXMinistry of Health (Mexico), National Institute of Statistics and Geography (Mexico). Mexico Vital Registration - Deaths 1991. X
Mexico 13 - MEXMinistry of Health (Mexico), National Institute of Statistics and Geography (Mexico). Mexico Vital Registration - Deaths 1992. X
Mexico 14 - MEXMinistry of Health (Mexico), National Institute of Statistics and Geography (Mexico). Mexico Vital Registration - Deaths 1993. X
Mexico 15 - MEXMinistry of Health (Mexico), National Institute of Statistics and Geography (Mexico). Mexico Vital Registration - Deaths 1994. X
Mexico 16 - MEXMinistry of Health (Mexico), National Institute of Statistics and Geography (Mexico). Mexico Vital Registration - Deaths 1995. X
Mexico 17 - MEXMinistry of Health (Mexico), National Institute of Statistics and Geography (Mexico). Mexico Vital Registration - Deaths 1996. X
Mexico 18 - MEXMinistry of Health (Mexico), National Institute of Statistics and Geography (Mexico). Mexico Vital Registration - Deaths 1997. X
Mexico 19 - MEXMinistry of Health (Mexico), National Institute of Statistics and Geography (Mexico). Mexico Vital Registration - Deaths 1998. X
Mexico 20 - MEXMinistry of Health (Mexico), National Institute of Statistics and Geography (Mexico). Mexico Vital Registration - Deaths 1999. X
Mexico 21 - MEXMinistry of Health (Mexico), National Institute of Statistics and Geography (Mexico). Mexico Vital Registration - Deaths 2000. X
Mexico 22 - MEXMinistry of Health (Mexico), National Institute of Statistics and Geography (Mexico). Mexico Vital Registration - Deaths 2001. X
Mexico 23 - MEXMinistry of Health (Mexico), National Institute of Statistics and Geography (Mexico). Mexico Vital Registration - Deaths 2002. X
Mexico 24 - MEXMinistry of Health (Mexico), National Institute of Statistics and Geography (Mexico). Mexico Vital Registration - Deaths 2003. X
Mexico 25 - MEXMinistry of Health (Mexico), National Institute of Statistics and Geography (Mexico). Mexico Vital Registration - Deaths 2004. X
Mexico 26 - MEXMinistry of Health (Mexico), National Institute of Statistics and Geography (Mexico). Mexico Vital Registration - Deaths 2005. X
Mexico 27 - MEXMinistry of Health (Mexico), National Institute of Statistics and Geography (Mexico). Mexico Vital Registration - Deaths 2006. X
Mexico 28 - MEXMinistry of Health (Mexico), National Institute of Statistics and Geography (Mexico). Mexico Vital Registration - Deaths 2007. X
Mexico 29 - MEXMinistry of Health (Mexico), National Institute of Statistics and Geography (Mexico). Mexico Vital Registration - Deaths 2008. X
Mexico 30 - MEXMinistry of Health (Mexico), National Institute of Statistics and Geography (Mexico). Mexico Vital Registration - Deaths 2010. X
Mexico 31 - MEXMinistry of Health (Mexico), National Institute of Statistics and Geography (Mexico). Mexico Vital Registration - Deaths 2011. X
Mexico 32 - MEXNational Institute of Statistics and Geography (Mexico). Mexico Vital Registration - Deaths 2012. X
Mexico 33 - MEXNational Institute of Statistics and Geography (Mexico). Mexico Vital Statistics - Deaths 2009 . X
Moldova 01 - MDAWorld Health Organization (WHO). WHO Mortality Database Version February 2014. Geneva, Switzerland: World Health Organization (WHO), 2014. X
Mongolia 01 - MNGWorld Health Organization (WHO). WHO Mortality Database Version February 2014. Geneva, Switzerland: World Health Organization (WHO), 2014. X
Montenegro 01 - MNEWorld Health Organization (WHO). WHO Mortality Database Version February 2014. Geneva, Switzerland: World Health Organization (WHO), 2014. X

Morocco 01 - MARWorld Health Organization (WHO). WHO Mortality Database Version February 2014. Geneva, Switzerland: World Health Organization (WHO), 2014. X
Mozambique 01 - MOZ
Centers for Disease Control and Prevention (CDC), MEASURE Evaluation Project, Carolina Population Center, University of North Carolina, Ministry of Health (Mozambique), National Statistics Institute (Mozambique), US Census Bureau. Mozambique National Survey on the Causes of Death 2007-2008.
X
Mozambique 02 - MOZINDEPTH. Mozambique - Manhiça Health and Demographic Surveillance System. X
Mozambique 03 - MOZ
Sacarlal J, Nhacolo AQ, Sigaúque B, Nhalungo DA, Abacassamo F, Sacoor CN, Aide P, Machevo S, Nhampossa T, Macete EV, Bassat Q, David C, Bardají A, Letang E, Saúte F, Aponte JJ, Thompson R, Alonso PL. A 10 year study of the cause of death in children under 15 years in Manhiça, Mozambique. BioMed Central Public Health. 2009; 9: 67.
X
Mpumalanga 01 - ZMPDepartment of Home Affairs (South Africa), Statistics South Africa. South Africa Mortality and Causes of Death 1997-2005. Pretoria, South Africa: Statistics South Africa.
X
Myanmar 01 - MMR
Myint, S. Cause of death verification study in Myanmar. Presentation at: World Health Organization Regional Office for South East Asia. Regional Consultation on Mortality Statistics. 2007; New Delhi, India. X
Netherlands 01 - NLDWorld Health Organization (WHO). WHO Mortality Database Version February 2014. Geneva, Switzerland: World Health Organization (WHO), 2014. X
New Zealand 01 - NZLWorld Health Organization (WHO). WHO Mortality Database Version February 2014. Geneva, Switzerland: World Health Organization (WHO), 2014. X
Nicaragua 01 - NICWorld Health Organization (WHO). WHO Mortality Database Version February 2014. Geneva, Switzerland: World Health Organization (WHO), 2014. X
Nigeria 01 - NGA
National Population Commission of Nigeria, United Nations Children's Fund (UNICEF). Nigeria Report of Livebirths, Deaths and Stillbirths 1994-2007. Abuja,Nigeria: National Population Commission of Nigeria, 2008. X
North-West 01 - ZNWDepartment of Home Affairs (South Africa), Statistics South Africa. South Africa Mortality and Causes of Death 1997-2005. Pretoria, South Africa: Statistics South Africa.
X
Northern Cape 01 - ZNCDepartment of Home Affairs (South Africa), Statistics South Africa. South Africa Mortality and Causes of Death 1997-2005. Pretoria, South Africa: Statistics South Africa.
X
Norway 01 - NORWorld Health Organization (WHO). WHO Mortality Database Version February 2014. Geneva, Switzerland: World Health Organization (WHO), 2014. X
Oman 01 - OMNWorld Health Organization (WHO). WHO Mortality Database Version February 2014. Geneva, Switzerland: World Health Organization (WHO), 2014. X
Pakistan 01 - PAKNational Institute of Population Studies (NIPS) (Pakistan), Macro International, Inc. Pakistan Demographic and Health Survey 2006-2007. Calverton, United States: Macro International, Inc.
X
Palestine 01 - PSEWorld Health Organization (WHO). WHO Mortality Database Version February 2014. Geneva, Switzerland: World Health Organization (WHO), 2014. X
Panama 01 - PANWorld Health Organization (WHO). WHO Mortality Database Version February 2014. Geneva, Switzerland: World Health Organization (WHO), 2014. X
Papua New Guinea 01 - PNG
World Health Organization (WHO). WHO Mortality Database Version February 2014. Geneva, Switzerland: World Health Organization (WHO), 2014. X
Paraguay 01 - PRYWorld Health Organization (WHO). WHO Mortality Database Version February 2014. Geneva, Switzerland: World Health Organization (WHO), 2014. X
Peru 01 - PERWorld Health Organization (WHO). WHO Mortality Database Version February 2014. Geneva, Switzerland: World Health Organization (WHO), 2014. X
Philippines 01 - PHLWorld Health Organization (WHO). WHO Mortality Database Version February 2014. Geneva, Switzerland: World Health Organization (WHO), 2014. X
Poland 01 - POLWorld Health Organization (WHO). WHO Mortality Database Version February 2014. Geneva, Switzerland: World Health Organization (WHO), 2014. X
Portugal 01 - PRTWorld Health Organization (WHO). WHO Mortality Database Version February 2014. Geneva, Switzerland: World Health Organization (WHO), 2014. X
Puerto Rico 01 - PRIWorld Health Organization (WHO). WHO Mortality Database Version February 2014. Geneva, Switzerland: World Health Organization (WHO), 2014. X
Qatar 01 - QATGeneral Secretariat for Development Planning (Qatar), Ministry of Public Health (Qatar). Qatar Vital Statistics Annual Bulletin 2000. 2001. X
Qatar 02 - QATGeneral Secretariat for Development Planning (Qatar), Ministry of Public Health (Qatar). Qatar Vital Statistics Annual Bulletin 2001. 2002. X
Qatar 03 - QATGeneral Secretariat for Development Planning (Qatar), Ministry of Public Health (Qatar). Qatar Vital Statistics Annual Bulletin 2002. 2003. X
Qatar 04 - QATGeneral Secretariat for Development Planning (Qatar), Ministry of Public Health (Qatar). Qatar Vital Statistics Annual Bulletin 2003. 2004. X
Qatar 05 - QATGeneral Secretariat for Development Planning (Qatar), National Health Authority (Qatar). Qatar Vital Statistics Annual Bulletin 2005. 2006. X
Qatar 06 - QATNational Health Authority (Qatar), Qatar Statistics Authority. Qatar Vital Statistics Annual Bulletin 2006. 2007. X
Qatar 07 - QATNational Health Authority (Qatar), Qatar Statistics Authority. Qatar Vital Statistics Annual Bulletin 2008. 2009. X
Qatar 08 - QATWorld Health Organization (WHO). WHO Mortality Database Version February 2014. Geneva, Switzerland: World Health Organization (WHO), 2014. X
Romania 01 - ROUWorld Health Organization (WHO). WHO Mortality Database Version February 2014. Geneva, Switzerland: World Health Organization (WHO), 2014. X
Russia 01 - RUS
Center for Demographic Research, New Economic School (Russia). Russia Mortality Rates by Region, Age, Sex, and Cause of Death 1989-1998. Moscow, Russia: Center for Demographic Research, New Economic School (Russia). X
Russia 02 - RUSWorld Health Organization (WHO). WHO Mortality Database Version February 2014. Geneva, Switzerland: World Health Organization (WHO), 2014. X
Saint Lucia 01 - LCAWorld Health Organization (WHO). WHO Mortality Database Version February 2014. Geneva, Switzerland: World Health Organization (WHO), 2014. X
Saint Vincent and the Grenadines 01 - VCT
World Health Organization (WHO). WHO Mortality Database Version February 2014. Geneva, Switzerland: World Health Organization (WHO), 2014. X
Sao Tome and Principe 01 - STP
World Health Organization (WHO). WHO Mortality Database Version February 2014. Geneva, Switzerland: World Health Organization (WHO), 2014. X
Senegal 01 - SENDuthe G, Pison G. Adult mortality in a rural area of Senegal: Non-communicable diseases have a large impact in Mlomp. Demographic Research. 2008; 19(37): 1419-48.
X
Serbia 01 - SRBWorld Health Organization (WHO). WHO Mortality Database Version February 2014. Geneva, Switzerland: World Health Organization (WHO), 2014. X
Seychelles 01 - SYCWorld Health Organization (WHO). WHO Mortality Database Version February 2014. Geneva, Switzerland: World Health Organization (WHO), 2014. X

Singapore 01 - SGPWorld Health Organization (WHO). WHO Mortality Database Version February 2014. Geneva, Switzerland: World Health Organization (WHO), 2014. X
Slovakia 01 - SVKWorld Health Organization (WHO). WHO Mortality Database Version February 2014. Geneva, Switzerland: World Health Organization (WHO), 2014. X
Slovenia 01 - SVNWorld Health Organization (WHO). WHO Mortality Database Version February 2014. Geneva, Switzerland: World Health Organization (WHO), 2014. X
South Africa 01 - ZAFGarrib A, Jaffar S, Knight S, Bradshaw D, Bennish ML. Rates and causes of child mortality in an area of high HIV prevalence in rural South Africa. Trop Med Int Health. 2006; 11(12): 1841-8.
X
South Africa 02 - ZAFMRC/Wits Rural Public Health and Health Transitions Research Unit (Agincourt), INDEPTH. South Africa - Agincourt Health and Socio-Demographic Surveillance System.
X
South Africa 03 - ZAF
Muhwava W. Contributions of the Africa Centre Demographic Surveillance to the Community. Umbiko. 2007; 12. 3-4.
X
South Africa 04 - ZAFWorld Health Organization (WHO). WHO Mortality Database Version February 2014. Geneva, Switzerland: World Health Organization (WHO), 2014. X
South Korea 01 - KORWorld Health Organization (WHO). WHO Mortality Database Version February 2014. Geneva, Switzerland: World Health Organization (WHO), 2014. X
Spain 01 - ESPWorld Health Organization (WHO). WHO Mortality Database Version February 2014. Geneva, Switzerland: World Health Organization (WHO), 2014. X
Sri Lanka 01 - LKAWorld Health Organization (WHO). WHO Mortality Database Version February 2014. Geneva, Switzerland: World Health Organization (WHO), 2014. X
Suriname 01 - SURWorld Health Organization (WHO). WHO Mortality Database Version February 2014. Geneva, Switzerland: World Health Organization (WHO), 2014. X
Sweden 01 - SWEWorld Health Organization (WHO). WHO Mortality Database Version February 2014. Geneva, Switzerland: World Health Organization (WHO), 2014. X
Switzerland 01 - CHEWorld Health Organization (WHO). WHO Mortality Database Version February 2014. Geneva, Switzerland: World Health Organization (WHO), 2014. X
Syria 01 - SYRWorld Health Organization (WHO). WHO Mortality Database Version February 2014. Geneva, Switzerland: World Health Organization (WHO), 2014. X
Taiwan 01 - TWNDepartment of Health (Taiwan). Taiwan Statistics of Causes of Death 2008.
X
Taiwan 02 - TWNDepartment of Health (Taiwan). Taiwan Statistics of Causes of Death 2009.
X
Taiwan 03 - TWNDepartment of Health (Taiwan). Taiwan Statistics of Causes of Death 2010.
X
Taiwan 04 - TWNDepartment of Health (Taiwan). Taiwan Statistics of Causes of Death 2011.
X
Taiwan 05 - TWNDepartment of Health (Taiwan). Taiwan Statistics of Causes of Death 2012.
X
Taiwan 06 - TWNDepartment of Health (Taiwan). Taiwan Vital Statistics - Deaths 2007.
X
Tajikistan 01 - TJKWorld Health Organization (WHO). WHO Mortality Database Version February 2014. Geneva, Switzerland: World Health Organization (WHO), 2014. X
Tanzania 01 - TZAINDEPTH. Tanzania - Ifakara Health and Demographic Surveillance System.
X
Tanzania 02 - TZAINDEPTH. Tanzania - Rufiji Health and Demographic Surveillance System.
X

Tanzania 03 - TZA
Illah E, Mbaruku G, Masanja H, Kahn K. Causes and risk factors for maternal mortality in rural Tanzania--case of Rufiji Health and Demographic Surveillance Site (HDSS). Afr J Reprod Health. 2013; 17(3): 119-30. .
X
Tanzania 04 - TZA
Kaatano GM, Mashauri FM, Kinung'hi SM, Mwanga JR, Malima RC, Kishamawe C, Nnko SE, Magesa SM, Mboera LE. Patterns of malaria related mortality based on verbal autopsy in Muleba District, north-western Tanzania. Tanzan J Health Res. 2009; 11(4): 210-8.
X
Tanzania 05 - TZAMacLeod J, Rhode R. Retrospective follow-up of maternal deaths and their associated risk factors in a rural district of Tanzania. Trop Med Int Health. 1998; 3(2): 130-7.
X
Tanzania 06 - TZA
Ministry of Health and Social Welfare (Tanzania), Newcastle University, UK Department for International Development (DFID). Tanzania Policy Implications of Mortality Burden 1995-2001. X
Tanzania 07 - TZA
Narah-Bana, S. Risk Factors and Causes of Adult Deaths in the Ifakara Health and Demographic Surveillance System Population, 2003-2007 [dissertation]. [Johannesburg, South Africa]: University of the Witwatersrand; 2010. 174 p. X
Tanzania 08 - TZA
Narh-Bana SA, Chirwa TF, Mwanyangala MA, Nathan R. Muertes de adultos y el futuro: Un análisis causa-específico de las muertes de adultos de un estudio longitudinal en Tanzania rural 2003-2007. Trop Med Int Health. 2012; 17(11): 1396-404.
X
Tanzania 09 - TZASangber-Dery MD. The Role of Birth Order in Infant Mortality in Ifakara DSS Area in Rural Tanzania [master's thesis]. [Johannesburg, South Africa]: Universityof the Witwatersrand; 2009.
X
Thailand 01 - THAMinistry of Public Health (Thailand). Thailand Burden of Disease and Injuries 1998-1999. X
Thailand 02 - THAWorld Health Organization (WHO). WHO Mortality Database Version February 2014. Geneva, Switzerland: World Health Organization (WHO), 2014. X
The Bahamas 01 - BHSWorld Health Organization (WHO). WHO Mortality Database Version February 2014. Geneva, Switzerland: World Health Organization (WHO), 2014. X
Trinidad and Tobago 01 - TTO
World Health Organization (WHO). WHO Mortality Database Version February 2014. Geneva, Switzerland: World Health Organization (WHO), 2014. X
Turkey 01 - TURBaskent University, Ministry of Health (Turkey), State Institute of Statistics (Turkey). Turkey Verbal Autopsy Survey 2003. X
Turkey 02 - TURTurkish Statistical Institute. Turkey Causes of Death Statistics 2010-2012. Ankara, Turkey: Turkish Statistical Institute. X
Turkmenistan 01 - TKMWorld Health Organization (WHO). WHO Mortality Database Version February 2014. Geneva, Switzerland: World Health Organization (WHO), 2014. X
Uganda 01 - UGA
MEASURE Evaluation Project, Carolina Population Center, University of North Carolina, Macro International, Inc, Uganda Bureau of Statistics. Uganda Child Verbal Autopsy Study 2007. Macro International, Inc. X
Uganda 02 - UGA
Mayanja BN, Baisley K, Nalweyiso N, Kibengo FM, Mugisha JO, Van der Paal L,Maher D, Kaleebu P. Using verbal autopsy to assess the prevalence of HIV infection among deaths in the ART period in rural Uganda: a prospective cohort study, 2006-2008. Popul Health Metr. 2011; 9(36): 36.
X
Ukraine 01 - UKRWorld Health Organization (WHO). WHO Mortality Database Version February 2014. Geneva, Switzerland: World Health Organization (WHO), 2014. X
United Kingdom 01 - GBRNational Records of Scotland. United Kingdom - Scotland Vital Events Reference Tables 2011. Edinburgh, Scotland: National Records of Scotland. X
United Kingdom 02 - GBRNational Records of Scotland. United Kingdom - Scotland Vital Events Reference Tables 2012. Edinburgh, Scotland: National Records of Scotland. X

United Kingdom 03 - GBR
Northern Ireland Statistics and Research Agency (NISRA). United Kingdom - Northern Ireland Registrar General Annual Report 2011. Belfast, Northern Ireland:Northern Ireland Statistics and Research Agency (NISRA), 2012. X
United Kingdom 04 - GBROffice for National Statistics (United Kingdom). United Kingdom - England and Wales Mortality Data 1981-1994. Newport, United Kingdom: Office for National Statistics (United Kingdom).
X
United Kingdom 05 - GBROffice for National Statistics (United Kingdom). United Kingdom - England and Wales Mortality Data 1995-2000. Newport, United Kingdom: Office for National Statistics (United Kingdom).
X
United Kingdom 06 - GBROffice for National Statistics (United Kingdom). United Kingdom - England and Wales Mortality Data 2001-2012. Newport, United Kingdom: Office for National Statistics (United Kingdom).
X
United Kingdom 07 - GBRWorld Health Organization (WHO). WHO Mortality Database Version February 2014. Geneva, Switzerland: World Health Organization (WHO), 2014. X
United States 01 - USAWorld Health Organization (WHO). WHO Mortality Database Version February 2014. Geneva, Switzerland: World Health Organization (WHO), 2014. X
Uruguay 01 - URYWorld Health Organization (WHO). WHO Mortality Database Version February 2014. Geneva, Switzerland: World Health Organization (WHO), 2014. X
Uzbekistan 01 - UZBWorld Health Organization (WHO). WHO Mortality Database Version February 2014. Geneva, Switzerland: World Health Organization (WHO), 2014. X
Venezuela 01 - VENWorld Health Organization (WHO). WHO Mortality Database Version February 2014. Geneva, Switzerland: World Health Organization (WHO), 2014. X
Vietnam 01 - VNM
Hanoi School of Public Health, Ministry of Health (Viet Nam), School of Population Health, University of Queensland (Australia). Vietnam Burden of Disease and Injury Study 2008. Hanoi, Vietnam: Hanoi School of Public Health, 2011.
X
Vietnam 02 - VNM
Hoa NP, Rao C, Hoy DG, Hinh ND, Chuc NT, Ngo DA. Mortality measures from sample-based surveillance: evidence of the epidemiological transition in Viet Nam. Bull World Health Organ. 2012; 90(10): 764-72. X
Vietnam 03 - VNMNgo AD, Rao C, Hoa NP, Adair T, Chuc NTK. Mortality patterns in Vietnam, 2006: Findings from a national verbal autopsy survey. BMC Res Notes. 2010; 3: 78.
X
Vietnam 04 - VNMQuyen BTT, Nhung NT, Cuong PV. The causes of deaths in Chililab between 2008-2010 based on verbal autopsy method. Vietnam Journal of Public Health. 2012; 1(1): 24-31.
X
Western Cape 01 - ZWCDepartment of Home Affairs (South Africa), Statistics South Africa. South Africa Mortality and Causes of Death 1997-2005. Pretoria, South Africa: Statistics South Africa.
X
Zambia 01 - ZMB
Mudenda SS, Kamocha S, Mswia R, Conkling M, Sikanyiti P, Potter D, Mayaka WC, Marx MA. Feasibility of using a WHO-standard methodology for Sample Vital Registration with Verbal Autopsy (SAVVY) to report leading causes of death in Zambia: results of a pilot in four provinces, 2010. Popul Health Metr. 2011; 9: 40.
X
Zimbabwe 01 - ZWERegistrar General's Department (Zimbabwe), Zimbabwe National Statistics Agency. Zimbabwe Mortality Report 2007. X
Zimbabwe 02 - ZWEWorld Health Organization (WHO). WHO Mortality Database Version February 2014. Geneva, Switzerland: World Health Organization (WHO), 2014. X

Covariate Direction Level
Cumulative Cigarettes (5 years) 1 1
Diabetes Fasting Plasma Glucose (mmol/L) 1 1
Health system access (unitless) -1 1
Indoor Air Pollution (All Cooking Fuels) 1 1
Malnutrition in children under 5 years - proportion > 2SD below mean weight for age (logit transform -1 1
Smoking Prevalence 1 1
Alcohol (liters per capita) 1 2
Population Density (500-1,000 ppl/sqkm, proportion) 1 2
Population Density (over 1,000 ppl/sqkm, proportion) 1 2
Education (years per capita) -1 3
Lag distributed income per capita (log transformed) -1 3
Appendix Table 5: Covariates used in CODEm for tuberculosis - Males and Females

Test 1 Rank Test 1 Rank
1 Spacetime Logit(CF)
Malnutrition - poroportion <2SD weight for age (logit transformed), Smoking Prevalence, Alcohol (liters per capita), Education (years per capita), Lag distributed income per capita (log transformed)
0.5960541 2 0.1723921 52 99
2 Spacetime Logit(CF)
Malnutrition - poroportion <2SD weight for age (logit transformed), Indoor Air Polluntion (All Cooking Fuels), Smoking Prevalence, Alcohol (liters per capita), Education (years per capita)
0.6105738 12 0.1722745 43 89
3 Spacetime Logit(CF)Malnutrition - poroportion <2SD weight for age (logit transformed), Smoking Prevalence, Education (years per capita), Lag distributed income per capita (log transformed)
0.6089908 9 0.172358 48 80
4 Spacetime Logit(CF)
Health System Access 2 (unitness), Malnutrition - proportion <2SD weight for age (logit transformed), Indoor Air Polluntion (All Cooking Fuels), Smoking Prevalence, Alcohol (liters per capita), Education (years per capita), Lag distributed income per capita (log transformed)
0.602951 4 0.1724631 61 72
5 Spacetime Logit(CF)Malnutrition - poroportion <2SD weight for age (logit transformed), Alcohol (liters per capita), Education (years per capita), Lag distributed income per capita (log transformed)
0.6050448 6 0.1724786 63 65
6 Spacetime Logit(CF)Malnutrition - poroportion <2SD weight for age (logit transformed), Indoor Air Polluntion (All Cooking Fuels), Smoking Prevalence, Education (years per capita)
0.6211647 29 0.1722964 46 59
7 Spacetime Logit(CF)
Health System Access 2 (unitness), Malnutrition - proportion <2SD weight for age (logit transformed), Indoor Air Polluntion (All Cooking Fuels), Smoking Prevalence, Education (years per capita), Lag distributed income per capita (log transformed)
0.6115596 14 0.1724719 62 53
8 Spacetime Logit(CF)
Health System Access 2 (unitness), Malnutrition - proportion <2SD weight for age (logit transformed), Smoking Prevalence, Alcohol (liters per capita), Education (years per capita), Lag distributed income per capita (log transformed)
0.5957156 1 0.1726189 78 48
9 Spacetime Logit(CF)Malnutrition - poroportion <2SD weight for age (logit transformed), Indoor Air Polluntion (All Cooking Fuels), Alcohol (liters per capita), Education (years per capita)
0.6215445 31 0.1723753 49 43
10 Spacetime Logit(CF)
Health System Access 2 (unitness), Malnutrition - proportion <2SD weight for age (logit transformed), Smoking Prevalence, Education (years per capita), Lag distributed income per capita (log transformed)
0.6069267 7 0.1725958 73 39
11 Spacetime Logit(CF)
Health System Access 2 (unitness), Malnutrition - proportion <2SD weight for age (logit transformed), Indoor Air Polluntion (All Cooking Fuels), Alcohol (liters per capita), Education (years per capita), Lag distributed income per capita (log transformed)
0.6102294 10 0.1726066 75 35
12 Spacetime Logit(CF)Malnutrition - poroportion <2SD weight for age (logit transformed), Indoor Air Polluntion (All Cooking Fuels), Smoking Prevalence
0.6211144 28 0.1724322 57 31
Root Mean Squared Error
Trend Test
Appendix Table 6a: CODEm sub-model performance for tuberculosis - Males
Overall Rank
Model typeDependent
variableCovariates Draws

13 Spacetime Logit(CF)Malnutrition - poroportion <2SD weight for age (logit transformed), Indoor Air Polluntion (All Cooking Fuels), Smoking Prevalence, Alcohol (liters per capita)
0.6232108 35 0.1723788 51 28
14 Spacetime Logit(CF)
Malnutrition - poroportion <2SD weight for age (logit transformed), Indoor Air Polluntion (All Cooking Fuels), Smoking Prevalence, Lag distributed income per capita (log transformed)
0.6215823 32 0.172421 55 26
15 Spacetime Logit(CF)
Health System Access 2 (unitness), Malnutrition - proportion <2SD weight for age (logit transformed), Alcohol (liters per capita), Education (years per capita), Lag distributed income per capita (log transformed)
0.6021707 3 0.1727518 85 23
16 Spacetime Logit(CF)
Malnutrition - poroportion <2SD weight for age (logit transformed), Indoor Air Polluntion (All Cooking Fuels), Smoking Prevalence, Alcohol (liters per capita), Lag distributed income per capita (log transformed)
0.6248376 41 0.1723759 50 21
17 Spacetime Logit(CF)
Health System Access 2 (unitness), Indoor Air Polluntion (All Cooking Fuels), Smoking Prevalence, Alcohol (liters per capita), Education (years per capita), Lag distributed income per capita (log transformed)
0.6103104 11 0.1726654 81 19
18 Linear Logit(CF)
Health System Access 2 (unitness), Malnutrition - proportion <2SD weight for age (logit transformed), Smoking Prevalence, Alcohol (liters per capita), Education (years per capita), Lag distributed income per capita (log transformed)
0.6330675 55 0.1722202 38 17
19 Linear Logit(CF)
Malnutrition - poroportion <2SD weight for age (logit transformed), Smoking Prevalence, Alcohol (liters per capita), Education (years per capita), Lag distributed income per capita (log transformed)
0.6497616 93 0.17195 2 15
20 Linear Logit(CF)
Health System Access 2 (unitness), Malnutrition - proportion <2SD weight for age (logit transformed), Indoor Air Polluntion (All Cooking Fuels), Smoking Prevalence, Alcohol (liters per capita), Education (years per capita), Lag distributed income per capita (log transformed)
0.6349105 60 0.1722029 35 14
21 Linear Logit(CF)
Malnutrition - poroportion <2SD weight for age (logit transformed), Indoor Air Polluntion (All Cooking Fuels), Smoking Prevalence, Alcohol (liters per capita), Education (years per capita)
0.6509259 95 0.1719492 1 12
22 Spacetime Logit(CF)Health System Access 2 (unitness), Indoor Air Polluntion (All Cooking Fuels), Smoking Prevalence, Education (years per capita), Lag distributed income per capita (log transformed)
0.6116747 15 0.1726727 82 11
23 Spacetime Logit(CF) Malnutrition - poroportion <2SD weight for age (logit transformed), Smoking Prevalence 0.6148293 21 0.1726072 76 10
24 Spacetime Logit(CF)
Health System Access 2 (unitness), Malnutrition - proportion <2SD weight for age (logit transformed), Indoor Air Polluntion (All Cooking Fuels), Education (years per capita), Lag distributed income per capita (log transformed)
0.6134158 18 0.1726473 80 9
25 Spacetime Logit(CF)Smoking Prevalence, Alcohol (liters per capita), Education (years per capita), Lag distributed income per capita (log transformed)
0.6075017 8 0.1728208 92 8
26 Spacetime Logit(CF)Malnutrition - poroportion <2SD weight for age (logit transformed), Education (years per capita), Lag distributed income per capita (log transformed)
0.6225402 34 0.1725045 66 7

27 Spacetime Logit(CF)Health System Access 2 (unitness), Smoking Prevalence, Alcohol (liters per capita), Education (years per capita), Lag distributed income per capita (log transformed)
0.6045502 5 0.1728993 98 7
28 Linear Logit(CF)
Health System Access 2 (unitness), Malnutrition - proportion <2SD weight for age (logit transformed), Smoking Prevalence, Education (years per capita), Lag distributed income per capita (log transformed)
0.6350008 62 0.17224 41 6
29 Linear Logit(CF)
Health System Access 2 (unitness), Malnutrition - proportion <2SD weight for age (logit transformed), Indoor Air Polluntion (All Cooking Fuels), Smoking Prevalence, Education (years per capita), Lag distributed income per capita (log transformed)
0.6368202 70 0.1722132 37 5
30 Spacetime Logit(CF)Cumulative Cigarettes (5 Years), Malnutrition - proportion <2SD weight for age (logit transformed), Education (years per capita), Lag distributed income per capita (log transformed)
0.6265637 43 0.1724813 64 5
31 Linear Logit(CF)Malnutrition - poroportion <2SD weight for age (logit transformed), Smoking Prevalence, Education (years per capita), Lag distributed income per capita (log transformed)
0.6527896 100 0.1719874 7 4
32 Spacetime Logit(CF) Malnutrition - poroportion <2SD weight for age (logit transformed), Smoking Prevalence, Alcohol (liters per capita) 0.6232836 36 0.1725922 72 4
33 Spacetime Logit(CF)Health System Access 2 (unitness), Malnutrition - proportion <2SD weight for age (logit transformed), Education (years per capita), Lag distributed income per capita (log transformed)
0.6159183 22 0.1727588 88 4
34 Spacetime Logit(CF)Health System Access 2 (unitness), Malnutrition - proportion <2SD weight for age (logit transformed), Indoor Air Polluntion (All Cooking Fuels), Smoking Prevalence
0.6203356 27 0.1727454 84 3
35 Linear Logit(CF)
Health System Access 2 (unitness), Malnutrition - proportion <2SD weight for age (logit transformed), Indoor Air Polluntion (All Cooking Fuels), Smoking Prevalence, Alcohol (liters per capita)
0.6465844 81 0.1721375 30 3
36 Spacetime Logit(CF)
Health System Access 2 (unitness), Malnutrition - proportion <2SD weight for age (logit transformed), Indoor Air Polluntion (All Cooking Fuels), Smoking Prevalence, Alcohol (liters per capita)
0.6191714 25 0.1727569 86 3
37 Spacetime Logit(CF)Indoor Air Polluntion (All Cooking Fuels), Smoking Prevalence, Alcohol (liters per capita), Education (years per capita), Lag distributed income per capita (log transformed)
0.6232977 37 0.1725978 74 2
38 Linear Logit(CF)Malnutrition - poroportion <2SD weight for age (logit transformed), Indoor Air Polluntion (All Cooking Fuels), Alcohol (liters per capita), Education (years per capita)
0.6543971 108 0.1719783 4 2
39 Linear Logit(CF)Malnutrition - poroportion <2SD weight for age (logit transformed), Indoor Air Polluntion (All Cooking Fuels), Smoking Prevalence, Education (years per capita)
0.6539899 107 0.1719785 5 2
40 Spacetime Logit(CF)Health System Access 2 (unitness), Smoking Prevalence, Education (years per capita), Lag distributed income per capita (log transformed)
0.6116784 16 0.1728707 95 2
41 Spacetime Logit(CF)
Cumulative Cigarettes (5 Years), Malnutrition - proportion <2SD weight for age (logit transformed), Indoor Air Polluntion (All Cooking Fuels), Lag distributed income per capita (log transformed)
0.6297367 48 0.1724942 65 2

42 Linear Logit(CF)Malnutrition - poroportion <2SD weight for age (logit transformed), Alcohol (liters per capita), Education (years per capita), Lag distributed income per capita (log transformed)
0.6557249 112 0.1719761 3 1
43 Linear Logit(CF) Malnutrition - poroportion <2SD weight for age (logit transformed), Smoking Prevalence, Alcohol (liters per capita)
0.653331 103 0.1720023 11 1
44 Spacetime Logit(CF)Malnutrition - poroportion <2SD weight for age (logit transformed), Indoor Air Polluntion (All Cooking Fuels), Education (years per capita)
0.6341395 58 0.1724572 60 1
45 Linear Logit(CF)Malnutrition - poroportion <2SD weight for age (logit transformed), Indoor Air Polluntion (All Cooking Fuels), Smoking Prevalence, Alcohol (liters per capita)
0.6539142 106 0.1719881 8 1
46 Spacetime Logit(CF)Health System Access 2 (unitness), Indoor Air Polluntion (All Cooking Fuels), Education (years per capita), Lag distributed income per capita (log transformed)
0.6139577 20 0.1728968 97 1
47 Spacetime Logit(CF)
Health System Access 2 (unitness), Indoor Air Polluntion (All Cooking Fuels), Alcohol (liters per capita), Education (years per capita), Lag distributed income per capita (log transformed)
0.6187676 24 0.1728544 94 1
48 Linear Logit(CF)Health System Access 2 (unitness), Malnutrition - proportion <2SD weight for age (logit transformed), Indoor Air Polluntion (All Cooking Fuels), Smoking Prevalence
0.6470698 84 0.1721395 31 1
49 Spacetime Logit(CF)Cumulative Cigarettes (5 Years), Malnutrition - proportion <2SD weight for age (logit transformed), Alcohol (liters per capita)
0.6273724 46 0.1725865 71 1
50 Spacetime Logit(CF)Cumulative Cigarettes (5 Years), Malnutrition - proportion <2SD weight for age (logit transformed), Indoor Air Polluntion (All Cooking Fuels), Alcohol (liters per capita)
0.6349741 61 0.1724133 54 1
51 Spacetime Logit(CF)
Cumulative Cigarettes (5 Years), Malnutrition - proportion <2SD weight for age (logit transformed), Indoor Air Polluntion (All Cooking Fuels), Alcohol (liters per capita), Lag distributed income per capita (log transformed)
0.6358166 65 0.1724109 53 1
52 Linear Logit(CF) Smoking Prevalence 0.7227351 226 0.1762145 254 0
53 Spacetime Logit(CF) Smoking Prevalence 0.6775581 155 0.1748969 157 0
54 Linear Logit(CF) Smoking Prevalence, Education (years per capita), Lag distributed income per capita (log transformed) 0.6799555 156 0.1729021 99 0
55 Spacetime Logit(CF) Smoking Prevalence, Education (years per capita), Lag distributed income per capita (log transformed) 0.6238866 38 0.1729484 102 0
56 Linear Logit(CF) Smoking Prevalence, Alcohol (liters per capita) 0.7218569 225 0.1761776 252 057 Spacetime Logit(CF) Smoking Prevalence, Alcohol (liters per capita) 0.6711252 147 0.1748657 156 0
58 Linear Logit(CF)Smoking Prevalence, Alcohol (liters per capita), Education (years per capita), Lag distributed income per capita (log transformed)
0.6692085 146 0.1727998 91 0
59 Linear Logit(CF) Indoor Air Polluntion (All Cooking Fuels) 0.7359339 242 0.1752197 182 060 Spacetime Logit(CF) Indoor Air Polluntion (All Cooking Fuels) 0.673189 151 0.174032 144 0
61 Linear Logit(CF)Indoor Air Polluntion (All Cooking Fuels), Education (years per capita), Lag distributed income per capita (log transformed)
0.6871679 159 0.1732281 120 0
62 Spacetime Logit(CF)Indoor Air Polluntion (All Cooking Fuels), Education (years per capita), Lag distributed income per capita (log transformed)
0.6475514 87 0.1731404 117 0
63 Linear Logit(CF) Indoor Air Polluntion (All Cooking Fuels), Alcohol (liters per capita) 0.7336282 235 0.1749857 164 0

64 Spacetime Logit(CF)Indoor Air Polluntion (All Cooking Fuels), Alcohol (liters per capita) 0.6762564 152 0.1737991 140 0
65 Linear Logit(CF)Indoor Air Polluntion (All Cooking Fuels), Alcohol (liters per capita), Education (years per capita), Lag distributed income per capita (log transformed)
0.663525 142 0.173181 118 0
66 Spacetime Logit(CF)Indoor Air Polluntion (All Cooking Fuels), Alcohol (liters per capita), Education (years per capita), Lag distributed income per capita (log transformed)
0.6411995 72 0.1728263 93 0
67 Linear Logit(CF) Indoor Air Polluntion (All Cooking Fuels), Smoking Prevalence 0.69322 166 0.1743038 146 0
68 Spacetime Logit(CF) Indoor Air Polluntion (All Cooking Fuels), Smoking Prevalence 0.6618539 135 0.173453 132 0
69 Linear Logit(CF)Indoor Air Polluntion (All Cooking Fuels), Smoking Prevalence, Education (years per capita), Lag distributed income per capita (log transformed)
0.6717304 148 0.1728763 96 0
70 Spacetime Logit(CF)Indoor Air Polluntion (All Cooking Fuels), Smoking Prevalence, Education (years per capita), Lag distributed income per capita (log transformed)
0.6363871 67 0.1727578 87 0
71 Linear Logit(CF) Indoor Air Polluntion (All Cooking Fuels), Smoking Prevalence, Alcohol (liters per capita) 0.692012 164 0.1741922 145 0
72 Spacetime Logit(CF) Indoor Air Polluntion (All Cooking Fuels), Smoking Prevalence, Alcohol (liters per capita) 0.6689523 145 0.1733532 128 0
73 Linear Logit(CF)Indoor Air Polluntion (All Cooking Fuels), Smoking Prevalence, Alcohol (liters per capita), Education (years per capita), Lag distributed income per capita (log transformed)
0.6580178 118 0.1727907 90 0
74 Linear Logit(CF) Malnutrition - poroportion <2SD weight for age (logit transformed) 0.662939 140 0.1720327 27 0
75 Spacetime Logit(CF) Malnutrition - poroportion <2SD weight for age (logit transformed) 0.6267299 45 0.1726788 83 0
76 Linear Logit(CF)Malnutrition - poroportion <2SD weight for age (logit transformed), Education (years per capita), Lag distributed income per capita (log transformed)
0.6622331 138 0.1720255 23 0
77 Linear Logit(CF) Malnutrition - poroportion <2SD weight for age (logit transformed), Alcohol (liters per capita) 0.6591483 124 0.1720118 14 0
78 Spacetime Logit(CF) Malnutrition - poroportion <2SD weight for age (logit transformed), Alcohol (liters per capita) 0.6277016 47 0.1726088 77 0
79 Linear Logit(CF) Malnutrition - poroportion <2SD weight for age (logit transformed), Smoking Prevalence 0.6551191 110 0.1720169 17 0
80 Linear Logit(CF) Malnutrition - poroportion <2SD weight for age (logit transformed), Indoor Air Polluntion (All Cooking Fuels) 0.6620538 137 0.1720356 28 0
81 Spacetime Logit(CF) Malnutrition - poroportion <2SD weight for age (logit transformed), Indoor Air Polluntion (All Cooking Fuels) 0.6342384 59 0.1725453 70 0
82 Linear Logit(CF)Malnutrition - poroportion <2SD weight for age (logit transformed), Indoor Air Polluntion (All Cooking Fuels), Lag distributed income per capita (log transformed)
0.6638193 143 0.172026 25 0
83 Spacetime Logit(CF)Malnutrition - poroportion <2SD weight for age (logit transformed), Indoor Air Polluntion (All Cooking Fuels), Lag distributed income per capita (log transformed)
0.6317616 53 0.1725316 69 0
84 Linear Logit(CF)Malnutrition - poroportion <2SD weight for age (logit transformed), Indoor Air Polluntion (All Cooking Fuels), Education (years per capita)
0.6603668 131 0.172022 22 0
85 Linear Logit(CF)Malnutrition - poroportion <2SD weight for age (logit transformed), Indoor Air Polluntion (All Cooking Fuels), Alcohol (liters per capita)
0.657848 116 0.1720166 16 0
86 Spacetime Logit(CF)Malnutrition - poroportion <2SD weight for age (logit transformed), Indoor Air Polluntion (All Cooking Fuels), Alcohol (liters per capita)
0.6354592 63 0.1724384 59 0

87 Linear Logit(CF)
Malnutrition - poroportion <2SD weight for age (logit transformed), Indoor Air Polluntion (All Cooking Fuels), Alcohol (liters per capita), Lag distributed income per capita (log transformed)
0.6601422 128 0.1720083 12 0
88 Spacetime Logit(CF)
Malnutrition - poroportion <2SD weight for age (logit transformed), Indoor Air Polluntion (All Cooking Fuels), Alcohol (liters per capita), Lag distributed income per capita (log transformed)
0.6360226 66 0.1724324 58 0
89 Linear Logit(CF)Malnutrition - poroportion <2SD weight for age (logit transformed), Indoor Air Polluntion (All Cooking Fuels), Smoking Prevalence
0.6549741 109 0.1719989 10 0
90 Linear Logit(CF)
Malnutrition - poroportion <2SD weight for age (logit transformed), Indoor Air Polluntion (All Cooking Fuels), Smoking Prevalence, Lag distributed income per capita (log transformed)
0.6587554 121 0.1719883 9 0
91 Linear Logit(CF)
Malnutrition - poroportion <2SD weight for age (logit transformed), Indoor Air Polluntion (All Cooking Fuels), Smoking Prevalence, Alcohol (liters per capita), Lag distributed income per capita (log transformed)
0.6580889 119 0.1719797 6 0
92 Linear Logit(CF) Health System Access 2 (unitness) 0.6598502 125 0.1761676 251 093 Spacetime Logit(CF) Health System Access 2 (unitness) 0.6426683 75 0.1747 153 0
94 Linear Logit(CF) Health System Access 2 (unitness), Education (years per capita), Lag distributed income per capita (log transformed) 0.6588548 122 0.1734445 131 0
95 Spacetime Logit(CF) Health System Access 2 (unitness), Education (years per capita), Lag distributed income per capita (log transformed) 0.6186669 23 0.1730828 110 0
96 Linear Logit(CF) Health System Access 2 (unitness), Alcohol (liters per capita) 0.6564471 114 0.1762135 253 0
97 Spacetime Logit(CF) Health System Access 2 (unitness), Alcohol (liters per capita) 0.6484318 92 0.1747965 154 0
98 Linear Logit(CF)Health System Access 2 (unitness), Alcohol (liters per capita), Education (years per capita), Lag distributed income per capita (log transformed)
0.6506145 94 0.1733849 129 0
99 Spacetime Logit(CF)Health System Access 2 (unitness), Alcohol (liters per capita), Education (years per capita), Lag distributed income per capita (log transformed)
0.6120552 17 0.1730775 109 0
100 Linear Logit(CF) Health System Access 2 (unitness), Smoking Prevalence 0.6524196 98 0.1753482 200 0
101 Spacetime Logit(CF) Health System Access 2 (unitness), Smoking Prevalence 0.636512 68 0.1743372 147 0
102 Linear Logit(CF)Health System Access 2 (unitness), Smoking Prevalence, Education (years per capita), Lag distributed income per capita (log transformed)
0.6477208 89 0.1731359 116 0
103 Linear Logit(CF) Health System Access 2 (unitness), Smoking Prevalence, Alcohol (liters per capita) 0.6518878 97 0.1753687 203 0
104 Spacetime Logit(CF)Health System Access 2 (unitness), Smoking Prevalence, Alcohol (liters per capita) 0.6356773 64 0.1744471 150 0
105 Linear Logit(CF)Health System Access 2 (unitness), Smoking Prevalence, Alcohol (liters per capita), Education (years per capita), Lag distributed income per capita (log transformed)
0.6425735 74 0.1730965 111 0
106 Linear Logit(CF)Health System Access 2 (unitness), Indoor Air Polluntion (All Cooking Fuels) 0.6613891 134 0.1744574 151 0
107 Spacetime Logit(CF) Health System Access 2 (unitness), Indoor Air Polluntion (All Cooking Fuels) 0.6341249 57 0.1735089 135 0
108 Linear Logit(CF)Health System Access 2 (unitness), Indoor Air Polluntion (All Cooking Fuels), Education (years per capita), Lag distributed income per capita (log transformed)
0.6634022 141 0.17342 130 0

109 Linear Logit(CF) Health System Access 2 (unitness), Indoor Air Polluntion (All Cooking Fuels), Alcohol (liters per capita)
0.6555287 111 0.1744695 152 0
110 Spacetime Logit(CF) Health System Access 2 (unitness), Indoor Air Polluntion (All Cooking Fuels), Alcohol (liters per capita)
0.6413046 73 0.1735324 136 0
111 Linear Logit(CF)
Health System Access 2 (unitness), Indoor Air Polluntion (All Cooking Fuels), Alcohol (liters per capita), Education (years per capita), Lag distributed income per capita (log transformed)
0.6526333 99 0.1733455 127 0
112 Linear Logit(CF) Health System Access 2 (unitness), Indoor Air Polluntion (All Cooking Fuels), Smoking Prevalence 0.6472619 85 0.1739097 142 0
113 Spacetime Logit(CF) Health System Access 2 (unitness), Indoor Air Polluntion (All Cooking Fuels), Smoking Prevalence 0.6305965 51 0.1732082 119 0
114 Linear Logit(CF)Health System Access 2 (unitness), Indoor Air Polluntion (All Cooking Fuels), Smoking Prevalence, Education (years per capita), Lag distributed income per capita (log transformed)
0.6516746 96 0.1730975 112 0
115 Linear Logit(CF)Health System Access 2 (unitness), Indoor Air Polluntion (All Cooking Fuels), Smoking Prevalence, Alcohol (liters per capita)
0.6468015 83 0.1739284 143 0
116 Spacetime Logit(CF)Health System Access 2 (unitness), Indoor Air Polluntion (All Cooking Fuels), Smoking Prevalence, Alcohol (liters per capita)
0.6303542 49 0.1732514 122 0
117 Linear Logit(CF)
Health System Access 2 (unitness), Indoor Air Polluntion (All Cooking Fuels), Smoking Prevalence, Alcohol (liters per capita), Education (years per capita), Lag distributed income per capita (log transformed)
0.6473855 86 0.1730489 105 0
118 Linear Logit(CF) Health System Access 2 (unitness), Malnutrition - proportion <2SD weight for age (logit transformed) 0.653684 104 0.1722355 40 0
119 Spacetime Logit(CF) Health System Access 2 (unitness), Malnutrition - proportion <2SD weight for age (logit transformed) 0.6245565 39 0.1732503 121 0
120 Linear Logit(CF)Health System Access 2 (unitness), Malnutrition - proportion <2SD weight for age (logit transformed), Education (years per capita), Lag distributed income per capita (log transformed)
0.6455116 79 0.1723075 47 0
121 Linear Logit(CF)Health System Access 2 (unitness), Malnutrition - proportion <2SD weight for age (logit transformed), Alcohol (liters per capita)
0.6531534 102 0.1722271 39 0
122 Spacetime Logit(CF)Health System Access 2 (unitness), Malnutrition - proportion <2SD weight for age (logit transformed), Alcohol (liters per capita)
0.6212522 30 0.1732754 125 0
123 Linear Logit(CF)
Health System Access 2 (unitness), Malnutrition - proportion <2SD weight for age (logit transformed), Alcohol (liters per capita), Education (years per capita), Lag distributed income per capita (log transformed)
0.6432653 77 0.1722791 44 0
124 Linear Logit(CF) Health System Access 2 (unitness), Malnutrition - proportion <2SD weight for age (logit transformed), Smoking Prevalence 0.6477809 90 0.1721821 33 0
125 Spacetime Logit(CF) Health System Access 2 (unitness), Malnutrition - proportion <2SD weight for age (logit transformed), Smoking Prevalence
0.6135879 19 0.173071 108 0
126 Linear Logit(CF)Health System Access 2 (unitness), Malnutrition - proportion <2SD weight for age (logit transformed), Smoking Prevalence, Alcohol (liters per capita)
0.6475686 88 0.1721747 32 0
127 Spacetime Logit(CF)Health System Access 2 (unitness), Malnutrition - proportion <2SD weight for age (logit transformed), Smoking Prevalence, Alcohol (liters per capita)
0.6109562 13 0.1731124 113 0

128 Linear Logit(CF)Health System Access 2 (unitness), Malnutrition - proportion <2SD weight for age (logit transformed), Indoor Air Polluntion (All Cooking Fuels)
0.65385 105 0.1722039 36 0
129 Spacetime Logit(CF)Health System Access 2 (unitness), Malnutrition - proportion <2SD weight for age (logit transformed), Indoor Air Polluntion (All Cooking Fuels)
0.626655 44 0.172935 101 0
130 Linear Logit(CF)
Health System Access 2 (unitness), Malnutrition - proportion <2SD weight for age (logit transformed), Indoor Air Polluntion (All Cooking Fuels), Education (years per capita), Lag distributed income per capita (log transformed)
0.6466863 82 0.1722907 45 0
131 Linear Logit(CF)Health System Access 2 (unitness), Malnutrition - proportion <2SD weight for age (logit transformed), Indoor Air Polluntion (All Cooking Fuels), Alcohol (liters per capita)
0.6528019 101 0.1721996 34 0
132 Spacetime Logit(CF)Health System Access 2 (unitness), Malnutrition - proportion <2SD weight for age (logit transformed), Indoor Air Polluntion (All Cooking Fuels), Alcohol (liters per capita)
0.6304522 50 0.1729246 100 0
133 Linear Logit(CF)
Health System Access 2 (unitness), Malnutrition - proportion <2SD weight for age (logit transformed), Indoor Air Polluntion (All Cooking Fuels), Alcohol (liters per capita), Education (years per capita), Lag distributed income per capita (log transformed)
0.6456704 80 0.1722718 42 0
134 Linear Logit(CF) Cumulative Cigarettes (5 Years) 0.7765191 313 0.1773649 305 0135 Spacetime Logit(CF) Cumulative Cigarettes (5 Years) 0.6998442 174 0.1756035 216 0
136 Linear Logit(CF) Cumulative Cigarettes (5 Years), Education (years per capita), Lag distributed income per capita (log transformed) 0.6867598 158 0.1731308 114 0
137 Spacetime Logit(CF) Cumulative Cigarettes (5 Years), Education (years per capita), Lag distributed income per capita (log transformed) 0.6435418 78 0.1732546 123 0
138 Linear Logit(CF) Cumulative Cigarettes (5 Years), Alcohol (liters per capita) 0.7757529 309 0.1772044 297 0
139 Spacetime Logit(CF) Cumulative Cigarettes (5 Years), Alcohol (liters per capita) 0.6941713 167 0.1754864 211 0
140 Linear Logit(CF)Cumulative Cigarettes (5 Years), Alcohol (liters per capita), Education (years per capita), Lag distributed income per capita (log transformed)
0.673102 150 0.1730311 104 0
141 Spacetime Logit(CF)Cumulative Cigarettes (5 Years), Alcohol (liters per capita), Education (years per capita), Lag distributed income per capita (log transformed)
0.6192465 26 0.1730041 103 0
142 Linear Logit(CF)Cumulative Cigarettes (5 Years), Indoor Air Polluntion (All Cooking Fuels) 0.7323562 231 0.1750238 165 0
143 Spacetime Logit(CF) Cumulative Cigarettes (5 Years), Indoor Air Polluntion (All Cooking Fuels) 0.672965 149 0.1738898 141 0
144 Linear Logit(CF)Cumulative Cigarettes (5 Years), Indoor Air Polluntion (All Cooking Fuels), Education (years per capita), Lag distributed income per capita (log transformed)
0.6774362 153 0.1731337 115 0
145 Spacetime Logit(CF)Cumulative Cigarettes (5 Years), Indoor Air Polluntion (All Cooking Fuels), Education (years per capita), Lag distributed income per capita (log transformed)
0.6481869 91 0.173065 106 0
146 Linear Logit(CF) Cumulative Cigarettes (5 Years), Indoor Air Polluntion (All Cooking Fuels), Alcohol (liters per capita) 0.7287478 230 0.1748051 155 0
147 Spacetime Logit(CF) Cumulative Cigarettes (5 Years), Indoor Air Polluntion (All Cooking Fuels), Alcohol (liters per capita) 0.6775439 154 0.1737005 138 0

148 Linear Logit(CF)
Cumulative Cigarettes (5 Years), Indoor Air Polluntion (All Cooking Fuels), Alcohol (liters per capita), Education (years per capita), Lag distributed income per capita (log transformed)
0.6602557 130 0.1730684 107 0
149 Spacetime Logit(CF)
Cumulative Cigarettes (5 Years), Indoor Air Polluntion (All Cooking Fuels), Alcohol (liters per capita), Education (years per capita), Lag distributed income per capita (log transformed)
0.6427336 76 0.1727808 89 0
150 Linear Logit(CF) Cumulative Cigarettes (5 Years), Malnutrition - proportion <2SD weight for age (logit transformed) 0.6609531 133 0.1720298 26 0
151 Spacetime Logit(CF) Cumulative Cigarettes (5 Years), Malnutrition - proportion <2SD weight for age (logit transformed) 0.6255799 42 0.1726444 79 0
152 Linear Logit(CF)Cumulative Cigarettes (5 Years), Malnutrition - proportion <2SD weight for age (logit transformed), Education (years per capita), Lag distributed income per capita (log transformed)
0.6599743 126 0.1720207 20 0
153 Linear Logit(CF)Cumulative Cigarettes (5 Years), Malnutrition - proportion <2SD weight for age (logit transformed), Alcohol (liters per capita)
0.6584365 120 0.172014 15 0
154 Linear Logit(CF)Cumulative Cigarettes (5 Years), Malnutrition - proportion <2SD weight for age (logit transformed), Alcohol (liters per capita), Lag distributed income per capita (log transformed)
0.6590921 123 0.1720207 19 0
155 Spacetime Logit(CF)Cumulative Cigarettes (5 Years), Malnutrition - proportion <2SD weight for age (logit transformed), Alcohol (liters per capita), Lag distributed income per capita (log transformed)
0.6311481 52 0.1725296 68 0
156 Linear Logit(CF)Cumulative Cigarettes (5 Years), Malnutrition - proportion <2SD weight for age (logit transformed), Indoor Air Polluntion (All Cooking Fuels)
0.660179 129 0.172036 29 0
157 Spacetime Logit(CF)Cumulative Cigarettes (5 Years), Malnutrition - proportion <2SD weight for age (logit transformed), Indoor Air Polluntion (All Cooking Fuels)
0.6324658 54 0.172506 67 0
158 Linear Logit(CF)
Cumulative Cigarettes (5 Years), Malnutrition - proportion <2SD weight for age (logit transformed), Indoor Air Polluntion (All Cooking Fuels), Lag distributed income per capita (log transformed)
0.6619837 136 0.1720258 24 0
159 Linear Logit(CF)Cumulative Cigarettes (5 Years), Malnutrition - proportion <2SD weight for age (logit transformed), Indoor Air Polluntion (All Cooking Fuels), Education (years per capita)
0.6579903 117 0.1720215 21 0
160 Spacetime Logit(CF)Cumulative Cigarettes (5 Years), Malnutrition - proportion <2SD weight for age (logit transformed), Indoor Air Polluntion (All Cooking Fuels), Education (years per capita)
0.6365533 69 0.1724302 56 0
161 Linear Logit(CF)Cumulative Cigarettes (5 Years), Malnutrition - proportion <2SD weight for age (logit transformed), Indoor Air Polluntion (All Cooking Fuels), Alcohol (liters per capita)
0.6571108 115 0.1720205 18 0
162 Linear Logit(CF)
Cumulative Cigarettes (5 Years), Malnutrition - proportion <2SD weight for age (logit transformed), Indoor Air Polluntion (All Cooking Fuels), Alcohol (liters per capita), Lag distributed income per capita (log transformed)
0.6599824 127 0.1720113 13 0
163 Linear Logit(CF) Cumulative Cigarettes (5 Years), Health System Access 2 (unitness), Indoor Air Polluntion (All Cooking Fuels) 0.6604289 132 0.1743774 148 0
164 Spacetime Logit(CF) Cumulative Cigarettes (5 Years), Health System Access 2 (unitness), Indoor Air Polluntion (All Cooking Fuels) 0.6338233 56 0.173467 133 0
165 Linear Logit(CF)Cumulative Cigarettes (5 Years), Health System Access 2 (unitness), Indoor Air Polluntion (All Cooking Fuels), Lag distributed income per capita (log transformed)
0.666151 144 0.1736978 137 0

166 Spacetime Logit(CF)Cumulative Cigarettes (5 Years), Health System Access 2 (unitness), Indoor Air Polluntion (All Cooking Fuels), Lag distributed income per capita (log transformed)
0.6248242 40 0.1732563 124 0
167 Linear Logit(CF)Cumulative Cigarettes (5 Years), Health System Access 2 (unitness), Indoor Air Polluntion (All Cooking Fuels), Alcohol (liters per capita)
0.6559005 113 0.1744251 149 0
168 Spacetime Logit(CF)Cumulative Cigarettes (5 Years), Health System Access 2 (unitness), Indoor Air Polluntion (All Cooking Fuels), Alcohol (liters per capita)
0.6410928 71 0.1734884 134 0
169 Linear Logit(CF)
Cumulative Cigarettes (5 Years), Health System Access 2 (unitness), Indoor Air Polluntion (All Cooking Fuels), Alcohol (liters per capita), Lag distributed income per capita (log transformed)
0.6629137 139 0.1737133 139 0
170 Spacetime Logit(CF)
Cumulative Cigarettes (5 Years), Health System Access 2 (unitness), Indoor Air Polluntion (All Cooking Fuels), Alcohol (liters per capita), Lag distributed income per capita (log transformed)
0.6225322 33 0.1732891 126 0
171 Linear Ln(Rate) Smoking Prevalence 0.8997263 350 0.1851731 352 0172 Spacetime Ln(Rate) Smoking Prevalence 0.8203284 338 0.1819459 341 0
173 Linear Ln(Rate) Smoking Prevalence, Education (years per capita), Lag distributed income per capita (log transformed) 0.795607 328 0.1770567 290 0
174 Spacetime Ln(Rate) Smoking Prevalence, Education (years per capita), Lag distributed income per capita (log transformed) 0.7329592 233 0.1768721 284 0
175 Linear Ln(Rate) Smoking Prevalence, Alcohol (liters per capita) 0.898167 349 0.1849845 351 0176 Spacetime Ln(Rate) Smoking Prevalence, Alcohol (liters per capita) 0.8241605 339 0.1818333 339 0
177 Linear Ln(Rate)Smoking Prevalence, Alcohol (liters per capita), Education (years per capita), Lag distributed income per capita (log transformed)
0.7657899 292 0.1769601 287 0
178 Spacetime Ln(Rate)Smoking Prevalence, Alcohol (liters per capita), Education (years per capita), Lag distributed income per capita (log transformed)
0.7098908 197 0.1765668 272 0
179 Linear Ln(Rate) Indoor Air Polluntion (All Cooking Fuels) 0.9218276 352 0.1820234 343 0180 Spacetime Ln(Rate) Indoor Air Polluntion (All Cooking Fuels) 0.8097579 337 0.179991 326 0
181 Linear Ln(Rate)Indoor Air Polluntion (All Cooking Fuels), Education (years per capita), Lag distributed income per capita (log transformed)
0.8481866 346 0.1774729 307 0
182 Spacetime Ln(Rate)Indoor Air Polluntion (All Cooking Fuels), Education (years per capita), Lag distributed income per capita (log transformed)
0.7474166 257 0.1772329 298 0
183 Linear Ln(Rate) Indoor Air Polluntion (All Cooking Fuels), Alcohol (liters per capita) 0.9107075 351 0.1815417 338 0
184 Spacetime Ln(Rate) Indoor Air Polluntion (All Cooking Fuels), Alcohol (liters per capita) 0.8031404 335 0.1796264 321 0
185 Linear Ln(Rate)Indoor Air Polluntion (All Cooking Fuels), Alcohol (liters per capita), Education (years per capita), Lag distributed income per capita (log transformed)
0.7813048 318 0.1774655 306 0
186 Spacetime Ln(Rate)Indoor Air Polluntion (All Cooking Fuels), Alcohol (liters per capita), Education (years per capita), Lag distributed income per capita (log transformed)
0.7268813 228 0.1766528 275 0
187 Linear Ln(Rate) Indoor Air Polluntion (All Cooking Fuels), Smoking Prevalence 0.8468554 345 0.1811555 336 0
188 Spacetime Ln(Rate)Indoor Air Polluntion (All Cooking Fuels), Smoking Prevalence 0.7890035 325 0.1791577 318 0
189 Linear Ln(Rate)Indoor Air Polluntion (All Cooking Fuels), Smoking Prevalence, Education (years per capita), Lag distributed income per capita (log transformed)
0.7984287 331 0.1770216 289 0
190 Spacetime Ln(Rate)Indoor Air Polluntion (All Cooking Fuels), Smoking Prevalence, Education (years per capita), Lag distributed income per capita (log transformed)
0.7360635 243 0.1766778 277 0
191 Linear Ln(Rate) Indoor Air Polluntion (All Cooking Fuels), Smoking Prevalence, Alcohol (liters per capita) 0.8331756 342 0.1807825 335 0

192 Spacetime Ln(Rate)Indoor Air Polluntion (All Cooking Fuels), Smoking Prevalence, Alcohol (liters per capita) 0.7762092 311 0.1789183 317 0
193 Linear Ln(Rate)Indoor Air Polluntion (All Cooking Fuels), Smoking Prevalence, Alcohol (liters per capita), Education (years per capita), Lag distributed income per capita (log transformed)
0.7652784 290 0.1769157 285 0
194 Spacetime Ln(Rate)Indoor Air Polluntion (All Cooking Fuels), Smoking Prevalence, Alcohol (liters per capita), Education (years per capita), Lag distributed income per capita (log transformed)
0.7179884 215 0.1763469 262 0
195 Linear Ln(Rate) Malnutrition - poroportion <2SD weight for age (logit transformed) 0.7818431 319 0.1752264 183 0
196 Spacetime Ln(Rate) Malnutrition - poroportion <2SD weight for age (logit transformed) 0.7171843 213 0.1760696 244 0
197 Linear Ln(Rate)Malnutrition - poroportion <2SD weight for age (logit transformed), Education (years per capita), Lag distributed income per capita (log transformed)
0.7721454 301 0.1751092 171 0
198 Spacetime Ln(Rate)Malnutrition - poroportion <2SD weight for age (logit transformed), Education (years per capita), Lag distributed income per capita (log transformed)
0.7113256 200 0.1757736 230 0
199 Linear Ln(Rate) Malnutrition - poroportion <2SD weight for age (logit transformed), Alcohol (liters per capita) 0.7664945 294 0.1751366 175 0
200 Spacetime Ln(Rate) Malnutrition - poroportion <2SD weight for age (logit transformed), Alcohol (liters per capita) 0.7206084 221 0.1758699 234 0
201 Linear Ln(Rate)Malnutrition - poroportion <2SD weight for age (logit transformed), Alcohol (liters per capita), Education (years per capita), Lag distributed income per capita (log transformed)
0.7504016 263 0.1749239 160 0
202 Spacetime Ln(Rate)Malnutrition - poroportion <2SD weight for age (logit transformed), Alcohol (liters per capita), Education (years per capita), Lag distributed income per capita (log transformed)
0.6922181 165 0.175697 224 0
203 Linear Ln(Rate) Malnutrition - poroportion <2SD weight for age (logit transformed), Smoking Prevalence 0.774226 305 0.1752329 184 0
204 Spacetime Ln(Rate) Malnutrition - poroportion <2SD weight for age (logit transformed), Smoking Prevalence 0.7140228 207 0.1760341 241 0
205 Linear Ln(Rate)Malnutrition - poroportion <2SD weight for age (logit transformed), Smoking Prevalence, Education (years per capita), Lag distributed income per capita (log transformed)
0.7658247 293 0.1750999 169 0
206 Spacetime Ln(Rate)Malnutrition - poroportion <2SD weight for age (logit transformed), Smoking Prevalence, Education (years per capita), Lag distributed income per capita (log transformed)
0.6966887 171 0.175619 217 0
207 Linear Ln(Rate) Malnutrition - poroportion <2SD weight for age (logit transformed), Smoking Prevalence, Alcohol (liters per capita) 0.7632111 285 0.1751439 177 0
208 Spacetime Ln(Rate) Malnutrition - poroportion <2SD weight for age (logit transformed), Smoking Prevalence, Alcohol (liters per capita)
0.7185084 217 0.175892 238 0
209 Linear Ln(Rate)
Malnutrition - poroportion <2SD weight for age (logit transformed), Smoking Prevalence, Alcohol (liters per capita), Education (years per capita), Lag distributed income per capita (log transformed)
0.7466923 255 0.1749254 161 0
210 Spacetime Ln(Rate)
Malnutrition - poroportion <2SD weight for age (logit transformed), Smoking Prevalence, Alcohol (liters per capita), Education (years per capita), Lag distributed income per capita (log transformed)
0.6856083 157 0.1756286 219 0
211 Linear Ln(Rate) Malnutrition - poroportion <2SD weight for age (logit transformed), Indoor Air Polluntion (All Cooking Fuels) 0.7963127 329 0.1752126 181 0

212 Spacetime Ln(Rate) Malnutrition - poroportion <2SD weight for age (logit transformed), Indoor Air Polluntion (All Cooking Fuels)
0.7208639 222 0.1761301 247 0
213 Linear Ln(Rate)
Malnutrition - poroportion <2SD weight for age (logit transformed), Indoor Air Polluntion (All Cooking Fuels), Education (years per capita), Lag distributed income per capita (log transformed)
0.7879914 323 0.1751052 170 0
214 Spacetime Ln(Rate)
Malnutrition - poroportion <2SD weight for age (logit transformed), Indoor Air Polluntion (All Cooking Fuels), Education (years per capita), Lag distributed income per capita (log transformed)
0.7196151 218 0.1757415 227 0
215 Linear Ln(Rate)Malnutrition - poroportion <2SD weight for age (logit transformed), Indoor Air Polluntion (All Cooking Fuels), Alcohol (liters per capita)
0.7753746 308 0.1751327 172 0
216 Spacetime Ln(Rate)Malnutrition - poroportion <2SD weight for age (logit transformed), Indoor Air Polluntion (All Cooking Fuels), Alcohol (liters per capita)
0.715349 209 0.1759122 239 0
217 Linear Ln(Rate)
Malnutrition - poroportion <2SD weight for age (logit transformed), Indoor Air Polluntion (All Cooking Fuels), Alcohol (liters per capita), Education (years per capita), Lag distributed income per capita (log transformed)
0.7606949 281 0.1749291 162 0
218 Spacetime Ln(Rate)
Malnutrition - poroportion <2SD weight for age (logit transformed), Indoor Air Polluntion (All Cooking Fuels), Alcohol (liters per capita), Education (years per capita), Lag distributed income per capita (log transformed)
0.7052094 186 0.1756245 218 0
219 Linear Ln(Rate)Malnutrition - poroportion <2SD weight for age (logit transformed), Indoor Air Polluntion (All Cooking Fuels), Smoking Prevalence
0.7889113 324 0.1752119 180 0
220 Spacetime Ln(Rate)Malnutrition - poroportion <2SD weight for age (logit transformed), Indoor Air Polluntion (All Cooking Fuels), Smoking Prevalence
0.711972 203 0.176049 243 0
221 Linear Ln(Rate)
Malnutrition - poroportion <2SD weight for age (logit transformed), Indoor Air Polluntion (All Cooking Fuels), Smoking Prevalence, Education (years per capita), Lag distributed income per capita (log transformed)
0.7784564 316 0.1750853 168 0
222 Spacetime Ln(Rate)
Malnutrition - poroportion <2SD weight for age (logit transformed), Indoor Air Polluntion (All Cooking Fuels), Smoking Prevalence, Education (years per capita), Lag distributed income per capita (log transformed)
0.7054198 187 0.1755772 213 0
223 Linear Ln(Rate)Malnutrition - poroportion <2SD weight for age (logit transformed), Indoor Air Polluntion (All Cooking Fuels), Smoking Prevalence, Alcohol (liters per capita)
0.770356 298 0.1751358 174 0
224 Spacetime Ln(Rate)Malnutrition - poroportion <2SD weight for age (logit transformed), Indoor Air Polluntion (All Cooking Fuels), Smoking Prevalence, Alcohol (liters per capita)
0.7137794 206 0.1758846 237 0
225 Linear Ln(Rate)
Malnutrition - poroportion <2SD weight for age (logit transformed), Indoor Air Polluntion (All Cooking Fuels), Smoking Prevalence, Alcohol (liters per capita), Education (years per capita), Lag distributed income per capita (log transformed)
0.7572497 275 0.1749237 159 0
226 Spacetime Ln(Rate)
Malnutrition - poroportion <2SD weight for age (logit transformed), Indoor Air Polluntion (All Cooking Fuels), Smoking Prevalence, Alcohol (liters per capita), Education (years per capita), Lag distributed income per capita (log transformed)
0.69522 168 0.1755493 212 0
227 Linear Ln(Rate) Health System Access 2 (unitness) 0.8011612 333 0.1829189 347 0

228 Spacetime Ln(Rate) Health System Access 2 (unitness) 0.7432997 251 0.1800358 329 0
229 Linear Ln(Rate) Health System Access 2 (unitness), Education (years per capita), Lag distributed income per capita (log transformed)
0.7614017 282 0.1771094 294 0
230 Spacetime Ln(Rate) Health System Access 2 (unitness), Education (years per capita), Lag distributed income per capita (log transformed)
0.7060783 189 0.1763821 266 0
231 Linear Ln(Rate) Health System Access 2 (unitness), Alcohol (liters per capita) 0.8021601 334 0.1831306 350 0
232 Spacetime Ln(Rate) Health System Access 2 (unitness), Alcohol (liters per capita) 0.7432454 250 0.1801611 332 0
233 Linear Ln(Rate)Health System Access 2 (unitness), Alcohol (liters per capita), Education (years per capita), Lag distributed income per capita (log transformed)
0.7356038 240 0.1770801 293 0
234 Spacetime Ln(Rate)Health System Access 2 (unitness), Alcohol (liters per capita), Education (years per capita), Lag distributed income per capita (log transformed)
0.7048678 185 0.1764937 268 0
235 Linear Ln(Rate) Health System Access 2 (unitness), Smoking Prevalence 0.7708038 299 0.1819732 342 0
236 Spacetime Ln(Rate) Health System Access 2 (unitness), Smoking Prevalence 0.7403119 247 0.1796597 322 0
237 Linear Ln(Rate)Health System Access 2 (unitness), Smoking Prevalence, Education (years per capita), Lag distributed income per capita (log transformed)
0.7431289 249 0.1767992 280 0
238 Spacetime Ln(Rate)Health System Access 2 (unitness), Smoking Prevalence, Education (years per capita), Lag distributed income per capita (log transformed)
0.6965069 170 0.1761446 249 0
239 Linear Ln(Rate) Health System Access 2 (unitness), Smoking Prevalence, Alcohol (liters per capita) 0.7729146 304 0.1821341 344 0
240 Spacetime Ln(Rate) Health System Access 2 (unitness), Smoking Prevalence, Alcohol (liters per capita) 0.7408845 248 0.1797972 325 0
241 Linear Ln(Rate)Health System Access 2 (unitness), Smoking Prevalence, Alcohol (liters per capita), Education (years per capita), Lag distributed income per capita (log transformed)
0.7341534 237 0.176807 281 0
242 Spacetime Ln(Rate)Health System Access 2 (unitness), Smoking Prevalence, Alcohol (liters per capita), Education (years per capita), Lag distributed income per capita (log transformed)
0.6986705 172 0.1763046 260 0
243 Linear Ln(Rate) Health System Access 2 (unitness), Indoor Air Polluntion (All Cooking Fuels) 0.7829222 320 0.180177 333 0
244 Spacetime Ln(Rate) Health System Access 2 (unitness), Indoor Air Polluntion (All Cooking Fuels) 0.7348819 239 0.1781564 315 0
245 Linear Ln(Rate)Health System Access 2 (unitness), Indoor Air Polluntion (All Cooking Fuels), Education (years per capita), Lag distributed income per capita (log transformed)
0.7667645 295 0.177281 302 0
246 Spacetime Ln(Rate)Health System Access 2 (unitness), Indoor Air Polluntion (All Cooking Fuels), Education (years per capita), Lag distributed income per capita (log transformed)
0.709747 196 0.1762954 259 0
247 Linear Ln(Rate) Health System Access 2 (unitness), Indoor Air Polluntion (All Cooking Fuels), Alcohol (liters per capita) 0.783702 321 0.1802492 334 0
248 Spacetime Ln(Rate) Health System Access 2 (unitness), Indoor Air Polluntion (All Cooking Fuels), Alcohol (liters per capita) 0.7365129 244 0.1781604 316 0
249 Linear Ln(Rate)
Health System Access 2 (unitness), Indoor Air Polluntion (All Cooking Fuels), Alcohol (liters per capita), Education (years per capita), Lag distributed income per capita (log transformed)
0.7447197 254 0.1771166 295 0

250 Spacetime Ln(Rate)
Health System Access 2 (unitness), Indoor Air Polluntion (All Cooking Fuels), Alcohol (liters per capita), Education (years per capita), Lag distributed income per capita (log transformed)
0.7117876 202 0.1763564 263 0
251 Linear Ln(Rate)Health System Access 2 (unitness), Indoor Air Polluntion (All Cooking Fuels), Smoking Prevalence 0.7605447 280 0.1796072 320 0
252 Spacetime Ln(Rate) Health System Access 2 (unitness), Indoor Air Polluntion (All Cooking Fuels), Smoking Prevalence 0.7325987 232 0.177864 310 0
253 Linear Ln(Rate)Health System Access 2 (unitness), Indoor Air Polluntion (All Cooking Fuels), Smoking Prevalence, Education (years per capita), Lag distributed income per capita (log transformed)
0.7534082 269 0.1769653 288 0
254 Spacetime Ln(Rate)Health System Access 2 (unitness), Indoor Air Polluntion (All Cooking Fuels), Smoking Prevalence, Education (years per capita), Lag distributed income per capita (log transformed)
0.7021331 178 0.1760446 242 0
255 Linear Ln(Rate)Health System Access 2 (unitness), Indoor Air Polluntion (All Cooking Fuels), Smoking Prevalence, Alcohol (liters per capita)
0.758745 278 0.1796708 323 0
256 Spacetime Ln(Rate)Health System Access 2 (unitness), Indoor Air Polluntion (All Cooking Fuels), Smoking Prevalence, Alcohol (liters per capita)
0.7339082 236 0.1778787 311 0
257 Linear Ln(Rate)
Health System Access 2 (unitness), Indoor Air Polluntion (All Cooking Fuels), Smoking Prevalence, Alcohol (liters per capita), Education (years per capita), Lag distributed income per capita (log transformed)
0.7399195 246 0.1768504 283 0
258 Spacetime Ln(Rate)
Health System Access 2 (unitness), Indoor Air Polluntion (All Cooking Fuels), Smoking Prevalence, Alcohol (liters per capita), Education (years per capita), Lag distributed income per capita (log transformed)
0.7045095 184 0.1761575 250 0
259 Linear Ln(Rate) Health System Access 2 (unitness), Malnutrition - proportion <2SD weight for age (logit transformed) 0.7617702 284 0.1753932 207 0
260 Spacetime Ln(Rate) Health System Access 2 (unitness), Malnutrition - proportion <2SD weight for age (logit transformed) 0.7167512 211 0.1766927 278 0
261 Linear Ln(Rate)Health System Access 2 (unitness), Malnutrition - proportion <2SD weight for age (logit transformed), Education (years per capita), Lag distributed income per capita (log transformed)
0.7531524 267 0.1753239 195 0
262 Spacetime Ln(Rate)Health System Access 2 (unitness), Malnutrition - proportion <2SD weight for age (logit transformed), Education (years per capita), Lag distributed income per capita (log transformed)
0.7021768 179 0.1757924 231 0
263 Linear Ln(Rate)Health System Access 2 (unitness), Malnutrition - proportion <2SD weight for age (logit transformed), Alcohol (liters per capita)
0.7516105 265 0.1753471 199 0
264 Spacetime Ln(Rate)Health System Access 2 (unitness), Malnutrition - proportion <2SD weight for age (logit transformed), Alcohol (liters per capita)
0.7082258 192 0.1766704 276 0
265 Linear Ln(Rate)
Health System Access 2 (unitness), Malnutrition - proportion <2SD weight for age (logit transformed), Alcohol (liters per capita), Education (years per capita), Lag distributed income per capita (log transformed)
0.7346905 238 0.1752726 187 0
266 Spacetime Ln(Rate)
Health System Access 2 (unitness), Malnutrition - proportion <2SD weight for age (logit transformed), Alcohol (liters per capita), Education (years per capita), Lag distributed income per capita (log transformed)
0.6878593 160 0.1758753 235 0

267 Linear Ln(Rate) Health System Access 2 (unitness), Malnutrition - proportion <2SD weight for age (logit transformed), Smoking Prevalence
0.7571113 274 0.1753909 206 0
268 Spacetime Ln(Rate) Health System Access 2 (unitness), Malnutrition - proportion <2SD weight for age (logit transformed), Smoking Prevalence
0.7068225 190 0.1765555 270 0
269 Linear Ln(Rate)
Health System Access 2 (unitness), Malnutrition - proportion <2SD weight for age (logit transformed), Smoking Prevalence, Education (years per capita), Lag distributed income per capita (log transformed)
0.7487134 260 0.1753082 192 0
270 Spacetime Ln(Rate)
Health System Access 2 (unitness), Malnutrition - proportion <2SD weight for age (logit transformed), Smoking Prevalence, Education (years per capita), Lag distributed income per capita (log transformed)
0.7017742 176 0.1756337 220 0
271 Linear Ln(Rate)Health System Access 2 (unitness), Malnutrition - proportion <2SD weight for age (logit transformed), Smoking Prevalence, Alcohol (liters per capita)
0.7503185 261 0.1753441 198 0
272 Spacetime Ln(Rate)Health System Access 2 (unitness), Malnutrition - proportion <2SD weight for age (logit transformed), Smoking Prevalence, Alcohol (liters per capita)
0.7020365 177 0.1765483 269 0
273 Linear Ln(Rate)
Health System Access 2 (unitness), Malnutrition - proportion <2SD weight for age (logit transformed), Smoking Prevalence, Alcohol (liters per capita), Education (years per capita), Lag distributed income per capita (log transformed)
0.7334803 234 0.175243 185 0
274 Spacetime Ln(Rate)
Health System Access 2 (unitness), Malnutrition - proportion <2SD weight for age (logit transformed), Smoking Prevalence, Alcohol (liters per capita), Education (years per capita), Lag distributed income per capita (log transformed)
0.6882305 161 0.1757632 229 0
275 Linear Ln(Rate)Health System Access 2 (unitness), Malnutrition - proportion <2SD weight for age (logit transformed), Indoor Air Polluntion (All Cooking Fuels)
0.7764699 312 0.1753248 196 0
276 Spacetime Ln(Rate)Health System Access 2 (unitness), Malnutrition - proportion <2SD weight for age (logit transformed), Indoor Air Polluntion (All Cooking Fuels)
0.7205243 219 0.176432 267 0
277 Linear Ln(Rate)
Health System Access 2 (unitness), Malnutrition - proportion <2SD weight for age (logit transformed), Indoor Air Polluntion (All Cooking Fuels), Education (years per capita), Lag distributed income per capita (log transformed)
0.7685915 297 0.1754184 209 0
278 Spacetime Ln(Rate)
Health System Access 2 (unitness), Malnutrition - proportion <2SD weight for age (logit transformed), Indoor Air Polluntion (All Cooking Fuels), Education (years per capita), Lag distributed income per capita (log transformed)
0.7054278 188 0.1757608 228 0
279 Linear Ln(Rate)Health System Access 2 (unitness), Malnutrition - proportion <2SD weight for age (logit transformed), Indoor Air Polluntion (All Cooking Fuels), Alcohol (liters per capita)
0.7553004 271 0.1752907 189 0
280 Spacetime Ln(Rate)Health System Access 2 (unitness), Malnutrition - proportion <2SD weight for age (logit transformed), Indoor Air Polluntion (All Cooking Fuels), Alcohol (liters per capita)
0.7127292 204 0.1763709 264 0
281 Linear Ln(Rate)
Health System Access 2 (unitness), Malnutrition - proportion <2SD weight for age (logit transformed), Indoor Air Polluntion (All Cooking Fuels), Alcohol (liters per capita), Education (years per capita), Lag distributed income per capita (log transformed)
0.7532427 268 0.1752978 190 0

282 Spacetime Ln(Rate)
Health System Access 2 (unitness), Malnutrition - proportion <2SD weight for age (logit transformed), Indoor Air Polluntion (All Cooking Fuels), Alcohol (liters per capita), Education (years per capita), Lag distributed income per capita (log transformed)
0.6904384 163 0.1758094 232 0
283 Linear Ln(Rate)Health System Access 2 (unitness), Malnutrition - proportion <2SD weight for age (logit transformed), Indoor Air Polluntion (All Cooking Fuels), Smoking Prevalence
0.7711259 300 0.1753232 194 0
284 Spacetime Ln(Rate)Health System Access 2 (unitness), Malnutrition - proportion <2SD weight for age (logit transformed), Indoor Air Polluntion (All Cooking Fuels), Smoking Prevalence
0.7107685 199 0.1762953 258 0
285 Linear Ln(Rate)
Health System Access 2 (unitness), Malnutrition - proportion <2SD weight for age (logit transformed), Indoor Air Polluntion (All Cooking Fuels), Smoking Prevalence, Education (years per capita), Lag distributed income per capita (log transformed)
0.7632225 286 0.1753818 205 0
286 Spacetime Ln(Rate)
Health System Access 2 (unitness), Malnutrition - proportion <2SD weight for age (logit transformed), Indoor Air Polluntion (All Cooking Fuels), Smoking Prevalence, Education (years per capita), Lag distributed income per capita (log transformed)
0.7003623 175 0.1755934 215 0
287 Linear Ln(Rate)
Health System Access 2 (unitness), Malnutrition - proportion <2SD weight for age (logit transformed), Indoor Air Polluntion (All Cooking Fuels), Smoking Prevalence, Alcohol (liters per capita)
0.7520313 266 0.175289 188 0
288 Spacetime Ln(Rate)
Health System Access 2 (unitness), Malnutrition - proportion <2SD weight for age (logit transformed), Indoor Air Polluntion (All Cooking Fuels), Smoking Prevalence, Alcohol (liters per capita)
0.702721 181 0.1762525 256 0
289 Linear Ln(Rate)
Health System Access 2 (unitness), Malnutrition - proportion <2SD weight for age (logit transformed), Indoor Air Polluntion (All Cooking Fuels), Smoking Prevalence, Alcohol (liters per capita), Education (years per capita), Lag distributed income per capita (log transformed)
0.7503575 262 0.175272 186 0
290 Spacetime Ln(Rate)
Health System Access 2 (unitness), Malnutrition - proportion <2SD weight for age (logit transformed), Indoor Air Polluntion (All Cooking Fuels), Smoking Prevalence, Alcohol (liters per capita), Education (years per capita), Lag distributed income per capita (log transformed)
0.6883399 162 0.1756866 223 0
291 Linear Ln(Rate) Cumulative Cigarettes (5 Years) 0.9774417 354 0.1869309 354 0292 Spacetime Ln(Rate) Cumulative Cigarettes (5 Years) 0.8394018 344 0.1829973 348 0
293 Linear Ln(Rate) Cumulative Cigarettes (5 Years), Education (years per capita), Lag distributed income per capita (log transformed) 0.8271533 340 0.1773345 304 0
294 Spacetime Ln(Rate) Cumulative Cigarettes (5 Years), Education (years per capita), Lag distributed income per capita (log transformed) 0.7484338 259 0.1772721 301 0
295 Linear Ln(Rate) Cumulative Cigarettes (5 Years), Alcohol (liters per capita) 0.9740766 353 0.1864473 353 0
296 Spacetime Ln(Rate) Cumulative Cigarettes (5 Years), Alcohol (liters per capita) 0.8360332 343 0.1828138 346 0
297 Linear Ln(Rate)Cumulative Cigarettes (5 Years), Alcohol (liters per capita), Education (years per capita), Lag distributed income per capita (log transformed)
0.7791402 317 0.1772638 300 0
298 Spacetime Ln(Rate)Cumulative Cigarettes (5 Years), Alcohol (liters per capita), Education (years per capita), Lag distributed income per capita (log transformed)
0.7158297 210 0.1767849 279 0

299 Linear Ln(Rate)Cumulative Cigarettes (5 Years), Indoor Air Polluntion (All Cooking Fuels) 0.8940675 348 0.181914 340 0
300 Spacetime Ln(Rate)Cumulative Cigarettes (5 Years), Indoor Air Polluntion (All Cooking Fuels) 0.8058109 336 0.1797802 324 0
301 Linear Ln(Rate)Cumulative Cigarettes (5 Years), Indoor Air Polluntion (All Cooking Fuels), Education (years per capita), Lag distributed income per capita (log transformed)
0.8280545 341 0.1772969 303 0
302 Spacetime Ln(Rate)Cumulative Cigarettes (5 Years), Indoor Air Polluntion (All Cooking Fuels), Education (years per capita), Lag distributed income per capita (log transformed)
0.7473947 256 0.17707 291 0
303 Linear Ln(Rate) Cumulative Cigarettes (5 Years), Indoor Air Polluntion (All Cooking Fuels), Alcohol (liters per capita) 0.8826818 347 0.1812827 337 0
304 Spacetime Ln(Rate) Cumulative Cigarettes (5 Years), Indoor Air Polluntion (All Cooking Fuels), Alcohol (liters per capita) 0.7932955 327 0.1794611 319 0
305 Linear Ln(Rate)
Cumulative Cigarettes (5 Years), Indoor Air Polluntion (All Cooking Fuels), Alcohol (liters per capita), Education (years per capita), Lag distributed income per capita (log transformed)
0.7778224 314 0.1772354 299 0
306 Spacetime Ln(Rate)
Cumulative Cigarettes (5 Years), Indoor Air Polluntion (All Cooking Fuels), Alcohol (liters per capita), Education (years per capita), Lag distributed income per capita (log transformed)
0.7272575 229 0.176558 271 0
307 Linear Ln(Rate) Cumulative Cigarettes (5 Years), Malnutrition - proportion <2SD weight for age (logit transformed) 0.7758464 310 0.1752026 179 0
308 Spacetime Ln(Rate) Cumulative Cigarettes (5 Years), Malnutrition - proportion <2SD weight for age (logit transformed) 0.7183508 216 0.1760085 240 0
309 Linear Ln(Rate)Cumulative Cigarettes (5 Years), Malnutrition - proportion <2SD weight for age (logit transformed), Education (years per capita), Lag distributed income per capita (log transformed)
0.7640032 287 0.1750596 166 0
310 Spacetime Ln(Rate)Cumulative Cigarettes (5 Years), Malnutrition - proportion <2SD weight for age (logit transformed), Education (years per capita), Lag distributed income per capita (log transformed)
0.7103578 198 0.1757131 225 0
311 Linear Ln(Rate)Cumulative Cigarettes (5 Years), Malnutrition - proportion <2SD weight for age (logit transformed), Alcohol (liters per capita)
0.7647547 288 0.1751352 173 0
312 Spacetime Ln(Rate)Cumulative Cigarettes (5 Years), Malnutrition - proportion <2SD weight for age (logit transformed), Alcohol (liters per capita)
0.7209538 223 0.175826 233 0
313 Linear Ln(Rate)
Cumulative Cigarettes (5 Years), Malnutrition - proportion <2SD weight for age (logit transformed), Alcohol (liters per capita), Education (years per capita), Lag distributed income per capita (log transformed)
0.7478431 258 0.1749235 158 0
314 Spacetime Ln(Rate)
Cumulative Cigarettes (5 Years), Malnutrition - proportion <2SD weight for age (logit transformed), Alcohol (liters per capita), Education (years per capita), Lag distributed income per capita (log transformed)
0.6953373 169 0.1756531 221 0
315 Linear Ln(Rate)Cumulative Cigarettes (5 Years), Malnutrition - proportion <2SD weight for age (logit transformed), Indoor Air Polluntion (All Cooking Fuels)
0.791119 326 0.1751974 178 0
316 Spacetime Ln(Rate)Cumulative Cigarettes (5 Years), Malnutrition - proportion <2SD weight for age (logit transformed), Indoor Air Polluntion (All Cooking Fuels)
0.7233111 227 0.1760732 245 0

317 Linear Ln(Rate)
Cumulative Cigarettes (5 Years), Malnutrition - proportion <2SD weight for age (logit transformed), Indoor Air Polluntion (All Cooking Fuels), Education (years per capita), Lag distributed income per capita (log transformed)
0.7839519 322 0.1750799 167 0
318 Spacetime Ln(Rate)
Cumulative Cigarettes (5 Years), Malnutrition - proportion <2SD weight for age (logit transformed), Indoor Air Polluntion (All Cooking Fuels), Education (years per capita), Lag distributed income per capita (log transformed)
0.7213597 224 0.1756795 222 0
319 Linear Ln(Rate)Cumulative Cigarettes (5 Years), Malnutrition - proportion <2SD weight for age (logit transformed), Indoor Air Polluntion (All Cooking Fuels), Alcohol (liters per capita)
0.7743682 306 0.175139 176 0
320 Spacetime Ln(Rate)Cumulative Cigarettes (5 Years), Malnutrition - proportion <2SD weight for age (logit transformed), Indoor Air Polluntion (All Cooking Fuels), Alcohol (liters per capita)
0.717223 214 0.175876 236 0
321 Linear Ln(Rate) Cumulative Cigarettes (5 Years), Malnutrition - proportion <2SD weight for age (logit transformed), Indoor Air 0.7586286 277 0.1749325 163 0
322 Spacetime Ln(Rate) Cumulative Cigarettes (5 Years), Malnutrition - proportion <2SD weight for age (logit transformed), Indoor Air 0.7080641 191 0.1755787 214 0
323 Linear Ln(Rate) Cumulative Cigarettes (5 Years), Health System Access 2 (unitness) 0.7980312 330 0.1827743 345 0
324 Spacetime Ln(Rate) Cumulative Cigarettes (5 Years), Health System Access 2 (unitness) 0.7435583 253 0.1799924 327 0
325 Linear Ln(Rate) Cumulative Cigarettes (5 Years), Health System Access 2 (unitness), Lag distributed income per capita (log transformed) 0.7655262 291 0.177676 308 0
326 Spacetime Ln(Rate) Cumulative Cigarettes (5 Years), Health System Access 2 (unitness), Lag distributed income per capita (log transformed) 0.7114833 201 0.1769271 286 0
327 Linear Ln(Rate) Cumulative Cigarettes (5 Years), Health System Access 2 (unitness), Alcohol (liters per capita) 0.8007963 332 0.1830267 349 0
328 Spacetime Ln(Rate) Cumulative Cigarettes (5 Years), Health System Access 2 (unitness), Alcohol (liters per capita) 0.7434803 252 0.1801172 330 0
329 Linear Ln(Rate)Cumulative Cigarettes (5 Years), Health System Access 2 (unitness), Alcohol (liters per capita), Lag distributed income per capita (log transformed)
0.7604757 279 0.1778369 309 0
330 Spacetime Ln(Rate)Cumulative Cigarettes (5 Years), Health System Access 2 (unitness), Alcohol (liters per capita), Lag distributed income per capita (log transformed)
0.6992214 173 0.1770751 292 0
331 Linear Ln(Rate) Cumulative Cigarettes (5 Years), Health System Access 2 (unitness), Indoor Air Polluntion (All Cooking Fuels) 0.7750004 307 0.1800118 328 0
332 Spacetime Ln(Rate) Cumulative Cigarettes (5 Years), Health System Access 2 (unitness), Indoor Air Polluntion (All Cooking Fuels) 0.7357185 241 0.1780843 313 0
333 Linear Ln(Rate)Cumulative Cigarettes (5 Years), Health System Access 2 (unitness), Indoor Air Polluntion (All Cooking Fuels), Education (years per capita) Lag distributed income per
0.7615894 283 0.1771683 296 0
334 Spacetime Ln(Rate)Cumulative Cigarettes (5 Years), Health System Access 2 (unitness), Indoor Air Polluntion (All Cooking Fuels), Education (years per capita) Lag distributed income per
0.7146927 208 0.176253 257 0
335 Linear Ln(Rate)Cumulative Cigarettes (5 Years), Health System Access 2 (unitness), Indoor Air Polluntion (All Cooking Fuels), Alcohol (liters per capita)
0.7782307 315 0.1801415 331 0
336 Spacetime Ln(Rate)Cumulative Cigarettes (5 Years), Health System Access 2 (unitness), Indoor Air Polluntion (All Cooking Fuels), Alcohol (liters per capita)
0.7373447 245 0.1780889 314 0
337 Linear Ln(Rate)
Cumulative Cigarettes (5 Years), Health System Access 2 (unitness), Indoor Air Polluntion (All Cooking Fuels), Alcohol (liters per capita), Lag distributed income per capita (log transformed)
0.7667912 296 0.1779643 312 0

338 Spacetime Ln(Rate)
Cumulative Cigarettes (5 Years), Health System Access 2 (unitness), Indoor Air Polluntion (All Cooking Fuels), Alcohol (liters per capita), Lag distributed income per capita (log transformed)
0.7082723 193 0.176847 282 0
339 Linear Ln(Rate)Cumulative Cigarettes (5 Years), Health System Access 2 (unitness), Malnutrition - proportion <2SD weight for age (logit transformed)
0.7576022 276 0.1753714 204 0
340 Spacetime Ln(Rate)Cumulative Cigarettes (5 Years), Health System Access 2 (unitness), Malnutrition - proportion <2SD weight for age (logit transformed)
0.7171739 212 0.1766435 274 0
341 Linear Ln(Rate)
Cumulative Cigarettes (5 Years), Health System Access 2 (unitness), Malnutrition - proportion <2SD weight for age (logit transformed), Lag distributed income per capita (log transformed)
0.7562107 272 0.1753254 197 0
342 Spacetime Ln(Rate)
Cumulative Cigarettes (5 Years), Health System Access 2 (unitness), Malnutrition - proportion <2SD weight for age (logit transformed), Lag distributed income per capita (log transformed)
0.703081 182 0.176134 248 0
343 Linear Ln(Rate)Cumulative Cigarettes (5 Years), Health System Access 2 (unitness), Malnutrition - proportion <2SD weight for age (logit transformed), Alcohol (liters per capita)
0.7509882 264 0.1753596 202 0
344 Spacetime Ln(Rate)Cumulative Cigarettes (5 Years), Health System Access 2 (unitness), Malnutrition - proportion <2SD weight for age (logit transformed), Alcohol (liters per capita)
0.7083781 194 0.176623 273 0
345 Linear Ln(Rate)
Cumulative Cigarettes (5 Years), Health System Access 2 (unitness), Malnutrition - proportion <2SD weight for age (logit transformed), Alcohol (liters per capita), Lag distributed income per capita (log transformed)
0.7564822 273 0.1753523 201 0
346 Spacetime Ln(Rate)
Cumulative Cigarettes (5 Years), Health System Access 2 (unitness), Malnutrition - proportion <2SD weight for age (logit transformed), Alcohol (liters per capita), Lag distributed income per capita (log transformed)
0.7027041 180 0.1762195 255 0
347 Linear Ln(Rate)Cumulative Cigarettes (5 Years), Health System Access 2 (unitness), Malnutrition - proportion <2SD weight for age (logit transformed), Indoor Air Polluntion (All Cooking Fuels)
0.7723057 302 0.1753126 193 0
348 Spacetime Ln(Rate)Cumulative Cigarettes (5 Years), Health System Access 2 (unitness), Malnutrition - proportion <2SD weight for age (logit transformed), Indoor Air Polluntion (All Cooking Fuels)
0.720533 220 0.176372 265 0
349 Linear Ln(Rate)
Cumulative Cigarettes (5 Years), Health System Access 2 (unitness), Malnutrition - proportion <2SD weight for age (logit transformed), Indoor Air Polluntion (All Cooking Fuels),Education (years per capita), Lag distributed income per capita (log transformed)
0.765276 289 0.1754018 208 0
350 Spacetime Ln(Rate)
Cumulative Cigarettes (5 Years), Health System Access 2 (unitness), Malnutrition - proportion <2SD weight for age (logit transformed), Indoor Air Polluntion (All Cooking Fuels),Education (years per capita), Lag distributed income per capita (log transformed)
0.7087311 195 0.1757314 226 0
351 Linear Ln(Rate)
Cumulative Cigarettes (5 Years), Health System Access 2 (unitness), Malnutrition - proportion <2SD weight for age (logit transformed), Indoor Air Polluntion (All Cooking Fuels),Alcohol (liters per capita)
0.754915 270 0.1753067 191 0

352 Spacetime Ln(Rate)
Cumulative Cigarettes (5 Years), Health System Access 2 (unitness), Malnutrition - proportion <2SD weight for age (logit transformed), Indoor Air Polluntion (All Cooking Fuels),Alcohol (liters per capita)
0.7128524 205 0.1763129 261 0
353 Linear Ln(Rate)
Cumulative Cigarettes (5 Years), Health System Access 2 (unitness), Malnutrition - proportion <2SD weight for age (logit transformed), Indoor Air Polluntion (All Cooking Fuels),Alcohol (liters per capita), Lag distributed income per capita (log transformed)
0.7726222 303 0.1754505 210 0
354 Spacetime Ln(Rate)
Cumulative Cigarettes (5 Years), Health System Access 2 (unitness), Malnutrition - proportion <2SD weight for age (logit transformed), Indoor Air Polluntion (All Cooking Fuels),Alcohol (liters per capita), Lag distributed income per capita (log transformed)
0.7033194 183 0.1760971 246 0

Test 1 Rank Test 1 Rank
1 Spacetime Logit(CF)
Health System Access 2 (unitless), Malnutrition - proportion <2SD weight for age (logit transformed), Indoor Air Pollution (All Cooking Fuels), Alcohol (liters per capita), Education (years per capita)
1.080079 6 0.570125 1 91
2 Spacetime Logit(CF)Health System Access 2 (unitless), Malnutrition - proportion <2SD weight for age (logit transformed), Indoor Air Pollution (All Cooking Fuels), Alcohol (liters per capita)
1.080779 7 0.5702222 7 83
3 Spacetime Logit(CF)
Health System Access 2 (unitless), Malnutrition - proportion <2SD weight for age (logit transformed), Alcohol (liters per capita), Education (years per capita), Lag distributed income per capita (log transformed)
1.078773 5 0.5702371 11 75
4 Spacetime Logit(CF)
Health System Access 2 (unitless), Malnutrition - proportion <2SD weight for age (logit transformed), Indoor Air Pollution (All Cooking Fuels), Smoking Prevalence, Alcohol (liters per capita) Education (years per capita)
1.083423 19 0.5701356 2 68
5 Spacetime Logit(CF)Health System Access 2 (unitless), Indoor Air Pollution (All Cooking Fuels), Smoking Prevalence, Education (years per capita), Lag distributed income per capita (log transformed)
1.082304 11 0.5702741 16 62
6 Spacetime Logit(CF)Health System Access 2 (unitless), Malnutrition - proportion <2SD weight for age (logit transformed), Indoor Air Pollution (All Cooking Fuels), Education (years per capita)
1.08371 22 0.5702243 8 56
7 Spacetime Logit(CF)Health System Access 2 (unitless), Malnutrition - proportion <2SD weight for age (logit transformed), Education (years per capita), Lag distributed income per capita (log transformed)
1.083056 17 0.5703178 24 51
8 Spacetime Logit(CF) Health System Access 2 (unitless), Indoor Air Pollution (All Cooking Fuels), Smoking Prevalence 1.082174 9 0.57037 34 47
9 Spacetime Logit(CF)
Health System Access 2 (unitless), Indoor Air Pollution (All Cooking Fuels), Smoking Prevalence, Alcohol (liters per capita), Education (years per capita), Lag distributed income per capita (log transformed)
1.088819 41 0.5701735 4 42
10 Spacetime Logit(CF)Health System Access 2 (unitless), Indoor Air Pollution (All Cooking Fuels), Education (years per capita), Lag distributed income per capita (log transformed)
1.08448 28 0.5702778 17 39
11 Spacetime Logit(CF) Health System Access 2 (unitless), Indoor Air Pollution (All Cooking Fuels) 1.08276 13 0.5703696 33 35
12 Spacetime Logit(CF)Health System Access 2 (unitless), Malnutrition - proportion <2SD weight for age (logit transformed), Indoor Air Pollution (All Cooking Fuels)
1.085086 32 0.5702565 14 32
13 Spacetime Logit(CF)Health System Access 2 (unitless), Malnutrition - proportion <2SD weight for age (logit transformed), Alcohol (liters per capita)
1.074759 1 0.570427 49 29
14 Spacetime Logit(CF) Health System Access 2 (unitless), Malnutrition - proportion <2SD weight for age (logit transformed) 1.074921 2 0.5704388 51 26
Appendix Table 6b: CODEm sub-model performance for tuberculosis - Females
Overall Rank Model typeDependent
variableCovariates
Root Mean Squared Error
Trend TestDraws

15 Spacetime Logit(CF)
Health System Access 2 (unitless), Malnutrition - proportion <2SD weight for age (logit transformed), Smoking Prevalence, Alcohol (liters per capita), Education (years per capita), Lag distributed income per capita (log transformed)
1.088655 40 0.570247 13 24
16 Spacetime Logit(CF)
Health System Access 2 (unitless), Malnutrition - proportion <2SD weight for age (logit transformed), Indoor Air Pollution (All Cooking Fuels), Smoking Prevalence, Alcohol (liters per capita)
1.089024 43 0.5702325 10 22
17 Spacetime Logit(CF)Health System Access 2 (unitless), Indoor Air Pollution (All Cooking Fuels), Smoking Prevalence, Alcohol (liters per capita)
1.083883 24 0.5703448 29 20
18 Spacetime Logit(CF)Health System Access 2 (unitless), Malnutrition - proportion <2SD weight for age (logit transformed), Smoking Prevalence, Alcohol (liters per capita)
1.07587 3 0.5704357 50 18
19 Spacetime Logit(CF)Health System Access 2 (unitless), Alcohol (liters per capita), Education (years per capita), Lag distributed income per capita (log transformed)
1.086486 35 0.5702954 19 16
20 Spacetime Logit(CF)
Health System Access 2 (unitless), Malnutrition - proportion <2SD weight for age (logit transformed), Indoor Air Pollution (All Cooking Fuels), Smoking Prevalence, Alcohol (liters per capita), Lag distributed income per capita (log transformed)
1.088951 42 0.5702402 12 15
21 Spacetime Logit(CF) Health System Access 2 (unitless), Indoor Air Pollution (All Cooking Fuels), Alcohol (liters per capita) 1.084079 26 0.5703368 28 14
22 Spacetime Logit(CF) Health System Access 2 (unitless), Malnutrition - proportion <2SD weight for age (logit transformed), Smoking Prevalence 1.076947 4 0.5704424 53 12
23 Spacetime Logit(CF)
Health System Access 2 (unitless), Indoor Air Pollution (All Cooking Fuels), Alcohol (liters per capita), Education (years per capita), Lag distributed income per capita (log transformed)
1.090899 55 0.570165 3 11
24 linear Logit(CF)Health System Access 2 (unitless), Malnutrition - proportion <2SD weight for age (logit transformed), Indoor Air Pollution (All Cooking Fuels)
1.083865 23 0.5703855 38 10
25 Spacetime Logit(CF)
Health System Access 2 (unitless), Malnutrition - proportion <2SD weight for age (logit transformed), Smoking Prevalence, Education (years per capita), Lag distributed income per capita (log transformed)
1.088455 38 0.5703198 25 9
26 linear Logit(CF)Health System Access 2 (unitless), Malnutrition - proportion <2SD weight for age (logit transformed), Indoor Air Pollution (All Cooking Fuels), Education (years per capita)
1.084552 30 0.5703762 35 8
27 linear Logit(CF)Health System Access 2 (unitless), Malnutrition - proportion <2SD weight for age (logit transformed), Indoor Air Pollution (All Cooking Fuels), Alcohol (liters per capita)
1.083176 18 0.5704087 46 8
28 linear Logit(CF)
Health System Access 2 (unitless), Malnutrition - proportion <2SD weight for age (logit transformed), Indoor Air Pollution (All Cooking Fuels), Smoking Prevalence, Education (years per capita)
1.086184 34 0.5703644 32 7
29 linear Logit(CF)
Health System Access 2 (unitless), Malnutrition - proportion <2SD weight for age (logit transformed), Indoor Air Pollution (All Cooking Fuels), Alcohol (liters per capita), Education (years per capita)
1.084309 27 0.5703863 40 6
30 linear Logit(CF)Health System Access 2 (unitless), Malnutrition - proportion <2SD weight for age (logit transformed), Indoor Air Pollution (All Cooking Fuels), Smoking Prevalence
1.085021 31 0.5703786 36 6
31 linear Logit(CF)
Health System Access 2 (unitless), Malnutrition - proportion <2SD weight for age (logit transformed), Indoor Air Pollution (All Cooking Fuels), Smoking Prevalence, Alcohol (liters per capita), Lag distributed income per capita (log transformed)
1.083885 25 0.5704004 43 5
32 linear Logit(CF)
Health System Access 2 (unitless), Malnutrition - proportion <2SD weight for age (logit transformed), Indoor Air Pollution (All Cooking Fuels), Smoking Prevalence, Alcohol (liters per capita), Education (years per capita)
1.085934 33 0.5703828 37 5

33 linear Logit(CF) Health System Access 2 (unitless), Malnutrition - proportion <2SD weight for age (logit transformed) 1.082859 14 0.5704545 58 4
34 Spacetime Logit(CF)Health System Access 2 (unitless), Malnutrition - proportion <2SD weight for age (logit transformed), Indoor Air Pollution (All Cooking Fuels), Smoking Prevalence
1.091221 56 0.5702605 15 4
35 linear Logit(CF)
Health System Access 2 (unitless), Malnutrition - proportion <2SD weight for age (logit transformed), Indoor Air Pollution (All Cooking Fuels), Smoking Prevalence, Alcohol (liters per capita)
1.084539 29 0.5704087 45 4
36 Spacetime Logit(CF)Malnutrition - proportion <2SD weight for age (logit transformed), Indoor Air Pollution (All Cooking Fuels), Alcohol (liters per capita), Education (years per capita)
1.095026 72 0.5701822 5 3
37 Spacetime Logit(CF)Health System Access 2 (unitless), Smoking Prevalence, Alcohol (liters per capita), Education (years per capita), Lag distributed income per capita (log transformed)
1.090547 52 0.5703035 22 3
38 linear Logit(CF)Health System Access 2 (unitless), Malnutrition - proportion <2SD weight for age (logit transformed), Education (years per capita), Lag distributed income per capita (log transformed)
1.082205 10 0.5704794 65 3
39 Spacetime Logit(CF)Malnutrition - proportion <2SD weight for age (logit transformed), Alcohol (liters per capita), Education (years per capita), Lag distributed income per capita (log transformed)
1.091336 57 0.5702994 20 2
40 Spacetime Logit(CF)
Malnutrition - proportion <2SD weight for age (logit transformed), Indoor Air Pollution (All Cooking Fuels), Smoking Prevalence, Alcohol (liters per capita), Education (years per capita)
1.095433 75 0.5702059 6 2
41 Spacetime Logit(CF) Health System Access 2 (unitless), Education (years per capita), Lag distributed income per capita (log transformed) 1.088492 39 0.5703912 42 2
42 linear Logit(CF)Health System Access 2 (unitless), Malnutrition - proportion <2SD weight for age (logit transformed), Alcohol (liters per capita)
1.082593 12 0.5704881 68 2
43 linear Logit(CF) Health System Access 2 (unitless), Malnutrition - proportion <2SD weight for age (logit transformed), Smoking Prevalence 1.083565 20 0.5704534 57 2
44 linear Logit(CF)
Health System Access 2 (unitless), Malnutrition - proportion <2SD weight for age (logit transformed), Smoking Prevalence, Education (years per capita), Lag distributed income per capita (log transformed)
1.08304 16 0.570473 62 2
45 Spacetime Logit(CF) Malnutrition - proportion <2SD weight for age (logit transformed), Alcohol (liters per capita) 1.086891 36 0.570479 64 1
46 Spacetime Logit(CF)
Malnutrition - proportion <2SD weight for age (logit transformed), Smoking Prevalence, Alcohol (liters per capita), Education (years per capita), Lag distributed income per capita (log transformed)
1.095155 74 0.5703246 26 1
47 Spacetime Logit(CF)Malnutrition - proportion <2SD weight for age (logit transformed), Indoor Air Pollution (All Cooking Fuels), Education (years per capita)
1.093418 62 0.5703507 30 1
48 Spacetime Logit(CF)Malnutrition - proportion <2SD weight for age (logit transformed), Indoor Air Pollution (All Cooking Fuels), Alcohol (liters per capita)
1.099033 85 0.570303 21 1
49 linear Logit(CF)Malnutrition - proportion <2SD weight for age (logit transformed), Indoor Air Pollution (All Cooking Fuels), Smoking Prevalence, Education (years per capita)
1.090419 50 0.5704511 56 1
50 linear Logit(CF)
Malnutrition - proportion <2SD weight for age (logit transformed), Indoor Air Pollution (All Cooking Fuels), Smoking Prevalence, Alcohol (liters per capita), Education (years per capita)
1.090761 53 0.570442 52 1
51 Spacetime Logit(CF)Health System Access 2 (unitless), Smoking Prevalence, Education (years per capita), Lag distributed income per capita (log transformed)
1.093883 64 0.5703874 41 1

52 linear Logit(CF)
Health System Access 2 (unitless), Malnutrition - proportion <2SD weight for age (logit transformed), Alcohol (liters per capita), Education (years per capita), Lag distributed income per capita (log transformed)
1.081894 8 0.5705036 74 1
53 linear Logit(CF)Health System Access 2 (unitless), Malnutrition - proportion <2SD weight for age (logit transformed), Smoking Prevalence, Alcohol (liters per capita)
1.083661 21 0.5704919 71 1
54 linear Logit(CF)
Health System Access 2 (unitless), Malnutrition - proportion <2SD weight for age (logit transformed), Smoking Prevalence, Alcohol (liters per capita), Education (years per capita), Lag distributed income per capita (log transformed)
1.082939 15 0.5705044 75 1
55 Spacetime Logit(CF)
Health System Access 2 (unitless), Malnutrition - proportion <2SD weight for age (logit transformed), Indoor Air Pollution (All Cooking Fuels), Smoking Prevalence, Education (years per capita)
1.095116 73 0.5702263 9 1
56 linear Logit(CF) Smoking Prevalence 1.233163 257 0.5725478 252 0
57 Spacetime Logit(CF) Smoking Prevalence 1.164472 209 0.5715402 153 0
58 linear Logit(CF) Smoking Prevalence, Education (years per capita), Lag distributed income per capita (log transformed) 1.139995 136 0.5708441 112 0
59 Spacetime Logit(CF) Smoking Prevalence, Education (years per capita), Lag distributed income per capita (log transformed) 1.12831 108 0.5706899 104 0
60 linear Logit(CF) Smoking Prevalence, Alcohol (liters per capita) 1.232413 256 0.5725289 250 0
61 Spacetime Logit(CF) Smoking Prevalence, Alcohol (liters per capita) 1.164189 205 0.5714986 144 0
62 linear Logit(CF)Smoking Prevalence, Alcohol (liters per capita), Education (years per capita), Lag distributed income per capita (log transformed)
1.133541 119 0.5706891 103 0
63 Spacetime Logit(CF)Smoking Prevalence, Alcohol (liters per capita), Education (years per capita), Lag distributed income per capita (log transformed)
1.120462 104 0.5704879 67 0
64 linear Logit(CF) Indoor Air Pollution (All Cooking Fuels) 1.198034 242 0.5712211 122 0
65 Spacetime Logit(CF) Indoor Air Pollution (All Cooking Fuels) 1.134738 123 0.5707774 108 0
66 linear Logit(CF)Indoor Air Pollution (All Cooking Fuels), Education (years per capita), Lag distributed income per capita (log transformed)
1.16129 189 0.5707199 105 0
67 Spacetime Logit(CF)Indoor Air Pollution (All Cooking Fuels), Education (years per capita), Lag distributed income per capita (log transformed)
1.117875 102 0.5705386 84 0
68 linear Logit(CF) Indoor Air Pollution (All Cooking Fuels), Alcohol (liters per capita) 1.192313 238 0.5710644 118 0
69 Spacetime Logit(CF) Indoor Air Pollution (All Cooking Fuels), Alcohol (liters per capita) 1.134293 122 0.5706553 100 0
70 linear Logit(CF)Indoor Air Pollution (All Cooking Fuels), Alcohol (liters per capita), Education (years per capita), Lag distributed income per capita (log transformed)
1.137636 130 0.5704915 70 0
71 Spacetime Logit(CF)Indoor Air Pollution (All Cooking Fuels), Alcohol (liters per capita), Education (years per capita), Lag distributed income per capita (log transformed)
1.103126 91 0.5702876 18 0
72 linear Logit(CF) Indoor Air Pollution (All Cooking Fuels), Smoking Prevalence 1.178214 228 0.5712475 124 0
73 Spacetime Logit(CF) Indoor Air Pollution (All Cooking Fuels), Smoking Prevalence 1.128259 107 0.5707785 109 0
74 linear Logit(CF)Indoor Air Pollution (All Cooking Fuels), Smoking Prevalence, Education (years per capita), Lag distributed income per capita (log transformed)
1.141948 143 0.5706869 101 0
75 Spacetime Logit(CF)Indoor Air Pollution (All Cooking Fuels), Smoking Prevalence, Education (years per capita), Lag distributed income per capita (log transformed)
1.108227 100 0.570521 78 0
76 linear Logit(CF) Indoor Air Pollution (All Cooking Fuels), Smoking Prevalence, Alcohol (liters per capita) 1.176949 226 0.5711427 120 0
77 Spacetime Logit(CF) Indoor Air Pollution (All Cooking Fuels), Smoking Prevalence, Alcohol (liters per capita) 1.128709 109 0.5706881 102 0
78 linear Logit(CF)Indoor Air Pollution (All Cooking Fuels), Smoking Prevalence, Alcohol (liters per capita), Education (years per capita), Lag distributed income per capita (log transformed)
1.127193 106 0.5704864 66 0

79 Spacetime Logit(CF)Indoor Air Pollution (All Cooking Fuels), Smoking Prevalence, Alcohol (liters per capita), Education (years per capita), Lag distributed income per capita (log transformed)
1.097603 83 0.5703099 23 0
80 linear Logit(CF) Malnutrition - proportion <2SD weight for age (logit transformed) 1.093363 61 0.5705072 76 0
81 Spacetime Logit(CF) Malnutrition - proportion <2SD weight for age (logit transformed) 1.089729 46 0.5705345 82 0
82 linear Logit(CF)Malnutrition - proportion <2SD weight for age (logit transformed), Education (years per capita), Lag distributed income per capita (log transformed)
1.102558 90 0.5705579 89 0
83 Spacetime Logit(CF)Malnutrition - proportion <2SD weight for age (logit transformed), Education (years per capita), Lag distributed income per capita (log transformed)
1.094042 67 0.570449 54 0
84 linear Logit(CF) Malnutrition - proportion <2SD weight for age (logit transformed), Alcohol (liters per capita) 1.094339 70 0.5705307 81 0
85 linear Logit(CF)Malnutrition - proportion <2SD weight for age (logit transformed), Alcohol (liters per capita), Education (years per capita), Lag distributed income per capita (log transformed)
1.101429 89 0.5705548 88 0
86 linear Logit(CF) Malnutrition - proportion <2SD weight for age (logit transformed), Smoking Prevalence 1.089692 45 0.5705036 73 0
87 Spacetime Logit(CF) Malnutrition - proportion <2SD weight for age (logit transformed), Smoking Prevalence 1.095867 79 0.5705515 86 0
88 linear Logit(CF)Malnutrition - proportion <2SD weight for age (logit transformed), Smoking Prevalence, Education (years per capita), Lag distributed income per capita (log transformed)
1.09673 81 0.5705448 85 0
89 Spacetime Logit(CF)Malnutrition - proportion <2SD weight for age (logit transformed), Smoking Prevalence, Education (years per capita), Lag distributed income per capita (log transformed)
1.096807 82 0.5704558 59 0
90 linear Logit(CF) Malnutrition - proportion <2SD weight for age (logit transformed), Smoking Prevalence, Alcohol (liters per capita) 1.090392 49 0.5705359 83 0
91 Spacetime Logit(CF) Malnutrition - proportion <2SD weight for age (logit transformed), Smoking Prevalence, Alcohol (liters per capita) 1.092337 59 0.5705107 77 0
92 linear Logit(CF)
Malnutrition - proportion <2SD weight for age (logit transformed), Smoking Prevalence, Alcohol (liters per capita), Education (years per capita), Lag distributed income per capita (log transformed)
1.096306 80 0.5705529 87 0
93 linear Logit(CF) Malnutrition - proportion <2SD weight for age (logit transformed), Indoor Air Pollution (All Cooking Fuels) 1.093248 60 0.5705019 72 0
94 Spacetime Logit(CF) Malnutrition - proportion <2SD weight for age (logit transformed), Indoor Air Pollution (All Cooking Fuels) 1.100847 88 0.5703858 39 0
95 linear Logit(CF)Malnutrition - proportion <2SD weight for age (logit transformed), Indoor Air Pollution (All Cooking Fuels), Education (years per capita)
1.093955 65 0.5704727 61 0
96 linear Logit(CF)Malnutrition - proportion <2SD weight for age (logit transformed), Indoor Air Pollution (All Cooking Fuels), Alcohol (liters per capita)
1.093863 63 0.5705243 80 0
97 linear Logit(CF)Malnutrition - proportion <2SD weight for age (logit transformed), Indoor Air Pollution (All Cooking Fuels), Alcohol (liters per capita), Education (years per capita)
1.094008 66 0.5704506 55 0
98 linear Logit(CF)Malnutrition - proportion <2SD weight for age (logit transformed), Indoor Air Pollution (All Cooking Fuels), Smoking Prevalence
1.089765 47 0.5704887 69 0
99 Spacetime Logit(CF)Malnutrition - proportion <2SD weight for age (logit transformed), Indoor Air Pollution (All Cooking Fuels), Smoking Prevalence
1.106221 94 0.5704016 44 0
100 Spacetime Logit(CF)Malnutrition - proportion <2SD weight for age (logit transformed), Indoor Air Pollution (All Cooking Fuels), Smoking Prevalence, Education (years per capita)
1.106445 95 0.5703562 31 0

101 linear Logit(CF)Malnutrition - proportion <2SD weight for age (logit transformed), Indoor Air Pollution (All Cooking Fuels), Smoking Prevalence, Alcohol (liters per capita)
1.090462 51 0.5705214 79 0
102 Spacetime Logit(CF)Malnutrition - proportion <2SD weight for age (logit transformed), Indoor Air Pollution (All Cooking Fuels), Smoking Prevalence, Alcohol (liters per capita)
1.103987 92 0.570335 27 0
103 linear Logit(CF) Health System Access 2 (unitless) 1.099879 86 0.5713618 128 0
104 Spacetime Logit(CF) Health System Access 2 (unitless) 1.089576 44 0.5708438 111 0
105 linear Logit(CF) Health System Access 2 (unitless), Education (years per capita), Lag distributed income per capita (log transformed) 1.094611 71 0.5705992 93 0
106 linear Logit(CF) Health System Access 2 (unitless), Alcohol (liters per capita) 1.100567 87 0.5713792 131 0
107 Spacetime Logit(CF) Health System Access 2 (unitless), Alcohol (liters per capita) 1.088097 37 0.5708471 113 0
108 linear Logit(CF)Health System Access 2 (unitless), Alcohol (liters per capita), Education (years per capita), Lag distributed income per capita (log transformed)
1.091768 58 0.5705833 90 0
109 linear Logit(CF) Health System Access 2 (unitless), Smoking Prevalence 1.106873 96 0.5713279 127 0
110 Spacetime Logit(CF) Health System Access 2 (unitless), Smoking Prevalence 1.090762 54 0.5708414 110 0
111 linear Logit(CF)Health System Access 2 (unitless), Smoking Prevalence, Education (years per capita), Lag distributed income per capita (log transformed)
1.098397 84 0.5705868 92 0
112 linear Logit(CF) Health System Access 2 (unitless), Smoking Prevalence, Alcohol (liters per capita) 1.108174 99 0.5713626 129 0
113 Spacetime Logit(CF) Health System Access 2 (unitless), Smoking Prevalence, Alcohol (liters per capita) 1.090199 48 0.5708507 114 0
114 linear Logit(CF)Health System Access 2 (unitless), Smoking Prevalence, Alcohol (liters per capita), Education (years per capita), Lag distributed income per capita (log transformed)
1.095768 77 0.5705841 91 0
115 linear Logit(CF) Health System Access 2 (unitless), Indoor Air Pollution (All Cooking Fuels) 1.107047 98 0.5706442 99 0
116 linear Logit(CF)Health System Access 2 (unitless), Indoor Air Pollution (All Cooking Fuels), Education (years per capita), Lag distributed income per capita (log transformed)
1.0941 68 0.570475 63 0
117 linear Logit(CF) Health System Access 2 (unitless), Indoor Air Pollution (All Cooking Fuels), Alcohol (liters per capita) 1.108463 101 0.5706197 94 0
118 linear Logit(CF)
Health System Access 2 (unitless), Indoor Air Pollution (All Cooking Fuels), Alcohol (liters per capita), Education (years per capita), Lag distributed income per capita (log transformed)
1.094115 69 0.5704135 48 0
119 linear Logit(CF) Health System Access 2 (unitless), Indoor Air Pollution (All Cooking Fuels), Smoking Prevalence 1.105652 93 0.57063 97 0
120 linear Logit(CF)Health System Access 2 (unitless), Indoor Air Pollution (All Cooking Fuels), Smoking Prevalence, Education (years per capita), Lag distributed income per capita (log transformed)
1.095834 78 0.5704578 60 0
121 linear Logit(CF)Health System Access 2 (unitless), Indoor Air Pollution (All Cooking Fuels), Smoking Prevalence, Alcohol (liters per capita)
1.106969 97 0.5706236 95 0
122 linear Logit(CF)
Health System Access 2 (unitless), Indoor Air Pollution (All Cooking Fuels), Smoking Prevalence, Alcohol (liters per capita), Education (years per capita), Lag distributed income per capita (log transformed)
1.095437 76 0.5704104 47 0
123 linear Logit(CF) Cumulative Cigarettes (5 years) 1.247688 263 0.5725533 253 0
124 Spacetime Logit(CF) Cumulative Cigarettes (5 years) 1.160898 187 0.571536 151 0
125 linear Logit(CF) Cumulative Cigarettes (5 years), Lag distributed income per capita (log transformed) 1.198657 243 0.5714251 136 0
126 Spacetime Logit(CF) Cumulative Cigarettes (5 years), Lag distributed income per capita (log transformed) 1.14068 137 0.5709975 116 0

127 linear Logit(CF) Cumulative Cigarettes (5 years), Alcohol (liters per capita) 1.248552 264 0.5724737 248 0
128 Spacetime Logit(CF) Cumulative Cigarettes (5 years), Alcohol (liters per capita) 1.159463 178 0.5714648 140 0
129 linear Logit(CF) Cumulative Cigarettes (5 years), Alcohol (liters per capita), Lag distributed income per capita (log transformed) 1.194489 241 0.5714008 132 0
130 Spacetime Logit(CF) Cumulative Cigarettes (5 years), Alcohol (liters per capita), Lag distributed income per capita (log transformed) 1.133682 121 0.5709086 115 0
131 linear Logit(CF) Cumulative Cigarettes (5 years), Indoor Air Pollution (All Cooking Fuels) 1.192941 239 0.571244 123 0
132 Spacetime Logit(CF) Cumulative Cigarettes (5 years), Indoor Air Pollution (All Cooking Fuels) 1.135056 125 0.5707603 107 0
133 linear Logit(CF)Cumulative Cigarettes (5 years), Indoor Air Pollution (All Cooking Fuels), Lag distributed income per capita (log transformed)
1.185173 231 0.5711617 121 0
134 Spacetime Logit(CF)Cumulative Cigarettes (5 years), Indoor Air Pollution (All Cooking Fuels), Lag distributed income per capita (log transformed)
1.133312 117 0.5707365 106 0
135 linear Logit(CF) Cumulative Cigarettes (5 years), Indoor Air Pollution (All Cooking Fuels), Alcohol (liters per capita) 1.185318 232 0.5711005 119 0
136 Spacetime Logit(CF) Cumulative Cigarettes (5 years), Indoor Air Pollution (All Cooking Fuels), Alcohol (liters per capita) 1.134967 124 0.5706439 98 0
137 linear Logit(CF)Cumulative Cigarettes (5 years), Indoor Air Pollution (All Cooking Fuels), Alcohol (liters per capita), Lag distributed income per capita (log transformed)
1.182799 230 0.5710558 117 0
138 Spacetime Logit(CF)Cumulative Cigarettes (5 years), Indoor Air Pollution (All Cooking Fuels), Alcohol (liters per capita), Lag distributed income per capita (log transformed)
1.129676 111 0.5706262 96 0
139 linear rate Smoking Prevalence 1.414474 283 0.5761269 285 0
140 Spacetime rate Smoking Prevalence 1.294262 271 0.5742085 282 0
141 linear rate Smoking Prevalence, Education (years per capita), Lag distributed income per capita (log transformed) 1.22542 253 0.5725418 251 0
142 Spacetime rate Smoking Prevalence, Education (years per capita), Lag distributed income per capita (log transformed) 1.193005 240 0.5723605 244 0
143 linear rate Smoking Prevalence, Alcohol (liters per capita) 1.415504 284 0.5761739 286 0
144 Spacetime rate Smoking Prevalence, Alcohol (liters per capita) 1.294177 270 0.5741756 280 0
145 linear rateSmoking Prevalence, Alcohol (liters per capita), Education (years per capita), Lag distributed income per capita (log transformed)
1.204741 249 0.572296 243 0
146 Spacetime rateSmoking Prevalence, Alcohol (liters per capita), Education (years per capita), Lag distributed income per capita (log transformed)
1.178268 229 0.5720463 232 0
147 linear rate Indoor Air Pollution (All Cooking Fuels) 1.343868 282 0.5736277 273 0
148 Spacetime rate Indoor Air Pollution (All Cooking Fuels) 1.255491 267 0.5727732 263 0
149 linear rateIndoor Air Pollution (All Cooking Fuels), Education (years per capita), Lag distributed income per capita (log transformed)
1.267861 269 0.5724215 246 0
150 Spacetime rateIndoor Air Pollution (All Cooking Fuels), Education (years per capita), Lag distributed income per capita (log transformed)
1.208621 250 0.5721589 238 0
151 linear rate Indoor Air Pollution (All Cooking Fuels), Alcohol (liters per capita) 1.323411 278 0.5734106 267 0
152 Spacetime rate Indoor Air Pollution (All Cooking Fuels), Alcohol (liters per capita) 1.249564 265 0.572593 255 0
153 linear rateIndoor Air Pollution (All Cooking Fuels), Alcohol (liters per capita), Education (years per capita), Lag distributed income per capita (log transformed)
1.216312 252 0.5721135 235 0
154 Spacetime rateIndoor Air Pollution (All Cooking Fuels), Alcohol (liters per capita), Education (years per capita), Lag distributed income per capita (log transformed)
1.176993 227 0.5717666 184 0
155 linear rate Indoor Air Pollution (All Cooking Fuels), Smoking Prevalence 1.31631 276 0.5737168 275 0

156 Spacetime rate Indoor Air Pollution (All Cooking Fuels), Smoking Prevalence 1.242572 260 0.5727732 262 0
157 linear rateIndoor Air Pollution (All Cooking Fuels), Smoking Prevalence, Education (years per capita), Lag distributed income per capita (log transformed)
1.227837 254 0.57237 245 0
158 Spacetime rateIndoor Air Pollution (All Cooking Fuels), Smoking Prevalence, Education (years per capita), Lag distributed income per capita (log transformed)
1.186607 234 0.572135 236 0
159 linear rate Indoor Air Pollution (All Cooking Fuels), Smoking Prevalence, Alcohol (liters per capita) 1.310121 274 0.5735299 269 0
160 Spacetime rate Indoor Air Pollution (All Cooking Fuels), Smoking Prevalence, Alcohol (liters per capita) 1.23903 259 0.5726462 256 0
161 linear rateIndoor Air Pollution (All Cooking Fuels), Smoking Prevalence, Alcohol (liters per capita), Education (years per capita), Lag distributed income per capita (log transformed)
1.201371 244 0.5720768 234 0
162 Spacetime rateIndoor Air Pollution (All Cooking Fuels), Smoking Prevalence, Alcohol (liters per capita), Education (years per capita), Lag distributed income per capita (log transformed)
1.167477 221 0.5718085 194 0
163 linear rate Malnutrition - proportion <2SD weight for age (logit transformed) 1.16502 213 0.5719637 220 0
164 Spacetime rate Malnutrition - proportion <2SD weight for age (logit transformed) 1.159943 182 0.572037 231 0
165 linear rateMalnutrition - proportion <2SD weight for age (logit transformed), Education (years per capita), Lag distributed income per capita (log transformed)
1.169704 222 0.5719323 214 0
166 Spacetime rateMalnutrition - proportion <2SD weight for age (logit transformed), Education (years per capita), Lag distributed income per capita (log transformed)
1.150063 161 0.5718463 204 0
167 linear rate Malnutrition - proportion <2SD weight for age (logit transformed), Alcohol (liters per capita) 1.166339 215 0.5719726 225 0
168 Spacetime rate Malnutrition - proportion <2SD weight for age (logit transformed), Alcohol (liters per capita) 1.160796 186 0.5719661 222 0
169 linear rateMalnutrition - proportion <2SD weight for age (logit transformed), Alcohol (liters per capita), Education (years per capita), Lag distributed income per capita (log transformed)
1.162039 195 0.5718503 205 0
170 Spacetime rateMalnutrition - proportion <2SD weight for age (logit transformed), Alcohol (liters per capita), Education (years per capita), Lag distributed income per capita (log transformed)
1.130767 113 0.5716256 157 0
171 linear rate Malnutrition - proportion <2SD weight for age (logit transformed), Smoking Prevalence 1.159977 183 0.5719609 219 0
172 Spacetime rate Malnutrition - proportion <2SD weight for age (logit transformed), Smoking Prevalence 1.157447 170 0.5720712 233 0
173 linear rateMalnutrition - proportion <2SD weight for age (logit transformed), Smoking Prevalence, Education (years per capita), Lag distributed income per capita (log transformed)
1.161864 193 0.5719143 211 0
174 Spacetime rateMalnutrition - proportion <2SD weight for age (logit transformed), Smoking Prevalence, Education (years per capita), Lag distributed income per capita (log transformed)
1.159042 176 0.5718718 209 0
175 linear rate Malnutrition - proportion <2SD weight for age (logit transformed), Smoking Prevalence, Alcohol (liters per capita) 1.162008 194 0.571977 226 0
176 Spacetime rate Malnutrition - proportion <2SD weight for age (logit transformed), Smoking Prevalence, Alcohol (liters per capita) 1.158685 174 0.572022 229 0
177 linear rate
Malnutrition - proportion <2SD weight for age (logit transformed), Smoking Prevalence, Alcohol (liters per capita), Education (years per capita), Lag distributed income per capita (log transformed)
1.156563 168 0.5718459 203 0
178 Spacetime rate
Malnutrition - proportion <2SD weight for age (logit transformed), Smoking Prevalence, Alcohol (liters per capita), Education (years per capita), Lag distributed income per capita (log transformed)
1.139839 135 0.5716791 162 0

179 linear rate Malnutrition - proportion <2SD weight for age (logit transformed), Indoor Air Pollution (All Cooking Fuels) 1.164945 212 0.57197 224 0
180 Spacetime rate Malnutrition - proportion <2SD weight for age (logit transformed), Indoor Air Pollution (All Cooking Fuels) 1.161253 188 0.5718119 196 0
181 linear rate
Malnutrition - proportion <2SD weight for age (logit transformed), Indoor Air Pollution (All Cooking Fuels), Education (years per capita), Lag distributed income per capita (log transformed)
1.166732 217 0.571874 210 0
182 Spacetime rate
Malnutrition - proportion <2SD weight for age (logit transformed), Indoor Air Pollution (All Cooking Fuels), Education (years per capita), Lag distributed income per capita (log transformed)
1.152553 165 0.5717261 175 0
183 linear rateMalnutrition - proportion <2SD weight for age (logit transformed), Indoor Air Pollution (All Cooking Fuels), Alcohol (liters per capita)
1.164394 207 0.5719657 221 0
184 Spacetime rateMalnutrition - proportion <2SD weight for age (logit transformed), Indoor Air Pollution (All Cooking Fuels), Alcohol (liters per capita)
1.16182 192 0.5717042 168 0
185 linear rate
Malnutrition - proportion <2SD weight for age (logit transformed), Indoor Air Pollution (All Cooking Fuels), Alcohol (liters per capita), Education (years per capita), Lag distributed income per capita (log transformed)
1.157117 169 0.5717413 177 0
186 Spacetime rate
Malnutrition - proportion <2SD weight for age (logit transformed), Indoor Air Pollution (All Cooking Fuels), Alcohol (liters per capita), Education (years per capita), Lag distributed income per capita (log transformed)
1.141981 144 0.5714844 143 0
187 linear rateMalnutrition - proportion <2SD weight for age (logit transformed), Indoor Air Pollution (All Cooking Fuels), Smoking Prevalence
1.158776 175 0.571954 215 0
188 Spacetime rateMalnutrition - proportion <2SD weight for age (logit transformed), Indoor Air Pollution (All Cooking Fuels), Smoking Prevalence
1.159657 180 0.5718447 202 0
189 linear rate
Malnutrition - proportion <2SD weight for age (logit transformed), Indoor Air Pollution (All Cooking Fuels), Smoking Prevalence, Education (years per capita), Lag distributed income per capita (log transformed)
1.158139 172 0.5718409 201 0
190 Spacetime rate
Malnutrition - proportion <2SD weight for age (logit transformed), Indoor Air Pollution (All Cooking Fuels), Smoking Prevalence, Education (years per capita), Lag distributed income per capita (log transformed)
1.163047 200 0.5717501 178 0
191 linear rateMalnutrition - proportion <2SD weight for age (logit transformed), Indoor Air Pollution (All Cooking Fuels), Smoking Prevalence, Alcohol (liters per capita)
1.159445 177 0.5719606 218 0
192 Spacetime rateMalnutrition - proportion <2SD weight for age (logit transformed), Indoor Air Pollution (All Cooking Fuels), Smoking Prevalence, Alcohol (liters per capita)
1.160547 184 0.5717618 181 0
193 linear rate
Malnutrition - proportion <2SD weight for age (logit transformed), Indoor Air Pollution (All Cooking Fuels), Smoking Prevalence, Alcohol (liters per capita), Education (years per capita), Lag distributed income per capita (log transformed)
1.151256 162 0.5717272 176 0
194 Spacetime rate
Malnutrition - proportion <2SD weight for age (logit transformed), Indoor Air Pollution (All Cooking Fuels), Smoking Prevalence, Alcohol (liters per capita), Education (years per capita), Lag distributed income per capita (log transformed)
1.142749 148 0.5715367 152 0
195 linear rate Health System Access 2 (unitless) 1.202368 247 0.5736186 272 0
196 Spacetime rate Health System Access 2 (unitless) 1.167345 220 0.57268 258 0
197 linear rate Health System Access 2 (unitless), Education (years per capita), Lag distributed income per capita (log transformed) 1.162689 198 0.5718664 208 0

198 Spacetime rate Health System Access 2 (unitless), Education (years per capita), Lag distributed income per capita (log transformed) 1.141862 142 0.5716475 158 0
199 linear rate Health System Access 2 (unitless), Alcohol (liters per capita) 1.201678 245 0.5736562 274 0
200 Spacetime rate Health System Access 2 (unitless), Alcohol (liters per capita) 1.16673 216 0.5726981 259 0
201 linear rateHealth System Access 2 (unitless), Alcohol (liters per capita), Education (years per capita), Lag distributed income per capita (log transformed)
1.157716 171 0.5718257 199 0
202 Spacetime rateHealth System Access 2 (unitless), Alcohol (liters per capita), Education (years per capita), Lag distributed income per capita (log transformed)
1.136096 127 0.5715248 148 0
203 linear rate Health System Access 2 (unitless), Smoking Prevalence 1.202328 246 0.573567 270 0
204 Spacetime rate Health System Access 2 (unitless), Smoking Prevalence 1.166895 218 0.572677 257 0
205 linear rateHealth System Access 2 (unitless), Smoking Prevalence, Education (years per capita), Lag distributed income per capita (log transformed)
1.16265 197 0.571862 207 0
206 Spacetime rateHealth System Access 2 (unitless), Smoking Prevalence, Education (years per capita), Lag distributed income per capita (log transformed)
1.141121 139 0.5716631 160 0
207 linear rate Health System Access 2 (unitless), Smoking Prevalence, Alcohol (liters per capita) 1.20237 248 0.5735979 271 0
208 Spacetime rate Health System Access 2 (unitless), Smoking Prevalence, Alcohol (liters per capita) 1.167158 219 0.5727059 260 0
209 linear rateHealth System Access 2 (unitless), Smoking Prevalence, Alcohol (liters per capita), Education (years per capita), Lag distributed income per capita (log transformed)
1.155358 167 0.5718277 200 0
210 Spacetime rateHealth System Access 2 (unitless), Smoking Prevalence, Alcohol (liters per capita), Education (years per capita), Lag distributed income per capita (log transformed)
1.135057 126 0.5715578 154 0
211 linear rate Health System Access 2 (unitless), Indoor Air Pollution (All Cooking Fuels) 1.187395 237 0.5722766 242 0
212 Spacetime rate Health System Access 2 (unitless), Indoor Air Pollution (All Cooking Fuels) 1.163616 202 0.571803 193 0
213 linear rateHealth System Access 2 (unitless), Indoor Air Pollution (All Cooking Fuels), Education (years per capita), Lag distributed income per capita (log transformed)
1.165522 214 0.5717794 188 0
214 Spacetime rateHealth System Access 2 (unitless), Indoor Air Pollution (All Cooking Fuels), Education (years per capita), Lag distributed income per capita (log transformed)
1.133623 120 0.5715181 147 0
215 linear rate Health System Access 2 (unitless), Indoor Air Pollution (All Cooking Fuels), Alcohol (liters per capita) 1.187159 236 0.5722407 239 0
216 Spacetime rate Health System Access 2 (unitless), Indoor Air Pollution (All Cooking Fuels), Alcohol (liters per capita) 1.164093 204 0.5717728 185 0
217 linear rate
Health System Access 2 (unitless), Indoor Air Pollution (All Cooking Fuels), Alcohol (liters per capita), Education (years per capita), Lag distributed income per capita (log transformed)
1.163568 201 0.5716979 166 0
218 Spacetime rate
Health System Access 2 (unitless), Indoor Air Pollution (All Cooking Fuels), Alcohol (liters per capita), Education (years per capita), Lag distributed income per capita (log transformed)
1.133484 118 0.5713741 130 0
219 linear rate Health System Access 2 (unitless), Indoor Air Pollution (All Cooking Fuels), Smoking Prevalence 1.186944 235 0.5722735 241 0
220 Spacetime rate Health System Access 2 (unitless), Indoor Air Pollution (All Cooking Fuels), Smoking Prevalence 1.164025 203 0.571809 195 0
221 linear rateHealth System Access 2 (unitless), Indoor Air Pollution (All Cooking Fuels), Smoking Prevalence, Education (years per capita), Lag distributed income per capita (log transformed)
1.160644 185 0.5717637 182 0

222 Spacetime rateHealth System Access 2 (unitless), Indoor Air Pollution (All Cooking Fuels), Smoking Prevalence, Education (years per capita), Lag distributed income per capita (log transformed)
1.131884 115 0.5715335 150 0
223 linear rateHealth System Access 2 (unitless), Indoor Air Pollution (All Cooking Fuels), Smoking Prevalence, Alcohol (liters per capita)
1.186307 233 0.5722497 240 0
224 Spacetime rateHealth System Access 2 (unitless), Indoor Air Pollution (All Cooking Fuels), Smoking Prevalence, Alcohol (liters per capita)
1.164398 208 0.5717919 190 0
225 linear rate
Health System Access 2 (unitless), Indoor Air Pollution (All Cooking Fuels), Smoking Prevalence, Alcohol (liters per capita), Education (years per capita), Lag distributed income per capita (log transformed)
1.158659 173 0.5716894 163 0
226 Spacetime rate
Health System Access 2 (unitless), Indoor Air Pollution (All Cooking Fuels), Smoking Prevalence, Alcohol (liters per capita), Education (years per capita), Lag distributed income per capita (log transformed)
1.12941 110 0.5714074 134 0
227 linear rate Health System Access 2 (unitless), Malnutrition - proportion <2SD weight for age (logit transformed) 1.15242 164 0.571791 189 0
228 Spacetime rate Health System Access 2 (unitless), Malnutrition - proportion <2SD weight for age (logit transformed) 1.142645 146 0.5717589 180 0
229 linear rateHealth System Access 2 (unitless), Malnutrition - proportion <2SD weight for age (logit transformed), Education (years per capita), Lag distributed income per capita (log transformed)
1.148161 158 0.5717244 174 0
230 Spacetime rateHealth System Access 2 (unitless), Malnutrition - proportion <2SD weight for age (logit transformed), Education (years per capita), Lag distributed income per capita (log transformed)
1.133175 116 0.5715012 146 0
231 linear rateHealth System Access 2 (unitless), Malnutrition - proportion <2SD weight for age (logit transformed), Alcohol (liters per capita)
1.154285 166 0.5718185 197 0
232 Spacetime rateHealth System Access 2 (unitless), Malnutrition - proportion <2SD weight for age (logit transformed), Alcohol (liters per capita)
1.143015 149 0.5717533 179 0
233 linear rate
Health System Access 2 (unitless), Malnutrition - proportion <2SD weight for age (logit transformed), Alcohol (liters per capita), Education (years per capita), Lag distributed income per capita (log transformed)
1.144758 154 0.5716961 164 0
234 Spacetime rate
Health System Access 2 (unitless), Malnutrition - proportion <2SD weight for age (logit transformed), Alcohol (liters per capita), Education (years per capita), Lag distributed income per capita (log transformed)
1.120277 103 0.5714035 133 0
235 linear rate Health System Access 2 (unitless), Malnutrition - proportion <2SD weight for age (logit transformed), Smoking Prevalence 1.149319 160 0.5717942 191 0
236 Spacetime rate Health System Access 2 (unitless), Malnutrition - proportion <2SD weight for age (logit transformed), Smoking Prevalence 1.142328 145 0.5717729 186 0
237 linear rate
Health System Access 2 (unitless), Malnutrition - proportion <2SD weight for age (logit transformed), Smoking Prevalence, Education (years per capita), Lag distributed income per capita (log transformed)
1.143707 151 0.571719 173 0
238 Spacetime rate
Health System Access 2 (unitless), Malnutrition - proportion <2SD weight for age (logit transformed), Smoking Prevalence, Education (years per capita), Lag distributed income per capita (log transformed)
1.13888 134 0.5715265 149 0
239 linear rateHealth System Access 2 (unitless), Malnutrition - proportion <2SD weight for age (logit transformed), Smoking Prevalence, Alcohol (liters per capita)
1.151562 163 0.5718245 198 0
240 Spacetime rateHealth System Access 2 (unitless), Malnutrition - proportion <2SD weight for age (logit transformed), Smoking Prevalence, Alcohol (liters per capita)
1.143284 150 0.5717741 187 0

241 linear rate
Health System Access 2 (unitless), Malnutrition - proportion <2SD weight for age (logit transformed), Smoking Prevalence, Alcohol (liters per capita), Education (years per capita), Lag distributed income per capita (log transformed)
1.141574 140 0.5716973 165 0
242 Spacetime rate
Health System Access 2 (unitless), Malnutrition - proportion <2SD weight for age (logit transformed), Smoking Prevalence, Alcohol (liters per capita), Education (years per capita), Lag distributed income per capita (log transformed)
1.131361 114 0.5714408 138 0
243 linear rateHealth System Access 2 (unitless), Malnutrition - proportion <2SD weight for age (logit transformed), Indoor Air Pollution (All Cooking Fuels)
1.14794 157 0.5717118 170 0
244 Spacetime rateHealth System Access 2 (unitless), Malnutrition - proportion <2SD weight for age (logit transformed), Indoor Air Pollution (All Cooking Fuels)
1.137669 131 0.5714842 142 0
245 linear rate
Health System Access 2 (unitless), Malnutrition - proportion <2SD weight for age (logit transformed), Indoor Air Pollution (All Cooking Fuels), Education (years per capita), Lag distributed income per capita (log transformed)
1.147296 156 0.5716743 161 0
246 Spacetime rate
Health System Access 2 (unitless), Malnutrition - proportion <2SD weight for age (logit transformed), Indoor Air Pollution (All Cooking Fuels), Education (years per capita), Lag distributed income per capita (log transformed)
1.137325 129 0.5714089 135 0
247 linear rateHealth System Access 2 (unitless), Malnutrition - proportion <2SD weight for age (logit transformed), Indoor Air Pollution (All Cooking Fuels), Alcohol (liters per capita)
1.148611 159 0.5717152 171 0
248 Spacetime rateHealth System Access 2 (unitless), Malnutrition - proportion <2SD weight for age (logit transformed), Indoor Air Pollution (All Cooking Fuels), Alcohol (liters per capita)
1.137767 132 0.571451 139 0
249 linear rate
Health System Access 2 (unitless), Malnutrition - proportion <2SD weight for age (logit transformed), Indoor Air Pollution (All Cooking Fuels), Alcohol (liters per capita), Education (years per capita), Lag distributed income per capita (log transformed)
1.143907 152 0.5716123 156 0
250 Spacetime rate
Health System Access 2 (unitless), Malnutrition - proportion <2SD weight for age (logit transformed), Indoor Air Pollution (All Cooking Fuels), Alcohol (liters per capita), Education (years per capita), Lag distributed income per capita (log transformed)
1.123377 105 0.57129 125 0
251 linear rateHealth System Access 2 (unitless), Malnutrition - proportion <2SD weight for age (logit transformed), Indoor Air Pollution (All Cooking Fuels), Smoking Prevalence
1.144257 153 0.5717057 169 0
252 Spacetime rateHealth System Access 2 (unitless), Malnutrition - proportion <2SD weight for age (logit transformed), Indoor Air Pollution (All Cooking Fuels), Smoking Prevalence
1.137153 128 0.5714992 145 0
253 linear rate
Health System Access 2 (unitless), Malnutrition - proportion <2SD weight for age (logit transformed), Indoor Air Pollution (All Cooking Fuels), Smoking Prevalence, Education (years per capita), Lag distributed income per capita (log transformed)
1.142707 147 0.5716588 159 0
254 Spacetime rate
Health System Access 2 (unitless), Malnutrition - proportion <2SD weight for age (logit transformed), Indoor Air Pollution (All Cooking Fuels), Smoking Prevalence, Education (years per capita), Lag distributed income per capita (log transformed)
1.141858 141 0.5714334 137 0
255 linear rate
Health System Access 2 (unitless), Malnutrition - proportion <2SD weight for age (logit transformed), Indoor Air Pollution (All Cooking Fuels), Smoking Prevalence, Alcohol (liters per capita)
1.14569 155 0.5717159 172 0
256 Spacetime rate
Health System Access 2 (unitless), Malnutrition - proportion <2SD weight for age (logit transformed), Indoor Air Pollution (All Cooking Fuels), Smoking Prevalence, Alcohol (liters per capita)
1.137975 133 0.5714752 141 0

257 linear rate
Health System Access 2 (unitless), Malnutrition - proportion <2SD weight for age (logit transformed), Indoor Air Pollution (All Cooking Fuels), Smoking Prevalence, Alcohol (liters per capita), Education (years per capita), Lag distributed income per capita (log transformed)
1.140685 138 0.5716064 155 0
258 Spacetime rate
Health System Access 2 (unitless), Malnutrition - proportion <2SD weight for age (logit transformed), Indoor Air Pollution (All Cooking Fuels), Smoking Prevalence, Alcohol (liters per capita), Education (years per capita), Lag distributed income per capita (log transformed)
1.129848 112 0.5713263 126 0
259 linear rate Cumulative Cigarettes (5 years) 1.433256 286 0.5761029 284 0
260 Spacetime rate Cumulative Cigarettes (5 years) 1.298792 272 0.5741854 281 0
261 linear rate Cumulative Cigarettes (5 years), Lag distributed income per capita (log transformed) 1.32945 280 0.5737989 278 0
262 Spacetime rate Cumulative Cigarettes (5 years), Lag distributed income per capita (log transformed) 1.246879 262 0.5730144 265 0
263 linear rate Cumulative Cigarettes (5 years), Alcohol (liters per capita) 1.425263 285 0.5759434 283 0
264 Spacetime rate Cumulative Cigarettes (5 years), Alcohol (liters per capita) 1.299392 273 0.5740901 279 0
265 linear rate Cumulative Cigarettes (5 years), Alcohol (liters per capita), Lag distributed income per capita (log transformed) 1.321099 277 0.573753 277 0
266 Spacetime rate Cumulative Cigarettes (5 years), Alcohol (liters per capita), Lag distributed income per capita (log transformed) 1.23774 258 0.5728932 264 0
267 linear rate Cumulative Cigarettes (5 years), Indoor Air Pollution (All Cooking Fuels) 1.340316 281 0.5737191 276 0
268 Spacetime rate Cumulative Cigarettes (5 years), Indoor Air Pollution (All Cooking Fuels) 1.252308 266 0.5727318 261 0
269 linear rateCumulative Cigarettes (5 years), Indoor Air Pollution (All Cooking Fuels), Education (years per capita), Lag distributed income per capita (log transformed)
1.258911 268 0.5724273 247 0
270 Spacetime rateCumulative Cigarettes (5 years), Indoor Air Pollution (All Cooking Fuels), Education (years per capita), Lag distributed income per capita (log transformed)
1.211302 251 0.5721417 237 0
271 linear rate Cumulative Cigarettes (5 years), Indoor Air Pollution (All Cooking Fuels), Alcohol (liters per capita) 1.325296 279 0.5734846 268 0
272 Spacetime rate Cumulative Cigarettes (5 years), Indoor Air Pollution (All Cooking Fuels), Alcohol (liters per capita) 1.246365 261 0.5725672 254 0
273 linear rateCumulative Cigarettes (5 years), Indoor Air Pollution (All Cooking Fuels), Alcohol (liters per capita), Lag distributed income per capita (log transformed)
1.315132 275 0.5732856 266 0
274 Spacetime rateCumulative Cigarettes (5 years), Indoor Air Pollution (All Cooking Fuels), Alcohol (liters per capita), Lag distributed income per capita (log transformed)
1.228627 255 0.5724902 249 0
275 linear rate Cumulative Cigarettes (5 years), Malnutrition - proportion <2SD weight for age (logit transformed) 1.164752 211 0.571959 216 0
276 Spacetime rate Cumulative Cigarettes (5 years), Malnutrition - proportion <2SD weight for age (logit transformed) 1.159822 181 0.5720331 230 0
277 linear rateCumulative Cigarettes (5 years), Malnutrition - proportion <2SD weight for age (logit transformed), Lag distributed income per capita (log transformed)
1.173801 225 0.5719875 227 0
278 Spacetime rateCumulative Cigarettes (5 years), Malnutrition - proportion <2SD weight for age (logit transformed), Lag distributed income per capita (log transformed)
1.16141 190 0.5720148 228 0
279 linear rateCumulative Cigarettes (5 years), Malnutrition - proportion <2SD weight for age (logit transformed), Indoor Air Pollution (All Cooking Fuels)
1.164231 206 0.5719595 217 0
280 Spacetime rateCumulative Cigarettes (5 years), Malnutrition - proportion <2SD weight for age (logit transformed), Indoor Air Pollution (All Cooking Fuels)
1.161611 191 0.5718026 192 0
281 linear rate
Cumulative Cigarettes (5 years), Malnutrition - proportion <2SD weight for age (logit transformed), Indoor Air Pollution (All Cooking Fuels), Lag distributed income per capita (log transformed)
1.170935 223 0.5719277 213 0

282 Spacetime rate
Cumulative Cigarettes (5 years), Malnutrition - proportion <2SD weight for age (logit transformed), Indoor Air Pollution (All Cooking Fuels), Lag distributed income per capita (log transformed)
1.162729 199 0.5718574 206 0
283 linear rateCumulative Cigarettes (5 years), Malnutrition - proportion <2SD weight for age (logit transformed), Indoor Air Pollution (All Cooking Fuels), Alcohol (liters per capita)
1.164475 210 0.5719676 223 0
284 Spacetime rateCumulative Cigarettes (5 years), Malnutrition - proportion <2SD weight for age (logit transformed), Indoor Air Pollution (All Cooking Fuels), Alcohol (liters per capita)
1.162225 196 0.571699 167 0
285 linear rate
Cumulative Cigarettes (5 years), Malnutrition - proportion <2SD weight for age (logit transformed), Indoor Air Pollution (All Cooking Fuels), Alcohol (liters per capita), Lag distributed income per capita (log transformed)
1.171937 224 0.5719219 212 0
286 Spacetime rate
Cumulative Cigarettes (5 years), Malnutrition - proportion <2SD weight for age (logit transformed), Indoor Air Pollution (All Cooking Fuels), Alcohol (liters per capita), Lag distributed income per capita (log transformed)
1.159616 179 0.571764 183 0

Country Source number Source Suveillance Verbal AutopsyVital
Registration
Albania 01 - ALB World Health Organization (WHO). WHO Mortality Database Version February 2014. Geneva, Switzerland: World Health Organization (WHO), 2014. X
Antigua and Barbuda 01 - ATG World Health Organization (WHO). WHO Mortality Database Version February
2014. Geneva, Switzerland: World Health Organization (WHO), 2014. X
Argentina 01 - ARG World Health Organization (WHO). WHO Mortality Database Version February 2014. Geneva, Switzerland: World Health Organization (WHO), 2014. X
Armenia 01 - ARM World Health Organization (WHO). WHO Mortality Database Version February 2014. Geneva, Switzerland: World Health Organization (WHO), 2014. X
Australia 01 - AUS World Health Organization (WHO). WHO Mortality Database Version February 2014. Geneva, Switzerland: World Health Organization (WHO), 2014. X
Austria 01 - AUT World Health Organization (WHO). WHO Mortality Database Version February 2014. Geneva, Switzerland: World Health Organization (WHO), 2014. X
Azerbaijan 01 - AZE World Health Organization (WHO). WHO Mortality Database Version February 2014. Geneva, Switzerland: World Health Organization (WHO), 2014. X
Bahrain 01 - BHR World Health Organization (WHO). WHO Mortality Database Version February 2014. Geneva, Switzerland: World Health Organization (WHO), 2014. X
Bangladesh 01 - BGDHussain A, Ali SM, Kvâle G. Determinants of mortality among children in the urban slums of Dhaka city, Bangladesh. Trop Med Int Health. 1999; 4(11): 758-64.
X
Bangladesh 02 - BGDINDEPTH, International Centre for Diarrhoeal Disease Research (Bangladesh). Bangladesh - Matlab Health and Demographic Surveillance System. Dhaka, Bangladesh: International Centre for Diarrhoeal Disease Research (Bangladesh).
X
Bangladesh 03 - BGD INDEPTH. Bangladesh - AMK Health and Demographic Surveillance System. X
Barbados 01 - BRB World Health Organization (WHO). WHO Mortality Database Version February 2014. Geneva, Switzerland: World Health Organization (WHO), 2014. X
Belarus 01 - BLR World Health Organization (WHO). WHO Mortality Database Version February 2014. Geneva, Switzerland: World Health Organization (WHO), 2014. X
Belgium 01 - BEL World Health Organization (WHO). WHO Mortality Database Version February 2014. Geneva, Switzerland: World Health Organization (WHO), 2014. X
Belize 01 - BLZ World Health Organization (WHO). WHO Mortality Database Version February 2014. Geneva, Switzerland: World Health Organization (WHO), 2014. X
Bermuda 01 - BMU World Health Organization (WHO). WHO Mortality Database Version February 2014. Geneva, Switzerland: World Health Organization (WHO), 2014. X
Bolivia 01 - BOL World Health Organization (WHO). WHO Mortality Database Version February 2014. Geneva, Switzerland: World Health Organization (WHO), 2014. X
Bosnia and Herzegovina 01 - BIH World Health Organization (WHO). WHO Mortality Database Version February
2014. Geneva, Switzerland: World Health Organization (WHO), 2014. X
Brazil 01 - BRAVictora CG, Barros FC, Huttly SR, Teixeira AM, Vaughan JP. Early childhood mortality in a Brazilian cohort: the roles of birthweight and socioeconomic status. Int J Epidemiol. 1992; 21(5): 911-5.
X
Brazil 02 - BRA
Victora CG, Smith PG, Vaughan JP, Nobre LC, Lombardi C, Teixeira AM, Fuchs SM, Moreira LB, Gigante LP, Barros FC. Evidence for protection by breast-feeding against infant deaths from infectious diseases in Brazil. Lancet. 1987; 2(8554): 319-22.
X
Brazil 03 - BRA World Health Organization (WHO). WHO Mortality Database Version February 2014. Geneva, Switzerland: World Health Organization (WHO), 2014. X
Brunei 01 - BRN World Health Organization (WHO). WHO Mortality Database Version February 2014. Geneva, Switzerland: World Health Organization (WHO), 2014. X
Appendix Table 7: Tuberculosis mortality data sources used in the GBD 2013.

Bulgaria 01 - BGR World Health Organization (WHO). WHO Mortality Database Version February 2014. Geneva, Switzerland: World Health Organization (WHO), 2014. X
Burkina Faso 01 - BFABell JS, Ouédraogo M, Ganaba R, Sombié I, Byass P, Baggaley RF, Filippi V, Fitzmaurice AE, Graham WJ. The epidemiology of pregnancy outcomes in rural Burkina Faso. Trop Med Int Health. 2008; 13 Suppl 1: 31-43.
X
Burkina Faso 02 - BFA INDEPTH, Nouna Health Research Center (Burkina Faso). Burkina Faso - Nouna Health and Demographic Surveillance System. X
Burkina Faso 03 - BFA
Ramroth H, Lorenz E, Rankin JC, Fottrell E, Yé M, Neuhann F, Ssennono M, Sié A, Byass P, Becher H. Causas de la distribución de muerte con el modelo InterVA y la codificación de médicos en un área rural de Burkina Faso. Trop Med Int Health. 2012; 17(7): 904-13.
X
Burkina Faso 04 - BFAWürthwein R, Gbangou A, Sauerborn R, Schmidt CM. Measuring the local burdenof disease. A study of years of life lost in sub-Saharan Africa. Int J Epidemiol. 2001; 30(3): 501-8.
X
Burkina Faso 05 - BFA
Yé M, Diboulo E, Niamba L, Sié A, Coulibaly B, Bagagnan C, Dembélé J, Ramroth H. An improved method for physician-certified verbal autopsy reduces the rate of discrepancy: experiences in the Nouna Health and Demographic Surveillance Site (NHDSS), Burkina Faso. Popul Health Metr. 2011; 9: 34.
X
Cambodia 01 - KHM Oum S, Chandramohan D, Cairncross S. Community-based surveillance: a pilot study from rural Cambodia. Trop Med Int Health. 2005; 10(7): 689-97. X
Canada 01 - CAN World Health Organization (WHO). WHO Mortality Database Version February 2014. Geneva, Switzerland: World Health Organization (WHO), 2014. X
Cape Verde 01 - CPVWessel H, Reitmaier P, Dupret A, Rocha E, Cnattingius S, Bergström S. Deaths among women of reproductive age in Cape Verde: causes and avoidability. Acta Obstet Gynecol Scand. 1999; 78(3): 225-32.
X
Cape Verde 02 - CPV World Health Organization (WHO). WHO Mortality Database Version February 2014. Geneva, Switzerland: World Health Organization (WHO), 2014. X
Chile 01 - CHL Ministry of Health (Chile), National Institute of Statistics (Chile). Chile Vital Registration - Deaths 1985. X
Chile 02 - CHL World Health Organization (WHO). WHO Mortality Database Version February 2014. Geneva, Switzerland: World Health Organization (WHO), 2014. X
China 01 - CHN Chinese Center for Disease Control and Prevention (CCDC). China Disease Surveillance Points 1991 - China CDC. X
China 02 - CHN Chinese Center for Disease Control and Prevention (CCDC). China Disease Surveillance Points 1993 - China CDC. X
China 03 - CHN Chinese Center for Disease Control and Prevention (CCDC). China Disease Surveillance Points 1994 - China CDC. X
China 04 - CHN Chinese Center for Disease Control and Prevention (CCDC). China Disease Surveillance Points 1995 - China CDC. X
China 05 - CHN Chinese Center for Disease Control and Prevention (CCDC). China Disease Surveillance Points 1996 - China CDC. X
China 06 - CHN Chinese Center for Disease Control and Prevention (CCDC). China Disease Surveillance Points 1997 - China CDC. X
China 07 - CHN Chinese Center for Disease Control and Prevention (CCDC). China Disease Surveillance Points 1998 - China CDC. X
China 08 - CHN Chinese Center for Disease Control and Prevention (CCDC). China Disease Surveillance Points 1999 - China CDC. X
China 09 - CHN Chinese Center for Disease Control and Prevention (CCDC). China Disease Surveillance Points 2000 - China CDC. X
China 10 - CHN Chinese Center for Disease Control and Prevention (CCDC). China Disease Surveillance Points 2001 - China CDC. X
China 11 - CHN Chinese Center for Disease Control and Prevention (CCDC). China Disease Surveillance Points 2002 - China CDC. X
China 12 - CHN Chinese Center for Disease Control and Prevention (CCDC). China Disease Surveillance Points 2004 - China CDC. X
China 13 - CHN Chinese Center for Disease Control and Prevention (CCDC). China Disease Surveillance Points 2005 - China CDC. X
China 14 - CHN Chinese Center for Disease Control and Prevention (CCDC). China Disease Surveillance Points 2006 - China CDC. X
China 15 - CHN Chinese Center for Disease Control and Prevention (CCDC). China Disease Surveillance Points 2007 - China CDC. X
China 16 - CHN Chinese Center for Disease Control and Prevention (CCDC). China Disease Surveillance Points 2008 - China CDC. X

China 17 - CHN Chinese Center for Disease Control and Prevention (CCDC). China Disease Surveillance Points 2009 - China CDC. X
China 18 - CHN Chinese Center for Disease Control and Prevention (CCDC). China Disease Surveillance Points 2010 - China CDC. X
China 19 - CHN Chinese Center for Disease Control and Prevention (CCDC). China Disease Surveillance Points 2011 - China CDC. X
China 20 - CHN Ministry of Health (China). China National Maternal and Child Health Surveillance System Child Mortality Data By Cause 1996-2012 - MCHS. X
China 21 - CHN World Health Organization (WHO). WHO Mortality Database Version February 2014. Geneva, Switzerland: World Health Organization (WHO), 2014. X
Colombia 01 - COLNational Administrative Department of Statistics (Colombia). Colombia Vital Statistics - Deaths 2008. Bogotá, Colombia: National Administrative Department of Statistics (Colombia).
X
Colombia 02 - COL World Health Organization (WHO). WHO Mortality Database Version February 2014. Geneva, Switzerland: World Health Organization (WHO), 2014. X
Costa Rica 01 - CRI World Health Organization (WHO). WHO Mortality Database Version February 2014. Geneva, Switzerland: World Health Organization (WHO), 2014. X
Croatia 01 - HRV World Health Organization (WHO). WHO Mortality Database Version February 2014. Geneva, Switzerland: World Health Organization (WHO), 2014. X
Cuba 01 - CUB World Health Organization (WHO). WHO Mortality Database Version February 2014. Geneva, Switzerland: World Health Organization (WHO), 2014. X
Cyprus 01 - CYP World Health Organization (WHO). WHO Mortality Database Version February 2014. Geneva, Switzerland: World Health Organization (WHO), 2014. X
Czech Republic 01 - CZE World Health Organization (WHO). WHO Mortality Database Version February 2014. Geneva, Switzerland: World Health Organization (WHO), 2014. X
Democratic Republic of the Congo
01 - CODCoghlan B, Brennan RJ, Ngoy P, Dofara D, Otto B, Clements M, Stewart T. Mortality in the Democratic Republic of Congo: a nationwide survey. Lancet. 2006; 367(9504): 44-51.
X
Denmark 01 - DNK World Health Organization (WHO). WHO Mortality Database Version February 2014. Geneva, Switzerland: World Health Organization (WHO), 2014. X
Dominica 01 - DMA World Health Organization (WHO). WHO Mortality Database Version February 2014. Geneva, Switzerland: World Health Organization (WHO), 2014. X
Dominican Republic 01 - DOM World Health Organization (WHO). WHO Mortality Database Version February
2014. Geneva, Switzerland: World Health Organization (WHO), 2014. X
Eastern Cape 01 - ZECDepartment of Home Affairs (South Africa), Statistics South Africa. South Africa Mortality and Causes of Death 1997-2005. Pretoria, South Africa: Statistics South Africa.
X
Ecuador 01 - ECU World Health Organization (WHO). WHO Mortality Database Version February 2014. Geneva, Switzerland: World Health Organization (WHO), 2014. X
Egypt 01 - EGY World Health Organization (WHO). WHO Mortality Database Version February 2014. Geneva, Switzerland: World Health Organization (WHO), 2014. X
El Salvador 01 - SLV World Health Organization (WHO). WHO Mortality Database Version February 2014. Geneva, Switzerland: World Health Organization (WHO), 2014. X
Estonia 01 - EST World Health Organization (WHO). WHO Mortality Database Version February 2014. Geneva, Switzerland: World Health Organization (WHO), 2014. X
Ethiopia 01 - ETH Anteneh A, Araya T, Misganaw A. Factors associated with place of death in Addis Ababa, Ethiopia. BMC Palliat Care. 2013; 12(14): 14. X
Ethiopia 02 - ETHFantahun M, Fottrell E, Berhane Y, Wall S, Högberg U, Byass P. Assessing a new approach to verbal autopsy interpretation in a rural Ethiopian community: the InterVA model. Bull World Health Organ. 2006; 84(3): 204-10.
X
Ethiopia 03 - ETH INDEPTH. Ethiopia - Butajira Health and Demographic Surveillance System. X
Ethiopia 04 - ETHLulu K, Berhane Y. The use of simplified verbal autopsy in identifying causes of adult death in a predominantly rural population in Ethiopia. BMC Public Health. 2005; 5: 58.
X

Ethiopia 05 - ETH
Weldearegawi B, Ashebir Y, Gebeye E, Gebregziabiher T, Yohannes M, Mussa S, Berhe H, Abebe Z. Emerging chronic non-communicable diseases in rural communities of Northern Ethiopia: evidence using population-based verbal autopsy method in Kilite Awlaelo surveillance site. Health Policy Plan. 2013. [Epub ahead of print]
X
Fiji 01 - FJI World Health Organization (WHO). WHO Mortality Database Version February 2014. Geneva, Switzerland: World Health Organization (WHO), 2014. X
Finland 01 - FIN World Health Organization (WHO). WHO Mortality Database Version February 2014. Geneva, Switzerland: World Health Organization (WHO), 2014. X
France 01 - FRA World Health Organization (WHO). WHO Mortality Database Version February 2014. Geneva, Switzerland: World Health Organization (WHO), 2014. X
Free State 01 - ZFSDepartment of Home Affairs (South Africa), Statistics South Africa. South Africa Mortality and Causes of Death 1997-2005. Pretoria, South Africa: Statistics South Africa.
X
Gauteng 01 - ZGADepartment of Home Affairs (South Africa), Statistics South Africa. South Africa Mortality and Causes of Death 1997-2005. Pretoria, South Africa: Statistics South Africa.
X
Georgia 01 - GEO World Health Organization (WHO). WHO Mortality Database Version February 2014. Geneva, Switzerland: World Health Organization (WHO), 2014. X
Germany 01 - DEU World Health Organization (WHO). WHO Mortality Database Version February 2014. Geneva, Switzerland: World Health Organization (WHO), 2014. X
Ghana 01 - GHA Births and Deaths Registry (Ghana). Ghana - Accra Births and Deaths Registry - Deaths 2000-2007. X
Ghana 02 - GHAGhana Statistical Service, Ghana Health Service, Macro International, Inc. Ghana Special Demographic and Health Survey 2007-2008. Calverton, United States: Macro International, Inc., 2010.
X
Ghana 03 - GHA
Hurt L, ten Asbroek A, Amenga-Etego S, Zandoh C, Danso S, Edmond K, Hurt C, Tawiah C, Hill Z, Fenty J, Owusu-Agyei S, Campbell OM, Kirkwood BR. Effect of vitamin A supplementation on cause-specific mortality in women of reproductive age in Ghana: a secondary analysis from the ObaapaVitA trial. Bull World Health Organ. 2013; 91(1): 19-27.
X
Ghana 04 - GHA INDEPTH. Ghana - Navrongo Health and Demographic Surveillance System. X
Greece 01 - GRC World Health Organization (WHO). WHO Mortality Database Version February 2014. Geneva, Switzerland: World Health Organization (WHO), 2014. X
Grenada 01 - GRD World Health Organization (WHO). WHO Mortality Database Version February 2014. Geneva, Switzerland: World Health Organization (WHO), 2014. X
Guatemala 01 - GTM World Health Organization (WHO). WHO Mortality Database Version February 2014. Geneva, Switzerland: World Health Organization (WHO), 2014. X
Guyana 01 - GUY World Health Organization (WHO). WHO Mortality Database Version February 2014. Geneva, Switzerland: World Health Organization (WHO), 2014. X
Haiti 01 - HTI World Health Organization (WHO). WHO Mortality Database Version February 2014. Geneva, Switzerland: World Health Organization (WHO), 2014. X
Honduras 01 - HND World Health Organization (WHO). WHO Mortality Database Version February 2014. Geneva, Switzerland: World Health Organization (WHO), 2014. X
Hungary 01 - HUN World Health Organization (WHO). WHO Mortality Database Version February 2014. Geneva, Switzerland: World Health Organization (WHO), 2014. X
Iceland 01 - ISL World Health Organization (WHO). WHO Mortality Database Version February 2014. Geneva, Switzerland: World Health Organization (WHO), 2014. X
India 01 - IND
Byrraju Foundation, Centre for Chronic Disease Control (India), Cooperative for Assistance and Relief Everywhere (CARE), School of Population Health, University of Queensland (Australia). India - Andhra Pradesh Rural Health Initiative.
X

India 02 - IND
Dongre A, Singh A, Deshmukh P, Garg B. A community based cross sectional study on feasibility of lay interviewers in ascertaining causes of adult deaths by using verbal autopsy in rural Wardha. Online Journal of Health and Allied Sciences. 2008; 7(4): 4.
X
India 03 - INDGajalakshmi V, Peto R, Kanaka S, Balasubramanian S. Verbal autopsy of 48 000 adult deaths attributable to medical causes in Chennai (formerly Madras), India. BMC Public Health. 2002; 2: 7.
X
India 04 - IND Indian Council of Medical Research (ICMR). India Study on Causes of Death by Verbal Autopsy 2003. X
India 05 - IND Institute of Health Systems (India). India Cause of Death Dataset Version 1.3 1980-1998. Hyperabad, India: Institute of Health Systems (India), 2002. X
India 06 - INDInternational Institute for Population Sciences (IIPS) (India), Macro International, Inc. India Demographic and Health Survey 1998-1999. Calverton, United States: Macro International, Inc.
X
India 07 - INDInternational Institute for Population Sciences (IIPS). India Demographic and Health Survey 1992-1993. Bombay, India: International Institute for Population Sciences (IIPS).
X
India 08 - IND
Joshi R, Cardona M, Iyengar S, Sukumar A, Raju CR, Raju KR, Raju K, Reddy KS, Lopez A, Neal B. Chronic diseases now a leading cause of death in rural India – mortality data from the Andhra Pradesh Rural Health Initiative. Int J Epidemiol. 2006; 35(6): 1522-9.
X
India 09 - IND
Kanungo S, Tsuzuki A, Deen JL, Lopez AL, Rajendran K, Manna B, Sur D, Kim DR, Gupta VK, Ochiai RL, Ali M, von Seidlein L, Bhattacharya SK, Clemens JD. Use of verbal autopsy to determine mortality patterns in an urban slum in Kolkata, India. Bull World Health Organ. 2010; 88(9): 667-74.
X
India 10 - INDKrishnan A, Kumar R, Nongkynrih B, Misra P, Srivastava R, Kapoor SK. Adult mortality surveillance by routine health workers using a short verbal autopsy tool in rural north India. J Epidemiol Community Health. 2012; 66(6): 501-6.
X
India 11 - IND Ministry of Health and Family Welfare (India), Office of the Registrar General andCensus Commissioner (India). India Special Survey of Deaths 2004. X
India 12 - INDOffice of the Registrar General & Census Commissioner (India). India Vital Statistics 1980. New Delhi, India: Office of the Registrar General & Census Commissioner (India).
X
India 13 - INDOffice of the Registrar General & Census Commissioner (India). India Vital Statistics 1981. New Delhi, India: Office of the Registrar General & Census Commissioner (India).
X
India 14 - INDOffice of the Registrar General & Census Commissioner (India). India Vital Statistics 1982. New Delhi, India: Office of the Registrar General & Census Commissioner (India).
X
India 15 - INDOffice of the Registrar General & Census Commissioner (India). India Vital Statistics 1983. New Delhi, India: Office of the Registrar General & Census Commissioner (India).
X
India 16 - INDOffice of the Registrar General & Census Commissioner (India). India Vital Statistics 1986. New Delhi, India: Office of the Registrar General & Census Commissioner (India).
X
India 17 - INDOffice of the Registrar General & Census Commissioner (India). India Vital Statistics 1987. New Delhi, India: Office of the Registrar General & Census Commissioner (India).
X
India 18 - INDOffice of the Registrar General & Census Commissioner (India). India Vital Statistics 1988. New Delhi, India: Office of the Registrar General & Census Commissioner (India).
X
India 19 - INDOffice of the Registrar General & Census Commissioner (India). India Vital Statistics 1989. New Delhi, India: Office of the Registrar General & Census Commissioner (India).
X
India 20 - IND Office of the Registrar General and Census Commissioner (India). India MCCD Vital Statistics - Deaths 1990-1998. X
India 21 - IND Office of the Registrar General and Census Commissioner (India). India MCCD Vital Statistics - Deaths 1999-2001. X
India 22 - INDOffice of the Registrar General and Census Commissioner (India). India Medical Certification of Cause of Death Report 2002. New Delhi, India: Office of the Registrar General and Census Commissioner (India), 2009.
X
India 23 - INDOffice of the Registrar General and Census Commissioner (India). India Medical Certification of Cause of Death Report 2003. New Delhi, India: Office of the Registrar General and Census Commissioner (India), 2009.
X

India 24 - INDOffice of the Registrar General and Census Commissioner (India). India Medical Certification of Cause of Death Report 2004. New Delhi, India: Office of the Registrar General and Census Commissioner (India), 2009.
X
India 25 - INDOffice of the Registrar General and Census Commissioner (India). India Medical Certification of Cause of Death Report 2005. New Delhi, India: Office of the Registrar General and Census Commissioner (India), 2012.
X
India 26 - INDOffice of the Registrar General and Census Commissioner (India). India Medical Certification of Cause of Death Report 2006. New Delhi, India: Office of the Registrar General and Census Commissioner (India), 2012.
X
India 27 - INDOffice of the Registrar General and Census Commissioner (India). India Medical Certification of Cause of Death Report 2008. New Delhi, India: Office of the Registrar General and Census Commissioner (India), 2013.
X
India 28 - INDSaha R, Nath A, Sharma N, Badhan SK, Ingle GK.. Changing profile of disease contributing to mortality in a resettlement colony of Delhi. National Medical Journal of India. 2007; 20(3): 125-7.
X
India 29 - IND
Singh RB, Fedacko J, Vargova V, Kumar A, Mohan V, Pella D, De Meester F, Wilson D. Singh's verbal autopsy questionnaire for the assessment of causes of death, social autopsy, tobacco autopsy and dietary autopsy, based on medical records and interview. Acta Cardiol. 2011; 66(4): 471-81.
X
Indonesia 01 - IDN
National Institute of Health Research and Development (NIHRD), Ministry of Health (Indonesia). Indonesia Sample Registration System 2012, Indonesia Cause of Death Survey 2010-2011, Indonesia Mortality Registration System Strengthening Project (IMRSSP), and Indonesia Basic Health Research 2007-2008.
X
Iran 01 - IRN Ministry of Health and Medical Education (Iran). Iran Vital Registration - Deaths 2007. X
Iran 02 - IRN Ministry of Health and Medical Education (Iran). Iran Vital Registration - Deaths 2008. X
Iran 03 - IRN Ministry of Health and Medical Education (Iran). Iran Vital Registration - Deaths 2009. X
Iran 04 - IRN Ministry of Health and Medical Education (Iran). Iran Vital Registration - Deaths 2010. X
Iran 05 - IRN World Health Organization (WHO). WHO Mortality Database Version February 2014. Geneva, Switzerland: World Health Organization (WHO), 2014. X
Iraq 01 - IRQ World Health Organization (WHO). WHO Mortality Database Version February 2014. Geneva, Switzerland: World Health Organization (WHO), 2014. X
Ireland 01 - IRL World Health Organization (WHO). WHO Mortality Database Version February 2014. Geneva, Switzerland: World Health Organization (WHO), 2014. X
Israel 01 - ISR World Health Organization (WHO). WHO Mortality Database Version February 2014. Geneva, Switzerland: World Health Organization (WHO), 2014. X
Italy 01 - ITA World Health Organization (WHO). WHO Mortality Database Version February 2014. Geneva, Switzerland: World Health Organization (WHO), 2014. X
Jamaica 01 - JAM World Health Organization (WHO). WHO Mortality Database Version February 2014. Geneva, Switzerland: World Health Organization (WHO), 2014. X
Japan 01 - JPN World Health Organization (WHO). WHO Mortality Database Version February 2014. Geneva, Switzerland: World Health Organization (WHO), 2014. X
Jordan 01 - JOR World Health Organization (WHO). WHO Mortality Database Version February 2014. Geneva, Switzerland: World Health Organization (WHO), 2014. X
Kazakhstan 01 - KAZ World Health Organization (WHO). WHO Mortality Database Version February 2014. Geneva, Switzerland: World Health Organization (WHO), 2014. X
Kenya 01 - KEN INDEPTH. Kenya - Kisumu Health and Demographic Surveillance System. X
Kenya 02 - KEN INDEPTH. Kenya - Nairobi Health and Demographic Surveillance System. X
Kenya 03 - KENvan Eijk AM, Adazu K, Ofware P, Vulule J, Hamel M, Slutsker L. Causes of deaths using verbal autopsy among adolescents and adults in rural western Kenya. Trop Med Int Health. 2008; 13(10): 1314-24.
X

Kiribati 01 - KIR World Health Organization (WHO). WHO Mortality Database Version February 2014. Geneva, Switzerland: World Health Organization (WHO), 2014. X
Kuwait 01 - KWT World Health Organization (WHO). WHO Mortality Database Version February 2014. Geneva, Switzerland: World Health Organization (WHO), 2014. X
KwaZulu-Natal 01 - ZKNDepartment of Home Affairs (South Africa), Statistics South Africa. South Africa Mortality and Causes of Death 1997-2005. Pretoria, South Africa: Statistics South Africa.
X
Kyrgyzstan 01 - KGZ World Health Organization (WHO). WHO Mortality Database Version February 2014. Geneva, Switzerland: World Health Organization (WHO), 2014. X
Latvia 01 - LVA World Health Organization (WHO). WHO Mortality Database Version February 2014. Geneva, Switzerland: World Health Organization (WHO), 2014. X
Liberia 01 - LBR Pacqué-Margolis S, Pacqué M, Dukuly Z, Boateng J, Taylor HR.. Application of the verbal autopsy during a clinical trial. Soc Sci Med. 1990; 31(5): 585-91. X
Limpopo 01 - ZLIDepartment of Home Affairs (South Africa), Statistics South Africa. South Africa Mortality and Causes of Death 1997-2005. Pretoria, South Africa: Statistics South Africa.
X
Lithuania 01 - LTU World Health Organization (WHO). WHO Mortality Database Version February 2014. Geneva, Switzerland: World Health Organization (WHO), 2014. X
Luxembourg 01 - LUX World Health Organization (WHO). WHO Mortality Database Version February 2014. Geneva, Switzerland: World Health Organization (WHO), 2014. X
Macedonia 01 - MKD World Health Organization (WHO). WHO Mortality Database Version February 2014. Geneva, Switzerland: World Health Organization (WHO), 2014. X
Madagascar 01 - MDG Population and Development Research Center (CEPED) (France). Madagascar - Antananorivo Mortality Report 1984-1995. X
Malawi 01 - MWIChecchi F, Nyasulu P, Chandramohan D, Roberts B. Rates and causes of death in Chiradzulu District, Malawi, 2008: a key informant study. Trop Med Int Health. 2011; 16(3): 375-8.
X
Malawi 02 - MWI
Chihana M, Floyd S, Molesworth A, Crampin AC, Kayuni N, Price A, Zaba B, Jahn A, Mvula H, Dube A, Ngwira B, Glynn JR, French N. Adult mortality and probable cause of death in rural northern Malawi in the era of HIV treatment. TropMed Int Health. 2012; 17(8): E74-83.
X
Malawi 03 - MWI
Jahn A, Floyd S, Crampin AC, Mvula H, Mwinuka V, Mwaiyeghele E, McGrath N, Zaba B, Fine PEM, Glynn JR. Declining child mortality in northern Malawi despite high rates of infection with HIV. Bull World Health Organ. 2010; 88: 746-53.
X
Malaysia 01 - MYS Department of Statistics (Malaysia).Vital Statistics: West Malaysia 1969. Kuala Lumpur, Malaysia:Department of Statistics (Malaysia), 1971. X
Malaysia 02 - MYS World Health Organization (WHO). WHO Mortality Database Version February 2014. Geneva, Switzerland: World Health Organization (WHO), 2014. X
Maldives 01 - MDV World Health Organization (WHO). WHO Mortality Database Version February 2014. Geneva, Switzerland: World Health Organization (WHO), 2014. X
Mali 01 - MLI National Institute for Demographic Studies (France), Sahel Institute. Mali Twelve Years of Urban Mortality in the Sahel 1974-1985. 1988. X
Malta 01 - MLT World Health Organization (WHO). WHO Mortality Database Version February 2014. Geneva, Switzerland: World Health Organization (WHO), 2014. X
Mauritius 01 - MUS World Health Organization (WHO). WHO Mortality Database Version February 2014. Geneva, Switzerland: World Health Organization (WHO), 2014. X
Mexico 01 - MEX Ministry of Health (Mexico), National Institute of Statistics and Geography (Mexico). Mexico Vital Registration - Deaths 1980 . X
Mexico 02 - MEX Ministry of Health (Mexico), National Institute of Statistics and Geography (Mexico). Mexico Vital Registration - Deaths 1981 . X
Mexico 03 - MEX Ministry of Health (Mexico), National Institute of Statistics and Geography (Mexico). Mexico Vital Registration - Deaths 1982. X
Mexico 04 - MEX Ministry of Health (Mexico), National Institute of Statistics and Geography (Mexico). Mexico Vital Registration - Deaths 1983. X
Mexico 05 - MEX Ministry of Health (Mexico), National Institute of Statistics and Geography (Mexico). Mexico Vital Registration - Deaths 1984. X

Mexico 06 - MEX Ministry of Health (Mexico), National Institute of Statistics and Geography (Mexico). Mexico Vital Registration - Deaths 1985. X
Mexico 07 - MEX Ministry of Health (Mexico), National Institute of Statistics and Geography (Mexico). Mexico Vital Registration - Deaths 1986. X
Mexico 08 - MEX Ministry of Health (Mexico), National Institute of Statistics and Geography (Mexico). Mexico Vital Registration - Deaths 1987. X
Mexico 09 - MEX Ministry of Health (Mexico), National Institute of Statistics and Geography (Mexico). Mexico Vital Registration - Deaths 1988. X
Mexico 10 - MEX Ministry of Health (Mexico), National Institute of Statistics and Geography (Mexico). Mexico Vital Registration - Deaths 1989. X
Mexico 11 - MEX Ministry of Health (Mexico), National Institute of Statistics and Geography (Mexico). Mexico Vital Registration - Deaths 1990. X
Mexico 12 - MEX Ministry of Health (Mexico), National Institute of Statistics and Geography (Mexico). Mexico Vital Registration - Deaths 1991. X
Mexico 13 - MEX Ministry of Health (Mexico), National Institute of Statistics and Geography (Mexico). Mexico Vital Registration - Deaths 1992. X
Mexico 14 - MEX Ministry of Health (Mexico), National Institute of Statistics and Geography (Mexico). Mexico Vital Registration - Deaths 1993. X
Mexico 15 - MEX Ministry of Health (Mexico), National Institute of Statistics and Geography (Mexico). Mexico Vital Registration - Deaths 1994. X
Mexico 16 - MEX Ministry of Health (Mexico), National Institute of Statistics and Geography (Mexico). Mexico Vital Registration - Deaths 1995. X
Mexico 17 - MEX Ministry of Health (Mexico), National Institute of Statistics and Geography (Mexico). Mexico Vital Registration - Deaths 1996. X
Mexico 18 - MEX Ministry of Health (Mexico), National Institute of Statistics and Geography (Mexico). Mexico Vital Registration - Deaths 1997. X
Mexico 19 - MEX Ministry of Health (Mexico), National Institute of Statistics and Geography (Mexico). Mexico Vital Registration - Deaths 1998. X
Mexico 20 - MEX Ministry of Health (Mexico), National Institute of Statistics and Geography (Mexico). Mexico Vital Registration - Deaths 1999. X
Mexico 21 - MEX Ministry of Health (Mexico), National Institute of Statistics and Geography (Mexico). Mexico Vital Registration - Deaths 2000. X
Mexico 22 - MEX Ministry of Health (Mexico), National Institute of Statistics and Geography (Mexico). Mexico Vital Registration - Deaths 2001. X
Mexico 23 - MEX Ministry of Health (Mexico), National Institute of Statistics and Geography (Mexico). Mexico Vital Registration - Deaths 2002. X
Mexico 24 - MEX Ministry of Health (Mexico), National Institute of Statistics and Geography (Mexico). Mexico Vital Registration - Deaths 2003. X
Mexico 25 - MEX Ministry of Health (Mexico), National Institute of Statistics and Geography (Mexico). Mexico Vital Registration - Deaths 2004. X
Mexico 26 - MEX Ministry of Health (Mexico), National Institute of Statistics and Geography (Mexico). Mexico Vital Registration - Deaths 2005. X
Mexico 27 - MEX Ministry of Health (Mexico), National Institute of Statistics and Geography (Mexico). Mexico Vital Registration - Deaths 2006. X
Mexico 28 - MEX Ministry of Health (Mexico), National Institute of Statistics and Geography (Mexico). Mexico Vital Registration - Deaths 2007. X
Mexico 29 - MEX Ministry of Health (Mexico), National Institute of Statistics and Geography (Mexico). Mexico Vital Registration - Deaths 2008. X
Mexico 30 - MEX Ministry of Health (Mexico), National Institute of Statistics and Geography (Mexico). Mexico Vital Registration - Deaths 2010. X
Mexico 31 - MEX Ministry of Health (Mexico), National Institute of Statistics and Geography (Mexico). Mexico Vital Registration - Deaths 2011. X
Mexico 32 - MEX National Institute of Statistics and Geography (Mexico). Mexico Vital Registration- Deaths 2012. X
Mexico 33 - MEX National Institute of Statistics and Geography (Mexico). Mexico Vital Statistics - Deaths 2009 . X
Moldova 01 - MDA World Health Organization (WHO). WHO Mortality Database Version February 2014. Geneva, Switzerland: World Health Organization (WHO), 2014. X
Mongolia 01 - MNG World Health Organization (WHO). WHO Mortality Database Version February 2014. Geneva, Switzerland: World Health Organization (WHO), 2014. X
Montenegro 01 - MNE World Health Organization (WHO). WHO Mortality Database Version February 2014. Geneva, Switzerland: World Health Organization (WHO), 2014. X
Morocco 01 - MARMinistry of Public Health (Morocco). Morocco National Survey on Causes and Circumstances of Infant and Child Deaths 1988-1989. Rabat, Morocco: Ministry of Public Health (Morocco).
X
Morocco 02 - MAR World Health Organization (WHO). WHO Mortality Database Version February 2014. Geneva, Switzerland: World Health Organization (WHO), 2014. X

Mozambique 01 - MOZ
Centers for Disease Control and Prevention (CDC), MEASURE Evaluation Project, Carolina Population Center, University of North Carolina, Ministry of Health (Mozambique), National Statistics Institute (Mozambique), US Census Bureau. Mozambique National Survey on the Causes of Death 2007-2008.
X
Mozambique 02 - MOZ INDEPTH. Mozambique - Manhiça Health and Demographic Surveillance System. X
Mozambique 03 - MOZ
Sacarlal J, Nhacolo AQ, Sigaúque B, Nhalungo DA, Abacassamo F, Sacoor CN, Aide P, Machevo S, Nhampossa T, Macete EV, Bassat Q, David C, Bardají A, Letang E, Saúte F, Aponte JJ, Thompson R, Alonso PL. A 10 year study of the cause of death in children under 15 years in Manhiça, Mozambique. BioMed Central Public Health. 2009; 9: 67.
X
Mpumalanga 01 - ZMPDepartment of Home Affairs (South Africa), Statistics South Africa. South Africa Mortality and Causes of Death 1997-2005. Pretoria, South Africa: Statistics South Africa.
X
Myanmar 01 - MMRMyint, S. Cause of death verification study in Myanmar. Presentation at: World Health Organization Regional Office for South East Asia. Regional Consultation on Mortality Statistics. 2007; New Delhi, India.
X
Netherlands 01 - NLD World Health Organization (WHO). WHO Mortality Database Version February 2014. Geneva, Switzerland: World Health Organization (WHO), 2014. X
New Zealand 01 - NZL World Health Organization (WHO). WHO Mortality Database Version February 2014. Geneva, Switzerland: World Health Organization (WHO), 2014. X
Nicaragua 01 - NIC World Health Organization (WHO). WHO Mortality Database Version February 2014. Geneva, Switzerland: World Health Organization (WHO), 2014. X
Nigeria 01 - NGAEkanem EE, Asindi AA, Okoi OU. Community-based surveillance of paediatric deaths in Cross River State, Nigeria. Tropical and Geographical Medicine. 1994; 46(5): 305-8.
X
North-West 01 - ZNWDepartment of Home Affairs (South Africa), Statistics South Africa. South Africa Mortality and Causes of Death 1997-2005. Pretoria, South Africa: Statistics South Africa.
X
Northern Cape 01 - ZNCDepartment of Home Affairs (South Africa), Statistics South Africa. South Africa Mortality and Causes of Death 1997-2005. Pretoria, South Africa: Statistics South Africa.
X
Norway 01 - NOR World Health Organization (WHO). WHO Mortality Database Version February 2014. Geneva, Switzerland: World Health Organization (WHO), 2014. X
Oman 01 - OMN World Health Organization (WHO). WHO Mortality Database Version February 2014. Geneva, Switzerland: World Health Organization (WHO), 2014. X
Pakistan 01 - PAKNational Institute of Population Studies (NIPS) (Pakistan), Macro International, Inc. Pakistan Demographic and Health Survey 2006-2007. Calverton, United States: Macro International, Inc.
X
Palestine 01 - PSE World Health Organization (WHO). WHO Mortality Database Version February 2014. Geneva, Switzerland: World Health Organization (WHO), 2014. X
Panama 01 - PAN World Health Organization (WHO). WHO Mortality Database Version February 2014. Geneva, Switzerland: World Health Organization (WHO), 2014. X
Papua New Guinea 01 - PNG
Moir JS, Garner PA, Heywood PF, Alpers MP. Mortality in a rural area of Madang Province, Papua New Guinea. Ann Trop Med Parasitol. 1989; 83(3): 305-19.
X
Papua New Guinea 02 - PNG World Health Organization (WHO). WHO Mortality Database Version February
2014. Geneva, Switzerland: World Health Organization (WHO), 2014. X
Paraguay 01 - PRY World Health Organization (WHO). WHO Mortality Database Version February 2014. Geneva, Switzerland: World Health Organization (WHO), 2014. X
Peru 01 - PER World Health Organization (WHO). WHO Mortality Database Version February 2014. Geneva, Switzerland: World Health Organization (WHO), 2014. X
Philippines 01 - PHLNational Epidemiology Center, Department of Health (Philippines). Philippines Field Health Service Information System Annual Report 1993. Manila, Philippines: National Epidemiology Center, Department of Health (Philippines).
X
Philippines 02 - PHL World Health Organization (WHO). WHO Mortality Database Version February 2014. Geneva, Switzerland: World Health Organization (WHO), 2014. X

Poland 01 - POL World Health Organization (WHO). WHO Mortality Database Version February 2014. Geneva, Switzerland: World Health Organization (WHO), 2014. X
Portugal 01 - PRT World Health Organization (WHO). WHO Mortality Database Version February 2014. Geneva, Switzerland: World Health Organization (WHO), 2014. X
Puerto Rico 01 - PRI World Health Organization (WHO). WHO Mortality Database Version February 2014. Geneva, Switzerland: World Health Organization (WHO), 2014. X
Qatar 01 - QAT World Health Organization (WHO). WHO Mortality Database Version February 2014. Geneva, Switzerland: World Health Organization (WHO), 2014. X
Romania 01 - ROU World Health Organization (WHO). WHO Mortality Database Version February 2014. Geneva, Switzerland: World Health Organization (WHO), 2014. X
Russia 01 - RUSCenter for Demographic Research, New Economic School (Russia). Russia Mortality Rates by Region, Age, Sex, and Cause of Death 1989-1998. Moscow, Russia: Center for Demographic Research, New Economic School (Russia).
X
Russia 02 - RUS World Health Organization (WHO). WHO Mortality Database Version February 2014. Geneva, Switzerland: World Health Organization (WHO), 2014. X
Saint Lucia 01 - LCA World Health Organization (WHO). WHO Mortality Database Version February 2014. Geneva, Switzerland: World Health Organization (WHO), 2014. X
Saint Vincent and the Grenadines
01 - VCT World Health Organization (WHO). WHO Mortality Database Version February 2014. Geneva, Switzerland: World Health Organization (WHO), 2014. X
Sao Tome and Principe 01 - STP World Health Organization (WHO). WHO Mortality Database Version February
2014. Geneva, Switzerland: World Health Organization (WHO), 2014. X
Senegal 01 - SENDuthe G, Pison G. Adult mortality in a rural area of Senegal: Non-communicable diseases have a large impact in Mlomp. Demographic Research. 2008; 19(37): 1419-48.
X
Serbia 01 - SRB World Health Organization (WHO). WHO Mortality Database Version February 2014. Geneva, Switzerland: World Health Organization (WHO), 2014. X
Seychelles 01 - SYC World Health Organization (WHO). WHO Mortality Database Version February 2014. Geneva, Switzerland: World Health Organization (WHO), 2014. X
Singapore 01 - SGP World Health Organization (WHO). WHO Mortality Database Version February 2014. Geneva, Switzerland: World Health Organization (WHO), 2014. X
Slovakia 01 - SVK World Health Organization (WHO). WHO Mortality Database Version February 2014. Geneva, Switzerland: World Health Organization (WHO), 2014. X
Slovenia 01 - SVN World Health Organization (WHO). WHO Mortality Database Version February 2014. Geneva, Switzerland: World Health Organization (WHO), 2014. X
South Africa 01 - ZAFGarrib A, Jaffar S, Knight S, Bradshaw D, Bennish ML. Rates and causes of child mortality in an area of high HIV prevalence in rural South Africa. Trop Med Int Health. 2006; 11(12): 1841-8.
X
South Africa 02 - ZAFMRC/Wits Rural Public Health and Health Transitions Research Unit (Agincourt), INDEPTH. South Africa - Agincourt Health and Socio-Demographic Surveillance System.
X
South Africa 03 - ZAF
Moyo S, Hawkridge T, Mahomed H, Workman L, Minnies D, Geiter LJ, Verver SKibel M, Hussey GD. Determining causes of mortality in children enrolled in a vaccine field trial in a rural area in the Western Cape Province of South Africa. J Paediatr Child Health. 2007; 43(3): 178-83.
X
South Africa 04 - ZAF
Muhwava W. Contributions of the Africa Centre Demographic Surveillance to the Community. Umbiko. 2007; 12. 3-4.
X
South Africa 05 - ZAF World Health Organization (WHO). WHO Mortality Database Version February 2014. Geneva, Switzerland: World Health Organization (WHO), 2014. X
South Korea 01 - KOR World Health Organization (WHO). WHO Mortality Database Version February 2014. Geneva, Switzerland: World Health Organization (WHO), 2014. X

Spain 01 - ESP World Health Organization (WHO). WHO Mortality Database Version February 2014. Geneva, Switzerland: World Health Organization (WHO), 2014. X
Sri Lanka 01 - LKA Registrar General’s Department (Sri Lanka). Sri Lanka Vital Statistics - Deaths 1993-1996. X
Sri Lanka 02 - LKA World Health Organization (WHO). WHO Mortality Database Version February 2014. Geneva, Switzerland: World Health Organization (WHO), 2014. X
Suriname 01 - SUR World Health Organization (WHO). WHO Mortality Database Version February 2014. Geneva, Switzerland: World Health Organization (WHO), 2014. X
Sweden 01 - SWE World Health Organization (WHO). WHO Mortality Database Version February 2014. Geneva, Switzerland: World Health Organization (WHO), 2014. X
Switzerland 01 - CHE World Health Organization (WHO). WHO Mortality Database Version February 2014. Geneva, Switzerland: World Health Organization (WHO), 2014. X
Syria 01 - SYR World Health Organization (WHO). WHO Mortality Database Version February 2014. Geneva, Switzerland: World Health Organization (WHO), 2014. X
Taiwan 01 - TWN Department of Health (Taiwan). Taiwan Statistics of Causes of Death 2008. X
Taiwan 02 - TWN Department of Health (Taiwan). Taiwan Statistics of Causes of Death 2009. X
Taiwan 03 - TWN Department of Health (Taiwan). Taiwan Statistics of Causes of Death 2010. X
Taiwan 04 - TWN Department of Health (Taiwan). Taiwan Statistics of Causes of Death 2011. X
Taiwan 05 - TWN Department of Health (Taiwan). Taiwan Statistics of Causes of Death 2012. X
Taiwan 06 - TWN Department of Health (Taiwan). Taiwan Vital Statistics - Deaths 2007. X
Tajikistan 01 - TJK World Health Organization (WHO). WHO Mortality Database Version February 2014. Geneva, Switzerland: World Health Organization (WHO), 2014. X
Tanzania 01 - TZA INDEPTH. Tanzania - Ifakara Health and Demographic Surveillance System. X
Tanzania 02 - TZA INDEPTH. Tanzania - Rufiji Health and Demographic Surveillance System. X
Tanzania 03 - TZA
Illah E, Mbaruku G, Masanja H, Kahn K. Causes and risk factors for maternal mortality in rural Tanzania--case of Rufiji Health and Demographic Surveillance Site (HDSS). Afr J Reprod Health. 2013; 17(3): 119-30. .
X
Tanzania 04 - TZA
Kaatano GM, Mashauri FM, Kinung'hi SM, Mwanga JR, Malima RC, Kishamawe C, Nnko SE, Magesa SM, Mboera LE. Patterns of malaria related mortality based on verbal autopsy in Muleba District, north-western Tanzania. Tanzan J Health Res. 2009; 11(4): 210-8.
X
Tanzania 05 - TZAMinistry of Health and Social Welfare (Tanzania), Newcastle University, UK Department for International Development (DFID). Tanzania Policy Implications of Mortality Burden 1995-2001.
X
Tanzania 06 - TZA
Narh-Bana SA, Chirwa TF, Mwanyangala MA, Nathan R. Muertes de adultos y el futuro: Un análisis causa-específico de las muertes de adultos de un estudio longitudinal en Tanzania rural 2003-2007. Trop Med Int Health. 2012; 17(11): 1396-404.
X
Tanzania 07 - TZASangber-Dery MD. The Role of Birth Order in Infant Mortality in Ifakara DSS Area in Rural Tanzania [master's thesis]. [Johannesburg, South Africa]: University of the Witwatersrand; 2009.
X
Thailand 01 - THA Ministry of Public Health (Thailand). Thailand Burden of Disease and Injuries 1998-1999. X
Thailand 02 - THA World Health Organization (WHO). WHO Mortality Database Version February 2014. Geneva, Switzerland: World Health Organization (WHO), 2014. X
The Bahamas 01 - BHS World Health Organization (WHO). WHO Mortality Database Version February 2014. Geneva, Switzerland: World Health Organization (WHO), 2014. X
Trinidad and Tobago 01 - TTO World Health Organization (WHO). WHO Mortality Database Version February
2014. Geneva, Switzerland: World Health Organization (WHO), 2014. X
Turkey 01 - TUR Baskent University, Ministry of Health (Turkey), State Institute of Statistics (Turkey). Turkey Verbal Autopsy Survey 2003. X

Turkey 02 - TURDemir A, Kalyoncu A, Selcuk T, Artvinli M, Sahin A. Prevalence of Asthma, Allergy, and Respiratory Symptoms in Hasançelebi/Hekimhan/Malatya in Eastern Turkey. Turkish Respiratory Journal. 2001; 2(2): 29-34.
X
Turkey 03 - TUR Turkish Statistical Institute. Turkey Causes of Death Statistics 2010-2012. Ankara,Turkey: Turkish Statistical Institute. X
Turkey 04 - TUR World Health Organization (WHO). WHO Mortality Database Version February 2014. Geneva, Switzerland: World Health Organization (WHO), 2014. X
Turkmenistan 01 - TKM World Health Organization (WHO). WHO Mortality Database Version February 2014. Geneva, Switzerland: World Health Organization (WHO), 2014. X
Uganda 01 - UGAMEASURE Evaluation Project, Carolina Population Center, University of North Carolina, Macro International, Inc, Uganda Bureau of Statistics. Uganda Child Verbal Autopsy Study 2007. Macro International, Inc.
X
Ukraine 01 - UKR World Health Organization (WHO). WHO Mortality Database Version February 2014. Geneva, Switzerland: World Health Organization (WHO), 2014. X
United Kingdom 01 - GBR National Records of Scotland. United Kingdom - Scotland Vital Events Reference
Tables 2011. Edinburgh, Scotland: National Records of Scotland. X
United Kingdom 02 - GBR National Records of Scotland. United Kingdom - Scotland Vital Events Reference
Tables 2012. Edinburgh, Scotland: National Records of Scotland. X
United Kingdom 03 - GBR
Northern Ireland Statistics and Research Agency (NISRA). United Kingdom - Northern Ireland Registrar General Annual Report 2011. Belfast, Northern Ireland: Northern Ireland Statistics and Research Agency (NISRA), 2012.
X
United Kingdom 04 - GBR
Office for National Statistics (United Kingdom). United Kingdom - England and Wales Mortality Data 1981-1994. Newport, United Kingdom: Office for National Statistics (United Kingdom).
X
United Kingdom 05 - GBR
Office for National Statistics (United Kingdom). United Kingdom - England and Wales Mortality Data 1995-2000. Newport, United Kingdom: Office for National Statistics (United Kingdom).
X
United Kingdom 06 - GBR
Office for National Statistics (United Kingdom). United Kingdom - England and Wales Mortality Data 2001-2012. Newport, United Kingdom: Office for National Statistics (United Kingdom).
X
United Kingdom 07 - GBR World Health Organization (WHO). WHO Mortality Database Version February
2014. Geneva, Switzerland: World Health Organization (WHO), 2014. X
United States 01 - USA World Health Organization (WHO). WHO Mortality Database Version February 2014. Geneva, Switzerland: World Health Organization (WHO), 2014. X
Uruguay 01 - URY World Health Organization (WHO). WHO Mortality Database Version February 2014. Geneva, Switzerland: World Health Organization (WHO), 2014. X
Uzbekistan 01 - UZB World Health Organization (WHO). WHO Mortality Database Version February 2014. Geneva, Switzerland: World Health Organization (WHO), 2014. X
Venezuela 01 - VEN World Health Organization (WHO). WHO Mortality Database Version February 2014. Geneva, Switzerland: World Health Organization (WHO), 2014. X
Vietnam 01 - VNM
Hanoi School of Public Health, Ministry of Health (Viet Nam), School of Population Health, University of Queensland (Australia). Vietnam Burden of Disease and Injury Study 2008. Hanoi, Vietnam: Hanoi School of Public Health, 2011.
X
Vietnam 02 - VNMHoa NP, Rao C, Hoy DG, Hinh ND, Chuc NT, Ngo DA. Mortality measures from sample-based surveillance: evidence of the epidemiological transition in Viet NamBull World Health Organ. 2012; 90(10): 764-72.
X
Vietnam 03 - VNMNgo AD, Rao C, Hoa NP, Adair T, Chuc NTK. Mortality patterns in Vietnam, 2006: Findings from a national verbal autopsy survey. BMC Res Notes. 2010; 3: 78.
X
Vietnam 04 - VNMQuyen BTT, Nhung NT, Cuong PV. The causes of deaths in Chililab between 2008-2010 based on verbal autopsy method. Vietnam Journal of Public Health. 2012; 1(1): 24-31.
X
Western Cape 01 - ZWCDepartment of Home Affairs (South Africa), Statistics South Africa. South Africa Mortality and Causes of Death 1997-2005. Pretoria, South Africa: Statistics South Africa.
X

Zambia 01 - ZMB
Mudenda SS, Kamocha S, Mswia R, Conkling M, Sikanyiti P, Potter D, Mayaka WC, Marx MA. Feasibility of using a WHO-standard methodology for Sample Vital Registration with Verbal Autopsy (SAVVY) to report leading causes of death in Zambia: results of a pilot in four provinces, 2010. Popul Health Metr. 2011; 9: 40.
X
Zimbabwe 01 - ZWE Registrar General's Department (Zimbabwe), Zimbabwe National Statistics Agency. Zimbabwe Mortality Report 2007. X
Zimbabwe 02 - ZWE World Health Organization (WHO). WHO Mortality Database Version February 2014. Geneva, Switzerland: World Health Organization (WHO), 2014. X

Covariate Direction Level
Cumulative Cigarettes (5 years) 1 1
Diabetes Fasting Plasma Glucose (mmol/L) 1 1
Health system access (unitless) -1 1
Indoor Air Pollution (All Cooking Fuels) 1 1
Malnutrition in children under 5 years - proportion > 2SD below mean weight for age (logit transform -1 1
Smoking Prevalence 1 1
Alcohol (liters per capita) 1 2
Population Density (500-1,000 ppl/sqkm, proportion) 1 2
Population Density (over 1,000 ppl/sqkm, proportion) 1 2
Education (years per capita) -1 3
Lag distributed income per capita (log transformed) -1 3
Appendix Table 8. Covariates used in CODEm for tuberculosis - Males and Females

Appendix Table 9: Tuberculosis data sources used in the DisMod-MR 2.0 for the GBD 2013
Aditama TY. Prevalence of tuberculosis in Indonesia, Singapore, Brunei Darussalam and the Philippines. Tubercle. 1991; 72(4): 255-60.Al-Kassimi FA, Abdullah AK, Al-Hajjaj MS, Al-Orainey IO, Bamgboye EA, Chowdhury MNH. Nationwide community survey of tuberculosis epidemiology in Saudi Arabia. Tuber Lung Dis. 1993; 74(4): 254-60.of tuberculosis, HIV and respiratory symptoms in two Zambian communities: implications for tuberculosis control in the era of HIV. PLoS One. 2009; 4(5): e5602.Bangladesh Rural Advancement Committee (BRAC), Damien Foundation, International Centre for Diarrhoeal Disease Research (Bangladesh), KNCV Tuberculosis Foundation, World Health Organization (WHO). Bangladesh Tuberculosis Disease-cum-Infection Prevalence Survey 2007-2009.Berhe, Gebretsadik, Enqueselassie, Fikre, Hailu, Elena, Mekonnen, Wondale, Teklu, Tsigemariam, Gebretsadik, Ataklti, Berhe, Rezene, Haile, Tweodros, Aseffa, Abraham. Population-based prevalence survey of tuberculosis in the Tigray region of Ethiopia. BMC Infect Dis. 2013; 448.Bhat J, Rao VG, Gopi PG, Yadav R, Selvakumar N, Tiwari B, Gadge V, Bhondeley MK, Wares F. Prevalence of pulmonary tuberculosis amongst the tribal population of Madhya Pradesh, central India. Int J Epidemiol. 2009; 38(4): 1026-32.Chadha VK, Kumar P, Anjinappa SM, Singh S, Narasimhaiah S, Joshi MV, Gupta J, Lakshminarayana, Ramchandra J, Velu M, Papkianathan S, Babu S, Krishna H. Prevalence of pulmonary tuberculosis among adults in a rural sub-district of South India. PLoS One. 2012; 7(8): e42625.Chadha VK. Tuberculosis epidemiology in India: a review. The International Journal of Tuberculosis and Lung Disease. 2005; 9(10): 1072-82.Chakma T, Rao PV, Pall S, Kaushal LS, Datta M, Tiwary RS. Survey of pulmonary tuberculosis in a primitive tribe of Madhya Pradesh. Indian J Tuberc. 1996; China National Random Tuberculosis Survey 2000China Tuberculosis Prevalence Survey 2010Chinese Center for Disease Control and Prevention (CCDC). China National Tuberculosis Survey 1984-1985.Chinese Center for Disease Control and Prevention (CCDC). China National Tuberculosis Survey 1990.Chinese Center for Disease Control and Prevention (CCDC). China Notifiable Infectious Diseases 2004.Chinese Center for Disease Control and Prevention (CCDC). China Notifiable Infectious Diseases 2007.Chinese Center for Disease Control and Prevention (CCDC). China Notifiable Infectious Diseases 2010.Citation being researchedDatta M, Gopi PG, Appegowda BN, Bhima Rao KR, Gopalan BN. Tuberculosis in North Arcot District of Tamil Nadu - a sample survey. Indian J Tuberc 1. 2000; 47(3): 147-54.Department of Health (Taiwan). Taiwan Tuberculosis Control Report 2007. Taipei City, Taiwan: Department of Health (Taiwan), 2007.Department of Health (Taiwan). Taiwan Tuberculosis Control Report 2008. Taipei City, Taiwan: Department of Health (Taiwan), 2008.Department of Health (Taiwan). Taiwan Tuberculosis Control Report 2009. Taipei City, Taiwan: Department of Health (Taiwan), 2009.Department of Health (Taiwan). Taiwan Tuberculosis Control Report 2010. Taipei City, Taiwan: Department of Health (Taiwan), 2010.Department of Health (Taiwan). Taiwan Tuberculosis Control Report 2012. Taipei City, Taiwan: Department of Health (Taiwan), 2012.2010-2011.Gopi PG, Subramani R, Radhakrishna S, Kolappan C, Sadacharam K, Devi TS, Frieden TR, Narayanan PR. A baseline survey of the prevalence of tuberculosis in a community in south India at the commencement of a DOTS programme. Int J Tuberc Lung Dis. 2003; 7(12): 1154-62.Health Protection Agency (United Kingdom). United Kingdom Tuberculosis Surveillance Report 2010. London, England: Health Protection Agency (United Kingdom), 2010.Hoa NB, Sy DN, Nhung NV, Tiemersma EW, Borgdorff MW, Cobelens FGJ. National survey of tuberculosis prevalence in Viet Nam. Bull World Health Organ. 2010; 88(4): 273-80.36.Institute for Health Metrics and Evaluation (IHME). IHME Custom Tuberculosis Excess Mortality Estimates 1950-2013.Institute for Health Metrics and Evaluation (IHME). IHME Custom Tuberculosis Mortality Estimates 1980-2013.Institute for Health Metrics and Evaluation (IHME). IHME Custom Tuberculosis Remission Estimates 1980-2013.Jamaica Vital Registration - Deaths 1998.Japan International Cooperation Agency, Ministry of Health (Cambodia), National Center for Tuberculosis and Leprosy Control (CENAT) (Cambodia). Cambodia National Tuberculosis Prevalence Survey 2010-2011.KNCV Tuberculosis Foundation, Ministry of Inter Provincial Coordination (Pakistan), National Tuberculosis Control Program (Pakistan). Pakistan Prevalence of Pulmonary Tuberculosis Among the Adult Population 2010-2011.the prevalence of pulmonary tuberculosis over a period of seven and half years in a ruralcommunity in south India with DOTS. Indian J Tuberc. 2013; 60(3): 168-76.Ministry of Health (Cambodia). Cambodia National Tuberculosis Prevalence Survey 2002.Ministry of Health (Laos). Laos Tuberculosis Prevalence Survey 2010-2011. 2014.Ministry of Health (Myanmar). Myanmar National Tuberculosis Prevalence Survey 2009-2010.Ministry of Health (Nigeria). Nigeria National Tuberculosis Survey 2012.Ministry of Health and Social Welfare (Gambia). Gambia National Tuberculosis Prevalence Survey 2011-2012.Ministry of Health and Social Welfare (Tanzania). Tanzania Tuberculosis Prevalence Survey 2012.Ministry of Public Health (Thailand). Thailand National Tuberculosis Survey 2012. 2013.1999; 113.Onozaki I. Prevalence Survey Global Overview: Background, Survey results since 2007, Lessons and Implications to the Program. Presented at: WHO Multi-country Global Workshop on TB Prevalence Surveys and TB Surveillance; 2013 April 29 - May 3; Accra, Ghana. PowerPoint presentation.Rao VG, Bhat J, Yadav R, Gopalan GP, Nagamiah S, Bhondeley MK, Anjinappa SM, Ramchandra J, Chadha VK, Wares F. Prevalence of Pulmonary Tuberculosis - A Baseline Survey in Central India. PLoS One. 2012; 7(8): e43225.Rwanda Biomedical Center. Rwanda National Tuberculosis Prevalence Survey 2012.

Sebhatu M, Kiflom B, Seyoum M, Kassim N, Negash T, Tesfazion A, Borgdorff MW, van der Werf MJ. Determining the burden of tuberculosis in Eritrea: a new approach. Bull World Health Organ. 2007; 85(8): 593-9.Soemantri S, Senewe FP, Tjandrarini DH, Day R, Basri C, Manissero D, Mehta F, Dye C. Three-fold reduction in the prevalence of tuberculosis over 25 years in Indonesia. Int J Tuberc Lung Dis. 2007; 11(4): 398-404.Tadesse, Takele, Demissie, Meaza, Berhane, Yemane, Kebede, Yigzaw, Abebe, Markos. Two-Thirds of Smear-Positive Tuberculosis Cases in teh Community Were Undiagnoised in Northwest Ethiopia: Population Based Cross-Sectional Study. PLoS One. 2011; 6(12): e28258.Thailand Tuberculosis Country Update 2012Tupasi TE, Radhakrishna S, Chua JA, Mangubat NV, Guilatco R, Galipot M, Ramos G, Quelapio MID, Beltran G, Legaspi J, Vianzon RG, Lagahid J. Significant decline in the tuberculosis burden in the Philippines ten years after initiating DOTS. Int J Tuberc Lung Dis. 2009; 13(10): 1224-30.Sarmiento A, Solon M, Solon FS, Mantala MJ. The 1997 Nationwide Tuberculosis Prevalence Survey in the Philippines. Int J Tuberc Lung Dis. 1999; 3(6): 471-7.Van't Hoog AH, Laserson KF, Githui WA, Meme HK, Agaya JA, Odeny LO, Muchiri BG, Marston BJ, DeCock KM, Borgdorff MW. High prevalence of pulmonary tuberculosis and inadequate case finding in rural western Kenya. Am J Respir Crit Care Med. 2011; 183(9): 1245-53.World Health Organization (WHO). WHO Tuberculosis Case Notifications.Yadav R, Rao VG, Bhat J, Gopi PG, Selvakumar N, Wares DF. Prevalence of pulmonary tuberculosis amongst the Baigas--a primitive tribe of Madhya Pradesh, Central India. Indian J Tuberc. 2010; 57(2): 114-6.Zaman K, Yunus M, Arifeen SE, Baqui AH, Sack DA, Hossain S, Rahim Z, Ali M, Banu S, Islam MA, Begum N, Begum V, Breiman RF, Black RE. Prevalence of sputum smear-positive tuberculosis in a rural area in Bangladesh. Epidemiol. Infect. 2006; 134(5): 1052-9.Zuluaga L, Betancur C, Abaunza M, Londoño J. Prevalences of tuberculosis and other respiratory diseases among people over age 15 in the northeast sector of Medellín, Colombia. Bull Pan Am Health Organ. 1992; 26(3): 247-55.

Incidence Prevalence Mortality Incidence Prevalence Mortality
Global 105·20(102·78 to 107·63)
168·28(163·99 to 172·88)
20·40(18·65 to 22·15)
0·55(0·37 to 0·73)
0·84(0·70 to 0·98)
-2·84(-3·58 to -2·19)
-0·69(-0·80 to -0·59)
-1·37(-1·47 to -1·27)
-3·71(-4·37 to -3·04)
Asia Pacific, High Income 34·37(33·43 to 35·27)
62·81(59·37 to 66·58)
2·15(1·92 to 2·60)
-0·04(-0·27 to 0·20)
-1·64(-1·99 to -1·30)
-6·22(-6·84 to -5·42)
0·11(-0·05 to 0·27)
0·13(-0·18 to 0·40)
-5·02(-5·84 to -3·98)
Asia, Central 122·60(118·97 to 126·17)
180·02(173·14 to 187·40)
11·26(8·06 to 12·83)
1·05(0·80 to 1·34)
1·05(0·84 to 1·28)
5·56(0·73 to 6·57)
-0·75(-0·91 to -0·57)
-0·67(-0·84 to -0·49)
-4·91(-5·75 to -4·00)
Asia, East 74·21(71·97 to 76·60)
130·78(125·30 to 136·75)
3·49(3·04 to 4·03)
0·23(-0·08 to 0·60)
0·68(0·34 to 1·01)
-6·67(-7·91 to -5·70)
-2·08(-2·36 to -1·85)
-3·16(-3·43 to -2·86)
-7·47(-8·44 to -6·56)
Asia, South 167·29(161·51 to 173·08)
267·33(258·06 to 276·80)
51·89(44·11 to 60·13)
-0·67(-1·02 to -0·30)
0·14(-0·13 to 0·41)
-4·78(-6·03 to -3·54)
-1·22(-1·44 to -0·98)
-2·61(-2·81 to -2·41)
-4·35(-5·76 to -3·03)
Asia, Southeast 146·46(142·69 to 150·07)
303·73(294·27 to 314·15)
42·32(34·93 to 47·63)
1·70(1·49 to 1·94)
1·56(1·36 to 1·75)
-3·98(-4·78 to -3·10)
-0·59(-0·71 to -0·47)
0·06(-0·08 to 0·21)
-3·62(-4·38 to -2·86)
Australasia 6·39(6·17 to 6·59)
11·12(10·49 to 11·80)
0·26(0·22 to 0·29)
-0·25(-0·62 to 0·14)
-1·01(-1·38 to -0·61)
-5·69(-6·54 to -4·82)
-0·22(-0·41 to -0·03)
-0·36(-0·66 to -0·08)
-3·88(-4·82 to -2·95)
Caribbean 57·71(56·27 to 59·14)
73·37(71·25 to 75·66)
8·59(7·60 to 10·80)
2·17(1·89 to 2·41)
1·07(0·88 to 1·27)
-4·33(-5·34 to -3·04)
-0·48(-0·59 to -0·35)
-1·36(-1·50 to -1·21)
-4·76(-5·61 to -3·46)
Europe, Central 26·73(25·98 to 27·48)
41·99(40·55 to 43·47)
1·72(1·59 to 2·00)
1·58(1·40 to 1·75)
0·41(0·26 to 0·56)
-2·72(-3·12 to -1·93)
-1·61(-1·74 to -1·50)
-0·30(-0·42 to -0·17)
-5·90(-6·37 to -5·24)
Europe, Eastern 81·18(78·29 to 83·70)
121·42(116·78 to 126·47)
8·59(5·99 to 9·32)
1·43(1·10 to 1·79)
1·83(1·51 to 2·13)
8·33(5·54 to 9·13)
-0·49(-0·73 to -0·32)
-0·66(-0·88 to -0·46)
-4·28(-6·75 to -3·51)
Europe, Western 10·87(10·55 to 11·18)
17·29(16·60 to 17·96)
0·60(0·55 to 0·70)
-0·26(-0·41 to -0·05)
-0·75(-0·90 to -0·59)
-4·79(-5·23 to -4·39)
-1·19(-1·29 to -1·09)
-0·65(-0·79 to -0·54)
-4·95(-5·54 to -3·88)
Latin America, Andean 118·36(114·40 to 122·53)
161·77(154·00 to 169·61)
9·61(8·41 to 12·18)
0·07(-0·24 to 0·40)
-0·83(-1·11 to -0·54)
-8·00(-8·83 to -5·66)
-0·84(-1·06 to -0·58)
-0·81(-1·08 to -0·55)
-4·87(-5·89 to -3·82)
Latin America, Central 32·66(31·89 to 33·47)
49·61(48·21 to 51·18)
3·62(3·35 to 4·52)
0·82(0·58 to 0·98)
-0·33(-0·55 to -0·13)
-6·67(-7·07 to -5·63)
-1·74(-1·87 to -1·60)
-1·56(-1·72 to -1·40)
-4·47(-5·02 to -3·33)
Latin America, Southern 26·69(25·93 to 27·45)
38·97(37·30 to 40·69)
2·23(2·03 to 2·48)
1·47(1·10 to 1·82)
-0·02(-0·31 to 0·27)
-4·06(-5·09 to -3·49)
-2·59(-2·77 to -2·40)
-1·58(-1·80 to -1·34)
-3·46(-4·09 to -2·85)
Latin America, Tropical 53·22(51·38 to 54·93)
92·60(87·25 to 97·98)
3·53(2·68 to 3·95)
0·51(0·06 to 0·95)
-0·12(-0·50 to 0·29)
-2·32(-6·02 to -1·41)
-1·31(-1·53 to -1·12)
-0·73(-1·09 to -0·40)
-4·31(-5·25 to -3·52)
North Africa and Middle East 34·55(33·77 to 35·37)
48·11(46·59 to 49·65)
4·66(4·19 to 5·46)
1·09(0·87 to 1·31)
-0·30(-0·49 to -0·10)
-3·62(-4·26 to -2·98)
-1·11(-1·19 to -1·03)
-1·26(-1·35 to -1·17)
-4·50(-5·24 to -3·83)
North America, High Income 5·04(4·86 to 5·22)
10·09(9·53 to 10·67)
0·36(0·29 to 0·52)
-0·82(-1·05 to -0·58)
-2·36(-2·69 to -2·06)
-9·36(-10·92 to -6·27)
-3·33(-3·57 to -3·12)
-2·29(-2·58 to -1·99)
-4·37(-5·66 to -2·51)
Oceania 110·92(107·85 to 114·09)
177·04(169·85 to 184·80)
21·40(14·06 to 41·69)
-0·57(-0·96 to -0·22)
-0·69(-1·02 to -0·35)
-5·84(-8·01 to -2·27)
0·74(0·57 to 0·93)
0·10(-0·12 to 0·32)
-2·85(-4·40 to -0·94)
Sub-Saharan Africa, Central 311·39(301·15 to 321·85)
529·80(503·07 to 560·25)
106·64(86·58 to 124·55)
0·98(0·54 to 1·41)
0·67(0·30 to 1·05)
0·07(-1·10 to 1·39)
-0·24(-0·40 to -0·06)
-0·46(-0·67 to -0·27)
-3·49(-4·66 to -2·16)
Sub-Saharan Africa, East 245·00(237·13 to 252·61)
374·70(360·50 to 389·45)
107·23(93·11 to 115·46)
0·54(0·35 to 0·74)
0·56(0·35 to 0·78)
0·39(-0·76 to 1·11)
-1·20(-1·31 to -1·08)
-1·24(-1·37 to -1·10)
-3·41(-4·28 to -2·82)
Sub-Saharan Africa, Southern 1121·35(1081·17 to 1164·24)
1470·51(1416·58 to 1529·67)
94·34(83·55 to 104·87)
-0·44(-0·97 to 0·13)
0·54(0·16 to 0·92)
3·40(1·84 to 4·74)
-0·07(-0·42 to 0·26)
-0·33(-0·60 to -0·04)
-2·64(-3·99 to -1·73)
Sub-Saharan Africa, West 173·93(168·60 to 179·56)
297·82(287·64 to 309·58)
55·60(48·98 to 62·37)
0·78(0·52 to 1·04)
0·67(0·44 to 0·89)
0·05(-0·72 to 0·80)
-0·76(-0·89 to -0·62)
-0·87(-1·00 to -0·73)
-2·88(-3·52 to -2·05)
Appendix Table 10. Age-standardized tuberculosis all forms incidence, prevalence, and mortality rates (per 100 000) and annualized rates of change (%), with 95% UI, for 21 GBD regions.
Age-standardized rates(per 100 000), 2013 Annualized rate of change (%)
Location Incidence Prevalence Mortality1990-2000 2000-2013

Appendix Table 11: Malaria non-fatal data sources used in DisMod in the GBD 2013
Abeyasinghe RR, Galappaththy GNL, Smith Gueye C, Kahn JG, Feachem RGA. Malaria control and elimination in Sri Lanka: documenting progress and success factors in a conflict setting. PLoS One. 2012; 7(8): e43162. .
Alonso PL, Smith T, Schellenberg JR, Masanja H, Mwankusye S, Urassa H, Bastos de Azevedo I, Chongela J, Kobero S, Menendez C. Randomised trial of efficacy of SPf66 vaccine against Plasmodium falciparum malaria in children in southern Tanzania. Lancet. 1994; 344(8931): 1175-81.Alves FP, Durlacher RR, Menezes MJ, Krieger H, Silva LHP, Camargo EP. High prevalence of asymptomatic Plasmodium vivax and Plasmodium falciparum infections in native Amazonian populations. Am J Trop Med Hyg. 2002; 66(6): 641-8.Bhatt RM, Sharma SN, Uragayala S, Dash AP, Kamaraju R. Effectiveness and durability of Interceptor® long-lasting insecticidal nets in a malaria endemic area of central India. Malar J. 2012; 189. .Bloland PB, Boriga DA, Ruebush TK, McCormick JB, Roberts JM, Oloo AJ, Hawley W, Lal A, Nahlen B, Campbell CC. Longitudinal cohort study of the epidemiology of malaria infections in an area of intense malaria transmission II. Descriptive epidemiology of malaria infection and disease among children. Am J Trop Med Hyg. 1999; 60(4): 641-8.
Boisier P, Jambou R, Raharimalala L, Roux J. Relationship between parasite density and fever risk in a community exposed to a low level of malaria transmission in Madagascar highlands. Am J Trop Med Hyg. 2002; 67(2): 137-40.
Camargo LM, Ferreira MU, Krieger H, De Camargo EP, Da Silva LP. Unstable hypoendemic malaria in Rondonia (western Amazon region, Brazil): epidemic outbreaks and work-associated incidence in an agro-industrial rural settlement. Am J Trop Med Hyg. 1994; 51(1): 16-25.Cardoso MA, Ferreira MU, Camargo LM, Szarfarc SC. Anaemia, iron deficiency and malaria in a rural community in Brazilian Amazon. Eur J Clin Nutr. 1994; 48(5): 326-32.Da Silva-Nunes M, Ferreira MU. Clinical spectrum of uncomplicated malaria in semi-immune Amazonians: beyond the symptomatic vs asymptomatic dichotomy. Mem Inst Oswaldo Cruz. 2007; 102(3): 341-7.
Dev V, Phookan S, Sharma VP, Anand SP. Physiographic and entomologic risk factors of malaria in Assam, India. Am J Trop Med Hyg. 2004; 71(4): 451-6.Dodoo D, Atuguba F, Bosomprah S, Ansah NA, Ansah P, Lamptey H, Egyir B, Oduro AR, Gyan B, Hodgson A, Koram KA. Antibody levels to multiple malaria vaccine candidate antigens in relation to clinical malaria episodes in children in the Kasena-Nankana district of Northern Ghana. Malar J. 2011; 10: 108.Duarte EC, Gyorkos TW, Pang L, Abrahamowicz M. Epidemiology of malaria in a hypoendemic Brazilian Amazon migrant population: a cohort study. Am J Trop Med Hyg. 2004; 70(3): 229-37.
Erhart A, Thang ND, Bien TH, Tung NM, Hung NQ, Hung LX, Tuy TQ, Speybroeck N, Cong LD, Coosemans M, D'Alessandro U. Malaria epidemiology in a rural area of the Mekong Delta: a prospective community-based study. Trop Med Int Health. 2004; 9(10): 1081-90.Erhart A, Thang ND, Hung NQ, Toi LV, Hung LX, Tuy TQ, Cong LD, Speybroeck N, Coosemans M, D'Alessandro U. Forest malaria in Vietnam: a challenge for control. Am J Trop Med Hyg. 2004; 70(2): 110-8.
Erhart A, Thang ND, Xa NX, Thieu NQ, Hung LX, Hung NQ, Nam NV, Toi LV, Tung NM, Bien TH, Tuy TQ, Cong LD, Thuan LK, Coosemans M, D'Alessandro U. Accuracy of the health information system on malaria surveillance in Vietnam. Trans R Soc Trop Med Hyg. 2007; 101(3): 216-25.Ernst KC, Adoka SO, Kowuor DO, Wilson ML, John CC. Malaria hotspot areas in a highland Kenya site are consistent in epidemic and non-epidemic years and are associated with ecological factors. Malar J. 2006; 78.
Ghosh SK, Tiwari SN, Sathyanarayan TS, Sampath TRR, Sharma VP, Nanda N, Joshi H, Adak T, Subbarao SK. Larvivorous fish in wells target the malaria vector sibling species of the Anopheles culicifacies complex in villages in Karnataka, India. Trans R Soc Trop Med Hyg. 2005; 99(2): 101-5.Grobusch MP, Lell B, Schwarz NG, Gabor J, Dornemann J, Potschke M, Oyakhirome S, Kiessling GC, Necek M, Langin MU, Klein Klouwenberg P, Klopfer A, Naumann B, Altun H, Agnandji ST, Goesch J, Decker M, Salazar CLO, Supan C, Kombila DU, Borchert L, Koster KB, Pongratz P, Adegnika AA, Glasenapp I von, Issifou S, Kremsner PG. Intermittent preventive treatment against malaria in infants in Gabon--a randomized, double-blind, placebo-controlled trial. J Infect Dis. 2007; 196(11): 1595-602.
Guinovart C, Dobaño C, Bassat Q, Nhabomba A, Quintó L, Manaca MN, Aguilar R, Rodríguez MH, Barbosa A, Aponte JJ, Mayor AG, Renom M, Moraleda C, Roberts DJ, Schwarzer E, Le Souëf PN, Schofield L, Chitnis CE, Doolan DL, Alonso PL. The role of age and exposure to Plasmodium falciparum in the rate of acquisition of naturally acquired immunity: a randomized controlled trial. PLoS One. 2012; 7(3): e32362. .Gupta V, Perez-Perez GI, Dorsey G, Rosenthal PJ, Blaser MJ. The seroprevalence of Helicobacter pylori and its relationship to malaria in Ugandan children. Trans R Soc Trop Med Hyg. 2012; 106(1): 35-42. .Guthmann JP, Llanos-Cuentas A, Palacios A, Hall AJ. Environmental factors as determinants of malaria risk. A descriptive study on the northern coast of Peru. Trop Med Int Health. 2002; 7(6): 518-25.Hamusse SD, Balcha TT, Belachew T. The impact of indoor residual spraying on malaria incidence in East Shoa Zone, Ethiopia. Glob Health Action. 2012; 11619. .Haque U, Glass GE, Bomblies A, Hashizume M, Mitra D, Noman N, Haque W, Kabir MM, Yamamoto T, Overgaard HJ. Risk factors associated with clinical malaria episodes in Bangladesh: a longitudinal study. Am J Trop Med Hyg. 2013; 88(4): 727-32. .Ijumba JN, Shenton FC, Clarke SE, Mosha FW, Lindsay SW. Irrigated crop production is associated with less malaria than traditional agricultural practices in Tanzania. Trans R Soc Trop Med Hyg. 2002; 96(5): 476-80.

Jambulingam P, Mohapatra SS, Govardhini P, Das LK, Manoharan A, Pani SP, Das PK. Microlevel epidemiological variations in malaria & its implications on control strategy. Indian J Med Res. 1991; 371-8.Jonker FAM, Calis JCJ, van Hensbroek MB, Phiri K, Geskus RB, Brabin BJ, Leenstra T. Iron status predicts malaria risk in Malawian preschool children. PLoS One. 2012; 7(8): e42670. .Kajeguka D, Mwanziva C, Daou M, Ndaro A, Matondo S, Mbugi E, Dolmans W, Chilongola J. CD36 c.1264 T>G null mutation impairs acquisition of IgG antibodies to Plasmodium falciparum MSP119 antigen and is associated with higher malaria incidences in Tanzanian children. Scand J Immunol. 2012; 75(3): 355-60. .Kamolratanakul P, Butraporn P, Prasittisuk M, Prasittisuk C, Indaratna K. Cost-effectiveness and sustainability of lambdacyhalothrin-treated mosquito nets in comparison to DDT spraying for malaria control in western Thailand. Am J Trop Med Hyg. 2001; 65(4): 279-84.Kamolratanakul P, Dhanamun B, Lertmaharit S, Seublinwong T, Udomsangpetch R, Chirakalwasorn N, Thaithong S. Malaria in a rural area of eastern Thailand: baseline epidemiological studies at Bo Thong. Southeast Asian J Trop Med Public Health. 1992; 23(4): 783-7.Khosa E, Kuonza LR, Kruger P, Maimela E. Towards the elimination of malaria in South Africa: a review of surveillance data in Mutale Municipality, Limpopo Province, 2005 to 2010. Malar J. 2013; 7. .Kinde-Gazard D, Baglo T. Assessment of microbial larvicide spraying with Bacillus thuringiensis israelensis, for the prevention of malaria. Med Mal Infect. 2012; 42(3): 114-8. .Kobbe R, Kreuzberg C, Adjei S, Thompson B, Langefeld I, Thompson PA, Abruquah HH, Kreuels B, Ayim M, Busch W, Marks F, Amoah K, Opoku E, Meyer CG, Adjei O, May J. A randomized controlled trial of extended intermittent preventive antimalarial treatment in infants. Clin Infect Dis. 2007; 45(1): 16-25.Konaté AT, Yaro JB, Ouédraogo AZ, Diarra A, Gansané A, Soulama I, Kangoyé DT, Kaboré Y, Ouédraogo E, Ouédraogo A, Tiono AB, Ouédraogo IN, Chandramohan D, Cousens S, Milligan PJ, Sirima SB, Greenwood BM, Diallo DA. Morbidity from malaria in children in the year after they had received
Krefis AC, Schwarz NG, Krüger A, Fobil J, Nkrumah B, Acquah S, Loag W, Sarpong N, Adu-Sarkodie Y, Ranft U, May J. Modeling the relationship between precipitation and malaria incidence in children from a holoendemic area in Ghana. Am J Trop Med Hyg. 2011; 84(2): 285-91. .Lemnge MM, Msangeni HA, Rønn AM, Salum FM, Jakobsen PH, Mhina JI, Akida JA, Bygbjerg IC. Maloprim malaria prophylaxis in children living in a holoendemic village in north-eastern Tanzania. Trans R Soc Trop Med Hyg. 1997; 91(1): 68-73.
Loha E, Lindtjørn B. Predictors of Plasmodium falciparum malaria incidence in Chano Mille, South Ethiopia: a longitudinal study. Am J Trop Med Hyg. 2012; 87(3): 450-9. .
Magris M, Rubio-Palis Y, Alexander N, Ruiz B, Galván N, Frias D, Blanco M, Lines J. Community-randomized trial of lambdacyhalothrin-treated hammock nets for malaria control in Yanomami communities in the Amazon region of Venezuela. Trop Med Int Health. 2007; 12(3): 392-403.Manimunda SP, Sugunan AP, Sha WA, Singh SS, Shriram AN, Vijayachari P. Tsunami, post-tsunami malaria situation in Nancowry group of islands, Nicobar district, Andaman and Nicobar Islands. Indian J Med Res. 2011; 76-82. .McGuinness D, Koram K, Bennett S, Wagner G, Nkrumah F, Riley E. Clinical case definitions for malaria: clinical malaria associated with very low parasite densities in African infants. Trans R Soc Trop Med Hyg. 1998; 92(5): 527-31.Menendez C, Kahigwa E, Hirt R, Vounatsou P, Aponte JJ, Font F, Acosta CJ, Schellenberg DM, Galindo CM, Kimario J, Urassa H, Brabin B, Smith TA, Kitua AY, Tanner M, Alonso PL. Randomised placebo-controlled trial of iron supplementation and malaria chemoprophylaxis for prevention of severe anaemia and malaria in Tanzanian infants. Lancet. 1997; 350(9081): 844-50.
Mitjà O, Paru R, Selve B, Betuela I, Siba P, De Lazzari E, Bassat Q. Malaria epidemiology in Lihir Island, Papua New Guinea. Malar J. 2013; 98. .Mnzava AE, Sharp BL, Mthembu DJ, le Sueur D, Dlamini SS, Gumede JK, Kleinschmidt I. Malaria control--two years' use of insecticide-treated bednets compared with insecticide house spraying in KwaZulu-Natal. S Afr Med J. 2001; 91(11): 978-83.Mockenhaupt FP, Reither K, Zanger P, Roepcke F, Danquah I, Saad E, Ziniel P, Dzisi SY, Frempong M, Agana-Nsiire P, Amoo-Sakyi F, Otchwemah R, Cramer JP, Anemana SD, Dietz E, Bienzle U. Intermittent preventive treatment in infants as a means of malaria control: a randomized, double-blind, placebo-controlled trial in northern Ghana. Antimicrob Agents Chemother. 2007; 51(9): 3273-81.Molez JF, Diop A, Gaye O, Lemasson JJ, Fontenille D. [Malaria morbidity in Barkedji, village of Ferlo, in Senegal Sahelian area]. Bull Soc Pathol Exot. 2006; 99(3): 187-90.Mtove G, Amos B, Nadjm B, Hendriksen ICE, Dondorp AM, Mwambuli A, Kim DR, Ochiai RL, Clemens JD, von Seidlein L, Reyburn H, Deen J. Decreasing incidence of severe malaria and community-acquired bacteraemia among hospitalized children in Muheza, north-eastern Tanzania, 2006-2010. Malar J. 2011; 10: 320. .Mwangi TW, Mohammed M, Dayo H, Snow RW, Marsh K. Clinical algorithms for malaria diagnosis lack utility among people of different age groups. Trop Med Int Health. 2005; 10(6): 530-6.Ndibazza J, Mpairwe H, Webb EL, Mawa PA, Nampijja M, Muhangi L, Kihembo M, Lule SA, Rutebarika D, Apule B, Akello F, Akurut H, Oduru G, Naniima P, Kizito D, Kizza M, Kizindo R, Tweyongere R, Alcock KJ, Muwanga M, Elliott AM. Impact of anthelminthic treatment in pregnancy and Ngomane L, de Jager C. Changes in malaria morbidity and mortality in Mpumalanga Province, South Africa (2001-2009): a retrospective study. Malar J. 2012; 19. .
Noya O, Gabaldón Berti Y, Alarcón de Noya B, Borges R, Zerpa N, Urbáez JD, Madonna A, Garrido E, Jimenéz MA, Borges RE. A population-based clinical trial with the SPf66 synthetic Plasmodium falciparum malaria vaccine in Venezuela. J Infect Dis. 1994; 170(2): 396-402.
Ouédraogo A, Tiono AB, Diarra A, Sanon S, Yaro JB, Ouedraogo E, Bougouma EC, Soulama I, Gansané A, Ouedraogo A, Konate AT, Nebie I, Watson NL, Sanza M, Dube TJT, Sirima SB. Malaria morbidity in high and seasonal malaria transmission area of Burkina Faso. PLoS One. 2013; 8(1): e50036. .

Özbilgina A, Topluoglu S, Es S, Islek E, Mollahaliloglu S, Erkoc Y. Malaria in Turkey: successful control and strategies for achieving elimination. Acta Trop. 2011; 120(1-2): 15-23.Parise EV, de Araújo GC, Pinheiro RT. [Spatial analysis and determination of priority areas for malaria control in the State of Tocantins, from 2003 to 2008]. Rev Soc bras Med trop. 2011; 44(1): 63-9. .Prakash A, Bhattacharyya DR, Mohapatra PK, Mahanta J. Role of the prevalent Anopheles species in the transmission of Plasmodium falciparum and P. vivax in Assam state, north-eastern India. Ann Trop Med Parasitol. 2004; 98(6): 559-68.Reid HL, Haque U, Roy S, Islam N, Clements ACA. Characterizing the spatial and temporal variation of malaria incidence in Bangladesh, 2007. Malar J. 2012; 170. .Richards FO Jr, Klein RE, Flores RZ, Weller S, Gatica M, Zeissig R, Sexton J. Permethrin-impregnated bed nets for malaria control in northern Guatemala: epidemiologic impact and community acceptance. Am J Trop Med Hyg. 1993; 49(4): 410-8.Rolfes MA, McCarra M, Magak NG, Ernst KC, Dent AE, Lindblade KA, John CC. Development of clinical immunity to malaria in highland areas of low and unstable transmission. Am J Trop Med Hyg. 2012; 87(5): 806-12. .Roper MH, Torres RS, Goicochea CG, Andersen EM, Guarda JS, Calampa C, Hightower AW, Magill AJ. The epidemiology of malaria in an epidemic area of the Peruvian Amazon. Am J Trop Med Hyg. 2000; 62(2): 247-56.
Rutta ASM, Francis F, Mmbando BP, Ishengoma DS, Sembuche SH, Malecela EK, Sadi JY, Kamugisha ML, Lemnge MM. Using community-owned resource persons to provide early diagnosis and treatment and estimate malaria burden at community level in north-eastern Tanzania. Malar J. 2012; 152. .Sahu SS, Jambulingam P, Vijayakumar T, Subramanian S, Kalyanasundaram M. Impact of alphacypermethrin treated bed nets on malaria in villages of Malkangiri district, Orissa, India. Acta Trop. 2003; 89(1): 55-66.Sahu SS, Vijayakumar T, Kalyanasundaram M, Subramanian S, Jambulingam P. Impact of lambdacyhalothrin capsule suspension treated bed nets on malaria in tribal villages of Malkangiri district, Orissa, India. Indian J Med Res. 2008; 128(3): 262-70.
Schellenberg D, Menendez C, Kahigwa E, Aponte J, Vidal J, Tanner M, Mshinda H, Alonso P. Intermittent treatment for malaria and anaemia control at time of routine vaccinations in Tanzanian infants: a randomised, placebo-controlled trial. Lancet. 2001; 357(9267): 1471-7.Schellenberg DM, Aponte JJ, Kahigwa EA, Mshinda H, Tanner M, Menendez C, Alonso PL. The incidence of clinical malaria detected by active case detection in children in Ifakara, southern Tanzania. Trans R Soc Trop Med Hyg. 2003; 97(6): 647-54.
Senn N, Rarau P, Stanisic DI, Robinson L, Barnadas C, Manong D, Salib M, Iga J, Tarongka N, Ley S, Rosanas-Urgell A, Aponte JJ, Zimmerman PA, Beeson JG, Schofield L, Siba P, Rogerson SJ, Reeder JC, Mueller I. Intermittent preventive treatment for malaria in Papua New Guinean infants exposed to Plasmodium falciparum and P. vivax: a randomized controlled trial. PLoS Med. 2012; 9(3): e1001195. .Sesay S, Milligan P, Touray E, Sowe M, Webb EL, Greenwood BM, Bojang KA. A trial of intermittent preventive treatment and home-based management of malaria in a rural area of The Gambia. Malar J. 2011; 10.Sharma SK, Chattopadhyay R, Chakrabarti K, Pati SS, Srivastava VK, Tyagi PK, Mahanty S, Misra SK, Adak T, Das BS, Chitnis CE. Epidemiology of malaria transmission and development of natural immunity in a malaria-endemic village, San Dulakudar, in Orissa state, India. Am J Trop Med Hyg. 2004; 71(4): 457-65.Sharma SK, Tyagi PK, Padhan K, Adak T, Subbarao SK. Malarial morbidity in tribal communities living in the forest and plain ecotypes of Orissa, India. Ann Trop Med Parasitol. 2004; 98(5): 459-68.Sharma SK, Tyagi PK, Padhan K, Upadhyay AK, Haque MA, Nanda N, Joshi H, Biswas S, Adak T, Das BS, Chauhan VS, Chitnis CE, Subbarao SK. Epidemiology of malaria transmission in forest and plain ecotype villages in Sundargarh District, Orissa, India. Trans R Soc Trop Med Hyg. 2006; 100(10): 917-25.Sharma SK, Tyagi PK, Upadhyay AK, Haque MA, Adak T, Dash AP. Building small dams can decrease malaria: a comparative study from Sundargarh District, Orissa, India. Acta Trop. 2008; 107(2): 174-8.Sharma SK, Upadhyay AK, Haque MA, Padhan K, Tyagi PK, Batra CP, Adak T, Dash AP, Subbarao SK. Effectiveness of mosquito nets treated with a tablet formulation of deltamethrin for malaria control in a hyperendemic tribal area of Sundargarh District, Orissa, India. J Am Mosq Control Assoc. 2006; 22(1): 111-8.Singh N, Mishra SS, Singh MP, Sharma VP. Seasonality of Plasmodium vivax and P. falciparum in tribal villages in central India (1987-1995). Ann Trop Med Parasitol. 2000; 94(2): 101-12.
Singh N, Shukla MM, Chand G, Bharti PK, Singh MP, Shukla MK, Mehra RK, Sharma RK, Dash AP. Epidemic of Plasmodium falciparum malaria in Central India, an area where chloroquine has been replaced by artemisinin-based combination therapy. Trans R Soc Trop Med Hyg. 2011; 105(3): 133-9. .Soe-Soe, Khin-Saw-Aye, Htay-Aung, Nay-Win, Tin-Aung, Than-Swe, Roussilhon C, Pérignon JL, Druilhe P. Premunition against Plasmodium falciparum in a malaria hyperendemic village in Myanmar. Trans R Soc Trop Med Hyg. 2001; 95(1): 81-4.Subramanian S, Manoharan A, Sahu S, Jambulingam P, Govardhini P, Mohapatra SS, Das PK. Living conditions and occurrence of malaria in a rural community. Indian J Malariol. 1991; 28(1): 29-37.
Thiam S, Thwing J, Diallo I, Fall FB, Diouf MB, Perry R, Ndiop M, Diouf ML, Cisse MM, Diaw MM, Thior M. Scale-up of home-based management of malaria based on rapid diagnostic tests and artemisinin-based combination therapy in a resource-poor country: results in Senegal. Malar J. 2012; 334. .
Thompson R, Begtrup K, Cuamba N, Dgedge M, Mendis C, Gamage-Mendis A, Enosse SM, Barreto J, Sinden RE, Hogh B. The Matola malaria project: a temporal and spatial study of malaria transmission and disease in a suburban area of Maputo, Mozambique. Am J Trop Med Hyg. 1997; 57(5): 550-9.

Thriemer K, Ley B, Ame S, von Seidlein L, Pak GD, Chang NY, Hashim R, Schmied WH, Busch CJ-L, Nixon S, Morrissey A, Puri MK, Ali M, Ochiai RL, Wierzba T, Jiddawi MS, Clemens JD, Ali SM, Deen JL. The burden of invasive bacterial infections in Pemba, Zanzibar. PLoS One. 2012; 7(2): e30350. .
Trape J-F, Tall A, Diagne N, Ndiath O, Ly AB, Faye J, Dieye-Ba F, Roucher C, Bouganali C, Badiane A, Sarr FD, Mazenot C, Touré-Baldé A, Raoult D, Druilhe P, Mercereau-Puijalon O, Rogier C, Sokhna C. Malaria morbidity and pyrethroid resistance after the introduction of insecticide-treated bednets and artemisinin-based combination therapies: a longitudinal study. Lancet Infect Dis. 2011; 11(12): 925-32. .Van den Berg H, Velayudhan R, Ebol A, Catbagan BHG Jr, Turingan R, Tuso M, Hii J. Operational efficiency and sustainability of vector control of malaria and dengue: descriptive case studies from the Philippines. Malar J. 2012; 269. .Van der Hoek W, Konradsen F, Dijkstra DS, Amerasinghe PH, Amerasinghe FP. Risk factors for malaria: a microepidemiological study in a village in Sri Lanka. Trans R Soc Trop Med Hyg. 1998; 92(3): 265-9.Veenemans J, Milligan P, Prentice AM, Schouten LRA, Inja N, van der Heijden AC, de Boer LCC, Jansen EJS, Koopmans AE, Enthoven WTM, Kraaijenhagen RJ, Demir AY, Uges DRA, Mbugi EV, Savelkoul HFJ, Verhoef H. Effect of supplementation with zinc and other micronutrients on malaria in Tanzanian children: a randomised trial. PLoS Med. 2011; 8(11): e1001125. .
Webb EL, Mawa PA, Ndibazza J, Kizito D, Namatovu A, Kyosiimire-Lugemwa J, Nanteza B, Nampijja M, Muhangi L, Woodburn PW, Akurut H, Mpairwe H, Akello M, Lyadda N, Bukusuba J, Kihembo M, Kizza M, Kizindo R, Nabulime J, Ameke C, Namujju PB, Tweyongyere R, Muwanga M, Whitworth JAG, Elliott AM. Effect of single-dose anthelmintic treatment during pregnancy on an infant's response to immunisation and on susceptibility to infectious diseases in infancy: a randomised, double-blind, placebo-controlled trial. Lancet. 2011; 377(9759): 52-62. .Wu N, Qin L, Liao G, Zhou W, Geng W, Shi Y, Tan Y, Zhao K. Field evaluation of bednets impregnated with deltamethrin for malaria control. Southeast Asian J Trop Med Public Health. 1993; 24(4): 664-71.Yadav RS, Sampath TR, Sharma VP, Adak T, Ghosh SK. Evaluation of lambdacyhalothrin-impregnated bednets in a malaria endemic area of India. Part 3. Effects on malaria incidence and clinical measures. J Am Mosq Control Assoc. 1998; 14(4): 444-50.Yadav RS, Sharma VP, Ghosh SK, Kumar A. Quartan malaria--an investigation on the incidence of Plasmodium malariae in Bisra PHC, District Sundargarh, Orissa. Indian J Malariol. 1990; 27(2): 85-94.Yamazaki A, Yasunami M, Ofori M, Horie H, Kikuchi M, Helegbe G, Takaki A, Ishii K, Omar AH, Akanmori BD, Hirayama K. Human leukocyte antigen class I polymorphisms influence the mild clinical manifestation of Plasmodium falciparum infection in Ghanaian children. Hum Immunol. 2011; 72(10): 881-8. .Yé Y, Kyobutungi C, Louis VR, Sauerborn R. Micro-epidemiology of Plasmodium falciparum malaria: Is there any difference in transmission risk between neighbouring villages?. Malar J. 2007; 46.Zaim M, Ghavami MB, Nazari M, Edrissian GH, Nateghpour M. Cyfluthrin (EW 050)-impregnated bednets in a malaria control program in Ghassreghand (Baluchistan, Iran). J Am Mosq Control Assoc. 1998; 14(4): 421-30.

Country Source number Source Surveillance Verbal AutopsyVital
Registration
Afghanistan 01 - AFGCenters for Disease Control and Prevention (CDC), United Nations Children's Fund (UNICEF). Afghanistan - Badghis Nutrition and Health Survey 2002. X
Albania 01 - ALBWorld Health Organization (WHO). WHO Mortality Database Version February 2014. Geneva, Switzerland: World Health Organization (WHO), 2014. X
Antigua and Barbuda 01 - ATG
World Health Organization (WHO). WHO Mortality Database Version February 2014. Geneva, Switzerland: World Health Organization (WHO), 2014. X
Argentina 01 - ARGWorld Health Organization (WHO). WHO Mortality Database Version February 2014. Geneva, Switzerland: World Health Organization (WHO), 2014. X
Armenia 01 - ARMWorld Health Organization (WHO). WHO Mortality Database Version February 2014. Geneva, Switzerland: World Health Organization (WHO), 2014. X
Australia 01 - AUSWorld Health Organization (WHO). WHO Mortality Database Version February 2014. Geneva, Switzerland: World Health Organization (WHO), 2014. X
Austria 01 - AUTWorld Health Organization (WHO). WHO Mortality Database Version February 2014. Geneva, Switzerland: World Health Organization (WHO), 2014. X
Azerbaijan 01 - AZEWorld Health Organization (WHO). WHO Mortality Database Version February 2014. Geneva, Switzerland: World Health Organization (WHO), 2014. X
Bahrain 01 - BHRWorld Health Organization (WHO). WHO Mortality Database Version February 2014. Geneva, Switzerland: World Health Organization (WHO), 2014. X
Bangladesh 01 - BGD
INDEPTH, International Centre for Diarrhoeal Disease Research (Bangladesh). Bangladesh - Matlab Health and Demographic Surveillance System. Dhaka, Bangladesh: International Centre for Diarrhoeal Disease Research (Bangladesh). X
Bangladesh 02 - BGDINDEPTH. Bangladesh - AMK Health and Demographic Surveillance System.
X
Barbados 01 - BRBWorld Health Organization (WHO). WHO Mortality Database Version February 2014. Geneva, Switzerland: World Health Organization (WHO), 2014. X
Belarus 01 - BLRWorld Health Organization (WHO). WHO Mortality Database Version February 2014. Geneva, Switzerland: World Health Organization (WHO), 2014. X
Belgium 01 - BELWorld Health Organization (WHO). WHO Mortality Database Version February 2014. Geneva, Switzerland: World Health Organization (WHO), 2014. X
Belize 01 - BLZWorld Health Organization (WHO). WHO Mortality Database Version February 2014. Geneva, Switzerland: World Health Organization (WHO), 2014. X
Bermuda 01 - BMUWorld Health Organization (WHO). WHO Mortality Database Version February 2014. Geneva, Switzerland: World Health Organization (WHO), 2014. X
Bolivia 01 - BOLWorld Health Organization (WHO). WHO Mortality Database Version February 2014. Geneva, Switzerland: World Health Organization (WHO), 2014. X
Bosnia and Herzegovina 01 - BIH
World Health Organization (WHO). WHO Mortality Database Version February 2014. Geneva, Switzerland: World Health Organization (WHO), 2014. X
Brazil 01 - BRAWorld Health Organization (WHO). WHO Mortality Database Version February 2014. Geneva, Switzerland: World Health Organization (WHO), 2014. X
Brunei 01 - BRNWorld Health Organization (WHO). WHO Mortality Database Version February 2014. Geneva, Switzerland: World Health Organization (WHO), 2014. X
Bulgaria 01 - BGRWorld Health Organization (WHO). WHO Mortality Database Version February 2014. Geneva, Switzerland: World Health Organization (WHO), 2014. X
Burkina Faso 01 - BFA
Abdullah S, Adazu K, Masanja H, Diallo D, Hodgson A, Ilboudo-Sanogo E, Nhacolo A, Owusu-Agyei S, Thompson R, Smith T, Binka FN. Patterns of age-specific mortality in children in endemic areas of sub-Saharan Africa. Am J Trop Med Hyg. 2007; 77(6 Suppl): 99-105.
X
Appendix Table 12: Malaria mortality data sources used in the GBD 2013.

Burkina Faso 02 - BFA
Bell JS, Ouédraogo M, Ganaba R, Sombié I, Byass P, Baggaley RF, Filippi V, Fitzmaurice AE, Graham WJ. The epidemiology of pregnancy outcomes in rural Burkina Faso. Trop Med Int Health. 2008; 13 Suppl 1: 31-43. X
Burkina Faso 03 - BFA
Diallo AH, Meda N, Sommerfelt H, Traore GS, Cousens S, Tylleskar T. The high burden of infant deaths in rural Burkina Faso: a prospective community-based cohort study. BMC Public Health. 2012; 12(739). X
Burkina Faso 04 - BFAINDEPTH, Nouna Health Research Center (Burkina Faso). Burkina Faso - Nouna Health and Demographic Surveillance System. X
Burkina Faso 05 - BFAOffice of Scientific and Technical Research Overseas (France). Burkina Faso - Niangoloko Childhood Mortality 1986-1988. 1989. X
Burkina Faso 06 - BFA
Office of Scientific and Technical Research Overseas (France). Burkina Faso - Pissila Analysis of Mortality in Childhood after Three Years of Observation 1985-1987. Office of Scientific and Technical Research Overseas (France), 1988. X
Burkina Faso 07 - BFA
Ramroth H, Lorenz E, Rankin JC, Fottrell E, Yé M, Neuhann F, Ssennono M, Sié A, Byass P, Becher H. Causas de la distribución de muerte con el modelo InterVA y la codificación de médicos en un área rural de Burkina Faso. Trop Med Int Health. 2012; 17(7): 904-13.
X
Burkina Faso 08 - BFA
Rowe AK, Rowe SY, Snow RW, Korenromp EL, Schellenberg JR, Stein C, Nahlen BL, Bryce J, Black RE, Steketee RW. The burden of malaria mortality among African children in the year 2000. Int J Epidemiol. 2006; 35(3): 691-704. X
Burkina Faso 09 - BFAWürthwein R, Gbangou A, Sauerborn R, Schmidt CM. Measuring the local burdenof disease. A study of years of life lost in sub-Saharan Africa. Int J Epidemiol. 2001; 30(3): 501-8.
X
Burkina Faso 10 - BFA
Yé M, Diboulo E, Niamba L, Sié A, Coulibaly B, Bagagnan C, Dembélé J, Ramroth H. An improved method for physician-certified verbal autopsy reduces the rate of discrepancy: experiences in the Nouna Health and Demographic Surveillance Site (NHDSS), Burkina Faso. Popul Health Metr. 2011; 9: 34.
X
Burundi 01 - BDI
Delacollette C, Barutwanayo M. Mortality and morbidity at young ages in a stable hyperendemic malaria region, community Nyanza-Lac, Imbo South, Burundi. Bull Soc Pathol Exot. 1993; 86(5): 373-9. X
Cambodia 01 - KHMOum S, Chandramohan D, Cairncross S. Community-based surveillance: a pilot study from rural Cambodia. Trop Med Int Health. 2005; 10(7): 689-97. X
Canada 01 - CANWorld Health Organization (WHO). WHO Mortality Database Version February 2014. Geneva, Switzerland: World Health Organization (WHO), 2014. X
Cape Verde 01 - CPVWorld Health Organization (WHO). WHO Mortality Database Version February 2014. Geneva, Switzerland: World Health Organization (WHO), 2014. X
Chile 01 - CHLMinistry of Health (Chile), National Institute of Statistics (Chile). Chile Vital Registration - Deaths 1985. X
Chile 02 - CHLWorld Health Organization (WHO). WHO Mortality Database Version February 2014. Geneva, Switzerland: World Health Organization (WHO), 2014. X
China 01 - CHNChinese Center for Disease Control and Prevention (CCDC). China Disease Surveillance Points 1991 - China CDC. X
China 02 - CHNChinese Center for Disease Control and Prevention (CCDC). China Disease Surveillance Points 1994 - China CDC. X
China 03 - CHNChinese Center for Disease Control and Prevention (CCDC). China Disease Surveillance Points 2000 - China CDC. X
China 04 - CHNChinese Center for Disease Control and Prevention (CCDC). China Disease Surveillance Points 2002 - China CDC. X
China 05 - CHNChinese Center for Disease Control and Prevention (CCDC). China Disease Surveillance Points 2004 - China CDC. X
China 06 - CHNChinese Center for Disease Control and Prevention (CCDC). China Disease Surveillance Points 2005 - China CDC. X
China 07 - CHNChinese Center for Disease Control and Prevention (CCDC). China Disease Surveillance Points 2006 - China CDC. X
China 08 - CHNChinese Center for Disease Control and Prevention (CCDC). China Disease Surveillance Points 2007 - China CDC. X
China 09 - CHNChinese Center for Disease Control and Prevention (CCDC). China Disease Surveillance Points 2008 - China CDC. X
China 10 - CHNChinese Center for Disease Control and Prevention (CCDC). China Disease Surveillance Points 2009 - China CDC. X
China 11 - CHNChinese Center for Disease Control and Prevention (CCDC). China Disease Surveillance Points 2010 - China CDC. X

China 12 - CHNChinese Center for Disease Control and Prevention (CCDC). China Disease Surveillance Points 2011 - China CDC. X
China 13 - CHNWorld Health Organization (WHO). WHO Mortality Database Version February 2014. Geneva, Switzerland: World Health Organization (WHO), 2014. X
Colombia 01 - COLNational Administrative Department of Statistics (Colombia). Colombia Vital Statistics - Deaths 2008. Bogotá, Colombia: National Administrative Department of Statistics (Colombia).
X
Colombia 02 - COLWorld Health Organization (WHO). WHO Mortality Database Version February 2014. Geneva, Switzerland: World Health Organization (WHO), 2014. X
Costa Rica 01 - CRIWorld Health Organization (WHO). WHO Mortality Database Version February 2014. Geneva, Switzerland: World Health Organization (WHO), 2014. X
Croatia 01 - HRVWorld Health Organization (WHO). WHO Mortality Database Version February 2014. Geneva, Switzerland: World Health Organization (WHO), 2014. X
Cuba 01 - CUBWorld Health Organization (WHO). WHO Mortality Database Version February 2014. Geneva, Switzerland: World Health Organization (WHO), 2014. X
Cyprus 01 - CYPWorld Health Organization (WHO). WHO Mortality Database Version February 2014. Geneva, Switzerland: World Health Organization (WHO), 2014. X
Czech Republic 01 - CZEWorld Health Organization (WHO). WHO Mortality Database Version February 2014. Geneva, Switzerland: World Health Organization (WHO), 2014. X
Democratic Republic of the Congo
01 - CODCoghlan B, Brennan RJ, Ngoy P, Dofara D, Otto B, Clements M, Stewart T. Mortality in the Democratic Republic of Congo: a nationwide survey. Lancet. 2006; 367(9504): 44-51.
X
Democratic Republic of the Congo
02 - COD
Delacollette C, Van der Stuyft P, Molima K, Delacollette-Lebrun C, Wery M. Etude de la mortalité globale et de la mortalité liée au paludisme dans le Kivu montagneux, Zaïre. Rev Epidemiol Sante Publique. 1989; 37(2): 161-6. X
Democratic Republic of the Congo
03 - CODGarenne M, Willie D, Maire B, Fontaine O, Eeckels R, Briend A, Van den Broeck J. Incidence and duration of severe wasting in two African populations. Public Health Nutr. 2009; 12(11): 1974-82.
X
Democratic Republic of the Congo
04 - CODVan Den Broeck J, Eeckels R, Vuylsteke J. Influence of nutritional status on child mortality in rural Zaire. Lancet. 1993; 341(8859): 1491-5. X
Denmark 01 - DNKWorld Health Organization (WHO). WHO Mortality Database Version February 2014. Geneva, Switzerland: World Health Organization (WHO), 2014. X
Dominica 01 - DMAWorld Health Organization (WHO). WHO Mortality Database Version February 2014. Geneva, Switzerland: World Health Organization (WHO), 2014. X
Dominican Republic 01 - DOM
World Health Organization (WHO). WHO Mortality Database Version February 2014. Geneva, Switzerland: World Health Organization (WHO), 2014. X
Eastern Cape 01 - ZECDepartment of Home Affairs (South Africa), Statistics South Africa. South Africa Mortality and Causes of Death 1997-2005. Pretoria, South Africa: Statistics South Africa.
X
Ecuador 01 - ECUWorld Health Organization (WHO). WHO Mortality Database Version February 2014. Geneva, Switzerland: World Health Organization (WHO), 2014. X
Egypt 01 - EGYWorld Health Organization (WHO). WHO Mortality Database Version February 2014. Geneva, Switzerland: World Health Organization (WHO), 2014. X
El Salvador 01 - SLVWorld Health Organization (WHO). WHO Mortality Database Version February 2014. Geneva, Switzerland: World Health Organization (WHO), 2014. X
Estonia 01 - ESTWorld Health Organization (WHO). WHO Mortality Database Version February 2014. Geneva, Switzerland: World Health Organization (WHO), 2014. X
Ethiopia 01 - ETHDeribew A, Tessema F, Girma B. Determinants of under-five mortality in Gilgel Gibe Field Research Center, Southwest Ethiopia. Ethiopian Journal of Health Development. 2007; 21(2): 117-24.
X
Ethiopia 02 - ETH
Fantahun M, Fottrell E, Berhane Y, Wall S, Högberg U, Byass P. Assessing a new approach to verbal autopsy interpretation in a rural Ethiopian community: the InterVA model. Bull World Health Organ. 2006; 84(3): 204-10. X
Ethiopia 03 - ETHINDEPTH. Ethiopia - Butajira Health and Demographic Surveillance System.
X

Ethiopia 04 - ETH
Weldearegawi B, Ashebir Y, Gebeye E, Gebregziabiher T, Yohannes M, Mussa S, Berhe H, Abebe Z. Emerging chronic non-communicable diseases in rural communities of Northern Ethiopia: evidence using population-based verbal autopsy method in Kilite Awlaelo surveillance site. <em>Health Policy Plan</em>. 2013. [Epub ahead of print]
X
Ethiopia 05 - ETH
World Health Organization (WHO). Deployment of artemetherlumefantrine with rapid diagnostic tests at community level, Raya Valley, Tigray, Ethiopia. Geneva, Switzerland: World Health Organization (WHO), 2009. X
Fiji 01 - FJIWorld Health Organization (WHO). WHO Mortality Database Version February 2014. Geneva, Switzerland: World Health Organization (WHO), 2014. X
Finland 01 - FINWorld Health Organization (WHO). WHO Mortality Database Version February 2014. Geneva, Switzerland: World Health Organization (WHO), 2014. X
France 01 - FRAWorld Health Organization (WHO). WHO Mortality Database Version February 2014. Geneva, Switzerland: World Health Organization (WHO), 2014. X
Free State 01 - ZFSDepartment of Home Affairs (South Africa), Statistics South Africa. South Africa Mortality and Causes of Death 1997-2005. Pretoria, South Africa: Statistics South Africa.
X
Gauteng 01 - ZGADepartment of Home Affairs (South Africa), Statistics South Africa. South Africa Mortality and Causes of Death 1997-2005. Pretoria, South Africa: Statistics South Africa.
X
Georgia 01 - GEOWorld Health Organization (WHO). WHO Mortality Database Version February 2014. Geneva, Switzerland: World Health Organization (WHO), 2014. X
Germany 01 - DEUWorld Health Organization (WHO). WHO Mortality Database Version February 2014. Geneva, Switzerland: World Health Organization (WHO), 2014. X
Ghana 01 - GHABawah AA, Binka FN. How many years of life could be saved if malaria were eliminated from a hyperendemic area of northern Ghana?. Am J Trop Med Hyg. 2007; 77(6 Suppl): 145-52.
X
Ghana 02 - GHA
Binka FN, Kubaje A, Adjuik M, Williams LA, Lengeler C, Maude GH, Armah GE, Kajihara B, Adiamah JH, Smith PG. Impact of permethrin impregnated bednets on child mortality in Kassena-Nankana district, Ghana: a randomized controlled trial. Trop Med Int Health. 1996; 1(2): 147-54.
X
Ghana 03 - GHABirths and Deaths Registry (Ghana). Ghana - Accra Births and Deaths Registry - Deaths 2000-2007. X
Ghana 04 - GHA
Ghana Statistical Service, Ghana Health Service, Macro International, Inc. Ghana Special Demographic and Health Survey 2007-2008. Calverton, United States: Macro International, Inc., 2010. X
Ghana 05 - GHAGhana VAST Study Team. Vitamin A supplementation in northern Ghana: effects on clinic attendances, hospital admissions, and child mortality. Lancet. 1993; 342(8862): 7-12.
X
Ghana 06 - GHA
Hurt L, ten Asbroek A, Amenga-Etego S, Zandoh C, Danso S, Edmond K, Hurt C, Tawiah C, Hill Z, Fenty J, Owusu-Agyei S, Campbell OM, Kirkwood BR. Effect of vitamin A supplementation on cause-specific mortality in women of reproductive age in Ghana: a secondary analysis from the ObaapaVitA trial. Bull World Health Organ. 2013; 91(1): 19-27.
X
Ghana 07 - GHAINDEPTH. Ghana - Navrongo Health and Demographic Surveillance System.
X
Ghana 08 - GHA
Manortney S, Carey A, Ansong D, Harvey R, Good B, Boaheng J, Crookston B, Dickerson T. Verbal autopsy: an analysis of the common causes of childhood death in the Barekese sub-district of Ghana. Journal of Public Health in Africa. 2011; 2(e18): 73-7.
X
Ghana 09 - GHAMills S, Williams JE, Wak G, Hodgson A. Maternal mortality decline in the Kassena-Nankana district of northern Ghana. Matern Child Health J. 2008; 12(5): 577-85.
X
Greece 01 - GRCWorld Health Organization (WHO). WHO Mortality Database Version February 2014. Geneva, Switzerland: World Health Organization (WHO), 2014. X
Grenada 01 - GRDWorld Health Organization (WHO). WHO Mortality Database Version February 2014. Geneva, Switzerland: World Health Organization (WHO), 2014. X
Guatemala 01 - GTMWorld Health Organization (WHO). WHO Mortality Database Version February 2014. Geneva, Switzerland: World Health Organization (WHO), 2014. X

Guinea 01 - GINBasic Support for Institutionalizing Child Survival (BASICS), Save the Children USA. Guinea - Mandiana Mortality Study 1998-1999. 2002. X
Guinea-Bissau 01 - GNB
Roth A, Gustafson P, Nhaga A, Djana Q, Poulsen A, Garly ML, Jensen H, Sodemann M, Rodriques A, Aaby P. BCG vaccination scar associated with better childhood survival in Guinea-Bissau. Int J Epidemiol. 2005; 34(3): 540-7. X
Guyana 01 - GUYWorld Health Organization (WHO). WHO Mortality Database Version February 2014. Geneva, Switzerland: World Health Organization (WHO), 2014. X
Haiti 01 - HTIWorld Health Organization (WHO). WHO Mortality Database Version February 2014. Geneva, Switzerland: World Health Organization (WHO), 2014. X
Honduras 01 - HNDWorld Health Organization (WHO). WHO Mortality Database Version February 2014. Geneva, Switzerland: World Health Organization (WHO), 2014. X
Hungary 01 - HUNWorld Health Organization (WHO). WHO Mortality Database Version February 2014. Geneva, Switzerland: World Health Organization (WHO), 2014. X
Iceland 01 - ISLWorld Health Organization (WHO). WHO Mortality Database Version February 2014. Geneva, Switzerland: World Health Organization (WHO), 2014. X
India 01 - IND
Bassani DG, Kumar R, Awasthi S, Morris SK, Paul VK, Shet A, Ram U, Gaffey MF, Black RE, Jha P. Causes of neonatal and child mortality in India: a nationally representative mortality survey. Lancet. 2010; 376(9755): 1853-60. X
India 02 - IND
Byrraju Foundation, Centre for Chronic Disease Control (India), Cooperative for Assistance and Relief Everywhere (CARE), School of Population Health, University of Queensland (Australia). India - Andhra Pradesh Rural Health Initiative.
X
India 03 - IND
Dhingra N, Jha P, Sharma VP, Cohen AA, Jotkar RM, Rodriguez PS, Bassani DG,Suraweera W, Laxminarayan R, Peto R. Adult and child malaria mortality in Indiaa nationally representative mortality survey. Lancet. 2010; 376(9754): 1768-74. X
India 04 - INDIndian Council of Medical Research (ICMR). India Study on Causes of Death by Verbal Autopsy 2003. X
India 05 - INDInstitute of Health Systems (India). India Cause of Death Dataset Version 1.3 1980-1998. Hyperabad, India: Institute of Health Systems (India), 2002. X
India 06 - INDInternational Institute for Population Sciences (IIPS) (India), Macro International, Inc. India Demographic and Health Survey 1998-1999. Calverton, United States: Macro International, Inc.
X
India 07 - INDInternational Institute for Population Sciences (IIPS). India Demographic and Health Survey 1992-1993. Bombay, India: International Institute for Population Sciences (IIPS).
X
India 08 - INDKumar V, Datta N, Wadhwa SS, Singhi S. Morbidity and mortality in diarrhea in rural Haryana Indian. Indian J Pediatr. 1985; 52(418): 455-61. X
India 09 - INDMinistry of Health and Family Welfare (India), Office of the Registrar General andCensus Commissioner (India). India Special Survey of Deaths 2004. X
India 10 - IND
Morris SK, Bassani DG, Awasthi S, Kumar R, Shet A, Suraweera W, Jha P. Diarrhea, Pneumonia, and Infectious Disease Mortality in Children Aged 5 to 14 Years in India. PLoS One. 2011; 6(5): e20119. X
India 11 - INDOffice of the Registrar General & Census Commissioner (India). India Vital Statistics 1980. New Delhi, India: Office of the Registrar General & Census Commissioner (India).
X
India 12 - INDOffice of the Registrar General & Census Commissioner (India). India Vital Statistics 1981. New Delhi, India: Office of the Registrar General & Census Commissioner (India).
X
India 13 - INDOffice of the Registrar General & Census Commissioner (India). India Vital Statistics 1982. New Delhi, India: Office of the Registrar General & Census Commissioner (India).
X
India 14 - INDOffice of the Registrar General & Census Commissioner (India). India Vital Statistics 1983. New Delhi, India: Office of the Registrar General & Census Commissioner (India).
X
India 15 - INDOffice of the Registrar General & Census Commissioner (India). India Vital Statistics 1986. New Delhi, India: Office of the Registrar General & Census Commissioner (India).
X
India 16 - INDOffice of the Registrar General & Census Commissioner (India). India Vital Statistics 1987. New Delhi, India: Office of the Registrar General & Census Commissioner (India).
X

India 17 - INDOffice of the Registrar General & Census Commissioner (India). India Vital Statistics 1988. New Delhi, India: Office of the Registrar General & Census Commissioner (India).
X
India 18 - INDOffice of the Registrar General & Census Commissioner (India). India Vital Statistics 1989. New Delhi, India: Office of the Registrar General & Census Commissioner (India).
X
India 19 - INDOffice of the Registrar General and Census Commissioner (India). India MCCD Vital Statistics - Deaths 1990-1998. X
India 20 - INDOffice of the Registrar General and Census Commissioner (India). India MCCD Vital Statistics - Deaths 1999-2001. X
India 21 - IND
Office of the Registrar General and Census Commissioner (India). India Medical Certification of Cause of Death Report 2002. New Delhi, India: Office of the Registrar General and Census Commissioner (India), 2009. X
India 22 - IND
Office of the Registrar General and Census Commissioner (India). India Medical Certification of Cause of Death Report 2003. New Delhi, India: Office of the Registrar General and Census Commissioner (India), 2009. X
India 23 - IND
Office of the Registrar General and Census Commissioner (India). India Medical Certification of Cause of Death Report 2004. New Delhi, India: Office of the Registrar General and Census Commissioner (India), 2009. X
India 24 - IND
Office of the Registrar General and Census Commissioner (India). India Medical Certification of Cause of Death Report 2005. New Delhi, India: Office of the Registrar General and Census Commissioner (India), 2012. X
India 25 - IND
Office of the Registrar General and Census Commissioner (India). India Medical Certification of Cause of Death Report 2006. New Delhi, India: Office of the Registrar General and Census Commissioner (India), 2012. X
India 26 - IND
Office of the Registrar General and Census Commissioner (India). India Medical Certification of Cause of Death Report 2008. New Delhi, India: Office of the Registrar General and Census Commissioner (India), 2013. X
Indonesia 01 - IDNAnwar Z, Djamil H, Pardede N, Ismail R. The pattern of the causes of death in children in rural swampy area of South Sumatra, Indonesia. Paediatr Indones. 1987; 27(6-May): 93-8.
X
Indonesia 02 - IDN
National Institute of Health Research and Development (NIHRD), Ministry of Health (Indonesia). Indonesia Sample Registration System 2012, Indonesia Cause of Death Survey 2010-2011, Indonesia Mortality Registration System Strengthening Project (IMRSSP), and Indonesia Basic Health Research 2007-2008.
X
Iran 01 - IRNMinistry of Health and Medical Education (Iran). Iran Vital Registration - Deaths 2007. X
Iran 02 - IRNMinistry of Health and Medical Education (Iran). Iran Vital Registration - Deaths 2008. X
Iran 03 - IRNMinistry of Health and Medical Education (Iran). Iran Vital Registration - Deaths 2009. X
Iran 04 - IRNMinistry of Health and Medical Education (Iran). Iran Vital Registration - Deaths 2010. X
Iran 05 - IRNWorld Health Organization (WHO). WHO Mortality Database Version February 2014. Geneva, Switzerland: World Health Organization (WHO), 2014. X
Iraq 01 - IRQWorld Health Organization (WHO). WHO Mortality Database Version February 2014. Geneva, Switzerland: World Health Organization (WHO), 2014. X
Ireland 01 - IRLWorld Health Organization (WHO). WHO Mortality Database Version February 2014. Geneva, Switzerland: World Health Organization (WHO), 2014. X
Israel 01 - ISRWorld Health Organization (WHO). WHO Mortality Database Version February 2014. Geneva, Switzerland: World Health Organization (WHO), 2014. X
Italy 01 - ITAWorld Health Organization (WHO). WHO Mortality Database Version February 2014. Geneva, Switzerland: World Health Organization (WHO), 2014. X
Jamaica 01 - JAMWorld Health Organization (WHO). WHO Mortality Database Version February 2014. Geneva, Switzerland: World Health Organization (WHO), 2014. X
Japan 01 - JPNWorld Health Organization (WHO). WHO Mortality Database Version February 2014. Geneva, Switzerland: World Health Organization (WHO), 2014. X

Jordan 01 - JORWorld Health Organization (WHO). WHO Mortality Database Version February 2014. Geneva, Switzerland: World Health Organization (WHO), 2014. X
Kazakhstan 01 - KAZWorld Health Organization (WHO). WHO Mortality Database Version February 2014. Geneva, Switzerland: World Health Organization (WHO), 2014. X
Kenya 01 - KEN
Hamel MJ, Adazu K, Obor D, Sewe M, Vulule J, Williamson JM, Slutsker L, Feikin DR, Laserson KF. A reversal in reductions of child mortality in western Kenya, 2003-2009. Am J Trop Med Hyg. 2011; 85(4): 597-605. X
Kenya 02 - KENINDEPTH. Kenya - Kisumu Health and Demographic Surveillance System.
X
Kenya 03 - KENINDEPTH. Kenya - Nairobi Health and Demographic Surveillance System.
X
Kenya 04 - KENMirza NM, Macharia WM, Wafula EM, Agwanda R, Onyango FE. Mortality patterns in a rural Kenyan community. East Afr Med J. 1990; 67(11): 823-9. X
Kenya 05 - KEN
Oti SO, Kyobutungi C. Verbal autopsy interpretation: a comparative analysis of the InterVA model versus physician review in determining causes of death in the Nairobi DSS. Popul Health Metr. 2010; 8: 21. X
Kenya 06 - KEN
Rowe AK, Rowe SY, Snow RW, Korenromp EL, Schellenberg JR, Stein C, Nahlen BL, Bryce J, Black RE, Steketee RW. The burden of malaria mortality among African children in the year 2000. Int J Epidemiol. 2006; 35(3): 691-704. X
Kenya 07 - KEN
van Eijk AM, Adazu K, Ofware P, Vulule J, Hamel M, Slutsker L. Causes of deaths using verbal autopsy among adolescents and adults in rural western Kenya. Trop Med Int Health. 2008; 13(10): 1314-24. X
Kiribati 01 - KIRWorld Health Organization (WHO). WHO Mortality Database Version February 2014. Geneva, Switzerland: World Health Organization (WHO), 2014. X
Kuwait 01 - KWTWorld Health Organization (WHO). WHO Mortality Database Version February 2014. Geneva, Switzerland: World Health Organization (WHO), 2014. X
KwaZulu-Natal 01 - ZKNDepartment of Home Affairs (South Africa), Statistics South Africa. South Africa Mortality and Causes of Death 1997-2005. Pretoria, South Africa: Statistics South Africa.
X
Kyrgyzstan 01 - KGZWorld Health Organization (WHO). WHO Mortality Database Version February 2014. Geneva, Switzerland: World Health Organization (WHO), 2014. X
Latvia 01 - LVAWorld Health Organization (WHO). WHO Mortality Database Version February 2014. Geneva, Switzerland: World Health Organization (WHO), 2014. X
Limpopo 01 - ZLIDepartment of Home Affairs (South Africa), Statistics South Africa. South Africa Mortality and Causes of Death 1997-2005. Pretoria, South Africa: Statistics South Africa.
X
Lithuania 01 - LTUWorld Health Organization (WHO). WHO Mortality Database Version February 2014. Geneva, Switzerland: World Health Organization (WHO), 2014. X
Luxembourg 01 - LUXWorld Health Organization (WHO). WHO Mortality Database Version February 2014. Geneva, Switzerland: World Health Organization (WHO), 2014. X
Macedonia 01 - MKDWorld Health Organization (WHO). WHO Mortality Database Version February 2014. Geneva, Switzerland: World Health Organization (WHO), 2014. X
Madagascar 01 - MDGPopulation and Development Research Center (CEPED) (France). Madagascar - Antananorivo Mortality Report 1984-1995. X
Malawi 01 - MWIChecchi F, Nyasulu P, Chandramohan D, Roberts B. Rates and causes of death in Chiradzulu District, Malawi, 2008: a key informant study. Trop Med Int Health. 2011; 16(3): 375-8.
X
Malawi 02 - MWI
Chihana M, Floyd S, Molesworth A, Crampin AC, Kayuni N, Price A, Zaba B, Jahn A, Mvula H, Dube A, Ngwira B, Glynn JR, French N. Adult mortality and probable cause of death in rural northern Malawi in the era of HIV treatment. TropMed Int Health. 2012; 17(8): E74-83.
X
Malawi 03 - MWI
Jahn A, Floyd S, Crampin AC, Mvula H, Mwinuka V, Mwaiyeghele E, McGrath N, Zaba B, Fine PEM, Glynn JR. Declining child mortality in northern Malawi despite high rates of infection with HIV. Bull World Health Organ. 2010; 88: 746-53.
X

Malawi 04 - MWI
Slutsker L, Bloland P, Steketee RW, Wirima JJ, Heymann DL, Breman JG. Infant and second-year mortality in rural Malawi: causes and descriptive epidemiology. Am J Trop Med Hyg. 1996; 55(1 Suppl): 77-81. X
Malaysia 01 - MYSDepartment of Statistics (Malaysia).Vital Statistics: West Malaysia 1969. Kuala Lumpur, Malaysia:Department of Statistics (Malaysia), 1971. X
Malaysia 02 - MYSWorld Health Organization (WHO). WHO Mortality Database Version February 2014. Geneva, Switzerland: World Health Organization (WHO), 2014. X
Maldives 01 - MDVWorld Health Organization (WHO). WHO Mortality Database Version February 2014. Geneva, Switzerland: World Health Organization (WHO), 2014. X
Mali 01 - MLINational Institute for Demographic Studies (France), Sahel Institute. Mali Twelve Years of Urban Mortality in the Sahel 1974-1985. 1988. X
Malta 01 - MLTWorld Health Organization (WHO). WHO Mortality Database Version February 2014. Geneva, Switzerland: World Health Organization (WHO), 2014. X
Mauritius 01 - MUSWorld Health Organization (WHO). WHO Mortality Database Version February 2014. Geneva, Switzerland: World Health Organization (WHO), 2014. X
Mexico 01 - MEXMinistry of Health (Mexico), National Institute of Statistics and Geography (Mexico). Mexico Vital Registration - Deaths 1980 . X
Mexico 02 - MEXMinistry of Health (Mexico), National Institute of Statistics and Geography (Mexico). Mexico Vital Registration - Deaths 1981 . X
Mexico 03 - MEXMinistry of Health (Mexico), National Institute of Statistics and Geography (Mexico). Mexico Vital Registration - Deaths 1982. X
Mexico 04 - MEXMinistry of Health (Mexico), National Institute of Statistics and Geography (Mexico). Mexico Vital Registration - Deaths 1983. X
Mexico 05 - MEXMinistry of Health (Mexico), National Institute of Statistics and Geography (Mexico). Mexico Vital Registration - Deaths 1984. X
Mexico 06 - MEXMinistry of Health (Mexico), National Institute of Statistics and Geography (Mexico). Mexico Vital Registration - Deaths 1985. X
Mexico 07 - MEXMinistry of Health (Mexico), National Institute of Statistics and Geography (Mexico). Mexico Vital Registration - Deaths 1986. X
Mexico 08 - MEXMinistry of Health (Mexico), National Institute of Statistics and Geography (Mexico). Mexico Vital Registration - Deaths 1987. X
Mexico 09 - MEXMinistry of Health (Mexico), National Institute of Statistics and Geography (Mexico). Mexico Vital Registration - Deaths 1988. X
Mexico 10 - MEXMinistry of Health (Mexico), National Institute of Statistics and Geography (Mexico). Mexico Vital Registration - Deaths 1989. X
Mexico 11 - MEXMinistry of Health (Mexico), National Institute of Statistics and Geography (Mexico). Mexico Vital Registration - Deaths 1990. X
Mexico 12 - MEXMinistry of Health (Mexico), National Institute of Statistics and Geography (Mexico). Mexico Vital Registration - Deaths 1991. X
Mexico 13 - MEXMinistry of Health (Mexico), National Institute of Statistics and Geography (Mexico). Mexico Vital Registration - Deaths 1992. X
Mexico 14 - MEXMinistry of Health (Mexico), National Institute of Statistics and Geography (Mexico). Mexico Vital Registration - Deaths 1993. X
Mexico 15 - MEXMinistry of Health (Mexico), National Institute of Statistics and Geography (Mexico). Mexico Vital Registration - Deaths 1994. X
Mexico 16 - MEXMinistry of Health (Mexico), National Institute of Statistics and Geography (Mexico). Mexico Vital Registration - Deaths 1995. X
Mexico 17 - MEXMinistry of Health (Mexico), National Institute of Statistics and Geography (Mexico). Mexico Vital Registration - Deaths 1996. X
Mexico 18 - MEXMinistry of Health (Mexico), National Institute of Statistics and Geography (Mexico). Mexico Vital Registration - Deaths 1997. X
Mexico 19 - MEXMinistry of Health (Mexico), National Institute of Statistics and Geography (Mexico). Mexico Vital Registration - Deaths 1998. X
Mexico 20 - MEXMinistry of Health (Mexico), National Institute of Statistics and Geography (Mexico). Mexico Vital Registration - Deaths 1999. X
Mexico 21 - MEXMinistry of Health (Mexico), National Institute of Statistics and Geography (Mexico). Mexico Vital Registration - Deaths 2000. X
Mexico 22 - MEXMinistry of Health (Mexico), National Institute of Statistics and Geography (Mexico). Mexico Vital Registration - Deaths 2001. X
Mexico 23 - MEXMinistry of Health (Mexico), National Institute of Statistics and Geography (Mexico). Mexico Vital Registration - Deaths 2002. X
Mexico 24 - MEXMinistry of Health (Mexico), National Institute of Statistics and Geography (Mexico). Mexico Vital Registration - Deaths 2003. X
Mexico 25 - MEXMinistry of Health (Mexico), National Institute of Statistics and Geography (Mexico). Mexico Vital Registration - Deaths 2004. X

Mexico 26 - MEXMinistry of Health (Mexico), National Institute of Statistics and Geography (Mexico). Mexico Vital Registration - Deaths 2005. X
Mexico 27 - MEXMinistry of Health (Mexico), National Institute of Statistics and Geography (Mexico). Mexico Vital Registration - Deaths 2006. X
Mexico 28 - MEXMinistry of Health (Mexico), National Institute of Statistics and Geography (Mexico). Mexico Vital Registration - Deaths 2007. X
Mexico 29 - MEXMinistry of Health (Mexico), National Institute of Statistics and Geography (Mexico). Mexico Vital Registration - Deaths 2008. X
Mexico 30 - MEXMinistry of Health (Mexico), National Institute of Statistics and Geography (Mexico). Mexico Vital Registration - Deaths 2010. X
Mexico 31 - MEXMinistry of Health (Mexico), National Institute of Statistics and Geography (Mexico). Mexico Vital Registration - Deaths 2011. X
Mexico 32 - MEXNational Institute of Statistics and Geography (Mexico). Mexico Vital Registration- Deaths 2012. X
Mexico 33 - MEXNational Institute of Statistics and Geography (Mexico). Mexico Vital Statistics - Deaths 2009 . X
Moldova 01 - MDAWorld Health Organization (WHO). WHO Mortality Database Version February 2014. Geneva, Switzerland: World Health Organization (WHO), 2014. X
Montenegro 01 - MNEWorld Health Organization (WHO). WHO Mortality Database Version February 2014. Geneva, Switzerland: World Health Organization (WHO), 2014. X
Morocco 01 - MARWorld Health Organization (WHO). WHO Mortality Database Version February 2014. Geneva, Switzerland: World Health Organization (WHO), 2014. X
Mozambique 01 - MOZ
Centers for Disease Control and Prevention (CDC), MEASURE Evaluation Project, Carolina Population Center, University of North Carolina, Ministry of Health (Mozambique), National Statistics Institute (Mozambique), US Census Bureau. Mozambique National Survey on the Causes of Death 2007-2008.
X
Mozambique 02 - MOZINDEPTH. Mozambique - Manhiça Health and Demographic Surveillance System. X
Mozambique 03 - MOZ
Sacarlal J, Nhacolo AQ, Sigaúque B, Nhalungo DA, Abacassamo F, Sacoor CN, Aide P, Machevo S, Nhampossa T, Macete EV, Bassat Q, David C, Bardají A, Letang E, Saúte F, Aponte JJ, Thompson R, Alonso PL. A 10 year study of the cause of death in children under 15 years in Manhiça, Mozambique. BioMed Central Public Health. 2009; 9: 67.
X
Mpumalanga 01 - ZMPDepartment of Home Affairs (South Africa), Statistics South Africa. South Africa Mortality and Causes of Death 1997-2005. Pretoria, South Africa: Statistics South Africa.
X
Myanmar 01 - MMR
Myint, S. Cause of death verification study in Myanmar. Presentation at: World Health Organization Regional Office for South East Asia. Regional Consultation on Mortality Statistics. 2007; New Delhi, India. X
Myanmar 02 - MMR
Ohnmar, Tun-Min, San-Shwe, Than-Win, Chongsuvivatwong V. Effects of malaria volunteer training on coverage and timeliness of diagnosis: a cluster randomized controlled trial in Myanmar. Malar J. 2012; 309. X
Netherlands 01 - NLDWorld Health Organization (WHO). WHO Mortality Database Version February 2014. Geneva, Switzerland: World Health Organization (WHO), 2014. X
New Zealand 01 - NZLWorld Health Organization (WHO). WHO Mortality Database Version February 2014. Geneva, Switzerland: World Health Organization (WHO), 2014. X
Nicaragua 01 - NICWorld Health Organization (WHO). WHO Mortality Database Version February 2014. Geneva, Switzerland: World Health Organization (WHO), 2014. X
Nigeria 01 - NGAEkanem EE, Asindi AA, Okoi OU. Community-based surveillance of paediatric deaths in Cross River State, Nigeria. Tropical and Geographical Medicine. 1994; 46(5): 305-8.
X
Nigeria 02 - NGALawoyin TO. Infant and maternal deaths in rural south west Nigeria: a prospective study. Afr J Med Med Sci. 2007; 36(3): 235-41. X
North-West 01 - ZNWDepartment of Home Affairs (South Africa), Statistics South Africa. South Africa Mortality and Causes of Death 1997-2005. Pretoria, South Africa: Statistics South Africa.
X
Northern Cape 01 - ZNCDepartment of Home Affairs (South Africa), Statistics South Africa. South Africa Mortality and Causes of Death 1997-2005. Pretoria, South Africa: Statistics South Africa.
X
Norway 01 - NORWorld Health Organization (WHO). WHO Mortality Database Version February 2014. Geneva, Switzerland: World Health Organization (WHO), 2014. X

Oman 01 - OMNWorld Health Organization (WHO). WHO Mortality Database Version February 2014. Geneva, Switzerland: World Health Organization (WHO), 2014. X
Pakistan 01 - PAK
Khan AJ, Khan JA, Akbar M, Addiss DG. Acute respiratory infections in children: a case management intervention in Abbottabad District, Pakistan. Bull World Health Organ. 1990; 68(5): 577-85. X
Pakistan 02 - PAKNational Institute of Population Studies (NIPS) (Pakistan), Macro International, Inc. Pakistan Demographic and Health Survey 2006-2007. Calverton, United States: Macro International, Inc.
X
Palestine 01 - PSEWorld Health Organization (WHO). WHO Mortality Database Version February 2014. Geneva, Switzerland: World Health Organization (WHO), 2014. X
Panama 01 - PANWorld Health Organization (WHO). WHO Mortality Database Version February 2014. Geneva, Switzerland: World Health Organization (WHO), 2014. X
Papua New Guinea 01 - PNG
Genton B, al-Yaman F, Beck HP, Hii J, Mellor S, Rare L, Ginny M, Smith T, Alpers MP. The epidemiology of malaria in the Wosera area, East Sepik Province, Papua New Guinea, in preparation for vaccine trials. II. Mortality and morbidity. Ann Trop Med Parasitol. 1995; 89(4): 377-90.
X
Papua New Guinea 02 - PNG
Kakazo M, Lehmann D, Coakley K, Gratten H, Saleu G, Taime J, Riley ID, Alphers MP. Mortality rates and the utilization of health services during terminal illness in the Asaro Valley, Eastern Highlands Province, Papua New Guinea. P N G Med J. 1999; 42(2-Jan): 13-26.
X
Papua New Guinea 03 - PNG
Lehmann D. Demography and causes of death among the Huli in the Tari Basin. P N G Med J. 2002; 45(1-2): 51-62. X
Papua New Guinea 04 - PNG
Moir JS, Garner PA, Heywood PF, Alpers MP. Mortality in a rural area of Madang Province, Papua New Guinea. Ann Trop Med Parasitol. 1989; 83(3): 305-19.
X
Papua New Guinea 05 - PNG
World Health Organization (WHO). WHO Mortality Database Version February 2014. Geneva, Switzerland: World Health Organization (WHO), 2014. X
Paraguay 01 - PRYWorld Health Organization (WHO). WHO Mortality Database Version February 2014. Geneva, Switzerland: World Health Organization (WHO), 2014. X
Peru 01 - PERWorld Health Organization (WHO). WHO Mortality Database Version February 2014. Geneva, Switzerland: World Health Organization (WHO), 2014. X
Philippines 01 - PHL
National Epidemiology Center, Department of Health (Philippines). Philippines Field Health Service Information System Annual Report 1993. Manila, Philippines: National Epidemiology Center, Department of Health (Philippines). X
Philippines 02 - PHLWorld Health Organization (WHO). WHO Mortality Database Version February 2014. Geneva, Switzerland: World Health Organization (WHO), 2014. X
Poland 01 - POLWorld Health Organization (WHO). WHO Mortality Database Version February 2014. Geneva, Switzerland: World Health Organization (WHO), 2014. X
Portugal 01 - PRTWorld Health Organization (WHO). WHO Mortality Database Version February 2014. Geneva, Switzerland: World Health Organization (WHO), 2014. X
Puerto Rico 01 - PRIWorld Health Organization (WHO). WHO Mortality Database Version February 2014. Geneva, Switzerland: World Health Organization (WHO), 2014. X
Qatar 01 - QATWorld Health Organization (WHO). WHO Mortality Database Version February 2014. Geneva, Switzerland: World Health Organization (WHO), 2014. X
Romania 01 - ROUWorld Health Organization (WHO). WHO Mortality Database Version February 2014. Geneva, Switzerland: World Health Organization (WHO), 2014. X
Russia 01 - RUS
Center for Demographic Research, New Economic School (Russia). Russia Mortality Rates by Region, Age, Sex, and Cause of Death 1989-1998. Moscow, Russia: Center for Demographic Research, New Economic School (Russia). X
Russia 02 - RUSWorld Health Organization (WHO). WHO Mortality Database Version February 2014. Geneva, Switzerland: World Health Organization (WHO), 2014. X
Saint Lucia 01 - LCAWorld Health Organization (WHO). WHO Mortality Database Version February 2014. Geneva, Switzerland: World Health Organization (WHO), 2014. X

Saint Vincent and the Grenadines 01 - VCT
World Health Organization (WHO). WHO Mortality Database Version February 2014. Geneva, Switzerland: World Health Organization (WHO), 2014. X
Sao Tome and Principe 01 - STP
World Health Organization (WHO). WHO Mortality Database Version February 2014. Geneva, Switzerland: World Health Organization (WHO), 2014. X
Senegal 01 - SEN
Etard JF, Le Hesran JY, Diallo A, Diallo JP, Ndiaye JL, Delaunay V. Childhood mortality and probable causes of death using verbal autopsy in Niakhar, Senegal, 1989-2000. Int J Epidemiol. 2004; 33(6): 1286-92. X
Senegal 02 - SENGarenne M, Willie D, Maire B, Fontaine O, Eeckels R, Briend A, Van den Broeck J. Incidence and duration of severe wasting in two African populations. Public Health Nutr. 2009; 12(11): 1974-82.
X
Senegal 03 - SEN
Population and Development Research Center (CEPED) (France). Senegal - Niakhar Risk of death associated with different nutritional states in children preschool age. Population and Development Research Center (CEPED) (France). X
Senegal 04 - SEN
Trape JF, Pison G, Preziosi MP, Enel C, Desgrées du Loû A, Delaunay V, Samb B, Lagarde E, Molez JF, Simondon F. Impact of chloroquine resistance on malaria mortality. Comptes Rendus de l'Académie des Sciences - Series III - Sciences de laVie. 1998; 321(8): 689-97.
X
Serbia 01 - SRBWorld Health Organization (WHO). WHO Mortality Database Version February 2014. Geneva, Switzerland: World Health Organization (WHO), 2014. X
Seychelles 01 - SYCWorld Health Organization (WHO). WHO Mortality Database Version February 2014. Geneva, Switzerland: World Health Organization (WHO), 2014. X
Sierra Leone 01 - SLEAmin R. Immunization coverage and child mortality in two rural districts of Sierra Leone. Soc Sci Med. 1996; 42(11): 1599-604. X
Sierra Leone 02 - SLEBarnish G, Maude GH, Bockarie MJ, Eggelte TA, Greenwood BM, Ceesay S. Malaria in a rural area of Sierra Leone. I. Initial results. Ann Trop Med Parasitol. 1993; 87(2): 125-36.
X
Singapore 01 - SGPWorld Health Organization (WHO). WHO Mortality Database Version February 2014. Geneva, Switzerland: World Health Organization (WHO), 2014. X
Slovakia 01 - SVKWorld Health Organization (WHO). WHO Mortality Database Version February 2014. Geneva, Switzerland: World Health Organization (WHO), 2014. X
Slovenia 01 - SVNWorld Health Organization (WHO). WHO Mortality Database Version February 2014. Geneva, Switzerland: World Health Organization (WHO), 2014. X
South Africa 01 - ZAFKahn K, Tollman SM, Garenne M, Gear JS. Validation and application of verbal autopsies in a rural area of South Africa. Trop Med Int Health. 2000; 5(11): 824-31.
X
South Africa 02 - ZAFMRC/Wits Rural Public Health and Health Transitions Research Unit (Agincourt), INDEPTH. South Africa - Agincourt Health and Socio-Demographic Surveillance System.
X
South Africa 03 - ZAFMuhwava W. Contributions of the Africa Centre Demographic Surveillance to the Community. <em>Umbiko</em>. 2007; 12. 3-4. X
South Africa 04 - ZAFWorld Health Organization (WHO). WHO Mortality Database Version February 2014. Geneva, Switzerland: World Health Organization (WHO), 2014. X
South Korea 01 - KORWorld Health Organization (WHO). WHO Mortality Database Version February 2014. Geneva, Switzerland: World Health Organization (WHO), 2014. X
Spain 01 - ESPWorld Health Organization (WHO). WHO Mortality Database Version February 2014. Geneva, Switzerland: World Health Organization (WHO), 2014. X
Sri Lanka 01 - LKARegistrar General’s Department (Sri Lanka). Sri Lanka Vital Statistics - Deaths 1993-1996. X
Sri Lanka 02 - LKAWorld Health Organization (WHO). WHO Mortality Database Version February 2014. Geneva, Switzerland: World Health Organization (WHO), 2014. X
Suriname 01 - SURWorld Health Organization (WHO). WHO Mortality Database Version February 2014. Geneva, Switzerland: World Health Organization (WHO), 2014. X
Sweden 01 - SWEWorld Health Organization (WHO). WHO Mortality Database Version February 2014. Geneva, Switzerland: World Health Organization (WHO), 2014. X
Switzerland 01 - CHEWorld Health Organization (WHO). WHO Mortality Database Version February 2014. Geneva, Switzerland: World Health Organization (WHO), 2014. X

Syria 01 - SYRWorld Health Organization (WHO). WHO Mortality Database Version February 2014. Geneva, Switzerland: World Health Organization (WHO), 2014. X
Taiwan 01 - TWNDepartment of Health (Taiwan). Taiwan Statistics of Causes of Death 2008.
X
Taiwan 02 - TWNDepartment of Health (Taiwan). Taiwan Statistics of Causes of Death 2009.
X
Taiwan 03 - TWNDepartment of Health (Taiwan). Taiwan Statistics of Causes of Death 2010.
X
Taiwan 04 - TWNDepartment of Health (Taiwan). Taiwan Statistics of Causes of Death 2011.
X
Taiwan 05 - TWNDepartment of Health (Taiwan). Taiwan Statistics of Causes of Death 2012.
X
Taiwan 06 - TWNDepartment of Health (Taiwan). Taiwan Vital Statistics - Deaths 2007.
X
Tajikistan 01 - TJKUnited Nations Children's Fund (UNICEF). Tajikistan Infant Mortality Report 2001-2003. X
Tajikistan 02 - TJKWorld Health Organization (WHO). WHO Mortality Database Version February 2014. Geneva, Switzerland: World Health Organization (WHO), 2014. X
Tanzania 01 - TZAAe-Ngibise KA, Masanja H, Kellerman R, Owusu-Agyei S. Risk factors for injury mortality in rural Tanzania: a secondary data analysis. BMJ Open. 2012; 2(6): e001721.
X
Tanzania 02 - TZAINDEPTH. Tanzania - Ifakara Health and Demographic Surveillance System.
X
Tanzania 03 - TZAINDEPTH. Tanzania - Rufiji Health and Demographic Surveillance System.
X
Tanzania 04 - TZA
Illah E, Mbaruku G, Masanja H, Kahn K. Causes and risk factors for maternal mortality in rural Tanzania--case of Rufiji Health and Demographic Surveillance Site (HDSS). Afr J Reprod Health. 2013; 17(3): 119-30. .
X
Tanzania 05 - TZA
Kaatano GM, Mashauri FM, Kinung'hi SM, Mwanga JR, Malima RC, Kishamawe C, Nnko SE, Magesa SM, Mboera LE. Patterns of malaria related mortality based on verbal autopsy in Muleba District, north-western Tanzania. Tanzan J Health Res. 2009; 11(4): 210-8.
X
Tanzania 06 - TZA
Kamara MK. Clustering of mortality among children under five years due to malaria at the Ifakara Demographic Surveillance Site in Tanzania [Dissertation]. [Johannesburg]: <span dir="ltr">University of the Witwatersrand; 2008. X
Tanzania 07 - TZA
Ministry of Health and Social Welfare (Tanzania), Newcastle University, UK Department for International Development (DFID). Tanzania Policy Implications of Mortality Burden 1995-2001. X
Tanzania 08 - TZAMtango FD, Neuvians D, Broome CV, Hightower AW, Pio A. Risk factors for deaths in children under 5 years old in Bagamoyo district, Tanzania. Trop Med Parasitol. 1992; 43(4): 229-33.
X
Tanzania 09 - TZA
Narah-Bana, S. Risk Factors and Causes of Adult Deaths in the Ifakara Health and Demographic Surveillance System Population, 2003-2007 [dissertation]. [Johannesburg, South Africa]: University of the Witwatersrand; 2010. 174 p. X
Tanzania 10 - TZA
Narh-Bana SA, Chirwa TF, Mwanyangala MA, Nathan R. Muertes de adultos y el futuro: Un análisis causa-específico de las muertes de adultos de un estudio longitudinal en Tanzania rural 2003-2007. Trop Med Int Health. 2012; 17(11): 1396-404.
X
Tanzania 11 - TZA
Premji Z, Ndayanga P, Shiff C, Minjas J, Lubega P, MacLeod J. Community basedstudies on childhood mortality in a malaria holoendemic area on the Tanzanian coast. Acta Trop. 1997; 63(2-3): 101-9. X
Tanzania 12 - TZASalum FM, Wilkes TJ, Kivumbi K, Curtis CF. Mortality of under-fives in a rural area of holoendemic malaria transmission. Acta Trop. 1994; 58(1): 29-34. X
Tanzania 13 - TZASangber-Dery MD. The Role of Birth Order in Infant Mortality in Ifakara DSS Area in Rural Tanzania [master's thesis]. [Johannesburg, South Africa]: University of the Witwatersrand; 2009.
X
Tanzania 14 - TZA
Sazawal S, Black RE, Ramsan M, Chwaya HM, Dutta A, Dhingra U, Stoltzfus RJ, Othman MK, Kabole FM. Effect of zinc supplementation on mortality in children aged 1-48 months: a community-based randomised placebo-controlled trial. Lancet. 2007; 369(9565): 927-34.
X
Thailand 01 - THAMinistry of Public Health (Thailand). Thailand Burden of Disease and Injuries 1998-1999. X

Thailand 02 - THAWorld Health Organization (WHO). WHO Mortality Database Version February 2014. Geneva, Switzerland: World Health Organization (WHO), 2014. X
The Bahamas 01 - BHSWorld Health Organization (WHO). WHO Mortality Database Version February 2014. Geneva, Switzerland: World Health Organization (WHO), 2014. X
The Gambia 01 - GMB
Alonso PL, Lindsay SW, Armstrong JRM, de Francisco A, Shenton FC, Greenwood BM, Conteh M, Cham K, Hill AG, David PH, Fegan G, Hall AJ. The effect of insecticide-treated bed nets on mortality of Gambian children. Lancet. 1991; 337(8756): 1499-502.
X
The Gambia 02 - GMB
D'Alessandro U, Olaleye BO, McGuire W, Langerock P, Bennett S, Aikins MK, Thomson MC, Cham MK, Cham BA, Greenwood BM. Mortality and morbidity from malaria in Gambian children after introduction of an impregnated bednet programme. Lancet. 1995; 345(8948): 479-83.
X
The Gambia 03 - GMB
Greenwood BM, Greenwood AM, Bradley AK, Tulloch S, Hayes R, Oldfield FS. Deaths in infancy and early childhood in a well-vaccinated, rural, West African population. Ann Trop Paediatr. 1987; 7 (2): 91-9. X
The Gambia 04 - GMB
Jaffar S, Leach A, Greenwood AM, Jepson A, Muller O, Ota MO, Bojang K, Obaro S, Greenwood BM. Changes in the pattern of infant and childhood mortality in upper river division, The Gambia, from 1989 to 1993. Trop Med Int Health. 1997; 2(1): 28-37.
X
The Gambia 05 - GMB
Menon A, Snow RW, Byass P, Greenwood BM, Hayes RJ, N'Jie AB. Sustained protection against mortality and morbidity from malaria in rural Gambian children by chemoprophylaxis given by village health workers. Trans R Soc Trop Med Hyg. 1990; 84(6): 768-72.
X
Trinidad and Tobago 01 - TTO
World Health Organization (WHO). WHO Mortality Database Version February 2014. Geneva, Switzerland: World Health Organization (WHO), 2014. X
Turkey 01 - TURBaskent University, Ministry of Health (Turkey), State Institute of Statistics (Turkey). Turkey Verbal Autopsy Survey 2003. X
Turkey 02 - TURTurkish Statistical Institute. Turkey Causes of Death Statistics 2010-2012. Ankara,Turkey: Turkish Statistical Institute. X
Turkey 03 - TURWorld Health Organization (WHO). WHO Mortality Database Version February 2014. Geneva, Switzerland: World Health Organization (WHO), 2014. X
Turkmenistan 01 - TKMWorld Health Organization (WHO). WHO Mortality Database Version February 2014. Geneva, Switzerland: World Health Organization (WHO), 2014. X
Uganda 01 - UGA
MEASURE Evaluation Project, Carolina Population Center, University of North Carolina, Macro International, Inc, Uganda Bureau of Statistics. Uganda Child Verbal Autopsy Study 2007. Macro International, Inc. X
Ukraine 01 - UKRWorld Health Organization (WHO). WHO Mortality Database Version February 2014. Geneva, Switzerland: World Health Organization (WHO), 2014. X
United Kingdom 01 - GBRNational Records of Scotland. United Kingdom - Scotland Vital Events Reference Tables 2011. Edinburgh, Scotland: National Records of Scotland. X
United Kingdom 02 - GBRNational Records of Scotland. United Kingdom - Scotland Vital Events Reference Tables 2012. Edinburgh, Scotland: National Records of Scotland. X
United Kingdom 03 - GBR
Northern Ireland Statistics and Research Agency (NISRA). United Kingdom - Northern Ireland Registrar General Annual Report 2011. Belfast, Northern Ireland: Northern Ireland Statistics and Research Agency (NISRA), 2012. X
United Kingdom 04 - GBROffice for National Statistics (United Kingdom). United Kingdom - England and Wales Mortality Data 1981-1994. Newport, United Kingdom: Office for National Statistics (United Kingdom).
X
United Kingdom 05 - GBROffice for National Statistics (United Kingdom). United Kingdom - England and Wales Mortality Data 1995-2000. Newport, United Kingdom: Office for National Statistics (United Kingdom).
X
United Kingdom 06 - GBROffice for National Statistics (United Kingdom). United Kingdom - England and Wales Mortality Data 2001-2012. Newport, United Kingdom: Office for National Statistics (United Kingdom).
X
United Kingdom 07 - GBRWorld Health Organization (WHO). WHO Mortality Database Version February 2014. Geneva, Switzerland: World Health Organization (WHO), 2014. X
United States 01 - USAWorld Health Organization (WHO). WHO Mortality Database Version February 2014. Geneva, Switzerland: World Health Organization (WHO), 2014. X

Uruguay 01 - URYWorld Health Organization (WHO). WHO Mortality Database Version February 2014. Geneva, Switzerland: World Health Organization (WHO), 2014. X
Uzbekistan 01 - UZBWorld Health Organization (WHO). WHO Mortality Database Version February 2014. Geneva, Switzerland: World Health Organization (WHO), 2014. X
Venezuela 01 - VENWorld Health Organization (WHO). WHO Mortality Database Version February 2014. Geneva, Switzerland: World Health Organization (WHO), 2014. X
Western Cape 01 - ZWCDepartment of Home Affairs (South Africa), Statistics South Africa. South Africa Mortality and Causes of Death 1997-2005. Pretoria, South Africa: Statistics South Africa.
X
Zambia 01 - ZMB
Mudenda SS, Kamocha S, Mswia R, Conkling M, Sikanyiti P, Potter D, Mayaka WC, Marx MA. Feasibility of using a WHO-standard methodology for Sample Vital Registration with Verbal Autopsy (SAVVY) to report leading causes of death in Zambia: results of a pilot in four provinces, 2010. Popul Health Metr. 2011; 9: 40.
X
Zambia 02 - ZMB
Turnbull E, Lembalemba MK, Brad Guffey M, Bolton-Moore C, Mubiana-Mbewe M, Chintu N, Giganti MJ, Nalubamba-Phiri M, Stringer EM, Stringer JS. Causes of stillbirth, neonatal death and early childhood death in rural Zambia by verbal autopsy assessments. Trop Med Int Health. 2011; 16(7): 894-901.
X
Zimbabwe 01 - ZWERegistrar General's Department (Zimbabwe), Zimbabwe National Statistics Agency. Zimbabwe Mortality Report 2007. X
Zimbabwe 02 - ZWEWorld Health Organization (WHO). WHO Mortality Database Version February 2014. Geneva, Switzerland: World Health Organization (WHO), 2014. X

Covariate Direction Level
Health System Access -1 1
ITN Coverage (proportion) -1 1
Malaria Endemicity (40-100%) from MAP 2010 1 1
Malaria Endemicity (5-100%) from MAP 2010 1 1
Malaria Indoor Residual Spraying Coverage -1 1
Malaria Lysenko PfPR (Hyperendemic-Holoendemic) 1 1
Malaria Lysenko PfPR (Mesoendemic-Holoendemic) 1 1
Malaria PfPR from MAP2010 1 1
Malaria Population-At-Risk (proportion) from WHO 1 1
Malaria Prevalence-Weighted Resistance 1 1
Rainfall (Quintiles 2-5) 1 1
Rainfall (Quintiles 3-5) 1 1
Rainfall (Quintiles 4-5) 1 1
Interaction of ITN coverage with log(Pfpr) 0 1
Education by Age -1 3
LDI (I$ per capita) -1 3
Appendix Table 13: Covariates used in CODEm for malaria - Males and Females

Test 1 Rank Test 1 Rank
1 spacetime Logit(CF)Interaction of malaria ITN and log PFPR covariates, Malaria Prevalence-Weighted Resistance, Malaria Lysenko PFPR (2 Highest Endemicity)
0.4208 3 0.2589 2 130
2 spacetime Logit(CF)Interaction of malaria ITN and log PFPR covariates, Malaria Prevalence-Weighted Resistance, Malaria Lysenko PFPR (2 Highest Endemicity), Log LDI
0.4273 7 0.2582 1 113
3 spacetime Logit(CF) Interaction of malaria ITN and log PFPR covariates, Malaria Prevalence-Weighted Resistance 0.4267 6 0.2591 3 99
4 spacetime Logit(CF)Interaction of malaria ITN and log PFPR covariates, Malaria Prevalence-Weighted Resistance, Malaria Lysenko PFPR (2 Highest Endemicity), Rainfall (Quintiles 2-5)
0.4356 20 0.2623 4 86
5 spacetime Logit(CF) Malaria Prevalence-Weighted Resistance, Malaria Lysenko PFPR (2 Highest Endemicity) 0.4180 2 0.2688 31 75
6 spacetime Logit(CF) Malaria Prevalence-Weighted Resistance 0.4146 1 0.2689 32 65
7 spacetime Ln(Rate) Interaction of malaria ITN and log PFPR covariates, Malaria Prevalence-Weighted Resistance 0.4447 31 0.2634 9 56
8 spacetime Ln(Rate)Interaction of malaria ITN and log PFPR covariates, Malaria Prevalence-Weighted Resistance, Malaria Lysenko PFPR (2 Highest Endemicity)
0.4447 32 0.2634 8 49
9 spacetime Ln(Rate) Interaction of malaria ITN and log PFPR covariates, Malaria Prevalence-Weighted Resistance, Log LDI 0.4512 37 0.2627 5 43
10 spacetime Ln(Rate) Malaria Prevalence-Weighted Resistance, Log LDI 0.4313 11 0.2692 33 37
11 spacetime Ln(Rate)Interaction of malaria ITN and log PFPR covariates, Malaria Prevalence-Weighted Resistance, Malaria Endemicity (5-100%)
0.4507 36 0.2644 11 32
12 spacetime Ln(Rate)Interaction of malaria ITN and log PFPR covariates, Malaria Prevalence-Weighted Resistance, Malaria Lysenko PFPR (2 Highest Endemicity), Education (years per capita)
0.4536 40 0.2630 7 28
13 spacetime Logit(CF) Interaction of malaria ITN and log PFPR covariates, Malaria Prevalence-Weighted Resistance, Rainfall (Quintiles 2-5) 0.4382 23 0.2671 24 24
14 spacetime Ln(Rate) Malaria Prevalence-Weighted Resistance 0.4348 18 0.2695 36 21
15 spacetime Ln(Rate)Interaction of malaria ITN and log PFPR covariates, Malaria Prevalence-Weighted Resistance, Malaria Lysenko PFPR (2 Highest Endemicity), Log LDI
0.4556 42 0.2647 12 18
16 spacetime Logit(CF)Interaction of malaria ITN and log PFPR covariates, Malaria Prevalence-Weighted Resistance, Malaria Lysenko PFPR (2 Highest Endemicity), Rainfall (Quintiles 2-5), Log LDI
0.4545 41 0.2649 14 16
17 spacetime Ln(Rate)Interaction of malaria ITN and log PFPR covariates, Malaria Prevalence-Weighted Resistance, Education (years per capita)
0.4531 39 0.2651 17 14
18 spacetime Ln(Rate) Malaria Prevalence-Weighted Resistance, Malaria Lysenko PFPR (2 Highest Endemicity), Log LDI 0.4401 24 0.2693 34 12
19 spacetime Ln(Rate) Malaria Prevalence-Weighted Resistance, Education (years per capita) 0.4345 16 0.2713 43 11
20 spacetime Ln(Rate)Interaction of malaria ITN and log PFPR covariates, Malaria Prevalence-Weighted Resistance, Malaria Population-At-Risk (proportion)
0.4681 54 0.2641 10 9
21 spacetime Ln(Rate) Malaria Prevalence-Weighted Resistance, Malaria Lysenko PFPR (2 Highest Endemicity) 0.4409 26 0.2703 39 8
Appendix Table 14a: CODEm sub-model performance - Malaria Africa under 5 Males
Overall Rank Model typeDependent
variableCovariates
Root Mean Squared Error
Trend Test
Draws

22 spacetime Ln(Rate)Interaction of malaria ITN and log PFPR covariates, Malaria Prevalence-Weighted Resistance, Malaria Endemicity (5-100%), Log LDI
0.4526 38 0.2678 28 7
23 spacetime Ln(Rate) Malaria Prevalence-Weighted Resistance, Malaria Lysenko PFPR (2 Highest Endemicity), Education (years per capita) 0.4486 33 0.2699 37 6
24 spacetime Ln(Rate)Interaction of malaria ITN and log PFPR covariates, Malaria Prevalence-Weighted Resistance, Malaria Population-At-Risk (proportion), Log LDI
0.4649 50 0.2672 26 5
25 spacetime Ln(Rate)Interaction of malaria ITN and log PFPR covariates, Malaria Prevalence-Weighted Resistance, Malaria Endemicity (5-100%), Malaria Lysenko PFPR (2 Highest Endemicity)
0.4598 44 0.2695 35 5
26 spacetime Ln(Rate) Malaria Prevalence-Weighted Resistance, Rainfall (Quintiles 2-5), Log LDI 0.4330 13 0.2776 67 4
27 spacetime Logit(CF) Malaria Prevalence-Weighted Resistance, Rainfall (Quintiles 2-5) 0.4213 4 0.2798 80 3
28 spacetime Ln(Rate) Interaction of malaria ITN and log PFPR covariates, Malaria Prevalence-Weighted Resistance, Rainfall (Quintiles 2-5) 0.4682 55 0.2684 30 3
29 spacetime Ln(Rate)Interaction of malaria ITN and log PFPR covariates, Malaria Prevalence-Weighted Resistance, Malaria Lysenko PFPR (2 Highest Endemicity), Rainfall (Quintiles 2-5)
0.4568 43 0.2701 38 3
30 spacetime Logit(CF) Malaria Prevalence-Weighted Resistance, Malaria Lysenko PFPR (2 Highest Endemicity), Rainfall (Quintiles 2-5) 0.4227 5 0.2799 83 2
31 spacetime Ln(Rate) Malaria Prevalence-Weighted Resistance, Rainfall (Quintiles 2-5), Education (years per capita) 0.4361 21 0.2776 66 2
32 spacetime Ln(Rate)
Interaction of malaria ITN and log PFPR covariates, Malaria Prevalence-Weighted Resistance, Malaria Lysenko PFPR (2 Highest Endemicity), Malaria Population-At-Risk (proportion)
0.4695 59 0.2683 29 2
33 spacetime Ln(Rate) Malaria Population-At-Risk (proportion) 0.4292 9 0.2822 91 1
34 spacetime Ln(Rate) Malaria Lysenko PFPR (2 Highest Endemicity) 0.4297 10 0.2824 92 1
35 spacetime Ln(Rate) Malaria Prevalence-Weighted Resistance, Rainfall (Quintiles 2-5) 0.4345 17 0.2785 74 1
36 spacetime Ln(Rate) Malaria Prevalence-Weighted Resistance, Malaria Lysenko PFPR (2 Highest Endemicity), Rainfall (Quintiles 2-5) 0.4424 27 0.2796 79 1
37 spacetime Ln(Rate)Malaria Prevalence-Weighted Resistance, Malaria Lysenko PFPR (2 Highest Endemicity), Rainfall (Quintiles 2-5), Education (years per capita)
0.4487 34 0.2767 61 1
38 spacetime Ln(Rate)Interaction of malaria ITN and log PFPR covariates, Malaria Prevalence-Weighted Resistance, Rainfall (Quintiles 2-5), Education (years per capita)
0.4688 57 0.2703 40 1
39 spacetime Ln(Rate)
Interaction of malaria ITN and log PFPR covariates, Malaria Prevalence-Weighted Resistance, Malaria Lysenko PFPR (2 Highest Endemicity), Malaria Population-At-Risk (proportion), Log LDI
0.4869 76 0.2650 15 1
40 spacetime Ln(Rate)
Interaction of malaria ITN and log PFPR covariates, Malaria Prevalence-Weighted Resistance, Malaria Endemicity (5-100%), Malaria Lysenko PFPR (2 Highest Endemicity), Log LDI
0.4811 72 0.2666 22 1

Test 1 Rank Test 1 Rank
1 spacetime Logit(CF) Malaria Prevalence-Weighted Resistance 0.4319 1 0.2823 16 130
2 spacetime Logit(CF) Malaria Prevalence-Weighted Resistance, Malaria Lysenko PFPR (2 Highest Endemicity) 0.4542 6 0.2822 15 113
3 spacetime Logit(CF) Interaction of malaria ITN and log PFPR covariates, Malaria Prevalence-Weighted Resistance 0.4586 11 0.2810 12 99
4 spacetime Ln(Rate) Malaria Prevalence-Weighted Resistance, Education (years per capita) 0.4477 4 0.2840 25 86
5 spacetime Logit(CF)Interaction of malaria ITN and log PFPR covariates, Malaria Prevalence-Weighted Resistance, Malaria Lysenko PFPR (2 Highest Endemicity)
0.4656 16 0.2819 13 75
6 spacetime Ln(Rate) Malaria Prevalence-Weighted Resistance, Log LDI 0.4502 5 0.2858 31 65
7 spacetime Ln(Rate) Malaria Prevalence-Weighted Resistance 0.4450 3 0.2863 35 56
8 spacetime Ln(Rate) Malaria Prevalence-Weighted Resistance, Malaria Lysenko PFPR (2 Highest Endemicity) 0.4584 10 0.2855 29 49
9 spacetime Ln(Rate) Malaria Prevalence-Weighted Resistance, Malaria Lysenko PFPR (2 Highest Endemicity), Log LDI 0.4637 15 0.2849 28 43
10 spacetime Ln(Rate) ITN Coverage (proportion) 0.4657 17 0.2846 27 37
11 spacetime Logit(CF)Interaction of malaria ITN and log PFPR covariates, Malaria Prevalence-Weighted Resistance, Malaria Lysenko PFPR (2 Highest Endemicity), Log LDI
0.4813 38 0.2802 8 32
12 spacetime Ln(Rate) Malaria Prevalence-Weighted Resistance, Malaria Lysenko PFPR (2 Highest Endemicity), Education (years per capita) 0.4715 29 0.2830 21 28
13 spacetime Ln(Rate) Interaction of malaria ITN and log PFPR covariates, Malaria Prevalence-Weighted Resistance, Log LDI 0.4939 50 0.2765 2 24
14 spacetime Logit(CF) Malaria Lysenko PFPR (2 Highest Endemicity) 0.4556 8 0.2888 45 21
15 spacetime Ln(Rate) Malaria Population-At-Risk (proportion), Log LDI 0.4759 31 0.2839 24 18
16 spacetime Ln(Rate) Interaction of malaria ITN and log PFPR covariates, Malaria Prevalence-Weighted Resistance 0.4966 54 0.2760 1 16
17 spacetime Ln(Rate) Interaction of malaria ITN and log PFPR covariates, Malaria Prevalence-Weighted Resistance, Education (years per capita) 0.4957 53 0.2777 3 14
18 spacetime Ln(Rate)Interaction of malaria ITN and log PFPR covariates, Malaria Prevalence-Weighted Resistance, Malaria Endemicity (5-100%), Log LDI
0.4934 49 0.2810 11 12
19 spacetime Ln(Rate) Malaria Lysenko PFPR (2 Highest Endemicity), Education (years per capita) 0.4696 25 0.2865 36 11
20 spacetime Ln(Rate) Malaria Endemicity (5-100%) 0.4708 26 0.2872 37 9
21 spacetime Ln(Rate) Malaria Lysenko PFPR (2 Highest Endemicity) 0.4658 18 0.2888 46 8
22 spacetime Ln(Rate) Malaria Population-At-Risk (proportion) 0.4712 27 0.2872 38 7
23 spacetime Ln(Rate)Interaction of malaria ITN and log PFPR covariates, Malaria Prevalence-Weighted Resistance, Malaria Population-At-Risk (proportion), Log LDI
0.5013 59 0.2804 9 6
24 spacetime Ln(Rate)Interaction of malaria ITN and log PFPR covariates, Malaria Prevalence-Weighted Resistance, Malaria Lysenko PFPR (2 Highest Endemicity)
0.5078 67 0.2781 4 5
25 spacetime Ln(Rate)Interaction of malaria ITN and log PFPR covariates, Malaria Prevalence-Weighted Resistance, Malaria Endemicity (5-100%)
0.4954 52 0.2825 18 5
26 spacetime Ln(Rate)Interaction of malaria ITN and log PFPR covariates, Malaria Prevalence-Weighted Resistance, Malaria Lysenko PFPR (2 Highest Endemicity), Education (years per capita)
0.5074 66 0.2795 7 4
27 spacetime Logit(CF) Interaction of malaria ITN and log PFPR covariates 0.4689 23 0.2906 57 3
28 spacetime Logit(CF) Interaction of malaria ITN and log PFPR covariates, Log LDI 0.4731 30 0.2896 51 3
Appendix Table 14b: CODEm sub-model performance - Malaria Africa under 5 Females
Overall Rank Model typeDependent
variableCovariates
Root Mean Squared Error
Trend Test
Draws

29 spacetime Ln(Rate)Interaction of malaria ITN and log PFPR covariates, Malaria Prevalence-Weighted Resistance, Malaria Population-At-Risk (proportion)
0.4953 51 0.2857 30 3
30 spacetime Logit(CF) Malaria Lysenko PFPR (2 Highest Endemicity), Log LDI 0.4765 33 0.2903 55 2
31 spacetime Ln(Rate) Malaria Lysenko PFPR (2 Highest Endemicity), Log LDI 0.4912 47 0.2886 43 2
32 spacetime Ln(Rate)Interaction of malaria ITN and log PFPR covariates, Malaria Prevalence-Weighted Resistance, Malaria Population-At-Risk (proportion), Education (years per capita)
0.5021 60 0.2838 23 2
33 spacetime Logit(CF) Interaction of malaria ITN and log PFPR covariates, Malaria Lysenko PFPR (2 Highest Endemicity) 0.4892 44 0.2902 54 1
34 spacetime Ln(Rate) Interaction of malaria ITN and log PFPR covariates, Malaria Endemicity (5-100%), Log LDI 0.4996 58 0.2892 47 1
35 spacetime Ln(Rate)Interaction of malaria ITN and log PFPR covariates, Malaria Prevalence-Weighted Resistance, Malaria Lysenko PFPR (2 Highest Endemicity), Log LDI
0.5301 94 0.2784 5 1
36 spacetime Ln(Rate)Interaction of malaria ITN and log PFPR covariates, Malaria Prevalence-Weighted Resistance, Malaria Lysenko PFPR (2 Highest Endemicity), Malaria Population-At-Risk (proportion)
0.5216 81 0.2860 33 1
37 spacetime Ln(Rate)
Interaction of malaria ITN and log PFPR covariates, Malaria Prevalence-Weighted Resistance, Malaria Lysenko PFPR (2 Highest Endemicity), Malaria Population-At-Risk (proportion), Log LDI
0.5231 84 0.2836 22 1
38 spacetime Ln(Rate)Interaction of malaria ITN and log PFPR covariates, Malaria Prevalence-Weighted Resistance, Malaria Endemicity (5-100%), Malaria Lysenko PFPR (2 Highest Endemicity)
0.5128 74 0.2843 26 1
39 spacetime Ln(Rate)
Interaction of malaria ITN and log PFPR covariates, Malaria Prevalence-Weighted Resistance, Malaria Endemicity (5-100%), Malaria Lysenko PFPR (2 Highest Endemicity), Log LDI
0.5188 79 0.2822 14 1
40 spacetime Ln(Rate) Interaction of malaria ITN and log PFPR covariates, log(malaria PfPR) 0.5280 91 0.2825 17 1

Test 1 Rank Test 1 Rank
1 spacetime Logit(CF) ITN Coverage (proportion), log(malaria PfPR) 0.5218 4 0.2403 1 123
2 spacetime Ln(Rate) ITN Coverage (proportion), log(malaria PfPR), Malaria Endemicity (40-100%) 0.5197 3 0.2548 4 108
3 spacetime Logit(CF) ITN Coverage (proportion), Interaction of malaria ITN and log PFPR covariates 0.5177 2 0.2558 5 94
4 spacetime Logit(CF) ITN Coverage (proportion), log(malaria PfPR), Malaria Endemicity (40-100%) 0.5285 8 0.2521 3 83
5 spacetime Logit(CF) Interaction of malaria ITN and log PFPR covariates, log(malaria PfPR), Malaria Endemicity (40-100%) 0.5134 1 0.2703 11 73
6 spacetime Logit(CF) Interaction of malaria ITN and log PFPR covariates, log(malaria PfPR) 0.5250 5 0.2648 7 64
7 spacetime Ln(Rate) ITN Coverage (proportion), log(malaria PfPR) 0.5292 10 0.2504 2 56
8 spacetime Ln(Rate) ITN Coverage (proportion), Interaction of malaria ITN and log PFPR covariates, Malaria Endemicity (40-100%) 0.5282 7 0.2655 8 49
9 spacetime Logit(CF) ITN Coverage (proportion), Interaction of malaria ITN and log PFPR covariates, Malaria Endemicity (40-100%) 0.5260 6 0.2656 9 43
10 spacetime Ln(Rate) ITN Coverage (proportion), Interaction of malaria ITN and log PFPR covariates 0.5414 15 0.2571 6 38
11 spacetime Ln(Rate) Interaction of malaria ITN and log PFPR covariates, log(malaria PfPR), Malaria Endemicity (40-100%) 0.5359 12 0.2767 15 33
12 spacetime Logit(CF) ITN Coverage (proportion), Malaria Prevalence-Weighted Resistance 0.5406 14 0.2743 14 29
13 spacetime Logit(CF) ITN Coverage (proportion) 0.5451 17 0.2715 12 25
14 spacetime Logit(CF) ITN Coverage (proportion), Malaria Endemicity (40-100%) 0.5367 13 0.2775 17 22
15 spacetime Ln(Rate) Interaction of malaria ITN and log PFPR covariates, log(malaria PfPR) 0.5424 16 0.2773 16 20
16 spacetime Logit(CF) ITN Coverage (proportion), Malaria Lysenko PFPR (3 Highest Endemicity) 0.5624 25 0.2687 10 17
17 spacetime Logit(CF) Interaction of malaria ITN and log PFPR covariates, log(malaria PfPR), Education (years per capita) 0.5292 9 0.2836 34 15
18 spacetime Ln(Rate) Interaction of malaria ITN and log PFPR covariates, log(malaria PfPR), Education (years per capita) 0.5668 29 0.2786 19 13
19 spacetime Logit(CF) ITN Coverage (proportion), Malaria Population-At-Risk (proportion) 0.5565 20 0.2863 39 12
20 spacetime Logit(CF) ITN Coverage (proportion), Malaria Endemicity (5-100%) 0.5578 22 0.2845 38 10
21 spacetime Logit(CF) log(malaria PfPR), Malaria Lysenko PFPR (2 Highest Endemicity), Education (years per capita) 0.5562 18 0.2958 47 9
22 spacetime Logit(CF) log(malaria PfPR) 0.5667 28 0.3008 55 8
23 spacetime Logit(CF) Health System Access (capped), ITN Coverage (proportion), log(malaria PfPR) 0.5723 35 0.2966 49 7
24 spacetime Logit(CF) log(malaria PfPR), Malaria Lysenko PFPR (2 Highest Endemicity) 0.5701 33 0.2990 52 6
25 spacetime Logit(CF) log(malaria PfPR), Malaria Prevalence-Weighted Resistance 0.5357 11 0.3058 77 5
26 spacetime Ln(Rate) ITN Coverage (proportion), Malaria Endemicity (40-100%) 0.5757 41 0.2977 50 5
27 spacetime Logit(CF) log(malaria PfPR), Education (years per capita) 0.5824 50 0.2966 48 4
28 spacetime Ln(Rate) ITN Coverage (proportion), Malaria Lysenko PFPR (3 Highest Endemicity) 0.5972 73 0.2786 20 4
29 spacetime Logit(CF) log(malaria PfPR), Malaria Prevalence-Weighted Resistance, Education (years per capita) 0.5748 39 0.3028 62 3
30 spacetime Logit(CF)Interaction of malaria ITN and log PFPR covariates, log(malaria PfPR), Malaria Lysenko PFPR (3 Highest Endemicity)
0.5621 23 0.3062 80 3
Appendix Table 14c: CODEm sub-model performance - Malaria Africa over 5 Males
Overall Rank Model typeDependent
variableCovariates
Root Mean Squared Error
Trend TestDraws

31 spacetime Logit(CF) ITN Coverage (proportion), Malaria Endemicity (40-100%), Malaria Population-At-Risk (proportion) 0.5650 26 0.3067 86 2
32 spacetime Logit(CF) Health System Access (capped), log(malaria PfPR), Malaria Prevalence-Weighted Resistance 0.5684 30 0.3053 75 2
33 spacetime Logit(CF) Health System Access (capped), Interaction of malaria ITN and log PFPR covariates, log(malaria PfPR) 0.5692 32 0.3050 74 2
34 spacetime Ln(Rate) ITN Coverage (proportion) 0.5754 40 0.3035 66 2
35 spacetime Logit(CF) log(malaria PfPR), Malaria Lysenko PFPR (2 Highest Endemicity), Log LDI 0.5878 59 0.3022 60 1
36 spacetime Logit(CF)Interaction of malaria ITN and log PFPR covariates, log(malaria PfPR), Malaria Lysenko PFPR (2 Highest Endemicity), Log LDI
0.6203 120 0.2728 13 1
37 spacetime Logit(CF) Health System Access (capped), log(malaria PfPR), Malaria Lysenko PFPR (2 Highest Endemicity) 0.5993 78 0.3020 59 1
38 spacetime Ln(Rate) log(malaria PfPR), Malaria Lysenko PFPR (2 Highest Endemicity), Education (years per capita) 0.5878 58 0.3010 57 1
39 spacetime Ln(Rate) log(malaria PfPR), Malaria Prevalence-Weighted Resistance 0.5623 24 0.3099 104 1
40 spacetime Ln(Rate) ITN Coverage (proportion), Malaria Population-At-Risk (proportion) 0.5565 19 0.3109 111 1
41 spacetime Ln(Rate) ITN Coverage (proportion), Malaria Prevalence-Weighted Resistance 0.5685 31 0.3070 89 1
42 spacetime Ln(Rate) ITN Coverage (proportion), Malaria Prevalence-Weighted Resistance, Malaria Endemicity (40-100%) 0.5846 53 0.3047 73 1
43 spacetime Ln(Rate) Health System Access (capped), ITN Coverage (proportion), log(malaria PfPR) 0.5954 72 0.2993 53 1

Test 1 Rank Test 1 Rank
1 spacetime Logit(CF)Interaction of malaria ITN and log PFPR covariates, log(malaria PfPR), Malaria Lysenko PFPR (3 Highest Endemicity)
0.7138 1 0.3290 6 160
2 spacetime Ln(Rate)Interaction of malaria ITN and log PFPR covariates, log(malaria PfPR), Malaria Lysenko PFPR (3 Highest Endemicity)
0.7380 6 0.3304 8 134
3 spacetime Logit(CF)Interaction of malaria ITN and log PFPR covariates, log(malaria PfPR), Malaria Lysenko PFPR (2 Highest Endemicity), Malaria Lysenko PFPR (3 Highest Endemicity)
0.7497 16 0.3289 4 113
4 spacetime Logit(CF)Interaction of malaria ITN and log PFPR covariates, log(malaria PfPR), Malaria Endemicity (40-100%), Malaria Lysenko PFPR (2 Highest Endemicity)
0.7541 21 0.3289 5 95
5 spacetime Logit(CF) Interaction of malaria ITN and log PFPR covariates, Malaria Prevalence-Weighted Resistance 0.7327 2 0.3518 28 80
6 spacetime Logit(CF) log(malaria PfPR), Malaria Prevalence-Weighted Resistance 0.7394 7 0.3491 23 67
7 spacetime Logit(CF)Health System Access (capped), Interaction of malaria ITN and log PFPR covariates, log(malaria PfPR), Malaria Lysenko PFPR (3 Highest Endemicity)
0.7583 31 0.3254 1 56
8 spacetime Logit(CF)Interaction of malaria ITN and log PFPR covariates, log(malaria PfPR), Malaria Lysenko PFPR (2 Highest Endemicity)
0.7552 25 0.3348 10 47
9 spacetime Logit(CF)ITN Coverage (proportion), Interaction of malaria ITN and log PFPR covariates, Malaria Lysenko PFPR (3 Highest Endemicity)
0.7543 23 0.3442 17 40
10 spacetime Logit(CF) log(malaria PfPR) 0.7429 11 0.3524 31 33
11 spacetime Ln(Rate)
Interaction of malaria ITN and log PFPR covariates, log(malaria PfPR), Malaria Lysenko PFPR (2 Highest Endemicity), Malaria Lysenko PFPR (3 Highest Endemicity), Education (years per capita)
0.7639 39 0.3281 3 28
12 spacetime Logit(CF)Interaction of malaria ITN and log PFPR covariates, Malaria Prevalence-Weighted Resistance, Malaria Endemicity (40-100%)
0.7327 3 0.3552 39 24
13 spacetime Ln(Rate)Interaction of malaria ITN and log PFPR covariates, log(malaria PfPR), Malaria Lysenko PFPR (2 Highest Endemicity), Malaria Lysenko PFPR (3 Highest Endemicity)
0.7640 41 0.3269 2 20
14 spacetime Logit(CF) log(malaria PfPR), Malaria Lysenko PFPR (2 Highest Endemicity), Education (years per capita) 0.7579 30 0.3431 16 17
15 spacetime Logit(CF) log(malaria PfPR), Malaria Endemicity (40-100%), Malaria Lysenko PFPR (2 Highest Endemicity) 0.7366 5 0.3572 42 14
16 spacetime Logit(CF) Interaction of malaria ITN and log PFPR covariates, log(malaria PfPR) 0.7541 22 0.3512 27 12
17 spacetime Ln(Rate)
Health System Access (capped), Interaction of malaria ITN and log PFPR covariates, log(malaria PfPR), Malaria Prevalence-Weighted Resistance, Malaria Lysenko PFPR (3 Highest Endemicity)
0.7693 55 0.3317 9 10
18 spacetime Ln(Rate)Health System Access (capped), Interaction of malaria ITN and log PFPR covariates, log(malaria PfPR), Malaria Lysenko PFPR (3 Highest Endemicity)
0.7705 58 0.3294 7 8
19 spacetime Logit(CF)ITN Coverage (proportion), Interaction of malaria ITN and log PFPR covariates, Malaria Prevalence-Weighted Resistance
0.7653 44 0.3478 22 7
20 spacetime Ln(Rate)ITN Coverage (proportion), Interaction of malaria ITN and log PFPR covariates, Malaria Lysenko PFPR (3 Highest Endemicity)
0.7593 32 0.3559 40 6
21 spacetime Logit(CF) log(malaria PfPR), Malaria Lysenko PFPR (2 Highest Endemicity) 0.7573 29 0.3573 43 5
Appendix Table 14d: CODEm sub-model performance - Malaria Africa over 5 Females
Overall Rank Model typeDependent
variableCovariates
Root Mean Squared Error
Trend TestDraws

22 spacetime Ln(Rate)Interaction of malaria ITN and log PFPR covariates, Malaria Prevalence-Weighted Resistance, Malaria Endemicity (40-100%)
0.7514 18 0.3668 56 4
23 spacetime Logit(CF)Interaction of malaria ITN and log PFPR covariates, Malaria Lysenko PFPR (2 Highest Endemicity), Education (years per capita)
0.7459 13 0.3694 62 3
24 spacetime Logit(CF)ITN Coverage (proportion), Interaction of malaria ITN and log PFPR covariates, Malaria Lysenko PFPR (2 Highest Endemicity)
0.7643 42 0.3528 32 3
25 spacetime Logit(CF)Interaction of malaria ITN and log PFPR covariates, Malaria Lysenko PFPR (2 Highest Endemicity), Malaria Lysenko PFPR (3 Highest Endemicity), Education (years per capita)
0.7498 17 0.3680 59 2
26 spacetime Logit(CF)Interaction of malaria ITN and log PFPR covariates, Malaria Prevalence-Weighted Resistance, Malaria Lysenko PFPR (2 Highest Endemicity), Education (years per capita)
0.7442 12 0.3709 64 2
27 spacetime Ln(Rate) Interaction of malaria ITN and log PFPR covariates, Malaria Prevalence-Weighted Resistance 0.7535 20 0.3665 55 2
28 spacetime Logit(CF) Interaction of malaria ITN and log PFPR covariates 0.7352 4 0.3743 84 1
29 spacetime Logit(CF)Interaction of malaria ITN and log PFPR covariates, Malaria Lysenko PFPR (3 Highest Endemicity), Education (years per capita)
0.7545 24 0.3661 54 1
30 spacetime Logit(CF) Interaction of malaria ITN and log PFPR covariates, Malaria Endemicity (5-100%) 0.7410 8 0.3737 81 1
31 spacetime Logit(CF) Interaction of malaria ITN and log PFPR covariates, Malaria Endemicity (40-100%) 0.7415 9 0.3717 70 1
32 spacetime Logit(CF) ITN Coverage (proportion), Interaction of malaria ITN and log PFPR covariates, Malaria Population-At-Risk (proportion) 0.7660 48 0.3520 29 1
33 spacetime Logit(CF)ITN Coverage (proportion), Interaction of malaria ITN and log PFPR covariates, Malaria Prevalence-Weighted Resistance, Malaria Lysenko PFPR (2 Highest Endemicity)
0.7672 51 0.3540 37 1
34 spacetime Ln(Rate)Interaction of malaria ITN and log PFPR covariates, log(malaria PfPR), Malaria Lysenko PFPR (2 Highest Endemicity)
0.7752 69 0.3361 11 1

Test 1 Rank Test 1 Rank
1 spacetime Logit(CF) Health System Access (capped), Malaria Lysenko PFPR (3 Highest Endemicity), Rainfall (Quintiles 3-5)
0.6517 54 0.4150 28 48
2 spacetime Logit(CF)Health System Access (capped), Malaria Lysenko PFPR (2 Highest Endemicity), Malaria Population-At-Risk (proportion), Rainfall (Quintiles 3-5)
0.6494 41 0.4155 46 45
3 spacetime Logit(CF)Health System Access (capped), Malaria Lysenko PFPR (3 Highest Endemicity), Malaria Population-At-Risk (proportion), Rainfall (Quintiles 4-5)
0.6524 58 0.4153 40 43
4 spacetime Logit(CF)Interaction of malaria ITN and log PFPR covariates, log(malaria PfPR), Malaria Population-At-Risk (proportion), Rainfall (Quintiles 4-5)
0.6618 98 0.4136 6 41
5 spacetime Logit(CF)Health System Access (capped), Malaria Prevalence-Weighted Resistance, Malaria Lysenko PFPR (3 Highest Endemicity), Rainfall (Quintiles 3-5)
0.6536 61 0.4156 52 39
6 spacetime Ln(Rate) Health System Access (capped), Malaria Lysenko PFPR (3 Highest Endemicity), Rainfall (Quintiles 3-5)
0.6571 77 0.4154 42 37
7 spacetime Logit(CF) ITN Coverage (proportion) 0.6613 91 0.4152 32 36
8 spacetime Logit(CF) Health System Access (capped), log(malaria PfPR), Malaria Population-At-Risk (proportion), Rainfall (Quintiles 3-5)
0.6478 20 0.4164 106 34
9 spacetime Logit(CF)Health System Access (capped), Malaria Population-At-Risk (proportion), Rainfall (Quintiles 4-5) 0.6585 81 0.4156 54 32
10 spacetime Logit(CF)ITN Coverage (proportion), Malaria Lysenko PFPR (3 Highest Endemicity) 0.6618 99 0.4152 36 31
11 spacetime Logit(CF)Interaction of malaria ITN and log PFPR covariates, log(malaria PfPR), Malaria Lysenko PFPR (2 Highest Endemicity)
0.6576 79 0.4157 57 29
12 spacetime Logit(CF)ITN Coverage (proportion), Interaction of malaria ITN and log PFPR covariates, Malaria Population-At-Risk (proportion), Rainfall (Quintiles 4-5)
0.6645 122 0.4147 15 28
13 spacetime Logit(CF)
Interaction of malaria ITN and log PFPR covariates, log(malaria PfPR), Malaria Lysenko PFPR (2 Highest Endemicity), Malaria Population-At-Risk (proportion), Rainfall (Quintiles 3-5)
0.6645 124 0.4146 14 27
14 spacetime Logit(CF)Health System Access (capped), Malaria Lysenko PFPR (3 Highest Endemicity) 0.6354 2 0.4168 136 25
15 spacetime Logit(CF) Health System Access (capped) 0.6347 1 0.4168 138 24
16 spacetime Logit(CF)Health System Access (capped), Interaction of malaria ITN and log PFPR covariates, Malaria Population-At-Risk (proportion), Rainfall (Quintiles 3-5)
0.6480 24 0.4166 116 23
17 spacetime Logit(CF)ITN Coverage (proportion), log(malaria PfPR), Malaria Lysenko PFPR (2 Highest Endemicity), Malaria Population-At-Risk (proportion), Rainfall (Quintiles 3-5)
0.6621 102 0.4153 39 22
18 spacetime Logit(CF)
ITN Coverage (proportion), Interaction of malaria ITN and log PFPR covariates, Malaria Lysenko PFPR (2 Highest Endemicity), Malaria Population-At-Risk (proportion), Rainfall (Quintiles 3-5)
0.6617 97 0.4155 45 21
19 spacetime Logit(CF) Health System Access (capped), Malaria Lysenko PFPR (2 Highest Endemicity), Rainfall (Quintiles 3-5)
0.6547 68 0.4160 77 20
20 spacetime Logit(CF) ITN Coverage (proportion), log(malaria PfPR), Malaria Population-At-Risk (proportion), Rainfall (Quintiles 4-5)
0.6652 136 0.4145 11 19
21 spacetime Logit(CF)Health System Access (capped), Malaria Lysenko PFPR (2 Highest Endemicity) 0.6372 3 0.4169 146 18
22 spacetime Logit(CF)Health System Access (capped), Malaria Lysenko PFPR (2 Highest Endemicity), Malaria Population-At-Risk (proportion)
0.6438 11 0.4168 139 17
Appendix Table 14g: CODEm sub-model performance - Malaria Outside Africa over 5 Males
Overall Rank Model typeDependent
variableCovariates
Root Mean Squared Error
Trend Test
Draws

23 spacetime Logit(CF)Interaction of malaria ITN and log PFPR covariates, log(malaria PfPR), Malaria Lysenko PFPR (2 Highest Endemicity), Malaria Population-At-Risk (proportion)
0.6608 85 0.4159 66 16
24 spacetime Logit(CF)Health System Access (capped), Malaria Population-At-Risk (proportion) 0.6394 4 0.4169 149 16
25 spacetime Ln(Rate)Health System Access (capped), Malaria Lysenko PFPR (3 Highest Endemicity), Malaria Population-At-Risk (proportion), Rainfall (Quintiles 3-5)
0.6538 63 0.4163 94 15
26 spacetime Logit(CF)ITN Coverage (proportion), Malaria Lysenko PFPR (2 Highest Endemicity), Malaria Lysenko PFPR (3 Highest Endemicity)
0.6651 134 0.4149 25 14
27 spacetime Ln(Rate) ITN Coverage (proportion) 0.6648 127 0.4152 34 13
28 spacetime Ln(Rate) Health System Access (capped), Rainfall (Quintiles 3-5) 0.6603 84 0.4160 75 13
29 spacetime Logit(CF)Interaction of malaria ITN and log PFPR covariates, log(malaria PfPR), Malaria Population-At-Risk (proportion), Rainfall (Quintiles 3-5)
0.6636 112 0.4156 49 12
30 spacetime Logit(CF)Health System Access (capped), ITN Coverage (proportion), log(malaria PfPR), Malaria Population-At-Risk (proportion), Rainfall (Quintiles 3-5)
0.6544 66 0.4163 95 12
31 spacetime Logit(CF)Health System Access (capped), ITN Coverage (proportion), Interaction of malaria ITN and log PFPR covariates, Malaria Population-At-Risk (proportion), Rainfall (Quintiles 3-5)
0.6544 65 0.4164 98 11
32 spacetime Logit(CF) Interaction of malaria ITN and log PFPR covariates, log(malaria PfPR), Malaria Population-At-Risk (proportion)
0.6592 82 0.4161 81 10
33 spacetime Logit(CF)ITN Coverage (proportion), Malaria Lysenko PFPR (2 Highest Endemicity) 0.6654 139 0.4149 26 10
34 spacetime Logit(CF)Health System Access (capped), Malaria Lysenko PFPR (3 Highest Endemicity), Malaria Population-At-Risk (proportion), Rainfall (Quintiles 3-5)
0.6506 49 0.4165 115 10
35 spacetime Logit(CF)ITN Coverage (proportion), Interaction of malaria ITN and log PFPR covariates, log(malaria PfPR), Malaria Population-At-Risk (proportion), Rainfall (Quintiles 4-5)
0.6662 145 0.4148 21 9
36 spacetime Ln(Rate)Health System Access (capped), Malaria Population-At-Risk (proportion), Rainfall (Quintiles 3-5) 0.6484 33 0.4168 132 9
37 spacetime Logit(CF)Interaction of malaria ITN and log PFPR covariates, log(malaria PfPR), Malaria Indoor Residual Spraying Coverage, Malaria Lysenko PFPR (2 Highest Endemicity)
0.6621 101 0.4159 69 8
38 spacetime Logit(CF)ITN Coverage (proportion), Malaria Lysenko PFPR (2 Highest Endemicity), Malaria Population-At-Risk (proportion)
0.6635 111 0.4158 58 8
39 spacetime Logit(CF)ITN Coverage (proportion), log(malaria PfPR), Malaria Lysenko PFPR (2 Highest Endemicity) 0.6638 116 0.4158 59 7
40 spacetime Logit(CF)ITN Coverage (proportion), log(malaria PfPR), Malaria Lysenko PFPR (2 Highest Endemicity), Malaria Population-At-Risk (proportion)
0.6616 96 0.4161 84 7
41 spacetime Ln(Rate)ITN Coverage (proportion), Malaria Lysenko PFPR (3 Highest Endemicity) 0.6655 140 0.4153 37 7
42 spacetime Logit(CF) Interaction of malaria ITN and log PFPR covariates, log(malaria PfPR), Rainfall (Quintiles 3-5)
0.6642 117 0.4159 63 6
43 spacetime Logit(CF)
Interaction of malaria ITN and log PFPR covariates, log(malaria PfPR), Malaria Indoor Residual Spraying Coverage, Malaria Population-At-Risk (proportion), Rainfall (Quintiles 4-5)
0.6637 113 0.4159 70 6
44 spacetime Logit(CF)ITN Coverage (proportion), Malaria Population-At-Risk (proportion) 0.6579 80 0.4164 101 6
45 spacetime Ln(Rate)Health System Access (capped), Malaria Prevalence-Weighted Resistance, Malaria Lysenko PFPR (3 Highest Endemicity), Rainfall (Quintiles 3-5)
0.6620 100 0.4161 83 6
46 spacetime Logit(CF)Health System Access (capped), Malaria Prevalence-Weighted Resistance 0.6404 5 0.4173 180 5
47 spacetime Logit(CF)Health System Access (capped), Malaria Prevalence-Weighted Resistance, Malaria Lysenko PFPR (2 Highest Endemicity), Rainfall (Quintiles 3-5)
0.6565 72 0.4165 112 5

48 spacetime Logit(CF)
Health System Access (capped), ITN Coverage (proportion), Interaction of malaria ITN and log PFPR covariates, Malaria Lysenko PFPR (2 Highest Endemicity), Malaria Population-At-Risk (proportion)
0.6502 46 0.4168 140 5
49 spacetime Ln(Rate)Health System Access (capped), ITN Coverage (proportion), log(malaria PfPR), Malaria Lysenko PFPR (2 Highest Endemicity), Malaria Population-At-Risk (proportion)
0.6486 36 0.4170 150 5
50 spacetime Logit(CF)ITN Coverage (proportion), Interaction of malaria ITN and log PFPR covariates, Malaria Lysenko PFPR (2 Highest Endemicity), Malaria Population-At-Risk (proportion)
0.6615 93 0.4163 93 4
51 spacetime Logit(CF)Health System Access (capped), Malaria Prevalence-Weighted Resistance, Malaria Lysenko PFPR (3 Highest Endemicity)
0.6424 9 0.4173 177 4
52 spacetime Logit(CF)Health System Access (capped), ITN Coverage (proportion), log(malaria PfPR), Malaria Lysenko PFPR (2 Highest Endemicity), Malaria Population-At-Risk (proportion)
0.6509 51 0.4168 135 4
53 spacetime Ln(Rate) Interaction of malaria ITN and log PFPR covariates, log(malaria PfPR), Malaria Population-At-Risk (proportion)
0.6648 126 0.4159 64 4
54 spacetime Ln(Rate)
Health System Access (capped), ITN Coverage (proportion), Interaction of malaria ITN and log PFPR covariates, Malaria Lysenko PFPR (2 Highest Endemicity), Malaria Population-At-Risk (proportion)
0.6485 34 0.4170 153 4
55 spacetime Logit(CF)Interaction of malaria ITN and log PFPR covariates, log(malaria PfPR), Malaria Indoor Residual Spraying Coverage, Malaria Population-At-Risk (proportion)
0.6612 90 0.4164 103 3
56 spacetime Logit(CF)ITN Coverage (proportion), Interaction of malaria ITN and log PFPR covariates, Malaria Lysenko PFPR (2 Highest Endemicity)
0.6645 121 0.4160 73 3
57 spacetime Logit(CF)Health System Access (capped), Malaria Lysenko PFPR (3 Highest Endemicity), Malaria Population-At-Risk (proportion)
0.6481 28 0.4171 163 3
58 spacetime Logit(CF)Health System Access (capped), Malaria Prevalence-Weighted Resistance, Malaria Lysenko PFPR (2 Highest Endemicity)
0.6418 7 0.4174 185 3
59 spacetime Ln(Rate)Interaction of malaria ITN and log PFPR covariates, log(malaria PfPR), Malaria Population-At-Risk (proportion), Rainfall (Quintiles 3-5)
0.6697 174 0.4148 23 3
60 spacetime Ln(Rate)ITN Coverage (proportion), Malaria Lysenko PFPR (2 Highest Endemicity) 0.6693 171 0.4150 27 3
61 spacetime Ln(Rate)Health System Access (capped), Malaria Lysenko PFPR (3 Highest Endemicity), Malaria Population-At-Risk (proportion), Rainfall (Quintiles 4-5)
0.6514 53 0.4168 137 3
62 spacetime Logit(CF)
Interaction of malaria ITN and log PFPR covariates, log(malaria PfPR), Malaria Indoor Residual Spraying Coverage, Malaria Lysenko PFPR (2 Highest Endemicity), Malaria Population-At-Risk (proportion)
0.6615 92 0.4166 119 2
63 spacetime Logit(CF)ITN Coverage (proportion), log(malaria PfPR), Malaria Population-At-Risk (proportion) 0.6630 106 0.4164 100 2
64 spacetime Logit(CF) ITN Coverage (proportion), Interaction of malaria ITN and log PFPR covariates, Malaria Population-At-Risk (proportion)
0.6627 105 0.4165 111 2
65 spacetime Logit(CF)ITN Coverage (proportion), Interaction of malaria ITN and log PFPR covariates, log(malaria PfPR), Malaria Population-At-Risk (proportion)
0.6637 114 0.4162 85 2
66 spacetime Logit(CF)ITN Coverage (proportion), Interaction of malaria ITN and log PFPR covariates, log(malaria PfPR), Malaria Population-At-Risk (proportion), Rainfall (Quintiles 3-5)
0.6651 132 0.4159 68 2
67 spacetime Ln(Rate)Interaction of malaria ITN and log PFPR covariates, log(malaria PfPR), Malaria Lysenko PFPR (2 Highest Endemicity)
0.6671 151 0.4158 62 2
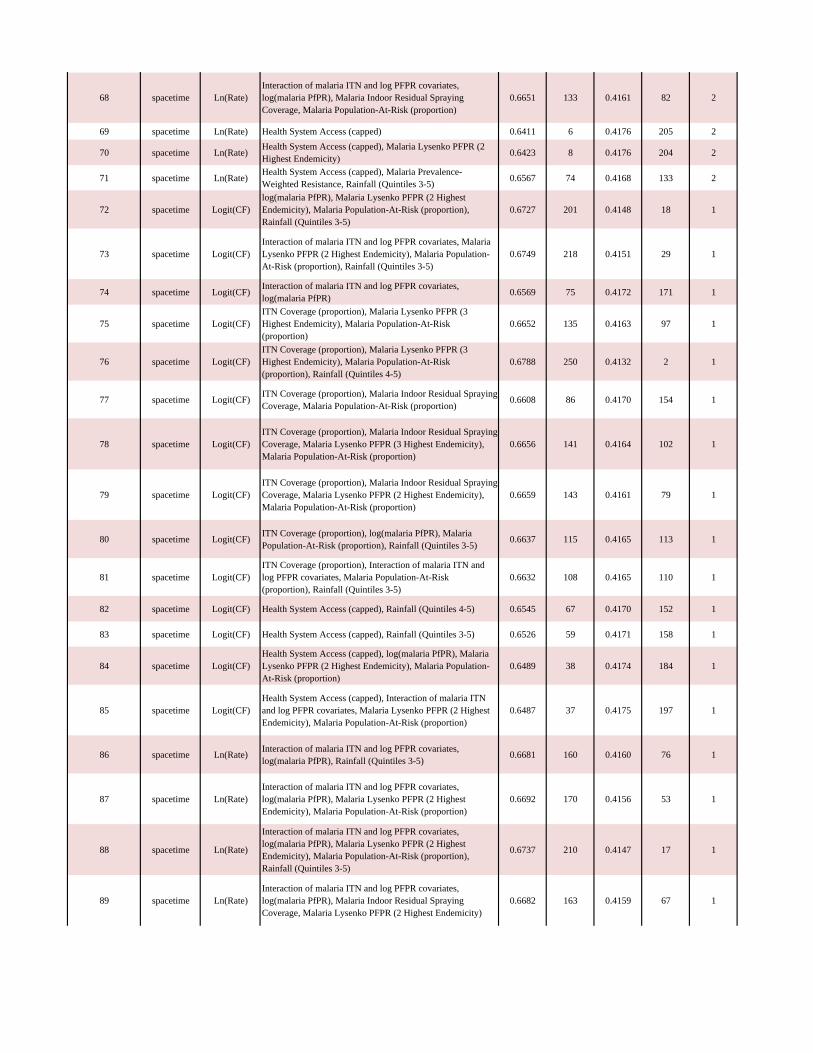
68 spacetime Ln(Rate)Interaction of malaria ITN and log PFPR covariates, log(malaria PfPR), Malaria Indoor Residual Spraying Coverage, Malaria Population-At-Risk (proportion)
0.6651 133 0.4161 82 2
69 spacetime Ln(Rate) Health System Access (capped) 0.6411 6 0.4176 205 2
70 spacetime Ln(Rate)Health System Access (capped), Malaria Lysenko PFPR (2 Highest Endemicity) 0.6423 8 0.4176 204 2
71 spacetime Ln(Rate)Health System Access (capped), Malaria Prevalence-Weighted Resistance, Rainfall (Quintiles 3-5) 0.6567 74 0.4168 133 2
72 spacetime Logit(CF)log(malaria PfPR), Malaria Lysenko PFPR (2 Highest Endemicity), Malaria Population-At-Risk (proportion), Rainfall (Quintiles 3-5)
0.6727 201 0.4148 18 1
73 spacetime Logit(CF)Interaction of malaria ITN and log PFPR covariates, Malaria Lysenko PFPR (2 Highest Endemicity), Malaria Population-At-Risk (proportion), Rainfall (Quintiles 3-5)
0.6749 218 0.4151 29 1
74 spacetime Logit(CF)Interaction of malaria ITN and log PFPR covariates, log(malaria PfPR) 0.6569 75 0.4172 171 1
75 spacetime Logit(CF)ITN Coverage (proportion), Malaria Lysenko PFPR (3 Highest Endemicity), Malaria Population-At-Risk (proportion)
0.6652 135 0.4163 97 1
76 spacetime Logit(CF)ITN Coverage (proportion), Malaria Lysenko PFPR (3 Highest Endemicity), Malaria Population-At-Risk (proportion), Rainfall (Quintiles 4-5)
0.6788 250 0.4132 2 1
77 spacetime Logit(CF) ITN Coverage (proportion), Malaria Indoor Residual Spraying Coverage, Malaria Population-At-Risk (proportion)
0.6608 86 0.4170 154 1
78 spacetime Logit(CF)ITN Coverage (proportion), Malaria Indoor Residual Spraying Coverage, Malaria Lysenko PFPR (3 Highest Endemicity), Malaria Population-At-Risk (proportion)
0.6656 141 0.4164 102 1
79 spacetime Logit(CF)ITN Coverage (proportion), Malaria Indoor Residual Spraying Coverage, Malaria Lysenko PFPR (2 Highest Endemicity), Malaria Population-At-Risk (proportion)
0.6659 143 0.4161 79 1
80 spacetime Logit(CF) ITN Coverage (proportion), log(malaria PfPR), Malaria Population-At-Risk (proportion), Rainfall (Quintiles 3-5)
0.6637 115 0.4165 113 1
81 spacetime Logit(CF)ITN Coverage (proportion), Interaction of malaria ITN and log PFPR covariates, Malaria Population-At-Risk (proportion), Rainfall (Quintiles 3-5)
0.6632 108 0.4165 110 1
82 spacetime Logit(CF) Health System Access (capped), Rainfall (Quintiles 4-5) 0.6545 67 0.4170 152 1
83 spacetime Logit(CF) Health System Access (capped), Rainfall (Quintiles 3-5) 0.6526 59 0.4171 158 1
84 spacetime Logit(CF)Health System Access (capped), log(malaria PfPR), Malaria Lysenko PFPR (2 Highest Endemicity), Malaria Population-At-Risk (proportion)
0.6489 38 0.4174 184 1
85 spacetime Logit(CF)Health System Access (capped), Interaction of malaria ITN and log PFPR covariates, Malaria Lysenko PFPR (2 Highest Endemicity), Malaria Population-At-Risk (proportion)
0.6487 37 0.4175 197 1
86 spacetime Ln(Rate) Interaction of malaria ITN and log PFPR covariates, log(malaria PfPR), Rainfall (Quintiles 3-5)
0.6681 160 0.4160 76 1
87 spacetime Ln(Rate)Interaction of malaria ITN and log PFPR covariates, log(malaria PfPR), Malaria Lysenko PFPR (2 Highest Endemicity), Malaria Population-At-Risk (proportion)
0.6692 170 0.4156 53 1
88 spacetime Ln(Rate)
Interaction of malaria ITN and log PFPR covariates, log(malaria PfPR), Malaria Lysenko PFPR (2 Highest Endemicity), Malaria Population-At-Risk (proportion), Rainfall (Quintiles 3-5)
0.6737 210 0.4147 17 1
89 spacetime Ln(Rate)Interaction of malaria ITN and log PFPR covariates, log(malaria PfPR), Malaria Indoor Residual Spraying Coverage, Malaria Lysenko PFPR (2 Highest Endemicity)
0.6682 163 0.4159 67 1

90 spacetime Ln(Rate)
Interaction of malaria ITN and log PFPR covariates, log(malaria PfPR), Malaria Indoor Residual Spraying Coverage, Malaria Lysenko PFPR (2 Highest Endemicity), Malaria Population-At-Risk (proportion)
0.6682 161 0.4162 86 1
91 spacetime Ln(Rate)Health System Access (capped), Malaria Population-At-Risk (proportion) 0.6455 12 0.4178 224 1
92 spacetime Ln(Rate)Health System Access (capped), Malaria Population-At-Risk (proportion), Rainfall (Quintiles 4-5) 0.6517 55 0.4171 162 1
93 spacetime Ln(Rate)Health System Access (capped), Malaria Lysenko PFPR (3 Highest Endemicity) 0.6427 10 0.4176 211 1
94 spacetime Ln(Rate)Health System Access (capped), log(malaria PfPR), Malaria Lysenko PFPR (2 Highest Endemicity), Malaria Population-At-Risk (proportion)
0.6462 13 0.4178 233 1

Test 1 Rank Test 1 Rank
1 spacetime Ln(Rate)Health System Access (capped), Malaria Lysenko PFPR (3 Highest Endemicity), Malaria Population-At-Risk (proportion), Rainfall (Quintiles 4-5)
0.6626 2 0.3869 18 48
2 spacetime Logit(CF)
Health System Access (capped), Interaction of malaria ITN and log PFPR covariates, Malaria Lysenko PFPR (3 Highest Endemicity), Malaria Population-At-Risk (proportion), Rainfall (Quintiles 4-5)
0.6686 15 0.3866 13 45
3 spacetime Logit(CF)
Health System Access (capped), ITN Coverage (proportion), Interaction of malaria ITN and log PFPR covariates, Malaria Lysenko PFPR (3 Highest Endemicity), Malaria Population-At-Risk (proportion), Rainfall (Quintiles 4-5)
0.6699 21 0.3858 10 43
4 spacetime Logit(CF)Health System Access (capped), log(malaria PfPR), Malaria Lysenko PFPR (3 Highest Endemicity), Malaria Population-At-Risk (proportion), Rainfall (Quintiles 4-5)
0.6695 18 0.3878 24 41
5 spacetime Logit(CF) Health System Access (capped), ITN Coverage (proportion), Interaction of malaria ITN and log PFPR covariates 0.6682 13 0.3889 32 39
6 spacetime Logit(CF)Health System Access (capped), Interaction of malaria ITN and log PFPR covariates, Malaria Population-At-Risk (proportion), Rainfall (Quintiles 4-5)
0.6716 43 0.3857 8 37
7 spacetime Logit(CF)
Health System Access (capped), ITN Coverage (proportion), log(malaria PfPR), Malaria Lysenko PFPR (3 Highest Endemicity), Malaria Population-At-Risk (proportion), Rainfall (Quintiles 4-5)
0.6710 33 0.3875 22 36
8 spacetime Logit(CF)Health System Access (capped), ITN Coverage (proportion), Interaction of malaria ITN and log PFPR covariates, Malaria Population-At-Risk (proportion)
0.6704 27 0.3889 31 34
9 spacetime Logit(CF) Health System Access (capped), ITN Coverage (proportion), log(malaria PfPR) 0.6700 22 0.3891 37 32
10 spacetime Ln(Rate) Health System Access (capped), Malaria Prevalence-Weighted Resistance, Rainfall (Quintiles 4-5) 0.6681 12 0.3899 50 31
11 spacetime Ln(Rate) Health System Access (capped), Malaria Population-At-Risk (proportion), Rainfall (Quintiles 4-5) 0.6736 61 0.3847 4 29
12 spacetime Logit(CF)
Health System Access (capped), ITN Coverage (proportion), Interaction of malaria ITN and log PFPR covariates, Malaria Lysenko PFPR (3 Highest Endemicity), Malaria Population-At-Risk (proportion)
0.6703 24 0.3894 42 28
13 spacetime Logit(CF)Health System Access (capped), Malaria Lysenko PFPR (3 Highest Endemicity), Malaria Population-At-Risk (proportion), Rainfall (Quintiles 4-5)
0.6738 64 0.3841 3 27
14 spacetime Logit(CF)Health System Access (capped), ITN Coverage (proportion), Interaction of malaria ITN and log PFPR covariates, Malaria Population-At-Risk (proportion), Rainfall (Quintiles 4-5)
0.6736 62 0.3849 6 25
15 spacetime Logit(CF) Health System Access (capped), log(malaria PfPR), Malaria Population-At-Risk (proportion), Rainfall (Quintiles 4-5) 0.6727 54 0.3869 16 24
16 spacetime Logit(CF) Health System Access (capped), ITN Coverage (proportion), log(malaria PfPR), Malaria Population-At-Risk (proportion) 0.6716 42 0.3889 35 23
17 spacetime Logit(CF)Health System Access (capped), ITN Coverage (proportion), Malaria Lysenko PFPR (3 Highest Endemicity), Malaria Population-At-Risk (proportion), Rainfall (Quintiles 4-5)
0.6657 6 0.3909 71 22
18 spacetime Logit(CF)Health System Access (capped), ITN Coverage (proportion), log(malaria PfPR), Malaria Lysenko PFPR (3 Highest Endemicity), Malaria Population-At-Risk (proportion)
0.6714 37 0.3895 45 21
Appendix Table 14h: CODEm sub-model performance - Malaria Ouside Africa over 5 Females
Overall Rank Model typeDependent
variableCovariates
Root Mean Squared Error
Trend Test
Draws

19 spacetime Logit(CF)Health System Access (capped), ITN Coverage (proportion), log(malaria PfPR), Malaria Population-At-Risk (proportion), Rainfall (Quintiles 4-5)
0.6749 70 0.3867 14 20
20 spacetime Logit(CF)Health System Access (capped), ITN Coverage (proportion), Interaction of malaria ITN and log PFPR covariates, Malaria Lysenko PFPR (2 Highest Endemicity)
0.6745 67 0.3890 36 19
21 spacetime Ln(Rate) Health System Access (capped), Rainfall (Quintiles 4-5) 0.6755 79 0.3885 27 18
22 spacetime Logit(CF) Health System Access (capped), Interaction of malaria ITN and log PFPR covariates 0.6704 25 0.3914 85 17
23 spacetime Logit(CF)Health System Access (capped), Interaction of malaria ITN and log PFPR covariates, Malaria Population-At-Risk (proportion)
0.6688 16 0.3916 98 16
24 spacetime Logit(CF)Health System Access (capped), ITN Coverage (proportion), Malaria Lysenko PFPR (2 Highest Endemicity), Malaria Population-At-Risk (proportion)
0.6729 56 0.3901 58 16
25 spacetime Logit(CF)Health System Access (capped), Interaction of malaria ITN and log PFPR covariates, Malaria Lysenko PFPR (2 Highest Endemicity)
0.6712 36 0.3913 80 15
26 spacetime Logit(CF)Health System Access (capped), ITN Coverage (proportion), log(malaria PfPR), Malaria Lysenko PFPR (2 Highest Endemicity)
0.6763 81 0.3892 38 14
27 spacetime Logit(CF)ITN Coverage (proportion), Malaria Lysenko PFPR (3 Highest Endemicity), Malaria Population-At-Risk (proportion), Rainfall (Quintiles 4-5)
0.6783 98 0.3889 33 13
28 spacetime Logit(CF) Health System Access (capped), Malaria Population-At-Risk (proportion), Rainfall (Quintiles 4-5) 0.6804 118 0.3839 2 13
29 spacetime Logit(CF) Health System Access (capped), Malaria Lysenko PFPR (2 Highest Endemicity) 0.6708 31 0.3917 106 12
30 spacetime Logit(CF)Health System Access (capped), Interaction of malaria ITN and log PFPR covariates, Malaria Lysenko PFPR (3 Highest Endemicity), Malaria Population-At-Risk (proportion)
0.6720 47 0.3916 93 12
31 spacetime Ln(Rate)
Health System Access (capped), ITN Coverage (proportion), Interaction of malaria ITN and log PFPR covariates, Malaria Lysenko PFPR (2 Highest Endemicity), Malaria Population-At-Risk (proportion)
0.6729 57 0.3914 88 11
32 spacetime Logit(CF) Health System Access (capped), Malaria Prevalence-Weighted Resistance, Rainfall (Quintiles 4-5) 0.6813 127 0.3883 25 10
33 spacetime Logit(CF) Health System Access (capped), log(malaria PfPR), Malaria Population-At-Risk (proportion) 0.6698 20 0.3921 131 10
34 spacetime Ln(Rate)Health System Access (capped), ITN Coverage (proportion), log(malaria PfPR), Malaria Lysenko PFPR (2 Highest Endemicity), Malaria Population-At-Risk (proportion)
0.6739 65 0.3915 89 10
35 spacetime Logit(CF)Health System Access (capped), Malaria Lysenko PFPR (2 Highest Endemicity), Malaria Population-At-Risk (proportion), Rainfall (Quintiles 4-5)
0.6824 138 0.3869 17 9
36 spacetime Logit(CF)Health System Access (capped), ITN Coverage (proportion), Malaria Lysenko PFPR (3 Highest Endemicity), Malaria Population-At-Risk (proportion)
0.6666 9 0.3925 148 9
37 spacetime Logit(CF)Health System Access (capped), Malaria Lysenko PFPR (2 Highest Endemicity), Malaria Population-At-Risk (proportion)
0.6748 69 0.3915 91 8
38 spacetime Logit(CF)
Health System Access (capped), ITN Coverage (proportion), Interaction of malaria ITN and log PFPR covariates, Malaria Lysenko PFPR (2 Highest Endemicity), Malaria Population-At-Risk (proportion)
0.6799 106 0.3899 53 8
39 spacetime Logit(CF) Health System Access (capped), Rainfall (Quintiles 4-5) 0.6842 154 0.3864 12 7
40 spacetime Logit(CF)Health System Access (capped), Malaria Prevalence-Weighted Resistance, Malaria Lysenko PFPR (2 Highest Endemicity)
0.6716 41 0.3920 124 7

41 spacetime Ln(Rate)
Health System Access (capped), ITN Coverage (proportion), Interaction of malaria ITN and log PFPR covariates, Malaria Lysenko PFPR (2 Highest Endemicity), Malaria Population-At-Risk (proportion), Rainfall (Quintiles 3-5)
0.6770 89 0.3911 76 7
42 spacetime Logit(CF) Health System Access (capped), log(malaria PfPR) 0.6715 40 0.3922 135 6
43 spacetime Logit(CF)Health System Access (capped), Interaction of malaria ITN and log PFPR covariates, Malaria Lysenko PFPR (2 Highest Endemicity), Malaria Population-At-Risk (proportion)
0.6761 80 0.3915 92 6
44 spacetime Logit(CF)Health System Access (capped), ITN Coverage (proportion), log(malaria PfPR), Malaria Lysenko PFPR (2 Highest Endemicity), Malaria Population-At-Risk (proportion)
0.6810 124 0.3899 51 6
45 spacetime Ln(Rate)
Health System Access (capped), ITN Coverage (proportion), log(malaria PfPR), Malaria Lysenko PFPR (2 Highest Endemicity), Malaria Population-At-Risk (proportion), Rainfall (Quintiles 3-5)
0.6782 97 0.3912 78 6
46 spacetime Logit(CF) Health System Access (capped), Malaria Population-At-Risk (proportion) 0.6709 32 0.3926 154 5
47 spacetime Logit(CF)Health System Access (capped), Malaria Lysenko PFPR (3 Highest Endemicity), Malaria Population-At-Risk (proportion)
0.6718 45 0.3923 138 5
48 spacetime Logit(CF)Health System Access (capped), Malaria Lysenko PFPR (2 Highest Endemicity), Malaria Lysenko PFPR (3 Highest Endemicity)
0.6746 68 0.3918 108 5
49 spacetime Logit(CF) Health System Access (capped), log(malaria PfPR), Malaria Lysenko PFPR (2 Highest Endemicity) 0.6730 58 0.3921 126 5
50 spacetime Logit(CF) Health System Access (capped) 0.6721 48 0.3926 158 4
51 spacetime Logit(CF)Health System Access (capped), log(malaria PfPR), Malaria Lysenko PFPR (3 Highest Endemicity), Malaria Population-At-Risk (proportion)
0.6726 52 0.3921 134 4
52 spacetime Logit(CF)Health System Access (capped), log(malaria PfPR), Malaria Lysenko PFPR (2 Highest Endemicity), Malaria Population-At-Risk (proportion)
0.6769 86 0.3920 122 4
53 spacetime Ln(Rate) Health System Access (capped), ITN Coverage (proportion), log(malaria PfPR), Malaria Population-At-Risk (proportion) 0.6740 66 0.3923 140 4
54 spacetime Ln(Rate)Health System Access (capped), ITN Coverage (proportion), Interaction of malaria ITN and log PFPR covariates, Malaria Population-At-Risk (proportion)
0.6735 60 0.3922 137 4
55 spacetime Logit(CF) Health System Access (capped), Malaria Lysenko PFPR (3 Highest Endemicity) 0.6753 76 0.3925 145 3
56 spacetime Logit(CF)Health System Access (capped), ITN Coverage (proportion), Malaria Lysenko PFPR (2 Highest Endemicity), Malaria Population-At-Risk (proportion), Rainfall (Quintiles 4-5)
0.6806 120 0.3915 90 3
57 spacetime Logit(CF)
Health System Access (capped), ITN Coverage (proportion), Interaction of malaria ITN and log PFPR covariates, Malaria Lysenko PFPR (2 Highest Endemicity), Malaria Population-At-Risk (proportion), Rainfall (Quintiles 3-5)
0.6802 111 0.3918 112 3
58 spacetime Ln(Rate)Health System Access (capped), Malaria Prevalence-Weighted Resistance, Malaria Lysenko PFPR (2 Highest Endemicity)
0.6660 7 0.3940 225 3
59 spacetime Ln(Rate)Health System Access (capped), Interaction of malaria ITN and log PFPR covariates, Malaria Lysenko PFPR (2 Highest Endemicity), Malaria Population-At-Risk (proportion)
0.6724 51 0.3928 168 3
60 spacetime Ln(Rate)Health System Access (capped), ITN Coverage (proportion), log(malaria PfPR), Malaria Lysenko PFPR (2 Highest Endemicity)
0.6752 73 0.3927 160 3
61 spacetime Ln(Rate)Health System Access (capped), ITN Coverage (proportion), Interaction of malaria ITN and log PFPR covariates, Malaria Lysenko PFPR (2 Highest Endemicity)
0.6753 74 0.3925 150 3
62 spacetime Logit(CF) Malaria Lysenko PFPR (2 Highest Endemicity) 0.6877 178 0.3906 61 2
63 spacetime Logit(CF) Malaria Lysenko PFPR (2 Highest Endemicity), Malaria Lysenko PFPR (3 Highest Endemicity) 0.6886 187 0.3906 62 2

64 spacetime Logit(CF)Malaria Lysenko PFPR (2 Highest Endemicity), Malaria Lysenko PFPR (3 Highest Endemicity), Malaria Population-At-Risk (proportion)
0.6887 191 0.3907 65 2
65 spacetime Logit(CF) Health System Access (capped), Malaria Prevalence-Weighted Resistance 0.6726 53 0.3930 181 2
66 spacetime Logit(CF)Health System Access (capped), Interaction of malaria ITN and log PFPR covariates, Malaria Population-At-Risk (proportion), Rainfall (Quintiles 3-5)
0.6694 17 0.3942 237 2
67 spacetime Logit(CF)Health System Access (capped), ITN Coverage (proportion), Malaria Lysenko PFPR (2 Highest Endemicity), Malaria Population-At-Risk (proportion), Rainfall (Quintiles 3-5)
0.6753 75 0.3929 176 2
68 spacetime Logit(CF)
Health System Access (capped), ITN Coverage (proportion), log(malaria PfPR), Malaria Lysenko PFPR (2 Highest Endemicity), Malaria Population-At-Risk (proportion), Rainfall (Quintiles 3-5)
0.6815 129 0.3921 128 2
69 spacetime Ln(Rate)Health System Access (capped), Malaria Lysenko PFPR (3 Highest Endemicity), Malaria Population-At-Risk (proportion)
0.6650 4 0.3941 231 2
70 spacetime Ln(Rate) Health System Access (capped), Malaria Lysenko PFPR (2 Highest Endemicity) 0.6719 46 0.3937 210 2
71 spacetime Ln(Rate)Health System Access (capped), log(malaria PfPR), Malaria Lysenko PFPR (2 Highest Endemicity), Malaria Population-At-Risk (proportion)
0.6730 59 0.3931 186 2
72 spacetime Logit(CF) Malaria Lysenko PFPR (3 Highest Endemicity) 0.6904 225 0.3907 63 1
73 spacetime Logit(CF) Malaria Lysenko PFPR (3 Highest Endemicity), Malaria Population-At-Risk (proportion), Rainfall (Quintiles 4-5) 0.6932 262 0.3824 1 1
74 spacetime Logit(CF) Malaria Lysenko PFPR (2 Highest Endemicity), Malaria Population-At-Risk (proportion) 0.6889 196 0.3907 64 1
75 spacetime Logit(CF) Malaria Lysenko PFPR (2 Highest Endemicity), Malaria Population-At-Risk (proportion), Rainfall (Quintiles 4-5) 0.6943 286 0.3854 7 1
76 spacetime Logit(CF) Malaria Indoor Residual Spraying Coverage, Malaria Population-At-Risk (proportion) 0.6854 163 0.3921 127 1
77 spacetime Logit(CF)Malaria Indoor Residual Spraying Coverage, Malaria Lysenko PFPR (3 Highest Endemicity), Malaria Population-At-Risk (proportion)
0.6868 172 0.3919 118 1
78 spacetime Logit(CF)Malaria Indoor Residual Spraying Coverage, Malaria Lysenko PFPR (3 Highest Endemicity), Malaria Population-At-Risk (proportion), Rainfall (Quintiles 4-5)
0.6932 263 0.3886 29 1
79 spacetime Logit(CF)Malaria Indoor Residual Spraying Coverage, Malaria Lysenko PFPR (2 Highest Endemicity), Malaria Population-At-Risk (proportion)
0.6871 174 0.3917 100 1
80 spacetime Logit(CF) ITN Coverage (proportion), Malaria Indoor Residual Spraying Coverage 0.6834 148 0.3921 133 1
81 spacetime Logit(CF)ITN Coverage (proportion), Malaria Indoor Residual Spraying Coverage, Malaria Lysenko PFPR (2 Highest Endemicity)
0.6861 167 0.3916 96 1
82 spacetime Logit(CF) Health System Access (capped), Rainfall (Quintiles 3-5) 0.6766 82 0.3933 194 1
83 spacetime Logit(CF)Health System Access (capped), Malaria Lysenko PFPR (2 Highest Endemicity), Malaria Population-At-Risk (proportion), Rainfall (Quintiles 3-5)
0.6752 72 0.3934 201 1
84 spacetime Logit(CF) Health System Access (capped), log(malaria PfPR), Malaria Population-At-Risk (proportion), Rainfall (Quintiles 3-5) 0.6706 29 0.3946 263 1
85 spacetime Ln(Rate) Health System Access (capped) 0.6678 11 0.3946 259 1
86 spacetime Ln(Rate) Health System Access (capped), Malaria Population-At-Risk (proportion) 0.6674 10 0.3944 252 1
87 spacetime Ln(Rate) Health System Access (capped), Malaria Lysenko PFPR (3 Highest Endemicity) 0.6714 38 0.3945 254 1
88 spacetime Ln(Rate)Health System Access (capped), Malaria Lysenko PFPR (2 Highest Endemicity), Malaria Population-At-Risk (proportion)
0.6737 63 0.3933 196 1
89 spacetime Ln(Rate) Health System Access (capped), Malaria Prevalence-Weighted Resistance 0.6620 1 0.3949 273 1

90 spacetime Ln(Rate)Health System Access (capped), Malaria Prevalence-Weighted Resistance, Malaria Lysenko PFPR (3 Highest Endemicity)
0.6644 3 0.3948 267 1
91 spacetime Ln(Rate)Health System Access (capped), Interaction of malaria ITN and log PFPR covariates, Malaria Lysenko PFPR (2 Highest Endemicity)
0.6769 87 0.3929 175 1
92 spacetime Ln(Rate)Health System Access (capped), ITN Coverage (proportion), log(malaria PfPR), Malaria Lysenko PFPR (3 Highest Endemicity), Malaria Population-At-Risk (proportion)
0.6779 96 0.3932 190 1
93 spacetime Ln(Rate) Health System Access (capped), ITN Coverage (proportion), Interaction of malaria ITN and log PFPR covariates 0.6802 112 0.3927 162 1
94 spacetime Ln(Rate)
Health System Access (capped), ITN Coverage (proportion), Interaction of malaria ITN and log PFPR covariates, Malaria Lysenko PFPR (3 Highest Endemicity), Malaria Population-At-Risk (proportion)
0.6776 91 0.3931 189 1

Study-level data WHO data adjusted for undercount WHO case report data used
AGO AFG BLZ
BDI ARE CHN
BEN ARG IRN
BFA ARM KGZ
CAF AZE PAN
CIV BGD SAU
CMR BOL TJK
COD BRA ZAF
COG BTN
ETH BWA
GAB COL
GHA COM
GIN CPV
GMB CRI
GNB DJI
GNQ DOM
GUF EGY
IDN ERI
IND GEO
KEN GTM
LBR GUY
MDG HND
MLI HTI
MMR IRQ
MOZ KHM
MRT KOR
MUS LAO
MWI LBY
MYT LKA
NER MAR
NGA MEX
PNG MYS
RWA NAM
SDN NIC
SEN NPL
SLE OMN
SOM PAK
SSD PER
TCD PHL
TGO PRK
TZA PRY
UGA SLB
YEM SLV
ZMB STP
Appendix Table 15: Countries grouped by data used for estimation of malaria incident cases

ZWE SUR
SWZ
SYR
THA
TKM
TLS
TUR
UZB
VEN
VNM
VUT