Global Journal of Research in Engineering - GlobalJournals.org
79
VOLUME 13 ISSUE 7 VERSION 1.0 Online ISSN : 2249-4596 Print ISSN : 0975-5861 Liner Honing Operation Thermomechanical Loading Excited Nonlinear Pendulum Estimated Fractal Dimensions
-
Upload
khangminh22 -
Category
Documents
-
view
2 -
download
0
Transcript of Global Journal of Research in Engineering - GlobalJournals.org

VOLUME 13 ISSUE 7 VERSION 1.0
Online ISSN : 2249-4596Print ISSN : 0975-5861
Liner Honing Operation Thermomechanical Loading
Excited Nonlinear Pendulum Estimated Fractal Dimensions

Global Journal of Researches in Engineering: A Mechanical and Mechanics Engineering

Global Journal of Researches in Engineering: A Mechanical and Mechanics Engineering
Open Association of Research Society

Global Journals Inc. (A Delaware USA Incorporation with “Good Standing”; Reg. Number: 0423089) Sponsors: Open Scientific Standards
Publisher’s Headquarters office
Global Journals Inc., Headquarters Corporate Office, Cambridge Office Center, II Canal Park, Floor No. 5th, Cambridge (Massachusetts), Pin: MA 02141 United States USA Toll Free: +001-888-839-7392 USA Toll Free Fax: +001-888-839-7392
Offset Typesetting
Packaging & Continental Dispatching Global Journals, India Find a correspondence nodal officer near you To find nodal officer of your country, please email us at [email protected]
eContacts Press Inquiries: [email protected] Investor Inquiries: [email protected] Technical Support: [email protected] Media & Releases: [email protected] Pricing (Including by Air Parcel Charges): For Authors: 22 USD (B/W) & 50 USD (Color) Yearly Subscription (Personal & Institutional): 200 USD (B/W) & 250 USD (Color)
© Global Journal of Researches in Engineering.
All rights reserved.
This is a special issue published in version 1.0 of “Global Journal of Researches in
Engineering.” By Global Journals Inc.
All articles are open access articles distributed under “Global Journal of Researches in
Engineering”
Reading License, which permits restricted use. Entire contents are copyright by of “Global
Journal of Researches in Engineering” unless otherwise noted on specific articles.
No part of this publication may be reproduced or transmitted in any form or by any means,
electronic or mechanical, including photocopy, recording, or any information
storage and retrieval system, without written permission.
The opinions and statements made in this book are those of the authors concerned. Ultraculture has not verified and neither
confirms nor denies any of the foregoing and no warranty or fitness is implied.
Engage with the contents herein at your own risk.
The use of this journal, and the terms and conditions for our providing information, is
governed by our Disclaimer, Terms and Conditions and Privacy Policy given on our
By referring / using / reading / any type of association / referencing this journal, this
signifies and you acknowledge that you have read them and that you accept and will be
bound by the terms thereof.
All information, journals, this journal, activities undertaken, materials, services and our website, terms and conditions, privacy policy, and this journal is subject to change
anytime without any prior notice.
Incorporation No.: 0423089
License No.: 42125/022010/1186
Registration No.: 430374
Import-Export Code: 1109007027
Employer Identification Number (EIN):
USA Tax ID: 98-0673427
Open Association of Research Society
Rainham, Essex, London RM13 8EUUnited Kingdom.
Open Association of Research Society, Marsh Road,
2013.
website
.
http://globaljournals.us/terms-and-condition/menu-id-1463/

John A. Hamilton,"Drew" Jr., Ph.D., Professor, Management Computer Science and Software Engineering Director, Information Assurance Laboratory Auburn University
Dr. Wenying Feng Professor, Department of Computing & Information Systems Department of Mathematics Trent University, Peterborough, ON Canada K9J 7B8
Dr. Henry Hexmoor IEEE senior member since 2004 Ph.D. Computer Science, University at Buffalo Department of Computer Science Southern Illinois University at Carbondale
Dr. Thomas Wischgoll Computer Science and Engineering, Wright State University, Dayton, Ohio B.S., M.S., Ph.D. (University of Kaiserslautern)
Dr. Osman Balci, Professor
Department of Computer Science Virginia Tech, Virginia University Ph.D.and M.S.Syracuse University, Syracuse, New York M.S. and B.S. Bogazici University, Istanbul, Turkey
Dr. Abdurrahman Arslanyilmaz Computer Science & Information Systems Department Youngstown State University Ph.D., Texas A&M University University of Missouri, Columbia Gazi University, Turkey
Yogita Bajpai M.Sc. (Computer Science), FICCT U.S.A.Email: [email protected]
Dr. Xiaohong He Professor of International Business University of Quinnipiac BS, Jilin Institute of Technology; MA, MS, PhD,. (University of Texas-Dallas)
Dr. T. David A. Forbes Associate Professor and Range Nutritionist Ph.D. Edinburgh University - Animal Nutrition M.S. Aberdeen University - Animal Nutrition
B.A. University of Dublin- Zoology
Burcin Becerik-Gerber University of Southern California Ph.D. in Civil Engineering DDes from Harvard University M.S. from University of California, Berkeley & Istanbul University
Editorial Board Members (HON.)

Dr. Bart Lambrecht Director of Research in Accounting and FinanceProfessor of Finance Lancaster University Management School BA (Antwerp); MPhil, MA, PhD (Cambridge)
Dr. Söhnke M. Bartram Department of Accounting and FinanceLancaster University Management SchoolPh.D. (WHU Koblenz) MBA/BBA (University of Saarbrücken)
Dr. Carlos García Pont Associate Professor of Marketing IESE Business School, University of Navarra Doctor of Philosophy (Management), Massachusetts Institute of Technology (MIT) Master in Business Administration, IESE, University of Navarra Degree in Industrial Engineering, Universitat Politècnica de Catalunya
Dr. Miguel Angel Ariño Professor of Decision Sciences IESE Business School Barcelona, Spain (Universidad de Navarra) CEIBS (China Europe International Business School). Beijing, Shanghai and Shenzhen Ph.D. in Mathematics University of Barcelona BA in Mathematics (Licenciatura) University of Barcelona
Dr. Fotini Labropulu Mathematics - Luther College University of ReginaPh.D., M.Sc. in Mathematics B.A. (Honors) in Mathematics University of Windso
Philip G. Moscoso Technology and Operations Management IESE Business School, University of Navarra Ph.D in Industrial Engineering and Management, ETH Zurich M.Sc. in Chemical Engineering, ETH Zurich
Dr. Lynn Lim Reader in Business and Marketing Roehampton University, London BCom, PGDip, MBA (Distinction), PhD, FHEA
Dr. Sanjay Dixit, M.D. Director, EP Laboratories, Philadelphia VA Medical Center Cardiovascular Medicine - Cardiac Arrhythmia Univ of Penn School of Medicine
Dr. Mihaly Mezei ASSOCIATE PROFESSOR Department of Structural and Chemical Biology, Mount Sinai School of Medical Center Ph.D., Etvs Lornd University Postdoctoral Training, New York University
Dr. Han-Xiang Deng MD., Ph.D Associate Professor and Research Department Division of Neuromuscular Medicine Davee Department of Neurology and Clinical NeuroscienceNorthwestern University Feinberg School of Medicine

Dr. Pina C. Sanelli Associate Professor of Public Health Weill Cornell Medical College Associate Attending Radiologist NewYork-Presbyterian Hospital MRI, MRA, CT, and CTA Neuroradiology and Diagnostic Radiology M.D., State University of New York at Buffalo,School of Medicine and Biomedical Sciences
Dr. Roberto Sanchez
Associate Professor Department of Structural and Chemical Biology Mount Sinai School of Medicine Ph.D., The Rockefeller University
Dr. Wen-Yih Sun
Professor of Earth and Atmospheric SciencesPurdue University Director National Center for Typhoon and Flooding Research, Taiwan University Chair Professor Department of Atmospheric Sciences, National Central University, Chung-Li, TaiwanUniversity Chair Professor Institute of Environmental Engineering, National Chiao Tung University, Hsin-chu, Taiwan.Ph.D., MS The University of Chicago, Geophysical Sciences BS National Taiwan University, Atmospheric Sciences Associate Professor of Radiology
Dr. Michael R. Rudnick
M.D., FACP Associate Professor of Medicine Chief, Renal Electrolyte and Hypertension Division (PMC) Penn Medicine, University of Pennsylvania Presbyterian Medical Center, Philadelphia Nephrology and Internal Medicine Certified by the American Board of Internal Medicine
Dr. Bassey Benjamin Esu B.Sc. Marketing; MBA Marketing; Ph.D Marketing Lecturer, Department of Marketing, University of Calabar Tourism Consultant, Cross River State Tourism Development Department Co-ordinator , Sustainable Tourism Initiative, Calabar, Nigeria
Dr. Aziz M. Barbar, Ph.D. IEEE Senior Member Chairperson, Department of Computer Science AUST - American University of Science & Technology Alfred Naccash Avenue – Ashrafieh

Dr. George Perry, (Neuroscientist) Dean and Professor, College of Sciences
Denham Harman Research Award (American Aging Association)
ISI Highly Cited Researcher, Iberoamerican Molecular Biology Organization
AAAS Fellow, Correspondent Member of Spanish Royal Academy of Sciences
University of Texas at San Antonio
Postdoctoral Fellow (Department of Cell Biology)
Baylor College of Medicine
Houston, Texas, United States
Dr. R.K. Dixit M.Sc., Ph.D., FICCT Chief Author, India Email: [email protected]
Vivek Dubey(HON.) MS (Industrial Engineering),
MS (Mechanical Engineering)
University of Wisconsin, FICCT
Editor-in-Chief, USA
Er. Suyog Dixit (M. Tech), BE (HONS. in CSE), FICCT SAP Certified Consultant CEO at IOSRD, GAOR & OSS Technical Dean, Global Journals Inc. (US) Website: www.suyogdixit.com Email:[email protected]
Pritesh Rajvaidya (MS) Computer Science Department California State University BE (Computer Science), FICCT Technical Dean, USA Email: [email protected]
Sangita Dixit M.Sc., FICCT
Dean & Chancellor (Asia Pacific) [email protected]
Luis Galárraga J!Research Project Leader Saarbrücken, Germany
President Editor (HON.)
Chief Author (HON.)
Dean & Editor-in-Chief (HON.)
Suyash Dixit
(B.E., Computer Science Engineering), FICCTT President, Web Administration and
Development CEO at IOSRD COO at GAOR & OSS
,
Contents of the Volume
i. Copyright Notice ii. Editorial Board Members iii. Chief Author and Dean iv. Table of Contents v. From the Chief Editor’s Desk vi. Research and Review Papers
1. Design and Modeling of Fixture for Cylinder Liner Honing Operation. 1-6 2. Correlation and Distribution Analyses of Estimated Fractal Dimensions and
Hurst’s Exponent from Waveforms of Excited Nonlinear Pendulum. 7-12 3.
4. Design and Optimization Radial Gas Turbine Blade. 19-215. Performance Evaluation of Cryogenic Treated Hss Drill. 23-276. Review of Magnetic Levitation (MAGLEV): a Technology to Propel Vehicles
with Magnets. 29-42
vii. Auxiliary Membershipsviii. Process of Submission of Research Paperix. Preferred Author Guidelinesx. Index
Deflection of Functionally Gradient Material Plate under Mechanical, Thermal and Thermomechanical Loading. 13-18

© 2013. Sandeep Soni & Ravindra Mane. This is a research/review paper, distributed under the terms of the Creative Commons Attribution-Noncommercial 3.0 Unported License http://creativecommons.org/licenses/by-nc/3.0/), permitting all non commercial use, distribution, and reproduction in any medium, provided the original work is properly cited.
Global Journal of Researches in Engineering Mechanical & Mechanics Volume 13 Issue 7 Version 1.0 Year 2013 Type: Double Blind Peer Reviewed International Research Journal Publisher: Global Journals Inc. (USA) Online ISSN: 2249-4596 & Print ISSN: 0975-5861
Design and Modeling of Fixture for Cylinder Liner Honing Operation
By Sandeep Soni & Ravindra Mane S.V. National Institute of Technology, India
Abstract - Model of new fixture design is presented for cylinder liners honing operation to improve productivity and reduce the rejection rate on honing machine. In mass production of cylinder liners, the industrial honing involves abrasive finishing process, during that liners need to be fixed on honing machine, For that a new model of fixture setup relative to honing operation of cylinder liner is proposed, planned and modeled such that the liners can be held in form closure and totally immobilized.
This paper uses newer and innovative design of present day manufacturing industries for locating, positioning, clamping, for uniforce clamping hydraulic clampings are used. Fixture design is one of the important factor that play a role in providing manufacturing processes with more productivity and have brought many benefits like reduced rejection.
Fixtures are used in many manufacturing processes to locate, hold and support the work securely. While designing this paper, a good number of literature written on the subject by renowned authors are referred. The paper includes finished parts model and 3D assembled view of fixture using Pro/Engineer Wildfire.
Keywords : honing fixture, cylinder liners, fixture planning and fixture assembly. GJRE-A Classification : For Code: 091399
Design and Modeling of Fixture for Cylinder Liner Honing Operation
Strictly as per the compliance and regulations of
:

Design and Modeling of Fixture for Cylinder Liner Honing Operation
Sandeep Soni α & Ravindra Mane σ
Abstract -
Model of new fixture design is presented for cylinder liners honing operation to improve productivity and reduce the rejection rate on honing machine. In mass production of cylinder liners, the industrial honing involves abrasive finishing process, during that liners need to be fixed on honing machine, For that a new model of fixture setup relative to honing operation of cylinder liner is proposed, planned and modeled such that the liners can be held in form closure and totally immobilized.
This paper uses newer and innovative design of present day manufacturing industries for locating, positioning, clamping, for uniforce clamping hydraulic clampings are used. Fixture design is one of the important factor that play a role in providing manufacturing processes with more productivity and have brought many benefits like reduced rejection.
Fixtures are used in many manufacturing processes to locate, hold and support the work securely. While designing this paper, a good number of literature written on the subject by renowned authors are referred. The paper includes finished parts model and 3D assembled view of fixture using Pro/Engineer Wildfire.
Keywords
:
honing fixture, cylinder liners, fixture planning and fixture assembly.
I.
Introduction
he need for improved productivity and reduced time to market has been increased significantly in manufacturing processes in recent decades.
Fixtures have a direct impact upon product manufacturing quality, productivity and cost hence there are many factors
playing roles in manufacturing processes in order to improve productivity and reduce production time. Fixtures are one of the important tools that are widely used to achieve this goal.
Fixtures are mechanism used to rapidly, accurately, and securely position workpiece during machining such that all machined parts fall within the design specifications. This accuracy facilitates the inter-changeability of parts.
Several designs and design methodologies associated with fixture design and their practical implementation, which have been addressed by many authors [1], [2], 3], [6], [9]. The most important work on
design of fixture is discussed as, the fixture designing and manufacturing is considered as complex process that demands the knowledge of different areas, such as geometry, tolerances, dimensions, procedures and manufacturing processes [1],[3]. Generally, the costs associated with fixture design and manufacture can account for 10%–20% of the total cost of a manufacturing system. Approximately 35% to 40% of rejected parts are due to dimensioning errors [6]. Therefore, with the increasingly intense global competition which pushes every manufacturer in industry to make the best effort to sharpen its competitiveness by enhancing the product’s quality, reducing the production costs and reducing the lead time to bring new products to the market, there is an strong desire for the upgrading of fixture designs with the hope of making sound fixture design more efficiently and at a lower cost. While designing this work, a good number of literatures written on the subject by renowned authors are referred. All findings and conclusions obtained from the literature review regarding the fixture design are used as guide to design the present work.
II. Problem Statement
Honing is a machining process for finishing internal cylindrical surfaces. In order to reduce engine oil consumption a high percentage contact area of cylinder liner is required and minimal dislocations in the boundary layer and the creation of a uniform and consistent surface over the whole cylinder bore. For guaranteed producibility with efficient productivity in mass production of cylinder liners, the industrial honing involves an interrupted multistage abrasive finishing process (fig. 1), for this cylinder liner must be fixed on fixture during honing operation [5].
(a) (b)
Figure 1 (a) : Photograph of cylinder liner, (b) photograph of honing tool with cylinder liner
T
Author α : Assistant Professor, Department of Mechanical Engineering, S.V. National Institute of Technology, Surat, India.E-mail : [email protected] σ : PG Student, Department of Mechanical Engineering, S.V. National Institute of Technology, Surat, India.E-mail : [email protected]
Globa
l Jo
urna
l of R
esea
rche
s in E
nginee
ring
Volum
e X
III Issue
VII
Version
I
1
()
AYear
013
2
© 2013 Global Journals Inc. (US)

The main problem in such operation is low
productivity with high rejection. It is cumbersome process for the workers. The main task for it is to make the loading and unloading process simple, the time required should be minimized and operation should be easier one. By observing industrial problems and studying previous process of fixing cylinder liner on honing machining, there is need of designing new fixture to increase the productivity and reduce the rejection rate with the loading and unloading process simple. For this fixture and innovative design are considered. Various areas related to design of fixture are already been very well described by various renowned authors, this paper integrates all these research works and theoretical knowledge of fixture design to design this new fixture for component like cylinder liner.
III. Design of Fixture - Methodology
A fixture is a production tool that locates, holds, and supports the work securely so the required machining operations can be performed. A fixture should be securely fastened to the table of machine upon which the work is done. Fixtures are essential elements of production processes as they are required in most of the automated manufacturing, inspection, and assembly operations [16].
In mass production fixture have five key aspects [12]:
− Reduce the cost of production. − Maintain consistent quality. − Speed up production. − Prevent or reduce improper techniques. − Improve the overall safety to the part, operator, and
machine.
Fixture planning is conceptualize by a basic fixture configuration through analyzing all the available information regarding the specifications of the workpiece such as its shape, dimensions and tolerances, material and geometry of the work-piece, operations required, processing equipment for the operations, and the operator [7]. Other factors also influence the machining outcome including machining operations sequence, cost considerations, direction and strength of machining forces, capabilities and orientation of the machine tools.
Typically the design process by which such fixtures are created has major four phases (fig. 2) such as fixture planning, fixture layout, fixture element design, fixture body design [8]:
Figure 2 : Phases of fixture design
The following inputs are included in the fixture plan:
− Fixture type and complexity.
− Number of work-pieces per fixture.
− Orientation of work-piece within fixture.
− Locating datum faces.
− Clamping surfaces.
− Support surfaces.
Generation of fixture layout is to represent the fixture concepts in a physical form. The following outputs are included in the fixture layout:
− Types and Position of locators.
− Types and Position of clamps.
− Types and Positions of supports.
− Clamping forces and sequence.
Fixture element design is either to detail the
design drawings committed on paper or to create the solid models in a CAD system of the practical embodiment of the conceptual locators, clamps and supports. It is possible to use standard designs or proprietary components. Fixture body design is to produce a rigid structure carrying all the individual fixture elements in their proper places.
IV. Work Holding Principles
a) Locating Principles
A locator is usually a fixed component of a fixture. It is used to establish and maintain the position of a part in the fixture by constraining the movement of the part. For work-pieces of greater variability in shapes and surface conditions, a locator can also be adjustable.
An unrestricted object is free to move in any twelve possible directions. Fig. 3 shows an object with three axis and planes, along which movement may occur [16]. An object is free to revolve around or move parallel to any axis in either direction. To illustrate this planes have been marked X-X, Y-Y, Z-Z, The directions of movement are numbered from one to twelve.
© 2013 Global Journals Inc. (US)
2
Year
013
2Design and Modeling of Fixture for Cylinder Liner Honing Operation
Globa
l Jo
urna
l of R
esea
rche
s in E
nginee
ring
Volum
e X
III Issue
VII
Version
I
()
A
ekta
Typewriter
ekta
Typewriter
ekta
Typewriter

Figure 3 : Degrees of freedom (DOF) and planes
of movement
To restrict the movement, accurately locate a part in fixture. This is done with locaters and clamps.
b) Characteristics of good location
− Minimum locating points should be used.
− Locating points should be placed as far as apart as possible.
− Locating should be small and size.
In general, three locating forms can be considered, namely plane, concentric, and radial. For plane locating form, locators are used to locate the workpiece on any surface such as flat, circular or irregular surfaces. For concentric locating form, pin-hole locators are used and for radial locating form, locators restrict the workpiece movement around the concentric locators [7]. The 3-2-1 principle is the most commonly method used. In this method, three perpendicular surfaces of the workpiece are used to define the locating position.
c)
Clamping Principles
As the locating is important to restrict the
movement of the workpiece, clamping is also important to resist the effects of cutting forces. The direction of clamps should be determined according to cutting force direction in order to perform machining operations securely. Clamping forces should be in the same direction of the machining forces which try to push the workpiece down onto the locators and supporters. The clamp should be large enough to hold the workpiece and small enough to stay away of the cutting tool path [7]. There are some other factors that should also be considered in use of clamps. These include machine tool vibration, loads and stresses, damage preventing of the workpiece, and improving loading/unloading speed.
A clamp is a force-actuating mechanism of a fixture. The forces exerted by the clamps hold a part securely in the fixture against all other external forces. In every machining operation, clamping of work-pieces is an essential requirement. A clamp can be defined as a
device for providing an invariant location with respect to an external loading system. In other words, the process of clamping induces a locking effect which, through frictional or some other forms of mechanism, provides a stability of location which cannot be changed until and unless external loading is able to overcome the locking effect [11]. Hence, when a cutting force is producing a load or moment on the work-piece, it is necessary that a sufficient clamping force must be exerted to withstand such actions.
It is also essential that the idle time involving loading, locking, unlocking and unloading of work-pieces should be minimized as much as possible to reduce the overall set-up and non-machining time. Clamping elements may be either manually operated or actuated by pneumatic, hydraulic or a combination of other power facilities [14]. They are also classified according to the mechanism by which a mechanical advantage is attained.
V. Component Details
In industries there are different types of cylinder liners are manufactured according to application requirement.. For this fixture all input data explained in above design procedure is collected. MS material is selected for design and components are designed and modeled. Top and base plate locate the cylinder liner, four guide pillars are used to guide the top plate for clamping and unclamping, guide bush of Gun Metal material is used to avoid the wear between guide pillar and top plate, oil ring is used at top plate to provide oil at inside surface of liner for cooling and to remove fine particles of machining, bottom plate and fixture riser ring are used as fixture body base. For clamping hydraulic cylinders are selected according to clamping force requirement,
Clamping force = P ×π4
d2
Where, P = Hydraulic pressure N/mm2. d = Cylinder diameter in mm.
Cylinder riser ring is used to get the required stroke length of hydraulic cylinder. Following figures shows the detailed 3D modeling of fixture components:
Figure 4 : 3D model of base plate
3
Year
013
2
© 2013 Global Journals Inc. (US)
Design and Modeling of Fixture for Cylinder Liner Honing Operation
Globa
l Jo
urna
l of R
esea
rche
s in E
nginee
ring
Volum
e X
III Issue
VII
Version
I
()
A

Figure 5 : 3D model of top plate
Figure
6 : 3D model of bottom plate
Figure 7 :
3D model of oil ring
Figure
8 :
3D model of liner loading guide plate
Figure 9 : 3D model of fixture riser ring
Figure 10
:
3D model of guide bush
Figure
11
:
3D model of
fixture assembly without liner
© 2013 Global Journals Inc. (US)
4
Design and Modeling of Fixture for Cylinder Liner Honing Operation
Year
013
2Globa
l Jo
urna
l of R
esea
rche
s in E
nginee
ring
Volum
e X
III Issue
VII
Version
I
()
A

Figure 12 : 3D model of fixture assembly with liner
VI. Results and Discussion
The flexibility of fixture plays an important role in reducing machining costs and the times in manufacturing industries.
Fixture design explained in this paper can help to improve productivity and accuracy of machining significantly, lowering the time and skill level needed.
i.
Due to new hydraulic automated fixture cylinder liners are exactly located, supported and clamped which reduces the machine settings time, hence productivity increased by 20% and also increase in accuracy and Process control.
ii.
Rejection rate reduced to less than 2% in new set up in comparison to 10% in an old set up, because use of new hydraulic automated fixture gives uniform clamping and reduced vibrations.
iii.
For this new hydraulic automated fixture oil ring (fig. 13) is provided to supply oil as coolant for cooling the honing area and to remove very small metal particles of machining, which is very advantageous, uniform and easy method as compared to old one.
Figure
13 (a)
:
Oil ring showing oil inlet to oil ring, (b) Oil holes to supply oil to honing area of liner
VII. Conclusion
The machining fixture is a key contributor to the manufacturability of a component, and should be designed to optimize the performance of the overall machining process. However, at the present time, due to increase in competition in many industries, they are using automated fixture for their early product launch and to increase productivity and accuracy.
The present fixture model development described in this paper includes the unique aspect of designing a hydraulic fixture is novel in that it enables the user to take account of machining strategy and all key interactions between fixture, component and other system elements at an early stage. By designing above automated fixture for honing machine, cylinder liners are exactly located, supported and clamped which reduces the machine settings time, hence productivity increased by 20% and which also increase the accuracy, improved quality of machining and process control. With less than 2 % rejection rate and 20 % increase in productivity, cost to build and maintain honing fixture set up can be recovered in less than a one year.
References Références Referencias
1. Nirav P. Maniar, D. P. Vakharia and Chetan M. Patel, “Design & Manufacturing With Modeling, Dynamic Balancing & Finite Element Analysis Of Rotary Fixture For CNC Turning Centre To Function As HMC”, ASME Early Career Technical Journal, Vol. 8, pp. 86-93, 2009.
2. Nirav P. Maniar, D. P. Vakharia and Chetan M. Patel, “Design & Manufacturing With Modeling Of Multi Component–Single Hydraulic Fixture With 10 Cylinders & Expandable Uniforce Clamp For Machining Earthing Terminal Block on CNC - VMC 430”, ASME Early Career Technical Journal, Vol. 8, pp. 118-123, 2009.
3. Amar Raj Singh Suri and A.P.S. Sethi, “Development of Gear Hobbing Fixture Design for Reduction in Machine Setting Time”, International Journal of Scientific and Research Publications, Vol. 2, Issue 10, pp 417-419, 2012.
4. T. Papastathis, O. Bakker, S. Ratchev and A. Popov, “Design Methodology for Mechatronic Active Fixtures with Movable Clamps”, CIRP Journal of Manufacturing Science and Technology, Vol. 3, pp. 323-328, 2012.
5. L. Sabri, S. Mezghani, M. El Mansori and H. Zahouanic, “Multiscale study of finish-honing process in mass production of cylinder liner”, An International Journal on the Science and Technology of Friction, Lubrication and Wear, Vol. 271, pp. 509-513, 2011.
6. Hui Wang, Yiming (Kevin) Rong, Hua Li and Price Shaun, “Computer aided fixture design: Recent
5
Year
013
2
© 2013 Global Journals Inc. (US)
Design and Modeling of Fixture for Cylinder Liner Honing Operation
(a) (b)
Globa
l Jo
urna
l of R
esea
rche
s in E
nginee
ring
Volum
e X
III Issue
VII
Version
I
()
A

research and trends”, Journal of Computer Aided Design, Vol. 42, pp. 1085-1094, 2010.
7. U. Farhan and M. Tolouei-Rad, “Design of modular fixtures using a 3D-modelling approach”, 19th International Congress on Modelling and Simulation, 2011.
8. Iain Boyle, Yiming Rong, David C and Brown, “A review and analysis of current computer-aided fixture design approaches”, Journal of Robotics and Computer-Integrated Manufacturing Vol. 27, pp. 1-12, 2011.
9. Yu Zheng and Chee-Meng Chew, “A geometric approach to automated fixture layout design”, Journal of Computer Aided Design, Vol. 42, pp. 202-212, 2010.
10. P. Pawlus, T. Cieslak and T. Mathia, “The study of cylinder liner plateau honing process”, Journal of Materials Processing Technology, Vol. 209, pp. 6078–6086, 2009.
11. M. Krsulja, B. Barisic & J. Kudlacek, “Assembly Setup For Modular Fixture Machining Process”, Journal of Advanced Engineering, Vol. 3, pp. 1, 2009.
12. Y. Wang, A. Hodgson, X. Chen and N. Gindy, “A methodology for the development of machining fixtures for components with complicated geometry”, International Journal of Computer Integrated Manufacturing, Vol. 21, pp. 448-456, 2008.
13. R. Hunter, A. Vizan, J. Perez and J. Rıos, “Knowledge model as an integral way to reuse the knowledge for fixture design process”, Journal of Materials Processing Technology, Vol. 164, pp. 1510-1518, 2005.
14. Utpai Roy and Pei-Liang Sun, “Selection of preliminary locating and clamping positions on a workpiece for an automatic fixture design system”, Journal of computer Integrated Manufacturing Systems, Vol. 7, pp. 161-172, 1994.
15. J. Cabadaj, “Theory of Computer Aided Fixture Design”, Journal of Intelligent Manufacturing Systems, 1990.
16. Edward G. Hoffman, “Jigs and Fixture Design”. Thomson Delmar Learning, USA, 2004.
© 2013 Global Journals Inc. (US)
6
Design and Modeling of Fixture for Cylinder Liner Honing Operation
Year
013
2Globa
l Jo
urna
l of R
esea
rche
s in E
nginee
ring
Volum
e X
III Issue
VII
Version
I
()
A

© 2013. Salau T.A.O. & Ajide O.O.. This is a research/review paper, distributed under the terms of the Creative Commons Attribution-Noncommercial 3.0 Unported License http://creativecommons.org/licenses/by-nc/3.0/), permitting all non commercial use, distribution, and reproduction in any medium, provided the original work is properly cited.
Global Journal of Researches in Engineering Mechanical & Mechanics Volume 13 Issue 7 Version 1.0 Year 2013 Type: Double Blind Peer Reviewed International Research Journal Publisher: Global Journals Inc. (USA) Online ISSN: 2249-4596 & Print ISSN: 0975-5861
Correlation and Distribution Analyses of Estimated Fractal Dimensions and Hurst’s Exponent from Waveforms of Excited Nonlinear Pendulum
By Salau T.A.O. & Ajide O.O. University of Ibadan, Nigeria
Keywords : fractal dimension, hurst’s exponent, excited nonlinear pendulum, waveforms and runge-kutta. GJRE-A Classification : For Code: 850508, 091399
Correlation and Distribution Analyses of Estimated Fractal Dimensions and Hursts Exponent from Waveforms of Excited Nonlinear Pendulum
Strictly as per the compliance and regulations of :
Abstract - This study utilised correlation and distribution analyses to investigate the acceptability of
application of two fractal dimension estimators to characterise the waveforms originating from excited
nonlinear pendulum. Parameters selection sensitive simulation of the excited nonlinear pendulum
waveforms was performed with the constant time step fourth order Runge-Kutta algorithm with codes
developed in FORTRAN90. However, the waveforms validated by Gregory and Jerry (1990) and treated as
time series were characterized using developed codes of Carlos (1998) and Hurst fractal dimension
estimation procedures. The validation results compare qualitatively well and the correlation coefficients
between Carlos (1998)-based and Hurst’s exponent based dimension estimate for the angular
displacement and velocity are respectively R2
= 0.68 and R2
= 0.66. A higher correlation coefficient
(R2 = 0.84) existed between the estimated Hurst’s exponent of the angular displacement and velocity. The
Hurst distribution exhibited both full spectrum and peak values range 0.04 to 1.00 and percentage
probability range 2 to 12. The sum of this study results is the interchange possibility and utility of the two
fractal dimension estimators as waveforms characterising tool.

Correlation and Distribution Analyses of Estimated Fractal Dimensions and Hurst’s
Exponent from Waveforms of Excited Nonlinear Pendulum
Salau T. A.O. α & Ajide O.O. σ
Abstract -
This study utilised correlation and distribution analyses to investigate the acceptability of application of two fractal dimension estimators to characterise the waveforms originating from excited nonlinear pendulum. Parameters selection sensitive simulation of the excited nonlinear pendulum waveforms was performed with the constant time step fourth order Runge-Kutta algorithm with codes developed in FORTRAN90. However, the waveforms validated by Gregory and Jerry (1990) and treated as time series were characterised using developed codes of Carlos (1998) and Hurst fractal dimension estimation procedures. The validation results compare qualitatively well and the correlation coefficients between Carlos (1998)-based and Hurst’s exponent based dimension estimate for the angular displacement and velocity
are respectively 2 0.68R = and 2 0.66R = . A higher
correlation coefficient ( 2 0.84R = ) existed between the estimated Hurst’s exponent of the angular displacement and velocity. The Hurst distribution exhibited both full spectrum and peak values range 0.04 to 1.00 and percentage probability range 2 to 12. The sum of this study results is the interchange possibility and utility of the two fractal dimension estimators as waveforms characterising tool.
Keywords
:
fractal dimension, hurst’s exponent, excited nonlinear pendulum, waveforms and runge-kutta.
I.
Introduction
electronic circuit modelling of a ball bouncing on an oscillating table in demonstrating these different
dynamic characteristics. Findings show that the fractal dimension of 1.07 and 1.7 respectively implies regular data and chaotic data. It was also shown that the fractal dimension which is infinite refers to data that are random. It is concluded from the paper
that the bouncing ball circuit system dynamics has a chaotic attractor of low fractal dimension. This paper has shown that fractal dimension can be utilised in characterising nonlinear system. Salau and Ajide (2012) asserted that the study of images play a significant role in engineering and several fields of study. The authors employed fractal dimension as the estimator for sectional images characterisation of selected dynamic systems. Findings obtained from the paper showed the high potentiality of fractal disk dimension as characterising tool for images.
The chaotic driven impact of two important parameters of excited Duffing oscillator has been studied using fractal disk dimension (Salau and Ajide, 2013). The outcome of the study has provided a very robust platform for the relevance of the use of fractal dimension as a reliable estimator for characterising nonlinear dynamic systems.
Hurst exponent can easily be computed from
fractal dimension. Wikipedia (2013) describes Hurst exponent as what can be utilized as a measure of long term memory of time series. It relates to the autocorrelations of the time series and the rate at which these decrease as the lag between pairs of values increases. It was further understood here that Hurst exponent were originally developed in hydrology for the practical matter of determining optimum dam sizing for the Nile River’s volatile rain and drought conditions that have been observed over a long period of time. The name “Hurst Exponent” was coined from Harold Edwin Hurst who was the lead researcher in this field. An extract from Ian (2013) article shows that Hurst exponent has a very wide application. It occurs in several areas of mathematics (Fractals and Chaos theory, Spectral Analysis, e.t.c.), biophysics, computer networking,
7
Year
013
2
© 2013 Global Journals Inc. (US)
Authors α σ : Department of Mechanical Engineering, University of Ibadan, Nigeria. E-mails : [email protected],[email protected]
hydrology and just to mention but a few. Hurst exponent has been found to be very useful in marketing, medicine, engineering and host of other fields. In business, the simulation model which describes the
ldrich et al in 2001 describes fractals as a rough shape that can easily be subdivided in parts of which are at least approximately a reduced copy
of the whole (self-similar). The use of a concept known as fractal dimension has made it easy for researcher in this field to measure the extent to which a one-dimensional thread fills up a three dimensional space (Scott,1990). The use of fractal dimension as an estimating tool for characterising nonlinear systems is becoming more appreciated in the recent times. The aim of Clark et al (1995) paper was to distinguish chaotic and non-chaotic (regular or random) behaviour using fractal dimension. The authors employed an
OGloba
l Jo
urna
l of R
esea
rche
s in E
nginee
ring
Volum
e X
III Issue
VII
Version
I
()
A

multi-level supply chain has been done using
Hurst exponent (Chien-Yuan and Jinsheng, 2013). The exponent satisfactorily analyzes the dynamic behaviour of inventory under various factors that include lead time, demand pattern, information sharing and RFID (Radio Frequency Identification). The outcome of the study showed that the lead time and RFID utilization effectualness greatly influence the inventory dynamics under the stock and supply line discrepancies of specified parameters. This paper has also shown the utility of Hurst exponent as a relevant estimator of supply chain dynamics. The trend in prices of gold has been analyzed by Priyadarshini and Babu (2010). The author utilised fractal dimension index (FDI) that was computed from Hurst exponents. The monthly gold rates required for study was collected from January 1971 to April 2010 (40 years). The results of FDI calculated from a constant Hurst exponent (H=1.047) revealed that it is useful tool for determining the amount of market growth. The author affirmed that this study has opened-up an immeasurable advantage for a businessman to venture into markets that have the most opportunity. Yu-Zhi et al
(2011) paper dwell on the possibility of Hurst exponent being utilised in ecology. A careful application of this exponent to rodent populations revealed that it is very convenient and effective exponent for detecting nonlinear systems in natural populations. In medicine, Kamalanand and Jawahar (2012) paper studied the behaviour of Human Immuno Virus (HIV) system using the three dimensional HIV model and a chaotic measure popularly referred to as Hurst exponent. Results of the study showed that Hurst exponents of cells and viral load vary nonlinearly in the selected parameters range. It was further shown that the three dimension HIV model can accommodate both persistent and anti-persistent dynamics of HIV states. The research output of this paper has clearly shown the high clinical relevance of Hurst exponent. This is because the analysis of the complexity of the HIV model is helpful for choosing appropriate parameter estimation methods. It has great benefits for identifying suitable treatment strategies.
Despite the richness of fractal dimensions and Hurst exponent as estimating tools in nonlinear dynamics, they are yet to be extensively explored in many nonlinear mechanical engineering system dynamics as characterising exponents. Extensive literature study shows that Duffing oscillator and excited nonlinear pendulum are just two of the so many mechanical systems that Hurst exponent has not been significantly used to characterize. The main objective of this paper is to investigate the correlation and distribution analyses of estimated Fractal dimensions and Hurst’s exponent from Waveforms of Excited Nonlinear Pendulum. The quest of filling this research gaps is a strong motivation for this paper.
II.
Methodology
a)
Equation of Motion
According to Gregory and Jerry (1990), the dimensionless representation of the damped, sinusoidally excited pendulum with fixed lumped-mass and length is described by equation (1) called equation of motion. This equation expresses Newton’s second law with the various terms on the left representing respectively variation with time (t) of the acceleration, damping and gravitation effect. The variation with time of the angular displacement, velocity and acceleration are
( )tθ , ( )tθ and ( )tθ . The angular velocity of the forcing
isD
ω , g is the forcing amplitude (not gravitational
acceleration) and q
is the damping parameter.
2 1 sin( ) cos( )Dd d g tdt q dtθ θ θ ω+ + =
(1)
The transformation of equation (1) under the
assumptions ( 1 angular displacement ADθ = = and
2 angular velocity AVθ = = ) to a pair of first order
differential equation leads to equations (2) and (3).
1 2θ θ
•
=
(2)
2 2 1
1cos( ) sin( )Dg tq
θ ω θ θ•
= − −
(3)
The transient and steady angular displacements
and velocities were obtained by simultaneous simulation of equations (3) and (4) using constant time step Runge-Kutta fourth order algorithms over large number of excitation periods. The results of the periodic time history of the steady angular displacement and velocity are the waveforms objects for the present investigation.
b)
Fractal Dimension of
Waveforms
This study utilised Carlos (1998) procedure to evaluate the fractal dimension of the waveforms. The method is of Hausdorff dimension (where for a curve:1 2hD≤ ≤ ) origin and in the simplified form equal to equation (4) for a curve of length (L) covered by N-open balls of radius (ε ). To achieve equal axes Carlos (1998) employed two linear transformations (assuming topology invariance under the transformation) that map an original waveform into another such that the transformed waveform is embedded in an equivalent
© 2013 Global Journals Inc. (US)
metric space. The equivalent transformation equations for the present study are given respectively for increasing simulation periods ( iT ), consecutive steady angular displacements ( 1,iθ ) and consecutive steady
Correlation and Distribution Analyses of Estimated Fractal Dimensions and Hurst’s Exponent from Waveforms of Excited Nonlinear Pendulum
8
Year
013
2Globa
l Jo
urna
l of R
esea
rche
s in E
nginee
ring
Volum
e X
III Issue
VII
Version
I
()
A
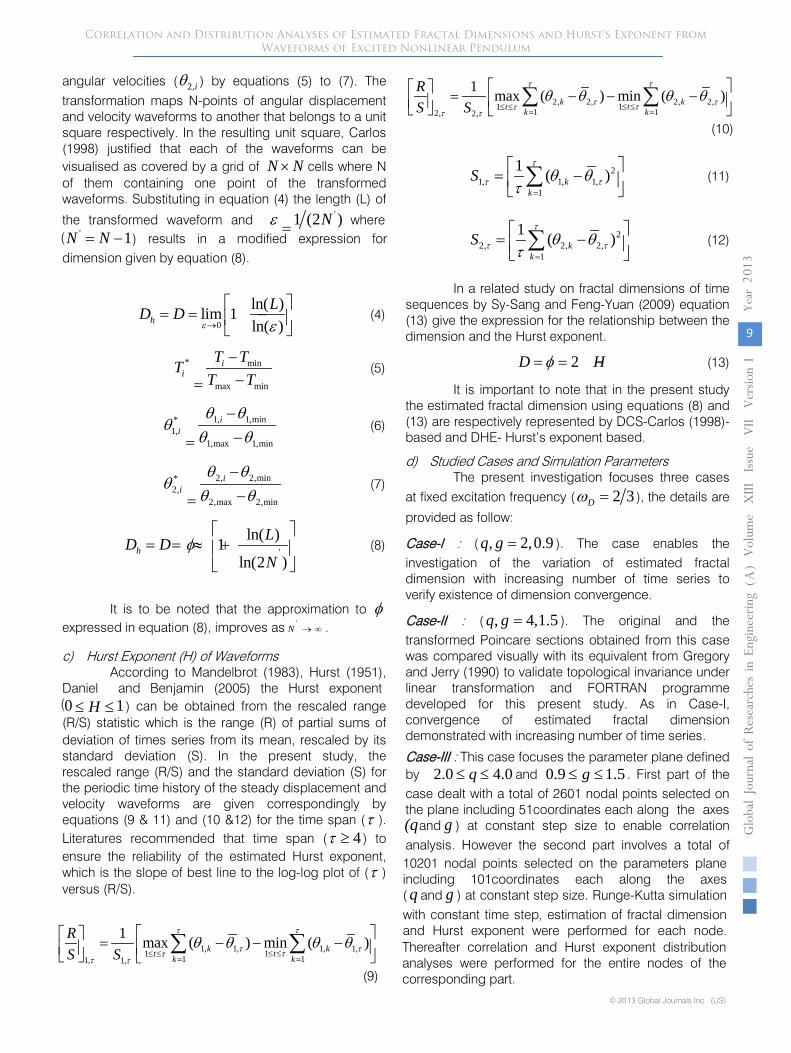
angular velocities ( 2,iθ ) by equations (5) to (7). The transformation maps N-points of angular displacement and velocity waveforms to another that belongs to a unit square respectively. In the resulting unit square, Carlos (1998) justified that each of the waveforms can be visualised as covered by a grid of N N× cells where N of them containing one point of the transformed waveforms. Substituting in equation (4) the length (L) of
the transformed waveform and '1 (2 )Nε = where ' 1N N= − ) results in a modified expression for
dimension given by equation (8).
0
ln( )lim 1ln( )h
LD Dε ε→
= = −
(4)
* min
max min
ii
T TTT T
−
= −
(5)
1, 1,min*1,
1,max 1,min
ii
θ θθ
θ θ−
= −
(6)
2, 2,min*2,
2,max 2,min
ii
θ θθ
θ θ−
= −
(7)
'
ln( )1ln(2 )
hLD DN
φ
= = ≈ +
(8)
It is to be noted that the approximation to φ
expressed in equation (8), improves as 'N → ∞ .
c)
Hurst Exponent (H) of Waveforms
According to Mandelbrot (1983), Hurst (1951), Daniel and Benjamin (2005) the Hurst exponent 0 1H≤ ≤ ) can be obtained from the rescaled range (R/S) statistic which is the range (R) of partial sums of deviation of times series from its mean, rescaled by its standard deviation (S). In the present study, the rescaled range (R/S) and the standard deviation (S) for the periodic time history of the steady displacement and velocity waveforms are given correspondingly by equations (9 & 11) and (10 &12) for the time span (τ ). Literatures recommended that time span ( 4τ ≥ ) to ensure the reliability of the estimated Hurst exponent, which is the slope of best line to the log-log plot of (τ ) versus (R/S).
1, 1, 1, 1,11 1 11, 1,
1 max ( ) min ( )k ktt k k
RS S
τ τ
τ ττττ τ
θ θ θ θ≤ ≤≤ ≤
= =
= − − − ∑ ∑
(9)
2, 2, 2, 2,11 1 12, 2,
1 max ( ) min ( )k ktt k k
RS S
τ τ
τ ττττ τ
θ θ θ θ≤ ≤≤ ≤
= =
= − − − ∑ ∑
(10)
21, 1, 1,
1
1 ( )kk
Sτ
τ τθ θτ =
= − ∑
(11)
22, 2, 2,
1
1 ( )kk
Sτ
τ τθ θτ =
= − ∑
(12)
In a related study on fractal dimensions of time sequences by Sy-Sang and Feng-Yuan (2009) equation (13) give the expression for the relationship between the dimension and the Hurst exponent.
2D Hφ= = −
(13)
It is important to note that in the present study the estimated fractal dimension using equations (8) and (13) are respectively represented by DCS-Carlos (1998)-based
and DHE-
Hurst’s exponent based.
d)
Studied Cases and Simulation Parameters
The present investigation focuses three cases at fixed excitation frequency ( 2 3Dω = ), the details are
provided as follow:
Case-I
:
( , 2,0.9q g = ). The case enables the investigation of the variation of estimated fractal dimension with increasing number of time series to verify existence of dimension convergence.
Case-II
: ( , 4,1.5q g = ). The original and the transformed Poincare sections obtained from this case was compared visually with its equivalent from Gregory and Jerry (1990) to validate
topological invariance under linear transformation and FORTRAN programme developed for this present study. As in Case-I, convergence of estimated fractal dimension demonstrated with increasing number of time series.
Case-III
: This case focuses the parameter plane defined by
2.0 4.0q≤ ≤ and
0.9 1.5g≤ ≤ . First part of the
case dealt with a total of 2601 nodal points selected on the plane including 51coordinates each along the axes(qand g ) at constant step size to enable correlation analysis. However the second part involves
a total of
9
Year
013
2
© 2013 Global Journals Inc. (US)
(
(
Correlation and Distribution Analyses of Estimated Fractal Dimensions and Hurst’s Exponent from Waveforms of Excited Nonlinear Pendulum
10201 nodal points selected on the parameters plane including 101coordinates each along the axes( q and g ) at constant step size. Runge-Kutta simulation with constant time step, estimation of fractal dimension and Hurst exponent were performed for each node. Thereafter correlation and Hurst exponent distribution analyses were performed for the entire nodes of the corresponding part.
Globa
l Jo
urna
l of R
esea
rche
s in E
nginee
ring
Volum
e X
III Issue
VII
Version
I
()
A

Simulation of equations (2) and (3) for each set of parameters selected with fourth order Runge-Kutta algorithms were effected from initial conditions (0, 0) using constant time step ( 500pt T∆ = ) over 3010
excitation periods ( 2p DT π ω= ) in which the results
from the first ten periods are regarded unsteady. The fractal dimension was estimated using the steady angular displacement and velocity solutions at 3000 consecutive excitation periods. However the Hurst exponent estimate was based on the first 2048 consecutive steady solutions over ten different time spans (τ = 4, 8, 16, 32, 64, 128, 256, 512, 1024
and 2048).
Comparison of the distribution of the estimated Hurst exponents was investigated in 100-equal intervals between the limits-values (Hurst exponents) for the angular displacement and velocity.
III.
Results and Discussion
Figure 1 refers. The visual quality of the untransformed and the transformed Poincare sections are same and compare very well with the corresponding result reported by Gregory and Jerry (1990). This demonstrated topological invariance under linear transformation as required by Carlos (1998) approach of estimating fractal dimension.
Likewise the invariance of Poincare section (periodic phase plots) suggested the invariance of the associated angular displacement and velocity waveforms that are the objects of analyses in this study. However, quantitative comparison of the limits-values
along the angular displacement (AD) and angular velocity (AV) axes are different.
Figure 1
:
The untransformed and the transformed Poincare sections for Case-II
Figure 2
:
Variation of estimated fractal dimension with increasing number of time series
Figure 2 refers. The variation of the estimated fractal dimension with increasing number of time series shows evidence of convergence for both Case-I and Case-II. In Case-I the observed variation of estimated fractal dimension remain the same for the angular displacement and velocity. However, a consistent relative higher estimated fractal dimension variation for the angular displacement is observed for Case-II. That is angular velocity sustained lower estimated fractal dimension relative to angular displacement in Case-II.
Untransformed Poincare Section
-1.0-0.50.00.51.01.52.02.53.03.5
-3.2 -2.2 -1.2 -0.2 0.8 1.8 2.8
AD
AV
Transformed Poincare Section
0.0
0.2
0.4
0.6
0.8
1.0
0.0 0.2 0.4 0.6 0.8 1.0
AD
AV
Case-I
1.06
1.07
1.08
1.09
1.10
1.11
300 3300 6300
Time series
Estim
ated
dim
ensi
on
AD
AV
Case-II
1.55
1.60
1.65
1.70
1.75
300 3300 6300
Time series
Est
imat
ed d
imen
sio
n
AD
AV
© 2013 Global Journals Inc. (US)
Correlation and Distribution Analyses of Estimated Fractal Dimensions and Hurst’s Exponent from Waveforms of Excited Nonlinear Pendulum
Figure 3 : Correlation of estimated fractal dimensions in Case-III
10
Year
013
2Globa
l Jo
urna
l of R
esea
rche
s in E
nginee
ring
Volum
e X
III Issue
VII
Version
I
()
A

Figure 3 refers. The correlation coefficients between Carlos (1998)-based and Hurst’s exponent based dimension estimated for the angular displacement (AD) and angular velocity (AV) are
respectively 2 0.68R = and 2 0.66R = . Higher correlation coefficients may be achieved by increasing the number of time series beyond its present value i.e. 3000-for dimension estimate and 2048-for Hurst exponent estimate. The quality of the visual pattern
created by the scatter plots of the dimensions correlation of angular displacement (AD) and angular velocity (AV) are the same. It is important to note that the small and negligible quantitative difference between the obtained correlation coefficients is an indication of common source of time series (i.e. the source is periodic sampling of solutions to harmonically excited nonlinear pendulum).
Figure 4
:
Correlation of estimated Hurst’s exponent between angular displacement and velocity
Figure 5
:
Normalised probability distribution of estimated Hurst’s exponents of angular displacement waveforms obtained from 10201 nodal parameter points
Case-III: (AD)
0.000.010.020.030.040.050.060.070.080.090.10
0.00 0.20 0.40 0.60 0.80 1.00
Hurst (H)
Norm
alis
ed p
roba
bilit
y
11
Year
013
2
© 2013 Global Journals Inc. (US)
Case-III: (AD)
0.000.010.020.030.040.050.060.070.080.090.10
0.00 0.20 0.40 0.60 0.80 1.00
Hurst (H)
Norm
alis
ed p
roba
bilit
y
Correlation and Distribution Analyses of Estimated Fractal Dimensions and Hurst’s Exponent from Waveforms of Excited Nonlinear Pendulum
Figure 4 refers. There is higher correlation coefficient between the estimated Hurst’s exponent of the angular displacement and velocity with value being
2 0.84R = . Higher coefficient value indicate common source of the angular displacement and velocity waveforms.
Case-III: (AV)
0.00
0.02
0.04
0.06
0.08
0.10
0.12
0.14
0.00 0.20 0.40 0.60 0.80 1.00
Hurst (H)
Norm
alis
ed p
roba
bilit
y
Figure 6 : Normalised probability distribution of estimated Hurst’s exponents of angular velocity waveforms obtained from 10201 nodal parameter points
Globa
l Jo
urna
l of R
esea
rche
s in E
nginee
ring
Volum
e X
III Issue
VII
Version
I
()
A

Figures 5 and 6 refer. In figure 5, the normalised probability distribution of the estimated Hurst’s exponents of the angular displacement waveforms peaked at three different Hurst-values: 1.00, 0.53 and 0.20. The
corresponding percentage probability is 9, 5 and 3. Likewise the distinct distribution peak points for the angular velocity waveforms are four at Hurst-
values: 0.99, 0.50, 0.20 and 0.04. The corresponding percentage probability is 9, 3, 5 and 2. The full
spectrum of Hurst-values ( 0 1H≤ ≤ ) coupled with the multiple peak points observed in these distributions is an indication of the richness of the pendulum dynamics when driven by arbitrary parameters selection from this parameter plane while holding constant the drive frequency. That is the pendulum can behave periodically, quasi-periodically or worst still chaotically depending on the choices of parameters from this plane.
IV.
Conclusions
This study established good correlation coefficients for two differently estimated fractal dimensions while the distribution of Hurst exponents exhibited full spectrum for the waveforms from excited nonlinear pendulum. The Hurst exponents’ distributions apart from having full spectrum show multiple distinct peak values as a possible indicator of pendulum multiple behaviours such as periodic, quasi-periodic, random or chaotic. The study therefore show that the pendulum drive parameters plane consist of large selection combinations with associated rich dynamics. Thus the present study has established the possible interchange and utility of the two fractal dimension estimators as waveforms characterising tool.
References Références Referencias
1.
Carlos S. (1998), A procedure to estimate the fractal dimension of waveforms, Complexity International (ISDN 1320-0683), Available Online at: http:// www.
complexity.org.au/ci/vol05/sevcik/sevcik.html Vol 5.
2.
Chien-Yuan S. and Jinsheng R. (2013), Using Hurst
exponent to investigate the impact of RFID implementation on supply chain dynamics. International Journal of Business and Management, Vol.8, No. 10, ISSN 1833-3850, E-ISSN 1833-8119. Published by Canadian Center of Science and Education.
3.
Clark B.K., Martin R.F., Moore R.J. and Jesse K.E.
(1995), Fractal dimension of the strange attractor of the bouncing ball circuit. American Journal of Physics, Vol. 63
(2).Copyright by American Association of Physics Teachers.
4.
Daniel O. C. and Benjamin M. T. (2005), the
rescaled variance statistic and the determination of the Hurst exponent, Elsevier: Mathematics and Computers in Simulation, Vol. 70, pp. 172-179. Available Online at:
www.sciencedirect.com
5.
Gregory L. B. and Jerry P. G. (1990), chaotic
dynamics: An Introduction, Cambridge University Press, USA, pp.3-5 & 40-75.
6.
Hurst, H.E. (1951), Long term storage capacity of reservoirs, Transactions of the American Society of Civil Engineering, 116, pp.776-808.
7.
Ian K. (2013), Estimating the Hurst Exponent. Article by Ian Kaplan in 2003 and revised in 2013.
8.
Kamalanand K. and Jawarhar P.M.
(2012), Predictability analysis on HIV/AIDS system using Hurst Exponents. International Journal of Medical and Biological Sciences, Vol. 6, pp.301-305.
9.
Mandelbrot, B. B. (1983),
the
fractal geometry of nature, W.H. Freeman, New York, pp.247-255.
10.
Oldrich Z., Michal V.,
Martin N. and Miroslav B. (2001) ,Fractal analysis of image structures.Harfa-Harmonic and Fractal Image Analyis. pp.3-5. http://www.fch.vutbr.cz/lectures
11.
Priyadarshini E. and Babu A.C. (2010), an
analysis of stability of trends in gold prices using Fractal dimension index computed from Hurst exponents. International Journal of Management (IJM), ISSN 0976-6502(Print).http://www.iaeme.com/ijm.html
© 2013 Global Journals Inc. (US)
Correlation and Distribution Analyses of Estimated Fractal Dimensions and Hurst’s Exponent from Waveforms of Excited Nonlinear Pendulum
12. Salau T.A.O. and Ajide O.O. (2013), Fractal characterisation and comparison of chaos impact of excited Duffing oscillator parameters. International Journal of Engineering Science and Technology (IJEST), Vol. 5, No. 3, ISSN: 0975-5462.
13. Salau T.A.O. and Ajide O.O. (2012), Fractal characterisation of dynamic systems sectional images. Journal of Information Engineering and Applications, Vol. 2, No.7, pp.21-31. www.iiste.org
14. Scott E.D. (1990), Fractals and Chaos theory: A Management Primer. An Advanced technology seminar (595.766.31).
15. Sy-Sang L. and Feng-Yuan C. (2009), Fractal dimensions of time sequences, Elsevier: Physica A 338, pp. 3100-3106.
16. Wikipedia (2013), Hurst Exponent. Extracted from the Wikipedia, the free encyclopedia on Monday, 8th July 2013.
17. Yu-Zhi W.,Bo L.,Ren-Qing W., Jing S. and Xiao-Xia R.(2011), Application of the Hurst Exponent in Ecology.Computers & Mathematics with Applications, Vol.61,Issue 8, pp.2129-2131, Pergamon press Inc., USA.
12
Year
013
2Globa
l Jo
urna
l of R
esea
rche
s in E
nginee
ring
Volum
e X
III Issue
VII
Version
I
()
A

© 2013. Manoj Sharma, Manish Bhandari & Dr. Kamlesh Purohit. This is a research/review paper, distributed under the terms of the Creative Commons Attribution-Noncommercial 3.0 Unported License http://creativecommons.org/licenses/by-nc/3.0/), permitting all non commercial use, distribution, and reproduction in any medium, provided the original work is properly cited.
Global Journal of Researches in Engineering Mechanical & Mechanics Volume 13 Issue 7 Version 1.0 Year 2013 Type: Double Blind Peer Reviewed International Research Journal Publisher: Global Journals Inc. (USA) Online ISSN: 2249-4596 & Print ISSN: 0975-5861
Deflection of Functionally Gradient Material Plate under Mechanical, Thermal and Thermomechanical Loading
By Manoj Sharma, Manish Bhandari & Dr. Kamlesh Purohit Rajasthan Technical University, India
Abstract -
Functionally gradient materials are one of the most widely used materials. The
objective of this research work is to perform a thermo-mechanical analysis of functionally gradient material square laminated plate made of Aluminum / Zirconia and compare with pure metal and ceramic. The plates are
assumed to have isotropic, two-constituent material
distribution through the thickness, and the modulus of elasticity of the plate is assumed to vary according to a power-law distribution in terms of the volume fractions of the constituents. To achieve this objective, we shall use first shear deformation theory of plates and numerical analysis will be accomplished using finite element model prepared in ANSYS software. The laminated Functionally Gradient Material plate is divided in to layers and their associated properties are then layered together to establish the through-the-thickness variation of material properties. The displacement fields for functionally gradient material plate structures under mechanical, thermal and thermo mechanical loads are analyzed under simply supported boundary condition.
Keywords :
FGM, computational techniques, thermo mechanical properties in FGM.
GJRE-A
Classification : For Code:
290501p
Deflection of Functionally Gradient Material Plate under Mechanical, Thermal and Thermomechanical Loading
Strictly as per the compliance and regulations of :

Manoj Sharma α, Manish Bhandari σ & Dr. Kamlesh Purohit ρ
Abstract -
Functionally gradient materials are one of the most widely used materials. The objective of this research work is to perform a thermo-mechanical analysis of functionally gradient material square laminated plate made of Aluminum / Zirconia and compare with pure metal and ceramic. The plates are assumed to have isotropic, two-constituent material distribution through the thickness, and the modulus of elasticity of the plate is assumed to vary according to a power-law distribution in terms of the volume fractions of the constituents. To achieve this objective, we shall use first shear deformation theory of plates and numerical analysis will be accomplished using finite element model prepared in ANSYS software. The laminated Functionally Gradient Material plate is divided in to layers and their associated properties are then layered together to establish the through-the-thickness variation of material properties. The displacement fields for functionally gradient material plate structures under mechanical, thermal
and thermo mechanical loads are analyzed under simply supported boundary condition.
Keywords
: FGM, computational techniques, thermo mechanical properties in FGM.
I.
Introduction
istory is often marked by the materials and technology that reflect human capability and understanding. Many times scales begins with
the stone age, which led to the Bronze, Iron, Steel, Aluminum and Alloy ages as improvements in refining, smelting took place and science made all these possible to move towards finding more advance materials possible. It has become possible to develop new composite materials with improved physical and mechanical properties. Functionally gradient materials (FGM) are a class of composites that have a gradual variation of material properties from one surface to another. These novel materials were proposed by the Japanese in 1984 and are projected as thermal barrier materials for applications in space planes, space structures and
nuclear reactors, to name only a few. In general, all the multi-phase materials, in which the material properties are varied gradually in a predetermined manner, fall into the category of
functionally gradient materials. The gradients can be continuous on a microscopic level, or they can be laminates comprised of gradients of metals, ceramics, polymers, or variations of porosity/density as shown in figure 1.
Figure 1 : Gradient of FGMs; (a) continuously graded and (b) discretely layered FGMs
II. LITERATURE REVIEW
A huge amount of published literature observed for evaluation of thermomechanical behavior of functionally gradient material plate using finite element techniques. It includes both linearity and non linearity in various areas. Few of published literature highlight the importance of topic. A laminated theory for a desired egree of approximation of the displacements through the laminate thickness, allowing for piecewise approximation of the inplane deformation through individual laminae reported by reddy [1]. S. Suresh and A. Mortensen (1997) focus a review of the processing of functionally graded metal-ceramic composites and their thermo mechanical behavior. They discussed various approximations for determination of properties and their limitations are highlighted. They have focused on various issues related to functionally gradient material manufacturing [2]. G. N. Praveen and reddy (1997) reported the static and dynamic response of the functionally graded material plates by varying the volume fraction of the ceramic and metallic constituents using a simple power law distribution. [3]. J. N. Reddy (1998) reported theoretical formulations and finite element analyses of the thermomechanical, transient response of functionally graded cylinders and plates with Nonlinearity. [4]. J. N. Reddy (2000) gives Navier's solutions of rectangular plates, and Finite element models based on the third-order shear deformation
H
Authors α σ : Asst. Prof. , Asso. Prof., Jodhpur Institute of Engg. Technology, Jodhpur, Affiliated to Rajasthan Technical University, Kota. E-mails : [email protected],[email protected] ρ : Prof. & HOD, J. N. V. University, Jodhpur, Rajasthan India.
13
Year
013
2
© 2013 Global Journals Inc. (US)
(a)
(b)
Deflection of Functionally Gradient Material Plate under Mechanical, Thermal and
Thermomechanical Loading
Globa
l Jo
urna
l of R
esea
rche
s in E
nginee
ring
Volum
e X
III Issue
VII
Version
I
()
A

plate theory for functionally graded plates. [5]. J.N. Reddy et. al. (2001) reported three-dimensional thermomechanical deformations of simply supported, functionally graded rectangular plates. The temperature, displacements and stresses of the plate are computed for different volume fractions of the ceramic and metallic constituents. [6]. Bhavani V. Sankar (2002) solved the thermoelastic equilibrium equations for a functionally graded beam in closed-form [7]. Senthil S. Vel and R.C. Batra (2003) calculate an analytical solution for three-dimensional thermomechanical deformations of a simply supported functionally graded rectangular plate subjected to time-dependent thermal loads [8]. M. Tahani1, M. A. Torabizadeh and A. Fereidoon (2006), have reported analytical method is developed to analyze analytically displacements and stresses in a functionally graded composite beam subjected to transverse load and the results obtained from this method are compared with the finite element solution done by ANSYS [9]. Ki-Hoon Shin (2006) suggests that the Finite Element Analysis (FEA) is an important step for the design of structures or components formed by heterogeneous objects such as multi-materials, Functionally Graded Materials (FGMs), etc [10]. Fatemeh Farhatnia, Gholam-Ali Sharifi and Saeid Rasouli (2009), determined the thermo-mechanical stress distribution has been determined for a three layered composite beam having a middle layer of functionally graded material (FGM), by analytical and numerical methods. They found that there is no practically considerable difference, between stress profiles obtained analytically and from FEM model and ANSYS [11]. M.K. Singha, T.Prakash and M.Ganapathi (2011) reported The nonlinear behaviors of functionally graded material (FGM) plates under transverse distributed load. [12].
D.K. Jha, Tarun Kant and R.K. Singh (2012) reported a critical review of the reported studies in the area of thermo-elastic and vibration analyses of functionally graded (FG) plates since 1998. They have presented various areas of work for FGM and their application. [13]. Srinivas.G and Shiva Prasad.U focused on analysis of FGM flat plates under pressure i.e. mechanical loading in order to understand the effect variation of material properties has on structural response. [14].
III. FGM Plate Modelling
a) Modeling Introduction With the advent of powerful computers and
robust software, computational modeling has emerged as a very informative and cost effective tool for materials design and analysis. Modeling often can both eliminate costly experiments and provide more information than can be obtained experimentally. A wide variety of software, for e.g. ABAQUS, ANSYS etc., are commercially available and can be used to model and
analyze FGM’s. In this report Ansys 13.0 is used as a tool for anaylsis and the element SHELL 181 is used.
b) Material Properties Volume fraction and material properties of
FGM’s may vary in the thickness direction or in the plane of a plate. The FGM modeled usually is done with one side of the material as ceramic and the other side as metal. A mixture of the two materials composes the through-the-thickness characteristics. This material variation is dictated by a parameter, n. At n = 0 the plate is a fully ceramic plate while at n = ∞ the plate is fully metal. Material properties are dependent on the n value and the position in the plate and vary according to a power law.
Here we assume that the material property gradation is through the thickness and we represent the profile for volume fraction variation by the expression of power law, i.e.
P(z) = (Pt −Pb)V +Pb n
hzV
=
For the material index (n)=2;
At bottom layer, (z/h)=0 and so V-=0
hence P(z) = Pb
At top layer , (z/h)=1 and so V=1
hence P(z)= Pt
where P denotes a generic material property like modulus, Pt and Pb denote the property of the top and bottom faces of the plate, respectively, h is the total thickness of the plate, and n is a parameter that dictates the material variation profile through the thickness.
Table 1 : Material Property
S.No. Property Aluminum Zirconia
1 Young's modulus 70 GPa 151 GPa 2 Poisson's ratio 0.3 0.3
3 Thermal conductivity
204 W/mK 2.09 W/mK
4 Thermal expansion
23x10-6 /°C 10x10-6 /°C
The study of the behaviour of an FGM plate under mechanical loads is done for a square plate whose constituent materials are taken to be Aluminum and zirconia. The top surface of the plate is ceramic (zirconia) rich and the bottom surface is metal (Aluminium) rich. Variation of effective youngs modulus, Thermal conductivity and Thermal expansion with respect to parameter z/h for various material index as shown in figure 2,3 and 4 respectively.
© 2013 Global Journals Inc. (US)
Thermomechanical LoadingDeflection of Functionally Gradient Material Plate under Mechanical, Thermal and
14
Year
013
2Globa
l Jo
urna
l of R
esea
rche
s in E
nginee
ring
Volum
e X
III Issue
VII
Version
I
()
A

Figure 2 : Variation of effective young’s modulus with respect to parameter z/h for various material index
Figure 3 : Variation of effective Thermal conductivity with respect to parameter z/h for various material index
Figure 4 : Variation of effective Thermal expansion with respect to parameter z/h for various material index
c) Analysis The static analysis was performed on a square
plate of side length a=b = 0.2m and thickness h = 0.01 m. The plate is assumed to be simply supported on all its edges. A regular 8 by 8 mesh of linear elements in a full size plate was chosen after convergence studies.
The value of the uniformly distributed loading chosen was equal to q0= 0.01x10⁶ N/m2. The results were plotted. The analysis is performed for fix values of the volume fraction exponent i.e n=2. The results are presented in terms of non-dimensional stress and deflection. The various non dimensional parameters used are non dimensional center deflection w = w0Eth
3/(q0a4) and non dimensional shear stress σxz
=σxzh2/(q0a
2). In the present analysis, in addition to the
uniform loading, the plate is subjected to a temperature field where the uniform temperature up to 300°C is given and the reference surface temperature is held at 20° C. The materials are assumed to be perfectly elastic throughout the deformation. A simply supported FG plate subjected to a uniformly distributed mechanical load and thermal loading as sown in figure 5.
Figure 5 : A simply supported FG plate subjected to a uniformly distributed mechanical load and thermal
loading
d) Boundary Conditions and Meshing The square plate modeled is meshed using the
mesh tool. The mesh tool provides a convenient path to many of the most common mesh controls, as well as to the most frequently performed meshing operations. The plate modeled throughout this project is subjected to simply supported Boundary condition i.e. along the X direction, Uy=UZ=0 and along the Y direction Ux=UZ=0. It is illustrated in Figure 6.
Figure 6 : Square plate with 8 layers, 8x8 mesh and Simply supported boundary condition
Using the APDL tool, the layer of the model along the thickness are divided into the number of layers desired; the other layers are then selected and divided
Variation of youngs modulus in FGM
70
90
110
130
150
0 0.2 0.4 0.6 0.8 1
Parameter (z/h)
Ypou
ngs M
odul
us (E
f)
n=2
n=0.5
n=1
Variation of Thermal conductivity in FGM
2.09
42.09
82.09
122.1
162.1
202.1
0 0.2 0.4 0.6 0.8 1
Parameter (z/h)
Ther
mal
cond
uctiv
ity (k
f)
n=2
n=0.5
n=1
1.00E-051.20E-051.40E-051.60E-051.80E-052.00E-052.20E-052.40E-05
0 0.5 1
Ther
mal
exp
ansi
on
Parameter (z/h)
Variation of Thermal expanssion in FGM
n=2
15
Year
013
2
© 2013 Global Journals Inc. (US)
Thermomechanical LoadingDeflection of Functionally Gradient Material Plate under Mechanical, Thermal and
Globa
l Jo
urna
l of R
esea
rche
s in E
nginee
ring
Volum
e X
III Issue
VII
Version
I
()
A

depending on the mesh size required. The following figure 6 shows an FGM plate modeled with 8 layers and a mesh count of size 8×8 along the x-y plane. Once the model is meshed; the model is modified in order to create layers with different material properties. This is done with the help of shell section. The material properties are then assigned to the respective layers defined along the thickness. It is to be noted that each layer is isotropic in nature.
IV. Result
In this section we present several numerical simulations, in order to assess the behavior of functionally graded plates subjected to mechanical, thermal and thermo-mechanical loads. A simple supported plate is considered for the investigation. The plate is made up of a ceramic material at the top, a metallic at the bottom. The simple power law with different values of n = 2 is used for the through-the-thickness variation. Following trends obtained as shown in various graphs.
a) Non dimensional deflection Here the non dimensional deflection parameter
is plotted against non dimensional parameter (z/h) for mechanical loading, thermal loading and thermo mechanical loading for metal plate, ceramic plate and functionally gradient material plate as shown in figure 7, 8 and 9 respectively.
Figure 7 : Variation of Non dimensional deflection for mechanical loading with z/h for n=2
Figure 8 : Variation of Non dimensional deflection for thermal loading with z/h for
Figure 9 : Variation of Non dimensional deflection for thermo mechanical loading with z/h for n=2
b) Ansys Diagram In this section we present several numerical
simulations diagram of deflection in figure 10, 11 and 12 for mechanical , thermal and thermomechanical loading respectively to assess the behavior of functionally graded plates.
Figure 10 : Variation of Non dimensional deflection for
mechanical loading in FGM
Mechanical Loading
1.E-05
1.E-04
1.E-03
1.E-02
1.E-01
0 0.2 0.4 0.6 0.8 1
Non dimensional parameter (z/h)
Non
dim
ensi
onal
def
lect
ion
Metal plateCeramic plateFGM plate
Thermal Loading
1.E-03
1.E-02
1.E-01
1.E+00
1.E+01
1.E+02
0 0.2 0.4 0.6 0.8 1
Non dimensional parameter (z/h)
Non
dim
e nsi
onal
def
lect
ion
Metal plateCeramic plateFGM plate
Thermomechanical Loading
1.E-03
1.E-02
1.E-01
1.E+00
1.E+01
1.E+02
0 0.2 0.4 0.6 0.8 1
Non dimensional parameter (z/h)
Non
dim
ensi
onal
def
lect
ion
Metal plateCeramic plateFGM plate
© 2013 Global Journals Inc. (US)
Thermomechanical LoadingDeflection of Functionally Gradient Material Plate under Mechanical, Thermal and
16
Year
013
2Globa
l Jo
urna
l of R
esea
rche
s in E
nginee
ring
Volum
e X
III Issue
VII
Version
I
()
A

Figure 11 : Variation of Non dimensional deflection for
thermal loading in FGM plate
Figure 12 : Variation of Non dimensional deflection for thermo mechanical loading in FGM plate
V. Conclusion
In this report analysis is carried out on a functionally gradient material square plate made of Aluminium/Zirconia. The plate considered is thick plate with a/h=20 and a/b=1. The structural response of this plate is studied with respect to mechanical, thermal and thermomechancial loads. The structural response of functionally gradient material plate is also compared with pure metal and pure ceramic plate under mechanical, thermal and thermomechancial loading. The properties of functionally gradient material are calculated for each layer according to power law. The material index, number of layers and mesh size is kept constant. The following points are summarized: 1. The modeling of functionally gradient material plate
in step wise variation in properties is successfully developed.
2. It is observed that the response of plates depends upon the intermediate properties of the metal and the ceramic.
3. In case of pure mechanical loading the non dimensional deflection of functionally gradient material plate is in between pure metal and ceramic plate.
4. In case of pure thermal and thermomechanical loading the non dimensional deflection is same nature. Ceramic plate having minimum deflection in mechanical, thermal and thermomechanical loading.
5. As for as review of literature it is also concluded that fine the number of mesh better the results. Also ANSYS gives faster approximate results and degree of accuracy depends on the mesh size, layers and solver.
6. In this report first order shear deformation theory has been used for formulation of the problem, it is concluded from the review that higher order theory can give approximate better results.
a) Future Scope The plate modeled here was a step wise graded
structure, with each layer being isotropic with specific material properties. The material properties for each layer have been calculated by any other methods like Mori-Tanka etc.which may give better estimation of properties. Also we can go for the coding of the material to get the continous variation of the properties. The material index, no of layers and meshing size can also be changed to get the better results. The position of natural axis and its eccentricity can also be considered for perfect analysis.
References Références Referencias
1. E. J. Barbero and J. N. Reddy, “An accurate determination of stresses in thick laminates using a generalized plate theory” International Journal for Numerical Methods in Engineering, 29, p.p. 1-14,1990.
2. S. Suresh and A. Mortensen, “Functionally graded metals and metal-ceramic composites: Part 2, Thermomechanical behavior”, International Materials Reviews, Vol. 42 No.3 85, 1997.
3. G. N. Praveen and J. N. Reddy, “Nonlinear transient thermoelastic analysis of functionally graded ceramic-metal plates”, Int. J. Solids Structure. Vol. 35. No. 33. pp. 4457- 4476, 1997.
4. J. N. Reddy, “Thermomechanical behavior of functionally graded materials”, Final Report for AFOSR Grant F49620-95-1-0342, CML Report 98-01, August 1998.
5. J. N. Reddy, “Analysis of functionally graded plates”, International journal for numerical methods in engineering, Int. J. Numer. Meth. Engg. 47, pp 663-684, 2000.
6. J.N. Reddy and Zhen-Qiang Cheng, “Three-dimensional thermomechanical deformations of
17
Year
013
2
© 2013 Global Journals Inc. (US)
Thermomechanical LoadingDeflection of Functionally Gradient Material Plate under Mechanical, Thermal and
Globa
l Jo
urna
l of R
esea
rche
s in E
nginee
ring
Volum
e X
III Issue
VII
Version
I
()
A

functionally graded rectangular plates”, Eur. J. Mech. A/Solids 20, pp. 841–855, 2001.
7. Bhavani V. Sankar and Jerome T. Tzeng, “Thermal stresses in functionally graded beams”, AIAA journal, Vol. 40, No. 6, June 2002.
8. Senthil S. Vel and R.C. Batra, “Three-dimensional analysis of transient thermal stresses in functionally graded plates”, International Journal of Solids and Structures 40, pp 7181–7196, 2003.
9. M. Tahani1, M. A. Torabizadeh and A. Fereidoon, “Non-Linear Response of Functionally graded beams under transverse loads” 14th Annual (International) Techanical Engineering Conference ,Isfahan University of Technology, Isfahan, Iran, May 2006.
10. Ki-Hoon Shin, “FEA Based Design of Heterogeneous Objects” International Design Engineering Technical Conferences & Computers and Information in Engineering Conference, Philadelphia, Pennsylvania, USA, September 10-13, 2006,
11. Fatemeh Farhatnia, Gholam-Ali Sharifi and Saeid Rasouli, “Numerical and Analytical Approach of Thermo-Mechanical Stresses in FGM Beams” Proceedings of the World Congress on Engineering, London, U.K, Vol II , July 1 - 3, 2009.
12. M.K. Singha, T.Prakash and M.Ganapathi , “Finite element analysis of functionally graded plates under transverse load” Finite Elements in Analysis and Design 47 ,453–460 , 2011.
13. D.K. Jha, Tarun Kant and R.K. Singh, “A critical review of recent research on functionally graded plates” , Composite Structures, (2012).
14. Srinivas.G and Shiva Prasad.U,” Simulation of Traditional Composites Under Mechanical Loads”, International Journal of Systems, Algorithms & Applications, Volume 2, Issue ICASE 2012, ISSN Online: 2277-2677, August 2012.
© 2013 Global Journals Inc. (US)
Thermomechanical LoadingDeflection of Functionally Gradient Material Plate under Mechanical, Thermal and
18
Year
013
2Globa
l Jo
urna
l of R
esea
rche
s in E
nginee
ring
Volum
e X
III Issue
VII
Version
I
()
A

© 2013. Rahul Mishra, Yogesh Kushwaha & Praveen Singh. This is a research/review paper, distributed under the terms of the Creative Commons Attribution-Noncommercial 3.0 Unported License http://creativecommons.org/licenses/by-nc/3.0/), permitting all non commercial use, distribution, and reproduction in any medium, provided the original work is properly cited.
Global Journal of Researches in Engineering Mechanical & Mechanics Volume 13 Issue 7 Version 1.0 Year 2013 Type: Double Blind Peer Reviewed International Research Journal Publisher: Global Journals Inc. (USA) Online ISSN: 2249-4596 & Print ISSN: 0975-5861
Design and Optimization Radial Gas Turbine Blade
By Rahul Mishra, Yogesh Kushwaha & Praveen Singh
Shri Rawatpura Sarkar Institute of Technology, India
Abstract - The combustion chamber of an automobile gas-turbine engine can be designed to
produce a gas temperature distribution at the inlet of the turbine increasing from blade root to
blade tip. It is shown in the paper, by means of comparative calculations, that by using such distributions of temperatures blade life can be substantially increased,
or else, un expensive
materials can be used. Such gas temperature distributions produce non-isentropic flow conditions. It is developed in the paper a method for the aerodynamic design of blades within a non-isentropic flow and it is also shown that if the blades are designed by taking an average gas temperature, as it is usually made, important errors are introduced in the resulting shape of the blade, which reduces the efficiency of the turbine.
GJRE-A Classification : For Code:
091399
Design and Optimization Radial Gas Turbine Blade
Strictly as per the compliance and regulations of
:
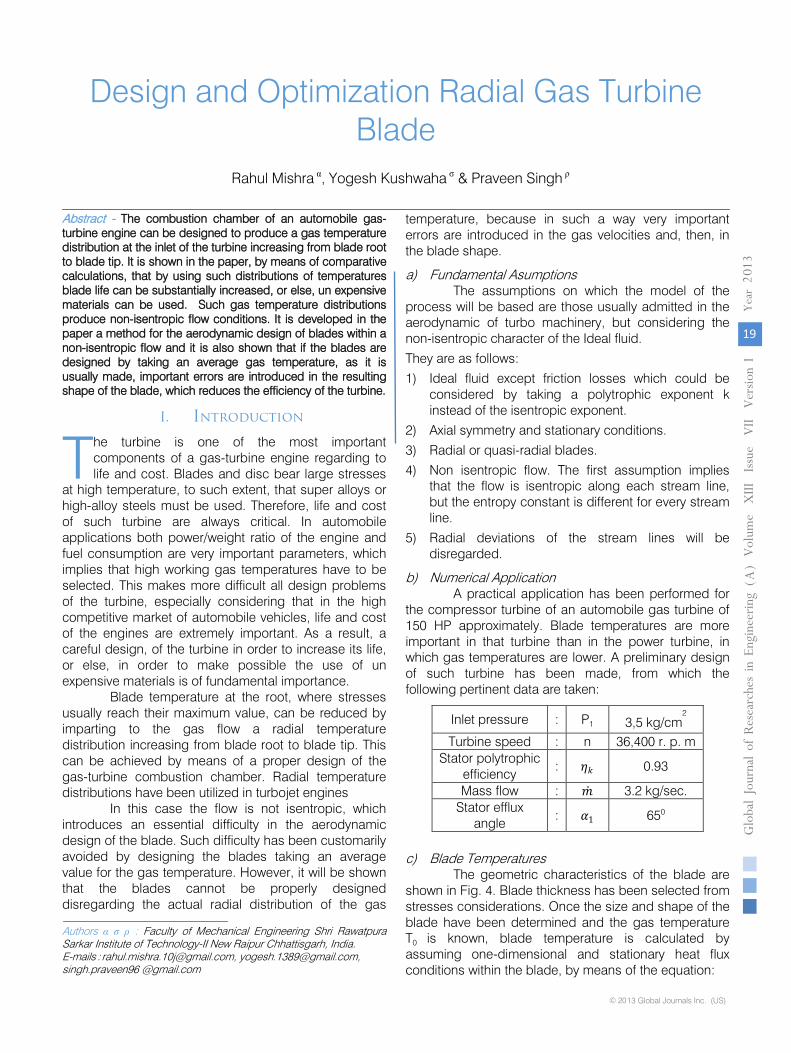
Design and Optimization Radial Gas Turbine Blade
Rahul Mishra α, Yogesh Kushwaha σ & Praveen Singh ρ
Abstract -
The combustion chamber of an automobile gas-turbine engine can be designed to produce a gas temperature distribution at the inlet of the turbine increasing from blade root to blade tip. It is shown in the paper, by means of comparative calculations, that by using such distributions of temperatures blade life can be substantially increased, or else, un expensive materials can be used. Such gas temperature distributions produce non-isentropic flow conditions. It is developed in the paper a method for the aerodynamic design of blades within a non-isentropic flow and it is also shown that if the blades are designed by taking an average gas temperature, as it is usually made, important errors are introduced in the resulting shape of the blade, which reduces the efficiency of the turbine.
I.
Introduction
he turbine is one of the most important components of a gas-turbine engine regarding to life and cost. Blades and disc bear large stresses
at high temperature, to such extent, that super alloys or high-alloy steels must be used. Therefore, life and cost of
such turbine are always critical. In automobile applications both power/weight ratio of the engine and fuel consumption are very important parameters, which implies that high working gas temperatures have to be selected. This makes more difficult all design problems of the turbine, especially considering that in the high competitive market of automobile vehicles, life and cost of the engines are extremely important. As a result, a careful design, of the turbine in order to increase its life, or else, in order to make possible the use of un expensive materials is of fundamental importance.
Blade temperature at the root, where stresses usually reach their maximum value, can be reduced by imparting to the gas flow a radial temperature distribution increasing from blade root to blade tip. This can be achieved by means of a proper design of the gas-turbine combustion chamber.
Radial temperature distributions have been utilized in turbojet engines
In this case the flow is not isentropic, which introduces an essential difficulty in the aerodynamic design of the blade. Such difficulty has been customarily avoided by designing the blades taking an average value for the gas temperature. However, it will be shown that the blades cannot be properly designed disregarding
the actual radial distribution of the gas
temperature, because in such a way very important errors are introduced in the gas velocities and, then, in the blade shape.
a) Fundamental Asumptions The assumptions on which the model of the
process will be based are those usually admitted in the aerodynamic of turbo machinery, but considering the non-isentropic character of the Ideal fluid.
They are as follows:
1) Ideal fluid except friction losses which could be considered by taking a polytrophic exponent k instead of the isentropic exponent.
2) Axial symmetry and stationary conditions.
3) Radial or quasi-radial blades.
4) Non isentropic flow. The first assumption implies that the flow is isentropic along each stream line, but the entropy constant is different for every stream line.
5) Radial deviations of the stream lines will be disregarded.
b) Numerical Application A practical application has been performed for
the compressor turbine of an automobile gas turbine of 150 HP approximately. Blade temperatures are more important in that turbine than in the power turbine, in which gas temperatures are lower. A preliminary design of such turbine has been made, from which the following pertinent data are taken:
Inlet pressure : P1 3,5 kg/cm2
Turbine speed : n 36,400 r. p. m Stator polytrophic
efficiency : 𝜂𝜂𝑘𝑘 0.93
Mass flow : �̇�𝑚 3.2 kg/sec. Stator efflux
angle : 𝛼𝛼1 650
c) Blade Temperatures
The geometric characteristics of the blade are shown in Fig. 4. Blade thickness has been selected from stresses considerations. Once the size and shape of the blade have been determined and the gas temperature T0 is known, blade temperature is calculated by assuming one-dimensional and stationary heat flux conditions within the blade, by means of the equation:
T
Authors α σ ρ : Faculty of Mechanical Engineering Shri Rawatpura Sarkar Institute of Technology-II New Raipur Chhattisgarh, India.E-mails : [email protected], [email protected],singh.praveen96 @gmail.com
19
Year
013
2
© 2013 Global Journals Inc. (US)
Globa
l Jo
urna
l of R
esea
rche
s in E
nginee
ring
Volum
e X
III Issue
VII
Version
I
()
A

(𝑇𝑇0 − 𝑇𝑇𝑏𝑏 )𝛺𝛺𝛼𝛼 = −𝜆𝜆𝑏𝑏𝑑𝑑𝑑𝑑𝑑𝑑�𝜎𝜎
𝑑𝑑𝑇𝑇𝑏𝑏𝑑𝑑𝑑𝑑
�
Which expresses the heat balance in a blade element of length dr, area 𝜎𝜎 and perimeter Ω. . In that formula 𝛌𝛌b is the blade thermal conductivity, α the heat transfer coefficient and Tb is the blade temperature.
Taking following data
α = 0,058 cal/cm2 sec
𝛌𝛌b = 0,05 cal/cm°C sec. Ta = 150°C (air temp.)
d) Blade Life and Blade Materials Two kinds of possible materials have been
considered for the blades: super alloys Nimonic N-80A and N-90 and stainless-steels 18 Cr-8Ni Cb and 18-8 Mo. Rupture stresses of these materials are shown in Fig. 6 as functions of the temperature*. A normal life of 10,000 hours has been considered.
Such distribution of temperature is approximately the best for the case studied. The super alloys needed for the isentropic case can be substituted, for the same 10,000 hours life, by stainless steel. On the other hand, if stainless steel would be used with isentropic flow, the life of the blade would be only 1,000 hours approximately.
II. Result and Optimization
The optimization procedure evaluates the objective function by means of the thermal code.
The Nusselt numbers have been evaluated by means of Florschuetz correlation equation, Florschuetz etal. [1981]:
Where the parameters A, B, m and n depend on geometric factors, z is the pitch of the holes and G is the mass flux.
The design variables involved in the Nusselt number evaluation are:
1. Impingement : hole diameter, position and pitch. 2. Film cooling : hole position, diameter, compound
angle
When the optimization procedure is started, a population of possible solutions, codified in string structures, is randomly initialized. A fitness value is assigned to each string based on the value assumed by the objective function. A fitness value is assigned to each string based on the value assumed by the objective function.
Midplane Stator Nozzle
Since the hot gas impacts the nozzle at the leading edge, the presence of impingement holes in this area is necessary to limit the temperature values. The pressure conditions at the leading edge make difficult to open film cooling holes in this area because of hot gas ingestion in the meatus. Moving towards the trailing edge, the pressure conditions become positive for positioning film cooling holes both on the pressure and suction side.
III. Conclusions
1. By means of a proper selection of radials distributions of gas temperature increasing from blade root to blade tip, the life of an automobile turbine could be substantially increased in many cases, or else, less expensive materials could be utilized instead of super alloys.
2. For such non-isentropic flows the aerodynamic design of blades has to be made considering the actual gas temperatures distributions, and not by taking an average value of the temperature. Otherwise, the efficiency of the turbine would be reduced.
References Références Referencias
1. Hyper Mesh, (2003) User's Manual v7.0, Altair Engineering Inc., Troy, MI, USA.
2. Hyper Study, (2003) Users Manual v7.0, Altair Engineering Inc., Troy, MI, USA.
3. Opti Struct, (2003) User's Manual v7. 0, Altair Engineering Inc., Troy, MI, USA.
4. Rao, J S. (2003), Recent Advanced in India for Airframe & Aeroengine Design and Scope for Global Cooperation, Society of Indian Aerospace Technologies & Industries, 11th Anniversary Seminar, February 8, 2003, Bangalore.
© 2013 Global Journals Inc. (US)
Design and Optimization Radial Gas Turbine Blade
20
Year
013
2Globa
l Jo
urna
l of R
esea
rche
s in E
nginee
ring
Volum
e X
III Issue
VII
Version
I
()
A

5. Rao, J S., et. al. (2000), Elastic Plastic Fracture Mechanics of a LP Last Stage Steam Turbine Blade Root, ASME-2000-GT-0569.
6. Jameson, A., 2003. Aerodynamic shape optima-zation using the adjoint method.
21
Year
013
2
© 2013 Global Journals Inc. (US)
Design and Optimization Radial Gas Turbine Blade
Globa
l Jo
urna
l of R
esea
rche
s in E
nginee
ring
Volum
e X
III Issue
VII
Version
I
()
A

© 2013 Global Journals Inc. (US)
Design and Optimization Radial Gas Turbine Blade
This page is intentionally left blank This page is intentionally left blank
22
Year
013
2Globa
l Jo
urna
l of R
esea
rche
s in E
nginee
ring
Volum
e X
III Issue
VII
Version
I
()
A

© 2013. P.V. Gopal Krishna, K. Kishore, T. Srihari & S. Venkataiah. This is a research/review paper, distributed under the terms of the Creative Commons Attribution-Noncommercial 3.0 Unported License http://creativecommons.org/licenses/by-nc/3.0/), permitting all non commercial use, distribution, and reproduction in any medium, provided the original work is properly cited.
Global Journal of Researches in Engineering Mechanical & Mechanics Volume 13 Issue 7 Version 1.0 Year 2013 Type: Double Blind Peer Reviewed International Research Journal Publisher: Global Journals Inc. (USA) Online ISSN: 2249-4596 & Print ISSN: 0975-5861
Performance Evaluation of Cryogenic Treated HSS Drill
By P.V. Gopal Krishna, K. Kishore, T. Srihari & S. Venkataiah
Vasavi College of Engineering, India
Abstract - Tool wear is a worn portion over the flank and face of the tool. Tool wear is significant
for determining tool life and hence it influences the machining economics. The wear measurements are carried by using a tool makers’ microscope in the present investigations. All the investigations are carried in dry machining. Life enhancement by using cryogenic treatment on HSS drill (T1-type) is the objective of study. Investigations are carried on different work materials such as AA6041, AISI 1040 and EN36. Improvement in tool life up to 140% for AA6041, 90% for AISI 1040, 38% for EN36 is observed. These investigations are aimed at benefiting small industries that use aforementioned tool work combinations. Regressions models are constructed for wear for both untreated machining and cryogenic treated machining.
Keywords : drilling, cryogenic treatment, regression analysis, tool wear.
GJRE-A Classification : For Code:
091003, 091399
Performance Evaluation of Cryogenic Treated HSS Drill
Strictly as per the compliance and regulations of
:

Performance Evaluation of Cryogenic Treated HSS Drill
P.V. Gopal Krishna α, K. Kishore σ, T. Srihari ρ & S. Venkataiah Ѡ
Abstract -
Tool wear is a worn portion over the flank and face of the tool. Tool wear is significant for determining tool life and hence it influences the machining economics. The wear measurements are carried by using a tool makers’ microscope in the present investigations. All the investigations are carried in dry machining. Life enhancement by using cryogenic treatment on HSS drill (T1-type) is the objective of study. Investigations are carried on different work materials such as AA6041, AISI 1040 and EN36. Improvement in tool life up to 140% for AA6041, 90% for AISI 1040, 38% for EN36 is observed.
These investigations are aimed at benefiting small industries that use aforementioned tool work combinations. Regressions models are constructed for wear for both untreated machining and cryogenic treated machining.
Keywords :
drilling, cryogenic treatment, regression analysis, tool wear.
I.
Introduction
o understand the effects of cryogenic processing, it is essential to get acquainted with the heat treating of metals. The primary reason for heat
treating steel is to improve its wear resistance through hardening. Gears, bearings and tooling for example are hardened because they need excellent wear resistance, improved fatigue life, stress relieving dimensional stability and corrosion resistance for extended reliability and performance. The steps in heat-treating are frequently explained in a simplistic manner but it takes significant skill and experience to execute heat treatments successfully. The steel tooling in practice would be immersed in liquid nitrogen for a period of time, allowed to warm up and then placed into service. It was also observed that the cryogenic treatment would convert the retained austenite into un-tempered martensite. The tools would experience a greatly enhanced service life. It was theorized that the increase in wear resistance was a direct result of the reduction in the amount of residual austenite. Liquid nitrogen systems have been the customary method for achieving cryogenic temperatures. Three types of systems have been developed viz heat exchanger systems, direct spray systems, and immersion systems. The last method i.e immersion system is used in present investigation.
The tool wear can be measured directly by using a microscope. However several indirect methods depending on the measurement of a parameter that influence the tool wear. Some of the methods for indirect prediction are cutting force, vibrations, acoustics, radioactive isotopes, image processing etc. It should be noted that no method is accurate for indirect prediction. Studies by Penn State University researchers in 1996 showed that retained austenite was reduced from near 18% to roughly 8% in T15 tool steel upon cryogenic treatment. Hardness increased by 2 points (HRC) with cryogenic treatment and subsequently decreased (in some cases more than 2 points) after a temper cycle. Still there has not yet been enough investigation to precisely determine optimum processing parameters, even for tool steels. Some researchers suggest that tools should be sharpened after cryogenic treatment rather than before. However for present work cryogenic treatment was carried out after grinding the HSS drill to the standard nomenclature to the required angles. The tools are dipped in liquid nitrogen (-1960 C) up to 24 hours and they are slowly brought down to room temperature.
The application of cryo-treated tools in metal cutting is a fascinating one and many investigators have shown keen interest in this area. Tool wear studies were carried out by Gill [1] et al on tungsten carbide cutting tools while turning AISI 1040. Wear studies on milling cutter treated by liquid nitrogen were performed by Young [2] et al. The influence of cryogenic treatment on the mechanical properties of tool steels were carried out by Molinari [3] et al. Structural changes in T-I type high speed steels when subjected to cryogenic treatment are reported by Popandopulo [4] et al. The lucid explanation by Carlson [5] about cold treatment of steels in his contribution for ASM hand book was a major inspiration for this work. Most of the modern investigators in the field of metal cutting preferred to use liquid nitrogen as a substitute coolant and they could obtain some improvements in cutting conditions. Yakup [6] et al was one of the investigators who tried to establish improvement of tool life due to a flood of liquid nitrogen. An overview on the performance of tool material after cryogenic treatment was presented as a review paper by Rupinder Singh [7] et al. Machining properties of titanium based alloy by cryogenic treated carbides and HSS tools was carried out by Aujla [8]. Improvement in cutting conditions using various means is a significant
T
Authors α Ѡ : Associate Professor. E-mail : [email protected] σ : Professor, Department of Mechanical Engineering, Vasavi College of Engineering, brahimbagh, Hyderabad, India.Author ρ : Professor, Department of Mechanical Engineering Shadan College of Engineering and Technology, Peerancherevu, Hyderabad, India.
23
Year
013
2
© 2013 Global Journals Inc. (US)
Globa
l Jo
urna
l of R
esea
rche
s in E
nginee
ring
Volum
e X
III Issue
VII
Version
I
()
A

issue in the area of manufacturing as it cost effective. Gopalkrishna [9] et al reported cryogenic treatment for turning tools wear. Hence present studies attain significance in the context of extending the cryogenic treatment methods to small industries.
II. Experimentation
Although a lot of choices are available for the industry, so far as tool materials are concerned, it is to be noted that most of the presently used multipoint cutting tools are made of HSS. This tool material has high toughness and is capable of taking impact loads. On the other hand still single point cutting tools made of HSS are routinely used in small and medium machine shops, which cannot effort expensive tools made of carbides or ceramics. An attempt is made in the present work to improve the tool life of single point cutting tools made of HSS, by exposing them to liquid nitrogen (-1960C). This cryogenic liquid is commercially available at very low cost, as nitrogen is abendently available in atmos[heric air.
The machining parameters considered during the current investigations to evaluate the tool life are the cutting speed, feed and depth of cut. Experiments are conducted using an L8 orthogonal array designed by Taguchi and the response is measured. All the experiments are conducted on work pieces 20mm thickness and 20 holes are taken over them before measuring the tool wear. The wear is measured by using a Tool makers’ microscope. All the experiments are conducted at random to avoid error and bias, each condition is repeated for confirmation of tool wear. The work materials selected in the present investigations are AA6041, AISI 1040 and EN36. The reason for selecting these materials is that most of the small and medium scale industries fabricate components made of these materials only. The present studies are targeted to benefit only these industries which cannot afford expensive tool materials, machines and necessary equipment for measurement of tool wear, torque and thrust.
The tool material used in the present investigations is T-1type HSS with 5% cobalt. The tools are ground to ASA standard 110-120–70-70–150–200– 0.5mm, on a tool and cutter grinder. A set of these tools are subjected to liquid nitrogen treatment for a period of 24hrs and are slowly brought to room temperature.
III. Results and Discussions
Tool wear and tool life are in separable in metal cutting industry. The machining parameters are set based on the final constraints such as quality of surface finish and productivity. The tool life will come to an end due to progressive wear or due to premature failure of the tool. The former is the main reason for most of the tools used in industry. An attempt is made in the present
work to improve the tool life by performing cold (cryogenic) treatment. This treatment brings about structural changes in cutting tools made of steel. Figures 1 and 2 respectively show microscope images of the tool before and after cryogenic treatment.
Figure 1 : Image of cutting tool before cryogenic treatment (magnification X600)
Figure 2 : Image of cutting tool after 24 hours cryogenic
treatment (magnification X600) The levels selected for the machining
parameters and experimental matrix used for different work materials are shown in tables 1 to 4. All experiments are carried out for dry condition only.
The influence of tool wear on various machining parameters is analyzed on AA6041, AISI 1040 and EN36 working materials. A few more experiments are conducted to obtain the relation between cutting speed and flank wear for all the work materials.
The flank wear in the tool materials selected for the present study with the speed for untreated and cryo-treated samples are shown in figure 3. It was observed that for the materials like AA6041, AISI 1040 and EN36 cutting speed has significant influence on tool life when compared to feed and depth of cut for both untreated and cryogenic treated HSS drill. It was also found that the interaction of speed, feed and depth of cut is more for untreated tool than cryogenic treated tool. The interaction of speed and feed is more on AA6041 when
© 2013 Global Journals Inc. (US)
compared to AISI 1040 and EN36 on both untreated and cryogenic treated tool.
Performance Evaluation of Cryogenic Treated Hss Drill
24
Year
013
2Globa
l Jo
urna
l of R
esea
rche
s in E
nginee
ring
Volum
e X
III Issue
VII
Version
I
()
A

Figure 3 : Variation of flank wear with speed in untreated and cryo-treated tools AA6041, AISI 1040 and EN36 It is evident from figure 3 that the flank wear is
less in all the cryo-treated sample tools i.e. AA604, AISI 1040, and EN36 compared to untreated tools at various speeds. So the low wear in the cryo-treated tools can be attributed to micro-hardening of the tools due to immersion in liquid nitrogen. The grain size on surface of the tool might have changed due to the cryogenic treated and hardened the tool.
A negative influence has been observed in the interaction of speed and depth of cut on both the tools. However, the interaction of feed and depth of cut has little influence on both treated and untreated material.
The regression analysis has been conducted on the data and the results are presented in table 5. The parameters in the regression analysis are speed (x1), feed (x2) and depth of cut (x3). From the regression analysis it can be concluded that the life of the tool increases by cryogenic treatment for both soft and hard materials. Hence cryogenic treated tools are found to be most effective at high speeds and feeds.
IV. Conclusions
The cold treatment on HSS drill tools in the present study has shown significant influence on the tool life. The tool life improvement up to 140%, 90% and 38% respectively are observed while machining AA6041, AISI 1040 and EN36 during the experiments. The interaction of speed, feed and depth of cut is more for untreated tool than cryogenic treated tool. This is evident from the regression analysis. The interaction of speed and feed is more on EN36 when compared to AISI 1040 and AA6041 on both untreated and cryogenic treated tool. It can be concluded that the life of the tools has increased
due to cryogenic treatment while
machining both soft and hard materials. The cryogenic treated tools are found to be most productive at high speeds and feeds. These findings will benefit small and medium machining shops.
V.
Acknowledgement
The authors are sincerely thankful to the Principal and Management of Vasavi College of Engineering for extending their support in carrying out this work. The cooperation extended by Mr. T. Manohar
Reddy, Lab Technician, during experimentations is highly appreciated.
References Références Referencias
1. Gill, S.S., Singh, R. and Singh, J., 2008, “Wear behavior of cryogenically treated tungsten carbide inserts under dry and wet turning conditions”, International Journal of Machine Tools Manufacturing, 49 (3-4), 256-260.
2. Young, A.Y.L., Seah, K.H.W. and Rahman, M. 2006, “Performance evaluation of Cryogenically treated tungsten carbide tools in turning Operation”, International journal of machine tools manufacturing technology, 46, 2051-2056.
3. Molinari, A., Pellizzari. M., Gialanella, S., Straffelini, G. and Stiasny, K.H., 2001 “effect of deep cryogenic treatment on the mechanical properties of tool steels”, Journal of Material Processing Technology 118(1-3) 35-355.
4. Popandopulo, N. and Zhukova, L.T., 1980, “Transformation in high speed steels during Cold treatment”, Met Sci Heat Treat, 22(10), 708-71.
5. Caarlson, E.A., 1990, “Cold treating and cryogenic treatment of steel in ASM Hand book,” Vol.4 Heat Treating, ASM international, 1oth Ed., Metals Park, OH.
6. Yakup Yildiz, Muammer Nalbant, 2008 “A review of cryogenic cooling in machining processes”, International Journal of Machine Tools and Manufacture, 48 (9) 947-964.
7. Rupinder Singh and Kamalijit Singh, 2010, “Enhancement of Toll Material Machining Characteristics with Cryogenic Treatment: A Review”, proceedings of the 2010 International Conference on Industrial Engineering and operations management, Dhaka, Bangladesh, January 9-10,2010.
8. Aujla, H.S. and Singh, R., 2008, “Applications of cryogenic treatment for Enhancing the Machining Properties of Titanium Alloy (Ti-6Al-4V),” Manu-facturing Technology Today, 7(10), 22-26.
9. Vishal S. Sharma, Manu Dogra, N.M. Suri , 2009, “Cooling techniques for improved productivity in turning”, International Journal of Machine Tools and Manufacture, Volume 49, Issue 6, Pages 435-453.
25
Year
013
2
© 2013 Global Journals Inc. (US)
Performance Evaluation of Cryogenic Treated Hss Drill
Globa
l Jo
urna
l of R
esea
rche
s in E
nginee
ring
Volum
e X
III Issue
VII
Version
I
()
A

10. P.V.Gopalkrishna, K. Kishore, G. Ramdev, Sikander Ali, 2012, “Performance evaluation of cryogenic treated tools in turning”, Advance in Production Engineering and Management journal” volume 7, issue 3, pages 187-192.
11. M. Dhananchezian, M. Pradeep Kumar, 2010 “Experimental investigation of cryogenic cooling by liquid nitrogen in the orthogonal machining of aluminium 6061-T6 alloy” International Journal of Machining and machinability of Materials - Vol. 7, No.3/4 pp. 274 - 285.
12. S.Chatterjee, 1992, “Performance characteristics of cryogenically treated high speed drills”, International journal of production research volume 30, no 4, 773-786.
13. David N. Collins, 1999 “Cryogenic treatment of tool steels”, Advanced materials and Process, December.
14. R.F. Barron, 1982 “Cryogenic treatment to improve wear resistance”, Butterworth & Co Ttd,.
15. Reitz.W, Pendray. J, 2001 “Cryoprocessing of materials- A review of current status”, Materials and manufacturing process.
Table 1 : Selection of process parameters
Level Cuttingspeed V
(m/min) x1
FeedS (mm/rev) x2
Depth of cut
t (mm)x3
Level-1 21.35 0.3 5.0 Level-2 11.30 0.1 2.5
Table 2 : Tool Wear for Machining of AISI 1040
S. No.
Cutting speed (V)
(m/min) x1
Feed (S)
(mm/rev) x2
Depth of
cut (t)
(mm) x3
Tool wear
Without cryogenic treatment (mm)
Tool wear with 24 hour cryogenic treatment
(mm) % Increase in
Tool life.
1. 1 1 1 0.6 0.306 49.00
2. 1 1 2 0.49 0.248 49.38
3. 1 2 1 0.37 0.168 54.59
4. 1 2 2 0.315 0.185 41.26
5. 2 1 1 0.29 0.136 53.10
6. 2 1 2 0.28 0.127 54.64
7. 2 2 1 0.185 0.125 70.27
8. 2 2 2 0.12 0.112 90.00
Table 3 : Tool Wear for Machining of AA6041
S. No.
Cutting
speed (V)
(m/min) x1
Feed (S)
(mm/rev) x2
Depth of cut (t)
(mm) x3
Tool wear
Without cryogenic treatment (mm)
Tool wear with 24 hour cryogenic treatment
(mm) % Increase in
Tool life.
1. 1 1 1 1.05 0.895 85.71
2. 1 1 2 0.88 0.665 75.56
3. 1 2 1 0.61 0.562 92.78
4. 1 2 2 0.56 0.551 91.25
5. 2 1 1 0.48 0.422 88.12
6. 2 1 2 0.45 0.315 90.00
7. 2 2 1 0.15 0.079 123.96
8. 2 2 2 0.12 0.051 140.0
Table 4 : Tool Wear for Machining of EN36
S. No.
Cutting
speed (V)
(m/min) x1
Feed (S)
(mm/rev) x2
Depth of cut (t)
(mm) x3
Tool wear
Without cryogenic treatment (mm)
Tool wear with 24 hour cryogenic treatment
(mm) % Increase in
Tool life.
1. 1 1 1 1.060 0.650 38.69
2. 1 1 2 1.380 0.930 32.60
3. 1 2 1 1.100 0.830 24.45
4. 1 2 2 0.875 0.770 12.00
5. 2 1 1 0.685 0.505 26.27
6. 2 1 2 0.635 0.440 30.70
7. 2 2 1 0.510 0.350 31.37
8. 2 2 2 0.450 0.320 28.88
© 2013 Global Journals Inc. (US)
Performance Evaluation of Cryogenic Treated Hss Drill
26
Year
013
2Globa
l Jo
urna
l of R
esea
rche
s in E
nginee
ring
Volum
e X
III Issue
VII
Version
I
()
A

Table 5 : Regression equations for various working materials
Working Material
Tool wear (mm) for Untreated HSS Tool wear (mm) for Cryogenic treated HSS for 24 hours
AISI 1040
y = 0.2312 + 0.112x1+ 0.0837 x2 + 0.03 x3 +
0.28 x1 x2- 0.2 x3 x1 + 0.22 x1 x2 x3.
y=0.1236+0.0608x1+0.0381x2+0.00031x3–0.171x1x2-0.099x2x3–0.48x3x1+0.03x1
x2 x3
AA 6041 y = 0.3756 + 0.1018 x1 + 0.0940 x2 + 0.0393 x3
+ 0.75 x1 x2 + 0.15 x2 x3 – 0.31 x3 x1+ 0.33 x1 x2 x3.
y = 0.1793 + 0.1118 x1 + 0.1081 x2 + 0.0143 x3 + 0.25 x1 x2 - 0.03 x2 x3- 0.73 x3 x1 + 0.01 x1 x2 x3.
EN36 y = 0.9993 + 0.4293 x1+ 0.2656 x2 + 0.0543 x3 + 1.21 x1x2 - 0.11x2x3 + 0.09 x3 x1 -0.07 x1 x2 x3
y = 0.7518 + 0.3443 x1 + 0.0843 x2 - 0.0143 x3 + 0.15 x1x2 + 1.05 x2x3 - 0.25 x3 x1 - 0.79 x1 x2 x3
27
Year
013
2
© 2013 Global Journals Inc. (US)
Performance Evaluation of Cryogenic Treated Hss Drill
Globa
l Jo
urna
l of R
esea
rche
s in E
nginee
ring
Volum
e X
III Issue
VII
Version
I
()
A

© 2013 Global Journals Inc. (US)
Performance Evaluation of Cryogenic Treated Hss Drill
This page is intentionally left blank This page is intentionally left blank
28
Year
013
2Globa
l Jo
urna
l of R
esea
rche
s in E
nginee
ring
Volum
e X
III Issue
VII
Version
I
()
A

© 2013. Monika Yadav, Nivritti Mehta, Aman Gupta, Akshay Chaudhary & D. V. Mahindru. This is a research/review paper, distributed under the terms of the Creative Commons Attribution-Noncommercial 3.0 Unported License http://creativecommons. org/licenses/by-nc/3.0/), permitting all non commercial use, distribution, and reproduction in any medium, provided the original work is properly cited.
Global Journal of Researches in Engineering Mechanical & Mechanics Volume 13 Issue 7 Version 1.0 Year 2013 Type: Double Blind Peer Reviewed International Research Journal Publisher: Global Journals Inc. (USA) Online ISSN: 2249-4596 & Print ISSN: 0975-5861
Review of Magnetic Levitation (MAGLEV): A Technology to Propel Vehicles with Magnets
By Monika Yadav, Nivritti Mehta, Aman Gupta, Akshay Chaudhary & D. V. Mahindru
SRMGPC, India Abstract - The term “Levitation” refers to a class of technologies that uses magnetic levitation to propel vehicles with magnets rather than with wheels, axles and bearings. Maglev (derived from magnetic levitation) uses magnetic levitation to propel vehicles. With maglev, a vehicle is levitated a short distance away from a “guide way” using magnets to create both lift and thrust. High-speed maglev trains promise dramatic improvements for human travel widespread adoption occurs. Maglev trains move more smoothly and somewhat more quietly than wheeled mass transit systems. Their nonreliance on friction means that acceleration and deceleration can surpass that of wheeled transports, and they are unaffected by weather. The power needed for levitation is typically not a large percentage of the overall energy consumption. Most of the power is used to overcome air resistance (drag). Although conventional wheeled transportation can go very fast, maglev allows routine use of higher top speeds than conventional rail, and this type holds the speed record for rail transportation. Vacuum tube train systems might hypothetically allow maglev trains to attain speeds in a different order of magnitude, but no such tracks have ever been built. Compared to conventional wheeled trains, differences in construction affect the economics of maglev trains. Keywords : maglev levitation, propel, vehicle, trains, vacuum tube. GJRE-A Classification : For Code: 091303
Review of Magnetic Levitation MAGLEV A Technology to Propel Vehicles with Magnets
Strictly as per the compliance and regulations of
:

Review of Magnetic Levitation (MAGLEV): A Technology to Propel Vehicles with Magnets
Abstract - The term “Levitation” refers to a class of technologies that uses magnetic levitation to propel vehicles with magnets rather than with wheels, axles and bearings. Maglev (derived from magnetic levitation) uses magnetic levitation to propel vehicles. With maglev, a vehicle is levitated a short distance away from a “guide way” using magnets to create both lift and thrust. High-speed maglev trains promise dramatic improvements for human travel widespread adoption occurs.
Maglev trains move more smoothly and somewhat more quietly than wheeled mass transit systems. Their non-reliance on friction means that acceleration and deceleration can surpass that of wheeled transports, and they are unaffected by weather. The power needed for levitation is typically not a large percentage of the overall energy consumption. Most of the power is used to overcome air resistance (drag). Although conventional wheeled transportation can go very fast, maglev allows routine use of higher top speeds than conventional rail, and this type holds the speed record for rail transportation. Vacuum tube train systems might hypothetically allow maglev trains to attain speeds in a different order of magnitude, but no such tracks have ever been built. Compared to conventional wheeled trains, differences in construction affect the economics of maglev trains. With wheeled trains at very high speeds, the wear and tear from friction along with the concentrated pounding from wheels on rails accelerates equipment deterioration and prevents mechanically-based train systems from routinely achieving higher speeds. Conversely, maglev tracks have historically been found to be much more expensive to construct, but require less maintenance and have low ongoing costs. Across the world, Engineering has the common language and common goal-“Improving the Quality of Life” of mankind without any boundary restrictions. To bring about this much needed change, Science and Technology need transformation by the frantic pace of market dynamics. What we need today is “Change Leaders” to bring about innovation, growth and a totally new work culture. Levitation is one such remarkable technology that is revolutionizing the technology to propel vehicles: • In the present work, extensive literature survey has been
carried out A demo model has been prepared and the same has been put to operation. The results are very encouraging .Maglev trains use magnets to levitate and propel the trains forward.
• Only the part of the track that is used will be electrified, so no energy is wasted.
• Since there is no friction these trains can reach high speeds.
• It is a safe and efficient way to travel. • Governments have different feedbacks about the
technology. Some countries, like China, have embraced it and others like Germany have balked at the expense.
Keywords : maglev levitation, propel, vehicle ,trains, vacuum tube .
I. Introduction
aglev (derived from magnetic levitation) uses magnetic levitation to propel vehicles with magnets rather than with wheels, axles and
bearings. With maglev, a vehicle is levitated a short distance away from a guide way using magnets to create both lift and thrust. High-speed maglev trains promise dramatic improvements for human travel if widespread adoption occurs.
Maglev trains move more smoothly and somewhat more quietly than wheeled mass transit systems. Their non-reliance on friction means that acceleration and deceleration can surpass that of wheeled transports, and they are unaffected by weather. The power needed for levitation is typically not a large percentage of the overall energy consumption most of the power is used to overcome air resistance (drag), as with any other high-speed form of transport. Although conventional wheeled transportation can go very fast, maglev allows routine use of higher top speeds than conventional rail, and this type holds the speed record for rail transportation. Vacuum tube train systems might hypothetically allow maglev trains to attain speeds in a different order of magnitude, but no such tracks have ever been built.
II. Description
• Principle of Maglev Maglev is a system in which the vehicle runs
levitated from the guide way (corresponding to the rail tracks of conventional railways) by using electromagnetic forces between superconducting magnets on board the vehicle and coils on the ground. The following is a general explanation of the principle of Maglev.
M
29
Year
013
2
© 2013 Global Journals Inc. (US)
Monika Yadav α, Nivritti Mehta σ, Aman Gupta ρ, Akshay ChaudharyѠ & D. V. Mahindru
Authors α σ ρ Ѡ : Final Year B.Tech. (Mech Engg) Mech. Engg. Deptt. SRMGPC,Tewari Ganj, Lucknow-227 105 U.P. India. Author : Professor (Mech. Engg.) in Mech. Engg. Deptt., SRMGPC, Tewari Ganj, Lucknow-227 105 India. E-mail : [email protected]
¥
¥
Globa
l Jo
urna
l of R
esea
rche
s in E
nginee
ring
Volum
e X
III Issue
VII
Version
I
()
A

a) Principle of magnetic levitation The "8" figured levitation coils are installed on
the sidewalls of the guide way. When the on-board superconducting magnets pass at a high speed about several centimeters below the center of these coils, an electric current is induced within the coils, which then acts as electromagnet temporarily. As a result, there are forces which push the superconducting magnet upwards and ones which pull them upwards simultaneously, thereby levitating the Maglev vehicle.
b)
Principle of lateral guidance The levitation coils facing each other are
connected under the guide way, constituting a loop. When a running Maglev vehicle, that is a super conducting magnet, displaces laterally, an electric current is induced in the loop, resulting in a repulsive force acting on the levitation coils of the side near the car and attractive force acting on the levitation coils of the side farther apart from the car. Thus, a running car is always located at the center of the guide way.
c)
Principle of Propulsion
A repulsive force and an attractive force
induced between the magnets are used to propel the vehicle (superconducting magnet). The propulsion coils located on the sidewalls on both sides of the guide way are energized by a three-phase alternating current from a substation, creating a shifting magnetic field on the guide way. The on-board superconducting magnets are attracted and pushed by the
shifting field, propelling the Maglev vehicle.
III.
Basic Concept
Magnets repel each other when they're placed with their like poles together because they create a magnetic field when they're created. While scientists don't rightly know why electromagnetic fields take the shape that they do, their general consensus states that the field leaves one pole and tries to reach the nearest opposite pole that it can, and when you place the like poles together the opposing fields repel one another.
Figure 4 :
Attraction and Repulsion of Poles
IV.
Fabrication of Demo Model
a)
Materials Used
•
Sagwan wood for track
•
Pine wood for train
•
Permanent magnets of area 2*1 cm2
b)
Construction of Demo Model
•
Build a magnetic base track of
length 30 cm
•
Remove material with the help of chisel
•
Stick permanent magnets at a distance of 1.5 cm each
•
5 magnets are placed on each side of the track
•
Make guide rails to prevent the
train from slipping sideways
© 2013 Global Journals Inc. (US)
Figure 2 : Principle of Lateral Guidance
Figure 1: Principle of Magnetic Levitation
Figure 3 : Principle of Propulsion
• Make the train of pine wood and stick the magnets on them also in the same way and maintain equal distance.
Review of Magnetic Levitation (MAGLEV): a Technology to Propel Vehicles with Magnets
30
Year
013
2Globa
l Jo
urna
l of R
esea
rche
s in E
nginee
ring
Volum
e X
III Issue
VII
Version
I
()
A

V. Procedure for Assembly
• Place the track on flat base of Sagwan wood. • The two tracks should be placed in such a way that
the magnets of the two tracks are not in the same line.
• Now place the guide rails on each side of the tracks in such a way that it prevents the sideward motion of the train.
• After that place the train in centre position. • Remove 1 guide rail after the train has levitated. • Place some weight on the levitating train. • Check if the weight is balanced by the magnetic
levitation force.
31
Year
013
2
© 2013 Global Journals Inc. (US)
Review of Magnetic Levitation (MAGLEV): a Technology to Propel Vehicles with Magnets
Globa
l Jo
urna
l of R
esea
rche
s in E
nginee
ring
Volum
e X
III Issue
VII
Version
I
()
A

Pictures of demo model created by our team in mechanical workshops, SRMGPC
VI. Chronological History of Maglev
1750 - The first beginnings of magnetic levitation can be traced back to John Mitchell where he noticed the repulsion of two magnets when the same pole of each was put together.
Early 1900s - Emile Bachelet in France and Frank Goddard in the United States discussed the possibility of using magnetically levitated vehicles for high speed transport.
1922 - Hermann Kemper in Germany pioneered attractive-mode (EMS) Maglev and received a patent for magnetic levitation of trains in 1934.
1934 - On August 14, Hermann Kemper of Germany receives a patent for the magnetic levitation of trains.
1962 - Research of linear motor propulsion and non-contact run started.
1965 - Maglev development in the U.S. began as a result of the High-Speed Ground Transportation (HSGT) Act of 1965.
1966 - In the USA, James Powell and Gordon Danby propose the first practical system for magnetically levitated transport, using superconducting magnets located on moving vehicles to induce currents in normal aluminum loops on a guideway. The moving vehicles are automatically levitated and stabilized, both
vertically and laterally, as they move along the guideway. The vehicles are magnetically propelled along the guideway by a small AC current. The original Powell-Danby maglev inventions form the basis for the maglev system in Japan, which is currently being demonstrated in Yamanashi Prefecture, Japan. Powell and Danby have subsequently developed new Maglev inventions that form the basis for their second generation M-2000 System. Powell and Danby were awarded the 2000 Benjamin Franklin Medal in Engineering by the Franklin Institute for their work on EDS Maglev.
1969 - Groups from Stanford, Atomics International and Sandia developed a continuous-sheet guide way (CSG) concept.
1970 - Study of electro dynamic levitation systems using superconducting magnets started formally.
1972 -LSM-propulsion experimental superconducting Maglev test vehicle (LSM200) succeeded in levitated run. LIM-propulsion experimental vehicle (ML100) succeeded in levitated run.
1977 - April, Miyazaki, Japan 7 km. maglev test track was opened. In July, test run of ML-500 inverted-T guide way started at the Miyazaki Test Track.
1979 - In January, a simulated tunnel run tested. May, a run with helium refrigerator on-board tested (ML-500R) and in December, a run of 517 km/h run was attained. (321 MPH).
1980 - November, a test run of MLU001 on U-type guide way started on the Miyazaki Maglev Test Track in Japan.
1982 - November, a manned two-car train test run started.
1984 - Research on the idea was quickly started and a small train was unveiled in Birmingham, England. It was used to ferry people between the town's airport and the city's main train station.
1986 - December, a three-car train registered 352.4 km/h run. (219 MPH)
1987 - January, an unmanned two-car train attained 405.3 km/h (252 MPH). February, a 400.8 km/h run of manned two-car train attained (249 MPH). April,
1989 - March, aerodynamic brake system tested (MLU001). November, 394 km/h run attained (MLU002) (245 MPH).
1990 - March, test of traverser-type turnout started. November, start of initial phase in construction of the Yamanashi Maglev Test Line celebrated.
1991 -
National Maglev Initiative receives one billion dollars federal government funding.
5
June, test
run using sidewall levitation system started. Test run energized by inverters started. October, the MLU002 burned down in a fire accident.
1992 -
The Federal Government in Germany decides to include the 300 km long super speed Maglev
© 2013 Global Journals Inc. (US)
Review of Magnetic Levitation (MAGLEV): a Technology to Propel Vehicles with Magnets
32
Year
013
2Globa
l Jo
urna
l of R
esea
rche
s in E
nginee
ring
Volum
e X
III Issue
VII
Version
I
()
A

system route Berlin-Hamburg in the 1992 Federal Transportation Master Plan. 1993 - January, Test run of MLU002N started.
1994 - February, the MLU002N attained 431 km/h. (268 MPH).
1995 - February, the MLU002N attained 411 km/h (manned). (255 MPH).
1997 - April, the running test of MLX01 on the Yamanashi Maglev Test Line started. December, the MLX01 attained 531 km/h (manned) (330 MPH). MLX01 attained 550 km/h (unmanned)(342 MPH).
1998 - In June, the US congress passes the Transportation Equity Act for the 21st Century (TEA 21). The law includes a Maglev deployment program allocating public funds for preliminary activities with regard to several projects and, later on, further funds for the design, engineering and construction of a selected project. 2 December, test of two trains passing each other at a relative speed of 966 km/h (600 MPH).
2000 - March, The Committee of the Ministry of Transport of Japan concluded "Maglev has the practica-bility for ultra high speed mass transportation system." August, a cumulative traveled distance exceeded 100,000 km.
2001 -In January, in the US, Transportation Secretary Rodney Slater selects the Pittsburgh and the Washington -Baltimore routes for detailed environmental and project planning. Later that month in China, a contract is concluded between the city of Shanghai and the industrial consortium consisting of Siemens, ThyssenKrupp, and Transrapid International to realize the Shanghai airport link. In March, the construction of the Shanghai project begins. 2 Their Imperial Highnesses Prince and Princess Akishino experienced Maglev trial ride.
2002
-
Sout hern California Association of Governments Maglev proposed a 275 mile network and a 54 mile Initial Operating Segment (IOS) was approved December 5 running from West Los Angeles to Ontario Airport.
5
February, cumulative traveled distance exceeded 200,000 km. March, number of passengers for Maglev trial ride exceeded 30,000 persons. July, test run of new train set including MLX01-901 started.
2003
-
March, longer traveled distance 1,219 km in a day was attained. July, cumulative traveled distance exceeded 300,000km and the number of passengers for Maglev trial ride exceeded 50,000 persons. November, longest traveled distance 2,876 km in a day was attained. December, the MLX01 arranged in a three-car train set attained 581 km/h (manned).
2004
-
August, the number of passengers for Maglev trial ride exceeded 80,000 persons. October, the cumulative traveled distance exceeded 400,000 km. November, a test of two trains passing each other at a maximum relative speed of 1,026 km/h.
2005
-
January, His Imperial Highness Crown Prince Naruhito experienced Maglev trial ride.
2006
-
Chinese developers unveiled the world’s first full-permanent magnetic levitation (Maglev) wind power generator at the Wind Power Asia Exhibition 2006 held June 28 in Beijing, according to
Xinhua News. On August 11, the Shanghai maglev caught fire from an onboard battery. September 22, an elevated Transrapid train collided with a maintenance vehicle on a test run in Lathen (Lower Saxony / north-western Germany). Twenty-three people were killed and ten were injured.
2008
-
Elevators controlled by magnetic levitation are set to debut.
33
Year
013
2
© 2013 Global Journals Inc. (US)
Review of Magnetic Levitation (MAGLEV): a Technology to Propel Vehicles with Magnets
Globa
l Jo
urna
l of R
esea
rche
s in E
nginee
ring
Volum
e X
III Issue
VII
Version
I
()
A

A. B. Demo Model at SRMGPC, Lucknow2013’May
VII. The Technology
a) Magnet A magnet is any object that has a magnetic
field. It attracts ferrous objects like pieces of iron, steel, nickel and cobalt. In the early days, the Greeks observed that the naturally occurring 'lodestone' attracted iron pieces. From that day onwards began the journey into the discovery of magnets.
These days’ magnets are made artificially in various shapes and sizes depending on their use. One of the most common magnets - the bar magnet - is a long, rectangular bar of uniform cross-section that attracts pieces of ferrous objects. The magnetic compass needle is also commonly used. The compass needle is a tiny magnet which is free to move horizontally on a pivot. One end of the compass needle points in the North direction and the other end points in the South direction.
The end of a freely pivoted magnet will always point in the North-South direction.
Figure 6.1 : Property of Magnet
The end that points in the North is called the North Pole of the magnet and the end that points south is called the South Pole of the magnet. It has been proven by experiments that like magnetic poles repel each other whereas unlike poles attract each other.
i. Magnetic Fields The space surrounding a magnet, in which
magnetic force is exerted, is called a magnetic field. If a bar magnet is placed in such a field, it will experience magnetic forces.
© 2013 Global Journals Inc. (US)
Review of Magnetic Levitation (MAGLEV): a Technology to Propel Vehicles with Magnets
34
Year
013
2Globa
l Jo
urna
l of R
esea
rche
s in E
nginee
ring
Volum
e X
III Issue
VII
Version
I
()
A

ii. Magnetic Lines of Force Just as an electric field is described by drawing
the electric lines of force, in the same way, a magnetic field is described by drawing the magnetic lines of force. When a small north magnetic pole is placed in the magnetic field created by a magnet, it will experience a force. influence of a magnetic field is called a magnetic line of force. In other words, the magnetic lines of force are the lines drawn in a magnetic field along which a north magnetic pole would move.
The direction of a magnetic line of force at any point gives the direction of the magnetic force on a north pole placed at that point. Since the direction of magnetic line of force is the direction of force on a North Pole, so the magnetic lines of force always begin on the N-pole of a magnet and end on the S-pole of the magnet. A small magnetic compass when moved along a line of force always sets itself along the line tangential to it. So, a line drawn from the South Pole of the compass to its North Pole indicates the direction of the magnetic field.
Figure 6.2 : Magnetic Field
iii. Properties of the magnetic lines of force 1. The magnetic lines of force originate from the North
Pole of a magnet and end at its South Pole. 2. The magnetic lines of force come closer to one
another near the poles of a magnet but they are widely separated at other places.
3. The magnetic lines of force do not intersect (or cross) one another.
4. When a magnetic compass is placed at different points on a magnetic line of force, it aligns itself along the tangent to the line of force at that point.
5. These are just some of the basic concepts of magnetism. One cannot possibly grasp the depth and appreciate the versatility of magnets without reading more about the uses of magnets, the
Figure 6.3 : Magnetic Field Lines
b) Types of Magnets There are various types of magnets depending
on their properties. Some of the most well known are listed below.
i. Permanent Magnets These are the most common type of magnets
that we know and interact with in our daily lives. E.g. The magnets used in our refrigerators. These magnets are permanent in the sense that once they have been magnetized they retain a certain degree of magnetism. Permanent magnets are generally made of ferromagnetic material. Such material consists of atoms and molecules that each have a magnetic field and are positioned to reinforce each other.
Figure 6.4 : Permanent Magnets
35
Year
013
2
© 2013 Global Journals Inc. (US)
Review of Magnetic Levitation (MAGLEV): a Technology to Propel Vehicles with Magnets
Globa
l Jo
urna
l of R
esea
rche
s in E
nginee
ring
Volum
e X
III Issue
VII
Version
I
()
A

ii. Classification Permanent Magnets can further be classified
into four types based on their composition: 1. Neodymium Iron Boron (NdFeB or NIB) 2. Samarium Cobalt (Sm Co) 3. Alnico 4. Ceramic or Ferrite.
NIB and SmCo are the strongest types of magnets and are very difficult to demagnetize. They are also known as rare earth magnets since their compounds come from the rare earth or Lathanoid series of elements in the periodic table. The 1970s and 80s saw the development of these magnets.
Permanent Magnets can also be classified into Injection Moulded and Flexible magnets. Injection molded magnets are a composite of various types of resin and magnetic powders, allowing parts of complex shapes to be manufactured by injection molding. The physical and magnetic properties of the product depend on the raw materials, but are generally lower in magnetic strength and resemble plastics in their physical properties.
iii. Shape & Configuration Permanent magnets can be made into any
shape imaginable. They can be made into round bars, rectangles, horseshoes, donuts, rings, disks and other custom shapes. While the shape of the magnet is important aesthetically and sometimes for experimentation, how the magnet is magnetized is equally important. For example: A ring magnet can be magnetized S on the inside and N on the outside, or N on one edge and S on the other, or N on the top side and S on the bottom. Depending on the end usage, the shape and configuration vary.
iv. Demagnetization Permanent magnets can be demagnetized in
the following ways: - Heat - Heating a magnet until it is red hot makes it loose its magnetic properties. - Contact with another magnet - Stroking one magnet with another in a random fashion, will demagnetize the magnet being stroked. - Hammering or jarring will loosen the magnet's atoms from their magnetic attraction.
v. Temporary Magnets Temporary magnets are those that simply act
like permanent magnets when they are within a strong magnetic field. Unlike permanent magnets however, they loose their magnetism when the field disappears. Paperclips, iron nails and other similar items are examples of temporary magnets. Temporary magnets are used in telephones and electric motors amongst other things.
vi. Electromagnets Had it not been for electromagnets we would
have been deprived of many luxuries and necessities in life including computers, television and telephones. Electromagnets are extremely strong magnets. They are produced by placing a metal core (usually an iron alloy)
inside a coil of wire carrying an electric current. The electricity in the current produces a magnetic field. The strength of the magnet is directly proportional to the strength of the current and the number of coils of wire. Its polarity depends on the direction of flow of current. While the current flows, the core behaves like a magnet. However, as soon as the current stops, the core is demagnetized.
Figure 6.5 : Electromagnet
Figure 6.6
: Direction of F, M, I
Electromagnets are most useful when a magnet must be switched on and off as in large cranes used to lift cables and rods in construction.
vii.
Superconductors
These are the strongest magnets. They don't need a metal core at all, but are made of coils of wire made from special metal alloys which become superconductors when cooled to very low temperatures.
viii.
Electromagn
An electromagnet is a type of magnet
in which
the magnetic field is produced by the flow of electric
current. The magnetic field disappears when the current is turned off. Electromagnets are widely used as components of other electrical devices, such as motors, generators, relays, loudspeakers, hard disks, MRI machines, scientific instruments, and magnetic separation
equipment, as well as being employed as
industrial lifting electromagnets for picking up and moving heavy iron objects like scrap iron.
© 2013 Global Journals Inc. (US)
Review of Magnetic Levitation (MAGLEV): a Technology to Propel Vehicles with Magnets
36
Year
013
2Globa
l Jo
urna
l of R
esea
rche
s in E
nginee
ring
Volum
e X
III Issue
VII
Version
I
()
A

A simple electromagnet consisting of a coil of insulated wire wrapped around an iron core. The strength of magnetic field generated is proportional to the amount of current.
Figure 6.7 : Faraday’s Thumb Rule
Current (I) through a wire produces a magnetic field (B). The field is oriented according to the right-hand rule. An electric current flowing in a wire creates a magnetic field around the wire (see drawing below). To concentrate the magnetic field, in an electromagnet the wire is wound into a coil with many turns of wire lying side by side. The magnetic field of all the turns of wire passes through the center of the coil, creating a strong magnetic field there. A coil forming the shape of a straight tube (a helix) is called a solenoid. Much stronger magnetic fields can be produced if a "core" of ferromagnetic material, such as soft iron, is placed inside the coil.
Figure 6.8 : Magnetic field produced by a solenoid
Magnetic field produced by a solenoid (coil of wire). This drawing shows a cross section through the center of the coil. The crosses are wires in which current is moving into the page; the dots are wires in which current is moving up out of the page.
The direction of the magnetic field through a coil of wire can be found from a form of the right-hand
rule. If the fingers of the right hand are curled around the coil in the direction of current flow (conventional current, flow of positive charge) through the windings, the thumb points in the direction of the field inside the coil. The side of the magnet that the field lines emerge from is defined to be the north pole.
The main advantage of an electromagnet over a permanent magnet is that the magnetic field can be rapidly manipulated over a wide range by controlling the amount of electric current. However, a continuous supply of electrical energy is required to maintain the field.
How to Make an Electromagnet To make a simple electromagnet, you can wrap
50 or 100 turns of thin insulated copper wire along the length of an iron nail, forming a neat coil of wire tight along and around the nail. (Leave about 9 inches of wire free at each end of the coil to attach to the power source). 1. Wrap the insulated wire around the nail, moving
down the nail as you go.
2. Fix the coil of wire in place with some sticky tape.
3.
Clean off the insulation at the ends of the extra wire, for about 1 inch, exposing the shiny metal inside.
4.
Bend the ends into loops and connect to a LOW VOLTAGE direct-current power supply, such as a model train transformer or a D-cell battery pack.
c) DC Motor A DC motor is a mechanically the principle
commutated electric motor powered from direct current (DC). The stator is stationary in space by definition and therefore its current. The current in the rotor is switched by the commutator to also be stationary in space. This is how the relative angle between the stator and rotor magnetic flux is maintained near 90 degrees, which generates the maximum torque. DC motors have a rotating armature winding (winding in which a voltage is induced) but non-rotating armature magnetic field and a static field winding (winding that produce the main magnetic flux) or permanent magnet. Different connections of the field and armature winding provide different inherent speed/torque regulation characteristics. The speed of a DC motor can be controlled by changing the voltage applied to the armature or by changing the field current. The introduction of variable resistance in the armature circuit or field circuit allowed speed control. The introduction of DC motors to run machinery eliminated the need for local steam or internal combustion engines, and line shaft drive systems.
i. Brush A brushed DC electric motor generating torque
from DC power supply by using internal mechanical commutation, space stationary permanent magnets
37
Year
013
2
© 2013 Global Journals Inc. (US)
Review of Magnetic Levitation (MAGLEV): a Technology to Propel Vehicles with Magnets
Globa
l Jo
urna
l of R
esea
rche
s in E
nginee
ring
Volum
e X
III Issue
VII
Version
I
()
A

form the stator field. Torque is produced by the principle of Lorentz force, which states that any current-carrying conductor placed within an external magnetic field experiences a force known as Lorentz The actual (Lorentz) force ( and also torque since torque is F x l where l is rotor radius) is a function for rotor angle and so the green arrow/vector actually changes length/magnitude force. with angle known as torque ripple) Since this is a single phase two pole motor the commutator consists of a split ring, so that the current reverses each half turn ( 180 degrees).
The brushed DC electric motor generates torque directly from DC power supplied to the motor by using internal commutation, stationary magnets (permanent or electromagnets), and rotating electrical magnets.
ii. Brushless Typical brushless DC motors use a rotating
permanent magnet in the rotor, and stationary electrical current/coil magnets on the motor housing for the rotor, but the symmetrical opposite is also possible. A motor controller converts DC to AC. This design is simpler than that of brushed motors because it eliminates the complication of transferring power from outside the motor to the spinning rotor. Advantages of brushless motors include long life span, little or no maintenance, and high efficiency. Disadvantages include high initial cost, and more complicated motor speed controllers. Some such brushless motors are sometimes referred to as "synchronous motors" although they have no external power supply to be synchronized with, as would be the case with normal AC synchronous motors.
Figure 6.9 : DC Motor
iii. Uncommutated Other types of DC motors require no
commutation. Homopolar motor – A homopolar motor has a magnetic field along the axis of rotation and an electric current that at some point is not parallel to the magnetic field. The name homopolar refers to the absence of polarity change.
Homopolar motors necessarily have a single-turn coil, which limits them to very low voltages. This has restricted the practical application of this type of motor. Ball bearing motor – A ball bearing motor is an unusual electric motor that consists of two ball bearing-type bearings, with the inner races mounted on a common conductive shaft, and the outer races connected to a high current, low voltage power supply.
iv. Connection Types There are three types of electrical connections
between the stator and rotor possible for DC electric motors: series, shunt/parallel and compound (various blends of series and shunt/parallel) and each has unique speed/torque characteristics appropriate for different loading torque profiles/signatures.
Figure 6.10 : Working of Dc Motor
v. Series Connection A series DC motor connects the
armature and field windings in series with a common D.C. power source. The motor speed varies as a non-linear function of load torque and armature current;
© 2013 Global Journals Inc. (US)
Review of Magnetic Levitation (MAGLEV): a Technology to Propel Vehicles with Magnets
38
Year
013
2Globa
l Jo
urna
l of R
esea
rche
s in E
nginee
ring
Volum
e X
III Issue
VII
Version
I
()
A

current is common to both the stator and rotor yielding I^2 (current) squared behavior. A series motor has very high starting torque and is commonly used for starting high inertia loads, such as trains, elevators or hoists. This speed/torque characteristic is useful in applications such as dragline excavators, where the digging tool moves rapidly when unloaded but slowly when carrying a heavy load.
With no mechanical load on the series motor, the current is low, the counter-EMF produced by the field winding is weak, and so the armature must turn faster to produce sufficient counter-EMF to balance the supply voltage. The motor can be damaged by over speed. This is called a runaway condition.
Series motors called "universal motors" can be used on alternating current. Since the armature voltage and the field direction reverse at (substantially) the same time, torque continues to be produced in the same direction.
vi. Shunt Connection A shunt DC motor connects the armature and
field windings in parallel or shunt with a common D.C. power source. This type of motor has good speed regulation even as the load varies, but does not have the starting torque of a series DC motor.
vii. Compound Connection A compound DC motor connects the armature
and fields windings in a shunt and a series combination to give it characteristics of both a shunt and a series DC motor. This motor is used when both a high starting torque and good speed regulation is needed. The motor can be connected in two arrangements: cumulatively or differentially. Cumulative compound motors connect the series field to aid the shunt field, which provides higher starting torque but less speed regulation.
VIII. Analysis
For Motor Power = V*I = 2πNT/60
12*2 =2*3.14*4400*T/60 T= 0.0521 N-m
For the track Length of track = 2*n + total gap between
magnets (n= number of magnets) Total gap between magnets= (n-1)*1
Thus, Total length of track= 2*30 + (30-1)*1= 89cm =.89m
For Train
Mass of the bogie=41.7gm=.0417kg
Force between the bogie and track,
F=AB²/2μ0 =mg
A-Total area of the magnets under the bogie
B-Flux density
We have,
A=area of one bar * no. of bars under bogie
and track
A= .02*.01*8= .0016
B=3.1*10¯² T
F= AB²/2μ0=.6118 N
Now we have, Weight of the bogie, W= .0417*9.81=.409N As, F>W so bogie is balanced by the magnetic force and thus the bogie is levitated.
Figure 7.1 : Levitation is Possible
Thrust calculation- 1. Voltage = 12V , Current = 1.9Amp
x= 9.2-7.8 = 1.4cm
h= x (Sh / Sₒ -1) = (1.4/100) (1750/1000 -1)
39
Year
013
2
© 2013 Global Journals Inc. (US)
Review of Magnetic Levitation (MAGLEV): a Technology to Propel Vehicles with Magnets
Globa
l Jo
urna
l of R
esea
rche
s in E
nginee
ring
Volum
e X
III Issue
VII
Version
I
()
A

= (1.4/100) X 0.75 = 0.0105 m =1.05 cm Velocity of air:
V = Cv 2gh Let, Cv = 1
V = √2 × 9.81 × 0.0105 = 0.45388 m/sec
Thrust force: Thrust = (dm/dt) × V
Mass flow rate (dm/dt) = ρav So, Thrust = 𝜌𝜌av v = ρav2
= 1.75× 1000 × (𝜋𝜋/4) × 0.08² × 0.45388 = 1.8114 N
2. Voltage = 12V, Current = 1.7 Amp
x = 9- 7.8 = 1.2 cm
h = x (Sh/ So -1) = 0.75 (1.2/100)
= 9 10-3 m Velocity of air:
V = √2𝑔𝑔ℎ = √2 × 9.81 × 0.009
= 0.4202 m/sec Thrust force:
Thrust = (dm/dt) × V Mass flow rate (dm/dt) = ρav
Thrust = 𝜌𝜌av2
= 1.75× 1000 × (𝜋𝜋/4) × 0.082× 0.42022 = 1.5532 N
3. Voltage = 12V , Current = 1.5 Amp x = 8.75 – 7.8
= 0.95 cm h = x (Sh/ So -1)
= 0.75 × (0.95/100) = 7.125× 10⁻³ m
Velocity of air: V =√2𝑔𝑔ℎ
V = √2 × 9.81 × 0.007125 = 0.3738 m/sec
Thrust force: Thrust = (dm/dt) × V
Mass flow rate (dm/dt) = ρav
Thrust = 𝜌𝜌av2
= 1.75× 1000 × (𝜋𝜋/4) × 0.08² × 0.37382
= 1.2296 N 4. Voltage = 12 V , Current = 1.3Amp
x= 8.6- 7.8 = 0.8cm
h=x (Sh/So -1) = 0.75× (0.8/100)
= 6× 10⁻³ m
Velocity of air: V =√2𝑔𝑔ℎ
V =√2 × 9.81 × 0.006 = 0.34310 m/sec
Thrust force: Thrust = (dm/dt) × V
Mass flow rate (dm/dt) = ρav Thrust = 𝜌𝜌av2
= 1.75× 1000 × (𝜋𝜋/4) × 0.08² × 0.343102 = 1.0355N
5. Voltage = 12V , Current = 1.1Amp
x = 8.45-7.8 = 0.65cm
h= x (Sh/So -1) = 0.75× (0.65/100)
= 4.875× 10⁻³m Velocity of air:
V =√2𝑔𝑔ℎ V = √2 × 9.81 × 0.004875
= 0.3092 m/sec Thrust force: Thrust = (dm/dt) × V
Mass flow rate (dm/dt) = ρav Thrust = 𝜌𝜌av2
= 1.75× 1000 × (𝜋𝜋/4) × 0.08² × 0.3092²
= 0.84135N
6. Voltage =12 V, Current= 1.08Amp x= 8.2-7.8 = 0.4 cm
h= x (Sh/So -1) = 0.75× (0.4/100)
= 3× 10⁻³ m Velocity of air:
V =√2𝑔𝑔ℎ V=√2 × 9.81 × 0.003
= 0.2426 m/sec Thrust force:
Thrust = (dm/dt) × V Mass flow rate (dm/dt) = ρav
Thrust= 𝜌𝜌av2
= 1.75× 1000 × (𝜋𝜋/4) × 0.08² × 0.2426²
= 0.51775N
Maglev Track
with Floating
Train in Place
(end view)
© 2013 Global Journals Inc. (US)
Review of Magnetic Levitation (MAGLEV): a Technology to Propel Vehicles with Magnets
40
Year
013
2Globa
l Jo
urna
l of R
esea
rche
s in E
nginee
ring
Volum
e X
III Issue
VII
Version
I
()
A

Figure 7.2
:
Floating Train
Calculation for the speed of bogie at different angles of inclination:
1. Angle of elevation is 00:
Speed = [0.17× (1/5.6) × (18/5)] = 0.10928 m/sec 2. For angle of 120 : a) While running down the plane Inclination (𝜃𝜃) = 12°
Speed = [(9.2/100) × (1/7.21)× (18/5)] = 0.0459 m/sec 3. For various angles while going up the plane: i. Inclination (𝜃𝜃) = 12°
Speed = 0.036 m/sec ii. Inclination = 11.5°
Speed = 0.04001 m/sec iii. Inclination = 11°
Speed = 0.03912 m/sec iv. Inclination = 10.5°
Speed = 0.0385 m/sec v. Inclination = 10° Speed = 0.0386 m/sec
Multiple Regressions Formulae of multiple regressions: y= a+ bx+cz ⅀y= na+ b⅀x+ c⅀z ⅀xy= a⅀x+ b⅀x2+ c⅀xz ⅀zy = a⅀z+ b⅀xz+c⅀z² Where, y= Speed of bogie (m/sec) x= Thrust (N) z= Inclination (degrees)
Putting the values from the table in the equations:
0.20213= 5a+6.411b+0.9641c Equation1
2.655= 6.411a+8.4854b+1.223c Equation 2
0.039= 0.9641a+1.223b+0.187c Equation 3
After solving equations 1, 2 and 3 We get,
a = -78.576
b = 22.089
c = 260.84
e = error
y = 22.089x+260.84z-78.576+e Graph derived from the above analysis:
VIII. Indian -Initiative
• Pune (Pimple Saudagar) – Mumbai (Panvel) : The Indian Ministry is currently in the process of reviewing a proposal to start a Maglev train system in India.[11] It has already been estimated that the cost to complete this process would be over $30 Billion. The company who sent the proposals is a company based in the United States. There have been feelers sent to Lalu Prasad, Railway Minister, in which the advantages of a Maglev train system were presented. Although still at a preliminary stage, if completed, the train travel time between the two cities will be reduced to three hours, compared to an original 16 hours. travel daily, making fuel consumption at .2 million liters a day . The business proposal is to reduce the fuel consumption and
0.8 0.9 1 1.1 1.2 1.3 1.4 1.5 1.6 1.7 1.8-6
-5
-4
-3
-2
-1
0
1
2
values of x in N
value
s of
y in
m/s
Regression Analysis
y(m/s) x(N)
z(degrees)
x² Xy
xz Yz
z²
0.0386 0.84315 0.209 0.70786 0.03247 0.1758 0.00806 0.04386
0.0385 1.0355 0.2007 1.0722 0.03986 0.2078 0.00772 0.04028
0.03912 1.2296 0.194 1.5119 0.0481 0.23851 0.00758 0.03685
0.04001 1.5532 0.1832 2.4124 0.0621 0.2845 0.00732 0.03558 0.0459
1.8114
0.1745
3.2811
0.083
0.31608
0.00801
0.03046
⅀y=0.20213
⅀x=6.411
⅀z=0.9641
⅀x²=8.4854
⅀xy=2.655
⅀xz=1.223
⅀yz=0.039
⅀z²=0.187
41
Year
013
2
© 2013 Global Journals Inc. (US)
__ __ | | | | | | | | | |____________________________________| | | |____________________________________| | | | |_____| |_____| | | | | _____ _____ | |_|__|__|____ |_____ __ |____ |_______ __ |__ |__
|_____________________________________________|
Review of Magnetic Levitation (MAGLEV): a Technology to Propel Vehicles with Magnets
Globa
l Jo
urna
l of R
esea
rche
s in E
nginee
ring
Volum
e X
III Issue
VII
Version
I
()
A

promote Maglev by income from Carbon Credit Sales.
• Mumbai – Delhi A maglev line project was presented to the then Indian railway minister (Mamta Banerjee) by an American company. A line was proposed to serve between the cities of Mumbai andDelhi, the Prime Minister Manmohan Singh said that if the line project is successful the Indian government would build lines between other cities and also between Mumbai Centraland Chhatrapati Shivaji International Airport.
• Mumbai - Nagpur The State of Maharashtra has also approved a feasibility study for a maglev train between Mumbai (the commercial capital of India as well as the State government capital) and Nagpur (the second State capital) about 1,000 km (620 mi) away. It plans to connect the regions of Mumbai and Pune with Nagpur via less developed hinterland (via Ahmednagar,Beed, Latur, Nanded and Yavatmal).
• Chennai - Bangalore - Mysore Large and Medium Scale Industries Minister of Karnataka Mr. Murugesh Nirani, a detailed report will be prepared and submitted by December 2012 and the project is expected to cost $26 million per kilometer of railway track. The speed of Maglev will be 350 kmph and will take 30 mins from Chennai to Mysore via Bangalore.
• KochiMetro Union Minister of State for Consumer Affairs, Food and Public Distribution K. V. Thomas proposed that Kochi Metro can adopt same technology as present in South Korea.
IX. Conclusion
• We were able to successfully demonstrate with our model the feasibility of Levitation as a “Powerful Source” to propel vehicles
• Dimension of the track and vehicle should be accurate in order to get better results.
• The train is best levitated in center position.
© 2013 Global Journals Inc. (US)
Review of Magnetic Levitation (MAGLEV): a Technology to Propel Vehicles with Magnets
42
Year
013
2Globa
l Jo
urna
l of R
esea
rche
s in E
nginee
ring
Volum
e X
III Issue
VII
Version
I
()
A

Global Journals Inc. (US)
Guidelines Handbook
2013
www.GlobalJournals.org

FELLOW OF ASSOCIATION OF RESEARCH SOCIETY IN ENGINEERING (FARSE) •
'FARSE' title will be awarded to the person after approval of Editor-in-Chief and Editorial Board. The title 'FARSE" can be added to name in the following manner. eg. Dr. John E. Hall, Ph.D., FARSE or William Walldroff Ph. D., M.S., FARSE
•
Being FARSE is a respectful honor. It authenticates your research activities. After becoming FARSE, you can use 'FARSE' title as you use your degree in suffix of your name. This will
definitely will enhance and add up your name. You can use it on your Career Counseling Materials/CV/Resume/Visiting Card/Name Plate etc.
•
60% Discount will be provided to FARSE members for publishing research papers in Global Journals Inc., if our Editorial Board and Peer Reviewers accept the paper. For the life time, if you are author/co-author of any paper bill sent to you will automatically be discounted one by 60%
•
FARSE will be given a renowned, secure, free professional email address with 100 GB of space [email protected]. You will be facilitated with Webmail, Spam Assassin, Email Forwarders, Auto-Responders, Email Delivery Route tracing, etc.
•
FARSE member is eligible to become paid peer reviewer at Global Journals Inc. to earn up to 15% of realized author charges taken from author of respective paper. After reviewing 5 or more papers you can request to transfer the amount to your bank account or to your PayPal account.
•
Eg. If we had taken 420 USD from author, we can send 63 USD to your account.
•
FARSE member can apply for free approval, grading and certification of some of their Educational and Institutional Degrees from Global Journals Inc. (US) and
Open Association of Research, Society U.S.A.
•
After you are FARSE. You can send us scanned copy of all of your documents. We will verify, grade and certify them within a month. It will be based on your academic records, quality of research papers published by you, and 50 more criteria. This is beneficial for your job interviews as recruiting organization need not just rely on you for authenticity and your unknown qualities, you would have authentic ranks of
all of your documents. Our scale is unique worldwide.
•
FARSE member can proceed to get benefits of free research podcasting in Global Research Radio with their research documents, slides and online movies.
•
After your publication anywhere in the world, you can upload you research paper with your recorded voice or you can use our professional RJs to record your paper their voice. We can also stream your conference videos and display your slides online.
•
FARSE will be eligible for free application of Standardization of their Researches by Open Scientific Standards. Standardization is next step and level after publishing in a journal. A team of research and professional will work with you to take your research to its next level, which is worldwide open standardization.
Fellows
© Copyright by Global Journals Inc.(US) | Guidelines Handbook
I

•
FARSE is eligible to earn from their researches: While publishing his paper with Global Journals Inc. (US), FARSE can decide whether he/she would like to publish his/her research in closed manner. When readers will buy that individual research paper for reading, 80% of its earning by Global Journals Inc. (US) will be transferred to FARSE member's bank account after certain threshold balance. There is no time limit for collection. FARSE member can decide its price and we can help in decision.
MEMBER OF ASSOCIATION OF RESEARCH SOCIETY IN ENGINEERING (MARSE)
•
'MARSE' title will be awarded to the person after approval of Editor-in-Chief and Editorial Board. The title 'MARSE" can be added to name in the following manner. eg. Dr. John E. Hall, Ph.D.,
MARSE or William Walldroff Ph. D., M.S., MARSE
•
Being MARSE is a respectful honor. It authenticates your research activities. After becoming MARSE, you can use 'MARSE' title as you use your degree in suffix of your name. This will definitely will enhance and add up your name. You can use it on your Career Counseling Materials/CV/Resume/Visiting Card/Name Plate etc.
•
40% Discount will be provided to MARSE members for publishing research papers in Global Journals Inc., if our Editorial Board and Peer Reviewers
accept the paper. For the life time, if you are author/co-author of any paper bill sent to you will automatically be discounted one by 60%
•
MARSE will be given a renowned, secure, free professional email address with 30 GB of space [email protected]. You will be facilitated with Webmail, SpamAssassin, Email Forwarders, Auto-Responders, Email Delivery Route tracing, etc.
•
MARSE member is eligible to become paid peer reviewer at Global Journals Inc. to earn up to 10% of realized author charges taken from author of respective paper. After reviewing 5 or more papers you can request to transfer the amount to your bank account or to your PayPal account.
•
MARSE member can apply for free approval, grading and certification of some of their Educational and Institutional Degrees from Global Journals Inc. (US) and
Open Association of Research,Society U.S.A.
•
MARSE is eligible to earn from their researches: While publishing his paper with Global Journals Inc. (US), MARSE can decide whether he/she would like to publish his/her research in closed manner. When readers will buy that individual research paper for reading, 40% of its earning by Global Journals Inc. (US) will be transferred to MARSE member's bank account after certain threshold balance. There is no time limit for collection. MARSE member can decide its price and we can help in decision.
II
© Copyright by Global Journals Inc.(US)| Guidelines Handbook
II
C Inc.(US)

Auxiliary Memberships
ANNUAL MEMBER
•
Annual Member will be authorized to
receive e - Journal GJRE
for one year
(subscription for one year).
•
The member will be allotted free 1 GB Web-space
along with subDomain to
contribute and participate in our activities. •
A professional email address
will be allotted free 500 MB email space.
PAPER PUBLICATION
• The members can publish paper once. The paper will be sent to two-peer reviewer. The paper will be published after the acceptance of peer reviewers and Editorial Board.
III
© Copyright by Global Journals Inc.(US) | Guidelines Handbook

Process of submission of Research Paper
The Area or field of specialization may or may not be of any category as mentioned in ‘Scope of Journal’ menu of the GlobalJournals.org website. There are 37 Research Journal categorized with Six parental Journals GJCST, GJMR, GJRE, GJMBR, GJSFR, GJHSS. For Authors should prefer the mentioned categories. There are three widely used systems UDC, DDC and LCC. The details are available as ‘Knowledge Abstract’ at Home page. The major advantage of this coding is that, the research work will be exposed to and shared with all over the world as we are being abstracted and indexed worldwide.
The paper should be in proper format. The format can be downloaded from first page of ‘Author Guideline’ Menu. The Author is expected to follow the general rules as mentioned in this menu. The paper should be written in MS-Word Format (*.DOC,*.DOCX).
The Author can submit the paper either online or offline. The authors should prefer online submission.Online Submission: There are three ways to submit your paper:
(A) (I) First, register yourself using top right corner of Home page then Login. If you are already registered, then login using your username and password.
(II) Choose corresponding Journal.
(III) Click ‘Submit Manuscript’. Fill required information and Upload the paper.
(B) If you are using Internet Explorer, then Direct Submission through Homepage is also available.
(C) If these two are not conveninet , and then email the paper directly to [email protected].
Offline Submission: Author can send the typed form of paper by Post. However, online submission should be preferred.
IV
© Copyright by Global Journals Inc.(US)| Guidelines Handbook
o

Preferred Author Guidelines
MANUSCRIPT STYLE INSTRUCTION (Must be strictly followed)
Page Size: 8.27" X 11'"
• Left Margin: 0.65 • Right Margin: 0.65 • Top Margin: 0.75 • Bottom Margin: 0.75 • Font type of all text should be Swis 721 Lt BT. • Paper Title should be of Font Size 24 with one Column section. • Author Name in Font Size of 11 with one column as of Title. • Abstract Font size of 9 Bold, “Abstract” word in Italic Bold. • Main Text: Font size 10 with justified two columns section • Two Column with Equal Column with of 3.38 and Gaping of .2 • First Character must be three lines Drop capped. • Paragraph before Spacing of 1 pt and After of 0 pt. • Line Spacing of 1 pt • Large Images must be in One Column • Numbering of First Main Headings (Heading 1) must be in Roman Letters, Capital Letter, and Font Size of 10. • Numbering of Second Main Headings (Heading 2) must be in Alphabets, Italic, and Font Size of 10.
You can use your own standard format also. Author Guidelines:
1. General,
2. Ethical Guidelines,
3. Submission of Manuscripts,
4. Manuscript’s Category,
5. Structure and Format of Manuscript,
6. After Acceptance.
1. GENERAL
Before submitting your research paper, one is advised to go through the details as mentioned in following heads. It will be beneficial, while peer reviewer justify your paper for publication.
Scope
The Global Journals Inc. (US) welcome the submission of original paper, review paper, survey article relevant to the all the streams of Philosophy and knowledge. The Global Journals Inc. (US) is parental platform for Global Journal of Computer Science and Technology, Researches in Engineering, Medical Research, Science Frontier Research, Human Social Science, Management, and Business organization. The choice of specific field can be done otherwise as following in Abstracting and Indexing Page on this Website. As the all Global
V
© Copyright by Global Journals Inc.(US) | Guidelines Handbook

Journals Inc. (US) are being abstracted and indexed (in process) by most of the reputed organizations. Topics of only narrow interest will not be accepted unless they have wider potential or consequences.
2. ETHICAL GUIDELINES
Authors should follow the ethical guidelines as mentioned below for publication of research paper and research activities.
Papers are accepted on strict understanding that the material in whole or in part has not been, nor is being, considered for publication elsewhere. If the paper once accepted by Global Journals Inc. (US) and Editorial Board, will become the copyright of the Global Journals Inc. (US).
Authorship: The authors and coauthors should have active contribution to conception design, analysis and interpretation of findings. They should critically review the contents and drafting of the paper. All should approve the final version of the paper before submission
The Global Journals Inc. (US) follows the definition of authorship set up by the Global Academy of Research and Development. According to the Global Academy of R&D authorship, criteria must be based on:
1) Substantial contributions to conception and acquisition of data, analysis and interpretation of the findings.
2) Drafting the paper and revising it critically regarding important academic content.
3) Final approval of the version of the paper to be published.
All authors should have been credited according to their appropriate contribution in research activity and preparing paper. Contributors who do not match the criteria as authors may be mentioned under Acknowledgement.
Acknowledgements: Contributors to the research other than authors credited should be mentioned under acknowledgement. The specifications of the source of funding for the research if appropriate can be included. Suppliers of resources may be mentioned along with address.
Appeal of Decision: The Editorial Board’s decision on publication of the paper is final and cannot be appealed elsewhere.
Permissions: It is the author's responsibility to have prior permission if all or parts of earlier published illustrations are used in this paper.
Please mention proper reference and appropriate acknowledgements wherever expected.
If all or parts of previously published illustrations are used, permission must be taken from the copyright holder concerned. It is the author's responsibility to take these in writing.
Approval for reproduction/modification of any information (including figures and tables) published elsewhere must be obtained by the authors/copyright holders before submission of the manuscript. Contributors (Authors) are responsible for any copyright fee involved.
3. SUBMISSION OF MANUSCRIPTS
Manuscripts should be uploaded via this online submission page. The online submission is most efficient method for submission of papers, as it enables rapid distribution of manuscripts and consequently speeds up the review procedure. It also enables authors to know the status of their own manuscripts by emailing us. Complete instructions for submitting a paper is available below.
Manuscript submission is a systematic procedure and little preparation is required beyond having all parts of your manuscript in a given format and a computer with an Internet connection and a Web browser. Full help and instructions are provided on-screen. As an author, you will be prompted for login and manuscript details as Field of Paper and then to upload your manuscript file(s) according to the instructions.
VI
© Copyright by Global Journals Inc.(US)| Guidelines Handbook
C

To avoid postal delays, all transaction is preferred by e-mail. A finished manuscript submission is confirmed by e-mail immediately and your paper enters the editorial process with no postal delays. When a conclusion is made about the publication of your paper by our Editorial Board, revisions can be submitted online with the same procedure, with an occasion to view and respond to all comments.
Complete support for both authors and co-author is provided.
4. MANUSCRIPT’S CATEGORY
Based on potential and nature, the manuscript can be categorized under the following heads:
Original research paper: Such papers are reports of high-level significant original research work.
Review papers: These are concise, significant but helpful and decisive topics for young researchers.
Research articles: These are handled with small investigation and applications
Research letters: The letters are small and concise comments on previously published matters.
5.STRUCTURE AND FORMAT OF MANUSCRIPT
The recommended size of original research paper is less than seven thousand words, review papers fewer than seven thousands words also.Preparation of research paper or how to write research paper, are major hurdle, while writing manuscript. The research articles and research letters should be fewer than three thousand words, the structure original research paper; sometime review paper should be as follows:
Papers: These are reports of significant research (typically less than 7000 words equivalent, including tables, figures, references), and comprise:
(a)Title should be relevant and commensurate with the theme of the paper.
(b) A brief Summary, “Abstract” (less than 150 words) containing the major results and conclusions.
(c) Up to ten keywords, that precisely identifies the paper's subject, purpose, and focus.
(d) An Introduction, giving necessary background excluding subheadings; objectives must be clearly declared.
(e) Resources and techniques with sufficient complete experimental details (wherever possible by reference) to permit repetition; sources of information must be given and numerical methods must be specified by reference, unless non-standard.
(f) Results should be presented concisely, by well-designed tables and/or figures; the same data may not be used in both; suitable statistical data should be given. All data must be obtained with attention to numerical detail in the planning stage. As reproduced design has been recognized to be important to experiments for a considerable time, the Editor has decided that any paper that appears not to have adequate numerical treatments of the data will be returned un-refereed;
(g) Discussion should cover the implications and consequences, not just recapitulating the results; conclusions should be summarizing.
(h) Brief Acknowledgements.
(i) References in the proper form.
Authors should very cautiously consider the preparation of papers to ensure that they communicate efficiently. Papers are much more likely to be accepted, if they are cautiously designed and laid out, contain few or no errors, are summarizing, and be conventional to the approach and instructions. They will in addition, be published with much less delays than those that require much technical and editorial correction.
VII
© Copyright by Global Journals Inc.(US) | Guidelines Handbook

The Editorial Board reserves the right to make literary corrections and to make suggestions to improve briefness.
It is vital, that authors take care in submitting a manuscript that is written in simple language and adheres to published guidelines.
Format
Language: The language of publication is UK English. Authors, for whom English is a second language, must have their manuscript efficiently edited by an English-speaking person before submission to make sure that, the English is of high excellence. It is preferable, that manuscripts should be professionally edited.
Standard Usage, Abbreviations, and Units: Spelling and hyphenation should be conventional to The Concise Oxford English Dictionary. Statistics and measurements should at all times be given in figures, e.g. 16 min, except for when the number begins a sentence. When the number does not refer to a unit of measurement it should be spelt in full unless, it is 160 or greater.
Abbreviations supposed to be used carefully. The abbreviated name or expression is supposed to be cited in full at first usage, followed by the conventional abbreviation in parentheses.
Metric SI units are supposed to generally be used excluding where they conflict with current practice or are confusing. For illustration, 1.4 l rather than 1.4 × 10⁻³ m3, or 4 mm somewhat than 4 × 10⁻³ m. Chemical formula and solutions must identify the form used, e.g. anhydrous or hydrated, and the concentration must be in clearly defined units. Common species names should be followed by underlines at the first mention. For following use the generic name should be constricted to a single letter, if it is clear.
Structure
All manuscripts submitted to Global Journals Inc. (US), ought to include:
Title: The title page must carry an instructive title that reflects the content, a running title (less than 45 characters together with spaces), names of the authors and co-authors, and the place(s) wherever the work was carried out. The full postal address in addition with the e-mail address of related author must be given. Up to eleven keywords or very brief phrases have to be given to help data retrieval, mining and indexing.
Abstract, used in Original Papers and Reviews:
Optimizing Abstract for Search Engines
Many researchers searching for information online will use search engines such as Google, Yahoo or similar. By optimizing your paper for search engines, you will amplify the chance of someone finding it. This in turn will make it more likely to be viewed and/or cited in a further work. Global Journals Inc. (US) have compiled these guidelines to facilitate you to maximize the web-friendliness of the most public part of your paper.
Key Words
A major linchpin in research work for the writing research paper is the keyword search, which one will employ to find both library and Internet resources.
One must be persistent and creative in using keywords. An effective keyword search requires a strategy and planning a list of possible keywords and phrases to try.
Search engines for most searches, use Boolean searching, which is somewhat different from Internet searches. The Boolean search uses "operators," words (and, or, not, and near) that enable you to expand or narrow your affords. Tips for research paper while preparing research paper are very helpful guideline of research paper.
Choice of key words is first tool of tips to write research paper. Research paper writing is an art.A few tips for deciding as strategically as possible about keyword search:
VIII
© Copyright by Global Journals Inc.(US)| Guidelines Handbook
C

• One should start brainstorming lists of possible keywords before even begin searching. Think about the most important concepts related to research work. Ask, "What words would a source have to include to be truly valuable in research paper?" Then consider synonyms for the important words.
• It may take the discovery of only one relevant paper to let steer in the right keyword direction because in most databases, the keywords under which a research paper is abstracted are listed with the paper.
• One should avoid outdated words.
Keywords are the key that opens a door to research work sources. Keyword searching is an art in which researcher's skills are bound to improve with experience and time.
Numerical Methods: Numerical methods used should be clear and, where appropriate, supported by references.
Acknowledgements: Please make these as concise as possible.
References
References follow the Harvard scheme of referencing. References in the text should cite the authors' names followed by the time of their publication, unless there are three or more authors when simply the first author's name is quoted followed by et al. unpublished work has to only be cited where necessary, and only in the text. Copies of references in press in other journals have to be supplied with submitted typescripts. It is necessary that all citations and references be carefully checked before submission, as mistakes or omissions will cause delays.
References to information on the World Wide Web can be given, but only if the information is available without charge to readers on an official site. Wikipedia and Similar websites are not allowed where anyone can change the information. Authors will be asked to make available electronic copies of the cited information for inclusion on the Global Journals Inc. (US) homepage at the judgment of the Editorial Board.
The Editorial Board and Global Journals Inc. (US) recommend that, citation of online-published papers and other material should be done via a DOI (digital object identifier). If an author cites anything, which does not have a DOI, they run the risk of the cited material not being noticeable.
The Editorial Board and Global Journals Inc. (US) recommend the use of a tool such as Reference Manager for reference management and formatting.
Tables, Figures and Figure Legends
Tables: Tables should be few in number, cautiously designed, uncrowned, and include only essential data. Each must have an Arabic number, e.g. Table 4, a self-explanatory caption and be on a separate sheet. Vertical lines should not be used.
Figures: Figures are supposed to be submitted as separate files. Always take in a citation in the text for each figure using Arabic numbers, e.g. Fig. 4. Artwork must be submitted online in electronic form by e-mailing them.
Preparation of Electronic Figures for Publication
Even though low quality images are sufficient for review purposes, print publication requires high quality images to prevent the final product being blurred or fuzzy. Submit (or e-mail) EPS (line art) or TIFF (halftone/photographs) files only. MS PowerPoint and Word Graphics are unsuitable for printed pictures. Do not use pixel-oriented software. Scans (TIFF only) should have a resolution of at least 350 dpi (halftone) or 700 to 1100 dpi (line drawings) in relation to the imitation size. Please give the data for figures in black and white or submit a Color Work Agreement Form. EPS files must be saved with fonts embedded (and with a TIFF preview, if possible).
For scanned images, the scanning resolution (at final image size) ought to be as follows to ensure good reproduction: line art: >650 dpi; halftones (including gel photographs) : >350 dpi; figures containing both halftone and line images: >650 dpi.
IX
© Copyright by Global Journals Inc.(US) | Guidelines Handbook

Figure Legends: Self-explanatory legends of all figures should be incorporated separately under the heading 'Legends to Figures'. In the full-text online edition of the journal, figure legends may possibly be truncated in abbreviated links to the full screen version. Therefore, the first 100 characters of any legend should notify the reader, about the key aspects of the figure.
6. AFTER ACCEPTANCE
Upon approval of a paper for publication, the manuscript will be forwarded to the dean, who is responsible for the publication of the Global Journals Inc. (US).
6.1 Proof Corrections
The corresponding author will receive an e-mail alert containing a link to a website or will be attached. A working e-mail address must therefore be provided for the related author.
Acrobat Reader will be required in order to read this file. This software can be downloaded
(Free of charge) from the following website:
www.adobe.com/products/acrobat/readstep2.html. This will facilitate the file to be opened, read on screen, and printed out in order for any corrections to be added. Further instructions will be sent with the proof.
Proofs must be returned to the dean at [email protected] within three days of receipt.
As changes to proofs are costly, we inquire that you only correct typesetting errors. All illustrations are retained by the publisher. Please note that the authors are responsible for all statements made in their work, including changes made by the copy editor.
6.2 Early View of Global Journals Inc. (US) (Publication Prior to Print)
The Global Journals Inc. (US) are enclosed by our publishing's Early View service. Early View articles are complete full-text articles sent in advance of their publication. Early View articles are absolute and final. They have been completely reviewed, revised and edited for publication, and the authors' final corrections have been incorporated. Because they are in final form, no changes can be made after sending them. The nature of Early View articles means that they do not yet have volume, issue or page numbers, so Early View articles cannot be cited in the conventional way.
6.3 Author Services
Online production tracking is available for your article through Author Services. Author Services enables authors to track their article - once it has been accepted - through the production process to publication online and in print. Authors can check the status of their articles online and choose to receive automated e-mails at key stages of production. The authors will receive an e-mail with a unique link that enables them to register and have their article automatically added to the system. Please ensure that a complete e-mail address is provided when submitting the manuscript.
6.4 Author Material Archive Policy
Please note that if not specifically requested, publisher will dispose off hardcopy & electronic information submitted, after the two months of publication. If you require the return of any information submitted, please inform the Editorial Board or dean as soon as possible.
6.5 Offprint and Extra Copies
A PDF offprint of the online-published article will be provided free of charge to the related author, and may be distributed according to the Publisher's terms and conditions. Additional paper offprint may be ordered by emailing us at: [email protected] .
X
You must strictly follow above Author Guidelines before submitting your paper or else we will not at all be responsible for anycorrections in future in any of the way.
© Copyright by Global Journals Inc.(US)| Guidelines Handbook
o

2. Evaluators are human: First thing to remember that evaluators are also human being. They are not only meant for rejecting a paper. They are here to evaluate your paper. So, present your Best.
3. Think Like Evaluators: If you are in a confusion or getting demotivated that your paper will be accepted by evaluators or not, then think and try to evaluate your paper like an Evaluator. Try to understand that what an evaluator wants in your research paper and automatically you will have your answer.
4. Make blueprints of paper: The outline is the plan or framework that will help you to arrange your thoughts. It will make your paper logical. But remember that all points of your outline must be related to the topic you have chosen.
5. Ask your Guides: If you are having any difficulty in your research, then do not hesitate to share your difficulty to your guide (if you have any). They will surely help you out and resolve your doubts. If you can't clarify what exactly you require for your work then ask the supervisor to help you with the alternative. He might also provide you the list of essential readings.
6. Use of computer is recommended: As you are doing research in the field of Computer Science, then this point is quite obvious.
7. Use right software: Always use good quality software packages. If you are not capable to judge good software then you can lose quality of your paper unknowingly. There are various software programs available to help you, which you can get through Internet.
8. Use the Internet for help: An excellent start for your paper can be by using the Google. It is an excellent search engine, where you can have your doubts resolved. You may also read some answers for the frequent question how to write my research paper or find model research paper. From the internet library you can download books. If you have all required books make important reading selecting and analyzing the specified information. Then put together research paper sketch out.
9. Use and get big pictures: Always use encyclopedias, Wikipedia to get pictures so that you can go into the depth.
10. Bookmarks are useful: When you read any book or magazine, you generally use bookmarks, right! It is a good habit, which helps to not to lose your continuity. You should always use bookmarks while searching on Internet also, which will make your search easier.
XI
Before start writing a good quality Computer Science Research Paper, let us first understand what is Computer Science Research Paper? So, Computer Science Research Paper is the paper which is written by professionals or scientists who are associated to Computer Science and Information Technology, or doing research study in these areas. If you are novel to this field then you can consult about
this field
from your supervisor or guide.
TECHNIQUES FOR WRITING A GOOD QUALITY RESEARCH PAPER:
1. Choosing the topic: In most cases, the topic is searched by the interest of author but it can be also suggested by the guides. You can
have several topics and then you can judge that in which topic or subject you are finding yourself most comfortable. This can be done by
asking several questions to yourself, like Will I be able to carry our search in this area? Will I find all necessary recourses to accomplish the search? Will I be able to find all information in this field area? If the answer of these types of questions will be "Yes" then you can choose that topic. In most of the cases, you may have to conduct the surveys and have to visit several places because this field is related to Computer Science and Information Technology. Also, you may have to do a lot of work to find all rise and falls regarding the various data of that subject. Sometimes, detailed information plays a vital role, instead of short information.
11. Revise what you wrote: When you write anything, always read it, summarize it and then finalize it.
© Copyright by Global Journals Inc.(US) | Guidelines Handbook

16. Use proper verb tense: Use proper verb tenses in your paper. Use past tense, to present those events that happened. Use present tense to indicate events that are going on. Use future tense to indicate future happening events. Use of improper and wrong tenses will confuse the evaluator. Avoid the sentences that are incomplete.
17. Never use online paper: If you are getting any paper on Internet, then never use it as your research paper because it might be possible that evaluator has already seen it or maybe it is outdated version.
Pick a good study spot: To do your research studies always try to pick a spot, which is quiet. Every spot is not for studies. Spot that suits you choose it and proceed further.
19. Know what you know: Always try to know, what you know by making objectives. Else, you will be confused and cannot achieve your target.
20. Use good quality grammar: Always use a good quality grammar and use words that will throw positive impact on evaluator. Use of good quality grammar does not mean to use tough words, that for each word the evaluator has to go through dictionary. Do not start sentence with a conjunction. Do not fragment sentences. Eliminate one-word sentences. Ignore passive voice. Do not ever use a big word when a diminutive one would suffice. Verbs have to be in agreement with their subjects. Prepositions are not expressions to finish sentences with. It is incorrect to ever divide an infinitive. Avoid clichés like the disease. Also, always shun irritating alliteration. Use language that is simple and straight forward. put together a neat summary.
21. Arrangement of information: Each section of the main body should start with an opening sentence and there should be a changeover at the end of the section. Give only valid and powerful arguments to your topic. You may also maintain your arguments with records.
22. Never start in last minute: Always start at right time and give enough time to research work. Leaving everything to the last minute will degrade your paper and spoil your work.
23. Multitasking in research is not good: Doing several things at the same time proves bad habit in case of research activity. Research is an area, where everything has a particular time slot. Divide your research work in parts and do particular part in particular time slot.
24. Never copy others' work: Never copy others' work and give it your name because if evaluator has seen it anywhere you will be in trouble.
25. Take proper rest and food: No matter how many hours you spend for your research activity, if you are not taking care of your health then all your efforts will be in vain. For a quality research, study is must, and this can be done by taking proper rest and food.
26. Go for seminars: Attend seminars if the topic is relevant to your research area. Utilize all your resources.
XII
12. Make all efforts: Make all efforts to mention what you are going to write in your paper. That means always have a good start. Try to mention everything in introduction, that what is the need of a particular research paper. Polish your work by good skill of writing and always give an evaluator, what he wants.
13. Have backups: When you are going to do any important thing like making research paper, you should always have backup copies of it either in your computer or in paper. This will help you to not to lose any of your important.
14. Produce good diagrams of your own: Always try to include good charts or diagrams in your paper to improve quality. Using several and unnecessary diagrams will degrade the quality of your paper by creating "hotchpotch." So always, try to make and include those diagrams, which are made by your own to improve readability and understandability of your paper.
15. Use of direct quotes: When you do research relevant to literature, history or current affairs then use of quotes become essential but if study is relevant to science then use of quotes is not preferable.
18.
© Copyright by Global Journals Inc.(US)| Guidelines Handbook
C

sufficient. Use words properly, regardless of how others use them. Remove quotations. Puns are for kids, not grunt readers. Amplification is a billion times of inferior quality than sarcasm.
32. Never oversimplify everything: To add material in your research paper, never go for oversimplification. This will definitely irritate the evaluator. Be more or less specific. Also too, by no means, ever use rhythmic redundancies. Contractions aren't essential and shouldn't be there used. Comparisons are as terrible as clichés. Give up ampersands and abbreviations, and so on. Remove commas, that are, not necessary. Parenthetical words however should be together with this in commas. Understatement is all the time the complete best way to put onward earth-shaking thoughts. Give a detailed literary review.
33. Report concluded results: Use concluded results. From raw data, filter the results and then conclude your studies based on measurements and observations taken. Significant figures and appropriate number of decimal places should be used. Parenthetical
remarks are prohibitive. Proofread carefully at final stage. In the end give outline to your arguments. Spot out perspectives of further study of this subject. Justify your conclusion by at the bottom of them with sufficient justifications and examples.
34. After conclusion: Once you have concluded your research, the next most important step is to present your findings. Presentation is extremely important as it is the definite medium though which your research is going to be in print to the rest of the crowd. Care should be taken to categorize your thoughts well and present them in a logical and neat manner. A good quality research paper format is essential because it serves to highlight your research paper and bring to light all necessary aspects in your research.
Key points to remember:
Submit all work in its final form. Write your paper in the form, which is presented in the guidelines using the template. Please note the criterion for grading the final paper by peer-reviewers.
Final Points:
A purpose of organizing a research paper is to let people to interpret your effort selectively. The journal requires the following sections, submitted in the order listed, each section to start on a new page.
The introduction will be compiled from reference matter and will reflect the design processes or outline of basis that direct you to make study. As you will carry out the process of study, the method and process section will be constructed as like that. The result segment will show related statistics in nearly sequential order and will direct the reviewers next to the similar intellectual paths throughout the data that you took to carry out your study. The discussion section will provide understanding of the data and projections as to the implication of the results. The use of good quality references all through the paper will give the effort trustworthiness by representing an alertness of prior workings.
XIII
27. Refresh your mind after intervals: Try to give rest to your mind by listening to soft music or by sleeping in intervals. This will also improve your memory.
28. Make colleagues: Always try to make colleagues. No matter how sharper or intelligent you are, if you make colleagues you can have several ideas, which will be helpful for your research.
Think technically: Always think technically. If anything happens, then search its reasons, its benefits, and demerits.
30. Think and then print: When you will go to print your paper, notice that tables are not be split, headings are not detached from their descriptions, and page sequence is maintained.
31. Adding unnecessary information: Do not add unnecessary information, like, I have used MS Excel to draw graph. Do not add irrelevant and inappropriate material. These all will create superfluous. Foreign terminology and phrases are not apropos. One should NEVER take a broad view. Analogy in script is like feathers on a snake. Not at all use a large word when a very small one would be
29.
© Copyright by Global Journals Inc.(US) | Guidelines Handbook

Separating a table/chart or figure - impound each figure/table to a single page Submitting a manuscript with pages out of sequence
In every sections of your document
· Use standard writing style including articles ("a", "the," etc.)
· Keep on paying attention on the research topic of the paper
· Use paragraphs to split each significant point (excluding for the abstract)
· Align the primary line of each section
· Present your points in sound order
· Use present tense to report well accepted
· Use past tense to describe specific results
· Shun familiar wording, don't address the reviewer directly, and don't use slang, slang language, or superlatives
· Shun use of extra pictures - include only those figures essential to presenting results
Title Page:
Choose a revealing title. It should be short. It should not have non-standard acronyms or abbreviations. It should not exceed two printed lines. It should include the name(s) and address (es) of all authors.
XIV
Writing a research paper is not an easy job no matter how trouble-free the actual research or concept. Practice, excellent preparation, and controlled record keeping are the only means to make straightforward the progression.
General style:
Specific editorial column necessities for compliance of a manuscript will always take over from directions in these general guidelines.
To make a paper clear
· Adhere to recommended page limits
Mistakes to evade
Insertion a title at the foot of a page with the subsequent text on the next page
© Copyright by Global Journals Inc.(US)| Guidelines Handbook
o Inc.(US)

shortening the outcome. Sum up the study, with the subsequent elements in any summary. Try to maintain the initial two items to no more than one ruling each.
Reason of the study - theory, overall issue, purpose Fundamental goal To the point depiction of the research Consequences, including definite statistics - if the consequences are quantitative in nature, account quantitative data; results of any numerical analysis should be reported Significant conclusions or questions that track from the research(es)
Approach:
Single section, and succinct As a outline of job done, it is always written in past tense A conceptual should situate on its own, and not submit to any other part of the paper such as a form or table Center on shortening results - bound background information to a verdict or two, if completely necessary What you account in an conceptual must be regular with what you reported in the manuscript Exact spelling, clearness of sentences and phrases, and appropriate reporting of quantities (proper units, important statistics) are just as significant in an abstract as they are anywhere else
Introduction:
The Introduction should "introduce" the manuscript. The reviewer should be presented with sufficient background information to be capable to comprehend and calculate the purpose of your study without having to submit to other works. The basis for the study should be offered. Give most important references but shun difficult to make a comprehensive appraisal of the topic. In the introduction, describe the problem visibly. If the problem is not acknowledged in a logical, reasonable way, the reviewer will have no attention in your result. Speak in common terms about techniques used to explain the problem, if needed, but do not present any particulars about the protocols here. Following approach can create a valuable beginning:
Explain the value (significance) of the study Shield the model - why did you employ this particular system or method? What is its compensation? You strength remark on its appropriateness from a abstract point of vision as well as point out sensible reasons for using it. Present a justification. Status your particular theory (es) or aim(s), and describe the logic that led you to choose them. Very for a short time explain the tentative propose and how it skilled the declared objectives.
Approach:
Use past tense except for when referring to recognized facts. After all, the manuscript will be submitted after the entire job is done. Sort out your thoughts; manufacture one key point with every section. If you make the four points listed above, you will need a
least of four paragraphs.
XV
Abstract:
The summary should be two hundred words or less. It should briefly and clearly explain the key findings reported in the manuscript--must have precise statistics. It should not have abnormal acronyms or abbreviations. It should be logical in itself. Shun citing references at this point.
An abstract is a brief distinct paragraph summary of finished work or work in development. In a minute or less a reviewer can be taught the foundation behind the study, common approach to the problem, relevant results, and significant conclusions or new questions.
Write your summary when your paper is completed because how can you write the summary of anything which is not yet written? Wealth of terminology is very essential in abstract. Yet, use comprehensive sentences and do not let go readability for briefness. You can maintain it succinct by phrasing sentences so that they provide more than lone rationale. The author can at this moment go straight to
© Copyright by Global Journals Inc.(US) | Guidelines Handbook

principle while stating the situation. The purpose is to text all particular resources and broad procedures, so that another person may use some or all of the methods in one more study or referee the scientific value of your work. It is not to be a step by step report of the whole thing you did, nor is a methods section a set of orders.
Materials:
Explain materials individually only if the study is so complex that it saves liberty this way. Embrace particular materials, and any tools or provisions that are not frequently found in laboratories. Do not take in frequently found. If use of a definite type of tools. Materials may be reported in a part section or else they may be recognized along with your measures.
Methods:
Report the method (not particulars of each process that engaged the same methodology) Describe the method entirely To be succinct, present methods under headings dedicated to specific dealings or groups of measures Simplify - details how procedures were completed not how they were exclusively performed on a particular day. If well known procedures were used, account the procedure by name, possibly with reference, and that's all.
Approach:
It is embarrassed or not possible to use vigorous voice when documenting methods with no using first person, which would focus the reviewer's interest on the researcher rather than the job. As a result when script up the methods most authors use third person passive voice. Use standard style in this and in every other part of the paper - avoid familiar lists, and use full sentences.
What to keep away from
Resources and methods are not a set of information. Skip all descriptive information and surroundings - save it for the argument. Leave out information that is immaterial to a third party.
Results:
The principle of a results segment is to present and demonstrate your conclusion. Create this part a entirely objective details of the outcome, and save all understanding for the discussion.
The page length of this segment is set by the sum and types of data to be reported. Carry on to be to the point, by means of statistics and tables, if suitable, to present consequences most efficiently.You must obviously differentiate material that would usually be incorporated in a study editorial from any unprocessed data or additional appendix matter that would not be available. In fact, such matter should not be submitted at all except requested by the instructor.
XVI
Present surroundings information only as desirable in order hold up a situation. The reviewer does not desire to read the whole thing you know about a topic. Shape the theory/purpose specifically - do not take a broad view. As always, give awareness to spelling, simplicity and correctness of sentences and phrases.
Procedures (Methods and Materials):
This part is supposed to be the easiest to carve if you have good skills. A sound written Procedures segment allows a capable scientist to replacement your results. Present precise information about your supplies. The suppliers and clarity of reagents can be helpful bits of information. Present methods in sequential order but linked methodologies can be grouped as a segment. Be concise when relating the protocols. Attempt for the least amount of information that would permit another capable scientist to spare your outcome but becautious that vital information is integrated. The use of subheadings is suggested and ought to be synchronized with the results section. When a technique is used that has been well described in another object, mention the specific item describing a way but draw the basic
© Copyright by Global Journals Inc.(US)| Guidelines Handbook
C Inc.(US)

Do not present the similar data more than once. Manuscript should complement any figures or tables, not duplicate the identical information. Never confuse figures with tables - there is a difference.
Approach As forever, use past tense when you submit to your results, and put the whole thing in a reasonable order.Put figures and tables, appropriately numbered, in order at the end of the report If you desire, you may place your figures and tables properly within the text of your results part.
Figures and tables If you put figures and tables at the end of the details, make certain that they are visibly distinguished from any attach appendix materials, such as raw facts Despite of position, each figure must be numbered one after the other and complete with subtitle In spite of position, each table must be titled, numbered one after the other and complete with heading All figure and table must be adequately complete that it could situate on its own, divide from text
Discussion:
The Discussion is expected the trickiest segment to write and describe. A lot of papers submitted for journal are discarded based onproblems with the Discussion. There is no head of state for how long a argument should be. Position your understanding of the outcomevisibly to lead the reviewer through your conclusions, and then finish the paper with a summing up of the implication of the study. Thepurpose here is to offer an understanding of your results and hold up for all of your conclusions, using facts from your research andgenerally accepted information, if suitable. The implication of result should be visibly described. Infer your data in the conversation in suitable depth. This means that when you clarify an observable fact you must explain mechanismsthat may account for the observation. If your results vary from your prospect, make clear why that may have happened. If your resultsagree, then explain the theory that the proof supported. It is never suitable to just state that the data approved with prospect, and let itdrop at that.
Make a decision if each premise is supported, discarded, or if you cannot make a conclusion with assurance. Do not just dismissa study or part of a study as "uncertain." Research papers are not acknowledged if the work is imperfect. Draw what conclusions you can based upon the results thatyou have, and take care of the study as a finished work You may propose future guidelines, such as how the experiment might be personalized to accomplish a new idea. Give details all of your remarks as much as possible, focus on mechanisms. Make a decision if the tentative design sufficiently addressed the theory, and whether or not it was correctly restricted. Try to present substitute explanations if sensible alternatives be present. One research will not counter an overall question, so maintain the large picture in mind, where do you go next? The beststudies unlock new avenues of study. What questions remain? Recommendations for detailed papers will offer supplementary suggestions.
Approach:
When you refer to information, differentiate data generated by your own studies from available information Submit to work done by specific persons (including you) in past tense. Submit to generally acknowledged facts and main beliefs in present tense.
XVII
Content
Sum up your conclusion in text and demonstrate them, if suitable, with figures and tables. In manuscript, explain each of your consequences, point the reader to remarks that are most appropriate. Present a background, such as by describing the question that was addressed by creation an exacting study. Explain results of control experiments and comprise remarks that are not accessible in a prescribed figure or table, if appropriate. Examine your data, then prepare the analyzed (transformed) data in the form of a figure (graph), table, or in manuscript form.
What to stay away from Do not discuss or infer your outcome, report surroundings information, or try to explain anything. Not at all, take in raw data or intermediate calculations in a research manuscript.
© Copyright by Global Journals Inc.(US) | Guidelines Handbook

Do not give permission to anyone else to "PROOFREAD" your manuscript.
Methods to avoid Plagiarism is applied by us on every paper, if found guilty, you will be blacklisted by all of our collaboratedresearch groups, your institution will be informed for this and strict legal actions will be taken immediately.) To guard yourself and others from possible illegal use please do not permit anyone right to use to your paper and files.
The major constraint is that you must independently make all content, tables, graphs, and facts that are offered in the paper.You must write each part of the paper wholly on your own. The Peer-reviewers need to identify your own perceptive of theconcepts in your own terms. NEVER extract straight from any foundation, and never rephrase someone else's analysis.
XVIII
Please carefully note down following rules and regulation before submitting your Research Paper to Global Journals Inc. (US):
Segment Draft and Final Research Paper: You have to strictly follow the template of research paper. If it is not done your paper may getrejected.
© Copyright by Global Journals Inc.(US)| Guidelines Handbook
C

CRITERION FOR GRADING A RESEARCH PAPER (COMPILATION)BY GLOBAL JOURNALS INC. (US)
Please note that following table is only a Grading of "Paper Compilation" and not on "Performed/Stated Research" whose grading
solely depends on Individual Assigned Peer Reviewer and Editorial Board Member. These can be available only on request and after
decision of Paper. This report will be the property of Global Journals Inc. (US).
Topics Grades
A-B C-D E-F
Abstract
Clear and concise with
appropriate content, Correct
format. 200 words or below
Unclear summary and no
specific data, Incorrect form
Above 200 words
No specific data with ambiguous
information
Above 250 words
Introduction
Containing all background
details with clear goal and
appropriate details, flow
specification, no grammar
and spelling mistake, well
organized sentence and
paragraph, reference cited
Unclear and confusing data,
appropriate format, grammar
and spelling errors with
unorganized matter
Out of place depth and content,
hazy format
Methods and
Procedures
Clear and to the point with
well arranged paragraph,
precision and accuracy of
facts and figures, well
organized subheads
Difficult to comprehend with
embarrassed text, too much
explanation but completed
Incorrect and unorganized
structure with hazy meaning
Result
Well organized, Clear and
specific, Correct units with
precision, correct data, well
structuring of paragraph, no
grammar and spelling
mistake
Complete and embarrassed
text, difficult to comprehend
Irregular format with wrong facts
and figures
Discussion
Well organized, meaningful
specification, sound
conclusion, logical and
concise explanation, highly
structured paragraph
reference cited
Wordy, unclear conclusion,
spurious
Conclusion is not cited,
unorganized, difficult to
comprehend
References
Complete and correct
format, well organized
Beside the point, Incomplete Wrong format and structuring
XIX
© Copyright by Global Journals Inc.(US) | Guidelines Handbook

A
Abrasive
· 1
Austenite
· 25
C
Clamping
· 1, 3, 6, 7
D
Discrepancies
· 9
E
Embodiment
· 2
I
Immobilized
· 1
O
Oscillating · 8
P
Philadelphia · 20
Pneumatic
· 3
Propelling
· 32
S
Sinusoidally
· 9
T
Thyssenkrupp
· 35
Z
Zirconia · 15, 16, 19

Global Journals