Global Development Finance - World Bank Document
320
THE WORLD BANK Global Development Finance Charting a Global Recovery Global Development Finance 2009 II: SUMMARY AND COUNTRY TABLES 49317 v2 Public Disclosure Authorized Public Disclosure Authorized Public Disclosure Authorized Public Disclosure Authorized Public Disclosure Authorized Public Disclosure Authorized Public Disclosure Authorized Public Disclosure Authorized
-
Upload
khangminh22 -
Category
Documents
-
view
1 -
download
0
Transcript of Global Development Finance - World Bank Document
T H E W O R L D B A N K
GlobalDevelopmentFinanceCharting a Global Recovery
GlobalDevelopmentFinance
2009I I : S U M M A R Y A N D C O U N T R Y T A B L E S
49317 v2
Pub
lic D
iscl
osur
e A
utho
rized
Pub
lic D
iscl
osur
e A
utho
rized
Pub
lic D
iscl
osur
e A
utho
rized
Pub
lic D
iscl
osur
e A
utho
rized
Pub
lic D
iscl
osur
e A
utho
rized
Pub
lic D
iscl
osur
e A
utho
rized
Pub
lic D
iscl
osur
e A
utho
rized
Pub
lic D
iscl
osur
e A
utho
rized


GlobalDevelopmentFinanceCharting a Global Recovery
II: Summary and Country Tables

GlobalDevelopmentFinanceCharting a Global Recovery
T H E W O R L D B A N K
I I : S U M M A R Y A N D C O U N T R Y T A B L E S 2009
© 2009 The International Bank for Reconstruction and Development/The World Bank1818 H Street, NWWashington, DC 20433Telephone 202-473-1000Internet www.worldbank.orgE-mail [email protected]
All rights reserved1 2 3 4 12 11 10 09
This volume is a product of the staff of the World Bank. The findings, interpretations, and conclusionsexpressed herein do not necessarily reflect the views of the Board of Executive Directors of the World Bankor the governments they represent.
The World Bank does not guarantee the accuracy of the data included in this work. The boundaries, colors,denominations, and other information shown on any map in this work do not imply any judgment on thepart of the World Bank concerning the legal status of any territory or the endorsement or acceptance ofsuch boundaries.
Rights and Permissions
The material in this work is copyrighted. Copying and/or transmitting portions or all of this work withoutpermission may be a violation of applicable law. The World Bank encourages dissemination of its work andwill normally grant permission promptly.
For permission to photocopy or reprint any part of this work, please send a request with completeinformation to the Copyright Clearance Center, Inc., 222 Rosewood Drive, Danvers, MA 01923, USA;telephone: 978-750-8400; fax: 978-750-4470; www.copyright.com.
All other queries on rights and licenses, including subsidiary rights, should be addressed to the Officeof the Publisher, World Bank, 1818 H Street NW, Washington, DC 20433, USA; fax: 202-522-2422;e-mail: [email protected].
Cover art: Charles Arnoldi, “Jumbo” 2000 (detail)Cover design: Critical Stages
ISBN: 978-0-8213–7842–7e-ISBN: 978-0-8213–8064–2ISSN 1020-5454DOI: 10.1596/ 978-0-8213–7842–7
Table of Contents
Preface vii
Acknowledgments ix
About the data xiMethodology xiMetadata xivCountry notes xxSources xxiSymbols xxi
Abbreviations xxiii
External debt stock and its components xxiv
Country groups xxv
Summary tables xxvii
Regional and income group aggregate tables 1
Country tables 21Afghanistan 22Albania 24Algeria 26Angola 28Argentina 30Armenia 32Azerbaijan 34Bangladesh 36Belarus 38Belize 40Benin 42Bhutan 44Bolivia, Plurinational State of 46Bosnia and Herzegovina 48Botswana 50Brazil 52Bulgaria 54Burkina Faso 56
v
Burundi 58Cambodia 60Cameroon 62Cape Verde 64Central African Republic 66Chad 68Chile 70China 72Colombia 74Comoros 76Congo, Democratic Republic of 78Congo, Republic of 80Costa Rica 82Côte d’Ivoire 84Croatia 86Djibouti 88Dominica 90Dominican Republic 92Ecuador 94Egypt, Arab Republic of 96El Salvador 98Eritrea 100Ethiopia 102Fiji 104Gabon 106Gambia, The 108Georgia 110Ghana 112Grenada 114Guatemala 116Guinea 118Guinea-Bissau 120Guyana 122Haiti 124Honduras 126India 128Indonesia 130Iran, Islamic Republic of 132
G L O B A L D E V E L O P M E N T F I N A N C E 2 0 0 9
Jamaica 134Jordan 136Kazakhstan 138Kenya 140Kyrgyz Republic 142Lao People’s Democratic Republic 144Latvia 146Lebanon 148Lesotho 150Liberia 152Macedonia, FYR 154Madagascar 156Malawi 158Malaysia 160Maldives 162Mali 164Mauritania 166Mauritius 168Mexico 170Moldova 172Mongolia 174Montenegro 176Morocco 178Mozambique 180Myanmar 182Nepal 184Nicaragua 186Niger 188Nigeria 190Pakistan 192Panama 194Papua New Guinea 196Paraguay 198Peru 200Philippines 202Poland 204
Romania 206Russian Federation 208Rwanda 210Samoa 212São Tomé and Principe 214Senegal 216Serbia 218Seychelles 220Sierra Leone 222Solomon Islands 224Somalia 226South Africa 228Sri Lanka 230St. Kitts and Nevis 232St. Lucia 234St. Vincent and the Grenadines 236Sudan 238Swaziland 240Tajikistan 242Tanzania 244Thailand 246Togo 248Tonga 250Tunisia 252Turkey 254Turkmenistan 256Uganda 258Ukraine 260Uruguay 262Uzbekistan 264Vanuatu 266Venezuela, República Bolivariana de 268Vietnam 270Yemen, Republic of 272Zambia 274Zimbabwe 276
vi
Preface
G lobal Development Finance 2009: Summaryand Country Tables is part of a two-volumeannual publication. Volume I: Review,
Analysis, and Outlook contains analysis and com-mentary on recent developments in internationalfinance for developing countries. Volume II: Sum-mary and Country Tables (GDF) contains statisti-cal tables on the external debt of the 128 countriesthat report public and publicly guaranteed exter-nal debt under the Debtor Reporting System(DRS). It also includes tables of key debt ratios forindividual reporting countries and the composi-tion of external debt stocks for individual report-ing countries and regional and income groupsalong with some graphical presentations. It is theculmination of a year-long process that requiresextensive cooperation from people and organiza-tions around the globe—national central banks,ministries of finance, major multilateral organiza-tions, and many departments of the World Bank.
The Little Data Book on External Debt 2009provides a quick reference to the data from theGDF.
Global Development Finance 2009 on CD-ROM contains a database of more than 200 timeseries indicators, covering the years 1970 to 2007 inmost cases, and to 2015 for “pipeline” data. It alsocontains the full contents of the print version of the
vii
.
GDF. Text providing country notes, definitions, andsource notes is linked to each table. The general cut-off date for data is December 2008. Not all databreakdowns are presented in the printed GDF Bookbut the entire breakdown can be found in the data-base. This database is also available online (GDFOnline) through the website of the World Bank.The database covers external debt stocks and flows,major economic aggregates, and key debt ratios, aswell as average terms of new commitments, cur-rency composition of long-term debt, debt restruc-turing, and scheduled debt service projections for allcountries reporting through the DRS.
The economic aggregates presented in the tablesare prepared for the convenience of users. Althoughdebt ratios can give useful information about devel-opments in a debt-servicing capacity, conclusionsdrawn from them will not be valid unless accompa-nied by careful economic evaluation.
The macroeconomic data provided are fromstandard sources, but many of them are subject toconsiderable margins of error. The usual care mustbe taken in interpreting the ratios, particularlyfor the most recent year or two, since figures arepreliminary and subject to revision.
Shaida BadieeDirector, Development Data Group

ix
Acknowledgments
This volume was prepared by the FinancialData Team of the Development DataGroup, led by Ibrahim Levent. The team
consists of Olga Akcadag, Nanasamudd Chhim,Nevin Fahmy, Shelley Fu, Akane Hanai, BalaBhaskar Naidu Kalimili, Nino Kostava, GloriaMoreno, Yasue Sakuramoto, Makiko Sano, andAlagiriswamy Venkatesan. The team was assistedby Awatif H. Abuzeid and Rosario Alipio. Thesystem support team was led by AbdolrezaFarivari; Soong Sup Lee provided the macroeco-nomic data, and K. M. Vijayalakshmi providedworker remittances and compensation of em-ployee data. Many others inside the World Bank
provided helpful input, especially the staff of theInternational Finance Team of the DevelopmentProspects Group (DECPG), the staff of theEconomic Policy and Debt Department (PRMED),and the country economists who reviewed thedata. The work was carried out under the manage-ment of Shaida Badiee.
The production of this volume was managedby Richard Fix, with the assistance of AzitaAmjadi and Beatriz Prieto Oramas. The CD-ROMand online database were prepared by BuyantErdene Khaltarkhuu and William Prince. Stafffrom External Affairs coordinated the publicationand dissemination of the book.

xi
.
About the data
Methodology
The World Bank is the sole repository for statis-tics on the external debt of developing coun-
tries on a loan-by-loan basis. The Debtor Report-ing System (DRS), set up in 1951 to monitor thesestatistics, is maintained by the staff of the Finan-cial Data Team (FIN), part of the DevelopmentData Group of Development Economics.
Methodology for aggregating dataThe DRS data are used in combination with infor-mation obtained from creditors through the debtdata collection systems of other agencies. The staffof the Financial Data Team calculates the externalindebtedness of developing countries. The data arealso supplemented by market sources and esti-mates made by the World Bank staff. The currentaccount balance data are taken from the Balanceof Payments (BOP) database of the InternationalMonetary Fund (IMF), which is the standard pre-sentation of the BOP yearbook and may produceregional and other aggregates that are differentfrom those presented in GDF, volume I.
Converting to a common currency Since debtdata are normally reported to the World Bank inthe currency of repayment, they have to be con-verted into a common currency (usually U.S. dol-lars) to produce the tables. Because flow data areconverted at annual average exchange rates andstock data at year-end exchange rates, year-to-yearchanges in debt outstanding and disbursed aresometimes not equal to net flows (disbursementsless principal repayments); similarly, changes indebt outstanding (including undisbursed debt)differ from commitments less repayments. Dis-crepancies are particularly significant whenexchange rates have moved sharply during the
year; cancellations and reschedulings of other liabil-ities into long-term public and publicly guaranteedexternal debt also contribute to the differences.
Exchange rates Data received by the WorldBank from its members and major multilateralagencies are expressed in the currencies in whichthe debts are repayable or in which the transac-tions took place. For aggregation, the Bank con-verts these amounts to U.S. dollars using the IMFpar values or central rates, or the current marketrates where appropriate. Service payments, com-mitments, and disbursements (flows) are con-verted to U.S. dollars at the average rate for theyear. Debt outstanding and disbursed at the end ofa given year (a stock) is converted at the rate ineffect at the end of that year. Projected debtservice, however, is converted to U.S. dollars at ratesin effect at end-December 2007. Debt repayable inmultiple currencies, goods, or services, and debtwith a provision for maintenance of value of thecurrency of repayment are shown at book value.
Beginning with 1991, all ruble debt owed tothe former Soviet Union is converted at a rate ofUS$1 � 0.6 ruble, except in cases where a bilateralagreement specifying a different conversion rate is inplace. This valuation method does not constitute anendorsement by World Bank staff of the appropri-ateness or validity of this method or the exchangerate used. The appropriate valuation is a matter to beresolved bilaterally between the Russian Federationand its debtor countries.
Adjustments Year-to-year changes in debt out-standing and disbursed are sometimes not equal tonet flows; similarly, changes in debt outstanding,including undisbursed, differ from commitmentsless repayments. The reasons for these differences
G L O B A L D E V E L O P M E N T F I N A N C E 2 0 0 9
xii
are cancellations, adjustments caused by the use ofdifferent exchange rates, and the rescheduling ofother liabilities into long-term public and publiclyguaranteed external debt.
Public and publicly guaranteed external debtAll data related to public and publicly guaranteedexternal debt are provided on a loan-by-loan basisby debtors, except for lending by some multilat-eral agencies, in which case data are taken fromthe creditors’ records. These creditors include theAfrican Development Bank, the Asian Develop-ment Bank, the Inter-American DevelopmentBank, and the International Bank for Reconstruc-tion and Development (IBRD) and the Interna-tional Development Association (IDA). (The IBRDand IDA are the institutions of the World Bank.)Reports contain annual stocks and flows informa-tion as well as terms and conditions of individualloans contracted.
Starting with the 1988–89 edition of WorldDebt Tables (the previous title of this book), alldata pertaining to World Bank loans from 1985onward are recorded at their current market value.Starting with the 1991–92 edition, all data per-taining to Asian Development Bank loans from1989 onward are recorded at their current marketvalue. Starting with the 1998 edition, all data per-taining to African Development Bank and AfricanDevelopment Fund loans from 1997 onward arerecorded at their current market value as well.
Private nonguaranteed external debt The DRSwas expanded in 1970 to incorporate long-termprivate nonguaranteed external debt. Reports,submitted annually, contain aggregate data for dis-bursed and outstanding debt, disbursements, prin-cipal repayments, interest payments, principal andinterest rescheduled for the reporting year, andprojected payments of principal and interest. Dataare usually presented in dollars, and currency con-version is not necessary.
Although the reporting countries fully recog-nize the importance of collecting data on privatenonguaranteed external debt when it constitutes asignificant portion of external debt, detailed dataare available only in countries that have registrationrequirements covering private external debt, mostcommonly in connection with exchange controls.Where formal registration of foreign borrowing is
not mandatory, compilers must rely on balance ofpayments data and financial surveys.
This edition includes data on private nonguar-anteed external debt, either as reported or as esti-mated, for countries for which this type of externaldebt is known to be significant. For privatenonguaranteed external debt that is not reported,the standard estimation approach starts from a cal-culation of the stock of debt outstanding, using dataavailable from creditors.
Amortization is estimated by making an as-sumption regarding the proportion of externaldebt repaid each year and then applying these ratiosto generate a first approximation of annual princi-pal repayments. Disbursements are then estimatedas a residual between net flows (equal to the changein the stock of external debt, adjusted by the effectof the currency composition of the public externaldebt) and estimated amortization. Interest paymentsare estimated by applying an assumed average inter-est rate to the stock of external debt outstanding.
Data on the balance of payments flows pro-vide useful guidelines for building a time series, be-cause private nonguaranteed external debt can betreated as a residual between net long-term exter-nal borrowing and net long-term borrowingrecorded in the DRS for public and publicly guar-anteed external debt.
Short-term external debt The World Bank re-gards the individual reporting country as the au-thoritative source of information on its own exter-nal liabilities. But for short-term external debt,defined as external debt with an original maturityof one year or less, accurate information is notwidely available from debtors. By its nature, short-term external debt is difficult to monitor; loan-by-loan registration is normally impractical, and mostreporting arrangements involve periodic returns toa country’s central bank from its banking sector.Since 1982 the quality of such reporting has im-proved, but only a few developing countries havefigures available for short-term external debt.
Where information from debtors is not avail-able, data from creditors can indicate the magni-tude of a country’s short-term external debt. Themost important source is the BIS quarterly seriesshowing the maturity distribution of commercialbanks’ claims on developing countries. Those dataare reported residually. However, an estimate ofshort-term external liabilities by original maturity

A B O U T T H E D A T A
xiii
can be calculated by deducting from claims duein one year those that, 12 months earlier, had amaturity of between one and two years.
There are several problems with this method.Valuation adjustments caused by exchange ratemovements will affect the calculations, as will pre-payment and refinancing of long-term maturitiesfalling due. Moreover, not all countries’ commercialbanks report in a way that allows the full maturitydistribution to be determined; and the BIS datainclude liabilities only to banks within the reportingarea. Even on this basis, however, the results needto be interpreted with caution. Where short-termexternal debt has been rescheduled, the effect oflags in reporting and differences in the treatmentof the rescheduled external debt by debtors and cred-itors may result in double counting if short-termexternal debt derived from creditor sources is addedto long-term external debt reported by the country toobtain external liabilities.
Some of the short-term external debt esti-mates published are drawn from debtor and credi-tor sources, but most are from creditor sources.Only for a few countries can the data be regardedas authoritative, but they offer a guide to the sizeof a country’s short-term (and, hence, its total) ex-ternal debt. Interest in arrears on long-term exter-nal debt and interest in arrears on the use of IMFcredit are added to the short-term external debt.
Use of IMF credit Data related to the operationsof the IMF come from the IMF Treasurer’s Depart-ment and are converted from special drawingrights (SDRs) into dollars using end-of-periodexchange rates for stocks and average over theperiod exchange rates for converting flows, asdescribed earlier. IMF trust fund (TF) and opera-tions under the enhanced structural adjustment(ESAF renamed in 1999), poverty reduction andgrowth facility (PRGF), and structural adjustmentfacility (SAF) are presented together with all of theFund’s special facilities (buffer stock, extendedfund (EFF), supplemental reserve (SRF), compen-satory and contingency, oil facilities, and otherfacilities).
Treatment of arrears The DRS collects informa-tion on arrears in both principal and interest. Prin-cipal in arrears is included and identified in theamount of long-term external debt outstanding.Interest in arrears on long-term external debt and
interest in arrears on the use of IMF credit areincluded and identified in the amount of short-termexternal debt outstanding. If and when interest inarrears is capitalized under a debt reorganizationagreement, the amount of interest capitalized willbe added to the amount of long-term external debtoutstanding and the corresponding deductionmade from the amount of short-term external debtoutstanding.
Treatment of external debt restructurings TheDRS attempts to capture accurately the effects ofthe different kinds of restructurings on both exter-nal debt stocks and external debt flows, consistentwith the circumstances under which the restructur-ing takes place.
In compiling and presenting the external debtdata, a distinction is made between cash flows andimputed flows. Based on this criterion, rescheduledservice payments and the shift in liabilities from onefinancial instrument to another as a result ofrescheduling are considered to be imputed flows.
The imputed flows are recorded separately inthe World Bank External Debt (WBXD) system,but these external debt restructuring transactionsare not evident in the main body of the externaldebt data—only the resulting effect of these trans-actions is reflected.
Changes in creditor and debtor status that canresult from external debt restructuring are also re-flected. For example, when insured commercialcredits are rescheduled, the creditor classificationshifts from private sources to official sources (bi-lateral). This reflects the assumption of the assetsby the official credit insurance agencies of thecreditor countries. The external debts to the origi-nal creditors are reduced by the amounts resched-uled, and a new obligation to the official creditoragencies is created. This shift also applies to pri-vate nonguaranteed external debt that is reducedby the amounts rescheduled, which in turn are in-cluded in the public and publicly guaranteed exter-nal debt owed to official creditors. On the debtorside, when a government accepts responsibility forthe payment of rescheduled external debt previ-ously owed by private enterprises, the DRS regis-ters a change in debtor categories in the DRS. Sim-ilarly, when short-term external debt is included ina restructuring agreement, the rescheduled amountis shifted from short-term to long-term externaldebt.
G L O B A L D E V E L O P M E N T F I N A N C E 2 0 0 9
xiv
Methodology for projecting dataThe WBXD system of the DRS projects future dis-bursements of unutilized commitments and futuredebt service payments.
Future disbursements Projections of disburse-ments help underpin future capital requirements inthe implementation of externally financed pro-jects. In addition, they help determine the interestportion of projected external debt service. Futureinterest payments are based on projected externaldebt outstanding, which is itself determined byprojected disbursements and repayments. The un-derlying assumptions of these projections are thatloan commitments will be fully utilized and thatthe debtor country will repay all sums due. Futuredisbursements and external debt service refer onlyto existing external debt and do not reflect anyassumptions on future borrowing.
Disbursement projections use two methods:
• Specific schedules: Debtor countries arerequested to submit a calendar of future disburse-ments, if available, at the time individual loans arefirst reported. Country authorities are in a betterposition to provide estimated disbursement sched-ules when there is a solid public sector investmentprogram in place.• Standard schedules: In the absence of specificschedules, the WBXD system projects disburse-ments by applying a set of profiles to the lastactual undisbursed balance of individual loans.
The profiles are derived under the assumptionthat specific sources of funds have some commoncharacteristics that cause them to disburse, in theaggregate, in some observable pattern. Accord-ingly, some thirty profiles have been derived thatroughly correspond to creditor type. Profiles existfor concessional and nonconcessional loans fromofficial creditors. For bilateral lending, profileshave been developed for the Development Assis-tance Committee (DAC), the Organization ofPetroleum Exporting Countries (OPEC), and othercreditor groupings. For multilateral lending, spe-cific profiles are available for major internationalorganizations. An estimating equation for eachprofile is derived by applying regression analysistechniques to a body of data that contains actual
disbursement information for each loan. Althoughthese standard profiles are reestimated from timeto time, under the best scenario they can onlyapproximate the disbursement pattern of anysingle loan.
Future external debt service payments Most pro-jections of future external debt service paymentsgenerated by the WBXD system are based on therepayment terms of the loans. Principal repayments(amortization) are based on the amount of loancommitments, and the amortization profile of mostloans follows a set pattern. Using the first and finalpayment dates and the frequency of the payments,the system calculates the stream of principal pay-ments due. If future payments are irregular, theWBXD system requires a schedule.
Projected future interest payments are calcu-lated similarly. Interest is based on the amount ofexternal debt disbursed and outstanding at thebeginning of the period. Again, using the first andfinal interest payment dates and the frequency ofpayments, the system calculates the stream ofinterest payments due. If interest payments areirregular, the WBXD system requires a schedule.
The published figures for projected externaldebt service obligations are converted into U.S. dol-lars using the end-December 2007 exchange rates.Likewise, the projection routine for variable interestrate debt, such as commercial bank debt based onthe London Interbank Offer Rate (LIBOR), assumesthat the rate prevailing at the end of December 2007will be effective throughout.
Metadata
Summary Table 1 provides key debt ratios for in-dividual reporting countries. Summary Table 2
presents the composition of external debt stocksfor individual reporting countries and regional andincome groups. For the 128 individual countriesthat report to the World Bank’s DRS, country ta-bles are presented in a two-page layout containing10 sections. The format of the regional and in-come group tables draws on the individual coun-try table format and includes graphical presenta-tions. As in the past, the database feeding the printedition continues to maintain all the derived indi-cator information.

A B O U T T H E D A T A
For all summary, regional, income, and indi-vidual country tables, data definitions are pre-sented on the following pages or footnoted whereappropriate.
1. Summary external debt data summarizes thestocks and flows of the major components of theexternal debt of the country. Not all data break-downs are presented in the printed GDF book, butthe entire breakdown can be found in the CD-ROMand in the online database.
External Debt Stocks consist of public and pub-licly guaranteed long-term external debt, privatenonguaranteed long-term external debt, the use ofIMF credit, and short-term external debt. The re-lation between external debt stock and its compo-nents is illustrated on page xxiv.
Interest in arrears on long-term external debtis added to the short-term external debt and isshown as a separate line. Interest in arrears on theuse of IMF credit is also added to the short-termexternal debt. Principal in arrears on long-term ex-ternal debt is shown as a memorandum item. Ar-rears of principal and of interest are disaggregatedto show the arrears owed to official creditors andthe arrears owed to private creditors (CD-ROMand online database only). Long-term public sec-tor external debt, long-term private sector externaldebt, and public and publicly guaranteed commit-ments are presented as memorandum items.
Long-term external debt is defined as debtthat has an original or extended maturity of morethan one year and that is owed to nonresidents byresidents of an economy and repayable in foreigncurrency, goods, or services.
Long-term external debt has three components:
• Public external debt, which is an externalobligation of a public debtor, including the na-tional government, a political subdivision (or anagency of either), and autonomous public bodies.• Publicly guaranteed external debt, which is anexternal obligation of a private debtor that is guar-anteed for repayment by a public entity.
Public external debt and publicly guaranteedexternal debt are shown as a single line in thetables.
• Private nonguaranteed external debt, which isan external obligation of a private debtor that isnot guaranteed for repayment by a public entity.
Use of IMF credit denotes members’ drawingson the IMF other than those drawn against thecountry’s reserve tranche position. Use of IMFcredit includes purchases and drawings underStand-By, Extended, Structural Adjustment, En-hanced Structural Adjustment, and Systemic Trans-formation Facility Arrangements, together withTrust Fund loans.
• IMF purchases are total drawings on the gen-eral resources account of the IMF during the yearspecified, excluding drawings in the reserve tranche.• IMF repurchases are total repayments of out-standing drawings from the general resourcesaccount during the year specified, excluding repay-ments due in the reserve tranche.
Short-term external debt is defined as externaldebt that has an original maturity of one year orless. Available data permit no distinction betweenpublic and private nonguaranteed short-termexternal debt.
Interest in arrears on long-term external debtis interest payment due but not paid, shown on acumulative basis. Interest arrears are regarded asshort-term external debt. Thus an increase in in-terest arrears will not be recorded as an increase inlong-term external debt outstanding and dis-bursed. On the other hand, a clearing of interestarrears as payments of interest arrears will beallocated to the relevant flows, being long-term orshort-term external debt, depending on the flowtoward which the interest payments took place. Itwill be recorded as (1) a reduction of short-termexternal debt; (2) a net change in interest arrears(CD-ROM and online database only). Similarly,the reduction of interest arrears through interestarrears restructured and interest arrears forgivenwill also be recorded as a reduction of short-termexternal debt and as a net change in interest arrears(CD-ROM and online database only). In addition,interest arrears restructuring and interest restruc-turing will be recorded as interest capitalization(CD-ROM and online database only).
Principal in arrears on long-term externaldebt is defined as principal repayment due but notpaid, on a cumulative basis.
xv

G L O B A L D E V E L O P M E N T F I N A N C E 2 0 0 9
xvi
Long-term public sector external debt andlong-term private sector external debt conveyinformation about the distribution of long-termexternal debt for DRS countries by type of debtor(central government, state and local government,central bank, public and mixed enterprises, officialdevelopment banks, private banks, and privateentities).
External Debt Flows are consolidated data on dis-bursements, principal repayments, interest pay-ments for long-term external debt, transactionswith the IMF, and short-term external debt.
Disbursements are drawings on loan commit-ments during the year specified.
Principal repayments are the amounts of prin-cipal (amortization) paid in foreign currency,goods, or services in the year specified.
Net flows on external debt are disbursementson long-term external debt and IMF purchasesminus principal repayments on long-term externaldebt and IMF repurchases up to 1984. Beginningin 1985 this line includes the change in stock ofshort-term debt (excluding interest arrears for long-term external debt). Thus if the change in stock ispositive, a disbursement is assumed to have takenplace; if negative, a repayment is assumed to havetaken place.
Interest payments are the amounts of interestpaid in foreign currency, goods, or services in theyear specified.
Net transfers on external debt are net flowsminus interest payments (or disbursements minusexternal debt service payments) (CD-ROM andonline database only).
External debt service paid is debt servicepayments on long-term external debt (public andpublicly guaranteed and private nonguaranteed),use of IMF credit, and interest on short-termexternal debt (breakdown in CD-ROM and onlinedatabase only).
2. Other non-debt resource flows include netresource flows as well as non-debt flows from vari-ous international organizations.
Foreign direct investment (FDI) is defined asinvestment that is made to acquire a lasting man-agement interest (usually 10 percent of votingstock) in an enterprise operating in a country otherthan that of the investor (defined according to
residency), the investor’s purpose being an effec-tive voice in the management of the enterprise. It isthe sum of equity capital, reinvestment of earn-ings, other long-term capital, and short-termcapital as shown in the balance of payments. FDIincludes intercompany debt.
Portfolio equity flows are the sum of coun-try funds, depository receipts (American orglobal), and direct purchases of shares by foreigninvestors.
Profit remittances on foreign direct invest-ment covers payments of direct investment income(debit side), which consist of income on equity(dividends, branch profits, and reinvested earn-ings) and income on the intercompany debt(interest).
Grants are defined as legally binding commit-ments that obligate a specific value of funds availablefor disbursement for which there is no repaymentrequirement.
Debt forgiveness grants are both debts can-celled by agreement between debtor and creditorand reductions in the net present value of non-official development assistance debt from conces-sional rescheduling or refinancing. Data are on adisbursement basis and cover flows from all bilat-eral and multilateral donors.
International Development Association (IDA)grants are net disbursements of grants from IDA.
The memorandum item technical cooperationgrants includes (1) free-standing technical cooper-ation grants, which are intended to finance thetransfer of technical and managerial skills or oftechnology for the purpose of building up generalnational capacity without reference to any specificinvestment projects; and (2) investment-relatedtechnical cooperation grants, which are providedto strengthen the capacity to execute specificinvestment projects.
3. Currency composition of public and publiclyguaranteed external debt provides information onthe currency composition of loans outstanding anddisbursed based on repayment currency of individ-ual loans. For major multilateral creditors, cur-rency composition is based on reporting currency,which is mostly U.S. dollars and unit of account.The major currencies in which the external debt oflow- and middle-income countries is contracted areseparately identified, as is debt denominated in
A B O U T T H E D A T A
xvii
special drawing rights and debt repayable inmultiple currencies (CD-ROM and online data-base only).
Beginning in 2001, debt denominated in thecurrencies of the members in the euro area isincluded under the euro.
4. Average terms of new commitments providesinformation on the average terms of new commit-ments on public and publicly guaranteed externaldebt and information on the level of commitmentsfrom official and private sources. To obtain aver-ages, the interest rates, maturities, and graceperiods in each category have been weighted bythe amounts of the loans.
Maturity is the number of years to originalmaturity date, which is the sum of grace andrepayment periods.
Grace period for principal is the period fromthe date of signature of the loan or the issue of thefinancial instrument to the first repayment of prin-cipal. The repayment period is the period from thefirst to last repayment of principal.
The grant element of a loan is the grant equiv-alent expressed as a percentage of the amountcommitted. It is used as a measure of the overallcost of borrowing. Loans with an original grantelement of 25 percent or more are defined as con-cessional. The average grant element has beenweighted by the amounts of the loans (CD-ROMand online database only). Commitments coverthe total amount of loans for which contracts weresigned in the year specified; data for privatenonguaranteed external debt are not available.
The grant equivalent of a loan is the nomi-nal value of all contractual future debt serviceless the discounted present value of its contrac-tual debt service. The calculation of the presentvalue of each commitment is made in accordancewith the stand methodology of the DAC of theOrganisation for Economic Co-operation andDevelopment using a 10 percent discount rate forall currencies.
Present value of debt outstanding is the nomi-nal value of all future debt service obligations onexisting debt discounted at prevailing market ratesof interest. The interest rates used in this calcula-tion are the Commercial Interest Reference Rates(CIIR) for each relevant currency compiled andpublished by the OECD.
5. Major economic aggregates provide data seriesfor major economic aggregates. The six economicaggregates for the reporting economies areprepared for the convenience of users; the usualcaution should be exercised in using them foreconomic analysis.
Gross national income, or GNI, is the sum ofvalue added by all resident producers plus anyproduct taxes (less subsidies) not included in thevaluation of output plus net receipts of primaryincome (compensation of employees and propertyincome) from abroad. Yearly average exchangerates are used to convert GNI from local currencyinto U.S. dollars.
Exports of goods, services, and income are thetotal value of goods and services exported, receiptsof compensation of employees, and investmentincome. Workers’ remittances, a transfer and notan income entry in the balance of payments, aretreated as compensation of employees in GlobalDevelopment Finance because they are often diffi-cult to distinguish from compensation of nonresi-dent workers and migrants.
Workers’ remittances and compensation ofemployees comprise current transfers by migrantworkers, and wages and salaries earned by nonres-ident workers. In addition, migrants’ transfers, apart of capital transfers, are treated as workers’remittances in Global Development Finance.
Imports of goods and services are the totalvalue of goods and services imported and incomepaid.
International reserves are the sum of a coun-try’s monetary authority’s holdings of special draw-ing rights (SDRs), its reserve position in the IMF, itsholdings of foreign exchange, and its holdings ofgold (valued at year-end London prices).
Current account balance is the sum of thecredits less the debits arising from internationaltransactions in goods, services, income, and cur-rent transfers. It represents the transactions thatadd to or subtract from an economy’s stock offoreign financial items.
6. Debt ratios The macroeconomic aggregates andexternal debt data provided in the tables are used togenerate ratios that analysts use to assess the exter-nal situations of developing countries. Different an-alysts give different weights to these indicators, butno single indicator or set of indicators can substitute
G L O B A L D E V E L O P M E N T F I N A N C E 2 0 0 9
xviii
for a thorough analysis of the overall situation of aneconomy. The advantage of the indicators in GlobalDevelopment Finance is that they are calculatedfrom standardized data series that are compiled ona consistent basis by the World Bank and the IMF.The ratios offer various measures of the cost of, orcapacity for, servicing debt in terms of the foreignexchange or output forgone. The following ratiosare provided based on external debt:
External debt stocks to exports (%): externaldebt to exports of goods and services (includingworkers’ remittances).
External debt stocks to GNI (%): externaldebt to gross national income.
External debt service to exports (%): alsocalled the external debt service ratio; external debtservice to exports of goods and services (includingworkers’ remittances).
Short-term to external debt stocks (%): short-term external debt to external debt.
Multilateral to external debt stocks (%): mul-tilateral external debt to external debt.
Reserves to external debt stocks (%): interna-tional reserves to external debt.
Reserves to imports (months): international re-serves in months of imports of goods and services(reserves/(imports/12)). This ratio shows reservesexpressed in terms of the number of months ofimports of goods and services they could pay for.
Concessional debt to external debt (CD-ROMand online database only).
Interest payments to exports (%): also called theinterest service ratio, interest payments to exports ofgoods and services (including workers’ remittances)(CD-ROM and online database only).
Interest payments to GNI (%): interest pay-ments to gross national income (CD-ROM andonline database only).
7. Long-term external debt provides detailed infor-mation on stocks and flows of long-term externaldebt and its various components. Data on bondsissued by private entities without public guarantee,compiled for major borrowers, are included in pri-vate nonguaranteed external debt. IBRD loans andIDA credits are shown separately.
Data on long-term external debt include eightmain elements, not all of which have been pro-vided in the print edition of the GDF:
Debt outstanding and disbursed is the out-standing debt at year end.
Disbursements are drawings on loan commit-ments by the borrower during the year.
Principal repayments are amounts paid by theborrower during the year.
Net flows received by the borrower during theyear are disbursements minus principal repay-ments (CD-ROM and online database only).
Interest payments are amounts paid by theborrower during the year.
Net transfers are net flows minus interest pay-ments during the year; negative transfers show nettransfers made by the borrower to the creditorduring the year (CD-ROM and online databaseonly).
Debt service is the sum of principal repay-ments and interest payments actually made (CD-ROM and online database only).
Undisbursed debt is debt undrawn at year end;data for private nonguaranteed external debt are notavailable (CD-ROM and online database only).
Data are aggregated by type of creditor: Official creditors include multilateral and bilaterallenders.
• Loans from multilateral organizations areloans and credits from the World Bank, regionaldevelopment banks, and other multilateral andintergovernmental agencies. Excluded are loansfrom funds administered by an international orga-nization on behalf of a single donor government;these are classified as loans from governments.• Bilateral loans are loans from governmentsand their agencies (including central banks), loansfrom autonomous bodies, and direct loans fromofficial export credit agencies.
Private creditors include bondholders, commercialbanks, and other private creditors. Other privatecreditors comprise trade-related lending.
• Bonds include publicly issued or privatelyplaced bonds.• Commercial banks are loans from privatebanks and other private financial institutions.• Other private includes credits from manufac-turers, exporters, and other suppliers of goods,and bank credits covered by a guarantee of anexport credit agency.
A B O U T T H E D A T A
xix
Concessional long-term external debt out-standing and disbursed conveys informationabout the borrower’s receipt of aid from officiallenders at concessional terms as defined by theDAC, that is, loans with an original grant ele-ment of 25 percent or more (CD-ROM and on-line database only). Loans from major regionaldevelopment banks—African DevelopmentBank, Asian Development Bank, and the Inter-American Development Bank—and from theWorld Bank are classified as concessional, ac-cording to each institution’s classification andnot according to the DAC definition, as was thepractice in earlier reports.
Variable interest rate long-term external debtoutstanding and disbursed is long-term externaldebt with interest rates that float with movementsin a key market rate such as the London interbankoffer rate (LIBOR) or the U.S. prime rate. Thisitem conveys information about the borrower’s ex-posure to changes in international interest rates(CD-ROM and online database only).
8. Debt stock-flow reconciliation reconciles thestock and flow data on external debt for eachyear, beginning with 1989. This section isdesigned to illustrate the changes in stock thathave taken place due to five factors: the net flowon external debt, the net change in interest ar-rears, the capitalization of interest, the reductionin debt resulting from debt forgiveness or otherdebt reduction mechanisms, and the cross-currency valuation effects. The residual differ-ence, the change in stock not explained by any ofthe factors identified above, is also presented. Theresidual is calculated as the sum of identifiedaccounts minus the change in stock. Where theresidual is large it can, in some cases, serve as anillustration of the inconsistencies in the reporteddata. More often, however, it can be explained byspecific borrowing phenomena in individualcountries. These are explained in the CountryNotes section. Not all components are providedin the GDF print edition.
Total change in external debt stocks is thevariation in the external debt stock between twoconsecutive years.
Net flows on external debt are disbursementson long-term external debt and IMF purchasesminus principal repayments on long-term external
debt, IMF repurchases, and changes in the stock ofthe short-term debt.
Cross-currency valuation effect arises frommovements in the value of the U.S. dollar againstother world currencies, as well as debt forgivenessor reduction, and affect the value of developingcountry debt. Countries contract debt in variouscurrencies. The external debt data that countriesreport to the DRS is expressed in the currencies inwhich the original debt was contracted or in cur-rencies in which it is repayable. For purposes ofstandardization and aggregation, the DRS con-verts these amounts into dollar values. The ex-change rates used are generally the par values orcentral rates specified by the IMF or market rateswhen necessary. Exchange rates in effect at the endof any given year are used to convert the stock ofdebt outstanding for that year in various curren-cies into the nominal dollar value.
Net change in interest arrears is the variationin the total amount of interest in arrears betweentwo consecutive years (CD-ROM and online data-base only).
Interest capitalized is the interest that becamepart of the stock of debt due to a reschedulingoperation (CD-ROM and online database only).
Debt forgiveness or reduction is the debtstock, principal, and/or interest that will not bepaid (CD-ROM and online database only).
Residual is the change in the external debtstock that is not justified by the operations listedabove (CD-ROM and online database only).
9. Debt restructurings provide information onrestructurings of long-term external debt startingin 1985.
Debt restructurings include restructurings inthe context of the Paris Club, commercial banks,debt-equity swaps, buybacks, and bond exchanges.In the event of a swap of long-term external debt(external debt-to-equity, external debt-for-nature,or external debt-for-development), the face value ofthe external debt swapped will be recorded as adecline in the long-term external debt stock,but the operation will not be recorded as a princi-pal repayment. For example, if a country swapsexternal debt of face value D against equity, thenlong-term external debt will decline by D, and aprincipal repayment will not be reported. Debtrestructuring data capture the non-cash or inferred
G L O B A L D E V E L O P M E N T F I N A N C E 2 0 0 9
xx
flows associated with rescheduling and restructur-ing. These are presented to complement the cash-basis transactions recorded in the main body of thedata, which show both the stock and flowsrescheduled each year. In addition, the amount ofexternal debt forgiven (interest forgiven is shownas a memorandum item) and the amount of exter-nal debt stock reduction (including debt buyback)are also shown separately.
Total amount rescheduled is the total amountof external debt rescheduled, which includes theexternal debt stock, principal, interest, charges,and penalties rescheduled.
External debt stock rescheduled is the amountof external debt outstanding rescheduled in anygiven year (CD-ROM and online database only).
Principal rescheduled is the amount of princi-pal due or in arrears that was rescheduled in anygiven year (CD-ROM and online database only).
Interest rescheduled is the amount of interestdue or in arrears that was rescheduled in any givenyear (CD-ROM and online database only).
Total amount forgiven is the amount of prin-cipal due or in arrears that was written off or for-given in any given year. It includes debt forgivenwithin and outside Paris Club agreements, princi-pal forgiven and principal arrears forgiven, andexcludes interest forgiven. Interest arrears forgivenand future interest obligations forgiven are recordedas a memo item under interest forgiven.
Interest forgiven is the amount of interest dueor in arrears that was written off or forgiven inany given year (CD-ROM and online databaseonly).
Debt stock reduction is the amount that hasbeen netted out of the stock of debt using debtconversion schemes such as buybacks and equityswaps or the discounted value of long-term bondsthat were issued in exchange for outstanding debt.It includes the effect of any financial operationthat will reduce the debt stock other than debtstock restructuring, repayment of principal, anddebt forgiven (which is recorded separately). Inparticular, “debt stock reduction” will include theface value of debt bought back, the face value ofdebt swapped for equity (or “nature” or “develop-ment”), any face value reduction that might resultas the consequence of a bond exchange, and anyface value reduction resulting from an exchange ofdebt for discount bonds (CD-ROM and onlinedatabase only).
Debt buyback is the repurchase by a debtor ofits own debt, discounted or at par. In the event of abuyback of long-term debt, the face value of thedebt bought back will be recorded as a decline inthe long-term debt stock, and the cash amountreceived by creditors will be recorded as a principalrepayment. For example, if a country buys backlong-term external debt of face value B at a price p,then long-term external debt will decline by B, andprincipal repayment will go up by p*B. The differ-ence between the secondary market price at whichthe debt was bought back and the face value isrecorded as a debt stock write-off (CD-ROM andonline database only). Both debt buyback and debtstock write-offs are included in the debt stockreduction.
10. Contractual obligations on outstanding long-term external debt provides anticipated disburse-ments and contractual obligations on long-termexternal debt contracted up to December 2007.
Projected debt service payments are estimatesof payments due on existing debt outstanding, in-cluding undisbursed. They do not include servicepayments that may become due as a result of newloans contracted in subsequent years. Nor do theyallow for effects on service payments of changes inrepayment patterns owing to prepayment of loansor to rescheduling or refinancing, including repay-ment of outstanding arrears that occurred after thelast year of reported data.
Projected disbursements are estimates ofdrawings of unutilized balances (CD-ROM andonline database only). The projections do not takeinto account future borrowing by the debtor coun-try. (See the Methodology section for a detailedexplanation of how undisbursed balances areprojected.)
Country notes
Country notes at the end of each country tablesummarize major events that have taken place
in the country in recent years; describe the sourcesof information for short-term and privatenonguaranteed external debt; and highlight mainissues on data collection process. Unless otherwisespecified in the country table, data on long-termpublic and publicly guaranteed external debt for2007 are based on reports provided by the coun-try, and short-term external debt data are World
A B O U T T H E D A T A
xxi
Bank staff estimates, based on BIS data on interna-tional bank lending.
Sources
The principal sources of information for thetables in this volume are reports to the World
Bank through the DRS from member countriesthat have received either IBRD loans or IDA cred-its. Additional information has been drawn fromthe files of the African Development Bank, theAsian Development Bank, the Central Bank forEconomic Integration, the Inter-American Devel-opment Bank, the IBRD and the IDA, and theIMF. (IBRD and IDA are the institutions of theWorld Bank)
Reporting countries submit detailed (loan-by-loan) reports through the DRS on the annual status,transactions, and terms of the long-term externaldebt of public agencies and that of private onesguaranteed by a public agency in the debtor coun-try. This information forms the basis for the tablesin this volume.
The short-term external debt data are as re-ported by the debtor countries or are estimates. Themost important source is the BIS quarterly seriesshowing the maturity distribution of commercialbanks’ claims on developing countries. For somecountries, estimates were prepared by pooling cred-itor and debtor information.
Data on long-term external debt reported bymember countries are checked against, and supple-mented by, data from several other sources. Amongthese are the statements and reports of severalregional development banks, government lendingagencies, and official government Web sites.
Data on exports and imports (on a balanceof payments basis), international reserves, andcurrent account balances are drawn mainly fromthe files of the IMF, supplemented by WorldBank staff estimates. Balance of payments dataare presented according to the fifth edition of the
IMF’s Balance of Payments Manual, which madeseveral adjustments to its presentation of tradestatistics. Coverage of goods was expanded toinclude in imports the value of goods receivedfor processing and repair (on a gross basis).Their subsequent re-export is recorded in ex-ports (also on a gross basis). This approach willcause a country’s imports and exports to in-crease without affecting the balance of goods.In addition, all capital transfers, which were in-cluded with current transfers in the fourth edi-tion of the Balance of Payments Manual, arenow shown in a separate capital (as opposed tofinancial) account, and so do not contribute tothe current account balance.
GNI data for most developing countries arecollected from national statistical organizationsand central banks by visiting and resident WorldBank missions. Data on GNI are from the Macro-economic Data Team of the Development Eco-nomics Development Data Group of the WorldBank.
Every effort has been made to ensure the ac-curacy and completeness of the external debtstatistics. Nevertheless, quality and coveragevary among debtors and may also vary for thesame debtor from year to year. Coverage hasbeen improved through the efforts of the report-ing agencies and the work of the World Bankmissions, which visit member countries to gatherdata and to provide technical assistance on debtissues.
Symbols
The following symbols have been usedthroughout:
0.0 indicates that data exist, but are negligible ora true zero.
.. indicates that data are not available.$ indicates current U.S. dollars unless other-
wise specified.


xxiii
Abbreviations
The following abbreviations are used in the principal ratios and indicator tables:
BIS Bank for International SettlementsCRS Creditor Reporting System (of the OECD)DAC Development Assistance Committee (of the OECD)DDSR Debt and debt service reductionDRS Debtor Reporting System (of the World Bank)FDI Foreign direct investmentGNI Gross national incomeIBRD International Bank for Reconstruction and Development/World BankIDA International Development Association (of the World Bank)IMF International Monetary FundLIBOR London interbank offer rateMYRA Multiyear rescheduling agreementODA Official development assistanceOECD Organisation for Economic Co-operation and DevelopmentOPEC Organization of the Petroleum Exporting CountriesSDR Special drawing right (of the IMF)WBXD World Bank External Debt System

G L O B A L D E V E L O P M E N T F I N A N C E 2 0 0 9
xxiv
External debt stock and its components
Total externaldebt (EDT)
Short-termdebt
Privatenonguaranteed debt
Public and publiclyguaranteed debt
Officialcreditors
Privatecreditors
by creditor
Long-term debt(LDOD)
Use of IMFcredits
Commercialbanks
Bonds OtherMultilateral Bilateral
by debtor

xxv
Country groups
East Asia and Pacific
Cambodia (A)
China (P)
Fiji (A)
Indonesia (A)
Lao PDR (P)
Malaysia (P)
Mongolia (E)
Myanmar (E)
Papua New Guinea (A)
Philippines (A)
Samoa (A)
Solomon Islands (A)
Thailand (P)
Tonga (A)
Vanuatu (A)
Vietnam (E)
Europe and Central Asia
Albania (A)
Armenia (A)
Azerbaijan (A)
Belarus (A)
Bosnia and Herzegovinaa (A)
Bulgaria (A)
Croatia (A)
Georgia (A)
Kazakhstan (A)
Kyrgyz Republic (A)
Latvia (A)
Macedonia, FYR (A)
Moldova (A)
Montenegro (A)
Poland (A)
Romania (A)
Russian Federation (P)
Serbiaa/b(A)
Tajikistan (P)
Turkey (A)
Turkmenistan (A)
Ukraine (P)
Uzbekistan (E)
Latin America and the Caribbean
Argentina (A)
Belize (A)
Bolivia (A)
Brazil (A)
Chile (A)
Colombia (A)
Costa Rica (A)
Dominica (A)
Dominican Republic (A)
Ecuador (A)
El Salvador (A)
Grenada (A)
Guatemala (A)
Guyana (A)
Haiti (P)
Honduras (A)
Jamaica (A)
Mexico (A)
Nicaragua (A)
Panama (A)
Paraguay (A)
Peru (A)
St. Kitts and Nevis (A)
St. Lucia (A)
St. Vincent and the Grenadines (A)
Uruguay (A)
Venezuela, R.B. de (A)
Middle East and North Africa
Algeria (A)
Djibouti (A)
Egypt, Arab Rep. of (A)
Iran, Islamic Rep. of (A)
Jordan (A)
Lebanon (A)
Morocco (A)
Tunisia (A)
Yemen, Republic of (A)
South Asia
Afghanistan (P)
Bangladesh (P)
Bhutan (A)
India (A)
Maldives (A)
Nepal (A)
Pakistan (A)
Sri Lanka (A)
Sub-Saharan Africa
Angola (A)
Benin (P)
Botswana (P)
Burkina Faso (A)
Burundi (A)
Cameroon (A)
Cape Verde (A)
Central African Republic (P)
Chad (A)
Comoros (P)
Congo, Dem. Rep. of (E)
Congo, Rep. of (P)
Côte d’Ivoire (A)
Eritrea (A)
Ethiopia (A)
Gabon (P)
Gambia,The (E)
Ghana (P)
Guinea (E)
Guinea-Bissau (P)
Kenya (A)
Lesotho (A)
Liberia (E)
Madagascar (A)
Malawi (A)
Mali (A)
Mauritania (A)
Mauritius (A)
Mozambique (P)
Niger (P)
Nigeria (P)
Rwanda (P)
São Tomé and Principe (A)
Senegal (P)
Seychelles (A)
Sierra Leone (P)
Somalia (E)
South Africa (P)
Sudan (A)
Swaziland (A)
Tanzania (E)
Togo (A)
Uganda (A)
Zambia (P)
Zimbabwe (A)
Regional groups
Note: Letters in parenthesis indicate DRS reporters’ status: (A) as reported, (P) preliminary, and (E) estimated. The status “as reported” indicates that the country was fully current in its reporting
under the DRS and that World Bank staff are satisfied that the reported data give an adequate and fair representation of the country’s total public debt. “Preliminary” data are based on reported
or collected information but, because of incompleteness or other reasons, include an element of staff estimation. “Estimated” data indicate that countries are not current in their reporting and
that a significant element of staff estimation has been necessary in producing the data tables.
a. For Bosnia and Herzegovina, total debt before 1999, excluding IBRD and IMF obligations and short-term debt, is included under Serbia.
b. Data prior to 2006 include Montenegro.
G L O B A L D E V E L O P M E N T F I N A N C E 2 0 0 9
xxvi
Low-income countries
Afganistan
Bangladesh
Benin
Burkina Faso
Burundi
Cambodia
Central African Republic
Chad
Comoros
Congo, Dem. Rep. of
Côte d’Ivoire
Eritrea
Ethiopia
Gambia, The
Ghana
Guinea
Guinea-Bissau
Haiti
Kenya
Kyrgyz Republic
Lao PDR
Liberia
Madagascar
Malawi
Mali
Mauritania
Mozambique
Myanmar
Nepal
Niger
Nigeria
Pakistan
Papua New Guinea
Rwanda
São Tomé and Principe
Senegal
Sierra Leone
Solomon Islands
Somalia
Tajikistan
Tanzania
Togo
Uganda
Uzbekistan
Vietnam
Yemen, Republic of
Zambia
Zimbabwe
Middle-income countries
Albania
Algeria
Angola
Argentina
Armenia
Azerbaijan
Belarus
Belize
Bhutan
Bolivia
Bosnia and Herzegovina
Botswana
Brazil
Bulgaria
Cameroon
Cape Verde
Chile
China
Colombia
Congo, Rep. of
Costa Rica
Croatia
Djibouti
Dominica
Dominican Republic
Ecuador
Egypt, Arab Rep. of
El Salvador
Fiji
Gabon
Georgia
Grenada
Guatemala
Guyana
Honduras
India
Indonesia
Iran, Islamic Rep. of
Jamaica
Jordan
Kazakhstan
Latvia
Lebanon
Lesotho
Macedonia, FYR
Malaysia
Maldives
Mauritius
Mexico
Moldova
Mongolia
Montenegro
Morocco
Nicaragua
Panama
Paraguay
Peru
Philippines
Poland
Romania
Russian Federation
Samoa
Serbia
Seychelles
South Africa
Sri Lanka
St. Kitts and Nevis
St. Lucia
St. Vincent and the Grenadines
Sudan
Swaziland
Thailand
Tonga
Tunisia
Turkey
Turkmenistan
Ukraine
Uruguay
Vanuatu
Venezuela, R.B. de
Income groups
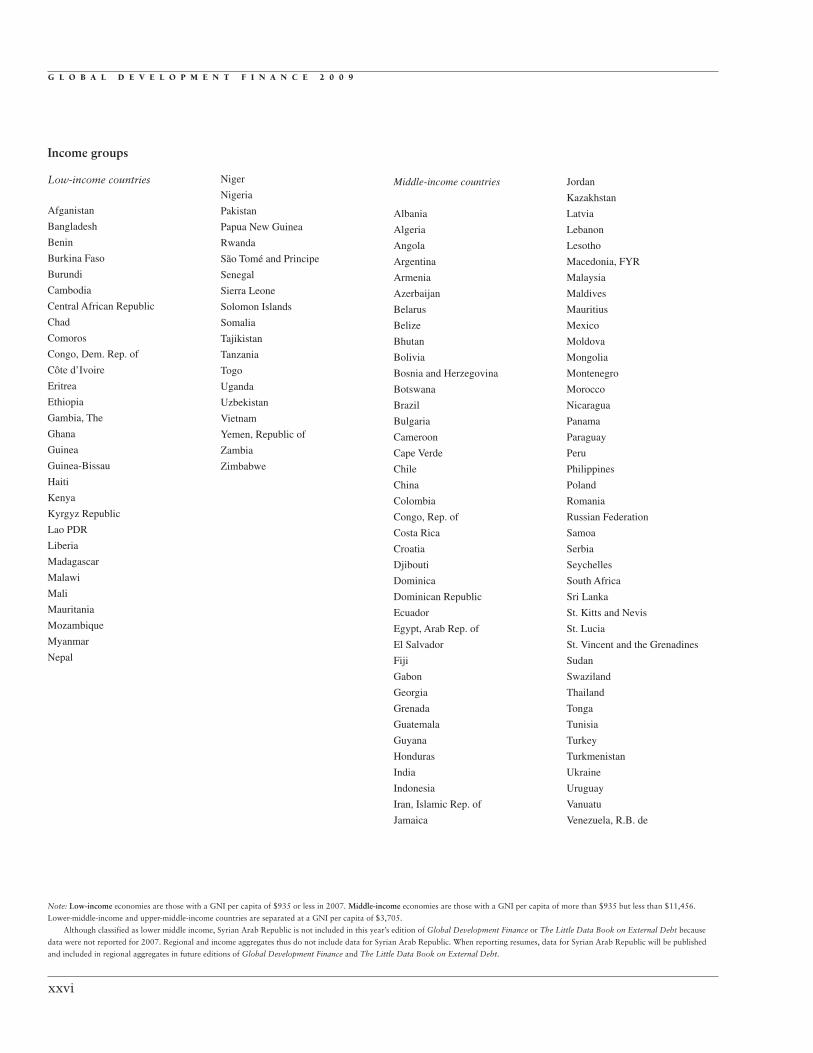
Note: Low-income economies are those with a GNI per capita of $935 or less in 2007. Middle-income economies are those with a GNI per capita of more than $935 but less than $11,456.
Lower-middle-income and upper-middle-income countries are separated at a GNI per capita of $3,705.
Although classified as lower middle income, Syrian Arab Republic is not included in this year’s edition of Global Development Finance or The Little Data Book on External Debt because
data were not reported for 2007. Regional and income aggregates thus do not include data for Syrian Arab Republic. When reporting resumes, data for Syrian Arab Republic will be published
and included in regional aggregates in future editions of Global Development Finance and The Little Data Book on External Debt.
xxvii
Summary tables


S U M M A R Y T A B L E S
xxix
Table 1. Key Indebtedness Indicators 2005–2007(US$ millions)
Ratio of Ratio of Ratio of Total Present total external present value of Ratio of total present value
external value of debt to exports of debt to exports of external debt of debt to Country debt 2007 debt 2007 GS (%) GS (%) to GNI (%) GNI (%)
Afghanistan 2,041 1,425 114 80 25 18Albania 2,776 2,117 77 61 28 22Algeria 5,541 5,087 9 9 5 4Angola 12,738 12,077 37 35 33 32Argentina 127,758 135,691 206 219 60 63Armenia 2,888 2,672 127 117 41 38Azerbaijan 3,021 2,592 19 16 16 14Bangladesh 22,033 15,142 121 84 33 22Belarus 9,470 9,132 41 40 25 25Belize 1,057 968 130 119 98 89Benin 857 569 87 58 18 12Bhutan 775 742 186 178 81 77Bolivia 4,947 2,599 98 52 45 24Bosnia and Herzegovina 6,479 5,602 91 80 48 42Botswana 402 316 6 5 4 3Brazil 237,472 261,702 141 155 23 25Bulgaria 32,968 32,516 146 144 102 100Burkina Faso 1,461 815 196 108 25 14Burundi 1,456 838 1,531 882 169 97Cambodia 3,761 3,222 73 63 53 46Cameroon 3,162 886 67 19 17 5Cape Verde 599 400 91 61 51 34Central African Republic 973 720 438 325 64 48Chad 1,797 998 50 28 34 19Chile 58,649 57,202 87 85 46 45China 373,635 363,630 33 32 14 13Colombia 44,976 45,908 131 133 27 28Comoros 291 186 246 157 71 45Congo, Dem. Rep. 12,283 8,731 459 326 157 111Congo, Rep. 5,156 5,113 88 88 94 93Costa Rica 7,846 7,817 62 62 35 35Cote d’Ivoire 13,938 11,445 150 123 82 67Croatia 48,584 46,784 204 197 113 109Djibouti 472 326 132 91 56 38Dominica 290 254 174 154 101 90Dominican Republic 10,342 10,157 71 70 34 33Ecuador 17,525 19,493 104 115 45 50Egypt, Arab Rep. 30,444 27,297 67 60 28 25El Salvador 8,809 9,049 101 104 48 50Eritrea 875 524 1,103 660 69 41Ethiopia 2,634 1,208 103 47 17 8Fiji 387 387 22 22 12 12Gabon 5,746 6,405 89 99 65 73Gambia, The 733 167 276 63 149 34Georgia 2,292 1,658 71 52 27 20Ghana 4,479 2,849 87 55 35 22Grenada 525 614 250 294 116 136Guatemala 6,260 6,361 53 54 21 21Guinea 3,268 2,327 294 210 89 64Guinea-Bissau 744 820 480 529 239 263Guyana 734 422 74 43 84 49Haiti 1,598 1,017 90 57 31 20Honduras 3,260 2,173 38 26 31 21India 220,956 194,337 93 82 23 20Indonesia 140,783 147,835 114 120 41 43Iran, Islamic Rep. 20,577 18,200 24 22 9 8
(table continues on next page)
G L O B A L D E V E L O P M E N T F I N A N C E 2 0 0 9
xxx
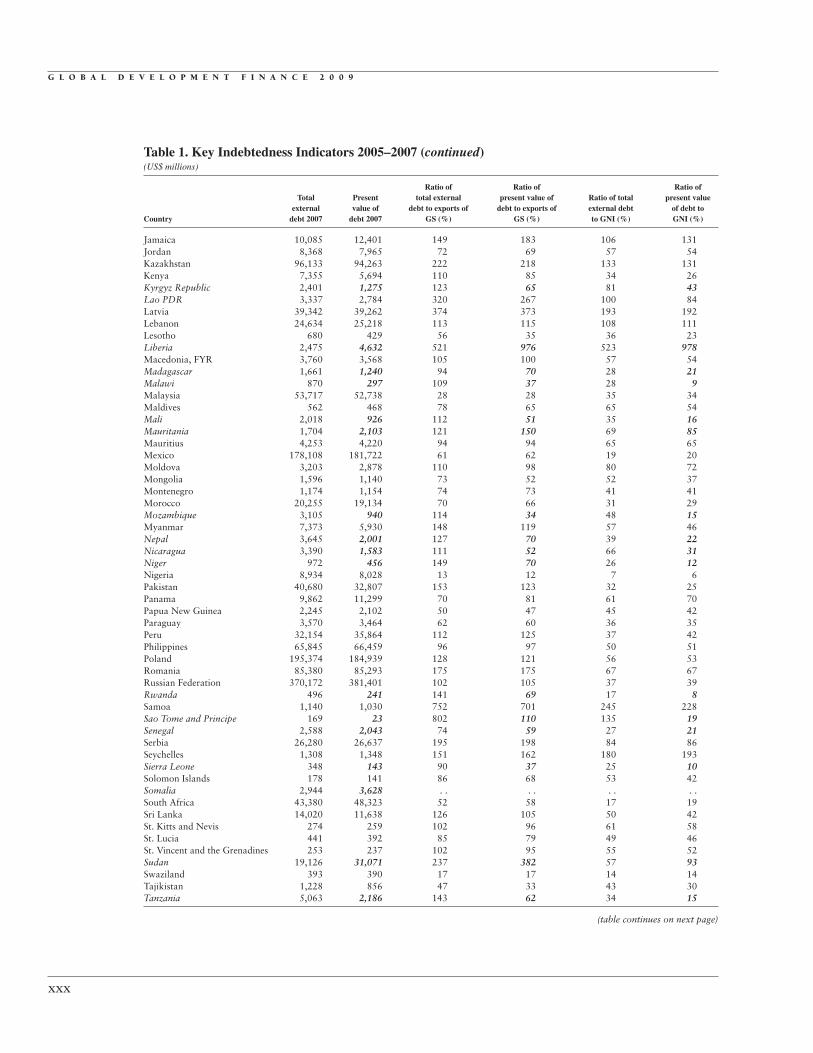
Table 1. Key Indebtedness Indicators 2005–2007 (continued)(US$ millions)
Ratio of Ratio of Ratio of Total Present total external present value of Ratio of total present value
external value of debt to exports of debt to exports of external debt of debt to Country debt 2007 debt 2007 GS (%) GS (%) to GNI (%) GNI (%)
Jamaica 10,085 12,401 149 183 106 131Jordan 8,368 7,965 72 69 57 54Kazakhstan 96,133 94,263 222 218 133 131Kenya 7,355 5,694 110 85 34 26Kyrgyz Republic 2,401 1,275 123 65 81 43Lao PDR 3,337 2,784 320 267 100 84Latvia 39,342 39,262 374 373 193 192Lebanon 24,634 25,218 113 115 108 111Lesotho 680 429 56 35 36 23Liberia 2,475 4,632 521 976 523 978Macedonia, FYR 3,760 3,568 105 100 57 54Madagascar 1,661 1,240 94 70 28 21Malawi 870 297 109 37 28 9Malaysia 53,717 52,738 28 28 35 34Maldives 562 468 78 65 65 54Mali 2,018 926 112 51 35 16Mauritania 1,704 2,103 121 150 69 85Mauritius 4,253 4,220 94 94 65 65Mexico 178,108 181,722 61 62 19 20Moldova 3,203 2,878 110 98 80 72Mongolia 1,596 1,140 73 52 52 37Montenegro 1,174 1,154 74 73 41 41Morocco 20,255 19,134 70 66 31 29Mozambique 3,105 940 114 34 48 15Myanmar 7,373 5,930 148 119 57 46Nepal 3,645 2,001 127 70 39 22Nicaragua 3,390 1,583 111 52 66 31Niger 972 456 149 70 26 12Nigeria 8,934 8,028 13 12 7 6Pakistan 40,680 32,807 153 123 32 25Panama 9,862 11,299 70 81 61 70Papua New Guinea 2,245 2,102 50 47 45 42Paraguay 3,570 3,464 62 60 36 35Peru 32,154 35,864 112 125 37 42Philippines 65,845 66,459 96 97 50 51Poland 195,374 184,939 128 121 56 53Romania 85,380 85,293 175 175 67 67Russian Federation 370,172 381,401 102 105 37 39Rwanda 496 241 141 69 17 8Samoa 1,140 1,030 752 701 245 228Sao Tome and Principe 169 23 802 110 135 19Senegal 2,588 2,043 74 59 27 21Serbia 26,280 26,637 195 198 84 86Seychelles 1,308 1,348 151 162 180 193Sierra Leone 348 143 90 37 25 10Solomon Islands 178 141 86 68 53 42Somalia 2,944 3,628 . . . . . . . .South Africa 43,380 48,323 52 58 17 19Sri Lanka 14,020 11,638 126 105 50 42St. Kitts and Nevis 274 259 102 96 61 58St. Lucia 441 392 85 79 49 46St. Vincent and the Grenadines 253 237 102 95 55 52Sudan 19,126 31,071 237 382 57 93Swaziland 393 390 17 17 14 14Tajikistan 1,228 856 47 33 43 30Tanzania 5,063 2,186 143 62 34 15
(table continues on next page)
xxxi
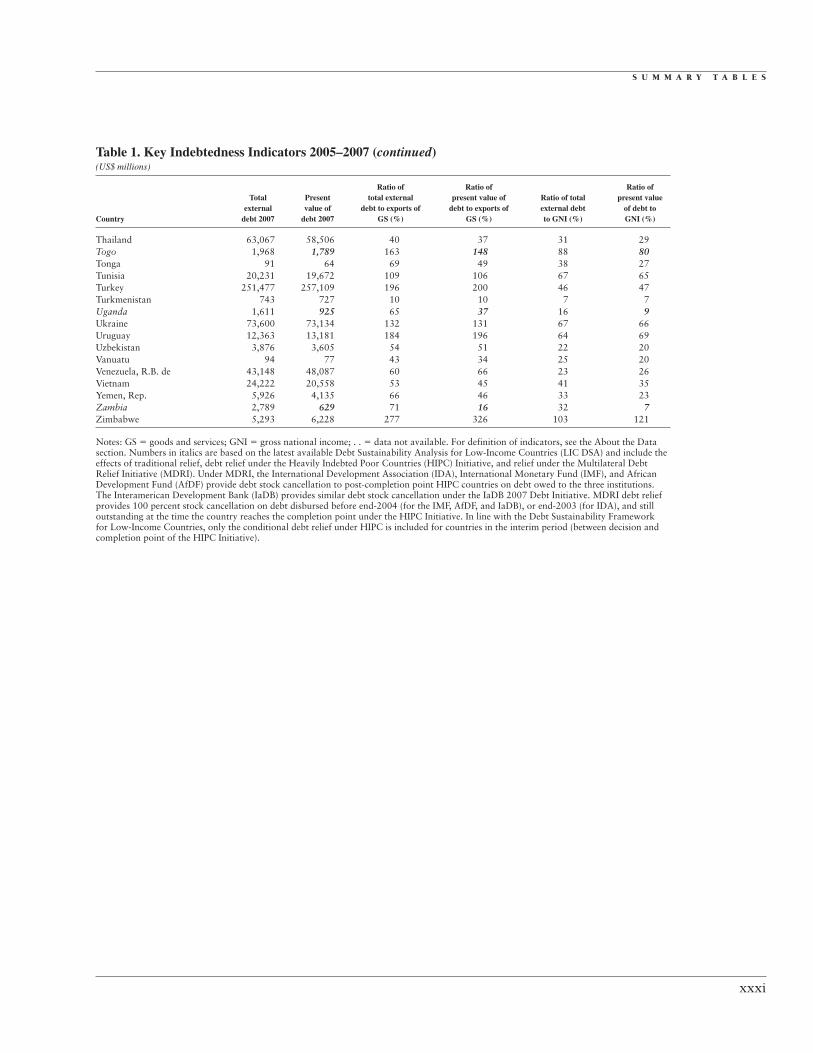
Table 1. Key Indebtedness Indicators 2005–2007 (continued)(US$ millions)
Ratio of Ratio of Ratio of Total Present total external present value of Ratio of total present value
external value of debt to exports of debt to exports of external debt of debt to Country debt 2007 debt 2007 GS (%) GS (%) to GNI (%) GNI (%)
Thailand 63,067 58,506 40 37 31 29Togo 1,968 1,789 163 148 88 80Tonga 91 64 69 49 38 27Tunisia 20,231 19,672 109 106 67 65Turkey 251,477 257,109 196 200 46 47Turkmenistan 743 727 10 10 7 7Uganda 1,611 925 65 37 16 9Ukraine 73,600 73,134 132 131 67 66Uruguay 12,363 13,181 184 196 64 69Uzbekistan 3,876 3,605 54 51 22 20Vanuatu 94 77 43 34 25 20Venezuela, R.B. de 43,148 48,087 60 66 23 26Vietnam 24,222 20,558 53 45 41 35Yemen, Rep. 5,926 4,135 66 46 33 23Zambia 2,789 629 71 16 32 7Zimbabwe 5,293 6,228 277 326 103 121
Notes: GS � goods and services; GNI � gross national income; . . � data not available. For definition of indicators, see the About the Datasection. Numbers in italics are based on the latest available Debt Sustainability Analysis for Low-Income Countries (LIC DSA) and include theeffects of traditional relief, debt relief under the Heavily Indebted Poor Countries (HIPC) Initiative, and relief under the Multilateral DebtRelief Initiative (MDRI). Under MDRI, the International Development Association (IDA), International Monetary Fund (IMF), and AfricanDevelopment Fund (AfDF) provide debt stock cancellation to post-completion point HIPC countries on debt owed to the three institutions.The Interamerican Development Bank (IaDB) provides similar debt stock cancellation under the IaDB 2007 Debt Initiative. MDRI debt reliefprovides 100 percent stock cancellation on debt disbursed before end-2004 (for the IMF, AfDF, and IaDB), or end-2003 (for IDA), and stilloutstanding at the time the country reaches the completion point under the HIPC Initiative. In line with the Debt Sustainability Frameworkfor Low-Income Countries, only the conditional debt relief under HIPC is included for countries in the interim period (between decision andcompletion point of the HIPC Initiative).
S U M M A R Y T A B L E S
xxxii
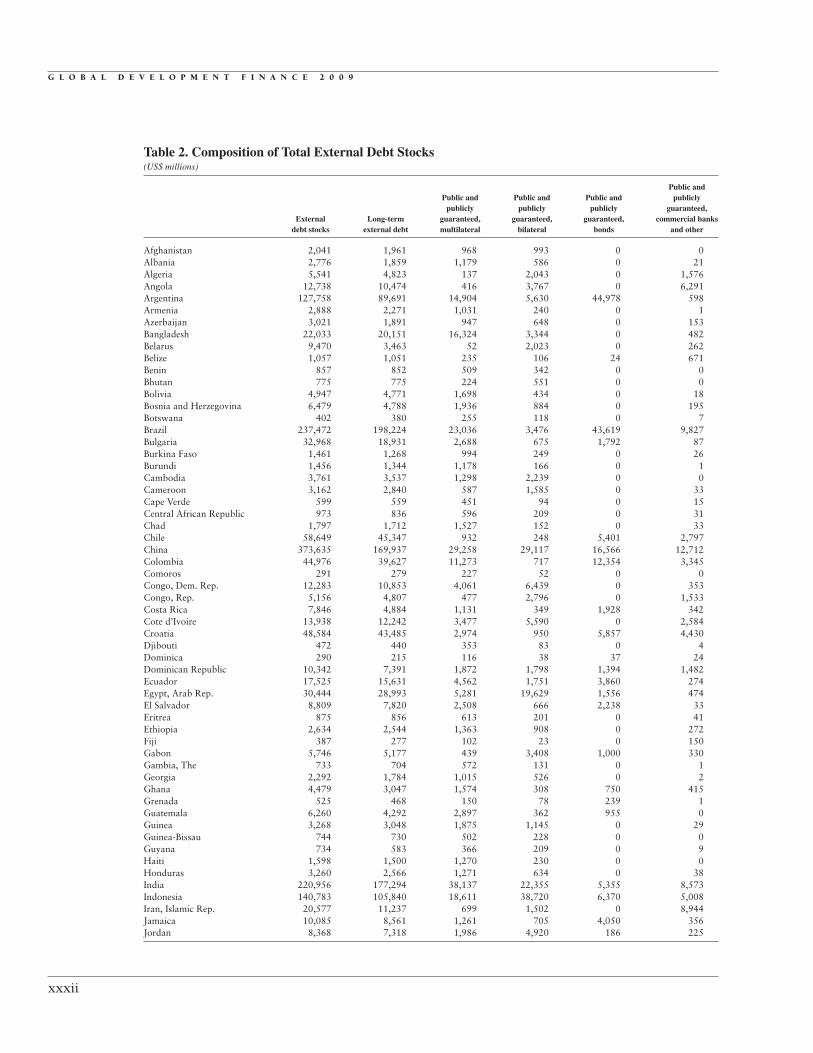
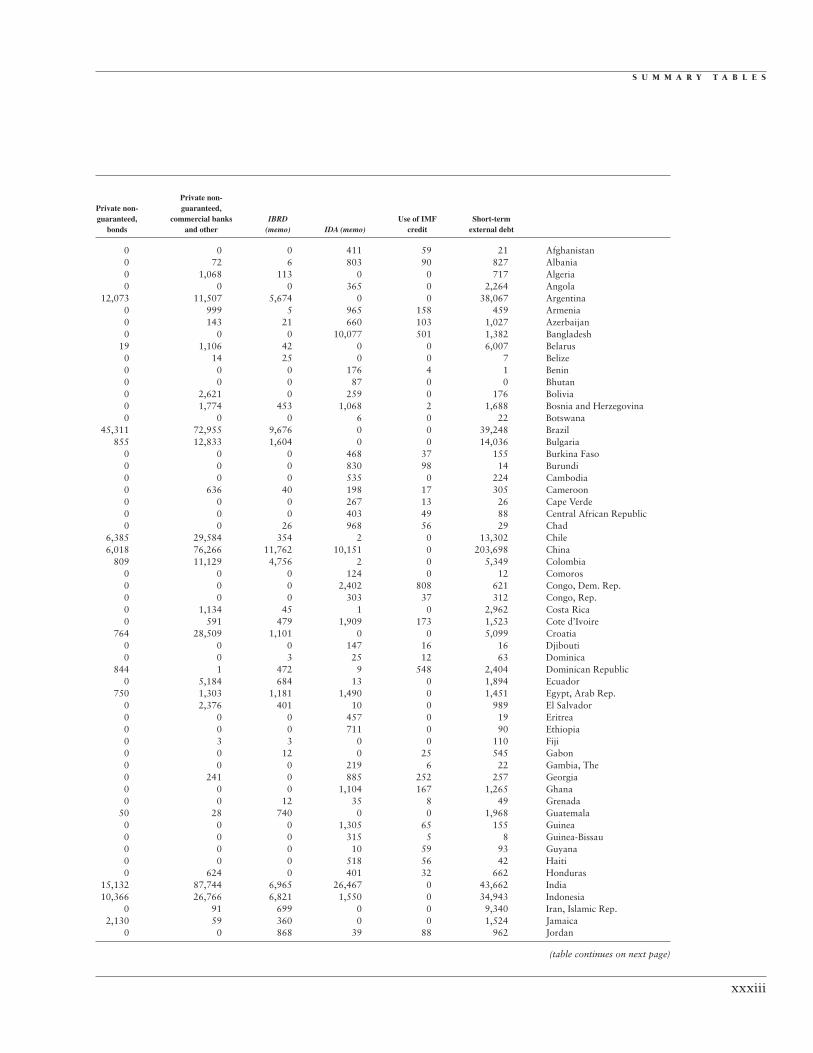
Table 2. Composition of Total External Debt Stocks (US$ millions)
Public andPublic and Public and Public and publicly
publicly publicly publicly guaranteed,External Long-term guaranteed, guaranteed, guaranteed, commercial banks
debt stocks external debt multilateral bilateral bonds and other
Afghanistan 2,041 1,961 968 993 0 0Albania 2,776 1,859 1,179 586 0 21Algeria 5,541 4,823 137 2,043 0 1,576Angola 12,738 10,474 416 3,767 0 6,291Argentina 127,758 89,691 14,904 5,630 44,978 598Armenia 2,888 2,271 1,031 240 0 1Azerbaijan 3,021 1,891 947 648 0 153Bangladesh 22,033 20,151 16,324 3,344 0 482Belarus 9,470 3,463 52 2,023 0 262Belize 1,057 1,051 235 106 24 671Benin 857 852 509 342 0 0Bhutan 775 775 224 551 0 0Bolivia 4,947 4,771 1,698 434 0 18Bosnia and Herzegovina 6,479 4,788 1,936 884 0 195Botswana 402 380 255 118 0 7Brazil 237,472 198,224 23,036 3,476 43,619 9,827Bulgaria 32,968 18,931 2,688 675 1,792 87Burkina Faso 1,461 1,268 994 249 0 26Burundi 1,456 1,344 1,178 166 0 1Cambodia 3,761 3,537 1,298 2,239 0 0Cameroon 3,162 2,840 587 1,585 0 33Cape Verde 599 559 451 94 0 15Central African Republic 973 836 596 209 0 31Chad 1,797 1,712 1,527 152 0 33Chile 58,649 45,347 932 248 5,401 2,797China 373,635 169,937 29,258 29,117 16,566 12,712Colombia 44,976 39,627 11,273 717 12,354 3,345Comoros 291 279 227 52 0 0Congo, Dem. Rep. 12,283 10,853 4,061 6,439 0 353Congo, Rep. 5,156 4,807 477 2,796 0 1,533Costa Rica 7,846 4,884 1,131 349 1,928 342Cote d’Ivoire 13,938 12,242 3,477 5,590 0 2,584Croatia 48,584 43,485 2,974 950 5,857 4,430Djibouti 472 440 353 83 0 4Dominica 290 215 116 38 37 24Dominican Republic 10,342 7,391 1,872 1,798 1,394 1,482Ecuador 17,525 15,631 4,562 1,751 3,860 274Egypt, Arab Rep. 30,444 28,993 5,281 19,629 1,556 474El Salvador 8,809 7,820 2,508 666 2,238 33Eritrea 875 856 613 201 0 41Ethiopia 2,634 2,544 1,363 908 0 272Fiji 387 277 102 23 0 150Gabon 5,746 5,177 439 3,408 1,000 330Gambia, The 733 704 572 131 0 1Georgia 2,292 1,784 1,015 526 0 2Ghana 4,479 3,047 1,574 308 750 415Grenada 525 468 150 78 239 1Guatemala 6,260 4,292 2,897 362 955 0Guinea 3,268 3,048 1,875 1,145 0 29Guinea-Bissau 744 730 502 228 0 0Guyana 734 583 366 209 0 9Haiti 1,598 1,500 1,270 230 0 0Honduras 3,260 2,566 1,271 634 0 38India 220,956 177,294 38,137 22,355 5,355 8,573Indonesia 140,783 105,840 18,611 38,720 6,370 5,008Iran, Islamic Rep. 20,577 11,237 699 1,502 0 8,944Jamaica 10,085 8,561 1,261 705 4,050 356Jordan 8,368 7,318 1,986 4,920 186 225
G L O B A L D E V E L O P M E N T F I N A N C E 2 0 0 9
xxxiii
Private non-Private non- guaranteed,guaranteed, commercial banks IBRD Use of IMF Short-term
bonds and other (memo) IDA (memo) credit external debt
0 0 0 411 59 21 Afghanistan0 72 6 803 90 827 Albania0 1,068 113 0 0 717 Algeria0 0 0 365 0 2,264 Angola
12,073 11,507 5,674 0 0 38,067 Argentina0 999 5 965 158 459 Armenia0 143 21 660 103 1,027 Azerbaijan0 0 0 10,077 501 1,382 Bangladesh
19 1,106 42 0 0 6,007 Belarus0 14 25 0 0 7 Belize0 0 0 176 4 1 Benin0 0 0 87 0 0 Bhutan0 2,621 0 259 0 176 Bolivia0 1,774 453 1,068 2 1,688 Bosnia and Herzegovina0 0 0 6 0 22 Botswana
45,311 72,955 9,676 0 0 39,248 Brazil855 12,833 1,604 0 0 14,036 Bulgaria
0 0 0 468 37 155 Burkina Faso0 0 0 830 98 14 Burundi0 0 0 535 0 224 Cambodia0 636 40 198 17 305 Cameroon0 0 0 267 13 26 Cape Verde0 0 0 403 49 88 Central African Republic0 0 26 968 56 29 Chad
6,385 29,584 354 2 0 13,302 Chile6,018 76,266 11,762 10,151 0 203,698 China
809 11,129 4,756 2 0 5,349 Colombia0 0 0 124 0 12 Comoros0 0 0 2,402 808 621 Congo, Dem. Rep.0 0 0 303 37 312 Congo, Rep.0 1,134 45 1 0 2,962 Costa Rica0 591 479 1,909 173 1,523 Cote d’Ivoire
764 28,509 1,101 0 0 5,099 Croatia0 0 0 147 16 16 Djibouti0 0 3 25 12 63 Dominica
844 1 472 9 548 2,404 Dominican Republic0 5,184 684 13 0 1,894 Ecuador
750 1,303 1,181 1,490 0 1,451 Egypt, Arab Rep.0 2,376 401 10 0 989 El Salvador0 0 0 457 0 19 Eritrea0 0 0 711 0 90 Ethiopia0 3 3 0 0 110 Fiji0 0 12 0 25 545 Gabon0 0 0 219 6 22 Gambia, The0 241 0 885 252 257 Georgia0 0 0 1,104 167 1,265 Ghana0 0 12 35 8 49 Grenada
50 28 740 0 0 1,968 Guatemala0 0 0 1,305 65 155 Guinea0 0 0 315 5 8 Guinea-Bissau0 0 0 10 59 93 Guyana0 0 0 518 56 42 Haiti0 624 0 401 32 662 Honduras
15,132 87,744 6,965 26,467 0 43,662 India10,366 26,766 6,821 1,550 0 34,943 Indonesia
0 91 699 0 0 9,340 Iran, Islamic Rep.2,130 59 360 0 0 1,524 Jamaica
0 0 868 39 88 962 Jordan
(table continues on next page)
S U M M A R Y T A B L E S

xxxiv
Table 2. Composition of Total External Debt Stocks (continued)(US$ millions)
Public andPublic and Public and Public and publicly
publicly publicly publicly guaranteed,External Long-term guaranteed, guaranteed, guaranteed, commercial banks
debt stocks external debt multilateral bilateral bonds and other
Kazakhstan 96,133 84,388 711 973 0 13Kenya 7,355 6,122 3,585 2,247 0 289Kyrgyz Republic 2,401 2,175 1,277 619 0 0Lao PDR 3,337 3,306 1,829 617 0 0Latvia 39,342 22,667 551 32 1,214 12Lebanon 24,634 20,319 866 829 17,707 388Lesotho 680 645 588 39 0 18Liberia 2,475 910 195 512 0 203Macedonia, FYR 3,760 2,564 1,040 199 221 60Madagascar 1,661 1,425 1,096 322 0 6Malawi 870 807 439 357 0 11Malaysia 53,717 38,467 471 3,904 11,806 2,259Maldives 562 426 264 46 0 117Mali 2,018 1,989 974 1,008 0 7Mauritania 1,704 1,437 805 611 0 20Mauritius 4,253 635 246 210 0 117Mexico 178,108 169,102 9,116 1,895 37,092 57,275Moldova 3,203 1,948 475 286 13 5Mongolia 1,596 1,571 942 533 75 15Montenegro 1,174 1,174 465 684 0 16Morocco 20,255 18,344 7,894 5,208 589 1,980Mozambique 3,105 2,533 1,387 1,137 0 9Myanmar 7,373 5,516 1,290 3,508 0 718Nepal 3,645 3,485 3,126 354 0 5Nicaragua 3,390 2,505 1,136 980 0 27Niger 972 882 667 196 0 0Nigeria 8,934 3,990 3,144 354 0 316Pakistan 40,680 37,070 19,860 13,223 2,650 184Panama 9,862 9,328 1,228 183 6,810 46Papua New Guinea 2,245 2,154 750 365 0 42Paraguay 3,570 2,767 1,297 546 0 352Peru 32,154 26,348 7,788 3,345 8,270 267Philippines 65,845 58,761 7,215 12,352 16,724 1,603Poland 195,374 135,009 1,870 4,317 37,011 400Romania 85,380 54,874 6,738 599 2,650 5,251Russian Federation 370,172 291,070 5,009 4,514 60,070 803Rwanda 496 456 403 52 0 0Samoa 1,140 226 216 10 0 0Sao Tome and Principe 169 147 38 109 0 0Senegal 2,588 2,229 1,402 622 0 5Serbia 26,280 23,628 4,531 2,514 0 1,179Seychelles 1,308 526 50 154 230 93Sierra Leone 348 308 243 65 0 0Solomon Islands 178 173 121 26 0 1Somalia 2,944 1,979 808 1,132 0 38South Africa 43,380 26,822 314 0 7,593 5,960Sri Lanka 14,020 12,137 5,363 4,979 565 971St. Kitts and Nevis 274 273 106 42 19 106St. Lucia 441 267 164 28 0 76St. Vincent and the Grenadines 253 199 106 28 0 66Sudan 19,126 12,337 2,994 6,906 0 2,438Swaziland 393 357 240 76 0 41Tajikistan 1,228 1,105 667 398 0 0Tanzania 5,063 3,688 2,163 1,396 0 125Thailand 63,067 41,427 288 5,940 2,566 1,049Togo 1,968 1,655 1,011 644 0 0Tonga 91 90 78 11 0 0Tunisia 20,231 16,579 6,255 3,317 3,899 3,108
G L O B A L D E V E L O P M E N T F I N A N C E 2 0 0 9
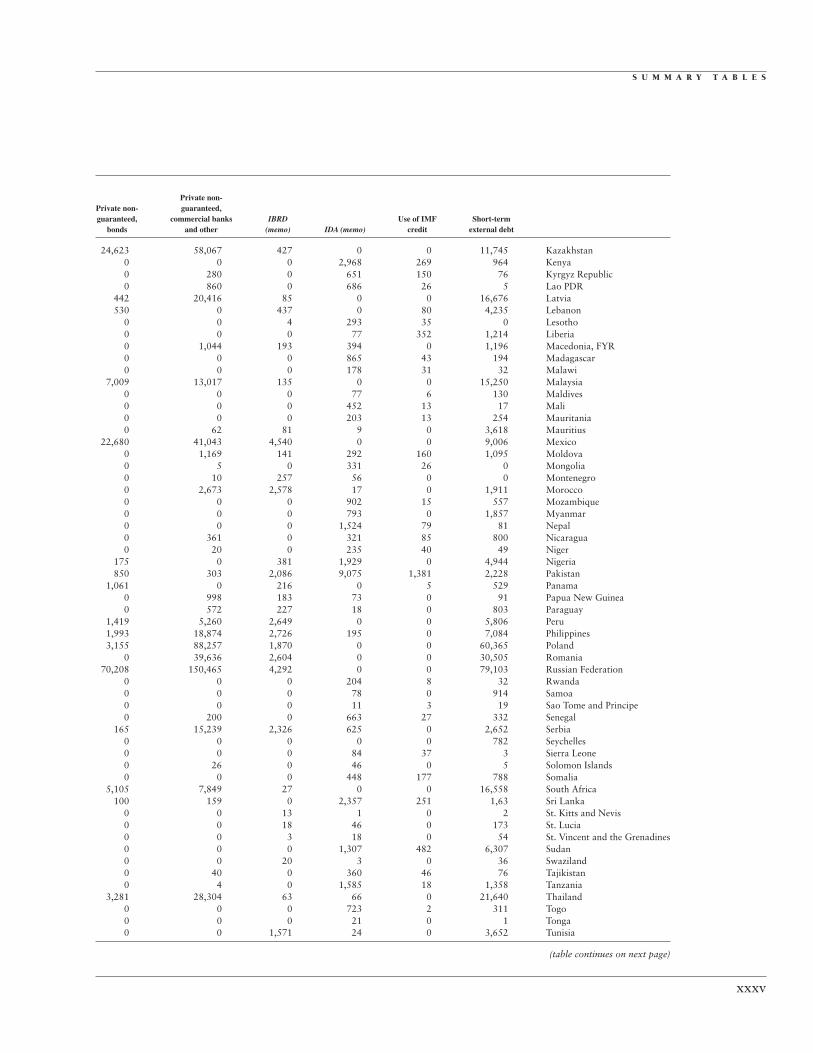
Private non-Private non- guaranteed,guaranteed, commercial banks IBRD Use of IMF Short-term
bonds and other (memo) IDA (memo) credit external debt
24,623 58,067 427 0 0 11,745 Kazakhstan0 0 0 2,968 269 964 Kenya0 280 0 651 150 76 Kyrgyz Republic0 860 0 686 26 5 Lao PDR
442 20,416 85 0 0 16,676 Latvia530 0 437 0 80 4,235 Lebanon
0 0 4 293 35 0 Lesotho0 0 0 77 352 1,214 Liberia0 1,044 193 394 0 1,196 Macedonia, FYR0 0 0 865 43 194 Madagascar0 0 0 178 31 32 Malawi
7,009 13,017 135 0 0 15,250 Malaysia0 0 0 77 6 130 Maldives0 0 0 452 13 17 Mali0 0 0 203 13 254 Mauritania0 62 81 9 0 3,618 Mauritius
22,680 41,043 4,540 0 0 9,006 Mexico0 1,169 141 292 160 1,095 Moldova0 5 0 331 26 0 Mongolia0 10 257 56 0 0 Montenegro0 2,673 2,578 17 0 1,911 Morocco0 0 0 902 15 557 Mozambique0 0 0 793 0 1,857 Myanmar0 0 0 1,524 79 81 Nepal0 361 0 321 85 800 Nicaragua0 20 0 235 40 49 Niger
175 0 381 1,929 0 4,944 Nigeria850 303 2,086 9,075 1,381 2,228 Pakistan
1,061 0 216 0 5 529 Panama0 998 183 73 0 91 Papua New Guinea0 572 227 18 0 803 Paraguay
1,419 5,260 2,649 0 0 5,806 Peru1,993 18,874 2,726 195 0 7,084 Philippines3,155 88,257 1,870 0 0 60,365 Poland
0 39,636 2,604 0 0 30,505 Romania70,208 150,465 4,292 0 0 79,103 Russian Federation
0 0 0 204 8 32 Rwanda0 0 0 78 0 914 Samoa0 0 0 11 3 19 Sao Tome and Principe0 200 0 663 27 332 Senegal
165 15,239 2,326 625 0 2,652 Serbia0 0 0 0 0 782 Seychelles0 0 0 84 37 3 Sierra Leone0 26 0 46 0 5 Solomon Islands0 0 0 448 177 788 Somalia
5,105 7,849 27 0 0 16,558 South Africa100 159 0 2,357 251 1,63 Sri Lanka
0 0 13 1 0 2 St. Kitts and Nevis0 0 18 46 0 173 St. Lucia0 0 3 18 0 54 St. Vincent and the Grenadines0 0 0 1,307 482 6,307 Sudan0 0 20 3 0 36 Swaziland0 40 0 360 46 76 Tajikistan0 4 0 1,585 18 1,358 Tanzania
3,281 28,304 63 66 0 21,640 Thailand0 0 0 723 2 311 Togo0 0 0 21 0 1 Tonga0 0 1,571 24 0 3,652 Tunisia
xxxv
(table continues on next page)
S U M M A R Y T A B L E S
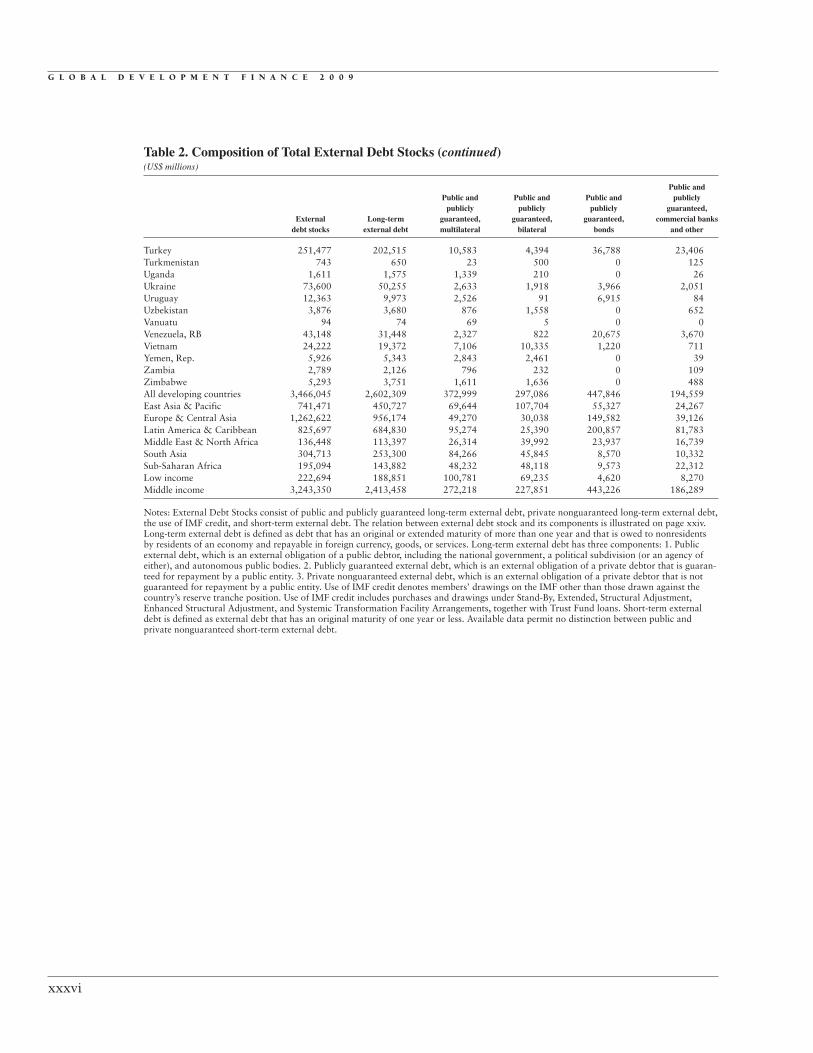
xxxvi
Table 2. Composition of Total External Debt Stocks (continued)(US$ millions)
Public andPublic and Public and Public and publicly
publicly publicly publicly guaranteed,External Long-term guaranteed, guaranteed, guaranteed, commercial banks
debt stocks external debt multilateral bilateral bonds and other
Turkey 251,477 202,515 10,583 4,394 36,788 23,406Turkmenistan 743 650 23 500 0 125Uganda 1,611 1,575 1,339 210 0 26Ukraine 73,600 50,255 2,633 1,918 3,966 2,051Uruguay 12,363 9,973 2,526 91 6,915 84Uzbekistan 3,876 3,680 876 1,558 0 652Vanuatu 94 74 69 5 0 0Venezuela, RB 43,148 31,448 2,327 822 20,675 3,670Vietnam 24,222 19,372 7,106 10,335 1,220 711Yemen, Rep. 5,926 5,343 2,843 2,461 0 39Zambia 2,789 2,126 796 232 0 109Zimbabwe 5,293 3,751 1,611 1,636 0 488All developing countries 3,466,045 2,602,309 372,999 297,086 447,846 194,559East Asia & Pacific 741,471 450,727 69,644 107,704 55,327 24,267Europe & Central Asia 1,262,622 956,174 49,270 30,038 149,582 39,126Latin America & Caribbean 825,697 684,830 95,274 25,390 200,857 81,783Middle East & North Africa 136,448 113,397 26,314 39,992 23,937 16,739South Asia 304,713 253,300 84,266 45,845 8,570 10,332Sub-Saharan Africa 195,094 143,882 48,232 48,118 9,573 22,312Low income 222,694 188,851 100,781 69,235 4,620 8,270Middle income 3,243,350 2,413,458 272,218 227,851 443,226 186,289
Notes: External Debt Stocks consist of public and publicly guaranteed long-term external debt, private nonguaranteed long-term external debt,the use of IMF credit, and short-term external debt. The relation between external debt stock and its components is illustrated on page xxiv.Long-term external debt is defined as debt that has an original or extended maturity of more than one year and that is owed to nonresidentsby residents of an economy and repayable in foreign currency, goods, or services. Long-term external debt has three components: 1. Publicexternal debt, which is an external obligation of a public debtor, including the national government, a political subdivision (or an agency ofeither), and autonomous public bodies. 2. Publicly guaranteed external debt, which is an external obligation of a private debtor that is guaran-teed for repayment by a public entity. 3. Private nonguaranteed external debt, which is an external obligation of a private debtor that is notguaranteed for repayment by a public entity. Use of IMF credit denotes members’ drawings on the IMF other than those drawn against thecountry’s reserve tranche position. Use of IMF credit includes purchases and drawings under Stand-By, Extended, Structural Adjustment,Enhanced Structural Adjustment, and Systemic Transformation Facility Arrangements, together with Trust Fund loans. Short-term externaldebt is defined as external debt that has an original maturity of one year or less. Available data permit no distinction between public andprivate nonguaranteed short-term external debt.
G L O B A L D E V E L O P M E N T F I N A N C E 2 0 0 9

xxxvii
Private non-Private non- guaranteed,guaranteed, commercial banks IBRD Use of IMF Short-term
bonds and other (memo) IDA (memo) credit external debt
6,662 120,683 7,541 59 7,158 41,803 Turkey0 2 15 0 0 93 Turkmenistan0 0 0 840 9 26 Uganda
4,185 35,502 2,309 0 431 22,914 Ukraine287 70 666 0 0 2,390 Uruguay
0 594 317 43 0 196 Uzbekistan0 0 0 13 0 20 Vanuatu
2,960 994 0 0 0 11,700 Venezuela, RB0 0 0 4,549 164 4,687 Vietnam0 0 0 2,058 169 413 Yemen, Rep.0 990 0 323 87 575 Zambia0 16 455 522 118 1,424 Zimbabwe
258,396 1,031,423 96,858 108,844 15,540 848,195 All developing countries28,666 165,119 21,693 19,086 215 290,530 East Asia & Pacific
111,079 577,079 25,610 6,862 8,550 297,898 Europe & Central Asia96,010 185,517 31,534 1,692 804 140,062 Latin America Caribbean
1,280 5,135 7,447 3,776 353 22,698 Middle East & North Africa16,082 88,206 9,051 50,075 2,277 49,136 South Asia
5,280 10,367 1,524 27,354 3,341 47,870 Sub-Saharan Africa1,025 4,920 3,925 56,002 5,361 28,482 Low income
257,371 1,026,503 92,933 52,842 10,179 819,713 Middle income
S U M M A R Y T A B L E S


1
Regional and income groupaggregate tables
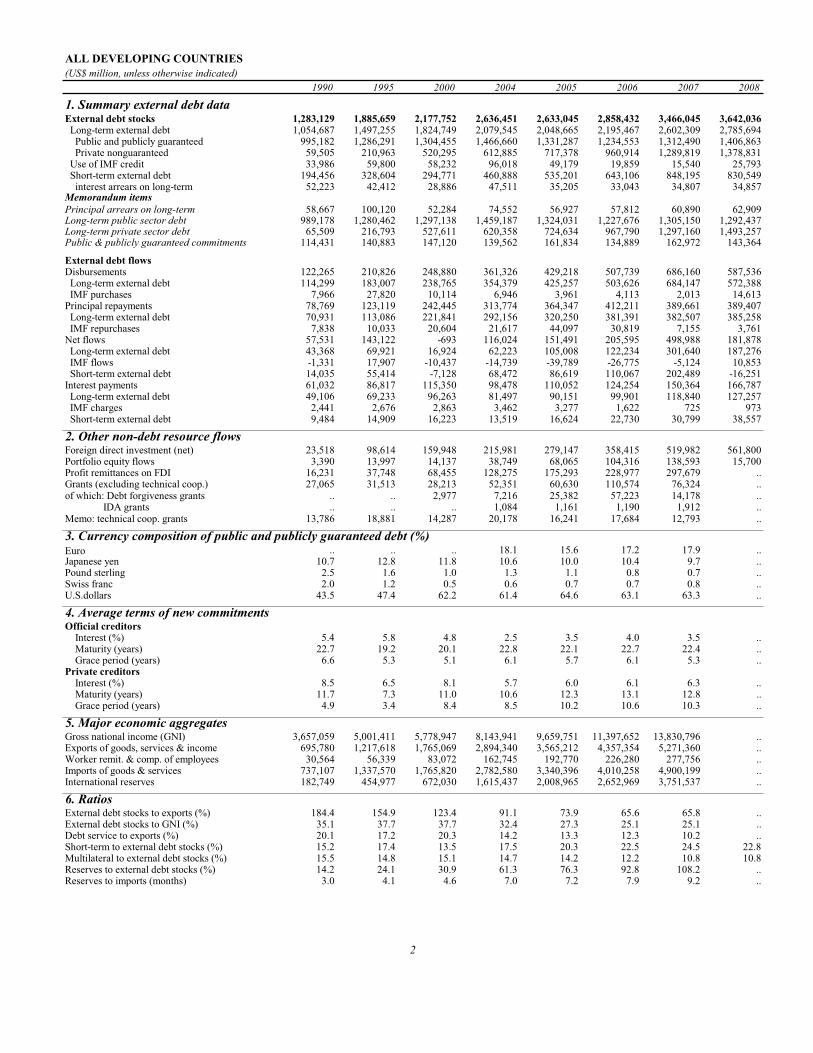
ALL DEVELOPING COUNTRIES(US$ million, unless otherwise indicated)
1990 1995 2000 2004 2005 2006 2007 2008
1. Summary external debt dataExternal debt stocks 1,283,129 1,885,659 2,177,752 2,636,451 2,633,045 2,858,432 3,466,045 3,642,036 Long-term external debt 1,054,687 1,497,255 1,824,749 2,079,545 2,048,665 2,195,467 2,602,309 2,785,694 Public and publicly guaranteed 995,182 1,286,291 1,304,455 1,466,660 1,331,287 1,234,553 1,312,490 1,406,863 Private nonguaranteed 59,505 210,963 520,295 612,885 717,378 960,914 1,289,819 1,378,831 Use of IMF credit 33,986 59,800 58,232 96,018 49,179 19,859 15,540 25,793 Short-term external debt 194,456 328,604 294,771 460,888 535,201 643,106 848,195 830,549 interest arrears on long-term 52,223 42,412 28,886 47,511 35,205 33,043 34,807 34,857Memorandum itemsPrincipal arrears on long-term 58,667 100,120 52,284 74,552 56,927 57,812 60,890 62,909Long-term public sector debt 989,178 1,280,462 1,297,138 1,459,187 1,324,031 1,227,676 1,305,150 1,292,437Long-term private sector debt 65,509 216,793 527,611 620,358 724,634 967,790 1,297,160 1,493,257Public & publicly guaranteed commitments 114,431 140,883 147,120 139,562 161,834 134,889 162,972 143,364
External debt flowsDisbursements 122,265 210,826 248,880 361,326 429,218 507,739 686,160 587,536 Long-term external debt 114,299 183,007 238,765 354,379 425,257 503,626 684,147 572,388 IMF purchases 7,966 27,820 10,114 6,946 3,961 4,113 2,013 14,613Principal repayments 78,769 123,119 242,445 313,774 364,347 412,211 389,661 389,407 Long-term external debt 70,931 113,086 221,841 292,156 320,250 381,391 382,507 385,258 IMF repurchases 7,838 10,033 20,604 21,617 44,097 30,819 7,155 3,761Net flows 57,531 143,122 -693 116,024 151,491 205,595 498,988 181,878 Long-term external debt 43,368 69,921 16,924 62,223 105,008 122,234 301,640 187,276 IMF flows -1,331 17,907 -10,437 -14,739 -39,789 -26,775 -5,124 10,853 Short-term external debt 14,035 55,414 -7,128 68,472 86,619 110,067 202,489 -16,251Interest payments 61,032 86,817 115,350 98,478 110,052 124,254 150,364 166,787 Long-term external debt 49,106 69,233 96,263 81,497 90,151 99,901 118,840 127,257 IMF charges 2,441 2,676 2,863 3,462 3,277 1,622 725 973 Short-term external debt 9,484 14,909 16,223 13,519 16,624 22,730 30,799 38,557
2. Other non-debt resource flowsForeign direct investment (net) 23,518 98,614 159,948 215,981 279,147 358,415 519,982 561,800Portfolio equity flows 3,390 13,997 14,137 38,749 68,065 104,316 138,593 15,700Profit remittances on FDI 16,231 37,748 68,455 128,275 175,293 228,977 297,679 ..Grants (excluding technical coop.) 27,065 31,513 28,213 52,351 60,630 110,574 76,324 ..of which: Debt forgiveness grants .. .. 2,977 7,216 25,382 57,223 14,178 .. IDA grants .. .. .. 1,084 1,161 1,190 1,912 ..Memo: technical coop. grants 13,786 18,881 14,287 20,178 16,241 17,684 12,793 ..
3. Currency composition of public and publicly guaranteed debt (%)Euro .. .. .. 18.1 15.6 17.2 17.9 ..Japanese yen 10.7 12.8 11.8 10.6 10.0 10.4 9.7 ..Pound sterling 2.5 1.6 1.0 1.3 1.1 0.8 0.7 ..Swiss franc 2.0 1.2 0.5 0.6 0.7 0.7 0.8 ..U.S.dollars 43.5 47.4 62.2 61.4 64.6 63.1 63.3 ..
4. Average terms of new commitmentsOfficial creditors Interest (%) 5.4 5.8 4.8 2.5 3.5 4.0 3.5 .. Maturity (years) 22.7 19.2 20.1 22.8 22.1 22.7 22.4 .. Grace period (years) 6.6 5.3 5.1 6.1 5.7 6.1 5.3 ..Private creditors Interest (%) 8.5 6.5 8.1 5.7 6.0 6.1 6.3 .. Maturity (years) 11.7 7.3 11.0 10.6 12.3 13.1 12.8 .. Grace period (years) 4.9 3.4 8.4 8.5 10.2 10.6 10.3 ..
5. Major economic aggregatesGross national income (GNI) 3,657,059 5,001,411 5,778,947 8,143,941 9,659,751 11,397,652 13,830,796 ..Exports of goods, services & income 695,780 1,217,618 1,765,069 2,894,340 3,565,212 4,357,354 5,271,360 ..Worker remit. & comp. of employees 30,564 56,339 83,072 162,745 192,770 226,280 277,756 ..Imports of goods & services 737,107 1,337,570 1,765,820 2,782,580 3,340,396 4,010,258 4,900,199 ..International reserves 182,749 454,977 672,030 1,615,437 2,008,965 2,652,969 3,751,537 ..
6. RatiosExternal debt stocks to exports (%) 184.4 154.9 123.4 91.1 73.9 65.6 65.8 ..External debt stocks to GNI (%) 35.1 37.7 37.7 32.4 27.3 25.1 25.1 ..Debt service to exports (%) 20.1 17.2 20.3 14.2 13.3 12.3 10.2 ..Short-term to external debt stocks (%) 15.2 17.4 13.5 17.5 20.3 22.5 24.5 22.8Multilateral to external debt stocks (%) 15.5 14.8 15.1 14.7 14.2 12.2 10.8 10.8Reserves to external debt stocks (%) 14.2 24.1 30.9 61.3 76.3 92.8 108.2 ..Reserves to imports (months) 3.0 4.1 4.6 7.0 7.2 7.9 9.2 ..
2
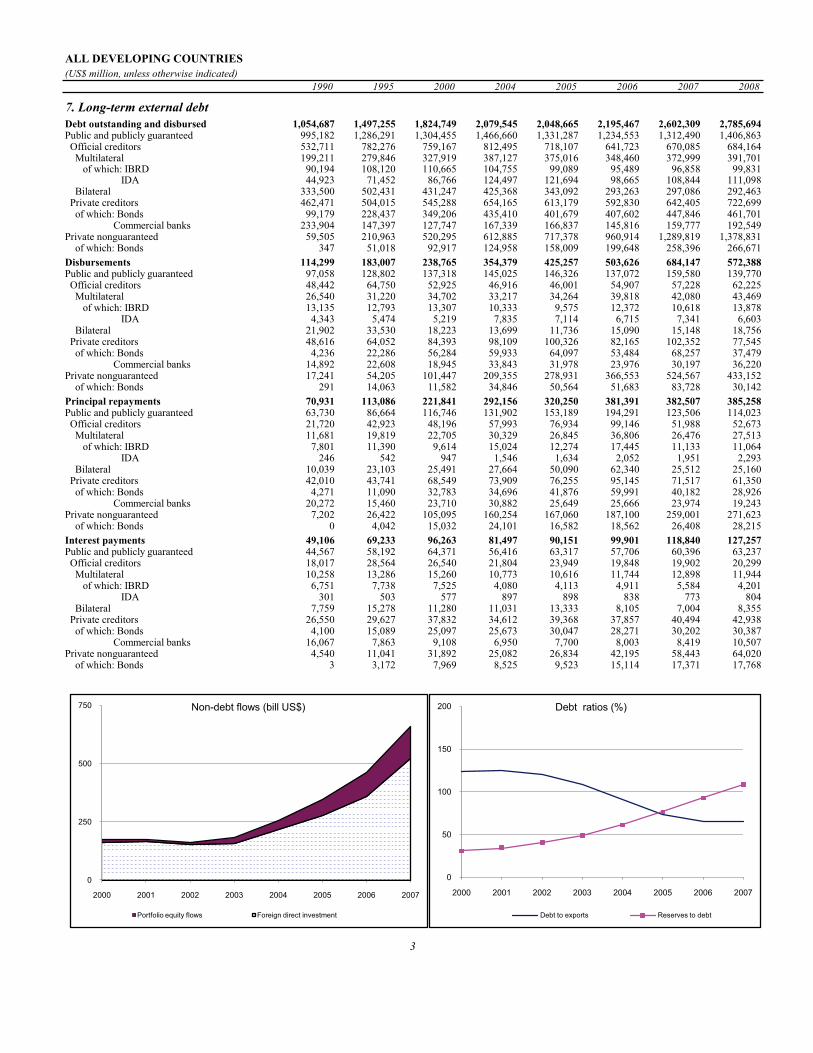
ALL DEVELOPING COUNTRIES(US$ million, unless otherwise indicated)
1990 1995 2000 2004 2005 2006 2007 2008
7. Long-term external debtDebt outstanding and disbursed 1,054,687 1,497,255 1,824,749 2,079,545 2,048,665 2,195,467 2,602,309 2,785,694Public and publicly guaranteed 995,182 1,286,291 1,304,455 1,466,660 1,331,287 1,234,553 1,312,490 1,406,863 Official creditors 532,711 782,276 759,167 812,495 718,107 641,723 670,085 684,164 Multilateral 199,211 279,846 327,919 387,127 375,016 348,460 372,999 391,701 of which: IBRD 90,194 108,120 110,665 104,755 99,089 95,489 96,858 99,831 IDA 44,923 71,452 86,766 124,497 121,694 98,665 108,844 111,098 Bilateral 333,500 502,431 431,247 425,368 343,092 293,263 297,086 292,463 Private creditors 462,471 504,015 545,288 654,165 613,179 592,830 642,405 722,699 of which: Bonds 99,179 228,437 349,206 435,410 401,679 407,602 447,846 461,701 Commercial banks 233,904 147,397 127,747 167,339 166,837 145,816 159,777 192,549Private nonguaranteed 59,505 210,963 520,295 612,885 717,378 960,914 1,289,819 1,378,831 of which: Bonds 347 51,018 92,917 124,958 158,009 199,648 258,396 266,671Disbursements 114,299 183,007 238,765 354,379 425,257 503,626 684,147 572,388Public and publicly guaranteed 97,058 128,802 137,318 145,025 146,326 137,072 159,580 139,770 Official creditors 48,442 64,750 52,925 46,916 46,001 54,907 57,228 62,225 Multilateral 26,540 31,220 34,702 33,217 34,264 39,818 42,080 43,469 of which: IBRD 13,135 12,793 13,307 10,333 9,575 12,372 10,618 13,878 IDA 4,343 5,474 5,219 7,835 7,114 6,715 7,341 6,603 Bilateral 21,902 33,530 18,223 13,699 11,736 15,090 15,148 18,756 Private creditors 48,616 64,052 84,393 98,109 100,326 82,165 102,352 77,545 of which: Bonds 4,236 22,286 56,284 59,933 64,097 53,484 68,257 37,479 Commercial banks 14,892 22,608 18,945 33,843 31,978 23,976 30,197 36,220Private nonguaranteed 17,241 54,205 101,447 209,355 278,931 366,553 524,567 433,152 of which: Bonds 291 14,063 11,582 34,846 50,564 51,683 83,728 30,142Principal repayments 70,931 113,086 221,841 292,156 320,250 381,391 382,507 385,258Public and publicly guaranteed 63,730 86,664 116,746 131,902 153,189 194,291 123,506 114,023 Official creditors 21,720 42,923 48,196 57,993 76,934 99,146 51,988 52,673 Multilateral 11,681 19,819 22,705 30,329 26,845 36,806 26,476 27,513 of which: IBRD 7,801 11,390 9,614 15,024 12,274 17,445 11,133 11,064 IDA 246 542 947 1,546 1,634 2,052 1,951 2,293 Bilateral 10,039 23,103 25,491 27,664 50,090 62,340 25,512 25,160 Private creditors 42,010 43,741 68,549 73,909 76,255 95,145 71,517 61,350 of which: Bonds 4,271 11,090 32,783 34,696 41,876 59,991 40,182 28,926 Commercial banks 20,272 15,460 23,710 30,882 25,649 25,666 23,974 19,243Private nonguaranteed 7,202 26,422 105,095 160,254 167,060 187,100 259,001 271,623 of which: Bonds 0 4,042 15,032 24,101 16,582 18,562 26,408 28,215Interest payments 49,106 69,233 96,263 81,497 90,151 99,901 118,840 127,257Public and publicly guaranteed 44,567 58,192 64,371 56,416 63,317 57,706 60,396 63,237 Official creditors 18,017 28,564 26,540 21,804 23,949 19,848 19,902 20,299 Multilateral 10,258 13,286 15,260 10,773 10,616 11,744 12,898 11,944 of which: IBRD 6,751 7,738 7,525 4,080 4,113 4,911 5,584 4,201 IDA 301 503 577 897 898 838 773 804 Bilateral 7,759 15,278 11,280 11,031 13,333 8,105 7,004 8,355 Private creditors 26,550 29,627 37,832 34,612 39,368 37,857 40,494 42,938 of which: Bonds 4,100 15,089 25,097 25,673 30,047 28,271 30,202 30,387 Commercial banks 16,067 7,863 9,108 6,950 7,700 8,003 8,419 10,507Private nonguaranteed 4,540 11,041 31,892 25,082 26,834 42,195 58,443 64,020 of which: Bonds 3 3,172 7,969 8,525 9,523 15,114 17,371 17,7688. Debt stock-flow reconciliationTotal change in external debt stocks 98,019 168,530 -60,021 165,968 -3,406 225,387 .. Net flows on external debt 57,531 143,122 -693 116,024 151,491 205,595 498,988 317,618 Cross-currency valuation 44,772 875 -51,185 36,160 -76,038 -3,639 47,635 ..9. Debt restructuringsTotal amount rescheduled 79,064 31,784 60,679 7,590 31,133 5,569 2,358 ..Total amount forgiven 12,603 2,244 931 4,832 9,861 85,519 3,060 ..Debt buyback 4,359 162 17,016 0 316 203 3,566 ..
3
0
250
500
750
2000 2001 2002 2003 2004 2005 2006 2007
Non-debt flows (bill US$)
Portfolio equity flows Foreign direct investment
0
50
100
150
200
2000 2001 2002 2003 2004 2005 2006 2007
Debt ratios (%)
Debt to exports Reserves to debt

EAST ASIA AND PACIFIC(US$ million, unless otherwise indicated)
1990 1995 2000 2004 2005 2006 2007 2008
1. Summary external debt dataExternal debt stocks 234,080 455,608 497,851 587,694 618,518 666,469 741,471 765,526 Long-term external debt 194,621 345,443 418,773 403,875 391,364 418,491 450,727 475,938 Public and publicly guaranteed 172,986 255,393 271,336 268,207 258,105 257,734 256,942 262,958 Private nonguaranteed 21,635 90,050 147,438 135,667 133,259 160,757 193,785 212,980 Use of IMF credit 2,085 1,337 16,452 10,964 8,545 239 215 171 Short-term external debt 37,374 108,828 62,626 172,856 218,609 247,740 290,530 289,417 interest arrears on long-term 1,885 2,952 5,334 8,467 8,849 8,821 8,931 8,899Memorandum itemsPrincipal arrears on long-term 2,965 10,943 7,415 15,931 15,842 15,886 16,359 16,242Long-term public sector debt 172,442 254,004 270,956 267,270 256,691 256,308 255,577 254,627Long-term private sector debt 22,179 91,439 147,818 136,605 134,673 162,183 195,150 221,310Public & publicly guaranteed commitments 23,347 46,438 26,963 25,046 24,503 17,748 27,942 25,156
External debt flowsDisbursements 29,503 59,109 41,429 61,215 73,475 71,423 84,614 72,166 Long-term external debt 29,445 58,907 39,936 61,215 73,475 71,423 84,614 72,166 IMF purchases 58 203 1,493 0 0 0 0 0Principal repayments 18,662 32,257 47,889 58,575 64,393 65,554 59,460 51,718 Long-term external debt 17,377 31,866 47,621 56,940 62,796 57,074 59,425 51,681 IMF repurchases 1,286 390 267 1,636 1,597 8,479 35 37Net flows 18,636 54,066 -16,300 35,327 54,453 35,027 67,789 14,785 Long-term external debt 12,068 27,040 -7,685 4,275 10,679 14,348 25,189 20,485 IMF flows -1,121 -338 1,242 -1,539 -1,523 -8,437 0 -37 Short-term external debt 7,795 27,213 -9,841 32,687 45,371 29,158 42,635 -5,663Interest payments 12,509 20,625 25,183 19,868 18,615 22,503 25,413 26,968 Long-term external debt 10,154 15,541 20,376 14,985 12,925 13,848 16,151 17,269 IMF charges 245 69 793 285 336 308 3 0 Short-term external debt 2,110 5,015 4,014 4,597 5,354 8,346 9,259 9,698
2. Other non-debt resource flowsForeign direct investment (net) 10,512 50,798 45,166 70,347 104,356 105,152 175,340 194,630Portfolio equity flows 440 3,746 6,589 19,313 25,683 56,229 35,168 7,400Profit remittances on FDI 5,159 15,885 31,681 40,619 47,096 55,932 70,996 ..Debt forgiveness grants .. .. 43 5 5 156 9 ..IDA grants .. .. .. 1 16 30 51 ..
3. Currency composition of public and publicly guaranteed debt (%)Euro .. .. .. 8.7 8.4 8.9 9.2 ..Japanese yen 29.1 28.2 28.3 28.4 26.8 25.6 24.5 ..Pound sterling 1.0 0.4 0.5 0.7 0.8 0.7 0.7 ..Swiss franc 1.0 0.5 0.2 0.3 0.3 0.2 0.2 ..U.S.dollars 23.6 36.7 55.8 54.0 56.5 57.7 58.4 ..
4. Average terms of new commitmentsOfficial creditors Interest (%) 4.9 5.3 3.8 2.2 3.1 4.4 2.9 .. Maturity (years) 24.6 22.0 26.9 25.0 24.8 24.4 21.5 .. Grace period (years) 7.1 5.6 6.3 6.6 6.5 6.5 5.8 ..Private creditors Interest (%) 8.3 6.4 6.8 5.3 5.7 6.6 5.7 .. Maturity (years) 14.1 9.6 11.9 8.7 10.4 14.8 15.7 .. Grace period (years) 3.5 4.4 4.5 6.8 8.2 8.9 11.7 ..
5. Major economic aggregatesGross national income (GNI) 659,141 1,283,954 1,683,914 2,624,598 3,024,183 3,613,427 4,355,630 ..Exports of goods, services & income 177,001 417,577 643,148 1,132,390 1,401,937 1,730,695 2,135,825 ..Worker remit. & comp. of employees 3,258 9,694 16,675 39,157 46,688 52,956 65,333 ..Imports of goods & services 182,910 452,272 606,342 1,064,740 1,249,935 1,459,290 1,742,777 ..International reserves 71,348 167,801 283,042 802,615 1,020,347 1,315,680 1,856,736 ..
6. RatiosExternal debt stocks to exports (%) 132.2 109.1 77.4 51.9 44.1 38.5 34.7 ..External debt stocks to GNI (%) 35.5 35.5 29.6 22.4 20.5 18.4 17.0 ..Debt service to exports (%) 17.6 12.7 11.4 6.9 5.9 5.1 4.0 ..Short-term to external debt stocks (%) 16.0 23.9 12.6 29.4 35.3 37.2 39.2 37.8Multilateral to external debt stocks (%) 14.9 11.8 13.2 11.3 10.4 10.0 9.4 9.3Reserves to external debt stocks (%) 30.5 36.8 56.9 136.6 165.0 197.4 250.4 ..Reserves to imports (months) 4.7 4.5 5.6 9.0 9.8 10.8 12.8 ..
4
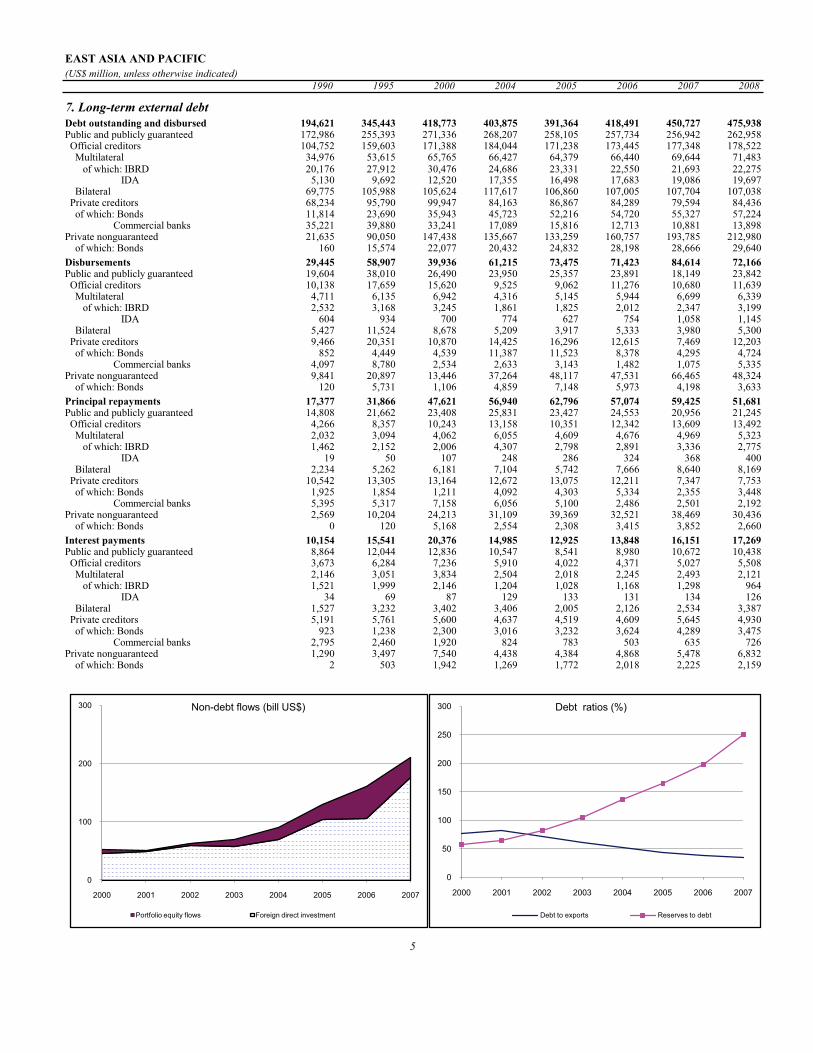
EAST ASIA AND PACIFIC(US$ million, unless otherwise indicated)
1990 1995 2000 2004 2005 2006 2007 2008
7. Long-term external debtDebt outstanding and disbursed 194,621 345,443 418,773 403,875 391,364 418,491 450,727 475,938Public and publicly guaranteed 172,986 255,393 271,336 268,207 258,105 257,734 256,942 262,958 Official creditors 104,752 159,603 171,388 184,044 171,238 173,445 177,348 178,522 Multilateral 34,976 53,615 65,765 66,427 64,379 66,440 69,644 71,483 of which: IBRD 20,176 27,912 30,476 24,686 23,331 22,550 21,693 22,275 IDA 5,130 9,692 12,520 17,355 16,498 17,683 19,086 19,697 Bilateral 69,775 105,988 105,624 117,617 106,860 107,005 107,704 107,038 Private creditors 68,234 95,790 99,947 84,163 86,867 84,289 79,594 84,436 of which: Bonds 11,814 23,690 35,943 45,723 52,216 54,720 55,327 57,224 Commercial banks 35,221 39,880 33,241 17,089 15,816 12,713 10,881 13,898Private nonguaranteed 21,635 90,050 147,438 135,667 133,259 160,757 193,785 212,980 of which: Bonds 160 15,574 22,077 20,432 24,832 28,198 28,666 29,640Disbursements 29,445 58,907 39,936 61,215 73,475 71,423 84,614 72,166Public and publicly guaranteed 19,604 38,010 26,490 23,950 25,357 23,891 18,149 23,842 Official creditors 10,138 17,659 15,620 9,525 9,062 11,276 10,680 11,639 Multilateral 4,711 6,135 6,942 4,316 5,145 5,944 6,699 6,339 of which: IBRD 2,532 3,168 3,245 1,861 1,825 2,012 2,347 3,199 IDA 604 934 700 774 627 754 1,058 1,145 Bilateral 5,427 11,524 8,678 5,209 3,917 5,333 3,980 5,300 Private creditors 9,466 20,351 10,870 14,425 16,296 12,615 7,469 12,203 of which: Bonds 852 4,449 4,539 11,387 11,523 8,378 4,295 4,724 Commercial banks 4,097 8,780 2,534 2,633 3,143 1,482 1,075 5,335Private nonguaranteed 9,841 20,897 13,446 37,264 48,117 47,531 66,465 48,324 of which: Bonds 120 5,731 1,106 4,859 7,148 5,973 4,198 3,633Principal repayments 17,377 31,866 47,621 56,940 62,796 57,074 59,425 51,681Public and publicly guaranteed 14,808 21,662 23,408 25,831 23,427 24,553 20,956 21,245 Official creditors 4,266 8,357 10,243 13,158 10,351 12,342 13,609 13,492 Multilateral 2,032 3,094 4,062 6,055 4,609 4,676 4,969 5,323 of which: IBRD 1,462 2,152 2,006 4,307 2,798 2,891 3,336 2,775 IDA 19 50 107 248 286 324 368 400 Bilateral 2,234 5,262 6,181 7,104 5,742 7,666 8,640 8,169 Private creditors 10,542 13,305 13,164 12,672 13,075 12,211 7,347 7,753 of which: Bonds 1,925 1,854 1,211 4,092 4,303 5,334 2,355 3,448 Commercial banks 5,395 5,317 7,158 6,056 5,100 2,486 2,501 2,192Private nonguaranteed 2,569 10,204 24,213 31,109 39,369 32,521 38,469 30,436 of which: Bonds 0 120 5,168 2,554 2,308 3,415 3,852 2,660Interest payments 10,154 15,541 20,376 14,985 12,925 13,848 16,151 17,269Public and publicly guaranteed 8,864 12,044 12,836 10,547 8,541 8,980 10,672 10,438 Official creditors 3,673 6,284 7,236 5,910 4,022 4,371 5,027 5,508 Multilateral 2,146 3,051 3,834 2,504 2,018 2,245 2,493 2,121 of which: IBRD 1,521 1,999 2,146 1,204 1,028 1,168 1,298 964 IDA 34 69 87 129 133 131 134 126 Bilateral 1,527 3,232 3,402 3,406 2,005 2,126 2,534 3,387 Private creditors 5,191 5,761 5,600 4,637 4,519 4,609 5,645 4,930 of which: Bonds 923 1,238 2,300 3,016 3,232 3,624 4,289 3,475 Commercial banks 2,795 2,460 1,920 824 783 503 635 726Private nonguaranteed 1,290 3,497 7,540 4,438 4,384 4,868 5,478 6,832 of which: Bonds 2 503 1,942 1,269 1,772 2,018 2,225 2,1598. Debt stock-flow reconciliationTotal change in external debt stocks 30,302 71,910 -41,123 46,190 30,824 47,951 .. Net flows on external debt 18,636 54,066 -16,300 35,327 54,453 35,027 67,789 48,447 Cross-currency valuation 10,348 -1,773 -13,908 5,481 -15,815 3,701 7,516 ..9. Debt restructuringsTotal amount rescheduled 1,478 314 2,468 0 2,809 3 1 ..Total amount forgiven 0 44 5 5 8 35 6 ..Debt buyback 721 0 0 0 0 0 0 ..
5
0
100
200
300
2000 2001 2002 2003 2004 2005 2006 2007
Non-debt flows (bill US$)
Portfolio equity flows Foreign direct investment
0
50
100
150
200
250
300
2000 2001 2002 2003 2004 2005 2006 2007
Debt ratios (%)
Debt to exports Reserves to debt

EUROPE AND CENTRAL ASIA(US$ million, unless otherwise indicated)
1990 1995 2000 2004 2005 2006 2007 2008
1. Summary external debt dataExternal debt stocks 187,631 293,781 440,432 662,155 730,741 911,413 1,262,622 1,367,018 Long-term external debt 152,958 244,132 349,687 507,608 567,714 701,957 956,174 1,062,844 Public and publicly guaranteed 148,037 231,636 252,088 281,028 241,886 233,318 268,016 299,963 Private nonguaranteed 4,921 12,497 97,599 226,579 325,828 468,640 688,158 762,881 Use of IMF credit 975 15,747 21,740 30,709 18,810 13,088 8,550 15,174 Short-term external debt 33,697 33,902 69,004 123,838 144,217 196,367 297,898 288,999 interest arrears on long-term 13,041 8,025 8,671 4,139 4,176 1,639 1,709 1,805Memorandum itemsPrincipal arrears on long-term 6,324 29,188 14,289 4,169 4,153 2,903 2,950 3,151Long-term public sector debt 147,279 230,580 250,927 279,793 240,828 232,413 266,865 280,707Long-term private sector debt 5,679 13,552 98,760 227,814 326,886 469,545 689,308 782,137Public & publicly guaranteed commitments 25,076 15,149 22,706 26,254 32,805 30,025 50,413 61,869
External debt flowsDisbursements 25,064 24,707 53,879 139,526 196,015 241,320 346,396 311,008 Long-term external debt 24,489 16,647 49,510 137,884 193,226 238,239 345,151 301,525 IMF purchases 575 8,060 4,369 1,642 2,789 3,081 1,245 9,483Principal repayments 16,486 15,272 40,608 94,828 130,783 142,448 162,572 178,239 Long-term external debt 16,084 13,220 35,689 87,314 118,223 133,558 156,292 175,774 IMF repurchases 402 2,052 4,919 7,513 12,560 8,889 6,280 2,465Net flows 1,930 14,967 21,175 65,107 85,574 153,559 285,107 127,114 Long-term external debt 8,405 3,427 13,821 50,569 75,002 104,681 188,860 125,751 IMF flows 172 5,951 -616 -5,839 -9,730 -5,789 -4,985 7,018 Short-term external debt -6,647 5,532 7,905 20,409 20,342 54,687 101,283 -5,655Interest payments 9,823 11,208 19,565 25,522 30,112 37,799 56,685 66,206 Long-term external debt 7,739 9,379 15,226 20,644 23,938 30,343 45,688 49,464 IMF charges 93 603 1,062 1,200 1,125 905 638 426 Short-term external debt 1,991 1,226 3,277 3,678 5,049 6,551 10,359 16,315
2. Other non-debt resource flowsForeign direct investment (net) 2,617 9,485 19,778 55,486 62,829 114,943 154,419 156,130Portfolio equity flows 89 465 1,311 3,641 7,994 10,456 26,398 -8,400Profit remittances on FDI 181 1,669 3,778 29,194 42,516 69,451 92,929 ..Debt forgiveness grants .. .. 35 1,396 717 5,389 32 ..IDA grants .. .. .. 2 16 36 57 ..
3. Currency composition of public and publicly guaranteed debt (%)Euro .. .. .. 32.9 29.6 32.9 33.4 ..Japanese yen 5.4 7.4 5.2 4.1 4.4 4.8 4.3 ..Pound sterling 2.0 1.1 0.7 0.8 0.5 0.5 0.4 ..Swiss franc 6.7 2.5 0.6 0.7 1.7 1.7 2.1 ..U.S.dollars 34.2 47.1 61.6 57.2 60.2 56.4 57.1 ..
4. Average terms of new commitmentsOfficial creditors Interest (%) 7.7 5.7 5.7 3.1 2.6 3.9 4.3 .. Maturity (years) 14.1 17.0 17.6 18.3 21.9 18.6 18.6 .. Grace period (years) 6.1 5.4 5.2 6.1 6.4 5.8 6.0 ..Private creditors Interest (%) 8.5 6.4 8.4 5.3 4.6 5.7 5.7 .. Maturity (years) 11.8 5.6 9.8 9.6 14.0 11.9 10.0 .. Grace period (years) 6.5 2.6 7.5 8.1 13.3 10.9 9.0 ..
5. Major economic aggregatesGross national income (GNI) 1,068,300 980,239 874,007 1,577,812 1,973,292 2,372,227 3,043,072 ..Exports of goods, services & income 0 251,159 323,708 612,803 761,249 941,317 1,170,201 ..Worker remit. & comp. of employees 3,382 7,854 12,734 21,853 30,684 37,319 48,950 ..Imports of goods & services 0 264,149 313,945 617,086 750,367 955,533 1,249,568 ..International reserves 0 59,264 97,722 268,709 361,667 542,066 785,130 ..
6. RatiosExternal debt stocks to exports (%) 0.0 117.0 136.1 108.1 96.0 96.8 107.9 ..External debt stocks to GNI (%) 17.6 30.0 50.4 42.0 37.0 38.4 41.5 ..Debt service to exports (%) 0.0 10.5 18.6 19.6 21.1 19.1 18.7 ..Short-term to external debt stocks (%) 18.0 11.5 15.7 18.7 19.7 21.5 23.6 21.1Multilateral to external debt stocks (%) 7.4 7.2 7.2 6.6 5.6 4.9 3.9 3.8Reserves to external debt stocks (%) 0.0 20.2 22.2 40.6 49.5 59.5 62.2 ..Reserves to imports (months) 0.0 2.7 3.7 5.2 5.8 6.8 7.5 ..
6
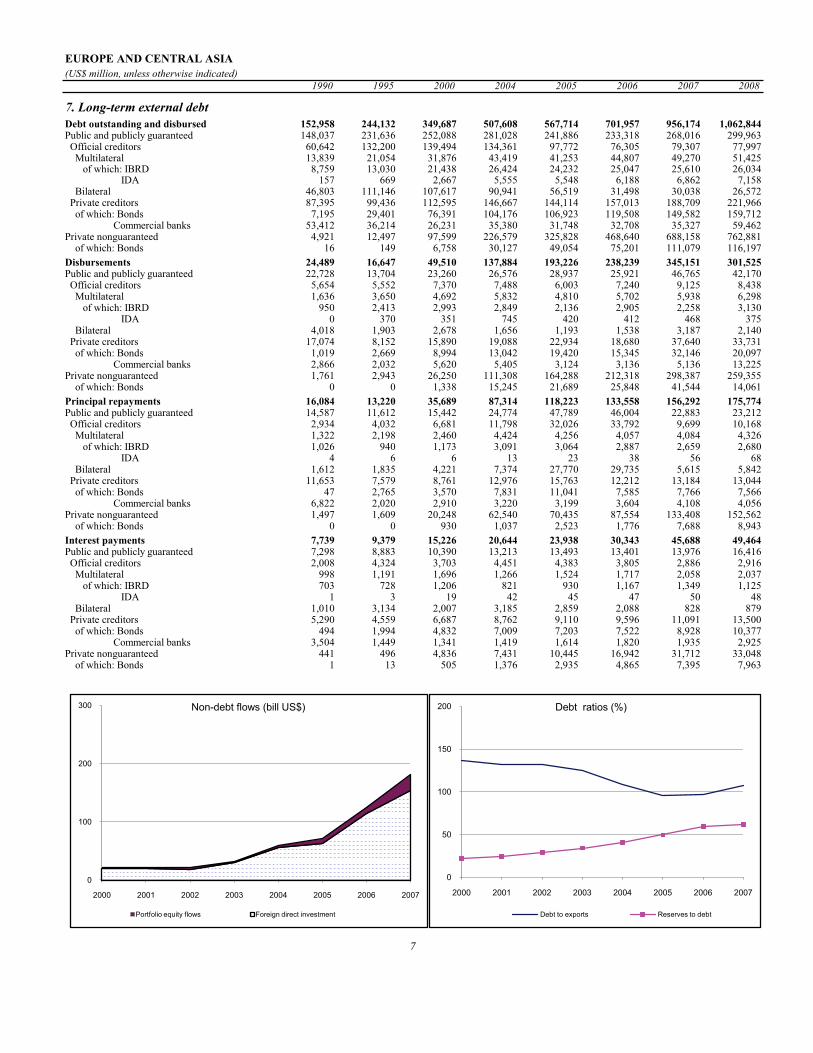
EUROPE AND CENTRAL ASIA(US$ million, unless otherwise indicated)
1990 1995 2000 2004 2005 2006 2007 2008
7. Long-term external debtDebt outstanding and disbursed 152,958 244,132 349,687 507,608 567,714 701,957 956,174 1,062,844Public and publicly guaranteed 148,037 231,636 252,088 281,028 241,886 233,318 268,016 299,963 Official creditors 60,642 132,200 139,494 134,361 97,772 76,305 79,307 77,997 Multilateral 13,839 21,054 31,876 43,419 41,253 44,807 49,270 51,425 of which: IBRD 8,759 13,030 21,438 26,424 24,232 25,047 25,610 26,034 IDA 157 669 2,667 5,555 5,548 6,188 6,862 7,158 Bilateral 46,803 111,146 107,617 90,941 56,519 31,498 30,038 26,572 Private creditors 87,395 99,436 112,595 146,667 144,114 157,013 188,709 221,966 of which: Bonds 7,195 29,401 76,391 104,176 106,923 119,508 149,582 159,712 Commercial banks 53,412 36,214 26,231 35,380 31,748 32,708 35,327 59,462Private nonguaranteed 4,921 12,497 97,599 226,579 325,828 468,640 688,158 762,881 of which: Bonds 16 149 6,758 30,127 49,054 75,201 111,079 116,197Disbursements 24,489 16,647 49,510 137,884 193,226 238,239 345,151 301,525Public and publicly guaranteed 22,728 13,704 23,260 26,576 28,937 25,921 46,765 42,170 Official creditors 5,654 5,552 7,370 7,488 6,003 7,240 9,125 8,438 Multilateral 1,636 3,650 4,692 5,832 4,810 5,702 5,938 6,298 of which: IBRD 950 2,413 2,993 2,849 2,136 2,905 2,258 3,130 IDA 0 370 351 745 420 412 468 375 Bilateral 4,018 1,903 2,678 1,656 1,193 1,538 3,187 2,140 Private creditors 17,074 8,152 15,890 19,088 22,934 18,680 37,640 33,731 of which: Bonds 1,019 2,669 8,994 13,042 19,420 15,345 32,146 20,097 Commercial banks 2,866 2,032 5,620 5,405 3,124 3,136 5,136 13,225Private nonguaranteed 1,761 2,943 26,250 111,308 164,288 212,318 298,387 259,355 of which: Bonds 0 0 1,338 15,245 21,689 25,848 41,544 14,061Principal repayments 16,084 13,220 35,689 87,314 118,223 133,558 156,292 175,774Public and publicly guaranteed 14,587 11,612 15,442 24,774 47,789 46,004 22,883 23,212 Official creditors 2,934 4,032 6,681 11,798 32,026 33,792 9,699 10,168 Multilateral 1,322 2,198 2,460 4,424 4,256 4,057 4,084 4,326 of which: IBRD 1,026 940 1,173 3,091 3,064 2,887 2,659 2,680 IDA 4 6 6 13 23 38 56 68 Bilateral 1,612 1,835 4,221 7,374 27,770 29,735 5,615 5,842 Private creditors 11,653 7,579 8,761 12,976 15,763 12,212 13,184 13,044 of which: Bonds 47 2,765 3,570 7,831 11,041 7,585 7,766 7,566 Commercial banks 6,822 2,020 2,910 3,220 3,199 3,604 4,108 4,056Private nonguaranteed 1,497 1,609 20,248 62,540 70,435 87,554 133,408 152,562 of which: Bonds 0 0 930 1,037 2,523 1,776 7,688 8,943Interest payments 7,739 9,379 15,226 20,644 23,938 30,343 45,688 49,464Public and publicly guaranteed 7,298 8,883 10,390 13,213 13,493 13,401 13,976 16,416 Official creditors 2,008 4,324 3,703 4,451 4,383 3,805 2,886 2,916 Multilateral 998 1,191 1,696 1,266 1,524 1,717 2,058 2,037 of which: IBRD 703 728 1,206 821 930 1,167 1,349 1,125 IDA 1 3 19 42 45 47 50 48 Bilateral 1,010 3,134 2,007 3,185 2,859 2,088 828 879 Private creditors 5,290 4,559 6,687 8,762 9,110 9,596 11,091 13,500 of which: Bonds 494 1,994 4,832 7,009 7,203 7,522 8,928 10,377 Commercial banks 3,504 1,449 1,341 1,419 1,614 1,820 1,935 2,925Private nonguaranteed 441 496 4,836 7,431 10,445 16,942 31,712 33,048 of which: Bonds 1 13 505 1,376 2,935 4,865 7,395 7,9638. Debt stock-flow reconciliationTotal change in external debt stocks 18,674 17,094 10,524 88,606 68,586 180,672 .. Net flows on external debt 1,930 14,967 21,175 65,107 85,574 153,559 285,107 185,543 Cross-currency valuation 8,680 5,784 -8,364 8,185 -17,264 9,774 12,063 ..9. Debt restructuringsTotal amount rescheduled 3,559 11,111 29,177 3,189 588 1,376 39 ..Total amount forgiven 232 0 12 34 221 69,864 46 ..Debt buyback 882 30 943 0 0 0 0 ..
7
0
100
200
300
2000 2001 2002 2003 2004 2005 2006 2007
Non-debt flows (bill US$)
Portfolio equity flows Foreign direct investment
0
50
100
150
200
2000 2001 2002 2003 2004 2005 2006 2007
Debt ratios (%)
Debt to exports Reserves to debt
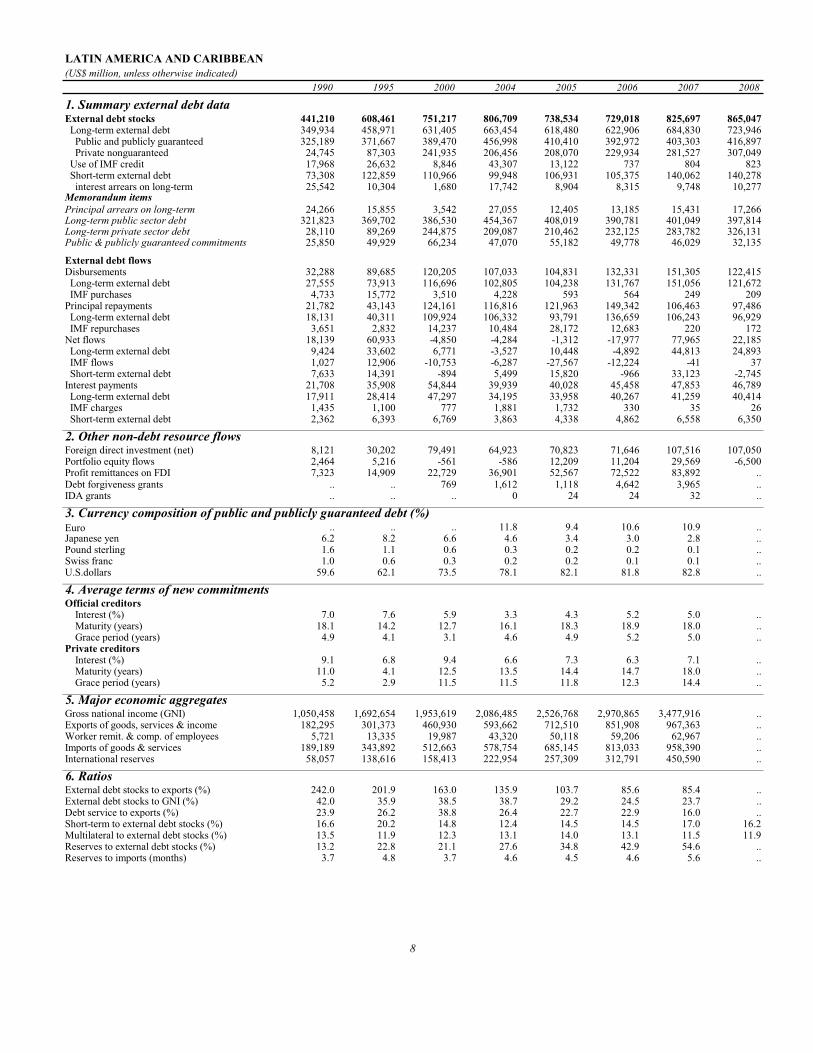
LATIN AMERICA AND CARIBBEAN(US$ million, unless otherwise indicated)
1990 1995 2000 2004 2005 2006 2007 2008
1. Summary external debt dataExternal debt stocks 441,210 608,461 751,217 806,709 738,534 729,018 825,697 865,047 Long-term external debt 349,934 458,971 631,405 663,454 618,480 622,906 684,830 723,946 Public and publicly guaranteed 325,189 371,667 389,470 456,998 410,410 392,972 403,303 416,897 Private nonguaranteed 24,745 87,303 241,935 206,456 208,070 229,934 281,527 307,049 Use of IMF credit 17,968 26,632 8,846 43,307 13,122 737 804 823 Short-term external debt 73,308 122,859 110,966 99,948 106,931 105,375 140,062 140,278 interest arrears on long-term 25,542 10,304 1,680 17,742 8,904 8,315 9,748 10,277Memorandum itemsPrincipal arrears on long-term 24,266 15,855 3,542 27,055 12,405 13,185 15,431 17,266Long-term public sector debt 321,823 369,702 386,530 454,367 408,019 390,781 401,049 397,814Long-term private sector debt 28,110 89,269 244,875 209,087 210,462 232,125 283,782 326,131Public & publicly guaranteed commitments 25,850 49,929 66,234 47,070 55,182 49,778 46,029 32,135
External debt flowsDisbursements 32,288 89,685 120,205 107,033 104,831 132,331 151,305 122,415 Long-term external debt 27,555 73,913 116,696 102,805 104,238 131,767 151,056 121,672 IMF purchases 4,733 15,772 3,510 4,228 593 564 249 209Principal repayments 21,782 43,143 124,161 116,816 121,963 149,342 106,463 97,486 Long-term external debt 18,131 40,311 109,924 106,332 93,791 136,659 106,243 96,929 IMF repurchases 3,651 2,832 14,237 10,484 28,172 12,683 220 172Net flows 18,139 60,933 -4,850 -4,284 -1,312 -17,977 77,965 22,185 Long-term external debt 9,424 33,602 6,771 -3,527 10,448 -4,892 44,813 24,893 IMF flows 1,027 12,906 -10,753 -6,287 -27,567 -12,224 -41 37 Short-term external debt 7,633 14,391 -894 5,499 15,820 -966 33,123 -2,745Interest payments 21,708 35,908 54,844 39,939 40,028 45,458 47,853 46,789 Long-term external debt 17,911 28,414 47,297 34,195 33,958 40,267 41,259 40,414 IMF charges 1,435 1,100 777 1,881 1,732 330 35 26 Short-term external debt 2,362 6,393 6,769 3,863 4,338 4,862 6,558 6,350
2. Other non-debt resource flowsForeign direct investment (net) 8,121 30,202 79,491 64,923 70,823 71,646 107,516 107,050Portfolio equity flows 2,464 5,216 -561 -586 12,209 11,204 29,569 -6,500Profit remittances on FDI 7,323 14,909 22,729 36,901 52,567 72,522 83,892 ..Debt forgiveness grants .. .. 769 1,612 1,118 4,642 3,965 ..IDA grants .. .. .. 0 24 24 32 ..
3. Currency composition of public and publicly guaranteed debt (%)Euro .. .. .. 11.8 9.4 10.6 10.9 ..Japanese yen 6.2 8.2 6.6 4.6 3.4 3.0 2.8 ..Pound sterling 1.6 1.1 0.6 0.3 0.2 0.2 0.1 ..Swiss franc 1.0 0.6 0.3 0.2 0.2 0.1 0.1 ..U.S.dollars 59.6 62.1 73.5 78.1 82.1 81.8 82.8 ..
4. Average terms of new commitmentsOfficial creditors Interest (%) 7.0 7.6 5.9 3.3 4.3 5.2 5.0 .. Maturity (years) 18.1 14.2 12.7 16.1 18.3 18.9 18.0 .. Grace period (years) 4.9 4.1 3.1 4.6 4.9 5.2 5.0 ..Private creditors Interest (%) 9.1 6.8 9.4 6.6 7.3 6.3 7.1 .. Maturity (years) 11.0 4.1 12.5 13.5 14.4 14.7 18.0 .. Grace period (years) 5.2 2.9 11.5 11.5 11.8 12.3 14.4 ..
5. Major economic aggregatesGross national income (GNI) 1,050,458 1,692,654 1,953,619 2,086,485 2,526,768 2,970,865 3,477,916 ..Exports of goods, services & income 182,295 301,373 460,930 593,662 712,510 851,908 967,363 ..Worker remit. & comp. of employees 5,721 13,335 19,987 43,320 50,118 59,206 62,967 ..Imports of goods & services 189,189 343,892 512,663 578,754 685,145 813,033 958,390 ..International reserves 58,057 138,616 158,413 222,954 257,309 312,791 450,590 ..
6. RatiosExternal debt stocks to exports (%) 242.0 201.9 163.0 135.9 103.7 85.6 85.4 ..External debt stocks to GNI (%) 42.0 35.9 38.5 38.7 29.2 24.5 23.7 ..Debt service to exports (%) 23.9 26.2 38.8 26.4 22.7 22.9 16.0 ..Short-term to external debt stocks (%) 16.6 20.2 14.8 12.4 14.5 14.5 17.0 16.2Multilateral to external debt stocks (%) 13.5 11.9 12.3 13.1 14.0 13.1 11.5 11.9Reserves to external debt stocks (%) 13.2 22.8 21.1 27.6 34.8 42.9 54.6 ..Reserves to imports (months) 3.7 4.8 3.7 4.6 4.5 4.6 5.6 ..
8

LATIN AMERICA AND CARIBBEAN(US$ million, unless otherwise indicated)
1990 1995 2000 2004 2005 2006 2007 2008
7. Long-term external debtDebt outstanding and disbursed 349,934 458,971 631,405 663,454 618,480 622,906 684,830 723,946Public and publicly guaranteed 325,189 371,667 389,470 456,998 410,410 392,972 403,303 416,897 Official creditors 120,589 158,881 139,723 143,973 133,749 122,956 120,663 128,131 Multilateral 59,685 72,110 92,520 105,907 103,053 95,475 95,274 102,885 of which: IBRD 34,683 36,299 37,429 36,408 34,958 31,528 31,534 33,864 IDA 1,117 2,186 3,387 5,136 5,049 1,529 1,692 1,764 Bilateral 60,904 86,771 47,203 38,067 30,696 27,482 25,390 25,246 Private creditors 204,600 212,786 249,747 313,025 276,661 270,016 282,640 288,765 of which: Bonds 75,572 165,105 209,444 246,965 209,429 198,722 200,857 203,578 Commercial banks 100,977 34,273 31,862 61,065 62,741 67,985 77,455 81,674Private nonguaranteed 24,745 87,303 241,935 206,456 208,070 229,934 281,527 307,049 of which: Bonds 171 33,829 60,325 69,833 74,487 80,608 96,010 97,411Disbursements 27,555 73,913 116,696 102,805 104,238 131,767 151,056 121,672Public and publicly guaranteed 22,857 46,383 58,631 54,059 55,491 50,490 46,040 35,543 Official creditors 13,106 23,594 16,449 12,671 12,937 16,360 14,847 16,276 Multilateral 8,925 9,876 13,536 10,534 10,494 14,450 13,294 14,651 of which: IBRD 6,114 4,624 5,595 4,333 3,550 5,570 3,067 5,643 IDA 119 277 202 391 306 178 129 95 Bilateral 4,182 13,719 2,912 2,136 2,444 1,910 1,553 1,625 Private creditors 9,751 22,788 42,182 41,388 42,554 34,130 31,193 19,268 of which: Bonds 1,938 13,654 34,442 24,540 27,566 20,386 16,334 10,245 Commercial banks 4,746 7,398 7,016 16,044 14,347 13,054 14,100 8,585Private nonguaranteed 4,698 27,530 58,065 48,746 48,747 81,277 105,015 86,663 of which: Bonds 171 7,412 8,312 11,623 15,066 17,459 26,341 9,948Principal repayments 18,131 40,311 109,924 106,332 93,791 136,659 106,243 96,929Public and publicly guaranteed 15,960 27,614 51,897 46,019 44,018 79,318 47,605 34,526 Official creditors 6,421 14,515 16,794 16,414 16,580 24,495 15,683 12,574 Multilateral 4,727 8,308 9,787 11,940 10,897 19,225 10,766 9,896 of which: IBRD 3,297 4,974 3,798 5,629 4,561 9,143 3,311 3,344 IDA 9 21 18 67 39 47 22 23 Bilateral 1,694 6,206 7,007 4,474 5,683 5,270 4,916 2,678 Private creditors 9,539 13,100 35,103 29,605 27,438 54,824 31,922 21,952 of which: Bonds 1,912 5,833 26,575 16,513 16,416 40,873 21,214 14,650 Commercial banks 5,100 4,240 6,932 12,203 10,234 12,774 9,932 6,060Private nonguaranteed 2,171 12,696 58,027 60,313 49,772 57,341 58,638 62,788 of which: Bonds 0 3,922 8,849 20,175 10,583 13,165 12,763 14,894Interest payments 17,911 28,414 47,297 34,195 33,958 40,267 41,259 40,414Public and publicly guaranteed 15,677 22,585 29,229 22,461 24,150 24,617 25,203 24,252 Official creditors 5,432 8,834 8,519 5,668 5,580 5,966 5,950 5,383 Multilateral 4,107 4,848 6,312 4,379 4,443 4,963 4,980 4,553 of which: IBRD 2,533 2,651 2,801 1,471 1,507 1,813 1,781 1,327 IDA 8 23 17 46 37 25 13 8 Bilateral 1,325 3,986 2,207 1,290 1,137 1,002 970 830 Private creditors 10,245 13,751 20,709 16,793 18,570 18,651 19,254 18,869 of which: Bonds 2,365 11,254 16,736 13,456 15,040 14,858 14,545 13,806 Commercial banks 6,627 1,567 3,166 3,121 3,326 3,606 4,373 4,782Private nonguaranteed 2,235 5,829 18,068 11,734 9,808 15,650 16,056 16,162 of which: Bonds 0 2,597 5,185 5,700 4,487 7,481 7,095 6,2428. Debt stock-flow reconciliationTotal change in external debt stocks 19,426 63,134 -14,524 -1,853 -68,175 -9,516 .. Net flows on external debt 18,139 60,933 -4,850 -4,284 -1,312 -17,977 77,965 50,478 Cross-currency valuation 11,380 1,916 -9,906 9,739 -13,652 2,759 9,637 ..9. Debt restructuringsTotal amount rescheduled 63,474 7,922 5,146 595 25,998 2,333 1,089 ..Total amount forgiven 173 534 98 554 808 349 1,199 ..Debt buyback 2,756 102 15,851 0 316 203 2,343 ..
9
0
50
100
150
200
2000 2001 2002 2003 2004 2005 2006 2007
Non-debt flows (bill US$)
Portfolio equity flows Foreign direct investment
0
50
100
150
200
250
2000 2001 2002 2003 2004 2005 2006 2007
Debt ratios (%)
Debt to exports Reserves to debt
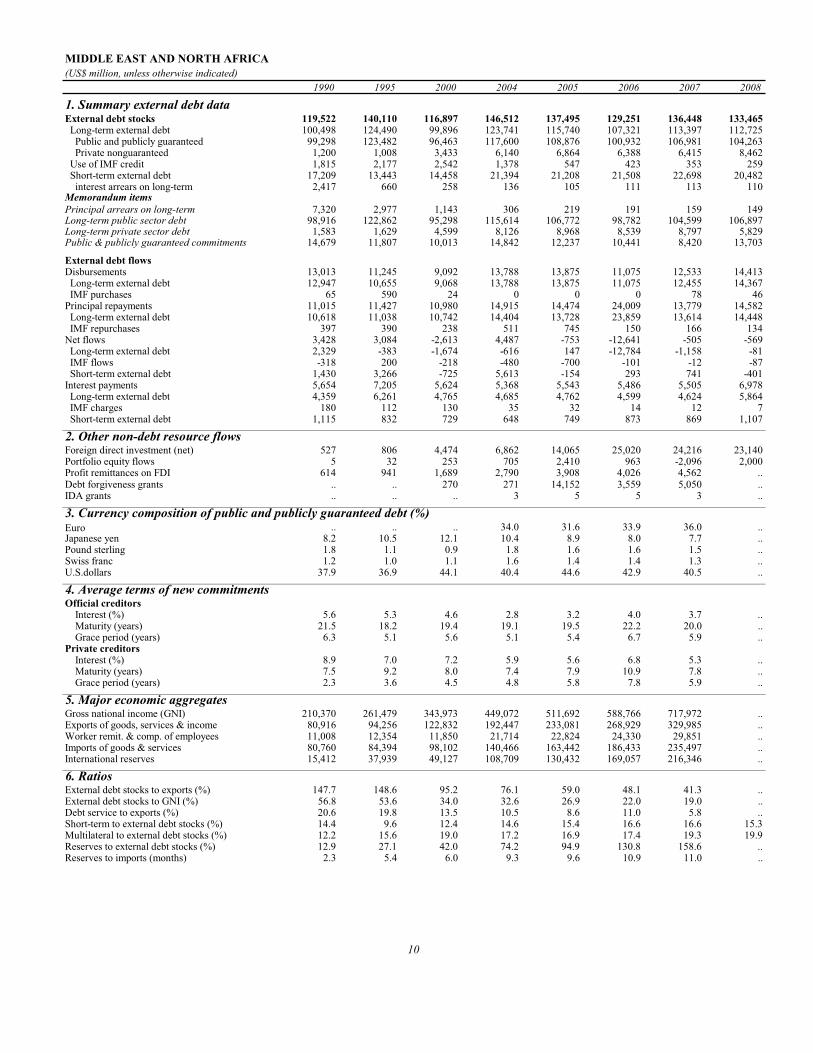
MIDDLE EAST AND NORTH AFRICA(US$ million, unless otherwise indicated)
1990 1995 2000 2004 2005 2006 2007 2008
1. Summary external debt dataExternal debt stocks 119,522 140,110 116,897 146,512 137,495 129,251 136,448 133,465 Long-term external debt 100,498 124,490 99,896 123,741 115,740 107,321 113,397 112,725 Public and publicly guaranteed 99,298 123,482 96,463 117,600 108,876 100,932 106,981 104,263 Private nonguaranteed 1,200 1,008 3,433 6,140 6,864 6,388 6,415 8,462 Use of IMF credit 1,815 2,177 2,542 1,378 547 423 353 259 Short-term external debt 17,209 13,443 14,458 21,394 21,208 21,508 22,698 20,482 interest arrears on long-term 2,417 660 258 136 105 111 113 110Memorandum itemsPrincipal arrears on long-term 7,320 2,977 1,143 306 219 191 159 149Long-term public sector debt 98,916 122,862 95,298 115,614 106,772 98,782 104,599 106,897Long-term private sector debt 1,583 1,629 4,599 8,126 8,968 8,539 8,797 5,829Public & publicly guaranteed commitments 14,679 11,807 10,013 14,842 12,237 10,441 8,420 13,703
External debt flowsDisbursements 13,013 11,245 9,092 13,788 13,875 11,075 12,533 14,413 Long-term external debt 12,947 10,655 9,068 13,788 13,875 11,075 12,455 14,367 IMF purchases 65 590 24 0 0 0 78 46Principal repayments 11,015 11,427 10,980 14,915 14,474 24,009 13,779 14,582 Long-term external debt 10,618 11,038 10,742 14,404 13,728 23,859 13,614 14,448 IMF repurchases 397 390 238 511 745 150 166 134Net flows 3,428 3,084 -2,613 4,487 -753 -12,641 -505 -569 Long-term external debt 2,329 -383 -1,674 -616 147 -12,784 -1,158 -81 IMF flows -318 200 -218 -480 -700 -101 -12 -87 Short-term external debt 1,430 3,266 -725 5,613 -154 293 741 -401Interest payments 5,654 7,205 5,624 5,368 5,543 5,486 5,505 6,978 Long-term external debt 4,359 6,261 4,765 4,685 4,762 4,599 4,624 5,864 IMF charges 180 112 130 35 32 14 12 7 Short-term external debt 1,115 832 729 648 749 873 869 1,107
2. Other non-debt resource flowsForeign direct investment (net) 527 806 4,474 6,862 14,065 25,020 24,216 23,140Portfolio equity flows 5 32 253 705 2,410 963 -2,096 2,000Profit remittances on FDI 614 941 1,689 2,790 3,908 4,026 4,562 ..Debt forgiveness grants .. .. 270 271 14,152 3,559 5,050 ..IDA grants .. .. .. 3 5 5 3 ..
3. Currency composition of public and publicly guaranteed debt (%)Euro .. .. .. 34.0 31.6 33.9 36.0 ..Japanese yen 8.2 10.5 12.1 10.4 8.9 8.0 7.7 ..Pound sterling 1.8 1.1 0.9 1.8 1.6 1.6 1.5 ..Swiss franc 1.2 1.0 1.1 1.6 1.4 1.4 1.3 ..U.S.dollars 37.9 36.9 44.1 40.4 44.6 42.9 40.5 ..
4. Average terms of new commitmentsOfficial creditors Interest (%) 5.6 5.3 4.6 2.8 3.2 4.0 3.7 .. Maturity (years) 21.5 18.2 19.4 19.1 19.5 22.2 20.0 .. Grace period (years) 6.3 5.1 5.6 5.1 5.4 6.7 5.9 ..Private creditors Interest (%) 8.9 7.0 7.2 5.9 5.6 6.8 5.3 .. Maturity (years) 7.5 9.2 8.0 7.4 7.9 10.9 7.8 .. Grace period (years) 2.3 3.6 4.5 4.8 5.8 7.8 5.9 ..
5. Major economic aggregatesGross national income (GNI) 210,370 261,479 343,973 449,072 511,692 588,766 717,972 ..Exports of goods, services & income 80,916 94,256 122,832 192,447 233,081 268,929 329,985 ..Worker remit. & comp. of employees 11,008 12,354 11,850 21,714 22,824 24,330 29,851 ..Imports of goods & services 80,760 84,394 98,102 140,466 163,442 186,433 235,497 ..International reserves 15,412 37,939 49,127 108,709 130,432 169,057 216,346 ..
6. RatiosExternal debt stocks to exports (%) 147.7 148.6 95.2 76.1 59.0 48.1 41.3 ..External debt stocks to GNI (%) 56.8 53.6 34.0 32.6 26.9 22.0 19.0 ..Debt service to exports (%) 20.6 19.8 13.5 10.5 8.6 11.0 5.8 ..Short-term to external debt stocks (%) 14.4 9.6 12.4 14.6 15.4 16.6 16.6 15.3Multilateral to external debt stocks (%) 12.2 15.6 19.0 17.2 16.9 17.4 19.3 19.9Reserves to external debt stocks (%) 12.9 27.1 42.0 74.2 94.9 130.8 158.6 ..Reserves to imports (months) 2.3 5.4 6.0 9.3 9.6 10.9 11.0 ..
10
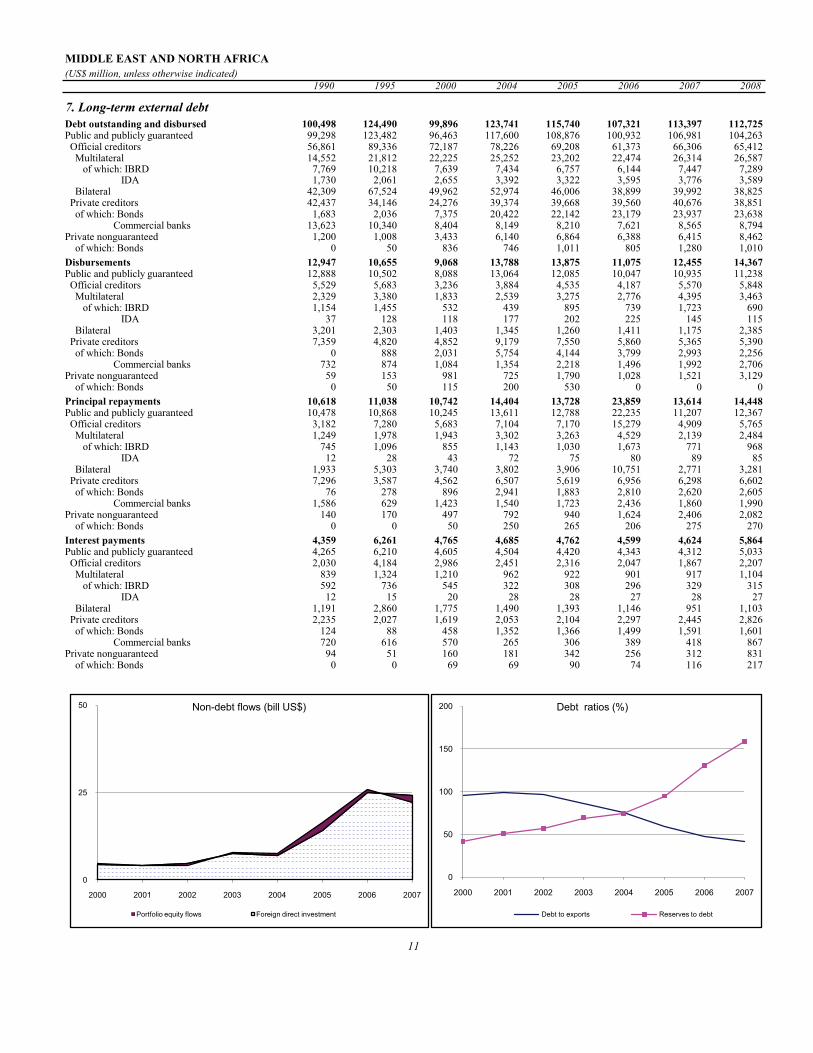
MIDDLE EAST AND NORTH AFRICA(US$ million, unless otherwise indicated)
1990 1995 2000 2004 2005 2006 2007 2008
7. Long-term external debtDebt outstanding and disbursed 100,498 124,490 99,896 123,741 115,740 107,321 113,397 112,725Public and publicly guaranteed 99,298 123,482 96,463 117,600 108,876 100,932 106,981 104,263 Official creditors 56,861 89,336 72,187 78,226 69,208 61,373 66,306 65,412 Multilateral 14,552 21,812 22,225 25,252 23,202 22,474 26,314 26,587 of which: IBRD 7,769 10,218 7,639 7,434 6,757 6,144 7,447 7,289 IDA 1,730 2,061 2,655 3,392 3,322 3,595 3,776 3,589 Bilateral 42,309 67,524 49,962 52,974 46,006 38,899 39,992 38,825 Private creditors 42,437 34,146 24,276 39,374 39,668 39,560 40,676 38,851 of which: Bonds 1,683 2,036 7,375 20,422 22,142 23,179 23,937 23,638 Commercial banks 13,623 10,340 8,404 8,149 8,210 7,621 8,565 8,794Private nonguaranteed 1,200 1,008 3,433 6,140 6,864 6,388 6,415 8,462 of which: Bonds 0 50 836 746 1,011 805 1,280 1,010Disbursements 12,947 10,655 9,068 13,788 13,875 11,075 12,455 14,367Public and publicly guaranteed 12,888 10,502 8,088 13,064 12,085 10,047 10,935 11,238 Official creditors 5,529 5,683 3,236 3,884 4,535 4,187 5,570 5,848 Multilateral 2,329 3,380 1,833 2,539 3,275 2,776 4,395 3,463 of which: IBRD 1,154 1,455 532 439 895 739 1,723 690 IDA 37 128 118 177 202 225 145 115 Bilateral 3,201 2,303 1,403 1,345 1,260 1,411 1,175 2,385 Private creditors 7,359 4,820 4,852 9,179 7,550 5,860 5,365 5,390 of which: Bonds 0 888 2,031 5,754 4,144 3,799 2,993 2,256 Commercial banks 732 874 1,084 1,354 2,218 1,496 1,992 2,706Private nonguaranteed 59 153 981 725 1,790 1,028 1,521 3,129 of which: Bonds 0 50 115 200 530 0 0 0Principal repayments 10,618 11,038 10,742 14,404 13,728 23,859 13,614 14,448Public and publicly guaranteed 10,478 10,868 10,245 13,611 12,788 22,235 11,207 12,367 Official creditors 3,182 7,280 5,683 7,104 7,170 15,279 4,909 5,765 Multilateral 1,249 1,978 1,943 3,302 3,263 4,529 2,139 2,484 of which: IBRD 745 1,096 855 1,143 1,030 1,673 771 968 IDA 12 28 43 72 75 80 89 85 Bilateral 1,933 5,303 3,740 3,802 3,906 10,751 2,771 3,281 Private creditors 7,296 3,587 4,562 6,507 5,619 6,956 6,298 6,602 of which: Bonds 76 278 896 2,941 1,883 2,810 2,620 2,605 Commercial banks 1,586 629 1,423 1,540 1,723 2,436 1,860 1,990Private nonguaranteed 140 170 497 792 940 1,624 2,406 2,082 of which: Bonds 0 0 50 250 265 206 275 270Interest payments 4,359 6,261 4,765 4,685 4,762 4,599 4,624 5,864Public and publicly guaranteed 4,265 6,210 4,605 4,504 4,420 4,343 4,312 5,033 Official creditors 2,030 4,184 2,986 2,451 2,316 2,047 1,867 2,207 Multilateral 839 1,324 1,210 962 922 901 917 1,104 of which: IBRD 592 736 545 322 308 296 329 315 IDA 12 15 20 28 28 27 28 27 Bilateral 1,191 2,860 1,775 1,490 1,393 1,146 951 1,103 Private creditors 2,235 2,027 1,619 2,053 2,104 2,297 2,445 2,826 of which: Bonds 124 88 458 1,352 1,366 1,499 1,591 1,601 Commercial banks 720 616 570 265 306 389 418 867Private nonguaranteed 94 51 160 181 342 256 312 831 of which: Bonds 0 0 69 69 90 74 116 2178. Debt stock-flow reconciliationTotal change in external debt stocks -3,206 6,090 -9,440 10,508 -9,017 -8,244 .. Net flows on external debt 3,428 3,084 -2,613 4,487 -753 -12,641 -505 -978 Cross-currency valuation 5,135 2,107 -3,923 3,695 -7,478 4,186 5,728 ..9. Debt restructuringsTotal amount rescheduled 4,565 8,947 340 258 286 208 196 ..Total amount forgiven 10,614 357 179 116 67 123 7 ..Debt buyback 0 0 85 0 0 0 0 ..
11
0
25
50
2000 2001 2002 2003 2004 2005 2006 2007
Non-debt flows (bill US$)
Portfolio equity flows Foreign direct investment
0
50
100
150
200
2000 2001 2002 2003 2004 2005 2006 2007
Debt ratios (%)
Debt to exports Reserves to debt

SOUTH ASIA(US$ million, unless otherwise indicated)
1990 1995 2000 2004 2005 2006 2007 2008
1. Summary external debt dataExternal debt stocks 124,433 151,740 160,108 196,003 191,330 249,804 304,713 311,303 Long-term external debt 107,562 137,436 152,131 183,367 177,300 217,724 253,300 264,041 Public and publicly guaranteed 105,835 129,135 133,617 153,686 142,039 131,226 149,012 195,151 Private nonguaranteed 1,727 8,301 18,514 29,680 35,261 86,498 104,287 68,889 Use of IMF credit 4,537 5,252 1,918 2,423 2,208 2,232 2,277 5,379 Short-term external debt 12,333 9,051 6,059 10,214 11,822 29,847 49,136 41,883 interest arrears on long-term 19 59 120 9 30 18 37 29Memorandum itemsPrincipal arrears on long-term 35 82 277 65 76 153 359 360Long-term public sector debt 105,068 128,462 132,854 153,282 141,850 131,063 148,856 129,814Long-term private sector debt 2,494 8,975 19,277 30,085 35,450 86,662 104,444 134,226Public & publicly guaranteed commitments 14,031 8,403 12,922 11,392 13,339 15,681 12,406 4,186
External debt flowsDisbursements 12,098 12,065 14,191 26,658 24,807 38,425 66,622 50,535 Long-term external debt 10,223 11,863 13,997 26,244 24,551 38,253 66,534 47,023 IMF purchases 1,875 202 195 414 256 171 88 3,512Principal repayments 5,258 11,599 9,784 20,539 20,502 13,405 35,331 35,622 Long-term external debt 4,103 9,601 9,301 19,856 20,226 13,144 35,174 35,351 IMF repurchases 1,155 1,998 483 683 275 261 157 271Net flows 8,390 2,503 3,469 8,758 5,892 43,056 50,546 14,094 Long-term external debt 6,120 2,262 4,696 6,387 4,325 25,109 31,360 11,672 IMF flows -401 109 -15 -564 -40 -182 -35 3,241 Short-term external debt 1,550 2,037 -938 2,639 1,587 18,037 19,255 -820Interest payments 6,046 6,520 5,655 4,599 7,686 8,590 9,871 13,089 Long-term external debt 4,595 5,663 5,273 4,304 7,203 7,344 7,327 9,902 IMF charges 249 233 58 30 26 26 23 23 Short-term external debt 1,202 624 323 265 457 1,220 2,521 3,165
2. Other non-debt resource flowsForeign direct investment (net) 542 2,931 4,358 7,776 10,257 23,158 29,926 47,380Portfolio equity flows 1 1,585 2,381 8,990 12,399 10,428 36,093 18,000Profit remittances on FDI 93 392 721 5,388 7,166 9,082 4,325 ..Debt forgiveness grants .. .. 182 314 86 323 214 ..IDA grants .. .. .. 99 270 207 407 ..
3. Currency composition of public and publicly guaranteed debt (%)Euro .. .. .. 6.3 6.0 7.3 7.1 ..Japanese yen 12.5 16.8 14.8 15.7 15.7 18.9 18.1 ..Pound sterling 5.0 3.6 2.8 2.0 1.8 1.8 1.5 ..Swiss franc 0.5 0.7 0.3 0.2 0.2 0.2 0.2 ..U.S.dollars 54.1 46.2 57.1 62.5 62.5 55.8 56.1 ..
4. Average terms of new commitmentsOfficial creditors Interest (%) 3.7 3.7 5.0 1.8 2.4 3.5 3.2 .. Maturity (years) 28.9 25.8 23.4 29.2 28.1 25.0 27.8 .. Grace period (years) 8.1 7.6 6.3 7.6 7.8 6.7 7.4 ..Private creditors Interest (%) 6.8 5.8 4.3 3.7 3.9 4.6 7.1 .. Maturity (years) 14.8 6.0 5.4 7.1 5.0 10.0 9.2 .. Grace period (years) 7.1 3.9 4.6 4.8 4.7 6.1 4.6 ..
5. Major economic aggregatesGross national income (GNI) 400,525 473,538 603,667 890,725 1,020,559 1,151,294 1,445,560 ..Exports of goods, services & income 41,150 71,062 105,844 185,068 237,201 292,774 350,314 ..Worker remit. & comp. of employees 5,572 10,005 17,212 28,694 33,092 39,615 52,086 ..Imports of goods & services 53,492 86,693 116,952 192,498 258,807 318,631 395,696 ..International reserves 8,896 30,704 47,221 149,907 156,714 198,524 302,315 ..
6. RatiosExternal debt stocks to exports (%) 302.4 213.5 151.3 105.9 80.7 85.3 87.0 ..External debt stocks to GNI (%) 31.1 32.0 26.5 22.0 18.7 21.7 21.1 ..Debt service to exports (%) 27.5 25.5 14.6 13.6 11.9 7.5 12.9 ..Short-term to external debt stocks (%) 9.9 6.0 3.8 5.2 6.2 11.9 16.1 13.5Multilateral to external debt stocks (%) 30.6 37.5 38.1 36.3 36.9 30.4 27.7 28.4Reserves to external debt stocks (%) 7.1 20.2 29.5 76.5 81.9 79.5 99.2 ..Reserves to imports (months) 2.0 4.3 4.8 9.3 7.3 7.5 9.2 ..
12

SOUTH ASIA(US$ million, unless otherwise indicated)
1990 1995 2000 2004 2005 2006 2007 2008
7. Long-term external debtDebt outstanding and disbursed 107,562 137,436 152,131 183,367 177,300 217,724 253,300 264,041Public and publicly guaranteed 105,835 129,135 133,617 153,686 142,039 131,226 149,012 195,151 Official creditors 81,544 103,718 100,851 114,184 110,156 118,642 130,110 136,632 Multilateral 38,068 56,875 61,023 71,064 70,510 75,971 84,266 88,534 of which: IBRD 9,646 13,035 10,210 7,326 7,795 8,421 9,051 9,376 IDA 21,071 29,001 31,963 43,386 42,833 45,484 50,075 49,573 Bilateral 43,475 46,844 39,828 43,120 39,646 42,670 45,845 48,098 Private creditors 24,291 25,417 32,766 39,502 31,883 12,584 18,902 58,520 of which: Bonds 2,613 3,421 10,903 9,320 2,394 4,480 8,570 8,062 Commercial banks 16,811 14,124 19,579 29,049 28,528 7,155 9,375 11,392Private nonguaranteed 1,727 8,301 18,514 29,680 35,261 86,498 104,287 68,889 of which: Bonds 0 1,065 1,560 3,820 7,318 13,352 16,082 18,119Disbursements 10,223 11,863 13,997 26,244 24,551 38,253 66,534 47,023Public and publicly guaranteed 9,970 9,929 13,410 16,794 11,823 17,029 20,783 17,233 Official creditors 6,904 6,378 6,129 7,159 7,282 9,483 8,952 13,183 Multilateral 4,402 3,975 4,347 5,097 5,669 6,252 6,434 7,974 of which: IBRD 1,576 860 866 819 1,155 1,145 1,193 1,171 IDA 1,558 1,374 1,655 2,712 2,616 2,396 2,538 2,102 Bilateral 2,501 2,403 1,782 2,062 1,612 3,231 2,517 5,209 Private creditors 3,066 3,551 7,281 9,636 4,541 7,546 11,832 4,050 of which: Bonds 427 86 5,512 4,210 1,444 3,500 9,040 158 Commercial banks 2,072 1,901 940 5,353 3,054 3,988 2,770 3,780Private nonguaranteed 252 1,934 586 9,449 12,728 21,224 45,751 29,789 of which: Bonds 0 520 0 2,920 4,825 2,404 5,883 2,500Principal repayments 4,103 9,601 9,301 19,856 20,226 13,144 35,174 35,351Public and publicly guaranteed 3,744 9,103 8,593 15,386 14,391 7,592 11,092 13,835 Official creditors 2,378 5,764 5,352 5,702 4,079 4,645 4,787 5,899 Multilateral 1,009 2,227 2,827 3,138 2,267 2,475 2,668 3,120 of which: IBRD 553 1,173 1,232 515 535 567 650 679 IDA 151 318 548 897 963 1,059 1,138 1,197 Bilateral 1,369 3,537 2,525 2,564 1,812 2,171 2,118 2,779 Private creditors 1,366 3,339 3,241 9,684 10,312 2,947 6,306 7,936 of which: Bonds 280 319 50 2,950 8,234 1,648 5,005 657 Commercial banks 371 1,992 2,843 6,376 1,896 1,222 1,253 1,603Private nonguaranteed 359 498 707 4,471 5,835 5,552 24,081 21,515 of which: Bonds 0 0 35 85 903 0 441 463Interest payments 4,595 5,663 5,273 4,304 7,203 7,344 7,327 9,902Public and publicly guaranteed 4,447 5,000 4,392 3,192 5,698 3,300 2,986 3,793 Official creditors 2,179 2,933 2,265 1,736 1,740 2,162 2,355 2,478 Multilateral 1,065 1,640 1,366 813 946 1,176 1,380 1,223 of which: IBRD 752 995 613 186 288 420 487 363 IDA 149 215 236 334 343 336 360 337 Bilateral 1,114 1,293 898 923 794 985 975 1,255 Private creditors 2,268 2,067 2,127 1,455 3,958 1,139 631 1,315 of which: Bonds 180 194 210 255 2,690 217 310 470 Commercial banks 1,806 1,315 1,809 1,176 1,253 912 310 502Private nonguaranteed 148 663 881 1,112 1,504 4,044 4,341 6,109 of which: Bonds 0 58 227 102 177 587 400 1,0418. Debt stock-flow reconciliationTotal change in external debt stocks 13,105 -4,311 -1,957 13,814 -4,673 58,474 .. Net flows on external debt 8,390 2,503 3,469 8,758 5,892 43,056 50,546 25,839 Cross-currency valuation 1,584 -8,069 -8,302 2,785 -8,279 2,597 8,833 ..9. Debt restructuringsTotal amount rescheduled 0 0 918 0 265 860 0 ..Total amount forgiven 0 7 9 146 2 83 84 ..Debt buyback 0 0 0 0 0 0 0 ..
13
0
25
50
75
2000 2001 2002 2003 2004 2005 2006 2007
Non-debt flows (bill US$)
Portfolio equity flows Foreign direct investment
0
50
100
150
200
2000 2001 2002 2003 2004 2005 2006 2007
Debt ratios (%)
Debt to exports Reserves to debt

SUB-SAHARAN AFRICA(US$ million, unless otherwise indicated)
1990 1995 2000 2004 2005 2006 2007 2008
1. Summary external debt dataExternal debt stocks 176,253 235,959 211,248 237,378 216,427 172,476 195,094 199,677 Long-term external debt 149,113 186,782 172,857 197,502 178,067 127,067 143,882 146,200 Public and publicly guaranteed 143,837 174,978 161,481 189,139 169,970 118,370 128,235 127,631 Private nonguaranteed 5,276 11,804 11,376 8,363 8,096 8,697 15,647 18,569 Use of IMF credit 6,606 8,654 6,734 7,238 5,947 3,140 3,341 3,986 Short-term external debt 20,534 40,522 31,657 32,638 32,413 42,269 47,870 49,490 interest arrears on long-term 9,317 20,412 12,822 17,019 13,141 14,138 14,268 13,738Memorandum itemsPrincipal arrears on long-term 17,757 41,074 25,618 27,027 24,233 25,494 25,631 25,740Long-term public sector debt 143,650 174,852 160,574 188,860 169,871 118,330 128,203 122,577Long-term private sector debt 5,463 11,930 12,283 8,641 8,196 8,738 15,679 23,623Public & publicly guaranteed commitments 11,448 9,157 8,282 14,957 23,768 11,216 17,761 6,315
External debt flowsDisbursements 10,300 14,016 10,083 13,106 16,215 13,166 24,690 16,999 Long-term external debt 9,640 11,022 9,559 12,444 15,893 12,868 24,337 15,635 IMF purchases 660 2,994 525 662 323 298 354 1,364Principal repayments 5,566 9,421 9,023 8,101 12,232 17,454 12,056 11,761 Long-term external debt 4,619 7,050 8,563 7,311 11,485 17,097 11,760 11,076 IMF repurchases 947 2,371 460 790 747 357 296 682Net flows 7,008 7,569 -1,575 6,630 7,636 4,571 18,085 4,270 Long-term external debt 5,021 3,972 995 5,134 4,407 -4,228 12,577 4,556 IMF flows -691 -921 -78 -31 -229 -41 -52 682 Short-term external debt 2,275 2,974 -2,635 1,625 3,653 8,859 5,451 -968Interest payments 5,291 5,351 4,479 3,181 8,068 4,416 5,038 6,757 Long-term external debt 4,348 3,974 3,326 2,684 7,364 3,499 3,791 4,344 IMF charges 238 559 43 30 27 39 14 490 Short-term external debt 705 819 1,111 467 677 878 1,233 1,923
2. Other non-debt resource flowsForeign direct investment (net) 1,199 4,393 6,681 10,588 16,816 18,496 28,564 33,480Portfolio equity flows 393 2,954 4,164 6,685 7,371 15,036 13,461 3,200Profit remittances on FDI 2,861 3,952 7,858 13,382 22,040 17,963 40,975 ..Debt forgiveness grants .. .. 1,677 3,619 9,304 43,153 4,908 ..IDA grants .. .. .. 979 831 888 1,361 ..
3. Currency composition of public and publicly guaranteed debt (%)Euro .. .. .. 23.9 19.5 22.4 21.7 ..Japanese yen 4.1 5.6 4.1 4.8 3.6 3.4 2.9 ..Pound sterling 5.5 3.8 2.1 4.9 4.1 1.6 1.5 ..Swiss franc 2.3 2.1 1.5 2.0 1.9 2.4 2.3 ..U.S.dollars 36.7 40.8 61.3 49.9 55.2 51.8 52.0 ..
4. Average terms of new commitmentsOfficial creditors Interest (%) 3.5 1.8 1.1 1.9 4.4 1.5 1.4 .. Maturity (years) 28.3 31.7 36.6 28.4 21.6 29.9 31.1 .. Grace period (years) 7.7 8.7 9.1 6.5 4.3 6.8 2.5 ..Private creditors Interest (%) 8.1 5.7 5.8 3.4 5.5 6.9 6.8 .. Maturity (years) 11.6 12.4 7.8 7.1 6.1 8.8 8.6 .. Grace period (years) 2.7 1.9 2.1 2.9 1.9 5.6 5.6 ..
5. Major economic aggregatesGross national income (GNI) 281,610 309,993 320,210 512,716 599,479 696,915 784,949 ..Exports of goods, services & income 79,252 92,676 117,041 190,586 239,508 286,219 343,509 ..Worker remit. & comp. of employees 1,623 3,097 4,614 8,006 9,364 12,854 18,570 ..Imports of goods & services 86,215 111,982 118,496 194,463 239,038 285,596 350,983 ..International reserves 15,362 20,652 36,505 62,543 82,495 114,851 140,420 ..
6. RatiosExternal debt stocks to exports (%) 222.4 254.6 180.5 124.6 90.4 60.3 56.8 ..External debt stocks to GNI (%) 62.6 76.1 66.0 46.3 36.1 24.7 24.9 ..Debt service to exports (%) 13.7 15.9 11.5 5.9 8.5 7.6 5.0 ..Short-term to external debt stocks (%) 11.7 17.2 15.0 13.7 15.0 24.5 24.5 24.8Multilateral to external debt stocks (%) 21.6 23.0 25.8 31.6 33.6 25.1 24.7 25.4Reserves to external debt stocks (%) 8.7 8.8 17.3 26.3 38.1 66.6 72.0 ..Reserves to imports (months) 2.1 2.2 3.7 3.9 4.1 4.8 4.8 ..
14
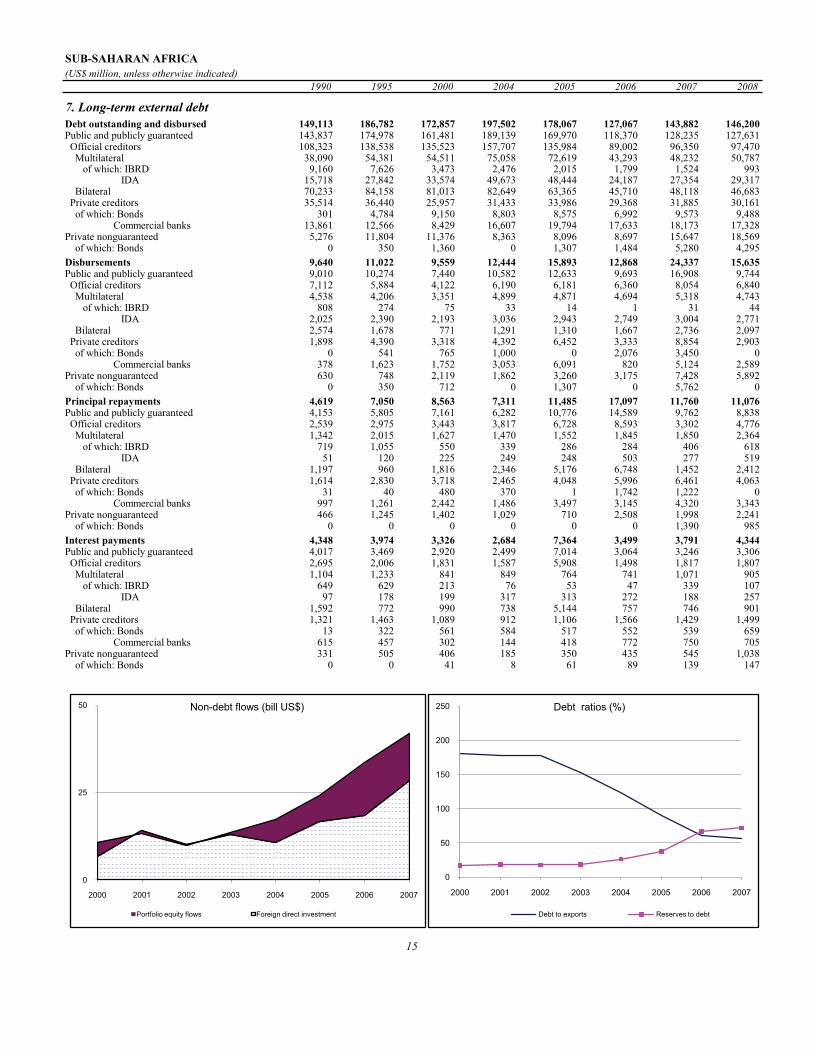
SUB-SAHARAN AFRICA(US$ million, unless otherwise indicated)
1990 1995 2000 2004 2005 2006 2007 2008
7. Long-term external debtDebt outstanding and disbursed 149,113 186,782 172,857 197,502 178,067 127,067 143,882 146,200Public and publicly guaranteed 143,837 174,978 161,481 189,139 169,970 118,370 128,235 127,631 Official creditors 108,323 138,538 135,523 157,707 135,984 89,002 96,350 97,470 Multilateral 38,090 54,381 54,511 75,058 72,619 43,293 48,232 50,787 of which: IBRD 9,160 7,626 3,473 2,476 2,015 1,799 1,524 993 IDA 15,718 27,842 33,574 49,673 48,444 24,187 27,354 29,317 Bilateral 70,233 84,158 81,013 82,649 63,365 45,710 48,118 46,683 Private creditors 35,514 36,440 25,957 31,433 33,986 29,368 31,885 30,161 of which: Bonds 301 4,784 9,150 8,803 8,575 6,992 9,573 9,488 Commercial banks 13,861 12,566 8,429 16,607 19,794 17,633 18,173 17,328Private nonguaranteed 5,276 11,804 11,376 8,363 8,096 8,697 15,647 18,569 of which: Bonds 0 350 1,360 0 1,307 1,484 5,280 4,295Disbursements 9,640 11,022 9,559 12,444 15,893 12,868 24,337 15,635Public and publicly guaranteed 9,010 10,274 7,440 10,582 12,633 9,693 16,908 9,744 Official creditors 7,112 5,884 4,122 6,190 6,181 6,360 8,054 6,840 Multilateral 4,538 4,206 3,351 4,899 4,871 4,694 5,318 4,743 of which: IBRD 808 274 75 33 14 1 31 44 IDA 2,025 2,390 2,193 3,036 2,943 2,749 3,004 2,771 Bilateral 2,574 1,678 771 1,291 1,310 1,667 2,736 2,097 Private creditors 1,898 4,390 3,318 4,392 6,452 3,333 8,854 2,903 of which: Bonds 0 541 765 1,000 0 2,076 3,450 0 Commercial banks 378 1,623 1,752 3,053 6,091 820 5,124 2,589Private nonguaranteed 630 748 2,119 1,862 3,260 3,175 7,428 5,892 of which: Bonds 0 350 712 0 1,307 0 5,762 0Principal repayments 4,619 7,050 8,563 7,311 11,485 17,097 11,760 11,076Public and publicly guaranteed 4,153 5,805 7,161 6,282 10,776 14,589 9,762 8,838 Official creditors 2,539 2,975 3,443 3,817 6,728 8,593 3,302 4,776 Multilateral 1,342 2,015 1,627 1,470 1,552 1,845 1,850 2,364 of which: IBRD 719 1,055 550 339 286 284 406 618 IDA 51 120 225 249 248 503 277 519 Bilateral 1,197 960 1,816 2,346 5,176 6,748 1,452 2,412 Private creditors 1,614 2,830 3,718 2,465 4,048 5,996 6,461 4,063 of which: Bonds 31 40 480 370 1 1,742 1,222 0 Commercial banks 997 1,261 2,442 1,486 3,497 3,145 4,320 3,343Private nonguaranteed 466 1,245 1,402 1,029 710 2,508 1,998 2,241 of which: Bonds 0 0 0 0 0 0 1,390 985Interest payments 4,348 3,974 3,326 2,684 7,364 3,499 3,791 4,344Public and publicly guaranteed 4,017 3,469 2,920 2,499 7,014 3,064 3,246 3,306 Official creditors 2,695 2,006 1,831 1,587 5,908 1,498 1,817 1,807 Multilateral 1,104 1,233 841 849 764 741 1,071 905 of which: IBRD 649 629 213 76 53 47 339 107 IDA 97 178 199 317 313 272 188 257 Bilateral 1,592 772 990 738 5,144 757 746 901 Private creditors 1,321 1,463 1,089 912 1,106 1,566 1,429 1,499 of which: Bonds 13 322 561 584 517 552 539 659 Commercial banks 615 457 302 144 418 772 750 705Private nonguaranteed 331 505 406 185 350 435 545 1,038 of which: Bonds 0 0 41 8 61 89 139 1478. Debt stock-flow reconciliationTotal change in external debt stocks 19,719 14,614 -3,502 8,703 -20,951 -43,951 .. Net flows on external debt 7,008 7,569 -1,575 6,630 7,636 4,571 18,085 8,289 Cross-currency valuation 7,646 910 -6,782 6,275 -13,552 -26,656 3,858 ..9. Debt restructuringsTotal amount rescheduled 5,987 3,489 22,630 3,548 1,187 789 1,033 ..Total amount forgiven 1,583 1,302 629 3,977 8,754 15,065 1,718 ..Debt buyback 0 29 137 0 0 0 1,222 ..
15
0
25
50
2000 2001 2002 2003 2004 2005 2006 2007
Non-debt flows (bill US$)
Portfolio equity flows Foreign direct investment
0
50
100
150
200
250
2000 2001 2002 2003 2004 2005 2006 2007
Debt ratios (%)
Debt to exports Reserves to debt
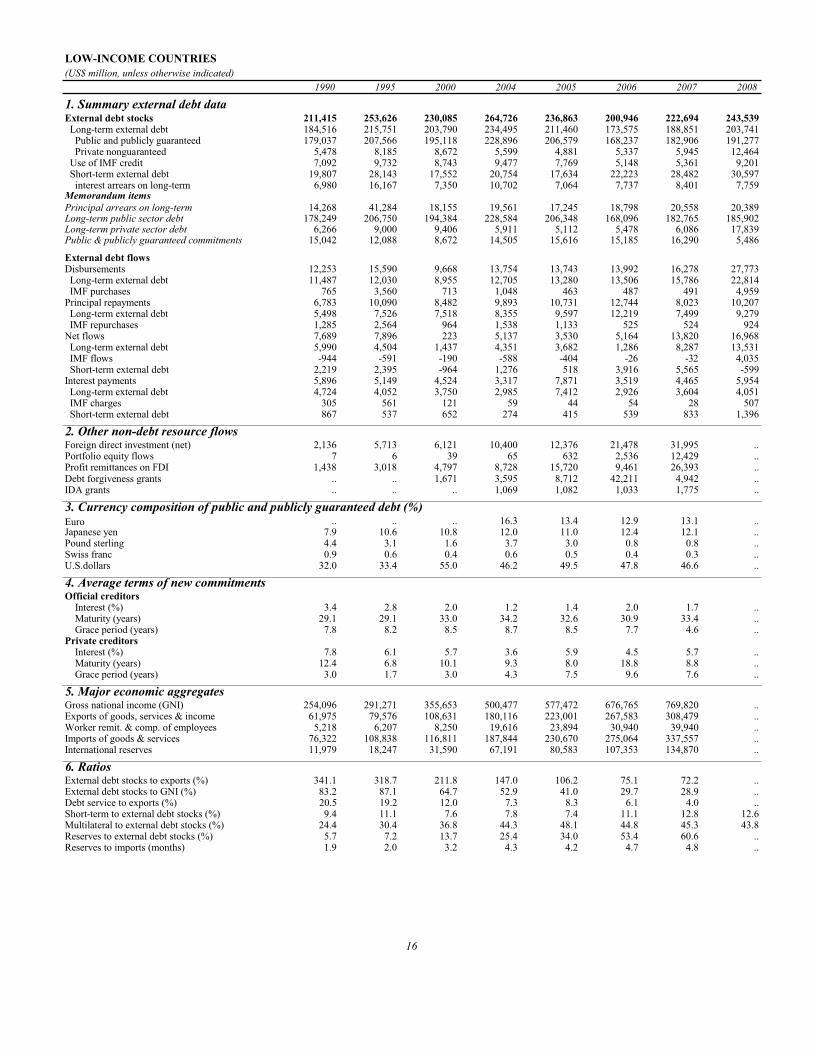
LOW-INCOME COUNTRIES(US$ million, unless otherwise indicated)
1990 1995 2000 2004 2005 2006 2007 2008
1. Summary external debt dataExternal debt stocks 211,415 253,626 230,085 264,726 236,863 200,946 222,694 243,539 Long-term external debt 184,516 215,751 203,790 234,495 211,460 173,575 188,851 203,741 Public and publicly guaranteed 179,037 207,566 195,118 228,896 206,579 168,237 182,906 191,277 Private nonguaranteed 5,478 8,185 8,672 5,599 4,881 5,337 5,945 12,464 Use of IMF credit 7,092 9,732 8,743 9,477 7,769 5,148 5,361 9,201 Short-term external debt 19,807 28,143 17,552 20,754 17,634 22,223 28,482 30,597 interest arrears on long-term 6,980 16,167 7,350 10,702 7,064 7,737 8,401 7,759Memorandum itemsPrincipal arrears on long-term 14,268 41,284 18,155 19,561 17,245 18,798 20,558 20,389Long-term public sector debt 178,249 206,750 194,384 228,584 206,348 168,096 182,765 185,902Long-term private sector debt 6,266 9,000 9,406 5,911 5,112 5,478 6,086 17,839Public & publicly guaranteed commitments 15,042 12,088 8,672 14,505 15,616 15,185 16,290 5,486
External debt flowsDisbursements 12,253 15,590 9,668 13,754 13,743 13,992 16,278 27,773 Long-term external debt 11,487 12,030 8,955 12,705 13,280 13,506 15,786 22,814 IMF purchases 765 3,560 713 1,048 463 487 491 4,959Principal repayments 6,783 10,090 8,482 9,893 10,731 12,744 8,023 10,207 Long-term external debt 5,498 7,526 7,518 8,355 9,597 12,219 7,499 9,279 IMF repurchases 1,285 2,564 964 1,538 1,133 525 524 924Net flows 7,689 7,896 223 5,137 3,530 5,164 13,820 16,968 Long-term external debt 5,990 4,504 1,437 4,351 3,682 1,286 8,287 13,531 IMF flows -944 -591 -190 -588 -404 -26 -32 4,035 Short-term external debt 2,219 2,395 -964 1,276 518 3,916 5,565 -599Interest payments 5,896 5,149 4,524 3,317 7,871 3,519 4,465 5,954 Long-term external debt 4,724 4,052 3,750 2,985 7,412 2,926 3,604 4,051 IMF charges 305 561 121 59 44 54 28 507 Short-term external debt 867 537 652 274 415 539 833 1,396
2. Other non-debt resource flowsForeign direct investment (net) 2,136 5,713 6,121 10,400 12,376 21,478 31,995 ..Portfolio equity flows 7 6 39 65 632 2,536 12,429 ..Profit remittances on FDI 1,438 3,018 4,797 8,728 15,720 9,461 26,393 ..Debt forgiveness grants .. .. 1,671 3,595 8,712 42,211 4,942 ..IDA grants .. .. .. 1,069 1,082 1,033 1,775 ..
3. Currency composition of public and publicly guaranteed debt (%)Euro .. .. .. 16.3 13.4 12.9 13.1 ..Japanese yen 7.9 10.6 10.8 12.0 11.0 12.4 12.1 ..Pound sterling 4.4 3.1 1.6 3.7 3.0 0.8 0.8 ..Swiss franc 0.9 0.6 0.4 0.6 0.5 0.4 0.3 ..U.S.dollars 32.0 33.4 55.0 46.2 49.5 47.8 46.6 ..
4. Average terms of new commitmentsOfficial creditors Interest (%) 3.4 2.8 2.0 1.2 1.4 2.0 1.7 .. Maturity (years) 29.1 29.1 33.0 34.2 32.6 30.9 33.4 .. Grace period (years) 7.8 8.2 8.5 8.7 8.5 7.7 4.6 ..Private creditors Interest (%) 7.8 6.1 5.7 3.6 5.9 4.5 5.7 .. Maturity (years) 12.4 6.8 10.1 9.3 8.0 18.8 8.8 .. Grace period (years) 3.0 1.7 3.0 4.3 7.5 9.6 7.6 ..
5. Major economic aggregatesGross national income (GNI) 254,096 291,271 355,653 500,477 577,472 676,765 769,820 ..Exports of goods, services & income 61,975 79,576 108,631 180,116 223,001 267,583 308,479 ..Worker remit. & comp. of employees 5,218 6,207 8,250 19,616 23,894 30,940 39,940 ..Imports of goods & services 76,322 108,838 116,811 187,844 230,670 275,064 337,557 ..International reserves 11,979 18,247 31,590 67,191 80,583 107,353 134,870 ..
6. RatiosExternal debt stocks to exports (%) 341.1 318.7 211.8 147.0 106.2 75.1 72.2 ..External debt stocks to GNI (%) 83.2 87.1 64.7 52.9 41.0 29.7 28.9 ..Debt service to exports (%) 20.5 19.2 12.0 7.3 8.3 6.1 4.0 ..Short-term to external debt stocks (%) 9.4 11.1 7.6 7.8 7.4 11.1 12.8 12.6Multilateral to external debt stocks (%) 24.4 30.4 36.8 44.3 48.1 44.8 45.3 43.8Reserves to external debt stocks (%) 5.7 7.2 13.7 25.4 34.0 53.4 60.6 ..Reserves to imports (months) 1.9 2.0 3.2 4.3 4.2 4.7 4.8 ..
16

LOW-INCOME COUNTRIES(US$ million, unless otherwise indicated)
1990 1995 2000 2004 2005 2006 2007 2008
7. Long-term external debtDebt outstanding and disbursed 184,516 215,751 203,790 234,495 211,460 173,575 188,851 203,741Public and publicly guaranteed 179,037 207,566 195,118 228,896 206,579 168,237 182,906 191,277 Official creditors 149,695 187,088 178,836 215,951 193,492 156,190 170,016 177,571 Multilateral 51,487 77,148 84,564 117,177 114,022 89,961 100,781 106,734 of which: IBRD 10,014 10,059 6,532 5,207 4,549 4,317 3,925 3,202 IDA 23,044 38,483 47,090 71,762 70,536 49,637 56,002 59,016 Bilateral 98,208 109,940 94,272 98,773 79,470 66,230 69,235 70,837 Private creditors 29,343 20,478 16,283 12,945 13,087 12,047 12,890 13,706 of which: Bonds 338 2,330 5,583 2,598 3,814 3,146 4,620 4,594 Commercial banks 12,203 5,977 4,937 5,082 4,697 4,810 4,875 6,258Private nonguaranteed 5,478 8,185 8,672 5,599 4,881 5,337 5,945 12,464 of which: Bonds 0 45 295 0 600 850 1,025 1,025Disbursements 11,487 12,030 8,955 12,705 13,280 13,506 15,786 22,814Public and publicly guaranteed 10,585 10,864 8,681 11,262 11,631 11,992 14,394 15,994 Official creditors 9,339 9,490 8,054 10,048 9,853 10,699 12,587 14,004 Multilateral 6,330 6,485 5,724 8,171 8,369 8,731 10,106 10,148 of which: IBRD 1,132 707 284 39 262 206 204 68 IDA 2,693 3,119 3,022 5,164 4,775 4,604 5,582 4,512 Bilateral 3,009 3,005 2,330 1,877 1,484 1,968 2,481 3,856 Private creditors 1,247 1,374 628 1,214 1,778 1,293 1,807 1,990 of which: Bonds 0 0 0 500 1,350 800 1,500 0 Commercial banks 223 712 208 288 183 175 155 1,835Private nonguaranteed 902 1,166 274 1,443 1,649 1,514 1,392 6,819 of which: Bonds 0 0 0 0 600 250 175 0Principal repayments 5,498 7,526 7,518 8,355 9,597 12,219 7,499 9,279Public and publicly guaranteed 4,936 6,637 6,450 7,112 8,615 11,382 6,473 8,406 Official creditors 3,471 4,914 4,739 5,924 7,568 9,018 5,173 7,335 Multilateral 1,601 2,578 2,542 3,528 2,627 3,062 3,203 4,235 of which: IBRD 695 1,133 715 622 586 545 760 936 IDA 85 225 402 586 591 936 732 999 Bilateral 1,870 2,336 2,197 2,396 4,941 5,956 1,970 3,101 Private creditors 1,465 1,723 1,711 1,188 1,046 2,364 1,300 1,071 of which: Bonds 31 62 46 229 135 1,467 26 26 Commercial banks 913 507 878 273 243 242 303 334Private nonguaranteed 562 889 1,068 1,242 983 838 1,026 877 of which: Bonds 0 0 0 0 0 0 0 0Interest payments 4,724 4,052 3,750 2,985 7,412 2,926 3,604 4,051Public and publicly guaranteed 4,336 3,661 3,225 2,739 7,099 2,611 3,207 3,272 Official creditors 3,073 2,818 2,384 2,425 6,673 2,136 2,783 2,736 Multilateral 1,283 1,720 1,287 1,233 1,202 1,238 1,658 1,432 of which: IBRD 695 776 384 168 155 170 476 210 IDA 147 273 301 498 499 465 399 459 Bilateral 1,790 1,098 1,097 1,192 5,471 899 1,126 1,305 Private creditors 1,263 843 841 314 426 475 424 535 of which: Bonds 16 144 365 139 238 310 243 297 Commercial banks 596 155 262 45 60 58 96 152Private nonguaranteed 389 390 525 245 313 315 397 779 of which: Bonds 0 2 16 0 3 52 74 728. Debt stock-flow reconciliationTotal change in external debt stocks 23,139 11,286 -16,959 10,194 -27,863 -35,916 .. Net flows on external debt 7,689 7,896 223 5,137 3,530 5,164 13,820 19,257 Cross-currency valuation 10,681 -1,270 -10,072 7,480 -18,247 -25,065 6,456 ..9. Debt restructuringsTotal amount rescheduled 5,117 1,824 22,868 724 1,419 1,494 263 ..Total amount forgiven 1,562 1,290 640 2,864 8,434 11,893 534 ..Debt buyback 0 29 137 0 0 0 0 ..
17
0
25
50
2000 2001 2002 2003 2004 2005 2006 2007
Non-debt flows (bill US$)
Portfolio equity flows Foreign direct investment
0
50
100
150
200
250
2000 2001 2002 2003 2004 2005 2006 2007
Debt ratios (%)
Debt to exports Reserves to debt
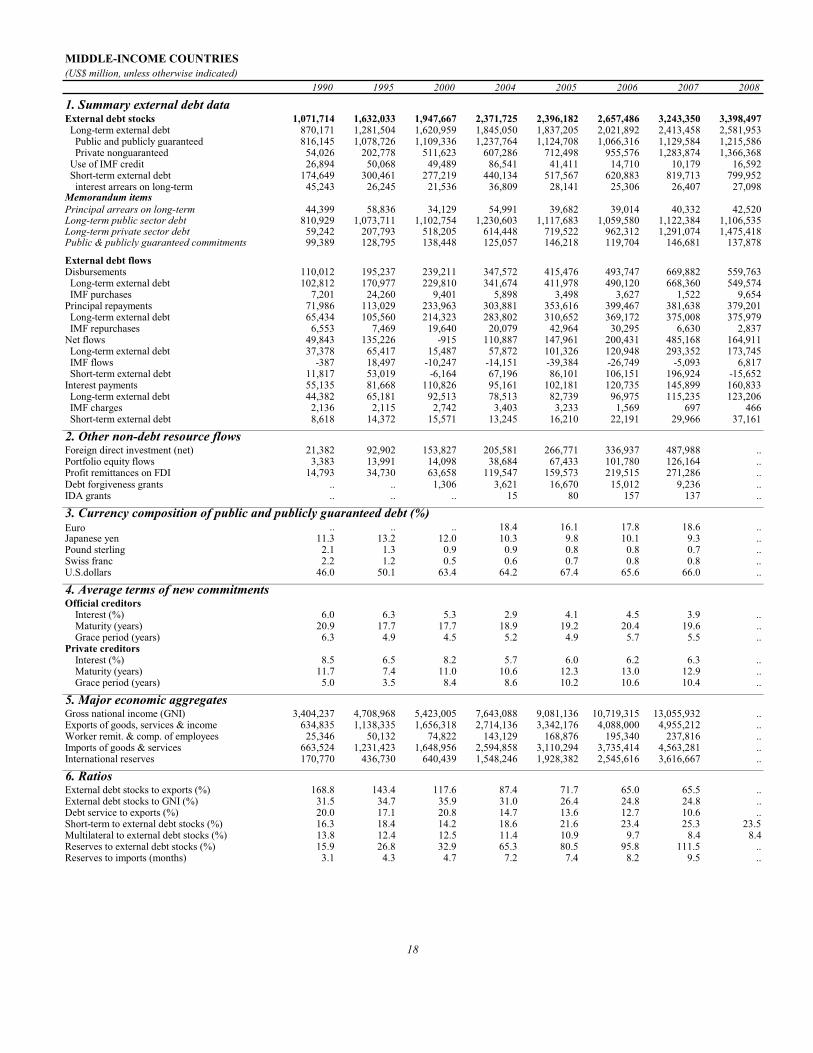
MIDDLE-INCOME COUNTRIES(US$ million, unless otherwise indicated)
1990 1995 2000 2004 2005 2006 2007 2008
1. Summary external debt dataExternal debt stocks 1,071,714 1,632,033 1,947,667 2,371,725 2,396,182 2,657,486 3,243,350 3,398,497 Long-term external debt 870,171 1,281,504 1,620,959 1,845,050 1,837,205 2,021,892 2,413,458 2,581,953 Public and publicly guaranteed 816,145 1,078,726 1,109,336 1,237,764 1,124,708 1,066,316 1,129,584 1,215,586 Private nonguaranteed 54,026 202,778 511,623 607,286 712,498 955,576 1,283,874 1,366,368 Use of IMF credit 26,894 50,068 49,489 86,541 41,411 14,710 10,179 16,592 Short-term external debt 174,649 300,461 277,219 440,134 517,567 620,883 819,713 799,952 interest arrears on long-term 45,243 26,245 21,536 36,809 28,141 25,306 26,407 27,098Memorandum itemsPrincipal arrears on long-term 44,399 58,836 34,129 54,991 39,682 39,014 40,332 42,520Long-term public sector debt 810,929 1,073,711 1,102,754 1,230,603 1,117,683 1,059,580 1,122,384 1,106,535Long-term private sector debt 59,242 207,793 518,205 614,448 719,522 962,312 1,291,074 1,475,418Public & publicly guaranteed commitments 99,389 128,795 138,448 125,057 146,218 119,704 146,681 137,878
External debt flowsDisbursements 110,012 195,237 239,211 347,572 415,476 493,747 669,882 559,763 Long-term external debt 102,812 170,977 229,810 341,674 411,978 490,120 668,360 549,574 IMF purchases 7,201 24,260 9,401 5,898 3,498 3,627 1,522 9,654Principal repayments 71,986 113,029 233,963 303,881 353,616 399,467 381,638 379,201 Long-term external debt 65,434 105,560 214,323 283,802 310,652 369,172 375,008 375,979 IMF repurchases 6,553 7,469 19,640 20,079 42,964 30,295 6,630 2,837Net flows 49,843 135,226 -915 110,887 147,961 200,431 485,168 164,911 Long-term external debt 37,378 65,417 15,487 57,872 101,326 120,948 293,352 173,745 IMF flows -387 18,497 -10,247 -14,151 -39,384 -26,749 -5,093 6,817 Short-term external debt 11,817 53,019 -6,164 67,196 86,101 106,151 196,924 -15,652Interest payments 55,135 81,668 110,826 95,161 102,181 120,735 145,899 160,833 Long-term external debt 44,382 65,181 92,513 78,513 82,739 96,975 115,235 123,206 IMF charges 2,136 2,115 2,742 3,403 3,233 1,569 697 466 Short-term external debt 8,618 14,372 15,571 13,245 16,210 22,191 29,966 37,161
2. Other non-debt resource flowsForeign direct investment (net) 21,382 92,902 153,827 205,581 266,771 336,937 487,988 ..Portfolio equity flows 3,383 13,991 14,098 38,684 67,433 101,780 126,164 ..Profit remittances on FDI 14,793 34,730 63,658 119,547 159,573 219,515 271,286 ..Debt forgiveness grants .. .. 1,306 3,621 16,670 15,012 9,236 ..IDA grants .. .. .. 15 80 157 137 ..
3. Currency composition of public and publicly guaranteed debt (%)Euro .. .. .. 18.4 16.1 17.8 18.6 ..Japanese yen 11.3 13.2 12.0 10.3 9.8 10.1 9.3 ..Pound sterling 2.1 1.3 0.9 0.9 0.8 0.8 0.7 ..Swiss franc 2.2 1.2 0.5 0.6 0.7 0.8 0.8 ..U.S.dollars 46.0 50.1 63.4 64.2 67.4 65.6 66.0 ..
4. Average terms of new commitmentsOfficial creditors Interest (%) 6.0 6.3 5.3 2.9 4.1 4.5 3.9 .. Maturity (years) 20.9 17.7 17.7 18.9 19.2 20.4 19.6 .. Grace period (years) 6.3 4.9 4.5 5.2 4.9 5.7 5.5 ..Private creditors Interest (%) 8.5 6.5 8.2 5.7 6.0 6.2 6.3 .. Maturity (years) 11.7 7.4 11.0 10.6 12.3 13.0 12.9 .. Grace period (years) 5.0 3.5 8.4 8.6 10.2 10.6 10.4 ..
5. Major economic aggregatesGross national income (GNI) 3,404,237 4,708,968 5,423,005 7,643,088 9,081,136 10,719,315 13,055,932 ..Exports of goods, services & income 634,835 1,138,335 1,656,318 2,714,136 3,342,176 4,088,000 4,955,212 ..Worker remit. & comp. of employees 25,346 50,132 74,822 143,129 168,876 195,340 237,816 ..Imports of goods & services 663,524 1,231,423 1,648,956 2,594,858 3,110,294 3,735,414 4,563,281 ..International reserves 170,770 436,730 640,439 1,548,246 1,928,382 2,545,616 3,616,667 ..
6. RatiosExternal debt stocks to exports (%) 168.8 143.4 117.6 87.4 71.7 65.0 65.5 ..External debt stocks to GNI (%) 31.5 34.7 35.9 31.0 26.4 24.8 24.8 ..Debt service to exports (%) 20.0 17.1 20.8 14.7 13.6 12.7 10.6 ..Short-term to external debt stocks (%) 16.3 18.4 14.2 18.6 21.6 23.4 25.3 23.5Multilateral to external debt stocks (%) 13.8 12.4 12.5 11.4 10.9 9.7 8.4 8.4Reserves to external debt stocks (%) 15.9 26.8 32.9 65.3 80.5 95.8 111.5 ..Reserves to imports (months) 3.1 4.3 4.7 7.2 7.4 8.2 9.5 ..
18

MIDDLE-INCOME COUNTRIES(US$ million, unless otherwise indicated)
1990 1995 2000 2004 2005 2006 2007 2008
7. Long-term external debtDebt outstanding and disbursed 870,171 1,281,504 1,620,959 1,845,050 1,837,205 2,021,892 2,413,458 2,581,953Public and publicly guaranteed 816,145 1,078,726 1,109,336 1,237,764 1,124,708 1,066,316 1,129,584 1,215,586 Official creditors 383,016 595,188 580,331 596,545 524,615 485,533 500,069 506,593 Multilateral 147,724 202,698 243,355 269,950 260,994 258,499 272,218 284,967 of which: IBRD 80,179 98,062 104,133 99,548 94,540 91,172 92,933 96,628 IDA 21,880 32,969 39,677 52,735 51,158 49,028 52,842 52,082 Bilateral 235,292 392,490 336,976 326,595 263,621 227,034 227,851 221,625 Private creditors 433,128 483,537 529,005 641,219 600,093 580,783 629,515 708,993 of which: Bonds 98,841 226,107 343,622 432,813 397,865 404,455 443,226 457,107 Commercial banks 221,702 141,419 122,810 162,257 162,140 141,005 154,902 186,291Private nonguaranteed 54,026 202,778 511,623 607,286 712,498 955,576 1,283,874 1,366,368 of which: Bonds 347 50,973 92,622 124,958 157,409 198,798 257,371 265,646Disbursements 102,812 170,977 229,810 341,674 411,978 490,120 668,360 549,574Public and publicly guaranteed 86,473 117,938 128,637 133,763 134,695 125,080 145,186 123,776 Official creditors 39,104 55,260 44,872 36,867 36,148 44,208 44,640 48,221 Multilateral 20,210 24,735 28,978 25,046 25,895 31,087 31,974 33,320 of which: IBRD 12,003 12,086 13,024 10,294 9,312 12,166 10,414 13,810 IDA 1,651 2,355 2,197 2,670 2,340 2,111 1,759 2,092 Bilateral 18,893 30,525 15,893 11,822 10,252 13,121 12,667 14,900 Private creditors 47,369 62,678 83,766 96,895 98,548 80,872 100,546 75,555 of which: Bonds 4,236 22,286 56,284 59,433 62,747 52,684 66,757 37,479 Commercial banks 14,669 21,896 18,738 33,555 31,796 23,801 30,042 34,385Private nonguaranteed 16,339 53,039 101,173 207,911 277,283 365,040 523,174 426,333 of which: Bonds 291 14,063 11,582 34,846 49,964 51,433 83,553 30,142Principal repayments 65,434 105,560 214,323 283,802 310,652 369,172 375,008 375,979Public and publicly guaranteed 58,794 80,027 110,296 124,790 144,574 182,909 117,032 105,617 Official creditors 18,249 38,009 43,457 52,069 69,366 90,128 46,815 45,338 Multilateral 10,080 17,242 20,163 26,801 24,217 33,744 23,273 23,279 of which: IBRD 7,106 10,256 8,898 14,403 11,688 16,900 10,373 10,128 IDA 161 317 545 960 1,043 1,116 1,218 1,294 Bilateral 8,169 20,767 23,294 25,268 45,149 56,385 23,542 22,060 Private creditors 40,545 42,018 66,838 72,721 75,208 92,781 70,217 60,279 of which: Bonds 4,240 11,028 32,737 34,466 41,741 58,523 40,157 28,900 Commercial banks 19,359 14,953 22,832 30,609 25,406 25,424 23,671 18,909Private nonguaranteed 6,640 25,533 104,027 159,012 166,078 186,263 257,976 270,746 of which: Bonds 0 4,042 15,032 24,101 16,582 18,562 26,408 28,215Interest payments 44,382 65,181 92,513 78,513 82,739 96,975 115,235 123,206Public and publicly guaranteed 40,231 54,530 61,146 53,677 56,218 55,095 57,189 59,965 Official creditors 14,945 25,746 24,156 19,378 17,276 17,712 17,118 17,563 Multilateral 8,975 11,566 13,973 9,540 9,414 10,506 11,240 10,512 of which: IBRD 6,056 6,962 7,141 3,912 3,958 4,742 5,107 3,991 IDA 154 230 276 398 400 373 375 345 Bilateral 5,970 14,180 10,183 9,839 7,862 7,206 5,878 7,051 Private creditors 25,287 28,784 36,991 34,299 38,942 37,383 40,070 42,402 of which: Bonds 4,084 14,944 24,732 25,534 29,809 27,962 29,959 30,091 Commercial banks 15,471 7,708 8,846 6,905 7,640 7,945 8,323 10,355Private nonguaranteed 4,151 10,651 31,366 24,836 26,521 41,880 58,046 63,241 of which: Bonds 3 3,169 7,953 8,525 9,520 15,062 17,297 17,6968. Debt stock-flow reconciliationTotal change in external debt stocks 74,880 157,244 -43,062 155,775 24,457 261,303 .. Net flows on external debt 49,843 135,226 -915 110,887 147,961 200,431 485,168 298,361 Cross-currency valuation 34,091 2,144 -41,113 28,681 -57,792 21,426 41,179 ..9. Debt restructuringsTotal amount rescheduled 73,947 29,960 37,811 6,866 29,714 4,075 2,095 ..Total amount forgiven 11,041 954 291 1,968 1,427 73,626 2,526 ..Debt buyback 4,359 132 16,879 0 316 203 3,566 ..
19
0
250
500
750
2000 2001 2002 2003 2004 2005 2006 2007
Non-debt flows (bill US$)
Portfolio equity flows Foreign direct investment
0
50
100
150
2000 2001 2002 2003 2004 2005 2006 2007
Debt ratios (%)
Debt to exports Reserves to debt


21
Country tables

AFGHANISTAN(US$ million, unless otherwise indicated)
1990 1995 2000 2003 2004 2005 2006 2007
1. Summary external debt dataExternal debt stocks .. .. .. .. .. .. 1,654 2,041 Long-term external debt .. .. .. .. .. .. 1,635 1,961 Public and publicly guaranteed .. .. .. .. .. .. 1,635 1,961 Private nonguaranteed .. .. .. .. .. .. 0 0 Use of IMF credit .. 0 0 0 0 0 0 59 Short-term external debt .. .. .. .. .. .. 18 21 interest arrears on long-term .. .. .. .. .. .. 18 21Memorandum itemsPrincipal arrears on long-term .. .. .. .. .. .. 87 89Long-term public sector debt .. .. .. .. .. .. 1,635 1,961Long-term private sector debt .. .. .. .. .. .. 0 0Public & publicly guaranteed commitments .. .. .. .. .. .. 130 37
External debt flowsDisbursements .. .. .. .. .. .. 146 202 Long-term external debt .. .. .. .. .. .. 146 147 IMF purchases .. 0 0 0 0 0 0 55Principal repayments .. .. .. .. .. .. 3 4 Long-term external debt .. .. .. .. .. .. 3 4 IMF repurchases .. 0 0 0 0 0 0 0Net flows .. .. .. .. .. .. 143 198 Long-term external debt .. .. .. .. .. .. 143 143 IMF flows .. 0 0 0 0 0 0 0 Short-term external debt .. .. .. .. .. .. 0 0Interest payments .. .. .. .. .. .. 6 16 Long-term external debt .. .. .. .. .. .. 6 16 IMF charges .. 0 0 0 0 0 0 0 Short-term external debt .. .. .. .. .. .. 0 0
2. Other non-debt resource flowsForeign direct investment (net) .. .. .. .. .. .. 242 288Portfolio equity flows .. .. .. .. .. .. 0 0Profit remittances on FDI .. .. .. .. .. .. 0 0Grants (excluding technical coop.) .. .. .. .. .. .. 2,052 3,212of which: Debt forgiveness grants .. .. .. .. .. .. 0 31 IDA grants .. .. .. 62 95 200 104 287Memo: technical coop. grants .. .. .. .. .. .. 844 518
3. Currency composition of public and publicly guaranteed debt (%)Euro .. .. .. .. .. .. 0.0 0.0Japanese yen .. .. .. .. .. .. 0.0 0.0Pound sterling .. .. .. .. .. .. 1.5 1.3Swiss franc .. .. .. .. .. .. 0.0 0.0U.S.dollars .. .. .. .. .. .. 79.6 68.2
4. Average terms of new commitmentsOfficial creditors Interest (%) .. .. .. .. .. .. 1.2 1.4 Maturity (years) .. .. .. .. .. .. 39.8 31.6 Grace period (years) .. .. .. .. .. .. 10.3 8.1Private creditors Interest (%) .. .. .. .. .. .. 0.0 0.0 Maturity (years) .. .. .. .. .. .. 0.0 0.0 Grace period (years) .. .. .. .. .. .. 0.0 0.0
5. Major economic aggregatesGross national income (GNI) .. .. .. .. .. .. 8,405 ..Exports of goods, services & income .. .. .. .. .. .. .. ..Worker remit. & comp. of employees .. .. .. .. .. .. 0 0Imports of goods & services .. .. .. .. .. .. .. ..International reserves .. .. .. .. .. .. .. ..Current account balance .. .. .. .. .. .. .. ..
6. RatiosExternal debt stocks to exports (%) .. .. .. .. .. .. .. ..External debt stocks to GNI (%) .. .. .. .. .. .. 19.7 ..Debt service to exports (%) .. .. .. .. .. .. .. ..Short-term to external debt stocks (%) .. .. .. .. .. .. 1.1 1.0Multilateral to external debt stocks (%) .. .. .. .. .. .. 39.5 47.4Reserves to external debt stocks (%) .. .. .. .. .. .. 0.0 0.0Reserves to imports (months) .. .. .. .. .. .. .. ..
22

AFGHANISTAN(US$ million, unless otherwise indicated)
1990 1995 2000 2003 2004 2005 2006 2007
7. Long-term external debtDebt outstanding and disbursed .. .. .. .. .. .. 1,635 1,961Public and publicly guaranteed .. .. .. .. .. .. 1,635 1,961 Official creditors .. .. .. .. .. .. 1,635 1,961 Multilateral .. .. .. .. .. .. 654 968 of which: IBRD .. 0 0 0 0 0 0 0 IDA .. 0 0 86 227 294 343 411 Bilateral .. .. .. .. .. .. 981 993 Private creditors .. .. .. .. .. .. 0 0 of which: Bonds .. .. .. .. .. .. 0 0 Commercial banks .. .. .. .. .. .. 0 0Private nonguaranteed .. .. .. .. .. .. 0 0 of which: Bonds .. .. .. .. .. .. 0 0Disbursements .. .. .. .. .. .. 146 147Public and publicly guaranteed .. .. .. .. .. .. 146 147 Official creditors .. .. .. .. .. .. 146 147 Multilateral .. .. .. .. .. .. 107 140 of which: IBRD .. 0 0 0 0 0 0 0 IDA .. 0 0 35 135 84 39 44 Bilateral .. .. .. .. .. .. 40 7 Private creditors .. .. .. .. .. .. 0 0 of which: Bonds .. .. .. .. .. .. 0 0 Commercial banks .. .. .. .. .. .. 0 0Private nonguaranteed .. .. .. .. .. .. 0 0 of which: Bonds .. .. .. .. .. .. 0 0Principal repayments .. .. .. .. .. .. 3 4Public and publicly guaranteed .. .. .. .. .. .. 3 4 Official creditors .. .. .. .. .. .. 3 4 Multilateral .. .. .. .. .. .. 3 4 of which: IBRD .. 0 0 0 0 0 0 0 IDA .. 0 0 25 3 3 3 3 Bilateral .. .. .. .. .. .. 0 0 Private creditors .. .. .. .. .. .. 0 0 of which: Bonds .. .. .. .. .. .. 0 0 Commercial banks .. .. .. .. .. .. 0 0Private nonguaranteed .. .. .. .. .. .. 0 0 of which: Bonds .. .. .. .. .. .. 0 0Interest payments .. .. .. .. .. .. 6 16Public and publicly guaranteed .. .. .. .. .. .. 6 16 Official creditors .. .. .. .. .. .. 6 16 Multilateral .. .. .. .. .. .. 6 6 of which: IBRD .. 0 0 0 0 0 0 0 IDA .. 0 0 6 2 3 3 3 Bilateral .. .. .. .. .. .. 0 9 Private creditors .. .. .. .. .. .. 0 0 of which: Bonds .. .. .. .. .. .. 0 0 Commercial banks .. .. .. .. .. .. 0 0Private nonguaranteed .. .. .. .. .. .. 0 0 of which: Bonds .. .. .. .. .. .. 0 08. Debt stock-flow reconciliationTotal change in external debt stocks .. .. .. .. .. .. 1,047 388 Net flows on external debt .. .. .. .. .. .. 143 198 Cross-currency valuation .. .. .. .. .. .. 25 319. Debt restructuringsTotal amount rescheduled .. .. .. .. .. .. 857 0Total amount forgiven .. .. .. .. .. .. 0 1Debt buyback .. .. .. .. .. .. 0 010. Contractual obligations on outstanding long-term external debt
2008 2009 2010 2011 2012 2013 2014 2015Official creditorsPrincipal 4 4 4 4 9 25 36 50Interest 28 30 30 31 31 32 32 32Private creditorsPrincipal 0 0 0 0 0 0 0 0Interest 0 0 0 0 0 0 0 0
Notes:The 2006 data are World Bank staff estimates based on reports provided by the country. The effects of the 2006 Paris Club rescheduling, and debt forgiveness from Russian Federation are reflected in the 2006 data.
23
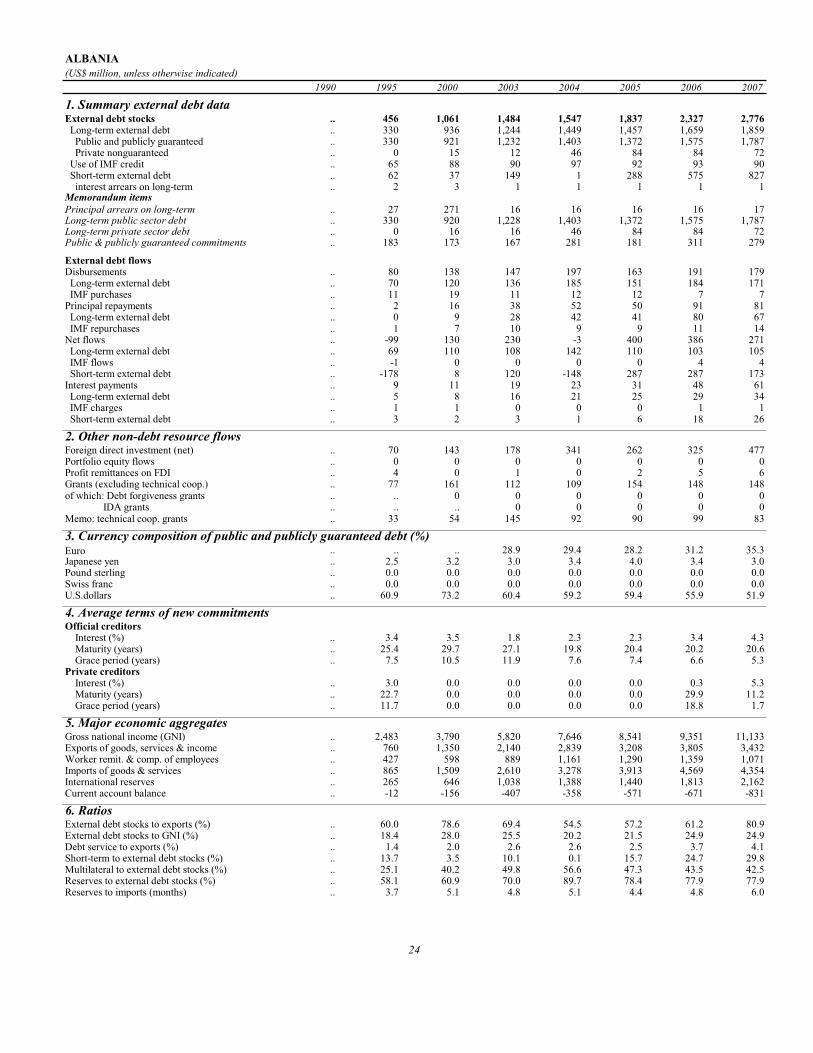
ALBANIA(US$ million, unless otherwise indicated)
1990 1995 2000 2003 2004 2005 2006 2007
1. Summary external debt dataExternal debt stocks .. 456 1,061 1,484 1,547 1,837 2,327 2,776 Long-term external debt .. 330 936 1,244 1,449 1,457 1,659 1,859 Public and publicly guaranteed .. 330 921 1,232 1,403 1,372 1,575 1,787 Private nonguaranteed .. 0 15 12 46 84 84 72 Use of IMF credit .. 65 88 90 97 92 93 90 Short-term external debt .. 62 37 149 1 288 575 827 interest arrears on long-term .. 2 3 1 1 1 1 1Memorandum itemsPrincipal arrears on long-term .. 27 271 16 16 16 16 17Long-term public sector debt .. 330 920 1,228 1,403 1,372 1,575 1,787Long-term private sector debt .. 0 16 16 46 84 84 72Public & publicly guaranteed commitments .. 183 173 167 281 181 311 279
External debt flowsDisbursements .. 80 138 147 197 163 191 179 Long-term external debt .. 70 120 136 185 151 184 171 IMF purchases .. 11 19 11 12 12 7 7Principal repayments .. 2 16 38 52 50 91 81 Long-term external debt .. 0 9 28 42 41 80 67 IMF repurchases .. 1 7 10 9 9 11 14Net flows .. -99 130 230 -3 400 386 271 Long-term external debt .. 69 110 108 142 110 103 105 IMF flows .. -1 0 0 0 0 4 4 Short-term external debt .. -178 8 120 -148 287 287 173Interest payments .. 9 11 19 23 31 48 61 Long-term external debt .. 5 8 16 21 25 29 34 IMF charges .. 1 1 0 0 0 1 1 Short-term external debt .. 3 2 3 1 6 18 26
2. Other non-debt resource flowsForeign direct investment (net) .. 70 143 178 341 262 325 477Portfolio equity flows .. 0 0 0 0 0 0 0Profit remittances on FDI .. 4 0 1 0 2 5 6Grants (excluding technical coop.) .. 77 161 112 109 154 148 148of which: Debt forgiveness grants .. .. 0 0 0 0 0 0 IDA grants .. .. .. 0 0 0 0 0Memo: technical coop. grants .. 33 54 145 92 90 99 83
3. Currency composition of public and publicly guaranteed debt (%)Euro .. .. .. 28.9 29.4 28.2 31.2 35.3Japanese yen .. 2.5 3.2 3.0 3.4 4.0 3.4 3.0Pound sterling .. 0.0 0.0 0.0 0.0 0.0 0.0 0.0Swiss franc .. 0.0 0.0 0.0 0.0 0.0 0.0 0.0U.S.dollars .. 60.9 73.2 60.4 59.2 59.4 55.9 51.9
4. Average terms of new commitmentsOfficial creditors Interest (%) .. 3.4 3.5 1.8 2.3 2.3 3.4 4.3 Maturity (years) .. 25.4 29.7 27.1 19.8 20.4 20.2 20.6 Grace period (years) .. 7.5 10.5 11.9 7.6 7.4 6.6 5.3Private creditors Interest (%) .. 3.0 0.0 0.0 0.0 0.0 0.3 5.3 Maturity (years) .. 22.7 0.0 0.0 0.0 0.0 29.9 11.2 Grace period (years) .. 11.7 0.0 0.0 0.0 0.0 18.8 1.7
5. Major economic aggregatesGross national income (GNI) .. 2,483 3,790 5,820 7,646 8,541 9,351 11,133Exports of goods, services & income .. 760 1,350 2,140 2,839 3,208 3,805 3,432Worker remit. & comp. of employees .. 427 598 889 1,161 1,290 1,359 1,071Imports of goods & services .. 865 1,509 2,610 3,278 3,913 4,569 4,354International reserves .. 265 646 1,038 1,388 1,440 1,813 2,162Current account balance .. -12 -156 -407 -358 -571 -671 -831
6. RatiosExternal debt stocks to exports (%) .. 60.0 78.6 69.4 54.5 57.2 61.2 80.9External debt stocks to GNI (%) .. 18.4 28.0 25.5 20.2 21.5 24.9 24.9Debt service to exports (%) .. 1.4 2.0 2.6 2.6 2.5 3.7 4.1Short-term to external debt stocks (%) .. 13.7 3.5 10.1 0.1 15.7 24.7 29.8Multilateral to external debt stocks (%) .. 25.1 40.2 49.8 56.6 47.3 43.5 42.5Reserves to external debt stocks (%) .. 58.1 60.9 70.0 89.7 78.4 77.9 77.9Reserves to imports (months) .. 3.7 5.1 4.8 5.1 4.4 4.8 6.0
24

ALBANIA(US$ million, unless otherwise indicated)
1990 1995 2000 2003 2004 2005 2006 2007
7. Long-term external debtDebt outstanding and disbursed .. 330 936 1,244 1,449 1,457 1,659 1,859Public and publicly guaranteed .. 330 921 1,232 1,403 1,372 1,575 1,787 Official creditors .. 305 899 1,209 1,380 1,350 1,552 1,765 Multilateral .. 115 426 739 876 868 1,013 1,179 of which: IBRD .. 0 0 0 0 0 0 6 IDA .. 109 346 583 677 655 729 803 Bilateral .. 190 473 469 503 482 539 586 Private creditors .. 25 22 23 23 22 23 22 of which: Bonds .. 0 0 0 0 0 0 0 Commercial banks .. 0 0 0 0 0 0 1Private nonguaranteed .. 0 15 12 46 84 84 72 of which: Bonds .. 0 0 0 0 0 0 0Disbursements .. 70 120 136 185 151 184 171Public and publicly guaranteed .. 70 120 136 148 116 168 165 Official creditors .. 70 120 136 148 116 168 163 Multilateral .. 48 101 107 113 82 115 131 of which: IBRD .. 0 0 0 0 0 0 5 IDA .. 43 64 61 67 34 46 48 Bilateral .. 22 19 30 35 34 53 32 Private creditors .. 0 0 0 0 0 0 2 of which: Bonds .. 0 0 0 0 0 0 0 Commercial banks .. 0 0 0 0 0 0 1Private nonguaranteed .. 0 0 0 36 35 15 7 of which: Bonds .. 0 0 0 0 0 0 0Principal repayments .. 0 9 28 42 41 80 67Public and publicly guaranteed .. 0 9 26 36 40 57 55 Official creditors .. 0 8 26 36 39 54 52 Multilateral .. 0 2 13 15 18 24 26 of which: IBRD .. 0 0 0 0 0 0 0 IDA .. 0 0 1 3 4 5 6 Bilateral .. 0 6 13 20 21 31 26 Private creditors .. 0 1 0 1 1 3 4 of which: Bonds .. 0 0 0 0 0 0 0 Commercial banks .. 0 0 0 0 0 0 0Private nonguaranteed .. 0 0 2 6 1 23 11 of which: Bonds .. 0 0 0 0 0 0 0Interest payments .. 5 8 16 21 25 29 34Public and publicly guaranteed .. 5 7 15 20 23 25 31 Official creditors .. 4 7 15 20 23 25 31 Multilateral .. 1 4 8 12 14 14 18 of which: IBRD .. 0 0 0 0 0 0 0 IDA .. 1 2 4 5 5 6 6 Bilateral .. 3 3 7 8 9 11 13 Private creditors .. 1 0 0 0 0 0 0 of which: Bonds .. 0 0 0 0 0 0 0 Commercial banks .. 0 0 0 0 0 0 0Private nonguaranteed .. 0 1 1 1 2 4 3 of which: Bonds .. 0 0 0 0 0 0 08. Debt stock-flow reconciliationTotal change in external debt stocks .. -427 352 366 63 289 490 370 Net flows on external debt .. -99 130 230 -3 400 386 271 Cross-currency valuation .. 8 -35 116 63 -121 85 1009. Debt restructuringsTotal amount rescheduled .. 6 28 15 0 10 9 0Total amount forgiven .. 0 0 0 4 0 2 0Debt buyback .. 30 0 0 0 0 0 010. Contractual obligations on outstanding long-term external debt
2008 2009 2010 2011 2012 2013 2014 2015Official creditorsPrincipal 80 84 103 114 121 124 128 130Interest 40 45 48 47 45 42 38 34Private creditorsPrincipal 10 11 11 11 9 9 9 15Interest 3 3 3 3 2 2 2 1
Notes:Private nonguaranteed debt data are World Bank staff estimates.
25

ALGERIA(US$ million, unless otherwise indicated)
1990 1995 2000 2003 2004 2005 2006 2007
1. Summary external debt dataExternal debt stocks 28,149 33,042 25,381 23,542 22,178 16,862 5,717 5,541 Long-term external debt 26,688 31,303 23,441 22,408 21,105 16,346 5,176 4,823 Public and publicly guaranteed 26,688 31,303 23,441 21,850 20,395 15,480 3,872 3,756 Private nonguaranteed 0 0 0 559 710 866 1,304 1,068 Use of IMF credit 670 1,478 1,718 988 643 0 0 0 Short-term external debt 791 261 222 146 431 516 541 717 interest arrears on long-term 0 3 0 0 0 0 0 0Memorandum itemsPrincipal arrears on long-term 1 1 0 0 0 0 0 0Long-term public sector debt 26,608 31,214 23,319 21,677 20,190 15,306 3,812 3,648Long-term private sector debt 80 89 122 732 914 1,040 1,364 1,175Public & publicly guaranteed commitments 8,054 2,427 1,419 1,250 1,421 331 208 82
External debt flowsDisbursements 7,017 4,157 1,215 1,932 2,112 1,239 842 424 Long-term external debt 7,017 3,683 1,215 1,932 2,112 1,239 842 424 IMF purchases 0 475 0 0 0 0 0 0Principal repayments 6,780 2,419 2,814 3,216 4,706 5,062 12,796 1,211 Long-term external debt 6,780 2,248 2,722 2,778 4,334 4,450 12,796 1,211 IMF repurchases 0 171 93 439 372 612 0 0Net flows -811 1,361 -1,573 -1,246 -2,308 -3,738 -11,929 -610 Long-term external debt 237 1,435 -1,507 -845 -2,222 -3,211 -11,953 -786 IMF flows 0 304 -93 -439 -372 -612 0 0 Short-term external debt -1,049 -378 27 38 285 85 25 176Interest payments 2,025 1,832 1,655 1,085 1,033 921 626 235 Long-term external debt 1,784 1,741 1,552 1,057 1,001 888 610 213 IMF charges 62 69 92 24 22 18 1 0 Short-term external debt 179 22 10 4 10 15 15 22
2. Other non-debt resource flowsForeign direct investment (net) 0 0 438 634 882 1,081 1,795 1,665Portfolio equity flows 0 0 0 0 0 0 0 0Profit remittances on FDI 151 0 0 0 0 0 0 0Grants (excluding technical coop.) 45 70 62 71 99 149 119 158of which: Debt forgiveness grants .. .. 0 0 0 38 24 0 IDA grants .. .. .. 0 0 0 0 0Memo: technical coop. grants 106 101 76 146 189 198 198 227
3. Currency composition of public and publicly guaranteed debt (%)Euro .. .. .. 37.6 42.0 40.5 58.3 60.8Japanese yen 15.1 13.1 14.4 12.8 11.1 8.2 6.1 5.0Pound sterling 1.5 0.9 1.0 1.7 2.0 1.4 0.0 0.0Swiss franc 0.8 0.7 0.5 0.9 1.0 0.8 0.1 0.1U.S.dollars 33.5 38.0 44.5 37.4 36.1 41.0 30.0 27.5
4. Average terms of new commitmentsOfficial creditors Interest (%) 7.0 6.2 6.2 2.0 3.0 3.2 0.5 0.9 Maturity (years) 16.8 11.7 14.9 14.0 13.3 12.9 16.8 14.7 Grace period (years) 4.0 3.3 4.1 4.3 3.3 3.6 3.2 7.7Private creditors Interest (%) 8.9 7.2 6.2 2.9 4.0 2.6 3.5 0.5 Maturity (years) 6.6 8.9 7.4 6.5 11.1 9.6 12.0 2.0 Grace period (years) 2.0 1.9 1.9 1.5 2.2 2.0 3.1 0.6
5. Major economic aggregatesGross national income (GNI) 59,955 39,574 52,080 65,319 81,414 97,259 111,939 133,575Exports of goods, services & income 13,887 .. .. .. .. .. .. ..Worker remit. & comp. of employees 352 1,120 790 1,750 2,460 2,060 1,610 2,120Imports of goods & services 12,448 .. .. .. .. .. .. ..International reserves 2,703 4,164 13,556 35,455 45,692 59,167 81,463 114,972Current account balance 1,420 .. .. .. .. .. .. ..
6. RatiosExternal debt stocks to exports (%) 202.7 .. .. .. .. .. .. ..External debt stocks to GNI (%) 47.0 83.5 48.7 36.0 27.2 17.3 5.1 4.1Debt service to exports (%) 63.4 .. .. .. .. .. .. ..Short-term to external debt stocks (%) 2.8 0.8 0.9 0.6 1.9 3.1 9.5 12.9Multilateral to external debt stocks (%) 7.2 11.8 16.2 17.5 15.8 14.5 2.5 2.5Reserves to external debt stocks (%) 9.6 12.6 53.4 150.6 206.0 350.9 1,425.0 2,075.1Reserves to imports (months) 2.6 .. .. .. .. .. .. ..
26

ALGERIA(US$ million, unless otherwise indicated)
1990 1995 2000 2003 2004 2005 2006 2007
7. Long-term external debtDebt outstanding and disbursed 26,688 31,303 23,441 22,408 21,105 16,346 5,176 4,823Public and publicly guaranteed 26,688 31,303 23,441 21,850 20,395 15,480 3,872 3,756 Official creditors 5,866 15,685 17,589 17,084 15,948 12,419 2,166 2,180 Multilateral 2,031 3,915 4,123 4,112 3,508 2,444 145 137 of which: IBRD 1,208 2,049 1,425 1,056 909 779 119 113 IDA 0 0 0 0 0 0 0 0 Bilateral 3,835 11,770 13,466 12,972 12,439 9,975 2,021 2,043 Private creditors 20,822 15,618 5,851 4,766 4,447 3,062 1,706 1,576 of which: Bonds 1,420 0 0 0 0 0 0 0 Commercial banks 5,851 4,529 2,508 1,802 1,454 1,038 59 76Private nonguaranteed 0 0 0 559 710 866 1,304 1,068 of which: Bonds 0 0 0 0 0 0 0 0Disbursements 7,017 3,683 1,215 1,932 2,112 1,239 842 424Public and publicly guaranteed 7,017 3,683 1,215 1,482 1,828 776 391 166 Official creditors 1,835 1,596 795 699 907 446 252 108 Multilateral 612 932 349 566 424 358 54 6 of which: IBRD 300 554 58 50 40 31 16 6 IDA 0 0 0 0 0 0 0 0 Bilateral 1,223 664 446 133 483 88 199 102 Private creditors 5,182 2,087 420 783 921 330 138 58 of which: Bonds 0 0 0 0 0 0 0 0 Commercial banks 206 222 0 25 9 8 34 20Private nonguaranteed 0 0 0 451 285 463 451 259 of which: Bonds 0 0 0 0 0 0 0 0Principal repayments 6,780 2,248 2,722 2,778 4,334 4,450 12,796 1,211Public and publicly guaranteed 6,780 2,248 2,722 2,766 4,118 4,222 12,644 646 Official creditors 1,174 671 1,056 1,535 2,702 2,849 10,942 252 Multilateral 312 454 351 521 1,201 1,190 2,396 16 of which: IBRD 130 260 172 202 189 156 677 12 IDA 0 0 0 0 0 0 0 0 Bilateral 862 217 705 1,014 1,500 1,658 8,546 236 Private creditors 5,606 1,577 1,666 1,231 1,417 1,373 1,702 394 of which: Bonds 16 278 0 0 0 0 0 0 Commercial banks 1,330 220 439 358 380 348 1,029 10Private nonguaranteed 0 0 0 11 216 229 151 565 of which: Bonds 0 0 0 0 0 0 0 0Interest payments 1,784 1,741 1,552 1,057 1,001 888 610 213Public and publicly guaranteed 1,784 1,741 1,552 1,055 984 863 557 145 Official creditors 312 823 1,131 881 825 711 441 61 Multilateral 117 251 297 253 217 163 118 7 of which: IBRD 73 137 128 85 60 46 21 6 IDA 0 0 0 0 0 0 0 0 Bilateral 195 572 834 628 608 547 322 53 Private creditors 1,472 917 421 174 159 152 116 84 of which: Bonds 105 13 0 0 0 0 0 0 Commercial banks 526 251 146 42 37 34 30 2Private nonguaranteed 0 0 0 3 17 25 53 68 of which: Bonds 0 0 0 0 0 0 0 08. Debt stock-flow reconciliationTotal change in external debt stocks 912 2,809 -2,618 709 -1,363 -5,316 -11,145 -176 Net flows on external debt -811 1,361 -1,573 -1,246 -2,308 -3,738 -11,929 -610 Cross-currency valuation 1,669 687 -1,144 1,951 922 -1,590 775 2549. Debt restructuringsTotal amount rescheduled 0 5,096 0 0 0 0 0 0Total amount forgiven 0 0 0 0 0 0 0 0Debt buyback 0 0 0 0 0 0 0 010. Contractual obligations on outstanding long-term external debt
2008 2009 2010 2011 2012 2013 2014 2015Official creditorsPrincipal 281 290 300 216 203 195 223 195Interest 65 61 57 50 45 40 35 29Private creditorsPrincipal 733 567 319 261 300 142 108 76Interest 107 75 50 37 27 19 14 11
Notes:Short-term debt is reported by the country.
27

ANGOLA(US$ million, unless otherwise indicated)
1990 1995 2000 2003 2004 2005 2006 2007
1. Summary external debt dataExternal debt stocks 8,592 11,500 9,408 8,695 9,341 12,646 10,384 12,738 Long-term external debt 7,603 9,543 8,085 7,620 8,147 10,332 8,247 10,474 Public and publicly guaranteed 7,603 9,543 8,085 7,620 8,147 10,332 8,247 10,474 Private nonguaranteed 0 0 0 0 0 0 0 0 Use of IMF credit 0 0 0 0 0 0 0 0 Short-term external debt 989 1,958 1,323 1,075 1,194 2,314 2,136 2,264 interest arrears on long-term 204 1,232 874 891 671 575 165 98Memorandum itemsPrincipal arrears on long-term 496 4,190 2,853 3,527 2,161 1,857 698 367Long-term public sector debt 7,599 9,513 8,059 7,596 8,135 10,321 8,241 10,473Long-term private sector debt 5 29 26 24 12 12 7 2Public & publicly guaranteed commitments 523 426 1,033 3,295 5,291 14,742 2,036 4,378
External debt flowsDisbursements 862 550 1,045 1,866 2,602 3,877 1,406 6,059 Long-term external debt 862 550 1,045 1,866 2,602 3,877 1,406 6,059 IMF purchases 0 0 0 0 0 0 0 0Principal repayments 183 332 1,530 1,317 1,702 2,415 3,610 3,855 Long-term external debt 183 332 1,530 1,317 1,702 2,415 3,610 3,855 IMF repurchases 0 0 0 0 0 0 0 0Net flows 977 -90 -733 486 1,239 2,677 -1,971 2,391 Long-term external debt 679 218 -485 549 900 1,461 -2,203 2,204 IMF flows 0 0 0 0 0 0 0 0 Short-term external debt 298 -308 -248 -63 339 1,216 232 187Interest payments 143 132 175 166 174 355 948 728 Long-term external debt 100 79 149 160 166 298 864 625 IMF charges 0 0 0 0 0 0 0 0 Short-term external debt 43 53 26 6 9 57 83 103
2. Other non-debt resource flowsForeign direct investment (net) -335 472 879 3,505 1,449 -1,304 -38 -893Portfolio equity flows 0 0 0 0 0 0 0 0Profit remittances on FDI 314 386 929 1,264 1,950 3,406 5,278 7,268Grants (excluding technical coop.) 192 328 206 412 365 325 302 297of which: Debt forgiveness grants .. .. 0 0 0 0 0 0 IDA grants .. .. .. 0 3 6 16 25Memo: technical coop. grants 36 73 47 80 70 81 73 44
3. Currency composition of public and publicly guaranteed debt (%)Euro .. .. .. 7.8 11.3 7.5 5.5 5.8Japanese yen 0.3 0.3 0.5 0.5 0.5 0.3 0.0 0.0Pound sterling 1.4 0.9 1.0 1.2 1.2 0.8 0.2 0.1Swiss franc 0.7 0.1 0.1 0.0 0.0 0.0 0.0 0.0U.S.dollars 80.7 81.0 86.3 85.1 83.4 88.7 91.5 92.0
4. Average terms of new commitmentsOfficial creditors Interest (%) 5.7 8.1 0.8 3.5 3.1 6.3 1.1 0.4 Maturity (years) 14.1 9.9 39.8 17.1 13.5 13.9 10.9 12.1 Grace period (years) 3.7 0.4 10.3 4.1 1.5 2.0 1.5 2.7Private creditors Interest (%) 7.7 8.1 5.0 3.6 2.9 6.6 8.0 6.3 Maturity (years) 7.7 8.6 3.1 6.1 6.8 7.7 9.0 6.8 Grace period (years) 1.8 0.4 1.3 0.5 0.6 1.3 0.8 1.0
5. Major economic aggregatesGross national income (GNI) 8,214 3,688 7,449 12,230 17,295 26,601 39,660 48,638Exports of goods, services & income 4,003 3,852 8,222 9,722 13,831 24,312 33,492 44,740Worker remit. & comp. of employees 0 0 0 0 0 0 0 0Imports of goods & services 4,161 4,302 7,454 10,540 13,151 19,201 22,612 35,116International reserves .. 213 1,198 634 1,374 3,197 8,599 11,197Current account balance -236 -295 796 -720 686 5,138 10,690 9,402
6. RatiosExternal debt stocks to exports (%) 214.6 298.6 114.4 89.4 67.5 52.0 31.0 28.5External debt stocks to GNI (%) 104.6 311.9 126.3 71.1 54.0 47.5 26.2 26.2Debt service to exports (%) 8.1 12.0 20.7 15.3 13.6 11.4 13.6 10.2Short-term to external debt stocks (%) 11.5 17.0 14.1 12.4 12.8 18.3 20.6 17.8Multilateral to external debt stocks (%) 0.7 1.7 3.1 4.0 4.1 2.9 3.8 3.3Reserves to external debt stocks (%) 0.0 1.9 12.7 7.3 14.7 25.3 82.8 87.9Reserves to imports (months) .. 0.6 1.9 0.7 1.3 2.0 4.6 3.8
28
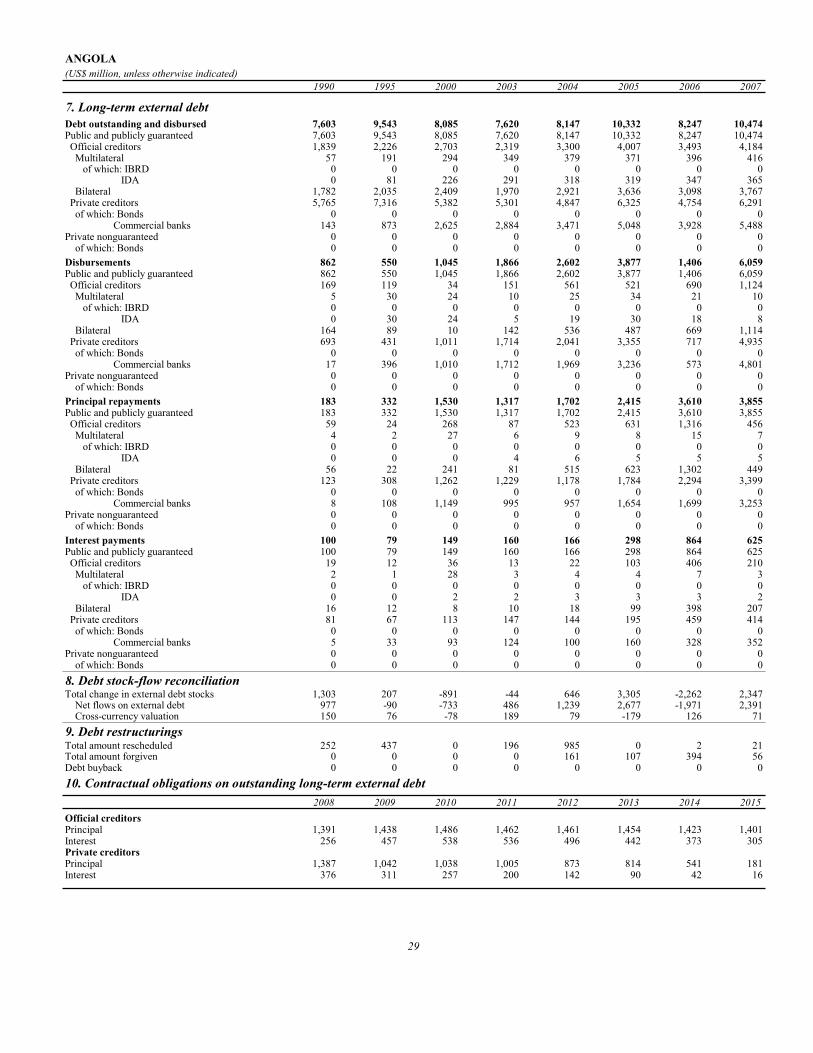
ANGOLA(US$ million, unless otherwise indicated)
1990 1995 2000 2003 2004 2005 2006 2007
7. Long-term external debtDebt outstanding and disbursed 7,603 9,543 8,085 7,620 8,147 10,332 8,247 10,474Public and publicly guaranteed 7,603 9,543 8,085 7,620 8,147 10,332 8,247 10,474 Official creditors 1,839 2,226 2,703 2,319 3,300 4,007 3,493 4,184 Multilateral 57 191 294 349 379 371 396 416 of which: IBRD 0 0 0 0 0 0 0 0 IDA 0 81 226 291 318 319 347 365 Bilateral 1,782 2,035 2,409 1,970 2,921 3,636 3,098 3,767 Private creditors 5,765 7,316 5,382 5,301 4,847 6,325 4,754 6,291 of which: Bonds 0 0 0 0 0 0 0 0 Commercial banks 143 873 2,625 2,884 3,471 5,048 3,928 5,488Private nonguaranteed 0 0 0 0 0 0 0 0 of which: Bonds 0 0 0 0 0 0 0 0Disbursements 862 550 1,045 1,866 2,602 3,877 1,406 6,059Public and publicly guaranteed 862 550 1,045 1,866 2,602 3,877 1,406 6,059 Official creditors 169 119 34 151 561 521 690 1,124 Multilateral 5 30 24 10 25 34 21 10 of which: IBRD 0 0 0 0 0 0 0 0 IDA 0 30 24 5 19 30 18 8 Bilateral 164 89 10 142 536 487 669 1,114 Private creditors 693 431 1,011 1,714 2,041 3,355 717 4,935 of which: Bonds 0 0 0 0 0 0 0 0 Commercial banks 17 396 1,010 1,712 1,969 3,236 573 4,801Private nonguaranteed 0 0 0 0 0 0 0 0 of which: Bonds 0 0 0 0 0 0 0 0Principal repayments 183 332 1,530 1,317 1,702 2,415 3,610 3,855Public and publicly guaranteed 183 332 1,530 1,317 1,702 2,415 3,610 3,855 Official creditors 59 24 268 87 523 631 1,316 456 Multilateral 4 2 27 6 9 8 15 7 of which: IBRD 0 0 0 0 0 0 0 0 IDA 0 0 0 4 6 5 5 5 Bilateral 56 22 241 81 515 623 1,302 449 Private creditors 123 308 1,262 1,229 1,178 1,784 2,294 3,399 of which: Bonds 0 0 0 0 0 0 0 0 Commercial banks 8 108 1,149 995 957 1,654 1,699 3,253Private nonguaranteed 0 0 0 0 0 0 0 0 of which: Bonds 0 0 0 0 0 0 0 0Interest payments 100 79 149 160 166 298 864 625Public and publicly guaranteed 100 79 149 160 166 298 864 625 Official creditors 19 12 36 13 22 103 406 210 Multilateral 2 1 28 3 4 4 7 3 of which: IBRD 0 0 0 0 0 0 0 0 IDA 0 0 2 2 3 3 3 2 Bilateral 16 12 8 10 18 99 398 207 Private creditors 81 67 113 147 144 195 459 414 of which: Bonds 0 0 0 0 0 0 0 0 Commercial banks 5 33 93 124 100 160 328 352Private nonguaranteed 0 0 0 0 0 0 0 0 of which: Bonds 0 0 0 0 0 0 0 08. Debt stock-flow reconciliationTotal change in external debt stocks 1,303 207 -891 -44 646 3,305 -2,262 2,347 Net flows on external debt 977 -90 -733 486 1,239 2,677 -1,971 2,391 Cross-currency valuation 150 76 -78 189 79 -179 126 719. Debt restructuringsTotal amount rescheduled 252 437 0 196 985 0 2 21Total amount forgiven 0 0 0 0 161 107 394 56Debt buyback 0 0 0 0 0 0 0 010. Contractual obligations on outstanding long-term external debt
2008 2009 2010 2011 2012 2013 2014 2015Official creditorsPrincipal 1,391 1,438 1,486 1,462 1,461 1,454 1,423 1,401Interest 256 457 538 536 496 442 373 305Private creditorsPrincipal 1,387 1,042 1,038 1,005 873 814 541 181Interest 376 311 257 200 142 90 42 16
29
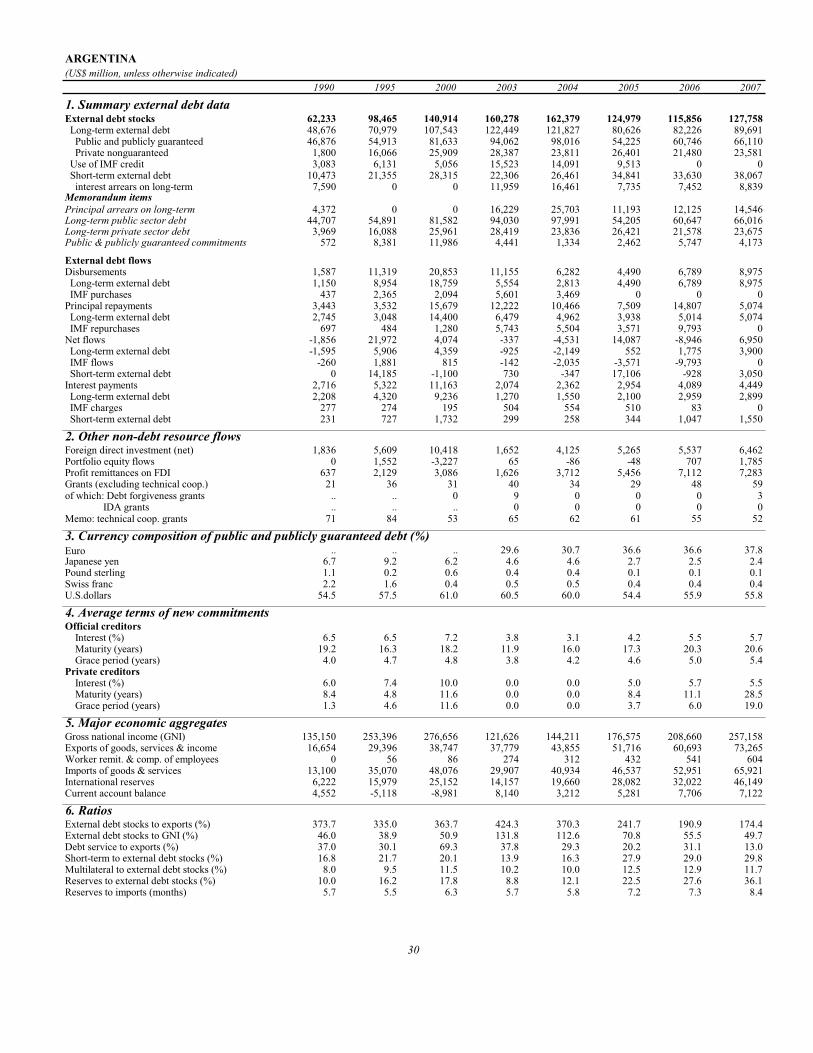
ARGENTINA(US$ million, unless otherwise indicated)
1990 1995 2000 2003 2004 2005 2006 2007
1. Summary external debt dataExternal debt stocks 62,233 98,465 140,914 160,278 162,379 124,979 115,856 127,758 Long-term external debt 48,676 70,979 107,543 122,449 121,827 80,626 82,226 89,691 Public and publicly guaranteed 46,876 54,913 81,633 94,062 98,016 54,225 60,746 66,110 Private nonguaranteed 1,800 16,066 25,909 28,387 23,811 26,401 21,480 23,581 Use of IMF credit 3,083 6,131 5,056 15,523 14,091 9,513 0 0 Short-term external debt 10,473 21,355 28,315 22,306 26,461 34,841 33,630 38,067 interest arrears on long-term 7,590 0 0 11,959 16,461 7,735 7,452 8,839Memorandum itemsPrincipal arrears on long-term 4,372 0 0 16,229 25,703 11,193 12,125 14,546Long-term public sector debt 44,707 54,891 81,582 94,030 97,991 54,205 60,647 66,016Long-term private sector debt 3,969 16,088 25,961 28,419 23,836 26,421 21,578 23,675Public & publicly guaranteed commitments 572 8,381 11,986 4,441 1,334 2,462 5,747 4,173
External debt flowsDisbursements 1,587 11,319 20,853 11,155 6,282 4,490 6,789 8,975 Long-term external debt 1,150 8,954 18,759 5,554 2,813 4,490 6,789 8,975 IMF purchases 437 2,365 2,094 5,601 3,469 0 0 0Principal repayments 3,443 3,532 15,679 12,222 10,466 7,509 14,807 5,074 Long-term external debt 2,745 3,048 14,400 6,479 4,962 3,938 5,014 5,074 IMF repurchases 697 484 1,280 5,743 5,504 3,571 9,793 0Net flows -1,856 21,972 4,074 -337 -4,531 14,087 -8,946 6,950 Long-term external debt -1,595 5,906 4,359 -925 -2,149 552 1,775 3,900 IMF flows -260 1,881 815 -142 -2,035 -3,571 -9,793 0 Short-term external debt 0 14,185 -1,100 730 -347 17,106 -928 3,050Interest payments 2,716 5,322 11,163 2,074 2,362 2,954 4,089 4,449 Long-term external debt 2,208 4,320 9,236 1,270 1,550 2,100 2,959 2,899 IMF charges 277 274 195 504 554 510 83 0 Short-term external debt 231 727 1,732 299 258 344 1,047 1,550
2. Other non-debt resource flowsForeign direct investment (net) 1,836 5,609 10,418 1,652 4,125 5,265 5,537 6,462Portfolio equity flows 0 1,552 -3,227 65 -86 -48 707 1,785Profit remittances on FDI 637 2,129 3,086 1,626 3,712 5,456 7,112 7,283Grants (excluding technical coop.) 21 36 31 40 34 29 48 59of which: Debt forgiveness grants .. .. 0 9 0 0 0 3 IDA grants .. .. .. 0 0 0 0 0Memo: technical coop. grants 71 84 53 65 62 61 55 52
3. Currency composition of public and publicly guaranteed debt (%)Euro .. .. .. 29.6 30.7 36.6 36.6 37.8Japanese yen 6.7 9.2 6.2 4.6 4.6 2.7 2.5 2.4Pound sterling 1.1 0.2 0.6 0.4 0.4 0.1 0.1 0.1Swiss franc 2.2 1.6 0.4 0.5 0.5 0.4 0.4 0.4U.S.dollars 54.5 57.5 61.0 60.5 60.0 54.4 55.9 55.8
4. Average terms of new commitmentsOfficial creditors Interest (%) 6.5 6.5 7.2 3.8 3.1 4.2 5.5 5.7 Maturity (years) 19.2 16.3 18.2 11.9 16.0 17.3 20.3 20.6 Grace period (years) 4.0 4.7 4.8 3.8 4.2 4.6 5.0 5.4Private creditors Interest (%) 6.0 7.4 10.0 0.0 0.0 5.0 5.7 5.5 Maturity (years) 8.4 4.8 11.6 0.0 0.0 8.4 11.1 28.5 Grace period (years) 1.3 4.6 11.6 0.0 0.0 3.7 6.0 19.0
5. Major economic aggregatesGross national income (GNI) 135,150 253,396 276,656 121,626 144,211 176,575 208,660 257,158Exports of goods, services & income 16,654 29,396 38,747 37,779 43,855 51,716 60,693 73,265Worker remit. & comp. of employees 0 56 86 274 312 432 541 604Imports of goods & services 13,100 35,070 48,076 29,907 40,934 46,537 52,951 65,921International reserves 6,222 15,979 25,152 14,157 19,660 28,082 32,022 46,149Current account balance 4,552 -5,118 -8,981 8,140 3,212 5,281 7,706 7,122
6. RatiosExternal debt stocks to exports (%) 373.7 335.0 363.7 424.3 370.3 241.7 190.9 174.4External debt stocks to GNI (%) 46.0 38.9 50.9 131.8 112.6 70.8 55.5 49.7Debt service to exports (%) 37.0 30.1 69.3 37.8 29.3 20.2 31.1 13.0Short-term to external debt stocks (%) 16.8 21.7 20.1 13.9 16.3 27.9 29.0 29.8Multilateral to external debt stocks (%) 8.0 9.5 11.5 10.2 10.0 12.5 12.9 11.7Reserves to external debt stocks (%) 10.0 16.2 17.8 8.8 12.1 22.5 27.6 36.1Reserves to imports (months) 5.7 5.5 6.3 5.7 5.8 7.2 7.3 8.4
30
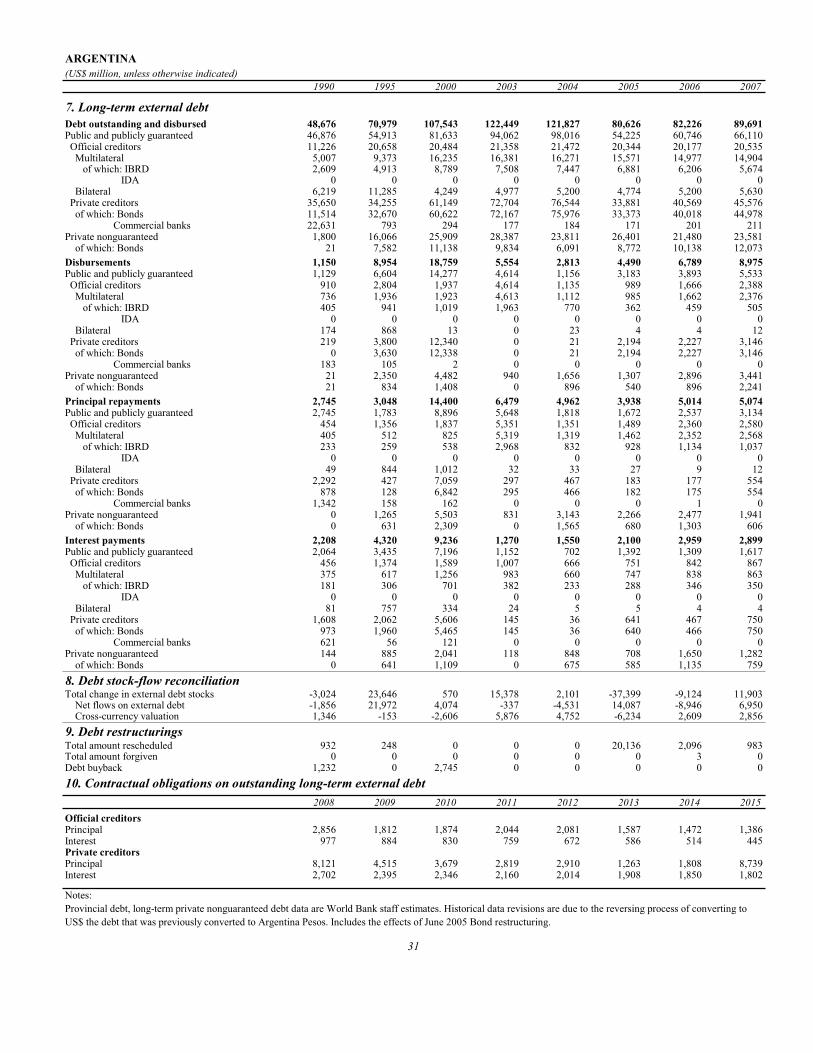
ARGENTINA(US$ million, unless otherwise indicated)
1990 1995 2000 2003 2004 2005 2006 2007
7. Long-term external debtDebt outstanding and disbursed 48,676 70,979 107,543 122,449 121,827 80,626 82,226 89,691Public and publicly guaranteed 46,876 54,913 81,633 94,062 98,016 54,225 60,746 66,110 Official creditors 11,226 20,658 20,484 21,358 21,472 20,344 20,177 20,535 Multilateral 5,007 9,373 16,235 16,381 16,271 15,571 14,977 14,904 of which: IBRD 2,609 4,913 8,789 7,508 7,447 6,881 6,206 5,674 IDA 0 0 0 0 0 0 0 0 Bilateral 6,219 11,285 4,249 4,977 5,200 4,774 5,200 5,630 Private creditors 35,650 34,255 61,149 72,704 76,544 33,881 40,569 45,576 of which: Bonds 11,514 32,670 60,622 72,167 75,976 33,373 40,018 44,978 Commercial banks 22,631 793 294 177 184 171 201 211Private nonguaranteed 1,800 16,066 25,909 28,387 23,811 26,401 21,480 23,581 of which: Bonds 21 7,582 11,138 9,834 6,091 8,772 10,138 12,073Disbursements 1,150 8,954 18,759 5,554 2,813 4,490 6,789 8,975Public and publicly guaranteed 1,129 6,604 14,277 4,614 1,156 3,183 3,893 5,533 Official creditors 910 2,804 1,937 4,614 1,135 989 1,666 2,388 Multilateral 736 1,936 1,923 4,613 1,112 985 1,662 2,376 of which: IBRD 405 941 1,019 1,963 770 362 459 505 IDA 0 0 0 0 0 0 0 0 Bilateral 174 868 13 0 23 4 4 12 Private creditors 219 3,800 12,340 0 21 2,194 2,227 3,146 of which: Bonds 0 3,630 12,338 0 21 2,194 2,227 3,146 Commercial banks 183 105 2 0 0 0 0 0Private nonguaranteed 21 2,350 4,482 940 1,656 1,307 2,896 3,441 of which: Bonds 21 834 1,408 0 896 540 896 2,241Principal repayments 2,745 3,048 14,400 6,479 4,962 3,938 5,014 5,074Public and publicly guaranteed 2,745 1,783 8,896 5,648 1,818 1,672 2,537 3,134 Official creditors 454 1,356 1,837 5,351 1,351 1,489 2,360 2,580 Multilateral 405 512 825 5,319 1,319 1,462 2,352 2,568 of which: IBRD 233 259 538 2,968 832 928 1,134 1,037 IDA 0 0 0 0 0 0 0 0 Bilateral 49 844 1,012 32 33 27 9 12 Private creditors 2,292 427 7,059 297 467 183 177 554 of which: Bonds 878 128 6,842 295 466 182 175 554 Commercial banks 1,342 158 162 0 0 0 1 0Private nonguaranteed 0 1,265 5,503 831 3,143 2,266 2,477 1,941 of which: Bonds 0 631 2,309 0 1,565 680 1,303 606Interest payments 2,208 4,320 9,236 1,270 1,550 2,100 2,959 2,899Public and publicly guaranteed 2,064 3,435 7,196 1,152 702 1,392 1,309 1,617 Official creditors 456 1,374 1,589 1,007 666 751 842 867 Multilateral 375 617 1,256 983 660 747 838 863 of which: IBRD 181 306 701 382 233 288 346 350 IDA 0 0 0 0 0 0 0 0 Bilateral 81 757 334 24 5 5 4 4 Private creditors 1,608 2,062 5,606 145 36 641 467 750 of which: Bonds 973 1,960 5,465 145 36 640 466 750 Commercial banks 621 56 121 0 0 0 0 0Private nonguaranteed 144 885 2,041 118 848 708 1,650 1,282 of which: Bonds 0 641 1,109 0 675 585 1,135 7598. Debt stock-flow reconciliationTotal change in external debt stocks -3,024 23,646 570 15,378 2,101 -37,399 -9,124 11,903 Net flows on external debt -1,856 21,972 4,074 -337 -4,531 14,087 -8,946 6,950 Cross-currency valuation 1,346 -153 -2,606 5,876 4,752 -6,234 2,609 2,8569. Debt restructuringsTotal amount rescheduled 932 248 0 0 0 20,136 2,096 983Total amount forgiven 0 0 0 0 0 0 3 0Debt buyback 1,232 0 2,745 0 0 0 0 010. Contractual obligations on outstanding long-term external debt
2008 2009 2010 2011 2012 2013 2014 2015Official creditorsPrincipal 2,856 1,812 1,874 2,044 2,081 1,587 1,472 1,386Interest 977 884 830 759 672 586 514 445Private creditorsPrincipal 8,121 4,515 3,679 2,819 2,910 1,263 1,808 8,739Interest 2,702 2,395 2,346 2,160 2,014 1,908 1,850 1,802
Notes:Provincial debt, long-term private nonguaranteed debt data are World Bank staff estimates. Historical data revisions are due to the reversing process of converting to US$ the debt that was previously converted to Argentina Pesos. Includes the effects of June 2005 Bond restructuring.
31

ARMENIA(US$ million, unless otherwise indicated)
1990 1995 2000 2003 2004 2005 2006 2007
1. Summary external debt dataExternal debt stocks .. 371 916 1,864 1,970 1,842 2,004 2,888 Long-term external debt .. 298 697 1,245 1,342 1,368 1,533 2,271 Public and publicly guaranteed .. 298 675 877 961 923 1,037 1,272 Private nonguaranteed .. 0 21 368 381 446 496 999 Use of IMF credit .. 70 175 215 218 176 164 158 Short-term external debt .. 2 44 404 410 298 307 459 interest arrears on long-term .. 1 6 0 0 0 0 0Memorandum itemsPrincipal arrears on long-term .. 75 4 0 0 0 0 0Long-term public sector debt .. 298 675 877 961 923 1,037 1,272Long-term private sector debt .. 0 21 368 381 446 496 999Public & publicly guaranteed commitments .. 131 74 45 116 251 65 211
External debt flowsDisbursements .. 148 84 135 166 177 175 751 Long-term external debt .. 102 84 107 138 168 165 741 IMF purchases .. 46 0 28 28 10 10 10Principal repayments .. 3 31 88 116 104 80 82 Long-term external debt .. 3 15 62 81 69 49 58 IMF repurchases .. 0 16 26 35 34 31 24Net flows .. 147 42 231 56 -38 104 821 Long-term external debt .. 100 69 45 56 98 116 683 IMF flows .. 46 -16 -10 -8 -2 0 0 Short-term external debt .. 1 -11 184 6 -112 9 152Interest payments .. 8 15 28 53 35 70 107 Long-term external debt .. 7 9 18 39 23 59 91 IMF charges .. 2 3 1 1 1 1 1 Short-term external debt .. 0 2 9 12 11 11 15
2. Other non-debt resource flowsForeign direct investment (net) .. 25 104 121 248 239 453 699Portfolio equity flows .. 0 0 0 1 1 -1 0Profit remittances on FDI .. 0 22 35 147 170 244 332Grants (excluding technical coop.) .. 91 61 54 63 87 57 129of which: Debt forgiveness grants .. .. 0 0 0 0 0 0 IDA grants .. .. .. 0 0 0 0 0Memo: technical coop. grants .. 39 94 94 97 84 103 41
3. Currency composition of public and publicly guaranteed debt (%)Euro .. .. .. 7.5 7.6 8.0 8.8 9.1Japanese yen .. 0.0 0.0 0.2 0.2 0.2 0.4 7.1Pound sterling .. 0.0 0.0 0.0 0.0 0.0 0.0 0.0Swiss franc .. 0.0 0.0 0.0 0.0 0.0 0.0 0.0U.S.dollars .. 62.6 93.3 90.5 87.7 86.3 82.6 71.0
4. Average terms of new commitmentsOfficial creditors Interest (%) .. 1.3 0.8 0.8 0.8 0.8 0.8 1.4 Maturity (years) .. 32.6 35.7 39.7 39.4 39.6 32.2 25.0 Grace period (years) .. 9.2 10.2 10.4 10.2 10.0 10.3 8.8Private creditors Interest (%) .. 0.0 0.0 0.0 0.0 0.0 0.0 0.0 Maturity (years) .. 0.0 0.0 0.0 0.0 0.0 0.0 0.0 Grace period (years) .. 0.0 0.0 0.0 0.0 0.0 0.0 0.0
5. Major economic aggregatesGross national income (GNI) .. 1,466 1,964 2,902 3,684 5,033 6,600 9,483Exports of goods, services & income .. 366 560 1,079 1,511 1,931 2,209 2,682Worker remit. & comp. of employees .. 65 87 162 435 498 658 846Imports of goods & services .. 741 1,017 1,477 1,918 2,449 2,946 4,122International reserves .. 111 314 502 548 669 1,072 1,659Current account balance .. -218 -278 -189 -20 -52 -117 -590
6. RatiosExternal debt stocks to exports (%) .. 101.1 163.7 172.7 130.4 95.4 90.7 107.7External debt stocks to GNI (%) .. 25.3 46.6 64.2 53.5 36.6 30.4 30.5Debt service to exports (%) .. 3.1 8.2 10.8 11.2 7.2 6.8 7.0Short-term to external debt stocks (%) .. 0.6 4.8 21.7 20.8 16.2 15.3 15.9Multilateral to external debt stocks (%) .. 56.1 52.9 40.1 43.0 43.9 45.1 35.7Reserves to external debt stocks (%) .. 30.0 34.3 26.9 27.8 36.3 53.5 57.4Reserves to imports (months) .. 1.8 3.7 4.1 3.4 3.3 4.4 4.8
32

ARMENIA(US$ million, unless otherwise indicated)
1990 1995 2000 2003 2004 2005 2006 2007
7. Long-term external debtDebt outstanding and disbursed .. 298 697 1,245 1,342 1,368 1,533 2,271Public and publicly guaranteed .. 298 675 877 961 923 1,037 1,272 Official creditors .. 298 658 875 959 921 1,036 1,271 Multilateral .. 208 485 747 848 808 905 1,031 of which: IBRD .. 5 8 8 8 6 6 5 IDA .. 91 388 662 773 746 841 965 Bilateral .. 90 173 128 111 113 131 240 Private creditors .. 0 17 2 1 1 1 1 of which: Bonds .. 0 0 0 0 0 0 0 Commercial banks .. 0 5 0 0 0 0 0Private nonguaranteed .. 0 21 368 381 446 496 999 of which: Bonds .. 0 0 0 0 0 0 0Disbursements .. 102 84 107 138 168 165 741Public and publicly guaranteed .. 102 63 91 94 50 83 197 Official creditors .. 102 62 91 94 50 83 197 Multilateral .. 102 58 84 83 37 72 100 of which: IBRD .. 3 0 0 0 0 0 0 IDA .. 88 54 77 78 34 64 93 Bilateral .. 0 4 6 11 14 11 97 Private creditors .. 0 1 0 0 0 0 0 of which: Bonds .. 0 0 0 0 0 0 0 Commercial banks .. 0 0 0 0 0 0 0Private nonguaranteed .. 0 21 16 44 117 82 544 of which: Bonds .. 0 0 0 0 0 0 0Principal repayments .. 3 15 62 81 69 49 58Public and publicly guaranteed .. 3 15 55 51 16 17 17 Official creditors .. 3 13 46 51 16 17 17 Multilateral .. 0 8 18 18 14 15 15 of which: IBRD .. 0 0 1 1 1 1 1 IDA .. 0 0 0 1 3 6 7 Bilateral .. 3 5 28 33 2 2 2 Private creditors .. 0 2 9 1 0 0 0 of which: Bonds .. 0 0 0 0 0 0 0 Commercial banks .. 0 0 0 0 0 0 0Private nonguaranteed .. 0 0 7 30 53 32 42 of which: Bonds .. 0 0 0 0 0 0 0Interest payments .. 7 9 18 39 23 59 91Public and publicly guaranteed .. 7 9 10 8 9 9 10 Official creditors .. 7 9 10 8 9 9 10 Multilateral .. 7 8 7 7 8 8 8 of which: IBRD .. 0 0 0 0 0 0 0 IDA .. 0 3 4 6 6 6 7 Bilateral .. 0 1 4 1 2 2 2 Private creditors .. 0 0 0 0 0 0 0 of which: Bonds .. 0 0 0 0 0 0 0 Commercial banks .. 0 0 0 0 0 0 0Private nonguaranteed .. 0 0 8 31 14 49 81 of which: Bonds .. 0 0 0 0 0 0 08. Debt stock-flow reconciliationTotal change in external debt stocks .. 156 15 271 106 -127 162 884 Net flows on external debt .. 147 42 231 56 -38 104 821 Cross-currency valuation .. -6 -31 83 48 -87 56 589. Debt restructuringsTotal amount rescheduled .. 0 14 0 0 0 0 0Total amount forgiven .. 0 0 0 0 0 0 0Debt buyback .. 0 0 0 0 0 0 010. Contractual obligations on outstanding long-term external debt
2008 2009 2010 2011 2012 2013 2014 2015Official creditorsPrincipal 15 21 25 27 30 30 32 41Interest 12 13 13 13 13 13 13 13Private creditorsPrincipal 59 74 94 81 148 138 136 135Interest 49 53 55 60 122 122 122 122
33

AZERBAIJAN(US$ million, unless otherwise indicated)
1990 1995 2000 2003 2004 2005 2006 2007
1. Summary external debt dataExternal debt stocks .. 321 1,328 1,727 1,949 1,815 1,986 3,021 Long-term external debt .. 206 836 1,365 1,602 1,465 1,550 1,891 Public and publicly guaranteed .. 206 737 1,288 1,372 1,278 1,446 1,748 Private nonguaranteed .. 0 99 76 230 187 104 143 Use of IMF credit .. 101 336 259 208 164 134 103 Short-term external debt .. 14 156 103 138 186 302 1,027 interest arrears on long-term .. 6 0 0 0 0 0 0Memorandum itemsPrincipal arrears on long-term .. 36 0 0 0 0 0 0Long-term public sector debt .. 206 737 1,288 1,372 1,278 1,446 1,748Long-term private sector debt .. 0 99 76 230 187 104 143Public & publicly guaranteed commitments .. 188 202 112 127 220 412 726
External debt flowsDisbursements .. 205 256 268 311 214 324 346 Long-term external debt .. 102 256 232 311 195 324 346 IMF purchases .. 103 0 36 0 19 0 0Principal repayments .. 0 74 186 206 197 207 104 Long-term external debt .. 0 22 107 147 149 169 67 IMF repurchases .. 0 51 79 60 48 37 37Net flows .. 207 309 103 139 64 233 1,014 Long-term external debt .. 102 234 125 164 45 155 279 IMF flows .. 103 -51 -63 -38 -24 -13 -11 Short-term external debt .. 2 127 21 35 48 116 772Interest payments .. 10 56 23 26 34 38 63 Long-term external debt .. 9 37 17 20 25 28 44 IMF charges .. 1 14 3 3 2 2 1 Short-term external debt .. 0 5 3 4 6 8 18
2. Other non-debt resource flowsForeign direct investment (net) .. 330 130 3,285 3,556 1,680 -584 -4,749Portfolio equity flows .. 0 0 0 0 0 1 2Profit remittances on FDI .. 0 317 422 581 1,582 2,624 4,995Grants (excluding technical coop.) .. 61 50 53 60 95 58 111of which: Debt forgiveness grants .. .. 0 0 0 0 0 0 IDA grants .. .. .. 0 0 0 0 0Memo: technical coop. grants .. 28 30 69 69 73 96 36
3. Currency composition of public and publicly guaranteed debt (%)Euro .. .. .. 3.9 4.3 4.6 4.8 4.6Japanese yen .. 0.0 20.8 33.1 31.5 29.2 25.1 21.6Pound sterling .. 0.0 0.0 0.0 0.0 0.0 0.0 0.0Swiss franc .. 0.0 6.5 7.3 6.3 4.8 3.9 3.2U.S.dollars .. 51.4 65.8 52.1 53.6 56.2 58.8 60.8
4. Average terms of new commitmentsOfficial creditors Interest (%) .. 1.4 4.3 1.6 2.7 3.6 4.5 5.2 Maturity (years) .. 32.2 22.6 31.8 22.0 19.9 24.7 20.1 Grace period (years) .. 9.4 4.7 8.4 5.5 6.3 8.0 4.2Private creditors Interest (%) .. 0.0 8.2 0.0 0.0 0.0 6.0 6.6 Maturity (years) .. 0.0 9.7 0.0 0.0 0.0 12.0 9.8 Grace period (years) .. 0.0 1.1 0.0 0.0 0.0 0.5 1.3
5. Major economic aggregatesGross national income (GNI) .. 3,039 4,987 6,834 7,980 11,599 18,302 26,169Exports of goods, services & income .. 795 2,231 3,263 4,492 9,024 14,897 24,037Worker remit. & comp. of employees .. 3 57 171 228 693 813 1,287Imports of goods & services .. 1,306 2,415 5,264 7,078 8,850 11,093 14,831International reserves .. 121 680 803 1,075 1,178 2,500 4,273Current account balance .. -401 -168 -2,021 -2,589 167 3,708 9,019
6. RatiosExternal debt stocks to exports (%) .. 40.4 59.5 52.9 43.4 20.1 13.3 12.6External debt stocks to GNI (%) .. 10.6 26.6 25.3 24.4 15.6 10.9 11.5Debt service to exports (%) .. 1.3 5.8 6.4 5.2 2.6 1.6 0.7Short-term to external debt stocks (%) .. 4.4 11.8 6.0 7.1 10.2 15.2 34.0Multilateral to external debt stocks (%) .. 30.8 24.3 32.5 32.5 34.7 37.0 31.3Reserves to external debt stocks (%) .. 37.7 51.2 46.5 55.2 64.9 125.9 141.4Reserves to imports (months) .. 1.1 3.4 1.8 1.8 1.6 2.7 3.5
34
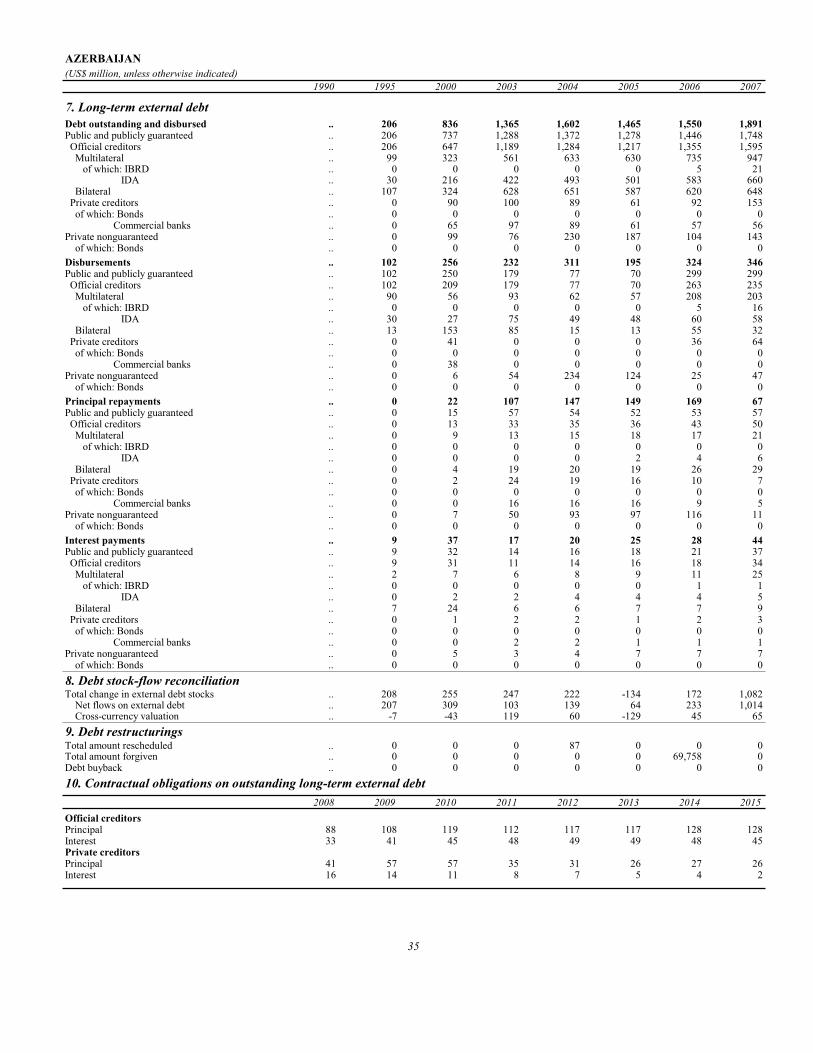
AZERBAIJAN(US$ million, unless otherwise indicated)
1990 1995 2000 2003 2004 2005 2006 2007
7. Long-term external debtDebt outstanding and disbursed .. 206 836 1,365 1,602 1,465 1,550 1,891Public and publicly guaranteed .. 206 737 1,288 1,372 1,278 1,446 1,748 Official creditors .. 206 647 1,189 1,284 1,217 1,355 1,595 Multilateral .. 99 323 561 633 630 735 947 of which: IBRD .. 0 0 0 0 0 5 21 IDA .. 30 216 422 493 501 583 660 Bilateral .. 107 324 628 651 587 620 648 Private creditors .. 0 90 100 89 61 92 153 of which: Bonds .. 0 0 0 0 0 0 0 Commercial banks .. 0 65 97 89 61 57 56Private nonguaranteed .. 0 99 76 230 187 104 143 of which: Bonds .. 0 0 0 0 0 0 0Disbursements .. 102 256 232 311 195 324 346Public and publicly guaranteed .. 102 250 179 77 70 299 299 Official creditors .. 102 209 179 77 70 263 235 Multilateral .. 90 56 93 62 57 208 203 of which: IBRD .. 0 0 0 0 0 5 16 IDA .. 30 27 75 49 48 60 58 Bilateral .. 13 153 85 15 13 55 32 Private creditors .. 0 41 0 0 0 36 64 of which: Bonds .. 0 0 0 0 0 0 0 Commercial banks .. 0 38 0 0 0 0 0Private nonguaranteed .. 0 6 54 234 124 25 47 of which: Bonds .. 0 0 0 0 0 0 0Principal repayments .. 0 22 107 147 149 169 67Public and publicly guaranteed .. 0 15 57 54 52 53 57 Official creditors .. 0 13 33 35 36 43 50 Multilateral .. 0 9 13 15 18 17 21 of which: IBRD .. 0 0 0 0 0 0 0 IDA .. 0 0 0 0 2 4 6 Bilateral .. 0 4 19 20 19 26 29 Private creditors .. 0 2 24 19 16 10 7 of which: Bonds .. 0 0 0 0 0 0 0 Commercial banks .. 0 0 16 16 16 9 5Private nonguaranteed .. 0 7 50 93 97 116 11 of which: Bonds .. 0 0 0 0 0 0 0Interest payments .. 9 37 17 20 25 28 44Public and publicly guaranteed .. 9 32 14 16 18 21 37 Official creditors .. 9 31 11 14 16 18 34 Multilateral .. 2 7 6 8 9 11 25 of which: IBRD .. 0 0 0 0 0 1 1 IDA .. 0 2 2 4 4 4 5 Bilateral .. 7 24 6 6 7 7 9 Private creditors .. 0 1 2 2 1 2 3 of which: Bonds .. 0 0 0 0 0 0 0 Commercial banks .. 0 0 2 2 1 1 1Private nonguaranteed .. 0 5 3 4 7 7 7 of which: Bonds .. 0 0 0 0 0 0 08. Debt stock-flow reconciliationTotal change in external debt stocks .. 208 255 247 222 -134 172 1,082 Net flows on external debt .. 207 309 103 139 64 233 1,014 Cross-currency valuation .. -7 -43 119 60 -129 45 659. Debt restructuringsTotal amount rescheduled .. 0 0 0 87 0 0 0Total amount forgiven .. 0 0 0 0 0 69,758 0Debt buyback .. 0 0 0 0 0 0 010. Contractual obligations on outstanding long-term external debt
2008 2009 2010 2011 2012 2013 2014 2015Official creditorsPrincipal 88 108 119 112 117 117 128 128Interest 33 41 45 48 49 49 48 45Private creditorsPrincipal 41 57 57 35 31 26 27 26Interest 16 14 11 8 7 5 4 2
35

BANGLADESH(US$ million, unless otherwise indicated)
1990 1995 2000 2003 2004 2005 2006 2007
1. Summary external debt dataExternal debt stocks 12,439 15,927 15,717 18,774 20,129 18,919 20,491 22,033 Long-term external debt 11,658 15,106 15,168 18,083 19,186 17,923 18,836 20,151 Public and publicly guaranteed 11,658 15,106 15,168 18,083 19,186 17,923 18,836 20,151 Private nonguaranteed 0 0 0 0 0 0 0 0 Use of IMF credit 626 622 216 74 231 308 476 501 Short-term external debt 156 199 334 617 712 688 1,178 1,382 interest arrears on long-term 1 15 0 0 0 16 0 16Memorandum itemsPrincipal arrears on long-term 11 15 4 4 0 8 66 270Long-term public sector debt 11,658 15,106 15,168 18,083 19,186 17,923 18,836 20,151Long-term private sector debt 0 0 0 0 0 0 0 0Public & publicly guaranteed commitments 1,317 716 708 1,460 1,199 1,172 1,194 1,586
External debt flowsDisbursements 1,273 763 889 938 1,151 982 1,126 1,092 Long-term external debt 1,213 763 889 867 1,004 884 976 1,092 IMF purchases 60 0 0 70 147 97 150 0Principal repayments 548 591 599 496 462 569 474 570 Long-term external debt 344 530 513 422 462 569 474 570 IMF repurchases 204 61 86 73 0 0 0 0Net flows 813 171 370 514 784 373 1,158 675 Long-term external debt 869 233 376 445 541 315 502 522 IMF flows -199 0 0 -69 0 0 0 0 Short-term external debt 88 -1 80 72 95 -40 506 153Interest payments 201 189 201 176 208 235 232 244 Long-term external debt 151 176 171 162 184 199 172 184 IMF charges 40 3 7 1 1 1 2 2 Short-term external debt 9 10 22 13 24 35 59 58
2. Other non-debt resource flowsForeign direct investment (net) 3 2 280 268 449 813 697 653Portfolio equity flows 0 -15 1 2 4 20 31 153Profit remittances on FDI 0 0 149 178 247 661 765 903Grants (excluding technical coop.) 772 693 592 478 837 685 913 1,015of which: Debt forgiveness grants .. .. 156 94 271 41 239 129 IDA grants .. .. .. 0 0 6 6 12Memo: technical coop. grants 234 293 209 246 208 186 164 146
3. Currency composition of public and publicly guaranteed debt (%)Euro .. .. .. 0.7 0.6 0.5 0.7 0.7Japanese yen 24.8 25.9 20.4 17.0 16.0 14.2 12.7 11.7Pound sterling 5.0 3.5 3.0 2.3 2.0 2.1 1.9 1.6Swiss franc 0.1 0.0 0.0 0.0 0.0 0.0 0.0 0.0U.S.dollars 48.1 41.9 44.7 50.1 50.1 51.6 52.5 51.5
4. Average terms of new commitmentsOfficial creditors Interest (%) 1.1 1.9 2.4 1.2 1.0 1.7 1.9 2.6 Maturity (years) 37.6 38.2 28.2 32.1 36.4 33.8 32.5 30.8 Grace period (years) 10.2 10.0 7.4 8.4 9.5 8.8 8.6 7.7Private creditors Interest (%) 5.4 0.0 3.3 2.7 3.0 4.9 0.0 0.0 Maturity (years) 14.1 0.0 13.0 4.7 17.3 10.8 0.0 0.0 Grace period (years) 3.5 0.0 4.8 1.5 5.8 1.3 0.0 0.0
5. Major economic aggregatesGross national income (GNI) 30,757 39,097 48,828 54,778 59,542 63,355 65,952 73,523Exports of goods, services & income 2,907 5,903 9,251 11,298 12,908 14,970 18,483 20,888Worker remit. & comp. of employees 779 1,202 1,968 3,192 3,584 4,314 5,428 6,562Imports of goods & services 4,140 7,790 10,018 11,565 13,562 15,618 17,802 20,765International reserves 660 2,376 1,516 2,625 3,222 2,825 3,877 5,277Current account balance -398 -824 -306 132 -279 -176 1,196 857
6. RatiosExternal debt stocks to exports (%) 427.9 269.8 169.9 166.2 155.9 126.4 110.9 105.5External debt stocks to GNI (%) 40.4 40.7 32.2 34.3 33.8 29.9 31.1 30.0Debt service to exports (%) 25.8 13.2 8.6 5.9 5.2 5.4 3.8 3.9Short-term to external debt stocks (%) 1.3 1.3 2.1 3.3 3.5 3.6 5.7 6.3Multilateral to external debt stocks (%) 51.8 60.8 69.9 72.4 73.2 74.3 73.1 74.1Reserves to external debt stocks (%) 5.3 14.9 9.6 14.0 16.0 14.9 18.9 24.0Reserves to imports (months) 1.9 3.7 1.8 2.7 2.9 2.2 2.6 3.0
36

BANGLADESH(US$ million, unless otherwise indicated)
1990 1995 2000 2003 2004 2005 2006 2007
7. Long-term external debtDebt outstanding and disbursed 11,658 15,106 15,168 18,083 19,186 17,923 18,836 20,151Public and publicly guaranteed 11,658 15,106 15,168 18,083 19,186 17,923 18,836 20,151 Official creditors 11,435 14,852 14,921 17,528 18,643 17,400 18,335 19,668 Multilateral 6,441 9,678 10,990 13,598 14,737 14,057 14,969 16,324 of which: IBRD 64 55 24 7 0 0 0 0 IDA 4,095 5,638 6,431 8,062 8,895 8,688 9,297 10,077 Bilateral 4,994 5,173 3,931 3,930 3,906 3,343 3,366 3,344 Private creditors 223 255 246 555 543 522 502 482 of which: Bonds 0 0 0 0 0 0 0 0 Commercial banks 21 12 15 29 41 34 31 27Private nonguaranteed 0 0 0 0 0 0 0 0 of which: Bonds 0 0 0 0 0 0 0 0Disbursements 1,213 763 889 867 1,004 884 976 1,092Public and publicly guaranteed 1,213 763 889 867 1,004 884 976 1,092 Official creditors 1,123 677 822 858 989 884 976 1,092 Multilateral 822 494 650 760 821 814 750 996 of which: IBRD 0 0 0 0 0 0 0 0 IDA 464 198 357 519 615 547 398 602 Bilateral 301 183 172 97 168 70 226 96 Private creditors 90 86 67 10 14 0 0 0 of which: Bonds 0 0 0 0 0 0 0 0 Commercial banks 22 0 15 0 14 0 0 0Private nonguaranteed 0 0 0 0 0 0 0 0 of which: Bonds 0 0 0 0 0 0 0 0Principal repayments 344 530 513 422 462 569 474 570Public and publicly guaranteed 344 530 513 422 462 569 474 570 Official creditors 310 423 482 395 433 555 450 549 Multilateral 62 104 168 237 290 290 328 384 of which: IBRD 2 5 5 6 7 0 0 0 IDA 13 41 82 124 141 153 172 193 Bilateral 248 319 314 158 142 265 122 165 Private creditors 34 107 31 27 30 14 24 21 of which: Bonds 0 0 0 0 0 0 0 0 Commercial banks 2 2 0 3 4 3 5 5Private nonguaranteed 0 0 0 0 0 0 0 0 of which: Bonds 0 0 0 0 0 0 0 0Interest payments 151 176 171 162 184 199 172 184Public and publicly guaranteed 151 176 171 162 184 199 172 184 Official creditors 140 167 160 155 178 197 169 182 Multilateral 51 87 93 109 129 133 137 144 of which: IBRD 4 4 2 1 0 0 0 0 IDA 28 42 47 55 67 70 70 72 Bilateral 89 80 67 46 49 64 32 38 Private creditors 11 9 12 6 5 2 2 2 of which: Bonds 0 0 0 0 0 0 0 0 Commercial banks 1 0 0 2 2 0 1 1Private nonguaranteed 0 0 0 0 0 0 0 0 of which: Bonds 0 0 0 0 0 0 0 08. Debt stock-flow reconciliationTotal change in external debt stocks 1,593 304 -850 1,727 1,355 -1,210 1,571 1,508 Net flows on external debt 813 171 370 514 784 373 1,158 675 Cross-currency valuation 925 -244 -1,087 1,543 691 -1,613 459 7289. Debt restructuringsTotal amount rescheduled 0 0 0 0 0 0 0 0Total amount forgiven 0 0 0 103 146 0 83 82Debt buyback 0 0 0 0 0 0 0 010. Contractual obligations on outstanding long-term external debt
2008 2009 2010 2011 2012 2013 2014 2015Official creditorsPrincipal 815 812 815 840 878 897 920 932Interest 229 236 240 241 237 231 222 211Private creditorsPrincipal 153 94 95 95 92 81 58 23Interest 14 14 13 11 8 5 2 1
37

BELARUS(US$ million, unless otherwise indicated)
1990 1995 2000 2003 2004 2005 2006 2007
1. Summary external debt dataExternal debt stocks .. 1,694 2,140 3,232 4,029 4,737 5,352 9,470 Long-term external debt .. 1,302 787 1,231 1,084 1,233 1,697 3,463 Public and publicly guaranteed .. 1,301 689 710 744 786 842 2,338 Private nonguaranteed .. 0 98 521 339 448 855 1,125 Use of IMF credit .. 283 114 26 9 0 0 0 Short-term external debt .. 110 1,239 1,975 2,936 3,503 3,654 6,007 interest arrears on long-term .. 19 14 2 0 1 4 2Memorandum itemsPrincipal arrears on long-term .. 140 29 19 1 37 22 10Long-term public sector debt .. 1,301 689 695 733 777 837 2,336Long-term private sector debt .. 0 98 536 351 456 860 1,127Public & publicly guaranteed commitments .. 145 136 32 255 412 174 1,639
External debt flowsDisbursements .. 441 249 259 308 648 747 2,532 Long-term external debt .. 258 249 259 308 648 747 2,532 IMF purchases .. 182 0 0 0 0 0 0Principal repayments .. 108 261 332 257 519 483 757 Long-term external debt .. 108 206 299 240 510 483 757 IMF repurchases .. 0 56 33 17 9 0 0Net flows .. 369 -89 272 1,014 695 412 4,130 Long-term external debt .. 150 43 -40 68 138 264 1,775 IMF flows .. 182 -56 -33 -17 -9 0 0 Short-term external debt .. 36 -76 345 963 566 148 2,354Interest payments .. 74 107 87 115 161 250 322 Long-term external debt .. 59 39 33 41 51 72 81 IMF charges .. 10 7 1 0 0 0 0 Short-term external debt .. 4 61 54 74 111 178 241
2. Other non-debt resource flowsForeign direct investment (net) .. 15 119 172 164 305 354 1,785Portfolio equity flows .. 0 1 3 1 1 -1 5Profit remittances on FDI .. 0 5 38 76 135 236 435Grants (excluding technical coop.) .. 136 0 0 0 32 42 59of which: Debt forgiveness grants .. .. 0 0 0 0 0 0 IDA grants .. .. .. 0 0 0 0 0Memo: technical coop. grants .. 27 0 0 0 28 34 29
3. Currency composition of public and publicly guaranteed debt (%)Euro .. .. .. 32.1 25.1 14.4 26.0 9.9Japanese yen .. 2.3 2.2 2.2 1.7 1.1 0.7 0.1Pound sterling .. 0.0 0.0 0.0 0.0 0.0 0.0 0.0Swiss franc .. 0.7 0.1 0.0 0.0 0.0 0.0 0.0U.S.dollars .. 50.8 48.9 52.3 61.6 71.8 61.1 85.5
4. Average terms of new commitmentsOfficial creditors Interest (%) .. 5.1 6.8 0.0 3.4 5.0 6.1 4.6 Maturity (years) .. 16.0 5.9 4.6 6.0 7.6 16.9 14.9 Grace period (years) .. 5.6 2.4 0.8 1.8 1.4 5.4 5.4Private creditors Interest (%) .. 8.1 7.2 3.9 3.6 8.9 7.2 4.8 Maturity (years) .. 5.8 2.5 5.1 9.2 1.1 2.3 3.0 Grace period (years) .. 1.6 1.0 0.6 2.4 1.1 1.3 1.0
5. Major economic aggregatesGross national income (GNI) .. 13,922 12,690 17,840 23,141 30,220 36,841 44,379Exports of goods, services & income .. 5,300 7,667 11,702 15,847 18,350 22,478 27,859Worker remit. & comp. of employees .. 29 139 222 257 255 340 354Imports of goods & services .. 5,805 8,160 12,351 17,343 18,079 24,129 31,107International reserves .. 377 350 637 837 1,342 1,386 4,179Current account balance .. -458 -338 -426 -1,193 436 -1,447 -3,060
6. RatiosExternal debt stocks to exports (%) .. 32.0 27.9 27.6 25.4 25.8 23.8 34.0External debt stocks to GNI (%) .. 12.2 16.9 18.1 17.4 15.7 14.5 21.3Debt service to exports (%) .. 3.4 4.8 3.6 2.3 3.7 3.3 3.9Short-term to external debt stocks (%) .. 6.5 57.9 61.1 72.9 74.0 68.3 63.4Multilateral to external debt stocks (%) .. 11.1 10.1 4.5 3.1 1.7 1.2 0.6Reserves to external debt stocks (%) .. 22.3 16.4 19.7 20.8 28.3 25.9 44.1Reserves to imports (months) .. 0.8 0.5 0.6 0.6 0.9 0.7 1.6
38

BELARUS(US$ million, unless otherwise indicated)
1990 1995 2000 2003 2004 2005 2006 2007
7. Long-term external debtDebt outstanding and disbursed .. 1,302 787 1,231 1,084 1,233 1,697 3,463Public and publicly guaranteed .. 1,301 689 710 744 786 842 2,338 Official creditors .. 769 400 381 480 566 571 2,076 Multilateral .. 188 217 146 124 81 65 52 of which: IBRD .. 116 105 84 73 59 50 42 IDA .. 0 0 0 0 0 0 0 Bilateral .. 582 183 234 356 485 506 2,023 Private creditors .. 532 289 329 265 219 271 262 of which: Bonds .. 0 0 0 0 0 0 0 Commercial banks .. 46 56 48 36 57 102 107Private nonguaranteed .. 0 98 521 339 448 855 1,125 of which: Bonds .. 0 0 0 0 0 0 19Disbursements .. 258 249 259 308 648 747 2,532Public and publicly guaranteed .. 258 143 47 198 254 207 1,717 Official creditors .. 131 25 14 181 188 74 1,596 Multilateral .. 77 25 1 2 7 5 7 of which: IBRD .. 11 6 1 2 7 5 7 IDA .. 0 0 0 0 0 0 0 Bilateral .. 54 0 14 179 181 69 1,589 Private creditors .. 127 118 33 16 66 133 121 of which: Bonds .. 0 0 0 0 0 0 0 Commercial banks .. 20 48 2 1 34 83 96Private nonguaranteed .. 0 106 212 111 395 540 815 of which: Bonds .. 0 0 0 0 0 0 19Principal repayments .. 108 206 299 240 510 483 757Public and publicly guaranteed .. 108 134 138 179 177 171 253 Official creditors .. 84 52 45 87 94 73 98 Multilateral .. 70 49 35 29 42 23 21 of which: IBRD .. 0 14 15 16 16 15 16 IDA .. 0 0 0 0 0 0 0 Bilateral .. 15 4 10 58 52 50 77 Private creditors .. 24 82 93 93 83 98 155 of which: Bonds .. 0 0 0 0 0 0 0 Commercial banks .. 0 28 20 13 12 42 101Private nonguaranteed .. 0 71 161 61 333 311 505 of which: Bonds .. 0 0 0 0 0 0 0Interest payments .. 59 39 33 41 51 72 81Public and publicly guaranteed .. 59 38 32 36 39 45 49 Official creditors .. 32 18 13 16 17 28 30 Multilateral .. 23 17 9 7 5 4 4 of which: IBRD .. 8 6 4 3 3 3 3 IDA .. 0 0 0 0 0 0 0 Bilateral .. 10 2 4 8 12 24 26 Private creditors .. 26 19 19 21 22 16 19 of which: Bonds .. 0 0 0 0 0 0 0 Commercial banks .. 1 4 3 3 4 6 8Private nonguaranteed .. 0 1 1 5 12 27 33 of which: Bonds .. 0 0 0 0 0 0 18. Debt stock-flow reconciliationTotal change in external debt stocks .. 398 -122 334 797 708 615 4,118 Net flows on external debt .. 369 -89 272 1,014 695 412 4,130 Cross-currency valuation .. 28 -26 63 22 -33 16 329. Debt restructuringsTotal amount rescheduled .. 0 50 0 0 0 0 0Total amount forgiven .. 0 0 0 0 0 0 0Debt buyback .. 0 0 0 0 0 0 010. Contractual obligations on outstanding long-term external debt
2008 2009 2010 2011 2012 2013 2014 2015Official creditorsPrincipal 93 86 84 47 51 202 202 166Interest 82 87 83 81 79 75 66 58Private creditorsPrincipal 424 180 232 124 103 67 44 29Interest 53 45 35 26 21 16 14 12
Notes:Short-term debt data are based on data from the National Bank of the Republic of Belarus.
39

BELIZE(US$ million, unless otherwise indicated)
1990 1995 2000 2003 2004 2005 2006 2007
1. Summary external debt dataExternal debt stocks 143 255 612 1,061 957 1,003 1,018 1,057 Long-term external debt 136 219 562 981 957 997 1,012 1,051 Public and publicly guaranteed 136 219 553 945 923 972 992 1,037 Private nonguaranteed 0 0 8 36 34 25 20 14 Use of IMF credit 0 0 0 0 0 0 0 0 Short-term external debt 6 36 50 80 0 6 7 7 interest arrears on long-term 1 1 0 0 0 6 7 7Memorandum itemsPrincipal arrears on long-term 2 1 0 0 0 2 0 1Long-term public sector debt 136 219 553 945 923 972 991 1,025Long-term private sector debt 0 0 8 36 34 25 20 26Public & publicly guaranteed commitments 5 29 224 231 271 153 100 591
External debt flowsDisbursements 18 31 223 265 223 210 84 598 Long-term external debt 18 31 223 265 223 210 84 598 IMF purchases 0 0 0 0 0 0 0 0Principal repayments 12 25 41 90 259 160 70 561 Long-term external debt 9 25 41 90 259 160 70 561 IMF repurchases 3 0 0 0 0 0 0 0Net flows 7 27 181 210 -116 50 14 37 Long-term external debt 9 6 182 175 -36 50 14 37 IMF flows -3 0 0 0 0 0 0 0 Short-term external debt 1 21 -1 35 -80 0 0 0Interest payments 6 11 35 67 75 73 64 64 Long-term external debt 6 10 32 65 73 73 64 64 IMF charges 0 0 0 0 0 0 0 0 Short-term external debt 0 1 3 2 2 0 0 0
2. Other non-debt resource flowsForeign direct investment (net) 17 21 23 -11 112 127 104 112Portfolio equity flows 0 0 0 0 0 0 4 0Profit remittances on FDI 7 8 31 31 42 35 55 87Grants (excluding technical coop.) 4 8 11 9 6 9 8 15of which: Debt forgiveness grants .. .. 0 2 3 2 2 1 IDA grants .. .. .. 0 0 0 0 0Memo: technical coop. grants 13 12 5 4 5 6 5 5
3. Currency composition of public and publicly guaranteed debt (%)Euro .. .. .. 1.5 1.7 1.4 1.4 1.3Japanese yen 0.0 0.0 0.0 0.0 0.0 0.0 0.0 0.0Pound sterling 23.6 10.0 1.8 0.7 0.6 0.4 0.4 0.3Swiss franc 0.0 0.1 0.0 0.0 0.0 0.0 0.0 0.0U.S.dollars 45.3 62.7 93.2 96.5 95.9 96.7 96.8 97.1
4. Average terms of new commitmentsOfficial creditors Interest (%) 5.0 5.9 6.3 3.6 3.0 0.0 2.8 5.3 Maturity (years) 10.0 17.9 21.1 15.4 20.0 0.0 9.9 22.3 Grace period (years) 2.5 3.9 5.3 3.3 4.6 0.0 2.2 5.6Private creditors Interest (%) 0.0 8.6 9.5 9.5 7.2 4.7 0.0 4.2 Maturity (years) 0.0 4.8 8.1 7.3 7.9 7.0 0.0 21.9 Grace period (years) 0.0 0.3 3.0 6.5 7.8 1.6 0.0 12.2
5. Major economic aggregatesGross national income (GNI) 406 598 775 902 942 1,000 1,095 1,152Exports of goods, services & income 269 314 464 563 579 675 869 901Worker remit. & comp. of employees 18 14 22 34 35 46 65 75Imports of goods & services 269 351 661 758 749 836 901 975International reserves 70 38 123 85 48 71 114 109Current account balance 15 -17 -162 -184 -155 -151 -16 -51
6. RatiosExternal debt stocks to exports (%) 53.1 81.2 131.8 188.6 165.2 148.7 117.2 117.3External debt stocks to GNI (%) 35.1 42.7 78.9 117.6 101.6 100.3 93.0 91.8Debt service to exports (%) 6.8 11.7 16.4 27.9 57.6 34.5 15.5 69.3Short-term to external debt stocks (%) 4.3 14.0 8.2 7.5 0.0 0.6 0.6 0.6Multilateral to external debt stocks (%) 40.2 35.1 22.2 19.5 23.1 21.6 21.5 22.2Reserves to external debt stocks (%) 48.9 14.7 20.1 8.0 5.0 7.1 11.2 10.3Reserves to imports (months) 3.1 1.3 2.2 1.3 0.8 1.0 1.5 1.3
40

BELIZE(US$ million, unless otherwise indicated)
1990 1995 2000 2003 2004 2005 2006 2007
7. Long-term external debtDebt outstanding and disbursed 136 219 562 981 957 997 1,012 1,051Public and publicly guaranteed 136 219 553 945 923 972 992 1,037 Official creditors 118 175 225 263 292 311 372 341 Multilateral 57 89 136 207 221 216 219 235 of which: IBRD 18 30 40 42 39 35 30 25 IDA 0 0 0 0 0 0 0 0 Bilateral 61 86 89 57 71 95 153 106 Private creditors 18 44 328 682 631 661 620 696 of which: Bonds 0 0 75 308 375 482 466 24 Commercial banks 16 39 245 371 254 169 146 666Private nonguaranteed 0 0 8 36 34 25 20 14 of which: Bonds 0 0 0 0 0 0 0 0Disbursements 18 31 223 265 223 210 84 598Public and publicly guaranteed 18 31 218 260 223 210 84 598 Official creditors 13 26 26 43 43 45 82 45 Multilateral 6 12 22 36 25 14 17 35 of which: IBRD 3 6 2 2 2 1 0 0 IDA 0 0 0 0 0 0 0 0 Bilateral 7 13 4 7 19 31 65 10 Private creditors 5 5 192 217 180 165 3 552 of which: Bonds 0 0 86 100 70 143 0 0 Commercial banks 5 5 96 117 110 12 3 552Private nonguaranteed 0 0 5 5 0 0 0 0 of which: Bonds 0 0 0 0 0 0 0 0Principal repayments 9 25 41 90 259 160 70 561Public and publicly guaranteed 9 25 41 88 257 158 66 555 Official creditors 7 18 20 24 26 23 22 78 Multilateral 3 7 9 14 16 17 15 21 of which: IBRD 1 2 4 5 5 4 5 5 IDA 0 0 0 0 0 0 0 0 Bilateral 4 11 11 10 9 6 7 57 Private creditors 2 8 22 64 231 135 44 477 of which: Bonds 0 0 11 3 3 36 16 441 Commercial banks 2 5 9 49 227 98 25 33Private nonguaranteed 0 0 0 2 3 2 5 6 of which: Bonds 0 0 0 0 0 0 0 0Interest payments 6 10 32 65 73 73 64 64Public and publicly guaranteed 6 10 32 65 72 72 64 63 Official creditors 4 8 12 12 12 13 15 17 Multilateral 3 4 7 9 9 9 10 11 of which: IBRD 1 2 3 2 2 2 2 2 IDA 0 0 0 0 0 0 0 0 Bilateral 1 4 4 3 3 4 5 6 Private creditors 1 2 20 53 61 59 49 47 of which: Bonds 0 0 1 27 38 41 36 23 Commercial banks 1 2 18 26 23 18 12 23Private nonguaranteed 0 0 0 1 0 1 1 0 of which: Bonds 0 0 0 0 0 0 0 08. Debt stock-flow reconciliationTotal change in external debt stocks 6 56 220 208 -104 46 15 39 Net flows on external debt 7 27 181 210 -116 50 14 37 Cross-currency valuation 7 1 -2 6 2 -2 2 39. Debt restructuringsTotal amount rescheduled 0 0 0 0 0 0 0 0Total amount forgiven 9 0 0 0 0 0 0 0Debt buyback 0 0 0 0 0 0 0 010. Contractual obligations on outstanding long-term external debt
2008 2009 2010 2011 2012 2013 2014 2015Official creditorsPrincipal 32 26 25 24 24 24 23 22Interest 17 17 16 15 14 12 11 10Private creditorsPrincipal 23 15 38 14 38 8 8 8Interest 35 34 32 29 28 25 25 24
Notes:Short-term debt data are World Bank staff estimates.
41

BENIN(US$ million, unless otherwise indicated)
1990 1995 2000 2003 2004 2005 2006 2007
1. Summary external debt dataExternal debt stocks 1291.8 1614.0 1590.9 1828.3 1920.4 1837.0 810.7 856.6 Long-term external debt 1218.5 1483.0 1441.9 1726.2 1831.1 1744.7 768.6 851.9 Public and publicly guaranteed 1218.5 1483.0 1441.9 1726.2 1831.1 1744.7 768.6 851.9 Private nonguaranteed 0.0 0.0 0.0 0.0 0.0 0.0 0.0 0.0 Use of IMF credit 17.9 84.1 83.9 73.1 65.3 52.8 2.6 4.2 Short-term external debt 55.4 46.9 65.2 29.0 24.0 39.4 39.5 0.6 interest arrears on long-term 20.5 7.9 0.0 0.0 0.0 0.4 0.5 0.6Memorandum itemsPrincipal arrears on long-term 68.9 70.7 0.0 0.0 0.0 0.0 0.0 0.0Long-term public sector debt 1218.5 1483.0 1441.9 1726.2 1831.1 1744.7 768.6 851.9Long-term private sector debt 0.0 0.0 0.0 0.0 0.0 0.0 0.0 0.0Public & publicly guaranteed commitments 85.1 110.6 109.3 0.0 220.5 153.2 76.4 205.7
External debt flowsDisbursements 120.3 115.0 39.3 69.4 80.6 87.2 81.1 124.2 Long-term external debt 120.3 101.3 30.4 60.0 78.6 85.9 79.8 122.8 IMF purchases 0.0 13.7 9.0 9.4 2.0 1.3 1.3 1.3Principal repayments 20.5 26.3 55.4 41.7 43.2 47.5 63.9 54.5 Long-term external debt 18.5 24.4 44.9 31.7 35.6 40.0 63.9 54.5 IMF repurchases 2.0 1.9 10.5 9.9 7.6 7.5 0.0 0.0Net flows 91.8 104.7 -64.5 -16.8 32.4 54.7 17.2 30.6 Long-term external debt 101.7 76.9 -14.5 28.3 43.0 45.8 15.9 68.3 IMF flows 0.0 0.0 0.0 0.0 0.0 0.0 0.0 0.0 Short-term external debt -8.0 16.0 -48.5 -44.6 -5.0 15.0 0.0 -39.0Interest payments 17.6 23.5 20.0 18.4 19.3 20.2 17.2 13.5 Long-term external debt 14.0 21.3 15.1 16.5 17.8 18.5 15.6 12.6 IMF charges 0.1 0.3 0.4 0.4 0.3 0.2 0.0 0.0 Short-term external debt 3.6 1.9 4.5 1.5 1.2 1.6 1.6 0.9
2. Other non-debt resource flowsForeign direct investment (net) 62.4 13.3 59.7 44.7 63.8 53.0 53.2 48.0Portfolio equity flows 0.0 0.3 0.1 -0.4 -2.9 2.3 0.3 0.0Profit remittances on FDI 0.4 5.9 -0.8 22.4 13.5 9.0 14.8 0.0Grants (excluding technical coop.) 110.1 149.0 145.3 198.7 327.6 217.6 1186.4 294.3of which: Debt forgiveness grants .. .. 21.4 58.1 88.8 22.5 1008.0 10.8 IDA grants .. .. .. 0.0 0.0 0.0 0.0 19.2Memo: technical coop. grants 49.0 61.5 67.9 90.6 87.4 91.7 109.5 81.0
3. Currency composition of public and publicly guaranteed debt (%)Euro .. .. .. 7.7 7.5 6.6 11.2 10.7Japanese yen 0.0 0.0 2.3 2.0 2.0 1.8 4.0 3.6Pound sterling 0.9 0.4 0.3 0.3 0.3 0.2 0.5 0.4Swiss franc 0.0 0.0 0.0 0.0 0.0 0.0 0.0 0.0U.S.dollars 50.8 51.8 60.9 59.7 57.9 57.0 42.7 39.5
4. Average terms of new commitmentsOfficial creditors Interest (%) 1.3 1.3 1.6 0.0 0.8 0.6 0.7 1.5 Maturity (years) 39.2 33.1 36.0 0.0 43.4 42.2 39.0 32.6 Grace period (years) 8.4 8.7 8.3 0.0 10.0 8.7 8.3 8.0Private creditors Interest (%) 0.0 0.0 0.0 0.0 0.0 0.0 0.0 0.0 Maturity (years) 0.0 0.0 0.0 0.0 0.0 0.0 0.0 0.0 Grace period (years) 0.0 0.0 0.0 0.0 0.0 0.0 0.0 0.0
5. Major economic aggregatesGross national income (GNI) 1806.1 1965.0 2242.6 3515.5 4005.7 4258.7 4623.4 5427.6Exports of goods, services & income 464.8 730.2 632.4 785.4 861.1 934.6 1162.6 ..Worker remit. & comp. of employees 101.0 100.0 87.0 55.4 63.0 172.7 224.0 224.0Imports of goods & services 491.7 925.8 743.5 1133.5 1189.0 1187.9 1452.0 ..International reserves 69.2 197.9 458.1 717.9 640.0 656.8 912.2 1209.2Current account balance -18.1 -167.0 -80.6 -331.2 -288.5 -226.1 -217.0 ..
6. RatiosExternal debt stocks to exports (%) 277.9 221.1 251.6 232.8 223.0 196.6 69.7 ..External debt stocks to GNI (%) 71.5 82.1 70.9 52.0 47.9 43.1 17.5 15.8Debt service to exports (%) 8.2 6.8 11.9 7.6 7.3 7.2 7.0 ..Short-term to external debt stocks (%) 4.3 2.9 4.1 1.6 1.2 2.1 4.9 0.1Multilateral to external debt stocks (%) 41.6 54.0 59.7 70.8 73.5 72.2 49.2 59.5Reserves to external debt stocks (%) 5.4 12.3 28.8 39.3 33.3 35.8 112.5 141.2Reserves to imports (months) 1.7 2.6 7.4 7.6 6.5 6.6 7.5 ..
42

BENIN(US$ million, unless otherwise indicated)
1990 1995 2000 2003 2004 2005 2006 2007
7. Long-term external debtDebt outstanding and disbursed 1218.5 1483.0 1441.9 1726.2 1831.1 1744.7 768.6 851.9Public and publicly guaranteed 1218.5 1483.0 1441.9 1726.2 1831.1 1744.7 768.6 851.9 Official creditors 1201.8 1478.9 1439.0 1722.4 1827.0 1744.7 768.6 851.9 Multilateral 536.8 871.4 949.9 1293.6 1412.5 1326.3 399.3 509.4 of which: IBRD 0.0 0.0 0.0 0.0 0.0 0.0 0.0 0.0 IDA 326.0 498.3 578.4 729.5 791.4 770.8 126.1 175.6 Bilateral 665.0 607.5 489.1 428.7 414.5 418.4 369.4 342.5 Private creditors 16.7 4.1 2.8 3.9 4.2 0.0 0.0 0.0 of which: Bonds 0.0 0.0 0.0 0.0 0.0 0.0 0.0 0.0 Commercial banks 0.0 0.0 0.0 0.0 0.0 0.0 0.0 0.0Private nonguaranteed 0.0 0.0 0.0 0.0 0.0 0.0 0.0 0.0 of which: Bonds 0.0 0.0 0.0 0.0 0.0 0.0 0.0 0.0Disbursements 120.3 101.3 30.4 60.0 78.6 85.9 79.8 122.8Public and publicly guaranteed 120.3 101.3 30.4 60.0 78.6 85.9 79.8 122.8 Official creditors 120.3 101.3 30.4 60.0 78.6 85.9 79.8 122.8 Multilateral 91.1 83.5 28.8 55.5 78.6 85.5 58.5 120.3 of which: IBRD 0.0 0.0 0.0 0.0 0.0 0.0 0.0 0.0 IDA 55.6 30.8 36.5 27.5 41.7 49.2 31.9 42.5 Bilateral 29.2 17.8 1.6 4.5 0.0 0.4 21.3 2.5 Private creditors 0.0 0.0 0.0 0.0 0.0 0.0 0.0 0.0 of which: Bonds 0.0 0.0 0.0 0.0 0.0 0.0 0.0 0.0 Commercial banks 0.0 0.0 0.0 0.0 0.0 0.0 0.0 0.0Private nonguaranteed 0.0 0.0 0.0 0.0 0.0 0.0 0.0 0.0 of which: Bonds 0.0 0.0 0.0 0.0 0.0 0.0 0.0 0.0Principal repayments 18.5 24.4 44.9 31.7 35.6 40.0 63.9 54.5Public and publicly guaranteed 18.5 24.4 44.9 31.7 35.6 40.0 63.9 54.5 Official creditors 18.4 24.3 44.9 31.7 35.6 36.2 63.9 54.5 Multilateral 18.4 16.5 15.3 14.3 17.5 21.1 26.3 16.2 of which: IBRD 0.0 0.0 0.0 0.0 0.0 0.0 0.0 0.0 IDA 0.8 3.4 3.9 4.1 5.2 6.4 7.6 0.0 Bilateral 0.0 7.8 29.6 17.4 18.1 15.1 37.5 38.4 Private creditors 0.1 0.1 0.0 0.0 0.0 3.8 0.0 0.0 of which: Bonds 0.0 0.0 0.0 0.0 0.0 0.0 0.0 0.0 Commercial banks 0.0 0.0 0.0 0.0 0.0 0.0 0.0 0.0Private nonguaranteed 0.0 0.0 0.0 0.0 0.0 0.0 0.0 0.0 of which: Bonds 0.0 0.0 0.0 0.0 0.0 0.0 0.0 0.0Interest payments 14.0 21.3 15.1 16.5 17.8 18.5 15.6 12.6Public and publicly guaranteed 14.0 21.3 15.1 16.5 17.8 18.5 15.6 12.6 Official creditors 13.9 21.3 15.1 16.5 17.8 18.2 15.6 12.6 Multilateral 12.8 8.5 9.4 10.7 12.8 13.0 11.1 7.9 of which: IBRD 0.0 0.0 0.0 0.0 0.0 0.0 0.0 0.0 IDA 2.1 3.6 3.8 4.7 5.6 6.0 3.8 1.4 Bilateral 1.2 12.7 5.7 5.8 5.0 5.3 4.5 4.7 Private creditors 0.1 0.0 0.0 0.0 0.0 0.2 0.0 0.0 of which: Bonds 0.0 0.0 0.0 0.0 0.0 0.0 0.0 0.0 Commercial banks 0.0 0.0 0.0 0.0 0.0 0.0 0.0 0.0Private nonguaranteed 0.0 0.0 0.0 0.0 0.0 0.0 0.0 0.0 of which: Bonds 0.0 0.0 0.0 0.0 0.0 0.0 0.0 0.08. Debt stock-flow reconciliationTotal change in external debt stocks 49.6 24.7 -96.0 -7.8 92.1 -83.5 -1026.2 45.9 Net flows on external debt 91.8 104.7 -64.5 -16.8 32.4 54.7 17.2 30.6 Cross-currency valuation 62.4 -4.0 -52.6 110.3 54.9 -119.2 -702.6 27.39. Debt restructuringsTotal amount rescheduled 12.4 5.5 53.3 0.0 0.0 0.0 0.0 0.0Total amount forgiven 122.1 137.4 4.2 11.9 12.4 13.0 4.2 0.0Debt buyback 0.0 0.0 0.0 0.0 0.0 0.0 0.0 0.010. Contractual obligations on outstanding long-term external debt
2008 2009 2010 2011 2012 2013 2014 2015Official creditorsPrincipal 60.1 58.4 61.0 61.0 63.9 65.2 40.4 39.2Interest 12.1 12.3 12.4 12.2 11.9 11.3 10.6 9.8Private creditorsPrincipal 0.0 0.0 0.0 0.0 0.0 0.0 0.0 0.0Interest 0.0 0.0 0.0 0.0 0.0 0.0 0.0 0.0
Notes:Benin was granted debt relief effective in 2006 under the Multilateral Debt Relief Initiative.
43
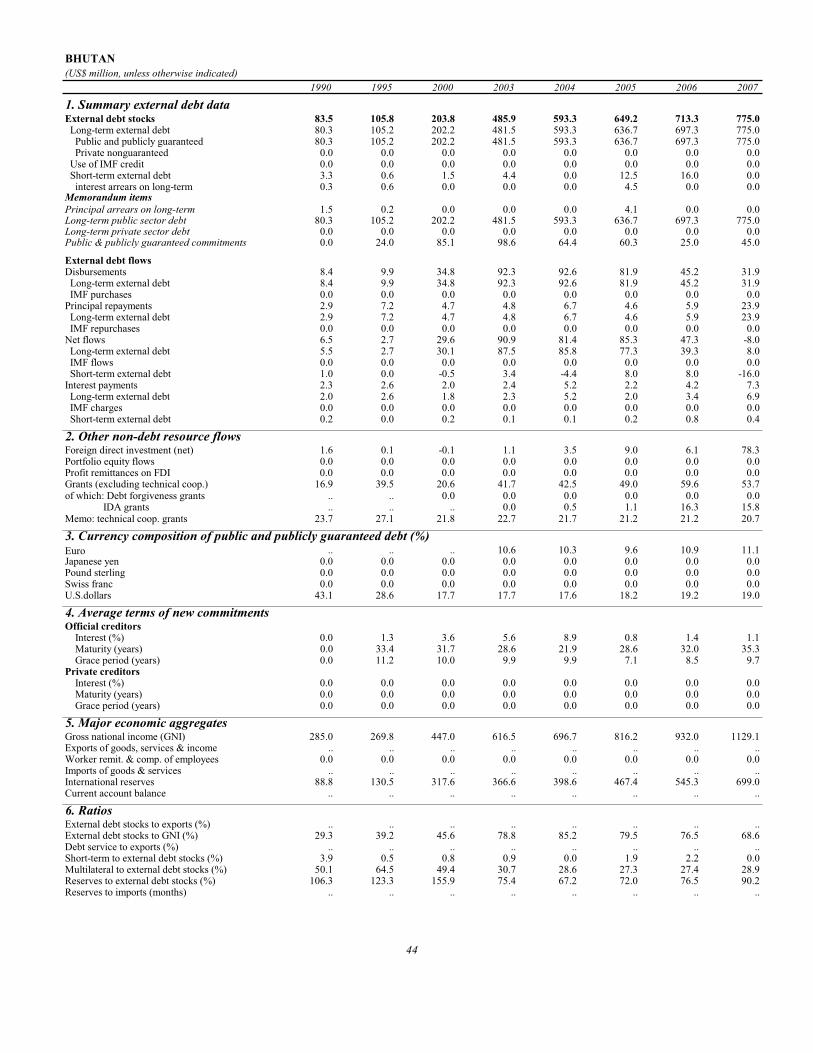
BHUTAN(US$ million, unless otherwise indicated)
1990 1995 2000 2003 2004 2005 2006 2007
1. Summary external debt dataExternal debt stocks 83.5 105.8 203.8 485.9 593.3 649.2 713.3 775.0 Long-term external debt 80.3 105.2 202.2 481.5 593.3 636.7 697.3 775.0 Public and publicly guaranteed 80.3 105.2 202.2 481.5 593.3 636.7 697.3 775.0 Private nonguaranteed 0.0 0.0 0.0 0.0 0.0 0.0 0.0 0.0 Use of IMF credit 0.0 0.0 0.0 0.0 0.0 0.0 0.0 0.0 Short-term external debt 3.3 0.6 1.5 4.4 0.0 12.5 16.0 0.0 interest arrears on long-term 0.3 0.6 0.0 0.0 0.0 4.5 0.0 0.0Memorandum itemsPrincipal arrears on long-term 1.5 0.2 0.0 0.0 0.0 4.1 0.0 0.0Long-term public sector debt 80.3 105.2 202.2 481.5 593.3 636.7 697.3 775.0Long-term private sector debt 0.0 0.0 0.0 0.0 0.0 0.0 0.0 0.0Public & publicly guaranteed commitments 0.0 24.0 85.1 98.6 64.4 60.3 25.0 45.0
External debt flowsDisbursements 8.4 9.9 34.8 92.3 92.6 81.9 45.2 31.9 Long-term external debt 8.4 9.9 34.8 92.3 92.6 81.9 45.2 31.9 IMF purchases 0.0 0.0 0.0 0.0 0.0 0.0 0.0 0.0Principal repayments 2.9 7.2 4.7 4.8 6.7 4.6 5.9 23.9 Long-term external debt 2.9 7.2 4.7 4.8 6.7 4.6 5.9 23.9 IMF repurchases 0.0 0.0 0.0 0.0 0.0 0.0 0.0 0.0Net flows 6.5 2.7 29.6 90.9 81.4 85.3 47.3 -8.0 Long-term external debt 5.5 2.7 30.1 87.5 85.8 77.3 39.3 8.0 IMF flows 0.0 0.0 0.0 0.0 0.0 0.0 0.0 0.0 Short-term external debt 1.0 0.0 -0.5 3.4 -4.4 8.0 8.0 -16.0Interest payments 2.3 2.6 2.0 2.4 5.2 2.2 4.2 7.3 Long-term external debt 2.0 2.6 1.8 2.3 5.2 2.0 3.4 6.9 IMF charges 0.0 0.0 0.0 0.0 0.0 0.0 0.0 0.0 Short-term external debt 0.2 0.0 0.2 0.1 0.1 0.2 0.8 0.4
2. Other non-debt resource flowsForeign direct investment (net) 1.6 0.1 -0.1 1.1 3.5 9.0 6.1 78.3Portfolio equity flows 0.0 0.0 0.0 0.0 0.0 0.0 0.0 0.0Profit remittances on FDI 0.0 0.0 0.0 0.0 0.0 0.0 0.0 0.0Grants (excluding technical coop.) 16.9 39.5 20.6 41.7 42.5 49.0 59.6 53.7of which: Debt forgiveness grants .. .. 0.0 0.0 0.0 0.0 0.0 0.0 IDA grants .. .. .. 0.0 0.5 1.1 16.3 15.8Memo: technical coop. grants 23.7 27.1 21.8 22.7 21.7 21.2 21.2 20.7
3. Currency composition of public and publicly guaranteed debt (%)Euro .. .. .. 10.6 10.3 9.6 10.9 11.1Japanese yen 0.0 0.0 0.0 0.0 0.0 0.0 0.0 0.0Pound sterling 0.0 0.0 0.0 0.0 0.0 0.0 0.0 0.0Swiss franc 0.0 0.0 0.0 0.0 0.0 0.0 0.0 0.0U.S.dollars 43.1 28.6 17.7 17.7 17.6 18.2 19.2 19.0
4. Average terms of new commitmentsOfficial creditors Interest (%) 0.0 1.3 3.6 5.6 8.9 0.8 1.4 1.1 Maturity (years) 0.0 33.4 31.7 28.6 21.9 28.6 32.0 35.3 Grace period (years) 0.0 11.2 10.0 9.9 9.9 7.1 8.5 9.7Private creditors Interest (%) 0.0 0.0 0.0 0.0 0.0 0.0 0.0 0.0 Maturity (years) 0.0 0.0 0.0 0.0 0.0 0.0 0.0 0.0 Grace period (years) 0.0 0.0 0.0 0.0 0.0 0.0 0.0 0.0
5. Major economic aggregatesGross national income (GNI) 285.0 269.8 447.0 616.5 696.7 816.2 932.0 1129.1Exports of goods, services & income .. .. .. .. .. .. .. ..Worker remit. & comp. of employees 0.0 0.0 0.0 0.0 0.0 0.0 0.0 0.0Imports of goods & services .. .. .. .. .. .. .. ..International reserves 88.8 130.5 317.6 366.6 398.6 467.4 545.3 699.0Current account balance .. .. .. .. .. .. .. ..
6. RatiosExternal debt stocks to exports (%) .. .. .. .. .. .. .. ..External debt stocks to GNI (%) 29.3 39.2 45.6 78.8 85.2 79.5 76.5 68.6Debt service to exports (%) .. .. .. .. .. .. .. ..Short-term to external debt stocks (%) 3.9 0.5 0.8 0.9 0.0 1.9 2.2 0.0Multilateral to external debt stocks (%) 50.1 64.5 49.4 30.7 28.6 27.3 27.4 28.9Reserves to external debt stocks (%) 106.3 123.3 155.9 75.4 67.2 72.0 76.5 90.2Reserves to imports (months) .. .. .. .. .. .. .. ..
44

BHUTAN(US$ million, unless otherwise indicated)
1990 1995 2000 2003 2004 2005 2006 2007
7. Long-term external debtDebt outstanding and disbursed 80.3 105.2 202.2 481.5 593.3 636.7 697.3 775.0Public and publicly guaranteed 80.3 105.2 202.2 481.5 593.3 636.7 697.3 775.0 Official creditors 61.8 98.4 202.2 481.5 593.3 636.7 697.3 775.0 Multilateral 41.9 68.2 100.6 149.1 169.6 177.1 195.8 223.7 of which: IBRD 0.0 0.0 0.0 0.0 0.0 0.0 0.0 0.0 IDA 16.1 22.5 26.1 49.2 60.3 63.3 76.0 87.5 Bilateral 19.9 30.2 101.6 332.4 423.7 459.6 501.5 551.4 Private creditors 18.5 6.8 0.0 0.0 0.0 0.0 0.0 0.0 of which: Bonds 0.0 0.0 0.0 0.0 0.0 0.0 0.0 0.0 Commercial banks 0.0 0.0 0.0 0.0 0.0 0.0 0.0 0.0Private nonguaranteed 0.0 0.0 0.0 0.0 0.0 0.0 0.0 0.0 of which: Bonds 0.0 0.0 0.0 0.0 0.0 0.0 0.0 0.0Disbursements 8.4 9.9 34.8 92.3 92.6 81.9 45.2 31.9Public and publicly guaranteed 8.4 9.9 34.8 92.3 92.6 81.9 45.2 31.9 Official creditors 8.4 9.9 34.8 92.3 92.6 81.9 45.2 31.9 Multilateral 7.2 5.8 11.8 12.7 16.4 22.1 15.1 21.4 of which: IBRD 0.0 0.0 0.0 0.0 0.0 0.0 0.0 0.0 IDA 2.0 1.2 3.6 6.9 9.0 8.4 10.3 8.8 Bilateral 1.2 4.1 23.0 79.6 76.1 59.9 30.1 10.5 Private creditors 0.0 0.0 0.0 0.0 0.0 0.0 0.0 0.0 of which: Bonds 0.0 0.0 0.0 0.0 0.0 0.0 0.0 0.0 Commercial banks 0.0 0.0 0.0 0.0 0.0 0.0 0.0 0.0Private nonguaranteed 0.0 0.0 0.0 0.0 0.0 0.0 0.0 0.0 of which: Bonds 0.0 0.0 0.0 0.0 0.0 0.0 0.0 0.0Principal repayments 2.9 7.2 4.7 4.8 6.7 4.6 5.9 23.9Public and publicly guaranteed 2.9 7.2 4.7 4.8 6.7 4.6 5.9 23.9 Official creditors 0.3 4.9 4.7 4.8 6.7 4.6 5.9 23.9 Multilateral 0.0 0.6 1.3 1.3 1.8 2.2 2.5 2.7 of which: IBRD 0.0 0.0 0.0 0.0 0.0 0.0 0.0 0.0 IDA 0.0 0.1 0.3 0.3 0.5 0.7 0.8 0.8 Bilateral 0.3 4.3 3.4 3.5 4.9 2.5 3.4 21.2 Private creditors 2.6 2.3 0.0 0.0 0.0 0.0 0.0 0.0 of which: Bonds 0.0 0.0 0.0 0.0 0.0 0.0 0.0 0.0 Commercial banks 0.0 0.0 0.0 0.0 0.0 0.0 0.0 0.0Private nonguaranteed 0.0 0.0 0.0 0.0 0.0 0.0 0.0 0.0 of which: Bonds 0.0 0.0 0.0 0.0 0.0 0.0 0.0 0.0Interest payments 2.0 2.6 1.8 2.3 5.2 2.0 3.4 6.9Public and publicly guaranteed 2.0 2.6 1.8 2.3 5.2 2.0 3.4 6.9 Official creditors 0.4 2.0 1.8 2.3 5.2 2.0 3.4 6.9 Multilateral 0.3 0.6 0.9 1.2 1.6 1.6 1.8 1.8 of which: IBRD 0.0 0.0 0.0 0.0 0.0 0.0 0.0 0.0 IDA 0.1 0.2 0.2 0.3 0.6 0.6 0.6 0.6 Bilateral 0.1 1.4 0.9 1.1 3.6 0.4 1.6 5.1 Private creditors 1.6 0.6 0.0 0.0 0.0 0.0 0.0 0.0 of which: Bonds 0.0 0.0 0.0 0.0 0.0 0.0 0.0 0.0 Commercial banks 0.0 0.0 0.0 0.0 0.0 0.0 0.0 0.0Private nonguaranteed 0.0 0.0 0.0 0.0 0.0 0.0 0.0 0.0 of which: Bonds 0.0 0.0 0.0 0.0 0.0 0.0 0.0 0.08. Debt stock-flow reconciliationTotal change in external debt stocks 9.7 1.3 20.0 108.0 107.3 55.9 64.1 61.7 Net flows on external debt 6.5 2.7 29.6 90.9 81.4 85.3 47.3 -8.0 Cross-currency valuation 1.1 -2.0 -10.6 27.4 22.7 -32.3 20.4 70.09. Debt restructuringsTotal amount rescheduled 0.0 0.0 0.0 0.0 0.0 0.0 0.0 0.0Total amount forgiven 0.0 0.0 0.0 0.0 0.0 0.0 0.0 0.0Debt buyback 0.0 0.0 0.0 0.0 0.0 0.0 0.0 0.010. Contractual obligations on outstanding long-term external debt
2008 2009 2010 2011 2012 2013 2014 2015Official creditorsPrincipal 50.9 52.0 56.0 56.0 56.5 56.8 58.5 60.8Interest 45.9 42.9 39.3 35.4 31.4 27.5 23.6 19.6Private creditorsPrincipal 0.0 0.0 0.0 0.0 0.0 0.0 0.0 0.0Interest 0.0 0.0 0.0 0.0 0.0 0.0 0.0 0.0
45

BOLIVIA, PLURINATIONAL STATE OF(US$ million, unless otherwise indicated)
1990 1995 2000 2003 2004 2005 2006 2007
1. Summary external debt dataExternal debt stocks 4,275 5,272 5,785 5,801 6,222 6,908 5,799 4,947 Long-term external debt 3,864 4,698 5,163 5,191 5,642 6,482 5,564 4,771 Public and publicly guaranteed 3,687 4,459 4,137 4,160 4,557 4,568 3,177 2,150 Private nonguaranteed 177 239 1,026 1,031 1,085 1,914 2,388 2,621 Use of IMF credit 257 268 220 279 307 244 15 0 Short-term external debt 154 307 402 332 272 182 220 176 interest arrears on long-term 6 20 2 0 0 0 0 0Memorandum itemsPrincipal arrears on long-term 31 30 19 0 0 0 0 0Long-term public sector debt 3,687 4,459 3,759 4,123 4,530 4,545 3,159 2,140Long-term private sector debt 177 239 1,403 1,067 1,112 1,937 2,406 2,631Public & publicly guaranteed commitments 549 684 180 759 479 551 185 1,042
External debt flowsDisbursements 331 520 759 932 729 895 365 868 Long-term external debt 300 494 744 842 673 880 365 868 IMF purchases 31 26 15 90 56 14 0 0Principal repayments 241 199 454 300 378 355 215 540 Long-term external debt 196 173 434 281 357 315 215 526 IMF repurchases 46 26 20 19 22 40 0 15Net flows 32 341 294 594 291 449 188 284 Long-term external debt 104 321 309 561 317 565 150 343 IMF flows -43 0 0 90 56 -4 0 -15 Short-term external debt -57 20 -10 -38 -60 -91 38 -44Interest payments 144 173 180 133 141 174 216 202 Long-term external debt 117 155 159 116 125 159 204 194 IMF charges 13 1 1 1 4 6 2 1 Short-term external debt 14 17 20 15 13 10 10 7
2. Other non-debt resource flowsForeign direct investment (net) 27 393 736 197 65 -239 281 204Portfolio equity flows 0 0 0 0 0 0 0 0Profit remittances on FDI 17 24 148 234 292 271 392 327Grants (excluding technical coop.) 202 328 221 473 804 297 2,082 1,591of which: Debt forgiveness grants .. .. 152 117 527 38 1,819 1,176 IDA grants .. .. .. 0 0 0 0 0Memo: technical coop. grants 108 217 147 265 240 240 302 109
3. Currency composition of public and publicly guaranteed debt (%)Euro .. .. .. 1.0 1.7 1.5 2.6 4.3Japanese yen 10.0 13.2 12.3 0.0 0.0 0.0 0.0 0.0Pound sterling 0.9 0.7 0.2 0.0 0.0 0.0 0.0 0.0Swiss franc 0.7 0.0 0.0 0.0 0.0 0.0 0.0 0.0U.S.dollars 41.3 32.7 45.0 70.6 72.9 75.3 66.2 77.6
4. Average terms of new commitmentsOfficial creditors Interest (%) 4.1 3.8 4.2 3.0 3.2 4.9 4.1 2.7 Maturity (years) 29.5 29.1 28.6 22.3 17.7 21.6 24.9 22.9 Grace period (years) 7.9 7.8 7.9 6.4 4.5 5.6 5.8 5.2Private creditors Interest (%) 9.4 6.7 7.4 0.0 0.0 0.0 0.0 0.0 Maturity (years) 5.8 5.6 5.8 0.0 0.0 0.0 0.0 0.0 Grace period (years) 1.5 1.0 0.8 0.0 0.0 0.0 0.0 0.0
5. Major economic aggregatesGross national income (GNI) 4,626 6,494 8,172 7,781 8,388 9,173 11,034 12,947Exports of goods, services & income 998 1,264 1,711 2,159 2,817 3,705 5,156 6,213Worker remit. & comp. of employees 5 7 127 159 211 346 612 927Imports of goods & services 1,354 1,809 2,443 2,422 2,792 3,363 4,091 4,620International reserves 511 1,005 1,184 1,097 1,271 1,795 3,194 5,314Current account balance -199 -303 -446 76 337 622 1,317 1,800
6. RatiosExternal debt stocks to exports (%) 428.6 417.1 338.2 268.7 220.9 186.5 112.5 79.6External debt stocks to GNI (%) 92.4 81.2 70.8 74.6 74.2 75.3 52.6 38.2Debt service to exports (%) 38.6 29.4 37.1 20.0 18.4 14.3 8.4 11.9Short-term to external debt stocks (%) 3.6 5.8 7.0 5.7 4.4 2.6 3.8 3.6Multilateral to external debt stocks (%) 37.2 48.9 48.5 67.6 68.2 60.9 47.6 34.3Reserves to external debt stocks (%) 12.0 19.1 20.5 18.9 20.4 26.0 55.1 107.4Reserves to imports (months) 4.5 6.7 5.8 5.4 5.5 6.4 9.4 13.8
46

BOLIVIA, PLURINATIONAL STATE OF(US$ million, unless otherwise indicated)
1990 1995 2000 2003 2004 2005 2006 2007
7. Long-term external debtDebt outstanding and disbursed 3,864 4,698 5,163 5,191 5,642 6,482 5,564 4,771Public and publicly guaranteed 3,687 4,459 4,137 4,160 4,557 4,568 3,177 2,150 Official creditors 3,362 4,396 4,103 4,135 4,531 4,545 3,156 2,132 Multilateral 1,589 2,579 2,803 3,923 4,245 4,210 2,762 1,698 of which: IBRD 194 95 0 0 0 0 0 0 IDA 393 770 1,096 1,571 1,750 1,673 233 259 Bilateral 1,773 1,817 1,300 212 286 336 395 434 Private creditors 325 63 33 25 26 23 20 18 of which: Bonds 35 17 0 0 0 0 0 0 Commercial banks 4 9 3 0 0 0 0 0Private nonguaranteed 177 239 1,026 1,031 1,085 1,914 2,388 2,621 of which: Bonds 0 0 0 0 0 0 0 0Disbursements 300 494 744 842 673 880 365 868Public and publicly guaranteed 300 427 276 618 496 434 260 275 Official creditors 291 427 263 617 494 433 259 275 Multilateral 204 383 238 597 408 350 186 222 of which: IBRD 0 0 0 0 0 0 0 0 IDA 49 113 61 143 124 71 34 16 Bilateral 86 45 25 20 85 83 73 53 Private creditors 9 0 13 1 2 1 1 0 of which: Bonds 0 0 0 0 0 0 0 0 Commercial banks 0 0 0 0 0 0 0 0Private nonguaranteed 0 67 468 224 177 447 105 593 of which: Bonds 0 0 0 0 0 0 0 0Principal repayments 196 173 434 281 357 315 215 526Public and publicly guaranteed 172 155 153 186 181 184 207 166 Official creditors 163 147 149 184 180 182 202 162 Multilateral 117 120 118 165 171 169 188 146 of which: IBRD 21 26 12 0 0 0 0 0 IDA 2 2 0 6 8 8 12 0 Bilateral 46 27 32 19 9 13 14 16 Private creditors 9 8 4 1 2 2 4 4 of which: Bonds 0 0 0 0 0 0 0 0 Commercial banks 2 4 1 0 0 0 0 0Private nonguaranteed 24 18 281 95 175 131 8 360 of which: Bonds 0 0 0 0 0 0 0 0Interest payments 117 155 159 116 125 159 204 194Public and publicly guaranteed 103 137 112 80 79 100 112 103 Official creditors 101 133 111 79 78 99 112 103 Multilateral 69 100 82 76 75 94 102 92 of which: IBRD 15 9 1 0 0 0 0 0 IDA 3 6 1 8 12 12 7 2 Bilateral 32 33 29 4 3 5 10 11 Private creditors 2 4 1 0 0 0 0 0 of which: Bonds 0 0 0 0 0 0 0 0 Commercial banks 1 1 0 0 0 0 0 0Private nonguaranteed 14 19 47 36 46 59 92 91 of which: Bonds 0 0 0 0 0 0 0 08. Debt stock-flow reconciliationTotal change in external debt stocks 143 396 237 796 420 686 -1,109 -852 Net flows on external debt 32 341 294 594 291 449 188 284 Cross-currency valuation 114 -33 -212 227 80 -195 -1,700 -709. Debt restructuringsTotal amount rescheduled 153 196 0 0 0 0 0 0Total amount forgiven 92 74 28 33 33 38 31 434Debt buyback 4 0 0 0 0 0 0 010. Contractual obligations on outstanding long-term external debt
2008 2009 2010 2011 2012 2013 2014 2015Official creditorsPrincipal 177 194 212 245 244 232 208 207Interest 118 120 116 108 96 84 73 61Private creditorsPrincipal 533 632 461 375 287 140 71 52Interest 116 109 72 44 24 12 6 4
Notes:Plurinational State of Bolivia was granted debt relief effective in 2006 under the Multilateral Debt Relief Initiative. Short-term debt data are based on country reports.
47
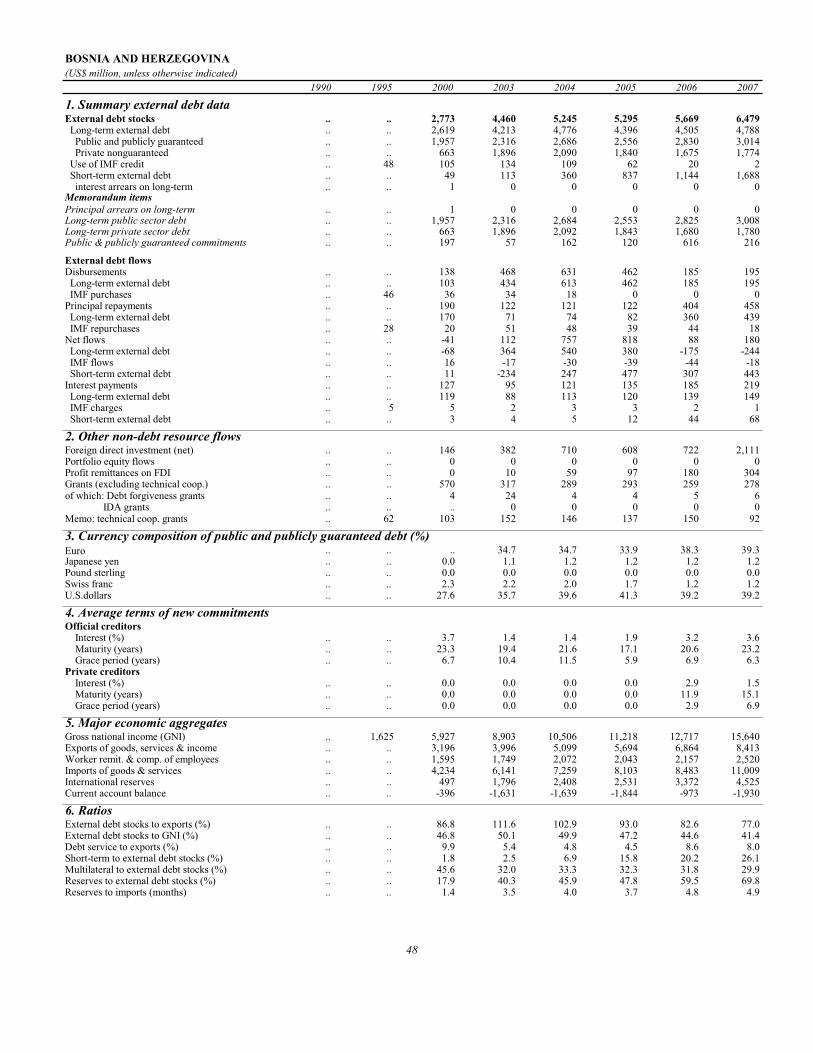
BOSNIA AND HERZEGOVINA(US$ million, unless otherwise indicated)
1990 1995 2000 2003 2004 2005 2006 2007
1. Summary external debt dataExternal debt stocks .. .. 2,773 4,460 5,245 5,295 5,669 6,479 Long-term external debt .. .. 2,619 4,213 4,776 4,396 4,505 4,788 Public and publicly guaranteed .. .. 1,957 2,316 2,686 2,556 2,830 3,014 Private nonguaranteed .. .. 663 1,896 2,090 1,840 1,675 1,774 Use of IMF credit .. 48 105 134 109 62 20 2 Short-term external debt .. .. 49 113 360 837 1,144 1,688 interest arrears on long-term .. .. 1 0 0 0 0 0Memorandum itemsPrincipal arrears on long-term .. .. 1 0 0 0 0 0Long-term public sector debt .. .. 1,957 2,316 2,684 2,553 2,825 3,008Long-term private sector debt .. .. 663 1,896 2,092 1,843 1,680 1,780Public & publicly guaranteed commitments .. .. 197 57 162 120 616 216
External debt flowsDisbursements .. .. 138 468 631 462 185 195 Long-term external debt .. .. 103 434 613 462 185 195 IMF purchases .. 46 36 34 18 0 0 0Principal repayments .. .. 190 122 121 122 404 458 Long-term external debt .. .. 170 71 74 82 360 439 IMF repurchases .. 28 20 51 48 39 44 18Net flows .. .. -41 112 757 818 88 180 Long-term external debt .. .. -68 364 540 380 -175 -244 IMF flows .. .. 16 -17 -30 -39 -44 -18 Short-term external debt .. .. 11 -234 247 477 307 443Interest payments .. .. 127 95 121 135 185 219 Long-term external debt .. .. 119 88 113 120 139 149 IMF charges .. 5 5 2 3 3 2 1 Short-term external debt .. .. 3 4 5 12 44 68
2. Other non-debt resource flowsForeign direct investment (net) .. .. 146 382 710 608 722 2,111Portfolio equity flows .. .. 0 0 0 0 0 0Profit remittances on FDI .. .. 0 10 59 97 180 304Grants (excluding technical coop.) .. .. 570 317 289 293 259 278of which: Debt forgiveness grants .. .. 4 24 4 4 5 6 IDA grants .. .. .. 0 0 0 0 0Memo: technical coop. grants .. 62 103 152 146 137 150 92
3. Currency composition of public and publicly guaranteed debt (%)Euro .. .. .. 34.7 34.7 33.9 38.3 39.3Japanese yen .. .. 0.0 1.1 1.2 1.2 1.2 1.2Pound sterling .. .. 0.0 0.0 0.0 0.0 0.0 0.0Swiss franc .. .. 2.3 2.2 2.0 1.7 1.2 1.2U.S.dollars .. .. 27.6 35.7 39.6 41.3 39.2 39.2
4. Average terms of new commitmentsOfficial creditors Interest (%) .. .. 3.7 1.4 1.4 1.9 3.2 3.6 Maturity (years) .. .. 23.3 19.4 21.6 17.1 20.6 23.2 Grace period (years) .. .. 6.7 10.4 11.5 5.9 6.9 6.3Private creditors Interest (%) .. .. 0.0 0.0 0.0 0.0 2.9 1.5 Maturity (years) .. .. 0.0 0.0 0.0 0.0 11.9 15.1 Grace period (years) .. .. 0.0 0.0 0.0 0.0 2.9 6.9
5. Major economic aggregatesGross national income (GNI) .. 1,625 5,927 8,903 10,506 11,218 12,717 15,640Exports of goods, services & income .. .. 3,196 3,996 5,099 5,694 6,864 8,413Worker remit. & comp. of employees .. .. 1,595 1,749 2,072 2,043 2,157 2,520Imports of goods & services .. .. 4,234 6,141 7,259 8,103 8,483 11,009International reserves .. .. 497 1,796 2,408 2,531 3,372 4,525Current account balance .. .. -396 -1,631 -1,639 -1,844 -973 -1,930
6. RatiosExternal debt stocks to exports (%) .. .. 86.8 111.6 102.9 93.0 82.6 77.0External debt stocks to GNI (%) .. .. 46.8 50.1 49.9 47.2 44.6 41.4Debt service to exports (%) .. .. 9.9 5.4 4.8 4.5 8.6 8.0Short-term to external debt stocks (%) .. .. 1.8 2.5 6.9 15.8 20.2 26.1Multilateral to external debt stocks (%) .. .. 45.6 32.0 33.3 32.3 31.8 29.9Reserves to external debt stocks (%) .. .. 17.9 40.3 45.9 47.8 59.5 69.8Reserves to imports (months) .. .. 1.4 3.5 4.0 3.7 4.8 4.9
48

BOSNIA AND HERZEGOVINA(US$ million, unless otherwise indicated)
1990 1995 2000 2003 2004 2005 2006 2007
7. Long-term external debtDebt outstanding and disbursed .. .. 2,619 4,213 4,776 4,396 4,505 4,788Public and publicly guaranteed .. .. 1,957 2,316 2,686 2,556 2,830 3,014 Official creditors .. .. 1,832 2,147 2,504 2,401 2,660 2,819 Multilateral .. .. 1,266 1,427 1,744 1,712 1,800 1,936 of which: IBRD .. 472 562 540 527 481 466 453 IDA .. 0 398 683 927 921 983 1,068 Bilateral .. .. 566 720 760 689 860 884 Private creditors .. .. 125 169 182 155 169 195 of which: Bonds .. .. 0 0 0 0 0 0 Commercial banks .. .. 125 169 182 155 169 195Private nonguaranteed .. .. 663 1,896 2,090 1,840 1,675 1,774 of which: Bonds .. .. 0 0 0 0 0 0Disbursements .. .. 103 434 613 462 185 195Public and publicly guaranteed .. .. 98 117 287 149 131 139 Official creditors .. .. 98 117 287 149 131 127 Multilateral .. .. 90 92 275 133 93 114 of which: IBRD .. 0 0 0 0 0 0 0 IDA .. 0 44 48 209 56 27 57 Bilateral .. .. 8 25 12 17 39 13 Private creditors .. .. 0 0 0 0 0 12 of which: Bonds .. .. 0 0 0 0 0 0 Commercial banks .. .. 0 0 0 0 0 12Private nonguaranteed .. .. 5 317 326 313 53 56 of which: Bonds .. .. 0 0 0 0 0 0Principal repayments .. .. 170 71 74 82 360 439Public and publicly guaranteed .. .. 170 48 51 54 125 136 Official creditors .. .. 170 48 51 51 122 129 Multilateral .. .. 166 34 35 44 56 63 of which: IBRD .. 0 0 24 24 24 24 24 IDA .. 0 0 0 0 0 4 9 Bilateral .. .. 3 13 16 7 65 65 Private creditors .. .. 0 0 0 3 3 7 of which: Bonds .. .. 0 0 0 0 0 0 Commercial banks .. .. 0 0 0 3 3 7Private nonguaranteed .. .. 1 23 22 28 235 303 of which: Bonds .. .. 0 0 0 0 0 0Interest payments .. .. 119 88 113 120 139 149Public and publicly guaranteed .. .. 89 47 47 53 64 72 Official creditors .. .. 86 43 42 48 58 65 Multilateral .. .. 74 29 29 35 43 49 of which: IBRD .. 0 33 17 15 17 23 26 IDA .. 0 3 5 6 7 8 8 Bilateral .. .. 13 14 13 13 16 17 Private creditors .. .. 2 5 5 6 6 6 of which: Bonds .. .. 0 0 0 0 0 0 Commercial banks .. .. 2 5 5 6 6 6Private nonguaranteed .. .. 30 41 67 67 75 78 of which: Bonds .. .. 0 0 0 0 0 08. Debt stock-flow reconciliationTotal change in external debt stocks .. .. 397 1,320 785 50 374 709 Net flows on external debt .. .. -41 112 757 818 88 180 Cross-currency valuation .. .. -116 233 115 -235 149 1769. Debt restructuringsTotal amount rescheduled .. .. 4 0 0 0 0 0Total amount forgiven .. .. 0 0 0 0 0 0Debt buyback .. .. 0 0 0 0 0 010. Contractual obligations on outstanding long-term external debt
2008 2009 2010 2011 2012 2013 2014 2015Official creditorsPrincipal 172 134 153 161 162 163 166 170Interest 76 81 83 81 78 73 68 62Private creditorsPrincipal 476 371 334 208 161 132 105 86Interest 82 61 46 33 25 18 13 8
Notes:Prior to 1999 data on long-term public and publicly guaranteed debt include only IBRD and IMF loans. Long-term private nonguaranteed debt data are World Bank staff estimates, includes intercompany debt starting from 2005.
49

BOTSWANA(US$ million, unless otherwise indicated)
1990 1995 2000 2003 2004 2005 2006 2007
1. Summary external debt dataExternal debt stocks 552.9 717.2 452.8 513.6 510.0 472.6 408.1 402.0 Long-term external debt 547.1 707.0 437.8 484.6 488.0 437.6 384.1 380.0 Public and publicly guaranteed 547.1 707.0 437.8 484.6 488.0 437.6 384.1 380.0 Private nonguaranteed 0.0 0.0 0.0 0.0 0.0 0.0 0.0 0.0 Use of IMF credit 0.0 0.0 0.0 0.0 0.0 0.0 0.0 0.0 Short-term external debt 5.8 10.2 15.0 29.0 22.0 35.0 24.0 22.0 interest arrears on long-term 2.6 6.2 0.0 0.0 0.0 0.0 0.0 0.0Memorandum itemsPrincipal arrears on long-term 2.7 9.0 1.0 0.0 0.0 0.0 0.0 0.0Long-term public sector debt 547.1 676.4 432.4 484.6 488.0 437.6 384.1 380.0Long-term private sector debt 0.0 30.5 5.4 0.0 0.0 0.0 0.0 0.0Public & publicly guaranteed commitments 80.6 0.0 0.0 29.7 20.0 48.2 73.2 20.6
External debt flowsDisbursements 27.0 67.4 28.0 13.5 22.1 37.5 2.6 21.4 Long-term external debt 27.0 67.4 28.0 13.5 22.1 37.5 2.6 21.4 IMF purchases 0.0 0.0 0.0 0.0 0.0 0.0 0.0 0.0Principal repayments 66.5 63.9 52.1 38.0 36.8 39.0 42.2 45.8 Long-term external debt 66.5 63.9 52.1 38.0 36.8 39.0 42.2 45.8 IMF repurchases 0.0 0.0 0.0 0.0 0.0 0.0 0.0 0.0Net flows -39.4 4.0 -28.8 -11.6 -21.7 11.5 -50.6 -32.4 Long-term external debt -39.5 3.4 -24.1 -24.6 -14.7 -1.5 -39.6 -24.4 IMF flows 0.0 0.0 0.0 0.0 0.0 0.0 0.0 0.0 Short-term external debt 0.1 0.6 -4.7 13.0 -7.0 13.0 -11.0 -8.0Interest payments 38.8 27.5 16.6 12.4 11.8 12.4 12.7 11.1 Long-term external debt 38.6 27.3 15.2 11.4 10.9 11.4 10.9 10.2 IMF charges 0.0 0.0 0.0 0.0 0.0 0.0 0.0 0.0 Short-term external debt 0.2 0.2 1.3 1.0 0.9 1.0 1.9 0.9
2. Other non-debt resource flowsForeign direct investment (net) 95.9 70.4 57.2 418.0 391.0 278.6 486.4 -28.6Portfolio equity flows 0.0 5.5 -5.9 10.2 0.6 61.6 35.9 9.4Profit remittances on FDI 406.9 415.7 657.9 1003.5 1092.3 1065.7 1042.5 631.8Grants (excluding technical coop.) 78.4 28.6 18.1 14.9 30.3 35.7 47.8 91.8of which: Debt forgiveness grants .. .. 2.7 2.8 1.0 5.5 4.5 2.6 IDA grants .. .. .. 0.0 0.0 0.0 0.0 0.0Memo: technical coop. grants 59.1 51.4 18.2 27.2 33.1 30.2 36.4 21.9
3. Currency composition of public and publicly guaranteed debt (%)Euro .. .. .. 6.9 7.2 6.5 7.7 8.3Japanese yen 4.4 11.1 11.4 17.9 17.4 16.1 9.7 9.1Pound sterling 10.1 3.8 2.3 5.5 5.3 4.9 5.7 5.3Swiss franc 0.0 0.1 0.1 0.2 0.2 0.1 0.0 0.0U.S.dollars 11.9 13.4 18.0 21.7 19.9 19.3 19.4 18.5
4. Average terms of new commitmentsOfficial creditors Interest (%) 5.6 0.0 0.0 3.2 3.1 1.6 4.7 3.8 Maturity (years) 17.6 0.0 0.0 14.9 20.5 12.0 17.8 19.6 Grace period (years) 4.5 0.0 0.0 5.1 5.0 3.0 5.2 5.1Private creditors Interest (%) 8.9 0.0 0.0 0.0 0.0 0.0 0.0 0.0 Maturity (years) 11.6 0.0 0.0 0.0 0.0 0.0 0.0 0.0 Grace period (years) 4.1 0.0 0.0 0.0 0.0 0.0 0.0 0.0
5. Major economic aggregatesGross national income (GNI) 3685.7 4741.3 5825.9 7561.9 8800.9 9702.4 10233.9 11656.7Exports of goods, services & income 2421.1 2903.8 3378.6 4050.2 4744.0 5836.0 5899.7 6645.7Worker remit. & comp. of employees 86.0 59.0 26.0 39.0 93.1 125.0 116.8 141.2Imports of goods & services 2508.9 2565.3 3050.2 3878.0 4910.4 4834.8 4752.5 5236.6International reserves 3331.5 4695.5 6318.2 5339.8 5661.4 6309.1 7992.4 9789.7Current account balance -19.3 299.7 545.2 462.2 308.9 1597.1 1939.8 2434.2
6. RatiosExternal debt stocks to exports (%) 22.8 24.7 13.4 12.7 10.8 8.1 6.9 6.0External debt stocks to GNI (%) 15.0 15.1 7.8 6.8 5.8 4.9 4.0 3.4Debt service to exports (%) 4.3 3.1 2.0 1.2 1.0 0.9 0.9 0.9Short-term to external debt stocks (%) 1.0 1.4 3.3 5.6 4.3 7.4 5.9 5.5Multilateral to external debt stocks (%) 70.0 70.1 65.7 64.8 64.3 60.8 65.9 63.3Reserves to external debt stocks (%) 602.5 654.7 1,395.5 1,039.6 1,110.0 1,334.9 1,958.3 2,435.3Reserves to imports (months) 15.9 22.0 24.9 16.5 13.8 15.7 20.2 22.4
50

BOTSWANA(US$ million, unless otherwise indicated)
1990 1995 2000 2003 2004 2005 2006 2007
7. Long-term external debtDebt outstanding and disbursed 547.1 707.0 437.8 484.6 488.0 437.6 384.1 380.0Public and publicly guaranteed 547.1 707.0 437.8 484.6 488.0 437.6 384.1 380.0 Official creditors 519.7 660.0 409.9 469.8 474.0 425.9 374.7 372.9 Multilateral 387.1 502.9 297.4 333.0 327.7 287.3 268.9 254.6 of which: IBRD 155.2 96.3 15.6 5.0 3.4 2.1 1.1 0.0 IDA 13.6 11.5 9.1 7.7 7.2 6.7 6.3 5.8 Bilateral 132.7 157.2 112.5 136.8 146.3 138.6 105.8 118.3 Private creditors 27.4 47.0 27.9 14.8 14.0 11.7 9.4 7.1 of which: Bonds 0.0 0.0 0.0 0.0 0.0 0.0 0.0 0.0 Commercial banks 3.0 32.8 19.9 8.8 8.7 7.1 5.5 3.9Private nonguaranteed 0.0 0.0 0.0 0.0 0.0 0.0 0.0 0.0 of which: Bonds 0.0 0.0 0.0 0.0 0.0 0.0 0.0 0.0Disbursements 27.0 67.4 28.0 13.5 22.1 37.5 2.6 21.4Public and publicly guaranteed 27.0 67.4 28.0 13.5 22.1 37.5 2.6 21.4 Official creditors 27.0 67.4 24.3 13.5 22.1 37.5 2.6 21.4 Multilateral 20.5 23.3 7.9 5.8 4.5 27.0 0.0 5.9 of which: IBRD 7.0 0.6 0.0 0.0 0.0 0.0 0.0 0.0 IDA 0.0 0.0 0.0 0.0 0.0 0.0 0.0 0.0 Bilateral 6.5 44.0 16.4 7.6 17.6 10.5 2.6 15.5 Private creditors 0.0 0.0 3.8 0.0 0.0 0.0 0.0 0.0 of which: Bonds 0.0 0.0 0.0 0.0 0.0 0.0 0.0 0.0 Commercial banks 0.0 0.0 3.8 0.0 0.0 0.0 0.0 0.0Private nonguaranteed 0.0 0.0 0.0 0.0 0.0 0.0 0.0 0.0 of which: Bonds 0.0 0.0 0.0 0.0 0.0 0.0 0.0 0.0Principal repayments 66.5 63.9 52.1 38.0 36.8 39.0 42.2 45.8Public and publicly guaranteed 66.5 63.9 52.1 38.0 36.8 39.0 42.2 45.8 Official creditors 48.0 57.7 45.3 35.8 36.0 36.7 39.8 43.5 Multilateral 36.6 48.3 33.2 25.4 25.5 26.8 29.9 33.1 of which: IBRD 19.0 23.7 7.4 3.0 1.7 1.1 1.1 1.1 IDA 0.3 0.5 0.5 0.5 0.5 0.5 0.5 0.5 Bilateral 11.4 9.4 12.1 10.3 10.5 9.8 9.9 10.4 Private creditors 18.5 6.2 6.9 2.3 0.8 2.3 2.3 2.3 of which: Bonds 0.0 0.0 0.0 0.0 0.0 0.0 0.0 0.0 Commercial banks 0.2 4.5 6.2 1.6 0.2 1.6 1.6 1.6Private nonguaranteed 0.0 0.0 0.0 0.0 0.0 0.0 0.0 0.0 of which: Bonds 0.0 0.0 0.0 0.0 0.0 0.0 0.0 0.0Interest payments 38.6 27.3 15.2 11.4 10.9 11.4 10.9 10.2Public and publicly guaranteed 38.6 27.3 15.2 11.4 10.9 11.4 10.9 10.2 Official creditors 35.6 24.2 13.9 11.2 10.7 11.1 10.6 10.0 Multilateral 27.8 21.0 11.1 8.4 7.8 7.4 7.6 6.5 of which: IBRD 14.2 8.6 1.2 0.3 0.2 0.1 0.1 0.0 IDA 0.1 0.1 0.1 0.1 0.1 0.1 0.1 0.0 Bilateral 7.8 3.2 2.9 2.8 2.9 3.7 3.0 3.4 Private creditors 3.0 3.0 1.3 0.2 0.2 0.2 0.3 0.2 of which: Bonds 0.0 0.0 0.0 0.0 0.0 0.0 0.0 0.0 Commercial banks 0.1 2.2 0.7 0.0 0.0 0.0 0.0 0.0Private nonguaranteed 0.0 0.0 0.0 0.0 0.0 0.0 0.0 0.0 of which: Bonds 0.0 0.0 0.0 0.0 0.0 0.0 0.0 0.08. Debt stock-flow reconciliationTotal change in external debt stocks 3.1 16.8 -51.5 25.2 -3.6 -37.4 -64.5 -12.1 Net flows on external debt -39.4 4.0 -28.8 -11.6 -21.7 11.5 -50.6 -32.4 Cross-currency valuation 21.2 0.2 -10.5 0.3 4.0 -24.3 -4.2 1.49. Debt restructuringsTotal amount rescheduled 0.0 0.0 0.0 0.0 0.0 0.0 0.0 0.0Total amount forgiven 0.0 0.0 0.0 0.0 0.0 0.0 27.6 0.0Debt buyback 0.0 0.0 0.0 0.0 0.0 0.0 0.0 0.010. Contractual obligations on outstanding long-term external debt
2008 2009 2010 2011 2012 2013 2014 2015Official creditorsPrincipal 40.3 37.8 35.6 46.1 34.1 29.4 26.7 25.9Interest 9.2 8.8 8.5 7.9 6.8 6.0 5.4 4.7Private creditorsPrincipal 4.6 0.7 0.6 0.6 0.6 0.0 0.0 0.0Interest 0.5 0.2 0.2 0.1 0.0 0.0 0.0 0.0
51

BRAZIL(US$ million, unless otherwise indicated)
1990 1995 2000 2003 2004 2005 2006 2007
1. Summary external debt dataExternal debt stocks 119,732 160,469 241,552 234,816 219,499 187,431 193,516 237,472 Long-term external debt 94,196 129,090 208,811 181,902 169,203 163,438 173,191 198,224 Public and publicly guaranteed 87,525 98,260 96,130 99,503 96,818 93,933 84,302 79,957 Private nonguaranteed 6,671 30,830 112,682 82,399 72,384 69,505 88,889 118,267 Use of IMF credit 1,821 142 1,768 28,317 25,029 0 0 0 Short-term external debt 23,715 31,238 30,973 24,597 25,268 23,993 20,325 39,248 interest arrears on long-term 8,790 1,546 176 3 1 0 2 2Memorandum itemsPrincipal arrears on long-term 3,597 3,936 1,821 16 19 18 4 6Long-term public sector debt 86,955 97,392 95,684 98,219 95,442 92,583 83,101 78,595Long-term private sector debt 7,241 31,698 113,127 83,683 73,761 70,855 90,090 119,628Public & publicly guaranteed commitments 3,012 7,606 30,534 18,524 10,034 12,627 9,038 7,008
External debt flowsDisbursements 4,087 20,207 44,054 45,328 26,834 27,398 52,614 59,831 Long-term external debt 4,087 20,207 44,054 27,653 26,834 27,398 52,614 59,831 IMF purchases 0 0 0 17,674 0 0 0 0Principal repayments 5,896 11,051 47,733 41,949 38,782 49,371 47,362 40,341 Long-term external debt 5,131 11,002 41,040 29,502 34,425 25,561 47,362 40,341 IMF repurchases 765 49 6,693 12,447 4,357 23,810 0 0Net flows -1,710 8,797 -1,848 4,578 -11,275 -23,247 1,582 38,412 Long-term external debt -1,044 9,205 3,014 -1,848 -7,591 1,837 5,252 19,489 IMF flows -765 -49 -6,693 5,227 -4,357 -23,810 0 0 Short-term external debt 99 -359 1,831 1,199 673 -1,274 -3,670 18,923Interest payments 2,260 10,522 17,111 16,327 14,707 13,271 14,783 14,978 Long-term external debt 2,029 8,719 15,280 13,890 11,549 10,292 13,148 13,016 IMF charges 231 10 336 757 1,208 1,079 109 0 Short-term external debt 0 1,792 1,494 1,680 1,950 1,900 1,526 1,962
2. Other non-debt resource flowsForeign direct investment (net) 989 4,859 32,779 10,144 18,166 15,066 18,782 34,585Portfolio equity flows 103 2,775 3,076 2,973 2,081 6,451 7,716 26,217Profit remittances on FDI 1,892 2,814 4,238 5,984 6,860 11,035 13,884 19,692Grants (excluding technical coop.) 41 65 54 82 91 113 94 155of which: Debt forgiveness grants .. .. 0 0 0 0 0 0 IDA grants .. .. .. 0 0 0 0 0Memo: technical coop. grants 145 239 187 219 200 194 207 251
3. Currency composition of public and publicly guaranteed debt (%)Euro .. .. .. 11.7 12.9 9.5 10.4 9.8Japanese yen 7.4 8.7 7.4 6.7 6.9 6.1 5.4 4.6Pound sterling 1.8 1.8 1.0 0.5 0.4 0.3 0.3 0.0Swiss franc 1.0 0.3 0.3 0.2 0.1 0.1 0.0 0.0U.S.dollars 60.5 68.3 70.4 75.3 74.2 79.3 79.0 80.8
4. Average terms of new commitmentsOfficial creditors Interest (%) 7.4 5.9 5.7 2.3 3.0 4.5 5.0 4.9 Maturity (years) 15.2 19.9 8.6 11.7 16.9 18.5 17.3 15.1 Grace period (years) 4.1 4.9 1.2 4.3 3.8 4.3 4.4 3.9Private creditors Interest (%) 9.0 7.7 9.9 7.9 7.2 8.7 7.5 9.1 Maturity (years) 8.0 3.3 15.4 9.9 12.8 14.5 15.2 17.6 Grace period (years) 3.2 2.1 14.2 8.3 11.5 14.0 15.1 17.5
5. Major economic aggregatesGross national income (GNI) 449,672 757,886 626,768 534,438 644,646 845,618 1,042,616 1,272,274Exports of goods, services & income 36,854 58,989 69,317 88,888 114,716 140,030 166,598 198,845Worker remit. & comp. of employees 573 3,315 1,649 2,822 3,575 3,540 4,253 4,382Imports of goods & services 40,949 77,855 93,950 85,559 103,788 127,123 154,393 198,605International reserves 9,200 51,477 33,015 49,297 52,935 53,799 85,843 180,334Current account balance -3,823 -18,136 -24,225 4,177 11,738 13,985 13,621 1,460
6. RatiosExternal debt stocks to exports (%) 324.9 272.0 348.5 264.2 191.3 133.9 116.2 119.4External debt stocks to GNI (%) 26.6 21.2 38.5 43.9 34.0 22.2 18.6 18.7Debt service to exports (%) 22.1 36.6 93.5 65.6 46.6 44.7 37.3 27.8Short-term to external debt stocks (%) 19.8 19.5 12.8 10.5 11.5 12.8 10.5 16.5Multilateral to external debt stocks (%) 9.5 5.8 7.6 8.7 8.9 10.3 11.2 9.7Reserves to external debt stocks (%) 7.7 32.1 13.7 21.0 24.1 28.7 44.4 75.9Reserves to imports (months) 2.7 7.9 4.2 6.9 6.1 5.1 6.7 10.9
52
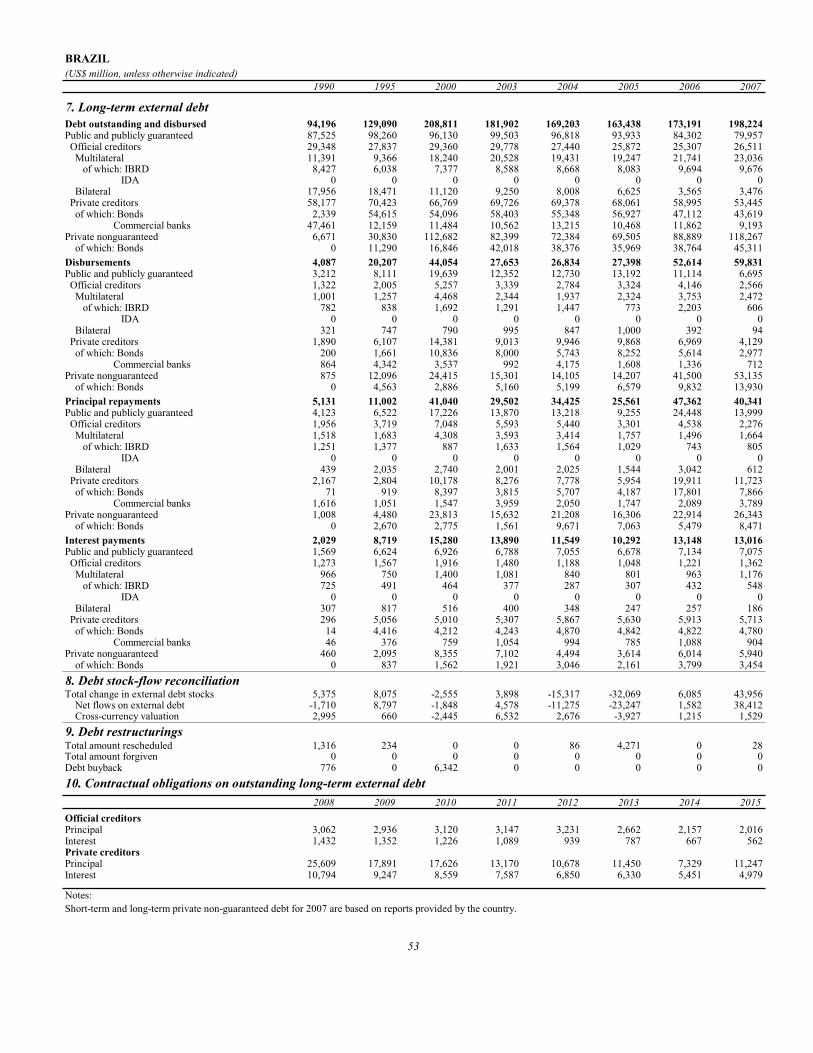
BRAZIL(US$ million, unless otherwise indicated)
1990 1995 2000 2003 2004 2005 2006 2007
7. Long-term external debtDebt outstanding and disbursed 94,196 129,090 208,811 181,902 169,203 163,438 173,191 198,224Public and publicly guaranteed 87,525 98,260 96,130 99,503 96,818 93,933 84,302 79,957 Official creditors 29,348 27,837 29,360 29,778 27,440 25,872 25,307 26,511 Multilateral 11,391 9,366 18,240 20,528 19,431 19,247 21,741 23,036 of which: IBRD 8,427 6,038 7,377 8,588 8,668 8,083 9,694 9,676 IDA 0 0 0 0 0 0 0 0 Bilateral 17,956 18,471 11,120 9,250 8,008 6,625 3,565 3,476 Private creditors 58,177 70,423 66,769 69,726 69,378 68,061 58,995 53,445 of which: Bonds 2,339 54,615 54,096 58,403 55,348 56,927 47,112 43,619 Commercial banks 47,461 12,159 11,484 10,562 13,215 10,468 11,862 9,193Private nonguaranteed 6,671 30,830 112,682 82,399 72,384 69,505 88,889 118,267 of which: Bonds 0 11,290 16,846 42,018 38,376 35,969 38,764 45,311Disbursements 4,087 20,207 44,054 27,653 26,834 27,398 52,614 59,831Public and publicly guaranteed 3,212 8,111 19,639 12,352 12,730 13,192 11,114 6,695 Official creditors 1,322 2,005 5,257 3,339 2,784 3,324 4,146 2,566 Multilateral 1,001 1,257 4,468 2,344 1,937 2,324 3,753 2,472 of which: IBRD 782 838 1,692 1,291 1,447 773 2,203 606 IDA 0 0 0 0 0 0 0 0 Bilateral 321 747 790 995 847 1,000 392 94 Private creditors 1,890 6,107 14,381 9,013 9,946 9,868 6,969 4,129 of which: Bonds 200 1,661 10,836 8,000 5,743 8,252 5,614 2,977 Commercial banks 864 4,342 3,537 992 4,175 1,608 1,336 712Private nonguaranteed 875 12,096 24,415 15,301 14,105 14,207 41,500 53,135 of which: Bonds 0 4,563 2,886 5,160 5,199 6,579 9,832 13,930Principal repayments 5,131 11,002 41,040 29,502 34,425 25,561 47,362 40,341Public and publicly guaranteed 4,123 6,522 17,226 13,870 13,218 9,255 24,448 13,999 Official creditors 1,956 3,719 7,048 5,593 5,440 3,301 4,538 2,276 Multilateral 1,518 1,683 4,308 3,593 3,414 1,757 1,496 1,664 of which: IBRD 1,251 1,377 887 1,633 1,564 1,029 743 805 IDA 0 0 0 0 0 0 0 0 Bilateral 439 2,035 2,740 2,001 2,025 1,544 3,042 612 Private creditors 2,167 2,804 10,178 8,276 7,778 5,954 19,911 11,723 of which: Bonds 71 919 8,397 3,815 5,707 4,187 17,801 7,866 Commercial banks 1,616 1,051 1,547 3,959 2,050 1,747 2,089 3,789Private nonguaranteed 1,008 4,480 23,813 15,632 21,208 16,306 22,914 26,343 of which: Bonds 0 2,670 2,775 1,561 9,671 7,063 5,479 8,471Interest payments 2,029 8,719 15,280 13,890 11,549 10,292 13,148 13,016Public and publicly guaranteed 1,569 6,624 6,926 6,788 7,055 6,678 7,134 7,075 Official creditors 1,273 1,567 1,916 1,480 1,188 1,048 1,221 1,362 Multilateral 966 750 1,400 1,081 840 801 963 1,176 of which: IBRD 725 491 464 377 287 307 432 548 IDA 0 0 0 0 0 0 0 0 Bilateral 307 817 516 400 348 247 257 186 Private creditors 296 5,056 5,010 5,307 5,867 5,630 5,913 5,713 of which: Bonds 14 4,416 4,212 4,243 4,870 4,842 4,822 4,780 Commercial banks 46 376 759 1,054 994 785 1,088 904Private nonguaranteed 460 2,095 8,355 7,102 4,494 3,614 6,014 5,940 of which: Bonds 0 837 1,562 1,921 3,046 2,161 3,799 3,4548. Debt stock-flow reconciliationTotal change in external debt stocks 5,375 8,075 -2,555 3,898 -15,317 -32,069 6,085 43,956 Net flows on external debt -1,710 8,797 -1,848 4,578 -11,275 -23,247 1,582 38,412 Cross-currency valuation 2,995 660 -2,445 6,532 2,676 -3,927 1,215 1,5299. Debt restructuringsTotal amount rescheduled 1,316 234 0 0 86 4,271 0 28Total amount forgiven 0 0 0 0 0 0 0 0Debt buyback 776 0 6,342 0 0 0 0 010. Contractual obligations on outstanding long-term external debt
2008 2009 2010 2011 2012 2013 2014 2015Official creditorsPrincipal 3,062 2,936 3,120 3,147 3,231 2,662 2,157 2,016Interest 1,432 1,352 1,226 1,089 939 787 667 562Private creditorsPrincipal 25,609 17,891 17,626 13,170 10,678 11,450 7,329 11,247Interest 10,794 9,247 8,559 7,587 6,850 6,330 5,451 4,979
Notes:Short-term and long-term private non-guaranteed debt for 2007 are based on reports provided by the country.
53

BULGARIA(US$ million, unless otherwise indicated)
1990 1995 2000 2003 2004 2005 2006 2007
1. Summary external debt dataExternal debt stocks 10,890 10,379 11,212 13,352 15,641 15,700 20,990 32,968 Long-term external debt 9,834 9,150 8,440 9,502 11,221 10,597 12,609 18,931 Public and publicly guaranteed 9,834 8,808 7,671 7,676 7,414 5,075 5,066 5,243 Private nonguaranteed 0 342 769 1,826 3,807 5,522 7,543 13,689 Use of IMF credit 0 717 1,322 1,188 1,183 660 341 0 Short-term external debt 1,056 512 1,450 2,663 3,237 4,442 8,040 14,036 interest arrears on long-term 226 74 0 0 0 0 0 0Memorandum itemsPrincipal arrears on long-term 356 227 1 0 0 0 0 0Long-term public sector debt 9,834 8,808 7,671 7,676 7,414 5,075 5,066 5,200Long-term private sector debt 0 342 769 1,826 3,807 5,522 7,543 13,732Public & publicly guaranteed commitments 563 678 700 385 533 266 102 345
External debt flowsDisbursements 875 259 995 1,042 3,054 3,710 3,616 7,741 Long-term external debt 875 259 719 896 2,977 3,710 3,616 7,741 IMF purchases 0 0 276 145 77 0 0 0Principal repayments 865 565 712 634 1,806 3,352 1,992 3,033 Long-term external debt 865 319 573 527 1,674 2,909 1,645 2,686 IMF repurchases 0 246 139 107 132 443 346 347Net flows -14 -194 465 1,231 1,823 1,564 5,222 10,705 Long-term external debt 11 -61 145 369 1,303 801 1,970 5,055 IMF flows 0 -246 137 38 -55 -443 -346 -347 Short-term external debt -24 113 183 824 574 1,206 3,598 5,996Interest payments 510 575 584 484 543 613 744 1,205 Long-term external debt 452 501 456 395 424 445 489 644 IMF charges 0 50 63 20 31 37 24 9 Short-term external debt 58 24 65 69 89 130 230 552
2. Other non-debt resource flowsForeign direct investment (net) 4 90 1,002 2,097 2,662 4,312 7,507 8,974Portfolio equity flows 0 0 5 -23 22 449 95 101Profit remittances on FDI 0 0 107 551 755 912 1,684 1,863Grants (excluding technical coop.) 3 22 130 211 393 0 0 0of which: Debt forgiveness grants .. .. 0 0 0 0 0 0 IDA grants .. .. .. 0 0 0 0 0Memo: technical coop. grants 1 91 150 182 202 0 0 0
3. Currency composition of public and publicly guaranteed debt (%)Euro .. .. .. 30.2 39.5 48.4 50.7 52.4Japanese yen 6.6 9.0 5.5 3.8 3.5 5.1 6.5 7.4Pound sterling 0.3 0.2 0.1 0.0 0.0 0.0 0.0 0.0Swiss franc 7.7 1.1 0.3 0.0 0.0 0.0 0.0 0.0U.S.dollars 42.1 66.1 80.1 64.8 55.8 44.9 41.7 39.3
4. Average terms of new commitmentsOfficial creditors Interest (%) 9.3 5.9 6.2 3.1 2.8 2.8 3.7 4.5 Maturity (years) 7.2 17.3 15.5 15.9 15.3 16.2 15.9 17.0 Grace period (years) 3.0 5.4 4.4 5.0 4.8 4.7 2.5 5.5Private creditors Interest (%) 9.1 3.4 7.6 0.0 0.0 4.2 5.0 0.0 Maturity (years) 3.2 4.7 16.0 0.0 0.0 9.4 10.0 0.0 Grace period (years) 2.3 3.2 4.9 0.0 0.0 1.9 0.5 0.0
5. Major economic aggregatesGross national income (GNI) 19,083 12,681 12,281 20,311 24,953 27,271 30,998 39,124Exports of goods, services & income 7,070 6,926 7,321 12,022 15,936 18,136 22,418 27,412Worker remit. & comp. of employees 0 0 58 1,718 1,723 1,613 1,707 2,086Imports of goods & services 8,905 7,084 8,314 13,058 18,093 22,034 28,501 36,194International reserves .. 1,635 3,507 6,826 9,337 8,697 11,756 17,545Current account balance -1,710 -26 -703 -1,022 -1,671 -3,347 -5,659 -8,716
6. RatiosExternal debt stocks to exports (%) 154.0 149.9 153.2 111.1 98.1 86.6 93.6 120.3External debt stocks to GNI (%) 57.1 81.8 91.3 65.7 62.7 57.6 67.7 84.3Debt service to exports (%) 19.4 16.5 17.7 9.3 14.7 21.9 12.2 15.5Short-term to external debt stocks (%) 9.7 4.9 12.9 19.9 20.7 28.3 38.3 42.6Multilateral to external debt stocks (%) 2.0 11.9 13.8 16.9 16.8 15.7 11.4 8.2Reserves to external debt stocks (%) 0.0 15.8 31.3 51.1 59.7 55.4 56.0 53.2Reserves to imports (months) .. 2.8 5.1 6.3 6.2 4.7 4.9 5.8
54

BULGARIA(US$ million, unless otherwise indicated)
1990 1995 2000 2003 2004 2005 2006 2007
7. Long-term external debtDebt outstanding and disbursed 9,834 9,150 8,440 9,502 11,221 10,597 12,609 18,931Public and publicly guaranteed 9,834 8,808 7,671 7,676 7,414 5,075 5,066 5,243 Official creditors 1,669 2,950 2,603 2,937 3,286 3,045 3,012 3,363 Multilateral 222 1,230 1,542 2,261 2,634 2,457 2,392 2,688 of which: IBRD 0 444 824 1,266 1,498 1,453 1,331 1,604 IDA 0 0 0 0 0 0 0 0 Bilateral 1,447 1,720 1,061 676 652 587 620 675 Private creditors 8,165 5,857 5,068 4,739 4,127 2,030 2,054 1,880 of which: Bonds 327 5,412 4,982 4,586 3,945 1,920 1,937 1,792 Commercial banks 7,084 394 26 78 105 111 116 86Private nonguaranteed 0 342 769 1,826 3,807 5,522 7,543 13,689 of which: Bonds 0 0 0 58 315 526 736 855Disbursements 875 259 719 896 2,977 3,710 3,616 7,741Public and publicly guaranteed 875 259 405 342 435 402 260 369 Official creditors 80 129 381 317 400 383 243 362 Multilateral 44 38 156 292 373 328 150 307 of which: IBRD 0 15 71 185 204 200 38 201 IDA 0 0 0 0 0 0 0 0 Bilateral 36 91 225 26 27 55 93 55 Private creditors 795 129 24 25 35 19 17 7 of which: Bonds 65 33 0 0 0 0 0 0 Commercial banks 652 96 24 25 35 19 16 7Private nonguaranteed 0 0 313 554 2,542 3,308 3,355 7,372 of which: Bonds 0 0 0 52 253 249 215 0Principal repayments 865 319 573 527 1,674 2,909 1,645 2,686Public and publicly guaranteed 865 319 345 315 981 1,761 515 404 Official creditors 23 92 297 243 273 255 502 299 Multilateral 22 25 58 144 179 214 430 253 of which: IBRD 0 0 27 50 80 85 276 65 IDA 0 0 0 0 0 0 0 0 Bilateral 1 67 239 99 93 41 73 47 Private creditors 842 228 48 71 708 1,507 13 105 of which: Bonds 0 39 46 67 696 1,496 0 87 Commercial banks 241 182 1 1 9 11 13 18Private nonguaranteed 0 0 229 212 693 1,147 1,130 2,282 of which: Bonds 0 0 0 0 0 10 49 0Interest payments 452 501 456 395 424 445 489 644Public and publicly guaranteed 452 501 424 349 351 327 352 326 Official creditors 14 178 139 100 94 93 100 129 Multilateral 13 61 81 79 75 75 82 110 of which: IBRD 0 31 49 42 41 40 44 62 IDA 0 0 0 0 0 0 0 0 Bilateral 0 118 58 21 19 18 19 19 Private creditors 438 323 285 249 256 234 252 197 of which: Bonds 15 315 284 246 253 229 245 190 Commercial banks 337 7 0 2 4 5 7 7Private nonguaranteed 0 0 32 46 73 118 137 318 of which: Bonds 0 0 0 4 5 30 44 558. Debt stock-flow reconciliationTotal change in external debt stocks 753 550 192 1,873 2,289 59 5,290 11,978 Net flows on external debt -14 -194 465 1,231 1,823 1,564 5,222 10,705 Cross-currency valuation 617 107 -215 635 220 -488 280 2999. Debt restructuringsTotal amount rescheduled 0 84 0 0 0 0 0 0Total amount forgiven 0 0 10 5 0 72 14 20Debt buyback 0 0 0 0 0 0 0 010. Contractual obligations on outstanding long-term external debt
2008 2009 2010 2011 2012 2013 2014 2015Official creditorsPrincipal 495 396 257 246 257 283 284 271Interest 168 147 131 121 110 99 86 72Private creditorsPrincipal 2,536 3,719 1,884 1,425 1,243 1,977 662 1,590Interest 606 528 439 369 322 349 251 122
55

BURKINA FASO(US$ million, unless otherwise indicated)
1990 1995 2000 2003 2004 2005 2006 2007
1. Summary external debt dataExternal debt stocks 832 1,271 1,422 1,735 2,007 2,003 1,123 1,461 Long-term external debt 748 1,140 1,226 1,597 1,863 1,879 1,003 1,268 Public and publicly guaranteed 748 1,140 1,226 1,597 1,863 1,879 1,003 1,268 Private nonguaranteed 0 0 0 0 0 0 0 0 Use of IMF credit 0 75 112 125 115 104 35 37 Short-term external debt 84 56 84 14 29 21 85 155 interest arrears on long-term 21 12 5 0 0 0 0 0Memorandum itemsPrincipal arrears on long-term 64 37 42 34 33 36 39 40Long-term public sector debt 747 1,140 1,226 1,597 1,863 1,879 1,003 1,268Long-term private sector debt 1 0 0 0 0 0 0 0Public & publicly guaranteed commitments 90 37 53 271 180 235 298 389
External debt flowsDisbursements 77 139 99 127 256 219 301 234 Long-term external debt 77 112 91 122 250 204 282 233 IMF purchases 0 27 7 5 5 15 19 1Principal repayments 19 28 33 31 35 29 34 26 Long-term external debt 18 28 26 27 32 25 34 26 IMF repurchases 1 0 7 3 3 4 0 0Net flows 68 124 47 101 236 183 331 289 Long-term external debt 59 83 65 95 218 179 248 207 IMF flows 0 0 0 0 0 0 0 0 Short-term external debt 10 14 -19 5 15 -8 64 81Interest payments 16 20 14 16 17 17 17 17 Long-term external debt 10 18 12 15 16 16 16 12 IMF charges 0 0 1 1 1 0 0 0 Short-term external debt 6 2 1 0 1 1 2 5
2. Other non-debt resource flowsForeign direct investment (net) 0 10 23 29 14 34 34 600Portfolio equity flows 0 0 -3 0 0 0 0 0Profit remittances on FDI 6 0 3 0 0 0 0 0Grants (excluding technical coop.) 158 242 375 345 410 432 1,669 635of which: Debt forgiveness grants .. .. 31 49 56 41 1,217 17 IDA grants .. .. .. 53 1 22 36 90Memo: technical coop. grants 112 123 76 104 103 96 126 111
3. Currency composition of public and publicly guaranteed debt (%)Euro .. .. .. 3.3 2.6 1.9 6.6 7.0Japanese yen 0.0 0.0 0.0 0.0 0.0 0.0 0.0 0.0Pound sterling 0.5 0.3 0.1 0.0 0.0 0.0 0.0 0.0Swiss franc 0.0 0.0 0.0 0.0 0.0 0.0 0.0 0.0U.S.dollars 39.1 55.5 59.4 59.7 58.7 56.5 40.1 39.3
4. Average terms of new commitmentsOfficial creditors Interest (%) 2.5 0.8 1.4 0.8 0.8 0.9 0.8 1.3 Maturity (years) 27.6 39.9 37.1 43.5 36.2 35.9 40.8 32.6 Grace period (years) 8.7 10.4 7.8 9.9 8.6 8.8 10.0 8.5Private creditors Interest (%) 0.0 0.0 0.0 0.0 0.0 4.2 0.0 0.0 Maturity (years) 0.0 0.0 0.0 0.0 0.0 11.2 0.0 0.0 Grace period (years) 0.0 0.0 0.0 0.0 0.0 1.7 0.0 0.0
5. Major economic aggregatesGross national income (GNI) 3,094 2,369 2,606 4,269 5,102 5,411 5,756 6,720Exports of goods, services & income 506 .. 313 .. .. .. .. ..Worker remit. & comp. of employees 140 80 67 50 50 50 50 50Imports of goods & services 776 .. 691 .. .. .. .. ..International reserves 305 347 244 752 669 438 555 1,029Current account balance -77 .. -319 .. .. .. .. ..
6. RatiosExternal debt stocks to exports (%) 164.3 .. 454.3 .. .. .. .. ..External debt stocks to GNI (%) 26.9 53.6 54.6 40.6 39.3 37.0 19.5 21.7Debt service to exports (%) 6.8 .. 14.9 .. .. .. .. ..Short-term to external debt stocks (%) 10.1 4.4 5.9 0.8 1.4 1.1 7.6 10.6Multilateral to external debt stocks (%) 67.7 77.2 72.0 83.5 84.1 85.3 70.2 68.0Reserves to external debt stocks (%) 36.6 27.3 17.1 43.3 33.3 21.9 49.4 70.4Reserves to imports (months) 4.7 .. 4.2 .. .. .. .. ..
56

BURKINA FASO(US$ million, unless otherwise indicated)
1990 1995 2000 2003 2004 2005 2006 2007
7. Long-term external debtDebt outstanding and disbursed 748 1,140 1,226 1,597 1,863 1,879 1,003 1,268Public and publicly guaranteed 748 1,140 1,226 1,597 1,863 1,879 1,003 1,268 Official creditors 710 1,135 1,222 1,597 1,863 1,879 991 1,243 Multilateral 563 981 1,024 1,449 1,689 1,709 789 994 of which: IBRD 0 0 0 0 0 0 0 0 IDA 282 608 593 861 1,027 1,043 371 468 Bilateral 147 154 198 148 175 169 202 249 Private creditors 38 5 3 0 0 0 12 26 of which: Bonds 0 0 0 0 0 0 0 0 Commercial banks 1 0 0 0 0 0 0 0Private nonguaranteed 0 0 0 0 0 0 0 0 of which: Bonds 0 0 0 0 0 0 0 0Disbursements 77 112 91 122 250 204 282 233Public and publicly guaranteed 77 112 91 122 250 204 282 233 Official creditors 77 112 91 122 250 204 271 219 Multilateral 43 106 76 109 204 191 233 171 of which: IBRD 0 0 0 0 0 0 0 0 IDA 15 85 38 55 132 107 125 80 Bilateral 34 6 16 13 46 13 38 48 Private creditors 0 0 0 0 0 0 12 14 of which: Bonds 0 0 0 0 0 0 0 0 Commercial banks 0 0 0 0 0 0 0 0Private nonguaranteed 0 0 0 0 0 0 0 0 of which: Bonds 0 0 0 0 0 0 0 0Principal repayments 18 28 26 27 32 25 34 26Public and publicly guaranteed 18 28 26 27 32 25 34 26 Official creditors 18 28 26 27 32 25 34 24 Multilateral 13 24 20 19 24 17 25 11 of which: IBRD 0 0 0 0 0 0 0 0 IDA 1 4 1 3 4 5 7 0 Bilateral 4 4 6 8 8 8 9 12 Private creditors 0 0 0 0 0 0 0 3 of which: Bonds 0 0 0 0 0 0 0 0 Commercial banks 0 0 0 0 0 0 0 0Private nonguaranteed 0 0 0 0 0 0 0 0 of which: Bonds 0 0 0 0 0 0 0 0Interest payments 10 18 12 15 16 16 16 12Public and publicly guaranteed 10 18 12 15 16 16 16 12 Official creditors 10 18 12 15 16 16 15 12 Multilateral 7 11 9 12 13 14 13 9 of which: IBRD 0 0 0 0 0 0 0 0 IDA 2 4 4 5 7 8 5 4 Bilateral 3 6 2 3 3 2 3 3 Private creditors 0 0 0 0 0 0 0 0 of which: Bonds 0 0 0 0 0 0 0 0 Commercial banks 0 0 0 0 0 0 0 0Private nonguaranteed 0 0 0 0 0 0 0 0 of which: Bonds 0 0 0 0 0 0 0 08. Debt stock-flow reconciliationTotal change in external debt stocks 115 139 -161 189 272 -4 -880 349 Net flows on external debt 68 124 47 101 236 183 331 289 Cross-currency valuation 25 -20 -229 97 50 -125 -876 59. Debt restructuringsTotal amount rescheduled 0 0 17 0 119 0 0 0Total amount forgiven 5 15 4 17 17 29 7 1Debt buyback 0 0 92 0 0 0 0 010. Contractual obligations on outstanding long-term external debt
2008 2009 2010 2011 2012 2013 2014 2015Official creditorsPrincipal 42 45 46 49 54 61 64 67Interest 17 18 19 19 19 18 18 17Private creditorsPrincipal 3 3 3 3 3 3 3 3Interest 1 1 1 1 1 0 0 0
Notes:Burkina Faso was granted debt relief effective in 2006 under the Multilateral Debt Relief Initiative.
57

BURUNDI(US$ million, unless otherwise indicated)
1990 1995 2000 2003 2004 2005 2006 2007
1. Summary external debt dataExternal debt stocks 907 1,162 1,108 1,328 1,390 1,322 1,412 1,456 Long-term external debt 851 1,099 1,036 1,252 1,327 1,230 1,291 1,344 Public and publicly guaranteed 851 1,099 1,036 1,252 1,327 1,230 1,291 1,344 Private nonguaranteed 0 0 0 0 0 0 0 0 Use of IMF credit 43 48 7 29 41 58 83 98 Short-term external debt 13 15 65 48 23 34 38 14 interest arrears on long-term 0 2 20 48 20 33 37 13Memorandum itemsPrincipal arrears on long-term 0 3 82 114 67 72 74 50Long-term public sector debt 849 1,099 1,036 1,252 1,327 1,230 1,291 1,344Long-term private sector debt 2 0 0 0 0 0 0 0Public & publicly guaranteed commitments 126 39 50 0 97 39 45 14
External debt flowsDisbursements 96 45 41 73 86 63 72 45 Long-term external debt 96 45 41 60 47 42 51 34 IMF purchases 0 0 0 13 39 21 21 11Principal repayments 28 27 14 21 71 27 29 28 Long-term external debt 28 18 9 21 43 27 29 28 IMF repurchases 1 9 5 0 29 0 0 0Net flows 65 26 18 -8 17 34 43 17 Long-term external debt 68 27 32 39 4 15 22 6 IMF flows 0 0 0 13 -29 0 0 0 Short-term external debt -3 8 -9 -60 3 -2 0 0Interest payments 14 12 8 8 17 12 10 11 Long-term external debt 12 11 4 7 16 12 9 11 IMF charges 0 0 0 0 0 0 0 0 Short-term external debt 2 1 3 1 0 0 0 0
2. Other non-debt resource flowsForeign direct investment (net) 1 2 12 0 0 1 0 1Portfolio equity flows 0 0 0 0 0 0 0 0Profit remittances on FDI 3 3 0 5 6 2 3 5Grants (excluding technical coop.) 135 229 59 172 259 288 330 415of which: Debt forgiveness grants .. .. 4 3 7 14 4 24 IDA grants .. .. .. 1 14 23 68 61Memo: technical coop. grants 60 44 15 31 27 39 50 40
3. Currency composition of public and publicly guaranteed debt (%)Euro .. .. .. 9.8 12.0 11.1 11.4 11.9Japanese yen 2.0 2.9 2.8 2.5 1.5 1.4 0.7 0.7Pound sterling 0.0 0.0 0.0 0.0 0.0 0.0 0.0 0.0Swiss franc 0.0 0.0 0.0 0.0 0.0 0.0 0.0 0.0U.S.dollars 50.3 55.1 59.4 60.4 60.9 61.8 61.3 60.4
4. Average terms of new commitmentsOfficial creditors Interest (%) 0.9 0.8 1.7 0.0 0.8 0.8 0.0 0.3 Maturity (years) 40.4 38.0 31.3 0.0 40.3 47.8 38.3 36.9 Grace period (years) 10.3 9.9 8.2 0.0 10.5 10.2 1.8 9.9Private creditors Interest (%) 0.0 0.0 0.0 0.0 0.0 0.0 0.0 0.0 Maturity (years) 0.0 0.0 0.0 0.0 0.0 0.0 0.0 0.0 Grace period (years) 0.0 0.0 0.0 0.0 0.0 0.0 0.0 0.0
5. Major economic aggregatesGross national income (GNI) 1,117 988 723 577 646 776 870 942Exports of goods, services & income 98 140 55 46 65 95 98 93Worker remit. & comp. of employees 0 0 0 0 0 0 0 0Imports of goods & services 341 282 165 194 253 344 460 449International reserves 112 216 38 67 66 101 131 177Current account balance -69 10 -50 -24 -33 -10 -134 -116
6. RatiosExternal debt stocks to exports (%) 928.7 831.6 1,999.7 2,880.8 2,140.1 1,393.4 1,443.5 1,572.8External debt stocks to GNI (%) 81.2 117.6 153.2 230.1 215.1 170.3 162.3 154.6Debt service to exports (%) 43.4 27.6 39.4 63.5 135.3 41.5 39.9 42.6Short-term to external debt stocks (%) 1.5 1.3 5.9 3.6 1.6 2.6 2.7 0.9Multilateral to external debt stocks (%) 72.7 80.1 80.4 81.4 81.8 80.3 79.6 80.9Reserves to external debt stocks (%) 12.3 18.6 3.4 5.1 4.8 7.6 9.3 12.2Reserves to imports (months) 3.9 9.2 2.7 4.2 3.1 3.5 3.4 4.7
58

BURUNDI(US$ million, unless otherwise indicated)
1990 1995 2000 2003 2004 2005 2006 2007
7. Long-term external debtDebt outstanding and disbursed 851 1,099 1,036 1,252 1,327 1,230 1,291 1,344Public and publicly guaranteed 851 1,099 1,036 1,252 1,327 1,230 1,291 1,344 Official creditors 842 1,098 1,032 1,241 1,320 1,227 1,291 1,343 Multilateral 660 930 890 1,081 1,137 1,062 1,124 1,178 of which: IBRD 0 0 0 0 0 0 0 0 IDA 398 591 600 732 793 751 797 830 Bilateral 182 167 142 160 183 166 167 166 Private creditors 9 2 4 11 7 2 1 1 of which: Bonds 0 0 0 0 0 0 0 0 Commercial banks 1 0 0 0 0 0 0 0Private nonguaranteed 0 0 0 0 0 0 0 0 of which: Bonds 0 0 0 0 0 0 0 0Disbursements 96 45 41 60 47 42 51 34Public and publicly guaranteed 96 45 41 60 47 42 51 34 Official creditors 93 45 38 49 47 42 49 34 Multilateral 64 41 38 49 47 42 49 32 of which: IBRD 0 0 0 0 0 0 0 0 IDA 49 27 36 41 43 27 29 19 Bilateral 30 4 0 0 0 0 0 2 Private creditors 2 0 3 11 0 0 2 0 of which: Bonds 0 0 0 0 0 0 0 0 Commercial banks 0 0 0 0 0 0 0 0Private nonguaranteed 0 0 0 0 0 0 0 0 of which: Bonds 0 0 0 0 0 0 0 0Principal repayments 28 18 9 21 43 27 29 28Public and publicly guaranteed 28 18 9 21 43 27 29 28 Official creditors 19 17 9 18 38 23 25 28 Multilateral 11 12 9 17 38 22 25 27 of which: IBRD 0 0 0 0 0 0 0 0 IDA 1 3 9 14 14 9 16 18 Bilateral 8 5 0 0 0 0 0 1 Private creditors 8 1 0 4 5 5 4 0 of which: Bonds 0 0 0 0 0 0 0 0 Commercial banks 5 0 0 0 0 0 0 0Private nonguaranteed 0 0 0 0 0 0 0 0 of which: Bonds 0 0 0 0 0 0 0 0Interest payments 12 11 4 7 16 12 9 11Public and publicly guaranteed 12 11 4 7 16 12 9 11 Official creditors 11 11 4 7 16 12 9 11 Multilateral 9 9 4 7 15 12 9 9 of which: IBRD 0 0 0 0 0 0 0 0 IDA 3 5 4 5 6 4 6 6 Bilateral 2 2 0 0 1 0 1 2 Private creditors 1 0 0 0 0 0 0 0 of which: Bonds 0 0 0 0 0 0 0 0 Commercial banks 1 0 0 0 0 0 0 0Private nonguaranteed 0 0 0 0 0 0 0 0 of which: Bonds 0 0 0 0 0 0 0 08. Debt stock-flow reconciliationTotal change in external debt stocks 18 35 -27 114 62 -69 90 44 Net flows on external debt 65 26 18 -8 17 34 43 17 Cross-currency valuation 26 -30 -38 77 45 -93 39 549. Debt restructuringsTotal amount rescheduled 0 0 0 0 54 0 4 3Total amount forgiven 105 16 0 0 1 9 8 19Debt buyback 0 0 0 0 0 0 0 010. Contractual obligations on outstanding long-term external debt
2008 2009 2010 2011 2012 2013 2014 2015Official creditorsPrincipal 47 44 43 44 45 47 46 49Interest 10 10 9 9 9 8 8 8Private creditorsPrincipal 0 0 0 0 0 0 0 0Interest 0 0 0 0 0 0 0 0
59

CAMBODIA(US$ million, unless otherwise indicated)
1990 1995 2000 2003 2004 2005 2006 2007
1. Summary external debt dataExternal debt stocks 1,845 2,284 2,628 3,193 3,439 3,515 3,527 3,761 Long-term external debt 1,683 2,110 2,328 2,868 3,080 3,155 3,318 3,537 Public and publicly guaranteed 1,683 2,110 2,328 2,868 3,080 3,155 3,318 3,537 Private nonguaranteed 0 0 0 0 0 0 0 0 Use of IMF credit 27 72 73 104 97 81 0 0 Short-term external debt 136 102 227 221 262 279 209 224 interest arrears on long-term 103 90 131 207 228 243 173 164Memorandum itemsPrincipal arrears on long-term 393 653 1,275 1,401 1,444 1,485 1,508 1,545Long-term public sector debt 1,683 2,110 2,328 2,868 3,080 3,155 3,318 3,537Long-term private sector debt 0 0 0 0 0 0 0 0Public & publicly guaranteed commitments 0 161 185 283 218 208 149 390
External debt flowsDisbursements 0 123 90 183 168 168 153 154 Long-term external debt 0 80 79 172 168 168 153 154 IMF purchases 0 42 11 12 0 0 0 0Principal repayments 0 5 14 16 15 16 15 13 Long-term external debt 0 5 7 3 5 8 15 13 IMF repurchases 0 0 7 13 10 9 0 0Net flows 15 100 128 156 172 154 138 159 Long-term external debt 0 75 72 168 163 160 138 141 IMF flows 0 0 -1 -1 0 0 0 0 Short-term external debt 15 -18 52 -10 20 2 0 18Interest payments 30 3 18 9 12 15 15 17 Long-term external debt 29 1 12 8 11 12 13 15 IMF charges 0 1 1 1 0 0 0 0 Short-term external debt 1 1 5 0 1 2 2 2
2. Other non-debt resource flowsForeign direct investment (net) 0 151 149 84 131 381 483 867Portfolio equity flows 0 0 0 0 0 0 0 0Profit remittances on FDI 0 -4 123 160 205 227 270 353Grants (excluding technical coop.) 23 312 201 195 182 232 332 414of which: Debt forgiveness grants .. .. 0 0 0 0 84 1 IDA grants .. .. .. 1 1 2 6 23Memo: technical coop. grants 19 143 100 162 155 182 181 131
3. Currency composition of public and publicly guaranteed debt (%)Euro .. .. .. 0.9 0.9 0.8 0.8 0.9Japanese yen 0.6 0.4 0.3 1.0 1.2 1.1 1.2 1.5Pound sterling 0.0 0.0 0.0 0.0 0.0 0.0 0.0 0.0Swiss franc 0.0 0.0 0.0 0.0 0.0 0.0 0.0 0.0U.S.dollars 12.6 27.2 30.2 37.2 39.2 39.4 39.0 39.0
4. Average terms of new commitmentsOfficial creditors Interest (%) 0.0 1.8 1.3 1.1 0.9 1.4 1.0 1.5 Maturity (years) 0.0 37.5 30.3 32.7 30.3 26.9 26.2 23.6 Grace period (years) 0.0 9.7 8.2 9.2 8.9 9.2 9.8 7.7Private creditors Interest (%) 0.0 0.0 0.0 0.0 0.0 0.0 0.0 0.0 Maturity (years) 0.0 0.0 0.0 0.0 0.0 0.0 0.0 0.0 Grace period (years) 0.0 0.0 0.0 0.0 0.0 0.0 0.0 0.0
5. Major economic aggregatesGross national income (GNI) .. 3,182 3,623 4,543 5,289 6,200 7,003 7,990Exports of goods, services & income .. 989 1,993 2,803 3,586 4,256 5,260 5,932Worker remit. & comp. of employees 0 12 121 138 177 200 297 353Imports of goods & services .. 1,442 2,453 3,325 4,053 4,897 5,922 6,799International reserves .. 192 611 982 1,118 1,158 1,411 2,140Current account balance .. -186 -136 -233 -183 -360 -339 -506
6. RatiosExternal debt stocks to exports (%) .. 230.9 131.9 113.9 95.9 82.6 67.0 63.4External debt stocks to GNI (%) .. 71.8 72.5 70.3 65.0 56.7 50.4 47.1Debt service to exports (%) .. 0.7 1.6 0.9 0.8 0.7 0.6 0.5Short-term to external debt stocks (%) 7.3 4.5 8.6 6.9 7.6 7.9 5.9 6.0Multilateral to external debt stocks (%) 0.1 5.2 14.5 26.8 29.5 30.1 33.1 34.5Reserves to external debt stocks (%) 0.0 8.4 23.3 30.8 32.5 32.9 40.0 56.9Reserves to imports (months) .. 1.6 3.0 3.5 3.3 2.8 2.9 3.8
60

CAMBODIA(US$ million, unless otherwise indicated)
1990 1995 2000 2003 2004 2005 2006 2007
7. Long-term external debtDebt outstanding and disbursed 1,683 2,110 2,328 2,868 3,080 3,155 3,318 3,537Public and publicly guaranteed 1,683 2,110 2,328 2,868 3,080 3,155 3,318 3,537 Official creditors 1,683 2,097 2,328 2,868 3,080 3,155 3,318 3,537 Multilateral 1 118 381 855 1,013 1,059 1,168 1,298 of which: IBRD 0 0 0 0 0 0 0 0 IDA 0 65 207 400 467 462 500 535 Bilateral 1,681 1,979 1,947 2,013 2,066 2,096 2,150 2,239 Private creditors 0 13 0 0 0 0 0 0 of which: Bonds 0 0 0 0 0 0 0 0 Commercial banks 0 0 0 0 0 0 0 0Private nonguaranteed 0 0 0 0 0 0 0 0 of which: Bonds 0 0 0 0 0 0 0 0Disbursements 0 80 79 172 168 168 153 154Public and publicly guaranteed 0 80 79 172 168 168 153 154 Official creditors 0 64 79 172 168 168 153 154 Multilateral 0 61 78 142 119 130 79 78 of which: IBRD 0 0 0 0 0 0 0 0 IDA 0 25 37 63 48 36 19 18 Bilateral 0 4 1 29 49 38 74 76 Private creditors 0 16 0 0 0 0 0 0 of which: Bonds 0 0 0 0 0 0 0 0 Commercial banks 0 0 0 0 0 0 0 0Private nonguaranteed 0 0 0 0 0 0 0 0 of which: Bonds 0 0 0 0 0 0 0 0Principal repayments 0 5 7 3 5 8 15 13Public and publicly guaranteed 0 5 7 3 5 8 15 13 Official creditors 0 2 7 3 5 8 15 13 Multilateral 0 0 0 2 3 5 9 11 of which: IBRD 0 0 0 0 0 0 0 0 IDA 0 0 0 0 1 2 4 5 Bilateral 0 2 7 2 2 2 6 2 Private creditors 0 3 0 0 0 0 0 0 of which: Bonds 0 0 0 0 0 0 0 0 Commercial banks 0 0 0 0 0 0 0 0Private nonguaranteed 0 0 0 0 0 0 0 0 of which: Bonds 0 0 0 0 0 0 0 0Interest payments 29 1 12 8 11 12 13 15Public and publicly guaranteed 29 1 12 8 11 12 13 15 Official creditors 29 1 12 8 11 12 13 15 Multilateral 0 1 3 6 9 10 10 11 of which: IBRD 0 0 0 0 0 0 0 0 IDA 0 0 1 2 4 4 4 4 Bilateral 29 0 9 2 2 3 3 4 Private creditors 0 0 0 0 0 0 0 0 of which: Bonds 0 0 0 0 0 0 0 0 Commercial banks 0 0 0 0 0 0 0 0Private nonguaranteed 0 0 0 0 0 0 0 0 of which: Bonds 0 0 0 0 0 0 0 08. Debt stock-flow reconciliationTotal change in external debt stocks 0 375 111 293 246 76 11 228 Net flows on external debt 15 100 128 156 172 154 138 159 Cross-currency valuation 0 0 -28 81 49 -111 52 729. Debt restructuringsTotal amount rescheduled 0 224 0 0 0 0 0 1Total amount forgiven 0 5 0 0 0 0 22 0Debt buyback 0 0 0 0 0 0 0 010. Contractual obligations on outstanding long-term external debt
2008 2009 2010 2011 2012 2013 2014 2015Official creditorsPrincipal 59 61 62 71 75 88 114 114Interest 29 31 33 34 34 33 33 31Private creditorsPrincipal 0 0 0 0 0 0 0 0Interest 0 0 0 0 0 0 0 0
Notes:Cambodia was granted debt relief effective in 2006 under the Multilateral Debt Relief Initiative.
61

CAMEROON(US$ million, unless otherwise indicated)
1990 1995 2000 2003 2004 2005 2006 2007
1. Summary external debt dataExternal debt stocks 6,421 10,807 10,230 10,876 10,368 7,357 3,364 3,162 Long-term external debt 5,364 9,765 8,771 10,168 9,423 6,678 2,760 2,840 Public and publicly guaranteed 5,134 9,477 8,454 9,553 8,791 6,085 2,270 2,204 Private nonguaranteed 230 288 317 615 632 592 489 636 Use of IMF credit 121 51 235 347 333 272 8 17 Short-term external debt 936 991 1,224 361 611 407 596 305 interest arrears on long-term 168 349 205 77 218 353 528 106Memorandum itemsPrincipal arrears on long-term 309 474 322 59 103 76 119 32Long-term public sector debt 5,011 9,400 8,407 9,553 8,791 6,085 2,270 2,204Long-term private sector debt 353 365 364 615 632 592 489 636Public & publicly guaranteed commitments 479 197 100 92 215 47 161 535
External debt flowsDisbursements 699 174 354 180 274 231 164 304 Long-term external debt 699 161 286 158 274 227 160 296 IMF purchases 0 13 69 22 0 4 4 8Principal repayments 267 216 269 253 363 577 379 368 Long-term external debt 266 210 251 242 340 538 358 368 IMF repurchases 1 6 17 11 23 39 21 0Net flows 669 118 -19 -381 19 -684 -201 -4 Long-term external debt 433 -49 35 -84 -66 -311 -198 -72 IMF flows 0 7 -17 0 0 0 0 0 Short-term external debt 237 160 -105 -308 109 -339 14 60Interest payments 246 214 288 187 246 245 140 142 Long-term external debt 192 173 214 173 232 231 136 137 IMF charges 11 2 2 2 2 1 0 0 Short-term external debt 42 38 72 13 12 12 4 4
2. Other non-debt resource flowsForeign direct investment (net) -113 7 159 220 86 244 16 433Portfolio equity flows 0 0 0 0 -8 -4 -6 -13Profit remittances on FDI 138 21 41 124 183 289 10 260Grants (excluding technical coop.) 313 205 172 795 607 341 3,014 1,790of which: Debt forgiveness grants .. .. 278 682 428 208 2,722 1,365 IDA grants .. .. .. 16 0 0 29 12Memo: technical coop. grants 126 124 93 138 151 149 178 196
3. Currency composition of public and publicly guaranteed debt (%)Euro .. .. .. 65.7 71.7 66.2 78.0 72.9Japanese yen 0.3 0.3 0.5 1.0 1.1 1.3 0.0 0.0Pound sterling 2.4 1.3 2.0 1.6 1.7 1.7 0.0 0.0Swiss franc 1.2 1.1 0.7 0.8 0.8 0.6 0.4 0.3U.S.dollars 11.5 9.8 24.7 24.0 17.0 20.8 10.4 12.2
4. Average terms of new commitmentsOfficial creditors Interest (%) 6.6 2.6 0.9 1.3 1.5 0.4 2.3 1.4 Maturity (years) 15.3 23.3 38.6 24.5 33.5 30.7 21.8 33.2 Grace period (years) 5.3 7.7 9.5 7.2 7.9 9.2 2.4 7.4Private creditors Interest (%) 7.0 0.0 0.0 0.0 0.0 0.0 0.0 0.0 Maturity (years) 13.2 0.0 0.0 0.0 0.0 0.0 0.0 0.0 Grace period (years) 2.7 0.0 0.0 0.0 0.0 0.0 0.0 0.0
5. Major economic aggregatesGross national income (GNI) 10,674 8,205 9,464 13,097 15,374 16,126 17,706 20,607Exports of goods, services & income 2,535 2,062 2,614 3,297 4,040 4,064 4,685 5,164Worker remit. & comp. of employees 23 11 11 76 103 77 130 167Imports of goods & services 3,041 2,032 2,960 3,986 4,725 5,010 5,031 5,974International reserves 37 15 220 652 842 965 1,735 2,932Current account balance -551 90 -249 -628 -626 -777 -151 -547
6. RatiosExternal debt stocks to exports (%) 253.3 524.2 391.3 329.9 256.6 181.0 71.8 61.2External debt stocks to GNI (%) 60.2 131.7 108.1 83.0 67.4 45.6 19.0 15.3Debt service to exports (%) 20.2 20.8 21.3 13.4 15.1 20.2 11.1 9.9Short-term to external debt stocks (%) 14.6 9.2 12.0 3.3 5.9 5.5 17.7 9.6Multilateral to external debt stocks (%) 20.2 15.4 13.8 14.4 16.7 21.4 14.8 18.6Reserves to external debt stocks (%) 0.6 0.1 2.2 6.0 8.1 13.1 51.6 92.7Reserves to imports (months) 0.1 0.1 0.9 2.0 2.1 2.3 4.1 5.9
62

CAMEROON(US$ million, unless otherwise indicated)
1990 1995 2000 2003 2004 2005 2006 2007
7. Long-term external debtDebt outstanding and disbursed 5,364 9,765 8,771 10,168 9,423 6,678 2,760 2,840Public and publicly guaranteed 5,134 9,477 8,454 9,553 8,791 6,085 2,270 2,204 Official creditors 3,782 8,714 8,219 9,466 8,680 5,977 2,179 2,172 Multilateral 1,299 1,664 1,410 1,570 1,732 1,578 498 587 of which: IBRD 633 624 214 145 117 84 46 40 IDA 238 443 769 944 1,083 1,032 170 198 Bilateral 2,483 7,050 6,809 7,896 6,948 4,399 1,681 1,585 Private creditors 1,351 763 235 86 111 108 91 33 of which: Bonds 0 0 0 0 0 0 0 0 Commercial banks 382 290 166 47 44 41 46 3Private nonguaranteed 230 288 317 615 632 592 489 636 of which: Bonds 0 0 0 0 0 0 0 0Disbursements 699 161 286 158 274 227 160 296Public and publicly guaranteed 646 161 247 146 200 130 121 214 Official creditors 542 161 247 146 200 130 120 214 Multilateral 195 81 115 106 177 68 86 117 of which: IBRD 70 6 0 35 5 0 0 0 IDA 0 35 55 36 107 31 29 20 Bilateral 347 80 133 40 23 62 34 97 Private creditors 105 0 0 0 0 0 1 0 of which: Bonds 0 0 0 0 0 0 0 0 Commercial banks 10 0 0 0 0 0 1 0Private nonguaranteed 53 0 39 12 74 98 39 82 of which: Bonds 0 0 0 0 0 0 0 0Principal repayments 266 210 251 242 340 538 358 368Public and publicly guaranteed 136 182 165 182 291 397 197 185 Official creditors 95 145 161 169 291 397 197 166 Multilateral 66 129 95 76 87 92 88 37 of which: IBRD 40 90 52 35 34 32 39 5 IDA 3 4 7 7 10 12 8 0 Bilateral 28 16 66 94 204 304 108 129 Private creditors 41 36 4 13 0 0 0 19 of which: Bonds 0 0 0 0 0 0 0 0 Commercial banks 28 25 4 11 0 0 0 16Private nonguaranteed 130 28 86 60 49 141 161 183 of which: Bonds 0 0 0 0 0 0 0 0Interest payments 192 173 214 173 232 231 136 137Public and publicly guaranteed 176 162 198 126 184 181 79 95 Official creditors 121 152 197 126 184 180 79 72 Multilateral 71 80 48 31 33 27 20 18 of which: IBRD 48 55 22 10 7 5 4 2 IDA 2 3 5 6 9 8 5 2 Bilateral 49 72 149 95 151 153 59 54 Private creditors 55 10 1 0 0 1 0 23 of which: Bonds 0 0 0 0 0 0 0 0 Commercial banks 39 5 1 0 0 0 0 23Private nonguaranteed 17 11 17 47 48 51 57 42 of which: Bonds 0 0 0 0 0 0 0 08. Debt stock-flow reconciliationTotal change in external debt stocks 1,180 1,679 -230 1,125 -508 -3,011 -3,993 -273 Net flows on external debt 669 118 -19 -381 19 -684 -201 -4 Cross-currency valuation 312 354 -493 1,272 582 -1,001 -630 2349. Debt restructuringsTotal amount rescheduled 75 1,070 206 85 54 68 20 1Total amount forgiven 10 0 4 300 249 164 2,866 144Debt buyback 0 0 0 0 0 0 0 010. Contractual obligations on outstanding long-term external debt
2008 2009 2010 2011 2012 2013 2014 2015Official creditorsPrincipal 196 218 180 179 146 143 141 140Interest 75 71 64 59 53 49 45 41Private creditorsPrincipal 134 101 93 81 73 62 37 32Interest 39 31 37 30 23 19 15 12
Notes:Cameroon was granted debt relief effective in 2006 under the Multilateral Debt Relief Initiative. Data on public and publicly guaranteed debt include World Bank staff estimates of the effects of the Paris Club debt restructuring agreements signed in 2006. Historical data on public and publicly guaranteed debt have been revised, based on reports provided by the country.
63

CAPE VERDE(US$ million, unless otherwise indicated)
1990 1995 2000 2003 2004 2005 2006 2007
1. Summary external debt dataExternal debt stocks 133.8 213.8 325.2 471.7 500.5 520.2 573.0 598.5 Long-term external debt 129.1 184.6 312.6 428.0 448.5 458.7 504.3 559.5 Public and publicly guaranteed 129.1 184.6 312.6 428.0 448.5 458.7 504.3 559.5 Private nonguaranteed 0.0 0.0 0.0 0.0 0.0 0.0 0.0 0.0 Use of IMF credit 0.0 0.0 0.0 7.3 9.6 12.3 13.0 13.5 Short-term external debt 4.7 29.2 12.6 36.4 42.4 49.1 55.7 25.6 interest arrears on long-term 2.3 4.6 3.9 1.8 1.0 0.9 0.7 1.3Memorandum itemsPrincipal arrears on long-term 11.1 19.6 32.2 7.7 2.6 3.2 2.4 2.4Long-term public sector debt 129.1 184.6 312.6 428.0 448.5 458.7 504.3 559.5Long-term private sector debt 0.0 0.0 0.0 0.0 0.0 0.0 0.0 0.0Public & publicly guaranteed commitments 35.9 11.5 15.0 27.0 37.5 88.8 28.5 209.9
External debt flowsDisbursements 12.1 21.4 28.8 37.7 28.7 77.1 48.0 51.1 Long-term external debt 12.1 21.4 28.8 34.3 26.8 73.4 48.0 51.1 IMF purchases 0.0 0.0 0.0 3.4 1.8 3.7 0.0 0.0Principal repayments 3.7 5.6 11.1 13.9 17.7 28.5 24.9 22.6 Long-term external debt 3.7 5.6 11.1 13.9 17.7 28.5 24.9 22.4 IMF repurchases 0.0 0.0 0.0 0.0 0.0 0.0 0.0 0.2Net flows 10.7 34.4 10.6 36.6 17.8 55.3 29.9 -2.3 Long-term external debt 8.3 15.8 17.7 20.4 9.2 44.9 23.1 28.6 IMF flows 0.0 0.0 0.0 0.0 0.0 0.0 0.0 0.0 Short-term external debt 2.4 18.7 -7.1 12.8 6.8 6.8 6.8 -30.7Interest payments 2.0 4.1 5.0 5.7 7.0 8.0 7.8 7.1 Long-term external debt 1.9 3.4 4.7 4.7 5.7 6.6 6.1 6.3 IMF charges 0.0 0.0 0.0 0.0 0.0 0.1 0.1 0.1 Short-term external debt 0.1 0.8 0.3 1.0 1.2 1.4 1.6 0.8
2. Other non-debt resource flowsForeign direct investment (net) 0.3 26.2 33.4 39.3 67.6 16.7 122.6 130.3Portfolio equity flows 0.0 0.0 0.0 0.0 0.0 0.0 0.3 5.4Profit remittances on FDI 0.0 0.5 5.1 2.8 3.8 10.3 29.5 21.4Grants (excluding technical coop.) 77.5 61.4 43.6 57.2 71.0 74.3 58.5 79.9of which: Debt forgiveness grants .. .. 0.1 0.1 0.4 0.1 0.1 0.1 IDA grants .. .. .. 0.0 0.0 0.0 0.0 0.0Memo: technical coop. grants 18.0 40.4 29.5 56.5 42.7 43.0 43.1 46.1
3. Currency composition of public and publicly guaranteed debt (%)Euro .. .. .. 13.3 12.7 13.4 15.0 16.2Japanese yen 0.0 0.0 0.0 0.0 0.0 0.0 0.0 0.0Pound sterling 0.0 0.0 0.0 0.0 0.0 0.0 0.0 0.0Swiss franc 0.0 0.0 0.0 0.0 0.0 0.0 0.0 0.0U.S.dollars 38.5 35.3 55.8 55.9 57.2 53.9 53.0 49.3
4. Average terms of new commitmentsOfficial creditors Interest (%) 1.5 0.8 0.8 1.3 2.6 3.5 2.8 1.3 Maturity (years) 42.6 39.8 45.9 26.8 27.8 32.5 38.2 25.7 Grace period (years) 9.1 10.3 9.3 6.3 6.2 8.4 8.7 8.2Private creditors Interest (%) 0.0 0.0 5.5 0.0 0.0 0.0 0.0 0.0 Maturity (years) 0.0 0.0 10.6 0.0 0.0 0.0 0.0 0.0 Grace period (years) 0.0 0.0 2.2 0.0 0.0 0.0 0.0 0.0
5. Major economic aggregatesGross national income (GNI) 340.5 485.3 520.0 781.0 907.0 972.3 1136.7 1385.2Exports of goods, services & income 119.3 191.4 236.6 379.8 427.0 521.2 673.6 787.9Worker remit. & comp. of employees 59.0 106.0 87.0 108.5 113.4 136.6 136.6 138.9Imports of goods & services 153.1 300.7 343.6 579.3 678.3 698.2 872.4 1091.0International reserves 77.0 36.9 28.3 93.6 139.5 174.0 254.5 281.2Current account balance -3.8 -61.6 -58.0 -90.6 -130.0 -34.6 -40.0 -132.6
6. RatiosExternal debt stocks to exports (%) 112.1 111.7 137.4 124.2 117.2 99.8 85.1 76.0External debt stocks to GNI (%) 39.3 44.1 62.5 60.4 55.2 53.5 50.4 43.2Debt service to exports (%) 4.8 5.1 6.8 5.2 5.8 7.0 4.8 3.8Short-term to external debt stocks (%) 3.5 13.7 3.9 7.7 8.5 9.4 9.7 4.3Multilateral to external debt stocks (%) 65.0 67.3 70.5 70.2 72.7 71.5 71.2 75.3Reserves to external debt stocks (%) 57.5 17.3 8.7 19.8 27.9 33.4 44.4 47.0Reserves to imports (months) 6.0 1.5 1.0 1.9 2.5 3.0 3.5 3.1
64
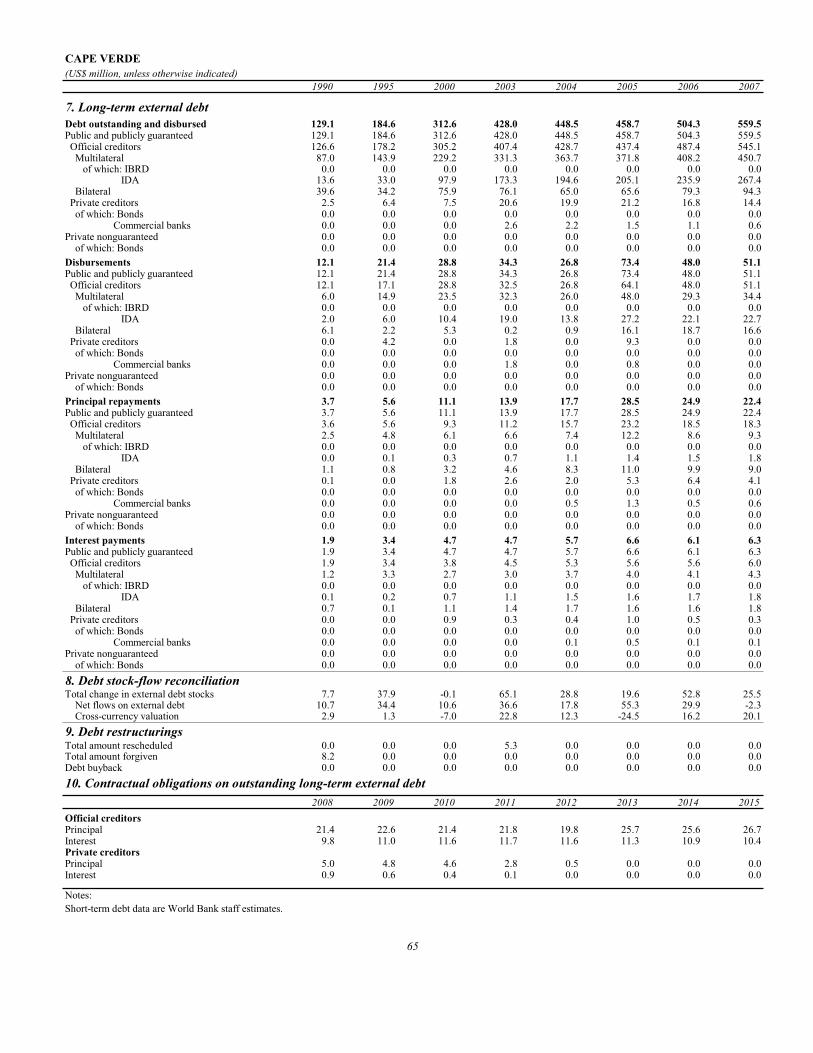
CAPE VERDE(US$ million, unless otherwise indicated)
1990 1995 2000 2003 2004 2005 2006 2007
7. Long-term external debtDebt outstanding and disbursed 129.1 184.6 312.6 428.0 448.5 458.7 504.3 559.5Public and publicly guaranteed 129.1 184.6 312.6 428.0 448.5 458.7 504.3 559.5 Official creditors 126.6 178.2 305.2 407.4 428.7 437.4 487.4 545.1 Multilateral 87.0 143.9 229.2 331.3 363.7 371.8 408.2 450.7 of which: IBRD 0.0 0.0 0.0 0.0 0.0 0.0 0.0 0.0 IDA 13.6 33.0 97.9 173.3 194.6 205.1 235.9 267.4 Bilateral 39.6 34.2 75.9 76.1 65.0 65.6 79.3 94.3 Private creditors 2.5 6.4 7.5 20.6 19.9 21.2 16.8 14.4 of which: Bonds 0.0 0.0 0.0 0.0 0.0 0.0 0.0 0.0 Commercial banks 0.0 0.0 0.0 2.6 2.2 1.5 1.1 0.6Private nonguaranteed 0.0 0.0 0.0 0.0 0.0 0.0 0.0 0.0 of which: Bonds 0.0 0.0 0.0 0.0 0.0 0.0 0.0 0.0Disbursements 12.1 21.4 28.8 34.3 26.8 73.4 48.0 51.1Public and publicly guaranteed 12.1 21.4 28.8 34.3 26.8 73.4 48.0 51.1 Official creditors 12.1 17.1 28.8 32.5 26.8 64.1 48.0 51.1 Multilateral 6.0 14.9 23.5 32.3 26.0 48.0 29.3 34.4 of which: IBRD 0.0 0.0 0.0 0.0 0.0 0.0 0.0 0.0 IDA 2.0 6.0 10.4 19.0 13.8 27.2 22.1 22.7 Bilateral 6.1 2.2 5.3 0.2 0.9 16.1 18.7 16.6 Private creditors 0.0 4.2 0.0 1.8 0.0 9.3 0.0 0.0 of which: Bonds 0.0 0.0 0.0 0.0 0.0 0.0 0.0 0.0 Commercial banks 0.0 0.0 0.0 1.8 0.0 0.8 0.0 0.0Private nonguaranteed 0.0 0.0 0.0 0.0 0.0 0.0 0.0 0.0 of which: Bonds 0.0 0.0 0.0 0.0 0.0 0.0 0.0 0.0Principal repayments 3.7 5.6 11.1 13.9 17.7 28.5 24.9 22.4Public and publicly guaranteed 3.7 5.6 11.1 13.9 17.7 28.5 24.9 22.4 Official creditors 3.6 5.6 9.3 11.2 15.7 23.2 18.5 18.3 Multilateral 2.5 4.8 6.1 6.6 7.4 12.2 8.6 9.3 of which: IBRD 0.0 0.0 0.0 0.0 0.0 0.0 0.0 0.0 IDA 0.0 0.1 0.3 0.7 1.1 1.4 1.5 1.8 Bilateral 1.1 0.8 3.2 4.6 8.3 11.0 9.9 9.0 Private creditors 0.1 0.0 1.8 2.6 2.0 5.3 6.4 4.1 of which: Bonds 0.0 0.0 0.0 0.0 0.0 0.0 0.0 0.0 Commercial banks 0.0 0.0 0.0 0.0 0.5 1.3 0.5 0.6Private nonguaranteed 0.0 0.0 0.0 0.0 0.0 0.0 0.0 0.0 of which: Bonds 0.0 0.0 0.0 0.0 0.0 0.0 0.0 0.0Interest payments 1.9 3.4 4.7 4.7 5.7 6.6 6.1 6.3Public and publicly guaranteed 1.9 3.4 4.7 4.7 5.7 6.6 6.1 6.3 Official creditors 1.9 3.4 3.8 4.5 5.3 5.6 5.6 6.0 Multilateral 1.2 3.3 2.7 3.0 3.7 4.0 4.1 4.3 of which: IBRD 0.0 0.0 0.0 0.0 0.0 0.0 0.0 0.0 IDA 0.1 0.2 0.7 1.1 1.5 1.6 1.7 1.8 Bilateral 0.7 0.1 1.1 1.4 1.7 1.6 1.6 1.8 Private creditors 0.0 0.0 0.9 0.3 0.4 1.0 0.5 0.3 of which: Bonds 0.0 0.0 0.0 0.0 0.0 0.0 0.0 0.0 Commercial banks 0.0 0.0 0.0 0.0 0.1 0.5 0.1 0.1Private nonguaranteed 0.0 0.0 0.0 0.0 0.0 0.0 0.0 0.0 of which: Bonds 0.0 0.0 0.0 0.0 0.0 0.0 0.0 0.08. Debt stock-flow reconciliationTotal change in external debt stocks 7.7 37.9 -0.1 65.1 28.8 19.6 52.8 25.5 Net flows on external debt 10.7 34.4 10.6 36.6 17.8 55.3 29.9 -2.3 Cross-currency valuation 2.9 1.3 -7.0 22.8 12.3 -24.5 16.2 20.19. Debt restructuringsTotal amount rescheduled 0.0 0.0 0.0 5.3 0.0 0.0 0.0 0.0Total amount forgiven 8.2 0.0 0.0 0.0 0.0 0.0 0.0 0.0Debt buyback 0.0 0.0 0.0 0.0 0.0 0.0 0.0 0.010. Contractual obligations on outstanding long-term external debt
2008 2009 2010 2011 2012 2013 2014 2015Official creditorsPrincipal 21.4 22.6 21.4 21.8 19.8 25.7 25.6 26.7Interest 9.8 11.0 11.6 11.7 11.6 11.3 10.9 10.4Private creditorsPrincipal 5.0 4.8 4.6 2.8 0.5 0.0 0.0 0.0Interest 0.9 0.6 0.4 0.1 0.0 0.0 0.0 0.0
Notes:Short-term debt data are World Bank staff estimates.
65

CENTRAL AFRICAN REPUBLIC(US$ million, unless otherwise indicated)
1990 1995 2000 2003 2004 2005 2006 2007
1. Summary external debt dataExternal debt stocks 696.4 941.6 857.6 1042.1 1064.8 1001.7 991.9 973.3 Long-term external debt 622.2 850.0 795.6 902.5 921.6 864.2 855.2 835.7 Public and publicly guaranteed 622.2 850.0 795.6 902.5 921.6 864.2 855.2 835.7 Private nonguaranteed 0.0 0.0 0.0 0.0 0.0 0.0 0.0 0.0 Use of IMF credit 36.7 34.9 21.5 36.4 44.1 35.9 42.1 49.4 Short-term external debt 37.6 56.7 40.6 103.3 99.2 101.6 94.7 88.2 interest arrears on long-term 14.9 35.3 25.4 91.6 90.2 92.6 85.7 76.2Memorandum itemsPrincipal arrears on long-term 21.7 70.3 95.9 174.7 197.3 213.9 205.4 180.4Long-term public sector debt 622.2 849.8 794.6 901.1 920.0 862.9 853.7 834.0Long-term private sector debt 0.0 0.3 1.0 1.4 1.5 1.3 1.5 1.6Public & publicly guaranteed commitments 174.9 16.6 28.0 0.0 0.0 0.0 4.9 10.0
External debt flowsDisbursements 121.1 32.6 16.1 0.0 8.3 0.0 10.2 46.8 Long-term external debt 112.8 32.6 16.1 0.0 0.0 0.0 0.0 15.1 IMF purchases 8.3 0.0 0.0 0.0 8.3 0.0 10.2 31.7Principal repayments 17.4 10.0 8.3 0.1 11.5 5.3 52.7 70.2 Long-term external debt 7.6 2.6 7.5 0.1 9.1 0.4 46.7 43.5 IMF repurchases 9.8 7.4 0.8 0.0 2.4 4.9 6.0 26.7Net flows 106.6 25.1 -13.8 2.6 -5.9 -5.3 -42.5 -21.4 Long-term external debt 105.2 30.0 8.6 -0.1 -9.1 -0.4 -46.7 -28.4 IMF flows -8.7 0.0 0.0 0.0 8.3 0.0 10.2 -19.2 Short-term external debt 2.9 2.4 -21.6 2.7 -2.7 0.0 0.0 2.0Interest payments 11.8 5.7 5.9 0.5 2.9 0.9 17.7 20.5 Long-term external debt 9.0 3.5 4.3 0.0 2.4 0.1 16.5 19.6 IMF charges 1.2 1.0 0.1 0.2 0.2 0.4 0.9 0.4 Short-term external debt 1.6 1.2 1.4 0.3 0.3 0.3 0.3 0.5
2. Other non-debt resource flowsForeign direct investment (net) 0.7 6.2 0.9 3.3 15.1 17.1 18.1 27.2Portfolio equity flows 0.0 0.0 0.0 0.0 0.0 0.0 0.0 0.0Profit remittances on FDI 2.1 0.0 0.0 0.0 0.0 0.0 0.0 0.0Grants (excluding technical coop.) 86.2 109.6 55.8 34.6 86.0 66.4 157.6 147.5of which: Debt forgiveness grants .. .. 10.5 8.5 7.8 7.1 7.1 10.9 IDA grants .. .. .. 0.0 0.0 0.0 80.3 4.1Memo: technical coop. grants 56.2 46.8 21.6 23.5 32.3 36.4 34.6 37.4
3. Currency composition of public and publicly guaranteed debt (%)Euro .. .. .. 7.1 6.2 5.9 6.4 3.8Japanese yen 0.7 0.7 0.7 0.6 0.6 0.6 0.6 0.3Pound sterling 0.1 0.0 0.1 0.1 0.1 0.1 0.1 0.1Swiss franc 2.6 2.8 2.2 2.6 2.8 2.6 2.8 2.2U.S.dollars 43.7 56.4 61.2 58.4 58.5 59.0 56.9 61.3
4. Average terms of new commitmentsOfficial creditors Interest (%) 1.0 0.8 0.8 0.0 0.0 0.0 0.0 0.0 Maturity (years) 37.6 39.7 39.8 0.0 0.0 0.0 40.0 40.0 Grace period (years) 10.2 10.2 10.3 0.0 0.0 0.0 1.0 11.0Private creditors Interest (%) 0.0 0.0 0.0 0.0 0.0 0.0 0.0 0.0 Maturity (years) 0.0 0.0 0.0 0.0 0.0 0.0 0.0 0.0 Grace period (years) 0.0 0.0 0.0 0.0 0.0 0.0 0.0 0.0
5. Major economic aggregatesGross national income (GNI) 1465.1 1100.9 946.8 1136.8 1268.0 1348.0 1472.9 1701.9Exports of goods, services & income 220.4 .. .. .. .. .. .. ..Worker remit. & comp. of employees 0.0 0.0 0.0 0.0 0.0 0.0 0.0 0.0Imports of goods & services 432.5 .. .. .. .. .. .. ..International reserves 122.9 237.9 136.3 137.1 153.2 144.9 132.4 91.9Current account balance -89.1 .. .. .. .. .. .. ..
6. RatiosExternal debt stocks to exports (%) 316.0 .. .. .. .. .. .. ..External debt stocks to GNI (%) 47.5 85.5 90.6 91.7 84.0 74.3 67.3 57.2Debt service to exports (%) 13.2 .. .. .. .. .. .. ..Short-term to external debt stocks (%) 5.4 6.0 4.7 9.9 9.3 10.1 9.5 9.1Multilateral to external debt stocks (%) 65.4 67.6 68.0 62.1 63.7 62.0 61.0 61.2Reserves to external debt stocks (%) 17.6 25.3 15.9 13.2 14.4 14.5 13.3 9.4Reserves to imports (months) 3.4 .. .. .. .. .. .. ..
66
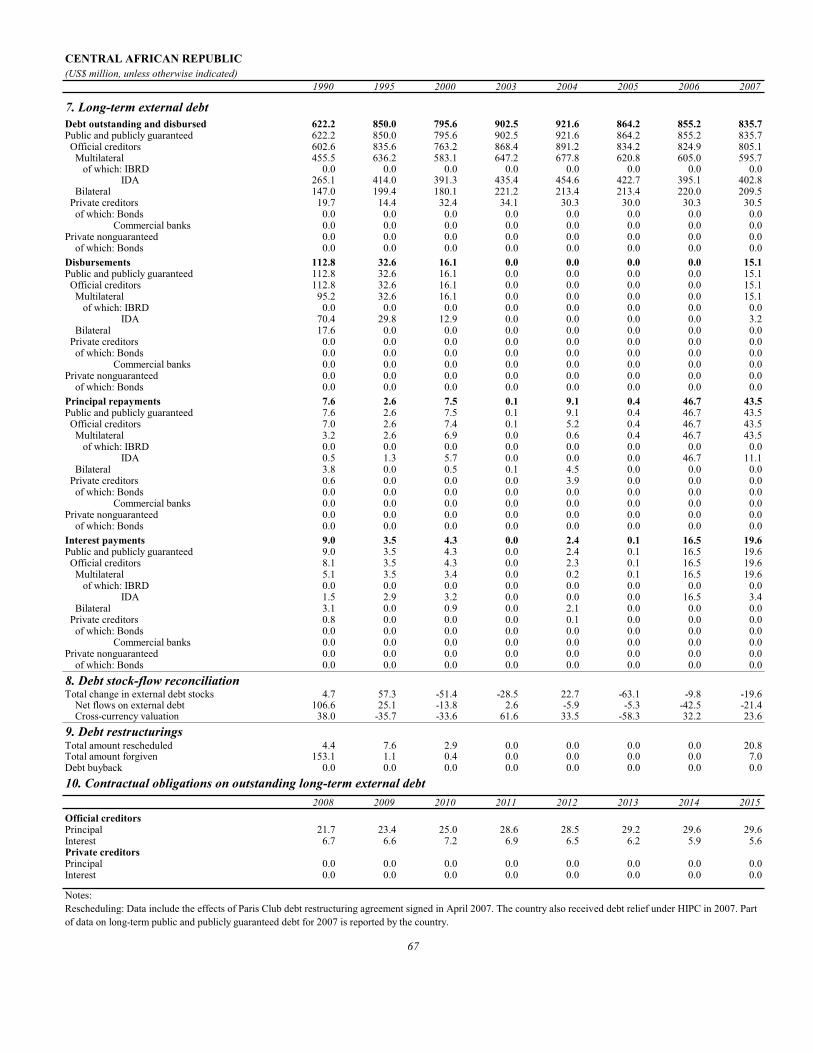
CENTRAL AFRICAN REPUBLIC(US$ million, unless otherwise indicated)
1990 1995 2000 2003 2004 2005 2006 2007
7. Long-term external debtDebt outstanding and disbursed 622.2 850.0 795.6 902.5 921.6 864.2 855.2 835.7Public and publicly guaranteed 622.2 850.0 795.6 902.5 921.6 864.2 855.2 835.7 Official creditors 602.6 835.6 763.2 868.4 891.2 834.2 824.9 805.1 Multilateral 455.5 636.2 583.1 647.2 677.8 620.8 605.0 595.7 of which: IBRD 0.0 0.0 0.0 0.0 0.0 0.0 0.0 0.0 IDA 265.1 414.0 391.3 435.4 454.6 422.7 395.1 402.8 Bilateral 147.0 199.4 180.1 221.2 213.4 213.4 220.0 209.5 Private creditors 19.7 14.4 32.4 34.1 30.3 30.0 30.3 30.5 of which: Bonds 0.0 0.0 0.0 0.0 0.0 0.0 0.0 0.0 Commercial banks 0.0 0.0 0.0 0.0 0.0 0.0 0.0 0.0Private nonguaranteed 0.0 0.0 0.0 0.0 0.0 0.0 0.0 0.0 of which: Bonds 0.0 0.0 0.0 0.0 0.0 0.0 0.0 0.0Disbursements 112.8 32.6 16.1 0.0 0.0 0.0 0.0 15.1Public and publicly guaranteed 112.8 32.6 16.1 0.0 0.0 0.0 0.0 15.1 Official creditors 112.8 32.6 16.1 0.0 0.0 0.0 0.0 15.1 Multilateral 95.2 32.6 16.1 0.0 0.0 0.0 0.0 15.1 of which: IBRD 0.0 0.0 0.0 0.0 0.0 0.0 0.0 0.0 IDA 70.4 29.8 12.9 0.0 0.0 0.0 0.0 3.2 Bilateral 17.6 0.0 0.0 0.0 0.0 0.0 0.0 0.0 Private creditors 0.0 0.0 0.0 0.0 0.0 0.0 0.0 0.0 of which: Bonds 0.0 0.0 0.0 0.0 0.0 0.0 0.0 0.0 Commercial banks 0.0 0.0 0.0 0.0 0.0 0.0 0.0 0.0Private nonguaranteed 0.0 0.0 0.0 0.0 0.0 0.0 0.0 0.0 of which: Bonds 0.0 0.0 0.0 0.0 0.0 0.0 0.0 0.0Principal repayments 7.6 2.6 7.5 0.1 9.1 0.4 46.7 43.5Public and publicly guaranteed 7.6 2.6 7.5 0.1 9.1 0.4 46.7 43.5 Official creditors 7.0 2.6 7.4 0.1 5.2 0.4 46.7 43.5 Multilateral 3.2 2.6 6.9 0.0 0.6 0.4 46.7 43.5 of which: IBRD 0.0 0.0 0.0 0.0 0.0 0.0 0.0 0.0 IDA 0.5 1.3 5.7 0.0 0.0 0.0 46.7 11.1 Bilateral 3.8 0.0 0.5 0.1 4.5 0.0 0.0 0.0 Private creditors 0.6 0.0 0.0 0.0 3.9 0.0 0.0 0.0 of which: Bonds 0.0 0.0 0.0 0.0 0.0 0.0 0.0 0.0 Commercial banks 0.0 0.0 0.0 0.0 0.0 0.0 0.0 0.0Private nonguaranteed 0.0 0.0 0.0 0.0 0.0 0.0 0.0 0.0 of which: Bonds 0.0 0.0 0.0 0.0 0.0 0.0 0.0 0.0Interest payments 9.0 3.5 4.3 0.0 2.4 0.1 16.5 19.6Public and publicly guaranteed 9.0 3.5 4.3 0.0 2.4 0.1 16.5 19.6 Official creditors 8.1 3.5 4.3 0.0 2.3 0.1 16.5 19.6 Multilateral 5.1 3.5 3.4 0.0 0.2 0.1 16.5 19.6 of which: IBRD 0.0 0.0 0.0 0.0 0.0 0.0 0.0 0.0 IDA 1.5 2.9 3.2 0.0 0.0 0.0 16.5 3.4 Bilateral 3.1 0.0 0.9 0.0 2.1 0.0 0.0 0.0 Private creditors 0.8 0.0 0.0 0.0 0.1 0.0 0.0 0.0 of which: Bonds 0.0 0.0 0.0 0.0 0.0 0.0 0.0 0.0 Commercial banks 0.0 0.0 0.0 0.0 0.0 0.0 0.0 0.0Private nonguaranteed 0.0 0.0 0.0 0.0 0.0 0.0 0.0 0.0 of which: Bonds 0.0 0.0 0.0 0.0 0.0 0.0 0.0 0.08. Debt stock-flow reconciliationTotal change in external debt stocks 4.7 57.3 -51.4 -28.5 22.7 -63.1 -9.8 -19.6 Net flows on external debt 106.6 25.1 -13.8 2.6 -5.9 -5.3 -42.5 -21.4 Cross-currency valuation 38.0 -35.7 -33.6 61.6 33.5 -58.3 32.2 23.69. Debt restructuringsTotal amount rescheduled 4.4 7.6 2.9 0.0 0.0 0.0 0.0 20.8Total amount forgiven 153.1 1.1 0.4 0.0 0.0 0.0 0.0 7.0Debt buyback 0.0 0.0 0.0 0.0 0.0 0.0 0.0 0.010. Contractual obligations on outstanding long-term external debt
2008 2009 2010 2011 2012 2013 2014 2015Official creditorsPrincipal 21.7 23.4 25.0 28.6 28.5 29.2 29.6 29.6Interest 6.7 6.6 7.2 6.9 6.5 6.2 5.9 5.6Private creditorsPrincipal 0.0 0.0 0.0 0.0 0.0 0.0 0.0 0.0Interest 0.0 0.0 0.0 0.0 0.0 0.0 0.0 0.0
Notes:Rescheduling: Data include the effects of Paris Club debt restructuring agreement signed in April 2007. The country also received debt relief under HIPC in 2007. Part of data on long-term public and publicly guaranteed debt for 2007 is reported by the country.
67

CHAD(US$ million, unless otherwise indicated)
1990 1995 2000 2003 2004 2005 2006 2007
1. Summary external debt dataExternal debt stocks 514 843 1,091 1,529 1,641 1,585 1,707 1,797 Long-term external debt 454 777 988 1,406 1,528 1,495 1,628 1,712 Public and publicly guaranteed 454 777 988 1,406 1,528 1,495 1,628 1,712 Private nonguaranteed 0 0 0 0 0 0 0 0 Use of IMF credit 30 49 78 106 96 79 68 56 Short-term external debt 30 17 25 17 17 11 12 29 interest arrears on long-term 6 9 10 8 9 6 8 6Memorandum itemsPrincipal arrears on long-term 16 36 52 48 27 26 24 22Long-term public sector debt 454 777 988 1,406 1,528 1,495 1,628 1,712Long-term private sector debt 0 0 0 0 0 0 0 0Public & publicly guaranteed commitments 83 116 178 138 32 182 26 141
External debt flowsDisbursements 103 73 59 188 113 116 117 53 Long-term external debt 94 61 46 181 113 110 117 53 IMF purchases 8 13 14 7 0 6 0 0Principal repayments 7 10 14 29 27 38 46 52 Long-term external debt 3 3 13 16 15 24 30 37 IMF repurchases 4 7 1 13 13 13 16 15Net flows 98 63 44 155 85 75 70 15 Long-term external debt 91 57 33 165 99 85 86 15 IMF flows -4 0 0 0 0 0 0 0 Short-term external debt 2 0 -2 -4 -1 -3 -1 15Interest payments 5 5 10 12 12 17 17 19 Long-term external debt 3 4 9 11 10 16 17 19 IMF charges 0 1 0 1 1 0 0 0 Short-term external debt 2 1 1 0 0 0 0 1
2. Other non-debt resource flowsForeign direct investment (net) 9 33 115 713 495 613 700 603Portfolio equity flows 0 0 0 0 0 0 0 0Profit remittances on FDI 0 0 0 0 0 0 0 0Grants (excluding technical coop.) 147 121 61 121 223 266 207 316of which: Debt forgiveness grants .. .. 12 31 16 15 7 17 IDA grants .. .. .. 0 1 7 5 10Memo: technical coop. grants 58 63 31 42 41 44 43 38
3. Currency composition of public and publicly guaranteed debt (%)Euro .. .. .. 3.9 3.9 3.3 3.9 3.6Japanese yen 0.0 0.0 0.0 0.0 0.0 0.0 0.0 0.0Pound sterling 0.1 0.0 0.0 0.0 0.0 0.0 0.0 0.0Swiss franc 0.0 0.0 0.0 0.0 0.0 0.0 0.0 0.0U.S.dollars 49.6 54.8 58.7 64.5 64.7 66.1 65.0 64.4
4. Average terms of new commitmentsOfficial creditors Interest (%) 1.8 1.0 0.7 0.9 1.0 1.1 0.0 1.3 Maturity (years) 30.0 38.0 40.5 38.5 38.8 28.3 37.0 19.9 Grace period (years) 9.1 8.7 10.1 9.6 9.8 5.1 3.1 6.9Private creditors Interest (%) 0.0 0.0 0.0 0.0 0.0 0.0 0.0 0.0 Maturity (years) 0.0 0.0 0.0 0.0 0.0 0.0 0.0 0.0 Grace period (years) 0.0 0.0 0.0 0.0 0.0 0.0 0.0 0.0
5. Major economic aggregatesGross national income (GNI) 1,721 1,441 1,368 2,279 3,720 4,847 4,942 6,152Exports of goods, services & income 274 .. .. .. .. .. .. ..Worker remit. & comp. of employees 0 0 0 0 0 0 0 0Imports of goods & services 511 .. .. .. .. .. .. ..International reserves 132 147 114 192 227 231 632 964Current account balance -46 .. .. .. .. .. .. ..
6. RatiosExternal debt stocks to exports (%) 187.5 .. .. .. .. .. .. ..External debt stocks to GNI (%) 29.9 58.5 79.8 67.1 44.1 32.7 34.5 29.2Debt service to exports (%) 4.3 .. .. .. .. .. .. ..Short-term to external debt stocks (%) 5.8 2.0 2.3 1.1 1.0 0.7 0.7 1.6Multilateral to external debt stocks (%) 65.5 76.5 76.5 80.8 82.9 84.5 84.9 85.0Reserves to external debt stocks (%) 25.7 17.4 10.4 12.5 13.8 14.6 37.0 53.7Reserves to imports (months) 3.1 .. .. .. .. .. .. ..
68

CHAD(US$ million, unless otherwise indicated)
1990 1995 2000 2003 2004 2005 2006 2007
7. Long-term external debtDebt outstanding and disbursed 454 777 988 1,406 1,528 1,495 1,628 1,712Public and publicly guaranteed 454 777 988 1,406 1,528 1,495 1,628 1,712 Official creditors 446 775 973 1,372 1,494 1,463 1,594 1,679 Multilateral 337 645 834 1,235 1,361 1,340 1,450 1,527 of which: IBRD 0 0 0 31 37 35 30 26 IDA 186 379 515 773 874 864 925 968 Bilateral 109 131 139 137 134 123 145 152 Private creditors 8 2 15 33 33 32 33 33 of which: Bonds 0 0 0 0 0 0 0 0 Commercial banks 0 0 0 0 0 0 0 0Private nonguaranteed 0 0 0 0 0 0 0 0 of which: Bonds 0 0 0 0 0 0 0 0Disbursements 94 61 46 181 113 110 117 53Public and publicly guaranteed 94 61 46 181 113 110 117 53 Official creditors 94 61 46 161 113 110 117 53 Multilateral 72 61 36 147 110 108 86 41 of which: IBRD 0 0 0 22 6 1 0 0 IDA 48 42 18 94 74 64 31 16 Bilateral 22 0 10 14 3 2 31 12 Private creditors 0 0 0 20 0 0 0 0 of which: Bonds 0 0 0 0 0 0 0 0 Commercial banks 0 0 0 0 0 0 0 0Private nonguaranteed 0 0 0 0 0 0 0 0 of which: Bonds 0 0 0 0 0 0 0 0Principal repayments 3 3 13 16 15 24 30 37Public and publicly guaranteed 3 3 13 16 15 24 30 37 Official creditors 3 3 13 16 15 23 30 37 Multilateral 3 3 10 8 11 17 24 31 of which: IBRD 0 0 0 0 0 2 5 5 IDA 1 1 4 2 4 4 11 11 Bilateral 0 1 3 8 4 5 6 5 Private creditors 1 0 1 0 0 1 1 1 of which: Bonds 0 0 0 0 0 0 0 0 Commercial banks 0 0 0 0 0 0 0 0Private nonguaranteed 0 0 0 0 0 0 0 0 of which: Bonds 0 0 0 0 0 0 0 0Interest payments 3 4 9 11 10 16 17 19Public and publicly guaranteed 3 4 9 11 10 16 17 19 Official creditors 3 4 9 11 10 16 17 19 Multilateral 2 3 6 8 9 14 13 15 of which: IBRD 0 0 0 0 1 1 2 2 IDA 1 3 3 4 7 6 7 7 Bilateral 1 0 3 3 1 2 3 3 Private creditors 0 0 0 0 0 0 0 0 of which: Bonds 0 0 0 0 0 0 0 0 Commercial banks 0 0 0 0 0 0 0 0Private nonguaranteed 0 0 0 0 0 0 0 0 of which: Bonds 0 0 0 0 0 0 0 08. Debt stock-flow reconciliationTotal change in external debt stocks 116 59 -8 262 112 -56 122 86 Net flows on external debt 98 63 44 155 85 75 70 15 Cross-currency valuation 8 -39 -63 60 18 -120 14 369. Debt restructuringsTotal amount rescheduled 8 46 0 0 0 12 0 0Total amount forgiven 12 54 0 10 8 10 15 5Debt buyback 0 0 0 0 0 0 0 010. Contractual obligations on outstanding long-term external debt
2008 2009 2010 2011 2012 2013 2014 2015Official creditorsPrincipal 62 56 63 68 72 74 79 83Interest 21 20 20 19 18 17 16 15Private creditorsPrincipal 4 4 4 2 2 2 2 2Interest 0 0 0 0 0 0 0 0
69

CHILE(US$ million, unless otherwise indicated)
1990 1995 2000 2003 2004 2005 2006 2007
1. Summary external debt dataExternal debt stocks 19,226 22,038 37,289 42,820 43,803 45,370 47,971 58,649 Long-term external debt 14,687 18,607 31,117 35,804 36,351 38,281 38,560 45,347 Public and publicly guaranteed 10,425 7,178 5,255 8,046 9,426 9,097 9,449 9,378 Private nonguaranteed 4,263 11,429 25,861 27,758 26,925 29,184 29,112 35,969 Use of IMF credit 1,156 0 0 0 0 0 0 0 Short-term external debt 3,382 3,431 6,172 7,016 7,452 7,089 9,411 13,302 interest arrears on long-term 0 0 0 0 0 0 0 0Memorandum itemsPrincipal arrears on long-term 0 0 0 0 0 0 0 17Long-term public sector debt 10,421 7,178 5,175 8,020 9,426 9,097 9,449 9,353Long-term private sector debt 4,267 11,429 25,941 27,785 26,925 29,184 29,112 35,994Public & publicly guaranteed commitments 1,049 314 324 2,299 2,372 995 1,423 763
External debt flowsDisbursements 2,253 3,821 4,979 6,841 8,388 9,156 12,147 13,106 Long-term external debt 2,253 3,821 4,979 6,841 8,388 9,156 12,147 13,106 IMF purchases 0 0 0 0 0 0 0 0Principal repayments 980 3,671 3,941 6,578 8,136 6,178 11,800 9,276 Long-term external debt 771 3,369 3,941 6,578 8,136 6,178 11,800 9,276 IMF repurchases 208 303 0 0 0 0 0 0Net flows 1,682 -284 2,893 1,456 688 2,616 2,669 7,721 Long-term external debt 1,481 452 1,038 263 252 2,979 347 3,830 IMF flows -208 -303 0 0 0 0 0 0 Short-term external debt 409 -434 1,855 1,193 436 -363 2,322 3,891Interest payments 1,792 1,293 2,236 1,485 1,429 1,509 1,992 2,386 Long-term external debt 1,364 1,114 2,082 1,286 1,275 1,289 1,651 1,721 IMF charges 118 13 0 0 0 0 0 0 Short-term external debt 310 165 154 200 154 221 341 665
2. Other non-debt resource flowsForeign direct investment (net) 661 2,957 4,860 4,307 7,173 6,984 7,358 14,457Portfolio equity flows 367 -249 -427 318 8 1,571 -194 404Profit remittances on FDI 387 2,178 2,539 4,611 8,231 11,416 19,991 21,754Grants (excluding technical coop.) 73 54 18 27 39 90 26 34of which: Debt forgiveness grants .. .. 0 0 0 0 0 0 IDA grants .. .. .. 0 0 0 0 0Memo: technical coop. grants 66 97 56 59 67 60 52 48
3. Currency composition of public and publicly guaranteed debt (%)Euro .. .. .. 6.1 5.4 1.0 1.1 1.2Japanese yen 8.2 9.5 5.5 2.0 0.9 0.7 2.7 2.4Pound sterling 3.4 2.9 0.2 0.1 0.0 0.0 0.0 0.0Swiss franc 0.6 0.9 0.1 0.0 0.0 0.0 0.0 0.0U.S.dollars 40.2 42.0 83.7 89.1 92.9 97.7 95.6 95.8
4. Average terms of new commitmentsOfficial creditors Interest (%) 7.7 6.1 1.0 1.6 1.8 4.1 5.2 5.1 Maturity (years) 18.8 19.5 17.0 19.4 8.3 13.1 13.1 19.5 Grace period (years) 4.3 5.8 1.5 5.2 4.5 4.7 6.0 4.6Private creditors Interest (%) 9.3 6.8 7.0 4.4 2.9 5.1 5.8 5.7 Maturity (years) 7.6 10.9 6.3 9.1 6.2 19.2 15.7 7.0 Grace period (years) 2.3 3.0 3.0 8.0 5.6 18.2 13.0 5.5
5. Major economic aggregatesGross national income (GNI) 29,800 68,637 72,333 69,528 87,815 107,790 128,005 145,638Exports of goods, services & income 10,705 20,226 24,891 28,286 40,537 50,853 69,767 82,017Worker remit. & comp. of employees 1 0 13 12 12 13 3 3Imports of goods & services 11,387 21,883 26,346 29,670 39,535 51,187 66,227 77,791International reserves 6,784 14,860 15,055 15,843 15,997 16,933 19,397 16,843Current account balance -485 -1,350 -898 -779 2,074 1,449 6,838 7,200
6. RatiosExternal debt stocks to exports (%) 179.6 109.0 149.8 151.4 108.1 89.2 68.8 71.5External debt stocks to GNI (%) 64.5 32.1 51.6 61.6 49.9 42.1 37.5 40.3Debt service to exports (%) 25.9 24.5 24.8 28.5 23.6 15.1 19.8 14.2Short-term to external debt stocks (%) 17.6 15.6 16.6 16.4 17.0 15.6 19.6 22.7Multilateral to external debt stocks (%) 21.5 13.0 3.8 2.4 2.3 1.8 1.9 1.6Reserves to external debt stocks (%) 35.3 67.4 40.4 37.0 36.5 37.3 40.4 28.7Reserves to imports (months) 7.1 8.1 6.9 6.4 4.9 4.0 3.5 2.6
70

CHILE(US$ million, unless otherwise indicated)
1990 1995 2000 2003 2004 2005 2006 2007
7. Long-term external debtDebt outstanding and disbursed 14,687 18,607 31,117 35,804 36,351 38,281 38,560 45,347Public and publicly guaranteed 10,425 7,178 5,255 8,046 9,426 9,097 9,449 9,378 Official creditors 5,182 3,582 1,915 1,437 1,335 1,113 1,173 1,180 Multilateral 4,143 2,871 1,406 1,049 1,015 827 897 932 of which: IBRD 1,860 1,372 808 422 441 289 346 354 IDA 14 11 7 5 4 4 3 2 Bilateral 1,039 711 509 388 321 285 275 248 Private creditors 5,242 3,596 3,341 6,609 8,091 7,984 8,276 8,198 of which: Bonds 39 0 0 4,254 5,362 5,406 5,938 5,401 Commercial banks 4,747 3,509 3,273 2,329 2,704 2,578 2,338 2,797Private nonguaranteed 4,263 11,429 25,861 27,758 26,925 29,184 29,112 35,969 of which: Bonds 0 866 6,339 4,529 4,951 4,761 4,779 6,385Disbursements 2,253 3,821 4,979 6,841 8,388 9,156 12,147 13,106Public and publicly guaranteed 708 342 382 2,255 2,561 1,197 1,186 648 Official creditors 650 194 161 156 378 176 112 87 Multilateral 583 146 113 141 371 162 92 72 of which: IBRD 251 83 48 37 259 55 62 14 IDA 0 0 0 0 0 0 0 0 Bilateral 67 48 47 15 7 14 20 15 Private creditors 58 148 221 2,099 2,184 1,022 1,074 561 of which: Bonds 0 0 0 1,800 1,250 500 650 0 Commercial banks 37 141 221 299 934 522 424 561Private nonguaranteed 1,545 3,479 4,597 4,586 5,827 7,959 10,961 12,458 of which: Bonds 0 500 672 330 1,125 700 813 250Principal repayments 771 3,369 3,941 6,578 8,136 6,178 11,800 9,276Public and publicly guaranteed 500 2,277 760 1,129 1,217 1,466 840 707 Official creditors 356 2,003 280 246 485 374 63 60 Multilateral 263 1,884 177 199 406 345 23 40 of which: IBRD 119 704 115 173 240 206 5 6 IDA 1 1 1 1 1 1 1 1 Bilateral 93 119 103 47 79 29 40 20 Private creditors 144 273 480 883 732 1,093 777 647 of which: Bonds 7 0 0 0 171 422 118 537 Commercial banks 32 240 479 882 560 646 659 110Private nonguaranteed 271 1,092 3,181 5,449 6,919 4,711 10,960 8,569 of which: Bonds 0 11 0 434 752 195 765 575Interest payments 1,364 1,114 2,082 1,286 1,275 1,289 1,651 1,721Public and publicly guaranteed 1,112 653 377 364 400 459 491 529 Official creditors 384 387 139 76 51 50 49 56 Multilateral 313 348 112 65 44 43 43 50 of which: IBRD 130 137 70 35 18 16 17 20 IDA 0 0 0 0 0 0 0 0 Bilateral 71 39 27 12 7 7 7 6 Private creditors 729 266 239 287 349 409 442 472 of which: Bonds 2 0 0 192 265 299 313 336 Commercial banks 688 258 234 95 84 110 129 136Private nonguaranteed 252 461 1,704 922 875 829 1,160 1,193 of which: Bonds 0 26 440 351 349 347 359 4718. Debt stock-flow reconciliationTotal change in external debt stocks 1,193 -117 2,474 1,602 983 1,567 2,602 10,678 Net flows on external debt 1,682 -284 2,893 1,456 688 2,616 2,669 7,721 Cross-currency valuation 508 14 -61 289 8 62 123 109. Debt restructuringsTotal amount rescheduled 4,172 0 0 0 0 0 0 0Total amount forgiven 0 0 0 0 0 0 0 0Debt buyback 0 0 0 0 0 0 0 010. Contractual obligations on outstanding long-term external debt
2008 2009 2010 2011 2012 2013 2014 2015Official creditorsPrincipal 285 91 160 131 73 87 85 83Interest 52 49 48 44 41 38 35 31Private creditorsPrincipal 12,198 6,047 3,452 3,715 4,972 4,585 3,165 1,406Interest 1,687 1,361 1,154 1,042 791 566 486 929
Notes:Short-term debt is based on reports provided by the country.
71
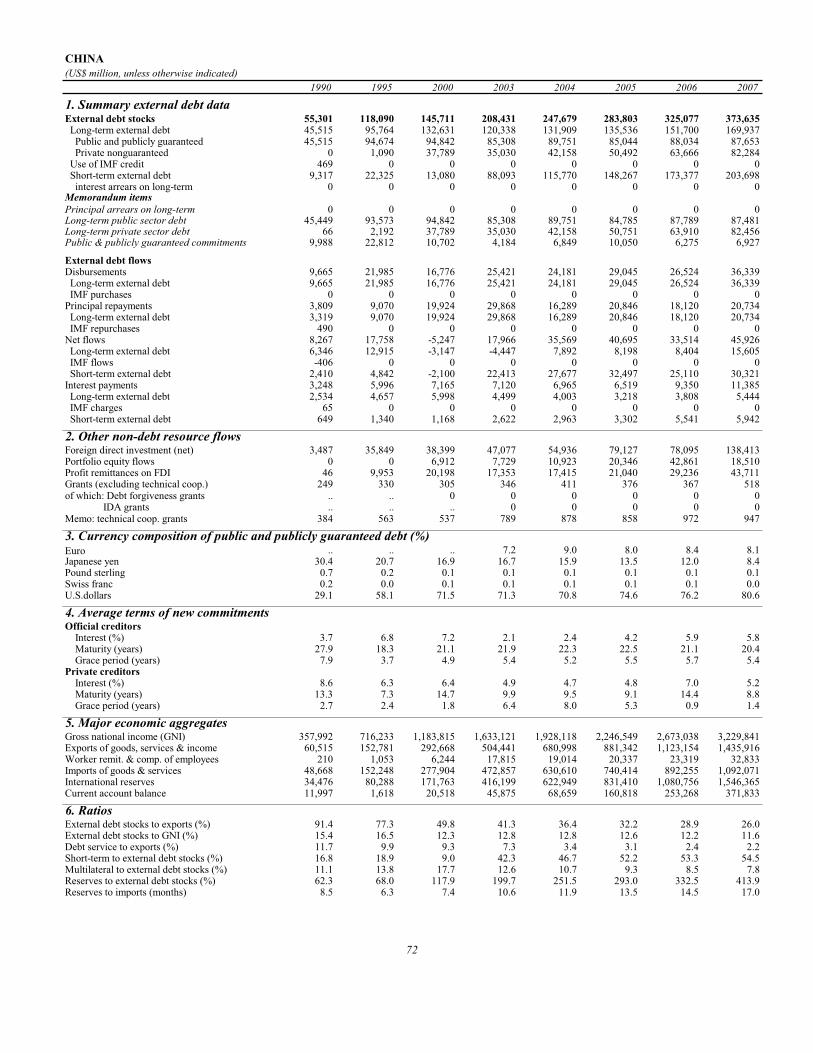
CHINA(US$ million, unless otherwise indicated)
1990 1995 2000 2003 2004 2005 2006 2007
1. Summary external debt dataExternal debt stocks 55,301 118,090 145,711 208,431 247,679 283,803 325,077 373,635 Long-term external debt 45,515 95,764 132,631 120,338 131,909 135,536 151,700 169,937 Public and publicly guaranteed 45,515 94,674 94,842 85,308 89,751 85,044 88,034 87,653 Private nonguaranteed 0 1,090 37,789 35,030 42,158 50,492 63,666 82,284 Use of IMF credit 469 0 0 0 0 0 0 0 Short-term external debt 9,317 22,325 13,080 88,093 115,770 148,267 173,377 203,698 interest arrears on long-term 0 0 0 0 0 0 0 0Memorandum itemsPrincipal arrears on long-term 0 0 0 0 0 0 0 0Long-term public sector debt 45,449 93,573 94,842 85,308 89,751 84,785 87,789 87,481Long-term private sector debt 66 2,192 37,789 35,030 42,158 50,751 63,910 82,456Public & publicly guaranteed commitments 9,988 22,812 10,702 4,184 6,849 10,050 6,275 6,927
External debt flowsDisbursements 9,665 21,985 16,776 25,421 24,181 29,045 26,524 36,339 Long-term external debt 9,665 21,985 16,776 25,421 24,181 29,045 26,524 36,339 IMF purchases 0 0 0 0 0 0 0 0Principal repayments 3,809 9,070 19,924 29,868 16,289 20,846 18,120 20,734 Long-term external debt 3,319 9,070 19,924 29,868 16,289 20,846 18,120 20,734 IMF repurchases 490 0 0 0 0 0 0 0Net flows 8,267 17,758 -5,247 17,966 35,569 40,695 33,514 45,926 Long-term external debt 6,346 12,915 -3,147 -4,447 7,892 8,198 8,404 15,605 IMF flows -406 0 0 0 0 0 0 0 Short-term external debt 2,410 4,842 -2,100 22,413 27,677 32,497 25,110 30,321Interest payments 3,248 5,996 7,165 7,120 6,965 6,519 9,350 11,385 Long-term external debt 2,534 4,657 5,998 4,499 4,003 3,218 3,808 5,444 IMF charges 65 0 0 0 0 0 0 0 Short-term external debt 649 1,340 1,168 2,622 2,963 3,302 5,541 5,942
2. Other non-debt resource flowsForeign direct investment (net) 3,487 35,849 38,399 47,077 54,936 79,127 78,095 138,413Portfolio equity flows 0 0 6,912 7,729 10,923 20,346 42,861 18,510Profit remittances on FDI 46 9,953 20,198 17,353 17,415 21,040 29,236 43,711Grants (excluding technical coop.) 249 330 305 346 411 376 367 518of which: Debt forgiveness grants .. .. 0 0 0 0 0 0 IDA grants .. .. .. 0 0 0 0 0Memo: technical coop. grants 384 563 537 789 878 858 972 947
3. Currency composition of public and publicly guaranteed debt (%)Euro .. .. .. 7.2 9.0 8.0 8.4 8.1Japanese yen 30.4 20.7 16.9 16.7 15.9 13.5 12.0 8.4Pound sterling 0.7 0.2 0.1 0.1 0.1 0.1 0.1 0.1Swiss franc 0.2 0.0 0.1 0.1 0.1 0.1 0.1 0.0U.S.dollars 29.1 58.1 71.5 71.3 70.8 74.6 76.2 80.6
4. Average terms of new commitmentsOfficial creditors Interest (%) 3.7 6.8 7.2 2.1 2.4 4.2 5.9 5.8 Maturity (years) 27.9 18.3 21.1 21.9 22.3 22.5 21.1 20.4 Grace period (years) 7.9 3.7 4.9 5.4 5.2 5.5 5.7 5.4Private creditors Interest (%) 8.6 6.3 6.4 4.9 4.7 4.8 7.0 5.2 Maturity (years) 13.3 7.3 14.7 9.9 9.5 9.1 14.4 8.8 Grace period (years) 2.7 2.4 1.8 6.4 8.0 5.3 0.9 1.4
5. Major economic aggregatesGross national income (GNI) 357,992 716,233 1,183,815 1,633,121 1,928,118 2,246,549 2,673,038 3,229,841Exports of goods, services & income 60,515 152,781 292,668 504,441 680,998 881,342 1,123,154 1,435,916Worker remit. & comp. of employees 210 1,053 6,244 17,815 19,014 20,337 23,319 32,833Imports of goods & services 48,668 152,248 277,904 472,857 630,610 740,414 892,255 1,092,071International reserves 34,476 80,288 171,763 416,199 622,949 831,410 1,080,756 1,546,365Current account balance 11,997 1,618 20,518 45,875 68,659 160,818 253,268 371,833
6. RatiosExternal debt stocks to exports (%) 91.4 77.3 49.8 41.3 36.4 32.2 28.9 26.0External debt stocks to GNI (%) 15.4 16.5 12.3 12.8 12.8 12.6 12.2 11.6Debt service to exports (%) 11.7 9.9 9.3 7.3 3.4 3.1 2.4 2.2Short-term to external debt stocks (%) 16.8 18.9 9.0 42.3 46.7 52.2 53.3 54.5Multilateral to external debt stocks (%) 11.1 13.8 17.7 12.6 10.7 9.3 8.5 7.8Reserves to external debt stocks (%) 62.3 68.0 117.9 199.7 251.5 293.0 332.5 413.9Reserves to imports (months) 8.5 6.3 7.4 10.6 11.9 13.5 14.5 17.0
72
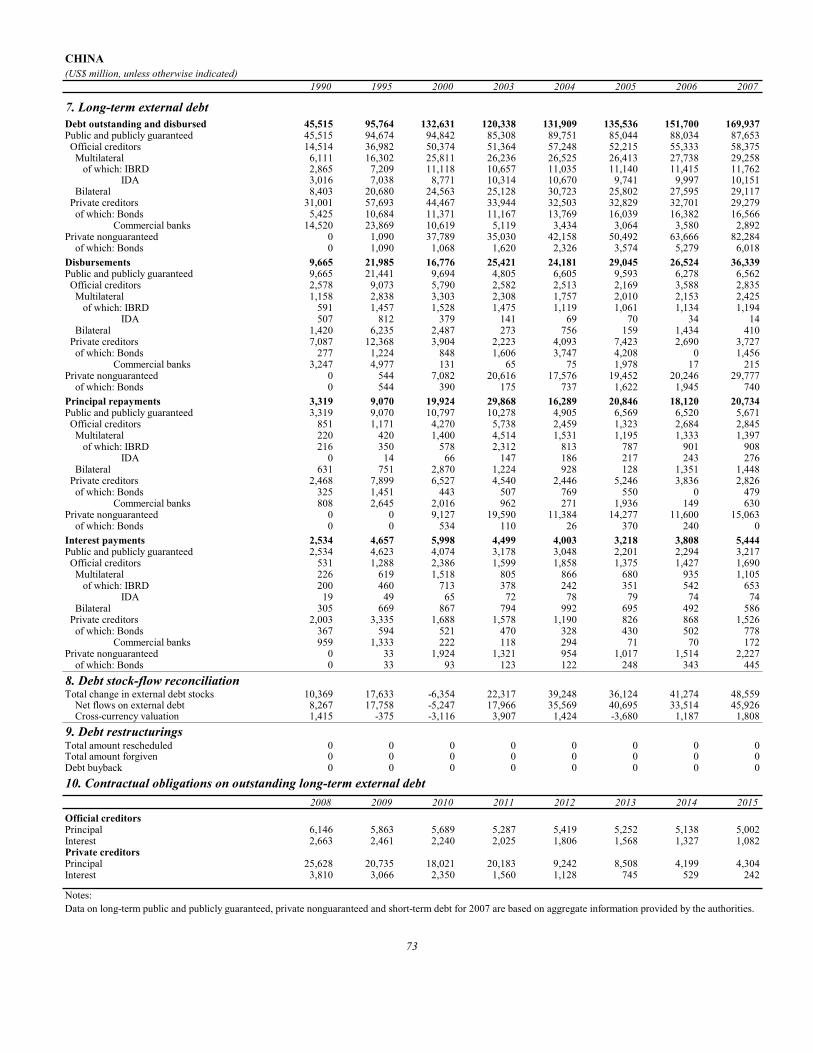
CHINA(US$ million, unless otherwise indicated)
1990 1995 2000 2003 2004 2005 2006 2007
7. Long-term external debtDebt outstanding and disbursed 45,515 95,764 132,631 120,338 131,909 135,536 151,700 169,937Public and publicly guaranteed 45,515 94,674 94,842 85,308 89,751 85,044 88,034 87,653 Official creditors 14,514 36,982 50,374 51,364 57,248 52,215 55,333 58,375 Multilateral 6,111 16,302 25,811 26,236 26,525 26,413 27,738 29,258 of which: IBRD 2,865 7,209 11,118 10,657 11,035 11,140 11,415 11,762 IDA 3,016 7,038 8,771 10,314 10,670 9,741 9,997 10,151 Bilateral 8,403 20,680 24,563 25,128 30,723 25,802 27,595 29,117 Private creditors 31,001 57,693 44,467 33,944 32,503 32,829 32,701 29,279 of which: Bonds 5,425 10,684 11,371 11,167 13,769 16,039 16,382 16,566 Commercial banks 14,520 23,869 10,619 5,119 3,434 3,064 3,580 2,892Private nonguaranteed 0 1,090 37,789 35,030 42,158 50,492 63,666 82,284 of which: Bonds 0 1,090 1,068 1,620 2,326 3,574 5,279 6,018Disbursements 9,665 21,985 16,776 25,421 24,181 29,045 26,524 36,339Public and publicly guaranteed 9,665 21,441 9,694 4,805 6,605 9,593 6,278 6,562 Official creditors 2,578 9,073 5,790 2,582 2,513 2,169 3,588 2,835 Multilateral 1,158 2,838 3,303 2,308 1,757 2,010 2,153 2,425 of which: IBRD 591 1,457 1,528 1,475 1,119 1,061 1,134 1,194 IDA 507 812 379 141 69 70 34 14 Bilateral 1,420 6,235 2,487 273 756 159 1,434 410 Private creditors 7,087 12,368 3,904 2,223 4,093 7,423 2,690 3,727 of which: Bonds 277 1,224 848 1,606 3,747 4,208 0 1,456 Commercial banks 3,247 4,977 131 65 75 1,978 17 215Private nonguaranteed 0 544 7,082 20,616 17,576 19,452 20,246 29,777 of which: Bonds 0 544 390 175 737 1,622 1,945 740Principal repayments 3,319 9,070 19,924 29,868 16,289 20,846 18,120 20,734Public and publicly guaranteed 3,319 9,070 10,797 10,278 4,905 6,569 6,520 5,671 Official creditors 851 1,171 4,270 5,738 2,459 1,323 2,684 2,845 Multilateral 220 420 1,400 4,514 1,531 1,195 1,333 1,397 of which: IBRD 216 350 578 2,312 813 787 901 908 IDA 0 14 66 147 186 217 243 276 Bilateral 631 751 2,870 1,224 928 128 1,351 1,448 Private creditors 2,468 7,899 6,527 4,540 2,446 5,246 3,836 2,826 of which: Bonds 325 1,451 443 507 769 550 0 479 Commercial banks 808 2,645 2,016 962 271 1,936 149 630Private nonguaranteed 0 0 9,127 19,590 11,384 14,277 11,600 15,063 of which: Bonds 0 0 534 110 26 370 240 0Interest payments 2,534 4,657 5,998 4,499 4,003 3,218 3,808 5,444Public and publicly guaranteed 2,534 4,623 4,074 3,178 3,048 2,201 2,294 3,217 Official creditors 531 1,288 2,386 1,599 1,858 1,375 1,427 1,690 Multilateral 226 619 1,518 805 866 680 935 1,105 of which: IBRD 200 460 713 378 242 351 542 653 IDA 19 49 65 72 78 79 74 74 Bilateral 305 669 867 794 992 695 492 586 Private creditors 2,003 3,335 1,688 1,578 1,190 826 868 1,526 of which: Bonds 367 594 521 470 328 430 502 778 Commercial banks 959 1,333 222 118 294 71 70 172Private nonguaranteed 0 33 1,924 1,321 954 1,017 1,514 2,227 of which: Bonds 0 33 93 123 122 248 343 4458. Debt stock-flow reconciliationTotal change in external debt stocks 10,369 17,633 -6,354 22,317 39,248 36,124 41,274 48,559 Net flows on external debt 8,267 17,758 -5,247 17,966 35,569 40,695 33,514 45,926 Cross-currency valuation 1,415 -375 -3,116 3,907 1,424 -3,680 1,187 1,8089. Debt restructuringsTotal amount rescheduled 0 0 0 0 0 0 0 0Total amount forgiven 0 0 0 0 0 0 0 0Debt buyback 0 0 0 0 0 0 0 010. Contractual obligations on outstanding long-term external debt
2008 2009 2010 2011 2012 2013 2014 2015Official creditorsPrincipal 6,146 5,863 5,689 5,287 5,419 5,252 5,138 5,002Interest 2,663 2,461 2,240 2,025 1,806 1,568 1,327 1,082Private creditorsPrincipal 25,628 20,735 18,021 20,183 9,242 8,508 4,199 4,304Interest 3,810 3,066 2,350 1,560 1,128 745 529 242
Notes:Data on long-term public and publicly guaranteed, private nonguaranteed and short-term debt for 2007 are based on aggregate information provided by the authorities.
73

COLOMBIA(US$ million, unless otherwise indicated)
1990 1995 2000 2003 2004 2005 2006 2007
1. Summary external debt dataExternal debt stocks 17,222 25,044 33,937 36,998 37,911 37,720 38,937 44,976 Long-term external debt 15,784 19,499 31,066 33,442 32,791 31,544 34,115 39,627 Public and publicly guaranteed 14,671 13,946 20,806 22,784 23,772 22,555 25,003 27,689 Private nonguaranteed 1,113 5,553 10,259 10,657 9,019 8,989 9,112 11,938 Use of IMF credit 0 0 0 0 0 0 0 0 Short-term external debt 1,438 5,545 2,871 3,556 5,120 6,176 4,822 5,349 interest arrears on long-term 28 2 0 0 0 0 0 0Memorandum itemsPrincipal arrears on long-term 409 177 8 0 0 0 0 0Long-term public sector debt 14,630 13,945 20,805 22,783 23,771 22,554 25,000 27,687Long-term private sector debt 1,154 5,555 10,261 10,658 9,020 8,990 9,115 11,940Public & publicly guaranteed commitments 1,269 1,792 3,782 5,029 3,030 4,855 5,195 4,766
External debt flowsDisbursements 1,994 4,179 3,803 6,935 4,416 6,496 9,395 9,323 Long-term external debt 1,994 4,179 3,803 6,935 4,416 6,496 9,395 9,323 IMF purchases 0 0 0 0 0 0 0 0Principal repayments 2,189 2,347 2,900 6,198 5,249 7,403 7,805 5,832 Long-term external debt 2,189 2,347 2,900 6,198 5,249 7,403 7,805 5,832 IMF repurchases 0 0 0 0 0 0 0 0Net flows -399 2,894 -191 634 731 149 236 4,018 Long-term external debt -195 1,832 903 737 -832 -907 1,590 3,491 IMF flows 0 0 0 0 0 0 0 0 Short-term external debt -204 1,062 -1,094 -103 1,564 1,056 -1,354 527Interest payments 1,701 1,998 2,204 2,447 2,440 2,838 2,635 3,079 Long-term external debt 1,558 1,687 2,032 2,295 2,262 2,584 2,415 2,835 IMF charges 0 0 0 0 0 0 0 0 Short-term external debt 143 311 172 152 178 254 220 244
2. Other non-debt resource flowsForeign direct investment (net) 500 968 2,395 1,758 3,016 10,252 6,656 9,040Portfolio equity flows 0 165 17 -52 130 86 -30 790Profit remittances on FDI 964 359 655 1,515 2,433 3,565 4,591 6,466Grants (excluding technical coop.) 35 74 79 104 142 191 246 529of which: Debt forgiveness grants .. .. 0 0 8 0 0 0 IDA grants .. .. .. 0 0 0 0 0Memo: technical coop. grants 79 98 182 768 475 530 778 231
3. Currency composition of public and publicly guaranteed debt (%)Euro .. .. .. 6.2 6.3 4.2 3.5 3.4Japanese yen 4.9 5.6 3.6 2.3 1.7 1.6 1.3 1.1Pound sterling 0.3 0.1 0.8 0.8 0.9 0.8 0.8 0.8Swiss franc 0.3 0.2 0.0 0.1 0.0 0.0 0.0 0.0U.S.dollars 44.0 49.9 74.4 79.2 81.4 85.2 88.2 89.9
4. Average terms of new commitmentsOfficial creditors Interest (%) 7.5 6.4 8.8 3.9 4.4 5.0 5.6 5.6 Maturity (years) 18.7 20.4 12.1 10.7 16.9 16.0 17.7 12.0 Grace period (years) 5.4 4.8 3.1 4.8 6.4 6.0 4.7 4.5Private creditors Interest (%) 9.3 3.8 7.6 8.9 9.0 8.0 7.3 9.2 Maturity (years) 10.2 6.1 10.2 15.1 12.3 11.4 18.4 13.4 Grace period (years) 2.2 4.0 7.5 15.0 12.1 10.2 16.9 13.2
5. Major economic aggregatesGross national income (GNI) 38,193 90,924 91,738 88,317 109,496 139,124 156,417 199,900Exports of goods, services & income 9,514 13,781 18,424 19,338 23,316 28,783 33,963 40,548Worker remit. & comp. of employees 495 815 1,610 3,076 3,190 3,346 3,928 4,523Imports of goods & services 9,510 18,286 17,728 20,569 24,783 31,435 37,808 47,153International reserves 4,869 8,452 9,006 10,920 13,537 14,955 15,437 20,951Current account balance 542 -4,516 792 -982 -913 -1,884 -2,992 -5,866
6. RatiosExternal debt stocks to exports (%) 181.0 181.7 184.2 191.3 162.6 131.0 114.6 110.9External debt stocks to GNI (%) 45.1 27.5 37.0 41.9 34.6 27.1 24.9 22.5Debt service to exports (%) 40.9 31.5 27.7 44.7 33.0 35.6 30.7 22.0Short-term to external debt stocks (%) 8.4 22.1 8.5 9.6 13.5 16.4 12.4 11.9Multilateral to external debt stocks (%) 35.4 21.2 18.5 27.3 27.5 25.5 27.8 25.1Reserves to external debt stocks (%) 28.3 33.7 26.5 29.5 35.7 39.6 39.6 46.6Reserves to imports (months) 6.1 5.5 6.1 6.4 6.6 5.7 4.9 5.3
74

COLOMBIA(US$ million, unless otherwise indicated)
1990 1995 2000 2003 2004 2005 2006 2007
7. Long-term external debtDebt outstanding and disbursed 15,784 19,499 31,066 33,442 32,791 31,544 34,115 39,627Public and publicly guaranteed 14,671 13,946 20,806 22,784 23,772 22,555 25,003 27,689 Official creditors 8,540 7,063 7,722 11,454 11,551 10,568 11,659 11,989 Multilateral 6,103 5,316 6,274 10,085 10,410 9,615 10,843 11,273 of which: IBRD 3,859 2,548 1,920 3,241 3,490 3,896 4,563 4,756 IDA 14 11 7 5 5 4 3 2 Bilateral 2,437 1,747 1,448 1,369 1,141 954 816 717 Private creditors 6,131 6,883 13,084 11,330 12,222 11,987 13,344 15,699 of which: Bonds 275 1,733 8,201 9,664 10,741 10,927 12,162 12,354 Commercial banks 4,208 4,163 4,252 1,293 1,144 800 1,034 2,505Private nonguaranteed 1,113 5,553 10,259 10,657 9,019 8,989 9,112 11,938 of which: Bonds 0 717 762 376 370 370 540 809Disbursements 1,994 4,179 3,803 6,935 4,416 6,496 9,395 9,323Public and publicly guaranteed 1,847 1,569 2,939 5,654 2,884 4,376 5,860 4,488 Official creditors 697 685 660 3,312 1,173 1,467 2,239 1,580 Multilateral 559 394 508 3,288 1,169 1,467 2,221 1,576 of which: IBRD 213 238 266 987 455 705 942 564 IDA 0 0 0 0 0 0 0 0 Bilateral 139 290 152 24 4 0 18 4 Private creditors 1,150 885 2,279 2,342 1,711 2,908 3,622 2,909 of which: Bonds 0 535 1,804 2,047 1,375 2,304 2,696 1,293 Commercial banks 874 257 469 268 292 591 926 1,615Private nonguaranteed 147 2,610 865 1,281 1,533 2,121 3,535 4,835 of which: Bonds 0 592 0 0 170 0 170 469Principal repayments 2,189 2,347 2,900 6,198 5,249 7,403 7,805 5,832Public and publicly guaranteed 1,875 2,200 2,068 3,944 2,083 4,712 3,863 2,905 Official creditors 737 1,110 557 1,294 1,123 2,223 1,177 1,366 Multilateral 527 647 440 1,118 943 2,072 1,005 1,249 of which: IBRD 434 414 242 211 255 218 259 432 IDA 1 1 1 1 1 1 1 1 Bilateral 210 463 116 176 180 151 171 117 Private creditors 1,138 1,090 1,511 2,649 961 2,488 2,686 1,540 of which: Bonds 4 119 469 2,070 441 1,723 1,879 1,353 Commercial banks 849 723 838 491 438 680 693 149Private nonguaranteed 314 147 832 2,254 3,165 2,692 3,942 2,927 of which: Bonds 0 0 110 282 176 0 0 200Interest payments 1,558 1,687 2,032 2,295 2,262 2,584 2,415 2,835Public and publicly guaranteed 1,240 962 1,414 1,630 1,636 1,947 1,664 1,960 Official creditors 627 505 541 544 545 574 580 681 Multilateral 476 388 470 489 497 529 543 648 of which: IBRD 318 190 126 146 152 174 210 256 IDA 0 0 0 0 0 0 0 0 Bilateral 150 118 71 55 48 44 37 33 Private creditors 613 457 873 1,086 1,091 1,373 1,083 1,279 of which: Bonds 27 58 515 998 1,009 1,284 1,005 1,058 Commercial banks 461 310 298 61 58 69 64 61Private nonguaranteed 318 725 618 665 625 637 751 875 of which: Bonds 0 15 84 75 38 36 43 758. Debt stock-flow reconciliationTotal change in external debt stocks 336 3,106 -490 3,793 913 -191 1,217 6,039 Net flows on external debt -399 2,894 -191 634 731 149 236 4,018 Cross-currency valuation 494 315 -364 704 426 -261 1,436 3769. Debt restructuringsTotal amount rescheduled 0 0 0 0 0 0 0 0Total amount forgiven 2 0 0 0 0 0 0 0Debt buyback 0 0 0 0 0 0 0 010. Contractual obligations on outstanding long-term external debt
2008 2009 2010 2011 2012 2013 2014 2015Official creditorsPrincipal 915 880 1,094 1,243 1,175 1,086 1,214 1,021Interest 677 643 600 541 475 417 358 299Private creditorsPrincipal 4,587 3,300 2,827 1,674 1,676 1,220 2,400 1,689Interest 1,379 1,292 1,197 1,103 1,070 966 948 794
Notes:Short-term debt is based on reports provided by the country.
75
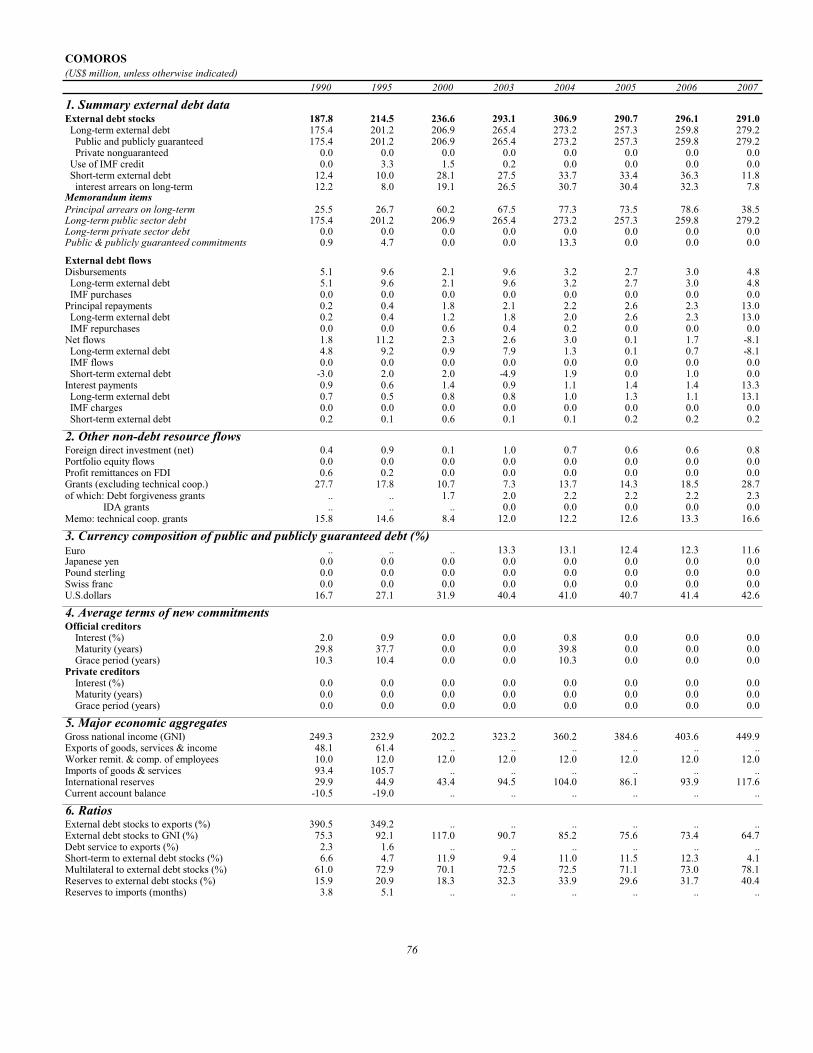
COMOROS(US$ million, unless otherwise indicated)
1990 1995 2000 2003 2004 2005 2006 2007
1. Summary external debt dataExternal debt stocks 187.8 214.5 236.6 293.1 306.9 290.7 296.1 291.0 Long-term external debt 175.4 201.2 206.9 265.4 273.2 257.3 259.8 279.2 Public and publicly guaranteed 175.4 201.2 206.9 265.4 273.2 257.3 259.8 279.2 Private nonguaranteed 0.0 0.0 0.0 0.0 0.0 0.0 0.0 0.0 Use of IMF credit 0.0 3.3 1.5 0.2 0.0 0.0 0.0 0.0 Short-term external debt 12.4 10.0 28.1 27.5 33.7 33.4 36.3 11.8 interest arrears on long-term 12.2 8.0 19.1 26.5 30.7 30.4 32.3 7.8Memorandum itemsPrincipal arrears on long-term 25.5 26.7 60.2 67.5 77.3 73.5 78.6 38.5Long-term public sector debt 175.4 201.2 206.9 265.4 273.2 257.3 259.8 279.2Long-term private sector debt 0.0 0.0 0.0 0.0 0.0 0.0 0.0 0.0Public & publicly guaranteed commitments 0.9 4.7 0.0 0.0 13.3 0.0 0.0 0.0
External debt flowsDisbursements 5.1 9.6 2.1 9.6 3.2 2.7 3.0 4.8 Long-term external debt 5.1 9.6 2.1 9.6 3.2 2.7 3.0 4.8 IMF purchases 0.0 0.0 0.0 0.0 0.0 0.0 0.0 0.0Principal repayments 0.2 0.4 1.8 2.1 2.2 2.6 2.3 13.0 Long-term external debt 0.2 0.4 1.2 1.8 2.0 2.6 2.3 13.0 IMF repurchases 0.0 0.0 0.6 0.4 0.2 0.0 0.0 0.0Net flows 1.8 11.2 2.3 2.6 3.0 0.1 1.7 -8.1 Long-term external debt 4.8 9.2 0.9 7.9 1.3 0.1 0.7 -8.1 IMF flows 0.0 0.0 0.0 0.0 0.0 0.0 0.0 0.0 Short-term external debt -3.0 2.0 2.0 -4.9 1.9 0.0 1.0 0.0Interest payments 0.9 0.6 1.4 0.9 1.1 1.4 1.4 13.3 Long-term external debt 0.7 0.5 0.8 0.8 1.0 1.3 1.1 13.1 IMF charges 0.0 0.0 0.0 0.0 0.0 0.0 0.0 0.0 Short-term external debt 0.2 0.1 0.6 0.1 0.1 0.2 0.2 0.2
2. Other non-debt resource flowsForeign direct investment (net) 0.4 0.9 0.1 1.0 0.7 0.6 0.6 0.8Portfolio equity flows 0.0 0.0 0.0 0.0 0.0 0.0 0.0 0.0Profit remittances on FDI 0.6 0.2 0.0 0.0 0.0 0.0 0.0 0.0Grants (excluding technical coop.) 27.7 17.8 10.7 7.3 13.7 14.3 18.5 28.7of which: Debt forgiveness grants .. .. 1.7 2.0 2.2 2.2 2.2 2.3 IDA grants .. .. .. 0.0 0.0 0.0 0.0 0.0Memo: technical coop. grants 15.8 14.6 8.4 12.0 12.2 12.6 13.3 16.6
3. Currency composition of public and publicly guaranteed debt (%)Euro .. .. .. 13.3 13.1 12.4 12.3 11.6Japanese yen 0.0 0.0 0.0 0.0 0.0 0.0 0.0 0.0Pound sterling 0.0 0.0 0.0 0.0 0.0 0.0 0.0 0.0Swiss franc 0.0 0.0 0.0 0.0 0.0 0.0 0.0 0.0U.S.dollars 16.7 27.1 31.9 40.4 41.0 40.7 41.4 42.6
4. Average terms of new commitmentsOfficial creditors Interest (%) 2.0 0.9 0.0 0.0 0.8 0.0 0.0 0.0 Maturity (years) 29.8 37.7 0.0 0.0 39.8 0.0 0.0 0.0 Grace period (years) 10.3 10.4 0.0 0.0 10.3 0.0 0.0 0.0Private creditors Interest (%) 0.0 0.0 0.0 0.0 0.0 0.0 0.0 0.0 Maturity (years) 0.0 0.0 0.0 0.0 0.0 0.0 0.0 0.0 Grace period (years) 0.0 0.0 0.0 0.0 0.0 0.0 0.0 0.0
5. Major economic aggregatesGross national income (GNI) 249.3 232.9 202.2 323.2 360.2 384.6 403.6 449.9Exports of goods, services & income 48.1 61.4 .. .. .. .. .. ..Worker remit. & comp. of employees 10.0 12.0 12.0 12.0 12.0 12.0 12.0 12.0Imports of goods & services 93.4 105.7 .. .. .. .. .. ..International reserves 29.9 44.9 43.4 94.5 104.0 86.1 93.9 117.6Current account balance -10.5 -19.0 .. .. .. .. .. ..
6. RatiosExternal debt stocks to exports (%) 390.5 349.2 .. .. .. .. .. ..External debt stocks to GNI (%) 75.3 92.1 117.0 90.7 85.2 75.6 73.4 64.7Debt service to exports (%) 2.3 1.6 .. .. .. .. .. ..Short-term to external debt stocks (%) 6.6 4.7 11.9 9.4 11.0 11.5 12.3 4.1Multilateral to external debt stocks (%) 61.0 72.9 70.1 72.5 72.5 71.1 73.0 78.1Reserves to external debt stocks (%) 15.9 20.9 18.3 32.3 33.9 29.6 31.7 40.4Reserves to imports (months) 3.8 5.1 .. .. .. .. .. ..
76

COMOROS(US$ million, unless otherwise indicated)
1990 1995 2000 2003 2004 2005 2006 2007
7. Long-term external debtDebt outstanding and disbursed 175.4 201.2 206.9 265.4 273.2 257.3 259.8 279.2Public and publicly guaranteed 175.4 201.2 206.9 265.4 273.2 257.3 259.8 279.2 Official creditors 175.4 201.2 206.9 265.4 273.2 257.3 259.8 279.2 Multilateral 114.6 156.5 165.9 212.6 222.6 206.8 216.3 227.4 of which: IBRD 0.0 0.0 0.0 0.0 0.0 0.0 0.0 0.0 IDA 37.5 64.1 70.8 112.4 118.7 111.1 117.1 124.4 Bilateral 60.8 44.7 41.1 52.8 50.7 50.6 43.5 51.8 Private creditors 0.0 0.0 0.0 0.0 0.0 0.0 0.0 0.0 of which: Bonds 0.0 0.0 0.0 0.0 0.0 0.0 0.0 0.0 Commercial banks 0.0 0.0 0.0 0.0 0.0 0.0 0.0 0.0Private nonguaranteed 0.0 0.0 0.0 0.0 0.0 0.0 0.0 0.0 of which: Bonds 0.0 0.0 0.0 0.0 0.0 0.0 0.0 0.0Disbursements 5.1 9.6 2.1 9.6 3.2 2.7 3.0 4.8Public and publicly guaranteed 5.1 9.6 2.1 9.6 3.2 2.7 3.0 4.8 Official creditors 5.1 9.6 2.1 9.6 3.2 2.7 3.0 4.8 Multilateral 0.9 9.6 2.1 8.6 3.2 2.7 3.0 4.8 of which: IBRD 0.0 0.0 0.0 0.0 0.0 0.0 0.0 0.0 IDA 0.7 9.6 2.1 8.6 3.2 2.7 3.0 4.8 Bilateral 4.2 0.0 0.0 1.0 0.0 0.0 0.0 0.0 Private creditors 0.0 0.0 0.0 0.0 0.0 0.0 0.0 0.0 of which: Bonds 0.0 0.0 0.0 0.0 0.0 0.0 0.0 0.0 Commercial banks 0.0 0.0 0.0 0.0 0.0 0.0 0.0 0.0Private nonguaranteed 0.0 0.0 0.0 0.0 0.0 0.0 0.0 0.0 of which: Bonds 0.0 0.0 0.0 0.0 0.0 0.0 0.0 0.0Principal repayments 0.2 0.4 1.2 1.8 2.0 2.6 2.3 13.0Public and publicly guaranteed 0.2 0.4 1.2 1.8 2.0 2.6 2.3 13.0 Official creditors 0.2 0.4 1.2 1.8 2.0 2.6 2.3 13.0 Multilateral 0.2 0.4 1.2 1.8 2.0 2.6 2.3 13.0 of which: IBRD 0.0 0.0 0.0 0.0 0.0 0.0 0.0 0.0 IDA 0.1 0.4 0.8 1.3 1.8 2.0 2.0 2.3 Bilateral 0.0 0.0 0.0 0.0 0.0 0.0 0.0 0.0 Private creditors 0.0 0.0 0.0 0.0 0.0 0.0 0.0 0.0 of which: Bonds 0.0 0.0 0.0 0.0 0.0 0.0 0.0 0.0 Commercial banks 0.0 0.0 0.0 0.0 0.0 0.0 0.0 0.0Private nonguaranteed 0.0 0.0 0.0 0.0 0.0 0.0 0.0 0.0 of which: Bonds 0.0 0.0 0.0 0.0 0.0 0.0 0.0 0.0Interest payments 0.7 0.5 0.8 0.8 1.0 1.3 1.1 13.1Public and publicly guaranteed 0.7 0.5 0.8 0.8 1.0 1.3 1.1 13.1 Official creditors 0.7 0.5 0.8 0.8 1.0 1.3 1.1 13.1 Multilateral 0.4 0.5 0.8 0.8 1.0 1.3 1.1 12.9 of which: IBRD 0.0 0.0 0.0 0.0 0.0 0.0 0.0 0.0 IDA 0.3 0.4 0.8 0.7 0.9 0.9 0.9 0.9 Bilateral 0.3 0.0 0.0 0.0 0.0 0.0 0.0 0.2 Private creditors 0.0 0.0 0.0 0.0 0.0 0.0 0.0 0.0 of which: Bonds 0.0 0.0 0.0 0.0 0.0 0.0 0.0 0.0 Commercial banks 0.0 0.0 0.0 0.0 0.0 0.0 0.0 0.0Private nonguaranteed 0.0 0.0 0.0 0.0 0.0 0.0 0.0 0.0 of which: Bonds 0.0 0.0 0.0 0.0 0.0 0.0 0.0 0.08. Debt stock-flow reconciliationTotal change in external debt stocks 10.7 11.9 0.6 18.6 13.8 -16.3 5.4 -5.1 Net flows on external debt 1.8 11.2 2.3 2.6 3.0 0.1 1.7 -8.1 Cross-currency valuation 2.5 -3.4 -9.5 13.6 6.6 -12.0 6.9 7.29. Debt restructuringsTotal amount rescheduled 0.0 2.0 0.0 0.0 0.0 0.0 0.0 68.6Total amount forgiven 0.1 0.4 0.0 0.0 0.0 0.0 0.0 0.0Debt buyback 0.0 0.0 0.0 0.0 0.0 0.0 0.0 0.010. Contractual obligations on outstanding long-term external debt
2008 2009 2010 2011 2012 2013 2014 2015Official creditorsPrincipal 7.7 7.8 7.5 7.7 8.0 7.3 7.5 7.9Interest 1.8 1.8 1.8 1.7 1.7 1.7 1.6 1.6Private creditorsPrincipal 0.0 0.0 0.0 0.0 0.0 0.0 0.0 0.0Interest 0.0 0.0 0.0 0.0 0.0 0.0 0.0 0.0
77

CONGO, DEMOCRATIC REPUBLIC OF(US$ million, unless otherwise indicated)
1990 1995 2000 2003 2004 2005 2006 2007
1. Summary external debt dataExternal debt stocks 10,259 13,239 11,692 11,254 11,434 10,600 11,201 12,283 Long-term external debt 8,994 9,636 7,880 10,161 10,125 9,412 9,848 10,853 Public and publicly guaranteed 8,994 9,636 7,880 10,161 10,125 9,412 9,848 10,853 Private nonguaranteed 0 0 0 0 0 0 0 0 Use of IMF credit 521 485 391 703 818 791 833 808 Short-term external debt 744 3,118 3,421 390 491 397 520 621 interest arrears on long-term 265 2,937 3,042 363 372 359 378 444Memorandum itemsPrincipal arrears on long-term 1,050 4,569 4,949 907 938 1,186 1,278 1,538Long-term public sector debt 8,994 9,621 7,867 10,161 10,125 9,412 9,848 10,853Long-term private sector debt 0 15 13 0 0 0 0 0Public & publicly guaranteed commitments 109 14 0 300 459 88 54 130
External debt flowsDisbursements 315 0 0 265 291 288 146 109 Long-term external debt 315 0 0 190 211 249 146 109 IMF purchases 0 0 0 75 79 39 0 0Principal repayments 201 1 0 56 67 112 172 283 Long-term external debt 49 0 0 56 67 112 172 219 IMF repurchases 152 1 0 0 0 0 0 64Net flows 88 61 20 -67 315 95 79 -135 Long-term external debt 266 0 0 134 144 137 -25 -110 IMF flows -147 -1 0 0 0 0 0 0 Short-term external debt -27 63 20 -276 92 -81 104 39Interest payments 147 24 25 91 73 102 148 291 Long-term external debt 88 0 0 85 69 97 139 279 IMF charges 38 16 0 1 2 2 4 4 Short-term external debt 21 8 25 5 2 3 5 8
2. Other non-debt resource flowsForeign direct investment (net) 23 122 166 323 10 -76 -116 720Portfolio equity flows 0 0 0 0 0 0 0 0Profit remittances on FDI 0 0 0 0 0 0 0 0Grants (excluding technical coop.) 374 161 137 4,846 1,460 1,057 1,754 1,112of which: Debt forgiveness grants .. .. 12 4,458 780 174 857 170 IDA grants .. .. .. 40 56 194 131 121Memo: technical coop. grants 146 55 48 125 139 184 178 115
3. Currency composition of public and publicly guaranteed debt (%)Euro .. .. .. 36.9 33.3 30.1 31.4 31.0Japanese yen 3.0 3.7 4.8 7.5 7.8 7.3 6.8 6.4Pound sterling 1.2 0.9 1.1 1.2 1.3 1.2 1.3 1.2Swiss franc 0.2 0.3 0.2 0.4 0.3 0.3 0.3 0.2U.S.dollars 41.5 40.8 44.6 41.7 43.1 46.0 45.3 41.9
4. Average terms of new commitmentsOfficial creditors Interest (%) 5.9 2.5 0.0 0.8 0.8 0.1 0.0 0.0 Maturity (years) 23.8 19.9 0.0 43.5 41.3 41.1 40.0 40.0 Grace period (years) 6.4 4.4 0.0 10.3 10.0 2.1 1.0 11.0Private creditors Interest (%) 0.0 0.0 0.0 2.0 0.0 0.0 0.0 0.0 Maturity (years) 0.0 0.0 0.0 11.1 0.0 0.0 0.0 0.0 Grace period (years) 0.0 0.0 0.0 2.9 0.0 0.0 0.0 0.0
5. Major economic aggregatesGross national income (GNI) 8,579 4,878 3,918 5,485 6,276 6,760 8,145 8,597Exports of goods, services & income .. .. .. .. .. .. .. ..Worker remit. & comp. of employees 0 0 0 0 0 0 0 0Imports of goods & services .. .. .. .. .. .. .. ..International reserves 261 157 83 98 236 131 155 181Current account balance .. .. .. .. .. .. .. ..
6. RatiosExternal debt stocks to exports (%) .. .. .. .. .. .. .. ..External debt stocks to GNI (%) 119.6 271.4 298.4 205.2 182.2 156.8 137.5 142.9Debt service to exports (%) .. .. .. .. .. .. .. ..Short-term to external debt stocks (%) 7.2 23.6 29.3 3.5 4.3 3.7 4.6 5.1Multilateral to external debt stocks (%) 18.6 18.0 18.5 24.8 27.1 28.8 29.3 33.1Reserves to external debt stocks (%) 2.5 1.2 0.7 0.9 2.1 1.2 1.4 1.5Reserves to imports (months) .. .. .. .. .. .. .. ..
78
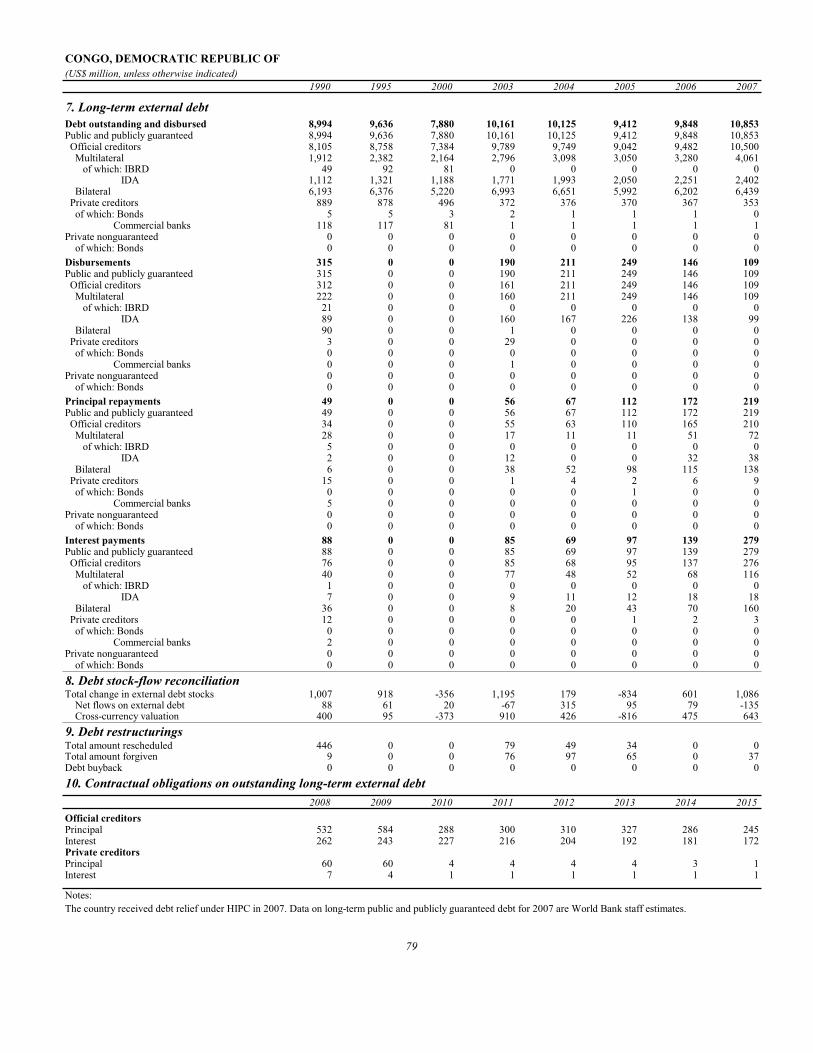
CONGO, DEMOCRATIC REPUBLIC OF(US$ million, unless otherwise indicated)
1990 1995 2000 2003 2004 2005 2006 2007
7. Long-term external debtDebt outstanding and disbursed 8,994 9,636 7,880 10,161 10,125 9,412 9,848 10,853Public and publicly guaranteed 8,994 9,636 7,880 10,161 10,125 9,412 9,848 10,853 Official creditors 8,105 8,758 7,384 9,789 9,749 9,042 9,482 10,500 Multilateral 1,912 2,382 2,164 2,796 3,098 3,050 3,280 4,061 of which: IBRD 49 92 81 0 0 0 0 0 IDA 1,112 1,321 1,188 1,771 1,993 2,050 2,251 2,402 Bilateral 6,193 6,376 5,220 6,993 6,651 5,992 6,202 6,439 Private creditors 889 878 496 372 376 370 367 353 of which: Bonds 5 5 3 2 1 1 1 0 Commercial banks 118 117 81 1 1 1 1 1Private nonguaranteed 0 0 0 0 0 0 0 0 of which: Bonds 0 0 0 0 0 0 0 0Disbursements 315 0 0 190 211 249 146 109Public and publicly guaranteed 315 0 0 190 211 249 146 109 Official creditors 312 0 0 161 211 249 146 109 Multilateral 222 0 0 160 211 249 146 109 of which: IBRD 21 0 0 0 0 0 0 0 IDA 89 0 0 160 167 226 138 99 Bilateral 90 0 0 1 0 0 0 0 Private creditors 3 0 0 29 0 0 0 0 of which: Bonds 0 0 0 0 0 0 0 0 Commercial banks 0 0 0 1 0 0 0 0Private nonguaranteed 0 0 0 0 0 0 0 0 of which: Bonds 0 0 0 0 0 0 0 0Principal repayments 49 0 0 56 67 112 172 219Public and publicly guaranteed 49 0 0 56 67 112 172 219 Official creditors 34 0 0 55 63 110 165 210 Multilateral 28 0 0 17 11 11 51 72 of which: IBRD 5 0 0 0 0 0 0 0 IDA 2 0 0 12 0 0 32 38 Bilateral 6 0 0 38 52 98 115 138 Private creditors 15 0 0 1 4 2 6 9 of which: Bonds 0 0 0 0 0 1 0 0 Commercial banks 5 0 0 0 0 0 0 0Private nonguaranteed 0 0 0 0 0 0 0 0 of which: Bonds 0 0 0 0 0 0 0 0Interest payments 88 0 0 85 69 97 139 279Public and publicly guaranteed 88 0 0 85 69 97 139 279 Official creditors 76 0 0 85 68 95 137 276 Multilateral 40 0 0 77 48 52 68 116 of which: IBRD 1 0 0 0 0 0 0 0 IDA 7 0 0 9 11 12 18 18 Bilateral 36 0 0 8 20 43 70 160 Private creditors 12 0 0 0 0 1 2 3 of which: Bonds 0 0 0 0 0 0 0 0 Commercial banks 2 0 0 0 0 0 0 0Private nonguaranteed 0 0 0 0 0 0 0 0 of which: Bonds 0 0 0 0 0 0 0 08. Debt stock-flow reconciliationTotal change in external debt stocks 1,007 918 -356 1,195 179 -834 601 1,086 Net flows on external debt 88 61 20 -67 315 95 79 -135 Cross-currency valuation 400 95 -373 910 426 -816 475 6439. Debt restructuringsTotal amount rescheduled 446 0 0 79 49 34 0 0Total amount forgiven 9 0 0 76 97 65 0 37Debt buyback 0 0 0 0 0 0 0 010. Contractual obligations on outstanding long-term external debt
2008 2009 2010 2011 2012 2013 2014 2015Official creditorsPrincipal 532 584 288 300 310 327 286 245Interest 262 243 227 216 204 192 181 172Private creditorsPrincipal 60 60 4 4 4 4 3 1Interest 7 4 1 1 1 1 1 1
Notes:The country received debt relief under HIPC in 2007. Data on long-term public and publicly guaranteed debt for 2007 are World Bank staff estimates.
79

CONGO, REPUBLIC OF(US$ million, unless otherwise indicated)
1990 1995 2000 2003 2004 2005 2006 2007
1. Summary external debt dataExternal debt stocks 4,915 5,896 4,790 5,412 6,619 5,831 6,011 5,156 Long-term external debt 4,171 4,874 3,687 4,343 5,521 5,088 5,245 4,807 Public and publicly guaranteed 4,171 4,874 3,687 4,343 5,521 5,088 5,245 4,807 Private nonguaranteed 0 0 0 0 0 0 0 0 Use of IMF credit 11 19 41 28 29 26 35 37 Short-term external debt 733 1,004 1,061 1,041 1,069 717 730 312 interest arrears on long-term 178 414 640 1,010 762 706 719 301Memorandum itemsPrincipal arrears on long-term 569 952 1,734 2,560 2,666 2,518 2,569 1,136Long-term public sector debt 4,171 4,874 3,687 4,343 5,521 5,088 5,245 4,807Long-term private sector debt 0 0 0 0 0 0 0 0Public & publicly guaranteed commitments 192 31 0 28 40 6 22 14
External debt flowsDisbursements 318 15 15 25 40 59 22 11 Long-term external debt 312 15 1 25 28 48 10 11 IMF purchases 5 0 14 0 12 12 12 0Principal repayments 357 84 6 33 119 71 50 42 Long-term external debt 350 82 6 25 107 59 46 42 IMF repurchases 7 2 0 8 12 12 4 0Net flows 99 166 -51 -248 197 -308 -29 -32 Long-term external debt -38 -67 -4 0 -79 -11 -36 -31 IMF flows -1 -2 14 -4 -8 -8 0 0 Short-term external debt 138 236 -61 -240 276 -296 0 -1Interest payments 163 97 38 29 99 35 41 32 Long-term external debt 114 61 7 28 88 35 40 31 IMF charges 1 1 1 0 0 0 0 0 Short-term external debt 48 35 30 1 11 0 0 0
2. Other non-debt resource flowsForeign direct investment (net) -14 125 166 323 -9 1,810 2,890 4,289Portfolio equity flows 0 0 0 0 0 0 0 0Profit remittances on FDI 0 326 466 388 647 1,296 1,403 1,651Grants (excluding technical coop.) 50 86 32 33 77 1,308 255 95of which: Debt forgiveness grants .. .. 6 3 5 1,234 157 13 IDA grants .. .. .. 0 6 11 10 13Memo: technical coop. grants 51 41 19 32 32 32 30 46
3. Currency composition of public and publicly guaranteed debt (%)Euro .. .. .. 52.7 37.6 33.4 34.4 37.2Japanese yen 0.2 0.2 0.2 0.2 0.2 0.2 0.2 0.2Pound sterling 5.4 3.5 4.9 4.9 3.7 4.2 4.6 3.8Swiss franc 0.4 0.5 0.3 0.3 0.1 0.2 0.2 0.3U.S.dollars 16.5 24.0 29.5 25.9 53.2 55.9 54.8 52.7
4. Average terms of new commitmentsOfficial creditors Interest (%) 4.3 2.2 0.0 0.8 0.8 4.2 0.0 0.7 Maturity (years) 16.9 31.8 0.0 39.6 42.4 23.7 40.0 25.4 Grace period (years) 7.2 9.0 0.0 10.1 10.4 7.2 1.0 6.8Private creditors Interest (%) 9.9 0.0 0.0 0.0 0.0 0.0 0.0 0.0 Maturity (years) 8.3 0.0 0.0 0.0 0.0 0.0 0.0 0.0 Grace period (years) 4.1 0.0 0.0 0.0 0.0 0.0 0.0 0.0
5. Major economic aggregatesGross national income (GNI) 2,324 1,228 2,275 2,679 3,247 4,509 5,979 5,989Exports of goods, services & income 1,503 1,384 2,644 2,846 3,649 4,983 6,352 6,151Worker remit. & comp. of employees 0 4 10 13 15 11 13 15Imports of goods & services 1,757 2,050 2,013 2,303 2,947 4,318 6,202 8,294International reserves 10 64 225 39 124 738 1,848 2,184Current account balance -251 -625 648 520 674 696 124 -2,181
6. RatiosExternal debt stocks to exports (%) 327.1 426.0 181.2 190.2 181.4 117.0 94.6 83.8External debt stocks to GNI (%) 211.5 480.0 210.5 202.0 203.8 129.3 100.5 86.1Debt service to exports (%) 34.6 13.1 1.6 2.2 6.0 2.1 1.4 1.2Short-term to external debt stocks (%) 14.9 17.0 22.2 19.2 16.2 12.3 12.2 6.0Multilateral to external debt stocks (%) 11.3 10.8 10.5 10.1 7.6 8.6 8.3 9.3Reserves to external debt stocks (%) 0.2 1.1 4.7 0.7 1.9 12.6 30.7 42.3Reserves to imports (months) 0.1 0.4 1.3 0.2 0.5 2.0 3.6 3.2
80

CONGO, REPUBLIC OF(US$ million, unless otherwise indicated)
1990 1995 2000 2003 2004 2005 2006 2007
7. Long-term external debtDebt outstanding and disbursed 4,171 4,874 3,687 4,343 5,521 5,088 5,245 4,807Public and publicly guaranteed 4,171 4,874 3,687 4,343 5,521 5,088 5,245 4,807 Official creditors 3,032 3,966 2,928 3,512 3,310 2,980 3,108 3,274 Multilateral 555 634 503 544 502 499 501 477 of which: IBRD 164 105 65 3 0 0 0 0 IDA 75 174 159 235 269 280 295 303 Bilateral 2,477 3,332 2,425 2,968 2,808 2,481 2,607 2,796 Private creditors 1,139 908 760 830 2,210 2,108 2,137 1,533 of which: Bonds 0 0 0 0 0 0 0 0 Commercial banks 724 785 693 740 2,113 2,023 2,043 1,452Private nonguaranteed 0 0 0 0 0 0 0 0 of which: Bonds 0 0 0 0 0 0 0 0Disbursements 312 15 1 25 28 48 10 11Public and publicly guaranteed 312 15 1 25 28 48 10 11 Official creditors 127 15 1 25 28 48 10 11 Multilateral 11 1 0 24 27 45 8 10 of which: IBRD 2 1 0 0 0 0 0 0 IDA 0 0 0 24 27 35 8 2 Bilateral 116 14 1 1 1 3 2 1 Private creditors 185 0 0 0 0 0 0 0 of which: Bonds 0 0 0 0 0 0 0 0 Commercial banks 174 0 0 0 0 0 0 0Private nonguaranteed 0 0 0 0 0 0 0 0 of which: Bonds 0 0 0 0 0 0 0 0Principal repayments 350 82 6 25 107 59 46 42Public and publicly guaranteed 350 82 6 25 107 59 46 42 Official creditors 66 32 6 25 107 59 46 42 Multilateral 26 19 6 24 98 43 28 22 of which: IBRD 6 18 2 6 3 0 0 0 IDA 0 1 1 2 4 5 5 5 Bilateral 40 13 0 1 9 16 19 20 Private creditors 283 50 0 0 0 0 0 0 of which: Bonds 0 0 0 0 0 0 0 0 Commercial banks 255 46 0 0 0 0 0 0Private nonguaranteed 0 0 0 0 0 0 0 0 of which: Bonds 0 0 0 0 0 0 0 0Interest payments 114 61 7 28 88 35 40 31Public and publicly guaranteed 114 61 7 28 88 35 40 31 Official creditors 62 20 7 28 88 35 40 31 Multilateral 25 11 7 23 84 25 14 11 of which: IBRD 12 10 1 1 0 0 0 0 IDA 1 1 1 2 2 2 2 2 Bilateral 38 9 0 5 4 10 27 21 Private creditors 51 40 0 0 0 0 0 0 of which: Bonds 0 0 0 0 0 0 0 0 Commercial banks 44 39 0 0 0 0 0 0Private nonguaranteed 0 0 0 0 0 0 0 0 of which: Bonds 0 0 0 0 0 0 0 08. Debt stock-flow reconciliationTotal change in external debt stocks 685 588 -138 363 1,207 -788 180 -855 Net flows on external debt 99 166 -51 -248 197 -308 -29 -32 Cross-currency valuation 316 116 -157 436 202 -320 243 2389. Debt restructuringsTotal amount rescheduled 780 108 0 0 1,097 96 136 802Total amount forgiven 0 24 0 0 915 110 112 1,063Debt buyback 0 0 0 0 0 0 0 010. Contractual obligations on outstanding long-term external debt
2008 2009 2010 2011 2012 2013 2014 2015Official creditorsPrincipal 227 228 63 102 108 115 120 112Interest 81 67 55 53 50 47 44 41Private creditorsPrincipal 0 0 0 0 23 46 46 46Interest 23 23 23 23 23 22 21 20
Notes:Data include the effects of London Club debt restructuring agreement signed in 2007.
81

COSTA RICA(US$ million, unless otherwise indicated)
1990 1995 2000 2003 2004 2005 2006 2007
1. Summary external debt dataExternal debt stocks 3,756 3,802 4,695 5,650 5,514 5,996 6,591 7,846 Long-term external debt 3,367 3,348 3,740 4,024 3,834 3,892 4,266 4,884 Public and publicly guaranteed 3,063 3,133 3,504 3,849 3,555 3,244 3,428 3,750 Private nonguaranteed 304 214 236 175 279 648 837 1,134 Use of IMF credit 11 24 0 0 0 0 0 0 Short-term external debt 377 430 955 1,626 1,680 2,104 2,326 2,962 interest arrears on long-term 77 32 20 16 10 9 10 10Memorandum itemsPrincipal arrears on long-term 173 118 68 63 40 40 40 40Long-term public sector debt 3,059 3,131 3,502 3,848 3,555 3,244 3,428 3,750Long-term private sector debt 308 216 237 176 279 648 837 1,135Public & publicly guaranteed commitments 230 25 824 902 292 358 211 70
External debt flowsDisbursements 206 211 758 945 385 412 477 483 Long-term external debt 206 211 758 945 385 412 477 483 IMF purchases 0 0 0 0 0 0 0 0Principal repayments 295 399 387 530 508 388 382 372 Long-term external debt 269 355 387 530 508 388 382 372 IMF repurchases 26 44 0 0 0 0 0 0Net flows -108 -146 550 542 -62 449 315 747 Long-term external debt -63 -144 371 415 -122 24 94 111 IMF flows -26 -44 0 0 0 0 0 0 Short-term external debt -20 42 179 128 60 425 221 636Interest payments 206 251 261 299 198 209 215 256 Long-term external debt 171 224 205 237 132 115 107 120 IMF charges 3 3 0 0 0 0 0 0 Short-term external debt 32 23 56 62 66 94 109 136
2. Other non-debt resource flowsForeign direct investment (net) 163 337 409 575 794 861 1,469 1,896Portfolio equity flows 0 0 0 0 0 0 0 0Profit remittances on FDI 60 109 1,141 644 330 743 853 1,131Grants (excluding technical coop.) 110 30 25 24 32 27 22 57of which: Debt forgiveness grants .. .. 0 0 0 0 0 0 IDA grants .. .. .. 0 0 0 0 0Memo: technical coop. grants 73 77 23 29 28 28 29 45
3. Currency composition of public and publicly guaranteed debt (%)Euro .. .. .. 1.5 1.6 1.3 1.2 1.3Japanese yen 3.0 8.1 4.0 3.0 3.0 2.7 2.1 2.5Pound sterling 0.2 0.1 0.0 0.0 0.0 0.0 0.0 0.0Swiss franc 0.0 0.0 0.0 0.0 0.0 0.0 0.0 0.0U.S.dollars 58.2 49.4 70.1 74.4 72.7 77.9 81.0 83.4
4. Average terms of new commitmentsOfficial creditors Interest (%) 6.4 2.2 6.3 5.5 6.3 5.7 2.3 5.9 Maturity (years) 17.6 7.3 4.3 12.5 8.3 17.5 22.1 11.7 Grace period (years) 5.0 1.2 1.8 2.9 3.2 4.0 6.5 4.8Private creditors Interest (%) 9.5 6.9 8.3 7.1 6.5 8.2 6.9 0.0 Maturity (years) 3.2 6.0 17.3 9.5 10.0 12.1 10.3 0.0 Grace period (years) 1.1 1.5 17.3 7.8 10.0 0.5 10.3 0.0
5. Major economic aggregatesGross national income (GNI) 7,151 11,497 14,697 16,804 17,818 19,174 21,788 25,468Exports of goods, services & income 2,094 4,713 8,113 8,636 9,058 10,928 12,673 14,213Worker remit. & comp. of employees 12 123 136 321 320 420 513 635Imports of goods & services 2,709 5,089 8,793 9,419 9,764 11,779 13,585 15,665International reserves 525 1,060 1,318 1,840 1,923 2,314 3,117 4,115Current account balance -424 -358 -707 -880 -796 -981 -1,053 -1,578
6. RatiosExternal debt stocks to exports (%) 179.4 80.7 57.9 65.4 60.9 54.9 52.0 55.2External debt stocks to GNI (%) 52.5 33.1 31.9 33.6 30.9 31.3 30.3 30.8Debt service to exports (%) 23.9 13.8 8.0 9.6 7.8 5.5 4.7 4.4Short-term to external debt stocks (%) 10.0 11.3 20.3 28.8 30.5 35.1 35.3 37.8Multilateral to external debt stocks (%) 30.4 36.3 27.8 25.9 25.8 19.4 18.9 14.4Reserves to external debt stocks (%) 14.0 27.9 28.1 32.6 34.9 38.6 47.3 52.4Reserves to imports (months) 2.3 2.5 1.8 2.3 2.4 2.4 2.8 3.2
82
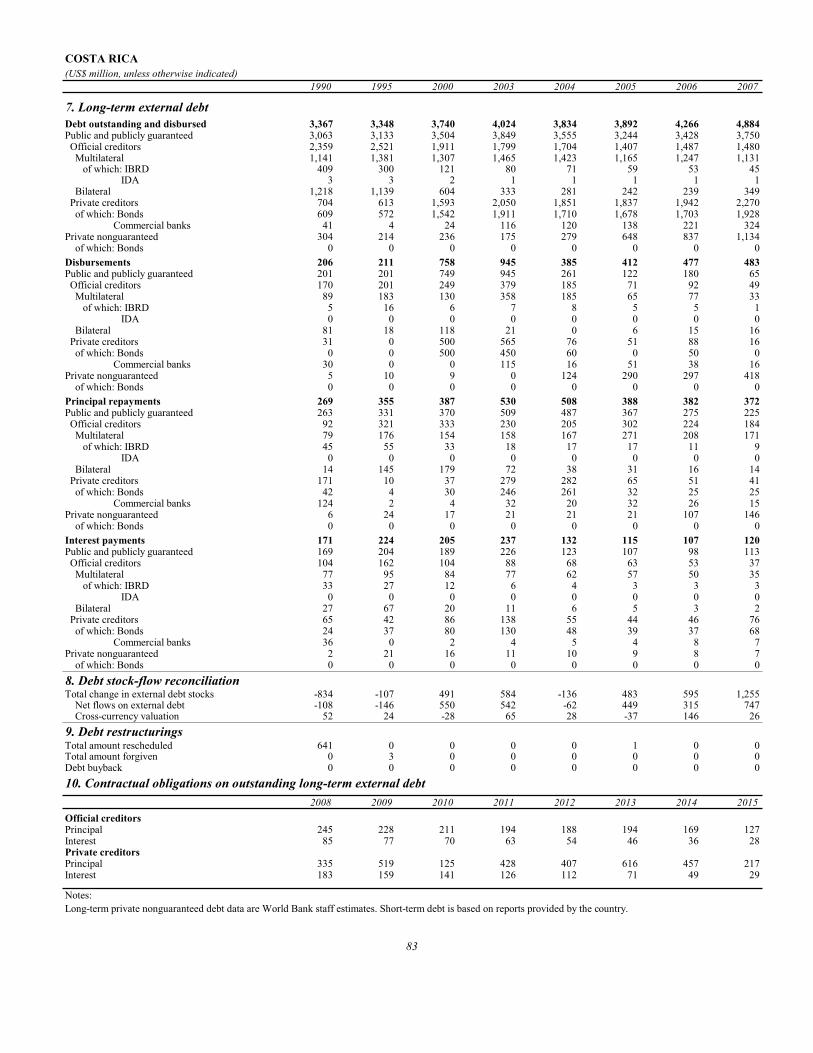
COSTA RICA(US$ million, unless otherwise indicated)
1990 1995 2000 2003 2004 2005 2006 2007
7. Long-term external debtDebt outstanding and disbursed 3,367 3,348 3,740 4,024 3,834 3,892 4,266 4,884Public and publicly guaranteed 3,063 3,133 3,504 3,849 3,555 3,244 3,428 3,750 Official creditors 2,359 2,521 1,911 1,799 1,704 1,407 1,487 1,480 Multilateral 1,141 1,381 1,307 1,465 1,423 1,165 1,247 1,131 of which: IBRD 409 300 121 80 71 59 53 45 IDA 3 3 2 1 1 1 1 1 Bilateral 1,218 1,139 604 333 281 242 239 349 Private creditors 704 613 1,593 2,050 1,851 1,837 1,942 2,270 of which: Bonds 609 572 1,542 1,911 1,710 1,678 1,703 1,928 Commercial banks 41 4 24 116 120 138 221 324Private nonguaranteed 304 214 236 175 279 648 837 1,134 of which: Bonds 0 0 0 0 0 0 0 0Disbursements 206 211 758 945 385 412 477 483Public and publicly guaranteed 201 201 749 945 261 122 180 65 Official creditors 170 201 249 379 185 71 92 49 Multilateral 89 183 130 358 185 65 77 33 of which: IBRD 5 16 6 7 8 5 5 1 IDA 0 0 0 0 0 0 0 0 Bilateral 81 18 118 21 0 6 15 16 Private creditors 31 0 500 565 76 51 88 16 of which: Bonds 0 0 500 450 60 0 50 0 Commercial banks 30 0 0 115 16 51 38 16Private nonguaranteed 5 10 9 0 124 290 297 418 of which: Bonds 0 0 0 0 0 0 0 0Principal repayments 269 355 387 530 508 388 382 372Public and publicly guaranteed 263 331 370 509 487 367 275 225 Official creditors 92 321 333 230 205 302 224 184 Multilateral 79 176 154 158 167 271 208 171 of which: IBRD 45 55 33 18 17 17 11 9 IDA 0 0 0 0 0 0 0 0 Bilateral 14 145 179 72 38 31 16 14 Private creditors 171 10 37 279 282 65 51 41 of which: Bonds 42 4 30 246 261 32 25 25 Commercial banks 124 2 4 32 20 32 26 15Private nonguaranteed 6 24 17 21 21 21 107 146 of which: Bonds 0 0 0 0 0 0 0 0Interest payments 171 224 205 237 132 115 107 120Public and publicly guaranteed 169 204 189 226 123 107 98 113 Official creditors 104 162 104 88 68 63 53 37 Multilateral 77 95 84 77 62 57 50 35 of which: IBRD 33 27 12 6 4 3 3 3 IDA 0 0 0 0 0 0 0 0 Bilateral 27 67 20 11 6 5 3 2 Private creditors 65 42 86 138 55 44 46 76 of which: Bonds 24 37 80 130 48 39 37 68 Commercial banks 36 0 2 4 5 4 8 7Private nonguaranteed 2 21 16 11 10 9 8 7 of which: Bonds 0 0 0 0 0 0 0 08. Debt stock-flow reconciliationTotal change in external debt stocks -834 -107 491 584 -136 483 595 1,255 Net flows on external debt -108 -146 550 542 -62 449 315 747 Cross-currency valuation 52 24 -28 65 28 -37 146 269. Debt restructuringsTotal amount rescheduled 641 0 0 0 0 1 0 0Total amount forgiven 0 3 0 0 0 0 0 0Debt buyback 0 0 0 0 0 0 0 010. Contractual obligations on outstanding long-term external debt
2008 2009 2010 2011 2012 2013 2014 2015Official creditorsPrincipal 245 228 211 194 188 194 169 127Interest 85 77 70 63 54 46 36 28Private creditorsPrincipal 335 519 125 428 407 616 457 217Interest 183 159 141 126 112 71 49 29
Notes:Long-term private nonguaranteed debt data are World Bank staff estimates. Short-term debt is based on reports provided by the country.
83
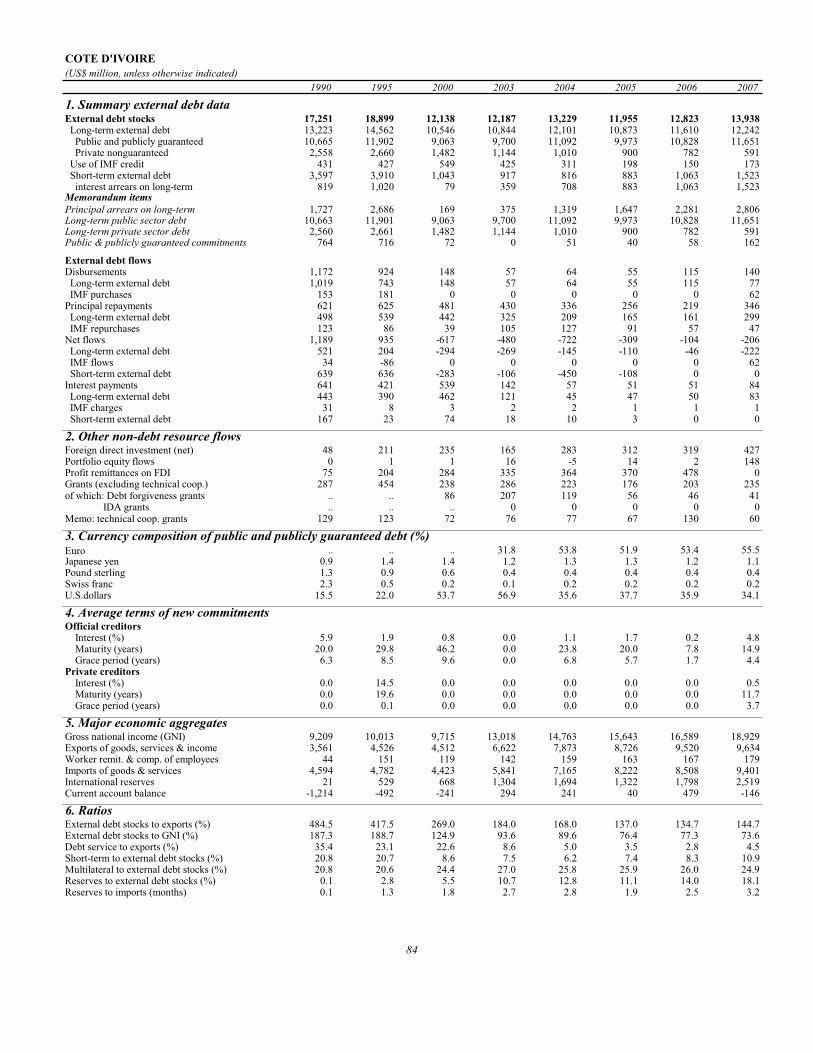
COTE D'IVOIRE(US$ million, unless otherwise indicated)
1990 1995 2000 2003 2004 2005 2006 2007
1. Summary external debt dataExternal debt stocks 17,251 18,899 12,138 12,187 13,229 11,955 12,823 13,938 Long-term external debt 13,223 14,562 10,546 10,844 12,101 10,873 11,610 12,242 Public and publicly guaranteed 10,665 11,902 9,063 9,700 11,092 9,973 10,828 11,651 Private nonguaranteed 2,558 2,660 1,482 1,144 1,010 900 782 591 Use of IMF credit 431 427 549 425 311 198 150 173 Short-term external debt 3,597 3,910 1,043 917 816 883 1,063 1,523 interest arrears on long-term 819 1,020 79 359 708 883 1,063 1,523Memorandum itemsPrincipal arrears on long-term 1,727 2,686 169 375 1,319 1,647 2,281 2,806Long-term public sector debt 10,663 11,901 9,063 9,700 11,092 9,973 10,828 11,651Long-term private sector debt 2,560 2,661 1,482 1,144 1,010 900 782 591Public & publicly guaranteed commitments 764 716 72 0 51 40 58 162
External debt flowsDisbursements 1,172 924 148 57 64 55 115 140 Long-term external debt 1,019 743 148 57 64 55 115 77 IMF purchases 153 181 0 0 0 0 0 62Principal repayments 621 625 481 430 336 256 219 346 Long-term external debt 498 539 442 325 209 165 161 299 IMF repurchases 123 86 39 105 127 91 57 47Net flows 1,189 935 -617 -480 -722 -309 -104 -206 Long-term external debt 521 204 -294 -269 -145 -110 -46 -222 IMF flows 34 -86 0 0 0 0 0 62 Short-term external debt 639 636 -283 -106 -450 -108 0 0Interest payments 641 421 539 142 57 51 51 84 Long-term external debt 443 390 462 121 45 47 50 83 IMF charges 31 8 3 2 2 1 1 1 Short-term external debt 167 23 74 18 10 3 0 0
2. Other non-debt resource flowsForeign direct investment (net) 48 211 235 165 283 312 319 427Portfolio equity flows 0 1 1 16 -5 14 2 148Profit remittances on FDI 75 204 284 335 364 370 478 0Grants (excluding technical coop.) 287 454 238 286 223 176 203 235of which: Debt forgiveness grants .. .. 86 207 119 56 46 41 IDA grants .. .. .. 0 0 0 0 0Memo: technical coop. grants 129 123 72 76 77 67 130 60
3. Currency composition of public and publicly guaranteed debt (%)Euro .. .. .. 31.8 53.8 51.9 53.4 55.5Japanese yen 0.9 1.4 1.4 1.2 1.3 1.3 1.2 1.1Pound sterling 1.3 0.9 0.6 0.4 0.4 0.4 0.4 0.4Swiss franc 2.3 0.5 0.2 0.1 0.2 0.2 0.2 0.2U.S.dollars 15.5 22.0 53.7 56.9 35.6 37.7 35.9 34.1
4. Average terms of new commitmentsOfficial creditors Interest (%) 5.9 1.9 0.8 0.0 1.1 1.7 0.2 4.8 Maturity (years) 20.0 29.8 46.2 0.0 23.8 20.0 7.8 14.9 Grace period (years) 6.3 8.5 9.6 0.0 6.8 5.7 1.7 4.4Private creditors Interest (%) 0.0 14.5 0.0 0.0 0.0 0.0 0.0 0.5 Maturity (years) 0.0 19.6 0.0 0.0 0.0 0.0 0.0 11.7 Grace period (years) 0.0 0.1 0.0 0.0 0.0 0.0 0.0 3.7
5. Major economic aggregatesGross national income (GNI) 9,209 10,013 9,715 13,018 14,763 15,643 16,589 18,929Exports of goods, services & income 3,561 4,526 4,512 6,622 7,873 8,726 9,520 9,634Worker remit. & comp. of employees 44 151 119 142 159 163 167 179Imports of goods & services 4,594 4,782 4,423 5,841 7,165 8,222 8,508 9,401International reserves 21 529 668 1,304 1,694 1,322 1,798 2,519Current account balance -1,214 -492 -241 294 241 40 479 -146
6. RatiosExternal debt stocks to exports (%) 484.5 417.5 269.0 184.0 168.0 137.0 134.7 144.7External debt stocks to GNI (%) 187.3 188.7 124.9 93.6 89.6 76.4 77.3 73.6Debt service to exports (%) 35.4 23.1 22.6 8.6 5.0 3.5 2.8 4.5Short-term to external debt stocks (%) 20.8 20.7 8.6 7.5 6.2 7.4 8.3 10.9Multilateral to external debt stocks (%) 20.8 20.6 24.4 27.0 25.8 25.9 26.0 24.9Reserves to external debt stocks (%) 0.1 2.8 5.5 10.7 12.8 11.1 14.0 18.1Reserves to imports (months) 0.1 1.3 1.8 2.7 2.8 1.9 2.5 3.2
84
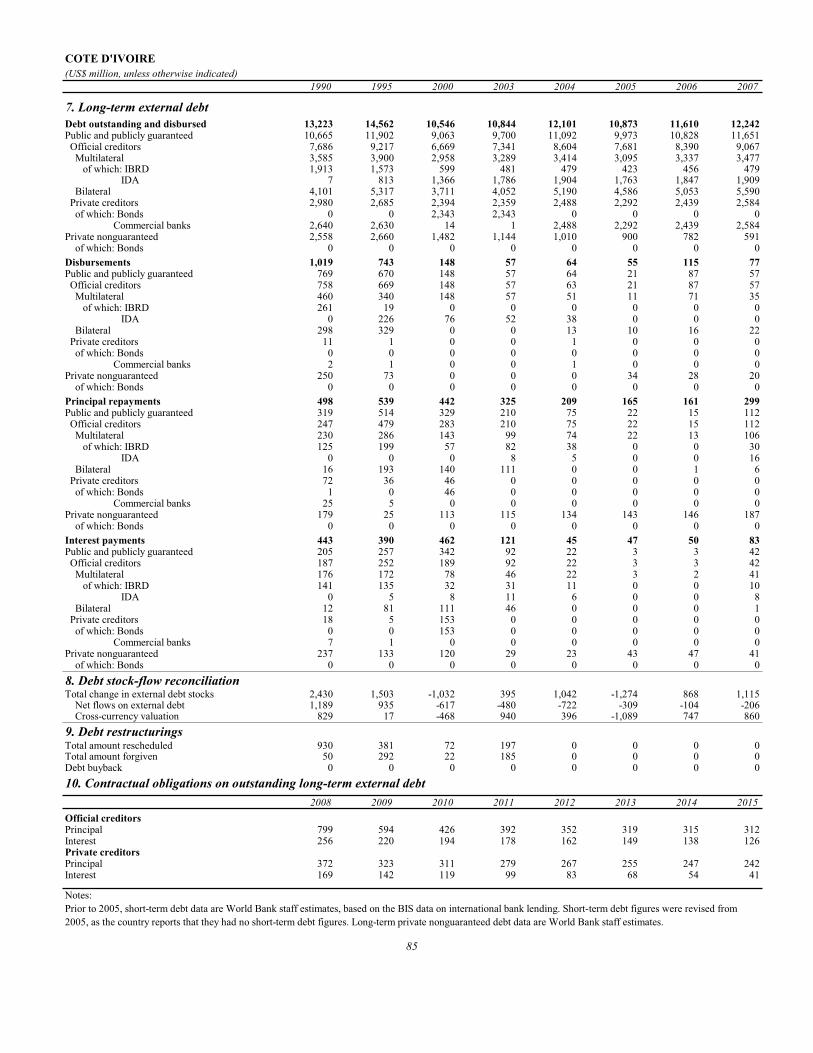
COTE D'IVOIRE(US$ million, unless otherwise indicated)
1990 1995 2000 2003 2004 2005 2006 2007
7. Long-term external debtDebt outstanding and disbursed 13,223 14,562 10,546 10,844 12,101 10,873 11,610 12,242Public and publicly guaranteed 10,665 11,902 9,063 9,700 11,092 9,973 10,828 11,651 Official creditors 7,686 9,217 6,669 7,341 8,604 7,681 8,390 9,067 Multilateral 3,585 3,900 2,958 3,289 3,414 3,095 3,337 3,477 of which: IBRD 1,913 1,573 599 481 479 423 456 479 IDA 7 813 1,366 1,786 1,904 1,763 1,847 1,909 Bilateral 4,101 5,317 3,711 4,052 5,190 4,586 5,053 5,590 Private creditors 2,980 2,685 2,394 2,359 2,488 2,292 2,439 2,584 of which: Bonds 0 0 2,343 2,343 0 0 0 0 Commercial banks 2,640 2,630 14 1 2,488 2,292 2,439 2,584Private nonguaranteed 2,558 2,660 1,482 1,144 1,010 900 782 591 of which: Bonds 0 0 0 0 0 0 0 0Disbursements 1,019 743 148 57 64 55 115 77Public and publicly guaranteed 769 670 148 57 64 21 87 57 Official creditors 758 669 148 57 63 21 87 57 Multilateral 460 340 148 57 51 11 71 35 of which: IBRD 261 19 0 0 0 0 0 0 IDA 0 226 76 52 38 0 0 0 Bilateral 298 329 0 0 13 10 16 22 Private creditors 11 1 0 0 1 0 0 0 of which: Bonds 0 0 0 0 0 0 0 0 Commercial banks 2 1 0 0 1 0 0 0Private nonguaranteed 250 73 0 0 0 34 28 20 of which: Bonds 0 0 0 0 0 0 0 0Principal repayments 498 539 442 325 209 165 161 299Public and publicly guaranteed 319 514 329 210 75 22 15 112 Official creditors 247 479 283 210 75 22 15 112 Multilateral 230 286 143 99 74 22 13 106 of which: IBRD 125 199 57 82 38 0 0 30 IDA 0 0 0 8 5 0 0 16 Bilateral 16 193 140 111 0 0 1 6 Private creditors 72 36 46 0 0 0 0 0 of which: Bonds 1 0 46 0 0 0 0 0 Commercial banks 25 5 0 0 0 0 0 0Private nonguaranteed 179 25 113 115 134 143 146 187 of which: Bonds 0 0 0 0 0 0 0 0Interest payments 443 390 462 121 45 47 50 83Public and publicly guaranteed 205 257 342 92 22 3 3 42 Official creditors 187 252 189 92 22 3 3 42 Multilateral 176 172 78 46 22 3 2 41 of which: IBRD 141 135 32 31 11 0 0 10 IDA 0 5 8 11 6 0 0 8 Bilateral 12 81 111 46 0 0 0 1 Private creditors 18 5 153 0 0 0 0 0 of which: Bonds 0 0 153 0 0 0 0 0 Commercial banks 7 1 0 0 0 0 0 0Private nonguaranteed 237 133 120 29 23 43 47 41 of which: Bonds 0 0 0 0 0 0 0 08. Debt stock-flow reconciliationTotal change in external debt stocks 2,430 1,503 -1,032 395 1,042 -1,274 868 1,115 Net flows on external debt 1,189 935 -617 -480 -722 -309 -104 -206 Cross-currency valuation 829 17 -468 940 396 -1,089 747 8609. Debt restructuringsTotal amount rescheduled 930 381 72 197 0 0 0 0Total amount forgiven 50 292 22 185 0 0 0 0Debt buyback 0 0 0 0 0 0 0 010. Contractual obligations on outstanding long-term external debt
2008 2009 2010 2011 2012 2013 2014 2015Official creditorsPrincipal 799 594 426 392 352 319 315 312Interest 256 220 194 178 162 149 138 126Private creditorsPrincipal 372 323 311 279 267 255 247 242Interest 169 142 119 99 83 68 54 41
Notes:Prior to 2005, short-term debt data are World Bank staff estimates, based on the BIS data on international bank lending. Short-term debt figures were revised from 2005, as the country reports that they had no short-term debt figures. Long-term private nonguaranteed debt data are World Bank staff estimates.
85

CROATIA(US$ million, unless otherwise indicated)
1990 1995 2000 2003 2004 2005 2006 2007
1. Summary external debt dataExternal debt stocks .. 3,830 12,438 25,783 32,968 30,641 38,355 48,584 Long-term external debt .. 3,117 11,338 23,649 29,325 26,328 32,783 43,485 Public and publicly guaranteed .. 1,860 6,111 10,111 11,654 10,035 11,109 14,212 Private nonguaranteed .. 1,257 5,227 13,538 17,671 16,293 21,674 29,273 Use of IMF credit .. 221 158 0 0 0 0 0 Short-term external debt .. 492 942 2,134 3,643 4,313 5,572 5,099 interest arrears on long-term .. 71 45 99 80 78 103 124Memorandum itemsPrincipal arrears on long-term .. 547 209 669 585 608 881 1,042Long-term public sector debt .. 1,309 5,415 9,483 11,125 9,633 10,820 13,966Long-term private sector debt .. 1,808 5,924 14,166 18,200 16,695 21,964 29,519Public & publicly guaranteed commitments .. 359 1,215 2,392 1,971 1,452 1,507 5,092
External debt flowsDisbursements .. 618 3,357 9,193 7,771 5,869 10,688 12,855 Long-term external debt .. 519 3,357 9,193 7,771 5,869 10,688 12,855 IMF purchases .. 99 0 0 0 0 0 0Principal repayments .. 240 2,442 3,495 4,077 4,339 6,650 7,482 Long-term external debt .. 234 2,413 3,495 4,077 4,339 6,650 7,482 IMF repurchases .. 6 29 0 0 0 0 0Net flows .. 627 1,164 7,139 5,222 2,203 5,272 4,879 Long-term external debt .. 285 944 5,698 3,694 1,531 4,038 5,373 IMF flows .. 93 -29 0 0 0 0 0 Short-term external debt .. 249 249 1,441 1,528 672 1,234 -494Interest payments .. 126 598 887 1,203 1,077 1,210 1,591 Long-term external debt .. 98 566 846 1,113 950 1,046 1,437 IMF charges .. 10 9 0 0 0 0 0 Short-term external debt .. 18 23 41 89 127 164 154
2. Other non-debt resource flowsForeign direct investment (net) .. 114 1,083 2,055 1,079 1,788 3,432 4,916Portfolio equity flows .. 4 0 16 178 113 417 435Profit remittances on FDI .. 6 161 1,018 753 1,073 1,328 1,498Grants (excluding technical coop.) .. 31 46 64 63 84 151 137of which: Debt forgiveness grants .. .. 0 0 0 0 0 0 IDA grants .. .. .. 0 0 0 0 0Memo: technical coop. grants .. 21 31 73 77 54 64 40
3. Currency composition of public and publicly guaranteed debt (%)Euro .. .. .. 61.5 67.2 65.7 71.3 77.8Japanese yen .. 3.7 9.6 10.9 9.7 9.8 7.0 3.2Pound sterling .. 3.3 0.6 0.4 0.3 0.3 0.2 0.2Swiss franc .. 2.7 2.0 1.4 1.0 1.1 0.7 0.4U.S.dollars .. 30.2 40.8 23.3 19.7 21.2 19.2 17.3
4. Average terms of new commitmentsOfficial creditors Interest (%) .. 6.1 6.4 3.2 3.3 2.3 4.1 4.6 Maturity (years) .. 13.7 12.5 12.5 12.7 14.3 20.5 19.8 Grace period (years) .. 3.9 5.7 -89.4 3.3 6.9 4.8 5.8Private creditors Interest (%) .. 2.7 5.8 3.1 4.2 2.0 3.2 4.7 Maturity (years) .. 2.4 5.9 7.5 7.3 4.7 6.5 8.1 Grace period (years) .. 1.2 4.6 4.4 7.3 3.0 3.9 5.2
5. Major economic aggregatesGross national income (GNI) .. 18,755 17,938 28,341 34,805 37,678 41,473 49,721Exports of goods, services & income .. 7,672 9,525 16,185 19,318 20,615 23,261 27,518Worker remit. & comp. of employees .. 544 641 1,085 1,222 1,222 1,234 1,394Imports of goods & services .. 9,353 10,404 18,958 21,827 23,800 27,257 32,785International reserves .. 1,896 3,524 8,191 8,758 8,800 11,488 13,675Current account balance .. -1,385 -533 -2,162 -1,875 -2,555 -3,295 -4,447
6. RatiosExternal debt stocks to exports (%) .. 49.9 130.6 159.3 170.7 148.6 164.9 176.6External debt stocks to GNI (%) .. 20.4 69.3 91.0 94.7 81.3 92.5 97.7Debt service to exports (%) .. 4.8 31.9 27.1 27.3 26.3 33.8 33.0Short-term to external debt stocks (%) .. 12.8 7.6 8.3 11.1 14.1 14.5 10.5Multilateral to external debt stocks (%) .. 7.9 4.8 5.5 4.9 5.3 6.3 6.1Reserves to external debt stocks (%) .. 49.5 28.3 31.8 26.6 28.7 30.0 28.1Reserves to imports (months) .. 2.4 4.1 5.2 4.8 4.4 5.1 5.0
86

CROATIA(US$ million, unless otherwise indicated)
1990 1995 2000 2003 2004 2005 2006 2007
7. Long-term external debtDebt outstanding and disbursed .. 3,117 11,338 23,649 29,325 26,328 32,783 43,485Public and publicly guaranteed .. 1,860 6,111 10,111 11,654 10,035 11,109 14,212 Official creditors .. 1,621 1,488 2,611 2,858 2,595 3,395 3,924 Multilateral .. 304 593 1,424 1,615 1,629 2,424 2,974 of which: IBRD .. 117 395 777 856 798 1,028 1,101 IDA .. 0 0 0 0 0 0 0 Bilateral .. 1,317 896 1,187 1,243 966 970 950 Private creditors .. 240 4,623 7,500 8,796 7,440 7,714 10,287 of which: Bonds .. 0 3,136 5,315 6,559 5,065 4,879 5,857 Commercial banks .. 135 1,211 1,937 2,010 2,045 2,507 3,930Private nonguaranteed .. 1,257 5,227 13,538 17,671 16,293 21,674 29,273 of which: Bonds .. 0 0 392 1,131 984 1,006 764Disbursements .. 519 3,357 9,193 7,771 5,869 10,688 12,855Public and publicly guaranteed .. 203 1,513 2,047 1,945 1,040 1,598 3,432 Official creditors .. 72 219 705 317 368 631 518 Multilateral .. 60 83 420 197 328 603 406 of which: IBRD .. 50 55 160 98 81 243 103 IDA .. 0 0 0 0 0 0 0 Bilateral .. 12 136 285 120 40 28 112 Private creditors .. 131 1,293 1,342 1,628 672 966 2,913 of which: Bonds .. 0 833 781 1,245 0 188 754 Commercial banks .. 100 307 519 360 515 695 1,931Private nonguaranteed .. 315 1,844 7,146 5,826 4,830 9,090 9,423 of which: Bonds .. 0 0 216 671 70 286 0Principal repayments .. 234 2,413 3,495 4,077 4,339 6,650 7,482Public and publicly guaranteed .. 73 696 808 1,145 1,453 1,708 1,894 Official creditors .. 52 151 189 266 327 400 506 Multilateral .. 52 44 73 107 139 172 234 of which: IBRD .. 20 22 47 62 70 73 101 IDA .. 0 0 0 0 0 0 0 Bilateral .. 0 107 117 159 188 229 272 Private creditors .. 21 545 618 879 1,127 1,308 1,387 of which: Bonds .. 0 129 302 392 785 754 420 Commercial banks .. 0 376 197 427 286 460 893Private nonguaranteed .. 161 1,717 2,688 2,931 2,885 4,941 5,588 of which: Bonds .. 0 0 0 0 292 0 243Interest payments .. 98 566 846 1,113 950 1,046 1,437Public and publicly guaranteed .. 32 393 416 427 490 509 604 Official creditors .. 27 80 82 94 102 137 181 Multilateral .. 25 32 42 49 57 89 130 of which: IBRD .. 7 19 24 21 26 39 51 IDA .. 0 0 0 0 0 0 0 Bilateral .. 2 48 39 44 45 48 51 Private creditors .. 5 313 334 334 388 372 423 of which: Bonds .. 0 223 259 259 305 266 267 Commercial banks .. 0 77 64 68 77 99 148Private nonguaranteed .. 66 173 430 686 460 537 833 of which: Bonds .. 0 0 32 40 76 85 1848. Debt stock-flow reconciliationTotal change in external debt stocks .. 1,776 1,028 9,094 7,186 -2,328 7,714 10,228 Net flows on external debt .. 627 1,164 7,139 5,222 2,203 5,272 4,879 Cross-currency valuation .. 29 -206 979 527 -1,188 770 9549. Debt restructuringsTotal amount rescheduled .. 1,065 0 0 0 0 0 0Total amount forgiven .. 0 0 0 0 0 0 0Debt buyback .. 0 0 0 0 0 0 010. Contractual obligations on outstanding long-term external debt
2008 2009 2010 2011 2012 2013 2014 2015Official creditorsPrincipal 594 583 394 437 447 451 387 594Interest 221 216 202 190 177 172 153 136Private creditorsPrincipal 6,484 6,719 5,047 6,470 3,264 793 1,551 1,109Interest 1,516 1,338 1,075 841 547 409 385 341
Notes:Short-term debt is based on reports provided by the country.
87

DJIBOUTI(US$ million, unless otherwise indicated)
1990 1995 2000 2003 2004 2005 2006 2007
1. Summary external debt dataExternal debt stocks 205.3 281.8 262.2 385.1 416.7 411.8 462.9 472.2 Long-term external debt 155.2 268.9 237.9 355.5 382.1 376.5 426.0 439.8 Public and publicly guaranteed 155.2 268.9 237.9 355.5 382.1 376.5 426.0 439.8 Private nonguaranteed 0.0 0.0 0.0 0.0 0.0 0.0 0.0 0.0 Use of IMF credit 0.0 0.0 13.4 20.4 21.2 18.7 18.0 16.1 Short-term external debt 50.1 12.9 10.9 9.2 13.4 16.6 18.8 16.3 interest arrears on long-term 0.1 3.5 6.9 8.3 8.7 8.7 9.2 3.3Memorandum itemsPrincipal arrears on long-term 1.2 13.1 24.4 16.8 20.3 22.7 26.4 9.0Long-term public sector debt 155.2 268.9 237.9 355.5 382.1 376.5 426.0 439.8Long-term private sector debt 0.0 0.0 0.0 0.0 0.0 0.0 0.0 0.0Public & publicly guaranteed commitments 6.2 0.0 48.6 27.6 57.0 49.4 37.8 22.7
External debt flowsDisbursements 27.0 18.4 11.3 30.4 26.3 30.6 51.9 29.0 Long-term external debt 27.0 18.4 7.7 30.4 26.3 30.6 51.9 29.0 IMF purchases 0.0 0.0 3.6 0.0 0.0 0.0 0.0 0.0Principal repayments 8.9 9.2 10.7 12.3 13.3 11.2 17.3 37.6 Long-term external debt 8.9 9.2 8.4 10.5 13.1 10.4 15.7 34.8 IMF repurchases 0.0 0.0 2.3 1.8 0.2 0.8 1.6 2.8Net flows 20.8 13.2 -2.2 15.5 16.8 22.6 36.2 -5.2 Long-term external debt 18.0 9.2 -0.7 19.9 13.2 20.2 36.1 -5.8 IMF flows 0.0 0.0 -2.3 -1.8 -0.2 0.0 0.0 0.0 Short-term external debt 2.8 3.9 -2.9 -2.6 3.8 3.2 1.7 3.4Interest payments 6.0 2.5 2.8 3.3 4.4 3.9 5.2 6.8 Long-term external debt 2.1 2.0 2.2 3.1 4.2 3.6 4.9 6.2 IMF charges 0.0 0.0 0.4 0.1 0.1 0.1 0.1 0.1 Short-term external debt 3.9 0.5 0.2 0.0 0.2 0.2 0.3 0.5
2. Other non-debt resource flowsForeign direct investment (net) 0.0 3.2 3.3 14.2 38.5 22.2 108.3 195.4Portfolio equity flows 0.0 0.0 0.0 0.0 0.0 0.0 0.0 0.0Profit remittances on FDI 0.0 4.6 4.2 6.0 6.0 5.9 5.9 0.0Grants (excluding technical coop.) 130.7 48.8 27.9 26.0 30.6 43.7 67.2 82.8of which: Debt forgiveness grants .. .. 0.3 0.1 0.1 0.1 0.1 0.1 IDA grants .. .. .. 1.1 2.6 4.6 4.7 2.7Memo: technical coop. grants 43.8 45.7 23.6 27.6 29.2 31.6 42.0 19.9
3. Currency composition of public and publicly guaranteed debt (%)Euro .. .. .. 14.1 13.9 11.8 11.4 7.2Japanese yen 0.0 0.0 0.0 0.0 0.0 0.0 0.0 0.0Pound sterling 0.0 0.0 0.0 0.0 0.0 0.0 0.0 0.0Swiss franc 0.0 0.0 0.0 0.0 0.0 0.0 0.0 0.0U.S.dollars 13.9 12.4 16.2 32.1 33.6 34.1 34.4 35.5
4. Average terms of new commitmentsOfficial creditors Interest (%) 0.8 0.0 2.3 0.9 2.2 0.9 2.8 4.1 Maturity (years) 39.7 0.0 29.9 25.3 31.8 43.3 9.4 24.8 Grace period (years) 10.2 0.0 6.9 6.1 6.9 10.3 4.6 5.8Private creditors Interest (%) 0.0 0.0 0.0 0.0 0.0 0.0 0.0 0.0 Maturity (years) 0.0 0.0 0.0 0.0 0.0 0.0 0.0 0.0 Grace period (years) 0.0 0.0 0.0 0.0 0.0 0.0 0.0 0.0
5. Major economic aggregatesGross national income (GNI) .. 515.0 567.0 673.0 731.1 775.8 853.9 911.9Exports of goods, services & income .. 221.8 219.2 287.1 287.0 322.8 350.8 ..Worker remit. & comp. of employees 0.0 12.0 0.0 24.7 24.7 25.9 28.5 28.5Imports of goods & services .. 263.5 287.1 315.5 349.3 372.3 443.1 ..International reserves 93.6 72.2 67.8 100.1 93.9 89.3 120.3 132.1Current account balance .. 17.5 -19.0 38.1 3.2 20.1 -17.2 ..
6. RatiosExternal debt stocks to exports (%) .. 127.1 119.6 134.1 145.2 127.6 131.9 ..External debt stocks to GNI (%) .. 54.7 46.2 57.2 57.0 53.1 54.2 51.8Debt service to exports (%) .. 5.2 6.2 5.4 6.2 4.7 6.4 ..Short-term to external debt stocks (%) 24.4 4.6 4.2 2.4 3.2 4.0 4.1 3.5Multilateral to external debt stocks (%) 41.9 48.4 52.8 63.5 65.9 66.2 69.0 74.7Reserves to external debt stocks (%) 45.6 25.6 25.9 26.0 22.5 21.7 26.0 28.0Reserves to imports (months) .. 3.3 2.8 3.8 3.2 2.9 3.3 ..
88

DJIBOUTI(US$ million, unless otherwise indicated)
1990 1995 2000 2003 2004 2005 2006 2007
7. Long-term external debtDebt outstanding and disbursed 155.2 268.9 237.9 355.5 382.1 376.5 426.0 439.8Public and publicly guaranteed 155.2 268.9 237.9 355.5 382.1 376.5 426.0 439.8 Official creditors 155.2 268.9 237.9 349.9 376.6 371.0 420.5 435.3 Multilateral 86.1 136.4 138.3 244.7 274.6 272.7 319.6 352.8 of which: IBRD 0.0 0.0 0.0 0.0 0.0 0.0 0.0 0.0 IDA 31.1 46.2 49.9 112.1 126.4 120.3 133.3 147.2 Bilateral 69.2 132.5 99.6 105.2 102.0 98.3 100.9 82.5 Private creditors 0.0 0.0 0.0 5.6 5.6 5.6 5.6 4.5 of which: Bonds 0.0 0.0 0.0 0.0 0.0 0.0 0.0 0.0 Commercial banks 0.0 0.0 0.0 5.6 5.6 5.6 5.6 4.5Private nonguaranteed 0.0 0.0 0.0 0.0 0.0 0.0 0.0 0.0 of which: Bonds 0.0 0.0 0.0 0.0 0.0 0.0 0.0 0.0Disbursements 27.0 18.4 7.7 30.4 26.3 30.6 51.9 29.0Public and publicly guaranteed 27.0 18.4 7.7 30.4 26.3 30.6 51.9 29.0 Official creditors 27.0 18.4 7.7 30.4 26.3 30.6 51.9 29.0 Multilateral 8.9 10.0 7.7 27.8 25.1 21.3 45.5 26.0 of which: IBRD 0.0 0.0 0.0 0.0 0.0 0.0 0.0 0.0 IDA 2.5 2.8 3.9 25.8 9.8 4.7 8.2 9.7 Bilateral 18.0 8.4 0.0 2.6 1.2 9.3 6.4 2.9 Private creditors 0.0 0.0 0.0 0.0 0.0 0.0 0.0 0.0 of which: Bonds 0.0 0.0 0.0 0.0 0.0 0.0 0.0 0.0 Commercial banks 0.0 0.0 0.0 0.0 0.0 0.0 0.0 0.0Private nonguaranteed 0.0 0.0 0.0 0.0 0.0 0.0 0.0 0.0 of which: Bonds 0.0 0.0 0.0 0.0 0.0 0.0 0.0 0.0Principal repayments 8.9 9.2 8.4 10.5 13.1 10.4 15.7 34.8Public and publicly guaranteed 8.9 9.2 8.4 10.5 13.1 10.4 15.7 34.8 Official creditors 8.3 9.2 8.4 10.5 13.1 10.4 15.7 34.8 Multilateral 3.5 4.4 4.0 3.4 5.1 4.9 9.0 8.6 of which: IBRD 0.0 0.0 0.0 0.0 0.0 0.0 0.0 0.0 IDA 0.0 0.3 0.5 0.9 1.2 1.4 1.2 1.8 Bilateral 4.8 4.8 4.4 7.0 8.0 5.4 6.7 26.2 Private creditors 0.6 0.0 0.0 0.0 0.0 0.0 0.0 0.0 of which: Bonds 0.0 0.0 0.0 0.0 0.0 0.0 0.0 0.0 Commercial banks 0.4 0.0 0.0 0.0 0.0 0.0 0.0 0.0Private nonguaranteed 0.0 0.0 0.0 0.0 0.0 0.0 0.0 0.0 of which: Bonds 0.0 0.0 0.0 0.0 0.0 0.0 0.0 0.0Interest payments 2.1 2.0 2.2 3.1 4.2 3.6 4.9 6.2Public and publicly guaranteed 2.1 2.0 2.2 3.1 4.2 3.6 4.9 6.2 Official creditors 2.1 2.0 2.2 3.1 4.2 3.6 4.9 6.2 Multilateral 1.3 0.9 1.4 2.2 2.6 2.6 3.8 4.7 of which: IBRD 0.0 0.0 0.0 0.0 0.0 0.0 0.0 0.0 IDA 0.2 0.3 0.4 0.7 1.1 1.0 0.8 1.1 Bilateral 0.8 1.1 0.8 1.0 1.6 1.0 1.1 1.5 Private creditors 0.0 0.0 0.0 0.0 0.0 0.0 0.0 0.0 of which: Bonds 0.0 0.0 0.0 0.0 0.0 0.0 0.0 0.0 Commercial banks 0.0 0.0 0.0 0.0 0.0 0.0 0.0 0.0Private nonguaranteed 0.0 0.0 0.0 0.0 0.0 0.0 0.0 0.0 of which: Bonds 0.0 0.0 0.0 0.0 0.0 0.0 0.0 0.08. Debt stock-flow reconciliationTotal change in external debt stocks 26.8 18.7 -12.5 58.9 31.6 -4.9 51.1 9.3 Net flows on external debt 20.8 13.2 -2.2 15.5 16.8 22.6 36.2 -5.2 Cross-currency valuation 3.0 1.8 -6.5 19.0 10.1 -18.0 11.8 17.99. Debt restructuringsTotal amount rescheduled 0.0 0.0 0.0 0.0 0.0 0.0 0.0 0.0Total amount forgiven 0.0 0.0 0.0 0.0 0.3 1.1 0.6 0.0Debt buyback 0.0 0.0 0.0 0.0 0.0 0.0 0.0 0.010. Contractual obligations on outstanding long-term external debt
2008 2009 2010 2011 2012 2013 2014 2015Official creditorsPrincipal 25.5 27.3 27.5 28.4 46.8 24.8 23.0 22.0Interest 6.2 6.8 7.2 7.2 7.0 6.2 5.7 5.4Private creditorsPrincipal 0.1 0.1 0.1 0.1 0.1 0.1 0.1 0.1Interest 0.0 0.0 0.0 0.0 0.0 0.0 0.0 0.0
Notes:Data on long-term public and publicly guaranteed debt for 2007 are based on reports provided by the country. Short-term debt data are World Bank staff estimates.
89

DOMINICA(US$ million, unless otherwise indicated)
1990 1995 2000 2003 2004 2005 2006 2007
1. Summary external debt dataExternal debt stocks 88.0 103.3 164.8 286.1 304.4 273.9 254.0 289.9 Long-term external debt 80.2 94.9 145.8 205.2 225.1 221.8 218.0 214.7 Public and publicly guaranteed 80.2 94.9 145.8 205.2 225.1 221.8 218.0 214.7 Private nonguaranteed 0.0 0.0 0.0 0.0 0.0 0.0 0.0 0.0 Use of IMF credit 5.7 1.7 0.0 7.9 9.2 11.6 14.0 12.1 Short-term external debt 2.0 6.7 19.0 73.0 70.1 40.6 22.0 63.0 interest arrears on long-term 0.0 0.2 0.0 3.0 3.1 8.6 11.0 14.0Memorandum itemsPrincipal arrears on long-term 0.2 1.8 0.3 2.6 5.8 9.3 8.4 24.3Long-term public sector debt 80.2 94.9 145.8 205.2 225.1 221.8 218.0 214.7Long-term private sector debt 0.0 0.0 0.0 0.0 0.0 0.0 0.0 0.0Public & publicly guaranteed commitments 3.4 5.1 57.3 15.8 13.5 25.8 0.0 6.0
External debt flowsDisbursements 11.5 9.5 56.2 23.7 30.1 8.0 6.5 4.9 Long-term external debt 11.5 9.5 56.2 19.2 29.2 4.5 3.1 4.9 IMF purchases 0.0 0.0 0.0 4.6 0.9 3.5 3.4 0.0Principal repayments 3.8 4.4 6.7 6.9 7.6 10.0 11.1 12.9 Long-term external debt 2.5 3.6 6.7 6.9 7.6 9.6 9.5 10.4 IMF repurchases 1.4 0.9 0.0 0.0 0.0 0.4 1.6 2.5Net flows 7.8 4.6 49.7 63.4 19.5 -37.0 -25.6 27.0 Long-term external debt 9.0 5.9 49.5 12.3 21.6 -5.2 -6.4 -5.6 IMF flows -1.4 0.0 0.0 1.3 0.0 -0.4 -1.6 -2.5 Short-term external debt 0.1 -0.5 0.2 46.5 -3.0 -35.0 -21.0 35.0Interest payments 2.0 2.4 4.1 8.1 8.8 6.2 6.8 6.6 Long-term external debt 1.6 2.0 3.0 6.6 6.6 4.6 5.5 4.9 IMF charges 0.2 0.0 0.0 0.1 0.1 0.2 0.2 0.1 Short-term external debt 0.2 0.4 1.1 1.4 2.1 1.5 1.1 1.6
2. Other non-debt resource flowsForeign direct investment (net) 12.9 54.1 17.6 31.5 26.2 19.2 26.8 46.4Portfolio equity flows -0.4 0.0 0.0 0.0 0.0 0.0 0.0 0.0Profit remittances on FDI 5.4 12.2 33.0 15.8 21.8 22.7 9.2 9.6Grants (excluding technical coop.) 3.1 24.6 5.0 2.8 17.5 5.9 16.6 19.8of which: Debt forgiveness grants .. .. 0.0 0.0 0.0 0.0 1.0 1.1 IDA grants .. .. .. 0.0 0.0 0.0 0.0 0.0Memo: technical coop. grants 2.9 3.6 3.3 2.3 2.4 2.8 1.4 2.0
3. Currency composition of public and publicly guaranteed debt (%)Euro .. .. .. 6.5 6.0 5.4 4.1 3.6Japanese yen 0.3 1.1 0.4 0.0 0.0 0.0 0.0 0.0Pound sterling 16.5 13.3 2.8 0.1 0.1 0.0 0.0 0.0Swiss franc 0.0 0.0 0.0 0.0 0.0 0.0 0.0 0.0U.S.dollars 51.7 60.8 81.1 85.0 85.1 86.0 87.2 86.7
4. Average terms of new commitmentsOfficial creditors Interest (%) 3.0 2.6 5.2 1.6 0.8 2.4 0.0 0.8 Maturity (years) 25.2 26.4 21.3 13.2 34.7 21.9 0.0 34.5 Grace period (years) 8.5 8.8 6.9 4.5 10.2 7.6 0.0 10.0Private creditors Interest (%) 0.0 0.0 1.9 0.0 3.5 0.0 0.0 0.0 Maturity (years) 0.0 0.0 9.2 0.0 28.0 0.0 0.0 0.0 Grace period (years) 0.0 0.0 2.3 0.0 15.0 0.0 0.0 0.0
5. Major economic aggregatesGross national income (GNI) 161.4 210.7 231.9 238.2 253.5 274.3 282.5 ..Exports of goods, services & income 102.8 121.6 162.1 134.8 152.7 155.7 171.6 167.5Worker remit. & comp. of employees 14.0 3.0 3.0 4.0 23.2 25.0 25.4 26.0Imports of goods & services 142.9 158.9 227.1 186.6 211.3 231.0 221.8 255.8International reserves 14.5 22.1 29.4 47.7 42.3 49.2 63.0 60.5Current account balance -43.5 -40.2 -59.8 -53.2 -60.2 -76.1 -51.6 -89.7
6. RatiosExternal debt stocks to exports (%) 85.5 85.0 101.7 212.2 199.3 175.9 148.0 173.1External debt stocks to GNI (%) 54.5 49.0 71.1 120.1 120.1 99.8 89.9 ..Debt service to exports (%) 5.6 5.6 6.7 11.1 10.8 10.4 10.5 11.6Short-term to external debt stocks (%) 2.3 6.5 11.5 25.5 23.0 14.8 8.7 21.7Multilateral to external debt stocks (%) 65.7 59.6 49.5 40.0 41.2 44.1 45.8 40.1Reserves to external debt stocks (%) 16.4 21.4 17.8 16.7 13.9 18.0 24.8 20.9Reserves to imports (months) 1.2 1.7 1.6 3.1 2.4 2.6 3.4 2.8
90

DOMINICA(US$ million, unless otherwise indicated)
1990 1995 2000 2003 2004 2005 2006 2007
7. Long-term external debtDebt outstanding and disbursed 80.2 94.9 145.8 205.2 225.1 221.8 218.0 214.7Public and publicly guaranteed 80.2 94.9 145.8 205.2 225.1 221.8 218.0 214.7 Official creditors 80.2 94.9 114.2 155.2 165.4 161.7 158.0 154.7 Multilateral 57.8 61.6 81.6 114.4 125.3 120.6 116.3 116.2 of which: IBRD 0.0 0.0 2.4 4.1 4.1 3.9 3.3 2.5 IDA 10.4 12.2 13.6 18.2 23.2 21.7 22.5 25.4 Bilateral 22.4 33.3 32.7 40.7 40.1 41.1 41.7 38.5 Private creditors 0.1 0.0 31.6 50.0 59.6 60.0 60.0 60.0 of which: Bonds 0.0 0.0 31.6 36.6 36.6 36.6 36.6 36.6 Commercial banks 0.1 0.0 0.0 10.9 20.5 21.0 21.0 21.0Private nonguaranteed 0.0 0.0 0.0 0.0 0.0 0.0 0.0 0.0 of which: Bonds 0.0 0.0 0.0 0.0 0.0 0.0 0.0 0.0Disbursements 11.5 9.5 56.2 19.2 29.2 4.5 3.1 4.9Public and publicly guaranteed 11.5 9.5 56.2 19.2 29.2 4.5 3.1 4.9 Official creditors 11.5 9.5 25.7 18.2 18.7 4.5 3.1 4.9 Multilateral 8.3 3.5 19.3 14.0 18.2 3.9 2.6 4.7 of which: IBRD 0.0 0.0 0.7 0.7 0.4 0.3 0.0 0.0 IDA 0.9 0.1 -0.1 0.3 4.3 0.5 0.1 2.3 Bilateral 3.2 6.0 6.3 4.2 0.5 0.6 0.5 0.1 Private creditors 0.0 0.0 30.5 1.0 10.5 0.0 0.0 0.0 of which: Bonds 0.0 0.0 30.5 1.0 0.0 0.0 0.0 0.0 Commercial banks 0.0 0.0 0.0 0.0 10.5 0.0 0.0 0.0Private nonguaranteed 0.0 0.0 0.0 0.0 0.0 0.0 0.0 0.0 of which: Bonds 0.0 0.0 0.0 0.0 0.0 0.0 0.0 0.0Principal repayments 2.5 3.6 6.7 6.9 7.6 9.6 9.5 10.4Public and publicly guaranteed 2.5 3.6 6.7 6.9 7.6 9.6 9.5 10.4 Official creditors 2.4 3.6 6.7 6.6 7.6 9.6 9.5 10.4 Multilateral 2.1 2.0 3.7 5.1 6.0 7.8 7.8 6.6 of which: IBRD 0.0 0.0 0.0 0.2 0.4 0.4 0.6 0.8 IDA 0.0 0.1 0.1 0.2 0.2 0.3 0.3 0.4 Bilateral 0.3 1.6 3.0 1.5 1.6 1.8 1.7 3.8 Private creditors 0.1 0.0 0.0 0.3 0.0 0.0 0.0 0.0 of which: Bonds 0.0 0.0 0.0 0.0 0.0 0.0 0.0 0.0 Commercial banks 0.1 0.0 0.0 0.3 0.0 0.0 0.0 0.0Private nonguaranteed 0.0 0.0 0.0 0.0 0.0 0.0 0.0 0.0 of which: Bonds 0.0 0.0 0.0 0.0 0.0 0.0 0.0 0.0Interest payments 1.6 2.0 3.0 6.6 6.6 4.6 5.5 4.9Public and publicly guaranteed 1.6 2.0 3.0 6.6 6.6 4.6 5.5 4.9 Official creditors 1.6 2.0 2.9 4.3 3.6 4.1 4.7 4.2 Multilateral 1.4 1.5 1.9 2.9 2.4 3.1 3.1 3.0 of which: IBRD 0.0 0.0 0.1 0.2 0.2 0.2 0.2 0.2 IDA 0.1 0.1 0.1 0.1 0.2 0.2 0.2 0.2 Bilateral 0.2 0.4 1.0 1.4 1.2 1.0 1.6 1.2 Private creditors 0.0 0.0 0.1 2.3 3.1 0.5 0.8 0.7 of which: Bonds 0.0 0.0 0.1 1.5 3.1 0.1 0.1 0.1 Commercial banks 0.0 0.0 0.0 0.8 0.0 0.4 0.8 0.6Private nonguaranteed 0.0 0.0 0.0 0.0 0.0 0.0 0.0 0.0 of which: Bonds 0.0 0.0 0.0 0.0 0.0 0.0 0.0 0.08. Debt stock-flow reconciliationTotal change in external debt stocks 10.4 5.2 49.3 58.4 18.3 -30.6 -19.8 32.9 Net flows on external debt 7.8 4.6 49.7 63.4 19.5 -37.0 -25.6 27.0 Cross-currency valuation 4.7 1.2 -2.6 4.4 2.9 -5.0 3.4 3.39. Debt restructuringsTotal amount rescheduled 0.0 0.0 0.0 0.0 17.8 14.6 11.5 0.0Total amount forgiven 3.3 0.0 0.0 0.0 0.0 0.1 0.0 0.0Debt buyback 0.0 0.0 0.0 0.0 0.0 0.0 0.0 0.010. Contractual obligations on outstanding long-term external debt
2008 2009 2010 2011 2012 2013 2014 2015Official creditorsPrincipal 11.8 11.3 8.8 8.6 8.0 8.8 8.6 8.7Interest 3.7 3.7 3.6 3.6 3.5 3.3 3.0 2.7Private creditorsPrincipal 0.0 1.9 0.4 0.0 0.0 0.0 30.6 0.0Interest 3.2 3.1 3.1 3.0 3.0 3.0 3.0 0.3
91
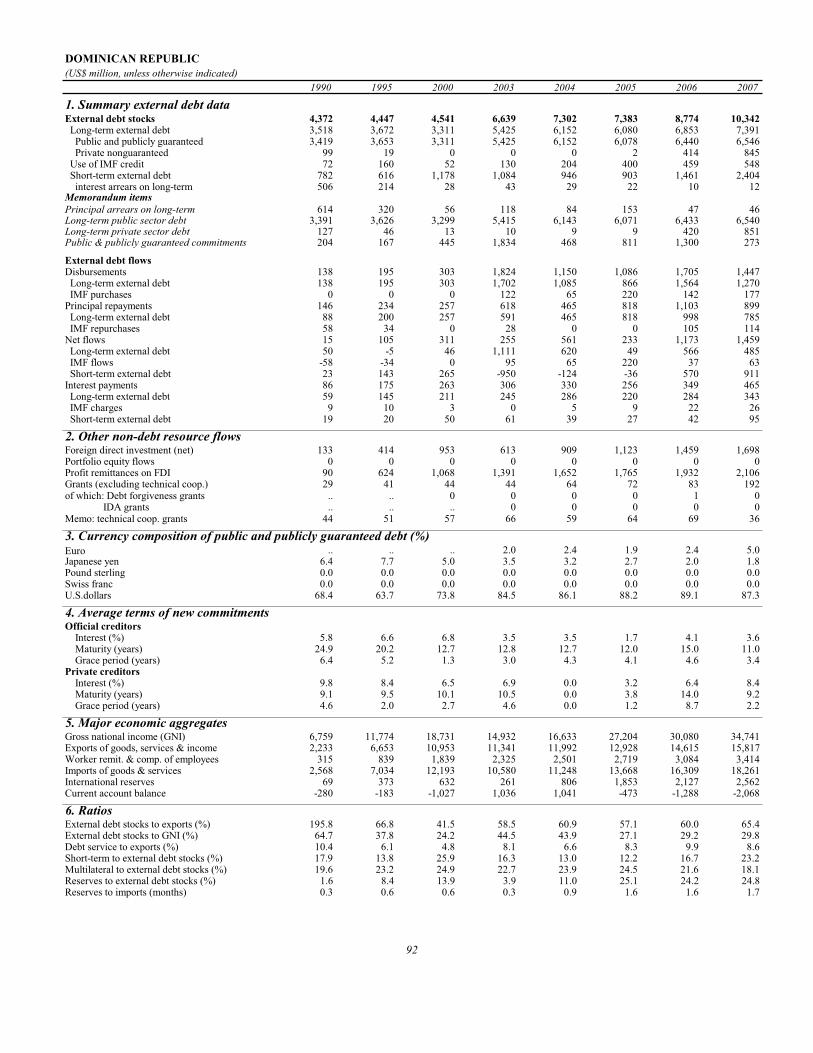
DOMINICAN REPUBLIC(US$ million, unless otherwise indicated)
1990 1995 2000 2003 2004 2005 2006 2007
1. Summary external debt dataExternal debt stocks 4,372 4,447 4,541 6,639 7,302 7,383 8,774 10,342 Long-term external debt 3,518 3,672 3,311 5,425 6,152 6,080 6,853 7,391 Public and publicly guaranteed 3,419 3,653 3,311 5,425 6,152 6,078 6,440 6,546 Private nonguaranteed 99 19 0 0 0 2 414 845 Use of IMF credit 72 160 52 130 204 400 459 548 Short-term external debt 782 616 1,178 1,084 946 903 1,461 2,404 interest arrears on long-term 506 214 28 43 29 22 10 12Memorandum itemsPrincipal arrears on long-term 614 320 56 118 84 153 47 46Long-term public sector debt 3,391 3,626 3,299 5,415 6,143 6,071 6,433 6,540Long-term private sector debt 127 46 13 10 9 9 420 851Public & publicly guaranteed commitments 204 167 445 1,834 468 811 1,300 273
External debt flowsDisbursements 138 195 303 1,824 1,150 1,086 1,705 1,447 Long-term external debt 138 195 303 1,702 1,085 866 1,564 1,270 IMF purchases 0 0 0 122 65 220 142 177Principal repayments 146 234 257 618 465 818 1,103 899 Long-term external debt 88 200 257 591 465 818 998 785 IMF repurchases 58 34 0 28 0 0 105 114Net flows 15 105 311 255 561 233 1,173 1,459 Long-term external debt 50 -5 46 1,111 620 49 566 485 IMF flows -58 -34 0 95 65 220 37 63 Short-term external debt 23 143 265 -950 -124 -36 570 911Interest payments 86 175 263 306 330 256 349 465 Long-term external debt 59 145 211 245 286 220 284 343 IMF charges 9 10 3 0 5 9 22 26 Short-term external debt 19 20 50 61 39 27 42 95
2. Other non-debt resource flowsForeign direct investment (net) 133 414 953 613 909 1,123 1,459 1,698Portfolio equity flows 0 0 0 0 0 0 0 0Profit remittances on FDI 90 624 1,068 1,391 1,652 1,765 1,932 2,106Grants (excluding technical coop.) 29 41 44 44 64 72 83 192of which: Debt forgiveness grants .. .. 0 0 0 0 1 0 IDA grants .. .. .. 0 0 0 0 0Memo: technical coop. grants 44 51 57 66 59 64 69 36
3. Currency composition of public and publicly guaranteed debt (%)Euro .. .. .. 2.0 2.4 1.9 2.4 5.0Japanese yen 6.4 7.7 5.0 3.5 3.2 2.7 2.0 1.8Pound sterling 0.0 0.0 0.0 0.0 0.0 0.0 0.0 0.0Swiss franc 0.0 0.0 0.0 0.0 0.0 0.0 0.0 0.0U.S.dollars 68.4 63.7 73.8 84.5 86.1 88.2 89.1 87.3
4. Average terms of new commitmentsOfficial creditors Interest (%) 5.8 6.6 6.8 3.5 3.5 1.7 4.1 3.6 Maturity (years) 24.9 20.2 12.7 12.8 12.7 12.0 15.0 11.0 Grace period (years) 6.4 5.2 1.3 3.0 4.3 4.1 4.6 3.4Private creditors Interest (%) 9.8 8.4 6.5 6.9 0.0 3.2 6.4 8.4 Maturity (years) 9.1 9.5 10.1 10.5 0.0 3.8 14.0 9.2 Grace period (years) 4.6 2.0 2.7 4.6 0.0 1.2 8.7 2.2
5. Major economic aggregatesGross national income (GNI) 6,759 11,774 18,731 14,932 16,633 27,204 30,080 34,741Exports of goods, services & income 2,233 6,653 10,953 11,341 11,992 12,928 14,615 15,817Worker remit. & comp. of employees 315 839 1,839 2,325 2,501 2,719 3,084 3,414Imports of goods & services 2,568 7,034 12,193 10,580 11,248 13,668 16,309 18,261International reserves 69 373 632 261 806 1,853 2,127 2,562Current account balance -280 -183 -1,027 1,036 1,041 -473 -1,288 -2,068
6. RatiosExternal debt stocks to exports (%) 195.8 66.8 41.5 58.5 60.9 57.1 60.0 65.4External debt stocks to GNI (%) 64.7 37.8 24.2 44.5 43.9 27.1 29.2 29.8Debt service to exports (%) 10.4 6.1 4.8 8.1 6.6 8.3 9.9 8.6Short-term to external debt stocks (%) 17.9 13.8 25.9 16.3 13.0 12.2 16.7 23.2Multilateral to external debt stocks (%) 19.6 23.2 24.9 22.7 23.9 24.5 21.6 18.1Reserves to external debt stocks (%) 1.6 8.4 13.9 3.9 11.0 25.1 24.2 24.8Reserves to imports (months) 0.3 0.6 0.6 0.3 0.9 1.6 1.6 1.7
92

DOMINICAN REPUBLIC(US$ million, unless otherwise indicated)
1990 1995 2000 2003 2004 2005 2006 2007
7. Long-term external debtDebt outstanding and disbursed 3,518 3,672 3,311 5,425 6,152 6,080 6,853 7,391Public and publicly guaranteed 3,419 3,653 3,311 5,425 6,152 6,078 6,440 6,546 Official creditors 2,383 2,996 2,565 2,589 3,073 3,249 3,550 3,670 Multilateral 858 1,033 1,132 1,510 1,745 1,808 1,891 1,872 of which: IBRD 238 282 292 350 379 405 438 472 IDA 20 17 14 12 11 11 10 9 Bilateral 1,525 1,962 1,433 1,079 1,328 1,441 1,659 1,798 Private creditors 1,036 657 746 2,836 3,079 2,830 2,890 2,876 of which: Bonds 0 520 506 1,547 1,527 1,134 1,414 1,394 Commercial banks 775 33 121 703 947 1,112 1,217 1,261Private nonguaranteed 99 19 0 0 0 2 414 845 of which: Bonds 0 0 0 0 0 0 412 844Disbursements 138 195 303 1,702 1,085 866 1,564 1,270Public and publicly guaranteed 138 195 303 1,702 1,085 865 1,152 839 Official creditors 136 187 147 233 556 460 592 464 Multilateral 84 157 100 188 325 199 182 178 of which: IBRD 39 36 39 31 66 64 67 73 IDA 0 0 0 0 0 0 0 0 Bilateral 53 30 46 45 231 261 410 285 Private creditors 2 8 156 1,469 529 405 560 375 of which: Bonds 0 0 0 600 0 0 300 0 Commercial banks 0 8 90 447 396 308 224 359Private nonguaranteed 0 0 0 0 0 2 412 431 of which: Bonds 0 0 0 0 0 0 412 431Principal repayments 88 200 257 591 465 818 998 785Public and publicly guaranteed 83 184 257 419 465 818 998 784 Official creditors 83 161 217 282 168 180 390 374 Multilateral 38 79 63 85 105 110 112 214 of which: IBRD 19 40 21 32 37 38 34 39 IDA 0 1 1 1 1 1 1 1 Bilateral 44 82 154 197 63 70 278 160 Private creditors 0 23 40 137 297 638 608 410 of which: Bonds 0 0 4 20 20 336 20 20 Commercial banks 0 3 18 67 158 206 224 333Private nonguaranteed 5 16 0 171 0 0 0 0 of which: Bonds 0 0 0 0 0 0 0 0Interest payments 59 145 211 245 286 220 284 343Public and publicly guaranteed 56 143 211 235 286 220 282 286 Official creditors 55 120 158 111 90 109 141 146 Multilateral 32 51 58 62 77 82 89 97 of which: IBRD 14 20 22 21 21 21 23 25 IDA 0 0 0 0 0 0 0 0 Bilateral 23 69 100 49 13 27 52 49 Private creditors 1 23 53 124 196 111 141 140 of which: Bonds 0 13 38 87 111 15 63 61 Commercial banks 0 3 7 24 32 44 62 68Private nonguaranteed 3 2 0 9 0 0 2 57 of which: Bonds 0 0 0 0 0 0 2 578. Debt stock-flow reconciliationTotal change in external debt stocks 334 173 -145 388 663 81 1,391 1,538 Net flows on external debt 15 105 311 255 561 233 1,173 1,459 Cross-currency valuation 52 18 -51 -126 9 100 207 549. Debt restructuringsTotal amount rescheduled 7 2 0 0 234 1,209 203 0Total amount forgiven 7 0 1 15 0 0 0 0Debt buyback 0 0 0 0 0 316 0 010. Contractual obligations on outstanding long-term external debt
2008 2009 2010 2011 2012 2013 2014 2015Official creditorsPrincipal 407 382 368 353 354 422 297 269Interest 141 134 128 118 106 94 76 64Private creditorsPrincipal 352 322 245 656 598 420 109 65Interest 305 295 283 272 185 131 110 105
Notes:Data include the effects of Paris Club debt restructuring agreement signed in 2005.
93

ECUADOR(US$ million, unless otherwise indicated)
1990 1995 2000 2003 2004 2005 2006 2007
1. Summary external debt dataExternal debt stocks 12,107 13,903 13,557 16,727 17,126 17,065 17,059 17,525 Long-term external debt 10,029 12,417 12,613 14,566 14,972 15,268 15,046 15,631 Public and publicly guaranteed 9,865 11,977 11,178 11,231 10,537 10,598 10,065 10,447 Private nonguaranteed 164 440 1,435 3,334 4,435 4,670 4,981 5,184 Use of IMF credit 265 173 148 390 290 78 23 0 Short-term external debt 1,814 1,312 797 1,772 1,864 1,719 1,990 1,894 interest arrears on long-term 1,522 13 3 1 0 0 0 0Memorandum itemsPrincipal arrears on long-term 1,096 10 6 5 5 5 0 0Long-term public sector debt 9,865 11,977 11,178 11,231 10,537 10,598 10,065 10,442Long-term private sector debt 164 440 1,435 3,334 4,435 4,670 4,981 5,188Public & publicly guaranteed commitments 641 1,162 404 500 274 1,221 1,304 1,281
External debt flowsDisbursements 638 1,040 1,133 2,014 2,732 3,135 2,623 2,987 Long-term external debt 606 1,040 983 1,929 2,732 3,135 2,623 2,987 IMF purchases 32 0 150 84 0 0 0 0Principal repayments 610 750 1,069 1,300 2,509 3,176 2,882 2,318 Long-term external debt 495 721 1,069 1,265 2,397 2,981 2,824 2,295 IMF repurchases 115 29 0 35 112 195 58 23Net flows 0 -161 -191 171 314 -187 12 574 Long-term external debt 110 319 -86 664 334 153 -201 692 IMF flows -83 -29 150 50 -112 -195 -58 -23 Short-term external debt -28 -451 -254 -543 92 -145 271 -95Interest payments 474 656 819 1,113 1,203 961 1,267 1,316 Long-term external debt 416 565 713 897 1,007 847 1,172 1,219 IMF charges 30 10 4 6 9 7 3 1 Short-term external debt 28 81 102 209 187 107 93 97
2. Other non-debt resource flowsForeign direct investment (net) 126 452 720 1,555 837 493 271 183Portfolio equity flows 0 13 0 9 1 2 0 1Profit remittances on FDI 125 144 329 595 964 1,004 977 1,160Grants (excluding technical coop.) 53 71 68 81 110 181 114 170of which: Debt forgiveness grants .. .. 0 0 13 0 3 0 IDA grants .. .. .. 0 0 0 0 0Memo: technical coop. grants 65 110 85 145 149 157 148 99
3. Currency composition of public and publicly guaranteed debt (%)Euro .. .. .. 2.4 2.5 2.2 2.1 2.0Japanese yen 6.9 4.3 5.2 5.2 5.3 3.6 3.5 3.3Pound sterling 1.6 0.7 0.4 0.3 0.3 0.1 0.1 0.1Swiss franc 0.5 0.0 0.0 0.0 0.0 0.0 0.0 0.0U.S.dollars 54.5 71.1 84.2 86.0 86.1 89.2 89.7 90.6
4. Average terms of new commitmentsOfficial creditors Interest (%) 5.2 6.2 6.9 1.5 5.1 6.5 6.7 5.3 Maturity (years) 22.2 16.4 17.1 22.1 12.9 5.7 16.6 20.4 Grace period (years) 6.0 6.0 5.2 5.4 3.6 1.3 4.5 4.2Private creditors Interest (%) 8.6 7.9 7.5 3.0 4.7 9.3 6.0 0.0 Maturity (years) 8.7 12.0 9.9 16.6 10.0 10.0 8.5 0.0 Grace period (years) 1.0 2.5 2.5 4.6 0.6 9.8 1.9 0.0
5. Major economic aggregatesGross national income (GNI) 9,145 19,281 14,530 27,108 30,740 35,245 39,452 42,442Exports of goods, services & income 3,337 5,677 7,293 8,982 10,851 14,020 17,317 19,384Worker remit. & comp. of employees 51 386 1,322 1,633 1,838 2,460 2,934 3,094Imports of goods & services 3,754 6,736 6,403 9,546 11,591 13,880 15,878 17,945International reserves 1,009 1,788 1,179 1,165 1,440 2,148 2,027 3,521Current account balance -360 -1,000 926 -422 -542 347 1,615 1,598
6. RatiosExternal debt stocks to exports (%) 362.8 244.9 185.9 186.2 157.8 121.7 98.5 90.4External debt stocks to GNI (%) 132.4 72.1 93.3 61.7 55.7 48.4 43.2 41.3Debt service to exports (%) 32.5 24.8 25.9 26.9 34.2 29.5 24.0 18.7Short-term to external debt stocks (%) 15.0 9.4 5.9 10.6 10.9 10.1 11.7 10.8Multilateral to external debt stocks (%) 17.6 21.9 27.1 23.2 22.0 21.0 23.2 26.0Reserves to external debt stocks (%) 8.3 12.9 8.7 7.0 8.4 12.6 11.9 20.1Reserves to imports (months) 3.2 3.2 2.2 1.5 1.5 1.9 1.5 2.4
94

ECUADOR(US$ million, unless otherwise indicated)
1990 1995 2000 2003 2004 2005 2006 2007
7. Long-term external debtDebt outstanding and disbursed 10,029 12,417 12,613 14,566 14,972 15,268 15,046 15,631Public and publicly guaranteed 9,865 11,977 11,178 11,231 10,537 10,598 10,065 10,447 Official creditors 4,065 5,235 6,172 6,398 6,151 5,688 5,890 6,313 Multilateral 2,127 3,044 3,670 3,884 3,767 3,588 3,953 4,562 of which: IBRD 816 1,082 840 888 835 799 746 684 IDA 32 26 21 17 16 15 14 13 Bilateral 1,938 2,190 2,503 2,514 2,384 2,100 1,937 1,751 Private creditors 5,800 6,742 5,005 4,833 4,386 4,910 4,175 4,134 of which: Bonds 0 5,999 3,950 3,950 3,950 4,600 3,860 3,860 Commercial banks 4,884 370 910 785 346 241 212 194Private nonguaranteed 164 440 1,435 3,334 4,435 4,670 4,981 5,184 of which: Bonds 0 10 0 0 0 0 0 0Disbursements 606 1,040 983 1,929 2,732 3,135 2,623 2,987Public and publicly guaranteed 575 830 602 638 340 972 913 1,296 Official creditors 329 745 532 576 278 299 830 1,272 Multilateral 227 593 446 556 276 298 826 1,263 of which: IBRD 47 319 69 152 29 39 21 8 IDA 0 0 0 0 0 0 0 0 Bilateral 101 152 85 20 2 1 4 9 Private creditors 246 85 71 61 62 674 83 24 of which: Bonds 0 0 0 0 0 650 0 0 Commercial banks 39 57 71 51 52 24 22 24Private nonguaranteed 30 210 381 1,291 2,392 2,162 1,710 1,691 of which: Bonds 0 10 0 0 0 0 0 0Principal repayments 495 721 1,069 1,265 2,397 2,981 2,824 2,295Public and publicly guaranteed 470 711 552 724 1,105 857 1,532 983 Official creditors 276 486 400 543 597 736 718 917 Multilateral 164 235 324 401 424 409 480 685 of which: IBRD 41 98 89 92 82 74 74 70 IDA 1 1 1 1 1 1 1 1 Bilateral 112 252 76 142 172 327 238 232 Private creditors 194 225 152 181 509 121 813 66 of which: Bonds 0 10 0 0 0 0 740 0 Commercial banks 27 59 119 163 492 101 51 42Private nonguaranteed 25 10 517 541 1,292 2,124 1,292 1,312 of which: Bonds 0 0 0 0 0 0 0 0Interest payments 416 565 713 897 1,007 847 1,172 1,219Public and publicly guaranteed 404 564 541 631 660 662 746 727 Official creditors 212 322 299 262 275 279 314 317 Multilateral 140 173 264 176 167 170 218 233 of which: IBRD 62 69 74 41 31 32 40 42 IDA 0 0 0 0 0 0 0 0 Bilateral 72 148 35 87 108 109 96 84 Private creditors 191 242 241 369 386 384 432 409 of which: Bonds 0 147 140 312 339 367 410 392 Commercial banks 132 48 89 51 42 12 16 10Private nonguaranteed 12 1 172 266 346 185 426 492 of which: Bonds 0 0 0 0 0 0 0 08. Debt stock-flow reconciliationTotal change in external debt stocks 791 -1,073 -2,527 411 399 -62 -6 466 Net flows on external debt 0 -161 -191 171 314 -187 12 574 Cross-currency valuation 193 60 -158 235 88 -169 49 849. Debt restructuringsTotal amount rescheduled 249 5,818 4,837 53 0 0 0 0Total amount forgiven 1 0 0 0 0 0 0 0Debt buyback 0 0 0 0 0 0 0 010. Contractual obligations on outstanding long-term external debt
2008 2009 2010 2011 2012 2013 2014 2015Official creditorsPrincipal 660 571 484 537 562 564 532 470Interest 341 320 298 277 251 223 195 167Private creditorsPrincipal 1,096 783 583 465 872 256 216 852Interest 818 918 774 648 513 419 405 397
Notes:Long-term private nonguaranteed debt data are World Bank staff estimates. Short-term debt is based on Central Bank data.
95

EGYPT, ARAB REPUBLIC OF(US$ million, unless otherwise indicated)
1990 1995 2000 2003 2004 2005 2006 2007
1. Summary external debt dataExternal debt stocks 32,992 33,475 29,015 29,245 30,956 29,505 28,763 30,444 Long-term external debt 28,414 31,000 24,911 27,380 28,987 27,649 27,128 28,993 Public and publicly guaranteed 27,414 30,687 24,338 27,064 27,020 25,794 25,495 26,940 Private nonguaranteed 1,000 313 573 316 1,968 1,855 1,633 2,053 Use of IMF credit 125 103 0 0 0 0 0 0 Short-term external debt 4,453 2,372 4,104 1,865 1,968 1,856 1,635 1,451 interest arrears on long-term 1,441 4 0 0 1 2 2 2Memorandum itemsPrincipal arrears on long-term 3,542 148 14 3 6 8 9 9Long-term public sector debt 27,393 30,684 24,337 27,063 27,019 25,793 25,495 26,939Long-term private sector debt 1,021 316 574 317 1,969 1,856 1,634 2,054Public & publicly guaranteed commitments 1,223 207 917 688 1,173 2,613 1,736 2
External debt flowsDisbursements 1,951 642 575 570 455 2,380 224 1,567 Long-term external debt 1,951 642 575 570 455 2,380 224 1,567 IMF purchases 0 0 0 0 0 0 0 0Principal repayments 1,750 988 1,100 1,986 1,348 1,627 1,477 1,617 Long-term external debt 1,704 894 1,100 1,986 1,348 1,627 1,477 1,617 IMF repurchases 47 94 0 0 0 0 0 0Net flows -1,301 92 -714 -1,701 -789 641 -1,475 -233 Long-term external debt 248 -251 -525 -1,415 -892 753 -1,253 -50 IMF flows -39 -94 0 0 0 0 0 0 Short-term external debt -1,502 438 -189 -286 103 -113 -222 -184Interest payments 1,322 1,393 733 664 652 703 734 807 Long-term external debt 1,007 1,252 619 637 622 635 639 730 IMF charges 14 9 0 0 0 0 0 0 Short-term external debt 301 132 113 27 30 68 96 77
2. Other non-debt resource flowsForeign direct investment (net) 734 598 1,235 237 1,253 5,376 10,043 11,578Portfolio equity flows 0 0 269 37 26 729 502 -3,199Profit remittances on FDI 14 228 92 47 56 647 915 1,015Grants (excluding technical coop.) 4,201 1,006 964 552 1,390 827 642 1,236of which: Debt forgiveness grants .. .. 222 147 150 150 153 173 IDA grants .. .. .. 0 0 0 0 0Memo: technical coop. grants 812 744 472 556 197 386 419 119
3. Currency composition of public and publicly guaranteed debt (%)Euro .. .. .. 36.4 38.1 33.5 36.2 36.7Japanese yen 8.2 13.1 13.8 12.4 12.5 11.3 11.0 9.9Pound sterling 2.5 1.4 1.2 2.2 2.3 2.1 2.3 2.1Swiss franc 3.0 2.7 2.1 2.2 2.3 2.0 2.1 2.0U.S.dollars 41.9 34.5 39.8 34.8 32.9 39.8 37.5 36.7
4. Average terms of new commitmentsOfficial creditors Interest (%) 4.7 3.1 4.7 2.6 1.7 2.9 5.2 5.0 Maturity (years) 28.6 22.0 21.8 12.2 17.9 17.5 21.2 10.2 Grace period (years) 7.5 6.6 5.5 3.9 5.2 6.9 7.4 3.6Private creditors Interest (%) 8.4 6.5 6.8 0.0 4.2 4.5 0.0 0.0 Maturity (years) 11.5 4.3 3.0 0.0 2.9 7.5 1.5 1.2 Grace period (years) 3.4 2.4 2.9 0.0 2.8 7.2 1.0 0.0
5. Major economic aggregatesGross national income (GNI) 42,025 60,038 100,838 83,006 78,757 89,474 107,219 131,010Exports of goods, services & income 15,035 18,064 21,587 23,600 30,429 37,159 44,570 55,363Worker remit. & comp. of employees 4,284 3,226 2,852 2,961 3,341 5,017 5,330 7,656Imports of goods & services 15,969 19,123 23,878 20,494 27,733 35,787 42,375 55,618International reserves 3,620 17,122 13,785 14,604 15,339 21,857 26,007 32,214Current account balance 2,327 -254 -971 3,743 3,922 2,103 2,635 412
6. RatiosExternal debt stocks to exports (%) 219.4 185.3 134.4 123.9 101.7 79.4 64.5 55.0External debt stocks to GNI (%) 78.5 55.8 28.8 35.2 39.3 33.0 26.8 23.2Debt service to exports (%) 20.4 13.2 8.5 11.2 6.6 6.3 5.0 4.4Short-term to external debt stocks (%) 13.5 7.1 14.1 6.4 6.4 6.3 5.7 4.8Multilateral to external debt stocks (%) 10.3 12.0 13.5 14.0 12.9 12.9 13.6 17.3Reserves to external debt stocks (%) 11.0 51.1 47.5 49.9 49.5 74.1 90.4 105.8Reserves to imports (months) 2.7 10.7 6.9 8.6 6.6 7.3 7.4 7.0
96

EGYPT, ARAB REPUBLIC OF(US$ million, unless otherwise indicated)
1990 1995 2000 2003 2004 2005 2006 2007
7. Long-term external debtDebt outstanding and disbursed 28,414 31,000 24,911 27,380 28,987 27,649 27,128 28,993Public and publicly guaranteed 27,414 30,687 24,338 27,064 27,020 25,794 25,495 26,940 Official creditors 21,165 28,934 23,799 26,170 26,145 23,225 23,409 24,910 Multilateral 3,403 4,022 3,921 4,094 3,978 3,821 3,906 5,281 of which: IBRD 1,480 1,320 639 539 503 492 544 1,181 IDA 921 1,035 1,266 1,386 1,465 1,420 1,481 1,490 Bilateral 17,763 24,912 19,878 22,076 22,167 19,405 19,503 19,629 Private creditors 6,249 1,753 540 894 875 2,569 2,086 2,030 of which: Bonds 0 0 0 695 584 1,829 1,576 1,556 Commercial banks 731 560 317 69 165 637 413 406Private nonguaranteed 1,000 313 573 316 1,968 1,855 1,633 2,053 of which: Bonds 0 0 100 100 0 0 0 750Disbursements 1,951 642 575 570 455 2,380 224 1,567Public and publicly guaranteed 1,900 642 368 570 455 2,380 223 1,567 Official creditors 1,198 602 223 551 319 474 218 1,566 Multilateral 269 392 174 534 305 468 206 1,556 of which: IBRD 92 42 6 29 26 97 108 723 IDA 8 83 49 33 75 69 57 13 Bilateral 929 209 50 16 15 6 13 10 Private creditors 703 40 144 20 136 1,906 5 1 of which: Bonds 0 0 0 0 0 1,250 0 0 Commercial banks 175 31 132 20 134 656 5 1Private nonguaranteed 51 0 207 0 0 0 1 0 of which: Bonds 0 0 0 0 0 0 0 0Principal repayments 1,704 894 1,100 1,986 1,348 1,627 1,477 1,617Public and publicly guaranteed 1,572 832 984 1,643 1,248 1,475 1,459 1,555 Official creditors 884 542 863 1,331 1,199 1,285 1,221 1,513 Multilateral 282 310 298 543 327 377 259 362 of which: IBRD 176 198 87 77 77 77 66 97 IDA 7 14 23 37 38 41 42 47 Bilateral 603 232 564 788 872 908 962 1,151 Private creditors 687 290 121 312 48 190 237 42 of which: Bonds 1 0 0 0 0 0 0 0 Commercial banks 34 91 57 294 39 181 230 8Private nonguaranteed 132 62 116 343 100 151 19 61 of which: Bonds 0 0 0 0 100 0 0 0Interest payments 1,007 1,252 619 637 622 635 639 730Public and publicly guaranteed 918 1,228 603 623 606 562 636 669 Official creditors 719 1,121 573 548 540 502 501 559 Multilateral 184 232 147 104 98 99 106 131 of which: IBRD 138 114 41 24 22 21 27 47 IDA 7 7 9 10 12 11 11 11 Bilateral 535 889 425 444 442 403 395 429 Private creditors 199 106 31 75 67 60 135 110 of which: Bonds 0 0 0 65 61 51 106 84 Commercial banks 48 44 16 6 3 6 26 24Private nonguaranteed 89 24 16 15 16 73 3 61 of which: Bonds 0 0 12 12 12 0 0 598. Debt stock-flow reconciliationTotal change in external debt stocks -12,667 976 -1,869 749 1,711 -1,451 -742 1,681 Net flows on external debt -1,301 92 -714 -1,701 -789 641 -1,475 -233 Cross-currency valuation 1,460 795 -899 2,491 1,085 -2,107 1,182 1,4699. Debt restructuringsTotal amount rescheduled 0 309 22 1 1 1 0 0Total amount forgiven 10,576 35 25 0 0 0 0 0Debt buyback 0 0 0 0 0 0 0 010. Contractual obligations on outstanding long-term external debt
2008 2009 2010 2011 2012 2013 2014 2015Official creditorsPrincipal 2,555 2,331 2,471 2,512 2,633 2,758 2,343 2,275Interest 660 620 578 531 479 422 362 301Private creditorsPrincipal 734 332 514 996 6 5 215 1,255Interest 326 290 259 178 117 117 87 57
Notes:Short-term debt is based on the Central Bank data from 2001.
97

EL SALVADOR(US$ million, unless otherwise indicated)
1990 1995 2000 2003 2004 2005 2006 2007
1. Summary external debt dataExternal debt stocks 2,145 2,509 4,467 8,157 8,400 8,455 9,218 8,809 Long-term external debt 1,935 1,984 2,822 6,398 6,620 6,880 7,988 7,820 Public and publicly guaranteed 1,909 1,979 2,710 4,815 4,858 4,775 5,587 5,444 Private nonguaranteed 26 5 111 1,583 1,762 2,105 2,401 2,376 Use of IMF credit 0 0 0 0 0 0 0 0 Short-term external debt 210 525 1,645 1,759 1,780 1,575 1,230 989 interest arrears on long-term 7 3 0 0 0 0 0 0Memorandum itemsPrincipal arrears on long-term 6 6 0 0 0 0 0 0Long-term public sector debt 1,901 1,972 2,705 4,810 4,854 4,771 5,584 5,440Long-term private sector debt 34 11 117 1,588 1,767 2,109 2,405 2,380Public & publicly guaranteed commitments 131 832 347 579 228 630 1,146 243
External debt flowsDisbursements 108 206 371 796 691 1,152 1,453 401 Long-term external debt 108 206 371 796 691 1,152 1,453 401 IMF purchases 0 0 0 0 0 0 0 0Principal repayments 124 160 157 390 467 385 617 541 Long-term external debt 118 160 157 390 467 385 617 541 IMF repurchases 5 0 0 0 0 0 0 0Net flows 2 383 807 1,001 245 563 491 -400 Long-term external debt -11 46 214 406 224 768 836 -140 IMF flows 0 0 0 0 0 0 0 0 Short-term external debt 18 337 592 595 21 -205 -345 -260Interest payments 84 120 212 417 522 434 521 506 Long-term external debt 75 98 139 254 338 333 450 447 IMF charges 0 0 0 0 0 0 0 0 Short-term external debt 9 22 73 163 184 101 70 59
2. Other non-debt resource flowsForeign direct investment (net) 2 38 173 141 363 511 219 1,526Portfolio equity flows 0 0 0 0 0 0 0 0Profit remittances on FDI 31 0 60 85 80 181 90 172Grants (excluding technical coop.) 160 102 72 103 119 138 110 162of which: Debt forgiveness grants .. .. 4 0 0 0 0 0 IDA grants .. .. .. 0 0 0 0 0Memo: technical coop. grants 127 130 85 122 136 86 74 53
3. Currency composition of public and publicly guaranteed debt (%)Euro .. .. .. 3.9 4.1 3.5 3.3 3.7Japanese yen 1.3 1.8 6.7 5.1 5.1 4.9 4.3 4.7Pound sterling 0.0 0.0 0.0 0.0 0.0 0.0 0.0 0.0Swiss franc 0.0 0.0 0.0 0.0 0.0 0.0 0.0 0.0U.S.dollars 56.5 46.7 68.3 79.9 80.2 81.4 84.1 83.3
4. Average terms of new commitmentsOfficial creditors Interest (%) 3.2 6.5 7.2 5.4 2.7 4.6 5.8 5.4 Maturity (years) 35.6 22.3 18.6 19.0 13.3 19.6 17.7 22.1 Grace period (years) 8.8 5.2 4.0 5.0 4.8 2.5 4.0 6.9Private creditors Interest (%) 10.4 6.1 9.6 7.8 7.6 7.7 7.6 0.0 Maturity (years) 5.0 26.3 9.2 19.8 29.6 30.4 27.9 0.0 Grace period (years) 0.5 5.8 2.3 19.8 29.6 30.4 27.9 0.0
5. Major economic aggregatesGross national income (GNI) 4,699 9,404 12,881 14,624 15,340 16,499 18,134 19,793Exports of goods, services & income 1,360 3,154 5,554 6,347 7,120 7,767 8,889 9,508Worker remit. & comp. of employees 366 1,064 1,765 2,122 2,564 3,030 3,485 3,711Imports of goods & services 1,785 3,744 6,031 7,058 7,755 8,353 9,567 10,707International reserves 595 940 1,901 1,988 1,938 1,890 1,963 2,304Current account balance -152 -262 -431 -702 -628 -569 -677 -1,119
6. RatiosExternal debt stocks to exports (%) 157.7 79.5 80.4 128.5 118.0 108.9 103.7 92.7External debt stocks to GNI (%) 45.6 26.7 34.7 55.8 54.8 51.2 50.8 44.5Debt service to exports (%) 15.3 8.9 6.6 12.7 13.9 10.5 12.8 11.0Short-term to external debt stocks (%) 9.8 20.9 36.8 21.6 21.2 18.6 13.3 11.2Multilateral to external debt stocks (%) 36.6 54.7 42.5 29.8 27.8 28.8 27.2 28.5Reserves to external debt stocks (%) 27.8 37.5 42.6 24.4 23.1 22.4 21.3 26.2Reserves to imports (months) 4.0 3.0 3.8 3.4 3.0 2.7 2.5 2.6
98
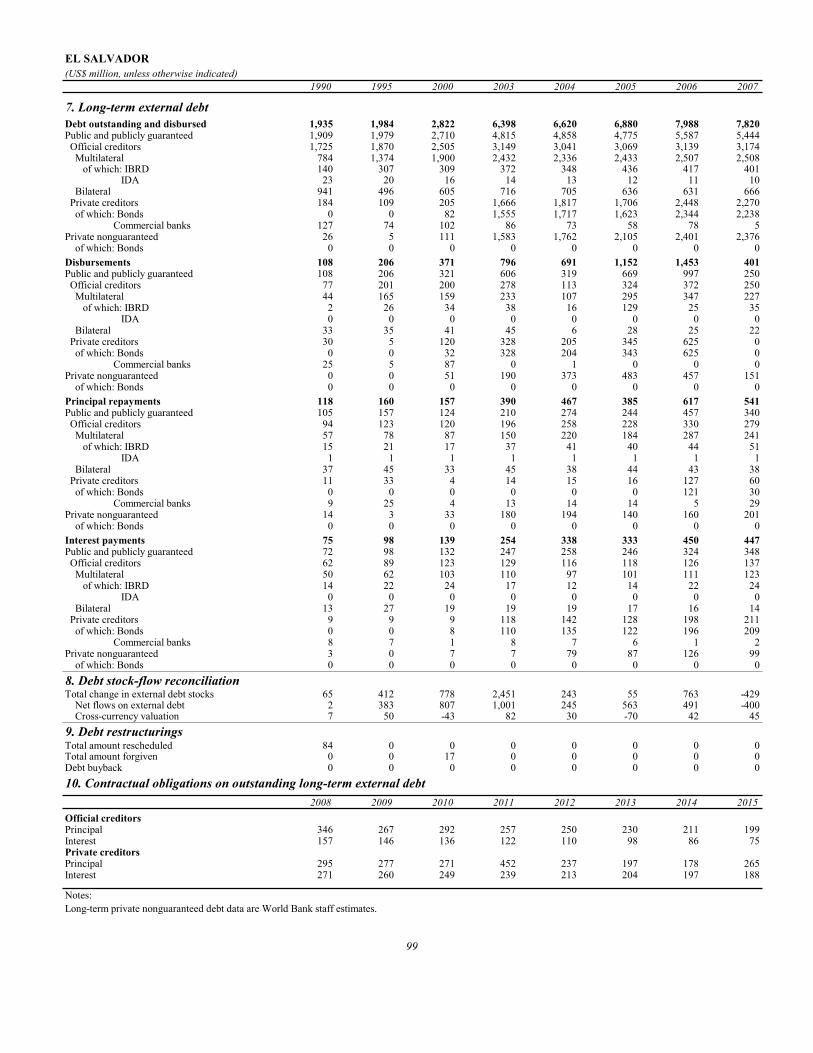
EL SALVADOR(US$ million, unless otherwise indicated)
1990 1995 2000 2003 2004 2005 2006 2007
7. Long-term external debtDebt outstanding and disbursed 1,935 1,984 2,822 6,398 6,620 6,880 7,988 7,820Public and publicly guaranteed 1,909 1,979 2,710 4,815 4,858 4,775 5,587 5,444 Official creditors 1,725 1,870 2,505 3,149 3,041 3,069 3,139 3,174 Multilateral 784 1,374 1,900 2,432 2,336 2,433 2,507 2,508 of which: IBRD 140 307 309 372 348 436 417 401 IDA 23 20 16 14 13 12 11 10 Bilateral 941 496 605 716 705 636 631 666 Private creditors 184 109 205 1,666 1,817 1,706 2,448 2,270 of which: Bonds 0 0 82 1,555 1,717 1,623 2,344 2,238 Commercial banks 127 74 102 86 73 58 78 5Private nonguaranteed 26 5 111 1,583 1,762 2,105 2,401 2,376 of which: Bonds 0 0 0 0 0 0 0 0Disbursements 108 206 371 796 691 1,152 1,453 401Public and publicly guaranteed 108 206 321 606 319 669 997 250 Official creditors 77 201 200 278 113 324 372 250 Multilateral 44 165 159 233 107 295 347 227 of which: IBRD 2 26 34 38 16 129 25 35 IDA 0 0 0 0 0 0 0 0 Bilateral 33 35 41 45 6 28 25 22 Private creditors 30 5 120 328 205 345 625 0 of which: Bonds 0 0 32 328 204 343 625 0 Commercial banks 25 5 87 0 1 0 0 0Private nonguaranteed 0 0 51 190 373 483 457 151 of which: Bonds 0 0 0 0 0 0 0 0Principal repayments 118 160 157 390 467 385 617 541Public and publicly guaranteed 105 157 124 210 274 244 457 340 Official creditors 94 123 120 196 258 228 330 279 Multilateral 57 78 87 150 220 184 287 241 of which: IBRD 15 21 17 37 41 40 44 51 IDA 1 1 1 1 1 1 1 1 Bilateral 37 45 33 45 38 44 43 38 Private creditors 11 33 4 14 15 16 127 60 of which: Bonds 0 0 0 0 0 0 121 30 Commercial banks 9 25 4 13 14 14 5 29Private nonguaranteed 14 3 33 180 194 140 160 201 of which: Bonds 0 0 0 0 0 0 0 0Interest payments 75 98 139 254 338 333 450 447Public and publicly guaranteed 72 98 132 247 258 246 324 348 Official creditors 62 89 123 129 116 118 126 137 Multilateral 50 62 103 110 97 101 111 123 of which: IBRD 14 22 24 17 12 14 22 24 IDA 0 0 0 0 0 0 0 0 Bilateral 13 27 19 19 19 17 16 14 Private creditors 9 9 9 118 142 128 198 211 of which: Bonds 0 0 8 110 135 122 196 209 Commercial banks 8 7 1 8 7 6 1 2Private nonguaranteed 3 0 7 7 79 87 126 99 of which: Bonds 0 0 0 0 0 0 0 08. Debt stock-flow reconciliationTotal change in external debt stocks 65 412 778 2,451 243 55 763 -429 Net flows on external debt 2 383 807 1,001 245 563 491 -400 Cross-currency valuation 7 50 -43 82 30 -70 42 459. Debt restructuringsTotal amount rescheduled 84 0 0 0 0 0 0 0Total amount forgiven 0 0 17 0 0 0 0 0Debt buyback 0 0 0 0 0 0 0 010. Contractual obligations on outstanding long-term external debt
2008 2009 2010 2011 2012 2013 2014 2015Official creditorsPrincipal 346 267 292 257 250 230 211 199Interest 157 146 136 122 110 98 86 75Private creditorsPrincipal 295 277 271 452 237 197 178 265Interest 271 260 249 239 213 204 197 188
Notes:Long-term private nonguaranteed debt data are World Bank staff estimates.
99

ERITREA(US$ million, unless otherwise indicated)
1990 1995 2000 2003 2004 2005 2006 2007
1. Summary external debt dataExternal debt stocks .. 36.7 311.1 634.6 718.2 735.5 799.9 874.8 Long-term external debt .. 36.7 298.0 605.1 704.0 723.0 781.4 855.7 Public and publicly guaranteed .. 36.7 298.0 605.1 704.0 723.0 781.4 855.7 Private nonguaranteed .. 0.0 0.0 0.0 0.0 0.0 0.0 0.0 Use of IMF credit .. 0.0 0.0 0.0 0.0 0.0 0.0 0.0 Short-term external debt .. 0.0 13.1 29.4 14.2 12.6 18.6 19.1 interest arrears on long-term .. 0.0 2.0 2.4 1.7 1.6 3.6 4.1Memorandum itemsPrincipal arrears on long-term .. 0.0 4.9 13.8 28.0 13.9 21.4 18.4Long-term public sector debt .. 36.7 298.0 605.1 704.0 723.0 781.4 855.7Long-term private sector debt .. 0.0 0.0 0.0 0.0 0.0 0.0 0.0Public & publicly guaranteed commitments .. 110.5 173.6 45.0 72.8 0.0 5.5 46.3
External debt flowsDisbursements .. 7.2 50.7 89.4 92.7 70.6 37.9 42.1 Long-term external debt .. 7.2 50.7 89.4 92.7 70.6 37.9 42.1 IMF purchases .. 0.0 0.0 0.0 0.0 0.0 0.0 0.0Principal repayments .. 0.0 0.5 5.8 10.4 11.8 6.2 1.7 Long-term external debt .. 0.0 0.5 5.8 10.4 11.8 6.2 1.7 IMF repurchases .. 0.0 0.0 0.0 0.0 0.0 0.0 0.0Net flows .. 7.2 61.2 80.4 67.9 57.4 35.7 40.4 Long-term external debt .. 7.2 50.2 83.6 82.4 58.9 31.7 40.4 IMF flows .. 0.0 0.0 0.0 0.0 0.0 0.0 0.0 Short-term external debt .. 0.0 11.0 -3.2 -14.5 -1.5 4.0 0.0Interest payments .. 0.2 2.8 6.0 9.0 8.8 6.5 4.4 Long-term external debt .. 0.2 2.5 5.0 8.6 8.4 6.1 4.0 IMF charges .. 0.0 0.0 0.0 0.0 0.0 0.0 0.0 Short-term external debt .. 0.0 0.3 0.9 0.5 0.4 0.4 0.4
2. Other non-debt resource flowsForeign direct investment (net) .. 0.0 27.9 22.0 -7.9 -1.0 0.5 -2.8Portfolio equity flows .. 0.0 0.0 0.0 0.0 0.0 0.0 0.0Profit remittances on FDI .. 0.0 4.4 0.0 0.0 0.0 0.0 0.0Grants (excluding technical coop.) .. 103.2 104.3 205.3 190.8 243.2 91.3 114.3of which: Debt forgiveness grants .. .. 0.0 0.0 0.0 0.0 0.0 0.0 IDA grants .. .. .. 8.7 6.9 8.2 4.4 12.3Memo: technical coop. grants .. 42.7 22.1 41.1 30.8 24.2 16.2 10.3
3. Currency composition of public and publicly guaranteed debt (%)Euro .. .. .. 1.2 6.4 5.3 5.4 5.5Japanese yen .. 0.0 0.0 0.0 0.0 0.0 0.0 0.0Pound sterling .. 0.0 0.0 0.0 0.0 0.0 0.0 0.0Swiss franc .. 0.0 0.0 0.0 0.0 0.0 0.0 0.0U.S.dollars .. 66.3 57.0 69.5 66.7 68.5 68.1 67.9
4. Average terms of new commitmentsOfficial creditors Interest (%) .. 2.0 0.7 0.8 0.8 0.0 1.0 2.0 Maturity (years) .. 23.9 39.7 40.0 36.3 0.0 27.7 -2.4 Grace period (years) .. 5.6 10.4 10.5 8.8 0.0 9.1 3.1Private creditors Interest (%) .. 0.0 0.0 0.0 0.5 0.0 0.0 0.0 Maturity (years) .. 0.0 0.0 0.0 36.1 0.0 0.0 0.0 Grace period (years) .. 0.0 0.0 0.0 24.6 0.0 0.0 0.0
5. Major economic aggregatesGross national income (GNI) .. 585.6 634.1 588.1 615.9 1152.0 1273.0 1365.4Exports of goods, services & income .. 142.4 106.9 .. .. .. .. ..Worker remit. & comp. of employees .. 0.0 3.0 0.0 0.0 0.0 0.0 0.0Imports of goods & services .. 498.2 510.3 .. .. .. .. ..International reserves .. 40.5 36.1 24.7 34.7 27.9 25.4 ..Current account balance .. -31.5 -104.7 .. .. .. .. ..
6. RatiosExternal debt stocks to exports (%) .. 25.8 291.1 .. .. .. .. ..External debt stocks to GNI (%) .. 6.3 49.1 107.9 116.6 63.8 62.8 64.1Debt service to exports (%) .. 0.1 3.1 .. .. .. .. ..Short-term to external debt stocks (%) .. 0.0 4.2 4.6 2.0 1.7 2.3 2.2Multilateral to external debt stocks (%) .. 66.3 48.8 65.1 67.1 69.4 70.2 70.1Reserves to external debt stocks (%) .. 110.4 11.6 3.9 4.8 3.8 3.2 0.0Reserves to imports (months) .. 1.0 0.8 .. .. .. .. ..
100

ERITREA(US$ million, unless otherwise indicated)
1990 1995 2000 2003 2004 2005 2006 2007
7. Long-term external debtDebt outstanding and disbursed .. 36.7 298.0 605.1 704.0 723.0 781.4 855.7Public and publicly guaranteed .. 36.7 298.0 605.1 704.0 723.0 781.4 855.7 Official creditors .. 36.7 298.0 605.1 666.1 690.1 744.7 814.7 Multilateral .. 24.3 151.9 413.1 481.7 510.1 561.6 613.2 of which: IBRD .. 0.0 0.0 0.0 0.0 0.0 0.0 0.0 IDA .. 24.3 84.5 301.4 352.0 381.1 419.4 456.9 Bilateral .. 12.4 146.1 192.0 184.4 180.0 183.1 201.5 Private creditors .. 0.0 0.0 0.0 37.9 32.9 36.7 41.0 of which: Bonds .. 0.0 0.0 0.0 0.0 0.0 0.0 0.0 Commercial banks .. 0.0 0.0 0.0 0.0 0.0 0.0 0.0Private nonguaranteed .. 0.0 0.0 0.0 0.0 0.0 0.0 0.0 of which: Bonds .. 0.0 0.0 0.0 0.0 0.0 0.0 0.0Disbursements .. 7.2 50.7 89.4 92.7 70.6 37.9 42.1Public and publicly guaranteed .. 7.2 50.7 89.4 92.7 70.6 37.9 42.1 Official creditors .. 7.2 50.7 89.4 58.1 70.6 37.4 42.1 Multilateral .. 5.4 39.2 72.2 56.6 70.0 33.1 28.4 of which: IBRD .. 0.0 0.0 0.0 0.0 0.0 0.0 0.0 IDA .. 5.4 31.6 58.7 35.6 57.3 20.2 20.5 Bilateral .. 1.8 11.5 17.2 1.5 0.6 4.3 13.6 Private creditors .. 0.0 0.0 0.0 34.6 0.0 0.5 0.0 of which: Bonds .. 0.0 0.0 0.0 0.0 0.0 0.0 0.0 Commercial banks .. 0.0 0.0 0.0 0.0 0.0 0.0 0.0Private nonguaranteed .. 0.0 0.0 0.0 0.0 0.0 0.0 0.0 of which: Bonds .. 0.0 0.0 0.0 0.0 0.0 0.0 0.0Principal repayments .. 0.0 0.5 5.8 10.4 11.8 6.2 1.7Public and publicly guaranteed .. 0.0 0.5 5.8 10.4 11.8 6.2 1.7 Official creditors .. 0.0 0.5 5.8 10.4 11.8 6.2 1.7 Multilateral .. 0.0 0.5 2.7 4.1 6.5 4.2 1.4 of which: IBRD .. 0.0 0.0 0.0 0.0 0.0 0.0 0.0 IDA .. 0.0 0.0 0.2 0.5 0.5 0.7 1.0 Bilateral .. 0.0 0.0 3.1 6.2 5.2 2.0 0.2 Private creditors .. 0.0 0.0 0.0 0.0 0.0 0.0 0.0 of which: Bonds .. 0.0 0.0 0.0 0.0 0.0 0.0 0.0 Commercial banks .. 0.0 0.0 0.0 0.0 0.0 0.0 0.0Private nonguaranteed .. 0.0 0.0 0.0 0.0 0.0 0.0 0.0 of which: Bonds .. 0.0 0.0 0.0 0.0 0.0 0.0 0.0Interest payments .. 0.2 2.5 5.0 8.6 8.4 6.1 4.0Public and publicly guaranteed .. 0.2 2.5 5.0 8.6 8.4 6.1 4.0 Official creditors .. 0.2 2.5 5.0 8.6 8.4 6.0 4.0 Multilateral .. 0.2 1.3 3.4 5.4 5.9 5.1 3.9 of which: IBRD .. 0.0 0.0 0.0 0.0 0.0 0.0 0.0 IDA .. 0.2 0.4 1.8 3.3 3.0 3.6 3.4 Bilateral .. 0.0 1.2 1.7 3.2 2.5 0.9 0.1 Private creditors .. 0.0 0.0 0.0 0.0 0.0 0.1 0.0 of which: Bonds .. 0.0 0.0 0.0 0.0 0.0 0.0 0.0 Commercial banks .. 0.0 0.0 0.0 0.0 0.0 0.0 0.0Private nonguaranteed .. 0.0 0.0 0.0 0.0 0.0 0.0 0.0 of which: Bonds .. 0.0 0.0 0.0 0.0 0.0 0.0 0.08. Debt stock-flow reconciliationTotal change in external debt stocks .. 7.6 58.4 114.2 83.6 17.3 64.4 74.8 Net flows on external debt .. 7.2 61.2 80.4 67.9 57.4 35.7 40.4 Cross-currency valuation .. 0.4 -4.2 30.2 15.1 -34.6 23.7 28.19. Debt restructuringsTotal amount rescheduled .. 0.0 0.0 0.0 0.0 0.0 0.0 16.7Total amount forgiven .. 0.0 0.0 0.0 0.0 0.0 0.0 3.0Debt buyback .. 0.0 0.0 0.0 0.0 0.0 0.0 0.010. Contractual obligations on outstanding long-term external debt
2008 2009 2010 2011 2012 2013 2014 2015Official creditorsPrincipal 22.3 23.7 25.5 28.9 29.5 29.4 29.4 25.3Interest 8.2 8.0 7.7 7.4 7.0 6.5 6.1 5.7Private creditorsPrincipal 0.0 0.0 0.0 0.0 0.0 0.0 0.0 0.0Interest 0.2 0.2 0.2 0.2 0.2 0.2 0.2 0.2
101

ETHIOPIA(US$ million, unless otherwise indicated)
1990 1995 2000 2003 2004 2005 2006 2007
1. Summary external debt dataExternal debt stocks 8,630 10,308 5,483 7,272 6,644 6,260 2,281 2,634 Long-term external debt 8,479 9,774 5,327 7,031 6,332 5,898 2,167 2,544 Public and publicly guaranteed 8,479 9,774 5,327 7,031 6,332 5,898 2,167 2,544 Private nonguaranteed 0 0 0 0 0 0 0 0 Use of IMF credit 6 73 77 157 183 160 0 0 Short-term external debt 145 460 79 83 129 202 114 90 interest arrears on long-term 43 437 65 41 36 36 36 32Memorandum itemsPrincipal arrears on long-term 236 3,628 651 566 546 512 373 372Long-term public sector debt 8,477 9,774 5,327 7,031 6,332 5,898 2,167 2,544Long-term private sector debt 1 0 0 0 0 0 0 0Public & publicly guaranteed commitments 580 170 500 558 333 741 479 873
External debt flowsDisbursements 374 232 185 386 403 534 368 450 Long-term external debt 374 232 185 372 372 534 368 450 IMF purchases 0 0 0 15 31 0 0 0Principal repayments 177 91 84 47 51 35 106 81 Long-term external debt 152 91 71 38 42 31 106 81 IMF repurchases 25 0 13 8 9 4 0 0Net flows 203 133 90 363 403 571 174 349 Long-term external debt 222 141 114 333 330 502 262 369 IMF flows -24 0 0 0 0 0 0 0 Short-term external debt 7 -8 -11 24 51 73 -88 -20Interest payments 59 63 53 45 49 54 57 47 Long-term external debt 48 61 52 43 46 49 53 44 IMF charges 2 0 0 1 1 1 0 0 Short-term external debt 8 1 1 1 2 4 4 3
2. Other non-debt resource flowsForeign direct investment (net) 12 14 135 465 545 265 545 223Portfolio equity flows 0 0 0 0 0 0 0 0Profit remittances on FDI 0 0 9 17 28 21 24 18Grants (excluding technical coop.) 604 476 425 1,263 1,459 1,470 5,185 1,897of which: Debt forgiveness grants .. .. 15 68 155 154 3,952 7 IDA grants .. .. .. 47 282 72 168 192Memo: technical coop. grants 250 164 120 166 173 196 258 123
3. Currency composition of public and publicly guaranteed debt (%)Euro .. .. .. 6.2 5.1 5.3 14.4 17.3Japanese yen 0.5 0.4 0.3 0.2 0.2 0.2 0.1 0.1Pound sterling 0.3 0.2 0.3 0.3 0.4 0.0 0.0 0.0Swiss franc 0.1 0.1 0.1 0.1 0.0 0.0 0.0 0.0U.S.dollars 24.2 29.0 76.0 76.9 74.6 72.7 64.3 58.4
4. Average terms of new commitmentsOfficial creditors Interest (%) 1.9 1.0 0.8 0.8 0.9 0.9 1.0 0.6 Maturity (years) 32.7 36.3 38.4 38.7 38.7 32.4 35.6 42.7 Grace period (years) 7.9 9.3 10.0 9.5 9.5 6.3 7.8 10.4Private creditors Interest (%) 9.8 0.0 0.0 1.5 0.0 0.0 0.0 0.0 Maturity (years) 14.1 0.0 0.0 12.8 0.0 0.0 0.0 0.0 Grace period (years) 0.4 0.0 0.0 4.0 0.0 0.0 0.0 0.0
5. Major economic aggregatesGross national income (GNI) 12,016 7,545 8,119 8,492 9,990 12,269 15,127 19,409Exports of goods, services & income 606 836 1,062 1,323 1,849 2,146 2,424 3,092Worker remit. & comp. of employees 5 27 53 47 134 174 172 359Imports of goods & services 1,349 1,533 1,673 2,647 3,787 4,943 5,314 6,957International reserves 55 815 363 956 1,497 1,121 833 ..Current account balance -294 39 13 -136 -668 -1,568 -1,786 -827
6. RatiosExternal debt stocks to exports (%) 1,424.6 1,233.1 516.5 549.4 359.3 291.7 94.1 85.2External debt stocks to GNI (%) 71.8 136.6 67.5 85.6 66.5 51.0 15.1 13.6Debt service to exports (%) 39.0 18.4 12.9 7.0 5.4 4.2 6.7 4.1Short-term to external debt stocks (%) 1.7 4.5 1.4 1.1 1.9 3.2 5.0 3.4Multilateral to external debt stocks (%) 14.7 22.7 50.0 60.4 72.5 74.9 46.8 51.8Reserves to external debt stocks (%) 0.6 7.9 6.6 13.1 22.5 17.9 36.5 0.0Reserves to imports (months) 0.5 6.4 2.6 4.3 4.7 2.7 1.9 ..
102

ETHIOPIA(US$ million, unless otherwise indicated)
1990 1995 2000 2003 2004 2005 2006 2007
7. Long-term external debtDebt outstanding and disbursed 8,479 9,774 5,327 7,031 6,332 5,898 2,167 2,544Public and publicly guaranteed 8,479 9,774 5,327 7,031 6,332 5,898 2,167 2,544 Official creditors 7,906 9,183 5,214 6,825 6,079 5,534 1,851 2,271 Multilateral 1,268 2,339 2,741 4,392 4,817 4,692 1,068 1,363 of which: IBRD 27 0 0 0 0 0 0 0 IDA 824 1,470 1,779 3,179 3,488 3,359 553 711 Bilateral 6,637 6,844 2,473 2,432 1,262 842 783 908 Private creditors 573 590 113 207 253 364 316 272 of which: Bonds 0 0 0 0 0 0 0 0 Commercial banks 116 253 12 1 1 1 0 0Private nonguaranteed 0 0 0 0 0 0 0 0 of which: Bonds 0 0 0 0 0 0 0 0Disbursements 374 232 185 372 372 534 368 450Public and publicly guaranteed 374 232 185 372 372 534 368 450 Official creditors 324 232 184 237 294 407 368 450 Multilateral 139 209 181 237 293 330 288 342 of which: IBRD 0 0 0 0 0 0 0 0 IDA 74 84 137 204 202 162 179 132 Bilateral 185 23 3 0 2 76 80 108 Private creditors 51 0 2 134 78 127 0 0 of which: Bonds 0 0 0 0 0 0 0 0 Commercial banks 0 0 0 0 0 0 0 0Private nonguaranteed 0 0 0 0 0 0 0 0 of which: Bonds 0 0 0 0 0 0 0 0Principal repayments 152 91 71 38 42 31 106 81Public and publicly guaranteed 152 91 71 38 42 31 106 81 Official creditors 45 43 62 32 35 20 61 37 Multilateral 16 40 55 21 28 14 56 31 of which: IBRD 7 4 0 0 0 0 0 0 IDA 4 12 21 9 13 0 23 0 Bilateral 29 3 6 12 7 6 5 6 Private creditors 107 48 10 6 7 11 45 44 of which: Bonds 0 0 0 0 0 0 0 0 Commercial banks 45 39 4 2 0 0 1 0Private nonguaranteed 0 0 0 0 0 0 0 0 of which: Bonds 0 0 0 0 0 0 0 0Interest payments 48 61 52 43 46 49 53 44Public and publicly guaranteed 48 61 52 43 46 49 53 44 Official creditors 24 32 48 41 45 39 37 29 Multilateral 13 23 33 31 39 29 32 17 of which: IBRD 2 0 0 0 0 0 0 0 IDA 6 11 13 17 23 15 16 6 Bilateral 11 9 14 10 6 11 5 12 Private creditors 24 29 4 2 1 10 17 15 of which: Bonds 0 0 0 0 0 0 0 0 Commercial banks 11 27 1 1 0 0 0 0Private nonguaranteed 0 0 0 0 0 0 0 0 of which: Bonds 0 0 0 0 0 0 0 08. Debt stock-flow reconciliationTotal change in external debt stocks 789 245 -61 746 -628 -384 -3,979 353 Net flows on external debt 203 133 90 363 403 571 174 349 Cross-currency valuation 585 22 -105 120 9 -500 -4,131 -1569. Debt restructuringsTotal amount rescheduled 0 30 0 22 0 163 0 0Total amount forgiven 66 7 0 157 56 431 247 10Debt buyback 0 0 0 0 0 0 0 010. Contractual obligations on outstanding long-term external debt
2008 2009 2010 2011 2012 2013 2014 2015Official creditorsPrincipal 76 89 86 102 107 112 120 130Interest 36 37 38 38 37 36 35 33Private creditorsPrincipal 105 84 76 0 0 0 0 0Interest 11 7 2 0 0 0 0 0
Notes:Ethiopia was granted debt relief effective in 2006 under the Multilateral Debt Relief Initiative.
103
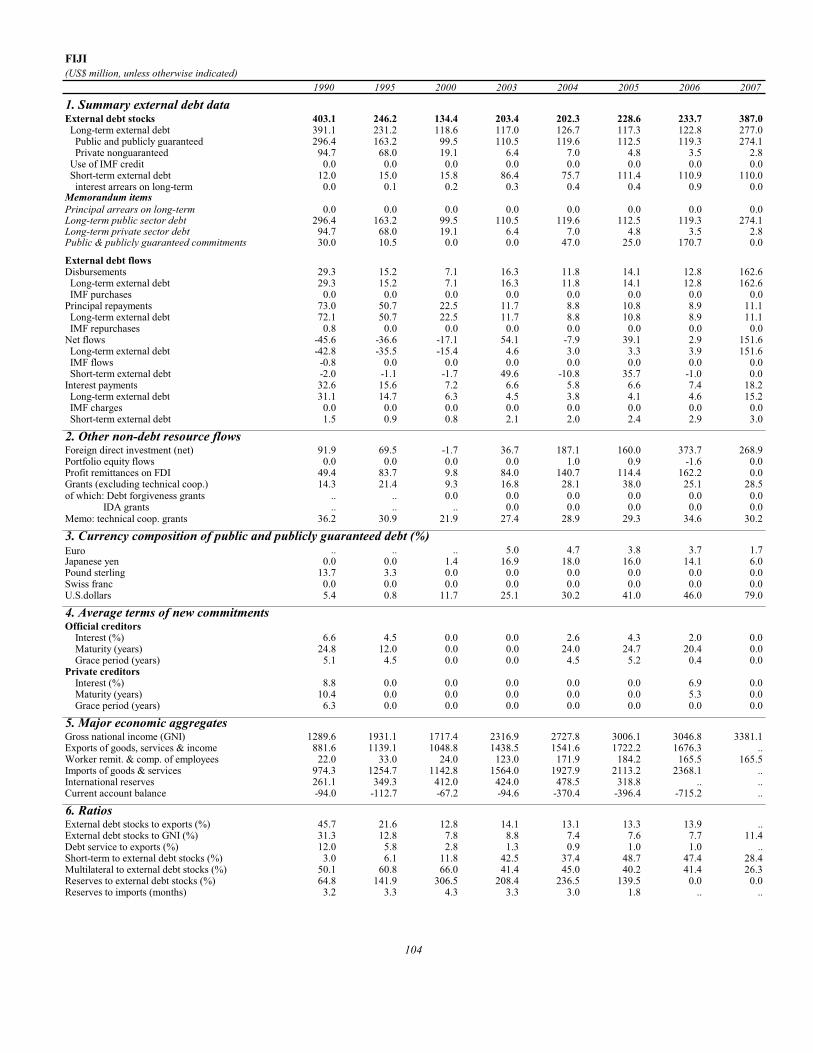
FIJI(US$ million, unless otherwise indicated)
1990 1995 2000 2003 2004 2005 2006 2007
1. Summary external debt dataExternal debt stocks 403.1 246.2 134.4 203.4 202.3 228.6 233.7 387.0 Long-term external debt 391.1 231.2 118.6 117.0 126.7 117.3 122.8 277.0 Public and publicly guaranteed 296.4 163.2 99.5 110.5 119.6 112.5 119.3 274.1 Private nonguaranteed 94.7 68.0 19.1 6.4 7.0 4.8 3.5 2.8 Use of IMF credit 0.0 0.0 0.0 0.0 0.0 0.0 0.0 0.0 Short-term external debt 12.0 15.0 15.8 86.4 75.7 111.4 110.9 110.0 interest arrears on long-term 0.0 0.1 0.2 0.3 0.4 0.4 0.9 0.0Memorandum itemsPrincipal arrears on long-term 0.0 0.0 0.0 0.0 0.0 0.0 0.0 0.0Long-term public sector debt 296.4 163.2 99.5 110.5 119.6 112.5 119.3 274.1Long-term private sector debt 94.7 68.0 19.1 6.4 7.0 4.8 3.5 2.8Public & publicly guaranteed commitments 30.0 10.5 0.0 0.0 47.0 25.0 170.7 0.0
External debt flowsDisbursements 29.3 15.2 7.1 16.3 11.8 14.1 12.8 162.6 Long-term external debt 29.3 15.2 7.1 16.3 11.8 14.1 12.8 162.6 IMF purchases 0.0 0.0 0.0 0.0 0.0 0.0 0.0 0.0Principal repayments 73.0 50.7 22.5 11.7 8.8 10.8 8.9 11.1 Long-term external debt 72.1 50.7 22.5 11.7 8.8 10.8 8.9 11.1 IMF repurchases 0.8 0.0 0.0 0.0 0.0 0.0 0.0 0.0Net flows -45.6 -36.6 -17.1 54.1 -7.9 39.1 2.9 151.6 Long-term external debt -42.8 -35.5 -15.4 4.6 3.0 3.3 3.9 151.6 IMF flows -0.8 0.0 0.0 0.0 0.0 0.0 0.0 0.0 Short-term external debt -2.0 -1.1 -1.7 49.6 -10.8 35.7 -1.0 0.0Interest payments 32.6 15.6 7.2 6.6 5.8 6.6 7.4 18.2 Long-term external debt 31.1 14.7 6.3 4.5 3.8 4.1 4.6 15.2 IMF charges 0.0 0.0 0.0 0.0 0.0 0.0 0.0 0.0 Short-term external debt 1.5 0.9 0.8 2.1 2.0 2.4 2.9 3.0
2. Other non-debt resource flowsForeign direct investment (net) 91.9 69.5 -1.7 36.7 187.1 160.0 373.7 268.9Portfolio equity flows 0.0 0.0 0.0 0.0 1.0 0.9 -1.6 0.0Profit remittances on FDI 49.4 83.7 9.8 84.0 140.7 114.4 162.2 0.0Grants (excluding technical coop.) 14.3 21.4 9.3 16.8 28.1 38.0 25.1 28.5of which: Debt forgiveness grants .. .. 0.0 0.0 0.0 0.0 0.0 0.0 IDA grants .. .. .. 0.0 0.0 0.0 0.0 0.0Memo: technical coop. grants 36.2 30.9 21.9 27.4 28.9 29.3 34.6 30.2
3. Currency composition of public and publicly guaranteed debt (%)Euro .. .. .. 5.0 4.7 3.8 3.7 1.7Japanese yen 0.0 0.0 1.4 16.9 18.0 16.0 14.1 6.0Pound sterling 13.7 3.3 0.0 0.0 0.0 0.0 0.0 0.0Swiss franc 0.0 0.0 0.0 0.0 0.0 0.0 0.0 0.0U.S.dollars 5.4 0.8 11.7 25.1 30.2 41.0 46.0 79.0
4. Average terms of new commitmentsOfficial creditors Interest (%) 6.6 4.5 0.0 0.0 2.6 4.3 2.0 0.0 Maturity (years) 24.8 12.0 0.0 0.0 24.0 24.7 20.4 0.0 Grace period (years) 5.1 4.5 0.0 0.0 4.5 5.2 0.4 0.0Private creditors Interest (%) 8.8 0.0 0.0 0.0 0.0 0.0 6.9 0.0 Maturity (years) 10.4 0.0 0.0 0.0 0.0 0.0 5.3 0.0 Grace period (years) 6.3 0.0 0.0 0.0 0.0 0.0 0.0 0.0
5. Major economic aggregatesGross national income (GNI) 1289.6 1931.1 1717.4 2316.9 2727.8 3006.1 3046.8 3381.1Exports of goods, services & income 881.6 1139.1 1048.8 1438.5 1541.6 1722.2 1676.3 ..Worker remit. & comp. of employees 22.0 33.0 24.0 123.0 171.9 184.2 165.5 165.5Imports of goods & services 974.3 1254.7 1142.8 1564.0 1927.9 2113.2 2368.1 ..International reserves 261.1 349.3 412.0 424.0 478.5 318.8 .. ..Current account balance -94.0 -112.7 -67.2 -94.6 -370.4 -396.4 -715.2 ..
6. RatiosExternal debt stocks to exports (%) 45.7 21.6 12.8 14.1 13.1 13.3 13.9 ..External debt stocks to GNI (%) 31.3 12.8 7.8 8.8 7.4 7.6 7.7 11.4Debt service to exports (%) 12.0 5.8 2.8 1.3 0.9 1.0 1.0 ..Short-term to external debt stocks (%) 3.0 6.1 11.8 42.5 37.4 48.7 47.4 28.4Multilateral to external debt stocks (%) 50.1 60.8 66.0 41.4 45.0 40.2 41.4 26.3Reserves to external debt stocks (%) 64.8 141.9 306.5 208.4 236.5 139.5 0.0 0.0Reserves to imports (months) 3.2 3.3 4.3 3.3 3.0 1.8 .. ..
104
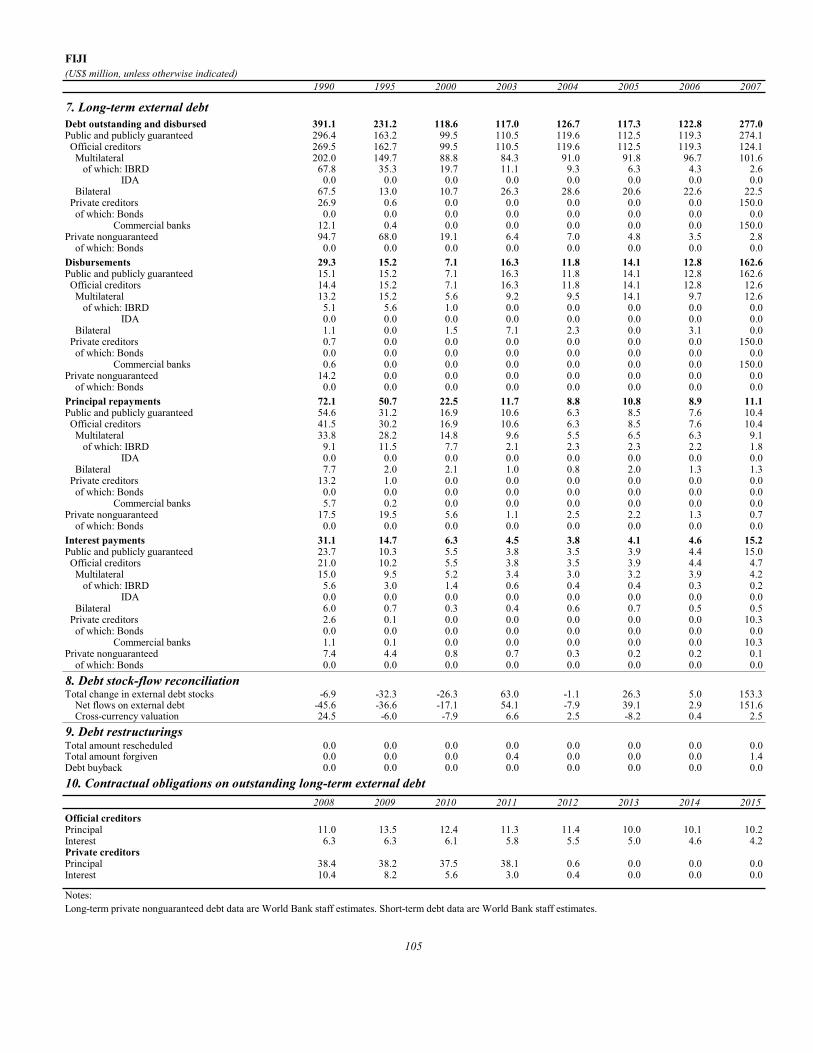
FIJI(US$ million, unless otherwise indicated)
1990 1995 2000 2003 2004 2005 2006 2007
7. Long-term external debtDebt outstanding and disbursed 391.1 231.2 118.6 117.0 126.7 117.3 122.8 277.0Public and publicly guaranteed 296.4 163.2 99.5 110.5 119.6 112.5 119.3 274.1 Official creditors 269.5 162.7 99.5 110.5 119.6 112.5 119.3 124.1 Multilateral 202.0 149.7 88.8 84.3 91.0 91.8 96.7 101.6 of which: IBRD 67.8 35.3 19.7 11.1 9.3 6.3 4.3 2.6 IDA 0.0 0.0 0.0 0.0 0.0 0.0 0.0 0.0 Bilateral 67.5 13.0 10.7 26.3 28.6 20.6 22.6 22.5 Private creditors 26.9 0.6 0.0 0.0 0.0 0.0 0.0 150.0 of which: Bonds 0.0 0.0 0.0 0.0 0.0 0.0 0.0 0.0 Commercial banks 12.1 0.4 0.0 0.0 0.0 0.0 0.0 150.0Private nonguaranteed 94.7 68.0 19.1 6.4 7.0 4.8 3.5 2.8 of which: Bonds 0.0 0.0 0.0 0.0 0.0 0.0 0.0 0.0Disbursements 29.3 15.2 7.1 16.3 11.8 14.1 12.8 162.6Public and publicly guaranteed 15.1 15.2 7.1 16.3 11.8 14.1 12.8 162.6 Official creditors 14.4 15.2 7.1 16.3 11.8 14.1 12.8 12.6 Multilateral 13.2 15.2 5.6 9.2 9.5 14.1 9.7 12.6 of which: IBRD 5.1 5.6 1.0 0.0 0.0 0.0 0.0 0.0 IDA 0.0 0.0 0.0 0.0 0.0 0.0 0.0 0.0 Bilateral 1.1 0.0 1.5 7.1 2.3 0.0 3.1 0.0 Private creditors 0.7 0.0 0.0 0.0 0.0 0.0 0.0 150.0 of which: Bonds 0.0 0.0 0.0 0.0 0.0 0.0 0.0 0.0 Commercial banks 0.6 0.0 0.0 0.0 0.0 0.0 0.0 150.0Private nonguaranteed 14.2 0.0 0.0 0.0 0.0 0.0 0.0 0.0 of which: Bonds 0.0 0.0 0.0 0.0 0.0 0.0 0.0 0.0Principal repayments 72.1 50.7 22.5 11.7 8.8 10.8 8.9 11.1Public and publicly guaranteed 54.6 31.2 16.9 10.6 6.3 8.5 7.6 10.4 Official creditors 41.5 30.2 16.9 10.6 6.3 8.5 7.6 10.4 Multilateral 33.8 28.2 14.8 9.6 5.5 6.5 6.3 9.1 of which: IBRD 9.1 11.5 7.7 2.1 2.3 2.3 2.2 1.8 IDA 0.0 0.0 0.0 0.0 0.0 0.0 0.0 0.0 Bilateral 7.7 2.0 2.1 1.0 0.8 2.0 1.3 1.3 Private creditors 13.2 1.0 0.0 0.0 0.0 0.0 0.0 0.0 of which: Bonds 0.0 0.0 0.0 0.0 0.0 0.0 0.0 0.0 Commercial banks 5.7 0.2 0.0 0.0 0.0 0.0 0.0 0.0Private nonguaranteed 17.5 19.5 5.6 1.1 2.5 2.2 1.3 0.7 of which: Bonds 0.0 0.0 0.0 0.0 0.0 0.0 0.0 0.0Interest payments 31.1 14.7 6.3 4.5 3.8 4.1 4.6 15.2Public and publicly guaranteed 23.7 10.3 5.5 3.8 3.5 3.9 4.4 15.0 Official creditors 21.0 10.2 5.5 3.8 3.5 3.9 4.4 4.7 Multilateral 15.0 9.5 5.2 3.4 3.0 3.2 3.9 4.2 of which: IBRD 5.6 3.0 1.4 0.6 0.4 0.4 0.3 0.2 IDA 0.0 0.0 0.0 0.0 0.0 0.0 0.0 0.0 Bilateral 6.0 0.7 0.3 0.4 0.6 0.7 0.5 0.5 Private creditors 2.6 0.1 0.0 0.0 0.0 0.0 0.0 10.3 of which: Bonds 0.0 0.0 0.0 0.0 0.0 0.0 0.0 0.0 Commercial banks 1.1 0.1 0.0 0.0 0.0 0.0 0.0 10.3Private nonguaranteed 7.4 4.4 0.8 0.7 0.3 0.2 0.2 0.1 of which: Bonds 0.0 0.0 0.0 0.0 0.0 0.0 0.0 0.08. Debt stock-flow reconciliationTotal change in external debt stocks -6.9 -32.3 -26.3 63.0 -1.1 26.3 5.0 153.3 Net flows on external debt -45.6 -36.6 -17.1 54.1 -7.9 39.1 2.9 151.6 Cross-currency valuation 24.5 -6.0 -7.9 6.6 2.5 -8.2 0.4 2.59. Debt restructuringsTotal amount rescheduled 0.0 0.0 0.0 0.0 0.0 0.0 0.0 0.0Total amount forgiven 0.0 0.0 0.0 0.4 0.0 0.0 0.0 1.4Debt buyback 0.0 0.0 0.0 0.0 0.0 0.0 0.0 0.010. Contractual obligations on outstanding long-term external debt
2008 2009 2010 2011 2012 2013 2014 2015Official creditorsPrincipal 11.0 13.5 12.4 11.3 11.4 10.0 10.1 10.2Interest 6.3 6.3 6.1 5.8 5.5 5.0 4.6 4.2Private creditorsPrincipal 38.4 38.2 37.5 38.1 0.6 0.0 0.0 0.0Interest 10.4 8.2 5.6 3.0 0.4 0.0 0.0 0.0
Notes:Long-term private nonguaranteed debt data are World Bank staff estimates. Short-term debt data are World Bank staff estimates.
105

GABON(US$ million, unless otherwise indicated)
1990 1995 2000 2003 2004 2005 2006 2007
1. Summary external debt dataExternal debt stocks 3,983 4,360 3,920 3,792 4,150 3,846 4,287 5,746 Long-term external debt 3,150 3,976 3,453 3,395 3,800 3,582 3,858 5,177 Public and publicly guaranteed 3,150 3,976 3,453 3,395 3,800 3,582 3,858 5,177 Private nonguaranteed 0 0 0 0 0 0 0 0 Use of IMF credit 140 97 89 59 100 68 57 25 Short-term external debt 693 287 377 339 250 195 371 545 interest arrears on long-term 130 0 63 268 188 189 371 545Memorandum itemsPrincipal arrears on long-term 82 26 124 425 267 441 1,009 1,666Long-term public sector debt 3,148 3,976 3,453 3,395 3,800 3,582 3,858 5,177Long-term private sector debt 2 0 0 0 0 0 0 0Public & publicly guaranteed commitments 65 89 20 0 107 182 40 1,575
External debt flowsDisbursements 204 279 49 29 202 33 88 1,111 Long-term external debt 195 222 32 29 140 33 88 1,111 IMF purchases 9 57 17 0 62 0 0 0Principal repayments 40 216 196 241 178 68 60 76 Long-term external debt 26 165 187 226 153 44 46 42 IMF repurchases 15 52 10 14 25 25 14 34Net flows 164 14 -341 -362 15 -91 22 1,035 Long-term external debt 170 57 -155 -197 -13 -10 42 1,069 IMF flows -6 5 8 -14 37 -25 -14 -34 Short-term external debt 0 -49 -194 -151 -9 -56 -6 0Interest payments 136 240 156 134 45 41 23 25 Long-term external debt 78 217 124 129 42 38 20 22 IMF charges 13 5 4 1 2 3 3 3 Short-term external debt 45 17 28 4 2 0 0 0
2. Other non-debt resource flowsForeign direct investment (net) 73 -315 -43 158 320 242 268 269Portfolio equity flows 0 0 0 0 0 0 0 0Profit remittances on FDI 116 236 473 359 722 765 0 0Grants (excluding technical coop.) 30 87 39 85 33 50 23 29of which: Debt forgiveness grants .. .. 2 2 2 1 0 15 IDA grants .. .. .. 0 0 0 0 0Memo: technical coop. grants 36 46 26 41 44 45 56 60
3. Currency composition of public and publicly guaranteed debt (%)Euro .. .. .. 72.8 57.1 47.5 49.9 42.9Japanese yen 0.7 0.9 0.8 0.9 0.6 0.5 0.5 0.4Pound sterling 5.3 5.0 4.6 6.9 5.3 4.4 4.7 3.5Swiss franc 0.3 0.8 0.5 0.3 0.2 0.2 0.2 0.2U.S.dollars 10.3 11.5 29.1 7.5 25.0 36.4 34.0 45.0
4. Average terms of new commitmentsOfficial creditors Interest (%) 7.7 4.7 0.0 0.0 2.0 2.2 4.2 4.9 Maturity (years) 19.0 13.0 8.7 0.0 19.6 15.5 14.4 19.4 Grace period (years) 5.4 5.9 0.7 0.0 5.1 5.4 2.9 5.3Private creditors Interest (%) 9.0 0.0 0.0 0.0 0.0 0.7 0.0 7.8 Maturity (years) 11.8 0.0 0.0 0.0 0.0 5.8 0.0 10.0 Grace period (years) 1.3 0.0 0.0 0.0 0.0 2.7 0.0 9.1
5. Major economic aggregatesGross national income (GNI) 5,336 4,293 4,289 5,342 5,987 7,708 8,437 10,228Exports of goods, services & income 2,750 2,984 3,549 3,403 4,243 5,648 .. ..Worker remit. & comp. of employees 0 4 6 6 7 11 11 11Imports of goods & services 2,448 2,423 2,483 2,452 3,133 3,395 .. ..International reserves 279 153 194 202 449 675 1,122 1,238Current account balance 168 515 1,001 766 924 1,983 .. ..
6. RatiosExternal debt stocks to exports (%) 144.8 146.1 110.5 111.4 97.8 68.1 .. ..External debt stocks to GNI (%) 74.6 101.6 91.4 71.0 69.3 49.9 50.8 56.2Debt service to exports (%) 6.4 15.3 9.9 11.0 5.3 1.9 .. ..Short-term to external debt stocks (%) 17.4 6.6 9.6 8.9 6.0 5.1 8.7 9.5Multilateral to external debt stocks (%) 8.0 13.5 11.8 10.6 11.2 10.6 10.0 7.6Reserves to external debt stocks (%) 7.0 3.5 4.9 5.3 10.8 17.6 26.2 21.5Reserves to imports (months) 1.4 0.8 0.9 1.0 1.7 2.4 .. ..
106

GABON(US$ million, unless otherwise indicated)
1990 1995 2000 2003 2004 2005 2006 2007
7. Long-term external debtDebt outstanding and disbursed 3,150 3,976 3,453 3,395 3,800 3,582 3,858 5,177Public and publicly guaranteed 3,150 3,976 3,453 3,395 3,800 3,582 3,858 5,177 Official creditors 2,435 3,778 3,335 3,136 3,558 3,356 3,602 3,847 Multilateral 317 588 464 403 465 406 428 439 of which: IBRD 69 110 64 49 38 30 19 12 IDA 0 0 0 0 0 0 0 0 Bilateral 2,118 3,189 2,871 2,734 3,093 2,949 3,174 3,408 Private creditors 715 199 119 258 242 227 257 1,330 of which: Bonds 0 0 0 0 0 0 0 1,000 Commercial banks 181 148 99 85 78 73 77 118Private nonguaranteed 0 0 0 0 0 0 0 0 of which: Bonds 0 0 0 0 0 0 0 0Disbursements 195 222 32 29 140 33 88 1,111Public and publicly guaranteed 195 222 32 29 140 33 88 1,111 Official creditors 158 222 11 29 126 28 73 56 Multilateral 84 150 9 18 112 18 52 33 of which: IBRD 10 4 9 2 3 0 0 0 IDA 0 0 0 0 0 0 0 0 Bilateral 74 72 2 12 14 10 21 23 Private creditors 37 0 21 0 14 6 15 1,055 of which: Bonds 0 0 0 0 0 0 0 1,000 Commercial banks 0 0 21 0 0 0 0 37Private nonguaranteed 0 0 0 0 0 0 0 0 of which: Bonds 0 0 0 0 0 0 0 0Principal repayments 26 165 187 226 153 44 46 42Public and publicly guaranteed 26 165 187 226 153 44 46 42 Official creditors 18 90 159 154 116 44 46 42 Multilateral 13 43 43 69 67 44 46 40 of which: IBRD 1 12 13 6 14 7 12 8 IDA 0 0 0 0 0 0 0 0 Bilateral 5 48 116 85 49 0 0 2 Private creditors 8 75 27 73 37 0 0 0 of which: Bonds 0 0 0 0 0 0 0 0 Commercial banks 3 26 27 25 9 0 0 0Private nonguaranteed 0 0 0 0 0 0 0 0 of which: Bonds 0 0 0 0 0 0 0 0Interest payments 78 217 124 129 42 38 20 22Public and publicly guaranteed 78 217 124 129 42 38 20 22 Official creditors 68 174 118 111 35 38 20 21 Multilateral 21 26 42 40 26 19 20 20 of which: IBRD 5 8 5 2 3 1 2 1 IDA 0 0 0 0 0 0 0 0 Bilateral 47 148 75 71 9 18 0 1 Private creditors 11 44 7 17 7 0 0 1 of which: Bonds 0 0 0 0 0 0 0 0 Commercial banks 5 26 7 7 2 0 0 1Private nonguaranteed 0 0 0 0 0 0 0 0 of which: Bonds 0 0 0 0 0 0 0 08. Debt stock-flow reconciliationTotal change in external debt stocks 632 189 -62 246 358 -304 441 1,459 Net flows on external debt 164 14 -341 -362 15 -91 22 1,035 Cross-currency valuation 293 228 -196 370 213 -332 215 2409. Debt restructuringsTotal amount rescheduled 271 472 637 0 735 365 0 0Total amount forgiven 0 40 0 67 0 0 0 0Debt buyback 0 0 0 0 0 0 0 010. Contractual obligations on outstanding long-term external debt
2008 2009 2010 2011 2012 2013 2014 2015Official creditorsPrincipal 575 573 317 279 241 207 210 62Interest 120 89 66 57 47 40 34 26Private creditorsPrincipal 39 35 45 22 22 19 17 17Interest 88 89 89 88 87 86 85 84
Notes:Data on long-term public and publicly guaranteed debt for 2007 are World Bank staff estimates.
107

GAMBIA, THE(US$ million, unless otherwise indicated)
1990 1995 2000 2003 2004 2005 2006 2007
1. Summary external debt dataExternal debt stocks 369.1 426.1 483.3 634.3 672.0 668.3 724.4 733.1 Long-term external debt 308.4 385.5 437.9 566.6 620.3 625.0 688.3 704.3 Public and publicly guaranteed 308.4 385.5 437.9 566.6 620.3 625.0 688.3 704.3 Private nonguaranteed 0.0 0.0 0.0 0.0 0.0 0.0 0.0 0.0 Use of IMF credit 44.9 25.8 18.1 34.9 24.8 20.8 17.8 6.3 Short-term external debt 15.7 14.8 27.3 32.8 26.9 22.5 18.3 22.5 interest arrears on long-term 0.6 0.7 0.0 2.8 2.9 1.5 1.3 1.5Memorandum itemsPrincipal arrears on long-term 0.9 2.2 2.0 14.7 18.6 20.5 21.0 24.3Long-term public sector debt 306.6 385.3 437.9 566.6 620.3 625.0 688.3 704.3Long-term private sector debt 1.8 0.2 0.0 0.0 0.0 0.0 0.0 0.0Public & publicly guaranteed commitments 37.9 40.3 24.5 9.1 84.3 51.7 37.0 12.2
External debt flowsDisbursements 32.8 23.0 29.7 39.9 51.4 62.6 59.2 63.0 Long-term external debt 23.5 23.0 20.7 39.9 51.4 62.6 59.2 56.9 IMF purchases 9.3 0.0 9.1 0.0 0.0 0.0 0.0 6.1Principal repayments 25.5 21.7 14.3 11.3 28.2 17.9 23.4 23.9 Long-term external debt 20.2 15.5 12.7 11.3 17.0 15.8 19.3 20.3 IMF repurchases 5.3 6.2 1.6 0.0 11.2 2.0 4.0 3.7Net flows 15.5 -7.6 20.6 21.6 17.2 41.7 31.8 42.1 Long-term external debt 3.4 7.5 8.0 28.6 34.4 46.7 39.9 36.6 IMF flows -5.0 0.0 0.0 0.0 0.0 0.0 0.0 0.0 Short-term external debt 8.1 -8.8 5.2 -7.0 -6.0 -3.0 -4.0 3.0Interest payments 12.3 6.3 7.3 9.1 9.1 10.5 9.8 11.6 Long-term external debt 10.2 5.2 6.0 8.6 8.0 9.5 8.8 10.5 IMF charges 1.3 0.2 0.1 0.1 0.2 0.1 0.1 0.1 Short-term external debt 0.8 0.9 1.2 0.4 0.8 0.9 0.9 1.0
2. Other non-debt resource flowsForeign direct investment (net) 14.1 7.8 43.5 21.9 56.8 51.9 82.1 68.5Portfolio equity flows 0.0 0.0 0.0 0.0 0.0 0.0 0.0 0.0Profit remittances on FDI 0.0 0.0 0.0 24.2 21.9 26.0 32.8 33.9Grants (excluding technical coop.) 44.7 17.6 21.7 20.5 28.8 27.0 32.5 72.7of which: Debt forgiveness grants .. .. 0.0 0.0 0.0 0.0 0.0 54.5 IDA grants .. .. .. 0.0 0.0 0.0 0.0 3.0Memo: technical coop. grants 24.2 22.8 9.6 14.1 9.7 9.1 11.2 9.3
3. Currency composition of public and publicly guaranteed debt (%)Euro .. .. .. 5.1 4.6 3.7 3.2 3.7Japanese yen 0.0 0.0 0.0 0.0 0.0 0.0 0.0 0.0Pound sterling 8.5 6.3 4.8 3.3 2.8 2.7 2.3 2.1Swiss franc 1.3 0.2 0.0 0.0 0.0 0.0 0.0 0.0U.S.dollars 39.1 43.5 51.3 53.9 54.2 55.1 53.9 47.5
4. Average terms of new commitmentsOfficial creditors Interest (%) 0.8 3.5 1.7 0.6 2.5 4.1 0.1 0.0 Maturity (years) 42.1 21.3 27.4 22.3 25.9 30.0 32.9 40.0 Grace period (years) 10.0 6.2 6.8 5.7 6.0 7.2 9.4 11.0Private creditors Interest (%) 0.0 0.0 0.0 0.0 0.0 0.0 0.0 0.0 Maturity (years) 0.0 0.0 0.0 0.0 0.0 0.0 0.0 0.0 Grace period (years) 0.0 0.0 0.0 0.0 0.0 0.0 0.0 0.0
5. Major economic aggregatesGross national income (GNI) 291.4 377.1 400.4 335.9 366.0 417.8 459.7 596.7Exports of goods, services & income 169.7 181.0 .. 230.3 245.5 240.4 268.0 286.0Worker remit. & comp. of employees 10.0 19.0 14.0 65.0 62.1 57.4 63.7 47.3Imports of goods & services 205.4 241.4 .. 224.6 282.5 296.2 358.1 369.4International reserves 55.4 106.1 109.4 59.3 83.8 98.3 120.6 142.8Current account balance 23.4 -8.2 .. 3.2 -31.0 -43.6 -65.6 -52.7
6. RatiosExternal debt stocks to exports (%) 217.5 235.4 .. 275.5 273.7 278.0 270.3 256.3External debt stocks to GNI (%) 126.7 113.0 120.7 188.9 183.6 160.0 157.6 122.9Debt service to exports (%) 22.2 15.5 .. 8.9 15.2 11.8 12.4 12.4Short-term to external debt stocks (%) 4.3 3.5 5.7 5.2 4.0 3.4 2.5 3.1Multilateral to external debt stocks (%) 55.0 76.6 71.1 71.1 75.2 76.2 78.7 78.1Reserves to external debt stocks (%) 15.0 24.9 22.6 9.3 12.5 14.7 16.7 19.5Reserves to imports (months) 3.2 5.3 .. 3.2 3.6 4.0 4.0 4.6
108
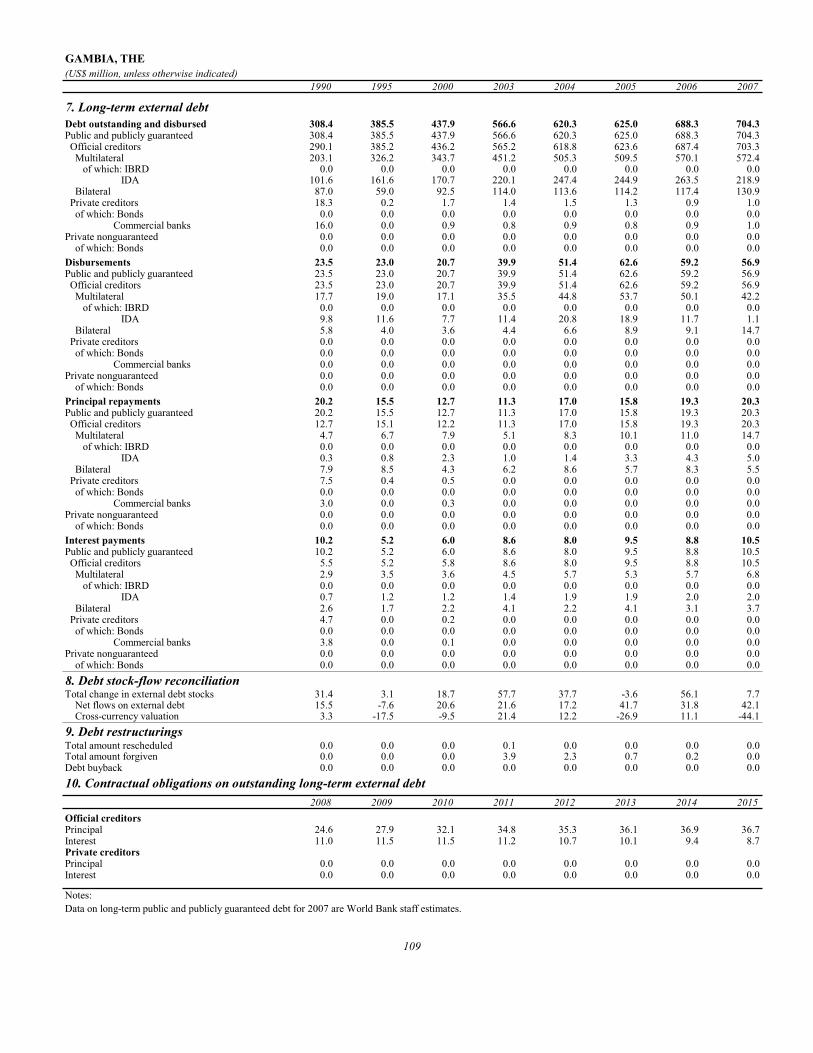
GAMBIA, THE(US$ million, unless otherwise indicated)
1990 1995 2000 2003 2004 2005 2006 2007
7. Long-term external debtDebt outstanding and disbursed 308.4 385.5 437.9 566.6 620.3 625.0 688.3 704.3Public and publicly guaranteed 308.4 385.5 437.9 566.6 620.3 625.0 688.3 704.3 Official creditors 290.1 385.2 436.2 565.2 618.8 623.6 687.4 703.3 Multilateral 203.1 326.2 343.7 451.2 505.3 509.5 570.1 572.4 of which: IBRD 0.0 0.0 0.0 0.0 0.0 0.0 0.0 0.0 IDA 101.6 161.6 170.7 220.1 247.4 244.9 263.5 218.9 Bilateral 87.0 59.0 92.5 114.0 113.6 114.2 117.4 130.9 Private creditors 18.3 0.2 1.7 1.4 1.5 1.3 0.9 1.0 of which: Bonds 0.0 0.0 0.0 0.0 0.0 0.0 0.0 0.0 Commercial banks 16.0 0.0 0.9 0.8 0.9 0.8 0.9 1.0Private nonguaranteed 0.0 0.0 0.0 0.0 0.0 0.0 0.0 0.0 of which: Bonds 0.0 0.0 0.0 0.0 0.0 0.0 0.0 0.0Disbursements 23.5 23.0 20.7 39.9 51.4 62.6 59.2 56.9Public and publicly guaranteed 23.5 23.0 20.7 39.9 51.4 62.6 59.2 56.9 Official creditors 23.5 23.0 20.7 39.9 51.4 62.6 59.2 56.9 Multilateral 17.7 19.0 17.1 35.5 44.8 53.7 50.1 42.2 of which: IBRD 0.0 0.0 0.0 0.0 0.0 0.0 0.0 0.0 IDA 9.8 11.6 7.7 11.4 20.8 18.9 11.7 1.1 Bilateral 5.8 4.0 3.6 4.4 6.6 8.9 9.1 14.7 Private creditors 0.0 0.0 0.0 0.0 0.0 0.0 0.0 0.0 of which: Bonds 0.0 0.0 0.0 0.0 0.0 0.0 0.0 0.0 Commercial banks 0.0 0.0 0.0 0.0 0.0 0.0 0.0 0.0Private nonguaranteed 0.0 0.0 0.0 0.0 0.0 0.0 0.0 0.0 of which: Bonds 0.0 0.0 0.0 0.0 0.0 0.0 0.0 0.0Principal repayments 20.2 15.5 12.7 11.3 17.0 15.8 19.3 20.3Public and publicly guaranteed 20.2 15.5 12.7 11.3 17.0 15.8 19.3 20.3 Official creditors 12.7 15.1 12.2 11.3 17.0 15.8 19.3 20.3 Multilateral 4.7 6.7 7.9 5.1 8.3 10.1 11.0 14.7 of which: IBRD 0.0 0.0 0.0 0.0 0.0 0.0 0.0 0.0 IDA 0.3 0.8 2.3 1.0 1.4 3.3 4.3 5.0 Bilateral 7.9 8.5 4.3 6.2 8.6 5.7 8.3 5.5 Private creditors 7.5 0.4 0.5 0.0 0.0 0.0 0.0 0.0 of which: Bonds 0.0 0.0 0.0 0.0 0.0 0.0 0.0 0.0 Commercial banks 3.0 0.0 0.3 0.0 0.0 0.0 0.0 0.0Private nonguaranteed 0.0 0.0 0.0 0.0 0.0 0.0 0.0 0.0 of which: Bonds 0.0 0.0 0.0 0.0 0.0 0.0 0.0 0.0Interest payments 10.2 5.2 6.0 8.6 8.0 9.5 8.8 10.5Public and publicly guaranteed 10.2 5.2 6.0 8.6 8.0 9.5 8.8 10.5 Official creditors 5.5 5.2 5.8 8.6 8.0 9.5 8.8 10.5 Multilateral 2.9 3.5 3.6 4.5 5.7 5.3 5.7 6.8 of which: IBRD 0.0 0.0 0.0 0.0 0.0 0.0 0.0 0.0 IDA 0.7 1.2 1.2 1.4 1.9 1.9 2.0 2.0 Bilateral 2.6 1.7 2.2 4.1 2.2 4.1 3.1 3.7 Private creditors 4.7 0.0 0.2 0.0 0.0 0.0 0.0 0.0 of which: Bonds 0.0 0.0 0.0 0.0 0.0 0.0 0.0 0.0 Commercial banks 3.8 0.0 0.1 0.0 0.0 0.0 0.0 0.0Private nonguaranteed 0.0 0.0 0.0 0.0 0.0 0.0 0.0 0.0 of which: Bonds 0.0 0.0 0.0 0.0 0.0 0.0 0.0 0.08. Debt stock-flow reconciliationTotal change in external debt stocks 31.4 3.1 18.7 57.7 37.7 -3.6 56.1 7.7 Net flows on external debt 15.5 -7.6 20.6 21.6 17.2 41.7 31.8 42.1 Cross-currency valuation 3.3 -17.5 -9.5 21.4 12.2 -26.9 11.1 -44.19. Debt restructuringsTotal amount rescheduled 0.0 0.0 0.0 0.1 0.0 0.0 0.0 0.0Total amount forgiven 0.0 0.0 0.0 3.9 2.3 0.7 0.2 0.0Debt buyback 0.0 0.0 0.0 0.0 0.0 0.0 0.0 0.010. Contractual obligations on outstanding long-term external debt
2008 2009 2010 2011 2012 2013 2014 2015Official creditorsPrincipal 24.6 27.9 32.1 34.8 35.3 36.1 36.9 36.7Interest 11.0 11.5 11.5 11.2 10.7 10.1 9.4 8.7Private creditorsPrincipal 0.0 0.0 0.0 0.0 0.0 0.0 0.0 0.0Interest 0.0 0.0 0.0 0.0 0.0 0.0 0.0 0.0
Notes:Data on long-term public and publicly guaranteed debt for 2007 are World Bank staff estimates.
109

GEORGIA(US$ million, unless otherwise indicated)
1990 1995 2000 2003 2004 2005 2006 2007
1. Summary external debt dataExternal debt stocks .. 1,240 1,638 1,935 2,064 1,911 1,973 2,292 Long-term external debt .. 1,039 1,316 1,608 1,692 1,626 1,625 1,784 Public and publicly guaranteed .. 1,039 1,274 1,564 1,593 1,494 1,466 1,543 Private nonguaranteed .. 0 42 44 99 132 159 241 Use of IMF credit .. 116 278 289 266 232 236 252 Short-term external debt .. 85 44 38 106 52 111 257 interest arrears on long-term .. 61 1 7 7 11 7 7Memorandum itemsPrincipal arrears on long-term .. 211 179 314 191 151 69 30Long-term public sector debt .. 1,039 1,264 1,559 1,591 1,493 1,466 1,543Long-term private sector debt .. 0 52 49 101 133 159 241Public & publicly guaranteed commitments .. 91 72 47 60 84 104 55
External debt flowsDisbursements .. 174 65 89 197 187 216 235 Long-term external debt .. 98 65 89 177 146 175 193 IMF purchases .. 76 0 0 21 41 41 43Principal repayments .. 0 68 139 200 157 234 146 Long-term external debt .. 0 42 91 145 103 185 106 IMF repurchases .. 0 26 47 55 54 49 40Net flows .. -272 33 -52 66 -28 45 201 Long-term external debt .. 98 23 -3 32 43 -10 87 IMF flows .. 76 -26 -16 -14 -3 0 0 Short-term external debt .. -446 36 -2 68 -58 63 111Interest payments .. 20 49 42 34 30 34 35 Long-term external debt .. 17 43 39 31 27 31 31 IMF charges .. 3 5 2 2 1 1 1 Short-term external debt .. 0 1 1 2 2 2 3
2. Other non-debt resource flowsForeign direct investment (net) .. 6 131 335 492 453 1,061 1,728Portfolio equity flows .. 0 0 0 0 3 143 34Profit remittances on FDI .. 0 0 89 100 116 94 298Grants (excluding technical coop.) .. 85 57 82 139 126 147 241of which: Debt forgiveness grants .. .. 4 112 1,330 486 4,556 0 IDA grants .. .. .. 0 0 7 3 4Memo: technical coop. grants .. 37 83 108 100 129 127 60
3. Currency composition of public and publicly guaranteed debt (%)Euro .. .. .. 19.3 20.9 20.2 15.5 17.5Japanese yen .. 0.0 0.2 2.3 2.8 2.7 3.0 3.1Pound sterling .. 0.0 0.0 0.0 0.0 0.0 0.0 0.0Swiss franc .. 0.4 0.2 0.2 0.2 0.2 0.0 0.0U.S.dollars .. 75.3 82.3 77.0 73.0 72.7 76.2 71.9
4. Average terms of new commitmentsOfficial creditors Interest (%) .. 1.5 1.1 0.8 1.3 0.8 1.4 0.8 Maturity (years) .. 32.3 32.0 39.7 33.3 40.3 34.8 26.9 Grace period (years) .. 9.6 8.9 10.4 9.9 10.7 8.8 10.2Private creditors Interest (%) .. 0.0 0.0 0.0 0.0 0.0 0.0 0.0 Maturity (years) .. 0.0 0.0 0.0 0.0 0.0 0.0 0.0 Grace period (years) .. 0.0 0.0 0.0 0.0 0.0 0.0 0.0
5. Major economic aggregatesGross national income (GNI) .. 2,574 3,175 4,023 5,220 6,505 7,938 10,399Exports of goods, services & income .. .. 939 1,530 1,963 2,545 3,046 3,909Worker remit. & comp. of employees .. 0 274 235 303 346 485 696Imports of goods & services .. .. 1,248 2,029 2,666 3,519 4,590 6,359International reserves .. 199 116 196 387 479 931 1,361Current account balance .. .. -269 -383 -353 -710 -1,174 -2,006
6. RatiosExternal debt stocks to exports (%) .. .. 174.5 126.4 105.2 75.1 64.8 58.6External debt stocks to GNI (%) .. 48.2 51.6 48.1 39.5 29.4 24.9 22.0Debt service to exports (%) .. .. 12.5 11.8 11.9 7.4 8.8 4.6Short-term to external debt stocks (%) .. 6.9 2.7 2.0 5.1 2.7 5.6 11.2Multilateral to external debt stocks (%) .. 19.7 29.2 38.4 40.5 42.9 45.8 44.3Reserves to external debt stocks (%) .. 16.0 7.1 10.1 18.7 25.0 47.2 59.4Reserves to imports (months) .. .. 1.1 1.2 1.7 1.6 2.4 2.6
110

GEORGIA(US$ million, unless otherwise indicated)
1990 1995 2000 2003 2004 2005 2006 2007
7. Long-term external debtDebt outstanding and disbursed .. 1,039 1,316 1,608 1,692 1,626 1,625 1,784Public and publicly guaranteed .. 1,039 1,274 1,564 1,593 1,494 1,466 1,543 Official creditors .. 939 1,272 1,561 1,590 1,492 1,464 1,541 Multilateral .. 245 478 744 836 819 904 1,015 of which: IBRD .. 0 0 0 0 0 0 0 IDA .. 84 347 583 678 679 785 885 Bilateral .. 694 794 818 754 673 560 526 Private creditors .. 100 2 3 3 2 2 2 of which: Bonds .. 0 0 0 0 0 0 0 Commercial banks .. 0 0 0 0 0 0 0Private nonguaranteed .. 0 42 44 99 132 159 241 of which: Bonds .. 0 0 0 0 0 0 0Disbursements .. 98 65 89 177 146 175 193Public and publicly guaranteed .. 98 37 72 102 76 119 100 Official creditors .. 98 37 72 102 76 119 100 Multilateral .. 96 25 50 74 60 88 82 of which: IBRD .. 0 0 0 0 0 0 0 IDA .. 85 18 43 65 54 76 72 Bilateral .. 2 13 22 28 16 31 18 Private creditors .. 0 0 0 0 0 0 0 of which: Bonds .. 0 0 0 0 0 0 0 Commercial banks .. 0 0 0 0 0 0 0Private nonguaranteed .. 0 28 16 74 69 56 93 of which: Bonds .. 0 0 0 0 0 0 0Principal repayments .. 0 42 91 145 103 185 106Public and publicly guaranteed .. 0 41 58 133 80 166 89 Official creditors .. 0 41 57 133 80 165 88 Multilateral .. 0 5 12 21 10 47 15 of which: IBRD .. 0 0 0 0 0 0 0 IDA .. 0 0 0 0 2 4 7 Bilateral .. 0 35 46 112 70 119 74 Private creditors .. 0 0 0 0 0 0 0 of which: Bonds .. 0 0 0 0 0 0 0 Commercial banks .. 0 0 0 0 0 0 0Private nonguaranteed .. 0 2 34 11 23 19 17 of which: Bonds .. 0 0 0 0 0 0 0Interest payments .. 17 43 39 31 27 31 31Public and publicly guaranteed .. 17 42 38 28 23 24 23 Official creditors .. 17 42 38 27 23 24 23 Multilateral .. 0 8 9 10 11 11 10 of which: IBRD .. 0 0 0 0 0 0 0 IDA .. 0 3 4 5 6 6 6 Bilateral .. 17 34 28 18 12 13 13 Private creditors .. 0 0 0 0 0 0 0 of which: Bonds .. 0 0 0 0 0 0 0 Commercial banks .. 0 0 0 0 0 0 0Private nonguaranteed .. 0 1 1 3 4 6 8 of which: Bonds .. 0 0 0 0 0 0 08. Debt stock-flow reconciliationTotal change in external debt stocks .. -210 -16 96 130 -154 62 285 Net flows on external debt .. -272 33 -52 66 -28 45 201 Cross-currency valuation .. 18 -51 132 68 -123 81 769. Debt restructuringsTotal amount rescheduled .. 0 0 0 61 57 44 0Total amount forgiven .. 0 0 0 0 0 89 0Debt buyback .. 0 0 0 0 0 0 010. Contractual obligations on outstanding long-term external debt
2008 2009 2010 2011 2012 2013 2014 2015Official creditorsPrincipal 33 55 57 61 61 75 43 46Interest 24 24 23 21 20 18 16 15Private creditorsPrincipal 19 41 50 51 28 19 18 14Interest 10 8 6 4 2 2 1 0
111
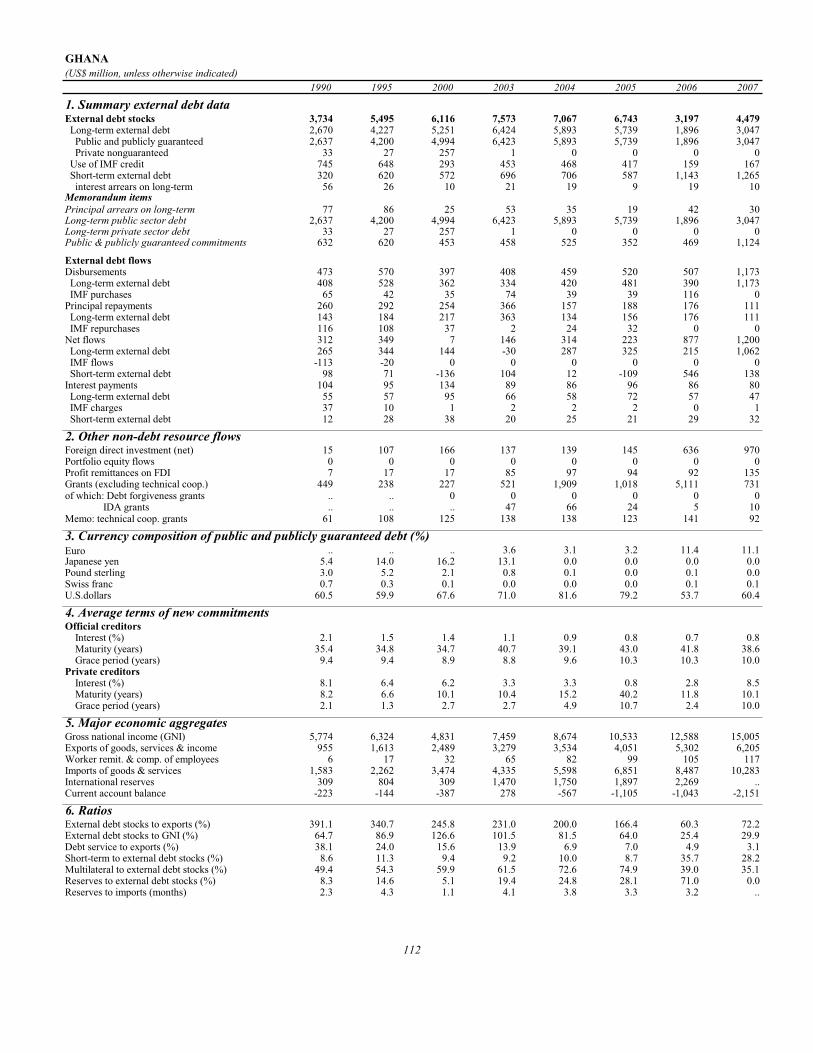
GHANA(US$ million, unless otherwise indicated)
1990 1995 2000 2003 2004 2005 2006 2007
1. Summary external debt dataExternal debt stocks 3,734 5,495 6,116 7,573 7,067 6,743 3,197 4,479 Long-term external debt 2,670 4,227 5,251 6,424 5,893 5,739 1,896 3,047 Public and publicly guaranteed 2,637 4,200 4,994 6,423 5,893 5,739 1,896 3,047 Private nonguaranteed 33 27 257 1 0 0 0 0 Use of IMF credit 745 648 293 453 468 417 159 167 Short-term external debt 320 620 572 696 706 587 1,143 1,265 interest arrears on long-term 56 26 10 21 19 9 19 10Memorandum itemsPrincipal arrears on long-term 77 86 25 53 35 19 42 30Long-term public sector debt 2,637 4,200 4,994 6,423 5,893 5,739 1,896 3,047Long-term private sector debt 33 27 257 1 0 0 0 0Public & publicly guaranteed commitments 632 620 453 458 525 352 469 1,124
External debt flowsDisbursements 473 570 397 408 459 520 507 1,173 Long-term external debt 408 528 362 334 420 481 390 1,173 IMF purchases 65 42 35 74 39 39 116 0Principal repayments 260 292 254 366 157 188 176 111 Long-term external debt 143 184 217 363 134 156 176 111 IMF repurchases 116 108 37 2 24 32 0 0Net flows 312 349 7 146 314 223 877 1,200 Long-term external debt 265 344 144 -30 287 325 215 1,062 IMF flows -113 -20 0 0 0 0 0 0 Short-term external debt 98 71 -136 104 12 -109 546 138Interest payments 104 95 134 89 86 96 86 80 Long-term external debt 55 57 95 66 58 72 57 47 IMF charges 37 10 1 2 2 2 0 1 Short-term external debt 12 28 38 20 25 21 29 32
2. Other non-debt resource flowsForeign direct investment (net) 15 107 166 137 139 145 636 970Portfolio equity flows 0 0 0 0 0 0 0 0Profit remittances on FDI 7 17 17 85 97 94 92 135Grants (excluding technical coop.) 449 238 227 521 1,909 1,018 5,111 731of which: Debt forgiveness grants .. .. 0 0 0 0 0 0 IDA grants .. .. .. 47 66 24 5 10Memo: technical coop. grants 61 108 125 138 138 123 141 92
3. Currency composition of public and publicly guaranteed debt (%)Euro .. .. .. 3.6 3.1 3.2 11.4 11.1Japanese yen 5.4 14.0 16.2 13.1 0.0 0.0 0.0 0.0Pound sterling 3.0 5.2 2.1 0.8 0.1 0.0 0.1 0.0Swiss franc 0.7 0.3 0.1 0.0 0.0 0.0 0.1 0.1U.S.dollars 60.5 59.9 67.6 71.0 81.6 79.2 53.7 60.4
4. Average terms of new commitmentsOfficial creditors Interest (%) 2.1 1.5 1.4 1.1 0.9 0.8 0.7 0.8 Maturity (years) 35.4 34.8 34.7 40.7 39.1 43.0 41.8 38.6 Grace period (years) 9.4 9.4 8.9 8.8 9.6 10.3 10.3 10.0Private creditors Interest (%) 8.1 6.4 6.2 3.3 3.3 0.8 2.8 8.5 Maturity (years) 8.2 6.6 10.1 10.4 15.2 40.2 11.8 10.1 Grace period (years) 2.1 1.3 2.7 2.7 4.9 10.7 2.4 10.0
5. Major economic aggregatesGross national income (GNI) 5,774 6,324 4,831 7,459 8,674 10,533 12,588 15,005Exports of goods, services & income 955 1,613 2,489 3,279 3,534 4,051 5,302 6,205Worker remit. & comp. of employees 6 17 32 65 82 99 105 117Imports of goods & services 1,583 2,262 3,474 4,335 5,598 6,851 8,487 10,283International reserves 309 804 309 1,470 1,750 1,897 2,269 ..Current account balance -223 -144 -387 278 -567 -1,105 -1,043 -2,151
6. RatiosExternal debt stocks to exports (%) 391.1 340.7 245.8 231.0 200.0 166.4 60.3 72.2External debt stocks to GNI (%) 64.7 86.9 126.6 101.5 81.5 64.0 25.4 29.9Debt service to exports (%) 38.1 24.0 15.6 13.9 6.9 7.0 4.9 3.1Short-term to external debt stocks (%) 8.6 11.3 9.4 9.2 10.0 8.7 35.7 28.2Multilateral to external debt stocks (%) 49.4 54.3 59.9 61.5 72.6 74.9 39.0 35.1Reserves to external debt stocks (%) 8.3 14.6 5.1 19.4 24.8 28.1 71.0 0.0Reserves to imports (months) 2.3 4.3 1.1 4.1 3.8 3.3 3.2 ..
112
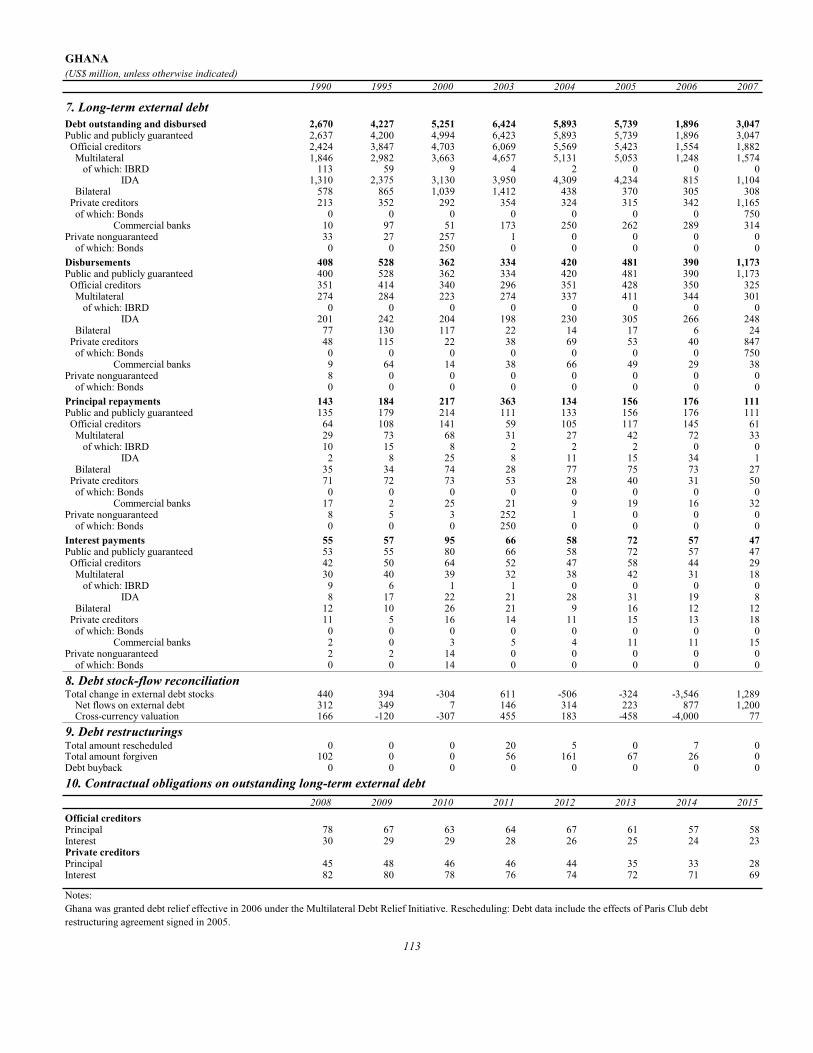
GHANA(US$ million, unless otherwise indicated)
1990 1995 2000 2003 2004 2005 2006 2007
7. Long-term external debtDebt outstanding and disbursed 2,670 4,227 5,251 6,424 5,893 5,739 1,896 3,047Public and publicly guaranteed 2,637 4,200 4,994 6,423 5,893 5,739 1,896 3,047 Official creditors 2,424 3,847 4,703 6,069 5,569 5,423 1,554 1,882 Multilateral 1,846 2,982 3,663 4,657 5,131 5,053 1,248 1,574 of which: IBRD 113 59 9 4 2 0 0 0 IDA 1,310 2,375 3,130 3,950 4,309 4,234 815 1,104 Bilateral 578 865 1,039 1,412 438 370 305 308 Private creditors 213 352 292 354 324 315 342 1,165 of which: Bonds 0 0 0 0 0 0 0 750 Commercial banks 10 97 51 173 250 262 289 314Private nonguaranteed 33 27 257 1 0 0 0 0 of which: Bonds 0 0 250 0 0 0 0 0Disbursements 408 528 362 334 420 481 390 1,173Public and publicly guaranteed 400 528 362 334 420 481 390 1,173 Official creditors 351 414 340 296 351 428 350 325 Multilateral 274 284 223 274 337 411 344 301 of which: IBRD 0 0 0 0 0 0 0 0 IDA 201 242 204 198 230 305 266 248 Bilateral 77 130 117 22 14 17 6 24 Private creditors 48 115 22 38 69 53 40 847 of which: Bonds 0 0 0 0 0 0 0 750 Commercial banks 9 64 14 38 66 49 29 38Private nonguaranteed 8 0 0 0 0 0 0 0 of which: Bonds 0 0 0 0 0 0 0 0Principal repayments 143 184 217 363 134 156 176 111Public and publicly guaranteed 135 179 214 111 133 156 176 111 Official creditors 64 108 141 59 105 117 145 61 Multilateral 29 73 68 31 27 42 72 33 of which: IBRD 10 15 8 2 2 2 0 0 IDA 2 8 25 8 11 15 34 1 Bilateral 35 34 74 28 77 75 73 27 Private creditors 71 72 73 53 28 40 31 50 of which: Bonds 0 0 0 0 0 0 0 0 Commercial banks 17 2 25 21 9 19 16 32Private nonguaranteed 8 5 3 252 1 0 0 0 of which: Bonds 0 0 0 250 0 0 0 0Interest payments 55 57 95 66 58 72 57 47Public and publicly guaranteed 53 55 80 66 58 72 57 47 Official creditors 42 50 64 52 47 58 44 29 Multilateral 30 40 39 32 38 42 31 18 of which: IBRD 9 6 1 1 0 0 0 0 IDA 8 17 22 21 28 31 19 8 Bilateral 12 10 26 21 9 16 12 12 Private creditors 11 5 16 14 11 15 13 18 of which: Bonds 0 0 0 0 0 0 0 0 Commercial banks 2 0 3 5 4 11 11 15Private nonguaranteed 2 2 14 0 0 0 0 0 of which: Bonds 0 0 14 0 0 0 0 08. Debt stock-flow reconciliationTotal change in external debt stocks 440 394 -304 611 -506 -324 -3,546 1,289 Net flows on external debt 312 349 7 146 314 223 877 1,200 Cross-currency valuation 166 -120 -307 455 183 -458 -4,000 779. Debt restructuringsTotal amount rescheduled 0 0 0 20 5 0 7 0Total amount forgiven 102 0 0 56 161 67 26 0Debt buyback 0 0 0 0 0 0 0 010. Contractual obligations on outstanding long-term external debt
2008 2009 2010 2011 2012 2013 2014 2015Official creditorsPrincipal 78 67 63 64 67 61 57 58Interest 30 29 29 28 26 25 24 23Private creditorsPrincipal 45 48 46 46 44 35 33 28Interest 82 80 78 76 74 72 71 69
Notes:Ghana was granted debt relief effective in 2006 under the Multilateral Debt Relief Initiative. Rescheduling: Debt data include the effects of Paris Club debt restructuring agreement signed in 2005.
113

GRENADA(US$ million, unless otherwise indicated)
1990 1995 2000 2003 2004 2005 2006 2007
1. Summary external debt dataExternal debt stocks 110.8 127.0 201.4 376.7 432.2 406.4 492.2 524.9 Long-term external debt 97.9 112.4 179.8 300.1 346.7 391.5 447.7 468.1 Public and publicly guaranteed 97.9 112.4 179.8 300.1 346.7 391.5 447.7 468.1 Private nonguaranteed 0.0 0.0 0.0 0.0 0.0 0.0 0.0 0.0 Use of IMF credit 0.0 0.0 0.0 4.4 9.1 8.4 9.5 7.7 Short-term external debt 12.9 14.6 21.6 72.2 76.3 6.5 35.0 49.1 interest arrears on long-term 6.9 6.6 4.5 6.2 13.3 4.5 6.0 12.1Memorandum itemsPrincipal arrears on long-term 17.0 20.8 10.6 6.0 7.4 9.6 10.5 13.4Long-term public sector debt 97.9 112.4 179.8 300.1 346.7 391.5 447.7 468.1Long-term private sector debt 0.0 0.0 0.0 0.0 0.0 0.0 0.0 0.0Public & publicly guaranteed commitments 15.9 17.0 97.4 26.0 60.1 17.5 28.1 25.3
External debt flowsDisbursements 14.8 4.9 77.6 24.9 59.0 38.5 27.8 23.6 Long-term external debt 14.8 4.9 77.6 20.8 54.6 38.5 25.5 23.6 IMF purchases 0.0 0.0 0.0 4.1 4.3 0.0 2.3 0.0Principal repayments 1.7 5.6 10.1 11.6 10.5 5.5 7.5 8.5 Long-term external debt 1.3 5.6 10.1 11.6 10.5 5.5 5.9 6.2 IMF repurchases 0.5 0.0 0.0 0.0 0.0 0.0 1.6 2.2Net flows 13.1 -1.7 63.4 12.3 45.5 -28.1 47.3 20.2 Long-term external debt 13.5 -0.8 67.5 9.3 44.2 32.9 19.6 17.4 IMF flows -0.4 0.0 0.0 4.1 4.3 0.0 -1.6 -2.2 Short-term external debt 0.0 -1.0 -4.1 -1.0 -3.0 -61.0 27.0 5.0Interest payments 1.6 2.3 4.4 19.5 19.0 4.9 8.0 10.0 Long-term external debt 1.2 1.7 3.4 18.7 17.0 3.3 6.8 7.9 IMF charges 0.0 0.0 0.0 0.0 0.1 0.3 0.4 0.4 Short-term external debt 0.4 0.5 1.0 0.8 1.9 1.3 0.8 1.7
2. Other non-debt resource flowsForeign direct investment (net) 12.9 20.0 37.4 89.2 65.0 70.2 85.2 139.5Portfolio equity flows 0.0 0.0 0.0 0.0 0.0 0.0 0.0 0.0Profit remittances on FDI 8.4 12.6 27.8 26.1 24.9 22.7 21.9 22.6Grants (excluding technical coop.) 4.2 8.1 7.1 8.4 12.6 37.5 4.5 7.3of which: Debt forgiveness grants .. .. 0.0 0.0 0.0 0.0 179.3 179.3 IDA grants .. .. .. 0.0 0.0 0.0 0.0 0.0Memo: technical coop. grants 2.8 3.8 4.7 1.3 1.2 1.7 1.2 0.6
3. Currency composition of public and publicly guaranteed debt (%)Euro .. .. .. 1.0 0.6 0.4 0.3 0.3Japanese yen 0.0 0.0 0.0 0.0 0.0 0.0 0.0 0.0Pound sterling 34.5 33.7 6.3 0.6 0.3 0.2 0.0 0.0Swiss franc 0.0 0.0 0.0 0.0 0.0 0.0 0.0 0.0U.S.dollars 57.3 59.7 78.7 89.0 91.1 91.3 92.2 92.2
4. Average terms of new commitmentsOfficial creditors Interest (%) 4.6 2.6 3.8 3.5 2.4 2.0 1.8 2.5 Maturity (years) 18.5 28.2 24.4 21.2 26.6 24.3 30.7 25.3 Grace period (years) 2.4 5.6 7.2 5.7 8.7 5.1 9.7 -70.2Private creditors Interest (%) 0.0 0.0 5.0 7.6 5.0 0.0 0.0 0.0 Maturity (years) 0.0 0.0 13.5 10.0 10.0 0.0 0.0 0.0 Grace period (years) 0.0 0.0 7.2 10.0 10.0 0.0 0.0 0.0
5. Major economic aggregatesGross national income (GNI) 208.9 262.9 375.3 397.1 380.0 452.4 448.7 451.0Exports of goods, services & income 105.5 148.4 265.0 208.5 248.5 187.1 202.3 237.2Worker remit. & comp. of employees 18.0 18.0 22.0 23.0 72.2 51.6 53.9 55.4Imports of goods & services 153.2 187.6 349.0 365.7 376.1 429.0 403.6 468.2International reserves 17.6 36.7 57.7 83.2 121.7 94.3 100.0 110.6Current account balance -46.2 -41.8 -88.1 -145.9 -54.7 -186.4 -192.8 -222.4
6. RatiosExternal debt stocks to exports (%) 105.0 85.6 76.0 180.7 173.9 217.2 243.3 221.3External debt stocks to GNI (%) 53.0 48.3 53.7 94.9 113.7 89.8 109.7 116.4Debt service to exports (%) 3.1 5.3 5.5 14.9 11.9 5.6 7.7 7.8Short-term to external debt stocks (%) 11.6 11.5 10.7 19.2 17.7 1.6 7.1 9.4Multilateral to external debt stocks (%) 35.7 39.6 31.4 22.4 21.8 27.4 26.1 28.5Reserves to external debt stocks (%) 15.9 28.9 28.6 22.1 28.2 23.2 20.3 21.1Reserves to imports (months) 1.4 2.4 2.0 2.7 3.9 2.6 3.0 2.8
114

GRENADA(US$ million, unless otherwise indicated)
1990 1995 2000 2003 2004 2005 2006 2007
7. Long-term external debtDebt outstanding and disbursed 97.9 112.4 179.8 300.1 346.7 391.5 447.7 468.1Public and publicly guaranteed 97.9 112.4 179.8 300.1 346.7 391.5 447.7 468.1 Official creditors 95.0 104.7 116.8 132.5 141.5 172.7 206.2 227.4 Multilateral 39.5 50.3 63.3 84.4 94.3 111.2 128.7 149.5 of which: IBRD 0.0 0.0 2.2 6.4 7.8 10.1 9.0 12.0 IDA 5.5 7.3 9.6 19.3 21.3 22.9 27.8 34.8 Bilateral 55.4 54.4 53.5 48.1 47.2 61.4 77.5 77.9 Private creditors 2.9 7.7 63.0 167.6 205.2 218.9 241.5 240.7 of which: Bonds 0.0 0.0 26.6 129.8 171.3 214.3 239.4 239.4 Commercial banks 0.7 0.3 32.2 34.2 31.7 2.4 1.5 1.1Private nonguaranteed 0.0 0.0 0.0 0.0 0.0 0.0 0.0 0.0 of which: Bonds 0.0 0.0 0.0 0.0 0.0 0.0 0.0 0.0Disbursements 14.8 4.9 77.6 20.8 54.6 38.5 25.5 23.6Public and publicly guaranteed 14.8 4.9 77.6 20.8 54.6 38.5 25.5 23.6 Official creditors 14.3 4.9 19.8 12.2 12.8 38.5 25.5 23.6 Multilateral 2.9 3.4 11.7 12.1 11.9 22.7 20.5 23.6 of which: IBRD 0.0 0.0 1.9 2.2 1.8 2.8 0.1 4.3 IDA 1.0 0.0 0.8 1.6 1.1 3.6 4.0 6.0 Bilateral 11.4 1.5 8.1 0.1 0.9 15.8 5.0 0.0 Private creditors 0.5 0.0 57.8 8.6 41.9 0.0 0.0 0.0 of which: Bonds 0.0 0.0 26.6 0.2 41.5 0.0 0.0 0.0 Commercial banks 0.0 0.0 30.0 8.4 0.4 0.0 0.0 0.0Private nonguaranteed 0.0 0.0 0.0 0.0 0.0 0.0 0.0 0.0 of which: Bonds 0.0 0.0 0.0 0.0 0.0 0.0 0.0 0.0Principal repayments 1.3 5.6 10.1 11.6 10.5 5.5 5.9 6.2Public and publicly guaranteed 1.3 5.6 10.1 11.6 10.5 5.5 5.9 6.2 Official creditors 1.1 3.9 6.3 7.7 6.1 5.2 5.9 6.2 Multilateral 1.0 2.8 3.2 3.3 3.2 3.7 4.5 4.5 of which: IBRD 0.0 0.0 0.0 0.0 0.3 0.6 1.1 1.2 IDA 0.0 0.1 0.1 0.1 0.1 0.2 0.3 0.3 Bilateral 0.1 1.1 3.2 4.4 2.9 1.5 1.4 1.8 Private creditors 0.2 1.8 3.7 3.8 4.4 0.4 0.0 0.0 of which: Bonds 0.0 0.0 0.0 0.0 0.0 0.0 0.0 0.0 Commercial banks 0.1 0.2 2.4 2.4 2.9 0.4 0.0 0.0Private nonguaranteed 0.0 0.0 0.0 0.0 0.0 0.0 0.0 0.0 of which: Bonds 0.0 0.0 0.0 0.0 0.0 0.0 0.0 0.0Interest payments 1.2 1.7 3.4 18.7 17.0 3.3 6.8 7.9Public and publicly guaranteed 1.2 1.7 3.4 18.7 17.0 3.3 6.8 7.9 Official creditors 1.0 1.6 2.3 3.9 4.5 3.3 4.5 5.5 Multilateral 1.0 1.3 1.1 2.1 2.3 2.6 3.8 3.9 of which: IBRD 0.0 0.0 0.0 0.3 0.3 0.4 0.5 0.5 IDA 0.0 0.1 0.1 0.1 0.2 0.2 0.2 0.2 Bilateral 0.0 0.2 1.3 1.8 2.3 0.7 0.7 1.6 Private creditors 0.2 0.2 1.1 14.7 12.4 0.0 2.3 2.3 of which: Bonds 0.0 0.0 0.0 12.0 9.3 0.0 2.3 2.3 Commercial banks 0.2 0.1 1.1 2.7 3.1 0.0 0.0 0.0Private nonguaranteed 0.0 0.0 0.0 0.0 0.0 0.0 0.0 0.0 of which: Bonds 0.0 0.0 0.0 0.0 0.0 0.0 0.0 0.08. Debt stock-flow reconciliationTotal change in external debt stocks 21.8 -2.0 65.6 10.7 55.5 -25.7 85.8 29.7 Net flows on external debt 13.1 -1.7 63.4 12.3 45.5 -28.1 47.3 20.2 Cross-currency valuation 6.3 0.2 -2.0 3.3 2.2 -3.3 2.3 3.29. Debt restructuringsTotal amount rescheduled 0.0 0.0 0.0 0.0 0.0 208.7 13.2 1.5Total amount forgiven 0.0 0.6 0.0 0.0 0.0 0.0 0.0 0.0Debt buyback 0.0 0.0 0.0 0.0 0.0 0.0 0.0 0.010. Contractual obligations on outstanding long-term external debt
2008 2009 2010 2011 2012 2013 2014 2015Official creditorsPrincipal 15.5 11.3 11.6 12.7 12.8 26.7 11.4 11.8Interest 6.5 6.4 6.2 5.9 5.5 5.1 4.3 3.9Private creditorsPrincipal 0.2 0.0 0.0 0.0 5.6 0.0 0.0 0.0Interest 4.8 11.9 11.9 11.9 21.1 21.0 28.1 28.1
Notes:Grenada went through Paris Club in 2006.
115

GUATEMALA(US$ million, unless otherwise indicated)
1990 1995 2000 2003 2004 2005 2006 2007
1. Summary external debt dataExternal debt stocks 2,849 3,282 3,853 5,082 5,531 5,349 5,496 6,260 Long-term external debt 2,368 2,470 2,681 3,512 3,915 3,793 4,012 4,292 Public and publicly guaranteed 2,241 2,328 2,540 3,427 3,794 3,687 3,921 4,214 Private nonguaranteed 127 142 142 86 120 105 91 78 Use of IMF credit 67 0 0 0 0 0 0 0 Short-term external debt 414 812 1,172 1,570 1,616 1,556 1,484 1,968 interest arrears on long-term 207 220 317 401 414 414 0 0Memorandum itemsPrincipal arrears on long-term 264 257 224 134 131 131 0 0Long-term public sector debt 2,238 2,328 2,540 3,427 3,794 3,687 3,921 4,214Long-term private sector debt 130 142 142 86 120 105 91 78Public & publicly guaranteed commitments 146 99 87 452 411 82 755 403
External debt flowsDisbursements 164 200 210 478 675 144 581 624 Long-term external debt 164 200 210 478 675 144 581 624 IMF purchases 0 0 0 0 0 0 0 0Principal repayments 118 211 188 240 290 214 258 372 Long-term external debt 106 211 188 240 290 214 258 372 IMF repurchases 12 0 0 0 0 0 0 0Net flows 50 142 56 562 418 -131 665 747 Long-term external debt 58 -11 22 238 385 -71 323 252 IMF flows -12 0 0 0 0 0 0 0 Short-term external debt 4 153 34 324 33 -60 342 495Interest payments 112 145 202 221 257 263 293 324 Long-term external debt 89 113 152 191 222 210 234 255 IMF charges 7 0 0 0 0 0 0 0 Short-term external debt 16 32 50 30 36 53 59 69
2. Other non-debt resource flowsForeign direct investment (net) 48 75 230 131 296 508 592 724Portfolio equity flows 0 0 0 0 0 0 0 0Profit remittances on FDI 37 95 248 319 270 370 607 740Grants (excluding technical coop.) 69 106 146 150 134 195 410 466of which: Debt forgiveness grants .. .. 43 26 71 27 16 28 IDA grants .. .. .. 0 0 0 0 0Memo: technical coop. grants 87 91 87 127 121 96 117 79
3. Currency composition of public and publicly guaranteed debt (%)Euro .. .. .. 3.2 3.0 2.5 2.3 2.1Japanese yen 0.0 2.5 2.9 3.8 3.7 3.5 3.3 3.1Pound sterling 0.0 0.0 0.0 0.0 0.0 0.0 0.0 0.0Swiss franc 0.0 0.5 0.2 0.0 0.0 0.0 0.0 0.0U.S.dollars 51.6 54.8 75.0 81.5 83.9 85.7 86.9 88.1
4. Average terms of new commitmentsOfficial creditors Interest (%) 4.9 4.2 7.2 5.7 4.2 5.4 5.6 5.9 Maturity (years) 23.1 30.9 19.2 19.8 13.9 18.8 23.0 17.2 Grace period (years) 6.2 7.9 4.7 4.2 3.7 5.1 4.1 3.8Private creditors Interest (%) 8.8 0.0 0.0 9.3 8.1 0.0 0.0 0.0 Maturity (years) 4.5 0.0 0.0 10.0 29.7 0.0 0.0 0.0 Grace period (years) 0.5 0.0 0.0 9.4 29.7 0.0 0.0 0.0
5. Major economic aggregatesGross national income (GNI) 7,494 14,498 19,065 21,589 23,698 26,934 29,906 33,540Exports of goods, services & income 1,695 3,228 4,640 6,404 9,041 10,114 11,733 13,501Worker remit. & comp. of employees 119 358 596 2,147 2,627 3,067 3,700 4,254Imports of goods & services 2,028 3,933 5,991 7,799 10,711 11,886 13,834 15,832International reserves 362 783 1,806 2,925 3,522 3,777 4,055 4,315Current account balance -213 -572 -1,050 -1,039 -1,165 -1,241 -1,512 -1,697
6. RatiosExternal debt stocks to exports (%) 168.1 101.7 83.0 79.4 61.2 52.9 46.8 46.4External debt stocks to GNI (%) 38.0 22.6 20.2 23.5 23.3 19.9 18.4 18.7Debt service to exports (%) 13.6 11.1 8.4 7.2 6.0 4.7 4.7 5.2Short-term to external debt stocks (%) 14.5 24.7 30.4 30.9 29.2 29.1 27.0 31.4Multilateral to external debt stocks (%) 36.4 30.4 38.0 38.1 37.0 37.6 44.2 46.3Reserves to external debt stocks (%) 12.7 23.9 46.9 57.6 63.7 70.6 73.8 68.9Reserves to imports (months) 2.1 2.4 3.6 4.5 3.9 3.8 3.5 3.3
116

GUATEMALA(US$ million, unless otherwise indicated)
1990 1995 2000 2003 2004 2005 2006 2007
7. Long-term external debtDebt outstanding and disbursed 2,368 2,470 2,681 3,512 3,915 3,793 4,012 4,292Public and publicly guaranteed 2,241 2,328 2,540 3,427 3,794 3,687 3,921 4,214 Official creditors 1,684 1,787 2,098 2,515 2,557 2,451 2,815 3,258 Multilateral 1,036 998 1,462 1,934 2,046 2,011 2,429 2,897 of which: IBRD 293 158 296 428 478 479 642 740 IDA 0 0 0 0 0 0 0 0 Bilateral 648 789 635 581 511 440 386 362 Private creditors 557 541 442 912 1,237 1,237 1,105 955 of which: Bonds 190 264 245 777 1,105 1,105 1,105 955 Commercial banks 118 61 0 0 0 0 0 0Private nonguaranteed 127 142 142 86 120 105 91 78 of which: Bonds 0 0 0 0 50 50 50 50Disbursements 164 200 210 478 675 144 581 624Public and publicly guaranteed 156 200 210 478 625 144 581 624 Official creditors 126 128 210 178 295 144 581 624 Multilateral 68 87 157 162 274 131 572 619 of which: IBRD 16 13 51 45 79 34 199 136 IDA 0 0 0 0 0 0 0 0 Bilateral 58 41 53 16 21 13 9 6 Private creditors 30 73 0 300 330 0 0 0 of which: Bonds 0 59 0 300 330 0 0 0 Commercial banks 14 2 0 0 0 0 0 0Private nonguaranteed 7 0 0 0 50 0 0 0 of which: Bonds 0 0 0 0 50 0 0 0Principal repayments 106 211 188 240 290 214 258 372Public and publicly guaranteed 103 192 168 223 274 199 244 359 Official creditors 59 151 136 191 273 199 234 209 Multilateral 28 92 78 130 170 145 163 163 of which: IBRD 5 40 13 18 29 33 36 38 IDA 0 0 0 0 0 0 0 0 Bilateral 31 59 58 61 102 54 71 46 Private creditors 44 42 32 33 2 1 11 150 of which: Bonds 11 15 31 32 1 0 0 150 Commercial banks 29 17 0 0 0 0 0 0Private nonguaranteed 3 19 20 17 16 15 14 13 of which: Bonds 0 0 0 0 0 0 0 0Interest payments 89 113 152 191 222 210 234 255Public and publicly guaranteed 79 108 133 187 214 203 227 249 Official creditors 52 80 110 111 113 102 127 148 Multilateral 33 52 84 92 96 87 114 137 of which: IBRD 3 14 21 19 17 19 28 37 IDA 0 0 0 0 0 0 0 0 Bilateral 19 29 26 20 18 15 13 11 Private creditors 27 28 23 75 101 101 101 101 of which: Bonds 18 23 22 75 101 101 101 101 Commercial banks 7 3 0 0 0 0 0 0Private nonguaranteed 10 5 19 4 8 7 6 6 of which: Bonds 0 0 0 0 5 5 5 58. Debt stock-flow reconciliationTotal change in external debt stocks 245 178 72 650 449 -182 147 775 Net flows on external debt 50 142 56 562 418 -131 665 747 Cross-currency valuation 36 10 -27 37 11 -27 17 249. Debt restructuringsTotal amount rescheduled 30 0 0 0 0 0 0 0Total amount forgiven 0 0 0 0 0 0 0 0Debt buyback 0 0 0 0 0 0 0 010. Contractual obligations on outstanding long-term external debt
2008 2009 2010 2011 2012 2013 2014 2015Official creditorsPrincipal 270 279 306 273 257 244 236 220Interest 175 166 153 140 127 115 103 92Private creditorsPrincipal 10 60 9 325 0 300 0 0Interest 93 91 88 88 27 27 27 27
Notes:Long-term private nonguaranteed debt data are World Bank staff estimates.
117

GUINEA(US$ million, unless otherwise indicated)
1990 1995 2000 2003 2004 2005 2006 2007
1. Summary external debt dataExternal debt stocks 2,476 3,242 3,388 3,457 3,538 3,247 3,281 3,268 Long-term external debt 2,253 2,987 2,940 3,154 3,188 2,931 2,980 3,048 Public and publicly guaranteed 2,253 2,987 2,940 3,154 3,188 2,931 2,980 3,048 Private nonguaranteed 0 0 0 0 0 0 0 0 Use of IMF credit 51 94 113 136 122 87 72 65 Short-term external debt 172 161 335 166 229 229 229 155 interest arrears on long-term 55 82 118 110 111 111 111 111Memorandum itemsPrincipal arrears on long-term 190 371 566 555 560 559 563 565Long-term public sector debt 2,253 2,987 2,940 3,154 3,188 2,931 2,980 3,048Long-term private sector debt 0 0 0 0 0 0 0 0Public & publicly guaranteed commitments 487 215 76 15 96 123 75 45
External debt flowsDisbursements 196 200 70 52 43 41 37 72 Long-term external debt 196 169 70 52 43 41 37 61 IMF purchases 0 31 0 0 0 0 0 11Principal repayments 110 129 98 97 128 115 121 134 Long-term external debt 96 121 90 84 108 89 101 112 IMF repurchases 14 9 8 13 19 26 19 21Net flows 86 98 -41 -167 -22 -74 -84 -143 Long-term external debt 100 49 -20 -32 -65 -48 -64 -51 IMF flows -13 0 0 0 0 0 0 0 Short-term external debt 0 27 -12 -123 62 0 0 -81Interest payments 59 49 57 34 44 47 44 41 Long-term external debt 53 44 41 30 40 42 40 39 IMF charges 2 0 1 1 0 1 0 0 Short-term external debt 4 5 15 4 4 4 4 1
2. Other non-debt resource flowsForeign direct investment (net) 18 1 10 79 98 105 108 111Portfolio equity flows 0 0 0 0 0 0 0 0Profit remittances on FDI 61 23 8 79 0 0 0 54Grants (excluding technical coop.) 93 235 112 183 210 145 123 184of which: Debt forgiveness grants .. .. 9 75 6 6 7 6 IDA grants .. .. .. 2 4 6 9 12Memo: technical coop. grants 61 72 51 69 70 62 73 51
3. Currency composition of public and publicly guaranteed debt (%)Euro .. .. .. 9.1 9.0 7.7 7.6 7.6Japanese yen 2.2 3.5 2.8 2.2 2.1 1.8 1.6 1.5Pound sterling 1.8 0.9 0.6 0.5 0.6 0.5 0.6 0.6Swiss franc 0.6 0.3 0.2 0.2 0.2 0.2 0.2 0.2U.S.dollars 33.1 48.5 54.1 57.8 58.0 58.6 58.9 58.8
4. Average terms of new commitmentsOfficial creditors Interest (%) 2.6 2.0 1.3 1.0 1.1 0.7 1.2 0.8 Maturity (years) 30.5 25.9 38.1 45.4 34.0 35.3 27.3 22.8 Grace period (years) 8.2 8.5 9.1 9.7 10.5 6.9 9.5 10.2Private creditors Interest (%) 0.0 2.7 0.0 0.0 0.0 0.0 0.0 0.0 Maturity (years) 0.0 3.5 0.0 0.0 2.9 2.9 2.9 3.0 Grace period (years) 0.0 0.1 0.0 0.0 0.6 0.6 0.6 0.9
5. Major economic aggregatesGross national income (GNI) 2,518 3,609 3,035 3,580 3,879 3,212 3,257 4,497Exports of goods, services & income 841 714 759 867 862 .. .. 1,328Worker remit. & comp. of employees 0 1 1 111 42 42 42 151Imports of goods & services 1,115 1,109 973 1,076 1,001 .. .. 1,638International reserves .. 87 168 282 113 97 .. ..Current account balance -203 -216 -140 -185 -162 .. .. -456
6. RatiosExternal debt stocks to exports (%) 294.3 454.3 446.4 398.9 410.3 .. .. 246.1External debt stocks to GNI (%) 98.4 89.8 111.6 96.6 91.2 101.1 100.7 72.7Debt service to exports (%) 20.0 25.0 20.4 15.1 19.9 .. .. 13.1Short-term to external debt stocks (%) 6.9 5.0 9.9 4.8 6.5 7.0 7.0 4.7Multilateral to external debt stocks (%) 27.4 45.0 47.7 54.2 54.0 54.0 55.1 57.4Reserves to external debt stocks (%) 0.0 2.7 4.9 8.2 3.2 3.0 0.0 0.0Reserves to imports (months) .. 0.9 2.1 3.1 1.4 .. .. ..
118
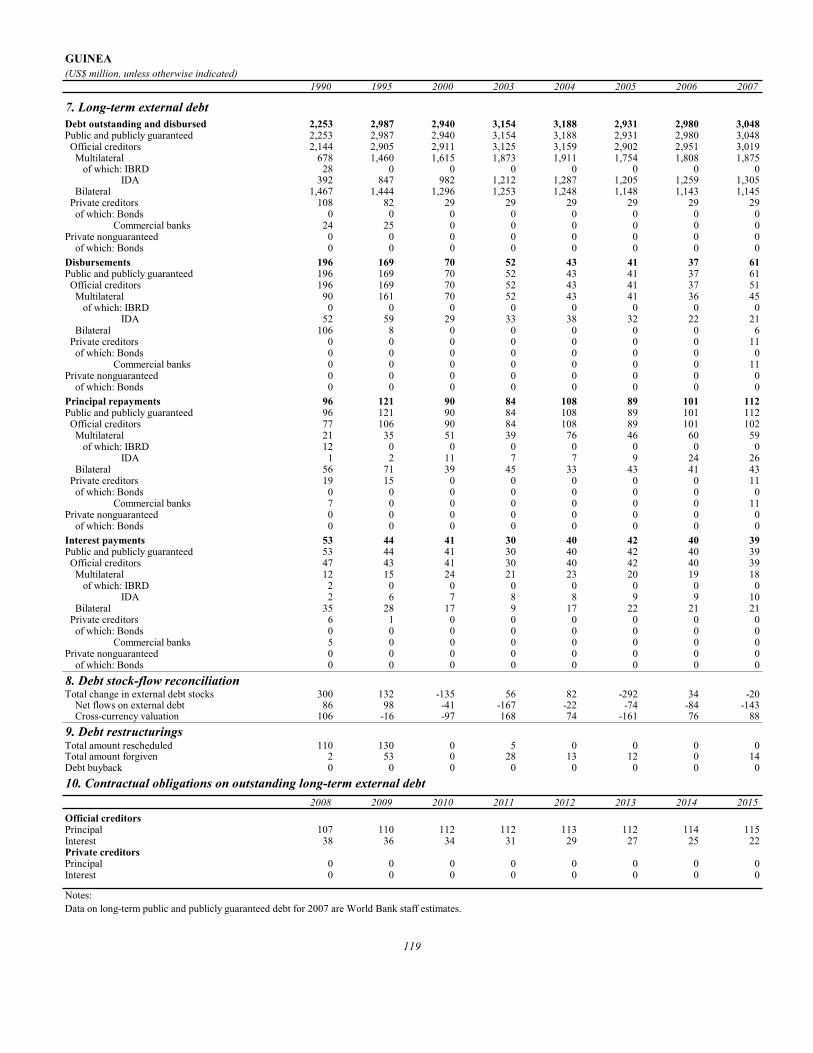
GUINEA(US$ million, unless otherwise indicated)
1990 1995 2000 2003 2004 2005 2006 2007
7. Long-term external debtDebt outstanding and disbursed 2,253 2,987 2,940 3,154 3,188 2,931 2,980 3,048Public and publicly guaranteed 2,253 2,987 2,940 3,154 3,188 2,931 2,980 3,048 Official creditors 2,144 2,905 2,911 3,125 3,159 2,902 2,951 3,019 Multilateral 678 1,460 1,615 1,873 1,911 1,754 1,808 1,875 of which: IBRD 28 0 0 0 0 0 0 0 IDA 392 847 982 1,212 1,287 1,205 1,259 1,305 Bilateral 1,467 1,444 1,296 1,253 1,248 1,148 1,143 1,145 Private creditors 108 82 29 29 29 29 29 29 of which: Bonds 0 0 0 0 0 0 0 0 Commercial banks 24 25 0 0 0 0 0 0Private nonguaranteed 0 0 0 0 0 0 0 0 of which: Bonds 0 0 0 0 0 0 0 0Disbursements 196 169 70 52 43 41 37 61Public and publicly guaranteed 196 169 70 52 43 41 37 61 Official creditors 196 169 70 52 43 41 37 51 Multilateral 90 161 70 52 43 41 36 45 of which: IBRD 0 0 0 0 0 0 0 0 IDA 52 59 29 33 38 32 22 21 Bilateral 106 8 0 0 0 0 0 6 Private creditors 0 0 0 0 0 0 0 11 of which: Bonds 0 0 0 0 0 0 0 0 Commercial banks 0 0 0 0 0 0 0 11Private nonguaranteed 0 0 0 0 0 0 0 0 of which: Bonds 0 0 0 0 0 0 0 0Principal repayments 96 121 90 84 108 89 101 112Public and publicly guaranteed 96 121 90 84 108 89 101 112 Official creditors 77 106 90 84 108 89 101 102 Multilateral 21 35 51 39 76 46 60 59 of which: IBRD 12 0 0 0 0 0 0 0 IDA 1 2 11 7 7 9 24 26 Bilateral 56 71 39 45 33 43 41 43 Private creditors 19 15 0 0 0 0 0 11 of which: Bonds 0 0 0 0 0 0 0 0 Commercial banks 7 0 0 0 0 0 0 11Private nonguaranteed 0 0 0 0 0 0 0 0 of which: Bonds 0 0 0 0 0 0 0 0Interest payments 53 44 41 30 40 42 40 39Public and publicly guaranteed 53 44 41 30 40 42 40 39 Official creditors 47 43 41 30 40 42 40 39 Multilateral 12 15 24 21 23 20 19 18 of which: IBRD 2 0 0 0 0 0 0 0 IDA 2 6 7 8 8 9 9 10 Bilateral 35 28 17 9 17 22 21 21 Private creditors 6 1 0 0 0 0 0 0 of which: Bonds 0 0 0 0 0 0 0 0 Commercial banks 5 0 0 0 0 0 0 0Private nonguaranteed 0 0 0 0 0 0 0 0 of which: Bonds 0 0 0 0 0 0 0 08. Debt stock-flow reconciliationTotal change in external debt stocks 300 132 -135 56 82 -292 34 -20 Net flows on external debt 86 98 -41 -167 -22 -74 -84 -143 Cross-currency valuation 106 -16 -97 168 74 -161 76 889. Debt restructuringsTotal amount rescheduled 110 130 0 5 0 0 0 0Total amount forgiven 2 53 0 28 13 12 0 14Debt buyback 0 0 0 0 0 0 0 010. Contractual obligations on outstanding long-term external debt
2008 2009 2010 2011 2012 2013 2014 2015Official creditorsPrincipal 107 110 112 112 113 112 114 115Interest 38 36 34 31 29 27 25 22Private creditorsPrincipal 0 0 0 0 0 0 0 0Interest 0 0 0 0 0 0 0 0
Notes:Data on long-term public and publicly guaranteed debt for 2007 are World Bank staff estimates.
119

GUINEA-BISSAU(US$ million, unless otherwise indicated)
1990 1995 2000 2003 2004 2005 2006 2007
1. Summary external debt dataExternal debt stocks 692.1 898.3 804.4 745.1 765.0 692.7 711.3 744.1 Long-term external debt 630.4 797.7 715.5 712.5 737.9 671.3 695.0 730.5 Public and publicly guaranteed 630.4 797.7 715.5 712.5 737.9 671.3 695.0 730.5 Private nonguaranteed 0.0 0.0 0.0 0.0 0.0 0.0 0.0 0.0 Use of IMF credit 5.3 5.9 24.7 20.5 15.8 11.5 8.2 5.2 Short-term external debt 56.5 94.6 64.2 12.1 11.2 9.9 8.1 8.4 interest arrears on long-term 29.9 88.6 51.2 8.1 8.2 7.9 8.1 8.4Memorandum itemsPrincipal arrears on long-term 112.8 252.0 114.7 27.4 27.7 27.1 27.6 28.2Long-term public sector debt 630.4 797.7 715.5 712.5 737.9 671.3 695.0 730.5Long-term private sector debt 0.0 0.0 0.0 0.0 0.0 0.0 0.0 0.0Public & publicly guaranteed commitments 97.9 22.0 27.2 0.0 3.0 6.0 8.5 5.6
External debt flowsDisbursements 36.5 23.5 22.2 19.5 30.8 18.2 12.6 18.3 Long-term external debt 36.5 21.1 13.6 19.5 30.8 18.2 12.6 18.3 IMF purchases 0.0 2.4 8.6 0.0 0.0 0.0 0.0 0.0Principal repayments 2.3 9.3 9.6 10.7 34.9 23.9 24.5 22.7 Long-term external debt 2.3 8.1 9.4 5.8 29.5 20.8 20.7 19.3 IMF repurchases 0.0 1.1 0.2 4.8 5.3 3.1 3.8 3.3Net flows 45.7 13.2 22.5 6.8 -5.1 -6.7 -13.8 -4.4 Long-term external debt 34.2 13.0 4.2 13.6 1.3 -2.6 -8.0 -1.1 IMF flows 0.0 0.0 1.9 -2.2 -2.2 -0.3 0.0 0.0 Short-term external debt 11.6 -1.0 10.0 -2.0 -1.1 -1.0 -2.0 0.0Interest payments 6.1 6.1 10.3 4.5 10.1 8.7 9.4 9.5 Long-term external debt 3.4 5.7 9.6 4.1 9.9 8.6 9.2 9.5 IMF charges 0.0 0.0 0.3 0.2 0.1 0.1 0.1 0.0 Short-term external debt 2.7 0.4 0.5 0.2 0.1 0.1 0.1 0.0
2. Other non-debt resource flowsForeign direct investment (net) 2.0 0.0 0.7 4.0 1.7 8.7 17.7 7.0Portfolio equity flows 0.0 0.0 0.0 0.3 0.0 0.0 0.0 0.0Profit remittances on FDI 0.0 0.0 0.0 0.2 0.0 0.0 0.0 0.0Grants (excluding technical coop.) 60.2 54.1 50.4 114.2 46.7 61.0 72.3 104.2of which: Debt forgiveness grants .. .. 22.4 12.9 41.2 46.3 289.8 413.7 IDA grants .. .. .. 0.0 0.0 1.6 2.0 3.3Memo: technical coop. grants 21.4 46.5 12.9 18.9 15.1 14.8 15.0 14.6
3. Currency composition of public and publicly guaranteed debt (%)Euro .. .. .. 12.3 12.5 11.7 12.3 12.9Japanese yen 0.0 0.0 0.0 0.0 0.0 0.0 0.0 0.0Pound sterling 0.0 0.0 0.0 0.0 0.0 0.0 0.0 0.0Swiss franc 8.6 6.6 12.7 9.1 7.5 5.8 5.9 6.0U.S.dollars 27.3 38.1 37.9 43.6 45.5 47.5 46.7 45.7
4. Average terms of new commitmentsOfficial creditors Interest (%) 2.2 0.8 0.9 0.0 0.8 0.5 0.0 0.8 Maturity (years) 28.1 39.8 37.9 0.0 39.7 40.3 40.0 49.7 Grace period (years) 10.4 10.3 9.8 0.0 10.2 10.6 1.0 10.2Private creditors Interest (%) 0.0 0.0 0.0 0.0 0.0 0.0 0.0 0.0 Maturity (years) 0.0 0.0 0.0 0.0 0.0 0.0 0.0 0.0 Grace period (years) 0.0 0.0 0.0 0.0 0.0 0.0 0.0 0.0
5. Major economic aggregatesGross national income (GNI) 233.3 235.9 203.1 224.8 258.5 289.1 298.0 348.4Exports of goods, services & income 27.1 29.6 .. 94.4 111.7 .. .. ..Worker remit. & comp. of employees 1.0 0.0 2.0 23.0 27.7 27.7 27.7 29.0Imports of goods & services 110.5 110.3 .. 112.5 138.1 .. .. ..International reserves 18.2 20.3 66.7 32.9 73.1 79.8 82.0 112.9Current account balance -45.3 -35.2 .. -0.3 13.9 .. .. ..
6. RatiosExternal debt stocks to exports (%) 2,554.0 3,035.7 .. 789.5 684.9 .. .. ..External debt stocks to GNI (%) 296.6 380.7 396.1 331.5 295.9 239.6 238.7 213.6Debt service to exports (%) 31.1 51.9 .. 16.1 40.2 .. .. ..Short-term to external debt stocks (%) 8.2 10.5 8.0 1.6 1.5 1.4 1.1 1.1Multilateral to external debt stocks (%) 39.5 41.1 48.6 58.6 62.4 64.9 66.3 67.5Reserves to external debt stocks (%) 2.6 2.3 8.3 4.4 9.6 11.5 11.5 15.2Reserves to imports (months) 2.0 2.2 .. 3.5 6.3 .. .. ..
120

GUINEA-BISSAU(US$ million, unless otherwise indicated)
1990 1995 2000 2003 2004 2005 2006 2007
7. Long-term external debtDebt outstanding and disbursed 630.4 797.7 715.5 712.5 737.9 671.3 695.0 730.5Public and publicly guaranteed 630.4 797.7 715.5 712.5 737.9 671.3 695.0 730.5 Official creditors 597.4 766.2 714.7 712.5 737.9 671.3 695.0 730.5 Multilateral 273.3 369.6 390.5 436.4 477.6 449.6 471.8 502.4 of which: IBRD 0.0 0.0 0.0 0.0 0.0 0.0 0.0 0.0 IDA 145.5 209.9 227.6 267.3 300.5 283.9 297.0 314.6 Bilateral 324.1 396.7 324.2 276.1 260.3 221.7 223.2 228.0 Private creditors 32.9 31.5 0.8 0.0 0.0 0.0 0.0 0.0 of which: Bonds 0.0 0.0 0.0 0.0 0.0 0.0 0.0 0.0 Commercial banks 0.0 0.0 0.0 0.0 0.0 0.0 0.0 0.0Private nonguaranteed 0.0 0.0 0.0 0.0 0.0 0.0 0.0 0.0 of which: Bonds 0.0 0.0 0.0 0.0 0.0 0.0 0.0 0.0Disbursements 36.5 21.1 13.6 19.5 30.8 18.2 12.6 18.3Public and publicly guaranteed 36.5 21.1 13.6 19.5 30.8 18.2 12.6 18.3 Official creditors 36.5 21.1 13.6 19.5 30.8 18.2 12.6 18.3 Multilateral 30.3 18.8 13.6 19.5 30.8 18.2 12.6 18.3 of which: IBRD 0.0 0.0 0.0 0.0 0.0 0.0 0.0 0.0 IDA 15.5 8.8 13.6 11.7 24.9 10.7 5.5 11.1 Bilateral 6.2 2.3 0.0 0.0 0.0 0.0 0.0 0.0 Private creditors 0.0 0.0 0.0 0.0 0.0 0.0 0.0 0.0 of which: Bonds 0.0 0.0 0.0 0.0 0.0 0.0 0.0 0.0 Commercial banks 0.0 0.0 0.0 0.0 0.0 0.0 0.0 0.0Private nonguaranteed 0.0 0.0 0.0 0.0 0.0 0.0 0.0 0.0 of which: Bonds 0.0 0.0 0.0 0.0 0.0 0.0 0.0 0.0Principal repayments 2.3 8.1 9.4 5.8 29.5 20.8 20.7 19.3Public and publicly guaranteed 2.3 8.1 9.4 5.8 29.5 20.8 20.7 19.3 Official creditors 2.3 8.0 9.4 5.8 29.5 20.8 20.7 19.3 Multilateral 1.5 7.8 2.7 1.8 2.4 1.4 10.2 10.7 of which: IBRD 0.0 0.0 0.0 0.0 0.0 0.0 0.0 0.0 IDA 0.1 0.9 2.4 0.1 0.0 0.0 5.8 5.9 Bilateral 0.8 0.2 6.7 4.1 27.1 19.4 10.5 8.7 Private creditors 0.1 0.2 0.0 0.0 0.0 0.0 0.0 0.0 of which: Bonds 0.0 0.0 0.0 0.0 0.0 0.0 0.0 0.0 Commercial banks 0.0 0.0 0.0 0.0 0.0 0.0 0.0 0.0Private nonguaranteed 0.0 0.0 0.0 0.0 0.0 0.0 0.0 0.0 of which: Bonds 0.0 0.0 0.0 0.0 0.0 0.0 0.0 0.0Interest payments 3.4 5.7 9.6 4.1 9.9 8.6 9.2 9.5Public and publicly guaranteed 3.4 5.7 9.6 4.1 9.9 8.6 9.2 9.5 Official creditors 3.1 5.6 9.6 4.1 9.9 8.6 9.2 9.5 Multilateral 2.6 4.4 1.7 1.5 2.4 2.2 3.3 3.7 of which: IBRD 0.0 0.0 0.0 0.0 0.0 0.0 0.0 0.0 IDA 1.1 1.6 1.6 0.9 1.6 1.4 2.0 2.3 Bilateral 0.6 1.2 7.9 2.6 7.5 6.4 5.9 5.8 Private creditors 0.3 0.0 0.0 0.0 0.0 0.0 0.0 0.0 of which: Bonds 0.0 0.0 0.0 0.0 0.0 0.0 0.0 0.0 Commercial banks 0.0 0.0 0.0 0.0 0.0 0.0 0.0 0.0Private nonguaranteed 0.0 0.0 0.0 0.0 0.0 0.0 0.0 0.0 of which: Bonds 0.0 0.0 0.0 0.0 0.0 0.0 0.0 0.08. Debt stock-flow reconciliationTotal change in external debt stocks 98.9 45.8 -129.3 45.7 19.8 -72.3 18.6 32.8 Net flows on external debt 45.7 13.2 22.5 6.8 -5.1 -6.7 -13.8 -4.4 Cross-currency valuation 35.1 11.3 -20.3 40.7 22.2 -49.6 24.0 25.59. Debt restructuringsTotal amount rescheduled 16.1 13.7 0.0 6.2 0.0 0.0 0.0 0.0Total amount forgiven 4.5 11.0 92.0 22.2 7.7 8.3 0.0 5.6Debt buyback 0.0 0.0 0.0 0.0 0.0 0.0 0.0 0.010. Contractual obligations on outstanding long-term external debt
2008 2009 2010 2011 2012 2013 2014 2015Official creditorsPrincipal 22.1 21.5 22.1 22.1 22.5 23.1 22.8 23.6Interest 9.5 9.2 8.8 8.5 8.3 8.0 7.7 7.4Private creditorsPrincipal 0.0 0.0 0.0 0.0 0.0 0.0 0.0 0.0Interest 0.0 0.0 0.0 0.0 0.0 0.0 0.0 0.0
Notes:Data on long-term public and publicly guaranteed debt for 2007 are World Bank staff estimates.
121

GUYANA(US$ million, unless otherwise indicated)
1990 1995 2000 2003 2004 2005 2006 2007
1. Summary external debt dataExternal debt stocks 1960.2 2116.1 1364.5 1432.4 1362.7 1215.9 1141.2 734.5 Long-term external debt 1772.6 1794.4 1127.8 1219.3 1143.5 1043.0 923.3 582.8 Public and publicly guaranteed 1772.6 1794.4 1123.8 1216.6 1141.2 1041.2 923.3 582.8 Private nonguaranteed 0.0 0.0 4.1 2.7 2.3 1.8 0.0 0.0 Use of IMF credit 112.9 171.8 117.4 95.4 88.1 90.9 55.8 58.6 Short-term external debt 74.7 149.9 119.2 117.8 131.2 82.0 162.1 93.1 interest arrears on long-term 62.7 133.4 67.4 90.8 100.2 82.0 86.1 93.1Memorandum itemsPrincipal arrears on long-term 183.9 114.5 65.3 63.1 70.1 65.9 75.6 75.1Long-term public sector debt 1772.6 1794.4 1123.8 1216.6 1141.2 1041.2 923.3 582.8Long-term private sector debt 0.0 0.0 4.1 2.7 2.3 1.8 0.0 0.0Public & publicly guaranteed commitments 282.3 44.6 84.9 78.0 84.0 166.1 4.2 144.2
External debt flowsDisbursements 263.9 58.8 73.4 77.8 82.8 131.1 136.5 99.6 Long-term external debt 159.5 45.2 64.2 69.4 73.9 103.7 109.2 99.6 IMF purchases 104.4 13.6 9.2 8.4 8.8 27.4 27.3 0.0Principal repayments 175.1 74.1 39.4 36.2 33.5 23.6 16.5 15.8 Long-term external debt 68.6 50.5 22.8 28.0 27.3 15.8 16.5 15.8 IMF repurchases 106.5 23.7 16.6 8.2 6.1 7.8 0.0 0.0Net flows 255.6 -7.9 20.6 24.2 53.3 76.5 196.0 7.7 Long-term external debt 90.9 -5.3 41.4 41.4 46.6 87.9 92.7 83.7 IMF flows -40.6 -23.7 0.0 0.0 0.0 0.0 0.0 0.0 Short-term external debt 166.8 7.4 -13.5 -17.4 4.0 -31.0 76.0 -76.0Interest payments 120.3 34.9 29.7 21.6 14.3 10.6 16.2 11.5 Long-term external debt 73.3 31.3 26.2 20.6 13.3 10.0 14.5 9.2 IMF charges 39.6 2.8 0.6 0.5 0.5 0.0 0.2 0.3 Short-term external debt 7.4 0.8 2.9 0.5 0.6 0.6 1.5 2.1
2. Other non-debt resource flowsForeign direct investment (net) 7.9 74.4 67.1 26.1 30.0 76.8 102.4 152.4Portfolio equity flows 0.0 0.0 0.0 0.0 0.0 0.0 0.0 0.0Profit remittances on FDI 0.0 0.0 6.0 2.3 2.7 6.9 9.2 10.1Grants (excluding technical coop.) 74.0 21.1 38.7 17.0 90.1 91.5 339.9 477.4of which: Debt forgiveness grants .. .. 0.9 0.7 0.8 0.8 0.8 37.9 IDA grants .. .. .. 0.0 0.0 0.5 12.0 2.1Memo: technical coop. grants 8.9 16.0 17.6 33.3 24.7 29.4 35.0 9.3
3. Currency composition of public and publicly guaranteed debt (%)Euro .. .. .. 6.0 4.3 2.1 2.7 4.6Japanese yen 0.3 0.2 0.0 0.0 0.0 0.0 0.0 0.0Pound sterling 10.4 9.1 5.6 4.1 0.9 0.2 0.2 0.1Swiss franc 0.1 0.1 0.0 0.0 0.0 0.0 0.0 0.0U.S.dollars 68.0 64.9 69.3 69.2 73.5 74.3 70.7 86.5
4. Average terms of new commitmentsOfficial creditors Interest (%) 1.3 1.5 2.0 3.0 1.4 1.3 1.9 1.0 Maturity (years) 39.7 38.7 40.0 29.7 33.8 30.5 29.8 36.6 Grace period (years) 9.9 10.4 10.5 8.5 8.7 9.2 7.6 9.0Private creditors Interest (%) 0.0 8.8 0.0 0.0 0.0 0.0 0.0 0.0 Maturity (years) 0.0 31.0 0.0 0.0 0.0 0.0 0.0 0.0 Grace period (years) 0.0 8.0 0.0 0.0 0.0 0.0 0.0 0.0
5. Major economic aggregatesGross national income (GNI) 275.1 567.2 660.6 691.2 675.8 745.5 862.2 1002.1Exports of goods, services & income .. 641.4 711.2 768.8 901.9 898.0 948.1 1129.1Worker remit. & comp. of employees 0.0 2.0 27.0 99.0 153.0 201.3 218.1 278.5Imports of goods & services .. 838.2 813.1 757.3 842.8 960.3 1127.0 1303.1International reserves 28.7 268.9 305.0 276.4 231.8 251.9 279.6 313.0Current account balance .. -134.8 -82.2 -44.6 -19.9 -96.3 -180.6 -165.7
6. RatiosExternal debt stocks to exports (%) .. 329.9 191.9 186.3 151.1 135.4 120.4 65.0External debt stocks to GNI (%) 712.5 373.1 206.6 207.2 201.7 163.1 132.4 73.3Debt service to exports (%) .. 17.0 9.7 7.5 5.3 3.8 3.4 2.4Short-term to external debt stocks (%) 3.8 7.1 8.7 8.2 9.6 6.7 14.2 12.7Multilateral to external debt stocks (%) 23.9 30.2 43.9 54.3 62.6 70.0 63.1 49.8Reserves to external debt stocks (%) 1.5 12.7 22.3 19.3 17.0 20.7 24.5 42.6Reserves to imports (months) .. 3.9 4.5 4.4 3.3 3.1 3.0 2.9
122
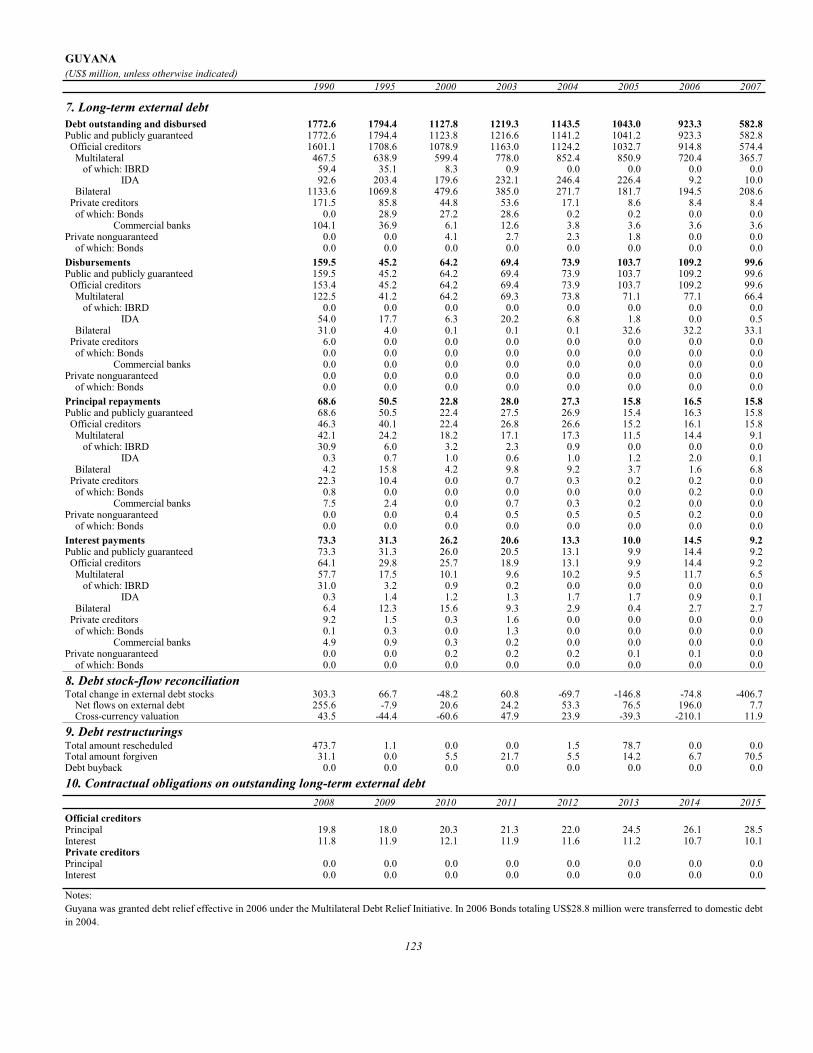
GUYANA(US$ million, unless otherwise indicated)
1990 1995 2000 2003 2004 2005 2006 2007
7. Long-term external debtDebt outstanding and disbursed 1772.6 1794.4 1127.8 1219.3 1143.5 1043.0 923.3 582.8Public and publicly guaranteed 1772.6 1794.4 1123.8 1216.6 1141.2 1041.2 923.3 582.8 Official creditors 1601.1 1708.6 1078.9 1163.0 1124.2 1032.7 914.8 574.4 Multilateral 467.5 638.9 599.4 778.0 852.4 850.9 720.4 365.7 of which: IBRD 59.4 35.1 8.3 0.9 0.0 0.0 0.0 0.0 IDA 92.6 203.4 179.6 232.1 246.4 226.4 9.2 10.0 Bilateral 1133.6 1069.8 479.6 385.0 271.7 181.7 194.5 208.6 Private creditors 171.5 85.8 44.8 53.6 17.1 8.6 8.4 8.4 of which: Bonds 0.0 28.9 27.2 28.6 0.2 0.2 0.0 0.0 Commercial banks 104.1 36.9 6.1 12.6 3.8 3.6 3.6 3.6Private nonguaranteed 0.0 0.0 4.1 2.7 2.3 1.8 0.0 0.0 of which: Bonds 0.0 0.0 0.0 0.0 0.0 0.0 0.0 0.0Disbursements 159.5 45.2 64.2 69.4 73.9 103.7 109.2 99.6Public and publicly guaranteed 159.5 45.2 64.2 69.4 73.9 103.7 109.2 99.6 Official creditors 153.4 45.2 64.2 69.4 73.9 103.7 109.2 99.6 Multilateral 122.5 41.2 64.2 69.3 73.8 71.1 77.1 66.4 of which: IBRD 0.0 0.0 0.0 0.0 0.0 0.0 0.0 0.0 IDA 54.0 17.7 6.3 20.2 6.8 1.8 0.0 0.5 Bilateral 31.0 4.0 0.1 0.1 0.1 32.6 32.2 33.1 Private creditors 6.0 0.0 0.0 0.0 0.0 0.0 0.0 0.0 of which: Bonds 0.0 0.0 0.0 0.0 0.0 0.0 0.0 0.0 Commercial banks 0.0 0.0 0.0 0.0 0.0 0.0 0.0 0.0Private nonguaranteed 0.0 0.0 0.0 0.0 0.0 0.0 0.0 0.0 of which: Bonds 0.0 0.0 0.0 0.0 0.0 0.0 0.0 0.0Principal repayments 68.6 50.5 22.8 28.0 27.3 15.8 16.5 15.8Public and publicly guaranteed 68.6 50.5 22.4 27.5 26.9 15.4 16.3 15.8 Official creditors 46.3 40.1 22.4 26.8 26.6 15.2 16.1 15.8 Multilateral 42.1 24.2 18.2 17.1 17.3 11.5 14.4 9.1 of which: IBRD 30.9 6.0 3.2 2.3 0.9 0.0 0.0 0.0 IDA 0.3 0.7 1.0 0.6 1.0 1.2 2.0 0.1 Bilateral 4.2 15.8 4.2 9.8 9.2 3.7 1.6 6.8 Private creditors 22.3 10.4 0.0 0.7 0.3 0.2 0.2 0.0 of which: Bonds 0.8 0.0 0.0 0.0 0.0 0.0 0.2 0.0 Commercial banks 7.5 2.4 0.0 0.7 0.3 0.2 0.0 0.0Private nonguaranteed 0.0 0.0 0.4 0.5 0.5 0.5 0.2 0.0 of which: Bonds 0.0 0.0 0.0 0.0 0.0 0.0 0.0 0.0Interest payments 73.3 31.3 26.2 20.6 13.3 10.0 14.5 9.2Public and publicly guaranteed 73.3 31.3 26.0 20.5 13.1 9.9 14.4 9.2 Official creditors 64.1 29.8 25.7 18.9 13.1 9.9 14.4 9.2 Multilateral 57.7 17.5 10.1 9.6 10.2 9.5 11.7 6.5 of which: IBRD 31.0 3.2 0.9 0.2 0.0 0.0 0.0 0.0 IDA 0.3 1.4 1.2 1.3 1.7 1.7 0.9 0.1 Bilateral 6.4 12.3 15.6 9.3 2.9 0.4 2.7 2.7 Private creditors 9.2 1.5 0.3 1.6 0.0 0.0 0.0 0.0 of which: Bonds 0.1 0.3 0.0 1.3 0.0 0.0 0.0 0.0 Commercial banks 4.9 0.9 0.3 0.2 0.0 0.0 0.0 0.0Private nonguaranteed 0.0 0.0 0.2 0.2 0.2 0.1 0.1 0.0 of which: Bonds 0.0 0.0 0.0 0.0 0.0 0.0 0.0 0.08. Debt stock-flow reconciliationTotal change in external debt stocks 303.3 66.7 -48.2 60.8 -69.7 -146.8 -74.8 -406.7 Net flows on external debt 255.6 -7.9 20.6 24.2 53.3 76.5 196.0 7.7 Cross-currency valuation 43.5 -44.4 -60.6 47.9 23.9 -39.3 -210.1 11.99. Debt restructuringsTotal amount rescheduled 473.7 1.1 0.0 0.0 1.5 78.7 0.0 0.0Total amount forgiven 31.1 0.0 5.5 21.7 5.5 14.2 6.7 70.5Debt buyback 0.0 0.0 0.0 0.0 0.0 0.0 0.0 0.010. Contractual obligations on outstanding long-term external debt
2008 2009 2010 2011 2012 2013 2014 2015Official creditorsPrincipal 19.8 18.0 20.3 21.3 22.0 24.5 26.1 28.5Interest 11.8 11.9 12.1 11.9 11.6 11.2 10.7 10.1Private creditorsPrincipal 0.0 0.0 0.0 0.0 0.0 0.0 0.0 0.0Interest 0.0 0.0 0.0 0.0 0.0 0.0 0.0 0.0
Notes:Guyana was granted debt relief effective in 2006 under the Multilateral Debt Relief Initiative. In 2006 Bonds totaling US$28.8 million were transferred to domestic debt in 2004.
123
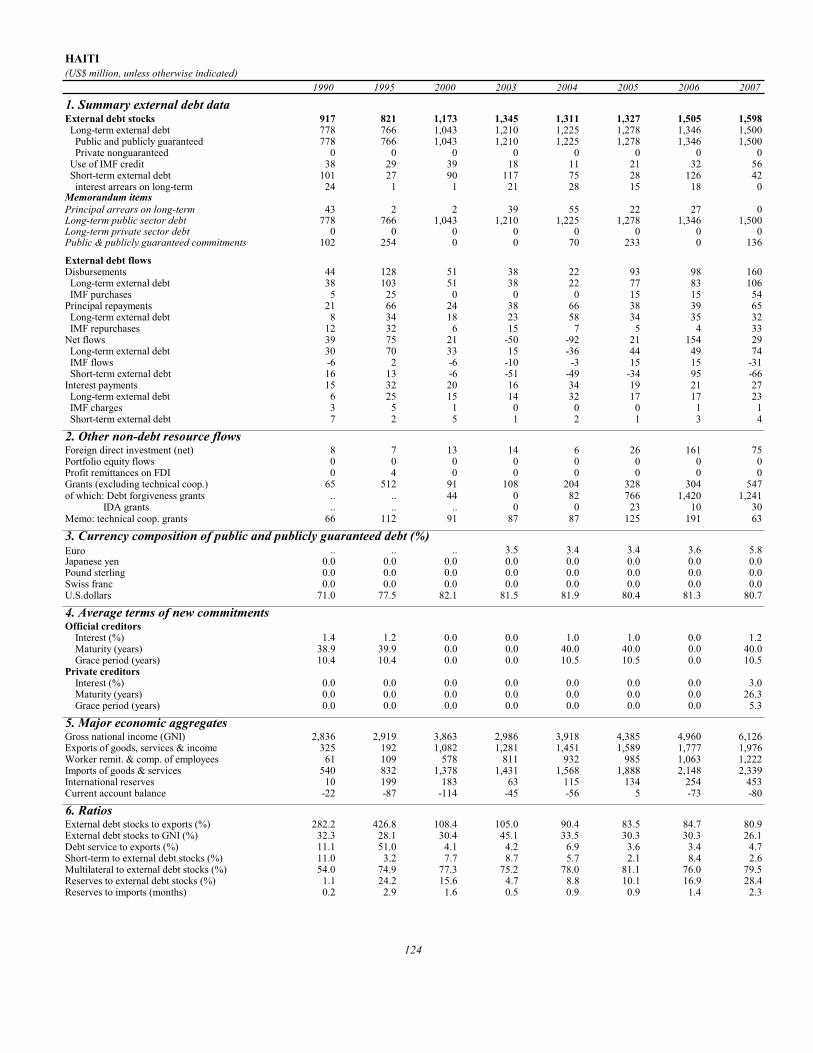
HAITI(US$ million, unless otherwise indicated)
1990 1995 2000 2003 2004 2005 2006 2007
1. Summary external debt dataExternal debt stocks 917 821 1,173 1,345 1,311 1,327 1,505 1,598 Long-term external debt 778 766 1,043 1,210 1,225 1,278 1,346 1,500 Public and publicly guaranteed 778 766 1,043 1,210 1,225 1,278 1,346 1,500 Private nonguaranteed 0 0 0 0 0 0 0 0 Use of IMF credit 38 29 39 18 11 21 32 56 Short-term external debt 101 27 90 117 75 28 126 42 interest arrears on long-term 24 1 1 21 28 15 18 0Memorandum itemsPrincipal arrears on long-term 43 2 2 39 55 22 27 0Long-term public sector debt 778 766 1,043 1,210 1,225 1,278 1,346 1,500Long-term private sector debt 0 0 0 0 0 0 0 0Public & publicly guaranteed commitments 102 254 0 0 70 233 0 136
External debt flowsDisbursements 44 128 51 38 22 93 98 160 Long-term external debt 38 103 51 38 22 77 83 106 IMF purchases 5 25 0 0 0 15 15 54Principal repayments 21 66 24 38 66 38 39 65 Long-term external debt 8 34 18 23 58 34 35 32 IMF repurchases 12 32 6 15 7 5 4 33Net flows 39 75 21 -50 -92 21 154 29 Long-term external debt 30 70 33 15 -36 44 49 74 IMF flows -6 2 -6 -10 -3 15 15 -31 Short-term external debt 16 13 -6 -51 -49 -34 95 -66Interest payments 15 32 20 16 34 19 21 27 Long-term external debt 6 25 15 14 32 17 17 23 IMF charges 3 5 1 0 0 0 1 1 Short-term external debt 7 2 5 1 2 1 3 4
2. Other non-debt resource flowsForeign direct investment (net) 8 7 13 14 6 26 161 75Portfolio equity flows 0 0 0 0 0 0 0 0Profit remittances on FDI 0 4 0 0 0 0 0 0Grants (excluding technical coop.) 65 512 91 108 204 328 304 547of which: Debt forgiveness grants .. .. 44 0 82 766 1,420 1,241 IDA grants .. .. .. 0 0 23 10 30Memo: technical coop. grants 66 112 91 87 87 125 191 63
3. Currency composition of public and publicly guaranteed debt (%)Euro .. .. .. 3.5 3.4 3.4 3.6 5.8Japanese yen 0.0 0.0 0.0 0.0 0.0 0.0 0.0 0.0Pound sterling 0.0 0.0 0.0 0.0 0.0 0.0 0.0 0.0Swiss franc 0.0 0.0 0.0 0.0 0.0 0.0 0.0 0.0U.S.dollars 71.0 77.5 82.1 81.5 81.9 80.4 81.3 80.7
4. Average terms of new commitmentsOfficial creditors Interest (%) 1.4 1.2 0.0 0.0 1.0 1.0 0.0 1.2 Maturity (years) 38.9 39.9 0.0 0.0 40.0 40.0 0.0 40.0 Grace period (years) 10.4 10.4 0.0 0.0 10.5 10.5 0.0 10.5Private creditors Interest (%) 0.0 0.0 0.0 0.0 0.0 0.0 0.0 3.0 Maturity (years) 0.0 0.0 0.0 0.0 0.0 0.0 0.0 26.3 Grace period (years) 0.0 0.0 0.0 0.0 0.0 0.0 0.0 5.3
5. Major economic aggregatesGross national income (GNI) 2,836 2,919 3,863 2,986 3,918 4,385 4,960 6,126Exports of goods, services & income 325 192 1,082 1,281 1,451 1,589 1,777 1,976Worker remit. & comp. of employees 61 109 578 811 932 985 1,063 1,222Imports of goods & services 540 832 1,378 1,431 1,568 1,888 2,148 2,339International reserves 10 199 183 63 115 134 254 453Current account balance -22 -87 -114 -45 -56 5 -73 -80
6. RatiosExternal debt stocks to exports (%) 282.2 426.8 108.4 105.0 90.4 83.5 84.7 80.9External debt stocks to GNI (%) 32.3 28.1 30.4 45.1 33.5 30.3 30.3 26.1Debt service to exports (%) 11.1 51.0 4.1 4.2 6.9 3.6 3.4 4.7Short-term to external debt stocks (%) 11.0 3.2 7.7 8.7 5.7 2.1 8.4 2.6Multilateral to external debt stocks (%) 54.0 74.9 77.3 75.2 78.0 81.1 76.0 79.5Reserves to external debt stocks (%) 1.1 24.2 15.6 4.7 8.8 10.1 16.9 28.4Reserves to imports (months) 0.2 2.9 1.6 0.5 0.9 0.9 1.4 2.3
124
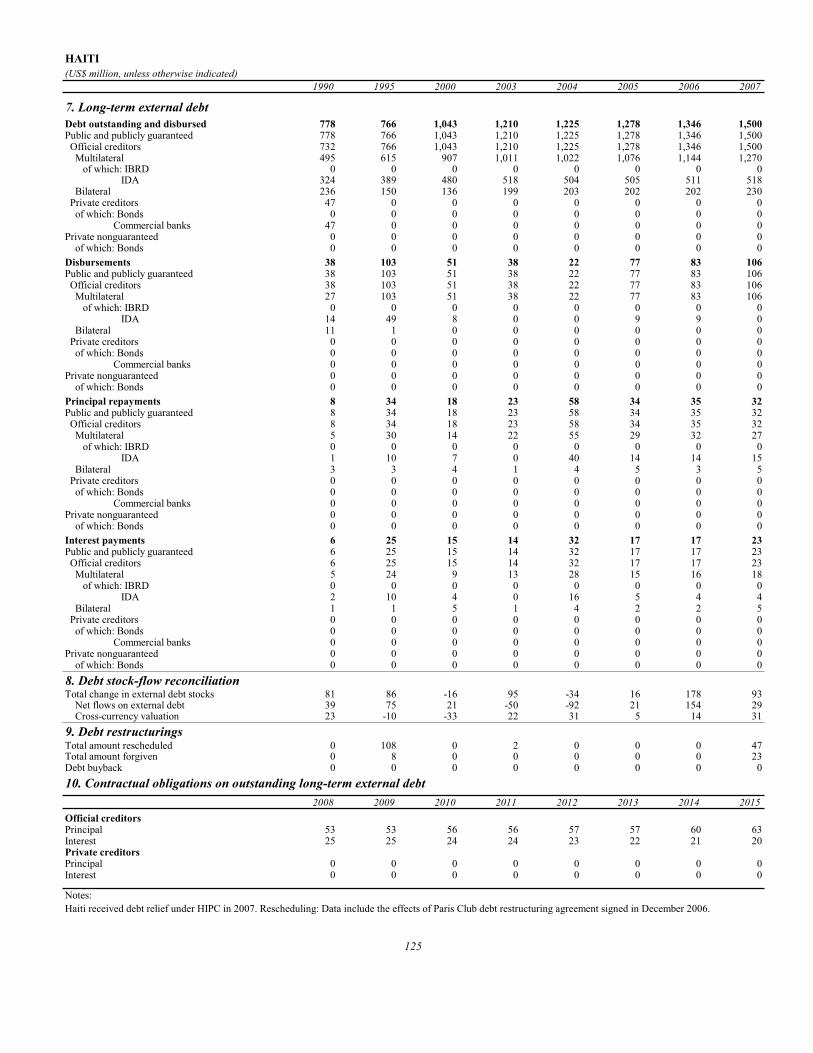
HAITI(US$ million, unless otherwise indicated)
1990 1995 2000 2003 2004 2005 2006 2007
7. Long-term external debtDebt outstanding and disbursed 778 766 1,043 1,210 1,225 1,278 1,346 1,500Public and publicly guaranteed 778 766 1,043 1,210 1,225 1,278 1,346 1,500 Official creditors 732 766 1,043 1,210 1,225 1,278 1,346 1,500 Multilateral 495 615 907 1,011 1,022 1,076 1,144 1,270 of which: IBRD 0 0 0 0 0 0 0 0 IDA 324 389 480 518 504 505 511 518 Bilateral 236 150 136 199 203 202 202 230 Private creditors 47 0 0 0 0 0 0 0 of which: Bonds 0 0 0 0 0 0 0 0 Commercial banks 47 0 0 0 0 0 0 0Private nonguaranteed 0 0 0 0 0 0 0 0 of which: Bonds 0 0 0 0 0 0 0 0Disbursements 38 103 51 38 22 77 83 106Public and publicly guaranteed 38 103 51 38 22 77 83 106 Official creditors 38 103 51 38 22 77 83 106 Multilateral 27 103 51 38 22 77 83 106 of which: IBRD 0 0 0 0 0 0 0 0 IDA 14 49 8 0 0 9 9 0 Bilateral 11 1 0 0 0 0 0 0 Private creditors 0 0 0 0 0 0 0 0 of which: Bonds 0 0 0 0 0 0 0 0 Commercial banks 0 0 0 0 0 0 0 0Private nonguaranteed 0 0 0 0 0 0 0 0 of which: Bonds 0 0 0 0 0 0 0 0Principal repayments 8 34 18 23 58 34 35 32Public and publicly guaranteed 8 34 18 23 58 34 35 32 Official creditors 8 34 18 23 58 34 35 32 Multilateral 5 30 14 22 55 29 32 27 of which: IBRD 0 0 0 0 0 0 0 0 IDA 1 10 7 0 40 14 14 15 Bilateral 3 3 4 1 4 5 3 5 Private creditors 0 0 0 0 0 0 0 0 of which: Bonds 0 0 0 0 0 0 0 0 Commercial banks 0 0 0 0 0 0 0 0Private nonguaranteed 0 0 0 0 0 0 0 0 of which: Bonds 0 0 0 0 0 0 0 0Interest payments 6 25 15 14 32 17 17 23Public and publicly guaranteed 6 25 15 14 32 17 17 23 Official creditors 6 25 15 14 32 17 17 23 Multilateral 5 24 9 13 28 15 16 18 of which: IBRD 0 0 0 0 0 0 0 0 IDA 2 10 4 0 16 5 4 4 Bilateral 1 1 5 1 4 2 2 5 Private creditors 0 0 0 0 0 0 0 0 of which: Bonds 0 0 0 0 0 0 0 0 Commercial banks 0 0 0 0 0 0 0 0Private nonguaranteed 0 0 0 0 0 0 0 0 of which: Bonds 0 0 0 0 0 0 0 08. Debt stock-flow reconciliationTotal change in external debt stocks 81 86 -16 95 -34 16 178 93 Net flows on external debt 39 75 21 -50 -92 21 154 29 Cross-currency valuation 23 -10 -33 22 31 5 14 319. Debt restructuringsTotal amount rescheduled 0 108 0 2 0 0 0 47Total amount forgiven 0 8 0 0 0 0 0 23Debt buyback 0 0 0 0 0 0 0 010. Contractual obligations on outstanding long-term external debt
2008 2009 2010 2011 2012 2013 2014 2015Official creditorsPrincipal 53 53 56 56 57 57 60 63Interest 25 25 24 24 23 22 21 20Private creditorsPrincipal 0 0 0 0 0 0 0 0Interest 0 0 0 0 0 0 0 0
Notes:Haiti received debt relief under HIPC in 2007. Rescheduling: Data include the effects of Paris Club debt restructuring agreement signed in December 2006.
125

HONDURAS(US$ million, unless otherwise indicated)
1990 1995 2000 2003 2004 2005 2006 2007
1. Summary external debt dataExternal debt stocks 3,718 4,797 5,360 5,469 6,039 5,181 4,184 3,260 Long-term external debt 3,487 4,316 4,771 4,834 5,400 4,601 3,621 2,566 Public and publicly guaranteed 3,420 4,193 4,211 4,423 4,832 4,092 2,986 1,942 Private nonguaranteed 66 123 560 411 568 509 635 624 Use of IMF credit 32 99 216 172 195 168 31 32 Short-term external debt 199 382 374 463 444 411 532 662 interest arrears on long-term 89 63 35 61 53 12 9 9Memorandum itemsPrincipal arrears on long-term 190 197 72 159 223 48 49 45Long-term public sector debt 3,313 4,169 4,191 4,423 4,832 4,092 2,986 1,942Long-term private sector debt 173 147 580 411 568 509 635 624Public & publicly guaranteed commitments 452 344 422 211 407 362 196 264
External debt flowsDisbursements 457 379 618 309 666 489 351 377 Long-term external debt 429 349 596 309 636 474 336 377 IMF purchases 29 31 21 0 30 15 15 0Principal repayments 211 376 259 316 205 277 201 229 Long-term external debt 176 332 254 276 196 261 201 229 IMF repurchases 35 44 5 41 9 15 0 0Net flows 129 66 296 -84 450 220 274 250 Long-term external debt 252 17 342 34 440 213 135 148 IMF flows -1 -44 0 -33 0 0 0 0 Short-term external debt -117 62 -63 -76 -11 8 124 102Interest payments 178 231 131 94 109 103 124 108 Long-term external debt 157 209 106 84 98 83 102 80 IMF charges 6 5 4 1 1 1 0 0 Short-term external debt 15 18 20 9 11 19 23 28
2. Other non-debt resource flowsForeign direct investment (net) 44 50 282 247 547 600 674 816Portfolio equity flows 0 0 0 0 0 0 0 0Profit remittances on FDI 72 40 160 292 390 479 624 737Grants (excluding technical coop.) 211 123 186 127 248 969 1,595 1,469of which: Debt forgiveness grants .. .. 0 0 0 0 0 0 IDA grants .. .. .. 0 0 0 0 0Memo: technical coop. grants 93 85 122 100 110 105 89 54
3. Currency composition of public and publicly guaranteed debt (%)Euro .. .. .. 7.3 7.6 5.4 4.3 7.7Japanese yen 8.4 9.3 7.9 9.5 8.6 0.5 0.0 0.0Pound sterling 0.9 0.6 0.4 0.0 0.0 0.0 0.0 0.0Swiss franc 2.1 1.5 0.9 0.2 0.1 0.1 0.2 0.2U.S.dollars 45.2 48.3 65.5 65.2 65.8 72.6 66.0 68.5
4. Average terms of new commitmentsOfficial creditors Interest (%) 6.1 2.3 5.1 2.1 1.2 1.3 1.7 1.8 Maturity (years) 22.7 29.8 30.9 25.3 36.1 26.3 29.3 27.1 Grace period (years) 6.5 7.3 19.1 6.7 9.6 9.4 8.7 8.5Private creditors Interest (%) 9.9 8.4 4.1 0.0 0.0 1.7 0.0 0.0 Maturity (years) 7.1 28.6 7.6 0.0 0.0 50.0 0.0 0.0 Grace period (years) 0.6 1.1 3.1 0.0 0.0 10.5 0.0 0.0
5. Major economic aggregatesGross national income (GNI) 2,797 3,649 6,951 7,756 8,327 9,211 10,216 11,635Exports of goods, services & income 1,103 1,787 4,443 5,255 6,404 7,668 8,408 9,130Worker remit. & comp. of employees 63 124 416 867 1,175 1,821 2,391 2,625Imports of goods & services 1,384 2,111 5,047 5,957 7,215 8,092 9,040 10,416International reserves 47 270 1,319 1,439 1,980 2,338 2,642 2,546Current account balance -51 -201 -508 -553 -683 -304 -510 -1,225
6. RatiosExternal debt stocks to exports (%) 337.0 268.4 120.7 104.1 94.3 67.6 49.8 35.7External debt stocks to GNI (%) 132.9 131.5 77.1 70.5 72.5 56.2 41.0 28.0Debt service to exports (%) 35.3 34.0 8.8 7.8 4.9 5.0 3.9 3.7Short-term to external debt stocks (%) 5.4 8.0 7.0 8.5 7.4 7.9 12.7 20.3Multilateral to external debt stocks (%) 42.5 44.9 50.9 53.3 53.3 61.4 54.5 39.0Reserves to external debt stocks (%) 1.3 5.6 24.6 26.3 32.8 45.1 63.2 78.1Reserves to imports (months) 0.4 1.5 3.1 2.9 3.3 3.5 3.5 2.9
126

HONDURAS(US$ million, unless otherwise indicated)
1990 1995 2000 2003 2004 2005 2006 2007
7. Long-term external debtDebt outstanding and disbursed 3,487 4,316 4,771 4,834 5,400 4,601 3,621 2,566Public and publicly guaranteed 3,420 4,193 4,211 4,423 4,832 4,092 2,986 1,942 Official creditors 2,978 3,828 4,108 4,351 4,751 4,038 2,934 1,904 Multilateral 1,581 2,153 2,728 2,917 3,218 3,183 2,282 1,271 of which: IBRD 558 443 151 85 70 0 0 0 IDA 77 386 838 1,143 1,310 1,353 349 401 Bilateral 1,396 1,675 1,381 1,434 1,533 855 652 634 Private creditors 442 364 102 72 81 55 52 38 of which: Bonds 0 139 0 0 0 0 0 0 Commercial banks 204 82 46 26 42 44 43 27Private nonguaranteed 66 123 560 411 568 509 635 624 of which: Bonds 0 0 0 0 0 0 0 0Disbursements 429 349 596 309 636 474 336 377Public and publicly guaranteed 421 287 412 201 395 295 204 222 Official creditors 364 258 409 201 381 290 204 221 Multilateral 190 209 372 159 296 253 183 147 of which: IBRD 82 7 0 0 0 0 0 0 IDA 0 77 38 45 125 151 58 46 Bilateral 174 49 36 42 85 37 20 74 Private creditors 57 29 4 0 15 4 0 1 of which: Bonds 0 0 0 0 0 0 0 0 Commercial banks 22 3 1 0 15 4 0 0Private nonguaranteed 8 62 184 108 240 179 133 155 of which: Bonds 0 0 0 0 0 0 0 0Principal repayments 176 332 254 276 196 261 201 229Public and publicly guaranteed 151 293 88 110 107 135 89 99 Official creditors 143 266 86 104 107 135 85 97 Multilateral 137 158 86 93 86 122 52 34 of which: IBRD 94 58 27 21 15 70 0 0 IDA 2 2 2 9 12 8 8 0 Bilateral 6 108 1 11 20 13 34 63 Private creditors 8 27 1 6 1 1 3 2 of which: Bonds 0 13 0 0 0 0 0 0 Commercial banks 4 6 1 6 1 1 1 1Private nonguaranteed 25 39 166 165 89 126 112 130 of which: Bonds 0 0 0 0 0 0 0 0Interest payments 157 209 106 84 98 83 102 80Public and publicly guaranteed 155 204 75 71 87 63 64 52 Official creditors 150 184 75 70 86 63 64 52 Multilateral 141 103 66 59 60 50 46 35 of which: IBRD 96 38 15 8 5 3 0 0 IDA 1 3 6 8 9 10 7 3 Bilateral 8 81 8 11 26 13 18 17 Private creditors 6 20 0 1 0 0 0 0 of which: Bonds 0 7 0 0 0 0 0 0 Commercial banks 5 5 0 1 0 0 0 0Private nonguaranteed 1 5 31 13 11 20 37 28 of which: Bonds 0 0 0 0 0 0 0 08. Debt stock-flow reconciliationTotal change in external debt stocks 332 96 37 222 571 -859 -997 -952 Net flows on external debt 129 66 296 -84 450 220 274 250 Cross-currency valuation 48 -74 -143 223 102 -228 -1,102 -199. Debt restructuringsTotal amount rescheduled 308 25 161 0 79 58 10 31Total amount forgiven 10 10 14 6 41 563 239 108Debt buyback 0 0 0 0 0 0 0 010. Contractual obligations on outstanding long-term external debt
2008 2009 2010 2011 2012 2013 2014 2015Official creditorsPrincipal 75 67 70 75 77 88 79 82Interest 62 62 62 60 58 56 53 51Private creditorsPrincipal 164 115 103 61 49 37 31 25Interest 38 28 21 14 10 7 5 3
Notes:Honduras was granted debt relief effective in 2006 under the Multilateral Debt Relief Initiative. Rescheduling: Debt data include the effects of Paris Club debt restructuring agreement signed in 2005.
127
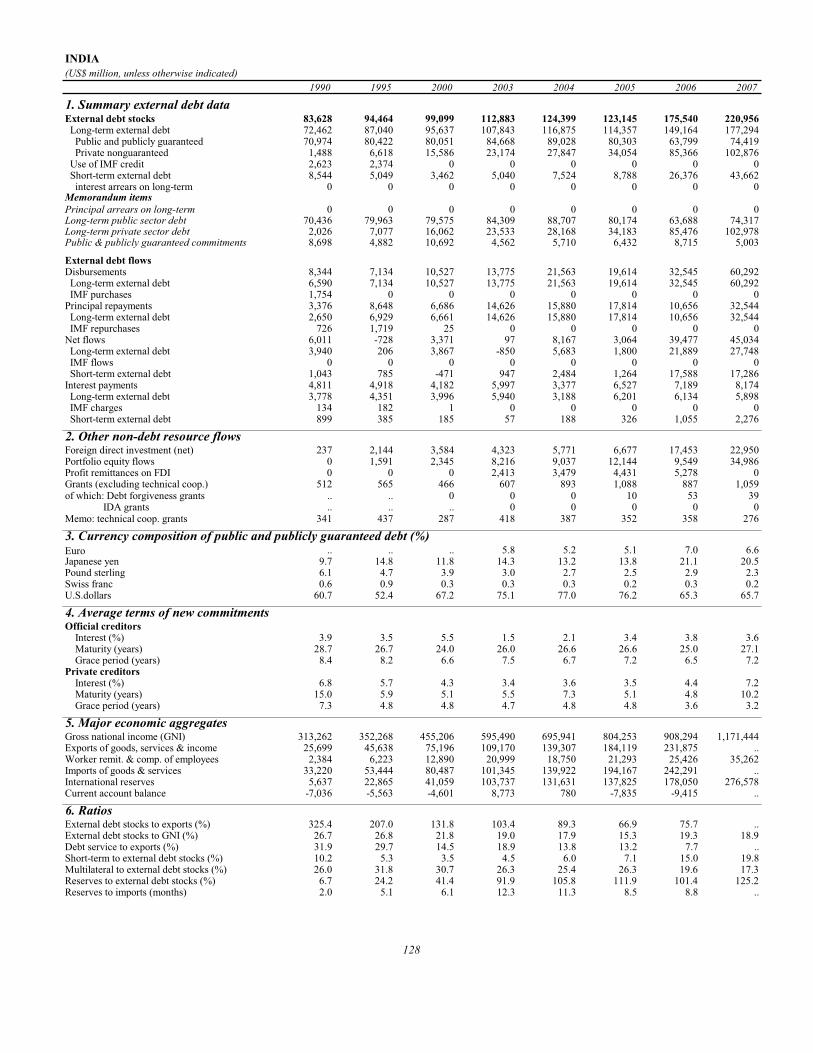
INDIA(US$ million, unless otherwise indicated)
1990 1995 2000 2003 2004 2005 2006 2007
1. Summary external debt dataExternal debt stocks 83,628 94,464 99,099 112,883 124,399 123,145 175,540 220,956 Long-term external debt 72,462 87,040 95,637 107,843 116,875 114,357 149,164 177,294 Public and publicly guaranteed 70,974 80,422 80,051 84,668 89,028 80,303 63,799 74,419 Private nonguaranteed 1,488 6,618 15,586 23,174 27,847 34,054 85,366 102,876 Use of IMF credit 2,623 2,374 0 0 0 0 0 0 Short-term external debt 8,544 5,049 3,462 5,040 7,524 8,788 26,376 43,662 interest arrears on long-term 0 0 0 0 0 0 0 0Memorandum itemsPrincipal arrears on long-term 0 0 0 0 0 0 0 0Long-term public sector debt 70,436 79,963 79,575 84,309 88,707 80,174 63,688 74,317Long-term private sector debt 2,026 7,077 16,062 23,533 28,168 34,183 85,476 102,978Public & publicly guaranteed commitments 8,698 4,882 10,692 4,562 5,710 6,432 8,715 5,003
External debt flowsDisbursements 8,344 7,134 10,527 13,775 21,563 19,614 32,545 60,292 Long-term external debt 6,590 7,134 10,527 13,775 21,563 19,614 32,545 60,292 IMF purchases 1,754 0 0 0 0 0 0 0Principal repayments 3,376 8,648 6,686 14,626 15,880 17,814 10,656 32,544 Long-term external debt 2,650 6,929 6,661 14,626 15,880 17,814 10,656 32,544 IMF repurchases 726 1,719 25 0 0 0 0 0Net flows 6,011 -728 3,371 97 8,167 3,064 39,477 45,034 Long-term external debt 3,940 206 3,867 -850 5,683 1,800 21,889 27,748 IMF flows 0 0 0 0 0 0 0 0 Short-term external debt 1,043 785 -471 947 2,484 1,264 17,588 17,286Interest payments 4,811 4,918 4,182 5,997 3,377 6,527 7,189 8,174 Long-term external debt 3,778 4,351 3,996 5,940 3,188 6,201 6,134 5,898 IMF charges 134 182 1 0 0 0 0 0 Short-term external debt 899 385 185 57 188 326 1,055 2,276
2. Other non-debt resource flowsForeign direct investment (net) 237 2,144 3,584 4,323 5,771 6,677 17,453 22,950Portfolio equity flows 0 1,591 2,345 8,216 9,037 12,144 9,549 34,986Profit remittances on FDI 0 0 0 2,413 3,479 4,431 5,278 0Grants (excluding technical coop.) 512 565 466 607 893 1,088 887 1,059of which: Debt forgiveness grants .. .. 0 0 0 10 53 39 IDA grants .. .. .. 0 0 0 0 0Memo: technical coop. grants 341 437 287 418 387 352 358 276
3. Currency composition of public and publicly guaranteed debt (%)Euro .. .. .. 5.8 5.2 5.1 7.0 6.6Japanese yen 9.7 14.8 11.8 14.3 13.2 13.8 21.1 20.5Pound sterling 6.1 4.7 3.9 3.0 2.7 2.5 2.9 2.3Swiss franc 0.6 0.9 0.3 0.3 0.3 0.2 0.3 0.2U.S.dollars 60.7 52.4 67.2 75.1 77.0 76.2 65.3 65.7
4. Average terms of new commitmentsOfficial creditors Interest (%) 3.9 3.5 5.5 1.5 2.1 3.4 3.8 3.6 Maturity (years) 28.7 26.7 24.0 26.0 26.6 26.6 25.0 27.1 Grace period (years) 8.4 8.2 6.6 7.5 6.7 7.2 6.5 7.2Private creditors Interest (%) 6.8 5.7 4.3 3.4 3.6 3.5 4.4 7.2 Maturity (years) 15.0 5.9 5.1 5.5 7.3 5.1 4.8 10.2 Grace period (years) 7.3 4.8 4.8 4.7 4.8 4.8 3.6 3.2
5. Major economic aggregatesGross national income (GNI) 313,262 352,268 455,206 595,490 695,941 804,253 908,294 1,171,444Exports of goods, services & income 25,699 45,638 75,196 109,170 139,307 184,119 231,875 ..Worker remit. & comp. of employees 2,384 6,223 12,890 20,999 18,750 21,293 25,426 35,262Imports of goods & services 33,220 53,444 80,487 101,345 139,922 194,167 242,291 ..International reserves 5,637 22,865 41,059 103,737 131,631 137,825 178,050 276,578Current account balance -7,036 -5,563 -4,601 8,773 780 -7,835 -9,415 ..
6. RatiosExternal debt stocks to exports (%) 325.4 207.0 131.8 103.4 89.3 66.9 75.7 ..External debt stocks to GNI (%) 26.7 26.8 21.8 19.0 17.9 15.3 19.3 18.9Debt service to exports (%) 31.9 29.7 14.5 18.9 13.8 13.2 7.7 ..Short-term to external debt stocks (%) 10.2 5.3 3.5 4.5 6.0 7.1 15.0 19.8Multilateral to external debt stocks (%) 26.0 31.8 30.7 26.3 25.4 26.3 19.6 17.3Reserves to external debt stocks (%) 6.7 24.2 41.4 91.9 105.8 111.9 101.4 125.2Reserves to imports (months) 2.0 5.1 6.1 12.3 11.3 8.5 8.8 ..
128
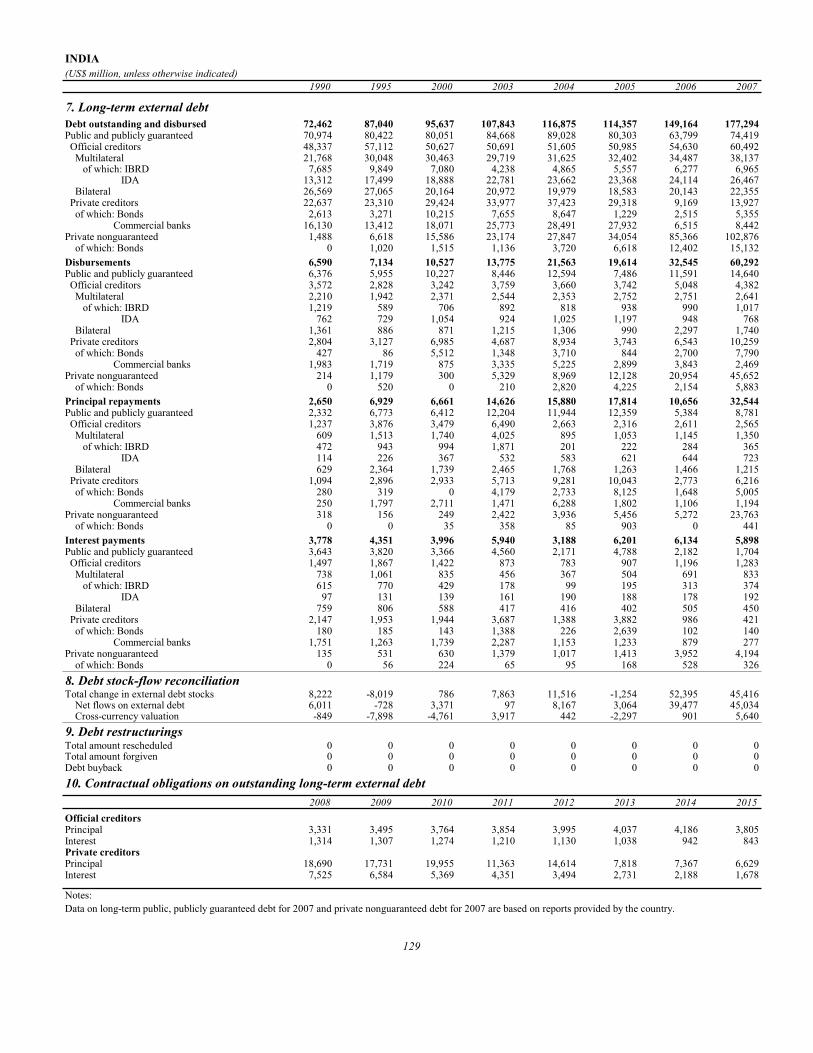
INDIA(US$ million, unless otherwise indicated)
1990 1995 2000 2003 2004 2005 2006 2007
7. Long-term external debtDebt outstanding and disbursed 72,462 87,040 95,637 107,843 116,875 114,357 149,164 177,294Public and publicly guaranteed 70,974 80,422 80,051 84,668 89,028 80,303 63,799 74,419 Official creditors 48,337 57,112 50,627 50,691 51,605 50,985 54,630 60,492 Multilateral 21,768 30,048 30,463 29,719 31,625 32,402 34,487 38,137 of which: IBRD 7,685 9,849 7,080 4,238 4,865 5,557 6,277 6,965 IDA 13,312 17,499 18,888 22,781 23,662 23,368 24,114 26,467 Bilateral 26,569 27,065 20,164 20,972 19,979 18,583 20,143 22,355 Private creditors 22,637 23,310 29,424 33,977 37,423 29,318 9,169 13,927 of which: Bonds 2,613 3,271 10,215 7,655 8,647 1,229 2,515 5,355 Commercial banks 16,130 13,412 18,071 25,773 28,491 27,932 6,515 8,442Private nonguaranteed 1,488 6,618 15,586 23,174 27,847 34,054 85,366 102,876 of which: Bonds 0 1,020 1,515 1,136 3,720 6,618 12,402 15,132Disbursements 6,590 7,134 10,527 13,775 21,563 19,614 32,545 60,292Public and publicly guaranteed 6,376 5,955 10,227 8,446 12,594 7,486 11,591 14,640 Official creditors 3,572 2,828 3,242 3,759 3,660 3,742 5,048 4,382 Multilateral 2,210 1,942 2,371 2,544 2,353 2,752 2,751 2,641 of which: IBRD 1,219 589 706 892 818 938 990 1,017 IDA 762 729 1,054 924 1,025 1,197 948 768 Bilateral 1,361 886 871 1,215 1,306 990 2,297 1,740 Private creditors 2,804 3,127 6,985 4,687 8,934 3,743 6,543 10,259 of which: Bonds 427 86 5,512 1,348 3,710 844 2,700 7,790 Commercial banks 1,983 1,719 875 3,335 5,225 2,899 3,843 2,469Private nonguaranteed 214 1,179 300 5,329 8,969 12,128 20,954 45,652 of which: Bonds 0 520 0 210 2,820 4,225 2,154 5,883Principal repayments 2,650 6,929 6,661 14,626 15,880 17,814 10,656 32,544Public and publicly guaranteed 2,332 6,773 6,412 12,204 11,944 12,359 5,384 8,781 Official creditors 1,237 3,876 3,479 6,490 2,663 2,316 2,611 2,565 Multilateral 609 1,513 1,740 4,025 895 1,053 1,145 1,350 of which: IBRD 472 943 994 1,871 201 222 284 365 IDA 114 226 367 532 583 621 644 723 Bilateral 629 2,364 1,739 2,465 1,768 1,263 1,466 1,215 Private creditors 1,094 2,896 2,933 5,713 9,281 10,043 2,773 6,216 of which: Bonds 280 319 0 4,179 2,733 8,125 1,648 5,005 Commercial banks 250 1,797 2,711 1,471 6,288 1,802 1,106 1,194Private nonguaranteed 318 156 249 2,422 3,936 5,456 5,272 23,763 of which: Bonds 0 0 35 358 85 903 0 441Interest payments 3,778 4,351 3,996 5,940 3,188 6,201 6,134 5,898Public and publicly guaranteed 3,643 3,820 3,366 4,560 2,171 4,788 2,182 1,704 Official creditors 1,497 1,867 1,422 873 783 907 1,196 1,283 Multilateral 738 1,061 835 456 367 504 691 833 of which: IBRD 615 770 429 178 99 195 313 374 IDA 97 131 139 161 190 188 178 192 Bilateral 759 806 588 417 416 402 505 450 Private creditors 2,147 1,953 1,944 3,687 1,388 3,882 986 421 of which: Bonds 180 185 143 1,388 226 2,639 102 140 Commercial banks 1,751 1,263 1,739 2,287 1,153 1,233 879 277Private nonguaranteed 135 531 630 1,379 1,017 1,413 3,952 4,194 of which: Bonds 0 56 224 65 95 168 528 3268. Debt stock-flow reconciliationTotal change in external debt stocks 8,222 -8,019 786 7,863 11,516 -1,254 52,395 45,416 Net flows on external debt 6,011 -728 3,371 97 8,167 3,064 39,477 45,034 Cross-currency valuation -849 -7,898 -4,761 3,917 442 -2,297 901 5,6409. Debt restructuringsTotal amount rescheduled 0 0 0 0 0 0 0 0Total amount forgiven 0 0 0 0 0 0 0 0Debt buyback 0 0 0 0 0 0 0 010. Contractual obligations on outstanding long-term external debt
2008 2009 2010 2011 2012 2013 2014 2015Official creditorsPrincipal 3,331 3,495 3,764 3,854 3,995 4,037 4,186 3,805Interest 1,314 1,307 1,274 1,210 1,130 1,038 942 843Private creditorsPrincipal 18,690 17,731 19,955 11,363 14,614 7,818 7,367 6,629Interest 7,525 6,584 5,369 4,351 3,494 2,731 2,188 1,678
Notes:Data on long-term public, publicly guaranteed debt for 2007 and private nonguaranteed debt for 2007 are based on reports provided by the country.
129
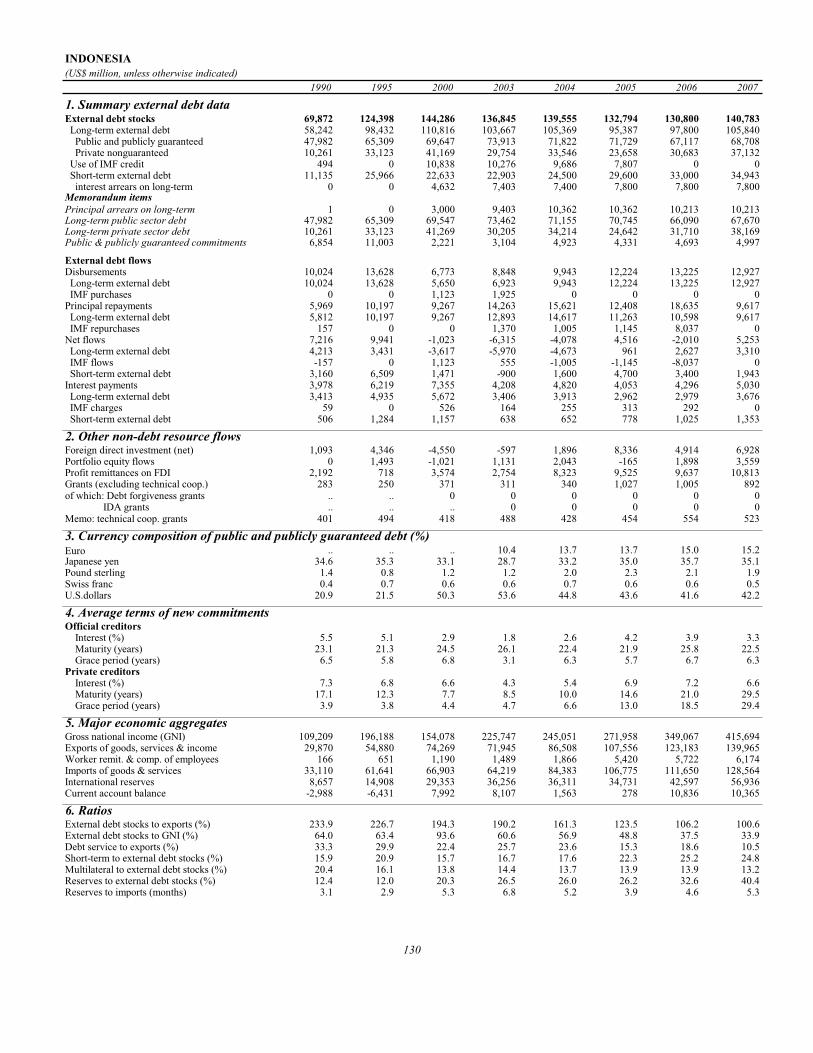
INDONESIA(US$ million, unless otherwise indicated)
1990 1995 2000 2003 2004 2005 2006 2007
1. Summary external debt dataExternal debt stocks 69,872 124,398 144,286 136,845 139,555 132,794 130,800 140,783 Long-term external debt 58,242 98,432 110,816 103,667 105,369 95,387 97,800 105,840 Public and publicly guaranteed 47,982 65,309 69,647 73,913 71,822 71,729 67,117 68,708 Private nonguaranteed 10,261 33,123 41,169 29,754 33,546 23,658 30,683 37,132 Use of IMF credit 494 0 10,838 10,276 9,686 7,807 0 0 Short-term external debt 11,135 25,966 22,633 22,903 24,500 29,600 33,000 34,943 interest arrears on long-term 0 0 4,632 7,403 7,400 7,800 7,800 7,800Memorandum itemsPrincipal arrears on long-term 1 0 3,000 9,403 10,362 10,362 10,213 10,213Long-term public sector debt 47,982 65,309 69,547 73,462 71,155 70,745 66,090 67,670Long-term private sector debt 10,261 33,123 41,269 30,205 34,214 24,642 31,710 38,169Public & publicly guaranteed commitments 6,854 11,003 2,221 3,104 4,923 4,331 4,693 4,997
External debt flowsDisbursements 10,024 13,628 6,773 8,848 9,943 12,224 13,225 12,927 Long-term external debt 10,024 13,628 5,650 6,923 9,943 12,224 13,225 12,927 IMF purchases 0 0 1,123 1,925 0 0 0 0Principal repayments 5,969 10,197 9,267 14,263 15,621 12,408 18,635 9,617 Long-term external debt 5,812 10,197 9,267 12,893 14,617 11,263 10,598 9,617 IMF repurchases 157 0 0 1,370 1,005 1,145 8,037 0Net flows 7,216 9,941 -1,023 -6,315 -4,078 4,516 -2,010 5,253 Long-term external debt 4,213 3,431 -3,617 -5,970 -4,673 961 2,627 3,310 IMF flows -157 0 1,123 555 -1,005 -1,145 -8,037 0 Short-term external debt 3,160 6,509 1,471 -900 1,600 4,700 3,400 1,943Interest payments 3,978 6,219 7,355 4,208 4,820 4,053 4,296 5,030 Long-term external debt 3,413 4,935 5,672 3,406 3,913 2,962 2,979 3,676 IMF charges 59 0 526 164 255 313 292 0 Short-term external debt 506 1,284 1,157 638 652 778 1,025 1,353
2. Other non-debt resource flowsForeign direct investment (net) 1,093 4,346 -4,550 -597 1,896 8,336 4,914 6,928Portfolio equity flows 0 1,493 -1,021 1,131 2,043 -165 1,898 3,559Profit remittances on FDI 2,192 718 3,574 2,754 8,323 9,525 9,637 10,813Grants (excluding technical coop.) 283 250 371 311 340 1,027 1,005 892of which: Debt forgiveness grants .. .. 0 0 0 0 0 0 IDA grants .. .. .. 0 0 0 0 0Memo: technical coop. grants 401 494 418 488 428 454 554 523
3. Currency composition of public and publicly guaranteed debt (%)Euro .. .. .. 10.4 13.7 13.7 15.0 15.2Japanese yen 34.6 35.3 33.1 28.7 33.2 35.0 35.7 35.1Pound sterling 1.4 0.8 1.2 1.2 2.0 2.3 2.1 1.9Swiss franc 0.4 0.7 0.6 0.6 0.7 0.6 0.6 0.5U.S.dollars 20.9 21.5 50.3 53.6 44.8 43.6 41.6 42.2
4. Average terms of new commitmentsOfficial creditors Interest (%) 5.5 5.1 2.9 1.8 2.6 4.2 3.9 3.3 Maturity (years) 23.1 21.3 24.5 26.1 22.4 21.9 25.8 22.5 Grace period (years) 6.5 5.8 6.8 3.1 6.3 5.7 6.7 6.3Private creditors Interest (%) 7.3 6.8 6.6 4.3 5.4 6.9 7.2 6.6 Maturity (years) 17.1 12.3 7.7 8.5 10.0 14.6 21.0 29.5 Grace period (years) 3.9 3.8 4.4 4.7 6.6 13.0 18.5 29.4
5. Major economic aggregatesGross national income (GNI) 109,209 196,188 154,078 225,747 245,051 271,958 349,067 415,694Exports of goods, services & income 29,870 54,880 74,269 71,945 86,508 107,556 123,183 139,965Worker remit. & comp. of employees 166 651 1,190 1,489 1,866 5,420 5,722 6,174Imports of goods & services 33,110 61,641 66,903 64,219 84,383 106,775 111,650 128,564International reserves 8,657 14,908 29,353 36,256 36,311 34,731 42,597 56,936Current account balance -2,988 -6,431 7,992 8,107 1,563 278 10,836 10,365
6. RatiosExternal debt stocks to exports (%) 233.9 226.7 194.3 190.2 161.3 123.5 106.2 100.6External debt stocks to GNI (%) 64.0 63.4 93.6 60.6 56.9 48.8 37.5 33.9Debt service to exports (%) 33.3 29.9 22.4 25.7 23.6 15.3 18.6 10.5Short-term to external debt stocks (%) 15.9 20.9 15.7 16.7 17.6 22.3 25.2 24.8Multilateral to external debt stocks (%) 20.4 16.1 13.8 14.4 13.7 13.9 13.9 13.2Reserves to external debt stocks (%) 12.4 12.0 20.3 26.5 26.0 26.2 32.6 40.4Reserves to imports (months) 3.1 2.9 5.3 6.8 5.2 3.9 4.6 5.3
130

INDONESIA(US$ million, unless otherwise indicated)
1990 1995 2000 2003 2004 2005 2006 2007
7. Long-term external debtDebt outstanding and disbursed 58,242 98,432 110,816 103,667 105,369 95,387 97,800 105,840Public and publicly guaranteed 47,982 65,309 69,647 73,913 71,822 71,729 67,117 68,708 Official creditors 33,041 51,296 54,897 61,462 60,614 59,054 57,087 57,330 Multilateral 14,285 20,013 19,904 19,767 19,173 18,514 18,246 18,611 of which: IBRD 9,542 12,503 11,715 9,779 8,943 8,132 7,423 6,821 IDA 842 756 714 880 996 1,001 1,318 1,550 Bilateral 18,756 31,284 34,992 41,695 41,441 40,540 38,841 38,720 Private creditors 14,941 14,012 14,750 12,451 11,209 12,675 10,031 11,377 of which: Bonds 696 704 971 1,029 1,949 3,734 4,945 6,370 Commercial banks 8,614 7,164 10,473 9,294 7,232 7,397 4,154 4,211Private nonguaranteed 10,261 33,123 41,169 29,754 33,546 23,658 30,683 37,132 of which: Bonds 120 3,420 6,337 3,854 4,374 6,275 8,948 10,366Disbursements 10,024 13,628 5,650 6,923 9,943 12,224 13,225 12,927Public and publicly guaranteed 5,009 6,665 3,300 2,792 3,112 4,997 5,686 5,078 Official creditors 4,000 4,254 3,037 1,590 1,876 2,578 3,231 3,381 Multilateral 1,794 1,777 1,750 856 1,156 1,667 1,876 2,134 of which: IBRD 987 1,045 1,051 317 537 585 696 767 IDA 0 0 59 91 122 67 315 219 Bilateral 2,206 2,477 1,287 734 721 911 1,355 1,246 Private creditors 1,009 2,411 263 1,202 1,236 2,419 2,455 1,697 of which: Bonds 0 605 0 250 920 2,095 1,930 1,425 Commercial banks 494 1,005 258 926 283 257 513 267Private nonguaranteed 5,015 6,963 2,350 4,131 6,831 7,227 7,539 7,849 of which: Bonds 120 1,763 350 250 620 2,361 2,673 2,983Principal repayments 5,812 10,197 9,267 12,893 14,617 11,263 10,598 9,617Public and publicly guaranteed 4,588 5,714 3,867 5,086 7,517 5,288 6,433 5,916 Official creditors 1,586 3,128 1,587 2,404 4,553 3,164 5,179 5,231 Multilateral 677 1,289 1,116 1,764 1,894 1,957 1,976 1,971 of which: IBRD 551 955 761 1,267 1,363 1,390 1,403 1,369 IDA 11 20 26 27 27 27 27 27 Bilateral 909 1,840 471 640 2,658 1,207 3,203 3,260 Private creditors 3,001 2,586 2,280 2,682 2,964 2,125 1,254 685 of which: Bonds 94 0 0 0 0 310 169 0 Commercial banks 1,718 1,678 2,105 2,572 2,500 1,394 870 486Private nonguaranteed 1,224 4,483 5,400 7,807 7,100 5,975 4,165 3,701 of which: Bonds 0 120 2,400 850 100 460 650 1,565Interest payments 3,413 4,935 5,672 3,406 3,913 2,962 2,979 3,676Public and publicly guaranteed 2,808 3,773 3,737 2,337 2,809 1,842 1,882 2,485 Official creditors 1,585 2,668 2,576 1,975 2,378 1,158 1,613 1,945 Multilateral 990 1,403 1,383 1,167 958 865 832 861 of which: IBRD 731 921 950 736 575 481 425 435 IDA 6 6 5 6 8 9 10 11 Bilateral 596 1,265 1,193 809 1,420 293 781 1,084 Private creditors 1,222 1,105 1,162 361 432 684 269 539 of which: Bonds 62 6 72 52 103 136 48 324 Commercial banks 699 674 870 243 235 485 150 181Private nonguaranteed 605 1,161 1,935 1,069 1,103 1,120 1,097 1,191 of which: Bonds 0 139 735 447 413 593 716 9328. Debt stock-flow reconciliationTotal change in external debt stocks 10,470 16,574 -7,173 3,880 2,710 -6,761 -1,994 9,982 Net flows on external debt 7,216 9,941 -1,023 -6,315 -4,078 4,516 -2,010 5,253 Cross-currency valuation 3,078 -44 -4,591 5,244 1,976 -5,581 1,706 2,5989. Debt restructuringsTotal amount rescheduled 0 0 2,461 3,086 0 2,608 0 0Total amount forgiven 0 0 0 0 0 0 0 0Debt buyback 0 0 0 0 0 0 0 010. Contractual obligations on outstanding long-term external debt
2008 2009 2010 2011 2012 2013 2014 2015Official creditorsPrincipal 6,253 6,222 5,122 4,529 4,407 4,289 3,845 3,627Interest 2,112 1,893 1,671 1,485 1,311 1,139 978 838Private creditorsPrincipal 6,903 2,894 4,695 4,012 3,113 1,724 2,333 1,592Interest 2,057 1,958 1,849 1,522 1,261 1,090 989 839
Notes:Data include the effects of a Tsunami-related Paris Club debt restructuring agreement signed in 2005. Short-term debt data are World Bank staff estimates.
131

IRAN, ISLAMIC REPUBLIC OF(US$ million, unless otherwise indicated)
1990 1995 2000 2003 2004 2005 2006 2007
1. Summary external debt dataExternal debt stocks 9,020 21,879 7,978 13,912 20,356 21,260 20,119 20,577 Long-term external debt 1,797 15,430 4,970 9,121 10,103 10,574 11,155 11,237 Public and publicly guaranteed 1,797 15,116 4,707 8,933 9,985 10,493 11,096 11,146 Private nonguaranteed 0 314 263 188 118 81 59 91 Use of IMF credit 0 0 0 0 0 0 0 0 Short-term external debt 7,224 6,449 3,008 4,791 10,253 10,686 8,964 9,340 interest arrears on long-term 456 6 0 0 0 0 0 0Memorandum itemsPrincipal arrears on long-term 1,517 48 0 0 0 0 0 0Long-term public sector debt 1,797 15,031 4,687 8,917 9,972 10,483 11,089 11,140Long-term private sector debt 0 398 283 204 131 91 66 97Public & publicly guaranteed commitments 1,241 1,978 2,809 2,407 2,771 1,991 786 0
External debt flowsDisbursements 139 979 1,465 2,538 2,202 2,735 1,721 1,113 Long-term external debt 139 979 1,465 2,538 2,202 2,735 1,721 1,113 IMF purchases 0 0 0 0 0 0 0 0Principal repayments 225 4,198 2,637 1,269 1,473 1,752 1,737 2,410 Long-term external debt 225 4,198 2,637 1,269 1,473 1,752 1,737 2,410 IMF repurchases 0 0 0 0 0 0 0 0Net flows 2,480 -305 -1,780 3,983 6,191 1,416 -1,738 -1,440 Long-term external debt -86 -3,219 -1,171 1,269 729 983 -16 -1,297 IMF flows 0 0 0 0 0 0 0 0 Short-term external debt 2,566 2,914 -609 2,714 5,462 433 -1,722 -143Interest payments 430 1,627 589 481 639 772 813 904 Long-term external debt 28 1,132 409 315 377 504 567 662 IMF charges 0 0 0 0 0 0 0 0 Short-term external debt 402 494 180 167 262 267 246 242
2. Other non-debt resource flowsForeign direct investment (net) -362 17 39 482 306 918 317 754Portfolio equity flows 0 0 0 0 0 0 0 0Profit remittances on FDI 0 0 0 0 0 0 0 0Grants (excluding technical coop.) 76 41 36 64 122 46 64 45of which: Debt forgiveness grants .. .. 0 0 98 13,954 3,370 4,866 IDA grants .. .. .. 0 0 0 0 0Memo: technical coop. grants 99 106 64 72 76 73 69 76
3. Currency composition of public and publicly guaranteed debt (%)Euro .. .. .. 46.6 50.5 52.2 55.8 58.3Japanese yen 4.2 4.9 9.4 11.9 10.5 8.1 6.8 6.9Pound sterling 0.0 0.0 0.6 0.4 0.3 0.1 0.1 0.0Swiss franc 0.0 0.6 3.8 6.3 5.4 4.4 3.6 3.4U.S.dollars 88.6 71.5 68.3 34.7 33.2 35.0 33.4 31.2
4. Average terms of new commitmentsOfficial creditors Interest (%) 7.3 7.5 4.9 2.0 3.0 4.4 0.0 0.0 Maturity (years) 13.5 8.2 13.4 16.9 15.2 17.0 0.0 0.0 Grace period (years) 5.0 2.3 4.4 3.6 5.4 5.5 0.0 0.0Private creditors Interest (%) 8.6 6.3 6.6 2.2 4.1 4.8 6.0 0.0 Maturity (years) 8.3 10.9 10.3 10.4 9.3 9.9 10.0 0.0 Grace period (years) 3.7 3.4 2.9 2.8 2.5 2.0 2.5 0.0
5. Major economic aggregatesGross national income (GNI) 115,922 90,172 101,335 132,753 160,332 188,503 219,296 283,000Exports of goods, services & income 20,197 19,269 30,131 .. .. .. .. ..Worker remit. & comp. of employees 0 1,600 536 1,178 1,032 1,032 1,032 1,115Imports of goods & services 22,370 15,907 18,107 .. .. .. .. ..International reserves .. .. .. .. .. .. .. ..Current account balance 327 3,358 12,481 .. .. .. .. ..
6. RatiosExternal debt stocks to exports (%) 44.7 113.5 26.5 .. .. .. .. ..External debt stocks to GNI (%) 7.8 24.3 7.9 10.5 12.7 11.3 9.2 7.3Debt service to exports (%) 3.2 30.2 10.7 .. .. .. .. ..Short-term to external debt stocks (%) 80.1 29.5 37.7 34.4 50.4 50.3 44.6 45.4Multilateral to external debt stocks (%) 1.3 1.7 6.4 2.5 1.6 1.8 2.8 3.4Reserves to external debt stocks (%) 0.0 0.0 0.0 0.0 0.0 0.0 0.0 0.0Reserves to imports (months) .. .. .. .. .. .. .. ..
132

IRAN, ISLAMIC REPUBLIC OF(US$ million, unless otherwise indicated)
1990 1995 2000 2003 2004 2005 2006 2007
7. Long-term external debtDebt outstanding and disbursed 1,797 15,430 4,970 9,121 10,103 10,574 11,155 11,237Public and publicly guaranteed 1,797 15,116 4,707 8,933 9,985 10,493 11,096 11,146 Official creditors 225 11,354 1,630 1,741 1,784 1,976 2,098 2,201 Multilateral 116 381 507 350 318 381 559 699 of which: IBRD 86 316 481 350 316 378 559 699 IDA 0 0 0 0 0 0 0 0 Bilateral 110 10,974 1,123 1,391 1,466 1,595 1,538 1,502 Private creditors 1,571 3,761 3,076 7,192 8,201 8,516 8,998 8,945 of which: Bonds 0 0 0 0 0 0 0 0 Commercial banks 1,055 5 1,041 2,998 3,477 4,082 4,701 5,030Private nonguaranteed 0 314 263 188 118 81 59 91 of which: Bonds 0 0 0 0 0 0 0 0Disbursements 139 979 1,465 2,538 2,202 2,735 1,721 1,113Public and publicly guaranteed 139 979 1,465 2,538 2,202 2,735 1,721 1,113 Official creditors 30 393 443 434 267 630 379 264 Multilateral 30 123 120 21 36 258 248 212 of which: IBRD 0 85 114 14 29 247 248 212 IDA 0 0 0 0 0 0 0 0 Bilateral 0 270 323 413 231 372 132 52 Private creditors 109 586 1,022 2,104 1,935 2,105 1,341 848 of which: Bonds 0 0 0 0 0 0 0 0 Commercial banks 0 1 268 830 995 1,442 1,067 697Private nonguaranteed 0 0 0 0 0 0 0 0 of which: Bonds 0 0 0 0 0 0 0 0Principal repayments 225 4,198 2,637 1,269 1,473 1,752 1,737 2,410Public and publicly guaranteed 225 4,120 2,344 1,219 1,431 1,715 1,715 2,368 Official creditors 86 3,497 1,785 174 200 318 264 277 Multilateral 67 41 108 70 68 155 75 73 of which: IBRD 67 6 70 63 63 145 66 73 IDA 0 0 0 0 0 0 0 0 Bilateral 18 3,456 1,677 104 131 163 189 204 Private creditors 139 622 559 1,045 1,232 1,397 1,451 2,091 of which: Bonds 0 0 0 0 0 0 0 0 Commercial banks 0 1 65 498 612 713 689 943Private nonguaranteed 0 78 293 50 42 37 22 42 of which: Bonds 0 0 0 0 0 0 0 0Interest payments 28 1,132 409 315 377 504 567 662Public and publicly guaranteed 28 1,107 393 308 371 418 508 571 Official creditors 14 787 189 79 104 98 92 100 Multilateral 10 27 44 29 22 39 25 36 of which: IBRD 10 19 40 29 22 39 25 36 IDA 0 0 0 0 0 0 0 0 Bilateral 4 759 145 50 82 59 67 64 Private creditors 14 321 204 230 267 320 416 470 of which: Bonds 0 0 0 0 0 0 0 0 Commercial banks 0 0 82 92 108 157 224 276Private nonguaranteed 0 25 16 6 6 86 59 91 of which: Bonds 0 0 0 0 0 0 0 08. Debt stock-flow reconciliationTotal change in external debt stocks 2,502 -755 -1,928 5,012 6,444 903 -1,141 -61 Net flows on external debt 2,480 -305 -1,780 3,983 6,191 1,416 -1,738 -1,440 Cross-currency valuation -6 -340 -139 412 265 -468 583 1,3909. Debt restructuringsTotal amount rescheduled 0 3,178 0 0 0 0 0 0Total amount forgiven 0 0 0 0 0 0 0 0Debt buyback 0 0 0 0 0 0 0 010. Contractual obligations on outstanding long-term external debt
2008 2009 2010 2011 2012 2013 2014 2015Official creditorsPrincipal 347 357 405 356 345 217 187 171Interest 82 75 65 55 45 37 30 25Private creditorsPrincipal 2,418 2,128 1,844 1,505 1,246 909 655 392Interest 386 319 245 178 122 77 46 25
Notes:Data related to the year ending in March. Long-term public and publicly guaranteed debt as of end-March 2007 are based on reports provided by the country. Long-term private nonguaranteed debt data are World Bank staff estimates.
133
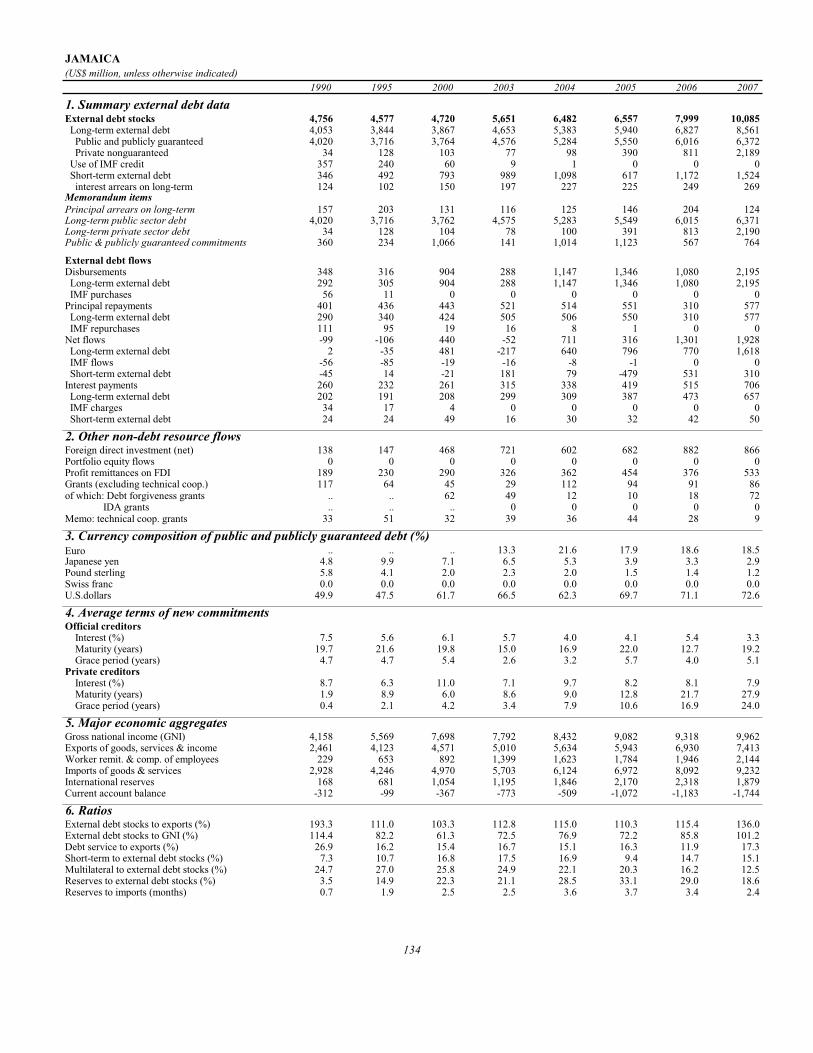
JAMAICA(US$ million, unless otherwise indicated)
1990 1995 2000 2003 2004 2005 2006 2007
1. Summary external debt dataExternal debt stocks 4,756 4,577 4,720 5,651 6,482 6,557 7,999 10,085 Long-term external debt 4,053 3,844 3,867 4,653 5,383 5,940 6,827 8,561 Public and publicly guaranteed 4,020 3,716 3,764 4,576 5,284 5,550 6,016 6,372 Private nonguaranteed 34 128 103 77 98 390 811 2,189 Use of IMF credit 357 240 60 9 1 0 0 0 Short-term external debt 346 492 793 989 1,098 617 1,172 1,524 interest arrears on long-term 124 102 150 197 227 225 249 269Memorandum itemsPrincipal arrears on long-term 157 203 131 116 125 146 204 124Long-term public sector debt 4,020 3,716 3,762 4,575 5,283 5,549 6,015 6,371Long-term private sector debt 34 128 104 78 100 391 813 2,190Public & publicly guaranteed commitments 360 234 1,066 141 1,014 1,123 567 764
External debt flowsDisbursements 348 316 904 288 1,147 1,346 1,080 2,195 Long-term external debt 292 305 904 288 1,147 1,346 1,080 2,195 IMF purchases 56 11 0 0 0 0 0 0Principal repayments 401 436 443 521 514 551 310 577 Long-term external debt 290 340 424 505 506 550 310 577 IMF repurchases 111 95 19 16 8 1 0 0Net flows -99 -106 440 -52 711 316 1,301 1,928 Long-term external debt 2 -35 481 -217 640 796 770 1,618 IMF flows -56 -85 -19 -16 -8 -1 0 0 Short-term external debt -45 14 -21 181 79 -479 531 310Interest payments 260 232 261 315 338 419 515 706 Long-term external debt 202 191 208 299 309 387 473 657 IMF charges 34 17 4 0 0 0 0 0 Short-term external debt 24 24 49 16 30 32 42 50
2. Other non-debt resource flowsForeign direct investment (net) 138 147 468 721 602 682 882 866Portfolio equity flows 0 0 0 0 0 0 0 0Profit remittances on FDI 189 230 290 326 362 454 376 533Grants (excluding technical coop.) 117 64 45 29 112 94 91 86of which: Debt forgiveness grants .. .. 62 49 12 10 18 72 IDA grants .. .. .. 0 0 0 0 0Memo: technical coop. grants 33 51 32 39 36 44 28 9
3. Currency composition of public and publicly guaranteed debt (%)Euro .. .. .. 13.3 21.6 17.9 18.6 18.5Japanese yen 4.8 9.9 7.1 6.5 5.3 3.9 3.3 2.9Pound sterling 5.8 4.1 2.0 2.3 2.0 1.5 1.4 1.2Swiss franc 0.0 0.0 0.0 0.0 0.0 0.0 0.0 0.0U.S.dollars 49.9 47.5 61.7 66.5 62.3 69.7 71.1 72.6
4. Average terms of new commitmentsOfficial creditors Interest (%) 7.5 5.6 6.1 5.7 4.0 4.1 5.4 3.3 Maturity (years) 19.7 21.6 19.8 15.0 16.9 22.0 12.7 19.2 Grace period (years) 4.7 4.7 5.4 2.6 3.2 5.7 4.0 5.1Private creditors Interest (%) 8.7 6.3 11.0 7.1 9.7 8.2 8.1 7.9 Maturity (years) 1.9 8.9 6.0 8.6 9.0 12.8 21.7 27.9 Grace period (years) 0.4 2.1 4.2 3.4 7.9 10.6 16.9 24.0
5. Major economic aggregatesGross national income (GNI) 4,158 5,569 7,698 7,792 8,432 9,082 9,318 9,962Exports of goods, services & income 2,461 4,123 4,571 5,010 5,634 5,943 6,930 7,413Worker remit. & comp. of employees 229 653 892 1,399 1,623 1,784 1,946 2,144Imports of goods & services 2,928 4,246 4,970 5,703 6,124 6,972 8,092 9,232International reserves 168 681 1,054 1,195 1,846 2,170 2,318 1,879Current account balance -312 -99 -367 -773 -509 -1,072 -1,183 -1,744
6. RatiosExternal debt stocks to exports (%) 193.3 111.0 103.3 112.8 115.0 110.3 115.4 136.0External debt stocks to GNI (%) 114.4 82.2 61.3 72.5 76.9 72.2 85.8 101.2Debt service to exports (%) 26.9 16.2 15.4 16.7 15.1 16.3 11.9 17.3Short-term to external debt stocks (%) 7.3 10.7 16.8 17.5 16.9 9.4 14.7 15.1Multilateral to external debt stocks (%) 24.7 27.0 25.8 24.9 22.1 20.3 16.2 12.5Reserves to external debt stocks (%) 3.5 14.9 22.3 21.1 28.5 33.1 29.0 18.6Reserves to imports (months) 0.7 1.9 2.5 2.5 3.6 3.7 3.4 2.4
134

JAMAICA(US$ million, unless otherwise indicated)
1990 1995 2000 2003 2004 2005 2006 2007
7. Long-term external debtDebt outstanding and disbursed 4,053 3,844 3,867 4,653 5,383 5,940 6,827 8,561Public and publicly guaranteed 4,020 3,716 3,764 4,576 5,284 5,550 6,016 6,372 Official creditors 3,458 3,358 2,444 2,446 2,403 2,150 2,030 1,966 Multilateral 1,174 1,234 1,218 1,407 1,430 1,333 1,298 1,261 of which: IBRD 672 595 415 476 439 410 387 360 IDA 0 0 0 0 0 0 0 0 Bilateral 2,284 2,124 1,227 1,039 973 817 732 705 Private creditors 561 358 1,320 2,130 2,881 3,400 3,986 4,406 of which: Bonds 0 25 1,004 1,821 2,524 3,043 3,568 4,050 Commercial banks 331 269 265 241 301 317 381 309Private nonguaranteed 34 128 103 77 98 390 811 2,189 of which: Bonds 0 55 0 0 0 300 730 2,130Disbursements 292 305 904 288 1,147 1,346 1,080 2,195Public and publicly guaranteed 292 250 904 288 1,117 1,039 650 795 Official creditors 253 193 311 141 136 86 103 129 Multilateral 110 125 255 69 120 67 82 93 of which: IBRD 35 61 98 15 6 17 18 19 IDA 0 0 0 0 0 0 0 0 Bilateral 144 68 57 72 16 19 21 36 Private creditors 39 57 593 147 981 952 548 666 of which: Bonds 0 13 553 50 859 875 450 625 Commercial banks 0 42 24 86 122 75 93 25Private nonguaranteed 0 55 0 0 30 307 430 1,400 of which: Bonds 0 0 0 0 0 300 430 1,400Principal repayments 290 340 424 505 506 550 310 577Public and publicly guaranteed 281 335 360 497 498 541 301 554 Official creditors 205 255 273 212 218 231 246 242 Multilateral 100 127 122 119 120 119 137 154 of which: IBRD 62 85 60 46 47 39 43 48 IDA 0 0 0 0 0 0 0 0 Bilateral 105 129 151 93 98 113 109 88 Private creditors 76 80 87 284 280 310 56 312 of which: Bonds 0 0 13 226 218 256 0 229 Commercial banks 1 73 47 43 48 44 44 73Private nonguaranteed 8 5 64 9 9 9 9 22 of which: Bonds 0 0 55 0 0 0 0 0Interest payments 202 191 208 299 309 387 473 657Public and publicly guaranteed 200 181 195 298 305 361 422 472 Official creditors 165 158 120 99 89 84 91 90 Multilateral 85 83 65 67 61 63 67 69 of which: IBRD 58 47 22 20 18 19 22 22 IDA 0 0 0 0 0 0 0 0 Bilateral 79 75 55 32 28 21 24 21 Private creditors 35 23 75 199 217 277 332 382 of which: Bonds 0 2 50 191 207 265 325 373 Commercial banks 20 19 18 6 8 11 6 8Private nonguaranteed 3 11 13 1 3 26 51 185 of which: Bonds 0 5 2 0 0 21 45 1818. Debt stock-flow reconciliationTotal change in external debt stocks 120 -29 798 154 831 75 1,442 2,064 Net flows on external debt -99 -106 440 -52 711 316 1,301 1,928 Cross-currency valuation 158 33 -91 224 80 -230 121 1579. Debt restructuringsTotal amount rescheduled 469 105 0 0 0 0 0 0Total amount forgiven 0 0 4 9 5 1 2 2Debt buyback 0 0 0 0 0 0 0 010. Contractual obligations on outstanding long-term external debt
2008 2009 2010 2011 2012 2013 2014 2015Official creditorsPrincipal 266 244 215 187 173 162 141 139Interest 91 81 72 63 55 48 41 35Private creditorsPrincipal 198 414 98 486 838 183 302 1,899Interest 732 701 677 647 610 530 524 355
Notes:Data on long-term private nonguaranteed debt are World Bank staff estimates based on information from market sources.
135

JORDAN(US$ million, unless otherwise indicated)
1990 1995 2000 2003 2004 2005 2006 2007
1. Summary external debt dataExternal debt stocks 8,333 7,661 7,355 8,337 8,066 7,696 8,000 8,368 Long-term external debt 7,202 6,624 6,183 7,173 7,227 6,878 7,143 7,318 Public and publicly guaranteed 7,202 6,624 6,183 7,173 7,227 6,878 7,143 7,318 Private nonguaranteed 0 0 0 0 0 0 0 0 Use of IMF credit 94 251 462 421 338 236 158 88 Short-term external debt 1,037 785 710 743 501 582 699 962 interest arrears on long-term 107 67 102 0 0 0 1 0Memorandum itemsPrincipal arrears on long-term 529 177 281 20 23 17 36 17Long-term public sector debt 7,202 6,624 6,148 7,149 7,214 6,790 7,001 7,168Long-term private sector debt 0 0 35 24 13 88 142 150Public & publicly guaranteed commitments 749 1,259 384 379 358 337 159 265
External debt flowsDisbursements 691 724 196 173 212 434 277 186 Long-term external debt 691 609 176 173 212 434 277 186 IMF purchases 0 115 20 0 0 0 0 0Principal repayments 252 337 424 978 526 418 441 486 Long-term external debt 242 329 393 878 428 341 353 409 IMF repurchases 10 8 31 100 98 77 88 76Net flows 604 484 -399 -580 -556 97 -48 -6 Long-term external debt 449 280 -217 -706 -216 93 -75 -223 IMF flows -10 107 -11 -100 -98 -77 -88 -76 Short-term external debt 165 97 -171 225 -242 81 116 293Interest payments 377 263 315 180 178 198 247 277 Long-term external debt 310 209 239 157 146 160 196 227 IMF charges 9 10 24 9 10 10 10 7 Short-term external debt 58 43 52 14 22 27 41 42
2. Other non-debt resource flowsForeign direct investment (net) 38 13 815 443 816 1,774 3,219 1,835Portfolio equity flows 0 0 -17 -58 -90 169 144 346Profit remittances on FDI 0 0 1 2 1 1 2 3Grants (excluding technical coop.) 672 219 386 1,165 516 546 506 611of which: Debt forgiveness grants .. .. 0 0 0 0 0 0 IDA grants .. .. .. 0 0 0 0 0Memo: technical coop. grants 68 160 120 114 109 125 114 58
3. Currency composition of public and publicly guaranteed debt (%)Euro .. .. .. 22.0 23.1 21.1 23.3 24.1Japanese yen 5.8 25.6 27.5 23.1 22.6 20.1 18.3 17.8Pound sterling 7.9 5.5 3.4 8.4 9.2 8.9 9.3 9.3Swiss franc 0.8 0.5 0.4 1.2 1.2 1.1 0.7 0.7U.S.dollars 45.7 28.9 29.3 24.0 22.9 26.4 25.9 25.3
4. Average terms of new commitmentsOfficial creditors Interest (%) 3.9 4.7 4.8 2.2 2.5 2.9 3.4 4.1 Maturity (years) 22.0 21.8 19.5 21.1 20.9 23.6 21.1 19.8 Grace period (years) 7.4 8.4 6.4 6.3 6.1 6.0 5.8 5.5Private creditors Interest (%) 8.9 0.0 0.0 1.0 5.3 0.0 0.2 0.0 Maturity (years) 7.0 0.0 0.0 30.0 16.2 0.0 34.3 0.0 Grace period (years) 1.0 0.0 0.0 5.0 13.2 0.0 11.3 0.0
5. Major economic aggregatesGross national income (GNI) 3,805 6,449 8,596 10,374 11,735 13,020 14,682 16,640Exports of goods, services & income 3,078 4,838 5,868 7,361 8,664 9,605 11,658 13,499Worker remit. & comp. of employees 499 1,441 1,845 2,201 2,330 2,500 2,883 3,434Imports of goods & services 3,850 5,297 6,331 7,341 9,732 12,242 13,682 16,060International reserves 1,139 2,279 3,441 5,366 5,447 5,461 6,982 7,925Current account balance -227 -259 60 1,245 89 -2,200 -1,598 -2,776
6. RatiosExternal debt stocks to exports (%) 270.8 158.3 125.3 113.3 93.1 80.1 68.6 62.0External debt stocks to GNI (%) 219.0 118.8 85.6 80.4 68.7 59.1 54.5 50.3Debt service to exports (%) 20.4 12.4 12.6 15.7 8.1 6.4 5.9 5.7Short-term to external debt stocks (%) 12.4 10.2 9.7 8.9 6.2 7.6 8.7 11.5Multilateral to external debt stocks (%) 10.6 15.5 23.2 24.3 24.3 24.8 24.5 23.7Reserves to external debt stocks (%) 13.7 29.8 46.8 64.4 67.5 71.0 87.3 94.7Reserves to imports (months) 3.5 5.2 6.5 8.8 6.7 5.4 6.1 5.9
136

JORDAN(US$ million, unless otherwise indicated)
1990 1995 2000 2003 2004 2005 2006 2007
7. Long-term external debtDebt outstanding and disbursed 7,202 6,624 6,183 7,173 7,227 6,878 7,143 7,318Public and publicly guaranteed 7,202 6,624 6,183 7,173 7,227 6,878 7,143 7,318 Official creditors 3,551 4,583 5,190 6,821 6,915 6,438 6,714 6,907 Multilateral 887 1,185 1,706 2,027 1,958 1,905 1,961 1,986 of which: IBRD 516 736 798 1,017 971 925 897 868 IDA 77 69 57 50 47 45 42 39 Bilateral 2,664 3,397 3,484 4,794 4,957 4,533 4,754 4,920 Private creditors 3,651 2,041 993 352 312 440 429 411 of which: Bonds 263 801 636 68 57 190 188 186 Commercial banks 1,604 337 1 0 0 0 0 0Private nonguaranteed 0 0 0 0 0 0 0 0 of which: Bonds 0 0 0 0 0 0 0 0Disbursements 691 609 176 173 212 434 277 186Public and publicly guaranteed 691 609 176 173 212 434 277 186 Official creditors 376 609 176 173 184 269 277 186 Multilateral 142 259 80 114 112 161 194 133 of which: IBRD 123 158 38 35 29 48 43 39 IDA 0 0 0 0 0 0 0 0 Bilateral 234 351 96 58 72 108 83 53 Private creditors 315 0 0 0 28 165 0 0 of which: Bonds 0 0 0 0 0 145 0 0 Commercial banks 73 0 0 0 0 0 0 0Private nonguaranteed 0 0 0 0 0 0 0 0 of which: Bonds 0 0 0 0 0 0 0 0Principal repayments 242 329 393 878 428 341 353 409Public and publicly guaranteed 242 329 393 878 428 341 353 409 Official creditors 142 128 238 399 383 322 340 392 Multilateral 94 117 124 173 215 170 168 174 of which: IBRD 52 77 53 65 86 73 78 78 IDA 1 2 3 3 3 3 3 3 Bilateral 48 11 114 226 168 152 172 218 Private creditors 100 201 155 479 44 20 12 17 of which: Bonds 0 0 95 467 11 11 1 2 Commercial banks 69 135 19 0 0 0 0 0Private nonguaranteed 0 0 0 0 0 0 0 0 of which: Bonds 0 0 0 0 0 0 0 0Interest payments 310 209 239 157 146 160 196 227Public and publicly guaranteed 310 209 239 157 146 160 196 227 Official creditors 123 116 158 127 134 153 179 209 Multilateral 54 63 91 73 71 76 90 97 of which: IBRD 37 48 53 32 25 33 45 50 IDA 1 1 0 0 0 0 0 0 Bilateral 69 53 67 53 63 77 89 112 Private creditors 187 94 80 31 13 7 18 18 of which: Bonds 14 41 46 26 4 4 12 12 Commercial banks 67 32 1 0 0 0 0 0Private nonguaranteed 0 0 0 0 0 0 0 0 of which: Bonds 0 0 0 0 0 0 0 08. Debt stock-flow reconciliationTotal change in external debt stocks 1,017 107 -728 229 -271 -370 304 397 Net flows on external debt 604 484 -399 -580 -556 97 -48 -6 Cross-currency valuation 309 57 -366 619 265 -545 283 3509. Debt restructuringsTotal amount rescheduled 350 365 194 563 257 220 208 196Total amount forgiven 0 322 28 53 68 0 0 0Debt buyback 0 0 85 0 0 0 0 010. Contractual obligations on outstanding long-term external debt
2008 2009 2010 2011 2012 2013 2014 2015Official creditorsPrincipal 523 551 576 593 610 605 537 525Interest 293 277 258 236 212 186 160 137Private creditorsPrincipal 27 28 29 25 26 23 10 11Interest 22 21 19 18 16 15 14 13
137

KAZAKHSTAN(US$ million, unless otherwise indicated)
1990 1995 2000 2003 2004 2005 2006 2007
1. Summary external debt dataExternal debt stocks .. 3,750 12,433 22,767 32,815 43,378 74,148 96,133 Long-term external debt .. 2,937 11,472 19,954 28,872 35,327 61,569 84,388 Public and publicly guaranteed .. 2,834 3,623 3,469 3,233 2,177 2,136 1,698 Private nonguaranteed .. 103 7,849 16,485 25,639 33,150 59,433 82,690 Use of IMF credit .. 432 0 0 0 0 0 0 Short-term external debt .. 381 961 2,813 3,943 8,051 12,579 11,745 interest arrears on long-term .. 162 0 0 0 0 0 0Memorandum itemsPrincipal arrears on long-term .. 0 0 0 0 0 0 0Long-term public sector debt .. 2,834 3,619 3,428 3,200 2,157 2,130 1,698Long-term private sector debt .. 103 7,852 16,526 25,672 33,170 59,439 82,690Public & publicly guaranteed commitments .. 982 688 354 35 159 30 0
External debt flowsDisbursements .. 881 3,057 8,180 16,118 17,238 37,916 44,750 Long-term external debt .. 740 3,057 8,180 16,118 17,238 37,916 44,750 IMF purchases .. 141 0 0 0 0 0 0Principal repayments .. 105 2,595 4,509 7,868 11,450 12,172 23,596 Long-term external debt .. 105 2,153 4,509 7,868 11,450 12,172 23,596 IMF repurchases .. 0 442 0 0 0 0 0Net flows .. 868 1,057 4,643 9,381 9,896 30,272 20,321 Long-term external debt .. 635 904 3,672 8,251 5,787 25,744 21,154 IMF flows .. 141 -442 0 0 0 0 0 Short-term external debt .. 93 595 971 1,130 4,109 4,527 -833Interest payments .. 130 775 794 907 1,730 2,360 3,927 Long-term external debt .. 102 713 723 811 1,526 1,953 3,537 IMF charges .. 17 11 0 0 0 0 0 Short-term external debt .. 10 51 70 96 204 408 389
2. Other non-debt resource flowsForeign direct investment (net) .. 964 1,283 2,092 4,157 1,971 6,278 10,189Portfolio equity flows .. 0 19 64 -13 150 2,789 841Profit remittances on FDI .. 74 1,046 1,432 2,347 4,633 7,694 10,411Grants (excluding technical coop.) .. 11 44 26 28 70 51 124of which: Debt forgiveness grants .. .. 11 12 24 19 17 11 IDA grants .. .. .. 0 0 0 0 0Memo: technical coop. grants .. 55 73 82 119 89 102 54
3. Currency composition of public and publicly guaranteed debt (%)Euro .. .. .. 2.2 1.6 1.9 2.1 2.6Japanese yen .. 8.9 13.8 18.6 24.6 32.6 34.9 46.7Pound sterling .. 0.0 0.6 0.5 0.4 0.0 0.0 0.0Swiss franc .. 0.0 0.0 0.0 0.0 0.0 0.0 0.0U.S.dollars .. 6.9 61.2 56.8 50.4 53.9 53.5 46.8
4. Average terms of new commitmentsOfficial creditors Interest (%) .. 5.5 3.0 1.9 1.8 4.6 5.7 0.0 Maturity (years) .. 14.3 27.6 22.5 24.6 16.8 16.3 0.0 Grace period (years) .. 4.5 8.4 6.7 5.1 5.3 4.8 0.0Private creditors Interest (%) .. 6.4 11.0 0.0 0.0 0.0 0.0 0.0 Maturity (years) .. 5.9 6.0 0.0 0.0 0.0 0.0 0.0 Grace period (years) .. 2.3 5.6 0.0 0.0 0.0 0.0 0.0
5. Major economic aggregatesGross national income (GNI) .. 20,191 17,150 29,089 40,300 51,757 71,687 92,709Exports of goods, services & income .. 6,020 10,544 15,239 23,088 31,265 43,084 55,501Worker remit. & comp. of employees .. 116 122 147 166 178 187 223Imports of goods & services .. 6,292 10,362 15,308 22,211 31,852 43,803 60,543International reserves .. 1,660 2,099 4,962 9,277 7,070 19,127 17,641Current account balance .. -213 366 -273 335 -1,056 -1,999 -7,333
6. RatiosExternal debt stocks to exports (%) .. 62.3 117.9 149.4 142.1 138.7 172.1 173.2External debt stocks to GNI (%) .. 18.6 72.5 78.3 81.4 83.8 103.4 103.7Debt service to exports (%) .. 3.9 32.0 34.8 38.0 42.2 33.7 49.6Short-term to external debt stocks (%) .. 10.2 7.7 12.4 12.0 18.6 17.0 12.2Multilateral to external debt stocks (%) .. 10.4 11.9 7.8 5.4 2.0 1.1 0.7Reserves to external debt stocks (%) .. 44.3 16.9 21.8 28.3 16.3 25.8 18.4Reserves to imports (months) .. 3.2 2.4 3.9 5.0 2.7 5.2 3.5
138

KAZAKHSTAN(US$ million, unless otherwise indicated)
1990 1995 2000 2003 2004 2005 2006 2007
7. Long-term external debtDebt outstanding and disbursed .. 2,937 11,472 19,954 28,872 35,327 61,569 84,388Public and publicly guaranteed .. 2,834 3,623 3,469 3,233 2,177 2,136 1,698 Official creditors .. 2,293 2,239 2,620 2,761 1,780 1,762 1,684 Multilateral .. 392 1,482 1,775 1,772 869 823 711 of which: IBRD .. 295 1,057 1,265 1,275 599 502 427 IDA .. 0 0 0 0 0 0 0 Bilateral .. 1,901 757 845 989 911 939 973 Private creditors .. 541 1,384 849 472 396 374 13 of which: Bonds .. 0 1,000 650 350 350 350 0 Commercial banks .. 17 263 189 122 46 24 13Private nonguaranteed .. 103 7,849 16,485 25,639 33,150 59,433 82,690 of which: Bonds .. 0 100 1,125 4,500 7,550 13,814 24,623Disbursements .. 740 3,057 8,180 16,118 17,238 37,916 44,750Public and publicly guaranteed .. 671 623 352 384 198 177 160 Official creditors .. 421 168 352 384 198 177 160 Multilateral .. 171 95 149 173 81 106 112 of which: IBRD .. 107 50 71 60 37 29 67 IDA .. 0 0 0 0 0 0 0 Bilateral .. 250 73 204 211 117 71 48 Private creditors .. 249 455 0 0 0 0 0 of which: Bonds .. 0 350 0 0 0 0 0 Commercial banks .. 17 105 0 0 0 0 0Private nonguaranteed .. 69 2,434 7,828 15,734 17,040 37,739 44,590 of which: Bonds .. 0 0 725 3,475 3,050 6,219 10,993Principal repayments .. 105 2,153 4,509 7,868 11,450 12,172 23,596Public and publicly guaranteed .. 95 216 272 690 1,090 222 640 Official creditors .. 27 133 200 311 1,018 200 279 Multilateral .. 0 31 118 218 921 160 226 of which: IBRD .. 0 20 75 87 658 130 143 IDA .. 0 0 0 0 0 0 0 Bilateral .. 27 102 82 93 97 40 53 Private creditors .. 68 83 72 379 72 22 361 of which: Bonds .. 0 0 0 300 0 0 350 Commercial banks .. 0 30 58 69 72 22 11Private nonguaranteed .. 11 1,937 4,237 7,177 10,360 11,949 22,957 of which: Bonds .. 0 0 0 100 0 0 400Interest payments .. 102 713 723 811 1,526 1,953 3,537Public and publicly guaranteed .. 100 235 195 187 146 113 96 Official creditors .. 59 124 105 96 102 71 74 Multilateral .. 15 82 73 70 73 44 46 of which: IBRD .. 14 62 48 44 54 31 29 IDA .. 0 0 0 0 0 0 0 Bilateral .. 44 42 32 26 28 27 29 Private creditors .. 41 112 90 90 44 42 22 of which: Bonds .. 0 90 80 80 39 39 19 Commercial banks .. 0 14 10 10 5 3 2Private nonguaranteed .. 1 477 528 624 1,380 1,839 3,441 of which: Bonds .. 0 11 99 96 543 834 1,5108. Debt stock-flow reconciliationTotal change in external debt stocks .. 961 6,304 4,786 10,048 10,564 30,770 21,986 Net flows on external debt .. 868 1,057 4,643 9,381 9,896 30,272 20,321 Cross-currency valuation .. -222 -162 177 65 -176 4 259. Debt restructuringsTotal amount rescheduled .. 0 0 0 0 0 0 0Total amount forgiven .. 0 0 0 0 0 0 0Debt buyback .. 0 0 0 0 0 0 010. Contractual obligations on outstanding long-term external debt
2008 2009 2010 2011 2012 2013 2014 2015Official creditorsPrincipal 120 127 136 149 164 147 147 147Interest 68 66 64 59 54 49 43 37Private creditorsPrincipal 14,867 17,625 13,500 11,082 8,883 3,870 4,765 1,266Interest 3,856 3,171 2,473 1,825 1,311 951 730 518
Notes:Long-term private nonguaranteed debt includes only registered private debt of National Bank of Kazakhstan. Short-term debt data have been revised from 2000 based on data from the National Bank of Kazakhstan.
139

KENYA(US$ million, unless otherwise indicated)
1990 1995 2000 2003 2004 2005 2006 2007
1. Summary external debt dataExternal debt stocks 7,055 7,309 6,145 6,869 6,919 6,428 6,534 7,355 Long-term external debt 5,639 6,302 5,220 5,848 6,081 5,770 5,806 6,122 Public and publicly guaranteed 4,759 5,857 5,045 5,824 6,071 5,770 5,806 6,122 Private nonguaranteed 880 445 175 24 10 0 0 0 Use of IMF credit 482 374 127 112 103 159 153 269 Short-term external debt 934 634 798 909 735 499 575 964 interest arrears on long-term 95 31 47 20 3 21 34 57Memorandum itemsPrincipal arrears on long-term 72 6 142 27 40 141 335 307Long-term public sector debt 4,759 5,857 5,045 5,824 6,071 5,770 5,806 6,122Long-term private sector debt 880 445 175 24 10 0 0 0Public & publicly guaranteed commitments 803 326 355 244 744 244 528 895
External debt flowsDisbursements 777 677 382 540 244 241 126 487 Long-term external debt 640 677 337 505 244 167 126 372 IMF purchases 136 0 44 35 0 74 0 115Principal repayments 457 605 449 446 271 447 333 350 Long-term external debt 352 566 407 427 257 440 319 340 IMF repurchases 105 39 42 20 14 7 14 10Net flows 613 78 -27 284 -184 -460 -144 475 Long-term external debt 288 111 -69 79 -13 -273 -194 32 IMF flows -104 0 0 0 0 0 0 0 Short-term external debt 294 6 41 190 -157 -254 63 338Interest payments 333 299 142 133 85 91 94 108 Long-term external debt 230 261 100 109 60 72 70 79 IMF charges 26 2 1 0 1 1 1 1 Short-term external debt 78 36 41 24 24 18 23 28
2. Other non-debt resource flowsForeign direct investment (net) 57 32 111 82 46 21 51 728Portfolio equity flows 0 6 -6 1 3 3 2 1Profit remittances on FDI 132 116 29 32 31 35 39 124Grants (excluding technical coop.) 977 242 202 329 402 493 655 902of which: Debt forgiveness grants .. .. 0 0 0 0 0 0 IDA grants .. .. .. 29 19 2 14 9Memo: technical coop. grants 207 221 136 173 211 218 280 140
3. Currency composition of public and publicly guaranteed debt (%)Euro .. .. .. 15.1 16.4 19.2 19.0 18.4Japanese yen 8.4 18.6 20.1 20.4 19.6 18.5 17.9 17.6Pound sterling 8.7 3.8 2.5 0.8 0.6 0.6 0.7 0.6Swiss franc 3.4 4.2 1.4 0.2 0.2 0.1 0.1 0.1U.S.dollars 30.9 35.8 49.7 51.5 50.8 49.3 49.2 49.1
4. Average terms of new commitmentsOfficial creditors Interest (%) 3.1 2.1 1.1 1.7 0.8 1.3 1.8 1.4 Maturity (years) 29.6 35.7 39.0 30.5 40.1 35.6 33.2 39.2 Grace period (years) 8.4 9.8 10.0 7.1 10.0 8.3 8.7 9.7Private creditors Interest (%) 7.4 4.8 7.5 3.0 0.0 0.0 0.0 0.0 Maturity (years) 12.8 5.2 5.9 6.8 10.5 0.0 0.0 17.3 Grace period (years) 4.9 0.6 1.4 0.3 0.5 0.0 0.0 2.5
5. Major economic aggregatesGross national income (GNI) 8,224 8,726 12,562 14,738 15,950 18,763 22,516 24,283Exports of goods, services & income 2,233 3,667 2,821 3,735 4,703 5,833 6,647 7,580Worker remit. & comp. of employees 139 298 538 538 620 805 1,128 1,588Imports of goods & services 3,128 6,195 3,941 4,407 5,461 6,921 8,341 10,145International reserves 236 384 898 1,482 1,520 1,799 2,416 3,355Current account balance -527 -1,578 -199 132 -132 -260 -479 -1,102
6. RatiosExternal debt stocks to exports (%) 315.9 199.3 217.9 183.9 147.1 110.2 98.3 97.0External debt stocks to GNI (%) 85.8 83.8 48.9 46.6 43.4 34.3 29.0 30.3Debt service to exports (%) 35.4 24.7 20.9 15.5 7.6 9.2 6.4 6.0Short-term to external debt stocks (%) 13.2 8.7 13.0 13.2 10.6 7.8 8.8 13.1Multilateral to external debt stocks (%) 35.3 39.7 46.1 47.9 50.5 53.3 52.6 48.7Reserves to external debt stocks (%) 3.3 5.3 14.6 21.6 22.0 28.0 37.0 45.6Reserves to imports (months) 0.9 0.7 2.7 4.0 3.3 3.1 3.5 4.0
140

KENYA(US$ million, unless otherwise indicated)
1990 1995 2000 2003 2004 2005 2006 2007
7. Long-term external debtDebt outstanding and disbursed 5,639 6,302 5,220 5,848 6,081 5,770 5,806 6,122Public and publicly guaranteed 4,759 5,857 5,045 5,824 6,071 5,770 5,806 6,122 Official creditors 3,712 5,212 4,563 5,417 5,711 5,420 5,495 5,832 Multilateral 2,492 2,903 2,836 3,288 3,497 3,426 3,437 3,585 of which: IBRD 871 435 47 6 1 0 0 0 IDA 1,185 1,977 2,262 2,736 2,882 2,663 2,764 2,968 Bilateral 1,220 2,309 1,728 2,129 2,214 1,994 2,058 2,247 Private creditors 1,047 645 482 407 360 351 312 289 of which: Bonds 0 0 0 0 0 0 0 0 Commercial banks 880 510 436 316 277 279 236 210Private nonguaranteed 880 445 175 24 10 0 0 0 of which: Bonds 0 0 0 0 0 0 0 0Disbursements 640 677 337 505 244 167 126 372Public and publicly guaranteed 585 677 337 505 244 167 126 372 Official creditors 404 545 252 232 203 138 126 372 Multilateral 297 219 196 150 148 65 76 220 of which: IBRD 3 0 0 0 0 0 0 0 IDA 234 159 170 122 78 34 41 159 Bilateral 106 326 56 82 55 74 49 152 Private creditors 182 132 85 274 42 28 0 0 of which: Bonds 0 0 0 0 0 0 0 0 Commercial banks 119 72 77 169 42 28 0 0Private nonguaranteed 55 0 0 0 0 0 0 0 of which: Bonds 0 0 0 0 0 0 0 0Principal repayments 352 566 407 427 257 440 319 340Public and publicly guaranteed 315 481 362 401 243 430 319 340 Official creditors 180 271 241 263 151 356 257 325 Multilateral 127 150 112 102 90 327 220 222 of which: IBRD 95 100 40 8 5 1 0 0 IDA 4 9 29 48 52 54 60 66 Bilateral 53 120 129 161 61 29 37 103 Private creditors 135 210 121 139 92 74 62 14 of which: Bonds 0 0 0 0 0 0 0 0 Commercial banks 114 164 108 131 83 72 61 12Private nonguaranteed 37 85 45 25 14 10 0 0 of which: Bonds 0 0 0 0 0 0 0 0Interest payments 230 261 100 109 60 72 70 79Public and publicly guaranteed 193 220 81 108 59 72 70 79 Official creditors 134 167 55 85 51 66 65 76 Multilateral 100 77 38 35 33 48 36 32 of which: IBRD 78 43 7 1 0 0 0 0 IDA 7 14 16 19 22 23 22 22 Bilateral 34 89 17 50 18 17 29 45 Private creditors 59 53 27 23 8 6 5 2 of which: Bonds 0 0 0 0 0 0 0 0 Commercial banks 52 45 23 21 6 6 3 1Private nonguaranteed 38 41 19 1 1 0 0 0 of which: Bonds 0 0 0 0 0 0 0 08. Debt stock-flow reconciliationTotal change in external debt stocks 1,166 185 -330 741 50 -491 106 792 Net flows on external debt 613 78 -27 284 -184 -460 -144 475 Cross-currency valuation 89 -253 -302 516 231 -506 240 2969. Debt restructuringsTotal amount rescheduled 0 0 122 10 153 127 137 0Total amount forgiven 84 0 10 1 19 1 5 0Debt buyback 0 0 0 0 0 0 0 010. Contractual obligations on outstanding long-term external debt
2008 2009 2010 2011 2012 2013 2014 2015Official creditorsPrincipal 290 246 264 294 311 320 316 327Interest 93 94 94 93 90 84 78 72Private creditorsPrincipal 21 17 12 7 7 7 7 3Interest 2 1 1 1 1 0 0 0
141

KYRGYZ REPUBLIC(US$ million, unless otherwise indicated)
1990 1995 2000 2003 2004 2005 2006 2007
1. Summary external debt dataExternal debt stocks .. 609 1,827 2,024 2,111 2,027 2,346 2,401 Long-term external debt .. 472 1,510 1,783 1,897 1,825 2,075 2,175 Public and publicly guaranteed .. 472 1,220 1,585 1,742 1,665 1,825 1,895 Private nonguaranteed .. 0 290 199 154 161 251 280 Use of IMF credit .. 124 188 202 207 178 163 150 Short-term external debt .. 13 129 39 7 24 108 76 interest arrears on long-term .. 11 10 3 3 3 4 7Memorandum itemsPrincipal arrears on long-term .. 11 28 4 12 6 4 9Long-term public sector debt .. 472 1,220 1,585 1,742 1,665 1,825 1,895Long-term private sector debt .. 0 290 199 154 161 251 280Public & publicly guaranteed commitments .. 164 201 39 26 86 16 46
External debt flowsDisbursements .. 201 180 142 156 151 199 160 Long-term external debt .. 155 161 112 127 133 195 156 IMF purchases .. 46 19 30 28 18 4 4Principal repayments .. 36 97 134 131 104 73 159 Long-term external debt .. 36 86 102 99 74 46 134 IMF repurchases .. 0 11 32 32 31 27 25Net flows .. 165 152 35 -8 63 209 -34 Long-term external debt .. 119 75 10 28 59 149 22 IMF flows .. 0 -7 -6 0 0 0 0 Short-term external debt .. 0 69 27 -32 17 83 -35Interest payments .. 24 76 29 30 23 24 28 Long-term external debt .. 20 69 27 28 21 21 24 IMF charges .. 4 2 1 1 1 1 1 Short-term external debt .. 0 5 1 0 0 2 3
2. Other non-debt resource flowsForeign direct investment (net) .. 96 -2 46 175 43 182 208Portfolio equity flows .. 0 0 5 0 0 0 2Profit remittances on FDI .. 0 37 27 58 36 40 40Grants (excluding technical coop.) .. 54 44 46 54 122 106 184of which: Debt forgiveness grants .. .. 3 2 0 4 2 0 IDA grants .. .. .. 0 1 6 10 27Memo: technical coop. grants .. 29 38 68 110 91 99 58
3. Currency composition of public and publicly guaranteed debt (%)Euro .. .. .. 3.1 3.3 2.8 3.5 4.3Japanese yen .. 14.3 15.0 14.6 14.3 13.5 12.5 12.7Pound sterling .. 0.0 0.0 0.0 0.0 0.0 0.0 0.0Swiss franc .. 1.3 0.0 0.0 0.0 0.0 0.0 0.0U.S.dollars .. 51.4 67.9 67.7 68.1 69.5 67.3 68.1
4. Average terms of new commitmentsOfficial creditors Interest (%) .. 3.7 1.0 1.2 1.2 1.0 1.4 0.5 Maturity (years) .. 28.9 35.8 34.2 34.4 36.2 31.6 26.7 Grace period (years) .. 8.1 9.5 8.8 8.8 9.3 8.1 7.3Private creditors Interest (%) .. 0.0 0.0 0.0 0.0 0.0 0.0 0.0 Maturity (years) .. 0.0 0.0 0.0 0.0 0.0 0.0 0.0 Grace period (years) .. 0.0 0.0 0.0 0.0 0.0 0.0 0.0
5. Major economic aggregatesGross national income (GNI) .. 1,626 1,288 1,857 2,110 2,372 2,785 3,692Exports of goods, services & income .. 453 592 824 1,130 1,276 1,799 2,769Worker remit. & comp. of employees .. 1 9 78 189 322 481 715Imports of goods & services .. 765 753 950 1,237 1,499 2,338 3,313International reserves .. 134 262 399 565 612 817 1,177Current account balance .. -235 -76 -42 29 -35 -282 -228
6. RatiosExternal debt stocks to exports (%) .. 134.5 308.6 245.6 186.9 158.9 130.4 86.7External debt stocks to GNI (%) .. 37.5 141.9 109.0 100.1 85.5 84.2 65.0Debt service to exports (%) .. 13.2 29.3 19.8 14.2 10.0 5.4 6.7Short-term to external debt stocks (%) .. 2.1 7.1 1.9 0.4 1.2 4.6 3.2Multilateral to external debt stocks (%) .. 30.3 39.5 50.2 53.7 54.2 50.7 53.2Reserves to external debt stocks (%) .. 21.9 14.3 19.7 26.7 30.2 34.8 49.0Reserves to imports (months) .. 2.1 4.2 5.0 5.5 4.9 4.2 4.3
142
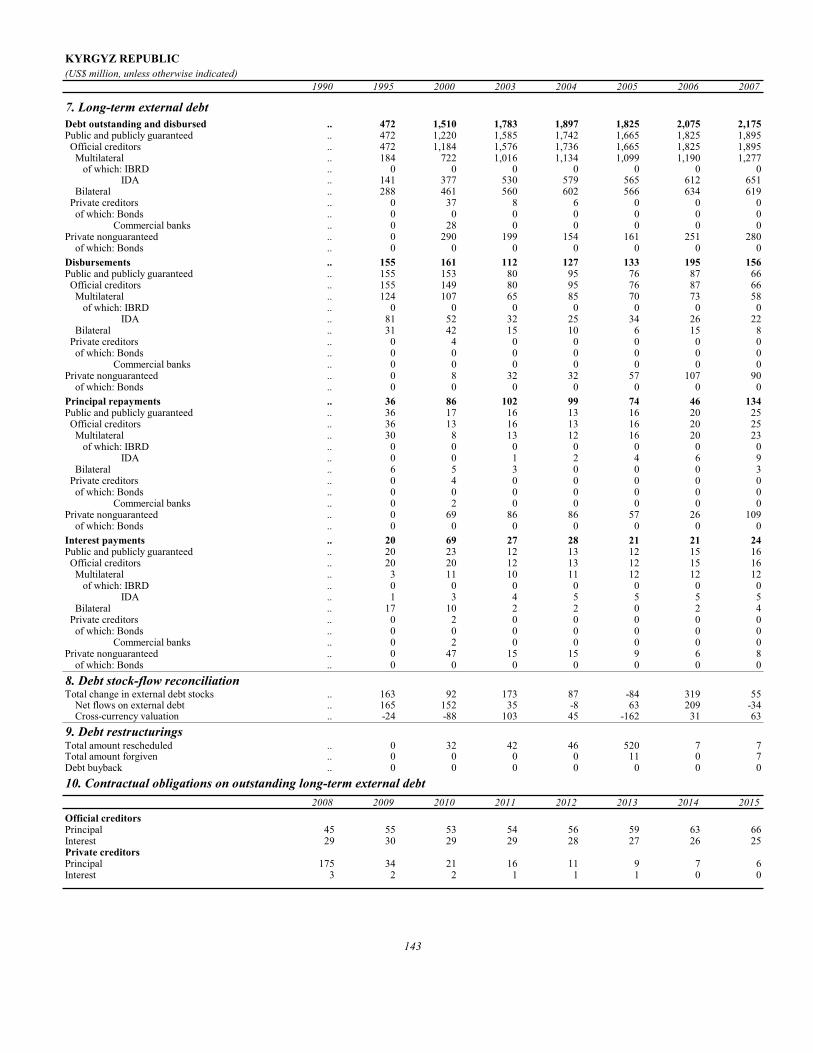
KYRGYZ REPUBLIC(US$ million, unless otherwise indicated)
1990 1995 2000 2003 2004 2005 2006 2007
7. Long-term external debtDebt outstanding and disbursed .. 472 1,510 1,783 1,897 1,825 2,075 2,175Public and publicly guaranteed .. 472 1,220 1,585 1,742 1,665 1,825 1,895 Official creditors .. 472 1,184 1,576 1,736 1,665 1,825 1,895 Multilateral .. 184 722 1,016 1,134 1,099 1,190 1,277 of which: IBRD .. 0 0 0 0 0 0 0 IDA .. 141 377 530 579 565 612 651 Bilateral .. 288 461 560 602 566 634 619 Private creditors .. 0 37 8 6 0 0 0 of which: Bonds .. 0 0 0 0 0 0 0 Commercial banks .. 0 28 0 0 0 0 0Private nonguaranteed .. 0 290 199 154 161 251 280 of which: Bonds .. 0 0 0 0 0 0 0Disbursements .. 155 161 112 127 133 195 156Public and publicly guaranteed .. 155 153 80 95 76 87 66 Official creditors .. 155 149 80 95 76 87 66 Multilateral .. 124 107 65 85 70 73 58 of which: IBRD .. 0 0 0 0 0 0 0 IDA .. 81 52 32 25 34 26 22 Bilateral .. 31 42 15 10 6 15 8 Private creditors .. 0 4 0 0 0 0 0 of which: Bonds .. 0 0 0 0 0 0 0 Commercial banks .. 0 0 0 0 0 0 0Private nonguaranteed .. 0 8 32 32 57 107 90 of which: Bonds .. 0 0 0 0 0 0 0Principal repayments .. 36 86 102 99 74 46 134Public and publicly guaranteed .. 36 17 16 13 16 20 25 Official creditors .. 36 13 16 13 16 20 25 Multilateral .. 30 8 13 12 16 20 23 of which: IBRD .. 0 0 0 0 0 0 0 IDA .. 0 0 1 2 4 6 9 Bilateral .. 6 5 3 0 0 0 3 Private creditors .. 0 4 0 0 0 0 0 of which: Bonds .. 0 0 0 0 0 0 0 Commercial banks .. 0 2 0 0 0 0 0Private nonguaranteed .. 0 69 86 86 57 26 109 of which: Bonds .. 0 0 0 0 0 0 0Interest payments .. 20 69 27 28 21 21 24Public and publicly guaranteed .. 20 23 12 13 12 15 16 Official creditors .. 20 20 12 13 12 15 16 Multilateral .. 3 11 10 11 12 12 12 of which: IBRD .. 0 0 0 0 0 0 0 IDA .. 1 3 4 5 5 5 5 Bilateral .. 17 10 2 2 0 2 4 Private creditors .. 0 2 0 0 0 0 0 of which: Bonds .. 0 0 0 0 0 0 0 Commercial banks .. 0 2 0 0 0 0 0Private nonguaranteed .. 0 47 15 15 9 6 8 of which: Bonds .. 0 0 0 0 0 0 08. Debt stock-flow reconciliationTotal change in external debt stocks .. 163 92 173 87 -84 319 55 Net flows on external debt .. 165 152 35 -8 63 209 -34 Cross-currency valuation .. -24 -88 103 45 -162 31 639. Debt restructuringsTotal amount rescheduled .. 0 32 42 46 520 7 7Total amount forgiven .. 0 0 0 0 11 0 7Debt buyback .. 0 0 0 0 0 0 010. Contractual obligations on outstanding long-term external debt
2008 2009 2010 2011 2012 2013 2014 2015Official creditorsPrincipal 45 55 53 54 56 59 63 66Interest 29 30 29 29 28 27 26 25Private creditorsPrincipal 175 34 21 16 11 9 7 6Interest 3 2 2 1 1 1 0 0
143
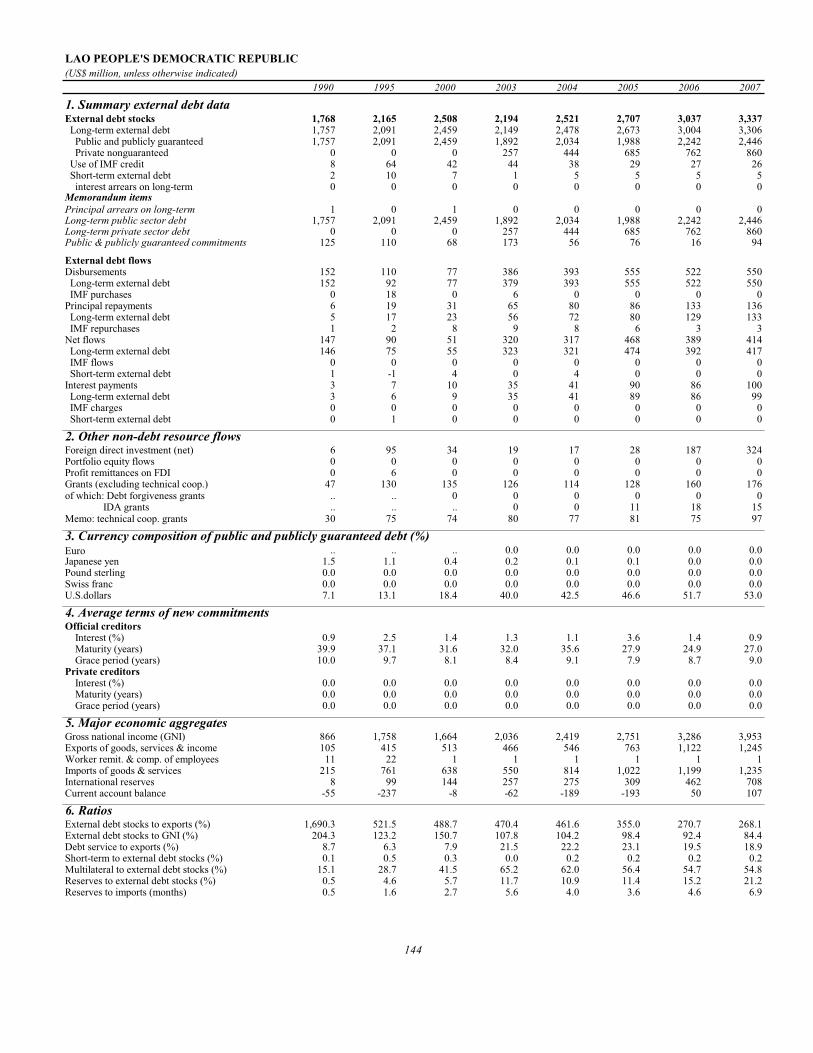
LAO PEOPLE'S DEMOCRATIC REPUBLIC(US$ million, unless otherwise indicated)
1990 1995 2000 2003 2004 2005 2006 2007
1. Summary external debt dataExternal debt stocks 1,768 2,165 2,508 2,194 2,521 2,707 3,037 3,337 Long-term external debt 1,757 2,091 2,459 2,149 2,478 2,673 3,004 3,306 Public and publicly guaranteed 1,757 2,091 2,459 1,892 2,034 1,988 2,242 2,446 Private nonguaranteed 0 0 0 257 444 685 762 860 Use of IMF credit 8 64 42 44 38 29 27 26 Short-term external debt 2 10 7 1 5 5 5 5 interest arrears on long-term 0 0 0 0 0 0 0 0Memorandum itemsPrincipal arrears on long-term 1 0 1 0 0 0 0 0Long-term public sector debt 1,757 2,091 2,459 1,892 2,034 1,988 2,242 2,446Long-term private sector debt 0 0 0 257 444 685 762 860Public & publicly guaranteed commitments 125 110 68 173 56 76 16 94
External debt flowsDisbursements 152 110 77 386 393 555 522 550 Long-term external debt 152 92 77 379 393 555 522 550 IMF purchases 0 18 0 6 0 0 0 0Principal repayments 6 19 31 65 80 86 133 136 Long-term external debt 5 17 23 56 72 80 129 133 IMF repurchases 1 2 8 9 8 6 3 3Net flows 147 90 51 320 317 468 389 414 Long-term external debt 146 75 55 323 321 474 392 417 IMF flows 0 0 0 0 0 0 0 0 Short-term external debt 1 -1 4 0 4 0 0 0Interest payments 3 7 10 35 41 90 86 100 Long-term external debt 3 6 9 35 41 89 86 99 IMF charges 0 0 0 0 0 0 0 0 Short-term external debt 0 1 0 0 0 0 0 0
2. Other non-debt resource flowsForeign direct investment (net) 6 95 34 19 17 28 187 324Portfolio equity flows 0 0 0 0 0 0 0 0Profit remittances on FDI 0 6 0 0 0 0 0 0Grants (excluding technical coop.) 47 130 135 126 114 128 160 176of which: Debt forgiveness grants .. .. 0 0 0 0 0 0 IDA grants .. .. .. 0 0 11 18 15Memo: technical coop. grants 30 75 74 80 77 81 75 97
3. Currency composition of public and publicly guaranteed debt (%)Euro .. .. .. 0.0 0.0 0.0 0.0 0.0Japanese yen 1.5 1.1 0.4 0.2 0.1 0.1 0.0 0.0Pound sterling 0.0 0.0 0.0 0.0 0.0 0.0 0.0 0.0Swiss franc 0.0 0.0 0.0 0.0 0.0 0.0 0.0 0.0U.S.dollars 7.1 13.1 18.4 40.0 42.5 46.6 51.7 53.0
4. Average terms of new commitmentsOfficial creditors Interest (%) 0.9 2.5 1.4 1.3 1.1 3.6 1.4 0.9 Maturity (years) 39.9 37.1 31.6 32.0 35.6 27.9 24.9 27.0 Grace period (years) 10.0 9.7 8.1 8.4 9.1 7.9 8.7 9.0Private creditors Interest (%) 0.0 0.0 0.0 0.0 0.0 0.0 0.0 0.0 Maturity (years) 0.0 0.0 0.0 0.0 0.0 0.0 0.0 0.0 Grace period (years) 0.0 0.0 0.0 0.0 0.0 0.0 0.0 0.0
5. Major economic aggregatesGross national income (GNI) 866 1,758 1,664 2,036 2,419 2,751 3,286 3,953Exports of goods, services & income 105 415 513 466 546 763 1,122 1,245Worker remit. & comp. of employees 11 22 1 1 1 1 1 1Imports of goods & services 215 761 638 550 814 1,022 1,199 1,235International reserves 8 99 144 257 275 309 462 708Current account balance -55 -237 -8 -62 -189 -193 50 107
6. RatiosExternal debt stocks to exports (%) 1,690.3 521.5 488.7 470.4 461.6 355.0 270.7 268.1External debt stocks to GNI (%) 204.3 123.2 150.7 107.8 104.2 98.4 92.4 84.4Debt service to exports (%) 8.7 6.3 7.9 21.5 22.2 23.1 19.5 18.9Short-term to external debt stocks (%) 0.1 0.5 0.3 0.0 0.2 0.2 0.2 0.2Multilateral to external debt stocks (%) 15.1 28.7 41.5 65.2 62.0 56.4 54.7 54.8Reserves to external debt stocks (%) 0.5 4.6 5.7 11.7 10.9 11.4 15.2 21.2Reserves to imports (months) 0.5 1.6 2.7 5.6 4.0 3.6 4.6 6.9
144

LAO PEOPLE'S DEMOCRATIC REPUBLIC(US$ million, unless otherwise indicated)
1990 1995 2000 2003 2004 2005 2006 2007
7. Long-term external debtDebt outstanding and disbursed 1,757 2,091 2,459 2,149 2,478 2,673 3,004 3,306Public and publicly guaranteed 1,757 2,091 2,459 1,892 2,034 1,988 2,242 2,446 Official creditors 1,757 2,091 2,459 1,892 2,034 1,988 2,242 2,446 Multilateral 266 620 1,041 1,432 1,564 1,525 1,660 1,829 of which: IBRD 0 0 0 0 0 0 0 0 IDA 131 285 403 561 616 598 643 686 Bilateral 1,491 1,471 1,418 460 470 462 583 617 Private creditors 0 0 0 0 0 0 0 0 of which: Bonds 0 0 0 0 0 0 0 0 Commercial banks 0 0 0 0 0 0 0 0Private nonguaranteed 0 0 0 257 444 685 762 860 of which: Bonds 0 0 0 0 0 0 0 0Disbursements 152 92 77 379 393 555 522 550Public and publicly guaranteed 152 92 77 106 86 150 119 144 Official creditors 152 92 77 106 86 150 119 144 Multilateral 78 92 73 104 85 113 105 107 of which: IBRD 0 0 0 0 0 0 0 0 IDA 32 28 20 48 37 35 26 27 Bilateral 74 0 4 2 1 37 14 37 Private creditors 0 0 0 0 0 0 0 0 of which: Bonds 0 0 0 0 0 0 0 0 Commercial banks 0 0 0 0 0 0 0 0Private nonguaranteed 0 0 0 274 307 405 403 405 of which: Bonds 0 0 0 0 0 0 0 0Principal repayments 5 17 23 56 72 80 129 133Public and publicly guaranteed 5 17 23 29 31 39 29 32 Official creditors 5 17 23 29 31 39 29 32 Multilateral 3 4 9 16 20 22 25 29 of which: IBRD 0 0 0 0 0 0 0 0 IDA 0 1 4 7 8 9 9 11 Bilateral 3 14 14 13 11 17 3 3 Private creditors 0 0 0 0 0 0 0 0 of which: Bonds 0 0 0 0 0 0 0 0 Commercial banks 0 0 0 0 0 0 0 0Private nonguaranteed 0 0 0 27 41 41 101 101 of which: Bonds 0 0 0 0 0 0 0 0Interest payments 3 6 9 35 41 89 86 99Public and publicly guaranteed 3 6 9 12 14 14 16 17 Official creditors 3 6 9 12 14 14 16 17 Multilateral 2 5 9 11 13 14 15 16 of which: IBRD 0 0 0 0 0 0 0 0 IDA 1 2 3 4 5 5 5 5 Bilateral 1 1 0 0 0 0 1 1 Private creditors 0 0 0 0 0 0 0 0 of which: Bonds 0 0 0 0 0 0 0 0 Commercial banks 0 0 0 0 0 0 0 0Private nonguaranteed 0 0 0 23 27 75 70 82 of which: Bonds 0 0 0 0 0 0 0 08. Debt stock-flow reconciliationTotal change in external debt stocks 296 85 -27 -754 327 186 330 300 Net flows on external debt 147 90 51 320 317 468 389 414 Cross-currency valuation 141 -31 -72 131 67 -141 54 909. Debt restructuringsTotal amount rescheduled 0 0 0 0 0 0 0 0Total amount forgiven 0 0 0 0 0 0 0 0Debt buyback 0 0 0 0 0 0 0 010. Contractual obligations on outstanding long-term external debt
2008 2009 2010 2011 2012 2013 2014 2015Official creditorsPrincipal 73 80 84 92 96 101 109 110Interest 26 27 27 27 26 26 25 24Private creditorsPrincipal 64 66 102 108 102 102 103 105Interest 84 60 78 80 82 84 84 86
Notes:Data on long-term public and publicly guaranteed debt for 2007 are World Bank staff estimates based on reports provided by the country. Long-term private nonguaranteed debt data for 2007 are World Bank staff estimates.
145
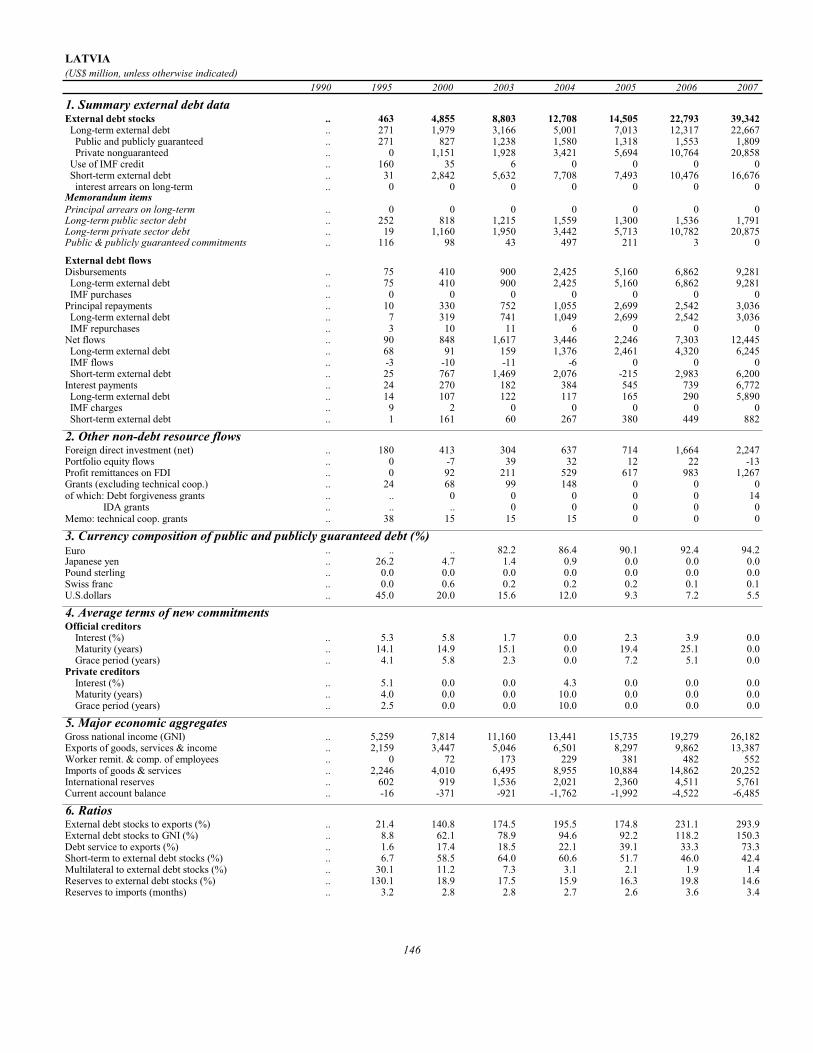
LATVIA(US$ million, unless otherwise indicated)
1990 1995 2000 2003 2004 2005 2006 2007
1. Summary external debt dataExternal debt stocks .. 463 4,855 8,803 12,708 14,505 22,793 39,342 Long-term external debt .. 271 1,979 3,166 5,001 7,013 12,317 22,667 Public and publicly guaranteed .. 271 827 1,238 1,580 1,318 1,553 1,809 Private nonguaranteed .. 0 1,151 1,928 3,421 5,694 10,764 20,858 Use of IMF credit .. 160 35 6 0 0 0 0 Short-term external debt .. 31 2,842 5,632 7,708 7,493 10,476 16,676 interest arrears on long-term .. 0 0 0 0 0 0 0Memorandum itemsPrincipal arrears on long-term .. 0 0 0 0 0 0 0Long-term public sector debt .. 252 818 1,215 1,559 1,300 1,536 1,791Long-term private sector debt .. 19 1,160 1,950 3,442 5,713 10,782 20,875Public & publicly guaranteed commitments .. 116 98 43 497 211 3 0
External debt flowsDisbursements .. 75 410 900 2,425 5,160 6,862 9,281 Long-term external debt .. 75 410 900 2,425 5,160 6,862 9,281 IMF purchases .. 0 0 0 0 0 0 0Principal repayments .. 10 330 752 1,055 2,699 2,542 3,036 Long-term external debt .. 7 319 741 1,049 2,699 2,542 3,036 IMF repurchases .. 3 10 11 6 0 0 0Net flows .. 90 848 1,617 3,446 2,246 7,303 12,445 Long-term external debt .. 68 91 159 1,376 2,461 4,320 6,245 IMF flows .. -3 -10 -11 -6 0 0 0 Short-term external debt .. 25 767 1,469 2,076 -215 2,983 6,200Interest payments .. 24 270 182 384 545 739 6,772 Long-term external debt .. 14 107 122 117 165 290 5,890 IMF charges .. 9 2 0 0 0 0 0 Short-term external debt .. 1 161 60 267 380 449 882
2. Other non-debt resource flowsForeign direct investment (net) .. 180 413 304 637 714 1,664 2,247Portfolio equity flows .. 0 -7 39 32 12 22 -13Profit remittances on FDI .. 0 92 211 529 617 983 1,267Grants (excluding technical coop.) .. 24 68 99 148 0 0 0of which: Debt forgiveness grants .. .. 0 0 0 0 0 14 IDA grants .. .. .. 0 0 0 0 0Memo: technical coop. grants .. 38 15 15 15 0 0 0
3. Currency composition of public and publicly guaranteed debt (%)Euro .. .. .. 82.2 86.4 90.1 92.4 94.2Japanese yen .. 26.2 4.7 1.4 0.9 0.0 0.0 0.0Pound sterling .. 0.0 0.0 0.0 0.0 0.0 0.0 0.0Swiss franc .. 0.0 0.6 0.2 0.2 0.2 0.1 0.1U.S.dollars .. 45.0 20.0 15.6 12.0 9.3 7.2 5.5
4. Average terms of new commitmentsOfficial creditors Interest (%) .. 5.3 5.8 1.7 0.0 2.3 3.9 0.0 Maturity (years) .. 14.1 14.9 15.1 0.0 19.4 25.1 0.0 Grace period (years) .. 4.1 5.8 2.3 0.0 7.2 5.1 0.0Private creditors Interest (%) .. 5.1 0.0 0.0 4.3 0.0 0.0 0.0 Maturity (years) .. 4.0 0.0 0.0 10.0 0.0 0.0 0.0 Grace period (years) .. 2.5 0.0 0.0 10.0 0.0 0.0 0.0
5. Major economic aggregatesGross national income (GNI) .. 5,259 7,814 11,160 13,441 15,735 19,279 26,182Exports of goods, services & income .. 2,159 3,447 5,046 6,501 8,297 9,862 13,387Worker remit. & comp. of employees .. 0 72 173 229 381 482 552Imports of goods & services .. 2,246 4,010 6,495 8,955 10,884 14,862 20,252International reserves .. 602 919 1,536 2,021 2,360 4,511 5,761Current account balance .. -16 -371 -921 -1,762 -1,992 -4,522 -6,485
6. RatiosExternal debt stocks to exports (%) .. 21.4 140.8 174.5 195.5 174.8 231.1 293.9External debt stocks to GNI (%) .. 8.8 62.1 78.9 94.6 92.2 118.2 150.3Debt service to exports (%) .. 1.6 17.4 18.5 22.1 39.1 33.3 73.3Short-term to external debt stocks (%) .. 6.7 58.5 64.0 60.6 51.7 46.0 42.4Multilateral to external debt stocks (%) .. 30.1 11.2 7.3 3.1 2.1 1.9 1.4Reserves to external debt stocks (%) .. 130.1 18.9 17.5 15.9 16.3 19.8 14.6Reserves to imports (months) .. 3.2 2.8 2.8 2.7 2.6 3.6 3.4
146

LATVIA(US$ million, unless otherwise indicated)
1990 1995 2000 2003 2004 2005 2006 2007
7. Long-term external debtDebt outstanding and disbursed .. 271 1,979 3,166 5,001 7,013 12,317 22,667Public and publicly guaranteed .. 271 827 1,238 1,580 1,318 1,553 1,809 Official creditors .. 200 591 687 446 338 462 582 Multilateral .. 139 543 640 400 311 433 551 of which: IBRD .. 55 242 185 187 111 100 85 IDA .. 0 0 0 0 0 0 0 Bilateral .. 61 49 47 46 27 29 32 Private creditors .. 71 236 551 1,134 980 1,091 1,226 of which: Bonds .. 39 209 537 1,124 973 1,087 1,214 Commercial banks .. 0 2 0 0 0 0 9Private nonguaranteed .. 0 1,151 1,928 3,421 5,694 10,764 20,858 of which: Bonds .. 0 0 0 6 124 380 442Disbursements .. 75 410 900 2,425 5,160 6,862 9,281Public and publicly guaranteed .. 75 94 60 550 21 125 118 Official creditors .. 26 91 60 53 21 125 110 Multilateral .. 23 91 57 53 21 125 110 of which: IBRD .. 9 63 3 6 2 0 0 IDA .. 0 0 0 0 0 0 0 Bilateral .. 3 1 3 0 0 0 0 Private creditors .. 49 3 0 497 0 0 8 of which: Bonds .. 43 0 0 497 0 0 0 Commercial banks .. 0 0 0 0 0 0 8Private nonguaranteed .. 0 316 839 1,874 5,139 6,737 9,162 of which: Bonds .. 0 0 0 6 125 246 0Principal repayments .. 7 319 741 1,049 2,699 2,542 3,036Public and publicly guaranteed .. 7 81 138 314 96 35 41 Official creditors .. 4 73 133 310 93 32 39 Multilateral .. 4 53 117 306 79 32 39 of which: IBRD .. 0 9 109 14 64 19 22 IDA .. 0 0 0 0 0 0 0 Bilateral .. 0 19 16 3 15 0 0 Private creditors .. 3 8 5 4 3 3 1 of which: Bonds .. 0 0 0 0 0 0 0 Commercial banks .. 0 1 1 0 0 0 0Private nonguaranteed .. 0 239 603 735 2,603 2,507 2,995 of which: Bonds .. 0 30 0 0 0 6 0Interest payments .. 14 107 122 117 165 290 5,890Public and publicly guaranteed .. 14 50 53 55 61 67 79 Official creditors .. 13 34 36 35 15 16 22 Multilateral .. 9 31 34 34 14 15 20 of which: IBRD .. 3 12 13 6 7 5 5 IDA .. 0 0 0 0 0 0 0 Bilateral .. 4 3 2 2 1 1 1 Private creditors .. 1 16 18 19 46 51 57 of which: Bonds .. 0 15 17 19 45 51 57 Commercial banks .. 0 0 0 0 0 0 0Private nonguaranteed .. 0 57 69 62 104 223 5,811 of which: Bonds .. 0 2 0 0 6 16 218. Debt stock-flow reconciliationTotal change in external debt stocks .. 89 794 1,994 3,906 1,797 8,288 16,549 Net flows on external debt .. 90 848 1,617 3,446 2,246 7,303 12,445 Cross-currency valuation .. 5 -49 164 75 -175 132 1639. Debt restructuringsTotal amount rescheduled .. 0 0 0 0 0 0 0Total amount forgiven .. 0 0 0 0 0 0 0Debt buyback .. 0 0 0 0 0 0 010. Contractual obligations on outstanding long-term external debt
2008 2009 2010 2011 2012 2013 2014 2015Official creditorsPrincipal 47 42 64 43 43 54 48 43Interest 27 26 25 23 22 20 18 16Private creditorsPrincipal 4,086 4,347 3,769 2,788 2,090 1,481 1,866 894Interest 1,172 1,301 714 520 367 260 177 88
Notes:Data on short-term debt are based on reports provided by the country.
147

LEBANON(US$ million, unless otherwise indicated)
1990 1995 2000 2003 2004 2005 2006 2007
1. Summary external debt dataExternal debt stocks 1,779 2,966 9,851 18,601 22,173 22,363 23,986 24,634 Long-term external debt 358 1,600 7,311 15,477 18,202 18,913 19,786 20,319 Public and publicly guaranteed 358 1,550 6,575 14,781 17,456 17,902 18,981 19,789 Private nonguaranteed 0 50 736 696 746 1,011 805 530 Use of IMF credit 0 0 0 0 0 0 0 80 Short-term external debt 1,421 1,365 2,541 3,124 3,971 3,450 4,200 4,235 interest arrears on long-term 39 10 0 0 0 0 0 0Memorandum itemsPrincipal arrears on long-term 132 43 0 0 0 0 0 0Long-term public sector debt 358 1,550 6,549 14,781 17,456 17,902 18,981 19,789Long-term private sector debt 0 50 762 696 746 1,011 805 530Public & publicly guaranteed commitments 0 1,324 2,188 2,283 5,201 2,654 3,548 3,234
External debt flowsDisbursements 12 907 2,313 2,434 5,493 3,097 3,640 3,334 Long-term external debt 12 907 2,313 2,434 5,493 3,097 3,640 3,256 IMF purchases 0 0 0 0 0 0 0 78Principal repayments 27 104 875 1,818 2,923 2,120 2,942 2,930 Long-term external debt 27 104 875 1,818 2,923 2,120 2,942 2,930 IMF repurchases 0 0 0 0 0 0 0 0Net flows 726 830 1,777 1,193 3,417 455 1,448 439 Long-term external debt -16 804 1,438 616 2,570 976 698 326 IMF flows 0 0 0 0 0 0 0 78 Short-term external debt 742 26 339 577 847 -521 750 35Interest payments 72 121 593 1,431 1,429 1,433 1,491 1,611 Long-term external debt 11 54 461 1,276 1,244 1,258 1,291 1,389 IMF charges 0 0 0 0 0 0 0 2 Short-term external debt 61 67 132 155 185 175 200 219
2. Other non-debt resource flowsForeign direct investment (net) 6 35 964 2,977 1,993 2,791 2,739 2,845Portfolio equity flows 0 0 0 207 148 1,436 551 791Profit remittances on FDI 0 0 0 69 91 95 96 64Grants (excluding technical coop.) 213 44 133 106 141 134 502 474of which: Debt forgiveness grants .. .. 0 0 0 0 0 0 IDA grants .. .. .. 0 0 0 0 0Memo: technical coop. grants 39 94 55 101 109 104 122 134
3. Currency composition of public and publicly guaranteed debt (%)Euro .. .. .. 13.5 11.5 8.0 8.5 8.3Japanese yen 0.5 0.0 0.1 0.2 0.2 0.1 0.1 0.2Pound sterling 0.7 0.1 0.0 0.0 0.0 0.0 0.0 0.0Swiss franc 0.5 0.0 0.0 0.0 0.0 0.0 0.0 0.0U.S.dollars 41.0 69.2 71.4 81.3 84.0 88.0 88.2 88.7
4. Average terms of new commitmentsOfficial creditors Interest (%) 0.0 5.6 7.5 4.8 0.0 4.2 8.0 3.6 Maturity (years) 0.0 18.6 14.7 15.3 0.0 17.0 8.6 20.7 Grace period (years) 0.0 3.8 5.2 3.8 0.0 4.3 3.1 7.7Private creditors Interest (%) 0.0 9.0 9.1 2.8 7.1 7.4 7.6 6.2 Maturity (years) 0.0 7.2 4.9 9.4 5.7 5.3 10.2 7.0 Grace period (years) 0.0 4.4 4.7 4.0 5.7 5.2 10.2 4.7
5. Major economic aggregatesGross national income (GNI) 3,461 12,211 17,143 19,137 20,648 21,381 22,606 24,197Exports of goods, services & income .. .. .. 16,557 17,996 19,500 21,834 24,289Worker remit. & comp. of employees 1,818 1,225 1,582 4,743 5,591 4,924 5,202 5,769Imports of goods & services .. .. .. 17,852 18,610 19,053 20,224 24,198International reserves 4,210 8,100 8,475 16,367 15,774 16,618 19,239 20,599Current account balance .. .. .. -4,930 -4,080 -2,748 -1,097 -2,046
6. RatiosExternal debt stocks to exports (%) .. .. .. 112.3 123.2 114.7 109.9 101.4External debt stocks to GNI (%) 51.4 24.3 57.5 97.2 107.4 104.6 106.1 101.8Debt service to exports (%) .. .. .. 19.6 24.2 18.2 20.3 18.7Short-term to external debt stocks (%) 79.9 46.0 25.8 16.8 17.9 15.4 17.5 17.2Multilateral to external debt stocks (%) 4.7 6.7 6.2 4.3 3.8 3.5 3.2 3.5Reserves to external debt stocks (%) 236.7 273.1 86.0 88.0 71.1 74.3 80.2 83.6Reserves to imports (months) .. .. .. 11.0 10.2 10.5 11.4 10.2
148

LEBANON(US$ million, unless otherwise indicated)
1990 1995 2000 2003 2004 2005 2006 2007
7. Long-term external debtDebt outstanding and disbursed 358 1,600 7,311 15,477 18,202 18,913 19,786 20,319Public and publicly guaranteed 358 1,550 6,575 14,781 17,456 17,902 18,981 19,789 Official creditors 188 428 926 1,740 1,810 1,615 1,617 1,695 Multilateral 84 198 611 809 841 779 759 866 of which: IBRD 34 113 248 362 387 360 314 437 IDA 0 0 0 0 0 0 0 0 Bilateral 104 230 315 931 969 835 857 829 Private creditors 169 1,123 5,648 13,041 15,647 16,288 17,365 18,094 of which: Bonds 0 700 5,260 12,800 15,453 16,142 17,253 17,707 Commercial banks 0 359 374 231 185 138 105 382Private nonguaranteed 0 50 736 696 746 1,011 805 530 of which: Bonds 0 50 736 696 746 1,011 805 530Disbursements 12 907 2,313 2,434 5,493 3,097 3,640 3,256Public and publicly guaranteed 12 857 2,198 2,274 5,293 2,567 3,640 3,256 Official creditors 5 213 116 679 96 59 81 215 Multilateral 0 80 100 102 81 51 72 194 of which: IBRD 0 51 42 57 49 32 37 162 IDA 0 0 0 0 0 0 0 0 Bilateral 5 133 16 577 15 9 9 21 Private creditors 6 644 2,082 1,595 5,197 2,508 3,558 3,042 of which: Bonds 0 300 2,031 1,590 5,195 2,500 3,547 2,738 Commercial banks 0 340 51 4 2 8 11 304Private nonguaranteed 0 50 115 160 200 530 0 0 of which: Bonds 0 50 115 160 200 530 0 0Principal repayments 27 104 875 1,818 2,923 2,120 2,942 2,930Public and publicly guaranteed 27 104 825 1,653 2,773 1,855 2,736 2,655 Official creditors 27 93 65 96 107 114 181 252 Multilateral 6 10 39 73 72 79 118 125 of which: IBRD 6 4 17 34 35 38 90 48 IDA 0 0 0 0 0 0 0 0 Bilateral 21 83 27 23 35 36 63 128 Private creditors 0 11 760 1,557 2,666 1,741 2,554 2,403 of which: Bonds 0 0 400 1,477 2,612 1,695 2,507 2,369 Commercial banks 0 9 358 78 53 45 47 33Private nonguaranteed 0 0 50 165 150 265 206 275 of which: Bonds 0 0 50 165 150 265 206 275Interest payments 11 54 461 1,276 1,244 1,258 1,291 1,389Public and publicly guaranteed 11 54 404 1,215 1,187 1,168 1,216 1,332 Official creditors 9 19 44 61 79 73 68 75 Multilateral 4 11 32 34 34 34 32 37 of which: IBRD 4 7 14 15 14 15 18 19 IDA 0 0 0 0 0 0 0 0 Bilateral 5 8 12 27 45 39 36 38 Private creditors 2 35 360 1,154 1,108 1,095 1,149 1,257 of which: Bonds 0 20 300 1,118 1,080 1,087 1,144 1,252 Commercial banks 0 12 58 35 27 7 4 4Private nonguaranteed 0 0 57 61 57 90 74 57 of which: Bonds 0 0 57 61 57 90 74 578. Debt stock-flow reconciliationTotal change in external debt stocks 755 839 1,650 1,524 3,572 190 1,623 648 Net flows on external debt 726 830 1,777 1,193 3,417 455 1,448 439 Cross-currency valuation 17 19 -88 263 167 -294 169 2249. Debt restructuringsTotal amount rescheduled 0 0 0 0 0 0 0 0Total amount forgiven 0 0 0 0 0 0 0 0Debt buyback 0 0 0 0 0 0 0 010. Contractual obligations on outstanding long-term external debt
2008 2009 2010 2011 2012 2013 2014 2015Official creditorsPrincipal 222 243 242 230 197 190 168 150Interest 82 79 70 61 52 44 35 28Private creditorsPrincipal 2,340 2,742 2,337 2,149 2,006 1,078 1,105 427Interest 1,260 1,123 873 717 602 453 381 338
149

LESOTHO(US$ million, unless otherwise indicated)
1990 1995 2000 2003 2004 2005 2006 2007
1. Summary external debt dataExternal debt stocks 395.6 684.4 671.8 703.2 766.6 662.0 652.4 680.2 Long-term external debt 377.7 642.0 656.7 672.6 721.6 618.9 616.0 644.8 Public and publicly guaranteed 377.7 642.0 656.7 672.6 721.6 618.9 616.0 644.8 Private nonguaranteed 0.0 0.0 0.0 0.0 0.0 0.0 0.0 0.0 Use of IMF credit 15.1 38.4 11.1 26.6 38.0 35.0 36.3 35.4 Short-term external debt 2.8 4.0 4.0 4.0 7.0 8.0 0.1 0.0 interest arrears on long-term 0.8 0.0 0.0 0.0 0.0 0.0 0.1 0.0Memorandum itemsPrincipal arrears on long-term 3.6 0.0 0.0 0.0 0.0 0.0 0.0 0.0Long-term public sector debt 376.5 641.3 656.4 672.6 721.6 618.9 616.0 644.8Long-term private sector debt 1.2 0.7 0.3 0.0 0.0 0.0 0.0 0.0Public & publicly guaranteed commitments 46.4 67.4 33.9 21.0 60.2 16.2 21.5 51.6
External debt flowsDisbursements 62.0 70.4 69.4 31.3 42.8 21.1 28.8 38.3 Long-term external debt 57.9 70.4 69.4 26.4 32.5 21.1 28.8 38.3 IMF purchases 4.1 0.0 0.0 4.9 10.4 0.0 0.0 0.0Principal repayments 15.0 24.7 38.3 52.7 38.3 65.3 36.1 34.2 Long-term external debt 14.8 22.0 33.2 50.2 37.8 65.3 35.6 31.6 IMF repurchases 0.2 2.7 5.2 2.5 0.6 0.0 0.5 2.7Net flows 47.0 45.7 31.0 -21.4 7.5 -43.2 -15.3 4.0 Long-term external debt 43.1 48.4 36.2 -23.7 -5.3 -44.2 -6.8 6.7 IMF flows 0.0 0.0 0.0 0.0 0.0 0.0 0.0 0.0 Short-term external debt 0.0 0.0 0.0 0.0 3.0 1.0 -8.0 0.0Interest payments 8.3 16.1 23.2 14.3 15.0 14.2 9.6 64.5 Long-term external debt 8.0 15.7 22.9 14.2 14.7 13.7 9.2 64.3 IMF charges 0.1 0.2 0.0 0.1 0.2 0.2 0.2 0.2 Short-term external debt 0.2 0.2 0.2 0.0 0.2 0.3 0.2 0.0
2. Other non-debt resource flowsForeign direct investment (net) 17.1 275.3 117.8 115.7 123.5 92.6 113.1 130.3Portfolio equity flows 0.0 0.0 0.0 0.0 0.0 0.0 0.0 0.0Profit remittances on FDI 12.7 71.4 15.0 14.4 20.6 10.7 11.6 12.9Grants (excluding technical coop.) 59.9 58.7 27.6 52.3 65.2 50.5 44.7 97.1of which: Debt forgiveness grants .. .. 0.0 0.0 0.0 0.0 0.0 0.0 IDA grants .. .. .. 0.0 0.0 0.3 1.0 4.0Memo: technical coop. grants 44.5 36.8 11.3 14.8 14.2 14.5 16.0 13.6
3. Currency composition of public and publicly guaranteed debt (%)Euro .. .. .. 11.5 10.8 9.8 9.7 9.1Japanese yen 0.0 0.0 0.0 0.0 0.0 0.0 0.0 0.0Pound sterling 1.7 0.8 1.8 1.3 1.1 0.9 0.7 0.5Swiss franc 0.0 0.0 1.9 0.7 0.5 0.2 0.0 0.0U.S.dollars 24.8 22.1 26.9 35.4 35.1 39.3 41.6 43.1
4. Average terms of new commitmentsOfficial creditors Interest (%) 1.0 5.9 0.3 0.8 1.3 1.6 0.8 1.2 Maturity (years) 25.1 27.5 19.3 39.7 34.7 31.7 38.1 35.0 Grace period (years) 6.2 5.7 5.4 10.2 7.8 7.9 10.3 7.8Private creditors Interest (%) 8.4 6.5 4.6 0.0 0.0 0.0 0.0 0.0 Maturity (years) 5.9 17.6 2.0 0.0 0.0 0.0 0.0 0.0 Grace period (years) 1.8 4.1 0.5 0.0 0.0 0.0 0.0 0.0
5. Major economic aggregatesGross national income (GNI) 1020.6 1345.8 1080.8 1294.5 1629.0 1729.5 1874.6 2017.5Exports of goods, services & income 555.0 671.4 542.7 840.5 1172.6 1079.1 1169.9 1411.4Worker remit. & comp. of employees 428.0 411.0 252.0 287.0 354.9 326.6 361.5 443.3Imports of goods & services 775.9 1203.8 832.8 1133.7 1474.4 1474.8 1488.6 1811.7International reserves 72.4 456.7 417.9 460.3 501.5 519.1 658.4 ..Current account balance 65.0 -323.0 -151.4 -134.7 -68.0 -102.0 66.3 211.8
6. RatiosExternal debt stocks to exports (%) 71.3 101.9 123.8 83.7 65.4 61.3 55.8 48.2External debt stocks to GNI (%) 38.8 50.9 62.2 54.3 47.1 38.3 34.8 33.7Debt service to exports (%) 4.2 6.1 11.3 8.0 4.6 7.4 3.9 7.0Short-term to external debt stocks (%) 0.7 0.6 0.6 0.6 0.9 1.2 0.0 0.0Multilateral to external debt stocks (%) 73.6 68.2 70.8 75.1 73.5 78.3 84.0 86.4Reserves to external debt stocks (%) 18.3 66.7 62.2 65.5 65.4 78.4 100.9 0.0Reserves to imports (months) 1.1 4.6 6.0 4.9 4.1 4.2 5.3 ..
150
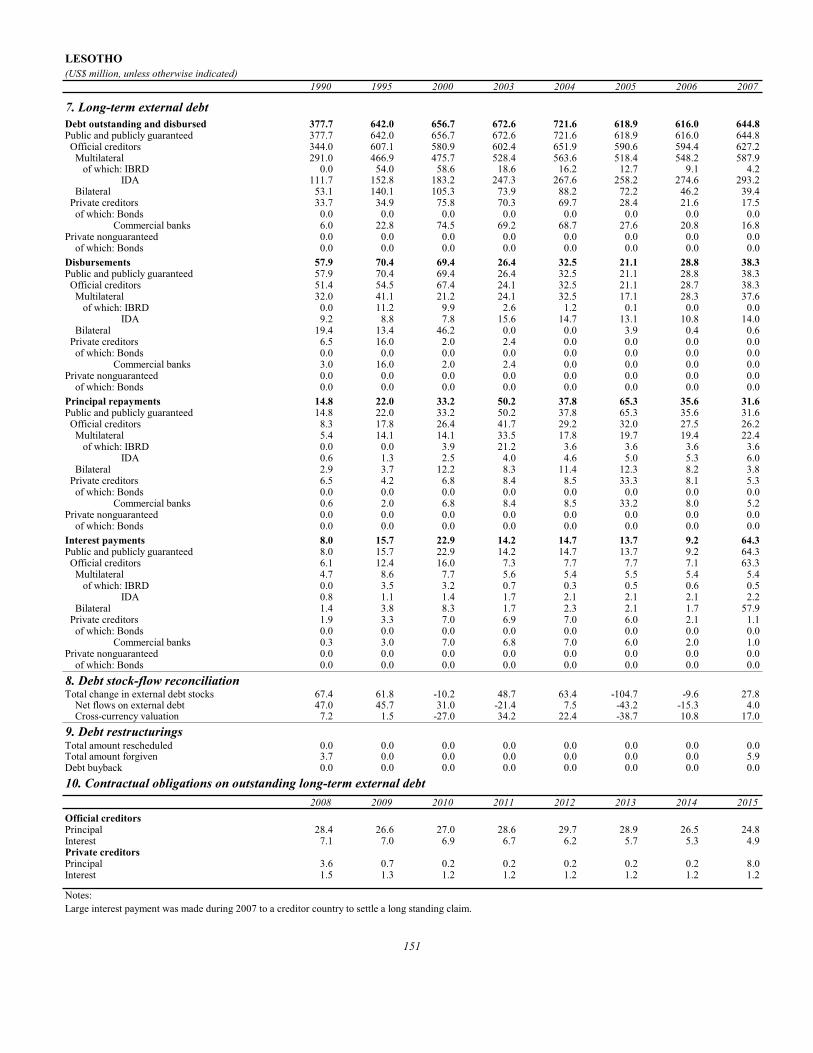
LESOTHO(US$ million, unless otherwise indicated)
1990 1995 2000 2003 2004 2005 2006 2007
7. Long-term external debtDebt outstanding and disbursed 377.7 642.0 656.7 672.6 721.6 618.9 616.0 644.8Public and publicly guaranteed 377.7 642.0 656.7 672.6 721.6 618.9 616.0 644.8 Official creditors 344.0 607.1 580.9 602.4 651.9 590.6 594.4 627.2 Multilateral 291.0 466.9 475.7 528.4 563.6 518.4 548.2 587.9 of which: IBRD 0.0 54.0 58.6 18.6 16.2 12.7 9.1 4.2 IDA 111.7 152.8 183.2 247.3 267.6 258.2 274.6 293.2 Bilateral 53.1 140.1 105.3 73.9 88.2 72.2 46.2 39.4 Private creditors 33.7 34.9 75.8 70.3 69.7 28.4 21.6 17.5 of which: Bonds 0.0 0.0 0.0 0.0 0.0 0.0 0.0 0.0 Commercial banks 6.0 22.8 74.5 69.2 68.7 27.6 20.8 16.8Private nonguaranteed 0.0 0.0 0.0 0.0 0.0 0.0 0.0 0.0 of which: Bonds 0.0 0.0 0.0 0.0 0.0 0.0 0.0 0.0Disbursements 57.9 70.4 69.4 26.4 32.5 21.1 28.8 38.3Public and publicly guaranteed 57.9 70.4 69.4 26.4 32.5 21.1 28.8 38.3 Official creditors 51.4 54.5 67.4 24.1 32.5 21.1 28.7 38.3 Multilateral 32.0 41.1 21.2 24.1 32.5 17.1 28.3 37.6 of which: IBRD 0.0 11.2 9.9 2.6 1.2 0.1 0.0 0.0 IDA 9.2 8.8 7.8 15.6 14.7 13.1 10.8 14.0 Bilateral 19.4 13.4 46.2 0.0 0.0 3.9 0.4 0.6 Private creditors 6.5 16.0 2.0 2.4 0.0 0.0 0.0 0.0 of which: Bonds 0.0 0.0 0.0 0.0 0.0 0.0 0.0 0.0 Commercial banks 3.0 16.0 2.0 2.4 0.0 0.0 0.0 0.0Private nonguaranteed 0.0 0.0 0.0 0.0 0.0 0.0 0.0 0.0 of which: Bonds 0.0 0.0 0.0 0.0 0.0 0.0 0.0 0.0Principal repayments 14.8 22.0 33.2 50.2 37.8 65.3 35.6 31.6Public and publicly guaranteed 14.8 22.0 33.2 50.2 37.8 65.3 35.6 31.6 Official creditors 8.3 17.8 26.4 41.7 29.2 32.0 27.5 26.2 Multilateral 5.4 14.1 14.1 33.5 17.8 19.7 19.4 22.4 of which: IBRD 0.0 0.0 3.9 21.2 3.6 3.6 3.6 3.6 IDA 0.6 1.3 2.5 4.0 4.6 5.0 5.3 6.0 Bilateral 2.9 3.7 12.2 8.3 11.4 12.3 8.2 3.8 Private creditors 6.5 4.2 6.8 8.4 8.5 33.3 8.1 5.3 of which: Bonds 0.0 0.0 0.0 0.0 0.0 0.0 0.0 0.0 Commercial banks 0.6 2.0 6.8 8.4 8.5 33.2 8.0 5.2Private nonguaranteed 0.0 0.0 0.0 0.0 0.0 0.0 0.0 0.0 of which: Bonds 0.0 0.0 0.0 0.0 0.0 0.0 0.0 0.0Interest payments 8.0 15.7 22.9 14.2 14.7 13.7 9.2 64.3Public and publicly guaranteed 8.0 15.7 22.9 14.2 14.7 13.7 9.2 64.3 Official creditors 6.1 12.4 16.0 7.3 7.7 7.7 7.1 63.3 Multilateral 4.7 8.6 7.7 5.6 5.4 5.5 5.4 5.4 of which: IBRD 0.0 3.5 3.2 0.7 0.3 0.5 0.6 0.5 IDA 0.8 1.1 1.4 1.7 2.1 2.1 2.1 2.2 Bilateral 1.4 3.8 8.3 1.7 2.3 2.1 1.7 57.9 Private creditors 1.9 3.3 7.0 6.9 7.0 6.0 2.1 1.1 of which: Bonds 0.0 0.0 0.0 0.0 0.0 0.0 0.0 0.0 Commercial banks 0.3 3.0 7.0 6.8 7.0 6.0 2.0 1.0Private nonguaranteed 0.0 0.0 0.0 0.0 0.0 0.0 0.0 0.0 of which: Bonds 0.0 0.0 0.0 0.0 0.0 0.0 0.0 0.08. Debt stock-flow reconciliationTotal change in external debt stocks 67.4 61.8 -10.2 48.7 63.4 -104.7 -9.6 27.8 Net flows on external debt 47.0 45.7 31.0 -21.4 7.5 -43.2 -15.3 4.0 Cross-currency valuation 7.2 1.5 -27.0 34.2 22.4 -38.7 10.8 17.09. Debt restructuringsTotal amount rescheduled 0.0 0.0 0.0 0.0 0.0 0.0 0.0 0.0Total amount forgiven 3.7 0.0 0.0 0.0 0.0 0.0 0.0 5.9Debt buyback 0.0 0.0 0.0 0.0 0.0 0.0 0.0 0.010. Contractual obligations on outstanding long-term external debt
2008 2009 2010 2011 2012 2013 2014 2015Official creditorsPrincipal 28.4 26.6 27.0 28.6 29.7 28.9 26.5 24.8Interest 7.1 7.0 6.9 6.7 6.2 5.7 5.3 4.9Private creditorsPrincipal 3.6 0.7 0.2 0.2 0.2 0.2 0.2 8.0Interest 1.5 1.3 1.2 1.2 1.2 1.2 1.2 1.2
Notes:Large interest payment was made during 2007 to a creditor country to settle a long standing claim.
151

LIBERIA(US$ million, unless otherwise indicated)
1990 1995 2000 2003 2004 2005 2006 2007
1. Summary external debt dataExternal debt stocks 1,849 2,154 2,032 2,567 2,715 2,576 2,697 2,475 Long-term external debt 1,116 1,161 1,040 1,127 1,177 1,115 1,115 910 Public and publicly guaranteed 1,116 1,161 1,040 1,127 1,177 1,115 1,115 910 Private nonguaranteed 0 0 0 0 0 0 0 0 Use of IMF credit 322 336 292 332 347 320 336 352 Short-term external debt 411 657 699 1,108 1,191 1,141 1,246 1,214 interest arrears on long-term 355 613 665 1,076 1,146 1,101 1,198 1,161Memorandum itemsPrincipal arrears on long-term 722 961 1,053 1,236 1,296 1,232 1,310 1,332Long-term public sector debt 1,116 1,161 1,040 1,127 1,177 1,115 1,115 910Long-term private sector debt 0 0 0 0 0 0 0 0Public & publicly guaranteed commitments 30 0 0 0 0 0 4 0
External debt flowsDisbursements 0 0 0 0 0 0 0 0 Long-term external debt 0 0 0 0 0 0 0 0 IMF purchases 0 0 0 0 0 0 0 0Principal repayments 2 0 1 0 0 0 1 257 Long-term external debt 1 0 0 0 0 0 0 256 IMF repurchases 1 0 1 0 0 0 1 1Net flows -1 0 -5 3 12 -5 8 -252 Long-term external debt -1 0 0 0 0 0 0 -256 IMF flows -1 0 0 0 0 0 -1 -1 Short-term external debt 1 0 -5 3 12 -5 9 4Interest payments 1 2 0 0 1 1 0 371 Long-term external debt 1 0 0 0 0 0 0 371 IMF charges 0 2 0 0 1 1 0 0 Short-term external debt 0 0 0 0 0 0 0 0
2. Other non-debt resource flowsForeign direct investment (net) 225 5 21 372 69 76 108 132Portfolio equity flows 0 0 0 0 0 0 0 0Profit remittances on FDI 0 0 0 0 6 7 14 15Grants (excluding technical coop.) 60 108 47 99 197 182 214 725of which: Debt forgiveness grants .. .. 0 0 0 0 0 0 IDA grants .. .. .. 0 0 0 1 442Memo: technical coop. grants 21 16 23 15 26 54 54 12
3. Currency composition of public and publicly guaranteed debt (%)Euro .. .. .. 12.7 13.2 12.0 13.4 18.4Japanese yen 6.1 7.7 7.7 7.6 7.5 7.0 6.9 8.8Pound sterling 1.2 1.2 1.3 1.2 1.2 1.2 1.2 1.0Swiss franc 0.0 0.0 0.0 0.0 0.0 0.0 0.0 0.0U.S.dollars 51.2 49.4 54.4 50.9 49.0 51.2 51.5 60.1
4. Average terms of new commitmentsOfficial creditors Interest (%) 4.0 0.0 0.0 0.0 0.0 0.0 0.0 0.0 Maturity (years) 24.8 0.0 0.0 0.0 0.0 0.0 40.0 0.0 Grace period (years) 5.3 0.0 0.0 0.0 0.0 0.0 1.0 0.0Private creditors Interest (%) 0.0 0.0 0.0 0.0 0.0 0.0 0.0 0.0 Maturity (years) 0.0 0.0 0.0 0.0 0.0 0.0 0.0 0.0 Grace period (years) 0.0 0.0 0.0 0.0 0.0 0.0 0.0 0.0
5. Major economic aggregatesGross national income (GNI) .. .. 389 350 373 417 444 560Exports of goods, services & income .. .. .. .. 320 353 509 562Worker remit. & comp. of employees 0 0 0 0 60 33 81 65Imports of goods & services .. .. .. .. 1,216 1,307 1,882 1,912International reserves .. 28 0 7 19 25 72 119Current account balance .. .. .. .. -152 -175 -173 -211
6. RatiosExternal debt stocks to exports (%) .. .. .. .. 847.4 730.1 529.5 440.3External debt stocks to GNI (%) .. .. 523.0 733.1 727.9 617.4 607.7 442.1Debt service to exports (%) .. .. .. .. 0.2 0.3 0.2 111.6Short-term to external debt stocks (%) 22.2 30.5 34.4 43.2 43.9 44.3 46.2 49.0Multilateral to external debt stocks (%) 23.4 21.0 19.5 16.9 17.3 17.1 15.7 7.9Reserves to external debt stocks (%) 0.0 1.3 0.0 0.3 0.7 1.0 2.7 4.8Reserves to imports (months) .. .. .. .. 0.2 0.2 0.5 0.7
152

LIBERIA(US$ million, unless otherwise indicated)
1990 1995 2000 2003 2004 2005 2006 2007
7. Long-term external debtDebt outstanding and disbursed 1,116 1,161 1,040 1,127 1,177 1,115 1,115 910Public and publicly guaranteed 1,116 1,161 1,040 1,127 1,177 1,115 1,115 910 Official creditors 924 954 843 923 970 917 917 707 Multilateral 433 453 395 434 469 440 424 195 of which: IBRD 143 161 130 152 162 146 147 0 IDA 105 108 100 108 111 106 109 77 Bilateral 491 501 448 488 501 477 493 512 Private creditors 192 208 197 204 207 198 199 203 of which: Bonds 0 0 0 0 0 0 0 0 Commercial banks 172 187 180 184 186 179 178 181Private nonguaranteed 0 0 0 0 0 0 0 0 of which: Bonds 0 0 0 0 0 0 0 0Disbursements 0 0 0 0 0 0 0 0Public and publicly guaranteed 0 0 0 0 0 0 0 0 Official creditors 0 0 0 0 0 0 0 0 Multilateral 0 0 0 0 0 0 0 0 of which: IBRD 0 0 0 0 0 0 0 0 IDA 0 0 0 0 0 0 0 0 Bilateral 0 0 0 0 0 0 0 0 Private creditors 0 0 0 0 0 0 0 0 of which: Bonds 0 0 0 0 0 0 0 0 Commercial banks 0 0 0 0 0 0 0 0Private nonguaranteed 0 0 0 0 0 0 0 0 of which: Bonds 0 0 0 0 0 0 0 0Principal repayments 1 0 0 0 0 0 0 256Public and publicly guaranteed 1 0 0 0 0 0 0 256 Official creditors 1 0 0 0 0 0 0 256 Multilateral 1 0 0 0 0 0 0 256 of which: IBRD 0 0 0 0 0 0 0 163 IDA 0 0 0 0 0 0 0 35 Bilateral 0 0 0 0 0 0 0 0 Private creditors 0 0 0 0 0 0 0 0 of which: Bonds 0 0 0 0 0 0 0 0 Commercial banks 0 0 0 0 0 0 0 0Private nonguaranteed 0 0 0 0 0 0 0 0 of which: Bonds 0 0 0 0 0 0 0 0Interest payments 1 0 0 0 0 0 0 371Public and publicly guaranteed 1 0 0 0 0 0 0 371 Official creditors 1 0 0 0 0 0 0 371 Multilateral 1 0 0 0 0 0 0 371 of which: IBRD 0 0 0 0 0 0 0 292 IDA 0 0 0 0 0 0 0 18 Bilateral 0 0 0 0 0 0 0 0 Private creditors 0 0 0 0 0 0 0 0 of which: Bonds 0 0 0 0 0 0 0 0 Commercial banks 0 0 0 0 0 0 0 0Private nonguaranteed 0 0 0 0 0 0 0 0 of which: Bonds 0 0 0 0 0 0 0 08. Debt stock-flow reconciliationTotal change in external debt stocks 164 98 -46 243 148 -139 122 -222 Net flows on external debt -1 0 -5 3 12 -5 8 -252 Cross-currency valuation 63 23 -32 76 59 -79 33 -119. Debt restructuringsTotal amount rescheduled 0 0 0 0 0 0 0 0Total amount forgiven 0 0 0 0 0 0 0 0Debt buyback 0 0 0 0 0 0 0 010. Contractual obligations on outstanding long-term external debt
2008 2009 2010 2011 2012 2013 2014 2015Official creditorsPrincipal 17 15 14 13 13 12 12 9Interest 3 3 2 2 2 1 1 1Private creditorsPrincipal 0 0 0 0 0 0 0 0Interest 0 0 0 0 0 0 0 0
Notes:Data on long-term public and publicly guaranteed debt for 2007 are estimates based on the original terms of the loans. Short-term debt data are World Bank staff estimates.
153

MACEDONIA, FYR(US$ million, unless otherwise indicated)
1990 1995 2000 2003 2004 2005 2006 2007
1. Summary external debt dataExternal debt stocks .. 1,277 1,469 1,894 2,551 2,853 3,177 3,760 Long-term external debt .. 1,078 1,333 1,775 1,937 2,124 2,381 2,564 Public and publicly guaranteed .. 788 1,206 1,466 1,573 1,654 1,576 1,520 Private nonguaranteed .. 289 127 309 364 471 805 1,044 Use of IMF credit .. 57 81 68 63 62 56 0 Short-term external debt .. 143 55 51 552 666 740 1,196 interest arrears on long-term .. 143 4 9 9 9 15 28Memorandum itemsPrincipal arrears on long-term .. 216 19 35 43 36 49 108Long-term public sector debt .. 785 1,201 1,463 1,571 1,652 1,574 1,519Long-term private sector debt .. 293 132 312 366 473 807 1,044Public & publicly guaranteed commitments .. 206 138 259 92 274 130 103
External debt flowsDisbursements .. 112 155 234 281 335 402 538 Long-term external debt .. 75 151 217 269 320 402 538 IMF purchases .. 38 4 17 12 16 0 0Principal repayments .. 20 93 192 193 182 440 542 Long-term external debt .. 19 74 170 173 171 430 485 IMF repurchases .. 1 19 22 20 11 10 57Net flows .. 74 59 20 589 268 30 439 Long-term external debt .. 56 78 47 96 148 -28 52 IMF flows .. 37 -18 1 0 13 -1 -46 Short-term external debt .. -18 -3 -22 501 114 68 443Interest payments .. 11 45 52 52 72 118 137 Long-term external debt .. 9 37 50 49 55 83 88 IMF charges .. 2 3 1 1 1 2 1 Short-term external debt .. 1 5 2 2 16 33 47
2. Other non-debt resource flowsForeign direct investment (net) .. 9 175 96 157 100 351 320Portfolio equity flows .. 0 0 1 15 52 77 0Profit remittances on FDI .. 0 7 34 66 86 39 0Grants (excluding technical coop.) .. 18 174 137 142 113 98 136of which: Debt forgiveness grants .. .. 13 62 7 3 0 0 IDA grants .. .. .. 0 0 0 0 0Memo: technical coop. grants .. 16 30 100 105 98 95 58
3. Currency composition of public and publicly guaranteed debt (%)Euro .. .. .. 32.5 35.1 41.4 52.8 63.0Japanese yen .. 6.5 0.4 0.1 0.1 0.2 0.5 1.4Pound sterling .. 1.1 0.2 0.1 0.1 0.1 0.1 0.0Swiss franc .. 0.9 2.4 0.9 0.8 0.6 0.5 0.1U.S.dollars .. 49.7 71.8 64.3 61.9 56.0 44.2 34.3
4. Average terms of new commitmentsOfficial creditors Interest (%) .. 3.8 5.3 2.3 2.2 2.8 4.4 4.6 Maturity (years) .. 23.0 18.9 19.2 20.1 16.7 16.8 17.0 Grace period (years) .. 6.7 6.1 5.2 5.9 5.1 5.4 5.0Private creditors Interest (%) .. 2.3 9.2 3.7 0.0 4.6 5.8 0.0 Maturity (years) .. 29.7 3.4 4.8 0.0 10.0 16.3 0.0 Grace period (years) .. 10.9 0.5 0.0 0.0 9.9 3.9 0.0
5. Major economic aggregatesGross national income (GNI) .. 4,410 3,522 4,567 5,329 5,701 6,336 7,638Exports of goods, services & income .. .. 1,760 1,896 2,326 2,778 3,330 ..Worker remit. & comp. of employees .. 0 81 174 213 227 267 267Imports of goods & services .. .. 2,366 2,640 3,371 3,755 4,396 ..International reserves .. 275 460 935 991 1,340 1,889 2,264Current account balance .. .. -72 -149 -415 -81 -24 ..
6. RatiosExternal debt stocks to exports (%) .. .. 83.5 99.9 109.7 102.7 95.4 ..External debt stocks to GNI (%) .. 29.0 41.7 41.5 47.9 50.0 50.1 49.2Debt service to exports (%) .. .. 7.9 12.9 10.5 9.1 16.8 ..Short-term to external debt stocks (%) .. 11.2 3.7 2.7 21.6 23.3 23.3 31.8Multilateral to external debt stocks (%) .. 22.6 38.8 43.5 37.6 32.5 32.8 27.7Reserves to external debt stocks (%) .. 21.5 31.3 49.4 38.9 47.0 59.5 60.2Reserves to imports (months) .. .. 2.3 4.2 3.5 4.3 5.2 ..
154

MACEDONIA, FYR(US$ million, unless otherwise indicated)
1990 1995 2000 2003 2004 2005 2006 2007
7. Long-term external debtDebt outstanding and disbursed .. 1,078 1,333 1,775 1,937 2,124 2,381 2,564Public and publicly guaranteed .. 788 1,206 1,466 1,573 1,654 1,576 1,520 Official creditors .. 605 921 1,178 1,301 1,219 1,317 1,239 Multilateral .. 288 570 824 959 928 1,043 1,040 of which: IBRD .. 97 116 175 218 244 259 193 IDA .. 84 249 356 387 364 383 394 Bilateral .. 317 352 355 341 290 274 199 Private creditors .. 184 284 288 272 435 258 281 of which: Bonds .. 0 0 0 0 177 198 221 Commercial banks .. 103 274 280 265 252 56 57Private nonguaranteed .. 289 127 309 364 471 805 1,044 of which: Bonds .. 0 0 0 0 0 0 0Disbursements .. 75 151 217 269 320 402 538Public and publicly guaranteed .. 75 98 143 150 295 113 142 Official creditors .. 74 96 127 135 106 85 138 Multilateral .. 74 79 88 112 94 71 108 of which: IBRD .. 20 13 26 43 54 11 54 IDA .. 42 38 33 14 8 5 0 Bilateral .. 0 17 39 23 13 14 31 Private creditors .. 0 1 16 15 189 29 3 of which: Bonds .. 0 0 0 0 187 0 0 Commercial banks .. 0 0 15 15 2 28 3Private nonguaranteed .. 0 54 74 119 25 289 396 of which: Bonds .. 0 0 0 0 0 0 0Principal repayments .. 19 74 170 173 171 430 485Public and publicly guaranteed .. 19 25 89 83 82 308 294 Official creditors .. 19 23 75 65 67 79 286 Multilateral .. 19 20 29 30 32 36 171 of which: IBRD .. 19 3 8 11 11 12 134 IDA .. 0 0 0 1 2 4 5 Bilateral .. 0 3 46 35 36 43 115 Private creditors .. 0 2 14 17 14 228 8 of which: Bonds .. 0 0 0 0 0 0 0 Commercial banks .. 0 2 13 17 14 227 6Private nonguaranteed .. 0 49 81 90 90 123 191 of which: Bonds .. 0 0 0 0 0 0 0Interest payments .. 9 37 50 49 55 83 88Public and publicly guaranteed .. 9 30 41 37 41 53 51 Official creditors .. 9 20 35 31 33 37 38 Multilateral .. 9 19 20 20 20 24 29 of which: IBRD .. 8 7 7 6 7 10 11 IDA .. 0 2 2 3 3 3 3 Bilateral .. 0 1 15 11 12 13 9 Private creditors .. 0 10 7 7 9 15 12 of which: Bonds .. 0 0 0 0 0 9 10 Commercial banks .. 0 10 6 6 8 6 2Private nonguaranteed .. 0 7 8 11 13 30 38 of which: Bonds .. 0 0 0 0 0 0 08. Debt stock-flow reconciliationTotal change in external debt stocks .. 174 44 204 658 301 324 583 Net flows on external debt .. 74 59 20 589 268 30 439 Cross-currency valuation .. -41 -36 103 55 -101 92 1099. Debt restructuringsTotal amount rescheduled .. 256 44 0 0 0 0 0Total amount forgiven .. 0 0 0 15 0 0 20Debt buyback .. 0 0 0 0 0 0 010. Contractual obligations on outstanding long-term external debt
2008 2009 2010 2011 2012 2013 2014 2015Official creditorsPrincipal 82 96 102 91 98 95 95 94Interest 39 38 36 33 30 27 24 20Private creditorsPrincipal 206 152 135 97 135 28 30 234Interest 72 51 50 47 52 25 22 21
Notes:The former Yugoslav Republic of Macedonia became a member of the World Bank in 1993. Debt outstanding as of end-1993 reflect only loans used directly by Macedonian beneficiaries. Short-term debt is based on Central Bank data.
155

MADAGASCAR(US$ million, unless otherwise indicated)
1990 1995 2000 2003 2004 2005 2006 2007
1. Summary external debt dataExternal debt stocks 3,689 4,302 4,691 4,952 3,790 3,466 1,453 1,661 Long-term external debt 3,320 3,687 4,286 4,616 3,487 3,179 1,236 1,425 Public and publicly guaranteed 3,320 3,687 4,286 4,616 3,487 3,179 1,236 1,425 Private nonguaranteed 0 0 0 0 0 0 0 0 Use of IMF credit 144 73 104 172 226 212 29 43 Short-term external debt 225 542 301 164 78 75 189 194 interest arrears on long-term 126 486 203 143 76 72 186 189Memorandum itemsPrincipal arrears on long-term 266 1,194 665 605 228 218 223 211Long-term public sector debt 3,244 3,555 4,164 4,499 3,432 3,133 1,231 1,421Long-term private sector debt 76 133 122 117 54 46 4 3Public & publicly guaranteed commitments 211 80 187 257 164 292 281 202
External debt flowsDisbursements 231 90 200 232 525 265 289 275 Long-term external debt 213 90 150 216 473 249 277 263 IMF purchases 17 0 50 16 52 17 12 12Principal repayments 121 38 79 37 52 48 46 9 Long-term external debt 69 24 74 33 45 38 46 9 IMF repurchases 51 15 5 4 6 10 0 0Net flows 194 59 45 125 455 218 243 268 Long-term external debt 144 66 76 182 428 211 232 254 IMF flows -47 -1 0 0 0 0 0 0 Short-term external debt 83 7 -76 -69 -18 1 0 2Interest payments 102 20 38 32 31 30 22 10 Long-term external debt 85 16 28 30 30 28 22 10 IMF charges 10 0 0 1 1 1 0 0 Short-term external debt 7 3 9 1 0 0 0 0
2. Other non-debt resource flowsForeign direct investment (net) 22 10 83 7 53 85 294 997Portfolio equity flows 0 0 0 0 0 0 0 0Profit remittances on FDI 1 3 4 32 21 38 0 0Grants (excluding technical coop.) 348 164 115 313 892 806 2,747 507of which: Debt forgiveness grants .. .. 0 1 0 0 0 0 IDA grants .. .. .. 0 91 4 5 11Memo: technical coop. grants 84 124 85 97 95 95 111 135
3. Currency composition of public and publicly guaranteed debt (%)Euro .. .. .. 15.4 2.5 2.3 5.8 3.0Japanese yen 6.9 7.7 7.4 6.6 0.0 0.0 0.0 0.0Pound sterling 0.1 0.1 0.1 0.1 0.0 0.0 0.0 0.0Swiss franc 1.4 1.3 0.9 0.9 0.2 0.1 0.4 0.4U.S.dollars 42.5 45.0 56.8 58.9 69.9 72.0 56.0 56.7
4. Average terms of new commitmentsOfficial creditors Interest (%) 1.1 1.1 0.8 0.8 0.7 0.8 0.8 1.3 Maturity (years) 36.4 36.8 40.1 41.3 41.4 38.1 43.7 32.5 Grace period (years) 9.7 9.6 10.2 10.4 9.8 9.8 10.1 8.7Private creditors Interest (%) 5.0 0.0 0.0 0.0 0.0 1.2 7.2 2.8 Maturity (years) 5.1 0.0 0.0 0.0 0.0 30.1 4.9 2.0 Grace period (years) 1.1 0.0 0.0 0.0 0.0 11.0 2.2 0.3
5. Major economic aggregatesGross national income (GNI) 2,958 3,002 3,807 5,394 4,285 4,960 5,435 7,323Exports of goods, services & income 490 765 1,210 1,200 1,435 1,357 .. ..Worker remit. & comp. of employees 8 14 11 16 12 11 11 11Imports of goods & services 985 1,161 1,584 1,824 2,154 2,146 .. ..International reserves 92 109 285 414 504 481 583 847Current account balance -265 -276 -260 -328 -399 -554 .. ..
6. RatiosExternal debt stocks to exports (%) 753.0 562.2 387.6 412.7 264.2 255.4 .. ..External debt stocks to GNI (%) 124.7 143.3 123.2 91.8 88.5 69.9 26.7 22.7Debt service to exports (%) 45.5 7.6 9.6 5.7 5.7 5.7 .. ..Short-term to external debt stocks (%) 6.1 12.6 6.4 3.3 2.1 2.2 13.0 11.7Multilateral to external debt stocks (%) 33.4 39.3 39.0 50.4 74.8 81.9 61.0 66.0Reserves to external debt stocks (%) 2.5 2.5 6.1 8.4 13.3 13.9 40.1 51.0Reserves to imports (months) 1.1 1.1 2.2 2.7 2.8 2.7 .. ..
156

MADAGASCAR(US$ million, unless otherwise indicated)
1990 1995 2000 2003 2004 2005 2006 2007
7. Long-term external debtDebt outstanding and disbursed 3,320 3,687 4,286 4,616 3,487 3,179 1,236 1,425Public and publicly guaranteed 3,320 3,687 4,286 4,616 3,487 3,179 1,236 1,425 Official creditors 3,180 3,603 4,247 4,578 3,475 3,170 1,229 1,418 Multilateral 1,231 1,690 1,828 2,496 2,836 2,839 887 1,096 of which: IBRD 26 12 0 0 0 0 0 0 IDA 770 1,110 1,378 1,975 2,269 2,298 636 865 Bilateral 1,949 1,913 2,419 2,083 639 331 342 322 Private creditors 140 84 39 37 12 9 6 6 of which: Bonds 0 0 0 0 0 0 0 0 Commercial banks 38 28 23 21 10 8 5 5Private nonguaranteed 0 0 0 0 0 0 0 0 of which: Bonds 0 0 0 0 0 0 0 0Disbursements 213 90 150 216 473 249 277 263Public and publicly guaranteed 213 90 150 216 473 249 277 263 Official creditors 212 89 150 216 473 249 277 263 Multilateral 136 78 143 215 308 248 255 254 of which: IBRD 0 0 0 0 0 0 0 0 IDA 64 76 94 195 227 221 178 198 Bilateral 77 11 7 0 166 1 23 9 Private creditors 1 1 0 0 0 0 0 0 of which: Bonds 0 0 0 0 0 0 0 0 Commercial banks 0 0 0 0 0 0 0 0Private nonguaranteed 0 0 0 0 0 0 0 0 of which: Bonds 0 0 0 0 0 0 0 0Principal repayments 69 24 74 33 45 38 46 9Public and publicly guaranteed 69 24 74 33 45 38 46 9 Official creditors 53 19 73 33 43 37 42 9 Multilateral 19 18 37 21 29 22 28 7 of which: IBRD 3 4 0 0 0 0 0 0 IDA 3 7 17 9 10 11 16 0 Bilateral 34 1 36 12 14 15 14 2 Private creditors 16 5 0 0 2 1 3 1 of which: Bonds 0 0 0 0 0 0 0 0 Commercial banks 11 1 0 0 2 1 3 0Private nonguaranteed 0 0 0 0 0 0 0 0 of which: Bonds 0 0 0 0 0 0 0 0Interest payments 85 16 28 30 30 28 22 10Public and publicly guaranteed 85 16 28 30 30 28 22 10 Official creditors 72 15 28 30 29 28 22 10 Multilateral 18 12 17 16 22 22 17 9 of which: IBRD 2 1 0 0 0 0 0 0 IDA 5 8 10 12 16 17 12 6 Bilateral 54 4 11 14 7 6 5 1 Private creditors 13 1 0 0 1 0 0 0 of which: Bonds 0 0 0 0 0 0 0 0 Commercial banks 10 0 0 0 0 0 0 0Private nonguaranteed 0 0 0 0 0 0 0 0 of which: Bonds 0 0 0 0 0 0 0 08. Debt stock-flow reconciliationTotal change in external debt stocks 271 226 -53 441 -1,161 -324 -2,013 208 Net flows on external debt 194 59 45 125 455 218 243 268 Cross-currency valuation 181 -45 -161 317 141 -233 -2,109 -139. Debt restructuringsTotal amount rescheduled 88 0 0 15 0 31 11 1Total amount forgiven 185 0 0 51 1,352 93 12 33Debt buyback 0 0 0 0 0 0 0 010. Contractual obligations on outstanding long-term external debt
2008 2009 2010 2011 2012 2013 2014 2015Official creditorsPrincipal 22 25 29 34 34 34 42 45Interest 16 17 17 15 15 15 15 14Private creditorsPrincipal 0 1 0 0 0 0 0 0Interest 0 0 0 0 0 0 0 0
Notes:Madagascar was granted debt relief effective in 2006 under the Multilateral Debt Relief Initiative.
157

MALAWI(US$ million, unless otherwise indicated)
1990 1995 2000 2003 2004 2005 2006 2007
1. Summary external debt dataExternal debt stocks 1556.8 2237.8 2704.9 3098.2 3427.3 3183.2 872.4 870.0 Long-term external debt 1383.5 2078.3 2544.1 2934.5 3295.6 3061.8 788.9 807.0 Public and publicly guaranteed 1381.0 2078.3 2544.1 2934.5 3295.6 3061.8 788.9 807.0 Private nonguaranteed 2.5 0.0 0.0 0.0 0.0 0.0 0.0 0.0 Use of IMF credit 115.0 116.0 82.5 102.2 92.5 75.2 19.5 31.0 Short-term external debt 58.4 43.5 78.3 61.6 39.3 46.2 64.0 32.0 interest arrears on long-term 6.4 1.4 36.7 35.6 28.3 34.2 0.0 0.0Memorandum itemsPrincipal arrears on long-term 19.2 7.2 72.3 40.9 1.7 13.3 0.0 0.0Long-term public sector debt 1370.9 2075.2 2541.4 2931.4 3293.8 3061.8 788.9 807.0Long-term private sector debt 12.5 3.1 2.7 3.1 1.7 0.0 0.0 0.0Public & publicly guaranteed commitments 258.8 102.3 58.5 66.2 102.6 24.7 86.3 80.3
External debt flowsDisbursements 161.0 226.7 127.0 88.1 85.7 96.5 108.4 80.3 Long-term external debt 135.8 215.1 118.6 79.1 85.7 88.5 94.0 70.0 IMF purchases 25.3 11.6 8.5 9.0 0.0 8.0 14.5 10.2Principal repayments 85.9 75.3 41.8 23.2 35.2 52.3 64.9 18.2 Long-term external debt 66.6 65.5 32.7 15.6 25.8 37.8 47.8 18.2 IMF repurchases 19.3 9.9 9.1 7.6 9.5 14.5 17.1 0.0Net flows 87.9 183.4 83.3 -1.5 35.4 45.3 95.5 30.1 Long-term external debt 69.2 149.6 85.8 63.5 59.9 50.8 46.2 51.8 IMF flows -18.7 0.0 0.0 0.0 0.0 -3.2 -6.4 0.0 Short-term external debt 12.8 32.1 -1.9 -66.4 -15.0 1.0 52.0 -32.0Interest payments 46.7 42.7 21.1 18.5 24.9 23.4 22.0 14.8 Long-term external debt 36.3 38.7 17.9 17.0 23.3 21.8 19.0 12.0 IMF charges 6.0 1.4 0.4 0.8 1.0 1.2 1.0 0.1 Short-term external debt 4.3 2.5 2.9 0.7 0.6 0.5 1.9 2.6
2. Other non-debt resource flowsForeign direct investment (net) 23.3 5.6 26.0 3.9 107.7 26.5 29.7 54.6Portfolio equity flows 0.8 0.0 0.0 0.0 0.0 0.0 0.0 0.0Profit remittances on FDI 5.3 8.6 15.1 0.0 0.0 0.0 0.0 0.0Grants (excluding technical coop.) 226.7 262.4 227.5 341.5 402.5 464.2 2728.9 802.7of which: Debt forgiveness grants .. .. 26.8 42.0 53.7 44.5 2307.9 219.0 IDA grants .. .. .. 19.6 12.8 70.7 29.5 63.6Memo: technical coop. grants 110.5 87.4 110.6 123.7 107.5 100.6 99.6 73.7
3. Currency composition of public and publicly guaranteed debt (%)Euro .. .. .. 1.9 3.4 3.3 8.7 5.5Japanese yen 9.3 12.3 8.4 4.9 7.0 6.2 0.0 0.0Pound sterling 16.8 9.0 6.2 5.1 4.9 4.8 0.0 0.0Swiss franc 0.1 0.1 0.1 0.1 0.0 0.0 0.0 0.0U.S.dollars 46.9 53.6 65.9 69.5 65.0 65.8 57.0 58.9
4. Average terms of new commitmentsOfficial creditors Interest (%) 1.1 1.0 0.8 0.8 1.0 1.4 0.2 1.8 Maturity (years) 39.5 38.6 44.7 41.3 37.6 41.4 38.7 39.2 Grace period (years) 9.4 9.6 10.1 10.3 8.6 8.9 3.3 10.4Private creditors Interest (%) 8.6 0.0 0.0 0.0 0.0 0.0 0.0 0.0 Maturity (years) 11.8 0.0 0.0 0.0 0.0 0.0 0.0 0.0 Grace period (years) 3.5 0.0 0.0 0.0 0.0 0.0 0.0 0.0
5. Major economic aggregatesGross national income (GNI) 1837.5 1350.1 1707.2 2384.5 2582.1 2813.4 3125.3 3539.5Exports of goods, services & income 452.4 473.8 471.4 .. .. .. .. ..Worker remit. & comp. of employees 0.0 1.0 1.0 1.0 1.0 1.0 1.0 1.0Imports of goods & services 637.7 708.2 679.6 .. .. .. .. ..International reserves 142.1 115.0 246.5 127.4 133.7 165.5 141.9 227.3Current account balance -86.2 -78.0 -73.5 .. .. .. .. ..
6. RatiosExternal debt stocks to exports (%) 344.1 472.3 573.8 .. .. .. .. ..External debt stocks to GNI (%) 84.7 165.8 158.4 129.9 132.7 113.1 27.9 24.6Debt service to exports (%) 29.3 24.9 13.3 .. .. .. .. ..Short-term to external debt stocks (%) 3.7 1.9 2.9 2.0 1.1 1.5 7.3 3.7Multilateral to external debt stocks (%) 69.9 76.3 75.6 81.4 79.9 80.5 49.4 50.4Reserves to external debt stocks (%) 9.1 5.1 9.1 4.1 3.9 5.2 16.3 26.1Reserves to imports (months) 2.7 1.9 4.4 .. .. .. .. ..
158

MALAWI(US$ million, unless otherwise indicated)
1990 1995 2000 2003 2004 2005 2006 2007
7. Long-term external debtDebt outstanding and disbursed 1383.5 2078.3 2544.1 2934.5 3295.6 3061.8 788.9 807.0Public and publicly guaranteed 1381.0 2078.3 2544.1 2934.5 3295.6 3061.8 788.9 807.0 Official creditors 1303.3 2049.9 2526.1 2923.9 3287.9 3043.4 777.6 795.4 Multilateral 1087.6 1708.3 2044.4 2521.0 2738.4 2561.4 430.8 438.6 of which: IBRD 90.7 55.0 8.5 0.7 0.3 0.0 0.0 0.0 IDA 763.5 1251.3 1592.2 1958.1 2075.3 1940.4 156.9 177.6 Bilateral 215.7 341.6 481.8 402.9 549.4 482.1 346.7 356.9 Private creditors 77.7 28.4 17.9 10.6 7.7 18.4 11.4 11.6 of which: Bonds 0.0 0.0 0.0 0.0 0.0 0.0 0.0 0.0 Commercial banks 35.4 0.0 0.0 0.0 5.7 16.7 10.0 10.3Private nonguaranteed 2.5 0.0 0.0 0.0 0.0 0.0 0.0 0.0 of which: Bonds 0.0 0.0 0.0 0.0 0.0 0.0 0.0 0.0Disbursements 135.8 215.1 118.6 79.1 85.7 88.5 94.0 70.0Public and publicly guaranteed 135.8 215.1 118.6 79.1 85.7 88.5 94.0 70.0 Official creditors 128.5 215.1 118.6 79.1 85.7 88.5 94.0 70.0 Multilateral 118.1 97.3 118.6 79.1 85.7 87.7 82.2 52.6 of which: IBRD 2.3 0.0 0.0 0.0 0.0 0.0 0.0 0.0 IDA 98.6 73.3 97.0 55.7 62.0 45.1 46.2 13.8 Bilateral 10.4 117.8 0.0 0.0 0.0 0.8 11.7 17.4 Private creditors 7.3 0.0 0.0 0.0 0.0 0.0 0.0 0.0 of which: Bonds 0.0 0.0 0.0 0.0 0.0 0.0 0.0 0.0 Commercial banks 0.0 0.0 0.0 0.0 0.0 0.0 0.0 0.0Private nonguaranteed 0.0 0.0 0.0 0.0 0.0 0.0 0.0 0.0 of which: Bonds 0.0 0.0 0.0 0.0 0.0 0.0 0.0 0.0Principal repayments 66.6 65.5 32.7 15.6 25.8 37.8 47.8 18.2Public and publicly guaranteed 65.4 65.5 32.7 15.6 25.8 37.8 47.8 18.2 Official creditors 61.0 42.6 32.7 15.6 23.8 35.2 46.2 17.3 Multilateral 20.0 28.3 30.1 12.0 18.7 29.7 40.9 6.5 of which: IBRD 7.8 11.7 7.6 1.7 0.5 0.2 0.0 0.0 IDA 2.5 7.1 15.8 8.9 11.1 12.4 25.9 0.0 Bilateral 41.1 14.3 2.6 3.6 5.1 5.5 5.4 10.8 Private creditors 4.4 22.8 0.0 0.0 2.0 2.5 1.5 0.9 of which: Bonds 0.0 0.0 0.0 0.0 0.0 0.0 0.0 0.0 Commercial banks 0.0 10.5 0.0 0.0 1.9 2.4 1.4 0.8Private nonguaranteed 1.2 0.0 0.0 0.0 0.0 0.0 0.0 0.0 of which: Bonds 0.0 0.0 0.0 0.0 0.0 0.0 0.0 0.0Interest payments 36.3 38.7 17.9 17.0 23.3 21.8 19.0 12.0Public and publicly guaranteed 36.0 38.7 17.9 17.0 23.3 21.8 19.0 12.0 Official creditors 30.4 35.2 17.9 17.0 22.8 21.6 18.8 11.7 Multilateral 18.9 25.2 17.2 15.0 20.2 20.1 17.6 4.3 of which: IBRD 7.7 6.5 1.0 0.1 0.0 0.0 0.0 0.0 IDA 5.0 9.3 11.7 10.9 13.8 14.2 10.7 1.3 Bilateral 11.6 10.0 0.6 2.0 2.6 1.5 1.2 7.5 Private creditors 5.6 3.6 0.0 0.0 0.5 0.2 0.2 0.3 of which: Bonds 0.0 0.0 0.0 0.0 0.0 0.0 0.0 0.0 Commercial banks 3.3 0.6 0.0 0.0 0.5 0.2 0.2 0.3Private nonguaranteed 0.3 0.0 0.0 0.0 0.0 0.0 0.0 0.0 of which: Bonds 0.0 0.0 0.0 0.0 0.0 0.0 0.0 0.08. Debt stock-flow reconciliationTotal change in external debt stocks 148.2 217.7 -36.4 211.4 329.1 -244.2 -2310.8 -2.3 Net flows on external debt 87.9 183.4 83.3 -1.5 35.4 45.3 95.5 30.1 Cross-currency valuation 22.0 -91.4 -111.0 167.0 78.2 -230.1 -2021.5 -12.39. Debt restructuringsTotal amount rescheduled 0.0 0.0 0.0 2.3 2.4 1.0 179.7 24.0Total amount forgiven 50.8 0.0 0.0 42.3 48.4 43.4 71.0 3.1Debt buyback 0.0 0.0 0.0 0.0 0.0 0.0 0.0 0.010. Contractual obligations on outstanding long-term external debt
2008 2009 2010 2011 2012 2013 2014 2015Official creditorsPrincipal 23.8 27.4 29.0 30.3 30.0 32.1 30.1 29.8Interest 15.9 15.9 15.6 15.2 14.8 14.3 13.8 13.4Private creditorsPrincipal 0.1 0.1 0.1 0.1 0.1 0.1 0.1 0.1Interest 0.3 0.3 0.3 0.3 0.3 0.3 0.3 0.3
Notes:Malawi received debt relief under HIPC in 2007. Malawi was also granted debt relief effective in 2006 under the Multilateral Debt Relief Initiative. The country also went through Paris Club in 2006.
159

MALAYSIA(US$ million, unless otherwise indicated)
1990 1995 2000 2003 2004 2005 2006 2007
1. Summary external debt dataExternal debt stocks 15,328 34,343 41,874 48,557 52,156 51,981 56,491 53,717 Long-term external debt 13,422 27,069 37,300 39,932 40,723 38,805 43,223 38,467 Public and publicly guaranteed 11,592 16,023 19,234 25,400 25,570 22,449 22,599 18,441 Private nonguaranteed 1,830 11,046 18,067 14,532 15,153 16,356 20,624 20,026 Use of IMF credit 0 0 0 0 0 0 0 0 Short-term external debt 1,906 7,274 4,573 8,625 11,432 13,176 13,268 15,250 interest arrears on long-term 0 0 0 0 0 0 0 0Memorandum itemsPrincipal arrears on long-term 0 0 0 0 0 0 0 0Long-term public sector debt 11,592 16,023 19,135 25,276 25,474 22,431 22,588 18,437Long-term private sector debt 1,830 11,046 18,166 14,656 15,249 16,374 20,635 20,030Public & publicly guaranteed commitments 701 3,772 5,464 1,514 2,436 1,212 1,990 202
External debt flowsDisbursements 1,683 8,503 5,921 5,636 7,786 6,050 7,038 5,037 Long-term external debt 1,683 8,503 5,921 5,636 7,786 6,050 7,038 5,037 IMF purchases 0 0 0 0 0 0 0 0Principal repayments 3,167 4,450 4,146 7,409 7,102 7,192 5,269 7,818 Long-term external debt 3,167 4,450 4,146 7,409 7,102 7,192 5,269 7,818 IMF repurchases 0 0 0 0 0 0 0 0Net flows -1,851 5,138 337 -1,516 3,491 601 1,862 -798 Long-term external debt -1,484 4,053 1,775 -1,772 684 -1,142 1,769 -2,780 IMF flows 0 0 0 0 0 0 0 0 Short-term external debt -367 1,085 -1,439 256 2,807 1,744 92 1,982Interest payments 1,166 1,591 2,299 2,184 2,089 2,197 2,362 2,189 Long-term external debt 997 1,150 2,033 1,909 1,783 1,872 1,882 1,615 IMF charges 0 0 0 0 0 0 0 0 Short-term external debt 169 441 266 275 306 325 480 574
2. Other non-debt resource flowsForeign direct investment (net) 2,332 4,178 3,788 2,473 4,624 3,966 6,064 8,456Portfolio equity flows 0 0 0 1,340 4,510 -1,200 2,392 -669Profit remittances on FDI 1,926 4,144 7,173 6,735 7,757 8,330 8,924 9,831Grants (excluding technical coop.) 42 11 9 14 14 21 18 16of which: Debt forgiveness grants .. .. 0 0 0 0 0 0 IDA grants .. .. .. 0 0 0 0 0Memo: technical coop. grants 125 121 82 62 64 50 46 44
3. Currency composition of public and publicly guaranteed debt (%)Euro .. .. .. 4.0 4.2 4.1 4.5 6.2Japanese yen 36.5 34.6 27.6 23.6 22.8 22.3 19.6 20.8Pound sterling 1.6 1.0 0.7 0.6 0.6 0.6 0.6 0.8Swiss franc 3.6 3.1 0.0 0.0 0.0 0.0 0.0 0.0U.S.dollars 31.8 48.5 62.8 68.5 70.0 70.8 73.5 70.6
4. Average terms of new commitmentsOfficial creditors Interest (%) 4.0 3.4 3.1 3.0 0.0 0.0 0.0 0.0 Maturity (years) 22.9 24.4 24.1 15.6 0.0 0.0 0.0 0.0 Grace period (years) 6.7 6.3 3.5 2.1 0.0 0.0 0.0 0.0Private creditors Interest (%) 8.9 6.3 7.0 1.4 3.0 5.2 5.7 5.7 Maturity (years) 11.4 16.9 7.6 6.1 8.3 9.6 9.3 9.0 Grace period (years) 2.6 14.0 4.0 0.6 3.2 9.5 5.7 0.8
5. Major economic aggregatesGross national income (GNI) 42,152 84,689 86,182 104,272 118,328 131,627 151,677 182,716Exports of goods, services & income 34,514 85,992 114,356 122,025 148,257 166,757 191,136 215,976Worker remit. & comp. of employees 325 716 981 987 1,128 1,281 1,550 1,803Imports of goods & services 35,486 93,618 103,944 106,197 129,264 142,299 161,056 182,358International reserves 10,659 24,699 28,651 44,310 66,394 70,458 82,876 101,995Current account balance -870 -8,644 8,488 13,381 15,079 19,980 25,488 28,931
6. RatiosExternal debt stocks to exports (%) 44.4 39.9 36.6 39.8 35.2 31.2 29.6 24.9External debt stocks to GNI (%) 36.4 40.6 48.6 46.6 44.1 39.5 37.2 29.4Debt service to exports (%) 12.6 7.0 5.6 7.9 6.2 5.6 4.0 4.6Short-term to external debt stocks (%) 12.4 21.2 10.9 17.8 21.9 25.3 23.5 28.4Multilateral to external debt stocks (%) 11.8 4.8 3.1 2.4 2.1 1.8 1.4 0.9Reserves to external debt stocks (%) 69.5 71.9 68.4 91.3 127.3 135.5 146.7 189.9Reserves to imports (months) 3.6 3.2 3.3 5.0 6.2 5.9 6.2 6.7
160

MALAYSIA(US$ million, unless otherwise indicated)
1990 1995 2000 2003 2004 2005 2006 2007
7. Long-term external debtDebt outstanding and disbursed 13,422 27,069 37,300 39,932 40,723 38,805 43,223 38,467Public and publicly guaranteed 11,592 16,023 19,234 25,400 25,570 22,449 22,599 18,441 Official creditors 4,191 5,489 4,950 6,193 6,976 6,542 6,605 4,375 Multilateral 1,812 1,644 1,314 1,182 1,092 936 798 471 of which: IBRD 1,102 1,059 812 708 639 533 437 135 IDA 0 0 0 0 0 0 0 0 Bilateral 2,378 3,845 3,637 5,011 5,884 5,606 5,807 3,904 Private creditors 7,401 10,533 14,284 19,207 18,594 15,907 15,994 14,066 of which: Bonds 4,090 6,062 9,945 13,698 13,754 12,647 12,845 11,806 Commercial banks 2,285 4,171 2,292 3,402 3,106 1,867 1,987 1,307Private nonguaranteed 1,830 11,046 18,067 14,532 15,153 16,356 20,624 20,026 of which: Bonds 0 1,765 3,402 4,157 6,271 7,623 7,960 7,009Disbursements 1,683 8,503 5,921 5,636 7,786 6,050 7,038 5,037Public and publicly guaranteed 798 4,150 3,460 2,303 3,917 2,182 1,801 558 Official creditors 737 837 1,446 867 1,481 981 396 206 Multilateral 273 135 61 122 43 36 30 21 of which: IBRD 205 88 15 87 17 0 0 0 IDA 0 0 0 0 0 0 0 0 Bilateral 464 702 1,385 744 1,438 944 366 185 Private creditors 61 3,313 2,015 1,436 2,436 1,201 1,405 352 of which: Bonds 0 2,100 1,061 0 915 1,150 1,000 0 Commercial banks 57 1,205 672 1,436 1,522 51 405 352Private nonguaranteed 885 4,353 2,461 3,334 3,868 3,868 5,237 4,479 of which: Bonds 0 480 361 906 3,218 1,615 620 0Principal repayments 3,167 4,450 4,146 7,409 7,102 7,192 5,269 7,818Public and publicly guaranteed 2,697 1,701 2,017 4,382 3,989 4,752 2,447 3,645 Official creditors 365 455 840 934 821 1,218 811 1,689 Multilateral 216 261 139 164 138 155 167 354 of which: IBRD 164 194 100 98 87 92 96 302 IDA 0 0 0 0 0 0 0 0 Bilateral 149 195 701 770 683 1,064 644 1,336 Private creditors 2,332 1,245 1,176 3,449 3,168 3,534 1,635 1,956 of which: Bonds 1,239 140 200 0 960 2,036 920 1,170 Commercial banks 664 420 864 3,061 1,811 1,256 484 556Private nonguaranteed 470 2,749 2,129 3,026 3,113 2,440 2,822 4,172 of which: Bonds 0 0 745 65 1,110 237 337 1,000Interest payments 997 1,150 2,033 1,909 1,783 1,872 1,882 1,615Public and publicly guaranteed 956 805 1,171 1,398 1,299 1,222 1,191 1,181 Official creditors 232 284 259 224 237 314 228 202 Multilateral 145 128 98 67 55 47 40 32 of which: IBRD 86 83 66 47 39 33 27 19 IDA 0 0 0 0 0 0 0 0 Bilateral 87 155 160 158 182 267 188 170 Private creditors 724 522 912 1,174 1,062 908 963 979 of which: Bonds 414 251 611 892 802 760 796 811 Commercial banks 199 190 189 195 184 91 109 119Private nonguaranteed 41 345 862 510 484 650 690 434 of which: Bonds 0 28 159 190 187 363 437 4348. Debt stock-flow reconciliationTotal change in external debt stocks -949 4,007 -30 285 3,599 -175 4,510 -2,774 Net flows on external debt -1,851 5,138 337 -1,516 3,491 601 1,862 -798 Cross-currency valuation 926 -104 -689 923 272 -867 91 3289. Debt restructuringsTotal amount rescheduled 0 0 0 0 0 0 0 0Total amount forgiven 0 0 0 0 0 0 0 0Debt buyback 0 0 0 0 0 0 0 010. Contractual obligations on outstanding long-term external debt
2008 2009 2010 2011 2012 2013 2014 2015Official creditorsPrincipal 746 728 442 373 361 267 240 187Interest 121 100 75 63 53 44 36 29Private creditorsPrincipal 5,189 8,256 3,442 3,289 1,662 1,176 2,515 4,036Interest 1,521 1,317 1,047 921 778 705 621 481
Notes:Data on long-term public and publicly guaranteed, private nonguaranteed, and short-term debt for 2007 are based on government statistics and World Bank staff estimates.
161

MALDIVES(US$ million, unless otherwise indicated)
1990 1995 2000 2003 2004 2005 2006 2007
1. Summary external debt dataExternal debt stocks 78.0 154.9 206.0 285.4 372.1 386.5 477.2 562.3 Long-term external debt 64.0 151.9 184.7 259.5 331.7 325.4 377.8 425.9 Public and publicly guaranteed 64.0 151.9 184.7 259.5 331.7 325.4 377.8 425.9 Private nonguaranteed 0.0 0.0 0.0 0.0 0.0 0.0 0.0 0.0 Use of IMF credit 0.0 0.0 0.0 0.0 0.0 5.9 6.2 6.5 Short-term external debt 14.0 3.0 21.4 25.9 40.5 55.3 93.2 130.0 interest arrears on long-term 0.0 0.0 0.0 0.0 0.5 0.3 0.2 0.0Memorandum itemsPrincipal arrears on long-term 0.0 0.0 0.0 0.0 0.1 0.0 0.0 0.0Long-term public sector debt 64.0 151.9 183.4 258.7 302.7 298.4 353.8 404.9Long-term private sector debt 0.0 0.0 1.2 0.8 29.0 27.0 24.0 21.0Public & publicly guaranteed commitments 15.5 29.2 38.1 0.6 51.8 73.7 144.4 70.8
External debt flowsDisbursements 13.0 34.7 13.6 38.8 73.0 55.2 63.7 59.0 Long-term external debt 13.0 34.7 13.6 38.8 73.0 49.1 63.7 59.0 IMF purchases 0.0 0.0 0.0 0.0 0.0 6.1 0.0 0.0Principal repayments 6.0 7.1 13.9 16.4 24.2 24.6 23.1 30.2 Long-term external debt 6.0 7.1 13.9 16.4 24.2 24.6 23.1 30.2 IMF repurchases 0.0 0.0 0.0 0.0 0.0 0.0 0.0 0.0Net flows 8.6 29.6 -3.8 -0.4 62.9 45.6 78.6 63.7 Long-term external debt 7.0 27.6 -0.4 22.4 48.8 24.5 40.6 28.7 IMF flows 0.0 0.0 0.0 0.0 0.0 6.1 0.0 0.0 Short-term external debt 1.6 2.0 -3.5 -22.8 14.1 15.0 38.0 35.0Interest payments 2.8 3.7 5.9 5.3 8.7 9.9 11.9 14.4 Long-term external debt 1.3 3.6 4.7 4.6 7.8 8.7 9.9 11.7 IMF charges 0.0 0.0 0.0 0.0 0.0 0.1 0.3 0.3 Short-term external debt 1.5 0.2 1.2 0.7 0.9 1.1 1.7 2.3
2. Other non-debt resource flowsForeign direct investment (net) 5.6 7.2 13.0 13.5 14.7 9.5 13.9 15.0Portfolio equity flows 0.0 0.0 0.0 0.0 0.0 0.0 0.0 0.0Profit remittances on FDI 13.9 19.9 34.4 39.0 36.4 31.0 41.0 44.9Grants (excluding technical coop.) 11.3 23.7 10.0 5.4 8.0 52.2 20.9 20.3of which: Debt forgiveness grants .. .. 0.0 0.0 0.0 0.0 0.0 0.0 IDA grants .. .. .. 0.0 0.0 5.6 0.0 0.0Memo: technical coop. grants 5.8 10.1 7.5 6.7 5.3 7.3 7.1 8.6
3. Currency composition of public and publicly guaranteed debt (%)Euro .. .. .. 14.8 10.9 8.0 14.4 21.0Japanese yen 0.0 0.0 0.0 0.0 0.0 0.0 0.0 0.0Pound sterling 0.4 0.0 0.2 0.0 0.0 0.0 0.0 0.0Swiss franc 0.0 0.0 0.0 0.0 0.0 0.0 0.0 0.0U.S.dollars 25.4 51.3 53.3 49.0 54.0 55.7 51.8 46.7
4. Average terms of new commitmentsOfficial creditors Interest (%) 0.8 2.5 2.5 0.0 0.6 1.1 3.6 4.1 Maturity (years) 37.3 34.8 34.7 0.0 32.5 30.5 19.4 20.1 Grace period (years) 9.2 10.1 9.3 0.0 7.5 7.4 4.5 5.2Private creditors Interest (%) 0.0 7.9 6.6 6.3 4.5 6.6 8.4 6.9 Maturity (years) 0.0 6.0 8.0 11.0 8.1 7.8 10.3 8.3 Grace period (years) 0.0 1.7 1.1 1.5 2.5 1.6 1.5 1.8
5. Major economic aggregatesGross national income (GNI) 193.9 379.0 594.3 655.4 719.2 725.9 877.8 997.7Exports of goods, services & income 183.8 322.4 462.8 590.1 698.4 495.4 792.7 877.4Worker remit. & comp. of employees 2.0 2.0 2.0 2.0 2.9 2.3 2.8 3.0Imports of goods & services 177.7 337.0 492.0 579.2 767.3 908.8 1101.3 1296.3International reserves 24.4 48.0 122.8 159.5 203.6 186.3 231.4 308.3Current account balance 9.9 -18.2 -56.1 -31.3 -122.4 -271.5 -300.4 -423.0
6. RatiosExternal debt stocks to exports (%) 42.4 48.0 44.5 48.4 53.3 78.0 60.2 64.1External debt stocks to GNI (%) 40.2 40.9 34.7 43.5 51.7 53.2 54.4 56.4Debt service to exports (%) 4.8 3.4 4.3 3.7 4.7 7.0 4.4 5.1Short-term to external debt stocks (%) 18.0 1.9 10.4 9.1 10.9 14.3 19.5 23.1Multilateral to external debt stocks (%) 41.7 58.8 58.5 56.7 51.1 45.5 45.9 46.9Reserves to external debt stocks (%) 31.3 31.0 59.6 55.9 54.7 48.2 48.5 54.8Reserves to imports (months) 1.6 1.7 3.0 3.3 3.2 2.5 2.5 2.9
162

MALDIVES(US$ million, unless otherwise indicated)
1990 1995 2000 2003 2004 2005 2006 2007
7. Long-term external debtDebt outstanding and disbursed 64.0 151.9 184.7 259.5 331.7 325.4 377.8 425.9Public and publicly guaranteed 64.0 151.9 184.7 259.5 331.7 325.4 377.8 425.9 Official creditors 60.2 142.6 154.8 194.4 224.1 217.4 263.8 309.0 Multilateral 32.5 91.1 120.5 161.9 190.3 176.0 219.2 263.5 of which: IBRD 0.0 0.0 0.0 0.0 0.0 0.0 0.0 0.0 IDA 10.0 36.1 46.4 57.6 65.6 64.4 69.8 76.7 Bilateral 27.6 51.5 34.3 32.5 33.8 41.4 44.7 45.5 Private creditors 3.8 9.4 29.9 65.1 107.6 108.0 114.0 116.8 of which: Bonds 0.0 0.0 0.0 0.0 0.0 0.0 0.0 0.0 Commercial banks 0.0 3.4 23.7 62.2 106.4 108.0 114.0 116.8Private nonguaranteed 0.0 0.0 0.0 0.0 0.0 0.0 0.0 0.0 of which: Bonds 0.0 0.0 0.0 0.0 0.0 0.0 0.0 0.0Disbursements 13.0 34.7 13.6 38.8 73.0 49.1 63.7 59.0Public and publicly guaranteed 13.0 34.7 13.6 38.8 73.0 49.1 63.7 59.0 Official creditors 9.6 30.9 6.3 18.1 17.6 28.1 46.3 42.5 Multilateral 3.6 18.7 6.1 14.4 11.7 16.1 38.9 39.0 of which: IBRD 0.0 0.0 0.0 0.0 0.0 0.0 0.0 0.0 IDA 1.2 3.9 3.3 3.2 6.1 4.6 3.4 5.2 Bilateral 5.9 12.2 0.2 3.8 6.0 12.0 7.4 3.5 Private creditors 3.5 3.8 7.3 20.7 55.4 21.0 17.5 16.4 of which: Bonds 0.0 0.0 0.0 0.0 0.0 0.0 0.0 0.0 Commercial banks 0.0 2.4 6.1 20.7 55.4 21.0 17.5 16.4Private nonguaranteed 0.0 0.0 0.0 0.0 0.0 0.0 0.0 0.0 of which: Bonds 0.0 0.0 0.0 0.0 0.0 0.0 0.0 0.0Principal repayments 6.0 7.1 13.9 16.4 24.2 24.6 23.1 30.2Public and publicly guaranteed 6.0 7.1 13.9 16.4 24.2 24.6 23.1 30.2 Official creditors 3.7 4.8 6.7 6.2 9.2 7.9 9.1 13.1 Multilateral 1.5 1.4 2.5 3.3 4.1 4.0 4.3 8.4 of which: IBRD 0.0 0.0 0.0 0.0 0.0 0.0 0.0 0.0 IDA 0.0 0.1 0.4 0.7 0.8 1.0 1.1 1.1 Bilateral 2.2 3.4 4.2 2.9 5.0 4.0 4.9 4.7 Private creditors 2.3 2.3 7.3 10.3 15.1 16.7 14.0 17.2 of which: Bonds 0.0 0.0 0.0 0.0 0.0 0.0 0.0 0.0 Commercial banks 1.5 0.6 6.1 8.8 13.2 15.6 14.0 17.2Private nonguaranteed 0.0 0.0 0.0 0.0 0.0 0.0 0.0 0.0 of which: Bonds 0.0 0.0 0.0 0.0 0.0 0.0 0.0 0.0Interest payments 1.3 3.6 4.7 4.6 7.8 8.7 9.9 11.7Public and publicly guaranteed 1.3 3.6 4.7 4.6 7.8 8.7 9.9 11.7 Official creditors 0.8 2.7 2.6 2.2 2.7 2.9 3.0 4.6 Multilateral 0.3 1.0 1.5 1.7 1.9 2.1 2.2 3.7 of which: IBRD 0.0 0.0 0.0 0.0 0.0 0.0 0.0 0.0 IDA 0.1 0.3 0.3 0.4 0.5 0.5 0.5 0.5 Bilateral 0.5 1.7 1.1 0.6 0.8 0.8 0.9 0.8 Private creditors 0.5 0.8 2.2 2.4 5.1 5.8 6.9 7.2 of which: Bonds 0.0 0.0 0.0 0.0 0.0 0.0 0.0 0.0 Commercial banks 0.1 0.2 1.8 2.1 5.0 5.7 6.9 7.2Private nonguaranteed 0.0 0.0 0.0 0.0 0.0 0.0 0.0 0.0 of which: Bonds 0.0 0.0 0.0 0.0 0.0 0.0 0.0 0.08. Debt stock-flow reconciliationTotal change in external debt stocks 11.2 31.3 -12.9 13.7 86.8 14.4 90.7 83.2 Net flows on external debt 8.6 29.6 -3.8 -0.4 62.9 45.6 78.6 63.7 Cross-currency valuation 1.2 1.1 -6.5 8.8 21.5 -18.7 10.3 17.19. Debt restructuringsTotal amount rescheduled 0.0 0.0 0.0 0.0 0.0 0.0 3.1 0.0Total amount forgiven 0.0 0.0 0.0 0.5 0.0 0.0 0.0 0.0Debt buyback 0.0 0.0 0.0 0.0 0.0 0.0 0.0 0.010. Contractual obligations on outstanding long-term external debt
2008 2009 2010 2011 2012 2013 2014 2015Official creditorsPrincipal 18.8 25.6 24.3 24.2 23.9 22.7 23.2 23.8Interest 6.8 6.6 6.3 5.9 5.3 4.8 4.3 3.7Private creditorsPrincipal 30.2 33.1 35.6 34.9 30.6 21.2 18.7 7.2Interest 9.3 10.2 9.0 7.1 5.1 3.3 1.8 0.7
163

MALI(US$ million, unless otherwise indicated)
1990 1995 2000 2003 2004 2005 2006 2007
1. Summary external debt dataExternal debt stocks 2,468 2,958 2,980 3,114 3,320 3,228 1,649 2,018 Long-term external debt 2,337 2,739 2,671 2,910 3,136 3,102 1,624 1,989 Public and publicly guaranteed 2,337 2,739 2,671 2,910 3,136 3,102 1,624 1,989 Private nonguaranteed 0 0 0 0 0 0 0 0 Use of IMF credit 69 147 176 169 145 109 8 13 Short-term external debt 62 72 134 35 39 17 17 17 interest arrears on long-term 9 28 42 6 6 0 0 0Memorandum itemsPrincipal arrears on long-term 63 342 541 115 134 22 29 26Long-term public sector debt 2,331 2,739 2,671 2,910 3,136 3,102 1,624 1,989Long-term private sector debt 6 0 0 0 0 0 0 0Public & publicly guaranteed commitments 123 163 245 102 219 437 215 443
External debt flowsDisbursements 195 238 109 216 168 282 151 262 Long-term external debt 167 193 100 198 166 280 145 258 IMF purchases 28 45 9 18 2 2 6 4Principal repayments 44 62 66 56 71 69 66 44 Long-term external debt 25 55 50 38 53 52 66 44 IMF repurchases 18 7 16 18 18 17 0 0Net flows 159 200 -11 51 100 197 85 218 Long-term external debt 142 138 50 159 112 228 79 214 IMF flows -11 -1 0 0 0 0 0 0 Short-term external debt 8 24 -53 -108 4 -16 0 0Interest payments 24 25 27 20 27 29 26 20 Long-term external debt 17 22 18 17 25 27 24 19 IMF charges 4 1 1 1 1 0 0 0 Short-term external debt 3 2 9 2 1 1 1 1
2. Other non-debt resource flowsForeign direct investment (net) 6 111 82 132 101 224 83 360Portfolio equity flows 0 0 0 1 -1 9 3 0Profit remittances on FDI 4 5 76 120 152 155 227 0Grants (excluding technical coop.) 201 208 308 333 510 470 2,233 722of which: Debt forgiveness grants .. .. 40 56 131 52 1,797 145 IDA grants .. .. .. 15 0 8 5 12Memo: technical coop. grants 93 132 120 127 119 128 134 107
3. Currency composition of public and publicly guaranteed debt (%)Euro .. .. .. 16.4 15.9 14.1 19.0 16.7Japanese yen 0.3 2.3 2.9 2.6 2.4 2.0 3.7 3.0Pound sterling 2.6 1.8 1.8 1.9 1.9 1.7 3.8 3.1Swiss franc 2.3 2.1 1.5 1.8 1.8 1.6 3.3 2.9U.S.dollars 14.8 22.5 33.9 44.2 45.0 44.6 29.1 29.6
4. Average terms of new commitmentsOfficial creditors Interest (%) 1.0 1.5 0.6 1.2 1.1 1.1 0.9 1.4 Maturity (years) 29.9 30.7 34.9 39.8 37.9 34.5 39.1 32.2 Grace period (years) 8.4 8.8 8.8 9.0 9.2 8.6 9.7 8.3Private creditors Interest (%) 0.0 0.0 0.0 3.6 0.0 0.0 0.0 0.0 Maturity (years) 0.0 0.0 0.0 9.9 0.0 0.0 0.0 0.0 Grace period (years) 0.0 0.0 0.0 3.4 0.0 0.0 0.0 0.0
5. Major economic aggregatesGross national income (GNI) 2,405 2,419 2,392 4,203 4,679 5,099 5,524 6,591Exports of goods, services & income 549 650 734 1,312 1,380 1,560 2,090 ..Worker remit. & comp. of employees 107 112 73 154 156 177 212 212Imports of goods & services 889 1,040 1,046 1,652 1,844 2,072 2,453 ..International reserves 198 323 381 952 861 855 970 1,087Current account balance -221 -284 -255 -271 -409 -438 -231 ..
6. RatiosExternal debt stocks to exports (%) 449.3 455.2 406.1 237.3 240.6 206.9 78.9 ..External debt stocks to GNI (%) 102.6 122.3 124.6 74.1 70.9 63.3 29.9 30.6Debt service to exports (%) 12.3 13.4 12.8 5.8 7.1 6.3 4.4 ..Short-term to external debt stocks (%) 2.5 2.4 4.5 1.1 1.2 0.5 1.0 0.8Multilateral to external debt stocks (%) 36.3 47.2 50.8 66.5 68.4 69.6 42.9 48.3Reserves to external debt stocks (%) 8.0 10.9 12.8 30.6 25.9 26.5 58.8 53.9Reserves to imports (months) 2.7 3.7 4.4 6.9 5.6 4.9 4.7 ..
164

MALI(US$ million, unless otherwise indicated)
1990 1995 2000 2003 2004 2005 2006 2007
7. Long-term external debtDebt outstanding and disbursed 2,337 2,739 2,671 2,910 3,136 3,102 1,624 1,989Public and publicly guaranteed 2,337 2,739 2,671 2,910 3,136 3,102 1,624 1,989 Official creditors 2,321 2,737 2,671 2,910 3,134 3,097 1,618 1,982 Multilateral 897 1,397 1,513 2,071 2,269 2,246 707 974 of which: IBRD 0 0 0 0 0 0 0 0 IDA 498 863 957 1,322 1,441 1,424 297 452 Bilateral 1,424 1,340 1,158 839 864 851 910 1,008 Private creditors 16 2 0 0 2 5 7 7 of which: Bonds 0 0 0 0 0 0 0 0 Commercial banks 0 2 0 0 2 5 7 7Private nonguaranteed 0 0 0 0 0 0 0 0 of which: Bonds 0 0 0 0 0 0 0 0Disbursements 167 193 100 198 166 280 145 258Public and publicly guaranteed 167 193 100 198 166 280 145 258 Official creditors 167 193 100 198 164 277 143 258 Multilateral 115 146 85 174 153 211 109 191 of which: IBRD 0 0 0 0 0 0 0 0 IDA 43 85 49 95 76 111 49 139 Bilateral 52 47 14 24 11 66 35 67 Private creditors 0 0 0 0 2 3 1 0 of which: Bonds 0 0 0 0 0 0 0 0 Commercial banks 0 0 0 0 2 3 1 0Private nonguaranteed 0 0 0 0 0 0 0 0 of which: Bonds 0 0 0 0 0 0 0 0Principal repayments 25 55 50 38 53 52 66 44Public and publicly guaranteed 25 55 50 38 53 52 66 44 Official creditors 24 55 50 38 53 52 66 43 Multilateral 14 23 26 26 33 34 46 22 of which: IBRD 0 0 0 0 0 0 0 0 IDA 2 6 7 5 7 9 12 0 Bilateral 11 32 24 12 20 19 20 22 Private creditors 1 0 0 0 0 0 0 1 of which: Bonds 0 0 0 0 0 0 0 0 Commercial banks 0 0 0 0 0 0 0 1Private nonguaranteed 0 0 0 0 0 0 0 0 of which: Bonds 0 0 0 0 0 0 0 0Interest payments 17 22 18 17 25 27 24 19Public and publicly guaranteed 17 22 18 17 25 27 24 19 Official creditors 17 22 18 17 25 27 24 19 Multilateral 10 12 12 14 19 21 16 11 of which: IBRD 0 0 0 0 0 0 0 0 IDA 3 6 7 8 10 11 7 3 Bilateral 7 10 5 3 6 6 7 8 Private creditors 1 0 0 0 0 0 1 0 of which: Bonds 0 0 0 0 0 0 0 0 Commercial banks 0 0 0 0 0 0 1 0Private nonguaranteed 0 0 0 0 0 0 0 0 of which: Bonds 0 0 0 0 0 0 0 08. Debt stock-flow reconciliationTotal change in external debt stocks 340 264 -216 287 205 -92 -1,578 369 Net flows on external debt 159 200 -11 51 100 197 85 218 Cross-currency valuation 119 -1 -182 212 103 -205 -1,306 979. Debt restructuringsTotal amount rescheduled 11 0 0 0 0 0 0 0Total amount forgiven 2 0 3 24 19 21 7 0Debt buyback 0 0 45 0 0 0 0 010. Contractual obligations on outstanding long-term external debt
2008 2009 2010 2011 2012 2013 2014 2015Official creditorsPrincipal 112 98 101 104 107 108 116 125Interest 25 25 27 28 28 27 25 24Private creditorsPrincipal 2 2 2 2 2 1 1 0Interest 1 1 0 0 0 0 0 0
Notes:Mali was granted debt relief effective in 2006 under the Multilateral Debt Relief Initiative.
165
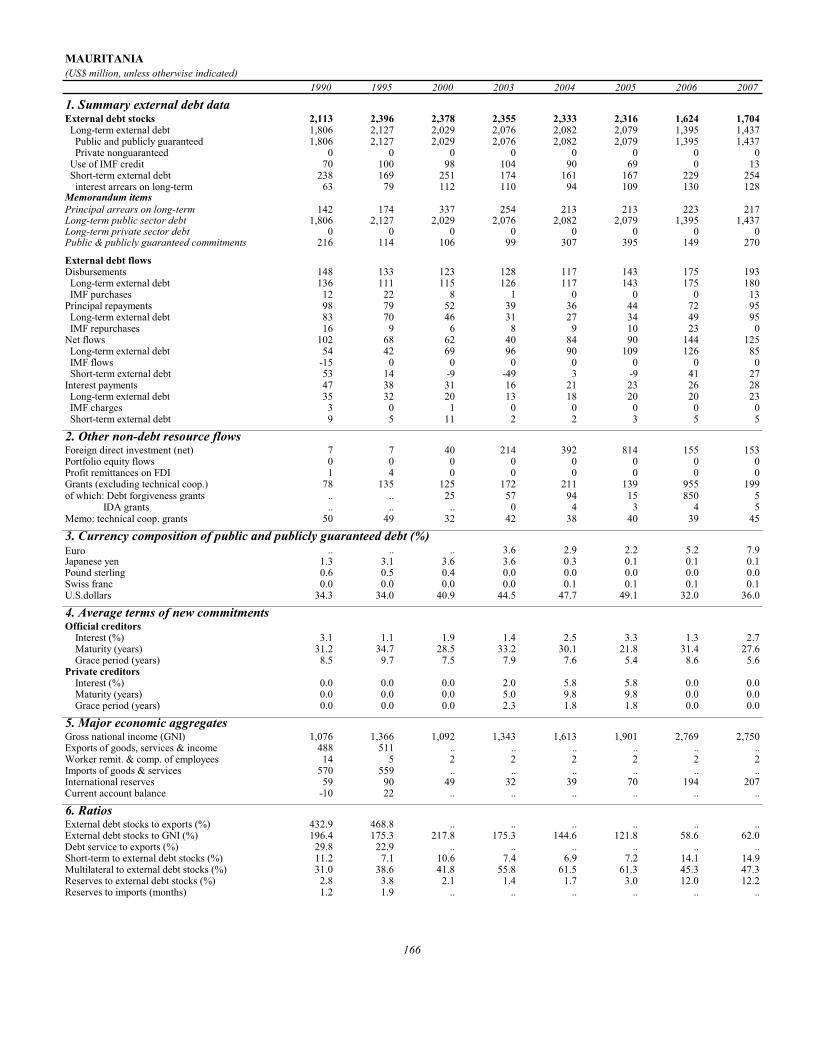
MAURITANIA(US$ million, unless otherwise indicated)
1990 1995 2000 2003 2004 2005 2006 2007
1. Summary external debt dataExternal debt stocks 2,113 2,396 2,378 2,355 2,333 2,316 1,624 1,704 Long-term external debt 1,806 2,127 2,029 2,076 2,082 2,079 1,395 1,437 Public and publicly guaranteed 1,806 2,127 2,029 2,076 2,082 2,079 1,395 1,437 Private nonguaranteed 0 0 0 0 0 0 0 0 Use of IMF credit 70 100 98 104 90 69 0 13 Short-term external debt 238 169 251 174 161 167 229 254 interest arrears on long-term 63 79 112 110 94 109 130 128Memorandum itemsPrincipal arrears on long-term 142 174 337 254 213 213 223 217Long-term public sector debt 1,806 2,127 2,029 2,076 2,082 2,079 1,395 1,437Long-term private sector debt 0 0 0 0 0 0 0 0Public & publicly guaranteed commitments 216 114 106 99 307 395 149 270
External debt flowsDisbursements 148 133 123 128 117 143 175 193 Long-term external debt 136 111 115 126 117 143 175 180 IMF purchases 12 22 8 1 0 0 0 13Principal repayments 98 79 52 39 36 44 72 95 Long-term external debt 83 70 46 31 27 34 49 95 IMF repurchases 16 9 6 8 9 10 23 0Net flows 102 68 62 40 84 90 144 125 Long-term external debt 54 42 69 96 90 109 126 85 IMF flows -15 0 0 0 0 0 0 0 Short-term external debt 53 14 -9 -49 3 -9 41 27Interest payments 47 38 31 16 21 23 26 28 Long-term external debt 35 32 20 13 18 20 20 23 IMF charges 3 0 1 0 0 0 0 0 Short-term external debt 9 5 11 2 2 3 5 5
2. Other non-debt resource flowsForeign direct investment (net) 7 7 40 214 392 814 155 153Portfolio equity flows 0 0 0 0 0 0 0 0Profit remittances on FDI 1 4 0 0 0 0 0 0Grants (excluding technical coop.) 78 135 125 172 211 139 955 199of which: Debt forgiveness grants .. .. 25 57 94 15 850 5 IDA grants .. .. .. 0 4 3 4 5Memo: technical coop. grants 50 49 32 42 38 40 39 45
3. Currency composition of public and publicly guaranteed debt (%)Euro .. .. .. 3.6 2.9 2.2 5.2 7.9Japanese yen 1.3 3.1 3.6 3.6 0.3 0.1 0.1 0.1Pound sterling 0.6 0.5 0.4 0.0 0.0 0.0 0.0 0.0Swiss franc 0.0 0.0 0.0 0.0 0.1 0.1 0.1 0.1U.S.dollars 34.3 34.0 40.9 44.5 47.7 49.1 32.0 36.0
4. Average terms of new commitmentsOfficial creditors Interest (%) 3.1 1.1 1.9 1.4 2.5 3.3 1.3 2.7 Maturity (years) 31.2 34.7 28.5 33.2 30.1 21.8 31.4 27.6 Grace period (years) 8.5 9.7 7.5 7.9 7.6 5.4 8.6 5.6Private creditors Interest (%) 0.0 0.0 0.0 2.0 5.8 5.8 0.0 0.0 Maturity (years) 0.0 0.0 0.0 5.0 9.8 9.8 0.0 0.0 Grace period (years) 0.0 0.0 0.0 2.3 1.8 1.8 0.0 0.0
5. Major economic aggregatesGross national income (GNI) 1,076 1,366 1,092 1,343 1,613 1,901 2,769 2,750Exports of goods, services & income 488 511 .. .. .. .. .. ..Worker remit. & comp. of employees 14 5 2 2 2 2 2 2Imports of goods & services 570 559 .. .. .. .. .. ..International reserves 59 90 49 32 39 70 194 207Current account balance -10 22 .. .. .. .. .. ..
6. RatiosExternal debt stocks to exports (%) 432.9 468.8 .. .. .. .. .. ..External debt stocks to GNI (%) 196.4 175.3 217.8 175.3 144.6 121.8 58.6 62.0Debt service to exports (%) 29.8 22.9 .. .. .. .. .. ..Short-term to external debt stocks (%) 11.2 7.1 10.6 7.4 6.9 7.2 14.1 14.9Multilateral to external debt stocks (%) 31.0 38.6 41.8 55.8 61.5 61.3 45.3 47.3Reserves to external debt stocks (%) 2.8 3.8 2.1 1.4 1.7 3.0 12.0 12.2Reserves to imports (months) 1.2 1.9 .. .. .. .. .. ..
166
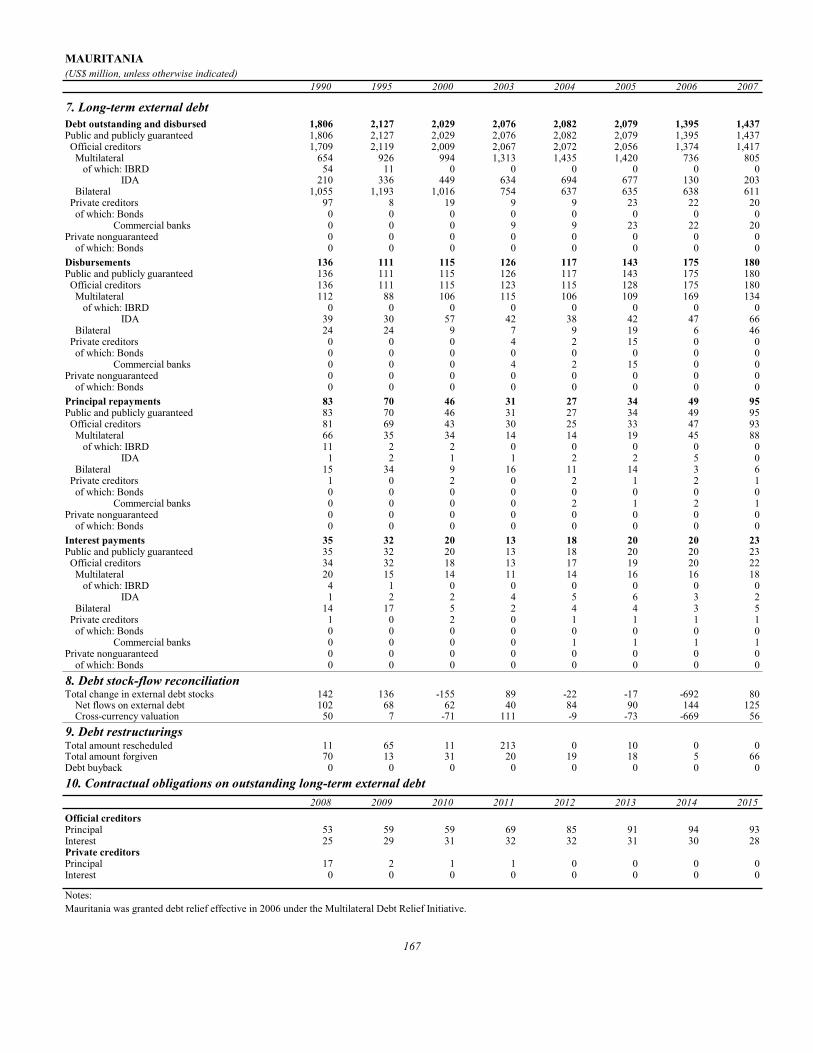
MAURITANIA(US$ million, unless otherwise indicated)
1990 1995 2000 2003 2004 2005 2006 2007
7. Long-term external debtDebt outstanding and disbursed 1,806 2,127 2,029 2,076 2,082 2,079 1,395 1,437Public and publicly guaranteed 1,806 2,127 2,029 2,076 2,082 2,079 1,395 1,437 Official creditors 1,709 2,119 2,009 2,067 2,072 2,056 1,374 1,417 Multilateral 654 926 994 1,313 1,435 1,420 736 805 of which: IBRD 54 11 0 0 0 0 0 0 IDA 210 336 449 634 694 677 130 203 Bilateral 1,055 1,193 1,016 754 637 635 638 611 Private creditors 97 8 19 9 9 23 22 20 of which: Bonds 0 0 0 0 0 0 0 0 Commercial banks 0 0 0 9 9 23 22 20Private nonguaranteed 0 0 0 0 0 0 0 0 of which: Bonds 0 0 0 0 0 0 0 0Disbursements 136 111 115 126 117 143 175 180Public and publicly guaranteed 136 111 115 126 117 143 175 180 Official creditors 136 111 115 123 115 128 175 180 Multilateral 112 88 106 115 106 109 169 134 of which: IBRD 0 0 0 0 0 0 0 0 IDA 39 30 57 42 38 42 47 66 Bilateral 24 24 9 7 9 19 6 46 Private creditors 0 0 0 4 2 15 0 0 of which: Bonds 0 0 0 0 0 0 0 0 Commercial banks 0 0 0 4 2 15 0 0Private nonguaranteed 0 0 0 0 0 0 0 0 of which: Bonds 0 0 0 0 0 0 0 0Principal repayments 83 70 46 31 27 34 49 95Public and publicly guaranteed 83 70 46 31 27 34 49 95 Official creditors 81 69 43 30 25 33 47 93 Multilateral 66 35 34 14 14 19 45 88 of which: IBRD 11 2 2 0 0 0 0 0 IDA 1 2 1 1 2 2 5 0 Bilateral 15 34 9 16 11 14 3 6 Private creditors 1 0 2 0 2 1 2 1 of which: Bonds 0 0 0 0 0 0 0 0 Commercial banks 0 0 0 0 2 1 2 1Private nonguaranteed 0 0 0 0 0 0 0 0 of which: Bonds 0 0 0 0 0 0 0 0Interest payments 35 32 20 13 18 20 20 23Public and publicly guaranteed 35 32 20 13 18 20 20 23 Official creditors 34 32 18 13 17 19 20 22 Multilateral 20 15 14 11 14 16 16 18 of which: IBRD 4 1 0 0 0 0 0 0 IDA 1 2 2 4 5 6 3 2 Bilateral 14 17 5 2 4 4 3 5 Private creditors 1 0 2 0 1 1 1 1 of which: Bonds 0 0 0 0 0 0 0 0 Commercial banks 0 0 0 0 1 1 1 1Private nonguaranteed 0 0 0 0 0 0 0 0 of which: Bonds 0 0 0 0 0 0 0 08. Debt stock-flow reconciliationTotal change in external debt stocks 142 136 -155 89 -22 -17 -692 80 Net flows on external debt 102 68 62 40 84 90 144 125 Cross-currency valuation 50 7 -71 111 -9 -73 -669 569. Debt restructuringsTotal amount rescheduled 11 65 11 213 0 10 0 0Total amount forgiven 70 13 31 20 19 18 5 66Debt buyback 0 0 0 0 0 0 0 010. Contractual obligations on outstanding long-term external debt
2008 2009 2010 2011 2012 2013 2014 2015Official creditorsPrincipal 53 59 59 69 85 91 94 93Interest 25 29 31 32 32 31 30 28Private creditorsPrincipal 17 2 1 1 0 0 0 0Interest 0 0 0 0 0 0 0 0
Notes:Mauritania was granted debt relief effective in 2006 under the Multilateral Debt Relief Initiative.
167
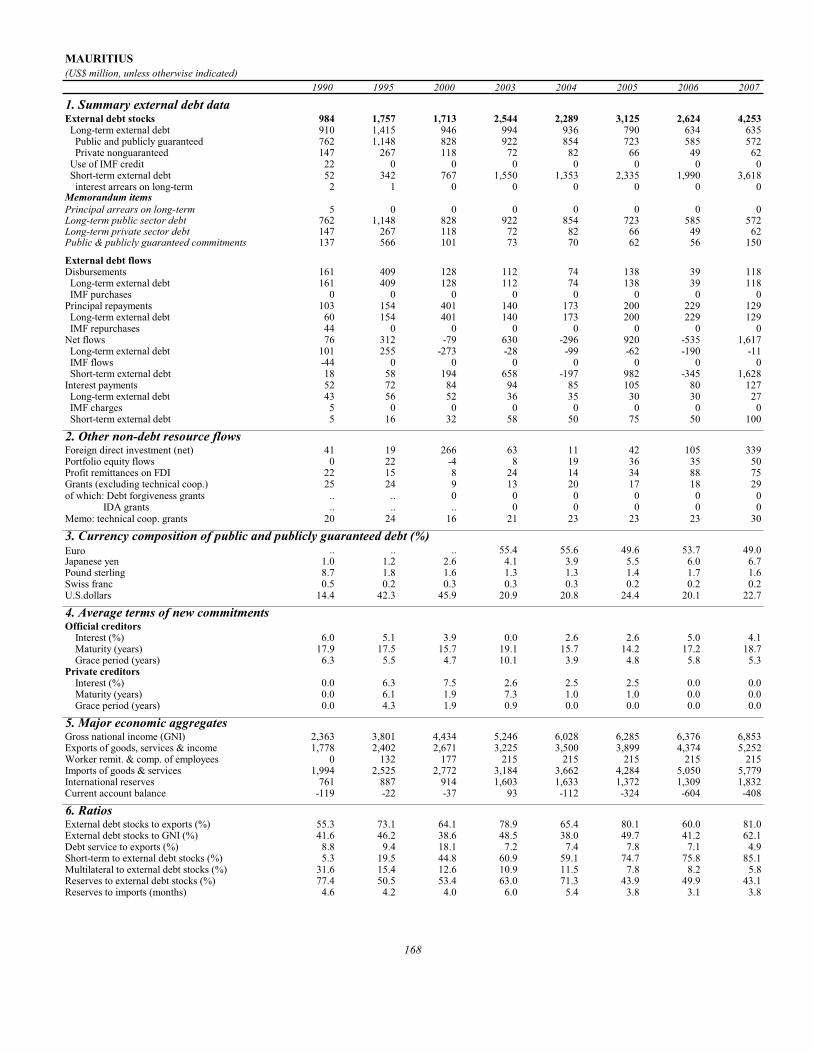
MAURITIUS(US$ million, unless otherwise indicated)
1990 1995 2000 2003 2004 2005 2006 2007
1. Summary external debt dataExternal debt stocks 984 1,757 1,713 2,544 2,289 3,125 2,624 4,253 Long-term external debt 910 1,415 946 994 936 790 634 635 Public and publicly guaranteed 762 1,148 828 922 854 723 585 572 Private nonguaranteed 147 267 118 72 82 66 49 62 Use of IMF credit 22 0 0 0 0 0 0 0 Short-term external debt 52 342 767 1,550 1,353 2,335 1,990 3,618 interest arrears on long-term 2 1 0 0 0 0 0 0Memorandum itemsPrincipal arrears on long-term 5 0 0 0 0 0 0 0Long-term public sector debt 762 1,148 828 922 854 723 585 572Long-term private sector debt 147 267 118 72 82 66 49 62Public & publicly guaranteed commitments 137 566 101 73 70 62 56 150
External debt flowsDisbursements 161 409 128 112 74 138 39 118 Long-term external debt 161 409 128 112 74 138 39 118 IMF purchases 0 0 0 0 0 0 0 0Principal repayments 103 154 401 140 173 200 229 129 Long-term external debt 60 154 401 140 173 200 229 129 IMF repurchases 44 0 0 0 0 0 0 0Net flows 76 312 -79 630 -296 920 -535 1,617 Long-term external debt 101 255 -273 -28 -99 -62 -190 -11 IMF flows -44 0 0 0 0 0 0 0 Short-term external debt 18 58 194 658 -197 982 -345 1,628Interest payments 52 72 84 94 85 105 80 127 Long-term external debt 43 56 52 36 35 30 30 27 IMF charges 5 0 0 0 0 0 0 0 Short-term external debt 5 16 32 58 50 75 50 100
2. Other non-debt resource flowsForeign direct investment (net) 41 19 266 63 11 42 105 339Portfolio equity flows 0 22 -4 8 19 36 35 50Profit remittances on FDI 22 15 8 24 14 34 88 75Grants (excluding technical coop.) 25 24 9 13 20 17 18 29of which: Debt forgiveness grants .. .. 0 0 0 0 0 0 IDA grants .. .. .. 0 0 0 0 0Memo: technical coop. grants 20 24 16 21 23 23 23 30
3. Currency composition of public and publicly guaranteed debt (%)Euro .. .. .. 55.4 55.6 49.6 53.7 49.0Japanese yen 1.0 1.2 2.6 4.1 3.9 5.5 6.0 6.7Pound sterling 8.7 1.8 1.6 1.3 1.3 1.4 1.7 1.6Swiss franc 0.5 0.2 0.3 0.3 0.3 0.2 0.2 0.2U.S.dollars 14.4 42.3 45.9 20.9 20.8 24.4 20.1 22.7
4. Average terms of new commitmentsOfficial creditors Interest (%) 6.0 5.1 3.9 0.0 2.6 2.6 5.0 4.1 Maturity (years) 17.9 17.5 15.7 19.1 15.7 14.2 17.2 18.7 Grace period (years) 6.3 5.5 4.7 10.1 3.9 4.8 5.8 5.3Private creditors Interest (%) 0.0 6.3 7.5 2.6 2.5 2.5 0.0 0.0 Maturity (years) 0.0 6.1 1.9 7.3 1.0 1.0 0.0 0.0 Grace period (years) 0.0 4.3 1.9 0.9 0.0 0.0 0.0 0.0
5. Major economic aggregatesGross national income (GNI) 2,363 3,801 4,434 5,246 6,028 6,285 6,376 6,853Exports of goods, services & income 1,778 2,402 2,671 3,225 3,500 3,899 4,374 5,252Worker remit. & comp. of employees 0 132 177 215 215 215 215 215Imports of goods & services 1,994 2,525 2,772 3,184 3,662 4,284 5,050 5,779International reserves 761 887 914 1,603 1,633 1,372 1,309 1,832Current account balance -119 -22 -37 93 -112 -324 -604 -408
6. RatiosExternal debt stocks to exports (%) 55.3 73.1 64.1 78.9 65.4 80.1 60.0 81.0External debt stocks to GNI (%) 41.6 46.2 38.6 48.5 38.0 49.7 41.2 62.1Debt service to exports (%) 8.8 9.4 18.1 7.2 7.4 7.8 7.1 4.9Short-term to external debt stocks (%) 5.3 19.5 44.8 60.9 59.1 74.7 75.8 85.1Multilateral to external debt stocks (%) 31.6 15.4 12.6 10.9 11.5 7.8 8.2 5.8Reserves to external debt stocks (%) 77.4 50.5 53.4 63.0 71.3 43.9 49.9 43.1Reserves to imports (months) 4.6 4.2 4.0 6.0 5.4 3.8 3.1 3.8
168
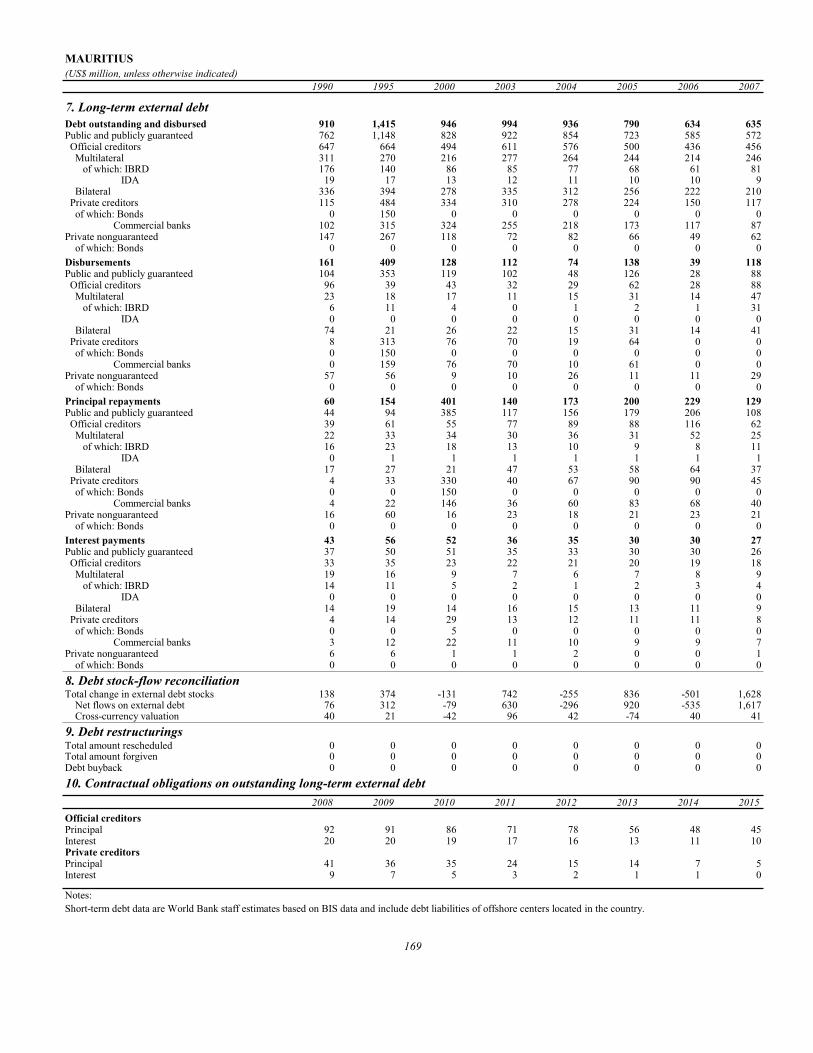
MAURITIUS(US$ million, unless otherwise indicated)
1990 1995 2000 2003 2004 2005 2006 2007
7. Long-term external debtDebt outstanding and disbursed 910 1,415 946 994 936 790 634 635Public and publicly guaranteed 762 1,148 828 922 854 723 585 572 Official creditors 647 664 494 611 576 500 436 456 Multilateral 311 270 216 277 264 244 214 246 of which: IBRD 176 140 86 85 77 68 61 81 IDA 19 17 13 12 11 10 10 9 Bilateral 336 394 278 335 312 256 222 210 Private creditors 115 484 334 310 278 224 150 117 of which: Bonds 0 150 0 0 0 0 0 0 Commercial banks 102 315 324 255 218 173 117 87Private nonguaranteed 147 267 118 72 82 66 49 62 of which: Bonds 0 0 0 0 0 0 0 0Disbursements 161 409 128 112 74 138 39 118Public and publicly guaranteed 104 353 119 102 48 126 28 88 Official creditors 96 39 43 32 29 62 28 88 Multilateral 23 18 17 11 15 31 14 47 of which: IBRD 6 11 4 0 1 2 1 31 IDA 0 0 0 0 0 0 0 0 Bilateral 74 21 26 22 15 31 14 41 Private creditors 8 313 76 70 19 64 0 0 of which: Bonds 0 150 0 0 0 0 0 0 Commercial banks 0 159 76 70 10 61 0 0Private nonguaranteed 57 56 9 10 26 11 11 29 of which: Bonds 0 0 0 0 0 0 0 0Principal repayments 60 154 401 140 173 200 229 129Public and publicly guaranteed 44 94 385 117 156 179 206 108 Official creditors 39 61 55 77 89 88 116 62 Multilateral 22 33 34 30 36 31 52 25 of which: IBRD 16 23 18 13 10 9 8 11 IDA 0 1 1 1 1 1 1 1 Bilateral 17 27 21 47 53 58 64 37 Private creditors 4 33 330 40 67 90 90 45 of which: Bonds 0 0 150 0 0 0 0 0 Commercial banks 4 22 146 36 60 83 68 40Private nonguaranteed 16 60 16 23 18 21 23 21 of which: Bonds 0 0 0 0 0 0 0 0Interest payments 43 56 52 36 35 30 30 27Public and publicly guaranteed 37 50 51 35 33 30 30 26 Official creditors 33 35 23 22 21 20 19 18 Multilateral 19 16 9 7 6 7 8 9 of which: IBRD 14 11 5 2 1 2 3 4 IDA 0 0 0 0 0 0 0 0 Bilateral 14 19 14 16 15 13 11 9 Private creditors 4 14 29 13 12 11 11 8 of which: Bonds 0 0 5 0 0 0 0 0 Commercial banks 3 12 22 11 10 9 9 7Private nonguaranteed 6 6 1 1 2 0 0 1 of which: Bonds 0 0 0 0 0 0 0 08. Debt stock-flow reconciliationTotal change in external debt stocks 138 374 -131 742 -255 836 -501 1,628 Net flows on external debt 76 312 -79 630 -296 920 -535 1,617 Cross-currency valuation 40 21 -42 96 42 -74 40 419. Debt restructuringsTotal amount rescheduled 0 0 0 0 0 0 0 0Total amount forgiven 0 0 0 0 0 0 0 0Debt buyback 0 0 0 0 0 0 0 010. Contractual obligations on outstanding long-term external debt
2008 2009 2010 2011 2012 2013 2014 2015Official creditorsPrincipal 92 91 86 71 78 56 48 45Interest 20 20 19 17 16 13 11 10Private creditorsPrincipal 41 36 35 24 15 14 7 5Interest 9 7 5 3 2 1 1 0
Notes:Short-term debt data are World Bank staff estimates based on BIS data and include debt liabilities of offshore centers located in the country.
169

MEXICO(US$ million, unless otherwise indicated)
1990 1995 2000 2003 2004 2005 2006 2007
1. Summary external debt dataExternal debt stocks 104,442 165,379 150,901 170,847 171,162 167,942 160,490 178,108 Long-term external debt 81,809 112,250 131,969 161,668 162,072 161,363 153,144 169,102 Public and publicly guaranteed 75,974 93,902 81,488 106,660 108,507 108,482 96,094 105,379 Private nonguaranteed 5,835 18,348 50,481 55,009 53,565 52,881 57,050 63,723 Use of IMF credit 6,551 15,828 0 0 0 0 0 0 Short-term external debt 16,082 37,300 18,932 9,178 9,090 6,578 7,346 9,006 interest arrears on long-term 0 0 0 0 0 0 0 0Memorandum itemsPrincipal arrears on long-term 0 0 0 0 0 0 0 0Long-term public sector debt 75,595 93,471 81,210 106,447 108,382 108,448 96,087 105,375Long-term private sector debt 6,214 18,779 50,758 55,221 53,690 52,916 57,058 63,727Public & publicly guaranteed commitments 12,484 24,610 10,828 24,738 16,437 14,933 14,964 16,668
External debt flowsDisbursements 14,229 42,966 34,024 36,031 40,316 33,895 31,998 37,107 Long-term external debt 12,045 29,678 32,830 36,031 40,316 33,895 31,998 37,107 IMF purchases 2,184 13,288 1,194 0 0 0 0 0Principal repayments 4,012 15,309 44,451 31,534 39,837 34,794 44,566 28,316 Long-term external debt 2,821 14,165 38,958 31,534 39,837 34,794 44,566 28,316 IMF repurchases 1,191 1,144 5,493 0 0 0 0 0Net flows 17,637 25,635 -15,557 3,775 390 -3,410 -11,801 10,451 Long-term external debt 9,224 15,513 -6,128 4,496 479 -899 -12,568 8,791 IMF flows 993 12,144 -4,299 0 0 0 0 0 Short-term external debt 7,420 -2,022 -5,130 -722 -89 -2,511 767 1,660Interest payments 7,301 10,801 14,059 10,704 10,644 10,338 11,505 11,985 Long-term external debt 5,797 7,645 12,014 10,364 10,194 9,694 10,985 11,302 IMF charges 522 545 153 0 0 0 0 0 Short-term external debt 982 2,611 1,892 340 450 644 520 683
2. Other non-debt resource flowsForeign direct investment (net) 2,549 9,526 17,942 15,007 22,883 20,945 19,291 24,686Portfolio equity flows 1,995 519 447 -123 -2,522 3,353 2,805 -482Profit remittances on FDI 2,304 4,259 6,018 3,569 3,606 6,149 6,110 6,695Grants (excluding technical coop.) 54 31 23 25 42 108 95 129of which: Debt forgiveness grants .. .. 0 1 0 0 0 0 IDA grants .. .. .. 0 0 0 0 0Memo: technical coop. grants 81 122 109 155 132 147 196 108
3. Currency composition of public and publicly guaranteed debt (%)Euro .. .. .. 0.3 1.3 1.1 1.3 1.1Japanese yen 6.3 8.3 7.6 3.7 2.6 1.8 1.0 0.8Pound sterling 1.4 0.7 0.2 0.2 0.2 0.1 0.1 0.1Swiss franc 0.6 0.4 0.0 0.2 0.2 0.2 0.2 0.2U.S.dollars 64.3 65.2 85.0 93.6 94.2 95.7 96.9 97.4
4. Average terms of new commitmentsOfficial creditors Interest (%) 7.8 9.1 5.4 2.2 2.1 4.1 4.9 7.1 Maturity (years) 15.6 9.3 14.8 13.7 12.2 20.4 13.7 13.0 Grace period (years) 4.5 2.9 4.8 7.1 3.7 4.7 4.4 4.3Private creditors Interest (%) 9.4 6.2 8.4 5.5 5.9 6.5 5.5 6.6 Maturity (years) 11.5 3.6 9.2 13.7 14.3 14.1 10.9 16.3 Grace period (years) 6.1 2.5 8.8 10.2 10.6 7.0 7.0 10.9
5. Major economic aggregatesGross national income (GNI) 254,084 273,409 566,409 688,020 749,084 833,350 934,379 1,008,694Exports of goods, services & income 54,570 96,707 192,425 194,891 224,392 256,012 296,466 321,457Worker remit. & comp. of employees 3,098 4,368 7,525 16,556 19,861 23,062 26,877 27,144Imports of goods & services 63,504 98,571 211,530 203,926 231,417 261,668 299,077 327,335International reserves 10,217 17,046 35,577 59,027 64,202 74,110 76,329 87,208Current account balance -7,451 -1,576 -18,684 -8,573 -6,594 -5,207 -2,229 -5,525
6. RatiosExternal debt stocks to exports (%) 191.4 171.0 78.4 87.7 76.3 65.6 54.1 55.4External debt stocks to GNI (%) 41.1 60.5 26.6 24.8 22.8 20.2 17.2 17.7Debt service to exports (%) 20.7 27.0 30.4 21.7 22.5 17.6 18.9 12.5Short-term to external debt stocks (%) 15.4 22.6 12.5 5.4 5.3 3.9 4.6 5.1Multilateral to external debt stocks (%) 13.7 11.3 11.4 10.3 9.8 9.8 5.1 5.1Reserves to external debt stocks (%) 9.8 10.3 23.6 34.5 37.5 44.1 47.6 49.0Reserves to imports (months) 1.9 2.1 2.0 3.5 3.3 3.4 3.1 3.2
170
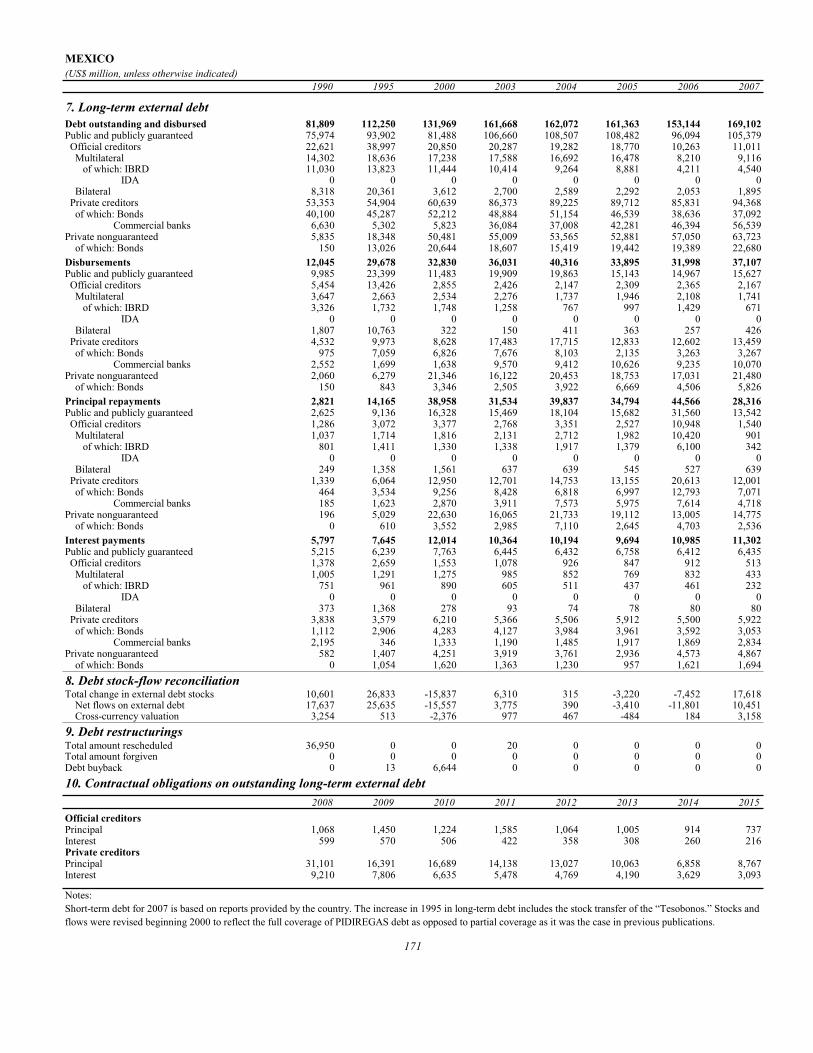
MEXICO(US$ million, unless otherwise indicated)
1990 1995 2000 2003 2004 2005 2006 2007
7. Long-term external debtDebt outstanding and disbursed 81,809 112,250 131,969 161,668 162,072 161,363 153,144 169,102Public and publicly guaranteed 75,974 93,902 81,488 106,660 108,507 108,482 96,094 105,379 Official creditors 22,621 38,997 20,850 20,287 19,282 18,770 10,263 11,011 Multilateral 14,302 18,636 17,238 17,588 16,692 16,478 8,210 9,116 of which: IBRD 11,030 13,823 11,444 10,414 9,264 8,881 4,211 4,540 IDA 0 0 0 0 0 0 0 0 Bilateral 8,318 20,361 3,612 2,700 2,589 2,292 2,053 1,895 Private creditors 53,353 54,904 60,639 86,373 89,225 89,712 85,831 94,368 of which: Bonds 40,100 45,287 52,212 48,884 51,154 46,539 38,636 37,092 Commercial banks 6,630 5,302 5,823 36,084 37,008 42,281 46,394 56,539Private nonguaranteed 5,835 18,348 50,481 55,009 53,565 52,881 57,050 63,723 of which: Bonds 150 13,026 20,644 18,607 15,419 19,442 19,389 22,680Disbursements 12,045 29,678 32,830 36,031 40,316 33,895 31,998 37,107Public and publicly guaranteed 9,985 23,399 11,483 19,909 19,863 15,143 14,967 15,627 Official creditors 5,454 13,426 2,855 2,426 2,147 2,309 2,365 2,167 Multilateral 3,647 2,663 2,534 2,276 1,737 1,946 2,108 1,741 of which: IBRD 3,326 1,732 1,748 1,258 767 997 1,429 671 IDA 0 0 0 0 0 0 0 0 Bilateral 1,807 10,763 322 150 411 363 257 426 Private creditors 4,532 9,973 8,628 17,483 17,715 12,833 12,602 13,459 of which: Bonds 975 7,059 6,826 7,676 8,103 2,135 3,263 3,267 Commercial banks 2,552 1,699 1,638 9,570 9,412 10,626 9,235 10,070Private nonguaranteed 2,060 6,279 21,346 16,122 20,453 18,753 17,031 21,480 of which: Bonds 150 843 3,346 2,505 3,922 6,669 4,506 5,826Principal repayments 2,821 14,165 38,958 31,534 39,837 34,794 44,566 28,316Public and publicly guaranteed 2,625 9,136 16,328 15,469 18,104 15,682 31,560 13,542 Official creditors 1,286 3,072 3,377 2,768 3,351 2,527 10,948 1,540 Multilateral 1,037 1,714 1,816 2,131 2,712 1,982 10,420 901 of which: IBRD 801 1,411 1,330 1,338 1,917 1,379 6,100 342 IDA 0 0 0 0 0 0 0 0 Bilateral 249 1,358 1,561 637 639 545 527 639 Private creditors 1,339 6,064 12,950 12,701 14,753 13,155 20,613 12,001 of which: Bonds 464 3,534 9,256 8,428 6,818 6,997 12,793 7,071 Commercial banks 185 1,623 2,870 3,911 7,573 5,975 7,614 4,718Private nonguaranteed 196 5,029 22,630 16,065 21,733 19,112 13,005 14,775 of which: Bonds 0 610 3,552 2,985 7,110 2,645 4,703 2,536Interest payments 5,797 7,645 12,014 10,364 10,194 9,694 10,985 11,302Public and publicly guaranteed 5,215 6,239 7,763 6,445 6,432 6,758 6,412 6,435 Official creditors 1,378 2,659 1,553 1,078 926 847 912 513 Multilateral 1,005 1,291 1,275 985 852 769 832 433 of which: IBRD 751 961 890 605 511 437 461 232 IDA 0 0 0 0 0 0 0 0 Bilateral 373 1,368 278 93 74 78 80 80 Private creditors 3,838 3,579 6,210 5,366 5,506 5,912 5,500 5,922 of which: Bonds 1,112 2,906 4,283 4,127 3,984 3,961 3,592 3,053 Commercial banks 2,195 346 1,333 1,190 1,485 1,917 1,869 2,834Private nonguaranteed 582 1,407 4,251 3,919 3,761 2,936 4,573 4,867 of which: Bonds 0 1,054 1,620 1,363 1,230 957 1,621 1,6948. Debt stock-flow reconciliationTotal change in external debt stocks 10,601 26,833 -15,837 6,310 315 -3,220 -7,452 17,618 Net flows on external debt 17,637 25,635 -15,557 3,775 390 -3,410 -11,801 10,451 Cross-currency valuation 3,254 513 -2,376 977 467 -484 184 3,1589. Debt restructuringsTotal amount rescheduled 36,950 0 0 20 0 0 0 0Total amount forgiven 0 0 0 0 0 0 0 0Debt buyback 0 13 6,644 0 0 0 0 010. Contractual obligations on outstanding long-term external debt
2008 2009 2010 2011 2012 2013 2014 2015Official creditorsPrincipal 1,068 1,450 1,224 1,585 1,064 1,005 914 737Interest 599 570 506 422 358 308 260 216Private creditorsPrincipal 31,101 16,391 16,689 14,138 13,027 10,063 6,858 8,767Interest 9,210 7,806 6,635 5,478 4,769 4,190 3,629 3,093
Notes:Short-term debt for 2007 is based on reports provided by the country. The increase in 1995 in long-term debt includes the stock transfer of the “Tesobonos.” Stocks and flows were revised beginning 2000 to reflect the full coverage of PIDIREGAS debt as opposed to partial coverage as it was the case in previous publications.
171
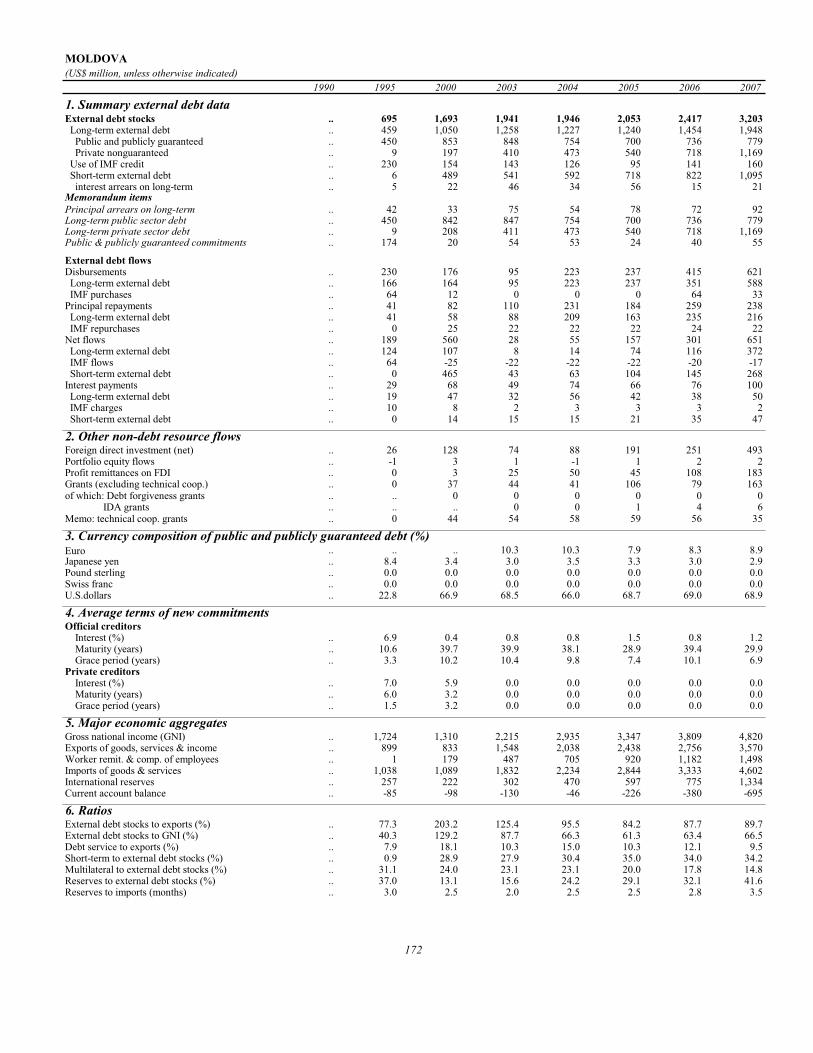
MOLDOVA(US$ million, unless otherwise indicated)
1990 1995 2000 2003 2004 2005 2006 2007
1. Summary external debt dataExternal debt stocks .. 695 1,693 1,941 1,946 2,053 2,417 3,203 Long-term external debt .. 459 1,050 1,258 1,227 1,240 1,454 1,948 Public and publicly guaranteed .. 450 853 848 754 700 736 779 Private nonguaranteed .. 9 197 410 473 540 718 1,169 Use of IMF credit .. 230 154 143 126 95 141 160 Short-term external debt .. 6 489 541 592 718 822 1,095 interest arrears on long-term .. 5 22 46 34 56 15 21Memorandum itemsPrincipal arrears on long-term .. 42 33 75 54 78 72 92Long-term public sector debt .. 450 842 847 754 700 736 779Long-term private sector debt .. 9 208 411 473 540 718 1,169Public & publicly guaranteed commitments .. 174 20 54 53 24 40 55
External debt flowsDisbursements .. 230 176 95 223 237 415 621 Long-term external debt .. 166 164 95 223 237 351 588 IMF purchases .. 64 12 0 0 0 64 33Principal repayments .. 41 82 110 231 184 259 238 Long-term external debt .. 41 58 88 209 163 235 216 IMF repurchases .. 0 25 22 22 22 24 22Net flows .. 189 560 28 55 157 301 651 Long-term external debt .. 124 107 8 14 74 116 372 IMF flows .. 64 -25 -22 -22 -22 -20 -17 Short-term external debt .. 0 465 43 63 104 145 268Interest payments .. 29 68 49 74 66 76 100 Long-term external debt .. 19 47 32 56 42 38 50 IMF charges .. 10 8 2 3 3 3 2 Short-term external debt .. 0 14 15 15 21 35 47
2. Other non-debt resource flowsForeign direct investment (net) .. 26 128 74 88 191 251 493Portfolio equity flows .. -1 3 1 -1 1 2 2Profit remittances on FDI .. 0 3 25 50 45 108 183Grants (excluding technical coop.) .. 0 37 44 41 106 79 163of which: Debt forgiveness grants .. .. 0 0 0 0 0 0 IDA grants .. .. .. 0 0 1 4 6Memo: technical coop. grants .. 0 44 54 58 59 56 35
3. Currency composition of public and publicly guaranteed debt (%)Euro .. .. .. 10.3 10.3 7.9 8.3 8.9Japanese yen .. 8.4 3.4 3.0 3.5 3.3 3.0 2.9Pound sterling .. 0.0 0.0 0.0 0.0 0.0 0.0 0.0Swiss franc .. 0.0 0.0 0.0 0.0 0.0 0.0 0.0U.S.dollars .. 22.8 66.9 68.5 66.0 68.7 69.0 68.9
4. Average terms of new commitmentsOfficial creditors Interest (%) .. 6.9 0.4 0.8 0.8 1.5 0.8 1.2 Maturity (years) .. 10.6 39.7 39.9 38.1 28.9 39.4 29.9 Grace period (years) .. 3.3 10.2 10.4 9.8 7.4 10.1 6.9Private creditors Interest (%) .. 7.0 5.9 0.0 0.0 0.0 0.0 0.0 Maturity (years) .. 6.0 3.2 0.0 0.0 0.0 0.0 0.0 Grace period (years) .. 1.5 3.2 0.0 0.0 0.0 0.0 0.0
5. Major economic aggregatesGross national income (GNI) .. 1,724 1,310 2,215 2,935 3,347 3,809 4,820Exports of goods, services & income .. 899 833 1,548 2,038 2,438 2,756 3,570Worker remit. & comp. of employees .. 1 179 487 705 920 1,182 1,498Imports of goods & services .. 1,038 1,089 1,832 2,234 2,844 3,333 4,602International reserves .. 257 222 302 470 597 775 1,334Current account balance .. -85 -98 -130 -46 -226 -380 -695
6. RatiosExternal debt stocks to exports (%) .. 77.3 203.2 125.4 95.5 84.2 87.7 89.7External debt stocks to GNI (%) .. 40.3 129.2 87.7 66.3 61.3 63.4 66.5Debt service to exports (%) .. 7.9 18.1 10.3 15.0 10.3 12.1 9.5Short-term to external debt stocks (%) .. 0.9 28.9 27.9 30.4 35.0 34.0 34.2Multilateral to external debt stocks (%) .. 31.1 24.0 23.1 23.1 20.0 17.8 14.8Reserves to external debt stocks (%) .. 37.0 13.1 15.6 24.2 29.1 32.1 41.6Reserves to imports (months) .. 3.0 2.5 2.0 2.5 2.5 2.8 3.5
172

MOLDOVA(US$ million, unless otherwise indicated)
1990 1995 2000 2003 2004 2005 2006 2007
7. Long-term external debtDebt outstanding and disbursed .. 459 1,050 1,258 1,227 1,240 1,454 1,948Public and publicly guaranteed .. 450 853 848 754 700 736 779 Official creditors .. 430 746 794 712 666 711 761 Multilateral .. 216 406 448 449 411 431 475 of which: IBRD .. 152 191 190 185 161 151 141 IDA .. 0 103 175 201 209 242 292 Bilateral .. 214 340 346 263 255 280 286 Private creditors .. 19 107 54 42 34 25 18 of which: Bonds .. 0 75 34 32 25 19 13 Commercial banks .. 4 12 9 10 7 6 5Private nonguaranteed .. 9 197 410 473 540 718 1,169 of which: Bonds .. 0 0 0 0 0 0 0Disbursements .. 166 164 95 223 237 351 588Public and publicly guaranteed .. 159 54 24 24 26 31 47 Official creditors .. 139 52 24 24 26 31 47 Multilateral .. 81 50 22 21 25 29 47 of which: IBRD .. 50 6 2 2 0 0 0 IDA .. 0 30 16 17 24 23 39 Bilateral .. 58 1 2 2 1 3 1 Private creditors .. 19 2 0 0 0 0 0 of which: Bonds .. 0 0 0 0 0 0 0 Commercial banks .. 4 0 0 0 0 0 0Private nonguaranteed .. 7 110 71 199 211 320 541 of which: Bonds .. 0 0 0 0 0 0 0Principal repayments .. 41 58 88 209 163 235 216Public and publicly guaranteed .. 39 30 47 79 43 53 40 Official creditors .. 39 27 41 74 36 45 33 Multilateral .. 35 22 36 36 36 23 20 of which: IBRD .. 0 5 11 13 13 14 15 IDA .. 0 0 0 0 0 0 1 Bilateral .. 4 5 4 38 0 22 13 Private creditors .. 0 3 6 6 7 8 7 of which: Bonds .. 0 0 2 2 6 6 6 Commercial banks .. 0 0 1 0 1 1 1Private nonguaranteed .. 2 28 41 130 120 181 176 of which: Bonds .. 0 0 0 0 0 0 0Interest payments .. 19 47 32 56 42 38 50Public and publicly guaranteed .. 19 40 20 32 22 17 18 Official creditors .. 19 28 17 28 20 15 16 Multilateral .. 11 18 11 10 10 11 12 of which: IBRD .. 8 11 7 6 6 7 8 IDA .. 0 1 1 2 2 2 2 Bilateral .. 8 10 5 18 10 3 4 Private creditors .. 0 11 3 4 2 3 2 of which: Bonds .. 0 7 2 2 2 2 2 Commercial banks .. 0 0 0 0 0 0 0Private nonguaranteed .. 0 7 12 24 20 21 33 of which: Bonds .. 0 0 0 0 0 0 08. Debt stock-flow reconciliationTotal change in external debt stocks .. 193 671 137 4 107 364 786 Net flows on external debt .. 189 560 28 55 157 301 651 Cross-currency valuation .. -9 -32 60 27 -47 25 309. Debt restructuringsTotal amount rescheduled .. 0 246 3 18 0 88 32Total amount forgiven .. 0 0 0 0 0 0 0Debt buyback .. 0 0 0 0 0 0 010. Contractual obligations on outstanding long-term external debt
2008 2009 2010 2011 2012 2013 2014 2015Official creditorsPrincipal 64 55 52 49 48 55 49 42Interest 26 21 18 15 13 14 12 10Private creditorsPrincipal 280 275 277 75 37 55 47 50Interest 18 16 14 6 2 4 5 5
Notes:Short-term debt data are based on government statistics and World Bank staff estimates.
173

MONGOLIA(US$ million, unless otherwise indicated)
1990 1995 2000 2003 2004 2005 2006 2007
1. Summary external debt dataExternal debt stocks .. 520 885 1,190 1,351 1,302 1,394 1,596 Long-term external debt .. 472 833 1,137 1,307 1,267 1,363 1,571 Public and publicly guaranteed .. 472 833 1,137 1,307 1,267 1,361 1,566 Private nonguaranteed .. 0 0 0 0 0 3 5 Use of IMF credit .. 47 50 50 44 35 31 26 Short-term external debt .. 0 2 3 0 0 0 0 interest arrears on long-term .. 0 2 3 0 0 0 0Memorandum itemsPrincipal arrears on long-term .. 4 17 15 27 21 25 26Long-term public sector debt .. 451 832 1,137 1,307 1,267 1,361 1,566Long-term private sector debt .. 22 1 0 0 0 3 5Public & publicly guaranteed commitments .. 250 102 66 24 64 55 130
External debt flowsDisbursements .. 101 83 122 128 91 92 165 Long-term external debt .. 101 75 111 128 91 92 165 IMF purchases .. 0 8 11 0 0 0 0Principal repayments .. 42 28 274 20 23 31 41 Long-term external debt .. 32 22 265 13 17 25 35 IMF repurchases .. 9 6 9 7 6 6 7Net flows .. 59 55 -151 108 69 61 123 Long-term external debt .. 68 53 -154 115 74 67 130 IMF flows .. -9 0 0 0 0 0 0 Short-term external debt .. 0 0 0 0 0 0 0Interest payments .. 10 10 12 14 15 15 15 Long-term external debt .. 9 9 12 14 15 15 14 IMF charges .. 1 0 0 0 0 0 0 Short-term external debt .. 0 0 0 0 0 0 0
2. Other non-debt resource flowsForeign direct investment (net) .. 10 54 132 93 185 344 328Portfolio equity flows .. 0 0 0 0 0 0 0Profit remittances on FDI .. 18 9 5 10 41 145 0Grants (excluding technical coop.) .. 74 82 68 74 65 80 98of which: Debt forgiveness grants .. .. 0 0 0 0 14 0 IDA grants .. .. .. 0 0 0 1 5Memo: technical coop. grants .. 56 61 77 73 85 79 76
3. Currency composition of public and publicly guaranteed debt (%)Euro .. .. .. 7.9 8.0 7.6 8.4 8.4Japanese yen .. 26.5 25.0 23.2 22.4 21.4 19.6 17.7Pound sterling .. 0.0 0.0 0.0 0.0 0.0 0.0 0.0Swiss franc .. 2.3 0.7 0.7 0.7 0.6 0.6 0.6U.S.dollars .. 38.1 35.8 39.9 42.9 44.5 45.2 47.1
4. Average terms of new commitmentsOfficial creditors Interest (%) .. 2.2 1.2 1.2 0.8 1.1 1.0 1.2 Maturity (years) .. 35.3 31.9 30.2 39.9 31.7 32.5 34.0 Grace period (years) .. 10.1 9.3 8.4 10.0 7.7 8.5 8.3Private creditors Interest (%) .. 0.0 0.0 1.2 0.0 0.0 0.0 8.6 Maturity (years) .. 0.0 0.0 10.4 0.0 0.0 0.0 3.0 Grace period (years) .. 0.0 0.0 2.4 0.0 0.0 0.0 3.0
5. Major economic aggregatesGross national income (GNI) .. 1,201 1,084 1,437 1,805 2,255 3,046 3,851Exports of goods, services & income .. 511 639 978 1,422 1,671 2,228 ..Worker remit. & comp. of employees .. 0 12 129 203 180 181 194Imports of goods & services .. 550 791 1,109 1,432 1,635 2,042 ..International reserves .. 158 202 243 250 430 1,062 1,396Current account balance .. 39 -70 -99 63 84 222 ..
6. RatiosExternal debt stocks to exports (%) .. 101.6 138.7 121.7 95.0 77.9 62.6 ..External debt stocks to GNI (%) .. 43.3 81.7 82.8 74.9 57.7 45.8 41.5Debt service to exports (%) .. 10.1 5.9 29.3 2.4 2.3 2.1 ..Short-term to external debt stocks (%) .. 0.1 0.2 0.3 0.0 0.0 0.0 0.0Multilateral to external debt stocks (%) .. 32.7 52.2 57.8 59.9 60.5 61.2 59.0Reserves to external debt stocks (%) .. 30.3 22.8 20.4 18.5 33.1 76.2 87.4Reserves to imports (months) .. 3.4 3.1 2.6 2.1 3.2 6.2 ..
174

MONGOLIA(US$ million, unless otherwise indicated)
1990 1995 2000 2003 2004 2005 2006 2007
7. Long-term external debtDebt outstanding and disbursed .. 472 833 1,137 1,307 1,267 1,363 1,571Public and publicly guaranteed .. 472 833 1,137 1,307 1,267 1,361 1,566 Official creditors .. 404 831 1,137 1,306 1,266 1,348 1,475 Multilateral .. 170 462 688 810 787 854 942 of which: IBRD .. 0 0 0 0 0 0 0 IDA .. 59 137 227 287 277 301 331 Bilateral .. 234 369 449 497 479 494 533 Private creditors .. 68 3 1 0 0 13 90 of which: Bonds .. 0 0 0 0 0 0 75 Commercial banks .. 15 1 1 0 0 0 0Private nonguaranteed .. 0 0 0 0 0 3 5 of which: Bonds .. 0 0 0 0 0 0 0Disbursements .. 101 75 111 128 91 92 165Public and publicly guaranteed .. 101 75 111 128 91 89 162 Official creditors .. 95 75 111 128 91 71 82 Multilateral .. 58 47 72 93 48 49 50 of which: IBRD .. 0 0 0 0 0 0 0 IDA .. 8 14 29 49 14 13 20 Bilateral .. 37 28 39 36 43 22 31 Private creditors .. 6 0 0 0 0 18 81 of which: Bonds .. 0 0 0 0 0 0 75 Commercial banks .. 0 0 0 0 0 0 0Private nonguaranteed .. 0 0 0 0 0 2 2 of which: Bonds .. 0 0 0 0 0 0 0Principal repayments .. 32 22 265 13 17 25 35Public and publicly guaranteed .. 32 22 265 13 17 25 35 Official creditors .. 13 19 265 13 17 20 31 Multilateral .. 0 0 2 4 6 8 11 of which: IBRD .. 0 0 0 0 0 0 0 IDA .. 0 0 1 1 2 2 3 Bilateral .. 13 19 264 9 11 12 21 Private creditors .. 19 3 0 0 0 5 3 of which: Bonds .. 0 0 0 0 0 0 0 Commercial banks .. 5 0 0 0 0 0 0Private nonguaranteed .. 0 0 0 0 0 0 0 of which: Bonds .. 0 0 0 0 0 0 0Interest payments .. 9 9 12 14 15 15 14Public and publicly guaranteed .. 9 9 12 14 15 15 14 Official creditors .. 5 9 12 14 15 15 14 Multilateral .. 1 4 6 7 7 8 8 of which: IBRD .. 0 0 0 0 0 0 0 IDA .. 0 1 1 2 2 2 2 Bilateral .. 4 5 6 7 8 7 6 Private creditors .. 4 0 0 0 0 0 0 of which: Bonds .. 0 0 0 0 0 0 0 Commercial banks .. 1 0 0 0 0 0 0Private nonguaranteed .. 0 0 0 0 0 0 0 of which: Bonds .. 0 0 0 0 0 0 08. Debt stock-flow reconciliationTotal change in external debt stocks .. 58 -8 196 161 -49 93 202 Net flows on external debt .. 59 55 -151 108 69 61 123 Cross-currency valuation .. 0 -60 103 51 -117 37 789. Debt restructuringsTotal amount rescheduled .. 0 0 0 0 0 3 0Total amount forgiven .. 0 0 0 0 0 13 0Debt buyback .. 0 0 0 0 0 0 010. Contractual obligations on outstanding long-term external debt
2008 2009 2010 2011 2012 2013 2014 2015Official creditorsPrincipal 43 46 48 56 61 63 65 69Interest 21 21 21 21 20 19 19 18Private creditorsPrincipal 4 7 79 3 3 3 0 0Interest 7 7 0 0 0 0 0 0
Notes:Data on long-term public and publicly guaranteed debt for 2007 are World Bank staff estimates.
175
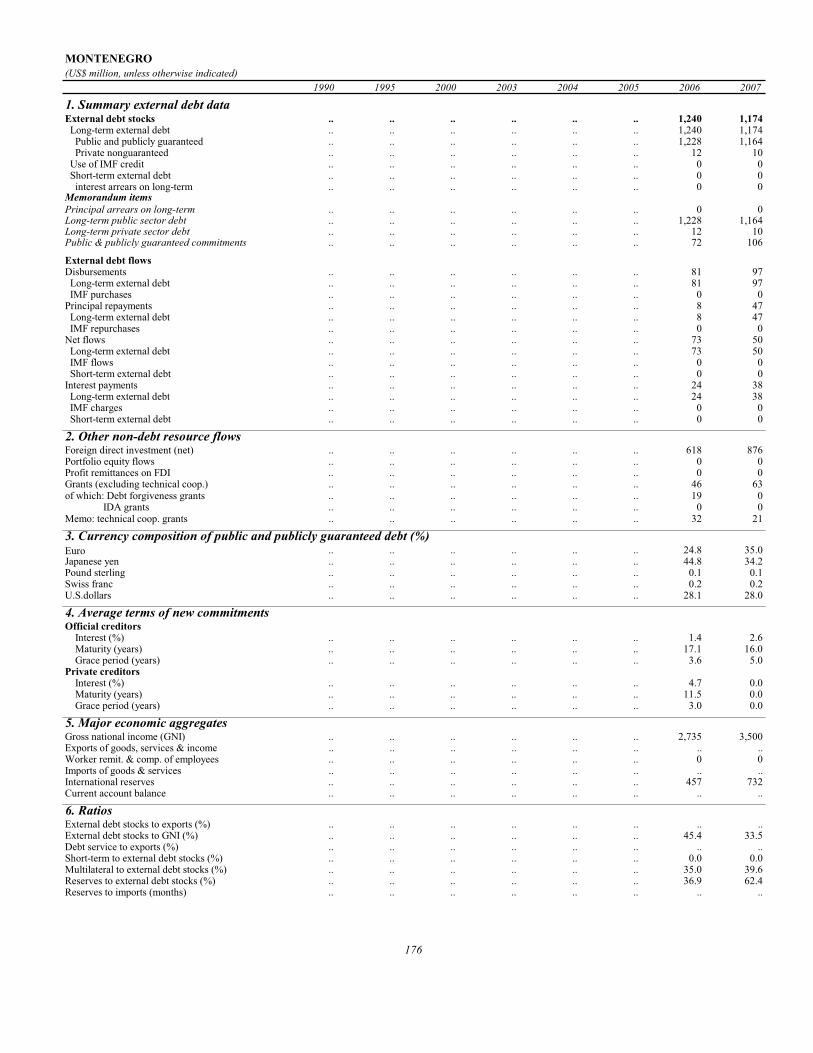
MONTENEGRO(US$ million, unless otherwise indicated)
1990 1995 2000 2003 2004 2005 2006 2007
1. Summary external debt dataExternal debt stocks .. .. .. .. .. .. 1,240 1,174 Long-term external debt .. .. .. .. .. .. 1,240 1,174 Public and publicly guaranteed .. .. .. .. .. .. 1,228 1,164 Private nonguaranteed .. .. .. .. .. .. 12 10 Use of IMF credit .. .. .. .. .. .. 0 0 Short-term external debt .. .. .. .. .. .. 0 0 interest arrears on long-term .. .. .. .. .. .. 0 0Memorandum itemsPrincipal arrears on long-term .. .. .. .. .. .. 0 0Long-term public sector debt .. .. .. .. .. .. 1,228 1,164Long-term private sector debt .. .. .. .. .. .. 12 10Public & publicly guaranteed commitments .. .. .. .. .. .. 72 106
External debt flowsDisbursements .. .. .. .. .. .. 81 97 Long-term external debt .. .. .. .. .. .. 81 97 IMF purchases .. .. .. .. .. .. 0 0Principal repayments .. .. .. .. .. .. 8 47 Long-term external debt .. .. .. .. .. .. 8 47 IMF repurchases .. .. .. .. .. .. 0 0Net flows .. .. .. .. .. .. 73 50 Long-term external debt .. .. .. .. .. .. 73 50 IMF flows .. .. .. .. .. .. 0 0 Short-term external debt .. .. .. .. .. .. 0 0Interest payments .. .. .. .. .. .. 24 38 Long-term external debt .. .. .. .. .. .. 24 38 IMF charges .. .. .. .. .. .. 0 0 Short-term external debt .. .. .. .. .. .. 0 0
2. Other non-debt resource flowsForeign direct investment (net) .. .. .. .. .. .. 618 876Portfolio equity flows .. .. .. .. .. .. 0 0Profit remittances on FDI .. .. .. .. .. .. 0 0Grants (excluding technical coop.) .. .. .. .. .. .. 46 63of which: Debt forgiveness grants .. .. .. .. .. .. 19 0 IDA grants .. .. .. .. .. .. 0 0Memo: technical coop. grants .. .. .. .. .. .. 32 21
3. Currency composition of public and publicly guaranteed debt (%)Euro .. .. .. .. .. .. 24.8 35.0Japanese yen .. .. .. .. .. .. 44.8 34.2Pound sterling .. .. .. .. .. .. 0.1 0.1Swiss franc .. .. .. .. .. .. 0.2 0.2U.S.dollars .. .. .. .. .. .. 28.1 28.0
4. Average terms of new commitmentsOfficial creditors Interest (%) .. .. .. .. .. .. 1.4 2.6 Maturity (years) .. .. .. .. .. .. 17.1 16.0 Grace period (years) .. .. .. .. .. .. 3.6 5.0Private creditors Interest (%) .. .. .. .. .. .. 4.7 0.0 Maturity (years) .. .. .. .. .. .. 11.5 0.0 Grace period (years) .. .. .. .. .. .. 3.0 0.0
5. Major economic aggregatesGross national income (GNI) .. .. .. .. .. .. 2,735 3,500Exports of goods, services & income .. .. .. .. .. .. .. ..Worker remit. & comp. of employees .. .. .. .. .. .. 0 0Imports of goods & services .. .. .. .. .. .. .. ..International reserves .. .. .. .. .. .. 457 732Current account balance .. .. .. .. .. .. .. ..
6. RatiosExternal debt stocks to exports (%) .. .. .. .. .. .. .. ..External debt stocks to GNI (%) .. .. .. .. .. .. 45.4 33.5Debt service to exports (%) .. .. .. .. .. .. .. ..Short-term to external debt stocks (%) .. .. .. .. .. .. 0.0 0.0Multilateral to external debt stocks (%) .. .. .. .. .. .. 35.0 39.6Reserves to external debt stocks (%) .. .. .. .. .. .. 36.9 62.4Reserves to imports (months) .. .. .. .. .. .. .. ..
176
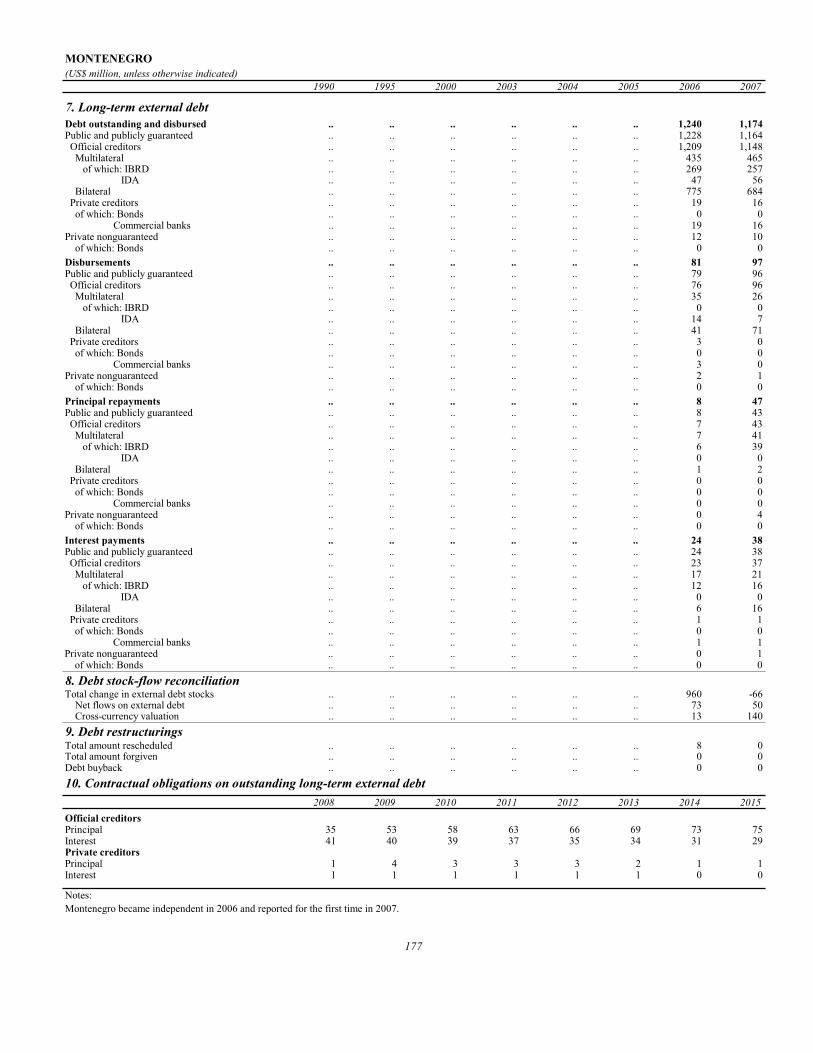
MONTENEGRO(US$ million, unless otherwise indicated)
1990 1995 2000 2003 2004 2005 2006 2007
7. Long-term external debtDebt outstanding and disbursed .. .. .. .. .. .. 1,240 1,174Public and publicly guaranteed .. .. .. .. .. .. 1,228 1,164 Official creditors .. .. .. .. .. .. 1,209 1,148 Multilateral .. .. .. .. .. .. 435 465 of which: IBRD .. .. .. .. .. .. 269 257 IDA .. .. .. .. .. .. 47 56 Bilateral .. .. .. .. .. .. 775 684 Private creditors .. .. .. .. .. .. 19 16 of which: Bonds .. .. .. .. .. .. 0 0 Commercial banks .. .. .. .. .. .. 19 16Private nonguaranteed .. .. .. .. .. .. 12 10 of which: Bonds .. .. .. .. .. .. 0 0Disbursements .. .. .. .. .. .. 81 97Public and publicly guaranteed .. .. .. .. .. .. 79 96 Official creditors .. .. .. .. .. .. 76 96 Multilateral .. .. .. .. .. .. 35 26 of which: IBRD .. .. .. .. .. .. 0 0 IDA .. .. .. .. .. .. 14 7 Bilateral .. .. .. .. .. .. 41 71 Private creditors .. .. .. .. .. .. 3 0 of which: Bonds .. .. .. .. .. .. 0 0 Commercial banks .. .. .. .. .. .. 3 0Private nonguaranteed .. .. .. .. .. .. 2 1 of which: Bonds .. .. .. .. .. .. 0 0Principal repayments .. .. .. .. .. .. 8 47Public and publicly guaranteed .. .. .. .. .. .. 8 43 Official creditors .. .. .. .. .. .. 7 43 Multilateral .. .. .. .. .. .. 7 41 of which: IBRD .. .. .. .. .. .. 6 39 IDA .. .. .. .. .. .. 0 0 Bilateral .. .. .. .. .. .. 1 2 Private creditors .. .. .. .. .. .. 0 0 of which: Bonds .. .. .. .. .. .. 0 0 Commercial banks .. .. .. .. .. .. 0 0Private nonguaranteed .. .. .. .. .. .. 0 4 of which: Bonds .. .. .. .. .. .. 0 0Interest payments .. .. .. .. .. .. 24 38Public and publicly guaranteed .. .. .. .. .. .. 24 38 Official creditors .. .. .. .. .. .. 23 37 Multilateral .. .. .. .. .. .. 17 21 of which: IBRD .. .. .. .. .. .. 12 16 IDA .. .. .. .. .. .. 0 0 Bilateral .. .. .. .. .. .. 6 16 Private creditors .. .. .. .. .. .. 1 1 of which: Bonds .. .. .. .. .. .. 0 0 Commercial banks .. .. .. .. .. .. 1 1Private nonguaranteed .. .. .. .. .. .. 0 1 of which: Bonds .. .. .. .. .. .. 0 08. Debt stock-flow reconciliationTotal change in external debt stocks .. .. .. .. .. .. 960 -66 Net flows on external debt .. .. .. .. .. .. 73 50 Cross-currency valuation .. .. .. .. .. .. 13 1409. Debt restructuringsTotal amount rescheduled .. .. .. .. .. .. 8 0Total amount forgiven .. .. .. .. .. .. 0 0Debt buyback .. .. .. .. .. .. 0 010. Contractual obligations on outstanding long-term external debt
2008 2009 2010 2011 2012 2013 2014 2015Official creditorsPrincipal 35 53 58 63 66 69 73 75Interest 41 40 39 37 35 34 31 29Private creditorsPrincipal 1 4 3 3 3 2 1 1Interest 1 1 1 1 1 1 0 0
Notes:Montenegro became independent in 2006 and reported for the first time in 2007.
177

MOROCCO(US$ million, unless otherwise indicated)
1990 1995 2000 2003 2004 2005 2006 2007
1. Summary external debt dataExternal debt stocks 25,004 23,771 20,674 18,203 16,883 16,174 17,880 20,255 Long-term external debt 23,847 23,521 19,101 16,949 16,704 15,492 16,083 18,344 Public and publicly guaranteed 23,647 23,190 17,239 14,457 14,105 12,441 13,496 15,670 Private nonguaranteed 200 331 1,862 2,493 2,598 3,051 2,588 2,673 Use of IMF credit 750 52 0 0 0 0 0 0 Short-term external debt 407 198 1,573 1,253 179 682 1,797 1,911 interest arrears on long-term 182 92 122 11 11 0 0 0Memorandum itemsPrincipal arrears on long-term 738 138 535 8 12 0 0 0Long-term public sector debt 23,583 22,944 17,077 14,349 14,040 12,381 13,425 15,586Long-term private sector debt 264 577 2,023 2,600 2,663 3,111 2,659 2,758Public & publicly guaranteed commitments 2,406 2,583 535 2,198 1,704 2,252 2,842 3,836
External debt flowsDisbursements 1,853 2,309 1,638 2,219 1,203 2,456 2,426 3,995 Long-term external debt 1,788 2,309 1,638 2,219 1,203 2,456 2,426 3,995 IMF purchases 65 0 0 0 0 0 0 0Principal repayments 908 2,368 1,631 2,966 2,379 2,138 2,784 3,325 Long-term external debt 680 2,268 1,631 2,966 2,379 2,138 2,784 3,325 IMF repurchases 228 100 0 0 0 0 0 0Net flows 1,032 -81 -448 -1,087 -2,250 832 757 823 Long-term external debt 1,108 41 7 -748 -1,176 318 -358 671 IMF flows -158 -100 0 0 0 0 0 0 Short-term external debt 86 -22 -455 -339 -1,074 514 1,115 152Interest payments 887 1,391 1,075 1,329 617 590 618 676 Long-term external debt 795 1,360 948 1,298 592 569 540 590 IMF charges 72 7 0 0 0 0 0 0 Short-term external debt 20 24 127 31 25 22 79 86
2. Other non-debt resource flowsForeign direct investment (net) 165 92 221 2,313 787 1,620 2,366 2,807Portfolio equity flows 0 20 18 8 597 64 -298 -64Profit remittances on FDI 69 100 268 593 670 594 674 730Grants (excluding technical coop.) 480 100 191 232 418 385 423 502of which: Debt forgiveness grants .. .. 38 0 7 0 2 2 IDA grants .. .. .. 0 0 0 0 0Memo: technical coop. grants 182 266 192 350 378 382 401 390
3. Currency composition of public and publicly guaranteed debt (%)Euro .. .. .. 45.1 47.2 46.7 50.0 56.8Japanese yen 2.2 3.8 3.3 5.0 5.4 5.1 5.0 4.7Pound sterling 0.1 0.2 0.1 0.0 0.0 0.0 0.0 0.0Swiss franc 0.2 0.1 0.1 0.2 0.1 0.1 0.1 0.0U.S.dollars 40.1 27.2 37.6 29.4 26.5 23.8 19.6 12.6
4. Average terms of new commitmentsOfficial creditors Interest (%) 5.4 4.4 3.4 3.8 3.4 3.0 3.7 3.9 Maturity (years) 24.1 19.8 25.0 20.2 19.9 19.3 23.0 19.6 Grace period (years) 8.3 5.4 6.4 5.0 4.5 5.5 6.5 5.7Private creditors Interest (%) 9.7 7.1 4.8 4.5 4.2 3.6 4.0 5.2 Maturity (years) 11.6 9.7 10.7 8.5 12.4 11.3 14.7 10.3 Grace period (years) 2.1 1.5 2.8 4.1 0.5 1.2 3.0 8.4
5. Major economic aggregatesGross national income (GNI) 24,835 31,668 36,053 48,783 55,961 58,760 64,703 74,139Exports of goods, services & income 8,328 11,265 12,890 18,234 21,358 24,066 27,916 35,003Worker remit. & comp. of employees 2,006 1,970 2,161 3,614 4,221 4,590 5,451 6,730Imports of goods & services 8,853 12,812 13,686 17,140 21,035 23,811 27,383 36,098International reserves 2,338 3,874 5,017 14,147 16,647 16,551 20,791 24,714Current account balance -196 -1,186 -475 1,582 970 1,041 1,411 -122
6. RatiosExternal debt stocks to exports (%) 300.2 211.0 160.4 99.8 79.0 67.2 64.0 57.9External debt stocks to GNI (%) 100.7 75.1 57.3 37.3 30.2 27.5 27.6 27.3Debt service to exports (%) 21.5 33.4 21.0 23.6 14.0 11.3 12.2 11.4Short-term to external debt stocks (%) 1.6 0.8 7.6 6.9 1.1 4.2 10.1 9.4Multilateral to external debt stocks (%) 18.7 29.1 29.5 31.6 35.6 36.3 37.1 39.0Reserves to external debt stocks (%) 9.3 16.3 24.3 77.7 98.6 102.3 116.3 122.0Reserves to imports (months) 3.2 3.6 4.4 9.9 9.5 8.3 9.1 8.2
178

MOROCCO(US$ million, unless otherwise indicated)
1990 1995 2000 2003 2004 2005 2006 2007
7. Long-term external debtDebt outstanding and disbursed 23,847 23,521 19,101 16,949 16,704 15,492 16,083 18,344Public and publicly guaranteed 23,647 23,190 17,239 14,457 14,105 12,441 13,496 15,670 Official creditors 16,968 16,875 12,754 11,017 11,092 10,117 11,195 13,102 Multilateral 4,687 6,913 6,091 5,758 6,014 5,874 6,635 7,894 of which: IBRD 3,099 3,966 2,837 2,719 2,524 2,258 2,267 2,578 IDA 39 33 27 22 21 20 18 17 Bilateral 12,280 9,962 6,663 5,259 5,078 4,243 4,560 5,208 Private creditors 6,679 6,315 4,485 3,440 3,013 2,325 2,301 2,568 of which: Bonds 0 0 152 587 589 472 527 589 Commercial banks 3,963 4,234 3,300 2,095 1,832 1,466 1,470 1,745Private nonguaranteed 200 331 1,862 2,493 2,598 3,051 2,588 2,673 of which: Bonds 0 0 0 0 0 0 0 0Disbursements 1,788 2,309 1,638 2,219 1,203 2,456 2,426 3,995Public and publicly guaranteed 1,780 2,206 980 1,578 963 1,658 1,850 2,733 Official creditors 1,220 1,521 631 869 861 1,562 1,531 1,830 Multilateral 781 1,008 466 637 651 1,134 1,030 1,125 of which: IBRD 426 426 138 142 129 262 176 418 IDA 0 0 0 0 0 0 0 0 Bilateral 439 513 166 232 210 427 501 705 Private creditors 560 686 349 710 102 97 320 904 of which: Bonds 0 0 0 452 0 0 0 0 Commercial banks 190 224 143 169 91 74 313 903Private nonguaranteed 8 103 658 640 240 798 575 1,262 of which: Bonds 0 0 0 0 0 0 0 0Principal repayments 680 2,268 1,631 2,966 2,379 2,138 2,784 3,325Public and publicly guaranteed 672 2,238 1,592 2,525 2,094 1,881 1,558 1,861 Official creditors 430 1,638 926 1,694 1,455 1,303 1,063 990 Multilateral 276 625 550 1,239 803 689 591 525 of which: IBRD 202 348 307 305 468 309 330 294 IDA 1 1 1 1 1 1 1 1 Bilateral 154 1,012 376 455 652 613 472 464 Private creditors 242 600 666 831 639 578 495 872 of which: Bonds 0 0 30 37 40 41 0 0 Commercial banks 40 112 350 588 395 372 372 777Private nonguaranteed 8 30 39 441 285 258 1,226 1,464 of which: Bonds 0 0 0 0 0 0 0 0Interest payments 795 1,360 948 1,298 592 569 540 590Public and publicly guaranteed 790 1,358 877 1,236 507 501 472 555 Official creditors 580 923 548 1,122 382 388 360 443 Multilateral 306 466 363 302 247 230 235 300 of which: IBRD 226 282 190 125 104 87 88 104 IDA 0 0 0 0 0 0 0 0 Bilateral 274 457 185 819 135 157 126 143 Private creditors 210 436 329 114 125 113 112 112 of which: Bonds 0 0 14 0 25 25 25 27 Commercial banks 45 259 228 64 58 65 70 72Private nonguaranteed 5 2 71 62 85 68 67 34 of which: Bonds 0 0 0 0 0 0 0 08. Debt stock-flow reconciliationTotal change in external debt stocks 2,773 798 -2,262 219 -1,320 -709 1,706 2,412 Net flows on external debt 1,032 -81 -448 -1,087 -2,250 832 757 823 Cross-currency valuation 1,097 757 -732 1,376 619 -1,147 628 9289. Debt restructuringsTotal amount rescheduled 4,118 0 0 0 0 0 0 0Total amount forgiven 31 0 117 0 0 0 0 0Debt buyback 0 0 0 0 0 0 0 010. Contractual obligations on outstanding long-term external debt
2008 2009 2010 2011 2012 2013 2014 2015Official creditorsPrincipal 1,291 1,241 1,344 1,346 1,451 1,361 1,349 1,269Interest 586 608 608 585 550 506 461 413Private creditorsPrincipal 1,109 519 516 483 491 487 470 454Interest 274 225 200 175 151 126 102 79
179

MOZAMBIQUE(US$ million, unless otherwise indicated)
1990 1995 2000 2003 2004 2005 2006 2007
1. Summary external debt dataExternal debt stocks 4,650 7,458 7,249 3,885 4,811 4,507 2,985 3,105 Long-term external debt 4,231 6,978 6,451 3,243 4,122 3,719 2,354 2,533 Public and publicly guaranteed 4,211 5,209 4,734 3,164 3,711 3,719 2,354 2,533 Private nonguaranteed 19 1,769 1,717 79 411 0 0 0 Use of IMF credit 74 202 219 209 197 157 10 15 Short-term external debt 345 279 578 432 491 631 621 557 interest arrears on long-term 207 250 413 370 439 543 532 429Memorandum itemsPrincipal arrears on long-term 725 1,086 762 490 604 520 577 586Long-term public sector debt 4,211 5,209 4,734 3,164 3,711 3,719 2,354 2,533Long-term private sector debt 19 1,769 1,717 79 411 0 0 0Public & publicly guaranteed commitments 177 150 238 81 362 179 313 535
External debt flowsDisbursements 242 267 184 225 351 344 372 347 Long-term external debt 230 267 125 213 349 339 367 342 IMF purchases 12 0 60 12 2 5 5 5Principal repayments 41 85 64 59 48 56 25 15 Long-term external debt 41 71 64 50 39 41 25 15 IMF repurchases 0 14 0 9 9 15 0 0Net flows 173 193 56 101 294 324 348 389 Long-term external debt 189 196 61 163 310 298 343 327 IMF flows 0 0 0 0 0 0 0 0 Short-term external debt -28 11 -64 -64 -10 36 1 57Interest payments 38 77 32 25 25 27 27 26 Long-term external debt 23 75 20 21 22 24 25 21 IMF charges 0 1 1 1 1 0 0 0 Short-term external debt 15 1 11 3 2 2 2 5
2. Other non-debt resource flowsForeign direct investment (net) 9 45 139 337 245 108 154 427Portfolio equity flows 0 0 0 0 0 0 0 0Profit remittances on FDI 0 0 0 42 168 284 471 554Grants (excluding technical coop.) 750 770 729 626 859 819 2,704 1,264of which: Debt forgiveness grants .. .. 187 30 31 31 1,814 2 IDA grants .. .. .. 4 7 20 29 40Memo: technical coop. grants 92 233 173 225 200 183 209 140
3. Currency composition of public and publicly guaranteed debt (%)Euro .. .. .. 2.7 2.5 2.2 3.6 4.4Japanese yen 1.8 1.8 1.8 1.5 1.3 1.1 1.8 1.7Pound sterling 2.4 2.1 2.1 0.0 0.0 0.0 0.0 0.0Swiss franc 0.0 0.0 0.0 0.0 0.0 0.0 0.0 0.0U.S.dollars 52.8 60.4 69.1 75.3 74.2 72.0 67.2 59.3
4. Average terms of new commitmentsOfficial creditors Interest (%) 1.3 0.9 0.8 0.8 0.9 0.7 0.7 1.1 Maturity (years) 34.8 36.8 46.7 41.9 38.0 38.7 43.5 33.2 Grace period (years) 9.2 9.3 12.9 9.7 9.4 9.4 9.7 -101.4Private creditors Interest (%) 9.0 0.0 0.0 0.0 0.0 0.0 4.9 5.7 Maturity (years) 4.9 0.0 0.0 0.0 0.0 0.0 11.2 11.5 Grace period (years) 2.9 0.0 0.0 0.0 0.0 0.0 1.7 2.0
5. Major economic aggregatesGross national income (GNI) 2,320 2,069 4,017 4,469 5,358 6,095 6,280 7,053Exports of goods, services & income 300 470 769 1,434 1,836 2,192 2,943 3,095Worker remit. & comp. of employees 70 59 37 70 58 57 80 99Imports of goods & services 1,164 1,254 1,763 2,443 2,755 3,350 4,201 4,452International reserves 232 195 742 948 1,159 1,103 1,216 1,524Current account balance -415 -445 -764 -816 -607 -761 -773 -795
6. RatiosExternal debt stocks to exports (%) 1,550.9 1,585.6 943.0 271.0 262.0 205.6 101.4 100.3External debt stocks to GNI (%) 200.4 360.6 180.4 86.9 89.8 73.9 47.5 44.0Debt service to exports (%) 26.2 34.5 12.5 5.8 4.0 3.8 1.8 1.3Short-term to external debt stocks (%) 7.4 3.7 8.0 11.1 10.2 14.0 20.8 17.9Multilateral to external debt stocks (%) 10.0 17.1 15.2 46.8 46.0 52.1 34.4 44.7Reserves to external debt stocks (%) 5.0 2.6 10.2 24.4 24.1 24.5 40.8 49.1Reserves to imports (months) 2.4 1.9 5.1 4.7 5.0 4.0 3.5 4.1
180

MOZAMBIQUE(US$ million, unless otherwise indicated)
1990 1995 2000 2003 2004 2005 2006 2007
7. Long-term external debtDebt outstanding and disbursed 4,231 6,978 6,451 3,243 4,122 3,719 2,354 2,533Public and publicly guaranteed 4,211 5,209 4,734 3,164 3,711 3,719 2,354 2,533 Official creditors 3,560 5,163 4,724 3,162 3,710 3,718 2,352 2,524 Multilateral 464 1,277 1,100 1,818 2,215 2,348 1,025 1,387 of which: IBRD 0 0 0 0 0 0 0 0 IDA 268 890 760 1,232 1,475 1,575 655 902 Bilateral 3,097 3,886 3,624 1,344 1,495 1,369 1,327 1,137 Private creditors 651 46 11 2 2 2 2 9 of which: Bonds 0 0 0 0 0 0 0 0 Commercial banks 147 7 0 0 0 0 0 7Private nonguaranteed 19 1,769 1,717 79 411 0 0 0 of which: Bonds 0 0 0 0 0 0 0 0Disbursements 230 267 125 213 349 339 367 342Public and publicly guaranteed 210 231 125 213 349 339 367 342 Official creditors 186 231 125 213 349 339 367 335 Multilateral 95 219 122 203 341 337 363 331 of which: IBRD 0 0 0 0 0 0 0 0 IDA 74 160 97 156 190 227 223 212 Bilateral 91 11 3 10 8 3 4 4 Private creditors 24 0 0 0 0 0 0 6 of which: Bonds 0 0 0 0 0 0 0 0 Commercial banks 0 0 0 0 0 0 0 6Private nonguaranteed 20 36 0 0 0 0 0 0 of which: Bonds 0 0 0 0 0 0 0 0Principal repayments 41 71 64 50 39 41 25 15Public and publicly guaranteed 29 67 34 27 16 20 25 15 Official creditors 23 58 33 27 16 20 25 15 Multilateral 9 13 18 11 8 13 15 9 of which: IBRD 0 0 0 0 0 0 0 0 IDA 0 0 2 2 4 5 8 0 Bilateral 13 45 15 16 7 7 9 6 Private creditors 7 9 1 0 0 0 0 0 of which: Bonds 0 0 0 0 0 0 0 0 Commercial banks 3 0 1 0 0 0 0 0Private nonguaranteed 12 3 30 24 23 21 0 0 of which: Bonds 0 0 0 0 0 0 0 0Interest payments 23 75 20 21 22 24 25 21Public and publicly guaranteed 22 74 20 21 22 24 25 21 Official creditors 17 71 20 21 22 24 25 21 Multilateral 7 12 9 11 16 18 17 14 of which: IBRD 0 0 0 0 0 0 0 0 IDA 1 6 4 6 11 12 9 6 Bilateral 10 59 11 9 6 6 7 8 Private creditors 6 3 0 0 0 0 0 0 of which: Bonds 0 0 0 0 0 0 0 0 Commercial banks 1 0 0 0 0 0 0 0Private nonguaranteed 0 1 0 0 0 0 0 0 of which: Bonds 0 0 0 0 0 0 0 08. Debt stock-flow reconciliationTotal change in external debt stocks 287 187 29 -1,149 926 -304 -1,522 138 Net flows on external debt 173 193 56 101 294 324 348 389 Cross-currency valuation 176 86 -262 151 65 -170 -1,304 359. Debt restructuringsTotal amount rescheduled 386 66 0 3 0 0 0 14Total amount forgiven 210 311 8 84 12 12 5 27Debt buyback 0 0 0 0 0 0 0 010. Contractual obligations on outstanding long-term external debt
2008 2009 2010 2011 2012 2013 2014 2015Official creditorsPrincipal 99 84 89 94 111 60 67 75Interest 33 32 30 29 28 26 25 24Private creditorsPrincipal 3 5 6 6 6 6 6 6Interest 1 2 2 2 2 2 1 1
Notes:Mozambique was granted debt relief effective in 2006 under the Multilateral Debt Relief Initiative. Data on long-term public and publicly guaranteed debt for 2007 are preliminary, based on reports provided by the country.
181

MYANMAR(US$ million, unless otherwise indicated)
1990 1995 2000 2003 2004 2005 2006 2007
1. Summary external debt dataExternal debt stocks 4,695 5,771 5,928 7,319 7,239 6,645 6,828 7,373 Long-term external debt 4,466 5,378 5,242 5,857 5,647 5,196 5,234 5,516 Public and publicly guaranteed 4,466 5,378 5,242 5,857 5,647 5,196 5,234 5,516 Private nonguaranteed 0 0 0 0 0 0 0 0 Use of IMF credit 0 0 0 0 0 0 0 0 Short-term external debt 229 393 686 1,461 1,593 1,450 1,595 1,857 interest arrears on long-term 200 351 488 745 774 718 756 882Memorandum itemsPrincipal arrears on long-term 376 1,359 1,738 2,613 2,724 2,598 2,755 3,188Long-term public sector debt 4,389 5,269 5,146 5,753 5,551 5,113 5,156 5,431Long-term private sector debt 77 109 95 104 96 83 77 85Public & publicly guaranteed commitments 42 118 0 0 0 0 0 0
External debt flowsDisbursements 122 86 15 3 2 1 0 1 Long-term external debt 122 86 15 3 2 1 0 1 IMF purchases 0 0 0 0 0 0 0 0Principal repayments 46 180 71 93 93 81 61 282 Long-term external debt 44 180 71 93 93 81 61 282 IMF repurchases 2 0 0 0 0 0 0 0Net flows 91 -74 -16 66 12 -167 46 -146 Long-term external debt 78 -95 -56 -90 -91 -80 -61 -281 IMF flows 0 0 0 0 0 0 0 0 Short-term external debt 14 20 41 155 103 -87 107 135Interest payments 14 70 16 28 33 25 25 73 Long-term external debt 13 68 4 14 13 10 9 54 IMF charges 0 0 0 0 0 0 0 0 Short-term external debt 2 2 12 14 20 15 17 19
2. Other non-debt resource flowsForeign direct investment (net) 163 280 258 251 214 235 279 428Portfolio equity flows 0 0 0 0 0 0 0 0Profit remittances on FDI 147 0 137 752 762 1,402 1,317 0Grants (excluding technical coop.) 37 164 45 70 90 107 110 163of which: Debt forgiveness grants .. .. 33 4 4 4 4 4 IDA grants .. .. .. 0 0 0 0 0Memo: technical coop. grants 34 45 50 52 36 38 34 34
3. Currency composition of public and publicly guaranteed debt (%)Euro .. .. .. 12.2 11.9 11.2 12.1 13.4Japanese yen 46.8 52.3 45.3 46.9 46.4 45.1 43.9 46.8Pound sterling 1.7 1.3 1.2 1.4 1.5 1.5 1.7 1.6Swiss franc 0.0 0.0 0.0 0.0 0.0 0.0 0.0 0.0U.S.dollars 24.3 22.6 34.9 30.6 31.5 33.3 33.4 29.3
4. Average terms of new commitmentsOfficial creditors Interest (%) 1.5 2.8 0.0 0.0 0.0 0.0 0.0 0.0 Maturity (years) 16.7 33.0 0.0 0.0 0.0 0.0 0.0 0.0 Grace period (years) 5.2 24.4 0.0 0.0 0.0 0.0 0.0 0.0Private creditors Interest (%) 3.5 0.8 0.0 0.0 0.0 0.0 0.0 0.0 Maturity (years) 11.6 6.4 0.0 0.0 0.0 0.0 0.0 0.0 Grace period (years) 2.1 1.8 0.0 0.0 0.0 0.0 0.0 0.0
5. Major economic aggregatesGross national income (GNI) .. .. .. .. .. .. .. ..Exports of goods, services & income 328 1,404 2,252 3,047 3,303 4,190 5,064 ..Worker remit. & comp. of employees 6 81 104 85 118 131 116 125Imports of goods & services 797 2,146 2,662 3,102 3,244 3,689 4,308 ..International reserves 410 651 286 647 773 889 1,383 ..Current account balance -436 -261 -212 -19 112 588 813 ..
6. RatiosExternal debt stocks to exports (%) 1,433.2 411.0 263.3 240.1 219.2 158.6 134.9 ..External debt stocks to GNI (%) .. .. .. .. .. .. .. ..Debt service to exports (%) 18.4 17.8 3.9 4.0 3.8 2.5 1.7 ..Short-term to external debt stocks (%) 4.9 6.8 11.6 20.0 22.0 21.8 23.4 25.2Multilateral to external debt stocks (%) 26.3 23.1 19.4 17.9 17.8 18.5 18.3 17.5Reserves to external debt stocks (%) 8.7 11.3 4.8 8.8 10.7 13.4 20.3 0.0Reserves to imports (months) 6.2 3.6 1.3 2.5 2.9 2.9 3.9 ..
182

MYANMAR(US$ million, unless otherwise indicated)
1990 1995 2000 2003 2004 2005 2006 2007
7. Long-term external debtDebt outstanding and disbursed 4,466 5,378 5,242 5,857 5,647 5,196 5,234 5,516Public and publicly guaranteed 4,466 5,378 5,242 5,857 5,647 5,196 5,234 5,516 Official creditors 4,216 5,011 4,262 4,979 4,794 4,385 4,415 4,799 Multilateral 1,234 1,331 1,148 1,308 1,285 1,228 1,253 1,290 of which: IBRD 0 0 0 0 0 0 0 0 IDA 716 777 684 762 774 752 776 793 Bilateral 2,982 3,680 3,114 3,672 3,508 3,158 3,162 3,508 Private creditors 250 367 980 878 853 810 819 717 of which: Bonds 0 0 0 0 0 0 0 0 Commercial banks 0 0 546 546 546 546 546 410Private nonguaranteed 0 0 0 0 0 0 0 0 of which: Bonds 0 0 0 0 0 0 0 0Disbursements 122 86 15 3 2 1 0 1Public and publicly guaranteed 122 86 15 3 2 1 0 1 Official creditors 119 17 12 3 2 1 0 1 Multilateral 68 0 1 1 1 0 0 0 of which: IBRD 0 0 0 0 0 0 0 0 IDA 57 0 0 0 0 0 0 0 Bilateral 51 16 11 2 1 1 0 1 Private creditors 3 69 3 0 0 0 0 0 of which: Bonds 0 0 0 0 0 0 0 0 Commercial banks 0 0 0 0 0 0 0 0Private nonguaranteed 0 0 0 0 0 0 0 0 of which: Bonds 0 0 0 0 0 0 0 0Principal repayments 44 180 71 93 93 81 61 282Public and publicly guaranteed 44 180 71 93 93 81 61 282 Official creditors 33 147 2 57 61 55 53 145 Multilateral 15 25 2 2 2 2 2 2 of which: IBRD 0 0 0 0 0 0 0 0 IDA 3 9 0 0 0 0 0 0 Bilateral 18 122 0 55 58 53 51 143 Private creditors 11 34 69 35 32 26 8 137 of which: Bonds 0 0 0 0 0 0 0 0 Commercial banks 0 0 0 0 0 0 0 137Private nonguaranteed 0 0 0 0 0 0 0 0 of which: Bonds 0 0 0 0 0 0 0 0Interest payments 13 68 4 14 13 10 9 54Public and publicly guaranteed 13 68 4 14 13 10 9 54 Official creditors 10 66 0 13 12 10 9 17 Multilateral 10 13 0 0 0 0 0 0 of which: IBRD 0 0 0 0 0 0 0 0 IDA 5 6 0 0 0 0 0 0 Bilateral 0 53 0 12 12 10 8 17 Private creditors 2 2 3 2 1 0 0 37 of which: Bonds 0 0 0 0 0 0 0 0 Commercial banks 0 0 0 0 0 0 0 37Private nonguaranteed 0 0 0 0 0 0 0 0 of which: Bonds 0 0 0 0 0 0 0 08. Debt stock-flow reconciliationTotal change in external debt stocks 504 -785 -76 735 -79 -594 183 544 Net flows on external debt 91 -74 -16 66 12 -167 46 -146 Cross-currency valuation 306 -755 -577 555 -21 -332 99 5799. Debt restructuringsTotal amount rescheduled 0 0 0 0 0 0 0 0Total amount forgiven 0 0 0 0 0 0 0 0Debt buyback 0 0 0 0 0 0 0 010. Contractual obligations on outstanding long-term external debt
2008 2009 2010 2011 2012 2013 2014 2015Official creditorsPrincipal 229 202 165 144 135 120 108 95Interest 26 22 19 16 14 12 10 9Private creditorsPrincipal 137 137 137 0 0 0 0 0Interest 24 16 7 0 0 0 0 0
Notes:Data relate to the year ending in March. Data on long-term public and publicly guaranteed debt for end-March 2008 are estimates based on the original terms of the loans.
183
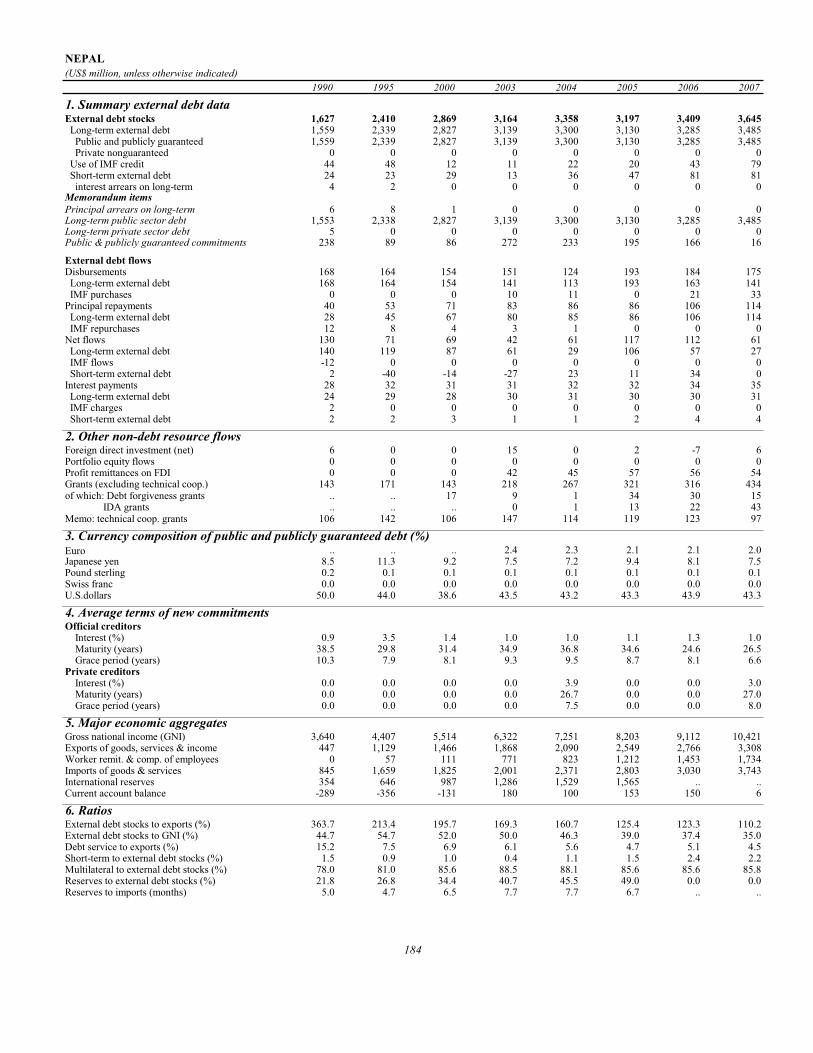
NEPAL(US$ million, unless otherwise indicated)
1990 1995 2000 2003 2004 2005 2006 2007
1. Summary external debt dataExternal debt stocks 1,627 2,410 2,869 3,164 3,358 3,197 3,409 3,645 Long-term external debt 1,559 2,339 2,827 3,139 3,300 3,130 3,285 3,485 Public and publicly guaranteed 1,559 2,339 2,827 3,139 3,300 3,130 3,285 3,485 Private nonguaranteed 0 0 0 0 0 0 0 0 Use of IMF credit 44 48 12 11 22 20 43 79 Short-term external debt 24 23 29 13 36 47 81 81 interest arrears on long-term 4 2 0 0 0 0 0 0Memorandum itemsPrincipal arrears on long-term 6 8 1 0 0 0 0 0Long-term public sector debt 1,553 2,338 2,827 3,139 3,300 3,130 3,285 3,485Long-term private sector debt 5 0 0 0 0 0 0 0Public & publicly guaranteed commitments 238 89 86 272 233 195 166 16
External debt flowsDisbursements 168 164 154 151 124 193 184 175 Long-term external debt 168 164 154 141 113 193 163 141 IMF purchases 0 0 0 10 11 0 21 33Principal repayments 40 53 71 83 86 86 106 114 Long-term external debt 28 45 67 80 85 86 106 114 IMF repurchases 12 8 4 3 1 0 0 0Net flows 130 71 69 42 61 117 112 61 Long-term external debt 140 119 87 61 29 106 57 27 IMF flows -12 0 0 0 0 0 0 0 Short-term external debt 2 -40 -14 -27 23 11 34 0Interest payments 28 32 31 31 32 32 34 35 Long-term external debt 24 29 28 30 31 30 30 31 IMF charges 2 0 0 0 0 0 0 0 Short-term external debt 2 2 3 1 1 2 4 4
2. Other non-debt resource flowsForeign direct investment (net) 6 0 0 15 0 2 -7 6Portfolio equity flows 0 0 0 0 0 0 0 0Profit remittances on FDI 0 0 0 42 45 57 56 54Grants (excluding technical coop.) 143 171 143 218 267 321 316 434of which: Debt forgiveness grants .. .. 17 9 1 34 30 15 IDA grants .. .. .. 0 1 13 22 43Memo: technical coop. grants 106 142 106 147 114 119 123 97
3. Currency composition of public and publicly guaranteed debt (%)Euro .. .. .. 2.4 2.3 2.1 2.1 2.0Japanese yen 8.5 11.3 9.2 7.5 7.2 9.4 8.1 7.5Pound sterling 0.2 0.1 0.1 0.1 0.1 0.1 0.1 0.1Swiss franc 0.0 0.0 0.0 0.0 0.0 0.0 0.0 0.0U.S.dollars 50.0 44.0 38.6 43.5 43.2 43.3 43.9 43.3
4. Average terms of new commitmentsOfficial creditors Interest (%) 0.9 3.5 1.4 1.0 1.0 1.1 1.3 1.0 Maturity (years) 38.5 29.8 31.4 34.9 36.8 34.6 24.6 26.5 Grace period (years) 10.3 7.9 8.1 9.3 9.5 8.7 8.1 6.6Private creditors Interest (%) 0.0 0.0 0.0 0.0 3.9 0.0 0.0 3.0 Maturity (years) 0.0 0.0 0.0 0.0 26.7 0.0 0.0 27.0 Grace period (years) 0.0 0.0 0.0 0.0 7.5 0.0 0.0 8.0
5. Major economic aggregatesGross national income (GNI) 3,640 4,407 5,514 6,322 7,251 8,203 9,112 10,421Exports of goods, services & income 447 1,129 1,466 1,868 2,090 2,549 2,766 3,308Worker remit. & comp. of employees 0 57 111 771 823 1,212 1,453 1,734Imports of goods & services 845 1,659 1,825 2,001 2,371 2,803 3,030 3,743International reserves 354 646 987 1,286 1,529 1,565 .. ..Current account balance -289 -356 -131 180 100 153 150 6
6. RatiosExternal debt stocks to exports (%) 363.7 213.4 195.7 169.3 160.7 125.4 123.3 110.2External debt stocks to GNI (%) 44.7 54.7 52.0 50.0 46.3 39.0 37.4 35.0Debt service to exports (%) 15.2 7.5 6.9 6.1 5.6 4.7 5.1 4.5Short-term to external debt stocks (%) 1.5 0.9 1.0 0.4 1.1 1.5 2.4 2.2Multilateral to external debt stocks (%) 78.0 81.0 85.6 88.5 88.1 85.6 85.6 85.8Reserves to external debt stocks (%) 21.8 26.8 34.4 40.7 45.5 49.0 0.0 0.0Reserves to imports (months) 5.0 4.7 6.5 7.7 7.7 6.7 .. ..
184

NEPAL(US$ million, unless otherwise indicated)
1990 1995 2000 2003 2004 2005 2006 2007
7. Long-term external debtDebt outstanding and disbursed 1,559 2,339 2,827 3,139 3,300 3,130 3,285 3,485Public and publicly guaranteed 1,559 2,339 2,827 3,139 3,300 3,130 3,285 3,485 Official creditors 1,461 2,281 2,822 3,133 3,294 3,125 3,281 3,480 Multilateral 1,268 1,952 2,457 2,800 2,959 2,737 2,918 3,126 of which: IBRD 0 0 0 0 0 0 0 0 IDA 667 1,023 1,132 1,388 1,491 1,396 1,468 1,524 Bilateral 193 329 365 334 335 388 362 354 Private creditors 97 58 5 6 6 5 5 5 of which: Bonds 0 0 0 0 0 0 0 0 Commercial banks 0 0 0 0 0 0 0 0Private nonguaranteed 0 0 0 0 0 0 0 0 of which: Bonds 0 0 0 0 0 0 0 0Disbursements 168 164 154 141 113 193 163 141Public and publicly guaranteed 168 164 154 141 113 193 163 141 Official creditors 166 164 154 141 113 193 163 141 Multilateral 146 151 142 139 96 86 157 135 of which: IBRD 0 0 0 0 0 0 0 0 IDA 68 82 49 102 72 33 43 35 Bilateral 20 13 11 2 17 107 6 6 Private creditors 2 0 0 0 0 0 0 0 of which: Bonds 0 0 0 0 0 0 0 0 Commercial banks 0 0 0 0 0 0 0 0Private nonguaranteed 0 0 0 0 0 0 0 0 of which: Bonds 0 0 0 0 0 0 0 0Principal repayments 28 45 67 80 85 86 106 114Public and publicly guaranteed 28 45 67 80 85 86 106 114 Official creditors 13 40 59 79 84 86 105 113 Multilateral 10 24 37 51 58 61 68 81 of which: IBRD 0 0 0 0 0 0 0 0 IDA 2 7 16 22 27 30 31 34 Bilateral 3 16 22 29 27 25 37 33 Private creditors 14 5 8 0 0 1 0 1 of which: Bonds 0 0 0 0 0 0 0 0 Commercial banks 0 0 0 0 0 0 0 0Private nonguaranteed 0 0 0 0 0 0 0 0 of which: Bonds 0 0 0 0 0 0 0 0Interest payments 24 29 28 30 31 30 30 31Public and publicly guaranteed 24 29 28 30 31 30 30 31 Official creditors 14 24 27 30 30 30 30 30 Multilateral 10 17 22 23 25 26 25 26 of which: IBRD 0 0 0 0 0 0 0 0 IDA 5 7 8 9 11 12 11 11 Bilateral 4 8 5 7 5 4 5 5 Private creditors 11 5 1 0 0 0 0 0 of which: Bonds 0 0 0 0 0 0 0 0 Commercial banks 0 0 0 0 0 0 0 0Private nonguaranteed 0 0 0 0 0 0 0 0 of which: Bonds 0 0 0 0 0 0 0 08. Debt stock-flow reconciliationTotal change in external debt stocks 271 89 -152 172 194 -161 212 236 Net flows on external debt 130 71 69 42 61 117 112 61 Cross-currency valuation 125 8 -190 284 131 -280 94 1669. Debt restructuringsTotal amount rescheduled 0 0 0 0 0 0 0 0Total amount forgiven 0 0 0 0 0 0 0 0Debt buyback 0 0 0 0 0 0 0 010. Contractual obligations on outstanding long-term external debt
2008 2009 2010 2011 2012 2013 2014 2015Official creditorsPrincipal 119 131 143 152 157 163 167 173Interest 43 44 44 43 42 40 39 37Private creditorsPrincipal 1 1 1 1 1 1 1 1Interest 0 0 0 0 0 0 0 0
185

NICARAGUA(US$ million, unless otherwise indicated)
1990 1995 2000 2003 2004 2005 2006 2007
1. Summary external debt dataExternal debt stocks 10,745 10,390 6,711 6,769 4,985 4,900 4,079 3,390 Long-term external debt 8,313 8,566 5,631 5,960 4,243 4,162 3,402 2,505 Public and publicly guaranteed 8,313 8,566 5,350 5,751 3,965 3,870 3,169 2,144 Private nonguaranteed 0 0 281 209 278 292 232 361 Use of IMF credit 0 39 169 213 248 201 63 85 Short-term external debt 2,432 1,785 911 595 495 538 615 800 interest arrears on long-term 1,693 1,475 789 434 362 362 436 464Memorandum itemsPrincipal arrears on long-term 2,464 3,230 893 665 543 543 551 475Long-term public sector debt 8,313 8,566 5,405 5,869 3,965 3,870 3,168 2,137Long-term private sector debt 0 0 226 91 278 292 233 368Public & publicly guaranteed commitments 447 361 185 116 233 146 572 67
External debt flowsDisbursements 577 277 527 362 408 290 306 594 Long-term external debt 577 277 500 333 367 290 245 576 IMF purchases 0 0 27 29 41 0 61 18Principal repayments 4 203 189 131 80 118 111 329 Long-term external debt 4 190 183 126 71 110 111 329 IMF repurchases 0 13 5 5 9 9 0 0Net flows 593 88 341 257 301 215 198 431 Long-term external debt 572 87 317 207 296 180 133 247 IMF flows 0 -13 0 0 0 0 0 0 Short-term external debt 21 13 3 26 -28 43 3 166Interest payments 11 85 98 55 46 53 58 78 Long-term external debt 5 76 90 49 39 45 50 65 IMF charges 0 1 1 1 1 0 0 0 Short-term external debt 6 8 7 6 6 8 8 13
2. Other non-debt resource flowsForeign direct investment (net) 1 89 267 201 250 241 287 382Portfolio equity flows 0 0 0 0 0 0 0 0Profit remittances on FDI 0 29 69 77 80 82 85 93Grants (excluding technical coop.) 241 410 255 507 1,153 508 1,541 1,706of which: Debt forgiveness grants .. .. 417 254 870 199 1,182 1,174 IDA grants .. .. .. 0 0 0 0 0Memo: technical coop. grants 73 132 116 103 102 108 114 84
3. Currency composition of public and publicly guaranteed debt (%)Euro .. .. .. 13.0 0.9 0.9 1.9 4.7Japanese yen 0.0 1.3 2.3 2.1 0.0 0.0 0.0 0.0Pound sterling 0.0 0.0 0.0 0.0 0.0 0.0 0.0 0.0Swiss franc 0.0 0.0 0.0 0.0 0.1 0.1 0.1 0.1U.S.dollars 79.9 72.7 71.0 72.0 79.8 80.3 75.5 83.8
4. Average terms of new commitmentsOfficial creditors Interest (%) 4.4 2.3 1.6 1.2 1.0 1.3 3.0 1.9 Maturity (years) 12.4 32.2 36.9 35.0 38.3 33.1 27.1 25.3 Grace period (years) 1.8 8.4 9.7 9.2 9.8 8.9 7.7 5.8Private creditors Interest (%) 9.4 7.4 0.7 0.0 0.0 0.0 0.0 0.0 Maturity (years) 4.9 9.0 39.9 0.0 0.0 0.0 0.0 0.0 Grace period (years) 0.4 1.0 10.5 0.0 0.0 0.0 0.0 0.0
5. Major economic aggregatesGross national income (GNI) 988 2,821 3,735 3,911 4,266 4,729 5,176 5,595Exports of goods, services & income 404 744 1,453 1,759 2,183 2,601 3,114 3,473Worker remit. & comp. of employees 0 75 320 439 519 616 698 740Imports of goods & services 911 1,529 2,385 2,609 3,068 3,577 4,098 4,856International reserves 166 142 492 508 668 728 922 1,103Current account balance -305 -722 -842 -663 -649 -734 -679 -1,048
6. RatiosExternal debt stocks to exports (%) 2,659.6 1,397.0 462.0 384.8 228.4 188.4 131.0 97.6External debt stocks to GNI (%) 1,087.8 368.3 179.7 173.0 116.9 103.6 78.8 60.6Debt service to exports (%) 3.9 38.7 19.7 10.6 5.8 6.6 5.5 11.7Short-term to external debt stocks (%) 22.6 17.2 13.6 8.8 9.9 11.0 15.1 23.6Multilateral to external debt stocks (%) 8.8 14.1 31.6 40.0 55.2 57.0 50.7 33.5Reserves to external debt stocks (%) 1.5 1.4 7.3 7.5 13.4 14.9 22.6 32.5Reserves to imports (months) 2.2 1.1 2.5 2.3 2.6 2.4 2.7 2.7
186

NICARAGUA(US$ million, unless otherwise indicated)
1990 1995 2000 2003 2004 2005 2006 2007
7. Long-term external debtDebt outstanding and disbursed 8,313 8,566 5,631 5,960 4,243 4,162 3,402 2,505Public and publicly guaranteed 8,313 8,566 5,350 5,751 3,965 3,870 3,169 2,144 Official creditors 6,767 7,556 5,139 5,548 3,798 3,780 3,077 2,116 Multilateral 940 1,464 2,119 2,704 2,752 2,791 2,070 1,136 of which: IBRD 239 65 5 0 0 0 0 0 IDA 60 276 654 998 1,167 1,136 256 321 Bilateral 5,827 6,092 3,020 2,844 1,046 989 1,007 980 Private creditors 1,545 1,010 211 203 167 90 92 27 of which: Bonds 0 524 0 0 0 0 0 0 Commercial banks 1,305 383 184 185 149 72 74 22Private nonguaranteed 0 0 281 209 278 292 232 361 of which: Bonds 0 0 0 0 0 0 0 0Disbursements 577 277 500 333 367 290 245 576Public and publicly guaranteed 577 277 215 259 299 229 245 367 Official creditors 554 258 214 252 299 226 245 367 Multilateral 7 177 170 227 285 215 223 338 of which: IBRD 0 0 0 0 0 0 0 0 IDA 0 18 87 112 126 63 61 53 Bilateral 546 80 44 25 13 11 22 29 Private creditors 23 20 2 7 1 3 0 0 of which: Bonds 0 0 0 0 0 0 0 0 Commercial banks 0 20 0 6 0 3 0 0Private nonguaranteed 0 0 285 74 68 61 0 209 of which: Bonds 0 0 0 0 0 0 0 0Principal repayments 4 190 183 126 71 110 111 329Public and publicly guaranteed 4 190 70 74 28 63 52 214 Official creditors 1 89 61 74 28 63 52 197 Multilateral 1 47 36 16 11 21 33 170 of which: IBRD 1 15 5 0 0 0 0 0 IDA 0 1 2 0 0 0 5 0 Bilateral 1 42 26 58 17 41 19 27 Private creditors 3 101 8 1 0 0 0 17 of which: Bonds 0 0 0 0 0 0 0 0 Commercial banks 0 96 5 1 0 0 0 17Private nonguaranteed 0 0 114 52 43 47 59 115 of which: Bonds 0 0 0 0 0 0 0 0Interest payments 5 76 90 49 39 45 50 65Public and publicly guaranteed 5 76 78 42 33 43 49 45 Official creditors 4 72 75 41 33 43 49 45 Multilateral 1 33 64 18 22 26 33 28 of which: IBRD 1 6 1 0 0 0 0 0 IDA 0 2 5 3 6 7 5 2 Bilateral 3 39 12 23 10 16 16 17 Private creditors 1 3 3 1 0 0 0 0 of which: Bonds 0 0 0 0 0 0 0 0 Commercial banks 0 3 2 1 0 0 0 0Private nonguaranteed 0 0 12 6 7 2 2 20 of which: Bonds 0 0 0 0 0 0 0 08. Debt stock-flow reconciliationTotal change in external debt stocks 1,060 -1,606 -56 428 -1,783 -85 -821 -680 Net flows on external debt 593 88 341 257 301 215 198 431 Cross-currency valuation 83 -58 -119 244 98 -124 -1,201 99. Debt restructuringsTotal amount rescheduled 30 263 149 110 176 0 0 0Total amount forgiven 0 438 28 251 435 128 42 461Debt buyback 0 89 0 0 0 0 0 010. Contractual obligations on outstanding long-term external debt
2008 2009 2010 2011 2012 2013 2014 2015Official creditorsPrincipal 78 84 79 75 79 81 77 80Interest 45 43 41 40 37 35 33 31Private creditorsPrincipal 72 72 72 73 73 1 1 1Interest 18 14 10 7 3 0 0 0
Notes:Nicaragua was granted debt relief effective in 2006 under the Multilateral Debt Relief Initiative.
187

NIGER(US$ million, unless otherwise indicated)
1990 1995 2000 2003 2004 2005 2006 2007
1. Summary external debt dataExternal debt stocks 1729.6 1576.0 1680.5 2073.9 1977.1 1983.9 857.1 971.7 Long-term external debt 1491.2 1452.3 1534.6 1932.9 1832.7 1814.8 781.3 882.2 Public and publicly guaranteed 1230.2 1318.9 1466.6 1887.3 1793.6 1782.3 755.3 862.7 Private nonguaranteed 261.0 133.4 68.0 45.6 39.1 32.6 26.1 19.5 Use of IMF credit 84.9 52.1 74.0 131.4 135.4 127.6 26.5 40.1 Short-term external debt 153.6 71.6 71.9 9.6 8.9 41.4 49.3 49.3 interest arrears on long-term 31.3 52.9 59.6 6.9 2.9 38.4 40.3 40.3Memorandum itemsPrincipal arrears on long-term 79.7 74.3 96.7 45.6 17.2 61.7 100.4 103.9Long-term public sector debt 1227.4 1318.9 1466.6 1887.3 1793.6 1782.3 755.3 862.7Long-term private sector debt 263.8 133.4 68.0 45.6 39.1 32.6 26.1 19.5Public & publicly guaranteed commitments 56.3 8.3 64.3 165.7 107.5 129.0 197.1 56.5
External debt flowsDisbursements 147.8 28.3 87.3 141.0 141.9 153.5 124.7 98.6 Long-term external debt 138.7 28.3 76.1 117.4 129.4 136.1 116.1 86.7 IMF purchases 9.2 0.0 11.2 23.7 12.5 17.4 8.6 11.9Principal repayments 62.8 41.1 15.8 22.3 29.5 23.8 170.6 20.6 Long-term external debt 47.2 30.9 14.0 17.1 22.8 18.5 56.5 20.6 IMF repurchases 15.5 10.2 1.8 5.2 6.7 5.3 114.1 0.0Net flows 123.3 -9.0 51.5 120.3 115.7 126.7 -39.9 78.0 Long-term external debt 91.5 -2.6 62.1 100.3 106.6 117.6 59.5 66.1 IMF flows -15.5 0.0 0.0 0.0 0.0 0.0 0.0 0.0 Short-term external debt 38.3 3.8 -20.0 1.5 3.3 -3.0 6.0 0.0Interest payments 36.0 14.7 10.2 11.1 13.3 14.2 12.5 10.6 Long-term external debt 23.3 12.5 8.2 10.5 12.5 13.5 12.0 10.0 IMF charges 3.5 1.1 0.3 0.6 0.6 0.4 0.1 0.2 Short-term external debt 9.1 1.0 1.7 0.0 0.2 0.2 0.4 0.4
2. Other non-debt resource flowsForeign direct investment (net) 40.8 7.2 8.4 14.9 26.3 44.0 50.5 27.0Portfolio equity flows 0.0 0.0 0.5 0.0 3.8 0.6 0.0 0.0Profit remittances on FDI 22.6 3.8 1.9 9.3 15.8 20.9 12.5 0.0Grants (excluding technical coop.) 225.9 169.9 112.2 295.3 456.4 394.6 1567.4 391.9of which: Debt forgiveness grants .. .. 22.3 145.8 211.1 61.6 1277.0 11.2 IDA grants .. .. .. 4.1 7.7 30.3 28.1 43.8Memo: technical coop. grants 100.6 108.7 45.5 58.5 57.1 60.3 102.2 58.2
3. Currency composition of public and publicly guaranteed debt (%)Euro .. .. .. 23.1 12.4 11.3 3.8 3.4Japanese yen 1.3 4.5 1.8 1.3 0.0 0.0 0.0 0.0Pound sterling 0.8 1.0 1.2 0.9 0.0 0.0 0.0 0.0Swiss franc 0.0 0.3 0.0 0.0 0.0 0.0 0.0 0.0U.S.dollars 27.3 37.4 47.4 51.6 58.7 57.8 49.5 48.9
4. Average terms of new commitmentsOfficial creditors Interest (%) 1.9 0.6 0.7 1.0 1.2 1.0 0.8 1.5 Maturity (years) 31.9 33.5 36.5 38.8 31.4 35.4 37.9 29.2 Grace period (years) 9.2 8.4 9.4 9.2 7.9 9.0 8.6 8.0Private creditors Interest (%) 0.0 0.0 0.0 0.0 0.0 0.0 0.0 0.0 Maturity (years) 0.0 0.0 0.0 0.0 0.0 0.0 0.0 0.0 Grace period (years) 0.0 0.0 0.0 0.0 0.0 0.0 0.0 0.0
5. Major economic aggregatesGross national income (GNI) 2423.4 1830.1 1781.9 2717.8 3039.3 3396.6 3706.7 4218.7Exports of goods, services & income 566.3 333.5 338.2 443.9 599.5 647.7 689.6 ..Worker remit. & comp. of employees 14.0 8.0 14.0 25.5 59.7 66.4 66.4 78.1Imports of goods & services 802.9 510.3 485.1 724.4 891.3 1095.4 1117.7 ..International reserves 226.5 94.7 80.4 260.1 258.0 249.5 370.9 593.0Current account balance -235.9 -151.7 -104.1 -218.7 -230.9 -311.5 -313.8 ..
6. RatiosExternal debt stocks to exports (%) 305.4 472.6 496.9 467.2 329.8 306.3 124.3 ..External debt stocks to GNI (%) 71.4 86.1 94.3 76.3 65.1 58.4 23.1 23.0Debt service to exports (%) 17.4 16.7 7.7 7.5 7.1 5.9 26.6 ..Short-term to external debt stocks (%) 8.9 4.5 4.3 0.5 0.5 2.1 5.8 5.1Multilateral to external debt stocks (%) 40.8 55.7 61.1 69.0 80.7 79.7 65.6 68.6Reserves to external debt stocks (%) 13.1 6.0 4.8 12.5 13.0 12.6 43.3 61.0Reserves to imports (months) 3.4 2.2 2.0 4.3 3.5 2.7 4.0 ..
188

NIGER(US$ million, unless otherwise indicated)
1990 1995 2000 2003 2004 2005 2006 2007
7. Long-term external debtDebt outstanding and disbursed 1491.2 1452.3 1534.6 1932.9 1832.7 1814.8 781.3 882.2Public and publicly guaranteed 1230.2 1318.9 1466.6 1887.3 1793.6 1782.3 755.3 862.7 Official creditors 1118.8 1318.9 1466.6 1887.3 1793.6 1782.3 755.3 862.7 Multilateral 705.4 878.3 1026.3 1430.9 1595.5 1580.3 562.4 666.6 of which: IBRD 0.0 0.0 0.0 0.0 0.0 0.0 0.0 0.0 IDA 460.6 597.9 723.2 1007.4 1106.1 1080.1 188.9 234.9 Bilateral 413.5 440.7 440.3 456.5 198.1 201.9 192.9 196.1 Private creditors 111.3 0.0 0.0 0.0 0.0 0.0 0.0 0.0 of which: Bonds 0.0 0.0 0.0 0.0 0.0 0.0 0.0 0.0 Commercial banks 109.1 0.0 0.0 0.0 0.0 0.0 0.0 0.0Private nonguaranteed 261.0 133.4 68.0 45.6 39.1 32.6 26.1 19.5 of which: Bonds 0.0 0.0 0.0 0.0 0.0 0.0 0.0 0.0Disbursements 138.7 28.3 76.1 117.4 129.4 136.1 116.1 86.7Public and publicly guaranteed 95.7 28.3 76.1 117.4 129.4 136.1 116.1 86.7 Official creditors 90.3 28.3 76.1 117.4 129.4 136.1 116.1 86.7 Multilateral 69.5 27.9 76.1 117.4 128.8 134.2 113.0 86.7 of which: IBRD 0.0 0.0 0.0 0.0 0.0 0.0 0.0 0.0 IDA 54.8 23.8 68.0 73.4 65.1 65.5 54.9 36.7 Bilateral 20.9 0.4 0.0 0.0 0.6 1.9 3.0 0.0 Private creditors 5.3 0.0 0.0 0.0 0.0 0.0 0.0 0.0 of which: Bonds 0.0 0.0 0.0 0.0 0.0 0.0 0.0 0.0 Commercial banks 5.3 0.0 0.0 0.0 0.0 0.0 0.0 0.0Private nonguaranteed 43.0 0.0 0.0 0.0 0.0 0.0 0.0 0.0 of which: Bonds 0.0 0.0 0.0 0.0 0.0 0.0 0.0 0.0Principal repayments 47.2 30.9 14.0 17.1 22.8 18.5 56.5 20.6Public and publicly guaranteed 10.2 7.1 12.0 9.1 16.3 12.0 50.0 14.1 Official creditors 8.6 7.1 12.0 9.1 16.3 12.0 50.0 14.1 Multilateral 6.7 6.9 10.4 7.0 12.0 11.8 36.6 13.9 of which: IBRD 0.0 0.0 0.0 0.0 0.0 0.0 0.0 0.0 IDA 1.3 2.9 8.2 1.6 1.9 0.9 8.3 0.0 Bilateral 1.9 0.2 1.6 2.1 4.4 0.1 13.5 0.2 Private creditors 1.6 0.0 0.0 0.0 0.0 0.0 0.0 0.0 of which: Bonds 0.0 0.0 0.0 0.0 0.0 0.0 0.0 0.0 Commercial banks 0.0 0.0 0.0 0.0 0.0 0.0 0.0 0.0Private nonguaranteed 37.0 23.8 2.0 8.0 6.5 6.5 6.5 6.5 of which: Bonds 0.0 0.0 0.0 0.0 0.0 0.0 0.0 0.0Interest payments 23.3 12.5 8.2 10.5 12.5 13.5 12.0 10.0Public and publicly guaranteed 7.2 7.0 8.1 9.7 11.5 11.9 10.1 8.3 Official creditors 7.1 7.0 8.1 9.7 11.5 11.9 10.1 8.3 Multilateral 5.7 6.6 6.6 8.3 11.2 11.7 9.6 7.4 of which: IBRD 0.0 0.0 0.0 0.0 0.0 0.0 0.0 0.0 IDA 2.7 4.9 5.6 5.6 6.8 6.0 4.9 1.8 Bilateral 1.4 0.4 1.4 1.4 0.3 0.3 0.5 1.0 Private creditors 0.1 0.0 0.0 0.0 0.0 0.0 0.0 0.0 of which: Bonds 0.0 0.0 0.0 0.0 0.0 0.0 0.0 0.0 Commercial banks 0.0 0.0 0.0 0.0 0.0 0.0 0.0 0.0Private nonguaranteed 16.1 5.5 0.2 0.8 1.0 1.5 1.9 1.7 of which: Bonds 0.0 0.0 0.0 0.0 0.0 0.0 0.0 0.08. Debt stock-flow reconciliationTotal change in external debt stocks 229.6 61.8 5.0 283.4 -96.9 6.8 -1126.7 114.6 Net flows on external debt 123.3 -9.0 51.5 120.3 115.7 126.7 -39.9 78.0 Cross-currency valuation 36.3 -37.3 -62.5 131.2 68.4 -120.6 -1026.8 41.69. Debt restructuringsTotal amount rescheduled 28.7 4.9 28.0 0.0 71.1 0.0 0.3 0.0Total amount forgiven 0.4 3.5 0.0 20.9 282.2 15.7 7.7 1.4Debt buyback 0.0 0.0 0.0 0.0 0.0 0.0 0.0 0.010. Contractual obligations on outstanding long-term external debt
2008 2009 2010 2011 2012 2013 2014 2015Official creditorsPrincipal 56.4 40.0 30.3 33.4 39.9 33.1 34.7 37.5Interest 10.3 10.0 10.1 10.2 10.1 9.8 9.5 9.1Private creditorsPrincipal 6.5 6.5 6.5 0.0 0.0 0.0 0.0 0.0Interest 1.1 0.7 0.4 0.0 0.0 0.0 0.0 0.0
Notes:Niger was granted debt relief effective in 2006 under the Multilateral Debt Relief Initiative.
189

NIGERIA(US$ million, unless otherwise indicated)
1990 1995 2000 2003 2004 2005 2006 2007
1. Summary external debt dataExternal debt stocks 33,439 34,092 31,355 34,700 37,883 22,178 7,799 8,934 Long-term external debt 31,935 28,441 30,235 31,350 32,637 20,342 3,909 3,990 Public and publicly guaranteed 31,545 28,140 30,020 31,350 32,637 20,342 3,909 3,815 Private nonguaranteed 391 301 215 0 0 0 0 175 Use of IMF credit 0 0 0 0 0 0 0 0 Short-term external debt 1,504 5,651 1,120 3,350 5,246 1,836 3,890 4,944 interest arrears on long-term 1,040 4,717 44 2,608 3,895 3 0 0Memorandum itemsPrincipal arrears on long-term 1,091 8,102 117 1,360 1,899 3 3 3Long-term public sector debt 31,545 28,077 29,964 31,308 32,599 20,313 3,885 3,796Long-term private sector debt 391 365 271 43 38 29 24 194Public & publicly guaranteed commitments 2,192 0 86 586 255 783 546 854
External debt flowsDisbursements 927 433 153 208 315 394 795 802 Long-term external debt 927 433 153 208 315 394 795 802 IMF purchases 0 0 0 0 0 0 0 0Principal repayments 1,180 918 1,091 1,218 1,165 3,874 6,470 892 Long-term external debt 1,180 918 1,091 1,218 1,165 3,874 6,470 892 IMF repurchases 0 0 0 0 0 0 0 0Net flows -34 -559 -696 -1,063 -242 -2,998 -3,618 1,038 Long-term external debt -253 -486 -937 -1,010 -850 -3,481 -5,675 -90 IMF flows 0 0 0 0 0 0 0 0 Short-term external debt 219 -73 241 -53 609 482 2,057 1,128Interest payments 2,155 915 754 425 566 5,007 383 351 Long-term external debt 2,123 859 690 409 545 4,943 269 106 IMF charges 0 0 0 0 0 0 0 0 Short-term external debt 32 56 64 15 21 64 114 245
2. Other non-debt resource flowsForeign direct investment (net) 588 1,079 1,140 2,005 1,874 2,013 5,445 6,087Portfolio equity flows 0 0 0 0 0 0 0 4,648Profit remittances on FDI 135 1,330 2,279 3,325 2,689 7,437 0 17,889Grants (excluding technical coop.) 125 33 49 113 164 5,852 11,389 1,313of which: Debt forgiveness grants .. .. 2 0 0 5,548 9,666 763 IDA grants .. .. .. 0 0 0 0 0Memo: technical coop. grants 94 79 69 166 244 204 315 161
3. Currency composition of public and publicly guaranteed debt (%)Euro .. .. .. 39.4 41.9 36.0 3.9 4.7Japanese yen 8.2 12.6 2.3 12.4 12.1 9.9 0.0 0.0Pound sterling 11.8 9.9 1.5 16.5 16.8 17.1 0.2 0.2Swiss franc 0.7 0.6 0.0 2.4 1.8 1.9 0.0 0.0U.S.dollars 38.8 29.6 85.1 22.0 21.0 27.0 56.7 53.5
4. Average terms of new commitmentsOfficial creditors Interest (%) 5.8 0.0 1.0 0.8 0.8 1.0 1.9 1.5 Maturity (years) 22.4 0.0 32.9 35.6 34.8 34.6 26.7 35.0 Grace period (years) 6.1 0.0 9.7 9.9 10.1 9.4 6.7 8.8Private creditors Interest (%) 7.9 0.0 0.0 0.0 0.0 0.0 0.0 6.0 Maturity (years) 13.1 0.0 0.0 0.0 0.0 0.0 0.0 10.4 Grace period (years) 3.7 0.0 0.0 0.0 0.0 0.0 0.0 3.0
5. Major economic aggregatesGross national income (GNI) 25,585 25,888 40,256 59,996 78,110 99,421 135,472 148,097Exports of goods, services & income 14,771 13,246 22,574 28,594 40,532 56,266 .. 87,295Worker remit. & comp. of employees 10 804 1,392 1,063 2,273 3,329 5,435 9,221Imports of goods & services 9,858 15,820 15,383 25,191 23,671 32,046 .. 65,394International reserves 4,129 1,709 10,099 7,415 17,257 28,632 42,735 51,907Current account balance 4,988 -2,578 7,427 3,391 16,840 24,202 .. 21,972
6. RatiosExternal debt stocks to exports (%) 226.4 257.4 138.9 121.4 93.5 39.4 .. 10.2External debt stocks to GNI (%) 130.7 131.7 77.9 57.8 48.5 22.3 5.8 6.0Debt service to exports (%) 22.6 13.8 8.2 5.7 4.3 15.8 .. 1.4Short-term to external debt stocks (%) 4.5 16.6 3.6 9.7 13.8 8.3 49.9 55.3Multilateral to external debt stocks (%) 11.2 14.5 10.5 8.6 7.8 12.1 36.6 35.2Reserves to external debt stocks (%) 12.3 5.0 32.2 21.4 45.6 129.1 548.0 581.0Reserves to imports (months) 5.0 1.3 7.9 3.5 8.7 10.7 .. 9.5
190

NIGERIA(US$ million, unless otherwise indicated)
1990 1995 2000 2003 2004 2005 2006 2007
7. Long-term external debtDebt outstanding and disbursed 31,935 28,441 30,235 31,350 32,637 20,342 3,909 3,990Public and publicly guaranteed 31,545 28,140 30,020 31,350 32,637 20,342 3,909 3,815 Official creditors 17,007 20,492 26,574 28,971 30,305 18,159 3,127 3,498 Multilateral 3,732 4,944 3,302 2,984 2,964 2,681 2,852 3,144 of which: IBRD 3,284 3,221 1,625 1,201 1,027 722 534 381 IDA 36 268 644 787 967 1,136 1,541 1,929 Bilateral 13,275 15,548 23,272 25,987 27,341 15,479 275 354 Private creditors 14,537 7,648 3,446 2,379 2,332 2,183 782 316 of which: Bonds 0 2,051 2,051 1,442 1,442 1,442 0 0 Commercial banks 5,714 0 0 16 20 11 0 0Private nonguaranteed 391 301 215 0 0 0 0 175 of which: Bonds 0 0 0 0 0 0 0 175Disbursements 927 433 153 208 315 394 795 802Public and publicly guaranteed 927 433 153 208 315 394 795 627 Official creditors 642 433 153 206 273 386 554 582 Multilateral 542 433 153 179 223 327 429 501 of which: IBRD 384 189 31 0 0 0 0 0 IDA 7 86 55 63 156 265 362 335 Bilateral 100 0 0 27 50 59 125 81 Private creditors 285 0 0 1 42 8 241 45 of which: Bonds 0 0 0 0 0 0 0 0 Commercial banks 0 0 0 0 0 0 0 0Private nonguaranteed 0 0 0 0 0 0 0 175 of which: Bonds 0 0 0 0 0 0 0 175Principal repayments 1,180 918 1,091 1,218 1,165 3,874 6,470 892Public and publicly guaranteed 1,165 908 1,056 1,218 1,165 3,874 6,470 892 Official creditors 774 470 914 969 1,029 3,696 4,830 359 Multilateral 246 470 404 350 364 379 368 347 of which: IBRD 241 392 273 203 216 224 211 176 IDA 1 1 4 17 19 19 19 20 Bilateral 528 0 510 619 665 3,317 4,461 12 Private creditors 391 438 142 249 136 179 1,640 533 of which: Bonds 0 0 0 0 0 0 1,442 0 Commercial banks 388 0 0 3 1 3 1 0Private nonguaranteed 15 10 35 0 0 0 0 0 of which: Bonds 0 0 0 0 0 0 0 0Interest payments 2,123 859 690 409 545 4,943 269 106Public and publicly guaranteed 2,120 840 673 409 545 4,943 269 99 Official creditors 1,300 323 516 315 408 4,724 101 93 Multilateral 262 323 190 137 120 104 96 86 of which: IBRD 243 266 103 62 49 39 33 25 IDA 0 2 5 5 11 12 14 15 Bilateral 1,038 0 326 178 288 4,620 5 7 Private creditors 820 516 157 94 137 220 168 6 of which: Bonds 0 128 128 90 90 170 143 0 Commercial banks 378 0 0 1 0 3 0 0Private nonguaranteed 3 19 18 0 0 0 0 7 of which: Bonds 0 0 0 0 0 0 0 78. Debt stock-flow reconciliationTotal change in external debt stocks 3,317 1,000 2,227 4,224 3,183 -15,705 -14,380 1,209 Net flows on external debt -34 -559 -696 -1,063 -242 -2,998 -3,618 1,038 Cross-currency valuation 2,014 606 -1,189 408 1,625 -3,143 1,375 479. Debt restructuringsTotal amount rescheduled 1,480 0 20,920 0 109 0 1 0Total amount forgiven 0 0 0 0 0 7,284 10,887 0Debt buyback 0 0 0 0 0 0 0 010. Contractual obligations on outstanding long-term external debt
2008 2009 2010 2011 2012 2013 2014 2015Official creditorsPrincipal 433 318 271 206 165 165 138 93Interest 93 73 58 47 40 35 31 29Private creditorsPrincipal 127 53 50 46 46 0 0 0Interest 14 18 14 11 9 7 7 7
Notes:Historical data from 1992 to 2002 are World Bank staff estimates. Rescheduling: Data include the effects of Paris Club debt restructuring agreement signed in 2005.
191

PAKISTAN(US$ million, unless otherwise indicated)
1990 1995 2000 2003 2004 2005 2006 2007
1. Summary external debt dataExternal debt stocks 20,663 30,229 32,781 35,741 35,536 33,158 35,877 40,680 Long-term external debt 16,643 25,381 29,733 32,388 32,415 30,436 33,185 37,070 Public and publicly guaranteed 16,506 23,788 27,173 30,769 30,878 29,472 32,278 35,917 Private nonguaranteed 138 1,593 2,560 1,619 1,537 964 907 1,153 Use of IMF credit 835 1,613 1,529 2,108 1,876 1,492 1,462 1,381 Short-term external debt 3,185 3,235 1,519 1,245 1,245 1,230 1,230 2,228 interest arrears on long-term 1 0 0 0 0 0 0 0Memorandum itemsPrincipal arrears on long-term 15 0 0 0 0 0 0 0Long-term public sector debt 16,374 23,694 26,995 30,712 30,842 29,458 32,264 35,903Long-term private sector debt 269 1,687 2,738 1,675 1,573 978 921 1,167Public & publicly guaranteed commitments 2,925 2,257 865 1,348 2,872 4,260 4,099 3,508
External debt flowsDisbursements 1,746 3,288 1,838 1,460 2,682 2,802 3,369 3,177 Long-term external debt 1,746 3,086 1,644 973 2,425 2,802 3,369 3,177 IMF purchases 0 202 195 488 256 0 0 0Principal repayments 1,071 2,013 1,869 2,228 3,524 1,697 1,438 1,506 Long-term external debt 905 1,837 1,587 1,634 2,954 1,460 1,331 1,354 IMF repurchases 166 176 282 595 570 237 107 152Net flows 1,089 2,572 -342 -1,063 -843 1,090 1,931 2,673 Long-term external debt 841 1,249 57 -661 -529 1,343 2,038 1,822 IMF flows -147 109 -15 -498 -461 -160 -28 -29 Short-term external debt 414 1,297 -311 -295 0 -15 0 1,003Interest payments 831 1,203 985 847 747 727 853 1,095 Long-term external debt 515 955 857 788 694 658 789 974 IMF charges 52 45 49 25 21 13 11 9 Short-term external debt 264 202 78 35 32 56 54 112
2. Other non-debt resource flowsForeign direct investment (net) 245 723 308 534 1,118 2,201 4,273 5,333Portfolio equity flows 0 10 35 -26 49 451 1,152 1,276Profit remittances on FDI 53 300 429 893 1,486 1,871 2,580 2,974Grants (excluding technical coop.) 324 188 124 1,322 299 890 1,044 976of which: Debt forgiveness grants .. .. 9 1,000 42 0 1 0 IDA grants .. .. .. 0 1 3 3 3Memo: technical coop. grants 318 181 72 138 129 185 208 148
3. Currency composition of public and publicly guaranteed debt (%)Euro .. .. .. 12.2 13.1 11.4 11.4 11.1Japanese yen 13.6 15.2 16.9 18.3 18.8 17.7 16.3 15.7Pound sterling 1.5 0.8 0.7 0.4 0.4 0.4 0.3 0.3Swiss franc 0.3 0.3 0.3 0.3 0.3 0.2 0.2 0.2U.S.dollars 35.7 31.2 41.5 41.0 38.6 42.0 44.3 44.1
4. Average terms of new commitmentsOfficial creditors Interest (%) 5.2 5.0 6.2 1.7 1.6 1.7 4.0 3.1 Maturity (years) 22.9 18.7 12.8 19.9 26.8 26.9 21.5 28.7 Grace period (years) 6.1 5.5 3.1 4.8 7.3 8.2 6.2 7.7Private creditors Interest (%) 8.8 7.0 8.0 0.0 4.4 5.2 4.8 6.8 Maturity (years) 11.3 4.4 5.3 0.0 5.0 5.0 20.0 10.0 Grace period (years) 4.8 0.9 1.0 0.0 5.0 5.0 11.3 10.0
5. Major economic aggregatesGross national income (GNI) 41,735 61,092 73,025 85,837 100,157 111,767 129,829 145,489Exports of goods, services & income 8,937 12,112 11,312 18,980 20,210 24,045 26,532 29,228Worker remit. & comp. of employees 2,006 1,712 1,075 3,964 3,945 4,280 5,121 5,998Imports of goods & services 11,386 16,311 14,484 17,676 24,610 32,453 39,110 42,617International reserves 1,046 2,528 2,087 11,816 10,718 11,109 12,878 15,798Current account balance -1,661 -3,349 -85 3,573 -817 -3,606 -6,750 -8,295
6. RatiosExternal debt stocks to exports (%) 231.2 249.6 289.8 188.3 175.8 137.9 135.2 139.2External debt stocks to GNI (%) 49.5 49.5 44.9 41.6 35.5 29.7 27.6 28.0Debt service to exports (%) 21.3 26.5 25.2 16.2 21.1 10.1 8.6 8.9Short-term to external debt stocks (%) 15.4 10.7 4.6 3.5 3.5 3.7 3.4 5.5Multilateral to external debt stocks (%) 33.4 40.3 41.1 45.2 45.8 47.9 49.0 48.8Reserves to external debt stocks (%) 5.1 8.4 6.4 33.1 30.2 33.5 35.9 38.8Reserves to imports (months) 1.1 1.9 1.7 8.0 5.2 4.1 4.0 4.4
192

PAKISTAN(US$ million, unless otherwise indicated)
1990 1995 2000 2003 2004 2005 2006 2007
7. Long-term external debtDebt outstanding and disbursed 16,643 25,381 29,733 32,388 32,415 30,436 33,185 37,070Public and publicly guaranteed 16,506 23,788 27,173 30,769 30,878 29,472 32,278 35,917 Official creditors 15,791 22,691 25,123 30,246 30,099 28,211 30,219 33,083 Multilateral 6,894 12,179 13,480 16,148 16,277 15,880 17,584 19,860 of which: IBRD 1,816 3,082 3,093 2,695 2,460 2,238 2,143 2,086 IDA 2,106 3,321 3,828 5,869 6,818 6,865 7,871 9,075 Bilateral 8,897 10,512 11,643 14,099 13,821 12,332 12,635 13,223 Private creditors 714 1,097 2,051 522 780 1,261 2,059 2,834 of which: Bonds 0 150 623 325 608 1,100 1,900 2,650 Commercial banks 401 371 1,099 91 45 30 7 26Private nonguaranteed 138 1,593 2,560 1,619 1,537 964 907 1,153 of which: Bonds 0 45 45 0 0 600 850 850Disbursements 1,746 3,086 1,644 973 2,425 2,802 3,369 3,177Public and publicly guaranteed 1,708 2,331 1,527 893 2,045 2,202 3,119 3,177 Official creditors 1,629 2,199 1,522 836 1,501 1,578 2,297 2,395 Multilateral 978 1,167 1,043 703 1,363 1,523 2,105 2,196 of which: IBRD 356 271 159 28 1 217 155 175 IDA 135 255 141 118 781 628 854 1,001 Bilateral 651 1,032 479 133 138 54 192 199 Private creditors 78 132 4 56 544 625 821 782 of which: Bonds 0 0 0 0 500 600 800 750 Commercial banks 8 87 0 0 0 0 0 22Private nonguaranteed 38 755 117 80 380 600 250 0 of which: Bonds 0 0 0 0 0 600 250 0Principal repayments 905 1,837 1,587 1,634 2,954 1,460 1,331 1,354Public and publicly guaranteed 866 1,497 1,142 1,254 2,492 1,133 1,088 1,082 Official creditors 725 1,267 1,104 931 2,206 990 1,064 1,076 Multilateral 307 559 828 820 1,805 770 823 726 of which: IBRD 73 219 227 268 304 312 284 284 IDA 19 35 64 88 105 115 165 134 Bilateral 418 708 276 111 401 220 241 349 Private creditors 141 230 37 323 286 143 23 7 of which: Bonds 0 0 0 120 217 108 0 0 Commercial banks 88 138 30 182 45 15 23 3Private nonguaranteed 39 340 445 379 462 327 243 272 of which: Bonds 0 0 0 0 0 0 0 0Interest payments 515 955 857 788 694 658 789 974Public and publicly guaranteed 505 825 641 698 619 582 710 842 Official creditors 450 759 527 650 587 531 598 669 Multilateral 247 445 383 317 245 229 256 308 of which: IBRD 126 217 182 105 87 92 107 114 IDA 15 24 29 42 47 52 56 64 Bilateral 204 313 144 333 342 303 342 361 Private creditors 54 66 114 48 32 50 112 174 of which: Bonds 0 9 61 40 27 47 110 171 Commercial banks 38 32 38 6 3 2 3 0Private nonguaranteed 11 130 217 90 75 76 79 132 of which: Bonds 0 2 2 0 0 3 52 678. Debt stock-flow reconciliationTotal change in external debt stocks 2,315 2,846 -1,109 2,155 -205 -2,378 2,719 4,808 Net flows on external debt 1,089 2,572 -342 -1,063 -843 1,090 1,931 2,673 Cross-currency valuation 1,085 108 -1,669 3,012 1,085 -3,134 844 1,6679. Debt restructuringsTotal amount rescheduled 0 0 918 10 0 0 0 0Total amount forgiven 0 0 0 7 0 0 0 0Debt buyback 0 0 0 0 0 0 0 010. Contractual obligations on outstanding long-term external debt
2008 2009 2010 2011 2012 2013 2014 2015Official creditorsPrincipal 1,426 1,309 1,248 1,291 1,374 1,404 1,452 1,488Interest 839 815 791 762 731 693 653 609Private creditorsPrincipal 131 592 1,252 39 37 285 34 34Interest 243 220 166 143 142 130 118 117
193

PANAMA(US$ million, unless otherwise indicated)
1990 1995 2000 2003 2004 2005 2006 2007
1. Summary external debt dataExternal debt stocks 6,493 6,099 7,038 8,688 9,378 9,743 9,989 9,862 Long-term external debt 3,842 3,782 6,484 8,204 8,957 9,234 9,469 9,328 Public and publicly guaranteed 3,842 3,782 5,704 6,482 7,215 7,492 7,774 8,267 Private nonguaranteed 0 0 780 1,723 1,742 1,742 1,694 1,061 Use of IMF credit 272 111 90 45 36 24 15 5 Short-term external debt 2,378 2,207 464 439 386 485 505 529 interest arrears on long-term 978 1,608 1 0 0 0 0 0Memorandum itemsPrincipal arrears on long-term 1,982 1,997 2 1 1 1 1 1Long-term public sector debt 3,842 3,782 5,704 6,482 7,215 7,492 7,774 8,267Long-term private sector debt 0 0 780 1,723 1,742 1,742 1,694 1,061Public & publicly guaranteed commitments 4 116 479 382 1,243 1,409 2,537 760
External debt flowsDisbursements 6 112 725 696 1,548 1,739 2,868 1,129 Long-term external debt 6 99 725 696 1,548 1,739 2,868 1,129 IMF purchases 0 13 0 0 0 0 0 0Principal repayments 121 172 463 406 798 1,413 2,665 181 Long-term external debt 51 133 411 396 788 1,403 2,655 171 IMF repurchases 70 39 52 9 10 10 10 10Net flows -115 -925 283 359 697 425 224 972 Long-term external debt -44 -34 314 299 760 336 213 958 IMF flows -70 -26 -52 -9 -10 -10 -10 -10 Short-term external debt 0 -866 20 69 -54 99 20 24Interest payments 223 144 454 548 596 666 794 680 Long-term external debt 90 101 418 534 585 654 780 664 IMF charges 16 7 7 1 1 1 1 1 Short-term external debt 117 36 30 13 10 11 13 15
2. Other non-debt resource flowsForeign direct investment (net) 136 223 624 818 1,019 918 2,498 1,907Portfolio equity flows -1 0 0 0 0 0 0 0Profit remittances on FDI 196 396 562 739 967 1,048 1,216 1,540Grants (excluding technical coop.) 126 15 10 19 12 13 22 29of which: Debt forgiveness grants .. .. 0 8 0 0 0 0 IDA grants .. .. .. 0 0 0 0 0Memo: technical coop. grants -16 43 23 35 31 26 37 16
3. Currency composition of public and publicly guaranteed debt (%)Euro .. .. .. 0.1 0.0 0.0 0.0 0.0Japanese yen 9.8 10.4 1.8 1.4 1.2 0.9 0.8 0.7Pound sterling 0.7 0.4 0.1 0.0 0.0 0.0 0.0 0.0Swiss franc 0.1 0.1 0.0 0.0 0.0 0.0 0.0 0.0U.S.dollars 62.2 70.8 91.8 94.4 95.4 96.5 97.1 97.6
4. Average terms of new commitmentsOfficial creditors Interest (%) 5.0 6.9 5.8 5.7 3.5 3.7 5.7 3.2 Maturity (years) 8.3 21.2 22.8 19.4 18.9 19.9 17.9 21.7 Grace period (years) 4.8 4.6 4.6 4.8 4.9 5.1 4.0 5.9Private creditors Interest (%) 0.0 3.3 10.4 8.7 8.0 7.6 5.7 6.7 Maturity (years) 0.0 14.7 19.0 29.2 17.3 21.5 20.9 30.0 Grace period (years) 0.0 3.1 19.0 29.1 17.3 21.5 20.9 30.0
5. Major economic aggregatesGross national income (GNI) 5,051 7,542 11,007 12,191 13,137 14,340 15,839 18,158Exports of goods, services & income 5,595 9,271 9,425 8,511 9,770 11,786 13,968 16,312Worker remit. & comp. of employees 110 112 16 94 109 130 157 180Imports of goods & services 5,588 9,878 10,258 9,188 10,885 12,925 14,598 17,814International reserves 344 781 723 1,011 631 1,211 1,335 1,935Current account balance 209 -471 -673 -537 -1,003 -1,022 -527 -1,422
6. RatiosExternal debt stocks to exports (%) 116.0 65.8 74.7 102.1 96.0 82.7 71.5 60.5External debt stocks to GNI (%) 128.5 80.9 63.9 71.3 71.4 67.9 63.1 54.3Debt service to exports (%) 6.2 3.4 9.7 11.2 14.3 17.6 24.8 5.3Short-term to external debt stocks (%) 36.6 36.2 6.6 5.1 4.1 5.0 5.1 5.4Multilateral to external debt stocks (%) 15.5 10.0 14.6 13.6 12.6 11.4 11.7 12.4Reserves to external debt stocks (%) 5.3 12.8 10.3 11.6 6.7 12.4 13.4 19.6Reserves to imports (months) 0.7 0.9 0.8 1.3 0.7 1.1 1.1 1.3
194

PANAMA(US$ million, unless otherwise indicated)
1990 1995 2000 2003 2004 2005 2006 2007
7. Long-term external debtDebt outstanding and disbursed 3,842 3,782 6,484 8,204 8,957 9,234 9,469 9,328Public and publicly guaranteed 3,842 3,782 5,704 6,482 7,215 7,492 7,774 8,267 Official creditors 1,489 1,262 1,292 1,417 1,393 1,308 1,352 1,411 Multilateral 1,006 612 1,026 1,185 1,179 1,113 1,168 1,228 of which: IBRD 462 175 283 270 245 212 185 216 IDA 0 0 0 0 0 0 0 0 Bilateral 483 650 266 231 215 195 183 183 Private creditors 2,353 2,520 4,412 5,065 5,822 6,184 6,422 6,856 of which: Bonds 260 3 4,141 4,955 5,726 6,105 6,360 6,810 Commercial banks 1,984 2,476 268 109 96 79 63 46Private nonguaranteed 0 0 780 1,723 1,742 1,742 1,694 1,061 of which: Bonds 0 0 266 510 503 635 581 1,061Disbursements 6 99 725 696 1,548 1,739 2,868 1,129Public and publicly guaranteed 6 99 487 421 1,302 1,469 2,299 649 Official creditors 6 95 99 134 113 94 183 199 Multilateral 0 93 88 128 104 91 182 188 of which: IBRD 0 3 22 16 12 9 15 74 IDA 0 0 0 0 0 0 0 0 Bilateral 6 2 11 6 9 3 1 11 Private creditors 0 5 388 287 1,189 1,375 2,116 450 of which: Bonds 0 0 370 275 1,176 1,374 1,676 450 Commercial banks 0 5 17 12 13 1 440 0Private nonguaranteed 0 0 238 275 246 270 569 480 of which: Bonds 0 0 0 0 0 150 300 480Principal repayments 51 133 411 396 788 1,403 2,655 171Public and publicly guaranteed 51 133 386 292 567 1,152 2,023 171 Official creditors 45 116 109 120 135 139 145 154 Multilateral 43 84 57 107 123 127 133 140 of which: IBRD 41 43 24 35 37 39 41 43 IDA 0 0 0 0 0 0 0 0 Bilateral 2 32 52 14 12 12 12 14 Private creditors 6 17 277 172 432 1,013 1,878 17 of which: Bonds 2 0 120 143 405 995 1,422 0 Commercial banks 1 4 156 28 27 17 456 17Private nonguaranteed 0 0 25 104 221 251 632 0 of which: Bonds 0 0 0 0 0 0 369 0Interest payments 90 101 418 534 585 654 780 664Public and publicly guaranteed 90 101 365 470 493 567 691 601 Official creditors 87 59 79 68 61 60 63 71 Multilateral 85 39 69 62 55 55 58 66 of which: IBRD 27 15 21 15 13 12 11 13 IDA 0 0 0 0 0 0 0 0 Bilateral 2 20 10 6 5 5 5 5 Private creditors 3 42 286 402 432 507 629 530 of which: Bonds 0 0 264 396 428 503 624 527 Commercial banks 0 37 22 6 4 4 5 3Private nonguaranteed 0 0 53 64 92 87 88 63 of which: Bonds 0 0 24 32 34 44 46 638. Debt stock-flow reconciliationTotal change in external debt stocks 274 -800 202 394 690 364 246 -127 Net flows on external debt -115 -925 283 359 697 425 224 972 Cross-currency valuation 74 -52 -42 -15 -43 -100 -56 -79. Debt restructuringsTotal amount rescheduled 0 5 0 0 0 0 0 0Total amount forgiven 0 0 0 2 16 0 0 0Debt buyback 0 0 120 79 0 0 203 010. Contractual obligations on outstanding long-term external debt
2008 2009 2010 2011 2012 2013 2014 2015Official creditorsPrincipal 169 160 163 161 164 164 155 139Interest 82 81 77 72 66 59 51 44Private creditorsPrincipal 215 11 89 592 572 1 119 1,404Interest 598 609 608 570 518 481 481 460
Notes:Data on long-term private nonguaranteed debt are World Bank staff estimates. Data for 1996–2002 include debt buybacks.
195

PAPUA NEW GUINEA(US$ million, unless otherwise indicated)
1990 1995 2000 2003 2004 2005 2006 2007
1. Summary external debt dataExternal debt stocks 2,594 2,506 2,556 2,464 2,286 2,276 2,372 2,245 Long-term external debt 2,461 2,378 2,468 2,231 2,113 2,044 2,205 2,154 Public and publicly guaranteed 1,523 1,668 1,454 1,505 1,445 1,266 1,225 1,156 Private nonguaranteed 938 711 1,014 727 668 777 980 998 Use of IMF credit 61 50 39 122 64 0 0 0 Short-term external debt 72 78 49 111 109 232 167 91 interest arrears on long-term 0 0 0 0 0 0 0 0Memorandum itemsPrincipal arrears on long-term 0 0 0 0 0 0 0 0Long-term public sector debt 1,501 1,667 1,440 1,505 1,445 1,266 1,225 1,156Long-term private sector debt 960 711 1,027 727 668 777 980 998Public & publicly guaranteed commitments 247 175 319 0 68 0 53 37
External debt flowsDisbursements 681 240 293 40 109 302 344 308 Long-term external debt 623 189 254 40 109 302 344 308 IMF purchases 58 51 38 0 0 0 0 0Principal repayments 391 509 215 222 390 317 261 320 Long-term external debt 388 493 196 217 330 256 261 320 IMF repurchases 3 16 19 5 60 61 0 0Net flows 197 -291 30 -135 -283 108 18 -79 Long-term external debt 235 -304 59 -177 -222 46 83 -12 IMF flows 58 34 19 -5 -60 -61 0 0 Short-term external debt -93 -21 -48 47 -2 123 -65 -67Interest payments 162 117 90 72 86 86 101 106 Long-term external debt 156 111 85 69 79 77 91 99 IMF charges 0 1 1 2 3 1 0 0 Short-term external debt 6 5 4 1 3 9 10 7
2. Other non-debt resource flowsForeign direct investment (net) 155 455 96 101 55 34 -7 96Portfolio equity flows 0 0 0 0 0 0 0 0Profit remittances on FDI 158 409 198 400 361 475 0 0Grants (excluding technical coop.) 304 269 98 105 113 138 119 171of which: Debt forgiveness grants .. .. 0 0 0 0 0 0 IDA grants .. .. .. 0 0 0 0 0Memo: technical coop. grants 44 89 144 148 186 160 187 181
3. Currency composition of public and publicly guaranteed debt (%)Euro .. .. .. 3.6 3.8 3.8 4.1 4.5Japanese yen 20.4 21.3 30.1 30.7 31.4 29.7 28.6 29.3Pound sterling 2.1 0.6 0.8 0.0 0.0 0.0 0.0 0.0Swiss franc 1.5 0.0 0.0 0.1 0.1 0.1 0.1 0.1U.S.dollars 27.3 19.4 21.3 26.0 28.2 33.7 36.4 35.4
4. Average terms of new commitmentsOfficial creditors Interest (%) 5.7 5.2 6.5 0.0 1.3 0.0 4.4 0.8 Maturity (years) 17.3 10.6 17.3 0.0 30.4 0.0 26.1 34.7 Grace period (years) 4.9 4.4 5.1 0.0 7.4 0.0 5.2 10.2Private creditors Interest (%) 7.2 0.0 6.2 0.0 0.0 0.0 0.0 0.0 Maturity (years) 9.5 0.0 5.3 0.0 0.0 0.0 0.0 0.0 Grace period (years) 3.2 0.0 2.5 0.0 0.0 0.0 0.0 0.0
5. Major economic aggregatesGross national income (GNI) 3,096 4,370 3,303 3,130 3,559 4,552 4,947 5,613Exports of goods, services & income 1,487 3,014 2,369 2,454 2,786 3,612 .. ..Worker remit. & comp. of employees 5 16 7 13 16 13 13 13Imports of goods & services 1,719 2,415 2,013 2,548 2,913 3,257 .. ..International reserves 427 267 304 520 660 750 1,441 2,106Current account balance -76 674 351 140 122 640 .. ..
6. RatiosExternal debt stocks to exports (%) 174.4 83.1 107.9 100.4 82.1 63.0 .. ..External debt stocks to GNI (%) 83.8 57.3 77.4 78.7 64.2 50.0 48.0 40.0Debt service to exports (%) 37.2 20.8 12.9 12.0 17.1 11.2 .. ..Short-term to external debt stocks (%) 2.8 3.1 1.9 4.5 4.8 10.2 7.0 4.1Multilateral to external debt stocks (%) 29.5 37.4 32.3 36.4 39.4 36.7 34.3 33.4Reserves to external debt stocks (%) 16.5 10.6 11.9 21.1 28.9 33.0 60.7 93.8Reserves to imports (months) 3.0 1.3 1.8 2.5 2.7 2.8 .. ..
196
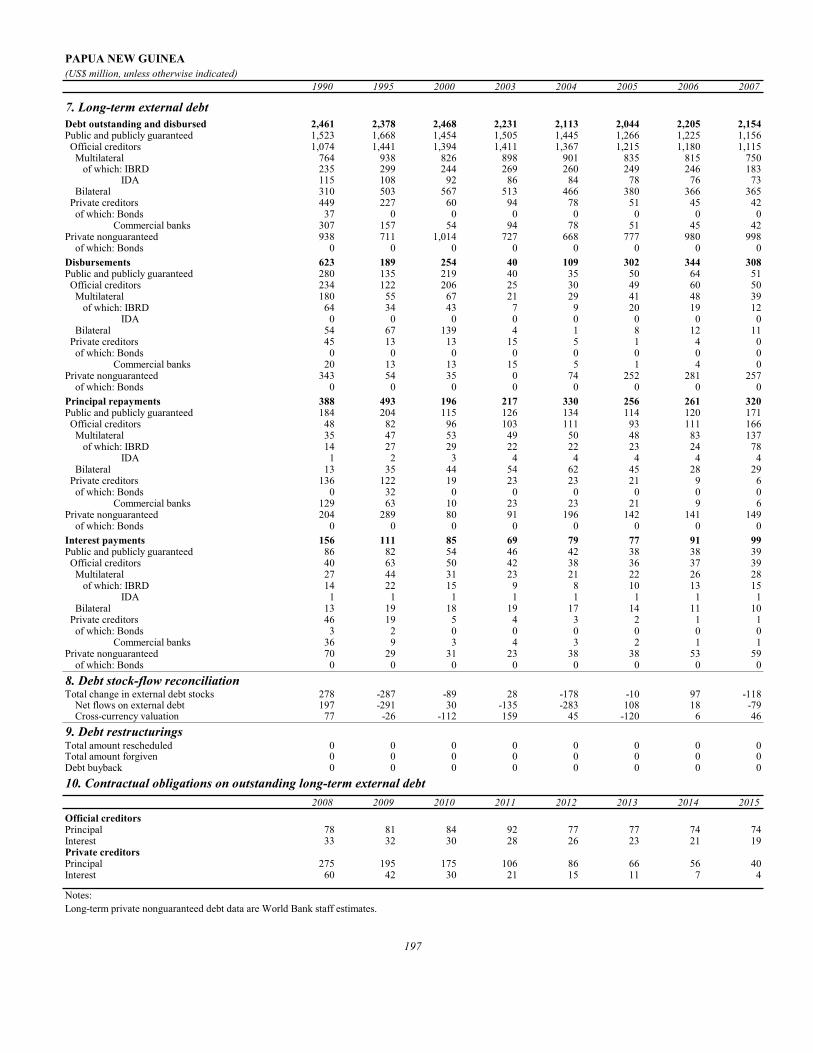
PAPUA NEW GUINEA(US$ million, unless otherwise indicated)
1990 1995 2000 2003 2004 2005 2006 2007
7. Long-term external debtDebt outstanding and disbursed 2,461 2,378 2,468 2,231 2,113 2,044 2,205 2,154Public and publicly guaranteed 1,523 1,668 1,454 1,505 1,445 1,266 1,225 1,156 Official creditors 1,074 1,441 1,394 1,411 1,367 1,215 1,180 1,115 Multilateral 764 938 826 898 901 835 815 750 of which: IBRD 235 299 244 269 260 249 246 183 IDA 115 108 92 86 84 78 76 73 Bilateral 310 503 567 513 466 380 366 365 Private creditors 449 227 60 94 78 51 45 42 of which: Bonds 37 0 0 0 0 0 0 0 Commercial banks 307 157 54 94 78 51 45 42Private nonguaranteed 938 711 1,014 727 668 777 980 998 of which: Bonds 0 0 0 0 0 0 0 0Disbursements 623 189 254 40 109 302 344 308Public and publicly guaranteed 280 135 219 40 35 50 64 51 Official creditors 234 122 206 25 30 49 60 50 Multilateral 180 55 67 21 29 41 48 39 of which: IBRD 64 34 43 7 9 20 19 12 IDA 0 0 0 0 0 0 0 0 Bilateral 54 67 139 4 1 8 12 11 Private creditors 45 13 13 15 5 1 4 0 of which: Bonds 0 0 0 0 0 0 0 0 Commercial banks 20 13 13 15 5 1 4 0Private nonguaranteed 343 54 35 0 74 252 281 257 of which: Bonds 0 0 0 0 0 0 0 0Principal repayments 388 493 196 217 330 256 261 320Public and publicly guaranteed 184 204 115 126 134 114 120 171 Official creditors 48 82 96 103 111 93 111 166 Multilateral 35 47 53 49 50 48 83 137 of which: IBRD 14 27 29 22 22 23 24 78 IDA 1 2 3 4 4 4 4 4 Bilateral 13 35 44 54 62 45 28 29 Private creditors 136 122 19 23 23 21 9 6 of which: Bonds 0 32 0 0 0 0 0 0 Commercial banks 129 63 10 23 23 21 9 6Private nonguaranteed 204 289 80 91 196 142 141 149 of which: Bonds 0 0 0 0 0 0 0 0Interest payments 156 111 85 69 79 77 91 99Public and publicly guaranteed 86 82 54 46 42 38 38 39 Official creditors 40 63 50 42 38 36 37 39 Multilateral 27 44 31 23 21 22 26 28 of which: IBRD 14 22 15 9 8 10 13 15 IDA 1 1 1 1 1 1 1 1 Bilateral 13 19 18 19 17 14 11 10 Private creditors 46 19 5 4 3 2 1 1 of which: Bonds 3 2 0 0 0 0 0 0 Commercial banks 36 9 3 4 3 2 1 1Private nonguaranteed 70 29 31 23 38 38 53 59 of which: Bonds 0 0 0 0 0 0 0 08. Debt stock-flow reconciliationTotal change in external debt stocks 278 -287 -89 28 -178 -10 97 -118 Net flows on external debt 197 -291 30 -135 -283 108 18 -79 Cross-currency valuation 77 -26 -112 159 45 -120 6 469. Debt restructuringsTotal amount rescheduled 0 0 0 0 0 0 0 0Total amount forgiven 0 0 0 0 0 0 0 0Debt buyback 0 0 0 0 0 0 0 010. Contractual obligations on outstanding long-term external debt
2008 2009 2010 2011 2012 2013 2014 2015Official creditorsPrincipal 78 81 84 92 77 77 74 74Interest 33 32 30 28 26 23 21 19Private creditorsPrincipal 275 195 175 106 86 66 56 40Interest 60 42 30 21 15 11 7 4
Notes:Long-term private nonguaranteed debt data are World Bank staff estimates.
197

PARAGUAY(US$ million, unless otherwise indicated)
1990 1995 2000 2003 2004 2005 2006 2007
1. Summary external debt dataExternal debt stocks 2,105 2,574 3,089 3,226 3,607 3,229 3,422 3,570 Long-term external debt 1,732 1,791 2,510 2,674 2,941 2,716 2,711 2,767 Public and publicly guaranteed 1,713 1,453 2,060 2,201 2,430 2,265 2,235 2,195 Private nonguaranteed 19 338 450 474 511 450 477 572 Use of IMF credit 0 0 0 0 0 0 0 0 Short-term external debt 373 784 580 551 666 513 711 803 interest arrears on long-term 115 7 11 23 0 0 0 0Memorandum itemsPrincipal arrears on long-term 321 60 55 61 9 8 8 8Long-term public sector debt 1,713 1,453 2,060 2,201 2,430 2,265 2,235 2,195Long-term private sector debt 19 338 450 474 511 450 477 572Public & publicly guaranteed commitments 117 363 125 170 0 99 608 43
External debt flowsDisbursements 77 224 192 271 249 210 244 206 Long-term external debt 77 224 192 271 249 210 244 206 IMF purchases 0 0 0 0 0 0 0 0Principal repayments 235 159 205 245 307 332 269 258 Long-term external debt 235 159 205 245 307 332 269 258 IMF repurchases 0 0 0 0 0 0 0 0Net flows -83 261 -185 87 80 -275 173 30 Long-term external debt -158 65 -13 27 -58 -122 -25 -53 IMF flows 0 0 0 0 0 0 0 0 Short-term external debt 75 196 -173 61 138 -153 198 83Interest payments 90 135 148 113 170 144 152 177 Long-term external debt 77 93 115 107 152 115 121 135 IMF charges 0 0 0 0 0 0 0 0 Short-term external debt 13 42 33 6 18 29 31 41
2. Other non-debt resource flowsForeign direct investment (net) 77 103 104 27 38 54 183 196Portfolio equity flows 0 0 0 0 0 0 0 0Profit remittances on FDI 17 62 84 60 192 158 203 284Grants (excluding technical coop.) 7 36 26 18 19 22 23 81of which: Debt forgiveness grants .. .. 0 0 0 0 0 0 IDA grants .. .. .. 0 0 0 0 0Memo: technical coop. grants 40 64 56 48 48 45 50 37
3. Currency composition of public and publicly guaranteed debt (%)Euro .. .. .. 3.5 2.5 2.6 2.6 2.8Japanese yen 15.6 22.7 15.0 13.5 14.0 13.4 13.7 14.0Pound sterling 2.0 0.3 0.1 0.1 0.1 0.0 0.0 0.0Swiss franc 0.3 0.1 0.1 0.1 0.0 0.0 0.0 0.0U.S.dollars 17.2 28.8 60.1 63.7 67.0 68.4 68.8 68.9
4. Average terms of new commitmentsOfficial creditors Interest (%) 3.5 5.5 6.4 2.7 0.0 4.5 4.3 5.3 Maturity (years) 34.4 19.3 21.8 17.8 0.0 16.4 27.3 22.7 Grace period (years) 10.1 5.6 3.0 4.9 0.0 4.7 7.7 9.9Private creditors Interest (%) 0.0 8.0 0.0 0.0 0.0 0.0 0.0 0.0 Maturity (years) 0.0 9.8 0.0 0.0 0.0 0.0 0.0 0.0 Grace period (years) 0.0 2.3 0.0 0.0 0.0 0.0 0.0 0.0
5. Major economic aggregatesGross national income (GNI) 5,381 8,176 7,094 5,543 6,812 7,486 9,790 12,456Exports of goods, services & income 2,631 5,210 3,336 3,020 3,786 4,412 5,855 6,976Worker remit. & comp. of employees 34 287 278 222 238 269 472 469Imports of goods & services 2,284 5,363 3,524 2,945 3,705 4,421 5,726 6,883International reserves 675 1,106 772 983 1,168 1,297 1,702 2,462Current account balance 390 -92 -163 129 143 53 219 126
6. RatiosExternal debt stocks to exports (%) 80.0 49.4 92.6 106.8 95.3 73.2 58.4 51.2External debt stocks to GNI (%) 39.1 31.5 43.6 58.2 53.0 43.1 35.0 28.7Debt service to exports (%) 12.4 5.6 10.6 11.8 12.6 10.8 7.2 6.2Short-term to external debt stocks (%) 17.7 30.4 18.8 17.1 18.5 15.9 20.8 22.5Multilateral to external debt stocks (%) 34.8 30.2 36.9 40.4 37.4 39.0 37.6 36.3Reserves to external debt stocks (%) 32.1 43.0 25.0 30.5 32.4 40.2 49.7 69.0Reserves to imports (months) 3.5 2.5 2.6 4.0 3.8 3.5 3.6 4.3
198

PARAGUAY(US$ million, unless otherwise indicated)
1990 1995 2000 2003 2004 2005 2006 2007
7. Long-term external debtDebt outstanding and disbursed 1,732 1,791 2,510 2,674 2,941 2,716 2,711 2,767Public and publicly guaranteed 1,713 1,453 2,060 2,201 2,430 2,265 2,235 2,195 Official creditors 1,182 1,320 1,611 1,749 1,985 1,845 1,853 1,843 Multilateral 732 778 1,141 1,302 1,351 1,260 1,286 1,297 of which: IBRD 279 154 201 256 246 223 234 227 IDA 41 36 28 24 22 21 19 18 Bilateral 450 543 471 446 635 584 567 546 Private creditors 531 133 449 452 445 421 381 352 of which: Bonds 0 0 0 0 0 0 0 0 Commercial banks 258 56 424 418 419 403 374 345Private nonguaranteed 19 338 450 474 511 450 477 572 of which: Bonds 0 0 0 0 0 0 0 0Disbursements 77 224 192 271 249 210 244 206Public and publicly guaranteed 77 216 192 153 139 144 154 111 Official creditors 50 204 192 135 135 141 154 111 Multilateral 31 129 166 127 95 75 111 101 of which: IBRD 16 26 47 42 17 17 32 13 IDA 0 0 0 0 0 0 0 0 Bilateral 19 75 26 9 39 66 44 10 Private creditors 27 11 0 18 5 3 0 0 of which: Bonds 0 0 0 0 0 0 0 0 Commercial banks 2 11 0 11 1 3 0 0Private nonguaranteed 0 8 0 118 110 66 90 95 of which: Bonds 0 0 0 0 0 0 0 0Principal repayments 235 159 205 245 307 332 269 258Public and publicly guaranteed 226 157 112 133 214 206 209 206 Official creditors 198 123 105 129 201 176 169 177 Multilateral 62 76 61 86 128 108 105 127 of which: IBRD 40 41 19 19 33 25 26 27 IDA 1 1 1 2 1 1 1 1 Bilateral 137 47 43 43 74 68 65 50 Private creditors 27 34 7 4 13 29 40 29 of which: Bonds 0 0 0 0 0 0 0 0 Commercial banks 10 10 4 3 7 18 30 29Private nonguaranteed 9 2 93 112 93 126 60 52 of which: Bonds 0 0 0 0 0 0 0 0Interest payments 77 93 115 107 152 115 121 135Public and publicly guaranteed 77 87 99 79 125 94 97 104 Official creditors 57 71 69 67 105 77 75 80 Multilateral 47 41 51 54 64 53 53 57 of which: IBRD 25 15 11 12 14 10 12 13 IDA 0 0 0 0 0 0 0 0 Bilateral 10 30 18 13 41 24 22 23 Private creditors 20 16 30 12 20 17 22 24 of which: Bonds 0 0 0 0 0 0 0 0 Commercial banks 2 2 29 11 13 16 21 24Private nonguaranteed 0 6 16 28 28 21 24 31 of which: Bonds 0 0 0 0 0 0 0 08. Debt stock-flow reconciliationTotal change in external debt stocks -277 469 -294 228 382 -379 194 138 Net flows on external debt -83 261 -185 87 80 -275 173 30 Cross-currency valuation 778 -28 -97 93 49 -92 19 459. Debt restructuringsTotal amount rescheduled 0 0 0 0 0 0 0 0Total amount forgiven 15 0 0 0 0 0 0 0Debt buyback 111 0 0 0 0 0 0 010. Contractual obligations on outstanding long-term external debt
2008 2009 2010 2011 2012 2013 2014 2015Official creditorsPrincipal 230 214 211 206 192 163 144 151Interest 90 88 83 76 69 62 55 49Private creditorsPrincipal 186 140 127 86 74 62 57 51Interest 48 39 31 25 20 16 13 9
Notes:Data on long-term public and publicly guaranteed debt and private nonguaranteed debt for 2007 are based on reports provided by the country.
199

PERU(US$ million, unless otherwise indicated)
1990 1995 2000 2003 2004 2005 2006 2007
1. Summary external debt dataExternal debt stocks 20,044 30,833 28,639 29,990 31,559 28,933 28,460 32,154 Long-term external debt 13,959 20,219 24,153 27,326 28,686 25,667 25,429 26,348 Public and publicly guaranteed 13,629 18,931 19,215 23,031 24,677 22,498 22,111 19,669 Private nonguaranteed 330 1,288 4,938 4,294 4,009 3,170 3,318 6,679 Use of IMF credit 755 955 558 139 104 57 20 0 Short-term external debt 5,330 9,659 3,928 2,525 2,769 3,208 3,011 5,806 interest arrears on long-term 3,713 4,584 14 23 22 0 16 16Memorandum itemsPrincipal arrears on long-term 8,345 4,150 29 9 29 0 33 7Long-term public sector debt 13,584 18,925 17,944 21,968 23,693 21,600 21,306 18,963Long-term private sector debt 376 1,294 6,209 5,358 4,993 4,067 4,123 7,386Public & publicly guaranteed commitments 179 930 1,263 2,327 2,488 2,191 599 3,125
External debt flowsDisbursements 289 880 2,065 2,243 2,670 2,766 1,648 7,144 Long-term external debt 289 880 2,065 2,243 2,670 2,766 1,648 7,144 IMF purchases 0 0 0 0 0 0 0 0Principal repayments 229 521 1,138 1,191 1,313 4,043 2,061 6,504 Long-term external debt 166 521 997 1,078 1,273 4,004 2,022 6,483 IMF repurchases 63 0 141 112 40 40 39 20Net flows 126 3,148 289 993 1,602 -816 -626 3,435 Long-term external debt 123 359 1,068 1,164 1,397 -1,238 -374 661 IMF flows -63 0 -141 -112 -40 -40 -39 -20 Short-term external debt 66 2,789 -638 -59 245 461 -213 2,795Interest payments 247 721 1,433 1,400 1,474 1,722 1,701 2,251 Long-term external debt 91 485 1,173 1,326 1,400 1,602 1,553 1,969 IMF charges 74 52 33 4 3 3 2 0 Short-term external debt 82 184 227 71 71 118 146 282
2. Other non-debt resource flowsForeign direct investment (net) 41 2,557 810 1,335 1,599 2,579 3,467 5,343Portfolio equity flows 0 171 123 1 -47 769 182 814Profit remittances on FDI 15 834 344 1,112 2,567 4,030 6,741 7,865Grants (excluding technical coop.) 180 279 159 185 192 253 200 370of which: Debt forgiveness grants .. .. 46 8 25 76 0 10 IDA grants .. .. .. 0 0 0 0 0Memo: technical coop. grants 127 127 151 284 279 285 315 121
3. Currency composition of public and publicly guaranteed debt (%)Euro .. .. .. 6.9 9.9 6.9 7.7 8.2Japanese yen 6.3 14.6 13.7 13.5 13.0 9.1 8.9 10.2Pound sterling 0.9 1.2 0.4 0.3 0.3 0.1 0.1 0.0Swiss franc 1.5 1.2 0.5 0.3 0.2 0.1 0.0 0.0U.S.dollars 48.0 41.9 73.7 74.8 72.9 80.5 80.3 78.6
4. Average terms of new commitmentsOfficial creditors Interest (%) 7.1 6.2 5.8 2.0 3.6 4.8 4.7 5.0 Maturity (years) 9.2 17.4 22.1 16.0 16.0 16.4 19.3 15.8 Grace period (years) 2.4 4.6 5.0 5.6 4.7 7.0 6.8 4.9Private creditors Interest (%) 5.5 0.0 9.0 9.4 7.8 7.7 0.0 7.5 Maturity (years) 6.7 0.0 5.0 19.2 10.8 22.0 0.0 21.8 Grace period (years) 1.3 0.0 0.1 19.2 10.8 22.0 0.0 20.6
5. Major economic aggregatesGross national income (GNI) 25,509 51,140 51,878 59,078 65,904 74,141 84,530 98,625Exports of goods, services & income 4,402 7,796 9,965 11,997 16,267 21,722 29,318 34,996Worker remit. & comp. of employees 87 599 718 869 1,133 1,440 1,837 2,131Imports of goods & services 6,015 12,653 11,794 13,286 16,547 20,906 26,911 33,855International reserves 1,891 8,653 8,676 10,242 12,665 14,171 17,442 27,786Current account balance -1,419 -4,625 -1,546 -949 19 1,148 2,755 1,505
6. RatiosExternal debt stocks to exports (%) 455.3 395.5 287.4 250.0 194.0 133.2 97.1 91.9External debt stocks to GNI (%) 78.6 60.3 55.2 50.8 47.9 39.0 33.7 32.6Debt service to exports (%) 10.8 15.9 25.8 21.6 17.1 26.5 12.8 25.0Short-term to external debt stocks (%) 26.6 31.3 13.7 8.4 8.8 11.1 10.6 18.1Multilateral to external debt stocks (%) 11.0 12.1 19.3 24.0 24.5 27.3 27.4 24.2Reserves to external debt stocks (%) 9.4 28.1 30.3 34.2 40.1 49.0 61.3 86.4Reserves to imports (months) 3.8 8.2 8.8 9.3 9.2 8.1 7.8 9.8
200

PERU(US$ million, unless otherwise indicated)
1990 1995 2000 2003 2004 2005 2006 2007
7. Long-term external debtDebt outstanding and disbursed 13,959 20,219 24,153 27,326 28,686 25,667 25,429 26,348Public and publicly guaranteed 13,629 18,931 19,215 23,031 24,677 22,498 22,111 19,669 Official creditors 6,594 15,229 14,385 17,050 17,403 13,793 13,431 11,133 Multilateral 2,199 3,716 5,532 7,193 7,744 7,900 7,787 7,788 of which: IBRD 1,188 1,729 2,590 2,789 2,834 2,816 2,633 2,649 IDA 0 0 0 0 0 0 0 0 Bilateral 4,395 11,513 8,853 9,857 9,660 5,893 5,644 3,345 Private creditors 7,035 3,702 4,830 5,982 7,273 8,704 8,680 8,537 of which: Bonds 1 0 3,727 5,630 6,949 8,390 8,390 8,270 Commercial banks 3,159 3,040 110 90 82 86 77 68Private nonguaranteed 330 1,288 4,938 4,294 4,009 3,170 3,318 6,679 of which: Bonds 0 60 150 94 91 218 192 1,419Disbursements 289 880 2,065 2,243 2,670 2,766 1,648 7,144Public and publicly guaranteed 289 725 1,488 2,188 2,542 2,633 596 3,189 Official creditors 187 720 1,454 938 1,233 983 596 1,070 Multilateral 38 631 813 697 1,049 799 472 928 of which: IBRD 0 202 266 344 234 192 36 256 IDA 0 0 0 0 0 0 0 0 Bilateral 149 89 640 241 184 184 124 142 Private creditors 103 5 35 1,250 1,308 1,650 0 2,119 of which: Bonds 0 0 0 1,250 1,308 1,650 0 2,119 Commercial banks 69 0 34 0 0 0 0 0Private nonguaranteed 0 155 577 55 128 133 1,052 3,955 of which: Bonds 0 0 0 0 0 127 0 1,227Principal repayments 166 521 997 1,078 1,273 4,004 2,022 6,483Public and publicly guaranteed 112 481 979 1,027 1,202 3,042 1,145 5,864 Official creditors 81 404 834 954 1,108 2,927 1,031 3,498 Multilateral 24 201 497 444 530 557 605 951 of which: IBRD 0 86 93 163 189 210 219 241 IDA 0 0 0 0 0 0 0 0 Bilateral 57 203 337 510 578 2,370 426 2,546 Private creditors 31 77 146 73 94 115 113 2,366 of which: Bonds 0 0 0 44 67 90 90 2,343 Commercial banks 9 28 130 7 9 11 9 9Private nonguaranteed 54 40 17 52 71 962 878 619 of which: Bonds 0 0 0 0 0 0 0 0Interest payments 91 485 1,173 1,326 1,400 1,602 1,553 1,969Public and publicly guaranteed 66 413 1,104 1,187 1,242 1,403 1,387 1,505 Official creditors 51 395 916 849 782 807 722 811 Multilateral 27 245 383 342 300 354 433 477 of which: IBRD 0 118 189 115 92 105 137 150 IDA 0 0 0 0 0 0 0 0 Bilateral 24 150 533 508 482 452 290 334 Private creditors 15 19 188 337 459 596 665 694 of which: Bonds 0 0 179 305 429 568 637 669 Commercial banks 8 10 5 9 8 8 8 7Private nonguaranteed 25 71 69 139 158 198 166 464 of which: Bonds 0 6 11 7 7 10 10 428. Debt stock-flow reconciliationTotal change in external debt stocks 1,479 4,323 -516 1,754 1,569 -2,626 -473 3,694 Net flows on external debt 126 3,148 289 993 1,602 -816 -626 3,435 Cross-currency valuation 642 267 -514 725 264 -801 210 3279. Debt restructuringsTotal amount rescheduled 0 919 1 0 0 21 0 0Total amount forgiven 0 0 0 51 17 64 25 57Debt buyback 0 0 0 0 0 0 0 2,34310. Contractual obligations on outstanding long-term external debt
2008 2009 2010 2011 2012 2013 2014 2015Official creditorsPrincipal 1,023 1,042 1,059 1,065 1,131 1,109 937 830Interest 581 533 481 427 371 310 255 211Private creditorsPrincipal 1,976 1,049 938 604 1,010 472 1,490 1,156Interest 1,242 1,182 1,145 1,114 1,055 991 934 764
Notes:Data on long-term private nonguaranteed debt are World Bank staff estimates. Data in 2007 include Bond prepayment and prepayment to Paris Club creditors.
201

PHILIPPINES(US$ million, unless otherwise indicated)
1990 1995 2000 2003 2004 2005 2006 2007
1. Summary external debt dataExternal debt stocks 30,580 39,379 58,304 62,589 60,968 61,658 60,282 65,845 Long-term external debt 25,241 33,372 50,777 55,213 55,165 54,874 55,273 58,761 Public and publicly guaranteed 24,040 28,525 33,744 36,147 35,981 35,364 36,751 37,895 Private nonguaranteed 1,201 4,847 17,033 19,066 19,184 19,510 18,522 20,867 Use of IMF credit 912 728 2,032 1,197 756 389 0 0 Short-term external debt 4,427 5,279 5,495 6,179 5,046 6,395 5,009 7,084 interest arrears on long-term 52 0 0 0 0 0 0 0Memorandum itemsPrincipal arrears on long-term 182 0 1 1 0 1 2 0Long-term public sector debt 23,667 28,369 33,674 36,071 35,904 35,295 36,685 37,829Long-term private sector debt 1,573 5,003 17,103 19,142 19,262 19,579 18,588 20,932Public & publicly guaranteed commitments 3,520 2,594 5,353 6,027 6,649 3,769 1,489 13,529
External debt flowsDisbursements 2,516 2,840 6,060 7,402 8,027 6,525 8,394 9,161 Long-term external debt 2,516 2,840 5,747 7,402 8,027 6,525 8,394 9,161 IMF purchases 0 0 313 0 0 0 0 0Principal repayments 1,818 3,099 4,055 7,341 7,712 6,403 9,800 6,343 Long-term external debt 1,473 2,737 4,047 6,733 7,240 6,085 9,399 6,343 IMF repurchases 345 363 8 608 473 317 400 0Net flows 1,123 -696 2,551 681 -818 1,472 -2,792 4,893 Long-term external debt 1,043 104 1,700 669 788 440 -1,005 2,818 IMF flows -339 -363 305 -608 -473 -317 -400 0 Short-term external debt 425 -437 546 620 -1,133 1,349 -1,386 2,075Interest payments 1,772 2,264 3,004 2,859 3,765 3,559 3,899 4,137 Long-term external debt 1,573 1,859 2,469 2,699 3,540 3,254 3,521 3,790 IMF charges 99 55 94 29 25 20 15 2 Short-term external debt 100 351 442 132 200 286 363 345
2. Other non-debt resource flowsForeign direct investment (net) 530 1,478 2,240 491 688 1,854 2,921 2,928Portfolio equity flows 0 0 -202 501 518 1,465 2,525 3,285Profit remittances on FDI 311 515 230 1,067 1,373 1,391 2,015 2,068Grants (excluding technical coop.) 362 277 158 179 167 155 144 298of which: Debt forgiveness grants .. .. 0 13 0 0 0 0 IDA grants .. .. .. 0 0 0 0 0Memo: technical coop. grants 243 381 224 251 229 239 252 173
3. Currency composition of public and publicly guaranteed debt (%)Euro .. .. .. 5.7 5.8 5.5 5.8 5.9Japanese yen 31.0 39.2 38.2 39.6 40.2 34.7 32.6 33.4Pound sterling 1.0 0.2 0.1 0.1 0.1 0.1 0.1 0.0Swiss franc 0.5 0.3 0.1 0.2 0.3 0.2 0.2 0.2U.S.dollars 36.2 27.3 42.2 41.6 41.6 49.5 52.9 52.7
4. Average terms of new commitmentsOfficial creditors Interest (%) 5.1 4.3 3.3 1.9 2.8 3.1 5.3 2.3 Maturity (years) 24.4 26.7 28.1 21.4 21.9 19.5 17.2 19.7 Grace period (years) 7.3 7.8 7.3 6.2 6.6 5.4 5.1 5.3Private creditors Interest (%) 9.2 7.1 8.3 6.0 7.2 7.6 8.8 6.4 Maturity (years) 15.1 11.0 11.4 8.3 8.5 10.8 23.7 24.6 Grace period (years) 7.6 10.2 10.8 6.9 8.2 10.2 23.7 24.5
5. Major economic aggregatesGross national income (GNI) 44,073 76,166 80,695 85,446 93,649 106,940 127,329 157,087Exports of goods, services & income 13,290 33,294 49,221 49,739 55,179 59,393 69,839 76,714Worker remit. & comp. of employees 1,465 5,360 6,212 10,243 11,471 13,566 15,251 16,291Imports of goods & services 16,437 35,722 51,928 50,156 54,089 58,132 65,208 71,124International reserves 2,036 7,781 15,074 17,084 16,234 18,474 22,963 33,740Current account balance -2,695 -1,980 -2,225 288 1,633 1,984 5,347 6,301
6. RatiosExternal debt stocks to exports (%) 230.1 118.3 118.5 125.8 110.5 103.8 86.3 85.8External debt stocks to GNI (%) 69.4 51.7 72.3 73.2 65.1 57.7 47.3 41.9Debt service to exports (%) 27.0 16.1 14.3 20.5 20.8 16.8 19.6 13.7Short-term to external debt stocks (%) 14.5 13.4 9.4 9.9 8.3 10.4 8.3 10.8Multilateral to external debt stocks (%) 20.5 21.6 12.4 11.9 12.0 10.7 11.4 11.0Reserves to external debt stocks (%) 6.7 19.8 25.9 27.3 26.6 30.0 38.1 51.2Reserves to imports (months) 1.5 2.6 3.5 4.1 3.6 3.8 4.2 5.7
202

PHILIPPINES(US$ million, unless otherwise indicated)
1990 1995 2000 2003 2004 2005 2006 2007
7. Long-term external debtDebt outstanding and disbursed 25,241 33,372 50,777 55,213 55,165 54,874 55,273 58,761Public and publicly guaranteed 24,040 28,525 33,744 36,147 35,981 35,364 36,751 37,895 Official creditors 15,301 22,626 19,890 21,112 21,108 18,580 18,623 19,568 Multilateral 6,273 8,490 7,207 7,434 7,297 6,620 6,874 7,215 of which: IBRD 3,943 5,002 3,627 3,445 3,317 2,885 2,690 2,726 IDA 101 183 207 215 214 197 196 195 Bilateral 9,029 14,137 12,683 13,678 13,810 11,960 11,749 12,352 Private creditors 8,739 5,899 13,855 15,034 14,874 16,784 18,128 18,327 of which: Bonds 825 4,666 10,466 12,578 12,149 14,290 16,256 16,724 Commercial banks 6,660 416 2,482 1,320 1,558 1,413 813 640Private nonguaranteed 1,201 4,847 17,033 19,066 19,184 19,510 18,522 20,867 of which: Bonds 0 1,925 2,856 4,154 3,465 2,975 2,476 1,993Disbursements 2,516 2,840 5,747 7,402 8,027 6,525 8,394 9,161Public and publicly guaranteed 2,224 1,816 5,228 5,211 6,333 3,874 7,370 3,052 Official creditors 1,373 1,413 1,528 1,706 1,227 1,144 1,905 1,934 Multilateral 854 621 386 568 325 381 974 805 of which: IBRD 506 393 152 201 145 129 132 372 IDA 0 10 10 0 0 0 0 0 Bilateral 519 792 1,142 1,138 902 763 931 1,129 Private creditors 852 403 3,701 3,505 5,105 2,730 5,465 1,119 of which: Bonds 575 278 2,630 2,479 4,405 2,384 5,248 1,048 Commercial banks 167 102 997 885 599 221 165 39Private nonguaranteed 291 1,024 519 2,191 1,695 2,651 1,024 6,109 of which: Bonds 0 864 5 585 283 250 0 0Principal repayments 1,473 2,737 4,047 6,733 7,240 6,085 9,399 6,343Public and publicly guaranteed 1,411 2,587 2,515 3,774 4,600 3,353 5,742 2,551 Official creditors 439 2,204 1,572 1,615 1,749 1,788 1,921 1,667 Multilateral 388 651 562 594 606 644 790 625 of which: IBRD 301 413 349 338 372 376 383 403 IDA 1 2 3 6 7 7 7 7 Bilateral 51 1,553 1,009 1,021 1,143 1,143 1,131 1,042 Private creditors 972 383 943 2,159 2,851 1,566 3,820 883 of which: Bonds 180 32 395 1,105 2,187 1,209 2,911 462 Commercial banks 743 76 474 980 568 265 831 251Private nonguaranteed 62 150 1,533 2,959 2,640 2,732 3,658 3,792 of which: Bonds 0 0 445 320 679 333 604 558Interest payments 1,573 1,859 2,469 2,699 3,540 3,254 3,521 3,790Public and publicly guaranteed 1,486 1,707 1,882 1,869 2,246 2,409 2,736 2,868 Official creditors 749 1,320 841 647 621 584 583 622 Multilateral 444 604 414 295 262 258 280 333 of which: IBRD 296 376 223 140 122 124 141 160 IDA 1 1 2 2 2 2 1 1 Bilateral 305 716 427 351 359 326 303 288 Private creditors 737 387 1,041 1,222 1,625 1,825 2,153 2,246 of which: Bonds 31 287 880 1,159 1,549 1,725 2,033 2,180 Commercial banks 671 34 130 39 48 70 92 35Private nonguaranteed 87 152 586 830 1,294 845 785 923 of which: Bonds 0 82 479 318 326 283 255 1408. Debt stock-flow reconciliationTotal change in external debt stocks 1,927 -878 -17 2,683 -1,622 690 -1,376 5,564 Net flows on external debt 1,123 -696 2,551 681 -818 1,472 -2,792 4,893 Cross-currency valuation 1,542 -250 -2,207 2,455 767 -2,504 185 9209. Debt restructuringsTotal amount rescheduled 1,068 0 0 0 0 0 0 0Total amount forgiven 0 0 0 0 0 0 0 0Debt buyback 721 0 0 0 0 0 0 010. Contractual obligations on outstanding long-term external debt
2008 2009 2010 2011 2012 2013 2014 2015Official creditorsPrincipal 1,828 1,716 1,721 1,686 1,608 1,503 1,319 1,281Interest 677 631 581 527 473 422 374 332Private creditorsPrincipal 3,510 3,372 4,951 3,501 1,917 1,681 1,777 3,964Interest 2,340 2,150 1,924 1,675 1,485 1,328 1,203 1,097
Notes:Long-term private nonguaranteed debt includes the following monitored aggregate private-sector debt: unregistered debt, intercompany debt and capital leases. Short-term debt are based on reports provided by the country.
203
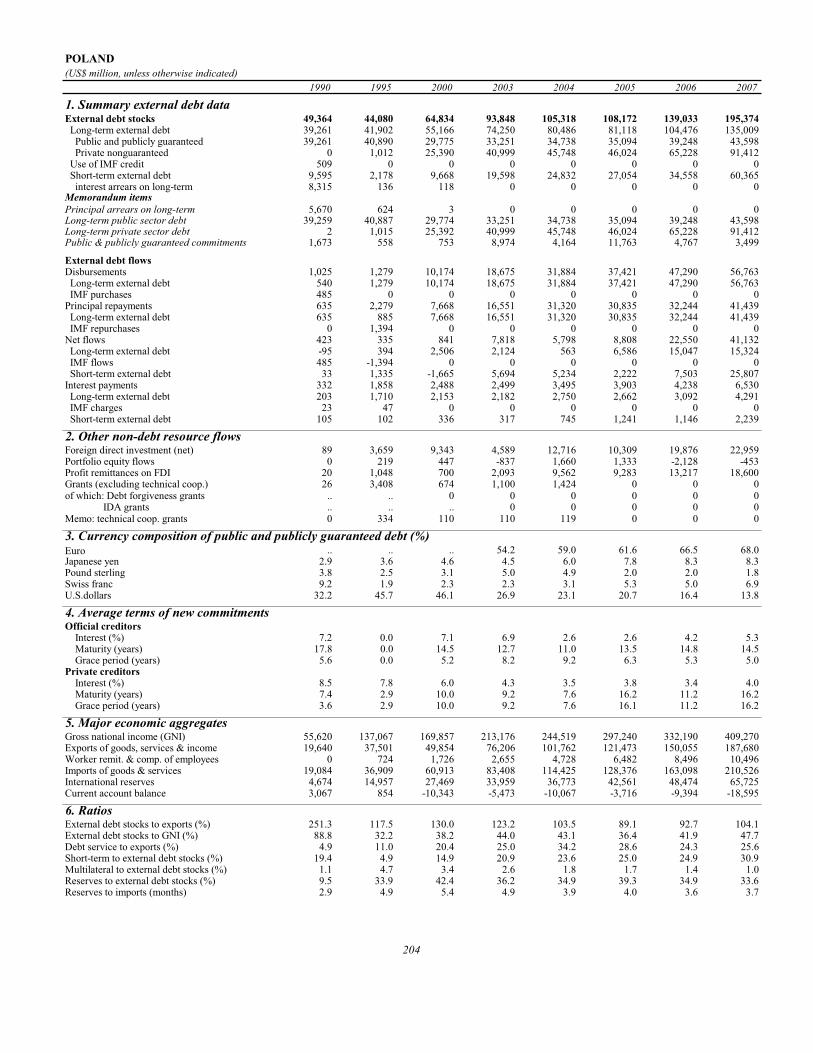
POLAND(US$ million, unless otherwise indicated)
1990 1995 2000 2003 2004 2005 2006 2007
1. Summary external debt dataExternal debt stocks 49,364 44,080 64,834 93,848 105,318 108,172 139,033 195,374 Long-term external debt 39,261 41,902 55,166 74,250 80,486 81,118 104,476 135,009 Public and publicly guaranteed 39,261 40,890 29,775 33,251 34,738 35,094 39,248 43,598 Private nonguaranteed 0 1,012 25,390 40,999 45,748 46,024 65,228 91,412 Use of IMF credit 509 0 0 0 0 0 0 0 Short-term external debt 9,595 2,178 9,668 19,598 24,832 27,054 34,558 60,365 interest arrears on long-term 8,315 136 118 0 0 0 0 0Memorandum itemsPrincipal arrears on long-term 5,670 624 3 0 0 0 0 0Long-term public sector debt 39,259 40,887 29,774 33,251 34,738 35,094 39,248 43,598Long-term private sector debt 2 1,015 25,392 40,999 45,748 46,024 65,228 91,412Public & publicly guaranteed commitments 1,673 558 753 8,974 4,164 11,763 4,767 3,499
External debt flowsDisbursements 1,025 1,279 10,174 18,675 31,884 37,421 47,290 56,763 Long-term external debt 540 1,279 10,174 18,675 31,884 37,421 47,290 56,763 IMF purchases 485 0 0 0 0 0 0 0Principal repayments 635 2,279 7,668 16,551 31,320 30,835 32,244 41,439 Long-term external debt 635 885 7,668 16,551 31,320 30,835 32,244 41,439 IMF repurchases 0 1,394 0 0 0 0 0 0Net flows 423 335 841 7,818 5,798 8,808 22,550 41,132 Long-term external debt -95 394 2,506 2,124 563 6,586 15,047 15,324 IMF flows 485 -1,394 0 0 0 0 0 0 Short-term external debt 33 1,335 -1,665 5,694 5,234 2,222 7,503 25,807Interest payments 332 1,858 2,488 2,499 3,495 3,903 4,238 6,530 Long-term external debt 203 1,710 2,153 2,182 2,750 2,662 3,092 4,291 IMF charges 23 47 0 0 0 0 0 0 Short-term external debt 105 102 336 317 745 1,241 1,146 2,239
2. Other non-debt resource flowsForeign direct investment (net) 89 3,659 9,343 4,589 12,716 10,309 19,876 22,959Portfolio equity flows 0 219 447 -837 1,660 1,333 -2,128 -453Profit remittances on FDI 20 1,048 700 2,093 9,562 9,283 13,217 18,600Grants (excluding technical coop.) 26 3,408 674 1,100 1,424 0 0 0of which: Debt forgiveness grants .. .. 0 0 0 0 0 0 IDA grants .. .. .. 0 0 0 0 0Memo: technical coop. grants 0 334 110 110 119 0 0 0
3. Currency composition of public and publicly guaranteed debt (%)Euro .. .. .. 54.2 59.0 61.6 66.5 68.0Japanese yen 2.9 3.6 4.6 4.5 6.0 7.8 8.3 8.3Pound sterling 3.8 2.5 3.1 5.0 4.9 2.0 2.0 1.8Swiss franc 9.2 1.9 2.3 2.3 3.1 5.3 5.0 6.9U.S.dollars 32.2 45.7 46.1 26.9 23.1 20.7 16.4 13.8
4. Average terms of new commitmentsOfficial creditors Interest (%) 7.2 0.0 7.1 6.9 2.6 2.6 4.2 5.3 Maturity (years) 17.8 0.0 14.5 12.7 11.0 13.5 14.8 14.5 Grace period (years) 5.6 0.0 5.2 8.2 9.2 6.3 5.3 5.0Private creditors Interest (%) 8.5 7.8 6.0 4.3 3.5 3.8 3.4 4.0 Maturity (years) 7.4 2.9 10.0 9.2 7.6 16.2 11.2 16.2 Grace period (years) 3.6 2.9 10.0 9.2 7.6 16.1 11.2 16.2
5. Major economic aggregatesGross national income (GNI) 55,620 137,067 169,857 213,176 244,519 297,240 332,190 409,270Exports of goods, services & income 19,640 37,501 49,854 76,206 101,762 121,473 150,055 187,680Worker remit. & comp. of employees 0 724 1,726 2,655 4,728 6,482 8,496 10,496Imports of goods & services 19,084 36,909 60,913 83,408 114,425 128,376 163,098 210,526International reserves 4,674 14,957 27,469 33,959 36,773 42,561 48,474 65,725Current account balance 3,067 854 -10,343 -5,473 -10,067 -3,716 -9,394 -18,595
6. RatiosExternal debt stocks to exports (%) 251.3 117.5 130.0 123.2 103.5 89.1 92.7 104.1External debt stocks to GNI (%) 88.8 32.2 38.2 44.0 43.1 36.4 41.9 47.7Debt service to exports (%) 4.9 11.0 20.4 25.0 34.2 28.6 24.3 25.6Short-term to external debt stocks (%) 19.4 4.9 14.9 20.9 23.6 25.0 24.9 30.9Multilateral to external debt stocks (%) 1.1 4.7 3.4 2.6 1.8 1.7 1.4 1.0Reserves to external debt stocks (%) 9.5 33.9 42.4 36.2 34.9 39.3 34.9 33.6Reserves to imports (months) 2.9 4.9 5.4 4.9 3.9 4.0 3.6 3.7
204

POLAND(US$ million, unless otherwise indicated)
1990 1995 2000 2003 2004 2005 2006 2007
7. Long-term external debtDebt outstanding and disbursed 39,261 41,902 55,166 74,250 80,486 81,118 104,476 135,009Public and publicly guaranteed 39,261 40,890 29,775 33,251 34,738 35,094 39,248 43,598 Official creditors 27,919 32,169 23,567 20,522 18,560 9,441 8,093 6,186 Multilateral 524 2,067 2,229 2,453 1,912 1,796 1,961 1,870 of which: IBRD 55 2,067 2,229 2,453 1,912 1,796 1,961 1,870 IDA 0 0 0 0 0 0 0 0 Bilateral 27,395 30,102 21,338 18,069 16,648 7,645 6,132 4,317 Private creditors 11,342 8,721 6,209 12,729 16,178 25,653 31,155 37,411 of which: Bonds 1 7,990 5,740 12,329 15,778 25,253 30,755 37,011 Commercial banks 9,759 556 456 400 400 400 400 400Private nonguaranteed 0 1,012 25,390 40,999 45,748 46,024 65,228 91,412 of which: Bonds 0 0 3,462 3,993 1,954 1,622 3,237 3,155Disbursements 540 1,279 10,174 18,675 31,884 37,421 47,290 56,763Public and publicly guaranteed 540 856 906 5,442 4,260 12,124 5,133 3,524 Official creditors 70 248 350 268 522 492 635 209 Multilateral 56 210 349 143 399 253 196 3 of which: IBRD 54 210 349 143 399 253 196 3 IDA 0 0 0 0 0 0 0 0 Bilateral 14 38 0 125 123 239 439 207 Private creditors 470 608 557 5,174 3,738 11,633 4,498 3,315 of which: Bonds 0 250 554 5,174 3,738 11,633 4,498 3,315 Commercial banks 300 353 2 0 0 0 0 0Private nonguaranteed 0 423 9,268 13,234 27,623 25,297 42,158 53,239 of which: Bonds 0 0 809 226 365 0 0 221Principal repayments 635 885 7,668 16,551 31,320 30,835 32,244 41,439Public and publicly guaranteed 635 611 2,272 3,794 3,629 8,006 3,827 2,806 Official creditors 147 332 799 1,979 3,329 8,006 2,611 2,743 Multilateral 46 158 199 352 1,076 174 180 261 of which: IBRD 0 19 199 352 1,076 174 180 261 IDA 0 0 0 0 0 0 0 0 Bilateral 101 173 600 1,627 2,253 7,832 2,430 2,482 Private creditors 488 279 1,473 1,814 300 0 1,216 63 of which: Bonds 0 0 1,224 1,805 300 0 1,216 63 Commercial banks 400 192 235 9 0 0 0 0Private nonguaranteed 0 275 5,396 12,758 27,691 22,829 28,417 38,633 of which: Bonds 0 0 0 0 335 249 246 651Interest payments 203 1,710 2,153 2,182 2,750 2,662 3,092 4,291Public and publicly guaranteed 203 1,654 1,067 966 982 993 1,305 1,495 Official creditors 113 1,215 653 468 466 273 159 133 Multilateral 31 148 122 95 91 50 64 89 of which: IBRD 1 133 122 95 91 50 64 89 IDA 0 0 0 0 0 0 0 0 Bilateral 82 1,067 531 373 375 222 95 44 Private creditors 90 439 414 498 516 720 1,146 1,362 of which: Bonds 0 378 380 497 508 706 1,125 1,339 Commercial banks 74 47 34 1 8 14 22 23Private nonguaranteed 0 56 1,086 1,216 1,768 1,669 1,787 2,795 of which: Bonds 0 0 193 563 116 127 236 2358. Debt stock-flow reconciliationTotal change in external debt stocks 6,279 1,590 -139 17,171 11,470 2,854 30,861 56,341 Net flows on external debt 423 335 841 7,818 5,798 8,808 22,550 41,132 Cross-currency valuation 2,795 1,404 -1,216 3,236 1,623 -3,215 2,691 3,5969. Debt restructuringsTotal amount rescheduled 3,559 0 0 0 0 0 0 0Total amount forgiven 232 0 0 2 0 83 0 0Debt buyback 0 0 943 0 0 0 0 010. Contractual obligations on outstanding long-term external debt
2008 2009 2010 2011 2012 2013 2014 2015Official creditorsPrincipal 2,868 1,619 179 382 237 178 519 97Interest 242 122 86 74 59 50 26 17Private creditorsPrincipal 8,859 13,901 12,213 12,437 10,806 9,657 6,619 9,820Interest 5,490 6,942 3,792 3,585 3,314 1,777 1,346 1,251
Notes:Short-term debt is based on Central Bank data.
205

ROMANIA(US$ million, unless otherwise indicated)
1990 1995 2000 2003 2004 2005 2006 2007
1. Summary external debt dataExternal debt stocks 1,140 6,832 11,160 22,627 29,573 38,861 54,001 85,380 Long-term external debt 230 4,491 9,945 19,525 24,751 31,187 37,285 54,874 Public and publicly guaranteed 223 3,957 6,583 11,724 13,662 13,330 14,204 15,238 Private nonguaranteed 7 534 3,362 7,801 11,089 17,858 23,081 39,636 Use of IMF credit 0 1,038 453 595 443 261 104 0 Short-term external debt 910 1,303 763 2,506 4,379 7,413 16,613 30,505 interest arrears on long-term 0 0 12 11 12 13 10 10Memorandum itemsPrincipal arrears on long-term 0 0 16 26 40 36 260 32Long-term public sector debt 223 3,899 6,440 11,531 13,249 12,962 13,840 14,872Long-term private sector debt 7 592 3,505 7,994 11,502 18,225 23,445 40,003Public & publicly guaranteed commitments 132 1,641 2,864 3,312 3,350 3,072 2,008 985
External debt flowsDisbursements 26 1,513 3,258 5,035 7,841 12,918 11,232 20,878 Long-term external debt 26 1,455 3,144 4,804 7,841 12,918 11,232 20,878 IMF purchases 0 57 114 231 0 0 0 0Principal repayments 4 675 1,801 2,702 3,573 5,331 6,458 8,305 Long-term external debt 4 302 1,705 2,591 3,402 5,179 6,291 8,199 IMF repurchases 0 373 96 111 171 152 167 105Net flows 44 1,174 1,843 3,539 6,139 10,620 13,976 26,467 Long-term external debt 22 1,153 1,439 2,213 4,439 7,739 4,941 12,679 IMF flows 0 -316 18 120 -171 -152 -167 -105 Short-term external debt 22 337 386 1,206 1,871 3,033 9,203 13,893Interest payments 14 321 698 866 1,142 1,587 2,177 3,302 Long-term external debt 0 206 632 815 1,006 1,248 1,404 1,956 IMF charges 0 69 24 9 14 13 10 3 Short-term external debt 14 47 42 42 122 326 763 1,343
2. Other non-debt resource flowsForeign direct investment (net) 0 419 1,037 1,844 6,517 6,482 11,393 9,492Portfolio equity flows 0 0 58 69 111 229 301 746Profit remittances on FDI 0 28 72 254 2,594 2,926 4,164 6,105Grants (excluding technical coop.) 2 35 193 398 739 0 0 0of which: Debt forgiveness grants .. .. 0 0 0 0 0 0 IDA grants .. .. .. 0 0 0 0 0Memo: technical coop. grants 2 152 109 143 148 0 0 0
3. Currency composition of public and publicly guaranteed debt (%)Euro .. .. .. 57.6 58.6 58.9 64.1 69.3Japanese yen 0.0 2.7 5.3 2.3 2.4 3.2 3.4 3.4Pound sterling 0.0 0.0 0.0 0.5 1.0 1.3 1.1 0.7Swiss franc 89.5 1.8 0.9 0.9 0.8 0.7 0.6 0.5U.S.dollars 9.8 34.4 42.5 27.1 27.2 26.9 22.8 18.9
4. Average terms of new commitmentsOfficial creditors Interest (%) 2.7 6.0 5.9 1.8 5.8 2.1 2.9 4.6 Maturity (years) 25.5 13.3 17.1 20.3 12.7 22.3 19.3 20.0 Grace period (years) 10.0 4.3 4.2 5.6 5.1 6.2 5.6 5.9Private creditors Interest (%) 8.4 6.9 9.1 4.3 3.0 3.8 4.1 5.2 Maturity (years) 8.2 7.2 5.7 7.4 8.2 10.0 11.9 11.0 Grace period (years) 3.6 2.7 2.5 3.7 2.7 7.8 3.8 3.2
5. Major economic aggregatesGross national income (GNI) 38,159 35,236 36,768 58,802 73,910 98,008 119,825 165,781Exports of goods, services & income 6,555 9,489 12,440 21,032 27,550 38,100 47,053 60,895Worker remit. & comp. of employees 0 9 96 124 132 4,733 6,718 8,533Imports of goods & services 9,915 11,628 14,653 26,190 37,611 47,298 60,454 83,913International reserves 1,374 2,624 3,396 9,449 16,095 21,601 30,206 39,974Current account balance -3,254 -1,774 -1,355 -3,311 -6,382 -8,504 -12,785 -23,136
6. RatiosExternal debt stocks to exports (%) 17.4 72.0 89.7 107.6 107.3 102.0 114.8 140.2External debt stocks to GNI (%) 3.0 19.4 30.4 38.5 40.0 39.7 45.1 51.5Debt service to exports (%) 0.3 10.5 20.1 17.0 17.1 18.2 18.4 19.1Short-term to external debt stocks (%) 79.8 19.1 6.8 11.1 14.8 19.1 30.8 35.7Multilateral to external debt stocks (%) 0.0 24.7 30.1 21.5 18.9 14.4 11.3 7.9Reserves to external debt stocks (%) 120.5 38.4 30.4 41.8 54.4 55.6 55.9 46.8Reserves to imports (months) 1.7 2.7 2.8 4.3 5.1 5.5 6.0 5.7
206

ROMANIA(US$ million, unless otherwise indicated)
1990 1995 2000 2003 2004 2005 2006 2007
7. Long-term external debtDebt outstanding and disbursed 230 4,491 9,945 19,525 24,751 31,187 37,285 54,874Public and publicly guaranteed 223 3,957 6,583 11,724 13,662 13,330 14,204 15,238 Official creditors 218 2,998 4,149 5,578 6,273 6,152 6,694 7,337 Multilateral 0 1,685 3,364 4,862 5,577 5,602 6,112 6,738 of which: IBRD 0 844 1,898 2,296 2,522 2,448 2,481 2,604 IDA 0 0 0 0 0 0 0 0 Bilateral 218 1,312 785 716 696 550 583 599 Private creditors 5 959 2,434 6,146 7,389 7,178 7,510 7,901 of which: Bonds 0 0 736 2,210 2,179 2,123 2,371 2,650 Commercial banks 0 250 1,157 3,594 4,962 4,874 5,000 5,115Private nonguaranteed 7 534 3,362 7,801 11,089 17,858 23,081 39,636 of which: Bonds 0 0 0 0 0 0 0 0Disbursements 26 1,455 3,144 4,804 7,841 12,918 11,232 20,878Public and publicly guaranteed 23 1,185 1,937 2,674 2,827 2,637 1,321 1,266 Official creditors 19 873 1,083 686 1,111 1,016 684 712 Multilateral 0 361 932 578 953 891 559 652 of which: IBRD 0 128 384 131 305 282 140 232 IDA 0 0 0 0 0 0 0 0 Bilateral 19 511 151 108 158 125 124 60 Private creditors 5 312 854 1,988 1,716 1,621 637 554 of which: Bonds 0 0 139 792 0 623 0 0 Commercial banks 0 165 674 1,147 1,682 958 620 528Private nonguaranteed 3 271 1,207 2,130 5,014 10,281 9,911 19,613 of which: Bonds 0 0 0 0 0 0 0 0Principal repayments 4 302 1,705 2,591 3,402 5,179 6,291 8,199Public and publicly guaranteed 0 217 984 1,424 1,504 1,697 1,423 1,449 Official creditors 0 132 493 570 639 589 543 567 Multilateral 0 14 326 330 432 376 437 496 of which: IBRD 0 0 91 145 163 205 195 211 IDA 0 0 0 0 0 0 0 0 Bilateral 0 118 168 239 207 213 106 70 Private creditors 0 85 491 854 866 1,107 880 882 of which: Bonds 0 0 0 0 186 374 0 0 Commercial banks 0 13 328 691 547 646 813 842Private nonguaranteed 4 86 721 1,167 1,898 3,482 4,868 6,750 of which: Bonds 0 0 75 0 0 0 0 0Interest payments 0 206 632 815 1,006 1,248 1,404 1,956Public and publicly guaranteed 0 179 439 570 629 672 707 802 Official creditors 0 124 269 205 204 229 272 315 Multilateral 0 70 207 170 178 206 252 299 of which: IBRD 0 53 104 69 65 88 111 132 IDA 0 0 0 0 0 0 0 0 Bilateral 0 54 62 35 27 23 20 17 Private creditors 0 56 171 365 425 443 435 487 of which: Bonds 0 0 45 131 193 184 131 171 Commercial banks 0 8 76 206 217 248 295 312Private nonguaranteed 0 27 193 245 376 576 697 1,153 of which: Bonds 0 0 7 0 0 0 0 08. Debt stock-flow reconciliationTotal change in external debt stocks 53 1,230 2,154 5,931 6,946 9,288 15,140 31,378 Net flows on external debt 44 1,174 1,843 3,539 6,139 10,620 13,976 26,467 Cross-currency valuation 39 123 -254 1,035 609 -1,175 914 1,1139. Debt restructuringsTotal amount rescheduled 0 0 0 0 0 0 0 0Total amount forgiven 0 0 0 0 2 0 0 0Debt buyback 0 0 0 0 0 0 0 010. Contractual obligations on outstanding long-term external debt
2008 2009 2010 2011 2012 2013 2014 2015Official creditorsPrincipal 843 899 823 782 907 988 973 947Interest 391 395 389 376 357 329 291 251Private creditorsPrincipal 6,653 5,725 6,609 5,498 6,452 5,339 5,330 5,846Interest 2,736 2,329 2,012 1,642 1,291 943 642 354
Notes:Short-term debt are based on reports provided by the country.
207

RUSSIAN FEDERATION(US$ million, unless otherwise indicated)
1990 1995 2000 2003 2004 2005 2006 2007
1. Summary external debt dataExternal debt stocks .. 121,401 159,993 175,675 196,783 229,911 250,480 370,172 Long-term external debt .. 101,582 132,751 140,149 166,772 202,780 210,031 291,070 Public and publicly guaranteed .. 101,582 110,989 99,028 103,404 76,827 56,427 70,396 Private nonguaranteed .. 0 21,762 41,121 63,368 125,953 153,604 220,673 Use of IMF credit .. 9,617 11,613 5,069 3,562 0 0 0 Short-term external debt .. 10,201 15,630 30,457 26,449 27,131 40,448 79,103 interest arrears on long-term .. 5,851 4,530 3,257 3,103 3,151 743 603Memorandum itemsPrincipal arrears on long-term .. 22,417 7,368 4,057 2,052 2,064 510 39Long-term public sector debt .. 101,582 110,989 99,028 103,404 76,827 56,427 70,396Long-term private sector debt .. 0 21,762 41,121 63,368 125,953 153,604 220,673Public & publicly guaranteed commitments .. 3,154 76 904 1,032 1,495 5,150 20,043
External debt flowsDisbursements .. 8,536 1,387 14,319 25,743 55,068 38,791 82,278 Long-term external debt .. 3,083 1,387 14,319 25,743 55,068 38,791 82,278 IMF purchases .. 5,453 0 0 0 0 0 0Principal repayments .. 3,273 6,221 10,897 12,718 32,475 37,474 24,249 Long-term external debt .. 3,273 3,333 9,001 11,062 29,086 37,474 24,249 IMF repurchases .. 0 2,888 1,897 1,656 3,389 0 0Net flows .. 4,913 -2,835 18,621 9,172 23,227 17,043 96,823 Long-term external debt .. -190 -1,947 5,318 14,682 25,982 1,317 58,029 IMF flows .. 5,453 -2,888 -1,897 -1,656 -3,389 0 0 Short-term external debt .. -350 2,000 15,200 -3,854 634 15,726 38,794Interest payments .. 2,885 5,604 8,242 8,367 9,446 12,880 16,083 Long-term external debt .. 2,591 4,284 7,461 7,550 8,569 11,589 13,719 IMF charges .. 294 691 113 112 27 0 0 Short-term external debt .. 0 630 669 705 850 1,291 2,364
2. Other non-debt resource flowsForeign direct investment (net) .. 2,065 2,714 7,958 15,444 12,886 29,701 55,073Portfolio equity flows .. 47 150 422 270 -100 6,480 18,844Profit remittances on FDI .. 197 887 12,521 10,294 19,483 34,601 43,195Grants (excluding technical coop.) .. 950 662 413 660 0 0 0of which: Debt forgiveness grants .. .. 0 0 0 0 0 0 IDA grants .. .. .. 0 0 0 0 0Memo: technical coop. grants .. 527 583 876 731 0 0 0
3. Currency composition of public and publicly guaranteed debt (%)Euro .. .. .. 22.3 24.8 11.5 6.3 5.2Japanese yen .. 2.0 0.8 1.3 1.2 1.3 1.6 1.1Pound sterling .. 0.8 0.1 0.1 0.1 0.0 0.0 0.0Swiss franc .. 2.8 0.0 0.0 0.0 0.0 0.0 0.0U.S.dollars .. 52.1 71.6 70.4 68.8 81.3 84.1 88.0
4. Average terms of new commitmentsOfficial creditors Interest (%) .. 7.0 7.3 2.6 3.0 4.2 0.0 5.0 Maturity (years) .. 16.7 16.8 14.4 15.1 17.3 0.0 15.9 Grace period (years) .. 5.6 5.3 4.2 4.2 4.8 0.0 4.1Private creditors Interest (%) .. 7.0 7.1 5.1 5.9 6.1 6.7 5.7 Maturity (years) .. 12.2 8.1 16.2 10.4 10.6 5.5 8.5 Grace period (years) .. 2.5 2.1 1.7 5.0 9.2 5.5 8.5
5. Major economic aggregatesGross national income (GNI) .. 392,156 252,972 418,316 578,973 745,542 960,921 1,258,578Exports of goods, services & income .. 97,265 119,350 163,515 216,725 286,772 364,923 441,452Worker remit. & comp. of employees .. 2,503 1,275 1,453 2,495 2,919 3,091 4,100Imports of goods & services .. 90,459 72,580 127,419 155,438 200,704 268,280 360,853International reserves .. 18,024 27,656 78,409 126,258 182,272 303,773 477,950Current account balance .. 6,963 46,839 35,410 59,512 84,409 94,340 76,241
6. RatiosExternal debt stocks to exports (%) .. 124.8 134.1 107.4 90.8 80.2 68.6 83.9External debt stocks to GNI (%) .. 31.0 63.2 42.0 34.0 30.8 26.1 29.4Debt service to exports (%) .. 6.3 9.9 11.7 9.7 14.6 13.8 9.1Short-term to external debt stocks (%) .. 8.4 9.8 17.3 13.4 11.8 16.1 21.4Multilateral to external debt stocks (%) .. 1.6 4.4 3.7 3.1 2.4 2.2 1.4Reserves to external debt stocks (%) .. 14.8 17.3 44.6 64.2 79.3 121.3 129.1Reserves to imports (months) .. 2.4 4.6 7.4 9.7 10.9 13.6 15.9
208
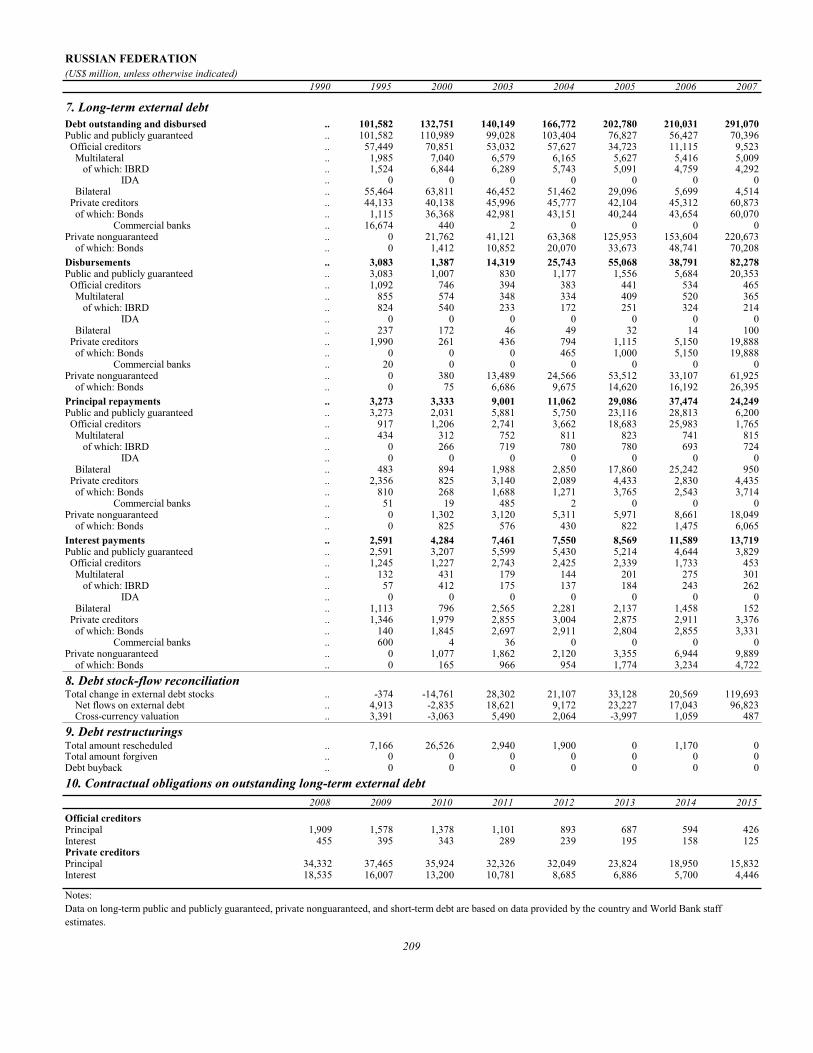
RUSSIAN FEDERATION(US$ million, unless otherwise indicated)
1990 1995 2000 2003 2004 2005 2006 2007
7. Long-term external debtDebt outstanding and disbursed .. 101,582 132,751 140,149 166,772 202,780 210,031 291,070Public and publicly guaranteed .. 101,582 110,989 99,028 103,404 76,827 56,427 70,396 Official creditors .. 57,449 70,851 53,032 57,627 34,723 11,115 9,523 Multilateral .. 1,985 7,040 6,579 6,165 5,627 5,416 5,009 of which: IBRD .. 1,524 6,844 6,289 5,743 5,091 4,759 4,292 IDA .. 0 0 0 0 0 0 0 Bilateral .. 55,464 63,811 46,452 51,462 29,096 5,699 4,514 Private creditors .. 44,133 40,138 45,996 45,777 42,104 45,312 60,873 of which: Bonds .. 1,115 36,368 42,981 43,151 40,244 43,654 60,070 Commercial banks .. 16,674 440 2 0 0 0 0Private nonguaranteed .. 0 21,762 41,121 63,368 125,953 153,604 220,673 of which: Bonds .. 0 1,412 10,852 20,070 33,673 48,741 70,208Disbursements .. 3,083 1,387 14,319 25,743 55,068 38,791 82,278Public and publicly guaranteed .. 3,083 1,007 830 1,177 1,556 5,684 20,353 Official creditors .. 1,092 746 394 383 441 534 465 Multilateral .. 855 574 348 334 409 520 365 of which: IBRD .. 824 540 233 172 251 324 214 IDA .. 0 0 0 0 0 0 0 Bilateral .. 237 172 46 49 32 14 100 Private creditors .. 1,990 261 436 794 1,115 5,150 19,888 of which: Bonds .. 0 0 0 465 1,000 5,150 19,888 Commercial banks .. 20 0 0 0 0 0 0Private nonguaranteed .. 0 380 13,489 24,566 53,512 33,107 61,925 of which: Bonds .. 0 75 6,686 9,675 14,620 16,192 26,395Principal repayments .. 3,273 3,333 9,001 11,062 29,086 37,474 24,249Public and publicly guaranteed .. 3,273 2,031 5,881 5,750 23,116 28,813 6,200 Official creditors .. 917 1,206 2,741 3,662 18,683 25,983 1,765 Multilateral .. 434 312 752 811 823 741 815 of which: IBRD .. 0 266 719 780 780 693 724 IDA .. 0 0 0 0 0 0 0 Bilateral .. 483 894 1,988 2,850 17,860 25,242 950 Private creditors .. 2,356 825 3,140 2,089 4,433 2,830 4,435 of which: Bonds .. 810 268 1,688 1,271 3,765 2,543 3,714 Commercial banks .. 51 19 485 2 0 0 0Private nonguaranteed .. 0 1,302 3,120 5,311 5,971 8,661 18,049 of which: Bonds .. 0 825 576 430 822 1,475 6,065Interest payments .. 2,591 4,284 7,461 7,550 8,569 11,589 13,719Public and publicly guaranteed .. 2,591 3,207 5,599 5,430 5,214 4,644 3,829 Official creditors .. 1,245 1,227 2,743 2,425 2,339 1,733 453 Multilateral .. 132 431 179 144 201 275 301 of which: IBRD .. 57 412 175 137 184 243 262 IDA .. 0 0 0 0 0 0 0 Bilateral .. 1,113 796 2,565 2,281 2,137 1,458 152 Private creditors .. 1,346 1,979 2,855 3,004 2,875 2,911 3,376 of which: Bonds .. 140 1,845 2,697 2,911 2,804 2,855 3,331 Commercial banks .. 600 4 36 0 0 0 0Private nonguaranteed .. 0 1,077 1,862 2,120 3,355 6,944 9,889 of which: Bonds .. 0 165 966 954 1,774 3,234 4,7228. Debt stock-flow reconciliationTotal change in external debt stocks .. -374 -14,761 28,302 21,107 33,128 20,569 119,693 Net flows on external debt .. 4,913 -2,835 18,621 9,172 23,227 17,043 96,823 Cross-currency valuation .. 3,391 -3,063 5,490 2,064 -3,997 1,059 4879. Debt restructuringsTotal amount rescheduled .. 7,166 26,526 2,940 1,900 0 1,170 0Total amount forgiven .. 0 0 0 0 0 0 0Debt buyback .. 0 0 0 0 0 0 010. Contractual obligations on outstanding long-term external debt
2008 2009 2010 2011 2012 2013 2014 2015Official creditorsPrincipal 1,909 1,578 1,378 1,101 893 687 594 426Interest 455 395 343 289 239 195 158 125Private creditorsPrincipal 34,332 37,465 35,924 32,326 32,049 23,824 18,950 15,832Interest 18,535 16,007 13,200 10,781 8,685 6,886 5,700 4,446
Notes:Data on long-term public and publicly guaranteed, private nonguaranteed, and short-term debt are based on data provided by the country and World Bank staff estimates.
209

RWANDA(US$ million, unless otherwise indicated)
1990 1995 2000 2003 2004 2005 2006 2007
1. Summary external debt dataExternal debt stocks 708.0 1029.0 1271.6 1538.2 1660.9 1518.2 418.6 495.8 Long-term external debt 660.8 970.7 1147.3 1416.5 1543.4 1419.6 389.3 455.5 Public and publicly guaranteed 660.8 970.7 1147.3 1416.5 1543.4 1419.6 389.3 455.5 Private nonguaranteed 0.0 0.0 0.0 0.0 0.0 0.0 0.0 0.0 Use of IMF credit 0.1 26.3 85.8 91.9 92.3 77.0 4.3 8.1 Short-term external debt 47.1 32.0 38.4 29.9 25.2 21.6 25.0 32.1 interest arrears on long-term 1.6 17.5 16.7 17.9 18.2 17.6 18.0 18.1Memorandum itemsPrincipal arrears on long-term 8.3 44.2 72.7 79.3 80.3 78.5 78.4 77.2Long-term public sector debt 660.8 970.7 1147.3 1416.5 1543.4 1419.6 389.3 455.5Long-term private sector debt 0.0 0.0 0.0 0.0 0.0 0.0 0.0 0.0Public & publicly guaranteed commitments 71.9 50.0 55.0 43.8 108.6 47.5 75.0 73.5
External debt flowsDisbursements 62.3 67.5 64.9 32.2 102.0 86.6 70.0 93.7 Long-term external debt 62.3 54.0 39.8 31.4 100.3 84.9 67.5 90.2 IMF purchases 0.0 13.5 25.1 0.8 1.7 1.7 2.5 3.5Principal repayments 8.7 11.4 23.9 13.4 13.3 14.3 22.2 9.5 Long-term external debt 7.9 11.4 12.7 11.7 12.8 10.6 22.2 9.5 IMF repurchases 0.8 0.0 11.1 1.7 0.6 3.7 0.0 0.0Net flows 55.5 52.6 24.7 2.7 83.7 69.3 50.9 90.2 Long-term external debt 54.4 42.6 27.1 19.7 87.6 74.3 45.4 80.7 IMF flows 0.0 13.5 -8.8 0.0 0.0 0.0 0.0 0.0 Short-term external debt 1.9 -3.5 -16.4 -16.2 -5.0 -3.0 3.0 6.0Interest payments 11.1 8.9 11.1 7.9 10.9 9.5 8.8 4.7 Long-term external debt 5.9 8.3 8.2 7.2 10.4 8.8 8.5 4.1 IMF charges 0.0 0.1 1.4 0.4 0.5 0.4 0.0 0.0 Short-term external debt 5.2 0.5 1.5 0.2 0.1 0.2 0.3 0.6
2. Other non-debt resource flowsForeign direct investment (net) 7.6 2.2 8.3 4.7 7.7 8.0 11.2 67.1Portfolio equity flows 0.0 0.0 0.0 0.0 0.0 0.0 0.0 0.0Profit remittances on FDI 6.0 1.5 3.1 5.5 3.0 4.7 3.9 9.3Grants (excluding technical coop.) 144.6 565.7 211.3 219.6 325.6 421.7 1562.5 525.7of which: Debt forgiveness grants .. .. 24.4 21.4 24.5 46.8 1205.8 1.5 IDA grants .. .. .. 1.8 59.6 65.9 19.5 73.4Memo: technical coop. grants 90.1 97.0 55.6 94.3 95.9 105.6 128.0 73.8
3. Currency composition of public and publicly guaranteed debt (%)Euro .. .. .. 7.1 6.6 4.2 6.9 6.3Japanese yen 1.5 1.3 0.4 0.2 0.1 0.0 0.0 0.0Pound sterling 0.0 0.0 0.0 0.0 0.0 0.0 0.0 0.0Swiss franc 0.0 0.0 0.0 0.0 0.0 0.0 0.0 0.0U.S.dollars 38.8 45.6 58.6 62.5 63.5 63.8 53.9 51.9
4. Average terms of new commitmentsOfficial creditors Interest (%) 1.4 0.8 0.8 1.0 0.8 0.8 0.2 0.0 Maturity (years) 33.9 39.8 39.7 45.0 46.7 44.4 38.1 40.0 Grace period (years) 9.0 10.3 10.2 9.4 10.3 10.1 5.2 11.0Private creditors Interest (%) 0.0 0.0 0.0 0.0 0.0 0.0 0.0 0.0 Maturity (years) 0.0 0.0 0.0 0.0 0.0 0.0 0.0 0.0 Grace period (years) 0.0 0.0 0.0 0.0 0.0 0.0 0.0 0.0
5. Major economic aggregatesGross national income (GNI) 2572.3 1298.9 1719.6 1746.0 1936.5 2351.4 2840.5 3321.7Exports of goods, services & income 147.9 98.8 145.1 155.1 215.9 293.3 319.7 439.6Worker remit. & comp. of employees 3.0 21.0 7.0 9.0 9.8 20.9 21.2 51.3Imports of goods & services 374.7 391.3 451.7 469.5 555.4 702.8 778.3 971.4International reserves 44.3 99.1 190.6 214.7 314.6 405.8 439.7 552.8Current account balance -84.6 57.5 -94.4 -97.5 -35.2 -52.1 -180.0 -146.6
6. RatiosExternal debt stocks to exports (%) 478.6 1,041.4 876.2 991.7 769.3 517.7 130.9 112.8External debt stocks to GNI (%) 27.5 79.2 73.9 88.1 85.8 64.6 14.7 14.9Debt service to exports (%) 13.4 20.5 24.1 13.7 11.2 8.1 9.7 3.2Short-term to external debt stocks (%) 6.7 3.1 3.0 1.9 1.5 1.4 6.0 6.5Multilateral to external debt stocks (%) 76.6 79.1 78.4 82.5 84.4 89.7 80.1 81.3Reserves to external debt stocks (%) 6.3 9.6 15.0 14.0 18.9 26.7 105.0 111.5Reserves to imports (months) 1.4 3.0 5.1 5.5 6.8 6.9 6.8 6.8
210

RWANDA(US$ million, unless otherwise indicated)
1990 1995 2000 2003 2004 2005 2006 2007
7. Long-term external debtDebt outstanding and disbursed 660.8 970.7 1147.3 1416.5 1543.4 1419.6 389.3 455.5Public and publicly guaranteed 660.8 970.7 1147.3 1416.5 1543.4 1419.6 389.3 455.5 Official creditors 660.8 970.7 1147.3 1416.5 1543.4 1419.6 389.3 455.5 Multilateral 542.2 813.7 997.4 1269.5 1402.3 1361.9 335.2 403.3 of which: IBRD 0.0 0.0 0.0 0.0 0.0 0.0 0.0 0.0 IDA 339.9 512.0 691.9 909.2 1019.9 980.3 168.5 203.8 Bilateral 118.6 157.0 150.0 147.0 141.1 57.7 54.1 52.3 Private creditors 0.0 0.0 0.0 0.0 0.0 0.0 0.0 0.0 of which: Bonds 0.0 0.0 0.0 0.0 0.0 0.0 0.0 0.0 Commercial banks 0.0 0.0 0.0 0.0 0.0 0.0 0.0 0.0Private nonguaranteed 0.0 0.0 0.0 0.0 0.0 0.0 0.0 0.0 of which: Bonds 0.0 0.0 0.0 0.0 0.0 0.0 0.0 0.0Disbursements 62.3 54.0 39.8 31.4 100.3 84.9 67.5 90.2Public and publicly guaranteed 62.3 54.0 39.8 31.4 100.3 84.9 67.5 90.2 Official creditors 62.3 54.0 39.8 31.4 100.3 84.9 67.5 90.2 Multilateral 36.8 54.0 39.8 31.4 100.3 84.9 67.5 90.2 of which: IBRD 0.0 0.0 0.0 0.0 0.0 0.0 0.0 0.0 IDA 21.7 34.8 37.2 23.8 82.3 46.8 37.0 27.6 Bilateral 25.5 0.0 0.0 0.0 0.0 0.0 0.0 0.0 Private creditors 0.0 0.0 0.0 0.0 0.0 0.0 0.0 0.0 of which: Bonds 0.0 0.0 0.0 0.0 0.0 0.0 0.0 0.0 Commercial banks 0.0 0.0 0.0 0.0 0.0 0.0 0.0 0.0Private nonguaranteed 0.0 0.0 0.0 0.0 0.0 0.0 0.0 0.0 of which: Bonds 0.0 0.0 0.0 0.0 0.0 0.0 0.0 0.0Principal repayments 7.9 11.4 12.7 11.7 12.8 10.6 22.2 9.5Public and publicly guaranteed 7.9 11.4 12.7 11.7 12.8 10.6 22.2 9.5 Official creditors 7.1 11.4 12.7 11.7 12.8 10.6 22.2 9.5 Multilateral 4.7 11.2 10.4 3.9 4.3 6.4 17.9 6.1 of which: IBRD 0.0 0.0 0.0 0.0 0.0 0.0 0.0 0.0 IDA 1.1 5.8 6.3 0.1 0.1 0.2 8.4 0.0 Bilateral 2.4 0.2 2.3 7.9 8.5 4.2 4.2 3.4 Private creditors 0.8 0.0 0.0 0.0 0.0 0.0 0.0 0.0 of which: Bonds 0.0 0.0 0.0 0.0 0.0 0.0 0.0 0.0 Commercial banks 0.0 0.0 0.0 0.0 0.0 0.0 0.0 0.0Private nonguaranteed 0.0 0.0 0.0 0.0 0.0 0.0 0.0 0.0 of which: Bonds 0.0 0.0 0.0 0.0 0.0 0.0 0.0 0.0Interest payments 5.9 8.3 8.2 7.2 10.4 8.8 8.5 4.1Public and publicly guaranteed 5.9 8.3 8.2 7.2 10.4 8.8 8.5 4.1 Official creditors 5.9 8.3 8.2 7.2 10.4 8.8 8.5 4.1 Multilateral 4.4 8.3 7.2 5.1 8.4 8.7 8.2 3.8 of which: IBRD 0.0 0.0 0.0 0.0 0.0 0.0 0.0 0.0 IDA 2.3 6.7 5.1 3.4 5.8 5.6 4.5 1.5 Bilateral 1.5 0.0 1.0 2.1 2.0 0.2 0.3 0.3 Private creditors 0.0 0.0 0.0 0.0 0.0 0.0 0.0 0.0 of which: Bonds 0.0 0.0 0.0 0.0 0.0 0.0 0.0 0.0 Commercial banks 0.0 0.0 0.0 0.0 0.0 0.0 0.0 0.0Private nonguaranteed 0.0 0.0 0.0 0.0 0.0 0.0 0.0 0.0 of which: Bonds 0.0 0.0 0.0 0.0 0.0 0.0 0.0 0.08. Debt stock-flow reconciliationTotal change in external debt stocks 88.9 76.7 -20.7 102.6 122.6 -142.6 -1099.7 76.2 Net flows on external debt 55.5 52.6 24.7 2.7 83.7 69.3 50.9 90.2 Cross-currency valuation 8.8 -20.9 -36.6 68.4 34.3 -99.2 -946.4 -14.89. Debt restructuringsTotal amount rescheduled 0.0 6.1 6.8 0.0 0.0 8.0 7.0 0.0Total amount forgiven 0.0 0.0 0.2 16.3 18.5 18.1 8.4 0.0Debt buyback 0.0 0.0 0.0 0.0 0.0 0.0 0.0 0.010. Contractual obligations on outstanding long-term external debt
2008 2009 2010 2011 2012 2013 2014 2015Official creditorsPrincipal 6.3 7.6 7.8 9.4 10.9 12.9 13.8 17.2Interest 4.2 4.4 4.5 4.6 4.5 4.4 4.3 4.2Private creditorsPrincipal 0.0 0.0 0.0 0.0 0.0 0.0 0.0 0.0Interest 0.0 0.0 0.0 0.0 0.0 0.0 0.0 0.0
Notes:Rwanda was granted debt relief effective in 2006 under the Multilateral Debt Relief Initiative. Data on long-term public and publicly guaranteed debt for 2006 are World Bank staff estimates.
211
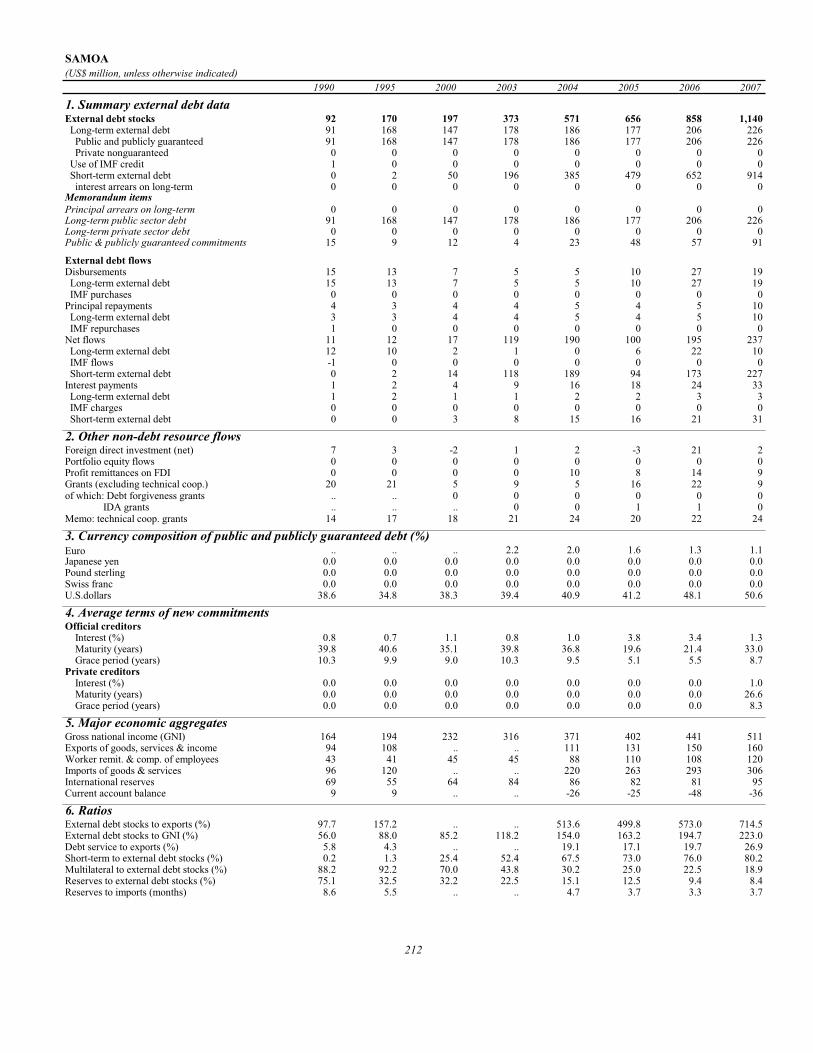
SAMOA(US$ million, unless otherwise indicated)
1990 1995 2000 2003 2004 2005 2006 2007
1. Summary external debt dataExternal debt stocks 92 170 197 373 571 656 858 1,140 Long-term external debt 91 168 147 178 186 177 206 226 Public and publicly guaranteed 91 168 147 178 186 177 206 226 Private nonguaranteed 0 0 0 0 0 0 0 0 Use of IMF credit 1 0 0 0 0 0 0 0 Short-term external debt 0 2 50 196 385 479 652 914 interest arrears on long-term 0 0 0 0 0 0 0 0Memorandum itemsPrincipal arrears on long-term 0 0 0 0 0 0 0 0Long-term public sector debt 91 168 147 178 186 177 206 226Long-term private sector debt 0 0 0 0 0 0 0 0Public & publicly guaranteed commitments 15 9 12 4 23 48 57 91
External debt flowsDisbursements 15 13 7 5 5 10 27 19 Long-term external debt 15 13 7 5 5 10 27 19 IMF purchases 0 0 0 0 0 0 0 0Principal repayments 4 3 4 4 5 4 5 10 Long-term external debt 3 3 4 4 5 4 5 10 IMF repurchases 1 0 0 0 0 0 0 0Net flows 11 12 17 119 190 100 195 237 Long-term external debt 12 10 2 1 0 6 22 10 IMF flows -1 0 0 0 0 0 0 0 Short-term external debt 0 2 14 118 189 94 173 227Interest payments 1 2 4 9 16 18 24 33 Long-term external debt 1 2 1 1 2 2 3 3 IMF charges 0 0 0 0 0 0 0 0 Short-term external debt 0 0 3 8 15 16 21 31
2. Other non-debt resource flowsForeign direct investment (net) 7 3 -2 1 2 -3 21 2Portfolio equity flows 0 0 0 0 0 0 0 0Profit remittances on FDI 0 0 0 0 10 8 14 9Grants (excluding technical coop.) 20 21 5 9 5 16 22 9of which: Debt forgiveness grants .. .. 0 0 0 0 0 0 IDA grants .. .. .. 0 0 1 1 0Memo: technical coop. grants 14 17 18 21 24 20 22 24
3. Currency composition of public and publicly guaranteed debt (%)Euro .. .. .. 2.2 2.0 1.6 1.3 1.1Japanese yen 0.0 0.0 0.0 0.0 0.0 0.0 0.0 0.0Pound sterling 0.0 0.0 0.0 0.0 0.0 0.0 0.0 0.0Swiss franc 0.0 0.0 0.0 0.0 0.0 0.0 0.0 0.0U.S.dollars 38.6 34.8 38.3 39.4 40.9 41.2 48.1 50.6
4. Average terms of new commitmentsOfficial creditors Interest (%) 0.8 0.7 1.1 0.8 1.0 3.8 3.4 1.3 Maturity (years) 39.8 40.6 35.1 39.8 36.8 19.6 21.4 33.0 Grace period (years) 10.3 9.9 9.0 10.3 9.5 5.1 5.5 8.7Private creditors Interest (%) 0.0 0.0 0.0 0.0 0.0 0.0 0.0 1.0 Maturity (years) 0.0 0.0 0.0 0.0 0.0 0.0 0.0 26.6 Grace period (years) 0.0 0.0 0.0 0.0 0.0 0.0 0.0 8.3
5. Major economic aggregatesGross national income (GNI) 164 194 232 316 371 402 441 511Exports of goods, services & income 94 108 .. .. 111 131 150 160Worker remit. & comp. of employees 43 41 45 45 88 110 108 120Imports of goods & services 96 120 .. .. 220 263 293 306International reserves 69 55 64 84 86 82 81 95Current account balance 9 9 .. .. -26 -25 -48 -36
6. RatiosExternal debt stocks to exports (%) 97.7 157.2 .. .. 513.6 499.8 573.0 714.5External debt stocks to GNI (%) 56.0 88.0 85.2 118.2 154.0 163.2 194.7 223.0Debt service to exports (%) 5.8 4.3 .. .. 19.1 17.1 19.7 26.9Short-term to external debt stocks (%) 0.2 1.3 25.4 52.4 67.5 73.0 76.0 80.2Multilateral to external debt stocks (%) 88.2 92.2 70.0 43.8 30.2 25.0 22.5 18.9Reserves to external debt stocks (%) 75.1 32.5 32.2 22.5 15.1 12.5 9.4 8.4Reserves to imports (months) 8.6 5.5 .. .. 4.7 3.7 3.3 3.7
212

SAMOA(US$ million, unless otherwise indicated)
1990 1995 2000 2003 2004 2005 2006 2007
7. Long-term external debtDebt outstanding and disbursed 91 168 147 178 186 177 206 226Public and publicly guaranteed 91 168 147 178 186 177 206 226 Official creditors 90 168 147 178 186 177 206 226 Multilateral 81 157 138 164 172 164 193 216 of which: IBRD 0 0 0 0 0 0 0 0 IDA 18 45 47 58 62 64 69 78 Bilateral 9 11 9 14 13 13 13 10 Private creditors 1 0 0 0 0 0 0 0 of which: Bonds 1 0 0 0 0 0 0 0 Commercial banks 0 0 0 0 0 0 0 0Private nonguaranteed 0 0 0 0 0 0 0 0 of which: Bonds 0 0 0 0 0 0 0 0Disbursements 15 13 7 5 5 10 27 19Public and publicly guaranteed 15 13 7 5 5 10 27 19 Official creditors 15 13 7 5 5 10 27 19 Multilateral 15 13 6 5 5 10 27 19 of which: IBRD 0 0 0 0 0 0 0 0 IDA 3 1 6 3 3 8 3 7 Bilateral 0 0 1 0 0 0 0 0 Private creditors 0 0 0 0 0 0 0 0 of which: Bonds 0 0 0 0 0 0 0 0 Commercial banks 0 0 0 0 0 0 0 0Private nonguaranteed 0 0 0 0 0 0 0 0 of which: Bonds 0 0 0 0 0 0 0 0Principal repayments 3 3 4 4 5 4 5 10Public and publicly guaranteed 3 3 4 4 5 4 5 10 Official creditors 3 3 4 4 5 4 5 10 Multilateral 2 3 3 4 4 4 5 6 of which: IBRD 0 0 0 0 0 0 0 0 IDA 0 0 1 1 1 1 1 1 Bilateral 1 0 1 0 1 0 0 4 Private creditors 0 0 0 0 0 0 0 0 of which: Bonds 0 0 0 0 0 0 0 0 Commercial banks 0 0 0 0 0 0 0 0Private nonguaranteed 0 0 0 0 0 0 0 0 of which: Bonds 0 0 0 0 0 0 0 0Interest payments 1 2 1 1 2 2 3 3Public and publicly guaranteed 1 2 1 1 2 2 3 3 Official creditors 1 2 1 1 2 2 3 3 Multilateral 1 2 1 1 2 2 3 3 of which: IBRD 0 0 0 0 0 0 0 0 IDA 0 0 0 0 1 1 1 1 Bilateral 0 0 0 0 0 0 0 0 Private creditors 0 0 0 0 0 0 0 0 of which: Bonds 0 0 0 0 0 0 0 0 Commercial banks 0 0 0 0 0 0 0 0Private nonguaranteed 0 0 0 0 0 0 0 0 of which: Bonds 0 0 0 0 0 0 0 08. Debt stock-flow reconciliationTotal change in external debt stocks 18 13 5 139 197 86 202 247 Net flows on external debt 11 12 17 119 190 100 195 237 Cross-currency valuation 6 -1 -10 18 7 -14 6 109. Debt restructuringsTotal amount rescheduled 0 0 0 0 0 0 0 0Total amount forgiven 0 0 0 0 0 0 0 0Debt buyback 0 0 0 0 0 0 0 010. Contractual obligations on outstanding long-term external debt
2008 2009 2010 2011 2012 2013 2014 2015Official creditorsPrincipal 10 10 10 11 11 11 12 13Interest 3 4 4 4 3 3 3 3Private creditorsPrincipal 0 0 0 0 1 1 1 1Interest 0 1 1 1 1 1 1 1
213

SAO TOME AND PRINCIPE(US$ million, unless otherwise indicated)
1990 1995 2000 2003 2004 2005 2006 2007
1. Summary external debt dataExternal debt stocks 150.0 245.7 310.1 350.2 366.3 340.3 355.3 168.6 Long-term external debt 132.9 231.8 284.4 332.0 346.6 323.1 336.4 147.3 Public and publicly guaranteed 132.9 231.8 284.4 332.0 346.6 323.1 336.4 147.3 Private nonguaranteed 0.0 0.0 0.0 0.0 0.0 0.0 0.0 0.0 Use of IMF credit 1.1 0.8 2.5 2.8 3.0 3.2 4.1 2.6 Short-term external debt 16.0 13.0 23.3 15.4 16.7 14.0 14.8 18.8 interest arrears on long-term 7.6 6.0 11.3 15.4 16.7 14.0 13.8 7.8Memorandum itemsPrincipal arrears on long-term 21.4 27.2 47.7 49.1 53.4 52.8 66.6 68.6Long-term public sector debt 132.9 231.8 284.4 332.0 346.6 323.1 336.4 147.3Long-term private sector debt 0.0 0.0 0.0 0.0 0.0 0.0 0.0 0.0Public & publicly guaranteed commitments 36.3 0.0 18.2 4.9 11.1 0.0 5.9 0.0
External debt flowsDisbursements 15.6 13.0 13.9 6.3 9.8 6.1 3.9 5.6 Long-term external debt 15.6 13.0 11.4 6.3 9.8 5.4 2.7 4.3 IMF purchases 0.0 0.0 2.5 0.0 0.0 0.6 1.2 1.3Principal repayments 1.1 1.1 2.2 2.4 3.9 3.7 7.3 6.3 Long-term external debt 1.1 0.8 2.2 2.4 3.9 3.5 6.7 5.5 IMF repurchases 0.0 0.2 0.0 0.0 0.0 0.1 0.6 0.8Net flows 9.2 12.9 11.7 -11.1 5.9 2.4 -2.4 9.3 Long-term external debt 14.4 12.2 9.2 3.9 5.9 1.9 -4.1 -1.3 IMF flows 0.0 0.0 0.0 0.0 0.0 0.0 0.0 0.0 Short-term external debt -5.3 1.0 0.0 -15.0 0.0 0.0 1.0 10.0Interest payments 1.7 1.2 2.1 2.2 2.6 2.1 2.0 1.5 Long-term external debt 1.2 0.9 1.2 2.1 2.6 2.1 2.0 1.2 IMF charges 0.0 0.0 0.0 0.0 0.0 0.0 0.0 0.0 Short-term external debt 0.5 0.3 0.9 0.2 0.0 0.0 0.0 0.3
2. Other non-debt resource flowsForeign direct investment (net) 0.0 0.0 3.8 3.4 3.5 15.7 37.5 35.3Portfolio equity flows 0.0 0.0 0.0 0.0 0.0 0.0 0.0 0.0Profit remittances on FDI 0.0 0.0 0.0 0.0 0.0 0.0 0.0 0.0Grants (excluding technical coop.) 26.7 24.6 13.3 21.1 18.3 20.3 16.3 99.0of which: Debt forgiveness grants .. .. 3.2 8.7 1.3 1.4 2.2 78.4 IDA grants .. .. .. 0.0 0.0 0.3 0.4 0.5Memo: technical coop. grants 7.0 20.5 11.8 12.7 14.5 10.5 10.7 12.0
3. Currency composition of public and publicly guaranteed debt (%)Euro .. .. .. 7.0 7.1 6.1 6.5 3.7Japanese yen 0.0 0.0 0.0 0.0 0.0 0.0 0.0 0.0Pound sterling 0.0 0.0 0.0 0.0 0.0 0.0 0.0 0.0Swiss franc 0.0 0.0 4.6 5.3 5.5 5.1 5.3 13.0U.S.dollars 39.3 40.0 44.9 46.3 45.3 46.0 45.6 65.7
4. Average terms of new commitmentsOfficial creditors Interest (%) 0.8 0.0 0.9 0.8 1.0 0.0 0.0 0.0 Maturity (years) 35.7 0.0 38.7 49.9 37.5 0.0 40.0 0.0 Grace period (years) 10.1 0.0 9.3 10.4 9.7 0.0 1.0 0.0Private creditors Interest (%) 0.0 0.0 0.0 0.0 0.0 0.0 0.0 0.0 Maturity (years) 0.0 0.0 0.0 0.0 0.0 0.0 0.0 0.0 Grace period (years) 0.0 0.0 0.0 0.0 0.0 0.0 0.0 0.0
5. Major economic aggregatesGross national income (GNI) .. .. .. .. .. 110.7 119.6 144.0Exports of goods, services & income 8.2 .. 16.7 18.8 17.4 19.4 23.9 19.8Worker remit. & comp. of employees 0.0 0.0 1.0 1.0 1.1 1.5 1.6 2.0Imports of goods & services 22.4 .. 39.7 50.9 58.2 57.6 80.1 85.8International reserves .. 5.1 11.6 25.5 19.5 26.7 34.2 39.3Current account balance -12.0 .. -19.1 -28.3 -37.7 -36.2 -57.7 -66.8
6. RatiosExternal debt stocks to exports (%) 1,820.9 .. 1,855.7 1,860.7 2,109.4 1,753.0 1,488.4 852.7External debt stocks to GNI (%) .. .. .. .. .. 307.5 297.0 117.1Debt service to exports (%) 34.4 .. 25.8 24.5 37.4 29.5 39.1 39.2Short-term to external debt stocks (%) 10.7 5.3 7.5 4.4 4.6 4.1 4.2 11.2Multilateral to external debt stocks (%) 48.4 61.9 54.6 56.9 57.8 58.0 57.2 22.4Reserves to external debt stocks (%) 0.0 2.1 3.8 7.3 5.3 7.8 9.6 23.3Reserves to imports (months) .. .. 3.5 6.0 4.0 5.6 5.1 5.5
214

SAO TOME AND PRINCIPE(US$ million, unless otherwise indicated)
1990 1995 2000 2003 2004 2005 2006 2007
7. Long-term external debtDebt outstanding and disbursed 132.9 231.8 284.4 332.0 346.6 323.1 336.4 147.3Public and publicly guaranteed 132.9 231.8 284.4 332.0 346.6 323.1 336.4 147.3 Official creditors 131.7 231.8 284.4 332.0 346.6 323.1 336.4 147.3 Multilateral 72.6 152.0 169.3 199.2 211.7 197.4 203.4 37.8 of which: IBRD 0.0 0.0 0.0 0.0 0.0 0.0 0.0 0.0 IDA 23.9 53.6 58.9 71.4 76.9 72.4 76.4 10.7 Bilateral 59.2 79.9 115.1 132.8 134.9 125.6 133.0 109.4 Private creditors 1.1 0.0 0.0 0.0 0.0 0.0 0.0 0.0 of which: Bonds 0.0 0.0 0.0 0.0 0.0 0.0 0.0 0.0 Commercial banks 0.0 0.0 0.0 0.0 0.0 0.0 0.0 0.0Private nonguaranteed 0.0 0.0 0.0 0.0 0.0 0.0 0.0 0.0 of which: Bonds 0.0 0.0 0.0 0.0 0.0 0.0 0.0 0.0Disbursements 15.6 13.0 11.4 6.3 9.8 5.4 2.7 4.3Public and publicly guaranteed 15.6 13.0 11.4 6.3 9.8 5.4 2.7 4.3 Official creditors 15.6 13.0 11.4 6.3 9.8 5.4 2.7 4.3 Multilateral 12.8 13.0 8.4 3.6 9.8 5.4 2.7 4.3 of which: IBRD 0.0 0.0 0.0 0.0 0.0 0.0 0.0 0.0 IDA 5.4 5.6 1.7 0.7 3.2 2.5 1.9 2.6 Bilateral 2.7 0.0 2.9 2.7 0.0 0.0 0.0 0.0 Private creditors 0.0 0.0 0.0 0.0 0.0 0.0 0.0 0.0 of which: Bonds 0.0 0.0 0.0 0.0 0.0 0.0 0.0 0.0 Commercial banks 0.0 0.0 0.0 0.0 0.0 0.0 0.0 0.0Private nonguaranteed 0.0 0.0 0.0 0.0 0.0 0.0 0.0 0.0 of which: Bonds 0.0 0.0 0.0 0.0 0.0 0.0 0.0 0.0Principal repayments 1.1 0.8 2.2 2.4 3.9 3.5 6.7 5.5Public and publicly guaranteed 1.1 0.8 2.2 2.4 3.9 3.5 6.7 5.5 Official creditors 1.0 0.8 2.2 2.4 3.9 3.5 6.7 5.5 Multilateral 0.4 0.8 1.9 2.1 3.0 2.0 4.9 4.4 of which: IBRD 0.0 0.0 0.0 0.0 0.0 0.0 0.0 0.0 IDA 0.0 0.1 0.5 0.1 0.1 0.1 1.3 0.1 Bilateral 0.6 0.0 0.3 0.3 0.9 1.5 1.9 1.1 Private creditors 0.1 0.0 0.0 0.0 0.0 0.0 0.0 0.0 of which: Bonds 0.0 0.0 0.0 0.0 0.0 0.0 0.0 0.0 Commercial banks 0.0 0.0 0.0 0.0 0.0 0.0 0.0 0.0Private nonguaranteed 0.0 0.0 0.0 0.0 0.0 0.0 0.0 0.0 of which: Bonds 0.0 0.0 0.0 0.0 0.0 0.0 0.0 0.0Interest payments 1.2 0.9 1.2 2.1 2.6 2.1 2.0 1.2Public and publicly guaranteed 1.2 0.9 1.2 2.1 2.6 2.1 2.0 1.2 Official creditors 1.1 0.9 1.2 2.1 2.6 2.1 2.0 1.2 Multilateral 0.3 0.8 1.2 1.0 1.4 1.4 1.7 1.2 of which: IBRD 0.0 0.0 0.0 0.0 0.0 0.0 0.0 0.0 IDA 0.1 0.3 0.5 0.2 0.4 0.5 0.6 0.1 Bilateral 0.9 0.1 0.0 1.1 1.2 0.7 0.3 0.0 Private creditors 0.1 0.0 0.0 0.0 0.0 0.0 0.0 0.0 of which: Bonds 0.0 0.0 0.0 0.0 0.0 0.0 0.0 0.0 Commercial banks 0.0 0.0 0.0 0.0 0.0 0.0 0.0 0.0Private nonguaranteed 0.0 0.0 0.0 0.0 0.0 0.0 0.0 0.0 of which: Bonds 0.0 0.0 0.0 0.0 0.0 0.0 0.0 0.08. Debt stock-flow reconciliationTotal change in external debt stocks 15.6 22.9 -15.0 9.1 16.1 -25.9 14.9 -186.6 Net flows on external debt 9.2 12.9 11.7 -11.1 5.9 2.4 -2.4 9.3 Cross-currency valuation 2.3 1.3 -7.6 1.8 0.5 -19.0 -1.9 -71.69. Debt restructuringsTotal amount rescheduled 0.0 30.3 7.2 0.5 0.0 0.0 0.0 0.0Total amount forgiven 0.0 0.0 4.8 2.1 2.3 2.5 0.0 0.1Debt buyback 0.0 0.0 0.0 0.0 0.0 0.0 0.0 0.010. Contractual obligations on outstanding long-term external debt
2008 2009 2010 2011 2012 2013 2014 2015Official creditorsPrincipal 7.7 7.8 7.5 7.4 7.4 6.8 6.6 5.6Interest 1.1 1.1 1.0 0.9 0.8 0.7 0.6 0.5Private creditorsPrincipal 0.0 0.0 0.0 0.0 0.0 0.0 0.0 0.0Interest 0.0 0.0 0.0 0.0 0.0 0.0 0.0 0.0
Notes:São Tomé and Principe was granted debt relief effective in 2007 under the Multilateral Debt Relief Initiative.
215

SENEGAL(US$ million, unless otherwise indicated)
1990 1995 2000 2003 2004 2005 2006 2007
1. Summary external debt dataExternal debt stocks 3,754 3,916 3,622 4,389 3,942 3,865 1,930 2,588 Long-term external debt 3,018 3,309 3,221 3,994 3,702 3,681 1,809 2,229 Public and publicly guaranteed 2,958 3,266 3,209 3,944 3,557 3,540 1,658 2,029 Private nonguaranteed 60 44 13 50 145 141 151 200 Use of IMF credit 314 347 255 240 204 148 26 27 Short-term external debt 421 260 146 156 36 36 95 332 interest arrears on long-term 4 9 1 2 0 0 0 0Memorandum itemsPrincipal arrears on long-term 0 51 17 10 13 10 18 15Long-term public sector debt 2,921 3,234 3,209 3,944 3,557 3,540 1,658 2,029Long-term private sector debt 97 76 13 50 145 141 151 200Public & publicly guaranteed commitments 375 328 241 233 327 288 509 294
External debt flowsDisbursements 261 256 156 217 455 387 275 505 Long-term external debt 232 173 137 213 450 382 255 505 IMF purchases 29 83 19 5 5 5 20 0Principal repayments 196 196 148 166 261 145 119 120 Long-term external debt 141 156 127 134 227 112 119 120 IMF repurchases 55 41 21 32 35 34 0 0Net flows 232 87 -153 -86 75 242 216 613 Long-term external debt 91 17 10 79 223 270 136 385 IMF flows -54 0 0 0 0 0 0 0 Short-term external debt 167 28 -161 -138 -118 0 59 228Interest payments 128 87 76 78 74 57 75 61 Long-term external debt 84 70 58 72 70 55 71 51 IMF charges 15 3 1 1 1 1 0 0 Short-term external debt 29 14 17 5 3 2 4 10
2. Other non-debt resource flowsForeign direct investment (net) 57 32 63 52 77 45 220 78Portfolio equity flows 1 4 -2 4 -28 -6 0 0Profit remittances on FDI 60 62 75 89 68 62 70 0Grants (excluding technical coop.) 553 373 246 176 787 355 2,559 392of which: Debt forgiveness grants .. .. 64 51 513 158 2,336 22 IDA grants .. .. .. 0 0 0 0 0Memo: technical coop. grants 175 185 123 205 217 227 358 204
3. Currency composition of public and publicly guaranteed debt (%)Euro .. .. .. 20.4 11.3 10.8 8.4 9.6Japanese yen 1.5 3.6 3.5 2.3 3.3 2.7 5.1 0.0Pound sterling 0.2 0.1 0.1 0.1 0.0 0.0 0.0 0.0Swiss franc 0.9 0.5 0.2 0.1 0.0 0.0 0.0 0.0U.S.dollars 32.8 35.8 45.0 48.8 58.2 58.9 39.9 40.3
4. Average terms of new commitmentsOfficial creditors Interest (%) 2.0 1.2 0.8 1.3 0.9 1.2 0.9 1.9 Maturity (years) 33.4 37.5 40.1 34.4 33.7 31.7 33.8 23.5 Grace period (years) 8.8 9.1 9.9 8.3 8.8 7.2 8.5 5.8Private creditors Interest (%) 8.3 0.0 3.0 6.9 0.0 0.0 7.7 0.0 Maturity (years) 10.1 0.0 9.3 7.2 0.0 0.0 7.5 0.0 Grace period (years) 2.6 0.0 2.8 0.5 0.0 0.0 0.5 0.0
5. Major economic aggregatesGross national income (GNI) 5,520 4,724 4,601 6,753 7,938 8,532 9,190 11,078Exports of goods, services & income 1,628 1,680 1,562 2,361 2,838 3,165 3,370 ..Worker remit. & comp. of employees 142 146 233 511 633 789 925 925Imports of goods & services 2,053 2,033 1,929 2,879 3,420 3,879 4,217 ..International reserves 22 272 384 1,111 1,386 1,191 1,334 1,660Current account balance -363 -244 -332 -436 -513 -677 -861 ..
6. RatiosExternal debt stocks to exports (%) 230.6 233.2 231.8 185.9 138.9 122.1 57.3 ..External debt stocks to GNI (%) 68.0 82.9 78.7 65.0 49.7 45.3 21.0 23.4Debt service to exports (%) 19.9 16.8 14.3 10.3 11.8 6.4 5.8 ..Short-term to external debt stocks (%) 11.2 6.6 4.0 3.5 0.9 0.9 4.9 12.8Multilateral to external debt stocks (%) 36.6 48.2 52.8 58.4 72.6 73.3 51.0 54.2Reserves to external debt stocks (%) 0.6 6.9 10.6 25.3 35.2 30.8 69.1 64.1Reserves to imports (months) 0.1 1.6 2.4 4.6 4.9 3.7 3.8 ..
216

SENEGAL(US$ million, unless otherwise indicated)
1990 1995 2000 2003 2004 2005 2006 2007
7. Long-term external debtDebt outstanding and disbursed 3,018 3,309 3,221 3,994 3,702 3,681 1,809 2,229Public and publicly guaranteed 2,958 3,266 3,209 3,944 3,557 3,540 1,658 2,029 Official creditors 2,793 3,194 3,204 3,930 3,545 3,530 1,651 2,024 Multilateral 1,376 1,889 1,913 2,565 2,861 2,832 985 1,402 of which: IBRD 88 35 1 0 0 0 0 0 IDA 747 1,126 1,330 1,806 2,040 2,045 495 663 Bilateral 1,417 1,305 1,291 1,364 684 699 666 622 Private creditors 166 72 5 14 12 9 7 5 of which: Bonds 0 0 0 0 0 0 0 0 Commercial banks 113 66 5 14 12 9 7 5Private nonguaranteed 60 44 13 50 145 141 151 200 of which: Bonds 0 0 0 0 0 0 0 0Disbursements 232 173 137 213 450 382 255 505Public and publicly guaranteed 217 172 136 198 340 333 220 481 Official creditors 217 172 131 196 340 333 220 481 Multilateral 145 144 119 168 291 262 193 402 of which: IBRD 0 0 0 0 0 0 0 0 IDA 117 107 92 107 173 182 131 133 Bilateral 72 28 12 28 49 71 27 79 Private creditors 0 0 5 2 0 0 0 0 of which: Bonds 0 0 0 0 0 0 0 0 Commercial banks 0 0 5 2 0 0 0 0Private nonguaranteed 15 1 1 14 110 49 35 24 of which: Bonds 0 0 0 0 0 0 0 0Principal repayments 141 156 127 134 227 112 119 120Public and publicly guaranteed 129 150 124 120 212 83 105 66 Official creditors 111 129 124 118 210 81 102 64 Multilateral 58 98 68 44 64 40 57 37 of which: IBRD 13 12 3 0 0 0 0 0 IDA 3 6 11 13 15 12 15 0 Bilateral 52 31 56 74 145 41 45 27 Private creditors 19 21 0 2 2 2 3 3 of which: Bonds 0 0 0 0 0 0 0 0 Commercial banks 8 12 0 2 2 2 3 3Private nonguaranteed 12 5 3 14 15 29 14 54 of which: Bonds 0 0 0 0 0 0 0 0Interest payments 84 70 58 72 70 55 71 51Public and publicly guaranteed 81 69 58 70 62 45 62 35 Official creditors 71 65 58 69 62 44 61 34 Multilateral 26 38 26 25 35 31 50 25 of which: IBRD 6 3 0 0 0 0 0 0 IDA 4 8 8 12 15 16 10 5 Bilateral 45 27 32 44 27 13 11 9 Private creditors 10 3 0 1 0 1 1 1 of which: Bonds 0 0 0 0 0 0 0 0 Commercial banks 7 2 0 1 0 1 1 1Private nonguaranteed 3 1 0 2 8 10 9 16 of which: Bonds 0 0 0 0 0 0 0 08. Debt stock-flow reconciliationTotal change in external debt stocks 475 218 -345 279 -447 -77 -1,935 649 Net flows on external debt 232 87 -153 -86 75 242 216 613 Cross-currency valuation 30 -191 -166 332 171 -256 -1,941 -159. Debt restructuringsTotal amount rescheduled 111 258 0 7 93 31 262 0Total amount forgiven 18 14 12 23 330 34 177 146Debt buyback 0 0 0 0 0 0 0 010. Contractual obligations on outstanding long-term external debt
2008 2009 2010 2011 2012 2013 2014 2015Official creditorsPrincipal 103 111 118 115 117 120 126 130Interest 35 36 36 34 33 32 30 29Private creditorsPrincipal 29 26 25 25 25 25 25 25Interest 11 10 8 7 6 4 3 1
Notes:Senegal was granted debt relief effective in 2006 under the Multilateral Debt Relief Initiative.
217

SERBIA(US$ million, unless otherwise indicated)
1990 1995 2000 2003 2004 2005 2006 2007
1. Summary external debt dataExternal debt stocks .. 10,785 11,499 14,028 14,320 15,944 19,522 26,280 Long-term external debt .. 8,562 6,789 10,306 11,667 12,835 17,281 23,628 Public and publicly guaranteed .. 6,788 6,178 8,129 8,122 7,621 7,473 8,224 Private nonguaranteed .. 1,773 611 2,177 3,545 5,214 9,808 15,404 Use of IMF credit .. 84 152 917 964 866 0 0 Short-term external debt .. 2,139 4,558 2,805 1,689 2,242 2,241 2,652 interest arrears on long-term .. 1,396 3,668 1,749 690 728 584 704Memorandum itemsPrincipal arrears on long-term .. 4,182 5,275 2,341 805 805 732 1,250Long-term public sector debt .. 6,693 6,095 8,129 8,122 7,621 7,473 8,186Long-term private sector debt .. 1,869 694 2,177 3,545 5,214 9,808 15,442Public & publicly guaranteed commitments .. 0 71 567 513 231 452 187
External debt flowsDisbursements .. 0 376 1,205 2,292 3,096 5,225 6,724 Long-term external debt .. 0 222 925 2,052 2,912 5,225 6,724 IMF purchases .. 0 154 280 241 185 0 0Principal repayments .. 0 73 168 587 776 1,558 2,340 Long-term external debt .. 0 0 168 353 570 1,319 2,340 IMF repurchases .. 0 73 0 235 206 239 0Net flows .. 120 51 1,072 1,648 2,836 3,811 4,675 Long-term external debt .. 0 222 757 1,699 2,342 3,906 4,383 IMF flows .. 0 81 280 6 -22 -239 0 Short-term external debt .. 120 -252 36 -57 515 143 291Interest payments .. 47 47 240 311 456 589 927 Long-term external debt .. 0 0 197 255 367 504 822 IMF charges .. 0 29 13 24 32 6 14 Short-term external debt .. 47 18 30 32 57 79 90
2. Other non-debt resource flowsForeign direct investment (net) .. 45 25 1,360 966 1,609 4,499 3,110Portfolio equity flows .. 0 0 0 0 0 0 0Profit remittances on FDI .. 0 0 0 0 0 0 0Grants (excluding technical coop.) .. 487 1,298 998 762 722 1,347 601of which: Debt forgiveness grants .. .. 0 216 31 201 689 0 IDA grants .. .. .. 0 0 0 0 0Memo: technical coop. grants .. 57 124 311 320 350 319 221
3. Currency composition of public and publicly guaranteed debt (%)Euro .. .. .. 26.4 32.2 31.9 33.7 36.3Japanese yen .. 2.2 2.0 1.1 1.2 0.9 0.9 0.8Pound sterling .. 0.7 0.5 0.2 0.2 0.2 0.2 0.2Swiss franc .. 3.6 2.8 1.9 2.1 1.9 3.5 3.3U.S.dollars .. 19.8 24.6 46.1 63.1 63.2 59.6 57.0
4. Average terms of new commitmentsOfficial creditors Interest (%) .. 0.0 0.4 2.4 3.3 1.7 3.8 4.1 Maturity (years) .. 0.0 23.2 17.7 23.2 19.1 13.0 16.9 Grace period (years) .. 0.0 7.8 7.1 8.8 7.7 2.1 5.6Private creditors Interest (%) .. 0.0 7.8 2.2 0.0 0.0 3.4 0.0 Maturity (years) .. 0.0 6.4 3.0 0.0 0.0 7.0 0.0 Grace period (years) .. 0.0 1.9 2.5 0.0 0.0 7.0 0.0
5. Major economic aggregatesGross national income (GNI) .. .. 8,962 20,021 23,986 25,442 29,515 38,485Exports of goods, services & income .. .. .. .. .. .. .. ..Worker remit. & comp. of employees .. 105 1,132 2,661 4,129 4,650 4,703 4,910Imports of goods & services .. .. .. .. .. .. .. ..International reserves .. .. 517 3,550 4,245 5,842 11,889 14,214Current account balance .. .. .. .. .. .. .. ..
6. RatiosExternal debt stocks to exports (%) .. .. .. .. .. .. .. ..External debt stocks to GNI (%) .. .. 128.3 70.1 59.7 62.7 66.1 68.3Debt service to exports (%) .. .. .. .. .. .. .. ..Short-term to external debt stocks (%) .. 19.8 39.6 20.0 11.8 14.1 11.5 10.1Multilateral to external debt stocks (%) .. 12.2 12.5 22.7 26.2 22.3 20.2 17.2Reserves to external debt stocks (%) .. 0.0 4.5 25.3 29.6 36.6 60.9 54.1Reserves to imports (months) .. .. .. .. .. .. .. ..
218

SERBIA(US$ million, unless otherwise indicated)
1990 1995 2000 2003 2004 2005 2006 2007
7. Long-term external debtDebt outstanding and disbursed .. 8,562 6,789 10,306 11,667 12,835 17,281 23,628Public and publicly guaranteed .. 6,788 6,178 8,129 8,122 7,621 7,473 8,224 Official creditors .. 4,588 4,243 6,201 7,047 6,546 6,344 7,045 Multilateral .. 1,311 1,440 3,183 3,750 3,559 3,951 4,531 of which: IBRD .. 1,252 1,097 2,268 2,470 2,147 2,127 2,326 IDA .. 0 0 275 434 486 553 625 Bilateral .. 3,277 2,803 3,018 3,297 2,986 2,393 2,514 Private creditors .. 2,200 1,935 1,928 1,076 1,076 1,128 1,179 of which: Bonds .. 0 0 0 0 0 0 0 Commercial banks .. 2,193 1,928 1,928 1,076 1,076 1,128 1,179Private nonguaranteed .. 1,773 611 2,177 3,545 5,214 9,808 15,404 of which: Bonds .. 0 0 0 0 0 0 165Disbursements .. 0 222 925 2,052 2,912 5,225 6,724Public and publicly guaranteed .. 0 222 299 524 319 398 378 Official creditors .. 0 187 299 524 319 398 337 Multilateral .. 0 0 231 293 286 385 273 of which: IBRD .. 0 0 0 0 0 0 0 IDA .. 0 0 87 142 85 43 47 Bilateral .. 0 187 69 231 33 13 64 Private creditors .. 0 35 0 0 0 0 41 of which: Bonds .. 0 0 0 0 0 0 0 Commercial banks .. 0 0 0 0 0 0 41Private nonguaranteed .. 0 0 626 1,527 2,593 4,828 6,345 of which: Bonds .. 0 0 0 0 0 0 165Principal repayments .. 0 0 168 353 570 1,319 2,340Public and publicly guaranteed .. 0 0 10 16 48 277 191 Official creditors .. 0 0 10 16 48 277 191 Multilateral .. 0 0 8 10 31 263 91 of which: IBRD .. 0 0 0 0 17 242 17 IDA .. 0 0 0 0 0 0 0 Bilateral .. 0 0 2 6 16 14 100 Private creditors .. 0 0 0 0 0 0 0 of which: Bonds .. 0 0 0 0 0 0 0 Commercial banks .. 0 0 0 0 0 0 0Private nonguaranteed .. 0 0 158 336 522 1,041 2,149 of which: Bonds .. 0 0 0 0 0 0 0Interest payments .. 0 0 197 255 367 504 822Public and publicly guaranteed .. 0 0 157 202 237 264 397 Official creditors .. 0 0 157 162 194 219 351 Multilateral .. 0 0 115 126 134 143 173 of which: IBRD .. 0 0 95 100 99 106 112 IDA .. 0 0 1 3 4 4 5 Bilateral .. 0 0 42 36 60 76 178 Private creditors .. 0 0 0 40 44 45 46 of which: Bonds .. 0 0 0 0 0 0 0 Commercial banks .. 0 0 0 40 44 45 46Private nonguaranteed .. 0 0 41 53 129 240 425 of which: Bonds .. 0 0 0 0 0 0 78. Debt stock-flow reconciliationTotal change in external debt stocks .. -315 599 2,748 292 1,624 3,578 6,759 Net flows on external debt .. 120 51 1,072 1,648 2,836 3,811 4,675 Cross-currency valuation .. 215 -164 821 -393 -503 370 1,3239. Debt restructuringsTotal amount rescheduled .. 0 0 0 1,076 0 50 0Total amount forgiven .. 0 0 0 0 54 0 0Debt buyback .. 0 0 0 0 0 0 010. Contractual obligations on outstanding long-term external debt
2008 2009 2010 2011 2012 2013 2014 2015Official creditorsPrincipal 301 326 312 309 355 420 452 483Interest 318 318 310 301 289 274 256 237Private creditorsPrincipal 3,327 2,982 1,942 1,800 1,804 945 802 1,187Interest 748 603 547 430 333 288 219 169
Notes:Beginning 2006 the DRS data for Serbia exclude Montenegro. Short-term debt is based on Central Bank data.
219

SEYCHELLES(US$ million, unless otherwise indicated)
1990 1995 2000 2003 2004 2005 2006 2007
1. Summary external debt dataExternal debt stocks 185 198 304 436 444 670 1,088 1,308 Long-term external debt 139 185 220 329 345 397 495 526 Public and publicly guaranteed 139 185 220 329 345 397 495 526 Private nonguaranteed 0 0 0 0 0 0 0 0 Use of IMF credit 0 0 0 0 0 0 0 0 Short-term external debt 46 13 84 107 99 273 593 782 interest arrears on long-term 1 2 5 34 45 57 48 61Memorandum itemsPrincipal arrears on long-term 9 20 21 91 99 116 100 110Long-term public sector debt 139 185 220 329 345 397 495 526Long-term private sector debt 0 0 0 0 0 0 0 0Public & publicly guaranteed commitments 22 9 32 33 13 56 236 30
External debt flowsDisbursements 13 17 38 54 38 56 211 55 Long-term external debt 13 17 38 54 38 56 211 55 IMF purchases 0 0 0 0 0 0 0 0Principal repayments 12 16 10 28 32 38 127 45 Long-term external debt 12 16 10 28 32 38 127 45 IMF repurchases 0 0 0 0 0 0 0 0Net flows 11 -9 71 8 -13 180 413 139 Long-term external debt 1 1 29 26 6 18 84 10 IMF flows 0 0 0 0 0 0 0 0 Short-term external debt 10 -10 42 -18 -19 162 329 129Interest payments 9 8 11 9 8 18 53 55 Long-term external debt 5 7 7 7 5 11 29 27 IMF charges 0 0 0 0 0 0 0 0 Short-term external debt 4 1 4 2 2 7 24 28
2. Other non-debt resource flowsForeign direct investment (net) 20 46 24 58 38 86 146 249Portfolio equity flows 0 0 0 0 0 0 0 0Profit remittances on FDI 8 14 8 26 17 20 25 29Grants (excluding technical coop.) 12 7 11 3 4 5 7 1of which: Debt forgiveness grants .. .. 0 0 0 0 0 0 IDA grants .. .. .. 0 0 0 0 0Memo: technical coop. grants 10 9 3 6 6 6 4 4
3. Currency composition of public and publicly guaranteed debt (%)Euro .. .. .. 18.6 19.3 14.5 12.4 11.3Japanese yen 0.0 0.0 2.1 2.8 1.5 1.8 1.3 1.1Pound sterling 16.6 7.8 6.5 5.2 5.4 4.2 3.8 3.3Swiss franc 7.1 6.0 4.5 3.7 3.9 2.9 2.5 2.4U.S.dollars 8.4 14.1 35.6 41.3 42.3 54.5 67.8 70.4
4. Average terms of new commitmentsOfficial creditors Interest (%) 4.9 4.3 3.3 4.3 0.0 2.0 4.2 0.0 Maturity (years) 20.4 18.2 12.8 20.8 0.0 14.4 16.0 0.0 Grace period (years) 9.0 4.7 2.6 6.0 0.0 4.8 3.8 0.0Private creditors Interest (%) 11.5 0.0 4.4 4.1 5.3 6.1 9.1 9.1 Maturity (years) 4.8 0.0 9.2 6.8 5.7 6.0 5.1 5.1 Grace period (years) 0.9 0.0 2.5 0.3 0.8 0.9 4.6 5.1
5. Major economic aggregatesGross national income (GNI) 355 489 583 663 666 683 731 686Exports of goods, services & income 241 345 495 634 644 741 874 884Worker remit. & comp. of employees 0 0 0 5 7 12 14 11Imports of goods & services 265 350 545 651 715 935 1,038 1,187International reserves 17 27 44 67 35 56 113 41Current account balance -13 1 -43 -9 -60 -174 -134 -264
6. RatiosExternal debt stocks to exports (%) 76.8 57.4 61.4 68.8 69.0 90.4 124.5 147.9External debt stocks to GNI (%) 52.0 40.5 52.1 65.8 66.7 98.2 148.7 190.8Debt service to exports (%) 8.9 6.9 4.2 5.9 6.2 7.5 20.6 11.2Short-term to external debt stocks (%) 24.9 6.6 27.7 24.6 22.4 40.7 54.5 59.8Multilateral to external debt stocks (%) 23.6 31.9 19.0 16.2 16.6 10.5 3.8 3.8Reserves to external debt stocks (%) 9.0 13.7 14.4 15.5 7.8 8.4 10.4 3.1Reserves to imports (months) 0.8 0.9 1.0 1.2 0.6 0.7 1.3 0.4
220
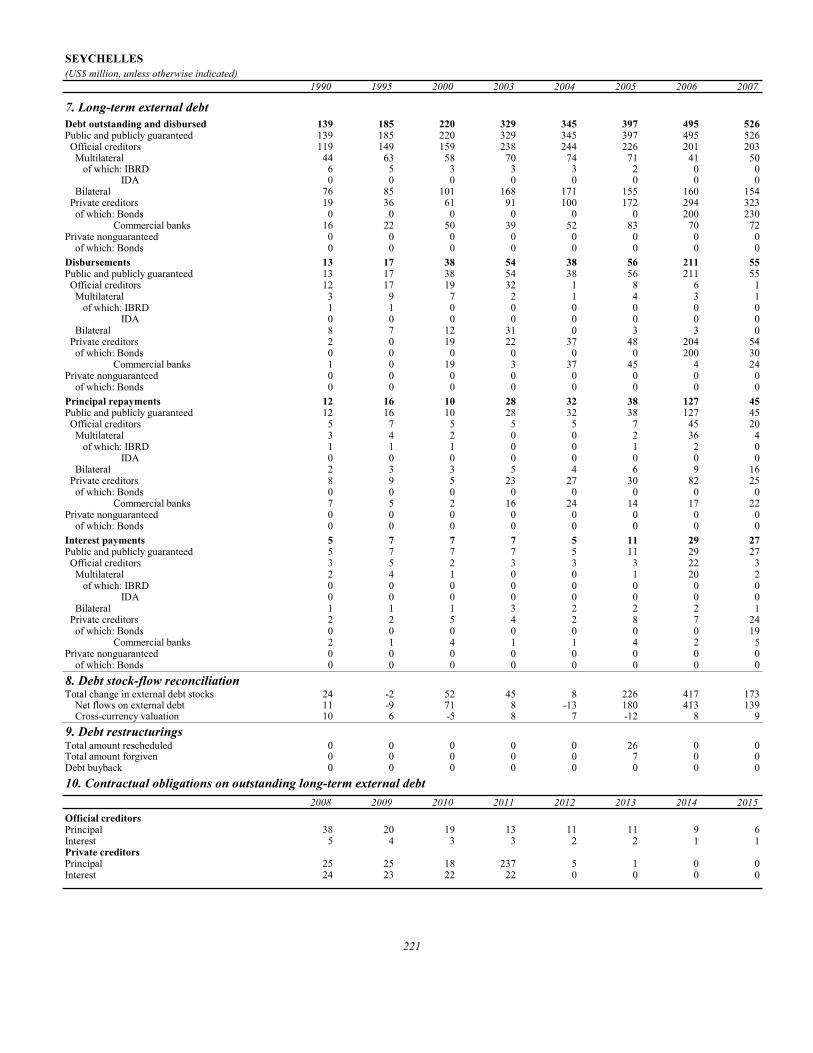
SEYCHELLES(US$ million, unless otherwise indicated)
1990 1995 2000 2003 2004 2005 2006 2007
7. Long-term external debtDebt outstanding and disbursed 139 185 220 329 345 397 495 526Public and publicly guaranteed 139 185 220 329 345 397 495 526 Official creditors 119 149 159 238 244 226 201 203 Multilateral 44 63 58 70 74 71 41 50 of which: IBRD 6 5 3 3 3 2 0 0 IDA 0 0 0 0 0 0 0 0 Bilateral 76 85 101 168 171 155 160 154 Private creditors 19 36 61 91 100 172 294 323 of which: Bonds 0 0 0 0 0 0 200 230 Commercial banks 16 22 50 39 52 83 70 72Private nonguaranteed 0 0 0 0 0 0 0 0 of which: Bonds 0 0 0 0 0 0 0 0Disbursements 13 17 38 54 38 56 211 55Public and publicly guaranteed 13 17 38 54 38 56 211 55 Official creditors 12 17 19 32 1 8 6 1 Multilateral 3 9 7 2 1 4 3 1 of which: IBRD 1 1 0 0 0 0 0 0 IDA 0 0 0 0 0 0 0 0 Bilateral 8 7 12 31 0 3 3 0 Private creditors 2 0 19 22 37 48 204 54 of which: Bonds 0 0 0 0 0 0 200 30 Commercial banks 1 0 19 3 37 45 4 24Private nonguaranteed 0 0 0 0 0 0 0 0 of which: Bonds 0 0 0 0 0 0 0 0Principal repayments 12 16 10 28 32 38 127 45Public and publicly guaranteed 12 16 10 28 32 38 127 45 Official creditors 5 7 5 5 5 7 45 20 Multilateral 3 4 2 0 0 2 36 4 of which: IBRD 1 1 1 0 0 1 2 0 IDA 0 0 0 0 0 0 0 0 Bilateral 2 3 3 5 4 6 9 16 Private creditors 8 9 5 23 27 30 82 25 of which: Bonds 0 0 0 0 0 0 0 0 Commercial banks 7 5 2 16 24 14 17 22Private nonguaranteed 0 0 0 0 0 0 0 0 of which: Bonds 0 0 0 0 0 0 0 0Interest payments 5 7 7 7 5 11 29 27Public and publicly guaranteed 5 7 7 7 5 11 29 27 Official creditors 3 5 2 3 3 3 22 3 Multilateral 2 4 1 0 0 1 20 2 of which: IBRD 0 0 0 0 0 0 0 0 IDA 0 0 0 0 0 0 0 0 Bilateral 1 1 1 3 2 2 2 1 Private creditors 2 2 5 4 2 8 7 24 of which: Bonds 0 0 0 0 0 0 0 19 Commercial banks 2 1 4 1 1 4 2 5Private nonguaranteed 0 0 0 0 0 0 0 0 of which: Bonds 0 0 0 0 0 0 0 08. Debt stock-flow reconciliationTotal change in external debt stocks 24 -2 52 45 8 226 417 173 Net flows on external debt 11 -9 71 8 -13 180 413 139 Cross-currency valuation 10 6 -5 8 7 -12 8 99. Debt restructuringsTotal amount rescheduled 0 0 0 0 0 26 0 0Total amount forgiven 0 0 0 0 0 7 0 0Debt buyback 0 0 0 0 0 0 0 010. Contractual obligations on outstanding long-term external debt
2008 2009 2010 2011 2012 2013 2014 2015Official creditorsPrincipal 38 20 19 13 11 11 9 6Interest 5 4 3 3 2 2 1 1Private creditorsPrincipal 25 25 18 237 5 1 0 0Interest 24 23 22 22 0 0 0 0
221

SIERRA LEONE(US$ million, unless otherwise indicated)
1990 1995 2000 2003 2004 2005 2006 2007
1. Summary external debt dataExternal debt stocks 1176.4 1219.6 1189.8 1522.8 1652.5 1563.7 1308.1 348.2 Long-term external debt 919.9 1027.7 972.8 1337.0 1434.3 1350.2 1256.5 308.2 Public and publicly guaranteed 919.9 1027.7 972.8 1337.0 1434.3 1350.2 1256.5 308.2 Private nonguaranteed 0.0 0.0 0.0 0.0 0.0 0.0 0.0 0.0 Use of IMF credit 108.4 164.9 173.6 169.1 195.8 192.1 34.8 36.5 Short-term external debt 148.1 26.9 43.5 16.8 22.4 21.4 16.9 3.4 interest arrears on long-term 148.1 6.9 36.3 4.8 2.4 11.4 11.9 2.4Memorandum itemsPrincipal arrears on long-term 546.9 107.6 66.0 42.8 46.7 53.6 62.7 54.8Long-term public sector debt 587.9 943.6 972.8 1337.0 1434.3 1350.2 1256.5 308.2Long-term private sector debt 332.0 84.1 0.0 0.0 0.0 0.0 0.0 0.0Public & publicly guaranteed commitments 18.2 47.7 65.0 130.8 95.5 62.9 14.3 59.5
External debt flowsDisbursements 15.0 114.8 90.3 63.1 124.5 71.4 59.1 28.3 Long-term external debt 15.0 95.0 76.6 43.5 83.0 50.7 45.7 28.3 IMF purchases 0.0 19.8 13.7 19.6 41.5 20.7 13.4 0.0Principal repayments 12.0 60.1 34.9 8.6 8.7 5.8 19.9 9.4 Long-term external debt 7.4 56.6 9.6 7.2 7.5 3.4 15.4 9.4 IMF repurchases 4.6 3.5 25.2 1.4 1.3 2.4 4.5 0.0Net flows 3.0 54.7 56.8 57.1 123.8 55.6 34.2 14.9 Long-term external debt 7.6 38.4 66.9 36.3 75.6 47.3 30.3 18.9 IMF flows -2.1 0.0 13.7 0.0 0.0 0.0 0.0 0.0 Short-term external debt 0.0 0.0 1.4 2.5 8.0 -10.0 -5.0 -4.0Interest payments 9.2 22.0 11.8 7.7 10.5 9.4 11.6 3.9 Long-term external debt 8.9 19.8 8.9 6.2 8.7 8.2 10.4 3.7 IMF charges 0.3 0.8 2.5 0.9 0.9 0.9 1.0 0.2 Short-term external debt 0.0 1.4 0.4 0.6 0.9 0.4 0.2 0.0
2. Other non-debt resource flowsForeign direct investment (net) 32.4 7.3 39.0 8.6 61.2 83.2 58.6 94.5Portfolio equity flows 0.0 0.0 0.0 0.0 0.0 0.0 0.0 0.0Profit remittances on FDI 50.7 11.3 1.8 9.4 32.4 41.2 27.3 121.8Grants (excluding technical coop.) 29.9 87.1 116.0 266.8 293.1 276.0 421.0 1028.1of which: Debt forgiveness grants .. .. 8.3 81.2 39.2 19.7 175.7 759.8 IDA grants .. .. .. 2.6 7.3 31.9 29.4 19.3Memo: technical coop. grants 27.6 24.4 20.8 68.5 36.2 30.2 40.2 49.7
3. Currency composition of public and publicly guaranteed debt (%)Euro .. .. .. 16.0 14.5 13.0 11.8 16.9Japanese yen 4.9 7.6 7.1 8.9 8.8 8.4 9.0 0.0Pound sterling 1.4 0.5 0.6 0.4 0.4 0.3 0.4 0.0Swiss franc 5.4 2.9 2.2 1.6 1.7 1.8 2.0 0.1U.S.dollars 54.0 41.0 44.9 47.4 47.4 47.6 44.3 40.9
4. Average terms of new commitmentsOfficial creditors Interest (%) 0.1 0.6 0.8 0.7 0.8 0.0 0.0 1.2 Maturity (years) 24.4 32.6 39.8 39.0 40.9 43.3 28.7 22.0 Grace period (years) 10.0 7.8 10.3 9.7 8.0 4.1 5.9 5.5Private creditors Interest (%) 9.1 0.0 0.0 0.0 0.0 0.0 0.0 0.0 Maturity (years) 3.0 0.0 0.0 0.0 0.0 0.0 0.0 0.0 Grace period (years) 1.0 0.0 0.0 0.0 0.0 0.0 0.0 0.0
5. Major economic aggregatesGross national income (GNI) 579.8 818.5 616.1 945.6 1013.8 1165.9 1364.8 1628.6Exports of goods, services & income 210.3 152.7 69.6 204.3 244.3 269.5 363.9 524.6Worker remit. & comp. of employees 0.0 24.0 7.0 26.0 24.7 2.4 50.0 148.4Imports of goods & services 286.6 290.3 262.4 421.2 437.8 509.3 489.0 637.2International reserves 5.4 34.6 49.2 66.6 125.1 170.5 183.9 216.6Current account balance -69.4 -118.1 -112.3 -82.8 -99.0 -104.9 -91.5 -181.1
6. RatiosExternal debt stocks to exports (%) 559.3 798.7 1,709.4 745.4 676.5 580.2 359.5 66.4External debt stocks to GNI (%) 202.9 149.0 193.1 161.1 163.0 134.1 95.8 21.4Debt service to exports (%) 10.0 53.7 67.1 7.9 7.9 5.7 8.6 2.5Short-term to external debt stocks (%) 12.6 2.2 3.7 1.1 1.4 1.4 1.3 1.0Multilateral to external debt stocks (%) 15.4 35.6 48.4 53.9 55.8 56.4 66.8 69.8Reserves to external debt stocks (%) 0.5 2.8 4.1 4.4 7.6 10.9 14.1 62.2Reserves to imports (months) 0.2 1.4 2.3 1.9 3.4 4.0 4.5 4.1
222

SIERRA LEONE(US$ million, unless otherwise indicated)
1990 1995 2000 2003 2004 2005 2006 2007
7. Long-term external debtDebt outstanding and disbursed 919.9 1027.7 972.8 1337.0 1434.3 1350.2 1256.5 308.2Public and publicly guaranteed 919.9 1027.7 972.8 1337.0 1434.3 1350.2 1256.5 308.2 Official creditors 488.5 935.5 967.5 1324.5 1432.2 1348.6 1256.4 308.2 Multilateral 181.7 433.6 576.0 820.8 922.2 881.8 874.2 243.0 of which: IBRD 10.6 2.9 0.0 0.0 0.0 0.0 0.0 0.0 IDA 81.3 231.3 353.7 542.5 590.6 558.6 533.5 83.6 Bilateral 306.9 501.9 391.5 503.7 510.1 466.8 382.2 65.2 Private creditors 431.4 92.2 5.3 12.5 2.1 1.6 0.1 0.0 of which: Bonds 0.0 0.0 0.0 0.0 0.0 0.0 0.0 0.0 Commercial banks 16.9 0.0 0.0 0.0 0.0 0.0 0.0 0.0Private nonguaranteed 0.0 0.0 0.0 0.0 0.0 0.0 0.0 0.0 of which: Bonds 0.0 0.0 0.0 0.0 0.0 0.0 0.0 0.0Disbursements 15.0 95.0 76.6 43.5 83.0 50.7 45.7 28.3Public and publicly guaranteed 15.0 95.0 76.6 43.5 83.0 50.7 45.7 28.3 Official creditors 11.0 95.0 76.6 43.5 83.0 50.7 45.7 28.3 Multilateral 1.3 87.3 74.4 40.5 79.4 49.5 44.2 24.4 of which: IBRD 0.0 0.0 0.0 0.0 0.0 0.0 0.0 0.0 IDA 0.0 44.0 70.1 24.5 30.7 18.7 16.3 14.2 Bilateral 9.6 7.7 2.2 3.0 3.7 1.3 1.5 3.9 Private creditors 4.0 0.0 0.0 0.0 0.0 0.0 0.0 0.0 of which: Bonds 0.0 0.0 0.0 0.0 0.0 0.0 0.0 0.0 Commercial banks 0.0 0.0 0.0 0.0 0.0 0.0 0.0 0.0Private nonguaranteed 0.0 0.0 0.0 0.0 0.0 0.0 0.0 0.0 of which: Bonds 0.0 0.0 0.0 0.0 0.0 0.0 0.0 0.0Principal repayments 7.4 56.6 9.6 7.2 7.5 3.4 15.4 9.4Public and publicly guaranteed 7.4 56.6 9.6 7.2 7.5 3.4 15.4 9.4 Official creditors 7.4 28.2 9.6 6.7 7.5 3.4 15.4 9.4 Multilateral 2.1 3.5 7.5 4.8 2.3 1.8 14.0 2.5 of which: IBRD 0.0 0.5 0.3 0.0 0.0 0.0 0.0 0.0 IDA 0.0 1.6 1.8 0.1 0.1 0.2 9.1 0.0 Bilateral 5.2 24.7 2.2 1.9 5.1 1.6 1.4 6.9 Private creditors 0.0 28.4 0.0 0.5 0.0 0.0 0.0 0.0 of which: Bonds 0.0 0.0 0.0 0.0 0.0 0.0 0.0 0.0 Commercial banks 0.0 28.4 0.0 0.0 0.0 0.0 0.0 0.0Private nonguaranteed 0.0 0.0 0.0 0.0 0.0 0.0 0.0 0.0 of which: Bonds 0.0 0.0 0.0 0.0 0.0 0.0 0.0 0.0Interest payments 8.9 19.8 8.9 6.2 8.7 8.2 10.4 3.7Public and publicly guaranteed 8.9 19.8 8.9 6.2 8.7 8.2 10.4 3.7 Official creditors 3.7 19.8 8.9 6.2 8.7 8.2 10.4 3.7 Multilateral 2.1 2.9 3.5 3.3 5.3 5.9 7.4 2.8 of which: IBRD 0.0 0.3 0.0 0.0 0.0 0.0 0.0 0.0 IDA 0.0 1.6 2.3 1.7 3.2 3.5 4.4 0.6 Bilateral 1.5 16.9 5.4 2.9 3.3 2.2 3.0 0.9 Private creditors 5.2 0.0 0.0 0.0 0.0 0.0 0.0 0.0 of which: Bonds 0.0 0.0 0.0 0.0 0.0 0.0 0.0 0.0 Commercial banks 0.0 0.0 0.0 0.0 0.0 0.0 0.0 0.0Private nonguaranteed 0.0 0.0 0.0 0.0 0.0 0.0 0.0 0.0 of which: Bonds 0.0 0.0 0.0 0.0 0.0 0.0 0.0 0.08. Debt stock-flow reconciliationTotal change in external debt stocks 98.6 -309.6 -70.8 166.3 129.7 -88.8 -255.6 -960.0 Net flows on external debt 3.0 54.7 56.8 57.1 123.8 55.6 34.2 14.9 Cross-currency valuation 44.0 18.0 -66.3 41.5 -18.5 -184.3 -137.2 -528.89. Debt restructuringsTotal amount rescheduled 0.0 29.3 0.4 9.4 16.5 4.6 4.6 8.8Total amount forgiven 0.0 17.5 0.0 18.4 28.3 23.6 14.5 3.4Debt buyback 0.0 29.4 0.0 0.0 0.0 0.0 0.0 0.010. Contractual obligations on outstanding long-term external debt
2008 2009 2010 2011 2012 2013 2014 2015Official creditorsPrincipal 13.0 14.2 13.2 14.3 16.0 16.2 18.8 17.9Interest 3.6 4.0 4.0 3.9 3.8 3.6 3.4 3.2Private creditorsPrincipal 0.0 0.0 0.0 0.0 0.0 0.0 0.0 0.0Interest 0.0 0.0 0.0 0.0 0.0 0.0 0.0 0.0
Notes:Data include the effects of Paris Club debt restructuring agreement signed in 2007. Sierra Leone was granted debt relief effective in 2007 under the Multilateral Debt Relief Initiative.
223

SOLOMON ISLANDS(US$ million, unless otherwise indicated)
1990 1995 2000 2003 2004 2005 2006 2007
1. Summary external debt dataExternal debt stocks 120.5 158.7 155.4 178.0 177.0 166.4 173.4 178.2 Long-term external debt 103.2 149.1 152.1 169.9 166.3 151.1 157.8 172.9 Public and publicly guaranteed 103.2 100.3 120.7 151.3 155.3 144.1 150.8 147.0 Private nonguaranteed 0.0 48.8 31.5 18.6 11.0 7.0 7.0 25.9 Use of IMF credit 0.7 0.0 0.0 0.0 0.0 0.0 0.0 0.0 Short-term external debt 16.6 9.7 3.2 8.1 10.8 15.3 15.6 5.3 interest arrears on long-term 0.1 8.4 1.8 6.7 9.8 12.3 13.6 3.3Memorandum itemsPrincipal arrears on long-term 0.2 11.4 3.3 7.4 8.8 11.3 13.6 11.9Long-term public sector debt 103.2 100.3 120.7 151.3 155.3 144.1 150.8 147.0Long-term private sector debt 0.0 48.8 31.5 18.6 11.0 7.0 7.0 25.9Public & publicly guaranteed commitments 2.5 12.3 4.0 0.0 0.0 0.4 0.6 0.0
External debt flowsDisbursements 5.2 11.8 3.4 0.4 2.2 5.7 5.1 24.4 Long-term external debt 5.2 11.8 3.4 0.4 2.2 5.7 5.1 24.4 IMF purchases 0.0 0.0 0.0 0.0 0.0 0.0 0.0 0.0Principal repayments 7.9 6.5 6.2 5.5 10.4 10.0 2.8 11.6 Long-term external debt 7.0 6.5 6.2 5.5 10.4 10.0 2.8 11.6 IMF repurchases 0.8 0.0 0.0 0.0 0.0 0.0 0.0 0.0Net flows 13.8 4.5 -4.4 -4.2 -8.6 -2.3 1.2 12.8 Long-term external debt -1.8 5.3 -2.9 -5.1 -8.2 -4.3 2.2 12.8 IMF flows 0.0 0.0 0.0 0.0 0.0 0.0 0.0 0.0 Short-term external debt 16.5 -0.8 -1.5 0.9 -0.3 2.0 -1.0 0.0Interest payments 3.7 1.6 2.9 3.9 6.2 4.0 1.5 3.4 Long-term external debt 3.1 1.5 2.7 3.9 6.2 3.9 1.3 3.3 IMF charges 0.1 0.0 0.0 0.0 0.0 0.0 0.0 0.0 Short-term external debt 0.5 0.1 0.1 0.0 0.0 0.1 0.2 0.1
2. Other non-debt resource flowsForeign direct investment (net) 10.4 2.0 13.0 -1.8 6.0 18.6 18.6 42.4Portfolio equity flows 0.0 0.0 0.0 0.0 0.0 0.0 0.0 0.0Profit remittances on FDI 2.0 6.8 8.3 5.5 6.8 5.3 11.0 0.0Grants (excluding technical coop.) 20.2 20.6 48.7 20.5 25.2 54.0 50.9 40.4of which: Debt forgiveness grants .. .. 0.0 0.0 0.0 0.0 0.0 0.0 IDA grants .. .. .. 0.0 0.0 0.0 0.0 0.0Memo: technical coop. grants 19.5 26.0 20.9 62.7 96.3 143.3 151.4 207.8
3. Currency composition of public and publicly guaranteed debt (%)Euro .. .. .. 6.1 6.4 7.0 7.5 8.5Japanese yen 4.8 3.8 3.4 2.9 2.9 2.8 2.6 0.0Pound sterling 13.1 6.4 2.9 0.0 0.0 0.0 0.0 0.0Swiss franc 0.0 0.0 0.0 0.0 0.0 0.0 0.0 0.0U.S.dollars 52.0 53.9 67.1 73.8 73.6 73.7 73.9 76.0
4. Average terms of new commitmentsOfficial creditors Interest (%) 2.2 3.4 0.8 0.0 0.0 0.0 0.0 0.0 Maturity (years) 17.7 18.9 40.0 0.0 0.0 0.0 0.0 0.0 Grace period (years) 11.5 3.6 10.5 0.0 0.0 0.0 0.0 0.0Private creditors Interest (%) 0.0 7.8 0.0 0.0 0.0 5.0 0.0 0.0 Maturity (years) 0.0 10.2 0.0 0.0 0.0 5.1 4.0 0.0 Grace period (years) 0.0 0.7 0.0 0.0 0.0 0.0 0.6 0.0
5. Major economic aggregatesGross national income (GNI) 207.3 320.7 299.7 228.0 265.7 294.8 338.3 384.2Exports of goods, services & income 97.8 211.3 128.8 96.5 129.1 157.6 209.6 ..Worker remit. & comp. of employees 0.0 0.0 2.0 4.0 8.7 7.2 20.4 20.4Imports of goods & services 163.6 239.4 176.4 162.8 171.0 250.1 325.0 ..International reserves 17.6 15.9 32.0 37.2 80.6 95.4 104.4 119.1Current account balance -27.8 8.3 -41.0 -39.9 -18.9 -90.2 -97.3 ..
6. RatiosExternal debt stocks to exports (%) 123.2 75.1 120.6 184.4 137.1 105.6 82.8 ..External debt stocks to GNI (%) 58.1 49.5 51.8 78.0 66.6 56.4 51.3 46.4Debt service to exports (%) 11.8 3.8 7.1 9.7 12.9 8.9 2.0 ..Short-term to external debt stocks (%) 13.8 6.1 2.1 4.5 6.1 9.2 9.0 3.0Multilateral to external debt stocks (%) 51.0 50.1 64.6 60.3 63.2 64.3 65.5 67.7Reserves to external debt stocks (%) 14.6 10.0 20.6 20.9 45.5 57.4 60.2 66.8Reserves to imports (months) 1.3 0.8 2.2 2.7 5.7 4.6 3.9 ..
224
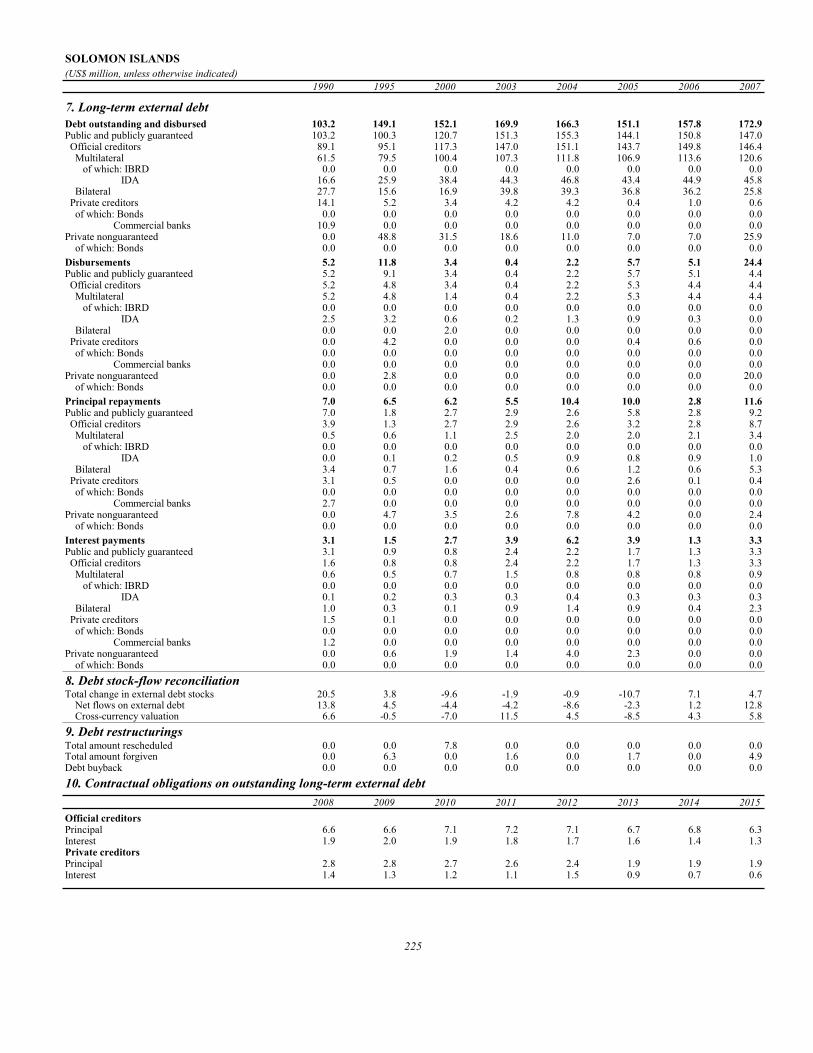
SOLOMON ISLANDS(US$ million, unless otherwise indicated)
1990 1995 2000 2003 2004 2005 2006 2007
7. Long-term external debtDebt outstanding and disbursed 103.2 149.1 152.1 169.9 166.3 151.1 157.8 172.9Public and publicly guaranteed 103.2 100.3 120.7 151.3 155.3 144.1 150.8 147.0 Official creditors 89.1 95.1 117.3 147.0 151.1 143.7 149.8 146.4 Multilateral 61.5 79.5 100.4 107.3 111.8 106.9 113.6 120.6 of which: IBRD 0.0 0.0 0.0 0.0 0.0 0.0 0.0 0.0 IDA 16.6 25.9 38.4 44.3 46.8 43.4 44.9 45.8 Bilateral 27.7 15.6 16.9 39.8 39.3 36.8 36.2 25.8 Private creditors 14.1 5.2 3.4 4.2 4.2 0.4 1.0 0.6 of which: Bonds 0.0 0.0 0.0 0.0 0.0 0.0 0.0 0.0 Commercial banks 10.9 0.0 0.0 0.0 0.0 0.0 0.0 0.0Private nonguaranteed 0.0 48.8 31.5 18.6 11.0 7.0 7.0 25.9 of which: Bonds 0.0 0.0 0.0 0.0 0.0 0.0 0.0 0.0Disbursements 5.2 11.8 3.4 0.4 2.2 5.7 5.1 24.4Public and publicly guaranteed 5.2 9.1 3.4 0.4 2.2 5.7 5.1 4.4 Official creditors 5.2 4.8 3.4 0.4 2.2 5.3 4.4 4.4 Multilateral 5.2 4.8 1.4 0.4 2.2 5.3 4.4 4.4 of which: IBRD 0.0 0.0 0.0 0.0 0.0 0.0 0.0 0.0 IDA 2.5 3.2 0.6 0.2 1.3 0.9 0.3 0.0 Bilateral 0.0 0.0 2.0 0.0 0.0 0.0 0.0 0.0 Private creditors 0.0 4.2 0.0 0.0 0.0 0.4 0.6 0.0 of which: Bonds 0.0 0.0 0.0 0.0 0.0 0.0 0.0 0.0 Commercial banks 0.0 0.0 0.0 0.0 0.0 0.0 0.0 0.0Private nonguaranteed 0.0 2.8 0.0 0.0 0.0 0.0 0.0 20.0 of which: Bonds 0.0 0.0 0.0 0.0 0.0 0.0 0.0 0.0Principal repayments 7.0 6.5 6.2 5.5 10.4 10.0 2.8 11.6Public and publicly guaranteed 7.0 1.8 2.7 2.9 2.6 5.8 2.8 9.2 Official creditors 3.9 1.3 2.7 2.9 2.6 3.2 2.8 8.7 Multilateral 0.5 0.6 1.1 2.5 2.0 2.0 2.1 3.4 of which: IBRD 0.0 0.0 0.0 0.0 0.0 0.0 0.0 0.0 IDA 0.0 0.1 0.2 0.5 0.9 0.8 0.9 1.0 Bilateral 3.4 0.7 1.6 0.4 0.6 1.2 0.6 5.3 Private creditors 3.1 0.5 0.0 0.0 0.0 2.6 0.1 0.4 of which: Bonds 0.0 0.0 0.0 0.0 0.0 0.0 0.0 0.0 Commercial banks 2.7 0.0 0.0 0.0 0.0 0.0 0.0 0.0Private nonguaranteed 0.0 4.7 3.5 2.6 7.8 4.2 0.0 2.4 of which: Bonds 0.0 0.0 0.0 0.0 0.0 0.0 0.0 0.0Interest payments 3.1 1.5 2.7 3.9 6.2 3.9 1.3 3.3Public and publicly guaranteed 3.1 0.9 0.8 2.4 2.2 1.7 1.3 3.3 Official creditors 1.6 0.8 0.8 2.4 2.2 1.7 1.3 3.3 Multilateral 0.6 0.5 0.7 1.5 0.8 0.8 0.8 0.9 of which: IBRD 0.0 0.0 0.0 0.0 0.0 0.0 0.0 0.0 IDA 0.1 0.2 0.3 0.3 0.4 0.3 0.3 0.3 Bilateral 1.0 0.3 0.1 0.9 1.4 0.9 0.4 2.3 Private creditors 1.5 0.1 0.0 0.0 0.0 0.0 0.0 0.0 of which: Bonds 0.0 0.0 0.0 0.0 0.0 0.0 0.0 0.0 Commercial banks 1.2 0.0 0.0 0.0 0.0 0.0 0.0 0.0Private nonguaranteed 0.0 0.6 1.9 1.4 4.0 2.3 0.0 0.0 of which: Bonds 0.0 0.0 0.0 0.0 0.0 0.0 0.0 0.08. Debt stock-flow reconciliationTotal change in external debt stocks 20.5 3.8 -9.6 -1.9 -0.9 -10.7 7.1 4.7 Net flows on external debt 13.8 4.5 -4.4 -4.2 -8.6 -2.3 1.2 12.8 Cross-currency valuation 6.6 -0.5 -7.0 11.5 4.5 -8.5 4.3 5.89. Debt restructuringsTotal amount rescheduled 0.0 0.0 7.8 0.0 0.0 0.0 0.0 0.0Total amount forgiven 0.0 6.3 0.0 1.6 0.0 1.7 0.0 4.9Debt buyback 0.0 0.0 0.0 0.0 0.0 0.0 0.0 0.010. Contractual obligations on outstanding long-term external debt
2008 2009 2010 2011 2012 2013 2014 2015Official creditorsPrincipal 6.6 6.6 7.1 7.2 7.1 6.7 6.8 6.3Interest 1.9 2.0 1.9 1.8 1.7 1.6 1.4 1.3Private creditorsPrincipal 2.8 2.8 2.7 2.6 2.4 1.9 1.9 1.9Interest 1.4 1.3 1.2 1.1 1.5 0.9 0.7 0.6
225
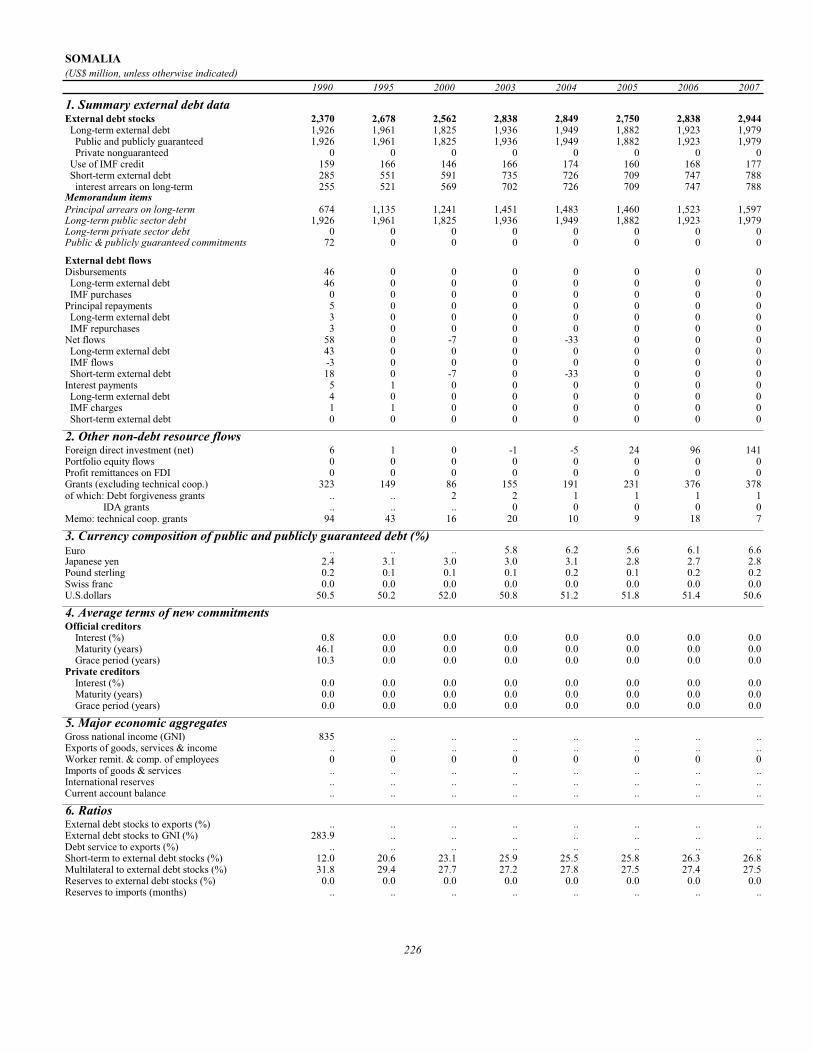
SOMALIA(US$ million, unless otherwise indicated)
1990 1995 2000 2003 2004 2005 2006 2007
1. Summary external debt dataExternal debt stocks 2,370 2,678 2,562 2,838 2,849 2,750 2,838 2,944 Long-term external debt 1,926 1,961 1,825 1,936 1,949 1,882 1,923 1,979 Public and publicly guaranteed 1,926 1,961 1,825 1,936 1,949 1,882 1,923 1,979 Private nonguaranteed 0 0 0 0 0 0 0 0 Use of IMF credit 159 166 146 166 174 160 168 177 Short-term external debt 285 551 591 735 726 709 747 788 interest arrears on long-term 255 521 569 702 726 709 747 788Memorandum itemsPrincipal arrears on long-term 674 1,135 1,241 1,451 1,483 1,460 1,523 1,597Long-term public sector debt 1,926 1,961 1,825 1,936 1,949 1,882 1,923 1,979Long-term private sector debt 0 0 0 0 0 0 0 0Public & publicly guaranteed commitments 72 0 0 0 0 0 0 0
External debt flowsDisbursements 46 0 0 0 0 0 0 0 Long-term external debt 46 0 0 0 0 0 0 0 IMF purchases 0 0 0 0 0 0 0 0Principal repayments 5 0 0 0 0 0 0 0 Long-term external debt 3 0 0 0 0 0 0 0 IMF repurchases 3 0 0 0 0 0 0 0Net flows 58 0 -7 0 -33 0 0 0 Long-term external debt 43 0 0 0 0 0 0 0 IMF flows -3 0 0 0 0 0 0 0 Short-term external debt 18 0 -7 0 -33 0 0 0Interest payments 5 1 0 0 0 0 0 0 Long-term external debt 4 0 0 0 0 0 0 0 IMF charges 1 1 0 0 0 0 0 0 Short-term external debt 0 0 0 0 0 0 0 0
2. Other non-debt resource flowsForeign direct investment (net) 6 1 0 -1 -5 24 96 141Portfolio equity flows 0 0 0 0 0 0 0 0Profit remittances on FDI 0 0 0 0 0 0 0 0Grants (excluding technical coop.) 323 149 86 155 191 231 376 378of which: Debt forgiveness grants .. .. 2 2 1 1 1 1 IDA grants .. .. .. 0 0 0 0 0Memo: technical coop. grants 94 43 16 20 10 9 18 7
3. Currency composition of public and publicly guaranteed debt (%)Euro .. .. .. 5.8 6.2 5.6 6.1 6.6Japanese yen 2.4 3.1 3.0 3.0 3.1 2.8 2.7 2.8Pound sterling 0.2 0.1 0.1 0.1 0.2 0.1 0.2 0.2Swiss franc 0.0 0.0 0.0 0.0 0.0 0.0 0.0 0.0U.S.dollars 50.5 50.2 52.0 50.8 51.2 51.8 51.4 50.6
4. Average terms of new commitmentsOfficial creditors Interest (%) 0.8 0.0 0.0 0.0 0.0 0.0 0.0 0.0 Maturity (years) 46.1 0.0 0.0 0.0 0.0 0.0 0.0 0.0 Grace period (years) 10.3 0.0 0.0 0.0 0.0 0.0 0.0 0.0Private creditors Interest (%) 0.0 0.0 0.0 0.0 0.0 0.0 0.0 0.0 Maturity (years) 0.0 0.0 0.0 0.0 0.0 0.0 0.0 0.0 Grace period (years) 0.0 0.0 0.0 0.0 0.0 0.0 0.0 0.0
5. Major economic aggregatesGross national income (GNI) 835 .. .. .. .. .. .. ..Exports of goods, services & income .. .. .. .. .. .. .. ..Worker remit. & comp. of employees 0 0 0 0 0 0 0 0Imports of goods & services .. .. .. .. .. .. .. ..International reserves .. .. .. .. .. .. .. ..Current account balance .. .. .. .. .. .. .. ..
6. RatiosExternal debt stocks to exports (%) .. .. .. .. .. .. .. ..External debt stocks to GNI (%) 283.9 .. .. .. .. .. .. ..Debt service to exports (%) .. .. .. .. .. .. .. ..Short-term to external debt stocks (%) 12.0 20.6 23.1 25.9 25.5 25.8 26.3 26.8Multilateral to external debt stocks (%) 31.8 29.4 27.7 27.2 27.8 27.5 27.4 27.5Reserves to external debt stocks (%) 0.0 0.0 0.0 0.0 0.0 0.0 0.0 0.0Reserves to imports (months) .. .. .. .. .. .. .. ..
226

SOMALIA(US$ million, unless otherwise indicated)
1990 1995 2000 2003 2004 2005 2006 2007
7. Long-term external debtDebt outstanding and disbursed 1,926 1,961 1,825 1,936 1,949 1,882 1,923 1,979Public and publicly guaranteed 1,926 1,961 1,825 1,936 1,949 1,882 1,923 1,979 Official creditors 1,889 1,924 1,792 1,900 1,912 1,846 1,886 1,940 Multilateral 754 786 709 771 793 755 779 808 of which: IBRD 0 0 0 0 0 0 0 0 IDA 419 432 396 431 444 422 435 448 Bilateral 1,136 1,138 1,083 1,129 1,119 1,091 1,107 1,132 Private creditors 37 37 33 36 37 35 37 38 of which: Bonds 0 0 0 0 0 0 0 0 Commercial banks 0 0 0 0 0 0 0 0Private nonguaranteed 0 0 0 0 0 0 0 0 of which: Bonds 0 0 0 0 0 0 0 0Disbursements 46 0 0 0 0 0 0 0Public and publicly guaranteed 46 0 0 0 0 0 0 0 Official creditors 46 0 0 0 0 0 0 0 Multilateral 46 0 0 0 0 0 0 0 of which: IBRD 0 0 0 0 0 0 0 0 IDA 35 0 0 0 0 0 0 0 Bilateral 0 0 0 0 0 0 0 0 Private creditors 0 0 0 0 0 0 0 0 of which: Bonds 0 0 0 0 0 0 0 0 Commercial banks 0 0 0 0 0 0 0 0Private nonguaranteed 0 0 0 0 0 0 0 0 of which: Bonds 0 0 0 0 0 0 0 0Principal repayments 3 0 0 0 0 0 0 0Public and publicly guaranteed 3 0 0 0 0 0 0 0 Official creditors 3 0 0 0 0 0 0 0 Multilateral 3 0 0 0 0 0 0 0 of which: IBRD 0 0 0 0 0 0 0 0 IDA 2 0 0 0 0 0 0 0 Bilateral 0 0 0 0 0 0 0 0 Private creditors 0 0 0 0 0 0 0 0 of which: Bonds 0 0 0 0 0 0 0 0 Commercial banks 0 0 0 0 0 0 0 0Private nonguaranteed 0 0 0 0 0 0 0 0 of which: Bonds 0 0 0 0 0 0 0 0Interest payments 4 0 0 0 0 0 0 0Public and publicly guaranteed 4 0 0 0 0 0 0 0 Official creditors 4 0 0 0 0 0 0 0 Multilateral 4 0 0 0 0 0 0 0 of which: IBRD 0 0 0 0 0 0 0 0 IDA 3 0 0 0 0 0 0 0 Bilateral 0 0 0 0 0 0 0 0 Private creditors 0 0 0 0 0 0 0 0 of which: Bonds 0 0 0 0 0 0 0 0 Commercial banks 0 0 0 0 0 0 0 0Private nonguaranteed 0 0 0 0 0 0 0 0 of which: Bonds 0 0 0 0 0 0 0 08. Debt stock-flow reconciliationTotal change in external debt stocks 211 62 -44 149 11 -98 87 106 Net flows on external debt 58 0 -7 0 -33 0 0 0 Cross-currency valuation 30 -14 -36 62 8 -59 37 519. Debt restructuringsTotal amount rescheduled 0 0 0 0 0 0 0 0Total amount forgiven 0 0 0 0 0 0 0 0Debt buyback 0 0 0 0 0 0 0 010. Contractual obligations on outstanding long-term external debt
2008 2009 2010 2011 2012 2013 2014 2015Official creditorsPrincipal 33 33 34 33 31 30 32 28Interest 8 7 6 6 5 5 5 4Private creditorsPrincipal 0 0 0 0 0 0 0 0Interest 0 0 0 0 0 0 0 0
Notes:Data on long-term public and publicly guaranteed debt for 2007 are estimates based on the original terms of the loans. Short-term debt data are World Bank staff estimates.
227

SOUTH AFRICA(US$ million, unless otherwise indicated)
1990 1995 2000 2003 2004 2005 2006 2007
1. Summary external debt dataExternal debt stocks .. 25,358 24,861 27,423 27,112 31,099 35,549 43,380 Long-term external debt .. 14,772 15,308 20,064 19,203 21,389 20,289 26,822 Public and publicly guaranteed .. 9,837 9,088 14,120 13,793 15,662 13,940 13,868 Private nonguaranteed .. 4,935 6,220 5,944 5,410 5,727 6,349 12,954 Use of IMF credit 0 913 0 0 0 0 0 0 Short-term external debt .. 9,673 9,553 7,359 7,909 9,710 15,260 16,558 interest arrears on long-term .. 0 0 0 0 0 0 0Memorandum itemsPrincipal arrears on long-term .. 0 0 0 0 0 0 0Long-term public sector debt .. 9,837 8,054 13,638 13,633 15,662 13,940 13,868Long-term private sector debt .. 4,935 7,254 6,427 5,571 5,727 6,349 12,954Public & publicly guaranteed commitments .. 3,225 2,223 1,414 2,622 2,270 1,876 1,967
External debt flowsDisbursements .. 3,549 3,611 3,027 3,235 5,670 4,877 8,727 Long-term external debt .. 3,549 3,611 3,027 3,235 5,670 4,877 8,727 IMF purchases 0 0 0 0 0 0 0 0Principal repayments .. 2,070 2,609 1,969 1,531 2,034 3,831 3,806 Long-term external debt .. 2,070 2,609 1,969 1,531 2,034 3,831 3,806 IMF repurchases 0 0 0 0 0 0 0 0Net flows .. 3,412 -260 1,016 2,254 5,437 6,597 6,219 Long-term external debt .. 1,478 1,002 1,057 1,704 3,636 1,047 4,921 IMF flows 0 0 0 0 0 0 0 0 Short-term external debt .. 1,934 -1,262 -41 550 1,801 5,550 1,298Interest payments .. 1,320 1,252 899 906 1,199 1,641 1,913 Long-term external debt .. 855 743 678 656 847 1,185 1,332 IMF charges 0 50 0 0 0 0 0 0 Short-term external debt .. 415 509 221 250 352 456 581
2. Other non-debt resource flowsForeign direct investment (net) .. 1,248 969 783 701 6,522 -184 5,746Portfolio equity flows .. 2,914 4,169 685 6,661 7,230 14,959 8,670Profit remittances on FDI .. 535 2,329 3,220 3,256 4,320 4,842 7,809Grants (excluding technical coop.) .. 156 219 323 364 398 343 566of which: Debt forgiveness grants .. .. 0 0 0 0 0 0 IDA grants .. .. .. 0 0 0 0 0Memo: technical coop. grants .. 214 224 265 238 250 281 167
3. Currency composition of public and publicly guaranteed debt (%)Euro .. .. .. 11.2 12.3 13.3 30.8 27.2Japanese yen .. 3.0 3.8 2.6 0.0 0.0 0.0 0.0Pound sterling .. 0.0 0.0 0.0 0.0 0.0 0.0 0.0Swiss franc .. 0.0 0.0 0.0 0.0 0.0 0.0 0.0U.S.dollars .. 90.6 92.0 84.8 85.9 84.9 66.9 70.7
4. Average terms of new commitmentsOfficial creditors Interest (%) .. 0.0 5.9 0.0 5.5 0.0 0.0 5.4 Maturity (years) .. 0.0 12.3 0.0 11.8 0.0 0.0 9.7 Grace period (years) .. 0.0 4.0 0.0 3.4 0.0 0.0 2.2Private creditors Interest (%) .. 5.4 6.1 5.3 4.1 3.9 6.5 6.8 Maturity (years) .. 14.3 9.8 10.0 6.9 3.3 8.9 10.1 Grace period (years) .. 1.8 2.3 10.0 4.9 2.9 8.9 9.9
5. Major economic aggregatesGross national income (GNI) .. 148,238 129,702 162,044 211,700 237,402 251,836 274,141Exports of goods, services & income .. 35,538 39,507 49,855 61,177 71,082 81,799 96,296Worker remit. & comp. of employees .. 26 344 435 523 658 734 834Imports of goods & services .. 37,386 38,771 50,762 66,423 78,003 95,470 113,974International reserves .. 4,464 7,702 8,154 14,886 20,624 25,593 32,919Current account balance .. -2,493 -191 -1,902 -7,003 -9,723 -16,487 -20,631
6. RatiosExternal debt stocks to exports (%) .. 71.4 62.9 55.0 44.3 43.8 43.5 45.0External debt stocks to GNI (%) .. 17.1 19.2 16.9 12.8 13.1 14.1 15.8Debt service to exports (%) .. 9.5 9.8 5.8 4.0 4.5 6.7 5.9Short-term to external debt stocks (%) .. 38.1 38.4 26.8 29.2 31.2 42.9 38.2Multilateral to external debt stocks (%) .. 0.0 0.6 0.8 1.0 1.0 1.0 0.7Reserves to external debt stocks (%) .. 17.6 31.0 29.7 54.9 66.3 72.0 75.9Reserves to imports (months) .. 1.4 2.4 1.9 2.7 3.2 3.2 3.5
228

SOUTH AFRICA(US$ million, unless otherwise indicated)
1990 1995 2000 2003 2004 2005 2006 2007
7. Long-term external debtDebt outstanding and disbursed .. 14,772 15,308 20,064 19,203 21,389 20,289 26,822Public and publicly guaranteed .. 9,837 9,088 14,120 13,793 15,662 13,940 13,868 Official creditors .. 0 145 212 263 314 342 314 Multilateral .. 0 145 212 263 314 342 314 of which: IBRD 0 0 3 16 23 31 29 27 IDA 0 0 0 0 0 0 0 0 Bilateral .. 0 0 0 0 0 0 0 Private creditors .. 9,837 8,943 13,909 13,530 15,347 13,598 13,554 of which: Bonds .. 2,454 4,749 7,187 7,360 7,132 6,791 7,593 Commercial banks .. 3,978 1,973 5,487 5,081 7,271 6,009 5,307Private nonguaranteed .. 4,935 6,220 5,944 5,410 5,727 6,349 12,954 of which: Bonds .. 350 1,110 548 0 1,307 1,484 5,105Disbursements .. 3,549 3,611 3,027 3,235 5,670 4,877 8,727Public and publicly guaranteed .. 3,199 1,597 1,490 1,969 2,707 2,075 1,870 Official creditors .. 0 91 76 49 87 49 0 Multilateral .. 0 91 76 49 87 49 0 of which: IBRD 0 0 3 3 7 9 0 0 IDA 0 0 0 0 0 0 0 0 Bilateral .. 0 0 0 0 0 0 0 Private creditors .. 3,199 1,506 1,414 1,920 2,620 2,026 1,870 of which: Bonds .. 391 765 1,414 1,000 0 1,876 1,670 Commercial banks .. 830 420 0 920 2,620 150 200Private nonguaranteed .. 350 2,014 1,537 1,266 2,963 2,802 6,857 of which: Bonds .. 350 712 0 0 1,307 0 5,587Principal repayments .. 2,070 2,609 1,969 1,531 2,034 3,831 3,806Public and publicly guaranteed .. 1,168 1,627 1,459 853 1,780 1,729 2,308 Official creditors .. 0 0 7 12 27 26 29 Multilateral .. 0 0 7 12 27 26 29 of which: IBRD 0 0 0 0 0 1 2 3 IDA 0 0 0 0 0 0 0 0 Bilateral .. 0 0 0 0 0 0 0 Private creditors .. 1,168 1,627 1,452 841 1,753 1,703 2,279 of which: Bonds .. 10 284 778 370 0 300 1,222 Commercial banks .. 719 949 326 326 1,608 1,257 912Private nonguaranteed .. 902 982 510 678 254 2,102 1,498 of which: Bonds .. 0 0 0 0 0 0 1,390Interest payments .. 855 743 678 656 847 1,185 1,332Public and publicly guaranteed .. 597 546 606 582 635 888 919 Official creditors .. 0 1 7 10 12 17 20 Multilateral .. 0 1 7 10 12 17 20 of which: IBRD 0 0 0 1 1 1 1 1 IDA 0 0 0 0 0 0 0 0 Bilateral .. 0 0 0 0 0 0 0 Private creditors .. 597 545 598 572 623 871 899 of which: Bonds .. 188 275 499 494 347 409 520 Commercial banks .. 245 130 13 7 212 408 333Private nonguaranteed .. 258 196 73 74 212 297 413 of which: Bonds .. 0 27 9 8 61 89 1328. Debt stock-flow reconciliationTotal change in external debt stocks .. 3,687 954 2,324 -311 3,986 4,450 7,831 Net flows on external debt .. 3,412 -260 1,016 2,254 5,437 6,597 6,219 Cross-currency valuation .. 63 -70 95 135 -228 243 5069. Debt restructuringsTotal amount rescheduled .. 0 0 0 0 0 0 0Total amount forgiven .. 0 0 0 0 0 0 0Debt buyback .. 0 0 0 0 0 0 1,22210. Contractual obligations on outstanding long-term external debt
2008 2009 2010 2011 2012 2013 2014 2015Official creditorsPrincipal 34 51 57 55 53 42 39 33Interest 17 16 14 12 10 8 6 4Private creditorsPrincipal 5,171 2,549 2,597 1,213 3,532 3,718 3,024 1,290Interest 2,370 2,151 2,010 1,839 1,672 1,206 792 498
Notes:Data on long-term public and publicly guaranteed and short-term debt for 2007 are based on aggregate information provided by the authorities and World Bank staff estimates.
229

SRI LANKA(US$ million, unless otherwise indicated)
1990 1995 2000 2003 2004 2005 2006 2007
1. Summary external debt dataExternal debt stocks 5,863 8,395 9,157 10,441 11,085 11,268 11,642 14,020 Long-term external debt 5,049 7,264 8,312 9,427 10,143 9,895 10,543 12,137 Public and publicly guaranteed 4,947 7,175 7,944 9,159 9,847 9,652 10,317 11,879 Private nonguaranteed 102 90 368 268 296 243 226 259 Use of IMF credit 410 595 161 393 294 381 244 251 Short-term external debt 405 535 685 621 648 992 855 1,632 interest arrears on long-term 11 35 112 0 0 0 0 0Memorandum itemsPrincipal arrears on long-term 0 42 216 0 0 0 0 0Long-term public sector debt 4,854 7,055 7,836 9,153 9,829 9,632 10,303 11,859Long-term private sector debt 194 210 476 274 315 262 240 278Public & publicly guaranteed commitments 837 406 448 921 915 938 1,208 2,140
External debt flowsDisbursements 545 671 735 1,001 795 971 946 1,595 Long-term external debt 485 671 735 918 795 818 946 1,595 IMF purchases 61 0 0 83 0 153 0 0Principal repayments 214 280 541 420 552 302 699 539 Long-term external debt 167 246 455 388 441 264 545 534 IMF repurchases 47 34 86 31 112 38 154 5Net flows 331 385 -24 600 269 1,013 110 1,850 Long-term external debt 318 425 280 530 354 554 400 1,061 IMF flows -43 0 0 29 -103 115 -154 -5 Short-term external debt 0 -6 -218 19 27 344 -137 794Interest payments 170 172 249 188 218 147 259 286 Long-term external debt 122 145 214 175 191 99 200 206 IMF charges 21 3 1 5 8 11 13 11 Short-term external debt 27 24 34 7 19 37 46 69
2. Other non-debt resource flowsForeign direct investment (net) 43 56 173 229 233 272 480 603Portfolio equity flows 0 0 0 -143 -100 -216 -304 -322Profit remittances on FDI 25 72 109 92 95 115 362 349Grants (excluding technical coop.) 221 175 109 141 194 662 393 432of which: Debt forgiveness grants .. .. 0 6 0 0 0 0 IDA grants .. .. .. 2 2 41 56 46Memo: technical coop. grants 104 115 78 97 75 94 111 91
3. Currency composition of public and publicly guaranteed debt (%)Euro .. .. .. 7.4 8.1 7.9 9.2 9.6Japanese yen 22.7 28.6 29.8 30.2 30.5 30.3 28.9 26.1Pound sterling 3.2 1.8 0.5 0.2 0.2 0.1 0.1 0.1Swiss franc 0.9 0.4 0.2 0.0 0.0 0.0 0.0 0.0U.S.dollars 36.2 35.9 38.9 40.0 39.6 41.0 41.2 44.5
4. Average terms of new commitmentsOfficial creditors Interest (%) 1.4 3.3 2.4 1.6 1.5 1.6 3.0 3.4 Maturity (years) 36.4 29.7 32.0 31.8 31.8 28.1 24.3 23.2 Grace period (years) 10.1 8.3 8.5 9.1 7.9 7.4 7.0 7.0Private creditors Interest (%) 8.0 4.8 6.6 2.7 1.9 4.3 4.8 7.4 Maturity (years) 9.9 11.3 10.4 9.1 13.1 2.3 7.5 5.9 Grace period (years) 1.6 1.9 1.3 3.2 4.3 2.3 3.3 4.0
5. Major economic aggregatesGross national income (GNI) 7,974 12,860 16,016 18,710 20,458 24,107 27,892 32,003Exports of goods, services & income 2,786 5,630 7,670 8,128 9,004 9,931 10,980 12,403Worker remit. & comp. of employees 401 809 1,166 1,438 1,590 1,991 2,185 2,527Imports of goods & services 3,224 6,342 8,554 8,025 9,468 10,441 12,321 13,580International reserves 447 2,112 1,131 2,334 2,205 2,736 2,943 3,654Current account balance -298 -770 -1,044 -71 -648 -650 -1,498 -1,368
6. RatiosExternal debt stocks to exports (%) 210.4 149.1 119.4 128.5 123.1 113.5 106.0 113.0External debt stocks to GNI (%) 73.5 65.3 57.2 55.8 54.2 46.7 41.7 43.8Debt service to exports (%) 13.8 8.0 10.3 7.5 8.6 4.5 8.7 6.7Short-term to external debt stocks (%) 6.9 6.4 7.5 5.9 5.8 8.8 7.3 11.6Multilateral to external debt stocks (%) 27.7 34.0 37.3 41.0 42.0 40.4 42.5 38.3Reserves to external debt stocks (%) 7.6 25.2 12.4 22.4 19.9 24.3 25.3 26.1Reserves to imports (months) 1.7 4.0 1.6 3.5 2.8 3.1 2.9 3.2
230
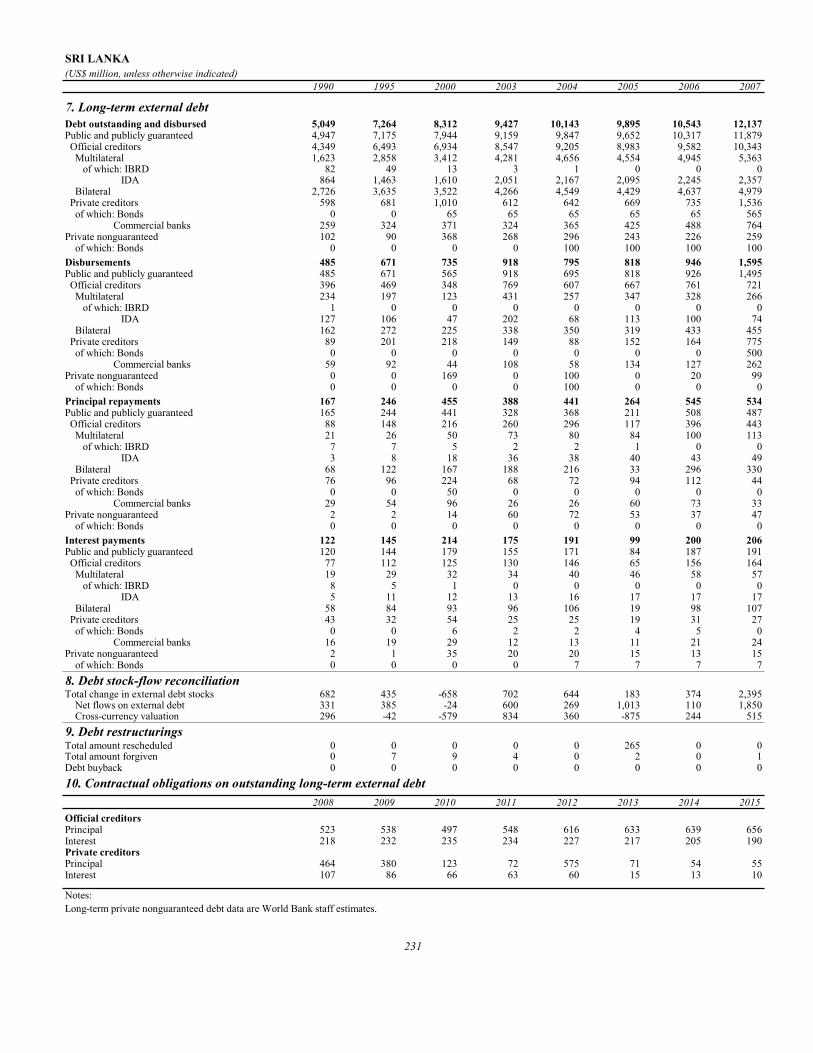
SRI LANKA(US$ million, unless otherwise indicated)
1990 1995 2000 2003 2004 2005 2006 2007
7. Long-term external debtDebt outstanding and disbursed 5,049 7,264 8,312 9,427 10,143 9,895 10,543 12,137Public and publicly guaranteed 4,947 7,175 7,944 9,159 9,847 9,652 10,317 11,879 Official creditors 4,349 6,493 6,934 8,547 9,205 8,983 9,582 10,343 Multilateral 1,623 2,858 3,412 4,281 4,656 4,554 4,945 5,363 of which: IBRD 82 49 13 3 1 0 0 0 IDA 864 1,463 1,610 2,051 2,167 2,095 2,245 2,357 Bilateral 2,726 3,635 3,522 4,266 4,549 4,429 4,637 4,979 Private creditors 598 681 1,010 612 642 669 735 1,536 of which: Bonds 0 0 65 65 65 65 65 565 Commercial banks 259 324 371 324 365 425 488 764Private nonguaranteed 102 90 368 268 296 243 226 259 of which: Bonds 0 0 0 0 100 100 100 100Disbursements 485 671 735 918 795 818 946 1,595Public and publicly guaranteed 485 671 565 918 695 818 926 1,495 Official creditors 396 469 348 769 607 667 761 721 Multilateral 234 197 123 431 257 347 328 266 of which: IBRD 1 0 0 0 0 0 0 0 IDA 127 106 47 202 68 113 100 74 Bilateral 162 272 225 338 350 319 433 455 Private creditors 89 201 218 149 88 152 164 775 of which: Bonds 0 0 0 0 0 0 0 500 Commercial banks 59 92 44 108 58 134 127 262Private nonguaranteed 0 0 169 0 100 0 20 99 of which: Bonds 0 0 0 0 100 0 0 0Principal repayments 167 246 455 388 441 264 545 534Public and publicly guaranteed 165 244 441 328 368 211 508 487 Official creditors 88 148 216 260 296 117 396 443 Multilateral 21 26 50 73 80 84 100 113 of which: IBRD 7 7 5 2 2 1 0 0 IDA 3 8 18 36 38 40 43 49 Bilateral 68 122 167 188 216 33 296 330 Private creditors 76 96 224 68 72 94 112 44 of which: Bonds 0 0 50 0 0 0 0 0 Commercial banks 29 54 96 26 26 60 73 33Private nonguaranteed 2 2 14 60 72 53 37 47 of which: Bonds 0 0 0 0 0 0 0 0Interest payments 122 145 214 175 191 99 200 206Public and publicly guaranteed 120 144 179 155 171 84 187 191 Official creditors 77 112 125 130 146 65 156 164 Multilateral 19 29 32 34 40 46 58 57 of which: IBRD 8 5 1 0 0 0 0 0 IDA 5 11 12 13 16 17 17 17 Bilateral 58 84 93 96 106 19 98 107 Private creditors 43 32 54 25 25 19 31 27 of which: Bonds 0 0 6 2 2 4 5 0 Commercial banks 16 19 29 12 13 11 21 24Private nonguaranteed 2 1 35 20 20 15 13 15 of which: Bonds 0 0 0 0 7 7 7 78. Debt stock-flow reconciliationTotal change in external debt stocks 682 435 -658 702 644 183 374 2,395 Net flows on external debt 331 385 -24 600 269 1,013 110 1,850 Cross-currency valuation 296 -42 -579 834 360 -875 244 5159. Debt restructuringsTotal amount rescheduled 0 0 0 0 0 265 0 0Total amount forgiven 0 7 9 4 0 2 0 1Debt buyback 0 0 0 0 0 0 0 010. Contractual obligations on outstanding long-term external debt
2008 2009 2010 2011 2012 2013 2014 2015Official creditorsPrincipal 523 538 497 548 616 633 639 656Interest 218 232 235 234 227 217 205 190Private creditorsPrincipal 464 380 123 72 575 71 54 55Interest 107 86 66 63 60 15 13 10
Notes:Long-term private nonguaranteed debt data are World Bank staff estimates.
231

ST. KITTS AND NEVIS(US$ million, unless otherwise indicated)
1990 1995 2000 2003 2004 2005 2006 2007
1. Summary external debt dataExternal debt stocks 45.2 56.8 156.6 316.7 316.2 294.3 291.9 274.5 Long-term external debt 44.2 54.2 152.7 314.9 313.3 292.6 289.5 272.9 Public and publicly guaranteed 44.2 54.2 152.7 314.9 313.3 292.6 289.5 272.9 Private nonguaranteed 0.0 0.0 0.0 0.0 0.0 0.0 0.0 0.0 Use of IMF credit 0.0 0.0 2.1 0.0 0.0 0.0 0.0 0.0 Short-term external debt 1.0 2.7 1.8 1.8 2.9 1.8 2.4 1.6 interest arrears on long-term 0.0 1.2 0.2 0.3 1.4 0.2 0.9 0.1Memorandum itemsPrincipal arrears on long-term 0.0 0.7 0.0 0.0 0.9 0.6 0.6 0.1Long-term public sector debt 40.7 52.9 152.7 314.9 313.3 292.6 289.5 272.9Long-term private sector debt 3.4 1.3 0.0 0.0 0.0 0.0 0.0 0.0Public & publicly guaranteed commitments 5.5 11.4 32.4 71.9 15.7 15.3 16.6 8.4
External debt flowsDisbursements 7.3 5.6 32.1 66.5 12.0 7.0 23.3 8.5 Long-term external debt 7.3 5.6 32.1 66.5 12.0 7.0 23.3 8.5 IMF purchases 0.0 0.0 0.0 0.0 0.0 0.0 0.0 0.0Principal repayments 1.5 4.8 12.8 23.5 24.3 27.3 27.4 26.6 Long-term external debt 1.5 4.8 12.8 22.4 24.3 27.3 27.4 26.6 IMF repurchases 0.0 0.0 0.0 1.1 0.0 0.0 0.0 0.0Net flows 5.8 0.3 18.9 43.0 -12.3 -20.3 -4.0 -18.1 Long-term external debt 5.8 0.9 19.3 44.1 -12.3 -20.3 -4.0 -18.1 IMF flows 0.0 0.0 0.0 -1.1 0.0 0.0 0.0 0.0 Short-term external debt 0.0 -0.6 -0.4 0.0 0.0 0.0 0.0 0.0Interest payments 1.5 2.0 7.3 21.0 22.5 20.5 19.3 19.3 Long-term external debt 1.4 1.9 7.1 20.9 22.4 20.5 19.3 19.3 IMF charges 0.0 0.0 0.1 0.0 0.0 0.0 0.0 0.0 Short-term external debt 0.1 0.1 0.1 0.0 0.0 0.0 0.0 0.0
2. Other non-debt resource flowsForeign direct investment (net) 48.8 20.5 96.2 75.6 46.1 93.0 110.4 142.6Portfolio equity flows 0.0 0.0 0.0 0.0 0.0 0.0 0.0 0.0Profit remittances on FDI 5.0 14.4 21.2 23.0 19.5 20.3 20.2 21.6Grants (excluding technical coop.) 2.0 0.8 1.8 0.2 0.3 2.4 4.8 5.4of which: Debt forgiveness grants .. .. 0.0 0.0 0.0 0.0 0.0 0.0 IDA grants .. .. .. 0.0 0.0 0.0 0.0 0.0Memo: technical coop. grants 2.2 2.3 0.6 0.1 0.5 0.7 0.3 0.5
3. Currency composition of public and publicly guaranteed debt (%)Euro .. .. .. 1.8 1.8 1.4 2.3 2.5Japanese yen 0.0 0.0 0.0 0.0 0.0 0.0 0.0 0.0Pound sterling 16.3 7.4 1.5 0.1 0.1 0.1 0.1 0.1Swiss franc 0.0 0.0 0.0 0.0 0.0 0.0 0.0 0.0U.S.dollars 37.8 51.4 79.5 83.5 84.1 84.4 84.4 84.2
4. Average terms of new commitmentsOfficial creditors Interest (%) 4.5 3.7 4.8 6.1 1.7 2.0 2.5 6.4 Maturity (years) 38.0 19.1 16.5 12.5 21.0 20.4 23.2 19.5 Grace period (years) 9.0 5.2 4.5 1.9 4.8 2.4 3.9 4.8Private creditors Interest (%) 2.0 0.0 7.0 8.3 0.0 0.0 5.4 0.0 Maturity (years) 5.8 0.0 9.7 11.7 0.0 0.0 19.3 0.0 Grace period (years) 1.3 0.0 1.1 11.7 0.0 0.0 3.4 0.0
5. Major economic aggregatesGross national income (GNI) 154.5 219.8 299.1 316.9 355.6 387.8 461.5 497.7Exports of goods, services & income 102.8 143.7 178.8 197.4 229.7 267.3 277.5 265.2Worker remit. & comp. of employees 19.0 2.0 4.0 3.0 31.3 33.5 36.2 37.3Imports of goods & services 140.1 189.9 284.4 305.2 288.1 325.9 366.9 399.6International reserves 16.3 33.5 45.2 64.8 78.5 71.6 88.7 95.8Current account balance -47.0 -45.5 -66.2 -115.8 -68.4 -64.7 -89.8 -135.4
6. RatiosExternal debt stocks to exports (%) 44.0 39.5 87.6 160.5 137.7 110.1 105.2 103.5External debt stocks to GNI (%) 29.3 25.9 52.4 99.9 88.9 75.9 63.2 55.2Debt service to exports (%) 2.9 4.7 11.2 22.6 20.4 17.9 16.8 17.3Short-term to external debt stocks (%) 2.3 4.7 1.1 0.6 0.9 0.6 0.8 0.6Multilateral to external debt stocks (%) 44.2 52.1 34.4 29.1 30.9 33.6 36.4 38.8Reserves to external debt stocks (%) 36.0 58.9 28.9 20.5 24.8 24.3 30.4 34.9Reserves to imports (months) 1.4 2.1 1.9 2.5 3.3 2.6 2.9 2.9
232

ST. KITTS AND NEVIS(US$ million, unless otherwise indicated)
1990 1995 2000 2003 2004 2005 2006 2007
7. Long-term external debtDebt outstanding and disbursed 44.2 54.2 152.7 314.9 313.3 292.6 289.5 272.9Public and publicly guaranteed 44.2 54.2 152.7 314.9 313.3 292.6 289.5 272.9 Official creditors 41.4 48.6 102.7 166.4 164.1 157.0 155.6 148.0 Multilateral 20.0 29.6 53.8 92.1 97.6 99.0 106.3 106.4 of which: IBRD 0.0 1.1 4.5 11.9 13.2 13.0 13.2 13.3 IDA 0.0 1.6 1.4 1.5 1.6 1.4 1.4 1.4 Bilateral 21.5 19.0 48.9 74.3 66.5 58.0 49.4 41.6 Private creditors 2.7 5.6 50.0 148.5 149.2 135.6 133.8 124.9 of which: Bonds 0.0 0.0 0.0 19.1 19.1 19.1 19.1 19.1 Commercial banks 0.0 0.0 42.8 126.0 128.3 115.9 114.8 105.8Private nonguaranteed 0.0 0.0 0.0 0.0 0.0 0.0 0.0 0.0 of which: Bonds 0.0 0.0 0.0 0.0 0.0 0.0 0.0 0.0Disbursements 7.3 5.6 32.1 66.5 12.0 7.0 23.3 8.5Public and publicly guaranteed 7.3 5.6 32.1 66.5 12.0 7.0 23.3 8.5 Official creditors 7.3 5.0 7.9 39.9 9.3 7.0 11.6 5.7 Multilateral 2.4 3.8 7.2 9.7 8.8 7.0 11.6 5.7 of which: IBRD 0.0 0.3 1.1 3.8 2.1 0.8 1.4 2.4 IDA 0.0 0.0 0.0 0.0 0.0 0.0 0.0 0.0 Bilateral 4.9 1.3 0.7 30.2 0.5 0.0 0.0 0.0 Private creditors 0.0 0.6 24.2 26.6 2.7 0.0 11.8 2.8 of which: Bonds 0.0 0.0 0.0 19.1 0.0 0.0 0.0 0.0 Commercial banks 0.0 0.0 24.2 7.5 2.7 0.0 11.8 2.8Private nonguaranteed 0.0 0.0 0.0 0.0 0.0 0.0 0.0 0.0 of which: Bonds 0.0 0.0 0.0 0.0 0.0 0.0 0.0 0.0Principal repayments 1.5 4.8 12.8 22.4 24.3 27.3 27.4 26.6Public and publicly guaranteed 1.5 4.8 12.8 22.4 24.3 27.3 27.4 26.6 Official creditors 1.1 3.3 4.8 10.4 12.3 13.0 13.9 14.8 Multilateral 0.7 1.5 2.1 2.9 4.0 4.4 5.2 6.5 of which: IBRD 0.0 0.0 0.1 0.6 0.7 1.0 1.3 2.2 IDA 0.0 0.0 0.0 0.0 0.0 0.0 0.0 0.0 Bilateral 0.3 1.8 2.7 7.4 8.3 8.5 8.7 8.3 Private creditors 0.4 1.5 8.0 12.0 11.9 14.3 13.5 11.8 of which: Bonds 0.0 0.0 0.0 0.0 0.0 0.0 0.0 0.0 Commercial banks 0.0 0.0 4.6 10.2 10.5 13.0 12.9 11.8Private nonguaranteed 0.0 0.0 0.0 0.0 0.0 0.0 0.0 0.0 of which: Bonds 0.0 0.0 0.0 0.0 0.0 0.0 0.0 0.0Interest payments 1.4 1.9 7.1 20.9 22.4 20.5 19.3 19.3Public and publicly guaranteed 1.4 1.9 7.1 20.9 22.4 20.5 19.3 19.3 Official creditors 1.4 1.5 4.1 8.0 8.3 7.6 7.7 7.8 Multilateral 0.7 1.0 2.0 3.4 3.3 3.7 4.2 5.0 of which: IBRD 0.0 0.1 0.3 0.6 0.6 0.7 0.7 0.8 IDA 0.0 0.0 0.0 0.0 0.0 0.0 0.0 0.0 Bilateral 0.7 0.5 2.2 4.6 5.0 3.9 3.6 2.8 Private creditors 0.0 0.4 3.0 12.9 14.2 12.9 11.5 11.5 of which: Bonds 0.0 0.0 0.0 0.8 1.6 1.6 1.6 1.6 Commercial banks 0.0 0.0 2.3 11.8 12.4 11.1 9.9 9.9Private nonguaranteed 0.0 0.0 0.0 0.0 0.0 0.0 0.0 0.0 of which: Bonds 0.0 0.0 0.0 0.0 0.0 0.0 0.0 0.08. Debt stock-flow reconciliationTotal change in external debt stocks 8.6 -1.4 18.6 52.8 -0.5 -21.9 -2.4 -17.4 Net flows on external debt 5.8 0.3 18.9 43.0 -12.3 -20.3 -4.0 -18.1 Cross-currency valuation 1.3 0.1 -0.8 1.6 1.5 -1.7 0.7 1.49. Debt restructuringsTotal amount rescheduled 0.0 0.0 0.0 0.0 0.0 0.0 0.0 0.0Total amount forgiven 0.0 0.0 0.0 0.0 0.0 0.0 0.0 0.0Debt buyback 0.0 0.0 0.0 0.0 0.0 0.0 0.0 0.010. Contractual obligations on outstanding long-term external debt
2008 2009 2010 2011 2012 2013 2014 2015Official creditorsPrincipal 17.2 17.3 18.2 17.9 17.5 13.3 10.3 9.8Interest 6.0 5.7 5.3 4.6 3.9 3.2 2.7 2.4Private creditorsPrincipal 19.9 12.5 9.6 13.2 18.5 22.5 3.3 2.9Interest 8.1 7.1 6.2 5.4 3.3 2.3 1.2 1.0
Notes:Short-term debt data are World Bank staff estimates.
233

ST. LUCIA(US$ million, unless otherwise indicated)
1990 1995 2000 2003 2004 2005 2006 2007
1. Summary external debt dataExternal debt stocks 79.2 128.3 235.3 343.1 365.7 424.9 373.4 440.8 Long-term external debt 72.1 111.3 167.6 235.0 256.6 248.9 256.4 267.4 Public and publicly guaranteed 72.1 111.3 167.6 235.0 256.6 248.9 256.4 267.4 Private nonguaranteed 0.0 0.0 0.0 0.0 0.0 0.0 0.0 0.0 Use of IMF credit 0.0 0.0 0.0 0.0 0.0 0.0 0.0 0.0 Short-term external debt 7.0 16.9 67.8 108.1 109.1 176.0 117.0 173.4 interest arrears on long-term 0.8 0.0 0.0 0.1 0.1 0.0 0.0 0.4Memorandum itemsPrincipal arrears on long-term 0.1 0.0 0.0 0.0 0.0 0.0 0.0 0.7Long-term public sector debt 72.1 111.3 167.6 235.0 256.6 248.9 256.4 267.4Long-term private sector debt 0.0 0.0 0.0 0.0 0.0 0.0 0.0 0.0Public & publicly guaranteed commitments 34.9 50.4 65.3 16.7 12.3 8.2 44.4 9.8
External debt flowsDisbursements 8.0 11.5 50.9 33.1 28.5 11.7 21.3 26.3 Long-term external debt 8.0 11.5 50.9 33.1 28.5 11.7 21.3 26.3 IMF purchases 0.0 0.0 0.0 0.0 0.0 0.0 0.0 0.0Principal repayments 3.2 6.2 20.9 15.6 9.8 14.2 17.7 19.9 Long-term external debt 3.2 6.2 20.9 15.6 9.8 14.2 17.7 19.9 IMF repurchases 0.0 0.0 0.0 0.0 0.0 0.0 0.0 0.0Net flows 7.0 12.3 42.5 36.4 19.6 64.5 -55.4 43.4 Long-term external debt 4.8 5.4 30.0 17.4 18.6 -2.5 3.6 6.4 IMF flows 0.0 0.0 0.0 0.0 0.0 0.0 0.0 0.0 Short-term external debt 2.2 6.9 12.5 19.0 1.0 67.0 -59.0 37.0Interest payments 3.1 5.7 10.3 15.6 15.0 18.7 16.9 16.6 Long-term external debt 2.8 4.8 7.5 12.0 11.4 13.9 13.2 12.4 IMF charges 0.0 0.0 0.0 0.0 0.0 0.0 0.0 0.0 Short-term external debt 0.3 0.9 2.8 3.6 3.6 4.8 3.7 4.2
2. Other non-debt resource flowsForeign direct investment (net) 44.8 32.8 53.7 106.4 76.5 78.2 233.9 260.9Portfolio equity flows 0.2 0.0 0.0 0.0 0.0 0.0 0.0 0.0Profit remittances on FDI 26.5 35.3 33.4 31.9 48.9 51.1 34.0 35.7Grants (excluding technical coop.) 3.1 42.8 10.3 11.6 2.7 4.9 4.2 9.1of which: Debt forgiveness grants .. .. 0.0 0.0 0.0 0.0 0.3 0.0 IDA grants .. .. .. 0.0 0.0 0.3 1.4 0.0Memo: technical coop. grants 3.5 4.7 4.4 3.3 2.1 2.5 4.1 3.7
3. Currency composition of public and publicly guaranteed debt (%)Euro .. .. .. 5.2 4.6 3.6 3.1 2.4Japanese yen 4.0 2.4 0.3 0.0 0.0 0.0 0.0 0.0Pound sterling 40.3 13.7 1.9 0.7 0.5 0.2 0.0 0.0Swiss franc 1.1 0.5 0.0 0.0 0.0 0.0 0.0 0.0U.S.dollars 32.8 53.4 50.3 62.4 66.1 67.3 66.4 66.6
4. Average terms of new commitmentsOfficial creditors Interest (%) 4.3 4.7 6.0 3.2 1.7 2.4 0.0 0.8 Maturity (years) 24.1 24.8 22.7 18.8 23.4 24.9 0.0 34.6 Grace period (years) 8.2 7.1 5.5 6.5 7.3 7.8 0.0 10.1Private creditors Interest (%) 0.0 0.0 8.7 0.0 0.0 0.0 7.2 0.0 Maturity (years) 0.0 0.0 13.2 0.0 0.0 0.0 10.3 0.0 Grace period (years) 0.0 0.0 13.2 0.0 0.0 0.0 10.3 0.0
5. Major economic aggregatesGross national income (GNI) 369.2 521.2 614.4 684.1 722.3 803.2 835.2 925.2Exports of goods, services & income 301.2 406.4 404.3 420.0 495.8 534.2 469.0 482.2Worker remit. & comp. of employees 16.0 2.0 3.0 2.0 28.7 29.5 30.3 31.1Imports of goods & services 352.1 440.0 494.2 555.1 570.9 670.4 755.9 785.4International reserves 44.6 63.1 78.8 106.9 132.5 116.4 134.5 153.7Current account balance -57.0 -35.7 -94.8 -147.3 -87.4 -150.1 -302.7 -319.7
6. RatiosExternal debt stocks to exports (%) 26.3 31.6 58.2 81.7 73.7 79.5 79.6 91.4External debt stocks to GNI (%) 21.4 24.6 38.3 50.1 50.6 52.9 44.7 47.6Debt service to exports (%) 2.1 2.9 7.7 7.4 5.0 6.1 7.4 7.6Short-term to external debt stocks (%) 8.9 13.2 28.8 31.5 29.8 41.4 31.3 39.3Multilateral to external debt stocks (%) 53.3 61.6 42.3 35.7 39.1 33.0 40.5 37.2Reserves to external debt stocks (%) 56.3 49.2 33.5 31.2 36.2 27.4 36.0 34.9Reserves to imports (months) 1.5 1.7 1.9 2.3 2.8 2.1 2.1 2.3
234

ST. LUCIA(US$ million, unless otherwise indicated)
1990 1995 2000 2003 2004 2005 2006 2007
7. Long-term external debtDebt outstanding and disbursed 72.1 111.3 167.6 235.0 256.6 248.9 256.4 267.4Public and publicly guaranteed 72.1 111.3 167.6 235.0 256.6 248.9 256.4 267.4 Official creditors 69.5 111.3 120.7 141.8 163.8 160.8 174.3 191.4 Multilateral 42.2 79.0 99.5 122.5 143.1 140.4 151.4 163.8 of which: IBRD 0.0 2.1 6.0 10.1 10.5 10.3 10.0 17.8 IDA 0.0 7.9 11.6 23.2 26.1 27.2 40.7 46.2 Bilateral 27.3 32.3 21.3 19.3 20.7 20.4 23.0 27.6 Private creditors 2.6 0.0 46.8 93.2 92.8 88.1 82.1 76.0 of which: Bonds 0.0 0.0 0.0 0.0 0.0 0.0 0.0 0.0 Commercial banks 2.6 0.0 46.8 93.2 92.8 88.1 82.1 76.0Private nonguaranteed 0.0 0.0 0.0 0.0 0.0 0.0 0.0 0.0 of which: Bonds 0.0 0.0 0.0 0.0 0.0 0.0 0.0 0.0Disbursements 8.0 11.5 50.9 33.1 28.5 11.7 21.3 26.3Public and publicly guaranteed 8.0 11.5 50.9 33.1 28.5 11.7 21.3 26.3 Official creditors 8.0 11.5 16.8 18.1 28.5 11.7 21.3 26.3 Multilateral 6.9 10.8 15.7 16.9 25.7 7.4 17.2 20.4 of which: IBRD 0.0 0.7 0.9 5.1 1.2 1.1 0.7 9.6 IDA 0.0 2.1 0.7 1.3 1.9 3.5 12.2 4.1 Bilateral 1.1 0.8 1.1 1.2 2.7 4.4 4.1 5.9 Private creditors 0.0 0.0 34.1 15.0 0.0 0.0 0.0 0.0 of which: Bonds 0.0 0.0 0.0 0.0 0.0 0.0 0.0 0.0 Commercial banks 0.0 0.0 34.1 15.0 0.0 0.0 0.0 0.0Private nonguaranteed 0.0 0.0 0.0 0.0 0.0 0.0 0.0 0.0 of which: Bonds 0.0 0.0 0.0 0.0 0.0 0.0 0.0 0.0Principal repayments 3.2 6.2 20.9 15.6 9.8 14.2 17.7 19.9Public and publicly guaranteed 3.2 6.2 20.9 15.6 9.8 14.2 17.7 19.9 Official creditors 2.4 6.2 11.7 9.6 9.5 9.5 11.7 13.8 Multilateral 2.4 4.2 6.6 7.2 6.9 7.0 8.3 10.2 of which: IBRD 0.0 0.1 0.5 1.5 1.0 1.0 1.1 1.8 IDA 0.0 0.0 0.1 0.1 0.1 0.3 0.4 0.4 Bilateral 0.0 2.0 5.1 2.4 2.5 2.5 3.4 3.6 Private creditors 0.8 0.0 9.2 6.0 0.4 4.7 6.0 6.0 of which: Bonds 0.0 0.0 0.0 0.0 0.0 0.0 0.0 0.0 Commercial banks 0.8 0.0 9.2 6.0 0.4 4.7 6.0 6.0Private nonguaranteed 0.0 0.0 0.0 0.0 0.0 0.0 0.0 0.0 of which: Bonds 0.0 0.0 0.0 0.0 0.0 0.0 0.0 0.0Interest payments 2.8 4.8 7.5 12.0 11.4 13.9 13.2 12.4Public and publicly guaranteed 2.8 4.8 7.5 12.0 11.4 13.9 13.2 12.4 Official creditors 2.6 4.8 5.2 4.5 4.7 6.3 6.0 5.7 Multilateral 1.8 3.0 4.0 3.7 3.9 5.4 5.1 4.6 of which: IBRD 0.0 0.1 0.3 0.4 0.5 0.5 0.5 0.7 IDA 0.0 0.0 0.1 0.2 0.2 0.2 0.3 0.3 Bilateral 0.8 1.8 1.2 0.8 0.8 0.9 0.9 1.1 Private creditors 0.2 0.0 2.3 7.5 6.7 7.6 7.2 6.7 of which: Bonds 0.0 0.0 0.0 0.0 0.0 0.0 0.0 0.0 Commercial banks 0.2 0.0 2.3 7.5 6.7 7.6 7.2 6.7Private nonguaranteed 0.0 0.0 0.0 0.0 0.0 0.0 0.0 0.0 of which: Bonds 0.0 0.0 0.0 0.0 0.0 0.0 0.0 0.08. Debt stock-flow reconciliationTotal change in external debt stocks 13.5 14.7 39.2 43.4 22.6 59.3 -51.5 48.4 Net flows on external debt 7.0 12.3 42.5 36.4 19.6 64.5 -55.4 43.4 Cross-currency valuation 5.8 2.2 -3.2 5.5 3.3 -5.0 2.8 3.19. Debt restructuringsTotal amount rescheduled 0.0 0.0 0.0 0.0 0.0 0.0 0.0 0.0Total amount forgiven 0.4 0.0 0.0 0.0 0.0 0.0 0.0 0.0Debt buyback 0.0 0.0 0.0 0.0 0.0 0.0 0.0 0.010. Contractual obligations on outstanding long-term external debt
2008 2009 2010 2011 2012 2013 2014 2015Official creditorsPrincipal 16.3 16.5 16.7 15.0 12.7 12.1 11.7 11.1Interest 6.2 5.7 5.2 4.6 4.1 3.7 3.2 2.8Private creditorsPrincipal 23.0 5.9 5.9 5.9 5.9 2.8 1.1 24.6Interest 6.7 6.3 6.6 6.5 6.1 5.7 5.5 4.4
235

ST. VINCENT AND THE GRENADINES(US$ million, unless otherwise indicated)
1990 1995 2000 2003 2004 2005 2006 2007
1. Summary external debt dataExternal debt stocks 62.4 118.3 194.6 227.2 256.6 280.5 298.7 253.5 Long-term external debt 60.3 91.3 163.3 194.0 223.0 246.3 241.0 199.3 Public and publicly guaranteed 60.3 91.3 163.3 194.0 223.0 246.3 241.0 199.3 Private nonguaranteed 0.0 0.0 0.0 0.0 0.0 0.0 0.0 0.0 Use of IMF credit 0.0 0.0 0.0 0.0 0.0 0.0 0.0 0.0 Short-term external debt 2.1 27.0 31.4 33.2 33.6 34.1 57.7 54.2 interest arrears on long-term 0.1 0.1 0.4 3.2 3.6 4.2 0.0 1.2Memorandum itemsPrincipal arrears on long-term 0.1 0.6 0.9 2.5 3.0 3.0 0.3 1.1Long-term public sector debt 60.3 91.3 163.3 194.0 223.0 246.3 241.0 199.3Long-term private sector debt 0.0 0.0 0.0 0.0 0.0 0.0 0.0 0.0Public & publicly guaranteed commitments 8.0 12.6 1.0 36.3 46.7 66.4 0.0 0.7
External debt flowsDisbursements 7.2 3.3 8.5 26.5 39.9 42.4 14.2 15.4 Long-term external debt 7.2 3.3 8.5 26.5 39.9 42.4 14.2 15.4 IMF purchases 0.0 0.0 0.0 0.0 0.0 0.0 0.0 0.0Principal repayments 2.4 4.5 6.1 9.2 12.9 15.5 22.1 17.5 Long-term external debt 2.4 4.5 6.1 9.2 12.9 15.5 22.1 17.5 IMF repurchases 0.0 0.0 0.0 0.0 0.0 0.0 0.0 0.0Net flows 5.2 3.0 1.6 17.3 27.1 26.8 19.8 -6.8 Long-term external debt 4.8 -1.2 2.4 17.3 27.1 26.9 -8.0 -2.1 IMF flows 0.0 0.0 0.0 0.0 0.0 0.0 0.0 0.0 Short-term external debt 0.4 4.2 -0.8 0.0 0.0 -0.1 27.8 -4.7Interest payments 1.9 4.1 7.0 5.7 7.6 9.4 13.5 11.3 Long-term external debt 1.7 2.6 5.1 4.5 6.4 8.2 11.2 9.2 IMF charges 0.0 0.0 0.0 0.0 0.0 0.0 0.0 0.0 Short-term external debt 0.2 1.5 1.9 1.2 1.2 1.2 2.3 2.1
2. Other non-debt resource flowsForeign direct investment (net) 7.7 30.6 37.7 55.2 65.7 40.1 109.1 91.6Portfolio equity flows 0.0 0.0 0.0 0.0 0.0 0.0 0.0 0.0Profit remittances on FDI 13.3 11.1 12.7 20.8 24.9 22.1 23.0 24.9Grants (excluding technical coop.) 3.4 46.0 3.6 3.9 8.9 5.0 4.0 62.9of which: Debt forgiveness grants .. .. 0.0 0.0 0.0 0.0 0.5 41.9 IDA grants .. .. .. 0.0 0.0 0.3 0.9 0.7Memo: technical coop. grants 2.4 2.7 1.2 1.5 1.9 1.7 2.1 1.2
3. Currency composition of public and publicly guaranteed debt (%)Euro .. .. .. 7.2 7.0 5.4 5.9 7.7Japanese yen 0.2 0.1 0.0 0.0 0.0 0.0 0.0 0.0Pound sterling 4.5 5.4 2.9 0.1 0.1 0.1 0.1 0.1Swiss franc 0.2 1.4 0.3 0.2 0.1 0.0 0.0 0.0U.S.dollars 65.9 68.2 82.2 72.5 68.7 74.3 75.5 71.7
4. Average terms of new commitmentsOfficial creditors Interest (%) 4.0 3.5 2.5 4.9 2.2 4.7 0.0 0.8 Maturity (years) 20.7 19.9 30.1 22.4 20.3 18.4 0.0 34.8 Grace period (years) 4.9 4.2 10.3 0.0 6.0 4.6 0.0 10.3Private creditors Interest (%) 0.0 0.0 0.0 7.4 7.0 7.0 0.0 0.0 Maturity (years) 0.0 0.0 0.0 10.1 9.9 10.0 0.0 0.0 Grace period (years) 0.0 0.0 0.0 1.5 1.3 0.5 0.0 0.0
5. Major economic aggregatesGross national income (GNI) 187.3 254.8 316.9 355.8 386.3 408.5 457.1 515.6Exports of goods, services & income 148.7 155.5 201.7 196.7 210.2 230.3 247.5 269.0Worker remit. & comp. of employees 16.0 2.0 3.0 3.4 25.5 26.5 29.7 30.5Imports of goods & services 167.9 190.0 222.8 269.0 305.6 326.4 365.9 415.4International reserves 26.5 29.8 55.2 51.2 75.0 69.5 78.7 87.0Current account balance -23.6 -40.2 -23.9 -79.5 -102.1 -99.4 -120.1 -149.0
6. RatiosExternal debt stocks to exports (%) 41.9 76.1 96.5 115.5 122.1 121.8 120.7 94.2External debt stocks to GNI (%) 33.3 46.4 61.4 63.9 66.4 68.7 65.3 49.2Debt service to exports (%) 2.9 5.5 6.5 7.6 9.8 10.8 14.4 10.7Short-term to external debt stocks (%) 3.4 22.8 16.1 14.6 13.1 12.2 19.3 21.4Multilateral to external debt stocks (%) 79.1 49.3 34.0 33.8 30.7 29.6 31.3 42.0Reserves to external debt stocks (%) 42.5 25.2 28.4 22.5 29.2 24.8 26.3 34.3Reserves to imports (months) 1.9 1.9 3.0 2.3 2.9 2.6 2.6 2.5
236
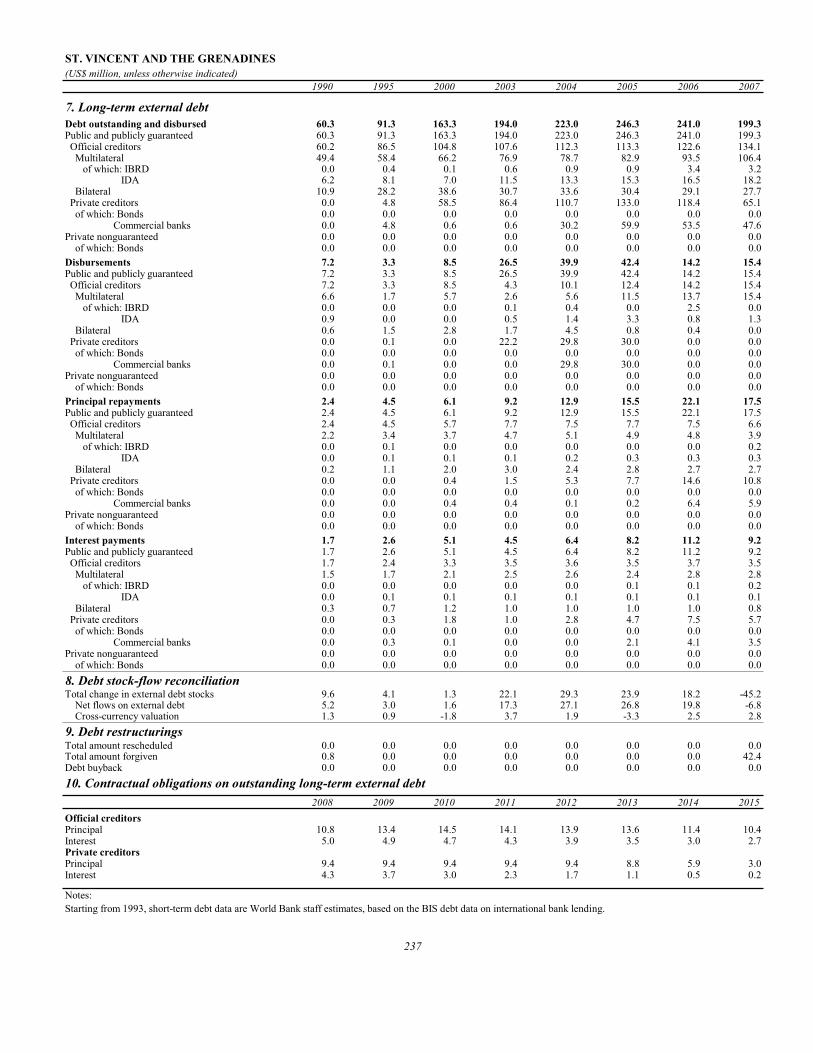
ST. VINCENT AND THE GRENADINES(US$ million, unless otherwise indicated)
1990 1995 2000 2003 2004 2005 2006 2007
7. Long-term external debtDebt outstanding and disbursed 60.3 91.3 163.3 194.0 223.0 246.3 241.0 199.3Public and publicly guaranteed 60.3 91.3 163.3 194.0 223.0 246.3 241.0 199.3 Official creditors 60.2 86.5 104.8 107.6 112.3 113.3 122.6 134.1 Multilateral 49.4 58.4 66.2 76.9 78.7 82.9 93.5 106.4 of which: IBRD 0.0 0.4 0.1 0.6 0.9 0.9 3.4 3.2 IDA 6.2 8.1 7.0 11.5 13.3 15.3 16.5 18.2 Bilateral 10.9 28.2 38.6 30.7 33.6 30.4 29.1 27.7 Private creditors 0.0 4.8 58.5 86.4 110.7 133.0 118.4 65.1 of which: Bonds 0.0 0.0 0.0 0.0 0.0 0.0 0.0 0.0 Commercial banks 0.0 4.8 0.6 0.6 30.2 59.9 53.5 47.6Private nonguaranteed 0.0 0.0 0.0 0.0 0.0 0.0 0.0 0.0 of which: Bonds 0.0 0.0 0.0 0.0 0.0 0.0 0.0 0.0Disbursements 7.2 3.3 8.5 26.5 39.9 42.4 14.2 15.4Public and publicly guaranteed 7.2 3.3 8.5 26.5 39.9 42.4 14.2 15.4 Official creditors 7.2 3.3 8.5 4.3 10.1 12.4 14.2 15.4 Multilateral 6.6 1.7 5.7 2.6 5.6 11.5 13.7 15.4 of which: IBRD 0.0 0.0 0.0 0.1 0.4 0.0 2.5 0.0 IDA 0.9 0.0 0.0 0.5 1.4 3.3 0.8 1.3 Bilateral 0.6 1.5 2.8 1.7 4.5 0.8 0.4 0.0 Private creditors 0.0 0.1 0.0 22.2 29.8 30.0 0.0 0.0 of which: Bonds 0.0 0.0 0.0 0.0 0.0 0.0 0.0 0.0 Commercial banks 0.0 0.1 0.0 0.0 29.8 30.0 0.0 0.0Private nonguaranteed 0.0 0.0 0.0 0.0 0.0 0.0 0.0 0.0 of which: Bonds 0.0 0.0 0.0 0.0 0.0 0.0 0.0 0.0Principal repayments 2.4 4.5 6.1 9.2 12.9 15.5 22.1 17.5Public and publicly guaranteed 2.4 4.5 6.1 9.2 12.9 15.5 22.1 17.5 Official creditors 2.4 4.5 5.7 7.7 7.5 7.7 7.5 6.6 Multilateral 2.2 3.4 3.7 4.7 5.1 4.9 4.8 3.9 of which: IBRD 0.0 0.1 0.0 0.0 0.0 0.0 0.0 0.2 IDA 0.0 0.1 0.1 0.1 0.2 0.3 0.3 0.3 Bilateral 0.2 1.1 2.0 3.0 2.4 2.8 2.7 2.7 Private creditors 0.0 0.0 0.4 1.5 5.3 7.7 14.6 10.8 of which: Bonds 0.0 0.0 0.0 0.0 0.0 0.0 0.0 0.0 Commercial banks 0.0 0.0 0.4 0.4 0.1 0.2 6.4 5.9Private nonguaranteed 0.0 0.0 0.0 0.0 0.0 0.0 0.0 0.0 of which: Bonds 0.0 0.0 0.0 0.0 0.0 0.0 0.0 0.0Interest payments 1.7 2.6 5.1 4.5 6.4 8.2 11.2 9.2Public and publicly guaranteed 1.7 2.6 5.1 4.5 6.4 8.2 11.2 9.2 Official creditors 1.7 2.4 3.3 3.5 3.6 3.5 3.7 3.5 Multilateral 1.5 1.7 2.1 2.5 2.6 2.4 2.8 2.8 of which: IBRD 0.0 0.0 0.0 0.0 0.0 0.1 0.1 0.2 IDA 0.0 0.1 0.1 0.1 0.1 0.1 0.1 0.1 Bilateral 0.3 0.7 1.2 1.0 1.0 1.0 1.0 0.8 Private creditors 0.0 0.3 1.8 1.0 2.8 4.7 7.5 5.7 of which: Bonds 0.0 0.0 0.0 0.0 0.0 0.0 0.0 0.0 Commercial banks 0.0 0.3 0.1 0.0 0.0 2.1 4.1 3.5Private nonguaranteed 0.0 0.0 0.0 0.0 0.0 0.0 0.0 0.0 of which: Bonds 0.0 0.0 0.0 0.0 0.0 0.0 0.0 0.08. Debt stock-flow reconciliationTotal change in external debt stocks 9.6 4.1 1.3 22.1 29.3 23.9 18.2 -45.2 Net flows on external debt 5.2 3.0 1.6 17.3 27.1 26.8 19.8 -6.8 Cross-currency valuation 1.3 0.9 -1.8 3.7 1.9 -3.3 2.5 2.89. Debt restructuringsTotal amount rescheduled 0.0 0.0 0.0 0.0 0.0 0.0 0.0 0.0Total amount forgiven 0.8 0.0 0.0 0.0 0.0 0.0 0.0 42.4Debt buyback 0.0 0.0 0.0 0.0 0.0 0.0 0.0 0.010. Contractual obligations on outstanding long-term external debt
2008 2009 2010 2011 2012 2013 2014 2015Official creditorsPrincipal 10.8 13.4 14.5 14.1 13.9 13.6 11.4 10.4Interest 5.0 4.9 4.7 4.3 3.9 3.5 3.0 2.7Private creditorsPrincipal 9.4 9.4 9.4 9.4 9.4 8.8 5.9 3.0Interest 4.3 3.7 3.0 2.3 1.7 1.1 0.5 0.2
Notes:Starting from 1993, short-term debt data are World Bank staff estimates, based on the BIS debt data on international bank lending.
237

SUDAN(US$ million, unless otherwise indicated)
1990 1995 2000 2003 2004 2005 2006 2007
1. Summary external debt dataExternal debt stocks 14,762 17,603 16,009 17,159 18,188 17,380 18,226 19,126 Long-term external debt 9,651 10,275 10,639 11,110 11,547 11,075 11,663 12,337 Public and publicly guaranteed 9,155 9,779 10,143 11,110 11,547 11,075 11,663 12,337 Private nonguaranteed 496 496 496 0 0 0 0 0 Use of IMF credit 956 960 625 599 593 518 518 482 Short-term external debt 4,155 6,368 4,745 5,450 6,048 5,787 6,045 6,307 interest arrears on long-term 3,705 5,737 4,474 5,317 5,646 5,376 5,709 6,033Memorandum itemsPrincipal arrears on long-term 5,703 7,637 7,290 7,816 8,140 7,752 8,132 8,359Long-term public sector debt 9,651 10,275 10,639 11,110 11,547 11,075 11,663 12,337Long-term private sector debt 0 0 0 0 0 0 0 0Public & publicly guaranteed commitments 35 0 343 490 554 231 597 299
External debt flowsDisbursements 185 51 861 127 314 414 455 662 Long-term external debt 185 51 861 127 314 414 455 662 IMF purchases 0 0 0 0 0 0 0 0Principal repayments 16 54 197 214 235 323 246 282 Long-term external debt 15 15 143 188 204 295 219 222 IMF repurchases 1 39 54 26 31 28 27 60Net flows 169 0 625 -91 348 100 134 416 Long-term external debt 170 36 718 -61 110 120 236 440 IMF flows -1 -35 -54 -26 -31 -28 -27 -60 Short-term external debt 0 3 -39 -4 269 9 -75 36Interest payments 34 15 42 58 79 67 50 82 Long-term external debt 9 2 42 58 79 67 50 82 IMF charges 0 13 0 0 0 0 0 0 Short-term external debt 25 0 0 0 0 0 0 0
2. Other non-debt resource flowsForeign direct investment (net) -31 12 392 1,349 1,511 2,305 3,534 2,426Portfolio equity flows 0 0 0 0 0 0 -35 -17Profit remittances on FDI 0 0 0 879 1,122 1,399 2,093 2,404Grants (excluding technical coop.) 433 149 176 564 898 1,671 1,781 1,932of which: Debt forgiveness grants .. .. 0 3 4 3 3 3 IDA grants .. .. .. 0 0 0 0 0Memo: technical coop. grants 184 77 28 54 81 124 202 87
3. Currency composition of public and publicly guaranteed debt (%)Euro .. .. .. 8.5 8.9 8.0 8.5 9.0Japanese yen 2.3 2.9 2.0 1.9 1.9 1.3 1.3 0.8Pound sterling 4.3 3.4 3.3 3.2 3.3 3.1 3.2 3.1Swiss franc 18.6 19.6 12.2 14.8 15.6 14.0 14.3 14.6U.S.dollars 48.1 47.6 60.3 53.8 52.4 54.0 52.1 50.3
4. Average terms of new commitmentsOfficial creditors Interest (%) 0.8 0.0 1.7 3.7 3.4 2.8 3.9 2.1 Maturity (years) 49.9 0.0 24.8 12.9 15.2 19.5 13.2 20.8 Grace period (years) 10.4 0.0 4.7 4.1 4.8 5.6 4.0 5.7Private creditors Interest (%) 0.0 0.0 0.0 0.0 0.0 0.0 0.0 0.0 Maturity (years) 0.0 0.0 0.0 0.0 0.0 2.0 0.0 0.0 Grace period (years) 0.0 0.0 0.0 0.0 0.0 2.0 0.0 0.0
5. Major economic aggregatesGross national income (GNI) 11,409 12,920 11,303 16,428 19,990 25,397 33,503 41,682Exports of goods, services & income 573 1,029 2,477 3,807 5,245 5,996 7,170 11,214Worker remit. & comp. of employees 62 346 641 1,223 1,403 1,016 1,179 1,769Imports of goods & services 1,025 1,243 2,594 4,246 5,785 9,196 12,008 13,098International reserves 11 163 138 529 1,338 1,869 1,660 1,378Current account balance -372 -500 -518 -939 -818 -2,768 -4,811 -3,268
6. RatiosExternal debt stocks to exports (%) 2,574.9 1,710.6 646.3 450.7 346.8 289.8 254.2 170.6External debt stocks to GNI (%) 129.4 136.3 141.6 104.4 91.0 68.4 54.4 45.9Debt service to exports (%) 8.7 6.7 9.7 7.2 6.0 6.5 4.1 3.2Short-term to external debt stocks (%) 28.1 36.2 29.6 31.8 33.3 33.3 33.2 33.0Multilateral to external debt stocks (%) 11.7 12.1 12.3 14.1 13.9 14.4 14.9 15.7Reserves to external debt stocks (%) 0.1 0.9 0.9 3.1 7.4 10.8 9.1 7.2Reserves to imports (months) 0.1 1.6 0.6 1.5 2.8 2.4 1.7 1.3
238

SUDAN(US$ million, unless otherwise indicated)
1990 1995 2000 2003 2004 2005 2006 2007
7. Long-term external debtDebt outstanding and disbursed 9,651 10,275 10,639 11,110 11,547 11,075 11,663 12,337Public and publicly guaranteed 9,155 9,779 10,143 11,110 11,547 11,075 11,663 12,337 Official creditors 7,500 7,921 8,385 8,944 9,183 8,882 9,358 9,899 Multilateral 1,723 2,133 1,968 2,421 2,527 2,510 2,716 2,994 of which: IBRD 19 6 1 0 0 0 0 0 IDA 1,028 1,272 1,167 1,262 1,300 1,234 1,271 1,307 Bilateral 5,777 5,787 6,417 6,523 6,656 6,372 6,642 6,906 Private creditors 1,655 1,859 1,758 2,166 2,365 2,193 2,305 2,438 of which: Bonds 0 0 0 0 0 0 0 0 Commercial banks 1,651 1,855 1,296 1,675 1,820 1,584 1,696 1,829Private nonguaranteed 496 496 496 0 0 0 0 0 of which: Bonds 0 0 0 0 0 0 0 0Disbursements 185 51 861 127 314 414 455 662Public and publicly guaranteed 185 51 861 127 314 414 455 662 Official creditors 185 51 318 127 260 347 455 662 Multilateral 185 51 171 33 71 124 150 211 of which: IBRD 0 0 0 0 0 0 0 0 IDA 121 0 0 0 0 0 0 0 Bilateral 0 0 146 94 188 223 306 451 Private creditors 0 0 543 0 54 68 0 0 of which: Bonds 0 0 0 0 0 0 0 0 Commercial banks 0 0 87 0 0 0 0 0Private nonguaranteed 0 0 0 0 0 0 0 0 of which: Bonds 0 0 0 0 0 0 0 0Principal repayments 15 15 143 188 204 295 219 222Public and publicly guaranteed 15 15 143 188 204 295 219 222 Official creditors 15 15 143 188 204 291 219 222 Multilateral 15 15 32 32 31 27 15 37 of which: IBRD 10 0 2 0 0 0 0 0 IDA 4 0 2 3 2 1 2 0 Bilateral 0 0 111 156 173 264 204 185 Private creditors 0 0 0 0 0 4 0 0 of which: Bonds 0 0 0 0 0 0 0 0 Commercial banks 0 0 0 0 0 0 0 0Private nonguaranteed 0 0 0 0 0 0 0 0 of which: Bonds 0 0 0 0 0 0 0 0Interest payments 9 2 42 58 79 67 50 82Public and publicly guaranteed 9 2 42 58 79 67 50 82 Official creditors 9 2 41 58 79 64 48 81 Multilateral 9 2 16 22 20 23 12 40 of which: IBRD 2 0 0 0 0 0 0 0 IDA 6 0 2 2 2 1 1 0 Bilateral 0 0 26 36 59 41 36 41 Private creditors 0 0 1 0 0 2 2 2 of which: Bonds 0 0 0 0 0 0 0 0 Commercial banks 0 0 0 0 0 0 0 0Private nonguaranteed 0 0 0 0 0 0 0 0 of which: Bonds 0 0 0 0 0 0 0 08. Debt stock-flow reconciliationTotal change in external debt stocks 1,403 685 -124 1,095 1,029 -808 847 998 Net flows on external debt 169 0 625 -91 348 100 134 416 Cross-currency valuation 518 274 -223 539 335 -580 347 4209. Debt restructuringsTotal amount rescheduled 0 0 0 0 0 0 0 0Total amount forgiven 0 0 0 0 0 13 0 40Debt buyback 0 0 0 0 0 0 0 010. Contractual obligations on outstanding long-term external debt
2008 2009 2010 2011 2012 2013 2014 2015Official creditorsPrincipal 394 413 433 449 433 410 400 323Interest 131 125 116 103 90 77 64 51Private creditorsPrincipal 11 11 11 11 11 11 11 11Interest 3 3 2 2 2 2 1 1
239

SWAZILAND(US$ million, unless otherwise indicated)
1990 1995 2000 2003 2004 2005 2006 2007
1. Summary external debt dataExternal debt stocks 256.8 249.5 264.8 367.6 411.9 431.2 402.9 393.2 Long-term external debt 252.2 238.3 262.9 355.4 353.8 351.1 353.8 356.7 Public and publicly guaranteed 252.2 238.3 262.9 355.4 353.8 351.1 353.8 356.7 Private nonguaranteed 0.0 0.0 0.0 0.0 0.0 0.0 0.0 0.0 Use of IMF credit 0.0 0.0 0.0 0.0 0.0 0.0 0.0 0.0 Short-term external debt 4.6 11.1 1.8 12.3 58.1 80.1 49.1 36.5 interest arrears on long-term 0.1 0.5 0.0 12.0 14.1 15.1 18.1 5.5Memorandum itemsPrincipal arrears on long-term 0.2 4.0 0.2 5.2 0.4 7.1 11.0 6.6Long-term public sector debt 252.2 238.3 262.9 355.4 353.8 351.1 353.8 356.7Long-term private sector debt 0.0 0.0 0.0 0.0 0.0 0.0 0.0 0.0Public & publicly guaranteed commitments 0.0 29.0 0.7 104.7 80.0 0.0 6.6 0.0
External debt flowsDisbursements 13.6 8.1 15.8 9.1 33.7 51.1 22.9 12.4 Long-term external debt 13.6 8.1 15.8 9.1 33.7 51.1 22.9 12.4 IMF purchases 0.0 0.0 0.0 0.0 0.0 0.0 0.0 0.0Principal repayments 34.6 13.5 12.4 12.4 26.7 17.7 17.3 23.4 Long-term external debt 34.2 13.5 12.4 12.4 26.7 17.7 17.3 23.4 IMF repurchases 0.3 0.0 0.0 0.0 0.0 0.0 0.0 0.0Net flows -37.6 -1.1 -47.5 -3.2 50.8 54.4 -28.4 -11.1 Long-term external debt -20.6 -5.4 3.4 -3.4 7.0 33.4 5.6 -11.1 IMF flows 0.0 0.0 0.0 0.0 0.0 0.0 0.0 0.0 Short-term external debt -16.7 4.3 -50.9 0.1 43.7 21.0 -34.0 0.0Interest payments 9.7 4.6 18.2 13.1 17.2 16.2 17.9 24.5 Long-term external debt 9.2 4.1 16.1 13.1 16.4 13.4 14.8 23.1 IMF charges 0.0 0.0 0.0 0.0 0.0 0.0 0.0 0.0 Short-term external debt 0.4 0.4 2.1 0.0 0.8 2.8 3.1 1.4
2. Other non-debt resource flowsForeign direct investment (net) 30.1 51.8 91.4 -60.9 69.6 -45.9 121.0 37.5Portfolio equity flows -2.2 0.8 1.4 -0.1 0.3 0.8 5.5 1.0Profit remittances on FDI 85.4 68.0 65.9 75.7 87.4 44.0 167.0 160.0Grants (excluding technical coop.) 20.1 18.9 9.9 18.5 23.5 38.9 25.1 46.3of which: Debt forgiveness grants .. .. 0.0 0.0 0.0 0.0 0.0 0.0 IDA grants .. .. .. 0.0 0.0 0.0 0.0 0.0Memo: technical coop. grants 27.3 28.1 9.4 7.6 4.3 5.6 5.2 4.9
3. Currency composition of public and publicly guaranteed debt (%)Euro .. .. .. 25.6 14.9 12.0 12.1 12.4Japanese yen 0.0 0.0 0.0 0.0 0.0 0.0 0.0 0.0Pound sterling 10.3 4.6 1.0 0.4 0.3 0.2 0.2 0.1Swiss franc 0.0 0.0 0.0 0.0 0.0 0.0 0.0 0.0U.S.dollars 11.3 8.2 10.4 11.7 14.1 13.7 12.8 11.7
4. Average terms of new commitmentsOfficial creditors Interest (%) 0.0 7.1 3.0 2.5 1.6 0.0 2.5 0.0 Maturity (years) 0.0 19.5 40.2 20.6 19.8 0.0 21.8 0.0 Grace period (years) 0.0 5.0 27.2 5.6 4.4 0.0 4.3 0.0Private creditors Interest (%) 0.0 0.0 0.0 11.2 0.0 0.0 0.0 0.0 Maturity (years) 0.0 0.0 0.0 20.6 0.0 0.0 0.0 0.0 Grace period (years) 0.0 0.0 0.0 4.1 0.0 0.0 0.0 0.0
5. Major economic aggregatesGross national income (GNI) 1174.0 1779.5 1523.8 1753.9 2284.1 2702.3 2683.7 2957.3Exports of goods, services & income 819.6 1182.2 1376.4 1933.0 2184.4 2191.7 2189.1 2481.8Worker remit. & comp. of employees 113.0 83.0 74.0 65.0 82.8 95.4 98.6 100.5Imports of goods & services 870.4 1355.9 1522.9 1993.8 2217.8 2390.5 2515.9 2739.8International reserves 216.5 298.2 351.8 277.5 323.6 243.9 372.5 774.2Current account balance 50.7 -29.7 -45.9 89.4 71.3 -102.6 -196.6 -65.5
6. RatiosExternal debt stocks to exports (%) 31.3 21.1 19.2 19.0 18.9 19.7 18.4 15.8External debt stocks to GNI (%) 21.9 14.0 17.4 21.0 18.0 16.0 15.0 13.3Debt service to exports (%) 5.4 1.5 2.2 1.3 2.0 1.5 1.6 1.9Short-term to external debt stocks (%) 1.8 4.5 0.7 3.3 14.1 18.6 12.2 9.3Multilateral to external debt stocks (%) 45.3 48.2 56.6 55.1 56.1 52.9 58.1 60.9Reserves to external debt stocks (%) 84.3 119.5 132.9 75.5 78.6 56.6 92.5 196.9Reserves to imports (months) 3.0 2.6 2.8 1.7 1.8 1.2 1.8 3.4
240

SWAZILAND(US$ million, unless otherwise indicated)
1990 1995 2000 2003 2004 2005 2006 2007
7. Long-term external debtDebt outstanding and disbursed 252.2 238.3 262.9 355.4 353.8 351.1 353.8 356.7Public and publicly guaranteed 252.2 238.3 262.9 355.4 353.8 351.1 353.8 356.7 Official creditors 245.4 238.1 243.1 314.9 306.1 306.7 310.9 315.9 Multilateral 116.2 120.3 149.9 202.6 230.9 228.0 234.0 239.6 of which: IBRD 36.9 19.2 9.0 14.8 23.7 23.6 22.4 20.1 IDA 6.8 5.9 4.7 3.9 3.7 3.4 3.2 2.9 Bilateral 129.2 117.8 93.2 112.3 75.3 78.7 76.9 76.3 Private creditors 6.8 0.3 19.8 40.4 47.7 44.4 42.9 40.8 of which: Bonds 0.0 0.0 0.0 0.0 0.0 0.0 0.0 0.0 Commercial banks 0.0 0.0 19.8 40.4 47.7 44.4 42.9 40.8Private nonguaranteed 0.0 0.0 0.0 0.0 0.0 0.0 0.0 0.0 of which: Bonds 0.0 0.0 0.0 0.0 0.0 0.0 0.0 0.0Disbursements 13.6 8.1 15.8 9.1 33.7 51.1 22.9 12.4Public and publicly guaranteed 13.6 8.1 15.8 9.1 33.7 51.1 22.9 12.4 Official creditors 13.6 8.1 15.8 9.1 33.7 49.2 19.3 12.4 Multilateral 8.2 7.2 15.8 9.1 29.0 32.0 19.3 11.9 of which: IBRD 1.0 0.0 0.7 6.8 10.2 1.5 0.0 0.0 IDA 0.0 0.0 0.0 0.0 0.0 0.0 0.0 0.0 Bilateral 5.5 1.0 0.0 0.0 4.8 17.2 0.0 0.5 Private creditors 0.0 0.0 0.0 0.0 0.0 1.9 3.7 0.0 of which: Bonds 0.0 0.0 0.0 0.0 0.0 0.0 0.0 0.0 Commercial banks 0.0 0.0 0.0 0.0 0.0 1.9 3.7 0.0Private nonguaranteed 0.0 0.0 0.0 0.0 0.0 0.0 0.0 0.0 of which: Bonds 0.0 0.0 0.0 0.0 0.0 0.0 0.0 0.0Principal repayments 34.2 13.5 12.4 12.4 26.7 17.7 17.3 23.4Public and publicly guaranteed 34.2 13.5 12.4 12.4 26.7 17.7 17.3 23.4 Official creditors 32.3 13.2 12.4 12.4 26.7 17.7 16.4 20.4 Multilateral 26.8 8.2 8.1 9.7 13.0 12.2 13.0 14.7 of which: IBRD 20.4 3.5 0.9 1.0 1.4 1.5 1.2 2.3 IDA 0.2 0.3 0.3 0.3 0.3 0.3 0.3 0.3 Bilateral 5.5 5.0 4.3 2.7 13.7 5.5 3.4 5.7 Private creditors 1.9 0.3 0.0 0.0 0.0 0.0 0.9 3.0 of which: Bonds 0.0 0.0 0.0 0.0 0.0 0.0 0.0 0.0 Commercial banks 0.2 0.0 0.0 0.0 0.0 0.0 0.9 3.0Private nonguaranteed 0.0 0.0 0.0 0.0 0.0 0.0 0.0 0.0 of which: Bonds 0.0 0.0 0.0 0.0 0.0 0.0 0.0 0.0Interest payments 9.2 4.1 16.1 13.1 16.4 13.4 14.8 23.1Public and publicly guaranteed 9.2 4.1 16.1 13.1 16.4 13.4 14.8 23.1 Official creditors 8.4 4.1 10.2 9.0 11.6 9.9 11.3 17.7 Multilateral 6.5 3.1 5.2 8.6 9.1 8.8 10.4 12.4 of which: IBRD 3.6 1.2 0.8 0.6 0.7 1.0 1.0 1.0 IDA 0.1 0.0 0.0 0.0 0.0 0.0 0.0 0.0 Bilateral 1.9 0.9 5.0 0.5 2.5 1.0 0.9 5.3 Private creditors 0.8 0.1 5.9 4.1 4.8 3.5 3.5 5.4 of which: Bonds 0.0 0.0 0.0 0.0 0.0 0.0 0.0 0.0 Commercial banks 0.0 0.0 5.9 4.1 4.8 3.5 3.5 5.4Private nonguaranteed 0.0 0.0 0.0 0.0 0.0 0.0 0.0 0.0 of which: Bonds 0.0 0.0 0.0 0.0 0.0 0.0 0.0 0.08. Debt stock-flow reconciliationTotal change in external debt stocks -14.5 8.8 -68.0 50.4 44.3 19.3 -28.3 -9.8 Net flows on external debt -37.6 -1.1 -47.5 -3.2 50.8 54.4 -28.4 -11.1 Cross-currency valuation 14.1 8.5 -15.1 23.1 20.8 -18.9 -4.0 4.69. Debt restructuringsTotal amount rescheduled 0.0 0.0 0.0 0.0 0.0 0.0 0.0 0.0Total amount forgiven 0.0 0.0 0.0 0.0 0.0 0.0 0.0 0.0Debt buyback 0.0 0.0 0.0 0.0 0.0 0.0 0.0 0.010. Contractual obligations on outstanding long-term external debt
2008 2009 2010 2011 2012 2013 2014 2015Official creditorsPrincipal 30.1 31.8 30.4 32.7 31.0 29.6 27.6 24.9Interest 14.0 13.8 13.2 12.2 11.0 9.6 8.3 7.2Private creditorsPrincipal 2.7 3.0 3.0 3.0 3.0 3.0 3.0 2.4Interest 6.1 6.5 6.3 6.0 5.6 5.2 4.8 4.4
241

TAJIKISTAN(US$ million, unless otherwise indicated)
1990 1995 2000 2003 2004 2005 2006 2007
1. Summary external debt dataExternal debt stocks .. 634 1,034 1,152 1,041 1,065 1,016 1,228 Long-term external debt .. 590 846 971 836 855 879 1,105 Public and publicly guaranteed .. 590 755 912 807 829 842 1,065 Private nonguaranteed .. 0 91 59 29 26 37 40 Use of IMF credit .. 0 111 100 122 127 44 46 Short-term external debt .. 43 77 81 83 84 93 76 interest arrears on long-term .. 43 45 2 0 2 0 0Memorandum itemsPrincipal arrears on long-term .. 142 121 28 17 23 1 0Long-term public sector debt .. 590 755 905 800 824 840 1,065Long-term private sector debt .. 0 91 66 36 31 39 40Public & publicly guaranteed commitments .. 0 53 110 82 87 640 136
External debt flowsDisbursements .. 28 62 69 129 137 164 266 Long-term external debt .. 28 37 58 100 108 149 266 IMF purchases .. 0 25 11 29 29 14 0Principal repayments .. 0 37 66 74 56 40 41 Long-term external debt .. 0 28 51 62 42 40 41 IMF repurchases .. 0 10 15 12 14 0 0Net flows .. 28 -4 31 59 80 135 207 Long-term external debt .. 28 9 7 38 66 109 224 IMF flows .. 0 -10 -4 0 0 0 0 Short-term external debt .. 0 -29 28 4 -1 11 -17Interest payments .. 0 25 16 25 14 29 38 Long-term external debt .. 0 21 15 22 11 25 32 IMF charges .. 0 2 0 1 1 0 0 Short-term external debt .. 0 2 1 2 3 4 5
2. Other non-debt resource flowsForeign direct investment (net) .. 10 24 32 272 54 339 360Portfolio equity flows .. 0 0 0 0 0 0 0Profit remittances on FDI .. 0 0 1 1 2 46 26Grants (excluding technical coop.) .. 54 50 79 86 107 219 137of which: Debt forgiveness grants .. .. 0 0 0 0 102 0 IDA grants .. .. .. 0 0 2 18 21Memo: technical coop. grants .. 12 14 38 50 55 49 35
3. Currency composition of public and publicly guaranteed debt (%)Euro .. .. .. 7.0 8.5 6.1 5.3 3.9Japanese yen .. 0.0 0.0 0.0 0.0 0.0 0.0 0.0Pound sterling .. 0.0 0.0 0.0 0.0 0.0 0.0 0.0Swiss franc .. 0.0 0.0 0.0 0.0 0.0 0.0 0.0U.S.dollars .. 97.0 97.9 89.5 86.0 86.4 85.7 86.3
4. Average terms of new commitmentsOfficial creditors Interest (%) .. 0.0 3.8 1.5 1.5 0.7 2.0 1.5 Maturity (years) .. 0.0 26.4 26.4 29.6 29.5 20.7 31.9 Grace period (years) .. 0.0 6.7 6.8 6.8 7.8 5.3 8.4Private creditors Interest (%) .. 0.0 0.0 0.0 0.0 0.0 0.0 0.0 Maturity (years) .. 0.0 0.0 0.0 0.0 0.0 0.0 0.0 Grace period (years) .. 0.0 0.0 0.0 0.0 0.0 0.0 0.0
5. Major economic aggregatesGross national income (GNI) .. 1,183 781 1,465 2,000 2,238 2,712 3,612Exports of goods, services & income .. .. .. 1,142 1,474 1,729 2,673 3,413Worker remit. & comp. of employees .. 0 0 146 252 467 1,019 1,691Imports of goods & services .. .. .. 1,218 1,504 1,733 2,425 3,780International reserves .. .. 94 118 172 189 204 ..Current account balance .. .. .. -5 -57 -19 -21 -495
6. RatiosExternal debt stocks to exports (%) .. .. .. 100.9 70.7 61.6 38.0 36.0External debt stocks to GNI (%) .. 53.6 132.3 78.6 52.1 47.6 37.5 34.0Debt service to exports (%) .. .. .. 7.2 6.7 4.1 2.6 2.3Short-term to external debt stocks (%) .. 6.8 7.5 7.0 8.0 7.9 9.2 6.2Multilateral to external debt stocks (%) .. 0.0 18.0 33.7 47.5 48.7 59.2 54.3Reserves to external debt stocks (%) .. 0.0 9.1 10.2 16.5 17.7 20.1 0.0Reserves to imports (months) .. .. .. 1.2 1.4 1.3 1.0 ..
242

TAJIKISTAN(US$ million, unless otherwise indicated)
1990 1995 2000 2003 2004 2005 2006 2007
7. Long-term external debtDebt outstanding and disbursed .. 590 846 971 836 855 879 1,105Public and publicly guaranteed .. 590 755 912 807 829 842 1,065 Official creditors .. 522 704 901 796 820 840 1,065 Multilateral .. 0 186 388 495 519 602 667 of which: IBRD .. 0 0 0 0 0 0 0 IDA .. 0 143 228 296 308 339 360 Bilateral .. 522 518 513 302 301 238 398 Private creditors .. 68 51 10 11 8 3 0 of which: Bonds .. 0 0 0 0 0 0 0 Commercial banks .. 68 51 0 0 0 0 0Private nonguaranteed .. 0 91 59 29 26 37 40 of which: Bonds .. 0 0 0 0 0 0 0Disbursements .. 28 37 58 100 108 149 266Public and publicly guaranteed .. 28 36 58 96 105 133 250 Official creditors .. 28 36 58 96 105 133 250 Multilateral .. 0 36 51 87 73 64 52 of which: IBRD .. 0 0 0 0 0 0 0 IDA .. 0 23 13 55 35 16 8 Bilateral .. 28 0 8 9 32 69 198 Private creditors .. 0 0 0 0 0 0 0 of which: Bonds .. 0 0 0 0 0 0 0 Commercial banks .. 0 0 0 0 0 0 0Private nonguaranteed .. 0 1 0 4 3 16 16 of which: Bonds .. 0 0 0 0 0 0 0Principal repayments .. 0 28 51 62 42 40 41Public and publicly guaranteed .. 0 15 27 36 37 34 29 Official creditors .. 0 15 11 35 37 30 29 Multilateral .. 0 0 2 2 14 11 12 of which: IBRD .. 0 0 0 0 0 0 0 IDA .. 0 0 0 0 0 0 1 Bilateral .. 0 15 9 34 22 19 17 Private creditors .. 0 0 16 1 0 3 0 of which: Bonds .. 0 0 0 0 0 0 0 Commercial banks .. 0 0 15 0 0 0 0Private nonguaranteed .. 0 12 24 26 5 6 12 of which: Bonds .. 0 0 0 0 0 0 0Interest payments .. 0 21 15 22 11 25 32Public and publicly guaranteed .. 0 7 11 20 9 23 30 Official creditors .. 0 4 10 19 9 21 30 Multilateral .. 0 1 4 5 6 14 23 of which: IBRD .. 0 0 0 0 0 0 0 IDA .. 0 1 2 2 2 3 3 Bilateral .. 0 3 7 15 3 7 7 Private creditors .. 0 4 1 0 0 2 0 of which: Bonds .. 0 0 0 0 0 0 0 Commercial banks .. 0 4 0 0 0 0 0Private nonguaranteed .. 0 14 4 2 1 2 2 of which: Bonds .. 0 0 0 0 0 0 08. Debt stock-flow reconciliationTotal change in external debt stocks .. 53 -241 10 -110 24 -49 211 Net flows on external debt .. 28 -4 31 59 80 135 207 Cross-currency valuation .. -4 -12 44 26 -50 32 279. Debt restructuringsTotal amount rescheduled .. 0 0 3 0 0 0 0Total amount forgiven .. 0 2 0 13 0 0 0Debt buyback .. 0 0 0 0 0 0 010. Contractual obligations on outstanding long-term external debt
2008 2009 2010 2011 2012 2013 2014 2015Official creditorsPrincipal 46 44 46 66 84 87 87 80Interest 20 22 23 23 23 21 20 18Private creditorsPrincipal 8 10 10 5 4 1 1 1Interest 2 1 1 1 0 0 0 0
Notes:Tajikistan was granted debt relief effective in 2006 under the Multilateral Debt Relief Initiative. Long-term private nonguaranteed debt data are World Bank staff estimates.
243

TANZANIA(US$ million, unless otherwise indicated)
1990 1995 2000 2003 2004 2005 2006 2007
1. Summary external debt dataExternal debt stocks 6,454 7,421 6,931 6,991 7,805 7,796 4,240 5,063 Long-term external debt 5,794 6,261 5,760 5,739 6,238 6,228 2,935 3,688 Public and publicly guaranteed 5,782 6,217 5,732 5,724 6,227 6,220 2,929 3,684 Private nonguaranteed 12 44 28 16 12 9 6 4 Use of IMF credit 140 197 324 437 423 342 13 18 Short-term external debt 520 963 848 814 1,144 1,225 1,293 1,358 interest arrears on long-term 404 904 645 657 815 798 890 930Memorandum itemsPrincipal arrears on long-term 824 1,508 705 682 720 713 719 759Long-term public sector debt 5,725 6,119 5,679 5,722 6,227 6,218 2,924 3,678Long-term private sector debt 70 141 80 17 12 10 10 9Public & publicly guaranteed commitments 697 141 391 279 616 592 818 719
External debt flowsDisbursements 325 262 261 501 426 489 594 691 Long-term external debt 296 262 208 476 418 481 590 686 IMF purchases 29 0 53 25 8 8 4 4Principal repayments 118 146 108 52 67 82 65 56 Long-term external debt 89 127 98 44 43 35 65 56 IMF repurchases 28 19 10 7 25 46 0 0Net flows 223 94 197 445 531 505 506 621 Long-term external debt 207 135 111 431 375 445 526 631 IMF flows -27 0 0 0 0 0 0 0 Short-term external debt 16 -22 44 -4 172 98 -24 -14Interest payments 62 86 64 40 52 50 48 45 Long-term external debt 47 82 52 33 43 40 36 29 IMF charges 6 1 2 2 2 1 0 0 Short-term external debt 9 4 10 5 7 9 12 17
2. Other non-debt resource flowsForeign direct investment (net) 0 120 463 308 331 494 597 647Portfolio equity flows 0 0 0 3 2 3 3 3Profit remittances on FDI 0 2 13 60 58 66 66 68Grants (excluding technical coop.) 677 451 730 1,029 1,351 1,026 5,264 2,045of which: Debt forgiveness grants .. .. 480 140 292 68 4,171 644 IDA grants .. .. .. 35 143 13 14 31Memo: technical coop. grants 208 265 150 158 174 176 207 100
3. Currency composition of public and publicly guaranteed debt (%)Euro .. .. .. 1.9 1.9 2.2 5.9 5.7Japanese yen 8.5 10.9 8.3 8.8 8.2 7.2 15.2 12.1Pound sterling 11.7 10.2 9.2 6.0 5.3 4.9 0.6 0.5Swiss franc 0.6 0.1 0.0 0.0 0.0 0.0 0.1 0.1U.S.dollars 35.7 39.0 50.3 56.1 56.5 53.6 34.2 31.8
4. Average terms of new commitmentsOfficial creditors Interest (%) 1.1 1.7 0.8 0.8 0.8 1.2 0.8 0.8 Maturity (years) 35.3 22.3 39.0 41.2 40.2 38.0 42.0 42.2 Grace period (years) 9.4 7.4 10.1 10.3 9.9 9.2 10.0 10.1Private creditors Interest (%) 2.5 1.9 2.5 3.0 3.2 3.2 0.0 0.0 Maturity (years) 13.3 3.7 23.8 26.8 11.7 6.2 0.0 0.0 Grace period (years) 6.8 1.6 4.3 9.3 2.5 1.0 0.0 0.0
5. Major economic aggregatesGross national income (GNI) 4,072 5,131 8,959 10,135 11,153 14,002 14,097 16,129Exports of goods, services & income 544 1,297 1,341 2,258 2,708 3,038 3,508 4,030Worker remit. & comp. of employees 0 1 8 9 11 18 15 14Imports of goods & services 1,665 2,281 2,230 2,885 3,653 4,390 5,260 6,494International reserves 193 270 974 2,038 2,296 2,049 2,259 2,886Current account balance -559 -590 -499 -118 -362 -864 -1,172 -1,856
6. RatiosExternal debt stocks to exports (%) 1,185.8 572.2 516.9 309.7 288.2 256.6 120.9 125.6External debt stocks to GNI (%) 158.5 144.6 77.4 69.0 70.0 55.7 30.1 31.4Debt service to exports (%) 32.9 17.9 12.8 4.1 4.4 4.3 3.2 2.5Short-term to external debt stocks (%) 8.1 13.0 12.2 11.6 14.7 15.7 30.5 26.8Multilateral to external debt stocks (%) 30.6 37.6 47.1 61.0 61.2 61.7 34.8 42.7Reserves to external debt stocks (%) 3.0 3.6 14.1 29.2 29.4 26.3 53.3 57.0Reserves to imports (months) 1.4 1.4 5.2 8.5 7.5 5.6 5.2 5.3
244

TANZANIA(US$ million, unless otherwise indicated)
1990 1995 2000 2003 2004 2005 2006 2007
7. Long-term external debtDebt outstanding and disbursed 5,794 6,261 5,760 5,739 6,238 6,228 2,935 3,688Public and publicly guaranteed 5,782 6,217 5,732 5,724 6,227 6,220 2,929 3,684 Official creditors 5,295 5,796 5,526 5,632 6,133 6,100 2,821 3,559 Multilateral 1,976 2,791 3,267 4,263 4,778 4,814 1,476 2,163 of which: IBRD 243 87 11 3 0 0 0 0 IDA 1,250 2,182 2,593 3,474 3,916 3,861 1,056 1,585 Bilateral 3,320 3,005 2,259 1,369 1,355 1,286 1,346 1,396 Private creditors 487 421 206 92 93 120 107 125 of which: Bonds 0 0 0 0 0 0 0 0 Commercial banks 83 73 80 38 39 60 37 44Private nonguaranteed 12 44 28 16 12 9 6 4 of which: Bonds 0 0 0 0 0 0 0 0Disbursements 296 262 208 476 418 481 590 686Public and publicly guaranteed 296 261 208 476 418 481 590 686 Official creditors 279 220 203 456 418 450 580 670 Multilateral 200 187 185 452 418 443 519 627 of which: IBRD 0 0 0 0 0 0 0 0 IDA 186 160 142 397 343 275 416 475 Bilateral 80 33 18 4 0 7 61 43 Private creditors 17 40 5 20 0 30 10 16 of which: Bonds 0 0 0 0 0 0 0 0 Commercial banks 4 5 5 20 0 23 4 6Private nonguaranteed 0 1 0 0 0 0 0 0 of which: Bonds 0 0 0 0 0 0 0 0Principal repayments 89 127 98 44 43 35 65 56Public and publicly guaranteed 89 122 94 41 39 32 62 54 Official creditors 77 100 77 41 39 32 55 48 Multilateral 45 78 29 21 29 26 49 14 of which: IBRD 26 34 4 3 3 0 0 0 IDA 6 12 9 9 13 15 31 1 Bilateral 33 21 47 20 10 6 7 34 Private creditors 12 22 17 1 0 0 7 6 of which: Bonds 0 0 0 0 0 0 0 0 Commercial banks 0 0 0 0 0 0 2 4Private nonguaranteed 0 5 4 3 4 3 3 2 of which: Bonds 0 0 0 0 0 0 0 0Interest payments 47 82 52 33 43 40 36 29Public and publicly guaranteed 47 80 51 32 42 39 36 29 Official creditors 44 77 49 32 42 39 34 26 Multilateral 27 56 23 26 36 38 29 17 of which: IBRD 17 8 1 0 0 0 0 0 IDA 8 16 15 20 28 30 20 10 Bilateral 17 20 26 6 6 2 5 9 Private creditors 3 3 2 0 0 0 2 3 of which: Bonds 0 0 0 0 0 0 0 0 Commercial banks 0 0 0 0 0 0 2 2Private nonguaranteed 0 1 1 1 0 0 0 0 of which: Bonds 0 0 0 0 0 0 0 08. Debt stock-flow reconciliationTotal change in external debt stocks 601 175 -724 149 814 -9 -3,556 784 Net flows on external debt 223 94 197 445 531 505 506 621 Cross-currency valuation 118 -136 -286 402 148 -414 -3,940 1239. Debt restructuringsTotal amount rescheduled 183 0 342 38 0 0 0 0Total amount forgiven 102 140 381 131 62 56 80 0Debt buyback 0 0 0 0 0 0 0 010. Contractual obligations on outstanding long-term external debt
2008 2009 2010 2011 2012 2013 2014 2015Official creditorsPrincipal 70 72 69 70 77 67 72 85Interest 47 48 49 49 49 49 48 47Private creditorsPrincipal 8 7 7 6 6 6 6 6Interest 3 3 2 2 2 1 1 1
Notes:Tanzania was granted debt relief effective in 2006 under the Multilateral Debt Relief Initiative. Data on long-term public and publicly guaranteed debt and private nonguaranteed debt for 2007 are World Bank staff estimates.
245
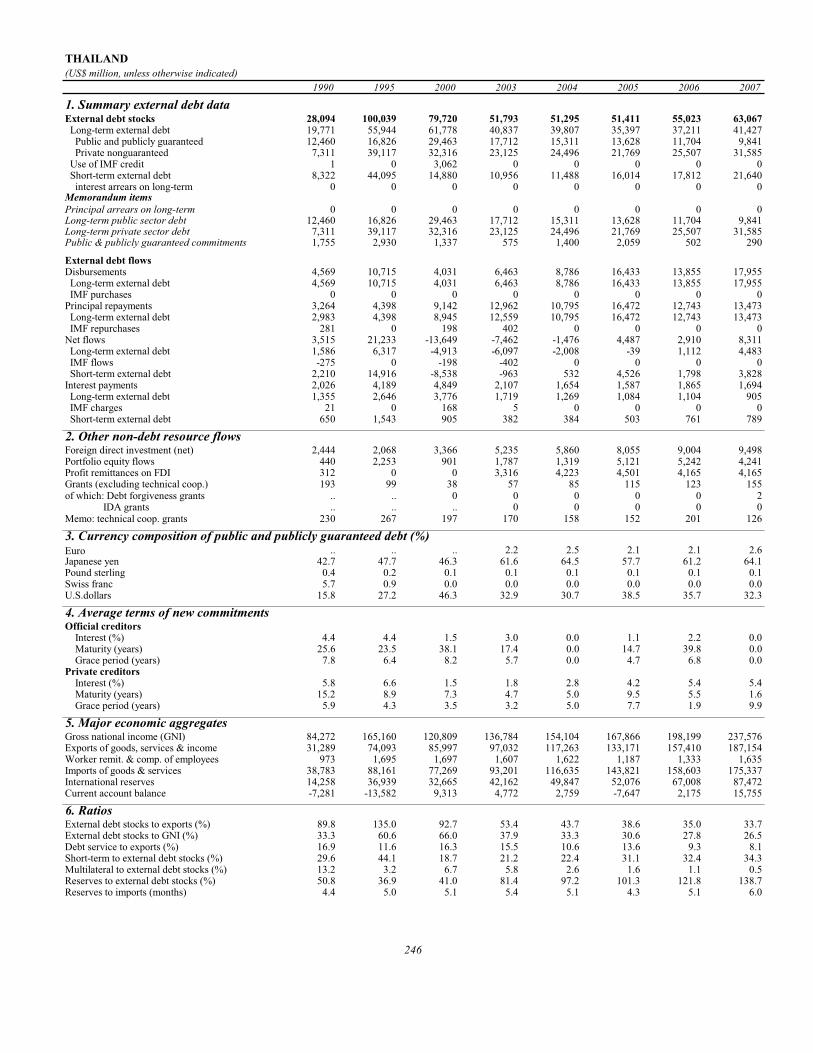
THAILAND(US$ million, unless otherwise indicated)
1990 1995 2000 2003 2004 2005 2006 2007
1. Summary external debt dataExternal debt stocks 28,094 100,039 79,720 51,793 51,295 51,411 55,023 63,067 Long-term external debt 19,771 55,944 61,778 40,837 39,807 35,397 37,211 41,427 Public and publicly guaranteed 12,460 16,826 29,463 17,712 15,311 13,628 11,704 9,841 Private nonguaranteed 7,311 39,117 32,316 23,125 24,496 21,769 25,507 31,585 Use of IMF credit 1 0 3,062 0 0 0 0 0 Short-term external debt 8,322 44,095 14,880 10,956 11,488 16,014 17,812 21,640 interest arrears on long-term 0 0 0 0 0 0 0 0Memorandum itemsPrincipal arrears on long-term 0 0 0 0 0 0 0 0Long-term public sector debt 12,460 16,826 29,463 17,712 15,311 13,628 11,704 9,841Long-term private sector debt 7,311 39,117 32,316 23,125 24,496 21,769 25,507 31,585Public & publicly guaranteed commitments 1,755 2,930 1,337 575 1,400 2,059 502 290
External debt flowsDisbursements 4,569 10,715 4,031 6,463 8,786 16,433 13,855 17,955 Long-term external debt 4,569 10,715 4,031 6,463 8,786 16,433 13,855 17,955 IMF purchases 0 0 0 0 0 0 0 0Principal repayments 3,264 4,398 9,142 12,962 10,795 16,472 12,743 13,473 Long-term external debt 2,983 4,398 8,945 12,559 10,795 16,472 12,743 13,473 IMF repurchases 281 0 198 402 0 0 0 0Net flows 3,515 21,233 -13,649 -7,462 -1,476 4,487 2,910 8,311 Long-term external debt 1,586 6,317 -4,913 -6,097 -2,008 -39 1,112 4,483 IMF flows -275 0 -198 -402 0 0 0 0 Short-term external debt 2,210 14,916 -8,538 -963 532 4,526 1,798 3,828Interest payments 2,026 4,189 4,849 2,107 1,654 1,587 1,865 1,694 Long-term external debt 1,355 2,646 3,776 1,719 1,269 1,084 1,104 905 IMF charges 21 0 168 5 0 0 0 0 Short-term external debt 650 1,543 905 382 384 503 761 789
2. Other non-debt resource flowsForeign direct investment (net) 2,444 2,068 3,366 5,235 5,860 8,055 9,004 9,498Portfolio equity flows 440 2,253 901 1,787 1,319 5,121 5,242 4,241Profit remittances on FDI 312 0 0 3,316 4,223 4,501 4,165 4,165Grants (excluding technical coop.) 193 99 38 57 85 115 123 155of which: Debt forgiveness grants .. .. 0 0 0 0 0 2 IDA grants .. .. .. 0 0 0 0 0Memo: technical coop. grants 230 267 197 170 158 152 201 126
3. Currency composition of public and publicly guaranteed debt (%)Euro .. .. .. 2.2 2.5 2.1 2.1 2.6Japanese yen 42.7 47.7 46.3 61.6 64.5 57.7 61.2 64.1Pound sterling 0.4 0.2 0.1 0.1 0.1 0.1 0.1 0.1Swiss franc 5.7 0.9 0.0 0.0 0.0 0.0 0.0 0.0U.S.dollars 15.8 27.2 46.3 32.9 30.7 38.5 35.7 32.3
4. Average terms of new commitmentsOfficial creditors Interest (%) 4.4 4.4 1.5 3.0 0.0 1.1 2.2 0.0 Maturity (years) 25.6 23.5 38.1 17.4 0.0 14.7 39.8 0.0 Grace period (years) 7.8 6.4 8.2 5.7 0.0 4.7 6.8 0.0Private creditors Interest (%) 5.8 6.6 1.5 1.8 2.8 4.2 5.4 5.4 Maturity (years) 15.2 8.9 7.3 4.7 5.0 9.5 5.5 1.6 Grace period (years) 5.9 4.3 3.5 3.2 5.0 7.7 1.9 9.9
5. Major economic aggregatesGross national income (GNI) 84,272 165,160 120,809 136,784 154,104 167,866 198,199 237,576Exports of goods, services & income 31,289 74,093 85,997 97,032 117,263 133,171 157,410 187,154Worker remit. & comp. of employees 973 1,695 1,697 1,607 1,622 1,187 1,333 1,635Imports of goods & services 38,783 88,161 77,269 93,201 116,635 143,821 158,603 175,337International reserves 14,258 36,939 32,665 42,162 49,847 52,076 67,008 87,472Current account balance -7,281 -13,582 9,313 4,772 2,759 -7,647 2,175 15,755
6. RatiosExternal debt stocks to exports (%) 89.8 135.0 92.7 53.4 43.7 38.6 35.0 33.7External debt stocks to GNI (%) 33.3 60.6 66.0 37.9 33.3 30.6 27.8 26.5Debt service to exports (%) 16.9 11.6 16.3 15.5 10.6 13.6 9.3 8.1Short-term to external debt stocks (%) 29.6 44.1 18.7 21.2 22.4 31.1 32.4 34.3Multilateral to external debt stocks (%) 13.2 3.2 6.7 5.8 2.6 1.6 1.1 0.5Reserves to external debt stocks (%) 50.8 36.9 41.0 81.4 97.2 101.3 121.8 138.7Reserves to imports (months) 4.4 5.0 5.1 5.4 5.1 4.3 5.1 6.0
246

THAILAND(US$ million, unless otherwise indicated)
1990 1995 2000 2003 2004 2005 2006 2007
7. Long-term external debtDebt outstanding and disbursed 19,771 55,944 61,778 40,837 39,807 35,397 37,211 41,427Public and publicly guaranteed 12,460 16,826 29,463 17,712 15,311 13,628 11,704 9,841 Official creditors 8,283 11,187 20,820 13,115 10,727 7,862 7,132 6,227 Multilateral 3,716 3,206 5,330 3,020 1,310 819 632 288 of which: IBRD 2,421 1,805 2,940 2,098 483 386 336 63 IDA 109 102 90 79 76 73 69 66 Bilateral 4,567 7,981 15,489 10,095 9,416 7,043 6,500 5,940 Private creditors 4,177 5,639 8,643 4,596 4,584 5,766 4,572 3,614 of which: Bonds 738 1,574 2,630 2,308 3,557 4,236 3,046 2,566 Commercial banks 2,126 3,045 5,116 1,880 652 1,039 1,118 728Private nonguaranteed 7,311 39,117 32,316 23,125 24,496 21,769 25,507 31,585 of which: Bonds 40 7,375 8,414 4,639 3,997 4,385 3,535 3,281Disbursements 4,569 10,715 4,031 6,463 8,786 16,433 13,855 17,955Public and publicly guaranteed 1,277 2,758 3,031 1,429 1,873 2,171 1,056 390 Official creditors 886 1,417 2,156 939 473 434 556 99 Multilateral 263 358 751 73 57 43 36 2 of which: IBRD 174 146 456 44 33 30 31 2 IDA 0 0 0 0 0 0 0 0 Bilateral 624 1,059 1,405 867 416 391 519 97 Private creditors 391 1,341 876 490 1,400 1,736 500 290 of which: Bonds 0 242 0 300 1,400 936 200 290 Commercial banks 110 1,088 455 190 0 600 300 0Private nonguaranteed 3,292 7,956 1,000 5,033 6,913 14,262 12,799 17,566 of which: Bonds 0 2,080 0 0 0 1,300 735 475Principal repayments 2,983 4,398 8,945 12,559 10,795 16,472 12,743 13,473Public and publicly guaranteed 2,393 1,888 3,010 6,460 4,170 2,716 2,709 1,985 Official creditors 788 925 1,666 5,047 3,123 2,321 1,210 1,274 Multilateral 438 360 753 515 1,770 528 224 351 of which: IBRD 207 201 181 294 1,648 128 81 275 IDA 1 2 3 3 3 3 3 3 Bilateral 349 566 912 4,532 1,352 1,793 986 923 Private creditors 1,605 962 1,344 1,413 1,047 396 1,499 712 of which: Bonds 87 199 174 192 163 172 1,308 219 Commercial banks 1,324 430 1,072 1,159 839 172 90 394Private nonguaranteed 591 2,510 5,935 6,099 6,625 13,755 10,034 11,488 of which: Bonds 0 0 1,044 1,637 640 908 1,585 729Interest payments 1,355 2,646 3,776 1,719 1,269 1,084 1,104 905Public and publicly guaranteed 874 874 1,577 858 736 447 446 343 Official creditors 442 521 1,008 608 469 234 186 151 Multilateral 284 218 350 205 259 54 36 26 of which: IBRD 188 135 178 150 219 29 21 16 IDA 1 1 1 1 1 1 1 1 Bilateral 158 302 658 403 209 180 151 125 Private creditors 432 353 569 250 267 213 260 193 of which: Bonds 46 97 193 124 212 158 188 125 Commercial banks 227 195 353 116 46 39 55 54Private nonguaranteed 481 1,772 2,199 861 534 637 658 562 of which: Bonds 2 222 476 283 220 286 268 2758. Debt stock-flow reconciliationTotal change in external debt stocks 4,606 34,505 -17,050 -7,588 -498 116 3,612 8,044 Net flows on external debt 3,515 21,233 -13,649 -7,462 -1,476 4,487 2,910 8,311 Cross-currency valuation 1,024 -182 -1,966 1,662 351 -1,219 -29 3479. Debt restructuringsTotal amount rescheduled 0 0 0 0 0 0 0 0Total amount forgiven 0 0 0 0 0 0 0 0Debt buyback 0 0 0 0 0 0 0 010. Contractual obligations on outstanding long-term external debt
2008 2009 2010 2011 2012 2013 2014 2015Official creditorsPrincipal 334 361 415 416 352 342 327 324Interest 117 110 102 93 84 77 69 63Private creditorsPrincipal 8,424 5,058 3,710 2,140 2,800 2,365 1,963 1,677Interest 937 752 609 522 469 382 299 211
Notes:Data on long-term public and publicly guaranteed, private nonguaranteed and short-term debt for 2007 are based on data reported by the country and World Bank staff estimates.
247
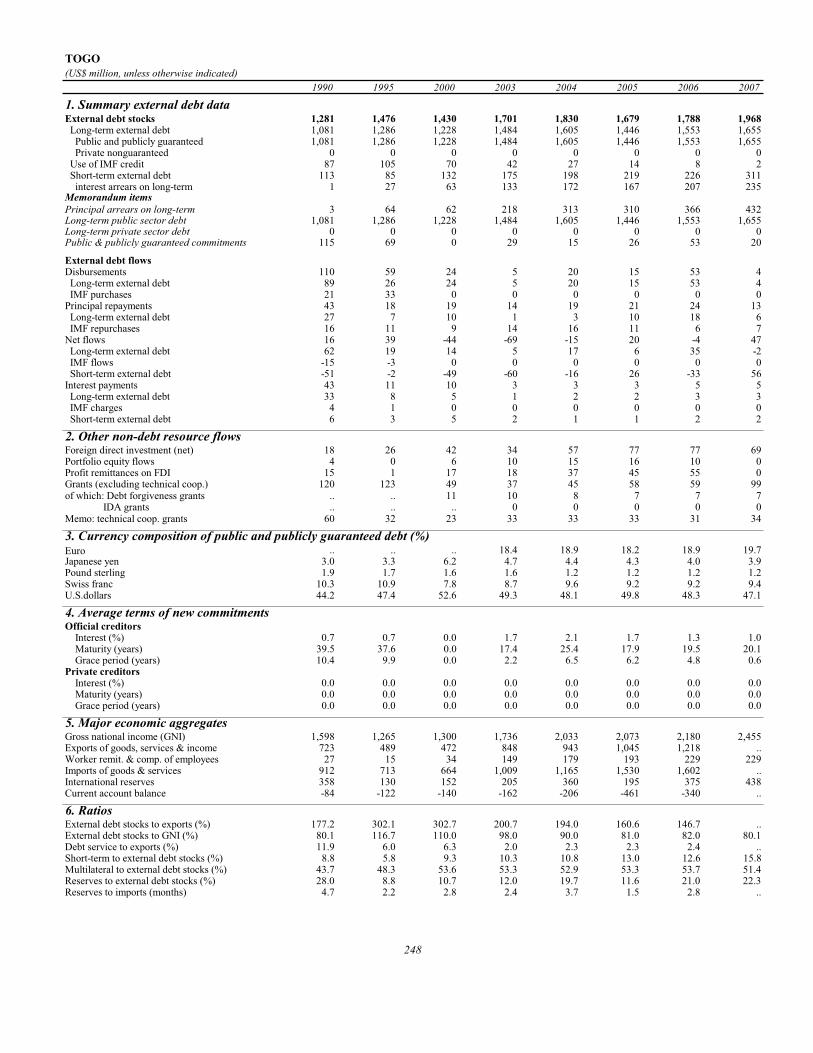
TOGO(US$ million, unless otherwise indicated)
1990 1995 2000 2003 2004 2005 2006 2007
1. Summary external debt dataExternal debt stocks 1,281 1,476 1,430 1,701 1,830 1,679 1,788 1,968 Long-term external debt 1,081 1,286 1,228 1,484 1,605 1,446 1,553 1,655 Public and publicly guaranteed 1,081 1,286 1,228 1,484 1,605 1,446 1,553 1,655 Private nonguaranteed 0 0 0 0 0 0 0 0 Use of IMF credit 87 105 70 42 27 14 8 2 Short-term external debt 113 85 132 175 198 219 226 311 interest arrears on long-term 1 27 63 133 172 167 207 235Memorandum itemsPrincipal arrears on long-term 3 64 62 218 313 310 366 432Long-term public sector debt 1,081 1,286 1,228 1,484 1,605 1,446 1,553 1,655Long-term private sector debt 0 0 0 0 0 0 0 0Public & publicly guaranteed commitments 115 69 0 29 15 26 53 20
External debt flowsDisbursements 110 59 24 5 20 15 53 4 Long-term external debt 89 26 24 5 20 15 53 4 IMF purchases 21 33 0 0 0 0 0 0Principal repayments 43 18 19 14 19 21 24 13 Long-term external debt 27 7 10 1 3 10 18 6 IMF repurchases 16 11 9 14 16 11 6 7Net flows 16 39 -44 -69 -15 20 -4 47 Long-term external debt 62 19 14 5 17 6 35 -2 IMF flows -15 -3 0 0 0 0 0 0 Short-term external debt -51 -2 -49 -60 -16 26 -33 56Interest payments 43 11 10 3 3 3 5 5 Long-term external debt 33 8 5 1 2 2 3 3 IMF charges 4 1 0 0 0 0 0 0 Short-term external debt 6 3 5 2 1 1 2 2
2. Other non-debt resource flowsForeign direct investment (net) 18 26 42 34 57 77 77 69Portfolio equity flows 4 0 6 10 15 16 10 0Profit remittances on FDI 15 1 17 18 37 45 55 0Grants (excluding technical coop.) 120 123 49 37 45 58 59 99of which: Debt forgiveness grants .. .. 11 10 8 7 7 7 IDA grants .. .. .. 0 0 0 0 0Memo: technical coop. grants 60 32 23 33 33 33 31 34
3. Currency composition of public and publicly guaranteed debt (%)Euro .. .. .. 18.4 18.9 18.2 18.9 19.7Japanese yen 3.0 3.3 6.2 4.7 4.4 4.3 4.0 3.9Pound sterling 1.9 1.7 1.6 1.6 1.2 1.2 1.2 1.2Swiss franc 10.3 10.9 7.8 8.7 9.6 9.2 9.2 9.4U.S.dollars 44.2 47.4 52.6 49.3 48.1 49.8 48.3 47.1
4. Average terms of new commitmentsOfficial creditors Interest (%) 0.7 0.7 0.0 1.7 2.1 1.7 1.3 1.0 Maturity (years) 39.5 37.6 0.0 17.4 25.4 17.9 19.5 20.1 Grace period (years) 10.4 9.9 0.0 2.2 6.5 6.2 4.8 0.6Private creditors Interest (%) 0.0 0.0 0.0 0.0 0.0 0.0 0.0 0.0 Maturity (years) 0.0 0.0 0.0 0.0 0.0 0.0 0.0 0.0 Grace period (years) 0.0 0.0 0.0 0.0 0.0 0.0 0.0 0.0
5. Major economic aggregatesGross national income (GNI) 1,598 1,265 1,300 1,736 2,033 2,073 2,180 2,455Exports of goods, services & income 723 489 472 848 943 1,045 1,218 ..Worker remit. & comp. of employees 27 15 34 149 179 193 229 229Imports of goods & services 912 713 664 1,009 1,165 1,530 1,602 ..International reserves 358 130 152 205 360 195 375 438Current account balance -84 -122 -140 -162 -206 -461 -340 ..
6. RatiosExternal debt stocks to exports (%) 177.2 302.1 302.7 200.7 194.0 160.6 146.7 ..External debt stocks to GNI (%) 80.1 116.7 110.0 98.0 90.0 81.0 82.0 80.1Debt service to exports (%) 11.9 6.0 6.3 2.0 2.3 2.3 2.4 ..Short-term to external debt stocks (%) 8.8 5.8 9.3 10.3 10.8 13.0 12.6 15.8Multilateral to external debt stocks (%) 43.7 48.3 53.6 53.3 52.9 53.3 53.7 51.4Reserves to external debt stocks (%) 28.0 8.8 10.7 12.0 19.7 11.6 21.0 22.3Reserves to imports (months) 4.7 2.2 2.8 2.4 3.7 1.5 2.8 ..
248

TOGO(US$ million, unless otherwise indicated)
1990 1995 2000 2003 2004 2005 2006 2007
7. Long-term external debtDebt outstanding and disbursed 1,081 1,286 1,228 1,484 1,605 1,446 1,553 1,655Public and publicly guaranteed 1,081 1,286 1,228 1,484 1,605 1,446 1,553 1,655 Official creditors 1,029 1,235 1,228 1,484 1,605 1,446 1,553 1,655 Multilateral 560 713 766 907 969 895 960 1,011 of which: IBRD 5 0 0 0 0 0 0 0 IDA 393 541 604 687 715 667 696 723 Bilateral 469 522 461 578 637 552 593 644 Private creditors 52 52 0 0 0 0 0 0 of which: Bonds 0 0 0 0 0 0 0 0 Commercial banks 51 52 0 0 0 0 0 0Private nonguaranteed 0 0 0 0 0 0 0 0 of which: Bonds 0 0 0 0 0 0 0 0Disbursements 89 26 24 5 20 15 53 4Public and publicly guaranteed 89 26 24 5 20 15 53 4 Official creditors 89 26 24 5 20 15 53 4 Multilateral 45 26 21 4 20 15 30 4 of which: IBRD 0 0 0 0 0 0 0 0 IDA 31 20 15 0 0 0 0 0 Bilateral 44 0 4 1 0 0 23 0 Private creditors 0 0 0 0 0 0 0 0 of which: Bonds 0 0 0 0 0 0 0 0 Commercial banks 0 0 0 0 0 0 0 0Private nonguaranteed 0 0 0 0 0 0 0 0 of which: Bonds 0 0 0 0 0 0 0 0Principal repayments 27 7 10 1 3 10 18 6Public and publicly guaranteed 27 7 10 1 3 10 18 6 Official creditors 27 7 10 1 3 10 18 6 Multilateral 17 6 9 1 1 3 4 4 of which: IBRD 8 0 0 0 0 0 0 0 IDA 1 3 5 0 0 0 0 0 Bilateral 10 1 2 0 2 7 14 2 Private creditors 0 0 0 0 0 0 0 0 of which: Bonds 0 0 0 0 0 0 0 0 Commercial banks 0 0 0 0 0 0 0 0Private nonguaranteed 0 0 0 0 0 0 0 0 of which: Bonds 0 0 0 0 0 0 0 0Interest payments 33 8 5 1 2 2 3 3Public and publicly guaranteed 33 8 5 1 2 2 3 3 Official creditors 28 8 5 1 2 2 3 3 Multilateral 8 5 5 1 1 1 1 1 of which: IBRD 1 0 0 0 0 0 0 0 IDA 3 4 3 0 0 0 0 0 Bilateral 20 3 0 0 1 1 2 2 Private creditors 5 0 0 0 0 0 0 0 of which: Bonds 0 0 0 0 0 0 0 0 Commercial banks 5 0 0 0 0 0 0 0Private nonguaranteed 0 0 0 0 0 0 0 0 of which: Bonds 0 0 0 0 0 0 0 08. Debt stock-flow reconciliationTotal change in external debt stocks 104 20 -94 129 129 -151 109 179 Net flows on external debt 16 39 -44 -69 -15 20 -4 47 Cross-currency valuation 42 -20 -66 137 73 -134 78 929. Debt restructuringsTotal amount rescheduled 79 133 0 12 0 0 0 0Total amount forgiven 18 85 0 0 0 0 0 0Debt buyback 0 0 0 0 0 0 0 010. Contractual obligations on outstanding long-term external debt
2008 2009 2010 2011 2012 2013 2014 2015Official creditorsPrincipal 51 54 55 57 59 63 64 62Interest 25 24 23 22 21 20 18 16Private creditorsPrincipal 0 0 0 0 0 0 0 0Interest 0 0 0 0 0 0 0 0
249
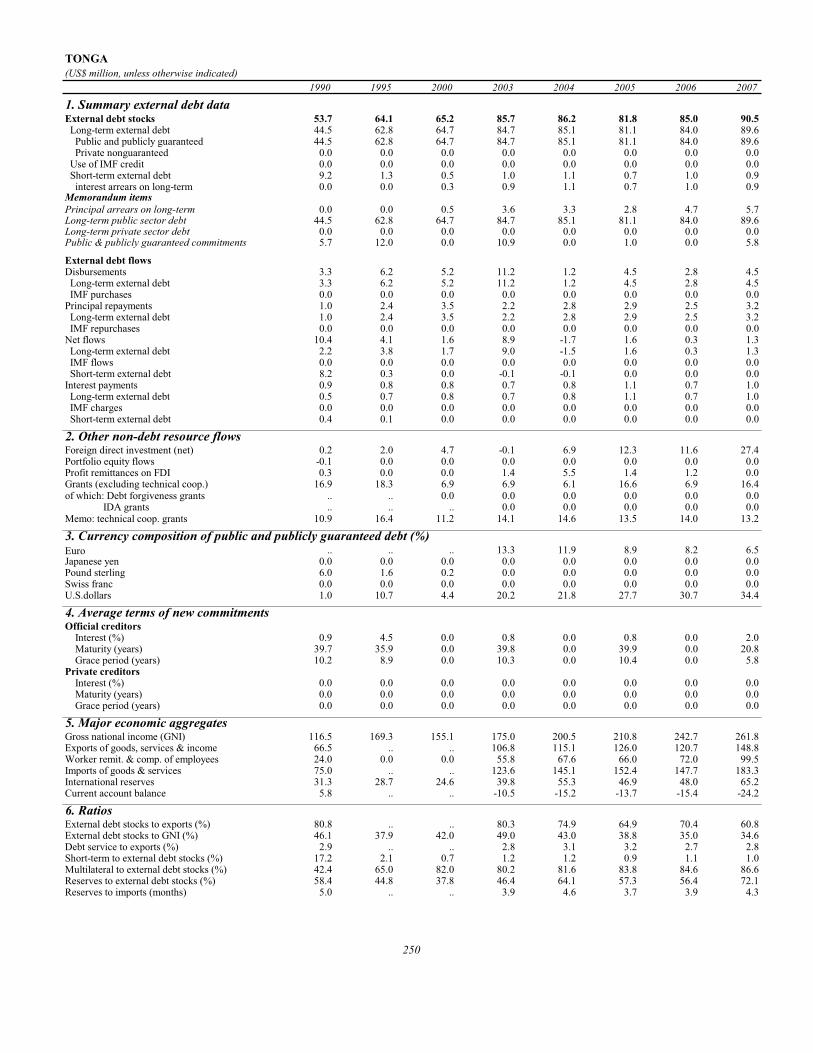
TONGA(US$ million, unless otherwise indicated)
1990 1995 2000 2003 2004 2005 2006 2007
1. Summary external debt dataExternal debt stocks 53.7 64.1 65.2 85.7 86.2 81.8 85.0 90.5 Long-term external debt 44.5 62.8 64.7 84.7 85.1 81.1 84.0 89.6 Public and publicly guaranteed 44.5 62.8 64.7 84.7 85.1 81.1 84.0 89.6 Private nonguaranteed 0.0 0.0 0.0 0.0 0.0 0.0 0.0 0.0 Use of IMF credit 0.0 0.0 0.0 0.0 0.0 0.0 0.0 0.0 Short-term external debt 9.2 1.3 0.5 1.0 1.1 0.7 1.0 0.9 interest arrears on long-term 0.0 0.0 0.3 0.9 1.1 0.7 1.0 0.9Memorandum itemsPrincipal arrears on long-term 0.0 0.0 0.5 3.6 3.3 2.8 4.7 5.7Long-term public sector debt 44.5 62.8 64.7 84.7 85.1 81.1 84.0 89.6Long-term private sector debt 0.0 0.0 0.0 0.0 0.0 0.0 0.0 0.0Public & publicly guaranteed commitments 5.7 12.0 0.0 10.9 0.0 1.0 0.0 5.8
External debt flowsDisbursements 3.3 6.2 5.2 11.2 1.2 4.5 2.8 4.5 Long-term external debt 3.3 6.2 5.2 11.2 1.2 4.5 2.8 4.5 IMF purchases 0.0 0.0 0.0 0.0 0.0 0.0 0.0 0.0Principal repayments 1.0 2.4 3.5 2.2 2.8 2.9 2.5 3.2 Long-term external debt 1.0 2.4 3.5 2.2 2.8 2.9 2.5 3.2 IMF repurchases 0.0 0.0 0.0 0.0 0.0 0.0 0.0 0.0Net flows 10.4 4.1 1.6 8.9 -1.7 1.6 0.3 1.3 Long-term external debt 2.2 3.8 1.7 9.0 -1.5 1.6 0.3 1.3 IMF flows 0.0 0.0 0.0 0.0 0.0 0.0 0.0 0.0 Short-term external debt 8.2 0.3 0.0 -0.1 -0.1 0.0 0.0 0.0Interest payments 0.9 0.8 0.8 0.7 0.8 1.1 0.7 1.0 Long-term external debt 0.5 0.7 0.8 0.7 0.8 1.1 0.7 1.0 IMF charges 0.0 0.0 0.0 0.0 0.0 0.0 0.0 0.0 Short-term external debt 0.4 0.1 0.0 0.0 0.0 0.0 0.0 0.0
2. Other non-debt resource flowsForeign direct investment (net) 0.2 2.0 4.7 -0.1 6.9 12.3 11.6 27.4Portfolio equity flows -0.1 0.0 0.0 0.0 0.0 0.0 0.0 0.0Profit remittances on FDI 0.3 0.0 0.0 1.4 5.5 1.4 1.2 0.0Grants (excluding technical coop.) 16.9 18.3 6.9 6.9 6.1 16.6 6.9 16.4of which: Debt forgiveness grants .. .. 0.0 0.0 0.0 0.0 0.0 0.0 IDA grants .. .. .. 0.0 0.0 0.0 0.0 0.0Memo: technical coop. grants 10.9 16.4 11.2 14.1 14.6 13.5 14.0 13.2
3. Currency composition of public and publicly guaranteed debt (%)Euro .. .. .. 13.3 11.9 8.9 8.2 6.5Japanese yen 0.0 0.0 0.0 0.0 0.0 0.0 0.0 0.0Pound sterling 6.0 1.6 0.2 0.0 0.0 0.0 0.0 0.0Swiss franc 0.0 0.0 0.0 0.0 0.0 0.0 0.0 0.0U.S.dollars 1.0 10.7 4.4 20.2 21.8 27.7 30.7 34.4
4. Average terms of new commitmentsOfficial creditors Interest (%) 0.9 4.5 0.0 0.8 0.0 0.8 0.0 2.0 Maturity (years) 39.7 35.9 0.0 39.8 0.0 39.9 0.0 20.8 Grace period (years) 10.2 8.9 0.0 10.3 0.0 10.4 0.0 5.8Private creditors Interest (%) 0.0 0.0 0.0 0.0 0.0 0.0 0.0 0.0 Maturity (years) 0.0 0.0 0.0 0.0 0.0 0.0 0.0 0.0 Grace period (years) 0.0 0.0 0.0 0.0 0.0 0.0 0.0 0.0
5. Major economic aggregatesGross national income (GNI) 116.5 169.3 155.1 175.0 200.5 210.8 242.7 261.8Exports of goods, services & income 66.5 .. .. 106.8 115.1 126.0 120.7 148.8Worker remit. & comp. of employees 24.0 0.0 0.0 55.8 67.6 66.0 72.0 99.5Imports of goods & services 75.0 .. .. 123.6 145.1 152.4 147.7 183.3International reserves 31.3 28.7 24.6 39.8 55.3 46.9 48.0 65.2Current account balance 5.8 .. .. -10.5 -15.2 -13.7 -15.4 -24.2
6. RatiosExternal debt stocks to exports (%) 80.8 .. .. 80.3 74.9 64.9 70.4 60.8External debt stocks to GNI (%) 46.1 37.9 42.0 49.0 43.0 38.8 35.0 34.6Debt service to exports (%) 2.9 .. .. 2.8 3.1 3.2 2.7 2.8Short-term to external debt stocks (%) 17.2 2.1 0.7 1.2 1.2 0.9 1.1 1.0Multilateral to external debt stocks (%) 42.4 65.0 82.0 80.2 81.6 83.8 84.6 86.6Reserves to external debt stocks (%) 58.4 44.8 37.8 46.4 64.1 57.3 56.4 72.1Reserves to imports (months) 5.0 .. .. 3.9 4.6 3.7 3.9 4.3
250

TONGA(US$ million, unless otherwise indicated)
1990 1995 2000 2003 2004 2005 2006 2007
7. Long-term external debtDebt outstanding and disbursed 44.5 62.8 64.7 84.7 85.1 81.1 84.0 89.6Public and publicly guaranteed 44.5 62.8 64.7 84.7 85.1 81.1 84.0 89.6 Official creditors 44.5 58.5 64.7 84.7 85.1 81.1 84.0 89.6 Multilateral 22.7 41.7 53.4 68.8 70.4 68.5 71.9 78.3 of which: IBRD 0.0 0.0 0.0 0.0 0.0 0.0 0.0 0.0 IDA 2.6 4.8 4.0 7.4 8.9 12.6 16.0 21.1 Bilateral 21.7 16.8 11.3 16.0 14.8 12.5 12.2 11.3 Private creditors 0.0 4.3 0.0 0.0 0.0 0.0 0.0 0.0 of which: Bonds 0.0 0.0 0.0 0.0 0.0 0.0 0.0 0.0 Commercial banks 0.0 0.0 0.0 0.0 0.0 0.0 0.0 0.0Private nonguaranteed 0.0 0.0 0.0 0.0 0.0 0.0 0.0 0.0 of which: Bonds 0.0 0.0 0.0 0.0 0.0 0.0 0.0 0.0Disbursements 3.3 6.2 5.2 11.2 1.2 4.5 2.8 4.5Public and publicly guaranteed 3.3 6.2 5.2 11.2 1.2 4.5 2.8 4.5 Official creditors 3.3 6.2 5.2 11.2 1.2 4.5 2.8 4.5 Multilateral 3.3 6.2 3.0 8.7 1.2 4.5 2.8 4.5 of which: IBRD 0.0 0.0 0.0 0.0 0.0 0.0 0.0 0.0 IDA 1.0 0.2 0.0 2.6 1.2 4.5 2.8 4.5 Bilateral 0.0 0.0 2.2 2.5 0.0 0.0 0.0 0.0 Private creditors 0.0 0.0 0.0 0.0 0.0 0.0 0.0 0.0 of which: Bonds 0.0 0.0 0.0 0.0 0.0 0.0 0.0 0.0 Commercial banks 0.0 0.0 0.0 0.0 0.0 0.0 0.0 0.0Private nonguaranteed 0.0 0.0 0.0 0.0 0.0 0.0 0.0 0.0 of which: Bonds 0.0 0.0 0.0 0.0 0.0 0.0 0.0 0.0Principal repayments 1.0 2.4 3.5 2.2 2.8 2.9 2.5 3.2Public and publicly guaranteed 1.0 2.4 3.5 2.2 2.8 2.9 2.5 3.2 Official creditors 1.0 2.4 2.3 2.2 2.8 2.9 2.5 3.2 Multilateral 0.5 0.8 1.0 0.9 1.1 2.0 1.4 1.4 of which: IBRD 0.0 0.0 0.0 0.0 0.0 0.0 0.0 0.0 IDA 0.0 0.0 0.1 0.1 0.1 0.1 0.1 0.1 Bilateral 0.5 1.7 1.2 1.3 1.6 0.9 1.1 1.7 Private creditors 0.0 0.0 1.3 0.0 0.0 0.0 0.0 0.0 of which: Bonds 0.0 0.0 0.0 0.0 0.0 0.0 0.0 0.0 Commercial banks 0.0 0.0 0.0 0.0 0.0 0.0 0.0 0.0Private nonguaranteed 0.0 0.0 0.0 0.0 0.0 0.0 0.0 0.0 of which: Bonds 0.0 0.0 0.0 0.0 0.0 0.0 0.0 0.0Interest payments 0.5 0.7 0.8 0.7 0.8 1.1 0.7 1.0Public and publicly guaranteed 0.5 0.7 0.8 0.7 0.8 1.1 0.7 1.0 Official creditors 0.5 0.7 0.7 0.7 0.8 1.1 0.7 1.0 Multilateral 0.2 0.5 0.5 0.6 0.7 0.9 0.7 0.7 of which: IBRD 0.0 0.0 0.0 0.0 0.0 0.0 0.0 0.0 IDA 0.0 0.0 0.0 0.0 0.1 0.1 0.1 0.1 Bilateral 0.3 0.2 0.2 0.2 0.1 0.3 0.1 0.3 Private creditors 0.0 0.0 0.1 0.0 0.0 0.0 0.0 0.0 of which: Bonds 0.0 0.0 0.0 0.0 0.0 0.0 0.0 0.0 Commercial banks 0.0 0.0 0.0 0.0 0.0 0.0 0.0 0.0Private nonguaranteed 0.0 0.0 0.0 0.0 0.0 0.0 0.0 0.0 of which: Bonds 0.0 0.0 0.0 0.0 0.0 0.0 0.0 0.08. Debt stock-flow reconciliationTotal change in external debt stocks 14.5 5.5 -3.7 13.3 0.5 -4.4 3.2 5.5 Net flows on external debt 10.4 4.1 1.6 8.9 -1.7 1.6 0.3 1.3 Cross-currency valuation 3.1 1.0 -4.2 7.1 2.6 -4.5 2.5 4.19. Debt restructuringsTotal amount rescheduled 0.0 0.0 0.0 0.0 0.0 0.0 0.0 0.0Total amount forgiven 0.0 0.0 0.0 0.0 0.0 0.0 0.0 0.0Debt buyback 0.0 0.0 0.0 0.0 0.0 0.0 0.0 0.010. Contractual obligations on outstanding long-term external debt
2008 2009 2010 2011 2012 2013 2014 2015Official creditorsPrincipal 3.8 3.2 3.5 3.7 3.9 4.1 3.8 3.8Interest 1.3 1.3 1.2 1.3 1.2 1.1 1.1 1.0Private creditorsPrincipal 0.0 0.0 0.0 0.0 0.0 0.0 0.0 0.0Interest 0.0 0.0 0.0 0.0 0.0 0.0 0.0 0.0
251

TUNISIA(US$ million, unless otherwise indicated)
1990 1995 2000 2003 2004 2005 2006 2007
1. Summary external debt dataExternal debt stocks 7,688 10,818 11,307 18,404 19,995 17,860 18,761 20,231 Long-term external debt 6,878 9,215 9,684 14,853 16,231 14,794 15,425 16,579 Public and publicly guaranteed 6,878 9,215 9,684 14,853 16,231 14,794 15,425 16,579 Private nonguaranteed 0 0 0 0 0 0 0 0 Use of IMF credit 176 293 32 0 0 0 0 0 Short-term external debt 634 1,310 1,590 3,551 3,764 3,066 3,336 3,652 interest arrears on long-term 0 0 0 0 0 0 0 0Memorandum itemsPrincipal arrears on long-term 15 1 0 0 0 0 0 0Long-term public sector debt 6,660 9,016 8,884 13,277 14,541 13,023 13,556 14,546Long-term private sector debt 218 200 800 1,576 1,689 1,772 1,869 2,033Public & publicly guaranteed commitments 799 1,949 1,412 2,594 1,653 1,738 869 584
External debt flowsDisbursements 1,017 1,389 1,542 2,104 1,927 1,256 1,547 1,584 Long-term external debt 1,017 1,389 1,542 2,104 1,927 1,256 1,547 1,584 IMF purchases 0 0 0 0 0 0 0 0Principal repayments 984 939 1,336 1,012 1,393 1,196 1,661 1,578 Long-term external debt 872 924 1,295 1,012 1,393 1,196 1,661 1,578 IMF repurchases 111 15 40 0 0 0 0 0Net flows 292 654 259 1,562 747 -638 156 322 Long-term external debt 144 465 246 1,092 534 60 -114 6 IMF flows -111 -15 -40 0 0 0 0 0 Short-term external debt 259 204 52 470 213 -698 270 316Interest payments 447 541 570 613 747 860 880 919 Long-term external debt 394 486 489 573 637 689 688 744 IMF charges 23 17 3 0 0 0 0 0 Short-term external debt 30 38 78 40 110 171 192 175
2. Other non-debt resource flowsForeign direct investment (net) 76 264 752 541 642 785 3,311 1,620Portfolio equity flows 5 12 -18 14 24 12 65 30Profit remittances on FDI 97 174 468 537 678 962 930 1,361Grants (excluding technical coop.) 174 59 44 98 137 137 186 172of which: Debt forgiveness grants .. .. 0 0 0 0 0 0 IDA grants .. .. .. 0 0 0 0 0Memo: technical coop. grants 100 122 96 130 142 145 149 164
3. Currency composition of public and publicly guaranteed debt (%)Euro .. .. .. 29.3 34.3 35.2 41.3 44.3Japanese yen 8.4 13.3 19.8 20.0 16.8 15.2 12.5 13.5Pound sterling 0.1 0.0 0.4 0.3 0.3 0.2 0.2 0.1Swiss franc 0.5 0.2 0.6 0.5 0.5 0.4 0.3 0.3U.S.dollars 24.3 19.2 35.8 30.9 28.4 29.6 27.3 24.3
4. Average terms of new commitmentsOfficial creditors Interest (%) 6.0 6.2 4.0 4.2 3.3 3.1 3.4 2.6 Maturity (years) 18.0 24.1 19.6 17.2 19.8 19.3 21.1 22.6 Grace period (years) 5.0 4.6 6.0 4.2 5.5 3.4 6.0 5.9Private creditors Interest (%) 8.1 6.0 3.9 4.5 4.4 4.4 4.8 3.4 Maturity (years) 9.4 8.5 14.4 16.0 8.4 14.4 13.2 19.9 Grace period (years) 2.1 5.1 12.5 15.8 7.0 12.7 1.8 18.9
5. Major economic aggregatesGross national income (GNI) 11,882 17,174 18,526 23,957 26,894 27,309 29,553 33,249Exports of goods, services & income 5,851 8,778 9,497 12,295 14,854 16,164 17,654 22,066Worker remit. & comp. of employees 551 680 796 1,250 1,432 1,393 1,510 1,716Imports of goods & services 6,591 9,646 10,347 13,089 15,513 16,580 18,412 23,143International reserves 867 1,689 1,871 3,036 4,031 4,548 6,912 8,032Current account balance -463 -774 -821 -730 -551 -299 -619 -904
6. RatiosExternal debt stocks to exports (%) 131.4 123.2 119.1 149.7 134.6 110.5 106.3 91.7External debt stocks to GNI (%) 64.7 63.0 61.0 76.8 74.3 65.4 63.5 60.8Debt service to exports (%) 24.5 16.9 20.1 13.2 14.4 12.7 14.4 11.3Short-term to external debt stocks (%) 8.2 12.1 14.1 19.3 18.8 17.2 17.8 18.1Multilateral to external debt stocks (%) 29.0 35.0 30.5 29.8 30.9 30.8 30.3 30.9Reserves to external debt stocks (%) 11.3 15.6 16.6 16.5 20.2 25.5 36.8 39.7Reserves to imports (months) 1.6 2.1 2.2 2.8 3.1 3.3 4.5 4.2
252

TUNISIA(US$ million, unless otherwise indicated)
1990 1995 2000 2003 2004 2005 2006 2007
7. Long-term external debtDebt outstanding and disbursed 6,878 9,215 9,684 14,853 16,231 14,794 15,425 16,579Public and publicly guaranteed 6,878 9,215 9,684 14,853 16,231 14,794 15,425 16,579 Official creditors 5,240 7,398 6,065 8,662 9,433 8,362 8,795 9,572 Multilateral 2,233 3,783 3,452 5,492 6,175 5,508 5,682 6,255 of which: IBRD 1,347 1,717 1,211 1,779 1,824 1,565 1,444 1,571 IDA 59 49 39 33 30 28 26 24 Bilateral 3,008 3,616 2,614 3,170 3,258 2,854 3,113 3,317 Private creditors 1,638 1,817 3,619 6,191 6,797 6,433 6,630 7,007 of which: Bonds 0 535 1,327 3,315 3,740 3,510 3,636 3,899 Commercial banks 339 236 809 847 954 836 860 915Private nonguaranteed 0 0 0 0 0 0 0 0 of which: Bonds 0 0 0 0 0 0 0 0Disbursements 1,017 1,389 1,542 2,104 1,927 1,256 1,547 1,584Public and publicly guaranteed 1,017 1,389 1,542 2,104 1,927 1,256 1,547 1,584 Official creditors 699 611 707 1,074 1,066 841 1,057 1,072 Multilateral 430 467 427 756 751 606 667 853 of which: IBRD 213 138 136 251 138 177 112 161 IDA 0 0 0 0 0 0 0 0 Bilateral 269 145 281 318 315 235 390 220 Private creditors 318 777 835 1,030 861 414 490 512 of which: Bonds 0 588 0 632 559 249 251 255 Commercial banks 88 56 489 146 123 32 67 67Private nonguaranteed 0 0 0 0 0 0 0 0 of which: Bonds 0 0 0 0 0 0 0 0Principal repayments 872 924 1,295 1,012 1,393 1,196 1,661 1,578Public and publicly guaranteed 872 924 1,295 1,012 1,393 1,196 1,661 1,578 Official creditors 357 639 661 778 932 876 1,157 1,100 Multilateral 168 363 408 488 533 540 851 790 of which: IBRD 111 203 150 205 226 232 366 169 IDA 1 2 2 2 2 2 2 2 Bilateral 189 276 253 290 399 336 306 310 Private creditors 515 285 634 234 461 320 504 478 of which: Bonds 60 0 371 0 277 136 301 250 Commercial banks 113 63 134 112 62 65 68 88Private nonguaranteed 0 0 0 0 0 0 0 0 of which: Bonds 0 0 0 0 0 0 0 0Interest payments 394 486 489 573 637 689 688 744Public and publicly guaranteed 394 486 489 573 637 689 688 744 Official creditors 249 368 295 308 323 333 337 352 Multilateral 149 255 213 232 244 252 264 272 of which: IBRD 103 129 79 81 77 69 72 67 IDA 0 0 0 0 0 0 0 0 Bilateral 100 113 82 76 79 81 74 80 Private creditors 146 118 194 265 314 356 351 393 of which: Bonds 5 14 99 163 182 200 211 216 Commercial banks 35 18 38 28 33 36 35 38Private nonguaranteed 0 0 0 0 0 0 0 0 of which: Bonds 0 0 0 0 0 0 0 08. Debt stock-flow reconciliationTotal change in external debt stocks 715 1,205 -553 2,941 1,591 -2,134 901 1,470 Net flows on external debt 292 654 259 1,562 747 -638 156 322 Cross-currency valuation 351 178 -409 1,157 284 -1,101 448 9399. Debt restructuringsTotal amount rescheduled 0 0 0 0 0 0 0 0Total amount forgiven 7 0 0 0 0 0 0 0Debt buyback 0 0 0 0 0 0 0 010. Contractual obligations on outstanding long-term external debt
2008 2009 2010 2011 2012 2013 2014 2015Official creditorsPrincipal 1,200 1,143 1,235 1,101 1,043 941 885 846Interest 397 388 369 337 304 270 238 205Private creditorsPrincipal 741 897 680 1,092 893 683 167 163Interest 341 314 270 246 172 123 99 92
Notes:Long-term private nonguaranteed debt data are World Bank staff estimates based on information from the government.
253

TURKEY(US$ million, unless otherwise indicated)
1990 1995 2000 2003 2004 2005 2006 2007
1. Summary external debt dataExternal debt stocks 49,424 73,781 116,784 144,027 160,720 169,269 207,773 251,477 Long-term external debt 39,924 57,396 83,696 96,922 107,313 117,523 154,696 202,515 Public and publicly guaranteed 38,870 50,317 55,868 63,123 67,337 61,909 67,133 75,171 Private nonguaranteed 1,054 7,079 27,828 33,799 39,976 55,614 87,563 127,344 Use of IMF credit 0 685 4,176 24,092 21,507 14,646 10,762 7,158 Short-term external debt 9,500 15,701 28,912 23,013 31,900 37,100 42,315 41,803 interest arrears on long-term 0 0 0 0 0 0 0 0Memorandum itemsPrincipal arrears on long-term 0 0 0 0 0 0 0 0Long-term public sector debt 38,570 50,131 55,850 63,076 67,201 61,737 66,940 74,750Long-term private sector debt 1,354 7,265 27,846 33,846 40,112 55,786 87,756 127,765Public & publicly guaranteed commitments 4,628 4,435 14,499 5,797 9,661 10,537 12,965 14,571
External debt flowsDisbursements 5,243 6,980 26,524 19,443 30,707 44,360 60,512 72,653 Long-term external debt 5,243 6,638 23,065 17,777 29,530 41,899 57,571 71,505 IMF purchases 0 341 3,459 1,666 1,176 2,461 2,941 1,147Principal repayments 4,010 7,020 13,864 21,546 25,640 32,535 31,012 36,793 Long-term external debt 3,961 7,020 13,777 19,834 20,959 24,754 23,519 31,629 IMF repurchases 49 0 87 1,712 4,681 7,780 7,493 5,164Net flows 4,988 4,350 18,100 4,486 13,954 17,025 34,715 35,348 Long-term external debt 1,282 -382 9,288 -2,057 8,571 17,145 34,052 39,877 IMF flows -49 341 3,372 -46 -3,504 -5,320 -4,552 -4,017 Short-term external debt 3,755 4,391 5,440 6,589 8,887 5,200 5,215 -512Interest payments 3,412 4,431 6,859 6,723 7,335 8,474 9,498 11,989 Long-term external debt 2,891 3,464 5,006 5,227 5,323 6,380 7,499 10,226 IMF charges 4 24 52 596 959 951 799 563 Short-term external debt 517 942 1,800 900 1,053 1,142 1,200 1,200
2. Other non-debt resource flowsForeign direct investment (net) 684 885 982 1,752 2,785 10,031 19,989 22,195Portfolio equity flows 89 195 489 905 1,427 5,669 1,939 5,138Profit remittances on FDI 161 312 279 643 1,043 1,051 1,168 2,193Grants (excluding technical coop.) 804 439 87 144 282 426 416 544of which: Debt forgiveness grants .. .. 0 0 0 0 0 0 IDA grants .. .. .. 0 0 0 0 0Memo: technical coop. grants 148 198 85 137 146 175 184 227
3. Currency composition of public and publicly guaranteed debt (%)Euro .. .. .. 26.2 26.3 24.7 26.2 27.5Japanese yen 12.1 23.3 12.1 6.5 4.5 3.9 3.4 3.1Pound sterling 0.8 0.9 0.8 0.2 0.1 0.1 0.0 0.0Swiss franc 5.2 2.9 0.3 0.3 0.3 0.3 0.3 0.2U.S.dollars 40.0 38.3 57.9 66.1 68.2 70.6 69.7 68.7
4. Average terms of new commitmentsOfficial creditors Interest (%) 6.7 5.4 6.5 4.0 2.7 2.7 4.7 4.4 Maturity (years) 17.0 17.7 14.6 17.5 17.8 24.9 16.1 17.5 Grace period (years) 7.3 5.7 4.8 5.4 5.3 6.8 6.3 6.8Private creditors Interest (%) 9.4 6.3 8.6 7.5 6.4 6.0 6.5 6.4 Maturity (years) 6.5 4.5 10.8 8.7 12.4 13.1 15.9 12.1 Grace period (years) 3.2 2.7 8.5 6.6 11.8 12.0 14.8 9.5
5. Major economic aggregatesGross national income (GNI) 210,102 241,741 263,207 299,037 387,401 478,585 523,241 648,739Exports of goods, services & income 25,205 41,397 57,749 73,382 94,950 109,472 124,417 151,802Worker remit. & comp. of employees 3,246 3,327 4,560 729 804 851 1,111 1,209Imports of goods & services 28,949 44,806 67,873 81,188 109,694 132,212 157,107 190,526International reserves 7,626 13,891 23,515 35,549 37,304 52,494 63,265 76,496Current account balance -2,625 -2,338 -9,920 -7,515 -14,431 -22,137 -31,893 -37,697
6. RatiosExternal debt stocks to exports (%) 196.1 178.2 202.2 196.3 169.3 154.6 167.0 165.7External debt stocks to GNI (%) 23.5 30.5 44.4 48.2 41.5 35.4 39.7 38.8Debt service to exports (%) 29.4 27.7 35.9 38.5 34.7 37.5 32.6 32.1Short-term to external debt stocks (%) 19.2 21.3 24.8 16.0 19.8 21.9 20.4 16.6Multilateral to external debt stocks (%) 19.5 12.1 4.9 4.6 4.8 4.5 4.2 4.2Reserves to external debt stocks (%) 15.4 18.8 20.1 24.7 23.2 31.0 30.4 30.4Reserves to imports (months) 3.2 3.7 4.2 5.3 4.1 4.8 4.8 4.8
254

TURKEY(US$ million, unless otherwise indicated)
1990 1995 2000 2003 2004 2005 2006 2007
7. Long-term external debtDebt outstanding and disbursed 39,924 57,396 83,696 96,922 107,313 117,523 154,696 202,515Public and publicly guaranteed 38,870 50,317 55,868 63,123 67,337 61,909 67,133 75,171 Official creditors 18,150 17,324 12,538 12,866 13,685 12,292 13,131 14,977 Multilateral 9,627 8,962 5,686 6,569 7,792 7,646 8,654 10,583 of which: IBRD 6,272 4,939 3,634 5,214 6,153 5,829 6,854 7,541 IDA 157 130 101 83 77 71 65 59 Bilateral 8,523 8,362 6,853 6,297 5,893 4,646 4,477 4,394 Private creditors 20,720 32,993 43,329 50,257 53,653 49,617 54,002 60,194 of which: Bonds 4,976 13,646 21,766 25,643 28,102 27,834 31,790 36,788 Commercial banks 13,403 15,643 19,411 23,262 24,477 21,017 21,629 22,937Private nonguaranteed 1,054 7,079 27,828 33,799 39,976 55,614 87,563 127,344 of which: Bonds 16 149 1,784 1,529 2,050 4,025 5,776 6,662Disbursements 5,243 6,638 23,065 17,777 29,530 41,899 57,571 71,505Public and publicly guaranteed 4,700 4,862 14,185 6,134 10,008 7,723 9,463 11,738 Official creditors 2,138 808 2,408 821 2,090 1,013 2,269 2,783 Multilateral 1,083 466 1,505 417 1,849 875 1,964 2,475 of which: IBRD 627 422 1,291 276 1,499 461 1,796 1,223 IDA 0 0 0 0 0 0 0 0 Bilateral 1,056 342 903 404 241 138 305 307 Private creditors 2,561 4,053 11,776 5,313 7,917 6,711 7,194 8,955 of which: Bonds 644 2,343 7,118 3,417 5,739 5,230 5,509 6,463 Commercial banks 1,435 1,256 4,258 1,763 2,131 1,476 1,684 2,492Private nonguaranteed 543 1,777 8,881 11,643 19,523 34,176 48,108 59,768 of which: Bonds 0 0 454 0 700 3,125 1,727 950Principal repayments 3,961 7,020 13,777 19,834 20,959 24,754 23,519 31,629Public and publicly guaranteed 3,677 5,987 6,301 8,532 8,053 8,007 6,142 6,403 Official creditors 1,920 1,991 1,747 2,109 1,600 1,675 1,650 1,564 Multilateral 825 1,229 1,044 711 717 894 992 889 of which: IBRD 620 882 486 496 580 755 807 666 IDA 4 6 6 6 6 6 6 6 Bilateral 1,094 762 702 1,398 883 780 658 675 Private creditors 1,758 3,996 4,554 6,423 6,453 6,332 4,492 4,839 of which: Bonds 47 1,716 1,869 2,939 4,083 3,993 2,463 2,798 Commercial banks 1,204 1,579 1,808 3,023 2,029 2,056 1,831 1,913Private nonguaranteed 283 1,033 7,476 11,303 12,906 16,748 17,376 25,226 of which: Bonds 0 0 0 431 172 1,150 0 200Interest payments 2,891 3,464 5,006 5,227 5,323 6,380 7,499 10,226Public and publicly guaranteed 2,830 3,126 3,473 3,972 4,095 4,375 4,322 5,207 Official creditors 1,043 977 659 511 440 595 525 587 Multilateral 688 656 374 292 266 447 399 476 of which: IBRD 511 396 237 232 201 248 329 389 IDA 1 1 1 1 1 1 1 0 Bilateral 355 321 285 219 174 149 126 112 Private creditors 1,787 2,149 2,814 3,461 3,655 3,780 3,797 4,620 of which: Bonds 383 1,074 1,598 2,291 2,563 2,668 2,592 3,352 Commercial banks 1,204 782 1,069 1,084 1,026 1,058 1,162 1,231Private nonguaranteed 61 339 1,533 1,255 1,228 2,005 3,177 5,019 of which: Bonds 1 13 126 189 165 338 328 4128. Debt stock-flow reconciliationTotal change in external debt stocks 7,847 7,532 15,092 13,365 16,693 8,550 38,504 43,704 Net flows on external debt 4,988 4,350 18,100 4,486 13,954 17,025 34,715 35,348 Cross-currency valuation 1,874 675 -1,965 5,745 2,507 -4,453 2,524 2,8069. Debt restructuringsTotal amount rescheduled 0 0 0 0 0 0 0 0Total amount forgiven 0 0 0 0 0 0 0 0Debt buyback 0 0 0 0 0 0 0 010. Contractual obligations on outstanding long-term external debt
2008 2009 2010 2011 2012 2013 2014 2015Official creditorsPrincipal 1,512 1,551 1,639 1,642 1,676 1,685 1,648 1,481Interest 718 730 722 691 648 598 541 479Private creditorsPrincipal 36,958 27,276 18,533 17,426 17,622 11,256 11,394 7,593Interest 9,805 9,301 8,160 7,354 6,661 5,607 5,144 4,242
Notes:Long-term debt data include nonresident deposits made under the Dresdner Bank scheme, amounting to $13.5 billion at end-2007. Short-term debt is based on reports provided by the country.
255
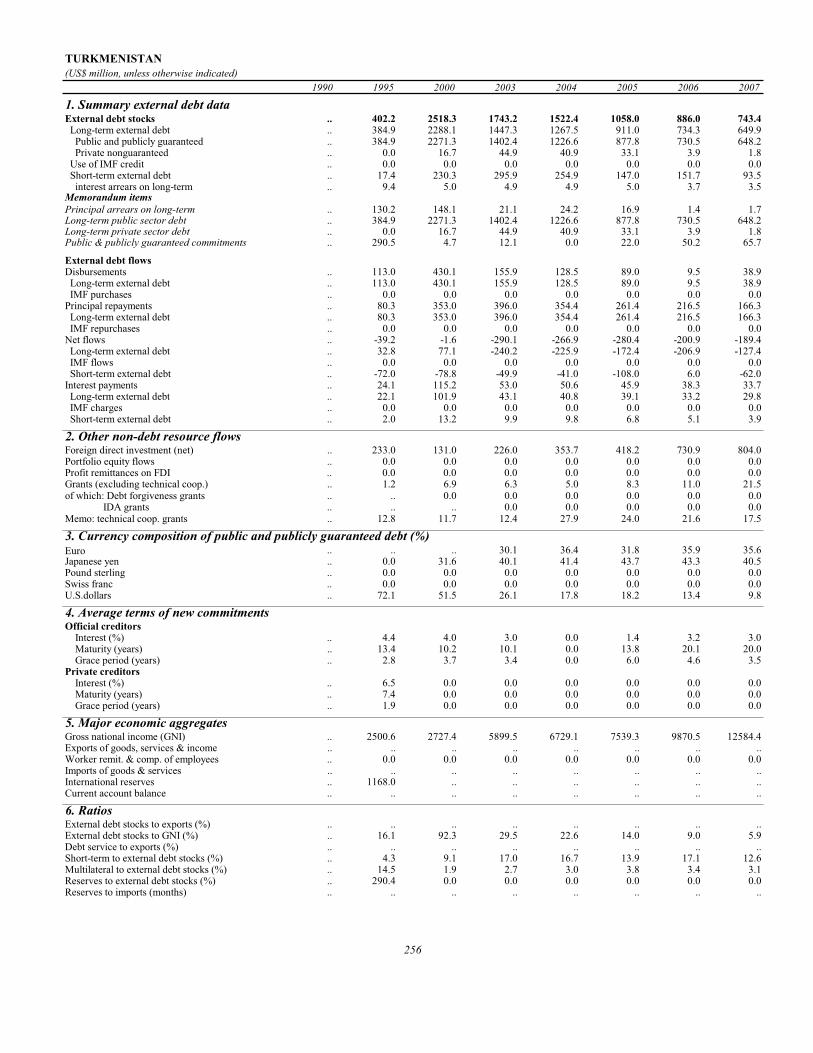
TURKMENISTAN(US$ million, unless otherwise indicated)
1990 1995 2000 2003 2004 2005 2006 2007
1. Summary external debt dataExternal debt stocks .. 402.2 2518.3 1743.2 1522.4 1058.0 886.0 743.4 Long-term external debt .. 384.9 2288.1 1447.3 1267.5 911.0 734.3 649.9 Public and publicly guaranteed .. 384.9 2271.3 1402.4 1226.6 877.8 730.5 648.2 Private nonguaranteed .. 0.0 16.7 44.9 40.9 33.1 3.9 1.8 Use of IMF credit .. 0.0 0.0 0.0 0.0 0.0 0.0 0.0 Short-term external debt .. 17.4 230.3 295.9 254.9 147.0 151.7 93.5 interest arrears on long-term .. 9.4 5.0 4.9 4.9 5.0 3.7 3.5Memorandum itemsPrincipal arrears on long-term .. 130.2 148.1 21.1 24.2 16.9 1.4 1.7Long-term public sector debt .. 384.9 2271.3 1402.4 1226.6 877.8 730.5 648.2Long-term private sector debt .. 0.0 16.7 44.9 40.9 33.1 3.9 1.8Public & publicly guaranteed commitments .. 290.5 4.7 12.1 0.0 22.0 50.2 65.7
External debt flowsDisbursements .. 113.0 430.1 155.9 128.5 89.0 9.5 38.9 Long-term external debt .. 113.0 430.1 155.9 128.5 89.0 9.5 38.9 IMF purchases .. 0.0 0.0 0.0 0.0 0.0 0.0 0.0Principal repayments .. 80.3 353.0 396.0 354.4 261.4 216.5 166.3 Long-term external debt .. 80.3 353.0 396.0 354.4 261.4 216.5 166.3 IMF repurchases .. 0.0 0.0 0.0 0.0 0.0 0.0 0.0Net flows .. -39.2 -1.6 -290.1 -266.9 -280.4 -200.9 -189.4 Long-term external debt .. 32.8 77.1 -240.2 -225.9 -172.4 -206.9 -127.4 IMF flows .. 0.0 0.0 0.0 0.0 0.0 0.0 0.0 Short-term external debt .. -72.0 -78.8 -49.9 -41.0 -108.0 6.0 -62.0Interest payments .. 24.1 115.2 53.0 50.6 45.9 38.3 33.7 Long-term external debt .. 22.1 101.9 43.1 40.8 39.1 33.2 29.8 IMF charges .. 0.0 0.0 0.0 0.0 0.0 0.0 0.0 Short-term external debt .. 2.0 13.2 9.9 9.8 6.8 5.1 3.9
2. Other non-debt resource flowsForeign direct investment (net) .. 233.0 131.0 226.0 353.7 418.2 730.9 804.0Portfolio equity flows .. 0.0 0.0 0.0 0.0 0.0 0.0 0.0Profit remittances on FDI .. 0.0 0.0 0.0 0.0 0.0 0.0 0.0Grants (excluding technical coop.) .. 1.2 6.9 6.3 5.0 8.3 11.0 21.5of which: Debt forgiveness grants .. .. 0.0 0.0 0.0 0.0 0.0 0.0 IDA grants .. .. .. 0.0 0.0 0.0 0.0 0.0Memo: technical coop. grants .. 12.8 11.7 12.4 27.9 24.0 21.6 17.5
3. Currency composition of public and publicly guaranteed debt (%)Euro .. .. .. 30.1 36.4 31.8 35.9 35.6Japanese yen .. 0.0 31.6 40.1 41.4 43.7 43.3 40.5Pound sterling .. 0.0 0.0 0.0 0.0 0.0 0.0 0.0Swiss franc .. 0.0 0.0 0.0 0.0 0.0 0.0 0.0U.S.dollars .. 72.1 51.5 26.1 17.8 18.2 13.4 9.8
4. Average terms of new commitmentsOfficial creditors Interest (%) .. 4.4 4.0 3.0 0.0 1.4 3.2 3.0 Maturity (years) .. 13.4 10.2 10.1 0.0 13.8 20.1 20.0 Grace period (years) .. 2.8 3.7 3.4 0.0 6.0 4.6 3.5Private creditors Interest (%) .. 6.5 0.0 0.0 0.0 0.0 0.0 0.0 Maturity (years) .. 7.4 0.0 0.0 0.0 0.0 0.0 0.0 Grace period (years) .. 1.9 0.0 0.0 0.0 0.0 0.0 0.0
5. Major economic aggregatesGross national income (GNI) .. 2500.6 2727.4 5899.5 6729.1 7539.3 9870.5 12584.4Exports of goods, services & income .. .. .. .. .. .. .. ..Worker remit. & comp. of employees .. 0.0 0.0 0.0 0.0 0.0 0.0 0.0Imports of goods & services .. .. .. .. .. .. .. ..International reserves .. 1168.0 .. .. .. .. .. ..Current account balance .. .. .. .. .. .. .. ..
6. RatiosExternal debt stocks to exports (%) .. .. .. .. .. .. .. ..External debt stocks to GNI (%) .. 16.1 92.3 29.5 22.6 14.0 9.0 5.9Debt service to exports (%) .. .. .. .. .. .. .. ..Short-term to external debt stocks (%) .. 4.3 9.1 17.0 16.7 13.9 17.1 12.6Multilateral to external debt stocks (%) .. 14.5 1.9 2.7 3.0 3.8 3.4 3.1Reserves to external debt stocks (%) .. 290.4 0.0 0.0 0.0 0.0 0.0 0.0Reserves to imports (months) .. .. .. .. .. .. .. ..
256
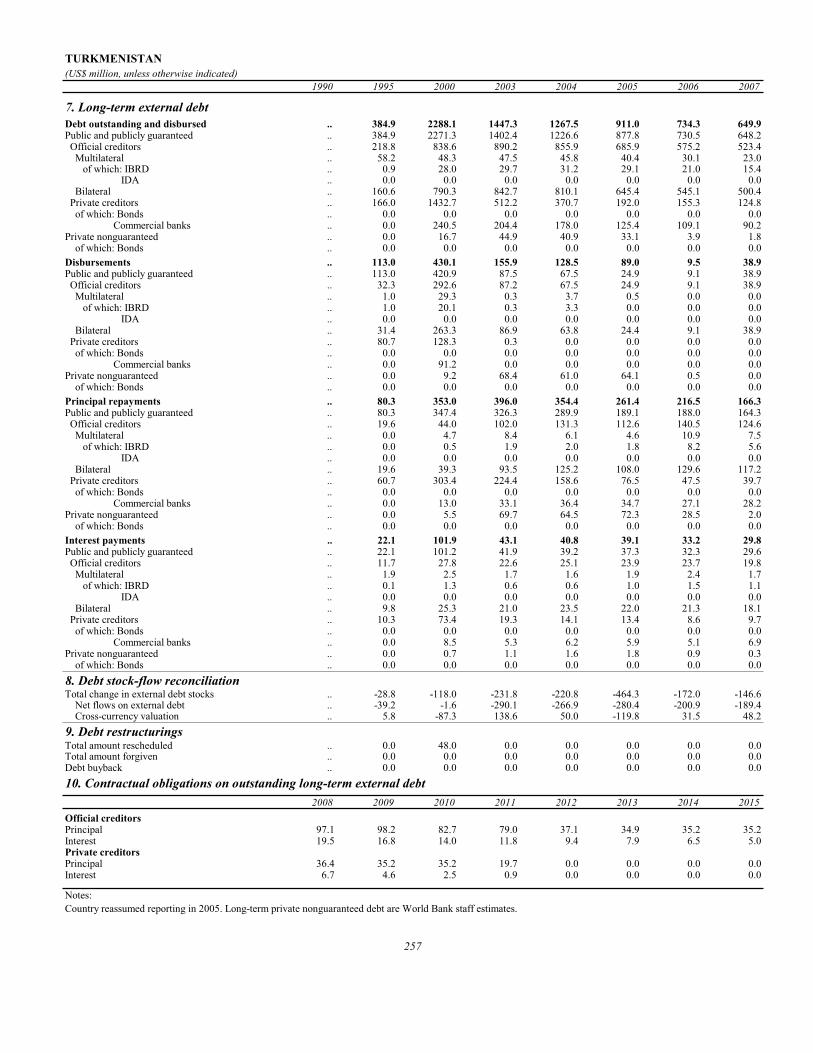
TURKMENISTAN(US$ million, unless otherwise indicated)
1990 1995 2000 2003 2004 2005 2006 2007
7. Long-term external debtDebt outstanding and disbursed .. 384.9 2288.1 1447.3 1267.5 911.0 734.3 649.9Public and publicly guaranteed .. 384.9 2271.3 1402.4 1226.6 877.8 730.5 648.2 Official creditors .. 218.8 838.6 890.2 855.9 685.9 575.2 523.4 Multilateral .. 58.2 48.3 47.5 45.8 40.4 30.1 23.0 of which: IBRD .. 0.9 28.0 29.7 31.2 29.1 21.0 15.4 IDA .. 0.0 0.0 0.0 0.0 0.0 0.0 0.0 Bilateral .. 160.6 790.3 842.7 810.1 645.4 545.1 500.4 Private creditors .. 166.0 1432.7 512.2 370.7 192.0 155.3 124.8 of which: Bonds .. 0.0 0.0 0.0 0.0 0.0 0.0 0.0 Commercial banks .. 0.0 240.5 204.4 178.0 125.4 109.1 90.2Private nonguaranteed .. 0.0 16.7 44.9 40.9 33.1 3.9 1.8 of which: Bonds .. 0.0 0.0 0.0 0.0 0.0 0.0 0.0Disbursements .. 113.0 430.1 155.9 128.5 89.0 9.5 38.9Public and publicly guaranteed .. 113.0 420.9 87.5 67.5 24.9 9.1 38.9 Official creditors .. 32.3 292.6 87.2 67.5 24.9 9.1 38.9 Multilateral .. 1.0 29.3 0.3 3.7 0.5 0.0 0.0 of which: IBRD .. 1.0 20.1 0.3 3.3 0.0 0.0 0.0 IDA .. 0.0 0.0 0.0 0.0 0.0 0.0 0.0 Bilateral .. 31.4 263.3 86.9 63.8 24.4 9.1 38.9 Private creditors .. 80.7 128.3 0.3 0.0 0.0 0.0 0.0 of which: Bonds .. 0.0 0.0 0.0 0.0 0.0 0.0 0.0 Commercial banks .. 0.0 91.2 0.0 0.0 0.0 0.0 0.0Private nonguaranteed .. 0.0 9.2 68.4 61.0 64.1 0.5 0.0 of which: Bonds .. 0.0 0.0 0.0 0.0 0.0 0.0 0.0Principal repayments .. 80.3 353.0 396.0 354.4 261.4 216.5 166.3Public and publicly guaranteed .. 80.3 347.4 326.3 289.9 189.1 188.0 164.3 Official creditors .. 19.6 44.0 102.0 131.3 112.6 140.5 124.6 Multilateral .. 0.0 4.7 8.4 6.1 4.6 10.9 7.5 of which: IBRD .. 0.0 0.5 1.9 2.0 1.8 8.2 5.6 IDA .. 0.0 0.0 0.0 0.0 0.0 0.0 0.0 Bilateral .. 19.6 39.3 93.5 125.2 108.0 129.6 117.2 Private creditors .. 60.7 303.4 224.4 158.6 76.5 47.5 39.7 of which: Bonds .. 0.0 0.0 0.0 0.0 0.0 0.0 0.0 Commercial banks .. 0.0 13.0 33.1 36.4 34.7 27.1 28.2Private nonguaranteed .. 0.0 5.5 69.7 64.5 72.3 28.5 2.0 of which: Bonds .. 0.0 0.0 0.0 0.0 0.0 0.0 0.0Interest payments .. 22.1 101.9 43.1 40.8 39.1 33.2 29.8Public and publicly guaranteed .. 22.1 101.2 41.9 39.2 37.3 32.3 29.6 Official creditors .. 11.7 27.8 22.6 25.1 23.9 23.7 19.8 Multilateral .. 1.9 2.5 1.7 1.6 1.9 2.4 1.7 of which: IBRD .. 0.1 1.3 0.6 0.6 1.0 1.5 1.1 IDA .. 0.0 0.0 0.0 0.0 0.0 0.0 0.0 Bilateral .. 9.8 25.3 21.0 23.5 22.0 21.3 18.1 Private creditors .. 10.3 73.4 19.3 14.1 13.4 8.6 9.7 of which: Bonds .. 0.0 0.0 0.0 0.0 0.0 0.0 0.0 Commercial banks .. 0.0 8.5 5.3 6.2 5.9 5.1 6.9Private nonguaranteed .. 0.0 0.7 1.1 1.6 1.8 0.9 0.3 of which: Bonds .. 0.0 0.0 0.0 0.0 0.0 0.0 0.08. Debt stock-flow reconciliationTotal change in external debt stocks .. -28.8 -118.0 -231.8 -220.8 -464.3 -172.0 -146.6 Net flows on external debt .. -39.2 -1.6 -290.1 -266.9 -280.4 -200.9 -189.4 Cross-currency valuation .. 5.8 -87.3 138.6 50.0 -119.8 31.5 48.29. Debt restructuringsTotal amount rescheduled .. 0.0 48.0 0.0 0.0 0.0 0.0 0.0Total amount forgiven .. 0.0 0.0 0.0 0.0 0.0 0.0 0.0Debt buyback .. 0.0 0.0 0.0 0.0 0.0 0.0 0.010. Contractual obligations on outstanding long-term external debt
2008 2009 2010 2011 2012 2013 2014 2015Official creditorsPrincipal 97.1 98.2 82.7 79.0 37.1 34.9 35.2 35.2Interest 19.5 16.8 14.0 11.8 9.4 7.9 6.5 5.0Private creditorsPrincipal 36.4 35.2 35.2 19.7 0.0 0.0 0.0 0.0Interest 6.7 4.6 2.5 0.9 0.0 0.0 0.0 0.0
Notes:Country reassumed reporting in 2005. Long-term private nonguaranteed debt are World Bank staff estimates.
257

UGANDA(US$ million, unless otherwise indicated)
1990 1995 2000 2003 2004 2005 2006 2007
1. Summary external debt dataExternal debt stocks 2,606 3,609 3,497 4,543 4,753 4,427 1,265 1,611 Long-term external debt 2,177 3,089 3,051 4,158 4,426 4,216 1,108 1,575 Public and publicly guaranteed 2,177 3,089 3,051 4,158 4,426 4,216 1,108 1,575 Private nonguaranteed 0 0 0 0 0 0 0 0 Use of IMF credit 282 417 316 236 192 131 9 9 Short-term external debt 146 103 129 148 135 79 148 26 interest arrears on long-term 89 69 58 73 76 29 27 26Memorandum itemsPrincipal arrears on long-term 225 226 124 198 204 75 64 53Long-term public sector debt 2,157 3,066 3,047 4,154 4,426 4,216 1,108 1,574Long-term private sector debt 20 23 5 4 0 0 0 1Public & publicly guaranteed commitments 440 95 145 264 68 441 254 686
External debt flowsDisbursements 372 290 230 349 215 236 263 496 Long-term external debt 293 234 219 343 212 230 260 496 IMF purchases 79 56 12 6 3 6 3 0Principal repayments 109 97 48 57 66 136 85 51 Long-term external debt 65 69 26 32 37 100 85 51 IMF repurchases 43 28 21 25 29 36 0 0Net flows 269 189 177 283 133 91 249 324 Long-term external debt 227 165 192 311 175 131 175 445 IMF flows -3 0 0 0 0 0 0 0 Short-term external debt 6 -4 -6 -9 -15 -10 71 -121Interest payments 36 38 26 27 37 36 30 16 Long-term external debt 18 34 21 25 34 33 25 13 IMF charges 13 2 2 1 1 0 0 0 Short-term external debt 5 2 4 1 2 3 4 3
2. Other non-debt resource flowsForeign direct investment (net) -6 121 161 202 295 380 393 484Portfolio equity flows 0 0 0 0 24 0 19 -48Profit remittances on FDI 0 60 19 83 219 202 236 266Grants (excluding technical coop.) 257 400 527 577 1,010 861 4,459 1,160of which: Debt forgiveness grants .. .. 51 44 111 47 3,440 10 IDA grants .. .. .. 18 178 184 124 1Memo: technical coop. grants 91 147 129 177 208 217 262 99
3. Currency composition of public and publicly guaranteed debt (%)Euro .. .. .. 3.2 3.0 2.8 13.8 10.2Japanese yen 0.3 1.2 1.8 1.4 0.0 0.0 0.0 0.0Pound sterling 6.7 2.1 0.6 0.0 0.0 0.0 0.0 0.0Swiss franc 0.0 0.0 0.0 0.0 0.0 0.0 0.0 0.0U.S.dollars 53.0 66.2 62.5 66.6 67.9 67.8 55.1 48.3
4. Average terms of new commitmentsOfficial creditors Interest (%) 1.1 0.9 0.8 0.7 1.0 0.6 0.5 0.8 Maturity (years) 36.5 39.2 40.0 46.4 25.2 46.4 39.6 41.1 Grace period (years) 9.9 10.0 7.9 10.3 6.5 10.1 6.8 9.9Private creditors Interest (%) 0.5 0.0 7.5 0.0 0.0 0.0 0.0 0.0 Maturity (years) 1.3 0.0 8.2 0.0 0.0 0.0 0.0 0.0 Grace period (years) 0.7 0.0 2.8 0.0 0.0 0.0 0.0 0.0
5. Major economic aggregatesGross national income (GNI) 4,227 5,698 6,086 6,481 7,098 8,991 9,718 11,548Exports of goods, services & income 178 682 954 1,162 1,475 1,898 2,377 3,132Worker remit. & comp. of employees 0 0 238 306 311 323 665 849Imports of goods & services 734 1,603 1,574 1,919 2,382 2,821 3,463 4,538International reserves 44 459 808 1,080 1,308 1,344 1,811 2,560Current account balance -263 -281 -359 -354 -316 -414 -323 -745
6. RatiosExternal debt stocks to exports (%) 1,465.6 529.2 366.4 390.8 322.2 233.3 53.2 51.4External debt stocks to GNI (%) 61.6 63.3 57.5 70.1 67.0 49.2 13.0 14.0Debt service to exports (%) 81.4 19.8 7.8 7.2 7.0 9.0 4.8 2.1Short-term to external debt stocks (%) 5.6 2.8 3.7 3.3 2.8 1.8 11.7 1.6Multilateral to external debt stocks (%) 49.4 61.8 75.3 83.3 86.4 89.0 67.8 83.1Reserves to external debt stocks (%) 1.7 12.7 23.1 23.8 27.5 30.4 143.2 158.9Reserves to imports (months) 0.7 3.4 6.2 6.8 6.6 5.7 6.3 6.8
258

UGANDA(US$ million, unless otherwise indicated)
1990 1995 2000 2003 2004 2005 2006 2007
7. Long-term external debtDebt outstanding and disbursed 2,177 3,089 3,051 4,158 4,426 4,216 1,108 1,575Public and publicly guaranteed 2,177 3,089 3,051 4,158 4,426 4,216 1,108 1,575 Official creditors 1,843 3,002 3,027 4,141 4,401 4,190 1,081 1,549 Multilateral 1,287 2,232 2,634 3,784 4,105 3,940 858 1,339 of which: IBRD 34 0 0 0 0 0 0 0 IDA 935 1,792 2,115 3,061 3,303 3,141 436 840 Bilateral 556 770 393 357 297 250 223 210 Private creditors 335 87 24 17 24 27 26 26 of which: Bonds 4 4 4 0 0 0 0 0 Commercial banks 89 21 9 4 3 2 2 1Private nonguaranteed 0 0 0 0 0 0 0 0 of which: Bonds 0 0 0 0 0 0 0 0Disbursements 293 234 219 343 212 230 260 496Public and publicly guaranteed 293 234 219 343 212 230 260 496 Official creditors 254 234 219 335 204 227 260 496 Multilateral 219 213 218 335 204 227 260 472 of which: IBRD 0 0 0 0 0 0 0 0 IDA 199 159 190 260 138 133 156 374 Bilateral 36 21 0 0 0 0 0 24 Private creditors 38 0 0 8 8 4 0 0 of which: Bonds 0 0 0 0 0 0 0 0 Commercial banks 4 0 0 0 0 0 0 0Private nonguaranteed 0 0 0 0 0 0 0 0 of which: Bonds 0 0 0 0 0 0 0 0Principal repayments 65 69 26 32 37 100 85 51Public and publicly guaranteed 65 69 26 32 37 100 85 51 Official creditors 44 60 25 31 36 99 84 50 Multilateral 19 49 9 26 30 35 52 26 of which: IBRD 4 12 0 0 0 0 0 0 IDA 2 8 3 16 17 21 24 0 Bilateral 25 11 16 5 6 64 33 24 Private creditors 22 9 1 1 1 1 1 1 of which: Bonds 0 0 0 0 0 0 0 0 Commercial banks 14 7 1 1 1 1 1 1Private nonguaranteed 0 0 0 0 0 0 0 0 of which: Bonds 0 0 0 0 0 0 0 0Interest payments 18 34 21 25 34 33 25 13Public and publicly guaranteed 18 34 21 25 34 33 25 13 Official creditors 17 32 20 25 34 33 25 13 Multilateral 13 22 10 23 32 31 24 12 of which: IBRD 2 1 0 0 0 0 0 0 IDA 5 13 6 18 24 24 15 5 Bilateral 4 10 11 2 2 2 1 1 Private creditors 1 2 0 0 0 0 0 0 of which: Bonds 0 0 0 0 0 0 0 0 Commercial banks 1 2 0 0 0 0 0 0Private nonguaranteed 0 0 0 0 0 0 0 0 of which: Bonds 0 0 0 0 0 0 0 08. Debt stock-flow reconciliationTotal change in external debt stocks 410 211 -1 563 210 -326 -3,162 346 Net flows on external debt 269 189 177 283 133 91 249 324 Cross-currency valuation 203 50 -150 290 139 -319 -3,088 -19. Debt restructuringsTotal amount rescheduled 16 172 35 6 3 154 10 0Total amount forgiven 51 0 13 26 31 34 14 20Debt buyback 0 0 0 0 0 0 0 010. Contractual obligations on outstanding long-term external debt
2008 2009 2010 2011 2012 2013 2014 2015Official creditorsPrincipal 57 63 49 49 53 58 55 53Interest 17 18 18 18 18 18 18 17Private creditorsPrincipal 0 0 1 0 0 0 1 2Interest 0 0 0 0 0 0 0 0
Notes:Uganada was granted debt relief effective in 2006 under the Multilateral Debt Relief Initiative.
259

UKRAINE(US$ million, unless otherwise indicated)
1990 1995 2000 2003 2004 2005 2006 2007
1. Summary external debt dataExternal debt stocks .. 8,429 12,190 23,991 30,186 33,297 49,887 73,600 Long-term external debt .. 6,664 9,670 13,140 18,140 20,047 33,696 50,255 Public and publicly guaranteed .. 6,581 8,142 8,891 10,590 10,458 9,538 10,568 Private nonguaranteed .. 84 1,528 4,250 7,551 9,588 24,158 39,687 Use of IMF credit .. 1,542 2,073 1,836 1,605 1,188 830 431 Short-term external debt .. 223 447 9,015 10,440 12,063 15,361 22,914 interest arrears on long-term .. 35 183 158 185 110 150 199Memorandum itemsPrincipal arrears on long-term .. 88 567 257 288 240 286 322Long-term public sector debt .. 6,581 8,117 8,883 10,579 10,442 9,529 10,568Long-term private sector debt .. 84 1,553 4,257 7,561 9,605 24,166 39,687Public & publicly guaranteed commitments .. 673 157 1,550 2,570 1,689 305 1,925
External debt flowsDisbursements .. 1,997 1,638 4,496 8,333 7,969 15,776 26,128 Long-term external debt .. 801 1,387 4,496 8,333 7,969 15,776 26,128 IMF purchases .. 1,196 251 0 0 0 0 0Principal repayments .. 636 2,952 3,151 3,524 4,411 7,135 8,834 Long-term external debt .. 636 2,103 2,949 3,225 4,111 6,724 8,407 IMF repurchases .. 0 849 202 299 300 410 427Net flows .. 1,337 -1,287 1,396 6,207 5,257 11,899 24,798 Long-term external debt .. 165 -716 1,548 5,108 3,858 9,051 17,721 IMF flows .. 1,196 -598 -202 -299 -300 -410 -427 Short-term external debt .. -24 26 50 1,398 1,698 3,258 7,504Interest payments .. 501 709 776 1,069 1,479 2,254 3,002 Long-term external debt .. 447 573 475 677 1,036 1,726 2,305 IMF charges .. 42 122 35 45 50 53 39 Short-term external debt .. 12 14 266 347 393 475 659
2. Other non-debt resource flowsForeign direct investment (net) .. 267 595 1,424 1,715 7,808 5,604 9,891Portfolio equity flows .. 0 146 84 -61 82 322 715Profit remittances on FDI .. 0 43 90 180 268 996 1,178Grants (excluding technical coop.) .. 64 0 0 0 207 230 284of which: Debt forgiveness grants .. .. 0 0 0 0 0 0 IDA grants .. .. .. 0 0 0 0 0Memo: technical coop. grants .. 120 0 0 0 214 260 126
3. Currency composition of public and publicly guaranteed debt (%)Euro .. .. .. 21.5 15.9 17.2 16.9 14.8Japanese yen .. 0.0 2.0 1.8 1.4 1.1 1.0 0.7Pound sterling .. 0.0 0.0 0.0 0.0 0.0 0.0 0.0Swiss franc .. 0.0 0.0 0.0 0.0 0.0 0.0 0.0U.S.dollars .. 63.3 53.2 62.4 71.6 72.2 72.9 77.1
4. Average terms of new commitmentsOfficial creditors Interest (%) .. 4.7 7.3 3.0 2.5 3.5 6.0 4.7 Maturity (years) .. 13.4 15.2 19.8 19.6 20.9 20.0 19.8 Grace period (years) .. 4.8 4.5 5.3 5.1 6.1 5.5 5.3Private creditors Interest (%) .. 6.5 0.0 7.7 7.6 5.2 0.0 6.9 Maturity (years) .. 8.0 0.0 10.0 6.7 10.7 0.0 6.7 Grace period (years) .. 2.5 0.0 10.0 4.4 9.9 0.0 6.7
5. Major economic aggregatesGross national income (GNI) .. 47,438 30,320 49,552 64,084 85,157 106,031 139,060Exports of goods, services & income .. 17,337 19,665 29,392 41,873 45,372 51,860 69,949Worker remit. & comp. of employees .. 0 33 330 411 595 829 4,503Imports of goods & services .. 18,961 19,032 28,500 37,347 45,450 56,361 76,468International reserves .. 1,069 1,477 6,946 9,718 19,388 22,360 32,484Current account balance .. -1,152 1,481 2,891 6,909 2,531 -1,617 -5,272
6. RatiosExternal debt stocks to exports (%) .. 48.6 62.0 81.6 72.1 73.4 96.2 105.2External debt stocks to GNI (%) .. 17.8 40.2 48.4 47.1 39.1 47.0 52.9Debt service to exports (%) .. 6.6 18.6 13.4 11.0 13.0 18.1 16.9Short-term to external debt stocks (%) .. 2.6 3.7 37.6 34.6 36.2 30.8 31.1Multilateral to external debt stocks (%) .. 7.8 19.5 11.3 8.6 8.3 5.3 3.6Reserves to external debt stocks (%) .. 12.7 12.1 29.0 32.2 58.2 44.8 44.1Reserves to imports (months) .. 0.7 0.9 2.9 3.1 5.1 4.8 5.1
260
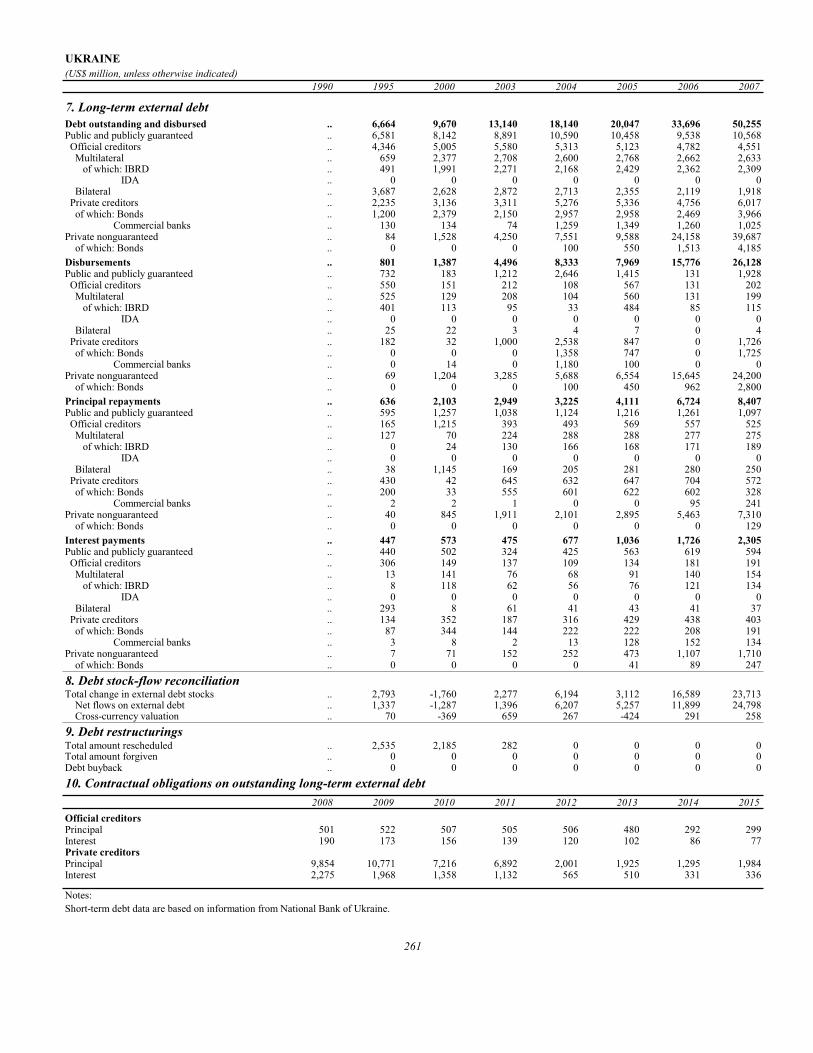
UKRAINE(US$ million, unless otherwise indicated)
1990 1995 2000 2003 2004 2005 2006 2007
7. Long-term external debtDebt outstanding and disbursed .. 6,664 9,670 13,140 18,140 20,047 33,696 50,255Public and publicly guaranteed .. 6,581 8,142 8,891 10,590 10,458 9,538 10,568 Official creditors .. 4,346 5,005 5,580 5,313 5,123 4,782 4,551 Multilateral .. 659 2,377 2,708 2,600 2,768 2,662 2,633 of which: IBRD .. 491 1,991 2,271 2,168 2,429 2,362 2,309 IDA .. 0 0 0 0 0 0 0 Bilateral .. 3,687 2,628 2,872 2,713 2,355 2,119 1,918 Private creditors .. 2,235 3,136 3,311 5,276 5,336 4,756 6,017 of which: Bonds .. 1,200 2,379 2,150 2,957 2,958 2,469 3,966 Commercial banks .. 130 134 74 1,259 1,349 1,260 1,025Private nonguaranteed .. 84 1,528 4,250 7,551 9,588 24,158 39,687 of which: Bonds .. 0 0 0 100 550 1,513 4,185Disbursements .. 801 1,387 4,496 8,333 7,969 15,776 26,128Public and publicly guaranteed .. 732 183 1,212 2,646 1,415 131 1,928 Official creditors .. 550 151 212 108 567 131 202 Multilateral .. 525 129 208 104 560 131 199 of which: IBRD .. 401 113 95 33 484 85 115 IDA .. 0 0 0 0 0 0 0 Bilateral .. 25 22 3 4 7 0 4 Private creditors .. 182 32 1,000 2,538 847 0 1,726 of which: Bonds .. 0 0 0 1,358 747 0 1,725 Commercial banks .. 0 14 0 1,180 100 0 0Private nonguaranteed .. 69 1,204 3,285 5,688 6,554 15,645 24,200 of which: Bonds .. 0 0 0 100 450 962 2,800Principal repayments .. 636 2,103 2,949 3,225 4,111 6,724 8,407Public and publicly guaranteed .. 595 1,257 1,038 1,124 1,216 1,261 1,097 Official creditors .. 165 1,215 393 493 569 557 525 Multilateral .. 127 70 224 288 288 277 275 of which: IBRD .. 0 24 130 166 168 171 189 IDA .. 0 0 0 0 0 0 0 Bilateral .. 38 1,145 169 205 281 280 250 Private creditors .. 430 42 645 632 647 704 572 of which: Bonds .. 200 33 555 601 622 602 328 Commercial banks .. 2 2 1 0 0 95 241Private nonguaranteed .. 40 845 1,911 2,101 2,895 5,463 7,310 of which: Bonds .. 0 0 0 0 0 0 129Interest payments .. 447 573 475 677 1,036 1,726 2,305Public and publicly guaranteed .. 440 502 324 425 563 619 594 Official creditors .. 306 149 137 109 134 181 191 Multilateral .. 13 141 76 68 91 140 154 of which: IBRD .. 8 118 62 56 76 121 134 IDA .. 0 0 0 0 0 0 0 Bilateral .. 293 8 61 41 43 41 37 Private creditors .. 134 352 187 316 429 438 403 of which: Bonds .. 87 344 144 222 222 208 191 Commercial banks .. 3 8 2 13 128 152 134Private nonguaranteed .. 7 71 152 252 473 1,107 1,710 of which: Bonds .. 0 0 0 0 41 89 2478. Debt stock-flow reconciliationTotal change in external debt stocks .. 2,793 -1,760 2,277 6,194 3,112 16,589 23,713 Net flows on external debt .. 1,337 -1,287 1,396 6,207 5,257 11,899 24,798 Cross-currency valuation .. 70 -369 659 267 -424 291 2589. Debt restructuringsTotal amount rescheduled .. 2,535 2,185 282 0 0 0 0Total amount forgiven .. 0 0 0 0 0 0 0Debt buyback .. 0 0 0 0 0 0 010. Contractual obligations on outstanding long-term external debt
2008 2009 2010 2011 2012 2013 2014 2015Official creditorsPrincipal 501 522 507 505 506 480 292 299Interest 190 173 156 139 120 102 86 77Private creditorsPrincipal 9,854 10,771 7,216 6,892 2,001 1,925 1,295 1,984Interest 2,275 1,968 1,358 1,132 565 510 331 336
Notes:Short-term debt data are based on information from National Bank of Ukraine.
261

URUGUAY(US$ million, unless otherwise indicated)
1990 1995 2000 2003 2004 2005 2006 2007
1. Summary external debt dataExternal debt stocks 4,415 5,318 8,113 11,803 15,160 14,465 11,190 12,363 Long-term external debt 3,114 3,960 6,048 7,942 8,276 8,200 8,982 9,973 Public and publicly guaranteed 3,045 3,833 5,513 7,468 7,813 7,779 8,597 9,616 Private nonguaranteed 69 127 535 474 462 421 385 357 Use of IMF credit 101 21 149 2,416 2,684 2,304 0 0 Short-term external debt 1,201 1,336 1,917 1,445 4,200 3,961 2,208 2,390 interest arrears on long-term 0 0 0 0 0 0 0 0Memorandum itemsPrincipal arrears on long-term 0 0 0 0 0 0 0 0Long-term public sector debt 3,042 3,831 5,512 7,468 7,813 7,779 8,597 9,616Long-term private sector debt 72 130 535 474 462 421 385 357Public & publicly guaranteed commitments 339 452 721 707 318 2,925 2,060 1,546
External debt flowsDisbursements 358 661 1,053 999 1,002 1,711 3,337 1,494 Long-term external debt 346 661 1,053 489 449 1,414 3,039 1,494 IMF purchases 12 0 0 509 552 297 298 0Principal repayments 559 484 670 572 954 1,563 5,078 771 Long-term external debt 434 474 670 492 553 1,094 2,408 771 IMF repurchases 124 10 0 80 401 469 2,670 0Net flows -134 281 506 272 2,803 -91 -3,494 887 Long-term external debt -88 187 383 -3 -104 320 632 722 IMF flows -112 -10 0 430 152 -172 -2,372 0 Short-term external debt 66 104 123 -155 2,755 -239 -1,753 165Interest payments 428 379 587 333 591 636 755 717 Long-term external debt 318 298 457 237 413 440 585 644 IMF charges 16 2 8 45 95 115 106 5 Short-term external debt 93 80 123 50 82 80 64 69
2. Other non-debt resource flowsForeign direct investment (net) 42 157 274 417 332 847 1,399 879Portfolio equity flows 0 0 5 -6 20 -2 -27 -27Profit remittances on FDI 0 54 99 127 229 228 266 349Grants (excluding technical coop.) 11 15 9 17 17 27 19 30of which: Debt forgiveness grants .. .. 0 0 0 0 0 0 IDA grants .. .. .. 0 0 0 0 0Memo: technical coop. grants 25 34 15 18 17 15 15 19
3. Currency composition of public and publicly guaranteed debt (%)Euro .. .. .. 5.9 5.8 8.3 7.1 6.4Japanese yen 5.1 6.4 3.4 3.3 3.2 2.9 2.5 4.8Pound sterling 3.6 1.9 1.0 0.2 0.1 0.1 0.0 0.0Swiss franc 1.5 0.0 0.0 0.0 0.0 0.0 0.0 0.0U.S.dollars 64.9 53.8 80.6 84.3 85.3 84.2 86.7 85.8
4. Average terms of new commitmentsOfficial creditors Interest (%) 7.8 3.9 7.2 1.6 5.0 4.1 5.3 4.7 Maturity (years) 20.1 14.9 14.8 17.0 19.6 17.7 24.3 16.5 Grace period (years) 5.0 5.5 5.2 4.9 4.2 5.3 5.9 6.5Private creditors Interest (%) 9.8 7.0 7.8 6.3 7.4 8.1 6.8 3.7 Maturity (years) 8.7 7.2 7.5 6.5 2.7 15.0 24.3 21.3 Grace period (years) 1.0 3.3 7.0 2.0 1.8 15.0 24.1 19.7
5. Major economic aggregatesGross national income (GNI) 8,949 18,059 20,382 10,682 12,612 16,102 18,840 22,728Exports of goods, services & income 2,417 3,911 4,441 3,356 4,699 5,725 6,622 7,800Worker remit. & comp. of employees 0 0 0 62 70 77 89 97Imports of goods & services 2,239 4,200 5,035 3,464 4,739 5,750 7,029 8,023International reserves 1,446 1,813 2,776 2,087 2,512 3,078 3,091 4,121Current account balance 186 -213 -566 -87 3 42 -369 -186
6. RatiosExternal debt stocks to exports (%) 182.7 136.0 182.7 351.7 322.6 252.7 169.0 158.5External debt stocks to GNI (%) 49.3 29.4 39.8 110.5 120.2 89.8 59.4 54.4Debt service to exports (%) 40.8 22.1 28.3 26.9 32.9 38.4 88.1 19.1Short-term to external debt stocks (%) 27.2 25.1 23.6 12.2 27.7 27.4 19.7 19.3Multilateral to external debt stocks (%) 15.8 23.7 23.7 25.9 20.3 21.4 22.6 20.4Reserves to external debt stocks (%) 32.7 34.1 34.2 17.7 16.6 21.3 27.6 33.3Reserves to imports (months) 7.7 5.2 6.6 7.2 6.4 6.4 5.3 6.2
262

URUGUAY(US$ million, unless otherwise indicated)
1990 1995 2000 2003 2004 2005 2006 2007
7. Long-term external debtDebt outstanding and disbursed 3,114 3,960 6,048 7,942 8,276 8,200 8,982 9,973Public and publicly guaranteed 3,045 3,833 5,513 7,468 7,813 7,779 8,597 9,616 Official creditors 895 1,588 2,227 3,188 3,200 3,205 2,632 2,616 Multilateral 699 1,259 1,925 3,060 3,077 3,095 2,530 2,526 of which: IBRD 359 513 552 722 785 816 653 666 IDA 0 0 0 0 0 0 0 0 Bilateral 196 329 302 129 123 110 101 91 Private creditors 2,150 2,245 3,285 4,280 4,613 4,575 5,965 6,999 of which: Bonds 567 1,963 2,737 3,977 4,163 4,283 5,875 6,915 Commercial banks 1,576 252 530 285 436 279 80 75Private nonguaranteed 69 127 535 474 462 421 385 357 of which: Bonds 0 110 300 300 300 300 300 287Disbursements 346 661 1,053 489 449 1,414 3,039 1,494Public and publicly guaranteed 346 591 891 477 440 1,414 3,039 1,407 Official creditors 174 128 300 475 209 389 160 189 Multilateral 90 103 299 469 200 384 159 189 of which: IBRD 51 32 134 97 144 134 42 74 IDA 0 0 0 0 0 0 0 0 Bilateral 85 25 1 6 9 5 1 0 Private creditors 171 463 591 2 231 1,025 2,879 1,217 of which: Bonds 164 348 578 0 0 1,004 2,835 1,207 Commercial banks 4 111 1 2 231 21 45 10Private nonguaranteed 0 70 162 12 9 0 0 87 of which: Bonds 0 70 0 0 0 0 0 87Principal repayments 434 474 670 492 553 1,094 2,408 771Public and publicly guaranteed 398 469 606 460 503 1,053 2,372 620 Official creditors 71 124 162 263 216 342 744 222 Multilateral 61 117 121 186 199 329 733 209 of which: IBRD 43 78 58 78 80 104 205 61 IDA 0 0 0 0 0 0 0 0 Bilateral 10 7 42 77 17 12 11 14 Private creditors 327 345 443 197 286 711 1,628 398 of which: Bonds 180 273 285 32 184 513 1,381 380 Commercial banks 143 66 154 163 99 196 245 16Private nonguaranteed 36 5 64 32 50 42 36 151 of which: Bonds 0 0 47 0 0 0 0 100Interest payments 318 298 457 237 413 440 585 644Public and publicly guaranteed 312 293 380 204 377 406 553 612 Official creditors 61 124 147 147 136 152 152 142 Multilateral 54 91 134 142 130 149 149 140 of which: IBRD 27 40 42 28 22 34 41 38 IDA 0 0 0 0 0 0 0 0 Bilateral 7 33 13 5 6 3 2 2 Private creditors 252 169 233 57 241 254 401 470 of which: Bonds 61 151 181 40 227 242 392 465 Commercial banks 190 15 51 16 12 12 9 4Private nonguaranteed 6 4 77 33 36 34 32 31 of which: Bonds 0 3 29 26 26 26 26 258. Debt stock-flow reconciliationTotal change in external debt stocks -33 243 642 1,233 3,357 -695 -3,275 1,156 Net flows on external debt -134 281 506 272 2,803 -91 -3,494 887 Cross-currency valuation 77 32 -96 432 170 -345 196 4959. Debt restructuringsTotal amount rescheduled 0 0 0 3,270 0 0 0 0Total amount forgiven 0 0 0 0 0 0 0 0Debt buyback 0 0 0 0 0 0 0 010. Contractual obligations on outstanding long-term external debt
2008 2009 2010 2011 2012 2013 2014 2015Official creditorsPrincipal 247 260 261 276 281 267 249 239Interest 150 146 139 128 116 103 91 79Private creditorsPrincipal 183 194 146 348 89 29 38 332Interest 499 512 502 489 477 474 474 460
263

UZBEKISTAN(US$ million, unless otherwise indicated)
1990 1995 2000 2003 2004 2005 2006 2007
1. Summary external debt dataExternal debt stocks .. 1,799 4,634 4,921 4,831 4,290 4,038 3,876 Long-term external debt .. 1,430 4,225 4,656 4,634 4,177 3,880 3,680 Public and publicly guaranteed .. 1,415 3,764 4,149 4,115 3,627 3,297 3,086 Private nonguaranteed .. 15 462 507 518 551 584 594 Use of IMF credit .. 157 127 43 19 0 0 0 Short-term external debt .. 212 282 221 178 112 158 196 interest arrears on long-term .. 0 3 7 8 8 0 0Memorandum itemsPrincipal arrears on long-term .. 0 17 34 39 35 0 0Long-term public sector debt .. 1,288 3,607 4,062 4,049 3,585 3,284 3,075Long-term private sector debt .. 142 618 595 584 592 597 605Public & publicly guaranteed commitments .. 980 310 489 629 141 107 129
External debt flowsDisbursements .. 791 769 615 609 401 306 385 Long-term external debt .. 630 769 615 609 401 306 385 IMF purchases .. 161 0 0 0 0 0 0Principal repayments .. 149 646 662 724 642 678 643 Long-term external debt .. 149 581 639 700 623 678 643 IMF repurchases .. 0 65 23 25 18 0 0Net flows .. 563 -221 -79 -160 -307 -318 -225 Long-term external debt .. 481 188 -24 -91 -222 -372 -258 IMF flows .. 161 -65 -23 -25 -18 0 0 Short-term external debt .. -79 -344 -31 -44 -66 54 33Interest payments .. 95 236 148 147 145 173 176 Long-term external debt .. 80 205 141 140 141 170 169 IMF charges .. 3 9 1 1 0 0 0 Short-term external debt .. 13 23 6 6 4 3 7
2. Other non-debt resource flowsForeign direct investment (net) .. -24 75 70 187 88 195 262Portfolio equity flows .. 0 0 0 0 0 0 0Profit remittances on FDI .. 0 0 0 0 0 0 0Grants (excluding technical coop.) .. 13 34 52 44 54 47 67of which: Debt forgiveness grants .. .. 0 0 0 0 0 0 IDA grants .. .. .. 0 0 0 0 0Memo: technical coop. grants .. 28 39 87 102 72 83 36
3. Currency composition of public and publicly guaranteed debt (%)Euro .. .. .. 21.2 21.0 18.1 18.0 18.1Japanese yen .. 3.1 21.2 21.6 22.4 21.3 21.2 22.8Pound sterling .. 0.0 0.0 0.0 0.0 0.0 0.0 0.0Swiss franc .. 0.1 0.0 0.0 0.1 0.5 0.4 0.4U.S.dollars .. 66.5 56.7 50.3 49.5 52.8 51.8 49.0
4. Average terms of new commitmentsOfficial creditors Interest (%) .. 5.2 6.0 4.5 2.0 2.0 2.9 3.1 Maturity (years) .. 18.1 18.4 19.2 28.6 24.2 22.0 28.2 Grace period (years) .. 5.1 4.4 4.3 6.9 6.8 6.7 6.1Private creditors Interest (%) .. 7.1 7.3 2.1 3.0 0.0 4.3 4.4 Maturity (years) .. 9.1 6.4 9.5 7.6 0.0 6.6 4.5 Grace period (years) .. 2.5 1.4 1.1 2.2 0.0 1.1 0.0
5. Major economic aggregatesGross national income (GNI) .. 13,324 13,541 10,012 11,981 14,283 17,072 22,370Exports of goods, services & income .. .. .. .. .. .. .. ..Worker remit. & comp. of employees .. 0 0 0 0 0 0 0Imports of goods & services .. .. .. .. .. .. .. ..International reserves .. .. .. .. .. .. .. ..Current account balance .. .. .. .. .. .. .. ..
6. RatiosExternal debt stocks to exports (%) .. .. .. .. .. .. .. ..External debt stocks to GNI (%) .. 13.5 34.2 49.1 40.3 30.0 23.7 17.3Debt service to exports (%) .. .. .. .. .. .. .. ..Short-term to external debt stocks (%) .. 11.8 6.1 4.5 3.7 2.6 3.9 5.1Multilateral to external debt stocks (%) .. 13.7 9.8 12.8 15.4 18.4 20.5 22.6Reserves to external debt stocks (%) .. 0.0 0.0 0.0 0.0 0.0 0.0 0.0Reserves to imports (months) .. .. .. .. .. .. .. ..
264
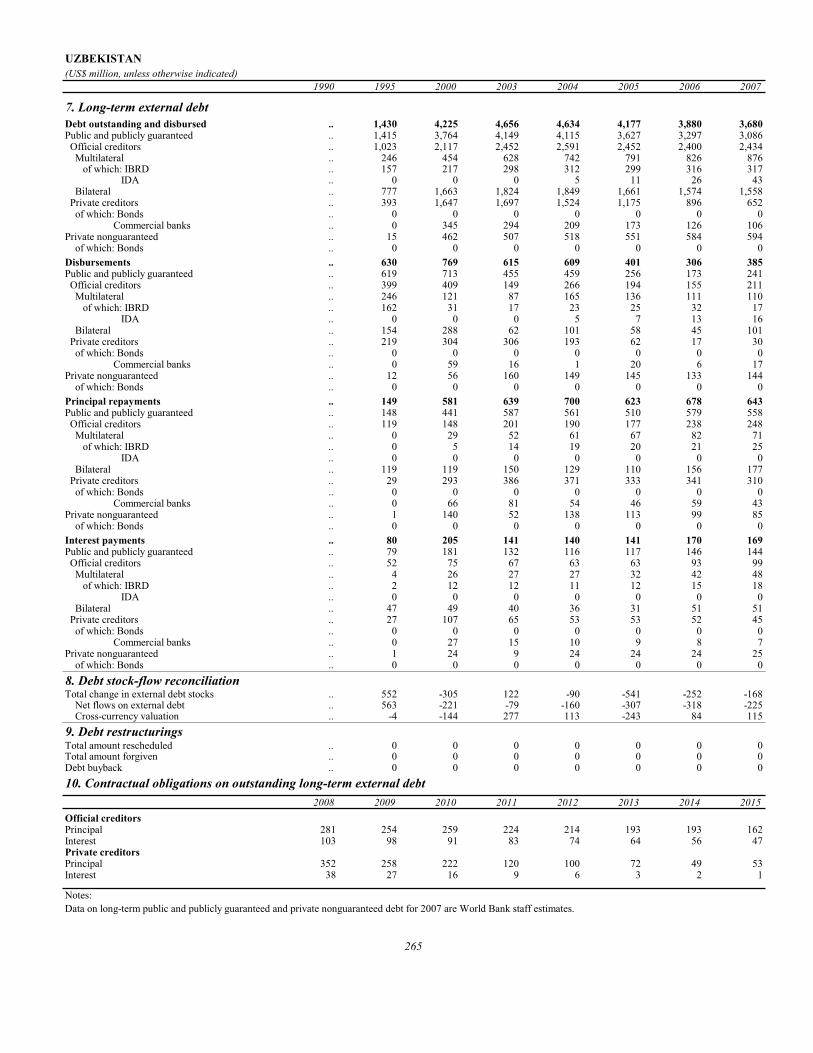
UZBEKISTAN(US$ million, unless otherwise indicated)
1990 1995 2000 2003 2004 2005 2006 2007
7. Long-term external debtDebt outstanding and disbursed .. 1,430 4,225 4,656 4,634 4,177 3,880 3,680Public and publicly guaranteed .. 1,415 3,764 4,149 4,115 3,627 3,297 3,086 Official creditors .. 1,023 2,117 2,452 2,591 2,452 2,400 2,434 Multilateral .. 246 454 628 742 791 826 876 of which: IBRD .. 157 217 298 312 299 316 317 IDA .. 0 0 0 5 11 26 43 Bilateral .. 777 1,663 1,824 1,849 1,661 1,574 1,558 Private creditors .. 393 1,647 1,697 1,524 1,175 896 652 of which: Bonds .. 0 0 0 0 0 0 0 Commercial banks .. 0 345 294 209 173 126 106Private nonguaranteed .. 15 462 507 518 551 584 594 of which: Bonds .. 0 0 0 0 0 0 0Disbursements .. 630 769 615 609 401 306 385Public and publicly guaranteed .. 619 713 455 459 256 173 241 Official creditors .. 399 409 149 266 194 155 211 Multilateral .. 246 121 87 165 136 111 110 of which: IBRD .. 162 31 17 23 25 32 17 IDA .. 0 0 0 5 7 13 16 Bilateral .. 154 288 62 101 58 45 101 Private creditors .. 219 304 306 193 62 17 30 of which: Bonds .. 0 0 0 0 0 0 0 Commercial banks .. 0 59 16 1 20 6 17Private nonguaranteed .. 12 56 160 149 145 133 144 of which: Bonds .. 0 0 0 0 0 0 0Principal repayments .. 149 581 639 700 623 678 643Public and publicly guaranteed .. 148 441 587 561 510 579 558 Official creditors .. 119 148 201 190 177 238 248 Multilateral .. 0 29 52 61 67 82 71 of which: IBRD .. 0 5 14 19 20 21 25 IDA .. 0 0 0 0 0 0 0 Bilateral .. 119 119 150 129 110 156 177 Private creditors .. 29 293 386 371 333 341 310 of which: Bonds .. 0 0 0 0 0 0 0 Commercial banks .. 0 66 81 54 46 59 43Private nonguaranteed .. 1 140 52 138 113 99 85 of which: Bonds .. 0 0 0 0 0 0 0Interest payments .. 80 205 141 140 141 170 169Public and publicly guaranteed .. 79 181 132 116 117 146 144 Official creditors .. 52 75 67 63 63 93 99 Multilateral .. 4 26 27 27 32 42 48 of which: IBRD .. 2 12 12 11 12 15 18 IDA .. 0 0 0 0 0 0 0 Bilateral .. 47 49 40 36 31 51 51 Private creditors .. 27 107 65 53 53 52 45 of which: Bonds .. 0 0 0 0 0 0 0 Commercial banks .. 0 27 15 10 9 8 7Private nonguaranteed .. 1 24 9 24 24 24 25 of which: Bonds .. 0 0 0 0 0 0 08. Debt stock-flow reconciliationTotal change in external debt stocks .. 552 -305 122 -90 -541 -252 -168 Net flows on external debt .. 563 -221 -79 -160 -307 -318 -225 Cross-currency valuation .. -4 -144 277 113 -243 84 1159. Debt restructuringsTotal amount rescheduled .. 0 0 0 0 0 0 0Total amount forgiven .. 0 0 0 0 0 0 0Debt buyback .. 0 0 0 0 0 0 010. Contractual obligations on outstanding long-term external debt
2008 2009 2010 2011 2012 2013 2014 2015Official creditorsPrincipal 281 254 259 224 214 193 193 162Interest 103 98 91 83 74 64 56 47Private creditorsPrincipal 352 258 222 120 100 72 49 53Interest 38 27 16 9 6 3 2 1
Notes:Data on long-term public and publicly guaranteed and private nonguaranteed debt for 2007 are World Bank staff estimates.
265

VANUATU(US$ million, unless otherwise indicated)
1990 1995 2000 2003 2004 2005 2006 2007
1. Summary external debt dataExternal debt stocks 38.2 48.9 74.5 97.0 120.7 82.1 86.1 94.1 Long-term external debt 28.6 43.9 73.1 82.0 83.6 71.9 72.0 74.0 Public and publicly guaranteed 28.6 43.9 73.1 82.0 83.6 71.9 72.0 74.0 Private nonguaranteed 0.0 0.0 0.0 0.0 0.0 0.0 0.0 0.0 Use of IMF credit 0.0 0.0 0.0 0.0 0.0 0.0 0.0 0.0 Short-term external debt 9.6 5.0 1.4 15.0 37.1 10.2 14.1 20.1 interest arrears on long-term 0.0 0.0 0.0 0.0 0.1 0.2 0.1 0.1Memorandum itemsPrincipal arrears on long-term 0.0 0.0 0.0 0.0 0.4 0.8 0.5 0.6Long-term public sector debt 28.6 43.9 73.1 82.0 83.6 71.9 72.0 74.0Long-term private sector debt 0.0 0.0 0.0 0.0 0.0 0.0 0.0 0.0Public & publicly guaranteed commitments 0.0 1.8 4.6 0.0 0.0 0.0 0.0 0.0
External debt flowsDisbursements 6.5 3.2 14.2 0.0 0.0 0.0 0.0 0.0 Long-term external debt 6.5 3.2 14.2 0.0 0.0 0.0 0.0 0.0 IMF purchases 0.0 0.0 0.0 0.0 0.0 0.0 0.0 0.0Principal repayments 1.0 0.8 0.9 1.1 1.6 1.1 2.2 2.1 Long-term external debt 1.0 0.8 0.9 1.1 1.6 1.1 2.2 2.1 IMF repurchases 0.0 0.0 0.0 0.0 0.0 0.0 0.0 0.0Net flows 5.7 2.4 13.6 0.0 20.4 -28.1 1.8 6.9 Long-term external debt 5.6 2.4 13.4 -1.0 -1.6 -1.1 -2.2 -2.1 IMF flows 0.0 0.0 0.0 0.0 0.0 0.0 0.0 0.0 Short-term external debt 0.1 0.0 0.3 1.0 22.0 -27.0 4.0 9.0Interest payments 1.5 0.8 1.0 1.1 1.9 1.5 1.6 1.7 Long-term external debt 0.7 0.5 0.6 0.7 0.9 0.7 1.0 0.8 IMF charges 0.0 0.0 0.0 0.0 0.0 0.0 0.0 0.0 Short-term external debt 0.7 0.3 0.3 0.4 1.0 0.8 0.6 0.9
2. Other non-debt resource flowsForeign direct investment (net) 13.1 31.0 20.3 18.0 19.8 13.3 43.5 34.2Portfolio equity flows 0.0 0.0 0.0 0.0 0.0 0.0 0.0 0.0Profit remittances on FDI 15.2 35.6 21.9 20.8 27.1 35.3 34.2 45.6Grants (excluding technical coop.) 22.0 22.5 12.0 7.1 10.6 13.3 14.8 19.1of which: Debt forgiveness grants .. .. 0.1 0.0 0.0 0.0 0.0 0.0 IDA grants .. .. .. 0.0 0.0 0.0 0.0 0.0Memo: technical coop. grants 22.2 21.5 20.6 26.7 29.1 28.0 36.0 39.9
3. Currency composition of public and publicly guaranteed debt (%)Euro .. .. .. 14.2 13.9 13.6 13.4 13.2Japanese yen 0.0 0.0 0.0 0.0 0.0 0.0 0.0 0.0Pound sterling 0.6 0.1 0.0 0.0 0.0 0.0 0.0 0.0Swiss franc 0.0 0.0 0.0 0.0 0.0 0.0 0.0 0.0U.S.dollars 22.4 43.3 56.8 53.1 53.2 54.0 54.1 54.1
4. Average terms of new commitmentsOfficial creditors Interest (%) 0.0 0.0 2.0 0.0 0.0 0.0 0.0 0.0 Maturity (years) 0.0 23.0 14.5 0.0 0.0 0.0 0.0 0.0 Grace period (years) 0.0 16.1 3.5 0.0 0.0 0.0 0.0 0.0Private creditors Interest (%) 0.0 0.0 0.0 0.0 0.0 0.0 0.0 0.0 Maturity (years) 0.0 0.0 0.0 0.0 0.0 0.0 0.0 0.0 Grace period (years) 0.0 0.0 0.0 0.0 0.0 0.0 0.0 0.0
5. Major economic aggregatesGross national income (GNI) 162.6 216.8 231.6 264.6 311.1 343.7 392.6 420.6Exports of goods, services & income 112.7 129.1 186.7 161.8 187.6 204.7 215.4 257.0Worker remit. & comp. of employees 8.0 14.0 35.0 9.0 4.9 5.1 5.0 5.5Imports of goods & services 136.5 164.5 178.8 191.1 224.4 258.6 270.7 313.2International reserves 37.7 48.3 38.9 43.8 61.8 67.2 104.7 119.6Current account balance -6.2 -18.2 5.0 -22.2 -22.4 -34.0 -30.1 -34.4
6. RatiosExternal debt stocks to exports (%) 33.9 37.9 39.9 59.9 64.3 40.1 40.0 36.6External debt stocks to GNI (%) 23.5 22.6 32.2 36.6 38.8 23.9 21.9 22.4Debt service to exports (%) 2.1 1.2 1.0 1.3 1.8 1.3 1.7 1.5Short-term to external debt stocks (%) 25.1 10.2 1.9 15.5 30.8 12.4 16.4 21.4Multilateral to external debt stocks (%) 41.6 63.7 86.1 74.8 61.5 82.1 78.3 73.6Reserves to external debt stocks (%) 98.6 98.7 52.3 45.2 51.2 81.9 121.5 127.1Reserves to imports (months) 3.3 3.5 2.6 2.8 3.3 3.1 4.6 4.6
266
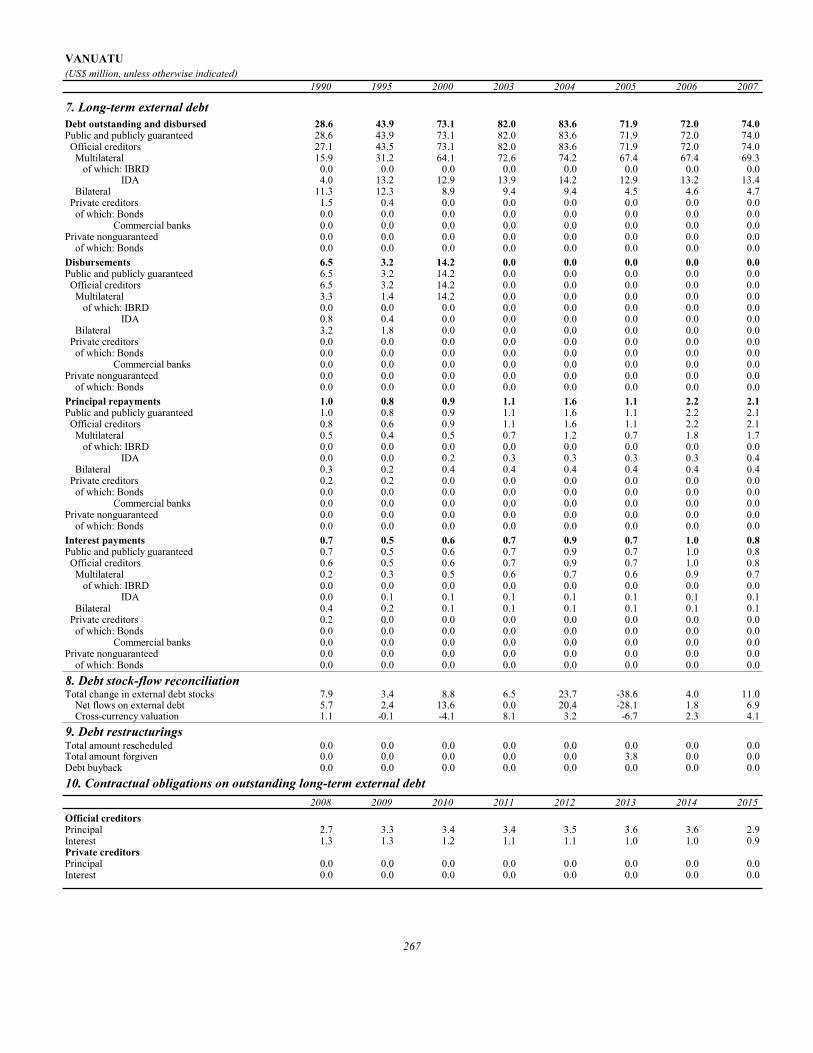
VANUATU(US$ million, unless otherwise indicated)
1990 1995 2000 2003 2004 2005 2006 2007
7. Long-term external debtDebt outstanding and disbursed 28.6 43.9 73.1 82.0 83.6 71.9 72.0 74.0Public and publicly guaranteed 28.6 43.9 73.1 82.0 83.6 71.9 72.0 74.0 Official creditors 27.1 43.5 73.1 82.0 83.6 71.9 72.0 74.0 Multilateral 15.9 31.2 64.1 72.6 74.2 67.4 67.4 69.3 of which: IBRD 0.0 0.0 0.0 0.0 0.0 0.0 0.0 0.0 IDA 4.0 13.2 12.9 13.9 14.2 12.9 13.2 13.4 Bilateral 11.3 12.3 8.9 9.4 9.4 4.5 4.6 4.7 Private creditors 1.5 0.4 0.0 0.0 0.0 0.0 0.0 0.0 of which: Bonds 0.0 0.0 0.0 0.0 0.0 0.0 0.0 0.0 Commercial banks 0.0 0.0 0.0 0.0 0.0 0.0 0.0 0.0Private nonguaranteed 0.0 0.0 0.0 0.0 0.0 0.0 0.0 0.0 of which: Bonds 0.0 0.0 0.0 0.0 0.0 0.0 0.0 0.0Disbursements 6.5 3.2 14.2 0.0 0.0 0.0 0.0 0.0Public and publicly guaranteed 6.5 3.2 14.2 0.0 0.0 0.0 0.0 0.0 Official creditors 6.5 3.2 14.2 0.0 0.0 0.0 0.0 0.0 Multilateral 3.3 1.4 14.2 0.0 0.0 0.0 0.0 0.0 of which: IBRD 0.0 0.0 0.0 0.0 0.0 0.0 0.0 0.0 IDA 0.8 0.4 0.0 0.0 0.0 0.0 0.0 0.0 Bilateral 3.2 1.8 0.0 0.0 0.0 0.0 0.0 0.0 Private creditors 0.0 0.0 0.0 0.0 0.0 0.0 0.0 0.0 of which: Bonds 0.0 0.0 0.0 0.0 0.0 0.0 0.0 0.0 Commercial banks 0.0 0.0 0.0 0.0 0.0 0.0 0.0 0.0Private nonguaranteed 0.0 0.0 0.0 0.0 0.0 0.0 0.0 0.0 of which: Bonds 0.0 0.0 0.0 0.0 0.0 0.0 0.0 0.0Principal repayments 1.0 0.8 0.9 1.1 1.6 1.1 2.2 2.1Public and publicly guaranteed 1.0 0.8 0.9 1.1 1.6 1.1 2.2 2.1 Official creditors 0.8 0.6 0.9 1.1 1.6 1.1 2.2 2.1 Multilateral 0.5 0.4 0.5 0.7 1.2 0.7 1.8 1.7 of which: IBRD 0.0 0.0 0.0 0.0 0.0 0.0 0.0 0.0 IDA 0.0 0.0 0.2 0.3 0.3 0.3 0.3 0.4 Bilateral 0.3 0.2 0.4 0.4 0.4 0.4 0.4 0.4 Private creditors 0.2 0.2 0.0 0.0 0.0 0.0 0.0 0.0 of which: Bonds 0.0 0.0 0.0 0.0 0.0 0.0 0.0 0.0 Commercial banks 0.0 0.0 0.0 0.0 0.0 0.0 0.0 0.0Private nonguaranteed 0.0 0.0 0.0 0.0 0.0 0.0 0.0 0.0 of which: Bonds 0.0 0.0 0.0 0.0 0.0 0.0 0.0 0.0Interest payments 0.7 0.5 0.6 0.7 0.9 0.7 1.0 0.8Public and publicly guaranteed 0.7 0.5 0.6 0.7 0.9 0.7 1.0 0.8 Official creditors 0.6 0.5 0.6 0.7 0.9 0.7 1.0 0.8 Multilateral 0.2 0.3 0.5 0.6 0.7 0.6 0.9 0.7 of which: IBRD 0.0 0.0 0.0 0.0 0.0 0.0 0.0 0.0 IDA 0.0 0.1 0.1 0.1 0.1 0.1 0.1 0.1 Bilateral 0.4 0.2 0.1 0.1 0.1 0.1 0.1 0.1 Private creditors 0.2 0.0 0.0 0.0 0.0 0.0 0.0 0.0 of which: Bonds 0.0 0.0 0.0 0.0 0.0 0.0 0.0 0.0 Commercial banks 0.0 0.0 0.0 0.0 0.0 0.0 0.0 0.0Private nonguaranteed 0.0 0.0 0.0 0.0 0.0 0.0 0.0 0.0 of which: Bonds 0.0 0.0 0.0 0.0 0.0 0.0 0.0 0.08. Debt stock-flow reconciliationTotal change in external debt stocks 7.9 3.4 8.8 6.5 23.7 -38.6 4.0 11.0 Net flows on external debt 5.7 2.4 13.6 0.0 20.4 -28.1 1.8 6.9 Cross-currency valuation 1.1 -0.1 -4.1 8.1 3.2 -6.7 2.3 4.19. Debt restructuringsTotal amount rescheduled 0.0 0.0 0.0 0.0 0.0 0.0 0.0 0.0Total amount forgiven 0.0 0.0 0.0 0.0 0.0 3.8 0.0 0.0Debt buyback 0.0 0.0 0.0 0.0 0.0 0.0 0.0 0.010. Contractual obligations on outstanding long-term external debt
2008 2009 2010 2011 2012 2013 2014 2015Official creditorsPrincipal 2.7 3.3 3.4 3.4 3.5 3.6 3.6 2.9Interest 1.3 1.3 1.2 1.1 1.1 1.0 1.0 0.9Private creditorsPrincipal 0.0 0.0 0.0 0.0 0.0 0.0 0.0 0.0Interest 0.0 0.0 0.0 0.0 0.0 0.0 0.0 0.0
267
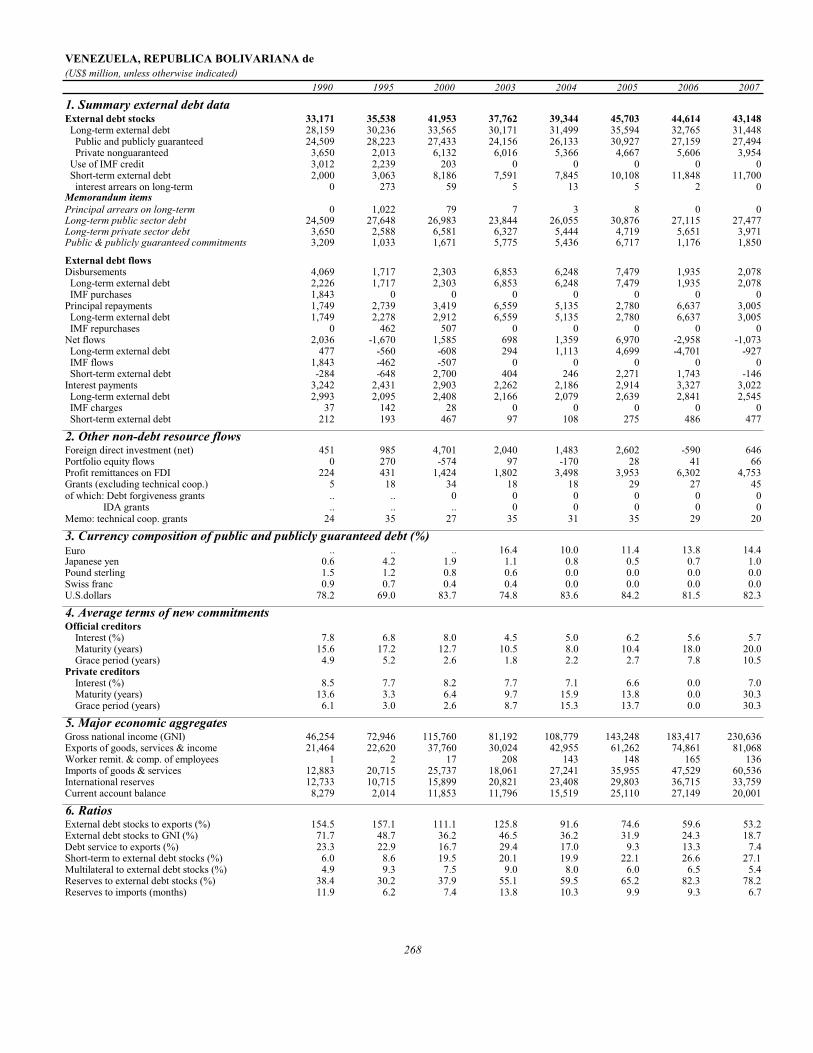
VENEZUELA, REPUBLICA BOLIVARIANA de(US$ million, unless otherwise indicated)
1990 1995 2000 2003 2004 2005 2006 2007
1. Summary external debt dataExternal debt stocks 33,171 35,538 41,953 37,762 39,344 45,703 44,614 43,148 Long-term external debt 28,159 30,236 33,565 30,171 31,499 35,594 32,765 31,448 Public and publicly guaranteed 24,509 28,223 27,433 24,156 26,133 30,927 27,159 27,494 Private nonguaranteed 3,650 2,013 6,132 6,016 5,366 4,667 5,606 3,954 Use of IMF credit 3,012 2,239 203 0 0 0 0 0 Short-term external debt 2,000 3,063 8,186 7,591 7,845 10,108 11,848 11,700 interest arrears on long-term 0 273 59 5 13 5 2 0Memorandum itemsPrincipal arrears on long-term 0 1,022 79 7 3 8 0 0Long-term public sector debt 24,509 27,648 26,983 23,844 26,055 30,876 27,115 27,477Long-term private sector debt 3,650 2,588 6,581 6,327 5,444 4,719 5,651 3,971Public & publicly guaranteed commitments 3,209 1,033 1,671 5,775 5,436 6,717 1,176 1,850
External debt flowsDisbursements 4,069 1,717 2,303 6,853 6,248 7,479 1,935 2,078 Long-term external debt 2,226 1,717 2,303 6,853 6,248 7,479 1,935 2,078 IMF purchases 1,843 0 0 0 0 0 0 0Principal repayments 1,749 2,739 3,419 6,559 5,135 2,780 6,637 3,005 Long-term external debt 1,749 2,278 2,912 6,559 5,135 2,780 6,637 3,005 IMF repurchases 0 462 507 0 0 0 0 0Net flows 2,036 -1,670 1,585 698 1,359 6,970 -2,958 -1,073 Long-term external debt 477 -560 -608 294 1,113 4,699 -4,701 -927 IMF flows 1,843 -462 -507 0 0 0 0 0 Short-term external debt -284 -648 2,700 404 246 2,271 1,743 -146Interest payments 3,242 2,431 2,903 2,262 2,186 2,914 3,327 3,022 Long-term external debt 2,993 2,095 2,408 2,166 2,079 2,639 2,841 2,545 IMF charges 37 142 28 0 0 0 0 0 Short-term external debt 212 193 467 97 108 275 486 477
2. Other non-debt resource flowsForeign direct investment (net) 451 985 4,701 2,040 1,483 2,602 -590 646Portfolio equity flows 0 270 -574 97 -170 28 41 66Profit remittances on FDI 224 431 1,424 1,802 3,498 3,953 6,302 4,753Grants (excluding technical coop.) 5 18 34 18 18 29 27 45of which: Debt forgiveness grants .. .. 0 0 0 0 0 0 IDA grants .. .. .. 0 0 0 0 0Memo: technical coop. grants 24 35 27 35 31 35 29 20
3. Currency composition of public and publicly guaranteed debt (%)Euro .. .. .. 16.4 10.0 11.4 13.8 14.4Japanese yen 0.6 4.2 1.9 1.1 0.8 0.5 0.7 1.0Pound sterling 1.5 1.2 0.8 0.6 0.0 0.0 0.0 0.0Swiss franc 0.9 0.7 0.4 0.4 0.0 0.0 0.0 0.0U.S.dollars 78.2 69.0 83.7 74.8 83.6 84.2 81.5 82.3
4. Average terms of new commitmentsOfficial creditors Interest (%) 7.8 6.8 8.0 4.5 5.0 6.2 5.6 5.7 Maturity (years) 15.6 17.2 12.7 10.5 8.0 10.4 18.0 20.0 Grace period (years) 4.9 5.2 2.6 1.8 2.2 2.7 7.8 10.5Private creditors Interest (%) 8.5 7.7 8.2 7.7 7.1 6.6 0.0 7.0 Maturity (years) 13.6 3.3 6.4 9.7 15.9 13.8 0.0 30.3 Grace period (years) 6.1 3.0 2.6 8.7 15.3 13.7 0.0 30.3
5. Major economic aggregatesGross national income (GNI) 46,254 72,946 115,760 81,192 108,779 143,248 183,417 230,636Exports of goods, services & income 21,464 22,620 37,760 30,024 42,955 61,262 74,861 81,068Worker remit. & comp. of employees 1 2 17 208 143 148 165 136Imports of goods & services 12,883 20,715 25,737 18,061 27,241 35,955 47,529 60,536International reserves 12,733 10,715 15,899 20,821 23,408 29,803 36,715 33,759Current account balance 8,279 2,014 11,853 11,796 15,519 25,110 27,149 20,001
6. RatiosExternal debt stocks to exports (%) 154.5 157.1 111.1 125.8 91.6 74.6 59.6 53.2External debt stocks to GNI (%) 71.7 48.7 36.2 46.5 36.2 31.9 24.3 18.7Debt service to exports (%) 23.3 22.9 16.7 29.4 17.0 9.3 13.3 7.4Short-term to external debt stocks (%) 6.0 8.6 19.5 20.1 19.9 22.1 26.6 27.1Multilateral to external debt stocks (%) 4.9 9.3 7.5 9.0 8.0 6.0 6.5 5.4Reserves to external debt stocks (%) 38.4 30.2 37.9 55.1 59.5 65.2 82.3 78.2Reserves to imports (months) 11.9 6.2 7.4 13.8 10.3 9.9 9.3 6.7
268

VENEZUELA, REPUBLICA BOLIVARIANA de(US$ million, unless otherwise indicated)
1990 1995 2000 2003 2004 2005 2006 2007
7. Long-term external debtDebt outstanding and disbursed 28,159 30,236 33,565 30,171 31,499 35,594 32,765 31,448Public and publicly guaranteed 24,509 28,223 27,433 24,156 26,133 30,927 27,159 27,494 Official creditors 1,933 4,703 5,924 3,888 3,513 3,167 3,583 3,149 Multilateral 1,640 3,300 3,158 3,390 3,139 2,727 2,914 2,327 of which: IBRD 974 1,639 972 484 294 200 51 0 IDA 0 0 0 0 0 0 0 0 Bilateral 293 1,403 2,766 498 375 440 669 822 Private creditors 22,577 23,520 21,508 20,267 22,620 27,761 23,576 24,345 of which: Bonds 19,644 20,745 16,217 16,066 18,410 23,546 19,478 20,675 Commercial banks 363 1,158 3,377 3,404 3,239 3,154 2,914 2,611Private nonguaranteed 3,650 2,013 6,132 6,016 5,366 4,667 5,606 3,954 of which: Bonds 0 114 3,880 4,327 3,682 3,670 4,734 2,960Disbursements 2,226 1,717 2,303 6,853 6,248 7,479 1,935 2,078Public and publicly guaranteed 2,226 1,637 2,303 5,888 5,023 7,479 1,835 2,078 Official creditors 1,103 529 782 406 409 432 1,114 514 Multilateral 1,035 267 399 357 296 172 771 254 of which: IBRD 840 47 50 23 16 13 9 0 IDA 0 0 0 0 0 0 0 0 Bilateral 69 262 382 50 113 260 342 260 Private creditors 1,122 1,108 1,522 5,482 4,614 7,046 722 1,564 of which: Bonds 599 349 462 3,763 4,000 6,143 0 1,250 Commercial banks 26 586 639 1,369 230 469 257 151Private nonguaranteed 0 80 0 965 1,225 0 100 0 of which: Bonds 0 0 0 0 260 0 100 0Principal repayments 1,749 2,278 2,912 6,559 5,135 2,780 6,637 3,005Public and publicly guaranteed 1,576 1,775 2,256 5,589 3,265 2,093 5,966 2,050 Official creditors 50 375 613 1,016 817 710 717 969 Multilateral 9 202 356 473 577 523 601 851 of which: IBRD 0 116 208 210 207 106 159 50 IDA 0 0 0 0 0 0 0 0 Bilateral 41 173 257 543 240 187 116 119 Private creditors 1,526 1,400 1,643 4,573 2,449 1,382 5,248 1,081 of which: Bonds 254 817 1,119 3,074 1,751 646 4,292 216 Commercial banks 706 45 370 978 467 430 577 529Private nonguaranteed 173 503 655 970 1,870 687 671 955 of which: Bonds 0 0 0 0 900 0 546 274Interest payments 2,993 2,095 2,408 2,166 2,079 2,639 2,841 2,545Public and publicly guaranteed 2,593 1,984 1,840 1,814 1,774 2,290 2,403 2,222 Official creditors 71 296 325 275 180 189 202 216 Multilateral 59 231 255 220 158 159 166 169 of which: IBRD 19 120 91 33 17 10 6 1 IDA 0 0 0 0 0 0 0 0 Bilateral 12 66 71 55 22 30 35 47 Private creditors 2,522 1,688 1,515 1,540 1,595 2,101 2,201 2,006 of which: Bonds 135 1,534 1,298 1,022 1,217 1,747 1,834 1,676 Commercial banks 2,198 65 169 431 321 289 284 261Private nonguaranteed 400 111 568 351 304 349 439 324 of which: Bonds 0 10 304 337 290 296 392 2718. Debt stock-flow reconciliationTotal change in external debt stocks 792 -1,313 1,266 1,446 1,582 6,358 -1,089 -1,465 Net flows on external debt 2,036 -1,670 1,585 698 1,359 6,970 -2,958 -1,073 Cross-currency valuation 379 366 -328 824 374 -431 427 4809. Debt restructuringsTotal amount rescheduled 17,659 0 0 0 0 0 0 0Total amount forgiven 0 0 0 0 0 0 0 0Debt buyback 634 0 0 0 0 0 0 010. Contractual obligations on outstanding long-term external debt
2008 2009 2010 2011 2012 2013 2014 2015Official creditorsPrincipal 537 493 478 471 435 406 296 189Interest 222 216 202 182 157 132 108 91Private creditorsPrincipal 2,641 655 2,779 2,010 753 1,676 1,861 1,398Interest 2,248 2,051 2,001 1,747 1,667 1,610 1,435 1,228
Notes:Short-term debt was revised from 1999 to 2004 based on the Central Bank data.
269

VIETNAM(US$ million, unless otherwise indicated)
1990 1995 2000 2003 2004 2005 2006 2007
1. Summary external debt dataExternal debt stocks 23,270 25,428 12,825 15,991 18,049 19,211 20,202 24,222 Long-term external debt 21,378 21,778 11,586 14,363 15,631 16,433 17,518 19,372 Public and publicly guaranteed 21,378 21,778 11,586 14,363 15,631 16,433 17,518 19,372 Private nonguaranteed 0 0 0 0 0 0 0 0 Use of IMF credit 112 377 316 339 277 203 181 164 Short-term external debt 1,780 3,272 923 1,289 2,141 2,575 2,504 4,687 interest arrears on long-term 1,530 2,501 78 82 54 75 77 81Memorandum itemsPrincipal arrears on long-term 2,011 8,915 1,378 1,379 1,362 1,360 1,364 1,370Long-term public sector debt 21,378 21,778 11,586 14,363 15,631 16,433 17,518 19,372Long-term private sector debt 0 0 0 0 0 0 0 0Public & publicly guaranteed commitments 11 2,466 1,191 1,736 2,352 2,660 2,297 1,247
External debt flowsDisbursements 13 730 1,273 1,588 1,670 2,047 1,228 1,805 Long-term external debt 13 639 1,273 1,588 1,670 2,047 1,228 1,805 IMF purchases 0 92 0 0 0 0 0 0Principal repayments 104 225 958 506 430 519 464 646 Long-term external debt 99 225 937 433 357 466 432 621 IMF repurchases 5 0 21 73 73 54 33 25Net flows -95 823 473 1,583 2,120 1,940 691 3,324 Long-term external debt -86 414 336 1,155 1,313 1,581 797 1,185 IMF flows 0 0 -5 -6 -1 0 0 0 Short-term external debt -4 317 158 502 880 413 -73 2,164Interest payments 70 139 352 300 357 437 453 610 Long-term external debt 46 81 298 270 306 321 329 416 IMF charges 0 11 3 2 2 1 1 1 Short-term external debt 23 46 51 29 49 115 123 193
2. Other non-debt resource flowsForeign direct investment (net) 180 1,780 1,298 1,450 1,610 1,954 2,400 6,700Portfolio equity flows 0 0 0 0 0 115 1,313 6,243Profit remittances on FDI 0 0 0 0 0 0 0 0Grants (excluding technical coop.) 96 348 236 319 400 505 547 643of which: Debt forgiveness grants .. .. 11 1 1 1 55 2 IDA grants .. .. .. 0 0 2 5 7Memo: technical coop. grants 98 229 245 291 307 309 352 350
3. Currency composition of public and publicly guaranteed debt (%)Euro .. .. .. 7.8 6.7 5.7 6.1 6.2Japanese yen 2.0 5.6 23.5 28.7 27.8 25.9 26.6 28.1Pound sterling 0.2 0.1 0.1 0.1 0.1 0.1 0.1 0.1Swiss franc 0.0 0.0 0.1 0.0 0.0 0.0 0.0 0.0U.S.dollars 5.5 8.4 43.3 39.6 41.7 44.8 44.2 42.8
4. Average terms of new commitmentsOfficial creditors Interest (%) 5.7 2.3 1.4 1.9 1.4 1.3 1.9 1.0 Maturity (years) 9.6 31.5 36.1 27.9 32.9 33.6 33.2 37.5 Grace period (years) 4.2 9.5 9.6 7.7 8.7 9.1 8.7 9.5Private creditors Interest (%) 0.0 6.7 0.0 0.0 3.9 6.9 4.2 0.0 Maturity (years) 0.0 7.2 0.0 0.0 12.2 10.2 21.1 0.0 Grace period (years) 0.0 2.0 0.0 0.0 2.3 10.1 6.6 0.0
5. Major economic aggregatesGross national income (GNI) 6,060 20,510 30,726 38,249 44,554 51,748 58,543 66,775Exports of goods, services & income .. .. 17,481 23,546 30,540 36,987 45,594 55,684Worker remit. & comp. of employees 0 0 0 2,700 3,200 4,000 4,800 5,500Imports of goods & services .. .. 18,107 27,716 34,590 40,927 49,807 69,106International reserves .. 1,324 3,417 6,224 7,041 9,051 13,384 23,479Current account balance .. .. 1,106 -1,931 -957 -560 -164 -6,992
6. RatiosExternal debt stocks to exports (%) .. .. 73.4 67.9 59.1 51.9 44.3 43.5External debt stocks to GNI (%) 384.0 124.0 41.7 41.8 40.5 37.1 34.5 36.3Debt service to exports (%) .. .. 7.5 3.4 2.6 2.6 2.0 2.3Short-term to external debt stocks (%) 7.7 12.9 7.2 8.1 11.9 13.4 12.4 19.3Multilateral to external debt stocks (%) 0.6 1.3 14.8 25.5 27.4 26.8 29.0 29.3Reserves to external debt stocks (%) 0.0 5.2 26.6 38.9 39.0 47.1 66.2 96.9Reserves to imports (months) .. .. 2.3 2.7 2.4 2.7 3.2 4.1
270

VIETNAM(US$ million, unless otherwise indicated)
1990 1995 2000 2003 2004 2005 2006 2007
7. Long-term external debtDebt outstanding and disbursed 21,378 21,778 11,586 14,363 15,631 16,433 17,518 19,372Public and publicly guaranteed 21,378 21,778 11,586 14,363 15,631 16,433 17,518 19,372 Official creditors 20,171 20,450 8,683 12,921 14,167 14,389 15,531 17,441 Multilateral 130 325 1,895 4,070 4,937 5,144 5,860 7,106 of which: IBRD 0 0 0 0 0 0 0 0 IDA 59 231 1,113 2,472 3,039 3,187 3,663 4,549 Bilateral 20,041 20,126 6,787 8,851 9,230 9,246 9,671 10,335 Private creditors 1,207 1,328 2,904 1,442 1,464 2,044 1,987 1,931 of which: Bonds 0 0 560 560 547 1,271 1,245 1,220 Commercial banks 684 1,043 1,658 372 483 438 469 502Private nonguaranteed 0 0 0 0 0 0 0 0 of which: Bonds 0 0 0 0 0 0 0 0Disbursements 13 639 1,273 1,588 1,670 2,047 1,228 1,805Public and publicly guaranteed 13 639 1,273 1,588 1,670 2,047 1,228 1,805 Official creditors 13 233 1,177 1,567 1,520 1,261 1,151 1,753 Multilateral 4 100 395 786 634 639 548 996 of which: IBRD 0 0 0 0 0 0 0 0 IDA 0 47 174 567 444 391 340 748 Bilateral 9 133 782 780 887 622 602 756 Private creditors 0 406 96 21 150 786 78 53 of which: Bonds 0 0 0 0 0 750 0 0 Commercial banks 0 389 9 19 150 36 78 53Private nonguaranteed 0 0 0 0 0 0 0 0 of which: Bonds 0 0 0 0 0 0 0 0Principal repayments 99 225 937 433 357 466 432 621Public and publicly guaranteed 99 225 937 433 357 466 432 621 Official creditors 99 175 134 153 216 306 288 482 Multilateral 3 7 6 9 23 31 43 61 of which: IBRD 0 0 0 0 0 0 0 0 IDA 1 1 2 2 8 14 23 30 Bilateral 96 168 128 144 193 275 245 421 Private creditors 0 50 802 280 141 160 144 139 of which: Bonds 0 0 0 0 13 26 26 26 Commercial banks 0 0 617 191 45 56 53 42Private nonguaranteed 0 0 0 0 0 0 0 0 of which: Bonds 0 0 0 0 0 0 0 0Interest payments 46 81 298 270 306 321 329 416Public and publicly guaranteed 46 81 298 270 306 321 329 416 Official creditors 26 50 77 204 250 260 235 303 Multilateral 2 2 14 30 47 52 55 64 of which: IBRD 0 0 0 0 0 0 0 0 IDA 0 2 7 14 28 30 33 34 Bilateral 24 47 63 174 203 208 180 239 Private creditors 20 32 220 66 56 61 94 113 of which: Bonds 0 0 23 22 22 22 57 72 Commercial banks 4 24 153 19 14 24 25 28Private nonguaranteed 0 0 0 0 0 0 0 0 of which: Bonds 0 0 0 0 0 0 0 08. Debt stock-flow reconciliationTotal change in external debt stocks 0 628 -10,385 2,647 2,058 1,162 991 4,005 Net flows on external debt -95 823 473 1,583 2,120 1,940 691 3,324 Cross-currency valuation 0 1 -457 908 480 -1,099 298 6259. Debt restructuringsTotal amount rescheduled 410 89 0 0 0 201 0 0Total amount forgiven 0 32 5 0 5 3 0 0Debt buyback 0 0 0 0 0 0 0 010. Contractual obligations on outstanding long-term external debt
2008 2009 2010 2011 2012 2013 2014 2015Official creditorsPrincipal 601 650 728 756 777 830 887 945Interest 334 344 345 340 333 321 308 289Private creditorsPrincipal 140 123 109 96 104 101 93 92Interest 111 107 102 97 93 88 83 79
Notes:Data on long-term public and publicly guaranteed debt for 2007 are World Bank staff estimates.
271
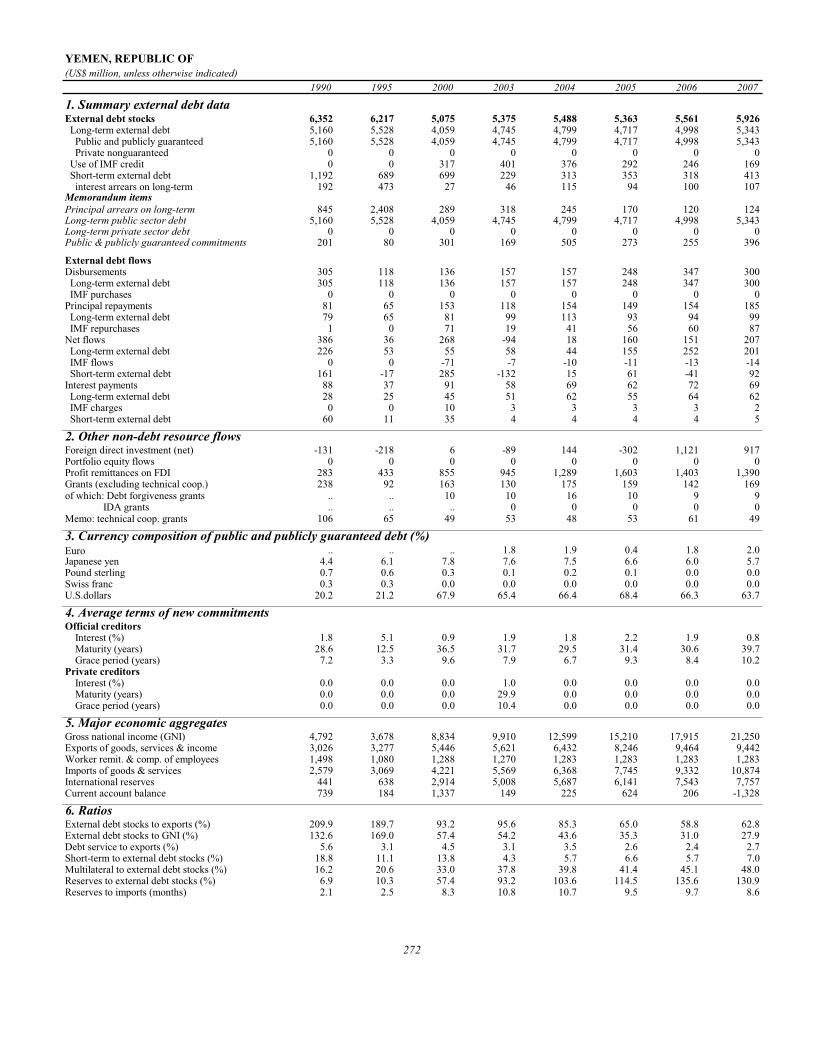
YEMEN, REPUBLIC OF(US$ million, unless otherwise indicated)
1990 1995 2000 2003 2004 2005 2006 2007
1. Summary external debt dataExternal debt stocks 6,352 6,217 5,075 5,375 5,488 5,363 5,561 5,926 Long-term external debt 5,160 5,528 4,059 4,745 4,799 4,717 4,998 5,343 Public and publicly guaranteed 5,160 5,528 4,059 4,745 4,799 4,717 4,998 5,343 Private nonguaranteed 0 0 0 0 0 0 0 0 Use of IMF credit 0 0 317 401 376 292 246 169 Short-term external debt 1,192 689 699 229 313 353 318 413 interest arrears on long-term 192 473 27 46 115 94 100 107Memorandum itemsPrincipal arrears on long-term 845 2,408 289 318 245 170 120 124Long-term public sector debt 5,160 5,528 4,059 4,745 4,799 4,717 4,998 5,343Long-term private sector debt 0 0 0 0 0 0 0 0Public & publicly guaranteed commitments 201 80 301 169 505 273 255 396
External debt flowsDisbursements 305 118 136 157 157 248 347 300 Long-term external debt 305 118 136 157 157 248 347 300 IMF purchases 0 0 0 0 0 0 0 0Principal repayments 81 65 153 118 154 149 154 185 Long-term external debt 79 65 81 99 113 93 94 99 IMF repurchases 1 0 71 19 41 56 60 87Net flows 386 36 268 -94 18 160 151 207 Long-term external debt 226 53 55 58 44 155 252 201 IMF flows 0 0 -71 -7 -10 -11 -13 -14 Short-term external debt 161 -17 285 -132 15 61 -41 92Interest payments 88 37 91 58 69 62 72 69 Long-term external debt 28 25 45 51 62 55 64 62 IMF charges 0 0 10 3 3 3 3 2 Short-term external debt 60 11 35 4 4 4 4 5
2. Other non-debt resource flowsForeign direct investment (net) -131 -218 6 -89 144 -302 1,121 917Portfolio equity flows 0 0 0 0 0 0 0 0Profit remittances on FDI 283 433 855 945 1,289 1,603 1,403 1,390Grants (excluding technical coop.) 238 92 163 130 175 159 142 169of which: Debt forgiveness grants .. .. 10 10 16 10 9 9 IDA grants .. .. .. 0 0 0 0 0Memo: technical coop. grants 106 65 49 53 48 53 61 49
3. Currency composition of public and publicly guaranteed debt (%)Euro .. .. .. 1.8 1.9 0.4 1.8 2.0Japanese yen 4.4 6.1 7.8 7.6 7.5 6.6 6.0 5.7Pound sterling 0.7 0.6 0.3 0.1 0.2 0.1 0.0 0.0Swiss franc 0.3 0.3 0.0 0.0 0.0 0.0 0.0 0.0U.S.dollars 20.2 21.2 67.9 65.4 66.4 68.4 66.3 63.7
4. Average terms of new commitmentsOfficial creditors Interest (%) 1.8 5.1 0.9 1.9 1.8 2.2 1.9 0.8 Maturity (years) 28.6 12.5 36.5 31.7 29.5 31.4 30.6 39.7 Grace period (years) 7.2 3.3 9.6 7.9 6.7 9.3 8.4 10.2Private creditors Interest (%) 0.0 0.0 0.0 1.0 0.0 0.0 0.0 0.0 Maturity (years) 0.0 0.0 0.0 29.9 0.0 0.0 0.0 0.0 Grace period (years) 0.0 0.0 0.0 10.4 0.0 0.0 0.0 0.0
5. Major economic aggregatesGross national income (GNI) 4,792 3,678 8,834 9,910 12,599 15,210 17,915 21,250Exports of goods, services & income 3,026 3,277 5,446 5,621 6,432 8,246 9,464 9,442Worker remit. & comp. of employees 1,498 1,080 1,288 1,270 1,283 1,283 1,283 1,283Imports of goods & services 2,579 3,069 4,221 5,569 6,368 7,745 9,332 10,874International reserves 441 638 2,914 5,008 5,687 6,141 7,543 7,757Current account balance 739 184 1,337 149 225 624 206 -1,328
6. RatiosExternal debt stocks to exports (%) 209.9 189.7 93.2 95.6 85.3 65.0 58.8 62.8External debt stocks to GNI (%) 132.6 169.0 57.4 54.2 43.6 35.3 31.0 27.9Debt service to exports (%) 5.6 3.1 4.5 3.1 3.5 2.6 2.4 2.7Short-term to external debt stocks (%) 18.8 11.1 13.8 4.3 5.7 6.6 5.7 7.0Multilateral to external debt stocks (%) 16.2 20.6 33.0 37.8 39.8 41.4 45.1 48.0Reserves to external debt stocks (%) 6.9 10.3 57.4 93.2 103.6 114.5 135.6 130.9Reserves to imports (months) 2.1 2.5 8.3 10.8 10.7 9.5 9.7 8.6
272

YEMEN, REPUBLIC OF(US$ million, unless otherwise indicated)
1990 1995 2000 2003 2004 2005 2006 2007
7. Long-term external debtDebt outstanding and disbursed 5,160 5,528 4,059 4,745 4,799 4,717 4,998 5,343Public and publicly guaranteed 5,160 5,528 4,059 4,745 4,799 4,717 4,998 5,343 Official creditors 3,502 3,810 3,996 4,673 4,723 4,686 4,959 5,304 Multilateral 1,026 1,278 1,676 2,032 2,185 2,218 2,506 2,843 of which: IBRD 0 0 0 0 0 0 0 0 IDA 602 827 1,216 1,567 1,701 1,689 1,894 2,058 Bilateral 2,476 2,532 2,320 2,641 2,538 2,468 2,452 2,461 Private creditors 1,658 1,718 63 71 77 31 39 39 of which: Bonds 0 0 0 0 0 0 0 0 Commercial banks 80 80 53 71 77 7 7 7Private nonguaranteed 0 0 0 0 0 0 0 0 of which: Bonds 0 0 0 0 0 0 0 0Disbursements 305 118 136 157 157 248 347 300Public and publicly guaranteed 305 118 136 157 157 248 347 300 Official creditors 139 118 136 157 157 223 339 299 Multilateral 56 109 111 138 154 216 262 289 of which: IBRD 0 0 0 0 0 0 0 0 IDA 27 42 65 89 92 129 160 122 Bilateral 84 9 25 18 4 7 78 10 Private creditors 166 0 0 0 0 24 7 1 of which: Bonds 0 0 0 0 0 0 0 0 Commercial banks 0 0 0 0 0 0 0 0Private nonguaranteed 0 0 0 0 0 0 0 0 of which: Bonds 0 0 0 0 0 0 0 0Principal repayments 79 65 81 99 113 93 94 99Public and publicly guaranteed 79 65 81 99 113 93 94 99 Official creditors 74 63 81 99 113 93 94 98 Multilateral 41 53 60 61 76 58 61 65 of which: IBRD 0 0 0 0 0 0 0 0 IDA 2 8 14 23 26 27 31 34 Bilateral 34 10 20 38 38 35 33 33 Private creditors 5 2 0 0 0 0 0 1 of which: Bonds 0 0 0 0 0 0 0 0 Commercial banks 0 0 0 0 0 0 0 1Private nonguaranteed 0 0 0 0 0 0 0 0 of which: Bonds 0 0 0 0 0 0 0 0Interest payments 28 25 45 51 62 55 64 62Public and publicly guaranteed 28 25 45 51 62 55 64 62 Official creditors 23 25 45 51 61 55 64 62 Multilateral 14 18 21 23 27 27 28 32 of which: IBRD 0 0 0 0 0 0 0 0 IDA 3 6 9 11 15 15 15 15 Bilateral 9 7 24 28 35 28 36 30 Private creditors 5 0 0 0 0 0 0 0 of which: Bonds 0 0 0 0 0 0 0 0 Commercial banks 0 0 0 0 0 0 0 0Private nonguaranteed 0 0 0 0 0 0 0 0 of which: Bonds 0 0 0 0 0 0 0 08. Debt stock-flow reconciliationTotal change in external debt stocks 759 92 -1,118 151 113 -126 199 368 Net flows on external debt 386 36 268 -94 18 160 151 207 Cross-currency valuation 233 -49 -139 234 78 -208 107 1569. Debt restructuringsTotal amount rescheduled 98 0 123 0 0 65 0 0Total amount forgiven 0 0 9 5 47 66 122 7Debt buyback 0 0 0 0 0 0 0 010. Contractual obligations on outstanding long-term external debt
2008 2009 2010 2011 2012 2013 2014 2015Official creditorsPrincipal 182 218 224 216 207 217 220 213Interest 69 71 70 69 67 64 61 58Private creditorsPrincipal 1 1 1 1 2 9 23 22Interest 6 11 11 11 11 11 11 10
273

ZAMBIA(US$ million, unless otherwise indicated)
1990 1995 2000 2003 2004 2005 2006 2007
1. Summary external debt dataExternal debt stocks 6,905 6,958 5,722 6,800 7,460 5,386 2,284 2,789 Long-term external debt 4,543 5,304 4,508 5,835 6,418 4,551 1,799 2,126 Public and publicly guaranteed 4,541 5,291 4,444 5,582 5,853 3,955 973 1,136 Private nonguaranteed 2 13 65 252 566 596 826 990 Use of IMF credit 949 1,239 1,138 859 890 591 41 87 Short-term external debt 1,413 415 76 106 151 244 443 576 interest arrears on long-term 738 177 33 36 62 90 140 148Memorandum itemsPrincipal arrears on long-term 1,493 772 137 538 742 340 315 315Long-term public sector debt 4,541 5,259 4,413 5,580 5,850 3,952 972 1,136Long-term private sector debt 2 45 95 255 569 599 827 990Public & publicly guaranteed commitments 202 382 330 76 173 58 175 185
External debt flowsDisbursements 164 2,606 287 206 822 237 443 421 Long-term external debt 164 352 261 206 577 220 419 378 IMF purchases 0 2,253 26 0 245 16 24 42Principal repayments 124 2,067 98 378 392 215 104 76 Long-term external debt 100 242 98 307 143 136 104 76 IMF repurchases 25 1,825 0 71 249 79 0 0Net flows -125 435 159 -170 449 86 489 462 Long-term external debt 65 110 163 -101 435 84 315 302 IMF flows -20 -826 0 0 0 0 0 0 Short-term external debt -165 -104 -30 2 19 65 149 118Interest payments 76 545 88 180 75 66 56 47 Long-term external debt 72 125 80 173 68 58 46 33 IMF charges 2 419 6 5 4 4 0 0 Short-term external debt 3 1 3 2 3 5 9 13
2. Other non-debt resource flowsForeign direct investment (net) 203 97 122 184 363 357 616 984Portfolio equity flows 0 0 6 2 0 5 2 4Profit remittances on FDI 115 0 0 24 238 461 1,107 1,362Grants (excluding technical coop.) 663 362 415 785 826 1,732 4,371 821of which: Debt forgiveness grants .. .. 217 439 389 1,213 3,819 65 IDA grants .. .. .. 16 10 22 20 20Memo: technical coop. grants 128 164 108 123 145 166 183 71
3. Currency composition of public and publicly guaranteed debt (%)Euro .. .. .. 14.1 14.7 5.9 20.7 18.3Japanese yen 10.0 11.2 13.9 10.1 9.7 1.2 0.0 0.0Pound sterling 8.5 7.7 3.9 5.6 5.6 5.0 0.7 0.4Swiss franc 0.5 0.1 0.0 0.0 0.0 0.0 0.0 0.0U.S.dollars 28.1 39.6 61.7 58.5 58.9 72.6 38.9 40.2
4. Average terms of new commitmentsOfficial creditors Interest (%) 6.5 1.5 0.8 1.9 0.8 0.8 2.2 2.2 Maturity (years) 20.7 37.3 39.6 31.5 41.4 35.8 28.8 26.3 Grace period (years) 6.6 10.3 10.1 8.1 10.1 8.2 7.6 6.5Private creditors Interest (%) 11.0 10.5 0.0 2.2 0.0 0.0 2.0 0.0 Maturity (years) 6.9 9.2 0.0 9.3 0.0 0.0 15.2 0.0 Grace period (years) 1.4 2.9 0.0 1.8 0.0 0.0 4.7 0.0
5. Major economic aggregatesGross national income (GNI) 3,008 3,235 3,082 4,231 5,128 6,717 9,717 9,979Exports of goods, services & income 1,362 .. 891 1,320 2,157 2,586 4,233 4,967Worker remit. & comp. of employees 0 0 0 36 48 53 58 59Imports of goods & services 2,336 .. 1,496 1,973 2,556 3,239 4,409 5,943International reserves 201 223 245 248 337 560 720 1,090Current account balance -594 .. -591 -642 -419 -600 128 -505
6. RatiosExternal debt stocks to exports (%) 507.0 .. 642.0 515.2 345.9 208.3 53.9 56.1External debt stocks to GNI (%) 229.5 215.1 185.7 160.7 145.5 80.2 23.5 27.9Debt service to exports (%) 14.7 .. 20.8 42.3 21.6 10.9 3.8 2.5Short-term to external debt stocks (%) 20.5 6.0 1.3 1.6 2.0 4.5 19.4 20.6Multilateral to external debt stocks (%) 20.1 30.5 42.0 45.3 45.0 58.3 30.3 28.5Reserves to external debt stocks (%) 2.9 3.2 4.3 3.6 4.5 10.4 31.5 39.1Reserves to imports (months) 1.0 .. 2.0 1.5 1.6 2.1 2.0 2.2
274

ZAMBIA(US$ million, unless otherwise indicated)
1990 1995 2000 2003 2004 2005 2006 2007
7. Long-term external debtDebt outstanding and disbursed 4,543 5,304 4,508 5,835 6,418 4,551 1,799 2,126Public and publicly guaranteed 4,541 5,291 4,444 5,582 5,853 3,955 973 1,136 Official creditors 4,097 5,080 4,412 5,157 5,413 3,654 868 1,028 Multilateral 1,389 2,120 2,403 3,077 3,358 3,139 692 796 of which: IBRD 539 163 25 3 0 0 0 0 IDA 274 1,270 1,823 2,405 2,637 2,488 260 323 Bilateral 2,708 2,960 2,009 2,080 2,055 515 176 232 Private creditors 444 210 31 426 439 301 105 108 of which: Bonds 0 0 0 0 0 0 0 0 Commercial banks 70 16 0 0 3 5 57 61Private nonguaranteed 2 13 65 252 566 596 826 990 of which: Bonds 0 0 0 0 0 0 0 0Disbursements 164 352 261 206 577 220 419 378Public and publicly guaranteed 162 351 251 141 199 116 162 138 Official creditors 117 327 251 141 196 113 110 136 Multilateral 106 251 249 116 196 111 110 99 of which: IBRD 0 0 0 0 0 0 0 0 IDA 3 209 210 74 141 77 40 51 Bilateral 11 76 2 25 1 2 0 37 Private creditors 46 24 0 0 3 3 52 2 of which: Bonds 0 0 0 0 0 0 0 0 Commercial banks 0 8 0 0 3 3 52 2Private nonguaranteed 2 1 10 65 379 105 257 241 of which: Bonds 0 0 0 0 0 0 0 0Principal repayments 100 242 98 307 143 136 104 76Public and publicly guaranteed 100 241 79 270 78 71 68 33 Official creditors 43 180 79 148 65 59 66 32 Multilateral 37 120 51 19 33 21 42 31 of which: IBRD 5 50 8 7 3 0 0 0 IDA 0 2 4 0 0 1 17 0 Bilateral 5 60 28 129 32 38 25 1 Private creditors 57 61 1 122 13 12 1 2 of which: Bonds 0 0 0 0 0 0 0 0 Commercial banks 0 2 0 0 0 0 1 2Private nonguaranteed 0 1 18 37 64 66 36 43 of which: Bonds 0 0 0 0 0 0 0 0Interest payments 72 125 80 173 68 58 46 33Public and publicly guaranteed 72 125 76 169 43 29 23 10 Official creditors 43 116 76 85 42 29 22 9 Multilateral 33 65 33 17 26 25 19 9 of which: IBRD 1 15 3 1 0 0 0 0 IDA 0 9 13 9 14 16 11 2 Bilateral 10 51 42 69 16 4 3 0 Private creditors 29 9 0 84 1 0 0 1 of which: Bonds 0 0 0 0 0 0 0 0 Commercial banks 0 1 0 0 0 0 0 1Private nonguaranteed 0 0 4 4 25 28 23 23 of which: Bonds 0 0 0 0 0 0 0 08. Debt stock-flow reconciliationTotal change in external debt stocks 351 149 -137 208 660 -2,073 -3,103 499 Net flows on external debt -125 435 159 -170 449 86 489 462 Cross-currency valuation 302 -103 -289 545 208 -525 -2,444 379. Debt restructuringsTotal amount rescheduled 690 20 169 2 1 58 8 51Total amount forgiven 114 1 39 67 50 51 66 9Debt buyback 0 0 0 0 0 0 0 010. Contractual obligations on outstanding long-term external debt
2008 2009 2010 2011 2012 2013 2014 2015Official creditorsPrincipal 65 70 60 54 55 49 52 52Interest 18 17 15 13 12 11 10 9Private creditorsPrincipal 159 151 136 112 92 61 34 26Interest 29 23 17 13 8 4 2 1
Notes:Zambia was granted debt relief effective in 2006 under the Multilateral Debt Relief Initiative. Rescheduling: Data include the effects of Paris Club debt restructuring agreement signed in 2005. Data on long-term public and publicly guaranteed debt for 2007 are World Bank staff estimates based on reports provided by the country. Long-term private nonguranteed debt data is the World Bank staff estimates in 2007.
275
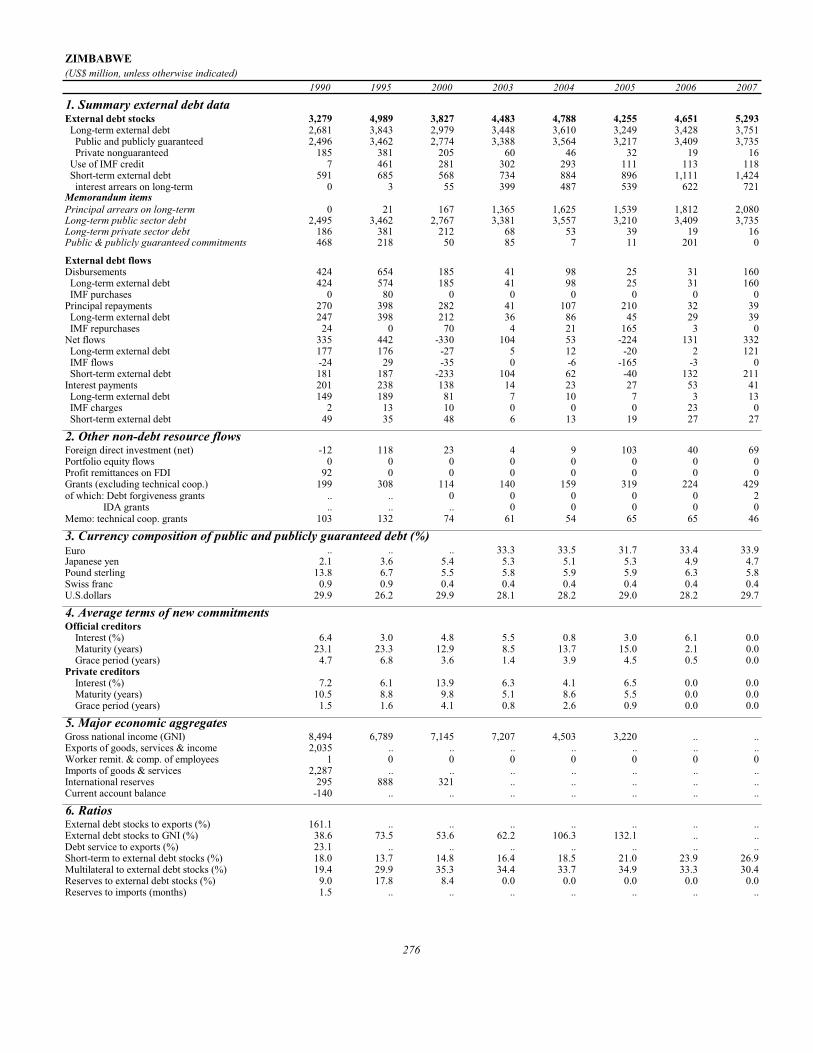
ZIMBABWE(US$ million, unless otherwise indicated)
1990 1995 2000 2003 2004 2005 2006 2007
1. Summary external debt dataExternal debt stocks 3,279 4,989 3,827 4,483 4,788 4,255 4,651 5,293 Long-term external debt 2,681 3,843 2,979 3,448 3,610 3,249 3,428 3,751 Public and publicly guaranteed 2,496 3,462 2,774 3,388 3,564 3,217 3,409 3,735 Private nonguaranteed 185 381 205 60 46 32 19 16 Use of IMF credit 7 461 281 302 293 111 113 118 Short-term external debt 591 685 568 734 884 896 1,111 1,424 interest arrears on long-term 0 3 55 399 487 539 622 721Memorandum itemsPrincipal arrears on long-term 0 21 167 1,365 1,625 1,539 1,812 2,080Long-term public sector debt 2,495 3,462 2,767 3,381 3,557 3,210 3,409 3,735Long-term private sector debt 186 381 212 68 53 39 19 16Public & publicly guaranteed commitments 468 218 50 85 7 11 201 0
External debt flowsDisbursements 424 654 185 41 98 25 31 160 Long-term external debt 424 574 185 41 98 25 31 160 IMF purchases 0 80 0 0 0 0 0 0Principal repayments 270 398 282 41 107 210 32 39 Long-term external debt 247 398 212 36 86 45 29 39 IMF repurchases 24 0 70 4 21 165 3 0Net flows 335 442 -330 104 53 -224 131 332 Long-term external debt 177 176 -27 5 12 -20 2 121 IMF flows -24 29 -35 0 -6 -165 -3 0 Short-term external debt 181 187 -233 104 62 -40 132 211Interest payments 201 238 138 14 23 27 53 41 Long-term external debt 149 189 81 7 10 7 3 13 IMF charges 2 13 10 0 0 0 23 0 Short-term external debt 49 35 48 6 13 19 27 27
2. Other non-debt resource flowsForeign direct investment (net) -12 118 23 4 9 103 40 69Portfolio equity flows 0 0 0 0 0 0 0 0Profit remittances on FDI 92 0 0 0 0 0 0 0Grants (excluding technical coop.) 199 308 114 140 159 319 224 429of which: Debt forgiveness grants .. .. 0 0 0 0 0 2 IDA grants .. .. .. 0 0 0 0 0Memo: technical coop. grants 103 132 74 61 54 65 65 46
3. Currency composition of public and publicly guaranteed debt (%)Euro .. .. .. 33.3 33.5 31.7 33.4 33.9Japanese yen 2.1 3.6 5.4 5.3 5.1 5.3 4.9 4.7Pound sterling 13.8 6.7 5.5 5.8 5.9 5.9 6.3 5.8Swiss franc 0.9 0.9 0.4 0.4 0.4 0.4 0.4 0.4U.S.dollars 29.9 26.2 29.9 28.1 28.2 29.0 28.2 29.7
4. Average terms of new commitmentsOfficial creditors Interest (%) 6.4 3.0 4.8 5.5 0.8 3.0 6.1 0.0 Maturity (years) 23.1 23.3 12.9 8.5 13.7 15.0 2.1 0.0 Grace period (years) 4.7 6.8 3.6 1.4 3.9 4.5 0.5 0.0Private creditors Interest (%) 7.2 6.1 13.9 6.3 4.1 6.5 0.0 0.0 Maturity (years) 10.5 8.8 9.8 5.1 8.6 5.5 0.0 0.0 Grace period (years) 1.5 1.6 4.1 0.8 2.6 0.9 0.0 0.0
5. Major economic aggregatesGross national income (GNI) 8,494 6,789 7,145 7,207 4,503 3,220 .. ..Exports of goods, services & income 2,035 .. .. .. .. .. .. ..Worker remit. & comp. of employees 1 0 0 0 0 0 0 0Imports of goods & services 2,287 .. .. .. .. .. .. ..International reserves 295 888 321 .. .. .. .. ..Current account balance -140 .. .. .. .. .. .. ..
6. RatiosExternal debt stocks to exports (%) 161.1 .. .. .. .. .. .. ..External debt stocks to GNI (%) 38.6 73.5 53.6 62.2 106.3 132.1 .. ..Debt service to exports (%) 23.1 .. .. .. .. .. .. ..Short-term to external debt stocks (%) 18.0 13.7 14.8 16.4 18.5 21.0 23.9 26.9Multilateral to external debt stocks (%) 19.4 29.9 35.3 34.4 33.7 34.9 33.3 30.4Reserves to external debt stocks (%) 9.0 17.8 8.4 0.0 0.0 0.0 0.0 0.0Reserves to imports (months) 1.5 .. .. .. .. .. .. ..
276

ZIMBABWE(US$ million, unless otherwise indicated)
1990 1995 2000 2003 2004 2005 2006 2007
7. Long-term external debtDebt outstanding and disbursed 2,681 3,843 2,979 3,448 3,610 3,249 3,428 3,751Public and publicly guaranteed 2,496 3,462 2,774 3,388 3,564 3,217 3,409 3,735 Official creditors 1,540 2,798 2,437 2,961 3,089 2,789 2,946 3,247 Multilateral 637 1,491 1,352 1,544 1,611 1,485 1,547 1,611 of which: IBRD 381 560 416 453 467 437 445 455 IDA 67 336 437 493 516 478 501 522 Bilateral 903 1,307 1,085 1,417 1,477 1,304 1,399 1,636 Private creditors 956 664 337 427 475 428 463 488 of which: Bonds 293 120 0 0 0 0 0 0 Commercial banks 208 162 198 272 295 264 287 306Private nonguaranteed 185 381 205 60 46 32 19 16 of which: Bonds 0 0 0 0 0 0 0 0Disbursements 424 574 185 41 98 25 31 160Public and publicly guaranteed 297 345 139 39 90 25 28 160 Official creditors 158 232 125 24 63 17 23 160 Multilateral 72 125 44 1 9 7 2 0 of which: IBRD 40 32 19 0 0 0 0 0 IDA 0 15 8 0 0 0 0 0 Bilateral 86 106 81 23 54 10 21 160 Private creditors 139 114 15 15 27 8 5 0 of which: Bonds 0 0 0 0 0 0 0 0 Commercial banks 29 72 11 1 3 4 0 0Private nonguaranteed 127 229 46 2 8 0 4 0 of which: Bonds 0 0 0 0 0 0 0 0Principal repayments 247 398 212 36 86 45 29 39Public and publicly guaranteed 229 307 147 11 64 31 13 36 Official creditors 78 166 114 10 58 21 11 36 Multilateral 46 77 77 3 6 5 2 2 of which: IBRD 33 47 46 0 2 2 0 0 IDA 0 1 0 0 0 0 0 0 Bilateral 32 89 37 7 51 16 9 33 Private creditors 151 142 33 1 6 10 2 0 of which: Bonds 30 30 0 0 0 0 0 0 Commercial banks 46 32 12 0 0 1 0 0Private nonguaranteed 18 91 65 25 22 14 16 3 of which: Bonds 0 0 0 0 0 0 0 0Interest payments 149 189 81 7 10 7 3 13Public and publicly guaranteed 141 163 64 1 7 3 2 13 Official creditors 67 115 51 1 6 2 2 13 Multilateral 43 81 37 0 5 2 0 0 of which: IBRD 33 46 26 0 1 1 0 0 IDA 0 2 1 0 0 0 0 0 Bilateral 24 34 14 1 1 0 2 12 Private creditors 74 48 13 0 0 1 0 0 of which: Bonds 13 6 0 0 0 0 0 0 Commercial banks 28 11 5 0 0 0 0 0Private nonguaranteed 9 26 17 6 3 4 0 1 of which: Bonds 0 0 0 0 0 0 0 08. Debt stock-flow reconciliationTotal change in external debt stocks 459 503 -495 596 304 -533 397 639 Net flows on external debt 335 442 -330 104 53 -224 131 332 Cross-currency valuation 148 23 -171 312 150 -289 168 1749. Debt restructuringsTotal amount rescheduled 0 0 0 1 0 0 0 0Total amount forgiven 24 66 0 0 0 0 0 0Debt buyback 0 0 0 0 0 0 0 010. Contractual obligations on outstanding long-term external debt
2008 2009 2010 2011 2012 2013 2014 2015Official creditorsPrincipal 567 272 222 184 121 99 81 69Interest 72 48 37 27 20 17 14 12Private creditorsPrincipal 36 21 7 1 1 1 1 1Interest 4 2 0 0 0 0 0 0
Notes:Long-term private nonguaranteed debt data are World Bank staff estimates.
277


For more information on the analysis, please seewww.worldbank.org/prospects; further details aboutthe Summary and Country Tables can be found atwww.worldbank.org/data. For general and orderinginformation, please visit the World Bank’s publications Website at www.worldbank.org/publications, or call 703-661-1580; within the United States, please call 1-800-645-7274.
THE WORLD BANK1818 H Street, NWWashington, DC 20433 USATelephone: 202 477-1234Facsimile: 202 477-6391Internet: www.worldbank.orgE-mail: [email protected]
ISBN 978-0-8213-7842-7
SKU 17842
Over the past two years, the world has seen turmoil in a
relatively small segment of the U.S. credit markets morph
into a severe global economic and fi nancial crisis. Although
aggressive monetary policy, fi scal stimulus, and guarantee
programs to shore up the banking industry have begun to
stabilize fi nancial markets and slow the pace of economic
contraction, policy makers face an extended battle to revive
the global economy.
Bleak indicators abound. The global economy will contract by
2.9 percent in 2009. Global trade will plunge by 10 percent.
Developing countries are expected to register economic
growth of just 1.3 percent, down from about 8 percent
in 2007. When China and India are excluded, developing
economies as a whole are projected to shrink by 1.6 percent
in 2009. Meanwhile, private investment fl ows to developing
countries plummeted more than 40 percent in 2008 as access
to international debt markets dried up and portfolio equity
infl ows dropped off signifi cantly.
Low-income developing countries, initially cushioned from
the direct impact of the fi nancial crisis, are now feeling eff ects
that have spread through other channels. Net private capital
fl ows will be insuffi cient to meet the external fi nancing needs
of many low-income countries, and the prospects for large
increases in other sources of fi nancing are poor as well. The
bulk of new commitments by international fi nancial institutions
will go to middle-income countries in 2009, and remittance
fl ows to low-income countries are projected to decline
by 5 percent. Absent substantial increases in offi cial fi nance,
many low-income countries may have to resort to more
contractionary adjustment policies, with serious implications
for long-term development and poverty reduction.
Underlying the current crisis is an interconnected world
economy that is in the midst of a tough transition from an
extended period of abundant credit and economic overheating
to a new era whose hallmarks will be a resurgence in the
role of government in global fi nancial aff airs, quantitative
easing by major central banks, continued consolidation of the
fi nancial sector, large excess capacity in many industrial sectors,
and, compared to the fi rst half of the decade, slower global
growth once recovery takes hold. Going forward, national and
international policy makers must support emerging signs of
recovery with persistent, robust eff orts to restore confi dence in
the fi nancial system and transform the adverse feedback loop
between the fi nancial sector and the real economy into
a positive one.
Global Development Finance 2009, I: Review, Analysis, and Outlook
is the World Bank’s annual review of recent trends in and
prospects for fi nancial fl ows to developing countries. Global
Development Finance 2009, II: Summary and Country Tables
includes a comprehensive set of tables with statistical data for
128 countries that report debt under the World Bank Debtor
Reporting System, as well as summary data for regions and
income groups. It contains data on total external debt stocks
and fl ows, aggregates, and key debt ratios, and provides a
detailed, country-by-country picture of debt. Debt data are also
available in an electronic format: GDF Online (a subscription
database) and the GDF CD-ROM. Each of these databases
provides access to more than 200 time series indicators from
1970 to 2007 and country group estimates for 2008.
“Prospects for the Global Economy” is an online companion
to Global Development Finance. It provides information on
the global economic outlook, detailed regional forecasts, and
additional features such as interactive graphs, analytical tools,
and access to underlying data. It is available in English, French,
and Spanish at www.worldbank.org/globaloutlook.
The Little Book on External Debt is a publication that provides
a quick reference to key debt data in aggregate and for
individual countries.
With analysis and data extending from short-term bank lending
to long-term bond issuance in both local and foreign currency,
Global Development Finance 2009 is unique in its breadth of
coverage of the trends and issues of fundamental importance to
the fi nancing of the developing world, including coverage of
capital originating from developing countries themselves. The
report is an indispensable resource for governments, economists,
investors, fi nancial consultants, academics, bankers, and the
entire development community.