Glance behaviours when using an in-vehicle smart driving aid: A real-world, on-road driving study
14
This article appeared in a journal published by Elsevier. The attached copy is furnished to the author for internal non-commercial research and education use, including for instruction at the authors institution and sharing with colleagues. Other uses, including reproduction and distribution, or selling or licensing copies, or posting to personal, institutional or third party websites are prohibited. In most cases authors are permitted to post their version of the article (e.g. in Word or Tex form) to their personal website or institutional repository. Authors requiring further information regarding Elsevier’s archiving and manuscript policies are encouraged to visit: http://www.elsevier.com/authorsrights
Transcript of Glance behaviours when using an in-vehicle smart driving aid: A real-world, on-road driving study

This article appeared in a journal published by Elsevier. The attachedcopy is furnished to the author for internal non-commercial researchand education use, including for instruction at the authors institution
and sharing with colleagues.
Other uses, including reproduction and distribution, or selling orlicensing copies, or posting to personal, institutional or third party
websites are prohibited.
In most cases authors are permitted to post their version of thearticle (e.g. in Word or Tex form) to their personal website orinstitutional repository. Authors requiring further information
regarding Elsevier’s archiving and manuscript policies areencouraged to visit:
http://www.elsevier.com/authorsrights

Author's personal copy
Glance behaviours when using an in-vehicle smart driving aid:A real-world, on-road driving study q
Stewart A. Birrell a,b,⇑, Mark Fowkes b
a Warwick Manufacturing Group (WMG), University of Warwick, Coventry, West Midlands CV4 7AL, UKb MIRA Ltd., Advanced Engineering, Watling Street, Nuneaton, Warwickshire CV10 0TU, UK
a r t i c l e i n f o
Article history:Received 16 January 2013Received in revised form 5 April 2013Accepted 14 November 2013
Keywords:In-vehicle information system (IVIS)Glance behaviourDistractionGlance durationReal-world driving
a b s t r a c t
In-vehicle information systems (IVIS) are commonplace in modern vehicles, from the initialsatellite navigation and in-car infotainment systems, to the more recent driving relatedSmartphone applications. Investigating how drivers interact with such systems when driv-ing is key to understanding what factors need to be considered in order to minimise dis-traction and workload issues while maintaining the benefits they provide. This studyinvestigates the glance behaviours of drivers, assessed from video data, when using a smartdriving Smartphone application (providing both eco-driving and safety feedback in real-time) in an on-road study over an extended period of time. Findings presented in this papershow that using the in-vehicle smart driving aid during real-world driving resulted in thedrivers spending an average of 4.3% of their time looking at the system, at an average of0.43 s per glance, with no glances of greater than 2 s, and accounting for 11.3% of the totalglances made. This allocation of visual resource could be considered to be taken from‘spare’ glances, defined by this study as to the road, but off-centre. Importantly glancesto the mirrors, driving equipment and to the centre of the road did not reduce with theintroduction of the IVIS in comparison to a control condition. In conclusion an ergonomi-cally designed in-vehicle smart driving system providing feedback to the driver via an inte-grated and adaptive interface does not lead to visual distraction, with the task beingintegrated into normal driving.
� 2013 The Authors. Published by Elsevier Ltd. All rights reserved.
1. Introduction
1.1. Background
Driving can be described as predominantly a visual task (Kramer & Rohr, 1982; Spence & Ho, 2009). However, Hughes andCole (1986) have suggested that drivers might have up to 50% ‘spare’ attentional capacity during ‘normal’ driving, withobservations placed in the categories of the immediate road surroundings, general surroundings, vegetation and advertisingbeing considered not relevant to the driving task. Green and Shah (2004) suggest that the goal of the distraction mitigationsystem should be to keep the level of attention allocated to the driving task above the attentional requirements demanded bythe current driving environment, and that during ‘routine’ driving approximately 40% of attention could be allocated to
1369-8478/$ - see front matter � 2013 The Authors. Published by Elsevier Ltd. All rights reserved.http://dx.doi.org/10.1016/j.trf.2013.11.003
q This is an open-access article distributed under the terms of the Creative Commons Attribution License, which permits unrestricted use, distribution,and reproduction in any medium, provided the original author and source are credited.⇑ Corresponding author at: Warwick Manufacturing Group (WMG), University of Warwick, Coventry, West Midlands CV4 7AL, UK. Tel.: +44 (0) 24 7657
3752.E-mail address: [email protected] (S.A. Birrell).
Transportation Research Part F 22 (2014) 113–125
Contents lists available at ScienceDirect
Transportation Research Part F
journal homepage: www.elsevier .com/locate / t r f
Author's personal copy
non-driving tasks. This suggests that any increase in crash risk may be mitigated if the resources allocated to complete asecondary task are obtained from this spare capacity, compared to if they are reallocated from tasks critical for safe driving.For the crash risk to manifest itself other contributing factors also have to occur concurrently (Angell et al., 2006).Contributing factors may include the presence of a junction, urban driving or unexpected events. The presence of such driv-ing situations occurring simultaneously as the driver is conducting a secondary task can impair the reactions of a distracted,or overloaded, driver since their spare attentional capacity has been absorbed by the secondary task. With the increasingprevalence and potential of new in-vehicle information systems (IVIS) coming to market, this spare capacity could soonget accounted for, thus creating workload issues if not carefully managed. The understanding of how drivers interact withthese systems when driving is key to minimising distraction and workload issues while maintaining the obvious benefitsto the user provided by Satnavs, infotainment and emerging driving related Smartphone applications.
The issue of driver distraction is a very difficult factor to quantify, firstly because it can take different forms (visual, cog-nitive, physical etc.), but also measuring distraction itself is almost impossible. We have certain techniques to infer distrac-tion which range from self-completed questionnaire, peripheral detection tasks, or measuring the time taken to complete acognitive task. One of the most effective ways to record driver distraction is by assessing glance behaviour, and recording thelength of time that the driver spent with their eyes off the road. The introduction of an in-vehicle information system willinevitably lead to drivers spending some time looking at the display while driving. As described above this may not be aproblem in itself; however, this allocation of visual resource should not be taken from the driving critical tasks such as look-ing at mirrors, the instrument panel and most importantly the road in front.
For this reason the ‘Visual-Manual NHTSA Driver Distraction Guidelines for In-Vehicle Electronic Devices’ proposed in2012 were devised to help limit potential driver distraction associated with non-driving-related, visual-manual tasks (Na-tional Highway Traffic Safety Administration (NHTSA), 2012). Along with other factors aimed at limiting physical interactionwith the IVIS (such as limiting manual text entry to 6 key presses or fewer or not requiring the use of two hands), they pro-pose certain guidelines for limiting glance behaviours. Most relevant to this study, and paraphrased below, are:
� For all other secondary, non-driving-related visual-manual tasks, the NHTSA Guidelines recommend that devices bedesigned so that tasks can be completed by the driver while driving with glances away from the roadway of 2 s or lessand a cumulative time spent glancing away from the roadway of 12 s or less. If a task does not meet the acceptance cri-teria, the NHTSA Guidelines recommend that in-vehicle devices be designed so that the task cannot be performed by thedriver while driving.
1.2. Aims and objectives
The aim of this study and current paper was to evaluate the effects that on-road driving with a smart driving system hason glance behaviours over an extended period of time in real-world driving scenarios verses a control condition. The analysiswill adopt a ‘holistic’ methodology rather than being ‘event driven’, by this we mean analysing a longer section of roadwayrather than a specific period of time surrounding IVIS activity or complex driving situations (such as approaching junctionsor overtaking). This offers the advantage of understanding IVIS use during comparatively normal or routine driving condi-tions, allowing us to make a better assessment of visual allocation. In addition the analysis of glance behaviours when usingin-vehicle systems during a specific ‘task’ is well represented with the literature (see Dingus, Antin, Hulse, & Wierwille,1989; Engstrom, Johansson, & Ostlund, 2005; Horrey & Wickens, 2007; Kaber, Liang, Rogers, & Gangakhedkar, 2012; Renge,1980; Rockwell, 1988; Victor, Harbluk, & Engstrom, 2005; and summarised by Green & Shah, 2004). However, the impact ofIVIS on normal driving is less well known, and hence addressed in this paper. Therefore data presented in this paper can beused as a reference for normal and extended periods of driving by future research to evaluate the use of IVIS.
Obviously placing an additional information source in the vehicle will attract the drivers’ attention – particularly a highlyvisual display that changes in real-time as being evaluated here – this is clear from the literature cited above. What is un-known is whether this re-allocation of visual resource is taken from driving critical procedures such as glances to the mirrors,instrument panel or the road ahead, or from any ‘spare’ visual capacity (c.f Green & Shah, 2004; Hughes & Cole, 1986).
2. Methodology
2.1. The foot-LITE smart driving aid
This current study utilised a smart driving system developed for a UK project called Foot-LITE.1 The system developedaims to bring information on safety and fuel efficiency together on a single, integrated, adaptive interface. Foot-LITE providesthe driver with feedback and information on smart driving behaviours in the vehicle, in real-time via a visual interface pre-sented on a Smartphone (HTC HD2). The smart driving advice offered is based on the analysis of real-time information relatedto vehicle operation and local road conditions, with data being collected via an adapted lane departure warning camera, thevehicles On-Board Diagnostics (OBDII) port, as well as 3-axis accelerometer and a Global Positioning Satellite (GPS) module.
1 See foot-lite.net.
114 S.A. Birrell, M. Fowkes / Transportation Research Part F 22 (2014) 113–125

Author's personal copy
The Foot-LITE human–machine interface (HMI) concept (Fig. 12) was developed based on principles of Ecological InterfaceDesign (EID; Burns & Hajdukiewicz, 2004). Specifically relevant to the Foot-LITE project, EID offers to dynamically reflect thedriving environment and integrate complex information onto a single, direct perception display (Burns & Hajdukiewicz,2004). Safety and Eco information is grouped together with all parameters being shown on the screen at the same time, andchanging in real-time depending on the driver’s inputs. Given the safety critical nature of evaluating in-vehicle systems inthe real-world and interacting with other road users, the HMI was rigorously tested and iterated throughout the Foot-LITE pro-ject until the version, shown in Fig. 1, was released for on-road trials. The ergonomic development and evaluation of the HMIhas been reported in previous papers (see Birrell & Young, 2011; Birrell, Young, Jenkins, & Stanton, 2012).
In-vehicle smart driving information presented to the driver in real-time were:
� Headway: A visual representation of time headway was presented to the driver as a cautionary threshold (shown asamber in Fig. 1, picture 2) when the driver was less than 2 s to the car in front, and a warning threshold (red) when below1.5 s. When the driver was greater than 2 s, or when headway information was not presented to the driver (i.e. below 15mph or headway confidence was not sufficient) the display shows as the default green.� Lane departure warning: A red warning was given to the driver when they deviated from their lane (Fig. 1, picture 2). For
this experimental setup the lane deviation threshold was set to be very sensitive, i.e. when the driver was close to the lanelines a warning was displayed, as well as when having actually left their lane. There was no cautionary advice for lanedeparture warning.� Gear change advice: The bottom half of picture 3 in Fig. 1 shows the gear change advice offered to the driver, with the
amber arrows suggesting either a single gear change up or down in a sequential manner. Red arrows indicate gear eithera block change (2nd to 4th gears for example) is preferable, or a single shift if high power demand are needed. Once thedriver changes to the recommended gear this section of the HMI will revert to the green default.� Acceleration and braking: As presented in the top half of picture 3 in Fig. 1 braking and acceleration advice is offered to the
driver in order to limit excessive acceleration, and also to try and encourage a smoother speed profile. Again cautionary(amber) and excessive (red) warnings are given.
2.2. Driving scenario
The driving scenario adopted for this study was a fixed driving route in the Leicestershire area (central England), it was40.1 miles (or 64.5 km) in length and took approximately 1 h and 15 min to complete. The scenario encompassed threeclearly defined sections of roadway which included only one type of road category – ‘Motorway’, ‘Urban’ or ‘Inter-Urban’(Fig. 2). To ensure comparisons could be made between each of the sections of roadway 3, 8 min segments were outlinedfor the video analysis. These were defined from a pilot benchmarking run where the test experimenter drove the route intypical traffic densities, adhering to the speed limit and UK Highway Code throughout. The start and end points for analysiswere based on fixed GPS points relating to 8 min of the benchmarking run, therefore each participant completed the samedistance and encountered the same traffic situations, but total driving time may vary slightly depending on self-selected
Fig. 1. Example screenshots from the Foot-LITE Smart driving advisor. Only one ‘oval’ is ever presented on the IVIS at any one time, but all aspects depictedcan change in real-time and in combination. Picture 1 (left) – default green display. Picture 2 (centre) – top-left to bottom – headway warning, lanedeviation warning, headway caution. Picture 3 (right) – top-left to bottom-right – braking caution, acceleration warning, change up caution, change downwarning. (For interpretation of the references to colour in this figure legend, the reader is referred to the web version of this article.)
2 This design is protected by Brunel University as a UK Registered Design (UK RD 4017134-41 Inc.); the unauthorized use or copying of these designsconstitutes a legal infringement.
S.A. Birrell, M. Fowkes / Transportation Research Part F 22 (2014) 113–125 115

Author's personal copy
driving speeds, traffic densities etc. This resulted in an average driving time analysed for all participants of 23.2 min(SD = 0.63 min) in the control condition and 22.8 min (0.78) in the experimental condition.
The motorway (i.e. freeway, autobahn etc.) section consisted of 3 or 4 lanes with the merging of two motorways approx-imately halfway through this section; the speed limit was 70 mph (�113 kph). The urban section of roadway was completedon unregistered, residential single carriageway and one-way roads. The speed limit was 30 mph (�48 kph), with numeroustraffic light controlled intersections, roundabouts and T-junctions included within this section. The inter-urban sectionlinked two conurbations, with speed limits of 50 and 60 mph (�80 and 97 kph). The main carriageway was all one lanein width with multiple lanes at intersections and roundabouts; this section of roadway selected for analysis could also beclassified as rural.
In all driving conditions participants were given route guidance instructions verbally by the experimenter, who accom-panied all participants at all times during the driving scenario and also dealt with any issues that arose with any logger orsystem within the vehicle. Directions were offered according to a fixed script to ensure all drivers received the same instruc-tions. The route guidance also included some tactical information such as upcoming changes to 30 mph speed limits,approaching traffic lights, as well as standard instructions such as ‘At the roundabout turn RIGHT, 2nd exit, right hand lane’.
2.3. Experimental equipment
Driver glance behaviour was recorded using 4 cameras installed inside the vehicle (Fig. 3). Data were collected using theRace Technology Video4 hardware in conjunction with a GPS data logger (also supplied by Race Technology; DL1 Mk3). Thefirst camera captured high definition video and was attached to the Smartphone holder and positioned to record the face ofthe driver. This made it easier to identify when the participant was looking at the smart driving IVIS. The three remainingcameras were standard definition and placed to record the forward and rearward facing driving scene, as well as one posi-tioned to record Smartphone activity. All three were attached to the windows via suction cups.
All participants drove the same instrumented vehicle throughout the study; this was a UK right-hand drive 2006 FordFocus Zetec, 1.6L diesel with manual transmission. The data loggers were fitted under the passenger seat, with associatedcabling concealed as much as possible. The Smartphone which runs the Foot-LITE application was installed via a phoneholder attached with a suction cup to the windscreen (Fig. 3).
2.4. Participants
Data presented in this paper is a subset of that collected as part of a larger Detailed Field Operational Trial (or DFOT) com-pleted for the TeleFOT project. TeleFOT is an EU funded project with wide reaching aims to investigate the use of nomadicdevices (e.g. Satnavs, Smartphones etc.) in vehicles, assessing their effectiveness, safety as well as overall user perceptions.For this specific DFOT a total of 40 participants were recruited, all of whom were employees at the trial management com-pany. Prospective volunteers replied to a companywide circular email if they were interested in taking part. The principalinclusion criterion was that participants were covered to drive a company vehicle on the company insurance policy, to satisfythis numerous criteria had to be met including: being over 21 years of age; having held their licence for greater than oneyear; and not having over 6 points on their licence or having been disqualified from driving for certain offences. Also onlyparticipants were selected who did not have a working knowledge of the project. Fifteen participants (10 male and 5 female;Table 1) were selected from the original 40 to be included in this analysis. This selection was based on those with the highestquality of raw video data collected in both the control and experimental conditions, and also if the Foot-LITE system wasworking effectively throughout the entire route. Details regarding the performance effects of the Foot-LITE Smart driving sys-tem on driving behaviours are presented separately (see Birrell, Fowkes, & Jennings, 2013); in this current paper the focus ison the effect of the IVIS on driver glance behaviours.
Fig. 2. Driving scenario adopted.
116 S.A. Birrell, M. Fowkes / Transportation Research Part F 22 (2014) 113–125

Author's personal copy
2.5. Procedure
Participants completed the same driving scenario on two separate occasions separated by one week, but on the same dayand at the same time of day in an attempt to limit external factors such as traffic. One condition was a ‘Control’ (no smartdriving feedback offered), the other ‘Experimental’ where feedback via the IVIS was offered. The order of which the partic-ipants completed the conditions were counterbalanced, this was to ensure an equal gender split (i.e. half the males and fe-males completed the smart driving experimental condition first) as well as to overcome some scheduling issues.
When participants arrived to take part in the study for their first condition they were given a verbal and written expla-nation of the TeleFOT project and also the specific aims of study. After this they were shown the Risk Assessment and finallysigned, informed consent was gained. Following this participants were shown to the test vehicle where they were instructedto adjust the seats, steering wheel and mirrors so they were comfortable and accessible. All drivers had the opportunity totake the test vehicle on a brief drive to familiarise themselves with the vehicle before the actual trial began. In addition tothis the first 15 min of the journey was excluded (Fig. 2: ‘Home’ to start of ‘Motorway’) to ensure the drivers were comfort-able with the vehicle controls.
Before the experimental condition participants were given a detailed introduction to the Foot-LITE system, includingbeing shown what feedback the system would offer, they also had chance to ask any questions. As explained previouslythe first 15 min of each driving trial was for vehicle familiarisation; in the experimental condition participants were also gi-ven further guidance on the smart driving interface as each event appeared on the screen. In both conditions participantswere simply instructed to drive as they would do normally; however, in the experimental condition they were encouragedto visually interact with the smart driving IVIS, but only when they deemed it safe to do so.
2.6. Data analysis and dependent variables
In-vehicle cameras collected raw video files which could be played-back at various speeds (including frame-by-frame)within Race Technology’s bespoke analysis software (Analysis v8); this also synchronised the video data with the GPSand accelerometer logger data collected. Pilot video analysis trials revealed that frame-by-frame video analysis was immen-sely time consuming; with a single 5 min reference period of video analysis for one participant taking up to 2 h to accuratelyprocess and code. As no automated analysis of raw video was available (to the authors’ knowledge) an alternative methodwas needed. For this particular study an innovative method to analyse the raw video data was established which used theJWatcher3 software. JWatcher is a freeware tool originally developed as an observational recording program for the BehaviouralSciences. Certain behaviours or activities could be identified and associated with specific keys on the keyboard, with the time in-between these keystrokes being recorded and saved as .text files. In this case each keystroke was associated with a glance to-wards a specific location, these were defined as:
Fig. 3. Camera locations taken from an example of video used for analysis.
Table 1Study participant demographics.
n Age (yrs) Driving experience (yrs)
Mean SD Mean SD
Group 15 39.40 12.95 19.07 12.52Male 10 39.64 14.89 19.55 13.36Female 5 38.75 6.60 17.75 11.53
3 http://www.jwatcher.ucla.edu.
S.A. Birrell, M. Fowkes / Transportation Research Part F 22 (2014) 113–125 117

Author's personal copy
� IVIS – the Foot-LITE Smart driving system.� Mirrors – left and right wing mirrors, rear-view mirror (initially coded separately).� Driving equipment – or vehicle controls (instrument panel, gear stick, handbrake etc.).� Road: centre – centre of the roadway, which may not always be straight ahead when cornering or when ‘tracking’ an
object from centre to off-centre.� Road: off-centre – looking out of the windscreen (but not centrally) or side windows (but not mirrors).� Other – glances to the experimenter, non-driving related in-vehicle equipment (e.g. HVAC controls) or any other unspec-
ified glances (daydreaming or where a glance cannot be determined).
Further pilot analysis was conducted using JWatcher which determined that video playback at one quarter speed was suf-ficient to accurately and reliably record glances. ISO 15007 (2002) defines glance duration as being from the very start of thetransition (or movement of the eye away from its fixed location), through to when it is fixed on its new location (dwell time),and ending just before the next transition begins. For real-time video analysis this poses a significant problem, as we do notknow where the driver is going to fixate (i.e. look at) when they start the first transition. For this reason we used a slightlyadapted definition of glance duration, i.e. going from fixation to fixation rather than transition to transition. This allowed theanalyst to determine where a glance fell before recording it with a keystroke and activating the JWatcher time recording forglance duration. The key to this method was accurately and reliably defining the start of each glance fixation.
To further ensure accuracy of the video processing methodology intra and inter-analyst variation was assessed againstthe 5 min reference period mentioned previously, with results being compared to the frame-by-frame analysis. Initially ana-lyst variations did occur, specifically with glances to the mirrors and experimenter. With limited guidance present in the lit-erature as to what constitutes a glance to a specific location when driving, the authors established their own rules based onextensive practical experience handling the pilot data. Whilst it is appreciated that each driver is different and not everyglance will be correctly identified, the comparison with the frame-by-frame analysis ensured reliability and repeatabilitywas maximised, essential given the critical nature of the video coding to the study. Examples of the rules are shown below:
� Glances to the ‘Rear View Mirror’ involve only movement of the eyes OR significant head movements, not both. Alsoglances would be in a general upwards direction and not laterally.� Glances to the ‘Examiner’ were defined as sideways (or lateral) glances involving movement of the eyes AND head, and
would typically be shorter in duration.� Glances to the ‘Left Wing Mirror’ were generally easy to define as they involve clear head AND eye movements across and
down, dwell times would typically be longer in duration.� Glances to the ‘Right Wing Mirror’ could be either only significant movement of the eyes OR head. These are different to
‘Road: Off-Centre’ as they will be looking in a downwards direction rather than just laterally.� Glances to ‘IVIS’ are easily defined as the driver facing camera was placed next to the Smartphone, and glances were
straight into the camera.
Since the accurate recording of glances was defined through the pilot analysis and the definition of the rules above,numerous other parameters could be defined from this. JWatcher recorded keystroke (or glance) data in text files that wereimported into MS Excel for processing and parameter calculation. Results presented in this study are for all three roadwaysections combined, i.e. the entire 24 min of the driving scenario. Statistical testing was conducted using SPSS 16.0 for Win-dows, with a MANOVA being used to evaluate potential differences between the control and experimental conditions, sig-nificance was accepted at p < 0.05. Dependent variables defined for this study are:
� Glance frequency – absolute and percentage of glances to a certain location.� Glance duration – average, maximum and percentage of time spent at each location, and number of glances greater than
2 s.� Glance transitions – percentage of glances to/from each location.
3. Results
The changes in glance behaviours when using a smart driving IVIS were assessed in this paper; the main interesting re-sults are summarised in the following tables.
3.1. Glance frequency
The mean number of glances (in absolute form) made to any of the locations by participants was recorded at 1103.3(SD = 130.3) glances in the control condition verses 1118.6 (110.3) in the experimental condition (Fig. 4). Fig. 4 also showsthat approximately 15 more individual glances were made in total in the experimental condition when driving on the motor-way. A similar number of glances were made in both conditions during urban and inter-urban driving.
The rest of the analysis presented will refer to combined results for the entire journey, separate statistical analysis wasnot conducted on individual roadway categories. Regarding the breakdown of glances to each recorded location for the entire
118 S.A. Birrell, M. Fowkes / Transportation Research Part F 22 (2014) 113–125

Author's personal copy
journey, Fig. 5 shows that the introduction of the Smart diving in-vehicle system resulted in a significant reduction(F(1,29) = 12.80, p < 0.01) in the percentage of glances to the ‘Road: Off-Centre’. This is to compensate for the glances to theIVIS which accounted for 11.3% (or 126.4 out of 1118.6) of the glances for the entire journey in the experimental condition.No other significant differences with respect to glance frequency were observed.
3.2. Glance duration
Mean single glance duration is shown in Table 2, with times of around 0.5–0.6 s when considering the driving equipment,mirrors and off-centre road glances in both conditions. The average time spent looking at the smart driving system was0.43 s (SD = 0.08). Maximum glance durations were again similar for both conditions, with times to areas other than the roadbeing consistently around 1.3–1.4 s (Table 2). Interestingly the maximum glance duration to the IVIS was the lowest re-corded (although not significantly) at 1.28 s.
With few changes being observed in average or maximum glance durations we would expect to see the percentage oftotal glance durations to each location to follow similar trends to glance frequencies, i.e. to allocate visual resource to theIVIS during the experimental condition we would see a reduction in the percentage of glance duration off-centre comparedto the control condition. This was observed in the analysis with the reduction being significant (F(1,29) = 6.25, p < 0.05), withno other interactions occurring (Fig. 6).
The final glance duration parameter is the number of glances greater than 2 s. Results show that there were no singleglances to the IVIS that were longer than 2 s made by any of the 15 participants for the 24 min of driving analysed. In factvery few glances were greater than 2 s (other than to the road), with only 1 glance to the mirrors, 3 to the driving equipment,and two others in the experimental condition.
3.3. Glance transitions
Table 3 shows that in the control condition 53.2% of glances were between the road centre and off-centre, this reduced to37.0% in the experimental condition, a significant decrease (F(1,29) = 9.02, p < 0.05) in the number of transitions by 16.2%,again to compensate for the introduction of the IVIS in the experimental condition. As with both glance frequencies anddurations a small reduction was also seen with respect to interactions with the mirrors, although as before this differencewas not statistically significant.
4. Discussion
4.1. Glance frequency
The main outcome relating to glance frequency with this current study was that the total number of glances made wassimilar for both the control and experimental condition, at approximately 1100. Therefore the glances made to the in-vehiclesmart driving system during the experimental condition must have, to some extent, been reallocated from a different loca-tion rather than simply increasing the absolute number of glances made. What we clearly would not want to see is a reducednumber of glances to the main roadway ahead, or to driving relevant in-vehicle tasks such as speed monitoring or checkingmirrors.
Hughes and Cole (1986) suggested that drivers might have up to 50% ‘spare’ attentional capacity during ‘normal’ driving,and Green and Shah (2004) suggest that during ‘routine’ driving approximately 40% of attention could be allocated to non-driving tasks. A notion proposed by this current study is that spare capacity, in a visual behaviour context, could be consid-ered as glances to two main categories – ‘Other’ and ‘Road: Off Centre’, as these contain glances that may not be consideredsafety or operationally critical to the driving task. Some obvious exceptions exist within off-road glances, such as those to
Fig. 4. Mean number of glances made to each location for the entire driving scenario, as well as each individual roadway section. Error bars representstandard deviation of the mean data.
S.A. Birrell, M. Fowkes / Transportation Research Part F 22 (2014) 113–125 119

Author's personal copy
high sided vehicles during overtaking on a motorway, or to side roads and pedestrians in the urban environment. Neverthe-less, the authors suggest, based on an understanding of the relevant literature and anecdotal evidence from the study par-ticipants, that a large proportion of glances within this category could be considered not safety or operationally critical to thedriving task. However, a more detailed glance analysis is needed to fully substantiate this. The primary difference is thatglances to the forward roadway and mirrors are essential for safe driving, as they are defined within the NHTSA risk ratiocalculations (Klauer, Dingus, Neale, Sudweeks, & Ramset, 2006).
Results presented in Fig. 5 show that glances to the IVIS were predominantly (and statistically significantly) reallocatedfrom the off-road glances with a reduction from 30.6% of glances made in the control condition to 22.1% in the experimentalcondition. No other significant interactions were observed. As described above this study is proposing that these would ac-count for the ‘spare’ glances, and would have limited detrimental effect on driving safety. It is worth noting that Table 2shows even in the experimental condition off-road glances still accounted for 22% of the total glances made, so those drivingtask related off-road glances would still likely be accounted for within this category. What is shown even more definitively isthat ‘Road: Centre’ glances did not alter at all with the introduction of the smart driving IVIS, with the percentage of glancesto this category being almost identical at 47.9% versus 47.6% for the control and experimental conditions respectively.
Research has suggested that when driving under higher mental workloads driver vision tends to focus on the forwardfacing view, and less on the peripheries (Harbluk, Noy, Trbovich, & Eizenman, 2007). Results from the current study couldbe interpreted as the smart driving IVIS leading to a reduction in the number of glances to the peripheries (as classified
Fig. 5. Mean percentage of glances to each location in the control and experimental conditions. Errors bars represent standard deviation of the mean data.Asterisks (⁄) indicates a significant difference (p < 0.05) between the conditions.
Table 2Mean glance frequency and duration results for all participants combined from each of the three roadway sections for both Control and Experimentalconditions.
% of Glances Ave. glance duration (s) % Total glance duration Max. glance duration (s) N of glances >2 s
Con. Exp. Con. Exp. Con. Exp. Con. Exp. Con. Exp.
Centre 47.87 47.60 2.32 2.20 77.98 77.49 19.58 18.41 158.4 155.7Off road 30.61 22.10 0.54 0.53 12.70 9.52 4.65 5.25 5.53 5.00Mirrors 9.78 7.47 0.49 0.50 3.99 2.96 1.39 1.38 0.13 0.07Equip 7.47 8.14 0.62 0.61 3.63 4.03 1.30 1.37 0.07 0.20Other 4.17 3.28 0.46 0.64 1.67 1.51 1.06 1.70 0.00 0.13IVIS NA 11.31 NA 0.43 NA 4.31 NA 1.28 NA 0.00
Fig. 6. Mean percentage of glance duration to each location in the control and experimental conditions. Errors bars represent standard deviation of the data.Asterisks (⁄) indicates a significant difference (p < 0.05) between the conditions.
120 S.A. Birrell, M. Fowkes / Transportation Research Part F 22 (2014) 113–125

Author's personal copy
as Road: Off Centre) as a result of an increased in mental workload caused by the system. However, this effect is not fullyborne out in the results when we consider the reallocation of glances to the IVIS (again in the peripheries of vision) as de-scribed above, but is a potential outcome worth noting.
A comparison between previous studies investigating the effects of IVIS on glance behaviour is possible by assessing thenumber of glances per minute to the in-vehicle system; with the current study this was 5.54 glances per minute to the Foot-LITE Smart driving system. Lansdown (2000) showed that 2.06 glances per minute were made to the in-car entertainmentsystem during a radio turning task and 4.94 glances per minute when interacting with a congestion warning device. Green,Hoekstra, Williams, Wen, and George (1993) showed a difference between older and younger drivers when using a Satnavsystem at an average of 7.1 and 7.5 glances per minute respectively. This suggests that using the smart driving IVIS in thisstudy required less visual interaction than using a Satnav but more than when adjusting an in-car entertainment system.Given the relative complexity of the information presented on the IVIS evaluated in this study, namely real-time feedbackon headway and lane deviation feedback as well as gear change and acceleration advice, this could be considered a positiveoutcome for the EID principles adopted for the HMI design.
4.2. Glance duration
Comparing the mean single glance duration results obtained in this study to other research conducted reveals comparabledurations for glances to the analogue speedometer at between 0.4 and 0.7 s (Bhise, Forbes, & Farber, 1986 taken from Wierw-ille & Tijerina, 1998) and 0.62 s (Dingus et al., 1989). Average glance duration to the driving equipment (including speedom-eter and gear lever) with the current study was 0.62 and 0.61 s in the control and experimental condition respectively, whichis comparable to the studies above and adds further credence to the accuracy and reliability of the method adopted to assessglance behaviour used here. Mean single glance durations to the mirrors in this current study (including left and right wingmirrors and rear-view) are generally a little lower than those reported in the literature at 0.5 s in both conditions comparedto 1.0 s (Wierwille & Tijerina, 1998), and 1.1 s (Rockwell, 1988). However, this may be a result of the method to calculate theparameter. The above studies calculate eyes-off-road time which may well have included both transitions from the road tothe mirror and then back again, unlike the current study which only included the single transition. Also, no specific drivingmanoeuvre or task was completed in this study, meaning mirror checking (particularly the rear-view) could predominatelybe considered a monitoring task which generally results in shorter glance durations (Kaber et al., 2012). Results from Lans-down (2000) showed mean single glance durations to the rear-view mirror to be 0.53 s, which is closer to the numbers foundin this study.
Mean single glance duration to the Smart driving IVIS was 0.43 s, with Fig. 7 showing approximately 75% of the glancesbeing between 0.2 and 0.6 s. Comparisons with previous research show that mean glance durations to a satellite navigation(or route guidance) system have been shown to be between 1.06 and 1.45 s (Dingus et al., 1989), approximately 1 second(Green et al., 1993), and 0.76 s (Morris, Reed, Welsh, Brown, & Birrell, 2013); glances to in car entertainment of 0.88 s(Lansdown, 2000), between 0.8 and 1.1 s (Dingus et al., 1989), and 0.6 s (menu navigation; Metz, Schomig, & Kruger,2011); a surrogate in-vehicle task (arrow identification) between 1 and 1.5 s (Victor et al., 2005) and 0.73 to 0.94 s (Horrey& Wickens, 2007) depending on complexity; and finally 1.1 s when using a congestion warning system (Lansdown, 2000).What is clear from the results presented above is that mean single glance durations to an IVIS vary given the specific taskand study, but in general times are around 0.8–1.1 s which is considerable greater than the 0.43 s in the current study.
This finding could be considered a positive outcome for the Foot-LITE Smart driving system, as whilst the number ofglances to the system was comparatively high (compared to the mirrors and driving equipment) the durations were short.This according to Wierwille’s prescriptive model, where shorter more frequent glances will be intermixed with periods witheyes-on-road, will preserve driving safety (Wierwille, 1993). Being able to perceive the information from the smart drivingaid quickly and easily was very much implicit in the design of the HMI (see Young & Birrell, 2012). With graphical represen-tations of environmental constraints for safety parameters and semantically mapped eco parameters, it would appear fromthis study that these criteria have been met.
Fig. 7. Distribution of the glance durations to IVIS during the experimental condition.
S.A. Birrell, M. Fowkes / Transportation Research Part F 22 (2014) 113–125 121

Author's personal copy
No significant differences were observed with respect to mean single glance duration between any of the locations or con-ditions measured in this study (with the exception of the expected longer glances to the road compared to other categories;Table 2). It is however relevant to note that the longer than normal in-vehicle glances (i.e. maximum glance durations) areimportant as these may have a greater safety implication (c.f. Horrey & Wickens, 2007).
The NHTSA guidelines on in-vehicle electronic devices suggest that using an in-vehicle system should not result inglances away from the roadway for greater than 2 s (NHTSA, 2012). Whilst the Smart driving system used in the studywas not specifically designed to limit visual interaction, attention was paid in the design process to limiting workload onthe driver (both visual and cognitive). Results from this current study show that when using the Foot-LITE Smart driving sys-tem in our mixed route driving scenario, no single glances were made to the IVIS which were longer than 2 s by any of the 15participants for the 24 min of driving analysed. This finding is fundamental, and whilst it cannot be concluded that the IVISevaluated in this study does not cause any form of distraction to the driver, it does suggests that it complies with the pro-posed NHTSA guidelines. Even adhering to the more conservative recommendations by Horrey and Wickens (2007) – whichsuggests a correlation between in-vehicle glances of longer than 1.6 s to the likelihood of a collision – only 3 of 1830 glances(0.16%) to the IVIS were over this threshold (Fig. 7). In addition, the average maximum glance duration to the IVIS for allparticipants was 1.28 s and was the shortest (not significant) of all the locations analysed.
Table 2 shows that the percentage of total glance duration (mean for all participants) towards the centre of the road wasalmost identical in the control verses experimental condition, at 77.98% and 77.49% respectively. This suggests clear differ-ences between the smart driving IVIS evaluated in this study and other IVIS. Victor et al. (2005) reported the percentage oftime with eyes on the road centre to be between approximately 70% and 85% for baseline driving on motorway and ruralroads. This decreased significantly when completing a surrogate in-vehicle task of varying complexity to between 55%and 65% of eyes on road centre for a simple visual task to between 35% and 55% for a complex visual task. Data from the100-car naturalistic driving study presented by Klauer (2005) suggest that on average the percentage of time with eyesoff forward roadway (excluding mirror glances) was approximately 18% for baseline driving (taken from 5000 5 s baselineepochs), this increased to approximately 26% when being involved in a near crash, and to 37% when involved in an actualcrash. Again Table 2 shows that using the same criteria as the 100-car naturalistic study the mean time with eyes off forwardroadway in this current study was 18.0% in the control condition and 19.5% in the experimental IVIS condition. From thecomparisons presented above, and with the 100-car naturalistic driving study using the total time eyes off forward roadwayas their principal measure to determine risk ratios of being involved in an incident or accident (Klauer et al., 2006), we caninfer that using the Foot-LITE Smart driving system would not increase the risk of being involved in a road traffic accident orincident.
4.3. Glance transitions
As one would probably expect the vast majority of glances either originated from, or ended at the centre of the road; withthese accounting for approximately 95% of all glance transitions (Table 3). In the experimental condition glances to the IVISaccounted for over a fifth of total transitions, showing significant interaction with the system during its use. An interestingfinding was that in the experimental condition there were an average of 11 more glances to the driving equipment per par-ticipant than in the control, and could suggest an increase in interaction with other ‘information’ displays in the vehicle. Con-versely, in the experimental condition glance transitions involving the mirrors reduced by 5.4% compared to the controlcondition (Table 3). Although these differences were not statistically significant, this final finding requires furtherinvestigation.
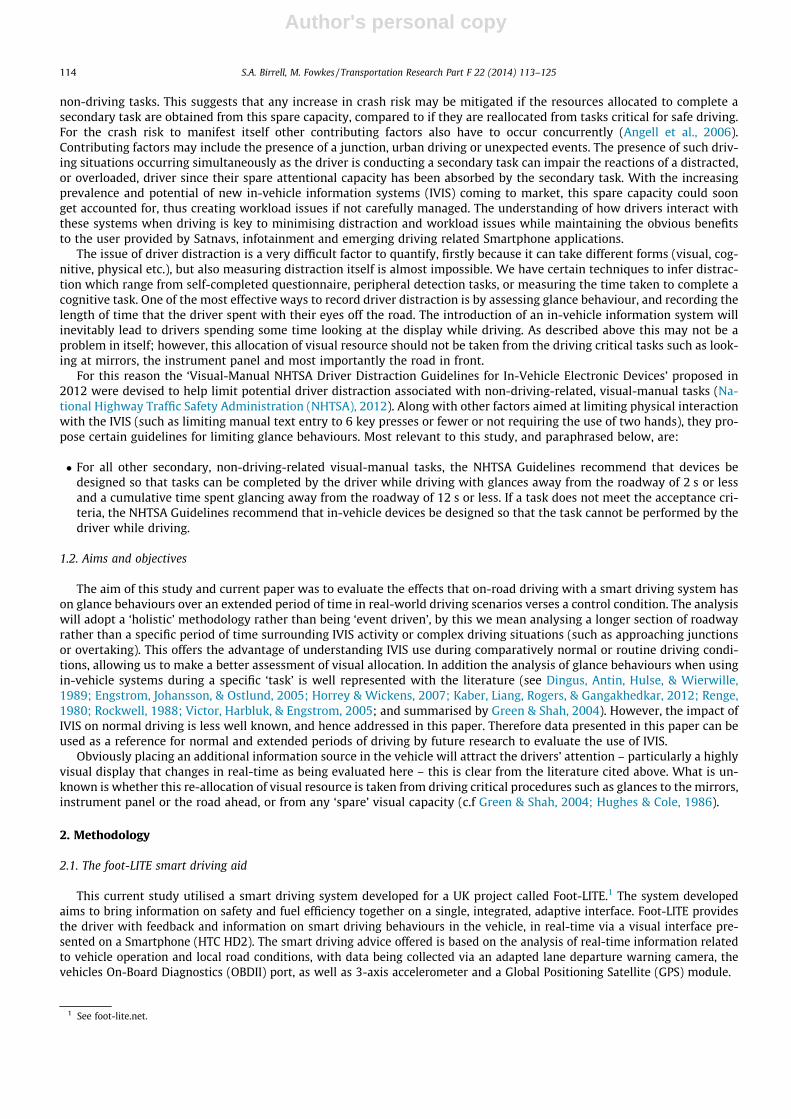
All the data presented thus far reveals some interesting findings regarding glance behaviours with the use of an in-vehiclesmart driving aid, however summarising these results into one easily digestible format is difficult. For the purpose of thisstudy a method was developed, termed Glance Transition Decomposition Analysis, adapted from work by Antin, Dingus, Hul-se, and Wierwille (1990) who produced a probability diagram showing the percentage of total glance duration and transi-tions between the locations. Fig. 8 shows the data from this current study, with the circles representing the percentage oftotal number of glances to each location and lines linking the circles indicating the percentage of glance transitions betweenthe two locations. The number of the lines either around the circles or of the linking lines indicates the percentage of glanceseither at or between each of the glance location categories.
Table 3Mean percentage of glance transitions either made from or to each location (e.g. either from Centre to Mirrors or Mirrors to Centre) in both the Control andExperimental conditions.
Transitions to/from Con. Exp.
Centre Mirrors 19.0 13.6Centre Off 53.2 37.0Centre Equip 14.5 15.1Centre Other 8.1 6.5Centre IVIS NA 21.8Centre Any 94.7 94.0Any Any 5.3 6.0
122 S.A. Birrell, M. Fowkes / Transportation Research Part F 22 (2014) 113–125
Author's personal copy
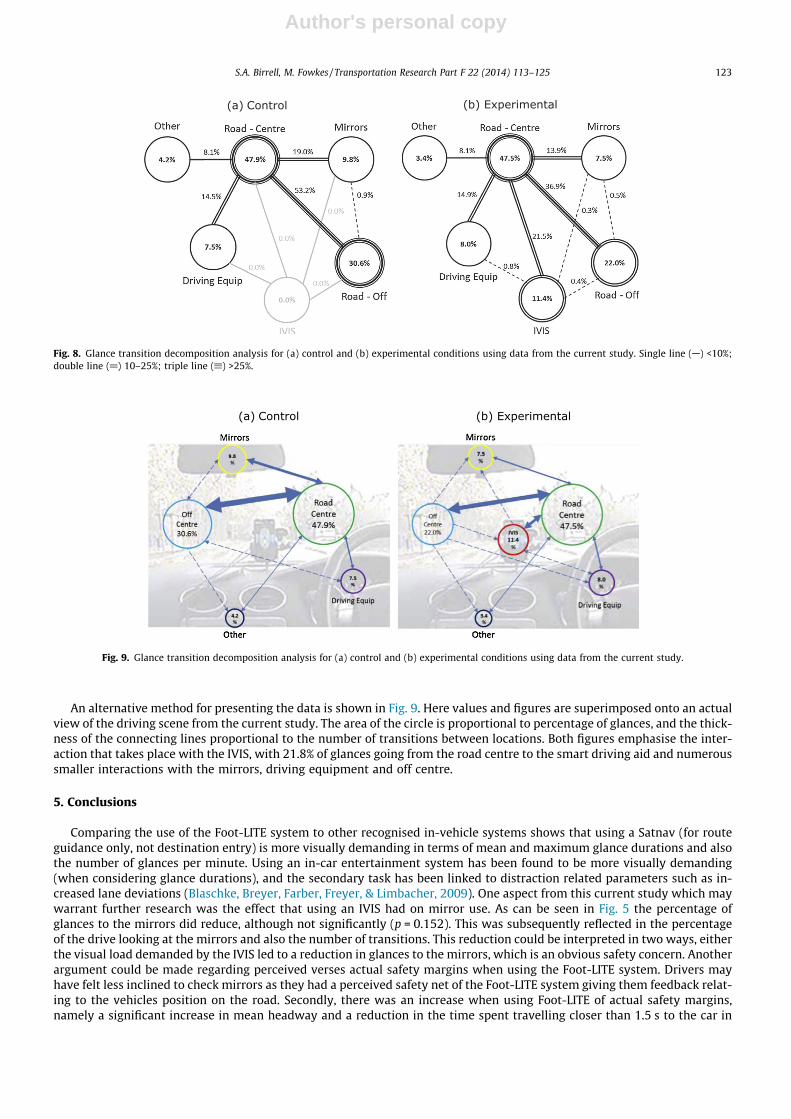
An alternative method for presenting the data is shown in Fig. 9. Here values and figures are superimposed onto an actualview of the driving scene from the current study. The area of the circle is proportional to percentage of glances, and the thick-ness of the connecting lines proportional to the number of transitions between locations. Both figures emphasise the inter-action that takes place with the IVIS, with 21.8% of glances going from the road centre to the smart driving aid and numeroussmaller interactions with the mirrors, driving equipment and off centre.
5. Conclusions
Comparing the use of the Foot-LITE system to other recognised in-vehicle systems shows that using a Satnav (for routeguidance only, not destination entry) is more visually demanding in terms of mean and maximum glance durations and alsothe number of glances per minute. Using an in-car entertainment system has been found to be more visually demanding(when considering glance durations), and the secondary task has been linked to distraction related parameters such as in-creased lane deviations (Blaschke, Breyer, Farber, Freyer, & Limbacher, 2009). One aspect from this current study which maywarrant further research was the effect that using an IVIS had on mirror use. As can be seen in Fig. 5 the percentage ofglances to the mirrors did reduce, although not significantly (p = 0.152). This was subsequently reflected in the percentageof the drive looking at the mirrors and also the number of transitions. This reduction could be interpreted in two ways, eitherthe visual load demanded by the IVIS led to a reduction in glances to the mirrors, which is an obvious safety concern. Anotherargument could be made regarding perceived verses actual safety margins when using the Foot-LITE system. Drivers mayhave felt less inclined to check mirrors as they had a perceived safety net of the Foot-LITE system giving them feedback relat-ing to the vehicles position on the road. Secondly, there was an increase when using Foot-LITE of actual safety margins,namely a significant increase in mean headway and a reduction in the time spent travelling closer than 1.5 s to the car in
Fig. 8. Glance transition decomposition analysis for (a) control and (b) experimental conditions using data from the current study. Single line (A) <10%;double line (@) 10–25%; triple line (B) >25%.
Fig. 9. Glance transition decomposition analysis for (a) control and (b) experimental conditions using data from the current study.
S.A. Birrell, M. Fowkes / Transportation Research Part F 22 (2014) 113–125 123

Author's personal copy
front (Birrell et al., 2013). Both of these factors may have led to the drivers’ perceived need to check the mirrors reduce, andcertainly is a consideration for future research.
Findings presented in this paper show that using an in-vehicle smart driving aid during real-world driving scenarios re-sulted in the drivers spending an average of 4.3% of their time looking at the system, at an average of 0.43 s per glance, withno glances of greater than 2 s, and accounting for 11.3% of the total glances made. Given the results, the authors propose thatthe allocation of visual resource towards the IVIS could be considered to be taken from ‘spare’ glances, resulting in limitedsafety implications during real-world, on-road use. Importantly glances to the mirrors, driving equipment and at the centreof the road did not reduce with the introduction of the IVIS. With the 100-car naturalistic driving study suggesting that verysimple secondary tasks do not appear to have a crash risk that is greater than normal driving (Klauer et al., 2006), this studyconcludes that an ergonomically designed in-vehicle interface, utilising ecological interface design principles, presentingboth safety and eco-driving information to the driver via an integrated and adaptive interface does not have to lead to visualdistraction, and the subsequent compromise in driving safety.
Acknowledgements
The smart driving system used in this study was developed as part of the Foot-LITE project which was sponsored by theTechnology Strategy Board, Engineering and Physical Sciences Research Council and the UK Department for Transport. TheTeleFOT project, for which these trials were conducted as part of by MIRA Ltd. in the UK, is an EU sponsored project under theSeventh Framework Programme. Specific thanks go to Nadia Shehata who assisted greatly with the data collection and videocoding.
References
Angell, L., Auflick, J., Austria, P., Kochhar, D., Tijerina, L., Biever, W., et al. (2006). Driver workload metrics project: Task 2 final report. Crash Avoidance MetricsPartnership (CAMP), Farmington Hills, MI, Report No.: DOT HS 810 635.
Antin, J., Dingus, T., Hulse, M., & Wierwille, W. (1990). An evaluation of the effectiveness and efficiency of an automobile moving-map navigational display.International Journal of Man-Machine Studies, 33, 581–594.
Bhise, V., Forbes, M., & Farber, E. (1986). Driver behaviour data and considerations in evaluating in-vehicle controls and displays. In Transportation ResearchBoard, 65th annual meeting, Washington, DC, January 1986.
Birrell, S., Fowkes, M., & Jennings, P. (2013). A smart driving smartphone application: Real-world effects on driving performance and glance behaviours.Third international conference on driver distraction and inattention. Gothenburg, Sweden, September 4–6.
Birrell, S., & Young, M. (2011). The impact of smart driving aids on driving performance and driver distraction. Transportation Research Part F, 14, 484–493.Birrell, S., Young, M., Jenkins, D., & Stanton, N. (2012). Cognitive Work Analysis for safe and efficient driving. Theoretical Issues in Ergonomics Science, 13,
430–449.Blaschke, C., Breyer, F., Farber, B., Freyer, J., & Limbacher, R. (2009). Driver distraction based lane-keeping assistance. Transportation Research Part F, 12,
288–299.Burns, C., & Hajdukiewicz, J. (2004). Ecological interface design. Boca Raton, FL: CRC Press.Dingus, T., Antin, J., Hulse, M., & Wierwille, W. (1989). Attentional demand of an automobile moving-map navigation system. Transportation Research Part A,
23, 301–315.Engstrom, J., Johansson, E., & Ostlund, J. (2005). Effects of visual and cognitive load in real and simulated motorway driving. Transportation Research Part F, 8,
97–120.Green, P., & Shah, R. (2004). Task time and glance measures of the use of telematics: A tabular summary of the literature. SAfety VEhicles using adaptive Interface
Technology (SAVE-IT) project, Literature review, Task 6, December 2004. The University of Michigan Transportation Research Institute.Green, P., Hoekstra, E., Williams, M., Wen, C., & George, K. (1993). Examination of a videotape-based method to evaluate the usability of route guidance and
traffic information systems (pp. 1–90). The University of Michigan Transportation Research Institute, Technical Report: UMTRI-93-31.Harbluk, J., Noy, Y., Trbovich, P., & Eizenman, M. (2007). An on-road assessment of cognitive distraction: Impacts on drivers’ visual behaviour and braking
performance. Accident Analysis & Prevention, 39, 372–379.Horrey, W., & Wickens, C. (2007). In-vehicle glance durations: Distributions, tails and a model of crash risk. Transportation Research Record, 2018, 22–28.Hughes, P., & Cole, B. (1986). What attracts attention when driving? Ergonomics, 29, 377–391.ISO 15007 (2002). Road vehicles – Measurement of driver visual behaviour with respect to transport information and control systems – Part 1: Definitions and
parameters. Geneva, Switzerland: International Organization for Standardization.Kaber, D., Liang, Y., Rogers, M., & Gangakhedkar, S. (2012). Driver performance effects of simultaneous visual and cognitive distraction and adaption
behaviour. Transportation Research Part F, 15, 491–501.Klauer, C. (2005). Naturalistic driving data: One of many tools in transportation researcher’s tool box. In Driver assessment conference 2005, Rockport, Maine,
US, 27–30 June.Klauer, S., Dingus, D., Neale, T., Sudweeks, J., & Ramset, D. (2006). The impact of driver inattention on near-crash/crash risk: An analysis using the 100-car
naturalistic study data (pp. 1–244). Washington, DC: National Highway Traffic Safety Administration (NHTSA). Report No.: DOT HS 810 594.Kramer, U., & Rohr, G. (1982). A model of driver behaviour. Ergonomics, 25, 891–907.Lansdown, T. (2000). Driver visual allocation and the introduction of intelligent transport systems. Proceedings of the Institute of Mechanical Engineers: Part D,
214, 645–652.Metz, B., Schomig, N., & Kruger, H.-P. (2011). Attention during visual secondary tasks in driving: Adaption to the demands of the driving task. Transportation
Research Part F, 14, 369–380.Morris, A., Reed, S., Welsh, R., Brown, L., & Birrell, S. (2013). Studying the effects of in-vehicle information systems on driver visual behaviour. In International
research council on biomechanics of injury (IRCOBI 2013), Gothenburg, Sweden, 11–13 September 2013.NHTSA (2012). Visual-manual NHTSA driver distraction guidelines for in-vehicle electronic devices (pp. 1–117). National Highway Traffic Safety Administration,
Report No. NHTSA-2010-0053.Renge, K. (1980). The effects of driving experience on a driver’s visual attention. An analysis of objects looked at using the ‘verbal report method.
International Association of Traffic Safety Sciences Research, 4, 95–106.Rockwell, T. (1988). Spare visual capacity in driving – revisited. In A. Gale, M. Freeman, C. Haslegrave, & P. Smith (Eds.), Vision in vehicles II (pp. 317–324).
Amsterdam: Elsevier.Spence, C., & Ho, C. (2009). Crossmodal information processing in driving. In C. Castro (Ed.), Human factors of visual and cognitive performance in driving
(pp. 187–200). Boca Raton, FL: CRC Press.
124 S.A. Birrell, M. Fowkes / Transportation Research Part F 22 (2014) 113–125

Author's personal copy
Victor, T., Harbluk, J., & Engstrom, J. (2005). Sensitivity of eye-movement measures to in-vehicle task difficultly. Transportation Research Part F, 8, 167–190.Wierwille, W. (1993). Demands on driver resources associated with introducing advanced technology into the vehicle. Transportation Research Part C, 1,
133–142.Wierwille, W., & Tijerina, L. (1998). Modelling the relationship between driver in-vehicle visual demands and accident occurrence. In A. Gale (Ed.), Vision in
vehicle IV (pp. 233–243). Amsterdam: Elsevier.Young, M., & Birrell, S. (2012). Ecological IVIS design: Using EID to develop a novel in-vehicle information system. Theoretical Issues in Ergonomics Science, 13,
225–239.
S.A. Birrell, M. Fowkes / Transportation Research Part F 22 (2014) 113–125 125