
GGD-88-75 High Yield Bonds: Nature of the Market and Effect ...
330
-
Upload
khangminh22 -
Category
Documents
-
view
1 -
download
0
Transcript of GGD-88-75 High Yield Bonds: Nature of the Market and Effect ...


PREFACE
On March 1, 1988, the U.S. General Accounting Office held a joint public hearing in conjunction with the Security and Exchange Commission, the Federal Home Loan Bank Board, the Comptroller of the Currency, the Federal Reserve System, the Federal Savings and Loan Insurance Corporation, the Federal Deposit Insurance Corporation, the Department of the Treasury, and the Department of Labor. The hearing fulfilled part of GAO'S responsibilities mandated in the Competitive Equality Banking Act of 1987 (see appendix I for a complete description of the requirements specified in the Act). Various witnesses comprised of market participants and academicians provided their views on the nature of the market of high yield bonds which are contained in the transcript and written comments. The witnesses were given the opportunity to review and edit the transcript for clarity prior to publication. Other than minor grammatical and punctuation changes by the GAO staff this transcript replicates, as closely as possible, the actual recording of the comments made during the hearing.
This product contains the transcript of the hearing, the Federal Register Notice of Public Hearing and the Request for Comments (appendix I), and the written comments provided by witnesses (appendix II through XI).
1

MODERATOR
Harry S. Havens
Craig A. Simmons
Owen Carney
Bob Miailovich
Martha Scanlon
James Barth
Janet Laufer
Ken Lehn
Gordon Eastburn
Assistant Comptroller General, U.S. General Accounting Office
PANEL MEMBERS
Senior Associate Director, Financial Institutions and Markets, General Government Division, U.S. General Accounting Office
Director, Investment Securities Division, Comptroller of the Currency
Associate Director, Division of Bank Supervision, Planning and Program Development Branch, Federal Deposit Insurance Corporation
Assistant Director, Division of Research and Statistics, Board of Governors of the Federal Reserve System
Director, Office of Policy and Economic Research, Federal Home Loan Bank Board
Pension and Welfare Benefits Administration, Office of Regulations and Interpretations, Department of Labor
Chief Economist, Securities and Exchange Commission
Director, Office of Financial Institutions, Department of the Treasury
2

L I
TABLE OF CONTENTS
Paae Preface.......................... 1
Opening Rem arks by M oderator. . . . . . . . . . . . . . . . 5
Academ ic Panel
S tatem ent of A . Zachary Sussman, Editor, Annual Review of Banking Law, Boston University . . . . . . . 7
S tatem ent of Dr. Glenn Yago, Associate Professor of M anagem ent, W . Averell Harrim an School for M anagem ent and Policy, S tate university of New York at S tony Brook. . . . . . . . . . . . . . . . 13
S tatem ent of Dr. Edward Altm an, Professor of Finance, New York University Graduate School of Business. . . . 18
Question and Answer Session . . . . . . . . . . . . . . . . 22
Rating Service
S tatem ent of Gail Hessol, M anaging Director, S tandard and Poor's Corporation . . . . . . . . . . . . . . . . 36
Question and Answer Session . . . . . . . . . . . . . . . . 40
Bond Issuers
S tatem ent of A rnold Brookstone, Chief Financial and Planning Officer, S tone Container Corporation representing the Alliance for Capital Access, accom panied by David K . Aylward, Executive Director, Alliance for Capital Access. . . . . . . . . 46
Question and Answer Session . . . . . . . . . . . . . . . . 53
Savinss and Loan Institutions
S tatem ent of M ichael Lea, Senior vice President, Imperial Corporation of A m erica, representing the U.S. League of Savings Institutions, accom panied by Brian S m ith, Senior vice President, U.S. League of Savings Institutions . . . . 59
S tatem ent of David A . Sachs, Senior Vice president, Colum bia Savings and Loan Association. . . . . . . . . 63
Question and Answer Session . . . . . . . . . . . . . . . . 71
3

Mutual Fund Manager
Statement of J. Thomas Madden, Senior Vice President, Federated Research Corporation, accompanied by Peter J. Germain, Associate Corporate Counsel, Federated Investors, Inc.. . . . . . . . . . . . . . . 80
Question and Answer Session . . . . . . . . . . . . . . . . 84
Appendix
I
II
III
IV
V
VI
VII
VIII
IX
X
XI
Federal Register, February 1, 1988. General Accounting Office Notice of Public Hearing and Request for Comments on the Nature of the Market for High Yield Bonds . . . . . . . . .
Comments Submitted by A. Zachary Sussman, Editor, Annual Review of Banking Law, Boston University. . .
Comments Submitted by Dr. Glenn Yago, Associate ProfeSSOr of Management, W. Averell Harriman School for Management and Policy, SUNY at Stony Brook . . .
Comments Submitted by Dr. Edward Altman, Professor of Finance, New York University Graduate School of Business. . . . . . . . . . . . .
Comments Submitted by Gail Hessol, Managing Director, Standard and Poor's Corporation. . . . . .
Comments Submitted by Arnold Brookstone, Chief Financial Officer, Stone Container Corporation . . .
Comments Submitted by the Alliance for Capital Access.......................
Comments Submitted by Michael Lea, Senior vice President, Imperial Corporation of America . . . . .
Comments Submitted by the U.S. League of Savings Institutions . . . . . . . . . . . . . . . . . . . .
Comments Submitted by David A. Sachs, Senior Vice President, Columbia Savings and Loan Association . .
Comments Submitted by Federated Research Corporation. . . . . . . . . . . . . . . . . . . . .
. 89
. 97
. 111
. 132
.177
.196
.212
.273
.291
.302
.315
4

PROCEEDINGS [ 10:00 a.m.1
MR. HAVENS: Good morning, and welcome to today's hearing on the high yield bond market. My name is Harry Havens. I am an Assistant Comptroller General in the U.S. General Accounting Office. I will be the moderator for today's hearing, which I interpret as being primarily a traffic cop.
The Competitive Equality Banking Act of 1987 mandates GAO to study the high yield or "junk" bond market, of which this hearing is a part. The issues on which we are seeking comments are detailed in the Notice which appeared in the Federal Register on February 1, 1988.
We have made available to the witnesses and panel members pre-publication copies of a preliminary report which discusses the issuers, purchasers, and purposes of high yield bonds. Copies are also available on the table. We will be issuing a final report in the future which will (1) summarize and analyze current laws regulating investments in high yield bonds by federally insured banks, thrifts, and pension funds; (2) review the effect of high yield bonds on corporate debt as it relates to federal monetary policy; (3) discuss other types of direct investments made by federally insured institutions and the effect those investments have had on federal insurance funds; and (4) include our conclusions and recommendations.
As part of our information gathering process, GAO is conducting this joint public hearing with representatives of the Federal Deposit Insurance Corporation, the Comptroller of the Currency, the Federal Reserve System, the Federal Home Loan Bank Board, the Federal Savings and Loan Insurance Corporation, the Securities and Exchange Commission, and the Departments of Labor and the Treasury. Representatives of these agencies are on the panel and I would like to introduce them and the GAO representatives at this time.
Starting all the way to the left is Janet Laufer, of the Pension and Welfare Benefits Administration, Office of Regulations and Interpretations, Department of Labor. Next is Martha Scanlon from the Federal Reserve Board. Next is Ken Lehn, Chief Economist of the SEC. On my immediate left is Craig Simmons, Senior Associate Director, Financial Institutions and Markets, of the u. S. General Accounting Office.
On my right is Gordon Eastburn, Director, Office of Financial Institutions of the Treasury. Jim Barth, Director of the Office of Policy and Economic Research, Federal Home Loan Bank Board. Bob Miailovich, is that correct? From the FDIC, substituting for Roger Watson.
5

On the far left is Owen Carney, Director of the Investment Securities Division, Comptroller of the Currency.
I would like to thank everybody on the panel for their cooperation and assistance in preparing for these hearings. Also on behalf of the panel members as whole, I would like to welcome the witnesses and thank each of you for being here and for taking the time to help us gather this information.
Before beginning, I would like to offer a few ground rules for the hearing. First, the panel members are not here to express their agency's views on the issue in this release, nor to respond to questions. Rather they are to ask the questions for the purpose of helping GAO and themselves gather whatever information seems relevant.
GAO intends to obtain the views of the agencies officially through interviews and comments on a draft report.
Second, we have a lengthy list of witnesses and a number of panel members who may wish to ask questions. In the interest of time, please keep all remarks brief and to the point. W itnesses should assume that all panel members are familiar with the material submitted in advance. Your full statements will be included in the record, and we ask that witnesses limit opening remarks to no more than 10 minutes.
Third, only panel members will be permitted to ask questions of the witnesses, and these questions will be asked on a round robin basis until all of the time has been expended or there are no further questions. We may also ask witnesses to respond in writing to questions which we were not able to ask because of time constraints.
A written transcript of the hearings will be prepared and available for review in the GAO Law Library at 441 G Street, and at our New York and Los Angeles regional offices as well, in about two weeks.
GAO will keep the public comment record open until 5:00 p.m. on March 15th, two weeks from today, so that anyone can respond to issues raised in the written submission or during the testimony today. Witnesses may also voluntarily submit additional written material by that time if they wish to do so.
I want to introduce two other GAO staff here today, who may be submitting questions from time to time through Craig Simmons --Mike Burnett and Frank Philippi, immediately behind me. They've been working with Craig, and are leaders in GAO's work in this area.
6

Craig, have I missed anything we need to cover at this point?
MR. SIMMONS: No, I think you've covered everything here.
MR. HAVENS: Okay. Our first witnesses constitute a panel of academicians, A. Zachary Sussman, Editor of the Annual Review of Banking Law, Boston University. Dr. Glenn Yago, Associate PrOfeSSOr for Management of the W. Averell Harriman School for Management and Policy, SUNY at Stony Brook. And Dr. Edward Altman, Professor of Finance, New York University Graduate school of Business.
Let me ask that we start with any opening remarks in that sequence. Mr. Sussman first.
MR. SUSSMAN: Shall I give my testimony?
MR. HAVENS: Yes, but please limit your remarks to no more than 10 minutes at this point, so that we can have time for questions.
STATEMENT OF A. ZACHARY SUSSMAN, EDITOR, ANNUAL REVIEW OF BANKING LAW, BOSTON UNIVERSITY
MR. SUSSMAN: Thank you for the opportunity to offer testimony here today. I am an Editor of the Annual Review of Banking Law, which is a law review of the Boston University School of Law. As a third year law student, I have accepted a position for the Fall as Associate Counsel for the Federal Home Loan Bank of San Francisco. However, all statements which I'll make here are my own. They do not necessarily reflect the views or opinions of Boston University, or those of the Federal Home Loan Bank System.
While in Law School, I have carefully researched the issue of direct investment, and have arrived at some specific conclusions, both of a legal nature, and of a policy nature, which are published at Seventh Edition Annual Review of Banking Law, page 425.
Today, I intend to address the issues raised by economic policy. These hearings have been ordered because there is a perception that a problem exists with direct investment in high yield instruments by federally insured institutions. The largest concern appears to be that the high yield promised to investors may be too low to compensate for future defaults. The high yield market, in its present form, has not been tested by significant negative economic events of a national scale.
The underwriters have strongly insisted that until now the yield has been far more than adequate to compensate for loss in
7

value due to defaults and other causes, and implicitly that this will continue to be the case.
I believe there is merit to both sides of this quantitative debate over the predictive validity of past default rates. However, I also believe that over time the negative publicity will fade, and the high yield market will mature and efficiently discount the risks just like any other market.
Furthermore, I could for example, easily present a very persuasive argument that real estate lending in Texas should be prohibited, if I were to rely on past quantitative data which speaks little of future economic conditions. Therefore I feel that policy considerations require an assessment of high yield debt from a qualitative viewpoint.
What is it about the nature of direct investment as compared to other forms of lending, which could be of value to the depository institutions as financial intermediaries? Direct investment implies intermediation of these bonds. The answer requires an analysis of the status of financial intermediation.
As a financial intermediary, a bank absorbs risks which its depositors are unable or unwilling to accept. Two primary risks are credit risk and interest rate risk. Simply put, a bank adds value as an intermediary by performing an analysis of these risks, and then prices its money accordingly. Hopefully the profit derived from the spread between interest paid and interest received will be large enough to attract and maintain bank capital.
The real world is typically a distortion of any economic model, and this is no exception. The models succeeds only under the assumption that banks maintain a competitive advantage at risk analysis, or at a minimum that they do not become relatively inefficient in providing this value.
For many years, when commercial banks held an oligopoly position protected by statute, and by lack of meaningful competition, this was the case. Today, however, securities are increasingly serving as a vehicle of choice, for matching those who want to borrow on a large scale, and those willing and able to lend.
The introduction of computerized securities analysis, and securities clearing, in conjunction with global capital-raising capabilities, has yielded great efficiencies in producing such matches, thus gradually substituting for large scale financial intermediation.
In the case of commercial banking, the industry's share of the short-term lending market fell from 90% in 1971, to under 50%
8

of a much larger base in 1986. The market for medium-term commercial debt securities was estimated at $40 billion in 1986, up from $17 billion in 1984.
In thrift lending, it's often more profitable to sell mortgage loans as securities than it is to service them. To the extent that a savings and loan derives its revenues from origination fees, it is no longer a financial intermediary.
On the depositors' side, financial instruments such as money market certificates, high interest CD's, and mutual funds have in part taken the place of low yielding bank vehicles such as savings and demand deposits.
More equity funds exist today than the number of firms listed on the New York Stock Exchange itself. It is clear that the competitive advantage which commercial banks once enjoyed at large scale financial intermediation is subtly declining, due to structural changes in the economy.
There are real dangers of this, above and beyond the obvious lack of profits. Specifically, there will be an incentive to increase revenues if a bank wishes to remain an intermediary. And importantly, revenue and risk are intimately connected in the financial industry. Risk, in and of itself, is not inherently dangerous, if fairly compensated, particularly if a bank has a competitive advantage at analyzing such risks over non-bank competitors.
To sterilize a lender from risk would be to force it to cease functioning. In theory, a bank could alter its risk structure to respond to external changes such as increased capital costs and competition for certain market segments.
However, regulation-based asset restrictions distort this ability to adapt to change. Regulations which were written during a previous era limit possible risk structures to narrow, pre-specified choices. "Regulatory lag" of this sort tends to limit bank assets to pre-determined choices which are less relevant today, thus straightjacketing institutions from adjusting to market forces.
The hidden danger of regulatory lag, however, is that the target would be more vigorous in its attempt to find new forms of risk taking than the regulators can control. Thus a bank may, for example, increase its interest rate exposure, or its unsystematic credit risk, which is itself an isolated form of risk, to the extent that these are not technically prohibited by the regulations.
9

The real problem is that these forms of risk and others which banks may resort to are not efficiently intermediated by banks.
For example, most banks, and small banks in particular, lack the expertise to evaluate national interest rate trends necessary to successfully intermediate term risk. Unsystematic credit risk is not efficient for banks either, and it is rarely compensated for fairly.
There is some evidence that such a scenario might exist today. In fact this could be the underlying reason for why we are here today discussing the diversification of bank assets into a new area.
The national regulations which govern bank investment in bonds, for example, were last amended substantively in 1971, and the bulk of asset regulations were last reviewed much earlier.
Keeping this in mind, we have seen the result of excessive unsystematic credit risk, every time an institution fails due to inadequate credit risk diversification away from agriculture, oil and real estate sectors, and frequently when a commercial bank takes a major writedown from a Latin American loan.
Term risk may also be on the rise, as Federal Reserve Board data indicates that the weighted-average maturity of long term commercial and industrial loans, as measured in months, has increased from the mid-40's in the 1970's to the low 50's in the 1980's. This trend should require further study on the part of the Federal Reserve Board.
To ensure safety and soundness of the bank system, the bank must be ensured a fair return on its capital. Commercial banks are increasingly trying to increase return on capital by performing securities-related services such as underwriting. As long as investors have no recourse against the bank, the securities generally don't need to be capitalized.
However, when we talk about high yield bonds, we're talking about intermediation of capital. Now, as an intermediary, commercial banks must invest in risks which they can successfully intermediate. The problems in large scale financial intermediation, caused in part by competition from securities, demand an expansion of intermediation opportunities.
High yield bonds could serve as an avenue for such an expansion. In order to evaluate high yield bonds as direct investments however, we must first answer the question of whether they require intermediation. In other words, is there an opportunity for banks to add value as credit intermediaries?
10

The bond rating services to some extent duplicate the credit intermediary function on a larger scale, so that rated high yield bonds are probably more fairly priced and present less opportunity as direct investments.
Nevertheless, some feel that the ratings of high yield issues have lagged behind changes of corporate affairs and have failed to adequately correlate with actual default figures. That does give banks the opportunity to act as credit intermediaries for performing independent risk evaluations.
Private placements and the unrated high yield bond segment represent even brighter opportunities. Private placements yield more benefits to investors that perform independent evaluations, as less public information is disclosed.
Unrated bonds, which are a significant portion of total of high yield bonds, may be evaluated de novo by a bank's credit analyst, creating a large opportunity for value added.
There is no reason to expect that a bank will choose to accept an unrated bond risk which it would not accept as a bank loan. Bank credit is, after all, also unrated.
In conclusion, the legislative history of the Garn-St Germain Act indicated congressional intent to increase the earnings potential and diversify earnings of savings and loans, by diversifying into commercial loan and commercial paper intermediation. Their experience has been largely successful. To a larger degree than savings and loans, commercial banks have a competitive advantage in their ability to analyze business credit risks, and have an equal need to diversify sources of intermediation revenue.
I therefore see very little reason why federal thrifts may invest up to 11% in high yield bonds, while federal commercial banks are barred completely from the market. High yield could be a particular benefit to small commercial banks. High yield bonds have lower origination cost than an equivalent sized loan portfolio, they're subject to some degree of SEC oversight, and are far more liquid than the interbank market for commercial loans. Although they are generally more subordinated than direct lending they are also more likely to have a market after default.
As a footnote to this proceeding, the need to diversify earnings could also be interpreted as requiring a re-evaluation of the Glass-Steagall Act, which would allow a bank to generate non-intermediation revenues. However, this hearing today.
that is not the purpose of
Regarding implementation of these ideas, I have suggested that regulations should permit more flexibility in the individual
11

forms of risk-taking open to banks, and that high yield bonds can play an important role in such a strategy.
Ultimately, an overall level of risk may be established which would dictate maximum risk levels that reflect social value regarding the banking system. Outside social values should not be confused with the forms of risk-taking, however, because that can lead to economic distortion.
Increased flexibility, however, makes uniform enforcement efforts much more difficult. Structuring the regulations so that some negative element varies directly with the pursuit of higher risk assets could improve enforcement efforts, because it would free the primary regulator somewhat from having to act as a policeman.
To this extent, the risk-based capital scheme currently under consideration by the major commercial banking regulators could succeed in imposing a market discipline on commercial banking assets.
The categories could ultimately be expanded to include high yield bonds or any other form of risk which a bank is willing to pay for. The maximum category was 100% in the Federal Reserve Board proposal. Possibly 150%, or 200% could be required for high yield bonds as assets.
Tying capital requirements to the risk formula causes market forces to discipline banks in favor of taking only fairly compensated risks. To some, market discipline is much more effective than regulatory discipline.
The FDIC already implements a market approach to debt securities risk. The FDIC does not prohibit high yield debt security purchases per se. Rather, it forces automatic writedowns of price depreciation and defaults for capital computation purposes.
Other forms of market discipline that have been proposed address the criticism that depository insurance skews the incentives for risk-taking by bank managers. The risk based insurance premium, if of sufficient weight, may succeed in restoring the proper incentives. Private depository insurance has been proposed, as well as personal liability for bank officers.
One scheme would increase the amount of subordinated debt that comprises bank equity capital. Now, supposedly subordinated debt holders are far more effective at market discipline than equity owners because they do not share in the upside potential of institution, only the downside.
12

In conclusion, whatever method is ultimately chosen to manage asset flexibility should recognize that risk is something to be managed and not feared. The role of regulation should be to discipline banks towards taking only the most efficient forms of risks while the overall level of risk may be established later on policy grounds.
High yield bonds are a relatively efficient form of credit risk for both commercial banks and savings and loans. They are amenable to financial intermediation and provide the regulators with one more tool to carry out their function. If managed properly they could provide a model or further expansion in bank powers if such a route is desired.
As an added tool for regulators, high yield bonds can further these goals, not only for savings and loans, but for commercial banks as well. Thank you.
[See Appendix II for the written statement of Mr. Sussman.]
MR. HAVENS: Thank you, Mr. Sussman. Next, Dr. Glenn Yago, Associate Professor for Management at SUNY at Stony Brook.
STATEMENT OF DR. GLENN YAGO, ASSOCIATE PROFESSOR OF MANAGEMENT, W. AVERELL HARRIMAN SCHOOL FOR MANAGEMENT AND POLICY, STATE UNIVERSITY OF NEW YORK AT STONY BROOK
DR. YAGO: Thank you, Mr. Havens. The testimony that we're going to be delivering today is a result of a study that we've been doing at the Economic Research Bureau at the Harriman School. Our study is based upon publicly available data for companies that issue high yield bonds between 1980 and 1986.
In the course of the study we reviewed available research information on high yield securities and their impact on the U.S. industrial competitiveness. We also undertook a systematic empirical analysis with investment, employment and productivity patterns of the issuing firms.
Most existing high yield bonds research assesses the financial performance of these bond issues in the secondary market. Instead we examined the financing impacts on firms and industries over the past decade, and tracked how these firms adopt new corporate structures and strategy, in response to major economic shifts.
In doing so, we're addressing an important policy issue: why Federally insured institutions should be permitted to continue to invest in high yield securities. As the study demonstrates, the high yield security served the public interest by providing a means for growing businesses to access capital. Our study shows
13

that high yield bond issuers have contributed substantially to employment in a wide range of industries, and in a variety of situations.
I'd like to stress the issue about the variety of applications of the use of these financial instruments, and that it would seem that the conclusion that could be derived from the study is that restricting investments would be a disservice to keeping economic growth alive.
I'd like to refer both the panel and anyone in the audience to the version of the testimony that's on the table over here which contains some tables and graphs that weren't in the earlier version, which might give you a little bit more of the detail and facts in the study.
SUNY focuses on 755 companies from 1980 to 1986, for which there was publicly available data. By 1987, high yield securities represented 23% of corporate debt issues outstanding, with less than one-third of these representing fallen angels, or issues that had once been investment grade.
Our study, I should emphasize, is focused on new public issues, on the new issue market, and it's important to note, I think, that some of the graphs here would indicate that high yield debt seems to follow rather than to lead recent trends in increased corporate indebtedness. I think that's an important differentiation to make, to see the role of the increased use of this financial instrument as a part of the general growth of corporate debt, and not the cause of it.
The Federal Reserve Banks flow of funds data indicate that the composition of corporate debt has shifted away from bank loans and towards capital markets over the past decades. Bank loans fell 8% while the combined credit market share of corporate debt increased over 13%.
Within this context, high yield securities played an increasingly important part in corporate finance. The decline of U.S. competitiveness generally has been ascribed to a range of factors other than the cost of capital, while research is focused on labor costs, energy costs, natural resource cost, various agency and assorted market costs.
HOW companies invest in their future, largely depends on how much capital is available and how it is allocated. Different types of financing may be required at various stages of firm and product development for R&D, new plant and equipment, marketing, employee training, management reorganization, other agency costs, acquisitions or market expansion.
14

Sometimes a firm cannot finance adaptation to new markets because banks won't extend credit or the firm's size or lack of a past credit history makes it unfavorable for equity offerings or other types of financing. Even if capital is available, the cost of capital in those situations may be prohibitive. Recent research suggests that higher capital costs may be a significant element in overall problems of industrial competitiveness.
The issues of leverage and whether or not American corporations are over leveraged is, I think, answered largely in a comparative context when you look at Japanese or German firms and find, especially within the manufacturing sector, much higher levels of debt to capital.
Let me discuss the competitive performance of high yield issuers. An important part of our study was to determine aggregate competitive performance, and in doing so, we took into consideration a number of fundamental issues relating to job creation, job retention, sales growth productivity, and a variety of those types of issues.
Aside from looking at the 755 companies, we extracted from that sampling companies upon which we made more intensive case studies. I'll just summarize what our basic conclusions were. Again, we find that high yield securities contributed substantially to corporate development but in very different ways depending on the company, depending on the industrial context, and depending on the strategic orientation of the firm's management.
Looking at both use of proceeds and going into case history information about the firms, we find a variety of ways that high yield securities were used which enabled firms to respond to industrial diseconomies of scale. They allowed firms to move outside of traditional industrial definition of goods and services and provide complimentary products or services that enhance competitive position.
High yield securities also maintained flexibility in the firm's organization of management, production and distribution. A lot of times the financing was used to apply advance technologies to many basic and mundane goods and services. The strategies that were utilized by the firms were to integrate marketing and production in ways their competitors did not, and to pursue financial flexibility through financing innovation and balance sheet management.
And finally, we looked at corporate strategies within the firms, and how they responded to demographic and economic shifts that affect market composition and demand.
15

Let me summarize some of the basic findings of the overall study from 1980 to 1986 of the larger group of firms.
Manufacturing industries had the highest concentration of high yield issue, 22.6%, followed by financial, insurance and real estate, and various services. We also computed a high yield index and found that finance, public utilities, mining and natural resource extraction, transportation, communications, insurance, leisure and repair services, and non-durable manufacturing participated more in the high yield bond market than their share of the U.S. economy as measured by percentage of GNP.
Let me talk about some of the specific variables we looked at. We looked at employment. Our analysis of high yield issuers over the 7 year period indicates that the average annual increase in employment among high yield issuers was 6.8% compared to industrial averages of 1.38%.
High yield firms added 80% of the annual average job growth of all publicly traded companies for which employment data were reported. There was a lot of variation in the weight of these employment impacts. High yield firms grew faster than their industry averages in the service sector, health and education, public utilities, leisure and repair services, retail trade, finance, and real estate.
On the other hand, in some sectors the high yield firms grew while their industries declined. This is true in communications, mining and natural resource extraction, and construction. In sectors that were declining, high yield firms declined slower than the industry as a whole. Manufacturing decline, for instance, was 1.77% for the industry as a whole, and .74% for high yield firms.
While there was diversity among firms and industries, high yield companies evidenced a greater capacity than U.S. industry in general to create new jobs, to retain old jobs, and to successfully equip themselves and manage the employment reductions in the context of overall industrial sector job loss.
We also looked at productivity and various ways of measuring productivity. The distribution of high yield securities generally parallels the distribution of restructuring activity and merger, acquisition and divestiture in the economy as a whole.
High yield financing has been concentrated in those sectors that have been deregulated such as finance, mining and natural resource extraction, or have experienced high levels of import penetration, for example, primary metals, fabricated metals, paper and allied products.
16

Using the Bureau of Labor Statistics data that was available on physical output per employee hour for 87 industries, productivity increases were associated with a high level of high yield security issuance in mining and natural resources, manufacturing, finance and public utilities.
We also looked at sales productivity as a separate measure for a broader range of firms and found that high yield firms compared to their industries performed at a higher level, 3.18% versus 2.4%.
We looked at sales, and again the findings are relatively consistent. High yield firms tended to grow more rapidly than other companies in sales, and this was true in a range of industries mentioned in the testimony.
Perhaps the most important area, I think, is comparative levels of capital expenditures. I think there's general agreement that new capital spending represents a commitment to future product production cycles and the enhancement of production capacity in the economy.
In examining new capital spending on construction, or acquisition of property, plant and equipment, high yield firms outperformed their industries more than double, 10.6% average annual growth over the period versus 3.8%. Within manufacturing, capital spending was four times higher than the manufacturing sector as a whole.
Aside from doing that, the cohort analysis of firms from 1980 to 1986, we also did a before and after analysis on the class of 1983, as we call it, the 163 issues of 1983 for which we could get a matching three-year before and after time measurement.
In examining firms before and after their high yield issue, we found that high yield manufacturing firms reversed declining rates of spending. Before the issue, their rate of spending was negative 4.8%, with a 17.9% increase after the issue, while overall capital spending in U.S. manufacturing industries as a whole was relatively flat, .54% from 1980 to 1983, and .59% from 1983 to 1986.
If manufacturing in some sectors is coming back to life, it is evident that high yield markets have played a major role in that behalf.
The empirical evidence of corporate strategies and performance in employment, investment and capital spending indicates that high yield firms act as agents of change within their industry. They appear to be seeking out new opportunities
17

in process technologies and product markets, and overcome obstacles of past production cycles and international competition.
The infusion of capital into firms from high yield securities does more than reshuffle securities, or reconfigure the firm's financial structure. Instead, it hastens the deployment of capital resources towards higher value operations and strategies. Thank you very much.
[See Appendix III for the written statement of Dr. Yago.]
MR. HAVENS: Thank you, Dr. Yago. Last, but certainly not least, Dr. Edward Altman, Professor of Finance, New York University Graduate School of Business. Dr. Altman.
STATEMENT OF DR. EDWARD ALTMAN, PROFESSOR OF FINANCE, NEW YORK UNIVERSITY GRADUATE SCHOOL OF BUSINESS
DR. ALTMAN: Good morning, thank you very much, Mr. Chairman, and ladies and gentlemen of the panel. I'd like to editorialize a moment by saying I'm pleased and mildly surprised to find not only a large and distinguished panel in name, but also in person, at this hearing. My experience in testifying in Washington usually is that it's a very important subject that's being discussed, but there are not many persons who are asking questions or who seem to be interested in at least hearing the testimony. Reading it might be a different story. So I'm pleased to be here.
Secondly, I'm going to deviate a little bit from standard testimony practice, and maybe I'll read a little bit, but I'll mainly chat a bit about the issues, and hopefully won't take the ten minutes.
I submitted a one page testimony which I will go over in some depth, and two articles that I may refer to from time to time.
First of all, the statistics in the high yield debt market, I'm sure, are quite known by the panel and researchers at GAO and related institutions. The market has grown dramatically from about a little under $4 billion in 1977, to approximately $160 billion today. And with that growth in the market, a number of institutions and regulatory bodies have expressed a great deal of concern with respect to their particular constituents investing in these markets, and they include of course, with respect to these hearings, the Federal Home Loan Bank Board, and the various Federal Home Loan Banks around the country, the Fed, SEC, state insurance departments and legislatures.
18

I guess the size of that market and the potential risk involved have generated these concerns, and they are legitimate concerns.
Also I'd like to mention that I'm not completely untainted, as the academic moniker might imply. To be candid, at times I have worked on research related projects for interested parties in this market. Sometimes my publications are not always a great delight to the people who paid for the study, but anyway the point is that sometimes the research is painted with a brush that's somewhat biased. I try not to be biased but sometimes it's not so easy.
Another aspect of the high yield junk bond market that is of particular interest of late is the fact that in the case of at least one issuer, Imperial Savings and Loan in California, high yield bonds are being used as collateral for new issues by this institution and perhaps others.
It's interesting that the rating services have established somewhat of a guideline of approximately 200%, or two to one collateral to the size of the issue, if the issue is collateralized with high yield junk bonds. I personally find that 200% not only ad hoc, but probably too steep. The analysis is on the conservative side. To get the Aaa rating from Moody's, I would think 150% rather than 200% makes a lot more sense if you look at potential default rates over a reasonably long time, like 10 years, and the possible loss in capital from those bonds that are behind the default rate statistics.
Interestingly enough, you will find there are now closed- end mutual funds rather than only the open-end traditional ones, that are coming out in the market to invest specifically in high yield bonds. One has been floated very successfully already, I forget the name of it, it had America in the title, but the interesting thing about this new issue is that these issues are accompanied by debt securities which receive a AAA rating--as long as something like 380% of bonds are collateralized behind the debt issue. So high yield bonds are more than an issue of regulation, it's an issue now of collateral and that of course presents a more comprehensive subject and its impact on the economy.
With respect to regulation, I have, in the article entitled "The Truth About the Junk Bond Market" --I must apologize for that title. Somehow or other I wrote an article which didn't have that title and it appeared in print with that title. And I must tell you that I was as surprised as anyone else, perhaps because it's a little presumptuous. But anyway, it sells magazines, and this appeared in a kind of professional magazine, a pretty good one actually. But the title is not mine.
19

With respect to regulation, however, ~'rn going to read a little bit from this article, from page 65 of the Investment Management Review. "While there is no evidence of excessive risk in these investments, the historical default rate on high yield bonds is nevertheless higher than on investment grade corporate debt securities." And I might add that I've looked at the default rates in great depth over the last few years, analyzing rates not only in a traditional way of looking at the average annual default rate, but in a new way in the paper that just came out last week, one that I provided a copy to the GAO at least a month ago. Looking at default rates or mortality rates in the way that insurance actuaries look at mortality rates of people when they accept their premiums.
"The question however becomes: Is default risk sufficient to require the imposition of regulation on federally insured thrift institutions or other types of institutions, who try to participate in this increasingly popular investment area?"
"Rather than imposing a restriction or moratorium, one possible solution would be to treat investments the same way traditional loans are handled by thrifts and other lending institutions. Loans for real estate development and home mortgages, commercial and industrial purposes, and consumer finance can also lead to default and loss", as we well know, and, as was pointed out by Mr. Sussman in the prior testimony, if the majority of loans are in certain areas of the country and we are not diversified, that oftentimes is the cause of a failing institution. These traditional types of loans should also be treated the same way that high yield bonds are treated, or the other way around, you could say, that is, adequate capital reserve be set aside to cover expected losses. Why not treat all investments including those in securities in a similar manner?
Now, I would like to go to the one page of, and again, I'm not sure I had the right wording, but I used the words "recommended thrift guidelines for investing in high yield bonds."
And this is the bottom line up front. The combination, in my opinion, of adequate reserves and prudent diversified investing is a recommended action with respect to all investments made by federally insured thrift institutions. It is important to note that I recommend treatment of high yield securities like any other risk asset, and advocate adequate reserves for all assets. The specifics of my recommendations are given a little bit further on.
However, I specifically do not recommend a cap on the amount of money invested in high yield bonds as long as the institution continues to hold a savings and loan, or mutual savings bank charter. I'm not sure I know, in fact I know I don't know, what
20

constitutes a charter with respect to an institution, but I imagine the primary business has to be in making the types of loans that S&L and mutual savings banks traditionally make, and therefore service the construction and housing sector of the economy. I think that's very important to remember. They still have to be able to engage in their primary business.
Based on the most recent three years of experience in the high yield debt market, I would advocate a reserve of capital of approximately 1.5 to 2% of the amount invested in such high yield investments. This is derived from an average taken on losses, and I emphasize losses, rather than rates of default, because after all, one of the important ingredients of the high yield market, as opposed to the private debt market, is the liquidity that the investor has to sell the security should there be default. And, on average we found that securities can be sold at about 40% of par after default. This percentage varies from year to year, however. In fact, in 1987, the average was 77.7% of par, mainly due to the Texaco case.
Anyway getting back to the number, this 1.5 to 2% is derived from an average taken on losses from defaults of 1% in 1985, 2.4% in 1986, and 1.5% in 1987. So if you average that out, you come out with something in the vicinity of 1.5 to 2%.
Actual losses due to default from a portfolio of high yield bonds would offset this reserve, and an annual replenishment would need to be accrued should the result fall below the reserve requirement. Estimates of losses from other securities, for example highly rated bonds and equities, as well as expected losses from traditional thrift activities--loans on single and multi-family dwellings, etc.--should also be assessed. They probably are, I'm not sure of the exact guidelines with respect to traditional loans, however.
As I said before, I do not recommend ad hoc restrictions on the amount of high yield investments by individual thrift institutions. The federally chartered S&L's have the 11% rule, and in New York state now, insurance companies are expected to have no more than 20% of their potential assets invested in high yield bonds, made up of private and public types, which is also ad hoc and arbitrary, as I testified before them about a year ago.
Indeed, a minimum amount of investment dollars is necessary for diversifying adequately, so restrictions could be counter- productive. I'd like to emphasize that. If you advocate diversification and at the same time you advocate limits on the amounts, you perhaps will constrain the portfolio manager from being adequately diversified.
21

What is adequate diversification? I really don't have the magic number of securities. I've seen studies that said as little as 15 to 20 securities would be adequate. I find that a little bit too few, especially if you didn't have other limitations. I advocate in the vicinity of 30 to 40 different issuers, not issues, but issuers, with no more than say, 5 to 10% of the total high yield portfolio invested in any one issuer or 10 to 15% in any one industry.
Now, those are not based on a tremendous amount of study, but I would guess that more precise guidelines should be based on a detailed study of the make up of the total market, which by the way changes over time.
An alternative scheme would be to study the portfolio make- up of the leading high yield mutual funds, those which have satisfactory to excellent returns and relatively low variability of return below industry average. These might include the most successful funds stratified by size because you probably have S&L's and mutual savings banks, which will also be stratified by size, and size is a barrier somewhat to adequate diversification.
That concludes the formal, or informal, testimony that I'd like to make.
[See Appendix IV for the written statement of Dr. Altman.]
MR. HAVENS: Thank you Dr. Altman. We will turn to Mr. Simmons of the General Accounting Office. We will then proceed round robin fashion, counter clockwise.
MR. SIMMONS: I have a question for Mr. Sussman. Mr. Sussman, in your testimony and in your article which you submitted to us, you clearly take strong exception to the prohibitions, current prohibitions that exist against commercial bank investment and high yield bonds. Thrifts, federally chartered thrifts are allowed to invest in high yield bonds up to the 11% limit, and state chartered banks are also permitted to invest in high yield bonds, which may be higher in some cases.
My question is, do you think the restrictions on thrift investments that currently exist are too severe, do you think there ought to be any restriction on thrift investments in high yield bonds?
MR. SUSSMAN: This is a question concerning whether that should be matched by --
MR. SIMMONS: No, simply whether there ought to be limits on thrift investments in high yield bonds. is that too restrictive,
They are currently 11%; should there be a restriction at all,
that's my question?
22

MR. SUSSMAN: To some extent, limits such as 11% may go to ensure diversification across different types of assets. Notwithstanding the merits of high yield bonds, to the extent that there is risk involved in securities as opposed to lending, as an asset, risk that is peculiar to securities, I think there should be some limits, as there should be with any type of particular asset.
As Dr. Altman mentioned with securities there should also be concentration restrictions in one particular issuer, which I believe already exist.
MR. HAVENS: Ken Lehn from SEC.
MR. LEHN: I have a couple of questions for the entire panel. First, what explains the phenomenal growth of the high yield bond market and corporate debt generally during the last five years? Does anybody have any ---
DR. ALTMAN: Well, as in any market, seller, so it isn't one side or the other.
you need a buyer and I think there are
probably a number of reasons. One fundamental reason that took place around the late '70's or early '80's, was that if you had invested your money in long term government securities, over the period 1978 to 1981, you would have lost money in three out of those four years due to the interest rate rise in that period.
If you had most of your money in a diversified portfolio of high yield bonds, you would have made money in every year except one, and the return spread between government and high yield bonds probably was between 5 or 6% average per year.
So what happened was, in my opinion, investors began to look around and say that they weren't earning anything, in fact they were losing money on risk free government securities, and they started forming these funds to siphon some of the monies from the government securities market, or new monies coming in, into higher yielding and higher risk, higher return securities. And this began to become well known, and so the mutual funds started, some of the pension money came in, and at the same time, the investment banks, particularly Drexel Burnham Lambert, were pioneering working with companies (as Professor Yago mentioned) to issue securities directly to the public as opposed to going to the private markets.
so you have this demand and supply beginning to increase at around the late '70's or early '80's. As you all well know, the market has been primarily fueled by a combination of the existing new issuers for industrial purposes and for restructurings. And the restructurings have probably accounted for something in the vicinity of 50%, perhaps even more than 50% of the new issuers.
23

And commercial banks, if I might editorialize, are more than happy to finance takeovers if they could, because it's very profitable to them. Perhaps Ms. Scanlon is aware, I’m sure she's aware of it, that there are many banks out there, particularly in my neck of the woods, in New York, probably have a much higher return on their assets because of the LBOs financing market over this last half a dozen years. I don't know if that is as well known as perhaps it should be, but I think that's an issue why the market has grown as well.
DR. YAGO: Let me amplify just a little bit on Dr. Altman's comments, moving from sort of the investor perspective to the issuer's perspective. Basically you had an under served market. Looking at figures like net nonresidential investment as a percent of GNP compared to earlier growth periods in the United States, it had been relatively eclipsing. So had the ability to try to get a hold of that portion of investment capital for firms that had basically been closed out of that market during earlier periods of time. I think probably one of the more frightening aspects of the notion of trying to restrict capital markets at this particular juncture in U.S. economic history is that the firms that had provided the main core of growth in the last recovery are the ones that seem to have been participating more heavily in the high yield market and have been closed out from other institutions.
The institutional structure of the capital market prior to the introduction of junk securities was one which restricted access to a lot of those firms, and if there are additional restrictions placed upon them, I think that the probability of keeping economic growth alive over a period of time, as we move towards world global competitive pressures and issues like that, becomes a really difficult point.
But to answer specifically your question it is I think an under served market, innovation within the capital markets to address it.
MR. HAVENS: Ms. Scanlon?
MS . SCANLON: Thank you. Professor Altman, I would like to ask your opinion on the securitization of the junk bond portfolio by Imperial Savings Association. Do you think that was made possible in part by deposit insurance, and more broadly, do you think there is a moral hazard problem from thrifts in terms of junk bond investments?
DR. ALTMAN: Perhaps without the deposit insurance, Moody's and Standard and Poor's would have asked for more than 200%. But I don't think deposit insurance itself is the issue here, because as I mentioned before, there are now closed end mutual funds
24

coming out, with junk bonds as collateral, and they're being accepted in the market place.
The ratio is higher, I don't know where they got that 3.8 to 1, it's crazy. But whatever, perhaps Gail Hess01 who is coming on next, can answer that question. But even if there is a right number there, you might argue that the deposit insurance, if it's 382 for closed end mutual funds, 200% for Imperial Savings and Loan, that you have to look at the differences between those two types of institutions with respect to the rest of their assets, and deposit insurance is one aspect of it.
As far as the moral hazard problem, in other words, individuals paying to subsidize the activities of S&L's and other risk taking, and other institutions, I consider much more of a moral hazard to have some of these institutions invest without diversification in real estate enterprises that they've gone into, far more risky to me as an individual than high yield bonds.
I'm very comfortable with high yield bonds in a diversified portfolio, to be perfectly honest with you, and at the same time, I would not do it myself from my own portfolio, unless I had enough assets to diversify, on the credit risk aspect.
even though I think I do a good job You know if I have ten securities and
two go under, I'm not going to do well. If I've got 100, and the average number goes under, I'm okay.
So I don't really believe that there is a significant moral hazard problem, but I have read that argument before, and my response to that is adequate reserves and prudent diversification to make sure that the hazard is not a significant one.
MR. SUSSMAN: If I may comment on the issue of depository insurance. The FSLIC charges the same rate for federally chartered S&L's as it does for state chartered S&L's, and state chartered S&L's are of course controlled by the state rules, certainly with regard to junk bond investments. Now the state rules are generally more lenient than the federal rules, and that has created some question over whether risk based deposit premiums should be instituted, because there is, well one could say that the state chartered institutions have a competitive advantage over federally chartered S&L's, because state S&L's don't have to pay their way, so to speak, in insurance rates.
MS. SCANLON: Thank you.
MR. HAVENS: Janet Laufer?
MS. LAUFER: I have no questions.
MR. HAVENS: Thank you. Owen Carney?
25

MR. CARNEY: Yes, sir. The question starts with diversification that Dr. Altman was articulating. YOU indicated that, and I understand the concept of large numbers of issues in effect answering the effects of default of a single issue, you're recommending 5% name limit, then 15% industry limit, which are pretty standard diversification themes in most portfolios.
DR. ALTMAN: Right.
MR. CARNEY: Is there anything peculiar to this market that would lend itself to other forms of diversification?
DR. ALTMAN: Yes, there is actually, I'm glad you mentioned that. I didn't mention earlier the question of liquidity. There are three risks primarily in this market for domestic investors. Interest rate risk, default risk and liquidity risk. I think the studies very clearly show that interest rate risk is, if anything, lower for high yield securities than for government securities of certainly long term, and if you match up durations, they are probably comparable.
So the interest rate risk I don't think is an issue. Default risk is clearly higher for high yield junk bonds than they are for investment grade, and that's what I talked about. Liquidity risk is another aspect. And there are no, to be honest with you, there are no good studies on this. But if you wanted some guidelines, I would say that you probably want to be sure that there are two, at least two, and probably three market makers in any security that you're investing in. But I would guess that if you're going to have a $250 million issue, you don't have any real problem with liquidity.
When you get below $150 million or $100 million, certainly below $100 million, then "ou might have a problem with not enough securities firms making markets. And the risk of liquidity of course is that when you want to sell and there's one market maker, you may have to sell at a big discount because the bid asked spread is so high.
So I say liquidity risk is another factor in addition to the maximum amount in any one issuer and the diversification by industry.
Finally, another issue is if the market shifts, so that if 20 to 30 percent of the market is now in cable T.V. issues, then I do not recommend hav'ng 20 to 30 percent of your portfolio in one industry which might be susceptible to a much higher risk than say the average of the industries across the board.
I do have another recommendation which is a little bit related to diversification, and maybe it's premature to talk
26

about it, and that is how you look at credit risk of individual issuers. I don't know if you're interested in that at this point, you were asking more about diversification.
I say diversify and then further, have a prudent credit strategy and I can recommend either computer credit screens, which I worked on, or taking a look at the quality of the people who are managing the portfolios. That's a little more qualitative and difficult, but after all, that may be the job of examiners to have that qualitative element as well as the quantitative numbers of diversification.
MR. CARNEY: Let me do a follow up on that. As I understood what you were saying on the smaller issues, where you might likely have one market maker, are you advocating diversification for underwriters of those issues?
DR. ALTMAN: That's right.
MR. CARNEY: Okay. Follow up question on diversification arguments that you were presenting earlier where you suggested mutual fund diversification or the diversification available through junk bond mutual funds, may be beneficial for smaller institutions that could not afford to diversify. I point out to you one dilemma and I'd ask you your reaction to it. AS I understand generally accepted accounting principles, as they apply to mutual funds held by financial institutions would be a good start, that they are required to be carried on a mark-to- market basis, where the actual market movements would be reflected in the institution's capital base. Not their earnings, but rather on a capital basis. Applicable to direct investments in junk bonds, you wouldn't have such a mark-to-market unless the instruments were subject to classification by a regulatory agency?
MR. SUSSMAN: Right. That presents a difference in treatment that I find unsettling.
DR. ALTMAN: Yes, so do I. This came up with the insurance industry's deliberations on should they regulate the amount and perhaps the diversification aspects of high yield bonds. And in a report that I co-authored for the New York State Life Insurance Association, we advocated marking to market of all assets, and we were opposed to regulating one type of security to market and not the rest of the portfolio. If you're going to look at capital, and I know this is a big issue, not only for high yield bonds, and not only for thrifts but for banks, commercial banks in particular, and they mark to market, the loans in the portfolio, particularly LDC debt, then we would have to change what we define as capital, I think.
27

But the point is that we advocate mark-to-market, I think that's the way to look at the risk of a portfolio. The other way to do it of course, is to mark at cost, but you examine a market, and you have your own ways of examining, and I would certainly as an examiner want to look at the market value of the portfolio, not the book value.
MR. HAVENS: Bob Miailovich.
MR. MIAILOVICH: At the present time, the banking agencies use as a standard for looking at securities the rating bands and so forth, and the idea that securities, the top four rating bands with securities of comparable credit quality are considered investment grade. You seem to be saying that something lower than that is an acceptable risk for institutions even given the fact that these are insured deposits, the institutions are investing.
The question I have is, other than the question of diversification and adequate reserves, is there in fact any credit point at which--regardless of risk, regardless of diversification and reserves, that this is just too far to go, the top four rating bands aren't right. At what level of risk are you saying, I don't care how you diversify, this is too far. Any observations, and keeping in mind we're talking about insured deposits.
DR. ALTMAN: One line of theory would say on individual issues, unsystematic risk is irrelevant if you diversify, the whole purpose of a diversification is to diversify away an individual issue's credit risk. And so if you're in a diversified portfolio, and some issues really can look terrible, then you'd never have it in your own portfolio, and then go on to the rest. The overall portfolio return is not going to suffer very much more than it would if that security continued to pay off well.
I find that somewhat difficult to support, but that's the theory, and there's a lot of very good studies that have documented it, particularly in the equity market. I could recommend a technique for eliminating what you would call probably very undesirable individual risk securities. But the only way to do that is to have a system that you are confident in. And that's a very subjective thing on my part to advocate, and it has to do with having a back-up to whoever your portfolio manager is. That's a bias in my case, because I think there are very good computer screens to more or less completely eliminate default possibility except for Texaco, and maybe a Storage Technology would have been difficult to predict and a few others. But you can --I think if you're willing to get out at some loss, whether you used the bond ratings, as Ms. Hessol's going to talk about in her testimony or some other technique. She mentioned
28

the fact that very few issues defaulted above a certain bond rating, and when they were triple C they have a really high probability of default. Don't deal in triple C's then if you are risk averse. I prefer for you to be in "quality-junk," if you want to have a term for it. I've used that before. You might get a lower yield. But I can put together a portfolio today that's essentially made up of double B's, and the chance of default of any significant number of those is so small, that we calculated a double B portfolio, over ten years, had something like a six percent cumulative mortality rate adjusted for calls and sinking funds.
And if you would take that and a loss of default on that 6%, and compare it with the very superior yield spreads that a double B rated security will give you, the risk-return trade-off is so favorable that I don't think anybody should be concerned with that. When you get to single B'S, then the default rates of course, start increasing. Then of course, you have to look at the risk-return trade-off there, but even there, the returns are far better than on risk free government bonds over a ten year period.
Triple C's is perhaps another story in terms of the risk- returns trade-off. By the way, I would say it's a mistake to classify all triple B and higher rated bonds in the same category. At the same time, I would say it's a mistake to categorize double B and lower as all in the same category. Those are very arbitrary definitions. I don't know if anyone on the panel knows, I don't, who decided that an investment grade security was triple B or higher, and who decided that a double B was junk. Sometime in the past somebody came up with that.
MR. MIAILOVICH: In a 1938 agreement that all the regulators got together in a room on.
DR. ALTMAN: Maybe we ought to look at the minutes of that meeting to see how it came up. But I guess S&P, and I guess we can ask Ms. Hess01 that, has guidelines that are supposedly consistent over time. I mean a triple B is a triple B no matter if it was 1938 or 1988. In that case, we have to look at the default rates of triple B's vis a vis A's and double A's, and double B's, to see if it really makes sense to use that category. And in the recent study that I just finished, I think for the first time maybe since the pioneering study in this area by Dr. Hickman, for the first time we can actually categorize default rates by bond rating instead of by bond grouping, which is, you know investment rating, non-investment rating. So I'm sorry that's a long answer.
MR. HAVENS: Jim Barth?
29

MR. BARTH: Thank you, I have two questions for Professor Altman. The first is related to two statements that appear in the banking law review piece that is presented by Mr. Sussman. In there are the final two sentences which I would like you to comment upon, if you would. "More than half of all high yield issues have been brought to the market since 1982, the first year in a historically long economic expansion. Today's average default figures do not reflect this statistical bias and may not remain accurate during less prosperous periods." Could you comment on those sentences?
DR. ALTMAN: Yes, I think it's probably an accurate statement of the numbers, and of course, it's easy to say that it may or may not reflect the true default rates, because we really don't know the true default rates. If we did, then there wouldn't be any purpose of these deliberations, with knowing you can set the right reserves.
If I might extrapolate your question, you're concerned with, and I think a lot of people are concerned with, what will happen when these new issues since 1982 come to fruition with respect to potential defaults, which might be during the next recession, or a bad recession, since we haven't had one since they've come out.
And I think that it's valid to presume that defaults will probably increase during a recession, certainly would increase during a severe recession. How dangerous is that to investors in this market, might be a way to ask that question? I'm not sure I have the right answer to that, but I would ask the question in a slightly different way. I would ask how high does default rates, adjusted for losses, have to be before an investor in high yield bonds would lose money. Let's suppose the default rate in 1990 was lo%, which it has never been. A 10% default rate today would mean $16 billion of defaults. This year we had somewhere around $7 billion not counting convertibles. And the vast majority of that is from Texaco.
But let's suppose the rate was lo%, and you got that $16 billion in defaults, the loss on that would be probably around 6% plus a coupon payment. So you're talking about maybe 6.25% loss from defaults, compared to risk premiums above risk free rates, or yield spreads, probably averaging today and over this period four or five hundred basis points (4-5%).
So you're talking about a net loss of 1.25-2.25% on the portfolio, assuming interest rates don't change. How dangerous is that? I would do a kind of a sensitivity analysis, maybe lo%, 12%, 15%, or was it in a depression, I mean if you're talking about depression scenario. And then take a look at the impact on the diversified portfolio to see what the impact is.
30

But this statement is accurate with respect to the amounts, and I don't know the answer in terms of how many defaults would take place.
DR. YAGO: I'd like to just add one point to that. I think that the new issue market really starts to take off around '77/'78. During the expansion there was obvious demand for capital growth and the new issue market boomed. However, it was not an insignificant market from in '80 to *82/*83, which everyone remembers was a fairly significant recession. And as I look at default rates in that period and see the way that the problems with credit risk were managed by the companies, there is evidence that the use of the equity swaps or other types of innovations inhibited problems of true economic loss.
So I would just say, you're right, '82, * 83 starts are real wave of expansion in the market, but the new issue market really was fairly substantial in '80 to '82 and that was a major recession.
MR. SUSSMAN: During a recession, bank loans themselves also probably default at a higher rate, in addition to high yield bonds. So any study on-- or any consideration of performance in future recessions should take into account the relative position of high yield bonds, relative to all forms of assets a bank can hold, and not focus on absolutes.
MR. BARTH: Thank you. One additional question for Professor Altman, and of course the other two panelists can comment on it if they wish. And that is new guidelines on investing in high yield bonds for thrifts, you mention a loan loss reserve figure of 1.5% to 2% based upon the aggregate amount of such investments, and then you mention the guidelines, you talk about minimum holdings of different issuers and what's the inter-relationship between that loan loss reserve figure and the minimum guidelines, that is to say would you prohibit investments in junk bonds unless these guidelines are satisfied, or would you adjust upwards or ratchet upwards, the loan loss reserves? IS there any interplay between the loan loss reserve figure and the guidelines, or are they strictly independent of one another?
DR. ALTMAN: That's a good question actually. I guess the 1.5 to 2 percent rate I was referring to, or reserve, assumes a certain risk portfolio. Therefore, you could use the averages of diversified portfolio performance. And if I understand your question correctly, what you're saying is, suppose that these other guidelines with respect to diversification and maybe size are violated? I guess the question is would that imply a higher reserve, or a lower reserve in the case of suitable diversification?
31

I guess I don't have an answer for that. I’m not so sure I would give under-diversification guidelines. I would be concerned with say five to ten issues in a portfolio, unless the case is so strong to the examiners that these issues have literally such a small default possibility that you could live with that. But that's a subjective thing. So I guess, I'm not willing to give on the diversification and therefore it would make the 1.5 to 2% firm also.
MR. BARTH: So would you-- would perhaps a minimum be 30 to 40, are you willing to give up to 25--
DR. ALTMAN: Oh, yes, on that one, I think I'd give them, because as I said in my testimony, I didn't really know if that was the best number. I would like to see, and I have not done this, really how well small mutual funds are diversified, and their performance in recession periods and the like. There's not that much history in that, so that's a difficult one.
I do know one mutual fund manager, portfolio manager, it's not a mutual fund, it's a private investment fund, that advocates being in ten quality junk issues. I won't mention the person's name, but he doesn't manage a good deal of money at this point. If he had a lot more money, I'm sure that he would have to be in more than ten issues, otherwise held be, you know, a predominant person in many of those securities, and he'd have to sell to himself, or something like that.
I guess the point is that I don't think ten is right, fifteen or twenty is probably a basic minimum, and 30 to 40, I put in there for a general guideline. I'd like to really observe how well the good funds are diversified and use that as some sort of guideline. Of course there is a problem with timing; how quickly in a start-up high yield situation can you get up to those 30 issues, and so that would have to be worked out a little more carefully.
But I really don't have the answer in terms of the trade-off between diversification and reserve requirement.
MR. HAVENS: Gordon Eastburn.
MR. EASTBURN: I wondered if anyone was ready to comment at this point on the events of October 19 and 20, and what their impressions were with regard to the junk bond market. Did it confirm everything you expected, or were there surprises? Have you reached any conclusions at this point?
DR. ALTMAN: Well, I looked a little bit at the results but I don't know if I come to any firm conclusion. But let me just throw out some observations. First of all, it's true that the high yield market suffered in that period and thereafter for a
32

I
short period of time. Probably fell something in the vicinity of 5 to 10%. The equity market fell by 30%.
Since that time, the high yield market is significantly above what it was on October 18th, well, above anyway. It was a flight to quality, and the spreads between high yields and governments probably increased by 150, maybe even 200 basis points, which caused the prices to go down in one case, and up in the risk free case.
So the "quasi-equity" nature of junk bonds certainly kicked- in there. If you had to sell on October 20th, you probably faced a liquidity problem. Maybe not as severe as in many common equities, but there clearly was difficulty in selling some of those high yield bonds. If your depositors rushed at you, and you needed to get out at that point, you m ight have had a problem-- would have had a problem in getting what price you perhaps thought was warranted.
I am really impressed with the market, actually what's happened since October 20th, in terms of how it's come back very strongly. And, what hasn't taken place until just about three, four weeks ago, is the new issue market also kicking in, which is now beginning to happen again as investors begin to take heart that the world hasn't come to an end.
But certainly it was far more risky to be in equities, than in high yield bonds. And if you're able to say "TO hell with the market, I'm just going to hold on to these securities until they mature, or even buy securities, there were tremendous opportunities to buy in that week. O f course you have to have a lot of stomach for that.
But the point is that you have to differentiate, I think, between worry about market impact to the generic quality of the issue, because I don't care what's going to happen, in terms of the market, as long you feel confident in that issue, that it's going to pay off in time , you don't have to sell. It's only when you're forced to sell due to perhaps redemptions, in some mutual funds perhaps, that you face that whammy of a market going down, and you not being able to hold to your investment strategies.
DR. YAGO: Just to amplify on that point, I think Dr. Altman's exactly right, I mean what happened was there was an initial dip and the market recovered very quickly. The high yield bond market responded very much the same way as the OTC market which is also comprised of smaller, lesser known firms. In the OTC equity market, there was flight to better known names after the crash, resulting in a dramatic dip in share values. In the quarters reported after October, smaller and medium sized companies showed positive signs of growth despite the crash, and the market began to respond to those signals. So, while there
33

was a short-term market failure at the time of the crash and a perception of lower value for both smaller equity and debt issues, the markets now appear to be responding more effectively. So I think the performance of the companies, even though there is a market failure if you will, at that particular moment in terms of a perceived lesser value of those issues, it's responding now more effectively.
MR. HAVENS: We've completed one round of questioning, and we have five minutes remaining in the allotted time for this section of the hearing. If we started around again, we probably wouldn't get very far.
MR. SIMMONS: I don't have anything else.
MR. LEHN: I just have one question, and that is, is there any evidence on the extent to which high yield, that the bonds of an issuer are tightly held as opposed to publicly held, because it seemed that the bankruptcy costs would be correlated with the extent to which there is diffuse holding of those bonds. Is there any such evidence of that?
DR. YAGO: We didn't have any in our study, we weren't looking at the purchase side.
DR. ALTMAN: I haven't looked really at the holdings in terms of the total market. I have looked, it was about a year and a half ago, as to the most popular issues held by the 30 or 40 largest mutual funds in this industry. So you can take a look at the composition that way. And the most popular issues are the most widely held. What I didn't look at is those maybe sizable issues that were not on that list, and there probably were some in there. So there is that risk.
There's another risk, and that takes place in investment grade bonds as well as non-investment grade bonds. If you track the trading, the volume of fixed income securities, you will find that new issues have a great deal of trading, both in the primary market and in the immediate secondary market also, as some who are able to get in on the original issue still think it was a good buy, and others want to make a quick profit.
But what tends to happen, in all grades of securities, investment and non-investment grade, is that trading volume tends to dry up in fixed income securities after a few months, maybe five or six months. Even your double A's and your triple A's, they're just not all that liquid, I shouldn't say not all that liquid because that's a different measure, they're not traded that much after some time.
And perhaps the reason for that is, a person buys a bond and swsr hey, this is a good buy, I like the company, I like the
34

I
yie ld I'm g e ttin g , a n d p u ts it a w a y . A n d if e n o u g h peop le d o th a t, the re 's n o t rad ing ac tivity.
M R . L E H N : Thank you .
M R . H A V E N S : M s. S can lon?
M S . S C A N L O N : Thank you . P ro fessor A ltm a n , w h e n w e we re ta lk ing a b o u t diversi f icat ion, a n d you we re focus ing o n th e h igh y ie ld b o n d po r tfo l io itself, has the re b e e n any analys is o f th e co-var iance b e tween th e h igh y ie ld b o n d s a n d th e o the r asse ts th a t m igh t b e he ld by th e inst i tut ions in pu rchas ing th e s e ?
D R . A L T M A N : O h , th a t's a very g o o d ques tio n . I was th ink ing th a t you we re go ing to ask a ques tio n a b o u t th e corre la t ion b e tween equ i ty securi t ies, investm e n t g r a d e b o n d s , a n d h igh y ie ld b o n d s .
I d o n 't k n o w a b o u t th e c o n s u m e r d e b t, I d o n 't k n o w a b o u t s ing le fa m ily dwel l ings, I d o n 't k n o w a b o u t th e cycle o f p rob lems in asse ts o f S & L 's. T h a t wou ld b e a very g o o d th ing to look a t.
W ith respec t to h igh y ie ld b o n d s a n d r isk f ree g o v e r n m e n ts, th e corre la t ion is in th e vicinity o f a r o u n d .7 5 - .8 5 , wh ich is h igher th a n a lot o f peop le think. T h a t's because o f interest ra te risk. They fluc tu a te to g e the r , a n d it's on ly th e credi t r isk dif ferential, a n d o f course O ctober 1 9 th is a very g o o d e x a m p l e , a very low covar iance o r n e g a tive covar iance in th is case . S o I wou ld say a b o u t .7 5 is w h a t th e studies te n d to s h o w b e tween h igh g r a d e a n d junk b o n d s .
W ith respec t to equ i ties , I'm sure th a t th e corre la t ion is lower . The re a re inst i tut ions a n d ind iv idua ls th a t a re bu i ld ing h e d g i n g strategies n o w , look ing a t those correlat ions.
M R . H A V E N S : I th ink th a t a b o u t uses u p th e tim e w e have ava i lab le fo r th is sect ion o f th e hea r ing . Thank you very m u c h , o thers o n th e pane l w h o d idn 't g e t to ask al l ques tions they m igh t have w a n te d to ask m a y have s o m e to submi t fo r wri t ten responses a fte rward . Thank you aga in very m u c h .
O u r nex t wi tness is G a il Hessol , M a n a g i n g Director, S ta n d a r d a n d P o o r 's Co rpo ra tio n . M s. Hessol , it s e e m e d th a t th e last pane l kep t say ing w e o u g h t to ask G a il Hess01 this, w e o u g h t to ask G a il Hess01 th a t. S o a t th is po in t, I th ink w e wou ld b e very p leased to hea r your o p e n i n g remarks , w e wou ld apprec ia te it if you wou ld ho ld it to n o m o r e th a n te n m inu tes .
3 5

STATEMENT OF GAIL HESSOL, MANAGING DIRECTOR, STANDARD AND POOR'S CORPORATION
MS. HESSOL: Okay. My planned remarks were fairly brief, and I was taking notes on some of the questions that came up earlier, and maybe I can try and work in my own responses to some of the things that have come up previously.
I was thinking to myself, when the question came up about the Imperial Savings issue, which was backed by a pool of junk bonds, and which we did assign a triple A rating to the issue. The last time I was in a public forum and was asked about the deal. It was a week after Black Monday and I was in Zurich with an audience of Swiss bankers, and they said, "My goodness, how could you put a triple A on anything connected to junk bonds," and we explained our methodology, and then of course the next question was "Was Standard and Poor's considering a downgrade of the U.S. Government's triple A rating." And we were the only people laughing.
So anyway, that is an introduction. I'm going to keep my comments, my formal comments to the topic of risk. How risky are junk bonds, not only how risky have they been historically, but how risky are they likely to be in the future.
I did, in my written testimony, cover a much broader ground, and if you have questions on those matters, I'll get into it after the formal presentation.
It's already been pointed out by the three earlier speakers and by your questions that the audience here is well familiar with the concept of risk, that you clearly understand the distinction between credit risk and the risk of a price change, the risk of volatility in the bonds, and of course it's the latter that goes into the studies of risk and return of junk bonds.
We all know that investors can have substantial gains or losses on U.S. Government Bonds, not because Uncle Sam is going to miss an interest payment, but simply because of the interest rate risk, and obviously the same holds true for high yield or junk bonds. And similarly there are considerable opportunities for profit buying bonds of bankrupt companies. I know if you buy at the right time and sell at the right time, you can have a 50% gain in a few months.
I'm sure all of you appreciate the distinction between credit risk and what goes on in the market. There has already been quite a bit of discussion about default rates and default risks, and that's what I want to pursue for the remainder of my comments.
36

I don't know if the members of the panel have a copy of the appendices that I submitted. Okay, well, I'll tell you what was in them, and if you want to check this out in your offices later, I'm sure you can.
There was a table that Standard and Poor's prepared showing year by year the amount of junk bonds defaulting, or precisely the amount of corporate bonds defaulting. And this figure has absolutely soared. We had $417 million in defaulted bonds in 1983, and it hit $9 billion last year. And this was of course during a healthy economic period.
There are many different ways to measure default rates, but I think any way that you measure them you would conclude that the default rate had been steadily rising. I would say since 1983; I think Professor Altman might start the point at 1984. And by the way, the only corporate bond to default with an investment grade rating was Manville Corporation back in 1982, so when we're talking about default rates on corporate bonds, they are all junk bonds. There are, or have not yet been many defaults, and I hope there won't be many of investment grade bonds.
But looking at those totals, the $9 billion I mentioned for 1987, and the five plus percent default rate that Professor Altman has calculated, many people say, "But of course that includes Texaco's bankruptcy and LTV's bankruptcy the year before. Doesn't that really distort the totals?" We would say no. First of all, LTV was a company that we always felt was a speculative grade credit. We had a junk bond rating on that company in the 1960's. Senior debt rating was CCC plus when it filed for bankruptcy.
Somewhat similarly we had a single B rating on Texaco senior debt for 16 months before it went under. Texaco was merely the largest company but by no means the first or the only to seek the refuge of bankruptcy to escape a crushing non-debt liability. This is a risk that we take very seriously at Standard and Poor's, the company's possible incentive for filing for bankruptcy, and that is factored into our rating process.
The other reason that these names are occasionally mentioned as being distortions is that they are simply so big. Texaco's default involved more than $7 billion of debt. We think that there are likely to be more giant defaults in the future. Up until maybe 1983 or 1984, there were very few speculative grade companies that had hundreds of millions, or billions of dollars in debt outstanding. As a result of the leveraged buyouts and recapitalizations, there are now several dozen junk bond issuers with large amounts of outstanding debt. I think the only reason they haven't shown up in force on the defaults yet is that it is simply too soon.
37

That sort of leads into another controversy, the distinction in default rates between fallen angels, the companies that were downgraded from investment grade to speculative grade, fallen angels on the one hand, and the "rising stars," or original issue junk bonds. "Rising star" is not our terminology.
By the way, we've been counting defaults since the beginning of 1972, and have found that 2/3 of the companies defaulting were original issue junk; they were not fallen angels. Fallen angels represent only a third of the defaults.
NOW, that's measured as the number of companies. If you're measuring the dollar amount of debt, there's no question that the fallen angels predominate, but as I said a couple of moments ago, I think that's just because there wasn't a lot--or there weren't many large original junk bond issues until recently.
Getting more prospective or future oriented, what is our outlook for defaults, we would expect definitely an increasing number of companies defaulting on public corporate bonds. We think there will likely be an increase in the amount of defaulting debt.
Now, I'm not saying that it's going to be $10 billion this year, and $12 billion next year, and straight on up. 1987 did have that huge Texaco number, but we would expect that over the intermediate term there could well be a year with ten or 15 billion dollars in defaulting corporate bonds.
And we are concerned about the next recession. Even if the recession is mild, which is the general expectation we would expect a significant number of casualties. One reason for thinking this way is really quite simple. There is a much larger pool of weak credits to choose from. The number of B rated bonds has quadrupled in the last four years.
The number of CCC's you used to be able to count on one hand, and now it's about 35 or 40. So with this huge pool of weak credits to choose from, I don't think I'm going out on a limb by saying the number of defaults are going to rise.
To move along a little bit, I just wanted to share a little bit of specific advice or recommendation for the junk bond investor. It is imperative for a junk bond buyer to carefully analyze each and every credit. I would also urge, not only investors but all of you here today, to look at those historical default rates skeptically and cautiously. The past may not be a good indication of the future.
I would second the earlier recommendations to diversify a portfolio of high yield securities. Remember back in 1980, we were waiting in line just to buy gasoline and a crash in the
38

price of oil seemed inconceivable. Well, six years later, 15 oil companies defaulted on their publicly held bonds.
Also I would urge the investor to carefully look at the business of the borrower, or junk bond issuer. You can't just buy bonds by the numbers, you really have to understand what industry this company is in, what is their position within that industry, what are management's strategies. Qualitative analysis is really important.
When one does look at the financial statements, the focus should be on prospective or projected cash flow analysis. Cash flow, both absolutely, and especially relative to debt service. Cash flow relative to the company's other requirements for funds, investment in plant and equipment, working capital, dividends and so forth. These are by far the most important measures of financial health.
My last suggestion is going to sound a little bit self- serving, we drop the hint that an investor might want to look at Standard and Poor's bond rating. And I'm pleased the subject came up with the earlier speakers.
Just to elaborate a little bit on our track record, our ratings by definition primarily evaluate default risk, and we really have been keeping score. Since the beginning of 1972, there were 132 companies that defaulted on public bonds which we rated, through the end of 1987.
So the universe is 132. You might want to compare that to what our ratings have been, and there are a couple of ways to slice it. Since 1972, we would estimate that about 800 industrial and utility companies were rated single A or better. Of that 800, 18 eventually defaulted. I think that's a pretty good record, although I would very strenuously caution any one not to extrapolate that trend. We think there's a real danger that bonds which were once rated single A or double A could well default in the future, and at much more than historical rates.
The simplest example is the company that used to be a double A and did an LB0 last year now it is a single B, and yes, they might go under in a couple of years. So ancient history becomes irrelevant for those types of firms.
Another way to look at the correlation between ratings and defaults is what our ratings were at the time the bonds went bust. At default 70%, of the bonds we rated were rated CCC, which is our lowest rating. Seven out of 10. And one year prior to default, 27% were rated CCC and another 33% were rated single B. There are various other ways to slice these statistics, but I'm quite comfortable sitting here and saying there's a strong correlation between our ratings and defaults.
39

Just by way of conclusion, I would say that to date junk bonds have provided an attractive return for prudent sophisticated investors, however, risks in the future may well be greater than in the past.
[See Appendix V for the written statement of Ms. Hessol.]
MR. HAVENS: Thank you, Ms. Hessol. Since Martha had the last question, we'll start around on this side, and go accordingly.
MR. CARNEY: Thank you. I was interested in your remarks about default risk related to non-debt liabilities, and I was wondering if your organization had any system for providing yourselves any assurance that the companies you're rating will avoid these kind of non-debt liabilities?
MS. HESSOL: There is nothing that can be done by us to prevent a company from getting enmeshed in lawsuits and so forth. We have very comprehensive procedures for assessing those situations. I mean, did on Texaco.
it was no accident that we had the rating we
We have detailed discussions, confidential discussions, with the management of the companies whose bonds we rate. If necessary, we consult outside expert sources. We do whatever we feel is necessary to assess that risk and to quantify it. Ultimately it's a judgment call. And that's why we have human beings rather than computers making rating decisions.
These are very difficult because I have sat across the table from managers, and asked them, filing?",
"Are you considering a bankruptcy and they will always tell you no, and you really have
to look whether their hand twitches or whether they blink when they say it. And I'm being serious on that. And that's part of the credit analysis that we do.
MR. CARNEY: And just by way of follow up, in your opinion, does the average institutional investor have the resources and the access to information that would enable them to make judgments, intelligent judgments about non-debt liabilities?
MS. HESSOL: Most probably do not. I know in the Texaco- Penzoil situation, a number of the major firms on Wall Street had hired their own law firms to research the issues and provide guidance and expertise. be highly unusual.
That requires a lot of money and would I'm not saying that we have perfect
information either.
MR. HAVENS: Thank you. Bob Miailovich?
40

MR. MIAILOVICH: Thank you. Do you have any observations or comments on the logic of the-regulatory agencies? decisions to cut off investment grade at the fourth band versus fifth band?
MS. HESSOL: I don't know when that happened. I know we didn't do it. Although we are obviously a beneficiary in some ways of that. The rating definitions do use the language speculative or investment, and I had thought it was one of your agencies that had done this many years ago, long before I was in the bond rating business.
MR. HAVENS: Jim Barth?
MR. BARTH: Yes, could you comment on the statement made by Professor Altman. He was commenting on the fact that some institutions issue liabilities which are backed by junk bonds-- junk bonds serve as collateral. And your agency rates the liability which is backed by the junk bonds. Could you say something about that process, or what you think of the use of junk bonds as collateral?
MS. HESSOL: I was not personally involved in that, and I'd be happy to have one of my colleagues respond to this question in writing. I do know a few general aspects of the methodology that we used. There was a distinction within the credit level. Professor Altman referred to the over collateralization. It was key to the actual rating. The over collateralization level was less for double B than single B, and I believe triple C was totally ruled out.
There were also mechanisms in the deal requiring securities to be priced very regularly and, if necessary, sold, so it was a rather complex transaction. Again, I'd be happy to have somebody respond in writing. Is there a particular aspect of that which you'd like to know more about?
MR. BARTH: No, I can provide more detail in writing to you. At the beginning of your comments you said that there are many different ways to measure default rates. Could you say something about one or two different ways, and which is the preferable way to measure a default rate. For example, would one look at numbers? Are you talking about numbers of defaults? Then there are dollar amounts lost in the event that there are defaults. Those are two measures that come to mind. Are there other measures, and which one is the most preferable, or is there such a measure?
MS. HESSOL: Dollar amount is certainly more scientific than numbers. What I had in the back of my mind was that some of the underwriters of junk bonds have chosen to distinguish between default rates on fallen angels, versus default rates on original
41

issue. I would not recommend that approach because I think the distinction over time is going to be meaningless anyway.
So I would certainly prefer comprehensive analysis of defaults. Often convertible bonds are excluded from the default rate calculations, and I understand why it's done, because if you're comparing default rates to returns, the pricing of converts is so different from straight debt that you can't mix apples and oranges. But I think if one is truly looking to isolate default rates on speculative grade credit, it would probably be appropriate to include convertible debt, which, although not high yield because of the convertibility feature, it's certainly speculative grade. There is a significant portion of speculative grade convert debt outstanding, and also converts are special in another way, in that they are very closely associated with the high technology industries, and that's a whole sector of the economy that would be sorely missed if you were looking at default rates without converts.
MR. BARTH: And one last question. YOU said something about a 70% accurate rating or the lowest rating at the time of default. What is the time of default? How do you actually assign a default date?
MS. HESSOL: Okay. The filing of a bankruptcy petition is a default. In virtually every bond indenture it is legally an event of default. Let me back up and answer your a question a little more carefully. What I'm terming a default is the date that Standard and Poor's puts a D rating on a bond. We do that the day of a bankruptcy filing. We do that the day a company misses an interest or principal payment on the issue. And occasionally we will do it a little earlier if the company makes an announcement they're not going to make the interest payment that's due next week.
MR. BARTH: Thank you.
MS. HESSOL: And by the way, 95% of the defaults involved bankruptcy and were very clear cut.
MR. EASTBURN: Let me come back to this categorization, well, grouping I guess is easier, of ratings by the regulators. Is it still fair to say from what you have been mentioning this morning in your paper that the non-investment grade categorization would still have a decay in rating that is substantially faster than the top four grades, and also, you're saying it would probably accelerate in the years ahead. I guess it comes back to the fact that if they have to use any kind of grouping, is this one particularly bad, or would you have a better one? Would you pick the top five categories, the top six, or--
42

MS. HESSOL: By intent, the rating categories are a continuum of credit risk. I think it's true that at one time there was thought to be a little bit more of a split between triple B and double B, but that distinction is becoming no less of a distinction than between double B and single B, for example.
For a number of reasons I discussed earlier, it's very tricky to talk about default risk by rating category over time because some of the ratings were assigned 25 years before the default, some ratings were assigned five years before. There is clearly a difference between single B and triple C. Senior debt rated triple C has demonstrated a very high default rate. And there is a noticeable pick up historically on default risk at the single B level, from double B to single B.
Probably not between double B and triple B, and again this is historical you know, retrospective analysis.
MR. EASTBURN: Should that be the case? I mean when you're buying a triple B, aren't you --or a double B, aren't you in effect betting or concluding that the decay in rating will be faster, or greater in that category than--
MS. HESSOL: No--no, I think the ratings, all the rating categories, are evaluating the likelihood of a default, not the likelihood of further deterioration. Slightly different.
MR. EASTBURN: Yes, I understand.
MR. HAVENS: Craig?
MR. SIMMONS: A number of the submissions that we've received have indicated that junk bond financing has been substituted for commercial loans, and my question is simply this. In the event the borrower gets into trouble and has done a junk bond financing as opposed to a commercial loan financing, aren't the options for restructuring and working out the borrower's troubles considerably more limited under junk bond financing arrangements than commercial lending financing arrangements, and is that something we ought to worry about in the next recession?
MS. HESSOL: I would agree with your first statement. For example, in a bank loan and in the typical insurance company private placement, there are various financial covenants which the borrower must meet. Otherwise it is a technical default. And oftentimes companies violate those covenants. In a private instrument there are opportunities for re-negotiations which are just not practical or feasible on the public instrument. "Protective Covenants" have been vanishing from public indentures, but if a company violates a covenant in a public indenture, it's just impractical to go back and re-structure a deal.
43

Your second question is, "Is this something we should worry about in the next recession?" Yes, I mean it's all part of the same scheme. It's also interesting --I was just talking about the vast amount of LB0 debt now outstanding. Many, not all, but many of those companies have very little bank debt, which means they don't have an approachable lender to work with if things get a little bit out of line. It's all or nothing. If you go back and look at the old fallen angels, they had lots of bankers to help them out and restructure.
MR. HAVENS: Ken Lehn?
MR. LEHN: Yes. Do you have any evidence on the default rate associated with high yield debt used to finance takeovers and LBOs, vis a vis the default rate on other high yield issues?
MS. HESSOL: We have gone back and counted them all. My estimate is that to date there have been virtually no defaults connected with takeovers. Technically Texaco got into trouble because it acquired Getty. I don't know how you can count that one.
MR. LEHN: When there is a highly leveraged takeover though, I don't want you to give away trade secrets here, but is it automatic that you lower the credit rating of the target firm? Because my impression is-- the evidence in the academic literature shows that on average there is no central tendency whereby the bond price of the target firm is reduced upon the announcement of LBOs and tender offers, yet my impression is that typically the ratings go down dramatically.
MS. HESSOL: I don't know the academic studies you're referring to, but I know in the real market those bond prices move.
MR. LEHN: Is there evidence that there is a central tendency-- in other words, if there are going to be subsequent asset sales, and in many of these transactions it's very clear there will be, it's not unreasonable to think the market reaction would be fairly small. Many LBOs, of course, have come public again in a short period of time, and I'm just wondering, given that there is some evidence that the central tendency is a very small price to pay, whether or not that's inconsistent with the rating system you have there.
MS. HESSOL: The issue begins when a company, a target company is put into play, in Wall Street lingo. There are several things that can happen. It could be acquired by a hostile bidder. It might also choose a defensive maneuver which could be extremely damaging to credit quality and its rating. Some of the most severe downgrades have not been companies that
44

were acquired by an outsider, but which bought their own stock in a defensive play, and some of the recapitalization plans, or for that matter, even a leverage buy out can be defensive.
And the ratings have generally fallen very sharply. If you look at the resulting debt burden, and the cash flow to service it, the margin is extremely thin.
MR. LEHN: Can you name five leveraged buyouts that have resulted in defaults?
MS. HESSOL: Oh, I thought I answered that question earlier. I don't think there have been any that have defaulted. I would add the word yet. These transactions were consummated within the last few years, and I think it is too soon. But I don't believe there have been any LB0 or any recapitalized companies that have defaulted. I could check that more precisely, unless you want to count Texaco.
MR. HAVENS: Ms. SCanlOn?
MS. SCANLON: Thank you, I would like to follow up a little bit on Ken's question which was you had in your paper a statement that yields on investment grade debt may not provide adequate compensation for a debt risk, and the implication there is that the holders of that debt are going to take a large loss when it's downgraded, associated with a takeover. Ken suggests that there's not much price effect observed in literature, at least I --
MS. HESSOL: I'm sure there's a price effect in the market.
MS. SCANLON: I wanted to just ask a more factual question. DO you keep track of what portion of those 800 A rated firms have been lowered below investment rates by event risk, and should that not be treated in a similar fashion to default risk if it's going to entail large losses?
MS. HESSOL: That is probably the most challenging job we have as bond raters: how to factor event risk into the rating. When there's a bid on the table, Company A is bidding for Company B, we can make some response, we can evaluate the terms of the bid, and at least come to a "what if" decision. We don't feel it's appropriate for us to change a rating just because there's rumor and speculation that someone may make some kind of bid for the company. We don't feel that there is sufficient information for us to evaluate, although in our hearts we may think this company whose bonds are rated AA is probably not going to be a double A for long. The situation right now with USG, that's been sort of under attack by Desert Partners on and off and we've maintained an investment grade rating. The one thing that we do
45

is to, at least in our publications, comment on what's going on, and to alert investors that these developments are occurring.
MS. SCANLON: But have you kept statistics historically on them?
MS. HESSOL: I'm not sure that I understand--
MS. SCANLON: How many downgrades of initial issue investment grade firms have occurred to below investment grade because of event risk?
MS. HESSOL: We haven't counted up that way. We could if it was of great interest. I do know that a third of all downgrades for the last five years have been connected to restructurings, acquisitions, leveraged buyouts. Those are all downgrades, not just from investment to speculative grade, but a third of all downgrades, and that's a lot.
MS. SCANLON: Thank you.
MR. HAVENS: We kept you a little long, but we appreciate your cooperation, Ms. Hessol, I know the GAO staff has a couple of additional questions that we'd like to submit for written response, and there may well be others around the panel. Thank you very much for your assistance.
MS. HESSOL: Thank you.
MR. HAVENS: Our next witness will be Arnold Brookstone, Chief Financial Officer of Stone Container, accompanied by Mr. Aylward of the Alliance for Capital Access. How would you wish to proceed, Mr. Brookstone, did you want to proceed first?
MR. BROOKSTONE: Yes.
MR. HAVENS: Okay.
STATEMENT OF ARNOLD BROOKSTONE, CHIEF FINANCIAL AND PLANNING OFFICER, STONE CONTAINER CORPORATION
MR. BROOKSTONE: Good afternoon. My name is Arnie Brookstone, and I am Senior Vice President, Chief Financial and Planning Officer of Stone Container Corporation, a Chicago based paper manufacturing company.
Our common stock and our high yield bonds are listed on the New York Stock Exchange. We believe that Stone Container is an appropriate company to speak to you on high yield financing. Not from a theoretical or academic basis, but from the real world practical vantage of a multiple issuer of these securities.
46

In just the three year period, 1985 through 1987, Stone Container, including our affiliates, high yield debt,
had six separate issues of aggregating a total of $717 million. Two of
those offerings, totaling $420 million, were public issues. The other four were privately placed, but gave the investors registration rights, thus enhancing the investor's protection against liquidity risk.
In addition to the six issues of $717 million straight high yield financings, financing,
we also used a closely related type of high coupon convertibles, which have been referred to
earlier today.
In 1986, our company made public issuances for $100 million each of convertible debt and convertible preferred stock.
I would like to emphasize that not one dollar of our eight financings aggregating $917 million, was used to fund a non-friendly takeover. Our company has grown dramatically and that growth was significantly by acquisition. But all of our acquisitions were friendly negotiations, none were hostile.
I am testifying here today on behalf of the Alliance for Capital Access. The Alliance is an association of more than 100 companies that have issued high yield bonds. Alliance members are engaged in a myriad of businesses. But we are united by our common interest in preserving vital free access to capital markets.
Relatively few businesses can position themselves to lead America into the front of the international pack without access to affordable long term capital. And for many companies, the high yield bond market is the only place where that precious commodity is available.
Of course being able to issue high yield bonds is of little value if there is not a market for such paper. And unfortunately we believe that investment in high yield bonds by savings and loan associations, institutions,
pension funds and other financial has been restricted by political attacks on such
securities. Expanded investment by such financial institutions would be a good investment for them, and it would expand a critical source of financing for growing American companies like ours.
Stone Container is a case in point. In the last few years, we have grown from a medium size family business, into the world's largest producer of container board and of craft paper. And by the conversion of those products, we are also the world's largest manufacturer of corrugated containers, and of paper bags and sacks. Commodity products.
47

Including our affiliates, we now employ more than 21,000 people. A few years ago, people were talking about the impending death of American basic industry. The paper industry was a prime example of a mature or sunset industry. Foreign competition was intense, plants were being closed, and workers were being laid off by the thousands.
During this period, some major companies who had interests in the paper industry concluded that their under-earning paper division no longer fit into their core business strategy. Our company saw an opportunity to acquire such orphans, operating divisions that the previous management sought to divest, and make them a vibrant part of the Stone Container organization, providing long term security to thousands of workers whose jobs had been at risk.
In 1983, we acquired the loss operations of Continental Group's Brown Paper System. In 1986, we acquired from Champion International their under-performing packaging division. And last year we acquired financially ailing Southwest Forest Industries. We did not have the cash to make those acquisitions. Instead, each transaction was financed with a substantial amount of debt. And each one has been enormously rewarding for our workers, and for our shareholders. They have also been very beneficial to our lender/investors.
Since 1982, our sales have grown more than 750% to $3.2 billion, and our annual mill capacity has about quintupled to 4.8 million tons. High yield bonds have made much of this growth possible. Recently, we were able to use high yield bonds in a way that is especially relevant to your study. We identified a 34 year old paper mill in Jacksonville, Florida that had ceased operations in 1985. We wanted to buy that plant, but our banks were unable, or unwilling to provide the necessary financing on reasonable terms. So we once again turned to the high yield bond market, where we raised through a newly established affiliate, Seminole Craft Corporation, the more than $100 million required to acquire and renovate that mill.
I might mention that Columbia Savings and Loan Association, one of the speakers later today, purchased $15 million of this high yield debt.
AS a direct result of this high yield financing, approximately 450 jobs were recreated. The Seminole Mill will annually produce more than 400,000 tons of craft paper, Seminole's 1988 sales will exceed $150 million, and importantly, the mill which had been shut down by its previous owner, because it was a loss operation is now operating profitably and will stay in production as a now viable facility.
48

It iS fair to say that were it not for the ability of S&L's such as Columbia to purchase high yield bonds, it would have been more difficult, perhaps impossible for us to have raised the funds required to reopen the Jacksonville mill, and return those 450 people to work.
In sum, we are a company that has made debt financed acquisitions and we have relied heavily on both banks and on SO called "junk bonds." We ourselves have been highly leveraged and S&L's have bought some of our high yield debt. To listen to some pew1 ef we are an example of all that is wrong with American business; we issue junk bonds. But in fact, we believe we are an example of a company helping to bring America back to the front lines of international competition. With that background, let me turn to some of the questions raised in your notice of public hearing.
The high yield bond market is dominated by companies raising capital to finance growth and expansion, rather than by hostile takeover artists, as the popular image might have you believe.
A just completed study by the Alliance found that between 1977 and '87, 958 corporations issued publicly traded high yield bonds in America. That excludes companies and entities that have issued such securities to initiate or to defend against hostile takeovers.
In the aggregate, those 958 companies raised $136 billion. More than 2.6 million people worked for those companies in nearly 17,000 facilities, in nearly every state of the Union.
I might add that Stone Container's 21,000 employees work in 139 manufacturing plants, located in 37 states.
Those 958 issuers are anything but fly-by-night companies. As of the end of 1985, the average high yield bond issue was a 36 year-old firm, with $1.1 billion in assets. Stone Container, for example, is more than 60 years old, and has $2.25 billion of assets. Publicly traded high yield bond issuers touch virtually every business sector in America.
It is true that high yield bonds have been used in hostile takeovers, but the fact is that bank borrowing, not high yield bonds, accounted for more than 70% of the financing used for such hostile takeovers. Corporate bonds, including high yield bonds, provided less than 10% of such funds.
Some express concern that the high yield bond market has grown by such leaps and bounds in recent years that previous experience is not a good guide to the future. There has been a tremendous growth in the size of the market and in the number of companies that have issued high yield bonds. But there is not
49

necessarily a correlation between an expanded market and an expanded risk. The market's growth has been marked by a move from fallen angel issuers to original issuers.
In other words, the growth has come, in our belief, from companies on the way up, and not on the way down, and this suggests that the added breadth of the market has reduced risk, not increased it.
Further, as previously mentioned, it is important to note that the actual issuers are generally not new companies. To the contrary, most have extensive credit histories, and have withstood the test of time posed by economic cycles. They are no more prone to default on their high yield bond debt than they would be if they borrowed from the banks.
Of course, some high yield bond issuers are highly leveraged, and thus might be hurt in a recession. But any company which borrowed too much from whatever source could face problems in a recession. There is simply no basis to generalize and to say that high yield bond issuers are more prone to default in a recession than a company which has relied more heavily on bank borrowing.
I wish to stress three points for you on your questions. First, available evidence tells us that high yield bonds are a good investment. A diversified portfolio of high yield bonds returned between 4% and 6.4% the year 1987, while a diversified portfolio of all so-called safe U.S. Treasury returned only 1.93%.
I do emphasize, as was emphasized earlier today by Dr. Altman, diversity is absolutely required for this type of a portfolio, but I would suggest it should be for all portfolios regardless of the type of investment.
Second, with respect to default risk, high yield bonds measure up well against other investment alternatives. An Alliance study of original issue high yield bonds revealed that the default rate was just 1.78% in 1987, lower than the recent historical data which had included the fallen angels. This is the first ever study of original issue default rates. All previous studies have combined the fallen angels with the original issues.
Third, while there has been extensive analysis of high yield bonds, there is a fundamental absence of data comparing the risk and returns on all types of S&L investments. It would be totally inappropriate, as well as analytically unsound, to reach a conclusion about the value of high yield bond investments by S&L's unless and until you compile reliable data on the risk and returns of all S&L investments.
50

We are particularly pleased to see that in the GAO report dated yesterday, it is intended that GAO's final report will address the issue of, and I quote "high yield bonds compared to other investments."
Finally, let me turn to some of the questions you raised about corporate debt levels. I am particularly sensitive to this question, because on occasion some critics have said that Stone Container is over leveraged. Our debt-to-equity and debt-to- capitalization ratios are in fact generally on the high side, but the important point to understand, and perhaps you do understand it, is that debt levels are not constant, nor is a single debt level appropriate for all companies and all industries.
There is no such thing as the correct debt equity ratio. Debt-equity ratios vary over time across industries and among companies within an industry. The structure of a corporation's debt also varies considerably. Some companies favor short-term, variable-rate financing, while others favor long-term, fixed-rate financing. Not only do debt-equity ratios not capture these differences, it is impossible to determine an appropriate structure for all companies. A company's cash position, it's susceptibility to a recession, and the markets it serves all enter into a company's decision as to the nature of its capital structure.
Our own company believes, and I suggest to you for your consideration, that a company's balance sheet debt ratio is neither the only, nor the most meaningful criteria for evaluating a company's ability to meet its obligations and to pay its debts.
Debt is not serviced by balance sheet ratios. Debt is serviced from cash flow. When we plan a financing, we study and stress the question that is key to us: Do we have the assured means of servicing our debt from available cash flow? A commonly used method of measuring cash flow, and one of the tests that we use in planning and managing Stone Container's financial affairs, is to look at earnings before depreciation, interest and taxes, or EBDIT for short. We compare the relationship of EBDIT to interest expense, and we call that ratio EBDIT interest coverage.
This ratio calculates how many dollars of cash flow would be available to pay each dollar of interest expense. Obviously the higher the ratio, the higher the comfort and confidence level. Stone Container, a high yield bond issuer, has a very strong EBDIT interest coverage.
In 1987, our coverage was a very healthy 4.2 times and forecasts for 1988 indicate an even higher coverage for the current year.
51

There is a common reason that companies take on debt. It is a cheaper source of capital than equity. Equity is the most expensive form of capital, and as you all know, it is also the riskiest form of capital.
At a time when American firms must increase investment in plant, equipment and labor, it is natural to gravitate to the least expensive sources of capital. Our major economic competitors worldwide understand this, which explains why the debt-equity ratios of Japanese and German companies are nearly double those of the typical U.S. firm.
Our government should not be trying to establish appropriate levels of debt for the private sector. Such a policy would amount to de facto federal credit controls.
It would be disastrous for the federal government to substitute a single, sweeping standard for the individual decisions of private businesses.
Finally, I wish to speak for a moment about the ill-conceived proposals to limit the use of high yield bonds--we believe it's ill-conceived--and for that matter, all debt in takeovers and LBOs. There is no evidence that the use of high yield bonds in takeovers and LBOs has any harmful effect on the economy. In fact, there is evidence that high yield bonds have financed hundreds of productive acquisitions, and that LBOs have saved and created jobs over the years.
As I mentioned at the outset of our comments, Stone Container has used debt to finance a series of acquisitions that have not only made our company stronger and more competitive, but have helped thousands of employees whose jobs were either preserved, restored, or created.
We're also disturbed about proposals that would disproportionately affect small and medium-size companies. Only a relatively small number of companies qualify for investment grade ratings. Most companies cannot grow without debt financing. It would be an outrage to enact a policy which invites only foreigners and large, cash-rich companies which qualify for investment grade to acquire other American companies, while Stone Container, and the rest of corporate America--the companies that for the most part are creating the jobs today-- would be cut off and denied the opportunity to grow. Thank you, I sincerely appreciate the opportunity to appear before you today.
[See Appendix VI for the written statement of Mr. Brookstone and Appendix VII for the comments submitted by the Alliance for Capital Access.]
52

MR. HAVENS: Thank you, Mr. Brookstone. Janet Laufer, would you like to start with the questioning?
MS. LAUFER: No.
MR. HAVENS: Okay. Mr. Carney?
MR. CARNEY: Yes. Mr. Brookstone, a couple of questions about composition of debt. Are you aware of the composition by type of institutional investor, that is, who holds your company's high yield bonds?
MR. BROOKSTONE: I would say it is a mixed group of portfolio holders. They are comprised, and I do not know the magnitude of each, but they are comprised of S&L's, insurance companies, investment management companies, both in individual portfolios and in mutual funds.
MR. CARNEY: Okay. I'd ask you about one of the comments you made, and it was specifically that, in your view, junk bond issuers are no more prone to default than bank borrowers, and how you might reconcile that statement with the expression of opinion that the previous speaker gave, that basically bank borrowers have more flexibility during periods of financial stress to work out their problems that bonded debt issuers.
MR. BROOKSTONE: Well, first of all, the fact that you have issued junk bonds does not mean by necessity that you do not have bank debt. Our own company, for example, has a $200 million revolving credit that we established last April. We have not used the first dollar of it. We have that just in reserve for a rainy day. It is much easier to get into trouble with the covenants of a bank obligation than it is with the virtual absence of covenants in public bonds, whether junk or investment grade. So yes, it is easier to deal with a bank than to deal with a trustee for bond holders.
It is much more frequently required to go back to the bank and request relief because of what may be considered onerous conditions that were imposed at the outset.
MR. CARNEY: IS this what you meant earlier when you spoke about the reluctance of banks to finance acquisitions in reasonable terms?
MR. BROOKSTONE: I referred to that with one specific transaction, the Jacksonville mill. All our major acquisitions have actually been funded by bank obligations and then were funded out partially through the so-called junk bond market. In other words, we have used both in our growth. We could not have done what we have done without banks. We could not have done what we did without high yield bonds. We consider a mix
53

appropriate for our company, and intend to maintain a mix in our capitalization. We do not-want to be in one market only, whichever that one market is.
We believe it's sound for our company to avail ourselves of the various markets that should be and are available to us today.
MR. CARNEY: Thank you.
MR. BROOKSTONE: Sure.
MR. HAVENS: Bob Miailovich.
MR. MIAILOVICH: I pass.
MR. HAVENS: Jim Barth?
MR. BARTH: Just one question. I was looking at page 10 in your written statement here. It mentioned that a diversified portfolio of high yield bonds returned between 4 and 6.41% for the year 1987, and then you compare that to the U.S. Treasury rate of return. Why do you say diversified portfolio and then have a range? Why for one year is the range 4 to 6% for a single portfolio?
MR. BROOKSTONE: There was more than one industry involved. And if you would like, I will have the Alliance supply you with the details from which those statistics were obtained.
MR. AYLWARD: Drexel has one return in its index, Shearson has another, Morgan has another for 1987. Those are the ranges of the major investment bank indexes.
MR. BARTH: Okay. So that explains it. Why the quotes around the word safe for U.S. Treasury securities?
MR. BROOKSTONE: Well, if you consider safety from the viewpoint of no default risk, it is absolutely safe. If you consider safety in terms of getting a positive as opposed to a negative yield, history has shown that it hasn't been safe. That was my choice to put the quotes on, and if I’m subject to criticism, I'm sorry.
MR. BARTH: Thank you.
MR. HAVENS: Mr. Eastburn?
MR. EASTBURN: I *m curious though, if you could address perhaps the apparent irony of one type of group of financial institutions, or one financial institution turning down your credit, and another one investing in it. Can you make any
54

general observations about that? Is it that one knows more than another, or is it simply that--go ahead.
MR. BROOKSTONE: I think that I'll--why don't you finish the question before--
MR. EASTBURN: No, I was just going to explore other possibilities.
MR. BROOKSTONE: I believe it's a question that each are operating under different criteria, both as an industry, and as a particular institution. And that which is permitted with one type of a lending group, may not be permitted for the other. It doesn't mean that it's unsafe, it just means that it's not available within that marketplace.
MR. HAVENS: Mr. Simmons?
MR. SIMMONS: Mr. Brookstone, Mr. Aylward, I totally agree with you that the General Accounting Office, in conducting its study of the high yield bond market, hasn't reached conclusions about whether high yield bonds are a good investment or perhaps are not a good investment for thrifts, or what percentage of portfolio ought to be invested in high yield bonds. And I appreciate the comment in your testimony that you'd be more than willing to help us. I have a couple of questions in that regard, or a couple of questions to ask you.
The first one is, would you be willing to share the results of any work that your organization has done in this area with the General Accounting Office?
MR. BROOKSTONE: The answer is yes, and that work has been done primarily by the Alliance, and the Alliance would be very pleased to cooperate.
MR. SIMMONS: All right. My second question is this, can we expect to get cooperation from the thrifts that number among your membership in obtaining data on comparative yields?
MR. BROOKSTONE: I have to refer that question to Mr. Aylward.
MR. AYLWARD: As you know, Mr. Simmons, from you and your staff having talked to both S&L's who are members of the Alliance and those who aren't, there is an understandable sensitivity by them as to some of their data. On the other hand, they are providing an enormous amount of data to the Home Loan Bank Board at this point anyway. For example, they report their entire portfolio at the end of each month in some cases, as I understand it. But we are very happy to work with you on that. And I think as you saw from our longer testimony, we took a shot at
55

drafting a questionnaire that we would be happy to work with you on, and maybe get the Home Loan Bank Board to put out.
MR. SIMMONS: Well, that may be a good place to start. Maybe we can start with the questionnaire.
MR. AYLWARD: As you know, our fundamental concern is that you not focus just on high yield bonds, as opposed to--high yield bonds as compared to what else.
MR. SIMMONS: I understand, absolutely.
MR. AYLWARD: In Imperial's testimony you'll see this afternoon is the first shot we've seen at trying to develop some very specific numbers, and I recommend a chart in Imperial's testimony to you. Not because I'm sure it's the exact right number, but it's showing some ranges for the first time.
MR. SIMMONS: Okay, thank you.
MR. HAVENS: Ken Lehn.
MR. LEHN: Many, if not most economists argue that one thing Washington could do is eliminate the double taxation of dividend income. First, I would appreciate your position on that, and second, could you provide us with an empirical fix on how important that is in affecting capital structure?
MR. BROOKSTONE: Well, it certainly is important. Our company's objective is to enhance all of our shareholders* wealth over time, and in selecting our choice of capital structure in financing, the non-deductibility of dividends to our corporation versus the deductibility of interest is considered in what we can bring down to the bottom line over an extended period of time. We do not make tax law. We follow the tax law, we pay taxes, and it is accepted that you can and should do what is reasonably prudent and appropriate to minimize the taxes rather than to maximize them.
MR. LEHN: Do you have any current estimates as to what effect double taxation of dividend income has on the cost of equity?
MR. BROOKSTONE: I do not, and I would not venture to guess.
MR. LEHN: Thank you.
MR. HAVENS: Ms. Scanlon?
MS. SCANLON: Thank you. I'd like to return just a bit to the buyer question. Is there any reason why a buyer who could
56

not negotiate with you a term loan satisfactory to both parties would have any incentive to buy your bonds to finance the same project?
MR. BROOKSTONE: The major reason initial financing was not done by the banks is because that mill had been shut down, and shut down in an unsatisfactory fashion by the prior owner. The banks under their requirements were not able to take a completion risk. We were going to buy the facility and then spend about $25 million to renovate it, and bring it back into an operating condition. The banks were unable to be totally comfortable that the mill could in fact be brought back into production because of the unsatisfactory close-down condition. And the banks were willing to come back after the fact and say, "Get it running and then we'll fund you." And we said, "But we have to be funded in order to buy it and renovate it." That was really the key issue there.
That was an issue that was dealt with through the high yield market by overprotections and we had certain corporate guarantees and so forth, and it was strictly a negotiating process, but there was a different view and a different world that banks and the bond holders were living in.
MS. SCANLON: I think my question is partly motivated by how much of a substitution for the bank loans were low rated bonds seen as opposed to different types of financing, and different risk structure and risk/return structure?
MR. BROOKSTONE: Well, we would have preferred in that case- -and we borrowed $102 million for that company--to have one half to one third coming from banks and the balance coming in the form of subordinated debt which by the nature of this subordination you can say would be quasi-equity and therefore supportive of the bank funding. It didn't work out that way, but other of our transactions have.
MS. SCANLON: Thank you.
MR. AYLWARD: If I can add something, Ms. Scanlon. Our members tell us, and it's the only information we have, an enormous amount of high yield bond issuance is direct substitution of what was ten years ago a commercial loan from a bank. And the result of that securitization is that the banks are increasingly being pushed out of some of the most profitable markets, or traditional markets they had, and you might well want to consider letting banks back into these kinds of credits.
MR. BROOKSTONE: If I can add a little bit, I think this would be some helpful input to you, and it's real world, but it might take a couple of minutes to comment on. When we did the acquisition of Southwest Forest Industries last April, we had set
57

up, besides the $200 million revolving credit that I mentioned, an $800 million term loan commitment, knowing that the amount was larger than we would need to fund the acquisition and to re-structure some of our other debt. We wanted to be sure that we had more dollars available when we came to the closing table, than less. We actually borrowed $730 of the $800 million, and cancelled the other $70 million.
Our bank agreement that was created to allow this to happen was very specific that we were to use our available cash flow for pay down of bank debt. And that $730 million has been paid down, it's less than a year yet, to $368 million. So we have developed cash flow, and we have paid down the bank very fast.
We are currently in the process of getting a modification of the bank agreement. The banks are, in a kidding way, unhappy with us. We are ruining their budget, and therefore their bonus opportunities because we are paying them down too fast. One of the changes that will be in this month's bank modification will permit us to buy in the open market some of our high yield debt, and use our excess cash flow to reduce that and keep the bank obligations outstanding, and paying them the interest.
So the banks are not willing to walk away, they want to be there. And we want the banks to be there. We say and we mean it, our banking relationship is the most important off-balance sheet asset our company has. And we work very hard at maintaining those relationships.
MS. SCANLON: Thank you.
MR. HAVENS: We have time for one more question. Are there any down at this end? Any questions outstanding?
MR. AYLWARD: We would like, Mr. Havens, if we could, to submit to you some additional comments.
MR. HAVENS: Sure, I'd be more than happy to receive it. Thank you, Mr. Brookstone.
MR. BROOKSTONE: Thank you.
MR. HAVENS: We appreciate you coming. At this point, the Panel will take a recess for lunch, and we are to resume here at 2:oo.
(Whereupon, the Panel recessed for lunch, to return at 2:OO p.m.1
58

AFTERNOON SESSION 2:00 p.m.
MR. HAVENS: Good afternoon, I assume everybody has had a glorious lunch and repast in the gourmet dining facilities in the neighborhood, a wonderful part of town, and is ready to get started again.
The first testimony this afternoon will be Mr. Michael Lea, of Imperial Savings Association representing the U.S. League of Savings Associations, accompanied by Brian Smith of the U.S. League, along with David Sachs, Senior Vice President of Columbia Savings and Loan Association. Mr. Lea, would you like to proceed?
MR. LEA: Okay I thank you very much.
MR. HAVENS: For opening statements, please hold them to ten minutes or less.
STATEMENT OF MICHAEL LEA, SENIOR VICE PRESIDENT, IMPERIAL CORPORATION OF AMERICA
MR. LEA: I should do so. As you mentioned, my name is Michael Lea, and I’m the Senior Vice President of Financial and Economic Analysis for the Imperial Corporation of America, which is the parent of an $11 billion savings and loan institution, headquartered in San Diego, California.
Imperial has an investment of approximately $1.4 billion in corporate high yield securities, which are managed by our Caywood-Christian Capital Management subsidiary. This company also manages approximately $700 million in corporate high yield securities for other clients, including thrifts, banks, and pension plans.
As a witness for the U.S. League of Savings Institutions, I will address issues of concern to the entire industry. I would also request that my full statement be admitted into the record as an amplification of the comments that are already filed by the League.
MR. HAVENS: It will be done.
MR. LEA: Thank you. High yield bonds are part of an ongoing securitization process whereby fund seekers approach fund providers directly via the capital market, rather than indirectly via on-balance-sheet portfolio lending intermediaries.
Approximately 70% of the U.S. financial assets now exist as securities and Wall Street is clearly taking aim at the rest. Securitization was traditionally associated with corporate equities and government bonds. However, recently in the
59

residential mortgage market we've seen an explosion of security issuance, particularly those guaranteed by the secondary market agencies supported by the government, Freddie, Fannie and Ginnie.
Also, we're starting to see a lot of securitization of commercial lending, which has traditionally been the province of banks, through commercial paper and high yield debt securities. The latter has been an alternative in the 198O*s for fixed-rate long-term sources of funds that haven't been available through the banks.
The U.S. League has expressed reservations over the ever increasing volume of pass-through and collateralized mortgage obligations, and real estate mortgage investment conduits by the federally backed agencies in the mortgage market. However, these reservations revolve around the targeting of federal guarantees, rather than the financial technology involved.
Fund users and providers should be allowed to find their most preferred way of transacting in private markets, absent any compelling public policy concerns.
Thrift institution investment in high yield debt securities has been questioned by some who point out that thrifts have traditionally been residential mortgage lenders, and have received subsidies to provide credit for this market. However, most of the subsidies thrifts receive for mortgage investment have been scaled back or eliminated.
Deposit rate ceilings have been removed, and the tax advantages available to institutions which meet the qualified lender task have been substantially reduced.
Furthermore, the activities of the federally backed secondary market agencies made mortgages more fungible, and reduced the yields available to the portfolio investors in mortgages. What we have is a classic profitability squeeze. Our cost of funds has been rising, and the asset yields have been shrinking in the traditional investment area.
High yield corporate bonds offer profitable diversification alternatives for thrifts. A portion of the portfolio invested in these type of instruments would reduce the dependence of thrifts on real estate markets, allowing them to diversify across industries and parts of the country.
In addition, high yield securities are typically less interest rate sensitive than Treasuries or fixed-rate mortgage securities, therefore allowing institutions to better match asset and liability maturities.
60

High yield bonds offer thrift institutions more liquidity or marketability in their investment than commercial loans: If a corporate borrower's credit begins to weaken, relative to the market, the bond can be sold, minimizing expected credit loss, whereas a lender in commercial mortgage cannot easily extricate itself from the transaction.
Securitization has also increased the amount of information available for institutions to do their own "due diligence" analysis. The additional level of underwriting is inherent to the ratings process and the prospectus disclosure in the security law provides for third party verification of information obtained in the underwriting process.
In addition, managers have up-to-the-minute price information on both corporate equities and debt to assist them in their monitoring capabilities. One of the questions asked of the GAO is to compare the risk to returns of investments in high yield securities with other thrift and bank investments. This is inherently a difficult process and involves a lot of assumptions about funding cost, risk based cost and other types of experience over time.
As was referred to earlier in my remarks, I prepared a table with the longer version of my remarks, which is meant to be an example of how the GAO might be able to do this, not going back and looking at actual portfolio experience, but rather looking at current yields available through a variety of instruments in the market place, and trying to come up with estimates of funding costs, risk based costs, such as for credit risks, or option based risk.
All I meant was for this not to be an exact bottom line estimate, not to say these are the definitive numbers that prevail right now, but rather as an example of sources of information as well as a way to look at the issue.
Existing studies of default risk indicate that returns from high yield bond investment have adequately compensated investors to date. However, even these numbers can overstate the expected loss experience of an actively managed, well diversified portfolio.
Active portfolio monitoring and management combined with a disciplined sell strategy significantly reduce the severity of loss over the “buy and hold" strategy assumed in academic studies. As part of my written testimony, I have attached more details about the investment monitoring process used by the Imperial Corporation of America and Caywood-Christian Capital management in evaluating corporate high yield fund investment.
61

The strategies are risk averse, credit intensive screening processes designed to avoid owning bonds that go into default. In the two and a quarter years that Caywood-Christian has been managing the high yield portfolio for Imperial, they've only had one bond with a face value of approximately $5 million go into default, and in addition, for the six years prior to that, this management company did not have any bonds that they held that went into default.
It does not mean that they don't take losses. Bonds are sold at both a loss and at a profit. Therefore, you really need to look at total returns in looking at the performance of these securities over time.
The Federal Home Loan Bank Board has examined the risks of high yield bonds, but has not found evidence precluding investment in such instruments by such thrift institutions. It is the U.S. League's position that if depositories have a charter authority to make commercial loans directly, the exercise of that authority via high yield bond investment should not pose any new public policy issues. There's no theoretical or empirical support to treat junk bond credits differently from directly originated commercial loans. Such relative evaluations can only be done on a case by case basis.
This is not to suggest that high yield bonds are free of risk, or more or less risky than other assets invested in by thrifts. There is clearly a public policy need to protect the insurance fund that stands behind deposits.
Fortunately, a risk control device is available via the Bank Board's authority to fix required capital levels. The Bank Board's authority in this regard was strengthened with the grant of the capital directive authority enjoyed by bank regulators to the Board with the 1987 Competitive Equality Banking Act.
The Bank Board has already issued implementing regulations on this statutory provision, and has extended its Classification of Assets credit appraisal system to the investment portfolio, including high yield bonds.
The Board, sensibly, has decided not to automatically classify all high yield bonds as dubious credits, but to assess each institution case-by-case. It is our hope that the Board will apply a portfolio approach to recognize that diversification considerably reduces the aggregate risk exposure of high yield bond investment.
Furthermore, we hope that institutions will be allowed to demonstrate their expertise and portfolio quality in establishing capital investment limitations and reserves. It is the U.S. League’s position that a prohibition on investing in corporate
62

high yield bonds for institutions with less than 6% GAAP capital- to-assets is needlessly restrictive and arbitrary.
An outright prohibition would penalize institutions that can demonstrate a track record or expertise in managing these risks, and deny them a potential source of profits from which they can build capital.
In conclusion, the U.S. League believes that, properly managed, high yield corporate bond investment can be an important source of earnings for thrift institutions without posing additional risk to the FSLIC. High yield bond investment will give thrift institutions a degree of parity with commercial banks, an important fact in an increasingly competitive financial market place.
In our opinion, the present regulatory systems are sufficient to monitor individual institutional investments in order to safeguard the FSLIC. Thank you.
[See Appendix VIII for the written statement of Mr. Lea and Appendix IX for the comments submitted by the U.S. League of Savings Institutions.]
MR. HAVENS: Thank you, Mr. Lea. Mr. Sachs, do you have an opening statement?
STATEMENT OF DAVID A. SACHS, SENIOR VICE PRESIDENT COLUMBIA SAVINGS AND LOAN ASSOCIATION
MR. SACHS: Yes, I do. First of all, my name is David Sachs, and I am Senior vice President in charge of the Investment Management Department at Columbia Savings and Loan. And I'd like very much to thank the General Accounting Office for this opportunity to participate in your review of the high yield market and commend your efforts to make that a study of both high yield and other alternative investments that thrifts may engage in.
First of all, I'd like to take a minute to tell you a little bit about Columbia Savings. We are an approximately $12 billion asset institution with executive offices in Beverly Hills, and administrative offices in Irvine, California. We operate 17 residential lending offices in northern and southern California, and 21 savings branches. We rank among the nation's 20 largest thrifts and we manage today a corporate securities portfolio of approximately $4 billion, and a mortgages and mortgage-backed securities portfolio of approximately $6 billion.
We are, we believe, among the nation's strongest capitalized thrifts, with total capital in excess of 7% of liabilities at
63

December 31, 1987, and we have regulatory net worth in excess of twice the required regulatory net worth as of that date.
We're glad, as I said, to be here. In fact, I am always somewhat surprised about all the scrutiny of high yield investments, or thrifts' high yield investments given the success that many institutions in the FSLIC insured organization have had with activity to date. To illustrate this, I'd like to just amplify one number that I think is interesting.
Last year, for the year ended December 31, 1986, Columbia Savings represented .84% of the total assets of the FSLIC insured thrift system. And for the year ended December 31, 1986, we generated 9.72% of the total net income of the FSLIC insured savings and loan business. We feel quite strongly that high yield bonds are not the answer for all institutions, as you have heard from some others here today, but are a very viable option for the thrift industry to generate capital in order to allow it to promote its primary goal of residential lending and mortgage lending.
Let me give you a little background on how we got involved with high yield bonds and what has been happening to the thrift industry in particular, and financial institutions in general, over the last several years.
Deregulation was brought about first of all by the elimination of Reg Q, deposit interest rate limitations, in the early 1980's, along with the introduction of securitization of mortgage loans, which necessitated a change in the asset liability management strategy of the thrift industry.
Congress recognized this with the passage in 1982 of the Garn-St Germain Act which deregulated investment powers of the thrift industry. As has been discussed earlier today, the business of financial institutions is an intermediation of risk. Thrifts have two primary risks they can choose from, interest rate risk or credit risk, to intermediate in order to earn a positive return on their capital.
Thrifts' traditional business, mortgage lending, as a result of securitization became two distinct businesses: origination and servicing, and secondly, portfolio ownership. This separation of the two businesses has increased the competition in the mortgage business.
Securitization and the competition has reduced profitability of thrifts in both segments of the business. I'd like to take a second now to direct your attention to the one page handout that I passed out prior to the beginning of this afternoon session, entitled," The Economics of the Single Family Mortgage Market.*' What I have tried to do here is, just as an example, show you
64

what current market rates are in California as of yesterday, for loans originated by the major California savings and loans.
On 30-year fixed-rate loans, I assume that the thrift was making the loan to sell it since it would be unable to appropriately hedge the interest rate risk any other way on a 30- year fixed-rate loan.
So step one, the thrift would make the loan at a yield to the borrower of something between 9.75 and 10%. Plus, it would receive generally a 2% loan origination fee, although some of our competitors are out there at 1.5 points.
Yesterday, a thrift could have sold back to one of the federal agencies, Fannie Mae or Freddie Mac, under a 30-day commitment at a net yield to that agency of something between 9.60 and 9.70. And as you can see in step 3, the thrift ends up with its 2% loan origination fee, less its direct out of pocket cost to originate, which approximates l%, and 15 to 40 basis points to spread over the life of the mortgage.
Hopefully everyone will agree, not a particularly lucrative business given the amount of people that need to be involved in mortgage origination, and the fact that we need to be able to sell the loans immediately to the agencies given the volatile interest rate environment we currently exist in.
Step 2, or the second option that is described here, is the one-year adjustable-rate loan, which is common throughout the country. In this process, the thrift makes a loan at about 7.75 to 8% initial start rate, plus a 1.5% loan origination fee. I assume that the thrift wants to keep this loan in its portfolio because it's an adjusting rate asset and it makes sense given the short nature of most thrift liabilities. I also have made the assumption in this case that the thrift wants to take no interest rate risk, so it matches it perfectly against a one-year CD. Secondly, I make an assumption throughout this example that the one-year Treasury rate remains constant in both the first year and the second year.
So you can see in the first year, it matches it with a one- year CD at 7.75. That is the mid-point of the current bond equivalent yield offered to retail that's below $100,000 deposits at the major California saving and loans.
I have not included in that number what an institution that is troubled or a smaller and less well known thrift would have to pay for its one year deposits. As you can see, the thrift is left with zero to a quarter of one percent spread for the first year r and 1.5% on the fee which, less its direct costs of 1% and
65

.
its general administrative expenses of 1.5 to 2%, leaves the thrift theoretically losing money or breaking even on that asset the first year.
The second year of the situation is not that much better. In the second year, the loan resets to 9.40. Assuming again that the thrift matched it with a one-year CD at 7.75, it's earning a 1.65% spread. It has received nothing in the second year in the way of fees, and given that the average general administrative expenses, as I mentioned, are 1.5 to 2%, you can see that the thrift is left very little opportunity to make money in the adjustable-rate mortgage market at this time. That's not to say that there aren't times when it does make sense and it is profitable to originate profit loans either for sale or for portfolio, but it is important to note that those opportunities come and go with the marketplace because each participant in the market place is free to set its own pricing.
NOW, turning to Columbia's diversification strategy. In the early 1980's, after the Garn-St Germain Act, Columbia had the opportunity to diversify into several new businesses including, among others, auto lending, credit card lending, direct commercial and industrial lending, and acquisition, development and construction loans. The management of our company evaluated each of these businesses as well as our institution's competitive strengths and weaknesses to try and determine which of these businesses we could profitably compete in. I'd like to go through a brief comparison of some of these businesses, and why Columbia chose not to enter them.
Auto lending. In 1981, Columbia had about a quarter of a billion dollars in total assets that would compare at that time, my guess is, to Great Western's ten billion dollars in total assets in the state, and Bank of America's probably somewhat greater than $75 billion in total assets, and we had approximately one dozen branch offices.
Needless to say, management felt we lacked the branch network, customer base and back office capabilities to profitably compete in the auto lending business.
We basically reached the same conclusion as relates to credit cards. Both of those businesses are generally most profitable when done on a volume basis because of the great efficiencies in terms of data processing.
In terms of commercial lending, Columbia lacked customer relationships as well as back office capabilities to engage in full service commercial lending. This usually requires an institution to provide its customers the corporate borrower services beyond just making loans. There's servicing the revolver, there's letters of credit, there's lock box services,
66

all types of financial and administrative services that the typical savings and loans' back office and data processing system is just not capable of doing, and we did not feel we could afford the capital investment to compete in that business.
Lastly, in terms of acquisition, development and construction lending, we felt that we didn't have a huge amount of expertise in the area. There was an inadequate return relative to the risk, and it was difficult to diversify the risk.
So management selected high yield bonds among its diversification routes because entry into the business required primarily credit analysis skills which Columbia already had, and which could be improved and expanded relatively easily with the addition of additional credit analysts.
High yield bonds also offered the following advantages and features to Columbia. One, the ability to diversify the portfolio geographically. Two, the ability to diversify the portfolio by industry and issuer. By way of knowledge over the last couple of years, Columbia has generally had, and has at this point, between 175 and 200 different issuers representing its portfolio, far in excess of what Professor Altman suggested might be the prudent number for diversification.
Three, high yield bonds offered us the ability to select intermediate term assets with call protection to match against similar maturity deposits and borrowings. If Columbia chose to buy mortgage securities, or originate 30-year fixed-rate mortgages, and try to match them with long-term or intermediate- term deposits, we could not control the fact that the borrower, the home mortgage borrower could pay off that mortgage at any time without a premium.
Four, the public market in high yield securities provides flexibility to change the portfolio in response to the changes of credit opinion by Columbia as it relates to a particular industry, or a particular company.
I think this point is particularly important to note, as it relates to one of the advantages and Columbia's opinion of high yield bonds relative to direct commercial lending.
If Columbia had, in 1982 with the passage of Garn-St Germain Act, hired the top five or six commercial lenders from a major commercial bank, and started pitching corporations like Phillips Petroleum, or Chrysler, or Ford Motor Credit, or Beatrice, or TWA, it would probably have taken us several years to get into those accounts, because if they have been properly served by their existing banking relationships, unless Columbia was willing to settle for a lesser return, there would be no reason for them to switch their business.
67

If after doing that, and getting in the business five or six years later, we became a participant in a revolving credit facility for, let's say, a major oil company, and economic circumstances changed such that we no longer like the oil and gas business, or wanted to reduce our commitment to it, it would be relatively difficult on an actual basis if a company had not violated the covenants or terms of its revolver, for the President of our company or myself to call up the senior officer of a major oil company that we spent five or six years trying to get into business, and say, "Sorry, you haven't violated any terms, but could you please give us back our money, and release us from our commitment."
When Columbia Savings and Loan makes a decision based on its own credit work and outside sources such as S&P, Moody's, research analysts on Wall Street from the equity and debt side, that we do not like a particular business, or its prospects over the short term, we have the ability without the issuer knowing to sell that security. That gives us a great amount of flexibility, we feel, over direct commercial lending.
The fifth feature that goes hand in hand with what I just mentioned about high yield bonds, that I don't think is well understood, is that high yield bonds have offered Columbia, as a thrift, access on a regular basis to the senior management of major American companies across many industries whose input on the economy in general has been very useful in the association's overall asset/liability management.
Of those 175 to 200 companies that we may have in our portfolio at any one time, a member of my department or myself has generally met with that company's CFO or President within the previous six months. In most cases, we've spoken with the CFO within the go-day period, in some cases we're in monthly communication with the companies. That information, the intangible information that we gather in that process, what's going on in the economy, what's going on with interest rates, is very important to our overall asset liability management.
Lastly, as it relates to high yield bonds, in our decision to go into them as a method of diversification, in our opinion and as shown by many academic studies, they provide a return in excess or commensurate with the risk assumed by a knowledgeable investor.
I'd like to turn now to our experience over the last half a dozen years. As I've mentioned, we've increased our assets through internal growth with no acquisitions from approximately a quarter billion dollars at the end of 1981 to approximately $12 billion today.
68

We've increased our capital base, more importantly, with less than $10 million at the end of 1981, to in excess of $740 million today. We've increased our mortgage loan origination from approximately $73 million a year in 1982, to in excess of $1 billion each of the last two years. And I might add that we've done that without sacrificing quality in either yield or credit risk in our single family mortgage loan portfolio which has today one of the lowest scheduled items to specified assets ratio of the major California thrift institutions.
We've increased our mortgage-backed securities portfolio which is a commitment to single family residential mortgage loans from $200 million to $4 billion. We've developed an investment management department of some 20 professionals, including individuals with accounting, data processing, investment banking, and legal backgrounds.
And lastly, I'd like to highlight a matter of direct comparative analysis between our portfolio and commercial bank lending. At 12/31/87, our portfolio of non-accruing high yield corporate bonds as a percentage of our total high yield portfolio was .75%. Three quarters of one percent of our corporate bond portfolio is non-accruing.
The association had at that date a credit loss reserve of 2.6% of the portfolio. In comparison, at September 30, 1987, Morgan Stanley's Bank Stock Universe which is comprised of the nation's top 36 banks by asset size, had non-performing loans, which are generally non-accruing, as a percent of total loans at 5.2%, and their loan loss reserves stood at 3.7%.
So Columbia is reserving approximately 347% or 3.5 times our non-accruing loans, whereas the top 36 banks in the country are reserved at approximately .71 or less than one to one times their non-accruing loans.
I'd like to discuss the regulatory and public policy issues as it relates to the high yield bonds. First in the broader sense, and I think the General Accounting Office recognizes this, we feel that risk is a function of knowledge and management, and it's not something that makes a particular asset inherently risky. It's how it's managed, who's managing, what the capital of an organization is.
Poor or criminal management has lost money in such traditional activities as mortgage lending, real estate development, and trading of U.S. Government securities. Risk needs to be evaluated relevant to each institution's overall asset/liability management strategy, capital, and management knowledge and capability.
69

Now, on the subject of liquidity and volatility. Again, the liquidity or volatility of an asset category is not related, in any context that I am aware of as a participant in the market, to credit quality. For example, there have been many times over the last couple of years where there has been illiquidity or volatility in the market for Ginnie Mae mortgage-backed securities. That illiquidity or volatility has occurred due to lack of information or lack of a consensus about where interest rates were going, or what pre-payment rates were going to be. But there have been times when you could not sell, without moving the market half a point, $50 million of a given mortgage-backed security.
Additionally, even in the U.S. Treasury market, there are times when there is not an active or liquid market because there is not a willing buyer or seller. So liquidity is not a function, in our opinion, of the credit quality of an instrument. It's a function of the willingness of another party who has a belief in where interest rates are going, or pre-payment rates, mortgage-backed securities, or the credit quality of the corporate security to make a bid for that security.
Finally, relating to a regulatory issue, and although this has been amplified a couple of times today, I think it needs mention again. The Competitive Equality Banking Act of 1987 gave the Federal Home Loan Bank Board the regulatory authority to set minimum capital requirements as appropriate in light of the particular circumstances of each institution.
In our opinion, there is not the need for any additional regulatory limits on high yield bonds, or regulations governing investment by thrifts, whether federal or state chartered.
On public policy issues, high yield bonds have allowed for diversification, in Columbia's opinion, of thrift assets in the spirit of both the Garn-St Germain Act and the Competitive Equality Banking Act of 1987. They've allowed industry diversification and geographic diversification and as importantly, they have allowed the thrift industry, and Columbia in particular, to generate a great deal of capital which it has been able to use to help support thrifts' basic public policy purpose of residential home lending.
Lastly, I'd like to take just one second and answer a couple of questions that were asked this morning where some of your respondents were not aware of an answer, just for your knowledge.
One subject that was brought up was whether high yield bond issuers or high yield bond purchasers faced less flexibility in working out a troubled situation. I believe the testimony from the representative from Standard and Poor's indicated that she felt that high yield bonds provided less flexibility for either
70

the purchaser or the issuer in a troubled situation. I would say from our experience, we find there's no great difference, in fact there may be just as much or greater flexibility. We, on an ongoing basis, amend covenants, amend indentures, have ongoing dialogue about what's right or wrong, because just as in the Congressional legislative process, things get put in indentures at 2 or 3 in the morning, and six months later, you figure out they just don't work.
At any given time in our company we usually are negotiating with three or four issuers, not necessarily troubled companies, but to change provisions of indentures that relate to cash flow coverage or debt limitation or what businesses their subsidiaries can go into.
Secondly, on the subject of default by LBOs, and I want to say that my mention of these two situations that I'm aware of does not necessarily mean that Columbia Savings participated in them, I’m just knowledgeable about the two of them. Dart Drug, which is a retail drug chain based here in, I believe, the Washington, D.C. area did a leveraged buyout several years ago. It was originally financed, my knowledge is, by General Electric Credit in the traditional private placement market. It was re-financed in the high yield market, and that issue, I believe, never made its first interest payment. Secondly, there was a leveraged buyout about a year ago of Republic Health, which is a mid-sized for-profit hospital chain based in Texas. They also have defaulted on their bonds, both bonds they issued before and after the LBO. So there have been, and just like there are in the banking community, there continue to be defaults in high yield bonds but in summary, Columbia feels very strongly that the return thrift industries are able to achieve through this investment avenue more than compensates the risk. Thank you.
[See Appendix X for the written statement of Mr. Sachs.]
MR. HAVENS: Thank you, Mr. Sachs. To continue our round robin questioning, I believe it's Jim Barth's turn to start.
MR. BARTH: Okay, well, let me ask a few questions. why don't I start with Mr. Lea. You mentioned in your prepared statement here that the high yield corporate securities are functionally equivalent to commercial loans. Does that translate into your saying that they are perfect substitutes for one another?
MR. LEA: No. I think the characteristics do differ in terms of the issuing institutions. I think particularly if you look at a thrift institution, and David alluded to this, I do not think we could establish relationships very easily with a lot of the very large-size companies that have been issuers in this market, and would tend to be probably more the middle market
71

type of arena. A high yield bond is an unsecured obligation of the corporation, and most commercial loans, a lot of commercial loans are unsecured. However, a lot of commercial loans and a lot of high yield bonds are secured by real estate or by other assets, specific assets from the corporations. So I think that generalization shouldn't be taken too literally in that regard. I think there are a lot of similarities but there are differences.
MR. BARTH: Can I ask, perhaps in line with what Mr. Sachs just said, perhaps both of you and Mr. Smith could say something about why is it that so few thrifts seem to, in terms of numbers, invest in junk bonds given some of the advantages that you seem to have pointed out in your comments?
MR. LEA: Well, I really don't think it's for everybody, and I think it's a very credit intensive screening processing that takes expertise. In the case of Imperial Savings, when new management came in at the end of 1985, the institution was not in very good shape at all. In fact, it had gone out into a variety of different markets, including the high yield market, without any expertise. People that had traditionally been real estate people were going into the new areas. A lot of those operations were immediately cut back or sold off to get back to what the new management felt comfortable they could actually manage in terms of understanding the risks.
The reason that we got in the high yield market was really two-fold. One is that we found some very high quality talent that we were able to effectively get over to Imperial to manage our portfolio, talent that had over ten years of experience in running high yield mutual funds and high yield funds for Security Pacific Bank. So that even though there was a lot of expertise coming in at the time, we didn't feel that we had the capabilities of actually managing this process ourselves.
Secondly, I think the other reason that people tend to not get in is just the economies of scale and being able to put together a significant sized portfolio that's well diversified. I think it is very difficult for an individual institution to go out and buy a couple of bonds here or there, even if they got good advice, and put together a well diversified portfolio. Perhaps mutual funds might be more appropriate for those smaller institutions.
MR. SACHS: I would agree with both of the reasons that were just mentioned by Mike. In addition, I think we would have to admit that thrift institutions that have involved themselves with the high yield bond market have been the subject of a quite a bit of publicity of a somewhat controversial nature. The improper association, in my view, of the high yield market with hostile takeovers and acquisition financing has also tainted the high
72

yield business as it relates to thrifts. Along with that, from the previous Home Loan Bank Administration to the one headed by M. Danny Wall, while not coming out against high yield bonds, certainly colored their comments, I believe, because they truly believe in an opinion of what the thrift industry was for, that high yield bonds were not appropriate. Therefore, many thrift managements that would like to invest in high yield bonds have stopped short of doing it to date, to my knowledge, because they just don't want to have to explain the activity to the press, some stock analysts on Wall Street, or to the Federal Home Loan Bank.
MR. SMITH: I think there are start up costs, entry barriers, but I think also that the savings and loan business, contrary to some public perceptions, is actually very conservative. Most of them are conservative operations. They haven't felt all that comfortable in what is a new and different business.
With 20/20 hindsight, I think the FSLIC ought to wish that a bigger chunk of its current case load had leaned somewhat more heavily into corporate securities than into ADC [acquisition, development and construction] lending, which has a long history in the business and is relatively familiar, but certainly is supposed to be inordinately risky because of the lack of diversification from the institution. But basically it's still a relatively unfamiliar type of product for the investment managers in most institutions.
MR. SACHS: If I might add two other things, I agree very much with comments that have been made here. Thrifts that get involved in high yield securities either need to establish internally a fairly meaningful portfolio in size so that they can diversify and support their own analytical staff, or hire qualified outside managers such as Caywood-Christian Capital Management. There are several others available to manage the portfolio for them.
Secondly, in answer to Mr. Barth's first question as to whether high yield securities might be the functional equivalent of commercial loans, I mention in my written remarks that were submitted to the General Accounting Office, probably about a dozen corporations of which Columbia has owned senior debt securities, in most of those cases the debt securities were explicitly subordinated to a senior bank credit facility. Generally, the one exception, if there is to be one, is to be on repayment upon asset sales. For some reason banks, as Mr. Brookstone from Stone Container mentioned, seemed to want to get their money back quickly at the very time that the credit is becoming de-leveraged and generally improving.
73

So while in these credits, Columbia has equal claim in a difficult situation, i.e. in a liquidation or a bankruptcy, we would not receive repayment of funds upon asset sales in the ordinary course of business, in the de-leveraging of the LB0 or recapitalization.
MR. BARTH: Let me ask just a couple more questions. One is fairly short. On page 10 of the prepared testimony here that I have, Michael, it states that the U.S. League's position that a prohibition from investing in corporate high yield bonds for institutions with less than 6% GAAP net worth would be needlessly restrictive, an arbitrary prohibition. Is that the U.S. League's view? Not a strict prohibition but some restrictions should be put in place, rather than requiring just a prohibition?
MR. SMITH: All we're saying is that you shouldn't necessarily regulate or foreclose that option out of existence when somewhat more of a judicious calibration of what the institution can do is feasible.
MR. BARTH: Okay. This morning Professor Altman suggested some guidelines and perhaps attributes from the industry itself. Could you comment on whether you think the reserves that he suggests of 1.5 to 2% loss reserve for all junk bond holdings are sufficient from your perspective and could you satisfy those reserves in your own case? Would you comment generally on what you think the institutions' holdings could satisfy those requirements?
MR. LEA: I don't think you can generalize. I think that, and I think this has been the case with both the auditing community as well as with the Federal Home Loan Bank in San Francisco, the regulating system really has to be examined on a case by case basis. For example, there is no basis in GAAP accounting to necessarily use historical default experience, such as in the Altman study, as the sole basis for the reserve policy of an individual institution. GAAP has several levels that have to be applied prior to that time. First of all, you have to have methodology for establishing when an asset becomes impaired. In the case of Imperial, we have worked out a formula by which we examine the price movements of individual bonds relative to the high yield market, the cash flow position of individual firms relative to pro forma, as well as the price of the equity relative to the general equity markets.
Those situations then identify cases in which you have reason to think that even if a bond has not yet missed a payment, that the credit is weakening. In those cases, reserves should be set up, and that is okay, under GAAP. The question then becomes how do you determine what the potential loss is going to be on this particular security. You have to look at a second level of evidence which is your own track record, and your own portfolio
74

quality, so that you don't adopt the assumption, as in the Altman study, that you buy and hold to maturity, and that you can seldom get out. That's in the past track record, if your management has used that. plus, you can't assume that you buy the market, because each individual portfolio is different, so that GAAP tells you that you need to go and consult your own track record t0 see what your likelihood of loss is going to be. Only if a track record is missing, and if your portfolio quality is substantially the same as the overall general market, would you be in the position to start using the general numbers that are industrywide, that Professor Altman suggested. This is not to suggest that the issue of reserves is not an important one, and I think that all parties involved would agree that reserving is a very important way to manage against fluctuations that occur in the value of the portfolio.
But I think it has to be on a case-by-case basis. I think I would go beyond that and say that in terms of setting general guidelines with regard to how much the regulators may be comfortable with in terms of a proportion of assets invested in this, again, it depends on the track record of the institution, and the portfolio quality that it has established over time. That's going to require a lot of work between regulatory body and the individual institution. I can testify that over the course of the last couple of years, we have worked very closely with our regulators to get them comfortable with what we are doing and we have ongoing dialogue with them on that. We have to treat it as a case-by-case basis.
MR. SACHS: I would amplify Michael's comment that I don't believe you can establish a set number or formula for loss reserves. I think you need to treat high yield bonds as you would treat any other asset of a savings and loan, or for that matter, a commercial bank, and that each institution's asset/ liability structure and capital and management are different. I do agree quite strongly though that a loss reserve, if that institution is in the high yield bond market, is necessary.
In Columbia's case, we began our loss reserve providing for a loss reserve in 1984. At the time we had quite extensive discussions with Touche, ROSS and Company, our certified public accountant, because we wanted to do something that was not in conformance with GAAP. We pushed hard enough because we thought that it was the right economic thing to do. We have a loss reserve where we, in somewhat similar fashion to what Michael described, can identify securities that we feel are impaired prior to when they go into default, in addition to those specific reserves we provide on a monthly basis. Just an overall blanket reserve or loss provision. As I mentioned in my testimony we have approximately 2.6% reserve today, in excess of what Professor Altman has suggested might be acceptable. I think our
75

current intention is to let that number keep building for a while, because we're better off being over-reserved than under- reserved.
MR. HAVENS: Thank you. Gordon?
MR. EASTBURN: I think I heard the suggestion that small and medium-sized institutions could utilize or access the junk bond market by use of mutual funds, or perhaps credit rating services of the agencies involved and so on. And if that's true, why wouldn't that be economical for you people also, even if you didn't invest in the actual mutual fund by the same issues. What's missing in that kind of credit analysis?
MR. SACHS: Well, first of all, Columbia Savings generally does buy many of the same issues that are purchased by the nation's largest high yield mutual funds. The problem with us
for that matter other thrifts, in my view, investing in high irild mutual funds iotentially, unless they are specially designed for thrifts, is that high yield mutual funds generally have as their objective sort of a divergence of objectives. YOU would think their objective is the highest total rate of return for their shareholders.
However, as many of you know, the investment managers of a mutual fund are generally concerned with dollars of assets under management and those assets under management are generally gathered through newspaper ads, where they get to promote their yield. So I find that very often high yield mutual funds, and this is only an outside observer's opinion, are run for the highest current yield and they sacrifice features that we as long-term portfolio investors might find important.
MR. EASTBURN: Isn't that a problem though for the smaller institution too?
MR. SACHS: Well, if they were to hire someone like Caywood-Christian or Equitable Investment Management--Prudential Insurance Company manages high yield funds as does First Boston- -they could set specific directives, as I'm sure Imperial has to Caywood-Christian, about having their own portfolio manager.
MR. LEA: Exactly, and then there's also the issue of fees. If you feel that you can have the talent and capabilities to do it cheaper than the mutual fund managers charge, then there's some gains to be had that way. In addition, I think there is the advantage of just being right up front in terms of deal flow and in terms of where these issues are, and you can, for example, be very selective in the types of credits that you get. And you know, you can either trust a manager to do it for you internally, or trust a mutual fund manager, but at least you have more direct
76

workings with your internal managers and that may facilitate some synergies with other activities of the institution.
MR. SMITH: One other aspect is that you might have some accounting risk because of the different treatment, that is, shares in a mutual fund are treated as equities, whereas direct investment is, unless it's classified as a trading portfolio is basically carried at cost. Depending on whatever happens to the financial instruments project at FASB, then this accounting differential may or may not partially or completely disappear over the next few years. This is dependent on what happens with the measurement basis.
MR. HAVENS: Craig?
MR. SIMMONS: Let me follow up on a question that Mr. Barth asked. I'm a little bit confused about something. In your statement you do indicate that you think a 6% GAAP capital requirement is too stringent or restrictive for investments of junk bonds. That's a pre-condition for investments of junk bonds. And you go on to say that the regulators, given the new authorities that they have under the Competitive Equality Banking Act can exercise considerable discretion in directing thrifts to achieve a given level of capital given their portfolio composition. Is it your view that there should not be a minimum capital requirement for the thrift industry that would be necessary to protect the interests of the insurance fund? Is it your view that capital requirements vary institution by institution based on their portfolio composition? I’m just trying to figure out where you're coming from on the capital requirement issue.
MR. SMITH: I think our only point is that we don't think it's economically necessary to single out high yield junk bonds for panic-stricken attention, when institutions with an equivalent amount of capital might not be singled out for doing perhaps a much riskier single agency project that might comprise a much bigger chunk of the total assets on the balance sheet. It's a question of evenhandedness, rather than to say that a minimum capital rule is inappropriate. Certainly it is appropriate. All we're saying is that there are minimum capital standards. Whether they be section 563.13, the general capital requirements, or 563.14, the customized capital requirements, they ought to be assessed on a rational basis in terms of the risk that the institution is accepting, rather than saying one particular sort of asset is ipso-facto terrible, when the historical record is such that this is not necessarily the case.
MR. SIMMONS: Okay.
MR. LEA: I'd like to add just one thing to that, and that is that you sort of have a catch-22 in the capital thrift
77

industry, and that is that, I think everybody agrees that capital is a necessary buffer to protect the insurance funds against risk, and so people want to see more capital. But the ability to attract capital to the industry is, in part, a function of the profitability opportunities that the industry enjoys. You can't at one hand take away profitable opportunities by saying you've got to have more capital, and say get more capital.
So what happens in those situations is that you look at those institutions that have less than what the threshold is, and say, are there reasons to think that we can let you go ahead with this activity. You can demonstrate, even though you have less of a buffer there, that this is something you can do safely and soundly. I think that's the approach that's being used and we endorse it.
MR. SIMMONS: Do you think that the 11% restriction for federally chartered institutions on investment in high yield bonds is too restrictive?
MR. LEA: I think it's needlessly arbitrary, because again, it implies there's something magical about that particular type of investment. I think the whole notion behind setting individual reserves and individual capital standards--you have to look at the whole portfolio of the institution. You can't say that, well, the institution has less than 11% high yield bonds, but it may have 25% in ADC loans, or it may have other very risky securities including mortgage-backed securities which, if you fund them wrong or don't hedge them properly, can be very risky in and of themselves. So I would say yes, 11% is not something that I think has any real relevance to riskiness of the position.
MR. SACHS: I think that the Garn-St Germain Act and the Competitive Equality Banking Act both sort of suggest a thriftness or qualified thrift lender test of approximately 60% of the assets of the thrift, in residential, mortgage related activities. To arbitrarily pick a number, such as 11% for high yield securities for federally chartered institutions, may force the institutions that want to diversify which are federally chartered into some of these other activities I mentioned earlier, which may be perfectly good activities for some institutions, such as auto lending and credit cards, but institutions who do not have the capabilities may end up going into those areas to diversify because they are up against their 11% limit.
MR. SIMMONS: Okay.
MR. HAVENS: Ken Lehn?
MR. LEHN: I have no questions.
78

MR. HAVENS: Ms. SCanlOn?
MS. SCANLON: Just a short question, based on your analyses that it depends on case-by-case or institution-by-institution, portfolio-by-portfolio and bond-by-bond, how would an outside observer judge whether a bond portfolio is being well managed?
MR. LEA: I think that if one criterion is used, it's total return criteria in which says, let's look at what's happened in both gains and losses, and in terms of the yield received over time, and let's look at that relative to some other kind of indices. I think you can do risk/return analysis through both comparing it to something like the Shearson Lehman corporate index which is high grade corporates and governments, and say what has the track record of your portfolio been in terms of both mean and variance of return, relative to that particular kind of index. I think that is the standard that is utilized.
MR. SACHS: I would agree with both methods, and just suggest in addition that in terms of examination of a high yield portfolio, relative to the examination of other assets a thrift might invest in, it's probably actually easier to obtain information on an institution's high yield portfolio than it is on an institution's single family mortgage portfolio. The beauty of the high yield business is the fact that,if you do it right, you're monitoring your credits on an ongoing basis. The typical management of a residential loan portfolio by a savings and loan is, you do not look at the file until someone misses a payment. And so you know the bulk of the industry's assets are in a category where nothing is looked at until there's a problem.
MR. LEA: One other thing that will be in our annual report this year, and it's been in other kinds of things that we've published, is that we include our diversification standards. We tell you how we're diversified across industries, and what our concentration levels are. We also have put in some general information about the kind of guidelines we have, restricting our investment in terms of percent of an issue, and percent of an industry and things of that sort. So we feel the best policy in this regard, to try to allay some concerns of the investor and the analyst and the regulatory community, is just be as up-front about it as possible, and say "Look, here it is!" You make your judgments and if there's something you don't like about them, tell us so we can respond to it and go from there.
MS. SCANLON: Thank you.
MR. HAVENS: Any other questions of this panel? Thank you very much, gentlemen. Our next witness is Mr. Thomas Madden, Senior vice President of Federated Research, accompanied, I believe, by Mr. Peter Germain, also of Federated Research.
79

For this part of the hearing, it is necessary for GAO to substitute Mr. Mike Burnett for Mr. Craig Simmons on the panel. Mr. Craig Simmons, being something less than 100% at this point, is forced to depart. Mr. Madden, if you'd like to proceed with your opening statement, please no more than ten minutes.
STATEMENT OF J. THOMAS MADDEN, SENIOR VICE PRESIDENT, FEDERATED RESEARCH CORPORATION
MR. MADDEN: Thank you. My name is J. Thomas Madden. I'm a senior vice president of Federated Research Corp., that's the investment arm of Federated Investors, Inc., located in Pittsburgh, Pennsylvania. Federated manages in excess of $42 billion of largely institutional assets. That is, we manage mutual funds for other financial intermediaries including bank trust departments and savings and loans.
I've been analyzing and managing high yield bonds for Federated for over ten years, and currently we have about three quarters of a billion dollars of high yield debt under management. We appreciate the opportunity to convey our perspective on the high yield or junk bond market to the GAO. My remarks incorporate by reference our comments in the GAO letter of February 18th, 1988, and I hope those would be included as part of the formal record.
AS the GAO evaluates the suitability of high yield bonds as investments for savings and loans, you've accessed a host of information about this market. It's surely not my purpose in this brief time to recapitulate in any fashion the remarks of Ed Altman, which I thought were very helpful this morning, or any of the studies which you have in your possession, the remarks of the Alliance for Capital Access, and so forth. I think that the historically low default rates and attractive returns of high yield bonds have been adequately demonstrated by a series of studies, which you have in your possession.
So instead, and perhaps in the nature of summarizing some of the remarks which you have heard in the very expert testimony already today, I just want to make three straightforward points about the character and evolution of the high yield market which may help your evaluation of high yield bonds as investments for savings and loans.
My first point, which I think has been amply demonstrated as you've listened to the testimony today, is that the high yield bond market is a heterogeneous market. The high yield bond is typically an unsecured subordinated debenture, but in larger transactions we've seen it's not unusual to find various tranches of debt obligations ranging from senior secured notes all the way down to junior preferred stock. The debenture may have a stated maturity, typically ten to fifteen years, but it may be shorter,
80

or longer in the case of lower rated utilities. The interest rate is frequently fixed, but it may also be floating or adjustable. The offering may be used to raise capital for a wide variety of corporate purposes. The company may be, as you heard from Stone Container, terming out short-term debt to ease the burden of debt repayment on the company's cash flow. It may finance a recent acquisition; it may pay for a new plant or equipment; it may re-finance a bridge loan associated with a leveraged or management buyout. The issue may be created through an exchange offer for common stock or other securities of the issuer. And as we've heard, the bond may be created through the downgrading of an investment grade company, Bethlehem Steel, International Harvester, Mellon Bank, and its subordinated debt in our own home town of Pittsburgh, Union Carbide and so forth.
As the GAO, I think, already recognizes, these securities are issued by companies which really cover the full spectrum of the U.S. economy. Utilities, housing companies, chemical companies --I'm picking examples from our portfolios--consumer product companies. They manufacture everything from blue jeans to beer cans, tractor trailers to ball bearings, cable television, and I think that as you survey the market, you're probably beginning to come to the conclusion that this is a financing vehicle which affects really most aspects of everyday economic life in the United States.
In the ten years that I've been managing in the high yield area, I've seen a variety of transactions, structures, uses of proceeds, and issuers which cover a very broad spectrum. I've seen very many imaginative and useful transactions which unequivocally help good companies grow. I've also seen transactions I would not sell to Muammar Quaddafi.
My first point, although simple, is one which is easily, I think, overlooked by people new to this market, namely that this is as varied and diverse a part of the capital market as you could imagine. I therefore caution the GAO, or indeed any other regulatory agency, about making summary inferences about the character of the market.
AS you study the issue of suitability, it may be useful to keep in mind that the high yield market, to rephrase the old saw, "is a market of individual issues. It is not a junk bond market." It is not some kind of speculative monolith.
My second point, which I think you've heard strong examples of, particularly in the last testimony, is equally simple and, we think, also critical to the issues that you're analyzing. In recent years, high yield bonds in a diversified portfolio would have outperformed the insufficiently diversified loan portfolios of many banks and savings and loans, and at a substantially lower cost.
81

In Pittsburgh, we see the Mellon Bank, once a financial colossus, is struggling to rise from its knees. To the informed observer, its current problems stem from overconcentration in areas like energy, commercial real estate and LDC loans. They suffer from illiquidity of the assets. They suffer from an internal bureaucracy which took too long to make good loans and too long to fix bad ones.
The savings and loan industry faces similar problems: nondiversified commercial loan portfolios, essentially caused by geographical constraints, the inability to achieve adequate diversification, and the illiquidity of those assets once they recognize that the assets are developing problems.
We further think as you study the market, and again you've heard examples of it already today, that you have to look to the net return on the asset-- the cost of originating, monitoring and zinistering that asset, not even including the cost of fixing the asset if it goes bad. Had the savings and loan industry, and indeed many troubled commercial banks, invested that portion of their portfolios aimed at higher returns in a diversified portfolio of high yield debt, they would not face their well publicized difficulties. High yield bonds provide attractive spreads from the typical savings and loans' cost of liabilities. They are liquid as you've heard already, allowing early exit at signs of trouble. They are cost effective to manage, and by that I mean very specifically fewer loan officers, smaller collection departments, fewer company cars, fewer country club memberships. Instead, they provide the opportunity for significantly greater diversification than the typical savings and loan or bank can achieve in its local market.
I think you've also heard evidence today, and in my own experience it's right on the mark, that it is precisely because of the difficulties and impediments many businessmen face approaching existing financial intermediaries that the high yield market is growing so rapidly. Again, not to pick on the Mellon Bank, but I'm told by people at home that in recent years, they required six levels of personnel in order to approve a commercial loan. Six levels of the organization.
High yield bond issuers, and you've heard again from Stone Container this morning, we've heard that they use the high yield market because bank loans and insurance companies' private placements are too cumbersome and they take too long to obtain. I believe that an important reason for the growth of the high yield debt market is simply that it is a more efficient mechanism for channeling term capital to worthy borrowers.
And although it's not in my prepared remarks, I want to add that if the regulation mechanism locks existing intermediaries
82

out of this more efficient channel, the risk may not be to the high yield market but to the intermediary.
As the Alliance for Capital Access says, perhaps what you want to be thinking about is how to let existing financial intermediaries into this attractive area of asset creation.
The last point we want to make about high yield investing by savings and loans comes from our own experience with that market. We have two institutionally oriented funds, which are sold in part to savings and loans. My examples are anecdotal, but they are memorable to me. In the case of those savings and loans who have had problems in the high yield market, that I have heard about directly myself, in every case the trouble can be traced to inadequate diversification.
While the high yield market continues to be of great use to the struggling savings and loan industry, an appropriate arena, we feel at Federated, for regulatory guidance is diversification. Our suggestion which we again detail in our letter, is that savings and loans be required to meet some reasonable standard of diversification in their high yield investments. And in fact, such a standard might in fact parallel the standards of diversification which are already required of mutual funds. Those, I think, ought to be interesting to you because they have served a rather lengthy and broad based test out there in the real economy.
We have every confidence that the savings and loan industry in concert with regulators could agree on some reasonable standard of diversification and we at Federated would be happy to continue to participate in the creation of such standards. There is no question to us though that the advantages of high yield bond investments appear only to diversified portfolios of these bonds.
Every study in your possession explicitly or implicitly recognizes the importance of diversification in a high yield bond portfolio.
Finally, if I could be allowed just to touch on two more points, and I think that they are responsive to the presentation you just heard, existing Federal Home Loan Bank Board Regulations have created the anomalous situation of preventing thrift participation in diversified portfolios of high yield bonds through the vehicle of mutual funds, while permitting investment directly in the market. We feel precisely in order to give the smaller institution some parallel access to this market, if it is as attractive a market as we believe is the case, those regulations need to be revised in order to encourage the safe participation of the smaller S&L in this market.
83

Secondly, I was sorry to see that Owen Carney had departed, although we speculated that was because his name was spelled wrong in the list of participants. The Office of the Comptroller as you may know, has taken the position that high yield bonds are speculative, and therefore not permitted for national banks. This position has effectively prevented national banks from participating in the high yield market, again, in one way through investment in mutual funds investing in high yield bonds. It is interesting that this position has been taken at the time when default rates on their commercial loan portfolios, you have evidence of this in the submissions, apparently are equaling or exceeding high yield bond market default experience. So again, we feel that national banks should have the ability to participate in this market.
The smaller institutions should also have some of the advantages and convenience which comes through participation in this market through the use of a mutual fund.
We've made specific suggestions again about how some of these things might be accomplished in our product, and with that I will come to a halt and see if you have any questions.
[See Appendix XI for the comments submitted by Federated Research Corporation.]
MR. HAVENS: Thank you, sir. Why don't we start this time with Gordon Eastburn.
MR. EASTBURN: I guess one question is, are you suggesting that the Bank Board's regulations at this point in time should be more detailed, or are you not?
MR. MADDEN: Well, I think that with regard to the issue of diversification, not with regard to the issue of how much of an institution's assets might go into the market, but specifically directed to the issue of what the diversification of that portfolio of high yield bonds should be once the institution has decided what portion of its assets it wants to put into the market, I think that yes, there is absolutely room for some additional direction from the regulators. And I'll stop there.
Well, let me just ask when you're talking about diversification, you mean a full range of things in terms of the type of issue or the industry in all this, or are you just mentioning --are we just talking about issuers or--Well, let me get Peter to respond to that, because he's given considerable thought to that point.
MR. GERMAIN: Well, in the formal comment that we submitted, we had proposed some specific regulatory measures that would
84

permit thrift institutions to participate in the market through a mutual fund and also specified-certain diversification requirements.
Specifically, we suggested that the regulations be amended to permit investment under the mutual fund powers so long as the portfolio of the fund investing in high yield bonds was diversified as described under Section 5(b)(l) of the Investment Company Act.
As a practical matter, we would make some specific suggestions, such as investment of no more than 5% in any one issuer, and the experience has been that the exposure in the average institutional high yield fund is no more than two percent in any one issuer.
We have no specific feeling that the 11% cap ought to be raised or lowered, but we would suggest that for mutual funds there should be a 5% limit per fund, and an aggregate limit subject to whatever cap the Bank Board may feel is appropriate.
We do believe that achieving diversification through mutual funds does permit safe participation in the market. There are specific problems with the regulations as they exist now, pertaining to mutual fund investment. And I think they're outlined pretty specifically in our letter.
MR. EASTBURN: Thank you.
MR. HAVENS: Mike?
MR. BURNETT: I just have one question, and one follow up. Would a bond fund that a thrift would invest in, a high yield bond mutual fund, differ in any significant way from a high yield bond mutual fund that anybody else would invest in?
MR. MADDEN: In the case of one of our funds, the answer is: very significantly. We have a shorter term high yield fund which invests in floating and variable-rate securities, designed especially for financial institutions with the purpose in mind that it has less sensitivity to interest rate fluctuation, and so this is really tailored for the asset management problems which a financial intermediary undoubtedly faces all the time.
We have another fund which is a longer term fund which, I think although perhaps I would argue somewhat higher in quality than many of the retail high income bond funds which are out there for the individual investor to purchase, is nevertheless, in terms of the way the portfolio is put together, probably somewhat similar to many of the retail funds that the folks from Columbia alluded to.
85

So I guess that within my own experience the answer is that the traditional high yield bond fund may indeed have some degree of homogeneity. In the case of our newer fund, it's really quite a different sort of a beast. But let me just make one more point. I think that if it was easier for the small savings and loan or bank to access this market, you could solve the market versus valuation-at-cost issue. What would happen would be that as you created a higher opportunity for the mutual fund industry to try to serve the smaller institution, you'd have more competition and probably more specialized vehicles designed to meet the various needs of the buyers as they defined them in the market place.
MR. BURNETT: In that regard, and with the importance that you've emphasized, of having a diversified portfolio and good management of the portfolio, do you think that the thrift regulators should take steps to assure that the management of the portfolio quality and the diversification in the mutual fund are in some way acceptable prior to allowing a thrift to invest in the fund, and if so, how would they go about making those determinations?
MR. MADDEN: Mr. Burnett, that's a good question, and it's so good, I'm going to let Peter take a shot at it.
MR. GERMAIN: Well, I think the regulators can go through a process similar to what they go through now, in providing or establishing criteria for other types of mutual funds. Presently a mutual fund is only a permitted investment if it limits itself by prospectus to securities which thrift institutions may purchase directly without limitation, and, if a fund invests in corporate debt obligations, the fund is limited to corporate debt rated in the four highest rating categories and subject to a five percent limit on investment. I think if the Bank Board adopted subsection (c) to Section 545.76 (a) and (b), allowing a savings and loans to invest in a mutual fund investing in high yield bonds, provided it limits its investments by investment policy solely to corporate debt, regardless of rating categories, and is a diversified company as that term is defined in the Investment Company Act, and, provided further, that its investment policies can't be changed without shareholder approval. I mean, I think that sort of regulatory scheme prevents the management of the investment company from changing the investment objectives of the fund; and the existence of the prospectus gives an additional level of review to an institution getting into the business. The prospectus is, of course, registered with the Securities and Exchange Commission, and the institution certainly has an opportunity to read through the investment policies and credit risks, and investment risks as the fund manager identifies them.
MR. MADDEN: I guess the only addendum that I would offer is that if the regulatory process essentially defined, as Peter
86

has suggested, the parameters of a mutual fund that would hold high yield securities, you would then essentially mandate whatever that set of screens might be in a fashion which presumably would be done with the concurrence of the people whom you are empowered to regulate, and you would then be sure under existing SEC regs of having such funds and only such funds available for investment by S&L's. I hope that's responsive.
MR. HAVENS: Ken?
MR. LEHN: No questions.
MR. HAVENS: Martha?
MS. SCANLON: On your mark-to-market proposal, or non-proposal, you're not suggesting, or you're not in favor of marking these portfolios to market?
MR. MADDEN: Well, let me answer that sort of near term and longer term. Near term, we would like to see the valuation of a fund which invests in an asset which the S&L may buy directly, treated the same as direct investment. Okay? So if you all are going to argue, and I think there are very powerful reasons which we are familiar with for this argument, that you're not going to use a market standard on direct investments, then our argument near term would be why prevent the smaller S&L's from accessing this attractive part of the market, because you essentially say to that smaller S&L, well you're different, you have to mark this high yield portfolio to market, while Columbia Savings and Loan can buy a billion and a half, and if they so choose, value the securities at cost.
So that's the first part of my answer. I would say that longer term as we look out towards the end of this decade, and on into the '90's, my own personal belief is that you will see all financial institutions push in the direction of marking to market, because as the banks' LDC problems magnificently illustrate, in the end the market discipline prevails, and the asset, no matter how hard you fight, turns out to be evaluated by what it will trade for.
MR. HAVENS: Jim Barth?
MR. BARTH: Yes. One or two questions. I guess I can't resist asking, now that we've heard all the other speakers, it seems like a lot of people have been talking about some of the benefits of junk bond investments, and we know there is a cap on the federal thrift at least, and maximums on other depository institutions, and based upon what people have said, would you say that we ought not to be focusing on maximum investment limitations, rather minimum investment limitations for
87

diversification purposes. Would you turn around and say the minimum should be ll%, 5% to achieve the diversification?
MR. MADDEN: If the institution is going to use the high yield bond market, than whatever portion of their assets they invest in the high yield market should be subject to a reasonable diversification standard. It is also my belief after ten years of watching this market evolve, that it is a disservice to all national intermediaries not to encourage them, let me say it this way, to encourage them to examine the high yield market very carefully if they have not done so today.
Because, again, I would emphasize to you, I think it is terribly important that the rise of this market is precisely analogous to the rise of the mortgage-backed market of the 1970's. It is simply a more efficient way of moving a certain kind of financial asset around in the system, and to the extent that a financial intermediary can't figure out how to be part of that process, one piece of its reason for being is disappearing.
So I guess my response would be I don't know that I would set a minimum standard, but I certainly would not set a maximum exposure to this market. I think that the magnificent success at Columbia Savings and Loan which you heard about, and which we've followed, and it's a tremendous story, is the testament to what an organization can accomplish with a significant participation in this market, managed very scrupulously.
MR. BARTH: And would you favor sort of a case-by-case approach to dealing with the junk bonds and other investments or would you prefer sort of general guidelines be set down?
MR. MADDEN: Well, I think that one of the advantages of high yield market is that the regulatory oversight process as it goes forward through time, not as you established initial regulation, but as you oversee the savings and loan industry, can discern what's happening in the high yield portfolios of any investor rapidly. This is because securities are literally marked each day, they're priced, you have tons of return information for the mutual funds that hasn't been mentioned. If you want to know how we or any of our competitors are doing, you only need get the analytical reports, that we sort of live and die by which are total return oriented, so you would be able to see what's going on in the market pretty straightforward. I hope I'm responding to your question.
MR. GERMAIN: I have some thoughts, if I may. I certainly wouldn't advocate mandating a minimum exposure to a high yield market for all thrifts. I mean there are certain thrifts that, for reasons of internal management, are perhaps skeptical of the market and may wish not to participate. But I do believe that rather than a case-by-case basis, general guidelines ought to be
88

established, if only for the reason that presently I think there are many thrifts that don't get involved in the high yield market, because they perceive that the current position of the regulator is to discourage investment in the high yield market. I think by establishing guidelines, which specifically enumerate the circumstances under which, and the conditions under which, a thrift can participate in the market, thrifts that were previously hesitant about getting involved may get involved.
MR. BARTH: Did you also say something earlier in your comments about savings and loans that had trouble with high yield bonds? Could you be a bit more specific, are you talking about large numbers, small numbers?
MR. MADDEN: What I intended to convey was that my own first hand knowledge of savings and loans which have problems investing in high yield bonds is a relatively small number of anecdotal descriptions over the last several years of difficulties in the market. What I was trying therefore to suggest was that while I do not have a statistically rigorous sample of institutions to look to, I have conversations at bond conferences in the course of conducting my business at which people tell me you know, Joe bought 12 issues, and he was a hero for the first two years because they all paid as agreed, and then three of them didn't, and he had to give his whole spread back and it didn't work out so well. So what I'm suggesting is that at least within my own personal knowledge, those institutions which have had difficulty in the market have inevitably in my own view had that problem because they owned too few bonds. Therefore, if one of them blew up, the impact on the portfolio, because they weren't adequately diversified, was very serious.
MR. BARTH: The impact on the junk bond portfolio, or the entire portfolio of the institution?
MR. MADDEN: Well, I would say the impact on the junk bond portfolio.
MR. BARTH: Okay.
MR. HAVENS: Are there any other questions of Mr. Madden or Mr. Germain? If not, thank you very much, we appreciate you coming.
That concludes the joint hearing, and we appreciate everybody's assistance and cooperation, and GAO in particular appreciates the assistance and cooperation of all the other agencies. Thank you very much. The hearing is adjourned.
(Whereupon, on Tuesday, March 1, 1988, at 3:35 p.m., the hearing adjourned.)
89

APPENDIX I
FEDERAL REGISTER, FEBRUARY 1, 1988 GENERAL ACCOUNTING OFFICE NOTICE OF PUBLIC HEARING AND REQUEST FOR COMMENTS ON THE NATURE OF THE MARKET FOR HIGH YIELD BONDS
APPENDIX I
90

'2-l-88 Vol. 53 No.20
Monday February 1, 1988
United States Government Printing Office SUPERINTENDENT OF DOCUMENTS Washmgron DC 2C402 OFFICIAL WSINESS Penalty lor pwate “se s300

Federal Register / Vol. 53, No. 20 1 Monday, February 1, 1988 / Notices 2785 ’
TRANSAOTIONS GRAUTED EARLY TERM- TRANSAIXIONS GRAMED EARLY TERM- TRANSACTIONS GRANTED EARLY TERMI- NATlOH 6ETWEEN: 01/14/88 AND ol/ tunoti BEIWEEN: 01/14/88 AND 011 NAnON BETWEEN: 01 I1408 AND Ol/ 25/88 25/88-Continued 25/88-Continued
Date tWlU?Ut-
ed
oats termmat-
ed
6s-cets 01114/86
01 m/68
01/14/6a
OlIW88
01/14/66
01/22/88
01/14/88
68-0664 01/22/88 884679 01/~4/6a
68-0690 0112208
_..__....“.....“...... oz Ltd.. Red Pies
tics curporaw Reed Plastics hporatx+l...~~-I
(8) fhs aorOr Company, bfr. H. Wayne Htuzerqa, Waco zT%nkw& Im...I- . . . . -” . . .
(9) stephgn Adama Levm w Jr., Turns out- AdverbsIng. Ltd.-..
(10) cawbfl soup cornpa- ny, Reckitt 8 Colman pk. CcmpamaEnvasadorade Lcmto .sAmJrkee Famous
88-0731 01/14/66 OllW68
(42) RAimrco, DanwIle Re- F Inc., Danvitk A* -2Towxa Inc .--.. “I . ..-... I.
(43) Kenneth R. Thomso% ~CEt&Wd~mABC3C~
.^“.--..“.-.._I- . . . . . . . . . . . . . . . [A? Rici Holding Corpora-
tlort, Rini Hoidirg Corpora- Son, Rti Holding Corpora- llon. ,.........-...............- . . . . . . . . . . . .
[45) Fisk Foods, Inc., F&her Fox& Inc., Flier Foods, Inc .._...._...................
LW Amencal Seaway
s $i& ,ngyt$Ig km Seaway Foods. Inc . . . . . .
“7II&3gr-& sz
Grwp: Rego Supermarket Grrp ..--. “-.I ._.^. I .-..... I..
01/15/88 01122f88
01/15/68
. ..-...-.....-...-..^. ,I;%& R. Jones, Geof-
fr6y R. Blifca& &omrd cam TV, Inc., and sub si&ries.-- ._...I._._ _ . . ..-
(12) Glenn A. Jonag Cable TV Fwd IX-C, Ltd., C&e Fund lX-C--.-,-
(13) Glenn R. Jones Cat& NFund10-4LtdwFund m-h Ltd - . . . . ..-. -..-
(14) Glenn R. Jones. Cable TV Fund lO-f3. Ltd., Fund 10-S. Ltd -.-- . . . . . . . . . . . . . .
“WgVk&i~QW&
-mere- r”’ --..--.---..-
WI Bass W.. HoiiQy SW= ration. Hoktay tnns. Inca- porated.“-. . . . . . . ..-....-. . . . . . . . .
(17) C%ar’es E. Hwritz, M- Group h., Mamam Group Inc . . . . . . . .
(18) Ckamota -Inc.. JN. buzan Ccmpaq, J.N. ceatlpncompay.-
(19). Case Foods k. TrWs PwfW. Inc, and Ardmore Poultry. Inc.? Troyer’SPoumy.kti Ardmore PO&y. blc -...
G?og gLE$$fwd PLG
EFigct$zT (21) Kenneth W. Ford, James
UGdd%Mh,DtAM mgs lnternabonat, SV ant Di.4 HOI- --.-.-._-
01/19/88
[22) Botdm Inc.. Robart M. Harrts and cealy w. nerlts,Numltonlndustries
ti$pQmy+~“-..“~
paetion, caltd corpora uor4saltet-sys- Iems. inc.-. .-.......... . -...
““nly~$y$y!g
&atlon. Foote Mineral ..“..-..-...--.“.
(25) lsomec - bans, Inc., Contei corpOr8- lb’. Gmtei Busmeas Sys- terns, Inc.-- . . . . . ...” . . . . . -.
(26) Exxon Corporstion, Leede Expbration, Leede Expmtin..., -. - -...
(27) Hanson Trust plc. Mar& ott Corpxatlon. Saga Res- taurants, lnc . . . . . ..-..... ,. _._.^.
(26) Georgaa Gult Cqxxa- bon. H.H Rchrtson Corn paw. Freeman charmcat lzaporatkm . . . . . . . . . . . . . . . ..-.........
(29) Marm E Zimmerman.. scientific Leasng Inc.. Sci- erllittc Leasin b-c -“-
m Ame’icm w-8 corn- pany. The Phlp Co. Trust ctllsiAutaPmsDiv?sm of Soumland Cocporation .._
(31) Da& J. Suiliian, Corw pact video, Inc., Image Transfwm. Inc . ..- - -. --
(32) Lees Holdings Inccqo- ration. Moqan Stanley Group 1cc.q Swtington In- dusti. Inc . ..-... _“.” . . . . . .
(33) Mernll Lynch 6 Ci& Inc.. Mark IV I- Inc. Code-A-Phone carporation.
WI corn monwesnh savings Assuabxt, Paafic Frst Financial corporation, Pe ctfc First FederaJ Savqs Bank . . . . . . . . . . . . . . . . . . . . . . ..-........... I
(35) Marbn E. Zhrnwman. Scienhfic Least-q Inc.. Scl- enbfll Leasing lnc . . ..--
(36) Corestates Financtal Corp., BankAmerica Q’PO- ratio&-corn. merclal cotporam . . . . . . -“I
(37) Peter w. May, CJt irk dusmes, Inc.. CJI hldus- e-lea Inc.... . . . . . . ..^ ---...
(38) Lutheran Generai Haaith CareSpMl.Q&f2iil3S HealthCareRewwcaa. Inc, auad cltles Hesntl Cara Resources. lnc--...
(39) Mlnalw, EngethsKt car- poratian,EngelhardCgxF
&yikrm& A&be ‘ii;; Corpowtion.
izitr-cupore. tlotl ---r....L--
(41) f.4imco. lnsptratm Re
ot/wsa
Ot/l6/86
FOR NRTHER INFORMAnON CONTACZ Sandra M. Peay, Contact Representative, Premerger Notification Office, Bureau of Competition, Room 301, Federal Trade Commission, Washhgton. DC 20580. (202) 32&3100.
01/22/6a
01/22/86
E5y direction of the Commission. EmilyH.Rock. Secretary. [FR DOG 88-1930 Filed l-24-88; 6~45 am] mJJNG CoaE sxo-o1-M
01119188 01/22/88
01/19/68 GENERAL ACCOUNTING OFFICE
01/t9/66
01lW86
OlIW88
01f22188
ot/w88
01 m/68
Qtf26m
01125I64
01 l26I68
01125/86
Public Hearing and Request for Comments on the Nature of the Market for High Yield Bonds
01/19/68 AGENCY: General Accounting Office [GAO).
. . 01/19/8a
01119l86
01/19/68
01/20/88
01120/88
01/20/86
011w6-8
ACnON: Notice of pubiic hearing and reauest for comments.
sources cQrpo(aW. IV* , ratlut Rexusces Corpora- lioll. ..-.....-...-.“-...--. -I 86-0674
SUYMAAIP. The General Accounting Offtce (GAO) is seeking comments on the nature of the market for high yield bonds. This request is part of a GAO study, mandated by the Competitive Equality Banking Act of 1987 (Pub. L 100-86). This Act requires GAO to identify, for a five year period preceding its date of enactment (August 10,1987), the issuers and purchasers of high yield bonds, the purposes for which such bonds are issued, and how investments in these bonds by federally insured institutions compare to other investments these institutions have made. GAO is also required to provide Congress a summary and anaIysis of
PMN No.
86-0375 01/25/66
86-0702 01 I25166
66-0736 01/25/86
86-0739 01/25/88
66-0740
66-0741
01125l66
1 Olf25l68
Dale termmat-
ed

27’66 Federal Register 1 Vol. 53, No. 20 -/ Monday, February I, 1988 / Notices
current laws regulating investment in high yield bonds and a review of the impact of these bonds on corporate debt as it relates to monetary policy.
AS provided by the Act, the study is being conducted in ordination and consultation with the Securities and Exchange Commission. the Federal Home Loan Bank Board. the Comptroller of the Currency, the Board of Governors of the Federal Reserve System, the Federal Savings and Loan Insurance Corporation, the Federal Deposit Insurance Corporation the Secretary of the Treasury and the Secretary of Labor, Comments received in writing w-i4 be shared wit!! these agencies.
Ah ; ,.._ ‘led by theActieA0 and thaw Z+X&S will conduct a joint public hearing. Those interested in the high yield bond market will have an opportullity to discusa theirtiewe on the2 topics included in the supplementary information section of this release. The results of the hearing will be merged with the izdhiduaI responses to this request for comment to form a body of evidence for consideration in a final GAO report on high yield bonda which is expected to be issued in rune 1988. DATEsz Comments must be received by February X+,1988. The public hearing will be held on March 1. ?.?388 at 1OzOO (e.s.t) at the hrblic Meeting Room (Room lC-3U) of the Securities and Exchange Commission in Waehiugton, DC, 450 5th Street NW. Individuals or orgeniz4tians waling to preeent their views at the public hearing should contact the GAO officials listed below by February 22 198fL ADoRe%szPleaa.e f&3 five copies 0% your comments with Qaig A Simmons, sfsior Assaciate Director, General Gavemmeut Divisian, us. General Accounting Office, Etam~a& C Street NW., Washington, DC 20548. Refer to File No. 233X6.
All comments will be available for review Monday-Friday. 6~00 a.m. to 4~43 p.m. (e.s.t.1 in Washingtorn. DCatGAO’a law Library, Room 7I.&& in New York, at GAO’s Regional Of&e, Room 4ll2 26 Federal Plaza; and in L&J Angeles, at GAO’s Regional OfBce,‘350 !3. Fisuepoa St,suitelmo. ’
F~~HearingM~on~- f.nfbnnatricrn 4Zbnfu& ibfkhael A. Aura&t or Frank PiziEpP% (2&Z) 2724X3, CittUEdG-Ditrirrian,eTs GenedAwomtttngOffioe~~ 3r35&%44~Gst.W,Wa~DG
-NW T?D?eThis supplementary Watton section explains the objectives, scope, and methodology for the GAO study and discusses the topics and que&ons
respondents should address. The discussion assumes a basic familiarity with the high yield bond market. Additional information about the high yield bond market can be found in the references shown in Appendix I.
Until 1977 the high yield bond market consisted primarily of “fa!?en angels”- bonds of large companies. primarily conglomerates, railroads, and utility companies-whose credit had been downgraded for various reasons. However, begkkng around 1977 the high yield bond market changed significantly. Companies with below investment grade ratings, which traditionally obtained their long term capital from private sources. commercial banks, or equity markets, began issuing below investment grade, high interest rate bonds. commonly referred to as “junk bonds”, to raise capital.
After growing from about $8.5 billion in 1977 to $29.2 biVion * in 1983. the high yieldbond market evolved further in 1984 se financiers and companies began to use funds raised from issuing high yield bonds to launch both friendly and hostile corporate takeover bids either through tender offers OF through leveraged buyouts. Another phase of the market that has developed is the use of high yield bonds to Gnanca either corporate reorganizations or to resist takeover attempts. As a rest&, many corporations have issued increasing amounts of debt; As of June 1987. tota? high yield bond issues outstanding wera estimated at abouW50 billioh This is about ZI% of the total corporate straight (non-convertibkz] debt market up from 3.5% in 1977.
AahighyteMbondsbecameasource of financing for corporate takeovers, especially hostile takeovera the Cuss became umcenk&abouUhe impiications for American business. Since 1985; the Cougreea has held munfxaus hearfngs on the subject of hostile takeovers and the use of high yield bonds as a me&a&m to finance them. Anumber of issues wm discussed in these hearings fmziuding
1. Concerns about the risks to the Federal Savings andLoanInsurance Corporation (F’SLIC’) represented by those federally insured savings iuetitutions whi&lmrestexteneiwIy in highyieh3beJrxk
z.whethePfnveatIug$ntakeaver reIated high yield bonda is an appropriate rote fae a fadera& insured home mortgage lending inst&ution;
3. Whether tax palicy shmld be changedtoE3tricttha;ttse0fhighyield
bonds as a tool to finance corporate takeovers; and
4. The effect of increased debt. either as a result of a takeover situation or from using bonds rather than equity as a source of corporate financing, on the long term financial stability and growth prospects of American business.
Several legislative proposals have been introduced in Congress to limit the use of high yield bonds to finance takeovers by imposing a moratorium, using tax code provisions to disallow interest deductions to the issuers, applying credit margin requirements to investors. or prohibiting outright the holding of high yield bonds by federally insured institutions. This leg&tive focus has been twofold. involving concern over the relationship of high yield bonds to takeover activity as well as concern over the inherent “riskmess” of these bonds as investment vehicIes for federally insured institutions. None of these proposals have been enacted. Objectives, Scope and Methodology of GAO Study
Section 1Xtl of the Competitive Equality Banking Act specifically requires GAO to include in its study. -The identity and rating (as determined
by Moody’s, Standard and Poor’s or other nationalIy recognized bond rating house) of the issuers of these bonds;
-The identity of the major purchasers of these bonds, in&ding but not limited to federally insured depository ins titUtiOtl&
-The percentage of the totai amount of high yield. non-investment grade bonds that are issued as a method of financing corporate takeovers;
-The identity of the purchasers -- llfcluding btinot limited tcpfederalty
insured depository institutions. that invest in high yield, non-investment grade bonds that are issued as a method of finan&g corporate takeovers:
-The purposes for which high yield. non-investment grade bonds are issued other than for financing ctxparete tak-
-A summary and anaiysis of the ~ofcurrank8tattzandfederal laws that regulate investment in high yield. non-investment grade bonds by investors, in&ding but not limited to faderaBy i?tmmeddapositaPy ir~stitutiom and pension funds: and
-A review of the impact of the issuance of and -invwtment in high yield. non- investment grade box&3 upon corporate debt as it relates to federal =Jne(asII &CY*

Federal Register / Vol. 53, No. 20 / Monday, February 1, 1988 / Notices 2787 a
The Act further requires that GAO examine all other types of direct investments made by federally insured institutions and the effect these investments have had on federal deposit insurance funds.
The principal t&ks-of GAO’s study are to provide the Congress with accurate data and information on the nature of the high yield, non-investment grade bond market and to assess public policy considerations relating to the market. In addressing these topics, the study will be concerned with the use of these bonds in corporate takeovers, especially hostile takeovers, and with :!-:., ncssible risks to the r+?y and
, ,ness of feder$& ;, , . ’ ,*@ .? ‘I,jrutiona which invest in t,L;: bonds.
Topics on Which GAO Is Seeking Comment
GAO is soliciting information which would clarify the Congress’ understanding of the high yield bond market and identify current problems, if any, in the high yield bond market. We are interested in receiving any suggested federal regulatory or legislative changes. To guide comments, the questions below are organized around the topics the Act has directed GAO to include in its study. Those commenting are urged to be specific, citing wherever possible quantitative information in support of their positions. Respondents-are also encouraged to bring to GAO’s attention any matter pertinent to the inquiry that is not specifically addressed in the following sections. Issuers of High Yield Bonds
GAO has found that much information is available on publicly traded high yield bonds, but little information is available% the role ~~s&iEcance’o~ privately placed high yield bonds. Questions
1. How large, in terms of dollar volume and number of issues, is the private placement high yield bond market?
2. To what extent in the past five years has the private placement market been affected by the growth of the publicly traded high yield bond market? Is the growth of publicly traded low grade bond offerings mostly a rechanneling of corporate borrowing away from individually negotiated loans toward public securities, as some commentators suggest?
3. To what extent are privately placed bonds used to finance corporate takeovers?
investors In High Yield Bonds According to investment bankers, the
major investors in high yield bonds are mutual funds, insurance companies, pension funds, and federally insured thrift institutions. Other categories of investors include individuals, foreign investors and corporations. Commercial bsnks do not invest in high yield bonds because of Federal Deposit Insurance Corporation, Comptroller of Currency and Federal Reserve Board restrictions.
Federally insured and federally chartered thrifts may invest up to 11 percent of their assets in these bonds. Federally insured, state chartered thrifts may invest more than 11 percent of their assets in high yield b&da, depending on individual state laws and regulations. Data maintained by the Bank Board shows that 80% of the $10 billion in high yield bonds held by all thrifts are owned by only 10 institutions. Some of these institutions hold more than 11 percent of their assets in high yield bonds.
At congressional hearings Federal Home Loan Bank Board witnesses have testified as to their concerns about federally insured thrift institution investments in high yield bonds. The Board’s concerns fall into two areas (1) The issue of risk to the FSLIC presented by extensive involvement of thrifts in the junk bond markets, and (2) whether federally insured lenders who are subsidized to provide a commitment to housing finance should be investing in high yield bonds which have been issued to finance corporate takeovers. Questions
1. How does the riskiness of high yield bonds compare to other investments and activities. such aa commercial loans, that thrift institutions may enter into? In evaluating risk. what factors should be _. .-a_ consrde~&and afe drere WtyzHcr quantify these risk factors?
2. Two studies indicate that compared to Treasury bonds and investment grade corporate bonds, historically the return of high yield bonds has more than compensated high yield bond holders for additional risks of default (See Appendix I: Studies). What are the analytical strengths and weaknesses of these studies?,Given the growth and change in the composition of the high yield bond market in the past several years, are historical risk and return factors necessarily a guide to the future?
3. How adequate are state laws and regulations governing investments by federally insured institutions in high yield bonds? Should state chartered institutions be subject to the same limitation of assets (11 percent) as federally chartered institutions?
4. What is the best way to protect FSLIC from unreasonable risk as a result ‘of thrift investments in high yield bonds? Some suggestions that have been made include restrictions or prohibitions on bond purchases, increased capital requirements, risk-based insurance premiums, additional regulation to require an appropriate credit analysia before purchase, and diversification of bond holdings.
5. From a public policy viewpoint, should federally insured institutions be restricted from purchasing high yield bonds which were issued in connection with the financing of a hostile takeover or a leveraged buyout?
6. Many bonds that are issued to finance takeovers and leveraged buyouts are likely to be repaid in whole or in part from the sale of assets rather than from future earnings. As an investment, are asset backed bonds riskier than bonds whose repayment is based on expected earnings? To what extent, if any, has the stock market turmoil of October 1987 increased the riskiness of bonds issued in connection with takeovers and leveraged buyouts?
7. Some investors actively trade high yield bonds in the secondary market. How large is the secondary market for these bonds? Can this market be maintained in the event of an economic downturn? To what extent was trading (price and volume) in tke secondary market affected by the October 1987 stock market decline?
8. Private pension plans, the benefits of which are federally insured. are permitted to invest in high yield bonds. However, there are no requirements that such investments be especiaily reported to the Department of Labcr. Should there be any special reporting requirement for high yield bonds? Is tln3Tiz~~~fnnd?3 may be investing too heavily in high yield bonds either directly or indirectly through insurance company annuities or mutual funds? Role of h!igh Yield Bonds in Increased Corporate Leverage
In the past several years significant concern has been expressed in Congressional hearings and elsewhere that the level of debt being assumed by some non-financial corporations is excessive. (=iting Federal Reserve Board statisticr, some of which indicate that debt to equity ratios have reached historically high levels, some observers warn that in the event of a business downturn or a substantial rise in interest rates. corporations with high debt burdens may not be able to meet their debt obligations and a high level of
94

2?88 Federal Register / Vol. 53, No. 20 / Monday, February 1, 1988 / Notices
defaults may occur. This could pose significant risks for the financial system and the economy as a whole.
The extent to which high yield bonds have contributed to. the growth of debt and an increased leveriging of corporations is unclear. Some observers believe that the growth of the high yield bond market. particularly the use of high yield bonds to finance corporate takeovers, corporate financial restructuring and leveraged buyouts, together with associated retirements of equity, has been a significant factor leading to increased leveraging and risk to the econo: 9;~; Qthen have discounted &e sig,,‘-~-‘;’ :-’ ’ ‘“... 2 high yield hi $d< market. p&~?~~~~;~ Y.?‘that although this segment of the’btind market has grown significantly, it still represents less than 25 percent of total new bond issues. Also, proponents of the high yield bond market question whether there is a leveraging problem at alL They argue that even though the amount of new debt assumed has been large in absolute terms, at market value the ratio of debt to equity has actually declined since the mid-1970’s because of the rising equity value of domestic corporations. Questions
I. The Federal Reserve Board reports the relationship of total debt to total equity of nonfinancial corporations in two ways, as shown by the following table:
DEBT-TO-EQUITY RATIOS FOR NONFINANCIAL CORPORATIONS
End of period
1962 ................ “.“. ............. 1964 ...... . ... . .......... ..- .... -. 1966 ........................ ..m ....... 1968 ................................... 1970 ................................... 1971................................... 1972 ................................... 1973 ................................... 1974.. ................................. 1975 ............................. ..- .. 1976. ..I.......................... .... 1977.. ..... . ........... . ............. 1978 ..... ..” ........ . ........ . ...... 1979 ................................... 1980 ..... ..“. ......................... 1981.............................. -. 1982 ................................... 1983 ................................... 1984 ................................... 1985 ................................... 1986 ...................................
38.2 42.4 40.4 37.7 428 43.4 45.4 35.6 46.4 48.0 45.5 46.7 45.4 45.4 45.1 61.9 40.8 91.1 37.8 72.0 37.0 72.9 37.6 84.0 38.9 87.5 38.7 79.0 35.1 60.4 35.3 70.3 36.6 71.5 37.1 83.6 42.4 75.4 47.3 70.3 53.0 69.4
Debt g-y’
DENT-TO-EQUITY RATIOS FOR NONFI- NANCIAL CORFORATIONS--COfltitl- lied
Debt Debt @ar) ’ (mar-
ket) = End of period
1987 (2nd quarter. estimated) . . . . . . . . . . . . . . . . . . . . . ! I 55.4 57.1
.:- * Debt is valued at par, and equity is bal- sheet net worth with tangible assets
&!.ed at replacement cost. *The market value of debt te a staff esti-
mate based on par value and ratios of market to par values of NYSE bonds; equity is market value of outstanding shares.
Which of these ratios most appropriately measures the significance of corporate debt? Is there another measure that is more meaningful such as earnings or cash flow coverage of debt services?
2. The publicly traded high yield bond market has grown from less than $3 billion in new issues in 1982 to about $34 billion in 1988. One reason for this growth appears to be a shift in corporate financing from additional stock, private placement bonds or bank loans to publicly traded bonds. What implications. if any, does this change in the source of corporate capital have on monetary policy?
3. It has been alleged that much of the increased corporate leverage is the result of using high yield bonds to finance takeovers, takeover defenses
Appendix 1 References Hearings
U.S. Congress, House Committee on Banking. Fiance and Urban Affairs, Subcommittee on General Oversight and Investigations. Issues Relating to High-Yield Securities (Junk Bonds), Hearing. 99th Congress, 1st session. Washington. DC U.S. Government Printing Office, 1988 (Serial No. 99-47).
U.S. Congress, House Committee on Energy and Commerce, Subcommittee on Telecommunications. Consumer Protection, and Finance. Debt, Financial Stability, and Economic Growth, Hearing, 59th Congress, 2nd session. Washington, DC. U.S. Covemment Printing Ofice. 1986 [Serial No. 99-w
U.S. Congress, House Committee on Energy and Commerce. Subcommittee on Telecommunications, Consumer Protection. and Fiance. Corporate Takeovers [Parts 1 and 21, Hearing. 99th Congress. 1st session. Washington, DC, U.S. Government Printing Office, 1986 [Serial Nos. -99 and 99-100).
U.S. Congress, Senate Committee on Banking. Housing, and Urban Affairs. Hostile Takeovers, Hearing, 10th Congress, 1st session. Washington, DC U.S. Government Printing Office, 1987 [Senate Hearing 100-50).
US. Congress, Senate Committee on Banking, Housing, and Urban Affairs. Regulating Hostile Takeovers, Hearing, lC0th Congress, 1st session. Washington. DC. U.S. Government Printing Office, 1987 (Senate Hearing 100-153).
Reports U.S. Congress. House Committee on Energy
and Commerce. Subcommittee on Telecommunications, Consumer Protection. and Finance. The Role of High Yield Bonds (Junk Bonds] in Capital Markets and Corporate Takeovers: Public Policy
xnd leveraged bnyonts;Tfie~tc~is---fmpftcations. A rep&prepared-by* often highly leveraged corporations which n&i selI assets and restrict spending to meet debt obligations. Should regulatory and tax policy be changed to make the use of high yield bonds in takeovers and leveraged buyouts less attractive?
Congressional Research Service. 99th Congress, 1st session. Washington. DC. U.S. Government Printing Office, 1965 (Committee Felt 99-W).
4. Others -allege that the preference for debt over equity financing arises from the double taxation of dividends and the deductibility of interest for tax purposes. What effect will the lower tax rate have on financing decisions? What would be the merits of elinilnating double taxation of dividends?
5. How can it be determined if corporate debt to equity ratios are too high or too low? If they are believed to be too high or low, what, if anything, should the Government do about it?
95
U.S, Congress, House Committee on Energy and Commerce, Subcommittee on Telecommunications, Consumer Protection, and Fjjance. Corporate Mergers and High Yield punk) Bonds: Recent Market Trends and Regulatory Developments. A report prepared by the Congressional Research Service. 99th Congress. 2nd session. Washington. DC, U.S. Government Printing Office, 1986 [Committee Print 99-00).
Studies Altman, Edward 1. and Scott A.
Nammacher. “Investing in Junk Bonds: Inside the High Yield Debt Market.” New York: Wiley 8 Sons. 1986.
Blume, Marshall E. and Donald B. Keim. “Lower-Grade Bonds: Their Risks and

Federal Register / Vol. 53, No. 20 / Monday, February 1, 1988 / Notices 2799 -
Returns.” Financial Analysts Journal, July- August 1987. pp. 2643. Rtcbad t Fogel, Assistant Comptroller Geneml. Geneml Government Pmgmms. [FR 130~. 8S1928 Filed l-29-88; 8:45 am] BILlIN COW 1616-614- -
GENERAL SERVICES ADMlNlSTRAllON
Agency Information Collection Activities Under OMB Review
AClENCv: Office of Administration, GSA. GSA hereby gives notice under the
Paperwork Reduction C. ’ ’ is requesting the Offic:. : I
’ :a;zl.t!iat it 7:. ilent
and Budget to renew expirii,, w.:part 3090-0071: Certification of Payment to Subcontractors and Suppliers. ADDRESSES: Send comments to Bruce McConnell, GSA Desk Officer, Room 3235. MOB. Washington DC 20503, and to Mary L Cunningham, GSA Clearance Officer. General Services Administration (CAIR), Washington, DC 20405. FOR FURTHER INFORMATION CONTACTi Ronald Shansby. 202-566-1576.
Annual Reporting Burden: Firms 1,500; responses, l&90& average time per response. .05 hours: burden hours, 900.
Copy of Proposal: Readers may obtain a copy of the proposal by writing the Information Collection Management Branch (CAlR), Room 3914, GS Bldg. Washington, DC 29495, or by telephoning 202-535-7974.
Dated: January 25.1988. EmilYc.Karam,
Director, Lnformation Management Division. ~Doc. 8&1934 Filed l-29-88; 8:45 am] EuJffi COOE 6620-23-M
DEPARTMENT OF HEALTH AND HUMAN SERVICES
Health Resources and Servfces Administration
Advisory Council; Meeting
In accordance with section 10(a)(2) of the Federal Advisory Committee Act Pub. L 92-403), announcement is made of the following National Advisory bodies scheduled to meet during the month of February 1988:
Name: Subcommittee on Graduate Medical Education Programs and Financing of the Council on Graduate Medical Education.
Time: February 16,1966,7:00 p.m.-999 p.m. February 17.1988,8:00 a.m.-s:00 p.m.
Place: Hyatt Regency, 2799 Jefferson Davis Highway, Crystal City, Virginia 22262.
firpose: The subcommittee identifies the issues and problems in current methods of financing and support. Assesses the implications of alternative financing policies on medical education programs, service delivery, cost containment, physician supply and distribution, and shortages and excesses of physicians.
Analyzes existing information and data on current and alternative medical education programs of hospitals, schools of medicine and osteopathy, and accrediting bodies: Federal policies reps: !iy ’ -! education programs; and tht,iii:.sa ; >n the supply and distribution of physicians.
The subcommittee will draft a chapter for the first report of the Council. Recommendations will concern the appropriate Federal policies and efforts to be carried out voluntarily by hospitals, schools of medicine and osteopathy and accrediting bodies with respect to medical education programs.
Agenda: Agenda items incIude: Discussions of issues and recommendations to be included in the Council’s first report to the Secretary of DHHS and the Congress, including (1) items for inclusion in GME payments, (2) appropriate sources for financing GME, and (3) iinancing GME in ambulatory settings.
Anyone requiring information regarding the subject Subcommittee should contact F. Lawrence Clare, M.D. Subcommittee Principal Staff Liaison, Division of Medicine, Bureau of Health Professions, Room 4C-18, Parklawn Building. 51399 Fishers Lane, Rockville, Maryland 20657 Telephone (301) 443- 6326.
Name: Subcommittee on Physician Manpower of The Council on Graduate Medical Education.
Time: February 17.1966 6:30 a.m.- 5:oo p.m.
Place: Hyatt Regency, 5800 Fishers Lane, Crystal City, Virginia 22262.
Open for entire meeting. hupose: The subcommittee reviews
and analyzes currently applicable studies of under and oversupply of physician manpower giving special attention to number and distribution of specialists, primary care physicians and residents. It also is concerned with studies and recommendations regarding the number of undergraduate medical students as well as the need for improving physician manpower data.
The subcommittee will draft a chapter for the first report of the Council.
96
Recommendations will concern the outlook for supply, appropriate federal policies and suggestions for voluntary action by hospitals, medical and osteopathic schools and accrediting bodies regarding physician supply, and shortages and excesses.
Agenda: Agenda items include: Discussion of the issues, conclusions, and recommendations to be included in the Council’s first report to the Secretary of DHHS and the Congress, including (1). the adequacy of the expected physician supply in the aggregate, (2) the adequacy of the primary care physician supply: (3) issues about the geographic supply of physicians: [4) issues about under represented groups, and (5) recommendations to deal with problems identified in the examination of the above issues.
Anyone requiring information regarding the subject Subcommittee should contact Jerald Ka tzoff, Subcommittee Principal Staff Liaison, Division of Medicine, Bureau of Health Professions, Room 4C-18. Parklawn Building, 5600 Fishers Lane, Rockville, Maryland 20657 Telephone (301) 443- 63&4.
Name: Subcommittee on Foreign Medical Graduates of the Council on Graduate Medical Education.
Time: February 17,1988.9:00 a.m.400
Place: Hyatt Regency, 2799 Jefferson Davis Highway, Crystal City, Virginia 22262. - -
Open for entire meeting. Purpose: The Subcommittee reviews
and analyzes existing data and information on alien and U.S. foreign medical graduates in training and in practice regarding adequacy of existing data bases, effect of existing policies and procedures regarding distribution, service dali4a.ry-and international relations.
The Subcommittee will draft a chapter for the first report of the Council. Recommendations will concern the appropriate Federal policies and efforts to be carried out voluntarily by hospitals, schools of medicine and osteopathy, licensing, certifying, and accrediting bodies with respect to issues relating to foreign medical graduates:
Agenda: Agenda items include: (1)’ The impact of removal of foreign medical graduates (FMGs) from Hospital-based training: (2) GME for international exchange visitors: (3) evaluation of various mechanisms for FMGs entry into GME; and (41 need for formal recognition of foreign medical schools. Presentations will be made on the availability of alternative sources of care to medically indigent populations

w
A P P E N D IX II
C O M M E N T S S U B M ITTE D B Y A . Z A C H A R Y S U S S M A N , E D ITO R , A N N U A L R E V IE W O F B A N K ING L A W , B O S T O N U N IV E R S ITY
A P P E N D IX II
9 7

.
THE CASE FOR DIRECT INVESTMENT IN HIGH YIELD BONDS
ALLEN 2. SUSSMAN EDITOR
ANNUAL REVIEW OF BANKING LAW PUBLISHED UNDER THE AUSPICES OF
THE MORIN CENTER FOR BANKING LAW STUDIES BOSTON UNIVERSITY SCHOOL OF LAW
Testimony given on March 1, 1988 for the U.S. General Accounting Office, pursuant to section 1201(c) of the Competitive Equality Banking Act of 1987, Washington, D.C.
98

I am an editor of the Annual Review of Banking Law, which is
a law review of the Boston University School of Law. As a third-
year law student at the University, I have accepted a position
for the fall as associate counsel for the Federal Home Loan Bank
of San Francisco. However, all statements which I will make here
are my own. They do not necessarily reflect the views or
opinions of Boston University or those of the Federal Home Loan
Bank System.
While in law school I have carefully researched the issue of
direct investment and have arrived at some specific conclusions,
both of a legal nature and of a policy nature, which are
published at 7 Ann. Rev. Banking L. 425. Today, I intend to
address the issues raised by economic policy.
These hearings have been ordered because there is a
perception that a problem exists with direct investment in high
yield instruments by federally insured institutions. The largest
concern appears to be quantitative, that the "high yield" which
is promised to investors may be too low to compensate for future
defaults. The high yield market, in its present form, has not
been tested by significant negative economic events of a national
scale. On the other hand, high yield bond underwriters have
strongly insisted that until now, the yield has been far more
than adequate to compensate for loss in value due to defaults and
other causes, and implicitly that this will continue to be the
case.
I believe there is merit to both sides of this quantitative
99

. .
debate over the predictive validity of past default rates.
However, I also believe that over time, the negative publicity
will fade, and the high yield market will mature and efficiently
discount the risks like any other market. Furthermore, I could,
for example, easily present a very persuasive argument that real
estate lending in Texas should be prohibited, if I were to rely
on past quantitative data which speaks little of future economic
conditions. Therefore, I feel that policy considerations require
an assessment of high yield debt from a qualitative viewpoint.
What is it about the nature of direct investment in high yield
instruments, as compared to other forms of lending, which could
be of value to depository institutions as financial
intermediaries? Direct investment in high yield bonds implies
financial intermediation of these debt securities. What is the
status of financial intermediation today? More specifically, do
commercial banks or thrifts need to diversify their opportunities
for financial intermediation?
FINANCIAL INTERMEDIATION
Commercial banking:
As financial intermediaries, all banks absorb risks which
their depositors are unable or unwilling to assume. Two primary
risks are credit risk and interest rate or term risk. Simply
put I a bank adds value as an intermediary by performing an
analysis of these risks, and then prices its money accordingly.
Hopefully, the profit derived from the spread between interest
paid and interest received will be large enough to attract and
100

maintain bank capital.
The real world is typically a distortion of any economic
model, and this is no exception. The model succeeds only under
the assumption that banks maintain a competitive advantage at
risk analysis, or at a minimum that they do not become relatively
inefficient at providing this value. For many years, when
commercial banking held an oligopoly position protected by
statute and by a lack of meaningful competition, this was the
case. Today however, securities are increasingly serving as the
vehicle of choice, for matching those wanting to borrow on a
large scale and those willing and able to lend. The introduction
of computerized securities analysis and securities clearing, in
concert with global capital-raising capabilities, has yielded
great efficiencies in producing such matches, thus gradually
substituting for large-scale financial intermediation.
Commercial banking's share of the short-term lending market
fell from ninety percent in 1971 to under fifty percent of a much
larger base in 1986. The market for medium-term commercial debt
securities was estimated at forty billion dollars in 1986, up
from seventeen billion in 1984.
On the depositors' side, financial instruments such as money
market certificates, high interest CD's, and mutual funds have in
part taken the place of lower yielding bank vehicles such as
savings and demand deposits. More equity funds exist today than
the number of firms listed on the New York Stock Exchange itself.
Most of these securitized depository instruments had been devised
101
during the inflationary 1970s, when depositors struggled to avoid
the negative real returns they received from bank deposits. They
still compete with bank deposits today, however, forcing upon
banks a higher cost of money than they previously enjoyed.
It is clear that the competitive advantage which commercial
banks once enjoyed at large-scale financial intermediation has
been steadily declining, due to structural changes in the
economy. There are real dangers of this, above and beyond the
obvious lack of profits. Specifically, there will be an
incentive to increase revenues to the extent a bank wishes to
remain an intermediary, and importantly, revenue and risk are
intimately connected in the financial industry.
Risk, in and of itself, is not inherently dangerous if
fairly compensated, particularly if a bank has a competitive
advantage at analyzing such risks over non-bank competitors. To
sterilize a lender from risk would force it to cease functioning.
In theory, a bank could alter its risk structure to respond to
external changes such as increased capital costs and competition
for certain market segments. However, regulation-based asset
restrictions distort the ability to adapt to change. Regulations
which were written during a previous era limit possible risk
structures to narrow, pre-specified choices. The bulk of
regulations governing permissible commercial bank assets were
substantially completed by 1935. The legislators of that period
could not have foreseen such occurrences as the popularity of
securitized financial instruments, computerized securities
102

I
c lear ing a n d g loba l capi ta l m a r k e ts, a n d th e e ffec t these dev ices
have h a d o n commerc ia l bank ing .
" R e g u l a tory l ag " o f th is sort tends to lim it bank asse ts to
p r e d e te r m i n e d cho ices wh ich a re less re levan t today , thus
stra ight jacket ing inst i tut ions from ad jus tin g to m a r k e t forces.
T h e h i dden d a n g e r o f regu la tory lag , howeve r , is th a t th e ta rge t
g r o u p wil l b e m o r e v igorous in its a tte m p t to fin d n e w fo r m s o f
r isk- taking th a n th e regu la tors can con trol. Thus a bank m a y ,
fo r e x a m p l e , inc rease its interest ra te exposure , o r its
unsys tematic credi t r isk -- wh ich is itself a n iso la ted fo r m o f
r isk -- to th e ex te n t th a t these a re n o t technica l ly proh ib i ted
by regu la tio n . T h e crux o f th e p r o b l e m is th a t these fo r m s o f
risk, a n d o thers wh ich a bank m a y resort to , a re n o t e fficiently
interm e d i a te d by banks . For e x a m p l e , m o s t banks , a n d smal l banks
in pa r t icular, lack th e exper tise in eva lua tin g n a tiona l interest
ra te t rends necessary to successful ly interm e d i a te te r m risk.
Unsys tematic credi t r isk is n o t e fficient fo r banks ei ther, a n d
it is rare ly c o m p e n s a te d fo r fair ly.
The re is s o m e ev idence th a t such a scenar io m igh t exist
today . In fac t, th is cou ld b e th e m o tivat ing fo rce beh ind these
hear ings , wh ich a re be ing he ld to d iscuss th e diversi f icat ion o f
bank asse ts into a n e w a rea . W e have seen th e resul ts o f
excess ive unsys tematic credi t r isk every tim e a n inst i tut ion
fai ls d u e to i n a d e q u a te credi t r isk diversi f icat ion a w a y from
agr icul ture, oil, a n d rea l es ta te sectors, a n d f requen tly w h e n a
commerc ia l bank takes a m a jor wr i tedown from a L a tin A m e r i c a n
loan. Term risk may also be on the rise, as Federal Reserve
Board data indicates that the weighted average maturity of long-
term commercial and industrial loans, as measured in months, has
increased from the mid-forties in the 1970s to the low-fifties in
the 1980s.
These trends indicate that "protecting" commercial banking
from itself may, over time, have resulted in a subtle, unintended
erosion in the ability to compete. What could benefit commercial
banking the most is the freedom to diversify into more
contemporary credit risks as the securities industry continues to
edge out commercial banking at low-tech, large-scale commercial
borrowing.
Savings and loan institutions:
Savings and loan institutions, as well as commercial banking
institutions, need the regulatory authority to diversify their
intermediation sources. For savings and loans, the Garn-St
Germain Act of 1982 provided that authority. To understand why
such authority should not be eliminated for savings and loans, we
must inquire into the reasons why S&L's need to diversify, which
requires an analysis separate from that for commercial banking
provided above.
Systematic risk has been defined as "the portion of total
variability in return caused by factors that simultaneously
affect the [values of all assets]."1 Unsystematic risk is that
portion of variability which is unique to an investment
1 See 7 Ann. Rev. Banking L. 425, 428, note 16.
104

portfolio. Lack of portfolio diversification increases
unsystematic risk, thereby allowing the portfolio to fall faster
than the overall marketplace in bad times, and rise faster in
good times.
The savings and loan industry was created under statutory
authority to promote mortgage lending. Permissible lending was
therefore originally limited, by mandate, to one class of loans.
It is very important, in order to understand the problems
experienced by the industry in recent years, to realize that the
legislators of that period unintentionally created a class of
banks with a high degree of unsystematic risk.
Savings and loans which were located in depressed regions
such as the Southwest and the Midwest during the 1980s
experienced a higher failure rate than that for similarly
situated commercial banks. Similarly, S&L's grew faster than
average during the early Post-war period when residential real
estate was a high-growth industry.
To the extent that any financial intermediary lacks an
equity participation in its investments, its potential for gain
is likely exceeded by its potential for loss. If the borrower
prospers, the lender only receives a fixed return; if the
borrower fails, the lender could potentially receive nothing. To
the extent that the institution lacks the ability to diversify --
legal or physical -- its downside potential is further increased
by its unsystematic risk, as defined above. This has been the
experience of savings and loans that failed due to inadequate
105

credit risk diversification in the 198Os, and one motivation
behind the push for inter-state banking.
RECOMMENDATIONS
To ensure the safety and soundness of the banking system,
banks must be ensured a fair return on their capital. As
intermediaries, 2 banks should lend to credit risks -- preferably
to diverse borrowers -- which they can analyze and successfully
intermediate. The structural problems facing commercial banks
and S&L's as intermediaries demand consideration of an expansion
in permissible intermediation possibilities. In order to
evaluate direct investment in high yield bonds as a new
opportunity for financial intermediation, we must first determine
whether these securities require intermediation. In other words,
is there an opportunity for banks to add value as credit
intermediaries?
The bond ratings services of Standard & Poor's and Moody's
to some extent duplicate the credit intermediary function on a
larger scale, so that rated high yield bonds and securities in
general are probably more fairly priced than privately placed
2 Some commentators argue that the best use of bank capital may no longer be for financial intermediation. Products may be diversified into non-intermediation financial services. As witnessed by the Glass-Steagall debate, commercial banks believe they could effectively generate non-intermediation revenues for performing securities-related services such as underwriting. Regulators would be wise, however, to first allow debt security underwriting over equities, if they wish to allow any deregulation of section 20 at all. There also remains a competitive advantage in the personalized service and retail establishment necessary to originate non-uniform lending. Loans could be routinely resold as asset-backed securities, with other parties bearing the credit and interest rate risks.
106

.
. .
financial instruments, and present less opportunity for banks as
direct investments. If analyses of high yield bonds are readily
available to all investors, there is little value added by a bank
as an intermediary. Nevertheless, some feel that the ratings of
high yield issues have lagged behind changes of corporate
affairs, and have failed to adequately correlate with actual
default figures. In fact, a few independent companies have
recently arisen which further evaluate publicly traded high yield
bonds for a fee. Thus, there may be an opportunity for banks to
act as credit intermediaries of rated bonds by performing an
independent risk evaluation. Separately, Congress may wish to
consider imposing certain standardization requirements on the
bond rating agencies, due to the enormous economic power which
they quietly wield.
In addition to rated issues, private placements and the
unrated high yield bond segment represent even brighter
opportunities. Private placements yield more benefits to
investors that perform independent valuations, as less public
information is disclosed. Unrated bonds, which are a significant
portion of the total, may be evaluated de novo by a bank's credit
analysts, creating a large opportunity for "value added." There
is little reason to expect that a bank will choose to accept an
unrated bond risk which it would not accept as a bank loan. Bank
credit is, after all, also unrated.
In conclusion, the legislative history of the Garn-St
Germain Act indicated a Congressional intent to increase the
107

.
.
earnings potential of savings and loans by diversifying
intermediation opportunities into commercial lending and
commercial paper. Their experience has been largely successful.
To a larger degree than savings and loans, commercial banks have
a competitive advantage in their ability to analyze business
credit risks, and have an equal need to diversify sources of
intermediation revenue. I therefore see little reason why
federal thrifts may invest up to 11 percent in high yield bonds
while federal commercial banks are barred completely from the
market. High yield could be of particular benefit to smaller
commercial banks. High yield bonds have a lower origination cost
than an equivalent-sized loan portfolio, they are subject to some
degree of SEC oversight, and they are far more liquid than the
inter-bank market for commercial loans. Banks too small to
maintain a large enough trading staff to diversify within the
high yield market could be permitted, as are savings and loans,
to invest in the shares of high yield bond mutual funds.
Although high yield bonds are generally more subordinated than
direct lending, they also are more likely to have a market after
default.
IMPLEMENTATION
I have suggested that regulations should permit more
flexibility in the individual forms of risk-taking open to banks,
and that high yield bonds could play an important role in such a
strategy. Ultimately, an overall level of risk may be
established, which would dictate maximum risk levels that reflect
108
. .
social values regarding the banking system. Outside social
values should not be confused with the forms of risk-taking,
however, because that can lead to economic distortion.
Increased flexibility, though, makes uniform enforcement
efforts more difficult. Structuring the regulations so that some
negative element varies directly with the pursuit of higher risk
assets could improve enforcement efforts because it would free
the primary regulator somewhat from having to act as policeman.
To this extent, the risk-based capital schemes currently
under consideration by the major commercial banking regulators
could succeed in imposing a market discipline on commercial
bankinq assets. The categories could ultimately be expanded to
include high yield bonds or any other form of risk which a bank
is willing to pay for. For example, high yield bonds could be
counted at 150%-200% of value, marked to market, for capital
computation purposes. Tying capital requirements to the
risk/return formula causes market forces to discipline banks in
favor of taking only fairly compensated risks. To some, market
discipline is more effective than regulatory discipline.
The FDIC already implements a market approach to debt
securities risk. The FDIC does not prohibit high yield debt
securities purchases per se. Rather, it forces automatic
writedowns of price depreciation and defaults for capital
computation purposes.
Other forms of market discipline that have been proposed
address the criticism that depository insurance skews the
109
incentives for risk-taking of bank managers. A risk-based
insurance premium, if of sufficient weight, may succeed in
restoring the proper incentives. Private depository insurance
has been proposed, as well as personal liability for bank
officers should the institution fail. One scheme would increase
the amount of subordinated debt that comprises bank equity
capital.3 Subordinated debtholders are more effective at market
discipline than equity owners because they do not share in the
upside potential of the institution, only in the downside.
Whatever method is ultimately chosen to manage asset
flexibility, should recognize that risk is something to be
managed and not feared. The role of regulation should be to
discipline banks toward taking only the most efficient forms of
risk, while the overall level of risk may be established later,
on policy grounds. High yield bonds are a relatively efficient
form of credit risk, for both commercial banks and savings and
loans. They are amenable to financial intermediation and provide
the regulators with one more tool to carry out their function.
If managed properly, they could provide a model for further
expansion in bank powers, if such a move is needed to further
ensure safety and soundness by broadening the earnings base. As
an added tool for regulators, high yield bonds can further these
goals, not only for savings and loans but for commercial banks as
well.
3 Benston, Eisenbeis, Horvits, Kane and Kaufman, Perspectives On Safe & Sound Banking, at 179 (1986).
110

.
APPENDIX III
COMMENTS SUBMITTED BY DR. GLENN YAGO, ASSOCIATE PROFESSOR OF MANAGEMENT, W. AVERELL HARRIMAN SCHOOL FOR MANAGEMENT AND POLICY, SUNY AT STONY BROOK
APPENDIX III
111
.
HIGH YIELD BONDS IN FOCUS
Glenn Yago Director
Economic Research Bureau W. Averell Harriman School for Management and Policy
State University of New York at Stony Brook
Testimony for the U.S. General Accounting Office for the Competitive Equality Banking Act of 1987
Washington, D.C. March 1, 1988
112

HIGH YIELD BONDS IN FOCUS
Introduction
Corporate debt securities that are rated below investment
grade or are unrated by bond rating agencies are one of the
fastest growing financial
believe that there has not
bonds and the benefits they
U.S. economy overall.
My testimony today is
tools in U.S. capital markets. We
been enough analysis of high yield
offer to issuers, investors, and the
based on the results of our recent
study at the W. Averell Harriman School for Management and Policy
at the State University of New York at Stony Brook. Our study
is based on publicly available data for companies that issued
high yield bonds between 1980 and 1986. In the course of our
study, we review available research and information on high yield
securities and their impact on U.S. industrial competitiveness.
Importantly, we undertake a systematic, empirical analysis of
investment, employment, and productivity patterns of issuing
firms.
Most existing high yield bond research assesses the
financial performance of these bond issues in the secondary
market. -Instead, we examine the financings' impact upon firms
and industries over the past decade and track how these firms
adopt new corporate structures and strategies in response to
113

.
major economic shifts. In doing so, we are addressing an
important policy issue: why federally insured institutions
should be permitted to continue to invest in high yield bonds.
As this study demonstrates, high yield securities serve the
public interest by providing a means for growing businesses to
access capital. Moreover, our study shows that high yield bond
issuers have contributed substantially to employment growth in
the United States within a wide range of industries. Restricting
investments in high yield bonds would be a disservice to our
economy.
Overview of the High Yield Market --
"Junkts financings include private placements and public
issues, convertible and straight debt, low-rated municipal bonds,
and low-rated preferred stock. Our study focuses on the 755
companies that issued new straight or convertible debt or low-
rated preferred stock between 1980 and 1986 for which data are
publicly available.
By 1987 high yield securities represented 23% of corporate
debt issues outs tanding, with less than one-third of these
representing l'fal .len angels" or issues that had once been rated
investment grade. Our study focuses on new public issues of high
yield securities. It is important to note that increases in high
114

yield debt follow rather than lead trends in increased corporate
indebtedness.
Illustration 1
As the Federal Reserve Bank's flow of funds data indicate,
the composition of corporate debt shifted away from bank loans
and toward the capital markets over the past decade. Bank loans
fell 8%, while the combined credit market share of corporate debt
increased over 13%.
Illustration 2
Because of tax reform and past misuse, industrial revenue
bonds have decreased as a source of capital from 12.9% to 6.5%.
Commercial banks became less responsive to businesses as a source
of development capital as indicated by bank loan declines.
Mortgages decreased from 2.1% to 0.5%. Finance company loans
increased slightly, 11.0% to 11.6%. Commercial paper also
increased somewhat, from 4.4% to 5.0%. Thus, high yield bonds
are increasingly important in corporate finance.
High Yield Bonds and Increased Corporate Leverage
The.issue of debt and corporate capital in the United States
is central to a consideration of the role of high yield bonds in
the U.S. economy today. The decline of U.S. competitiveness has
115
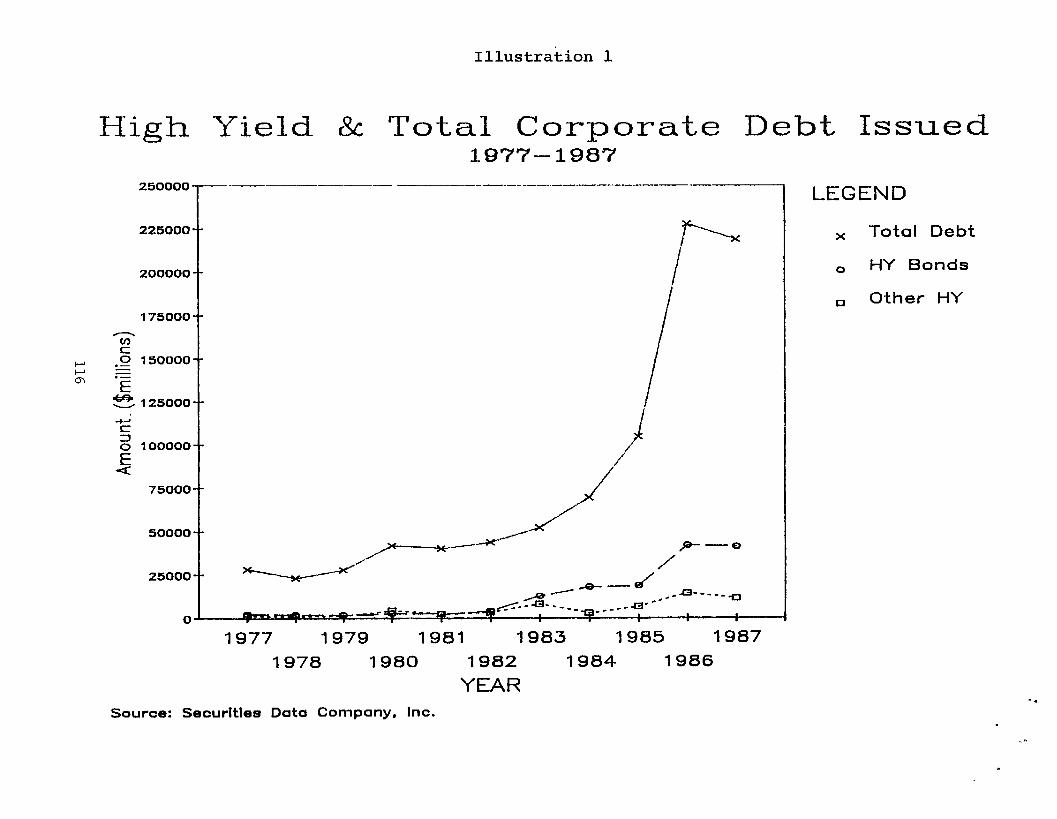
Illustration 1
High Yield SC Total Corporate Debt Issued 1977-1987
1977 1979 1981 1983 1985 1987
1978 1980 1982 1984 1986
YEAR Source: Securities Data Company, Inc.
LEGEND
x Total Debt
0 HY Bonds
0 Other HY
-.

I .
I l lustrat ion 2
C o m p o sitio n o f C r e d it M a rke t D e b t
1 9 7 7 - 1 9 0 3
C o m m m i a ! P a p e r 4 . 4 %
F inance Co. ‘L o a n s
Tax-Etempt B o n d
1 9 8 4 - 1 9 8 6
Commercb ! P a p e r 5 %
F inance Co. L o a n s
Tax-Tempt B a n d s 6.5.‘;
O ther Oi : U o ~ q a q e a .5x
Corpora te 3 0 n d s
1 1 7
Source : Federa l Reae rve R o w of F u n d Accoun ts
,
generally been ascribed to any and all factors other than cost of
capital, e.g., labor, energy, and natural resources. How
companies invest in their future largely depends on how much
capital is available and how it is allocated. Different types of
financing may be required at various stages of firm and product
development--for R & D, new plant and equipment, marketing,
employee training, management reorganization, other agency costs,
acquisitions, or market expansion. Sometimes a firm cannot
finance adaptation to new markets because banks won't extend
credit or the firm's size makes it unfavorable for equity
offerings.
Even if capital is available, the cost of capital may be
prohibitive. Recent cumulative evidence suggests that higher
capital costs may be a significant element in overall U.S.
industrial decline. While it is widely believed that U.S.
corporations are overleveraged, the evidence suggests otherwise.
In the manufacturing sector, German and Japanese manufacturers
averaged 66% and 64% of debt in their capital structure versus
30% for similar U.S. firms. Foreign manufacturers showed a lower
after-tax cost of capital, increased growth rate at given
profitability levels, and reduced short-term pressures for
share/price performance. And adjusting for changes in the market
value of debt and cyclicality in asset values, corporate debt
peaked in the mid 1970s and has since declined slightly. Debt-
equity ratios vary about 15% from peak to trough. Consequently, U.S. firms appear to be much less leveraged than foreign firms.
118

Debt has played a central role in the capacity of U.S. firms
to respond to structural economic changes and firm competition.
Financial restructuring and new firm or strategy financing have
mobilized assets in new directions. To see how high yield debt
was allocated by U.S. industries, we examined the use of proceeds
in our sample of 755 public firms that have issued high yield
debt since 1980. We found that acquisitions, purchase of plant
and equipment, development of products, installation of new m
production processes, and a variety of other corporate purposes
were pursued through new debt.
Competitive Performance of High Yield Issuers -
An important part of our study was to determine the
aggregate competitive performance of high yield companies. We
took into consideration several fundamentals of U.S. industrial
change, particularly job creation and job retention, sales
growth, and productivity.
It is ironic, I think, that the current request for the
GAO's study of the high yield bond market specifically requires
information on "the purpose for which high yield non-investment
grade bonds are issued other than for financing corporate
takeovers.1@ Since only about 3.3% of high yield financing
between 1980 and 1986 was used for takeovers, this question
119
-,
>
assumes the worst. In fact, use of proceeds for hostile
takeovers was almost insignificant.
Our study showed that high yield securities contributed
substantially to corporate development. In fact, based on our
analyses of the use of proceeds by individual companies in the
case history portion of our study, high yield securities enabled
firms to:
0 achieve strategies that respond to industrial diseconomies of scale;
0 move outside traditional industrial definitions of goods and services, providing complementary products or services that enhanced competitive position;
0 maintain flexibility in firm organization of management, production, and distribution:
0 apply advanced technologies to basic goods and services:
0 integrate marketing and production;
0 pursue financial flexibility through financing innovation and balance sheet management;
0 respond to demographic and economic shifts affecting market composition and demand.
KEY FINDINGS ON COMPETITIVE PERFORMANCE OF HIGH YIELD ISSUERS: 1980-1986
Industry .Distribution of High Yield Firms - Manufacturing industries had the highest concentration of
high yield issuers (22.6%), followed by finance, insurance, and
120
% ' real estate (12.87% 1, and various services
Illustration 3
Based on a high yield index, finance, public utilities,
mining and natural resource extraction, transportation,
communications, insurance, leisure and repair, and nondurable
manufacturing participated more in the high yield bond market
than their share in the U.S. economy as measured by percentage
of GNP.
EMPLOYMENT Our analysis of high yield issuers over this seven year
period indicates that the average annual increase in employment
was 6.7% compared to industrial averages of 1.38%.
High yield firms added 82% of the annual average job growth
of all publicly traded companies for which employment data were
reported.
High yield firms grew faster than industry averages in the
service sector (health and education, public utilities, leisure
and repair), retail trade, finance, and real estate; grew while
their industries declined in communications, mining, and
construction sectors; or declined slower than the industry as a
whole, e.g., a manufacturing decline of 1.77% total versus .74%
for high yield firms.
While there was a diversity among firms and industries, high
yield companies evidenced a greater capacity than U.S. industry
in general to create new jobs, retain old ones, or successfully
121

Illustration 3
Industry Distribution of High Yield Securities by Number of Firms and Net Proceeds: 1980-86
% Firms
Agriculture 0.26
Mining 3.09
Construction 0.62
Manufacturing, durable 16.23
Manufacturing, nondurable 6.35
Transportation
Communications
Public Utilities
Wholesale Trade
3.09
1.41
3.17
3.35
Retail Trade 6.26
Finance 9.26
Insurance 1.41
Real Estate 2.20
Business & Professional Services 3.62
Leisure & Repair Services 2.73
Health & Educational Services 3.53
5 Amount
0.26
7.50
0.34
15.16
10.38
6.65
6.15
11.50
2.65
8.57
11.77
2.76
4.46
2.70
4.65
4.50
Source: DBL High Yield Issuers Database, 1980-86; Economic Research Bureau, SUNY Stony Brook.
122

manage employment reductions in the context of industrial sector
job loss.
Illustration 4
Productivity
The distribution of high yield securities parallels the
distribution of merger, acquisition, and divestiture activity in
the economy as a whole. High yield financing has been
concentrated in those sectors which have been deregulated
(finance, mining and natural resource extraction) or have
experienced import penetration, e.g., primary metals, fabricated
metals, paper and allied products.
Illustrations 5 and 6
Examining Bureau of Labor Statistics data on physical output
per employee hour for 87 industries, productivity increases were
associated with high levels of high yield bond issuance in
mining, manufacturing, finance, and public utilities.
Sales productivity was also higher for high yield firms
compared to the industries (3.18% versus 2.41%) in general.
Sales
High yield firms grew more rapidly than other companies in
sales (9.3% versus 6.42%). Retail trade, finance, insurance, and
leisure and repair services did the best relative to their
industries in sales. Overall, high yield manufacturing also
123

Average Annuai Change (percent)
6 a Ii --aCommunications 2 9'0 T T
ip *it! 1
a ??Public Utilities $ 0 a G.
i 0 ‘1- g.&holesale Trade [D ;c : LO cRetail Trade
-0' : s a
;; ;Finance
g >eal Estate I E- 2 E
aBusiness & nProfessiona1
a ?I Leisure & Repair
-!-
T
/ T
Health & Educational
TOTAL
a . . A A ’ Ip lk a N Ip 0 m E Fl z ii & g 2
:
, I r 1 I I t I , I
*Mining & Natural- 1 8 1
I I 8 I I I 4 1 . 4
IO3 q 3aResource Extract- c qj Y 0 CConstruction
,d
3 ;T t c1 g;Manufactoring- i o a-Durable c m?Manufactoring . -hFNondurable r-47 0, 4 g -l-b- T L-
I
3 QqTransportation 1
124

:
. Illustration 4A
Changes in Employment, High Yield Firms vs. Industry Totals
Average Annual Change, 1980-1986 ---------------------------------------
High Yield Firms Industry Total -------------_------- -----____-_______
Industry (SIC) N Absolute Percent Absolute ~-____---__-----~~~~~--~--~--~-~-~- --- -----w-s -------- ---es---
A. Breakdown by Industry Group
Agricultural Products (01,02) -0.518 -1.344 0.342 Mining (10-14) 283 1.556 2.887 -25.107 Construction (15-17) 4 0.249 1.386 -6.205 Manufacturing Durable (24,25,32-39) 148 -8.058 Manufacturing Nondurabie 69 -1.894
I;.;;: -152.512 .
Transportation (40-47: 28 23.527 &?92 -38.963 li3.922
Communication (48) :‘o
1.670 8.316 -1.455 Public Utilities (49) 3.654 4.039 3.923 Wholesale (50,51) 38 -4.823 -b.Zli 25.339 Retail (52-59) 62 60. OOi 13.348 187.586 Finance (60-62.673 45 7.308 10.263 16.320 Real Estate :65) 23 2.093 8 ‘Oa 1.73; Business & Professional (7389) 33 5.917 7: 82i 22.567 Leisure & Repair (70) 72,75-79) 25 11.257 lb. 125 27.970 Health & Educational (80,82) 34 41.037 i7.787 49.135
Total 583 188.442 6.678 225). 459
B. Fur’her BreakdorYn by i-Digit SIC for Manufacturing Industries
Food & Kindred Products (20) Textile Mill Products (22) Lumber & Wood Products (24) Furniture h Fixtures (25) Paper & Allied Products (26) Printing & Publishing (27) Chemicals & Allied Products (28) Petroleum & Coal Products (29) Rubber & Plastic Products (30) Stone, Clay, & Glass (32) Primary Metal Industries (33) Fabricated Metal Products (34) Machinery, except Electrical (35) Electric & Electronic Equip. (36) Transportation Equipment (37) Instruments (38) Misc. Manufacturing (39)
12 6 2 1 8 7
5”
ii 9
11 15 63
i: 10
-0.418 -0.347 47.049 5.532 -3.516 -6.543 6.146 10.579
0.267 16.834 0.246 1.683 0.583 9.712 6.042 8.129 5.138 6.773 6.296 1.609 0.379 1.430 13.402 4.433 0.026 0.509 -29.873 -4.064
-0.301 -1.533 -57.918 -5.079 -5.294 -6.529 -24.066 -7.375
0.456 1.368 -2.176 -0.988 -4.492 -2.760 -14.727 -2.251
3.459 10.008 -8.925 -1.922 -1.161 -0.160 -25.947 -3.680 -0.658 -0.073 -20.866 -1.742 -5.850 -2.453 -99.544 -3.280 -0.663 -1.836 5.911 1.119
1.853 7.860 7.474 12.318
Total Manufacturing 217 -9.952 -0.742 -191.475 -1.774
Percent --------
72.555 -7.215 -3.560 -2.199 -1.001 11.369 -2.025
0.871 10.242
6.303 7.9&f! 5.319
12.121 8.27i
16.975
1.379
Note: Absolute changes are in thousands of jobs.
Source: COMPUSTAT Data, S&P, 1980-86.
125
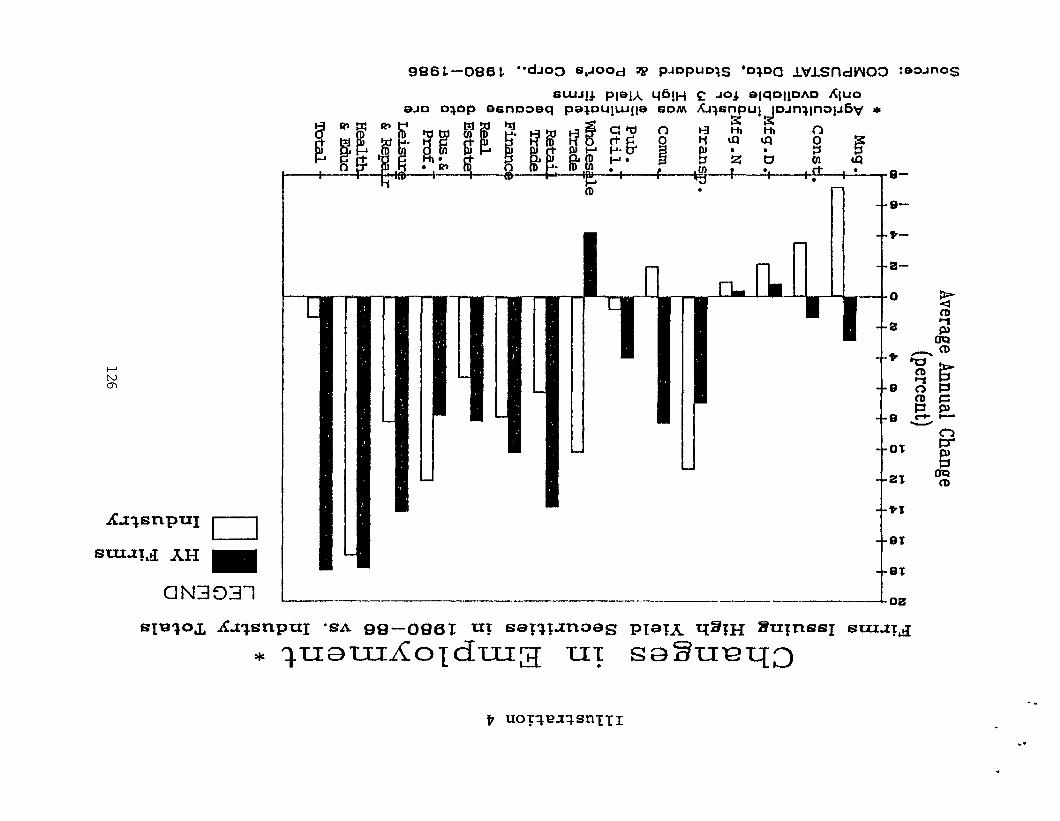
ALxqsnpuI I
===?,d AH I
CIN3331
986 L-086 1 ‘*dAo3 S$OOd 38 PJDPIJO~S ‘D’)Da ~v~Sn#J03 :83JnOS
=U’-‘!J Ple1.A Y6!H C Jo4 ‘Vl’=Il=‘“~ ‘%Jo 6JD D$Op 66nD38q p6~DlJ!UJ!l6 6DM h~Sl77pU! JDJnqlna,lJ6v *
- e-
+-
-.

, .‘
Illustration 5
Comparat - .ive D istribution of Corporate Restructuring and H igh Yield Financing: Summary Table, 1980-87
Share of Mergers Share of Acquisitions, or Firms Issuing Share of D ivestitures HY Bonds output
Mining and natural resource extraction
Manufacturing
17.4 4.9 3.4
40.5 33.71 22.2
Deregulated Industries:
Transportation & Communications 10.. 4 6.96 6.4
FIRE 18.2 19.60 4.4 -B-w s--m- --s-
SUBTOTAL 86.5 65.16 36.2
BALANCE OF U.S. ECONOMY 13.5 34.40 63.8
Source: Paulus and Gay, 1987; Economic Research Bureau, 1988: Industrial Productivity: BLS Productivity Index.
127
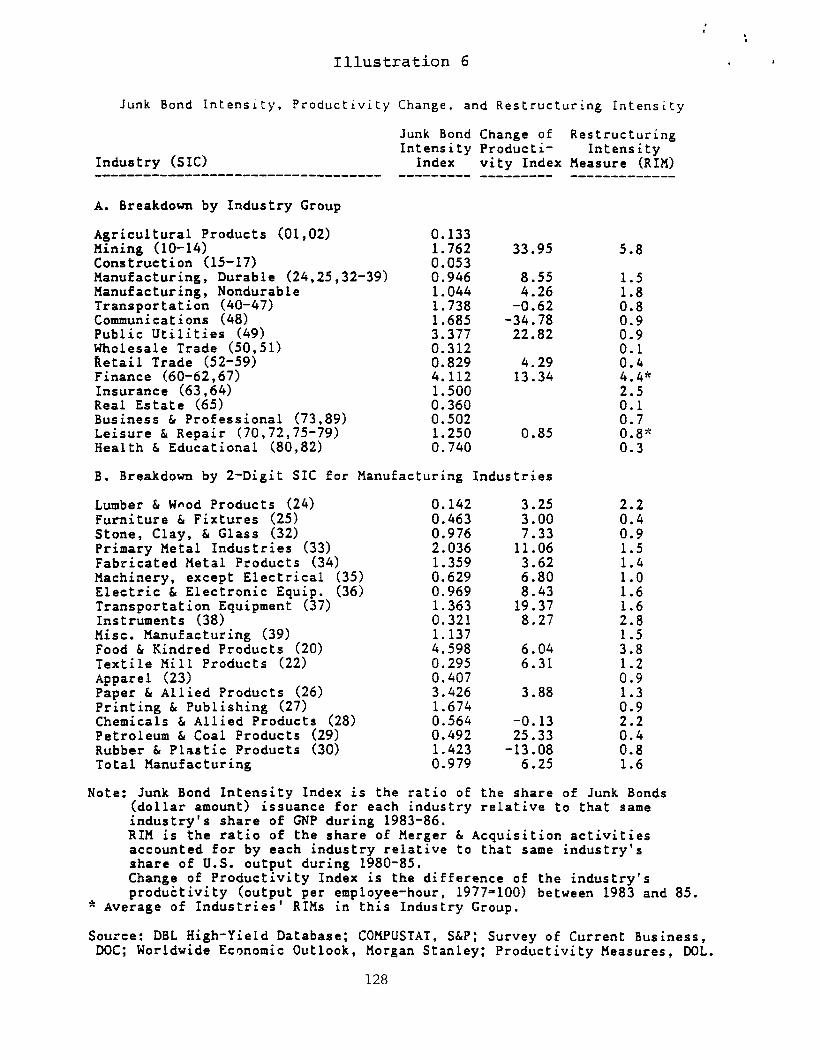
Illustration 6
.
* .
1
Junk Bond intensity, Productivity Change, and Restructuring Intensity
Junk Bond Change of Restructuring
Industry (SIC) Intensity Producti- Intensity
Index vity Index neasure (RIH) _---------------------------------- --------- --------- -------------
A. Breakdown by Industry Group
Agricultural Products (01,OZ) Xining (lo-141 Construction (15-17) Manufacturing, Durable (24,25,32-39) Manufacturing, Nondurable Transportation (40-47) Communications (48) Public Utilities (49) Wholesale Trade (50,511 Retail Trade (52-59) Finance (60-62,671 Insurance (63,641 Real Estate (65) Business & Professional (73,891 Leisure & Repair (70,72,75-79) Health & Educational (80,82)
0.133 1.762 0.053 0.946 1.044 1.738 1.685 - 3.377 0.312 0.829 4.112 1.500 0.360 0.502 1.250 0.740
33.95
8.55 4.26
-0.62 ,34.78 22.82
4.29 13.34
0.85
B. Breakdown by 2-Digit SIC for Manufacturing Industries
Lumber f Wnod Products (24) Furniture & Fixtures (25) Stone, Clay, & Glass (32) Primary Hetal Industries (33) Fabricated Hetal Products (34) Machinery, except Electrical (35) Electric & Electronic Equip. (36) Transportation Equipment (37) Instruments (38) Misc. Manufacturing (39) Food & Kindred Products (20) Textile Mill Products (22) Apparel (23) Paper & Allied Products (26) Printing & Publishing (27) Chemicals & Allied Products (28) Petroleum & Coal Products (29) Rubber & Plastic Products (30) Total Manufacturing
0.142 3.25 0.463 3.00 0.976 7.33 2.036 11.06 1.359 3.62 0.629 6.80 0.969 8.43 1.363 19.37 0.321 8.27 1.137 4.598 6.04 0.295 6.31 0.407 3.426 3.88 1.674 0.564 -0.13 0.492 25.33 1.423 -13.08 0.979 6.25
4.4” 2.5
i:: 0.8" 0.3
i-z 0:9 1.5 1.4
:::
23
::i
i:; 1.3
;:;
8:; 1.6
Note: Junk Bond Intensity Index is the ratio of the share of Junk Bonds (dollar amount) issuance for each industry relative to that same industry’s share of GNP during 1983-86. RIH is the ratio of the share of Merger & Acquisition activities accounted for by each industry relative to that same industry’s share of U.S. output during 1980-85. Change of Productivity Index is the difference of the industry’s produitivity (output per employee-hour, 1977=100) between 1983 and 85.
* Average of Industries’ RIHs in this Industry Group,
Source: DBL High-Yield Database; COKPUSTAT, S&P; Survey of Current Business, WC; Worldwide Economic Outlook, Horgan Stanley; Productivity Measures, DGL.
128
.
outperformed manufacturing in general in sales growth in the
period (5.57% versus 3.78%).
Capital Investment: Corporate Capital Structure
Overall, high yield firms have a greater annual percentage
change than industry in general (12.37% growth rate versus 9.85%
in general) in the total amount of invested capital (equity and
debt).
The most rapidly growing rates of invested capital were in
the insurance, health and educational services, retail, and real
estate industries.
Capital Expenditures
In examining new capital spending on construction and/or
acquisition of property, plant, and equipment, high yield firms
outperformed their industries more than double (10.6% growth over -- the period vs. 3.8%). Within manufacturing, capital spending was
four times higher than the manufacturing sector as a whole.
Growth rates in new capital spending among high yield firms
outstripped industry expenditures in durable and nondurable
manufacturing, transportation, communications, retail trade, real
estate, business and professional services, and health and
educational services.
In examining firms before and after their high yield issue,
we found that high yield manufacturing firms reversed declining
rates of spending (-4.8%) with a 17.9% increase after the issue,
129

while overall capital spending in U.S. manufacturing was flat
(0.54% vs. 0.59%).
In about a third of the manufacturing companies, high yield
firms increased R t D spending faster than their industries,
e.g., paper and allied products; fabricated metals: stone, clay,
and glass.
Illustrations 7 and 8
If, as recent figures show, manufacturing is coming back to
life, it is evident that the high yield markets played a major
role.
Conclusion
The empirical evidence of corporate strategies and
performance in employment, investment, and spending indicates
that high yield firms act as agents of change within their
industry. They seek out new opportunities in process
technologies and product markets and overcome obstacles of past
production cycles and international competition. The infusion of
capital into firms from high yield securities does more than
reconfigure the firm's financial structure. It hastens
deployment of capital resources towards higher value strategies
and operations.
130
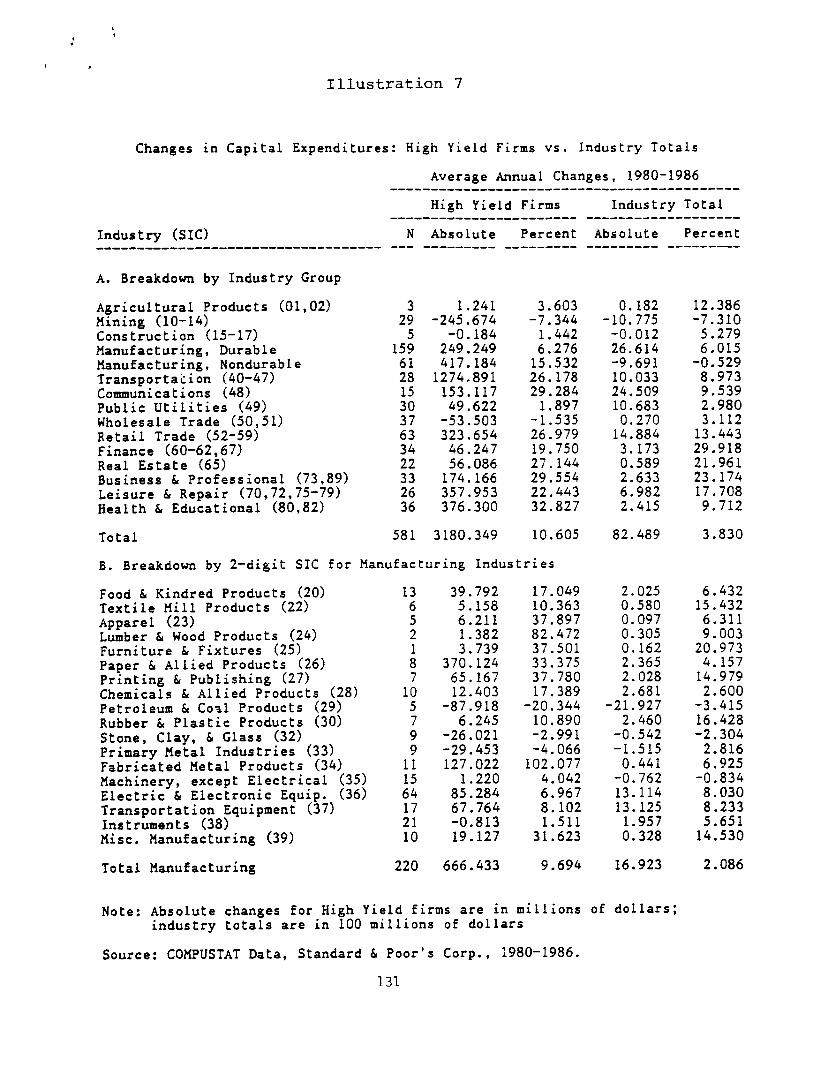
Illustration 7
Changes in Capital Expenditures: High Yield Firms vs. Industry Totals
Average Annual Changes, 1980-1986 --------------_----------------------------
High Yield Firms Industry Total -----------_____------- ------_------------
Industry (SIC) N Absolute Percent Absolute Percent ----------------------------------- --- --------- --w------ -------em e--------
A. Breakdown by Industry Group
Agricultural Products (01,021 nining (lo-141 Construction (15-17) hanufacturing, Durable Manufacturing, Nondurable Transportaiion (40-47) Communications (48) Public Utilities (49) Wholesale Trade (50,511 Retail Trade (52-59) Finance (60-62,671 Real Estate (65) Business & Professional (73.89) Leisure & Repair (70,72,75-79) Health & Educational (80,821
Total 581 3180.349 10.605 82.489 3.830
2; 5
159
1.241 3.603 0.182 -245.674 -7.344 - .10.775
-0.184 1.442 -0.012 249.249 6..276 26.614
61 417.184 15.532 -9.691 28 1274.891 26.178 10.033 15 30 37 63 34 22
153.117 49.622
-53.503 323.654
46.247 56.086
33 174.166 26 357.953 36 376.300
29.284 1.897
-1.535 26.979 19.750 27.144 29.554 22.443 32.827
B. Breakdown by 2-digit SIC for Manufacturing Industries
Food & Kindred Products (20) Textile Hill Products (22) Apparel (23) Lumber C Wood Products (24) Furniture & Fixtures (25) Paper & Allied Products (26) Printing & Publishing (27) Chemicals & Allied Products (28) Petroleum & Co31 Products (29) Rubber & Plastic Products (30) Stone, Clay, & Glass (32) Primary Hetal Industries (33) Fabricated netal Products (34) Machinery, except Electrical (35) Electric & Electronic Equip. (36) Transportation Equipment (37) Instruments (38) Misc. Hanufacturing (39)
13 6
;
i 7
17.049 10.363 37.897 82.472 37.501 33.375
10 5 7 9 9
11
39.792 5.158 6.211 1.382 3.739
370.124 65.167 12.403
-87.918 6.245
-26.021 -29.453 127.022
1.220 85.284 67.764 -0.813 19.127
37.780 17.389
-20.344 - 10.890 -2.991
15 64 17 21 10
-4.066 102.077
4.042 6.967 8.102 1.511
31.623
2.025 0.580 0.097 0.305 0.162 2.365 2.028 2.681
-21.927 2.460
-0.542 -1.515
0.441 -0.762 13.114 13.125
1.957 0.328
6.432 15.432
6.311 9.003
20.973 4.157
14.979 2.600
-3.415 16.428 -2.304
2.816 6.925
-0.834 8.030 8.233 5.651
14.530
Total Manufacturing 220 666.433 9.694 16.923 2.086
24.509 10.683
0.270 14.884
3.173 0.589 2.633 6.982 2.415
12.386 -7.310
5.279 6.015
-0.529 8.973 9.539 2.980 3.112
13.443 29.918 21.961 23.174 17.708
9.712
Note: Absolute changes for High Yield firms are in millions of dollars; industry totals are in 100 millions of dollars
Source: COXPUSTAT Data, Standard & Poor’s Corp., 1980-1986.
131

APPENDIX IV
COMMENTS SUBMITTED BY DR. EDWARD ALTMAN, PROFESSOR OF FINANCE, NEW YORK UNIVERSITY GRADUATE SCHOOL OF BUSINESS
APPENDIX IV
132
New York University A privafe university in the public service
Graduate School of Business Administration 100 Trinity Place New York, N.Y. 10006 Telephone: (212) 285-6238 Telex: 235128 NYU UR
Dr. Edward I. Altman Chairman, MBA Program
February 16, 1988
Mr. Craig A. Simmons Senior Associate Director U.S. General Accounting Office Room 3858 A 441 G Street, N.W. Washington. D.C. 20548
Dear Mr. Simmons:
Frank Philippi has asked me to testify at your hearings on "The Nature of the Market For High Yield Bonds". I would like to submit a number of documents for the hearing and I will be able to testify on that day. I would prefer to go on some time between 1O:OO a.m. and the luncheon break, if any,
Since my schedule does not permit a totally new testimony at this time, I am submitting three (3) recent articles on the topic of "Investing in High Yield Bonds", Please refer to pages 65-66 of the paper "The Truth About Junk Bonds" which refers directly to the thrift industry. A summary of this material, updated for the most recent results, is also provided. I would be pleased to amplify on these documents at the public hearing.
Sincerely,
Edward I. Altman Professor of Finance
EIA/am Enclosures
cc: Mr. Frank Philippi
133

SUPPLEMENTAL EXHIBITS
FOR TESTIMONY ON
"The Nature of the Market For High Yield Bonds"
Dr. Edward I. Altman Professor of Finance
New York University
for the
Public Hearings Held by the General Accounting Office
Washington, D.C.
March 1, 1988
134

Recommended Thrift Guidelines On Investing In High Yield Bonds
Dr. Edward I. Altman New York University
The combination of adequate reserves and prudent, diversified investing is the recommended action with respect to all investments made by federally insured thrift institutions. It is important to note that I recommend treatment of high yield securities like any other risk asset and advocate adequate reserves for all assets. The specifics of my recommendation are given below. I specifically do not recommend a cap on the amount of money invested in high yield bonds, as long as the institution continues to hold a Savings & Loan or Mutual Savings Bank charter.
Based on the most recent three years of experience in the high yield debt market, I would advocate a reserve against capital of approximately 1.5%-2.0% of the amount invested in such instruments. This is derived from an average taken on losses from defaults of l.O%, 2.4%, and 1.5% over the period 1985-1987, respectively Actual losses from a portfolio of high yield bonds would offset this reserve and an annual replenishment accrued should the reserve fall below the reserve requirement. Estimates of losses from other securities (e.g., high grade bonds, equities, etc., as well as expected losses from traditional thrift activities, e.g., loans on single and multi-family dwellings, other commercial real estate, etc.) should also be assessed.
I specifically do not recommend ad hoc restrictions on the amount of high yield debt investing by individual thrift institutions. Indeed, since a minimum amount of investment dollars is necessary for diversifying adequately, restrictions could be counter productive.
With respect to adequate diversification, there is no magic number of securities or investment dollars but reasonable "guide linestl might be:
A minimum of thirty to forty (30-40) different issuers with no more than 5-10% of the total high yield portfolio invested in any one issuer nor more than 15-20% in any one industry. More precise guidelines should be based on a detailed study of the makeup of the total market.
An alternative scheme would be to study the portfolio makeup of the leading high yield mutual funds, i.e., those which have satisfactory to excellent returns and relatively little variability of return below the industry average. These might include the most successful funds stratified by different size of net tangible assets.
135
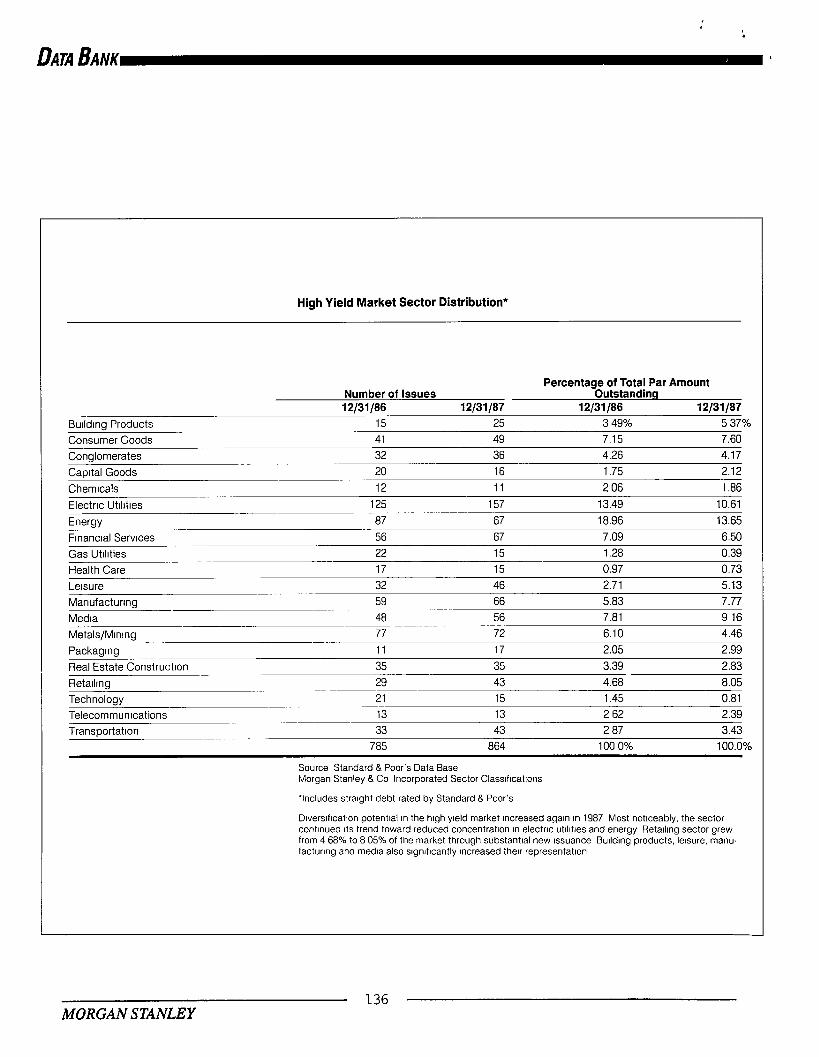
*
DATA BANK
High Yield Market Sector Distribution*
Burldrng Products Consumer Goods
Percentage of Total Par Amount Number of Issues Outstanding
12/31/86 12131187 12131186 12/31/87 15 25 3.49% 537% 41 49 7.15 7.60
Conglomerates 32 36 4.26 4.17 Caprtal Goods 20 16 1.75 2.12 Chemrcals 12 11 206 1.86 Electric Utrlrtres 125 157 13.49 10.61 Enerov 87 67 18.96 13.65 Frnancral Servrces 56 67 7.09 6.50 Gas Utrlrties 22 15 1.28 0.39 Health Care 17 15 0.97 0.73 Lersure 32 46 2.71 5.13 Manufacturing 59 66 5.83 7.77 Media 48 56 7.81 916 Metals/Mrnrng 77 72 6.10 4.46 Packaging 11 17 2.05 2.99 Real Estate Constructron 35 35 3.39 2.83 Retailing 29 43 4.68 8.05 Technology 21 15 1.45 0.81 Telecommunrcations 13 13 262 2.39 Transportation 33 43 287 3.43
785 864 100 0% 100.0%
Source Standard & Poor’s Data Base Morgan Stanley & Co Incorporated Sector Classlflcattons
‘Includes straight debt rated by Standard & Poor’s
Dlverslflcatlon potential In the high yield market Increased agaln In 1987 Most notlceably, the sector continued Its trend toward reduced concentration In electnc utllrhes and energy RetaIlIng sector grew from 4 68% to 8 05% of the market through substantial new issuance BulldIng products, leisure, man”. factunng and media also significantly Increased their representation
136 MORGAN STANLEY

Annual Returns, Yields and Spreads on Long-Term(LT) Government Bonds and High Yield (HY) Bonds
____-----------------------------------------------
Return (W) Promised Yield (X) -----------___-------~~~~~~-~~~~ --------__-----------~-~-~-~~
Year HY LT Govt --__--- ------_--- -----a---
1988 ------ ------ 1987 4.67 -2.67 1986 16.09 24.08 1985 22.51 31.54 1984 8.50 14.82 1983 21.80 2.23 1982 32.45 42.08 1981 7.56 0.48 1980 -1.00 -2.96 1979 3.69 -0.86 1978 7.57 -1.11
Arithmetic Averages: 1978-1983
12.01 6.64 1978-1987
12.38 10.76
Compound Averages: 1978-1983
11.45 5.62
1978-1987 11.96 9.74
Spread HY LT Govt Spread __------ m---s---- ----_---_ _-----a--
------ 13.95 9.00 4.95 7.34 12.66 8.75 3.91
-7.99 14.45 9.55 4.90 -9.03 15.40 11.65 3.75 -6.32 14.97 11.87 3.10 19.57 15.74 10.70 5.04 -9.63 17.84 13.86 3.98
7.08 15.97 12.08 3.89 1.96 13.46 10.23 3.23 4.55 12.07 9.13 2.94 8.68 10.92 8.11 2.81
5.37 14.33 10.69 3.65
1.62 14.35 10.59 3.76
5.00
2.22
(1) Morgan Stanley composite generated from over 440 high yield issues. Actual portfolio ranged in size from 153 in 1978 to 339 issues in 1983. This data base goes through 3/31/84; Composite of several indices for 1985-1987.
(2) Shearson Lehman Long -Term Government Index. (3) Promised yield as of beginning of year. It represents the internal
rate of return based on the security's current price and scheduled payments of interest and principal.
137

,
Year --------
1987
1986
1985
1984
1983
1982
1981
1980
1979
1978
1977
1976
1975
1974
1973
1972
1971
1970
Historical Default Rate--Low Rated, Straight Debt Only
-------------------------------------------- ( $ millions )
Par Value Outstanding Par Value With Utilities Default -------------- -----------
$136,952 $7,114.60 (1470.6)*
92,985 3,155.76
59,078 992.10
41,700 344.16
28,233 301,08
18,536 577.34
17,362 27.00
15,126 224.11
10,675 20.00
9,401 118.90
8,479 380.57
8,015 29.51
7,720 204.10
11,101 122.82
8,082 49.07
7,106 193.25
6,643 82.00
6,996 796.71
Average Default Rate 1970 to 1987 Average Default Rate 1974 to 1987 Average Default Rate 1978 to 1987 Average Default Rate 1983 to 1987
Default Rate ------------
5.195% (1.07x)*
3.394%
1.679%
0.825%
1.066%
3.115%
0.156%
1.482%
0.187%
1.265%
4.488%
0.368%
2.644%
1.106%
0.607%
2.720%
1.234%
11.388%
2.384% 1..926% 1.836% 2.432%
* $1,470.6 million without Texaco, Inc., Texaco Capital and Texaco Capital N.V. The default rate without these is 1.07%.
138

Default Loss to Investors: 1987 (Based on 39 Defaulting Issues)
Arithmetic Weighted Calculation Calculation
Background Data --------- --_-_----- -------------we Average Default Rate 1987 = 5.19% 5.19%
Average End of Month Price after default = 64.35 77.37
Average Loss of Principal = 35.65%
Average Coupon Payment = 11.87%
Median Coupon Payment 3 11.50%
22.63%
12.01%
Default Loss Computation ----_----------------- - Default Rate X Loss of Principal
Loss from Principal + l/2 Coupon X Def. Rate
Default Loss 1987
5.190% 5.190% 0.357 0.226
--------- -------_-- 1.850% 1.174% 0.308% 0.312%
---------- -----.-__-_- 2.158% 1.486%
1974-1987 Statistics
Default Loss 1974-1986 Default Loss 1987
Loss --r---- 1.095% 2.158%
Average Default Loss -m---m
1.171%
No. of Years -- -----v-----m
13 1
--e--m---- 14
Wgt. ---s.y-
0.929 0.071 ----- 1.000
1974-1987 (Equal Yearly Weight) ------ ------ ---------- ---------- --e-m em---
139

. .
I
R a tin g Distr ibut ion o f D e fau l tin g 1ss;tes a t Va r ious P o ints P r ior to D e fau l t
------------------------------------ (Th rough D e c e m b e r 1 9 8 7 )
Inc lud ing Texaco 's d e fau l t - -------------------------
O rig ina l R a tin g A A A A A A B B B B B B ccc cc T o ta l ____-- - - - - - - - - - - --m -e- - - - - -w ------ ------ ------ - - -we- ------ ------ --m ------ N u m b e r 2 1 9 P e r c e n ta g e 2 .2 i% 5 .% 6 .E % 1 4 .E % 1 2 .:3x 4 1 .;:x 1 5 .$ % *.9 :w 1 0 0 .0 0 %
R a tin g O n e Y e a r P r ior A A A A A A B B B B B B ccc cc T o ta l -_------ - - - - - - - - - - - - -e - - -e-e - -_-- - ------ ------ - - - - -_ ------ ------ --------- N u m b e r 0 0 2 1 1 2 9 1 1 0 7 4 9 2 3 5 P e r c e n ta g e 0 .0 0 % 0 .0 0 % 0 .8 5 % 4 .6 8 % 1 2 .3 4 % 4 6 .8 1 % 3 1 .4 9 % 3 .8 3 % 1 0 0 .0 0 %
R a tin g 6 M o n ths P r ior A A A A A A B B B B B B ccc cc T o ta l _ _ _ _ _ _ _ _ _ _ -- -_-- - -----m ----m m e-e- - - -em-- - -----m - - -w-m _--- - - ----m e ---------
0 0 2 3 1 1 1 0 7 1 0 3 1 5 2 4 1 0 .0 0 % 0 .0 0 % 0 .8 3 % '..2 4 % 4 .5 6 % 4 4 .4 0 % 4 2 .7 4 % 6 .2 2 % 1 0 0 .0 0 %
_---------------------------------------------------------------------------------
Exc lud ing Texaco 's d e faul t --------------------------
O r ig ina l R a tin g A A A A A A B B B B B B ccc cc T o ta l _______-_- - - - - - - ------ ------ ------ ------ I----- - - - -_- ------ ------ --------- N u m b e r 1 9 8 P e r c e n ta g e O .O i% 1 .5 Z % 5 .Z% 1 5 .zx 1 3 .;ax 4 4 .;;% 1 7 .E % 1 .0 :x 1 0 0 .0 0 %
R a tin g O n e Y e a r P r ior A A A A A A B B B l 3 B B ccc cc T o ta l __________- - - - - - ------ ------ ------ ------ ------ ------ ------ -----m -----v-v- N u m b e r 0 0 2 1 1 2 9 8 9 7 5 9 2 1 5 P e r c e n ta g e 0 .0 0 % 0 .0 0 % 0 .9 3 % 5 .1 2 % 1 3 .4 9 % 4 1 .4 0 % 3 4 .8 8 % 4 .1 9 % 1 0 0 .0 0 %
R a tin g 6 M o n ths P r ior A A A A A A B B B B B B ccc cc T o ta l _------ - - - - - - - - - ------ - - -e-w ------ - - - - -e - -e- -e - -e- -w ------ ------ ---------
0 0 2 3 1 1 8 6 1 0 3 1 5 2 2 0 0 .0 0 % 0 .0 0 % 0 .9 1 % 1 .3 6 % 5 .0 0 % 3 9 .0 9 % 4 6 .8 2 % 6 .8 2 % 1 0 0 .0 0 %
1 4 0

1 h’EIET’RSJ~ ABOUT THE JUNKBOND CT
T en years ago, in 1977, the amount of corporate low-rated debt in the United states was 3.77 percent of the outstanding straight (nonconverti-
bIe) public indebtedness. Little did anyone realize then that it would rise to a level above 21 percent, fueled by a dramatic increase in high-yield, low-rated debt measured at almost $140 billion in June 1977. This high yield debt market is now an established and dynamic financial sector which is not only safer than many claim but has produced returns to in- vestors which have been comparatively excel-
IYw;~rtl 1. hllmu~ is proli'shor 01'lin:Imx* :mtl cl~;lirtwn 01 the MllA program at New York University and a consul- tant to Merrill Lynch’s high yield debt group. He co- authored with Scott A. Nammacher, “Investing in Junk Bonds: Inside the High-Yield Debt Market;‘John Wiley CL Sons, (New York,1986). An earlier version of this paper was prepared for NYU BUSINESS, SPRING/SUMMER 1986, PPIO-11,26-27, New York University School of Business.
Do high-yield bonds create high-risk portfolios? Here is an expert’s view of the junk bond market: where it’s been, where it’s going and what it all means for investors.
BY EDWARD I. ALTMAN
lent over the last 10 years and less volatile than the so-called risk free government market.
THE ISSUES Despite its periodic shocks and
consistent critics, this market continues to provide a mechanism for financing the growth and restructurings of corporations whose pub- lic debt instruments are rated below the so- called “investment-grade” level.
How much concern should be raised by the issuance of so much new debt - in particular, by its use to finance merger activity and nascent growth companies? What of tiit~ :tbility of corpor:tt~ debt issttc-rs to nlcet these Wure obligations? Should federally in- sured financial institutions be restricted in some way from investing in high-yield bonds? For that matter, how emotionally loaded is the term “junk bonds: used to describe such indebtedness? Or can we say, like Shakespeare’s Juliet, “Tis but thy name that is my enemy?

“Dcspitc its periodic shocks and consistent critics, this market continues to provide a mechanism for financing the growth and restructuring of corporations whose public debt instruments are rated below the so-called investment-grade level:
To answer the charges and ques- tions we must first recognize that there arc several types of low grade debt, each with its own distinctive characteristics. Issuers in this market comprise essentiaily three types of firms including (1) fallen angels, (2) emerging growth companies, and (3) corporate restructurings.
THE ISXJERS
Fallen angels arc firms whose debt was originally rated in one of the four investment grade categories but has since been downgraded to non-investment grade status due to credit deterioration and the consequent non-trivial probability of default. The fallen angel component comprised 28.3% of’ the total high yield market as of June 30, 1987. Due to its deteriorated state, bonds in this group were referred to as “junk” in the mid to late 1970’s when they comprised the vast majority of the total market. See table I for a listing of the market size over time.
Emerging growth firms, probably about 20-25% of the market, involve firms which prior to the early 1980’s were consid- ered too young, small or otherwise unsuited for a public debt security and had to rely on bank debt or other private pacement sources to raise capital. The securttization of private debt via the high yield market is one of the more important fin:tnci:ll innov;~tions of the 198Q’s.
.
The last category, corporate iC-
structurings, involve leverage buyouts (going private, in some cases to avoid a take- ovcr),mcrgers and acquisition financing, levcr- age recapitalizations (a defensive takeover strategy), distress exchange of debt issues for failing companies, etc. These heavily pub- licized transactions probably comprise slightly over 50% of the market and have raised the emotion level of market commentators and participants. Such financing usually involve large companies, perhaps which have enjoyed higher ratings in the past, but due to the enormous amount of debt raised, the com- pany’s status is considered quite risky Despite such risk, and the need for corporations to raise capital, the question that remains is what market conditions existed to create such an appetite for these instruments?
THE ALLURE OF HIGHER RETURNS
Beginning in the late 1970’s, the United States experienced rising interest rates and relatively low return on high-quality debt instrumeqts. To acquire needed capital, a grow- iug number of companies began to offer high returns to purchasers of corporate debt. A few financial institutio:ls were quick to esplore the attractions of these lower-rated securities for the underwriting as well as for investment.
To understand why the high- yield debt market became attractive, one need only look at what happened to yields bemcen 1978 and 1987 (table II). There were wide variations in bond portfolio expected yield and actual return performance. Holders of government bonds fist saw rising interest rates create substantial reductions in the mar- ket values of their holdings, more than offset- ting the coupon income these bonds gener- ated. Then they were saved in 1982 and 1984 by a decline in interest rates that helped many investors avoid having a negative rctum over the 1979-1984 period. Governments con- tinued their good relative performance in 1985 and 1986 as interest rates fell. Through the first 8 months of 1987, however, high yield corpo- rate far outperformed investment grade and governments as interest rates turned around and began to rise.
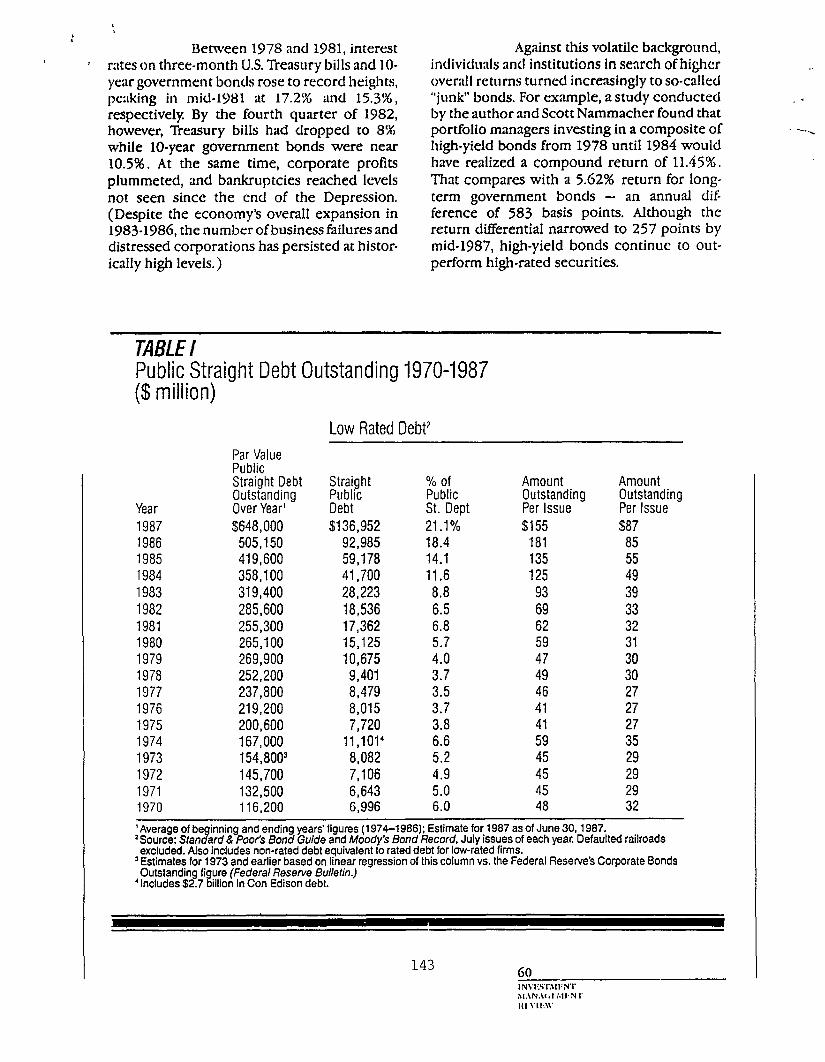
Between 1978 and 1981, interest rates on three-month U.S. Treasury bills and lo- year government bonds rose to record heights, pczlking in mid-1981 at 17.2% and 15.3‘%, respectively. By the fourth quarter of 1982, however, Treasury bills had dropped to 8% while lo-year government bonds were near 10.5%. At the same time, corporate profits plummeted, and bankruptcies reached levels not seen since the end of the Depression. (Despite the economy’s overall expansion in 1983.1986, the number of business failures and distressed corporations has persisted at histor- ically high levels.)
Against this volatile background, individuals and institutions in search of higher overall returns turned increasingly to so-called “junk” bonds. For example, a study conducted by the author and Scott Nammacher found that portfolio managers investing in a composite of high-yield bonds from 1978 until 1984 would have realized a compound return of 11.45%. That compares with a 5.62% return for long- term government bonds - an annual difi ference of 583 basis points. Although the return differential narrowed to 257 points by mid-1987, high-yield bonds continue to out- perform high-rated securities.
TABLE/ Public Straiaht Debt Outstanding 19704987 ($ million) y
Low Rated Debt7
Year 1987 1986 1985 1984 1983 1982 1981 1980 1979 1978 1977 1976 1975 1974 1973 1972 1971 1970
Par Value Public Straight Debt Outstanding Over Year’ $648,000
505,150 419,600 358,100 319,400 285,600 255,300 265,100 269,900 252,200 237,800 219,200 200,600 167,000 1 54,8003 145,700 132,500 116,200
;t6”(gh’ Debt $136,952
92,985 59,178 41,700 28,223 18,536 17,362 15,125 10,675 9,401 8,479 8,015 7,720
11,101’ 8,082 7,106 6,643 6,996
% of Amount Amount Public Outstanding St. Dept Per Issue
Outstanding Per Issue
21.1% $155 $87 18.4 181 85 14.1 135 55 11.6 125 49 8.8 93 39 6.5 69 33 6.8 62 32 5.7 59 31 4.0 47 30 3.7 49 30 3.5 46 27 3.7 41 27 3.8 41 27 6.6 59 35 5.2 45 29 4.9 45 29 5.0 45 29 6.0 48 32
‘Average of be *Source: Stan t?
inning and ending years’ figures (1974-1966); Estimate for 1967 as of June 30,1987. ard & Poor’s Bond Guide and Moody’s Bond Record, July issues of each year. Defaulted railroads
excluded. Also includes non-rated debt equivalent to rated debt for low-rated firms. ‘Estimates for 1973 and earlier based on linear regression of this column vs. the Federal Reserve’s Corporate Bonds
Outstanding figure [Federal Reserve Bulletin.) ’ Includes $2.7 billion in Con Edison debt.

. .
“--
Low- ra ted o r “junk” b o n d d e b t g r e w f rom less th a n $ 1 0 bi l l ion in 1 9 7 8 to near l y $ 9 3 bi l l ion a t th e e n d o f 1 9 8 6 , a n d al l l lO s t $ 1 4 0 b i l l ion by mid-11 )&V. In the lnst 3 % years, s o m e $ 8 0 b i l l ion stra ight h igh-y ie ld B n a n c i n g w a s i ssued ( tab le III).
U n d e r s ta n d a b l y , th e b a n k i n g a n d i nsu rance c o m m u n i ties, par t icu lar ly th e B o a r d o f G o v e r n o r s o f th e Fede ra l Rese rve Sys tem a n d th e S ta te In s u r a n c e D e p a r tm e n ts, h a v e b e c o m e c o n c e r n e d ove r so m u c h n e w d e b t i ssuance. W h i le to ta l pub l i c stra ight d e b t g r e w by 1 5 7 % f rom 1 9 7 8 to 1 9 8 7 , h igh-y ie ld , low- ra ted pub l i c d e b t g r e w m o r e th a n th i r teenfo ld . B y 1 9 8 7 , low- ra ted d e b t rep resen ted a t least 2 1 % o f th e to ta l co rpora te s t ra ight -debt m a r k e t.
:
E N T E R T H E T H R U F T S
“Junk” b o n d s a re b e c o m i n g e v e n m o r e re levant to thrift inst i tut ions as issuers o f n e w d e b t fin a n c i n g a tte m p t to u s e the i r ex ten- s ive por t fo l io o f co rpora te b o n d s , m u c h o f th e m in th e non- inves tmen t g r a d e status, as co l la tera l in o rde r to assu re investors o f th e re lat ively r isk f ree n a tu re o f th e issue. Investors re ly o n th e cash flo w f rom th e secur i t ies to cover interest a n d pr inc ipa l r e p a y m e n ts, n o t th e issuer’s o w n credit . Imper ia l S a v i n g s Asso - c ia t ion o f S a n D i e g o is th e first c o m p a n y to a tte m p t th is innova t ive fin a n c i n g a n d as such is o f spec ia l interest to th e thrift indust ry W h y is th e r e so m u c h interest in th is te c h n i q u e ?
A n n u a l R e tu rns , Y ie lds a n d S p r e a d s o n L o n g -Term (LT) G o v e r n m e n t B o n d s a n d H ig h Y ie ld (HY ) B o n d s*
R e tu rn ( O h ) P romised Y ie ld ( O h ) ”
Y e a r H Y '
6 - 3 0 - 8 7 5 .80 1 9 8 G 16 .09 1 9 8 5 22 .51 1 9 8 4 8 .50 1 9 8 3 21 .80 1 9 8 2 32 .45 1 9 8 1 7 .56 1 9 8 0 -1 .00 1 9 7 9 3 .69 1 9 7 8 7 .57
Ar i thmet ic Averages : 1 9 7 6 - 1 9 8 3
12 .01
1 9 7 8 - 1 9 8 7 ( J u n e 3 0 ) 13 .15
C o m p o u n d e d Averages : 1 9 7 8 - 1 9 8 3
11 .45
1 9 7 8 - 1 9 8 7 ( J u n e 30 ) 12 .75
L T Gov t2 S p r e a d H Y LTGov t S p r e a d
-3 .47 9 .27 1 2 .66 8 .75 3 .9 1 24 .08 -7 .99 1 4 .45 9 .55 4 .9 0 31 .54 -9 .03 1 5 .40 i l .65 3 .75 14 .82 -6 .32 1 4 .97 11 .87 3 .10
2 .23 19 .57 1 5 .74 10 .70 5 .04 42 .08 -9 .63 1 7 .84 13 .86 3 .98
0 .48 7 .08 1 5 .97 12 .08 3 .89 -2 .96 1 .96 1 3 .46 10 .23 3 .23 -0 .86 4 .55 1 2 .07 9 .13 2 .94 -1 .11 8 .68 1 0 .92 8 .11 2 .81
6 .64 5.37 ' 1 4 .33 10 .68 3 .65
11 .25 1 .9 1 3 .04 9 .6 3 3 .41
5 .62 5 .83
10 .18 2 .57
‘M a r a n S tanley compos i te enera ted f rom over 4 4 0 h igh y ie ld issues. Ac tua l port fo l io r a n g e d in s ize f rom 1 5 3 in 1 9 7 i to 3 3 9 issues in 1983. 9. h is da ta -base goes th rough 3/31/84; M o r g a n S tanley cst imatos b a s e d o n S tandard & P o o r data for 1985,86.
*S h e a r s o n L e h m a n L o n g - T e r m G o v e r n m e n t Index. ‘P r o m i s e d y ie ld as of beg inn ing of year. It represen ls the in ternal rate 0 1 re lu rn b a s e d o n the secur i ly’s current pr ice
a n d schedu led paymen ts of interest a n d pr inc ipal . *This tab le is part ia l ly re 1 9 8 6 Update: M o r g a n .8
reduced f rom E . A l tman & S . N a m m a c h e r , “T h e A n a t o m y of the H igh Y ie ld Debt Market : tan ley & Co. Incorpora ted (New York , Apn l1987) .
0 1 INVI:.SI’.M IIN T ,\IA N A (;lih ll% ‘l IIIi\'lli\v
i

Because Moody’s Investors Services, Inc. fol- lowed by Standard & Poor’s Corp., have given their top bond rating to this issue thereby guaranteeing a relatively low cost of funds to Imperial (i.e., the differential between a triple- A rating and non-investment grade status in today’s market probably means a saving of over 3% on the cost of financing).
This new financing has set off a furious debate as to whether the rating agen- cies shouid accept “junk” bonds as collateral. Their response has been the acceptability of “over colIatera!ization” by requiring firms like Imperial to put up a great clcal more “junk” bonds in terms of market value compared to the value of bonds they want to issue. As much as 180% - 200% of the new issue’s value is the original estimate and some investors may want even higher ratios, especially if the high yield market suffers from another scare like the 1986 LTV bankruptcy or the Boesky insider trading scandal. This over collateralization coupled with “tieing-up” significant amounts of assets is not a trivial cost to the issuer.
To my mind, the rating agencies are being quite conservative requiring such a great deal of over collateralization. Based on the default rate and default loss data presented
at a later point, and some new work on mortality rates of corporate bonds, a much lower over-collateralization would seem to be justified. For example, default losses on a diversified portfolio of “junk” bonds probably will not exceed 20.30% over a ten-year period. Without even considering the superior yields received over that period, collateral of 140-lSO% of the issue size would seem to be sufficient to permit investors to sleep comfortably
BIGGER DEAL!3 No1 only has the high-yield bond
market changed, but so has the size of indi- vidual corporate issues. In the last ten years, debt increased from $49 million per company (1978) to $155 million (1987). The average individual bond issue grew from $30 million to $87 million.
The number of deals involving $100 million of more rose from only two in 1978 to.23 in 1983, and to 129 in 1986 (over 50% of the new issues), including 11 greater than $500 million. The trend has not abated. In the first six months of 1987 there were over 60 new issues (out of 116) of $100 million or more.
TABLE 111 New Non-Convertible Domestic Debt Issues: 1978~1987’ ($MM) Total Par Value Total Par Value % New
New Public New High Yield Issue Straight Debt Issues Debt Issues Dollars
Year Amount No. Amount No. Pet.
1987 $116,065 728 $15,5712 1162 13.4% 1986 155,672 1,041 34,1773 2343 22.0 1985 101,098 1,212 14,670 188 14.5 1984 99,416 721 14,952 124 15.0 1983 46,903 511 7,417 86 15.8 1982 47,798 513 2,798 48 5.9 1981 41,651 357 1,648 32 4.0 1980 37,272 398 1,442 43 3.9 1979 25,678 277 1,307 45 5.0 1978 22,416 287 1,493 52 6.7 Total $693,969 6,045 $95,475 968 13.75%
‘Not including exchange offers, secondary offerings, tax exempts, convertibles or government agencies. Six month figures in 1987.
Source: Investors’ Dealers Digest, Merrill Lynch & Co., and Morgan Stanley & Co., inc.
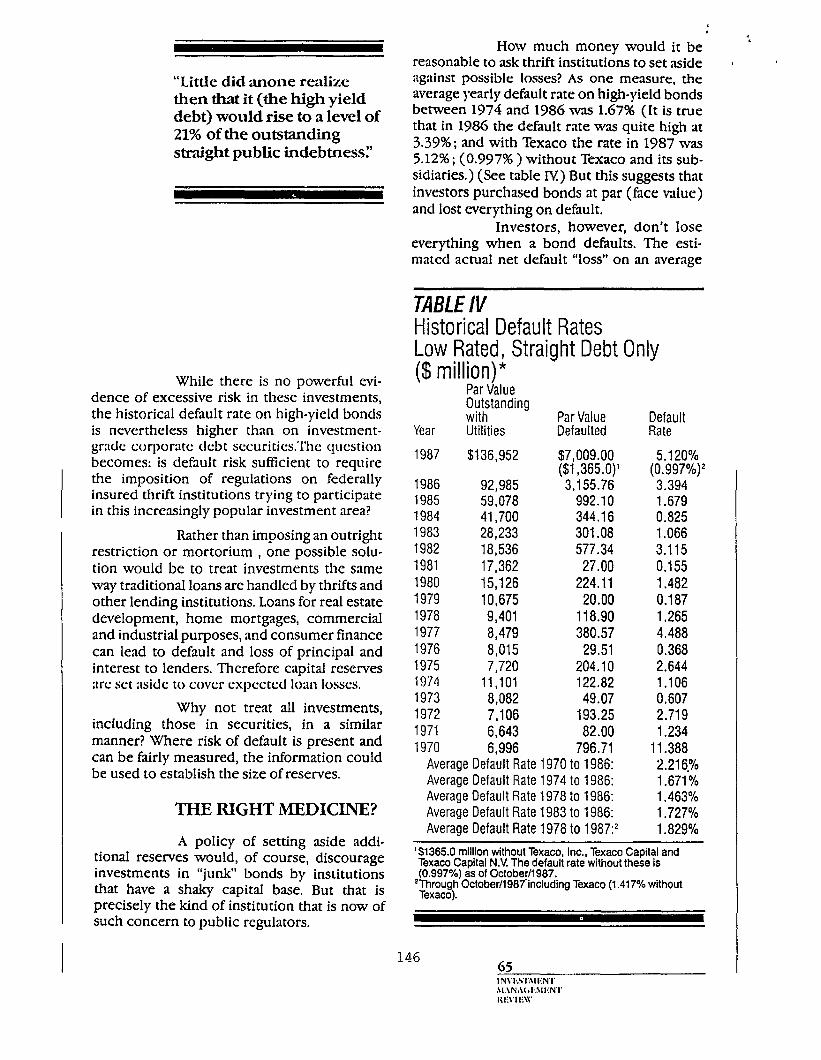
“Little did anone realize then that it (the high yield debt) would rise to a level of 21% of the outstanding stmight public indebtness:
While there is no powerful evi- dence of excessive risk in these-investments, the historical default rate on high-yield bonds is nevertheless higher than on investment- grade corporate debt sccurities.The question becomes: is default risk sufficient to require the imposition of regulations on federally insured thrift institutions trying to participate in this increasingly popular investment area?
Rather than imposing an outright restriction or mortorium , one possible solu- tion would be to treat investments the same way traditional loans are handled by thrifts and other lending institutions. Loans for real estate development, home mortgages, commercial and industrial purposes, and consumer finance can lead to default and loss of principal and interest to lenders. Therefore capital reserves arc set aside to cover cxpcctcd loan losses.
Why not treat all investments, including those in securities, in a similar manner? Where risk of default is present and can be fairly measured, the information couid be used to establish the size of reserves.
THE RIGHT j!bliEDICINE? A policy of setting aside addi-
tional resemes wouId, of course, discourage investments in “junk” bonds by institutions that have a shaky capital base. But that is precisely the kind of institution that is now of such concern to public regulators.
. How much money would it be
reasonable to ask thrift institutions to set aside against possible losses? As one measure, the average yearly default rate on high-yield bonds between 1974 and 1986 was 1.67% (It is true that in 1986 the default rate was quite high at 3.39% ; and with Texaco the rate in 1987 was 5.12%; (0.997% ) without Texaco and its sub- sidiaries.) (See table II!) But this suggests that investors purchased bonds at par (face value) and lost werything on default.
Investors, however, don’t lose everything when a bond defaults. The esti- mated actual net default “loss” on an average
TABLE/V Historical Default Rates Low Rated. Straight Debt Only ($ million)”
Par \ialue CM$anding
Utilities Year
1987 $136,952
1986
Average Default Rate
92,985 1985
Average Default Rate
59,078 1984
Average Default Rate
41,700 1983
Average Default Rate
28,233 1982
Average Default Rate
18,536 1981 17,362 1980 15,126 1979 10,675 1978 9,401 1977 8,479 1976 8,015 1975 7,720 1971 11,101 1973 8,082 1972 7,106 1971 6,643 1970 6,996
1970to1986:
$7,009.00
1974to1986:
($1,365.0)’ 3,155.76
1978to1986:
992.10 344.16
1983to1986:
301.08 577.34
1978to 1987?
27.00 224.11
20.00 118.90 380.57
29.51 204.10 122.82 49.07
193.25 82.00
796.71
Par Value Default Defaulted Rate
5.120% (0.997%)2 3.394 1.679 0.825 1.066 3.115 0.155 1.482 0.187 1.265 4.488 0.368 2.644 1.106 0.607 2.719 1.234
11.388 2.216.% 1.671% 1.463% 1.727% 1.829%
‘$1365.0 million without Texaco, Inc., Texaco Capital and Texaco Capital N.V. The default rate without these is (0.997%) as of OctoberA987.
*Through October/l987’including Texaco (1.417% without Texaco).
:

:
. annual basis had been npl~rosimatcly I. I’% . (‘t’hc loss rate from defrlults in 1986 were relatively high, however, registering 2.3% .) This finding is based on the observation that debt securities sell an average at about 4.7% of par after default, and investors must also forgo at least one interest payment upon default. In fact, expected yield spreads from high-yield debt securities have been very attractive, rang ing from three to five percentage points above risk-free securities (table 2).
It appears, therefore, that if reg- ulators decide to treat risky investments like risky loans, then a 1.5-2.50x, loss reserve would be appropriate for a diversified portfolio of bonds. Adequate diversification should be stressed; it is absolutely imperative to ensure average return and risk performance and to eliminate the possibility of investing in too high ;I proportion of defaulting securities.
Assuming prudent diversifica- tion, a 2.5% loss reserve would be adequate protection against defaults and losses as expe- rienced in recent years. Faced with the re- quirement of loss reserves, investment manag- ers, acting in concert with other thrift officers and with boards of directors, would be forced to consider whether the return from high- yield bonds justified the set-aside amount.
What would be the overall im- pact on the financial system if institutions were required to hold such additional reserves? Obviously, it could reduce the credit available to potential borrowers. But how severe would the impact be on financial institutions?While that is impossible to predict with certainty, it wouId probably lead to a slight reduction in the use of high-yield debt investments to increase the earnings of such institutions; but at the same time, it would help to provide for a more stable financial system.
An investment strategy similar to that of diversification based on the number of securities in the portfolio is to manage a diversified list of companies with extremely low default risk. The Zeta score technique mentioned earlier is particularly relevant to such a strategy Zeta scores correctly identified bankrupt firms more than 95% OC the time based on data from one financial statement prior to bankruptcy in the 1978-1986 period. The data contained over 40 issuer defaults. All
“Low-rated or junk bond debt grew from less than $10 billion in 1978 to nearly $93 billion in 1986 and almost $140 billion by mid-1987:’
but two of the defaults could have been avoided with a strategy of selling (or not including) a firm’s debt when its Zeta score was below zero.
What are the alternative reme- dies? They do not appear to be abundant or sound. For cxaniplc, an outright restriction or moratorium on investing in “junk” bonds does not seem justified. For example, the New York State Department of Life Insurance hzls put a cap of 20% of net assets as the amount of permitted investments in “junk” bonds. While this amount will not Sect many life insurance carriers, it seems a bit ad-hoc and arbitrary.
Other solutions could be to limit the percentage an institution can invest in any one security or industry, or to mandate in- creases in capital requirements on investment amounts in specific securities that exceed a prescribed percentage. (In other words, a penalty for too much concentration in indi- vidual securities.)
At the very least, requiring diver- sification guidelines would seem to be pru- dent. Meanwhile, a percentage formulation of loan reserves would be a compromise berween total restrictions and no restrictions at all, as is now the case. (Incidentally, a loan-loss reserve system, if adopted for “junk bonds, might be appropriate for all risky investments, even high-grade bonds.) These guidelines are rele- vant for other investors including pension fund managers.
Whatever the solution, we live in a world in which not all portfolio managers will exercise a prudent, sophisticated ap- proach to credit purchase. So it is not unrea- sonable to impose incentives, guidelines, and even penalties to reduce excessive risk-taking. If good health dictates that we not indis- criminatcly consum c’ food, perhaps the same can be said of “junk” bonds.

February 1988 ’ ’
Measuring Corporate Bond
Mortality and
Performance
Edward I. Altman PROFESSOR OF FINANCE, NEW YORK UNIVERSITY
148

Table of Contents -
Abstract . . . . . . . . . . . . . . . . . . . . . . . . . . . . . . . . . . . . . . . . . . . . . . . . . . . . . . . . . . . . . . 1
I.Introductioll . . . . . . . . . . . . . . . . . . . . . . . . . . . . . . . . . . . . . . . . . . . . . . . . . . . . . . . . . 3
ILPriorStudies . . . . . . . . . . . . ..*......................................... 5
IILTzaditionalMeasuresofDefaultRatesandhxses ........................... 7 Default Losses ................................................... 9 Defaults by Original Bond Rating .................................... 10
IY The Mortality Rate Concept . . . . . . . . . . . . . , . . . . . . . . . . . . . . . . . . . . . . . . . . . . . . 12
V Empirical Results ..................................................... 15 Mortality Rates .................................................. 15 hses ......................................................... 18 Net Return Performance ........................................... 20
vI.l.mplications . . . . . . . . . . . . . . . . . . . . . . . . . . . . . . . . . . . . . . . . . . . . . . . . . . . . . . . . 25
References . . . . . . . . . . . . . . . . . . . . . . . . . . . . . . . . . . . . . . . . . . . . . . . . . . . . . . . . . . . . 27

Abstract This study seeks to explore further the notion of default risk by developing an alternative way to measure that risk and to suggest an appropriate method to assess the performance of fixed- income investors over the entire spectrum of credit-quality classes. This approach, a kind of “mortality rate” concept, seeks to measure the expected mortality of bonds in a manner similar to the way actuaries assess mortality of human beings. Our term mortality refers specifically to a life expectancy or survival rate for various periods of time, not necessarily for one year.
For the first time, performance of corporate bonds issued with quality ratings ranging from AAA to CCC will be assessed on a year-by-year basii after issuance. The simulation algorithm will be sufficiently robust so that we can calculate net returns for different assumptions of risk- free interest rates, yield spreads, coupon reinvestment rates, and loss of principal and interest payments after default.
The results show that under current interest-rate scenarios, all bond rating categories outperform riskless Wasuries over a ten-year horizon: that despite relatively high mortality rates, B-rated securities outperform all rating categories for our ten year horizon. If one utilizes interest rate spreads which were more typical over our sample period, then BB-rated securities outperform single-B debt subsequent to the third year after issuance.
The reader is cautioned that our mortality rate estimates for relatively long horizons are based on a limited number of observations and are not necessarily indicative of the expected mortality of more recently issued securities in the low-rated categories.
150

I. Introduction The recent emergence of the high yield corporate debt market in the United States has intensified interest and research into the relation between expected yield spreads of bonds of various credit quality and expected losses from defaults. In addition to default risk, investors also consider the effects of the two other major risk dimensions of investing in fixed-iiterest . mstruments, i.e., interest-rate risk and liquidity risk. The better appreciation of duration measures on interest sensitivity and periodic liquidity crises have captured the attention of practitioners as well as researchers. The interaction among the three dimensions of risk has raised the analytic content of fixed-income assessment to an increasingly sophisticated level. The analysis of default risk, however, has probably been the area of most concern and empiricA measurement over the years since the initial pioneering work by Hickman in 1958.
The appropriate measure of default risk and the accuracy of its measurement is critical in the pricing of debt inshuments, in the measurement of their performance, and in pe assessment of market efficiency Corporate defaults are triggered either by the non-payment oEnterest and/or principal when those payments become due or by the filing of a lxnkruptcy petition by the firm. Such actions result in the bond’s rating falling to the D (default) level. Analysts have concentiated their efforts on measuring the default rate for finite periods of time-for example, one year-and then averaging the annual rates for longer periods. In almost all previous studies, the rate of default has been measured simply as the value of defaulting issues for some specific population of debt compared with the value of bonds outstanding that could have defaulted. For example, a study might be concerned with all corporate straight (non-convertible) debt or might concentrate on the non-investment grade, “junk-bond” market. Annual defaults are then usually compared with observed yield spreads in order to assess the attractiveness of particular bonds or classes of bonds. Another approach would be to compare default rates with =-post returns to assess whether investors have been compensated for the risks they had accepted.
An alternative approach would be to estimate the default risk premium included in the price of a bond-that is, the required risk premium-and to compare that premium with the actual default experience of a particular quality class of debt. We will discuss that approach at a later point.
This study seeks to explore further the notion of default risk by developing an alternative way of measuring that risk and by suggesting an appropriate method of assessing the performance of fixed-income investors over the entire spectrum of creditquality classes. Our approach, which is a kind of “mortality rate” concept, seeks to measure the expected mortality of bonds in a manner similar to that used by actuaries in assessing human mortality Our use of the term mortality refers specifically to a life expectancy or survival rate for various periods of time, not necessarily for one year Although it is informative to measure default rates and losses based on the average annual rate and loss method, that traditional method has at least two deficiencies. It fails to consider that there are other ways in which a bond dies, namely redemptions from calls, sinking funds, and maturation. Nor does it answer the question of the probability of default for various time periods in the future on the basis of an issue’s attributes at issuance. Specifically this study seeks to answer the following:
151.

: , .
Given an issue’s initial bond rating:
( l] What is the estimated probability of default and loss over a specific time horizon of one year, 2 years, 3 years or N years?
(2) Contingent on the successful payment of interest and sinking fund (if any] over a specified period of time, what is the probability of default over some finite period in the future?
(3) What are the estimates of the cumulative annual mortality rates and losses for various time frames as well as the marginal rates for specific one-year periods?
(4) Given estimates of cumulative mortality losses suffered by investors and expected return spreads earned on the surviving population of bonds, what are the simulated net return spreads earned or lost in comparison with returns on risk-free securities?
For the first time, performance of corporate bonds issued with quahty ratings ranging from AAAtocccwglbe assessed on a year-by-year basis after issuance. The simulation algorithm will be sufficiently robust to enable us to calculate net returns for different assumptiorls of risk free interest rates, yield spreads, coupon reinvestment rates, and loss of principal and interest payments after default. Indeed, to illustrate the model, we will simulate expected net return spreads for recent actual market conditions.
The balance of this study is organized as follows: In Section II we review relevant sfudies dealing with default rates and risk premium analysis of corporate bonds. In Section III we discuss traditional methods of measuring default rates and losses and report on the historical experience of defaults in the 1900-1987 period. Section IV includes an analysis of the issues that are not resolved by traditional measures and presents a method of assessing the mortality rates and losses on straight corporate debt. In Section V we list the observed empirical results of mortality rates on all corporate bonds for periods up to 10 years after issuance. Results cover bonds issued from 1971-1985 and defaults from 1971-1986. We also report selected mortality rates for non-investment grade, high-yield bonds for the period 19761986, because that market sector had its impressive growth beginning in the late 1970’s. Tb complete the picture, we then simulate investment performance for the various bond rating categories. Included are data on yield spreads, new issues and various kinds of bond mortalities. In the Enal section we discuss the implications of our results.
153.

II. Prior Studies Previous works in the area of default were of three general kinds. The first example, which might be called Hickman-style reports, usually presented exhaustive statistics on annual default rates and actual returns to bond holders over various time frames. Hickman’s work, which covered the period 1900-1949, was updated by Atkinson in 1967. In general, the studies concluded that investors had been well compensated for the risks incurred. The works were the first to include estimates of the loss to investors. Hill and Post in 1978 examined experience of low-rated debt in the 1970’s, and Altman and Nammacher in 1985 and 1986 and Altman in 1987 concentrated on the high-yield market for the period 1970-1986 and also provided estimates of the default on all corporate debt. All of those studies measured annual default rates using the methods as noted earlier- We will return later to that methodology updating the data through 1987 and also indicating average losses from defaults. Almran and Nammacher argued that the relevant population, especially for “junk” bond investors, was the total population of straight, high-yield bonds in existence for each annual period.
A second kind of study emphasized the default risk potential of individual~ompany debt by examking the dete rminants of risk premiums over risk-free securities, e.g., Fisher (19591, or by constructing univariate (Beaver, 1967) or multivariate classiication models based on the combiition of micro-finance measures (usually financial statement ratios) and statistical classification techniques, such as d&Cmmant and logit-probit analysis. These Iatter studies included the Z-Score models (Altman, 1968), Zeta (Altman, Haldeman and Narayanan, 1977) as well as similar models by Ohlson (1980) and others.’ Variants on those models were based on gambler’s ruin concept (Wilcox, 1971)‘ recursive partitioning techniques (Frydman, &man and Kao, 1985), and market indicators of survival (Queen and Roll, 1987). The latter study is particularly relevant because it introduces to finance the firm mortality concept and emphasii the distinction between favorable and unfavorable disappearance. An example of favorable disappearance would be a merger in which stockholders were bought out at a healthy premiurn2 Our measure of mortality of bonds has some similar qualities in that we adjust the population for various kinds of redemptions. We do not, however, attempt to measure the effects of sinking fund or call probabilities on required risk premiums.
1 Scott (1981) summarizes many of those empirical studies and assesses their conformity with a theory of fhancial distress prediction.
2 Queen and Roll [ 1987) examined five market indicators [size, price, return, volatility, and beta) and concluded that all but beta can be used in predicting favorable and unfavorable firm mortality Sii was the best predictor, and the authors presented empirical estimates of those disappearance probabilities.
153

Finally, a study by Fons in 1987 attempts to combine observed pricing and the inherent default risk premium with estimates of corporate bond default experience. He incorporates default experience measured by Aitman and Nammacher and others with a risk-neutral investment strategy-that is, where the only factor that matters is the return distribution on debt with no relevance for volatility or liquidity factors. Using all low-rated debt combined, he assesses the default premium expected and concludes that investors holding a well diversified portfolio of low-rated bonds were well rewarded for bearing the implicit default risk. Fons’ conclusions imply either a systematic mispricing of those issues or that his risk-neutral model could not fully capture the market’s assessment of default-risk probabilities. Blume and Keim (1987) reach similar conclusions by observing return spreads after default and comparative volatility patterns between low-rated and investment grade debt portfolios.
Fans did not believe, however, that default rates on particular bond-rating classes could be meaningfully addressed txxause the ratings are not permanent designations and because bonds are usually downgraded prior to default. Ahman (1987) shows this progression to be true with about 30% of defaulting issues rated investment grade at ori~‘issuance; 6% of defaulting issues rated investment grade one year before default; and 2% rated investment grade six months before default. Yet, it does appear to be relevant to measure losses to investors by original investment in specific bond-rating categories. The assumption implicit in our analysis is that of a buy-and-hold strategy for various time horizons, with specific year-by-year observations of default losses and return spreads on the surviving population.
154

l .
.
III. T rad i tio n a l M e a sures o f D e fa u lt R a tes a n d Losses Accura te m e a s u r e m e n t o f d e faul t r isk is c e n tral to ou r d iscuss ion o f th e t radeof f b e tween requ i red r isk p r e m i u m s o n b o n d s o f d i f ferent credi t qual i ty a n d re turns o n th o s e secur i t ies. T h e m a r k e t h a s pretty m u c h a c c e p te d th e d ist inct ion b e tween so-ca l led inves tmen t -g rade a n d n o n - inves tment g r a d e ca tegor ies w h e r e th e latter i nc ludes al l secur i t ies ra ted d o u b l e - B ( S & P a n d Fi tch’s d e s i g n a tions ) o r B a ( M o o d y ’s) o r lower . A t th e s a m e tim e , b o n d s rece ive m o r e p rec ise ra t ings wi th fou r c lasses o f i nves tmen t -g rade d e b t a n d e s s e n tia l ly th r e e c lasses o f lowerqua l i ty j unk b o n d s .3
Desp i te th e fine r dist inct ions, a l l pub l i shed analy t ica l works c o n c e n tite o n e i ther th e e n tire co rpo ra te -bond un ive rse o r just th e h i g h y ie ld, non - inves tmen t -g rade sector. In a d d i tio n , th e e m p h a s i s is pr imar i ly re la ted to stra ight d e b t secur i t ies. D e faul t ra tes a re ca lcu la ted o n a n a v e r a g e a n n u a l basis , wi th ind iv idua l ra tes fo r e a c h year c o m b i i e d wi th ra tes fo r o the r years ove r s o m e l onge r tim e ho r i zon to fo r m th e es t imate fo r th e a v e r a g e a n n u a l rate.4 E a c h year is usua l ly g i ven e q u a l w e i g h tin g in ca lcu la t ing th e a v e r a g e .
% b le 1 i l lustrates th e a v e r a g e a n n u a l d e faul t ra te compi la t ion o n low- ra ted d e b t fo r th e pe r id 1 9 7 0 - 1 9 8 7 a n d fo r shor ter in tervals wi th in th e e n tire l& y e a r per iod . M o s t observe rs ci te m o r e recent pe r iods as re levant b e c a u s e or ig ina l issue, h igh-y ie ld d e b t actua l ly b e g a n a t a b o u t 1 9 7 7 , w h e n $ 1 .1 8 b i l l ion o f low- ra ted d e b t w a s i ss~ed .~ T h e a v e r a g e a n n u a l d e faul t ra te fo r th e pe r i od 1 9 7 7 - 1 9 8 7 w a s 2 .0 8 % (1 .69% exc lud ing Texaco , Inc.).
% b le 2 l ists th e a v e r a g e a n n u a l d e faul t ra te o n aJ l co rpora te stra ight d e b t fo r se lec ted pe r iods f rom 1 9 0 0 th r o u g h 1 9 8 6 . T h e reade r is c a u tio n e d th a t es t imates a re n o t strictly c o m p a r a b l e b e c a u s e var ious researchers u s e d s o m e w h a t di f ferent cr i ter ia fo r m e a s u r i n g d e faul t rates. Never the less , th e d a ta a re instruct ive a n d permi t th e r eade r to obse rve t rends ove r a l o n g per iod .
3 S ince 1 9 7 3 (Fitch] a n d 1 9 7 4 [S tandard & P o o r ’s) h a v e a d d e d p lus ( + ) a n d m inus ( -1 subcategor ies in e a c h rat ing class wh i le M o o d y ’s in t roduced a 1,2,3 dist inct ion in e a c h class in 1982 . For a d iscuss ion of rat ings a n d the process see W i lson (1987 ) a n d Eder ing ton & Yawi tz (1987) .
*The rate for e a c h year is b a s e d o n the do l lar a m o u n t of defau l t ing issues in that year d iv ided by the total popu la t ion ou ts tand ing as of s o m e poin t du r ing that year.
s Not inc lud ing S 1 .45 bi l l ion of non- ra ted debt . B e c a u s e m u c h of that non- ra ted deb t was not c lear ly ident i f ied wi th a specif ic ra t ing category, w e d id not inc lude this segmen t of the market in ou r analysis.

.
‘able 1 Historical Default Rates--Low Rated, Straight Debt Only
($ in millions]
Par Value Outstandingl with Utilities
Par Value Defaulted Default Rate
1987 . . . . . . . . . . . . . . . . . . $136,952 $7,009.00 ($1,345.0)2 5.120% (0.997%)2 1986 .................. 1985 .................. 1984 .................. 1983 ................... 1982 .................. 1981 .................. 1980 .................. 1979 .................. 1978 .................. 1977 .................. 1976 .................. 1975 .................. 1974 .................. 1973 .................. 1972 .................. 1971 .................. 1970 ..................
92,985 3S55.76 3.394 59,078 992.10 1.679 41,700 344.16 0.825 28,233 301.08 1.066 18,536 577.34 3.115 17,362 27.00 0.155 15,126 224.11 1.432 10,675 20.00 0.187
9,401 118.90 1.265 8,479 380.57 4.488 8,015 29.51 0.368 7,720 204.10 2.644
11,101 122.82 1.106 8,082 49.07 0.607 7,106 193.25 2.719 6,643 82.00 1.234 6,996 796.71 11.388
Average Default Rate 1970 to 1986: ................................ 2.216% Average Default Rate 1974 to 1986: ................................ 1.671% Average Defadt Rate 1977 to 1986: ................................ 1.776% Average Default Rate 1983 to 1986: ................................ 1.727% Average Default Rate 1977 to 1987: ................................ 2.080%3
1 As of June 30 each year.
2 $1.345 biion without Texaco, Inc., Texaco Capital and Texaco Capital N.Y The default rate without the.seisO.997%.
3 1.69% without Texaco.
156
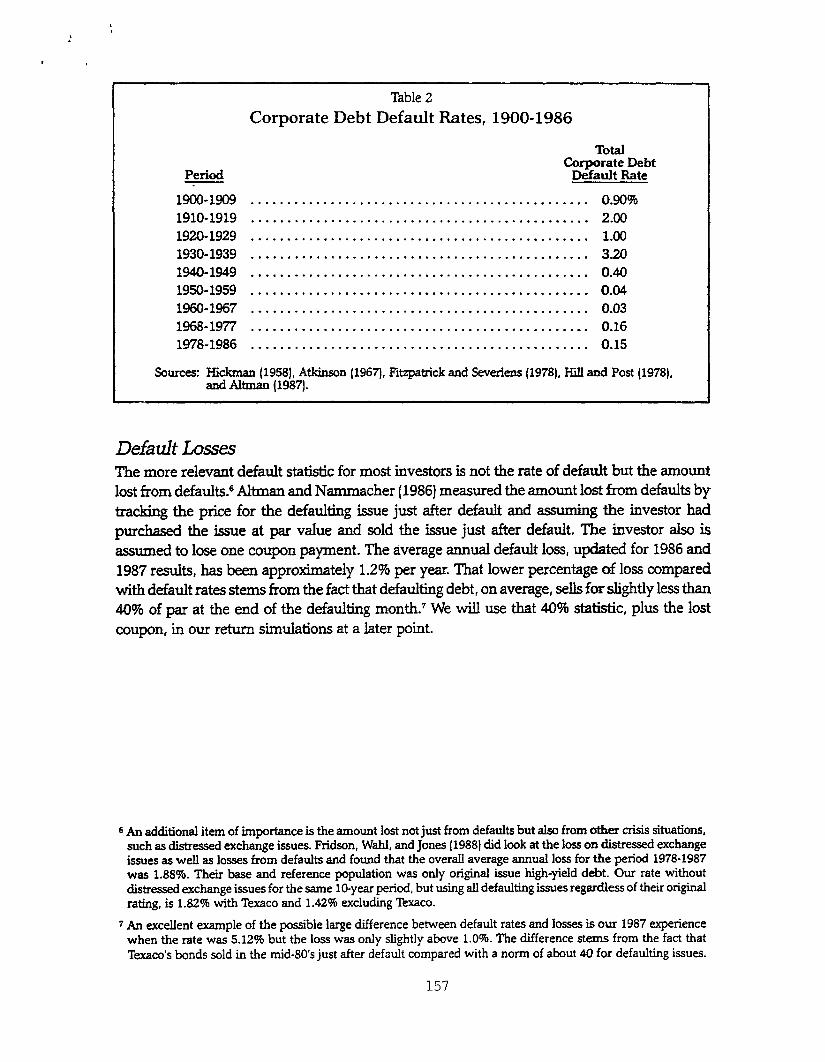
l’&ble 2 Corporate Debt Default Rates, 1900-1986
Total
Period Corporate Debt
Default Rate
1900-1909 . . . . . . . . . . . . . . . . . . . . . . . . . . . . . . . . . . . . . . . . . . . . . . . 0.90% 1910-1919 ..*............................................ 2.00 1926 1929 . . . . . . . . . . . . . . . . . . . . . . . . . . . . . ..e............... 1.00 1930-1939 . . . . . . . . . . . . . . . . . . . . . . . . . . . . . . . . . . . . . . . . . . . . . . . 3.20 1940-1949 . . . . . . . . . . . . . . . . . . . . . . . . . . . . . . . . . . . . . . . . . . . . . . . 0.40 1950-1959 . . . . . . . . . . . . . . . . . . . . . . . . . . . . . . . . . . . . . . . . . . . ...* 0.04 1960-1967 . . . . . . . . . . . . . . . . . . . . . . . . . . . . . . . . . . . . . . . . . . . . . . . 0.03 1968-1977 . . . . . . . . . . . . . . . . . . . . . . . . . . . . . . . . . . . . . . . . . . . . . . . 0.16 1978-1986 . . . . . . . . . . . . . . . . . . . . . . . . . . . . . . . . . . . . . . . . . . . . . . . 0.15
Sources: Hickman (19581, Atkinson (1967), Fitzpatrick and Severiens (1978). HiIl and Post (19781, and Ahman (1987).
Default Losses The more relevant default statistic for most investors is not the rate of default but the amount lost from defaults6 Altman and Nammacher (1986) measured the amount lost from defaults by tracking the price for the defaulting issue just after default and assuming the investor had purchased the issue at par value and sold the issue just after default. The investor also is assumed to lose one coupon payment. The average annual default loss, updated for 1986 and 1987 results, has been approximately 1.2% per year. That lower percentage of loss compared with default rates stems from the fact that defaulting debt, on average, sells for slightly less than 40% of par at the end of the defaulting month.’ We will use that 4.0% stafistic, plus the lost coupon, in our return simulations at a later point.
6 An additional item of importance is the amount lost not just from defaults but also from other crisis situations, such as distressed exchange issues. Fridson, Wahl, and Jones (1988) did look at the loss on distressed exchange issues as well as losses from defaults and found that the overall average annual loss for the period 1978-1987 was 1.88%. Their base and reference population was only original issue high-yield debt. Our rate without distressed exchange issues for the same lO-year period, but using all defaulting issues regardless of their original rating, is 1.82% with Texaco and 1.42% excluding Texaco.
f An excellent example of the possible large difference between default rates and losses is our 1987 experience when the rate was 5.12% but the loss was only slightly above 1.0%. The difference stems from the fact that Texaco’s bonds sold in the middO’s just after default compared with a norm of about 40 for defaulting issues.
157

Defaults by Original Bond Rating Until now, we have reported default rates based on the average annual calculation, but we have also reported data on the tracking of bond ratings of defaulting issues at various points. %ble 3 lists bond ratings at issuance, at one year before default, and at six months before default for D-rated issues. The data are denominated in number of issues, with the percentage of total issues for the various bond ratings listed as well. We observe that about 29% of the issues had an original investment-grade rating; those can be referred to as “defaulting fallen angels.” The remaining 71% are original-issue non-investment-grade bonds.
F&ding Distribution of Defaulting Issues at Various Points Prior to Default
Inch ding Texaco’s Default:
OriginalBating A4A AA A BBB BB B ccc cc Total ~~~-~~~~- Number 5 13 15 30 28 91 35 1 218 Percentage 2.29% 5.96% 6.88% 13.76% 12.84% 41.74% 16.06% 0.46% 100.009i
Batin One earPrior AAA AA B A BBB BB B ccc cc &al ---------
NUmk 0 0 2 12 29 110 74 9 236 Percentage 0.00% 0.00% 0.85% 5.08% 1229% 46.61% 31.36% 3.81% 100.00’3
Rating 6MonthsPrior AAA kL4 A BBB BB B ccc cc Total ---------
Number il 0 2 3 11 107 102 15 240 Percentage 0.00% 0.00% 0.83% 1.25% 4.58% 44.58% 42.50% 6.25% 100.00?4
JZxhdingTexaco’s Default:
originalBating AAA AA A BBB BB B ccc cc Total ~~-~~~~~-
NlXllk 0 3 11 30 28 89 35 1 197 Percentage 0.00% 1.52% 5.58% 15.23% 14.21% 45.18% 17.77% 0.51% 100.00‘3
Batin One earPrior &IA AA IF A BBB BB B ccc cc Total ---------
Number 0 0 2 12 29 89 74 9 2k5 Percentage 0.00% 0.00% 0.93% 5.58% 13.49% 41.40% 34.42% 4.19% lOO.OOW
Rating 6MonthsPrior AAA AA A BBB BB B ccc cc Total ------P-P
Number 0 0 2 3 11 86 102 15 219 Percentage 0.00% 0.00% 0.91% 1.37% 5.02% 39.27% 46.58% 6.85% 100.0047
158

‘
:
T h e p ropor t ions fo r do l la r a m o u n ts a re qu i te di f ferent wi th m o r e th a n 5 7 % o f d e fau l t ing do l la rs f rom fa l l en -ange l d e b t. T h e d a ta i nc lude Texaco Inc. a n d subs id iar ies . W ith o u t Texaco , wh ich h a d m o r e th a n $ 5 b i l l ion o f pub l i c d e b t a n d w a s a n u n u s u a l d e faul t s i tuat ion, th e p ropor t ion o f th e n u m b e r o f o r ig ina l i nves tmen t -g rade d e fau l t ing issues w o u l d d r o p to 2 3 % a n d th e do l l a r -amoun t p ropor t ion w o u l d fa l l to th e s a m e 2 3 % .
A lth o u g h th e d a ta o n d e fau l t ing d e b t’s or ig ina l i ssue b o n d ra t ings a re ava i lab le , th e d e faul t ra tes a n d losses by b o n d ra t ing h a v e n o t b e e n repor ted . W e n o w tu rn to th a t task.
1 5 9

IV The Mortality Rate Concept We retain the notion that default rates for individual periods-yearly for example-are measured on the basis of defaults in the period in relation to some base population in that same period. The calculation, however, becomes more complex when we begin with a specific cohort group such as a specific bond-rating category and track that group’s performance for multiple time periods. Because the original population can change over time as a rest& of a number of different events, we think that it is best to consider mortalities in relation to a survival population and then to input the defaults to calculate mortality rates. Bonds can exit from the original population by means of at least four different events: defaults; calls; sinking funds; and rnaturitie~.~
The individual mortality rate for each year (marginal mortality rate = MMR) is calculated by:
wt, = Total Value of Defaulting Debt in the-year,,,
Total Value of the Population of Bonds at the Start of the Year,,,
We then measure the cumulative mortality rate (CMRJ over a specific time period (1, 2,...., T years) by subtracting the product of the surviving populations of each of the previous years from one (1.01, that is:
CMR, = l- -+-
SR,
t 1 =
where CA&, = cumulative mortality rate in (T) S&t, = survival rate in (t); 1 - m,,
The examples in Tables 4 and 5 illustrate calculations of the margina3 and cumulative mortality rates. The calcuiations are for a specific year’s cohort group, e.g., BB-rated bonds issued in 1981 for one year and two years after issuance (Table 4) and for the same cohort group based on new issues for the period 1981-1984 (Table 5). The resulting CMR is 1.00% for one year after issuance and 4.40% for two year~.~
8 There might be other “terminal” dates such as defeasance but we have not included them in this analysis.
9 Note that by simply adding the individual year marginal mortalities, the result is virtually the same (4.43%). This will be the case for relatively low marginal mortalities in the earlier years, with the differential increasing in later years especially as defaults and redemptions increase.
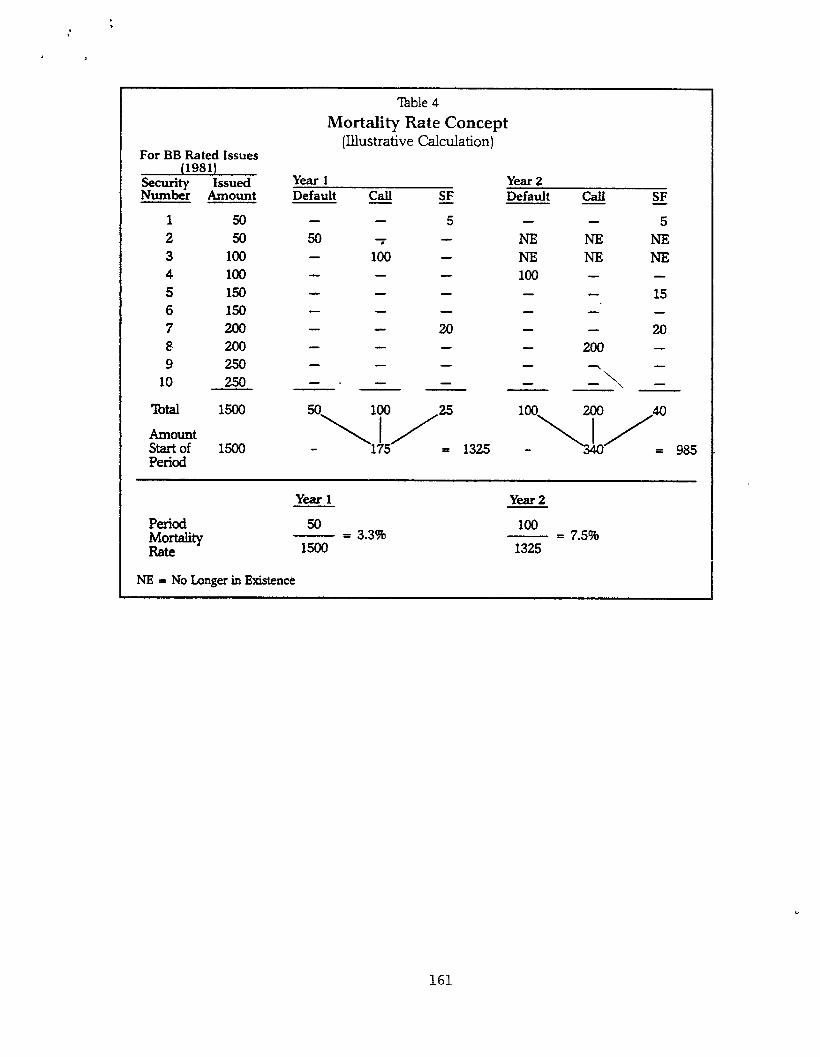
For BB Rated Issues (1981)
security Issued Number Amount
1 50 2 50 3 100 4 100 5 150 6 150 7 8 9
10 250
lbtal 1500
Amount start of 1500 Period
%ble 4
Mortality Rate Concept [Illustrative Calculation)
Year 1 Default Call SF -
Year2 Default CalI SF
- 5 5 50
Go - NE NE NE NE NE NE
- loo - - 15
- 20 20
200 -
- . -A - --- P. -
Year1
50 - = 3.3%
1500
Year2
100 - = 7.5%
1325
NE = No Longer in Ekistenct:

Table 5
Mortality Rate Concept (Summary of Results - Illustrative Calculation)
1981 (BBI
Amount Defaulted
Amount outstanding
(BB1 1982
Amount Defaulted Amoiult chltstaudillg
(BBI 1983
Amount Defaulted
Amount outstanding
(BBl 1984
Amount Defaulted
Amount outstanding
Marginal Mortality Rate
Cumulative Mortality Rate
Year1 Year 2
50 100 = 3.3% = 7.5%
1,500 1,325
0 150 = 0.0% = 6.0%
3,ooo 2,500
150 150 = 3.0% - = 4.1%
5ooo 3,675
0 200 = 0.0% = 2.Im
10,ooo 10,ooo
Summary of Results Year1 Year2
200 600 = 1.00% = 3.43%
No00 17,500
= 1.00% = 4.40%
The two-year cumulative mortality rate is calculated by:
1 - (2900 x .9657] = 4.40%
Note that the mortality rate is a value-weighted rate in the particular year after issuance, rather than an unweighted average. If we were to simply average each of the year one rates in Tmble 5, our results would be susceptible to significant specific year bias. If, for example, the amount of new issues is very small and the defaults emanating from that year are high in relation to khe amount issued, the unweighted average could be improperly affected. Our weighted-average technique biases the results toward the larger-issue years, especially the more recent years.
162

. . :
V: Empirical Results ‘Gble 6 lists the dollar amount, by bond rating, issued for the period 1971-1985 according to statistics compiled from Standard & Poor’s Bond Guide.“’ Note that investment-grade categories dominated new listings over much of the sample period. During the 1971-1981 period, the high-yield sector showed small, relatively consistent BB issues ranging from a low of $6 million in 1975 to a high of $579 million in 1977. Since 1982, however, BB new issues exceeded $1 billion each year. Single-B debt had small, sporadic new issues from 1971-1976. Since 1977, however, volume has picked up with more than $500 million issued in 1977; more than $1 billion issued in 1978; and more than $6 billion in 1984-1985. Non-rated debt was not included in our formal analysis because the risk nature of those issues appears to have shifted over the years with the most recent data probably dominated by low-rated equivalent securities. The earlier non-rated debt data appear to have included all risk types.
The data in ‘Able 7 include our mortality rate computations, &justed for redembtions and defaults, for the entire period 1971-1986. The data include individual year and cumulative mortalities for up to 10 years after issuance. It is possible to list the data for beyond 10 years but the number of observations obviously diminishes as the number of years after issuance increases.”
10 For a comparison with data compiled by Richard Wilson based on Moodyspubkations, see R. Wilson, (1987’), p. 10.
I* We have only included results for five years for CCC-rated debt since new issues in this category were essentially non-existent prior to 1982.
163
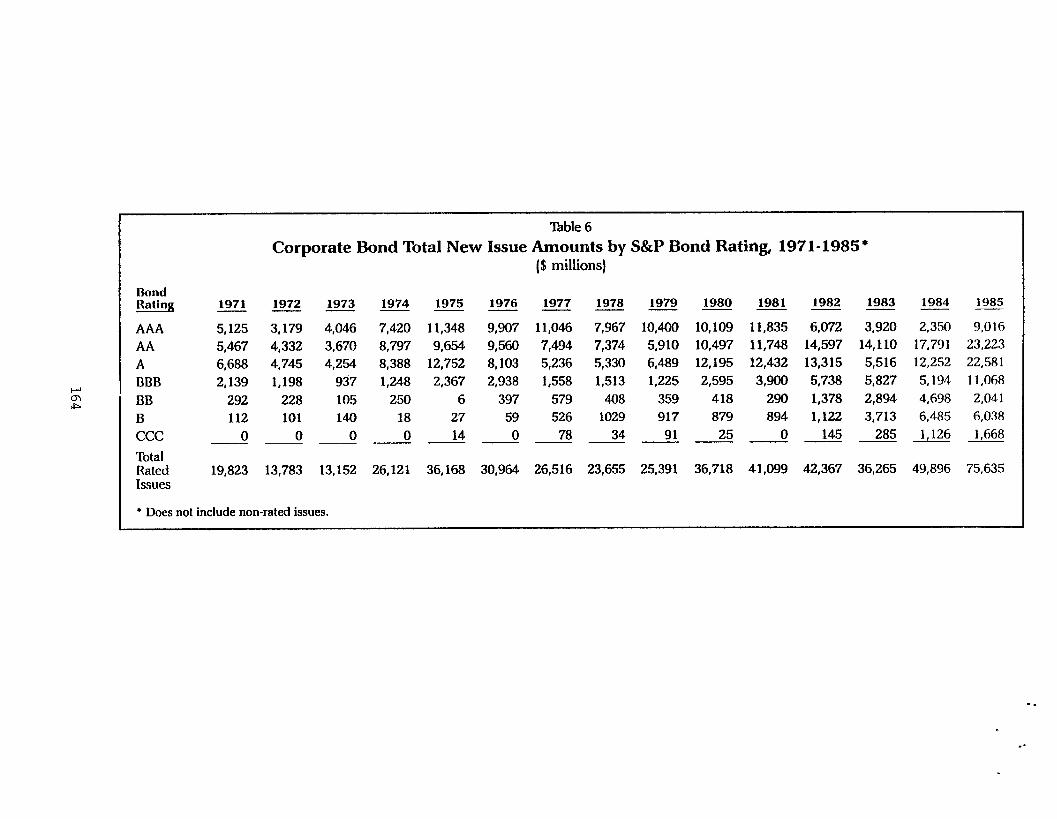
kmd Rating
AAA AA A BBB BB B ccc
Total Rated Issues
l’bble 6
Corporate Bond Total New Issue Amournts by S&P Bond Rating, 1971-1985 * ($ m illions)
1971 1972 --
5,125 3,179 5,467 4,332 6,688 4,745 2,139 1,198
292 228 112 101
0 0 --
19,823 13,783 13,152 26,121 36,168 30,964 26,516 23,655 25,391 36,718 41,099 42,367 36,265 49,896 75,635
1973 1974 1975 1976 1977 1978 1979 1980 1981 1982 1983 1984 3985
4,046 7,420 11,348 9,907 11,046 7,967 10,400 10,109 11,835 6,072 3,920 2,3!iO 9,016 3,670 8,797 9,654 9,560 7,494 7,374 5,910 10,497 11,748 14,597 14,110 17,791 23,223 4,254 8,388 12,752 8,103 5,236 5,330 6,489 12,195 12,432 13,315 5,516 12,252 22,581
937 1,248 2,367 2,938 1,558 1,513 1,225 2,595 3,900 5,738 5,827 5,194 11,068 105 250 6 397 579 408 359 418 290 1,378 2,894 4,698 2,041 140 18 27 59 526 1029 917 879 894 1,122 3,713 6,485 6,038
0 0 14 0 78 34 91 25 0 145 285 1,126 1,668
l Does not include non-rated issues.

l%ble 7 Adjusted* Mortality Rates by 0rigina.l S&P Bond Rating
Covering Defaults and Issues from 1971-1986
origird Years After Issuance Rating 1 2 3 4 5 6 7 8 9 10 -----P---v
liAA Ymly 0.00% 0.00% 0.00% 0.00% 0.00% 0.00% 0.00% 0.00% 0.00% 0.00% Cumulative 0.00% 0.00% 0.00% 0.00% 0.00% 0.00% 0.00% 0.00% 0.00% 0.00%
AA Yearly 0.00% 0.00% 0.00% 0.00% 0.00% 0.00% 0.00% 0.00% 0.00% 0.00% Cumulative 0.00% 0.00% 0.00% 0.09% 0.09% 0.09% 0.09% 0.09% 0.23% 0.23%
A Yearly 0.00% 0.00% 0.00% 0.00% 0.00% 0.07% 0.14% 0.00% 0.04% 0.00% Cumulative 0.00% 0.00% 0.00% 0.00% 0.00% 0.07% 0.22% 0.22% 0.26% 0.26%
BBB YearIy 0.06% 0.35% 0.22% 0.00% 0.55% 0.00% 0.18% 0.00% 0.24% 0.93% Cumdative 0.06% 0.41% 0.64% 0.64% 1.18%~ 1.18% --i-36% 1.36% 1.60% 2.51%
'_ BB Yaly 0.00% 0.93% 0.75% 0.50% 0.48% 3.81% 0.00% 0.00% 0.00% 0.00%
Cumulative 0.00% 0.93% 1.67% 2.15% 2.63% 6.34% 6.34% 6.34% 6.34% 6.34%
B Yearly 0.82% 1.82% 0.48% 6.36% 2.40% 5.54% 2.54% 4.78% 9SO% 3.93% Cumulative 0.82% 2.62% 3.09% 9.26% 11.43% 16.34% 18.47% 22.36% 29.43% 32.21%
* cc Yearly 7.69% 6.21% 8.50% 0.00% 1.74% NIA N/A N/A NIA T, NIA
Cumulative 7.69p 13.42% 20.78% 20.78% 22.16% N/A N/A N/A N/A .NIA
* Adjusted for changes in population [cohort groups) due to defaults, calls and sinking fund redemptions.
N/A = Not Applicable
The relative results across cohort groups are pretty much in line with expectations, with the mortality rates very low for the higher-rated bonds and increasing for lower-rating issues. For example, AAA-rated debt had a zero mortality rate for the entire sample period and AA-rated and A-rated debt reached just 0.23% and 0.26% respectively over a 10 year perki.12 The mortality rates for BBB and lower bonds begin to increase almost immediately after issuance, with BBB (the lowest investment-grade debt level) showing a cumulative rate of 1.18% after five years and 2.51% after 10 years.
12 These results will change when we update for 1987 default data since the giant Texaco Co.3 debt structure had five (5) A.,%4 original issue ratings and many AA levels. Those categories will therefore show higher mortality rates.
165

. :
The surprise for many readers perhaps will be the relatively high single-B mortality rates throughout the period and particularly in the later years. There are many reasons for that, but despite the high cumulative mortality rates, the net return to investors in B-rated bonds remains quite attractive. For one thing, single-B-rated debt had relatively small issue amounts throughout the 1970’s, and when we calculate mortality rates for 10 years after issuance, the number of observations is quite small. For example, years 1971-1977 are the only years contributing to our lo-year results; 1971-1978 to nine-year results, and so on. Hence, we emphasize that the longer-term mortality results should be analyzed with considerable caution. Future updates will provide more confident results.
The results for five years after issuance do provide for more observations, but they too lack results for new issues in the most recent, high-growth years (1982-1986). The five-year cumulative rate of 11.4% for B-rated debt might also be considered to be surprisingly high, but is it really? Consider that the average annual default rate calculated in the traditional way is 1.78% per year for the period 1977-1986 (Table 1 above). If we simply add-the one-year rates, the result is 8.85% for five years compared with the CMRs of 1 1.4%.13 As for the six to ten year resuits, only time will te)l if the relatively large marginal one year rates for the sixth and ninth years continue in the future.‘”
Losses As in the previous discussion on traditional measurements of default, the loss to investors from defaults is of paramount importance. In our ensuing analysis of net return spreads for each category of bond rating, we assume that the investor was able to sell the defaulting issue for 40% of par and that one coupon payment was also lost. with respect to the mortality losses, simply multiplying the rates listed in ‘Iable 7 by 0.6 (the assumed loss of principal percentage) would give a rough estimate.
We did look at the relation between individual bond ratings at issuance and the subsequent average price that could be realized upon default and found essentially that no relationship existed. Table 8 lists those results and shows that the average retention rate was actually 38.9%. BBB-rated bonds registered the highest recovery (48.7%, for 17 observations), non-rated debt registered a 30% rate, and CCC’s posted a 34.2% rate. Note, however, that there is vhtually no correlation between initial bond rating and average price after default.
There also does not appear to be a strong correlation between the price after default and the number of years that a bond is in existence before default. The data are hated in ‘Iable 9 and have a correlation of r = -.07.
13 The traditional default rates are calculated on the basis of the population on June Xl (‘Ikble l), while the mortality rates use survival population data from the start of each year. Therefore, the “old” way understates default rates somewhat.
14 If we begin our analysis in 1976, rather than in 1971, the five-year B-rated cumulative rate is slightly higher at 11.7%; the eight-year rate is 24.2%; and the lo-year rate is 38.5%. The latter is due to the relatively high nine and ten-year defaults of 1977 new issues ($85.5 million and $26.7 million respectively from the $526 million issued).
166
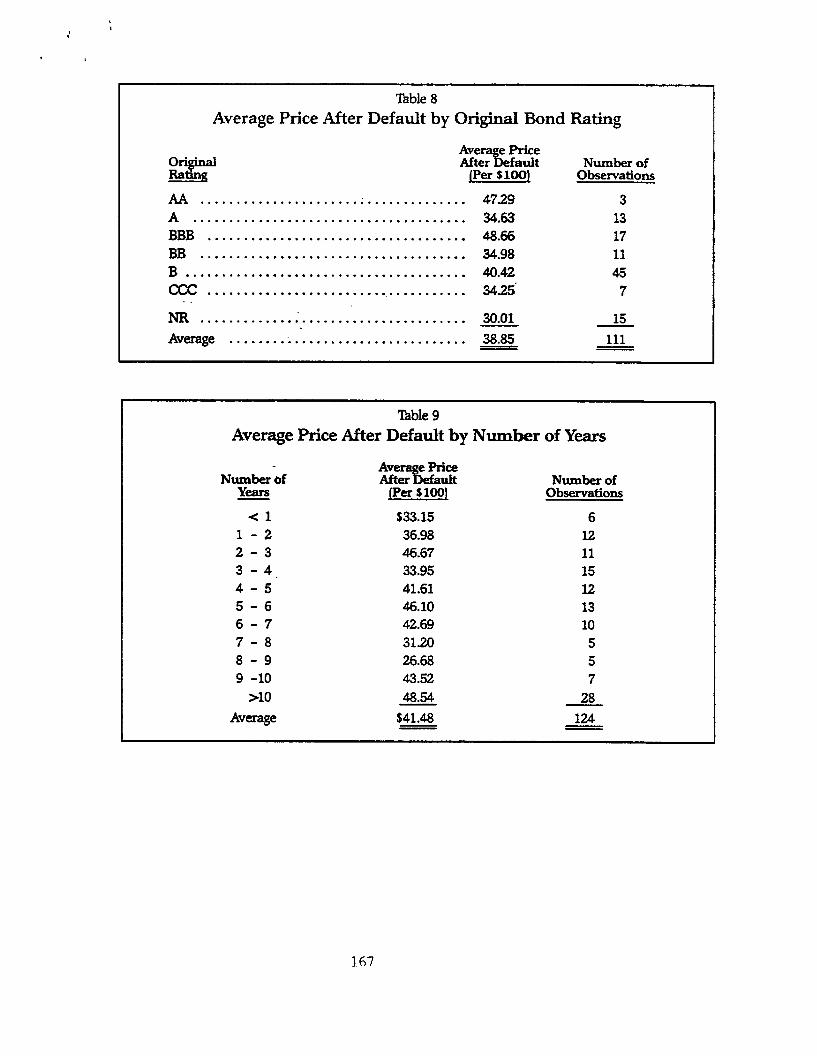
‘able 8 Average Price After Default by Original Bond Rating
Avera e Price Ol-ipld After be fault RaturR JPer SlOOl
M . . . . . . . . . . . . . . . . . . . . . . . . . . . . . . . . . . . . . 47.29 A . . . . . . . . . . . . . . . . . . . . . ..a*............. 34.63 BBB . . . . . . . . . . . . . . . . . . . . . . . . . . . . . . . . . . . . 48.66 BB . . . . . . . . . . . . . . . . . . . . . . . . . . . . . . . . . ..a. 34.98 B . . . . . . . . . . . . . . . . . . . . . ..*a.....*....*... 40.42
. . . . . . . . . . . . . . . . . . ..*a............... 34.25 . NR . . . . . . ..I..................*......... 30.01 Average . . . . . . ..i........................ 38.85
Numberof Observations
3 13 17 11 45
7
15
111
‘Bible 9 Average Price After Default by Number of Years
Numberof YearS
Number of Observations
tl 1 -2 2-3 3 - 4. 4-5 5-6 6-7 7-8 8-9 9 -10
>lO Average
$33.15 6 36.98 12 46.67 11 33.95 15 41.61 12 46.10 13 42.69 10 31.20 5 26.68 5 43.52 7 48.54 28
$41.48 124
167

Net Retum Performance The bottom line to this discussion is the ability to track performance of bonds from issuance over relevant time horizons and to use this information to assess current investment opportunities. In order to do that effectively we can compare the performance of various risky bond categories with default risk free U.S. Treasury securities. By factoring into the analysis losses from defaults (based on our cumulative mortality rate and recovery statistics], and yield spreads earned over Treasuries, a more complete analysis can be made.
We have simulated return-spread performance under two scenarios, but the algorithm used is sufficiently robust to handle any set of assumptions on the variable analyzed. ‘lbble 10 presents return spread results under the following assumptions:
The bcdy of the table represents returns reahzed above what would have been earned on risk-free Treasuries, measured in dollars per $100 of investment. Table 10 assumes a long-term Treasury coupon rate of 8.75% yield, spreads at bii for the different rating categories, the sale of defaulted debt at 40% of par value, the loss of one coupon payment, and the reinvestment of cash flows at the same interest rate for that bond rating group. Cash flows are reinvested from coupon payments on the surviving population including reinvestment of sinking funds, calls, and 40% of defaulted debt. The results assume that interest rates do not change over the measurement period and the investor follows a buy-and-hold strategy for thevarious horizons.
168

a
.
‘Ihble 10
Expected Return Spread on Net Investment’ in Corporate Bonds Over Risk Free Government Bonds
Bond Rating at Issuance AA A BBB BB B ccc
Yeaps After Yield Spread
Iasuane 0.5% 1.0% 1.5% 2.0% 3.0% 4.0% 5.0%
0.0 $0.00 $0.00 siuxl $0.00 SO.00 $0.00 $0.00 0.5 0.25 0.50 0.75 0.98 1.50 1.73 -0.07 1.0 0.52 1.05 1.57 2.06 3.15 3.64 -0.15 1.5 0.82 1.64 2.47 3.13 4.63 5.37 0.31 2.0 1.14 2.29 3.45 4.30 6.24 7.26 0.80 2.5 1.49 3.00 4.52 5.63 8.08 9.90 0.43 3.0 1.87 3.76 5.68 7.08 lo.@ 12.80 0.02 3.5 2.28 4.55 6.94 8.75 12.39 13.20 3.26 4.0 2.72 5.41 8.30 10.57 14.90 13.61 6.85 4.5 3.20 6.38 9.79 12.28 17.64 16.07 9.99 5.0 3.72 7.42 11.39 14.12 20.63 18.70 13.43 5.5 4.27 8.55 13.09 16.41 21.96 19.80 6.0 4.87 9.77 14.92 18.90 23.36 20.95 6.5 5.5; 11.08 16.85 21.48 27.24 24.05 7.0 6.20 12.49 18.94 24.26 31.46 27.39 7.5 6.95 14.01 21.28 27.38 36.04 29.46 8.0 7.74 15.65 23.79 30.76 41.01 31.66 8.5 8.60 17.30 26.47 34.21 46.39 30.70 9.0 9.51 19.08 29.35 37.93 52.23 29.61 9.5 10.49 21.09 32.48 41.36 58.54 32.62
10.0 11.54 23.25 35.83 45.03 65.36 35.84
l Net Investment adjusted for cumulative mortality rate-s, calls and sinking fund redemptions. Assume sale of defaulted debt at 40% of par, plus loss of one coupon payment. Assumes coupon rate on Government bonds of 8.75%. Returns are expressed in dollars per $100 of investment.
169

Chart I
Expected Return Spread on Net Investment in Corporate Bonds Over Risk Free Governments’
Return Spread (per $100 Bond) $80
$60 -
$40 -
$0 0 1 2 3 4 5 6 7 8 Q 10
Years After Issuance
1. Assumed coupon rate of 8.75% on risk free government bonds. Source: Table 10; assume normal yield spreads.
Our initial results are based on what we consider to be a reasonable estimate of yield spreads under fairly normal market conditions (%ble 10) and under the larger spreads that followed the problems of the high-yield bond market in the period after October 19, 1987 (&ble 11). For example, the “normal” scenario (Table 10) assumes yield spreads of 0.5, 1.0, 1.5, 2.0, 3.0, 4.0, and 5.0 percent for ratings from AAA to CCC. Results show that A&i-rated bonds can be expected to earn $0.52 (per $100 investment) more than Treasuries over one year (two semi- annual coupon payments) and % 11.54 after 10 years. BB-rated bonds eam $3.15 after one yq and an impressive $65.36 more than ‘IYeasuries after 10 years. Again, our results assume a buy- and-hold strategy for the various holding periods and no change in interest rates over that horizon, i.e., no capital gains or 10sses.~~
Of interest is that for the fist four years after issuance, the lower the bond rating the higher the net return spread, with single-B-rated bonds doing best. That does not hold for the CCC category which does relatively poorly assuming a 5.0% yield spread and our calculated mortality losses. After the fourth year, however, the BB-rated category begins to dominate, while the B-rated bonds lose ground. That crossover is also illustrated in Chart I. For virtually all holding periods, all bonds do well and have positive spreads over Treasuries.
*5 An alternative format for demonstrating our results is to show the breakeven yield spread necessaq to equate returns between each rating class and Treasuries.
170
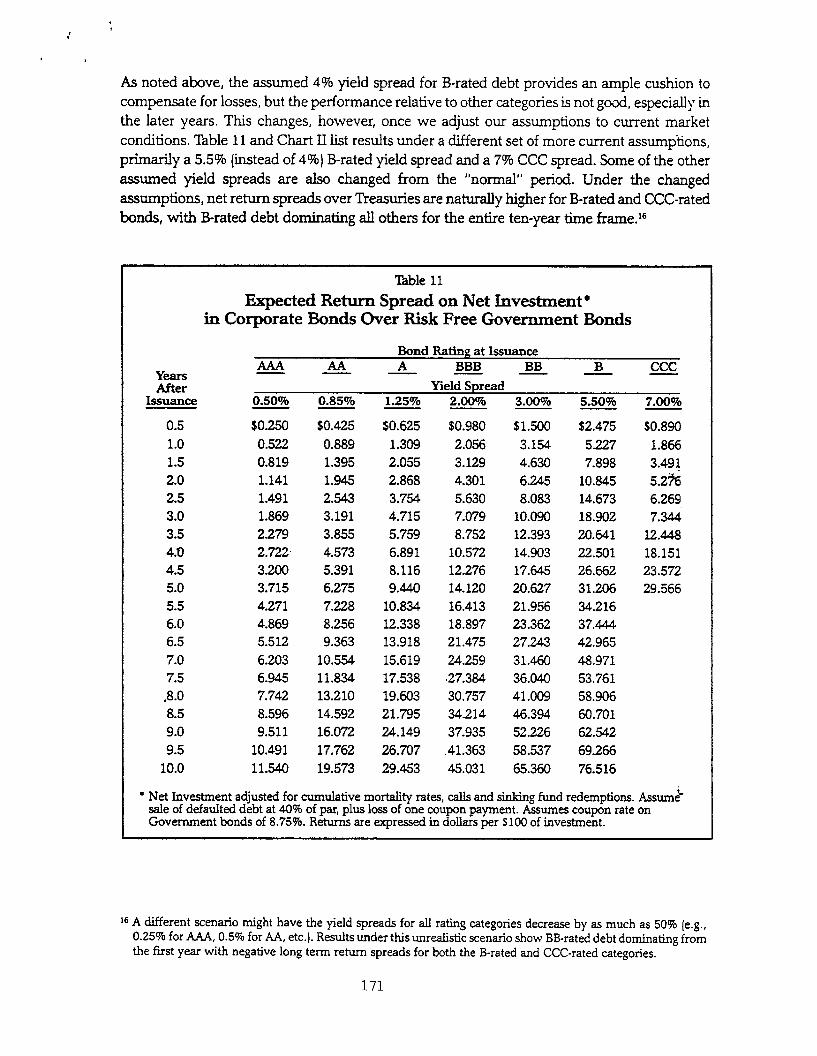
As noted above, the assumed 4% yield spread for B-rated debt provides an ample cushion to compensate for losses, but the performance relative to other categories is not good, especially in the later years. This changes, however, once we adjust our assumptions to current market conditions. %ble 11 and Chart II list results under a different set of more current assuxrqtions, primarily a 5.5% (instead of 4%) B-rated yield spread and a 7% CCC spread. Some of the other assumed yield spreads are also changed from the “normal” period. Under the changed assumptions, net return spreads over Treasuries are naturally higher for B-rated and CCC-rated bonds, with B-rated debt dominating alI others for the entire ten-year time frame.16
lhble 11
Expected Return Spread on Net Investment l
in Corporate Bonds Over Risk Free Government Bonds
Bond Rating at Issuance AA
Years A BBB BB B CCC
After Yield Spread IsSUanCe 0.50% 0.85% 1.25% 2.00% 3.00% 5.50% 7.00% - P - P - - -
0.5 $0.250 $0.425 $0.625 $0.980 $1.500 $2.475 $0.890 1.0 0.522 0.889 1.309 2.056 3.154 5.227 1.866 1.5 0.819 1.395 2.055 3.129 4.630 7.898 3.491 2.0 1.141 1.945 2.868 4.301 6.245 10.845 5.2% 2.5 1.491 2.543 3.754 5.630 8.083 14.673 6.269 3.0 1.869 3.191 4.715 7.079 10.090 18.902 7.344 3.5 2.279 3.855 5.759 8.752 12.393 20.641 12.448 4.0 2.722. 4.573 6.891 10.572 14.903 22.501 18.151 4.5 3.200 5.391 8.116 12.276 17.645 26.662 23.572 5.0 3.715 6.275 9.440 14.120 20.627 31.206 29.566 5.5 4.271 7.228 10.834 16.413 21.956 34.216 6.0 4.869 8.256 12.338 18.897 23.362 37.444 6.5 5.512 9.363 13.918 21.475 27.243 42.965 7.0 6.203 10.554 15.619 24.259 31.460 48.971 7.5 6.945 11.834 17.538 .27.384 36.040 53.761
,8.0 7.742 13.210 19.603 30.757 41.009 58.906 8.5 8.596 14.592 21.795 34.214 46.394 60.701 9.0 9.511 16.072 24.149 37.935 52.226 62.542 9.5 10.491 17.762 26.707 .41.363 58.537 69.266
10.0 11.540 19.573 29.453 45.03 1 65.360 76.516
l Net Investment adjusted for cumulative mortality rates, calls and sinking fund redemptions. Assume! sale of defaulted debt at 40% of par, plus loss of one coupon payment. Assumes coupon rate on Government bonds of 8.75%. Returns are expressed in dollars per $100 of investment.
16 A different scenario might have the yield spreads for all rating categories decrease by as much as 50% [e.g., 0.25% for AAA, 0.5% for AA, etc.). Results under this unrealistic scenario show BB-rated debt dominating from the first year with negative long term return spreads for both the B-rated and CCC-rated categories.
171
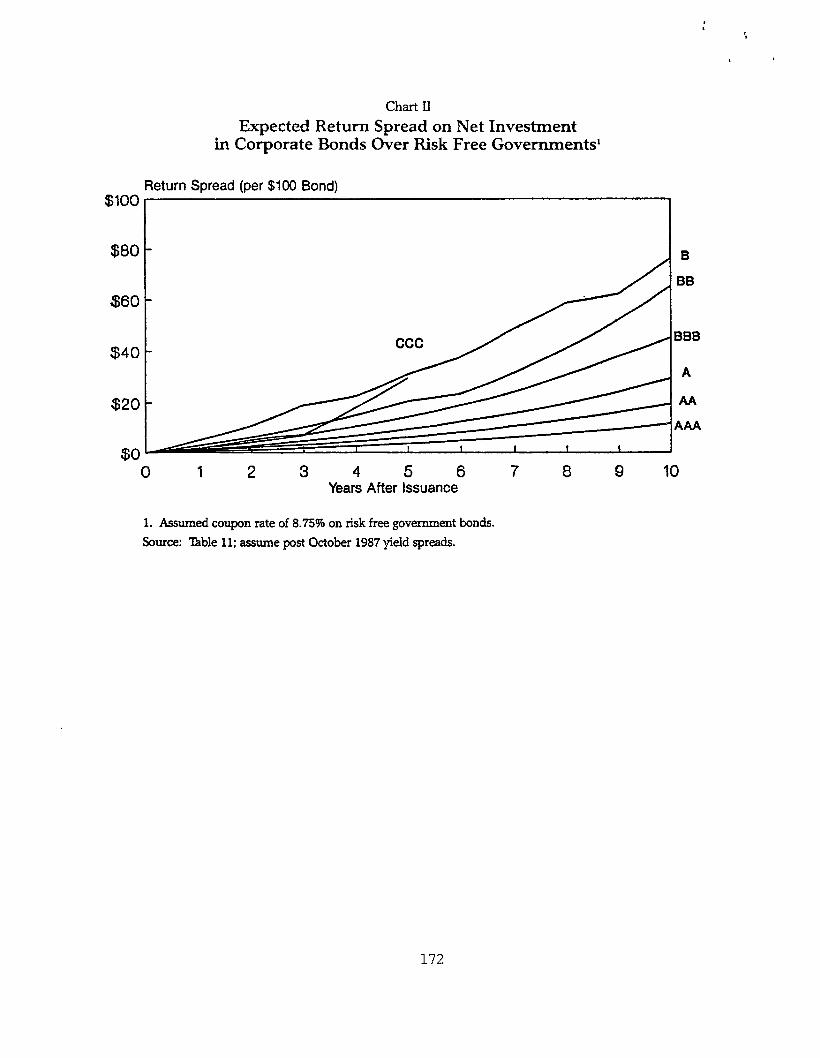
Chart II Expected Return Spread on Net Investment
in Corporate Bonds Over Risk Free Government9
Return Spread (per $100 Bond) $100
$80 -
$60 i
BB
$40
t
$20
en QU
0 1 2 3 4 5 6 7 8 Q 10 Years After issuance
1. Assumed coupon rate of 8.75% on risk free government bonds. Source: l’hble 11; assume post October 1987 yield spreads.
172
VI. Implications To summarize, the results indicate the expected adjusted mortality rates and losses, cumulated for a number of years after issuance, for various bond-rating categories. Despite somewhat higher-than-expected cumulative mortality rates over long holding periods, return spreads on all corporate bonds are positive, with impressive results for the high yield categories. That is even more the case under post-October 19, 1987 interest-rate conditions, when historic cumulative mortality rates are used. If the analyst wishes to use higher (or lower) than historic mortality rates to reflect a number of macro and micro-economic uncertainties, that is certainly feasible in our simulations.
An example of the kind of investment strategy a portfolio manager might use on the basii of these data follows. Fist, an investigation can be done on the existing portfolio held, especially with respect to the proportion of securities held in each bond-rating c&gory and the number of years that the issues have aheady existed. From that information, an expected future mortality rate on the portfolio and on each issue, could be constructed. The assumption must be made that a particular current bond rating on an issue implies the same risk of default whether it was originally issued at that bond rating or whether the rating has changed over time. Rating agency representatives would certainly agree with that assumption.
Why do we observe such relatively consistent positive return spreads for all rating atcgories? Given our assumptions, the implication is that investors have been more than satisfatiorily compensated for investing in high-risk securities. Indeed, if expected default losses amfully discounted in the prices (and yields] of securities, our return spread results should be insignificantly different from zero over any holding period. The fact that the spreads are so positive has a number of possible explanations-none of them easily corroborated.
One possible explanation is that the fixed-income market has been n6spricing corporate issues in relation to ex-ante vs. ex-post spreads and the discrepancy has pen&ted, perhaps because of the lack of appropriate information. That implies market inefficient which is both hard to prove conclusively and not very satisfying to certain market theorists and even to some practitioners. If, however, default losses are consistently lower than return spreads and this comparison is the only relevant determinant of future yield spreads, inefficiency is a reasonable conclusion.
If all other things are not equal for dete mining yield spreads on corporate bonds, then the Illiirket inefficiency conclusion is difficult to reach. For example, liquidity risk is often mentioned as important to price determination. If liquidity risk increases with lower bond ratings, then the excess returns noted earlier may in part be the returns necessary to bear the liquidity risk. Indeed, during the post-October 19,1987 period, poor liquidity was cited as one cause of the precipitous drop in common-stock prices and the rise in y5elds of certain high yield debt issues.
173

The fmal risk element that is not isolated in our study is interest-rate or reinvestment risk. Actual returns on bonds are obviously affected by interest-rate changes. Although our simulations assume no change in interest rates over time and, therefore, no capital gains or losses, the actual interest-rate environment is extremely volatile and affects returns in the direction that would generally be expected. The price fluctuations perhaps have, in the past, clouded the effect of default losses and liquidity conditions on returns on high-risk bonds, especially on lowerquality issues.
Another explanation of the persistent positive return spreads attributed to lower-rated bonds is the variability of retention values after default. Our assumption of a selling price of 40% of par value just after default is an expected value. Investors might require positive spreads based on the possibility that retention values will be below the 40% average. In addition, the 40% retention is relevant only for a portfolio of defaulting bonds. An investor may not be well diversified and may be vulnerable to higher-than-average mortality losses on specific issues. Therefore, if the market prices low-quality issues as individual investments and not as portfolios, required spreads are likely to be higher than is perhaps necessary
Investors might al&be restricted in relation to the risk class of possible investments, thereby creating an artificial barrier to supply-demand equilibrium. For instance, certain institutions are prohibited from investing in low-grade bonds or are limited in the amount that they can invest in such securities. That reduces demand and inflates yield and return spreads.
Other, more qualitative reasons, cited by practitioners for obsenred positive-return spreads are that issuers have been very optimistic about what they could earn on their new investments, especially leverage buyouts, and have been willing to pay relatively high rates. Also, the bigh- yield market is still relatively young in comparison with the market for high-grade issues and must offer very attractive yields to secure capital. Nevertheless, that does not explain the positive return spreads across all rating categories.
The old cliche that “only time will tell” is perhaps appropriate with respect to our risk and return analysis. So far, high-yield bond investments have resulted in very attractive returns.
174
References Edward 1. Aitman, “Financial Ratios, Discriminant Analysis and the Prediction of Corporate Bankruptcy”, journ& oiFinance,.@eptember 1968), 589-609.
Edward I. Altman, Robert Haldeman & E Narayanan, “ZETA AnaIysis: A New Model To Identify Bankruptcy Risk of Corporations”, /oumd of Banking & Finance, 1, (June 1977), 29-54.
Edward I. Ahman and Scott A. Nammacher, “The Default Rate Experience on High Yield Corporate Debt”, Morgan Stanley & Co., Inc. March 1985 and FinancialAnalysts]ournal, July- August 1985.
Edward I. Altman, Lnvesting Ln Junk Bounds: Inside the I-ligh Yield Debt Market, John Wiiey N.Y., 1987.
TR. Atkinson, Z?ends in Corporate Bond Quality National Bureau of Economic Research, N.Y. (1967).
Wii Beaver, “Financial Ratios as Predictors of Failure”, in Empirical Research in Accounting, selected studies, 1966 supplement to the journal ofAccounting Research, January 1967, 71-111.
Marshall E. Blume and Donald B. Keim, ‘Risk and Return Characteristics of Lower Grade Bonds”, Financial Analysts]ournal, UuIy-August 1987), 26-33.
Louis H. Ederington and Jess B. Yawitz, “The Bond Rating Process”, Section 23 in Handbook of Financial Markets and Institutions, Sixth Edition, E. A&man editor, John Wiley & Sons, N.Y., 1987.
John D. Fitzpatrick and J.T. Severiens, “Hickman Revisited: The Case for Junk Bonds”, The Journal of Portfolio Management V 4, No. 4, (Summer 1978).
Lawrence Fisher, “Determinants of Risk Premiums on Corporate Bonds”, /our& of Political Economy 67, (June 1959),217-237.
Jerome S. Fans, “The Default Premium and Corporate Bond Experience”, Journal of Finance, (March 1987), 81-97.
Martin S. Fridson, Fritz WahI and Steven B. Jones, “New Techniques for Analyzing Default Risk”, High Perfomance, January 1988.
HaIina Frydman, Edward I. Ahman and Duen-Li Kao, “Introducing Recursive Partitioning Analysis to Financial Analysis: The Case of Financial Distress Classification”, /ournal of Finance, (1985), 269-291.
W. Braddock Hickman, Corporate Bond Quality and Investor Expen’ence, Princeton: Princeton University Press and the National Bureau of Economic Research, 1958.
175

:
Jeffrey H. HiIl and Lawrence A. Post, The 1977-78 Lower Rated Debt Market: Selectivity High Yields Opportunity Smith Barney Harris Upham & Co., (December 1978).
James OhIson, “Financial Ratios and Probabilistic Prediction of Bankmtptcy”, Joumal of Accounting Research, (Spring 1986), 109-131.
Maggie Queen and Richard Roll, “Firm Mortality: Using Market Indicators to Predict SurvivaI”, Financial Analysts Journ&, (May-June 1987), 9-26.
James Scott, Jr., “The Probability of Bankruptcy: A Comparison of Empirical and Prediction Models”, Joumd of Banking and Finance, (September 1981), 317344.
Jerrod W Wilcox, “A Gamblers Ruin Prediction of Business Failure Using Accounting Data,” Sloan Management Review, Y 12, No. 3, (September 19711, l-10.
Richard S. Wilson, Corporate Senior Securities, Probus Publishing Co., Chicago, Illinois, 1987.
176

APPENDIX V
COMMENTS SUBMITTED BY GAIL HESSOL, MANAGING DIRECTOR, STANDARD AND POOR'S CORPORATION
APPENDIX V
177
.
Standard & Poor’s Corporation 25 Broadway, New York. New York 10004
Gail I. Hess01
industrial Ratings 2121208-7831
COMMENTS ON THE NATURE OF THE
MARKET FOR HIGH YIELD BONDS
FOR: The U.S. General Accounting Office File No. 233203
SUBMITTED BY: Gail I. H&ssol, Managing Director, Standard & Poor's Corp.
February 18, 1988
178

Standard 4 Poor’s Corp. currently rates the debt of approximately 615 speculative grade bond issuers, of which 500 are U.S. industrials (see Appendix 1). These rated bonds cons.titute an estimated 97% of all SEC-registered, outs tanding low qua1 ity bonds. As a matter of policy, (see Appendix 2) S&P generally rates all new, SEC-registered corporate bond issues of at least $10 million: Privately placed (unregistered 1 issues are rated only on request; and to date, SGP has received relatively few rating requests for speculative grade private placements.
RATING DEFINITIONS :
S&P’s debt rating definitions are attached as Appendix 3. Ratings from l’AA.A” through tfBBB-V* are considered “investment grade” and ratings from rtBB+t’ through “C’ are ftspeculative grade”, commonly called junk. The t’D’* rating is reserved for issues in default.
Our ratings primarily evaluate the likelihood of default - the obliger’s capacity and willingness to make timely debt service payments. A secondary consideration is the bondholder’s potential for ultimate recovery of principal and interest following bankruptcy. The debt rating is not a recommendation to purchase, sell, or hold a security, inasmuch as it does not comment, as to market price or suitability for a particular investor . The ratings are based on current information furnished by the issuer or obtained by SGP from other sources it considers reliable. S&P does not perform an audit in connection with any rating and may, on occasion, rely on unaudited financial information. The ratings may be changed, suspended, or withdrawn as a result of changes in, or unavailability of, such information, or for other circumstances.
The concept of an implied senior debt rating is critical to the iflt erpretat ion of SIP’s ratings. This is particularly so in the junk bond sector, which is largely a subordinated debt universe. S&P rates specific debt securities rather than overall credit-worthiness, and generally assigns different ratings to debt securities of a single issuer based on their relative ranking in liquidation or bankruptcy. The
179

1 ikelihood of default, however, is virtually the same for all debt securities of a single issuer, and is indicated by the senior rating. Likewise, senior debt of one issuer may be rated the same as subordinated debt of another, although the risk of default for the first is higher. For instance , the “B” senior debt rating assigned to Macy Credit Corp. conveys significantly greater risk of default than the 9” subordinated debt rating assigned to Control Data, even though the ratings are ident ical.
If senior debt is not rated, an implied senior rating is determined. If the actual or implied senior debt rating is speculative, namely “BB+” or lower, subordinated debt, with few exceptions, will be rated two designations below the senior rating. Ratings shown in Appendix 1 represent actual or implied senior debt ratings.
Unrated bonds are not necessarily speculative grade quality. The absence of a rating on a particular bond issue is not a reflection of the issue’s or issuer’s credit quality. It simply indicates that no rating has been requested, that there is insufficient information on which to base a rating, or. that S&P does not rate a particular obligation as a matter of policy. Most unrated, privately placed, corporate debt and most unrated commercial paper could be rated by S&P if the issuer requested a rating.
CREDIT QUALITY SPECTRUM AND TRENDS:
The debt of most rated American corporations, excluding utility, financial and transportation businesses, falls into speculative grade. Table 1 shows the current (actual or implied) senior debt rating distribution for U.S. industrial companies. l’Bfr is the largest category, accounting for 35% of the total and 60% of industrial junk bond issuers. ‘fCCCf rated companies outnumber the ffAAAffs by a wide margin. This distribution is based on the number of issuers. If calculated by the value of outstanding debt, the investment grade categories would predominate.
180
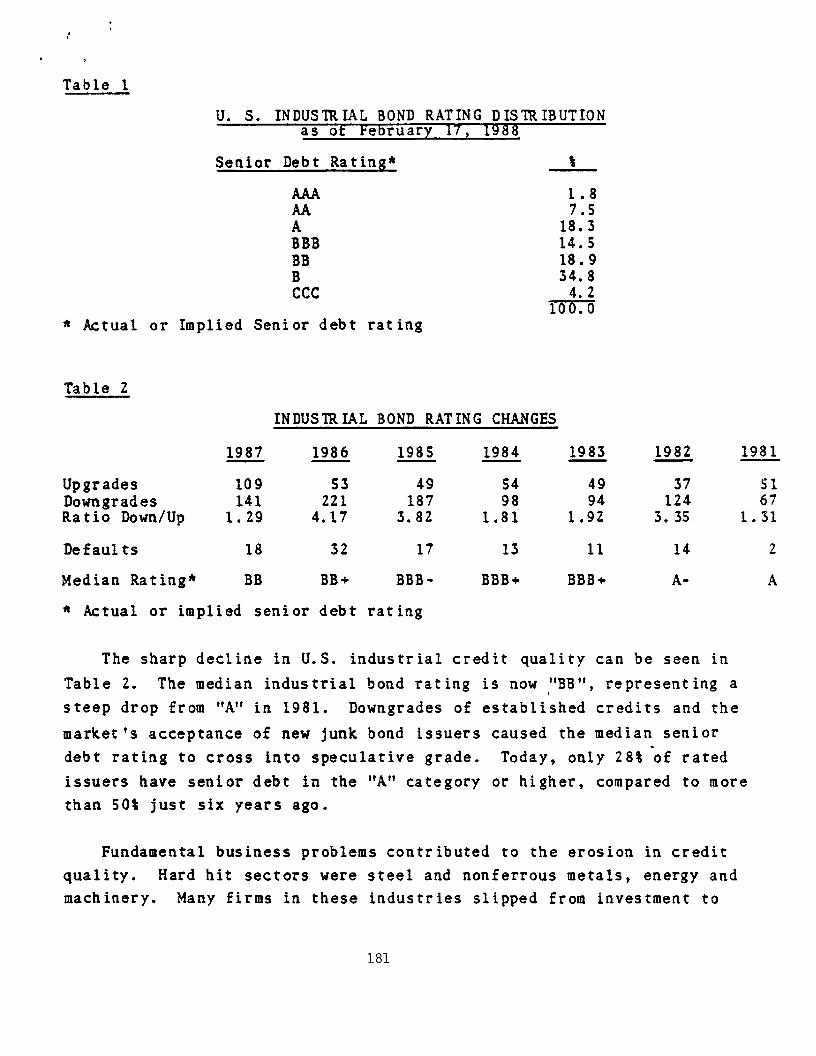
Table 1
U. S. INDUSTRIAL BOND RATING DISTRIBUTION as of February II, 1988
Senior Debt Rating*
f
BBB BB B
%
1.8 18.3 7.5
14.5 18.9 34.8
ccc * Actual or Implied Senior debt rating
Table 2
INDUSTR IAL BOND RATING CHANGES
1987 1986 1985 1984 1983 1982 1981
Upgrades 109 53 49 54 49 37 51 Downgrades 141 221 187 98 124 67 Ratio Down/Up 1.29 4.17 3.82 1.81 1.49: 3. 35 1.31
Defaults 18 32 17 13 11 14 2
Median Rating* BB BB+ BBB -
* Actual or implied senior debt rating
BBB+ BBB+ A- A
The sharp decline in U.S. industrial credit quality can be seen in Table 2. The median industrial bond rating is now ,“BB”, representing a steep drop from “Aft in 1981. Downgrades of established credits and the market 3 acceptance of new junk bond issuers caused the median senior debt rating to cross into speculative grade. Today, only 28% ‘of rated issuers have senior debt in the “A” category or higher, compared to more than SO% just six years ago.
Fundamental business problems contributed to the erosion in credit quality. Hard hit sectors were steel and nonferrous metals, energy and machinery. Many firms in these industries slipped from investment to
181
speculative grade. However, deliberate management actions, including acquisitions and stock repurchases, caused about one-third of all industrial debt rating downgrades over the past five years.
The dwindling number of U.S. industrials with ffAAAft debt reflects the recognition that maintaining the top credit rating may be too’costly. The price of missed business opportunities may exceed the modest financing advantages afforded by an “AAA” or ffAA”. The Coca-Cola Co., Atlantic Richfield Co. and other string investment grade companies have adopted less conservative financial policies to promote new business strategies while preserving returns on equity.
The 1986 acquisition of Sperry Corp. by Burroughs Corp. is an attempt to combine complementary data processing operations and realize economies of scale in manufacturing and marketing. Debt leverage initially rose to 55%.60%, although asset disposals have permitted rapid payment of acquisition financing. Burroughs f (renamed Unisys Corp.) senior debt rating was lowered to ffBBBff from “A” at the time of the transaction, partly to reflect management’s willingness to tolerate more debt,. at least temporarily.
Acquisitions such as the Unisys transaction are outnumbered by +zorporate restructurings” offering more dubious strategic benefits. Indeed, many restructurings’ primary objectives are to provide an immediate reward for shareholders and to preserve corporate independence. Leveraged buyouts and recapitalitations, in which outstanding equity is repurchased with debt, often lead to severe drops in credit quality. Examples of two such downgrades are Safeway Stores Inc. ‘s senior debt rating falling to ffB+fr from “Aft and Colt Industries Inc. Is cut to ffBt’ f ram lrA+lt.
The availability of junk bond financing has surely fueled takeover activity as well as defensive actions to thwart hostile bids. Yet a vibrant junk bond market has also provided capital for plant expansion and internal growth. Junk bonds were instrumental in financing Atlantic City’s casino/hotels, a major new industry in the region. The cable
152
television industry has relied heavily on junk bonds to build new systems and finance consolidation of existing systems. Growth in the amount and percentage of speculative grade debt has been boosted by hundreds of companies entering the public debt market. These first -time issuers, especially from mid-1985 through mid-1987, often merited debt ratings at the lower end of the speculative grade category (“Bfl and fVCCC*r).
Although junk bonds are usually described as high-yield securities, many speculative grade bonds are low-yield convertible debt. Rapidly growing nigh technology companies are major issuers of converts, and most of this debt is rated speculative grade (see Appendix 4). Because investors have the potential to convert the bonds .into the issuer’s common s to&, convert yields are low and pricing largely tracks the performance of the underlying stock, rather than bond market indicators. For these reasons converts have been excluded from studies measuring junk bond risks and returns, even though converts represent a significant portion of the speculative grade universe.
MEASURING CREDIT RISK:
Measuring the risks and returns of junk bonds requires the pricing of bonds at various intervals over a de.fined period of time. Bond prices are largely determined by the coupon interest rate, maturity and the market *s estimate of future interest rate levels. The liquidity of the issue, call provisions and other factors can influe?ce pricing, too. Credit risk is just one key component of the pricing equation. And credit risk can be further divided into two components: default risk (will the issuer miss an interest or principal payment when due) and ultimate recovery (after a default, what portion of the total promised payment will the bondholder receive, and when).
In securities analysis the term rfriskff is often equated with price volatility, which is quite different from credit risk. Fixed income securities in general, and junk bonds in particular, do experience price
183

.
volatility. An investor can realize large gains or losses depending on the timing of his purchase and sale, regardless of whether the issue defaults.
Standard 4 Poor’s does not have the expertise to quantify returns on investment for junk bonds or to compare them to returns on other investments, such as (“risk-free”) U.S. Treasury bonds, high-grade corporate bonds, common stocks or loans extended by financial institutions (for which regular prices are not available). Nor can we fully evaluate studies prepared by others, e.g., Edward I. Altman and Marshall E. Blume. We do caution readers of these studies to recognize the nuances of l’risk’V and to carefully review the methodology for measuring returns. (Blume’s study measures the risk of price changes, rather than the risk of default.)
Default Rates: A bond default rate, in simple terms, is the ratio of defaults to outstanding bonds. It can be calculated in many ways with differing results. Each method has flaws.
The par value of defaulting bonds for a given period, usually one year, can be divided by the average par value of all outstanding bonds for that period. In some studies the numerator is only the difference between the par value and market value of the defaulting bonds at the time of default. This will produce a (lower) ratio which more closely approximates the possible loss experienced by an investor. Substantial losses on bonds that do not default but which are exchanged under duress for other securities are often-ignored in default rate studies.
Because defaults typically surface several years after the bond is issued, comparing defaults to total bonds outstanding at default understates the default rate in growth periods. This phenomenon occurred over the past decade. An alternate method, commonly used to measure losses on consumer loans, would deflate the denominator. This ratio measures losses to liquidations: the par value of defaulting bonds for
each year divided by principal payments made on all outstanding bonds during that period. Bullet maturities and sinking funds that begin late in an issue’s life would overstate the default rate in a growth period.
Unfortunately SGP does not have the computer tools or complete data to precisely quantify the appropriate denominator for any of these ratios. Hence, we have not published historical junk bond default rates, nor can we verify default rates published by others who have used our ratings in their analyses. (Most studies use a blend of ratings from S&P, other rating agencies and the authors’ judgement to determine which bonds are counted as speculative grade. >
Standard & Poor’s has been carefully tracking all corporate bonds rated by S&P which have defaulted since the beginning of 1972. Table 1 in Appendix 5 depicts all companies that defaulted on rated public debt from 1977 through 1987. With the exception of $175 million of Manville _ Corp. debt in 1982, all defaults were confined to the speculative grade sector. Junk bond defaults soared from $417 milllion in 1983 to $9.0 billion in 1987. This far outstrips the growth in outstanding junk bonds. By any measure, the junk bond default rate has been climbing since 1983.
Some would argue that the 1986 and 1987 totals are distorted by the large LTV and Texaco bankruptcies which are highlighted in the table’s footnotes. That reasoning provides little comfort for the holders of those ill-fated bonds. Moreover, we don’t view LTV, or Texaco as aberrations. S&P had always rated LTV’s debt speculative and at the time of default its senior debt was rated “CCC+“. Texaco’s senior debt had been rated ‘3” by S&P for 16 months prior to its default. Texaco was merely the largest company to seek the refuge of bankruptcy in order to escape a crushing non-debt liability. Several other solvent firms, including icianville have chosen this strategy since the bankruptcy laws were changed in 1979. This risk is always carefully weighed by S&P and incorporated in our ratings when appropriate.
185

Giant defaults may become more common simply because there are so many more companies with huge junk bond issues outstanding. The pioneering default studies, based on data from the 1920s to World War II, found a relationship between size and default risk. Big companies were Less likely to default. This theory should be applied gingerly in the current environment. Size is an advantage primarily if it enhances a firm’s business profile. Bankers today may be less willing to help a troubled credit just because the bank’s exposure is large. They would rather write off the bad loan now than postpone an inevitable loss. Moreover, many of the largest junk bond issuers have relatively little bank debt, and therefore have limited flexibility to restructure debt and avert a default.
As stated earlier, SIP debt ratings assess credit risk and only credit risk. Default risk is captured in the (actual or implied) senior debt rating while the potential for ultimate recovery, relative to the issuer’s most senior obligation, is reflected in the rating of junior debt. There is a clear correlation between S&P’s ratings and defaults,
Ratings and Defaults: SBP rat ings, in the aggregate, have accurately measured the likelihood of default. Table 3 in Appendix S summarizes the rating history for the 132 corporate issuers that defaulted since the beginning of 1972. Multiple obligations of a single issuer are counted as one senior debt rating. Because most of the defaulted issues were subordinated obligations, an implied senior debt ra+ting is used for those issuers whose senior debt was unrated.
At default, 70% of the issuers were rated t’CCCIV on a senior debt basis. One year prior to default, 27% were rated “CCC” and 33% were rated “Btl. S&P’s initial rating assignments to issues that ultimately defaulted were concentrated in the “BB” and ‘3” categories. Bonds originally issued as speculative grade accounted for more than two-thirds of the defaults. This evidence undermines claims that “original issue junk!’ is less risky than “fallen angel” bonds, which were downgraded to speculative from investment grade.
186
Out of an estimated 800 industrial, utility, and transportation issuers whose debt was rated “A” or higher since 1972, only 18 eventually went into default. This trend, however, should be extrapolated with care because many companies that were once highly rated have already experienced severe deterioration in credit quality as a result of massive acquisitions and stock repurchases. In fact, there may be discrepancies between the relative risk/reward of speculative and investment grade debt. Yields on investment grade debt of U.S. industrials may not provide adequate compensation for “event risk”, that is, the potential for a sudden and dramatic drop in credit quality (and bond values) resulting from an acquisition, leveraged buyout, or other corporate restructuring.
Debt ratings do incorporate an opinion about management’s willingness to assume financial risk, but it is impossible to fully capture event risk and anticipate a company’s specific response to a rumored corporate raider. Thus, the potential for default on debt once rated rrAAr’, for example, is probably greater than historical data would indicate.
Credit Analysis : There is no magic financial ratio that can definitively predict a default, and a bankruptcy filing may be induced by more than simple insolvency.
S&P’s approach to credit analysis is based on a comprehensive rating methodology profile (see Appendix 7). This encompasses a company ’ s industry environment and position within it, management’s operating and financing strategies, as well as financial statement analysis. The weighting of the profile elements depends on what is most relevant for each situation. The high incidence of oil company defaults in 1986 illustrates the importance of understanding business fundamentals and looking beyond historical financial performance.
Cash flow ratios are often the most telling indicators of financial health for both investment and speculative grade credits. A firm’s ability to generate funds from operations and the relationships between
187
cash flow and requirements for funds, including working capital investments, capital expenditures, and debt service, are critical. S&P’s cash flow analysis ip explained more fully on pages 16-18 of Appendix 8.
An analysis of 0x0~0 Inc., which defaulted on its rated debt in April 1985, reveals large cash shortfalls year after year during the early 1980’s. This aggressive oil company maintained reasonable profitability through 1984, and debt leverage was fairly constant over 1981-1984. 0x0~0~s demise resulted from excessive capital spending coupled with the decline in energy prices not anticipated by management. 0x0~0~s subordinated debt initially was rated ItCCCrt in 1982.
Debt leverage ratios alone are often misleading measures of default risk, even though they may indicate potential for ultimate bondholder recovery after bankruptcy. At the time of their bankruptcies, several high technology and oil service firms exhibited debt ratios comparable to medians for ttBBtr or trBBBrr industrials. Yet they did not have a positive funds flow from operations or other sources of liquidity to meet their obligations.
Moreover, debt leverage ratios based on historical asset costs do not always immediately reflect diminished asset values and can be further distorted by acquisition-related write-ups. Using market values of debt and equity to measure financial leverage can be dangerous, too. Market value ratios can be very volatile, inhibiting analysis of trends over time. Stock prices fluctuate widely and may, on occassion, have an inverse relationship to a company’s ability to service its debt. For example, a takeover rumor can hike a company’s stock price 20%, automatically r%mprovingtr its market value debt to equity ratio. In reality, credit quality may be on the verge of plunging, if management responds to the takeover threat with a large debt-financed stock repurchase.
188
. OUTLOOK FOR CREDIT QUALITY AND DEFAULTS:
SGP projects an increasing number of defaults over the next two-four years. The amount of debt defaulting annually, however, may be less than the $9.0 billion recorded in 1987 when Texaco’s bankruptcy alone accounted for $7.2 billion. The default rate will likely rise over the next few years. Not only will the numerator of the relationship swell, but the denominator may also be constrained by a prolonged contraction, or at least slower growth, in the junk bond market.
The number of industrial companies in the rrBtr category has doubled over the past five years. trCCCtr has been the hot, growth category, jumping from seven to 39 issuers on a senior debt basis. A tremendously expanded roster of default candidates. Those in the ‘tgtr and trCCCrr categories, points strongly to a larger number of future casualties.
The lowest rungs on the credit ladder contain a fair share of companies with poor business profiles: high technology firms whose fortunes are tied to a single product, companies mired in the steel industry, over-extended retail.ers, and restaurant chains whose profits are withering under blistering competition. These types of companies are not new to the junk bond .market and have been well represented in the default statistics.
The modern breed of junk bond issuers are distinguished from the old by their favorable business position - and by their, extraordinary financial risk. They include leveraged buyouts, the recapitalized companies, and those that have aggressively gobbled up acquisitions. These companies have not shown up on the default statistics, yet. It is only a matter of time before potential problems materialize for some. Most LB0 and recap transactions were consummated within the past three years. They have not been tested by an adverse business or financing environment. Similarly, the surge in original issue junk was in 1985-1987.
189
,
Defaults traditionally paralleled the economic cycle. So the growth in public bond defaults during 1983-1987 is curious and disturbing. It portends more defaults in the next recession, even if it is mild, than during the rocky 1980-1982 period. Servicing debt with funds from operations can be difficult when business softens.
The ability to generate extra cash from asset sales is an advantage. This source of funds has forestalled the demise of many “fallen angels” including USX Corp., and Navistar International Transportation. Only a
year after BCI Holdings Inc. Is leveraged buy-out and Holiday Corp.‘s recapitalization their ratings were raised reflecting greater than expected benefits from asset sales.
These successes notwithstanding, a requirement to sell assets carries risks. How quickly can the assets be sold? What price will they fetch? Are there many potential buyers? These concerns figure prominently in S8Prs credit evaluation of the recent LBOs by Jim Walter Corp. and Burlington Holdings. Inc. Potential asset sales must be compared to the amount and timing of a company$‘s need for funds, and may be viewed positively or negatively depending on the circumstances.
The junk bond market has demonstrated some skittishness. Prices dropped and liquidity was constrained following the October 19 stock market crash, the LTV bankruptcy filing, and publicity about possible insider trading violations by leading junk bond underwriters. In each case the market subsequently recovered. It is probable that the market will again experience temporary pricing and liquidity shocks. These should not be confused with credit stress of junk bond issuers, although they do present opportunities for losses.
CON CLUS ION :
Overall credit quality of rated U.S. corporations, including those whose debt is rated investment grade, has clearly and significantly deteriorated. And rising defaults are projected over the
190

“
intermediate-term. However, these trends may not hold true for the thousands of smaller businesses that have not sold public bonds, and who thus escape review by S&P’s bond raters. Much of the junk bond market’s growth represents a shifting of borrowers from private finance (banks and insurance companies) to the more visible public bond market. The financial risk assumed by these borrowers is not necessarily greater than it would have been had they continued with their traditional lenders. In fact, access to new sources of capital ‘at competitive prices m ight be considered a positive credit development.
SSP is uncomfortable recommending new legislation or regulatory guidelines to control investors’ exposure to junk bonds. W e do recommend investor prudence and caution. Astute analysis of each credit is essential for speculative grade bond buyers. Specifically we offer the following suggestions.
o Cautiously view historical default rates o Diversify among industries o Don’t overlook business analysis o Projected cash flow is critical o Note S&P rating
191

, ‘2
APPEND ICES
1.
2.
3.
4.
5.
6.
7.
8.
9.
List of junk bond issuers rated by S&P
Obligations Rated by S&P
S&P debt rating definitions
High-tech Issuers F lood Market, S6P CreditWeek,, June 15, 1987
Corporate Defaults Hit $9 billion, S&P CreditWeek, January 18, 1988
Corporate Bond Defaults Skyrocket, reprinted December 1986 from S&P CreditWeek
SIP Debt Ratings Criteria Industrial Overview, 1986
S&P Speculative Grade Debt Credit Review, July 7, 1986
SSP Speculative Grade Debt Credit Review, June IS, 1987
GAO Note: Due to the volume of the above material, it has not been included in this publication. It is available for public review in the ma in GAO Law Library.
192
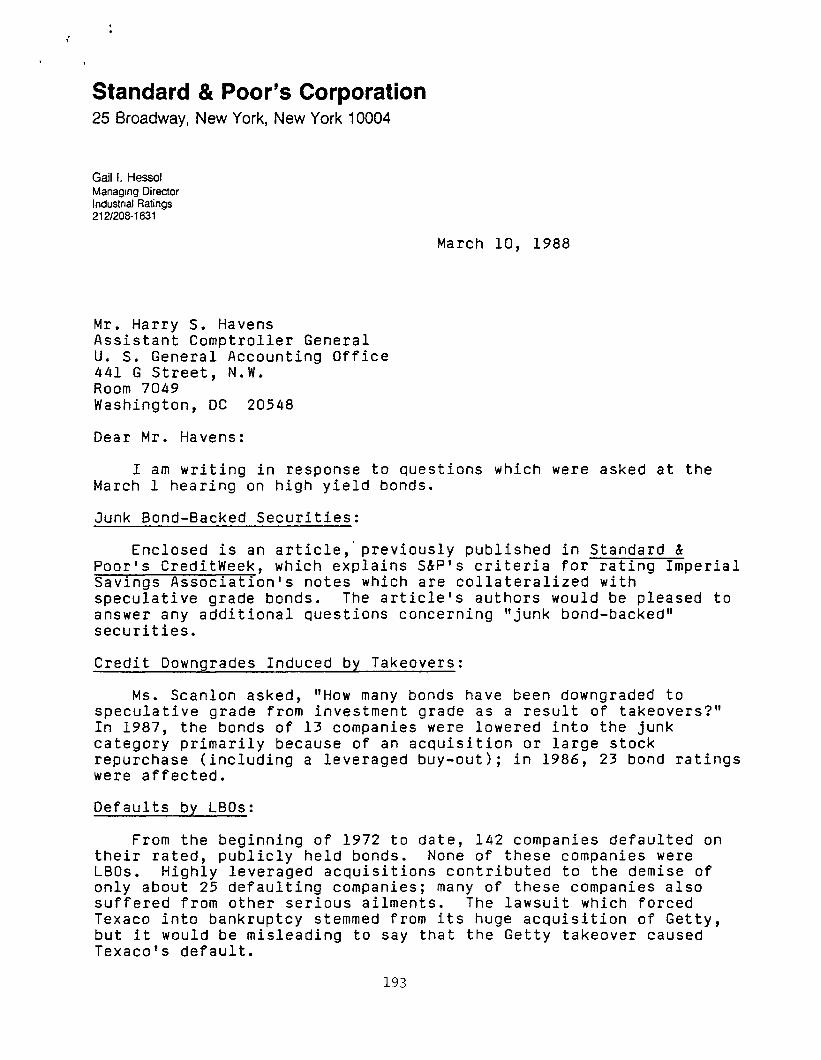
.
r
Standard & Poor’s Corporation 25 Broadway, New York, New York 10004
Gail I. Hessol Managmg Director lndustrtal Ratings 212/208-1831
March 10, 1988
Mr. Harry S. Havens Assistant Comptroller General U. S. General Accounting Office 441 G Street, N.W. Room 7049 Washington, DC 20548
Dear Mr. Havens:
I am writing in response to questions which were asked at the March 1 hearing on high yield bonds.
Junk Bond-Backed Securities:
Enclosed is an article,‘previously published in Standard & Poor’s CreditWeek, which explains S&P's criteria for rating Imperial Savings Association's notes which are collateralized with speculative grade bonds. The article’s authors would be pleased to answer any additional questions concerning "junk bond-backed" securities.
Credit Downgrades Induced by Takeovers:
Ms. Scanlon asked, rlH~w many bonds have been downgraded to speculative grade from investment grade as a result of takeovers?” In 1987, the bonds of 13 companies were lowered into the junk category primarily because of an acquisition or large stock repurchase (including a leveraged buy-out); in 1986, 23 bond ratings were affected.
Defaults by LBOs:
From the beginning of 1972 to date, 142 companies defaulted on their rated, publicly held bonds. None of these companies were LBOs. Highly leveraged acquisitions contributed to the demise of only about 25 defaulting companies; many of these companies also suffered from other serious ailments. The lawsuit which forced Texaco into bankruptcy stemmed from its huge acquisition of Getty, but it would be misleading to say that the Getty takeover caused Texaco's default.
193

:
March 10, 1988 Page 2
As I indicated at the hearings, the absence of LBOs, recapitalized companies and aggressive corporate acquirers from the default list merely reflects the recency of these transactions. A healthy economic environment for the past few years has helped, too. Over time, we do expect a significant number of these companies to fail.
If you require any additional information, please feel free to call me.
Very truly yours,
Gail I. Hess01 Managing Director
GIH/pm Enclosures
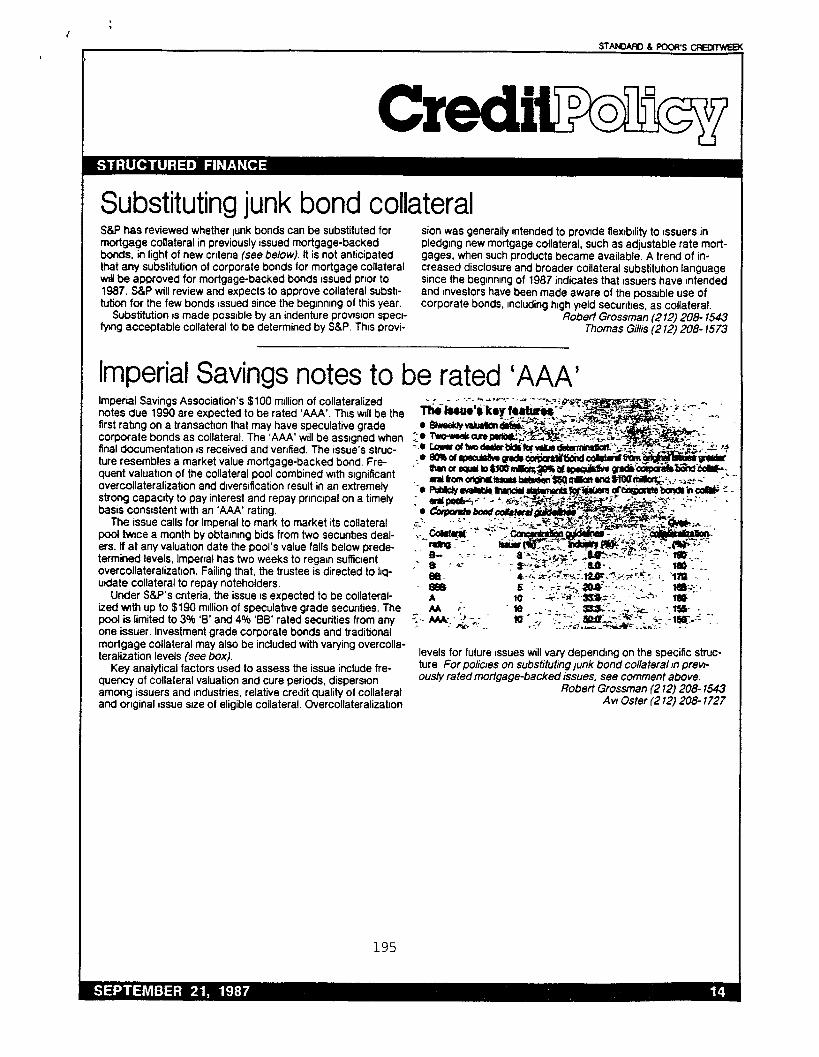
Credit Substituting junk bond collateral S&P has reviewed whether junk bonds can be substituted for mortgage collateral in previously issued mortgage-backed bonds, in light of new cntena (see below). lt is not anticipated that any substitution of corporate bonds for mortgage collateral mll be approved for mortgage-backed bonds issued pnor to 1987. S&P will review and expects to approve collateral substl- Mion for the few bonds Issued since the begrnnlng of this year.
Substitution IS made possible by an indenture provlson spea- tying acceptable collateral to be determined by S&P. This provi-
sion was generaliy Intended to provide IlexlbMy to Issuers in pledging new mortgage collateral, such as adjustable rate mort- gages, when such products became available. A trend of in- creased disclosure and broader collateral substitution language since the begInnIng of 1987 indicates that Issuers have Intended and Investors have been made aware of the possible use of corporate bonds, Including high yteld secuntles. as collateral.
Robert Grossman (2 12) 208- 1543 Thomas Gillis (2 12) 208- 1573
Imperial Savings notes to be rated ‘AAA’ Imperial Savings Association’s $100 million of collateralized tWteS due 1990 are expected to be rated ‘AAA’. This WIII be the first rabng on a Iransactlon that may have speculative grade c-ate bonds as collateral. The ‘AAA’ will be asslgned when 2 final documentation IS received and venlied. The issue’s strut- Y ture resembles a market value mortgage-backed bond. Fre- quent valuation of the collateral pool combined with significant overcdlateralization and diversification result in an extremely strong capacity to pay interest and repay pnnclpal on a timely basis consistent with an ‘AAA’ rating.
The issue calls for lmpenal to mark to market its collateral pool tmce a month by obtalnlng bids from hvo secuntles deal- ers. ll at any valuatton date the pool’s value falls below prede- termined levels, lmpenal has two weeks to regarn sufficient overcollateralizatlon. Failing that, the trustee is directed to Lq- ’ utdate collateral to repay noteholders.
BB.-
Under S&P’s cnteria. the issue IS expected to be collateral- -BBB
ized mth up to $190 million of speculative grade secunties. The -le ‘7.. -1. -,-‘* _, -.* , pool is limited to 3% ‘8’ and 4% ‘66’ rated securities from any
RI 2 -y’,j.:-,. s-.“;‘*m.y
one issuer. Investment grade corporate bonds and traditional _ .‘r -1 ;..:&T; _.- *z$zre;*.;? -- ‘6g---: ?
mortgage collateral may also be included with varying overcolla- teraiization levels (see box).
Key analytical factors used to assess the issue include fre- quency of collateral valuation and cure periods, dispersion among issuers and Industries, relative credit quality of collateral and original Issue size of eligible collateral. Overcollateralization
levels for future Issues will vary depending on the specific struc- ture For polioes on substituting Junk bond co/lateral In prew ousty rated mortgage-backed issues, see comment above.
Robert Grossman (2 12) 208- 1543 A VI Oster (2 12) 208- 1727
135

APPENDIX VI
COMMENTS SUBMITTED BY ARNOLD BROOKSTONE, CHIEF FINANCIAL OFFICER, STONE CONTAINER CORPORATION
APPENDIX VI
196

Statement of Mr. Arnold Brookstone
Chief Financial Officer
Stone Container Corporation
to the
General Accounting Office
Public Hearing on the Nature of the Market for High Yield Bonds
March 1, 1988
197

I am pleased to testify here today on behalf of the Alliance
for Capital Access.
The Alliance is an association of more than 100 companies
that have issued high yield bonds. Alliance members are engaged
in a myriad of businesses. But we are united by our common
interest in preserving free access to the capital markets.
Almost all observers agree that American business is facing
a high stakes battle to remain competitive in an increasingly
global economy. This means investing in plants and equipment to
make each new facility more productive; it means restructuring so
each companies focus on their core business; it means investing
in research and development to make the best products at the
low&t cost; it means giving our workers the tools to deliver the
best products and services possible and; it means investing in,
and retraining workers to fill the jobs of the nineties and
beyond.
But few businesses can position themselves to lead America
into the front of the international pack without access to
affordable, long term capital. And for many companies, the high
yield bond market is the only place where that precious commodity
is available.
Of course, being able to issue high yield bonds is of little
value if there isn't a market of buyers. And unfortunately, we
198

l
:
.
be l ieve investm e n t in h i g h y ie ld b o n d s by sav ings a n d l o a n
assoc ia tio n s , p e n s i o n fu n d s , a n d o the r financ ia l institu tio n s h a s
b e e n res tricte d by th e po l i tica l a ttacks o n th e s e secur i ties .
E x p a n d e d investm e n t by th e m w ill n o t on ly improve the i r re tu rn o n
investm e n t, b u t w ill e x p a n d a crit ical source o f fin a n c i n g fo r
g r o w i n g A m e r ican co rpo ra tio n s l ike ours .
S to n e C o n ta ine r is a case in p o i n t. In th e last fe w years ,
w e h a v e g r o w n fro m a m e d ium-s ized fa m ily bus iness in to th e
la rges t m a n u fac tu re r o f co r ruga te d c o n ta iners , b a g s , a n d sacks in
th e wor ld . O u r a n n u a l sa les a p p r o a c h $ 3 b i l l ion a n d w e e m p loy
1 6 ,0 0 0 pe rsons . A n d th e p la in a n d sim p le fac t is th a t w ith o u t
h i g h y ie ld b o n d s , n o n e o f th is w o u ld h a v e h a p p e n e d .
A fe w years a g o , eve ryone w a s ta lk ing a b o u t th e d e a th o f
A m e r ican bas ic i ndus try. T h e p a p e r i ndus try w a s a p r ime e x a m p l e
o f a @ @ sunse t" i ndus try. Fo re ign c o m p e titio n w a s in te n s e ; p l a n ts
w e r e b e i n g c losed a n d workers w e r e b e i n g la id o ff by th e
th o u s a n d . M a jor c o m p a n i e s conc luded th a t the i r p a p e r d iv is ions
w e r e ba rnac les th a t n o l onge r fit in to the i r co re bus iness
stra teg ies . In d e e d , by 1 9 8 3 , s o m e c o m p a n i e s , l ike C h a m p ion
In te r n a tio n a l a n d C o n tin e n ta l G r o u p w e r e tryin g to ba i l o u t o f
th e bus iness .
W e s a w a n o p p o r tun i ty to acqu i re th e s e o r p h a n s -- d iv is ions
th a t th e p rev ious m a n a g e m e n t d i d n 't ca re a b o u t -- a n d m a k e th e m a
1 9 9
vibrant part of the Stone Container family, providing long term
job security to thousands of workers whose jobs were at risk.
In 1983, we acquired Continental's forest products
division: in 1986, we acquired Champion's brown paper bag
division; and last year, we acquired financially ailing
Southwest Forest Industries. We didn't have the cash to buy
these companies. Instead, each acquisition was financed with a
substantial amount of debt. And each one has been enormously
rewarding, both for workers and our shareholders.
Today, as I said, we are the largest paper bag manufacturer
in the world. Since 1980, sales have grown over 500 percent and
our annual capacity has quintupled. And high yield bonds have
made much of this growth possible.
Recently, we were able to use high yield bonds in a way that
is especially relevant to your study. We identified a 35 year
old paper mill in Jacksonville, Florida that had closed in 1984,
putting 600 people out of work. We wanted to buy the plant, but
our banks were unable to provide the financing under reasonable
terms. So we once again turned to the high yield bond market
where we raised $110 million required to re-fit the plant with
state-of-the-art technology. Columbia Savings and Loan
Association of Beverly Hills purchased $15 million of this high
yield debt.
200

It is fair to say that were it not for the ability of
Columbia to purchase high yield bonds, it would have been more
difficult for us to raise the funds required to re-open the
Jacksonville mill and return 450 to work.
In sum, we are a company that has made heavily debt-financed
acquisitions: we have relied heavily on "junk bondsll; at times,
we ourselves have been highly leveraged; and S&Ls have bought
some of our high yield debt. To listen to some, we are an
example of all that is wrong with American business.
In fact, we are an example of a company helping to bring
America back to the front lines of international competition. We
are a leader in our markets; we are one of the lowest cost
producers in our markets; we are contributing to a rebirth of a
"sunsetI industry; we are retaining and creating jobs. That's
not a bad record for a "junk bond" company.
With that backdrop, let me turn to some of the questions
raised in your Notice of Public Hearing.
201
Who Issues Hiqh Yield Bonds
The high yield bond market is dominated by companies
raising capital to finance growth and expansion, rather than by
hostile takeover artists, as the popular image would have you
believe.
We earnestly hope that your study helps put an end to the
mythology that high yield bonds are the province of lVbust-uptl
corporate raiders. The facts tell quite a different story.
A just completed study. by the Alliance found that between
1977 and 1987 over 958 corporations issued publicly traded high
yield bonds in America, excludinq companies and entities that
have issued these securities to initiate or defend against
hostile takeovers. Toqether, these 958 companies have raised
$136 billion.
And these are anything but fly-by-night companies. As of
the end of 1985, the average high yield bond issuer was a 36 year
old firm with $1.1 billion in assets. The ACA membership list
attached to this testimony is a representative sampling of
issuing companies.
High yield bond issuers touch virtually every business
sector in America: 368 are manufacturers, 57 are in the
202

communications industry, 145 are in the finance industry, 243 are
in the service and retail industries, 59 are in the energy and
mining business, 43 are in the transportation industry, 28 are in
the health care industry, and 16 are in housing and construction.
More than 2.6 million people work for these companies in
nearly 17,000 facilities in virtually every state in the Union.
It is true that high yield bonds have been used in hostile
takeovers. But the fact is that bank borrowing, not high yield
bonds, accounted for 78 percent of the financing used for hostile
takeovers, according to a study by the Securities and Exchange
Commission covering the period June, 1986 through May, 1987.
Corporate bonds, including high yield bonds, provided only nine
percent of the funds used for hostile takeovers in the period.
The Past is not Prolosue?
Some express concern that the high yield bond market has
grown by such leaps and bounds in recent years that previous
experience is not a good guide to the future.
There has indeed been a tremendous growth in the size of the
market and in the number of companies that have issued high yield
bonds but there is not necessarily a correlation between an
expanded market and increased risk, as some imply.
203

First, the market's growth has been marked by a move from
llfallen angel" issuers to original issuers. In other words, the
growth comes from companies on the way up, not on the way down.
That suggests that in this case, the added breadth of the market
has reduced risk, not increased it.
Furthermore, it is important to note that the actual issuers
are generally not new companies. To the contrary, most issuers
have extensive credit histories and they have withstood the test
posed by economic cycles. They are no more prone to default on
their high yield bond debt than they would be when they borrowed
from the bank.
Finally, another cause for optimism is that the credit
quality of the new issuers in the high yield' bond market is
improving. A Morgan Stanley & Co. study found that in 1986 the
creditworthiness (as opposed to the actual bond rating) of new
bond issues in the below-investment grade category improved and
their probability of default decreased.
Of course, some high yield bond companies are highly
leveraged and thus might be hurt in a recession. But any company
which has borrowed too much -- whether in the high yield bond
market or from a bank -- will face problems in a recession.
There is simply no basis to generalize and say that high yield
204
.
bond companies are more prone to default in a recession than a
company which has relied more heavily on bank borrowing.
Investment in Hish Yield Bonds
With respect to investment in high yield bonds, let me make
the following points that respond to some of your questions.
High yield bonds have been studied perhaps more than any
other thrift investment, and every one of those studies has
concluded that when all types of risks are taken into account,
including credit risk, interest rate risk, and liquidity risk,
the return on a high yield bond portfolio can equal or exceed
that of alternative investments.
Let's look at interest rate risk. By any standard, 1987
was a difficult year for investors in all U.S. stocks and bonds.
The image of "junk bonds" would lead you to conclude that they
must have been clobbered in this volatile environment. But a
diversified portfolio of high yield bonds returned between 4.0
and 6.41 percent for the year while a diversified portfolio of
all lIsafeN U.S. Treasuries returned only 1.93 percent. Seven
year Treasuries (of a similar maturity to the present market of
high yield bonds) lost .35%.
205
With respect to default risk, much of the attention on high
yield bonds has been on the surge in the original issues market.
Historical default rates, say the doomsayers, are meaningless
because they don't reflect the explosion of issues by new and
untested companies. These original issuers, say critics, will
cause a sharp rise in the high yield bond default rate. Of
course, they've been saying that for years now. The only thing
that changes is that the date of Junk Bond Armageddon keeps
getting pushed farther into the future.
In fact, as is often the case with high yield bond critics,
the charges about exploding default rates are a triumph of
presumption over reality. An Alliance study of original issue
high yield bonds found that the default rate was just 1.78
percent in 1987, lower than 'the recent historical data which
included the fallen angels. This is the first ever study of
original issue default rates. All previous studies have included
original issue high yield bonds and the debt of those
"investment grade" companies whose debt has been downgraded.
In contrast, we know that the default rate on commercial
loans by banks and bank loans secured by real estate were 5.1
percent and 3.6 percent respectively in 1986. It is safe to
assume that banks have lower default rates in these investments
than thrifts simply because the banks have been in the business
longer and have considerably more experience evaluating
206

applicants. But is anyone talking about limits on S&L
commercial loans?
We believe it is vitally important that high yield bonds be
measured against other investments. Indeed, as I understand it,
that is a major objective of the study you are conducting.
The statement of managers of the recently passed S&L
recapitalization bill states that "The Senate amendment requires
the Comptroller General, by July 1, 1988, to make a comDarative
study between the issuance of and investment in hiah vield non-
investment srade bonds and other tvnes of investments made by
federallv insured institutions. . . . " I emphasize the word
ncomparative.ll
As the discussion above on default risk suggests, there is a
fundamental absence of data comparing the risks and returns on
all S&L investments. It would be totally inappropriate, and
analytically unsound, to reach a conclusion about the value of
high yield bond investments by S&Ls until you or the Federal Home
Loan Bank Board compiles reliable data on the risks and returns
of all S&L investments. ACA stands ready to help you develop
this information in any way you deem appropriate.
We believe such a study would find that prudent thrift
investment in high yield bonds should be encouraged. Indeed,
207
given the record of these securities and the impressive
experience of most S&Ls with high yield bond portfolios, the
FSLIC may be best protected by promoting prudent high yield bond
investments, not limiting them.
Hostile Takeovers and LBOs
GAO also raises questions in several places about S&L
investment in high yield bonds connected with LBOs and hostile
takeovers, both from a public policy point of view and from a
safety point of view. As to the public policy questions,
Congress has, to date, consciously chosen not to impose limits on
hostile takeover or LB0 financing, in large part because members
recognize that no amount of legislative or regulatory alchemy
can distinguish between "good" transactions and "bad"
transactions. In view of that, it would be extremely
inappropriate to recommend limits on S&L investment in bonds
issued to finance these transactions.
Regarding safety, it is important to realize that the
transaction which gives rise to the existence of a given bond is
irrelevant. The relevant issue is the underlying credit quality
of the issuer and its ability to pay bondholders. There is
absolutely no reason to believe that bonds issued for hostile
takeovers or LBOs are any more or less safe than those issued for
general corporate purposes.
208

Cornorate Debt
Finally, let me turn to some of the questions you raised
about corporate debt levels. I am particularly sensitive to this
because, on occasion, critics have said that Stone Container is
over-leveraged. Our debt-to-equity ratio has at times been very
high. But the important point to understand -- and frankly, few
policymakers do understand it -- is that debt levels are not
constant, nor is a single debt level appropriate for all
companies in all industries.
There is no such thing as "the correct" debt-equity ratio.
Debt-equity ratios vary over time, across industries and among
companies within an industry. The structure of a corporation's
debt also varies considerably. Some companies favor short-term,
variable-rate financing while other favor long-term, fixed-rate
financing. Not only do debt-to-equity ratios not capture these
differences, it is impossible to determine an appropriate
structure for all companies. A company's cash position,.
susceptibility to a recession and the market it serves all enter
into a company's decisions as to the nature of its capital
structure.
There is at least one other reason companies take on debt:
it is a cheaper source of capital than equity. At a time when
American firms must increase investment in plant, eg,uipment, and
209
labor, it is natural to gravitate to the least expensive sources
of capital. Our major economic competitors understand that,
which explains why debt-to-equity ratios of Japanese and German
companies are nearly double those of the typical U.S. firm.
The government simply has no business trying to establish
appropriate levels of debt,for the private sector. Such a policy
would amount to de facto federal credit controls. It would be
disastrous for the federal government to substitute a single,
sweeping standard for the individual decisions of private
businesses.
Finally, I want to speak for a moment about the wrongheaded
proposals to limit the use of high yield bonds -- and, for that
matter, all debt -- in takeovers .and LBOs.
There is no evidence that the use of high yield bonds in
takeovers and LBOs has any harmful effects on the economy.
Second, there is ample evidence that high yield bonds have
financed hundreds of productive acquisitions and LBOs that have
saved and created jobs over the years. In fact, as I mentioned
at the outset of my comments, Stone Container has used debt to
finance a series of acquisitions that have not only made our
company stronger and more competitive, but have helped thousands
of employees whose jobs might otherwise have been endangered.
210

I am also angered by these proposals because they would
disproportionately affect small and medium sized companies like
ours. We tend to have less cash than Fortune 500 firms. We
cannot grow without debt financing. It would be an outrage to
enact a policy which invites only large, cash-rich companies, and
foreigners, to acquire American companies while Stone and other
companies that are creating the most jobs today are cut off.
Thank you for the opportunity to appear here today.
211.

APPENDIX VII
COMMENTS SUBMITTED BY THE ALLIANCE FOR CAPITAL ACCESS
APPENDIX VII
212

HIGH YIELD BONDS AND THE AMERICAN FINANCIAL SYSTEM
Testimony Presented to the General Accounting Office
AIhnce for Capital Access
Suite 704 19i 9 Pennsylvania Avenue, NW.
Washington, D.C. 20006 202/429-9628
February, 1988
21.3

Alliance F3r Capitd Acces,r
‘;‘- -r--,j, . : : - _- : -
..- . :
_ - --. :*Js?-~‘c- _,_ L . :
--^ ,,.- -#-‘.: &_I&, -L--v-L-
February 22, 1988
Mr. Craig A. Simmons Senior Associate Director General Government Division U.S. General Accounting Off ice Room 3858A 441 G St., NW Washington, D.C. 20548
Re: Comments on the Nature of the Market for High Yield Bonds
(File No. 233203)
Dear Mr. Simmons:
The AlIiance for Capital Access is please to reply to the Request for Comments of the
General Accounting Office on the nature of “ne market for high yield bonds. It is a long
overdue opportunity to address the considerable amount of confusion and misunderstanding
about these securities and their contribution to the American economy.
The Alliance for Capital Access is a trade association made up of more than 100
companies that have issued or invested in high yield bonds. The members of the Alliance
are united by our common interest in preserving free access to the capital markets.
Alliance members are engaged in everything from making cans, boxes, bags, and steel to
sophisticated computer equipment and movies, building homes, and providing day care.
Together, our members employ over 400,000 workers throughout the country. A list of
our membership is included in Section 8.
2101

Before answering most of the questions asked in the Notice of Public Hearing
published in the Federal Register on February 1, we want to discuss some of the broader
issues involving high yield bonds.
We suggest that were it not for the name “junk bonds” and the association of these
securities with hostile takeovers, we would not be here today.
Suppose we offered you an opportunity to buy what we will call a Growth Bond, a
security which primarily finances growth companies, the default risk of which is lower
than that of a commercial bank loan, which provides issuers with fixed-rate, long-term
funds, which has .a relatively liquid secondary market, and which would provide you a
return that exceeds that of virtually any other fixed income investment. Would you buy
it?
We think most people would find this “Growth Bond” most attractive. In fact;
Congress might look for ways to encourage the development of “Growth Bonds.”
Unfortunately, these bonds have been labeled “junk bonds” and many legislators and
regulators have moved to limit their development and use.
It is time to move the discussion about these securities beyond labels and euphemisms
to the reality of what they are and how they are used, and what risks and rewards they
provide to investors.
That is why we were pleased when Congress adopted the high yield bond study
amendment and accompanying Statement of Managers. For the first time, the right
215
.
questions are being asked. Instead of singling out high yield bonds from other
investments, Congress explicitly sought comparative data on the risks and returns of all
types of investments; instead of using default experience as the sole criteria for assessing
high yield bond investments, Congress recognized that other types of risk must be
assessed, in addition to recognizing that assessing risks without also analyzing data on
returns of a given investment is an incomplete basis on which to make poIicy.
We believe investment in high yield bonds by S&Ls, pension funds, and other financial
institutions has been restricted by the political attacks on these securities. Expanded
investment by them will snot only improve their return on investment, but will expand a
critical source of financing for growing American corporations.
What Are High Yields Bonds?
High yield bonds are, quite simply, one of the most successful new financing tools to
come along in years. They have helped change the face of corporate finance in America
by giving hundreds of companies access to long-term, fixed-rate capital.
Almost all publicly traded debt securities issued by corporations receive a credit
rating from one or more of the private bond rating agencies (i.e. Standard & Poor’s or
Mood y’s). These ratings are an attempt to quantify the ability of the corporation to
repay that particular debt, in addition to making the promised interest payments on time.
In the case of Standard & Poor’s, these ratings range from “AAA” (highest quality) to D
(default).
216

Securities given one of the top four Standard & Poor’s ratings (AAA, AA, A, BBB) are
called “investment grade” bonds. Any bond rated below BBB (BB, B, CCC, CC, C) are
referred to as “non-investment grade” securities. On the Moody’s scale, “investment
grade” bonds are in the top five categories which range from Aaa down to Baa and the
“non-investment” bonds range from Ba down to C. A high yield bond is simply another
name for any bond rated “non-investment grade.”
The term “junk bonds” was coined by the securities industry years ago to refer to
bonds originally issued with “investment grade” ratings, but downgraded when the issuing
company experienced financial difficulties. The bonds of Penn Central Corporation and
Chrysler Corporation, both downgraded in the 1970’s, are two examples.
In the late 1970’s however, growing, mid-sized corporations which had not yet
achieved “investment grade” ratings found themselves facing an increasing need for Iong-
term capital as the banks ceased making long-term, fixed-rate loans. At the same time,
sophisticated investors recognized that the bonds of mid-sized firms lacking top grade
ratings did not carry unacceptable investment risks and would generate higher returns.
Since that time, the market in lower rated bonds has changed dramatically from one
dominated by downgraded issues traditionally known as “junk,” to one in which the vast
majority of bond issues are the high yield securities of mid-sized growth firms on the way
up, not the way down. By 1987, these “growth bonds” composed over 70% of the high
yield market.
217
Whv Is The Market Growing So Fast?
Until the late seventies, all but the largest American businesses had only three
principal means of raising long term capital from outside their company:
1) Additional stock, which had the disadvantage of diluting the value of existing
owners’ and investors’ stock;
2) Private placement bonds, essentially large private loans made by insurance
companies and other institutional investors. Institutional investors frequently imposed
higher interest rates and onerous “covenants” restricting how the company conducted its
business for the life of the bond because they would generally hold the bond to maturity;
3) Bank borrowing, which also often carried onerous restrictions on a company’s
operations. Bank borrowing was, by far, the principal source of long term capital for
business.
But things began to change in the late 1970’s. High yield bonds have grown in
popularity because banks generally stopped making long-term, fixed-rate loans in response
to the interest rate volatility first experienced in the late 1970’s. As a result,
increasingly, the only source of fixed-rate, long-term capital available to most American
corporations is through the high yield bond market. Indeed, available evidence suggests
that a substantial portion of the original issue high yield bond market has simply replaced
bank debt and, to a lesser degree, private placement debt. This is one reason why the
suggestion in some quarters that high yield bonds are largely responsible for increasing
corporate debt levels is simplistic. The fact is that this market has, to a large extent,
218

supplanted other sources of lending -- banks and insurance companies -- with another--
high yield bonds, rather than causing an aggregate increase in debt levels.
Who Issues Hiah Yield Bonds?
The conventional wisdom is that this market is dominated by “hostile takeover artists”
and speculative, fly-by-night companies with little credit history. The facts paint a very
different story.
A just completed study by the Alliance found that between ‘1977 and 1987 over 958
corporations issued publicly traded high yield bonds in America, excluding companies and
entities that have issued these securities to initiate m defend against hostile takeovers.
This study was designed to assess the use of high yield bonds to raise “non-controversial”
growth capital by American corporations and therefore excluded all bonds issued by a
corporate “raider” m by a company to’ buy its own stock to defend against a hostile
takeover attempt. Together. these 958 comnanies have r$ised $136 billion..
And these are anything but fly-by-night companies. As of the end of 1985, the
average high yield bond issuer was a 36 year old firm with $1.1 billion in assets. Many
high yield bond issuers are making major contributions to America’s economic future--
companies like Kinder-Care, MCI, Occidental Petroleum, Compaq Computer, Control Data,
Stone Container, Sun Microsystems, Tcle-Communications, and Triangle Industries.
The issuing companies touch virtually every business sector in America: 368 are
manufacturers, 57 are in the communications industry, 145 are in the finance industry, 243
are in the service and retail industries, 59 are in the energy and mining business, 43 are

in the transportation industry, 28 are in the health care industry, and 16 are in housing
and construction.
More than 2.6 million people work for these companies in nearly 17,000 facilities in
virtually every state in the Union.
It is true that high yield bonds have been used in hostile takeovers. But these
transactions neither dominate the market, nor do these securities provide the bulk of
hostile takeover financing.
According to a study by the Chief Economist of the Securities and Exchange
Commission (which has not been disputed), bank borrowing, not high yield bonds,
accounted for over 73 percent of all takeover financing (both hostile and friendly)
between June, 1986 and May, 1987. Another 13 percent of takeover financing came from
corporate debt issues, including both investment grade and non-investment grade
securities.
The bulk of hostile takeover financing also comes from banks (78 percent) according
to the same study. Corporate bonds, including high yield bonds, provided only nine
percent of the funds used for hostile takeovers in the period. (Some aborted hostile
takeovers would have been financed with a combination of high yield bonds and bank
financing, which would swell the aggregate universe in the SEC study somewhat. But
even if these additional, uncompleted takeovers were included in the study, the essential
thrust of the SEC figures would remain unchanged: bank loans, not high yield bonds,
provide most of the fues for hostile takeovers.)
220

It should also be noted that almost all of the bonds issued by the thrift industry in
the past few years have been “non-investment” grade. This new long term capital has
been very important to these thrifts by adding to the capital cushion available to them.
In this way, high yield bonds have actually increased protection of the FSLIC by raising
S&L capital levels, which means that there is an additional source of private funds that
would be tapped in a bankruptcy prior to the need to invade the insurance fund itself.
Are High Yield Bonds a Safe Investment?
There are two issues raised in discussing investment in high yield bonds. First, there
are concerns that federally-insured institutions should not be financing an economic
activity - hostile takeovers and leveraged buyouts -- which some people regard as
undesirable. Second, there is the issue of what the risks and returns are on these
investments, compared to other alternatives.
On the first point, the study cited above makes it clear that the primary beneficiaries
of S&L investment in high yield bonds are growth companies, not hostile bidders.
Increasingly, S&Ls are a valuable source of growth capital for American business. A
policy that attempts to limit hostile takeovers by limiting S&L investment in high yield
bonds will not achieve the desired results. It will not slow takeover activity, which is
largely financed by banks; it will, however, undercut the ability of many companies to
finance expansion and growth.
221

Recent Return and Default Data
Every available study has concluded that when all types of risks are taken into
account, including credit risk, interest rate risk, and liquidity risk, the return on a high
yield bond portfolio can equal or exceed that of alternative investments.
1987 was a difficult year for investors in all U.S. stocks and bonds. It is thus
illustrative to look at how high yield bonds performed compared to a supposedly “safe”
investment in U.S. Government securities. A diversified portfolio of high yield bonds
returned 6.41 percent for the year while a diversified portfolio of all U.S. Treasuries
returned only 1.93 percent. Seven year Treasuries (of a similar maturity to the present
market of high yield bonds) m .35%.
With respect to default, much of the attention on high yield bonds has been on the
surge in the original issues market. The AlIiance has recently completed the first ever
study of the default rate for original issue high yield bonds. All previous studies of the
high yield bond market default rate have included original issue high yield bonds and the
debt of those “investment-grade” companies whose debt had been downgraded.
The study found a 1987 default rate of 1.78 percent for original issue high bonds,
lower than the recent historical data which included the fallen angels.
The Need for a Comnarative Analvsis
We would also note at this point that a central objective of Congress in asking for
the study you are conducting was this comparative analysis of risks and returns. In fact,
222
the statement of managers states that “The Senate amendment requires the Comptroller
General, by July 1, 1988, to make a comoarative studv between the issuance of and
investment in high vield non-investment prade bonds and other tvoes of investments made
bv federallv insured institutions. . ..”
Congress recognized that there is a fundamental absence of data on comparative
investments made by federally-insured institutions. And that is why it asked GAO to
provide it with comparisons of risks and returns on all S&L investments, the profitability
of typical portfolios of each type of investment, and the amount of each investment held
by insured institutions. However, it is unclear to us whether GAO is obtaining this data.
It is our view that a study which does not include this data cannot be viewed as
responsive to the statutory language. Nor can recommendations be responsibly made in
the absence of such data! If GAO is unable to develop this data on its own, it should
seek the assistance of the Federal Home Loan Bank Board.
It would be totally inappropriate, and analytically unsound, to reach a conclusion
about the value of high yield bond investments by S&Ls until you or the Federal Home
Loan Bank Board compiles reliable data on the risks and returns of all S&L investments.
Such a study will help regulators and lawmakers make- sound decisions on the nature
and extent of various S&L investment practices. For example, if the study found that
S&L commercial loans carry greater risks and lower returns than investments in high yield
bonds, you might well conclude that it would be unwise to adopt a policy to limit high
yield bond investments if that would push S&Ls into making more, and riskier, commercial
loans. Indeed, were the data to show that the performance of S&Ls in other activities
poses a far greater risk to the insurance system than high yield bond investments, you
223

might conclude that limits should be placed on these activities. Conversely, if you were
to find, as we suspect you would, that the relatively high returns on high yield bond
investments enable thrifts to more ably carry out their primary responsibility of providing
home mortgages, you should conclude that such investments should be encouraged.
Let us turn now to some of the specific questions you raised.

I. PRIVATE PLACEMENT MARKET FOR HIGH YIELD BONDS
Before addressing the specific questions about the private placement market, we would
like to offer some general observations about this segment of the securities market.
Today’s private placement market is considerably different than it was even five years
ago. Where it was once characterized by the placement of an entire issue of a
corporation’s debt with one or two very large investors who planned to hold the debt
until maturity, the majority of private placement bonds today have registration rights
which will result in them ending up in the publicly traded market within a year or so.
Moreover, they are usually placed with a broader group of investors. As a result, the
traditional “risk” associated with private placement bonds -- their lack of liquidity -- is
of less concern than in an earlier era.
This is especially relevant in the case of the handful of savings and loan associations
that do purchase private placement high yield bonds. Instead of being “stuck” with these
investments, they are usually able to trade out of their private placement investments
should they so desire. (Many S&Ls faced barriers to investing in private placement
issues until a recent SEC decision allowed them to qualify automatically as accredited
investors.)
It is worth noting that investors in private placement bonds are often able to get
more, not less, information about the issuing company than investors in publicly traded
bonds, including projections of the company’s earnings and cash flow, and other
information not usually contained in the prospectuses of publicly traded high yield bonds.
Assuming the investor has a knowledgeable credit review staff, this additional information
225

offers some compensation for the reduced independent scrutiny and analysis applied to a
publicly traded bond.
With respect to your specific questions in this area:
A. How large is the private placement market?
We know of no data that lists the percentage of the private placement market that is
comprised of non-investment grade bonds. However, we have located the following more
general data on the size of the market which may be helpful to you.
The Private Placement Market
Ycat
Total Private Total Private Placement Market Placement Market [Debt onlv) (11 [Debt and eauitv) (21
1984 $36 Billion $53.3 Billion 1985 $46 Billion $73.1 Billion 1986 $8 1 Billion $1,234.0 Billion
(1) Federal Reserve Flow of Funds, p. A-34 (2) IDD Information Services, Inc.
B. To what extent in the past five years has the private placement market been affected
by the growth of the publicly traded high yield bond market?
Again, there is little direct evidence on this issue. However, it is commonly believed
226

c
that much of the growth of the public high yield bond market has come at the expense of
the private placement market and commercial bank loans.
John Paulus, Chief Economist at Morgan Stanley & Co., has said that two-thirds of
the high yield bond market has come “at the expense of the banks.” According to Paulus’
data, there was a sharp drop in the growth rate of outstanding commercial and industrial
bank loans starting in 1982, a drop which coincides with the surge in the original issue
high yield bond market. In a speech to a conference sponsored by the Citizens for a
Sound Economy in November, 1986, Paulus concluded that “two-thirds of this $90-100
billion (high yield bond) market is simply replacing borrowing from commercial banks . . .
and therefore (high yield bonds) are no more of a threat to the stability of the financial
system than that bank debt itself was.”
From a public policy point of view as well as from an investor and issuer point of
view, this substitution is a salutary development. The public high yield bond market
offers many important protections to investors, some of which are not available in the
private placement market. (As noted earlier, though, there are some factors which, under
certain circumstances, compensate private placement investors for the reduced degree of
independent analysis and disclosure.)
An investor in a private placement offering or commercial loan is primarily dependent
on the acumen of its own analysts in judging the issuer or borrower. In contrast,
publicly traded high yield bonds generally offer more information from many more
sources. Every publicly traded high yield bond enjoys the benefits of public disclosure
and due diligence required by federal securities laws, as well as the judgment of
independent underwriters, independent analysts in securities firms other than the
227

J underwriter, and the judgement of other investors. Even more important, the presence of
a public market which constantly prices the security every day affords an investor an
opportunity to measure his investment judgment against that of the market. Ultimately,
an investor may usually more easily sell a publicly traded bond than a privately placed
bond should the issuing company encounter financial difficulties. And these securities are
certainly more liquid than the bank debt they replaced.
To issuers, they are also more desirable. They lack the restrictive covenants referred
to in our introductory remarks, and they carry lower rates than demanded by private
placement lenders who want to be compensated for agreeing to hold bonds to maturity.
C. To what extent are privately placed bonds used to finance corporate takeovers?
We know of no data indicating that the composition of the privately placed high yield
market is significantly different than the public high yield market. In the public market,
studies have estimated that no more than 30 to 40% of the high yield bonds have been
issued for all types of acquisition financing, friendly or hostile. A higher percentage of
the private placement bonds are probably used for takeovers because of the fact that they
can be placed far more quickly and with less public disclosure than public securities. In
anv event. the imnortant fact is that Dubliclv traded bonds. including both investment
grade and non-investment grade. brovided onlv 13 Dercent of all takeover financing in the
year ending in Mav. 1987,
228
II. INVESTMENT IN HIGH YIELD BONDS
Again, WC offer some general observations prior to addressing your specific questions.
Through the seventies, S&L investments were largely confined to home mortgages.
Specifically, they predominantly made fixed rate, 30 year home mortgage loans. But as
interest rates spiraled upward and Regulation Q was repealed, S&Ls found themselves
squeezed by these fixed rate loans at a time when their cost of funds was increasing.
This situation led Congress to pass the Garn-St Germain Act in 1982. One goal of that
act was to give S&Ls the ability to diversify their investments so as to not be solely
dependent upon the mortgage market. This liberalization of investment powers was
designed to be both a response and partial solution to the financial woes of the S&L
industry.
Since that time, both the managers of S&Ls and the regulators (state and federal)
have grappled with both: (1) the continued linkage of this industry to a cyclical real
estate market and instable interest rates, and (2) the opportunities and dangers posed by
these broadened investment powers to the institutions themselves, as well as to the
deposit insurance system.
Six years and several hundred foreclosed and liquidated S&Ls later, there is still no
comprehensive data on the comparative risk and return of the various investment
alternatives open to the S&L industry. That is one reason that the Comprehensive
Banking Equality Act (CEBA) mandated a study by the GAO of the risk and return of a
the investment alternatives open to insured thrifts, not just high yield bond investments.

Without such data, how can one single out high yield bonds -- or any other
investment -- for special scrutiny? Indeed, in April, 1985, Eric Hemel, Director of the
Bank Board’s Office of Policy and Economic Research, concluded in a memorandum to
Chairman Edwin Gray that, based on the empirical evidence, “precluding the holding of
junk bonds on the grounds of safety and soundness could be deemed arbitrary in the
absence of data to substantiate the assertion of excessive risk.” To date, no such data
has been developed and, we believe, if it is developed, it will show precisely the opposite:
that high yield bonds do not pose an excessive risk.
That is why we urge, at a minimum, that prior to recommending any limits on high
yield bond investments, the GAO or the regulators undertake precisely this type of study.
In our introductory remarks, we note the potential value of this type of study.
We are concerned that the questions raised by the GAO in the Federal Register
suggest that .it may not be able to complete the study sought by Congress. Recognizing
the problems involved in collecting and analyzing data for all FSLIC insured institutions
before the due date for this report, we would suggest that the GAO survey a
representative sample of state and federally chartered thrift institutions and ask them to
state their investment experience in all their investments since 1982. We have attached in
section 3 a sample questionnaire that may be a useful model to follow.
230

A. How does the riskiness of high yield bonds compare to other investments and
activities, such as commercial loans, that thrift institutions may enter into? In evaluating
risk, what factors should be considered and are there ways to quantify these risk
factors?
There are many kinds of risk: default risk, interest rate risk, and liquidity risk.
Many observers tend to focus exclusively on default risk, particularly when comparing high
yield bonds to other fixed income investments. But this is a misleading measurement.
While the risk of default by the issuing corporation is very important to an investor, of
equal or greater importance to the investor is the risk of significant interest rate
movements over the life of the bond. As any investor in fixed rate bonds will tell you,
regardless of the credit quality of the issuer, it is the interest risk that most often
accounts for the losses in their portfoIio. This is particularly true for Treasury and
investment grade bonds. High yield bonds have far less volatility overall; indeed, their
market value tends to rise or fall depending on the fortunes of the issuer, not the
morning’s news about the trade deficit.
231
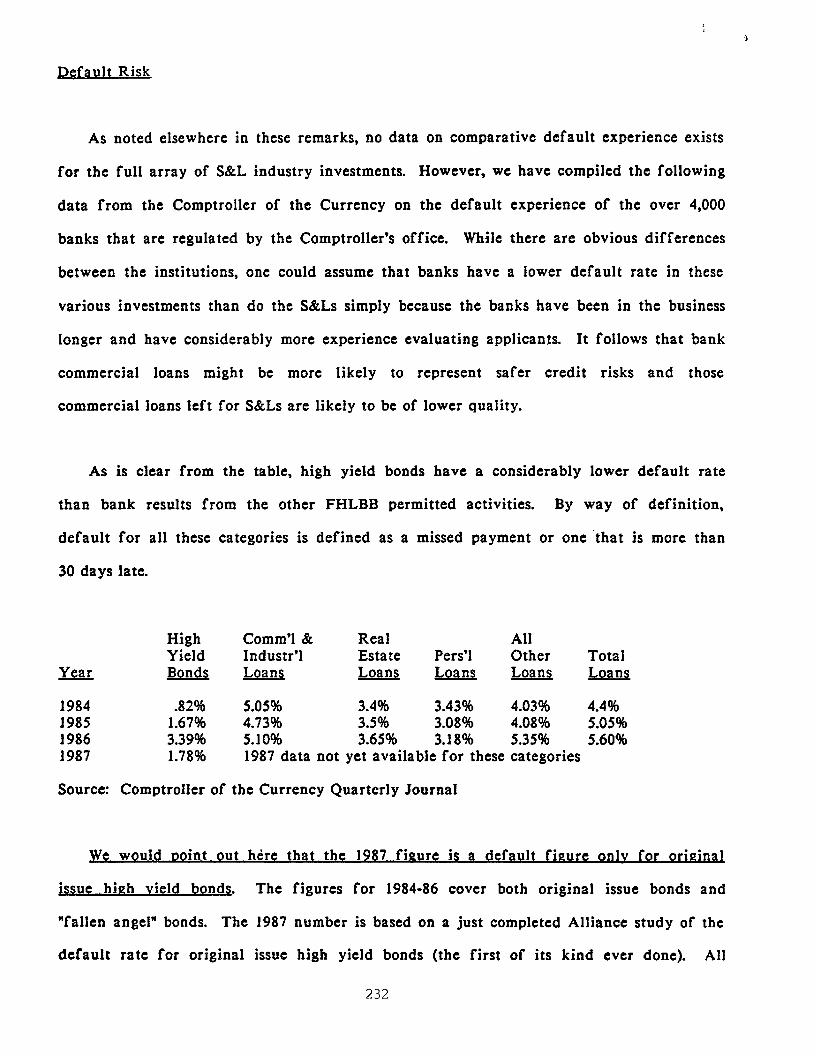
Pefault Risk
As noted elsewhere in these remarks, no data on comparative default experience exists
for the full array of S&L industry investments. However, we have compiled the following
data from the Comptroller of the Currency on the default experience of the over 4,000
banks that are regulated by the Comptroller’s office. While there are obvious differences
between the institutions, one could assume that banks have a lower default rate in these
various investments than do the S&Ls simply because the banks have been in the business
longer and have considerably more experience evaluating applicants. It follows that bank
commercial loans might be more likely to represent safer credit risks and those
commercial loans left for S&Ls are likely to be of lower quality.
As is clear from the table, high yield bonds have a considerably lower default rate
than bank results from the other FHLBB permitted activities. By way of definition,
default for all these categories is defined as a missed payment or one ‘that is more than
30 days fate.
Year
1984 1985 1986 1987
High Comm’l & Real AI1 Yield Industr’l Estate Pers’l Other Total Bonds Loans Loan5 Loans Loans Loans.
.82% 5.05% 3.4% 3.43% 4.03% 4.4% 1.67% 4.73% 3.5% 3.08% 4.08% 5.05% 3.39% 5.10% 3.65% 3.18% 5.35% 5.60% 1.78% 1987 data not yet available for these categories
Source: Comptroller of the Currency Quarterly Journal
We would ooint out here that the 1987 figure is a default fiaure onlv for original . Issue birch vield bonds. The figures for 1984-86 cover both original issue bonds and
“fallen angel” bonds. The 1987 number is based on a just completed Alliance study of the
default rate for original issue high yield bonds (the first of its kind ever done). All
232
t t
previous studies of the high yield bond market default rate have included original issue
high yield bonds and the debt of those “investment-grade” companies whose debt had been
downgraded. It is the rapid expansion of this new part of the market in recent years
that has sparked so much attention and controversy, not the debt of the “fallen angels.”
As the data indicates, the 1987 default rate for original issue high bonds is lower
than the recent data which included the fallen angels. We would further note that the
jump in 1986 was entirely due to the LTV default -- a “fallen angel” that issued both
investment and non-investment grade debt. Including only LTV’s original issue high yield
debt, the 1986 default rate would have been 2.1%.
The Alliance data also showed that the 1.78% default rate on original issue high yield
bonds in 1987 in fact translated into an actual monetary loss of less than one per cent.
Defaulted corporate bonds do not disappear from view. They continue to trade on
the public market, although at a substantially reduced price. In 1987, defaulted high
yield bonds continued to trade at approximately 38% of their original value.
As a result, the study reported, the actual loss to investors from defaults of high
yield bonds was 0.95% of a diversified portfolio’s value.
233

Interest Rate Risk
Of far more relevance to S&Ls than default risk is interest rate risk. The fact is
that few S&Ls or commercial banks today invest in high yield bonds, Treasury securities,
or investment grade bonds to maturity. Most trade these securities on a shorter term
basis. Therefore, while default risk is certainly important, interest rate risk, which
affects the day-to-day value of the security, is far more critical. A sharp rise in interest
rates can quickly devastate a portfolio of fixed income securities.
When market interest rates rise, previously issued bonds with lower interest rates lose
value - their market price drops, representing a loss to investors. With respect to
“quantifying” this interest rate risk, the best guide is recent history. Experience over the
past decade has shown that “risk-free” U.S. Government securities (and high grade
corporate bonds) carry an interest rate risk which far outweighs the interest rate and
default risk of high yield securities.
Recent history illustrates this point. Beginning in March, 1987, interest rates rose
steadily, triggering a virtual collapse of the U.S. Treasury and high grade corporate bond
markets. From January I through September 1, a portfolio of U.S. Government securities
posted a net return of negative 6.8 percent. High yield bonds -- which are less
vulnerable to interest rate fluctuations -- returned a net positive 7.4 percent, according
to the Drexel Burnham Lambert Composite High Yield Bond Index.
Conversely, the rapid drop in interest rates caused by the Federal Reserve Board’s
move to ease credit in the wake of Black Monday, coupled with a “flight to quality”
234

helped Treasuries post a net positive 3.96 return for the month of October while high
yield bonds returned a net negative 3.3 percent.
From that point through the rest of the year, high yield bonds have recovered
smartly. For the full year, a diversified portfolio of high yield bonds returned a net
positive 6.41 percent while all Treasuries returned a net positive 1.93 percent. Further,
those Treasuries with the most similar maturities to high yield bonds -- seven year bonds
-- returned only a positive 0.35 percent. The graphs in section 4 illustrate the returns
offered by high yield bonds.
235

3
B. Altman and Blume and Klein have reported that compared to Treasury bonds and
investment grade corporate bonds, historically the return of high yield bonds has more
than compensated high yield bond holders for additional risks of default.
1. What are the strengths and weaknesses of these studies?
W e are not aware of any academic studies that question the conclusions reached by
either the Altman or Blume and Klein studies. Furthermore, there are several studies
which predate these two which support the basic conclusion that the higher interest rates
offered by high yield bonds more than offset the higher default rate experienced by the
corporate issuers. In addition, there are a few studies that post-date Blumt and Klein
and Altman which echo their conclusions as well. These studies are listed in section 5.
It should also be noted that over the last few years, the Federal Home Loan Bank
Board has looked at the-issue of S&L’ investment in high yield bonds on several occasions.
The Bank Board’s own studies have twice concluded that insufficient basis exists to
restrict S&L investment in high yield bonds. This is entirely appropriate since the
present problems facing the insurance system stem from making fixed rate home loans in
an unstable interest rate environment, exacerbated by speculative land acquisit ion and
development, speculative real estate and construction loans, and questionable lending
practices, rather than any investment in high yield bonds.
In October, 1986, Robert Sahadi, Director of the Office of Policy and Economic
Research concluded in a memorandum to Chairman Edwin Gray that, “The best statistical
evidence says that non-takeover junk bonds when broadly diversified and actively managed
significantly outperform comparable portfolios of Treasury issues even after taking defaults
236

into consideration . . . It is not appropriate to single out junk bond holdings (for special
regulatory treatment) per se because of their perceived risk because consumer loans and
credit card receivables, both of which have non-negligible default rates, are not singled
out because of their riskiness.”
Finally, the Fortune Magazine article on March 16, 1987, which expressed some
concerns about high yield bonds, concluded that even if the default rate in the high yield
bond market reaches six percent, nearly double the highest level default rate reached to
date, a reasonably well diversified portfolio of high yield securities would provide the
same return as a portfolio composed entirely of long-term United States Government
securities. In other words, under the worst case scenario postulated by Fortune, an S&L
investing in a diversified portfolio would do no worse than had it invested in U.S.
Treasuries, widely regarded as the “safest” of any investment.
J,iauiditv Risk
A final measure of risk is liquidity. Clearly, the more liquid an investment the
greater the flexibility to limit risk or react to changing market conditions. As we discuss
elsewhere, there is an active, growing, and liquid market for high yield bonds which has
withstood numerous tests in the past year. Commercial loans cannot be readily sold for
cash should the borrower begin to experience business difficulties which lead a financial
institution to believe that its principal may be threatened. High yield bonds, on the
other hand, can be sold daily in an increasingly active secondary market, allowing
investors to minimize losses by disposing of a bond at the first sign of financial difficulty.
Also, it is worth noting that investors in high yield bonds may purchase as much or as
237

little of an issue as they want, in contrast to a commercial loan where, typically, the
S&L advances the bulk of the credit, heightening its exposure considerably.
2. Given the growth and change in the composition of the high yield bond market in the
past several years, are historical risk and return factors necessarily a guide to the future?
The short answer to this question is “no.” History is never a completely accurate
guide to the future. But you are asking the wrong question.
The question is whether the high yield bond market has changed to such a degree
that, in the event of an economic downturn, there is a greater danger to issuers and
investors today than ever before. On this question, the answer is also “no.”
There has indeed been a tremendous growth in the size of the market and in the
number of companies that have issued high yield bonds but there is not necessarily a
correlation between an expanded market and increased risk, as some imply.
First, the market’s growth has been marked by a move from “fallen angel” issuers to
original issuers. In other words, we are looking at a market where the growth comes
from companies on the way up, not on the way down. That suggests that in this case,
the added breadth of the market has reduced risk, not increased it.
Furthermore, it is important to note that the actual issuers are generally not new
companies. The argument that they have not been tested in a recession just doesn’t
wash. To the contrary, most issuers have extensive credit histories and they have
withstood the test posed by economic cycles. In 1985 (the last year for which figures are
238

available), according to Altman’s research, the average issuer was a 36 year-old company
with assets of over $1.1 billion. These companies have a credit history through good
times and bad times. They are no more prone to default on their high yield bond debt
than they would be when they borrowed from the bank.
Some critics acknowledge that the issuers are strong but that the strength of the
market itself is not. They contend that even if issuers are solid, if the market collapses
underneath them, investors will get hurt. It is true that the market for original issue
high yield bonds is relatively new. But it has proven to be enormously resilient.
Consider, for example, its performance after Black Monday, certainly one of the gravest
challenges ever to the strength of the market. After an initial drop in value (though a
far less drop than occurred in the equity markets), the high yield bond market recovered
strongly, as the graphs in section 4 show.
Yet another reason to be optimistic about the replicability of past experience is that
the credit quality of the new issuers in the high yield bond market is improving. A
Morgan Stanley & Co. study found that in 1986 the creditworthiness (as opposed to the
actual bond rating) of new bonds in the investment grade category declined. Put another
way, the probability of default among these high grade bonds increased. Meanwhile, the
credit quality of new bond issues in the below-investment grade category improved and
their probability of default decreased. No such study has yet been completed for the new
issues in 1987.
Of course, some high yield bond companies are highly leveraged and thus might be
hurt in a recession. But m company which has borrowed too much -- whether in the
high yield bond market or from a bank -- will face problems in a recession. There is
239

simply no basis to generalize and say that high yield bond companies are more prone to
default in a recession than a company which has relied more heavily on bank borrowing.
In other words, the type of financing you have bears no relationship to your ability to
withstand a recession.
Remember that high yield bonds provide fixed-rate,- long-term credit, as opposed to
the variable rate financing usually available from banks. In a recession, a company with
fixed rate financing will be better off than a company with variable interest rates
because recessions are generally accompanied by a severe upward spike in market rates.
To see this point, consider a company with variable-rate, short-term bank loans. In a
recession, this company can easily find itself facing decreased cash flow coupled with
rising interest costs and the inability to refinance expiring loans. We submit that such a
company is far more vulnerable to default than bond issuers whose debt costs remain
constant and who do not need to refinance short-term loans in the middle of a recession.
240

C. How adequate are state laws and regulations governing investments by federally
insured institutions in high yield bonds ? Should state chartered institutions be subject to
the same limitation of assets (11 percent) as federalIy chartered institutions?
There is absolutely no reason to extend the federal 11 percent cap to state chartered
institutions. Indeed, based on the evidence we have seen, a far more compelling case can
be made to lift this cap. Certainly, there appears to be far more data to support high
yield bond investments than there is to support what amounts to a rather arbitrary limit.
First, as we have shown above, high yield bonds do not present a threat to the
FSLIC. In fact, they represent one of the best investment options currently available to
thrift institutions.
Second, the federal 11 percent limitation was developed with commercial loans in
mind. High yield bonds are included only because regulators have chosen to classify them
as commercial loans, thus bringing them under the cap. But that classification itself is
flawed. High yield bonds are much safer and sounder investments than commercial loans.
They offer greater liquidity and are subject to greater disclosure and scrutiny than
commercial loans.
We find it a bit puzzling that some would extend the 11 percent cap on high yield
bonds to state-chartered S&Ls, but no one is talking about extending the 11 percent cap
on commercial loans to state-chartered S&Ls, even though this is a far more prevalent
and risky activity. As Eric Hemel, former director of the Bank Board’s Office of Policy
and Economic Research noted in an April, 1985 memo to Chairman Edwin Gray, “S&Ls
241

originating commercial loans must depend solely on their in-house underwriting expertise.
Few S&Ls have the experience and quality of personnel necessary to reach these credit
quality judgments.
In addition, the widespread view that state-chartered S&Ls are more loosely regulated
is not entirely accurate. In the case of high yield bonds, a survey of those states where
S&Ls have invested in high yield securities to any appreciable degree revealed significant
investment restrictions.
SUMMARY OF STATE REGULATION OF high yield bond INVESTMENT STATE CHARTERED THRIFTS
State
California
Florida
Missouri
Ohio
Texas
Regulation
15% of assets (5% in corporate securities, 10% in commercial loans); more only with approval of the regulators.
Not permitted to purchase high yield bonds since 10/85. Permitted to invest up to 20% of assets in non-rated (private placement) bonds and direct investments.
Tend to track federal investment guidelines but with a 15% of assets limit on commercial loans instead of the federal limit of 10%. However, the state has not yet made a determination on how to define high yield bonds.
20% of assets (10% in high yield bonds, 10% in commercial loans).
Not directly permitted, but S&Ls can petition regulators for approval to buy high yield bonds.
242

D. What is the best way to protect the FSLIC from unreasonable risk as a result of
thrift investments in high yield bonds? Suggestions have included restrictions or
prohibitions on high yield bond purchases, increased capital requirements, risk-based
insurance premiums, additiona regulation to require appropriate credit analysis and
diversification of bond holdings.
We do not believe that high yield bond investment by thrifts presents a threat to the
FSLIC. Nor are any additional regulations required at this time.
It is important to note that Section 406 of the CEBA conferred on the Bank Board
extraordinary authority to “establish the minimum level of capital for an association at
such amount or at such ratio of capital-to-assets as the Board determines to be necessary
or appropriate for such association in light of the particular circumstances of the
association.”
In addition, the Board recently adopted new classification of asset regulations which
cover high yield bonds, among other investments. These give examiners discretion to
increase capital requirements and/or loan loss reserves if they believe an S&L’s high yield
bond portfolio is precarious.
We suggest that these two powers provide more than enough protection to the
insurance system and serve as a significant check on abusive investment in this area.
Finally, there have been over two hundred thrift failures in the past several years.
High yield bonds have never been listed as the cause of a single one of these failures,
243
Indeed, to our knowledge, they have only been implicated in one instance -- the failure of
the Beverly Hills S&L.
In the case of the Beverly Hills S&L, the thrift assembled an undiversified $320
million high yield bond portfolio in its last 9 months of existence in an attempt to offset
the tremendous losses from earlier and much larger real estate investments and loans.
Given the hasty, last-minute nature of this investment policy, the thrift ended up taking
write-downs of between $5-9 million on its high yield bond portfolio. To put this loss in
perspective, the institution lost over $100 million in that year from the other investments.
Poor management and a lack of regulatory oversight were responsible for the demise
of the Beverly Hills S&L, not high yield bonds. While some have expressed concern that
other troubled S&Ls will follow Beverly Hills into the worst type of high yield bond
investments, these are unrealized fears. There is no evidence that any S&L is pursuing
this course. And it would be quite a heavy handed policy that sought to flatly limit S&L
investments, even by healthy, well-capitalized thrifts, to prevent one more Beverly Hills.
The unfortunate fact is that one cannot legislate or regulate against poor
management. You can, however, give regulators additional authority and tools to
anticipate and address this type of problem, which is precisely what has occurred with the
new capital adequacy provisions of CEBA and the new asset classification regulations.
With respect to high yield bond investments, the key is diversification. Any rational
investor - whether an S&L, a mutual fund, or an insurer -- diversifies its portfolio.
The attached article from Morgan Stanley & Co. in section 7 lays out a possible
diversification framework.
244

E. From a public policy viewpoint, should federally insured institutions be restricted from
purchasing high yleld bonds which were issued in connection with the financing of a
hostile takeover or a leveraged buyout?
There arc two policy questions implied in this question. First, arc hostile takeovers
and leveraged buyouts business transactions which should be encouraged or discouraged by
the government? Second, are the non-investment grade securities issued by companies
which engage in hostile takeovers or leveraged buyouts inherently riskier than other non-
investment grade bonds and therefore of greater danger to the FSLIC?
The answer to the first question is beyond the purview of this study and of any
regulatory body. It is a question that has been examined and debated extensively by the
Congress with the answer to date being “no. Congress has not decided to curb either
type of business transaction, in part because members recognize that they cannot legislate
definition’s of good transactions and bad transactions.
The answer to the second question is that we are aware of no data that would
support such a conclusion. In anaIyzing any bond, the transaction that gave rise to its
existence is irrelevant. The relevant point to examine is the underlying credit quality of
the issuing corporation and its ability to pay the bondholders. And as we have shown
throughout this testimony, the returns offered by high yield bonds more than offset their
default rate and these bonds are currently among the most attractive investments open to
thrifts.
We would like to point out however, that it makes no sense to limit the debate of
such a policy question to thrift institutions. Commercial banks which also receive federal
245

deposit insurance are by far the single largest source of financing for both takeovers and
LBOs. In fact, the SEC estimates that over 75% of the financing for acquisitions has
been provided by the commercial banks in the 1980’s.
F. Many bonds that are issued to finance takeovers and. leveraged buyouts are likely to
be repaid in whole or in part from the sale of assets rather than from future earnings.
1. As an investment, are asset backed bonds riskier than bonds whose repayment is based
on expected earnings?
While we know of no data that either supports or disproves the statement, we would
question the statement that “many bonds that are issued to finance takeovers ._ are likely
to be repaid in whole or in part from the sale of assets.”
More to the point, we would like to note that the assets referred to are either
divisions or entire companies and as such their sale price is based on a current estimation
of their future earnings. Therefore, the future earnings of the companies in question will
be used to pay down the debt and the only question is if it will be done as one company
or as several.
2. To what extent, if any, has the stock market turmoil of October 1987 increased the
riskiness of bonds issued in connection with takeovers and leveraged buyouts?
246

The stock market turmoil of October, 1987, only affected those pre-October
transactions which assumed asset sales post-October. Obviously, the 25 percent drop in
the stock market value of the publicly traded companies would affect the sale price of
these assets.
G. How large is the secondary market for high yield bonds? c Can this market be
maintained in the event of an ecouomic downturn ? To what extent was trading (price and
volume) in the secondary market affected by the October 1987 stock market decline?
Given that all publicly registered high yield bonds are available for trading, we define
the size of the secondary market to be the same as the total of all outstanding public
high yield bonds which at the end of 1987 was $164 billion.
In the past 2-3 years, there have been repeated dire predictions that the secondary
market would dry up because of (1) the Boesky scandal, (2) the dominance of the market
by one firm, (3) the ongoing investigation of Drexel Burnham Lambert, (4) the stock
market crash of October, and (5) the impending but continually postponed recession.
What the facts show are the emergence of a huge $160 billion plus market that is
comprised of the debt of over -900 companies that is held by hundreds of sophisticated,
institutional investors. Furthermore, it is a market which has attracted at least four
major, bulge bracket investment banks which have pledged considerable resources and
prestige to becoming major underwriters and market makers in the high yield bond market.
247

We would draw your attention to a recent article in the Wall Street Journal “Heard on
the Street” Column which details these developments. “Other brokers (in addition to
Drexel Burnham Lambert) have already made sizeable inroads into the high yield, or junk,
bond market. According to IDD Information Services, three others -- Morgan Stanley,
First Boston and Merrill Lynch -- have boosted their share of the public market for new-
issue junk bonds to a combined 41 percent last year from 14 percent in 1986.”
The high yield bond market did suffer a drop in value in mid-October but within
three weeks after the crash, the market had regained its pre-October 19th value. Since
that time, the market has continued to grow and outperform many other investments.
One obvious explanation is, as we have discussed earlier, that investors recognize that the
underlying credit quality of the issuers was unaffected by the crash: they were just as
well-positioned to meet their debt obligations after “Black Monday” as they were prior to
it.
H. Private pension plans, the benefits of which are federally insured, are permitted to
invest in high yield bonds. However, there are no requirements that such investments be
especially reported to the Department of Labor.
1. Should there be any special reporting requirement for high yield bonds?
In support of the premise that full disclosure of investment practices and returns in
the interest of both the benef-iciaries and the regulators, we would not object to a
requirement that all categories of investments by pension funds be reported to the
Department of Labor.
248

2. Is there any indication that pension funds may be investing too heavily in high yield
bonds either directly or indirectly through insurance company annuities or mutual funds?
No. As a general matter, we would note that if the same investment standards
discussed elsewhere in these comments are applied by pension fund managers and insurance
companies, then both should achieve the same impressive results reported by Altman,
Blume and Klein, and by S&Ls investing in high yield bonds.
In fact, rather than investing too heavily in high yield bonds, we suggest that due to
investment restrictions imposed by the states, many pension funds are being deprived of
the ability to participate in the high yield bond market, denying beneficiaries of an
opportunity to profit from prudent investment in these securities.

III. ROLE OF HIGH YIELD BONDS IN INCREASED CORPORATE LEVERAGE
1. The Federal Reserve reports the relationship of total debt to total equity of
nonfinancial corporations in two ways. One, debt valued at par (book value) and equity
defined as Total Assets less Total Liabilities (with assets valued at replacement cost).
Two, debt valued at market and equity valued as market value of outstanding shares.
Which of these ratios most appropriately measures the significance of corporate debt?
Is there another measure that is more meaningful such as earnings or cash flow coverage
of debt services?
We believe that the market valuation approach is a far more meaningful measurement
of corporate debt among the two you have listed. This is because traditional debt-to-
equity ratios use book value to measure increases in debt, but ignore offsetting increases
in the actual value of a company’s business and assets. Thus, they exaggerate the size of
a company’s debt burden. It is akin to arguing that it is unsafe for a family to receive a
$20,000 home equity loan on top of its $90,000 mortgage, even though the market value of
their house has risen from $100,000 ten years ago to $200,000 today, and the family’s
income has risen substantially as well.
We would also suggest that there are, in fact, other useful measures of corporate debt
levels. Keep in mind that the basic concern is not what the aggregate debt level is, but
whether the ability of companies to service that debt is reduced. Since it takes income
and, ultimately, cash to pay back the interest and principal of all debt, we would

encourage the GAO and others to concentrate upon ratios that more closely approximate a
corporation’s ability to pay back its debts. Both the earnings and cash flow coverage
ratios do this. However, we prefer the cash flow figures because they represent the
funds actually available to pay down debt while earnings numbers include accounting
income which distorts the true ability of a company to meet its debt obligations.
The interest coverage ratios show that the percentage of business income required to
meet the interest payments on corporate debt was actually lower in 1986 than it was in
1974. According to the U.S. Department of Commerce’s Bureau of Economic Analysis, U.S.
corporations generated sufficient cash flow in 1986 to cover their interest payments 6.4
times, compared with 6.3 times in 1980 and 6.2 times in 1974. For your use, the cash
flow coverage ratio table is included in section 6 of this report.
It is true that in the aggregate U.S. companies have taken on more debt in the past
decade. But it is important to note two facts. One, high yield bond debt represents less
than 6% of the new debt assumed. Of the $1.5 trillion of new corporate debt assumed
between 1978 and 1986, high yield bonds represented only 5.3% ($79.9 billion) of the total,
while “investment grade” bonds made up 25.8% ($387 billion) of the total, and bank loans
and other short-term paper accounted for 68.9% ($1.03 trillion), according to data compiled
by the Federal Reserve Board and Morgan Stanley & Co. (However, in recent years, high
yield bonds as a percentage of total corporate bonds have risen to approximately 20%.)
Second, it should be noted that the business sector share of the nation’s debt
(consumer, government and business debt) has decreased since 1970. In other words, while
the entire debt load of the United States has increased, the corporate share has
251

decreased in percentage terms from 30.7% to 28.6% of total debt outstanding. See section
7 for the data.
In sum, an examination of these statistics shows that while the corporate debt load of
U.S. corporations has increased, their ability to repay that debt is still exceptionally
strong. And, as noted before, that is the key fact, not whether the aggregate debt
levels are higher or lower. Furthermore, there is no reason to believe that any curb on
these high yield bonds would have resulted in less borrowing by corporations. In all
likelihood, as demonstrated by the John Paulus analysis referred to earlier in this
testimony, companies would have borrowed most of the funds from other sources such as
banks or insurance companies or pension funds.
B. The publicly traded high yield bond market has grown from less than $3 billion in
new issues in 1982 to about $34 billion in 1986. One reason for this growth appears to be
a shift in corporate financing from additional stock, private placement bonds or bank
loans to publicly traded bonds. What implications, if any, does this change in the source
of corporate capital have on monetary policy?
It is certainly true that the shift from bank lending to securitized, non-investment
grade debt has decreased the Federal Reserve’s control of our monetary system. However,
other factors such as the internationalization of the capital markets and securitization of
investment grade debt (e.g. commercial paper, Eurobonds) are far more important in this
regard. But, we do not know whether this trend has yet had negative implications on
monetary policy.
252

We do not believe it has hurt American companies. This is because if you view all
financing options open to a corporation on a continuum, with straight bank debt at one
end and straight common stock at the other end, it really does not matter where a
corporation raises its funds so long as it can invest them in projects that offer a higher
return than the weighted average cost of capital of the firm.
We would like to note that more and more companies are turning to the high yield
market to finance their business. The high yield bond market has grown dramatically
since 1978, increasing from approximately $8 billion of the corporate bond market in that
year to $164 billion in 1987. In 1986, the last year in which we have comparative data,
high yield bonds accounted for 22% of the bonds offered in the public markets.
While the overall size of the high yield market has grown, it is important to
understand why the market continues to attract hundreds of corporations.
The wide swings in interest rates which began in the late 1970’s forced banks to
largely cease offering long-term corporate loans at fixed interest rates. Corporate
borrowers lost access to one of their traditional sources of affordable, fixed rate, long-
term growth capital: bank loans. Their only other alternative was the private placement
market, complete with its lack of liquidity and covenants restricting the flexibility of
corporate managers.
Thus, small and medium-sized companies seeking to borrow funds were forced to
accept the terms that most banks were offering - namely, short-term, variable-rate loans.
That is why they were searching for alternatives.
253

Enter high yield bonds. By offering higher interest rates than the top rated firms, the
companies have been able to access the public bond markets to raise fixed-rate, long-
term growth capital.
Between 1977 and October, 1987, approximately 958 such companies issued bonds for
the first time and have doubled the number of U.S. companies using the public bond
markets. With fixed-rate, long-term bank debt continuing to be rare, it is likely that
more and more U.S. corporations will become increasingly dependent upon the “junk” bond
market over the next decade.
C. Should regulatory and tax policy be changed to make the use of high yield bonds in
takeovers. and leveraged buyouts less attractive?
Absolutely not. First, there is no evidence that the use of high yield bonds in
takeovers and LBOs has any harmful effects on the economy. Second, there is ample
evidence that high yield bonds have financed hundreds of productive acquisitions and LBOs
that have saved and created jobs over the years. (We would be happy to provide you with
detailed examples of such transactions).
Limits on the use of high yield bonds in takeovers and LBOs will disproportionately
affect small and medium sized companies since they tend to have less cash than Fortune
500 firms. Yet, these are the very companies which, according to recent studies, are
creating the most jobs today.
254

Finally, such a policy would be highly discriminatory. Why should different rules
apply to the 800 investment grade companies than to the more than 23,000 non-investment
grade firms? Moreover, as we have shown elsewhere in this testimony, bank debt plays a
far greater role in financing takeovers and LBOs than high yield bonds.
D. Others allege that the preference for debt over equity financing arises from the
double taxation of dividends and the deductibility of interest for tax purposes. What
effect will the lower tax rate have on financing decisions? What would be the merits of
eliminating double taxation of dividends?
Quite frankly, we believe this issue to be too complicated and too far removed from
the question at hand to be adequately addressed today.
However, we would note that there is considerable disagreement among economic
experts about the extent to which the federal tax system actually favors debt over equity
financing. Arguments purporting to demonstrate that such a bias exists invariably rest on
the premise that, all other things being equal, the deductibility of interest payments
without a corresponding deduction for dividends paid will produce a preference for debt
financing. Such arguments are seriously misleading, however, because, in fact, all other
things are not equal. The different tax treatment of dividend and interest payments at
the corporate level is only one aspect of a complicated system of corporate and
shareholder taxation containing a number of provisions tending to offset the pro-debt
bias provided by the interest deduction. As a result, numerous studies have concluded
that when the system is viewed in its entirety, it may have little or no aggregate
pro-debt bias. See section 5 for a representative list of the studies.
255

The most important of these offsetting factors is that although dividends are subject
to taxation in full when received by non-corporate shareholders, in practice that potential
tax liabiiity is substantially avoided by the widespread corporate practice of retaining
earnings, rather than paying them out in dividends. The resulting increase in value of the
corporation’s stock goes untaxed to the shareholder until sale of the stock or is
eliminated entirely if the stock is held until the death of a shareholder, or is donated to
a charity.
In addition, there are substantial limits to the tax advantages of debt. For example,
the deductibility of interest payments may make a firm’s net income small enough that it
finds itself unable to use all of its depreciation allowances and has to carry them forward
one or more years. If that occurs, then the user cost of equipment and structure
investments will rise and reduce, perhaps substantially, the advantage of debt.
The financial markets also limit a corporation’s debt level. Both the stockholders
and holders of existing debt will sell their holdings if a company’s debt level exceeds a
level they believe to be appropriate. In many ways, this is the most effective check on
corporate debt levels and is a much more efficient check on corporate debt than any
attempt at government control.
E. How can it be determined if corporate debt to equity ratios are too high or too low?
If they are believed to be too high or low, what, if anything should the Government do
about it?
256

It is important to recognize that there is no such thing as “the correct” debt-equity
ratio. Debt-equity ratios vary over time, across industries and among companies within an
industry.
When a company decides to issue debt, it invariably examines its future cash flow and
its consequent ability to service the debt - under both normal and recessionary economic
assumptions. This ability will vary significantly across industries. Television broadcast
stations, for example, although susceptible to declines in viewer ratings, have
comparatively secure commercial markets and relatively stable production costs, and
therefore may make good candidates for higher levels of debt financing. New high
technology concerns, on the other hand, which have more uncertain future earnings
streams, would probably not wish to carry as high a percentage debt load as broadcasting
operations could safely service. Since market conditions and other important determi-
nants of future cash flow vary even within industries, the best judge of the suitable
debt-equity ratio for a given company at any point in time is the company itself.
The structure of a corporation’s debt also varies considerably. Some companies favor
short-term, variable-rate financing while other favor long-term, fixed-rate financing. Not
only do debt-to-equity ratios not capture these differences, it is impossible to determine
an appropriate structure for all companies. For example, short- term, variable-rate loans
offer lower rates but in the case of a recession (which in recent times have been
accompanied by a sharp spike in interest rates) long-term, fixed-rate financing would be
better for a company. The
market it serves all enter
structure.
company’s cash position, susceptibility to a recession and the
into a company’s decisions as to the nature of its capital
257

Different exigencies face a privately-held corporation compared with one which is ’
publicly-owned. Privately held corporations are immune from many of the shareholder and
lender pressures on public companies to keep down balance sheet debt, and therefore,
traditionally have had much higher debt/equity ratios than privately held companies.
In all these cases, the government simply has no business trying to establish
appropriate levels of debt for the private sector. Such a policy would amount to de facto
federal credit controls. The fact is there is no one appropriate level of debt for a
business. Further, debt levels are not constant. Companies are constantly rearranging
their balance sheets depending on developments in their business and the economy at
large. At different times, different capital structures may be more appropriate to meet
the challenges they face. To be sure, some will overextend themselves. But, it would be
disastrous for the federal government to substitute a single, sweeping standard for the
individual decisions of private businesses. And, as mentioned above, the existing
stockholders and bondholders by holding or selling their investments act as a much more
efficient check cn corporate debt levels than any government regulation could.
Respectfully submitted,
David IL Aylward Executive Director Alliance for Capital Access
258
ACR AJliance For Capital Access
1919 Pennsylvania Avenue. NW Sure 701 WashIngton. DC 20006 2021429-9628
March 24, 1988
Mr. Craig A. Simmons Senior Associate Director General Government Division U.S. General Accounting Office Room 3858A 441 G Street, N.W. Washington, D.C. 20548
Dear Mr. Simmons:
Thank you very much for holding the recent hearing on thrift investment in high yield bonds.
The hearing was the first recent public opportunity in Washington to address the considerable amount of confusion and misunderstanding about these securities and their role in the American economy. The hearing also provided considerable information about the important contribution high yield bonds have made to the investment portfolios of several thrifts.
The testimony presented at the hearing, as well as the interim report prepared by the General Accounting Office, have already gone a long way towards dispelling many of the myths surrounding high yield bonds. Specifically, the witnesses at the hearing concluded that:
* There is no need for any additional regulation or legislation in this area.
* From a thrift's point of view, a diversified portfolio of high yield bonds is one the best investment alternatives available today and the high returns offered by high yield bonds actually support and enhance a thrift's ability to fulfill its traditional role of financing home ownership.
* The sharp distinction between [email protected]" and "non- investment" grade bonds is no longer meaningful and should no longer have such a strong impact on investment regulation.
* High yield bonds are a critical source of long term growth capital for over 900 American companies and S&Ls are becoming important investors in this market.
259

March 24, 1988 Page Two
The attached supplementary comments expand on these conclusions.
While there is no definitive comparative data, all the testimony presented at the hearing indicated that not only are high yield bonds a good investment, they are among the best investment alternatives open to thrifts. In fact, the only comparative data presented at the hearing -- by Mike Lea of Imperial Corporation of America -- indicated that high yield bonds currently offer the highest spread to Imperial.
The GAO is in a unique position to further develop much of this data. And, as we have discussed, we are prepared to help you in any way possible in this endeavor.
The Alliance looks forward to working with you over the next several months.
David K. Aylward Executive Director
260
: c
ADDITIONAL COMMENTS BY THE ALLIANCE FOR CAPITAL ACCESS
We commend the GAO for holding such a wide ranging and thorough hearing on thrift
investment in high yield bonds. As we noted in our earlier comments, this is an area
that has been the subject of considerable rhetorical attack but very little analytical
review until the GAO was asked to look into it. Before commenting on some specific
points raised at the hearing, we would like to highlight some of the important
conclusions reached by the witnesses at the hearing.
One. There is no need for more restrictive regulation or legislation in this area.
None of the nine witnesses supported the need for any new restrictions on either the
issuance or investment in high yield bonds. Almost all strongly opposed any new
restrictions; most suggested liberalizing existing rules. Even the witness from Standard
and Poor’s, who was by far the most critical of high yield bonds, concluded her
testimony by saying that “S&P is uncomfortable recommending new legislation or
regulatory guidelines to control investors’ exposure to junk bonds.”
Professor Altman offered his diversification guidelines and reserve requirements with
the critical caveat that high yield bonds should not be singled out for any special
treatment. He said: “It is important to note that I recommend treatment of high yield
securities like any other risk asset and advocate adequate reserves for all assets.”
Contrary to public perception, state chartered S&L investment in high yield bonds is
already closely regulated. We would refer you to page 29 of our initial testimony for a
brief overview of the state regulations for those states in which thrifts have invested in
high yield bonds.

Two. From a thrift’s point of view, a diversified portfolio of high yield bonds is one
of the best investment alternatives available today. The high returns offered by high
yield bonds actually support and enhance a thrift’s ability to fulfill its traditional role of
financing home ownership.
The academic studies presented at the hearing, as well as many others, have all
concluded that the higher interest rates offered by high yield bonds far more than offset
the higher default rates that these bonds experience. The lower volatility, higher total
return, and lower overhead required to invest in high yield bonds have all combined to
make these very attractive investments -- just the opposite of their pejorative name
“junk.” See pages 19 - 24 of the Alliance’s earlier testimony for more information.
Confirming these academic studies is the investment history of those few thrifts that
have made significant high yield bond investments. As both Imperial and Columbia S&L
testified, and as GAO’s study of six California thrifts indicated, thrifts have made a
considerable amount of money by investing in high yield bonds without threatening their
capital or the FSLIC’s funds. We would refer you to the chart attached to the testimony
of Michael Lea of Imperial Corporation of America which indicates that high yield bonds
currently offer a far higher spread to S&Ls than most other S&L investments. At a time
of significant S&L failures, when policy makers are forced to ask fundamental questions
about the future of the industry, this chart presents the critical comparisons. The chart
submitted at the hearing by David Sachs of Columbia Savings and Loan further emphasizes
the extraordinary difficulty S&Ls face today in carrying out their traditional functions
profitably.
262

Further protecting the FSLIC is the fact that there exists a large and liquid
secondary market for high yield bonds. The existence of this market allows S&Ls the
opportunity to sell the bonds should they need the cash or should they (or the
regulators) become uncomfortable with the credit quality of a particular company. In
addition, the secondary market provides a daily, independent appraisal of the value of the
bonds -- a major benefit to both the thrift and the regulators, This liquidity is in sharp
contrast to the real estate and commercial loans that S&Ls make. (Please see page 24 of
our earlier testimony for more information on this point.)
Three. The sharp distinction between “investment” and “non-investment” grade bonds
is no longer meaningful.
While there may have been a significant difference between bonds in these two
categories in the past -- when all non-investment grade bonds were formerly investment
grade bonds “gone bad” -- such a distinction no longer exists. Both Professor Altman and
Ms. Hess01 stated at the hearing that the credit gap between the lowest rating in the
investment grade category (BBB) and the highest rating in the non-investment grade
category (BB) is no wider than the gap between any other of the ratings on the 9 point
S&P continuum. In fact, Professor Altman’s studies and projections show that a BB bond
is (on average) a much more profitable investment than a BBB.
Yet this outdated distinction between investment grade and non-investment grade
continues to have important public policy ramifications. For one, it has been used as
short-hand by both regulators and policy makers to differentiate between “safe” and
“unsafe” investments. Yet. as was testified to in the hearing this is not the case. Due to
the high risk premiums paid by the high yield bond issuers and the higher volatility of
263

the investment grade bonds and the US Government bonds, high yield bonds have
consistently proven to be the more profitable and therefore “safer” investment. Evidence
of this performance is presented on pages 19-22 and section 4 of our earlier testimony.
We would also note that to the extent high yield bonds are replacing commercial
loans, banks are finding themselves in the ironic position of being prohibited from making
a more liquid, better scrutinized, and higher return version (i.e. a high yield bond) of the
approved commercial loan.
We would therefore encourage the GAO to recommend that the regulatory agencies
and Congress re-examine the statutes and regulations that limit banks and other regulated
entities to investing solely in investment grade debt. While simple to enforce and easy to
understand, the present arbitrary limit needlessly limits the investment opportunities open
to federally-regulated institutions without significantly increasing the safety of those
institution’s investments.
An alternative mode of regulation could be the adoption of the “prudent person”
investment rule that is used by many pension fund statutes. This “prudent person”
standard more accurately reflects the real world and allows both the investing institution
and the regulators the necessary flexibility to adapt to changing market conditions. In
the field of pension investment regulation, both the Department of Labor and state
regulators have been moving towards this “prudent person” rule and away from a rigid list
of “approved investments.”
260,

Four. Mr. Brookstone and many other witnesses testified that high yield bonds are a
critical source of long term growth capital for over 900 American companies and S&Ls are
becoming important investors in this market.
As we noted in our earlier testimony on pages 6-8, 958 corporations issued publicly
traded high yield bonds in America between 1977 and 1987. These companies raised over
$136 billion, employ more than 2.6 million people and have nearly 17,000 facilities
throughout the United States. (It is important to note that these statistics exclude any
transactions that were in anv way related to hostile takeovers.)
S&Ls already account for over 10% of the market for high yield bonds and have the
potential to become much larger investors in this market. The Alliance and its members
believe that the regulatory cloud of uncertainty combined with active opposition by many
S&L examiners have needlessly kept more thrifts from this very profitable market, thus
reducing the pool of long term capital available to growth companies. As the GAO noted
in its interim report, and as the S&Ls that appeared at the hearing testified, high yield
bond investments have been extremely lucrative for those thrifts that have invested in
them.
The future economic growth of America and its companies stand to benefit from
greater thrift investment in high yield bonds. There is no reason to continue to limit
their involvement in this lucrative market.
265

Several concerns and criticisms of the high yield bond market were raised at the
hearing that we believe are unfounded and merit a reply.
One. It was stated by one witness that because the high yield market has grown
tremendously in both total dollar volume and in the dollar size of the average corporate
debt offering, there will be more and larger defaults in the future.
This was asserted without evidence to support it and there is, of course, no way to
predict whether this will turn out to be the case. However, the key point to concentrate
upon is whether returns on high yield bonds will continue to more than offset any default
risk. And on this point, the witnesses at the hearing who have dedicated the most time
to studying defaults unanimously agreed that the returns should continue to offset losses
estimated by even the most ominous default scenarios.
Dr. Altman, in his testimony before the panel, indicated that a lOoh default rate would
leave the average investor with a total loss of less than 1% -- which would certainly not
threaten either the institution or FSLIC. We believe this to be a very conservative
prediction in that Professor Altman’s calculation of a 1987 default rate of 5Oh (which
included fallen angels like Texaco) led to less than a 1% actual loss to the investors.
From this we would postulate that the historical coupon spread of 3-4% between
Treasuries and high yield bonds (now between 4-5%) would allow for tripling of Altman’s
default rate before any actual losses would accrue to the investor.
We also disagree with assigning a 5O/6 default rate to high yield bonds for 1987. As
Professor Altman noted, that number includes the Texaco default. Without Texaco, the
default rate in 1987 was .997OZ1. Companies go through a life cycle of growth, maturity
266

and decline. Accordingly, we believe that a distinction should be made between original
issue high yield bonds, and the bonds of formerly investment grade companies which slide
into non-investment grade status as a result of their decline.
The Alliance has recently conducted a study of the default rate of original issue high
yield bonds that concluded the 1987 default rate was 1.8% in 1987. Please see pages 19-20
for more information on this report. We have also attached the report to these comments
for your information.
In any event, default rates alone do not tell the important story. Even though lower
rated bonds have a higher default rate than do the investment grade bonds, the additional
interest rates they offer more than offset that risk. It is misleading and imprudent to
conclude that the default rate alone is the measure of risk to the investor. Instead, it is
the total return (including defaults) to the investor that should be examined and then
compared to the other investment alternatives open to thrifts today.
High yield bonds, through a combination of their higher interest payments, liquid
secondary market, and the fact that they retain an average of 400/6 of their value even in
the case of default, have offered investors consistently high returns since the early
1900’s. Study after study, investor after investor, have all confirmed the fact that a
diversified portfolio of high yield bonds is among the most profitable fixed income
securities investments available. Again, see pages 19-24 of our earlier testimony for more
information.
In 1987, for example, default-free and therefore “riskless” U.S. Government Bonds
returned a minimal 1.93% while high yield bonds returned 6.41°h. Those Treasuries with
267

f ,
the most similar maturities to high yield bonds -- seven year bonds -- returned only a
positive 0.35%. High yield bonds have also outperformed the investment grade bonds over
the past seven years. For example, the First Boston High Yield Index provided a
compound annual return of 16.36% while the Shearson/Lehman Corporate Index returned
15.29Oh. Additional comparative data was submitted on pages 19-22 and section four of our
written testimony.
In conclusion, we would note that this preoccupation with default rates has kept
policy-makers and analysts from sufficiently analyzing the net, total return to investors of
high yield bonds compared to the other thrift investment options, including residential and
commercial mortgages. Such an analysis will, we believe, show high yield bonds to be
among the most profitable investments open to the thrifts and, in the case of those few
thrifts that are currently investing in high yield bonds, have generated sufficient profits
to allow the institutions to continue to provide mortgages. Certainly these were the
conclusions of the only quantitative testimony submitted to the GAO on this critical
comparative question. (See testimony of Columbia and Imperial.)
Two. It was stated at the hearing that high yield bonds are more volatile than other
fixed income securities and therefore pose a greater threat to investors.
This is simplv not true. Every study (and common experience) shows the opposite.
US Government bonds and the higher rated investment grade bonds are much more volatile
because they are viewed by investors as “interest rate plays” and therefore are buffeted
by the rumors and speculation surrounding the future direction of interest rates. For
example, the first quarter of 1987 was a terrible month for investors in US Treasuries.
3.68

Seven year U.S. Treasuries (the maturity most similar to high yield bonds) returned only
.30% while high yield bonds returned 8.69%.
This point was recently confirmed by a recent report by the First Boston Corporation,
“the First Boston High Yield Index posted a volatility of annual returns of 9.79Oh, the
lowest for any security type, except the Shearson Lehman Government Agency Index which
has a shorter duration.” page 7, High Yield Handbook, First Boston Corporation, January
1988. (For your use, a copy of the report is attached.)
There are also several academic studies on volatility that have concluded that high
yield bonds are less volatile than other fixed income securities. The most recent is a
study by Professors Blume and Keim of the Wharton School at the University of
Pennsylvania which states that high yield bonds “tend to move up or down in price in line
with the issuer’s fortunes, avoiding the larger, day to day swings in the bond market.”
(Blume and Keim, “Risk and Return Characteristics of Lower Grade Bonds,” Financial
Analvsts Journal, July-August, 1987.)
Three. It was stated by the witness from Standard and Poor’s Corporation that the drop
in the average of all industrial bond ratings represents a drop in the credit quality of
American corporations.
We are somewhat confused by her statement because it conflicts with her later
conclusion that much of the growth in the high yield bond market has been at the
expense of the banks and insurance companies. In other words, many of the participants
in the high yield market previously raised their funds from banks and the private
placement market and therefore were not rated by the rating agencies. We would note
269

that Ms. Hess01 concluded her testimony by saying “Much of the junk bond market’s
growth represents a shifting of borrowers from private finance (banks and insurance
companies) to the more visible public bond market. The financial risk assumed by these
borrowers is not necessarily greater that it would have been had they continued with
their traditional lenders. In fact, access to new sources of capital at competitive prices
might be considered a positive credit development.” This directly conflicted with the
widely reported assertion at the beginning of the S&P testimony that there would be more
and larger defaults in the HYB market in the future.
In any event, it is factually correct that the average bond rating has dropped. But
before jumping to alarming conclusions, it is necessary to put this drop in average ratings
in context. It is almost entirely due to the development and growth of the high yield
bond market. Ten years ago the market for publicly traded corporate bonds was limited
to the 900 or so investment grade companies. The development of the high yield bond
market, which is now supported by all the major investment banks, has led to the addition
of over 1,000 non-investment grade companies to the market for publicly traded corporate
bonds.
With the majority of companies whose debt is publicly traded now being of a non-
investment grade rating, it is arithmetically correct to expect that the average rating
will be BB instead of the 1981 average company rating of A. Measured by dollar volume,
however, high yield bonds account for less than 25% of the market and the average rating
is well within the investment grade range, as Ms. Hess01 herself noted in her written
testimony.
270

While we believe that the rating agencies serve a valuable function, they are certainly
not infallible. We believe there is no reason to assign any more validity to the ratings or
market predictions of two private organizations than is given to other market and
business analysts. Until recently, Standard and Poor’s and Moody’s have tended to pay
relatively little attention to the emerging original issue high yield bond companies.
Moreover, S&Ps predictions of impending widespread defaults should be tempered by
the fact that the low ratings S&P has assigned to original issued HYBs for years (forcing
these companies to pay sharply higher rates for their debt) contrast markedly with the
very & historical default rate. Similarly, because few companies drop from good health
to default without prolonged warning, we are not convinced that the fact that 26% of the
bonds which defaulted were assigned a C rating by S&P six months or more prior to
default proves that the rating system is an accurate predictor of defaults. We do agree
with Moody’s which clearly says that “[Ratings] have no value in forecasting the direction
of future trends of market price.”
Four. Contrary to some of the testimony presented at the hearing, there is a marked
difference in the character and make-up of the fallen angels and original issue high yield
companies, especially from an investor’s point of view.
Ms. Hess01 of S&P stated that two-thirds of the corporate defaults since 1972 were
original issue non-investment grade. While we do not argue with this claim, we would
note that she is measuring the number of companies that have defaulted, not the dollar
volume of debt that has defaulted. From an investor’s standpoint, it is not how many
defaults that counts, it is the dollar volume of defaulted debt.
271

The Alliance has recently completed a study contrasting the default rate (measured by
dollar volume) of original issue high yield companies vs. the entire high yield market. For
the years 1985-87, the study shows that the default rate for original issue companies was
1.5%, 2.1% and 1.8%, respectively. This contrasts with a default rate for the entire high
yield market in those years of 1.69%, 3.39% and 5.5%. Obviously, the default rate of
fallen angel debt is much higher. Please review the attached default study and the earlier
testimony, pages 19-24.
While on the surface, this contrasts sharply with S&P’s data and conclusion, the
explanation lies in the fact that while more original issue companies defaulted on their
debt than did fallen angels, the average size of the debt issue was much smaller for the
original issue companies than it was for the fallen angels.
* * * * * * * * *
In conclusion, the Alliance and its members would note that the “flip-side” to all the
above arguments about the safety of high yield bonds and the fact that investors have
been overcompensated for buying bonds labelled as “junk” is that the growth companies of
America are paving too high an interest rate for their long-term. fixed-rate capital.
Contributing to this phenomena are arbitrary government guidelines based upon outdated
distinctions between “investment” and “non-investment” grade corporate bonds. Further
contributing to our members’ higher than necessary cost of capital is a system of ratings
that have clearly not kept up with significant changes in the marketplace but which
continue to hold enormous sway over both investors and regulators.
272

APPENDIX VIII
COMMENTS SUBMITTED BY MICHAEL LEA, SENIOR VICE PRESIDENT, IMPERIAL CORPORATION OF AMERICA
APPENDIX VIII
273

COMMENTS
U.S. General Accounting Office Study on Corporate High Yield Bonds
March 1, 1988
Michael Lea Senior Vice President Imperial Corporation of
America for
U.S. League of Savings Institutions
274
The U.S. League of Savings Institutions is pleased to offer
its input to the Congressionally-mandated study by the General
Accounting Office on the issuance of and investment in
corporate high yield debt securities. My name is Michael Lea,
Senior Vice President for Financial and Economic Analysis for
the Imperial Corporation of America, the parent of an $11
billion savings and loan institution headquartered in San
Diego, California. Imperial has an investment of approximately
$1.4 billion in corporate high yield securities, which are
managed by our Caywood-Christian Capital Management
subsidiary. This company also manages approximately $700
million in corporate high yield securities for other clients
including thrifts, banks and pension plans. As I am
representing the U.S. League of Savings Institutions, I will
address issues of concern to the entire thrift industry, I
would also request that my full statement be admitted into the
record as an amplification of the comment letter already filed
by the League.
The Hiah Yield Bond Phenomenon
High yield bonds are part of an ongoing securitization
process whereby funds-seekers approach funds-providers directly
via the capital markets rather than indirectly via
275

,
on-balance-sheet portfolio lending intermediaries. As shown in
Figure 1, 70 percent of U.S. financial assets now exist as
securities -- and Wall Street is taking aim at the rest.
Securitization has typically been associated with corporate
equities and government bonds. Loans to businesses and
households have been the province of banks and thrifts
(Figure 2). However, securitization is increasing the
competition for these assets. Residential mortgage loan
securitization has grown at an explosive pace in recent years,
due in part to the availability of guarantees from the
federally backed secondary mortgage market agencies (Ginnie
Mae, Freddie Mac, Fannie Mae). And commercial paper and high
yield corporate bond issuance have begun to make serious
inroads to the commercial lending market.
The U.S. League has expressed reservations over the ever
increasing volume of pass-through and collateralized mortgage
obligations (CMOS) and real estate mortgage investment conduits
(REMICS) by the federally backed agencies in the mortgage
market. However, these reservations revolve around the scope
and targeting of those federal guarantees rather than the
"financial technology" involved. Funds users and providers
should be allowed to find their most preferred way of
transacting in private markets, absent any compelling public
policy concerns.
276

It is the economics of cheaper and more flexible funding
that has driven corporations to the capital markets. Direct
market issues of short-term commercial paper and longer-term
bonds now substitute for traditional commercial bank loans and
lines of credit. Through the high yield bond market,
corporations have been able to obtain long-term, fixed-rate
funds that have not been available from commercial banks since
the late 1970s.
Securitization allows users of funds to tap larger pools of
funds that heretofore possible in a segmented financial
market. Investors as diverse as thrift institutions and
pension plans can now lend to corporations via the
securitization channel. The high yield bond market also offers
investors direct market access to a much wider class of
corporate borrowers. They can lend to investment-grade and
below investment-grade corporations, both within local markets
and nationwide.
Securitization is here to stay, driven by the demand for as
well as the supply of funds. Relatively few corporations carry
unimpeachable triple-A credit ratings (and no commercial banks
or thrift institutions do so) but have a need for funds. The
below-investment-grade corporate debt market is no longer
confined to "fallen angels". Rather it is dominated by
original issuers which are funding growth or restructuring for
greater efficiency in their operations.
277

: ,
Depository Institution Investment
Corporate high yield debt securities are the functional
equivalents of commercial loans. If depository institutions
have the right to extend such credit in the traditional
borrower-lender manner, they should also have the right to
extend funds via securities investment.
Thrift institution investment in high yield debt securities
has been questioned by some who point out that thrifts have
traditionally been primarily residential mortgage lenders and
have received subsidies to provide credit to this market.
However, most of the subsidies thrifts receive for mortgage
investment have been scaled back or eliminated. Deposit rate
ceilings have been eliminated and the tax advantage available
to institutions which meet the qualified lender test has been
substantially reduced. Furthermore, the activities of the
federally backed secondary mortgage market agencies have made
mortgages more fungible and reduced the yield spreads available
to portfolio investors in mortgages.
Investment in high yield bonds can offer depository
institutions the opportunity to profitably diversify their
portfolios without costly investment in a commercial loan
origination network. Portfolio diversification can reduce the
dependence of thrifts on the cyclical swings of real estate

markets. High yield bond investment offers institutions the
opportunity to diversify across industries and areas of the
country. It should be noted that most of the failures in the
thrift industry are related to a lack of diversification, as
failed institutions typically have portfolios primarily
comprised of real estate loans made in "their own back yards."
Furthermore, high yield bonds are less interest rate sensitive
than mortgages and Treasury securities allowing thrifts to
better match asset and liability maturities. For these
reasons, high yield bond investment can reduce the volatility
of thrift earnings.
High yield bonds offer thrift institutions more liquidity,
or marketability, in their investment than commercial loans.
If a corporate borrower's credit begins to weaken, relative to
the market, the bond can be sold (minimizing expected credit
loss) whereas the lender in a commercial mortgage cannot easily
extricate itself from the transaction. Although the liquidity
of the high yield market suffered in the October equity market
gyrations, buyers remained for most market issues. Yield
spreads widened after the crash but have returned to the levels
that existed before that time. More importantly, the high
yield bond market still remains far more liquid than the
inter-depository secondary market for direct commercial credits.
279

Securitization also has increased the amount of information
available for institutions to do their own "due diligence"
analysis. An additional level of underwriting is inherent in
the ratings process and the prospectus disclosure under the
securities laws provides for third party verification of the
information obtained in the underwriting process. High yield
bonds are publicly traded. Therefore, investors have up to the
minute price information on a firm's equity as well as debt
securities available to monitor their investments.
Risk-Return Trade-offs
One of the questions asked of the GAO is to compare the
risks and returns of investment in high yield securities with
other thrift and bank investments. Such a comparison is
difficult to make because of the volatility in yields funding
costs and risks of different investments. Furthermore,
comparison between actively traded and thinly traded
instruments is complicated by a paucity of data on yields of
infrequently traded assets.
Table 1 contains an attempt to quantify the risk-return
tradeoffs existing at a point in time (February 24, 1988).
Spreads are calculated as the difference between secondary
market yields and the sum of funding costs, risk-based costs
(including credit risk) and servicing costs. Although yields
ml

and costs can vary considerably, both over time and within
asset class, these relationships are indicative of the
trade-offs available to depository institutions. High yield
bonds offer institutions larger risk-adjusted spreads than any
other asset than can be obtained in quantity. Compared to
mortgages, the traditional thrift investment, investors can
expect a risk-adjusted spread on high yield bond investment of
approximately 300 basis points, relative to a spread of less
than 10 basis points for fixed-rate mortgage investment. The
point of this analysis is that the margin to absorb increased
cost is much greater in high yield investment than in other
investments.
Portfolio Manasement
Existing studies of default risk indicate that the returns
from high yield bond investment have adequately compensated
investors to date. However, even these numbers can overstate
the expected loss experience of an actively managed, well
diversified portfolio. Active portfolio monitoring and
management, combined with a disciplined sell strategy, can
significantly reduce the severity of loss over the "buy and
hold" strategy assumed in academic studies. Furthermore,
investors rarely "buy the market." Diversification is a tenet
for successful financial management, and experienced portfolio
managers can reduce their risk through selective investments.
281
Attachment 1 details the investment and monitoring process
which the Imperial Corporation of America and Caywood Christian
Capital Management uses in evaluating high yield corporate bond
investment. The strategy is a risk adverse, credit intensive
screening process designed to avoid owning bonds that go into
default. Losses are taken on the portfolio - as individual
issues may be sold at a loss if they show signs of credit
weakness. Thus, portfolio performance should be judged on the
basis of total return, incorporating yield as well as gains and
losses on sale (Figure 3).
Resulation
The Federal Home Loan Bank Board has examined the risks of
high yield bonds but has not found evidence to preclude
investment in such instruments by thrift institutions. It is
the U.S. League's position that, if depositories have the
charter authority to make commercial loans directly, the
exercise of that authority via high yield bond investments
should not post any new public policy issues. There is no
theoretical or empirical support to treat "junk bond" credits
differently from directly originated commercial loans. Such
relative evaluations can be done only on a case-by-case basis.
This is not to suggest that high yield bonds are free of
risk - or less risky than other assets invested in by thrifts.
282

Clearly there is a public policy need to protect the insurance
funds that stand behind deposits. Thus, it is vital that the
Federal Savings and Loan Insurance Corporation have a way to
manage its risk exposure from the asset deployment of its
insured clientele.
Fortunately, such a risk control device is already
available via the Bank Board‘s plenary authority to fix
required capital levels. A variable, risk-sensitive premium
structure may have some theoretical appeal but actual
implementation has always been a much more difficult task. In
any event, neither the FSLIC nor the Federal Deposit Insurance
Corporation currently has the authority to assess
risk-adjusted, or variable premiums. But, the "deductible"
equivalent of variable capital standards is already built into
their statutory framework allowing capital requirements to be
adjusted for expected risk. The Bank Board's authority in this
regard was strengthened with the grant of the capital directive
authority already enjoyed by the bank regulators to the Bank
Board by the 1987 Competitive Equality in Banking Act (CEBA).
The Bank Board has already issued implementing regulations
on this statutory provision and has also extended its
Classification of Assets credit appraisal system to the
investment portfolio, including junk bonds. The Board,
sensibly, has decided not to automatically classify all high
yield bonds as dubious credits but to assess each institution
case-by-case. 283

It is our hope that the Board will apply a portfolio
approach to this task to recognize that diversification
considerably reduces the aggregate risk exposure of high yield
bond investment. Furthermore, we hope that institutions will
be allowed to demonstrate their expertise and portfolio quality
in establishing investment limitations and reserves.
It is the U.S. League's position that a prohibition from
investing in corporate high yield bonds for institutions with
less than 6 percent GAAP capital-to-assets is needlessly
restrictive and arbitrary. Although high yield bonds may
represent increased risk to the FSLIC relative to some other
asset categories, and capital provides a buffer against that
risk, an outright prohibition would penalize institutions that
can demonstrate a track record or expertise in managing these
risks -- and deny them a potential source of profits from which
they can build capital.
Additional detail in reporting investment positions by
insured institutions would make perfect sense, however. This
also would apply to pension funds insured by the Pension
Benefit Guaranty Corporation. It is certainly conceivable
that, because of the recent change in accounting requirements
for corporate pension liabilities (FASB No. 87), pension funds
will shift somewhat from equities into bonds and high yield
instruments will be a natural magnet for these investment
dollars. 284

Public Policy Issues
On the broader issues of public policy, the League would
make only two summary comments. The double taxation occasioned
by the non-deductibility of distributed corporate dividends
clearly biases the financial structure of corporations towards
debt rather than equity. Agency theory argues for some role
for debt to show the willingness of management to achieve some
margin of net revenues but the lopsided nature of corporate
financial structures is clearly exacerbated by the present tax
rules.
Integration of the corporate tax into the individual tax
system makes assessing the incidence of the tax burden somewhat
simpler and places the burden where it ultimately belongs -- on
the owners of factors of production. The demise of even the
limited integration via dividend deductibility in the initial
draft of the tax reform proposals was truly unfortunate.
Reviving that proposal would be most helpful.
Finally, on the question of tax and public policy towards
hostile takeovers, there is an obvious need to balance
competing, worthy goals: preventing incumbent management from
impregnable retrenchment versus allowing that incumbent
management a sufficiently long tenure to plan corporate
activities without a total focus on the next quarter's earnings
results and share price. Neutrality, apart from enforcing
disclosure, in public policy may be the only feasible policy.
In conclusion, the U.S. League believes that, properly
managed, high yield corporate bond investment can be an
important source of earnings for thrift institutions without
posing additional risks for the FSLIC. High yield bond
investment will give thrift institutions a degree of parity
with commercial banks - an important fact in an increasingly
competitive financial marketplace. In our opinion, the present
regulatory systems are sufficient to monitor individual
institution investment in order to safeguard the FSLIC.
286

001’1 lVllN3UlS3Y
006 VllN3QlS3M-NOF
006 SNVOl
553N1SnE
009 licl3tl3
lN3WWlSNl M3t’WSNO~
NflOS9’ES
JWjW?Cl uo!W’z!I!Jn,J5 VdS :@iJllnfJ JAJJSJU IPJJPJj :88, S)Jl(JPW (elXWU!j JO)
WtU’SEW salqen!am apea ‘hqrnoq pampejnueru
‘\ . ‘\ \ \ \ ~N011118 OSE’IL$ = %OOl
s39w91bloPl 03ZlllWl33S-NON
s- c__--*
03ZlllMf03S-NON
183a 3iavzimmxs AllWllN3lOd %OE ’ ’ *
OOO’E \
06b H3dVd 13WW’J
N3dO
s3timb3 31VklOdU03
\ /’ /’ #’
#’ -’
53lIlN33V /53lmsw3u I
001 a3zucmxs
ti3ti10
.*--- cc
___L-- _.
s3wm3s 9NIaNVlSlnO

\ \ \ \ \ \ \ \ \ \ \
288

I I
c . cn .
289


APPENDIX IX
COMMENTS SUBMITTED BY THE U.S. LEAGUE OF SAVINGS INSTITUTIONS
APPENDIX IX

UNITED ,STATES LEAGUE of SAVINGS INSTITUTIONS WASHINGTON OFFICE 1709 NEW YORK AVENUE. N W. I WASHINGTON, DC. 20006 I TEL. (202) 637-8900
,BRIAN P. SMITH Senmr Vice Prestdenl for Regulatory Affairs and Asms~anl lo the Presldenl
February 22, 1988
Craig A. Simmons Senior Associate Director General Government Division U.S. General Accounting Office Room 3858A 441 G Street, N.W. Washington, DC 20548
RE: File No. 233203
Dear Mr. Simmons:
The U.S. League of.Savings Institutions* is pleased to
offer its input to the Congressionally-mandated study by the
General Accounting Office on the impact of the surge in this
*The U. S. League of Savings Institutions serves the more than 3,200 member institutions which make up the $1.4 trillion savings association and savings bank businesses. League membership includes all types of institutions -- federal and state-chartered, stock and mutual. The principal officers include: Theo H. Pitt, Jr., Chairman, Rocky Mount, North Carolina; B.R. (Barney) Beeksma, Vice Chairman, Oak Harbor, Washington; William B. O'Connell, President, Chicago, Illinois; Philip Gasteyer, Executive Vice President and Director of Washington Operations; and Brian Smith, Senior Vice President, Regulatory Operations. League headquarters are at 111 East Wacker Drive, Chicago, Illinois 60601. The Washington Office is located at 1709 New York Avenue, N.W., Washington, D.C. 20006. Telephone: (202) 637-8900.
292
THE AMERICAN HOME: THE SAFEGUARD OF AMERICAN LIBERTIES

I
decade in high yield bond issuance and holdings. The League
has already requested the opportunity to testify at the public
hearing to be conducted as part of this study, and the sum m ary
com m ents herein are subject to amplification and revision by
the fuller statement to be subm itted at that time. This
response addresses only those issues raised by the GAO
invitation which are of most direct concern to savings
institutions. Some of the broader public policy aspects of the
phenomenon are beyond the scope of our concerns and expertise.
It is worth noting, however, that the entire high yield or
junk bond phenomenon (to drop the euphem ism and revert to the
pithier modifier in com m on currency) is itself an aspect of a
process about which savings institutions have already expressed
reservations in a separate context. Junk bonds are part of the
securitization process whereby funds-seekers approach
funds-providers directly via the capital markets rather than
indirectly via on-balance-sheet portfolio lending
intermediaries. This process has gone furthest in the
residential mortgage market because of the availability of
low-priced federal guarantees on such debt. The reservations
expressed by the League over the ever increasing volume of
pass-through and maturity-managed collateralized mortgage
obligations (CMOS) and real estate mortgage investment conduits
(REMICS) basically, however, revolve around the scope and
targeting of those federal guarantees rather than the
"financial technology" involved. Funds users and providers
should be allowed to find their most preferred way of
transacting in private-markets, absent any compelling public
policy concerns.
Clearly many corporations have found cheaper funding via
direct market issues of short term commercial paper and longer
term bonds as substitutes for traditional commercial bank loans
and lines of credit. The junk bond phenomenon has offered
direct market access to a much wider class of corporate
borrowers. Relatively few corporations carry unimpeachable
triple-A credit ratings (and no commercial banks or thrift
institutions do so) but the lower-rated market and indeed the
below-investment-grade market, no longer confined to "fallen
angels*', offer broad funding alternatives, though minimum size
requirements still close out the smaller borrower from the
public markets.
These securities, however, remain the functional
equivalents of commercial loans and, if depository institutions
have the right to extend such credit in the traditional
borrower-lender manner, they should also have the right to
extend funds via securities investment. As a practical matter,
it is only the divisibility of the credit extension process
offered by this mechanism which will permit smaller
depositories to access any wide range of corporate customers.
Unlike the commercial real estate loan market, the straight
"C&I" loan has never been easily participated out by the lead
lender.
Furthermore, the underwriting process and the prospectus
disclosure under the securities laws do provide a reasonable
basis for credit extension by a prudent lending institution
which does its own '*due diligence" analysis from that
documentation. The junk bond market enables credit to be
extended in the capital markets across the entire corporate
credit worthiness spectrum, just as direct bank lending has
always been available, at a price, to corporate borrowers.
There can be little question that the markets do assess
risk and charge premia on borrowing rates in accordance with
that estimate. These market determinations appear to be at
least as discriminating as the excess charges over prime which
banks assess individually against less than top flight
borrowers.
It remains an open question, however, as to whether these
ex ante premia will impact adequately compensate ex post for
the risks inherent in junk bond investments. The history of a
market beyond that of the traditional "fallen angels" is
relatively short and the market at present volumes has not
weathered a full business cycle. Existing studies of default
risk indicate that the excess returns have so far adequately
compensated the investor. Even so, these studies implicitly
assume a strict "buy and hold" strategy. A major risk for any
investor who might consider portfolio adjustments and trading

prior to maturity is the potential impact of further
downgrading without actual default. By trading even further
away from the riskless Treasury curve, trading losses in excess
of those caused by simple rate moves would be occasioned.
Especially in light of the increased role of leveraged
buy-outs (LBOs) where the debt service and retirement depends
on extensive asset redeployment, the past record of success of
premia in covering default risk may be little consolation.
Clearly, in statistical terms, there is no guarantee that the
time series of returns is mean-variance stable or ergodic.
Equally clearly, the liquidity of the market suffered
severely.in the October equity market gyrations and probably
has still not returned to the ease of trading prevalent up to
those events. Even so, the junk bond market still remains far
more liquid than the inter-depository secondary market for
direct commercial credits.
From that perspective, if depositories have the charter
authority to make commercial loans directly, the exercise of
that authority via bond investments should not pose any new
public policy issues. There is no theoretical.or empirical
support to indicate that every junk bond credit is shakier than
every direct commercial loan. Such relative evaluations can be
done only on a case-by-case basis. Junk bond debentures versus
296

junk mortgage bonds secured by general corporate assets should
be assessed in the same way.
As far as the risks to the Federal Savings and Loan
Insurance Corporation are concerned, at least hitherto
supposedly safer secured commercial real estate mortgage loans
have been far more prejudicial financially than junk bond
investments. Even so, to the extent that the past may not be
prologue, it is vital that the FSLIC have some way to manage
its risk exposure from the asset deployment of its insured
clientele.
Fortunately, such a risk control device is already
available via the Bank Board's plenary authority to fix
required capital levels. A variable, risk-sensitive premium
structure may have some theoretical appeal but actual
implementation has always been a much more difficult task. In
any event, neither the FSLIC nor its twin, the Federal Deposit
Insurance Corporation, currently has the authority to assess
variable premia. But, the "deductible" equivalent of variable
capital standards is already built into their statutory
framework. The finishing touches to the Bank Board's authority
in this regard was the grant of the capital directive authority
already enjoyed by the bank regulators to the Bank Board by the
1987 Competitive Equality in Banking Act (CEBA).
The Board has already issued implementing regulations on
this statutory provision and has also extended its
Classification of Assets credit appraisal system to the
investment portfolio, including junk bonds. The Board,
sensibly, has decided not to automatically classify all junk
bonds as dubious credits but to assess each institution
case-by-case.
It is our hope that the Board will apply a portfolio
approach to this task to recognize that the diversification
requirements already in place considerably reduce the aggregate
risk exposure and that a bond-by-bond analysis duplicating that
already performed by the rating agencies would be otiose and
misleading. To the extent that this rating is already
available, however, it is clear that junk bonds represent an
easier credit assessment than direct but unrated commercial
credit.
Additional detail in reporting investment positions by
insured institutions would make perfect sense, however. This
also would apply to pension funds insured by the Pension
Benefit Guaranty Corporation. It is certainly conceivable
that, because of the recent change in accounting requirements
for corporate pension liabilities (FASB No. 87), pension funds
will shift somewhat from equities into bonds and high yield
instruments will be a natural magnet for these investment
dollars. 298

: c
On the broader issues of public policy, the League would
make only.two summary comments. The double taxation occasioned
by the non-deductibility of distributed corporate dividends
clearly biases the financial structure of corporations towards
debt rather than equity. Agency theory argues for some role
for debt to show the w illingness of management to achieve some
margin of net revenues but the lopsided nature of corporate
financial structures is clearly exacerbated by the present tax
rules.
Integration of the corporate tax into the individual tax
system makes assessing the incidence of the tax burden somewhat
simpler and places the burden where it ultimately belongs -- on
the owners of factors of production. The demise of even the
lim ited integration via dividend deductibility in the initial
draft of the tax reform proposals was truly unfortunate.
Reviving that proposal would be most helpful.
Finally, on the question of tax and public policy towards
hostile takeovers, there is an obvious need to balance
competing, worthy goals: preventing incumbent management from
impregnable retrenchment versus allowing that incumbent
management a sufficiently long tenure to plan corporate
activities w ithout a total focus on the next quarter's earnings
results and share price. Neutrality, apart from enforcing
disclosure, in public policy may be the only feasible policy.
2.99

One way of entrenching management, the LBO, should perhaps
be examined more closely. To the extent that management itself
has preferred access to the true underlying asset values,
shareholders may be disadvantaged in LB0 price-setting. The
fairness opinions of investment bankers may not be completely
unbiased or reliable. In a way, it may be encouraging that a
number of LBOs have recently run into difficulties since that
may indicate that management did not secure a "sure-thing"
position.
In general, however, the U.S. League has not seen any
great, unmanageable exposure to the FSLIC from investments in
junk bonds though clearly risk is present. But risk is
unavoidable. The FSLIC has a tool in variable capital
requirements which can ensure that its risk exposure can be
controlled even where state-charter authorities are wider than
for federals. The classification of assets regulation and the
equity risk regulation, both of which have no doubt already
been explained by the Bank Board to GAO analysis, are already
set up to handle such exposure. Furthermore, the tax code
composition test (IRC 7701(a)(19)(C)) and the qualifying thrift
lender (QTL) test enacted by CEBA both make it extremely
unlikely that any significant number of state-chartered
institutions will hold the majority of their assets in this
form.
: c
Overall, we understand the public policy motivations
driving this study and-the inclusion of savings institutions
and the Bank Board w ithin its scope. Nonetheless, we do not
see any regulatory vacuum at this point which would further
imperil the stretched financial position of the FSLIC.
Naturally, should you w ish any further amplification of our
views prior to the public hearing, please call the undersigned.
Brian Smith
301

APPENDIX X
COMMENTS SUBMITTED BY DAVID A. SACHS, SENIOR VICE PRESIDENT, COLUMBIA SAVINGS AND LOAN ASSOCIATION
APPENDIX X
302

Statement in Response to General Accounting Office Notice of Public Hearing and Request for Comments on the
Nature of the Market for High Yield Bonds pursuant to mandate given by the
Competitive Equality Banking Act of 1987
David A. Sachs Senior Vice President--Investment Management
Columbia Savings and Loan Association Beverly Hills, California
February 24, 1988
Columbia Savings and Loan Association, with approximately $12 billion in total assets and a corporate securities portfolio of some $4 billion, appreciates the opportunity to present its viewpoint in connection with the Genera1 Accounting Office’s congressionalIy-mandated inquiry into the Nature of the Market for High Yield Bonds. Columbia became one of the 20 largest thrifts in the nation during the 1980’s and is a major investor in high yield bonds as part of its diversified asset/liability strategy. Columbia has an exceedingly strong financial foundation, with actual capital in excess of twice that required by its regulators. The Association’s commitment to high yield bonds has occurred alongside a well- maintained commitment to home ownership financing. In point of fact, Columbia’s portfolio of mortgages and mortgage-backed securities, totaling some $6 billion, exceeds its commitment to corporate securities.
Columbia applauds the well-thought-out focus of the Accounting Office’s inquiry, which generally puts thrift ownership of high yield bonds into a larger public policy context. More specifically, it is encouraging to note that this issue is being framed in view of the revolution in the nation’s financial structure during the 1980’s, which has affected non- financial and financial companies alike, and all depository institutions, thrifts and banks alike. As the U.S. economic and financial system becomes ever more part of a global economic and financial system, it is imperative that Congress avoid micro-oriented, reac- tive regulatory actions. Only by looking at the entire vista of new economic and financial arrangements will Congress be able to frame macro-oriented, forward-looking public policy. It is in this spirit that Columbia offers its perspective.
Background: The Depository Industry Structure of the 1980s
The early 1980’s repeal of Regulation Q, which had capped the rate of interest that depository institutions could pay, alongside the advent of securitization of their traditional loans into financial market instruments changed the depository industry at its very core. Deregulation with respect to deposit interest rates opened the industry to competition from financial market savings vehicles with similar consumer attributes, thus raising the industry’s cost of funds from an artificially low level. Securitization of the industry’s traditional loan activities deepened the pool of funds that could be used for such loans, thus pushing down the interest rate spread over the cost of funds that these loans had traditionally earned. Simply put, the depository industry underwent a profit margin squeeze.
While affecting all depositories, these effects were most profound in the thrift industry. Under Regulation Q, thrifts had been legally allowed to pay fractionally more than banks for deposits, which provided a sure funding mechanism as long as open market interest
303
rates were not appreciably above Regulation Q ceilings. In return for the slightly higher Regulation Q rate caps, thrifts were required to commit themselves to financing homeownership. That industry structure, which served the nation’s goal of increased homeownership exceedingly well, was overcome by macroeconomic events and technologi- cal progress in the financial markets. It is wistful to think that earlier thrift industry structure will, or should, be restored. It is also folly to assume that the regulatory framework in place in that earlier era to insure safety and soundness of the thrift industry is still appropriate. Such regulation must reflect new realities. Various Congressional Acts--notably the Garn-St. Germain Act of 1982 and the Competitive Equality Banking Act of 1987--have been major positive steps in this direction.
The Mortgage Industry Is Now Two Distinct Businesses
The origination, servicing and ownership of home mortgages--the traditional activity of thrifts--has, as the result of securitization of mortgages, become two distinctly different businesses. Origination and servicing of mortgages is a people-intensive service business while ownership of mortgages is a capital-intensive investment business. There is no reason to assume that all thrifts will be equally skilled in both businesses or that their shareholders’ objectives will be well served by equal commitment to each business. It is, however, very reasonable to assume that access to federally insured deposits by thrifts will, and should, require a major commitment to some aspect of the housing finance industry. At the same time, since mortgages have, through securitization, become capital market in- struments, it naturally follows that thrift institutions, in the interest of maximizing shareholder value as an investment business, will weigh the rate of return to mortgage ownership against other investment vehicles in the securities markets. This new reality is evident in guidelines provided by Congress in the Competitive Equality Banking Act of 1987, which requires that only 60% of thrifts’ asset activity need be devoted to mortgage ownership.
Thrift Institutions As An Investment Business
Intermediation of funds between lenders and borrowers, be it through the financial markets or a thrift, involves intermediation of several types of risks, notably, interest rate risk and credit risk. What’s at issue in present debates regarding the appropriate regulatory structure for thrifts is how these risks should be apportioned. The goal of this effort is, and should be, to protect the safety and soundness of the nation’s payments system at min- imal costs to the federal government without unduly stifling the financing of the nation’s economic growth. This is indeed a tall task.
The Fiduciary Role of the Deposit Insurer
Intermediation of risk associated with lending and borrowing in the capital markets is ex- plicitly priced according to the market’s assessment of the magnitude of the risk. In con- trast, in a regime of fixed-rate federal deposit insurance, thrifts’ cost of (non-capital) funds is independent of their risk-taking. Thus, the thrift industry’s deposit insurer has a clear fiduciary responsibility to limit its exposure to unsuccessful risk-taking within the industry. In carrying out this mandate, it is imperative that the thrifts’ deposit insurer expressly consider the incentives associated with any given regulatory regime. In Columbia’s view, more sternly enforced capital requirements for access to deposit insurance
304

alongside skilled supervision represent a solid approach for carrying out this fiduciary responsibility.
The incentive effects of more strongly enforced capitalization standards would be salutary on a number of fronts. Simply put, if equityholders in insured thrifts have more to lose in the event of imprudent risk-taking by their management, the market for equity capital will impose the discipline against excessive risk-taking endeavors that is needed to protect the insurance fund’s financial resources. Therein lies the challenge to formulating regulatory solutions to evident problems within the thrift industry: To secure equity capital to reduce the exposure of the deposit insurance fund while simultaneously creating a fertile environment for earning a sufficient rate of return to attract that equity capital.
It is important to recognize that stringently enforced capitalization standards will not eliminate risk-taking within the thrift industry. The market for equity capital is, by definition, predicated on a return to risk-taking. Risk-free intermediation of funds--on both interest rate risk and credit risk fronts--is inherently a very low rate of return to equity endeavor. It is unlikely that the equity market will allocate increased capital to the thrift industry if its members are allowed to engage only in risk-free activities. Yet it is abundantly clear that preservation of the deposit insurance fund’s financial integrity requires a stronger equity base within the thrift industry. In grappling with these crosscurrents, it is useful to consider how thrifts, as an investment business, earn a rate of return for their shareholders.
Earning a Return on Thrift Capital
From an asset/liability management perspective, there are two primary routes for a thrift to generate a strong rate of return on equity: (1) biasing asset/liability maturities to shorter-term liabilities, thus providing opportunities for profit in the event of declining interest rates and/or (2) acquiring assets which, because of their credit risk or growth op- portunities, provide a positive net yield relative to insured liabilities of a similar maturity (which, from the buyer’s standpoint, are risk-free from a credit perspective). From the viewpoint of a long-term equity investor in a thrift, the potential rate of return vis-a-vis other potential uses of his equity is the ability of the thrift’s management to profitably manage exposure to interest rate fluctuations and to earn spread income commensurate with the credit risk it is taking.
Managing asset/liability maturity mismatch to profit from fluctuations in interest rates is an exceedingly difficult business; even with the best of information and diligent work, highly trained interest rate forecasters are frequently wrong. What is more, potential in- vestors in the thrift industry have the ability to make more “pure” interest rate bets in the long-term bond market. Thus, while thrifts may, in a declining interest rate environment, be able to attract equity capital by taking interest rate risk exposure, their ability to at- tract and retain capital across interest rate cycles will, we believe, stem from well re- searched and actively-managed investments in vehicles that offer positive spread income relative to liabilities of similar maturities.
High Yield Bonds: Appropriate For Some, But Not All Thrifts
High yield bonds of America’s corporations are, we strongly believe, an asset class that dovetails well with the profitability imperatives of strongly capitalized thrifts. Whereas
305

the success of interest rate risk-taking is hostage to nonquantifiable events in the global macroeconomic environment, credit risks with respect to high yield bonds can be diver- sified through a combination of diligent microeconomic assessment of individual industries and companies and active portfolio management. If funded with relatively long-term liabilities, a well-diversified portfolio of high yield bonds is, from the equityholders’ standpoint, effectively immunized from interest rate fluctuations.
The attractiveness of an equity investment in a thrift engaged in high yield bond invest- ments funded in this fashion becomes, all else held constant, a function of the individual institution’s ability to assess and manage credit risk. The thrift industry’s deposit insurer should not artificially restrain members’ percent-of-assets freedom to participate in the high yield bond market, but rather limit the activity itself to institutions in full com- pliance with capital requirements who possess strong management skills in interest rate risk immunization and credit risk assessment.
As a pragmatic matter, the market for equity capital should become both the disciplinary force in determining which thrifts can be in the high yield bond arena as well as the cushion against losses to the thrift deposits insurance fund. High yield bonds are clearly not appropriate relative to the capital base and management skills of all thrifts. But ar- tificially restraining the asset flexibility of thrifts with the necessary attributes is not the answer to the systemic problem in the thrift industry. That problem is excessive risk taking by managements of failed and failing thrifts who, in effect, are not subject to the discipline of the market for equity capital. Those who have little to lose if they are wrong should not be allowed access to the government-insured deposits arena. In contrast, those who have much capital to lose, and thus take very seriously their fiduciary role to the providers of that capital, should not be stifled in their efforts to earn a sufficient rate of return to retain that capital.
Columbia’s Responses to the Accounting Office’s Questions
In its Notice of Public Hearing and Request for Comments, the General Accounting Office enumerated a number of specific questions upon which it is seeking information. Colum- bia has special expertise and opinions with respect to a number of those questions and of- fers the following responses. These responses follow the sequence presented in the Ac- counting Office’s Request, with questions 2 and 8 omitted.
Question 1: “How does the riskiness of high yield bonds compare to other investments and activities, such as commercial loans, that thrift institutions may enter into? In evaluating risk, what factors should be considered and are there ways to quantify these risk factors?”
Columbia believes that thrifts’ involvement in high yield bonds can be fruitfully evaluated only in the context of an individual thrift’s (1) capital strength and management knowledge and experience; (2) asset/liability management strategy, with particular focus on interest rate risk immunization; and (3) approach to asset mix, with particular focus on the risk/return profile and avenues for diversification within individual asset classes and the variability of returns across asset classes. We stress the importance of this broad framework for analysis of the appropriateness of high yield bonds in thrifts’ business plans because Congress’ current focus stems from a dual concern in the safety and soundness of the thrift industry and the financial integrity of the thrift industry’s deposit insurer. Ac- cordingly, Columbia believes that high yield bonds should not be considered in a vacuum, but rather as part of more elemental structural issues.

We cite deep capitalization and knowledgeable management as the lead requisites for evaluating thrifts because, without those strengths, thrifts pose excessive risks to their deposit insurer regardless of the specific business strategies they pursue. For strongly capitalized and skillfully managed thrifts, however, no one business strategy is unam- biguously superior to another. With respect to the danger of excessive exposure to fluctua- tions in interest rates, which the thrift industry learned all too well in the early 198Os, there are a variety of risk reduction strategies. The common thread of all such strategies is to mitigate the potential for appreciable swings in net spread income in response to sharp swings in market interest rates. Essentially, the goal is to have the yields and maturities of both sides of the balance sheet move in sympathy.
No One Asset/Liability Structure is “Correct”
Interest rate risk reduction can be accomplished with a balance sheet structure that adjusts very quickly to changes in interest rates, such as a heavy commitment to variable rate mortgages funded with money market demand accounts and short-term certificates of deposit. Conversely, volatility in net spread income can be reduced through a commitment to long-term fixed rate, noncallable loans, funded with long-term certificates of deposit carrying stringent terms for early withdrawal. And conceivably, a thrift could employ both interest rate risk-reducing strategies to good effect. The important point is that in today’s volatile interest rate environment, prudent management of a thrift requires a sys- tematic effort to mitigate volatility in net spread income and thus preserve the thrift’s ability to attract and retain equity capital. No one asset/liability “matching” strategy is correct, but the existence of such a strategy is imperative.
It is, of course, impossible to formulate an asset/liability strategy in isolation from an assessment of what types of assets a thrift can properly evaluate, monitor and manage. No- where is this more clear than in considering the relative merits of a portfolio of commer- cial and industrial loans versus a portfolio of high yield bonds. Both asset classes are financing vehicles for America’s corporations. Commercial and industrial loans, the tradi- tional province of commercial banks, are now an eligible activity for thrifts. Historically, banks generated these loans as part of what was known as relationship banking, wherein the bank and the borrower did business on a variety of fronts.
The Nature of Commercial and Industrial Loans
With respect to the commercial and industrial loan activities of banks, there are many im- plicit understandings. In general, these understandings are based on the notion that the borrower, in exchange for continuous access to credit, provides the lender access to con- tinuous information regarding its creditworthiness. Given the nature of the “bundle” of services associated with “relationship” commercial and industrial loans, such loans tend to be nonstandardized and thus limited in their transferability and liquidity. Many commer- cial and industrial loans of banks are, to be sure, syndicated, which requires a degree of standardization beyond a “relationship” loan. Nonetheless, the lead bank in such loan syn- dications tends to have a multifaceted relationship with the borrower, which provides the credit assessment foundation for other syndicate members. In addition, an individual bank’s portfolio of these !oans, as a pragmatic matter, tends to be narrow in geographical scope and concentrated in ldustry type as a result of prohibitions on interstate banking.
Thrifts are now permitted to engage in commercial and industrial loan activity, which is
307

likely to meld well with their traditional linkages with the homebuilding and commercial development industries. In a more general sense, however, thrifts do not have a long- standing network of business relationships with industrial America on which to build a portfolio of commercial and industrial loans. Thrifts do, however, have a deep back- ground in assessing creditworthiness and collateral value; both of these skills are used in evaluating every mortgage application. Thus, participation in commercial and industrial loans that stand alone from a bundle of banking services is a line of business for thrifts to reasonably consider.
The High Yield Bond Avenue to Commercial Lending
One avenue for participation in this line of business is high yield bonds, which are, in substance if not in detail, commercial and industrial loans in securitized form. This asser- tion is not intended to minimize the differences in detail between commercial and in- dustrial loans and high yield bonds. To the contrary, Columbia believes that the distin- guishing characteristics of high yield bonds--on legal, availability and rate of return grounds--make these instruments the preferred vehicle for many thrifts in lending to America’s corporations.
On the legal front, the most significant distinction is that the issuance of high yield bonds to the public involves the issuance of “securities”-- unlike bank loans, which case law has determined are not “securities”--and that such issuance is regulated under the Securities Act of 1933 by the Securities and Exchange Commission (the “SEC”). The SEC exercises scrutiny over information provided by issuers to the public in connection with the public issuance of high yield bonds--as it does with the public issuance of all other types of securities--through a formal review of the related prospectuses and other materials in- volved with the registration of the securities. The issuers and others involved in the is- suance (including counsel to the Company, the accountants and the underwriters and their counsel) are subject to potential civil and criminal liability for misstatement and nondis- closure of material information, and can be prohibited from selling, or required to rescind sales of, securities.
Public high yield bond issuances also come under state Blue Sky laws, which are often more stringent than Securities Act regulations. State security regulators not only evaluate adequacy of disclosure, but also the investment merits of high yield bonds, and can prohibit their sale or require a rescission of an issuance of the securities. For instance, the California Corporate Securities Code of 1968 provides for prohibition of issuance of securities or rescission of their sales if the securities are not a “fair, just and equitable” in- vestment.
The Securities Act of 1933 and state laws also extend to the quality of disclosure in the private sale of securities, providing civil and criminal liabilities as well as rescissionary and related remedies, and the private placement of securities, though not subject to formal review by the SEC or state regulators, involves the distribution of disclosure documents similar to registration statements and due diligence by the experts.
An additional safeguard for high yield bond purchasers not afforded direct lenders in the commercial and industrial loan market is the National Association of Securities Dealers’ (NASD) scrutiny of the independence of underwriters. In public transactions involving the sale of high yield bonds, the underwriter and the compensation structure of the underwrit- ing must, without exception, be reviewed by NASD, and the SEC cannot accelerate the ef-

fectiveness of a registration statement without the approval of the underwriting from the NASD.
Perhaps the strongest review of high yield bonds afforded purchasers is the underwriting process itself, which involves participation of experts--including attorneys and accountants for both the issuer and underwriters--who are, under the Securities Act of 1933, liable for omissions and misstatements of material fact in disclosure documents and other informa- tion disseminated in both public and private deals. Given this liability, these participants take their “due diligence” obligation very seriously. They question management, review books, records and contracts, talk to suppliers and major customers, etc. Similarly, ac- countants issue “comfort letters” which explain the derivation and correctness of data in registration statements, certify audited financial statements and, to a more limited extent, unaudited financial materials.
The Process of Portfolio Management
In general, the “due diligence” process provides a thrift purchaser of high yield bonds with a wealth of information, which can then be used in the thrift’s own research in assessing the investment merits of any high yield bond issue. We stress that the underwriting process is not a substitute for independent research by the purchaser, but rather is the beginning point, one which begins with information that is richer in detail than would be involved in an attempt to build a portfolio of commercial and industrial loans.
High yield bonds generally, but not always, rank below commercial and industrial loans in issuers’ capital structures, which makes them riskier. For a thrift involved in this market, the critical question relative to any individual issue is whether the higher yield adequately compensates for the higher risk. The critical question relative to a portfolio of high yield bond issues is whether geographic, industry and company risks tend to offset each other. The existence of a secondary market for high yield bonds allows these questions to be asked continuously in a pro-active way, with individual issues being bought and sold ac- cording to the yield-over-Treasuries reward versus the risk and the contribution of any bond to portfolio diversification.
We stress that the secondary market valuation of high yield bonds should not dominate portfolio management of high yield bonds. The secondary market is an avenue for adjust- ing a portfolio in response to independently-derived assessments of changing risk-reward parameters. Put differently, the day-to-day market value of a high yield bond is of secon- dary importance if research work indicates that the yield of a bond more than compensates for associated risks. In that connection, it is important to note that, contrary to popular perceptions, not all high yield bonds rank below bank loans in issuers’ capitalization struc- tures. Many are senior obligations of the issuer and have the same ranking as bank debt. High yield bonds that Columbia has owned that fit this description have been issued by: Allied Stores, Bally’s, Beatrice, Coastal, Color Tile, Continental Airlines, Eastern Airlines, Edgcomb Steel, Macy’s, Occidental Petroleum, Phillips Petroleum, Storer Communications, Turner Broadcasting, Transworld Airlines, Union Carbide, Warnaco and Zales.
In a similar vein, not all high yield bonds are unsecured. Many are backed by particular assets and thus have priority over general creditors in bankruptcy proceedings. High yield bonds with such security have involved: commercial transportation equipment, broadcast- ing stations, cable television systems, casinos and resort hotels, lumber mills, paper mills, electric generating plants, refineries and steel mills.

The Comparative Rewards of High Yield Bonds
High yield bond investing is important to Columbia not just because of the bonds’ par- ticular characteristics versus commercial and industrial loans but also their yield and default characteristics. At 12/31/87, non-accruing high yield corporate bonds as a percent of Columbia’s total high yield bond portfolio were .75Oh. The Association has established reserves of 2.6% against its portfolio. In comparison, at g/30/87, Morgan Stanley’s Bank Stock Universe, which is comprised of the nation’s top 36 banks by asset size, indicated that nonperforming loans as a percent of total loan-related assets for those banks stood at 5.2%; the loan-loss reserve stood at 3.7% of these loans. Thus, Columbia is reserved at 347% of nonperforming high yield bonds versus 71% by the top thirty-six banks for their non- performing loans.
Question 3: “How adequate are state laws and regulations governing investments by federally insured institutions in high yield bonds ? Should state chartered institutions be subject to the same limitation of assets (11 percent) as federally chartered institutions?”
Far-reaching powers were granted to the FHLBB under the Competitive Equality Banking Act of 1987, permitting the Bank Board to set thrifts’ capital requirements on a case-by- case basis according to each thrift’s business strategies, including whether a thrift’s assets have “weak credit quality or significant likelihood of loss.” Thus, debate regarding variance in asset guidelines in state charters for thrifts has become a sterile debate. The critical issue with respect to the safety and soundness of the thrift industry is the risk ex- posure of the industry’s deposit insurer. Now that the federal agency in control of that insurer has strong enforcement powers, it is exceedingly unlikely that state chartered thrifts could engage in activities under more accommodative state charter asset standards that would put excessive risks on the national deposit insurer.
While Columbia believes that the issue raised in this question has been made moot by the Competitive Equality Banking Act of 1987, the Association notes that under its California Charter, it is allowed to automatically invest up to 15Oh of its assets in non-investment grade bonds. A greater percentage is allowed upon the express approval of the California Savings and Loan Commissioner. Columbia has been granted such approval.
Question 4: “What is the best way to protect FSLIC from unreasonable risk as a result of thrift investments in high yield bonds? Some suggestions that have been made include restrictions or prohibitions on bond purchases, increased capital requirements, risk-based insurance premiums, additional regulation to require an appropriate credit analysis before purchase, and diversification of bond holdings.”
Columbia believes that, with the exception of the idea of risk-based insurance premiums, the concerns raised by this question have been adequately addressed in the Competitive Equality Banking Act of 1987, which vested the FHLBB with the power to “establish the minimum level of capital for an association at such amount or at such ratio of capital-to- assets as the Board determines to be necessary or appropriate for such association in light of the particular circumstances of the association.” This was a very sweeping grant of authority to the Bank Board to take whatever supervisory action deemed necessary to protect the financial integrity of FSLIC. Based upon its new powers, the Bank Board has the authority, on a case-by-case basis, to effectively deem that any particular thrift is not fully suited to high yield bond investments, and to prohibit, limit or condition such in-

volvement. In addition, the FHLBB is permitted, under the Competitive Equality Banking Act of 1987, to base its case-by-case capital adequacy review of thrifts on the basis of “underwriting policy, standards or procedures for loans and securities.” Thus, no additional legislation regarding thrifts’ involvement in the high yield bond arena is needed.
The suggestion of risk-based deposit insurance premiums is of an entirely different charac- ter than the other mentioned suggestions. As discussed in Columbia’s general comments, the existence of fixed-rate deposit insurance premiums lies at the heart of the deposit insurer’s fiduciary duty. A move to risk-based deposit premiums would likely have the perverse effect of increasing rather than decreasing the deposit insurance fund’s exposure to excessive risk-taking in the industry, which, in Columbia’s opinion, stems from the in- adequate equity capitalization of some members of the industry.
If an institution is very thinly capitalized, the lion’s share of the losses associated with risk-taking fall upon the deposit insurance fund; this creates an incentive for managements of such institutions to take large risks, because the return to equity holders of success will be proportionately higher than for strongly capitalized institutions. Under a risk-based deposit insurance premium regime, managements of thinly capitalized institutions would have the same incentives as at present for excessive risk-taking, with a higher all-in cost for government guaranteed liabilities; the result, logic would suggest, would be even more extreme risk taking. What is more, depositors, at the margin, would tend to gravitate towards such thinly capitalized institutions, because the return to them is independent of the amount of insurance premium the institutions pay. This outcome would raise the cost of funds for well-capitalized institutions, reducing their return to equity capital and hence their ability to retain and attract it. Thus, risk-based deposit insurance is clearly not the answer for reducing the thrift industry’s deposit insurance fund’s exposure to losses; it would likely have the opposite effect.
Question 5: “From a public policy viewpoint, should federally insured institutions be restricted from purchasing high yield bonds which were issued in connection with the financing of a hostile takeover or a leveraged buyout?”
Columbia believes that public policy regarding hostile takeovers and leveraged buyouts is an issue unto itself, separate and distinct from the merits of thrifts’ involvement in the high yield bond arena. If Congress deems changes to be necessary in the rules guiding takeovers and buyouts, Columbia urges a direct Congressional focus in that direction. That issue should not be allowed to muddle questions regarding actions to protect the financial integrity of the thrift industry’s deposit insurer. Thrift managements should be required to operate in a safe and sound manner, not to make corporate governance deci- sions on behalf of those elected to make such decisions.
Columbia finds the line of inquiry embodied in this question not only inappropriate but myopic. If Congress were, for whatever reasons, to choose to legislate takeovers and leveraged buyouts though the “back door” of prohibitions on who can participate in the as- sociated financing, logic and fairness would require that banks’ involvement through com- mercial loans, which is much larger than thrifts’ involvement through high yield bonds, be considered. Likewise, investment banks’ involvement through bridge loans, which can be a large percentage of an investment bank’s capital, would also need to be considered.
Question 6: “Many bonds that are issued to finance takeovers and leveraged buyouts are likely to be repaid in whole or in part from the sale of assets rather than from future earn- ings. As an investment, are asset backed bonds riskier than bonds whose repayment is

based on expected earnings? To what extent, if any, has the stock market turmoil of Oc- tober 1987 increased the riskiness of bonds issued in connection with takeovers and leveraged buyouts?”
The realized yield spread that high yield bonds offer over Treasury securities of a similar maturity is a function of the riskiness of debt service and repayment. With respect to debt service, risk is primarily a function of the cash flow of the issuers’ business; with respect to debt repayment, risk is a function of both the issuers’ cash flow and the multiple that the market applies to that cash flow. That is, the ultimate soundness of a high yield bond depends, in part, not only on the ability of the issuer to carry it to maturity but also to redeem or refinance it. Thus, whether or not a high yield bond is “money good” does depend in part on valuation parameters for assets and businesses in the secondary market.
Evaluation of the ability of a borrower to repay or refinance is a fundamental part of credit lending. Uncertainty in this connection is reflected in high yield bond purchasers’ initial spread-to-Treasuries demands and is adjusted in the secondary market value of bonds as new information becomes available. This process is very similar to construction lending, when the ability of a borrower to ultimately repay or refinance a loan depends upon the ability of the project to generate income upon completion and the market multiple (cap rate) that the secondary market places on that income. Since the October 1987 stock market turmoil, some high yield bonds have widened in spread to Treasuries in light of reduced multiples being accorded their businesses and/or assets in the secondary market. There is nothing extraordinary about this; in-depth credit analysis on an ongoing basis is designed to evaluate such changes in creditworthiness. Sometimes the result of analysis is to sell a high yield bond, while other times research indicates that the secondary market has over-discounted changes in asset values and that purchase of a high yield bond is war- ranted. This process is what value-lending, in whatever form, is all about.
Question 7: “Some investors actively trade high yield bonds in the secondary market. How large is the secondary market for these bonds. 3 Can this market be maintained in the event of an economic downturn? To what extent was trading (price and volume) in the secondary market affected by the October 1987 stock market decline?”
Before answering the specific question that has been posed, Columbia believes a general statement regarding the nature of secondary market valuations is needed. Day-to-day changes in the price of assets--financial and nonfinancial alike--are not necessarily reflec- tive of the underlying quality of the assets. The most obvious example of this phenomena is the “real time” valuation of Treasury securities. While of unquestioned quality, the secondary market value of Treasuries has become increasingly volatile in recent years, the result of changing supply/demand conditions in response to shifting perceptions of the macroeconomic outlook. Similarly, mortgage-backed securities, even those with the full faith and credit of the federal government, experience sharp price swings in sympathy with Treasuries and also in response to technical supply/demand conditions stemming from changes in market estimates of prepayment rates.
With respect to the Accounting Office’s specific question, Columbia would like to draw a distinction between using the secondary market as a resource in managing a diversified in- vestment portfolio of high yield bonds and “trading” high yield bonds. As stressed in opening general remarks, Columbia views its high yield bond portfolio, which is funded with relatively long-term liabilities, as a core credit evaluation business, with spread in- come commensurate with risk as the dominant portfolio objective. Changes in the secon- dary market value of its high yield bonds stemming from fluctuations in market interest
312

rates also generate changes in the mark-to-market value of the underlying liabilities.
What a bond will fetch in the secondary market is only significant to the extent that Columbia’s research indicates that a bond is “over- or under-valued” relative to intrinsic risks. In that case, the secondary market can be used to adjust the Association’s portfolio mix. Consequently, the depth of the secondary market for high yield bonds at any par- ticular moment in time is not of paramount importance to Columbia’s investment strategy; Columbia does not plan to liquidate its portfolio. In fact, illiquidity in the secondary market occasionally affords the Association the opportunity to add to its holdings of high yield bonds of sound credit quality at extraordinarily attractive spreads.
While Columbia’s investment policy with respect to high yield bonds is not dependent on day-to-day secondary market liquidity, the Association does, in the natural course of portfolio management, gain insight into the nature of that liquidity. In recent years, Columbia has increased the number of market makers with which it deals, and believes that the secondary market is becoming progressively deeper, a trend the Association expects to continue.
313

THE ECONOMICS OF THE SINGLE FAMILY MORTGAGE MARKET
TWO OPTIONS
1. 30 Year Fixed Rate Loan
Steps:
1. Thrift makes the loan 9.75% - 10.00% + 2% loan origination fee
2. Thrift sells mortgage to secondary market to avoid interest rate risk
Secondary market (FNMA or FHLMC) demands a net yield of 9.60 - 9.70%
3. Thrift makes gross profit: 2% loan origination fee (of which approximately 1% goes to direct expenses), and servicing fee of .I5 - .40% spread over the life of the mortgage.
2. One Year Adjustable Rate Loan
Steps:
1. Thrift makes the loan 7.75 - 8.00% + 1.5% loan origination fee
2. Thrift keeps mortgage because the rate increases to 2.75O/b over the US Treasury bill rate after the first year. Rate increase is limited to 2% per year and no more than 5% over the life of the mortgage.
3. First Year Result Thrift matches loan with 1 year CD at 7.75%, leaving thrift with 0 to .25% spread + 1.5% fee (of which approximately 1% goes to direct expenses). Thrift has General and Administrative expenses of 1.5 - 2.0%, thus thrift loses money in the first year on the loan.
4. Second Year Result Loan resets to 9.40% (US T Bill rate of 6.65% + 2.75Oh spread). Thrift matches loan w/ 1 year CD at 7.75OX1, leaving a 1.65% spread. Given General and Administrative expenses ranging from 1.5 - 2.0°h, thrift loses money in 2nd and subsequent years, or makes a tiny gain.
314

APPENDIX XI
COMMENTS SUBMITTED BY FEDERATED RESEARCH CORPORATION
APPENDIX XI

FEDERATED INVESTORS, INC.
FEDERATED INVEST~RSTOWER PITTSBURGH. PA 15222-3779 +12-288.1900
February 18, 1988
Craig A. Simmons, Senior Associate Director General Government Division U.S. General Accounting Office - Room 3858A 441 G Street, N.W. Washington, D.C. 20548
RE: 233203
Dear Mr. Simmons:
The purpose of this letter is to comment generally on questions raised by the General Accounting Office pursuant to the Notice published in the Federal Register on February 1, 1988, 53 Fed. Reg. 2785, concerning the propriety of federally chartered savings and loan associations' ("Federal associations") investment in high yield bonds. Specifically, we would like to offer our comments on the question of whether Federal associations should be permitted to invest in high yield bonds through the safety and convenience of mutual funds.
Federated Investors, Inc. ("Federated") is a diversified financial services company which, through its affiliates and subsidiaries, provides professional investment management to 50 mutual funds with assets of approximately $42 billion. Federated, through its distributor, Federated Securities Corp., currently offers a variety of no-load mutual funds which are permitted investments for Federal associations and which are designed to assist them in meeting their asset/liability management needs.
It is our opinion that lower-rated corporate debt obligations ("high yield bonds"), when part of a professionally managed, diversified portfolio, provide Federal associations witQ a more favorable risk/reward ratio than many other eligible investments. We further believe that existing
1 Keven Winch and Carolyn Kay Brancato, "The Role of High Yield Bonds [Junk Bonds] in Capital Markets and Corporate Takeovers: Public Policy Implications," Congressional Research Service, The Library of Congress (April 19, 1985); See also Marshall E. Blume and Donald B. Keim, "Risk and Return Characteristics of Lower-Grade Bonds," (December 1984); Edward I. Altman and Scott A. Namacher "Investing in Junk Bonds: Inside the High Yield Debt Market" pp. 12-18 (1987)
Note: While this comment refers specifically to Federal associations, we believe that our assertions are applicable to state-chartered, FSLIC- insured, institutions as well. Most state-chartered savings and loan associations have the power, through state parity provisions, to make any investment authorized for federally chartered institutions.
One of thebETNA LIFE & CASUALTY companies

Craig A. Simmons, Senior Associate Director February 18, 1988 Page Two
regulations should be modified to specifically authorize Federal associations and FSLIC insured institutions to invest in shares of a mutual fund, the portfolio of which consists of high yield bonds, because investment in the high yield market through the use of a mutual fund provides associations with a portfolio of such securities.
giversified and professionally managed It is our further belief that direct
investment in the high yield market by Federal associations should be subject to strict diversification standards.
A. Direct Investment in High Yield Bonds
In general, the ability of Federal associations to invest in corporate debt securities is defined by 12 C.F.R. Section 545.75. Under 12 C.F.R. Section 545.75(d), a Federal association may invest up to 1% of its assets in any corporate debt security, notwithstanding any quality limitations. In addition, Federal associations have the power to "invest in, sell. purchase, participate in, or otherwise deal in loans for commercial, coroorate, business or agricultural purpose..." 12 C.F.R. Section 545.46. In the release promulgating this regulation, the staff stated in part:
"Commercial loans made nursuant to the new authority may take the form of loan transactions in which funds are advanced in exchange for a term note or under a revolving credit agreement, or mav take less conventional forms. For example. commercial credit mav be extended through... the Durchase of debt obligations of a business entitv. With respect to the last example. the Board wishes to clarifv that an investment in notes, paper. or debt securities mav be treated as a commercial loan to the issuer, whether or not thev satisfy the rating. marketabilitv. and other reauirements of Section 545.75" (Emphasis added) 48 Fed. Reg. 23045 (1983)
Currently, commercial loans by Federal associations are subject to a limit of 10% of assets. 12 C.F.R. Section 545.46. A Federal association, therefore, has the ability to invest up to 11% of its assets in high yield bonds. 12 C.F.R. Sections 545.46, 545.75(d)
B. The Proprietv of Investment in High Yield Bonds
Should Federal associations be allowed to invest in the high yield bonds? Despite recent adverse publicity directed toward the high yield bond market, virtually all major studies indicate that a well diversified portfolio of high yield bonds have historically afforded investors a government bonds. Further, concerning the Federal associations' commercial loan portfolio, investments in high yield bonds have distinct advantages over the more traditional form of commercial loan. The first advantage is liquidity; high yield bonds can be resold or traded in what has been characterized as a liquid secondary market. This provides Federal
317

Craig A, Simmons, Senior Associate Director February 18, 1988 Page Three
associations with added flexibility in structuring their commercial loan portfolios. Another advantage is that investment in the high yield bond market gives Federal associations access to a potential market of corporate borrowers to which they historically have had no access, providing opportunity for diversification without traditional geographic limitations. Additionally, the expenses associated with a direct investment in high yield bonds are less than commercial loans because the analysis is normally limited to a credit review, whereas traditional commercial loan expenses are much higher and include added personnel and expenses associated with investigation and origination of the loan.
Investments in high yield bonds have other advantages over commercial loans. In an ordinary commercial loan, only the lending institution reviews the creditworthiness of the borrower and suitability of the loan. With high yield bonds, an additional level of review is provided by the underwriter or placement agent. Further, a registration statement containing pertinent financial information is usually filed with the Securities and Exchange Commission. This additional disclosure assists Federal associations in making an informed investment decision.
In broader terms, high yield bonds have replaced commercial loans as the preferred method for emerging and restructuring companies to meet their medium and long term capital needs. The "securitization" of commercial lending has resulted in a more efficient means of satisfying capital demand by spreading risk, increasing liquidity and reducing costs associated with traditional commercial lending.
There has been, in recent years, a measure of adverse publicity directed toward the high yield bond market. Much of the criticism concerned the use of high yield bonds to fund corporate takeover bids. In 1984, these issues, however, made up f ess than 2% of the $122 billion used to finance mergers and acquisitions. Much of the high yield bond market is, in fact, made up of issues of emerging growth companies which have short credit histories and have not yet received credit ratings. One source indicated that nearly 85% of all public U.S. corporations woutd not be able to get an investment grade rating were they to apply for one.
3 Testimony Statement of Frederick H. Joseph, Vice Chairman and Chief Executive Officer, Drexel Burnham Lambert, Inc. Before the Subcommittee on Securities on The Committee on Banking, Housing and Urban Affairs Committee (June 6, 1985)(Copies available upon request).
4 Kevin Winch and Carolyn Kay Brancato, "The Role of High Yield Bonds [Junk Bonds] in Capital Markets and Corporate Takeovers; Public Policy Implications," 39 Congressional Research Service, The Library of Congress (April 19, 1985).

Craig A. Simmons, Senior Associate Director February 18, 1988 Page Four
C. Investment in Mutual Funds
Federal associations are authorized to invest in mutual funds pursuant to Section 5(c)(l)(Q) of the Home Owners' Loan Act of 1933. Regulations of the Federal Home Loan Bank Board set forth pertinent criteria governing mutual fund investment as follows:
"[AIn association may invest in, redeem, or hold shares or certificates in any open-end management investment company... the portfolio of which is restricted by such management investment company's investment policy... solely to any such investments any association by law or regulation may, without limitation as to percentage of assets, invest in, sell, redeem, hold or otherwise deal with.
(b) Limitations. Where the investments of the ooen-end management investment comnanv consist of . . . cornorate debt securities. such investments must come within the limitations of Section 545.75(b)(l) and (2) of this part...". (Emphasis added) 12 C.F.R. Section 545.76
The above-cited provision directs us to 12 C.F.R. Section 545.75(b) when determining whether a mutual fund which invests in corporate debt obligations is a permissible investment for Federal associations. Section 545.75(b)(l) and (2) allows a Federal association to purchase corporate debt securities in one of the four highest rating categories. See_, 12 C.F.R. Section 545.75(b)(l), (2). Therefore, under existing regulations, it would appear that a Federal association could purchase shares of a mutual fund investing in corporate debt securities & so long as the debt securities in which the mutual fund invests are rated in the four highest rating categories. However, in September of 1985, then General Counsel, Norman H. Raiden, issued an opinion which concluded that Federal associations could invest in high yield bonds through the safety and convenience offered by a mutual fund, not ithstanding the limitations contained in 12 C.F.R. Section 545.76(b).
r
D. The Desirabilitv of the High Yield Bond Fund vs. Direct Investment
Despite the fact that a diversified portfolio of high yield bonds appears to be an attractive investment from a risk/reward perspective, it is clear that direct investment in these instruments by Federal associations involves greater risk of default and requires more careful credit risk analysis than many other currently permitted investments. Since many Federal associations do not have the size or expertise to effectively manage a diversified portfolio of high yield bonds, we would suggest that existing regulations governing commercial loans and investment in mutual funds be revised to (1) require diversification of high yield bond investments, and (2) expressly permit investment in diversified mutual funds which invest in high yield bonds.
5 a, Letter from Norman H. Raiden, General Counsel, Federal Home Loan Bank Board, to Raymond B. Perkins, Vice President, Merrill Lynch Capital Markets (September 26, 1985)(Attached)
319

Craig A. Simmons, Senior Associate Director February 18, 1988 Page Five
Such revised regulations should continue to allow direct investment in high yield bonds, but should require diversification of such investments. Direct investments in high yield bonds, authorized pursuant to 12 C.F.R. Section 545.46, should be subject to a single borrower limit of 15% of unimpaired capital and unimpaired surplus. Indirect but diversified investment in high yield bonds should also be specifically authorized through use of mutual funds. Regulations should be revised to eliminate present quality constraints as they apply to mutual funds investing in corporate debt securities. Additionally, any such revision should require that a mutual fund investing in lower-rated corporate debt securities be a "diversified company," as defined in Section 5(b)(l) of the Investment Company Act of 1940, which provides:
" (1) 'Diversified company' means a management company which meets the following requirements: At least 75 percentum of the value of its total assets is represented by cash and cash items (including receivables), government securities, securities of other investment companies, and other securities for purposes of this calculation limited in respect of any one issuer to an amount not greater than 5 percentum of the value of the total assets of such management company and to not more than 10 percentum of the outstanding voting securities of such issuer." Section 5(b)(l) of the Investment Company Act of 1940.
E. Suggested Revisions
In view of the foregoing, we would suggest that subsection (b) to Section 545.76 be revised as follows:
(b) Limitations. Where the investments of the open-end management investment company otherwise eligible under this Section include commercial paper and corporate debt-securities, such company must meet the requirements for status as a "diversified company" set forth in Section 5(b)(l) of the Investment Company Act of 1940. No more than five percent of an association's assets shall be invested in any one such investment company.
Section 545.75 should also be revised to include the following:
(e) Investment in lower-rated corporate debt obligations or commercial paper through use of an open-end management investment company which invests in commercial paper or corporate debt securities shall be governed by Section 545.76(b), notwithstanding quality limitations contained herein.
320

Craig A. Simmons, Senior Associate Director February 18, 1988 Page Six
Those sections of the regulations which govern commercial loans by Federal associations should be revised to insure diversification of direct high yield bond investments. 12 C.F.R. Section 545.46 should, therefore, be revised to include the following:
(c) Any loan or extension of credit permitted hereunder, which takes the form of the purchase of the corporate debt security of issuer not rated in any of the four highest rating categories by a nationally recognized rating service, shall be subject to a single issuer limit of 15% of the association's net worth.
The diversification requirement of the suggested 12 C.F.R. Section 545.76(b) would require a mutual fund investing in high yield bonds to restrict its investments with respect to 75%60f its total assets to not more than 5% of its assets in any single issuer . Such diversification requirement should assure the safe participation of Federal associations in this important market. Mutual funds authorized pursuant to 12 C.F.R. Section 545.76(a) investing in U.S. government securities and short-term money market instruments would not necessarily need to meet the 5(b)(l) diversification requirement.
F. Conclusion
In responding to the question of continued thrift participation in the high yield market, our general response is that neither the interests of FSLIC, the public, nor the associations would be served by precluding investment in what is very clearly an important and growing market. Federated believes that diversification and professional management of investments in high yield bonds through the use of mutual funds reduces many risks of associations participating in this market. Federated further believes that adoption of specific regulations (such as those suggested above) would insure the safe participation of federally-chartered and federally-insured associations in what is clearly an important market. Adoption of specific regulations would also eliminate c9nfusion surrounding this question which has existed since September of 1985 . These changes would afford mid-size and smaller Federal associations the considerable
6. As a practical matter most mutual funds investing in high yield bonds invest no more than 2% of total assets in the securities of any one issuer. This would mean that a Federal association investing 5% of its total assets in such a fund would have no more than 0.1% of its assets at risk with respect to any one issuer.
7. See Note 5, Sunra at p. 4
321

Craig A. Simmons, Senior Associate Director February 18, 1988 Page Seven
benefits of diversification, professional management, and credit risk analysis which only a mutual fund could provide and also obligate larger Federal associations that invest directly to diversify their portfolios, thereby reducing their risk.
Thank you for the opportunity to express our view on this very important subject. We at Federated would be happy to answer any of your questions and to discuss the issues raised herein in greater detail.
Sincerely yours,
4iii$jim& Asso ia e Corporate Counsel
PJG:fr
322

&era1 Home Loan Bank Board
1700 G Street, N.W. Washnqton. D.C 20552
Federal Home Loan Bank System Federal Home Loan Mortgage Corporation Federal Savmgs and Loan Insurance Corporation
September 26,1985
Raymond B. Perkins Vice President - Marketing Manager Merrill Lynch Capital Markets One Liberty Plaza 165 Broadway New York, New York, 10080
Dear Mr. Perkins:
This replies to your letter of July 25 and other recent inquiries as to whether Federal associations (12 C.F.R. 541.8 “Federals”) may lawfully invest in shares of the Trust for Thrift Institutions (“Trust”). In my opinion, such investment is lawful under, and within the limitations of, 12 C.F.R. 545.56 and 545.75 (d).
According to the prospectus and other materials you have provided us, the Trust is an open- end, diversified management investment company (mutual fund) registered with the Securities and Exchange Commission under the Investment Company Act of 1940. Federals could therefore invest up to five percent of their assets in the Trust under 12 C.F.R. 545.76 if the Trust’s portfolio were restricted, by a policy changeable only if authorized by shareholder vote, solely to investments authorized for investment by Federals without limitation as to percentage of assets However, it is the policy of the Trust to invest primarily in low-rated corporate debt securities in which Federals may invest only within the percentage of assets limitations required by 12 U.S.C. 1464 (c)(2)(B). Consequently, investment in the Trust is not authorized by 12 C.F.R. 545.76. The question is whether it is otherwise authorized.
In my view, authority for Federals to invest in the Trust is provided by 12 C.F.R. 545.56 and 545.75(d) within the limitations therein. Section 545.56 authorizes Federals to invest up to ten percent of their assets in commercial loans, which the Board has made clear includes debt securities, whether or not they satisfy the rating or other requirements of 545.75.
323

See 48 F.R. 23045 (5/23/83). Section 545.75(d) provides that a Federal may invest up to one percent of its assets in commercial paper and corporate debt securities if, in its “prudent judgment”, it determines that the obliger(s) will be able to perform fully the debt service and other undertakings connected with such securities.
Although it may be argued that 12 C.F.R. 545.46 and 545.75(d) contemplate direct investment, nothing in their language excludes indirect investment through a mutual fund, and such investment would clearly be consistent with the “prudent judgment” requirement explicit in Section 545.75(d) and the “safety and soundness” requirement implicit in all investment authority of Federals. To read these regulations as authorizing only direct investment might preclude any investment in low-rated securities under them, especially by small Federals, for which the diversification required for prudent investment in such securities may be available only through investment in a mutual fund.
It may also be argued that the existence of express authority in 12 C.F.R. 545.76 for investment by Federals in certain mutual funds implies an absence of authority for their investment in other mutual funds not expressly provided for. In my view, such argument is greatly outweighed by the manifest good sense of reading 12 C.F.R. 545.46 and 545.75(d) to permit Federals investing under them to do so with the added safety and convenience available through a mutual fund. I therefore conclude that such indirect investment through a mutual fund is authorized by these regulations within their requirements and limitations. Of course, such indirect investment in the obligations of any “one borrower” as defined in 12 C.F.R. 563.9-3 must also comply with the requirements and limitations of that regulation.
I am pleased to provide this opinion in response to your inquiries and trust that it will be helpful. If I can be of further assistance, please let me know.
Very truly yours,
Norman H. Raiden General Counsel
324

” FEDERATED cl
INVESTORS, INC.
March 14, 1988
Craig A. Simmons, Senior Associate Director General Government Division U.S. General Accounting Office - Room 3858A 441 G Street, N.W. Washington, DC 20548
RE: 233203
FHXRATED INVESTORSTOWER PI’I-I-SRURGH. PA m2-3?79 412 2RR.I%M0
Dear Mr. Simmons: First, both Tom Madden and I would like to thank the
General Accounting Office for the opportunity to express our opinions during the recent public hearing concerning the high yield bond market and the,propriety of federally chartered savings and loan association ("federal associationll) investment in high yield bonds. The purpose of this letter is to provide some further comment on a few points raised by panelists and witnesses during the hearing and to emphasize certain points raised during Tom Madden's testimony. I will proceed by identifying the points which we would like to address, and then provide such additional information or clarification as we may feel appropriate.
Usefulness of Hiah Yield Bond Ratinss
Although the major rating services (Moody*s and S&P) provide additional perspective on the financial strength of high yield issuers, much high yield debt is successfully purchased and traded by investors without the benefit of such ratings. Issuers may choose to forego the time consuming process of appearing before the rating agencies on the belief that the high yield market already understands the financial structure business and other fundamentals. Further, many high yield issues brought to market in the last several years came as private placements which are typically not rated. rights,
These issues may have registration which allow them to be transformed into public bonds
after some period of time. rated.
These now public issues may then be
Some high yield buyers believe that during the 1970s the rating agencies were less sensitive to the asset strength and improving quality of many familiar high yield issues. include: Teledyne,
Examples American Financial, Rapid American, and
others. Thus, while the performance of the rating services has undoubtedly improved in recent years, a variety of high yield investors have operated successfully within the market over a longer time period using the ratings as only one of a number of analytical inputs to the investment decision. We believe limiting high yield investments by financial institutions to issuers rated by Moody's and S&P would be unnecessarily restrictive. An application of such a standard over the last several years would be excluding attractive offerings (for example, Reliance Electric) which, although not rated initially, were perfectly suitable for investment as part of a diversified portfolio.
One of the ATNA LIFE 8 CASUALTY companies

‘I
Craig A. Simmons, Senior Associate Director March 14, 1988 Page 2
Diversification standarda In order to underscore our testimony a prudent
diversification standard for a thrift's high yield bond portfolio would look very much like the diversification standards adopted by mutual funds investing in high yield bonds. That is, no more than 5% of the total high yield portfolio should be invested in any one issuer. While diversification by industry is also an important point, we do not believe an arbitrary standard should be established (i.e., no more than 15% of the total portfolio may be invested in any one industry) because such a standard could have the deleterious effect of forcing exposure to cyclical or depressed industries.
Naximum Thrift Exnosure To Hiah Yield Bonds While our position would be to advocate no arbitrary
limits in terms of maximum exposure for thrifts investing in high yield bonds, we believe that any limits imposed should be cognizant of issues presented under I.R.C. Section 7701(19), the so-called "thriftness test", and the "guplified thrift lender test" found at 12 C.F.R. Section 583.27.
Winimum Thrift Exnosure We do not believe,
panelists, as was suggested by one of the
there should be a regulatorily prescribed minimum exposure to high yield bonds. regulatorily mandated
Theoretically, though, some portfolio diversification might enhance the
profitability of many federal associations.
Accounting for Investment in Mutual Funds Investing in Hiah Yield Bonds
During the hearing, one of the panelists obsewed that, according to Generally Accepted Accounting Principles (GAAP), a depository institution investing in a mutual fund must carry its investment in that mutual fund at the lower of cost or market. This, of course, differs from GAAP treatment of directly held debt securities yhich can be,carried on an institution's books at historical cost. The practical effect of this disparate treatment has been that an institution's investment in a mutual fund fluctuates in reaction to market conditions and this
'These standards make it clear that a thrift could not invest more than 40% of its assets in high yield bonds without losing its status as a "building and loan association" under the tax code and a Itqualified thrift lender" under Federal Home Loan Bank system regulations.
2The accounting profession employs the fiction that the institution intends to hold the direct-held debt security to maturity.

Craig A. Simmons, Senior Associate Director March 14, 1988 Page 3
fluctuation is disclosed in regulato reports and financial statements while the true value of d rectly held debt securities r in a depository institutiongs portfolio is not. While we vigorously disagree with the accounting profession's disparate treatment of depository institution investments in mutual funds, we do not believe that the mere fact that accounting standards require disclosure of the market value of an asset makes it a less attractive investment vehicle or in any way an imprudent investment, In fact, many would argue that such disclosure is desirable.&
-
Conclusion
We would like to reiterate our diversified portfolio of high yield debt associations with more favorable returns - _ -. ._- .
belief that can provide . - _
a federal
on a risk/reward basis than many other eligible investments. Further, we believe that the smaller federal associations should be allowed to participate in this market through the safety, convenience, and diversification offered through mutual funds and, that Federal Home Loan Bank system regulations should be modified to make clear that such an investment is, in fact, permitted.
We would like to thank you again for this opportunity to express our views on this important topic. If you have any further questions of Tom Madden or myself, we can be reached at the numbers listed below.
Very truly yours, /3 A
f-- . Associ#t+ Co&ate Counsel
J. Thomas Madden (412) 288-1922 Peter J. Germain (412) 288-6331
V
3We do not believe at this point a dissertation on risk-based deposit insurance or risk-based capital is necessary.
33.7


nited States meral Accounting Office