Germany 1850-1939 - Rate of profit, output-capital ratio and distribution
51
1851 1855 1859 1863 1867 187 1 1875 187 9 188 3 1887 189 1 1895 1899 1903 1907 191 1 1915 1919 192 3 1927 193 1 193 5 1939 0.20 0.30 0.40 0.50 0.60 0.70 0.80 0.90 0.20 0.40 0.60 0.80 1.00 1.20 1.40 1.60 Maximum rate of profit on total (Yn/K) and private reproductive fixed capital (Yn/K-II, right) - Germany 1851-1939 Yn/K Yn / K-II
Transcript of Germany 1850-1939 - Rate of profit, output-capital ratio and distribution

1851
1855
1859
1863
1867
1871
1875
1879
1883
1887
1891
1895
1899
1903
1907
1911
1915
1919
1923
1927
1931
1935
1939
0.20
0.30
0.40
0.50
0.60
0.70
0.80
0.90
0.20
0.40
0.60
0.80
1.00
1.20
1.40
1.60
Maximum rate of profit on total (Yn/K) and private reproductive fixed capital (Yn/K-II, right) - Germany 1851-1939
Yn/K Yn / K-II

1868
1871
1874
1877
1880
1883
1886
1889
1892
1895
1898
1901
1904
1907
1910
1913
1916
1919
1922
1925
1928
1931
1934
1937
-100%
-80%
-60%
-40%
-20%
0%
20%
40%
60%
80%
100%
0%
5%
10%
15%
20%
25%
30%
35%
40%
45%
Rate of profit (right axis), nominal accumulation rate and investment effort - Germany 1868-1939
Nominal Accumulation Rate Nominal Investment Effort Rate of profit

1851 1860 1869 1878 1887 1896 1905 1914 1923 1932 1941 1950 1959 1968 1977 1986 1995 20040.0%
5.0%
10.0%
15.0%
20.0%
25.0%
30.0%
35.0%
40.0%
45.0%
0.30
0.40
0.50
0.60
0.70
0.80
0.90
Rate of profit and maximum rate of profit (right) - Germany 1851-2011
ROP Linear (ROP) Max ROP

DataDE1c: Raw 1850-1950 national accounts series for Germany1850-1913: Hoffmann (1965) [NB: 1850-1870 data unreliable, too large discrepancy between various estimates]1925-1938: Ritschl (2002)1914-1924 & 1939-1950: Ritschl & Spoerer (1997); Ritschl (2003)For more details see Piketty and Zucman data appendix for "Capital is Back", pages 78-85 for net reproductive fixed capital ( piketty.pse.ens.fr/files/PikettyZucman2013Appendix.pdf )
BX CJ CN BX+CJ+CN
Notations Net Reproductive Fixed Capital Yn/K
Business assets
Source Hoffmann Tab 40
German name Gewerbe
Note
18501851 5.8 0.5 3.8 10.1 0.641852 6.0 0.6 3.9 10.5 0.691853 6.9 0.7 4.1 11.7 0.611854 8.1 0.8 4.3 13.2 0.621855 8.6 0.9 4.5 14.0 0.561856 8.6 0.9 4.5 14.1 0.651857 8.5 1.0 4.6 14.1 0.611858 8.2 1.0 4.6 13.8 0.601859 7.8 1.0 4.6 13.4 0.611860 7.8 1.1 4.5 13.4 0.721861 7.9 1.2 4.4 13.4 0.701862 8.1 1.2 4.4 13.7 0.731863 8.4 1.3 4.3 14.1 0.741864 8.8 1.4 4.2 14.4 0.711865 8.9 1.5 4.1 14.6 0.701866 9.0 1.7 4.2 14.8 0.721867 8.9 1.7 4.2 14.9 0.781868 9.1 1.8 4.3 15.2 0.851869 9.4 2.0 4.5 15.9 0.741870 9.7 2.3 4.8 16.9 0.76
P&Z EXCEL FILE COLUMN
Public railways at market value
Public constructions
Total Fixed Capital
Maximum Rate of profit (National Income / K)
Hoffmann Tab 40 Yn / Total Fixed
Reproductive Capital

1871 11.1 2.8 5.3 19.2 0.731872 14.3 3.7 5.7 23.7 0.701873 17.3 4.8 6.3 28.3 0.631874 17.1 5.3 6.7 29.0 0.671875 15.3 5.3 6.6 27.2 0.671876 14.0 5.5 6.3 25.8 0.691877 13.1 5.6 6.0 24.7 0.701878 12.4 5.7 5.8 23.8 0.751879 11.7 5.8 5.5 22.9 0.731880 12.1 6.2 5.3 23.5 0.721881 12.7 6.3 5.2 24.2 0.721882 13.2 6.5 5.3 25.0 0.701883 13.9 6.8 5.5 26.2 0.691884 14.1 6.9 5.6 26.6 0.701885 14.4 6.9 5.9 27.2 0.691886 14.9 7.0 6.1 28.0 0.681887 15.9 7.3 6.4 29.6 0.651888 18.1 7.8 6.7 32.5 0.641889 20.7 8.4 6.8 35.9 0.621890 23.6 9.0 6.4 39.0 0.611891 24.2 9.1 6.4 39.7 0.571892 22.7 8.8 6.8 38.3 0.631893 22.1 8.5 6.8 37.4 0.651894 22.3 8.4 6.9 37.5 0.641895 23.2 8.6 7.0 38.8 0.651896 25.7 9.1 7.4 42.2 0.641897 29.3 9.8 7.9 46.9 0.611898 33.1 10.5 8.4 51.9 0.601899 39.6 11.6 8.9 60.1 0.531900 48.0 13.1 9.3 70.4 0.461901 48.4 13.4 9.6 71.4 0.441902 43.4 12.9 9.7 66.0 0.481903 43.4 13.1 10.0 66.4 0.511904 46.5 13.6 10.4 70.4 0.511905 50.6 14.4 10.9 75.8 0.511906 57.6 15.7 11.5 84.7 0.481907 65.2 17.2 12.2 94.6 0.451908 65.0 17.7 12.6 95.3 0.441909 61.4 17.7 12.9 91.9 0.481910 63.6 18.4 13.3 95.3 0.481911 68.2 19.4 14.1 101.7 0.471912 75.5 20.8 14.9 111.1 0.461913 82.9 22.3 15.7 120.9 0.4319141915
1868
1871
1874
1877
1880
1883
1886
1889
1892
1895
1898
1901
1904
1907
1910
1913
1916
1919
1922
1925
1928
1931
1934
1937
-20%
-15%
-10%
-5%
0%
5%
10%
15%
20%
25%
0%
5%
10%
15%
20%
25%
30%
35%
40%
45%
GDP Nominal Accumulation Rate ROP
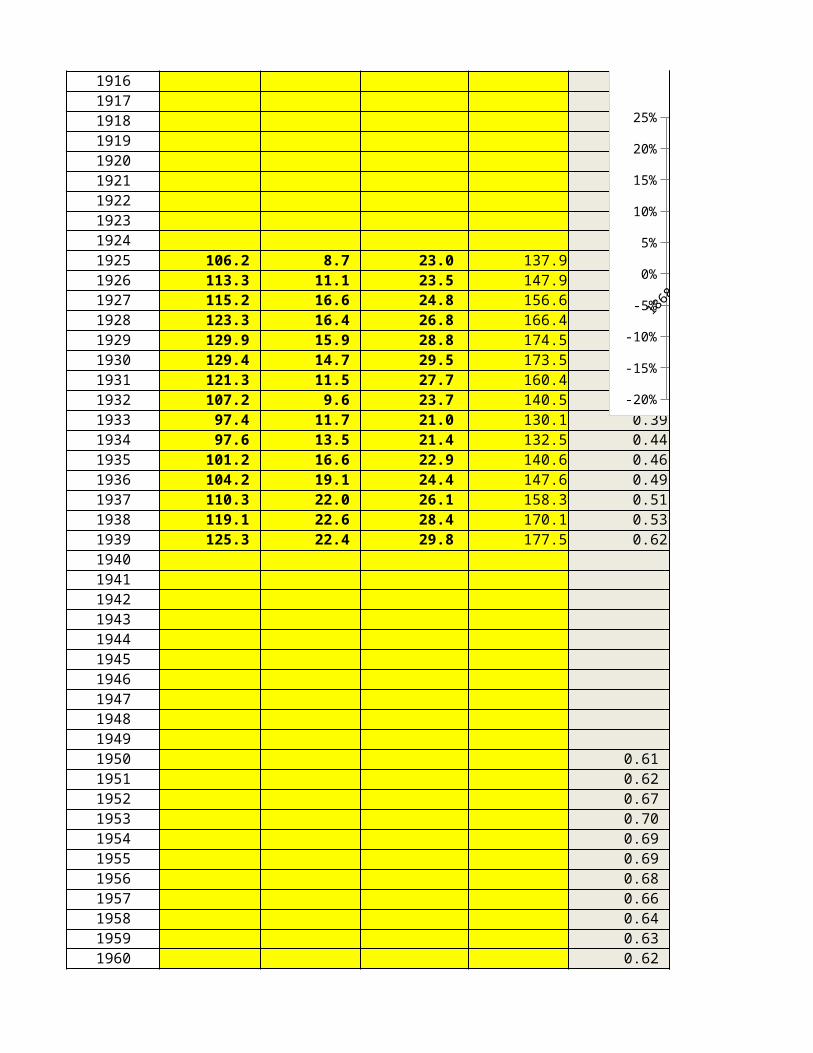
1916191719181919192019211922192319241925 106.2 8.7 23.0 137.9 0.471926 113.3 11.1 23.5 147.9 0.461927 115.2 16.6 24.8 156.6 0.491928 123.3 16.4 26.8 166.4 0.491929 129.9 15.9 28.8 174.5 0.471930 129.4 14.7 29.5 173.5 0.431931 121.3 11.5 27.7 160.4 0.381932 107.2 9.6 23.7 140.5 0.351933 97.4 11.7 21.0 130.1 0.391934 97.6 13.5 21.4 132.5 0.441935 101.2 16.6 22.9 140.6 0.461936 104.2 19.1 24.4 147.6 0.491937 110.3 22.0 26.1 158.3 0.511938 119.1 22.6 28.4 170.1 0.531939 125.3 22.4 29.8 177.5 0.6219401941194219431944194519461947194819491950 0.61 1951 0.62 1952 0.67 1953 0.70 1954 0.69 1955 0.69 1956 0.68 1957 0.66 1958 0.64 1959 0.63 1960 0.62
1868
1871
1874
1877
1880
1883
1886
1889
1892
1895
1898
1901
1904
1907
1910
1913
1916
1919
1922
1925
1928
1931
1934
1937
-20%
-15%
-10%
-5%
0%
5%
10%
15%
20%
25%
0%
5%
10%
15%
20%
25%
30%
35%
40%
45%
GDP Nominal Accumulation Rate ROP

1961 0.59 1962 0.57 1963 0.54 1964 0.54 1965 0.54 1966 0.53 1967 0.52 1968 0.54 1969 0.52 1970 0.50 1971 0.50 1972 0.50 1973 0.50 1974 0.49 1975 0.48 1976 0.49 1977 0.49 1978 0.48 1979 0.47 1980 0.45 1981 0.44 1982 0.45 1983 0.45 1984 0.45 1985 0.46 1986 0.47 1987 0.47 1988 0.47 1989 0.48 1990 0.48 1991 0.53 1992 0.52 1993 0.51 1994 0.52 1995 0.52 1996 0.53 1997 0.53 1998 0.54 1999 0.54 2000 0.54 2001 0.55 2002 0.55 2003 0.56 2004 0.56 2005 0.56

2006 0.57 2007 0.57 2008 0.56 2009 0.52 2010 0.54 2011 0.55

1850-1913: Hoffmann (1965) [NB: 1850-1870 data unreliable, too large discrepancy between various estimates]
For more details see Piketty and Zucman data appendix for "Capital is Back", pages 78-85 for net reproductive fixed capital ( piketty.pse.ens.fr/files/PikettyZucman2013Appendix.pdf )
B C D E FNational income
Yn / K-II
6.1 10.5 0.351.10 6.4 10.6 0.361.21 7.3 11.1 0.351.04 7.2 10.6 0.351.01 8.2 11.0 0.330.92 7.9 10.3 0.341.06 9.1 11.6 0.341.01 8.6 11.8 0.391.02 8.3 12.1 0.421.04 8.1 12.2 0.461.23 9.6 13.6 0.451.19 9.4 13.0 0.451.24 10.1 13.7 0.471.23 10.4 14.6 0.501.17 10.2 14.7 0.531.15 10.3 14.9 0.561.19 10.7 15.1 0.561.29 11.6 15.1 0.541.43 13.0 16.6 0.551.26 11.8 15.7 0.601.32 12.9 16.7 0.61
Yt GDPt Tpt
Maximum Rate of profit (National Income / K)
National income
Memo: national income
(constant 1913 prices)
Gross national product
Gross national product
(constant 1913 prices)
Product taxe (net
of subsidies)
Yn/Business Assets
1870-1913: Hoffmann Tab. 252; 1925-1938: Ritschl b5-d
1850-1913: Hoffmann Tab. 249; 1914-
onwards: using % change of Ritschl & Spoerer
(1997), Table A1, "BSP zu
Marketpreisen"
Ritschl & Spoerer (1997) Table A1
Ritschl & Spoerer (1997) Table A1
1850-1913: Burhop & Wolff JEH (2005),
Table A3; 1925-1938: Ritschl
(2002)BSP zu
Marketpreisen
Indirekte Steuern abzüglich
Subventionen
At current market prices
Post 1945: East+W Germany
1925-1938: same as Ritschl
(2002). Post 1945: East+W
Germany
Post 1945: East+W Germany
1850-1913: susbsidies
assumed to be equal to 0

1.26 14.0 17.4 0.601.16 16.6 19.1 0.581.04 18.0 19.8 0.581.14 19.5 21.3 0.601.19 18.2 21.1 0.661.28 17.9 20.9 0.691.33 17.4 20.7 0.731.44 17.9 21.8 0.781.43 16.7 21.2 0.841.40 16.9 20.6 0.841.37 17.4 21.4 0.891.33 17.5 21.5 0.921.30 18.1 22.7 0.981.32 18.6 23.7 1.031.30 18.7 24.3 1.091.28 18.9 24.8 1.141.21 19.3 25.2 1.191.15 20.7 26.5 1.211.07 22.2 27.6 1.221.00 23.6 28.5 1.230.93 22.6 27.5 1.291.06 24.0 29.1 1.341.10 24.3 31.3 1.481.08 24.1 31.5 1.551.09 25.2 32.8 1.621.05 27.0 34.4 1.650.98 28.7 35.8 1.680.94 30.9 38.5 1.740.80 31.6 38.0 1.750.67 32.3 37.5 1.760.65 31.4 37.1 33.6 38 1.850.73 31.9 37.5 34.2 40 1.880.79 34.2 40.5 35.5 41 1.930.77 35.9 42.5 37.0 43 1.960.77 38.7 44.2 38.9 43 2.060.70 40.3 44.1 41.8 45 2.100.66 43.0 46.1 43.8 47 2.220.65 42.1 46.2 45.0 49 2.250.72 44.3 47.3 47.1 50 2.520.72 45.6 47.1 49.6 51 2.680.70 47.9 49.5 51.8 54 2.880.68 51.4 51.9 54.3 55 2.830.63 52.1 52.4 56.6 56.6 2.87
48.4 5244.5 48
1868
1871
1874
1877
1880
1883
1886
1889
1892
1895
1898
1901
1904
1907
1910
1913
1916
1919
1922
1925
1928
1931
1934
1937
-20%
-15%
-10%
-5%
0%
5%
10%
15%
20%
25%
0%
5%
10%
15%
20%
25%
30%
35%
40%
45%
GDP Nominal Accumulation Rate ROP

42.4 4641.4 4540.3 4435.8 3940.1 4342.5 4645.0 4939.2 4243.6 47
0.62 65.5 46.8 71.1 50.55 8.30.60 67.8 47.3 73.7 51.09 7.90.66 76.4 52.1 82.8 56.20 9.40.66 81.8 53.6 88.5 57.90 9.90.63 81.5 52.7 88.4 56.86 9.90.58 75.1 49.0 81.9 52.90 9.70.51 61.6 42.5 68.0 45.90 8.70.46 49.7 39.1 55.5 42.21 7.90.53 51.2 42.2 57.0 45.53 8.00.59 57.9 46.7 63.8 50.42 8.40.64 64.8 52.5 71.2 56.70 9.00.69 72.2 58.6 79.2 63.30 9.80.74 81.2 65.2 88.6 70.36 11.10.76 90.9 71.4 98.7 77.08 12.80.88 109.8 84.9 119 92 15.4
98.6 134 106112.6 146 122118.9 152 128126.5 164 137115.8 158 12532.3 34.9228.0 49 3033.1 61 3639.3 84 4247.2 108 5153.1 117 57
1868
1871
1874
1877
1880
1883
1886
1889
1892
1895
1898
1901
1904
1907
1910
1913
1916
1919
1922
1925
1928
1931
1934
1937
-20%
-15%
-10%
-5%
0%
5%
10%
15%
20%
25%
0%
5%
10%
15%
20%
25%
30%
35%
40%
45%
GDP Nominal Accumulation Rate ROP


Depreciation= P&Z series from 1925. 1900-1913 directly estimated from P&Z as, like 1925-1939, GDP minus Na
For more details see Piketty and Zucman data appendix for "Capital is Back", pages 78-85 for net reproductive fixed capital ( piketty.pse.ens.fr/files/PikettyZucman2013Appendix.pdf )
G N
Depreciation
Ritschl b3-d
ROP ROP-b
5.76.16.96.87.97.58.88.27.97.79.28.99.69.99.79.710.111.012.4 0.3 39.4% 20.2%11.2 0.3 32.5% 15.8% 4.4% 13.6%12.3 0.3 31.7% 13.6% 5.8% 18.4%
Yt - Tpt
Factor-cost national income
Rate of profit
Rate of profit
(Piketty Total Capital Income)
Nominal Accumulatio
n Rate
Nominal Investment
Effort
1868
1873
1878
1883
1888
1893
1898
1903
1908
1913
1918
1923
1928
1933
1938
0%
10%
20%
30%
40%
0%
5%
10%
15%
20%
25%ROP ROP-b

13.4 0.4 31.0% 14.0% 12.2% 39.4%16.0 0.5 29.3% 12.7% 18.9% 64.6%17.4 0.6 26.1% 11.0% 16.4% 62.7%18.9 0.6 27.7% 11.8% 2.5% 8.9%17.6 0.6 25.6% 9.4% -6.7% -26.0%17.2 0.5 27.1% 10.7% -5.6% -20.5%16.7 0.5 28.2% 12.3% -4.3% -15.4%17.1 0.5 29.6% 12.7% -3.8% -13.0%15.8 0.5 28.7% 12.7% -3.8% -13.2%16.1 0.5 29.8% 14.7% 2.5% 8.6%16.5 0.5 29.3% 14.2% 2.7% 9.2%16.6 0.6 28.2% 13.4% 3.2% 11.4%17.1 0.6 28.4% 14.4% 4.5% 16.0%17.5 0.6 28.6% 14.6% 1.7% 5.9%17.6 0.7 27.8% 14.0% 2.2% 7.8%17.8 0.7 26.8% 13.5% 2.8% 10.3%18.1 0.7 26.6% 14.3% 5.3% 19.9%19.5 0.8 25.9% 14.0% 8.9% 34.5%21.0 0.9 25.1% 13.8% 9.6% 38.1%22.4 1.0 25.6% 15.0% 7.9% 30.8%21.3 1.0 23.4% 13.4% 1.8% 7.7%22.7 1.0 26.0% 15.0% -3.7% -14.3%22.9 1.0 26.5% 15.2% -2.3% -8.6%22.6 1.0 25.7% 14.7% 0.2% 0.8%23.6 1.1 25.5% 14.4% 3.4% 13.5%25.3 1.2 25.0% 14.3% 8.0% 32.1%27.0 1.4 24.8% 15.0% 10.0% 40.4%29.2 1.5 24.5% 15.2% 9.7% 39.4%29.9 1.8 21.5% 13.4% 13.5% 62.7%30.6 2.1 19.0% 12.0% 14.7% 77.4%29.6 2.2 17.7% 11.0% 1.4% 7.7%30.0 2.4 19.7% 12.5% -8.1% -41.2%32.3 1.3 20.7% 13.1% 0.7% 3.2%33.9 1.1 20.5% 13.1% 5.7% 27.7%36.6 0.2 21.0% 13.8% 7.1% 33.7%38.2 1.5 19.8% 13.2% 10.5% 53.0%40.8 0.8 18.6% 12.3% 10.4% 56.1%39.9 2.9 17.8% 11.8% 0.8% 4.6%41.8 2.9 19.1% 12.6% -3.7% -19.3%42.9 4.0 19.4% 13.1% 3.5% 18.3%45.0 3.9 19.0% 12.8% 6.3% 33.0%48.5 3.0 19.0% 13.0% 8.5% 44.8%49.2 4.5 17.7% 12.2% 8.0% 45.4%
1868
1871
1874
1877
1880
1883
1886
1889
1892
1895
1898
1901
1904
1907
1910
1913
1916
1919
1922
1925
1928
1931
1934
1937
-20%
-15%
-10%
-5%
0%
5%
10%
15%
20%
25%
0%
5%
10%
15%
20%
25%
30%
35%
40%
45%
GDP Nominal Accumulation Rate ROP

57.2 5.6 15.2% 10.6%59.8 5.9 14.9% 10.8% 6.8% 45.5%67.0 6.4 15.8% 11.0% 5.5% 34.8%71.9 6.7 15.4% 10.5% 5.9% 38.3%71.6 6.9 14.3% 9.8% 4.7% 32.7%65.4 6.9 12.7% 8.3% -0.6% -4.5%52.9 6.4 10.2% 6.6% -8.2% -79.9%41.8 5.8 9.6% 5.8% -14.2% -147.5%43.2 5.8 11.3% 6.7% -8.0% -70.8%49.5 5.8 13.2% 8.5% 1.8% 13.9%55.8 6.4 14.5% 9.8% 5.8% 39.8%62.4 7.0 16.3% 10.9% 4.7% 29.0%70.1 7.4 17.7% 12.9% 6.8% 38.3%78.1 7.8 18.9% 13.8% 6.9% 36.7%94.4 20.2% 14.6% 4.2% 20.6%
22.9%23.0%25.4%25.5%24.6%25.1%24.4%23.9%22.9%22.9%23.0%
1868
1871
1874
1877
1880
1883
1886
1889
1892
1895
1898
1901
1904
1907
1910
1913
1916
1919
1922
1925
1928
1931
1934
1937
-20%
-15%
-10%
-5%
0%
5%
10%
15%
20%
25%
0%
5%
10%
15%
20%
25%
30%
35%
40%
45%
GDP Nominal Accumulation Rate ROP

20.7%19.1%18.1%18.0%17.7%16.9%16.7%17.9%16.5%15.4%14.5%14.0%13.6%12.7%12.6%12.9%12.7%12.3%11.9%10.8%10.5%10.8%11.3%11.7%12.2%12.7%12.1%12.7%13.4%13.7%14.0%13.3%12.7%13.7%14.2%14.3%14.9%15.1%14.7%14.0%14.3%14.7%14.9%15.8%16.5%

17.6%17.9%16.8%13.8%15.4%15.3%

AG AH BP BQ BR X
Self-employed
0.40.71.11.31.91.52.11.81.31.31.91.82.12.22.22.02.02.3
5.98 6.43 31% 3.1 5.17 5.98 31% 2.5 5.35 6.92 31% 2.3
Please note that in Piketty & Zucman database this shares (AG & AH columns) are only for 1925-1939. From 1868 to 1913 we estimated both taking Factor Cost National Income (G) minus Total Capital Income -
column X of P&Z excel file- (obtaining Wages + Self Employment). Then we rest Self Employment (according to its share -BR column-related to wage employment, and considering individual mixed income = 100% of wage) and added to Total Capital Income obtaining Net Operating Surplus and Wages (THIS excel AA and
AB columns) for long run and comparative harmonization
Ykt
Total capital income + self-employment
income
Labor income (excluding self-
emplyment)
Salaried workers
Share self-employed
Total capital income
Hoffmann & Muller (1959)
Hoffmann & Muller (1959)
Hoffmann Table 22
Hoffmann Tab. 122Einkommen aus
Unternehmertätigkeit und Vermögen
Includes retained
earnings, and capital income from government
companies (öffentliche Vermögens- und Unternehmereink
ommen)
This breakdown between salaried workers/self-employed is not consistent with official Destatis data for the 1950s (one potential pb = unpaid family workers)
186818711874187718801883188618891892189518981901190419071910191319161919192219251928193119341937
- 5.00
10.00 15.00 20.00 25.00 30.00 35.00 40.00
Comparative between Piketty & Zucman 1925-1939 net operating surplus (capital+selfemployment) and own
estimates for 1868-1939
P&Z Net operating surplus

5.95 7.46 30% 2.7 6.94 9.10 30% 3.0 7.39 9.98 30% 3.1 8.04 10.91 30% 3.4 6.97 10.61 29% 2.6 6.98 10.24 29% 2.8 6.96 9.72 29% 3.0 7.05 10.04 29% 3.0 6.58 9.26 28% 2.9 7.02 9.06 28% 3.5 7.09 9.39 28% 3.4 7.06 9.54 14,381 5,577 28% 3.4 7.45 9.62 14,610 5,578 28% 3.8 7.62 9.93 14,851 5,579 27% 3.9 7.56 10.08 14,997 5,580 27% 3.8 7.51 10.28 15,392 5,581 27% 3.8 7.87 10.20 15,683 5,582 26% 4.2 8.41 11.08 16,023 5,583 26% 4.5 9.02 12.00 16,505 5,585 25% 5.0 9.97 12.43 16,786 5,586 25% 5.8 9.28 11.97 16,898 5,587 25% 5.3 9.94 12.77 17,000 5,588 25% 5.7 9.91 12.95 17,149 5,589 25% 5.7 9.65 12.90 17,480 5,590 24% 5.5 9.90 13.72 17,814 5,591 24% 5.6 10.55 14.76 18,290 5,602 23% 6.0 11.64 15.36 18,678 5,612 23% 7.0 12.74 16.45 19,097 5,623 23% 7.9 12.94 16.94 19,449 5,633 22% 8.0 13.35 17.21 19,905 5,644 22% 8.5 12.65 16.91 19,963 5,654 22% 7.9 13.00 17.01 20,205 5,665 22% 8.2 13.77 18.50 20,674 5,675 22% 8.7 14.46 19.46 21,149 5,686 21% 9.2 15.93 20.69 21,525 5,696 21% 10.5 16.78 21.46 22,028 5,707 21% 11.2 17.57 23.18 22,449 5,717 20% 11.7 16.99 22.87 20% 11.3 17.59 24.18 20% 11.5 18.49 24.41 20% 12.5 19.33 25.72 20% 13.0 21.09 27.46 19% 14.5 21.40 27.84 19% 14.7

20.9 36.3 25,169 5,864 18.9% 14.622.0 37.7 23,974 5,878 19.7% 16.024.8 42.2 26,071 5,892 18.4% 17.325.6 46.4 26,625 5,906 18.2% 17.524.9 46.9 26,346 5,920 18.3% 17.122.1 43.8 24,549 5,934 19.5% 14.516.4 37.0 22,167 5,948 21.2% 10.513.5 28.8 20,151 5,962 22.8% 8.214.7 29.0 20,711 5,976 22.4% 8.717.5 32.6 22,893 5,918 20.5% 11.320.5 36.0 24,226 5,860 19.5% 13.824.1 39.2 25,607 5,803 18.5% 16.228.0 43.1 26,994 5,745 17.5% 20.532.1 47.5 28,194 5,687 16.8% 23.535.9 51.3 34,051 5,629 14.2% 26.0
3,485 17%3,472 16%3,461 16%3,453 16%3,453 15%3,454 15%3,450 14%3,478 14%3,541 14%3,536 14%


(G-X) * (1-BR)
Wages Wage / Income
ROP III ROP IV
6.0 6.4 49.6% 66.1% 33.8%5.2 6.0 50.9% 55.2% 26.8%5.4 6.9 53.7% 55.0% 23.7%
In previous versions we used ROP III considering
just private fixed reproductive capital (Business Assets)
Net operating surplus
Net Operating Surplus / Business Assets
Total Capital Income / Business Assets
186818711874187718801883188618891892189518981901190419071910191319161919192219251928193119341937
- 5.00
10.00 15.00 20.00 25.00 30.00 35.00 40.00
Comparative between Piketty & Zucman 1925-1939 net operating surplus (capital+selfemployment) and own
estimates for 1868-1939
P&Z Net operating surplus
186818721876188018841888189218961900190419081912191619201924192819321936
0.0%
10.0%
20.0%
30.0%
40.0%
50.0%
60.0%
70.0%
0.0%5.0%10.0%15.0%20.0%25.0%30.0%35.0%40.0%
ROP III ROP IV
6.0 7.5 53.2% 53.4% 24.2%6.9 9.1 54.7% 48.6% 21.0%7.4 10.0 55.6% 42.8% 18.0%8.0 10.9 55.8% 47.0% 20.1%7.0 10.6 58.2% 45.6% 16.7%7.0 10.2 57.2% 49.9% 19.7%7.0 9.7 55.8% 53.2% 23.1%7.0 10.0 56.2% 56.8% 24.4%6.6 9.3 55.5% 56.2% 24.8%7.0 9.1 53.6% 58.0% 28.6%7.1 9.4 54.1% 55.8% 27.1%7.1 9.5 54.5% 53.5% 25.4%7.4 9.6 53.3% 53.6% 27.2%7.6 9.9 53.4% 54.0% 27.6%7.6 10.1 53.8% 52.5% 26.5%7.5 10.3 54.3% 50.6% 25.5%7.9 10.2 53.0% 49.5% 26.7%8.4 11.1 53.5% 46.6% 25.2%9.0 12.0 54.0% 43.6% 24.0%
10.0 12.4 52.6% 42.2% 24.7%9.3 12.0 53.1% 38.4% 22.0%9.9 12.8 53.1% 43.9% 25.3%9.9 12.9 53.2% 44.8% 25.8%9.7 12.9 53.5% 43.4% 24.8%9.9 13.7 54.4% 42.7% 24.1%
10.6 14.8 54.7% 41.1% 23.5%11.6 15.4 53.6% 39.8% 24.0%12.7 16.4 53.2% 38.5% 23.9%12.9 16.9 53.6% 32.7% 20.3%13.3 17.2 53.3% 27.8% 17.6%12.6 16.9 53.8% 26.2% 16.2%13.0 17.0 53.3% 29.9% 19.0%13.8 18.5 54.1% 31.7% 20.0%14.5 19.5 54.3% 31.1% 19.9%15.9 20.7 53.5% 31.5% 20.7%16.8 21.5 53.2% 29.2% 19.5%17.6 23.2 53.9% 27.0% 17.9%17.0 22.9 54.3% 26.1% 17.3%17.6 24.2 54.6% 28.7% 18.8%18.5 24.4 53.6% 29.1% 19.6%19.3 25.7 53.7% 28.3% 19.1%21.1 27.5 53.4% 27.9% 19.2%21.4 27.8 53.4% 25.8% 17.7%

22.7 34.6 52.7% 19.7% 13.8%24.7 35.2 51.9% 19.4% 14.1%26.5 40.5 53.0% 21.5% 15.0%27.4 44.5 54.5% 20.8% 14.2%27.1 44.5 54.6% 19.2% 13.1%24.4 41.0 54.6% 17.1% 11.2%19.5 33.4 54.2% 13.5% 8.7%15.8 25.9 52.2% 12.6% 7.6%16.4 26.8 52.3% 15.1% 8.9%19.1 30.4 52.5% 17.9% 11.5%21.9 33.8 52.2% 20.2% 13.6%24.7 37.7 52.2% 23.1% 15.5%29.2 40.9 50.4% 25.4% 18.6%32.7 45.5 50.0% 27.0% 19.7%35.7 58.7 53.4% 28.7% 20.8%


CFK/K GDP
1.42% - 1.42%1.44% 0.15 6.58 1.44%1.46% 0.15 7.44 1.46%1.49% 0.17 7.37 1.49%1.51% 0.20 8.40 1.51%1.53% 0.21 8.10 1.53%1.56% 0.22 9.36 1.56%1.58% 0.22 8.80 1.58%1.60% 0.22 8.56 1.60%1.63% 0.22 8.35 1.63%1.65% 0.22 9.85 1.65%1.68% 0.23 9.60 1.68%1.70% 0.23 10.28 1.70%1.73% 0.24 10.62 1.73%1.76% 0.25 10.46 1.76%1.78% 0.26 10.54 1.78%1.81% 0.27 10.98 1.81%1.84% 0.27 11.83 1.84%1.87% 0.28 13.25 3.96% 4.24% 1.87%1.89% 0.30 12.05 4.02% 4.30% 1.89%1.92% 0.32 13.20 4.08% 4.37% 1.92%
CFK or Depreciation Depreciatio
n as % of GDP
Depreciation as % of Income
Depreciation as % of total K
0.00%
2.00%
4.00%
6.00%
8.00%
10.00%
12.00%
14.00%
Column AJColumn AKColumn AL
186818721876188018841888189218961900190419081912191619201924192819321936
0.0%
10.0%
20.0%
30.0%
40.0%
50.0%
60.0%
70.0%
0.0%5.0%10.0%15.0%20.0%25.0%30.0%35.0%40.0%
ROP III ROP IV

1.95% 0.37 14.39 4.15% 4.43% 1.95%1.98% 0.47 17.10 4.21% 4.50% 1.98%2.01% 0.57 18.52 4.27% 4.57% 2.01%2.04% 0.59 20.14 4.34% 4.64% 2.04%2.07% 0.56 18.81 4.40% 4.71% 2.07%2.11% 0.54 18.46 4.47% 4.78% 2.11%2.14% 0.53 17.94 4.54% 4.86% 2.14%2.17% 0.52 18.39 4.61% 4.93% 2.17%2.20% 0.51 17.18 4.68% 5.00% 2.20%2.24% 0.53 17.44 4.75% 5.08% 2.24%2.27% 0.55 17.92 4.82% 5.16% 2.27%2.31% 0.58 18.09 4.90% 5.24% 2.31%2.34% 0.61 18.66 4.97% 5.32% 2.34%2.38% 0.63 19.21 5.05% 5.40% 2.38%2.41% 0.66 19.39 5.12% 5.48% 2.41%2.45% 0.69 19.62 5.20% 5.56% 2.45%2.49% 0.74 19.99 5.28% 5.65% 2.49%2.52% 0.82 21.52 5.36% 5.73% 2.52%2.56% 0.92 23.16 5.44% 5.82% 2.56%2.60% 1.01 24.65 5.52% 5.91% 2.60%2.64% 1.05 23.60 5.61% 6.00% 2.64%2.68% 1.03 25.07 5.69% 6.09% 2.68%2.72% 1.02 25.36 5.78% 6.18% 2.72%2.76% 1.04 25.14 5.87% 6.28% 2.76%2.81% 1.09 26.32 5.96% 6.37% 2.81%2.85% 1.20 28.16 6.05% 6.47% 2.85%2.89% 1.36 30.04 6.14% 6.57% 2.89%2.94% 1.53 32.45 6.23% 6.67% 2.94%2.98% 1.79 33.41 6.33% 6.77% 2.98%3.03% 2.13 34.44 6.43% 6.87% 3.03%3.07% 2.19 33.60 6.5% 7.0% 3.1%3.57% 2.36 34.25 6.9% 7.4% 3.6%1.93% 1.28 35.48 3.6% 3.8% 1.9%1.53% 1.08 36.96 2.9% 3.0% 1.5%0.30% 0.23 38.91 0.6% 0.6% 0.3%1.74% 1.48 41.82 3.5% 3.7% 1.7%0.88% 0.84 43.81 1.9% 1.9% 0.9%3.06% 2.92 45.03 6.5% 6.9% 3.1%3.10% 2.85 47.14 6.0% 6.4% 3.1%4.19% 4.00 49.58 8.1% 8.8% 4.2%3.82% 3.88 51.81 7.5% 8.1% 3.8%2.66% 2.96 54.34 5.4% 5.8% 2.7%3.73% 4.51 56.62 8.0% 8.7% 3.7%
0.00%
2.00%
4.00%
6.00%
8.00%
10.00%
12.00%
14.00%
Column AJColumn AKColumn AL

4.08% 5.63 71.14 7.9% 8.6% 4.1%3.97% 5.88 73.66 8.0% 8.7% 4.0%4.11% 6.43 82.82 7.8% 8.4% 4.1%4.03% 6.70 88.49 7.6% 8.2% 4.0%3.98% 6.94 88.45 7.8% 8.5% 4.0%3.97% 6.88 81.93 8.4% 9.2% 4.0%3.97% 6.36 67.95 9.4% 10.3% 4.0%4.15% 5.83 55.54 10.5% 11.7% 4.1%4.47% 5.82 57.03 10.2% 11.4% 4.5%4.40% 5.83 63.75 9.1% 10.1% 4.4%4.55% 6.40 71.20 9.0% 9.9% 4.6%4.74% 7.00 79.17 8.8% 9.7% 4.7%4.67% 7.40 88.62 8.4% 9.1% 4.7%4.59% 7.80 98.72 7.9% 8.6% 4.6%4.60% 8.17 117.98 0.0% 0.0% 0.0%


BO
0.3%15,028 5.2%15,085 0.4% -4.4%15,141 0.4% 3.1%15,198 0.4% -5.9%15,296 0.6% 12.0%15,394 0.6% 2.5%15,492 0.6% 1.8%15,650 1.0% 1.4%15,809 1.0% 11.3%15,967 1.0% -4.4%16,001 0.2% 5.6%16,035 0.2% 6.6%16,069 0.2% 0.3%16,103 0.2% 1.2%16,137 0.2% 1.7%16,171 0.2% 0.0%16,463 1.8% 10.0%16,754 1.8% -5.8%17,046 1.7% 6.7%
Employed population
Hoffmann Table 20Die Beschäftigten nach Wirtschaftsbereichen Not clear whether this fully includes self-employed (& soldiers) and how unpaid family workers are counted
0.00%
2.00%
4.00%
6.00%
8.00%
10.00%
12.00%
14.00%
Column AJColumn AKColumn AL

17,337 1.7% 4.1%17,664 1.9% 10.0%17,990 1.8% 3.3%18,317 1.8% 7.8%18,643 1.8% -1.2%18,891 1.3% -0.9%19,108 1.1% -0.9%19,277 0.9% 5.3%19,554 1.4% -2.8%19,638 0.4% -2.9%19,745 0.5% 4.1%19,958 1.1% 0.2%20,188 1.2% 5.5%20,430 1.2% 4.7%20,577 0.7% 2.6%20,973 1.9% 1.9%21,265 1.4% 1.6%21,606 1.6% 5.2%22,090 2.2% 4.2%22,372 1.3% 3.3%22,485 0.5% -3.5%22,588 0.5% 5.8%22,738 0.7% 7.5%23,070 1.5% 0.7%23,405 1.5% 4.2%23,891 2.1% 4.8%24,290 1.7% 4.2%24,719 1.8% 7.3%25,082 1.5% -1.3%25,548 1.9% -1.2%25,617 0.3% -1.1%25,869 1.0% 1.1%26,349 1.9% 8.0%26,834 1.8% 4.7%27,221 1.4% 4.0%27,734 1.9% -0.2%28,166 1.6% 4.6%28,350 0.7% 0.2%28,762 1.5% 2.4%29,420 2.3% -0.5%30,034 2.1% 5.2%30,549 1.7% 4.8%30,968 1.4% 1.1%
-7.7%-8.1%
0.00%
2.00%
4.00%
6.00%
8.00%
10.00%
12.00%
14.00%
Column AJColumn AKColumn AL

-4.6%-2.4%-2.7%-11.1%11.9%6.0%6.0%
-13.0%11.4%
31,033 7.3%29,852 -3.8% 1.1%31,963 7.1% 10.0%32,531 1.8% 3.0%32,266 -0.8% -1.8%30,483 -5.5% -7.0%28,115 -7.8% -13.2%26,113 -7.1% -8.0%26,687 2.2% 7.9%28,811 8.0% 10.8%30,086 4.4% 12.5%31,409 4.4% 11.6%32,739 4.2% 11.2%33,881 3.5% 9.5%39,680 17.1% 18.9%

1850 GDP Impuestos Ganancias Salarios CKF Ganancias 1851 6.7 0.361852 7.5 0.351853 7.5 0.351854 8.5 0.331855 8.2 0.341856 9.5 0.341857 8.9 0.391858 8.7 0.421859 8.5 0.461860 10.0 0.451861 9.7 0.451862 10.4 0.471863 10.7 0.501864 10.6 0.531865 10.7 0.561866 11.1 0.561867 11.9 0.541868 13.3 0.55 5.98 6.43 0.38 44.8%1869 12.2 0.60 5.17 5.98 0.40 42.5%1870 13.3 0.61 5.35 6.92 0.42 40.3%1871 14.5 0.60 5.95 7.46 0.49 41.0%1872 17.3 0.58 6.94 9.10 0.63 40.2%1873 18.7 0.58 7.39 9.98 0.78 39.5%1874 20.3 0.60 8.04 10.91 0.77 39.6%1875 18.9 0.66 6.97 10.61 0.70 36.8%1876 18.6 0.69 6.98 10.24 0.64 37.6%1877 18.0 0.73 6.96 9.72 0.62 38.6%1878 18.5 0.78 7.05 10.04 0.58 38.2%1879 17.2 0.84 6.58 9.26 0.56 38.2%1880 17.5 0.84 7.02 9.06 0.58 40.1%1881 18.0 0.89 7.09 9.39 0.62 39.4%1882 18.2 0.92 7.06 9.54 0.65 38.9%1883 18.7 0.98 7.45 9.62 0.70 39.7%1884 19.3 1.03 7.62 9.93 0.72 39.5%1885 19.5 1.09 7.56 10.08 0.75 38.8%1886 19.7 1.14 7.51 10.28 0.79 38.1%1887 20.1 1.19 7.87 10.20 0.86 39.1%1888 21.7 1.21 8.41 11.08 0.99 38.8%1889 23.4 1.22 9.02 12.00 1.16 38.5%1890 25.0 1.23 9.97 12.43 1.35 39.9%1891 24.0 1.29 9.28 11.97 1.40 38.8%

1892 25.4 1.34 9.94 12.77 1.34 39.2%1893 25.7 1.48 9.91 12.95 1.33 38.6%1894 25.5 1.55 9.65 12.90 1.36 37.9%1895 26.7 1.62 9.90 13.72 1.44 37.1%1896 28.6 1.65 10.55 14.76 1.62 36.9%1897 30.6 1.68 11.64 15.36 1.87 38.1%1898 33.1 1.74 12.74 16.45 2.15 38.5%1899 34.2 1.75 12.94 16.94 2.61 37.8%1900 35.5 1.76 13.35 17.21 3.22 37.6%1901 34.7 1.85 12.65 16.91 3.29 36.4%1902 34.9 1.88 13.00 17.01 2.99 37.3%1903 37.2 1.93 13.77 18.50 3.04 37.0%1904 39.2 1.96 14.46 19.46 3.30 36.9%1905 42.3 2.06 15.93 20.69 3.64 37.6%1906 44.5 2.10 16.78 21.46 4.20 37.7%1907 47.8 2.22 17.57 23.18 4.82 36.8%1908 47.0 2.25 16.99 22.87 4.88 36.2%1909 49.0 2.52 17.59 24.18 4.66 35.9%1910 50.5 2.68 18.49 24.41 4.90 36.6%1911 53.2 2.88 19.33 25.72 5.32 36.3%1912 57.3 2.83 21.09 27.46 5.96 36.8%1913 58.7 2.87 21.40 27.84 6.63 36.4%191419151916191719181919192019211922192319241925 74.6 8.3 22.68 34.55 9.13 30.4%1926 77.6 7.9 24.66 35.17 9.83 31.8%1927 86.1 9.4 26.45 40.50 9.69 30.7%1928 91.9 9.9 27.38 44.54 10.10 29.8%1929 92.6 9.9 27.08 44.52 11.05 29.3%1930 86.9 9.7 24.38 40.97 11.86 28.1%1931 74.1 8.7 19.51 33.38 12.53 26.3%1932 62.3 7.9 15.83 25.94 12.56 25.4%1933 62.3 8.0 16.43 26.77 11.06 26.4%1934 67.7 8.4 19.13 30.41 9.81 28.2%1935 74.8 9.0 21.95 33.82 10.00 29.3%1936 82.3 9.8 24.70 37.68 10.11 30.0%
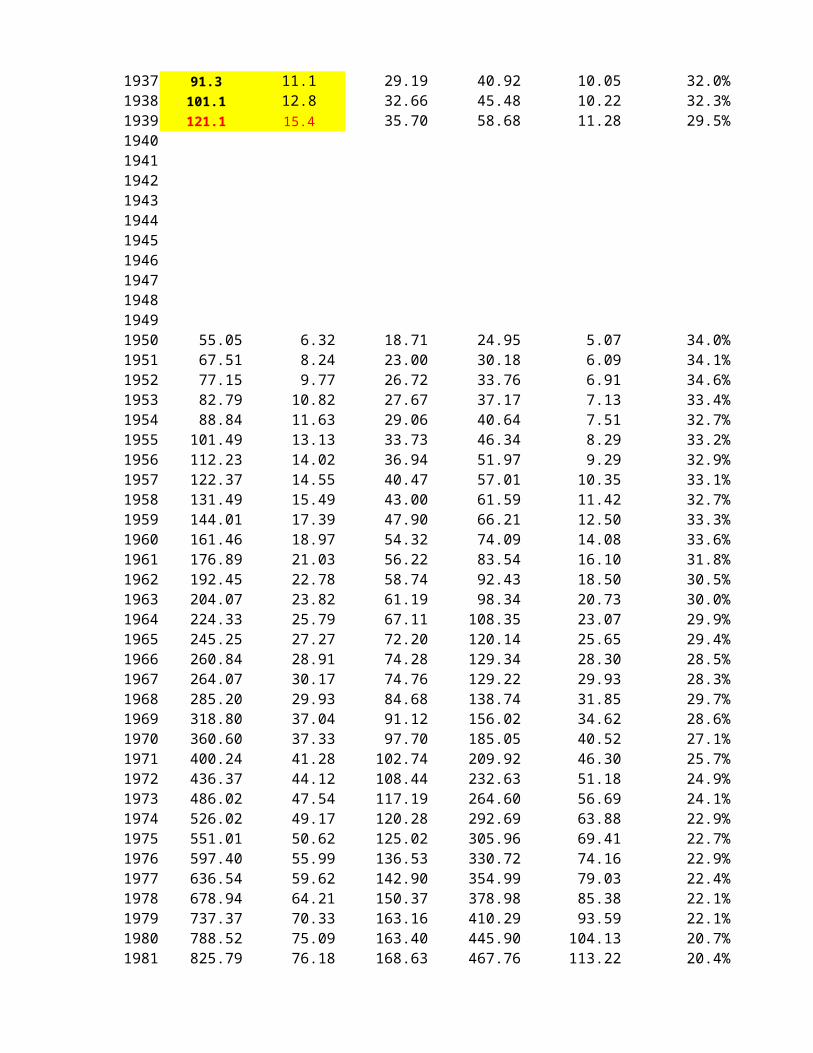
1937 91.3 11.1 29.19 40.92 10.05 32.0%1938 101.1 12.8 32.66 45.48 10.22 32.3%1939 121.1 15.4 35.70 58.68 11.28 29.5%19401941194219431944194519461947194819491950 55.05 6.32 18.71 24.95 5.07 34.0%1951 67.51 8.24 23.00 30.18 6.09 34.1%1952 77.15 9.77 26.72 33.76 6.91 34.6%1953 82.79 10.82 27.67 37.17 7.13 33.4%1954 88.84 11.63 29.06 40.64 7.51 32.7%1955 101.49 13.13 33.73 46.34 8.29 33.2%1956 112.23 14.02 36.94 51.97 9.29 32.9%1957 122.37 14.55 40.47 57.01 10.35 33.1%1958 131.49 15.49 43.00 61.59 11.42 32.7%1959 144.01 17.39 47.90 66.21 12.50 33.3%1960 161.46 18.97 54.32 74.09 14.08 33.6%1961 176.89 21.03 56.22 83.54 16.10 31.8%1962 192.45 22.78 58.74 92.43 18.50 30.5%1963 204.07 23.82 61.19 98.34 20.73 30.0%1964 224.33 25.79 67.11 108.35 23.07 29.9%1965 245.25 27.27 72.20 120.14 25.65 29.4%1966 260.84 28.91 74.28 129.34 28.30 28.5%1967 264.07 30.17 74.76 129.22 29.93 28.3%1968 285.20 29.93 84.68 138.74 31.85 29.7%1969 318.80 37.04 91.12 156.02 34.62 28.6%1970 360.60 37.33 97.70 185.05 40.52 27.1%1971 400.24 41.28 102.74 209.92 46.30 25.7%1972 436.37 44.12 108.44 232.63 51.18 24.9%1973 486.02 47.54 117.19 264.60 56.69 24.1%1974 526.02 49.17 120.28 292.69 63.88 22.9%1975 551.01 50.62 125.02 305.96 69.41 22.7%1976 597.40 55.99 136.53 330.72 74.16 22.9%1977 636.54 59.62 142.90 354.99 79.03 22.4%1978 678.94 64.21 150.37 378.98 85.38 22.1%1979 737.37 70.33 163.16 410.29 93.59 22.1%1980 788.52 75.09 163.40 445.90 104.13 20.7%1981 825.79 76.18 168.63 467.76 113.22 20.4%

1982 860.21 78.13 178.47 482.76 120.85 20.7%1983 898.27 82.72 195.07 493.53 126.95 21.7%1984 942.00 86.37 208.77 512.84 134.02 22.2%1985 984.41 87.53 223.63 533.48 139.77 22.7%1986 1,037.13 89.07 240.92 561.74 145.40 23.2%1987 1,065.13 90.67 236.40 587.27 150.79 22.2%1988 1,123.29 94.99 258.73 611.81 157.76 23.0%1989 1,200.66 104.13 289.05 639.87 167.61 24.1%1990 1,306.68 117.36 317.92 689.96 181.44 24.3%1991 1,534.60 111.14 351.19 861.20 211.07 22.9%1992 1,648.40 123.41 362.21 933.22 229.56 22.0%1993 1,696.90 136.07 361.92 954.67 244.24 21.3%1994 1,782.20 145.84 403.69 978.56 254.11 22.7%1995 1,848.50 144.47 428.06 1,012.76 263.21 23.2%1996 1,875.00 147.92 436.90 1,020.98 269.20 23.3%1997 1,912.60 153.99 458.66 1,024.11 275.84 24.0%1998 1,959.70 161.35 471.12 1,044.91 282.32 24.0%1999 2,000.20 177.10 462.75 1,071.26 289.09 23.1%2000 2,047.50 180.82 454.14 1,111.20 301.34 22.2%2001 2,101.90 188.34 470.97 1,131.93 310.66 22.4%2002 2,132.20 193.79 483.45 1,138.84 316.12 22.7%2003 2,147.50 200.84 487.20 1,141.61 317.85 22.7%2004 2,195.70 202.64 524.74 1,145.39 322.93 23.9%2005 2,224.40 205.29 553.51 1,137.64 327.96 24.9%2006 2,313.90 213.74 608.25 1,156.08 335.83 26.3%2007 2,428.50 237.64 651.42 1,187.11 352.33 26.8%2008 2,473.80 241.92 635.99 1,229.80 366.09 25.7%2009 2,374.50 241.07 528.46 1,231.48 373.49 22.3%2010 2,476.80 243.89 593.35 1,262.87 376.69 24.0%2011 2,570.80 262.36 606.40 1,318.32 383.72 23.6%

Ganancias Brutas Salarios CKF IN
48.2% 2.8% 4.1% 6.43 49.2% 3.3% 4.9% 5.98 52.0% 3.1% 4.6% 6.92 51.4% 3.4% 4.2% 7.46 52.7% 3.6% 3.4% 9.10 53.3% 4.1% 3.1% 9.98 53.7% 3.8% 2.9% 10.91 56.0% 3.7% 3.5% 10.61 55.2% 3.5% 3.7% 10.24 53.9% 3.4% 4.1% 9.72 54.4% 3.2% 4.2% 10.04 53.7% 3.3% 4.9% 9.26 51.8% 3.3% 4.8% 9.06 52.2% 3.5% 4.9% 9.39 52.5% 3.6% 5.0% 9.54 51.3% 3.7% 5.2% 9.62 51.5% 3.7% 5.4% 9.93 51.7% 3.8% 5.6% 10.08 52.1% 4.0% 5.8% 10.28 50.7% 4.3% 5.9% 10.20 51.1% 4.6% 5.6% 11.08 51.3% 5.0% 5.2% 12.00 49.8% 5.4% 4.9% 12.43 50.0% 5.9% 5.4% 11.97
1868188018921904191619281940195219641976198820000%
10%20%30%40%50%60%70%80%90%
100%
Ganancias CKF Imp.NetosSalarios

50.3% 5.3% 5.3% 12.77 50.5% 5.2% 5.8% 12.95 50.7% 5.3% 6.1% 12.90 51.4% 5.4% 6.1% 13.72 51.6% 5.7% 5.8% 14.76 50.3% 6.1% 5.5% 15.36 49.7% 6.5% 5.3% 16.45 49.5% 7.6% 5.1% 16.94 48.4% 9.1% 4.9% 17.21 48.7% 9.5% 5.3% 16.91 48.8% 8.6% 5.4% 17.01 49.7% 8.2% 5.2% 18.50 49.7% 8.4% 5.0% 19.46 48.9% 8.6% 4.9% 20.69 48.2% 9.4% 4.7% 21.46 48.5% 10.1% 4.6% 23.18 48.7% 10.4% 4.8% 22.87 49.4% 9.5% 5.1% 24.18 48.4% 9.7% 5.3% 24.41 48.3% 10.0% 5.4% 25.72 47.9% 10.4% 4.9% 27.46 47.4% 11.3% 4.9% 27.84
46.3% 12.2% 11.1% 34.55 45.3% 12.7% 10.2% 35.17 47.0% 11.3% 11.0% 40.50 48.5% 11.0% 10.7% 44.54 48.1% 11.9% 10.7% 44.52 47.1% 13.6% 11.2% 40.97 45.0% 16.9% 11.7% 33.38 41.7% 20.2% 12.8% 25.94 43.0% 17.8% 12.9% 26.77 44.9% 14.5% 12.4% 30.41 45.2% 13.4% 12.1% 33.82 45.8% 12.3% 11.9% 37.68

44.8% 11.0% 12.2% 40.92 45.0% 10.1% 12.6% 45.48 48.5% 9.3% 12.8% 80.99
45.3% 9.2% 11.5%44.7% 9.0% 12.2%43.8% 9.0% 12.7%44.9% 8.6% 13.1%45.7% 8.5% 13.1%45.7% 8.2% 12.9%46.3% 8.3% 12.5%46.6% 8.5% 11.9%46.8% 8.7% 11.8%46.0% 8.7% 12.1%45.9% 8.7% 11.7%47.2% 9.1% 11.9%48.0% 9.6% 11.8%48.2% 10.2% 11.7%48.3% 10.3% 11.5%49.0% 10.5% 11.1%49.6% 10.9% 11.1%48.9% 11.3% 11.4%48.6% 11.2% 10.5%48.9% 10.9% 11.6%51.3% 11.2% 10.4%52.4% 11.6% 10.3%53.3% 11.7% 10.1%54.4% 11.7% 9.8%55.6% 12.1% 9.3%55.5% 12.6% 9.2%55.4% 12.4% 9.4%55.8% 12.4% 9.4%55.8% 12.6% 9.5%55.6% 12.7% 9.5%56.5% 13.2% 9.5%56.6% 13.7% 9.2%
56.1% 14.0% 9.1%54.9% 14.1% 9.2%54.4% 14.2% 9.2%54.2% 14.2% 8.9%54.2% 14.0% 8.6%55.1% 14.2% 8.5%54.5% 14.0% 8.5%53.3% 14.0% 8.7%52.8% 13.9% 9.0%56.1% 13.8% 7.2%56.6% 13.9% 7.5%56.3% 14.4% 8.0%54.9% 14.3% 8.2%54.8% 14.2% 7.8%54.5% 14.4% 7.9%53.5% 14.4% 8.1%53.3% 14.4% 8.2%53.6% 14.5% 8.9%54.3% 14.7% 8.8%53.9% 14.8% 9.0%53.4% 14.8% 9.1%53.2% 14.8% 9.4%52.2% 14.7% 9.2%51.1% 14.7% 9.2%50.0% 14.5% 9.2%48.9% 14.5% 9.8%49.7% 14.8% 9.8%51.9% 15.7% 10.2%51.0% 15.2% 9.8%51.3% 14.9% 10.2%

1868188018921904191619281940195219641976198820000%
10%20%30%40%50%60%70%80%90%100%
Ganancias CKF Imp.NetosSalarios

source: Statistisches Bundesamt, Statistisches Jahrbuch 2012 , sección "Volkswirtschaftliche Gesamtrechnungen" -Cuentas Nacionales- p.320-321
Wage share in national income 1925-2011own I (exp.own II (inc)
1925 59.9% 52.7% 60.4%1926 59.0% 51.9% 58.8%1927 58.8% 53.0% 60.5%1928 60.3% 54.5% 61.9%1929 61.9% 54.6% 62.2%1930 63.3% 54.6% 62.7%1931 64.6% 54.2% 63.3%1932 61.8% 52.2% 62.1%1933 59.8% 52.3% 62.0%1934 58.7% 52.5% 61.4%1935 56.9% 52.2% 60.6%1936 55.6% 52.2% 60.4%1937 55.2% 50.4% 58.4%1938 54.9% 50.0% 58.2%1939 53.4% 62.2%19401941194219431944194519461947194819491950 58.2%1951 58.0%1952 57.1%1953 58.8%1954 60.1%1955 59.7%1956 60.3%1957 60.4%1958 60.9%1959 60.2%1960 60.1%1961 62.4%1962 63.9%1963 64.9%1964 64.5%1965 65.3%

1966 66.4%1967 66.1%1968 64.7%1969 65.7%1970 65.6%1971 67.4%1972 68.5%1973 69.6%1974 71.1%1975 71.1%1976 70.4%1977 71.4%1978 71.3%1979 71.6%1980 73.2%1981 73.6%1982 73.2%1983 71.6%1984 70.6%1985 70.0%1986 69.7%1987 71.2%1988 69.7%1989 68.2%1990 67.8%1991 70.8%1992 71.9%1993 72.5%1994 71.4%1995 71.1%1996 70.7%1997 69.9%1998 70.0%1999 71.1%2000 72.1%2001 71.8%2002 71.6%2003 71.0%2004 67.9%2005 66.4%2006 63.9%2007 63.2%2008 64.9%2009 68.2%2010 66.5%

2011 66.9%

source: Statistisches Bundesamt, Statistisches Jahrbuch 2012 , sección "Volkswirtschaftliche Gesamtrechnungen" -Cuentas Nacionales- p.320-321
own II (inc)
1925 1926 1927 1928 1929 1930 1931 1932 1933 1934 1935 1936 1937 193840%
45%
50%
55%
60%
65%
70%
Wage share in Germany (1925-1938), official series and own estimates based on Expenditure and Income Approach series
Official Ours (Exp.) Ours (Income.)
1868
1871
1874
1877
1880
1883
1886
1889
1892
1895
1898
1901
1904
1907
1910
1913
1916
1919
1922
1925
1928
1931
1934
1937
40%
45%
50%
55%
60%
65%
70%
Wage share in Germany (1868-1938), official series and own estimates based on Expenditure and Income Approach series
from Piketty & Zucman based on Hoffman (1868-1938)
Official Exp. Income

source: Statistisches Bundesamt, Statistisches Jahrbuch 2012 , sección "Volkswirtschaftliche Gesamtrechnungen" -Cuentas Nacionales- p.320-321
own I (exp.own II (inc1868 49.6% 48.6%1869 50.9% 52.2%1870 53.7% 54.1%1871 53.2% 53.1%1872 54.7% 53.3%1873 55.6% 54.4%1874 55.8% 53.9%1875 58.2% 57.9%1876 57.2% 57.4%1877 55.8% 56.0%1878 56.2% 56.0%1879 55.5% 56.5%1880 53.6% 54.6%1881 54.1% 55.1%1882 54.5% 55.7%1883 53.3% 54.7%1884 53.4% 54.8%1885 53.8% 55.4%1886 54.3% 56.3%1887 53.0% 55.5%1888 53.5% 55.5%1889 54.0% 55.4%1890 52.6% 53.8%1891 53.1% 55.6%1892 53.1% 54.7%1893 53.2% 55.1%1894 53.5% 56.1%1895 54.4% 56.6%1896 54.7% 56.5%1897 53.6% 55.1%1898 53.2% 54.2%1899 53.6% 54.9%1900 53.3% 55.0%1901 53.8% 56.4%1902 53.3% 56.0%1903 54.1% 56.1%1904 54.3% 56.1%
Official (1925-1939)

1905 53.5% 55.0%1906 53.2% 55.1%1907 53.9% 55.6%1908 54.3% 56.6%1909 54.6% 56.6%1910 53.6% 56.3%1911 53.7% 56.6%1912 53.4% 55.9%1913 53.4% 56.3%191419151916191719181919192019211922192319241925 52.7% 60.4% 59.9%1926 51.9% 58.8% 59.0%1927 53.0% 60.5% 58.8%1928 54.5% 61.9% 60.3%1929 54.6% 62.2% 61.9%1930 54.6% 62.7% 63.3%1931 54.2% 63.3% 64.6%1932 52.2% 62.1% 61.8%1933 52.3% 62.0% 59.8%1934 52.5% 61.4% 58.7%1935 52.2% 60.6% 56.9%1936 52.2% 60.4% 55.6%1937 50.4% 58.4% 55.2%1938 50.0% 58.2% 54.9%1939 53.4% 62.2%