
Geodemographics and Security
24
| 103 1.1 Geodemographics and security Luca Muscarà INTRODUCTION Ever since the first military statistics were used to estimate manpower, demo- graphics has been employed as a priceless tool to investigate the condition of re- gional or global powers in order to better assess their strengths and liabilities. Relatively simple indicators, such as fertility and mortality, offer the invaluable advantage of enabling prediction of the future with a reasonable degree of cer- tainty. Whilst in the United States the “baby boomers” of the post-war years were followed twenty years later by their “baby echo” (the 1977-1995 generation), con- versely, a fall in births triggers an inevitable reduction in fertility within the space of two decades, as is already happening in Western Europe. Similarly, a preference for male children, that is so pronounced as to trigger a significant reduction in the number of baby girls, will prevent tens of millions of men finding a spouse in twenty years time, as is happening right now in Asia. Yet again, an increase in infant mortality rates prompted Emmanuel Todd, a French historian, demographer, sociologist and politologist, to predict, back in 1976, the downfall of the Soviet Union 1 . In 2007, together with Youssef Courbage, based on demographic indicators, this researcher had already foreseen the recent so-called “Arab Spring” 2 . 1 E. Todd, La chute finale: Essais sur la décomposition de la sphère soviétique [The Final Fall: An Essay on the Decomposition of the Soviet Sphere], Laffont, Paris, 1976. 2 Y. Courbage, E. Todd, Les rendez-vous de civilizations[The Encounter of Civilisations], Seuil, Paris, 2007.
Transcript of Geodemographics and Security

| 103
1.1
Geodemographics and securityLuca Muscarà
INTRODUCTION
Ever since the first military statistics were used to estimate manpower, demo-graphics has been employed as a priceless tool to investigate the condition of re-gional or global powers in order to better assess their strengths and liabilities. Relatively simple indicators, such as fertility and mortality, offer the invaluable advantage of enabling prediction of the future with a reasonable degree of cer-tainty. Whilst in the United States the “baby boomers” of the post-war years were followed twenty years later by their “baby echo” (the 1977-1995 generation), con-versely, a fall in births triggers an inevitable reduction in fertility within the space of two decades, as is already happening in Western Europe.
Similarly, a preference for male children, that is so pronounced as to trigger a significant reduction in the number of baby girls, will prevent tens of millions of men finding a spouse in twenty years time, as is happening right now in Asia. Yet again, an increase in infant mortality rates prompted Emmanuel Todd, a French historian, demographer, sociologist and politologist, to predict, back in 1976, the downfall of the Soviet Union1. In 2007, together with Youssef Courbage, based on demographic indicators, this researcher had already foreseen the recent so-called “Arab Spring”2.
1 E. Todd, La chute finale: Essais sur la décomposition de la sphère soviétique [The Final Fall: An Essay on the Decomposition of the Soviet Sphere], Laffont, Paris, 1976.2 Y. Courbage, E. Todd, Les rendez-vous de civilizations[The Encounter of Civilisations], Seuil, Paris, 2007.
N&K 2011 inglese.indd 103 12-09-2011 17:14:52

104 | Nomos & Khaos
Nevertheless, possibly mindful of events in the 1920s, it seems that in Italy in-sufficient attention is paid to demographics compared to other countries, such as the United States. Indeed, only after the demand for democracy exploded in Egypt was the notion that over 60% of Egyptians are less than 35 years old taken seriously. Considering the demographic framework for medium and long-term policies, this new attitude would appear to be sensible – and all the more so given the fact that, today, the most developed nations are not only gerontocratic but are becoming ever more geriatric. Furthermore, in spite of the fact that demographic indicators are obviously of great interest for marketing, as well as for electoral geographic purposes, the ruling class and the population in general apparently prefer to dodge any question whose repercussions will not be felt in the short or immediate term.
Certainly, a liberal dose of caution is needed when making demographic fore-casts.
Primarily, because forecasts are unable to factor in the wide range of unpredict-able variables. Even without going so far as to evoke the spectre of mass extinction, in all probability man-made or natural catastrophes – pandemics, wars, famines, invasion etc – will remain ever-present, albeit highly random,
possibilities.
Secondly, because, if forecasts as to the natural balance make a fairly reliable indicator, it is nevertheless difficult to surmise how patterns of migration may change. With regard to the European nations, migration is the principle factor be-hind population growth. Thus, it is possible to look forward no more than 40 years (up to 2050), and with greater certainty around 20 years (up to 2030), because the further we go into the future, the greater the risk that unforeseeable factors may intervene to reshape the scenario3.
Furthermore, the size of the population and territory in question also affects the accuracy of forecasts. For states such as China and India, projections of births are more reliable than for smaller states.
Lastly, and no less importantly, the temptation to resort to determinism is al-ways lying in wait. When faced with the growing difficulty of finding one’s bear-ings in the complex post-bipolar world, resorting to an “objective” piece of in-formation such as demographic data, would appear to offer a degree of certainty
3 There are generally three projections, a higher, a lower and an intermediate one. The projections cited here are from the year in course to 2050 and refer to an intermediate scenario.
N&K 2011 inglese.indd 104 12-09-2011 17:14:52

Part 2. 1.1. Geodemographics and security | 105
in the struggle against cognitive chaos. However, the availability of quantitative indicators regarding a population could easily lead one to incline towards single-cause explanations of reality.
Malthus’ warning about the depletion of resources, grounded on expected ex-ponential growth in populations, and Ehrlich’s later “demographic time-bomb”, remain paradigms in this regard. Even more recently, Huntingdon’s xenophobic arguments on the clash of civilisations proved to be based, inter alia, on faulty generalisations of demographic data. As will be seen below, a stereotypical view of demographics in the Muslim world became a pretext for an islamophobic world-view.
Obviously, other variables need to be taken into account. What could make a considerable difference is an understanding as to which factors amongst the countless economic, political, cultural, historical etc variables are the most per-tinent, and which therefore should be used to tweak demographic forecasts. For example, in the last two and a half years there have been 261,000 less births in the United States4. And, given the consequences of the economic and financial crisis in terms of job losses and the ensuing impossibility of repaying mortgages, and in light of the lack of confidence in the economy and general uncertainty, it should come as no surprise that the reproductive behaviour of Americans has been af-fected. Moreover, in so far as demographics are closely intertwined with the most intimate aspects of a person’s life – marriage, reproduction, death etc, this field represents a sort of “psychoanalysis of society” (Courbage, 2009) and, as such, should be held in greater regard.
Thus, as part of that recent branch of studies which exploits demographic in-dicators to assess the risk of conflict within states, otherwise known as security demographics, it should also be borne in mind that the notion of “security risk” is anything but objective. Demographic indicators may be objective, but the percep-tion of what constitutes a “risk”, certainly is not. This varies over time and space and is influenced by such cultural factors as a nation’s identity, or different concep-tions of the nature of risk5.
And the recent concern sparked by the expected dramatic rise in migration to-wards Europe in the aftermath of the period of uncertainty and change in North
4 National Center for Health Statistics, National Vital Statistics Reports, vol. 59, no. 3, 21 December 2010, http://www.cdc.gov/nchs/data/nvsr/nvsr59/nvsr59_03.pdf.5 M. Schwarz, M. Thompson, Divided We Stand: Redefining Politics, Technology and Social Choice, Har-vester-Wheatsheaf, London and University of Pennsylvania Press, Philadelphia, 1990.
N&K 2011 inglese.indd 105 12-09-2011 17:14:52

106 | Nomos & Khaos
Africa, evokes this very risk-perception psychology. Without wishing to belittle the drama and difficulties involved locally, particularly for those migrants who were already blocked along Libya’s African borders after fleeing areas of strife, the prob-lem in Europe would appear, rather, to be linked to the issue of psychology and identity. Especially for the migration destination countries.
This is all the more the case if one considers that the European population is steadily ageing – especially in Germany and Italy. It seems reasonable to ask one-self why the treatment of tens of thousands of migrants must be seen as a national priority and given priority over energy policies or the state of the nuclear industry in Europe after Fukushima.
A GLOBAL FRAMEWORK
It is estimated that the world’s population now stands at 6.9 billion people6. Regionally, population distribution is as follows: 60% in Asia (4.1 billion); a fur-ther 15% in Africa (one billion); 13.5% in the two Americas (0.9 billion), whilst in Europe (including Russia) there are little more than 10% of the total (0.7 billion). Lastly, in Oceania there are 35 million people or 0.5% of the world population.
According to the United Nations regionalisation scheme, the demographic heart of the planet can be found in two macro-regions: Central South Asia and East Asia. From Iran to the ex-Soviet republics and the Indian subcontinent it is esti-mated that there are some 1,756 million people.
Another 1,570 million people live in China, Japan, the two Koreas, Taiwan, Hong Kong, Macau and Mongolia. Below the billion threshold, again in Asia, in the Southeast, around 615 million people live in Indonesia, the Philippines, Vietnam, Thailand, Burma, Malaysia, Cambodia, Laos, Singapore, Timor-Leste and Brunei. The fourth and the fifth most populous demographic regions are the Americas: 400 million in Latin America and 347 million in North America (including Green-land).
Immediately below this latter region we have the first two population centres in Africa and the first European demographic region: 336 million live in East Africa, 304 million in West Africa and 290 million in East Europe. Again, in the over 200 million bracket we have the least populous Asian regions: Western Asia, includ-
6 This estimate, like all the demographic data presented herein, unless otherwise specified, is taken from the Us Bureau of Census International Data Base, March 2011, http://www.census.gov/ipc/www/idb/, consulted in March 2011.
N&K 2011 inglese.indd 106 12-09-2011 17:14:52

Part 2. 1.1. Geodemographics and security | 107
ing the Caucasus, Turkey, the Middle East, the Arabian Peninsula, Cyprus, Israel and the West Bank etc where some 234 million people live. North Africa is home to another 211 million. Central America and the Caribbean (195 million) stop just shy of 200 million, as does Western Europe (190 million), the second of the four European regions.
Table 1.1.1 The twenty five most populous states in 2011No. CouNTry PoPulaTioN
1 China 1,336,718,015
2 India 1,189,172,906
3 United States 313,232,044
4 Indonesia 245,613,043
5 Brazil 203,429,773
6 Pakistan 187,342,721
7 Bangladesh 158,570,535
8 Nigeria 155,215,573
9 Russia 138,739,892
10 Japan 126,475,664
11 Mexico 113,724,226
12 Philippines 101,833,938
13 Ethiopia 90,873,739
14 Vietnam 90,549,390
15 Egypt 82,079,636
16 Germany 81,471,834
17 Turkey 78,785,548
18 Iran 77,891,220
19 Congo (Kinshasa) 71,712,867
20 Thailand 66,720,153
21 France 65,102,719
22 United Kingdom 62,698,362
23 Italy 61,016,804
24 Burma 53,999,804
25 South Africa 49,004,031
Source: Us Census – International Data Base 2011.
Lower down in the demographic classification we find Southern Europe (in-cluding Italy) with 155 million, Central Africa with 127 million, Northern Europe, which stands at almost 100 million, and Southern Africa with 56 million.
Thus at the top of the ranking of the most populous states, China and India both exceed one billion people. Followed in the 200 to 300 million people group by the United States, Indonesia and Brazil. With populations exceeding 100 million, Rus-sia and Japan have in the last 10 years both been overtaken by Pakistan, Bangla-desh and Nigeria, though they are still ahead of Mexico and the Philippines. Lastly, in a further dozen countries there are populations in excess of 50 million people:
N&K 2011 inglese.indd 107 12-09-2011 17:14:52

108 | Nomos & Khaos
Ethiopia, Vietnam and Egypt have now outstripped Germany, whilst Turkey, Iran, Congo (Kinshasa) and Thailand have surpassed France, the United Kingdom and Italy – which has Burma close on its heels7.
Taking into consideration the speed of demographic growth, a rapid geographi-cal-political comparison helps us update our mental maps, as well as being a good antidote to the risk of ethnocentrism. Whilst Nigeria is more populous than Rus-sia, and Egypt more than Germany, France, the United Kingdom or Italy, Burma has more people than Spain, Sudan more than Canada, Syria more than Australia, Saudi Arabia more than the Netherlands, Somalia more than Austria, Sweden or Israel, Cuba more than Portugal or Greece. There are more Eritreans than Danes, Finns, Norwegians, Irish, Bosnians or Croats. There are more Moldavians than New Zealanders. The number of Lebanese is more than twice the population of Slovenia. And Djibouti has more than twice the population of Iceland.
That said, a numerous population certainly does not necessarily denote power. In fact, according to recent estimates, the population of the least developed coun-tries amounts to some 5.7 billion against 1.2 billion people in the most developed nations8.
This population breakdown becomes all the more significant if we consider dis-tribution by age group. Whilst globally two thirds of the world population is now less than 40 years old, more than half are younger than 30, and over a third less than 20; almost half of those who are less than 25 years old are in the least de-veloped countries. On the other hand, only 28.9% of the population of the most developed countries is in the same group.
Looking at the figures in greater detail, over 60% of Africans are less than 25 years old, 45% of Latin Americans and almost 43% of Asians are in the under 25 group. In North America, however, 33.5% of the population is in the young group, and in Europe 27.7%.
The presence of a sizeable youthful population often goes hand-in-hand with a low number of old people. And vice versa. Above sixty years, predictably, the lowest figures are for Africa, where out of a billion people, only 35 million (3.4%)
7 Out of the total number of 227 states and territories considered by the Us bureau of Census in addition to the 24 already mentioned, 60 have a population in excess of 10 million; 31 states exceed 5 million; 44 have a population of more than a million people. Further down the scale there are 59 entities, mostly islands. 8 This generalisation is necessarily very approximate. For example, the least developed countries include Israel and Kuwait, whilst the most developed include Kosovo and Moldova.
N&K 2011 inglese.indd 108 12-09-2011 17:14:52
Part 2. 1.1. Geodemographics and security | 109
reach the age of 65. A slightly higher percentage can be seen in Asia: excluding Japan, 269 million Asians (6.4%) were older than 65. Japan is the country with the largest population of over 65s, amounting to almost 23%. So much so, that observ-ers have recorded increasing instances of “silver-haired criminals”. Nevertheless, it is of interest to know that the triple catastrophe occurring in March 2011, with over 27,000 dead and dispersed, appears to have largely struck the more elderly population.
Overall, Europe is the oldest region, with some 120 million people over the age of 65, amounting to 16.4% of the total; in Europe the most geriatric states are Ger-many (20.6%) and Italy (20.3%), followed closely by Greece (19.8%) and Sweden (19.7%). The situation improves somewhat in France and the United Kingdom (respectively 16.8% and 16.5% of the total), and in the Netherlands (15.6%).
Both the American continents have 46 million people over the age of 65, making up 13.4% in North America and 6.9% in Latin America.
The relationship between the level of development, age distribution and migra-tory potential thus appears clear: populations afflicted by low levels of economic development in which young people predominate, will obviously be attracted to the more developed countries, which often have a more numerous, aged popula-tion.
With regard to the global picture, only 215 million people officially live outside their nation of birth. The three primary global migration trajectories are: towards Western Europe from Africa, Eastern Europe and Russia; towards North America from Central America and Asia; and towards the Middle East, above all from the Philippines, Indonesia and India, thereby confirming a general correlation be-tween demographic imbalance and economic imbalance.
And maybe it is on account of Europe’s ageing population, as well as to the in-tensification of the trend, that global migratory currents give rise to such concern nationally and locally.
THE DEMOGRAPHIC TRANSITION
However, these considerations offer a relatively static image of the demographic reality, which is actually all the more interesting when we appreciate its intrinsi-cally dynamic character. For example, if we assess the position of a state in relation to the so-called demographic transition, in other words a change in its population structure due to impact with modernisation, we can detect patterns which may
N&K 2011 inglese.indd 109 12-09-2011 17:14:53

110 | Nomos & Khaos
make it possible to reduce civil strife in the future. By measuring the gap between fertility and mortality, the theory of demographic transition enables us to distin-guish four key stages in population growth.
In the first stage, the population grows very slowly, as both fertility and mortality are similarly high. Then, helped by improvements in diet and hygienic and sanitary conditions, which inevitably go hand in hand with modernisation, mortality falls, whilst fertility remains high. It is in this second stage that the overall population starts to increase. In the third stage, in part as a consequence of increased female schooling, fertility also starts to drop and thus the total growth rate tails off. Lastly, in the fourth stage, fertility and mortality are again synchronised at similarly low levels, but the total population has now grown. Thus over a period of two centu-ries, from Europe to Japan, the developed world has already passed through all four of the demographic transition stages and since the 1960s has entered a period in which fertility is below the replacement threshold (less than two children per woman), whilst the population continues to age.
There are a number of exceptions, such as the United States and France, but, generally, a population tends to increase primarily owing to the contribution made by immigrants, who initially tend to have more children than the native popula-tion, as is happening in Italy.
Figure 1.1.1. The demographic transition in the united Kingdom
Source: Department of Geography, University of Cincinnati.
N&K 2011 inglese.indd 110 12-09-2011 17:14:53
Part 2. 1.1. Geodemographics and security | 111
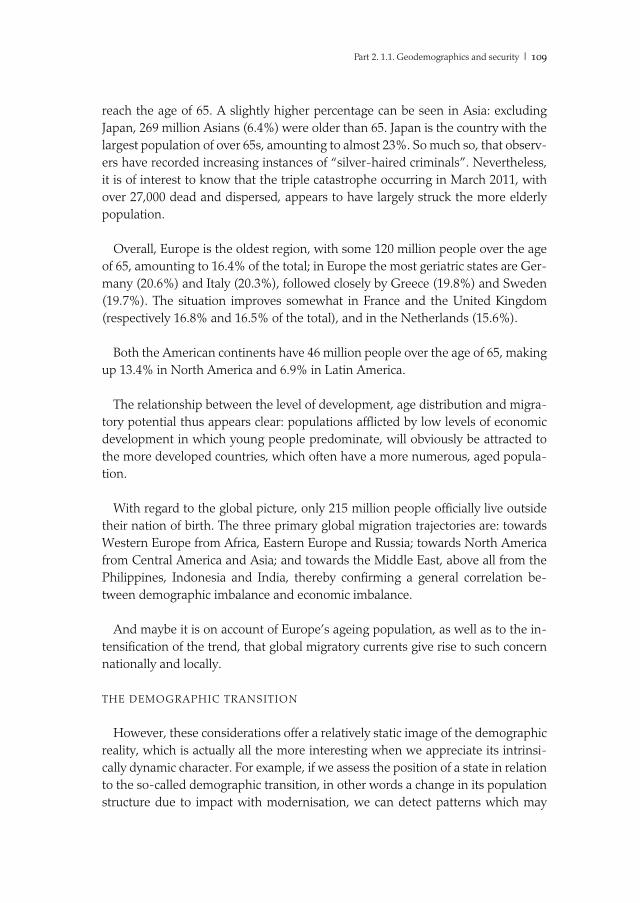
Figure 1.1.2. Population pyramid in italy
Total population would reach 61 million people this year. Fertility rate is 1.4 children per woman.Source: Us Census Bureau, International Data Base 2011.
Figure: 1.1.3. Population pyramid in France
In 2011, France’s population is estimated to be 65 million and fertility rate has reached replacement levels.Source: Us Census Bureau, International Data Base 2011.
N&K 2011 inglese.indd 111 12-09-2011 17:14:54

112 | Nomos & Khaos
Almost all the other countries are now going down the same road. As part of Asia’s demographic rise, primarily in China and India, we are seeing these two states rapidly advance in their demographic transition. Over the next 20 years, China’s population will be outstripped by India’s, before the latter’s fertility rates start to decline as well. Western Asia and North Africa are also at an advanced stage in their demographic transition; indeed, rapid growth occurring over the last 20 years has already started to ease.
Nevertheless, a Nato report still places demographics as number one on the list of the six main security risks factors9. Another report following in its wake and published by the National Intelligence Council, continues in similar vein10. Whilst dominant theory dictates that only when the demographic transition is complete will the risk of civil conflict be significantly reduced11, this assumption appears to have been refuted by the democratic character of the Arab Spring12.
It is important to note that whilst in Europe around two centuries were needed to complete all four stages of the demographic transition, North Africa, in just 30 years, has fallen from an average of 7.5 children per woman to 2. The speed of the transition should not be underestimated on account of its cultural impact. In fact, it aids our understanding of the recent demand for democracy that has been sweeping through the Middle East from Tunisia to Egypt, the Arabian Peninsula and Iran. Sub-Saharan Africa is now almost the only region still in the early de-mographic transition stage: its youthful population will continue to increase for many years to come.
In China the demographic transition commenced in the 1950s, shortly after the revolution, with a decline in mortality – in accordance with the aforementioned theory. Despite forecasts that the Chinese population would reach 1.336 billion people this year, the effects of its family planning policies introduced in the 1970s, especially the one-child policy inaugurated in 1979, have long been evident. Be-tween 1990 and 2005 the Chinese population’ growth rate fell to a quarter, that is, from an annual rate of 2% to the current low 0.5%, and, by 2025, it is predicted that the rate will have fallen to zero.
9 Nato, Towards a Grand Strategy for an Uncertain World, Lunteren, Noaber Foundation , 2007 http://bit.ly/dIe7ge..10 Us National Intelligence Council, Global Trends 2025: A Transformed World, 2088, http://1.usa.gov/cZvcKi.11 R. Cincotta, R. Engelman, D. Anastasion, The Security Demographic – Population and Civil Conflict After the Cold War, Population Action International, 2003, http://bit.ly/ic4der.12 Y. Courbage, Clash or Encounter of Civilizations? How demography may arbitrate, a paper pre-sented at the Colegio de Mexico, 18 May 2010.
N&K 2011 inglese.indd 112 12-09-2011 17:14:54

Part 2. 1.1. Geodemographics and security | 113
Figure 1.1.4. Population pyramid in China
Source: Us Census Bureau, International Data Base 2011.Total estimated population today is 1.33 billion people. Fertility rate is 1.5 children per woman.
With an average fertility rate of 1.5 children per woman, for the last 20 years this rate has been below the replacement level. Thus in China too, the population is set to gradually age. Whilst those over the age of 60 comprise only 11.3% of the total, the number is set to grow to 21% in 2025 and 35% of the Chinese population in 2050. The median age is currently 34.2 years rising to 38.9 in 2025. Life expectancy has already increased, rising in just two decades from 69 to the current 75 years, whilst infant mortality has been more than halved.
China is thus set to conclude its demographic transition between 2015 and 2025, and its population is forecast to increase by “only” 30 million people. After all, China’s one-child policy was quite a catastrophe.
In India, on the other hand, the demographic transition was set in motion much later than in China. Despite the fact that family planning policies had been in place since the 1950s, they did not achieve the desired results. Mortality started to decline, whilst average life expectancy has increased by more than 31 years since 1951.
N&K 2011 inglese.indd 113 12-09-2011 17:14:54
114 | Nomos & Khaos
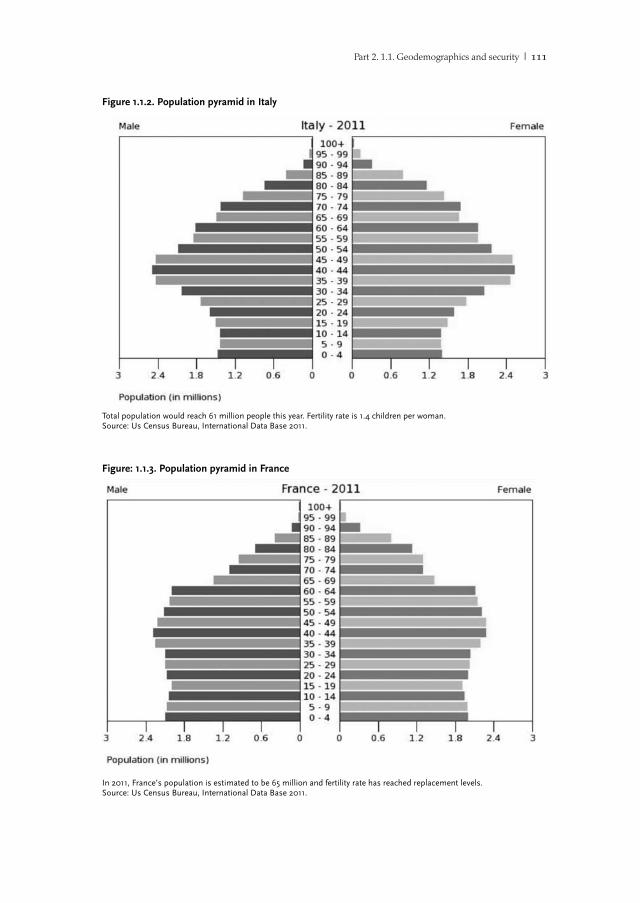
Figure 1.1.5. Population pyramid in india
Population is estimated to be 1.18 billion people and the fertility rate is 2.6 children per woman.Source: Us Census Bureau, International Data Base 2011.
The fertility rate started to fall at the end of the 1960s. With the current popula-tion of 1.2 billion and a 1.4% growth rate per year, the world’s second most popu-lous state is poised to become the first. Forecasts indicate that, with a population in excess of 1.6 billion, India will outstrip China in 2025. For many years yet it will remain a relatively young country. Whilst today 30% of the population is under 15 years old, more than half is under 25, and over 65% of Indians are less than 35 years old, for 2020 a median age of 29 is forecast, as against 37 in China and 48 in Japan.
The United States is the world’s third most populous state. Whilst in 1961 the American population stood at 182 million, and by 1981 had surged to 229 million, in 2011 it is expected to reach 313 million, with an annual growth rate of 1% and a fertility rate of 2.1 children per woman. Though part of the group of most industri-alised countries, its demographic behaviour is still heavily influenced by the large numbers of immigrants which, this year alone, are estimated at 1.3 million people. For 2050 the American population is forecast to reach 439 million people, with an annual growth rate of 0.8% and fertility rates equal to the replacement rate, whilst life expectancy at birth is set to reach 83 as against the current 78.
All this is provided that the impact of the financial crisis, which has already caused a decline in births, is not excessively protracted. After reaching the highest
N&K 2011 inglese.indd 114 12-09-2011 17:14:55
Part 2. 1.1. Geodemographics and security | 115
number of births in the history of the United States in 2007, between 2008 and June 2010 there has been a 4% decline in births13. The decline concerns the fertil-ity of all main ethnic groups in the United States and almost every one of the 50 states. Such a dramatic drop had not been seen since 1973, which was also the year of an economic crisis, on that occasion being due to the oil price shock.
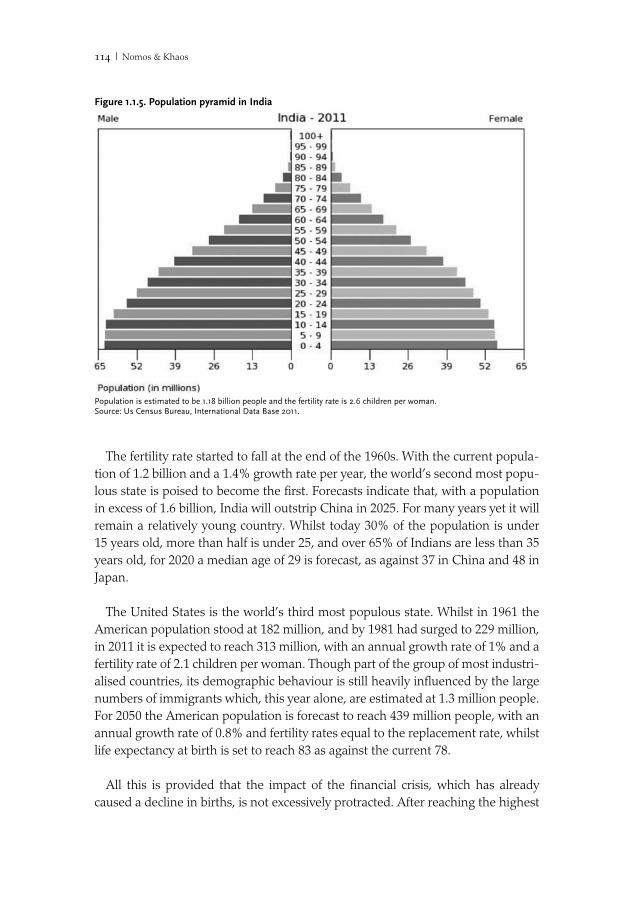
Figure 1.1.6. Population pyramid in the united States
The Us population was almost 309 million according to the 2010 census. The current 2011 estimate is close to 313 million people.Source: Us Census Bureau, International Data Base 2011.
With 245 million inhabitants, Indonesia is the world’s fourth most populous country and for some time now has been in a state of demographic transition. In 1981, it had a population of 153 million people, growing at a rate of 2% per year, with 4.2 children per woman. Indonesian population currently growing at a rate of 1.1% per year and fertility has dropped to 2.3 children per woman. In addition, life expectancy has increased from 55 to 71 years. In 2050, the population of Indonesia should amount to some 313 million people, a growth rate that is close to zero and a fertility rate that is just below the replacement level.
Brazil’s growth has been quite spectacular. It is the world’s fifth most populous state and its population has almost trebled in just 50 years. Whilst in 1961 there
13 National Center for Health Statistics, “Recent Decline in Births in the United States, 2007-2009”, Nchs Data Brief, n. 60, March 2011, http://www.cdc.gov/nchs/data/databriefs/db60.htm.
N&K 2011 inglese.indd 115 12-09-2011 17:14:55

116 | Nomos & Khaos
were some 73 million people, by 1991 the population had more than doubled, reaching 153 million, a growth rate of 1.6% per year and a fertility rate of 2.6 chil-dren per woman. In 2011, the population should stand at 203 million. However, the growth rate will have fallen to 1.1% per year from 2.7% in 1970. Fertility now stands at 2.2 children per woman and life expectancy at birth is 73 years, as against 58 in 1970. In 2050, the Brazilian population is forecast at 260 million people, with a 0.2% growth rate and fertility below the replacement level (1.8%), whilst life expectancy at birth will be 80 years.
Overall, in 2050, four of the five most populous states will still be at the top of the demographic ranking. Whilst India will overtake China, and the United States and Indonesia ought to keep their current positions, Brazil could be relegated to eighth position, overtaken by Pakistan.
Over the last 20 years Pakistan, Bangladesh and Nigeria have outstripped Russia and Japan. Pakistan is now the sixth most populous state in the world. The demo-graphic transition occurred later here than in China and India. Whilst mortality has started to decline since the 1950s, fertility started to drop only at the end of the 1980s. Compared to the 1950s, life expectancy at birth has however increased by 20 years. From 6.9 children per woman up to 1985, the rate has fallen to the current 3.2 even though it is estimated that it is only in 2050 that Pakistani fertil-ity will fall below the replacement level. Meanwhile the Pakistani population will have reached 200 million in 2020 and 290 million in 2050.
Bangladesh is also on the road to demographic transition. The former East Pa-kistan, at the time of independence, in 1971, had a population of 69 million. 40 years later, the population has more than doubled, being in excess of 158 million people (the world’s seventh most populous state). The fertility rate has fallen to 2.6 children per woman and is set to reach the replacement rate in 2040, whilst the total population could reach 250 million in 2050.
The African state with the largest population is Nigeria, with over 155 million people. It will continue to grow at a rate of 1.9% per year. Fertility currently stands at 4.7 children per woman and life expectancy at birth is only 48 years. In 1991 the Nigerian population stood at 99 million people, growing at 2.5% per year with an average of 6.4 children per woman. Life expectancy at birth was 45 years. Forecasts for 2050 predict a population of 264 million people, which will grow at 0.9% per year, with 2.4 children per woman and life expectancy of 62 years.
The only European country at the top of the demographic ranking, Russia, has a population of 138 million and a growth rate of -0.5%, despite the fact that fertility
N&K 2011 inglese.indd 116 12-09-2011 17:14:55

Part 2. 1.1. Geodemographics and security | 117
has increased slightly to 1.4 children per woman. By 2050 the Russian population will probably have dropped to 109 million, the same figure as in 1954; the coun-try will have a negative growth rate (-0.7%) and an average of 1.7 children per woman.
Figure 1.1.7. Population pyramid in russia
The Russian population has dropped to 138 million. The fertility rate is 1.4 children per woman equal to the Italian one. Source: Us Census Bureau, International Data Base 2011.
In the year of its collapse, 1991, the Ussr had reached 148 million people but its annual growth rate was already close to zero. Life expectancy stood at 69 years. The end of the Soviet Union in the 1990s saw a dramatic drop in births. Already back in 1995 the Russian growth rate became negative; fertility fell to 1.3 children per woman and life expectancy dropped to 65 years. Since then the youth popula-tion in Russia has dropped significantly, whilst the general population has aged.
The 10th most populous state is now Japan with 126 million people. The growth rate is negative (-0.3%), fertility stands at 1.2 children per woman and life expec-tancy is 82 years. In 2005, the country had reached a zero growth rate that in 2006 became negative. Forecasts for 2050 predict a contraction in the total population to 93 million people, 33 million less than the current population, the same figure as in 1959. Despite this, in 2050 fertility is expected to increase to 1.6 children per woman, whilst life expectancy at birth should reach 84 years.
The forecasts regarding 2050 also see the demographic rise of Ethiopia, which
N&K 2011 inglese.indd 117 12-09-2011 17:14:56

118 | Nomos & Khaos
is set to overtake Nigeria, Brazil and Bangladesh in the 250 to 280 million bracket, as well as the Philippines, which is now in 13th position after overtaking Germany. Then the total population is expected to reach 171 million people.
Figure 1.1.8. Population pyramid in Japan
Total population is estimated to 126 million of inhabitants. The fertility rate has dropped to 1.2 children per woman. Source: Us Census Bureau, International Data Base 2011.
So, in view of the demographic transition, the so-called developed world appears for the time being to have little alternative to a growing dual population14. On the one hand, there will be increasing numbers of elderly native citizens, on the other hand, a large pool of young migrants born abroad, coming primarily from Africa and Asia, who will be increasingly indispensable in propping up the economy and providing services in these affluent, yet ever more geriatric countries.
By 2050 the only states which are still youthful will be those countries which today are amongst the poorest in the world, such as sub-Saharan Africa, Somalia, Iraq and Afghanistan. With their young populations they will be the only states able to look after the rest of the world, which will be increasingly elderly with a dependency ratio (between those over 65 and the working population) which is set to become ever more lopsided.
14 W. A. V. Clark, “Human Mobility in a Globalizing World: Urban development Trends and Policy Implications”, H. S. Geyer (ed.), International Handbook of Urban Policy, vol. I, Contentious Global Issues, Edward Elgar, 2008.
N&K 2011 inglese.indd 118 12-09-2011 17:14:56

Part 2. 1.1. Geodemographics and security | 119
SECURITY DEMOGRAPHICS
As we have seen, as part of the general boom in security studies over the last decade, researchers have turned to demographics to obtain information to enable them to discern whether specific states are particularly prone to conflict. Research on the relationship between demographics and conflict had previously focused on the impact that conflict has on demographics.
Data on countries involved in the two world wars has shown that there was a decline in fertility during wartime, usually followed by a “baby boom”. Whilst we are still waiting for detailed analysis of any impact the 2001 attacks might have had on Us fertility rates, this relationship is still open to question, considering that more recent studies – those based on Eritrea, for example – have questioned the possibility the there should always be a post-war population growth.
In addition to the various already considered aspects of demographic transition – from poor replacement birth rates in the developed economies to the imbalance between youthful populations and the impact of demographics on legal and illegal immigration – analyses have been conducted within the security demographics field on the consequences of pandemics on the reproductive capacity of a popula-tion, and on the implications for security of gender imbalance.
The gender imbalance
The ratio between the number of males and the number of females in a popula-tion can in fact be an indicator to assess potential security risks, especially when there is an imbalance in the first childbearing age group15.
Globally, this ratio is currently about 103.3 males for every hundred females. In Asia in general, there is a scarcity of females. The average in the region is 104.4 males for every hundred females.
The most extreme case concerns China, with 120 males to every hundred fe-males. The general preference for sons and the devaluation of females are amongst the primary causes of this phenomenon, but it has been made worse by the fact that parents are increasingly resorting to selective abortion in the wake of the in-creasing take-up of prenatal gender identification and visualisation techniques.
15 V. Hudson, A. M. Den Boer, “Bare Branches and Security in Asia”, Harvard Asia Pacific Review, 2007, pp. 18-20.
N&K 2011 inglese.indd 119 12-09-2011 17:14:56

120 | Nomos & Khaos
Furthermore, daughters often tend to be neglected, a phenomenon which can border on abandonment. The consequence is that there are higher rates of infant mortality for girls. And the situation continues even into adulthood: 55% of all female suicides in the world are Chinese women of childbearing age. In India too there is an imbalance, albeit less marked: 106 women per 100 men. Similar skewed figures can also be seen in Pakistan, Bangladesh, Nepal, Bhutan, Taiwan, Afghani-stan and South Korea (there is no data for North Korea). Lastly, the Gulf States also have a shortage of women due to the high number of male migrants attracted by the prospect of working in the oil economy.
In certain other regions of the world the situation is reversed. In Russia and in the ex-Warsaw Pact countries the shortage affects adult males. In the 1990s, Rus-sian male mortality greatly exceeded female mortality on account, inter alia, of very high rates of alcoholism. The gender imbalance is already visible in the 25 to 29 age group and steadily increases in all the following groups.
Between the ages of 50 and 54, there are now one million more women than men, while in the 70 to 74 group, there are over 2 million more women, twice as many as men. In 2011 the average life expectancy at birth for men stands at just 59.8 years, whilst for women it is over 73.
In Africa, the male to female ratio sees 98.9 males for every 100 females, a figure close to that of Latin America, where in 2000 there were 98 males to every 100 females. Lastly, in Europe the ratio is 93.1 to 100 (Russia and Eastern Europe skew the figures).
Is it possible that a shortage of females may even affect state security? The an-thropologist Barbara D. Miller contends that maintaining gender balance is a ne-glected “public good”. And the demographer Valerie Hudson (2007) wonders “Will it matter to India and China that by the year 2020, 12-15% of their young adult males will not be able to form culturally traditional families because the girls that would have grown up to be their wives were disposed of by their societies instead?”
Hudson observes a heightened crime risk as marriage is “a reliable predictor of a downturn in reckless, antisocial, illegal, and violent behaviour by young adult males. If this transition cannot be effected for a sizeable proportion of a society’s young men, the society is likely to become less stable”. Even a delayed marriage age for men can be an instability factor – as shown by Egypt where the average age at which men marry has climbed to 32 years.
Quite conceivably, the gender imbalance in Pakistan, India, China and Tai-
N&K 2011 inglese.indd 120 12-09-2011 17:14:56
Part 2. 1.1. Geodemographics and security | 121
wan is not a direct cause of conflict but is nevertheless a factor which is liable to aggravate the situation. 30 million less Chinese girls also means that 30 million young Chinese men will be unable to find a bride in their age group with whom to form a family and mate. And undoubtedly it will be the most economically and educationally underprivileged who are unable to marry, potentially sparking strife within Chinese society.
It is true that the official demographic figures fail to take into account the exist-ence of hei hanzi, “illegal” children whose parents failed to register them in order to avoid hefty penalties on families contravening China’s strict one-child policy16. Ac-cording to UNhcr statistics there may be millions of such people, often females.
However, as they are deprived of citizenship, these “hidden” children have no rights, education, medical assistance, work etc, especially when they migrate to the cities from the countryside where the phenomenon is more widespread. As, officially, they do not exist, they are liable to fuel a disturbing trade in women of childbearing age. Trafficking in women which occurs not only in China, but also in much of Asia, has been under way for a long time. According to the Ameri-can State Department, many women are “imported” from North Korea, Vietnam, Burma, Mongolia and Thailand17.
Demographics in the Muslim world
In the last decade, security demographics has naturally dealt with Muslim popu-lations, usually based on the presupposition that, whilst on the one hand religion was an obstacle to a reduction in fertility, on the other hand the army of surplus young men in areas of poor economic development offered fertile ground for re-cruitment to Islamic fundamentalist groups.
These alarm bells, set ringing at least five years ago, failed to prevent youthful fundamentalism from gaining ground in Somalia where 63.4% of the total popula-tion is less than 24 years old and where civil war has been the norm for the last 20 years. The fundamentalist youth movement grew after 2007 to such an extent that
16 A partial admission of their existence was made in 2008 in the aftermath of the Sichuan earth-quake, when the government allowed families who had lost their first child because of the seism to legalise the second. See: A. Jacobs, “China’s One-Child Policy has Exceptions for Quake Victims’ Parents”, International Herald Tribune Online, http://www.iht.com/articles/2008/05/27/asia/27child.php, 27 May 2008.17 M. P. Lagon, “Trafficking in China”, Office to Monitor and Combat Trafficking in Persons, United States Department of State, Congressional Human Rights Caucus Briefing, Washington Dc, 31 October .
N&K 2011 inglese.indd 121 12-09-2011 17:14:56

122 | Nomos & Khaos
the shabab (“youth” in Arabic) gained control of almost all South Central Somalia (though recently they tactically withdrew from Mogadishu).
However, aside from this specific Somali case, in which errors committed by the “international community” were certainly a contributing factor, the stereotypes which portray the Islamic world as being inherently dogmatic, unchanging, exces-sively wary of modernisation and unable to accept the demographic transition, have now been disproven. (Samuel Huntington made a significant contribution to disseminating this stereotype, exploiting the myth of population growth as a pretext for his anti-Islamic arguments on the clash between civilisations).
The approach adopted by Courbage and Todd was confirmed by the recent 2011 “Arab Spring” which, from Tunisia and Egypt, swept across to the Arabian Penin-sula, the Middle East and sub-Saharan Africa. These two French researchers even foresaw this demand for democracy back in 200718. They also succeeded in disa-vowing the myths which traditionally surround analysis of demographics in Mus-lim countries. Though late in starting, the Muslim world is making – much more quickly – the transition Europe has already experienced. The decisive modernisa-tion factor appears to be the increase in schooling, particularly amongst girls, ac-companied by increased use of contraception, thereby resulting in a fall in fertility rates. Furthermore, educated sons are increasingly less tolerant of their ignorant fathers’ authoritarianism, as shown in the call for democracy movement which has gripped North Africa and the Middle Eastern States19.
Thus the data refute the myth that Muslim fertility is universally high and devoid of any downward tendency, or the supposed fact that Muslim fertility rates are always higher than rates for other believers. The two researchers also find a cor-relation between nationalism and demographics. As demonstrated by the stalled transition in Palestine and Israel (the so-called “cradle war”), in the Albanian world (Kosovo and Macedonia), and in Yemen, where the fertility rate remains six children per woman.
In addition, the recent Pew Research Centre report20 confirms these results. Glo-
18 T. Courbage, Les rendez-vous, cit.19 In the Indian subcontinent the ratio between Muslims and Hindus in the three most populous states, India, Pakistan and Bangladesh stood at 400 million Muslims and twice as many Hindus and followers of other religions in 2000. Forecasts for 2050 project that the number of Muslims will climb to over 900 million, whilst Hindus and other religions will stand at 1.2 billion. 20 Pew Research Center’s Forum on Religion and Public Life, The future of the global Muslim popu-lation. Projections for 2010-2030, 27 January 2011, http://pewforum.org/The-Future-of-the-Global-Muslim-Population.aspx.
N&K 2011 inglese.indd 122 12-09-2011 17:14:56

Part 2. 1.1. Geodemographics and security | 123
bally, the Muslim population is set to increase from the current 1.6 billion to 2.2 billion in 2030, rising from the current 23.4% to 26.4% of the world population (the global population will then reach 8.3 billion). Nevertheless, this increase will be slower over the next 20 years than it has been over the last two decades. Since standing at 2.3% during the period 1990-2000, it dropped to 2.1% over the last 10 years, whilst between 2010 and 2030 the rate is set to fall to 1.5%. The reason for this is the decline in fertility rates in many Muslim countries, including Indonesia and Bangladesh, helped by schooling for girls, improvements in living standards and urbanisation. The decline is taking place in the Asian region, the Middle East/North Africa and Europe rather than in sub-Saharan Africa. In 2030, 60% of Mus-lims will continue to live in the Asia/Pacific region, whilst approximately 20% will be in the Middle East and North Africa. Pakistan, as has already been seen, will overtake Indonesia, becoming the country with the largest Muslim population.
Muslims will increase in number primarily in sub-Saharan Africa. Nigeria will overtake Egypt, whilst there will be minorities in the Usa (where Muslims are ex-pected to increase from the current 2.6 million to 6.2 million owing to immigration and higher fertility rates) and in Europe (where over the next 20 years they will rise from 6% to 8% of the population). Aside from Russia, the major increases by 2030 will take place in France (from the current 7.5% to 10.3%), Belgium (from 6 to 10.2%), Sweden (from 4.9% to 9.9%), Austria (from 5.7 to 9.3%) and the United Kingdom (from 4.6 to 8.2%). Of course, interpretation of the demographic transi-tion in the Muslim world may vary greatly according to whether or not one sees believers of this creed as a threat or as a resource.
Whilst the Arab Spring demonstrates that the automatic association between young Muslims and fundamentalism is outdated, it is clear that opinions articu-lated over the last decade on the implications of the so-called “youth bulge” on security need to be revisited. All the more so in light of the fact that after the 2000 peak, the number of young people is actually declining. While in 1990 over two thirds of the total population in predominantly Muslim countries were under 30, this percentage has now dropped to 60% and is set to fall to 50% by 2030. Mean-while the median age has climbed from 19 (1990) to 24 in 2010, and is expected to reach 44 in 203021. Of course, this trend is not limited to Muslim countries. The entire world is ageing.
21 Sunnis will continue to make up the vast majority of Muslims, at 87% – 90%, whilst Shiites will decline on account of falling birth-rates in Iran.
N&K 2011 inglese.indd 123 12-09-2011 17:14:56

124 | Nomos & Khaos
GLOBAL DEMOGRAPHY, SECURITY AND THE ENVIRONMENT
Around 2012, the world’s population will reach 7 billion. This figure has never been seen before in human history and the number is difficult to relate to any aspect of human experience, especially if we consider that in a century there are “just” 3.15 billion seconds.
Nevertheless, despite the recent easing, the speed with which the world’s popu-lation has risen is all the more astonishing. Prior to the invention of agriculture, it is estimated that the human beings stood at approximately one million.
The first billion was reached around 1800. Since then, the figure has continued to surge faster and faster. The third billion was reached in 1960, the fourth in 1975, the fifth in 1987 and the sixth in 1999. Whilst some 12,000 years were needed to reach the first billion, the second was reached after just 130 years, the third in 30 years, the fourth in 15, the fifth and sixth in 12 years each. Over the last decade the rate of growth has eased somewhat, with the result that the seventh billion is expected to take approximately 13 years.
Now, whilst it is clear that such rise mirrored the industrial revolution, it is equally clear that human society and its economic, political and cultural infra-structures were not ready to deal with such high growth rates or with their reper-cussions in such a short time-frame. Currently, 2.4 people are added to the world population per second. Mid-term forecasts show that the population could rise to 9.15 billion by about 2050. Thus, whilst last year it was estimated that the world population increased by around 76 million people (more than the entire nation of Egypt), by 2050, it is set to increase by “only” 31 million (nearly half the current Italian population).
This is no reason to yield to the temptation to claim that there are insufficient re-sources or insufficient space for everyone on our planet. Relating the current world population of 7 billion people to the approximate 150 million square kilometres of land, gives a theoretical density of almost 47 people per square kilometre, lower, for example, than in the province of Siena in Italy.
And even if every part of the Earth were theoretically habitable with the aid of suitable technologies, we would have to halve the useful surface area so as to subtract all those areas which on account of extreme topographic and/or diffi-cult climatic conditions are uninhabitable. Even with a hundred people per square kilometre, we would have an average density of half the Italian figure and so still very far from the minimum threshold of 400 people per square kilometre that dis-
N&K 2011 inglese.indd 124 12-09-2011 17:14:56

Part 2. 1.1. Geodemographics and security | 125
tinguishes urban areas from rural areas. Therefore, it is not room for growth which is lacking on Earth.
With regard to resources, Grübler (1994) estimated arable land requirements at 0.2 ha per person, amounting to 14 million square kilometres; in other words one tenth of the land that, according to Xiao et al. (1999), is potentially cultivable. At least theoretically, our planet can support a much larger population than the present one.
The problem therefore concerns the distribution of population and resources, considering that 90% of human beings are concentrated in just 20% of the land area (currently north of the equator). Certainly, the problem of “overcrowding” exerts pressure on urban areas throughout the world, considering that in recent decades the average annual urbanisation rate (4.5%) has been three times the population growth rate (1.5%). If in 1950 the urban population was one third of the total and, whilst today more than half the population live in cities, at current rates the unwavering rural migration to the cities means that by 2050 over two thirds of the total world population will be urbanized.
So, it is not so much the total world population figure which exceeds carrying capacity in terms of our planet’s space and resources. The critical issue is current infrastructure capacity, including urban, economic and political infrastructure, and whether it can cope. The greatest impact is in fact psychological in so far as the developed world will continue to see the other part of the world, the more numer-ous part, as a threat rather than as a resource and will base its decisions, first and foremost regarding energy, on reasoning and decisions typical of the last century.
It is here that the impact of population growth shows potentially the most dra-matic consequences. The increasing global demand for arable land, water and en-ergy, has long put alarming pressure on natural systems and resources22. We have seen a drastic decline in biodiversity: the current rate of extinction of species is estimated at between one hundred and a thousand times the natural rate.
Amongst all the forms of man-made pressure on resources, it is probably the demand for fossil fuels which has grown the most rapidly. This is no surprise if we consider that the energy produced by a barrel of oil is equivalent to the energy produced in eight years by an average person. Thus, in the United States alone, in
22 According to the IUcN Red List, there were throughout the world in 2009 almost 17,000 species at risk of extinction: over one fifth of mammals, almost one third of reptiles and amphibians, 12% of birds and 37% of fish.
N&K 2011 inglese.indd 125 12-09-2011 17:14:56
lucamuscara
Cross-Out
lucamuscara
Cross-Out

126 | Nomos & Khaos
the last century, demand for oil has climbed from 39 million to 6.6 billion barrels per year, an increase two times faster than the population increase.
There is no dodging the issue: a billion people, 15% of the world population, enjoy a lifestyle that has a shocking impact on resources. According to Jared Dia-mond, an average person living in the United States (or Western Europe, Japan or Australia) consumes 32 times more than a Kenyan. And consumption figures for most of the world’s population are closer to those of an average Kenyan.
On the other hand, as observed by Larry Smith, if our lifestyle were to be ex-tended to all humanity, the global consumption of resources would be multiplied 11 times, as if, instead of the current 7 billion people, the Earth had to support over 70 billion people23. Thus, the impact of the estimated 2050 world population of 9 billion would be equivalent to a population of some hundred and five billion today. A future reflection on the relationship between demographics and security maybe ought to start here, that is from the consciousness that are not the population val-ues per se to represent a risk for security, but the demographic transition pace and the difficulty of adapting to these changes, not only regarding infrastructure but also at psychological level. After all it is not so much the lack of land and resources, as their geographical distribution to be the cause of conflicts and imbalances. From this point of view, and without denying the differences of History, it is perhaps the geo-economic and geopolitical model pursued that needs to be questioned. Here, once again, Japan shows to be in advance. After the triple catastrophe of 2011, there is now an ongoing debate about the “systemic” error in the development model pursued in the last sixty years, which could lead to significant changes not only for energy production policies, but above all for those of energy consumption. It is to be hoped that such rethinking will be extended outside Japan as soon as possible, as beyond all geopolitical divisions, the Earth is one and the real issue on security is that concerning the biosphere.
23 L. Smith, The World in 2050. Four Forces Shaping Civilization’s Northern Future, Boston: Dutton, 2010, p.328.
N&K 2011 inglese.indd 126 12-09-2011 17:14:57
lucamuscara
Cross-Out
lucamuscara
Cross-Out