Genetic variation in biomass traits among 20 diverse rice varieties
12
Genetic Variation in Biomass Traits among 20 Diverse Rice Varieties 1[W][OA] Courtney E. Jahn, John K. Mckay, Ramil Mauleon, Janice Stephens, Kenneth L. McNally, Daniel R. Bush, Hei Leung, and Jan E. Leach* Bioagricultural Sciences and Pest Management and Program in Molecular Plant Biology, Colorado State University, Fort Collins, Colorado 80523–1177 (C.E.J., J.K.M., J.S., J.E.L.); International Rice Research Institute, DAPO 7777, Metro Manila, Philippines (R.M., K.L.M., H.L.); and Department of Biology and Program in Molecular Plant Biology, Colorado State University, Fort Collins, Colorado 80523–1878 (D.R.B.) Biofuels provide a promising route of producing energy while reducing reliance on petroleum. Developing sustainable liquid fuel production from cellulosic feedstock is a major challenge and will require significant breeding efforts to maximize plant biomass production. Our approach to elucidating genes and genetic pathways that can be targeted for improving biomass production is to exploit the combination of genomic tools and genetic diversity in rice (Oryza sativa). In this study, we analyzed a diverse set of 20 recently resequenced rice varieties for variation in biomass traits at several different developmental stages. The traits included plant size and architecture, aboveground biomass, and underlying physiological processes. We found significant genetic variation among the 20 lines in all morphological and physiological traits. Although heritability estimates were significant for all traits, heritabilities were higher in traits relating to plant size and architecture than for physiological traits. Trait variation was largely explained by variety and breeding history (advanced versus landrace) but not by varietal groupings (indica, japonica, and aus). In the context of cellulosic biofuels development, cell wall composition varied significantly among varieties. Surprisingly, photosynthetic rates among the varieties were inversely correlated with biomass accumulation. Examining these data in an evolutionary context reveals that rice varieties have achieved high biomass production via independent developmental and physiological pathways, suggesting that there are multiple targets for biomass improvement. Future efforts to identify loci and networks underlying this functional variation will facilitate the improvement of biomass traits in other grasses being developed as energy crops. Developing a sustainable biofuels program that makes significant contributions to our current and future national energy budget requires unprecedented inputs of biomass for energy conversion. At present, the U.S. fuel-ethanol industry produces its bioethanol from corn (Zea mays) grain; however, this is not con- sidered a sustainable source of energy, as an increase in demand for corn-based ethanol will have significant land requirements, compete with food and feed in- dustries, and reduce exports of animal products (Sun and Cheng, 2002; Elobeid et al., 2007). Because of these issues, liquid fuel production from plant lignocellulose is considered a better alternative and is being pursued from both agronomic and engineering perspectives. Plants display a variety of architectures that en- compass branching (tillering) patterns, plant height, arrangement and size of leaves, and structure of re- productive organs. Widespread adoption of wheat (Triticum aestivum) and rice (Oryza sativa) cultivars with altered plant architecture (semidwarf varieties) averted severe food shortages in the 1960s and was an essential component of the “Green Revolution” (Khush, 1999). Continued use of these semidwarf varieties in conjunction with higher rates of nitrogen application has resulted in doubled grain yields; these gains are due to increased allocation of resources to grain rather than vegetative tissues and also greater resistance to lodging in extreme weather events (Khush, 1999, 2001; Reinhardt and Kuhlemeier, 2002). In many ways, improvement of plants for both food and fuel or for dedicated biofuel feedstock purposes will require new breeding and selection emphases that are differ- ent from those targeted during the Green Revolution. Therefore, understanding the genetic and molecular pro- cesses that control key morphological and physiological processes will facilitate the breeding of high-biomass- yielding crops. Leaf traits, such as leaf thickness, size, and shape, leaf number, and orientation, are key factors influencing biomass formation (Yang and Hwa, 2008). In 1 This work was supported by a Colorado Center for Biorefining and Biofuels-Chevron fellowship (to C.E.J.), by the Colorado Agri- cultural Experiment Station (to J.K.M. and J.E.L.), and by grants from the U.S. Department of Agriculture-Cooperative State Research, Education, and Extension Service (grant no. 2008–35504–04852), the Office of Science (Biological and Environmental Research), the U.S. Department of Energy (grant no. DE–FG02–08ER64629), and Colo- rado State University’s Clean Energy Supercluster. * Corresponding author; e-mail [email protected]. The author responsible for distribution of materials integral to the findings presented in this article in accordance with the policy described in the Instructions for Authors (www.plantphysiol.org) is: Jan E. Leach ([email protected]). [W] The online version of this article contains Web-only data. [OA] Open Access articles can be viewed online without a sub- scription. www.plantphysiol.org/cgi/doi/10.1104/pp.110.165654 Plant Physiology Ò , January 2011, Vol. 155, pp. 157–168, www.plantphysiol.org Ó 2010 American Society of Plant Biologists 157
Transcript of Genetic variation in biomass traits among 20 diverse rice varieties
Genetic Variation in Biomass Traits among 20 DiverseRice Varieties1[W][OA]
Courtney E. Jahn, John K. Mckay, Ramil Mauleon, Janice Stephens, Kenneth L. McNally, Daniel R. Bush,Hei Leung, and Jan E. Leach*
Bioagricultural Sciences and Pest Management and Program in Molecular Plant Biology, Colorado StateUniversity, Fort Collins, Colorado 80523–1177 (C.E.J., J.K.M., J.S., J.E.L.); International Rice Research Institute,DAPO 7777, Metro Manila, Philippines (R.M., K.L.M., H.L.); and Department of Biology and Program inMolecular Plant Biology, Colorado State University, Fort Collins, Colorado 80523–1878 (D.R.B.)
Biofuels provide a promising route of producing energy while reducing reliance on petroleum. Developing sustainable liquidfuel production from cellulosic feedstock is a major challenge and will require significant breeding efforts to maximize plantbiomass production. Our approach to elucidating genes and genetic pathways that can be targeted for improving biomassproduction is to exploit the combination of genomic tools and genetic diversity in rice (Oryza sativa). In this study, we analyzeda diverse set of 20 recently resequenced rice varieties for variation in biomass traits at several different developmental stages.The traits included plant size and architecture, aboveground biomass, and underlying physiological processes. We foundsignificant genetic variation among the 20 lines in all morphological and physiological traits. Although heritability estimateswere significant for all traits, heritabilities were higher in traits relating to plant size and architecture than for physiologicaltraits. Trait variation was largely explained by variety and breeding history (advanced versus landrace) but not by varietalgroupings (indica, japonica, and aus). In the context of cellulosic biofuels development, cell wall composition varied significantlyamong varieties. Surprisingly, photosynthetic rates among the varieties were inversely correlated with biomass accumulation.Examining these data in an evolutionary context reveals that rice varieties have achieved high biomass production viaindependent developmental and physiological pathways, suggesting that there are multiple targets for biomass improvement.Future efforts to identify loci and networks underlying this functional variation will facilitate the improvement of biomasstraits in other grasses being developed as energy crops.
Developing a sustainable biofuels program thatmakes significant contributions to our current andfuture national energy budget requires unprecedentedinputs of biomass for energy conversion. At present,the U.S. fuel-ethanol industry produces its bioethanolfrom corn (Zea mays) grain; however, this is not con-sidered a sustainable source of energy, as an increasein demand for corn-based ethanol will have significantland requirements, compete with food and feed in-dustries, and reduce exports of animal products (Sunand Cheng, 2002; Elobeid et al., 2007). Because of these
issues, liquid fuel production from plant lignocelluloseis considered a better alternative and is being pursuedfrom both agronomic and engineering perspectives.
Plants display a variety of architectures that en-compass branching (tillering) patterns, plant height,arrangement and size of leaves, and structure of re-productive organs. Widespread adoption of wheat(Triticum aestivum) and rice (Oryza sativa) cultivarswith altered plant architecture (semidwarf varieties)averted severe food shortages in the 1960s and wasan essential component of the “Green Revolution”(Khush, 1999). Continued use of these semidwarfvarieties in conjunction with higher rates of nitrogenapplication has resulted in doubled grain yields; thesegains are due to increased allocation of resources tograin rather than vegetative tissues and also greaterresistance to lodging in extremeweather events (Khush,1999, 2001; Reinhardt and Kuhlemeier, 2002). In manyways, improvement of plants for both food and fuel orfor dedicated biofuel feedstock purposes will requirenew breeding and selection emphases that are differ-ent from those targeted during the Green Revolution.Therefore, understanding the genetic andmolecular pro-cesses that control key morphological and physiologicalprocesses will facilitate the breeding of high-biomass-yielding crops. Leaf traits, such as leaf thickness, size,and shape, leaf number, and orientation, are key factorsinfluencing biomass formation (Yang and Hwa, 2008). In
1 This work was supported by a Colorado Center for Biorefiningand Biofuels-Chevron fellowship (to C.E.J.), by the Colorado Agri-cultural Experiment Station (to J.K.M. and J.E.L.), and by grants fromthe U.S. Department of Agriculture-Cooperative State Research,Education, and Extension Service (grant no. 2008–35504–04852), theOffice of Science (Biological and Environmental Research), the U.S.Department of Energy (grant no. DE–FG02–08ER64629), and Colo-rado State University’s Clean Energy Supercluster.
* Corresponding author; e-mail [email protected] author responsible for distribution of materials integral to the
findings presented in this article in accordance with the policydescribed in the Instructions for Authors (www.plantphysiol.org) is:Jan E. Leach ([email protected]).
[W] The online version of this article contains Web-only data.[OA] Open Access articles can be viewed online without a sub-
scription.www.plantphysiol.org/cgi/doi/10.1104/pp.110.165654
Plant Physiology�, January 2011, Vol. 155, pp. 157–168, www.plantphysiol.org � 2010 American Society of Plant Biologists 157
rice, erect leaves have a higher leaf area index thatincreases photosynthetic carbon assimilation ratesthrough increased light capture and nitrogen use ef-ficiency (Sinclair and Sheehy, 1999; Sakamoto et al.,2006). Leaves are the predominant photosynthetic or-gan and, thus, are critical targets for maximizing car-bon assimilation by improving morphological traitsand/or improving photosynthetic efficiency (Zhuet al., 2010).
Many nonfood crops, including perennial C4 rhizo-matous grass species such as switchgrass (Panicumvirgatum) and Miscanthus, have potential to serve asviable, long-term sources of energy. Rice shares pat-terns of growth and development (plant architecture,flowering and maturity timelines, and senescencepatterns) and physiological processes (photosyntheticlight reactions, assimilate partitioning, and secondarymetabolism) with these other grasses. Unfortunately,many of these perennial grasses have very large ge-nomes, and the genetic and genomic resources neces-sary to propel their development forward as biomasscrops do not exist. Rice, in contrast, has all these toolsreadily available (Bush and Leach, 2007), and, despitelarge differences between genome size and chromo-some number, gene content and order are well con-served among the grasses (Gale and Devos, 1998;Feuillet and Keller, 2002; Jannoo et al., 2007). In addi-tion, available rice germplasm collections contain ge-netic and phenotypic variation accumulated overyears of domestication and selection under very di-verse environments (e.g. well watered, flooded, waterlimited; Leung et al., 2007). Thus, rice serves as anexcellent model grass for biomass gene discovery, andthat information can be transferred to the new energycrops (Bush and Leach, 2007). However, currentunderstanding regarding the magnitude of geneticvariation for biomass traits in all plants is limited,including the variability in rice.
Here, we investigate biomass variation in theOryzaSNP set (Table I), a collection 20 rice varietiesthat are genetically and agronomically diverse andthat were resequenced for the purpose of identifyingsingle nucleotide polymorphisms (SNPs; McNallyet al., 2009). This diversity set contains varieties thatare widely used in a number of international breedingprograms and that are representative of the two majorlineages, indica and japonica. The set also includes aus,deep water, and aromatic rice groups. The OryzaSNPset also can be divided into two varietal classes basedon their breeding history and usage, advanced andlandrace varieties. Landraces are varieties that havelittle modern breeding but have persisted over gener-ations through farmer maintenance. Advanced varie-ties have complex breeding histories and are productsof breeding programs that enhance specific and desir-able traits. An interesting outcome of the OryzaSNPresequencing project was the detection of chromo-somal regions introgressed from one varietal lineageinto another, revealing the effects of rice’s long breed-ing history (McNally et al., 2009). Some introgressions
contained genes responsible for important agronomictraits; given this, it has been hypothesized that otherintrogressed regions might contain additional traitsimportant for agriculture. To capture and investigatethe diversity represented in this collection (McNallyet al., 2006, 2009), populations of recombinant inbredlines based on pairwise crosses of the 20 lines in theOryzaSNP set are being developed. These resourcesare valuable tools to assess the diversity of traitsrelated to biomass accumulation.
While breeding for seed yield may also select forbiomass traits, the high-yielding dwarf varieties areexamples where seed production and biomass are notinvariably linked. Selection for high harvest index isexpected to favor alleles that reduce vegetative bio-mass and favor grain yield. Although increased veg-etative biomass per se has not been a target of standardgrass crop breeding programs, selection for vigorouscrop establishment in modern cultivation may havefavored genes and alleles optimizing vegetativegrowth. A number of morphological traits (height,tiller number, dry biomass) are routinely measured toinvestigate disease resistance, drought tolerance, hy-brid vigor, root traits, seedling characteristics, andyield (Albar et al., 1998; Hemamalini et al., 2000; Liet al., 2001; Xing et al., 2002; Courtois et al., 2003; Xuet al., 2004; Lian et al., 2005; Cui et al., 2008). Gasexchange has been compared in many rice studies tolook for physiological differences, specifically in wateruse efficiency (WUE), nitrogen deficiency, and increas-ing atmospheric CO2 (Sage, 1994; Huang et al., 2004;Xu et al., 2009). However, no comprehensive investi-gation of biomass and underlying traits in diverse ricegermplasm has been reported. To achieve maximalbiomass production in the new energy crops, it isimportant to identify genes and genetic pathways thatare critical to biomass yield, understand the selectiveforces that have shaped the frequencies of these genesin modern varieties, and determine which physiolog-ical and morphological traits lead to larger and denserplants. Using the diverse OryzaSNP set, we systemat-ically assessed which of these traits contribute to bio-mass accumulation in greenhouse conditions. Here, wereport the variation and heritability of key traits thatsignificantly impact biomass and the genomic regionsassociated with this variation.
RESULTS
Large Natural Variation Exists in Biomass Traits in Rice
By growing the 20 OryzaSNP varieties in a commongreenhouse, we show that they display many plantarchitectural and morphological differences that arepredicted to underlie variation in biomass production(Fig. 1). We measured wet and dry biomass, harvestindex, and percentage water content for all 20 varieties(Table II). The cell wall polymer composition (ratio ofcellulose, hemicellulose, and lignin) and ash content
Jahn et al.
158 Plant Physiol. Vol. 155, 2011
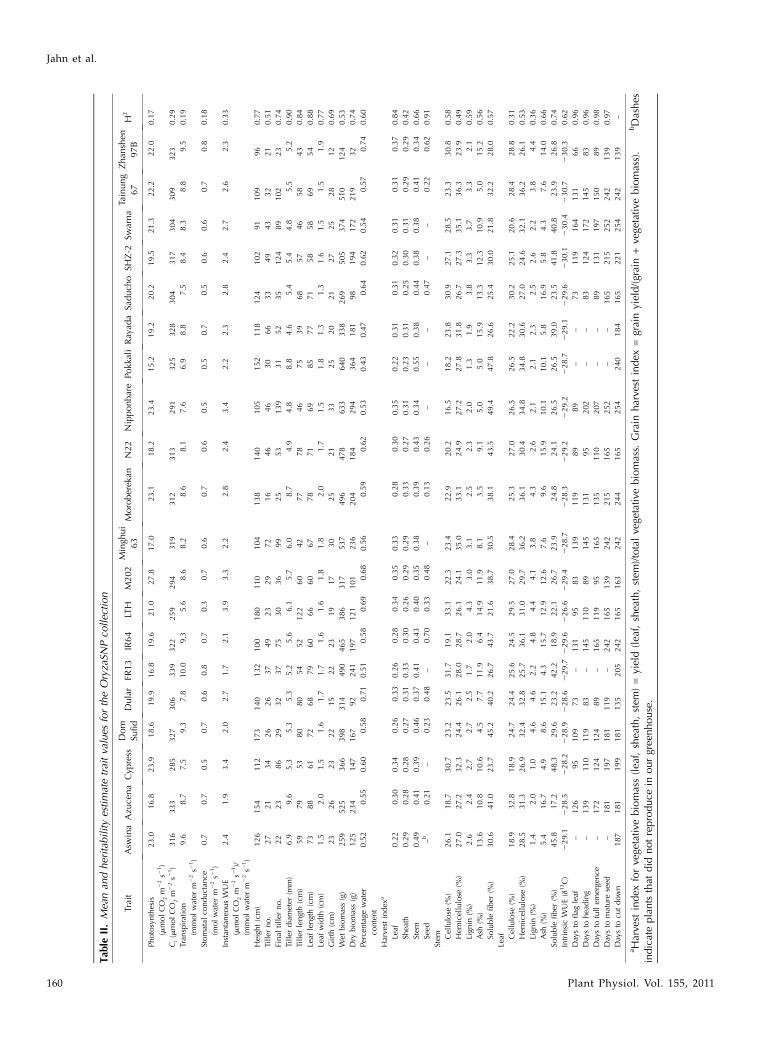
were determined for leaves and stems. We also mea-sured a series of physiological traits related to growthand carbon capture, including leaf-area-based photo-synthesis, transpiration, stomatal conductance, andWUE. Morphological traits assessed were leaf lengthand width, height, tiller diameter, tiller length, tillernumber, and plant girth (Table II).Both wet and dry biomass were measured to de-
termine the percentage water content of biomass foreach variety (Table II). Total percentage water contentranged between 43% and 74% of the wet biomass inthe 20 rice varieties, revealing large genetic variation inleaf and stem water content (Table II). Overall biomassproduction also varied considerably. For example, thedry biomass yield of Pokkali was 11-fold higher thanthat of the smallest variety, Zhenshan 97B (Fig. 1).
Other morphological traits that might be involvedin biomass accumulation also exhibited large traitvariation across the 20 varieties. Leaf lengths rangedfrom 53.6 cm in the advanced variety Zhenshan 97B to88.2 cm in the landrace Azucena. For all varieties, leafwidth ranged between 1.3 and 2.0 cm, but the aver-age was 1.6 cm. LTH, the tallest plant of all 20 lines(180 cm), was twice the height of the smallest plant,Swarna (90 cm). Tiller diameter of most varietieswas approximately 5 mm, but three landraces (i.e.Moroberekan, Pokkali, and Azucena) had larger tillerdiameters (8.7, 8.8, and 9.6 mm, respectively). Girth ofplants was measured 2 cm above the soil line andranged from 12 to 33 cm. We also observed severalphenotypes that are unfavorable for agricultural de-velopment. For example, var Dular displayed severe
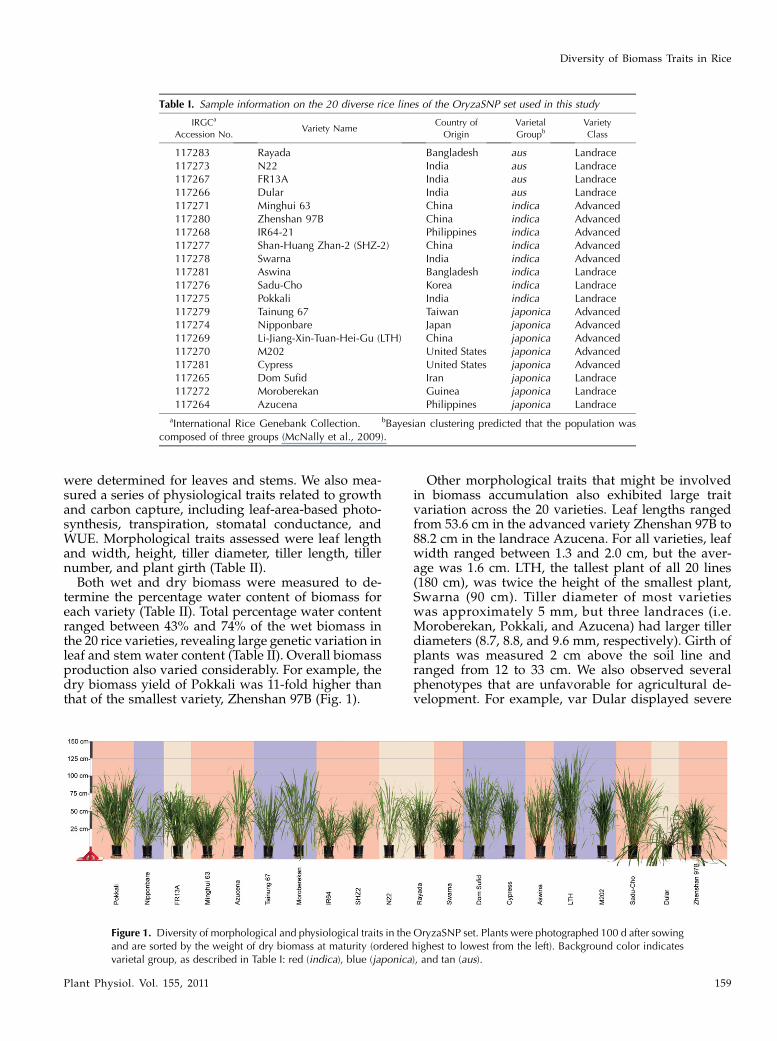
Table I. Sample information on the 20 diverse rice lines of the OryzaSNP set used in this study
IRGCa
Accession No.Variety Name
Country of
Origin
Varietal
GroupbVariety
Class
117283 Rayada Bangladesh aus Landrace117273 N22 India aus Landrace117267 FR13A India aus Landrace117266 Dular India aus Landrace117271 Minghui 63 China indica Advanced117280 Zhenshan 97B China indica Advanced117268 IR64-21 Philippines indica Advanced117277 Shan-Huang Zhan-2 (SHZ-2) China indica Advanced117278 Swarna India indica Advanced117281 Aswina Bangladesh indica Landrace117276 Sadu-Cho Korea indica Landrace117275 Pokkali India indica Landrace117279 Tainung 67 Taiwan japonica Advanced117274 Nipponbare Japan japonica Advanced117269 Li-Jiang-Xin-Tuan-Hei-Gu (LTH) China japonica Advanced117270 M202 United States japonica Advanced117281 Cypress United States japonica Advanced117265 Dom Sufid Iran japonica Landrace117272 Moroberekan Guinea japonica Landrace117264 Azucena Philippines japonica Landrace
aInternational Rice Genebank Collection. bBayesian clustering predicted that the population wascomposed of three groups (McNally et al., 2009).
Figure 1. Diversity of morphological and physiological traits in the OryzaSNP set. Plants were photographed 100 d after sowingand are sorted by the weight of dry biomass at maturity (ordered highest to lowest from the left). Background color indicatesvarietal group, as described in Table I: red (indica), blue (japonica), and tan (aus).
Diversity of Biomass Traits in Rice
Plant Physiol. Vol. 155, 2011 159
Tab
leII.Meanan
dheritab
ilityestimatetraitva
lues
fortheOryza
SNPco
llec
tion
Trait
Asw
ina
Azu
cena
Cyp
ress
Dom
Sufid
Dular
FR13
IR64
LTH
M202
Mingh
ui
63
Moroberek
anN22
Nipponbare
Pokk
aliRayad
aSa
duch
oSH
Z-2
Swarna
Tainung
67
Zhan
shen
97B
H2
Photosynthesis
(mmolCO
2m
22s2
1)
23.0
16.8
23.9
18.6
19.9
16.8
19.6
21.0
27.8
17.0
23.1
18.2
23.4
15.2
19.2
20.2
19.5
21.3
22.2
22.0
0.17
Ci(mmolCO
2m
22s2
1)
316
333
285
327
306
339
322
259
294
319
312
313
291
325
328
304
317
304
309
323
0.29
Tran
spiration
(mmolwater
m22s2
1)
9.6
8.7
7.5
9.3
7.8
10.0
9.3
5.6
8.6
8.2
8.6
8.1
7.6
6.9
8.8
7.5
8.4
8.3
8.8
9.5
0.19
Stomatal
conductan
ce
(molwater
m22s2
1)
0.7
0.7
0.5
0.7
0.6
0.8
0.7
0.3
0.7
0.6
0.7
0.6
0.5
0.5
0.7
0.5
0.6
0.6
0.7
0.8
0.18
Instan
taneo
usW
UE
(mmolCO
2m
22s2
1)/
(mmolwater
m22s2
1)
2.4
1.9
3.4
2.0
2.7
1.7
2.1
3.9
3.3
2.2
2.8
2.4
3.4
2.2
2.3
2.8
2.4
2.7
2.6
2.3
0.33
Heigh
t(cm)
126
154
112
173
140
132
100
180
110
104
138
140
105
152
118
124
102
91
109
96
0.77
Tiller
no.
27
21
34
26
26
37
49
23
29
72
16
46
46
30
66
33
49
43
32
21
0.51
Final
tiller
no.
22
23
86
29
32
37
75
30
36
99
25
53
139
31
52
35
124
89
102
23
0.74
Tiller
diameter
(mm)
6.9
9.6
5.3
5.3
5.3
5.2
5.6
6.1
5.7
6.0
8.7
4.9
4.8
8.8
4.6
5.4
5.4
4.8
5.5
5.2
0.90
Tiller
length(cm)
59
79
53
80
80
54
52
122
60
42
77
78
46
75
39
68
57
46
58
43
0.84
Leaf
length(cm)
73
88
61
72
68
79
60
66
60
67
78
71
69
85
77
71
58
58
69
54
0.88
Leaf
width
(cm)
1.5
2.0
1.5
1.6
1.7
1.7
1.6
1.6
1.8
1.8
2.0
1.7
1.5
1.8
1.3
1.3
1.6
1.5
1.5
1.9
0.77
Girth
(cm)
23
26
23
22
15
22
23
19
17
30
25
21
33
25
20
21
27
25
28
12
0.69
Wet
biomass(g)
259
525
366
398
314
490
465
386
317
537
496
478
633
640
338
269
505
374
510
124
0.53
Dry
biomass(g)
125
234
147
167
92
241
197
121
101
236
204
184
294
364
181
98
194
172
219
32
0.74
Percentage
water
content
0.52
0.55
0.60
0.58
0.71
0.51
0.58
0.69
0.68
0.56
0.59
0.62
0.53
0.43
0.47
0.64
0.62
0.54
0.57
0.74
0.60
Harve
stindex
a
Leaf
0.22
0.30
0.34
0.26
0.33
0.26
0.28
0.34
0.35
0.33
0.28
0.30
0.35
0.22
0.31
0.31
0.32
0.31
0.31
0.37
0.84
Sheath
0.29
0.28
0.28
0.27
0.31
0.33
0.30
0.26
0.29
0.29
0.33
0.27
0.31
0.23
0.31
0.25
0.30
0.31
0.29
0.29
0.42
Stem
0.49
0.41
0.39
0.46
0.37
0.41
0.43
0.40
0.35
0.38
0.39
0.43
0.34
0.55
0.38
0.44
0.38
0.38
0.41
0.34
0.66
Seed
–b0.21
–0.23
0.48
–0.70
0.33
0.48
–0.13
0.26
––
–0.47
––
0.22
0.62
0.91
Stem Cellulose
(%)
26.1
18.7
30.7
23.2
23.5
31.7
19.1
33.1
22.3
23.4
22.9
20.2
16.5
18.2
23.8
30.9
27.1
28.5
23.3
30.8
0.58
Hem
icellulose
(%)
27.0
27.2
32.3
24.4
26.1
28.0
28.7
26.1
24.1
35.0
33.1
24.9
27.2
27.8
31.8
26.7
27.3
35.1
36.3
23.9
0.49
Lign
in(%
)2.6
2.4
2.7
2.7
2.5
1.7
2.0
4.3
3.0
3.1
2.5
2.3
2.0
1.3
1.9
3.8
3.3
3.7
3.3
2.1
0.59
Ash
(%)
13.6
10.8
10.6
4.5
7.7
11.9
6.4
14.9
11.9
8.1
3.5
9.1
5.0
5.0
15.9
13.3
12.3
10.9
5.0
15.2
0.56
Soluble
fiber
(%)
30.6
41.0
23.7
45.2
40.2
26.7
43.7
21.6
38.7
30.5
38.1
43.5
49.4
47.8
26.6
25.4
30.0
21.8
32.2
28.0
0.57
Leaf Cellulose
(%)
18.9
32.8
18.9
24.7
24.4
25.6
24.5
29.5
27.0
28.4
25.3
27.0
26.5
26.5
22.2
30.2
25.1
20.6
28.4
28.8
0.31
Hem
icellulose
(%)
28.5
31.3
26.9
32.4
32.8
25.7
36.1
31.0
29.7
36.2
36.1
30.4
34.8
34.8
30.6
27.0
24.6
32.1
36.2
26.1
0.53
Lign
in(%
)1.4
2.0
1.0
4.6
4.6
2.2
4.8
4.4
4.1
3.8
4.3
2.6
2.1
2.1
2.3
2.5
2.6
2.2
3.8
4.4
0.36
Ash
(%)
5.4
16.7
4.9
8.6
15.1
4.3
15.7
12.9
12.6
7.6
9.6
15.9
10.1
10.1
5.8
16.9
5.8
4.3
7.6
14.0
0.66
Soluble
fiber
(%)
45.8
17.2
48.3
29.6
23.2
42.2
18.9
22.1
26.7
23.9
24.8
24.1
26.5
26.5
39.0
23.5
41.8
40.8
23.9
26.8
0.74
IntrinsicW
UE(d
13C)
229.1
228.5
228.2
228.9
228.6
229.7
229.6
226.6
229.4
228.7
228.3
229.2
229.2
228.7
229.1
229.6
230.1
230.4
230.7
230.3
0.62
Daysto
flag
leaf
–126
95
109
73
–131
95
83
139
119
89
89
––
73
119
164
131
66
0.96
Daysto
hea
ding
–139
110
119
83
–145
110
89
145
131
95
202
––
83
124
172
145
83
0.96
Daysto
fullem
erge
nce
–172
124
124
89
–165
119
95
165
135
110
207
––
89
131
197
150
89
0.98
Daysto
mature
seed
–181
197
181
119
–242
165
139
242
215
165
252
––
165
215
252
242
139
0.97
Daysto
cutdown
187
181
199
181
135
205
242
165
163
242
244
165
254
240
184
165
221
254
242
139
–
a Harvest
index
forvege
tative
biomass(lea
f,sheath,stem
)=yield(lea
f,sheath,stem
)/totalvege
tative
biomass.
Grain
harvest
index
=grainyield/(grain+vege
tative
biomass).
bDashes
indicateplantsthat
did
notreproduce
inourgree
nhouse.
Jahn et al.
160 Plant Physiol. Vol. 155, 2011
lodging and high propensity for seed shattering in thegreenhouse (Fig. 1).The harvest index for vegetative biomass was de-
termined using the mass of a specific tissue relative tototal biomass (Table II). The 20 varieties vary in howthey allocate biomass to leaves, sheaths, and stems(23%–37%, 23%–33%, and 34%–55% of the total bio-mass, respectively). In all but three varieties, stemsconstituted the largest component of total dry bio-mass. For these three varieties, dry biomass was splitalmost evenly among the three tissues. In Pokkali, theplant with themost biomass, approximately 55% of theweight is in the stems, with the remaining partitionedevenly between the leaves and sheaths.Not all varieties reproduced and set seed in our
greenhouse conditions, so a subset of 10 floweringvarieties was analyzed for partitioning of resourcesbetween seed and biomass. The harvest index for seed(grain dry weight to total aboveground dry weight)ranged from 0.13 to 0.70. Not surprisingly, there was astrong negative relationship between harvest indexand total dry biomass (r = 20.79993, P = 4.3 3 10237).Cell wall polymer composition among higher plants
can differ substantially in quality and quantity (Paulyand Keegstra, 2008) and is an important considerationfor bioenergy production. The amounts of cell wallstructural polymers and ash content were determinedfor leaf and stem tissues gravimetrically after treat-ment with either neutral or acidic detergent. Cellulose,hemicellulose, lignin, ash, and soluble fiber contentvaried widely among the varieties. Cell wall polymers(cellulose, hemicellulose, and lignin) constituted 45%to 67% of both the stem and leaf tissues. Lignin levelsin these greenhouse-grown plants were low relative toreports from field-grown plants and ranged from 1.3%to 4.3% total dry weight. The remaining portion con-sists of proteins, nonstructural carbohydrates (starchand sugar), and ash. Ash levels ranged from about 4%to 16% of total dry weight in both leaves and stems.Several physiological traits varied across the 20
varieties, including photosynthesis, instantaneousWUE, and carbon isotope ratio. Particularly notablewas the large variation in leaf area-based photosyn-thetic rate across the 20 lines. The landrace Pokkali andthe U.S. advanced var M202 had the lowest andhighest rates, respectively, with Pokkali having halfthe photosynthetic rate of M202. Instantaneous WUEwas measured on all plants during the vegetativestage, and integrated WUE across the growing seasonwas determined from the carbon isotope ratio mea-sured postharvest. Both integrated and instantaneousWUE measures predict that the advanced varietiesCypress and LTH have the highest WUE.All morphological traits had higher heritabilities
than those for physiological traits. Morphologicaltraits (not including total biomass) were all greaterthan 0.50, with six out of seven being greater than 0.69(Table II). Heritability estimates were relatively similarfor stem structural polymer composition, rangingfrom approximately 0.5 to 0.6, but were highly variable
for leaf polymer composition. Heritability estimatesfor fresh weights were lower than the correspondingdry material, indicating environmental contributionsto variation in water content.
Traits Related to Biomass Covary
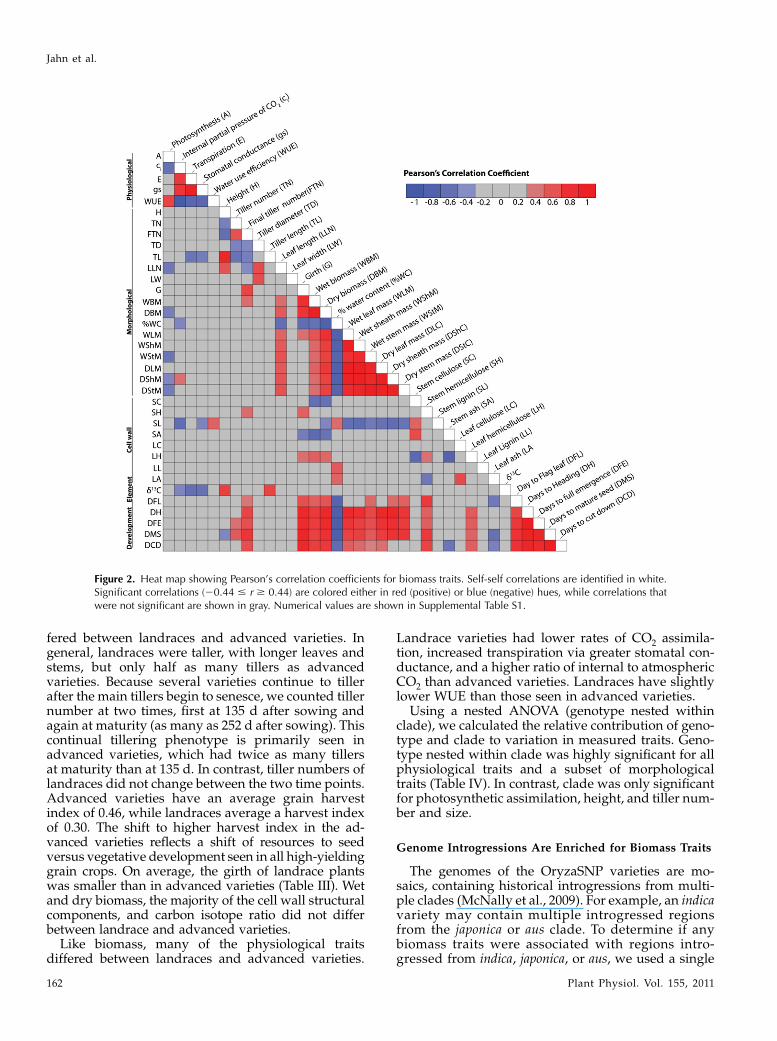
Among the 37 traits tested for genetic correlationwith total biomass, final tiller number, girth, leaflength, individual tissue weights (leaves, sheaths, andstems), and days to maturity were the most positivelycorrelated to final biomass (Fig. 2; Supplemental TableS1). Percentage water content and leaf area-based pho-tosynthesiswere negatively correlated to total biomass.Biomass of leaves, sheath, and stem tissues as well astotal dry biomass were all positively correlated to leaflength and negatively correlated to lignin levels in thestems. Tiller diameter was negatively correlated to tillernumber. Many of the physiological traits were corre-lated to each other, but only photosynthesis was signif-icantly correlated to dry biomass.
In cell wall fractions of stems (but not leaves), cellu-lose, lignin, and ash were negatively correlated to totaldry biomass (Fig. 2; Supplemental Table S1). In contrast,hemicellulose was positively correlated to biomass inboth stems and leaves. Quantities of cell wall polymerswere often not correlated among tissue types; only thequantity of hemicellulose was correlated betweenleaves and stems. Comparison of cell wall componentsin leaves versus stems revealed different cellulose con-tent and lignin content in each of these tissues. The lackof correlation between cell wall polymers in these twotissues suggests independent genetic regulation in theleaves and stems. Thus, for improvement of biomasstraits, alteration of cellulose and lignin content could betargeted independently in leaves and stems.
As expected, wet and dry weights for partial tissueand total plant weight positively covaried across all ofthe growth and developmental stages. Biomass mea-sures at each time point were also positively correlatedto tiller number, plant girth, and hemicellulose levels inboth stems and leaves. Leaf ash levels were negativelycorrelated to many growth stages as well as height anddays to mature seed (Fig. 2; Supplemental Table S1).
Sources of Trait Variation Are Linked to Varietal Classand Genotype But Not to Varietal Grouping
The genetic makeup of modern rice varieties hasbeen shaped through directed selection by breeders.The OryzaSNP set population can be divided into twovarietal classes (advanced and landrace) and struc-tured into three distinct clades (indica, japonica, andaus; McNally et al., 2009). We investigated these divi-sions within the 20 lines to identify potential sources oftrait variation.
Trait values were compared between landrace andadvanced varieties. Overall, landraces had lower wa-ter content than advanced lines (Table III). Morpho-logical traits, such as plant height, final tiller number,tiller diameter, tiller length, and leaf length, also dif-
Diversity of Biomass Traits in Rice
Plant Physiol. Vol. 155, 2011 161
fered between landraces and advanced varieties. Ingeneral, landraces were taller, with longer leaves andstems, but only half as many tillers as advancedvarieties. Because several varieties continue to tillerafter the main tillers begin to senesce, we counted tillernumber at two times, first at 135 d after sowing andagain at maturity (as many as 252 d after sowing). Thiscontinual tillering phenotype is primarily seen inadvanced varieties, which had twice as many tillersat maturity than at 135 d. In contrast, tiller numbers oflandraces did not change between the two time points.Advanced varieties have an average grain harvestindex of 0.46, while landraces average a harvest indexof 0.30. The shift to higher harvest index in the ad-vanced varieties reflects a shift of resources to seedversus vegetative development seen in all high-yieldinggrain crops. On average, the girth of landrace plantswas smaller than in advanced varieties (Table III). Wetand dry biomass, the majority of the cell wall structuralcomponents, and carbon isotope ratio did not differbetween landrace and advanced varieties.
Like biomass, many of the physiological traitsdiffered between landraces and advanced varieties.
Landrace varieties had lower rates of CO2 assimila-tion, increased transpiration via greater stomatal con-ductance, and a higher ratio of internal to atmosphericCO2 than advanced varieties. Landraces have slightlylower WUE than those seen in advanced varieties.
Using a nested ANOVA (genotype nested withinclade), we calculated the relative contribution of geno-type and clade to variation in measured traits. Geno-type nested within clade was highly significant for allphysiological traits and a subset of morphologicaltraits (Table IV). In contrast, clade was only significantfor photosynthetic assimilation, height, and tiller num-ber and size.
Genome Introgressions Are Enriched for Biomass Traits
The genomes of the OryzaSNP varieties are mo-saics, containing historical introgressions from multi-ple clades (McNally et al., 2009). For example, an indicavariety may contain multiple introgressed regionsfrom the japonica or aus clade. To determine if anybiomass traits were associated with regions intro-gressed from indica, japonica, or aus, we used a single
Figure 2. Heat map showing Pearson’s correlation coefficients for biomass traits. Self-self correlations are identified in white.Significant correlations (20.44 # r $ 0.44) are colored either in red (positive) or blue (negative) hues, while correlations thatwere not significant are shown in gray. Numerical values are shown in Supplemental Table S1.
Jahn et al.
162 Plant Physiol. Vol. 155, 2011
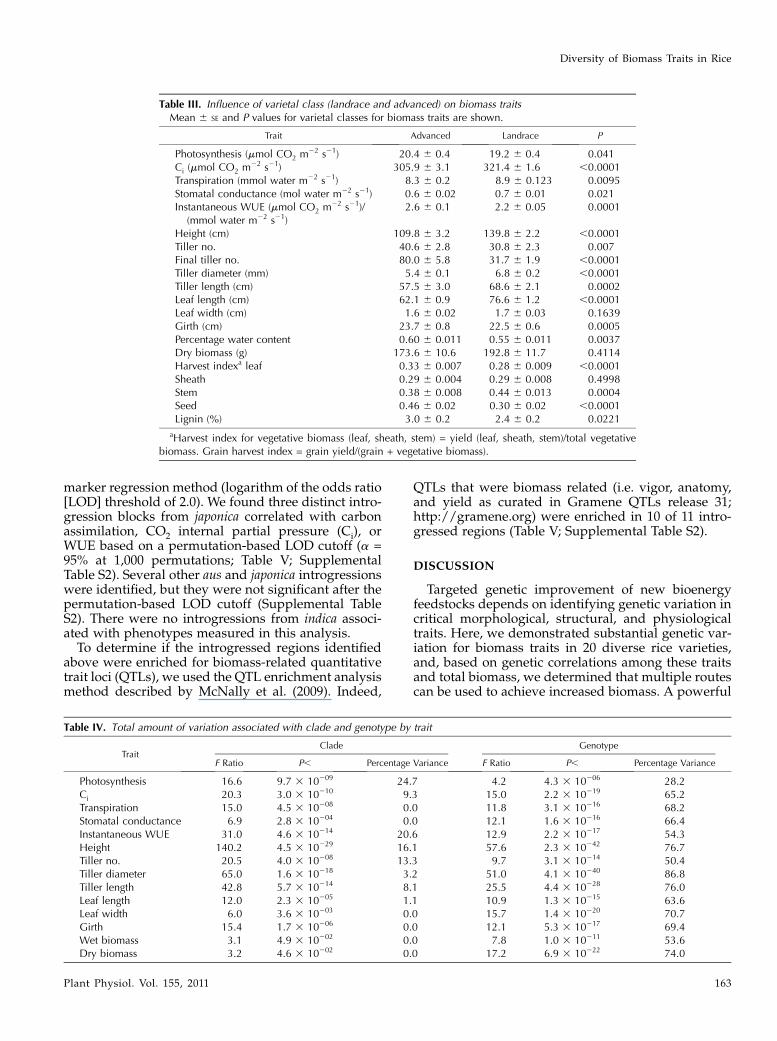
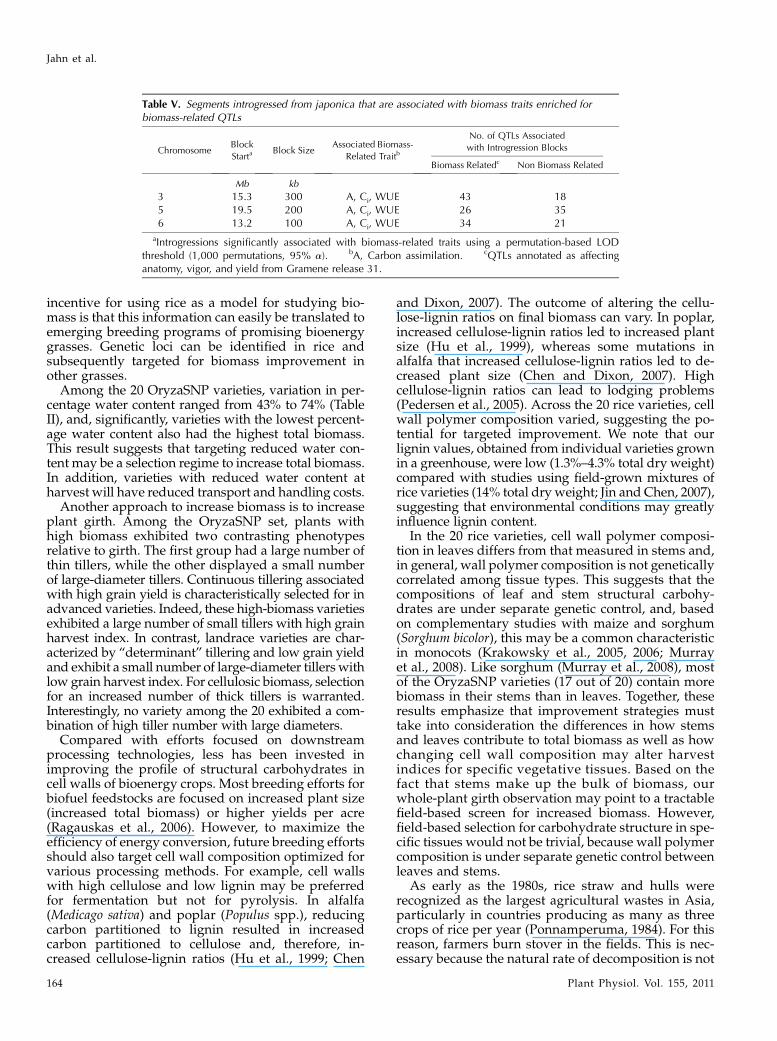
marker regression method (logarithm of the odds ratio[LOD] threshold of 2.0). We found three distinct intro-gression blocks from japonica correlated with carbonassimilation, CO2 internal partial pressure (Ci), orWUE based on a permutation-based LOD cutoff (a =95% at 1,000 permutations; Table V; SupplementalTable S2). Several other aus and japonica introgressionswere identified, but they were not significant after thepermutation-based LOD cutoff (Supplemental TableS2). There were no introgressions from indica associ-ated with phenotypes measured in this analysis.To determine if the introgressed regions identified
above were enriched for biomass-related quantitativetrait loci (QTLs), we used the QTL enrichment analysismethod described by McNally et al. (2009). Indeed,
QTLs that were biomass related (i.e. vigor, anatomy,and yield as curated in Gramene QTLs release 31;http://gramene.org) were enriched in 10 of 11 intro-gressed regions (Table V; Supplemental Table S2).
DISCUSSION
Targeted genetic improvement of new bioenergyfeedstocks depends on identifying genetic variation incritical morphological, structural, and physiologicaltraits. Here, we demonstrated substantial genetic var-iation for biomass traits in 20 diverse rice varieties,and, based on genetic correlations among these traitsand total biomass, we determined that multiple routescan be used to achieve increased biomass. A powerful
Table III. Influence of varietal class (landrace and advanced) on biomass traitsMean 6 SE and P values for varietal classes for biomass traits are shown.
Trait Advanced Landrace P
Photosynthesis (mmol CO2 m22 s21) 20.4 6 0.4 19.2 6 0.4 0.041Ci (mmol CO2 m22 s21) 305.9 6 3.1 321.4 6 1.6 ,0.0001Transpiration (mmol water m22 s21) 8.3 6 0.2 8.9 6 0.123 0.0095Stomatal conductance (mol water m22 s21) 0.6 6 0.02 0.7 6 0.01 0.021Instantaneous WUE (mmol CO2 m22 s21)/
(mmol water m22 s21)2.6 6 0.1 2.2 6 0.05 0.0001
Height (cm) 109.8 6 3.2 139.8 6 2.2 ,0.0001Tiller no. 40.6 6 2.8 30.8 6 2.3 0.007Final tiller no. 80.0 6 5.8 31.7 6 1.9 ,0.0001Tiller diameter (mm) 5.4 6 0.1 6.8 6 0.2 ,0.0001Tiller length (cm) 57.5 6 3.0 68.6 6 2.1 0.0002Leaf length (cm) 62.1 6 0.9 76.6 6 1.2 ,0.0001Leaf width (cm) 1.6 6 0.02 1.7 6 0.03 0.1639Girth (cm) 23.7 6 0.8 22.5 6 0.6 0.0005Percentage water content 0.60 6 0.011 0.55 6 0.011 0.0037Dry biomass (g) 173.6 6 10.6 192.8 6 11.7 0.4114Harvest indexa leaf 0.33 6 0.007 0.28 6 0.009 ,0.0001Sheath 0.29 6 0.004 0.29 6 0.008 0.4998Stem 0.38 6 0.008 0.44 6 0.013 0.0004Seed 0.46 6 0.02 0.30 6 0.02 ,0.0001Lignin (%) 3.0 6 0.2 2.4 6 0.2 0.0221
aHarvest index for vegetative biomass (leaf, sheath, stem) = yield (leaf, sheath, stem)/total vegetativebiomass. Grain harvest index = grain yield/(grain + vegetative biomass).
Table IV. Total amount of variation associated with clade and genotype by trait
TraitClade Genotype
F Ratio P, Percentage Variance F Ratio P, Percentage Variance
Photosynthesis 16.6 9.7 3 10209 24.7 4.2 4.3 3 10206 28.2Ci 20.3 3.0 3 10210 9.3 15.0 2.2 3 10219 65.2Transpiration 15.0 4.5 3 10208 0.0 11.8 3.1 3 10216 68.2Stomatal conductance 6.9 2.8 3 10204 0.0 12.1 1.6 3 10216 66.4Instantaneous WUE 31.0 4.6 3 10214 20.6 12.9 2.2 3 10217 54.3Height 140.2 4.5 3 10229 16.1 57.6 2.3 3 10242 76.7Tiller no. 20.5 4.0 3 10208 13.3 9.7 3.1 3 10214 50.4Tiller diameter 65.0 1.6 3 10218 3.2 51.0 4.1 3 10240 86.8Tiller length 42.8 5.7 3 10214 8.1 25.5 4.4 3 10228 76.0Leaf length 12.0 2.3 3 10205 1.1 10.9 1.3 3 10215 63.6Leaf width 6.0 3.6 3 10203 0.0 15.7 1.4 3 10220 70.7Girth 15.4 1.7 3 10206 0.0 12.1 5.3 3 10217 69.4Wet biomass 3.1 4.9 3 10202 0.0 7.8 1.0 3 10211 53.6Dry biomass 3.2 4.6 3 10202 0.0 17.2 6.9 3 10222 74.0
Diversity of Biomass Traits in Rice
Plant Physiol. Vol. 155, 2011 163
incentive for using rice as a model for studying bio-mass is that this information can easily be translated toemerging breeding programs of promising bioenergygrasses. Genetic loci can be identified in rice andsubsequently targeted for biomass improvement inother grasses.
Among the 20 OryzaSNP varieties, variation in per-centage water content ranged from 43% to 74% (TableII), and, significantly, varieties with the lowest percent-age water content also had the highest total biomass.This result suggests that targeting reduced water con-tent may be a selection regime to increase total biomass.In addition, varieties with reduced water content atharvest will have reduced transport and handling costs.
Another approach to increase biomass is to increaseplant girth. Among the OryzaSNP set, plants withhigh biomass exhibited two contrasting phenotypesrelative to girth. The first group had a large number ofthin tillers, while the other displayed a small numberof large-diameter tillers. Continuous tillering associatedwith high grain yield is characteristically selected for inadvanced varieties. Indeed, these high-biomass varietiesexhibited a large number of small tillers with high grainharvest index. In contrast, landrace varieties are char-acterized by “determinant” tillering and low grain yieldand exhibit a small number of large-diameter tillers withlow grain harvest index. For cellulosic biomass, selectionfor an increased number of thick tillers is warranted.Interestingly, no variety among the 20 exhibited a com-bination of high tiller number with large diameters.
Compared with efforts focused on downstreamprocessing technologies, less has been invested inimproving the profile of structural carbohydrates incell walls of bioenergy crops. Most breeding efforts forbiofuel feedstocks are focused on increased plant size(increased total biomass) or higher yields per acre(Ragauskas et al., 2006). However, to maximize theefficiency of energy conversion, future breeding effortsshould also target cell wall composition optimized forvarious processing methods. For example, cell wallswith high cellulose and low lignin may be preferredfor fermentation but not for pyrolysis. In alfalfa(Medicago sativa) and poplar (Populus spp.), reducingcarbon partitioned to lignin resulted in increasedcarbon partitioned to cellulose and, therefore, in-creased cellulose-lignin ratios (Hu et al., 1999; Chen
and Dixon, 2007). The outcome of altering the cellu-lose-lignin ratios on final biomass can vary. In poplar,increased cellulose-lignin ratios led to increased plantsize (Hu et al., 1999), whereas some mutations inalfalfa that increased cellulose-lignin ratios led to de-creased plant size (Chen and Dixon, 2007). Highcellulose-lignin ratios can lead to lodging problems(Pedersen et al., 2005). Across the 20 rice varieties, cellwall polymer composition varied, suggesting the po-tential for targeted improvement. We note that ourlignin values, obtained from individual varieties grownin a greenhouse, were low (1.3%–4.3% total dry weight)compared with studies using field-grown mixtures ofrice varieties (14% total dry weight; Jin and Chen, 2007),suggesting that environmental conditions may greatlyinfluence lignin content.
In the 20 rice varieties, cell wall polymer composi-tion in leaves differs from that measured in stems and,in general, wall polymer composition is not geneticallycorrelated among tissue types. This suggests that thecompositions of leaf and stem structural carbohy-drates are under separate genetic control, and, basedon complementary studies with maize and sorghum(Sorghum bicolor), this may be a common characteristicin monocots (Krakowsky et al., 2005, 2006; Murrayet al., 2008). Like sorghum (Murray et al., 2008), mostof the OryzaSNP varieties (17 out of 20) contain morebiomass in their stems than in leaves. Together, theseresults emphasize that improvement strategies musttake into consideration the differences in how stemsand leaves contribute to total biomass as well as howchanging cell wall composition may alter harvestindices for specific vegetative tissues. Based on thefact that stems make up the bulk of biomass, ourwhole-plant girth observation may point to a tractablefield-based screen for increased biomass. However,field-based selection for carbohydrate structure in spe-cific tissues would not be trivial, because wall polymercomposition is under separate genetic control betweenleaves and stems.
As early as the 1980s, rice straw and hulls wererecognized as the largest agricultural wastes in Asia,particularly in countries producing as many as threecrops of rice per year (Ponnamperuma, 1984). For thisreason, farmers burn stover in the fields. This is nec-essary because the natural rate of decomposition is not
Table V. Segments introgressed from japonica that are associated with biomass traits enriched forbiomass-related QTLs
ChromosomeBlock
StartaBlock Size
Associated Biomass-
Related Traitb
No. of QTLs Associated
with Introgression Blocks
Biomass Relatedc Non Biomass Related
Mb kb
3 15.3 300 A, Ci, WUE 43 185 19.5 200 A, Ci, WUE 26 356 13.2 100 A, Ci, WUE 34 21
aIntrogressions significantly associated with biomass-related traits using a permutation-based LODthreshold (1,000 permutations, 95% a). bA, Carbon assimilation. cQTLs annotated as affectinganatomy, vigor, and yield from Gramene release 31.
Jahn et al.
164 Plant Physiol. Vol. 155, 2011
sufficient for turnover, and burning reduces plant path-ogen pressure on subsequent crops (Ponnamperuma,1984). Thus, despite its availability, rice stover has notbeen fully exploited as an energy feedstock. Likewise,rice hulls, which can make up to 20% of the total dryweight of a rice field, have not been widely used, al-though they are sometimes feedstock for energy pro-duction through gasification (Beagle, 1978; Lin et al.,1998).The composition and quantity of cell wall compo-
nents are primary factors determining whether or nota feedstock can be burned effectively for a particularapplication. For example, alkali metals, in combinationwith silica and sulfur, are primary factors responsiblefor clogging gasification equipment when heated atrelatively low temperatures (Jenkins et al., 1998). Totalash content of grasses varies greatly, from less than1% to greater than 15% (for review, see Pauly andKeegstra, 2008). In rice, the ash content is primarilycomposed of silica, the largest mineral component ofperennial grasses (Samson et al., 2005; Jin and Chen,2007). Silica content is influenced by soil type andwater uptake as well as by genetic variation. For ex-ample, in our controlled conditions, we observed awide range of ash content (4%–16%) in the OryzaSNPcollection, suggesting noteworthy genetic variation inash content. Apart from forage crops, few breedingefforts have targeted ash compositional changes ingrass species. A long-term breeding effort would benecessary to change ash composition, and improve-ments would have to be balanced against negativeeffects, because silica is believed to help preventanimal herbivory (Salim and Saxena, 1992; Cotterillet al., 2007; Keeping et al., 2009).On a global scale, the largest restriction to plant
production is the availability of water; therefore, theability of plants to use water efficiently is of greatimportance to agriculture (Boyer, 1982; Pennisi, 2008).We found significant differences in both instantaneousWUE and integrated WUE (d13C) among the 20 lines,and both methods of measuring WUE predicted thesame highly efficient varieties. However, varieties thatwere less efficient at water use did not rank the samebetween methods. WUE is calculated as the ratio ofcarbon assimilation to transpirational water loss, whiled13C is measured from the relative abundance of 13C inthe tissue. Both WUE and d13C are negative functionsof Ci/Ca under constant atmospheric CO2 (Ca) and thevapor pressure difference between the inside of theleaf and ambient air, but the correlations between WUEand d13C are never equal to 1 (Farquhar et al., 1989;Ehleringer and Monson, 1993; Araus et al., 2002). Dif-ferences in d13C are due to photosynthetic capacity(Amax) and/or stomatal conductance. The genetic dif-ferences inAmax are partially explained by differences incarboxylation capacity or the regeneration of ribulosebisphosphate (Farquhar and von Caemmerer, 1981).Substantial increases in productivity of major grain
crops over the last 50 years have contributed signifi-cantly to the world’s ability to feed an increasing
human population. This was achieved primarilythrough reducing plant size and reallocation of assim-ilated carbon to seed yield in conjunction with in-creased nitrogen fertilization. Because past breedingfocused primarily on increasing photoassimilate par-titioning to harvested tissues, little effort directlytargeted improving photosynthesis, although new ini-tiatives to improve photosynthetic rates are consid-ered a frontier for grain and biomass yields (Hibberdand Covshoff, 2010; Zhu et al., 2010). However, simplyincreasing daytime carbon assimilation rates may nothave the desired effect if enhancements are not cou-pled with positive changes in shoot architecture andcarbon metabolism, such as decreasing rates of res-piration. We found a negative correlation betweenphotosynthetic CO2 assimilation rates and biomassaccumulation in the OryzaSNP set. Although counter-intuitive, this result is not unique to rice; strongnegative correlations have been observed betweenphotosynthetic rates and total leaf area in field-grownsoybean (Glycine max; Hesketh et al., 1981) and amongphotosynthetic rates and leaf size in field-grownwheatand goatgrass (Aegilops spp.; Austin et al., 1982).Photosynthetic rates were also negatively correlatedwith biomass accumulation in greenhouse-growncommon cocklebur (Xanthium strumarium; Wassomet al., 2003). This suggests that multiple, semiinde-pendent components contribute to carbon capture andallocation. One possibility is that respiration rates aresubstantially different among the OryzaSNP set. Fur-ther investigation is necessary to understand the neg-ative relationship between photosynthetic rates andbiomass accumulation in the OryzaSNP set.
Rice varieties are commonly grouped based ongeographic distribution as well as plant and grainmorphology. As early as 200 B.C.E., rice varieties inChina were recorded as “hsien” and “keng,” and, in thelate 1920s, Japanese scientists divided cultivated riceinto two subspecies, “indica” and “japonica” (Katoet al., 1928; Chang et al., 1965). The indica (hsien) groupwas characterized as profusely tillering, tall-statureplants with light green leaves, while the japonica (keng)group was a medium tillering, short-stature plant withdark green leaves (Chang et al., 1965). Molecular andgenetic methods support the phenotypic characteristicsthat differentiate various rice varieties, including indicaand japonica, as well as landrace and advanced modernvarieties (McNally et al., 2009; Zhao et al., 2010). Incontrast to the above, examination of physiological andmorphological traits associated with high biomass didnot follow the same clade topology, suggesting thathigh biomass production may be achieved via multiple,independent developmental and physiological path-ways. This supports our hypothesis that novel geneticloci with major effects on biomass yield have not beenuncovered in traditional breeding programs.
One reason for selecting the 20 OryzaSNP varietiesfor detailed characterization was the potential to relatedetailed phenotypic measurements to the high-densitySNP data that are available for these varieties. The
Diversity of Biomass Traits in Rice
Plant Physiol. Vol. 155, 2011 165
small sample size of the OryzaSNP varieties is notsuitable for formal association mapping. However, asshown by McNally et al. (2009), it is possible to iden-tify chromosomal regions that reflect the breeding his-tory of key rice clades. In some instances, the distinctjaponica, indica, and aus introgressions align well withknown traits under strong selection in rice breeding(McNally et al., 2009). Using single marker regressionanalysis, we tested for significant effects of introgres-sions from japonica, indica, or aus on our measuredphenotypes. Of 3,838 blocks tested, three chromo-somal regions we identified had significant associa-tions to photosynthetic assimilation and its correlatedtraits (e.g. Ci/Ca). It is not clear why significant asso-ciations were not detected for morphological traits orwhy there were no associations between indica intro-gressions and biomass traits, although lack of power iscertainly a factor. To reduce false positives with thislimited sample size, we used a conservative permuta-tion-based LOD score as a threshold cutoff for callingassociations. Interestingly, the identified regions wereenriched with QTLs reported to be related to plantvigor, anatomy, and yield, providing promising leadsfor future studies. A limitation of this analysis is thatintrogressed regions were broadly categorized onlyinto japonica, indica, and aus clades. Thus, each regioncarries heterogeneous genetic loci from diverse back-grounds rather than the unique chromosomal locifound in biparental mapping populations. Nonethe-less, the results from this analysis suggest considerablebenefits from detailed phenotyping of a small set of“founder varieties,” such that specific regions can beidentified for validation using recombinant popula-tions sharing those introgression regions.
CONCLUSION
Creating a successful program that makes significantcontributions to the national energy budget requiresunprecedented inputs of biomass for energy conversion.The data presented here identify physiological and mor-phological traits that vary with biomass across a broadspectrum of rice varieties.We identified a suite of traits inrice that have a substantial impact on “biomass” yield.Moreover, different varieties achieved high yields byemploying unique combinations of different traits, sup-porting the hypothesis that multiple genetic loci contrib-ute to overall productivity. Efforts are under way toexploit genomic tools in rice to identify loci responsiblefor the observed trait variation. Finally, the traits identi-fied here exhibited a significant level of genetic variation,supporting the idea that they are good targets for tradi-tional breeding to enhance yield in new energy crops.
MATERIALS AND METHODS
Plant Materials
The OryzaSNP collection (Table I), a set 20 varieties, germplasm lines,
and landraces that are genetically and agronomically diverse, was chosen to
represent the biomass diversity found within rice (Oryza sativa; McNally et al.,
2009). The complete OryzaSNP set was analyzed for biomass traits (July 2008–
April 2009; n = 5) and for vegetative harvest index (leaf, sheath, and stems;
January–October, 2009; n = 2). A subset of flowering varieties (Azucena, Dom
Sufid, Dular, IR64, LTH, M202, Moroberekan, N22, Sadu-Cho, Tainung 67, and
Zhenshan 97B) were used to determine grain harvest index (April–October
2008; n = 15).
Growth Conditions
Plants were grown in a greenhouse environment with controlled temper-
ature and relative humidity (approximately 78�C and 55%) at Colorado State
University. To standardize total irradiance levels across experiments, supple-
mental high-intensity discharge lighting was used to maintain a 16-h-light/
8-h-dark photoperiod. Rice seeds were pregerminated in fungicide Maxim
XL (Syngenta) for 3 d prior to planting in potting mixture (4:4:1 Canadian
sphagnum peat:Pro-Mix BX:sand). Pro-Mix BX is a general purpose peat-
based growing medium (Premier Horticulture). Greenhouse-grown rice
plants were fertilized twice weekly with Peters Excel 15-5-15 Cal-Mag (Scotts),
starting at 1 month of age at a rate of 300 mg L21.
Trait Screening
Plant height was measured from the soil surface to the tip of the longest
leaf. Height and tiller number were measured weekly from 6 weeks after
germination to maturity. At maturity, tiller diameter and length were deter-
mined from five individual tillers and averaged. Tiller length was measured
from the soil surface to the node of the most distant leaf. Tiller diameter was
measured using a caliper. Leaf length and width were measured at least three
times throughout the growing season, and the maximummeasure is reported.
Girth was measured 2 cm above the soil surface 135 d after sowing and at
plant maturity.
All aboveground biomass was harvested, transferred to a paper bag, and
then weighed. The samples were oven dried at 93�C until they achieved a
constant weight. Percentage dry weight was calculated as dry weight divided
by wet sample weight. To determine the allocation of aboveground biomass,
plants were stripped into leaves, sheaths, and stems, and wet and dry weights
were determined. Leaf harvest index was calculated by dividing the leaf dry
yield value by the total vegetative plant weight. Sheath and stem harvest
indices were calculated as above, substituting the appropriate tissue. Grain
harvest index was calculated as the total grain dry weight divided by the total
aboveground biomass weight (vegetative and grain weight).
For cell wall polymer determination, 5 g of leaves and stems for each plant
was separately ground to produce a fine powder using a Braun Aromatic KSM
2 coffee grinder. Tissue powder was sent to the Soil and Forage Analysis
Laboratory of the University of Wisconsin (Marshfield). The cell wall struc-
tural components were determined by using acid detergent fiber, lignin acid
detergent fiber, and neutral detergent fiber procedures. Acid detergent fiber is
the fiber portion of plants (cellulose and lignin), while neutral detergent fiber
values are the acid detergent fiber fraction plus hemicelluloses.
Dried plant tissue was processed for carbon isotope analysis by randomly
sampling dried leaves at maturity. Leaf sample (50 mg) from each individual
was cut into 2-mm strips and then transferred into a 2-mL microfuge tube
containing stainless-steel BBs. Tissue was ground to a fine powder by shaking
for 5 min on a paint shaker. The resulting uniform powder was then
subsampled, and 2 mg for each plant was analyzed. Samples were analyzed
for d13C at the University of California Davis Stable Isotope Facility. Isotope
ratio data were provided as ratios relative to the Pee Dee Belemnite standard
(PDB), where d13C = (Rs/RPDB 2 1) 3 1,000 (Hubick et al., 1986).
Gas-Exchange Measurements
Gas-exchange measurements including CO2 fixation rate, stomatal con-
ductance, transpiration rate, and Ci were obtained using a LI-6400 portable
photosynthesis system (LI-COR) with a leaf chamber fluorometer cuvette.
Short-term, intrinsic WUE was calculated from the corrected CO2 fixation rate
and transpiration rate. Measurements were taken in the greenhouse on the
youngest fully expanded leaf of each plant. The mid part of the selected leaf
was enclosed in the leaf chamber, and the measurements were logged after
stability was attained in the chamber. Measurements were taken under
constant leaf temperature (20�C) and photosynthetic photon flux density
(1,200 mmol m–2 s–1), and CO2 was maintained at 400 mmol mol21. Five
Jahn et al.
166 Plant Physiol. Vol. 155, 2011
individuals per genotype were measured weekly in a stratified manner over
the course of 2 d from 9 AM to 4 PM for 6 weeks, while all the plants were in the
vegetative stage. The plants were measured five times at each measurement
session. We logged a total of 3,000 measurements from 100 individual plants.
These data were checked for technical error, and then a mean for each plant
each day was calculated. A general linear model was calculated with time as a
covariate.
Statistical Analysis
For each trait, data were transformed to improve normality using a box-cox
transformation. ANOVAwas calculated using the statistical software package
JMP V8.0 (SAS Institute). For evaluation of varietal group effects, all traits
were analyzed in ANOVA, where varietal group was entered as the primary
model effect and group nested within genotype were considered as fixed
effects. To calculate the relative contributions of genotype and varietal
groupings to the total variation in biomass traits, both varietal group and
genotype nested within varietal group were considered random effects. The
genetic correlation between traits is presented as Pearson’s correlation coef-
ficients among genotype means. The estimation of broad-sense heritability for
each trait is based on the resemblance among full sibs within each variety and
was calculated from variance components obtained through mixed-model
ANOVAs using restricted maximum likelihood with models including only
variety, which was considered a random effect (Falconer and Mackay, 1996).
Introgression Analysis
To estimate the association of biomass-related traits with introgressed
genome regions from indica, japonica, or aus origins, we used the single marker
regression method, which is usually used to identify markers linked to QTLs
(Collard et al., 2005). This method is suited to the OryzaSNP varieties because
it does not require marker position information and does not assume linkage
between markers. Previously, McNally et al. (2009) used SNP data from the 20
OryzaSNP varieties to define introgressed genome blocks of 100 kb from
indica, japonica, or aus clades. For the analysis of phenotypes in this study, we
generated three independent genotype data sets of the 20 varieties for each
type of introgression (i.e. from indica, japonica, or aus; Supplemental Table S3).
We illustrate the construction of the introgressed genotype data set using two
indica varieties, SHZ-2 and Minghui 63, as an example. If, after comparing a
chromosome 1 genome block of 100 kb from variety SHZ-2 with the other 19
OryzaSNP varieties, no introgressed indica segment was detected, then this
SHZ-2 block would be scored as ,nonintrogressed. (score = 3). In contrast,
for the same genome block, if comparison of Minghui 63 with the other 19
OryzaSNP varieties shows an indica introgression, then the Minghui 63 100-kb
block would be scored as,introgressed. (score = 1). These comparisons were
repeated for contiguous 100-kb blocks on the whole genome (3,838 blocks in
all) for each variety, and each introgression type was identified (Supplemental
Table S3). A linear model was then fitted to each introgression block using the
biomass trait data and the introgression score per 100-kb block, and the
coefficient of determination (r2) that explains the phenotypic variation attrib-
uted to the introgressed segment was determined. This marker regression
analysis was implemented using the R/qtl package (Broman et al., 2003).
Regions of introgression significantly associated with biomass-related traits
were determined at an initial LOD threshold of 2.0. The permutation-based
LOD threshold was also determined at 95% a for 1,000 permutations.
Enrichment of Gramene-curated QTLs in introgressed segments with signif-
icant effect on biomass traits was determined by comparing for a higher
frequency of occurrence of QTLs within these segments against the genome-
wide occurrence of QTLs using a one-sided Fisher exact test (McNally et al.,
2009).
Supplemental Data
The following materials are available in the online version of this article.
Supplemental Table S1. Pearson’s correlation coefficients among the total
biomass traits measured.
Supplemental Table S2. LOD scores and r2 values for biomass traits
correlated to segments introgressed from aus and japonica.
Supplemental Table S3. Three independent genotype data sets of the 20
varieties for each type of introgression.
ACKNOWLEDGMENTS
We thank Bryant Mason and Emily Peachy for technical support.
Received September 8, 2010; accepted November 8, 2010; published No-
vember 9, 2010.
LITERATURE CITED
Albar L, Lorieux M, Ahmadi N, Rimbault I, Pinel A, Sy AA, Fargette D,
Ghesquiere A (1998) Genetic basis and mapping of the resistance to rice
yellow mottle virus. I. QTLs identification and relationship between
resistance and plant morphology. Theor Appl Genet 97: 1145–1154
Araus JL, Slafer GA, Reynolds MP, Royo C (2002) Plant breeding and
drought in C-3 cereals: what should we breed for? Ann Bot (Lond) 89:
925–940
Austin RB, Morgan CL, Ford MA (1982) Flag leaf photosynthesis of
Triticum aestivum and related diploid and tetraploid species. Ann Bot
(Lond) 49: 177–189
Beagle EC (1978) Rice husk conversion to energy. FAO Agricultural
Services Bulletin 37
Boyer JS (1982) Plant productivity and environment. Science 218: 443–448
Broman KW, Wu H, Sen S, Churchill GA (2003) R/qtl: QTL mapping in
experimental crosses. Bioinformatics 19: 889–890
Bush DR, Leach JE (2007) Translational genomics for bioenergy produc-
tion: there’s room for more than one model. Plant Cell 19: 2971–2973;
author reply 2973
Chang TT, Bardenas EA, Del Rosario AC (1965) The morphology and
varietal characteristics of the rice plant. IRRI Tech Bull 4: 1–40
Chen F, Dixon RA (2007) Lignin modification improves fermentable sugar
yields for biofuel production. Nat Biotechnol 25: 759–761
Collard BCY, Jahufer MZZ, Brouwer JB, Pang ECK (2005) An introduction
to markers, quantitative trait loci (QTL) mapping and marker-assisted
selection for crop improvement: the basic concepts. Euphytica 142: 169–196
Cotterill JV, Watkins RW, Brennon CB, Cowan DP (2007) Boosting silica
levels in wheat leaves reduces grazing by rabbits. Pest Manag Sci 63:
247–253
Courtois B, Shen L, Petalcorin W, Carandang S, Mauleon R, Li Z (2003)
Locating QTLs controlling constitutive root traits in the rice population
IAC165 3 CO39. Euphytica 134: 335–345
Cui KH, Huang JL, Xing YZ, Yu SB, Xu CG, Peng SB (2008) Mapping QTLs
for seedling characteristics under different water supply conditions in
rice (Oryza sativa). Physiol Plant 132: 53–68
Ehleringer JR, Monson RK (1993) Evolutionary and ecological aspects of
photosynthetic pathway variation. Annu Rev Ecol Syst 24: 411–439
Elobeid A, Tokgoz S, Hart C (2007) The ethanol outlook for Brazil and the
United States and implications for livestock. Int Sugar J 109: 174–177
Falconer DS, Mackay TFC (1996) Quantitative Genetics, Ed 4. Longman,
Essex, UK
Farquhar GD, Ehleringer JR, Hubick KT (1989) Carbon isotope discrim-
ination and photosynthesis. Annu Rev Plant Physiol Plant Mol Biol 40:
503–537
Farquhar GD, von Caemmerer S (1981) Electron transport limitations on
the CO2 assimilation rate of Phaseolus vulgaris L. In G Akounoglou, ed,
The Fifth International Congress on Photosynthesis, Vol 4. Bababan,
Philadelphia, pp 163–175
Feuillet C, Keller B (2002) Comparative genomics in the grass family:
molecular characterization of grass genome structure and evolution.
Ann Bot (Lond) 89: 3–10
Gale MD, Devos KM (1998) Comparative genetics in the grasses. Proc Natl
Acad Sci USA 95: 1971–1974
Hemamalini GS, Shashidhar HE, Hittalmani S (2000) Molecular marker
assisted tagging of morphological and physiological traits under two
contrasting moisture regimes at peak vegetative stage in rice (Oryza
sativa L.). Euphytica 112: 69–78
Hesketh JD, Ogren WL, Hageman ME, Peters DB (1981) Correlations
among leaf CO2-exchange rates, areas and enzyme activities among
soybean cultivars. Photosynth Res 2: 21–30
Hibberd JM, Covshoff S (2010) The regulation of gene expression required
for C4 photosynthesis. Annu Rev Plant Biol 61: 181–207
Hu WJ, Harding SA, Lung J, Popko JL, Ralph J, Stokke DD, Tsai CJ,
Chiang VL (1999) Repression of lignin biosynthesis promotes cellulose
Diversity of Biomass Traits in Rice
Plant Physiol. Vol. 155, 2011 167
accumulation and growth in transgenic trees. Nat Biotechnol 17:
808–812
Huang ZA, Jiang DA, Yang Y, Sun JW, Jin SH (2004) Effects of nitrogen
deficiency on gas exchange, chlorophyll fluorescence, and antioxidant
enzymes in leaves of rice plants. Photosynthetica 42: 357–364
Hubick KT, Farquhar GD, Shorter R (1986) Correlation between water-use
efficiency and carbon isotope discrimination in diverse peanut (Arachis)
germplasm. Aust J Plant Physiol 13: 803–816
Jannoo N, Grivet L, Chantret N, Garsmeur O, Glaszmann JC, Arruda P,
D’Hont A (2007) Orthologous comparison in a gene-rich region among
grasses reveals stability in the sugarcane polyploid genome. Plant J 50:
574–585
Jenkins BM, Baxter LL, Miles TR (1998) Combustion properties of bio-
mass. Fuel Process Technol 54: 17–46
Jin SY, Chen HZ (2007) Near-infrared analysis of the chemical composition
of rice straw. Ind Crops Prod 26: 207–211
Kato S, Kosaka H, Hara S (1928) On the affinity of rice varieties as shown
by the fertility of hybrid plants. Bull Sci Facult Terkult Kyushu Imp Univ
3: 132–147
Keeping MG, Kvedarasa OL, Bruton AG (2009) Epidermal silicon in
sugarcane: cultivar differences and role in resistance to sugarcane borer
Eldana saccharina. Environ Exp Bot 66: 54–60
Khush GS (1999) Green revolution: preparing for the 21st century. Genome
42: 646–655
Khush GS (2001) Challenges for meeting the global food and nutrient
needs in the new millennium. Proc Nutr Soc 60: 15–26
KrakowskyMD, LeeM, Coors JG (2005) Quantitative trait loci for cell-wall
components in recombinant inbred lines of maize (Zea mays L.). I. Stalk
tissue. Theor Appl Genet 111: 337–346
Krakowsky MD, Lee M, Coors JG (2006) Quantitative trait loci for cell wall
components in recombinant inbred lines of maize (Zea mays L.). II. Leaf
sheath tissue. Theor Appl Genet 112: 717–726
Leung H, McNally KL, Mackill D (2007) Rice. In MP Weiner, SB Gabriel,
JC Stephens, eds, Genetic Variation: A Laboratory Manual. Cold Spring
Harbor Laboratory Press, Cold Spring Harbor, NY, pp 335–351
Li ZK, Luo LJ, Mei HW, Wang DL, Shu QY, Tabien R, Zhong DB, Ying CS,
Stansel JW, Khush GS, et al (2001) Overdominant epistatic loci are the
primary genetic basis of inbreeding depression and heterosis in rice. I.
Biomass and grain yield. Genetics 158: 1737–1753
Lian XM, Xing YZ, Yan H, Xu CG, Li XH, Zhang QF (2005) QTLs for low
nitrogen tolerance at seedling stage identified using a recombinant
inbred line population derived from an elite rice hybrid. Theor Appl
Genet 112: 85–96
Lin KS, Wang HP, Lin CJ, Juch CI (1998) A process development for
gasification of rice husk. Fuel Process Technol 55: 185–192
McNally KL, Bruskiewich R, Mackill D, Buell CR, Leach JE, Leung H
(2006) Sequencing multiple and diverse rice varieties: connecting
whole-genome variation with phenotypes. Plant Physiol 141: 26–31
McNally KL, Childs KL, Bohnert R, Davidson RM, Zhao K, Ulat VJ,
Zeller G, Clark RM, Hoen DR, Bureau TE, et al (2009) Genomewide
SNP variation reveals relationships among landraces and modern
varieties of rice. Proc Natl Acad Sci USA 106: 12273–12278
Murray SC, Rooney WL, Mitchell SE, Sharma A, Klein PE, Mullet
JE, Kresovich S (2008) Genetic improvement of sorghum as a biofuel
feedstock. II. QTL for stem and leaf structural carbohydrates. Crop Sci
48: 2180–2193
Pauly M, Keegstra K (2008) Cell-wall carbohydrates and their modification
as a resource for biofuels. Plant J 54: 559–568
Pedersen JF, Vogel KP, Funnell DL (2005) Impact of reduced lignin on
plant fitness. Crop Sci 45: 812–819
Pennisi E (2008) Plant genetics: the blue revolution, drop by drop, gene by
gene. Science 320: 171–173
Ponnamperuma FN (1984) Straw as a source of nutrients for wetland rice.
In Organic Matter and Rice. International Rice Research Institute,
Manila, Philippines, pp 117–136
Ragauskas AJ, Williams CK, Davison BH, Britovsek G, Cairney J, Eckert
CA, Frederick WJ Jr, Hallett JP, Leak DJ, Liotta CL, et al (2006) The path
forward for biofuels and biomaterials. Science 311: 484–489
Reinhardt D, Kuhlemeier C (2002) Plant architecture. EMBO Rep 3: 846–851
Sage RF (1994) Acclimation of photosynthesis to increasing atmospheric
CO2: the gas exchange perspective. Photosynth Res 39: 351–368
Sakamoto T, Morinaka Y, Ohnishi T, Sunohara H, Fujioka S, Ueguchi-
Tanaka M, Mizutani M, Sakata K, Takatsuto S, Yoshida S, et al (2006)
Erect leaves caused by brassinosteroid deficiency increase biomass
production and grain yield in rice. Nat Biotechnol 24: 105–109
Salim M, Saxena RC (1992) Iron, silica, and aluminum stresses and varietal
resistance in rice: effects on whitebacked planthopper. Crop Sci 32: 212–219
Samson R, Mani S, Boddey R, Sokhansanj S, Quesada D, Urquiaga S,
Reis V, Lem CH (2005) The potential of C4 perennial grasses for develop-
ing global BIOHEAT industry. CRC Crit Rev Plant Sci 24: 461–495
Sinclair TR, Sheehy JE (1999) Erect leaves and photosynthesis in rice.
Science 283: 1455
Sun Y, Cheng JY (2002) Hydrolysis of lignocellulosic materials for ethanol
production: a review. Bioresour Technol 83: 1–11
Wassom JJ, Knepp AW, Tranel PJ, Wax LM (2003) Variability in photosyn-
thetic rates and accumulated biomass among greenhouse-grown common
cocklebur (Xanthium strumarium) accessions. Weed Technol 17: 84–88
Xing Z, Tan F, Hua P, Sun L, Xu G, Zhang Q (2002) Characterization of the
main effects, epistatic effects and their environmental interactions of
QTLs on the genetic basis of yield traits in rice. Theor Appl Genet 105:
248–257
Xu CG, Li XQ, Xue Y, Huang YW, Gao J, Xing YZ (2004) Comparison of
quantitative trait loci controlling seedling characteristics at two seedling
stages using rice recombinant inbred lines. Theor Appl Genet 109: 640–647
Xu YB, This D, Pausch RC, Vonhof WM, Coburn JR, Comstock JP,
McCouch SR (2009) Leaf-level water use efficiency determined by
carbon isotope discrimination in rice seedlings: genetic variation asso-
ciated with population structure and QTL mapping. Theor Appl Genet
118: 1065–1081
Yang XC, Hwa CM (2008) Genetic modification of plant architecture and
variety improvement in rice. Heredity 101: 396–404
Zhao K, Wright M, Kimball J, Eizenga G, McClung A, Kovach M, Tyagi
W, Ali ML, Tung CW, Reynolds A, et al (2010) Genomic diversity and
introgression in O. sativa reveal the impact of domestication and
breeding on the rice genome. PLoS ONE 5: e10780
Zhu XG, Long SP, Ort DR, Eizenga G, McClung A, Kovach M, Tyagi W,
Ali ML, Tung CW, Reynolds A, et al (2010) Improving photosynthetic
efficiency for greater yield. Annu Rev Plant Biol 61: 235–261
Jahn et al.
168 Plant Physiol. Vol. 155, 2011