Genetic drift outweighs natural selection at toll-like receptor ( TLR ) immunity loci in a...
13
Genetic drift outweighs natural selection at toll-like receptor (TLR) immunity loci in a re-introduced population of a threatened species CATHERINE E. GRUEBER,* † GRAHAM P. WALLIS* and IAN G. JAMIESON* † *Department of Zoology, University of Otago, PO Box 56, Dunedin 9054, New Zealand Abstract During population establishment, genetic drift can be the key driver of changes in genetic diversity, particularly while the population is small. However, natural selection can also play a role in shaping diversity at functionally important loci. We used a well-studied, re-introduced population of the threatened Stewart Island robin (N = 722 pedigreed individuals) to determine whether selection shaped genetic diversity at innate immunity toll-like receptor (TLR) genes, over a 9-year period of population growth following establishment with 12 genetic founders. We found no evidence for selection operating with respect to TLR diversity on first-year overwinter survival for the majority of loci, genotypes and alleles studied. However, survival of individuals with TLR4 BE genotype was significantly improved: these birds were less than half as likely to die prior to maturity compared with all other TLR4 genotypes. Furthermore, the population frequency of this genotype, at a two-fold excess over Hardy–Weinberg expectation, was increased by nonrandom mating. Near-complete sampling and full pedigree and reproductive data enabled us to eliminate other potential causes of these patterns including inbreeding, year effects, density dependence, selection on animals at earlier life history stages or genome-level association of the TLR4 E allele with ‘good genes’. However, comparison of observed levels of gene diversity to predictions under simulated genetic drift revealed results consistent with neutral expectations for all loci, including TLR4. Although selection favoured TLR4 BE heterozygotes in this population, these effects were insufficient to outweigh genetic drift. This is the first empirical study to show that genetic drift can overwhelm natural selection in a wild population immediately following establishment. Keywords: bottleneck, colonization, conservation, heterozygosity, pedigree, Petroica, survival Received 14 March 2013; revision received 14 May 2013; accepted 23 May 2013 Introduction When unoccupied habitat (e.g. an offshore island or for- est fragment) becomes colonized by a few individuals, genetic change relative to the source population occurs at the initial founding event and subsequently as a result of genetic drift while the population remains small (Nei et al. 1975). These forces tend to reduce genetic diversity of the population, although the genetic makeup of the descendent population can also be shaped by natural selection if the environment differs from that of the source population (Schluter 2000). If selection pressures are strong, their action on founder diversity can act in opposition to, or in combination with, genetic drift (Hal- dane 1927; Clegg et al. 2002). For example, mechanisms of diversifying selection may maintain genetic diversity in the face of drift if animals with versatile (e.g. hetero- zygous, sensu Lerner 1954) genotypes proliferate (e.g. Bensch et al. 2006), whereas in cases where strong direc- tional selection occurs, genetic diversity is expected to be rapidly eroded (Ejsmond & Radwan 2011). Correspondence: Catherine E. Grueber, Fax: +64 3 479 7584; E-mail: [email protected] †Allan Wilson Centre for Molecular Ecology and Evolution, Palmerston North, New Zealand © 2013 John Wiley & Sons Ltd Molecular Ecology (2013) doi: 10.1111/mec.12404
-
Upload
independent -
Category
Documents
-
view
4 -
download
0
Transcript of Genetic drift outweighs natural selection at toll-like receptor ( TLR ) immunity loci in a...
Genetic drift outweighs natural selection at toll-likereceptor (TLR) immunity loci in a re-introducedpopulation of a threatened species
CATHERINE E. GRUEBER,*† GRAHAM P. WALLIS* and IAN G. JAMIESON*†
*Department of Zoology, University of Otago, PO Box 56, Dunedin 9054, New Zealand
Abstract
During population establishment, genetic drift can be the key driver of changes in
genetic diversity, particularly while the population is small. However, natural selection
can also play a role in shaping diversity at functionally important loci. We used a
well-studied, re-introduced population of the threatened Stewart Island robin (N = 722
pedigreed individuals) to determine whether selection shaped genetic diversity at
innate immunity toll-like receptor (TLR) genes, over a 9-year period of population
growth following establishment with 12 genetic founders. We found no evidence for
selection operating with respect to TLR diversity on first-year overwinter survival for
the majority of loci, genotypes and alleles studied. However, survival of individuals
with TLR4BE genotype was significantly improved: these birds were less than half as
likely to die prior to maturity compared with all other TLR4 genotypes. Furthermore,
the population frequency of this genotype, at a two-fold excess over Hardy–Weinberg
expectation, was increased by nonrandom mating. Near-complete sampling and full
pedigree and reproductive data enabled us to eliminate other potential causes of these
patterns including inbreeding, year effects, density dependence, selection on animals
at earlier life history stages or genome-level association of the TLR4E allele with ‘good
genes’. However, comparison of observed levels of gene diversity to predictions under
simulated genetic drift revealed results consistent with neutral expectations for all loci,
including TLR4. Although selection favoured TLR4BE heterozygotes in this population,
these effects were insufficient to outweigh genetic drift. This is the first empirical
study to show that genetic drift can overwhelm natural selection in a wild population
immediately following establishment.
Keywords: bottleneck, colonization, conservation, heterozygosity, pedigree, Petroica, survival
Received 14 March 2013; revision received 14 May 2013; accepted 23 May 2013
Introduction
When unoccupied habitat (e.g. an offshore island or for-
est fragment) becomes colonized by a few individuals,
genetic change relative to the source population occurs
at the initial founding event and subsequently as a result
of genetic drift while the population remains small (Nei
et al. 1975). These forces tend to reduce genetic diversity
of the population, although the genetic makeup of the
descendent population can also be shaped by natural
selection if the environment differs from that of the
source population (Schluter 2000). If selection pressures
are strong, their action on founder diversity can act in
opposition to, or in combination with, genetic drift (Hal-
dane 1927; Clegg et al. 2002). For example, mechanisms
of diversifying selection may maintain genetic diversity
in the face of drift if animals with versatile (e.g. hetero-
zygous, sensu Lerner 1954) genotypes proliferate (e.g.
Bensch et al. 2006), whereas in cases where strong direc-
tional selection occurs, genetic diversity is expected to be
rapidly eroded (Ejsmond & Radwan 2011).
Correspondence: Catherine E. Grueber, Fax: +64 3 479 7584;
E-mail: [email protected]
†Allan Wilson Centre for Molecular Ecology and Evolution,
Palmerston North, New Zealand
© 2013 John Wiley & Sons Ltd
Molecular Ecology (2013) doi: 10.1111/mec.12404
Much attention has been given to the relative influ-
ences of these forces in newly established populations,
as they have bearing on several issues not only in evo-
lution but also in conservation biology, including the
ability to introduce and recover small numbers of indi-
viduals of threatened species in new habitat. The rela-
tive effects of genetic drift and natural selection in
small founder populations have been the subject of a
number of simulation and laboratory-based studies (e.g.
Ejsmond & Radwan 2011; Ellison et al. 2013). Recent
studies have also compared pre- and postbottleneck
change in putatively neutral genetic diversity (e.g.
microsatellites) to changes in functional diversity (e.g.
genes of the major histocompatibility complex, MHC),
indicating that a combination of genetic drift and selec-
tive forces is at play during population bottlenecks
z(Piertney & Oliver 2006; van Oosterhout 2009; Radwan
et al. 2010; Sutton et al. 2011). These empirical findings
are similar to those obtained from simulation studies
(Ejsmond & Radwan 2011), although conflicting results
continue to be reported (e.g. smaller loss of functional
diversity than neutral: Oliver & Piertney 2012; Strand
et al. 2012; greater loss of functional diversity: Eimes
et al. 2011). Certainly, the effects of genetic drift and
natural selection in small populations are difficult to
disentangle using molecular markers alone (Alcaide
2010; Bollmer et al. 2011; Sutton et al. 2011; van Oosterh-
out 2013).
In most studies of selection and genetic drift in natu-
ral populations, the influence of drift is quantified using
a sample of presumed neutral markers, such as micro-
satellites (e.g. Agudo et al. 2011; Eimes et al. 2011; Oli-
ver & Piertney 2012; Taylor et al. 2012). In the current
study, we take advantage of a complete and reliable
pedigree that has been constructed for our study popu-
lation based on breeding observations and offspring
banded in the nest (Townsend & Jamieson 2013a), as
well as detailed data of the reproductive success of all
breeders and genotypes of their offspring. This detailed
knowledge of the contributions of each animal to
annual changes in the genetic composition of the popu-
lation allows us to use pedigree data to generate expec-
tations under chance, thus avoiding tacit assumptions
associated with using microsatellites (e.g. selective neu-
trality, unbiased genome representation, independent
assortment among loci).
Recently, Gratten et al. (2012) employed extensive
pedigree information in a well-studied island popula-
tion of Soay sheep (Ovis aries) to show that changes in
the frequency of a particular coat-colour allele were dri-
ven by selection, not drift. Our study differs from this
previous work in two ways. First, whereas the Soay
sheep population was established several decades prior
to the study (Overall et al. 2005), our island population
has been sampled over a period of natural population
growth immediately following human-assisted estab-
lishment, including genotyping of the 12 genetic foun-
ders. This allows us to address the roles of selection
and drift immediately following colonization of a new
site. Second, unlike the Soay sheep study population,
our population is isolated, preventing low rates of
immigration or emigration that might mask any effects
of drift or selection.
We scored variation at seven innate immunity toll-
like receptor (TLR) loci, whose genes encode binding
proteins that initiate innate and acquired aspects of the
immune response (Brownlie & Allan 2011). Although
the majority of TLR sequence variation is subject to
purifying selection (Barreiro et al. 2009; Mukherjee et al.
2009), several TLR genes are thought to evolve under
balancing selection (Ferrer-Admetlla et al. 2008) and
show high levels of diversity in wild populations
(Alcaide & Edwards 2011; Bergman et al. 2012; Grueber
et al. 2012). The main technical advantage of using Toll-
like receptors (TLRs) in studies of nonmodel species is
the rarity of gene duplication in derived lineages
(Alcaide & Edwards 2011). The more commonly used
major histocompatibility complex (MHC) is typified by
a high degree of copy number variation, especially in
passerine birds (Babik 2010; Bollmer et al. 2010). High
levels of gene duplication in MHC can lead to co-ampli-
fication of multiple loci during PCR, complicating geno-
typing and increasing the probability of PCR artefacts
(reviewed by Babik et al. 2009).
Toll-like receptors are a particularly interesting family
of genes to study the immunogenetics of wild popula-
tions, as together they play a crucial role in host front-
line defence against a wide diversity of pathogens (i.e.
bacteria, viruses, fungi; Uematsu & Akira 2008). Varia-
tion in TLR sequences has also been associated with vari-
ation in resilience to infections (Villase~nor-Cardoso &
Ortega 2011). In the current study, we do not have
cause-of-death information for animals that died, nor
specific information about the disease environment of
the habitat; therefore, we cannot make specific a priori
predictions about the relationship between any TLR
locus and survival. Therefore, rather than establishing
the genetic mechanisms underpinning variation in indi-
vidual fitness traits (e.g. Acevedo-Whitehouse et al. 2005;
Gratten et al. 2012), our goal is to test predictions centred
on population-level processes.
Previous authors have highlighted the important role
played by chance in influencing changes in population
genetic diversity after colonization (e.g. Kaeuffer et al.
2007; Bouzat 2010). Because only strong selection is
expected to overcome drift in small populations (Bouzat
2010; Hedrick 2012), we asked whether selection operat-
ing on TLR diversity would overcome the genetic drift
© 2013 John Wiley & Sons Ltd
2 C. E . GRUEBER, G. P . WALLIS and I . G. JAMIESON

that occurs during population establishment. The unique
advantages of our study system, as described above,
allow us to address this question explicitly by examin-
ing population growth as it unfolded, correlating sur-
vival rates of descendants with their genotypes. Our
ability to trace founder representation, mating patterns
and genotype transmission as the population grew from
12 genetic founders to 346 adults enables us to execute
the first empirical study to distinguish several selective
and demographic forces from chance, during the earli-
est stages of colonization.
Materials and methods
Our analysis proceeded in two major steps: first, we
determined whether there was evidence for selection on
TLR genotypes in the population. Second, we tested
whether the magnitude of selection detected was suffi-
cient to outweigh the influence of genetic drift on tem-
poral changes in genetic diversity of the population.
Study population, sampling and genotyping
Our study animal is a nonmigratory forest passerine,
the Stewart Island robin Petroica australis rakiura. This
subspecies is threatened on the mainland of Stewart
Island, and therefore a number of individuals were
re-introduced to Ulva Island where introduced preda-
tors were eradicated (Laws & Jamieson 2010; Townsend
& Jamieson 2013a). The study took place over a 9-year
period of natural population growth: from the time the
robins were translocated and released over two breed-
ing seasons (2000/2001 and 2001/2002) to the end of
the 2009/2010 breeding season. All 722 known (banded)
birds were included in the pedigree (excluding foun-
ders), of which we genotyped 656 (91%).
Natural selection was defined here by differential sur-
vival of TLR genotypes. Adult robin annual survival is
generally high on Ulva Island (approximately 90%; IGJ,
unpublished data), so our fitness trait of choice
focussed on the birds’ most vulnerable period: first-year
over-winter survival. Robins are able to breed in the
season after they hatched (i.e. aged approximately
1 year), so this measure can also be interpreted as sur-
vival to maturity. Systematic monitoring during each
breeding season indicates that any birds not sighted
each year are likely to have died since the previous sea-
son (see Laws & Jamieson 2010 for detailed field meth-
ods). The genotyped birds included 96% of all known
birds that survived to maturity (N = 517, of 538 survi-
vors) and 76% of known birds that died over their first
winter (N = 139, of 184 birds that died). Of the 9%
(N = 66) of known birds (survived or died) that were
not included, the majority (N = 58) were unsampled,
and most of these (N = 34) were animals that died in
the last year of the study (during the winter of 2010).
Six sampled birds were excluded from the final molecu-
lar data set as a result of poor-quality DNA and/or
genotyping. Our final data set included 99% of all
known breeders [as defined as pairs that produced at
least one nestling, regardless of whether it survived
(N = 246)].
Blood samples were collected as part of routine moni-
toring, and DNA was extracted using a standard Chelex
protocol (Walsh et al. 1991; Casquet et al. 2012) for pre-
vious studies (Taylor et al. 2007; Townsend et al. 2012).
DNA sample concentrations were standardized to
15 ng/ll and samples genotyped at seven TLR loci
using a total of 13 SNPs diagnostic for alleles identified
in the study by Grueber et al. (2012) (Table S1, Support-
ing information). These SNPs inform the allelic state of
approximately 6.4 kb of coding sequence in total (range,
522–1279 bp per TLR locus, Table S1, Supporting infor-
mation). All birds were genotyped for all SNPs in single
multiplexes on two Sequenom iPLEX MassARRAY
chips (service provided by GenomNZ). SNP genotypes
were distilled into allele haplotypes following Grueber
et al. (2012). TLR21 exhibited synonymous variants for
the SNPs studied here, so two TLR21 DNA haplotypes
were pooled into a single amino acid variant, giving
three ‘alleles’ for this locus (Grueber et al. 2012). Due to
a high degree of sequence similarity between robin
TLR2A and TLR2B sequences, TLR2A could not be
genotyped, and only one SNP from TLR2B could be
genotyped. TLR2B exhibited two synonymous variants,
expected to be selectively neutral. For all remaining loci,
each DNA haplotype translated as a unique amino acid
variant.
Tests of selection
For our survival analyses, we defined TLR diversity in
a number of ways, each of which represents a subtly
different potential target of natural selection. First, we
used generalized linear mixed effects modelling
(GLMM) to estimate the effect of TLR heterozygosity on
survival, both as a composite metric, and for each locus
individually. Composite heterozygosity was quantified
using standardized observed multilocus heterozygosity
(referred to here as H), calculated with the package Rhh
(Alho et al. 2010) for R (R Core Development Team
2011). We chose this metric as it controls for differing
levels of heterozygosity among loci (see Results), as
well as any missing genotypes (only 0.3% of the data
set). The effect of heterozygosity at individual loci on
survival was estimated by fitting separate models
for each locus, where heterozygosity was coded as a
0/1 (for homozygote or heterozygote, respectively)
© 2013 John Wiley & Sons Ltd
DRIFT AND SELECTION AFTER RE- INTRODUCTION 3
predictor. Aside from heterozygosity predictors, these
survival models also included inbreeding coefficient F
(calculated from pedigrees, see Townsend & Jamieson
2013a) and ‘cohort’ (breeding year) as the random fac-
tor. Our composite heterozygosity model also included
the H 9 F interaction, following previous observations
in this population by Townsend & Jamieson (2013b)
that the effect of microsatellite-based multilocus hetero-
zygosity on survival varied with F. See Methods S1
(Supporting information) section ‘Generalized linear
mixed modelling’ for more details.
Second, it is possible that certain alleles or genotypes
affect survival independently of heterozygosity per se.
We therefore tested whether allele frequencies of each
locus differed between birds that survived vs. died
using per-locus FST (Weir & Cockerham 1984) calcu-
lated with FSTAT (Goudet 1995). We tested the influ-
ence of genotypes by focussing on those loci with >2alleles (TLR4, TLR5, TLR21). In this part of the analysis,
we followed the approach of Sepil et al. (2012) by mod-
elling the effect of each genotype on survival separately,
where each individual is coded with a 1/0 predictor
indicating presence/absence of the genotype in ques-
tion. These models all included F and the random factor
cohort, as mentioned above. AICC values of all geno-
type models were ranked (following Burnham &
Anderson 2002), along with a ‘base’ model that
included only F and cohort. Where a genotype model
ranked highly (i.e. was ≥2 AICC from the next best
model and superior to the base model), we interpreted
this as evidence that the genotype in question influ-
enced survival (Sepil et al. 2012).
We found evidence that one particular genotype
(TLR4BE) conferred a survival advantage and was pres-
ent in excess of Hardy–Weinberg equilibrium (HWE)
expectation (see Results). We therefore examined
processes other than selection that could lead to devia-
tions from HWE. Birds entered our data set at banding
age (approximately 2 weeks old), so possible selection
pressures occurring prior to this (e.g. during fertiliza-
tion, egg development, early nestling stages) were
tested by examining whether observed genotype
frequencies in offspring deviated from predictions
under Mendelian inheritance, given observed parental
genotype combinations. We compared annual produc-
tion of TLR4BE offspring to predictions generated using
Monte Carlo simulations (see Methods S1 section
‘Prediction of Mendelian frequencies’, Supporting
information). We also tested whether the excess of
TLR4BE individuals could be attributed to nonrandom
mating by comparing annual frequencies of TLR4BE to
those expected under random mating (see Methods S1
section ‘Simulation of random mating’, Supporting
information).
Predictions under genetic drift
To forecast changes in annual levels of gene diversity
expected under genetic drift, we wrote a genedropping
simulation (MacCluer et al. 1986; Gratten et al. 2012) in
R (R Core Development Team 2011). As genedropping
simulates transmission of alleles through the known
pedigree following Mendelian inheritance only, it can
be used to predict levels of genetic diversity in the
absence of selection while accounting for known pedi-
gree relationships, inbreeding [which has been gradu-
ally increasing (Jamieson 2011)], disproportionate
reproductive success among individuals (Jamieson
2011) and increasing population size. We used allele
frequencies among the living descendants (adults only)
to calculate annual gene diversity (D) for each locus
using 1�Pni¼1 p
2i (Hedrick 2000), where pi is the fre-
quency of the i th allele at a locus. The means and 95%
quantiles of N = 5000 simulations were taken as our
predicted values and compared with equivalent values
calculated using the observed TLR allele frequency data.
The pedigree used for genedropping was 98.1% com-
plete; see Methods S1 section (Supporting information)
‘Genedropping’ for specific details regarding handling
of the small proportion of missing pedigree data.
Unless stated otherwise, all analyses were conducted
using functions available in the base package of R
(R Core Development Team 2011).
Results
Of the 656 genotyped animals, >99% were successfully
genotyped at all SNPS for all 7 TLR loci, and all were
genotyped at ≥3 TLR loci. For two unsampled founders
and two other unsampled birds, full genotypes could
be inferred because of extensive first-degree pedigree
relationships with genotyped animals (following
Grueber et al. 2012), permitting their inclusion in the
analysis.
Effects of TLR diversity on survival
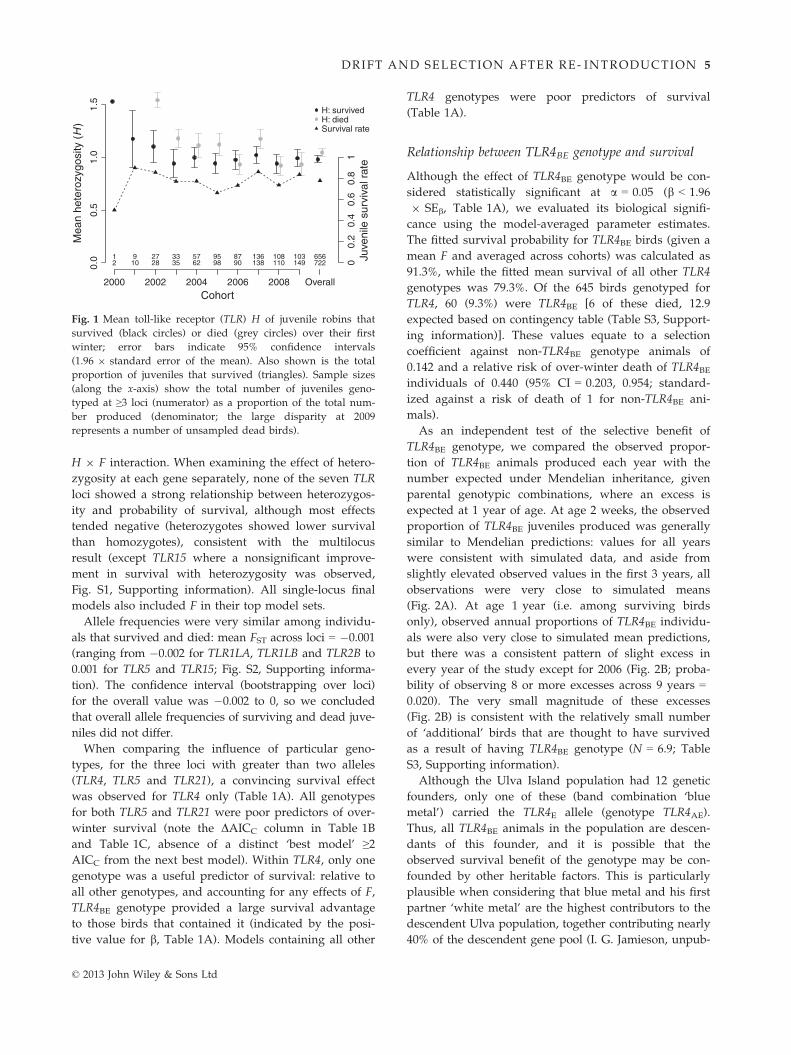
There was little effect of composite heterozygosity at
seven TLR loci on juvenile robin survival [GLMM
model-averaged standardized coefficient (� adjusted
SE): bH = �0.300 (�0.196), relative importance = 0.54,
model set provided in Table S2, Supporting informa-
tion; Fig. 1]. The negative coefficient for H suggests that
survivors showed slightly decreased overall TLR hetero-
zygosity (Fig. 1), but this effect was estimated with poor
precision, as the standard error was large. The final
model also included individual inbreeding [where
bF = �0.136 (�0.198), relative importance = 0.32, Table
S2, Supporting information], but no evidence of an
© 2013 John Wiley & Sons Ltd
4 C. E . GRUEBER, G. P . WALLIS and I . G. JAMIESON
H 9 F interaction. When examining the effect of hetero-
zygosity at each gene separately, none of the seven TLR
loci showed a strong relationship between heterozygos-
ity and probability of survival, although most effects
tended negative (heterozygotes showed lower survival
than homozygotes), consistent with the multilocus
result (except TLR15 where a nonsignificant improve-
ment in survival with heterozygosity was observed,
Fig. S1, Supporting information). All single-locus final
models also included F in their top model sets.
Allele frequencies were very similar among individu-
als that survived and died: mean FST across loci = �0.001
(ranging from �0.002 for TLR1LA, TLR1LB and TLR2B to
0.001 for TLR5 and TLR15; Fig. S2, Supporting informa-
tion). The confidence interval (bootstrapping over loci)
for the overall value was �0.002 to 0, so we concluded
that overall allele frequencies of surviving and dead juve-
niles did not differ.
When comparing the influence of particular geno-
types, for the three loci with greater than two alleles
(TLR4, TLR5 and TLR21), a convincing survival effect
was observed for TLR4 only (Table 1A). All genotypes
for both TLR5 and TLR21 were poor predictors of over-
winter survival (note the DAICC column in Table 1B
and Table 1C, absence of a distinct ‘best model’ ≥2AICC from the next best model). Within TLR4, only one
genotype was a useful predictor of survival: relative to
all other genotypes, and accounting for any effects of F,
TLR4BE genotype provided a large survival advantage
to those birds that contained it (indicated by the posi-
tive value for b, Table 1A). Models containing all other
TLR4 genotypes were poor predictors of survival
(Table 1A).
Relationship between TLR4BE genotype and survival
Although the effect of TLR4BE genotype would be con-
sidered statistically significant at a = 0.05 (b < 1.96
9 SEb, Table 1A), we evaluated its biological signifi-
cance using the model-averaged parameter estimates.
The fitted survival probability for TLR4BE birds (given a
mean F and averaged across cohorts) was calculated as
91.3%, while the fitted mean survival of all other TLR4
genotypes was 79.3%. Of the 645 birds genotyped for
TLR4, 60 (9.3%) were TLR4BE [6 of these died, 12.9
expected based on contingency table (Table S3, Support-
ing information)]. These values equate to a selection
coefficient against non-TLR4BE genotype animals of
0.142 and a relative risk of over-winter death of TLR4BEindividuals of 0.440 (95% CI = 0.203, 0.954; standard-
ized against a risk of death of 1 for non-TLR4BE ani-
mals).
As an independent test of the selective benefit of
TLR4BE genotype, we compared the observed propor-
tion of TLR4BE animals produced each year with the
number expected under Mendelian inheritance, given
parental genotypic combinations, where an excess is
expected at 1 year of age. At age 2 weeks, the observed
proportion of TLR4BE juveniles produced was generally
similar to Mendelian predictions: values for all years
were consistent with simulated data, and aside from
slightly elevated observed values in the first 3 years, all
observations were very close to simulated means
(Fig. 2A). At age 1 year (i.e. among surviving birds
only), observed annual proportions of TLR4BE individu-
als were also very close to simulated mean predictions,
but there was a consistent pattern of slight excess in
every year of the study except for 2006 (Fig. 2B; proba-
bility of observing 8 or more excesses across 9 years =0.020). The very small magnitude of these excesses
(Fig. 2B) is consistent with the relatively small number
of ‘additional’ birds that are thought to have survived
as a result of having TLR4BE genotype (N = 6.9; Table
S3, Supporting information).
Although the Ulva Island population had 12 genetic
founders, only one of these (band combination ‘blue
metal’) carried the TLR4E allele (genotype TLR4AE).
Thus, all TLR4BE animals in the population are descen-
dants of this founder, and it is possible that the
observed survival benefit of the genotype may be con-
founded by other heritable factors. This is particularly
plausible when considering that blue metal and his first
partner ‘white metal’ are the highest contributors to the
descendent Ulva population, together contributing nearly
40% of the descendent gene pool (I. G. Jamieson, unpub-
0.0
0.5
1.0
1.5
Cohort2000 2002 2004 2006 2008
Mea
n he
tero
zygo
sity
(H
)
00.
20.
40.
60.
81
Juve
nile
sur
viva
l rat
e
2 7221 9 27 33 57
10 28 35 62 98 90 138 110 14995 87 136 108 103 656
Overall
H: survivedH: diedSurvival rate
Fig. 1 Mean toll-like receptor (TLR) H of juvenile robins that
survived (black circles) or died (grey circles) over their first
winter; error bars indicate 95% confidence intervals
(1.96 9 standard error of the mean). Also shown is the total
proportion of juveniles that survived (triangles). Sample sizes
(along the x-axis) show the total number of juveniles geno-
typed at ≥3 loci (numerator) as a proportion of the total num-
ber produced (denominator; the large disparity at 2009
represents a number of unsampled dead birds).
© 2013 John Wiley & Sons Ltd
DRIFT AND SELECTION AFTER RE- INTRODUCTION 5

lished data). If the apparent survival benefit of TLR4BEgenotype is due to co-inheritance of ‘good genes’ from
blue metal, this may also explain why blue metal’s line-
age dominated. Our ‘good genes’ hypothesis predicts a
positive correlation between degree of relatedness to the
blue metal lineage (calculated using the pedigree and
denoted RBM, see Methods S1 section ‘Relatedness to
blue metal’, Supporting information) and probability of
survival, but only a weak relationship was observed,
with a very large standard error (standardized effect size
bRBM= 0.038 � 0.202 SE; RI = 0.19, Table S4, Supporting
information). After accounting for the effect of RBM in
the model, there remained a strong positive influence of
TLR4BE genotype on probability of survival (standardized
effect size bBE = 1.003 � 0.448 SE; RI = 1.00, Table S4,
Supporting information). There was no interaction
Table 1 Effect of toll-like receptor (TLR) genotypes on first-year survival probability of Ulva Island robins, for three loci with more
than two alleles in the population [A: TLR4 (5 alleles); B: TLR5 (3 alleles); C: TLR21 (3 alleles)]. Only years with mixed survival are
included (i.e. data from 2001 is excluded)
Model* bij (� SEb)† Deviance AICC DAICC wi Nij
‡ Survivalij (%)§
(A): TLR4
Base + BE 1.007 (0.448) 659.5 667.6 — 0.511 60 90
Base + AA 0.463 (0.303) 663.4 671.4 3.82 0.076 95 84
Base — 666.3 672.4 4.79 0.047 645¶ 78¶
Base + BD �0.443 (0.394) 664.7 672.7 5.14 0.039 34 71
Base + BC 0.456 (0.456) 664.8 672.8 5.24 0.037 42 86
Base + DD �1.491 (1.437) 664.9 672.9 5.34 0.035 2 50
Base + CE �0.942 (0.932) 664.9 673.0 5.40 0.034 5 60
Base + AC �0.272 (0.278) 665.0 673.0 5.40 0.034 81 74
Base + CC �0.847 (0.889) 665.0 673.1 5.53 0.032 6 67
Base + BB �0.230 (0.283) 665.2 673.3 5.69 0.030 79 75
Base + EE �1.025 (1.449) 665.4 673.4 5.85 0.027 2 50
Base + AD �0.236 (0.352) 665.4 673.5 5.90 0.027 48 75
Base + AE �0.239 (0.428) 665.6 673.6 6.03 0.025 31 74
Base + AB �0.078 (0.234) 665.8 673.8 6.22 0.023 137 77
Base + CD �0.079 (0.589) 665.8 673.9 6.31 0.022 17 76
Base + DE — — — — — 6 100
(B): TLR5
Base + AC �1.203 (0.697) 663.6 671.7 — 0.313 9 56
Base — 666.3 672.4 0.69 0.222 646¶ 78¶
Base + BB �0.293 (0.260) 665.1 673.2 1.49 0.149 94 73
Base + AA 0.190 (0.202) 665.5 673.5 1.82 0.126 247 80
Base + BC �0.612 (0.883) 665.9 674.0 2.27 0.101 6 67
Base + AB 0.086 (0.196) 666.2 674.2 2.52 0.089 290 80
Base + CC — — — — — 0 —(C): TLR21
Base + AB �0.310 (0.239) 664.2 672.3 — 0.275 122 75
Base — 666.3 672.4 0.08 0.264 645¶ 78¶
Base + AA 0.245 (0.233) 664.8 672.8 0.54 0.210 511 79
Base + BB 0.301 (1.129) 665.8 673.9 1.55 0.127 5 80
Base + AC 0.121 (1.137) 665.9 673.9 1.61 0.123 5 80
Base + CC — — — — — 2 100
Base + BC — — — — — 0 —
Model shown in bold is the most parsimonious model supported by the data for each locus (where the ‘best’ model is ≥2 AICC units
from the next best model); models could only be fitted for genotypes with mixed survival.
*Generalized linear mixed effects model with a binomial response (survived or not), where the base model contains individual
inbreeding coefficient F and cohort as a random factor. Genotype models include base parameters plus a 1/0 binary predictor for
presence/absence of the specified genotype.†Parameter estimates for the specified genotype (ij, as indicated in the ‘Model’ column) namely effect size coefficient (b) and its stan-
dard error (SEb).‡Number of animals containing the specified genotype (ij) — note that these vary widely, as a result of uneven allele frequencies in
the population (see Fig. S2, Supporting information).§Survival rate of animals containing the specified genotype.
Overall sample size and survival rate for this locus (all genotypes combined).
© 2013 John Wiley & Sons Ltd
6 C. E . GRUEBER, G. P . WALLIS and I . G. JAMIESON

between RBM and presence/absence of TLR4BE genotype
in the final model, indicating that the selective advan-
tage of TLR4BE genotype is consistent across animals
that are both closely related and distantly related to
blue metal. This latter result suggests that the correla-
tion between TLR4BE genotype and survival is unlikely
to result from a genome-wide influence of ‘good genes’
generally in blue metal. In addition, the lack of a strong
relationship between RBM and survival suggests that
blue metal’s lineage did not necessarily dominate
because of intrinsic ‘good genes’.
Temporal patterns in TLR4BE frequency
There was a decline in the frequency of TLR4BE genotype
in the adult population, which was not accounted for by
increasing the precision of genotype frequency estimates
as population size increased [GLM with binomial error,
standardized slope = �0.913 (95% CI: �1.43, �0.39),
Fig. 3A: filled circles]. Although the observed frequency
of TLR4BE animals always exceeded the expected fre-
quency under Hardy–Weinberg equilibrium (HWE;
Fig. 3A: open circles), the magnitude of this deviation
decreased [ratio observed/expected frequencies
declined: GLM with quasi-Poisson error, standardized
slope = �0.533 (95% CI: �0.65, �0.42), Fig. 3B]. Never-
theless, there remained nearly a two-fold excess of
TLR4BE adults by the end of the study period (observed
number in 2009 = 34; expected under HWE = 17.9;
Fig. 3A). The slightly higher than expected production
of TLR4BE offspring by observed pairs in the first
3 years of the study (Fig. 2) was insufficient to account
for the ultimate excess of TLR4BE adults in 2009 [4.6
excess TLR4BE birds over mean Mendelian predictions
in 2001–2003 (Fig. 2) <16.1 excess TLR4BE adults in
2009 (Fig. 3A)].
The temporal trend in the magnitude of deviation
from HWE frequency of TLR4BE is unlikely to result
from unidentified selection pressure occurring on either
the TLR4B orTLR4E alleles, as their frequencies have
remained relatively constant over the study period (Fig.
S3, Supporting information). Similarly, it is unlikely that
there is undetected selection on other TLR4 genotypes
as none of these showed deviations from expected
frequencies at any point during the study (Fig. S4, Sup-
porting information). Furthermore, our observation that
the proportion of 2-week-old juveniles produced (2004
0.0
0.1
0.2
0.3
0.4
ObservedPredicted
927
3356
95
87136
108 103
2 weeks
0.0
0.1
0.2
0.3
0.4
ObservedPredicted
Pro
port
ion
with
TLR
4 BE g
enot
ype
2000 2001 2002 2003 2004 2005 2006 2007 2008 2009
924
2645
62
65118
80 86
Cohort
1 year
(A)
(B)
Fig. 2 Proportion of locally produced juveniles [A: at banding
age (2 weeks); B: at maturity (1 year)] in each cohort with the
TLR4BE genotype (filled circles), compared with simulated pre-
dictions under Mendelian inheritance (open circles; error bars
indicate the 95% quantiles of 5000 randomization simulations).
Values above points indicate the number of genotyped offspring
at that stage for which both parents were also genotyped.
Freq
uenc
y of
adu
lts w
ithT
LR4 B
E g
enot
ype Observed
Expected
0.0
0.1
0.2
0.3
0.4
0.5
0.6
01
23
4
Rat
io o
f TLR
4 BE
obse
rved
:exp
ecte
d
1 9 32 53 94 148 192 293 343
2000 2002 2004 2006 2008
Year
(A)
(B)
Fig. 3 Frequency of the TLR4BE genotype over time in the non-
founder adult population. In (A) filled circles indicate observed
proportion of adults with this genotype [error bars are Agres-
ti–Coull 95% confidence interval for proportions (Agresti &
Coull 1998), evaluated using the R package binom (Sundar
2009)]; open circles indicated expected frequency of TLR4BEgenotypes under Hardy–Weinberg (error bars are 95% confi-
dence intervals derived using logit transformation for frequen-
cies, Sutton et al. 2011). Panel (B) shows the ratio of observed/
expected frequencies in each year, where a value of 1 (horizon-
tal dotted line) is expected under Hardy–Weinberg equilib-
rium. The size of the genotyped adult population in each year
is indicated along the x-axis of B.
© 2013 John Wiley & Sons Ltd
DRIFT AND SELECTION AFTER RE- INTRODUCTION 7

onward) was generally similar to the number expected
under Mendelian inheritance (Fig. 2A) indicates that
temporal patterns in TLR4BE frequency are unlikely to
result from selection at early life history stages. Taken
together, the declining number of TLR4BE individuals is
unlikely to result from undetected viability selection on
this locus and probably signifies decrease in the magni-
tude of deviation from HWE.
To test whether early deviation from HWE was
caused by nonrandom mating, we compared the num-
ber of TLR4BE 2-week-olds (i.e. prior to overwinter via-
bility selection) produced by observed pairings to
simulated data where breeding animals were random-
ized within each year (see Methods S1 section ‘Simula-
tion of random mating’, Supporting information). In the
first 5 years of the study, observed pairings produced
an excess of TLR4BE offspring (2001–2005, notably 2002,
where the excess would be considered statistically sig-
nificant, Fig. 4), while production was consistent with
random mating from 2006 onward. The combination of
high TLR4BE survival and early excess productivity
apparently explains the ultimate excess of TLR4BE indi-
viduals in 2009: over the entire study period, a total of
17.1 additional TLR4BE 2-week-olds were produced over
mean random mating expectations (62 observed, 44.9
expected; Fig. 4).
In the latter part of the study, when TLR4BE produc-
tion was consistent with random mating (i.e. the period
2006–2009, Fig. 4), TLR4BE genotype remained the most
useful predictor of survival (statistically significant
effect at a = 0.05; Table S5, Supporting information).
Thus, the observed survival benefit of TLR4BE genotype
overall was not limited to the early period of the study
when population density was low and juvenile survival
was relatively high (Fig. S5, Supporting information).
Role of genetic drift
We next examined whether the TLR4BE survival advan-
tage detected above, or indeed possible undetected sur-
vival advantages associated with diversity at any loci,
was sufficient to outweigh genetic drift and drive tem-
poral patterns of overall genetic diversity at each locus
(gene diversity, D) in the Ulva Island robin population.
Our genedropping simulations revealed that for every
year of the study, observed values of D for every locus
were consistent with predictions under genetic drift
(Fig. 5). These results implicate drift as the predominant
force influencing gene diversity.
Gene diversity for TLR2B was often slightly above
mean predictions (Fig. 5), possibly indicating a form of
weak balancing selection that was not detected by our
main analysis (e.g. selection operating on traits other
than first-year over-winter survival). Conversely,
observed levels of TLR21 gene diversity were slightly
lower than neutral predictions, which may indicate
undetected positive selection. In both of these cases,
however, observed values were generally consistent
with simulated predictions (i.e. within simulated confi-
dence intervals, Fig. 5).
Discussion
The Ulva Island robin population presents an ideal
study system for investigating the evolutionary and
population genetic processes that occur in a small pop-
ulation following colonization of a new habitat. This
unique data set results from intensive monitoring
efforts that have provided full pedigree and reproduc-
tive data for founders and all descendants for several
generations, as well as near-complete genetic sampling.
Over the 9-year period of natural population growth,
there was little evidence that TLR diversity was under
natural selection, as defined by the probability of juve-
nile robins surviving their most vulnerable stage, their
first winter. There were no associations between sur-
vival and particular alleles for any loci, and none of the
loci tested showed a relationship between overall het-
erozygosity and survival.
We detected viability selection for one genotype,
TLR4BE, which conferred a 0.44 relative risk of over-
winter death as compared to birds with all other TLR4
Num
ber
of 2
−w
eek
old
juve
nile
sw
ith T
LR4B
E g
enot
ype
05
1015
2000 2002 2004 2006 2008
1 2 7 10 20 26 35 39 384 10 15 23 39 46 64 61 63
ObservedPredicted
Cohort
Fig. 4 Production of 2-week-old juveniles with TLR4BE geno-
type (filled circles), compared with predictions under random
mating (open circles; error bars indicate 95% quantiles of 5000
simulations). Values along the x-axis indicate the number of
pairs: the numerator is the number of established pairs (those
that had bred together in previous years and therefore held
fixed during the randomization – see Methods S1, Supporting
information); the denominator is the total number of pairs.
© 2013 John Wiley & Sons Ltd
8 C. E . GRUEBER, G. P . WALLIS and I . G. JAMIESON

genotypes. This effect remained after accounting for
inbreeding and year effects, and an ultimate two-fold
excess of this genotype over Hardy–Weinberg expecta-
tions did not result from selection on the TLR4B or
TLR4E alleles, other TLR4 genotypes, nor selection at
earlier life history stages. Neither could this pattern be
attributed to association between TLR4BE genotype and
‘good genes’, nor density dependence. Therefore, the
excess of TLR4BE in 2009 is probably due to improved
viability of animals with this genotype in combination
with nonrandom mating in the first half of the study.
Multiple mechanisms could give rise to a deviation
from random mating: for example, inbreeding avoid-
ance, mating to minimize allele sharing or mating of
compatible genotypes; distinguishing among these with
our data set was beyond the scope of this study.
Despite detecting statistically significant selection
operating on the TLR4BE genotype, the combined effect
of this and other processes was insufficient to drive
(deterministically) overall gene diversity (D) at the
TLR4 locus beyond predictions under genetic drift.
While the selection coefficient we report (0.142) could
be considered relatively large [recent sequence-based esti-
mates of selection for human HLA genes were all ≤0.044(Kawashima et al. 2012; Yasukochi & Satta 2013)], it is
worth noting that the genotype under selection, TLR4BE,
was at a relatively low frequency (see Fig. 3A). Its selec-
tive benefit may therefore be diluted when considering
patterns at the locus level, as in the gene diversity metric.
We also observed minor (nonsignificant) deviations from
predictions under genetic drift at two other loci (Fig. 5),
neither of which were found to be important predictors
of over-winter survival. It is possible that these devia-
tions result from a combination of subtle effects on multi-
ple traits, including or in addition to overwinter survival.
Nevertheless, the combined strength of these effects was
insufficient to result in statistically significant deviations
from neutral predictions.
With currently available data, we are unable to deter-
mine the specific mechanism by which TLR4BE geno-
type confers a survival advantage to juvenile robins,
although heterozygote advantage has been previously
reported for several genes (reviewed in Hedrick 2012),
and adaptive significance of particular immunity
0.0
0.1
0.2
0.3
0.4
0.5
0.6 TLR1LA
0.0
0.1
0.2
0.3
0.4
0.5
0.6 TLR1LB
0.0
0.1
0.2
0.3
0.4
0.5
0.6 TLR2B
ObservedPredicted
0.0
0.1
0.2
0.3
0.4
0.5
0.6
0.7
0.8
0.9 TLR4
2000
2001
2002
2003
2004
2005
2006
2007
2008
2009
0.0
0.1
0.2
0.3
0.4
0.5
0.6 TLR5
2000
2001
2002
2003
2004
2005
2006
2007
2008
2009
0.0
0.1
0.2 TLR15
2000
2001
2002
2003
2004
2005
2006
2007
2008
2009
0.0
0.1
0.2
0.3
0.4
0.5 TLR21
2000
2001
2002
2003
2004
2005
2006
2007
2008
2009
Gen
e di
vers
ity
Year
Fig. 5 Changes in annual gene diversity (D) among the adult population at each toll-like receptor (TLR) locus (filled circles are
observed values, open circles are the mean of 5000 genedropping simulations assuming neutrality, where the error bars are the 95%
quantiles of simulated distributions).
© 2013 John Wiley & Sons Ltd
DRIFT AND SELECTION AFTER RE- INTRODUCTION 9

genotypes has also been observed (as opposed to het-
erozygosity per se; e.g. Sepil et al. 2012). Neither the
TLR4B nor TLR4E alleles have a unique amino acid resi-
due at any position (Table S6, Supporting information).
The TLR4 gene is well studied in mammals, and evi-
dence suggests that the avian ortholog has similar func-
tions (e.g. Saponaro et al. 2011). The protein has been
associated with resistance to a number of common envi-
ronmental pathogens that are probably present in the
forest environment of Ulva Island, including gram-neg-
ative bacteria, fungi, viruses and protozoa (Akira et al.
2006; Vinkler et al. 2009; Villase~nor-Cardoso & Ortega
2011). Importantly, variation at TLR4 has been associ-
ated with variation in susceptibility to several infectious
diseases (Leveque et al. 2003; Villase~nor-Cardoso & Ort-
ega 2011). Our results are therefore not at odds with
theoretical predictions of TLR immune function, although
targeted investigation of disease pressure in this popula-
tion (e.g. following Ewen et al. 2007; Middleton et al.
2010) would be challenging, given the diversity of poten-
tial candidate pathogens.
Despite apparent selection for a heterozygote geno-
type, it is possible that in the long term, the Ulva robin
population may lose genetic diversity if population
growth is limited. This can occur, for example, if selec-
tion favours the TLR4B and TLR4E alleles, to the detri-
ment of the TLR4A, TLR4C and TLR4D alleles. Selection
coefficients for all other TLR4 genotypes were unknown
because they were not useful predictors of survival
(Table 1A). As a result, it is difficult to forecast the time
frame over which such losses of genetic diversity may
occur. A simulation analysis that incorporates uncer-
tainty of selection coefficients of all genotypes may be
useful for estimating the long-term equilibrium state of
the five TLR4 alleles once this relatively small popula-
tion reaches its demographic equilibrium (estimated
carrying capacity approximately 250 pairs, IGJ unpub-
lished data). Further investigation into the nature and
role of nonrandom mating in this population may also
provide valuable information for predicting long-term
changes in genetic diversity.
This is the first empirical study to examine the roles
of selection and drift immediately following a popula-
tion bottleneck of a wild population. Our results sup-
port the general assertion that drift plays a significant
role in determining the genetic makeup of small popu-
lations (Bouzat 2010). Our findings demonstrate that
this can be true even where natural selection is operat-
ing. We provide empirical support for the theoretical
prediction that neutral processes can overwhelm selec-
tion when a population is small and assert that genetic
drift is therefore a significant concern during the estab-
lishment phase of colonization. In a conservation con-
text, translocations to establish new populations in
protected or restored areas, or to re-introduce extirpated
species to their former range, are key strategies for the
management of threatened species (Seddon 2010; Tho-
mas 2011). Where the aim is to establish a self-sustain-
ing population, conservation-motivated translocations
may be conducted without provision for ongoing, supple-
mentary translocations. Isolated populations lacking
opportunity for genetic exchange are likely to experience
significant genetic drift, particularly while they remain
small (Weiser et al. 2012, 2013), and the resulting losses of
genetic diversity may impact on the population’s ability
to respond to future environmental changes, such emerg-
ing infectious diseases (O’Brien & Evermann 1988). Our
results show that genetic drift can be the major determi-
nant of the genetic makeup of a population, even when
natural selection confers a survival advantage to a hetero-
zygote genotype, such as those associated with the innate
immune system.
Acknowledgements
We are grateful to S. Townsend and T. King (University of
Otago) and T. Manly, R. Rickman, P. Renshaw and M. McE-
wan (GenomNZ) for technical assistance; A. Senior and J. Sut-
ton for statistical advice; and the Evolutionary Genetics Lab
Group (University of Otago), J. Slate and the Molecular Ecol-
ogy Laboratory (University of Sheffield) and J. Pemberton
(University of Edinburgh) for helpful discussions in the early
stages of this analysis. We also acknowledge constructive com-
ments from three anonymous reviewers. This research received
funding from the Marsden Fund (Contract no. UOO1009),
Landcare Research (Contract no. C09X0503), University of
Otago and the Allan Wilson Centre for Molecular Ecology and
Evolution.
References
Acevedo-Whitehouse K, Vicente J, Gortazar C, Hofle U, Fer-
nandez-De-Mera IG, Amos W (2005) Genetic resistance to
bovine tuberculosis in the Iberian wild boar. Molecular Ecol-
ogy, 14, 3209–3217.
Agresti A, Coull BA (1998) Approximate is better than “exact”
for interval estimation of binomial proportions. The American
Statistician, 52, 119–126.
Agudo R, Alcaide M, Rico C et al. (2011) Major histocompati-
bility complex variation in insular populations of the Egyp-
tian vulture: inferences about the roles of genetic drift and
selection. Molecular Ecology, 11, 2329–2340.
Akira S, Uematsu S, Takeuchi O (2006) Pathogen recognition
and innate immunity. Cell, 124, 783–801.
Alcaide M (2010) On the relative roles of selection and genetic
drift in shaping MHC variation. Molecular Ecology, 19, 3842–
3844.
Alcaide M, Edwards SV (2011) Molecular evolution of the toll-
like receptor multigene family in birds. Molecular Biology and
Evolution, 28, 1703–1715.
Alho JS, V€alim€aki K, Meril€a J (2010) Rhh: an R extension for
estimating multilocus heterozygosity and heterozygosity–het-
© 2013 John Wiley & Sons Ltd
10 C. E . GRUEBER, G. P . WALLIS and I . G. JAMIESON
erozygosity correlation. Molecular Ecology Resources, 10, 720–
722.
Babik W (2010) Methods for MHC genotyping in non-model
vertebrates. Molecular Ecology, 10, 237–251.Babik W, Taberlet P, Ejsmond MJ, Radwan J (2009) New gener-
ation sequencers as a tool for genotyping of highly polymor-
phic multilocus MHC system. Molecular Ecology Resources, 9,
713–719.Barreiro LB, Ben-Ali M, Quach H et al. (2009) Evolutionary
dynamics of human Toll-like receptors and their different
contributions to host defense. PLoS Genetics, 5, e1000562.
Bensch S, Andr�en H, Hansson B et al. (2006) Selection for het-
erozygosity gives hope to a wild population of inbred
wolves. PLoS ONE, 1, e72.
Bergman IM, Edman K, Ekdahl KN, Rosengren KJ, Edfors I
(2012) Extensive polymorphism in the porcine Toll-like
receptor 10 gene. International Journal of Immunogenetics, 39,
68–76.Bollmer JL, Dunn PO, Whittingham LA, Wimpee C (2010)
Extensive MHC class II B gene duplication in a Passerine,
the common yellowthroat (Geothlypis trichas). Journal of Hered-
ity, 101, 448–460.Bollmer JL, Ruder EA, Johnson JA, Eimes JA, Dunn PO (2011)
Drift and selection influence geographic variation at immune
loci of prairie-chickens. Molecular Ecology, 20, 4695–4706.
Bouzat JL (2010) Conservation genetics of population bottle-
necks: the role of chance, selection, and history. Conservation
Genetics, 11, 463–478.
Brownlie R, Allan B (2011) Avian toll-like receptors. Cell and
Tissue Research, 343, 121–130.
Burnham KP, Anderson DR (2002) Model Selection and Multi-
model Inference: A Practical Information-Theoretic Approach, 2nd
edn. Springer, Berlin.
Casquet J, Thebaud C, Gillespie RG (2012) Chelex without boil-
ing, a rapid and easy technique to obtain stable amplifiable
DNA from small amounts of ethanol-stored spiders. Molecu-
lar Ecology Resources, 12, 136–141.Clegg SM, Degnan SM, Moritz C, Estoup A, Kikkawa J, Owens
IPF (2002) Microevolution in island forms: The roles of drift
and directional selection in morphological divergence of a
passerine bird. Evolution, 56, 2090–2099.Eimes JA, Bollmer JL, Whittingham LA, Johnson JA, Van Oo-
sterhout C, Dunn PO (2011) Rapid loss of MHC class II vari-
ation in a bottlenecked population is explained by drift and
loss of copy number variation. Journal of Evolutionary Biology,
24, 1847–1856.
Ejsmond MJ, Radwan J (2011) MHC diversity in bottlenecked
populations: a simulation model. Conservation Genetics, 12,
129–137.Ellison A, Allainguillaume J, Girdwood S et al. (2013) Maintain-
ing functional major histocompatibility complex diversity
under inbreeding: the case of a selfing vertebrate. Proceedings
of the Royal Society B: Biological Sciences, 279, 5004–5013.Ewen JG, Thorogood R, Nicol C, Armstrong DP, Alley M
(2007) Salmonella Typhimurium in hihi, New Zealand. Emerg-
ing Infectious Diseases, 13, 788–790.
Ferrer-Admetlla A, Bosch E, Sikora M et al. (2008) Balancing
selection is the main force shaping the evolution of innate
immunity genes. The Journal of Immunology, 181, 1315–1322.Goudet J (1995) FSTAT (version 1.2): a computer progam to
calculate F-statistics. Journal of Heredity, 86, 485–486.
Gratten J, Pilkington JG, Brown EA, Clutton-Brock TH, Pem-
berton JM, Slate J (2012) Selection and microevolution of coat
pattern are cryptic in a wild population of sheep. Molecular
Ecology, 21, 2977–2990.Grueber CE, Wallis GP, King TM, Jamieson IG (2012) Varia-
tion at innate immunity Toll-like receptor genes in a bot-
tlenecked population of a New Zealand robin. PLoS ONE,
7, e45011.
Haldane JBS (1927) A mathematical theory of natural and arti-
ficial selection, Part V: Selection and mutation. Proceedings of
the Cambridge Philosophical Society, 23, 838–844.
Hedrick PW (2000) Genetics of Populations, 2nd edn. Jones and
Bartlett Publishers, Sudbury, MA.
Hedrick PW (2012) What is the evidence for heterozygote advan-
tage selection? Trends in Ecology & Evolution, 27, 698–704.
Jamieson IG (2011) Founder effects, inbreeding, and loss of
genetic diversity in four avian reintroduction programs. Con-
servation Biology, 25, 115–123.Kaeuffer R, Coltman DW, Chapuis JL, Pontier D, Reale D
(2007) Unexpected heterozygosity in an island mouflon pop-
ulation founded by a single pair of individuals. Proceedings of
the Royal Society B-Biological Sciences, 274, 527–533.Kawashima M, Ohashi J, Nishida N, Tokunaga K (2012) Evolu-
tionary analysis of classical HLA class I and II genes suggests
that recent positive selection acted on DPB1*04:01 in Japa-
nese population. PLoS ONE, 7, e46806.
Laws RJ, Jamieson IG (2010) Is lack of evidence of inbreeding
depression in a threatened New Zealand robin indicative of
reduced genetic load? Animal Conservation, 14, 47–55.Lerner IM (1954) Genetic Homeostasis. Oliver & Boyd, London.
Leveque G, Forgetta V, Morroll S et al. (2003) Allelic variation
in TLR4 is linked to susceptibility to Salmonella enterica ser-
ovar typhimurium infection in chickens. Infection and Immu-
nity, 71, 1116–1124.
MacCluer JW, Vandeberg JL, Read B, Ryder OA (1986) Pedi-
gree analysis by computer-simulation. Zoo Biology, 5, 147–
160.
Middleton DMRL, Minot EO, Gartrell BD (2010) Salmonella ent-
erica serovars in lizards of New Zealand’s offshore islands.
New Zealand Journal of Ecology, 34, 247–252.
Mukherjee S, Sarkar-Roy N, Wagener DK, Majumder PP (2009)
Signatures of natural selection are not uniform across genes
of innate immune system, but purifying selection is the dom-
inant signature. Proceedings of the National Academy of Sciences
USA, 106, 7073–7078.Nei M, Maruyama T, Chakraborty R (1975) The bottleneck
effect and genetic variability in populations. Evolution, 29,
1–10.
O’Brien SJ, Evermann JF (1988) Interactive influence of infec-
tious disease and genetic diversity in natural populations.
Trends in Ecology & Evolution, 3, 254–259.Oliver MK, Piertney SB (2012) Selection maintains MHC diver-
sity through a natural population bottleneck. Molecular Biol-
ogy and Evolution, 29, 1713–1720.
van Oosterhout C (2009) A new theory of MHC evolution:
beyond selection on the immune genes. Proceedings of the
Royal Society B-Biological Sciences, 276, 657–665.van Oosterhout C (2013) Maintenance of major histocompatibil-
ity supertype variation in selfing vertebrate is no evidence
for overdominant selection. Proceedings of the Royal Society B:
Biological Sciences, 280, 20122501.
© 2013 John Wiley & Sons Ltd
DRIFT AND SELECTION AFTER RE- INTRODUCTION 11

Overall ADJ, Byrne KA, Pilkington JG, Pemberton JM (2005)
Heterozygosity, inbreeding and neonatal traits in Soay sheep
on St Kilda. Molecular Ecology, 14, 3383–3393.
Piertney SB, Oliver MK (2006) The evolutionary ecology of the
major histocompatibility complex. Heredity, 96, 7–21.
R Core Development Team (2011) R: A Language and Environ-
ment for Statistical Computing, Version 2.12.2. R Foundation
for Statistical Computing, Vienna.
Radwan J, Biedrzycka A, Babik W (2010) Does reduced MHC
diversity decrease viability of vertebrate populations? Biologi-
cal Conservation, 143, 537–544.
Saponaro C, Cianciulli A, Calvello R, Cavallo P, Mitolo V, Pa-
naro MA (2011) First identification of Toll-like receptor-4 in
avian brain: evolution of lipopolysaccharide recognition and
inflammation-dependent responses. Immunopharmacology and
Immunotoxicology, 33, 64–72.Schluter D (2000) The Ecology of Adaptive Radiation. Oxford Uni-
versity Press, Oxford.
Seddon PJ (2010) From reintroduction to assisted colonization:
moving along the conservation translocation spectrum. Resto-
ration Ecology, 18, 796–802.
Sepil I, Lachish S, Sheldon BC (2012) Mhc-linked survival and
lifetime reproductive success in a wild population of great
tits. Molecular Ecology, 22, 384–396.Strand TM, Segelbacher G, Quintela M, Xiao L, Axelsson T,
H€oglund J (2012) Can balancing selection on MHC loci coun-
teract genetic drift in small fragmented populations of black
grouse? Ecology and Evolution, 2, 341–353.
Sundar D-R (2009) Binom: Binomial Confidence Intervals for Sev-
eral Parameterizations (version 1.0-5. R package). Available
from http://CRAN.R-project.org/package=binom.
Sutton JT, Nakagawa S, Robertson BC, Jamieson IG (2011) Dis-
entangling the roles of natural selection and genetic drift in
shaping variation at MHC immunity genes. Molecular Ecol-
ogy, 20, 4408–4420.Taylor SS, Jamieson IG, Wallis GP (2007) Historic and contem-
porary levels of genetic variation in two New Zealand passe-
rines with different histories of decline. Journal of
Evolutionary Biology, 20, 2035–2047.Taylor SS, Jenkins DA, Arcese P (2012) Loss of Mhc and neu-
tral variation in Peary caribou: genetic drift is not mitigated
by balancing selection or exacerbated by Mhc allele distribu-
tions. PLoS ONE, 7, e36748.
Thomas CD (2011) Translocation of species, climate change,
and the end of trying to recreate past ecological communi-
ties. Trends in Ecology & Evolution, 26, 216–221.
Townsend SM, Jamieson IG (2013a) Molecular and pedigree
measures of relatedness provide similar estimates of inbreed-
ing depression in a bottlenecked population. Journal of Evolu-
tionary Biology, 26, 889–899.
Townsend SM, Jamieson IG (2013b) Inbreeding influences
within-brood heterozygosity-fitness correlations (HFCs) in an
isolated passerine population. Evolution, online early,
doi:10.1111/evo.12113.
Townsend SM, King TM, Jamieson IG (2012) Isolation and
characterisation of microsatellite markers from the South
Island robin (Petroica australis). Conservation Genetics Resources,
4, 633–636.
Uematsu S, Akira S (2008) Toll-like receptors (TLRs) and
their ligands. Handbook of Experimental Pharmacology, 183,
1–20.
Villase~nor-Cardoso MI, Ortega E (2011) Polymorphisms of
innate immunity receptors in infection by parasites. Parasite
Immunology, 33, 643–653.
Vinkler M, Bryjova A, Albrecht T, Bryja J (2009) Identification
of the first Toll-like receptor gene in passerine birds: TLR4
orthologue in zebra finch (Taeniopygia guttata). Tissue Anti-
gens, 74, 32–41.
Walsh PS, Metzger DA, Higuchi R (1991) Chelex-100 as a med-
ium for simple extraction of DNA for PCR-based typing
from forensic material. BioTechniques, 10, 506–513.Weir BS, Cockerham CC (1984) Estimating F-statistics for the
analysis of population structure. Evolution, 38, 1358–1370.Weiser EL, Grueber CE, Jamieson IG (2012) AlleleRetain: a pro-
gram to assess management options for conserving allelic
diversity in small, isolated populations. Molecular Ecology
Resources, 12, 1161–1167.Weiser EL, Grueber CE, Jamieson IG (2013) Simulating reten-
tion of rare alleles in small populations to assess manage-
ment options for species with different life histories.
Conservation Biology, 27, 334–344.Yasukochi Y, Satta Y (2013) Current perspectives on the inten-
sity of natural selection of MHC loci. Immunogenetics, 65,
479–483.
C.E.G., I.G.J. and G.P.W. designed the study; C.E.G.
and I.G.J. collected the data; C.E.G. analysed the data;
and C.E.G., I.G.J. and G.P.W. wrote the article.
Data accessibility
Raw data from this manuscript (individual data includ-
ing genotypes and survival, pairwise juvenile produc-
tion, pedigree data, population-level juvenile production)
have been deposited in the DRYAD data repository
(doi:10.5061/dryad.k3311).
Supporting information
Additional supporting information may be found in the online ver-
sion of this article.
Table S1 SNPs genotyped in this analysis.
Table S2 Top model set (top 2AICC) of models for the effect of
inbreeding (F) and composite heterozygosity at seven TLR loci
(H) on juvenile robin survival.
Table S3 Observed (and expected) number of robins that sur-
vived to 1 year or not, based on TLR4 genotype (birds from 2001
excluded, for consistency with the main survival analysis).
Table S4 Model-averaged standardised predictors of first year
overwinter survival.
Table S5 Effect of TLR4 genotypes on first year survival proba-
bility of Ulva Island robins, data restricted to the period 2006
onwards.
© 2013 John Wiley & Sons Ltd
12 C. E . GRUEBER, G. P . WALLIS and I . G. JAMIESON
Table S6 Characteristics of the variable amino acids of each
TLR4 haplotype.
Fig. S1 Forest plot of standardised coefficients for effects of TLR
heterozygosity on over-winter survival of Ulva robins; positive
values indicate that heterozygotes are more likely to survive
than homozygotes; also shown is the multilocus effect of H for
comparison.
Fig. S2 Allele frequencies for the seven genotyped loci in birds
that survived (“Alive”, N = 507) or not (“Died”, N = 139) their
first winter (for consistency with the main analysis, these data
exclude years where all offspring survived, and birds with fewer
than 3 loci genotyped).
Fig. S3 Change in observed frequencies of each of TLR4 allele in
the adult population over time.
Fig. S4 Frequencies of each TLR4 genotype over time among the
non-founder adult population.
Fig. S5 Number of surviving juveniles produced by each pair in
each breeding season, including all known Ulva robin breeding
pairs (i.e. including ungenotyped animals); N = 475 pair-years.
Fig. S6 Correlation between relatedness of genotyped animals.
to blue-metal and to his first partner white-metal (N = 624 indi-
viduals with non-zero relatedness to either); points shown may
represent overlay of multiple individuals with equal relatedness.
Data S1Methods.
© 2013 John Wiley & Sons Ltd
DRIFT AND SELECTION AFTER RE- INTRODUCTION 13