GABRA2 markers moderate the subjective effects of alcohol
25
GABRA2 MARKERS MODERATE THE SUBJECTIVE EFFECTS OF ALCOHOL Magdalena Uhart 1,3 , Elise M Weerts 2 , Mary E McCaul 2 , Xiuqing Guo 4 , Xiaofei Yan 4 , Henry R Kranzler 5 , Ning Li 6 , and Gary S Wand 1,2 1 Department of Medicine, The Johns Hopkins University School of Medicine, Baltimore, MD 2 Department of Psychiatry and Behavioral Sciences, The Johns Hopkins University School of Medicine, Baltimore, MD 3 Department of Medicine, Cedars-Sinai Medical Center, David Geffen School of Medicine at UCLA, Los Angeles, CA 4 Medical Genetics Institute, Cedars-Sinai Medical Center, Los Angeles, CA 5 University of Pennsylvania Perelman School of Medicine and the VISN 4 MIRECC, Philadelphia VAMC, Philadelphia, PA 6 Department of Medicine, Cedars-Sinai Medical Center, Los Angeles, CA Abstract Background—Individual differences in subjective responses to alcohol (SR) are moderated by genetic variants and may be risk factors for the development of alcohol use disorders. Variation in the GABA A 2 receptor subunit gene (GABRA2) has been associated with alcohol dependence (AD). Therefore, we examined whether individual differences in SR, which reflect sensitivity to the effects of alcohol, are associated with variation in GABRA2. Methods—Sixty-nine healthy subjects (21–30 yr) underwent a laboratory-based within-session, cumulative oral alcohol dosing procedure, achieving a mean peak blood alcohol level of 100.4 mg/ dL (SE =2.5). Subjective assessments were obtained throughout the session, including ascending and descending limbs of the alcohol curve. We genotyped single nucleotide polymorphisms (SNPs) across the chromosome 4 region spanning GABRA2 and analyzed the effect of genotype and haplotypes on subjective responses to alcohol. Population substructure was characterized through the use of ancestry informative markers. Results—Individual SNP analysis demonstrated that carriers of the minor alleles for SNPs rs279858, rs279844, rs279845, rs279826, rs279828 and rs279836 had lower “Negative” alcohol effects scores than individuals homozygous for the common allele at each SNP (p=0.0060, p=0.0035, p=0.0045, p=0.0043, p=0.0037, p=0.0061, respectively). Haplotype effects of block 1 showed concordant results with SNPs in this block (p=0.0492 and p=0.0150 for haplotypes 1 and 4, respectively). The minor alleles for several of these SNPs have previously been associated with AD. Corresponding author: Magdalena Uhart, Cedars-Sinai Medical Center, 8700 Beverly Boulevard, Los Angeles, CA 90048, Ph: 310-423-8248, Fax: 310-248-6748, [email protected]. Authors Contributions MU, EMW, MEM, HRK and GSW were responsible for the study concept and design, data acquisition, and interpretation of findings. XG, XY and NL assisted with data analysis and interpretation of findings. MU drafted the manuscript. EMW, MEM, HRK and GSW provided critical revision of the manuscript for important intellectual content. All authors critically reviewed content and approved final version for publication. NIH Public Access Author Manuscript Addict Biol. Author manuscript; available in PMC 2014 March 01. Published in final edited form as: Addict Biol. 2013 March ; 18(2): 357–369. doi:10.1111/j.1369-1600.2012.00457.x. NIH-PA Author Manuscript NIH-PA Author Manuscript NIH-PA Author Manuscript
Transcript of GABRA2 markers moderate the subjective effects of alcohol

GABRA2 MARKERS MODERATE THE SUBJECTIVE EFFECTSOF ALCOHOL
Magdalena Uhart 1,3, Elise M Weerts 2, Mary E McCaul 2, Xiuqing Guo 4, Xiaofei Yan 4, Henry RKranzler 5, Ning Li 6, and Gary S Wand 1,2
1Department of Medicine, The Johns Hopkins University School of Medicine, Baltimore, MD
2Department of Psychiatry and Behavioral Sciences, The Johns Hopkins University School ofMedicine, Baltimore, MD
3Department of Medicine, Cedars-Sinai Medical Center, David Geffen School of Medicine atUCLA, Los Angeles, CA
4Medical Genetics Institute, Cedars-Sinai Medical Center, Los Angeles, CA
5University of Pennsylvania Perelman School of Medicine and the VISN 4 MIRECC, PhiladelphiaVAMC, Philadelphia, PA
6Department of Medicine, Cedars-Sinai Medical Center, Los Angeles, CA
Abstract
Background— Individual differences in subjective responses to alcohol (SR) are moderated bygenetic variants and may be risk factors for the development of alcohol use disorders. Variation inthe GABAA 2 receptor subunit gene (GABRA2) has been associated with alcohol dependence(AD). Therefore, we examined whether individual differences in SR, which reflect sensitivity tothe effects of alcohol, are associated with variation in GABRA2.
Methods— Sixty-nine healthy subjects (21–30 yr) underwent a laboratory-based within-session,cumulative oral alcohol dosing procedure, achieving a mean peak blood alcohol level of 100.4 mg/dL (SE =2.5). Subjective assessments were obtained throughout the session, including ascendingand descending limbs of the alcohol curve. We genotyped single nucleotide polymorphisms(SNPs) across the chromosome 4 region spanning GABRA2 and analyzed the effect of genotypeand haplotypes on subjective responses to alcohol. Population substructure was characterizedthrough the use of ancestry informative markers.
Results— Individual SNP analysis demonstrated that carriers of the minor alleles for SNPsrs279858, rs279844, rs279845, rs279826, rs279828 and rs279836 had lower “Negative” alcoholeffects scores than individuals homozygous for the common allele at each SNP (p=0.0060,p=0.0035, p=0.0045, p=0.0043, p=0.0037, p=0.0061, respectively). Haplotype effects of block 1showed concordant results with SNPs in this block (p=0.0492 and p=0.0150 for haplotypes 1 and4, respectively). The minor alleles for several of these SNPs have previously been associated withAD.
Corresponding author: Magdalena Uhart, Cedars-Sinai Medical Center, 8700 Beverly Boulevard, Los Angeles, CA 90048, Ph:310-423-8248, Fax: 310-248-6748, [email protected].
Authors ContributionsMU, EMW, MEM, HRK and GSW were responsible for the study concept and design, data acquisition, and interpretation of findings.XG, XY and NL assisted with data analysis and interpretation of findings. MU drafted the manuscript. EMW, MEM, HRK and GSWprovided critical revision of the manuscript for important intellectual content. All authors critically reviewed content and approvedfinal version for publication.
NIH Public AccessAuthor ManuscriptAddict Biol. Author manuscript; available in PMC 2014 March 01.
Published in final edited form as:Addict Biol. 2013 March ; 18(2): 357–369. doi:10.1111/j.1369-1600.2012.00457.x.
NIH
-PA
Author M
anuscriptN
IH-P
A A
uthor Manuscript
NIH
-PA
Author M
anuscript

Conclusions— Our findings provide further evidence that variation within GABRA2 isassociated with attenuated negative responses to alcohol, a known risk factor for vulnerability toalcohol use disorders.
Keywords
Alcoholism; Alcohol Dependence; GABA; GABRA2; Subjective Response
Introduction
Risk of AD has a substantial genetic component, with heritability of 0.52–0.64 (Bienvenu etal., 2011; Kendler, 2001). GABA (gamma-aminobutyric acid) is the most abundant andwidespread inhibitory neurotransmitter in the central nervous system. The actions of GABAare mediated by receptors belonging to two major classes, termed GABAA and GABAB(Chu et al., 1990). Specifically, GABAA receptors, which are coupled with chloridechannels, have been suggested to contribute to ethanol’s actions (Chu et al., 1990; Korpi etal., 2007). Functional mammalian GABAA receptors are formed by the assembly of fivesubunit proteins, with the usual subunit arrangement of two alpha, two beta, and one gammaor delta subunit (Olsen et al., 2007; Tretter et al., 1997). GABAA receptors are the principalsite of action of benzodiazepines (Mohler et al., 2002). These receptors also mediate severalbehavioral effects of alcohol, and the molecular mechanisms mediating these effects areunder current investigation (Korpi et al., 2007; Olsen et al., 2007).
Two genome-wide scans provided evidence for linkage of AD to chromosome 4p (Long etal., 1998; Reich et al., 1998). By fine mapping this region, using family-based associationmethods, the COGA research group (Edenberg et al., 2004) found that SNPs and theirhaplotypes throughout the gene encoding the GABAA 2 subunit (GABRA2) wereassociated with AD. This finding has subsequently been replicated using haplotypicassociation in different case-control samples (Covault et al., 2004; Enoch et al., 2009; Enochet al., 2006; Fehr et al., 2006; Lappalainen et al., 2005; Soyka et al., 2008). The significanceof these findings is underscored by animal studies, which identify the -2 subunit as theprimary alpha subunit in limbic regions (Fritschy and Mohler, 1995), and a key mediator ofthe anxiolytic effects of benzodiazepines (Low et al., 2000). However, results of humanstudies remain contradictory, as demonstrated in a recent report in which no evidence of anassociation between 3′-GABRA2 polymorphisms and alcoholism was observed in an Italiansample (Onori et al., 2010).
Therefore, the use of endophenotypes, or specialized intermediate phenotypes, has beenproposed as a strategy to aid gene identification efforts for complex phenotypes, such as AD(Gottesman and Gould, 2003). Endophenotypes are rigorously defined (Ray et al., 2010) andallow for a critical analysis of genetic risk for alcohol use disorders (AUDs). As part of theCOGA project, the use of endophenotypes has successfully led to the identification of genesassociated with AD (Dick et al., 2006). Of note, Edenberg et al (Edenberg et al., 2004)reported that variation at the GABRA2 locus is associated with EEG power. Anotherpotential endophenotype is subjective response to alcohol, a measure of individualdifferences in sensitivity to the pharmacological effects of alcohol, and a predictor of thedevelopment of AUDs (Morean and Corbin, 2010; Quinn and Fromme, 2011). The exactpattern of subjective responses to alcohol associated with increased risk for alcoholproblems, however, remains unclear. In the Low Level of Response (LLR) Model, high-riskindividuals experience a dampened response to the full range of alcohol effects; thus a LLRto alcohol appears to be an inherited intermediate phenotype for the development of AUDs(Heath et al., 1999; Schuckit and Smith, 1996, 2000; Trim et al., 2009). However, theDifferentiator Model (DM) asserts that high risk status is associated with a greater response
Uhart et al. Page 2
Addict Biol. Author manuscript; available in PMC 2014 March 01.
NIH
-PA
Author M
anuscriptN
IH-P
A A
uthor Manuscript
NIH
-PA
Author M
anuscript

to alcohol’s positive, stimulant effects, which are most prominent on the ascending limb ofthe blood alcohol concentration (BAC) curve, and a lower response to negative, sedativeeffects, which are most prominent on the descending limb of the BAC curve (Newlin andThomson, 1990).
Given that twin studies have shown that inherited factors account for 40% to 60% of thevariance in alcohol sensitivity (Heath et al., 1999), and under the hypothesis that the samegenes that predict increased risk for alcoholism may also mediate a distinctive response toalcohol, studies have begun to examine the association of subjective responses to alcoholwith variants in GABRA2. In one such study, individuals homozygous for the morecommon allele of a GABRA2 single SNP (rs279858) reported greater subjective effects ofalcohol than individuals with 1 or 2 copies of the AD-associated minor allele (Pierucci-Lagha et al., 2005). However, this study examined only a single SNP. More recently, in astudy that used the alcohol clamp method for intravenous (i.v.) alcohol administration,subjects with the more common allele in 3 SNPs located in the middle of GABRA2 showedgreater subjective responses to alcohol than individuals homozygous for the AD-associatedminor alleles (Roh et al., 2010).
The present study examined the effects of genetic variation within the GABRA2 gene regionon the subjective effects of alcohol in healthy social drinkers. Differing from previousstudies that used an oral challenge, we evaluated the effects of several SNPs within theregion and their haplotypes on the subjective responses to alcohol. In addition, as opposed tothe i.v. paradigm, we used a within-session, cumulative oral alcohol dosing procedure thatmore closely approximates real-world alcohol consumption (Morean and Corbin, 2010;Quinn and Fromme, 2011). Based on the previous studies, we hypothesized that individualswith GABRA2 variants shown to be associated with AD would have lower subjectiveresponses to alcohol.
Subjects and Methods
Subjects
Sixty-nine healthy subjects between the ages of 21 and 30 years were recruited to participateby newspaper advertisements and posted flyers in the Baltimore area. Subjects whoappeared to qualify for research participation based on a telephone screen were invited foran in-person interview. All participants provided written informed consent approved by theJohns Hopkins Medicine Institutional Review Board. Subject assessment included a medicalhistory and physical exam, complete blood count, comprehensive metabolic panel (includingrenal and hepatic function tests), electrocardiogram, urinalysis, alcohol breathalyzer test andurine toxicology screen. The Semi-Structured Assessment for the Genetics of Alcoholism(SSAGA) (Bucholz et al., 1994) was administered by a master’s degree-level interviewer toidentify DSM-IV axis I psychiatric diagnoses, including past or current diagnoses of alcoholand drug abuse or dependence. Minimum and maximum alcohol consumption patterns wereestablished for this study, quantified using the 90-day Time Line Follow Back (TLFB)(Sobell et al., 1988). To minimize adverse reactions to the alcohol administration,participants had to report at least two drinking episodes in any 30-day period during the 90day TLFB and at least one of these episodes had to entail two or more drinks for women andthree or more drinks for men. In addition, subjects could not report drinking more than 28alcoholic drinks per month for women or 56 alcoholic drinks for men (i.e., less than NIAAAguidelines for heavy/hazardous drinking). Subjects with heavy/hazardous drinking or currentalcohol use disorders were excluded because of the potential for such subjects to havealready undergone a change in alcohol sensitivity due to heavy alcohol exposure.
Uhart et al. Page 3
Addict Biol. Author manuscript; available in PMC 2014 March 01.
NIH
-PA
Author M
anuscriptN
IH-P
A A
uthor Manuscript
NIH
-PA
Author M
anuscript

Additional exclusion criteria were: (a) serious medical conditions or use of prescriptionmedications, (b) current or lifetime history of a DSM-IV axis I disorder, (c) use ofpsychoactive medications within the past 90 days, (d) treatment in the last 6 months withany medication that may affect GABAergic function, including antidepressants,antipsychotics, sedative hypnotics, glucocorticoids, appetite suppressants, opioids, ordopaminergic medications, (e) positive urine toxicology screen, or (f) positive pregnancytest or lactating.
Laboratory Procedures
Alcohol dosing— A terminal blood ethanol concentration of 100mg/dL was selectedbased on our experience in previous studies (McCaul et al., 2000; Turkkan et al., 1988). Thetotal alcohol dose needed to achieve a BAC of 100 mg/dL was divided equally over threedrinks. Each alcohol drink was prepared by mixing the appropriate amount of 95% ethylalcohol (Spectrum Chemicals) with a non-calorically sweetened beverage (Kool-Aid) toachieve a volume of 4 oz. Placebo drinks were prepared by floating one ml of ethanol on topof the 4 oz of sweetened beverage immediately prior to administration to blind the subject toits content. Also as part of the blinding procedures, an ethanol-soaked wrist band was placedaround each glass to deliver a strong alcohol odor.
Alcohol Challenge Session— On the session day, subjects completed a urine toxicologyscreen, alcohol breathalyzer test, and urine pregnancy test; positive finding/s resulted intermination of their study participation. Subjects reported to the laboratory fasting and thenconsumed a calorie-restricted meal to control for possible dietary effects on alcoholabsorption. Subjects were in a quiet laboratory room, where they were monitored by theresearch nurse. A cumulative dosing procedure was used. At time 0, a placebo drink wasadministered. Three equal doses of alcoholized beverage were then administered at 45 minintervals (+45, +90 and +135); subjects had 10 minutes to finish each drink. Subjectscompleted subjective response assessments using a laptop computer and mouse at baseline(−25 min), following each drink (+15, +60, +105, +150 min) and at 45-minute intervals forthe remainder of the session (+195, +240, +285 min) (Figure 1). Following completion ofthe laboratory session, subjects were admitted to the inpatient Johns Hopkins GeneralClinical Research Unit to monitor them while intoxicated and were discharged the followingmorning.
Subjective Response Assessments— Visual Analog Drug Effect Questionnaire(VAS) includes the following questions 1) “Do you feel GOOD effects from the drink(s)?”;2) “Do you feel BAD effects of the drink(s)?”; 3) “Do you LIKE the effects of thedrink(s)?”; 4) “Do you DISLIKE the effects of the drink(s)?”; 5) “Is this the WORST youhave ever felt?”, and 6) “Is this the BEST you have ever felt?”. Subjects responded bypositioning an arrow on a 100-point line anchored by “not at all” on the left and “extremely”on the right. These measures were summed to yield two scales: (a) “Positive” effects, whichis the sum of “Good, Like and Best” effect responses, and (b) “Negative” effects, which isthe sum of “Bad, Dislike and Worst” effects responses.
Biphasic Alcohol Effects Scale (BAES) (Martin et al., 1993) is composed of 14 itemsmeasuring both stimulant and sedative effects of alcohol. Subjects rated the extent to whichthey experienced these feelings at the present time on a scale from 1 (not at all) to 9(extremely). These measures were summed to yield two scales: (a) “Stimulant” effects,which are the sum of “elated, energized, excited, stimulated, talkative, up, and vigorous”effects, and (b) “Sedative” effects, which are the sum of “difficulty concentrating, down,heavy head, inactive, sedated, slow thoughts and sluggish” effects.
Uhart et al. Page 4
Addict Biol. Author manuscript; available in PMC 2014 March 01.
NIH
-PA
Author M
anuscriptN
IH-P
A A
uthor Manuscript
NIH
-PA
Author M
anuscript

Subjective High Assessment Scale (SHAS) (Schuckit, 1980) consists of 13 descriptors ofalcohol’s effects, including uncomfortable, high, clumsy, muddled or confused, slurredspeech, dizzy, nauseated, drunk or intoxicated, sleepy, distorted sense of time, effects ofalcohol or drug, difficulty concentrating, and feelings of floating. Subjects were instructed torespond to how they felt “right now” using a horizontal line anchored by “not at all” on theleft and “extremely” on the right. Based on previous studies that have used this scale tostudy genetic influences on subjective responses to alcohol (Hu et al., 2005; Ray andHutchison, 2004; Schuckit et al., 1999), we analyzed GABRA2 genotype and haplotypeeffects on “High” and “Drunk or Intoxicated” effects.
Alcohol Levels Determination— In most subjects, BAC was assayed from plasma usingan Alcohol analyzer (Analox Instruments, Hammersmith, London). Coefficient of variancefor precision is 1–2% and sensitivity is 0.1 mg/dL. In 9 participants in whom plasma was notobtained BAC was estimated from breath using an Alco-Sensor IV Instrument (IntoximetersInc., St Louis, MO). Correlation of blood and breath alcohol levels was 0.959 (p<0.0001) in28 participants in which both measures were obtained.
Genotyping Procedures
SNP markers— Genotyping was conducted across 140.2 kb in the chromosome 4 regionthat contains GABRA2, and extending 63.1 kb 3′ towards the region where GABRG1 islocated and 8 kb 5′. The intergenic region 3′GABRA2-5′GABRG1 was included based onprevious literature showing association of SNPs in this region with AD (Covault et al., 2004;Covault et al., 2007). Twenty-six SNPs were selected from those already characterized inthe literature as associated with AD and those identified in the region by the InternationalHapMap Project (http://www.hapmap.org), which includes SNPs that have also beenregistered in The National Center for Biotechnology Information (NCBI) database (http://www.ncbi.nih.gov). Individual SNPs had to show a minor allele frequency > 0.05. Linkagedisequilibrium (LD) between neighboring SNPs was taken into account by selecting SNPsthat pair wise showed an r2 of <0.8. Table 1 lists the characteristics of the SNPs examined inthe current study.
Genomic DNA— Genomic DNA was extracted from leukocytes using the Gentra Puregenekit (Quiagen, Minneapolis, MN).
Polymerase Chain Reaction (PCR) amplification of SNPs— Genotyping wasperformed by the 50-nuclease method using fluorogenic allele-specific probes.Oligonucleotide primer and probe sets were selected from the human TaqMan® Pre-Designed SNP Genotyping Assays or designed using Applied Biosystems’ CustomTaqMan® SNP Genotyping Assay service (ABI, Foster City, CA). PCR amplificationreactions for Pre-Designed SNPs were performed in 5 μl volume containing 0.125μl 40Xassay mix, 2.5 μl Master Mix, and 7.5 ng genomic DNA. PCR amplification reactions forCustom SNPs were performed in 5 μl volume containing 0.25μl 20X assay mix or 0.125μl40X assay mix, 2.5μl Master Mix, and 7.5 ng genomic DNA. Reactions were incubated at50°C for 2 min and at 95°C for 10 min, and amplified for 40 cycles at 92°C for 15 s and60°C for 1 min. Allele-specific signals were distinguished by measuring endpoint 6-FAM orVIC fluorescence intensities using an ABI 7900HT Sequence Detection System andgenotypes were generated using SDS v2.1 software (Applied Biosystems). As a qualitycontrol, 20% of genotypes were repeated. PCR amplification failed or provided ambiguousgenotype results in 2.8% of SNP Markers.
Genotype distributions were in Hardy-Weinberg equilibrium (HWE) for all SNPs genotyped(range of p-values = 0.05–1.0).
Uhart et al. Page 5
Addict Biol. Author manuscript; available in PMC 2014 March 01.
NIH
-PA
Author M
anuscriptN
IH-P
A A
uthor Manuscript
NIH
-PA
Author M
anuscript

Genotyping for population markers— To estimate genetic ancestry proportions foreach subject, DNA samples were genotyped using a panel of 23 markers with highefficiency at clustering individuals into population subgroups (Smith et al., 2001; Yang etal., 2005). Short tandem repeat markers D1S252, D2S319, D12S352, D17S799, D8S272,D1S196, D7S640, D8S1827, D7S657, D22S274, D5S407, D2S162, D10S197, D11S935,D9S175, and D5S410 were selected from Applied Biosystems (AB, Foster City, CA)Linkage Mapping Set v2.5. Markers D7S2469, D16S3017, D10S1786, D15S1002,D6S1610, and D1S2628 were synthesized by Applied Biosystems with fluorescent dyePET® to allow genotyping in the same lane with the other markers. Samples were PCRamplified in 10μl using 30 ng DNA, 0.5U Taq Gold polymerase (Applied Biosystems),0.15μM primers, 0.6mM dNTPs (CLP, San Diego, CA), 2.5mM MgCl2 and 1X buffersupplied by the manufacturer. Reactions were amplified in a Veriti thermocycler (AppliedBiosystems, Foster City, CA) at 94°C for 12 minutes followed by 40 cycles of 94°C for 30sec., 55°C for 30 sec., 72°C for 30 sec., with a final extension at 72°C for 10 minutes. PCRproducts for the individual markers were pooled before electrophoresis on a 3730XL DNAAnalyzer (Applied Biosystems, Foster City, CA). Data were collected and analyzed withGeneMapper software (Applied Biosystems, Foster City, CA) that calculates fragmentlength in reference to an internal lane standard Genescan-500 labeled with LIZ. Allgenotypes were manually checked. Duffy Antigen SNP rs2814778 was genotyped usingTaqMan® Pre-Designed SNP Genotyping Assay (Applied Biosystems, Foster City, CA).Samples were PCR amplified in 5μl reaction volume containing 0.125μl 40X assay mix,2.5μl Master Mix and 8ng DNA. PCR and end point detection of fluorescence were carriedout in an ABI 7900HT Sequence Detection System (Applied Biosystems, Foster City, CA).Fluorescence data were analyzed with SDS v2.1 software. As a quality control, 20% ofgenotypes were repeated. PCR amplification failed or provided ambiguous genotype resultsin 4% of population markers and 2% of Duffy Antigen SNP.
Statistical Analysis
Summary values for demographic characteristics are expressed as means (SD) forcontinuous variables and frequencies (%) for categorical ones. The major outcomes ofinterest were subjective measurements described above. The correlations among thesesubjective measures were low and in some cases moderate in magnitude, thereforesuggesting that analyzing them separately would yield distinct information.
Population substructure— The population analysis software Structure 2.3.3 (developedby J. Pritchard from University of Chicago) was utilized to check for population geneticsubstructure in our sample using the 23 markers genotyped as described above. The first twoancestry proportions were adjusted for in the association analysis.
We conducted two different sets of analyses to assess the effect of genotype and haplotypeson the subjective responses to alcohol. Change from baseline in the subjective outcomemeasures was the dependent variable in the longitudinal analysis. Linear mixed effectsmodels were used to take into account correlation due to multiple measurements per subject.The change scores were normally-distributed. Given that we have a placebo drink during thesession at time 0 prior to the three alcohol drinks, this enables within-subject comparisonwith the placebo condition. In our analysis, we model unstructured time trend from thebeginning to the end of the session, in which placebo drink is the reference time point andresponses following alcohol drinks subsequent to the placebo drink are all contrasted withthis reference. Thus, comparison of the genotype groups takes into account the treatmentdifference across time.
Uhart et al. Page 6
Addict Biol. Author manuscript; available in PMC 2014 March 01.
NIH
-PA
Author M
anuscriptN
IH-P
A A
uthor Manuscript
NIH
-PA
Author M
anuscript

In addition, we evaluated if the placebo drink was believable for participants. We observedthat the “drunk or intoxicated” SHAS subjective response scores were significantly differentfollowing placebo drink administration compared to baseline subjective response scores(p=0.0015), whereas there was no difference in BAC levels between baseline and followingplacebo drink administration, with BAC being zero at both time points (Figure 2). Also, weobserved significant differences between subjective response scores following placebo drinkand all time points following alcohol administration (p<0.0001); as expected, the drunk orintoxicated scores increased with the cumulative alcohol drinks until participants reachedpeak BAC, and decreased following the alcohol drinks as BAC was declining.
A. Individual SNP analysis— The linear mixed effects model included a contrast forgenotype differences as a major predictor, while controlling for time, BAC (time-dependent), genetic ancestry proportion as well as demographic characteristics includingage, gender and drinking behavior variables that were significant for the outcome of interest.No significant interaction effects between time and genotypes were detected; therefore, theresults reported were obtained from models without the interaction term.
Determining significance level for individual SNP analysis— The conventionalalpha or Type I error level to declare a finding significant (p<0.05) was corrected formultiple tests. Because the analyzed SNPs are in LD with each other, the tests are notindependent. Thus, the method proposed by Nyholt (Nyholt, 2004) was used to evaluate thecorrelation between SNPs to determine the effective number of independent tests in theanalysis. To do this, we used Haploview to calculate the number of haplotype blocksincluded in the candidate gene using the procedures described below. Tagging SNPs that didnot fall within a defined block were counted as an independent test. We estimated a total of8 effective independent tests. Therefore, using a conservative approach, we applied aBonferroni correction for Type I error for 8 tests ( = 0.05/8=0.0062). The tests were twosided with a 0.0062 significance level.
B. Haplotype analysis— Given that our sample was predominantly Caucasian (see Table2), the haplotype analysis was limited to the 52 individuals who self-reported their race asCaucasian and were also determined to be so based on their genetic ancestry proportion. Thelinear mixed effects model included a contrast for haplotype differences as a majorpredictor, while controlling for time, BAC, as well as demographic characteristics includingage, gender and drinking behavior variables that were significant for the outcome of interest.
B.1. Reconstruction of haplotypes in the study cohort (Caucasian population)—The program Haploview (v4.2) was used to delineate haplotype blocks (Barrett et al.,2005). Haploview calculates linkage disequilibrium (D′ or r2) between each pair of SNPs.We used the method of confidence intervals to assign haplotype blocks (Gabriel et al.,2002). For SNPs within the same haplotypic block, haplotypes were reconstructed using theprogram PHASE2 (Stephens et al., 2001), which employs an iterative stochastic-samplingstrategy and the pseudo-Gibbs sampler for assignment of haplotype phases. Based on thehaplotype frequency estimation, we assumed a dominant genetic model in Haplotypeassociation analysis. The tests were two sided with a 0.05 significance level.
All association analyses were performed using the SAS software, version 9.2 (SAS InstituteInc, Cary, NC).
Uhart et al. Page 7
Addict Biol. Author manuscript; available in PMC 2014 March 01.
NIH
-PA
Author M
anuscriptN
IH-P
A A
uthor Manuscript
NIH
-PA
Author M
anuscript

Results
1. Demographics
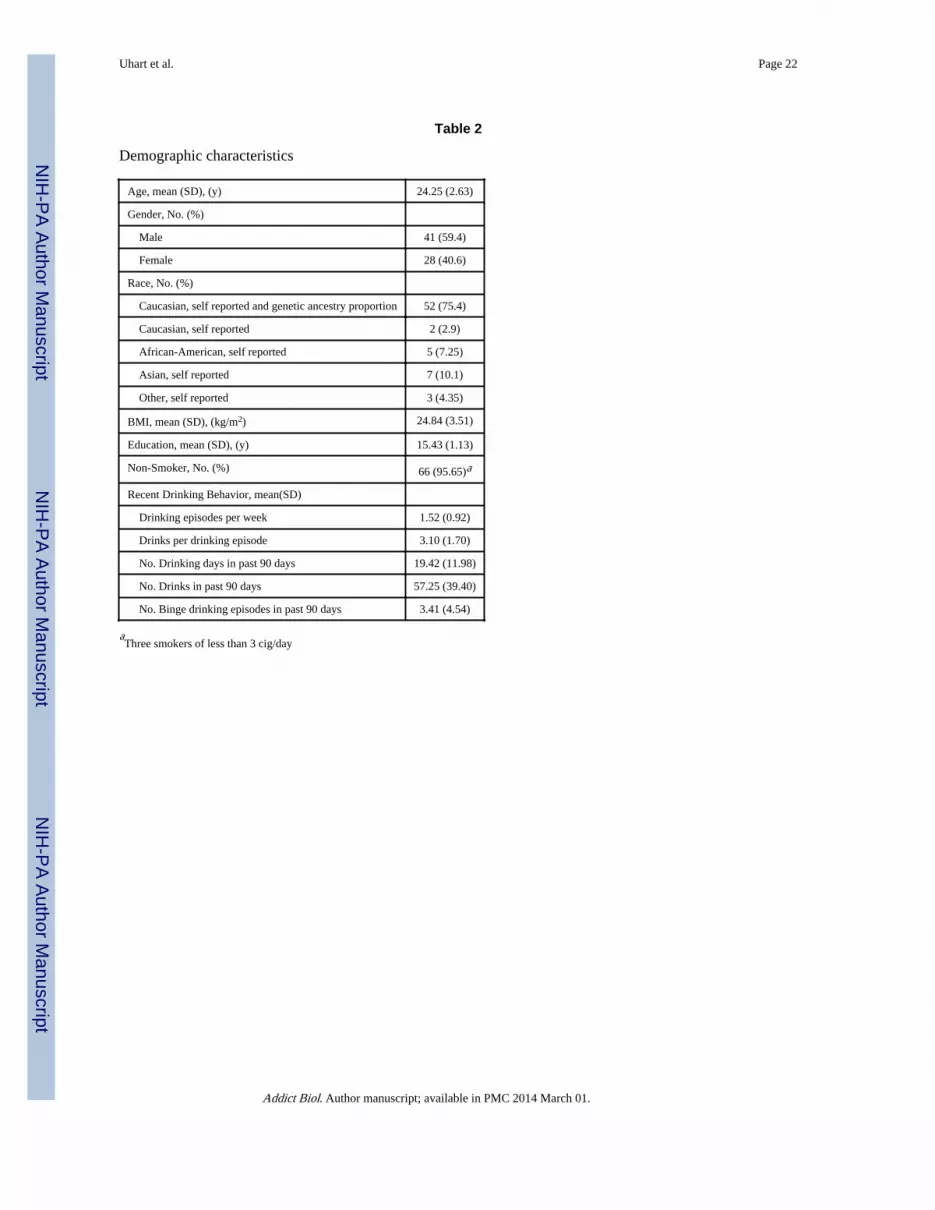
Demographic characteristics for the participants who underwent the alcohol challenge arepresented in Table 2. Subjects were healthy, with a mean age of 24 years, an average of 3years of college, and were predominantly Caucasian. The subjects drank an average of 1.5days per week, averaging 3 drinks per episode. There were three subjects who were smokersof less than 3 cigarettes per day. Demographic characteristics that predicted the subjectiveoutcome measures being analyzed were adjusted for in our statistical models.
2. Blood alcohol level
As shown in Figure 2, a range of BAC levels obtained over time captured both the ascendingand descending limb of the alcohol dose effect curve within the session. In addition, thepeak blood alcohol level (mean 100.4 mg/dL, SE =2.5) indicated the target dose of 100 mg/dL was obtained using the cumulative oral alcohol dosing procedure. There were nosignificant genotype group differences in BAC levels.
3. Individual SNPs effects on Subjective Responses to Alcohol
3. A. Visual Analog Drug Effect Questionnaire (VAS)— During the alcoholchallenge session, subjects with one or two copies of the minor alleles for the followingSNPs reported on average significantly lower “Negative” effects (i.e., the sum of “Bad,Dislike and Worst” effects scores) than those homozygous for the common allele afteradjusting for time, BAC, genetic ancestry proportion and number of binge drinking episodes(Table 3). rs279858: Negative effects score was lower in carriers of the minor allele, C, thanin subjects homozygous for the common allele (F(1, 62) = 8.10, p=0.0060) (Figure 3.A.). rs279844: Negative effects score was lower in carriers of the minor allele, T, than in subjectshomozygous for the common allele (F(1, 62) = 9.22, p=0.0035). rs 279845: Negative effectsscore was lower in carriers of the minor allele, A, than in subjects homozygous for thecommon allele (F(1, 61) = 8.70, p=0.0045). rs279826: Negative effects score was lower incarriers of the minor allele, G, than in subjects homozygous for the common allele (F(1, 61)= 8.80, p=0.0043). rs279828: Negative effects score was lower in carriers of the minorallele, C, than in subjects homozygous for the common allele (F(1, 63) = 9.07, p=0.0037). rs279836: Negative effects score was lower in carriers of the minor allele, A, than in subjectshomozygous for the common allele (F(1, 62) = 8.08, p=0.0061) (Figure 3.B.). When theSNPs described above were analyzed in the Caucasian subsample only, the effects weresimilar (Table 3).
We did not observe significant association of individual SNPs with alcohol’s positive andstimulant effects, SHAS High and Intoxicated effects or alcohol’s sedative effects.
4. Haplotype block structure in the Caucasian cohort
Two main haplotype blocks were observed (Figure 4). The first haplotype block includesSNPs extending from the intergenic region 5′ GABRG1-3′ GABRA2 to intron 3 ofGABRA2. The second haplotype block includes SNPs located in intron 3 of GABRA2.Table 4 describes the haplotype blocks and frequencies in our population.
5. Haplotype effects on Subjective Responses to Alcohol
5. A. Block 1: intergenic region 5 ′ GABRG1-3′ GABRA2 and GABRA2 region
5. A.1. Visual Analog Drug Effect Questionnaire (VAS): Carriers of one or two copies ofblock 1, haplotype 1, GTGGTACCTCTTAGCAGC, had significantly lower mean alcohol“Negative” effects scores (14.18, SE = 3.93) than non-carriers [mean = 23.17 (SE = 3.26),
Uhart et al. Page 8
Addict Biol. Author manuscript; available in PMC 2014 March 01.
NIH
-PA
Author M
anuscriptN
IH-P
A A
uthor Manuscript
NIH
-PA
Author M
anuscript
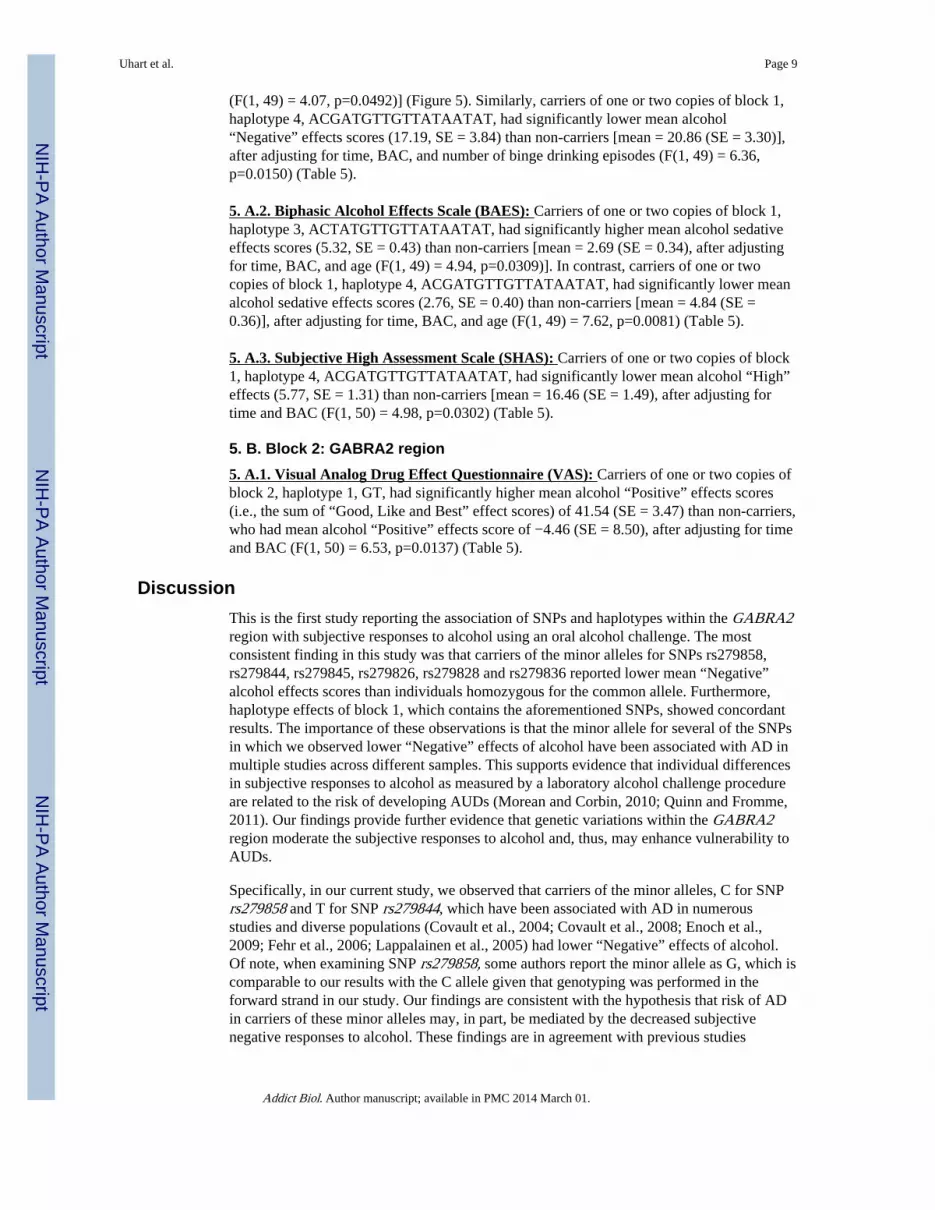
(F(1, 49) = 4.07, p=0.0492)] (Figure 5). Similarly, carriers of one or two copies of block 1,haplotype 4, ACGATGTTGTTATAATAT, had significantly lower mean alcohol“Negative” effects scores (17.19, SE = 3.84) than non-carriers [mean = 20.86 (SE = 3.30)],after adjusting for time, BAC, and number of binge drinking episodes (F(1, 49) = 6.36,p=0.0150) (Table 5).
5. A.2. Biphasic Alcohol Effects Scale (BAES): Carriers of one or two copies of block 1,haplotype 3, ACTATGTTGTTATAATAT, had significantly higher mean alcohol sedativeeffects scores (5.32, SE = 0.43) than non-carriers [mean = 2.69 (SE = 0.34), after adjustingfor time, BAC, and age (F(1, 49) = 4.94, p=0.0309)]. In contrast, carriers of one or twocopies of block 1, haplotype 4, ACGATGTTGTTATAATAT, had significantly lower meanalcohol sedative effects scores (2.76, SE = 0.40) than non-carriers [mean = 4.84 (SE =0.36)], after adjusting for time, BAC, and age (F(1, 49) = 7.62, p=0.0081) (Table 5).
5. A.3. Subjective High Assessment Scale (SHAS): Carriers of one or two copies of block1, haplotype 4, ACGATGTTGTTATAATAT, had significantly lower mean alcohol “High”effects (5.77, SE = 1.31) than non-carriers [mean = 16.46 (SE = 1.49), after adjusting fortime and BAC (F(1, 50) = 4.98, p=0.0302) (Table 5).
5. B. Block 2: GABRA2 region
5. A.1. Visual Analog Drug Effect Questionnaire (VAS): Carriers of one or two copies ofblock 2, haplotype 1, GT, had significantly higher mean alcohol “Positive” effects scores(i.e., the sum of “Good, Like and Best” effect scores) of 41.54 (SE = 3.47) than non-carriers,who had mean alcohol “Positive” effects score of −4.46 (SE = 8.50), after adjusting for timeand BAC (F(1, 50) = 6.53, p=0.0137) (Table 5).
Discussion
This is the first study reporting the association of SNPs and haplotypes within the GABRA2region with subjective responses to alcohol using an oral alcohol challenge. The mostconsistent finding in this study was that carriers of the minor alleles for SNPs rs279858,rs279844, rs279845, rs279826, rs279828 and rs279836 reported lower mean “Negative”alcohol effects scores than individuals homozygous for the common allele. Furthermore,haplotype effects of block 1, which contains the aforementioned SNPs, showed concordantresults. The importance of these observations is that the minor allele for several of the SNPsin which we observed lower “Negative” effects of alcohol have been associated with AD inmultiple studies across different samples. This supports evidence that individual differencesin subjective responses to alcohol as measured by a laboratory alcohol challenge procedureare related to the risk of developing AUDs (Morean and Corbin, 2010; Quinn and Fromme,2011). Our findings provide further evidence that genetic variations within the GABRA2region moderate the subjective responses to alcohol and, thus, may enhance vulnerability toAUDs.
Specifically, in our current study, we observed that carriers of the minor alleles, C for SNPrs279858 and T for SNP rs279844, which have been associated with AD in numerousstudies and diverse populations (Covault et al., 2004; Covault et al., 2008; Enoch et al.,2009; Fehr et al., 2006; Lappalainen et al., 2005) had lower “Negative” effects of alcohol.Of note, when examining SNP rs279858, some authors report the minor allele as G, which iscomparable to our results with the C allele given that genotyping was performed in theforward strand in our study. Our findings are consistent with the hypothesis that risk of ADin carriers of these minor alleles may, in part, be mediated by the decreased subjectivenegative responses to alcohol. These findings are in agreement with previous studies
Uhart et al. Page 9
Addict Biol. Author manuscript; available in PMC 2014 March 01.
NIH
-PA
Author M
anuscriptN
IH-P
A A
uthor Manuscript
NIH
-PA
Author M
anuscript

showing that a low level of overall response to alcohol appears to represent an importantcomponent of inherited risk for AUDs, supporting the low level of response model (Heath etal., 1999; Schuckit and Smith, 1996, 2000; Trim et al., 2009). Adding further evidence,another study which examined the influence of a single SNP, rs279858, on subjective effectsof alcohol (Pierucci-Lagha et al., 2005) described that participants homozygotes for themore common allele (comparable to our results with the T allele) reported greaterstimulation following alcohol administration than the G-allele carriers (AD associated allelecomparable to our results with the C allele) as measured by the BAES and CentralStimulation subscale of the Alcohol Sensation Scale. In this study, the authors interpretedthat the decreased subjective response to alcohol of individuals carrying the minor allele, G,may in part mediate the increased risk for AD observed in population studies.
Our haplotypic analysis indicated that carriers of block 1, haplotypes 1 and 4 had loweralcohol “Negative” effects than non-carriers. As expected, carriers of block 1, haplotype 1, apredominantly minor allele haplotype, had concordant results with the analysis of SNPs inthis block. Interestingly, carriers of haplotype 4, although a predominantly major allelehaplotype, also contained the minor alleles for various SNPs in the haplotype; therefore,these findings are also concordant with the individual SNP analyses.
Because of their ability to use the information inherent in LD, testing associations withhaplotypes may be more powerful than with individual SNPs (Chapman and Wijsman, 1998;Chiano and Clayton, 1998; Johnson et al., 2001). We observed associations of block 1,haplotype 4 with subjective “High” effects of alcohol using an uncorrected p-value, and ofblock 2, haplotype 1, with “Positive” effects of alcohol. However, individual analyisis ofSNPs that compose these haplotypes did not reveal significant associations with positive andstimulant effects of alcohol. More studies of the association of haplotypes in this region toAD are needed to validate our findings.
One of the strengths of our study is that we used an oral alcohol challenge, and achieved atarget peak BAC of 100.4 mg/dL 25 minutes following the cumulative alcohol doses, whichallowed us to observe subjective responses on both the ascending and descending limbs ofthe BAC. In addition, given that subjective responses to alcohol have been found to differ bydrinking phenotype (i.e., heavy alcohol consumption or persons at increased risk for AD)(Morean and Corbin, 2010; Quinn and Fromme, 2011), we took into account recent drinkingbehavior in our analysis and adjusted for these variables when they had a significant effecton the subjective response being evaluated. Also, we observed not only SNP, but alsohaplotype effects on subjective responses to alcohol measured throughout the whole session.Other strengths of the study include the selection of SNPs spanning the GABRA2 regionincluding several SNPs that have been consistently associated with AD (Covault et al., 2004;Covault et al., 2008; Enoch et al., 2009; Fehr et al., 2006; Lappalainen et al., 2005), whichallowed for a comprehensive examination of GABRA2 SNPs on subjective responses toalcohol. Furthermore, the number of subjects who participated in our study is relatively largecompared to other studies (Pierucci-Lagha et al., 2005), which provided the statistical powernecessary to examine a larger group of SNPs. In addition, we were very stringent in settingsignificance levels. Importantly, we estimated genetic ancestry proportions for each subjectto identify population substructure within our sample, and ancestries were adjusted for in theSNP and haplotype association analyses.
The results of our study must be viewed in the context of its limitations. Our findings thatindividuals carrying the AD-associated alleles for SNPs in the GABRA2 region experiencelower negative responses to alcohol may indicate that these individuals can drink morealcohol without experiencing its negative effects than non-carriers of the minor allele andmay therefore be more likely to drink and drink heavily when given access to alcohol. It
Uhart et al. Page 10
Addict Biol. Author manuscript; available in PMC 2014 March 01.
NIH
-PA
Author M
anuscriptN
IH-P
A A
uthor Manuscript
NIH
-PA
Author M
anuscript

could be argued that further studies are needed to determine the effects of GABRA2 alleleson drinking behavior as it occurs in natural settings or using self-administration paradigms.Another limitation of the study is that the haplotype analyses included only Caucasiansubjects; therefore, similar studies are needed in other population groups to ensure that thefindings generalize to these groups. Finally, although we observed that SNPs and haplotypeswere associated with differences in subjective responses to alcohol, to our knowledge thefunctional effects of the allelic variants examined remain unknown. Therefore, the SNPsexamined may be in LD with variation at other loci within the GABRA2 gene or genes inclose proximity that are responsible for the effects observed in our study. Future researchshould examine additional polymorphisms within this gene cluster and aim to elucidate thepotential mechanisms by which these variants influence the subjective responses to alcohol.
Our findings provide further evidence that genetic variations within the GABRA2 regionmoderate the subjective responses to alcohol and thus, may increase vulnerability to AUDs.These findings are important in that they may aid in the identification of individuals at riskfor AUDs and those who are the most critical targets for alcohol prevention interventions.
Acknowledgments
Supported by NIH grants AA017466 (M Uhart), and AA020342 and MH076953 (GS Wand).
References
Barrett JC, Fry B, Maller J, Daly MJ. Haploview: analysis and visualization of LD and haplotypemaps. Bioinformatics. 2005; 21:263–265. [PubMed: 15297300]
Bienvenu OJ, Davydow DS, Kendler KS. Psychiatric ‘diseases’ versus behavioral disorders and degreeof genetic influence. Psychol Med. 2011; 41:33–40. [PubMed: 20459884]
Bucholz KK, Cadoret R, Cloninger CR, Dinwiddie SH, Hesselbrock VM, Nurnberger JI Jr, Reich T,Schmidt I, Schuckit MA. A new, semi-structured psychiatric interview for use in genetic linkagestudies: a report on the reliability of the SSAGA. J Stud Alcohol. 1994; 55:149–158. [PubMed:8189735]
Chapman NH, Wijsman EM. Genome screens using linkage disequilibrium tests: optimal markercharacteristics and feasibility. Am J Hum Genet. 1998; 63:1872–1885. [PubMed: 9837839]
Chiano MN, Clayton DG. Fine genetic mapping using haplotype analysis and the missing dataproblem. Ann Hum Genet. 1998; 62:55–60. [PubMed: 9659978]
Chu DC, Albin RL, Young AB, Penney JB. Distribution and kinetics of GABAB binding sites in ratcentral nervous system: a quantitative autoradiographic study. Neuroscience. 1990; 34:341–357.[PubMed: 2159128]
Covault J, Gelernter J, Hesselbrock V, Nellissery M, Kranzler HR. Allelic and haplotypic associationof GABRA2 with alcohol dependence. Am J Med Genet B Neuropsychiatr Genet. 2004; 129:104–109. [PubMed: 15274050]
Covault J, Gelernter J, Jensen K, Anton R, Kranzler HR. Markers in the 5′-Region of GABRG1Associate to Alcohol Dependence and are in Linkage Disequilibrium with Markers in the AdjacentGABRA2 Gene. Neuropsychopharmacology. 2007
Covault J, Gelernter J, Jensen K, Anton R, Kranzler HR. Markers in the 5′-region of GABRG1associate to alcohol dependence and are in linkage disequilibrium with markers in the adjacentGABRA2 gene. Neuropsychopharmacology. 2008; 33:837–848. [PubMed: 17507911]
Dick DM, Jones K, Saccone N, Hinrichs A, Wang JC, Goate A, Bierut L, Almasy L, Schuckit M,Hesselbrock V, Tischfield J, Foroud T, Edenberg H, Porjesz B, Begleiter H. Endophenotypessuccessfully lead to gene identification: results from the collaborative study on the genetics ofalcoholism. Behav Genet. 2006; 36:112–126. [PubMed: 16341909]
Edenberg HJ, Dick DM, Xuei X, Tian H, Almasy L, Bauer LO, Crowe RR, Goate A, Hesselbrock V,Jones K, Kwon J, Li TK, Nurnberger JI Jr, O’Connor SJ, Reich T, Rice J, Schuckit MA, PorjeszB, Foroud T, Begleiter H. Variations in GABRA2, encoding the alpha 2 subunit of the GABA(A)
Uhart et al. Page 11
Addict Biol. Author manuscript; available in PMC 2014 March 01.
NIH
-PA
Author M
anuscriptN
IH-P
A A
uthor Manuscript
NIH
-PA
Author M
anuscript

receptor, are associated with alcohol dependence and with brain oscillations. Am J Hum Genet.2004; 74:705–714. [PubMed: 15024690]
Enoch MA, Hodgkinson CA, Yuan Q, Albaugh B, Virkkunen M, Goldman D. GABRG1 andGABRA2 as independent predictors for alcoholism in two populations.Neuropsychopharmacology. 2009; 34:1245–1254. [PubMed: 18818659]
Enoch MA, Schwartz L, Albaugh B, Virkkunen M, Goldman D. Dimensional anxiety mediates linkageof GABRA2 haplotypes with alcoholism. Am J Med Genet B Neuropsychiatr Genet. 2006;141:599–607. [PubMed: 16874763]
Fehr C, Sander T, Tadic A, Lenzen KP, Anghelescu I, Klawe C, Dahmen N, Schmidt LG, Szegedi A.Confirmation of association of the GABRA2 gene with alcohol dependence by subtype-specificanalysis. Psychiatr Genet. 2006; 16:9–17. [PubMed: 16395124]
Fritschy JM, Mohler H. GABAA-receptor heterogeneity in the adult rat brain: differential regional andcellular distribution of seven major subunits. J Comp Neurol. 1995; 359:154–194. [PubMed:8557845]
Gabriel SB, Schaffner SF, Nguyen H, Moore JM, Roy J, Blumenstiel B, Higgins J, DeFelice M,Lochner A, Faggart M, Liu-Cordero SN, Rotimi C, Adeyemo A, Cooper R, Ward R, Lander ES,Daly MJ, Altshuler D. The structure of haplotype blocks in the human genome. Science. 2002;296:2225–2229. [PubMed: 12029063]
Gottesman, Gould TD. The endophenotype concept in psychiatry: etymology and strategic intentions.Am J Psychiatry. 2003; 160:636–645. [PubMed: 12668349]
Heath AC, Madden PA, Bucholz KK, Dinwiddie SH, Slutske WS, Bierut LJ, Rohrbaugh JW, StathamDJ, Dunne MP, Whitfield JB, Martin NG. Genetic differences in alcohol sensitivity and theinheritance of alcoholism risk. Psychol Med. 1999; 29:1069–1081. [PubMed: 10576299]
Hu X, Oroszi G, Chun J, Smith TL, Goldman D, Schuckit MA. An expanded evaluation of therelationship of four alleles to the level of response to alcohol and the alcoholism risk. Alcohol ClinExp Res. 2005; 29:8–16. [PubMed: 15654286]
Johnson GC, Esposito L, Barratt BJ, Smith AN, Heward J, Di Genova G, Ueda H, Cordell HJ, EavesIA, Dudbridge F, Twells RC, Payne F, Hughes W, Nutland S, Stevens H, Carr P, Tuomilehto-Wolf E, Tuomilehto J, Gough SC, Clayton DG, Todd JA. Haplotype tagging for the identificationof common disease genes. Nat Genet. 2001; 29:233–237. [PubMed: 11586306]
Kendler KS. Twin studies of psychiatric illness: an update. Arch Gen Psychiatry. 2001; 58:1005–1014.[PubMed: 11695946]
Korpi ER, Debus F, Linden A-M, Malécot C, Leppä E, Vekovischeva O, Rabe H, Böhme I, Aller MI,Wisden W, Lüddens H. Does ethanol act preferentially via selected brain GABAA receptorsubtypes? the current evidence is ambiguous. Alcohol. 2007; 41:163–176. [PubMed: 17591542]
Lappalainen J, Krupitsky E, Remizov M, Pchelina S, Taraskina A, Zvartau E, Somberg LK, Covault J,Kranzler HR, Krystal JH, Gelernter J. Association between alcoholism and gamma-amino butyricacid alpha2 receptor subtype in a Russian population. Alcohol Clin Exp Res. 2005; 29:493–498.[PubMed: 15834213]
Long JC, Knowler WC, Hanson RL, Robin RW, Urbanek M, Moore E, Bennett PH, Goldman D.Evidence for genetic linkage to alcohol dependence on chromosomes 4 and 11 from an autosome-wide scan in an American Indian population. Am J Med Genet. 1998; 81:216–221. [PubMed:9603607]
Low K, Crestani F, Keist R, Benke D, Brunig I, Benson JA, Fritschy JM, Rulicke T, Bluethmann H,Mohler H, Rudolph U. Molecular and neuronal substrate for the selective attenuation of anxiety.Science. 2000; 290:131–134. [PubMed: 11021797]
Martin CS, Earleywine M, Musty RE, Perrine MW, Swift RM. Development and validation of theBiphasic Alcohol Effects Scale. Alcohol Clin Exp Res. 1993; 17:140–146. [PubMed: 8452195]
McCaul ME, Wand GS, Eissenberg T, Rohde CA, Cheskin LJ. Naltrexone alters subjective andpsychomotor responses to alcohol in heavy drinking subjects. Neuropsychopharmacology. 2000;22:480–492. [PubMed: 10731623]
Mohler H, Fritschy JM, Rudolph U. A new benzodiazepine pharmacology. J Pharmacol Exp Ther.2002; 300:2–8. [PubMed: 11752090]
Uhart et al. Page 12
Addict Biol. Author manuscript; available in PMC 2014 March 01.
NIH
-PA
Author M
anuscriptN
IH-P
A A
uthor Manuscript
NIH
-PA
Author M
anuscript

Morean ME, Corbin WR. Subjective response to alcohol: a critical review of the literature. AlcoholClin Exp Res. 2010; 34:385–395. [PubMed: 20028359]
Newlin DB, Thomson JB. Alcohol challenge with sons of alcoholics: a critical review and analysis.Psychol Bull. 1990; 108:383–402. [PubMed: 2270234]
Nyholt DR. A simple correction for multiple testing for single-nucleotide polymorphisms in linkagedisequilibrium with each other. Am J Hum Genet. 2004; 74:765–769. [PubMed: 14997420]
Olsen RW, Hanchar HJ, Meera P, Wallner M. GABAA receptor subtypes: the “one glass of wine”receptors. Alcohol. 2007; 41:201–209. [PubMed: 17591543]
Onori N, Turchi C, Solito G, Gesuita R, Buscemi L, Tagliabracci A. GABRA2 and Alcohol UseDisorders: No Evidence of an Association in an Italian Case–Control Study. Alcoholism: Clinicaland Experimental Research. 2010; 34:659–668.
Pierucci-Lagha A, Covault J, Feinn R, Nellissery M, Hernandez-Avila C, Oncken C, Morrow AL,Kranzler HR. GABRA2 alleles moderate the subjective effects of alcohol, which are attenuated byfinasteride. Neuropsychopharmacology. 2005; 30:1193–1203. [PubMed: 15702134]
Quinn PD, Fromme K. Subjective response to alcohol challenge: a quantitative review. Alcohol ClinExp Res. 2011; 35:1759–1770. [PubMed: 21777258]
Ray LA, Hutchison KE. A polymorphism of the mu-opioid receptor gene (OPRM1) and sensitivity tothe effects of alcohol in humans. Alcohol Clin Exp Res. 2004; 28:1789–1795. [PubMed:15608594]
Ray LA, Mackillop J, Monti PM. Subjective responses to alcohol consumption as endophenotypes:advancing behavioral genetics in etiological and treatment models of alcoholism. Subst UseMisuse. 2010; 45:1742–1765. [PubMed: 20590398]
Reich T, Edenberg HJ, Goate A, Williams JT, Rice JP, Van Eerdewegh P, Foroud T, Hesselbrock V,Schuckit MA, Bucholz K, Porjesz B, Li TK, Conneally PM, Nurnberger JI Jr, Tischfield JA,Crowe RR, Cloninger CR, Wu W, Shears S, Carr K, Crose C, Willig C, Begleiter H. Genome-wide search for genes affecting the risk for alcohol dependence. Am J Med Genet. 1998; 81:207–215. [PubMed: 9603606]
Roh S, Matsushita S, Hara S, Maesato H, Matsui T, Suzuki G, Miyakawa T, Ramchandani VA, Li TK,Higuchi S. Role of GABRA2 in Moderating Subjective Responses to Alcohol. Alcohol Clin ExpRes. 2010
Schuckit MA. Self-rating of alcohol intoxication by young men with and without family histories ofalcoholism. J Stud Alcohol. 1980; 41:242–249. [PubMed: 7374142]
Schuckit MA, Mazzanti C, Smith TL, Ahmed U, Radel M, Iwata N, Goldman D. Selective genotypingfor the role of 5-HT2A, 5-HT2C, and GABA alpha 6 receptors and the serotonin transporter in thelevel of response to alcohol: a pilot study. Biol Psychiatry. 1999; 45:647–651. [PubMed:10088053]
Schuckit MA, Smith TL. An 8-year follow-up of 450 sons of alcoholic and control subjects. Arch GenPsychiatry. 1996; 53:202–210. [PubMed: 8611056]
Schuckit MA, Smith TL. The relationships of a family history of alcohol dependence, a low level ofresponse to alcohol and six domains of life functioning to the development of alcohol usedisorders. J Stud Alcohol. 2000; 61:827–835. [PubMed: 11188488]
Smith MW, Lautenberger JA, Shin HD, Chretien JP, Shrestha S, Gilbert DA, O’Brien SJ. Markers formapping by admixture linkage disequilibrium in African American and Hispanic populations. AmJ Hum Genet. 2001; 69:1080–1094. [PubMed: 11590548]
Sobell LC, Sobell MB, Leo GI, Cancilla A. Reliability of a timeline method: assessing normaldrinkers’ reports of recent drinking and a comparative evaluation across several populations. Br JAddict. 1988; 83:393–402. [PubMed: 3395719]
Soyka M, Preuss UW, Hesselbrock V, Zill P, Koller G, Bondy B. GABA-A2 receptor subunit gene(GABRA2) polymorphisms and risk for alcohol dependence. J Psychiatr Res. 2008; 42:184–191.[PubMed: 17207817]
Stephens M, Smith NJ, Donnelly P. A new statistical method for haplotype reconstruction frompopulation data. Am J Hum Genet. 2001; 68:978–989. [PubMed: 11254454]
Tretter V, Ehya N, Fuchs K, Sieghart W. Stoichiometry and assembly of a recombinant GABAAreceptor subtype. J Neurosci. 1997; 17:2728–2737. [PubMed: 9092594]
Uhart et al. Page 13
Addict Biol. Author manuscript; available in PMC 2014 March 01.
NIH
-PA
Author M
anuscriptN
IH-P
A A
uthor Manuscript
NIH
-PA
Author M
anuscript

Trim RS, Schuckit MA, Smith TL. The relationships of the level of response to alcohol and additionalcharacteristics to alcohol use disorders across adulthood: a discrete-time survival analysis. AlcoholClin Exp Res. 2009; 33:1562–1570. [PubMed: 19485971]
Turkkan JS, Stitzer ML, McCaul ME. Psychophysiological effects of oral ethanol in alcoholics andsocial drinkers. Alcohol Clin Exp Res. 1988; 12:30–38. [PubMed: 3279857]
Yang BZ, Zhao H, Kranzler HR, Gelernter J. Practical population group assignment with selectedinformative markers: characteristics and properties of Bayesian clustering via STRUCTURE.Genetic epidemiology. 2005; 28:302–312. [PubMed: 15782414]
Uhart et al. Page 14
Addict Biol. Author manuscript; available in PMC 2014 March 01.
NIH
-PA
Author M
anuscriptN
IH-P
A A
uthor Manuscript
NIH
-PA
Author M
anuscript

Figure 1.Timeline of events during the Alcohol Challenge Session. At time 0, placebo wasadministered, using blinding procedures. Three equal doses of alcohol were thenadministered at 45-min intervals; subjects had 10 minutes to finish each drink. Subjectiveassessments were obtained at baseline, following each drink, and at 45-minute intervals forthe remainder of the session. BAC depicts times at which alcohol concentration wasmeasured.
Uhart et al. Page 15
Addict Biol. Author manuscript; available in PMC 2014 March 01.
NIH
-PA
Author M
anuscriptN
IH-P
A A
uthor Manuscript
NIH
-PA
Author M
anuscript

Figure 2.Blood alcohol concentration achieved over time during the Alcohol Challenge Session.Values reflect mean (SE) time course of blood alcohol level during the alcohol sensitivitysession. P denotes time of placebo drink. A denotes times of alcohol drinks.
Uhart et al. Page 16
Addict Biol. Author manuscript; available in PMC 2014 March 01.
NIH
-PA
Author M
anuscriptN
IH-P
A A
uthor Manuscript
NIH
-PA
Author M
anuscript

Figure 3.A. Visual Analog Drug Effect Questionnaire (VAS) “Negative” effects responses to acutealcohol administration by GABRA2 SNP rs279858. Values reflect unadjusted means (SE). Pdenotes time of placebo drink. A denotes times of alcohol drinks. Subjects homozygous (n=14) or heterozygous (n=31) for the minor allele, C, reported on average a lower meanchange from baseline “Negative” effects than those homozygous for the common allele(n=23) (p=0.0060).B. Visual Analog Drug Effect Questionnaire (VAS) “Negative” effects responses to acutealcohol administration by GABRA2 SNP rs279836. Values reflect unadjusted means (SE). Pdenotes time of placebo drink. A denotes times of alcohol drinks. Subjects homozygous (n=14) or heterozygous (n=33) for the minor allele, A, reported on average a lower meanchange from baseline “Negative” effects than those homozygous for the common allele(n=21) (p=0.0061).
Uhart et al. Page 17
Addict Biol. Author manuscript; available in PMC 2014 March 01.
NIH
-PA
Author M
anuscriptN
IH-P
A A
uthor Manuscript
NIH
-PA
Author M
anuscript

Figure 4.Pattern of linkage disequilibrium (LD) within the tagging SNPs genotyped across theChromosome 4 region that contains GABRA2 in the Caucasian population. The numbers onthe top correspond to each SNP’s rs number as named in Table 1. Each number in thediamonds represents LD (D′) values for the respective SNP pairs. ◆, Absolute LD (D′=1);95, D′: 0.95 between SNPs 3 and 13.
Uhart et al. Page 18
Addict Biol. Author manuscript; available in PMC 2014 March 01.
NIH
-PA
Author M
anuscriptN
IH-P
A A
uthor Manuscript
NIH
-PA
Author M
anuscript

Figure 5.Visual Analog Drug Effect Questionnaire (VAS) “Negative” effects responses to acutealcohol administration by Haplotype block1, haplotype 1, GTGGTACCTCTTAGCAGC(B1,H1). Values reflect unadjusted means (SE). P denotes time of placebo drink. A denotestimes of alcohol drinks. Subjects who were carriers of one or two copies of B1,H1,predominantly a minor allele haplotype (n=24), reported on average significantly lowermean change from baseline alcohol “Negative” effects (which is the sum of “Bad, Dislikeand Worst” effects responses) than non-carriers (n=28) (p=0.0492).
Uhart et al. Page 19
Addict Biol. Author manuscript; available in PMC 2014 March 01.
NIH
-PA
Author M
anuscriptN
IH-P
A A
uthor Manuscript
NIH
-PA
Author M
anuscript

NIH-PA Author ManuscriptNIH-PA Author ManuscriptNIH-PA Author Manuscript
Uhart et al.
Page 20
Table 1
Characteristics of GABRA2 SNPs Examined
NCBI SNP (dbSNP build 126) Genome assembly position (Chromosome 4) Location in GABRA2 Alleles MA MAF
3′GABRA2
rs 4280776 45883288 63.1 kb 3′ T-C T 0.331
rs 488447 45887802 58.6 kb 3′ G-A G 0.457
rs 479277 45893428 53 kb 3′ T-C C 0.500
rs 478179 45933494 12.9 kb 3′ G-T T 0.232
rs 567926 45936526 9.9 kb 3′ C-T C 0.432
GABRA2
rs 3822051 45951469 Intron T-C C 0.179
rs 534459 45951562 Intron T-C T 0.493
rs 529826 45966409 Intron C-T T 0.478
rs 279871 46000490 Intron T-C C 0.433
rs 279869 46002752 Intron G-T T 0.493
rs 279858 46009350 Exon (synonymous) C-T C 0.434
rs 3775282 46016620 Intron T-C C 0.152
rs 279844 46024412 Intron T-A T 0.449
rs 279845 46024480 Intron A-T A 0.448
rs 279826 46028966 Intron G-A G 0.463
rs 279828 46029567 Intron A-C C 0.471
rs 279836 46033827 Intron T-A A 0.449
rs 279837 46034080 Intron A-G G 0.449
rs 1442059 46051709 Intron C-T C 0.440
rs 1442060 46060824 Intron G-A A 0.492
rs 3849591 46063398 Intron G-T T 0.194
rs 13152740 46075978 Intron G-A A 0.246
rs 16859354 46080335 Intron T-G G 0.311
rs 11503014 46085622 UTR-5 C-G G 0.311
5′GABRA2
Addict B
iol. Author m
anuscript; available in PM
C 2014 M
arch 01.

NIH-PA Author ManuscriptNIH-PA Author ManuscriptNIH-PA Author Manuscript
Uhart et al.
Page 21
NCBI SNP (dbSNP build 126) Genome assembly position (Chromosome 4) Location in GABRA2 Alleles MA MAF
rs 1372472 46090955 4.25 kb 5′ A-T T 0.339
rs 1025852 46095088 8.38 kb 5′ G-A A 0.336
MA, minor allele in our study population; MAF, minor allele frequency in our study population.
Addict B
iol. Author m
anuscript; available in PM
C 2014 M
arch 01.
NIH
-PA
Author M
anuscriptN
IH-P
A A
uthor Manuscript
NIH
-PA
Author M
anuscript
Uhart et al. Page 22
Table 2
Demographic characteristics
Age, mean (SD), (y) 24.25 (2.63)
Gender, No. (%)
Male 41 (59.4)
Female 28 (40.6)
Race, No. (%)
Caucasian, self reported and genetic ancestry proportion 52 (75.4)
Caucasian, self reported 2 (2.9)
African-American, self reported 5 (7.25)
Asian, self reported 7 (10.1)
Other, self reported 3 (4.35)
BMI, mean (SD), (kg/m2) 24.84 (3.51)
Education, mean (SD), (y) 15.43 (1.13)
Non-Smoker, No. (%) 66 (95.65)a
Recent Drinking Behavior, mean(SD)
Drinking episodes per week 1.52 (0.92)
Drinks per drinking episode 3.10 (1.70)
No. Drinking days in past 90 days 19.42 (11.98)
No. Drinks in past 90 days 57.25 (39.40)
No. Binge drinking episodes in past 90 days 3.41 (4.54)
aThree smokers of less than 3 cig/day
Addict Biol. Author manuscript; available in PMC 2014 March 01.

NIH-PA Author ManuscriptNIH-PA Author ManuscriptNIH-PA Author Manuscript
Uhart et al.
Page 23
Table 3
Relative means (SE) of SNPs effects on subjective measures of alcohol effects. The analysis for all the subjects was adjusted for demographic covariatesincluding genetic ancestry proportion and number of binge drinking episodes. The analysis for Caucasians only was adjusted for number of bingedrinking episodes.
Subjective Measure Gene/Region SNP Haplotype Block Minor Allele MAF Model* N0 N1 N2
Overall mean of change frombaseline
P-value Overall mean ofchange from
baseline(Caucasians
Only)
Mean0 (SE) Mean1 (SE) Mean0 (SE)
VAS Negative
GABRA2 rs279858 B1 C 0.434 DOM 23 31 14 27.63 (3.74) 16.72 (2.80) 0.0060 26.60 (4.03)
GABRA2 rs279844 B1 T 0.449 DOM 22 31 15 25.59 (3.77) 17.93 (2.79) 0.0035 26.60 (4.03)
GABRA2 rs279845 B1 A 0.448 DOM 22 30 15 25.59 (3.77) 19.80 (2.83) 0.0045 26.60 (4.03)
GABRA2 rs279826 B1 G 0.463 DOM 20 32 15 26.20 (3.92) 19.79 (2.77) 0.0043 24.90 (4.10)
GABRA2 rs279828 B1 C 0.471 DOM 20 33 16 26.20 (3.92) 18.54 (2.69) 0.0037 24.90 (4.10)
GABRA2 rs279836 B1 A 0.449 DOM 21 33 14 28.41 (3.89) 16.84 (2.74) 0.0061 24.90 (4.10)
*Model: Dominant (DOM): compare carriers of one or two minor alleles versus non-carriers.
N0: number of participants that are non-carriers of the minor allele; N1: number of participants that carry one minor allele; N2: number of participants that carry two minor alleles
Mean0 (SE) is the overall mean and standard error among non-carriers; Mean1 (SE) is the overall mean and standard error among carriers of one or two minor alleles.
Addict B
iol. Author m
anuscript; available in PM
C 2014 M
arch 01.

NIH
-PA
Author M
anuscriptN
IH-P
A A
uthor Manuscript
NIH
-PA
Author M
anuscript
Uhart et al. Page 24
Table 4
Haplotype blocks and frequencies
Haplotype Haplotype frequency
Block1 H1 GTGGTACCTCTTAGCAGC 0.241154
Block1 H2 GTGGCACCTCCTAGCAGC 0.132733
Block1 H3 ACTATGTTGTTATAATAT 0.234777
Block1 H4 ACGATGTTGTTATAATAT 0.292999
Block2 H1 GT 0.683293
Block2 H2 AG 0.224732
For each haplotype block, the table shows haplotypes with frequency > 0.1
Block 1 is composed of SNPs rs488447, rs479277, rs478179, rs567926, rs3822051, rs534459, rs529826, rs279871, rs279869, rs279858,rs3775282, rs279844, rs279845, rs279826, rs279828, rs279836, rs279837, rs1442059. Alleles corresponding to each SNP in the block are shown inthis order in the table. Block 2 is composed of SNPs rs13152740, rs16859354. Alleles corresponding to each SNP in the block are shown in thisorder in the table.
Addict Biol. Author manuscript; available in PMC 2014 March 01.

NIH-PA Author ManuscriptNIH-PA Author ManuscriptNIH-PA Author Manuscript
Uhart et al.
Page 25
Table 5
Relative means (SE) of Haplotype effects on subjective measures of alcohol effects
Subjective Measure Gene/Region Haplotype Block N0 N1 Overall mean of change from baseline P-value Demographic covariates adjusted for
Mean0 (SE) Mean1 (SE)
VAS Negative Intergenic-GABRA2 B1, H1 28 24 23.17 (3.26) 14.18 (3.93) 0.0492 Number of binge drinking episodes
Intergenic-GABRA2 B1, H4 26 26 20.86 (3.30) 17.19 (3.84) 0.0150 Number of binge drinking episodes
VAS Positive GABRA2 B2, H1 4 48 −4.46 (8.50) 41.54 (3.47) 0.0137
Sedation (BAES) Intergenic-GABRA2 B1, H3 30 22 2.69 (0.34) 5.32 (0.43) 0.0309 Age
Intergenic-GABRA2 B1, H4 26 26 4.84 (0.36) 2.76 (0.40) 0.0081 Age
SHAS High Intergenic-GABRA2 B1, H4 26 26 16.46 (1.49) 5.77 (1.31) 0.0302
N0: number of participants that are non-carriers of the haplotype; N1: number of participants that carry one or two copies of the haplotype.
Mean0 (SE): overall mean and standard error for non-carriers of the haplotype. Mean1 (SE): overall mean and standard error for carriers of 1 or 2 copies of the haplotype.
Addict B
iol. Author m
anuscript; available in PM
C 2014 M
arch 01.