G-Resources Group Limited Interim Financial Report 2012/2013
44
For the six months ended 31 December 2012 (Incorporated in Bermuda with limited liability) Stock Code 1051
-
Upload
khangminh22 -
Category
Documents
-
view
0 -
download
0
Transcript of G-Resources Group Limited Interim Financial Report 2012/2013

G-R
esources Group Lim
ited Interim Financial R
eport 國際資源集團有限公司中期財務報告
2012/2013
For the six months ended 31 December 2012(Incorporated in Bermuda with limited liability)
Stock Code 1051
截至二零一二年十二月三十一日止六個月(於百慕達註冊成立之有限公司)
股份代號 1051

SILVER 2.2 millionounces
GOLD 250,000 ounces
The strong fundamentals of Martabe remain the same as we deliver on target.
In 2012 the Martabe Project developed into the Martabe Gold Mine. During this period the mine underwent commissioning and ramp up and by the end of year was exceeding production expectations. In 2013 we move to an optimisation phase targeting maximum output from the Martabe Gold Mine.
OPTIMISATION
白銀 2,200,000
盎司
黃金 250,000
盎司
在我們成功達標的同時,Martabe 強大的基礎依然穩健不變。
於二零一二年,Martabe金銀礦項目發展成為Martabe
金礦。於此期間,礦山進行調試及提產,於年底,
礦山產量超過預期。於二零一三年,我們邁向優化
階段,目標是令Martabe金礦達到最高產量。
優化

Overview
Biographical Details of Directors and Senior Management
6-9
Chairman’s Statement 10
CeO’s report 11-12
ManageMent DiSCuSSiOn anD analySiS
Management Discussion and analysis
13 -14
PrOjeCt Overview: MartaBe
exploration, resource and reserve Development activities
15 - 19
GROWTH in value fOR all OuR sTakeHOldeRs ResPeCT fOR OuR PeOPle, OuR COmmuniTies and fOR all sTakeHOldeRs EXCellenCe in eveRyTHing We dO ACTiOn TO deliveR On OuR COmmiTmenTs TRansPaRenCy OPenness, HOnesTy and gOOd gOveRnanCe
Contents
FinanCial StateMentS
report on review of Condensed Consolidated Financial Statements
20
group results 21
Condensed Consolidated Statement of Profit or loss
21
Condensed Consolidated Statement of Profit or loss and Other Comprehensive income
22
Condensed Consolidated Statement of Financial Position
23
Condensed Consolidated Statement of Changes in equity
24
Condensed Consolidated Statement of Cash Flows
25
notes to the Condensed Consolidated Financial Statements
26-34
StatutOry DiSClOSure
interim Dividend 35
Statutory Disclosure 35-41
COrPOrate inFOrMatiOn
Corporate information 42
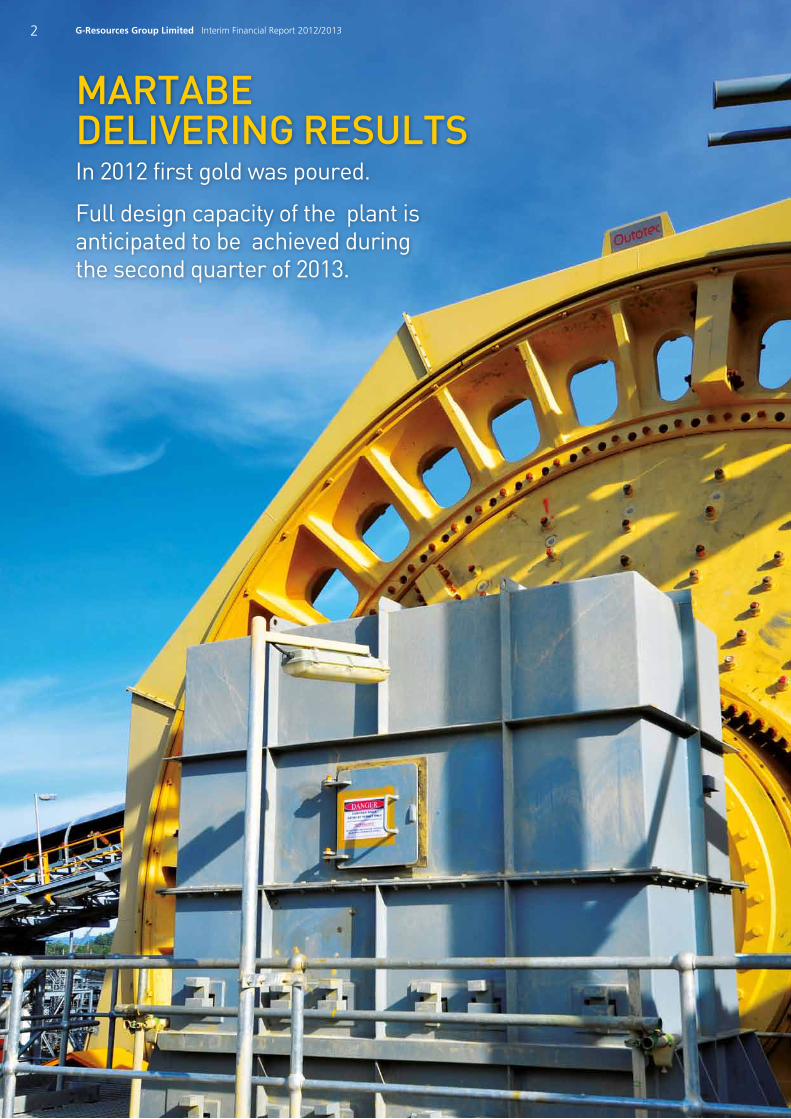
MARTABE DELIVERING RESULTSin 2012 first gold was poured.
Full design capacity of the plant is anticipated to be achieved during the second quarter of 2013.
2 G-Resources Group Limited Interim Financial Report 2012/2013

PROCESSING – our team is fine-tuning the plant to achieve maximum output from the operation.
EXPLORATION – our programme is aggressive both close to existing deposits and regionally across the 1,639km2 Cow.
SUSTAINABLE GROwThthrough continued optimisation of development opportunities at Martabe as well as exploration on our Cow area.
STEADy PRODUCTIONour production profile is designed for an extensive mine life and future growth.
3G-Resources Group Limited Interim Financial Report 2012/2013
wE ARE CONFIDENT IN GOLDthe unique demand and supply dynamics of the gold market underpin the precious metal’s extensive appeal.
4 G-Resources Group Limited Interim Financial Report 2012/2013

2012 GOLD PRICE AVERAGE USD1,669per oz2012 London PM Fix – USD Cumulative Average
SUPPLymarginally contracted with reducing mine supply and a contraction in recycling.
DEMANDannual demand for gold in 2012 reached a record value of uSD236.4 bn.
5G-Resources Group Limited Interim Financial Report 2012/2013
Biographical Details of Directors and Senior Management
Executive Directors
Chiu Tao, aged 57was appointed as the Chairman and an executive director
of the Company on 19 August 2009 and 22 July 2009,
respectively. Mr Chiu is an experienced executive and
merchant, and was engaged as the chairman of various
listed companies in Hong Kong. Mr Chiu has extensive
experience in the metal business, trading, investment
planning, business acquisitions and development, and
corporate management. He is currently the Chairman and
an executive director of CST Mining Group Limited, whose
shares are listed on the main board of The Stock Exchange
of Hong Kong Limited (the “Stock Exchange”) (“CST”).
Owen L Hegarty, aged 64was appointed as Vice-Chairman and an executive director
of the Company on 19 August 2009 and 10 May 2009,
respectively. Mr Hegarty has some 40 years’ experience in
the global mining industry. Mr Hegarty had 25 years with
the Rio Tinto group where he was Managing Director of
Rio Tinto Asia and Managing Director of the Group’s
Australian copper and gold business. He was founder and
chief executive officer of Oxiana Limited Group which grew
from a small exploration company to a multi-billion dollar
Australia, Asia and Pacific-focused base and precious metals
producer, developer and explorer. Oxiana Limited became
OZ Minerals Limited.
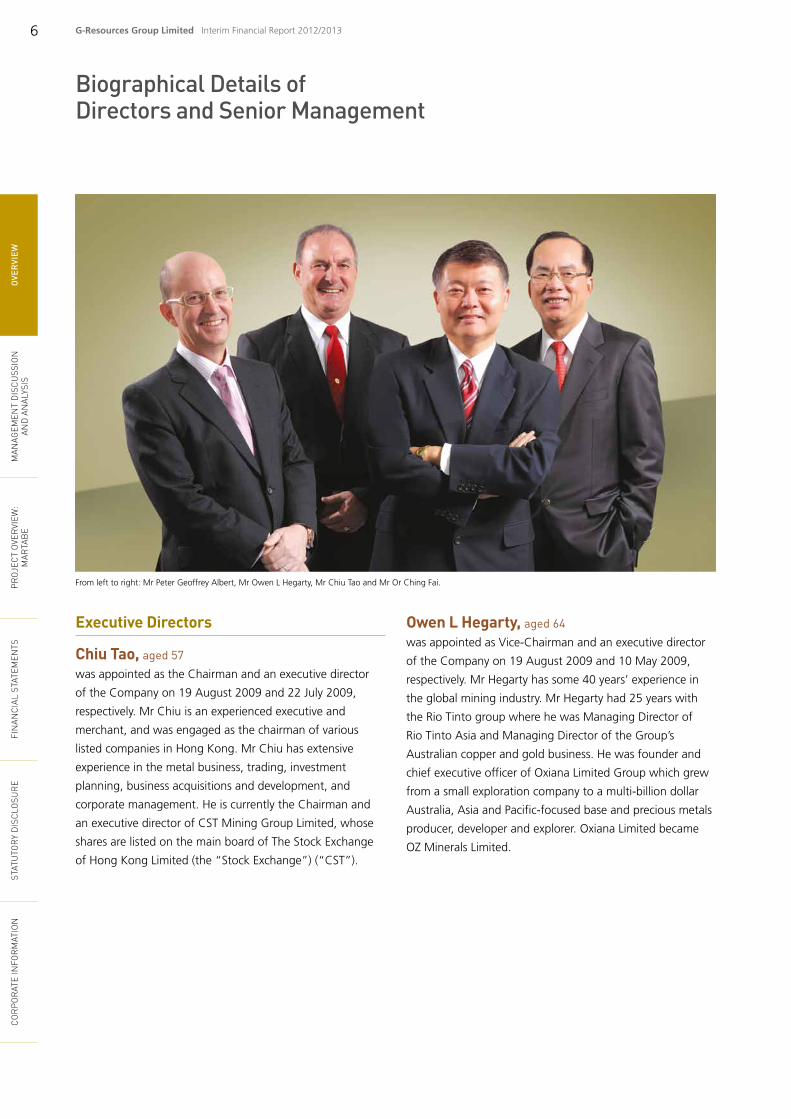
From left to right: Mr Peter Geoffrey Albert, Mr Owen L Hegarty, Mr Chiu Tao and Mr Or Ching Fai.
CO
RP
OR
aTe
infO
Rm
aTiO
n
sTaT
uTO
Ry
dis
ClO
suR
e fi
nan
Cia
l sT
aTem
enTs
P
ROj
eCT
Ove
Rvi
eW:
maR
Tab
em
anag
emen
T d
isC
uss
iOn
an
d a
nal
ysis
OVE
RVI
Ew
6 G-Resources Group Limited Interim Financial Report 2012/2013

For his achievements and leadership in the mining industry,
Mr Hegarty was awarded the AusIMM Institute Medal in
2006 and the G.J. Stokes Memorial Award in 2008.
Mr Hegarty was the executive director and vice chairman of
CST. He is currently a non-executive director of Fortescue
Metals Group Limited and Tigers Realm Coal Limited (whose
shares are both listed on the Australian Stock Exchange
(“ASX”)); chairman of Tigers Realm Minerals Pty Ltd and
EMR Capital Pty Ltd and a director of the Australasian
Institute of Mining and Metallurgy (“AusIMM”); Mr Hegarty
is also a member of a number of Government and industry
advisory groups.
Peter Geoffrey Albert, aged 54was appointed as the Chief Executive Officer and
an executive director of the Company on 22 July 2009.
Mr Albert is a metallurgist and holds an Executive
MBA degree. He has 30 years of experience in project
management, general management and operations
management in mining and minerals processing in Australia,
Africa and Asia. He is a member of the Institute of Materials,
Minerals and Mining (London), a member of the AusIMM
and a Chartered Engineer.
For his achievements and leadership in the mining industry,
and voted by his peers, Mr Albert was awarded the “Mining
CEO of the Year”, at the 2012 Asia Mining Congress.
He was the Executive General Manager – Asia of OZ
Minerals Limited covering off-shore operations; the Sepon
copper and gold operations and projects; the development
of the Martabe Project; business development in Asia, and
Asian government relations. He joined Oxiana Limited in
2000 from Fluor Daniel, where he held the position of
General Manager – Projects. Mr Albert has also worked
with Shell-Billiton (Australia), Aker Kvaerner (Australia)
and JCI (South Africa).
Ma Xiao, aged 47was appointed as the Deputy Chief Executive Officer and an
executive director of the Company on 22 July 2009. Mr Ma
has over 20 years of international minerals and metals
trading, financing and hedging experience. Mr Ma also
has extensive experience in mineral company acquisitions
and development. He previously held senior and executive
positions with several base and precious metals companies,
including China Minmetals. Mr Ma was based in London for
four years working for Minmetals (UK) Limited and was the
Managing Director of Guizhou H-Gold & Mining Limited and
was a director of the China Minerals Acquisition Fund.
Wah Wang Kei, Jackie, aged 46was appointed as an executive director and Company
Secretary of the Company on 9 April 2008 and 1 December
2009, respectively. Mr Wah graduated from The University
of Hong Kong in 1990 and was qualified as a solicitor in
1992. Up until 1997, Mr Wah was a partner of a Hong Kong
law firm. He was also an executive director of CST. Mr Wah
is currently an executive director of China New Energy
Power Group Limited, whose shares are listed on the main
board of the Stock Exchange (“China New Energy Power”).
Hui Richard Rui, aged 44was appointed as an executive director of the Company
on 5 March 2009. Mr Hui graduated from the University
of Technology, Sydney in Australia with a Bachelor’s degree
in Mechanical Engineering. He has more than 10 years’
experience in management positions with companies
in Australia, Hong Kong and PRC. Mr Hui is currently
an executive director of CST and an executive director
of China Strategic Holdings Limited, whose shares are
listed on the main board of the Stock Exchange (“China
Strategic”). He is also a member of AusIMM.
CO
RP
OR
aTe
infO
Rm
aTiO
n
sTaT
uTO
Ry
dis
ClO
suR
e fi
nan
Cia
l sT
aTem
enTs
P
ROj
eCT
Ove
Rvi
eW:
maR
Tab
em
anag
emen
T d
isC
uss
iOn
an
d a
nal
ysis
OVE
RVI
Ew
7G-Resources Group Limited Interim Financial Report 2012/2013

Independent Non-Executive Directors
Or Ching Fai, aged 63was appointed as a Vice-Chairman and an independent
non-executive director of the Company on 22 July 2009.
Mr Or began his career with The Hongkong and Shanghai
Banking Corporation Limited in 1972 after receiving
a bachelor’s degree in Economics and Psychology from
the University of Hong Kong. He was the Vice-Chairman,
Chief Executive Officer and an executive director of
Hang Seng Bank Limited, whose shares are listed on
the main board of the Stock Exchange. Mr Or was also
an independent non-executive director of Hutchison
Whampoa Limited and Cathay Pacific Airways Limited,
the shares of both companies are listed on the main board
of the Stock Exchange. Mr Or is currently an independent
non-executive director of Chow Tai Fook Jewellery Group
Limited and Industrial and Commercial Bank of China
Limited and Television Broadcasts Limited (whose shares
are all listed on the main board of the Stock Exchange);
Chairman and an independent non-executive director of
Esprit Holdings Limited (whose shares are listed on the main
board of the Stock Exchange); Chairman and an executive
director of China Strategic.
Ma Yin Fan, aged 49was appointed as an independent non-executive director of
the Company on 25 March 2009. She obtained a bachelor’s
degree with honours in accountancy at Middlesex University
in the United Kingdom. She also holds an MBA and Master
in Professional Accounting degree from Heriot-Watt
University in the United Kingdom and Hong Kong
Polytechnic University, respectively. Ms Ma is a CPA
(Practising) in Hong Kong and has been working in auditing,
accounting and taxation for more than 20 years. She is the
principal of Messrs Ma Yin Fan & Company CPAs. Ms Ma
is a fellow of the Hong Kong Institute of Certified Public
Accountants, Taxation Institute of Hong Kong, Association
of Chartered Certified Accountants, Hong Kong Institute of
Chartered Secretaries and Institute of Chartered Secretaries
and Administrators. She is also a member of the Institute
of Chartered Accountant in England and Wales and
a certified Tax Adviser in Hong Kong. Ms Ma is currently
an independent non-executive director of China Strategic,
China New Energy Power and CST.
Leung Hoi Ying, aged 62was appointed as an independent non-executive director
of the Company on 31 March 2009. Mr Leung graduated
from the Guangdong Foreign Trade School in the People’s
Republic of China. He has over 30 years of experience in
international trade and business development. Mr Leung is
currently an independent non-executive director of China
Strategic and China New Energy Power.
Senior Management
Arthur Ellis, aged 52was appointed Chief Financial Officer of the Company on
1 December 2009. Mr Ellis is a member of the Institute of
Chartered Accountants in Australia and holds a BA (Hons)
Accounting and Finance degree. He has over 15 years’
experience in the resources industry. He was the Group
Financial Controller for Kingsgate Consolidated Limited
(“Kingsgate”), an ASX listed gold mining company. He
joined Kingsgate in 2000 as Financial Controller at the start
of the construction of the Chatree Gold mine in Thailand.
Prior to that, he worked in Australia and Hong Kong and
provided accounting, corporate, tax and auditing services.
biOgRaPHiCal deTails Of diReCTORs and seniOR managemenT
CO
RP
OR
aTe
infO
Rm
aTiO
n
sTaT
uTO
Ry
dis
ClO
suR
e fi
nan
Cia
l sT
aTem
enTs
P
ROj
eCT
Ove
Rvi
eW:
maR
Tab
em
anag
emen
T d
isC
uss
iOn
an
d a
nal
ysis
OVE
RVI
Ew
8 G-Resources Group Limited Interim Financial Report 2012/2013

Timothy John Vincent Duffy, aged 46was appointed as the General Manager of Operations of
the Company on 8 June 2009 and subsequently appointed
as Executive General Manager of PT Agincourt Resources
(“PTAR”) on 1 January 2013. Mr Duffy is a Certified
Practicing Accountant and holds a bachelor’s degree in
Commerce. He has 20 years of experience in the mining
industry and has operational experience in gold, silver,
nickel, copper, uranium, coal, and open cut and underground
mining operations. He has been engaged in finance and
commercial roles in mining projects and has strategic
capability across the full suite of mining activities in an Asian
environment. Mr Duffy was the General Manager Finance –
Asia of OZ Minerals Limited, mainly responsible for providing
commercial guidance and strategic direction for Asian
operations and business.
Linda H D Siahaan, aged 51was appointed as the Director Government Relations for
G-Resources’ Indonesian subsidiary, PTAR on 31 March
2011 and subsequently appointed as the Director External
Relations of PTAR on 1 October 2011. From 1 January 2013,
Ms Siahaan has been appointed as the Deputy President
Director of PTAR reporting directly to the G-Resources’ CEO.
Ms Siahaan is based in Jakarta, where she has worked
for PTAR since July 2007. Her responsibilities include
maintaining harmonious relationships with the government
of the Republic of Indonesia to ensure that the Company
complies with Indonesian laws and regulations. She is also
responsible for establishing and maintaining relationships
with all relevant stakeholders. Ms Siahaan is from Medan
in North Sumatra, the province where the G-Resources
Martabe Mine is located. She has accounting qualifications
from the University of North Sumatra, as well as a diploma
in communications from the Ketchum Institute of Public
Relations in Fairfax, USA. Ms Siahaan began her career with
Mobil Oil Indonesia. From 1997 until 2007, she worked in
the External Relations department of PT Newmont Nusa
Tenggara, one of the largest copper and gold mining
companies in the world.
Shawn David Crispin, aged 45was appointed as Senior Manager, Resource Development
and Exploration on 6 November 2010. He was promoted to
the position of Chief Geologist of PTAR on 1 January 2013.
Mr Crispin has over 18 years mining industry experience
which covers open pit and underground mine geology,
resource drilling and estimation programmes, project
acquisition and greenfields and brownfields exploration.
This experience was gained with a wide range of commodities
including gold and copper. He is an Australian citizen
with international experience in Papua New Guinea
and South America. Previously Mr Crispin was Principal
Exploration Geologist for OK Tedi Mining Ltd in Papua
New Guinea. Mr Crispin is a member of the AusIMM and
Chartered Professional.
CO
RP
OR
aTe
infO
Rm
aTiO
n
sTaT
uTO
Ry
dis
ClO
suR
e fi
nan
Cia
l sT
aTem
enTs
P
ROj
eCT
Ove
Rvi
eW:
maR
Tab
em
anag
emen
T d
isC
uss
iOn
an
d a
nal
ysis
OVE
RVI
Ew
9G-Resources Group Limited Interim Financial Report 2012/2013
Dear Shareholders,
These past six months or so have been very exciting for
G-Resources – much progress has been made on all fronts.
Most importantly, we brought Martabe into gold and silver
production in July 2012, just three years after we bought
the project in the middle of 2009. At that time, there was
no mine, no plant, no infrastructure, no contractors had
been hired and we had very few people. In three and
a half busy years, we have now constructed Asia’s newest
significant gold and silver mine and are, at the time of
writing to you, ramping up to its full production capacity of
250,000 oz/a gold and 2-2.5 million oz/a silver. Martabe in
North Sumatra, Indonesia, is an operation and achievement
of which we are proud – our employees, our nearby
communities, the regional Government of South Tapanuli,
the Provincial Government of North Sumatra, the Central
Government of the Republic of Indonesia, our financiers and
our many contractors, suppliers, consultants and customers
– all stakeholders are proud of our united achievements and
we thank them all for their support during this sometimes
challenging, busy time.
Further contingency funding was seen as necessary in
the half year and we appreciate our shareholder support
in providing this. We also thank our shareholders for
their patience – and we look forward to rewarding our
shareholders with value growth as we ramp up production
and the Board will consider to declare dividends once we
generate sufficient free cash flow.
The gold and silver markets have been buoyant these
past three years and we are confident they will remain so.
Gold is a wonderful metal and commodity, we think the
strong demand factors and relatively weak supply outlook
will ensure an excellent price outlook.
Looking ahead, we are totally devoted to meeting the
production and cost targets we have set out for Martabe for
2013. We also want to grow the gold and silver resources
and reserves base so that we can look at an incremental
expansion of the existing plant; plus the possibility of a
sulphide gold ore treatment plant which will give a step
change to the production profile. The exploration upside
at Martabe is excellent and we have an aggressive programme
and team devoted to further discovery of gold and silver.
I want to thank the management team, led by our CEO
Peter Albert, for their dedication and hard work these past
six months and I look forward to working with them all
in 2013 as we continue to make progress and grow value.
I also want to thank our Board Members for their support
and especially thank our two retiring members – Horace Tsui
and Jimmy Kwan – for their contribution to G-Resources
over these past three and a half years.
Finally, I just wanted to reiterate my thanks to our
shareholders for their patience and support and I look
forward with great enthusiasm to 2013 as another major
year of achievements for G-Resources.
Chiu TaoChairman
Hong Kong, 28 February 2013
lOOking aheaD, we are tOtally DevOteD tO Meeting the PrODuCtiOn anD COSt targetS we have Set Out FOr MartaBe FOr 2013.
Chairman’s Statement
CO
RP
OR
aTe
infO
Rm
aTiO
n
sTaT
uTO
Ry
dis
ClO
suR
e fi
nan
Cia
l sT
aTem
enTs
P
ROj
eCT
Ove
Rvi
eW:
maR
Tab
em
anag
emen
T d
isC
uss
iOn
an
d a
nal
ysis
OVE
RVI
Ew
10 G-Resources Group Limited Interim Financial Report 2012/2013
Dear Shareholders,
For G-Resources, the past six months has been one of
challenge, excitement and achievement. I cannot say
enough about our people in G-Resources who have all
worked extremely hard to deliver some outstanding results
against some very challenging hurdles.
The Martabe Mine produced first gold on 24 July 2012
and in the remainder of 2012, a total of 47,858 ounces of
gold and 218,361 ounces of silver was produced. This was
a very pleasing result, especially as these were the early
commissioning and ramp up months, as well as the
operations shutting down for a period of six weeks to
address some community concerns relating to discharge of
clean water into the local Batangtoru river. In December, the
process plant achieved 80% of design tonnage throughput
and in excess of 100% of gold output. The head grade of
gold in ore delivered to the mill was on plan at 2.35 grammes
per tonne, whilst recoveries of gold at over 90% was well
in excess of plan. By the end of December all construction
works had been completed with all construction crews
demobilized. The only remaining work at the end of the year
is the connection to the high voltage power grid which is
anticipated to be completed in the first half of 2013.
The strong fundamentals of Martabe remain unchanged
and are continually being enhanced by the addition of
more ounces of gold and silver in Resources and Reserves.
Martabe has a great ore body, good grade, low mining
cost, simple process technology, outstanding existing
infrastructure and logistics, and an experienced and capable
management team. The past year has seen the Martabe
Project crystallise into the Martabe Gold Mine and the next
few months will see the mine reach full design capacity
and then move into a phase of optimisation to achieve
the maximum output from the operation.
By the end of the year the financial position of the company
was on a solid footing with USD41.9 million revenue received
from the sale of bullion, USD57.4 million cash in the bank
and marketable securities, and a further 16,997 ounces of
gold and 47,866 ounces of silver in the process of being
sold. The reduction in project and operations creditors,
including the debt facility to the banks, is accelerating.
Like all mining operations around the world, Martabe
is experiencing some operating cost pressures due to
significant increases in consumable costs, labour costs and
general inflation. In December, a re-estimate of operating
costs for 2013 was completed and despite additional cost
pressures as a result of continued operation of the diesel
power plant, Martabe cash costs for 2013 are estimated
to be USD450/ounce, maintaining Martabe’s position as
a low cash cost gold producer. Sustaining capex in 2013
is estimated to be USD80 million for continued building of
the TSF wall, anticipated land acquisition around Barani and
mine development. Sustaining capex in future years is likely
to decrease to USD40-50 million per annum.
The operations team is now at full strength, with significant
effort having been made to recruit and train the maximum
number of local persons into the team as possible. The
mine’s goal of 70% local employment is well on the way
to being achieved. A recent review of the organization
structure has led to the appointment of two Deputy General
Managers to enhance the breadth and depth of the
organization, and in addition the Head of External Affairs
Linda Siahaan, has been appointed Deputy President
Director of the Indonesian operating company.
the MartaBe Mine PrODuCeD FirSt gOlD On 24 july 2012 anD in the reMainDer OF 2012, a tOtal OF 47,858 OunCeS OF gOlD anD 218,361 OunCeS OF Silver waS PrODuCeD.
CEO’s Report
CO
RP
OR
aTe
infO
Rm
aTiO
n
sTaT
uTO
Ry
dis
ClO
suR
e fi
nan
Cia
l sT
aTem
enTs
P
ROj
eCT
Ove
Rvi
eW:
maR
Tab
em
anag
emen
T d
isC
uss
iOn
an
d a
nal
ysis
OVE
RVI
Ew
11G-Resources Group Limited Interim Financial Report 2012/2013
2011 was a year of significant growth in Resources and
Reserves at Martabe, whereas 2012 has deliberately
been a year of consolidation and focus on the regional
opportunities. Much work has been done to identify and
firm up both new and known targets. The exploration team
has also spent considerable time developing a sulphide
resource programme at Martabe as well as a copper-gold
porphyry programme on the wider Contract of Work. These
programmes will accelerate and gain maximum momentum
in the coming months.
The safety record during construction at Martabe was
outstanding. In the second half of 2012 during the
operations phase of the commissioning and ramp up,
this safety performance continued with not one single
Lost Time Injury occurring during this period. The Board
and management of G-Resources is particularly proud of
this achievement by the whole team at Martabe. The safety
statistics are a testament to the Company’s focus to protect
the safety, health and wellbeing of all our employees and
contractors. This is part of our GREAT (Growth, Respect,
Excellence, Action and Transparency) core values and our
commitment to social responsibility. In addition to safety,
we are working to maintain the environmental integrity of
the Martabe district and to implement social programmes
such as our eye cataract surgery project.
After the operation commenced producing gold, it became
apparent that a small part of the local community was
not well informed about the mine’s process of chemically
cleaning any excess water prior to discharging clean water
to the local river system. In order to preserve our good
relations with the community and to ensure appropriate
dialogue occurred, we shut down the operations for a
period of 6 weeks whilst appropriate consultations and
community relations activities took place to educate and
to inform. As a consequence of our long standing good
relations with the local community as well as government
at all levels, we were able to resolve the issue and
re-commence operations at the end of October. Continued
maintenance and nurturing of our Social Licence remains a
top priority for the Board and management of G-Resources.
I would like to take this opportunity to recognise the
support of the governments within Indonesia at the Central,
Provincial and District levels. Without their support and
guidance, our task would be that much harder. Within
the Indonesian Government, there is a clear recognition of
the sustained value that can be added to the country and
standards of living by long term mining projects.
I would also like to give my heartfelt thanks to our Directors
for their encouragement over the past year as well as
our shareholders who continued to demonstrate their
confidence in the Martabe operation. In particular, I would
like to give special mention to our staff at the Martabe
Mine, who have worked so hard over the past year to
achieve all of the milestones that we have met.
This is an exciting time to be at G-Resources as the Martabe
mine takes its place amongst the top tier of Asian gold
mines, and I am proud to work alongside this immensely
talented and dedicated team.
Peter Geoffrey Albert
Chief Executive Officer
Hong Kong, 28 February 2013
CeO’s RePORT
CO
RP
OR
aTe
infO
Rm
aTiO
n
sTaT
uTO
Ry
dis
ClO
suR
e fi
nan
Cia
l sT
aTem
enTs
P
ROj
eCT
Ove
Rvi
eW:
maR
Tab
em
anag
emen
T d
isC
uss
iOn
an
d a
nal
ysis
OVE
RVI
Ew
12 G-Resources Group Limited Interim Financial Report 2012/2013

Management Discussion and Analysis
Business Review and ResultsG-Resources achieved first gold pour in July 2012 and
commissioning and testing activities occurred in the
following 2 months. Cost and revenue from sale of test
production were capitalised until Martabe Gold Mine
achieved commercial production in September 2012.
six months ended 31 December
2012USD’000
2011USD’000
FinAnCiAL SummARy
Revenue 41,922 –
Cost of sales (24,161) –
Gross Profit 17,761 –
Loss attributable to
temporary suspension
of production (7,244) –
EBITDA 3,779 (9,064)
Loss before taxation (7,414) (9,185)
Taxation (576) –
Loss for the period (7,990) (9,185)
The Group generated revenue of USD41.9 million (2011:
Nil) from the sale of gold and silver at an average price of
USD1,706.7 per ounce and USD32.3 per ounce respectively.
The Group earned a gross profit of USD17.8 million (2011:
Nil) and its EBITDA was USD3.8 million (2011: (USD9.1
million)) for the period. The improvement in its financial
results over the previous year was due to contributions
from its Martabe Gold Mine as it entered gold and
silver production.
Production activities of Martabe Gold Mine were curtailed
for six weeks in September 2012 whilst consultations were
undertaken with the local community and government due
to some concerns about the discharge of clean water to the
local river; during this period the Group incurred a write off
of USD7.2 million (2011: Nil). G-Resources incurred a loss
before taxation of USD7.4 million (2011: USD9.2 million)
for the period.
The cash costs for the mine calculated according to
the Gold Institute Standard was USD680 per oz of gold
produced. The relatively high cash costs (as compared to
normal operations) were expected as the plant ramped up
production towards its design capacity. The mine’s cash
costs were also negatively impacted by the interruption
in production in September 2012 (which was shortly after
Martabe achieved commercial production). The Company
expects the cash cost for 2013 will be much lower when
the Martabe Mine reaches designed capacity.
Total assets were USD1,085.9 million (30 June 2012:
USD959.1 million) an increase of USD126.8 million as
the Group invested in both non-current and current asset.
Non-current assets were USD977.2 million (30 June 2012:
USD881.4 million) an increase of USD95.8 million as the
Group completed the construction of Martabe Gold Mine.
Current assets were USD108.7 million (30 June 2012:
USD77.7 million) an increase of USD31.0 million which
was mainly due to increases in inventory which consist of
gold and silver bullion and consumables.
Total liabilities were USD178.7 million (30 June 2012:
USD166.3 million) an increase of USD12.4 million and the
increase is mainly a result of increases in trade and other
payments and a reduction of Group’s bank borrowings.
Net Asset ValueAs at 31 December 2012, the Group’s total net asset
amounted to approximately USD907.2 million, represented
an increase of USD114.4 million as compared to
approximately USD792.8 million as at 30 June 2012.
The increase in net assets was mainly attributable to
the share placement of USD99.0 million (net proceeds)
in August 2012.
Cash Flow, Liquidity and Financial ResourcesThe Group’s cash balance at the end of December 2012
was USD47.9 million (30 June 2012: USD65.3 million)
a decrease of USD17.4 million as USD124.9 million were
invested in property, plant and equipment (which included
USD2.6 million in near mine exploration and evaluation) and
USD2.9 million for regional exploration. USD11.0 million
were used to partially repay the syndicated revolving credit
facility. These activities were mainly financed by receipts of
USD99.0 million from share placement and USD41.9 million
revenue from bullion sale.
CO
RP
OR
aTe
infO
Rm
aTiO
n
sTaT
uTO
Ry
dis
ClO
suR
e fi
nan
Cia
l sT
aTem
enTs
P
ROj
eCT
Ove
Rvi
eW:
maR
Tab
eM
ANAG
EMEN
T D
ISCU
SSIO
N
AND
AN
ALyS
ISO
veR
vieW
13G-Resources Group Limited Interim Financial Report 2012/2013

managemenT disCussiOn and analysis
The Group has a secured revolving credit facility with
BNP Paribas, Commonwealth Bank of Australia, Hang Seng
Bank Limited and Sumitomo Mitsui Banking Corporation
(“Facility”) for the purpose of financing the Martabe
Gold Mine. The Facility is fully drawn. It was arranged
on a floating rate basis. The maturity profile of the Group’s
borrowing net of capitalised borrowing costs is set out
as follows:
31 December 2012
USD’000
30 June 2012
USD’000
Within one year 48,521 33,568
More than one year, but not
exceeding two years 24,260 48,568
Total borrowings 72,781 82,136
The Group’s gearing ratio as a percentage of the Group’s
total borrowing over shareholders’ equity was 8% as at
31 December 2012 (10% as at 30 June 2012).
Material Acquisitions and Disposals of Subsidiaries and Associated CompaniesThere was no material acquisition or disposal of subsidiaries
and associated companies during the period.
Exposure to Fluctuations in Exchange Rates and Related hedgeThe Group conducted most of its business in United States
dollars (“USD”), Australian dollars (“AUD”), Indonesian
Rupiah (“IDR”) and Hong Kong dollars (“HKD”). The foreign
currency exposure to USD is minimal as HKD is pegged to
USD. The Group has exposure to foreign currency risk that
are denominated in AUD and IDR.
In 2012, the Group entered into forward currency contracts
to sell USD and purchase IDR at a fixed rate in the normal
course of business in order to limit its exposure to adverse
fluctuations in currency exchange rates. These instruments
are executed with creditworthy financial institutions.
Management will continue to monitor the Group’s other
foreign currency exposure and impose other hedging policy
should the need arise.
Business OutlookThe Company achieved first gold pour in July 2012 and
commercial production in September 2012. The focus for
2013 will be to ramp up production to reach design capacity
as soon as possible.
Production guidance for 2013 is 250,000 ounces gold and
2,200,000 ounces of silver, at a cash cost of USD450 per
ounce of gold. In January and February 2013, the Martabe
Mine has already produced over 42,000 ounces of gold and
over 146,000 ounces of silver.
Martabe has a great ore body, good grade, low mining
cost, simple processing, and an experienced and capable
management team.
We intend to expand the Group’s resources and reserves
through near mine exploration at Martabe and to continue
to develop a sulphide resource programme at Martabe.
The Group has defined exploration targets such as Golf
Mike, Gambir-Kapur, Tango Papa and Pahae prospects for
future discoveries on its Contract of Work.
The Group continues to review opportunities in the gold
sector for quality gold projects or gold producing assets in
Asia Pacific region which could deliver substantial value to
shareholders.
human ResourcesAs at 31 December 2012, the Group had 26 employees in
Hong Kong, 578 employees in Indonesia and 1 employee
in Australia. Employees are remunerated at a competitive
level and are rewarded according to their performance.
Our Group’s remuneration packages include a medical
scheme, group insurance, mandatory provident fund,
performance bonus and options for our employees.
According to the share option scheme adopted by the
Company on 30 July 2004, share options may be granted
to directors and eligible employees of the Group to
subscribe for shares in the Company in accordance
with the terms and conditions stipulated therein.
CO
RP
OR
aTe
infO
Rm
aTiO
n
sTaT
uTO
Ry
dis
ClO
suR
e fi
nan
Cia
l sT
aTem
enTs
P
ROj
eCT
Ove
Rvi
eW:
maR
Tab
eM
ANAG
EMEN
T D
ISCU
SSIO
N
AND
AN
ALyS
ISO
veR
vieW
14 G-Resources Group Limited Interim Financial Report 2012/2013

Figure 1: Martabe Mine Location.
Medan
Tebing Tinggi
PematangsiantarTanjung Balai
Parapat
Kabanjahe
Sidikalang
Rantau PrapatTarutungBarus
Lake Toba
S U M A T R A
Sibolga
Padangsidempuan
Kotanopan
Lubuksikaping
BatangtoruGunung Sitoli
NIASISLAND
MARTABE DEPOSITS
0 80km N
Sulawesi Irian Jaya
JavaNusa Tenggara
IndianOcean
I N D O N E S I AMARTABE GOLD MINE
KalimantanSumatraJakarta
97 E 98 E 99 E 100 E
3 N
2 N
1 N
Martabe OverviewThe Martabe Gold Mine is located on the western side of
the Indonesian island of Sumatra in the Province of North
Sumatra, in the Batangtoru sub-district (Figure 1). Martabe
is established under a sixth generation Contract of Work
(“CoW”) which was signed in April 1997. The CoW
defines all of the terms, conditions and obligations of
both G-Resources and the Government of Indonesia for
the life of the CoW.
Martabe, with a resource base of 8.05 million ounces of
gold and 77 million ounces of silver, is G-Resources Group’s
core starter asset. Martabe commenced production from
the Purnama pit in July 2012 and is anticipated to reach
full production in the second quarter of 2013. When at
full capacity the Plant is expected to produce at a rate of
250,000 ounces per annum of gold and 2-3 million ounces
per annum of silver at a competitive mine cash cost as
compared to global gold producers.
G-Resources is seeking to organically grow gold production
through continued exploration success on the large and
highly prospective CoW area. The Martabe Mine enjoys
the strong support of the Indonesian Central, Provincial
and Local Governments and the nearby communities
of Batangtoru.
Project Construction and Commissioning CompletionOn 24 July 2012 the first gold and silver bullion was
produced at the Martabe Mine marking a significant
moment in the development of the world class gold mine
for G-Resources and transforming Martabe from a project
to a producing mine. On site for the first gold pour were
the Bupati of South Tapanuli as well as leaders and
representatives from the nearby communities. A formal
signing ceremony to transfer 5% of the mine to the regional
governments of North Sumatra and South Tapanuli was also
conducted on this day.
Commissioning of the process plant was completed in
September 2012 with all project personnel having left
the site by mid October 2012. During the latter half of
September and most of October, the mine was shut down
whilst the Company completed its consultation with
the local community regarding the completion of the
construction of the Clean Water Pipeline (“CWP”) to
the Batangtoru River. During the shut down period the
Company took the opportunity to undertake various
modifications and remedial mechanical works.
Exploration, Resource and Reserve Development Activities
Figure 1: Martabe Mine Location.
CO
RP
OR
aTe
infO
Rm
aTiO
n
sTaT
uTO
Ry
dis
ClO
suR
e fi
nan
Cia
l sT
aTem
enTs
PR
OjEC
T O
VER
VIEw
: M
ARTA
BE
man
agem
enT
dis
Cu
ssiO
n
and
an
alys
isO
veR
vieW
15G-Resources Group Limited Interim Financial Report 2012/2013
eXPlORaTiOn, ResOuRCe and ReseRve develOPmenT aCTiviTies
The CWP construction was completed by 13 November
2012, whilst the process plant was restarted in late October
2012. Community activities undertaken during the last
quarter of 2012 included a series of discussions, site visits,
clean water demonstration ceremonies and a number of
specific community related activities. These events proved
to further develop the long term relationships between the
Company and the local communities and the Government.
In the month of December the process plant achieved over
100% of nameplate gold production and 80% of design
mill throughput, the only remaining construction activity
is the tie-in to the Indonesian main grid power, which
is expected to occur in the first half of 2013. In the
meantime, power necessary for ramp up to full design
capacity is being provided by the temporary diesel
power station.
OperationsThe operations team at Martabe consists of approximately
2,200 people. The employment goal is for at least 70%
of the mine workers to come from the local community,
with a further 25% Indonesians from other parts of
the archipelago.
SafetySafety performance across the project and operations in
2012 was excellent with a total of ten lost time injuries
(“LTI’s”) being recorded during construction from January
to June and zero LTI’s occurring in the second half of 2012.
The safety performance at Martabe compares with the best
performance in the industry. This outstanding performance
is a direct reflection of quality of management and
leadership across the Martabe Mine site.
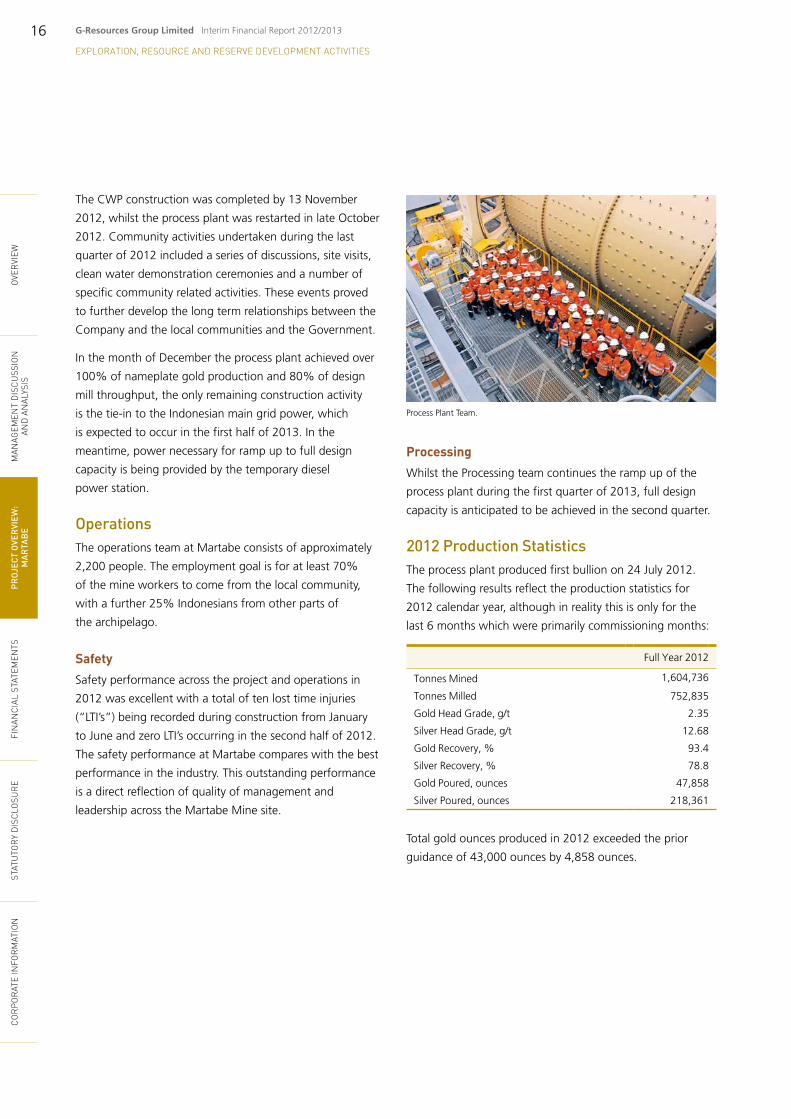
Process Plant Team.
ProcessingWhilst the Processing team continues the ramp up of the
process plant during the first quarter of 2013, full design
capacity is anticipated to be achieved in the second quarter.
2012 Production StatisticsThe process plant produced first bullion on 24 July 2012.
The following results reflect the production statistics for
2012 calendar year, although in reality this is only for the
last 6 months which were primarily commissioning months:
Full Year 2012
Tonnes Mined 1,604,736
Tonnes Milled 752,835
Gold Head Grade, g/t 2.35
Silver Head Grade, g/t 12.68
Gold Recovery, % 93.4
Silver Recovery, % 78.8
Gold Poured, ounces 47,858
Silver Poured, ounces 218,361
Total gold ounces produced in 2012 exceeded the prior
guidance of 43,000 ounces by 4,858 ounces.
CO
RP
OR
aTe
infO
Rm
aTiO
n
sTaT
uTO
Ry
dis
ClO
suR
e fi
nan
Cia
l sT
aTem
enTs
PR
OjEC
T O
VER
VIEw
: M
ARTA
BE
man
agem
enT
dis
Cu
ssiO
n
and
an
alys
isO
veR
vieW
16 G-Resources Group Limited Interim Financial Report 2012/2013
MiningThe Mining team continues to perform well and at the end
of 2012 the Purnama Ridge height was lowered to RL465,
some 40 metres below the original height. The team
continues to deliver ore to stockpiles at the run of mine
(“ROM”) area where it is blended according to grade,
ready for delivery to the process plant crusher.
Mining activities are predominantly focused on the Purnama
open-pit and are proceeding according to plan. At the end
of 2012, 604,297 tonnes of ore were stored in separate
grade controlled stockpiles. Grade control drilling continues
to deliver results which are consistent with the Resource
model. The annualised gold head grade at the end of 2012
met the plan of 2.35 g/t, and it is pleasing to note the
recovery significantly exceeded plan at 93.4% versus 82.9%.
The progress on the raising of the tailing storage facility
(“TSF”) is ahead of schedule and in the first quarter of 2013
the TSF will reach a level where there is 18 months of
storage capacity available whilst the next and following lifts
are completed.
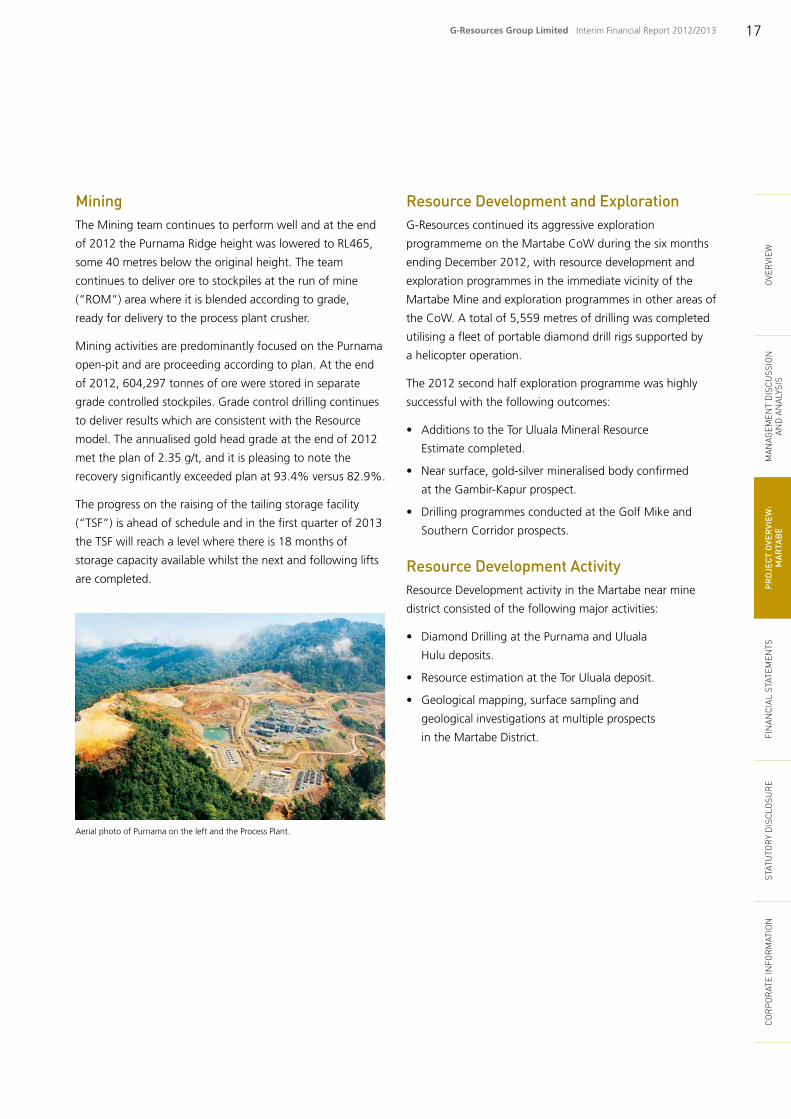
Aerial photo of Purnama on the left and the Process Plant.
Resource Development and ExplorationG-Resources continued its aggressive exploration
programmeme on the Martabe CoW during the six months
ending December 2012, with resource development and
exploration programmes in the immediate vicinity of the
Martabe Mine and exploration programmes in other areas of
the CoW. A total of 5,559 metres of drilling was completed
utilising a fleet of portable diamond drill rigs supported by
a helicopter operation.
The 2012 second half exploration programme was highly
successful with the following outcomes:
• AdditionstotheTorUlualaMineralResource
Estimate completed.
• Nearsurface,gold-silvermineralisedbodyconfirmed
at the Gambir-Kapur prospect.
• DrillingprogrammesconductedattheGolfMikeand
Southern Corridor prospects.
Resource Development ActivityResource Development activity in the Martabe near mine
district consisted of the following major activities:
• DiamondDrillingatthePurnamaandUluala
Hulu deposits.
• ResourceestimationattheTorUlualadeposit.
• Geologicalmapping,surfacesamplingand
geological investigations at multiple prospects
in the Martabe District.
CO
RP
OR
aTe
infO
Rm
aTiO
n
sTaT
uTO
Ry
dis
ClO
suR
e fi
nan
Cia
l sT
aTem
enTs
PR
OjEC
T O
VER
VIEw
: M
ARTA
BE
man
agem
enT
dis
Cu
ssiO
n
and
an
alys
isO
veR
vieW
17G-Resources Group Limited Interim Financial Report 2012/2013

eXPlORaTiOn, ResOuRCe and ReseRve develOPmenT aCTiviTies
A major programme of geophysical measurements in drill
core was undertaken. Magnetic susceptibility, induced
polarisation and resistivity were measured from core
representing typical sections across the Martabe deposits
and surrounding rocks. These are being used to construct
geophysical computer simulations of deep targets and to
improve the analysis of the subsurface geology.
Martabe Contract of work Exploration ActivityExploration in the Martabe Contract of Work consisted of
these major activities:
• DiamonddrillingattheGolfMikeandSouthern
Corridor prospects.
• Geologicalmappingandsurfacesamplingatthe
Gambir-Kapur, Golf Mike, Southern Corridor and
Pahae prospects.
Exploration targets included epithermal gold targets and
buried copper-gold porphyry targets. Figure 2 shows the
location of these prospects.
Diamond DrillingEight holes for 2,197 metres were completed with break
down by prospect as follows:
• GolfMike,sixholesfor1,813metres.
• SouthernCorridor,twoholesfor384metres.
Earlier drilling results at the Gambir-Kapur prospect were
analysed, identifying a near surface, oxidized, gold and silver
deposit of relatively small tonnage. This deposit has not yet
been defined to JORC status. Work is currently focused on
the potential for nearby satellite deposits based on previous
encouraging exploration results.
Diamond DrillingSeventeen diamond drill holes were completed for a total
of 3,362 metres. Of these, twelve holes were completed
at the Purnama deposit. This included a metallurgical
sampling programme of six holes and a further six holes
targeting northern extensions of the Purnama deposit.
Drilling at Purnama North produced significant intersections
including a best result of:
• APSD1210:[email protected]/tAu,5g/tAg
from surface.
A further five diamond drill holes were completed at the
Uluala Hulu deposit. Results were awaited at the end of
the reporting period.
Resource EstimationA programme of resource estimation was completed at the
Tor Uluala deposit, to integrate drilling completed during the
first half of 2012. This resulted in an additional estimated
190,000 ounces of gold and 3,520,000 ounces of silver,
as reported in an announcement on 4 September 2012.
Geological Mapping, Surface Sampling and other InvestigationsSignificant programmes of geological mapping and sampling
were completed to the east and west of the Martabe Mine
area and at the Uluala Hulu prospect four kilometres north
of the Martabe operation. These involved a small team of
geologists and field technicians at each location, with the
aim of defining new exploration targets. This work resulted
in early stage drill targets being identified, with drilling
planned to commence in late 2013.
CO
RP
OR
aTe
infO
Rm
aTiO
n
sTaT
uTO
Ry
dis
ClO
suR
e fi
nan
Cia
l sT
aTem
enTs
PR
OjEC
T O
VER
VIEw
: M
ARTA
BE
man
agem
enT
dis
Cu
ssiO
n
and
an
alys
isO
veR
vieW
18 G-Resources Group Limited Interim Financial Report 2012/2013
Sibolga
Tango Papa
Sibio-bio
Baning
Golf MikePadang Sidempuan
Gambir-Kapur
Southern Corridor
Muarasoma
Panyabungan
Rantau Panjang
North Tapanuli
Sipirok
South Tapanuli
Central Tapanuli
Mandailing Natal
1oN
99oE
Pahae
20km
Martabe Deposits(8.05 Moz Au)
Medan
SibolgaSumatra
Martabe
Lubuksikaping Batangtoru
Contract of Work Exploration Project Map
Exploration targets /prospectsRoad
Regional outline
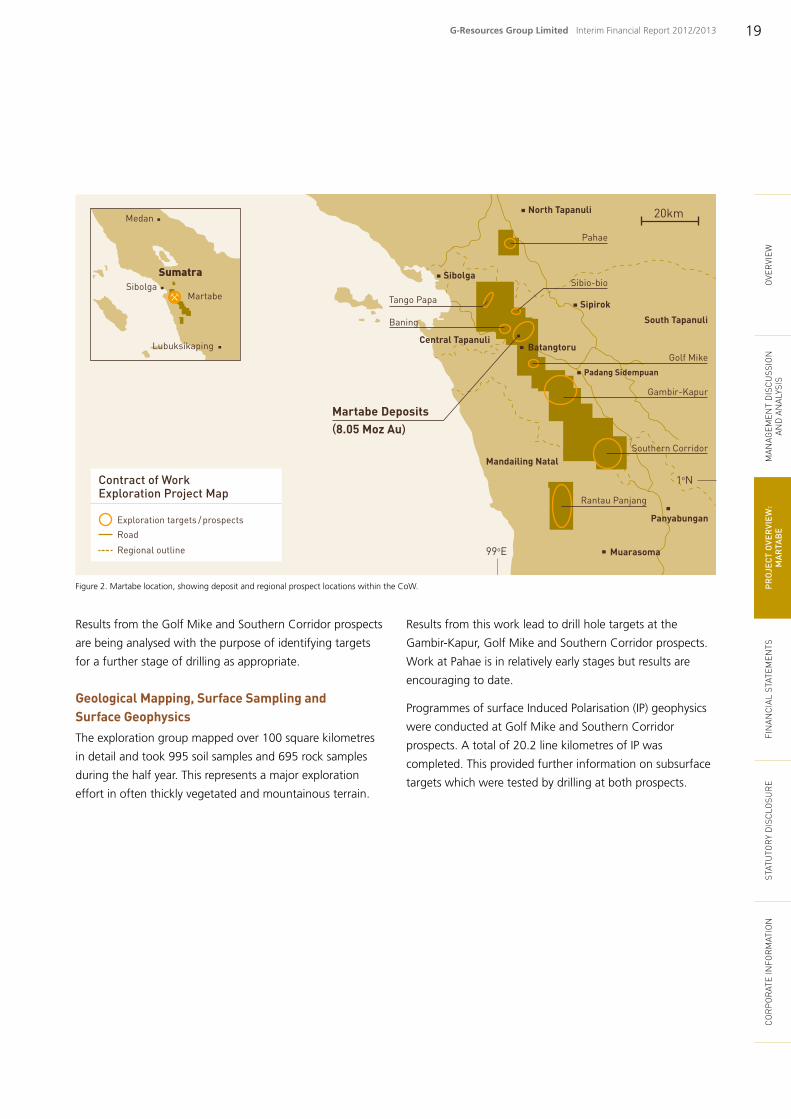
Results from the Golf Mike and Southern Corridor prospects
are being analysed with the purpose of identifying targets
for a further stage of drilling as appropriate.
Geological Mapping, Surface Sampling and Surface GeophysicsThe exploration group mapped over 100 square kilometres
in detail and took 995 soil samples and 695 rock samples
during the half year. This represents a major exploration
effort in often thickly vegetated and mountainous terrain.
Figure 2. Martabe location, showing deposit and regional prospect locations within the CoW.
Results from this work lead to drill hole targets at the
Gambir-Kapur, Golf Mike and Southern Corridor prospects.
Work at Pahae is in relatively early stages but results are
encouraging to date.
Programmes of surface Induced Polarisation (IP) geophysics
were conducted at Golf Mike and Southern Corridor
prospects. A total of 20.2 line kilometres of IP was
completed. This provided further information on subsurface
targets which were tested by drilling at both prospects.C
OR
PO
RaT
e in
fOR
maT
iOn
sT
aTu
TOR
y d
isC
lOsu
Re
fin
anC
ial
sTaT
emen
Ts
PROj
ECT
OVE
RVI
Ew:
MAR
TAB
Em
anag
emen
T d
isC
uss
iOn
an
d a
nal
ysis
Ove
Rvi
eW
19G-Resources Group Limited Interim Financial Report 2012/2013
Report on Review of Condensed Consolidated Report on Review of Condensed Consolidated Financial StatementsFinancial Statements
TO THE BOARD OF DIRECTORS OF G-RESOURCES GROUP LIMITED(incorporated in Bermuda with limited liability)
IntroductionIntroductionWe have reviewed the condensed consolidated financial statements of G-Resources Group Limited (the “Company”) and its subsidiaries set out on pages 21 to 34, which comprise the condensed consolidated statement of financial position as of 31 December 2012 and the related condensed consolidated statement of profit or loss, statement of profit or loss and other comprehensive income, statement of changes in equity and statement of cash flows for the six-month period then ended, and certain explanatory notes. The Main Board Listing Rules Governing the Listing of Securities on The Stock Exchange of Hong Kong Limited require the preparation of a report on interim financial information to be in compliance with the relevant provisions thereof and Hong Kong Accounting Standard 34 “Interim Financial Reporting” (“HKAS 34”) issued by the Hong Kong Institute of Certified Public Accountants. The directors of the Company are responsible for the preparation and presentation of these condensed consolidated financial statements in accordance with HKAS 34. Our responsibility is to express a conclusion on these condensed consolidated financial statements based on our review, and to report our conclusion solely to you, as a body, in accordance with our agreed terms of engagement, and for no other purpose. We do not assume responsibility towards or accept liability to any other person for the contents of this report.
Scope of ReviewScope of ReviewWe conducted our review in accordance with Hong Kong Standard on Review Engagements 2410 “Review of Interim Financial Information Performed by the Independent Auditor of the Entity” issued by the Hong Kong Institute of Certified Public Accountants. A review of these condensed consolidated financial statements consist of making enquiries, primarily of persons responsible for financial and accounting matters, and applying analytical and other review procedures. A review is substantially less in scope than an audit conducted in accordance with Hong Kong Standards on Auditing and consequently does not enable us to obtain assurance that we would become aware of all significant matters that might be identified in an audit. Accordingly, we do not express an audit opinion.
ConclusionConclusionBased on our review, nothing has come to our attention that causes us to believe that the condensed consolidated financial statements are not prepared, in all material respects, in accordance with HKAS 34.
Deloitte Touche TohmatsuCertified Public AccountantsHong Kong28 February 2013
CO
RP
OR
aTe
infO
Rm
aTiO
n
sTaT
uTO
Ry
dis
ClO
suR
e FI
NAN
CIAL
STA
TEM
ENTS
P
ROj
eCT
Ove
Rvi
eW:
maR
Tab
em
anag
emen
T d
isC
uss
iOn
an
d a
nal
ysis
Ove
Rvi
eW
20 G-Resources Group Limited Interim Financial Report 2012/2013
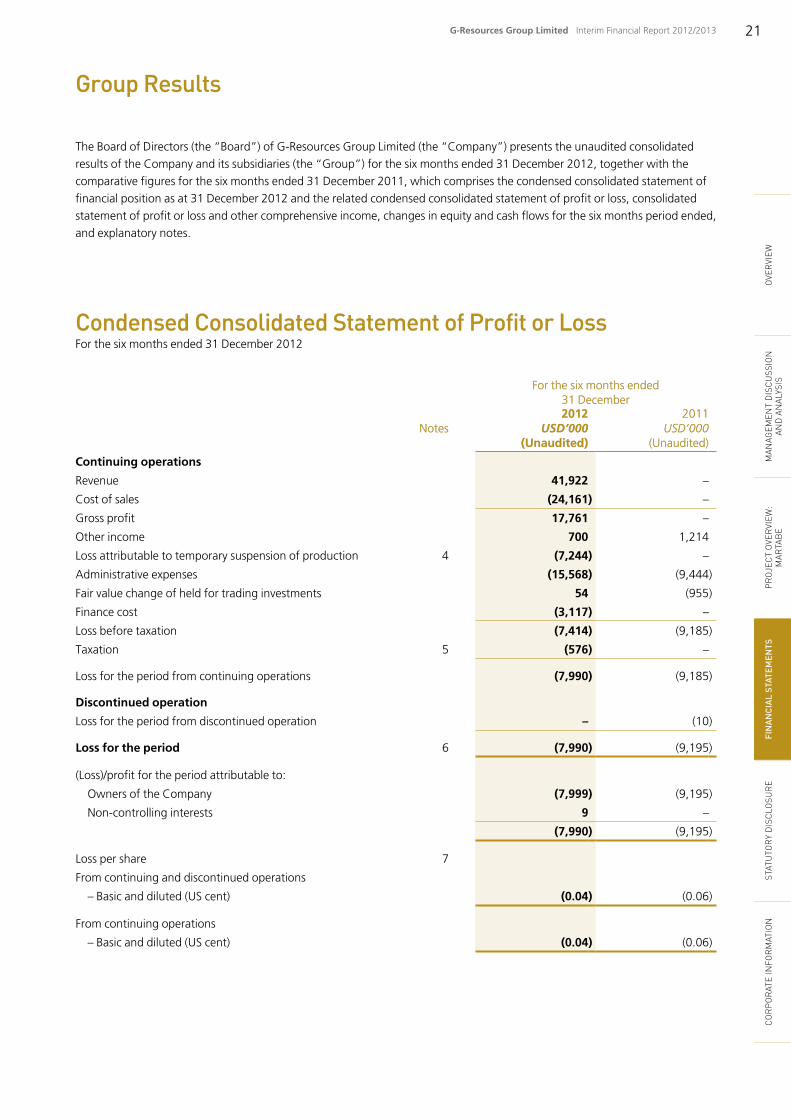
The Board of Directors (the “Board”) of G-Resources Group Limited (the “Company”) presents the unaudited consolidated results of the Company and its subsidiaries (the “Group”) for the six months ended 31 December 2012, together with the comparative figures for the six months ended 31 December 2011, which comprises the condensed consolidated statement of financial position as at 31 December 2012 and the related condensed consolidated statement of profit or loss, consolidated statement of profit or loss and other comprehensive income, changes in equity and cash flows for the six months period ended, and explanatory notes.
Group ResultsGroup Results
Condensed Consolidated Statement of Profit or LossCondensed Consolidated Statement of Profit or LossFor the six months ended 31 December 2012
For the six months ended For the six months ended 31 December31 December
NotesNotes20122012
USD’000 USD’000 (unaudited)(unaudited)
20112011USD’000USD’000
(Unaudited)(Unaudited)
Continuing operations
Revenue 41,922 –
Cost of sales (24,161) –
Gross profit 17,761 –
Other income 700 1,214
Loss attributable to temporary suspension of production 4 (7,244) –
Administrative expenses (15,568) (9,444)
Fair value change of held for trading investments 54 (955)
Finance cost (3,117) –
Loss before taxation (7,414) (9,185)
Taxation 5 (576) –
Loss for the period from continuing operations (7,990) (9,185)
Discontinued operation
Loss for the period from discontinued operation – (10)
Loss for the period 6 (7,990) (9,195)
(Loss)/profit for the period attributable to:
Owners of the Company (7,999) (9,195)
Non-controlling interests 9 –
(7,990) (9,195)
Loss per share 7
From continuing and discontinued operations
– Basic and diluted (US cent) (0.04) (0.06)
From continuing operations
– Basic and diluted (US cent) (0.04) (0.06)
CO
RP
OR
aTe
infO
Rm
aTiO
n
sTaT
uTO
Ry
dis
ClO
suR
e FI
NAN
CIAL
STA
TEM
ENTS
P
ROj
eCT
Ove
Rvi
eW:
maR
Tab
em
anag
emen
T d
isC
uss
iOn
an
d a
nal
ysis
Ove
Rvi
eW
21G-Resources Group Limited Interim Financial Report 2012/2013
Condensed Consolidated Statement of Profit or Loss and Condensed Consolidated Statement of Profit or Loss and Other Comprehensive IncomeOther Comprehensive IncomeFor the six months ended 31 December 2012
For the six months ended For the six months ended 31 December31 December20122012
USD’000 USD’000 (unaudited)(unaudited)
20112011USD’000USD’000
(Unaudited)(Unaudited)
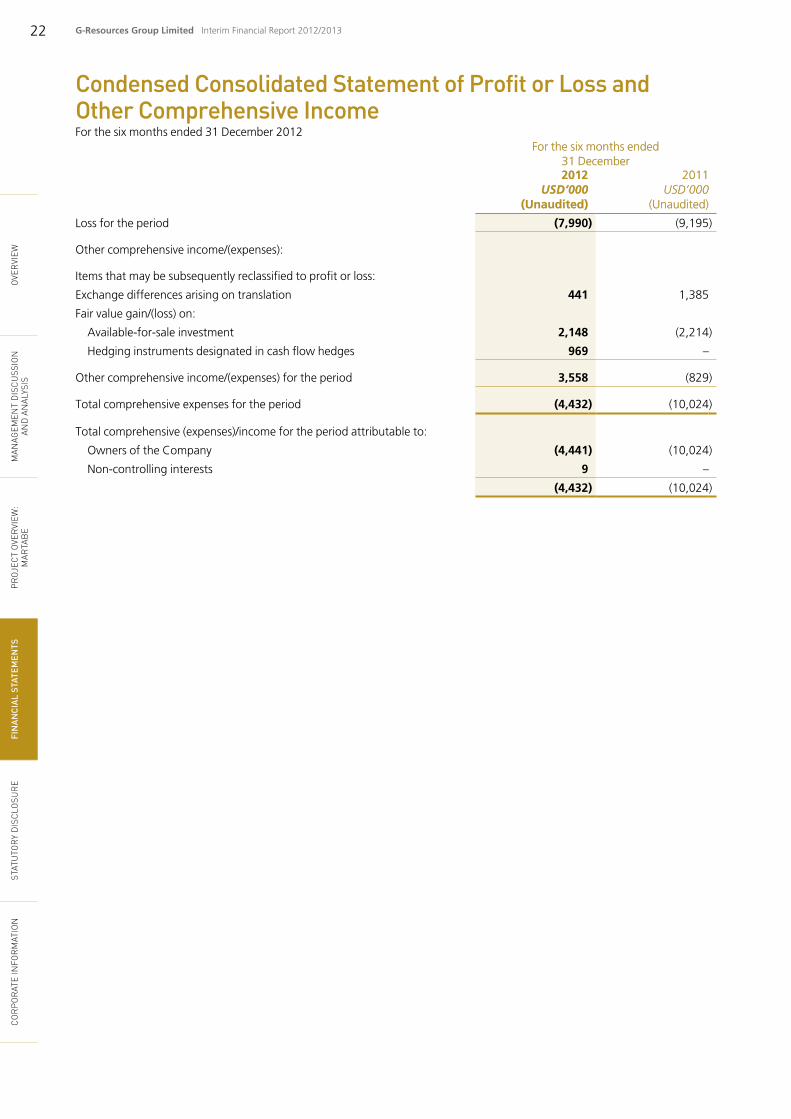
Loss for the period (7,990) (9,195)
Other comprehensive income/(expenses):
Items that may be subsequently reclassified to profit or loss:
Exchange differences arising on translation 441 1,385
Fair value gain/(loss) on:
Available-for-sale investment 2,148 (2,214)
Hedging instruments designated in cash flow hedges 969 –
Other comprehensive income/(expenses) for the period 3,558 (829)
Total comprehensive expenses for the period (4,432) (10,024)
Total comprehensive (expenses)/income for the period attributable to:
Owners of the Company (4,441) (10,024)
Non-controlling interests 9 –
(4,432) (10,024)
CO
RP
OR
aTe
infO
Rm
aTiO
n
sTaT
uTO
Ry
dis
ClO
suR
e FI
NAN
CIAL
STA
TEM
ENTS
P
ROj
eCT
Ove
Rvi
eW:
maR
Tab
em
anag
emen
T d
isC
uss
iOn
an
d a
nal
ysis
Ove
Rvi
eW
22 G-Resources Group Limited Interim Financial Report 2012/2013

Condensed Consolidated Statement of Financial PositionCondensed Consolidated Statement of Financial PositionAs at 31 December 2012
NotesNotes
31 December 31 December 20122012
USD’000 USD’000 (unaudited)(unaudited)
30 June 30 June 20122012
USD’000USD’000(Audited)(Audited)
nOn-CuRREnT ASSETS
Property, plant and equipment 8 899,952 825,000
Exploration and evaluation assets 9 8,266 5,338
Available-for-sale investment 10 7,586 5,438
Other receivable 11 61,472 45,595
977,276 881,371
CuRREnT ASSETS
Inventories 42,827 –
Other receivables 11 16,037 10,516
Held for trading investments 12 1,863 1,808
Pledged bank deposits 81 82
Bank balances and cash 47,857 65,338
108,665 77,744
CuRREnT LiABiLiTiES
Trade and other payables 13 92,106 70,850
Derivative financial liabilities 235 1,204
Borrowings 14 48,521 33,568
Tax Payable 576 –
141,438 105,622
nET CuRREnT LiABiLiTiES (32,773) (27,878)
TOTAL ASSETS LESS CuRREnT LiABiLiTiES 944,503 853,493
nOn-CuRREnT LiABiLiTiES
Other payables 13 1,879 1,493
Provision for mine rehabilitation cost 15 11,172 10,615
Borrowings 14 24,260 48,568
37,311 60,676
907,192 792,817
CAPiTAL AnD RESERVES
Share capital 16 24,390 21,757
Reserves 866,528 771,060
Equity attributable to owners of the Company 890,918 792,817
Non-controlling interests 16,274 –
TOTAL EQuiTy 907,192 792,817
The condensed consolidated financial statements on pages 21 to 34 were approved and authorised for issue by the Board of Directors on 28 February 2013 and are signed on its behalf by:
Peter Geoffrey Albert Hui Richard RuiDirector Director
CO
RP
OR
aTe
infO
Rm
aTiO
n
sTaT
uTO
Ry
dis
ClO
suR
e FI
NAN
CIAL
STA
TEM
ENTS
P
ROj
eCT
Ove
Rvi
eW:
maR
Tab
em
anag
emen
T d
isC
uss
iOn
an
d a
nal
ysis
Ove
Rvi
eW
23G-Resources Group Limited Interim Financial Report 2012/2013

Attributable to owners of the CompanyAttributable to owners of the Company
Share Share capital capital
USD’000USD’000
Share Share premium premium USD’000USD’000
Capital Capital redemption redemption
reserve reserve USD’000USD’000
Contributed Contributed surplus surplus
USD’000USD’000
Share Share options options reserve reserve
USD’000USD’000
Cash flow Cash flow hedges hedges reserve reserve
USD’000USD’000
Exchange Exchange reserve reserve
USD’000USD’000
Investment Investment revaluation revaluation
reserve reserve USD’000USD’000
Accumulated Accumulated losses losses
USD’000USD’000Total Total
USD’000USD’000
Non-Non-controlling controlling
interests interests USD’000USD’000
Total Total USD’000USD’000
(Unaudited)
At 1 July 2011 18,147 563,657 212 11,658 20,296 – (1,771) (596) (21,405) 590,198 – 590,198
Loss for the period – – – – – – – – (9,195) (9,195) – (9,195)
Fair value loss on:
Available-for-sale investment – – – – – – – (2,214) – (2,214) – (2,214)
Exchange difference arising on translation – – – – – – 1,385 – – 1,385 – 1,385
Total comprehensive income/ (expenses) for the period – – – – – – 1,385 (2,214) (9,195) (10,024) – (10,024)
Issue of shares 3,610 213,000 – – – – – – – 216,610 – 216,610
Transaction costs attributable to issue of shares – (3,457) – – – – – – – (3,457) – (3,457)
Recognition of equity-settled share-based payment – – – – 5,251 – – – – 5,251 – 5,251
At 31 December 2011 21,757 773,200 212 11,658 25,547 – (386) (2,810) (30,600) 798,578 – 798,578
At 1 July 2012 21,757 773,200 212 11,658 31,588 (1,204) 784 (4,487) (40,691) 792,817 – 792,817
(Loss)/profit for the period – – – – – – – – (7,999) (7,999) 9 (7,990)
Fair value gain on:
Available-for-sale investment – – – – – – – 2,148 – 2,148 – 2,148
Hedging instruments designated in cash flow hedge – – – – – 969 – – – 969 – 969
Exchange difference arising on translation – – – – – – 441 – – 441 – 441
Total comprehensive income/ (expenses) for the period – – – – – 969 441 2,148 (7,999) (4,441) 9 (4,432)
Issue of shares 2,633 97,379 – – – – – – – 100,012 – 100,012
Transaction costs attributable to issue of shares – (1,014) – – – – – – – (1,014) – (1,014)
Transfer of interest in a subsidiary without losing control (Note 21) – – – – – – – – – – 12,265 12,265
Capital injection in a subsidiary from non-controlling interests – – – – – – – – – – 4,000 4,000
Reversal of equity-settled share-based payment – – – – (95) – – – 95 – – –
Recognition of equity-settled share-based payment – – – – 3,544 – – – – 3,544 – 3,544
At 31 December 2012 24,390 869,565 212 11,658 35,037 (235) 1,225 (2,339) (48,595) 890,918 16,274 907,192
Condensed Consolidated Statement of Changes in EquityCondensed Consolidated Statement of Changes in EquityFor the six months ended 31 December 2012
CO
RP
OR
aTe
infO
Rm
aTiO
n
sTaT
uTO
Ry
dis
ClO
suR
e FI
NAN
CIAL
STA
TEM
ENTS
P
ROj
eCT
Ove
Rvi
eW:
maR
Tab
em
anag
emen
T d
isC
uss
iOn
an
d a
nal
ysis
Ove
Rvi
eW
24 G-Resources Group Limited Interim Financial Report 2012/2013

Condensed Consolidated Statement of Cash FlowsCondensed Consolidated Statement of Cash FlowsFor the six months ended 31 December 2012
For the six months ended For the six months ended 31 December31 December20122012
USD’000 USD’000 (unaudited)(unaudited)
20112011USD’000USD’000
(Unaudited)(Unaudited)
OPERATinG ACTiViTiES
Loss before taxation (7,414) (9,195)
Adjustments for:
Interest income (700) (1,214)
Amortisation and depreciation 8,076 121
Share-based payment expenses 3,544 5,251
Allowance for other receivables – 746
Fair value change of held for trading investments (54) 955
Finance cost 3,117 –
Operating cash flows before movements in working capital 6,569 (3,336)
Increase in inventories (34,841) –
Increase in other receivable (non-current portion) (15,877) (12,617)
Increase in other receivables (1,521) (2,080)
Increase/(decrease) in trade and other payables 69,038 (692)
net cash from/(used in) Operating Activities 23,368 (18,725)
inVESTinG ACTiViTiES
Purchase of property, plant and equipment (124,872) (176,799)
Purchase of exploration and evaluation assets (2,928) (1,023)
Interest received 700 1,214
net cash used in investing Activities (127,100) (176,608)
FinAnCinG ACTiViTiES
Finance cost paid (3,136) –
Net proceeds from issue of shares 98,998 213,153
Bank borrowings raised, net of transaction costs 1,000 –
Repayment of bank borrowings (11,000) –
net cash from Financing Activities 85,862 213,153
net (decrease)/increase in cash and cash equivalents (17,870) 17,820
Cash and cash equivalents at beginning of the period 65,338 135,627
Effect of foreign exchange rate changes 389 1,220
Cash and cash equivalents at end of the period, represented by bank balances and cash 47,857 154,667
CO
RP
OR
aTe
infO
Rm
aTiO
n
sTaT
uTO
Ry
dis
ClO
suR
e FI
NAN
CIAL
STA
TEM
ENTS
P
ROj
eCT
Ove
Rvi
eW:
maR
Tab
em
anag
emen
T d
isC
uss
iOn
an
d a
nal
ysis
Ove
Rvi
eW
25G-Resources Group Limited Interim Financial Report 2012/2013

1. Basis of Preparation1. Basis of PreparationThe condensed consolidated interim financial statements have been prepared in accordance with Hong Kong Accounting Standard (“HKAS”) 34 “Interim Financial Reporting” issued by the Hong Kong Institute of Certified Public Accountants (“HKICPA”) as well as with the applicable disclosure requirements of Appendix 16 to the Rules Governing the Listing of Securities on The Stock Exchange of Hong Kong Limited (“Stock Exchange”).
The condensed consolidated interim financial statements do not include all the information and disclosures required in the annual financial statements, and should be read in conjunction with the Group’s annual financial statements for the year ended 30 June 2012.
2. Principal Accounting Policies2. Principal Accounting PoliciesThe condensed consolidated interim financial statements have been prepared on the historical basis, except for certain financial instruments, which are measured at fair values.
The accounting policies and methods of computation used in the condensed consolidated financial statements for the six months ended 31 December 2012 are the same as those followed in the preparation of the Group’s annual financial statements for the year ended 30 June 2012, except for the following accounting policies, which have been adopted by the Group in respect of the operation of the Group’s mining business which commenced operation during the current interim period, as described below:
Non-controlling interestsNon-controlling interestsNon-controlling interests that are present ownership interests and entitle their holdings to a proportionate share of the entity’s net assets in the event of liquidation may be initially measured either at fair value or at the non-controlling interest’s proportionate share of the recognised amounts of the acquiree’s identifiable net assets.
Allocation of total comprehensive income to non-controlling interestsAllocation of total comprehensive income to non-controlling interestsTotal comprehensive income and expense of a subsidiary is attributed to the owners of the Company and to the non-controlling interests even if this results in the non-controlling interests having a deficit balance.
InventoriesInventoriesInventories comprise raw materials, work in progress and finished goods. Work in progress inventories mainly comprise ore stockpiles and other partly processed materials.
Inventories are stated at the lower of cost and net realisable value, primarily on a weighted average cost basis.
Cost for inventories comprises labour costs, material costs and contractor expenses which are directly attributable to the extraction and processing of ore; and a systematic allocation of the amortisation and depreciation of mining properties and leases and of property, plant and equipment used in the extraction and processing of ore; and production overheads. Cost for purchased materials is determined after deducting discounts.
Net realisable value is the estimated selling price in the ordinary course of business less the estimated costs of completion and the estimated costs necessary to make the sale.
Stockpiles represent ore that has been extracted and is awaiting for further processing. If there is significant uncertainty as to when the stockpiled ore will be processed it is expensed as incurred. Where the future processing of this ore can be predicted with reasonable certainty, it is valued at the lower of cost and net realisable value.
Notes to the Condensed Consolidated Financial StatementsNotes to the Condensed Consolidated Financial StatementsFor the six months ended 31 December 2012
CO
RP
OR
aTe
infO
Rm
aTiO
n
sTaT
uTO
Ry
dis
ClO
suR
e FI
NAN
CIAL
STA
TEM
ENTS
P
ROj
eCT
Ove
Rvi
eW:
maR
Tab
em
anag
emen
T d
isC
uss
iOn
an
d a
nal
ysis
Ove
Rvi
eW
26 G-Resources Group Limited Interim Financial Report 2012/2013
2. Principal Accounting Policies 2. Principal Accounting Policies (continued)(continued)
In the current interim period, the Group has applied, for the first time, the following amendments issued by the HKICPA.
HKAS 1 (Amendments) Presentation of Items of Other Comprehensive IncomeHKAS12 (Amendments) Deferred Tax – Recovery of Underlying Assets
Amendments to HKAS 1 Presentation of Items of Other Comprehensive IncomeAmendments to HKAS 1 Presentation of Items of Other Comprehensive IncomeThe amendments to HKAS 1 introduce new terminology for statement of comprehensive income and income statement. Under the amendments to HKAS 1, a statement of comprehensive income is renamed as a statement of profit or loss and other comprehensive income and an income statement is renamed as a statement of profit or loss. The amendments to HKAS 1 retain the option to present profit or loss and other comprehensive income in either a single statement or in two separate but consecutive statements. However, the amendments to HKAS 1 require additional disclosures to be made in the other comprehensive section such that items of other comprehensive income are grouped into two categories: (a) items that will not be reclassified subsequently to profit or loss; and (b) items that may be reclassified subsequently to profit or loss when specific conditions are met. Income tax on items of other comprehensive income is required to be allocated on the same basis – the amendments do not change the option to present items of other comprehensive income either before tax or net of tax. The amendments have been applied retrospectively, and hence the presentation of items of other comprehensive income has been modified to reflect the changes. Other than the above mentioned presentation changes, the application of the amendments to HKAS 1 does not result in any impact on profit or loss, other comprehensive income and total comprehensive income.
The application of the amendments to HKAS12 in the current interim period has had no material effect on the amounts reported in these condensed consolidated financial statements and/or disclosures set out in these condensed consolidated financial statements.
The Group has not early applied new or revised Hong Kong Accounting Standards, Hong Kong Financial Reporting Standards, amendments and interpretations (hereinafter collectively referred to as “new and revised HKFRSs”) that have been issued but are not yet effective. The Group is in the process of making an assessment of the impact of these new or revised HKFRSs but is not yet in the position to state whether these new or revised HKFRSs would have significant impact on the Group’s results of operations and financial position.
3. Segment Information3. Segment InformationFor management purposes, the Group’s operating businesses are structured and managed separately according to the nature of their operations and the products and services they provide. Each of the Group’s business segments represents a strategic business unit that offers products and services which are subject to risks and returns that are different from those of the other business segments.
Segment information reported externally was analysed on the basis of the following operating divisions:
• miningbusiness–exploration,mining,processingandsalesofgoldandsilver;• provisionoffinancialinformationservices;and• securitiestrading
CO
RP
OR
aTe
infO
Rm
aTiO
n
sTaT
uTO
Ry
dis
ClO
suR
e FI
NAN
CIAL
STA
TEM
ENTS
P
ROj
eCT
Ove
Rvi
eW:
maR
Tab
em
anag
emen
T d
isC
uss
iOn
an
d a
nal
ysis
Ove
Rvi
eW
27G-Resources Group Limited Interim Financial Report 2012/2013
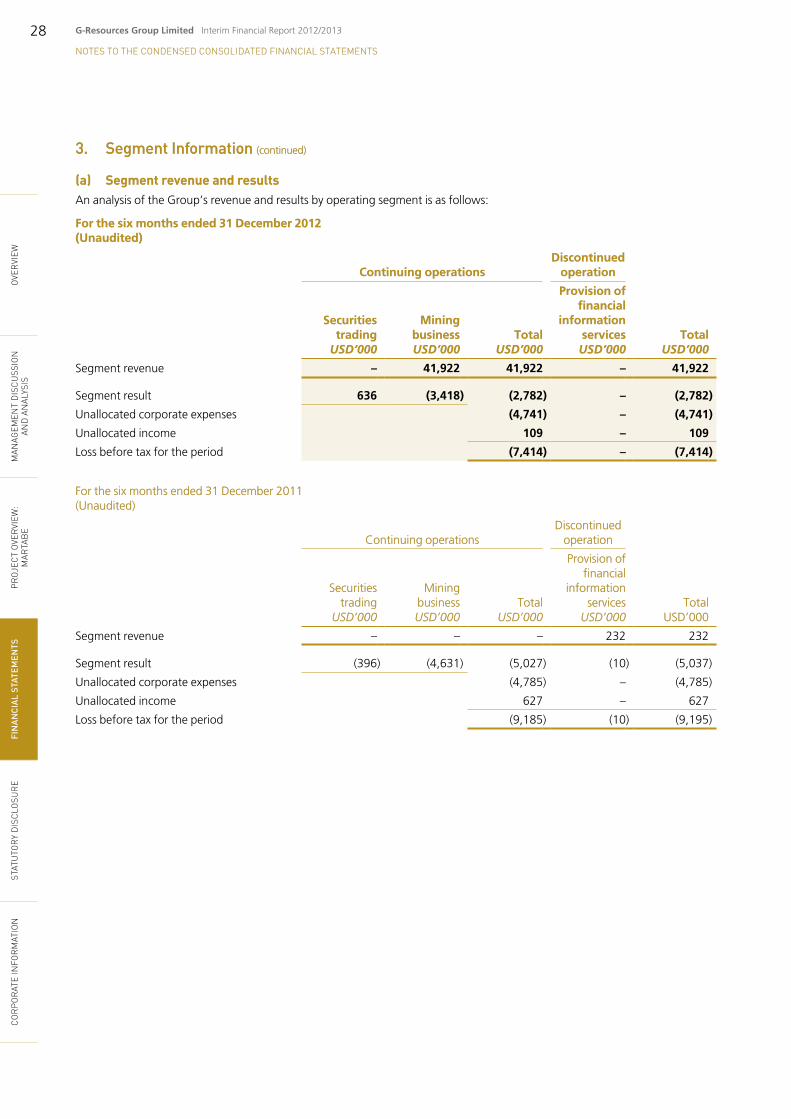
nOTes TO THe COndensed COnsOlidaTed finanCial sTaTemenTsnOTes TO THe COndensed COnsOlidaTed finanCial sTaTemenTs
3. Segment Information 3. Segment Information (continued)(continued)
(a) Segment revenue and results(a) Segment revenue and resultsAn analysis of the Group’s revenue and results by operating segment is as follows:
For the six months ended 31 December 2012For the six months ended 31 December 2012(unaudited)(unaudited)
Continuing operationsContinuing operationsDiscontinued Discontinued
operationoperation
Securities Securities trading trading
USD’000USD’000
mining mining businessbusinessUSD’000USD’000
TotalTotalUSD’000USD’000
Provision of Provision of financial financial
information information servicesservices
USD’000USD’000TotalTotal
USD’000USD’000
Segment revenue – 41,922 41,922 – 41,922
Segment result 636 (3,418) (2,782) – (2,782)
Unallocated corporate expenses (4,741) – (4,741)
Unallocated income 109 – 109
Loss before tax for the period (7,414) – (7,414)
For the six months ended 31 December 2011For the six months ended 31 December 2011(Unaudited)(Unaudited)
Continuing operationsContinuing operationsDiscontinued Discontinued
operationoperation
Securities Securities trading trading
USD’000USD’000
Mining Mining businessbusinessUSD’000USD’000
TotalTotalUSD’000USD’000
Provision of Provision of financial financial
information information servicesservices
USD’000USD’000TotalTotal
USD’000USD’000
Segment revenue – – – 232 232
Segment result (396) (4,631) (5,027) (10) (5,037)
Unallocated corporate expenses (4,785) – (4,785)
Unallocated income 627 – 627
Loss before tax for the period (9,185) (10) (9,195)
CO
RP
OR
aTe
infO
Rm
aTiO
n
sTaT
uTO
Ry
dis
ClO
suR
e FI
NAN
CIAL
STA
TEM
ENTS
P
ROj
eCT
Ove
Rvi
eW:
maR
Tab
em
anag
emen
T d
isC
uss
iOn
an
d a
nal
ysis
Ove
Rvi
eW
28 G-Resources Group Limited Interim Financial Report 2012/2013

3. Segment Information 3. Segment Information (continued)(continued)
(b) Segment assets(b) Segment assetsAn analysis of the Group’s assets by operating segment is as follows:
At 31 December 2012At 31 December 2012(unaudited)(unaudited)
Continuing operationsContinuing operationsDiscontinued Discontinued
operationoperation
Securities Securities trading trading
USD’000USD’000
mining mining businessbusinessUSD’000USD’000
Provision of Provision of financial financial
information information servicesservices
USD’000USD’000TotalTotal
USD’000USD’000
ASSETS
Segment assets 9,543 1,075,903 – 1,085,446
Unallocated corporate assets 495
Total assets 1,085,941
At 30 June 2012At 30 June 2012(Audited)(Audited)
Continuing operationsContinuing operationsDiscontinued Discontinued
operationoperation
Securities Securities trading trading
USD’000USD’000
Mining Mining businessbusinessUSD’000USD’000
Provision of Provision of financial financial
information information servicesservices
USD’000USD’000TotalTotal
USD’000USD’000
ASSETS
Segment assets 7,995 950,576 70 958,641
Unallocated corporate assets 474
Total assets 959,115
4. Loss Attributable to Temporary Suspension of Production4. Loss Attributable to Temporary Suspension of ProductionProduction at Martabe Gold Mine was suspended for six weeks starting mid-September 2012 due to interruption of construction of certain pipelines for the mine. Accordingly, the cost incurred during the six weeks period to maintain the mine operation of USD7,244,000 (six months ended 31 December 2011: nil) is recognised as loss attributable to temporary suspension of production.
5. Taxation5. TaxationHong Kong Profits Tax is calculated at 16.5% of the estimated assessable profit for both periods. Taxation arising in other jurisdictions is calculated at the rates prevailing in the relevant jurisdictions.
Under the relevant tax law, the tax rate of the Indonesian subsidiary is 25%.
No provision for Hong Kong Profits Tax has been made in the condensed consolidated interim financial statements for both periods as the Group had no Hong Kong assessable profits in both periods.
CO
RP
OR
aTe
infO
Rm
aTiO
n
sTaT
uTO
Ry
dis
ClO
suR
e FI
NAN
CIAL
STA
TEM
ENTS
P
ROj
eCT
Ove
Rvi
eW:
maR
Tab
em
anag
emen
T d
isC
uss
iOn
an
d a
nal
ysis
Ove
Rvi
eW
29G-Resources Group Limited Interim Financial Report 2012/2013

nOTes TO THe COndensed COnsOlidaTed finanCial sTaTemenTsnOTes TO THe COndensed COnsOlidaTed finanCial sTaTemenTs
6. Loss for the Period6. Loss for the PeriodFor the six months ended 31 DecemberFor the six months ended 31 December
Continuing Continuing operationsoperations
Discontinued Discontinued operationoperation ConsolidatedConsolidated
2012 2012 USD’000USD’000
2011 2011 USD’000USD’000
2012 2012 USD’000USD’000
2011 2011 USD’000USD’000
2012 2012 USD’000USD’000
2011 2011 USD’000USD’000
(Unaudited)
Loss for the period has been arrived at after charging/(crediting):
Amortisation and depreciation of property, plant and equipment, included in
– Cost of sales 6,629 – – – 6,629 –
– Administrative expenses 1,447 104 – 17 1,447 121
Share-based payment expenses (included in administrative expenses) 3,544 5,251 – – 3,544 5,251
Exchange loss, net 944 524 – – 944 524
Allowance for other receivables – 746 – – – 746
Interest income (700) (1,214) – – (700) (1,214)
7. Loss per Share7. Loss per Share
For continuing and discontinued operationsFor continuing and discontinued operationsThe calculation of the basic and diluted loss per share attributable to owners of the Company is based on the following data:
For the six months ended For the six months ended 31 December31 December
20122012USD’000USD’000
(unaudited)(unaudited)
20112011USD’000USD’000
(Unaudited)(Unaudited)
Loss for the period attributable to owners of the Company, for the purposes of basic and diluted loss per share (7,999) (9,195)
Number of sharesNumber of shares
20122012 20112011
Weighted average number of ordinary shares for the purposes of basic and diluted loss per share 18,322,409,591 16,375,625,233
The computation of diluted loss per share does not assume the exercise of the Group’s outstanding share options as the exercise price of those options is higher than the average market price for shares for both the six months ended 31 December 2012 and 2011.
CO
RP
OR
aTe
infO
Rm
aTiO
n
sTaT
uTO
Ry
dis
ClO
suR
e FI
NAN
CIAL
STA
TEM
ENTS
P
ROj
eCT
Ove
Rvi
eW:
maR
Tab
em
anag
emen
T d
isC
uss
iOn
an
d a
nal
ysis
Ove
Rvi
eW
30 G-Resources Group Limited Interim Financial Report 2012/2013
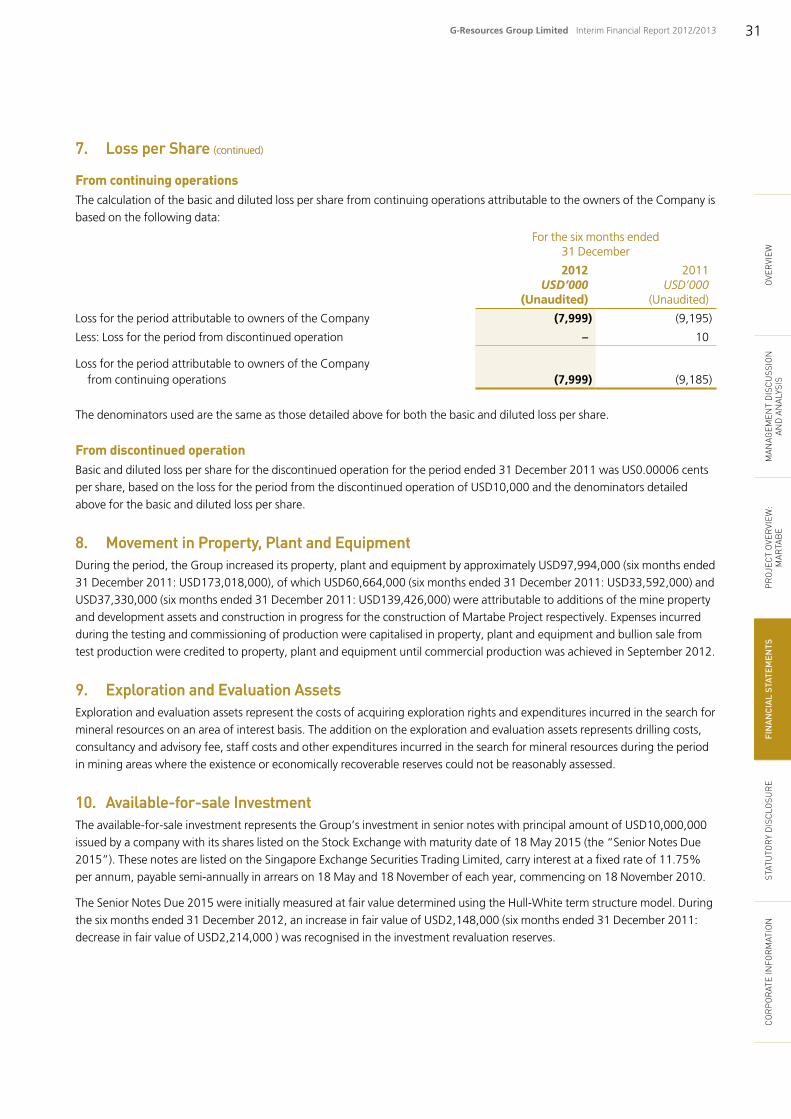
7. Loss per Share 7. Loss per Share (continued)(continued)
From continuing operationsFrom continuing operationsThe calculation of the basic and diluted loss per share from continuing operations attributable to the owners of the Company is based on the following data:
For the six months ended For the six months ended 31 December31 December
20122012USD’000USD’000
(unaudited)(unaudited)
20112011USD’000USD’000
(Unaudited)(Unaudited)
Loss for the period attributable to owners of the Company (7,999) (9,195)
Less: Loss for the period from discontinued operation – 10
Loss for the period attributable to owners of the Company from continuing operations (7,999) (9,185)
The denominators used are the same as those detailed above for both the basic and diluted loss per share.
From discontinued operationFrom discontinued operationBasic and diluted loss per share for the discontinued operation for the period ended 31 December 2011 was US0.00006 cents per share, based on the loss for the period from the discontinued operation of USD10,000 and the denominators detailed above for the basic and diluted loss per share.
8. Movement in Property, Plant and Equipment8. Movement in Property, Plant and EquipmentDuring the period, the Group increased its property, plant and equipment by approximately USD97,994,000 (six months ended 31 December 2011: USD173,018,000), of which USD60,664,000 (six months ended 31 December 2011: USD33,592,000) and USD37,330,000 (six months ended 31 December 2011: USD139,426,000) were attributable to additions of the mine property and development assets and construction in progress for the construction of Martabe Project respectively. Expenses incurred during the testing and commissioning of production were capitalised in property, plant and equipment and bullion sale from test production were credited to property, plant and equipment until commercial production was achieved in September 2012.
9. Exploration and Evaluation Assets9. Exploration and Evaluation AssetsExploration and evaluation assets represent the costs of acquiring exploration rights and expenditures incurred in the search for mineral resources on an area of interest basis. The addition on the exploration and evaluation assets represents drilling costs, consultancy and advisory fee, staff costs and other expenditures incurred in the search for mineral resources during the period in mining areas where the existence or economically recoverable reserves could not be reasonably assessed.
10. Available-for-sale Investment10. Available-for-sale InvestmentThe available-for-sale investment represents the Group’s investment in senior notes with principal amount of USD10,000,000 issued by a company with its shares listed on the Stock Exchange with maturity date of 18 May 2015 (the “Senior Notes Due 2015”). These notes are listed on the Singapore Exchange Securities Trading Limited, carry interest at a fixed rate of 11.75% per annum, payable semi-annually in arrears on 18 May and 18 November of each year, commencing on 18 November 2010.
The Senior Notes Due 2015 were initially measured at fair value determined using the Hull-White term structure model. During the six months ended 31 December 2012, an increase in fair value of USD2,148,000 (six months ended 31 December 2011: decrease in fair value of USD2,214,000 ) was recognised in the investment revaluation reserves.
CO
RP
OR
aTe
infO
Rm
aTiO
n
sTaT
uTO
Ry
dis
ClO
suR
e FI
NAN
CIAL
STA
TEM
ENTS
P
ROj
eCT
Ove
Rvi
eW:
maR
Tab
em
anag
emen
T d
isC
uss
iOn
an
d a
nal
ysis
Ove
Rvi
eW
31G-Resources Group Limited Interim Financial Report 2012/2013
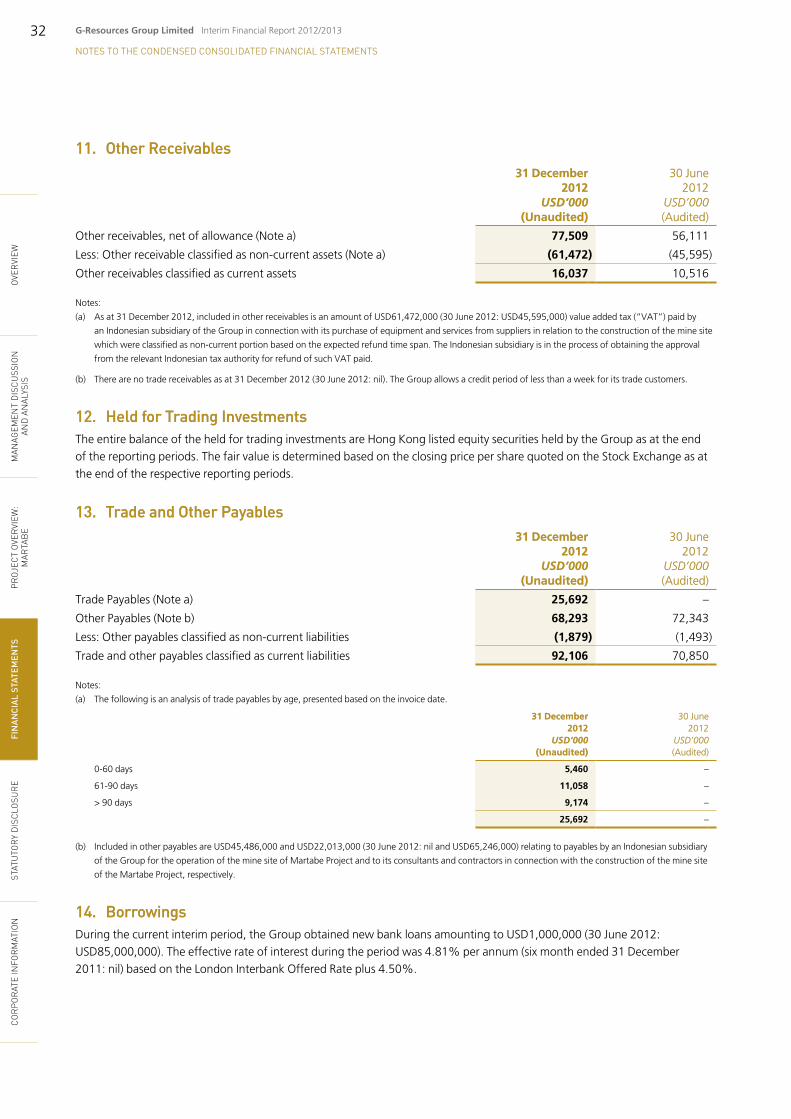
nOTes TO THe COndensed COnsOlidaTed finanCial sTaTemenTsnOTes TO THe COndensed COnsOlidaTed finanCial sTaTemenTs
11. Other Receivables11. Other Receivables31 December 31 December
20122012USD’000USD’000
(unaudited)(unaudited)
30 June 30 June 20122012
USD’000USD’000(Audited)(Audited)
Other receivables, net of allowance (Note a) 77,509 56,111
Less: Other receivable classified as non-current assets (Note a) (61,472) (45,595)
Other receivables classified as current assets 16,037 10,516
Notes:
(a) As at 31 December 2012, included in other receivables is an amount of USD61,472,000 (30 June 2012: USD45,595,000) value added tax (“VAT”) paid by
an Indonesian subsidiary of the Group in connection with its purchase of equipment and services from suppliers in relation to the construction of the mine site
which were classified as non-current portion based on the expected refund time span. The Indonesian subsidiary is in the process of obtaining the approval
from the relevant Indonesian tax authority for refund of such VAT paid.
(b) There are no trade receivables as at 31 December 2012 (30 June 2012: nil). The Group allows a credit period of less than a week for its trade customers.
12. held for Trading Investments12. held for Trading InvestmentsThe entire balance of the held for trading investments are Hong Kong listed equity securities held by the Group as at the end of the reporting periods. The fair value is determined based on the closing price per share quoted on the Stock Exchange as at the end of the respective reporting periods.
13. Trade and Other Payables13. Trade and Other Payables31 December 31 December
20122012USD’000USD’000
(unaudited)(unaudited)
30 June 30 June 20122012
USD’000USD’000(Audited)(Audited)
Trade Payables (Note a) 25,692 –
Other Payables (Note b) 68,293 72,343
Less: Other payables classified as non-current liabilities (1,879) (1,493)
Trade and other payables classified as current liabilities 92,106 70,850
Notes:
(a) The following is an analysis of trade payables by age, presented based on the invoice date.
31 December 31 December 20122012
USD’000USD’000 (unaudited)(unaudited)
30 June 30 June 20122012
USD’000USD’000(Audited)(Audited)
0-60 days 5,460 –
61-90 days 11,058 –
> 90 days 9,174 –
25,692 –
(b) Included in other payables are USD45,486,000 and USD22,013,000 (30 June 2012: nil and USD65,246,000) relating to payables by an Indonesian subsidiary
of the Group for the operation of the mine site of Martabe Project and to its consultants and contractors in connection with the construction of the mine site
of the Martabe Project, respectively.
14. Borrowings14. BorrowingsDuring the current interim period, the Group obtained new bank loans amounting to USD1,000,000 (30 June 2012: USD85,000,000). The effective rate of interest during the period was 4.81% per annum (six month ended 31 December 2011: nil) based on the London Interbank Offered Rate plus 4.50%.
CO
RP
OR
aTe
infO
Rm
aTiO
n
sTaT
uTO
Ry
dis
ClO
suR
e FI
NAN
CIAL
STA
TEM
ENTS
P
ROj
eCT
Ove
Rvi
eW:
maR
Tab
em
anag
emen
T d
isC
uss
iOn
an
d a
nal
ysis
Ove
Rvi
eW
32 G-Resources Group Limited Interim Financial Report 2012/2013

15. Provision for Mine Rehabilitation Cost15. Provision for Mine Rehabilitation CostIn accordance with relevant rules and regulations in Indonesia, the Indonesian subsidiary of the Group accrued for the cost of land rehabilitation and mine closure for the Group’s gold and silver mine. The provision for rehabilitation cost has been determined by the directors based on their best estimates in accordance with the Indonesian rules and regulations.
Provision for mine rehabilitation cost incurred for the period of USD557,000 (six months ended 31 December 2011: USD2,186,000) was capitalised as part of mine property and development assets (included in property, plant and equipment).
16. Share Capital16. Share CapitalNumber of sharesNumber of shares ValueValue
USD’000USD’000
Ordinary shares of HKD0.01 each
Authorised:
At 30 June 2012 and 31 December 2012 60,000,000,000 76,923
issued and fully paid:
At 1 July 2010 and 30 June 2011 (Audited) 14,066,831,950 18,147
Issue of shares (Note a) 2,813,364,000 3,610
At 30 June 2012 (Audited) 16,880,195,950 21,757
Issue of shares (Note b) 2,041,287,000 2,633
At 31 December 2012 (Unaudited) 18,921,482,950 24,390
Notes:
(a) On 3 August 2011, 2,813,364,000 shares of HKD0.01 each were issued and allotted at a price of HKD0.60 per share pursuant to the placing agreement with
the placing agent dated 27 July 2011. Details of the share placement were announced on 28 July 2011 and 3 August 2011.
(b) On 24 August 2012, 2,041,287,000 shares of HKD0.01 each were issued and allotted at a price of HKD0.38 per share pursuant to the placing agreement with
the placing agent dated 17 August 2012. Details of the share placement were announced on 17 August 2012 and 24 August 2012.
All the shares issued by the Company during the period ended 31 December 2012 rank pari passu with the then existing ordinary shares in all respects.
17. Share-based Payment Transactions17. Share-based Payment TransactionsThe Company has a share option scheme for directors and eligible employees of the Group.
Details of the share options outstanding during the current period are as follows:
Number of Number of share optionsshare options
Outstanding at 1 July 2012 (Audited) 1,464,740,261
Forfeited during the period (48,500,000)
Outstanding at 31 December 2012 (Unaudited) 1,416,240,261
Share-based payment was recognised over the vesting period based on the management’s estimation of the timing when the vesting conditions disclosed above are met. No share options was granted during the six months ended 31 December 2012. (The fair value of the total share options granted during the six months ended 31 December 2011 is USD1,520,000).
For the six months ended 31 December 2012, the Group recognised a share-based expenses of USD3,544,000 (six months ended 31 December 2011: USD5,251,000).
At the end of each reporting period, the Group revises its estimates of the number of options that are expected to ultimately vest. The impact of the revision of the estimates, if any, is recognised in profit or loss, with a corresponding adjustment to the share option reserve.
CO
RP
OR
aTe
infO
Rm
aTiO
n
sTaT
uTO
Ry
dis
ClO
suR
e FI
NAN
CIAL
STA
TEM
ENTS
P
ROj
eCT
Ove
Rvi
eW:
maR
Tab
em
anag
emen
T d
isC
uss
iOn
an
d a
nal
ysis
Ove
Rvi
eW
33G-Resources Group Limited Interim Financial Report 2012/2013
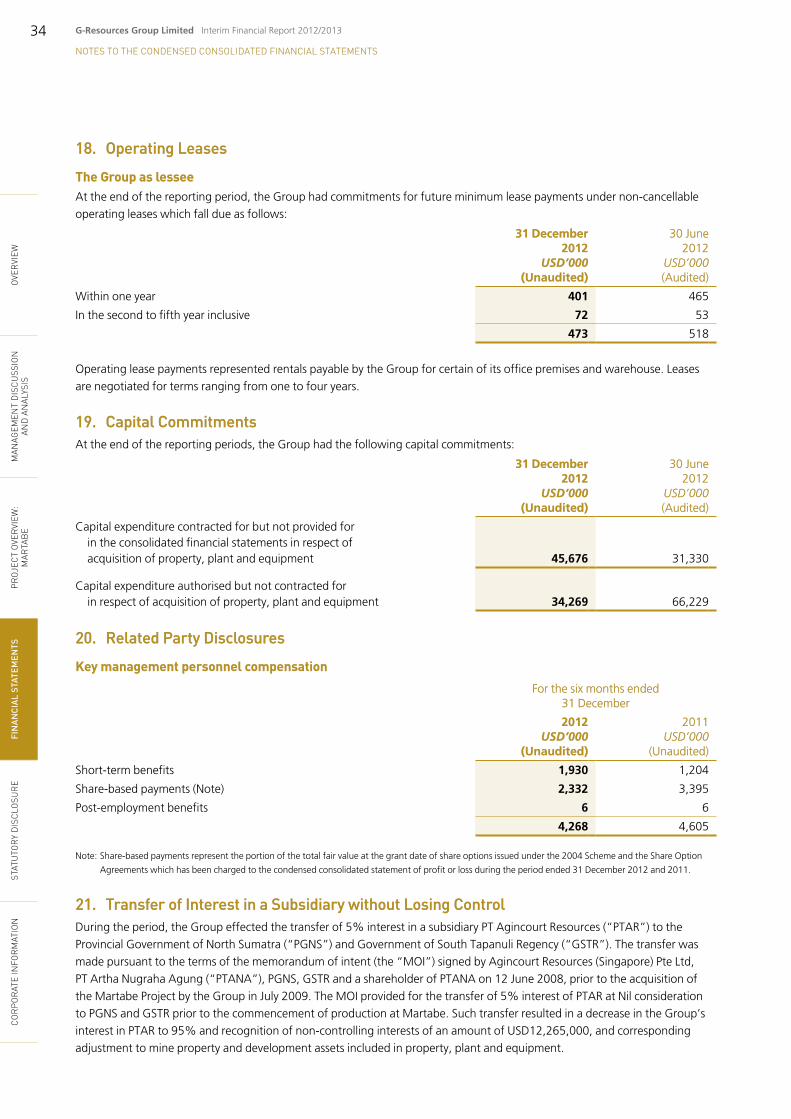
nOTes TO THe COndensed COnsOlidaTed finanCial sTaTemenTsnOTes TO THe COndensed COnsOlidaTed finanCial sTaTemenTs
18. Operating Leases18. Operating Leases
The Group as lesseeThe Group as lesseeAt the end of the reporting period, the Group had commitments for future minimum lease payments under non-cancellable operating leases which fall due as follows:
31 December 31 December 20122012
USD’000USD’000 (unaudited)(unaudited)
30 June 30 June 20122012
USD’000USD’000(Audited)(Audited)
Within one year 401 465
In the second to fifth year inclusive 72 53
473 518
Operating lease payments represented rentals payable by the Group for certain of its office premises and warehouse. Leases are negotiated for terms ranging from one to four years.
19. Capital Commitments19. Capital CommitmentsAt the end of the reporting periods, the Group had the following capital commitments:
31 December 31 December 20122012
USD’000USD’000 (unaudited)(unaudited)
30 June 30 June 20122012
USD’000USD’000(Audited)(Audited)
Capital expenditure contracted for but not provided for in the consolidated financial statements in respect of acquisition of property, plant and equipment 45,676 31,330
Capital expenditure authorised but not contracted for in respect of acquisition of property, plant and equipment 34,269 66,229
20. Related Party Disclosures20. Related Party Disclosures
Key management personnel compensationKey management personnel compensation
For the six months ended For the six months ended 31 December31 December
20122012USD’000USD’000
(unaudited)(unaudited)
20112011USD’000USD’000
(Unaudited)(Unaudited)
Short-term benefits 1,930 1,204
Share-based payments (Note) 2,332 3,395
Post-employment benefits 6 6
4,268 4,605
Note: Share-based payments represent the portion of the total fair value at the grant date of share options issued under the 2004 Scheme and the Share Option
Agreements which has been charged to the condensed consolidated statement of profit or loss during the period ended 31 December 2012 and 2011.
21. Transfer of Interest in a Subsidiary without Losing Control21. Transfer of Interest in a Subsidiary without Losing ControlDuring the period, the Group effected the transfer of 5% interest in a subsidiary PT Agincourt Resources (“PTAR”) to the Provincial Government of North Sumatra (“PGNS”) and Government of South Tapanuli Regency (“GSTR”). The transfer was made pursuant to the terms of the memorandum of intent (the “MOI”) signed by Agincourt Resources (Singapore) Pte Ltd, PT Artha Nugraha Agung (“PTANA”), PGNS, GSTR and a shareholder of PTANA on 12 June 2008, prior to the acquisition of the Martabe Project by the Group in July 2009. The MOI provided for the transfer of 5% interest of PTAR at Nil consideration to PGNS and GSTR prior to the commencement of production at Martabe. Such transfer resulted in a decrease in the Group’s interest in PTAR to 95% and recognition of non-controlling interests of an amount of USD12,265,000, and corresponding adjustment to mine property and development assets included in property, plant and equipment.
CO
RP
OR
aTe
infO
Rm
aTiO
n
sTaT
uTO
Ry
dis
ClO
suR
e FI
NAN
CIAL
STA
TEM
ENTS
P
ROj
eCT
Ove
Rvi
eW:
maR
Tab
em
anag
emen
T d
isC
uss
iOn
an
d a
nal
ysis
Ove
Rvi
eW
34 G-Resources Group Limited Interim Financial Report 2012/2013

The Board does not recommend the payment of an interim dividend for the six months ended 31 December 2012 (six months ended 31 December 2011: Nil).
Interim DividendInterim Dividend
Statutory DisclosureStatutory Disclosure
Directors and Executive Officers’ Interests and Short Positions in Shares and Underlying Directors and Executive Officers’ Interests and Short Positions in Shares and Underlying Shares of the CompanyShares of the CompanyAs at 31 December 2012, the interests and short positions of the directors and executive officers of the Company and their respective associates in the shares, underlying shares, convertible notes or debentures of the Company or its associated corporations (within the meaning of Part XV of the Securities and Futures Ordinance (“SFO”)) as recorded in the register maintained by the Company pursuant to Section 352 of the SFO or as otherwise notified to the Company and The Stock Exchange of Hong Kong Limited (the “Stock Exchange”) pursuant to Divisions 7 and 8 of Part XV of the SFO (including interests or short positions which were taken or deemed to have under such provisions of the SFO) or pursuant to the Model Code for Securities Transactions by directors and executive officers of the Company (the “Model Code”), were disclosed as follows in accordance with the Rules Governing the Listing of Securities on the Stock Exchange (the “Listing Rules”):
Long Positions in Shares and Underlying Shares of the CompanyLong Positions in Shares and Underlying Shares of the Company
Number of * shares / underlying sharesNumber of * shares / underlying shares
Name of Directors/Name of Directors/ Executive OfficersExecutive Officers
PersonalPersonal interestsinterests
Corporate Corporate interestsinterests
Share Share optionsoptions TotalTotal
Approximate % Approximate % of the issued of the issued
share capital of share capital of the Companythe Company NotesNotes
Chiu Tao – – 280,000,000 280,000,000 1.47%
Owen L Hegarty (“Mr Hegarty”) 1,002,000 175,179,000 322,181,050 498,362,050 2.63% 1
Or Ching Fai 9,999,000 – 109,000,000 118,999,000 0.62%
Peter Geoffrey Albert (“Mr Albert”) 33,213,000 – 301,681,050 334,894,050 1.76% 2
Ma Xiao – – 50,000,000 50,000,000 0.26%
Wah Wang Kei, Jackie 1,272,000 – 50,000,000 51,272,000 0.27%
Hui Richard Rui – – 50,000,000 50,000,000 0.26%
Kwan Kam Hung, Jimmy – – 21,500,000 21,500,000 0.11% 3
Arthur Ellis 210,000 – 38,000,000 38,210,000 0.20%
* Ordinary shares unless otherwise specified in the Note
CO
RP
OR
aTe
infO
Rm
aTiO
n
STAT
UTO
Ry
DIS
CLO
SUR
E fi
nan
Cia
l sT
aTem
enTs
P
ROj
eCT
Ove
Rvi
eW:
maR
Tab
em
anag
emen
T d
isC
uss
iOn
an
d a
nal
ysis
Ove
Rvi
eW
35G-Resources Group Limited Interim Financial Report 2012/2013

sTaTuTORy disClOsuResTaTuTORy disClOsuRe
Notes:
1. 175,179,000 shares are held by Asia Linkage International Corp. (“Asia Linkage”), and Asia Linkage was wholly-owned by Mr Hegarty. By virtue of SFO,
Mr Hegarty is deemed to have interest in all of the shares.
Pursuant to a share option agreement entered into between Mr Hegarty and the Company on 10 May 2009, the Company agreed to grant to Mr Hegarty
201,681,050 share options upon the fulfilment of certain conditions precedent pursuant to such share option agreement. Upon fulfilment of these conditions
precedent, the share options granted to Mr Hegarty became effective on 24 July 2009 and shall be valid for a maximum period of five years thereafter.
2. Pursuant to an investment agreement entered into between Mr Albert and the Company on 8 June 2009, Mr Albert agreed to subscribe for 33,213,000
shares at HKD0.35 each in an aggregate amount of USD1,500,000. The shares were issued and allotted to Mr Albert on 9 July 2009 upon completion of
placing of new shares under specific mandate.
Pursuant to a share option agreement entered into between Mr Albert and the Company on 10 May 2009, the Company agreed to grant to Mr Albert
201,681,050 share options upon the fulfilment of certain conditions precedent pursuant to such share option agreement. Upon fulfilment of these conditions
precedent, the share option granted to Mr Albert became effective on 24 July 2009 and shall be valid for a maximum period of five years thereafter.
3. Mr Kwan Kam Hung, Jimmy resigned as director of the Company on 31 December 2012.
Save as disclosed above, none of the directors and executive officers of the Company or their associates had any interests and short positions in the shares, underlying shares, convertible notes or debentures of the Company or any of its associated corporations as recorded in the register maintained by the Company pursuant to Section 352 of the SFO or otherwise notified by the Company pursuant to the Model Code required to be disclosed in accordance with the Listing Rules as at 31 December 2012.
Disclosable Interests and Short Positions of Substantial Shareholders other than Directors Disclosable Interests and Short Positions of Substantial Shareholders other than Directors and Executive Officersand Executive OfficersAs at 31 December 2012, so far as known to the directors or executive officers of the Company, the following persons/entities are the shareholders (other than the directors or executive officers of the Company) who had interests or short positions in the shares and underlying shares of the Company which would fall to be disclosed to the Company under the provisions of Divisions 2 and 3 of Part XV of the SFO, or be directly or indirectly interested in 5% or more of the nominal value of any class of share capital carrying rights to vote in all circumstances of general meetings of the Company or who were recorded in the register of substantial shareholders maintained by the Company pursuant to Section 336 of the SFO or had otherwise notified the Company.
Long Positions in Shares and Underlying Shares of the CompanyLong Positions in Shares and Underlying Shares of the Company
Name of shareholdersName of shareholders CapacityCapacityNumber of shares/Number of shares/ underlying sharesunderlying shares
Approximate %Approximate % of the issuedof the issued share capitalshare capital
CST Mining Group Limited (“CST”) (Note 2) Interest of a controlled corporation 3,115,231,571 (L) 16.46%
Skytop Technology Limited (“Skytop”) (Note 2) Beneficial owner 3,115,231,571 (L) 16.46%
BlackRock, Inc. (Note 3) Interest of a controlled corporation 1,429,350,000 (L) 7.55%
2,000 (S) 0.00%
McGoldrick Mark Interest of a controlled corporation 1,305,419,050 (L) 6.90%
Mount Kellett Capital Management GP LLC Investment manager 1,305,419,050 (L) 6.90%
Notes:
1. “L” denotes long position and “S” denotes short position.
2. CST is the ultimate beneficial owner of Skytop. Under Part XV of the SFO, CST is deemed to have interest in the shares of the Company held by Skytop.
CO
RP
OR
aTe
infO
Rm
aTiO
n
STAT
UTO
Ry
DIS
CLO
SUR
E fi
nan
Cia
l sT
aTem
enTs
P
ROj
eCT
Ove
Rvi
eW:
maR
Tab
em
anag
emen
T d
isC
uss
iOn
an
d a
nal
ysis
Ove
Rvi
eW
36 G-Resources Group Limited Interim Financial Report 2012/2013
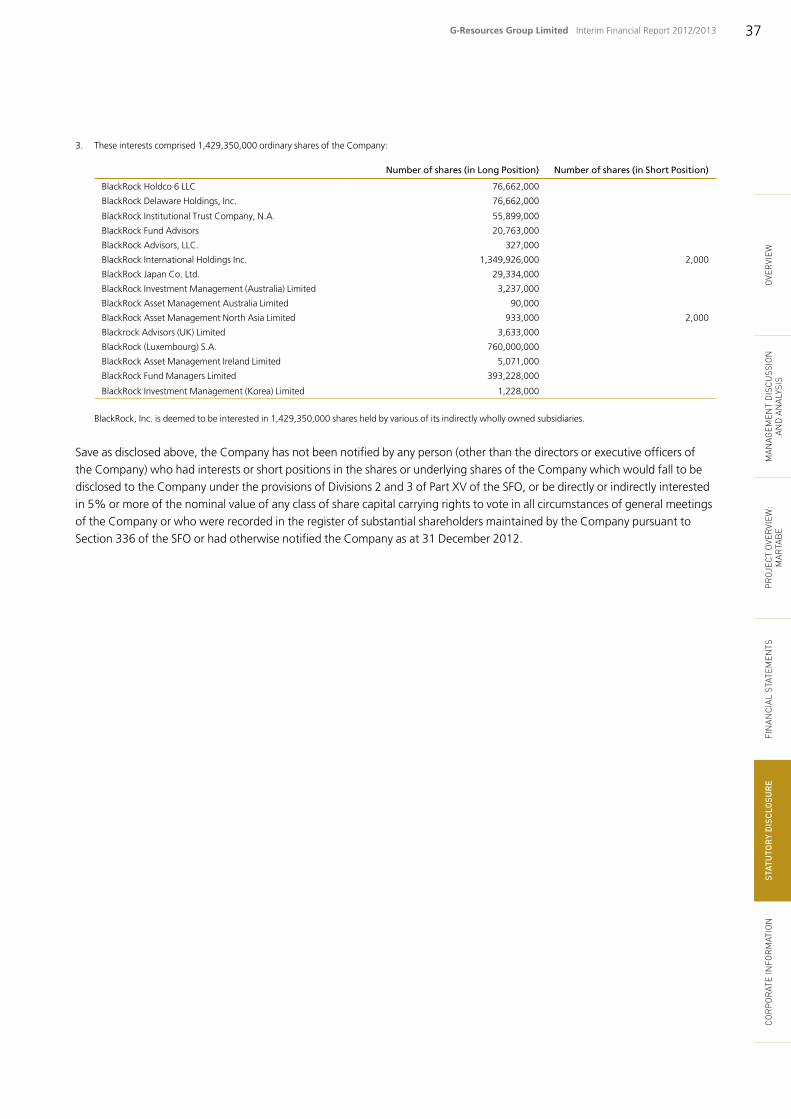
3. These interests comprised 1,429,350,000 ordinary shares of the Company:
Number of shares (in Long Position) Number of shares (in Short Position)
BlackRock Holdco 6 LLC 76,662,000
BlackRock Delaware Holdings, Inc. 76,662,000
BlackRock Institutional Trust Company, N.A. 55,899,000
BlackRock Fund Advisors 20,763,000
BlackRock Advisors, LLC. 327,000
BlackRock International Holdings Inc. 1,349,926,000 2,000
BlackRock Japan Co. Ltd. 29,334,000
BlackRock Investment Management (Australia) Limited 3,237,000
BlackRock Asset Management Australia Limited 90,000
BlackRock Asset Management North Asia Limited 933,000 2,000
Blackrock Advisors (UK) Limited 3,633,000
BlackRock (Luxembourg) S.A. 760,000,000
BlackRock Asset Management Ireland Limited 5,071,000
BlackRock Fund Managers Limited 393,228,000
BlackRock Investment Management (Korea) Limited 1,228,000
BlackRock, Inc. is deemed to be interested in 1,429,350,000 shares held by various of its indirectly wholly owned subsidiaries.
Save as disclosed above, the Company has not been notified by any person (other than the directors or executive officers of the Company) who had interests or short positions in the shares or underlying shares of the Company which would fall to be disclosed to the Company under the provisions of Divisions 2 and 3 of Part XV of the SFO, or be directly or indirectly interested in 5% or more of the nominal value of any class of share capital carrying rights to vote in all circumstances of general meetings of the Company or who were recorded in the register of substantial shareholders maintained by the Company pursuant to Section 336 of the SFO or had otherwise notified the Company as at 31 December 2012.
CO
RP
OR
aTe
infO
Rm
aTiO
n
STAT
UTO
Ry
DIS
CLO
SUR
E fi
nan
Cia
l sT
aTem
enTs
P
ROj
eCT
Ove
Rvi
eW:
maR
Tab
em
anag
emen
T d
isC
uss
iOn
an
d a
nal
ysis
Ove
Rvi
eW
37G-Resources Group Limited Interim Financial Report 2012/2013

sTaTuTORy disClOsuResTaTuTORy disClOsuRe
Share OptionShare Option
1. Share Option Scheme1. Share Option SchemeThe following table discloses movements in the Company’s share options held by each of the directors and the employees of the Company in aggregate granted under the share option scheme of the Company during the six months ended 31 December 2012:
Name or Category Name or Category of participants of participants
Date ofDate ofgrantgrant
Exercisable Exercisable periodperiod NotesNotes
Exercise Exercise period period
HKDHKD
Outstanding Outstanding as atas at
01.07.201201.07.2012
Granted Granted during during
the periodthe period
Exercised Exercised duringduring
the periodthe period
Cancelled Cancelled during during
the periodthe period
Lapsed Lapsed during during
the periodthe period
Outstanding Outstanding as atas at
31.12.201231.12.2012
Market Market value value
per share per share at date of at date of
grant of grant of optionsoptions
HKDHKD
Option Option value value
per share per share HKDHKD
(a) DiRECTORS
Chiu Tao 23.11.2009 23.11.2009 – 22.11.2014
1 0.5500 140,000,000 – – – – 140,000,000 0.5400 0.2412
01.12.2010 01.12.2010 – 30.11.2015
2 0.7000 140,000,000 – – – – 140,000,000 0.5200 0.1814
Owen L Hegarty 01.12.2010 01.12.2010 – 30.11.2015
2 0.7000 120,500,000 – – – – 120,500,000 0.5200 0.1814
Or Ching Fai 23.11.2009 23.11.2009 – 22.11.2014
1 0.5500 9,000,000 – – – – 9,000,000 0.5400 0.2412
03.03.2011 03.03.2011 – 02.03.2016
2 0.7000 100,000,000 – – – – 100,000,000 0.5400 0.2170
Peter Geoffrey Albert 01.12.2010 01.12.2010 – 30.11.2015
2 0.7000 100,000,000 – – – – 100,000,000 0.5200 0.1814
Ma Xiao 20.10.2009 20.10.2009 –19.10.2014
1 0.4800 3,954,057 – – – – 3,954,057 0.4750 0.2288
23.11.2009 23.11.2009 – 22.11.2014
1 0.5500 31,045,943 – – – – 31,045,943 0.5400 0.2412
01.12.2010 01.12.2010 – 30.11.2015
2 0.7000 15,000,000 – – – – 15,000,000 0.5200 0.1814
Wah Wang Kei, Jackie 20.10.2009 20.10.2009 –19.10.2014
1 0.4800 3,954,057 – – – – 3,954,057 0.4750 0.2288
23.11.2009 23.11.2009 – 22.11.2014
1 0.5500 31,045,943 – – – – 31,045,943 0.5400 0.2412
01.12.2010 01.12.2010 – 30.11.2015
2 0.7000 15,000,000 – – – – 15,000,000 0.5200 0.1814
Hui Richard Rui 20.10.2009 20.10.2009 –19.10.2014
1 0.4800 3,954,057 – – – – 3,954,057 0.4750 0.2288
23.11.2009 23.11.2009 – 22.11.2014
1 0.5500 31,045,943 – – – – 31,045,943 0.5400 0.2412
01.12.2010 01.12.2010 – 30.11.2015
2 0.7000 15,000,000 – – – – 15,000,000 0.5200 0.1814
Kwan Kam Hung, Jimmy
23.11.2009 23.11.2009 – 22.11.2014
1, 5 0.5500 15,000,000 – – – – 15,000,000 0.5400 0.2412
01.12.2010 01.12.2010 – 30.11.2015
2, 5 0.7000 6,500,000 – – – – 6,500,000 0.5200 0.1814
Total for Directors 781,000,000 – – – – 781,000,000
CO
RP
OR
aTe
infO
Rm
aTiO
n
STAT
UTO
Ry
DIS
CLO
SUR
E fi
nan
Cia
l sT
aTem
enTs
P
ROj
eCT
Ove
Rvi
eW:
maR
Tab
em
anag
emen
T d
isC
uss
iOn
an
d a
nal
ysis
Ove
Rvi
eW
38 G-Resources Group Limited Interim Financial Report 2012/2013
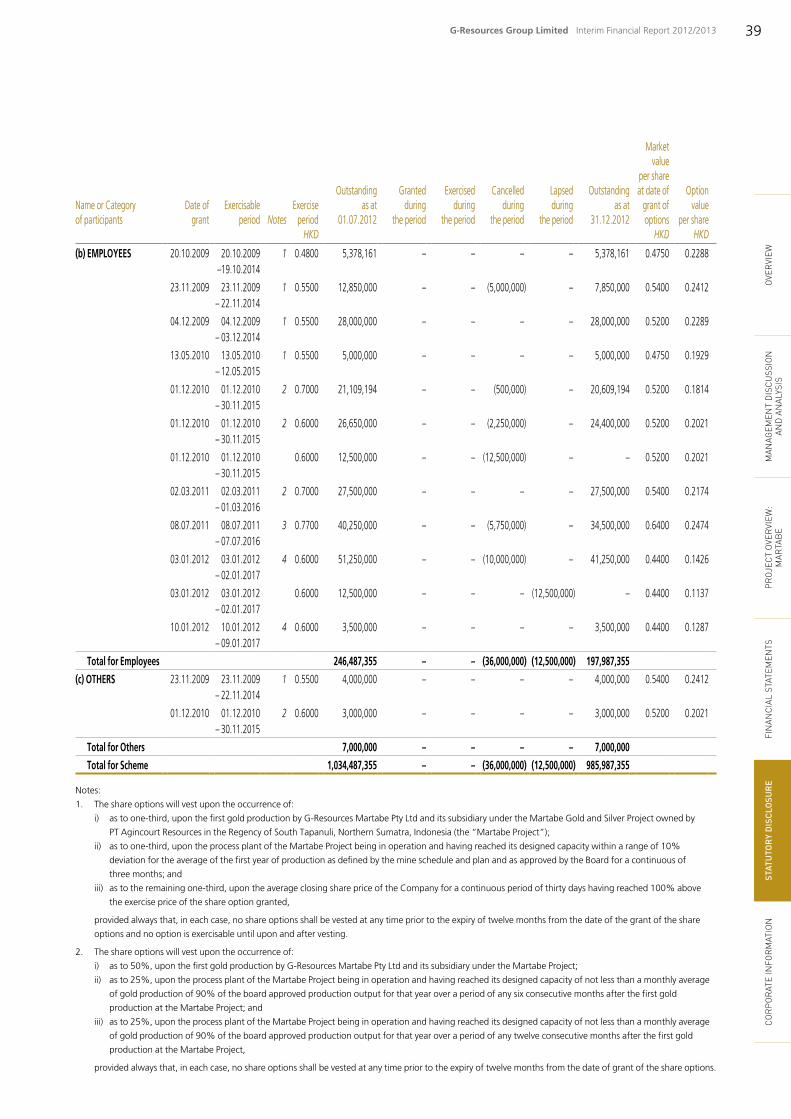
Name or Category Name or Category of participants of participants
Date ofDate ofgrantgrant
Exercisable Exercisable periodperiod NotesNotes
Exercise Exercise period period
HKDHKD
Outstanding Outstanding as atas at
01.07.201201.07.2012
Granted Granted during during
the periodthe period
Exercised Exercised duringduring
the periodthe period
Cancelled Cancelled during during
the periodthe period
Lapsed Lapsed during during
the periodthe period
Outstanding Outstanding as atas at
31.12.201231.12.2012
Market Market value value
per share per share at date of at date of
grant of grant of optionsoptions
HKDHKD
Option Option value value
per share per share HKDHKD
(b) EmPLOyEES 20.10.2009 20.10.2009–19.10.2014
1 0.4800 5,378,161 – – – – 5,378,161 0.4750 0.2288
23.11.2009 23.11.2009 – 22.11.2014
1 0.5500 12,850,000 – – (5,000,000) – 7,850,000 0.5400 0.2412
04.12.2009 04.12.2009 – 03.12.2014
1 0.5500 28,000,000 – – – – 28,000,000 0.5200 0.2289
13.05.2010 13.05.2010 – 12.05.2015
1 0.5500 5,000,000 – – – – 5,000,000 0.4750 0.1929
01.12.2010 01.12.2010 – 30.11.2015
2 0.7000 21,109,194 – – (500,000) – 20,609,194 0.5200 0.1814
01.12.2010 01.12.2010 – 30.11.2015
2 0.6000 26,650,000 – – (2,250,000) – 24,400,000 0.5200 0.2021
01.12.2010 01.12.2010 – 30.11.2015
0.6000 12,500,000 – – (12,500,000) – – 0.5200 0.2021
02.03.2011 02.03.2011 – 01.03.2016
2 0.7000 27,500,000 – – – – 27,500,000 0.5400 0.2174
08.07.2011 08.07.2011 – 07.07.2016
3 0.7700 40,250,000 – – (5,750,000) – 34,500,000 0.6400 0.2474
03.01.2012 03.01.2012 – 02.01.2017
4 0.6000 51,250,000 – – (10,000,000) – 41,250,000 0.4400 0.1426
03.01.2012 03.01.2012 – 02.01.2017
0.6000 12,500,000 – – – (12,500,000) – 0.4400 0.1137
10.01.2012 10.01.2012 – 09.01.2017
4 0.6000 3,500,000 – – – – 3,500,000 0.4400 0.1287
Total for Employees 246,487,355 – – (36,000,000) (12,500,000) 197,987,355
(c) OTHERS 23.11.2009 23.11.2009 – 22.11.2014
1 0.5500 4,000,000 – – – – 4,000,000 0.5400 0.2412
01.12.2010 01.12.2010 – 30.11.2015
2 0.6000 3,000,000 – – – – 3,000,000 0.5200 0.2021
Total for Others 7,000,000 – – – – 7,000,000
Total for Scheme 1,034,487,355 – – (36,000,000) (12,500,000) 985,987,355
Notes:
1. The share options will vest upon the occurrence of:
i) as to one-third, upon the first gold production by G-Resources Martabe Pty Ltd and its subsidiary under the Martabe Gold and Silver Project owned by
PT Agincourt Resources in the Regency of South Tapanuli, Northern Sumatra, Indonesia (the “Martabe Project”);
ii) as to one-third, upon the process plant of the Martabe Project being in operation and having reached its designed capacity within a range of 10%
deviation for the average of the first year of production as defined by the mine schedule and plan and as approved by the Board for a continuous of
three months; and
iii) as to the remaining one-third, upon the average closing share price of the Company for a continuous period of thirty days having reached 100% above
the exercise price of the share option granted,
provided always that, in each case, no share options shall be vested at any time prior to the expiry of twelve months from the date of the grant of the share
options and no option is exercisable until upon and after vesting.
2. The share options will vest upon the occurrence of:
i) as to 50%, upon the first gold production by G-Resources Martabe Pty Ltd and its subsidiary under the Martabe Project;
ii) as to 25%, upon the process plant of the Martabe Project being in operation and having reached its designed capacity of not less than a monthly average
of gold production of 90% of the board approved production output for that year over a period of any six consecutive months after the first gold
production at the Martabe Project; and
iii) as to 25%, upon the process plant of the Martabe Project being in operation and having reached its designed capacity of not less than a monthly average
of gold production of 90% of the board approved production output for that year over a period of any twelve consecutive months after the first gold
production at the Martabe Project,
provided always that, in each case, no share options shall be vested at any time prior to the expiry of twelve months from the date of grant of the share options.
CO
RP
OR
aTe
infO
Rm
aTiO
n
STAT
UTO
Ry
DIS
CLO
SUR
E fi
nan
Cia
l sT
aTem
enTs
P
ROj
eCT
Ove
Rvi
eW:
maR
Tab
em
anag
emen
T d
isC
uss
iOn
an
d a
nal
ysis
Ove
Rvi
eW
39G-Resources Group Limited Interim Financial Report 2012/2013

sTaTuTORy disClOsuResTaTuTORy disClOsuRe
3. The share options will vest upon the occurrence of:
i) as to 50%, 90 days after the first gold production by G-Resources Martabe Pty Ltd and its subsidiary under the Martabe Project;
ii) as to 25%, upon the process plant of the Martabe Project being in operation and having reached its designed capacity of not less than a monthly
average of gold production of 90% of the board approved production output for that year over a period of any six consecutive months after the first
gold production at the Martabe Project; and
iii) as to 25%, upon the process plant of the Martabe Project being in operation and having reached its designed capacity of not less than a monthly
average of gold production of 90% of the board approved production output for that year over a period of any twelve consecutive months after the
first gold production at the Martabe Project,
provided always that, in each case, no share options shall be vested at any time prior to the expiry of twelve months from the date of grant of the share options.
4. The share options will vest upon the occurrence of:
i) as to 50%, 180 days after the first gold production by G-Resources Martabe Pty Ltd and its subsidiary under the the Martabe Project;
ii) as to 25%, upon the process plant of the Martabe Project being in operation and having reached its designed capacity of not less than a monthly
cumulated average of gold production of 90% of the board approved production output for that year over a period of any six consecutive months
after the first gold production at the Martabe Project; and
iii) as to 25%, upon the process plant of the Martabe Project being in operation and having reached its designed capacity of not less than a monthly
cumulated average of gold production of 90% of the board approved production output for that year over a period of any twelve consecutive months
after the first gold production at the Martabe Project,
provided always that, in each case, no share options shall be vested at any time prior to the expiry of nine months from the date of grant of the share options.
5. Mr Kwan Kam Hung, Jimmy resigned as director of the Company on 31 December 2012.
2. Share Option Agreements2. Share Option AgreementsOn 10 May 2009 and 8 June 2009, two Directors and five employees of the Company entered into share option agreements with the Company respectively, pursuant to which the Company agreed to grant to each of them an option to subscribe for shares of the Company subject to fulfilment of the conditions under the share option agreement. The options were subsequently granted on 15 July 2009.
Details of movements of the options granted pursuant to the above share option agreements during the period under review were as follows:
Name or Category Name or Category of participants of participants
Date ofDate ofgrantgrant
Exercisable Exercisable periodperiod NoteNote
Exercise Exercise period period
HKDHKD
Outstanding Outstanding as atas at
01.07.201201.07.2012
Granted Granted during during
the periodthe period
Exercised Exercised duringduring
the periodthe period
Cancelled Cancelled during during
the periodthe period
Lapsed Lapsed during during
the periodthe period
Outstanding Outstanding as atas at
31.12.201231.12.2012
Market Market value value
per share per share at date of at date of
grant of grant of optionsoptions
HKDHKD
Option Option value value
per share per share HKDHKD
(a) DiRECTORS
Owen L Hegarty 15.07.2009 24.07.2009 – 23.07.2014
1 0.3850 201,681,050 – – – – 201,681,050 0.4150 0.1962
Peter Geoffrey Albert 15.07.2009 24.07.2009 – 23.07.2014
1 0.3850 201,681,050 – – – – 201,681,050 0.4150 0.1962
Total for Directors 403,362,100 – – – – 403,362,100
(b) EmPLOyEES 15.07.2009 03.08.2009 – 02.08.2014
1 0.4025 26,890,806 – – – – 26,890,806 0.4150 0.1959
Total for Employees 26,890,806 – – – – 26,890,806
Total 430,252,906 – – – – 430,252,906
Note:
1. The share options will vest upon the occurrence of:
i) as to one-third, upon the first gold production by G-Resources Martabe Pty Ltd and its subsidiary under the Martabe Gold and Silver Project owned by
PT Agincourt Resources in the Regency of South Tapanuli, Northern Sumatra, Indonesia (the “Martabe Project”);
ii) as to one-third, upon the process plant of the Martabe Project being in operation and having reached its designed capacity within a range of 10%
deviation for the average of the first year of production as defined by the mine schedule and plan and as approved by the Board for a continuous period
of three months; and
iii) as to the remaining one-third, upon the average closing share price of the Company for a continuous period of thirty days having reached 100% above
the exercise price of the share option granted,
provided always that, in each case, no share options shall be vested at any time prior to the expiry of twelve months from the date of the grant of the share
options and no option is exercisable until upon and after vesting.
CO
RP
OR
aTe
infO
Rm
aTiO
n
STAT
UTO
Ry
DIS
CLO
SUR
E fi
nan
Cia
l sT
aTem
enTs
P
ROj
eCT
Ove
Rvi
eW:
maR
Tab
em
anag
emen
T d
isC
uss
iOn
an
d a
nal
ysis
Ove
Rvi
eW
40 G-Resources Group Limited Interim Financial Report 2012/2013

Purchase, Sale or Redemption of the Company’s Listed SecuritiesPurchase, Sale or Redemption of the Company’s Listed SecuritiesDuring the six months ended 31 December 2012, neither the Company nor any of its subsidiaries purchased, sold or redeemed any of the Company’s listed securities.
Code on Corporate Governance PracticesCode on Corporate Governance PracticesThe Company has adopted the principles and complied with the revised corporate governance rules and codes as well as those of the former rules and codes of the Corporate Governance Code (the “Code”) as set out in Appendix 14 of the Rules Governing the Listing of Securities on The Stock Exchange of Hong Kong Limited (the “Listing Rules”) for the six months ended 31 December 2012.
Model Code for Securities Transactions by DirectorsModel Code for Securities Transactions by DirectorsThe Company has adopted the Model Code for Securities Transactions by Directors of Listed Issuers (the “Model Code”) set out in Appendix 10 to the Listing Rules as its own code of conduct regarding directors’ securities transactions. Enquiry has been made of all directors, and the directors have confirmed compliance with the required standard set out in the Model Code during the six months ended 31 December 2012.
Audit CommitteeAudit CommitteeThe Audit Committee, with terms of reference in compliance with the provisions set out in the Code, comprises three members who were all independent non-executive directors of the Company for the six months ended 31 December 2012. The Audit Committee has reviewed with the management the accounting principles and practices adopted by the Group and discussed the auditing, internal controls and financial reporting matters. The interim report for the six months ended 31 December 2012 has been reviewed by the Company’s Audit Committee and the Company’s auditors, Deloitte Touche Tohmatsu.
By Order of the BoardChiu TaoChairmanHong Kong, 28 February 2013
CO
RP
OR
aTe
infO
Rm
aTiO
n
STAT
UTO
Ry
DIS
CLO
SUR
E fi
nan
Cia
l sT
aTem
enTs
P
ROj
eCT
Ove
Rvi
eW:
maR
Tab
em
anag
emen
T d
isC
uss
iOn
an
d a
nal
ysis
Ove
Rvi
eW
41G-Resources Group Limited Interim Financial Report 2012/2013
Board of DirectorsBoard of DirectorsExecutive DirectorsExecutive DirectorsMr Chiu Tao, ChairmanMr Owen L Hegarty, Vice-ChairmanMr Peter Geoffrey Albert, Chief Executive OfficerMr Ma Xiao, Deputy Chief Executive OfficerMr Wah Wang Kei, JackieMr Hui Richard RuiMr Kwan Kam Hung, Jimmy (resigned on 31 December 2012)
Non-Executive DirectorNon-Executive DirectorMr Tsui Ching Hung (resigned on 31 December 2012)
Independent Non-Executive DirectorsIndependent Non-Executive DirectorsMr Or Ching Fai, Vice-ChairmanMs Ma Yin FanMr Leung Hoi Ying
Investment and Management CommitteeInvestment and Management CommitteeMr Chiu Tao, ChairmanMr Owen L HegartyMr Peter Geoffrey AlbertMr Ma XiaoMr Hui Richard Rui
Audit CommitteeAudit CommitteeMr Or Ching Fai, ChairmanMs Ma Yin FanMr Leung Hoi Ying
Remuneration CommitteeRemuneration CommitteeMr Or Ching Fai, ChairmanMs Ma Yin FanMr Leung Hoi Ying
Nomination CommitteeNomination CommitteeMr Chiu Tao, ChairmanMr Or Ching FaiMs Ma Yin Fan
Company SecretaryCompany SecretaryMr Wah Wang Kei, Jackie
Chief Financial OfficerChief Financial OfficerMr Arthur Ellis
Corporate InformationCorporate Information
AuditorAuditorDeloitte Touche Tohmatsu
Legal AdvisorsLegal AdvisorsHong Kong: Freshfields Bruckhaus Deringer, Tung & Co., Mayer Brown JSMBermuda: ApplebyIndonesia: Brigitta I. Rahayoe and Partners, Hadiputranto, Hadinoto & Partners, Christian Teo & Associates
Principal BankersPrincipal BankersHang Seng Bank LimitedBNP ParibasSumitomo Mitsui Banking CorporationCommonwealth Bank of Australia
Share RegistrarsShare RegistrarsHong KongHong KongUnion Registrars Limited18/F, Fook Lee Commercial CentreTown Place, 33 Lockhart RoadWanchai, Hong Kong
BermudaBermudaButterfield Fulcrum Group (Bermuda) Limited26 Burnaby Street Hamilton HM 11 Bermuda
Registered OfficeRegistered OfficeCanon’s Court22 Victoria StreetHamilton HM 12Bermuda
head Office and Principal head Office and Principal Place of Business Place of BusinessRooms 4501-02, 4510, 45th FloorChina Resources Building26 Harbour RoadWanchai, Hong Kong
websitewebsitewww.g-resources.com
COR
POR
ATE
INFO
RM
ATIO
N
sTaT
uTO
Ry
dis
ClO
suR
e fi
nan
Cia
l sT
aTem
enTs
P
ROj
eCT
Ove
Rvi
eW:
maR
Tab
em
anag
emen
T d
isC
uss
iOn
an
d a
nal
ysis
Ove
Rvi
eW
42 G-Resources Group Limited Interim Financial Report 2012/2013