Functions and Their Graphs Jackie Nicholas Janet Hunter ...
44
Functions and Their Graphs Jackie Nicholas Janet Hunter Jacqui Hargreaves Mathematics Learning Centre University of Sydney NSW 2006 c 1999 University of Sydney
-
Upload
khangminh22 -
Category
Documents
-
view
0 -
download
0
Transcript of Functions and Their Graphs Jackie Nicholas Janet Hunter ...

Functions and Their Graphs
Jackie Nicholas
Janet Hunter
Jacqui Hargreaves
Mathematics Learning Centre
University of Sydney
NSW 2006
c©1999 University of Sydney

Mathematics Learning Centre, University of Sydney i
Contents
1 Functions 1
1.1 What is a function? . . . . . . . . . . . . . . . . . . . . . . . . . . . . . . . 1
1.1.1 Definition of a function . . . . . . . . . . . . . . . . . . . . . . . . . 1
1.1.2 The Vertical Line Test . . . . . . . . . . . . . . . . . . . . . . . . . 2
1.1.3 Domain of a function . . . . . . . . . . . . . . . . . . . . . . . . . . 2
1.1.4 Range of a function . . . . . . . . . . . . . . . . . . . . . . . . . . . 2
1.2 Specifying or restricting the domain of a function . . . . . . . . . . . . . . 6
1.3 The absolute value function . . . . . . . . . . . . . . . . . . . . . . . . . . 7
1.4 Exercises . . . . . . . . . . . . . . . . . . . . . . . . . . . . . . . . . . . . . 8
2 More about functions 11
2.1 Modifying functions by shifting . . . . . . . . . . . . . . . . . . . . . . . . 11
2.1.1 Vertical shift . . . . . . . . . . . . . . . . . . . . . . . . . . . . . . 11
2.1.2 Horizontal shift . . . . . . . . . . . . . . . . . . . . . . . . . . . . . 11
2.2 Modifying functions by stretching . . . . . . . . . . . . . . . . . . . . . . . 12
2.3 Modifying functions by reflections . . . . . . . . . . . . . . . . . . . . . . . 13
2.3.1 Reflection in the x-axis . . . . . . . . . . . . . . . . . . . . . . . . . 13
2.3.2 Reflection in the y-axis . . . . . . . . . . . . . . . . . . . . . . . . . 13
2.4 Other effects . . . . . . . . . . . . . . . . . . . . . . . . . . . . . . . . . . . 14
2.5 Combining effects . . . . . . . . . . . . . . . . . . . . . . . . . . . . . . . . 14
2.6 Graphing by addition of ordinates . . . . . . . . . . . . . . . . . . . . . . . 16
2.7 Using graphs to solve equations . . . . . . . . . . . . . . . . . . . . . . . . 17
2.8 Exercises . . . . . . . . . . . . . . . . . . . . . . . . . . . . . . . . . . . . . 19
2.9 Even and odd functions . . . . . . . . . . . . . . . . . . . . . . . . . . . . 21
2.10 Increasing and decreasing functions . . . . . . . . . . . . . . . . . . . . . . 23
2.11 Exercises . . . . . . . . . . . . . . . . . . . . . . . . . . . . . . . . . . . . . 24
3 Piecewise functions and solving inequalities 27
3.1 Piecewise functions . . . . . . . . . . . . . . . . . . . . . . . . . . . . . . . 27
3.1.1 Restricting the domain . . . . . . . . . . . . . . . . . . . . . . . . . 27
3.2 Exercises . . . . . . . . . . . . . . . . . . . . . . . . . . . . . . . . . . . . . 29
3.3 Inequalities . . . . . . . . . . . . . . . . . . . . . . . . . . . . . . . . . . . 32
3.4 Exercises . . . . . . . . . . . . . . . . . . . . . . . . . . . . . . . . . . . . . 35
Mathematics Learning Centre, University of Sydney ii
4 Polynomials 36
4.1 Graphs of polynomials and their zeros . . . . . . . . . . . . . . . . . . . . 36
4.1.1 Behaviour of polynomials when |x| is large . . . . . . . . . . . . . . 36
4.1.2 Polynomial equations and their roots . . . . . . . . . . . . . . . . . 37
4.1.3 Zeros of the quadratic polynomial . . . . . . . . . . . . . . . . . . . 37
4.1.4 Zeros of cubic polynomials . . . . . . . . . . . . . . . . . . . . . . . 39
4.2 Polynomials of higher degree . . . . . . . . . . . . . . . . . . . . . . . . . . 41
4.3 Exercises . . . . . . . . . . . . . . . . . . . . . . . . . . . . . . . . . . . . . 42
4.4 Factorising polynomials . . . . . . . . . . . . . . . . . . . . . . . . . . . . . 44
4.4.1 Dividing polynomials . . . . . . . . . . . . . . . . . . . . . . . . . . 44
4.4.2 The Remainder Theorem . . . . . . . . . . . . . . . . . . . . . . . . 45
4.4.3 The Factor Theorem . . . . . . . . . . . . . . . . . . . . . . . . . . 46
4.5 Exercises . . . . . . . . . . . . . . . . . . . . . . . . . . . . . . . . . . . . . 49
5 Solutions to exercises 50

X Y
1
2
3
4
5
3
2
f
X Y
1
2
3
4
5
3
6
2
g
Mathematics Learning Centre, University of Sydney 1
1 Functions
In this Chapter we will cover various aspects of functions. We will look at the definition ofa function, the domain and range of a function, what we mean by specifying the domainof a function and absolute value function.
1.1 What is a function?
1.1.1 Definition of a function
A function f from a set of elements X to a set of elements Y is a rule thatassigns to each element x in X exactly one element y in Y .
One way to demonstrate the meaning of this definition is by using arrow diagrams.
f : X → Y is a function. Every elementin X has associated with it exactly oneelement of Y .
g : X → Y is not a function. The ele-ment 1 in set X is assigned two elements,5 and 6 in set Y .
A function can also be described as a set of ordered pairs (x, y) such that for any x-value inthe set, there is only one y-value. This means that there cannot be any repeated x-valueswith different y-values.
The examples above can be described by the following sets of ordered pairs.
F = {(1,5),(3,3),(2,3),(4,2)} is a func-tion.
G = {(1,5),(4,2),(2,3),(3,3),(1,6)} is nota function.
The definition we have given is a general one. While in the examples we have used numbersas elements of X and Y , there is no reason why this must be so. However, in these noteswe will only consider functions where X and Y are subsets of the real numbers.
In this setting, we often describe a function using the rule, y = f(x), and create a graphof that function by plotting the ordered pairs (x, f(x)) on the Cartesian Plane. Thisgraphical representation allows us to use a test to decide whether or not we have thegraph of a function: The Vertical Line Test.

0
x
y
y
0
x
Mathematics Learning Centre, University of Sydney 2
1.1.2 The Vertical Line Test
The Vertical Line Test states that if it is not possible to draw a vertical line through agraph so that it cuts the graph in more than one point, then the graph is a function.
This is the graph of a function. All possi-ble vertical lines will cut this graph onlyonce.
This is not the graph of a function. Thevertical line we have drawn cuts thegraph twice.
1.1.3 Domain of a function
For a function f : X → Y the domain of f is the set X.
This also corresponds to the set of x-values when we describe a function as a set of orderedpairs (x, y).
If only the rule y = f(x) is given, then the domain is taken to be the set of all real x forwhich the function is defined. For example, y =
√x has domain; all real x ≥ 0. This is
sometimes referred to as the natural domain of the function.
1.1.4 Range of a function
For a function f : X → Y the range of f is the set of y-values such that y = f(x) forsome x in X.
This corresponds to the set of y-values when we describe a function as a set of orderedpairs (x, y). The function y =
√x has range; all real y ≥ 0.
Example
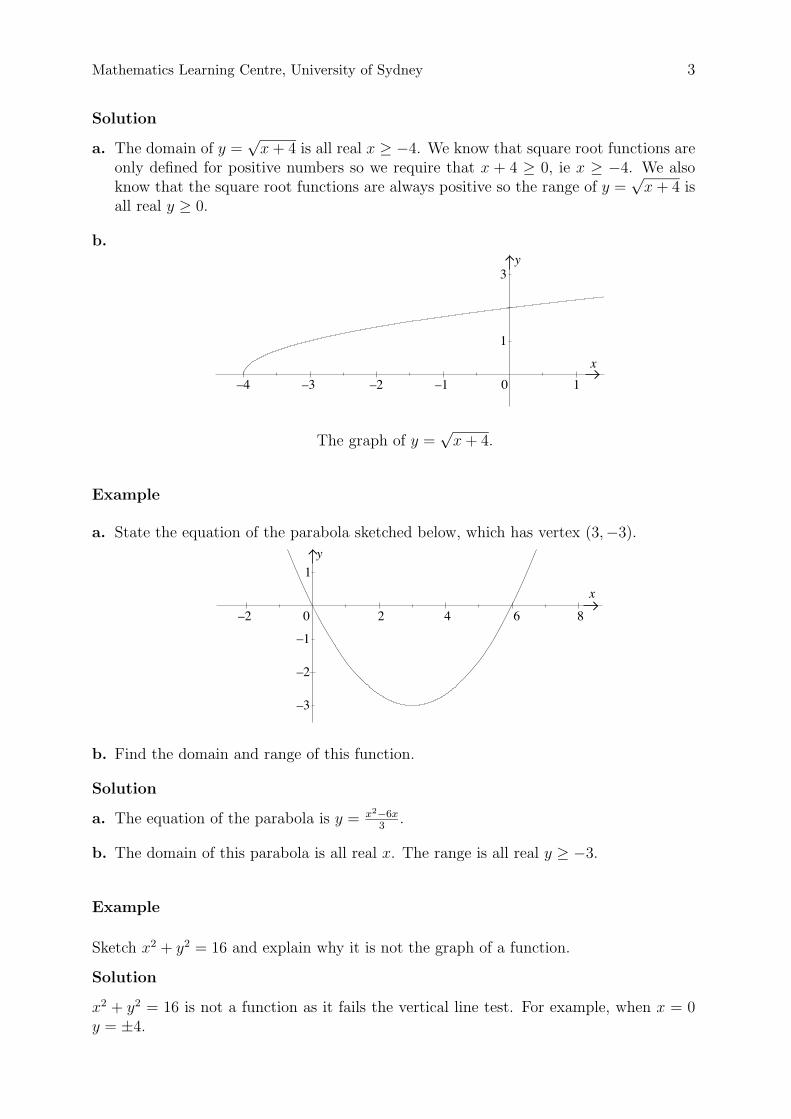
a. State the domain and range of y =√
x + 4.
b. Sketch, showing significant features, the graph of y =√
x + 4.
–4 –2 –1
x
y
10
1
–3
3
1
–2
x
y
0 2 4 6 8
–1
–2
–3
Mathematics Learning Centre, University of Sydney 3
Solution
a. The domain of y =√
x + 4 is all real x ≥ −4. We know that square root functions areonly defined for positive numbers so we require that x + 4 ≥ 0, ie x ≥ −4. We alsoknow that the square root functions are always positive so the range of y =
√x + 4 is
all real y ≥ 0.
b.
The graph of y =√
x + 4.
Example
a. State the equation of the parabola sketched below, which has vertex (3,−3).
b. Find the domain and range of this function.
Solution
a. The equation of the parabola is y = x2−6x3
.
b. The domain of this parabola is all real x. The range is all real y ≥ −3.
Example
Sketch x2 + y2 = 16 and explain why it is not the graph of a function.
Solution
x2 + y2 = 16 is not a function as it fails the vertical line test. For example, when x = 0y = ±4.

2
4
–4
y
0
–2
2 4–2
x
–4
0 21 3–1
1
2
x
y
Mathematics Learning Centre, University of Sydney 4
The graph of x2 + y2 = 16.
Example
Sketch the graph of f(x) = 3x − x2 and find
a. the domain and range
b. f(q)
c. f(x2)
d. f(2+h)−f(2)h
, h �= 0.
Solution
The graph of f(x) = 3x − x2.
a. The domain is all real x. The range is all real y where y ≤ 2.25.
b. f(q) = 3q − q2

–2
x
2
4
6y
0 2 4
Mathematics Learning Centre, University of Sydney 5
c. f(x2) = 3(x2) − (x2)2
= 3x2 − x4
d.
f(2 + h) − f(2)
h=
(3(2 + h) − (2 + h)2) − (3(2) − (2)2)
h
=6 + 3h − (h2 + 4h + 4) − 2
h
=−h2 − h
h
= −h − 1
Example
Sketch the graph of the function f(x) = (x − 1)2 + 1 and show that f(p) = f(2 − p).
Illustrate this result on your graph by choosing one value of p.
Solution
The graph of f(x) = (x − 1)2 + 1.
f(2 − p) = ((2 − p) − 1)2 + 1
= (1 − p)2 + 1
= (p − 1)2 + 1
= f(p)

–2
x
2
4
6y
0 2 4
–1
x
2
4y
0 21
Mathematics Learning Centre, University of Sydney 6
The sketch illustrates the relationship f(p) = f(2 − p) for p = −1. If p = −1 then2 − p = 2 − (−1) = 3, and f(−1) = f(3).
1.2 Specifying or restricting the domain of a function
We sometimes give the rule y = f(x) along with the domain of definition. This domainmay not necessarily be the natural domain. For example, if we have the function
y = x2 for 0 ≤ x ≤ 2
then the domain is given as 0 ≤ x ≤ 2. The natural domain has been restricted to thesubinterval 0 ≤ x ≤ 2.
Consequently, the range of this function is all real y where 0 ≤ y ≤ 4. We can bestillustrate this by sketching the graph.
The graph of y = x2 for 0 ≤ x ≤ 2.

0 4–2
|–2|=2 |4|=4
a x
| | = | |a – x x – a
y = –x x < 0
y
1
1
2
0–1
x
2–2
y = x x ≥ 0
Mathematics Learning Centre, University of Sydney 7
1.3 The absolute value function
Before we define the absolute value function we will review the definition of the absolutevalue of a number.
The Absolute value of a number x is written |x| and is defined as
|x| = x if x ≥ 0 or |x| = −x if x < 0.
That is, |4| = 4 since 4 is positive, but | − 2| = 2 since −2 is negative.
We can also think of |x| geometrically as the distance of x from 0 on the number line.
More generally, |x − a| can be thought of as the distance of x from a on the numberline.
Note that |a − x| = |x − a|.
The absolute value function is written as y = |x|.We define this function as
y =
⎧⎪⎨⎪⎩
+x if x ≥ 0
−x if x < 0
From this definition we can graph the function by taking each part separately. The graphof y = |x| is given below.
The graph of y = |x|.

y
1
1
2
0
x
2
y = x – 2 x ≥ 2 y = –x + 2 x < 2
3 4
Mathematics Learning Centre, University of Sydney 8
Example
Sketch the graph of y = |x − 2|.
Solution
For y = |x − 2| we have
y =
⎧⎪⎨⎪⎩
+(x − 2) when x − 2 ≥ 0 or x ≥ 2
−(x − 2) when x − 2 < 0 or x < 2
That is,
y =
⎧⎪⎨⎪⎩
x − 2 for x ≥ 2
−x + 2 for x < 2
Hence we can draw the graph in two parts.
The graph of y = |x − 2|.
We could have sketched this graph by first of all sketching the graph of y = x − 2 andthen reflecting the negative part in the x-axis. We will use this fact to sketch graphs ofthis type in Chapter 2.
1.4 Exercises
1. a. State the domain and range of f(x) =√
9 − x2.
b. Sketch the graph of y =√
9 − x2.
2. Given ψ(x) = x2 + 5, find, in simplest form,ψ(x + h) − ψ(x)
hh �= 0.
3. Sketch the following functions stating the domain and range of each:

Mathematics Learning Centre, University of Sydney 9
a. y =√
x − 1
b. y = |2x|c. y = 1
x−4
d. y = |2x| − 1.
4. a. Find the perpendicular distance from (0, 0) to the line x + y + k = 0
b. If the line x + y + k = 0 cuts the circle x2 + y2 = 4 in two distinct points, find therestrictions on k.
5. Sketch the following, showing their important features.
a. y =(
12
)x
b. y2 = x2.
6. Explain the meanings of function, domain and range. Discuss whether or not y2 = x3
is a function.
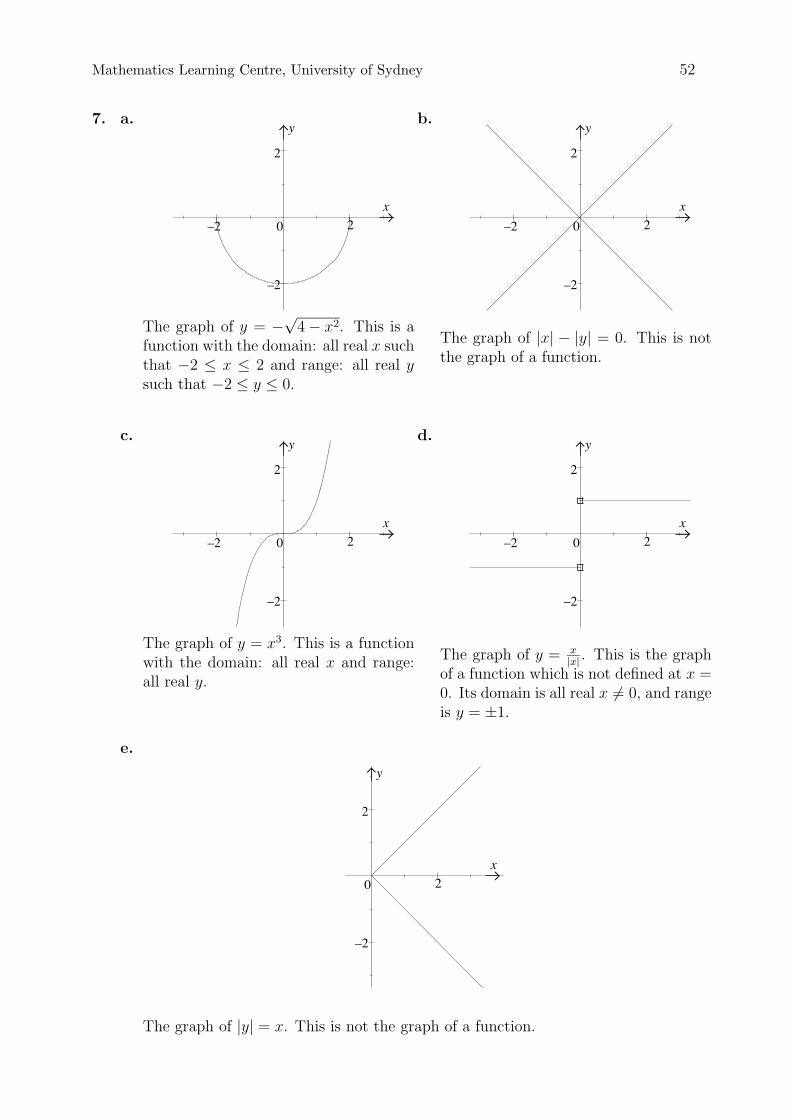
7. Sketch the following relations, showing all intercepts and features. State which onesare functions giving their domain and range.
a. y = −√
4 − x2
b. |x| − |y| = 0
c. y = x3
d. y = x|x| , x �= 0
e. |y| = x.
8. If A(x) = x2 + 2 + 1x2 , x �= 0, prove that A(p) = A(1
p) for all p �= 0.
9. Write down the values of x which are not in the domain of the following functions:
a. f(x) =√
x2 − 4x
b. g(x) = xx2−1
10. If φ(x) = log(
xx−1
), find in simplest form:
a. φ(3) + φ(4) + φ(5)
b. φ(3) + φ(4) + φ(5) + · · · + φ(n)
11. a. If y = x2 + 2x and x = (z − 2)2, find y when z = 3.
b. Given L(x) = 2x + 1 and M(x) = x2 − x, find
i. L(M(x))
ii. M(L(x))

–1 1
x
y
2
0
–2
(–2,1)
0x
–2
y
2
1
5
(2,1)
Mathematics Learning Centre, University of Sydney 10
12. Using the sketches, find the value(s) of the constants in the given equations:
y = ax2 − by = a
bx2+1
13. a. Define |a|, the absolute value of a, where a is real.
b. Sketch the relation |x| + |y| = 1.
14. Given that S(n) = n2n+1
, find an expression for S(n − 1).
Hence show that S(n) − S(n − 1) = 1(2n−1)(2n+1)
.
2
y
1–1–2 0
3
–3
2
(1,–2)
x
(1,1)
y = x 2
y = x – 3
Mathematics Learning Centre, University of Sydney 11
2 More about functions
In this Chapter we will look at the effects of stretching, shifting and reflecting the basicfunctions, y = x2, y = x3, y = 1
x, y = |x|, y = ax, x2 + y2 = r2. We will introduce the
concepts of even and odd functions, increasing and decreasing functions and will solveequations using graphs.
2.1 Modifying functions by shifting
2.1.1 Vertical shift
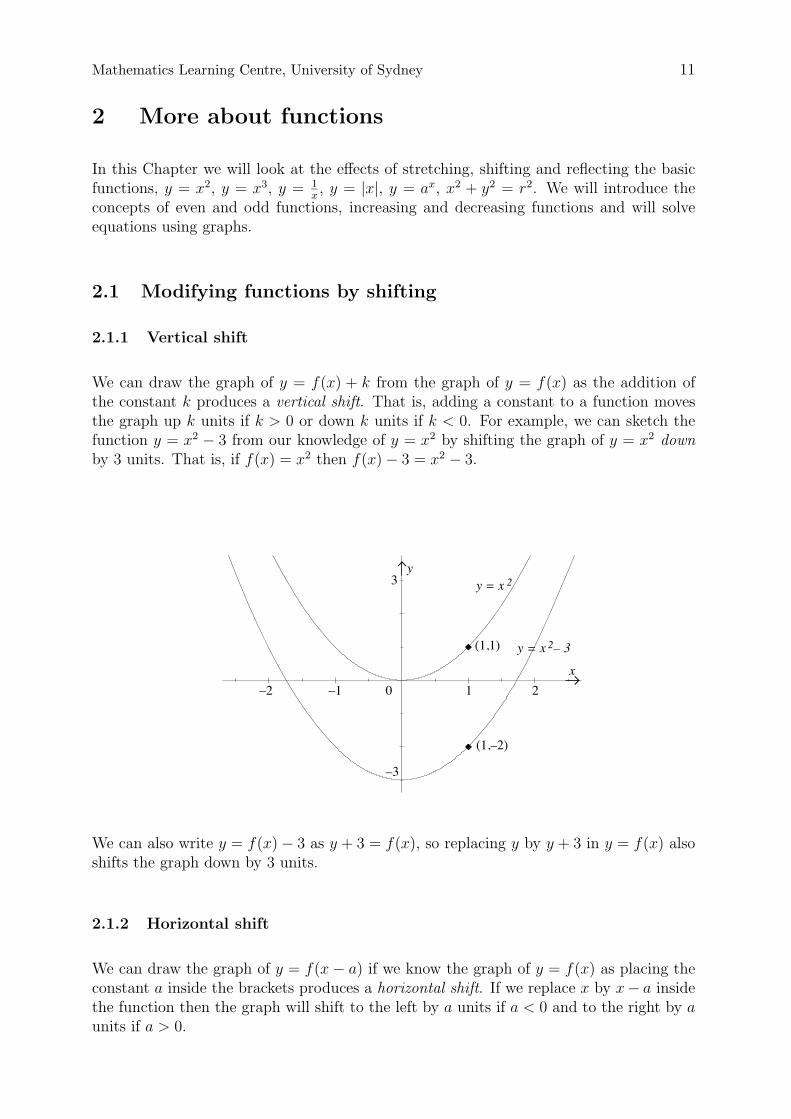
We can draw the graph of y = f(x) + k from the graph of y = f(x) as the addition ofthe constant k produces a vertical shift. That is, adding a constant to a function movesthe graph up k units if k > 0 or down k units if k < 0. For example, we can sketch thefunction y = x2 − 3 from our knowledge of y = x2 by shifting the graph of y = x2 downby 3 units. That is, if f(x) = x2 then f(x) − 3 = x2 − 3.
We can also write y = f(x) − 3 as y + 3 = f(x), so replacing y by y + 3 in y = f(x) alsoshifts the graph down by 3 units.
2.1.2 Horizontal shift
We can draw the graph of y = f(x − a) if we know the graph of y = f(x) as placing theconstant a inside the brackets produces a horizontal shift. If we replace x by x− a insidethe function then the graph will shift to the left by a units if a < 0 and to the right by aunits if a > 0.
(–1,–1) (1,–1)
(1,1)
1–1–2
–3
0
3
2 x3 4
(1,3)
y
y
1
1
2
0–1
x
(1,1)
y
1
1
2
0–1
x
(1,2)
Mathematics Learning Centre, University of Sydney 12
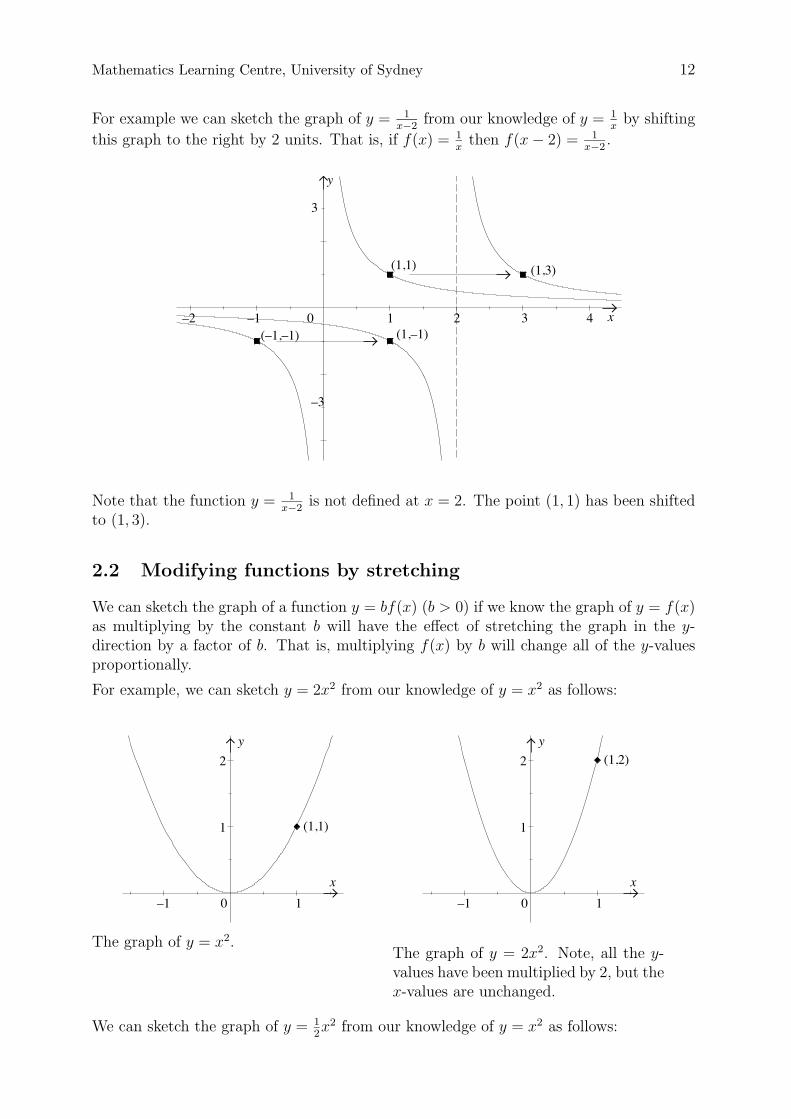
For example we can sketch the graph of y = 1x−2
from our knowledge of y = 1x
by shifting
this graph to the right by 2 units. That is, if f(x) = 1x
then f(x − 2) = 1x−2
.
Note that the function y = 1x−2
is not defined at x = 2. The point (1, 1) has been shiftedto (1, 3).
2.2 Modifying functions by stretching
We can sketch the graph of a function y = bf(x) (b > 0) if we know the graph of y = f(x)as multiplying by the constant b will have the effect of stretching the graph in the y-direction by a factor of b. That is, multiplying f(x) by b will change all of the y-valuesproportionally.
For example, we can sketch y = 2x2 from our knowledge of y = x2 as follows:
The graph of y = x2.The graph of y = 2x2. Note, all the y-values have been multiplied by 2, but thex-values are unchanged.
We can sketch the graph of y = 12x2 from our knowledge of y = x2 as follows:

y
1
1
2
0–1
x
(1,1)
y
1
1
2
0–1
x
(1,1/2)
y
1
1
2
0–1
x
0–1
xy
1
Mathematics Learning Centre, University of Sydney 13
The graph of y = x2.The graph of y = 1
2x2. Note, all the
y-values have been multiplied by 12, but
the x-values are unchanged.
2.3 Modifying functions by reflections
2.3.1 Reflection in the x-axis
We can sketch the function y = −f(x) if we know the graph of y = f(x), as a minus signin front of f(x) has the effect of reflecting the whole graph in the x-axis. (Think of thex-axis as a mirror.) For example, we can sketch y = −|x| from our knowledge of y = |x|.
The graph of y = |x|.The graph of y = −|x|. It is the reflec-tion of y = |x| in the x-axis.
2.3.2 Reflection in the y-axis
We can sketch the graph of y = f(−x) if we know the graph of y = f(x) as the graph ofy = f(−x) is the reflection of y = f(x) in the y-axis.
0
1
2
–1
x
y
1
0
1
2
–1
x
y
1
–3
0
2
–1
x
y
1
10
2
–1
x
y
4
Mathematics Learning Centre, University of Sydney 14
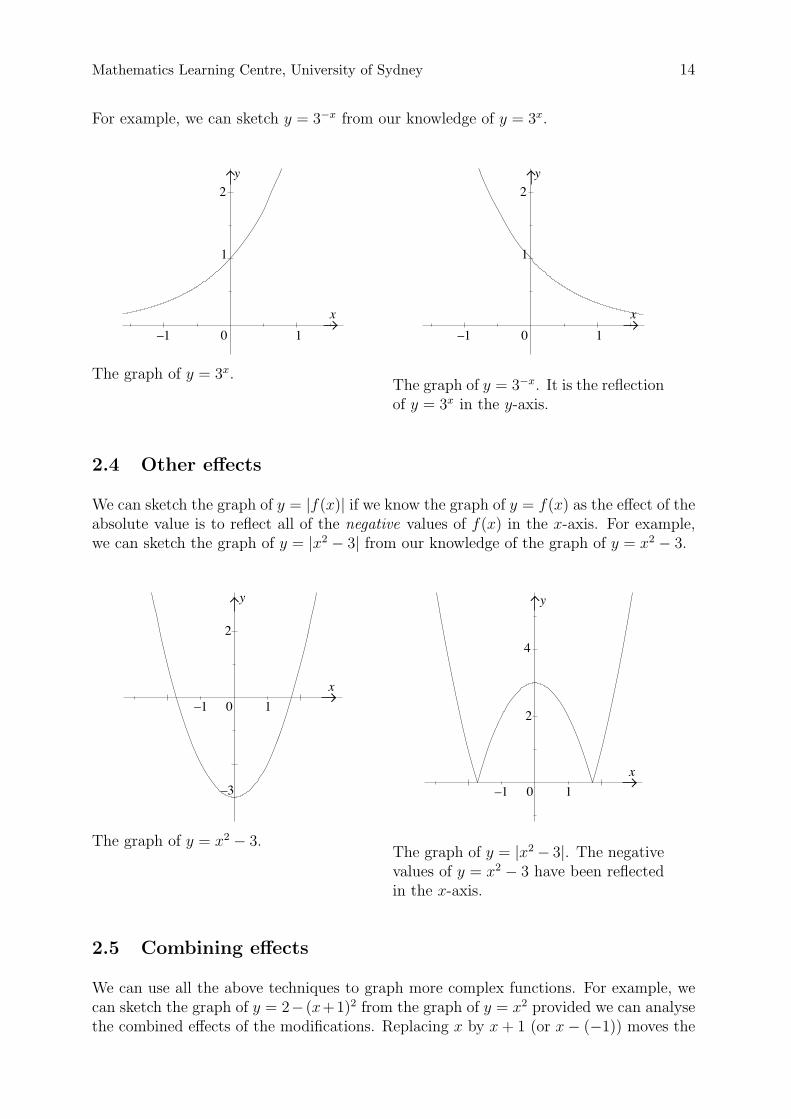
For example, we can sketch y = 3−x from our knowledge of y = 3x.
The graph of y = 3x.The graph of y = 3−x. It is the reflectionof y = 3x in the y-axis.
2.4 Other effects
We can sketch the graph of y = |f(x)| if we know the graph of y = f(x) as the effect of theabsolute value is to reflect all of the negative values of f(x) in the x-axis. For example,we can sketch the graph of y = |x2 − 3| from our knowledge of the graph of y = x2 − 3.
The graph of y = x2 − 3.The graph of y = |x2 − 3|. The negativevalues of y = x2 − 3 have been reflectedin the x-axis.
2.5 Combining effects
We can use all the above techniques to graph more complex functions. For example, wecan sketch the graph of y = 2− (x+1)2 from the graph of y = x2 provided we can analysethe combined effects of the modifications. Replacing x by x + 1 (or x − (−1)) moves the

0
1
2
–1
x
y
1
x
y
0
1
2
–2 –1
–2 –1
xy
0
–1
–2
0–2 –1
x
y
1
2
Mathematics Learning Centre, University of Sydney 15
graph to the left by 1 unit. The effect of the − sign in front of the brackets turns thegraph up side down. The effect of adding 2 moves the graph up 2 units. We can illustratethese effects in the following diagrams.
The graph of y = x2.The graph of y = (x + 1)2. The graphof y = x2 has been shifted 1 unit to theleft.
The graph of y = −(x + 1)2. The graphof y = (x + 1)2 has been reflected in thex-axis.
The graph of y = 2−(x+1)2. The graphof y = −(x + 1)2 has been shifted up by2 units.
Similarly, we can sketch the graph of (x−h)2+(y−k)2 = r2 from the graph of x2+y2 = r2.Replacing x by x − h shifts the graph sideways h units. Replacing y by y − k shifts thegraph up or down k units. (We remarked before that y = f(x) + k could be written asy − k = f(x).)
For example, we can use the graph of the circle of radius 3, x2 + y2 = 9, to sketch thegraph of (x − 2)2 + (y + 4)2 = 9.

2
4
–4
y
0
–2
2 4–2
x
–4
–4
y
0
–2
2 4–2
x
(2,–4)
(2,–7)
(5,–4)(–1,–4)
(2,–1)
Mathematics Learning Centre, University of Sydney 16
The graph of x2 + y2 = 9.
This is a circle centre (0, 0), radius 3.
The graph of (x − 2)2 + (y + 4)2 = 9.
This is a circle centre (2,−4), radius 3.
Replacing x by x − 2 has the effect of shifting the graph of x2 + y2 = 9 two units to theright. Replacing y by y + 4 shifts it down 4 units.
2.6 Graphing by addition of ordinates
We can sketch the graph of functions such as y = |x| + |x − 2| by drawing the graphs ofboth y = |x| and y = |x − 2| on the same axes then adding the corresponding y-values.

0
2
2 4 6–2
x
y
4
y = |x|
y = |x – 2|
0
2
2 4 6–2
x
y
4
Mathematics Learning Centre, University of Sydney 17
The graph of y = |x| + |x − 2|.
At each point of x the y-values of y = |x| and y = |x − 2| have been added. This allowsus to sketch the graph of y = |x| + |x − 2|.
This technique for sketching graphs is very useful for sketching the graph of the sum oftwo trigonometric functions.
2.7 Using graphs to solve equations
We can solve equations of the form f(x) = k by sketching y = f(x) and the horizontal liney = k on the same axes. The solution to the equation f(x) = k is found by determiningthe x-values of any points of intersection of the two graphs.
(5,2)
y
4
0
2
2 4 6–2
x
(1,2)
3 4
y
1–1
–2
–4
2
0 2 x
(3,–4)
Mathematics Learning Centre, University of Sydney 18
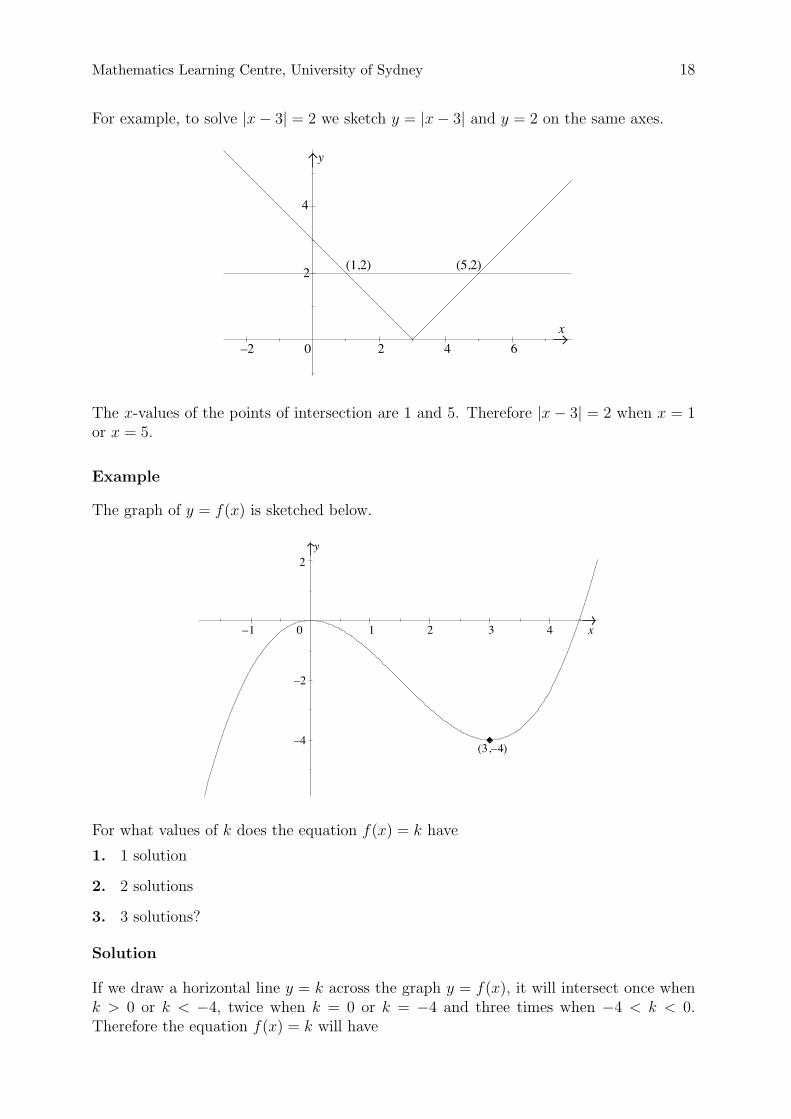
For example, to solve |x − 3| = 2 we sketch y = |x − 3| and y = 2 on the same axes.
The x-values of the points of intersection are 1 and 5. Therefore |x − 3| = 2 when x = 1or x = 5.
Example
The graph of y = f(x) is sketched below.
For what values of k does the equation f(x) = k have
1. 1 solution
2. 2 solutions
3. 3 solutions?
Solution
If we draw a horizontal line y = k across the graph y = f(x), it will intersect once whenk > 0 or k < −4, twice when k = 0 or k = −4 and three times when −4 < k < 0.Therefore the equation f(x) = k will have

Mathematics Learning Centre, University of Sydney 19
1. 1 solution if k > 0 or k < −4
2. 2 solutions if k = 0 or k = −4
3. 3 solutions if −4 < k < 0.
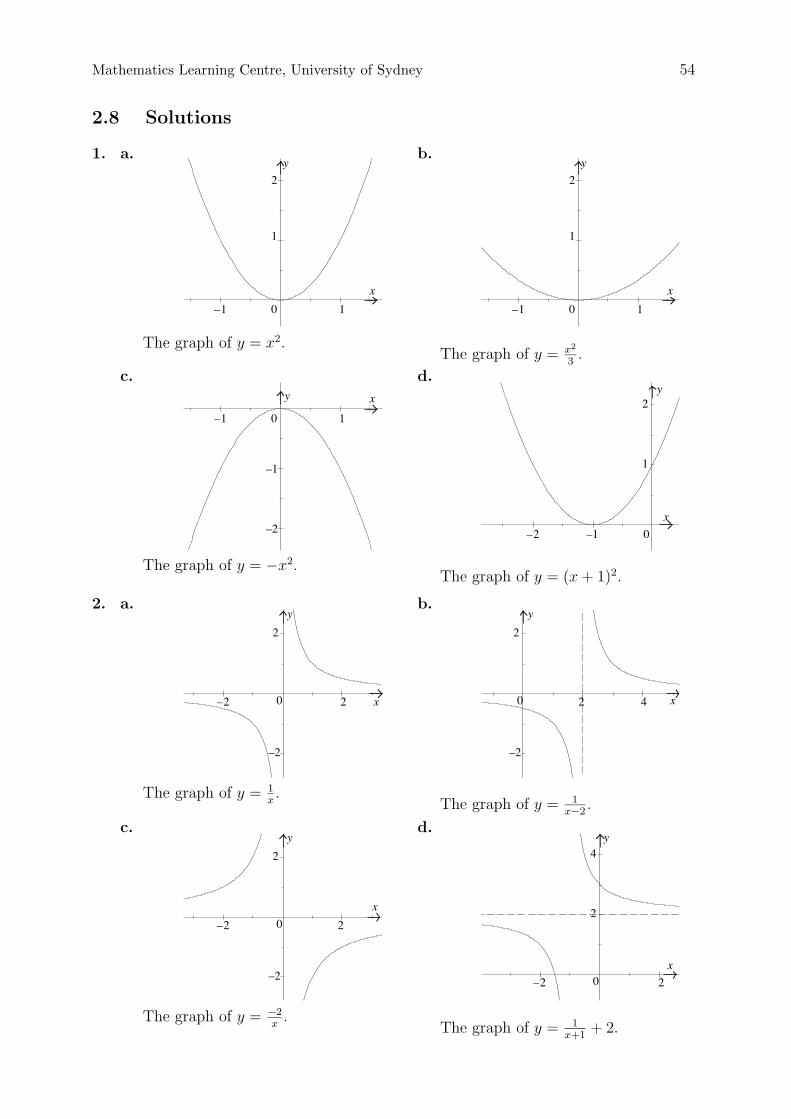
2.8 Exercises
1. Sketch the following:
a. y = x2 b. y = 13x2 c. y = −x2 d. y = (x + 1)2
2. Sketch the following:
a. y = 1x
b. y = 1x−2
c. y = −2x
d. y = 1x+1
+ 2
3. Sketch the following:
a. y = x3 b. y = |x3 − 2| c. y = 3 − (x − 1)3
4. Sketch the following:
a. y = |x| b. y = 2|x − 2| c. y = 4 − |x|
5. Sketch the following:
a. x2 + y2 = 16 b. x2 + (y + 2)2 = 16 c. (x − 1)2 + (y − 3)2 = 16
6. Sketch the following:
a. y =√
9 − x2 b. y =√
9 − (x − 1)2 c. y =√
9 − x2 − 3
7. Show thatx − 1
x − 2=
1
x − 2+ 1.
Hence sketch the graph of y =x − 1
x − 2.
8. Sketch y = x+1x−1
.
9. Graph the following relations in the given interval:
a. y = |x| + x + 1 for −2 ≤ x ≤ 2 [Hint: Sketch by adding ordinates]
b. y = |x| + |x − 1| for −2 ≤ x ≤ 3
c. y = 2x + 2−x for −2 ≤ x ≤ 2
d. |x − y| = 1 for −1 ≤ x ≤ 3.
10. Sketch the function f(x) = |x2 − 1| − 1.

y
0x
–3 1.5
–2
Mathematics Learning Centre, University of Sydney 20
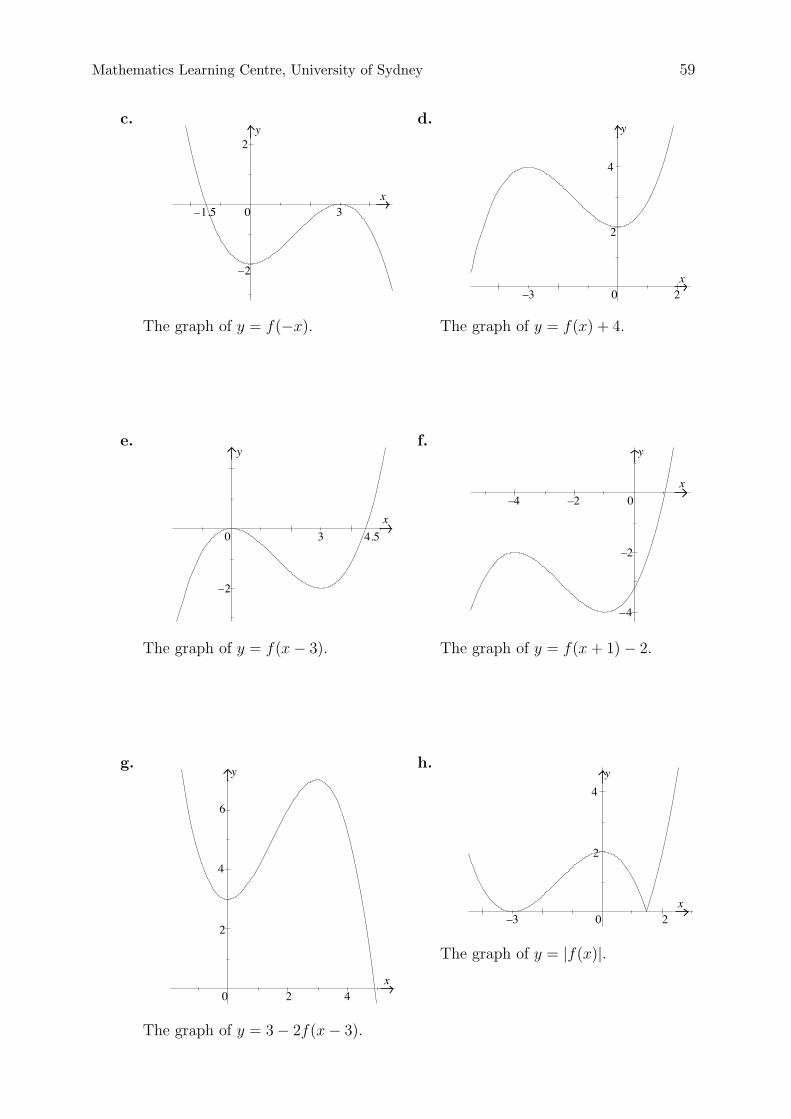
11. Given y = f(x) as sketched below, sketch
a. y = 2f(x)
b. y = −f(x)
c. y = f(−x)
d. y = f(x) + 4
e. y = f(x − 3)
f. y = f(x + 1) − 2
g. y = 3 − 2f(x − 3)
h. y = |f(x)|
12. By sketching graphs solve the following equations:
a. |2x| = 4
b. 1x−2
= −1
c. x3 = x2
d. x2 = 1x
13. Solve |x − 2| = 3.
a. algebraically
b. geometrically.
14. The parabolas y = (x − 1)2 and y = (x − 3)2 intersect at a point P . Find thecoordinates of P .
15. Sketch the circle x2 + y2 − 2x − 14y + 25 = 0. [Hint: Complete the squares.] Findthe values of k, so that the line y = k intersects the circle in two distinct points.
16. Solve 45−x
= 1, using a graph.
17. Find all real numbers x for which |x − 2| = |x + 2|.
18. Given that Q(p) = p2 − p, find possible values of n if Q(n) = 2.
19. Solve |x − 4| = 2x.
a. algebraically
b. geometrically.
–x 0 2
x
y
1–1–2
2
4
x
y
1–1–2 x
1
–1
y
–x
0 2
x
–y
Mathematics Learning Centre, University of Sydney 21
2.9 Even and odd functions
Definition:
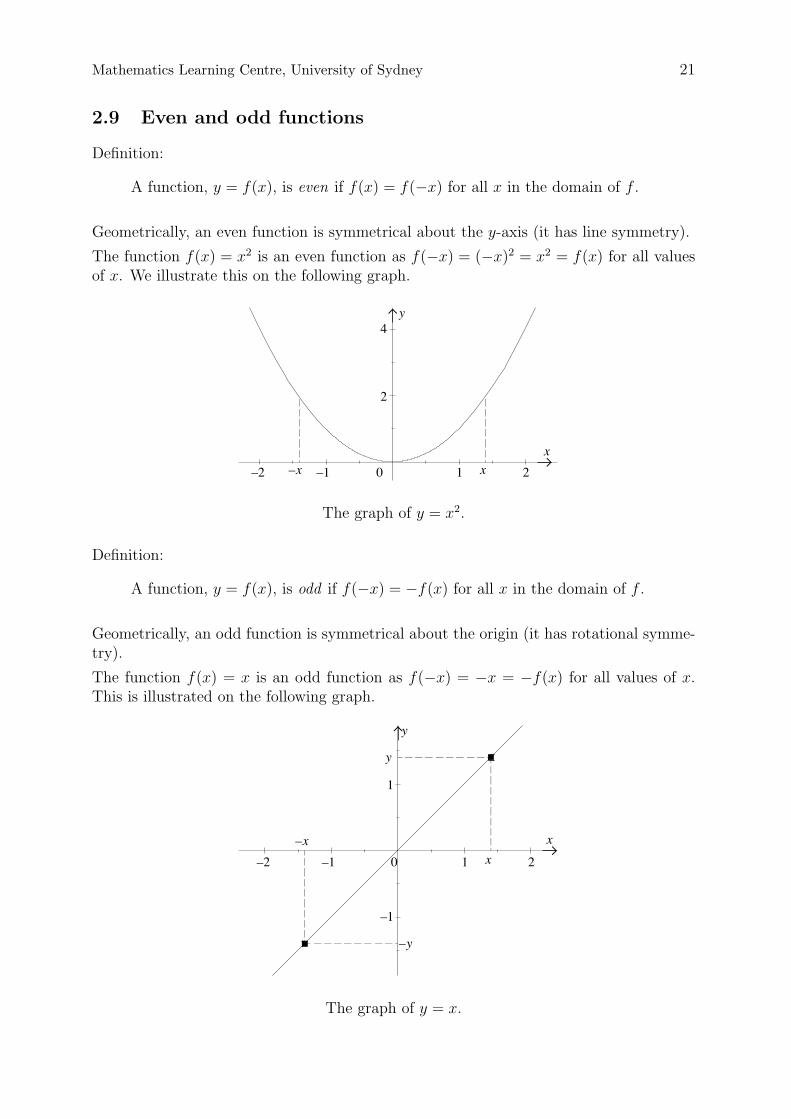
A function, y = f(x), is even if f(x) = f(−x) for all x in the domain of f .
Geometrically, an even function is symmetrical about the y-axis (it has line symmetry).
The function f(x) = x2 is an even function as f(−x) = (−x)2 = x2 = f(x) for all valuesof x. We illustrate this on the following graph.
The graph of y = x2.
Definition:
A function, y = f(x), is odd if f(−x) = −f(x) for all x in the domain of f .
Geometrically, an odd function is symmetrical about the origin (it has rotational symme-try).
The function f(x) = x is an odd function as f(−x) = −x = −f(x) for all values of x.This is illustrated on the following graph.
The graph of y = x.
0x
y
Mathematics Learning Centre, University of Sydney 22
Example
Decide whether the following functions are even, odd or neither.
1. f(x) = 3x2 − 4
2. g(x) = 12x
3. f(x) = x3 − x2.
Solution
1.
f(−x) = 3(−x)2 − 4 = 3x2 − 4 = f(x)
The function f(x) = 3x2 − 4 is even.
2.
g(−x) =1
2(−x)=
1
−2x= − 1
2x= −g(x)
Therefore, the function g is odd.
3.
f(−x) = (−x)3 − (−x)2 = −x3 − x2
This function is neither even (since −x3 − x2 �= x3 − x2) nor odd (since −x3 − x2 �=−(x3 − x2)).
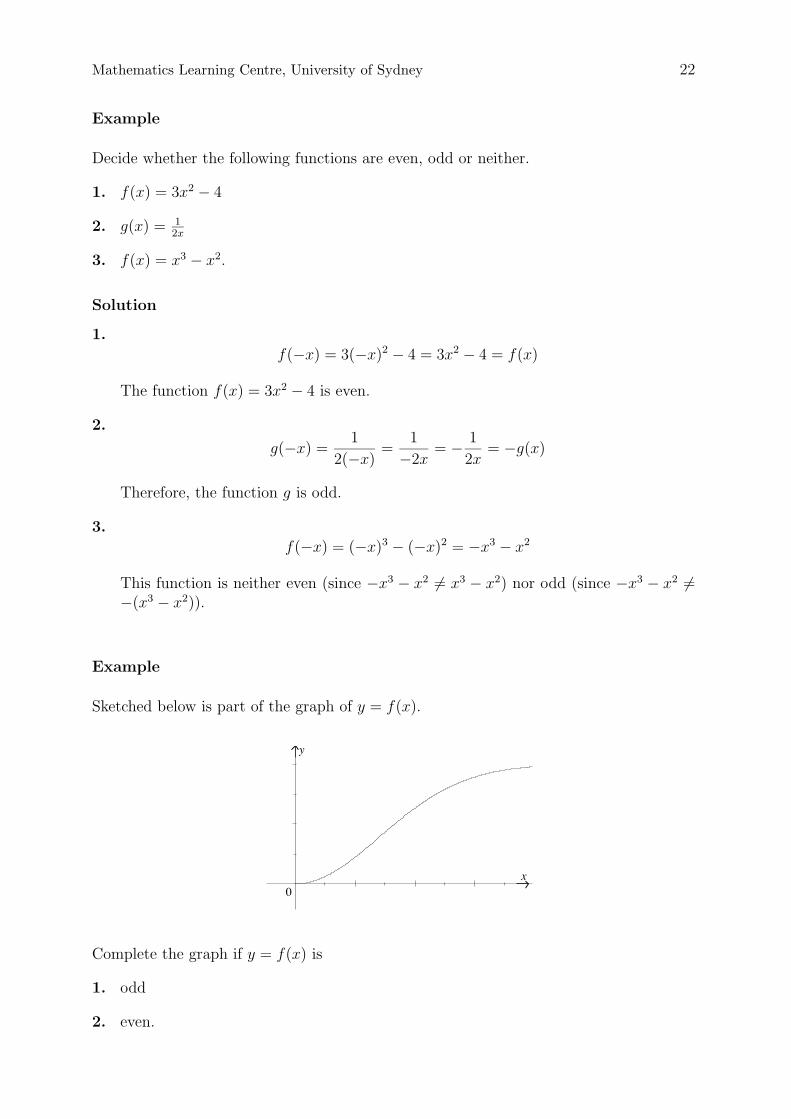
Example
Sketched below is part of the graph of y = f(x).
Complete the graph if y = f(x) is
1. odd
2. even.

y
0
x
y
0x
Mathematics Learning Centre, University of Sydney 23
Solution
y = f(x) is an odd function.
y = f(x) is an even function.
2.10 Increasing and decreasing functions
Here we will introduce the concepts of increasing and decreasing functions. In Chapter 5we will relate these concepts to the derivative of a function.
Definition:
A function is increasing on an interval I, if for all a and b in I such that a < b,f(a) < f(b).
The function y = 2x is an example of a function that is increasing over its domain. Thefunction y = x2 is increasing for all real x > 0.
x
y
10
2
4
b
f(b)
f(a)
0
1
2
–1
x
y
1
a
0
1
2
–1
x
y
1
a
f(a)
f(b)
0
1
2
–1
x
y
1
b
Mathematics Learning Centre, University of Sydney 24
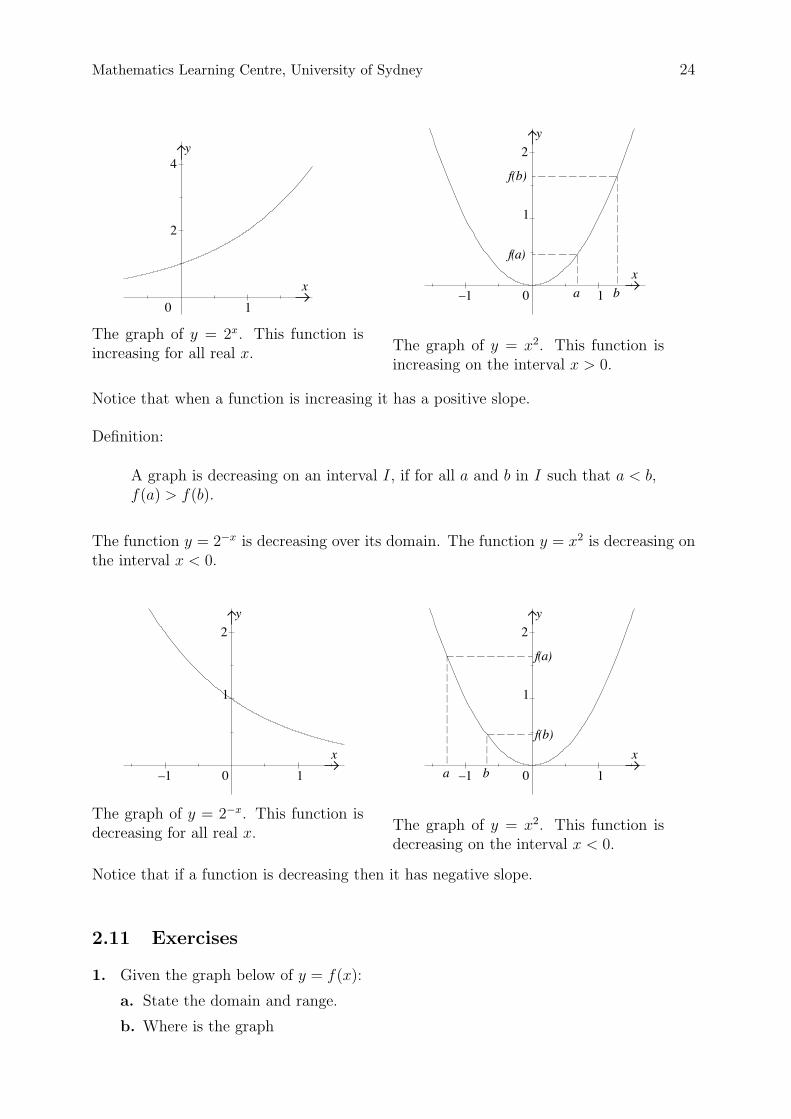
The graph of y = 2x. This function isincreasing for all real x. The graph of y = x2. This function is
increasing on the interval x > 0.
Notice that when a function is increasing it has a positive slope.
Definition:
A graph is decreasing on an interval I, if for all a and b in I such that a < b,f(a) > f(b).
The function y = 2−x is decreasing over its domain. The function y = x2 is decreasing onthe interval x < 0.
The graph of y = 2−x. This function isdecreasing for all real x. The graph of y = x2. This function is
decreasing on the interval x < 0.
Notice that if a function is decreasing then it has negative slope.
2.11 Exercises
1. Given the graph below of y = f(x):
a. State the domain and range.
b. Where is the graph

40
x
y
2–2–4
–2
x
y
0
0
x
y
Mathematics Learning Centre, University of Sydney 25
i. increasing?
ii. decreasing?
c. if k is a constant, find the values of k such that f(x) = k has
i. no solutions
ii. 1 solution
iii. 2 solutions
iv. 3 solutions
v. 4 solutions.
d. Is y = f(x) even, odd or neither?
2. Complete the following functions if they are defined to be (a) even (b) odd.
y = f(x) y = g(x)
3. Determine whether the following functions are odd, even or neither.
a. y = x4 + 2 b. y =√
4 − x2 c. y = 2x d. y = x3 + 3x
e. y = xx2 f. y =
1
x2 − 4g. y =
1
x2 + 4h. y =
x
x3 + 3
i. y = 2x + 2−x j. y = |x − 1| + |x + 1|
4. Given y = f(x) is even and y = g(x) is odd, prove
a. if h(x) = f(x) · g(x) then h(x) is odd
b. if h(x) = (g(x))2 then h(x) is even

Mathematics Learning Centre, University of Sydney 26
c. if h(x) =f(x)
g(x), g(x) �= 0, then h(x) is odd
d. if h(x) = f(x) · (g(x))2 then h(x) is even.
5. Consider the set of all odd functions which are defined at x = 0. Can you prove thatfor every odd function in this set f(0) = 0? If not, give a counter-example.

y
0 2 4–2
x
–4
2
4
0
4
x
y
2
1 3 5
4
x
2
y
2
0–2
Mathematics Learning Centre, University of Sydney 50
5 Solutions to exercises
1.4 Solutions
1. a. The domain of f(x) =√
9 − x2 is all real x where −3 ≤ x ≤ 3. The range is allreal y such that 0 ≤ y ≤ 3.
b.
The graph of f(x) =√
9 − x2.
2.
ψ(x + h) − ψ(x)
h=
(x + h)2 + 5 − (x2 + 5)
h
=x2 + 2xh + h2 + 5 − x2 − 5
h
=h2 + 2xh
h= h + 2x
3. a.
The graph of y =√
x − 1. The domainis all real x ≥ 1 and the range is all realy ≥ 0.
b.
The graph of y = |2x|. Its domain is allreal x and range all real y ≥ 0.

y
0
2
x62 4 8
2
y
2
0–2
4
x
–1
4
x
2
y
2
0–2
2
–2
0–2
x
2
y
Mathematics Learning Centre, University of Sydney 51
c.
The graph of y = 1x−4
. The domain is all real x �= 4 and the range is all real y �= 0.
d.
The graph of y = |2x| − 1. The domain is all real x, and the range is all realy ≥ −1.
4. a. The perpendicular distance d from (0, 0) to x + y + k = 0 is d = | k√2|.
b. For the line x+y+k = 0 to cut the circle in two distinct points d < 2. ie |k| < 2√
2or −2
√2 < k < 2
√2.
5. a.
The graph of y = (12)x.
b.
The graph of y2 = x2.
6. y2 = x3 is not a function.
2
–2
0–2
x
2
y
2
–2
0–2
x
2
y
2
–2
0–2
x
2
y
0–2
x
2
y
2
–2
x
2
y
2
–2
0
Mathematics Learning Centre, University of Sydney 52
7. a.
The graph of y = −√
4 − x2. This is afunction with the domain: all real x suchthat −2 ≤ x ≤ 2 and range: all real ysuch that −2 ≤ y ≤ 0.
b.
The graph of |x| − |y| = 0. This is notthe graph of a function.
c.
The graph of y = x3. This is a functionwith the domain: all real x and range:all real y.
d.
The graph of y = x|x| . This is the graph
of a function which is not defined at x =0. Its domain is all real x �= 0, and rangeis y = ±1.
e.
The graph of |y| = x. This is not the graph of a function.

x
1–1
y
1
–1
0
Mathematics Learning Centre, University of Sydney 53
8.
A(1
p) = (
1
p)2 + 2 +
1
(1p)2
=1
p2+ 2 +
11p2
=1
p2+ 2 + p2
= A(p)
9. a. The values of x in the interval 0 < x < 4 are not in the domain of the function.
b. x = 1 and x = −1 are not in the domain of the function.
10. a. φ(3) + φ(4) + φ(5) = log(2.5)
b. φ(3) + φ(4) + φ(5) + · · · + φ(n) = log(n2)
11. a. y = 3 when z = 3.
b. i. L(M(x)) = 2(x2 − x) + 1
ii. M(L(x)) = 4x2 + 2x
12. a. a = 2, b = 2 so the equations is y = 2x2 − 2.
b. a = 5, b = 1 so the equation is y = 5x2+1
.
13. b.
The graph of |x| + |y| = 1.
14. S(n − 1) = n−12n−1
Hence
S(n) − S(n − 1) =n
2n + 1− n − 1
2n − 1
=n(2n − 1) − (2n + 1)(n − 1)
(2n − 1)(2n + 1)
=2n2 − n − (2n2 − n − 1)
(2n − 1)(2n + 1)
=1
(2n − 1)(2n + 1)
0
1
2
–1
x
y
1
0
1
2
–1
x
y
1
10–1
xy
–1
–2 –1
x
y
1
2
–2 0
2
–2 0
–2
x
y
2
2
0
–2
4 x
y
2
x
y
2
2
0
–2
–2
x
y
2
0 2–2
4
Mathematics Learning Centre, University of Sydney 54
2.8 Solutions
1. a.
The graph of y = x2.
b.
The graph of y = x2
3.
c.
The graph of y = −x2.
d.
The graph of y = (x + 1)2.
2. a.
The graph of y = 1x.
b.
The graph of y = 1x−2
.
c.
The graph of y = −2x
.
d.
The graph of y = 1x+1
+ 2.

0–1
x
1
y
1
–1x
y
0 2–2
2
4
x
y
40 2
2
4
x
y
0 2–2
2
4
2 4
2
4
x
y
0
2 4
2
4
x
y
0–2–4
Mathematics Learning Centre, University of Sydney 55
3. a.
The graph of y = x3.
b.
The graph of y = |x3 − 2|.
c.
The graph of y = 3 − (x − 1)3.
4. a.
The graph of y = |x|.
b.
The graph of y = 2|x − 2|.
c.
The graph of y = 4 − |x|.

–2–4 2 4
2
4
x
y
0
–2
–4
2 4
x
y
0
2
–6
–2
–4
–2–4
(0,–2)
x
y
0
(1,3)
–2–4 2 4
2
4
6
–3 3x
y
0
3
0
3
2 4–2x
y
(1,0)
xy
–3
0–3 3
Mathematics Learning Centre, University of Sydney 56
5.
a.
The graph of x2 + y2 = 16.
b.
The graph of x2 + (y + 2)2 = 16.
c.
The graph of (x − 1)2 + (y − 3)2 = 16.
6. a.
The graph of y =√
9 − x2.
b.
The graph of y =√
9 − (x − 1)2.
c.
The graph of y =√
9 − x2 − 3.

4–2x
y
0
2
2
4–2x
y
0
2
2
–2
x
y
0 2–2
2
4
x
y
0 2–2
2
4
Mathematics Learning Centre, University of Sydney 57
7.
1
x − 2+ 1 =
1 + (x − 2)
x − 2=
x − 1
x − 2
The graph of y = x−1x−2
.
8.
The graph of y = x+1x−1
.
9. a.
The graph of y = |x| + x + 1for −2 ≤ x ≤ 2.
b.
The graph of y = |x| + |x − 1|for −2 ≤ x ≤ 3.

4
x
y
0 2–2
2
2–2
2
–2
4
x
y
0
2–2
2
–1
4
x
y
0
y
0x
–3 1.5
–20
x–3 1.5
2
–2
y
Mathematics Learning Centre, University of Sydney 58
c.
The graph of y = 2x + 2−x
for −2 ≤ x ≤ 2.
d.
The graph of |x − y| = 1 for−1 ≤ x ≤ 3.
10.
The graph of f(x) = |x2 − 1| − 1.
11. a.
The graph of y = 2f(x).
b.
The graph of y = −f(x).
3
–2
y
0x
2
–1.5
x–3
4
2
2
y
0
y
0
x
3 4.5
–2
0
x
–2
–4
–2–4
y
2
2
y
4
6
0 4x
0x
–3 2
2
y
4
Mathematics Learning Centre, University of Sydney 59
c.
The graph of y = f(−x).
d.
The graph of y = f(x) + 4.
e.
The graph of y = f(x − 3).
f.
The graph of y = f(x + 1) − 2.
g.
The graph of y = 3 − 2f(x − 3).
h.
The graph of y = |f(x)|.

2
4
20
x
–2
y
20x
–2 4
–2
y
2
1
2
x
10
y
10
y
1
x
Mathematics Learning Centre, University of Sydney 60
12. a.
x = −2 and x = 2 are solutions of theequation |2x| = 4.
b.
x = 1 is a solution of 1x−2
= −1.
c.
x = 0 and x = 1 are solutions of theequation x3 = x2.
d.
x = 1 is a solution of x2 = 1x.
13.
a. For x ≥ 2, |x − 2| = x − 2 = 3. Therefore x = 5 is a solution of the inequality.(Note that x = 5 is indeed ≥ 2.)
For x < 2, |x − 2| = −(x − 2) = −x + 2 = 3. Therefore x = −1 is a solution.(Note that x = −1 is < 2.)

x
2 4–2
2
0
y
4
5
10
5–5
(1,7)
0
y
x
(1,1)
5
50
y
x
10
–5
Mathematics Learning Centre, University of Sydney 61
b.
The points of intersection are (−1, 3) and (5, 3).
Therefore the solutions of |x − 2| = 3 are x = −1 and x = 5.
14. The parabolas intersect at (2, 1).
15.
y = k intersects the circle at two distinct points when 2 < k < 12.
16.
The point of intersection is (1, 1). Therefore the solution of 45−x
= 1 is x = 1.

x
2 4–2–4
2
0
y
4
2 4 6
2
0
y
4
x
(4/3,8/3)
Mathematics Learning Centre, University of Sydney 62
17.
The point of intersection is (0, 2). Therefore the solution of |x− 2| = |x + 2| is x = 0.
18. n = −1 or n = 2.
19. a. For x ≥ 4, |x − 4| = x − 4 = 2x when x = −4, but this does not satisfy thecondition of x ≥ 4 so is not a solution.
For x < 4, |x − 4| = −x + 4 = 2x when x = 43. x = 4
3is < 4 so is a solution.
Therefore, x = 43
is a solution of |x − 4| = 2x.
b.
The graph of y = |x − 4| and y = 2x intersect at the point (43, 8
3). So the solution
of |x − 4| = 2x is x = 43.
2.11 Solutions
1. a. The domain is all real x, and the range is all real y ≥ −2.
b. i. −2 < x < 0 or x > 2
ii. x < −2 or 0 < x < 2
c. i. k < −2
ii. There is no value of k for which f(x) = k has exactly one solution.
iii. k = 2 or k > 0

x
y
0
x
y
0
y
0
x
y
0
x
Mathematics Learning Centre, University of Sydney 63
iv. k = 0
v. −2 < k < 0
d. y = f(x) is even
2. a.
y = f(x) is even.
b.
y = f(x) is odd.
a.
y = g(x) is even.
b.
y = g(x) is odd.
3. a. even b. even c. neither d. odd e. odd
f. even g. even h. neither i. even j. even
4. a.
h(−x) = f(−x) · g(−x)
= f(x) · −g(x)
= −f(x) · g(x)
= −h(x)
Therefore h is odd.
b.
h(−x) = (g(−x))2
= (−(g(x))2
= (g(x))2
= h(x)
Therefore h is even.

–2
x
y
–4 –2 42
2
Mathematics Learning Centre, University of Sydney 64
c.
h(−x) =f(−x)
g(−x)
=f(x)
−g(x)
= −f(x)
g(x)
= −h(x)
Therefore h is odd.
d.
h(−x) = f(−x) · (g(−x))2
= f(x) · (−g(x))2
= f(x) · (g(x))2
= h(x)
Therefore h is even.
5. If f is defined at x = 0
f(0) = f(−0) (since 0 = −0)
= −f(0) (since f is odd)
2f(0) = 0 (adding f(0) to both sides)
Therefore f(0) = 0.
3.2 Solutions
1. a. 2f(−1) + f(2) = 2(1 − (−1)) + (1 − (2)2) = 4 + (−3) = 1.
b. f(a2) = 1 − (a2)2 = 1 − a4 since a2 ≥ 0.
2. You can see from the graph below that there is one solution to f(x) = 2, and thatthis solution is at x = −1.