Functional optical zone and visual quality after SMILE and FS ...
16
Page 1/16 Functional optical zone and visual quality after SMILE and FS-LASIK treatment for high myopia Xuan Ding Fudan University Eye Ear Nose and Throat Hospital Department of Ophthalmology Dan Fu Fudan University Eye Ear Nose and Throat Hospital Department of Ophthalmology Meiyan Li Fudan University Eye Ear Nose and Throat Hospital Department of Ophthalmology Lin Wang Fudan University Eye Ear Nose and Throat Hospital Department of Ophthalmology Xingtao Zhou Fudan University Eye Ear Nose and Throat Hospital Department of Ophthalmology zhiqiang Yu ( [email protected] ) Fudan University Eye Ear Nose and Throat Hospital Department of Ophthalmology https://orcid.org/0000-0002-5094-8065 Research article Keywords: Functional optical zone, Small incision lenticule extraction, femtosecond laser-assisted in situ keratomileusis, Wavefront aberrations Posted Date: September 23rd, 2019 DOI: https://doi.org/10.21203/rs.2.14743/v1 License: This work is licensed under a Creative Commons Attribution 4.0 International License. Read Full License
-
Upload
khangminh22 -
Category
Documents
-
view
0 -
download
0
Transcript of Functional optical zone and visual quality after SMILE and FS ...
Page 1/16
Functional optical zone and visual quality afterSMILE and FS-LASIK treatment for high myopiaXuan Ding
Fudan University Eye Ear Nose and Throat Hospital Department of OphthalmologyDan Fu
Fudan University Eye Ear Nose and Throat Hospital Department of OphthalmologyMeiyan Li
Fudan University Eye Ear Nose and Throat Hospital Department of OphthalmologyLin Wang
Fudan University Eye Ear Nose and Throat Hospital Department of OphthalmologyXingtao Zhou
Fudan University Eye Ear Nose and Throat Hospital Department of Ophthalmologyzhiqiang Yu ( [email protected] )
Fudan University Eye Ear Nose and Throat Hospital Department of Ophthalmologyhttps://orcid.org/0000-0002-5094-8065
Research article
Keywords: Functional optical zone, Small incision lenticule extraction, femtosecond laser-assisted in situkeratomileusis, Wavefront aberrations
Posted Date: September 23rd, 2019
DOI: https://doi.org/10.21203/rs.2.14743/v1
License: This work is licensed under a Creative Commons Attribution 4.0 International License. Read Full License
Page 2/16
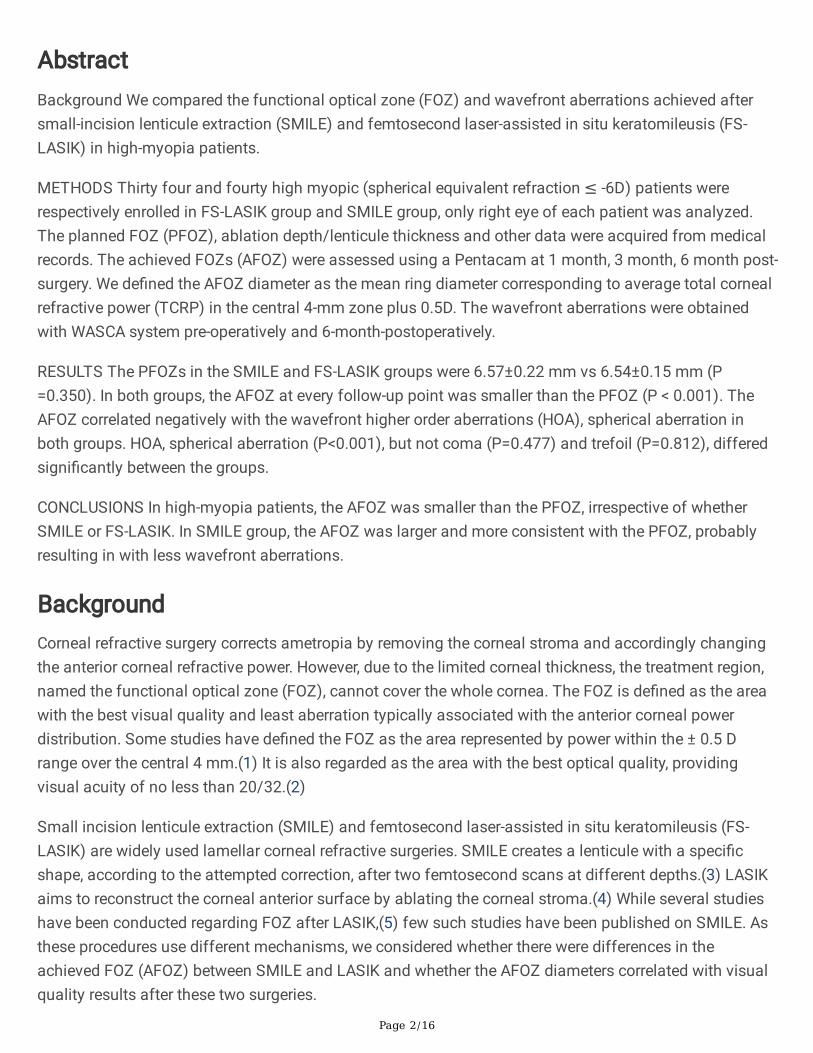
AbstractBackground We compared the functional optical zone (FOZ) and wavefront aberrations achieved aftersmall-incision lenticule extraction (SMILE) and femtosecond laser-assisted in situ keratomileusis (FS-LASIK) in high-myopia patients.
METHODS Thirty four and fourty high myopic (spherical equivalent refraction ≤ -6D) patients wererespectively enrolled in FS-LASIK group and SMILE group, only right eye of each patient was analyzed.The planned FOZ (PFOZ), ablation depth/lenticule thickness and other data were acquired from medicalrecords. The achieved FOZs (AFOZ) were assessed using a Pentacam at 1 month, 3 month, 6 month post-surgery. We de�ned the AFOZ diameter as the mean ring diameter corresponding to average total cornealrefractive power (TCRP) in the central 4-mm zone plus 0.5D. The wavefront aberrations were obtainedwith WASCA system pre-operatively and 6-month-postoperatively.
RESULTS The PFOZs in the SMILE and FS-LASIK groups were 6.57±0.22 mm vs 6.54±0.15 mm (P=0.350). In both groups, the AFOZ at every follow-up point was smaller than the PFOZ (P < 0.001). TheAFOZ correlated negatively with the wavefront higher order aberrations (HOA), spherical aberration inboth groups. HOA, spherical aberration (P<0.001), but not coma (P=0.477) and trefoil (P=0.812), differedsigni�cantly between the groups.
CONCLUSIONS In high-myopia patients, the AFOZ was smaller than the PFOZ, irrespective of whetherSMILE or FS-LASIK. In SMILE group, the AFOZ was larger and more consistent with the PFOZ, probablyresulting in with less wavefront aberrations.
BackgroundCorneal refractive surgery corrects ametropia by removing the corneal stroma and accordingly changingthe anterior corneal refractive power. However, due to the limited corneal thickness, the treatment region,named the functional optical zone (FOZ), cannot cover the whole cornea. The FOZ is de�ned as the areawith the best visual quality and least aberration typically associated with the anterior corneal powerdistribution. Some studies have de�ned the FOZ as the area represented by power within the ± 0.5 Drange over the central 4 mm.(1) It is also regarded as the area with the best optical quality, providingvisual acuity of no less than 20/32.(2)
Small incision lenticule extraction (SMILE) and femtosecond laser-assisted in situ keratomileusis (FS-LASIK) are widely used lamellar corneal refractive surgeries. SMILE creates a lenticule with a speci�cshape, according to the attempted correction, after two femtosecond scans at different depths.(3) LASIKaims to reconstruct the corneal anterior surface by ablating the corneal stroma.(4) While several studieshave been conducted regarding FOZ after LASIK,(5) few such studies have been published on SMILE. Asthese procedures use different mechanisms, we considered whether there were differences in theachieved FOZ (AFOZ) between SMILE and LASIK and whether the AFOZ diameters correlated with visualquality results after these two surgeries.
Page 3/16
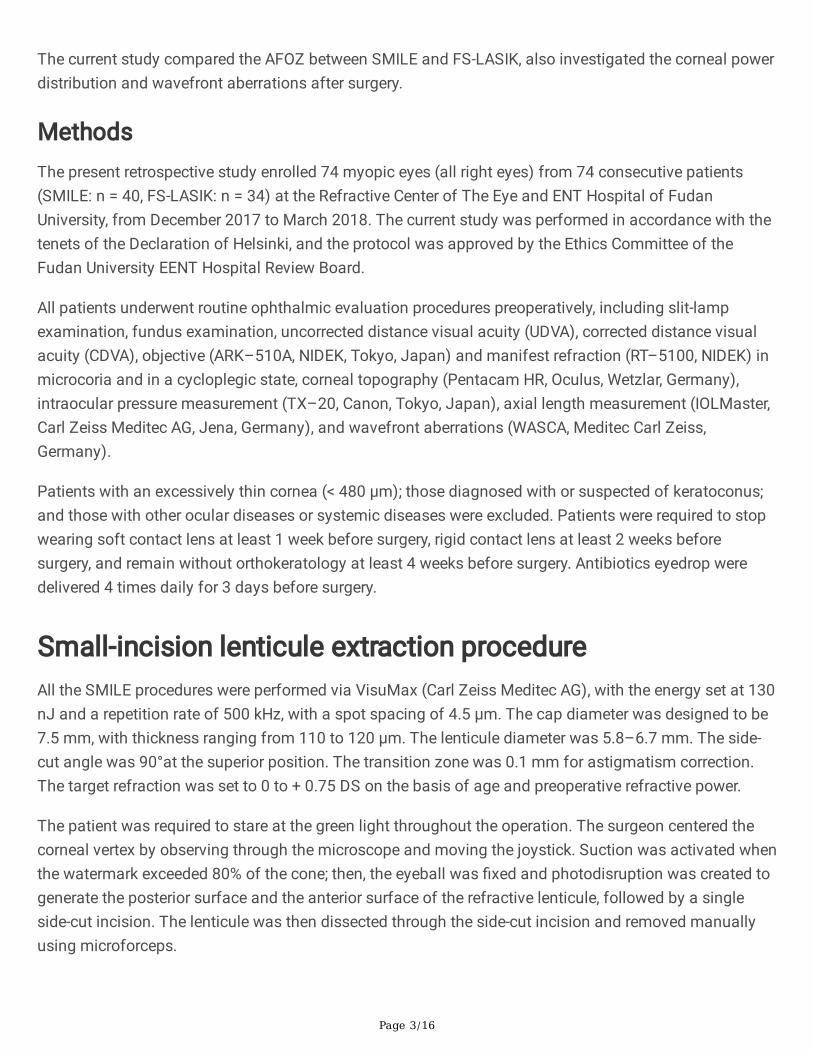
The current study compared the AFOZ between SMILE and FS-LASIK, also investigated the corneal powerdistribution and wavefront aberrations after surgery.
MethodsThe present retrospective study enrolled 74 myopic eyes (all right eyes) from 74 consecutive patients(SMILE: n = 40, FS-LASIK: n = 34) at the Refractive Center of The Eye and ENT Hospital of FudanUniversity, from December 2017 to March 2018. The current study was performed in accordance with thetenets of the Declaration of Helsinki, and the protocol was approved by the Ethics Committee of theFudan University EENT Hospital Review Board.
All patients underwent routine ophthalmic evaluation procedures preoperatively, including slit-lampexamination, fundus examination, uncorrected distance visual acuity (UDVA), corrected distance visualacuity (CDVA), objective (ARK–510A, NIDEK, Tokyo, Japan) and manifest refraction (RT–5100, NIDEK) inmicrocoria and in a cycloplegic state, corneal topography (Pentacam HR, Oculus, Wetzlar, Germany),intraocular pressure measurement (TX–20, Canon, Tokyo, Japan), axial length measurement (IOLMaster,Carl Zeiss Meditec AG, Jena, Germany), and wavefront aberrations (WASCA, Meditec Carl Zeiss,Germany).
Patients with an excessively thin cornea (< 480 µm); those diagnosed with or suspected of keratoconus;and those with other ocular diseases or systemic diseases were excluded. Patients were required to stopwearing soft contact lens at least 1 week before surgery, rigid contact lens at least 2 weeks beforesurgery, and remain without orthokeratology at least 4 weeks before surgery. Antibiotics eyedrop weredelivered 4 times daily for 3 days before surgery.
Small-incision lenticule extraction procedureAll the SMILE procedures were performed via VisuMax (Carl Zeiss Meditec AG), with the energy set at 130nJ and a repetition rate of 500 kHz, with a spot spacing of 4.5 μm. The cap diameter was designed to be7.5 mm, with thickness ranging from 110 to 120 μm. The lenticule diameter was 5.8–6.7 mm. The side-cut angle was 90°at the superior position. The transition zone was 0.1 mm for astigmatism correction.The target refraction was set to 0 to + 0.75 DS on the basis of age and preoperative refractive power.
The patient was required to stare at the green light throughout the operation. The surgeon centered thecorneal vertex by observing through the microscope and moving the joystick. Suction was activated whenthe watermark exceeded 80% of the cone; then, the eyeball was �xed and photodisruption was created togenerate the posterior surface and the anterior surface of the refractive lenticule, followed by a singleside-cut incision. The lenticule was then dissected through the side-cut incision and removed manuallyusing microforceps.
Page 4/16
FS-LASIK ProcedureFlaps were cut using the VisuMax femtosecond laser, with energy set at 180 nJ and a repetition rate setat 500 kHz. The �ap diameter was intended to be 8.5 mm, and the thickness was 110 µm. The side-cutangle was 90°, with a 4-mm-wide hinge immediately above. The corneal stroma was ablated using theMEL 80 excimer laser (Carl Zeiss Meditec AG), with energy set at 0.9 mJ and a repetition rate set at 250Hz. The targeted diopter was set as 0 to +0.75 DS. The ablation optical zone was centered on theintersection of the optical axis and the corneal plane, and its diameters were set at 5.75 mm to 6.75 mm,with a 2-mm transition zone. A bandage contact lens (ACUVEOASYS, Inc., Jacksonville, FL) was placedafter the flap was well repositioned.
Post-operative management and follow-upAfter both procedures, 0.5% o�oxacin eye drops (Santen Pharmaceutical Co., Ltd., Osaka, Japan) wereinstilled 4 times daily for 1 week, 0.1% �uorometholone eye drops (Santen, Pharmaceutical Co., Ltd.) wereinstilled 4 times daily for 4 weeks, and 0.3% sodium hyaluronate eye drops (Santen, Pharmaceutical Co.,Ltd.) were instilled 4 times daily for 2–3 months.
The bandage lenses were removed 1 day after FS-LASIK. Patients were followed up at 1 day, 1 month, 3month, and 6 month postoperatively. Slit-lamp examination, UDVA, CDVA, and intraocular pressuremeasurement were performed at each visit. Corneal topography (Pentacam HR, Oculus, Germany)examinations were performed at 1 month, 3 month, and 6 month postoperatively. Wavefront aberrationswas examed at 6 month after the sugery.
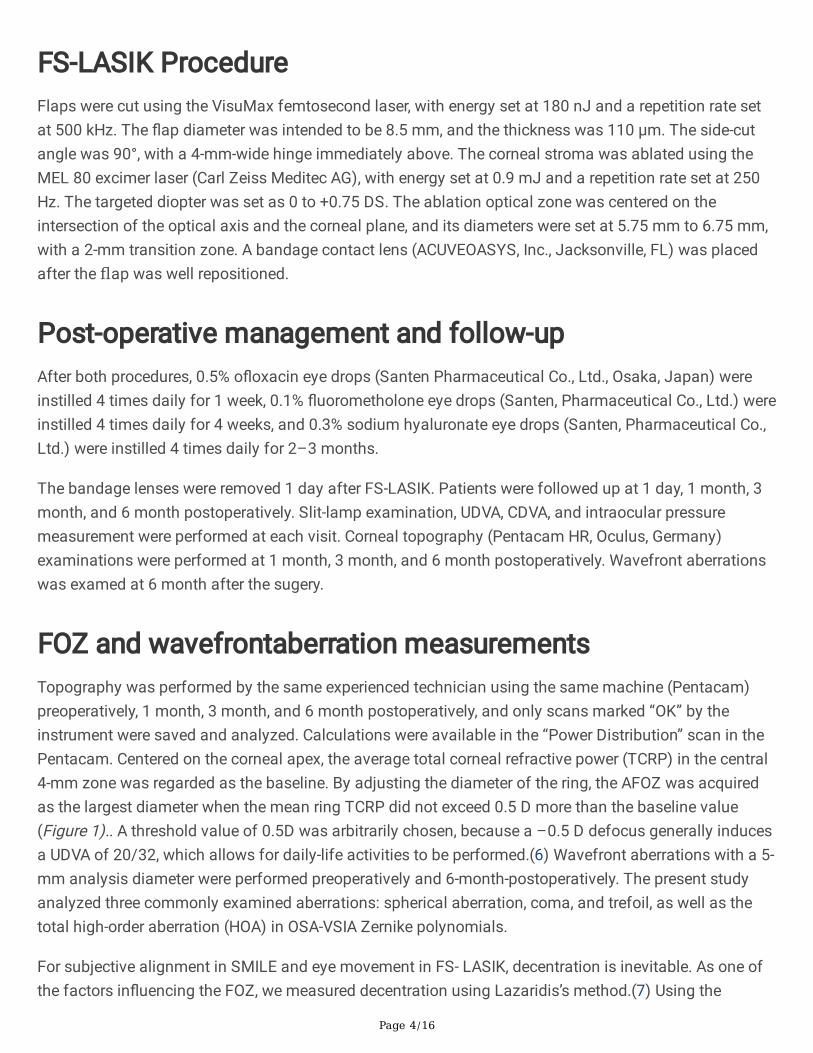
FOZ and wavefrontaberration measurementsTopography was performed by the same experienced technician using the same machine (Pentacam)preoperatively, 1 month, 3 month, and 6 month postoperatively, and only scans marked “OK” by theinstrument were saved and analyzed. Calculations were available in the “Power Distribution” scan in thePentacam. Centered on the corneal apex, the average total corneal refractive power (TCRP) in the central4-mm zone was regarded as the baseline. By adjusting the diameter of the ring, the AFOZ was acquiredas the largest diameter when the mean ring TCRP did not exceed 0.5 D more than the baseline value(Figure 1).. A threshold value of 0.5D was arbitrarily chosen, because a –0.5 D defocus generally inducesa UDVA of 20/32, which allows for daily-life activities to be performed.(6) Wavefront aberrations with a 5-mm analysis diameter were performed preoperatively and 6-month-postoperatively. The present studyanalyzed three commonly examined aberrations: spherical aberration, coma, and trefoil, as well as thetotal high-order aberration (HOA) in OSA-VSIA Zernike polynomials.
For subjective alignment in SMILE and eye movement in FS- LASIK, decentration is inevitable. As one ofthe factors in�uencing the FOZ, we measured decentration using Lazaridis’s method.(7) Using the
Page 5/16
thickness difference map in the Pentacam (postoperative 1 month - preoperative), the distance (r = √(x2 +y2)) from the point with the largest value (x, y) to the corneal vertex (0, 0) was regarded as thedecentration value. Because the maxium value point isn’t the only one, three consecutive measurementswere taken by the same observer and the average values were calculated.
Statistical AnalysisUsing SPSS (24.0 IBM Corporation, Armonk, NY), the KolmogorovSmirnov test was �rstly applied toestablish whether the data followed a normal distribution or not. For values with a normal distribution,Student’s t-test and the paired t-test were utilized for between-group and intra-group comparisons,respectively. The FOZs at different timepoints were compared by repeated-measures analysis of variance.Pearson’s analysis was then used to assess the relationship between preoperative parameters and AFOZ.For abnormally distributed data, Kruskal–Wallis and Spearman analyses were used. P-values less than0.05 were considered as indicating statistically signi�cant differences.
Results
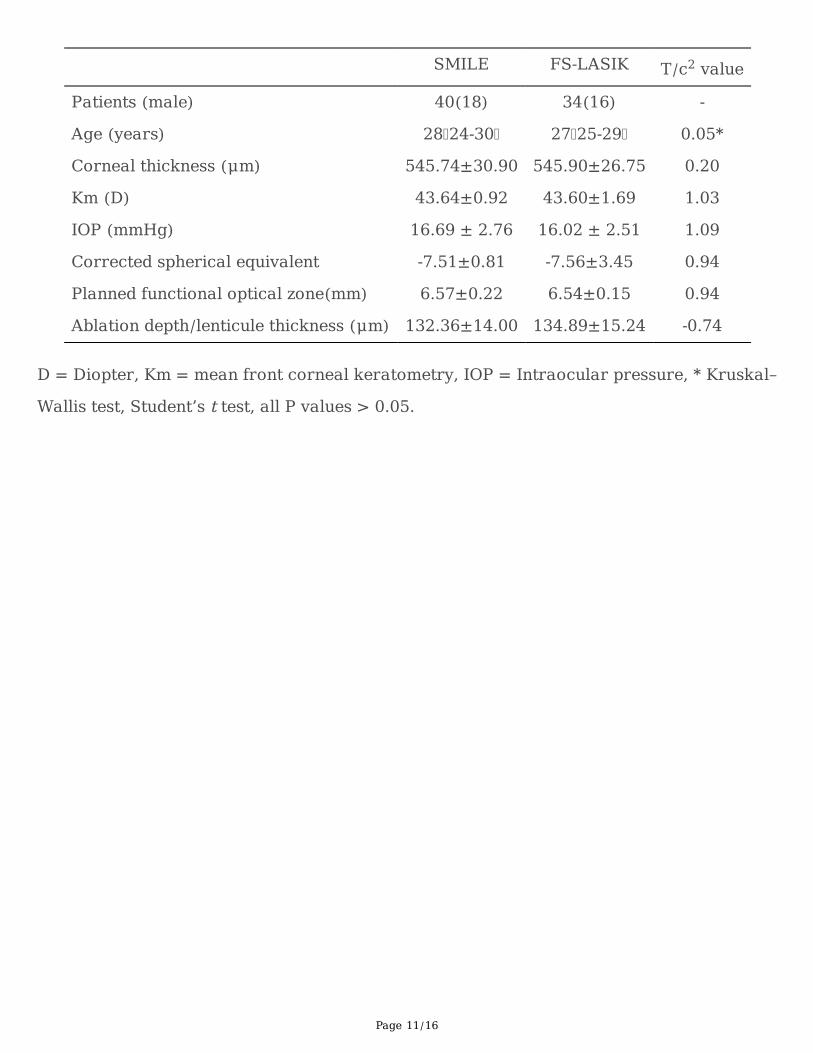
Patient characteristicsIn total, 74 participants (SMILE group, 40 eyes; FS-LASIK group, 34 eyes) were included in the study. Thetwo groups were comparable in terms of age, spherical equivalent, intraocular pressure (IOP), cornealthickness, ablation depth or lenticule thickness, corneal front mean keratometry (Km), and planned FOZ(PFOZ) (Table 1)..
Visual outcomesAll surgeries were uneventful, without suction loss, di�cult dissection, incomplete scanning, wrecklenticule, and postoperative infection or diffuse lamellar keratitis.
The 6-month postoperative refractive outcomes are shown in Figure 2. The safety index (postoperativeCDVA/preoperative CDVA) and e�ciency index (postoperative UDCA/ preoperative CDVA) were 1.08 ±0.66 and 1.18 ± 0.43, respectively, after SMILE and 1.06 ± 0.89 and 1.17 ± 0.88, respectively, after FS-LASIK (P > 0.05).
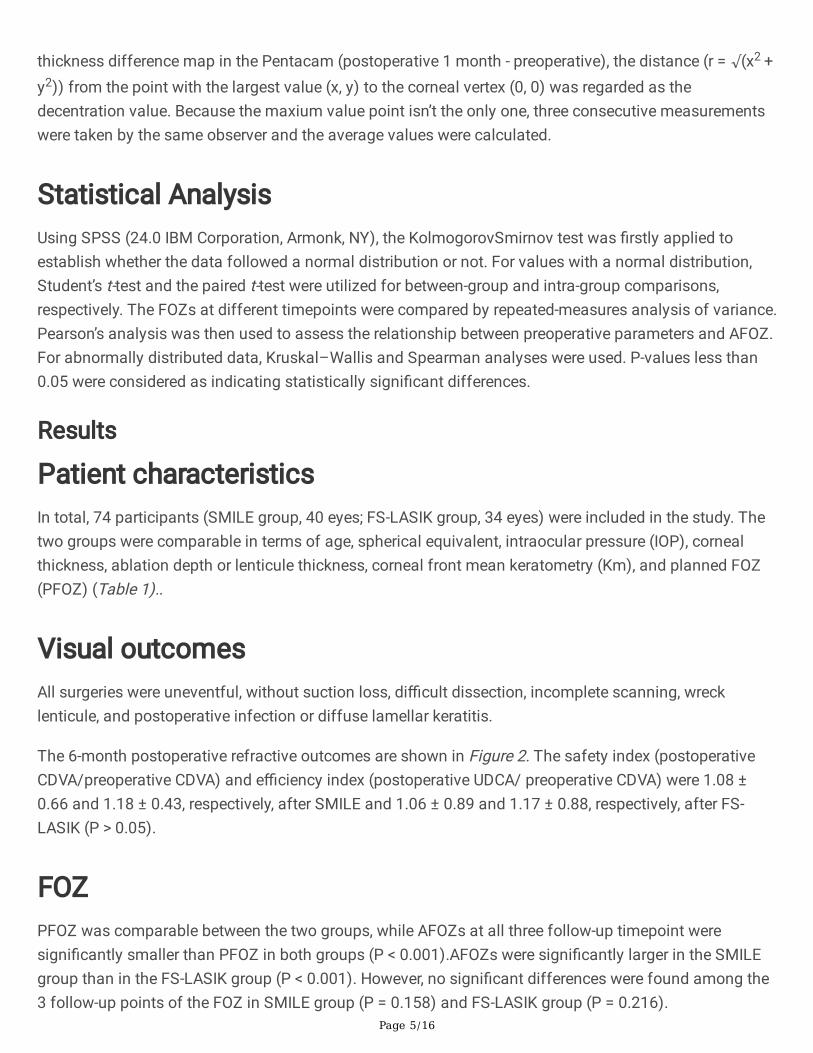
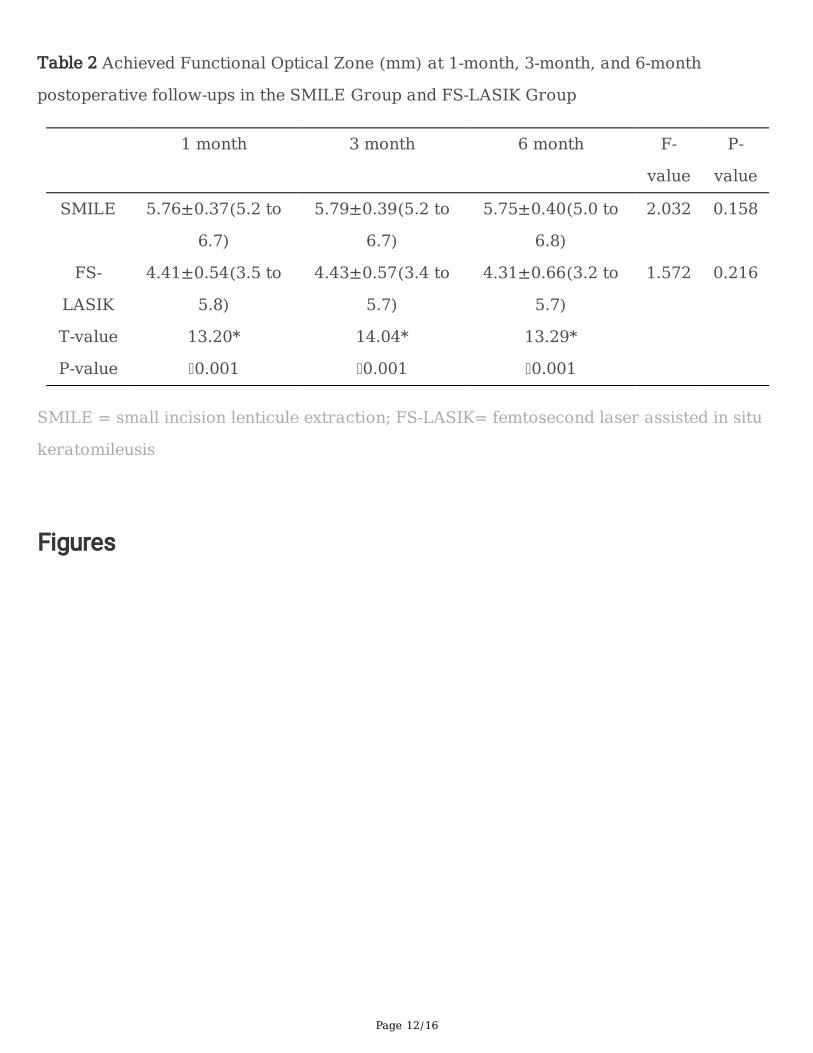
FOZPFOZ was comparable between the two groups, while AFOZs at all three follow-up timepoint weresigni�cantly smaller than PFOZ in both groups (P < 0.001).AFOZs were signi�cantly larger in the SMILEgroup than in the FS-LASIK group (P < 0.001). However, no signi�cant differences were found among the3 follow-up points of the FOZ in SMILE group (P = 0.158) and FS-LASIK group (P = 0.216).
Page 6/16
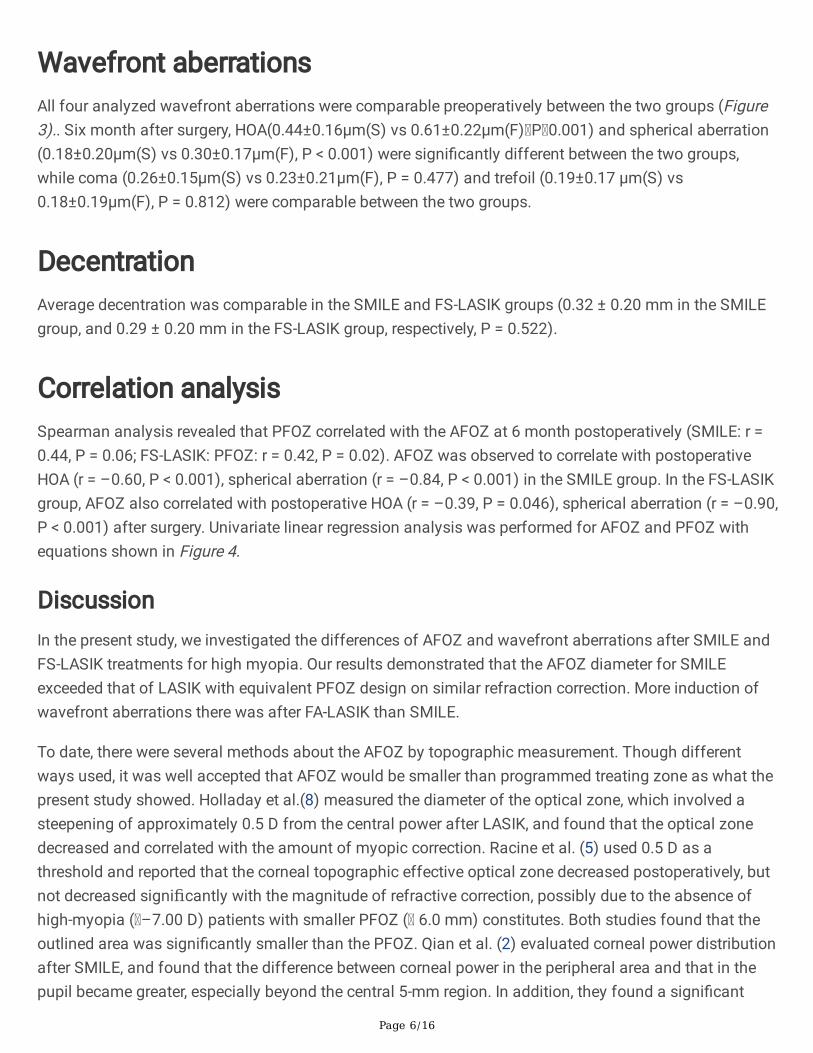
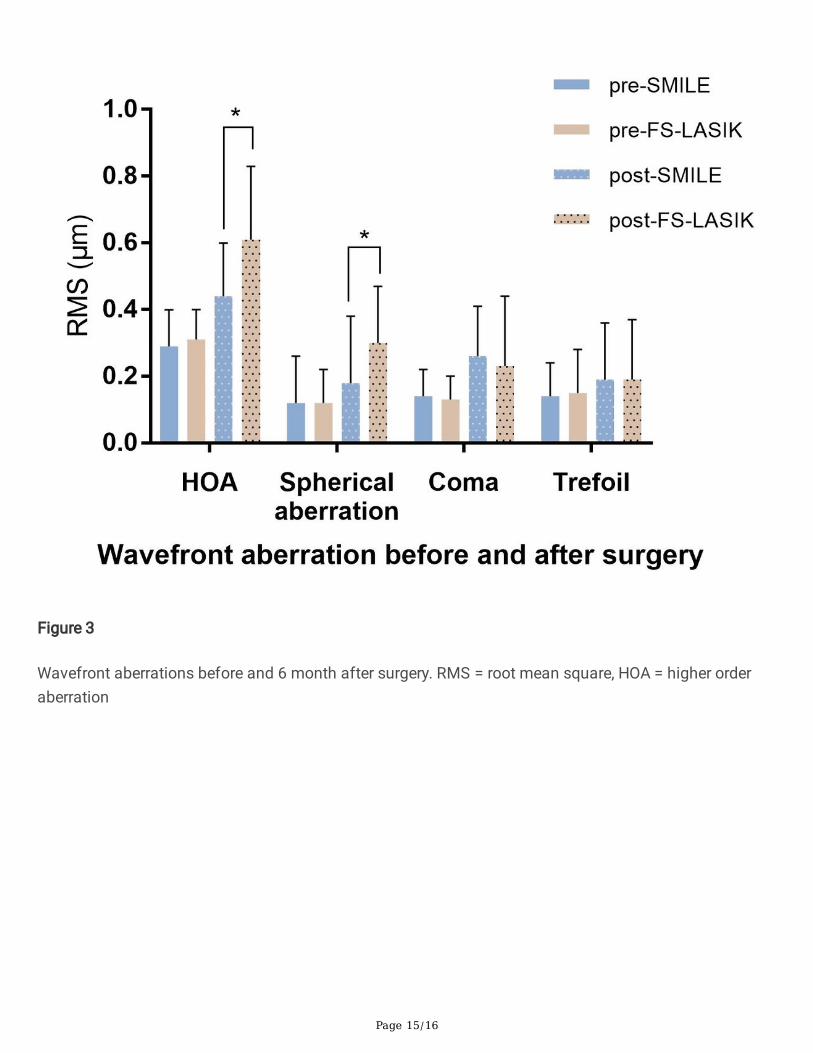
Wavefront aberrationsAll four analyzed wavefront aberrations were comparable preoperatively between the two groups (Figure3).. Six month after surgery, HOA(0.44±0.16μm(S) vs 0.61±0.22μm(F) P 0.001) and spherical aberration(0.18±0.20μm(S) vs 0.30±0.17μm(F), P < 0.001) were signi�cantly different between the two groups,while coma (0.26±0.15μm(S) vs 0.23±0.21μm(F), P = 0.477) and trefoil (0.19±0.17 μm(S) vs0.18±0.19μm(F), P = 0.812) were comparable between the two groups.
DecentrationAverage decentration was comparable in the SMILE and FS-LASIK groups (0.32 ± 0.20 mm in the SMILEgroup, and 0.29 ± 0.20 mm in the FS-LASIK group, respectively, P = 0.522).
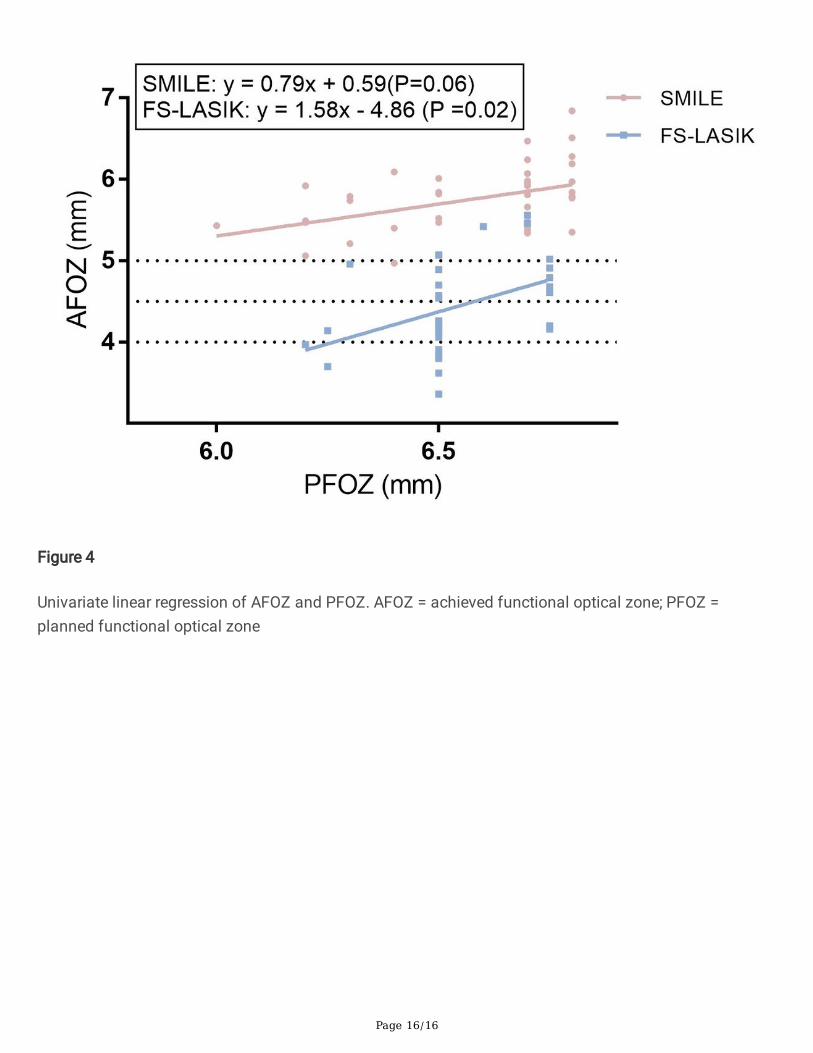
Correlation analysisSpearman analysis revealed that PFOZ correlated with the AFOZ at 6 month postoperatively (SMILE: r =0.44, P = 0.06; FS-LASIK: PFOZ: r = 0.42, P = 0.02). AFOZ was observed to correlate with postoperativeHOA (r = –0.60, P < 0.001), spherical aberration (r = –0.84, P < 0.001) in the SMILE group. In the FS-LASIKgroup, AFOZ also correlated with postoperative HOA (r = –0.39, P = 0.046), spherical aberration (r = –0.90,P < 0.001) after surgery. Univariate linear regression analysis was performed for AFOZ and PFOZ withequations shown in Figure 4.
DiscussionIn the present study, we investigated the differences of AFOZ and wavefront aberrations after SMILE andFS-LASIK treatments for high myopia. Our results demonstrated that the AFOZ diameter for SMILEexceeded that of LASIK with equivalent PFOZ design on similar refraction correction. More induction ofwavefront aberrations there was after FA-LASIK than SMILE.
To date, there were several methods about the AFOZ by topographic measurement. Though differentways used, it was well accepted that AFOZ would be smaller than programmed treating zone as what thepresent study showed. Holladay et al.(8) measured the diameter of the optical zone, which involved asteepening of approximately 0.5 D from the central power after LASIK, and found that the optical zonedecreased and correlated with the amount of myopic correction. Racine et al. (5) used 0.5 D as athreshold and reported that the corneal topographic effective optical zone decreased postoperatively, butnot decreased significantly with the magnitude of refractive correction, possibly due to the absence ofhigh-myopia ( –7.00 D) patients with smaller PFOZ ( 6.0 mm) constitutes. Both studies found that theoutlined area was signi�cantly smaller than the PFOZ. Qian et al. (2) evaluated corneal power distributionafter SMILE, and found that the difference between corneal power in the peripheral area and that in thepupil became greater, especially beyond the central 5-mm region. In addition, they found a signi�cant
Page 7/16
difference between attempted correction and changed total corneal power. Their study de�ned the FOZ asthe largest ring diameter when the difference between the ring power and the pupil center power was 1.50D or less, leading to the same conclusion in SMILE correction..
Besides, this study demonstrated SMILE would achieve larger AFOZ than FS-LASIK did on the premise ofidentical correction design. A possible reason for these �ndings may be the difference in the mechanismof tissue removal. The excimer laser changes the corneal shape by breaking down molecular bonds andablating corneal tissues. The region in which the excimer laser releases is distant from the cornea. Theexcimer laser is perpendicular to the corneal plane when ablating the central cornea, but it is at an angleto the corneal plane when ablating the peripheral cornea. Due to the curvature of the peripheral cornea,part of the energy will be re�ected by the cornea, leading to attenuation of the functional laser energy.(9)This effect is similar to the difference in heating effects produced by sunlight on the earth’s equator andon the hemispheres. The energy attenuation in the peripheral area reduces the amount of tissue actuallyablated and causes a corresponding reduction in the corrected diopter, so that the size of the centralcornea with good vision will be reduced. In SMILE, the femtosecond laser scans the corneal stroma twiceat different depths, thus isolate a lenticule with speci�c diopters. Then, the lenticule was extractedthrough a 2-mm incision, leading to a change in corneal shape.(4) In SMILE, the femtosecond laser islaunched closely to the corneal plane, such that there is no peripheral energy attenuation as occurred inFS-LASIK. Moreover, the shape of lenticule is determined by the scan depth, which is not related to theenergy value. Therefore, the distribution of corneal refractive power is not signi�cantly different and alarger area of the central cornea with good vision, de�ned as AFOZ in this study, can be achieved. Acontinuous observation was performed at three postoperative timepoints, but we found no signi�cantdifference in the AFOZs among 1 month, 3month and 6month after both two surgeries. This �nding wasconsistant with what Hou et al(10) reported, who outlined the zero diopter on the tangential curvaturedifference map as the rim of the effective optical zone measurement.
The present study also compared the wavefront aberrations at 6 month after high myopic correction bySMILE and FS-LASIK. Among the four analyzed wavefront aberrations components, HOA, sphericalaberration, and coma were signi�cantly increased in both groups. We also found that more HOA andspherical aberration were induced in FS-LASIK group than that in SMILE group. Our results agree with theresults reported by both Ganesh et al(11) and Lin et al(12), which suggested that SMILE might providebetter visual quality than FS-LASIK for high myopia. The curvature change of anterior corneal surface isthe mechanism for the corneal refractive suguries. However, these procedures change the anterior cornealsurface from a prolate shape to an oblate shape, increase corneal asphericity and, consequently, breakthe physiological ocular aberration state and cause induction of higher order aberrations. BothGyldenkerne et al(13) and Zhang et at(14) came to the same conclusion that SMILE preserves thephysiological corneal asphericity better than FS-LASIK does, which is related with the tissue removaldifference between excimer laser and femtosecond laser. Furthermore, the trasition zone and �apdesign(15, 16), corneal wound healing response and remodeling difference(17) may attribute to moreHOA induction in FS-LASIK. The increase in spherical aberration and coma is usually associated withtreatment decentration(13, 18). In current study, the decentration in the SMILE and FS-LASIK groups were
Page 8/16
comparable, suggesting that decentration has little effect on the conclusions of this study. Anotherimportant �nding was that the increase of higher order aberrations and spherical aberration werecorrelated with AFOZ for both SMILE and FS-LASIK procedures, which may provide potential insights intopredicting visual quality through AFOZ size.
The limitation of the present study is that it lacked other objective and subjective indicators, such ascontrast sensitivity and subjective questionnaire-based visual quality evaluation. Further studies thatcombine these approaches with visual quality assessment are warranted.
ConclusionIn conclusion, this study compared the corneal power distribution and wavefront aberration after SMILEand LASIK, and identi�ed that AFOZs are larger in SMILE group than FS-LASIK, which would beasscociated with better optical quality after surgery.
AbbreviationFOZ:Functional optical zone; SMILE:Small-incision lenticule extraction; FS-LASIK:Femtosecond laser-assisted in situ keratomileusis; PFOZ:Planned functional optical zone;AFOZ:Achieved functional opticalzone;HOA:Higher order aberrations; UDVA:Uncorrected distance visual acuity; CDVA:Corrected distancevisual acuity; TCRP:Total corneal refractive power; IOP:Intraocular pressure; Km:Corneal front meankeratometry
Declarations•Ethics approval and consent to participate
This study was approved by the Medical Ethics Committee of Eye, Ear, Nose and Throat Hospital, Fudanuniversity, and was carried out in accordance with the Declaration of Helsinki. Informed written consentwas obtained from all participants.
•Consent for publication
Written informed consent was obtained from the patients for publication of this study. Copies of thewritten consent are available for review by the Editor of this journal.
•Availability of data and material
The datasets during and/or analyzed during the current study available from the corresponding author onreasonable request.
•Competing interests
Page 9/16
No competing interests.
•Funding
No �nancial support was received for this submission.
•Authors’ contributions
XD and DF contribute equally for this study. XD conceived of the study and drafted the manuscript. DFcollected the data and helped in drafting and revising the manuscript.. MYL critically revised themanuscript.. LW performed the measurements. XTZ performed the surgery and critically revised themanuscript. ZQY conceived of the study and revised the manuscript. All authors read and approved the�nal manuscript.
•Acknowledgements
We would like to thank all the patients enrolled in our study for their understanding and cooperation.
References1.Tabernero J, Klyce SD, Sarver EJ, Artal P. Functional optical zone of the cornea. Investigativeophthalmology & visual science. 2007;48(3):1053–60.
2.Qian Y, Huang J, Zhou X, Hanna RB. Corneal Power Distribution and Functional Optical Zone FollowingSmall Incision Lenticule Extraction for Myopia. Journal of refractive surgery. 2015;31(8):532–8.
3.Moshirfar M, McCaughey MV, Reinstein DZ, Shah R, Santiago-Caban L, Fenzl CR. Small-incisionlenticule extraction. Journal of cataract and refractive surgery. 2015;41(3):652–65.
4.Lee JK, Chuck RS, Park CY. Femtosecond laser refractive surgery: small-incision lenticule extraction vs.femtosecond laser-assisted LASIK. Current opinion in ophthalmology. 2015;26(4):260–4.
5.Racine L, Wang L, Koch DD. Size of corneal topographic effective optical zone: comparison of standardand customized myopic laser in situ keratomileusis. American journal of ophthalmology.2006;142(2):227–32.
6.Nizam A, Waring GO, 3rd, Lynn MJ, Ward MA, Asbell PA, Balyeat HD, et al. Stability of refraction andvisual acuity during 5 years in eyes with simple myopia. The PERK Study Group. Refractive & cornealsurgery. 1992;8(6):439–47.
7.Lazaridis A, Droutsas K, Sekundo W. Topographic analysis of the centration of the treatment zone afterSMILE for myopia and comparison to FS-LASIK: subjective versus objective alignment. J Refract Surg.2014;30(10):680–6.
Page 10/16
8.Holladay JT, Janes JA. Topographic changes in corneal asphericity and effective optical zone afterlaser in situ keratomileusis. Journal of cataract and refractive surgery. 2002;28(6):942–7.
9.Kwon Y, Bott S. Postsurgery corneal asphericity and spherical aberration due to ablation e�ciencyreduction and corneal remodelling in refractive surgeries. Eye (London, England). 2009;23(9):1845–50.
10.Hou J, Wang Y, Lei Y, Zheng X. Comparison of effective optical zone after small-incision lenticuleextraction and femtosecond laser-assisted laser in situ keratomileusis for myopia. Journal of cataractand refractive surgery. 2018;44(10):1179–85.
11.Ganesh S, Gupta R. Comparison of visual and refractive outcomes following femtosecond laser-assisted lasik with smile in patients with myopia or myopic astigmatism. Journal of refractive surgery.2014;30(9):590–6.
12.Lin F, Xu Y, Yang Y. Comparison of the visual results after SMILE and femtosecond laser-assistedLASIK for myopia. Journal of refractive surgery. 2014;30(4):248–54.
13.Gyldenkerne A, Ivarsen A, Hjortdal JO. Comparison of corneal shape changes and aberrations inducedBy FS-LASIK and SMILE for myopia. Journal of refractive surgery. 2015;31(4):223–9.
14.Zhang H, Wang Y, Li H. Corneal Spherical Aberration and Corneal Asphericity after Small IncisionLenticule Extraction and Femtosecond Laser-Assisted LASIK. Journal of ophthalmology.2017;2017:4921090.
15.Ryu IH, Kim BJ, Lee JH, Kim SW. Comparison of Corneal Epithelial Remodeling After FemtosecondLaser-Assisted LASIK and Small Incision Lenticule Extraction (SMILE). Journal of refractive surgery.2017;33(4):250–6.
16.Fang L, Wang Y, He X. Theoretical analysis of wavefront aberration caused by treatment decentrationand transition zone after custom myopic laser refractive surgery. Journal of cataract and refractivesurgery. 2013;39(9):1336–47.
17.Dong Z, Zhou X, Wu J, Zhang Z, Li T, Zhou Z, et al. Small incision lenticule extraction (SMILE) andfemtosecond laser LASIK: comparison of corneal wound healing and in�ammation. The British journal ofophthalmology. 2014;98(2):263–9.
18.Li M, Zhao J, Miao H, Shen Y, Sun L, Tian M, et al. Mild decentration measured by a Scheimp�ugcamera and its impact on visual quality following SMILE in the early learning curve. Investigativeophthalmology & visual science. 2014;55(6):3886–92.
Tables
Table 1 Basic Data of Subjects Included in Study
Page 11/16
SMILE FS-LASIK T/c2 value
Patients (male) 40(18) 34(16) -
Age (years) 28 24-30 27 25-29 0.05*
Corneal thickness (μm) 545.74±30.90 545.90±26.75 0.20
Km (D) 43.64±0.92 43.60±1.69 1.03
IOP (mmHg) 16.69 ± 2.76 16.02 ± 2.51 1.09
Corrected spherical equivalent -7.51±0.81 -7.56±3.45 0.94
Planned functional optical zone(mm) 6.57±0.22 6.54±0.15 0.94
Ablation depth/lenticule thickness (μm) 132.36±14.00 134.89±15.24 -0.74
D = Diopter, Km = mean front corneal keratometry, IOP = Intraocular pressure, * Kruskal–
Wallis test, Student’s t test, all P values > 0.05.
Page 12/16
Table 2 Achieved Functional Optical Zone (mm) at 1-month, 3-month, and 6-month
postoperative follow-ups in the SMILE Group and FS-LASIK Group
1 month 3 month 6 month F-
value
P-
value
SMILE 5.76±0.37(5.2 to
6.7)
5.79±0.39(5.2 to
6.7)
5.75±0.40(5.0 to
6.8)
2.032 0.158
FS-
LASIK
4.41±0.54(3.5 to
5.8)
4.43±0.57(3.4 to
5.7)
4.31±0.66(3.2 to
5.7)
1.572 0.216
T-value 13.20* 14.04* 13.29*
P-value 0.001 0.001 0.001
SMILE = small incision lenticule extraction; FS-LASIK= femtosecond laser assisted in situ
keratomileusis
Figures

Page 13/16
Figure 1
An example of functional optical zone (FOZ) measurement

Page 14/16
Figure 2
Refractive outcomes. A. Uncorrected distance visual acuity after surgery; B. Changes in corrected distancevisual acuity; C. Predictability of attempted correction; D. Refractive astigmatism after surgery
Page 15/16
Figure 3
Wavefront aberrations before and 6 month after surgery. RMS = root mean square, HOA = higher orderaberration
Page 16/16
Figure 4
Univariate linear regression of AFOZ and PFOZ. AFOZ = achieved functional optical zone; PFOZ =planned functional optical zone