Functional Integration of Floral Plant Traits - bonndoc
257
1 Functional Integration of Floral Plant Traits: Shape and Symmetry, Optical Signal, Reward and Reproduction in the Angiosperm Flower Dissertation zur Erlangung des Doktorgrades (Dr. rer. nat.) der Mathematisch-Naturwissenschaftlichen Fakultät der Rheinischen Friedrich-Wilhelms-Universität Bonn vorgelegt von Andreas Wilhelm Mues aus Kirchhellen Bonn, den 20. Januar 2020
-
Upload
khangminh22 -
Category
Documents
-
view
1 -
download
0
Transcript of Functional Integration of Floral Plant Traits - bonndoc
1
Functional Integration of Floral Plant Traits:
Shape and Symmetry, Optical Signal,
Reward and Reproduction
in the Angiosperm Flower
Dissertation zur
Erlangung des Doktorgrades (Dr. rer. nat.)
der
Mathematisch-Naturwissenschaftlichen Fakultät
der
Rheinischen Friedrich-Wilhelms-Universität Bonn
vorgelegt von
Andreas Wilhelm Mues aus Kirchhellen
Bonn, den 20. Januar 2020

2
3
Angefertigt mit Genehmigung der Mathematisch-Naturwissenschaftlichen Fakultät
der Rheinischen Friedrich-Wilhelms-Universität Bonn
Erstgutachter: Prof. Dr. Maximilian Weigend, Universität Bonn
Zweitgutachter: Prof. Dr. Eberhard Fischer, Universität Koblenz
Tag der Promotion: 30. April 2020
Erscheinungsjahr: 2020

4

5
Acknowledgements
I thank Prof. Dr. Maximilian Weigend, supervisor, for his guidance and support, and for giving me the
opportunity to study the holistic subject of floral functional integration and plant-animal interaction.
I am grateful for the experience and for the research agendas he entrusted to me: Working with the
extensive Living Collections of Bonn Botanical Gardens was an honour, and I have learned a lot.
I thank Prof. Dr. Eberhard Fisher, for agreeing to be my second supervisor, his advice and our shared
passion for the plant world.
I would like to thank many people of the Nees Institute and Bonn Botanical Gardens who contributed to
this work and who gave me good memories of my years of study:
I thank Lisabeth Hoff, Tianjun Liu, Luisa Sophie Nicolin and Simon Brauwers for their contribution in
collecting shares of the raw data together with me, and for being eager students – especially counting
pollen and ovule numbers and measuring nectar reward was a test of patience sometimes, and we have
counted and measured a lot … Thank you!
Special thanks go to Gardeners of the Bonn Botanical Gardens, for their constant support throughout
the years, their love for the plant world in general and their commitment and care for the Living
Collection: Klaus Mahlberg (Streptocarpus), Birgit Emde (carnivorous plants), Klaus Bahr (Geraniales),
Bernd Reinken and Klaus Michael Neumann.
I thank Dr. Stefan Abrahamczyk and Dr. Federico Luebert for their support and valuable advice. I thank
my other colleagues and peers for their collegiality and for sharing a good time at the Nees Institute,
especially my roommates Dr. Bernadette Große-Veldmann and Dr. Rafael Acuña Castillo, and Dr. Julia
Bechteler, Tim Böhnert, Dr. Juliana Chacón, Hans-Jürgen Ensikatt, Dr. Jonathan Hense, Dr. Norbert
Holstein, Julius Jeiter, Thomas Joßberger, Sandro Kolbaia, Dr. Michael Krug, Karola Maul, Felix
Merklinger, Dr. Adeel Mustafa, Dr. Jens Mutke, Constantin Poretschkin, Nicole Schmandt, Claudia
Schütte, Amélie Tessartz and Dr. Lara Weiser. Special thanks go to Elke Hedke and Prof. Dr. Annette
Sheersoi for their support and for keeping up the good team spirit.
I thank my siblings Christian and Angelika and my brother-in-law Peter for their friendship, and I am
grateful for my parents Wilhelm and Sylvia, and their constant support throughout the years.

6
7
CONTENTS I. General Introduction ........................................................................................................................... 15
I.1 Foreword ..................................................................................................................................... 15
I.2 Organisation of pollen receipt and guidance .............................................................................. 16
I.2.1 Floral structure – morphology, architecture, symmetry and shapes ..................................... 16
I.2.2 Plant presentation traits – floral attractants and reward ....................................................... 18
I.3 Reproduction: Sexual systems, breeding systems, gamete production and p/o ratio ............... 23
I.4 Pollination syndromes, suites of floral plant traits and plant-animal interaction ...................... 24
I.5 Hypotheses ................................................................................................................................. 30
I.6 Goals ........................................................................................................................................... 30
I.6.1 Research Questions................................................................................................................. 30
I.6.2 Specific Objectives .................................................................................................................. 31
I.7 Overview of the Dissertation ...................................................................................................... 32
I.8 Contribution to Chapters ............................................................................................................ 33
I.9 Literature .................................................................................................................................... 36
II. Diversification of floral function in Geraniales – why so dapper? Breeding system related variables
not correlated to pollinator guilds and flower symmetry .......................................................................... 45
II.1 Abstract ....................................................................................................................................... 45
II.2 Introduction ................................................................................................................................ 46
II.3 Materials and Methods ............................................................................................................... 48
II.3.1 Assessment of gamete production and nectar reward ...................................................... 48
II.3.2 Level of measurement and Statistical Analysis ................................................................... 49
II.4 Results ......................................................................................................................................... 51
II.4.1 Pollinator guilds .................................................................................................................. 51
II.4.2 Flower symmetry ................................................................................................................ 51
II.4.3 Growth habit ....................................................................................................................... 52
II.4.4 Gamete production ............................................................................................................. 52
II.4.5 Nectar production ............................................................................................................... 55
II.4.6 NMDS ordinations and vector fitting .................................................................................. 57
II.4.7 Phylogenetic mapping of plant traits and pollinator guilds ................................................ 59
II.5 Discussion .................................................................................................................................... 60
II.5.1 Missing resource efficacy despite pollinator positioning via flower symmetry ................. 60
8
II.5.2 Pollinator guilds correlate with nectar, but not with variables of the breeding system .... 61
II.5.3 Pollinator guilds and plant traits are phylogenetically constraint ...................................... 62
II.6 Acknowledgments ....................................................................................................................... 63
II.7 Literature .................................................................................................................................... 63
III. Frost flowers – Pollination syndromes of Hamamelidaceae independent from flowering time ....... 69
III.1 Abstract ....................................................................................................................................... 69
III.2 Introduction ................................................................................................................................ 70
III.3 Materials and Methods ............................................................................................................... 72
III.3.1 Assessment of inflorescence and flower morphology ........................................................ 72
III.3.2 Assessment of pollen production, ovule numbers and p/o ratios ...................................... 73
III.3.3 Assessment of inflorescence size ........................................................................................ 74
III.3.4 Assessment of UV light patterns ......................................................................................... 74
III.3.5 Assessment of nectar reward ............................................................................................. 74
III.3.6 Cryo-Scanning Electron Microscopy (CSEM) ....................................................................... 75
III.3.7 Phylogenetic Analysis .......................................................................................................... 75
III.3.8 Statistical Analysis ............................................................................................................... 75
III.4 Results ......................................................................................................................................... 77
III.4.1 Clustering of gametic variables retrieves two clusters ....................................................... 77
III.4.2 Clustering of non-gametic variables retrieves three clusters ............................................. 80
III.4.3 Reciprocal NMDS ordinations and vector fitting reveal high integration ........................... 82
III.4.4 Floral function and flowering time are separated .............................................................. 84
III.4.5 Retrieved clusters evolved more than once and show a strong phylogenetic signal ......... 85
III.5 Discussion .................................................................................................................................... 87
III.5.1 Retrieved clusters of floral function are highly indicative for pollination syndromes ........ 87
III.5.2 Five to six independent origins of zoophily in Hamamelidaceae........................................ 88
III.5.3 Ambophily evolved early – arguing against an ephemeral transitional stage .................... 89
III.5.4 Flowering at the fringe of the growth season evolved disjunct from pollination syndromes,
and at least three times in Hamamelidaceae ..................................................................................... 90
III.6 Acknowledgements ..................................................................................................................... 90
III.7 Literature .................................................................................................................................... 90
IV. No indication of a pollinator-prey conflict in floral functional traits of carnivorous plants of the
active flypaper type – Pinguicula (Lentibulariaceae) and Drosera (Droseraceae) ..................................... 95
9
IV.1 Abstract ....................................................................................................................................... 95
IV.2 Introduction ................................................................................................................................ 96
IV.3 Materials and Methods ............................................................................................................... 99
IV.3.1 Assessment of floral plant traits ....................................................................................... 100
IV.3.2 Statistical Analysis ............................................................................................................. 101
IV.4 Results ....................................................................................................................................... 102
IV.4.1 Optical signal ..................................................................................................................... 102
IV.4.2 Nectar reward ................................................................................................................... 103
IV.4.3 Flower morphology, symmetry, pollen presentation and aggregation ............................ 104
IV.4.4 Gamete production and PDU/ovule ratios ....................................................................... 105
IV.4.5 Breeding systems .............................................................................................................. 105
IV.4.6 Interplay of floral functional traits .................................................................................... 107
IV.4.7 Group comparisons for pollen presentation strategies and breeding systems ................ 110
IV.5 Discussion .................................................................................................................................. 112
IV.5.1 Optical flower signal is crucial for sorting of pollinator and prey taxa ............................. 112
IV.5.2 Functional integration of flower traits and reported pollinators ..................................... 112
IV.5.3 Equally efficient: Zygomorphy in Pinguicula and pollen tetrads in Droseraceae ............. 113
IV.5.4 Autogamy as reproductive assurance mechanism in Droseraceae .................................. 114
IV.5.5 Generally low p/o ratios indicate missing pollinator-prey conflict ................................... 114
IV.6 Acknowledgements ................................................................................................................... 115
IV.7 Literature .................................................................................................................................. 115
V. Plasticity of flower traits in Streptocarpus: Floral architecture, optical signal, nectar reward and
reproductive system largely disjunct and evolutionary recombined ....................................................... 121
V.1 Abstract ..................................................................................................................................... 121
V.2 Introduction .............................................................................................................................. 122
V.3 Materials and Methods ............................................................................................................. 125
V.3.1 Floral types ........................................................................................................................ 125
V.3.2 Assessment of plant traits ................................................................................................. 125
V.3.3 Phylogenetic Analysis ........................................................................................................ 127
V.3.4 Statistical Analysis ............................................................................................................. 127
V.4 Results ....................................................................................................................................... 129
V.4.1 Floral architecture ............................................................................................................. 129
10
V.4.2 Optical signal ..................................................................................................................... 130
V.4.3 Nectar reward ................................................................................................................... 135
V.4.4 Gamete production ........................................................................................................... 136
V.4.5 Growth habit, life cycle, habitat preference and breeding system .................................. 137
V.4.6 Reciprocal NMDS ordinations and vector fitting of trait subsets ..................................... 138
V.4.7 Phylogenetic pattern of floral functional traits and flower types .................................... 140
V.5 Discussion .................................................................................................................................. 141
V.5.1 Floral types reported for Streptocarpus only correlate to floral architecture .................. 141
V.5.2 Floral traits are largely uncorrelated ................................................................................ 141
V.5.3 Floral traits show almost free recombination along the course of evolution .................. 143
V.5.4 Floral plasticity and pollinator-driven speciation ............................................................. 143
V.6 Acknowledgments ..................................................................................................................... 144
V.7 Literature .................................................................................................................................. 144
VI. Vigorous hybrid seed set between three closely related species of Streptocarpus subgenus
Streptocarpus indicate postzygotic barriers of no relevance for reproductive isolation ......................... 151
VI.1 Abstract ..................................................................................................................................... 151
VI.2 Introduction .............................................................................................................................. 151
VI.3 Materials and Methods ............................................................................................................. 153
VI.3.1 Seed Count ........................................................................................................................ 154
VI.3.2 Statistical Analysis ............................................................................................................. 154
VI.4 Results ....................................................................................................................................... 156
VI.5 Discussion .................................................................................................................................. 160
VI.6 Acknowledgements ................................................................................................................... 160
VI.7 Literature .................................................................................................................................. 161
VII. Functional floral architecture, optical signal and nectar reward in Streptocarpus hybrids, allowing
for homoploid hybrid speciation .............................................................................................................. 163
VII.1 Abstract ..................................................................................................................................... 163
VII.2 Introduction .............................................................................................................................. 164
VII.3 Materials and Methods ............................................................................................................. 166
VII.3.1 Crossing procedures .......................................................................................................... 166
VII.3.2 Assessment of floral plant traits ....................................................................................... 166
VII.3.3 Assessment of instability of floral architecture and nectar reward ................................. 167
11
VII.3.4 Statistical Analysis ............................................................................................................. 168
VII.4 Results ....................................................................................................................................... 169
VII.4.1 Crossability ........................................................................................................................ 169
VII.4.2 Optical flower signal.......................................................................................................... 170
VII.4.3 Floral architecture ............................................................................................................. 175
VII.4.4 Nectar reward ................................................................................................................... 178
VII.5 Discussion .................................................................................................................................. 182
VII.5.1 Hybridisation is achieved with ease in Streptocarpus subgenus Streptocarpus ............... 182
VII.5.2 Fully functional F1 hybrids allow for homoploid hybrid speciation .................................. 183
VII.6 Acknowledgments ..................................................................................................................... 184
VII.7 Literature .................................................................................................................................. 184
VIII. General Conclusions .......................................................................................................................... 187
VIII.1 Major results ......................................................................................................................... 187
VIII.2 Intercorrelation of floral plant traits: Breeding system is disjunct ....................................... 188
VIII.3 Heredity and gene flow between pollination syndromes..................................................... 189
VIII.4 Phylogenetic constraints and syndrome evolution .............................................................. 190
VIII.5 Outlook.................................................................................................................................. 191
VIII.6 Literature............................................................................................................................... 191
IX. Summary ........................................................................................................................................... 193
X. Appendices ........................................................................................................................................ 195
X.1 Appendix to chapter II............................................................................................................... 196
X.2 Appendix to chapter III.............................................................................................................. 204
X.3 Appendix to chapter IV ............................................................................................................. 220
X.4 Appendix to Chapter V .............................................................................................................. 227
X.5 Appendix to Chapter VI ............................................................................................................. 240
X.6 Appendix to Chapter VII ............................................................................................................ 244
XI. Curriculum Vitae ............................................................................................................................... 257
12
List of Tables Table I.1: Preferred nectar concentrations of pollinator taxa ..................................................................................... 22
Table I.2: Pollen to ovule ratios as indicator of breeding systems .............................................................................. 24
Table I.3: Overview of reported pollination syndromes, and floral plant traits associated with them ....................... 28
Table III.1: Vector fitting of non-gametic variables onto gametic ordination of Geraniales ....................................... 84
Table III.2: Vector fitting of gametic variables onto non-gametic NMDS ordination of Geraniales ............................ 84
Table IV.1: Correlations between analysed variables of Droseraceae ...................................................................... 107
Table IV.2: Correlations between analysed variables of Pinguicula .......................................................................... 109
Table V.1: display size measurements of Streptocarpus species ............................................................................... 129
Table V.2: Categorisation of optical flower signal of Streptocarpus species ............................................................. 131
Table V.3: Nectar reward measurements of Streptocarpus species.......................................................................... 135
Table V.4: Pollen and ovule production as well as p/o ratio of Streptocarpus species ............................................. 136
Table V.5: Breeding systems of Streptocarpus species .............................................................................................. 137
Table VI.1: Seed set, fruit length and ripening time of S. johannis, S. rexii, S. roseoalbus and hybrid offspring ....... 157
Table VI.2: Final GEE Model for seed set of S. johannis, S. rexii, S. roseoalbus and hybrid offspring ........................ 159
Table VII.1: Overview of optical flower signal of nine Streptocarpus species and forty hybrids ............................... 174
Supplementary Tables Table A X.1.1: Data bandwidth of floral morphology, life cycle and growth habit of Geraniales species ................. 196
Table A X.1.2: Data bandwidth of pollen and ovule production and p/o ratio of Geraniales species ....................... 197
Table A X.1.3: Data bandwidth of nectar reward of Geraniales species ................................................................... 198
Table A X.1.4: Overview of flower visitors and functional pollinator guilds for the Geraniales species analysed .... 200
Table A X.1.5: Accession and voucher numbers for Geraniales species .................................................................... 203
Table A X.2.1: Data bandwidth of gamete production in Hamamelidaceae ............................................................. 205
Table A X.2.2: Composition and size of inflorescences and size of reproductive organs in Hamamelidaceae ......... 206
Table A X.2.3: Measurements of perianth organs and flower signal of Hamamelidaceae ........................................ 207
Table A X.2.4: Nectar production of Hamamelidaceae species ................................................................................. 209
Table A X.2.5: Classification of flowering time for Hamamelidaceae species ........................................................... 211
Table A X.2.6: Correlations between ratio scaled and ordinal variables of Hamamelidaceae .................................. 216
Table A X.2.7: GenBank accession numbers for outgroup species ............................................................................ 217
Table A X.2.8: Analysis of phylogenetic signal for Hamamelidaceae species ............................................................ 218
Table A X.2.9: Accession and voucher numbers for analysed Hamamelidaceae....................................................... 219
Table A X.3.1: Data bandwidth of morphological variables of Droseraceae and Pinguicula ..................................... 220
Table A X.3.2: Categorisation of optical flower and leaf signal of Droseraceae and Pinguicula ............................... 221
Table A X.3.3: Data bandwidth of nectar reward of Droseraceae and Pinguicula .................................................... 222
Table A X.3.4: Data bandwidth of gamete production of Droseraceae and Pinguicula ............................................ 223
Table A X.3.5: Breeding systems of Droseraceae and Pinguicula .............................................................................. 225
Table A X.3.6: Accession numbers for Droseraceae and Pinguicula .......................................................................... 226
Table A X.4.1: Data bandwidth of floral architecture for Streptocarpus species ...................................................... 228
Table A X.4.2: Kendalls´s τb correlations for floral architecture of Streptocarpus ..................................................... 229
Table A X.4.3: Distribution, habitat, source, life cycle and growth habit of analysed Streptocarpus species ........... 230
Table A X.4.4: Vector fitting for NMDS of gamete production of Streptocarpus species .......................................... 236
Table A X.4.5: Vector fitting for NMDS of nectar reward of Streptocarpus species .................................................. 236
Table A X.4.6: Vector fitting for NMDS of optical flower signal of Streptocarpus species ........................................ 237
Table A X.4.7: Vector fitting for NMDS of floral architecture of Streptocarpus species ............................................ 238
13
Table A X.4.8: GenBank accession numbers for analysed Streptocarpus species ..................................................... 238
Table A X.4.9: Accession and voucher numbers for analysed Streptocarpus species ............................................... 239
Table A X.5.1: Intercept-Only Model for seed set of Streptocarpus species and hybrids ......................................... 240
Table A X.5.2: Covariate Interaction Model for seed set of Streptocarpus species and hybrids ............................... 240
Table A X.5.3: Complete GEE Model for seed set of Streptocarpus species and hybrids .......................................... 242
Table A X.6.1: Data bandwidth of frontal and lateral display size for Streptocarpus species and hybrids ................ 244
Table A X.6.2: Data bandwidth of floral architecture for Streptocarpus species and hybrids ................................... 245
Table A X.6.3: Coefficients of variation for floral architecture of Streptocarpus species and hybrids ...................... 247
Table A X.6.4: Data bandwidth of nectar reward for Streptocarpus species and hybrids ......................................... 249
Table A X.6.5: Coefficients of variation for nectar reward of Streptocarpus species and hybrids ............................ 251
Table A X.6.6: Accession and voucher numbers for Streptocarpus species and hybrids ........................................... 256
List of Figures Figure I.1: Flower signals and animal behaviour ......................................................................................................... 20
Figure I.2: Making the invisible visible – UV light pattern ........................................................................................... 20
Figure I.3: Depictions of selected pollination syndromes and pollen vectors ............................................................. 29
Figure II.1: Shape, symmetry and colour signal of Geraniales flowers ........................................................................ 53
Figure II.2: Data bandwidth of gamete production and nectar reward in Geraniales ................................................. 54
Figure II.3: NMDS Ordinations for gamete production and nectar reward ................................................................. 58
Figure II.4: Phylogenetic mapping of plant traits and pollinator guilds of Geraniales ................................................ 60
Figure III.1: Winter flowering Hamamelidaceae in Bonn Botanical Garden ................................................................ 70
Figure III.2: Hamamelidaceae, depictions of inflorescences – I ................................................................................... 78
Figure III.3: Hamamelidaceae, depictions of inflorescences – II .................................................................................. 79
Figure III.4: Reciprocal NMDS and vector fitting of gametic and non-gametic datasets of Hamamelidaceae ............ 83
Figure III.5: NMDS of gametic and non-gametic datasets combined, and visualisation of flowering time ................. 85
Figure III.6: ETS-ITS Maximum Likelihood Tree for Hamamelidaceae ......................................................................... 86
Figure IV.1: Depictions of plant-animal interactions in Droseraceae and Pinguicula.................................................. 96
Figure IV.2: Floral symmetry and optical signal in daylight spectrum and UV light for flowers and trap leaves ...... 104
Figure IV.3: SEM pictures of reproductive flower organs and pollen material ......................................................... 106
Figure IV.4: Group comparisons for pollen presentation strategies and breeding systems ..................................... 111
Figure V.1: Depicitions of flower types and growth habits of selected Streptocarpus species ................................. 123
Figure V.2: Close-up of Streptocarpus flowers, architecture and signal – I ............................................................... 132
Figure V.3: Close-up of Streptocarpus flowers, architecture and signal – II .............................................................. 133
Figure V.4: Close-up of Streptocarpus flowers, architecture and signal – III ............................................................. 134
Figure V.5: Reciprocal NMDS ordinations and vector fitting of analysed trait subsets ............................................. 138
Figure V.6: Phylogeny of Streptocarpus species and mapping of floral functional traits and flower types .............. 140
Figure VI.1: Distribution of Streptocarpus johannis, S. rexii and S. roseoalbus in South Africa ................................. 153
Figure VI.2: Crossing plan for S. johannis, S. rexii and S. roseoalbus and depiction of the resulting F1 .................... 156
Figure VII.1: Streptocarpus crossing grid and siring success for crosspollination, allogamy and geitonogamy ........ 169
Figure VII.2: Floral architecture and colour signal in visible light spectrum of species and hybrids ......................... 171
Figure VII.3: Floral UV signal of species and hybrids, after 1 sec. UV light exposure ................................................ 173
Figure VII.4: Results of NMDS ordination and hierarchical clustering of floral architecture ..................................... 177
Figure VII.5: Data bandwidth of nectar reward of nine Streptocarpus species and forty hybrids ............................ 180
Figure VII.6: Results of NMDS ordination and hierarchical clustering of nectar reward ........................................... 181
14
Supplementary Figures Figure A X.1.1: Cluster selection and hierarchical clustering of nectar and gamete production in Geraniales......... 199
Figure A X.2.1: Flower visitors of Hamamelidaceae in Bonn University Botanical Gardens ...................................... 204
Figure A X.2.2: UV light signal of Hamamelidaceae flowers and inflorescences ....................................................... 208
Figure A X.2.3: CSEM pictures of Hamamelidaceae flowers and presence of nectar ................................................ 210
Figure A X.2.4: Selection of clusters for datasets of Hamamelidaceae ..................................................................... 214
Figure A X.2.5: Hierarchical clustering of Hamamelidaceae datasets ....................................................................... 215
Figure A X.2.6: cpDNA Maximum Likelihood Tree for Hamamelidaceae .................................................................. 217
Figure A X.4.1: Optical signal of Streptocarpus leaves in daylight and UV light ........................................................ 227
Figure A X.4.2: Selection of clusters (gamete production, floral architecture, reward) for Streptocarpus ............... 232
Figure A X.4.3: Hierarchical clustering (gametes, reward, optical signal, floral architecture) for Streptocarpus ...... 233
Figure A X.4.4: Selection of clusters and hierarchical clustering with all Streptocarpus datasets analysed at once . 234
Figure A X.4.5: NMDS for all datasets of Streptocarpus analysed at once ................................................................ 235
Figure A X.6.1: Selection of clusters (floral architecture, reward) for Streptocarpus species and hybrids ............... 253
Figure A X.6.2: Hierarchical clustering (floral architecture, reward) for Streptocarpus species and hybrids ............ 254
Figure A X.6.3: Hierarchical clustering (optical flower signal) for Streptocarpus species and hybrids ...................... 255
I. General Introduction
15
I. GENERAL INTRODUCTION I. General Introduction
I.1 FOREWORD
Flowering plants comprise probably about 450,000 extant species worldwide (Pimm and Joppa, 2015;
Joppa et al., 2011). Round about a third of them is at risk of extinction, and they are going extinct at least
1,000 times the pre-human background extinction rate (Pimm and Joppa, 2015), comparable to
estimations on vertebrate extinction: The accelerated, human-induced loss of biodiversity is already
labelled as the 6th mass extinction (Ceballos et al., 2015). Mankind’s role in this process and its
responsibility to find a solution to it are understood and expressed univocally by the world´s nations
since the first Earth summit 1992 in Rio de Janeiro. Cardinale et al. (2012) conclude on basis of two
decades of scientific research that biodiversity loss has an alarming impact on ecosystem functions:
Biodiversity loss decreases the stability of ecosystem functions and diminishes the spectrum of
functional traits of organisms that constitute these functions.
A key ecosystem function is pollination, provided by the organisms involved, their functional traits and
plant-pollinator as well as plant-environment interactions. The 2016 IPBES assessment on pollinators,
pollination and food production states: Approximately 90 % of wild flowering plants depend at least to
some extent on animal pollination. 75 % of food crops also depend on animal pollination, with an
estimated annual market value of global crop production of $235 billion – $577 billion directly
attributable to pollinators (2015, US $: IPBES, 2016; Lautenbach et al., 2012). Diversity of wild animal
pollinators is critical to crop pollination, even when pollinators such as honeybees are managed by
humans: The majority of pollinator species are wild. Where Red List assessments are available, they
show high levels of threat for pollinators, i.e. often more than 40 % of wild bee species may be
threatened. Plant-pollinator interactions contribute to many other economic and social values beside
crop pollination, such as medicine, production of biofuels, fibres or construction materials, and also to
cultural values and good quality of human life: They contribute to education and recreation, are a source
of inspiration, i.e. for art, music, science and religion, are symbols of identity and constitute a globally
significant heritage (cf. IPBES, 2016). The basis for this ecosystem service and the interface for plant-
pollinator interactions is the angiosperm flower.
However: What is a flower?
Flowers fascinate mankind. We use them to celebrate important events, please our senses and express
love (cf. Buchmann, 2015). From a biological perspective, flowers are, in essence, the sex organs of
angiosperms – specialised structures that secure reproduction, predominantly via outcrossing (cf.
Willmer, 2011; Buchmann, 2015). In order to secure reproduction, flowers rely on abiotic (wind, water)
or biotic pollen vectors (animal taxa). Probably between 130,000 and 300,000 animal taxa are regular
flower visitors, and at least 25,000 species of bees are obligate flower visitors (Willmer, 2011, citing
Buchmann and Nabhan, 1996; Kearns et al., 1998). From an evolutionary perspective, flowers are a key
innovation: Offering food to animal visitors in the form of pollen or nectar is a key mutualism that
secures sexual reproduction of plants, and is hypothesised to have caused rapid speciation in early
angiosperm evolution (Lunau, 2000; Pellmyr, 1992; Willmer, 2011, citing Dodd et al., 1999, and Kay et al.,
2006). Diversification and establishment of major angiosperm lineages synchronously took place 135–
I. General Introduction
16
130 million years ago (Magallón et al., 2015). The common ancestor of all seed plants, angiosperms and
gymnosperms, originated much earlier, likely 310-350 Ma ago (Sauquet et al., 2017, citing Doyle, 2012,
and Magallón et al., 2013).
Main objective of this dissertation is to contribute to better understanding of the functional aspects of
angiosperm flowers and their interplay, constituting the basis for successful plant-pollinator and plant-
environment interactions and siring success:
In its core functions, flowers produce pollen grains, the male gametophytes, dispense them, organise the
receipt of incoming pollen and guide their genetic material to the ovules, which contain the female
gametophytes (cf. Willmer, 2011). Organisation of pollen receipt and guidance can be divided into
aspects of mechanical fit between floral structures and pollen vectors (realised via floral morphology,
architecture and symmetry), see section I 2.1 of this introduction, as well as plant presentation traits
(Willmer, 2011, citing Thomson, 1983), see section I 2.2. Plant presentation traits are introduced with
focus on pollinator attraction and optical flower signal (I 2.2.1), as well as reward (I 2.2.2). Basic
parameters of reproduction in angiosperms, such as sexual systems, pollen and ovule production, the
relevance of the pollen to ovule ratio and its correlation to breeding systems, are introduced in section
I 3. In section I 4 the concept of pollination syndromes is presented, which offers an integrated view of
floral structure, attraction, reward and parameters of reproduction: Pollination syndromes are groups of
floral phenotypes that reflect specialisation towards pollen vectors. Afterwards specific hypotheses (I 5)
and goals (I 6) of this work are presented, an overview of the dissertation (I 7) is given and the author’s
contributions to the chapters (I 8) are listed.
I.2 ORGANISATION OF POLLEN RECEIPT AND GUIDANCE
In the following, floral strategies of pollen receipt and guidance are described separately for aspects of
mechanical fit between floral structures and pollen vectors (section I 2.1), as well as for plant
presentation traits, flower signal and reward (section I 2.2).
I.2.1 FLORAL STRUCTURE – MORPHOLOGY, ARCHITECTURE, SYMMETRY AND SHAPES
Floral structure can be described by four fundamental morphological components that are present in
most flowers, but can vary strongly between species. These components are arranged from outer to
inner as sepals, petals, stamens and carpels (cf. Willmer, 2011):
Sepals and petals (tepals, if undifferentiated) form the perianth. Sepals as the outermost structure and
protect the inner, sexual flower organs. Petals also have protective function, but often play an important
role in pollinator attraction, i.e. due to distinctive colour. Sepals can also be of importance for pollinator
attraction in some species.
The stamens are the male sexual flower organs, in sum called the androecium. Each stamen is formed of
a filament that bears the anther as its apical end. The anther itself contains the male gametophytes or
pollen grains.
Carpels are the female organs in the centre of a flower that contain the ovules, in sum called the
gynoecium. One or several carpels constitute the pistil, the female reproductive structure. A flower can
bear one or more pistils. In general, pistils can be described by three components: The stigma is the
apical and pollen-receptive part, sometimes on tip of a style that connects to the ovary, which contains
the ovules.
I. General Introduction
17
Male and female flower organs come in very different shapes and colours and can therefore serve
additional roles, i.e. as visual or olfactory attractants.
Diversity of flower shapes in angiosperms is realised on two structural levels: While variation in floral
morphology addresses changes in the arrangement and number of floral organs, variation of floral
architecture addresses the modification of floral organs (Jeiter et al., 2017; Jeiter and Weigend, 2018) via
synorganisation, fusion and differential growth rates (Endress, 1996).
Flower symmetry is a key trait in angiosperm flower structure (Endress, 1996, 1999). It is caused by
repetitions of structural units, which are assessed in relation to the principal axis of the flower (Neal et
al., 1998). Four types of flower symmetry are usually distinguished, namely "asymmetric" (without any
symmetry plane), "monosymmetric" or "zygomorphic" (also called "bilateral", one symmetry plane),
"disymmetric" (two symmetry planes) and "actinomorphic" (also called "polysymmetric" or "radially
symmetric", with several symmetry planes). Actinomorphic and zygomorphic flower symmetry are the
most common types.
Many hypotheses try to explain the role of flower symmetry for plant-pollinator interactions. Neal et al.
(1998) present four major categories: (a) environmental conditions (i.e. protection from rain etc.), (b)
perception by the pollinators, (c) information processing (i.e. learning abilities and innate preferences) by
pollinators, and (d) activity patterns (i.e., behaviour and movement of pollinators) controlled by flower
symmetry.
Plant-animal interactions related to symmetry patterns are commonly understood as a driving force in
evolution and species diversification (Endress, 1999). Actinomorphy is considered to be ancestral in
angiosperms (Endress, 2011; Reyes et al., 2016). Fossil records indicate a relatively late origin of
zygomorphy in angiosperm evolution, dating back to the upper Cretaceous (Crepet, 1996; Endress,
1999). Amongst the basal magnoliids zygomorphic flowers are absent, and only seldom to find among
basal eudicots. They are much more common and represented in larger groups among rosids and
asterids, however (Endress, 1999; Reyes et al., 2016). The occurrence of zygomorpic flowers in the upper
Cretaceous is often interpreted as a selective advantage due to pollinator preference and/or fostered
pollen economy and precise pollen placement, coinciding with the appearance of bees round about 123
million years ago (Cardinal and Danforth, 2013; Reyes et al., 2016). Contrary to this, actinomorphic
flowers offer approach and landing of potential pollinators as well as reward from every direction (cf.
Endress, 1999; Willmer, 2011).
Reyes et al. (2016) showed in their reconstruction of floral symmetry evolution a minimum of 130 origins
of zygomorphy in angiosperms, almost double the amount of previous estimations, and 69 reversals to
actinomorphy. The authors conclude selective advantages of this symmetry type in some circumstances,
but not in others, due to the absence of zygomorphy in basal angiosperms and its uneven distribution in
clades in which it is present.
Beyond floral symmetry, specific floral shapes are described in botany in order to treat the arrangement
of floral organs, floral morphology and floral architecture in a holistic way, in example (cf. Willmer,
2011):
I. General Introduction
18
Open disk or bowl flowers are the simplest and most common flower shape, allowing free access for
most flower visitors. The petals display a flattened disk when the flower is fully opened, or form a bowl
when remaining in a more erect orientation.
Tubular or funnel-shaped flowers are characterised by elongated perianths, which are at least fused at
their base to form the tube. Nectar reward is concealed by this flower type, and can only be accessed
with suiting mouthparts. Tubular flowers can show actinomorphic as well as zygomorphic flower
symmetry. The later do control pollinators more strongly by their build-up, nototribic pollen position and
usually also by consistent orientation of flowers on the plant.
Trumped-shaped and bell-shaped flowers are a variation of actinomorphic, funnel-shaped flowers: The
tube is more open and allows pollinators to enter the flower with their whole body. Sexual flower organs
are usually arranged at the centre.
Spherical or urceolate flowers have a narrow mouth and are also contracted at the base, while the
corolla in between widens out.
Many other flower shapes are described in botany, and arrangement of floral structures does not stop at
the individual flower level: In many species flowers are grouped in inflorescences. Some reproductive
structures of plants are called flowers, but are actually inflorescences, i.e. composite flowers of
Asteraceae, or brush blossoms (headed inflorescences with elongated stamens constituting the "brush").
Flower shapes and inflorescence structures are presented in more detail in the following chapters of this
thesis, if necessary.
I.2.2 PLANT PRESENTATION TRAITS – FLORAL ATTRACTANTS AND REWARD
Animal-pollinated plants show plant presentation traits that secure successful interaction with animal
taxa. Plant presentation traits can be divided into floral attractants and rewards (Willmer, 2011, citing
Thomson, 1983).
Floral attractants comprise various stimuli for the sensory systems of animal taxa in order to draw them
to the flower. Floral rewards go beyond attraction and satisfy substantial needs of the flower visitors, like
nutritional needs, in order to ensure repeated visitation and therefore pollination (Dafni, 2005).
I.2.2.1 FLORAL ATTRACTANTS
Flowers address the sensory systems of potential pollen vectors in medium or even long distance via
attractants. Olfactory signals are very successful to this end, but are not further analysed here.
Advertising signals in focus of this thesis are visual flower cues.
Flower shape and size are important optical attractants. Floral display size is sometimes measured as the
total expanse of blooming flowers on a plant individual. Here, display size is defined as the expanse of
single flowers or functional units of reproductive structures (i.e. inflorescences) that can be optically
perceived and measured from frontal and lateral view.
Further, optical advertising via flower colour is one of the most important floral attractants, either in
the light spectrum that can be perceived by the human eye, or beyond. Many animal taxa are able to
perceive the ultraviolet (UV) spectrum. Several methods exist to measure and standardise colour and its
perception. In practice, these methods often produce similar results: Using the human eye to rate
colours is therefore still widespread (Willmer, 2011, citing Kevan, 1978, and Chittka and Kevan, 2005),
I. General Introduction
19
and also the method of choice for the research presented here. UV light pattern are detected by spectral
photography and application of specialised lens filters.
The following aspects of colour and UV signal in flowers were of special research interest in the last
years, and their relevance for plant-pollinator interactions has been demonstrated:
Colour preferences of pollinator taxa: Flower colour signal shows a lot of common features across
different plant taxa, and not all possible colour hues are realised to the same extent in angiosperm
flowers, indicating a coevolution with pollinator cognition. There is reasonable evidence that pollinating
animal taxa show a (learned or innate) preference for certain colours, as follows (cf. Willmer, 2011, citing
Kevan, 1983, and Scogin, 1983):
Bees: Blue, purple, pink, white; yellow in less advanced and/or short-tongued types. Beetles: Cream, dull
or light green; red or orange in few species. Butterflies and diurnal moths: Red, pink, purple; yellow in
less advanced types. Moths: White or cream. Flies: White, cream, yellow/green. Carrion flies: Brown,
deep red, purple. Wasps: Brown and green. Bats: White, cream, dull green, dull purple. Non-flying
mammals: Red, brown, dull shades. Birds: Red, orange.
Reddish flower colour is classically assumed as a good indicator for bird-pollination. Moreover, it is
hypothesised to be a double strategy to simultaneously attract birds and distract bees due to their bad
perception of red hues (Chittka et al., 2001, citing Raven, 1972). However, bees do visit red flowers that
are bird-pollinated, and can learn to distinguish red hues (Chittka and Waser, 1997). Chittka et al. (2001)
point out that there is no need for exclusivity, and simultaneous attraction of birds and distraction of
bees might both be of advantage, even if positive changes by natural selection are minimal.
Anther dummy signal: Also described as mimic stamens, fist described by Osche (Lunau, 2006, citing e.g.
Osche, 1979). Pollen and anthers show a yellow colouration due to the UV light protective function of
flavonoid pigments. This colouration represents a primary food signal that could be perceived by insects
early in angiosperm evolution. Colour vision in insects evolved earlier than flower colour (Lunau, 2006,
citing Chittka, 1996). Anther dummy signals copy the yellow colouration of pollen and anthers and
present it as colour pattern on other parts of the flower. Sometimes anther dummies also copy the
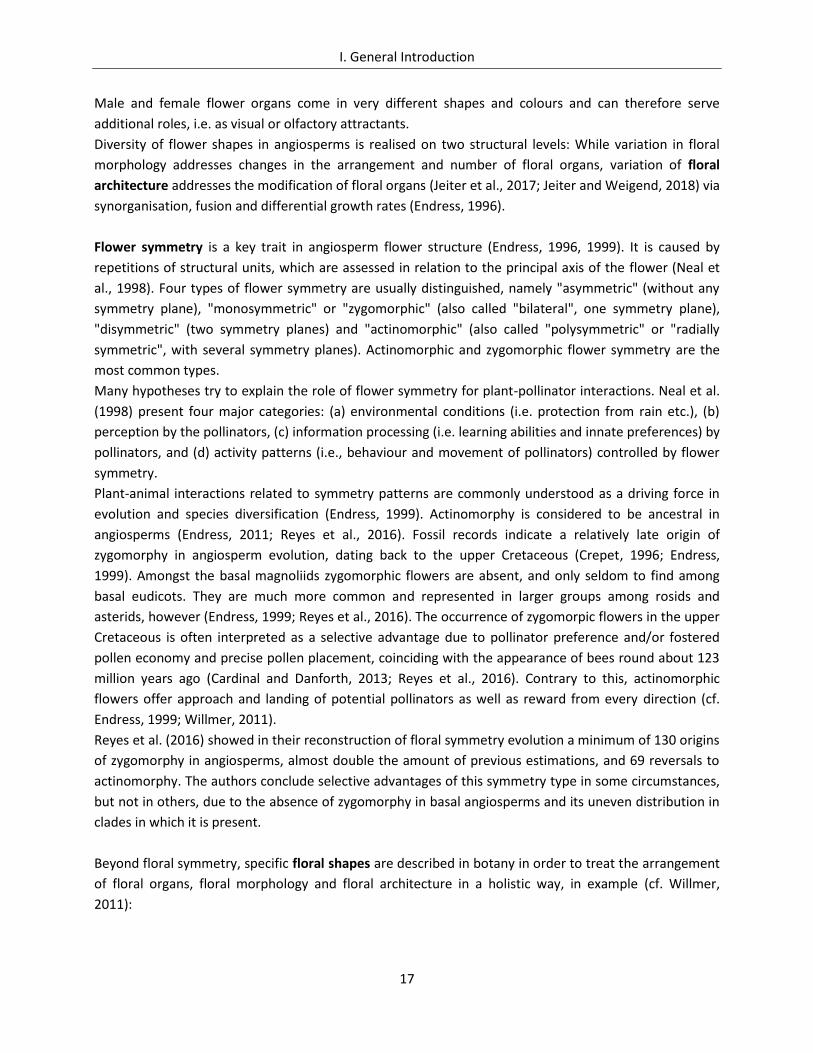
structure of anthers. Anther dummy signals cause the same innate pollinator responses like the original
cues: Approach, targeting with antennae, landing, proboscis extension and intake were experimentally
demonstrated for several Hymenoptera and Diptera species (Lunau, 1990, 2006; Lunau and Wacht,
1994), see also figure I.1. Anther dummy signals are no typical mimicry systems, because model and
mimicry stamens of the same plant species often do not resemble each other (cf. Lunau, 2006).
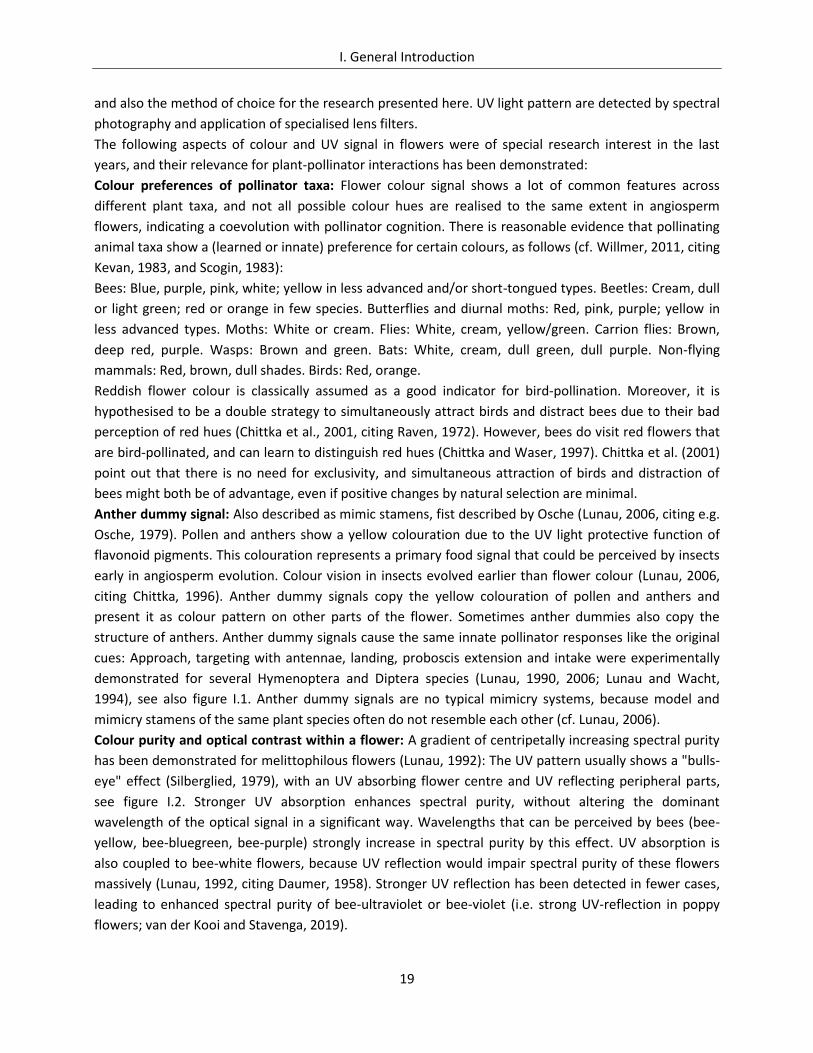
Colour purity and optical contrast within a flower: A gradient of centripetally increasing spectral purity
has been demonstrated for melittophilous flowers (Lunau, 1992): The UV pattern usually shows a "bulls-
eye" effect (Silberglied, 1979), with an UV absorbing flower centre and UV reflecting peripheral parts,
see figure I.2. Stronger UV absorption enhances spectral purity, without altering the dominant
wavelength of the optical signal in a significant way. Wavelengths that can be perceived by bees (bee-
yellow, bee-bluegreen, bee-purple) strongly increase in spectral purity by this effect. UV absorption is
also coupled to bee-white flowers, because UV reflection would impair spectral purity of these flowers
massively (Lunau, 1992, citing Daumer, 1958). Stronger UV reflection has been detected in fewer cases,
leading to enhanced spectral purity of bee-ultraviolet or bee-violet (i.e. strong UV-reflection in poppy
flowers; van der Kooi and Stavenga, 2019).
I. General Introduction
20
Nectar guides are a variation of colour contrast in melittophilous flowers, such as contrasting blotches,
concentric colour rings or lines converging towards the flower centre, etc. (Willmer, 2011).
Centripetally increasing spectral purity and colour contrasts serve as cues for innate orientations of
potential pollinators, such as approach, antennal contact, landing reaction, proboscis extension and
intake (Lunau, 1988, 1990, 1991, 1992).
It is likely that the diversity of colours and their hues are necessary cues for discrimination learning,
beyond innate orientations. Learning ability of one sort or another has been found in virtually all
pollinating animal taxa tested (Weiss, 2001, citing Alloway, 1973).
Optical contrast to the background: Optical signal pattern of the environment are also of relevance for
pollinator attraction. In many cases, entomophilous flowers contrast to their background due to higher
spectral purity. Soil or leaves usually show a low spectral purity, i.e. by only weak peaks of green leaf
colour in the bee-yellow range, reflection of incident light by waxy leaf-surfaces, light dispersion on
uneven surfaces, etc. (Barthlott and Rosen, 1991; Lunau, 1992).
FIGURE I.2: MAKING THE INVISIBLE VISIBLE – UV LIGHT PATTERN Frontal flower displays photographed in full-spectrum light (left) and UV light (right).
Upper row: Masked flower type of Utricularia subulata L. The lower lip is closing the
flower tube, and the body weight of a potential pollinator is necessary to bow down
the lip and get access to the nectar. The UV light spectrum shows a bulls-eye effect in
the flower centre, which is not visible in daylight and can also be interpreted as a
three-dimensional anther dummy signal due to shape and colouration. Lower row:
Bulls eye effect of Pulmonaria mollis Wulfen ex Hornem. The flower shows a whitish centre
in daylight coupled to UV light absorption, which is a sharp contrast to the otherwise
pinkish and UV reflecting corolla. Scale bars indicating 1 cm. Pictures by A. W. Mues.
FIGURE I.1: FLOWER SIGNALS AND ANIMAL BEHAVIOUR Flowers of Proboscidea louisianica (Mill.) Thell., a native plant of North America, and behaviour of flower visitors in Bonn University Botanic Gardens, Germany. Flowers show a pink colour and a dominant yellow stripe on ground of the sympetalous corolla, an anther dummy signal. Mind also the sharp contrast of flower colour to the background of greenish leaves. A. An innate proboscis extension can be observed when syrphid flies get in contact with the anther dummy signal. B. Optical flower signals trigger and control several other innate behavioural responses, such as approach and antennal orientation (B-left) or landing and body orientation (B-right), here observed for Bombus terrestris L. Innate reactions of insect taxa to optical colour cues were verified in experimental settings, isolated from other possible cues (odour, flower size and symmetry, etc.). Although optical flower signals trigger similar innate reactions in different insect taxa (here even shown for a plant non-native to Europe), successful pollination is influenced by many other factors: The bumblebee is a potential pollen vector due to successful pollen placement on the upper thorax, but the syrphid fly is not. Pictures by A. W. Mues.
I. General Introduction
21
I.2.2.2 FLORAL REWARD
Floral rewards satisfy needs of animal visitors and come in many ways, such as oils or floral tissues as
food reward, resins and gums as antibacterial and antifungal building material in brood sites, scents that
are (likely) used for attraction and guidance of other individuals, or flowers that are directly functioning
as a brood place, cf. Willmer (2011) for an overview. However, the most common floral rewards are
pollen and nectar as food rewards.
Pollen as a reward is collected deliberately by some animal taxa, and it provides a balanced and
nourishing diet when compared to other possible food sources offered by plants (Willmer, 2011). Round
about 20,000 plant species exclusively offer pollen as reward for potential pollinators and produce it in
high amounts, likely to compensate for the high pollen demand of pollen collecting bees (Willmer, 2011).
Indeed, "pollen-only" flowers produce significantly more pollen than species that offer nectar reward
(Cruden, 2000).
Nectar reward is offered by 70 to 80 % and therefore the majority of extant angiosperm species
(Abrahamczyk et. al., 2017 a, citing Heywood et al., 2007). It is essentially a mixture of sugar and water,
with concentrations typically ranging from 10 % to 75 % (Willmer, 2011). Nectar reward is produced by
specialised structures called nectaries, which are derived from different floral tissues. Nectaries can
come in very different shapes and sizes: Usually they are arranged inside and near the base of flower (i.e.
formed from parts of or all of a sepal, petal, stamen or ovary), so that flower visitors have to insert their
mouth parts or even their whole body to access the nectar – and in return become pollen vectors by
getting in contact with the anthers (Willmer, 2011). Nectar spurs are also very common structures that
are formed as more or less elongated tubes from the flower base. Nectar spurs protect nectar from
environmental conditions, and only flower visitors with a sufficient proboscis length can access the
nectar.
Beside water, sugars are the predominant components of nectar reward, usually glucose, fructose and
sucrose. It has long been hypothesised about the relevance of the proportions of these sugars for
adaption to pollinator guilds. Scientific evidence is contradictory at present (Willmer, 2011), and the
proportion of sugar components might rather be a consequence of phylogenetic constraints
(Abrahamczyk et. al., 2017 a, citing e.g. van Wyk et al., 1993; Nicolson and Thornburg, 2007). Sugar
proportions might also be restricted by flower shapes in interplay with environmental conditions
(Abrahamczyk et. al. 2017 a, citing e.g. Baker and Baker, 1983; Nicolson et al., 2007). However,
Abrahamczyk et. al. 2017 a show a (weak) evolutionary adaption of nectar sucrose proportion in their
extensive study of asterids, with high sucrose percentages shown for specialist-pollinated and low
proportions shown for generalist-pollinated plants.
Amino acids in nectar rewards seem to be indicative for pollinator groups: Very high amino acid content
is often found in flowers visited by carrion flies, elevated levels correlate to pollination by Lepidoptera,
moderate levels are found in flowers visited by wasps, bees, flies and hawkmoths, and very low levels
correlate to pollination by birds and bats (Willmer, 2011, citing Baker and Baker, 1973, 1986).
Other components of nectar reward (i.e. lipids, scents etc.) are insufficiently researched, although
scattered evidence for their relevance in plant-pollinator interaction does exist: Johnson et al. (2006) e.g.
I. General Introduction
22
showed that dark nectar colour and bitter taste are relevant filters for flower visitors in a bird-pollinated
plant.
The most important nectar parameters for the assessment of plant-pollinator interactions are nectar
volume, nectar concentration and sugar content. Analysis of these parameters requires rigorous
standardisation of the experimental assessment: The amount and composition is highly influenced by
environmental conditions, such as water availability and heat, age of the flower, time of day etc. The
following statements therefore refer to retrieved species profiles on average and general pattern of
plant-pollinator interactions.
The nectar volume produced by a flower strongly influences the interaction with possible pollinators and
is indicative for pollinator guilds. Importantly, nectar volume is not only of caloric relevance due to sugar
intake, but also serves as a water resource, and nectar feeders have to manage their water balance in
relation to nectar uptake. This is of special importance in arid environments, and for bees (except Apis),
that do not collect free water (Willmer, 1986, 1988, 2011). Large avian and mammalian pollinators are
rewarded with the highest nectar amounts, ranging between several hundred µl to some ml. Flowers
that have adapted to Diptera show very low amounts, often less than 0.05 µl, and bee pollinated flowers
are somewhere in between, nectar volume is usually ranging between .01 and 10 µl (Willmer, 2011).
The amount of sugar that is contained in nectar reward is often used a caloric measurement for energy
uptake, and also an indicator for the bodily requirements of pollinator groups. Total sugar contend of
nectar reward is a deduced variable, calculated from nectar volume and the measured concentration of
the nectar.
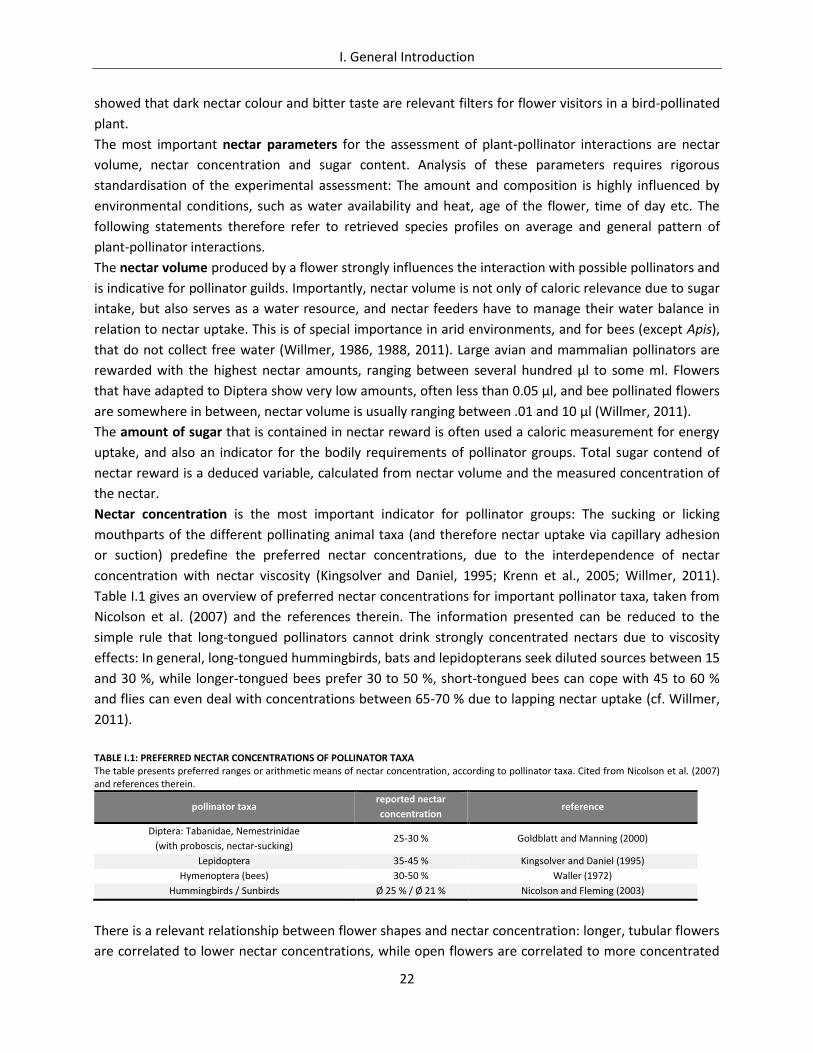
Nectar concentration is the most important indicator for pollinator groups: The sucking or licking
mouthparts of the different pollinating animal taxa (and therefore nectar uptake via capillary adhesion
or suction) predefine the preferred nectar concentrations, due to the interdependence of nectar
concentration with nectar viscosity (Kingsolver and Daniel, 1995; Krenn et al., 2005; Willmer, 2011).
Table I.1 gives an overview of preferred nectar concentrations for important pollinator taxa, taken from
Nicolson et al. (2007) and the references therein. The information presented can be reduced to the
simple rule that long-tongued pollinators cannot drink strongly concentrated nectars due to viscosity
effects: In general, long-tongued hummingbirds, bats and lepidopterans seek diluted sources between 15
and 30 %, while longer-tongued bees prefer 30 to 50 %, short-tongued bees can cope with 45 to 60 %
and flies can even deal with concentrations between 65-70 % due to lapping nectar uptake (cf. Willmer,
2011).
TABLE I.1: PREFERRED NECTAR CONCENTRATIONS OF POLLINATOR TAXA The table presents preferred ranges or arithmetic means of nectar concentration, according to pollinator taxa. Cited from Nicolson et al. (2007) and references therein.
pollinator taxa reported nectar
concentration reference
Diptera: Tabanidae, Nemestrinidae
(with proboscis, nectar-sucking) 25-30 % Goldblatt and Manning (2000)
Lepidoptera 35-45 % Kingsolver and Daniel (1995)
Hymenoptera (bees) 30-50 % Waller (1972)
Hummingbirds / Sunbirds Ø 25 % / Ø 21 % Nicolson and Fleming (2003)
There is a relevant relationship between flower shapes and nectar concentration: longer, tubular flowers
are correlated to lower nectar concentrations, while open flowers are correlated to more concentrated
I. General Introduction
23
nectar (cf. Willmer, 2011). Due to this correlation, a broader functional classification of flower types and
their flower visitors is presented by Nicolson et al. (2007; citing Corbet, 2006), which is cutting across
insect orders and is presenting pollinator guilds: In general, flower types with fully exposed or only
moderately concealed nectar and higher concentration are matching short-tongued pollinators like
Diptera, beetles or short-tongued Hymenoptera. Complementary, flowers with abundant, deeply
concealed nectar are matching long-tongued Hymenopthera, Diptera or Lepidoptera.
I.3 REPRODUCTION: SEXUAL SYSTEMS, BREEDING SYSTEMS, GAMETE PRODUCTION AND
P/O RATIO
In order to secure siring success, largely immobile and sessile plant organisms have to transmit pollen
(respectively male gametophytes) effectively to ovules (and the female gametophytes they contain) via
abiotic or biotic vectors. Compared to floral structure and floral advertising, this core aspect of
pollination and floral ecology is largely "cryptic" to animal pollen vectors, but determines reproductive
success in the long term (cf. Willmer, 2011).
Unfortunately, plant reproductive biology covers a variety of concepts and confusing terminology, Neal
and Anderson (2005) take a stand on this issue. An important aspect of plant reproduction, sometimes
covered by the label breeding system, are sexual systems – the arrangement of reproductive structures
within flowers and their distribution between plant individuals of a species (cf. Bawa and Beach, 1981;
Renner, 2014): Flowers are usually hermaphroditic, containing both male and female sexual flower
organs, therefore also called bisexual or perfect flowers. Unisexual or imperfect flowers are called
pistillate (female, lacking stamens) or staminate (only male, lacking pistils). Species with both sexes on
the same plant are called monoecious. When sexes are separated between plant individuals, the species
is called dioecious. Separate sexes occur in round about 6 % of extant species (Renner and Ricklefs,
1995). Between 10 and 15 % of angiosperms show mixed strategies, the majority of species is bisexual
however, at least 80 % (Willmer, 2011).
In this thesis, the term breeding system is used when treating genetic relatedness and pairing of
gametes between or within plant individuals, out of reasons of continuity to the bulk of literature cited
(esp. research done by R. W. Cruden, see below). Breeding systems represent basic strategies of sexual
plant reproduction that range from self-pollination, called autogamy, to outcrossing and pollen transfer
between individuals, called xenogamy. These terms can be further defined by epithets that express the
rigidity of the respective strategy, with "facultative" describing an optional but predominantly occurring
pattern, and "obligate" describing the respective pattern as exclusive and fixed. Cleistogamy describes an
extreme form of obligate autogamy, the self-pollination within non-opening flowers. It is important to
note in this context that the presence or absence of a physiological or genetic self-incompatibility is a
powerful strategy of plants to control the degree of outcrossing.
Siring success strongly relies on successful pollen dispersal and receipt: Only round about 1 % of all
produced pollen grains successfully reach a stigma (Willmer, 2011, citing Harder, 2000). Minnaar et al.
(2019) present 16 barriers that diminish the probability of pollen grains to reach a conspecific stigma
along three main phases of pollen transfer: Before (e.g. pollen grains remaining in anthers), during (e.g.
grooming behaviour of an animal pollen vector) and after the pollen transfer (e.g. pollen lost on self-
stigmas that otherwise could have reached other plant individuals for outcrossing).
I. General Introduction
24
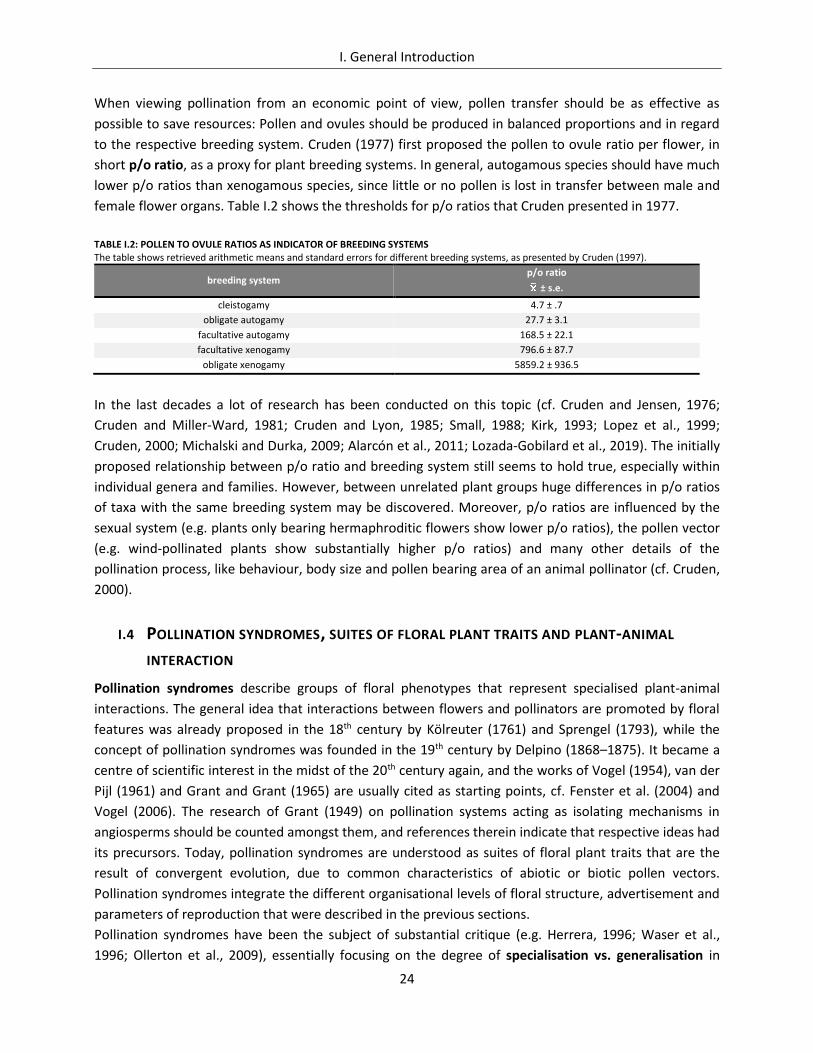
When viewing pollination from an economic point of view, pollen transfer should be as effective as
possible to save resources: Pollen and ovules should be produced in balanced proportions and in regard
to the respective breeding system. Cruden (1977) first proposed the pollen to ovule ratio per flower, in
short p/o ratio, as a proxy for plant breeding systems. In general, autogamous species should have much
lower p/o ratios than xenogamous species, since little or no pollen is lost in transfer between male and
female flower organs. Table I.2 shows the thresholds for p/o ratios that Cruden presented in 1977.
TABLE I.2: POLLEN TO OVULE RATIOS AS INDICATOR OF BREEDING SYSTEMS The table shows retrieved arithmetic means and standard errors for different breeding systems, as presented by Cruden (1997).
breeding system p/o ratio
± s.e.
cleistogamy 4.7 ± .7
obligate autogamy 27.7 ± 3.1
facultative autogamy 168.5 ± 22.1
facultative xenogamy 796.6 ± 87.7
obligate xenogamy 5859.2 ± 936.5
In the last decades a lot of research has been conducted on this topic (cf. Cruden and Jensen, 1976;
Cruden and Miller-Ward, 1981; Cruden and Lyon, 1985; Small, 1988; Kirk, 1993; Lopez et al., 1999;
Cruden, 2000; Michalski and Durka, 2009; Alarcón et al., 2011; Lozada-Gobilard et al., 2019). The initially
proposed relationship between p/o ratio and breeding system still seems to hold true, especially within
individual genera and families. However, between unrelated plant groups huge differences in p/o ratios
of taxa with the same breeding system may be discovered. Moreover, p/o ratios are influenced by the
sexual system (e.g. plants only bearing hermaphroditic flowers show lower p/o ratios), the pollen vector
(e.g. wind-pollinated plants show substantially higher p/o ratios) and many other details of the
pollination process, like behaviour, body size and pollen bearing area of an animal pollinator (cf. Cruden,
2000).
I.4 POLLINATION SYNDROMES, SUITES OF FLORAL PLANT TRAITS AND PLANT-ANIMAL
INTERACTION
Pollination syndromes describe groups of floral phenotypes that represent specialised plant-animal
interactions. The general idea that interactions between flowers and pollinators are promoted by floral
features was already proposed in the 18th century by Kölreuter (1761) and Sprengel (1793), while the
concept of pollination syndromes was founded in the 19th century by Delpino (1868–1875). It became a
centre of scientific interest in the midst of the 20th century again, and the works of Vogel (1954), van der
Pijl (1961) and Grant and Grant (1965) are usually cited as starting points, cf. Fenster et al. (2004) and
Vogel (2006). The research of Grant (1949) on pollination systems acting as isolating mechanisms in
angiosperms should be counted amongst them, and references therein indicate that respective ideas had
its precursors. Today, pollination syndromes are understood as suites of floral plant traits that are the
result of convergent evolution, due to common characteristics of abiotic or biotic pollen vectors.
Pollination syndromes integrate the different organisational levels of floral structure, advertisement and
parameters of reproduction that were described in the previous sections.
Pollination syndromes have been the subject of substantial critique (e.g. Herrera, 1996; Waser et al.,
1996; Ollerton et al., 2009), essentially focusing on the degree of specialisation vs. generalisation in
I. General Introduction
25
plant-pollinator interactions (respectively allophilic, generalist flowers vs. euphilic, specialised flowers).
Critics discard the pollination syndromes concept because it allegedly does not successfully describe the
diversity of floral phenotypes, is unable to predict the pollinators of most plant species and narrows
down the perspective of convergent floral adaption to the idea of a single most effective pollinator or
functional pollinator guild (cf. Ollerton 2009). Selection of floral traits might be shaped simultaneously by
many different pollinating animal taxa, and also by non-pollinator agents. Strauss and Whittall (2006)
e.g. present an overview on biotic and abiotic factors like herbivory, spread of disease or climatic
conditions that can exert influence on selection and evolutionary shaping of floral diversity.
Complementary, generalist flowers that are not dependent on specific pollen vectors are often proposed
as rather the rule than the exception (cf. Waser et al., 1996). Three levels of generalisation are
distinguished by Ollerton et al. (2007): Ecological generalisation refers to the number of pollinating
animal taxa involved in the plant-pollinator interaction, while functional generalisation refers to
pollinator guilds that serve as pollen vectors (typically family level or above) and phenotypic
generalisation refers to the adaption of floral traits itself.
In the last decades however, a strong body of scientific evidence has also emerged that supports the idea
of pollination syndromes (e.g. Faergi and van der Pijl, 1979; Baker and Hurd, 1986; Culley et al., 2002;
Friedman and Barrett, 2009; Johnson, 2010; Gómez et al., 2008; van der Niet and Johnson, 2012;
Newman et al., 2014; Rosas-Guerrero et al., 2014; Abrahamczyk et al., 2017 b; Johnson and Wester,
2017; Dellinger et al., 2018; Ibañez et al., 2019). There are many good reasons to defend floral
specialisation via pollination syndromes (cf. Willmer, 2011): A specialised form of plant-animal
interaction improves foraging efficiency and reduces interspecific competition for the animal pollen
vector. Moreover, specialisation is not necessarily riskier than generalisation. Many additional strategies
can compensate for the restriction to fewer pollinators, such as longevity or self-fertilisation, to secure
reproduction.
Pollination syndromes and their characteristic suites of floral traits are presented in table I.3, showing
basic differences between abiotic and biotic pollination as well as descriptions of classical biotic
pollination syndromes. Figure I.3 illustrates selected pollination syndromes and pollen vectors. As for
abiotic pollination syndromes, wind pollination or anemophily is the most important form: It relies on
wind dispersal of large amounts of pollen that by chance might arrive at a conspecific stigma, evolved
repeatedly in several lineages and is present in round about 18 % of angiosperm families (Culley et al.,
2002, citing Ackerman, 2000). Water pollination or hydrophily is only realised by round about 3 % of
angiosperms (Willmer, 2011). It shows commonalities with wind pollination due to abiotic pollen
transport, such as missing floral advertising and longer stamens and styles for enhanced pollen dispersal
and reception.
However, pollination by animal taxa, zoophily, is by far the most common form, realised by
approximately 90 % of extant angiosperms (Willmer, 2011). Classical biotic pollination syndromes
describe floral phenotypes that are indicative for pollination by bees, butterflies, moths, hawkmoths,
flies, carrion flies, beetles, birds and bats. Floral traits associated with pollination by beetles (cf. table I.3)
are also associated with generalist flowers and pollination by an assemblage of less prominent
pollinators, like wasps. Respective floral suites can therefore be interpreted as a generalist pollination
syndrome (cf. Willmer, 2011). Vogel (2006) presents estimations for the quantitative distribution of
biotic pollination syndromes amongst angiosperms: Generalist flowers form the majority. Of the 340
I. General Introduction
26
families listed in Engler´s traditional syllabus, 140 families are strongly specialised (41.3 %) and another
26 families at least specialised to some degree (6.7 %). The share of melittophilous pollination
syndromes has not been quantified, but most likely outnumbers the other syndromes. Bird pollination
occurs at least in 687 genera in 113 families, with the majority of such families (47 %) restricted to the
New World. Bat pollination is recognised in 148 families, with 47 genera occurring in the paleotropics
and 134 genera occurring in the neotropics.
Review of evidence indicates that the concept of pollination syndromes is a promising approach for
better understanding of plant-pollinator interactions and the integration of floral functions. However, its
restrictions have to be acknowledged, and one should be aware of the methodological issues that
characterise the majority of research undertaken on this topic so far:
• The pollination syndromes concept suffers from incomplete understanding of pollinator taxa. As an
example, the importance of bee-flies (Bombyliidae) is strongly undervalued, like many other Diptera
(i.e. Syrphidae, Tabanidae, Nemestrinidae), cf. Kastinger and Weber (2001): Although a clearly
distinguishable bee-fly syndrome does not exist, significant correlations between aspects of floral
organisation, floral advertisement and pollination by bee-flies have been detected. Flowers
pollinated by these Diptera show flower traits that are more similar to bee- than to fly pollination
syndromes (e.g. blue or violet corolla colour, funnel- or bell-shaped, narrow tubes, concealed
nectar).
• The research of pollination syndromes is very often shrouded by insufficient differentiation between
flower visitors and true pollinators that contribute to outcrossing (cf. Willmer, 2011).
• Pollination syndromes should rather be understood as a specialisation towards pollinator guilds than
towards single animal species. Extreme specialisation is rather seldom the case. However, animal
taxa can often be aggregated to functional groups that behave in similar ways, exert similar selection
pressures and in turn generate correlations among floral traits (cf. Fenster, 2004). Pollinator guilds
should therefore rather be interpreted as a form of specialisation than a form of generalisation (see
above, against Ollerton, 2007).
• Even when dealing with true pollinators and pollinator guilds, one should be aware of the fact that
different pollinating animal taxa can be pollen vectors of different value. Stebbins (1970) highlighted
that only frequent and effective pollinators are of relevance, and can be accounted for the moulding
of floral traits in the evolutionary long-run (cf. Fenster, 2004).
• Due to this, pollination syndromes are rather statistical than absolute constructs (Willmer, 2011) that
contain a clear centre with bad boundaries (Vogel, 2006, citing van der Pijl; no exact source given).
• Data quality is a crucial factor. A large part of research on pollination syndromes relies on categorical
data, at best allowing for rudimentary resolution. Exactly quantified floral traits have much higher
power to retrieve pollination syndromes (Abrahamczyk et al. 2017 b). Ollerton´s article of 2009 in
example, often cited as evidence for the invalidity of the pollination syndromes concept, analysed 41
alternative manifestations of 13 major flower traits: All of them are coded dichotomous however, a
strong reduction of the natural conditions (cf. Ollerton et al., 2009).
• Incomplete representation of floral traits and their interaction is a common phenomenon in this
field of research, too (cf. Fenster et al., 2004; Abrahamcyk et. al., 2017 b). Focus is usually placed on
aspects of floral structure, flower signal and nectar reward, while reproductive core functions like
pollen and ovule production or breeding systems are often neglected.
I. General Introduction
27
The points listed above show that research of the pollination syndromes concept is an interdisciplinary
task to which zoologists as well as botanists can contribute equally well. This thesis is a botanical work.
Main purpose and motivation for this work is therefore to address some of the topics that can be
elucidated directly by botanical science: Integrative assessment of the different levels of floral function
and intensified use of quantitative data on floral plant traits, aside with categorical information.
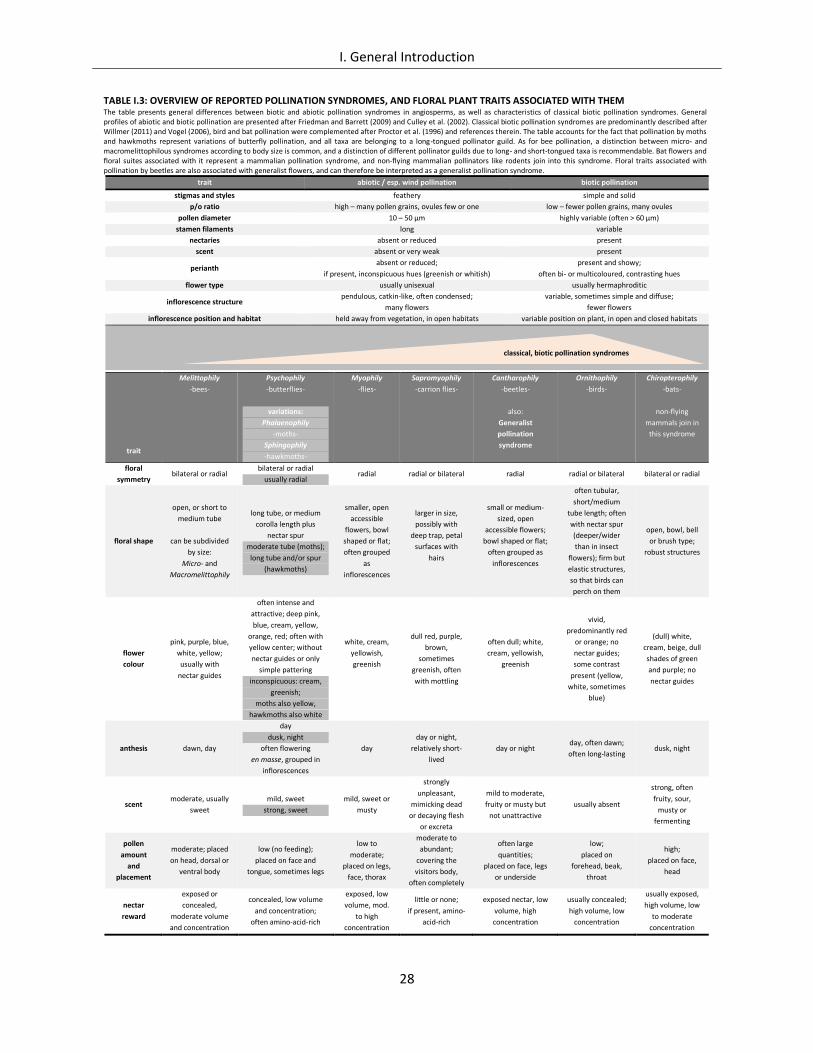
I. General Introduction
28
TABLE I.3: OVERVIEW OF REPORTED POLLINATION SYNDROMES, AND FLORAL PLANT TRAITS ASSOCIATED WITH THEM The table presents general differences between biotic and abiotic pollination syndromes in angiosperms, as well as characteristics of classical biotic pollination syndromes. General profiles of abiotic and biotic pollination are presented after Friedman and Barrett (2009) and Culley et al. (2002). Classical biotic pollination syndromes are predominantly described after Willmer (2011) and Vogel (2006), bird and bat pollination were complemented after Proctor et al. (1996) and references therein. The table accounts for the fact that pollination by moths and hawkmoths represent variations of butterfly pollination, and all taxa are belonging to a long-tongued pollinator guild. As for bee pollination, a distinction between micro- and macromelittophilous syndromes according to body size is common, and a distinction of different pollinator guilds due to long- and short-tongued taxa is recommendable. Bat flowers and floral suites associated with it represent a mammalian pollination syndrome, and non-flying mammalian pollinators like rodents join into this syndrome. Floral traits associated with pollination by beetles are also associated with generalist flowers, and can therefore be interpreted as a generalist pollination syndrome.
trait abiotic / esp. wind pollination biotic pollination
stigmas and styles feathery simple and solid
p/o ratio high – many pollen grains, ovules few or one low – fewer pollen grains, many ovules
pollen diameter 10 – 50 μm highly variable (often > 60 μm)
stamen filaments long variable
nectaries absent or reduced present
scent absent or very weak present
perianth absent or reduced;
if present, inconspicuous hues (greenish or whitish)
present and showy;
often bi- or multicoloured, contrasting hues
flower type usually unisexual usually hermaphroditic
inflorescence structure pendulous, catkin-like, often condensed;
many flowers
variable, sometimes simple and diffuse;
fewer flowers
inflorescence position and habitat held away from vegetation, in open habitats variable position on plant, in open and closed habitats
trait
Melittophily
-bees-
Psychophily
-butterflies-
variations:
Phalaenophily
-moths-
Sphingophily
-hawkmoths-
Myophily
-flies-
Sapromyophily
-carrion flies-
Cantharophily
-beetles-
also:
Generalist
pollination
syndrome
Ornithophily
-birds-
Chiropterophily
-bats-
non-flying
mammals join in
this syndrome
floral
symmetry bilateral or radial
bilateral or radial
usually radial radial radial or bilateral radial radial or bilateral bilateral or radial
floral shape
open, or short to
medium tube
can be subdivided
by size:
Micro- and
Macromelittophily
long tube, or medium
corolla length plus
nectar spur
moderate tube (moths);
long tube and/or spur
(hawkmoths)
smaller, open
accessible
flowers, bowl
shaped or flat;
often grouped
as
inflorescences
larger in size,
possibly with
deep trap, petal
surfaces with
hairs
small or medium-
sized, open
accessible flowers;
bowl shaped or flat;
often grouped as
inflorescences
often tubular,
short/medium
tube length; often
with nectar spur
(deeper/wider
than in insect
flowers); firm but
elastic structures,
so that birds can
perch on them
open, bowl, bell
or brush type;
robust structures
flower
colour
pink, purple, blue,
white, yellow;
usually with
nectar guides
often intense and
attractive; deep pink,
blue, cream, yellow,
orange, red; often with
yellow center; without
nectar guides or only
simple pattering
inconspicuous: cream,
greenish;
moths also yellow,
hawkmoths also white
white, cream,
yellowish,
greenish
dull red, purple,
brown,
sometimes
greenish, often
with mottling
often dull; white,
cream, yellowish,
greenish
vivid,
predominantly red
or orange; no
nectar guides;
some contrast
present (yellow,
white, sometimes
blue)
(dull) white,
cream, beige, dull
shades of green
and purple; no
nectar guides
anthesis dawn, day
day
dusk, night
often flowering
en masse, grouped in
inflorescences
day
day or night,
relatively short-
lived
day or night day, often dawn;
often long-lasting dusk, night
scent moderate, usually
sweet
mild, sweet
strong, sweet
mild, sweet or
musty
strongly
unpleasant,
mimicking dead
or decaying flesh
or excreta
mild to moderate,
fruity or musty but
not unattractive
usually absent
strong, often
fruity, sour,
musty or
fermenting
pollen
amount
and
placement
moderate; placed
on head, dorsal or
ventral body
low (no feeding);
placed on face and
tongue, sometimes legs
low to
moderate;
placed on legs,
face, thorax
moderate to
abundant;
covering the
visitors body,
often completely
often large
quantities;
placed on face, legs
or underside
low;
placed on
forehead, beak,
throat
high;
placed on face,
head
nectar
reward
exposed or
concealed,
moderate volume
and concentration
concealed, low volume
and concentration;
often amino-acid-rich
exposed, low
volume, mod.
to high
concentration
little or none;
if present, amino-
acid-rich
exposed nectar, low
volume, high
concentration
usually concealed;
high volume, low
concentration
usually exposed,
high volume, low
to moderate
concentration
classical, biotic pollination syndromes
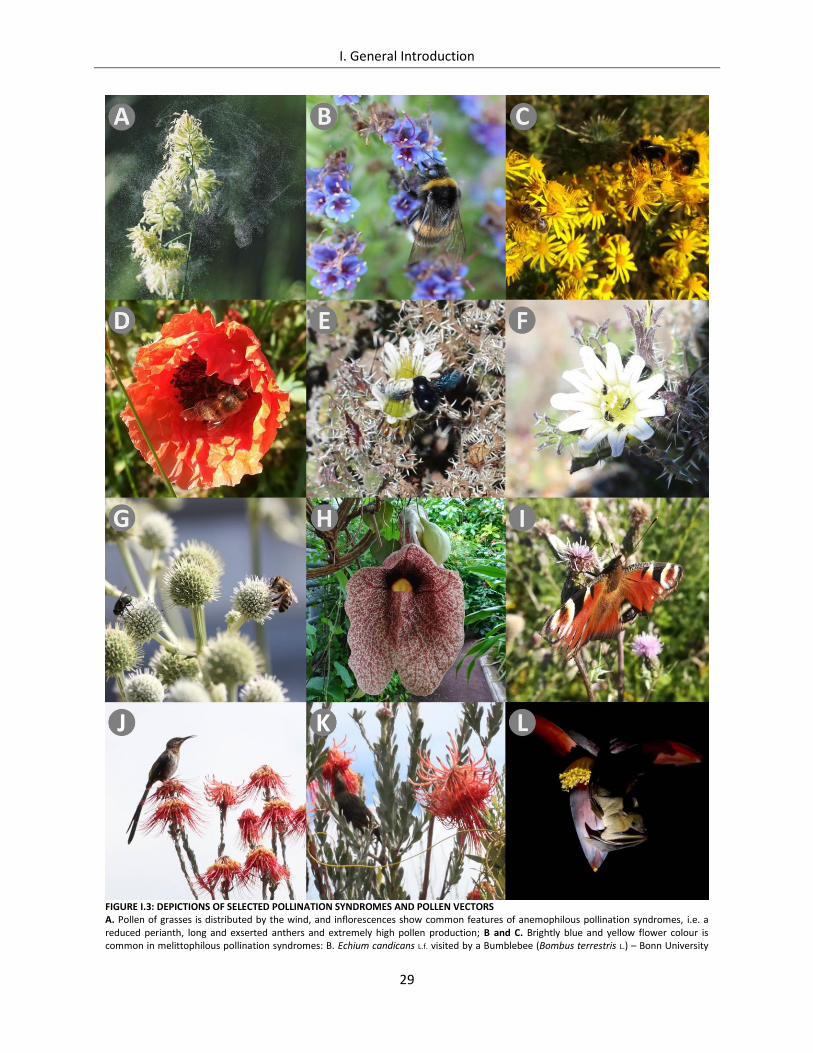
I. General Introduction
29
FIGURE I.3: DEPICTIONS OF SELECTED POLLINATION SYNDROMES AND POLLEN VECTORS A. Pollen of grasses is distributed by the wind, and inflorescences show common features of anemophilous pollination syndromes, i.e. a reduced perianth, long and exserted anthers and extremely high pollen production; B and C. Brightly blue and yellow flower colour is common in melittophilous pollination syndromes: B. Echium candicans L.f. visited by a Bumblebee (Bombus terrestris L.) – Bonn University
I. General Introduction
30
Botanic Gardens, Germany; C. Bumblebees (Bombus lapidarius L.) and Honeybees (Apis mellifera L.) were observed as frequent visitors of Jacobaea vulgaris Gaertn. – Kirchhellen, Germany; D. Pollination syndromes are no clear-cut pattern: Although brightly red flower colour is often indicative for bird pollination, insect pollinated plants occasionally display this flower colour, too. Actinomorphic, red coloured poppy flowers (Papaver rhoeas L.) show a bulls-eye pattern due to darker anthers and UV reflecting petals (cf. section I 2.2.1). They offer a high amount of pollen as reward, which is easily accessed by honeybees – Weltacker, Berlin, Germany. E. A large carpenter bee, Xylocopa spec., visits Codon royenii L. The noisy arrival of this large pollinator, ending the silence of the Namaqualand semi-desert, is impressive: A pollen vector capable of long distance travel is of high importance for outcrossing between the scattered populations of this plant. Codon royenii displays features that are indicative for macromelittophily: The actinomorphic flowers are larger and occur on stouter spikes, able to bear the weight of Xylocopa. The pollination syndrome is further supported by day blooming, white to yellowish flowers with nectar guides on the petals of the gamopetalous corolla, and nectar in moderate amount and concentration – Springbok, South Africa; F. Beetles were also observed as visitors of Codon royenii, and may play a role as pollinators on short distance within Codon populations – Springbok, South Africa; G: Eryngium paniculatum Cav. & Dombey ex F.Delaroche displays a generalist pollination syndrome, here visited by a blow fly (Lucilia spec.) and a honeybee (Apis mellifera L.). Wasps, bumblebees and beetles were also frequently observed. Flowers are greenish and have a strong smell, experienced as unpleasant by humans. Nectar and pollen can be accessed by short-tongued pollinator guilds – Bonn University Botanic Gardens, Germany; H. Aristolochia gigantea Mart. shows a carrion-fly pollination syndrome, mimicking animal carcasses by reddish-brown and yellowish colour pattering and unpleasant scent. Attracted flies are trapped by the U-shaped corolla (see flower in lateral view, behind), and released again after some time to secure deposition and transfer of new pollen to the animal vectors – Bonn University Botanic Gardens, Germany; I. Cirsium arvense (L.) Scop. displays a psychophilous pollination syndrome: The mauve coloured and sweet smelling flowers are blooming during day, and nectar is concealed. Butterflies are common flower visitors. Here, Aglais io L. inserts its long lepidopteran proboscis into the heads of Cirsium to access nectar reward – Kirchhellen, Germany; J and K. The rocket pincushion (Leucospermum reflexum Buek ex Meissn.) shows characteristics of a bird pollination syndrome: Flower colour is reddish, and inflorescences are stout enough to bear the body weight of birds. Flowers are even directed straight downwards during anthesis, offering a landing platform. Cape Sugarbirds (Promerops cafer (L.)) were observed as flower visitors, feeding from nectar – Helderberg Nature Reserve, Somerset West, South Africa; L: Musa spec. visited by a fruit bat, showing a chiropterophilous pollination syndrome: The pendent inflorescence is stout enough to bear mammalian visitors, flowers are coloured cream and bracts are dull-purple. Picture credits: A by Alex Jones, L by U. Wilsan, both "Unsplash" internet source, free licence, electronically retrieved 22.09.2019. Pictures B to K by A. W. Mues.
I.5 HYPOTHESES
Pollination syndromes represent floral suites that have originated and diversified in interaction with
biotic and abiotic pollen vectors. Plant trait pattern that constitute respective syndromes have been
used extensively to predict pollen vectors. However, research in this field has seemingly suffered from
poor data quality, especially overreliance on categorical data, and insufficient integration of important
floral plant traits, especially related to the floral core function of reproduction and gamete production. If
so, assessment of plant traits via quantitative data and better representation of different aspects of
floral function (i) should allow for clearer description and retrieval of pollination syndromes, (ii) this
integrative approach should allow for better prediction of pollen vectors, (iii) should allow for better
understanding of the evolution and diversification of plant-pollinator interaction by combination with
the latest phylogenies, and (iv) allow for better understanding of the inheritance of these plant traits by
experimental botany (crossing experiments).
I.6 GOALS
Based on the hypotheses presented, the following research questions were selected. The objectives
represent special cases of plant-animal interactions that could help to elucidate the validity of the
pollination syndromes concept. The selected model organisms contain several taxonomic levels, ranging
from species to order level.
I.6.1 RESEARCH QUESTIONS
1. Do floral plant traits and their diversification show functional integration in order Geraniales,
backing up reported pollinator guilds?
I. General Introduction
31
2. Does flowering time at the fringe of the growth season affect floral plant traits of winter- and
autumn-flowering members of Hamamelidaceae?
3. Do floral plant traits of carnivorous plants show special pattern, due to nutrition deprived
habitats and a possible pollinator-prey conflict?
4. Does floral diversity of Streptocarpus subgenus Streptocarpus mirror pollination syndromes and
functional integration of floral plant traits within groups of floral phenotypes, as well as
differentiation between them?
5. Is hybridisation of closely related but florally diverse members of Streptocarpus subgenus
Streptocarpus prevented by postzygotic pollination barriers, without necessity of isolating
effects of pollination syndromes?
6. If hybridisation is successful between members of Streptocarpus subgenus Streptocarpus, do
hybrids show functional floral plant traits, possibly by inheritance of pollination syndromes, or is
attraction and guidance of biotic vectors disturbed and therefore isolating gene flow?
I.6.2 SPECIFIC OBJECTIVES
1. Compare diversification of floral plant traits and pollinator guilds within order Geraniales.
Quantify gamete production (pollen and ovule production, p/o ratio) and nectar reward
(amount, concentration, sugar content). Analyse their pattern within order Geraniales via
hierarchical clustering and Non-metric Multidimensional Scaling (NMDS). Test for functional
integration via vector fitting of remaining data on floral function, especially floral morphology,
symmetry and described pollinator guilds. Analyse the evolutionary history of these patterns via
mapping onto the latest phylogeny of the order.
2. Compare diversification of floral plant traits and flowering time for members of family
Hamamelidaceae. Quantify gamete production, assess other levels of floral function
(morphology, signal, reward) and analyse their pattern separately and combined within the
family via hierarchical clustering and NMDS. Test for functional integration via reciprocal vector
fitting. Test the explanatory value of flowering time for the retrieved patterns via Permutational
Multivariate Analysis of Variance (PERMANOVA). Analyse the evolutionary history of the
retrieved pattern via phylogenetic mapping.
3. Compare diversification of floral plant traits between carnivorous genera Drosera, Dionaea and
Pinguicula. Assess floral plant traits (gamete production, nectar reward, floral morphology,
optical flower signal) as well as true breeding systems via pollination experiments. Analyse
correlations between variables of floral function. Test for differences of gamete production
between retrieved breeding systems via group comparisons, in order to elucidate a possible
pollinator-prey conflict and its effect on floral function.
4. Compare diversification of floral plant traits within Streptocarpus subgenus Streptocarpus.
Assess floral plant traits (gamete production, nectar reward, floral structure, optical flower
signal) and analyse their pattern via hierarchical clustering and NMDS. Test for functional
integration via reciprocal vector fitting. Analyse the evolutionary history of the retrieved pattern
via phylogenetic mapping.
5. Compare siring success and hybrid seed set between three closely related members of
Streptocarpus subgenus Streptocarpus. Perform crossing procedures within the parental and F1
I. General Introduction
32
generation and count the seed set. Analyse possible factors of influence on seed set (maternal
and paternal effects, ripening time, fruit length, generational level, pollination procedure) via
Generalised Linear Modelling (Generalised Estimating Equations).
6. Compare functionality of floral plant traits of hybrid offspring between members of
Streptocarpus subgenus Streptocarpus. Assess floral plant traits (nectar reward, floral
architecture, optical flower signal) for parental species and hybrids, and analyse the retrieved
pattern via hierarchical clustering and NMDS. Assess severe floral malfunction as well as the
degree of trait instability via coefficients of variation for hybrids. Assess the heredity of the
retrieved pattern.
I.7 OVERVIEW OF THE DISSERTATION
This work is a monograph. The subsequent chapters are intended to be published in peer reviewed
scientific journals. Due to this, chapters II to VII are structured in the style of journal articles (abstract,
introduction, materials and methods, results, discussion, literature), in order to allow for extraction,
further development and subsequent submission. General conclusions are drawn in chapter VIII. A
summary of the thesis in English is presented in chapter IX. Appendices to chapters II to VII are
presented at the end of the thesis in chapter X, as well as the curriculum vitae of the author (XI).
In chapter II diversification of floral plant traits and pollinator guilds are presented for members of order
Geraniales (objective 1). The order is small but florally diverse, and therefore particularly suitable for
comparative studies. Core variables of reproduction (gamete production) and nectar reward are
analysed in depth. Integration of floral plant traits and correlations to reported pollinator guilds are
tested. Floral morphology and floral symmetry appear as unrelated to gamete production and nectar
reward, arguing against the hypothesis of higher resource efficiency in zygomorphic flowers.
Phylogenetic mapping reveals phylogenetic constrains of gamete production, nectar reward and
pollination syndromes.
In chapter III diversification of floral plant traits and flowering time for Hamamelidaceae are studied
(objective 2). Hamamelidaceae are a small family which is known for the peculiar flowering time of some
of its members in late autumn or winter. Analysis of floral plant traits and their functional integration
reveals clear clusters of wind- and animal pollinated species, as well as a mixed pollination mode.
Phylogenetic analysis shows that animal pollination was evolutionary reinvented at least three times
from an ancestral wind pollination mode. Pollination syndromes and flowering time appear to be
recombined quite freely during evolution. Surprisingly, animal pollination appears to be common in
winter flowering species.
In chapter IV floral plant traits of carnivorous plants are compared between Droseraceae and genus
Pinguicula (objective 3). Carnivorous plants are animal pollinated, and the potential capture of
legitimate pollinators has long been researched under the term pollinator-prey conflict, usually focusing
on sorting between pollinators and prey by the trap types. Here, floral plant traits and their functional
integration are analysed, and experimentally retrieved true breeding systems are presented. The
detected p/o ratios are extremely low, thus indicating high resource efficiency and reliability of pollen
transfer even in xenogamous species – clearly arguing against a pollinator-prey conflict. Optical flower
signal ensures a sorting of pollinators from prey.
I. General Introduction
33
In chapter V floral plant traits and their functional integration are analysed for 18 members of
Streptocarpus subgenus Streptocarpus, with focus on reproduction (gamete production, breeding
system), nectar reward, optical flower signal and floral structure (objective 4). The subgenus contains a
broad diversity of floral phenotypes that are indicative of different biotic pollination syndromes. Analysis
of floral plant traits shows low integration of floral functions however, and almost free combination of
floral trait clusters along the course of evolution. The data indicate two separate evolutionary driving
forces: Floral architecture controlling for pollinator access, pollen placement and gamete production,
and the interaction of floral signal and nectar reward as an adjustment to sensory capacities and
nutritional needs of pollinator taxa.
In chapter VI postzygotic pollination barriers are analysed for three closely related but florally diverse
members of Streptocarpus subgenus Streptocarpus via crossing experiments and hybridisation
(objective 5). Seed set was vigorous: Even in experimental groups with lowest siring success, seed set
has to be regarded high enough to allow for the establishment of hybrid swarms in nature. Praezygotic
pollination barriers and pollinator guidance via floral plant traits appear to be of high importance for
reproductive isolation, especially for sympatric species with overlapping flowering time.
Chapter VII presents the crossability of nine species of Streptocarpus subgenus Streptocarpus, as well as
functionality and inheritance of floral plant traits for hybrid offspring (objective 6). The majority of
hybrids appeared fully functional in terms of floral architecture, nectar reward and optical flower signal.
Hybrids showed floral trait pattern for all three analysed levels of floral function that are already present
in the paternal generation, representing a general compatibility to pollinator guilds. Only 5 out of 40
hybrids showed severe malfunctions of the (male) reproductive system. Due to this, establishment of
functional hybrid swarms and hybrid speciation is likely in case of freak pollination events.
Chapter VIII represents general conclusions of this thesis. Main results are reviewed and discussed, and
objectives for future research are given.
I.8 CONTRIBUTION TO CHAPTERS
Chapter II: Mues, A. W., Kelch, A., Ackermann, M. and Weigend, M. Diversification of floral function in
Geraniales – why so dapper? Breeding system related variables not correlated to pollinator guilds and
flower symmetry.
General concept and research question by A. W. Mues and M. Weigend.
Collection of processed raw data for gamete production predominantly done by: Alexandra Kelch
(unpublished Diploma Thesis 2011, Freie Universität Berlin). Additional sampling: Alexa Brox collected
data for Francoa appendiculata and Melianthus dregeanus; T. Joßberger collected data for Greyia
flanaganii, Greyia sutherlandii, Melianthus villosus and Viviania elegans; A. W. Mues collected data for
Erodium manescavi, Francoa sonchifolia, Geranium sanguineum, G. reuteri, G. sylvaticum,
G. yunannense and Hypseocharis bilobata.
Collection of processed raw data for nectar production predominantly done by: Alexandra Kelch
(unpublished Diploma Thesis 2011, Freie Universität Berlin). Additional sampling: M. Ackermann
collected data for genus Greyia and Melianthus comosus, M. pectinatus and M. villosus. T. Joßberger
collected data for genus Viviania and Geranium reuteri. M. Ackermann and T. Joßberger both collected
I. General Introduction
34
data for Francoa appendiculata and Melianthus dregeanus. A. W. Mues collected data for
Geranium sanguineum, G. sylvaticum, G. yunannense and Hypseocharis bilobata.
Data collection and literature research for categorisation of other variables done by A. W. Mues.
Data processing, statistical analysis and interpretation done by A. W. Mues.
Chapter written by A. W. Mues. Supervision by M. Weigend.
Chapter III: Mues, A. W., Hoff, L., Luebert, F. and Weigend, M. Frost flowers – Pollination syndromes
of Hamamelidaceae independent from flowering time.
General concept and research question by A. W. Mues and M. Weigend.
Collection of raw data for genera Corylopsis (C. glabrescens, C. pauciflora, C. spicata, C. veitchiana,
C. willmottiae), Fothergilla (F. gardenii, F. major) and Fortunearia (F. sinensis) done by L. Hoff
(unpublished project work, bachelor´s programme biology, university of Bonn).
Collection of raw data for genera Corylopsis (C. sinensis), Disanthus (D. cercidifolius), Distyliopsis
(D. tutcheri), Distylium (D. myricoides, D. racemosum), Hamamelis (H. japonica, H. mollis, H. vernalis, H.
virginiana), Loropetalum (L. chinense), Parrotia (P. persica), Parrotiopsis (P. jacquemontiana),
Sinowilsonia (S. henryi) and Sycopsis (S. sinensis) done by A. W. Mues.
Literature research for categorisation of flowering time done by A. W. Mues.
Assessment concept, data processing, statistical analysis and interpretation done by A. W. Mues.
Analysis of DNA-sequencing, retrieval of phylogenetic trees and testing of phylogenetic signal performed
by F. Luebert.
Chapter written by A. W. Mues, except phylogenetic methods written by F. Luebert.
Supervision by M. Weigend.
Chapter IV: Mues, A. W., Brauwers, S. and Weigend, M. No indication of a pollinator-prey conflict in
floral functional traits of carnivorous plants of the active flypaper type – Pinguicula (Lentibulariaceae)
and Drosera (Droseraceae).
General concept and research question by A. W. Mues and M. Weigend.
Sampling of raw data done by A. W. Mues and S. Brauwers (unpublished project work and bachelor
thesis, university of Bonn). Gametic variables (count of pollen and ovules): 48.8 % by S. Brauwers, 51.2 %
by A. W. Mues. Nectar measurements: 48.9 % by S. Brauwers, 51.1 % by A. W. Mues. Sampling of
morphological data (display sizes, flower opening and spur length) done by A. W. Mues. Photographic
documentation of flower colour and UV signal done by S. Brauwers (63.4 %) and A. W. Mues (36.6 %),
documentation of colour and UV signal of trap leaves done by S. Brauwers. Testing of breeding systems
done by A. W. Mues.
Data processing, statistical analysis and interpretation done by A. W. Mues.
Chapter written by A. W. Mues, supervision by M. Weigend.
Chapter V: Mues, A. W., Liu, T. and Weigend, W. Plasticity of flower traits in Streptocarpus: Floral
architecture, optical signal, nectar reward and reproductive system largely disjunct and evolutionary
recombined.
General concept and research question by A. W. Mues and M. Weigend.
I. General Introduction
35
Sampling of raw data done by A. W. Mues and T. Liu (internship and unpublished project work, Bonn
University). Assessment of gametic variables (count of pollen and ovules): 61.1 % by T. Liu, 38.9 % by
A. W. Mues. Assessment of nectar production: 56.7 % by T. Liu, 43.3 % by A. W. Mues. Photographic
documentation and measurement of flower display sizes done by A. W. Mues. Measurement of floral
architecture: 61.1 % by T. Liu, 38.9 % by A. W. Mues. Analysis of UV signal (flowers and leaves) done by
A. W. Mues. Breeding systems tested by A. W. Mues.
Collection of DNA samples by A. W. Mues, sequencing by N. Schmandt, construction of phylogenetic
tree by J. C. Pinilla and A. W. Mues.
Data processing, statistical analysis and interpretation of results done by A. W. Mues.
Chapter written by A. W. Mues, supervision by M. Weigend.
Chapter VI: Mues, A. W. and Weigend, M. Vigorous hybrid seed set between three closely related
species of Streptocarpus subgenus Streptocarpus indicate postzygotic barriers of no relevance for
reproductive isolation.
General concept and research question by A. W. Mues and M. Weigend.
Sampling of raw data, counting of seed material, data processing, statistical analysis and interpretation
of results done by A. W. Mues.
Chapter written by A. W. Mues, supervision by M. Weigend.
Chapter VII: Mues, A. W., Nicolin, L., Hoff, L. and Weigend, M. Functional floral architecture, optical
signal and nectar reward in Streptocarpus hybrids, allowing for homoploid hybrid speciation.
General concept and research question by A. W. Mues and M. Weigend.
Sampling of raw data done by L. Hoff (internship), T. Liu (internship and unpublished project work),
L. Nicolin (unpublished bachelor thesis) and A. W. Mues. All: Nees Institute for biodiversity of plants,
university of Bonn. Raw data of parental species is identical with raw data presented in chapter V.
Crossing experiment performed by A. W. Mues. Photographic documentation and measurement of
flower display sizes for parental species done by A. W. Mues. Photographic documentation of F1 hybrids
predominantly done by L. Nicolin, and measurement of flower display sizes for F1 hybrids predominantly
done by L. Hoff (8.5 % added by A. W. Mues). As for measurements of other variables of floral
architecture, parental species: 77.8 % by T. Liu, 22.2 % by A. W. Mues; F1 hybrids: 82.3 % L. Hoff, 12.7 %
L. Nicolin and 5.1 % A. W. Mues. Analysis of UV signal done by A. W. Mues for parental species, and
predominantly done by L. Nicolin for F1 hybrids. Nectar measurements of parental species performed by
T. Liu (77.8 %) and A. W. Mues (22.2 %). Assessment of hybrid nectar production performed by
L. Nicolin.
Data processing, statistical analysis and interpretation of results done by A. W. Mues.
Chapter written by A. W. Mues, supervision by M. Weigend.
I. General Introduction
36
I.9 LITERATURE
Abrahamczyk, S., Kessler, M., Hanley, D., Karger, D.N., Müller, M.P.J., Knauer, A.C., Keller, F.,
Schwerdtfeger, M., Humphreys, A.M., 2017 a. Pollinator adaptation and the evolution of floral
nectar sugar composition. Journal of Evolutionary Biology 30, 112–127.
https://doi.org/10.1111/jeb.12991
Abrahamczyk, S., Lozada-Gobilard, S., Ackermann, M., Fischer, E., Krieger, V., Redling, A., Weigend, M.,
2017 b. A question of data quality – Testing pollination syndromes in Balsaminaceae. PLOS ONE
12, e0186125. https://doi.org/10.1371/journal.pone.0186125
Ackerman, J.D., 2000. Abiotic pollen and pollination: Ecological, functional, and evolutionary
perspectives. Plant Systematics and Evolution 222, 167–185.
Alarcón, M.L., Roquet, C., Aldasoro, J.J., 2011. Evolution of pollen/ovule ratios and breeding system in
Erodium (Geraniaceae). Systematic Botany 36, 661–676.
https://doi.org/10.1600/036364411X583637
Alloway, T.M., 1973. Learning in insects except Apoidea, In: Corning, W.C., Dyal, J.A., Willows, A.O.D.,
eds. Invertebrate learning: Volume 2 Arthropods and Gastropod Mollusks. Springer US, Boston.
131–171. https://doi.org/10.1007/978-1-4684-3009-7_3
Baker, H.G., Baker, I., 1986. The occurrence and significance of amino acids in floral nectar. Plant
Systematics and Evolution 151, 175–186. https://doi.org/10.1007/BF02430273
Baker, H.G., Baker, I., 1983. Floral nectar sugar constituents in relation to pollinator type. In: Jones, C.E.,
Little, R.J., eds. Handbook of experimental biology. Van Nostrand Reynold, New York. 141–163
Baker, H.G., Baker, I., 1973. Amino-acids in nectar and their evolutionary significance. Nature 241, 543–
545. https://doi.org/10.1038/241543b0
Baker, H.G., Hurd, P.D., 1968. Intrafloral ecology. Annual Review of Entomology 13, 385–414.
https://doi.org/10.1146/annurev.en.13.010168.002125
Barthlott, W., Rosen, D., 1991. Ökologische Aspekte der Ultraviolett-Reflexion von Blumen in
Mitteleuropa, besonders in der Eifel. Decheniana 144, 72–112.
Bawa, K., Beach, J., 1981. Evolution of sexual systems in flowering plants. Annals of the Missouri
Botanical Garden 68, 254. https://doi.org/10.2307/2398798
Buchmann, S., 2015. The reason for flowers: Their history, culture, biology, and how they change our
lives. Scribner, New York.
Buchmann, S.L., Nabhan, G.P., 1996. The forgotten pollinators. Island Press, Washington D.C.
Cardinal, S., Danforth, B.N., 2013. Bees diversified in the age of eudicots. Proceedings of the Royal
Society B: Biological Sciences 280, 20122686. https://doi.org/10.1098/rspb.2012.2686
Cardinale, B.J., Duffy, J.E., Gonzalez, A., Hooper, D.U., Perrings, C., Venail, P., Narwani, A., Mace, G.M.,
Tilman, D., Wardle, D.A., Kinzig, A.P., Daily, G.C., Loreau, M., Grace, J.B., Larigauderie, A.,
Srivastava, D.S., Naeem, S., 2012. Biodiversity loss and its impact on humanity. Nature 486, 59–
67. https://doi.org/10.1038/nature11148
Ceballos, G., Ehrlich, P.R., Barnosky, A.D., García, A., Pringle, R.M., Palmer, T.M., 2015. Accelerated
modern human–induced species losses: Entering the sixth mass extinction. Science Advances 1,
e1400253. https://doi.org/10.1126/sciadv.1400253
I. General Introduction
37
Chittka, L., 1996. Does bee color vision predate the evolution of flower color? Naturwissenschaften 83,
136–138. https://doi.org/10.1007/BF01142181
Chittka, L., Kevan, P.G., 2005. Flower colour as advertisement. In: Dafni, A., Kevan, P.G., Husband,
B.C., eds. Practical pollination biology. Enviroquest Ltd., Cambridge, Ontario. 157–196.
Chittka, L., Spaethe, J., Schmidt, A., Hickelsberger, A., 2001. Adaptation, constraint, and chance in
the evolution of flower color and pollinator color vision. In: Chittka, L., Thomson, J.D., eds.
Cognitive ecology of pollination. Animal behavior and floral evolution. Cambridge University
Press, Cambridge. 106–126. https://doi.org/10.1017/CBO9780511542268.007
Chittka, L., Waser, N., 1997. Why red flowers are not invisible to bees. Israel Journal of Plant Sciences 45,
169–183. https://doi.org/10.1080/07929978.1997.10676682
Corbet, S.A., 2006. A typology of pollination systems: Implications for crop management and the
conservation of wild plants. In: Waser, N.M., Ollerton, J., eds. Plant-pollinator interactions:
From specialization to generalization. University of Chicago Press, Chicago. 315–340.
Crepet, W.L., 1996. Timing in the evolution of derived floral characters: upper cretaceous (turonian) taxa
with tricolpate and tricolpate-derived pollen. Review of Palaeobotany and Palynology 90, 339–
359. https://doi.org/10.1016/0034-6667(95)00091-7
Cruden, R.W., 2000. Pollen grains: Why so many? Plant Systematics and Evolution 222, 143–165.
https://doi.org/10.1007/BF00984100
Cruden, R.W., 1977. Pollen-ovule ratios: A conservative indicator of breeding systems in flowering
plants. Evolution 31, 32–46. https://doi.org/10.2307/2407542
Cruden, R.W., Jensen, K.G., 1979. Viscin threads, pollination efficiency and low pollen-ovule ratios.
American Journal of Botany 66, 875–879. https://doi:10.1002/j.1537-2197.1979.tb06295.x
Cruden, R.W., Lyon, D.L., 1985. Correlations among stigma depth, style length, and pollen grain size: Do
they reflect function or phylogeny? Botanical Gazette 146, 143–149.
https://doi.org/10.1086/337509
Cruden, R.W., Miller-Ward, S., 1981. Pollen-ovule ratio, pollen size, and the ratio of stigmatic area to the
pollen-bearing area of the pollinator: An hypothesis. Evolution 35, 964–974.
https://doi.org/10.2307/2407867
Culley, T., Weller, S., Sakai, A., 2002. The evolution of wind pollination in angiosperms. Trends in Ecology
& Evolution 17, 361–369. https://doi.org/10.1016/S0169-5347(02)02540-5
Dafni, A., 2005. Rewards in flowers – Introduction. In: Dafni, A., Kevan, P.G., Husband, B.C., eds.
Practical pollination biology. Enviroquest Ltd., Cambridge, Ontario.
Daumer, K., 1958. Blumenfarben, wie sie die Bienen sehen. Zeitschrift für vergleichende Physiologie 41,
49–110. https://doi.org/10.1007/BF00340242
Dellinger, A.S., Chartier, M., Fernández‐Fernández, D., Penneys, D.S., Alvear, M., Almeda, F.,
Michelangeli, F.A., Staedler, Y., Armbruster, W.S., Schönenberger, J., 2018. Beyond buzz‐
pollination – departures from an adaptive plateau lead to new pollination syndromes. New
Phytologist, 221, 1136–1149. https://doi.org/10.1111/nph.15468
Delpino, F., 1868–1875. Ulteriori osservazione sulla dicogamia nel regno vegetale. Atti della Societa
Italiana di Scienze Naturali Milano, Vols. 1 and 2.
Dodd, M.E., Silvertown, J., Chase, M.W., 1999. Phylogenetic analysis of trait evolution and species
diversity variation among angiosperm families. Evolution 53, 732–744.
I. General Introduction
38
https://doi.org/10.1111/j.1558-5646.1999.tb05367.x
Doyle, J.A., 2012. Molecular and fossil evidence on the origin of angiosperms. Annual Review of Earth
and Planetary Sciences 40, 301–326. https://doi.org/10.1146/annurev-earth-042711-105313
Endress, P.K., 2011. Evolutionary diversification of the flowers in angiosperms. American Journal of
Botany 98, 370–396. https://doi.org/10.3732/ajb.1000299
Endress, P.K., 1999. Symmetry in flowers: Diversity and evolution. International Journal of Plant Sciences
160, 3–23. https://doi.org/10.1086/314211
Endress, P.K., 1996. Homoplasy in angiosperm flowers. In: Sanderson, M.J., Hufford, L., eds.
Homoplasy – the recurrence of similarity in evolution. Academic Press, San Diego. 303–325.
Engler, A., 1898. Syllabus der Pflanzenfamilien, 2nd edn. Gebrüder Borntraeger, Berlin.
Fægri,K., van der Pijl, L., 1979. The Principles of pollination ecology. 3rd ed. Pergamon, Oxford.
Fenster, C.B., Armbruster, W.S., Wilson, P., Dudash, M.R., Thomson, J.D., 2004. Pollination
syndromes and floral specialization. Annual Review of Ecology, Evolution, and Systematics
35, 375–403. https://doi.org/10.1146/annurev.ecolsys.34.011802.132347
Friedman, J., Barrett, S., 2009. Wind of change: New insights on the ecology and evolution of
pollination and mating in wind-pollinated plants. Annals of Botany 103, 1515–1527.
Goldblatt, P., Manning, J., 2000. The long-proboscid fly pollination system in Southern Africa. Annals
of the Missouri Botanical Garden 87, 146–170. https://doi.org/10.2307/2666158
Gómez, J.M., Bosch, J., Perfectti, F., Fernandez, J.D., Abdelaziz, M., Camacho, J.P.M., 2008.
Association between floral traits and rewards in Erysimum mediohispanicum (Brassicaceae).
Annals of Botany 101, 1413–1420. https://doi.org/10.1093/aob/mcn053
Grant, V., 1949. Pollination systems as isolating mechanisms in angiosperms. Evolution 3, 82–97.
https://doi.org/10.1111/j.1558-5646.1949.tb00007.x
Grant, V., Grant, K.A., 1965. Flower pollination in the Phlox family. Columbia University Press, New York.
Harder, L.D., 2000. Pollen dispersal and the floral diversity of Monocotyledons. In: Wilson, K.L.,
Morrison, D., eds. Monocots: Systematics and evolution. CSIRO Publishing, Melbourne. 243–245.
Herrera, C.M., 1996. Floral traits and plant adaptation to insect pollinators: a devil’s advocate approach.
In Lloyd, D.G., Barrett, S.C.H., eds. Floral biology: Studies on floral evolution in animal-pollinated
plants. Chapman & Hall, New York. 65–87.
Heywood, V.H., Brummitt, R.K., Culham, A., Seberg, O., 2007. Flowering plants of the world. Firely Books,
New York.
Ibañez, A.C., Moré, M., Salazar, G., Leiva, S., Barboza, G.E., Cocucci, A.A., 2019. Crescendo, diminuendo
and subito of the trumpets: winds of change in the concerted evolution between flowers and
pollinators in Salpichroa (Solanaceae). Molecular Phylogenetics and Evolution 132, 90–99.
https://doi.org/10.1016/j.ympev.2018.11.020
IPBES, 2016. Summary for policymakers of the assessment report of the Intergovernmental Science-
Policy Platform on Biodiversity and Ecosystem Services on pollinators, pollination and food
production. Potts, S.G., Imperatriz-Fonseca, V.L., Ngo, H.T., Biesmeijer, J.C., Breeze, T.D., Dicks,
L.V., Garibaldi, L.A., Hill, R., Settele, J., Vanbergen, A.J., Aizen, M.A., Cunningham, S.A., Eardley,
C., Freitas, B.M., Gallai, N., Kevan, P.G., Kovacs-Hostyanszki, A., Kwapong, P.K., Li, J., Li, X.,
Martins, D.J., Nates-Parra, G., Pettis, J.S., Rader, R., Viana, B.F., eds. Secretariat of the
Intergovernmental Science-Policy Platform on Biodiversity and Ecosystem Services, Bonn.
I. General Introduction
39
Jeiter, J., Hilger, H.H., Smets, E.F., Weigend, M., 2017. The relationship between nectaries and floral
architecture: a case study in Geraniaceae and Hypseocharitaceae. Annals of Botany 120, 791–
803. https://doi.org/10.1093/aob/mcx101
Jeiter, J., Weigend, M., 2018. Simple scales make complex compartments – ontogeny and
morphology of stamen-corolla tube modifications in Hydrophyllaceae (Boraginales).
Botanical Journal of the Linnean Society 125, 802–820.
https://doi.org/10.1093/biolinnean/bly167
Johnson, S.D., 2010. The pollination niche and its role in the diversification and maintenance of the
southern African flora. Philosophical Transactions of the Royal Society B: Biological Sciences
365, 499–516. https://doi.org/10.1098/rstb.2009.0243
Johnson, S.D., Hargreaves, A.L., Brown, M., 2006. Dark, bitter-tasting nectar functions as a filter of
flower visitors in a bird-pollinated plant. Ecology 87, 2709–2716. https://doi.org/10.1890/0012-
9658(2006)87[2709:DBNFAA]2.0.CO;2
Johnson, S.D., Wester, P., 2017. Stefan Vogel’s analysis of floral syndromes in the South African flora: An
appraisal based on 60 years of pollination studies. Flora 232, 200–206.
https://doi.org/10.1016/j.flora.2017.02.005
Joppa, L.N., Roberts, D.L., Pimm, S.L., 2011. How many species of flowering plants are there?
Proceedings of the Royal Society B: Biological Sciences 278, 554–559.
https://doi.org/10.1098/rspb.2010.1004
Kastinger, C., Weber, A., 2001. Bee-flies (Bombylius spp., Bombyliidae, Diptera) and the pollination of
flowers. Flora 196, 3–25. https://doi.org/10.1016/S0367-2530(17)30015-4
Kay, K.M., Voelckel, C., Yang, J.Y., Hufford, K.M., Kaska, D.D., Hodges, S.A., 2006. Floral characters and
species diversification. In: Harder, L.D., Barrett, S.C.H., eds. Ecology and evolution of flowers.
311–325. Oxford University Press, Oxford.
Kearns, C.A., Inouye, D.W., Waser, N.M., 1998. Endangered mutualisms: The conservation of plant-
pollinator interactions. Annual Review of Ecology and Systematics 29, 83–112.
https://doi.org/10.1146/annurev.ecolsys.29.1.83
Kevan, P.G., 1983. Floral colors through the insect eye: what they are and what they mean. In: Jones,
C.E. and Little, R.J., eds. Handbook of experimental pollination biology. Van Nostrand Reinhold,
New York.
Kevan, P.G., 1978. Floral coloration, its colorimetric analysis and significance in anthecology. In:
Richards, A.J., ed. The pollination of flowers by insects. Academic Press, London.
Kingsolver, J.G., Daniel, T.L., 1995. Mechanics of food handling by fluid-feeding insects. In: Chapman,
R.F., de Boer, G., eds. Regulatory mechanisms in insect feeding. Springer US, Boston. 32–73.
https://doi.org/10.1007/978-1-4615-1775-7_2
Kirk, W.D.J., 1993. Interspecific size and number variation in pollen grains and seeds. Botanical Journal of
the Linnean Society 49, 239–248. https://doi.org/10.1111/j.1095-8312.1993.tb00903.x
Kölreuter, J.G., 1761. Vorläufige Nachrichten von einigen das Geschlecht der Pflanzen betreffenden
Versuchen und Beobachtungen. Gleditschischen Handlung, Leipzig.
Krenn, H., Plant, J., Szucsich, N., 2005. Mouthparts of flower-visiting insects. Arthropod Structure &
Development 34, 1–40. https://doi.org/10.1016/j.asd.2004.10.002

I. General Introduction
40
Lautenbach, S., Seppelt, R., Liebscher, J., Dormann, C.F., 2012. Spatial and temporal trends of global
pollination benefit. PLoS ONE 7, e35954.
López, J., Rodríguez-Riaño, T., Ortega-Olivencia, A., Antonio Devesa, J., Ruiz, T., 1999. Pollination
mechanisms and pollen-ovule ratios in some Genisteae (Fabaceae) from Southwestern Europe.
Plant Systematics and Evolution 216, 23–47. https://doi.org/10.1007/BF00985099
Lozada‐Gobilard, S., Weigend, M., Fischer, E., Janssens, S.B., Ackermann, M., Abrahamczyk, S., 2019.
Breeding systems in Balsaminaceae in relation to pollen/ovule ratio, pollination syndromes, life
history and climate zone. Plant Biology 21, 157–166. https://doi.org/10.1111/plb.12905
Lunau, K., 2006. Stamens and mimic stamens as components of floral colour patterns. Botanische
Jahrbücher 127, 13–41. https://doi.org/10.1127/0006-8152/2006/0127-0013
Lunau, K., 2000. The ecology and evolution of visual pollen signals. Plant Systematics and Evolution 222,
89–111. https://doi.org/10.1007/BF00984097
Lunau, K., 1992. A new interpretation of flower guide colouration: absorption of ultraviolet-light
enhances colour saturation. Plant Systematics and Evolution 183, 51–65.
https://doi.org/10.1007/BF00937735
Lunau, K., 1991. Innate flower recognition in bumblebees (Bombus terrestris, B. lucorum; Apidae):
Optical signals from stamens as landing reaction releasers. Ethology 88, 203–214.
https://doi.org/10.1111/j.1439-0310.1991.tb00275.x
Lunau, K., 1990. Colour saturation triggers innate reactions to flower signals: Flower dummy
experiments with bumblebees. Journal of Comparative Physiology 166, 827–834.
https://doi.org/10.1007/BF00187329
Lunau, K., 1988. Angeborenes und erlerntes Verhalten beim Blütenbesuch von Schwebfliegen –
Attrappenversuche mit Eristalis pertinax (Scopoli) (Diptera, Syrphidae). Zoologische Jahrbücher.
Abteilung für allgemeine Zoologie und Physiologie der Tiere 92, 487–499.
Lunau, K., Wacht, S., 1994. Optical releasers of the innate proboscis extension in the hoverfly Eristalis
tenax L. (Syrphidae, Diptera). Journal of Comparative Physiology 174, 575–579.
https://doi.org/10.1007/BF00217378
Magallón, S., Gómez‐Acevedo, S., Sánchez‐Reyes, L.L., Hernández‐Hernández, T., 2015. A meta‐
calibrated timetree documents the early rise of flowering plant phylogenetic diversity. New
Phytologist 207, 437–453. https://doi.org/10.1111/nph.13264
Magallón, S., Hilu, K.W., Quandt, D., 2013. Land plant evolutionary timeline: gene effects are secondary
to fossil constraints in relaxed clock estimation of age and substitution rates. American Journal
of Botany 100, 556–573. https://doi.org/10.3732/ajb.1200416
Michalski, S.G., Durka, W., 2009. Pollination mode and life form strongly affect the relation between
mating system and pollen to ovule ratios. New Phytologist 183, 470–479.
Minnaar, C., Anderson, B., de Jager, M.L., Karron, J.D., 2019. Plant–pollinator interactions along the
pathway to paternity. Annals of Botany 123, 225–245. https://doi.org/10.1093/aob/mcy167
Neal, P.R., Anderson, G.J., 2005. Are ‘mating systems’ ‘breeding systems’ of inconsistent and confusing
terminology in plant reproductive biology? or is it the other way around? Plant Systematics and
Evolution 250, 173–185. https://doi.org/10.1007/s00606-004-0229-9
I. General Introduction
41
Neal, P.R., Dafni, A., Giurfa, M., 1998. Floral symmetry and its role in plant-pollinator systems:
Terminology, distribution, and hypotheses. Annual Review of Ecology and Systematics 2, 345–
373. https://doi.org/10.1146/annurev.ecolsys.29.1.345
Newman, E., Manning, J., Anderson, B., 2014. Matching floral and pollinator traits through guild
convergence and pollinator ecotype formation. Annals of Botany 113, 373–384.
https://doi.org/10.1093/aob/mct203
Nicolson, S.W., Fleming, P.A., 2003. Nectar as food for birds: the physiological consequences of drinking
dilute sugar solutions. Plant Systematics and Evolution 238, 139–153.
https://doi.org/10.1007/s00606-003-0276-7
Nicolson, S.W., Nepi, M., Pacini, E., 2007. Nectaries and nectar. Springer Netherlands, Dordrecht.
https://doi.org/10.1007/978-1-4020-5937-7
Nicolson, S.W., Thornburg, R.W. 2007. Nectar chemistry. In: Nicolson, S.W., Nepi, M., Pacini, E., eds.
Nectaries and nectar. Springer Netherlands, Dordrecht. https://doi.org/10.1007/978-1-4020-
5937-7
Ollerton, J., Alarcón, R., Waser, N.M., Price, M.V., Watts, S., Cranmer, L., Hingston, A., Peter, C.I.,
Rotenberry, J., 2009. A global test of the pollination syndrome hypothesis. Annals of Botany 103,
1471–1480. https://doi.org/10.1093/aob/mcp031
Ollerton, J., Killick, A., Lamborn, E., Watts, S., Whiston, M., 2007. Multiple meanings and modes: On the
many ways to be a generalist flower. Taxon 56, 717–728. https://doi.org/10.2307/25065856
Osche, G., 1979. Zur Evolution optischer Signale bei Blütenpflanzen. Biologie in unserer Zeit 9, 161–170.
https://doi.org/10.1002/biuz.19790090604
Pellmyr, O., 1992. Evolution of insect pollination and angiosperm diversification. Trends in Ecology &
Evolution 7, 46–49. https://doi.org/10.1016/0169-5347(92)90105-K
Pimm, S.L., Joppa, L.N., 2015. How many plant species are there, where are they, and at what rate are
they going extinct? Annals of the Missouri Botanical Garden 100, 170–176.
https://doi.org/10.3417/2012018
Proctor, M.C.F., Yeo, P.F., Yeo, P., Lack, A.J., 1996. The natural history of pollination. Timber Press,
Portland.
Raven, P.H., 1972. Why are bird-visited flowers predominantly red? Evolution 26, 674.
https://doi.org/10.1111/j.1558-5646.1972.tb01975.x
Renner, S.S., 2014. The relative and absolute frequencies of angiosperm sexual systems: Dioecy,
monoecy, gynodioecy, and an updated online database. American Journal of Botany 101, 1588–
1596. https://doi.org/10.3732/ajb.1400196
Renner, S.S., Ricklefs, R.E., 1995. Dioecy and its correlates in the flowering plants. American Journal of
Botany 82, 596–606. https://doi.org/10.5282/ubm/epub.14619
Reyes, E., Sauquet, H., Nadot, S., 2016. Perianth symmetry changed at least 199 times in angiosperm
evolution. Taxon 65, 945–964. https://doi.org/10.12705/655.1
Rosas-Guerrero, V., Aguilar, R., Martén-Rodríguez, S., Ashworth, L., Lopezaraiza-Mikel, M., Bastida, J.M.,
Quesada, M., 2014. A quantitative review of pollination syndromes: do floral traits predict
effective pollinators? Ecology Letters 17, 388–400. https://doi.org/10.1111/ele.12224
Sauquet, H., von Balthazar, M., Magallón, S., Doyle, J.A., Endress, P.K., Bailes, E.J., Barroso de Morais, E.,
Bull-Hereñu, K., Carrive, L., Chartier, M., Chomicki, G., Coiro, M., Cornette, R., El Ottra, J.H.L.,
I. General Introduction
42
Epicoco, C., Foster, C.S.P., Jabbour, F., Haevermans, A., Haevermans, T., Hernández, R., Little,
S.A., Löfstrand, S., Luna, J.A., Massoni, J., Nadot, S., Pamperl, S., Prieu, C., Reyes, E., dos Santos,
P., Schoonderwoerd, K.M., Sontag, S., Soulebeau, A., Staedler, Y., Tschan, G.F., Wing-Sze Leung,
A., Schönenberger, J., 2017. The ancestral flower of angiosperms and its early diversification.
Nature Communications 8, 16047. https://doi.org/10.1038/ncomms16047
Scogin, R., 1983. Visible floral pigments and pollinators. In: Jones, C.E. and Little, R.J., eds. Handbook of
experimental pollination biology. Van Nostrand Reinhold, New York.
Silberglied, R.E., 1979. Communication in the ultraviolet. Annual Review of Ecology and Systematics 10,
373–398. https://doi.org/10.1146/annurev.es.10.110179.002105
Small, E., 1988. Pollen-ovule patterns in tribe Trifolieae (Leguminosae). Plant Systematics and Evolution
160, 195–205. https://doi.org/10.1007/BF00936047
Sprengel, C.K., 1793. Das entdeckte Geheimniss der Natur im Bau und in der Befruchtung der Blumen.
Vieweg, Berlin.
Stebbins, G.L., 1970. Adaptive radiation of reproductive characteristics in angiosperms. I: Pollination
mechanisms. Annual Review of Ecology and Systematics 1, 307–326.
Thomson, J.D., 1983. Component analysis of community-level interactions in pollination systems. In:
Jones, C.E. and Little, R.J., eds. Handbook of experimental pollination biology. Van Nostrand
Reinhold, New York.
van der Kooi, C.J., Stavenga, D.G., 2019. Vividly coloured poppy flowers due to dense pigmentation and
strong scattering in thin petals. Journal of Comparative Physiology A 205, 363–372.
https://doi.org/10.1007/s00359-018-01313-1
van der Niet, T., Johnson, S.D., 2012. Phylogenetic evidence for pollinator-driven diversification of
angiosperms. Trends in Ecology & Evolution 27, 353–361.
https://doi.org/10.1016/j.tree.2012.02.002
van der Pijl, L., 1961. Ecological aspects of flower evolution. II. Zoophilous flower classes. Evolution 15,
44–59. https://doi.org/10.2307/2405842
van Wyk, B.-E., Whitehead, C.S., Glen, H.F., Hardy, D.S., van Jaarsveld, E., Smith, G.F., 1993. Nectar sugar
composition in the subfamily Alooidae (Asphodelaceae). Biochemical Systematical Ecology 21,
271–277.
Vogel, S., 2006. Floral syndromes: empiricism versus typology. Botanische Jahrbücher für Systematik,
Pflanzengeschichte und Pflanzengeographie 127, 5–11.
http://doi.org/10.1127/0006-8152/2006/0127-0005
Vogel, S., 1954. Blütenbiologische Typen als Elemente der Sippengliederung, dargestellt anhand der
Flora Südafrikas. Botanische Studien 1. Fischer, Jena.
Waller, G.D., 1972. Evaluating responses of honey bees to sugar solutions using an artificial-flower
feeder. Annals of the Entomological Society of America 65, 857–862.
https://doi.org/10.1093/aesa/65.4.857
Waser, N.M., Chittka, L., Price, M.V., Williams, N.M., Ollerton, J., 1996. Generalization in pollination
systems, and why it matters. Ecology 77, 1043–1060. https://doi.org/10.2307/2265575
Weiss, M., 2001. Vision and learning in some neglected pollinators: Beetles, flies, moths, and butterflies.
In: Chittka, L., Thomson, J.D., eds. Cognitive ecology of pollination. Animal behavior and floral
evolution. Cambridge University Press, Cambridge. 171–190.
I. General Introduction
43
https://doi:10.1017/CBO9780511542268.010
Willmer, P.G., 2011. Pollination and floral ecology. Princeton University Press, Princeton, N.J.
Willmer, P.G., 1988. The role of insect water balance in pollination ecology: Xylocopa and Calotropis.
Oecologia 76, 430–438. https://doi.org/10.1007/BF00377039
Willmer, P.G., 1986. Foraging patterns and water balance: Problems of optimization for a xerophilic bee,
Chalicodoma sicula. Journal of Animal Ecology 55, 941–962. https://doi.org/10.2307/4426

I. General Introduction
44
II. Diversification of floral function in Geraniales
45
II. DIVERSIFICATION OF FLORAL FUNCTION IN GERANIALES – WHY SO DAPPER?
BREEDING SYSTEM RELATED VARIABLES NOT CORRELATED TO POLLINATOR
GUILDS AND FLOWER SYMMETRY II. Diversification of floral function in Geraniales
Authors
A. W. Mues*, A. Kelch**, M. Ackermann*** and M. Weigend* * Nees Institut für Biodiversität der Pflanzen, Universität Bonn, 53115 Bonn, Germany
** Freie Universität Berlin, Kaiserswerther Str. 16/18, 14195 Berlin, Germany
*** Institut für Integrierte Naturwissenschaften, Abt. Biologie, University Koblenz-Landau, Universitätsstraße 1, 56070 Koblenz, Germany
II.1 ABSTRACT
Background and aims: Geraniales are a small but florally diverse order of five families, allowing for
comparative studies on diversification of floral function. Here we present a detailed analysis on
variables related to breeding system (pollen production, ovule numbers, p/o ratios) and variables that
have been considered as instrumental for pollinator interaction: Nectar reward pattern (amount,
concentration, sugar production per flower) and pollinator positioning (flower symmetry). We further
analyse floral morphological aspects (anther number, secretory tissue) and growth habit as factors
considered closely tied to reproductive strategies. Reported pollinator guilds are tested for explanatory
value of the analysed variables. Pollinator guilds and retrieved plant trait pattern are mapped onto the
latest phylogeny of the order and discussed from an evolutionary perspective.
Methods: Pollen and ovule counting, nectar measurements (amounts, sugar concentration), hierarchical
clustering, Non-metric Multidimensional Scaling (NMDS), vector fitting.
Key results: Pollinator guilds are not correlated to breeding system related variables, but to nectar
reward pattern. Pollinator positioning via flower symmetry is of no explanatory value for the analysed
variables. Other floral morphological variables (anther number, secretory tissue) are also of no
explanatory value, however growth habit is: Plants of stouter growth habit show higher resource
investment into breeding system related variables and nectar reward. Phylogenetic constraints are
present: Gamete production and investment in nectar reward is very high in phylogenetically
neighbouring genera Greyia and Melianthus. Pollen production is highest in genus Balbisia. Geraniaceae
s. str. show lower gamete production and nectar amount.
Conclusions: Breeding system and pollination mode appear as separate aspects of the floral ecology of
Geraniales. The uncoupling of flower symmetry from pollen and nectar production discount pollen
position hypothesis and reward wastage hypothesis as explanations for the flower symmetry in the
order.
Key words: Geraniales, floral function, breeding system, pollinator guilds, symmetry, nectar, reward,
pollen, ovules, p/o ratio.
II. Diversification of floral function in Geraniales
46
II.2 INTRODUCTION
On the one hand, comparative studies on floral function are often focused to genera and species,
mostly because species numbers at the family and order levels and the degree of divergence are too
high for generating or analysing relevant datasets. On the other hand, the higher degree of expected
divergence in functional traits makes a higher-level study particularly interesting. Here we investigate
the order Geraniales, a group of five families and ca. 900 species in the Rosid II clade (Angiosperm
Phylogeny Group, 2009; 2016; Berger et al., 2016). Their phyletic diversity is particularly high in the
southern hemisphere: Melianthaceae are largely restricted to southern Africa while Vivianiaceae and
Hypseocharitaceae are restricted to South America. Francoaceae is represented in southern South
America by Francoa and Tetilla, while Greyia is restricted to southern Africa. The only wide-ranging
family with representatives on the northern hemisphere are Geraniaceae. Only the genus Geranium is
subcosmopolitan in temperate and Mediterranean climates, Pelargonium has a clear centre of diversity
on southern Africa, Monsonia is restricted to Africa and southwest Asia and Erodium has its main
distribution area in the Mediterranean region. Palazzesi et al. (2012) provided a phylogeny based on a
broad sampling at the genus level. They propose the recognition of five families: Francoaceae (genera
Francoa, Greyia, Tetilla), Geraniaceae (Erodium, Geranium, Monsonia, Pelargonium), Melianthaceae
(Bersama, Melianthus), Hypseocharitaceae (Hypseocharis) and Vivianaceae (Balbisia, Rhynchotheca,
Viviania). Sytsma et al. (2014) retrieves the same clades based on essentially the same dataset.
In their current circumscription, Geraniales include a range of genera previously assigned to other
families because of their superficially very different vegetative and floral morphology, such as Francoa
(formely Saxifragaceae) or Hypseocharis (formerly Oxalidaceae; Engler, 1898; Chronquist, 1981;
Ehrendorfer, 1983; Takhtajan, 1997). Flower morphology is particularly diversified and flower structure
and biology of some individual genera and species of Geraniales have been studied extensively in the
recent past (e.g. Struck, 1997; Ronse de Craene and Smets, 1999; Aldasoro et al., 2001; Weigend, 2005;
Linder et al., 2006; Fiz et al., 2008; Endress, 2010; Jeiter et al., 2017 a, b). With the well-resolved
phylogenies available (Palazzesi et al., Sytsma et al.) a closer study of the evolution of floral function at
the order level is of particular interest. The evolution of floral function and plant-pollinator interactions
is a complex field, but an understanding of the phylogenetic history together with in depth information
on functional traits, preferably linked to pollinator observations, permit an identification of evolutionary
trends in individual lineages, including possible phylogenetic constraints on particular characters or
suites of characters.
In this study we investigate a range of functional traits, with a special emphasis on variables related to
the breeding system (pollen, ovules, p/o ratio) and nectar reward (amount, sugar concentration,
absolute sugar production per flower). Breeding systems represent the basic strategies of sexual plant
reproduction to ensure persistence of species in their environment, either by relying on selfing
(autogamy) or pollen transfer between individuals (xenogamy). The pollen to ovule ratio per flower as a
proxy for plant breeding systems was first proposed by Cruden (1977), and its general validity has
repeatedly been demonstrated. The theory generally states that autogamous species should have much
lower p/o ratios than xenogamous species, since little or no pollen is lost in transfer between male and
female flower organs, and p/o ratios should also be influenced by pollination mode and details of the
pollination process, i.e. body size of the pollinator, size of the pollen bearing area, pollinator behaviour
II. Diversification of floral function in Geraniales
47
(e.g. grooming, pollen consumption). These overall correlations seem to hold true, especially when
looking at species within individual genera and families, but between unrelated plant groups huge
differences in the p/o ratios of taxa with the same breeding system may be observed (compare Cruden
and Jensen, 1979; Cruden and Miller-Ward, 1981; Cruden and Lyon, 1985; Small, 1988; Kirk, 1993; López
et al., 1999; Cruden, 2000; Michalski and Durka, 2009; Alarcón et al., 2011; Lozada-Gobilard et al.,
2019). Beside breeding system and pollination mode, other factors like growth habit may also have
influence on the p/o ratio, with higher p/o ratios found in woody perennials than in herbs (Michalski
and Durka, 2009).
We further use flower symmetry as a key trait of flower morphology and architecture controlling plant-
pollinator interaction (Neal et al., 1989; Endress, 1996, 1999). Symmetry determines the type of
interaction between a potential pollinator and the flower and influences expenditure of nectar and
pollen, which may also influence breeding system. According to the number of symmetry planes four
types of floral symmetry are used in conventional terms: "asymmetric" (without any symmetry plane),
"monosymmetric" or "zygomorphic" (one symmetry plane), "disymmetric" (two symmetry planes) and
“polysymmetric”, "radially symmetric" or "actinomorphic" (with several symmetry planes).
Neal et al. (1989) present an overview on flower symmetry and the vast field of hypotheses that try to
explain its role in plant-pollinator interactions. In general, Neal et al. (p. 355) sort hypotheses in four
major categories, based on the phase of the pollination process in which selection acts on flower
symmetry: (a) environmental conditions (e.g. protection from rain, etc.), (b) perception by the
pollinators, (c) information processing (i.e. learning abilities and innate preferences) by pollinators, and
(d) activity patterns (i.e. behaviour and movement) of the pollinators on the flower. Here we focus on
category (d), especially on the pollen position hypothesis and the reward wastage hypothesis. The pollen
position hypothesis suggests that zygomorphic flowers are restricting pollinators in their possibilities to
approach flowers, and therefore leading to precise pollen placement and stigma contact of the
pollinator during the pollination process (Armbruster et al., 1994; Laverty, 1980; Macior, 1974), while
actinomorphic flowers do not constrain the pollinator (Faegri and van der Pijl, 1979; Harper, 1979;
Leppik, 1972). The reward wastage hypothesis is similar, stating that zygomorphic flowers only allow
specialised pollinators access to reward, which is often hidden and only accessible by advanced
behavioural patterns and/or fitting mouthparts. They thus discourage non-pollinating flower visitors,
presumably increasing pollination efficiency.
Fortunately, reports on flower visitors and potential pollen vectors are considerable for the order
(although not complete, and there is no comprehensive view of floral functional traits in most of the
smaller, southern hemisphere groups). The data here presented is therefore also discussed with respect
to pollination syndromes: There has been frequent criticism about the usefulness of the pollination
syndromes approach, especially because strict specialisation of a plant species to single pollinator guilds
is rather uncommon (e.g. Waser et al., 1996; Ollerton et al., 2009), and this theory cannot cover all the
complex facets of pollination in nature. We agree with Willmer (2011), that pollination syndromes
should be understood as a statistical rather than an absolute constructs, meaning that particular floral
parameters are more likely in plant species visited more frequent by a particular type of pollinator. The
validity of pollination syndromes has found many advocates in the course of scientific endeavour (e.g.
Delpino, 1868–1875; Vogel, 1954; van der Pijl, 1961; Baker and Hurd, 1986; Faergi and van der Pijl,
1979; Johnson, 2010; Gómez et al., 2008; van der Niet and Johnson, 2012; Newman et al., 2014; Rosas-
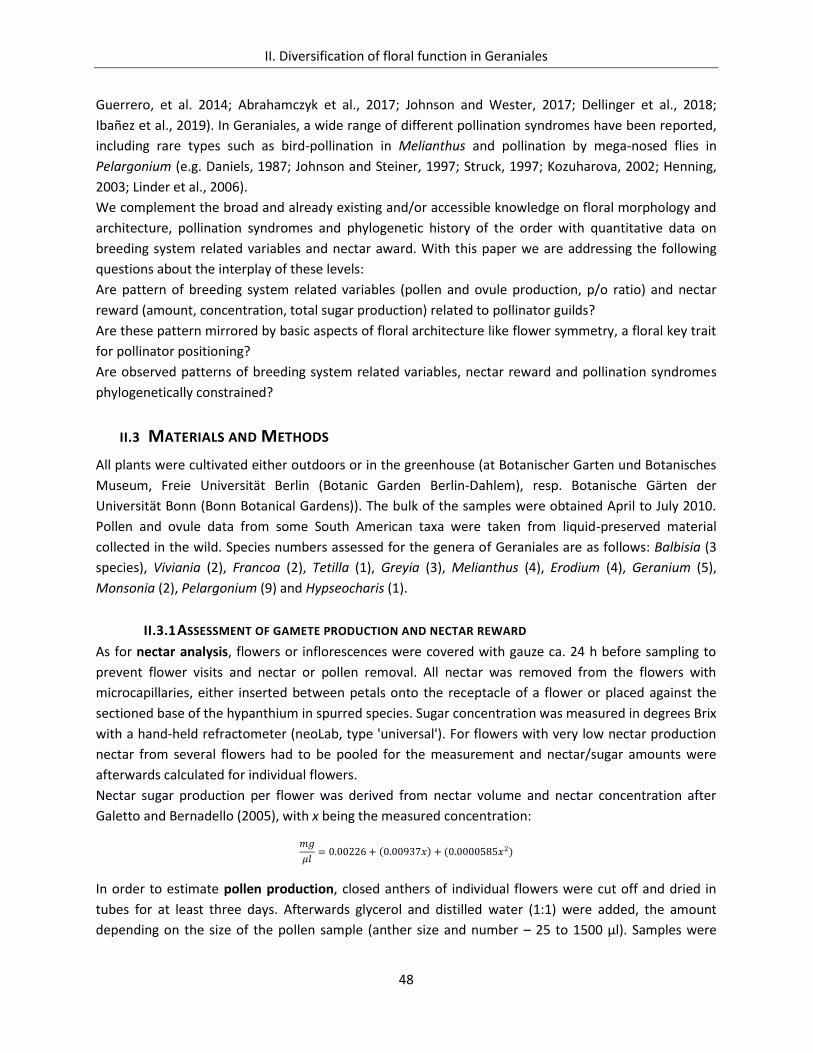
II. Diversification of floral function in Geraniales
48
Guerrero, et al. 2014; Abrahamczyk et al., 2017; Johnson and Wester, 2017; Dellinger et al., 2018;
Ibañez et al., 2019). In Geraniales, a wide range of different pollination syndromes have been reported,
including rare types such as bird-pollination in Melianthus and pollination by mega-nosed flies in
Pelargonium (e.g. Daniels, 1987; Johnson and Steiner, 1997; Struck, 1997; Kozuharova, 2002; Henning,
2003; Linder et al., 2006).
We complement the broad and already existing and/or accessible knowledge on floral morphology and
architecture, pollination syndromes and phylogenetic history of the order with quantitative data on
breeding system related variables and nectar award. With this paper we are addressing the following
questions about the interplay of these levels:
Are pattern of breeding system related variables (pollen and ovule production, p/o ratio) and nectar
reward (amount, concentration, total sugar production) related to pollinator guilds?
Are these pattern mirrored by basic aspects of floral architecture like flower symmetry, a floral key trait
for pollinator positioning?
Are observed patterns of breeding system related variables, nectar reward and pollination syndromes
phylogenetically constrained?
II.3 MATERIALS AND METHODS
All plants were cultivated either outdoors or in the greenhouse (at Botanischer Garten und Botanisches
Museum, Freie Universität Berlin (Botanic Garden Berlin-Dahlem), resp. Botanische Gärten der
Universität Bonn (Bonn Botanical Gardens)). The bulk of the samples were obtained April to July 2010.
Pollen and ovule data from some South American taxa were taken from liquid-preserved material
collected in the wild. Species numbers assessed for the genera of Geraniales are as follows: Balbisia (3
species), Viviania (2), Francoa (2), Tetilla (1), Greyia (3), Melianthus (4), Erodium (4), Geranium (5),
Monsonia (2), Pelargonium (9) and Hypseocharis (1).
II.3.1 ASSESSMENT OF GAMETE PRODUCTION AND NECTAR REWARD
As for nectar analysis, flowers or inflorescences were covered with gauze ca. 24 h before sampling to
prevent flower visits and nectar or pollen removal. All nectar was removed from the flowers with
microcapillaries, either inserted between petals onto the receptacle of a flower or placed against the
sectioned base of the hypanthium in spurred species. Sugar concentration was measured in degrees Brix
with a hand-held refractometer (neoLab, type 'universal'). For flowers with very low nectar production
nectar from several flowers had to be pooled for the measurement and nectar/sugar amounts were
afterwards calculated for individual flowers.
Nectar sugar production per flower was derived from nectar volume and nectar concentration after
Galetto and Bernadello (2005), with x being the measured concentration:
𝑚𝑔
𝜇𝑙= 0.00226 + (0.00937𝑥) + (0.0000585𝑥2)
In order to estimate pollen production, closed anthers of individual flowers were cut off and dried in
tubes for at least three days. Afterwards glycerol and distilled water (1:1) were added, the amount
depending on the size of the pollen sample (anther size and number – 25 to 1500 µl). Samples were
II. Diversification of floral function in Geraniales
49
mixed 2 to 5 minutes in a laboratory mill, then placed into an ultrasonic bath for 15 minutes to disperse
the pollen grains in the solvent. Samples were then vortexed to ensure equal suspension of pollen
grains before counting. The number of pollen grains was counted in a hemocytometer (Fuchs-Rosenthal
ruling pattern). Per sample, pollen grains on five squares (each 1x1 mm) of the hemocytometer
chamber were counted. Total pollen amount of the sample was calculated with the following formula
(Neuendorf, 2013):
pollen per sample =counted pollen grains
counted surface (mm2) · chamber depth (mm) · dilution (1 ÷ amount of diluent)
Pollen production per anther was derived by division of pollen number per sample by the number of
anthers per sample. Pollen production per flower was subsequently calculated by multiplying anther
pollen production with the anther number per flower.
The number of viable ovules per flower is fixed and single-digit for many species of Geraniales. For
species with varying ovule number, ovaries were opened carefully and ovules were counted under a
stereomicroscope. Afterwards p/o ratios were calculated by dividing pollen production per flower by
the ovule number per flower.
Due to unequal sample sizes for gametic and nectar variables, data points were excluded randomly with
RAND function in Microsoft Excel until the lowest common denominator per species and variable was
found. A sample size of five data points was chosen as lowest acceptable threshold. As for nectar data,
the remaining sample size is usually ten, but 25 for Francoaceae and Melianthus. Nectar information is
scanty for Viviana and Hypseocharis and was not used for further analysis, while information on nectar
production of Tetilla is missing. As for gametic variables, remaining sample sizes usually range between
seven and twelve data points, but only five for Melianthus. Twelve data points were obtained for ovule
number of Tetilla, but only one data point was available for pollen production, and therefore also p/o
ratio. Due to non-normality of the dataset, data points selected for analysis were used for data
exploration and description of data bandwidth, while arithmetic means on species level were used for
further analysis.
II.3.2 LEVEL OF MEASUREMENT AND STATISTICAL ANALYSIS
Variables analysed are either ratio scaled or nominal. Ratio scaled variables are all variables of gamete
production and nectar reward: Pollen production per anther and flower, number of viable ovules per
flower, p/o ratio, produced nectar amount in µl, nectar sugar concentration in percent and total nectar
sugar production per flower in mg. Further, anther number per flower (ranging from 4 to 15 for the
species analysed) as well as number of secretory organs (ranging from 1 to 10 in rewarding species,
otherwise absent) are ratio scaled.
Nominal variables are flower symmetry, growth habit and pollinator guild, as well as additional
information on secretory organs. R function "factor" was used to introduce respective variables to
calculations, and levels per variable were introduced as unordered to denote nominal level of
measurement. Secretory tissue for nectar rewarding species was classified after Jeiter et al. (2017 b),
and information was extrapolated for the genus level, with two nominal variables assessed: Position of
secretory organs (coded 1 for extrastaminal, 2 for both extra- and interstaminal and 3 for interstaminal),
II. Diversification of floral function in Geraniales
50
and possible linkage between the vasculature of secretory organs and the main vasculature of the plant
(coded 1 for not linked and 2 for linked).
Flower symmetry was coded in three categories: Actinomorphic flowers with several symmetry planes
allow pollinators to approach sexual flower organs and possible reward freely, and were coded with 1.
Disymmetric V. marifolia was included in this category. Non-functionally zygomorphic flowers with a
single symmetry plane for the corolla (due to shape, colouration etc.), but a radially symmetric
androecium and gynoecium, were coded with 2. Functionally zygomorphic flowers with a single
symmetry plane, and therefore coercing potential pollinators to approach nectar respectively touch
anthers and stigmatic surfaces in a distinctive way, were coded with 3.
Growth habit was classified in three categories, based on observation and literature, and coded 1 for
herbs (i.e. annual or perennial plants without a persistent woody stem, including geophytes), 2 for
subshrubs (i.e. woody plants with size below 1.5 m) and 3 for shrubs (i.e. woody plants with size above
1.5 m, including small trees).
Pollinator guilds were derived from flower visitors reported in literature, as well as from features
generally accepted as indicators of pollination syndromes, namely flower colour, flower shape and
visibility of nectar site. Three superordinate functional pollinator guilds are distinguished here, generally
reflecting commonalities between pollinators in regard to suitable nectar reward (amount, viscosity),
bodily requirements and "mechanical fit" for successful interactions with the flowers: Pollinators with
short proboscis (short-tongued flies and bees, including beetles, coded with 1), pollinators with long
proboscis (long-tongued flies and bees, butterflies, moths and hawkmoths, coded with 2) and avian
pollinators (coded with 3).
Detailed information on continuous and nominal variables on species level are presented in the
appendix (tables A X.1.1 to A X.1.4).
Cluster analysis and multivariate ordination were performed with R package vegan, version 2.5-1
(compare Oksanen, 2013): Hierarchical clustering was performed separately with arithmetic means of
gametic data (all species used) and nectar data (only nectar-bearing species with complete assessment
of nectar variables). Cluster analyses were conducted with average linkage, and dissimilarity matrices
were produced via Bray Curtis index. Linkage method was selected by means of R function cophenetic,
and average linkage performed best. Optimal number of clusters was selected after visual inspection of
cluster dendrograms, Elbow-method and R package NBclust (see appendix, figure A X.1.1).
Ordination was performed by means of Non-Metric Multidimensional Scaling (NMDS), with same
dissimilarity matrices used as for hierarchical clustering. Function metaMDS was used for iterative
testing and selection of the solution with smallest stress, with stress between .05 and .1 interpreted as
good, and stress below .05 as very good (McCune et al., 2002). Data were standardised by square root
transformation and Wisconsin double standardisation. In order to interpret the obtained ordinations,
nominal variables were introduced via factor function and fitted onto the ordination by means of
function "envfit" (999 permutations). As for the ordination of gametic variables, vector fitting was
performed with flower symmetry, pollinator guild, growth habit, and anther number. As for the
ordination of nectar reward, variables regarding the morphology of the secretory tissue replaced anther
number for vector fitting.
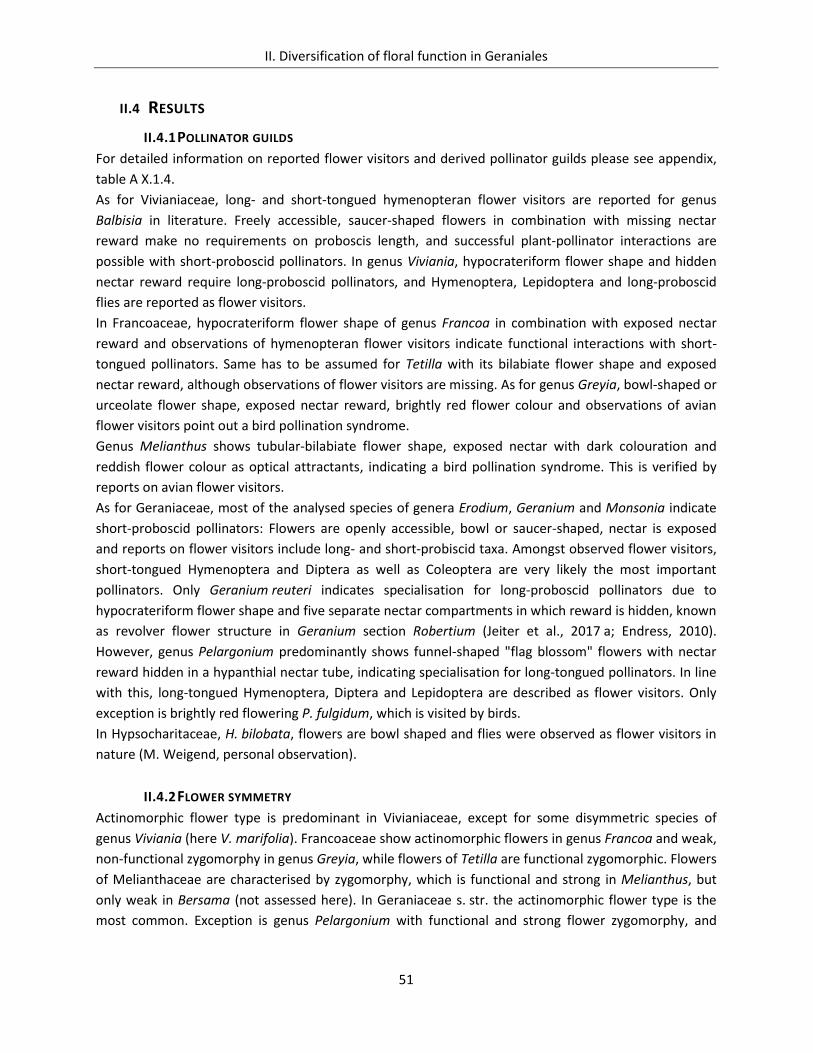
II. Diversification of floral function in Geraniales
51
II.4 RESULTS
II.4.1 POLLINATOR GUILDS
For detailed information on reported flower visitors and derived pollinator guilds please see appendix,
table A X.1.4.
As for Vivianiaceae, long- and short-tongued hymenopteran flower visitors are reported for genus
Balbisia in literature. Freely accessible, saucer-shaped flowers in combination with missing nectar
reward make no requirements on proboscis length, and successful plant-pollinator interactions are
possible with short-proboscid pollinators. In genus Viviania, hypocrateriform flower shape and hidden
nectar reward require long-proboscid pollinators, and Hymenoptera, Lepidoptera and long-proboscid
flies are reported as flower visitors.
In Francoaceae, hypocrateriform flower shape of genus Francoa in combination with exposed nectar
reward and observations of hymenopteran flower visitors indicate functional interactions with short-
tongued pollinators. Same has to be assumed for Tetilla with its bilabiate flower shape and exposed
nectar reward, although observations of flower visitors are missing. As for genus Greyia, bowl-shaped or
urceolate flower shape, exposed nectar reward, brightly red flower colour and observations of avian
flower visitors point out a bird pollination syndrome.
Genus Melianthus shows tubular-bilabiate flower shape, exposed nectar with dark colouration and
reddish flower colour as optical attractants, indicating a bird pollination syndrome. This is verified by
reports on avian flower visitors.
As for Geraniaceae, most of the analysed species of genera Erodium, Geranium and Monsonia indicate
short-proboscid pollinators: Flowers are openly accessible, bowl or saucer-shaped, nectar is exposed
and reports on flower visitors include long- and short-probiscid taxa. Amongst observed flower visitors,
short-tongued Hymenoptera and Diptera as well as Coleoptera are very likely the most important
pollinators. Only Geranium reuteri indicates specialisation for long-proboscid pollinators due to
hypocrateriform flower shape and five separate nectar compartments in which reward is hidden, known
as revolver flower structure in Geranium section Robertium (Jeiter et al., 2017 a; Endress, 2010).
However, genus Pelargonium predominantly shows funnel-shaped "flag blossom" flowers with nectar
reward hidden in a hypanthial nectar tube, indicating specialisation for long-tongued pollinators. In line
with this, long-tongued Hymenoptera, Diptera and Lepidoptera are described as flower visitors. Only
exception is brightly red flowering P. fulgidum, which is visited by birds.
In Hypsocharitaceae, H. bilobata, flowers are bowl shaped and flies were observed as flower visitors in
nature (M. Weigend, personal observation).
II.4.2 FLOWER SYMMETRY
Actinomorphic flower type is predominant in Vivianiaceae, except for some disymmetric species of
genus Viviania (here V. marifolia). Francoaceae show actinomorphic flowers in genus Francoa and weak,
non-functional zygomorphy in genus Greyia, while flowers of Tetilla are functional zygomorphic. Flowers
of Melianthaceae are characterised by zygomorphy, which is functional and strong in Melianthus, but
only weak in Bersama (not assessed here). In Geraniaceae s. str. the actinomorphic flower type is the
most common. Exception is genus Pelargonium with functional and strong flower zygomorphy, and
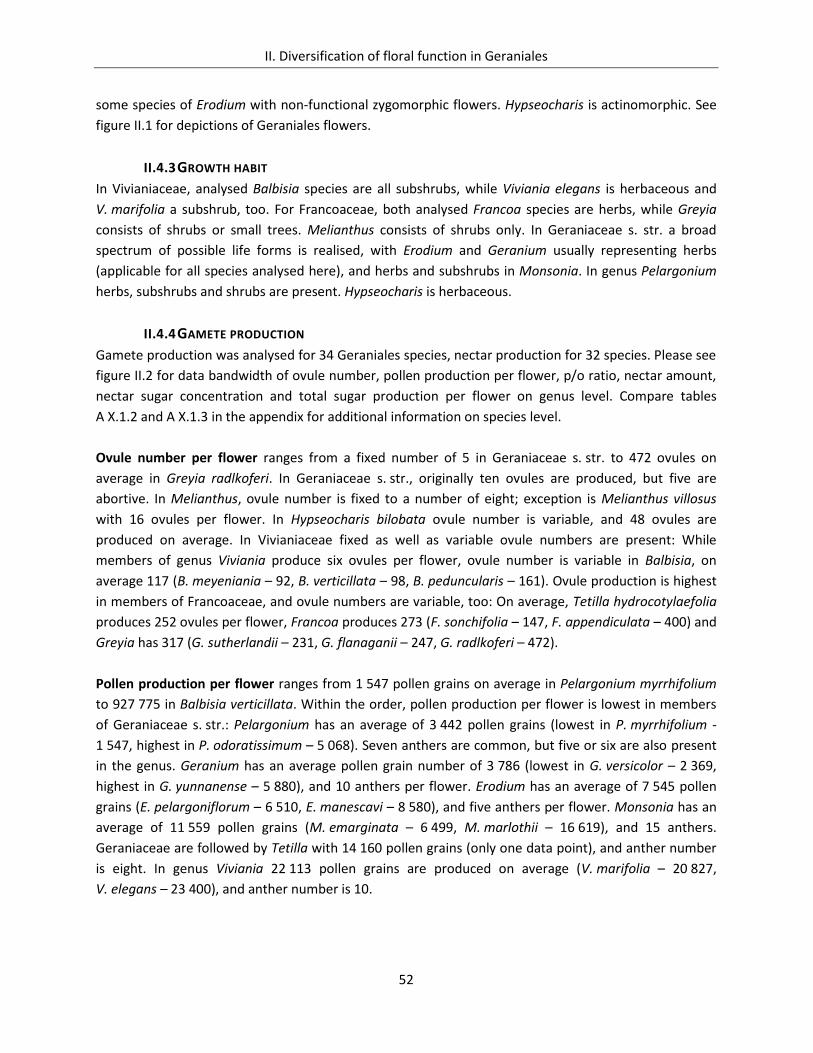
II. Diversification of floral function in Geraniales
52
some species of Erodium with non-functional zygomorphic flowers. Hypseocharis is actinomorphic. See
figure II.1 for depictions of Geraniales flowers.
II.4.3 GROWTH HABIT
In Vivianiaceae, analysed Balbisia species are all subshrubs, while Viviania elegans is herbaceous and
V. marifolia a subshrub, too. For Francoaceae, both analysed Francoa species are herbs, while Greyia
consists of shrubs or small trees. Melianthus consists of shrubs only. In Geraniaceae s. str. a broad
spectrum of possible life forms is realised, with Erodium and Geranium usually representing herbs
(applicable for all species analysed here), and herbs and subshrubs in Monsonia. In genus Pelargonium
herbs, subshrubs and shrubs are present. Hypseocharis is herbaceous.
II.4.4 GAMETE PRODUCTION
Gamete production was analysed for 34 Geraniales species, nectar production for 32 species. Please see
figure II.2 for data bandwidth of ovule number, pollen production per flower, p/o ratio, nectar amount,
nectar sugar concentration and total sugar production per flower on genus level. Compare tables
A X.1.2 and A X.1.3 in the appendix for additional information on species level.
Ovule number per flower ranges from a fixed number of 5 in Geraniaceae s. str. to 472 ovules on
average in Greyia radlkoferi. In Geraniaceae s. str., originally ten ovules are produced, but five are
abortive. In Melianthus, ovule number is fixed to a number of eight; exception is Melianthus villosus
with 16 ovules per flower. In Hypseocharis bilobata ovule number is variable, and 48 ovules are
produced on average. In Vivianiaceae fixed as well as variable ovule numbers are present: While
members of genus Viviania produce six ovules per flower, ovule number is variable in Balbisia, on
average 117 (B. meyeniania – 92, B. verticillata – 98, B. peduncularis – 161). Ovule production is highest
in members of Francoaceae, and ovule numbers are variable, too: On average, Tetilla hydrocotylaefolia
produces 252 ovules per flower, Francoa produces 273 (F. sonchifolia – 147, F. appendiculata – 400) and
Greyia has 317 (G. sutherlandii – 231, G. flanaganii – 247, G. radlkoferi – 472).
Pollen production per flower ranges from 1 547 pollen grains on average in Pelargonium myrrhifolium
to 927 775 in Balbisia verticillata. Within the order, pollen production per flower is lowest in members
of Geraniaceae s. str.: Pelargonium has an average of 3 442 pollen grains (lowest in P. myrrhifolium -
1 547, highest in P. odoratissimum – 5 068). Seven anthers are common, but five or six are also present
in the genus. Geranium has an average pollen grain number of 3 786 (lowest in G. versicolor – 2 369,
highest in G. yunnanense – 5 880), and 10 anthers per flower. Erodium has an average of 7 545 pollen
grains (E. pelargoniflorum – 6 510, E. manescavi – 8 580), and five anthers per flower. Monsonia has an
average of 11 559 pollen grains (M. emarginata – 6 499, M. marlothii – 16 619), and 15 anthers.
Geraniaceae are followed by Tetilla with 14 160 pollen grains (only one data point), and anther number
is eight. In genus Viviania 22 113 pollen grains are produced on average (V. marifolia – 20 827,
V. elegans – 23 400), and anther number is 10.
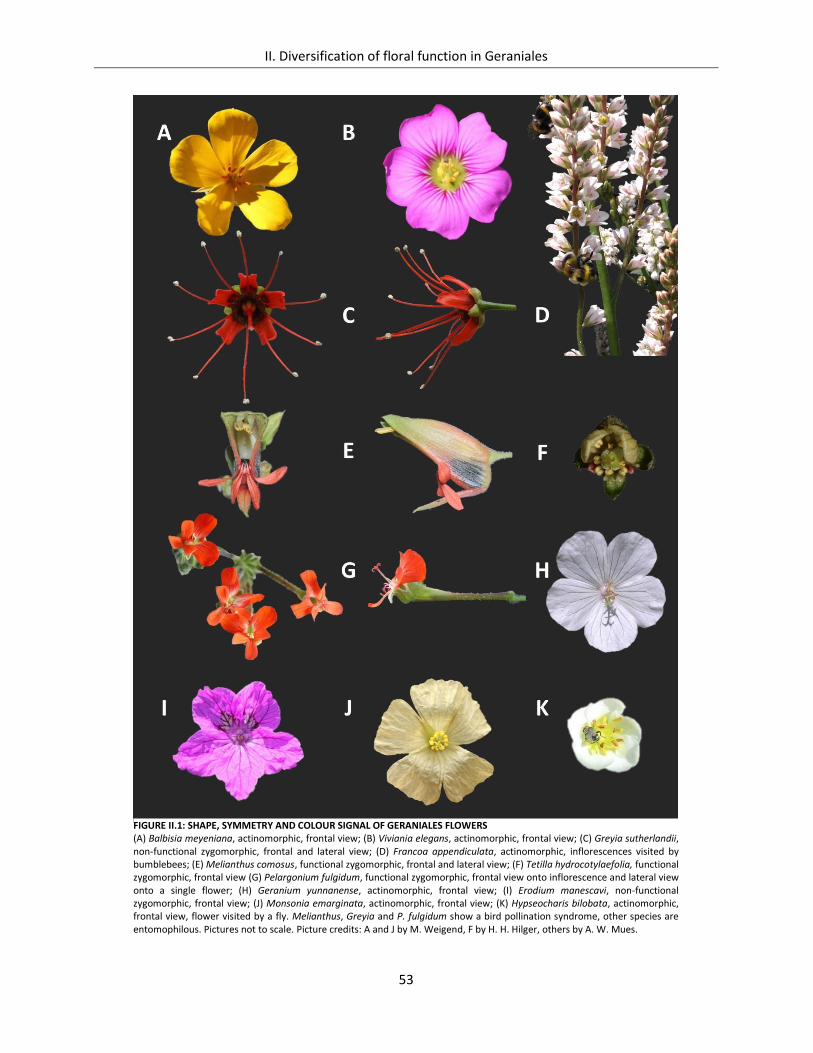
II. Diversification of floral function in Geraniales
53
FIGURE II.1: SHAPE, SYMMETRY AND COLOUR SIGNAL OF GERANIALES FLOWERS (A) Balbisia meyeniana, actinomorphic, frontal view; (B) Viviania elegans, actinomorphic, frontal view; (C) Greyia sutherlandii, non-functional zygomorphic, frontal and lateral view; (D) Francoa appendiculata, actinomorphic, inflorescences visited by bumblebees; (E) Melianthus comosus, functional zygomorphic, frontal and lateral view; (F) Tetilla hydrocotylaefolia, functional zygomorphic, frontal view (G) Pelargonium fulgidum, functional zygomorphic, frontal view onto inflorescence and lateral view onto a single flower; (H) Geranium yunnanense, actinomorphic, frontal view; (I) Erodium manescavi, non-functional zygomorphic, frontal view; (J) Monsonia emarginata, actinomorphic, frontal view; (K) Hypseocharis bilobata, actinomorphic, frontal view, flower visited by a fly. Melianthus, Greyia and P. fulgidum show a bird pollination syndrome, other species are entomophilous. Pictures not to scale. Picture credits: A and J by M. Weigend, F by H. H. Hilger, others by A. W. Mues.
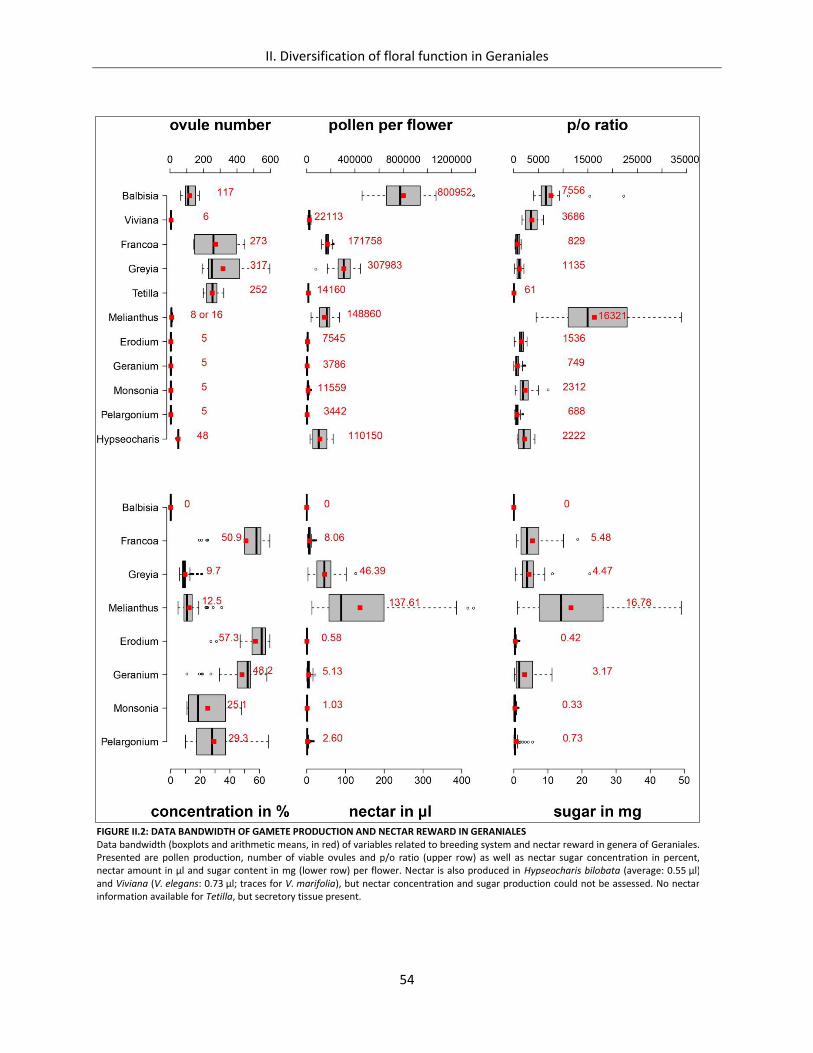
II. Diversification of floral function in Geraniales
54
FIGURE II.2: DATA BANDWIDTH OF GAMETE PRODUCTION AND NECTAR REWARD IN GERANIALES Data bandwidth (boxplots and arithmetic means, in red) of variables related to breeding system and nectar reward in genera of Geraniales. Presented are pollen production, number of viable ovules and p/o ratio (upper row) as well as nectar sugar concentration in percent, nectar amount in µl and sugar content in mg (lower row) per flower. Nectar is also produced in Hypseocharis bilobata (average: 0.55 µl) and Viviana (V. elegans: 0.73 µl; traces for V. marifolia), but nectar concentration and sugar production could not be assessed. No nectar information available for Tetilla, but secretory tissue present.
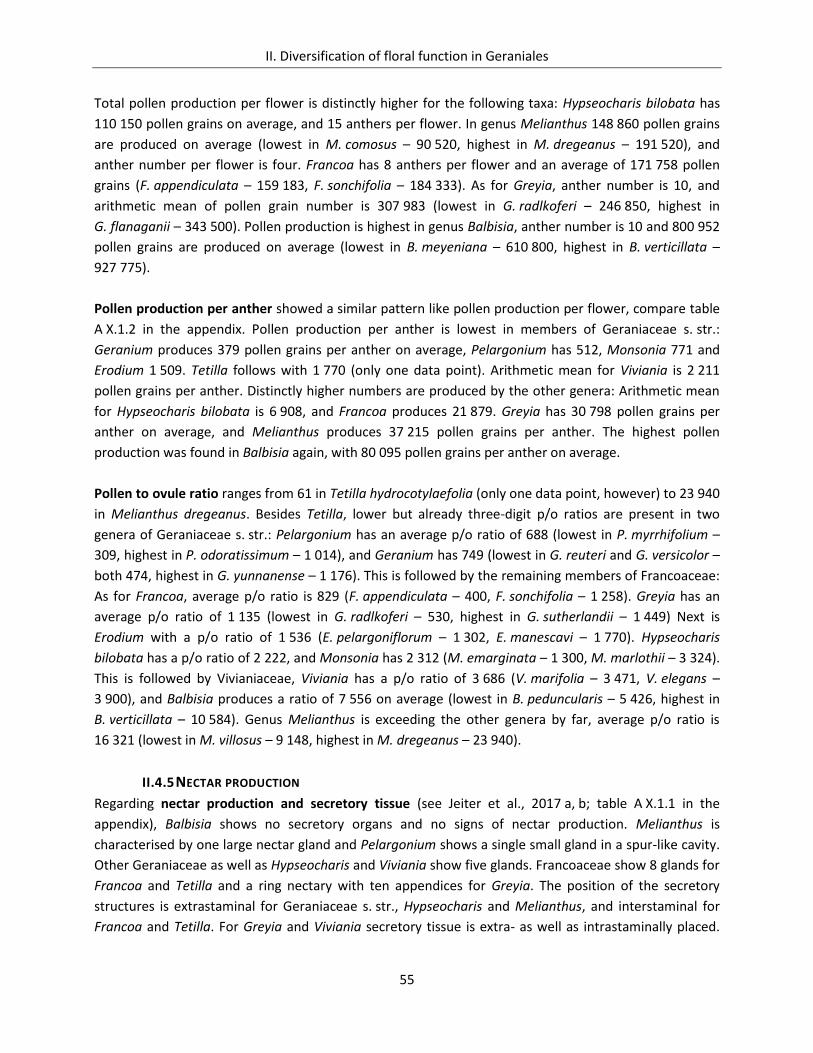
II. Diversification of floral function in Geraniales
55
Total pollen production per flower is distinctly higher for the following taxa: Hypseocharis bilobata has
110 150 pollen grains on average, and 15 anthers per flower. In genus Melianthus 148 860 pollen grains
are produced on average (lowest in M. comosus – 90 520, highest in M. dregeanus – 191 520), and
anther number per flower is four. Francoa has 8 anthers per flower and an average of 171 758 pollen
grains (F. appendiculata – 159 183, F. sonchifolia – 184 333). As for Greyia, anther number is 10, and
arithmetic mean of pollen grain number is 307 983 (lowest in G. radlkoferi – 246 850, highest in
G. flanaganii – 343 500). Pollen production is highest in genus Balbisia, anther number is 10 and 800 952
pollen grains are produced on average (lowest in B. meyeniana – 610 800, highest in B. verticillata –
927 775).
Pollen production per anther showed a similar pattern like pollen production per flower, compare table
A X.1.2 in the appendix. Pollen production per anther is lowest in members of Geraniaceae s. str.:
Geranium produces 379 pollen grains per anther on average, Pelargonium has 512, Monsonia 771 and
Erodium 1 509. Tetilla follows with 1 770 (only one data point). Arithmetic mean for Viviania is 2 211
pollen grains per anther. Distinctly higher numbers are produced by the other genera: Arithmetic mean
for Hypseocharis bilobata is 6 908, and Francoa produces 21 879. Greyia has 30 798 pollen grains per
anther on average, and Melianthus produces 37 215 pollen grains per anther. The highest pollen
production was found in Balbisia again, with 80 095 pollen grains per anther on average.
Pollen to ovule ratio ranges from 61 in Tetilla hydrocotylaefolia (only one data point, however) to 23 940
in Melianthus dregeanus. Besides Tetilla, lower but already three-digit p/o ratios are present in two
genera of Geraniaceae s. str.: Pelargonium has an average p/o ratio of 688 (lowest in P. myrrhifolium –
309, highest in P. odoratissimum – 1 014), and Geranium has 749 (lowest in G. reuteri and G. versicolor –
both 474, highest in G. yunnanense – 1 176). This is followed by the remaining members of Francoaceae:
As for Francoa, average p/o ratio is 829 (F. appendiculata – 400, F. sonchifolia – 1 258). Greyia has an
average p/o ratio of 1 135 (lowest in G. radlkoferi – 530, highest in G. sutherlandii – 1 449) Next is
Erodium with a p/o ratio of 1 536 (E. pelargoniflorum – 1 302, E. manescavi – 1 770). Hypseocharis
bilobata has a p/o ratio of 2 222, and Monsonia has 2 312 (M. emarginata – 1 300, M. marlothii – 3 324).
This is followed by Vivianiaceae, Viviania has a p/o ratio of 3 686 (V. marifolia – 3 471, V. elegans –
3 900), and Balbisia produces a ratio of 7 556 on average (lowest in B. peduncularis – 5 426, highest in
B. verticillata – 10 584). Genus Melianthus is exceeding the other genera by far, average p/o ratio is
16 321 (lowest in M. villosus – 9 148, highest in M. dregeanus – 23 940).
II.4.5 NECTAR PRODUCTION
Regarding nectar production and secretory tissue (see Jeiter et al., 2017 a, b; table A X.1.1 in the
appendix), Balbisia shows no secretory organs and no signs of nectar production. Melianthus is
characterised by one large nectar gland and Pelargonium shows a single small gland in a spur-like cavity.
Other Geraniaceae as well as Hypseocharis and Viviania show five glands. Francoaceae show 8 glands for
Francoa and Tetilla and a ring nectary with ten appendices for Greyia. The position of the secretory
structures is extrastaminal for Geraniaceae s. str., Hypseocharis and Melianthus, and interstaminal for
Francoa and Tetilla. For Greyia and Viviania secretory tissue is extra- as well as intrastaminally placed.
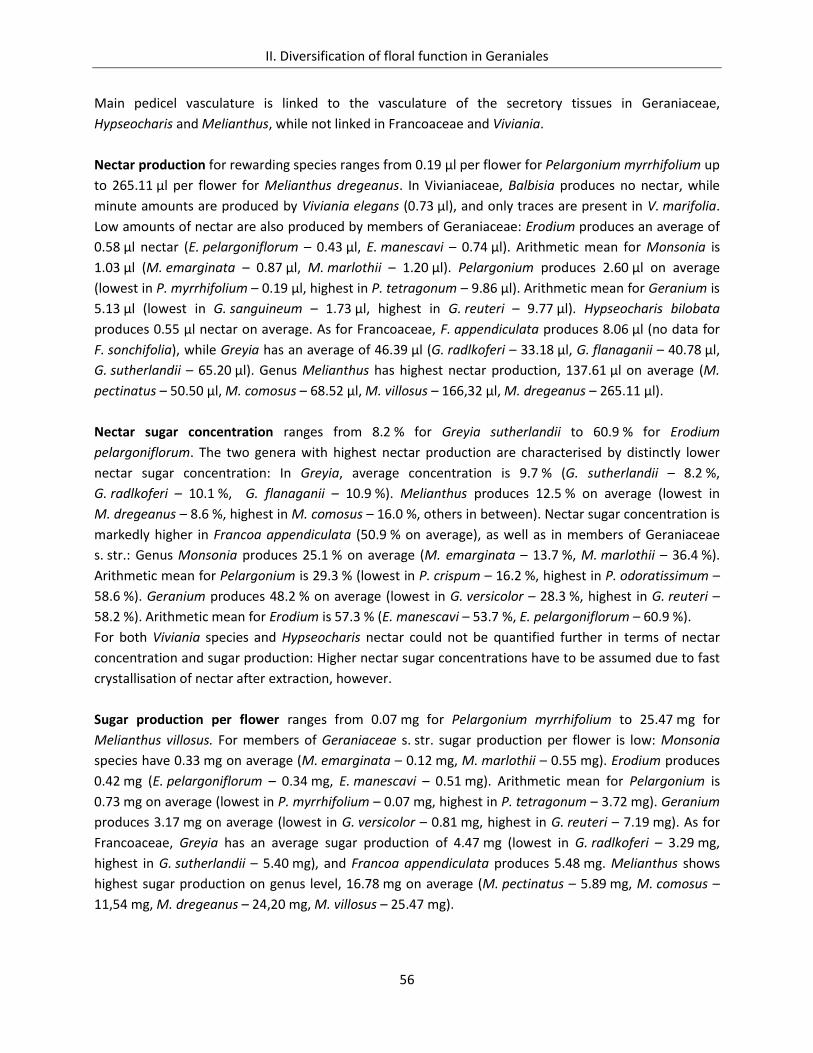
II. Diversification of floral function in Geraniales
56
Main pedicel vasculature is linked to the vasculature of the secretory tissues in Geraniaceae,
Hypseocharis and Melianthus, while not linked in Francoaceae and Viviania.
Nectar production for rewarding species ranges from 0.19 µl per flower for Pelargonium myrrhifolium up
to 265.11 µl per flower for Melianthus dregeanus. In Vivianiaceae, Balbisia produces no nectar, while
minute amounts are produced by Viviania elegans (0.73 µl), and only traces are present in V. marifolia.
Low amounts of nectar are also produced by members of Geraniaceae: Erodium produces an average of
0.58 µl nectar (E. pelargoniflorum – 0.43 µl, E. manescavi – 0.74 µl). Arithmetic mean for Monsonia is
1.03 µl (M. emarginata – 0.87 µl, M. marlothii – 1.20 µl). Pelargonium produces 2.60 µl on average
(lowest in P. myrrhifolium – 0.19 µl, highest in P. tetragonum – 9.86 µl). Arithmetic mean for Geranium is
5.13 µl (lowest in G. sanguineum – 1.73 µl, highest in G. reuteri – 9.77 µl). Hypseocharis bilobata
produces 0.55 µl nectar on average. As for Francoaceae, F. appendiculata produces 8.06 µl (no data for
F. sonchifolia), while Greyia has an average of 46.39 µl (G. radlkoferi – 33.18 µl, G. flanaganii – 40.78 µl,
G. sutherlandii – 65.20 µl). Genus Melianthus has highest nectar production, 137.61 µl on average (M.
pectinatus – 50.50 µl, M. comosus – 68.52 µl, M. villosus – 166,32 µl, M. dregeanus – 265.11 µl).
Nectar sugar concentration ranges from 8.2 % for Greyia sutherlandii to 60.9 % for Erodium
pelargoniflorum. The two genera with highest nectar production are characterised by distinctly lower
nectar sugar concentration: In Greyia, average concentration is 9.7 % (G. sutherlandii – 8.2 %,
G. radlkoferi – 10.1 %, G. flanaganii – 10.9 %). Melianthus produces 12.5 % on average (lowest in
M. dregeanus – 8.6 %, highest in M. comosus – 16.0 %, others in between). Nectar sugar concentration is
markedly higher in Francoa appendiculata (50.9 % on average), as well as in members of Geraniaceae
s. str.: Genus Monsonia produces 25.1 % on average (M. emarginata – 13.7 %, M. marlothii – 36.4 %).
Arithmetic mean for Pelargonium is 29.3 % (lowest in P. crispum – 16.2 %, highest in P. odoratissimum –
58.6 %). Geranium produces 48.2 % on average (lowest in G. versicolor – 28.3 %, highest in G. reuteri –
58.2 %). Arithmetic mean for Erodium is 57.3 % (E. manescavi – 53.7 %, E. pelargoniflorum – 60.9 %).
For both Viviania species and Hypseocharis nectar could not be quantified further in terms of nectar
concentration and sugar production: Higher nectar sugar concentrations have to be assumed due to fast
crystallisation of nectar after extraction, however.
Sugar production per flower ranges from 0.07 mg for Pelargonium myrrhifolium to 25.47 mg for
Melianthus villosus. For members of Geraniaceae s. str. sugar production per flower is low: Monsonia
species have 0.33 mg on average (M. emarginata – 0.12 mg, M. marlothii – 0.55 mg). Erodium produces
0.42 mg (E. pelargoniflorum – 0.34 mg, E. manescavi – 0.51 mg). Arithmetic mean for Pelargonium is
0.73 mg on average (lowest in P. myrrhifolium – 0.07 mg, highest in P. tetragonum – 3.72 mg). Geranium
produces 3.17 mg on average (lowest in G. versicolor – 0.81 mg, highest in G. reuteri – 7.19 mg). As for
Francoaceae, Greyia has an average sugar production of 4.47 mg (lowest in G. radlkoferi – 3.29 mg,
highest in G. sutherlandii – 5.40 mg), and Francoa appendiculata produces 5.48 mg. Melianthus shows
highest sugar production on genus level, 16.78 mg on average (M. pectinatus – 5.89 mg, M. comosus –
11,54 mg, M. dregeanus – 24,20 mg, M. villosus – 25.47 mg).
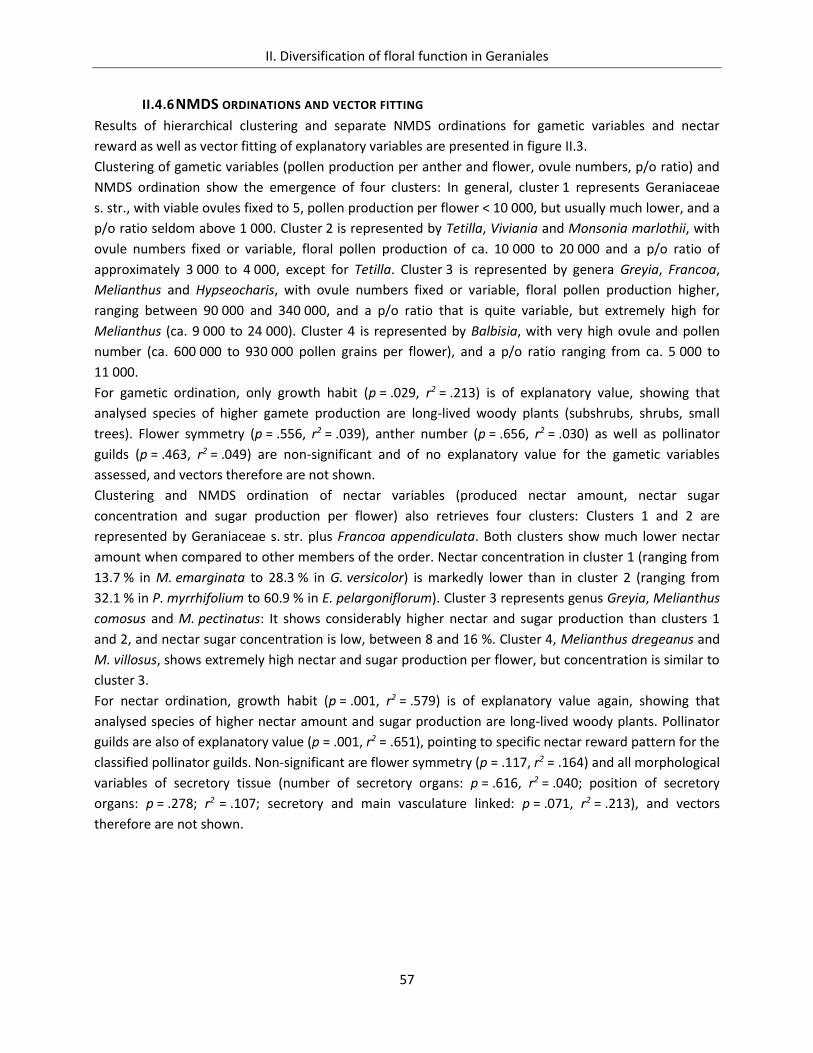
II. Diversification of floral function in Geraniales
57
II.4.6 NMDS ORDINATIONS AND VECTOR FITTING
Results of hierarchical clustering and separate NMDS ordinations for gametic variables and nectar
reward as well as vector fitting of explanatory variables are presented in figure II.3.
Clustering of gametic variables (pollen production per anther and flower, ovule numbers, p/o ratio) and
NMDS ordination show the emergence of four clusters: In general, cluster 1 represents Geraniaceae
s. str., with viable ovules fixed to 5, pollen production per flower < 10 000, but usually much lower, and a
p/o ratio seldom above 1 000. Cluster 2 is represented by Tetilla, Viviania and Monsonia marlothii, with
ovule numbers fixed or variable, floral pollen production of ca. 10 000 to 20 000 and a p/o ratio of
approximately 3 000 to 4 000, except for Tetilla. Cluster 3 is represented by genera Greyia, Francoa,
Melianthus and Hypseocharis, with ovule numbers fixed or variable, floral pollen production higher,
ranging between 90 000 and 340 000, and a p/o ratio that is quite variable, but extremely high for
Melianthus (ca. 9 000 to 24 000). Cluster 4 is represented by Balbisia, with very high ovule and pollen
number (ca. 600 000 to 930 000 pollen grains per flower), and a p/o ratio ranging from ca. 5 000 to
11 000.
For gametic ordination, only growth habit (p = .029, r2 = .213) is of explanatory value, showing that
analysed species of higher gamete production are long-lived woody plants (subshrubs, shrubs, small
trees). Flower symmetry (p = .556, r2 = .039), anther number (p = .656, r2 = .030) as well as pollinator
guilds (p = .463, r2 = .049) are non-significant and of no explanatory value for the gametic variables
assessed, and vectors therefore are not shown.
Clustering and NMDS ordination of nectar variables (produced nectar amount, nectar sugar
concentration and sugar production per flower) also retrieves four clusters: Clusters 1 and 2 are
represented by Geraniaceae s. str. plus Francoa appendiculata. Both clusters show much lower nectar
amount when compared to other members of the order. Nectar concentration in cluster 1 (ranging from
13.7 % in M. emarginata to 28.3 % in G. versicolor) is markedly lower than in cluster 2 (ranging from
32.1 % in P. myrrhifolium to 60.9 % in E. pelargoniflorum). Cluster 3 represents genus Greyia, Melianthus
comosus and M. pectinatus: It shows considerably higher nectar and sugar production than clusters 1
and 2, and nectar sugar concentration is low, between 8 and 16 %. Cluster 4, Melianthus dregeanus and
M. villosus, shows extremely high nectar and sugar production per flower, but concentration is similar to
cluster 3.
For nectar ordination, growth habit (p = .001, r2 = .579) is of explanatory value again, showing that
analysed species of higher nectar amount and sugar production are long-lived woody plants. Pollinator
guilds are also of explanatory value (p = .001, r2 = .651), pointing to specific nectar reward pattern for the
classified pollinator guilds. Non-significant are flower symmetry (p = .117, r2 = .164) and all morphological
variables of secretory tissue (number of secretory organs: p = .616, r2 = .040; position of secretory
organs: p = .278; r2 = .107; secretory and main vasculature linked: p = .071, r2 = .213), and vectors
therefore are not shown.
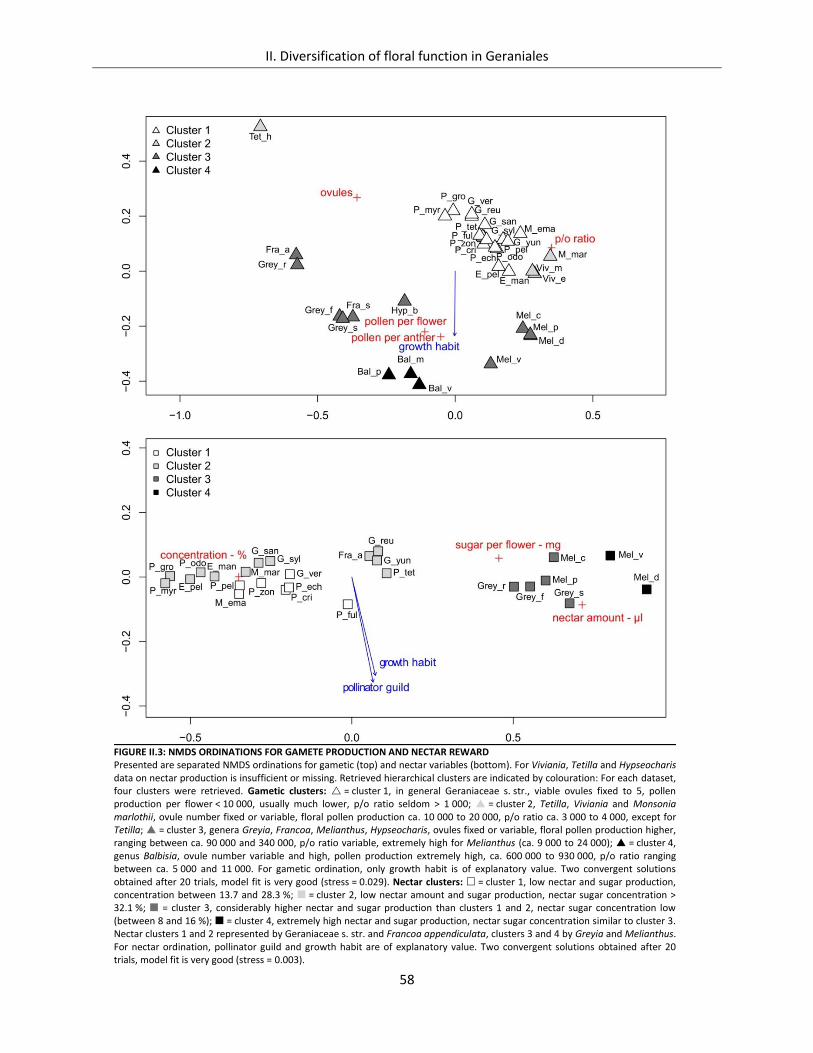
II. Diversification of floral function in Geraniales
58
FIGURE II.3: NMDS ORDINATIONS FOR GAMETE PRODUCTION AND NECTAR REWARD Presented are separated NMDS ordinations for gametic (top) and nectar variables (bottom). For Viviania, Tetilla and Hypseocharis data on nectar production is insufficient or missing. Retrieved hierarchical clusters are indicated by colouration: For each dataset, four clusters were retrieved. Gametic clusters: = cluster 1, in general Geraniaceae s. str., viable ovules fixed to 5, pollen production per flower < 10 000, usually much lower, p/o ratio seldom > 1 000; = cluster 2, Tetilla, Viviania and Monsonia marlothii, ovule number fixed or variable, floral pollen production ca. 10 000 to 20 000, p/o ratio ca. 3 000 to 4 000, except for Tetilla; = cluster 3, genera Greyia, Francoa, Melianthus, Hypseocharis, ovules fixed or variable, floral pollen production higher, ranging between ca. 90 000 and 340 000, p/o ratio variable, extremely high for Melianthus (ca. 9 000 to 24 000); = cluster 4, genus Balbisia, ovule number variable and high, pollen production extremely high, ca. 600 000 to 930 000, p/o ratio ranging between ca. 5 000 and 11 000. For gametic ordination, only growth habit is of explanatory value. Two convergent solutions obtained after 20 trials, model fit is very good (stress = 0.029). Nectar clusters: = cluster 1, low nectar and sugar production, concentration between 13.7 and 28.3 %; = cluster 2, low nectar amount and sugar production, nectar sugar concentration > 32.1 %; = cluster 3, considerably higher nectar and sugar production than clusters 1 and 2, nectar sugar concentration low (between 8 and 16 %); = cluster 4, extremely high nectar and sugar production, nectar sugar concentration similar to cluster 3. Nectar clusters 1 and 2 represented by Geraniaceae s. str. and Francoa appendiculata, clusters 3 and 4 by Greyia and Melianthus. For nectar ordination, pollinator guild and growth habit are of explanatory value. Two convergent solutions obtained after 20 trials, model fit is very good (stress = 0.003).
II. Diversification of floral function in Geraniales
59
II.4.7 PHYLOGENETIC MAPPING OF PLANT TRAITS AND POLLINATOR GUILDS
Figure II.4 shows the latest phylogeny of Geraniales (after Palazzesi et al., 2012, and Sytsma et al.,
2014), with retrieved gametic and nectar clusters, flower symmetry and growth habit mapped onto it,
as well as retrieved pollinator guilds. As can be seen, resource investment in gamete and nectar
production is high in phylogenetically neighbouring genera Greyia and Melianthus, with extreme
observations made for genus Melianthus. Phylogenetically closely related genera within
Geraniaceae s. str. are strongly conserved in their gamete production, showing fixed ovule numbers as
well as low pollen production and p/o ratios, when compared to other families of the order. Production
of nectar reward is similarly low in Geraniaceae, and only somewhat higher nectar concentration and
sugar production rates within the family can be reported for genera Erodium and Geranium. Balbisia
shows highest pollen production of the order, which is coupled to missing nectar reward – a rare
exception in Geraniales. Other genera are in between the described patterns: Francoa is similar to
Greyia in pollen and ovule production, p/o ratio and sugar production per flower, however nectar
amount is lower and nectar concentration is higher. While we are not able to provide solid
measurements on nectar amount or concentration for Tetilla, Viviania and Hypseocharis, nectar is
definitely present in low amounts in these genera. Moreover, Viviania differs strongly from closely
related Balbisia in regard to gamete production, with fixed and low instead of high and variable ovule
numbers, and only moderate pollen production. For Hypseocharis a trend towards higher pollen
production has to be stated, compared to closely related Geraniaceae s. str.
Regarding flower symmetry, fully functional zygomorphic flowers have evolved three times in
Geraniales (Tetilla, Melianthus, Pelargonium), non-functionally zygomorphic flowers two times (Greyia,
Erodium), other genera are actinomorphic.
Regarding phylogenetic pattern of growth habit, the woody habit of Balbisia (subshrubs), Greyia and
Melianthus (shrubs, small trees) have to be highlighted as distinctive patterns on the phylogenetic tree,
coupled to high investment in gamete and/or nectar production.
Pollinator guilds show predominance of short-probiscid pollinators in Geraniaceae s. str.; only exception
is genus Pelargonium with specialisation on long-probiscid pollinators and one bird-pollinated species,
P. fulgidum. Phylogenetically neighbouring Hypseocharis shares short-proboscid pollinators (flies) with
Geraniaceae s. str. Birds are reported as flower visitors of Melianthus and Greyia, therefore two genera
of Geraniales are completely specialised on bird pollination, without any exception on species level. As
for the remaining genera, short-probiscid pollinators are predominant again (Balbisia, Francoa, Tetilla),
only Viviania shows specialisation on long-probiscid pollinators.
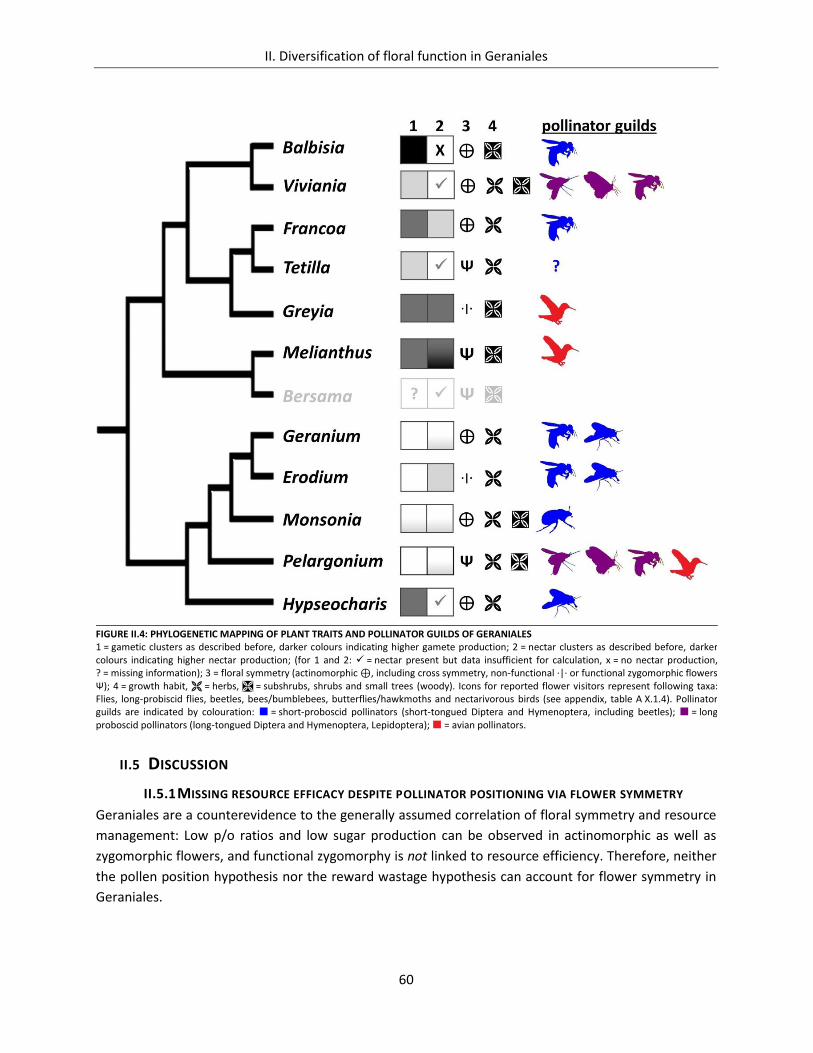
II. Diversification of floral function in Geraniales
60
II.5 DISCUSSION
II.5.1 MISSING RESOURCE EFFICACY DESPITE POLLINATOR POSITIONING VIA FLOWER SYMMETRY
Geraniales are a counterevidence to the generally assumed correlation of floral symmetry and resource
management: Low p/o ratios and low sugar production can be observed in actinomorphic as well as
zygomorphic flowers, and functional zygomorphy is not linked to resource efficiency. Therefore, neither
the pollen position hypothesis nor the reward wastage hypothesis can account for flower symmetry in
Geraniales.
FIGURE II.4: PHYLOGENETIC MAPPING OF PLANT TRAITS AND POLLINATOR GUILDS OF GERANIALES 1 = gametic clusters as described before, darker colours indicating higher gamete production; 2 = nectar clusters as described before, darker colours indicating higher nectar production; (for 1 and 2: = nectar present but data insufficient for calculation, x = no nectar production, ? = missing information); 3 = floral symmetry (actinomorphic ⊕, including cross symmetry, non-functional ·|· or functional zygomorphic flowers Ψ); 4 = growth habit, = herbs, = subshrubs, shrubs and small trees (woody). Icons for reported flower visitors represent following taxa: Flies, long-probiscid flies, beetles, bees/bumblebees, butterflies/hawkmoths and nectarivorous birds (see appendix, table A X.1.4). Pollinator guilds are indicated by colouration: = short-proboscid pollinators (short-tongued Diptera and Hymenoptera, including beetles); = long proboscid pollinators (long-tongued Diptera and Hymenoptera, Lepidoptera); = avian pollinators.
II. Diversification of floral function in Geraniales
61
Additionally, core morphological variables like anther number, number and position of nectar glands
and linkage of secretory tissue to main plant vasculature are also of no explanatory value for gamete
production and nectar reward.
Bird pollinated genera Greyia and Melianthus deserve special attention in this context: Bird pollination
is realised by different floral shape and symmetry in phylogenetically closely related taxa. In using birds
as pollen vectors, plants have to produce enough pollen to cover relevant areas of the birds bodies
(pollen-bearing areas; Cruden, 1981, 2000) in order to ensure contact with the stigma of another flower
and thus pollination. In Greyia, pollen and nectar is presented by only weakly zygomorphic flowers not
controlling for placement of pollen onto the pollinator, whereas Melianthus shows highly specialised,
zygomorphic and bilabiate blossoms. Further, pollen production per flower in Melianthus is lower than
in Greyia, but pollen production per anther is very similar in both genera: Equivalent pollen production
per anther in combination with reduced anther number hints at a more effective placement and/or a
smaller pollen bearing area, beside zygomorphy. Melianthus flowers therefore should be more effective
– however they are not: Extreme resource investment into gamete production and nectar reward is
reflected by highest p/o ratios and highest total sugar production per flower found in the whole order.
What could be the reasons?
For Melianthus, Linder et al. (2006) are suggesting from field observation and literature (Marloth, 1908,
1925; Skead, 1967; Maclean, 1993) that the pollination system is a generalist one, demanding for more
resource investment – most bird species are able to access the shallow and open flowers. Zygomorphy
of Melianthus therefore rather might reflect the need for protection of nectar against desiccation in a
dry environment, and a general need to attract avian pollinators. Our controlled nectar data support the
hypothesis of Linder et al. (2006) that interspecific variation of Melianthus in nectar volume is related to
the aridity of the habitats, showing that species from dry habitats (M. comosus and M. pectinatus) do
produce significantly less nectar than species from wet habitats (M. dregeanus and M. villosus).
An additional cause of missing resource efficacy might be pollen and nectar theft by bees (cf. Huryn and
Moller, 1995). The bilabiate flower shape of Melianthus is insufficient to prevent nectar- and pollen
collection from bees (see Westerkamp and Claßen-Bockhoff, 2007), and the species might have to
compensate for the loss of pollen material.
II.5.2 POLLINATOR GUILDS CORRELATE WITH NECTAR, BUT NOT WITH VARIABLES OF THE BREEDING
SYSTEM
As another core result, pollinator guilds in Geraniales are mirrored by the nectar reward pattern we
found for the order. In general, a high amount of nectar production in correlation with low nectar sugar
concentration (~20 %) is understood as indicator for bird pollination (Nicolson and Fleming, 2003;
Nicolson, 2007). Low nectar amount and intermediate concentration (~25 – 30 %) is seen as suitable
reward for Diptera and Lepidoptera (Kingsolver and Daniel, 1995; Goldblatt and Manning, 2000;
Nicolson, 2007) and low nectar production in combination with higher concentration (~30–50 %, Waller,
1972; Roubik and Buchmann, 1984) is assumed to be most suitable for Hymenoptera. However, as
Willmer (2011) clearly points out, optimum nectar concentration depends on mouthpart morphology
due to correlation between viscosity and concentration: while long-tongued pollinators need lower
concentration (~15 – 30 %), short-tongued pollinators can cope with much higher concentrations (45 –
II. Diversification of floral function in Geraniales
62
60 % or even higher, becoming crystalline), and there is an often reported relationship between longer,
tubular flowers and lower concentration and long-tongued insect visitors, and higher concentration in
openly accessible flowers and short-tongued insect pollinators (Willmer, 2011).
Our data confirm these general statements: High nectar production coupled with lower concentration is
found in bird pollinated genera Greyia and Melianthus, and this pattern is also reflected within the
phylogenetic constrains of Geraniaceae s. str. (see below) by bird pollinated Pelargonium fulgidum.
Other nectar rewarding species of Geraniales are entomophilous, and a general coupling of short-
tongued pollinators to species with higher nectar concentrations (Geranium, Erodium, Francoa) as well
as a coupling of long-tongued pollinators to lower concentrations (Pelargonium) is evident.
This interplay between nectar reward pattern and pollinator guilds (already categorised on basis of
flower visitors, flower colour as visual attractant, general flower shape and visibility of nectar site)
strongly supports the pollination syndromes concept.
Interestingly, pollinator guilds are uncoupled from breeding system related variables. Although hard
facts on true breeding systems of the order are scarce to almost non-existent in literature (many
published data for Geraniales are only inferred on basis of p/o ratios and Cruden´s theory), the generally
high p/o ratios point to predominantly xenogamous breeding systems - often approximating a ratio of
1 000 in Geraniaceae, and way above in most other families. When considering xenogamy as true
breeding system for most of the species analysed, the extreme bandwidth of gamete production we
have demonstrated here clearly points to additional factors influencing the p/o ratio.
Growth habit is one of these factors: Woody species (subshrubs, shrubs or small trees) surpass herbal
species in their gamete production and p/o ratios, possibly as a counterbalance for higher inbreeding
depression in larger and long-lived than smaller and shot-lived plants (Michalski and Durka, 2009;
Husband and Schemske, 1996).
Additionally, pollen as predominant reward has to be accounted as another relevant factor: Highest
pollen production coupled to missing nectar reward is constrained to genus Balbisia, and higher pollen
production coupled to traced of nectar reward is present in Hypseocharis bilobata: The pattern of both
taxa are indicative for pollen flowers. Pollen production is also higher in Francoa, making pollen a likely
reward for Hymenoptera in the field, as observed for plants in Bonn Botanical Gardens.
II.5.3 POLLINATOR GUILDS AND PLANT TRAITS ARE PHYLOGENETICALLY CONSTRAINT
Seldom exceptions (like bird-pollinated P. fulgidum in Geraniaceae) underline the general observation
that pollination syndromes are phylogenetically constrained in Geraniales. Switch to bird pollination
occurred three times: two times on genus level for Greyia and Melianthus, and additionally on species
level within Pelargonium for P. fulgidum. Pelargonium is otherwise constrained to long-tongued insect
pollinators, similar to genus Viviania. As for other genera, short-probiscid insect pollinators are
predominant.
Similarly, detected patterns of gamete production and nectar reward are phylogenetically constrained,
with highest resource investment in genera Balbisia, Greyia and Melianthus, and lowest investment in
Geraniaceae s. str. (other genera in between).
Although phylogenetic constrains are obvious for pollinator guilds, gamete production and nectar
reward, it is remarkable that these constrains are largely uncoupled. The described correlation between
pollinator guilds and nectar reward is realised within phylogenetic constrains of the respective genera,
II. Diversification of floral function in Geraniales
63
and the phylogenetic constrains of gamete production are completely uncoupled from the retrieved
pollinator guilds: Bird pollination, in example, is realised in genera Greyia and Melianthus, together with
extremely high gamete production. However, bird pollination is also realised in Pelargonium fulgidum,
showing only round about 1 % percent of the total pollen production per flower of Greyia sutherlandii,
although both are even sharing the same pollinator: Nectarinia chalybea (see table A X.1.4, appendix).
Entomophilous syndromes show a similar pattern, with both long- and short-tongued pollinators being
the relevant pollen vectors for Geraniales species with lower or higher gamete production, covering the
whole bandwidth of gamete production of the order.
This uncoupling might be best interpreted in terms of pollinators acting as drivers of speciation (see van
der Niet and Johnson, 2012): Modifications in floral architecture, reward and attraction pattern within
the general framework of a phylogenetic trajectory have led to radiation of species and stabilisation of
the interplay of pollinator guilds and genera of Geraniales. While nectar reward is a necessary interface
for successful plant-pollinator interaction, the observed pattern of gametic variables are primarily
shaped, stabilised and constrained by other evolutionary forces than pollinator interaction, and
therefore combined almost freely with pollinator guilds in Geraniales.
II.6 ACKNOWLEDGMENTS
We thank Thomas Joßberger for collecting vouchers. Andreas W. Mues thanks colleagues of the Nees
Institute for fruitful discussions: Stefan Abrahamczyk for discussions on pollination syndromes and
research design, and Julius Jeiter for discussions on flower shapes and nectar reward.
II.7 LITERATURE
Abrahamczyk, S., Lozada-Gobilard, S., Ackermann, M., Fischer, E., Krieger, V., Redling, A., Weigend, M.,
2017. A question of data quality – Testing pollination syndromes in Balsaminaceae. PLOS ONE
12, e0186125. https://doi.org/10.1371/journal.pone.0186125
Alarcón, M.L., Roquet, C., Aldasoro, J.J., 2011. Evolution of pollen/ovule ratios and breeding system in
Erodium (Geraniaceae). Systematic Botany 36, 661–676.
https://doi.org/10.1600/036364411X583637
Aldasoro, J.J., Navarro, C., Vargas, P., Aedo, C., 2001. Anatomy, morphology, and cladistic analysis of
Monsonia L. (Geraniaceae). Anales del Jardín Botánico de Madrid 59, 75–100.
https://doi.org/10.3989/ajbm.2001.v59.i1.77
Angiosperm Phylogeny Group, 2009. An update of the Angiosperm Phylogeny Group classification for
the orders and families of flowering plants: APG III. Botanical Journal of the Linnean Society 161,
105–121.
Angiosperm Phylogeny Group, 2016. An update of the Angiosperm Phylogeny Group classification for
the orders and families of flowering plants: APG IV. Botanical Journal of the Linnean Society 181,
1–20. https://doi.org/10.1111/boj.12385
Armbruster, W.S., Edwards, M.E., Debevec, E.M., 1994. Floral character displacement generates
assemblage structure of western Australian triggerplants (Stylidium). Ecology 75, 315–329.
https://doi.org/10.2307/1939537
II. Diversification of floral function in Geraniales
64
Baker, H.G., Hurd, P.D., 1968. Intrafloral ecology. Annual Review of Entomology 13, 385–414.
https://doi.org/10.1146/annurev.en.13.010168.002125
Berger, B.A., Kriebel, R., Spalink, D., Sytsma, K.J., 2016. Divergence times, historical biogeography, and
shifts in speciation rates of Myrtales. Molecular Phylogenetics and Evolution 95, 116–136.
https://doi.org/10.1016/j.ympev.2015.10.001
Cronquist A., 1981. An integrated system of classification of flowering plants. Columbia University
Press, New York.
Cruden, R.W., 1977. Pollen-ovule ratios: A conservative indicator of breeding systems in flowering
plants. Evolution 31, 32–46. https://doi.org/10.2307/2407542
Cruden, R.W., 2000. Pollen grains: Why so many? Plant Systematics and Evolution 222, 143–165.
https://doi.org/10.1007/BF00984100
Cruden, R.W., Jensen, K.G., 1979. Viscin threads, pollination efficiency and low pollen-ovule ratios.
American Journal of Botany 66, 875–879. https://doi:10.1002/j.1537-2197.1979.tb06295.x
Cruden, R.W., Lyon, D.L., 1985. Correlations among stigma depth, style length, and pollen grain size: Do
they reflect function or phylogeny? Botanical Gazette 146, 143–149.
https://doi.org/10.1086/337509
Cruden, R.W., Miller-Ward, S., 1981. Pollen-ovule ratio, pollen size, and the ratio of stigmatic area to the
pollen-bearing area of the pollinator: An hypothesis. Evolution 35, 964–974.
https://doi.org/10.2307/2407867
Daniels, C.L., 1987. The feeding ecology of nectarivorous birds in the Natal Drakensberg (Master thesis).
University of Natal, South Africa.
Dellinger, A.S., Chartier, M., Fernández‐Fernández, D., Penneys, D.S., Alvear, M., Almeda, F.,
Michelangeli, F.A., Staedler, Y., Armbruster, W.S., Schönenberger, J., 2018. Beyond buzz‐
pollination – departures from an adaptive plateau lead to new pollination syndromes. New
Phytologist, 221, 1136–1149. https://doi.org/10.1111/nph.15468
Delpino, F., 1868–1875. Ulteriori osservazione sulla dicogamia nel regno vegetale. Atti della Societa
Italiana di Scienze Naturali Milano, Vols. 1 and 2.
Ehrendorfer, F., 1983. Übersicht des Pflanzenreichs – Spermatophyta, Samenpflanzen. In: von
Denffer, D., Ziegler, H., Ehrendorfer, F., Bresinsky, A., eds. Strasburger – Lehrbuch der
Botanik , 32nd edn. Fischer, Jena.
Endress, P.K., 1996. Homoplasy in angiosperm flowers. In: Sanderson, M.J., Hufford, L., eds.
Homoplasy – the recurrence of similarity in evolution. Academic Press, San Diego, 303–325.
https://doi.org/10.1016/B978-012618030-5/50014-9
Endress, P.K., 1999. Symmetry in flowers: Diversity and evolution. International Journal of Plant Sciences
160, 3–23. https://doi.org/10.1086/314211
Endress, P.K., 2010. Synorganisation without organ fusion in the flowers of Geranium robertianum
(Geraniaceae) and its not so trivial obdiplostemony. Annals of Botany 106, 687–695.
https://doi.org/10.1093/aob/mcq171
Engler, A., 1898. Syllabus der Pflanzenfamilien , 2nd edn. Gebrüder Borntraeger, Berlin.
Fægri, K., van der Pijl, L., 1979. The principles of pollination ecology. 3rd ed. Pergamon, Oxford.
II. Diversification of floral function in Geraniales
65
Fiz, O., Vargas, P., Alarcón, M., Aedo, C., García, J.L., Aldasoro, J.J., 2008. Phylogeny and historical
biogeography of Geraniaceae in relation to climate changes and pollination ecology. Systematic
Botany 33, 326–342. https://doi.org/10.1600/036364408784571482
Galetto, L., Bernardello, G., 2005. Nectar. In: Dafni, A., Kevan, P.G., Husband, B.C., eds. Practical
pollination biology. Enviroquest Ltd., Cambridge, Ontario. 261–313.
Goldblatt, P., Manning, J., 2000. The long-proboscid fly pollination system in southern Africa. Annals
of the Missouri Botanical Garden 87, 146–170. https://doi.org/10.2307/2666158
Gómez, J.M., Bosch, J., Perfectti, F., Fernandez, J.D., Abdelaziz, M., Camacho, J.P.M., 2008.
Association between floral traits and rewards in Erysimum mediohispanicum (Brassicaceae).
Annals of Botany 101, 1413–1420. https://doi.org/10.1093/aob/mcn053
Harper, K.T., 1979. Some reproductive and life history characteristics of rare plants and implications
of management. Great Basin Naturalist Memoirs 3, 129–137.
Henning, J., 2003. Further studies with Melianthus L.: A molecular phylogeny, evolutionary patterns
of diversification in the genus and pollinator syndromes (Master thesis). University of Cape
Town, South Africa.
Huryn, V.M.B., Moller, H., 1995. An assessment of the contribution of honey bees (Apis mellifera) to
weed reproduction in New Zealand protected natural areas. New Zealand Journal of
Ecology 19, 111–122.
Husband, B.C., Schemske, D.W., 1996. Evolution of the magnitude and timing of inbreeding depression
in plants. Evolution 50, 54–70. https://doi.org/10.2307/2410780
Ibañez, A.C., Moré, M., Salazar, G., Leiva, S., Barboza, G.E., Cocucci, A.A., 2019. Crescendo,
diminuendo and subito of the trumpets: winds of change in the concerted evolution
between flowers and pollinators in Salpichroa (Solanaceae). Molecular Phylogenetics and
Evolution 132, 90–99. https://doi.org/10.1016/j.ympev.2018.11.020
Jeiter, J., Hilger, H.H., Smets, E.F., Weigend, M., 2017 a. The relationship between nectaries and floral
architecture: a case study in Geraniaceae and Hypseocharitaceae. Annals of Botany 120, 791–
803. https://doi.org/10.1093/aob/mcx101
Jeiter, J., Weigend, M., Hilger, H.H., 2017 b. Geraniales flowers revisited: evolutionary trends in floral
nectaries. Ann Bot 119, 395–408. https://doi.org/10.1093/aob/mcw230
Johnson, S.D., 2010. The pollination niche and its role in the diversification and maintenance of the
southern African flora. Philosophical Transactions of the Royal Society B: Biological Sciences
365, 499–516. https://doi.org/10.1098/rstb.2009.0243
Johnson, S.D., Steiner, K.E., 1997. Long-tongued fly pollination and evolution of floral spur length in the
Disa Draconis complex (Orchidaceae). Evolution 51, 45–53. https://doi.org/10.1111/j.1558-
5646.1997.tb02387.x
Johnson, S.D., Wester, P., 2017. Stefan Vogel’s analysis of floral syndromes in the South African flora: An
appraisal based on 60 years of pollination studies. Flora 232, 200–206.
https://doi.org/10.1016/j.flora.2017.02.005
Kingsolver, J.G., Daniel, T.L., 1995. Mechanics of food handling by fluid-feeding insects. In: Chapman,
R.F., de Boer, G. eds. Regulatory mechanisms in insect feeding. Springer US, Boston. 32–73.
https://doi.org/10.1007/978-1-4615-1775-7_2
II. Diversification of floral function in Geraniales
66
Kirk, W.D.J., 1993. Interspecific size and number variation in pollen grains and seeds. Botanical Journal
of the Linnean Society 49, 239–248. https://doi.org/10.1111/j.1095-8312.1993.tb00903.x
Kozuharova, E., 2002. Co-evolutionary trends in the pollination of Geranium L. species in the bulgarian
flora. Comptes rendus de l´Académie bulgare des Sciences 55, 69–72.
Laverty, T.M., 1980. The flower-visiting behaviour of bumble bees: floral complexity and learning.
Canadian Journal of Zoology 58, 1324–1335.
Leppik, E.E., 1972. Origin and evolution of bilateral symmetry in flowers. Evolutionary Biology 5, 49-85.
Linder, H.P., Dlamini, T., Henning, J., Verboom, G.A., 2006. The evolutionary history of Melianthus
(Melianthaceae). American Journal of Botany 93, 1052–1064.
https://doi.org/10.3732/ajb.93.7.1052
López, J., Rodríguez-Riaño, T., Ortega-Olivencia, A., Antonio Devesa, J., Ruiz, T., 1999. Pollination
mechanisms and pollen-ovule ratios in some Genisteae (Fabaceae) from southwestern Europe.
Plant Systematics and Evolution 216, 23–47. https://doi.org/10.1007/BF00985099
Lozada‐Gobilard, S., Weigend, M., Fischer, E., Janssens, S.B., Ackermann, M., Abrahamczyk, S., 2019.
Breeding systems in Balsaminaceae in relation to pollen/ovule ratio, pollination syndromes, life
history and climate zone. Plant Biology 21, 157–166. https://doi.org/10.1111/plb.12905
MacIean, G. 1993. Roberts’ birds of southern Africa. John Voelcker Bird Book Fund, Cape Town.
Macior, L.W., 1974. Behavioral aspects of coadaptations between flowers and insect pollinators. Annals
of the Missouri Botanical Garden 61, 760–769. https://doi.org/10.2307/2395027
Marloth, R., 1908. Some observations on entomophilous flowers. South African Journal of Science 4,
110–113.
Marloth, R., 1925. Flora of South Africa, vol. 2, section 2. Darter, Cape Town.
McCune, B., Grace, J.B., Urban, D.L., 2002. Analysis of ecological communities. MjM Software Design.
Michalski, S.G., Durka, W., 2009. Pollination mode and life form strongly affect the relation between
mating system and pollen to ovule ratios. New Phytologist 183, 470–479.
https://doi.org/10.1111/j.1469-8137.2009.02861.x
Neal, P.R., Dafni, A., Giurfa, M., 1998. Floral symmetry and its role in plant-pollinator systems:
Terminology, distribution, and hypotheses. Annual Review of Ecology and Systematics 2, 345–
373. https://doi.org/10.1146/annurev.ecolsys.29.1.345
Neuendorf, J., 2013. Das Urinsediment: Mikroskopie-Präanalytik-Auswertung und Befundung. Springer-
Verlag, Berlin, Heidelberg. https://doi.org/10.1007/978-3-642-37810-2
Newman, E., Manning, J., Anderson, B., 2014. Matching floral and pollinator traits through guild
convergence and pollinator ecotype formation. Annals of Botany 113, 373–384.
https://doi.org/10.1093/aob/mct203
Nicolson, S.W., 2007. Amino acid concentrations in the nectars of southern African bird-pollinated
flowers, especially Aloe and Erythrina. Journal of Chemical Ecology 33, 1707–1720.
https://doi.org/10.1007/s10886-007-9342-x
Nicolson, S.W., Fleming, P.A., 2003. Nectar as food for birds: the physiological consequences of drinking
dilute sugar solutions. Plant Systematics and Evolution 238, 139–153.
https://doi.org/10.1007/s00606-003-0276-7
II. Diversification of floral function in Geraniales
67
Oksanen, J., Blanchet, F.G., Kindt, R., Legendre, P., Minchin, P., O’Hara, R., Simpson, G., Solymos, P.,
Stevens, M., Wagner, H., 2013. Vegan: Community ecology package. R package version. 2.0-10.
CRAN.
Ollerton, J., Alarcón, R., Waser, N.M., Price, M.V., Watts, S., Cranmer, L., Hingston, A., Peter, C.I.,
Rotenberry, J., 2009. A global test of the pollination syndrome hypothesis. Annals of Botany
103, 1471–1480. https://doi.org/10.1093/aob/mcp031
Palazzesi, L., Gottschling, M., Barreda, V., Weigend, M., 2012. First Miocene fossils of Vivianiaceae shed
new light on phylogeny, divergence times, and historical biogeography of Geraniales. Botanical
Journal of the Linnean Society 107, 67–85. https://doi.org/10.1111/j.1095-8312.2012.01910.x
Ronse Decraene, L.P., Smets, E.F., 1999. Similarities in floral ontogeny and anatomy between the genera
Francoa (Francoaceae) and Greyia (Greyiaceae). International Journal of Plant Sciences 160,
377–393. https://doi.org/10.1086/314123
Rosas-Guerrero, V., Aguilar, R., Martén-Rodríguez, S., Ashworth, L., Lopezaraiza-Mikel, M., Bastida, J.M.,
Quesada, M., 2014. A quantitative review of pollination syndromes: do floral traits predict
effective pollinators? Ecology Letters 17, 388–400. https://doi.org/10.1111/ele.12224
Roubik, D.W., Buchmann, S.L., 1984. Nectar selection by Melipona and Apis mellifera (Hymenoptera:
Apidae) and the ecology of nectar intake by bee colonies in a tropical forest. Oecologia 61, 1–
10. https://doi.org/10.1007/BF00379082
Skead, C. 1967. Sunbirds of southern Africa. Cape and Transvaal Printers, Cape Town.
Small, E., 1988. Pollen-ovule patterns in tribe Trifolieae (Leguminosae). Plant Systematics and Evolution
160, 195–205. https://doi.org/10.1007/BF00936047
Struck, M., 1997. Floral divergence and convergence in the genus Pelargonium (Geraniaceae) in
southern Africa: Ecological and evolutionary considerations. Plant Systematics and Evolution
208, 71–97. https://doi.org/10.1007/BF00986083
Sytsma, K.J., Spalink, D., Berger, B., 2014. Calibrated chronograms, fossils, outgroup relationships, and
root priors: re-examining the historical biogeography of Geraniales. Biological Journal of the
Linnean Society 113, 29–49. https://doi.org/10.1111/bij.12297
Takhtajan, A.L., 1997. Diversity and classification of flowering plants. Columbia University Press, New
York.
van der Niet, T., Johnson, S.D., 2012. Phylogenetic evidence for pollinator-driven diversification of
angiosperms. Trends in Ecology & Evolution 27, 353–361.
https://doi.org/10.1016/j.tree.2012.02.002
van der Pijl, L., 1961. Ecological aspects of flower evolution. II. Zoophilous flower classes. Evolution 15,
44–59. https://doi.org/10.2307/2405842
Vogel, S., 1954. Blütenbiologische Typen als Elemente der Sippengliederung, dargestellt anhand der
Flora Südafrikas. Botanische Studien 1. Fischer, Jena.
Waller, G.D., 1972. Evaluating responses of honey bees to sugar solutions using an artificial-flower
feeder. Annals of the Entomological Society of America 65, 857–862.
https://doi.org/10.1093/aesa/65.4.857
Waser, N.M., Chittka, L., Price, M.V., Williams, N.M., Ollerton, J., 1996. Generalization in pollination
systems, and why it matters. Ecology 77, 1043–1060. https://doi.org/10.2307/2265575
II. Diversification of floral function in Geraniales
68
Weigend, M., 2005. Notes on the floral morphology in Vivianiaceae (Geraniales). Plant Systematics and
Evolution 253, 125–131. https://doi.org/10.1007/s00606-004-0273-5
Westerkamp, C., Claßen-Bockhoff, R., 2007. Bilabiate flowers: The ultimate response to bees?
Annals of Botany 100, 361–374. https://doi.org/10.1093/aob/mcm123
Willmer, P.G., 2011. Pollination and floral ecology. Princeton University Press, Princeton, N.J.
III. Frost flowers – Pollination syndromes of Hamamelidaceae
69
III. FROST FLOWERS – POLLINATION SYNDROMES OF HAMAMELIDACEAE
INDEPENDENT FROM FLOWERING TIME
III. Frost flowers – Pollination syndromes of Hamamelidaceae
Authors
Andreas Wilhelm Mues*, Lisabeth Hoff*, Federico Luebert* and Maximilian Weigend* * Nees Institut für Biodiversität der Pflanzen, Universität Bonn, 53115 Bonn, Germany
III.1 ABSTRACT
Background and Aims: Hamamelidaceae are a family of 82 species, comprising several extant taxa
flowering "out of season" in late autumn and winter. Flower function and pollination syndromes are
poorly documented in this family. We collected data from 22 species and 12 genera on floral functional
plant traits: Pollen and ovule production, p/o ratio, optical flower signal, nectar reward as well as flower
and inflorescence morphology. Floral plant trait clusters are retrieved in order to test the validity of the
floral syndromes concept. Moreover, interplay between retrieved floral functional pattern and
flowering time is tested, and data are presented in a phylogenetic context.
Methods: Pollen and ovule counting, nectar measurements (amounts, sugar concentration), UV light
photography, morphometry, Cryo-Scanning Electron Microscopy (CSEM), hierarchical clustering, Non-
metric Multidimensional Scaling (NMDS), vector fitting, phylogenetic analysis.
Key results: Three major floral functional trait clusters are retrieved via hierarchical clustering an NMDS
(complete dataset, stress: 0.092, good fit; two convergent solutions after 20 tries). Flowering time
appears as disjunct from the retrieved clusters (PERMANOVA: non. sig., p = .124).
Conclusions: Clear floral functional clusters indicative for wind resp. animal pollination are retrieved,
but also a separate group with ambophilous, mixed pollination mode (corresponding to the genera
Fothergilla and Parrotiopsis). Surprisingly, animal pollination appears to be common in winter flowering
species, and pollination syndromes and flowering time appear to be recombined quite freely during
evolution. Zoophily was evolutionary reinvented five to six times from an ancestral anemophilous
condition in Hamamelidaceae. Ambophily is apparently stabilised in two genera, at least dating back to
the Eocene, and possibly even the Upper Cretaceous, arguing against this representing an ephemeral
transitional stage.
Key words: Hamamelidaceae, flowering time, floral function, plant traits, pollination syndromes,
anemophily, zoophily, ambophily, hierarchical clustering, NMDS, phylogeny.
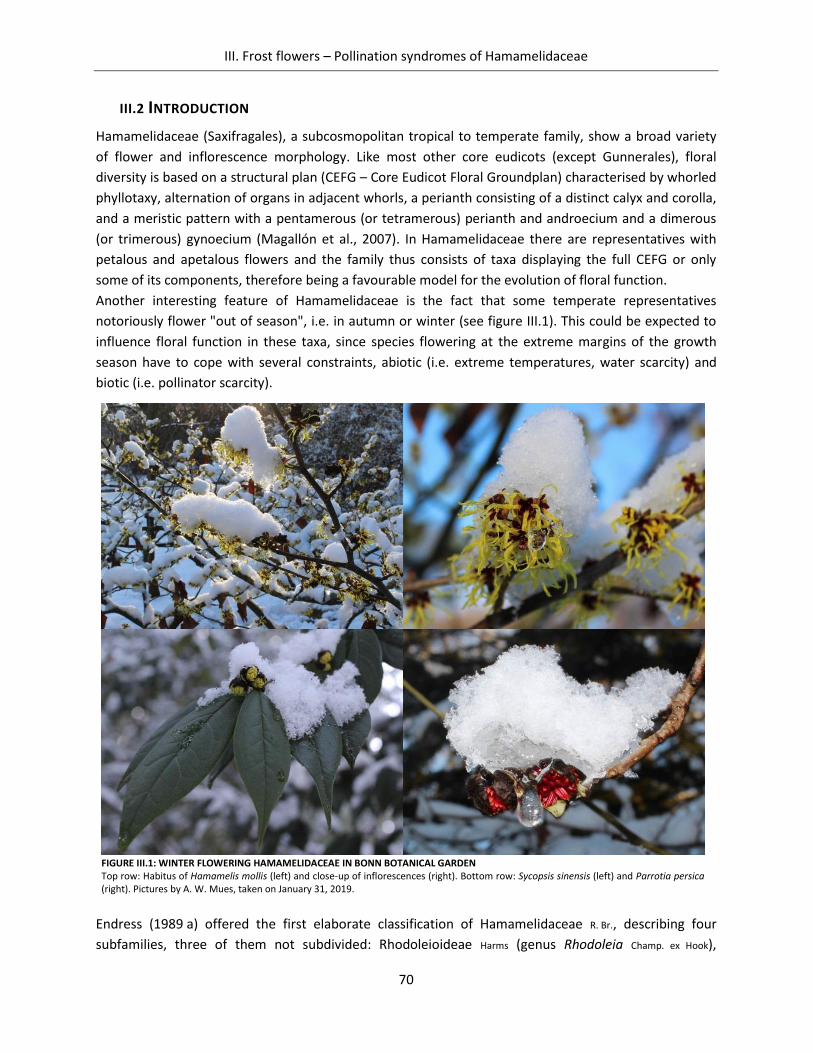
III. Frost flowers – Pollination syndromes of Hamamelidaceae
70
III.2 INTRODUCTION
Hamamelidaceae (Saxifragales), a subcosmopolitan tropical to temperate family, show a broad variety
of flower and inflorescence morphology. Like most other core eudicots (except Gunnerales), floral
diversity is based on a structural plan (CEFG – Core Eudicot Floral Groundplan) characterised by whorled
phyllotaxy, alternation of organs in adjacent whorls, a perianth consisting of a distinct calyx and corolla,
and a meristic pattern with a pentamerous (or tetramerous) perianth and androecium and a dimerous
(or trimerous) gynoecium (Magallón et al., 2007). In Hamamelidaceae there are representatives with
petalous and apetalous flowers and the family thus consists of taxa displaying the full CEFG or only
some of its components, therefore being a favourable model for the evolution of floral function.
Another interesting feature of Hamamelidaceae is the fact that some temperate representatives
notoriously flower "out of season", i.e. in autumn or winter (see figure III.1). This could be expected to
influence floral function in these taxa, since species flowering at the extreme margins of the growth
season have to cope with several constraints, abiotic (i.e. extreme temperatures, water scarcity) and
biotic (i.e. pollinator scarcity).
Endress (1989 a) offered the first elaborate classification of Hamamelidaceae R. Br., describing four
subfamilies, three of them not subdivided: Rhodoleioideae Harms (genus Rhodoleia Champ. ex Hook),
FIGURE III.1: WINTER FLOWERING HAMAMELIDACEAE IN BONN BOTANICAL GARDEN Top row: Habitus of Hamamelis mollis (left) and close-up of inflorescences (right). Bottom row: Sycopsis sinensis (left) and Parrotia persica (right). Pictures by A. W. Mues, taken on January 31, 2019.
III. Frost flowers – Pollination syndromes of Hamamelidaceae
71
Exbucklandioideae Reinsch (genera: Disanthus Maxim. (later separated as Disanthoideae Harms (Takhtajan,
1997)), Mytilaria Lecomte, Chunia Chan, Exbucklandia R. W. Br.), and Altingioideae Reinsch (genera:
Liquidambar L., Altingia Nor., Semiliquidambar Chang). Altingioideae are today classified as the
independent family Altingiaceae Horan. (Takhtajan, 1997; Angiosperm Phylogeny Group, 2003). The
fourth, larger subfamily, Hamamelidoideae Reinsch, is subdivided in four tribes: Eustigmateae Harms (three
genera: Eustigma Gardn. & Champ., Fortunearia Rehd. & Wils., Sinowilsonia Hemsl.), Corylopsideae Harms (one
genus, Corylopsis Sieb. & Zucc.), Fothergilleae A. DC. (eight genera: Molinadendron Endress, Fothergilla Murray in
L., Parrotiopsis Schneider, Parrotia C. A. Mey., Sycopsis Oliv., Distyliopsis Endress, Distylium Sieb. & Zucc., Matudaea
Lundell). The fourth tribe Hamamelideae A. DC., is further divided in three subtribes: Hamamelidinae Endress
subtrib. nov. (genus: Hamamelis L.), Loropetalinae Endress subtrib. nov. (four genera: Loropetalum R. Br. ex Reichb.,
Tetrahyrium Benth., Maingaya Oliv., Embolanthera Merr.) and Dicoryphinae Endress subtrib. nov. (five genera:
Dicoryphe Du Petit-Thouars, Trichocladus Pers., Ostrearia Baill., Neostrearia L. S. Smith, Noahdendron Endress, Hyland
& Tracey).
Regarding floral morphology, the full CEFG is present in Rhodoleioideae, Disanthoideae, genus Mytilaria
(Exbucklandioideae) as well as in three of four tribes of subfamily Hamamelidoideae, namely
Corylopsideae, Hamamelideae and Eustigmateae (however only very small petals in Eustigma, and
petals rudimentary in Fortunearia and Sinowilsonia). The perianth is missing or highly reduced in tribe
Fothergilleae, subfamily Exbucklandioideae, genera Chunia and Exbucklandia, and in Altingiaceae. In
addition to variations of the CEFG on flower level, presentation of flowers in inflorescences also varies
widely between taxa (Bogle, 1970; Morley and Chao, 1977; Endress, 1989 b; Mione and Bogle, 1990;
Endress, 1993; Magallón, 2007).
Regarding the high floral diversity present in Hamamelidaceae, Endress (1977, p. 324 ff.) already stated
the general idea that "Here, obviously, an adaptive radiation has led to mainly bee, fly, bird, and wind
pollinated flowers …", emphasising the importance of plant-animal interactions for the understanding of
floral diversity in this family. There has been frequent criticism about the usefulness of the pollination
syndromes approach (e.g. Waser et al., 1996; Ollerton et al., 2009). We agree with Willmer (2011) that it
is unfortunate that the syndrome concept has been criticised for something it was never intended for: A
pollination syndrome should be understood as a statistical rather than an absolute construct, meaning
that a particular set of floral characters is more likely for specific biotic or abiotic vectors in order to
secure outcrossing. There is a broad body of evidence for a predictive value of floral characters on both
zoophilous and abiotic pollination systems (e.g. Delpino, 1868–1875; Vogel, 1954; van der Pijl, 1961;
Baker and Hurd, 1986; Faergi and van der Pijl, 1979; Johnson, 2010; Gómez et al., 2008; van der Niet
and Johnson, 2012; Newman et al., 2014; Rosas-Guerrero et al., 2014; Abrahamczyk et al., 2017;
Johnson and Wester, 2017; Dellinger et al., 2018; Ibañez et al., 2019; abiotic/wind: Michalski and Durka,
2010; Molina et al.,1996; Culley et al., 2002; Friedman and Barrett, 2009).
The present article aligns with this research. Flower function is poorly documented in Hamamelidaceae,
and we therefore collected a broad sample of floral plant traits. The retrieved dataset was subsequently
analysed with a multivariate, statistical approach in order to discuss the validity of pollination
syndromes in Hamamelidaceae. To this end, 22 species from 12 genera are investigated with regard to
flower morphology, optical signal, nectar reward, pollen and ovule production as well as p/o ratios – a
common indicator for pollination efficiency. Hierarchical clustering and Non-metric Multidimensional
Scaling (NMDS) are used to retrieve clusters of floral functional traits, and interplay of these characters
III. Frost flowers – Pollination syndromes of Hamamelidaceae
72
is tested via vector fitting and Permutational Multivariate Analysis of Variance (PERMANOVA). Results
are further compared in a phylogenetic context.
With this paper we want to address the following research questions:
Are clusters of floral traits indicative for pollination syndromes in Hamamelidaceae?
Is there a relationship between floral traits and flowering time?
Are differences in floral traits and flowering time correlated with phylogenetic relatedness?
III.3 MATERIALS AND METHODS
Samples for analysis of floral function were taken from the living collection of Bonn University Botanic
Gardens, with primary focus on subfamily Hamamelidoideae, representing the bulk of floral diversity
found in the family: Corylopsis (C. glabrescens, C. pauciflora, C. sinensis, C. spicata, C. veitchiana,
C. willmottiae), Distyliopsis (D. tutcheri), Distylium (D. myricoides, D. racemosum), Fothergilla
(F. gardenii, F. major), Fortunearia (F. sinensis), Hamamelis (H. japonica, H. mollis, H. vernalis,
H. virginiana), Loropetalum (L. chinense), Parrotia (P. persica), Parrotiopsis (P. jacquemontiana),
Sinowilsonia (S. henryi) and Sycopsis (S. sinensis). Additionally Disanthus cercidifolius (Disanthoideae)
was analysed. Sampling of flowers took place between September 2015 (Hamamelis virginiana) to
October 2016 (Disanthus cercidifolius).
Additionally, material from all species was collected and stored in silica gel for sequencing and
phylogenetic analysis, together with sequences downloaded from GenBank (outgroups, see below).
III.3.1 ASSESSMENT OF INFLORESCENCE AND FLOWER MORPHOLOGY
Individual flowers of the species investigated are often strongly reduced and synorganised into
inflorescences as functional units. We therefore summarised functional parameters at inflorescence
level, additional to the flower level. Twelve inflorescences per species were analysed under a stereo
microscope: Flowers were either classified as perfect, staminate or pistillate. The total number of
flowers per flower type was recorded, as well as the total number of stamens and ovules or every
flower and inflorescence. For all species studied, the number of carpels is fixed to two.
Ten mid-anthetic flowers per species were measured to obtain data on anther length, filament length,
style length, distance between anther and stigma, petal length and petal width, if applicable. Averages
and standard deviations were calculated. In three cases, namely Fortunearia sinensis, Parrotia persica
and Sycopsis sinensis, a distinctive enlargement of styles was observed during the pistillate phase. Two
values for style length (pre and post style elongation) were therefore recorded. Morley and Chao (1977)
described protogyny of flowers for Corylopsis. Filament elongation brings anthers with or above level of
the stigmas when petals are fully expanded, and all flowers are functionally hermaphroditic. Due to this,
morphometry of Corylopsis was done with randomly selected, fully opened flowers.
Terminal inflorescences (T) are found to be more vigorous than lateral inflorescences (L) in three
species: Distyliopsis tutcheri, Parrotia persica and Sycopsis sinensis. In order to cater for this difference,
T:L ratios were approximated by a complete count of inflorescences from a randomly selected branch.
The obtained T:L ratios are 1:1 for Distyliopsis tutcheri (n = 25 inflorescences), 1:3 for Parrotia persica
(n = 40) and 1:2 for Sycopsis sinensis (n = 51). T:L ratios were applied for subsequent sampling.
III. Frost flowers – Pollination syndromes of Hamamelidaceae
73
III.3.2 ASSESSMENT OF POLLEN PRODUCTION, OVULE NUMBERS AND P/O RATIOS
Twelve inflorescences per species were analysed for pollen and ovule production as well as p/o ratio.
Ten anthers per inflorescence were randomly selected for the pollen count. Where different flower
types (perfect vs. staminate) were present, samples representing each flower type were taken
separately. If a certain flower type was represented with less than ten anthers in an inflorescence (for
example staminate flowers in an inflorescence of predominantly perfect ones), the maximum number of
available anthers was used.
Only fully developed and completely closed anthers were used for pollen counts. Anthers were removed
with tweezers and dried in Eppendorf tubes for at least three days. During drying the pollen material
usually was released from the anthers. In some cases anthers failed to open. These were carefully
smashed open with a small pestle, which was subsequently rinsed with the solvent to recover adhering
pollen material. A mixture of glycerol and distilled water (1:1) was used for dispersal of pollen grains
during the counting procedure. Glycerol was applied to increase viscosity and slow down the
sedimentation of pollen grains. Depending on anther size and pollen number, the amount of added
solvent was adjusted, ranging from 100 μl (Corylopsis, Disanthus) to 800 μl (Distylium, Parrotia,
Parrotiopsis, Sinowilsonia, Sycopsis). Samples were mixed 5 minutes in a laboratory mill (Retsch®
MM200), and afterwards placed 10 minutes into an ultrasonic bath (Bandelin Sonorex RK52H).
Immediately before counting, samples were vortexed for 30 sec. (neoLab® 7-2020). 20 μl of the
suspension were pipetted on a Fuchs-Rosenthal hemocytometer, and pollen grains were counted in five
1 mm2 squares under a binocular microscope. Total pollen amount of the sample was calculated with
the following formula (Neuendorf, 2013):
pollen per sample =counted pollen grains
counted surface (mm2) · chamber depth (mm) · dilution (1 ÷ amount of diluent)
Pollen production per anther was afterwards calculated by division of pollen number per sample by the
number of anthers per sample. In case of perfect and staminate flowers present in an inflorescence, the
integrated average pollen production per anther was calculated, too:
𝑥 pollen per anther(,) =(pollen per anther · number of anthers) + (pollen per anther · number of anthers)
∑ anthers,per inflorescence
Average pollen production per flower was calculated by multiplication of anther-specific pollen
production with the average number of anthers per flower and flower type, for each inflorescence
assessed. In case of perfect and staminate flowers present in an inflorescence, the integrated average
pollen production per flower was calculated as follows:
𝑥 pollen per flower(,) =(pollen per flower · number of flowers) + (pollen per flower · number of flowers)
∑ flowers,per inflorescence
Total pollen production per inflorescence and flower type was calculated by multiplication of anther-
specific pollen number by the total number of anthers of each inflorescence and flower type. For
inflorescences bearing perfect as well as staminate flowers, total pollen production of the respective
inflorescences was calculated by adding up the values.
Flowers of all species analysed have two carpels, each of them usually containing one ovule. In genus
Corylopsis three ovules per carpel are produced, with only one reaching maturity (Magallón, 2007).
III. Frost flowers – Pollination syndromes of Hamamelidaceae
74
Ovule number of most species is therefore fixed to two per flower, the only exception is Disanthus with
six, rarely seven ovules per carpel.
Pollen to ovule ratios (p/o) were obtained by dividing the total pollen production per inflorescence by
the number of ovules per inflorescence. First proposed by Cruden (1977), p/o ratios are commonly used
as indicators for plant breeding systems and pollination syndromes: Pollination efficiency varies
between different biotic or abiotic pollen vectors (compare Cruden and Jensen, 1979; Cruden and
Miller-Ward, 1981; Cruden and Lyon, 1985; Small, 1988; Kirk, 1993; López et al., 1999; Cruden, 2000;
Michalski and Durka, 2009; Alarcón et al., 2011; Lozada-Gobilard et al., 2019).
III.3.3 ASSESSMENT OF INFLORESCENCE SIZE
Ten inflorescences per species were pictured frontal and lateral, together with graph paper as a
reference. Frontal inflorescence size is defined as the surface of the functional reproductive unit
oriented orthogonal to the peduncle (representing the main axis), connecting the functional unit to the
branch (top view). Lateral inflorescence size is defined as the surface of the functional unit oriented
parallel to the main axis (side view). Inflorescences were photographed with single-lens reflex camera
Canon EOS 600D. Display size was then measured and calculated by means of Adobe® Photoshop® CS6
imaging software and the Magnetic Lasso Tool, with 1 cm2 of the graph paper scale set as reference.
Except for coloured bracts of genus Corylopsis and Parrotiopsis jacquemontiana, bracts were excluded
from measurement.
III.3.4 ASSESSMENT OF UV LIGHT PATTERNS
For each species, inflorescences were illuminated with UV light, and observed pattern were depicted
from frontal and lateral view. Pictures were taken with a single-lens reflex camera (Nikon R D300s), with
an infrared neutralizer (OPTIK MAKARIO IR NG 52D) in combination with a UV light filter (OPTIK
MAKARIO SP 400 UV 52D). A photo series was created with a fixed aperture, but different shutter
speeds (1/5, 1/4, 1/3, 1/2, 1/1.6, 1, 1.6, 2, 3, 4, 5 sec.).
III.3.5 ASSESSMENT OF NECTAR REWARD
Flowers were protected from pollinators with a covering of gauze ca. 24 h before nectar sampling. Glass
microcapillaries (0.5 and 1 μl minicaps®; Hirschmann Laborgeräte, Germany) were used for extracting
the nectar, and nectar concentration was subsequently measured in degrees Brix with a hand-held
refractometer (neoLab, type ‘universal’). In some flowers nectar amount was too low to be successfully
extracted, in others nectar had to be pooled from several flowers in order to be measured on the
refractometer.
Nectar sugar production in mg per flower was afterwards calculated with the following formula, with x
being the measured concentration (cf. Galetto and Bernardello, 2005):
𝑚𝑔
𝜇𝑙= 0.00226 + (0.00937𝑥) + (0.0000585𝑥2)
The number of nectar measurements was standardised to n = 10 per species, surplus data was excluded
randomly. Only five nectar measurements could be obtained for Corylopsis glabrescens.
III. Frost flowers – Pollination syndromes of Hamamelidaceae
75
III.3.6 CRYO-SCANNING ELECTRON MICROSCOPY (CSEM)
For some species nectar could not be extracted with microcapillaries. In order to validate absence of
nectar, flowers were studied under the CSEM. Flowers and inflorescences were fixed to a conducting
carrier (SEM stub) and attached with conductive coal to prevent electric charging. Samples were cooled
down with liquid nitrogen and examined for nectar droplets and nectar stomata. If necessary, the
perianth was partly removed. Scanning was performed with a Cambridge Stereoscan 200 (Cambridge
Instruments Ltd., Cambridge, UK).
III.3.7 PHYLOGENETIC ANALYSIS
Sequence data of two nuclear (ETS and ITS) and four plastid markers (trnL-F, rps16, atpB-rbcL and psbA-
trnH) was generated for all species analysed in our study and complemented with additional sequences
of Hamamlidaceae, downloaded from GenBank (provided by Xie et al., 2010). We used four species of
the family Altingiaceae as outgroup. Altingiaceae has been retrieved as sister to the Hamamelidaceae in
several phylogenetic studies (e.g. Soltis et al., 2013; Xiang et al., 2019).
DNA was extracted from silica-gel using a modified CTAB method (Doyle and Dickson, 1987) and
amplified following Xie et al. (2010). PCR products were purified with the GeneJET PCR Purification Kit
(Thermo Fisher Scientific Biosciences, St. Leon-Rot, Germany) following manufacturer’s instructions.
Cycle sequencing was performed using BigDye Terminator v.3.1 (Applied Biosystems, Foster City,
California, U.S.A.). The resulting electropherograms were assembled using Geneious v.5.6.5 (Biomatters,
Auckland, New Zealand) and the consensus sequences aligned with MAFFT v.6.850b (Katoh et al., 2002),
followed by manual adjustments in PhyDE v.0.9971 (available at http:// www.phyde.de). Phylogenetic
analyses were conducted via Maximum Likelihood (ML) method (Felsenstein, 1981) as implemented in
RaxML v. 8.2.10 (Stamatakis, 2014) on the CIPRES Science Gateway (Miller et al., 2010). Since
incongruence between nuclear and plastid datasets has been reported in previous phylogenetic studies
of the Hamamelidaceae (Xie et al., 2010), ML analyses were conducted separately for concatenated,
marker-partitioned matrices of nuclear and plastid markers. Analyses were conducted with unlinked
partitions and branch support was calculated with 1,000 bootstrap replicates. Trees were rooted with
the Altingiaceae.
III.3.8 STATISTICAL ANALYSIS
Data exploration and basic statistics were carried out with the IBM software package SPSS, version 24.
Statistical procedures beyond data exploration were performed in R version 3.3.3 with arithmetic
means on species level. Continuous, ratio scaled variables are pollen production per anther, anther
number per flower, pollen production per flower, flowers per inflorescence, anthers per inflorescence,
pollen per inflorescence, ovules per inflorescence, p/o ratio, anther length, filament length, style length,
petal length, petal width, frontal inflorescence size and lateral inflorescence size. Categorical variables
were assigned via R factor function, and factor levels were labelled as unordered (nominal) or ordered
(ordinal). Categorical variables are the presence or absence of staminate flowers in inflorescences
(ordered factor – coded 0 for absence, 1 for occasional occurrence and 2 for large proportions of
staminate flowers), sexual functionality (unordered – coded 0 for joint male and female function within
an inflorescence, 1 for functional unisexuality via temporal separation and 2 for full unisexuality via
III. Frost flowers – Pollination syndromes of Hamamelidaceae
76
separation of male and female inflorescences), presence or absence of showy colour signal of
inflorescences (perianth organs, bracts or filaments, ordered, coded 0 or 1), colour signal of anthers
(unordered – coded 1 for yellow anthers, 2 for red and 3 for dark red anthers), nectar reward (ordered –
coded 0 for absence, 1 for nectar traces and 2 for substantial amounts of nectar measurable with our
refractometer technique) and flowering time (unordered): Winter flowering species are coded 1, spring
flowering species 2 and autumn flowering species 3. In spite of some minor differences in flowering
time in cultivated conditions at Bonn Botanical Gardens, observed flowering times are usually in line
with reported phenology for the species’ native ranges (appendix, table A X.2.5). Flowering time was
labelled as "winter flowering", describing species flowering in late winter or early spring, blooming
noticeably earlier than "spring flowering" species, and "autumn flowering" was chosen for the other
extreme of the spectrum, species flowering at the end of the season. Winter and autumn flowering
species are therefore marking the marginal extremes of the growth period.
UV light signal of inflorescences was found to be strongly conserved and is therefore not included in the
statistical analysis (see appendix, table A X.2.3 and figure A X.2.2).
Bivariate correlations are presented in the appendix, table A X.2.6: Due to non-normality of data,
correlations between continuous, ratio scaled variables as well as between ratio scaled and ordinal
variables were analysed with non-parametric Kendall tau rank correlation coefficient (τb). Correlations
from .1 to .3 are rated as low, from .3 to .5 as moderate, from .5 and above as strong (cf. Cohen, 1988).
Cluster analysis and multivariate ordinations were performed in order to structure, analyse and visualise
available information on floral plant traits. Both methods were performed with the arithmetic means of
continuous variables and nominal coding of discrete variables with R package vegan, version 2.5-1
(Oksanen et al., 2013). Where both staminate and perfect flowers were present within inflorescences,
flower type specific information for gametic variables had to be aggregated via arithmetic means to
have species-specific profiles. To account for this, presence or absence of staminate flowers was
introduced as a nominal variable. As for Sinowilsonia henryi, male and female inflorescences were
analysed separately. Most variables are unambiguous, except number of flowers per inflorescence as
well as frontal and lateral inflorescence size. Respective variables were averaged across male and female
inflorescences. Only data of fully anthetic flowers were used.
Hierarchical clustering was performed in R with gametic data, with non-gametic data and with all
variables at once. Ovule production per carpel and flower are highly conserved within the family and
were therefore excluded from these procedures, but female gamete production is represented via ovule
number per inflorescence. Clustering of all variables also included flowering time. Cluster analyses were
conducted with complete linkage and Gower dissimilarity matrices, except for gamete production
analysed via Bray Curtis index (only metric variables); cf. appendix, figures A X.2.4 and A X.2.5.
Ordination was performed in vegan by means of Non-metric Multidimensional Scaling (NMDS) in order
to handle different measuring scales and non-normality of data. We used the same dissimilarity
matrices as for hierarchical clustering. Function metaMDS was used for iterative testing and selection of
the solution with smallest stress. Data were standardised by square root transformation and Wisconsin
double standardisation. For NMDS with gametic variables, non-gametic variables were fitted onto the
ordination as vectors (R function envfit, 999 permutations). For the second model the procedure was
reversed, NMDS ordination was done with non-gametic variables and gametic variables were then fitted
onto the ordination. Model stresses between .05 and .1 were interpreted as good (McCune et al., 2002).
III. Frost flowers – Pollination syndromes of Hamamelidaceae
77
For the final NMDS model all floral plant traits plus flowering time were used, and influence of flowering
time as a source of variation in the Gower dissimilarity matrix was checked with Permutational
Multivariate Analysis of Variance (PERMANOVA, 200 permutations applied). Phylogenetic signal was
evaluated for all single variables as well as for NMDS-axes using Pagel’s λ (Pagel, 1999) as implemented
in the R-package Geiger v.2.0.6.2 (Harmon et al., 2008) for discrete and continuous data, depending on
the variable. The ARD (all rates different) model was employed for all analyses of discrete variables. We
used the trees based on both nuclear and plastid data separately, pruning from them the species for
which no measurements were available. Pagel’s λ approaches 1 when the association between
morphological covariance and phylogenetic relatedness is maximum.
III.4 RESULTS
For the taxa analysed in depth here, the following inflorescence structures are realised, please compare
depictions in figures III.2 and III.3: Corylopsis (thyrses, racemes), Disanthus (2-flowered), Distyliopsis
(condensed panicles or botroids), Distylium (compound inflorescences: a lateral axis stemming from a
branch is bearing small axillary inflorescences – spikes, racemes or panicles), Fothergilla (spikes),
Fortunearia (racemes), Hamamelis (heads), Loropetalum (tightly clustered raceme or panicle), Parrotia
(bracteate heads), Parrotiopsis (subcapitate spikes), Sinowilsonia (catkins; male: racemes, female:
spikes) and Sycopsis (panicles, spikes or heads). In the following, data bandwidth of analysed variables is
presented in line with the results of hierarchical clustering, please see figure III.4 for NMDS-ordination
of clusters.
III.4.1 CLUSTERING OF GAMETIC VARIABLES RETRIEVES TWO CLUSTERS
Hierarchical clustering exclusively performed on gametic variables retrieves two clusters (cf. table
A X.2.1 and figures A X.2.4 and A X.2.5 in the appendix): Cluster A is generally built up of species
characterised by high to very high gamete production when compared to the rest of the family,
namely: Sycopsis, Parrotia, Fortunearia, Sinowilsonia, both species of Fothergilla and Parrotiopsis.
Cluster B is built up of all other species analysed.
Pollen production per inflorescence is remarkably higher in cluster A than in cluster B, approximating
1 million pollen grains per inflorescence or even way above this value. Sycopsis is marking the lower
bound of cluster A, with 724 993.3 pollen grains on average. Monoecious Sinowilsonia henryi with its
unisexual staminate inflorescences is marking the upper bound with 3 430 566.7 pollen grains. For
species in cluster B, pollen production per inflorescence is in the tens to hundreds of thousands: The
lowest production was found for Disanthus with 42 333.3 pollen grains on average. C. willmottiae shows
maximum production in cluster B (643 650.0 pollen grains).
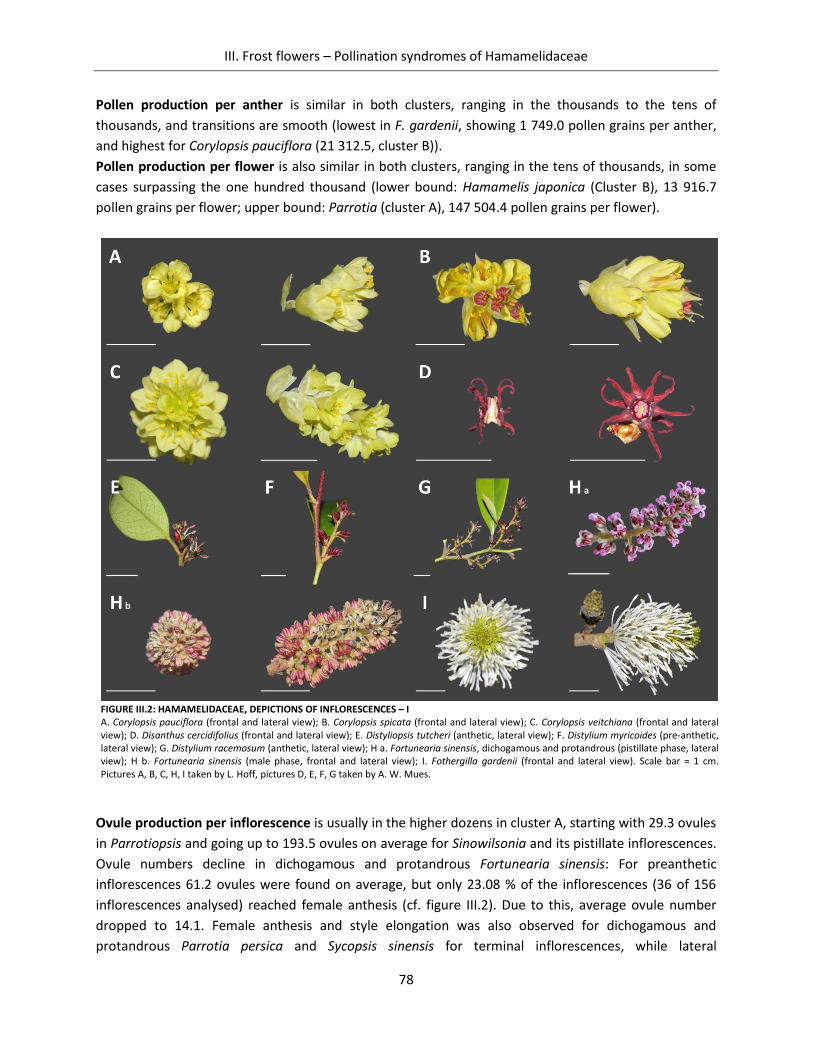
III. Frost flowers – Pollination syndromes of Hamamelidaceae
78
Pollen production per anther is similar in both clusters, ranging in the thousands to the tens of
thousands, and transitions are smooth (lowest in F. gardenii, showing 1 749.0 pollen grains per anther,
and highest for Corylopsis pauciflora (21 312.5, cluster B)).
Pollen production per flower is also similar in both clusters, ranging in the tens of thousands, in some
cases surpassing the one hundred thousand (lower bound: Hamamelis japonica (Cluster B), 13 916.7
pollen grains per flower; upper bound: Parrotia (cluster A), 147 504.4 pollen grains per flower).
Ovule production per inflorescence is usually in the higher dozens in cluster A, starting with 29.3 ovules
in Parrotiopsis and going up to 193.5 ovules on average for Sinowilsonia and its pistillate inflorescences.
Ovule numbers decline in dichogamous and protandrous Fortunearia sinensis: For preanthetic
inflorescences 61.2 ovules were found on average, but only 23.08 % of the inflorescences (36 of 156
inflorescences analysed) reached female anthesis (cf. figure III.2). Due to this, average ovule number
dropped to 14.1. Female anthesis and style elongation was also observed for dichogamous and
protandrous Parrotia persica and Sycopsis sinensis for terminal inflorescences, while lateral
FIGURE III.2: HAMAMELIDACEAE, DEPICTIONS OF INFLORESCENCES – I A. Corylopsis pauciflora (frontal and lateral view); B. Corylopsis spicata (frontal and lateral view); C. Corylopsis veitchiana (frontal and lateral view); D. Disanthus cercidifolius (frontal and lateral view); E. Distyliopsis tutcheri (anthetic, lateral view); F. Distylium myricoides (pre-anthetic, lateral view); G. Distylium racemosum (anthetic, lateral view); H a. Fortunearia sinensis, dichogamous and protandrous (pistillate phase, lateral view); H b. Fortunearia sinensis (male phase, frontal and lateral view); I. Fothergilla gardenii (frontal and lateral view). Scale bar = 1 cm. Pictures A, B, C, H, I taken by L. Hoff, pictures D, E, F, G taken by A. W. Mues.
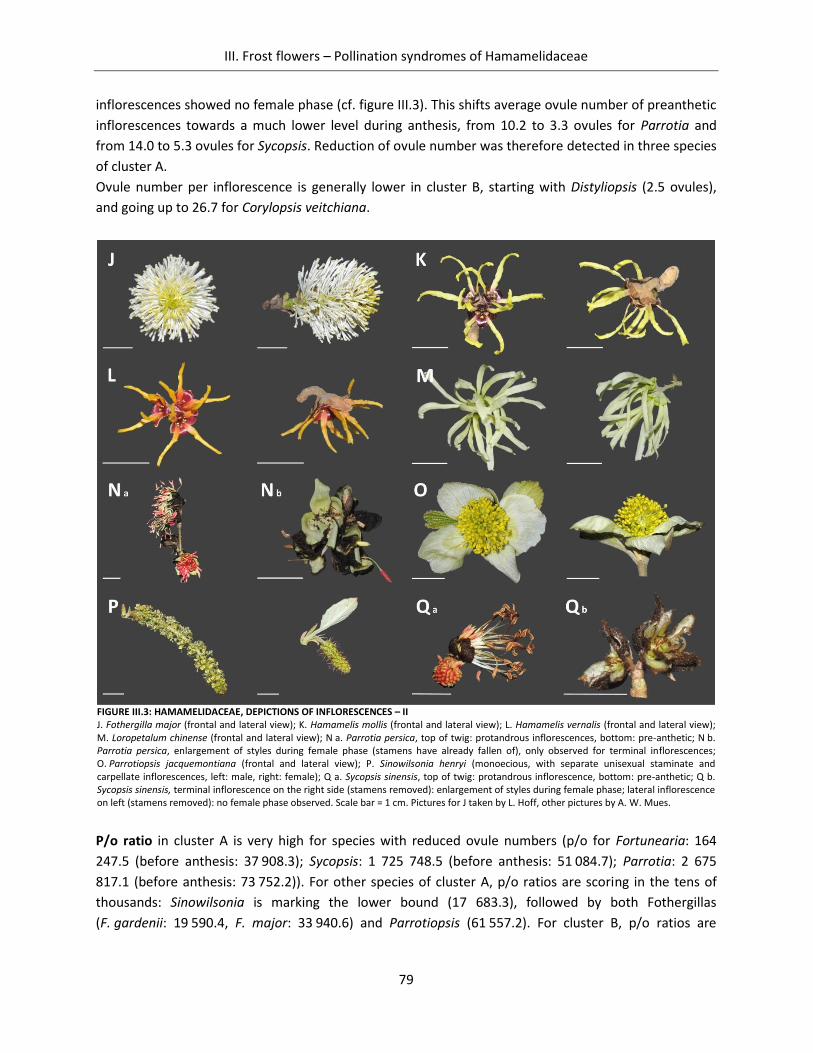
III. Frost flowers – Pollination syndromes of Hamamelidaceae
79
inflorescences showed no female phase (cf. figure III.3). This shifts average ovule number of preanthetic
inflorescences towards a much lower level during anthesis, from 10.2 to 3.3 ovules for Parrotia and
from 14.0 to 5.3 ovules for Sycopsis. Reduction of ovule number was therefore detected in three species
of cluster A.
Ovule number per inflorescence is generally lower in cluster B, starting with Distyliopsis (2.5 ovules),
and going up to 26.7 for Corylopsis veitchiana.
P/o ratio in cluster A is very high for species with reduced ovule numbers (p/o for Fortunearia: 164
247.5 (before anthesis: 37 908.3); Sycopsis: 1 725 748.5 (before anthesis: 51 084.7); Parrotia: 2 675
817.1 (before anthesis: 73 752.2)). For other species of cluster A, p/o ratios are scoring in the tens of
thousands: Sinowilsonia is marking the lower bound (17 683.3), followed by both Fothergillas
(F. gardenii: 19 590.4, F. major: 33 940.6) and Parrotiopsis (61 557.2). For cluster B, p/o ratios are
FIGURE III.3: HAMAMELIDACEAE, DEPICTIONS OF INFLORESCENCES – II J. Fothergilla major (frontal and lateral view); K. Hamamelis mollis (frontal and lateral view); L. Hamamelis vernalis (frontal and lateral view); M. Loropetalum chinense (frontal and lateral view); N a. Parrotia persica, top of twig: protandrous inflorescences, bottom: pre-anthetic; N b. Parrotia persica, enlargement of styles during female phase (stamens have already fallen of), only observed for terminal inflorescences; O. Parrotiopsis jacquemontiana (frontal and lateral view); P. Sinowilsonia henryi (monoecious, with separate unisexual staminate and carpellate inflorescences, left: male, right: female); Q a. Sycopsis sinensis, top of twig: protandrous inflorescence, bottom: pre-anthetic; Q b. Sycopsis sinensis, terminal inflorescence on the right side (stamens removed): enlargement of styles during female phase; lateral inflorescence on left (stamens removed): no female phase observed. Scale bar = 1 cm. Pictures for J taken by L. Hoff, other pictures by A. W. Mues.
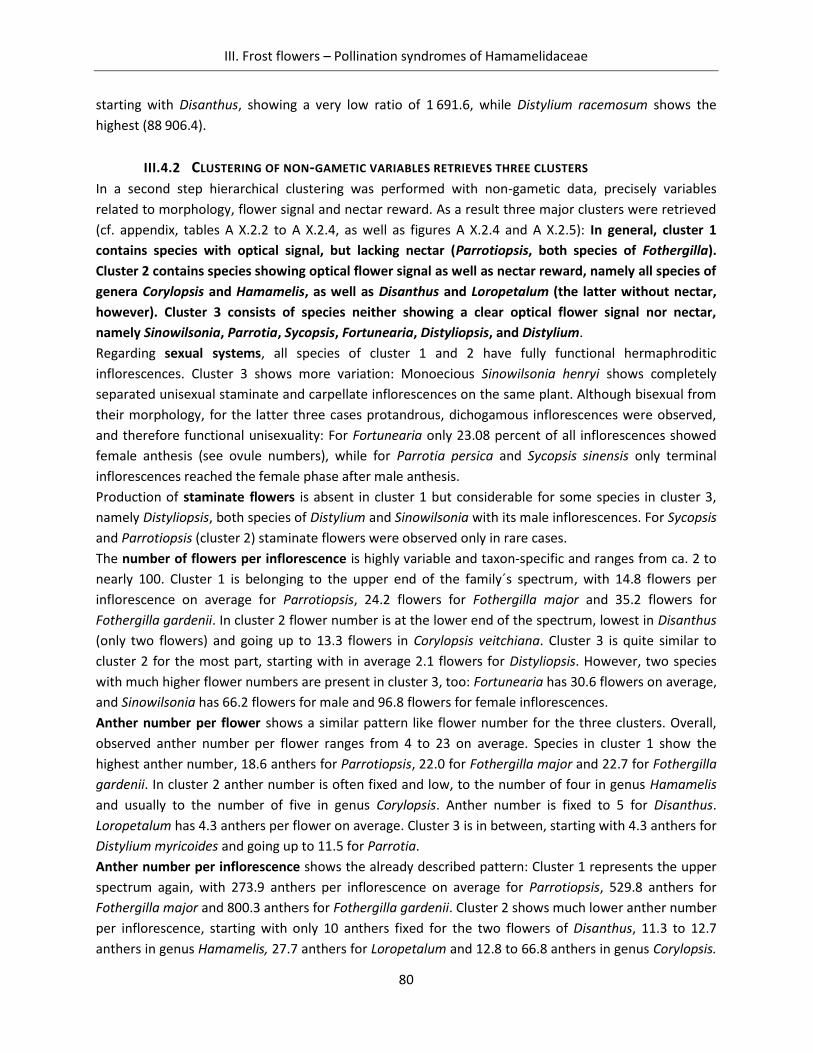
III. Frost flowers – Pollination syndromes of Hamamelidaceae
80
starting with Disanthus, showing a very low ratio of 1 691.6, while Distylium racemosum shows the
highest (88 906.4).
III.4.2 CLUSTERING OF NON-GAMETIC VARIABLES RETRIEVES THREE CLUSTERS
In a second step hierarchical clustering was performed with non-gametic data, precisely variables
related to morphology, flower signal and nectar reward. As a result three major clusters were retrieved
(cf. appendix, tables A X.2.2 to A X.2.4, as well as figures A X.2.4 and A X.2.5): In general, cluster 1
contains species with optical signal, but lacking nectar (Parrotiopsis, both species of Fothergilla).
Cluster 2 contains species showing optical flower signal as well as nectar reward, namely all species of
genera Corylopsis and Hamamelis, as well as Disanthus and Loropetalum (the latter without nectar,
however). Cluster 3 consists of species neither showing a clear optical flower signal nor nectar,
namely Sinowilsonia, Parrotia, Sycopsis, Fortunearia, Distyliopsis, and Distylium.
Regarding sexual systems, all species of cluster 1 and 2 have fully functional hermaphroditic
inflorescences. Cluster 3 shows more variation: Monoecious Sinowilsonia henryi shows completely
separated unisexual staminate and carpellate inflorescences on the same plant. Although bisexual from
their morphology, for the latter three cases protandrous, dichogamous inflorescences were observed,
and therefore functional unisexuality: For Fortunearia only 23.08 percent of all inflorescences showed
female anthesis (see ovule numbers), while for Parrotia persica and Sycopsis sinensis only terminal
inflorescences reached the female phase after male anthesis.
Production of staminate flowers is absent in cluster 1 but considerable for some species in cluster 3,
namely Distyliopsis, both species of Distylium and Sinowilsonia with its male inflorescences. For Sycopsis
and Parrotiopsis (cluster 2) staminate flowers were observed only in rare cases.
The number of flowers per inflorescence is highly variable and taxon-specific and ranges from ca. 2 to
nearly 100. Cluster 1 is belonging to the upper end of the family´s spectrum, with 14.8 flowers per
inflorescence on average for Parrotiopsis, 24.2 flowers for Fothergilla major and 35.2 flowers for
Fothergilla gardenii. In cluster 2 flower number is at the lower end of the spectrum, lowest in Disanthus
(only two flowers) and going up to 13.3 flowers in Corylopsis veitchiana. Cluster 3 is quite similar to
cluster 2 for the most part, starting with in average 2.1 flowers for Distyliopsis. However, two species
with much higher flower numbers are present in cluster 3, too: Fortunearia has 30.6 flowers on average,
and Sinowilsonia has 66.2 flowers for male and 96.8 flowers for female inflorescences.
Anther number per flower shows a similar pattern like flower number for the three clusters. Overall,
observed anther number per flower ranges from 4 to 23 on average. Species in cluster 1 show the
highest anther number, 18.6 anthers for Parrotiopsis, 22.0 for Fothergilla major and 22.7 for Fothergilla
gardenii. In cluster 2 anther number is often fixed and low, to the number of four in genus Hamamelis
and usually to the number of five in genus Corylopsis. Anther number is fixed to 5 for Disanthus.
Loropetalum has 4.3 anthers per flower on average. Cluster 3 is in between, starting with 4.3 anthers for
Distylium myricoides and going up to 11.5 for Parrotia.
Anther number per inflorescence shows the already described pattern: Cluster 1 represents the upper
spectrum again, with 273.9 anthers per inflorescence on average for Parrotiopsis, 529.8 anthers for
Fothergilla major and 800.3 anthers for Fothergilla gardenii. Cluster 2 shows much lower anther number
per inflorescence, starting with only 10 anthers fixed for the two flowers of Disanthus, 11.3 to 12.7
anthers in genus Hamamelis, 27.7 anthers for Loropetalum and 12.8 to 66.8 anthers in genus Corylopsis.
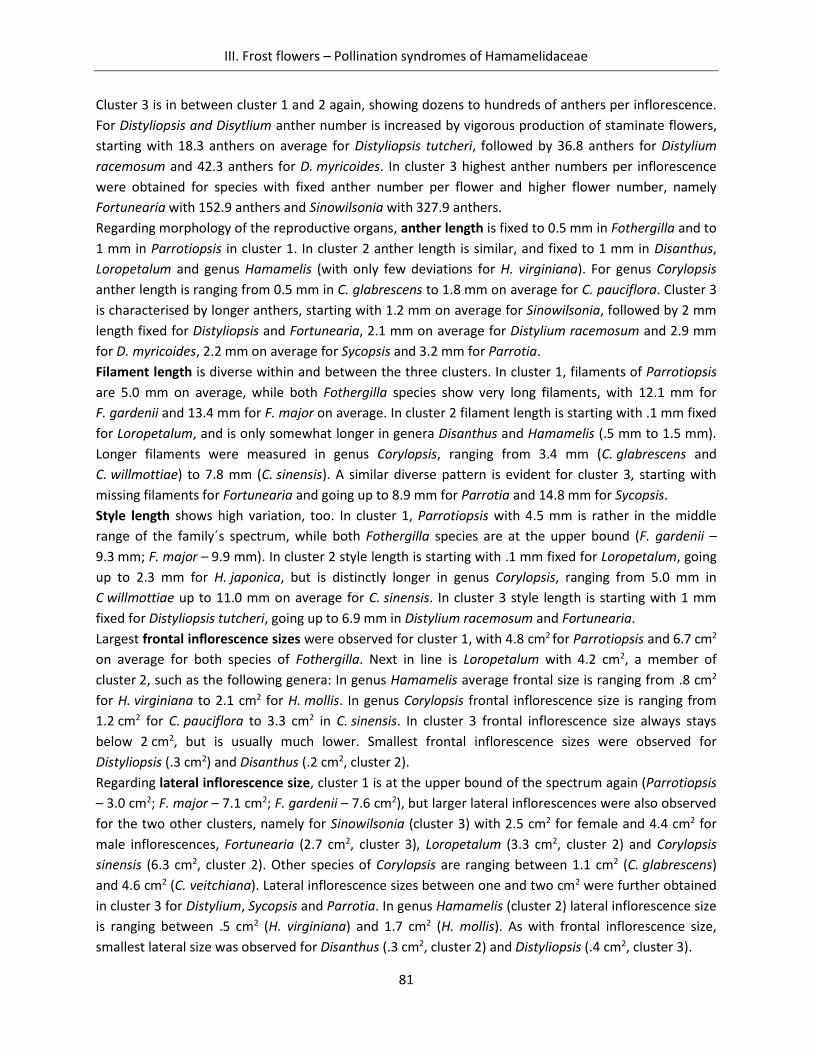
III. Frost flowers – Pollination syndromes of Hamamelidaceae
81
Cluster 3 is in between cluster 1 and 2 again, showing dozens to hundreds of anthers per inflorescence.
For Distyliopsis and Disytlium anther number is increased by vigorous production of staminate flowers,
starting with 18.3 anthers on average for Distyliopsis tutcheri, followed by 36.8 anthers for Distylium
racemosum and 42.3 anthers for D. myricoides. In cluster 3 highest anther numbers per inflorescence
were obtained for species with fixed anther number per flower and higher flower number, namely
Fortunearia with 152.9 anthers and Sinowilsonia with 327.9 anthers.
Regarding morphology of the reproductive organs, anther length is fixed to 0.5 mm in Fothergilla and to
1 mm in Parrotiopsis in cluster 1. In cluster 2 anther length is similar, and fixed to 1 mm in Disanthus,
Loropetalum and genus Hamamelis (with only few deviations for H. virginiana). For genus Corylopsis
anther length is ranging from 0.5 mm in C. glabrescens to 1.8 mm on average for C. pauciflora. Cluster 3
is characterised by longer anthers, starting with 1.2 mm on average for Sinowilsonia, followed by 2 mm
length fixed for Distyliopsis and Fortunearia, 2.1 mm on average for Distylium racemosum and 2.9 mm
for D. myricoides, 2.2 mm on average for Sycopsis and 3.2 mm for Parrotia.
Filament length is diverse within and between the three clusters. In cluster 1, filaments of Parrotiopsis
are 5.0 mm on average, while both Fothergilla species show very long filaments, with 12.1 mm for
F. gardenii and 13.4 mm for F. major on average. In cluster 2 filament length is starting with .1 mm fixed
for Loropetalum, and is only somewhat longer in genera Disanthus and Hamamelis (.5 mm to 1.5 mm).
Longer filaments were measured in genus Corylopsis, ranging from 3.4 mm (C. glabrescens and
C. willmottiae) to 7.8 mm (C. sinensis). A similar diverse pattern is evident for cluster 3, starting with
missing filaments for Fortunearia and going up to 8.9 mm for Parrotia and 14.8 mm for Sycopsis.
Style length shows high variation, too. In cluster 1, Parrotiopsis with 4.5 mm is rather in the middle
range of the family´s spectrum, while both Fothergilla species are at the upper bound (F. gardenii –
9.3 mm; F. major – 9.9 mm). In cluster 2 style length is starting with .1 mm fixed for Loropetalum, going
up to 2.3 mm for H. japonica, but is distinctly longer in genus Corylopsis, ranging from 5.0 mm in
C willmottiae up to 11.0 mm on average for C. sinensis. In cluster 3 style length is starting with 1 mm
fixed for Distyliopsis tutcheri, going up to 6.9 mm in Distylium racemosum and Fortunearia.
Largest frontal inflorescence sizes were observed for cluster 1, with 4.8 cm2 for Parrotiopsis and 6.7 cm2
on average for both species of Fothergilla. Next in line is Loropetalum with 4.2 cm2, a member of
cluster 2, such as the following genera: In genus Hamamelis average frontal size is ranging from .8 cm2
for H. virginiana to 2.1 cm2 for H. mollis. In genus Corylopsis frontal inflorescence size is ranging from
1.2 cm2 for C. pauciflora to 3.3 cm2 in C. sinensis. In cluster 3 frontal inflorescence size always stays
below 2 cm2, but is usually much lower. Smallest frontal inflorescence sizes were observed for
Distyliopsis (.3 cm2) and Disanthus (.2 cm2, cluster 2).
Regarding lateral inflorescence size, cluster 1 is at the upper bound of the spectrum again (Parrotiopsis
– 3.0 cm2; F. major – 7.1 cm2; F. gardenii – 7.6 cm2), but larger lateral inflorescences were also observed
for the two other clusters, namely for Sinowilsonia (cluster 3) with 2.5 cm2 for female and 4.4 cm2 for
male inflorescences, Fortunearia (2.7 cm2, cluster 3), Loropetalum (3.3 cm2, cluster 2) and Corylopsis
sinensis (6.3 cm2, cluster 2). Other species of Corylopsis are ranging between 1.1 cm2 (C. glabrescens)
and 4.6 cm2 (C. veitchiana). Lateral inflorescence sizes between one and two cm2 were further obtained
in cluster 3 for Distylium, Sycopsis and Parrotia. In genus Hamamelis (cluster 2) lateral inflorescence size
is ranging between .5 cm2 (H. virginiana) and 1.7 cm2 (H. mollis). As with frontal inflorescence size,
smallest lateral size was observed for Disanthus (.3 cm2, cluster 2) and Distyliopsis (.4 cm2, cluster 3).
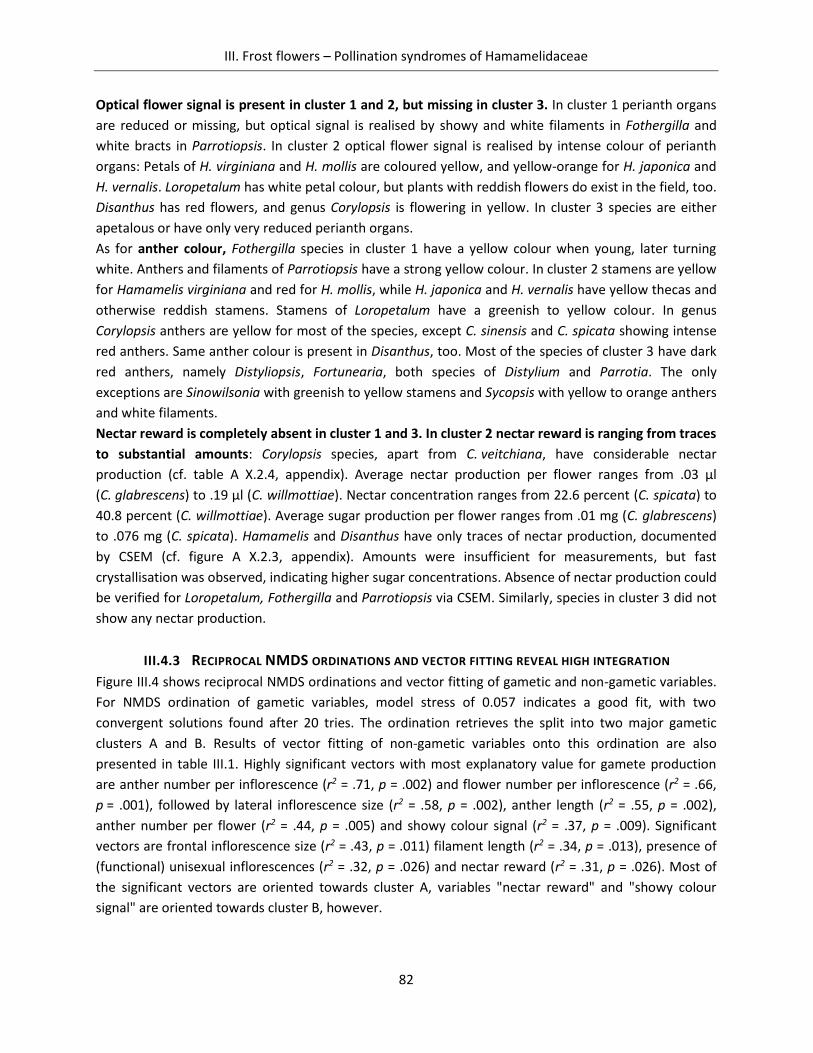
III. Frost flowers – Pollination syndromes of Hamamelidaceae
82
Optical flower signal is present in cluster 1 and 2, but missing in cluster 3. In cluster 1 perianth organs
are reduced or missing, but optical signal is realised by showy and white filaments in Fothergilla and
white bracts in Parrotiopsis. In cluster 2 optical flower signal is realised by intense colour of perianth
organs: Petals of H. virginiana and H. mollis are coloured yellow, and yellow-orange for H. japonica and
H. vernalis. Loropetalum has white petal colour, but plants with reddish flowers do exist in the field, too.
Disanthus has red flowers, and genus Corylopsis is flowering in yellow. In cluster 3 species are either
apetalous or have only very reduced perianth organs.
As for anther colour, Fothergilla species in cluster 1 have a yellow colour when young, later turning
white. Anthers and filaments of Parrotiopsis have a strong yellow colour. In cluster 2 stamens are yellow
for Hamamelis virginiana and red for H. mollis, while H. japonica and H. vernalis have yellow thecas and
otherwise reddish stamens. Stamens of Loropetalum have a greenish to yellow colour. In genus
Corylopsis anthers are yellow for most of the species, except C. sinensis and C. spicata showing intense
red anthers. Same anther colour is present in Disanthus, too. Most of the species of cluster 3 have dark
red anthers, namely Distyliopsis, Fortunearia, both species of Distylium and Parrotia. The only
exceptions are Sinowilsonia with greenish to yellow stamens and Sycopsis with yellow to orange anthers
and white filaments.
Nectar reward is completely absent in cluster 1 and 3. In cluster 2 nectar reward is ranging from traces
to substantial amounts: Corylopsis species, apart from C. veitchiana, have considerable nectar
production (cf. table A X.2.4, appendix). Average nectar production per flower ranges from .03 µl
(C. glabrescens) to .19 µl (C. willmottiae). Nectar concentration ranges from 22.6 percent (C. spicata) to
40.8 percent (C. willmottiae). Average sugar production per flower ranges from .01 mg (C. glabrescens)
to .076 mg (C. spicata). Hamamelis and Disanthus have only traces of nectar production, documented
by CSEM (cf. figure A X.2.3, appendix). Amounts were insufficient for measurements, but fast
crystallisation was observed, indicating higher sugar concentrations. Absence of nectar production could
be verified for Loropetalum, Fothergilla and Parrotiopsis via CSEM. Similarly, species in cluster 3 did not
show any nectar production.
III.4.3 RECIPROCAL NMDS ORDINATIONS AND VECTOR FITTING REVEAL HIGH INTEGRATION
Figure III.4 shows reciprocal NMDS ordinations and vector fitting of gametic and non-gametic variables.
For NMDS ordination of gametic variables, model stress of 0.057 indicates a good fit, with two
convergent solutions found after 20 tries. The ordination retrieves the split into two major gametic
clusters A and B. Results of vector fitting of non-gametic variables onto this ordination are also
presented in table III.1. Highly significant vectors with most explanatory value for gamete production
are anther number per inflorescence (r2 = .71, p = .002) and flower number per inflorescence (r2 = .66,
p = .001), followed by lateral inflorescence size (r2 = .58, p = .002), anther length (r2 = .55, p = .002),
anther number per flower (r2 = .44, p = .005) and showy colour signal (r2 = .37, p = .009). Significant
vectors are frontal inflorescence size (r2 = .43, p = .011) filament length (r2 = .34, p = .013), presence of
(functional) unisexual inflorescences (r2 = .32, p = .026) and nectar reward (r2 = .31, p = .026). Most of
the significant vectors are oriented towards cluster A, variables "nectar reward" and "showy colour
signal" are oriented towards cluster B, however.
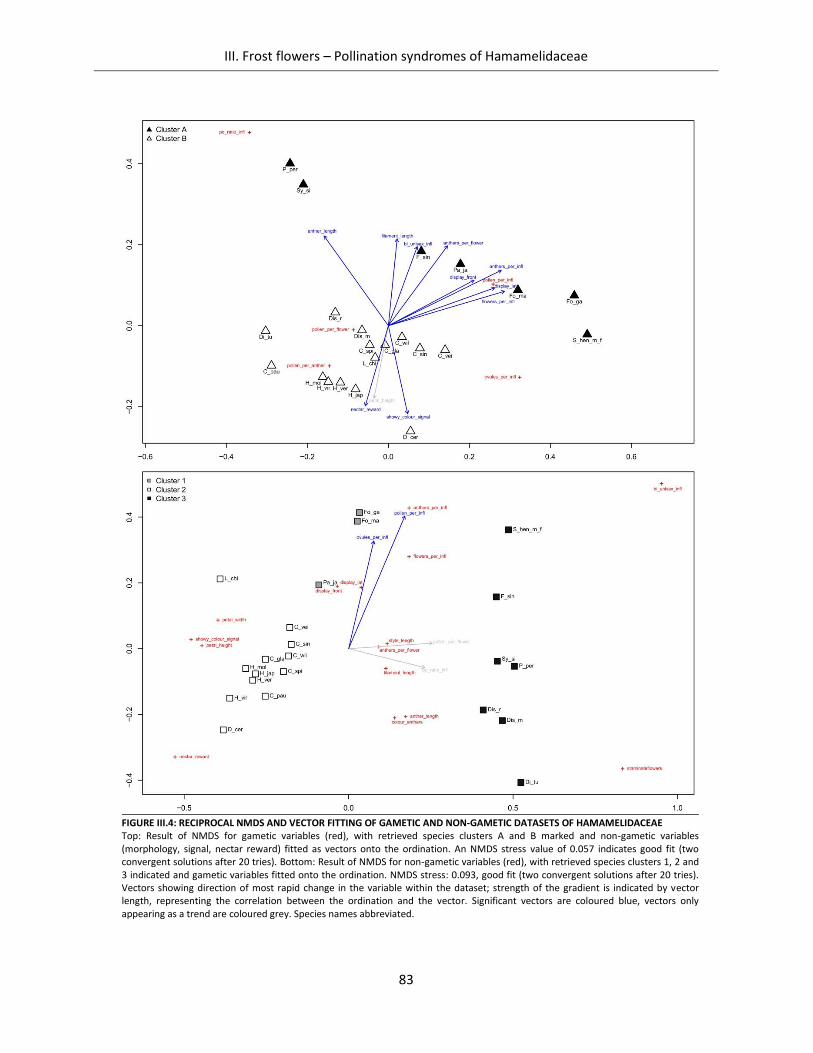
III. Frost flowers – Pollination syndromes of Hamamelidaceae
83
FIGURE III.4: RECIPROCAL NMDS AND VECTOR FITTING OF GAMETIC AND NON-GAMETIC DATASETS OF HAMAMELIDACEAE Top: Result of NMDS for gametic variables (red), with retrieved species clusters A and B marked and non-gametic variables (morphology, signal, nectar reward) fitted as vectors onto the ordination. An NMDS stress value of 0.057 indicates good fit (two convergent solutions after 20 tries). Bottom: Result of NMDS for non-gametic variables (red), with retrieved species clusters 1, 2 and 3 indicated and gametic variables fitted onto the ordination. NMDS stress: 0.093, good fit (two convergent solutions after 20 tries). Vectors showing direction of most rapid change in the variable within the dataset; strength of the gradient is indicated by vector length, representing the correlation between the ordination and the vector. Significant vectors are coloured blue, vectors only appearing as a trend are coloured grey. Species names abbreviated.
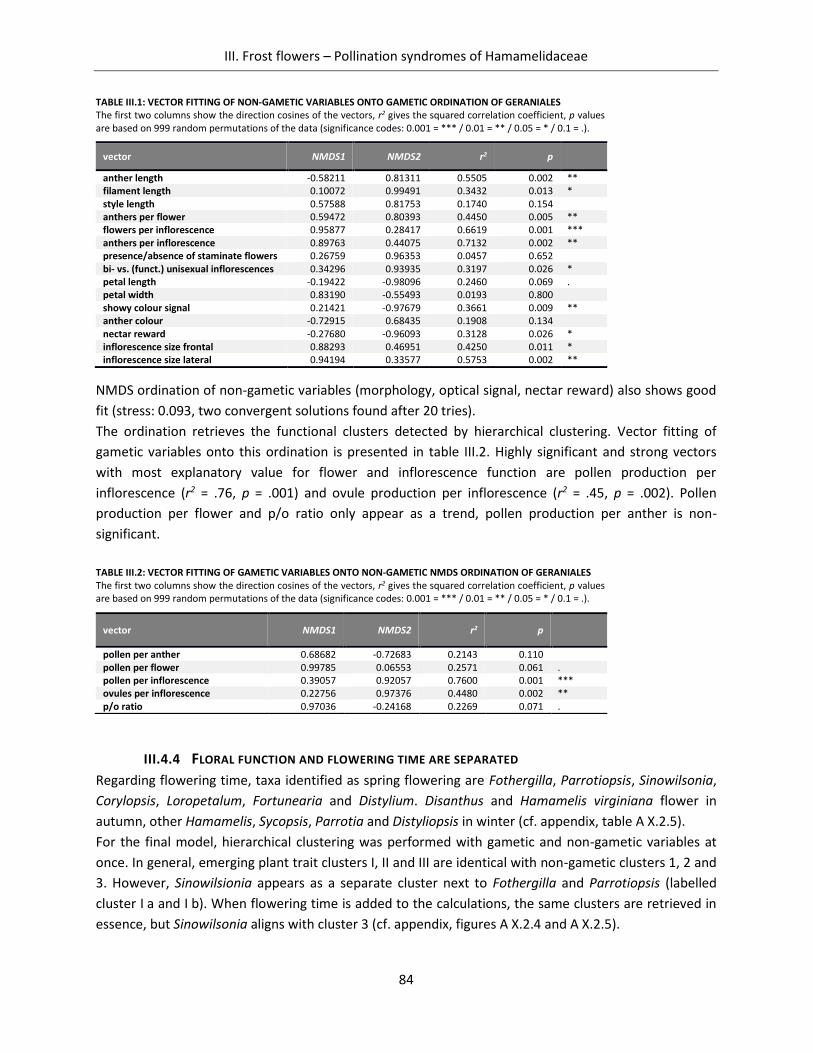
III. Frost flowers – Pollination syndromes of Hamamelidaceae
84
TABLE III.1: VECTOR FITTING OF NON-GAMETIC VARIABLES ONTO GAMETIC ORDINATION OF GERANIALES The first two columns show the direction cosines of the vectors, r2 gives the squared correlation coefficient, p values are based on 999 random permutations of the data (significance codes: 0.001 = *** / 0.01 = ** / 0.05 = * / 0.1 = .).
NMDS ordination of non-gametic variables (morphology, optical signal, nectar reward) also shows good
fit (stress: 0.093, two convergent solutions found after 20 tries).
The ordination retrieves the functional clusters detected by hierarchical clustering. Vector fitting of
gametic variables onto this ordination is presented in table III.2. Highly significant and strong vectors
with most explanatory value for flower and inflorescence function are pollen production per
inflorescence (r2 = .76, p = .001) and ovule production per inflorescence (r2 = .45, p = .002). Pollen
production per flower and p/o ratio only appear as a trend, pollen production per anther is non-
significant.
TABLE III.2: VECTOR FITTING OF GAMETIC VARIABLES ONTO NON-GAMETIC NMDS ORDINATION OF GERANIALES The first two columns show the direction cosines of the vectors, r2 gives the squared correlation coefficient, p values are based on 999 random permutations of the data (significance codes: 0.001 = *** / 0.01 = ** / 0.05 = * / 0.1 = .).
III.4.4 FLORAL FUNCTION AND FLOWERING TIME ARE SEPARATED
Regarding flowering time, taxa identified as spring flowering are Fothergilla, Parrotiopsis, Sinowilsonia,
Corylopsis, Loropetalum, Fortunearia and Distylium. Disanthus and Hamamelis virginiana flower in
autumn, other Hamamelis, Sycopsis, Parrotia and Distyliopsis in winter (cf. appendix, table A X.2.5).
For the final model, hierarchical clustering was performed with gametic and non-gametic variables at
once. In general, emerging plant trait clusters I, II and III are identical with non-gametic clusters 1, 2 and
3. However, Sinowilsionia appears as a separate cluster next to Fothergilla and Parrotiopsis (labelled
cluster I a and I b). When flowering time is added to the calculations, the same clusters are retrieved in
essence, but Sinowilsonia aligns with cluster 3 (cf. appendix, figures A X.2.4 and A X.2.5).
vector NMDS1 NMDS2 r2 p
anther length -0.58211 0.81311 0.5505 0.002 ** filament length 0.10072 0.99491 0.3432 0.013 * style length 0.57588 0.81753 0.1740 0.154 anthers per flower 0.59472 0.80393 0.4450 0.005 ** flowers per inflorescence 0.95877 0.28417 0.6619 0.001 *** anthers per inflorescence 0.89763 0.44075 0.7132 0.002 ** presence/absence of staminate flowers 0.26759 0.96353 0.0457 0.652 bi- vs. (funct.) unisexual inflorescences 0.34296 0.93935 0.3197 0.026 * petal length -0.19422 -0.98096 0.2460 0.069 . petal width 0.83190 -0.55493 0.0193 0.800 showy colour signal 0.21421 -0.97679 0.3661 0.009 ** anther colour -0.72915 0.68435 0.1908 0.134 nectar reward -0.27680 -0.96093 0.3128 0.026 * inflorescence size frontal 0.88293 0.46951 0.4250 0.011 * inflorescence size lateral 0.94194 0.33577 0.5753 0.002 **
vector NMDS1 NMDS2 r2 p
pollen per anther 0.68682 -0.72683 0.2143 0.110 pollen per flower 0.99785 0.06553 0.2571 0.061 . pollen per inflorescence 0.39057 0.92057 0.7600 0.001 *** ovules per inflorescence 0.22756 0.97376 0.4480 0.002 ** p/o ratio 0.97036 -0.24168 0.2269 0.071 .
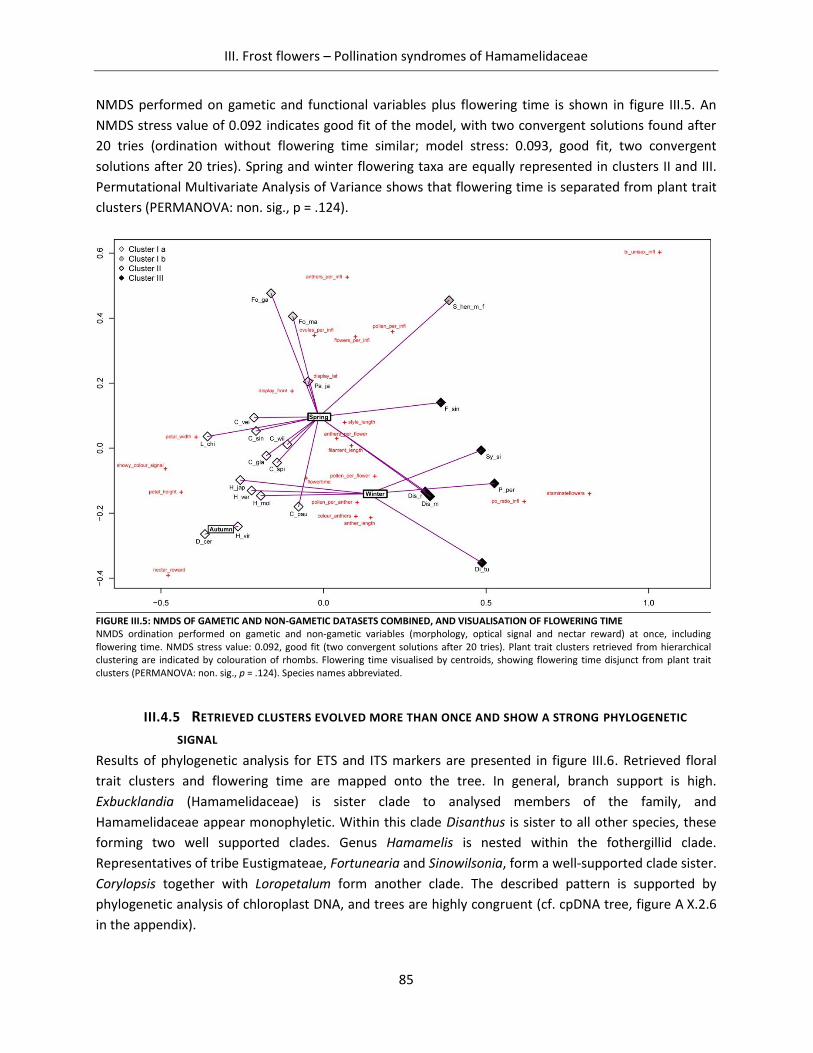
III. Frost flowers – Pollination syndromes of Hamamelidaceae
85
NMDS performed on gametic and functional variables plus flowering time is shown in figure III.5. An
NMDS stress value of 0.092 indicates good fit of the model, with two convergent solutions found after
20 tries (ordination without flowering time similar; model stress: 0.093, good fit, two convergent
solutions after 20 tries). Spring and winter flowering taxa are equally represented in clusters II and III.
Permutational Multivariate Analysis of Variance shows that flowering time is separated from plant trait
clusters (PERMANOVA: non. sig., p = .124).
III.4.5 RETRIEVED CLUSTERS EVOLVED MORE THAN ONCE AND SHOW A STRONG PHYLOGENETIC
SIGNAL
Results of phylogenetic analysis for ETS and ITS markers are presented in figure III.6. Retrieved floral
trait clusters and flowering time are mapped onto the tree. In general, branch support is high.
Exbucklandia (Hamamelidaceae) is sister clade to analysed members of the family, and
Hamamelidaceae appear monophyletic. Within this clade Disanthus is sister to all other species, these
forming two well supported clades. Genus Hamamelis is nested within the fothergillid clade.
Representatives of tribe Eustigmateae, Fortunearia and Sinowilsonia, form a well-supported clade sister.
Corylopsis together with Loropetalum form another clade. The described pattern is supported by
phylogenetic analysis of chloroplast DNA, and trees are highly congruent (cf. cpDNA tree, figure A X.2.6
in the appendix).
FIGURE III.5: NMDS OF GAMETIC AND NON-GAMETIC DATASETS COMBINED, AND VISUALISATION OF FLOWERING TIME NMDS ordination performed on gametic and non-gametic variables (morphology, optical signal and nectar reward) at once, including flowering time. NMDS stress value: 0.092, good fit (two convergent solutions after 20 tries). Plant trait clusters retrieved from hierarchical clustering are indicated by colouration of rhombs. Flowering time visualised by centroids, showing flowering time disjunct from plant trait clusters (PERMANOVA: non. sig., p = .124). Species names abbreviated.
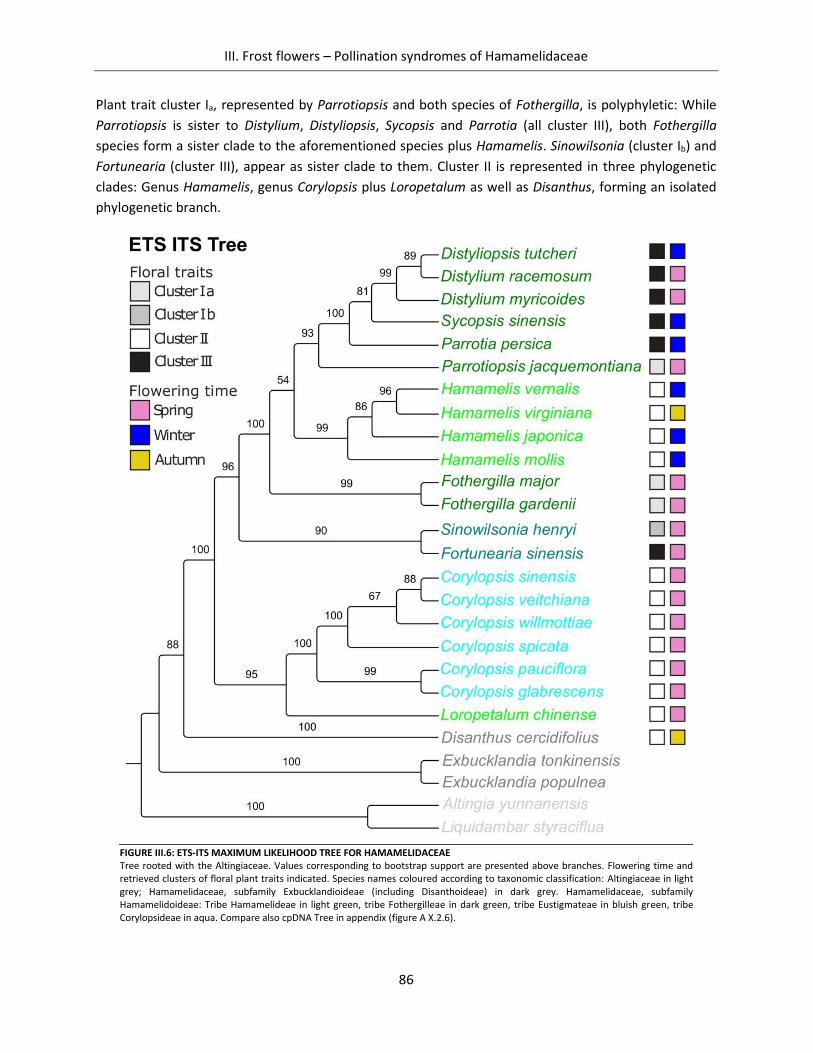
III. Frost flowers – Pollination syndromes of Hamamelidaceae
86
Plant trait cluster Ia, represented by Parrotiopsis and both species of Fothergilla, is polyphyletic: While
Parrotiopsis is sister to Distylium, Distyliopsis, Sycopsis and Parrotia (all cluster III), both Fothergilla
species form a sister clade to the aforementioned species plus Hamamelis. Sinowilsonia (cluster Ib) and
Fortunearia (cluster III), appear as sister clade to them. Cluster II is represented in three phylogenetic
clades: Genus Hamamelis, genus Corylopsis plus Loropetalum as well as Disanthus, forming an isolated
phylogenetic branch.
FIGURE III.6: ETS-ITS MAXIMUM LIKELIHOOD TREE FOR HAMAMELIDACEAE Tree rooted with the Altingiaceae. Values corresponding to bootstrap support are presented above branches. Flowering time and retrieved clusters of floral plant traits indicated. Species names coloured according to taxonomic classification: Altingiaceae in light grey; Hamamelidaceae, subfamily Exbucklandioideae (including Disanthoideae) in dark grey. Hamamelidaceae, subfamily Hamamelidoideae: Tribe Hamamelideae in light green, tribe Fothergilleae in dark green, tribe Eustigmateae in bluish green, tribe Corylopsideae in aqua. Compare also cpDNA Tree in appendix (figure A X.2.6).
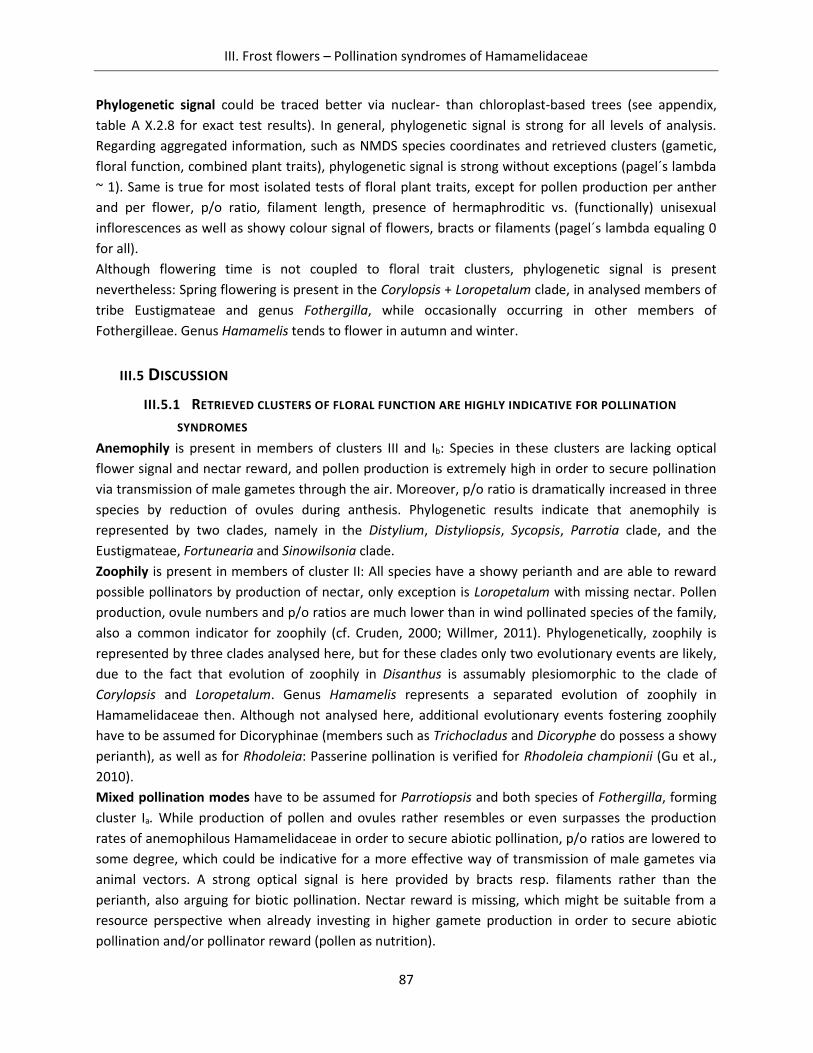
III. Frost flowers – Pollination syndromes of Hamamelidaceae
87
Phylogenetic signal could be traced better via nuclear- than chloroplast-based trees (see appendix,
table A X.2.8 for exact test results). In general, phylogenetic signal is strong for all levels of analysis.
Regarding aggregated information, such as NMDS species coordinates and retrieved clusters (gametic,
floral function, combined plant traits), phylogenetic signal is strong without exceptions (pagel´s lambda
~ 1). Same is true for most isolated tests of floral plant traits, except for pollen production per anther
and per flower, p/o ratio, filament length, presence of hermaphroditic vs. (functionally) unisexual
inflorescences as well as showy colour signal of flowers, bracts or filaments (pagel´s lambda equaling 0
for all).
Although flowering time is not coupled to floral trait clusters, phylogenetic signal is present
nevertheless: Spring flowering is present in the Corylopsis + Loropetalum clade, in analysed members of
tribe Eustigmateae and genus Fothergilla, while occasionally occurring in other members of
Fothergilleae. Genus Hamamelis tends to flower in autumn and winter.
III.5 DISCUSSION
III.5.1 RETRIEVED CLUSTERS OF FLORAL FUNCTION ARE HIGHLY INDICATIVE FOR POLLINATION
SYNDROMES
Anemophily is present in members of clusters III and Ib: Species in these clusters are lacking optical
flower signal and nectar reward, and pollen production is extremely high in order to secure pollination
via transmission of male gametes through the air. Moreover, p/o ratio is dramatically increased in three
species by reduction of ovules during anthesis. Phylogenetic results indicate that anemophily is
represented by two clades, namely in the Distylium, Distyliopsis, Sycopsis, Parrotia clade, and the
Eustigmateae, Fortunearia and Sinowilsonia clade.
Zoophily is present in members of cluster II: All species have a showy perianth and are able to reward
possible pollinators by production of nectar, only exception is Loropetalum with missing nectar. Pollen
production, ovule numbers and p/o ratios are much lower than in wind pollinated species of the family,
also a common indicator for zoophily (cf. Cruden, 2000; Willmer, 2011). Phylogenetically, zoophily is
represented by three clades analysed here, but for these clades only two evolutionary events are likely,
due to the fact that evolution of zoophily in Disanthus is assumably plesiomorphic to the clade of
Corylopsis and Loropetalum. Genus Hamamelis represents a separated evolution of zoophily in
Hamamelidaceae then. Although not analysed here, additional evolutionary events fostering zoophily
have to be assumed for Dicoryphinae (members such as Trichocladus and Dicoryphe do possess a showy
perianth), as well as for Rhodoleia: Passerine pollination is verified for Rhodoleia championii (Gu et al.,
2010).
Mixed pollination modes have to be assumed for Parrotiopsis and both species of Fothergilla, forming
cluster Ia. While production of pollen and ovules rather resembles or even surpasses the production
rates of anemophilous Hamamelidaceae in order to secure abiotic pollination, p/o ratios are lowered to
some degree, which could be indicative for a more effective way of transmission of male gametes via
animal vectors. A strong optical signal is here provided by bracts resp. filaments rather than the
perianth, also arguing for biotic pollination. Nectar reward is missing, which might be suitable from a
resource perspective when already investing in higher gamete production in order to secure abiotic
pollination and/or pollinator reward (pollen as nutrition).
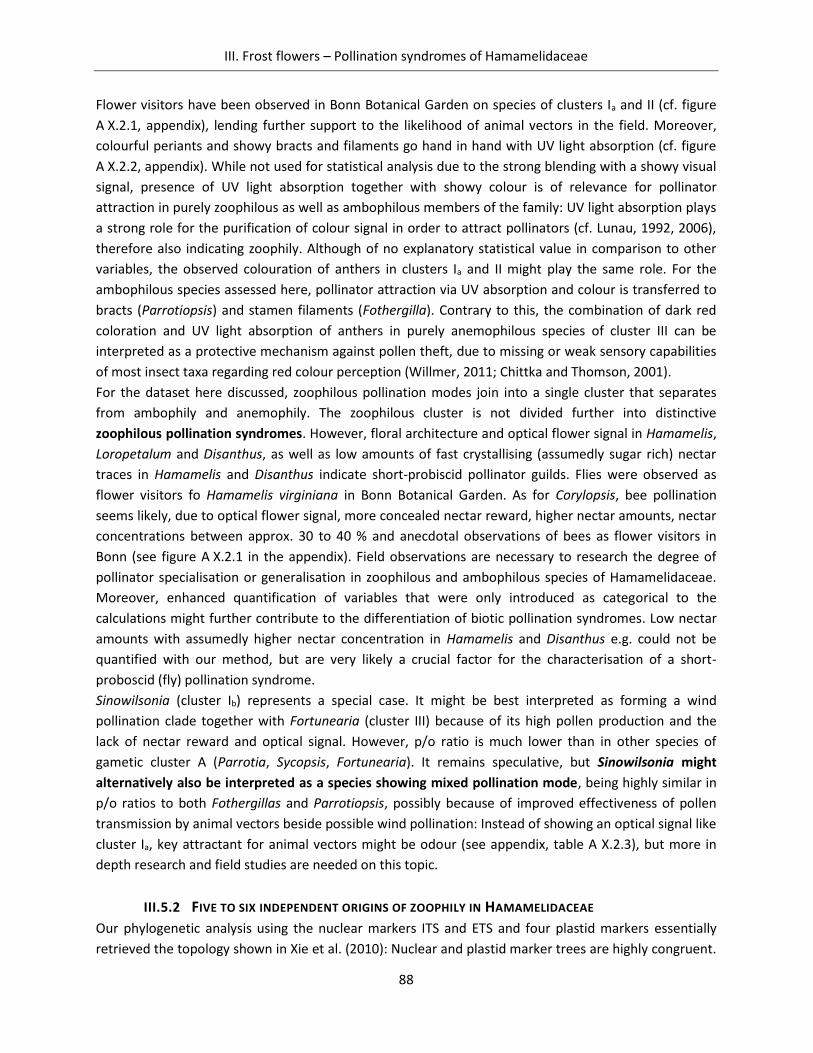
III. Frost flowers – Pollination syndromes of Hamamelidaceae
88
Flower visitors have been observed in Bonn Botanical Garden on species of clusters Ia and II (cf. figure
A X.2.1, appendix), lending further support to the likelihood of animal vectors in the field. Moreover,
colourful periants and showy bracts and filaments go hand in hand with UV light absorption (cf. figure
A X.2.2, appendix). While not used for statistical analysis due to the strong blending with a showy visual
signal, presence of UV light absorption together with showy colour is of relevance for pollinator
attraction in purely zoophilous as well as ambophilous members of the family: UV light absorption plays
a strong role for the purification of colour signal in order to attract pollinators (cf. Lunau, 1992, 2006),
therefore also indicating zoophily. Although of no explanatory statistical value in comparison to other
variables, the observed colouration of anthers in clusters Ia and II might play the same role. For the
ambophilous species assessed here, pollinator attraction via UV absorption and colour is transferred to
bracts (Parrotiopsis) and stamen filaments (Fothergilla). Contrary to this, the combination of dark red
coloration and UV light absorption of anthers in purely anemophilous species of cluster III can be
interpreted as a protective mechanism against pollen theft, due to missing or weak sensory capabilities
of most insect taxa regarding red colour perception (Willmer, 2011; Chittka and Thomson, 2001).
For the dataset here discussed, zoophilous pollination modes join into a single cluster that separates
from ambophily and anemophily. The zoophilous cluster is not divided further into distinctive
zoophilous pollination syndromes. However, floral architecture and optical flower signal in Hamamelis,
Loropetalum and Disanthus, as well as low amounts of fast crystallising (assumedly sugar rich) nectar
traces in Hamamelis and Disanthus indicate short-probiscid pollinator guilds. Flies were observed as
flower visitors fo Hamamelis virginiana in Bonn Botanical Garden. As for Corylopsis, bee pollination
seems likely, due to optical flower signal, more concealed nectar reward, higher nectar amounts, nectar
concentrations between approx. 30 to 40 % and anecdotal observations of bees as flower visitors in
Bonn (see figure A X.2.1 in the appendix). Field observations are necessary to research the degree of
pollinator specialisation or generalisation in zoophilous and ambophilous species of Hamamelidaceae.
Moreover, enhanced quantification of variables that were only introduced as categorical to the
calculations might further contribute to the differentiation of biotic pollination syndromes. Low nectar
amounts with assumedly higher nectar concentration in Hamamelis and Disanthus e.g. could not be
quantified with our method, but are very likely a crucial factor for the characterisation of a short-
proboscid (fly) pollination syndrome.
Sinowilsonia (cluster Ib) represents a special case. It might be best interpreted as forming a wind
pollination clade together with Fortunearia (cluster III) because of its high pollen production and the
lack of nectar reward and optical signal. However, p/o ratio is much lower than in other species of
gametic cluster A (Parrotia, Sycopsis, Fortunearia). It remains speculative, but Sinowilsonia might
alternatively also be interpreted as a species showing mixed pollination mode, being highly similar in
p/o ratios to both Fothergillas and Parrotiopsis, possibly because of improved effectiveness of pollen
transmission by animal vectors beside possible wind pollination: Instead of showing an optical signal like
cluster Ia, key attractant for animal vectors might be odour (see appendix, table A X.2.3), but more in
depth research and field studies are needed on this topic.
III.5.2 FIVE TO SIX INDEPENDENT ORIGINS OF ZOOPHILY IN HAMAMELIDACEAE
Our phylogenetic analysis using the nuclear markers ITS and ETS and four plastid markers essentially
retrieved the topology shown in Xie et al. (2010): Nuclear and plastid marker trees are highly congruent.
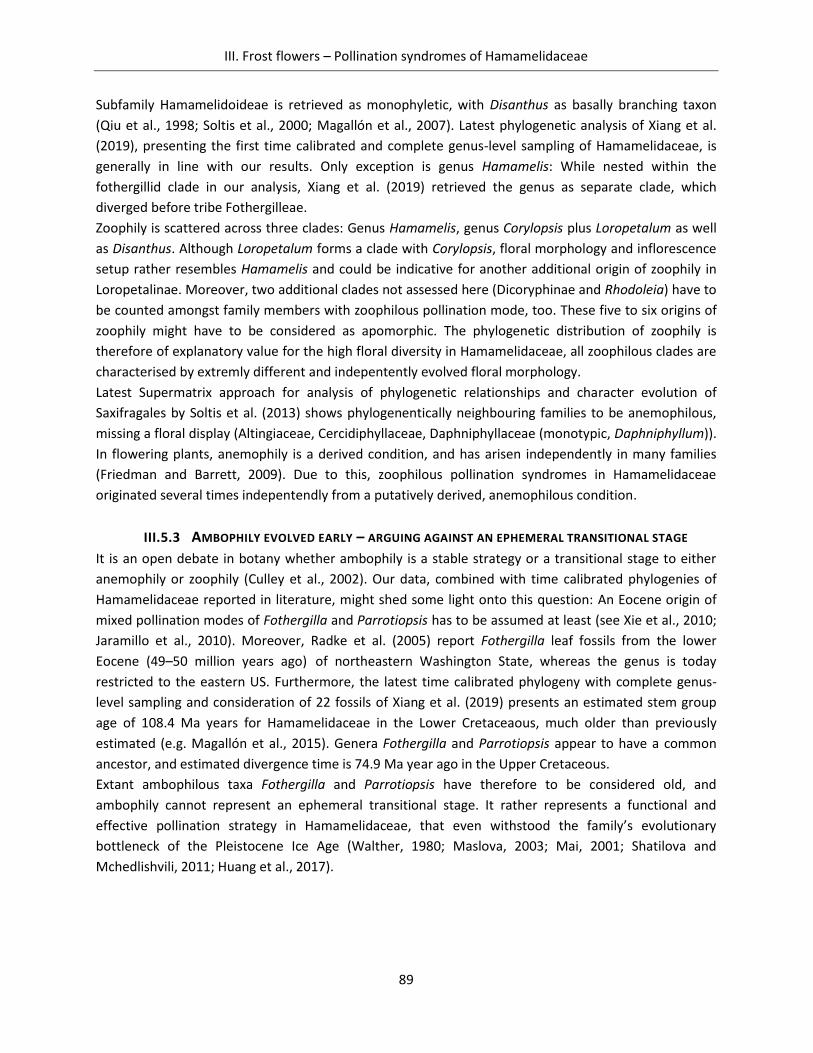
III. Frost flowers – Pollination syndromes of Hamamelidaceae
89
Subfamily Hamamelidoideae is retrieved as monophyletic, with Disanthus as basally branching taxon
(Qiu et al., 1998; Soltis et al., 2000; Magallón et al., 2007). Latest phylogenetic analysis of Xiang et al.
(2019), presenting the first time calibrated and complete genus-level sampling of Hamamelidaceae, is
generally in line with our results. Only exception is genus Hamamelis: While nested within the
fothergillid clade in our analysis, Xiang et al. (2019) retrieved the genus as separate clade, which
diverged before tribe Fothergilleae.
Zoophily is scattered across three clades: Genus Hamamelis, genus Corylopsis plus Loropetalum as well
as Disanthus. Although Loropetalum forms a clade with Corylopsis, floral morphology and inflorescence
setup rather resembles Hamamelis and could be indicative for another additional origin of zoophily in
Loropetalinae. Moreover, two additional clades not assessed here (Dicoryphinae and Rhodoleia) have to
be counted amongst family members with zoophilous pollination mode, too. These five to six origins of
zoophily might have to be considered as apomorphic. The phylogenetic distribution of zoophily is
therefore of explanatory value for the high floral diversity in Hamamelidaceae, all zoophilous clades are
characterised by extremly different and indepentently evolved floral morphology.
Latest Supermatrix approach for analysis of phylogenetic relationships and character evolution of
Saxifragales by Soltis et al. (2013) shows phylogenentically neighbouring families to be anemophilous,
missing a floral display (Altingiaceae, Cercidiphyllaceae, Daphniphyllaceae (monotypic, Daphniphyllum)).
In flowering plants, anemophily is a derived condition, and has arisen independently in many families
(Friedman and Barrett, 2009). Due to this, zoophilous pollination syndromes in Hamamelidaceae
originated several times indepentendly from a putatively derived, anemophilous condition.
III.5.3 AMBOPHILY EVOLVED EARLY – ARGUING AGAINST AN EPHEMERAL TRANSITIONAL STAGE
It is an open debate in botany whether ambophily is a stable strategy or a transitional stage to either
anemophily or zoophily (Culley et al., 2002). Our data, combined with time calibrated phylogenies of
Hamamelidaceae reported in literature, might shed some light onto this question: An Eocene origin of
mixed pollination modes of Fothergilla and Parrotiopsis has to be assumed at least (see Xie et al., 2010;
Jaramillo et al., 2010). Moreover, Radke et al. (2005) report Fothergilla leaf fossils from the lower
Eocene (49–50 million years ago) of northeastern Washington State, whereas the genus is today
restricted to the eastern US. Furthermore, the latest time calibrated phylogeny with complete genus-
level sampling and consideration of 22 fossils of Xiang et al. (2019) presents an estimated stem group
age of 108.4 Ma years for Hamamelidaceae in the Lower Cretaceaous, much older than previously
estimated (e.g. Magallón et al., 2015). Genera Fothergilla and Parrotiopsis appear to have a common
ancestor, and estimated divergence time is 74.9 Ma year ago in the Upper Cretaceous.
Extant ambophilous taxa Fothergilla and Parrotiopsis have therefore to be considered old, and
ambophily cannot represent an ephemeral transitional stage. It rather represents a functional and
effective pollination strategy in Hamamelidaceae, that even withstood the family’s evolutionary
bottleneck of the Pleistocene Ice Age (Walther, 1980; Maslova, 2003; Mai, 2001; Shatilova and
Mchedlishvili, 2011; Huang et al., 2017).
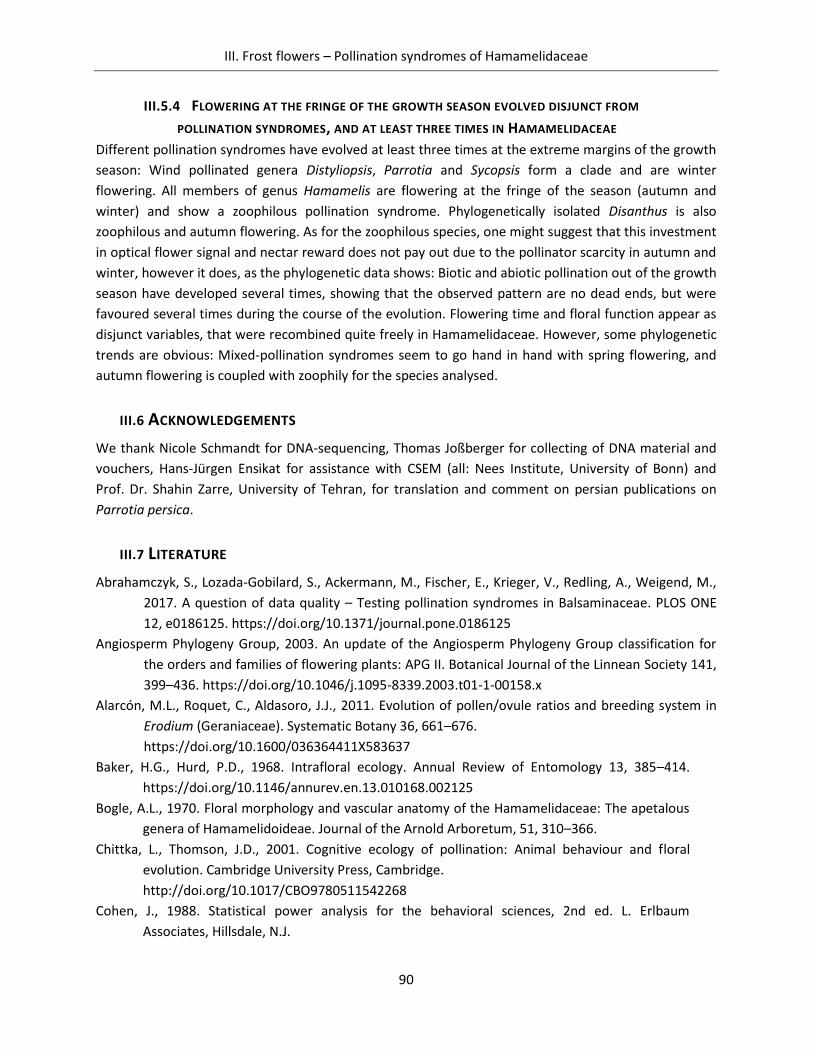
III. Frost flowers – Pollination syndromes of Hamamelidaceae
90
III.5.4 FLOWERING AT THE FRINGE OF THE GROWTH SEASON EVOLVED DISJUNCT FROM
POLLINATION SYNDROMES, AND AT LEAST THREE TIMES IN HAMAMELIDACEAE
Different pollination syndromes have evolved at least three times at the extreme margins of the growth
season: Wind pollinated genera Distyliopsis, Parrotia and Sycopsis form a clade and are winter
flowering. All members of genus Hamamelis are flowering at the fringe of the season (autumn and
winter) and show a zoophilous pollination syndrome. Phylogenetically isolated Disanthus is also
zoophilous and autumn flowering. As for the zoophilous species, one might suggest that this investment
in optical flower signal and nectar reward does not pay out due to the pollinator scarcity in autumn and
winter, however it does, as the phylogenetic data shows: Biotic and abiotic pollination out of the growth
season have developed several times, showing that the observed pattern are no dead ends, but were
favoured several times during the course of the evolution. Flowering time and floral function appear as
disjunct variables, that were recombined quite freely in Hamamelidaceae. However, some phylogenetic
trends are obvious: Mixed-pollination syndromes seem to go hand in hand with spring flowering, and
autumn flowering is coupled with zoophily for the species analysed.
III.6 ACKNOWLEDGEMENTS
We thank Nicole Schmandt for DNA-sequencing, Thomas Joßberger for collecting of DNA material and
vouchers, Hans-Jürgen Ensikat for assistance with CSEM (all: Nees Institute, University of Bonn) and
Prof. Dr. Shahin Zarre, University of Tehran, for translation and comment on persian publications on
Parrotia persica.
III.7 LITERATURE
Abrahamczyk, S., Lozada-Gobilard, S., Ackermann, M., Fischer, E., Krieger, V., Redling, A., Weigend, M.,
2017. A question of data quality – Testing pollination syndromes in Balsaminaceae. PLOS ONE
12, e0186125. https://doi.org/10.1371/journal.pone.0186125
Angiosperm Phylogeny Group, 2003. An update of the Angiosperm Phylogeny Group classification for
the orders and families of flowering plants: APG II. Botanical Journal of the Linnean Society 141,
399–436. https://doi.org/10.1046/j.1095-8339.2003.t01-1-00158.x
Alarcón, M.L., Roquet, C., Aldasoro, J.J., 2011. Evolution of pollen/ovule ratios and breeding system in
Erodium (Geraniaceae). Systematic Botany 36, 661–676.
https://doi.org/10.1600/036364411X583637
Baker, H.G., Hurd, P.D., 1968. Intrafloral ecology. Annual Review of Entomology 13, 385–414.
https://doi.org/10.1146/annurev.en.13.010168.002125
Bogle, A.L., 1970. Floral morphology and vascular anatomy of the Hamamelidaceae: The apetalous
genera of Hamamelidoideae. Journal of the Arnold Arboretum, 51, 310–366.
Chittka, L., Thomson, J.D., 2001. Cognitive ecology of pollination: Animal behaviour and floral
evolution. Cambridge University Press, Cambridge.
http://doi.org/10.1017/CBO9780511542268
Cohen, J., 1988. Statistical power analysis for the behavioral sciences, 2nd ed. L. Erlbaum
Associates, Hillsdale, N.J.
III. Frost flowers – Pollination syndromes of Hamamelidaceae
91
Cruden, R.W., 1977. Pollen-ovule ratios: A conservative indicator of breeding systems in flowering
plants. Evolution 31, 32–46. https://doi.org/10.2307/2407542
Cruden, R.W., 2000. Pollen grains: Why so many? Plant Systematics and Evolution 222, 143–165.
https://doi.org/10.1007/BF00984100
Cruden, R.W., Jensen, K.G., 1979. Viscin threads, pollination efficiency and low pollen-ovule ratios.
American Journal of Botany 66, 875–879. https://doi:10.1002/j.1537-2197.1979.tb06295.x
Cruden, R.W., Lyon, D.L., 1985. Correlations among stigma depth, style length, and pollen grain size: Do
they reflect function or phylogeny? Botanical Gazette 146, 143–149.
https://doi.org/10.1086/337509
Cruden, R.W., Miller-Ward, S., 1981. Pollen-ovule ratio, pollen size, and the ratio of stigmatic area to the
pollen-bearing area of the pollinator: An hypothesis. Evolution 35, 964–974.
https://doi.org/10.2307/2407867
Culley, T., Weller, S., Sakai, A., 2002. The evolution of wind pollination in angiosperms. Trends in Ecology
& Evolution 17, 361–369. https://doi.org/10.1016/S0169-5347(02)02540-5
Dellinger, A.S., Chartier, M., Fernández‐Fernández, D., Penneys, D.S., Alvear, M., Almeda, F.,
Michelangeli, F.A., Staedler, Y., Armbruster, W.S., Schönenberger, J., 2018. Beyond buzz‐
pollination – departures from an adaptive plateau lead to new pollination syndromes. New
Phytologist 221, 1136–1149. https://doi.org/10.1111/nph.15468
Delpino, F., 1868–1875. Ulteriori osservazione sulla dicogamia nel regno vegetale. Atti della Societa
Italiana di Scienze Naturali Milano, Vols. 1 and 2.
Doyle, J.J., Dickson, E.E., 1987. Preservation of plant samples for DNA restriction endonuclease
analysis. Taxon 36, 715–722. https://doi.org/10.2307/1221122
Endress, P.K., 1977. Evolutionary trends in the Hamamelidales-Fagales-group. In: Kubitzki, K., ed.
Flowering plants: Evolution and classification of higher categories – Symposium, Hamburg,
September 8–12, 1976, 321–347. Springer, Vienna. https://doi.org/10.1007/978-3-7091-
7076-2_20
Endress, P.K., 1989 a. A suprageneric taxonomic classification of the Hamamelidaceae. Taxon 38,
371–376. https://doi.org/10.2307/1222267
Endress, P.K., 1989 b. Aspects of evolutionary differentiation of the Hamamelidaceae and lower
Hamamelididae. Plant Systematics and Evolution 162, 193–211.
Endress, P.K., 1993. Hamamelidaceae. In: Kubitzki, K., J. G. Rohwer, J.G., Bittrich, V., eds. The
families and genera of vascular plants. Vol. II: Flowering plants, 322–331. Springer, Berlin.
Fægri, K., van der Pijl, L., 1979. The principles of pollination ecology. 3rd ed. Pergamon, Oxford.
Felsenstein, J., 1981. Evolutionary trees from DNA sequences: A maximum likelihood approach. Journal
of molecular evolution 17, 368–376. https://doi.org/10.1007/BF01734359
Friedman, J., Barrett, S., 2009. Wind of change: New insights on the ecology and evolution of pollination
and mating in wind-pollinated plants. Annals of Botany 103, 1515–1527.
https://doi.org/10.1093/aob/mcp035
Galetto, L., Bernardello, G., 2005. Nectar. In: Dafni, A., Kevan, P.G., Husband, B.C., eds. Practical
pollination biology. Enviroquest Ltd., Cambridge, Ontario. 261–313.
III. Frost flowers – Pollination syndromes of Hamamelidaceae
92
Gómez, J.M., Bosch, J., Perfectti, F., Fernandez, J.D., Abdelaziz, M., Camacho, J.P.M., 2008. Association
between floral traits and rewards in Erysimum mediohispanicum (Brassicaceae). Annals of
Botany 101, 1413–1420. https://doi.org/10.1093/aob/mcn053
Gu, L., Luo, Z., Zhang, D., Renner, S.S., 2010. Passerine pollination of Rhodoleia championii
(Hamamelidaceae) in subtropical China. Biotropica 42, 336–341.
https://doi.org/10.1111/j.1744-7429.2009.00585.x
Harmon, L.J., Weir, J.T., Brock, C.D., Glor, R.E., Challenger, W., 2008. GEIGER: investigating evolutionary
radiations. Bioinformatics 24, 129–131. https://doi.org/10.1093/bioinformatics/btm538
Huang, J., Shi, G.-L., Su, T., Zhou, Z.-K., 2017. Miocene Exbucklandia (Hamamelidaceae) from Yunnan,
China and its biogeographic and palaeoecologic implications. Review of Palaeobotany and
Palynology 244, 96–106. https://doi.org/10.1016/j.revpalbo.2016.10.004
Ibañez, A.C., Moré, M., Salazar, G., Leiva, S., Barboza, G.E., Cocucci, A.A., 2019. Crescendo, diminuendo
and subito of the trumpets: winds of change in the concerted evolution between flowers and
pollinators in Salpichroa (Solanaceae). Molecular Phylogenetics and Evolution 132, 90–99.
https://doi.org/10.1016/j.ympev.2018.11.020
Jaramillo, C., Ochoa, D., Contreras, L., Pagani, M., Carvajal-Ortiz, H., Pratt, L.M., Krishnan, S., Cardona, A.,
Romero, M., Quiroz, L., Rodriguez, G., Rueda, M.J., de la Parra, F., Moron, S., Green, W., Bayona,
G., Montes, C., Quintero, O., Ramirez, R., Mora, G., Schouten, S., Bermudez, H., Navarrete, R.,
Parra, F., Alvaran, M., Osorno, J., Crowley, J.L., Valencia, V., Vervoort, J., 2010. Effects of rapid
global warming at the Paleocene-Eocene boundary on neotropical vegetation. Science 330, 957–
961. https://doi.org/10.1126/science.1193833
Johnson, S.D., 2010. The pollination niche and its role in the diversification and maintenance of the
southern African flora. Philosophical Transactions of the Royal Society B: Biological Sciences 365,
499–516. https://doi.org/10.1098/rstb.2009.0243
Johnson, S.D., Wester, P., 2017. Stefan Vogel’s analysis of floral syndromes in the South African flora: An
appraisal based on 60 years of pollination studies. Flora 232, 200–206.
https://doi.org/10.1016/j.flora.2017.02.005
Katoh, K., Misawa, K., Kuma, K., Miyata, T., 2002. MAFFT: a novel method for rapid multiple sequence
alignment based on fast Fourier transform. Nucleic Acids Research 30, 3059–3066.
https://doi.org/10.1093/nar/gkf436
Kirk, W.D.J., 1993. Interspecific size and number variation in pollen grains and seeds. Botanical Journal
of the Linnean Society 49, 239–248. https://doi.org/10.1111/j.1095-8312.1993.tb00903.x
López, J., Rodríguez-Riaño, T., Ortega-Olivencia, A., Antonio Devesa, J., Ruiz, T., 1999. Pollination
mechanisms and pollen-ovule ratios in some Genisteae (Fabaceae) from southwestern Europe.
Plant Systematics and Evolution 216, 23–47. https://doi.org/10.1007/BF00985099
Lozada‐Gobilard, S., Weigend, M., Fischer, E., Janssens, S.B., Ackermann, M., Abrahamczyk, S., 2019.
Breeding systems in Balsaminaceae in relation to pollen/ovule ratio, pollination syndromes, life
history and climate zone. Plant Biology 21, 157–166. https://doi.org/10.1111/plb.12905
Lunau, K., 2006. Stamens and mimic stamens as components of floral colour patterns. Botanische
Jahrbücher 127, 13–41. https://doi.org/10.1127/0006-8152/2006/0127-0013
Lunau, K., 1992. A new interpretation of flower guide colouration: Absorption of ultraviolet light
enhances colour saturation. Plant Systematics and Evolution 183, 51–65.
III. Frost flowers – Pollination syndromes of Hamamelidaceae
93
https://doi.org/10.1007/BF00937735
Mai, D.H., 2001. The fossils of Rhodoleia Champion (Hamamelidaceae) in Europe. Acta Paleobotanica
41, 161–175.
Magallón, S., 2007. From fossils to molecules: Phylogeny and the Core Eudicot Floral Groundplan in
Hamamelidoideae (Hamamelidaceae, Saxifragales). Systematic Botany 32, 317–347.
https://doi.org/10.1600/036364407781179617
Magallón, S., Gómez‐Acevedo, S., Sánchez‐Reyes, L. L., Hernández‐Hernández, T., 2015. A meta‐
calibrated timetree documents the early rise of flowering plant phylogenetic diversity. New
Phytologist 207, 437–453. https ://doi.org/10.1111/nph.13264
Maslova, N.P., 2003. Extinct and extant Platanaceae and Hamamelidaceae: Morphology, systematics,
and phylogeny. Paleontological Journal 37, 467–590.
McCune, B., Grace, J.B., Urban, D.L., 2002. Analysis of ecological communities. MjM Software Design.
Michalski, S.G., Durka, W., 2009. Pollination mode and life form strongly affect the relation between
mating system and pollen to ovule ratios. New Phytologist 183, 470–479.
https://doi.org/10.1111/j.1469-8137.2009.02861.x
Miller, M., Pfeiffer, W.T., Schwartz, T., 2010. Creating the CIPRES Science Gateway for inference of large
phylogenetic trees. In: Proceedings of the Gateway Computing Environments Workshop: 14 Nov
2010, 1–8. https://doi.org/10.1109/GCE.2010.5676129
Mione, T. and Bogle, A.L., 1990. Comparative ontogeny of the inflorescence and flower of Hamamelis
virginiana and Loropetalum chinense (Hamamelidaceae). American Journal of Botany 77, 77–91.
Molina, R.T., Rodríguez, A.M., Palaciso, I.S., López, F.G., 1996. Pollen production in anemophilous trees.
Grana 35, 38–46. https://doi.org/10.1080/00173139609430499
Morley, B., Chao, J.M., 1977. A review of Corylopsis (Hamamelidaceae). Journal of the Arnold Arboretum
58, 382–415.
Neuendorf, J., 2013. Das Urinsediment: Mikroskopie-Präanalytik-Auswertung und Befundung. Springer-
Verlag, Berlin, Heidelberg. https://doi.org/10.1007/978-3-642-37810-2
Newman, E., Manning, J., Anderson, B., 2014. Matching floral and pollinator traits through guild
convergence and pollinator ecotype formation. Annals of Botany 113, 373–384.
https://doi.org/10.1093/aob/mct203
Oksanen, J., Blanchet, F.G., Kindt, R., Legendre, P., Minchin, P., O’Hara, R., Simpson, G., Solymos, P.,
Stevens, M., Wagner, H., 2013. Vegan: Community ecology package. R package version. 2.0-10.
CRAN.
Ollerton, J., Alarcón, R., Waser, N.M., Price, M.V., Watts, S., Cranmer, L., Hingston, A., Peter, C.I.,
Rotenberry, J., 2009. A global test of the pollination syndrome hypothesis. Annals of Botany
103, 1471–1480. https://doi.org/10.1093/aob/mcp031
Pagel, M., 1999. Inferring the historical patterns of biological evolution. Nature 401, 877–884.
https://doi.org/10.1038/44766
Qiu, Y., Chase, M., Hoot, S., & Conti, E., 1998. Phylogenetics of the Hamamelidae and their allies:
Parsimony analyses of nucleotide sequences of the plastid gene rbcL. International Journal of
Plant Sciences 159, 891–905. https://doi.org/10.1086/314084
Radtke, M.G., Pigg, K.B., Wehr, W.C., 2005. Fossil Corylopsis and Fothergilla leaves (Hamamelidaceae)
from the Lower Eocene flora of Republic, Washington, U.S.A., and their evolutionary and
III. Frost flowers – Pollination syndromes of Hamamelidaceae
94
biogeographic significance. International Journal of Plant Sciences 166, 347–356.
https://doi.org/10.1086/427483
Rosas-Guerrero, V., Aguilar, R., Martén-Rodríguez, S., Ashworth, L., Lopezaraiza-Mikel, M., Bastida, J.M.,
Quesada, M., 2014. A quantitative review of pollination syndromes: do floral traits predict
effective pollinators? Ecology Letters 17, 388–400. https://doi.org/10.1111/ele.12224
Shatilova, I., Mchedlishvili, N., 2011. The genus Disanthus (Hamamelidaceae) from Sarmatian and
Meotian deposits of Georgia. Bulletin of the Georgian National Academy of Sciences 5, 139–142.
Small, E., 1988. Pollen-ovule patterns in tribe Trifolieae (Leguminosae). Plant Systematics and Evolution
160, 195–205. https://doi.org/10.1007/BF00936047
Soltis, D.E., Soltis, P.S., Chase, M.W., Mort, M.E., Albach, D.C., Zanis, M., Savolainen, V., Hahn, W.H.,
Hoot, S.B., Fay, M.F., Axtell, M., Swensen, S.M., Prince, L.M., Kress, W.J., Nixon, K.C., Farris, J.S.,
2000. Angiosperm phylogeny inferred from 18S rDNA, rbcL and atpB sequences. Botanical
Journal of the Linnean Society 133, 381-461.
Soltis, D.E., Mort, M.E., Latvis, M., Mavrodiev, E.V., O’Meara, B.C., Soltis, P.S., Burleigh, J.G., Rubio de
Casas, R., 2013. Phylogenetic relationships and character evolution analysis of Saxifragales using
a supermatrix approach. American Journal of Botany 100, 916–929.
https://doi.org/10.3732/ajb.1300044
Stamatakis, A., 2014. RAxML version 8: a tool for phylogenetic analysis and post-analysis of large
phylogenies. Bioinformatics 30, 1312–1313. https://doi.org/10.1093/bioinformatics/btu033
Takhtajan, A.L., 1997. Diversity and classification of flowering plants. Columbia University Press, New
York.
van der Niet, T., Johnson, S.D., 2012. Phylogenetic evidence for pollinator-driven diversification of
angiosperms. Trends in Ecology & Evolution 27, 353–361.
https://doi.org/10.1016/j.tree.2012.02.002
van der Pijl, L., 1961. Ecological aspects of flower evolution. II. Zoophilous flower classes. Evolution 15,
44–59. https://doi.org/10.2307/2405842
Vogel, S., 1954. Blütenbiologische Typen als Elemente der Sippengliederung, dargestellt anhand der
Flora Südafrikas. Botanische Studien 1. Fischer, Jena.
Walther, H., 1980. Matudaea menzelii Walther, ein neues neotropisches Geoelement in der Tertiärflora
Mitteleuropas. Flora 170, 498–516. https://doi.org/10.1016/S0367-2530(17)31236-7
Waser, N.M., Chittka, L., Price, M.V., Williams, N.M., Ollerton, J., 1996. Generalization in pollination
systems, and why it matters. Ecology 77, 1043–1060. https://doi.org/10.2307/2265575
Willmer, P.G., 2011. Pollination and floral ecology. Princeton University Press, Princeton, N.J.
Xiang, X., Xiang, K., Ortiz, R.D.C., Jabbour, F., Wang, W., 2019. Integrating palaeontological and
molecular data uncovers multiple ancient and recent dispersals in the pantropical
Hamamelidaceae. Journal of Biogeography 46, 2622–2631. https://doi.org/10.1111/jbi.13690
Xie, L., Yi, T.-S., Li, R., Li, D.-Z., Wen, J., 2010. Evolution and biogeographic diversification of the witch-
hazel genus (Hamamelis L., Hamamelidaceae) in the northern hemisphere. Molecular
Phylogenetics and Evolution 56, 675–689. https://doi.org/10.1016/j.ympev.2010.02.018
IV. No indication of a pollinator-prey conflict in floral functional traits of carnivorous plants
95
IV. NO INDICATION OF A POLLINATOR-PREY CONFLICT IN FLORAL FUNCTIONAL
TRAITS OF CARNIVOROUS PLANTS OF THE ACTIVE FLYPAPER TYPE –
PINGUICULA (LENTIBULARIACEAE) AND DROSERA (DROSERACEAE) IV. No indication of a pollinator-prey conflict in floral functional traits of carnivorous plants Authors
A. W. Mues*, S. Brauwers* and M. Weigend* * Nees Institut für Biodiversität der Pflanzen, Universität Bonn, 53115 Bonn, Germany
IV.1 ABSTRACT
Background and aims: The bulk of carnivorous (essentially insectivorous) plants are entomophilous. This
has led to the hypothesis that these plants might suffer a "pollinator-prey conflict", compromising
pollination services by trapping pollinators. The present study aims at investigating floral function in two
prominent carnivorous genera based on a broad set of floral functional parameters. Breeding systems,
pollen and ovule numbers and characters regarding optical flower signal (display size, colour, UV light
pattern) and nectar reward are investigated for 19 species of Pinguicula (Lentibulariaceae) and 17
species of Drosera. Closely related Dionaea is added for comparison of floral functional traits.
Methods: Pollen and ovule counting procedures, pollination experiments, refractometer nectar
analysis, UV light photography, Scanning Electron Microscopy (SEM), bivariate correlations,
nonparametric group comparisons.
Key results: Pinguicula and Droseraceae differ strongly in flower symmetry and pollinator positioning.
Patterns of optical signal in flowers (colouration, UV light reflection/absorption) are generally strongly
contrasting to trap leaves. Nectar as a reward could be verified for Pinguicula and Dionaea, but not for
Drosera. Autogamy as well as (facultative or obligate) xenogamy are found in Droseraceae, while
Pinguicula is found to be (facultatively or obligately) xenogamous. Pollen is dispensed in tetrads in
Droseraceae, but as single pollen grains in Pinguicula. The p/o ratios found in both genera are extremely
low compared to other xenogamous, entomophilous species. They do not differ significantly between
Pinguicula and xenogamous Drosera species.
Conclusions: Highly conserved optical flower signal, strongly contrasting to trap leaves, indicates an
important role for segregation of pollinators and prey. The overall low p/o ratios in the carnivorous
plants here investigated – independent of breeding system – clearly argue that there is no pollinator-
prey conflict. The zygomorphic and highly sophisticated flower structure in Pinguicula and the
synorganisation of pollen material into tetrads in Droseraceae likely represent alternative ways of
optimising pollen transfer in xenogamous breeding systems.
Key words: Carnivory, pollinator-prey-conflict, Drosera, Dionaea, Pinguicula, p/o ratio, pollen dispersal
unit, breeding system, optical flower signal, attraction.
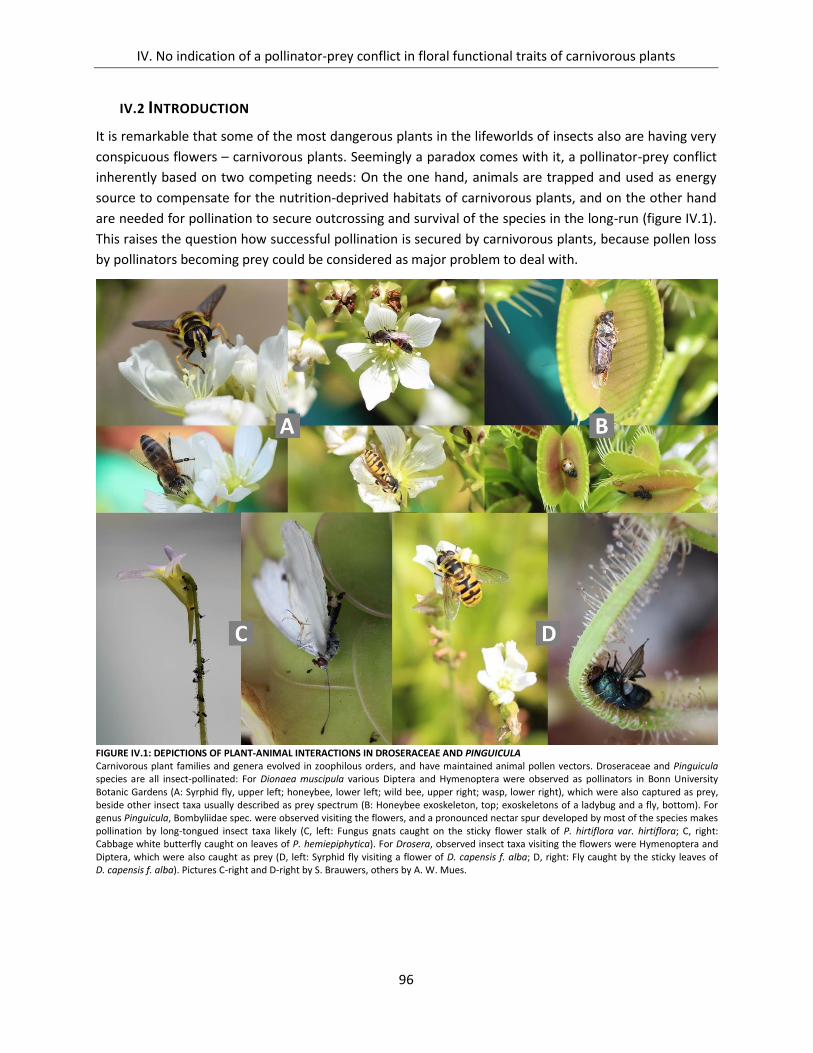
IV. No indication of a pollinator-prey conflict in floral functional traits of carnivorous plants
96
IV.2 INTRODUCTION
It is remarkable that some of the most dangerous plants in the lifeworlds of insects also are having very
conspicuous flowers – carnivorous plants. Seemingly a paradox comes with it, a pollinator-prey conflict
inherently based on two competing needs: On the one hand, animals are trapped and used as energy
source to compensate for the nutrition-deprived habitats of carnivorous plants, and on the other hand
are needed for pollination to secure outcrossing and survival of the species in the long-run (figure IV.1).
This raises the question how successful pollination is secured by carnivorous plants, because pollen loss
by pollinators becoming prey could be considered as major problem to deal with.
FIGURE IV.1: DEPICTIONS OF PLANT-ANIMAL INTERACTIONS IN DROSERACEAE AND PINGUICULA Carnivorous plant families and genera evolved in zoophilous orders, and have maintained animal pollen vectors. Droseraceae and Pinguicula species are all insect-pollinated: For Dionaea muscipula various Diptera and Hymenoptera were observed as pollinators in Bonn University Botanic Gardens (A: Syrphid fly, upper left; honeybee, lower left; wild bee, upper right; wasp, lower right), which were also captured as prey, beside other insect taxa usually described as prey spectrum (B: Honeybee exoskeleton, top; exoskeletons of a ladybug and a fly, bottom). For genus Pinguicula, Bombyliidae spec. were observed visiting the flowers, and a pronounced nectar spur developed by most of the species makes pollination by long-tongued insect taxa likely (C, left: Fungus gnats caught on the sticky flower stalk of P. hirtiflora var. hirtiflora; C, right: Cabbage white butterfly caught on leaves of P. hemiepiphytica). For Drosera, observed insect taxa visiting the flowers were Hymenoptera and Diptera, which were also caught as prey (D, left: Syrphid fly visiting a flower of D. capensis f. alba; D, right: Fly caught by the sticky leaves of D. capensis f. alba). Pictures C-right and D-right by S. Brauwers, others by A. W. Mues.
IV. No indication of a pollinator-prey conflict in floral functional traits of carnivorous plants
97
The presence or absence of such a conflict in carnivorous plants is open to debate in botanical science.
In their review article, Ellison and Gotelli (2009) point out that carnivorous plants have to deal with such
a conflict: Although different types of carnivorous genera do show a specialisation to different prey
taxa, the captured prey does not differ from the relative abundance of potential prey species in the
environment. The degree of prey specialisation does not differ from simple passive traps, which capture
rates can be largely understood on basic geometric variables like size, shape and orientation. However,
this general conclusion might be too simplistic. In another review article, Jürgens et al. (2012) criticise
that pollinator-prey conflict often has been assumed only on overlap of possible pollen vectors and prey
taxa on higher taxonomic levels, disregarding the fact that flower visitors not necessarily are valid
pollinators, and even a true pollinator-prey overlap must not necessarily lead to a pollinator-prey
conflict, i.e. when pollen or pollinators are plenty, or only ineffective pollinators are caught. Although
literature on carnivorous plants as a charismatic plant group is vast, pollinator-prey overlap has been
quantified explicitly in only few published studies (Jürgens et al., 2012, citing: Moran, 1996; Zamora,
1999; Murza et al., 2006; Anderson, 2010; see also Jürgens et al., 2015; El-Sayed et al., 2016;
Youngsteadt et al., 2018). The authors further point out that a valid pollinator-prey conflict only can
occur under the following three preconditions: 1. dependence on animal pollen vectors for
reproduction (i.e. no selfing mechanism), 2. pollen vectors and prey do overlap, and 3. pollination
success is limited (in regard to quantity and/or quality of transferred pollen). To alleviate a possible
pollinator-prey conflict, two possible mechanisms can occur in carnivorous plants (compare Jürgens et
al., 2012, in the following): 1. reproductive assurance mechanisms, and 2. specialisation towards
pollinator and prey, further distinguished into strategies of temporal and spatial separation, as well as
specialised attraction and guidance of animal taxa.
Reproductive assurance mechanisms are vegetative reproduction as well as obligate or facultative
autogamous breeding systems, allowing for propagation in absence of animal pollen vectors – which are
indeed reported in literature (Wilson, 1995; Chen et al., 1997; Zamora, 1999; Murza and Davis, 2003;
Murza and Davis, 2005; Murza et al., 2006; Sciligo, 2009). No general trend towards breeding systems
seems to be present; the full spectrum from obligate autogamous to obligate xenogamous breeding
systems is reported for carnivorous plants (Jürgens et al., 2012). However, the full picture is far from
complete, and breeding systems are unknown for most carnivorous plant species.
As for specialisation towards pollinators and prey, temporal and spatial separation of traps and flowers
can completely prevent pollinator-prey overlap in its extreme forms, i.e. when trap leaves and flowers
are not present or active at the same time, or perfectly spatially separated by submerged aquatic traps
in Utricularia, Genlisea and Aldrovanda (cf. Jürgens et al., 2012; Anderson and Midgley, 2001). In
intermediate forms (i.e. flowers and traps active at the same time, but separated by the length of the
flower stalk), temporal and spatial separation can alleviate pollinator-prey conflict, i.e. by partitioning
insects of the same taxa or sorting of different taxa as prey or pollination agents, due to their diurnal,
seasonal and spatial activity pattern (cf. Jürgens et al., 2012).
Attraction and guidance of pollinators and prey extends this sorting of animal taxa to the level of
specialised optical and/or olfactory signal of traps and flowers, as well as reward. Minnaar et al. (2019)
give an excellent overview of plant traits relevant for siring success of flowering plants in general, like
floral display size (e.g. Harder and Barrett, 1995; Karron et al., 2012); corolla tube shape (Kulbaba and
Worley, 2012, 2013); scent (Kessler et al., 2008; Larue et al., 2015), colour (e.g. overall colour (Stanton
IV. No indication of a pollinator-prey conflict in floral functional traits of carnivorous plants
98
et al., 1986), colour pattern (de Jager et al., 2016; Kemp et al., 2019), colour brightness and contrast
(Sletvold et al., 2016)) as well as shape and symmetry (e.g. Møller, 1995; Gómez et al., 2006). In
extension to flower symmetry and "mechanical fit in plant–pollinator interactions", securing the plant´s
control over pollinator interactions, Minnaar et al. (2019) further highlight the importance of pollen
presentation traits and pollen aggregation.
As for carnivorous plants, Jürgens et al. (2012) point out three possible attraction and guidance
strategies to alleviate pollinator-prey conflict: 1. attraction of pollinators to flowers, 2. distraction of
pollinators from traps and 3. attraction of prey taxa to traps. Astonishingly, studies explicitly quantifying
the specific influence of plant traits on pollinator and prey attraction or distraction from flowers or traps
are rare: Jürgens et al. (2015) experimentally tested the effect of leaf colour and flower-trap distance
for Drosera arcturi and D. spatulata. Flower-trap distance had no significant effect on trapping of
pollinators, but higher model flowers received more pollinator visitations. However, potential
pollinators were trapped significantly less by traps with red leaves compared to green ones. Pollinator
distraction was therefore induced by trap colour. El-Sayed et al. (2016) demonstrate utilisation of colour
signal and spatial separation of traps and flowers in Drosera spatulata and D. arcturi, as well as
additional chemical signals in D. auriculata to separate pollinators from prey taxa. Reports that only
indicate the possible role of plant traits for luring of prey taxa to traps are more frequent, e.g.: Reward,
like extra-floral nectar, offered by traps (Jürgens et al., 2012, citing Juniper et al., 1989; Dress et al.,
1997; Deppe et al., 2000; Merbach et al., 2001), UV light reflection and/or absorption pattern in traps,
especially close to the capture spots (Jürgens et al. 2012, citing Glossner, 1992; Moran, 1996; Moran et
al., 1999; see also Joel et al. (1985) on UV pattern and glistening of mucilage, and Kurup et al. (2016) for
distinct blue fluorescence emission at trap entrances), as well as odour emitted from traps (Jürgens et
al., 2012, citing e.g. Miles et al. 1975; Moran, 1996; Moran et al., 1999; note Jürgens et al., 2009).
However, scientific analysis of attraction or distraction of pollinator and prey taxa mainly focuses on
attraction and guidance mechanisms of traps. Floral traits of carnivorous plants that could play a
distinctive role are often neglected.
In the present paper we take an in-depth approach on floral plant traits for a broader sample of
carnivorous plants. We focus our analysis on floral ecology of active flypaper traps Drosera (17 species
analysed) and Pinguicula (19 species) in order to control for trap-dependent influences (i.e. trapping
mechanism, resource efficiency in nutrition-deprived habitats). Monotypic Dionaea muscipula is added
due to phylogenetic proximity to Drosera.
The selected model organisms are similar in regard to temporal and spatial separation of flowers and
traps: Temporal separation is missing in Drosera, Dionaea and Pinguicula, with flowers and trap leaves
being present and active at the same time in all of them. Spatial separation is realised to an
intermediate degree, the model organisms are separating flowers from trap leaves more or less strongly
by flower stalks. Focus of our analysis is therefore laid on plant traits related to attraction, guidance and
control of pollinator and prey taxa, allowing for correlational analysis and exploration of interplay of
these traits, like optical signal (floral display size, colour, UV light reflection pattern) and floral nectar
reward. Actionmorphic flowers of Droseraceae and zygomorpic flowers of Pinguicula further allow for
comparison of pollinator control via flower symmetry on efficiency of pollen transmission. Results will
also be presented in regard to pollen presentation strategies: Pollen material is dispersed in tetrads in
Drosera and Dionaea, but as single pollen grains in Pinguicula (Rodoni et al. 2010, Halbritter et al. 2012).
IV. No indication of a pollinator-prey conflict in floral functional traits of carnivorous plants
99
We present a broad sampling of breeding system related variables: Pollen and ovule production, pollen
to ovule ratio (p/o) as well as experimentally retrieved true breeding systems in order to control for
reproductive assurance mechanisms. We use the average p/o ratio per flower as indicator for effectivity
of pollen transmission. Cruden (1977) proposed p/o ratios as indicators of plant breeding systems first:
Autogamous species usually have much lower p/o ratios than xenogamous species, since pollen loss
during transfer from male to female flower organs is minimal. However, siring success is influenced by
many factors likely also influencing the p/o ratio (e.g. size of the pollen bearing area of the pollinator, or
behavioural pattern like grooming, pollen consumption, etc.). While overall correlations between p/o
ratios and true breeding systems seem to hold true in general (especially for species within genera and
families), huge differences between taxa with the same breeding system may be observed (compare
Cruden and Jensen, 1979; Cruden and Miller-Ward, 1981; Cruden and Lyon, 1985; Small, 1988; Kirk,
1993; López et al., 1999; Cruden, 2000; Michalski and Durka, 2009; Alarcón et al., 2011; Lozada-Gobilard
et al., 2019). P/o ratios should be of explanatory value for possible pollinator-prey conflicts of
carnivorous plants. Inefficient pollen transmission due to trapping of pollinators should demand for
higher p/o ratios, like any other cause of pollen loss. Main research questions are therefore:
Are floral plant traits and characteristics of trap leaves indicative for attraction and guidance of
pollinator and prey taxa, in order to alleviate a possible-pollinator-prey conflict?
Are pollen production, ovule numbers and p/o ratios indicative for breeding systems and possible
pollinator-prey conflict?
Are attraction, guidance and control mechanisms, variables of gamete production and true breeding
systems interrelated, showing an interplay of characters?
Do the differences in regard to mechanical control of pollinators and pollen dispersal between
Droseraceae and Pinguicula exert an influence on breeding systems and gamete production?
IV.3 MATERIALS AND METHODS
Living collections of Droseraceae and Pinguicula were cultivated either outdoors or in the greenhouse at
Bonn University Botanic Gardens. Samples for pollen and ovule data, nectar production, morphology
and UV signal were obtained from 2014 to 2016. Experimental testing of breeding systems was
performed in 2015 and 2016.
For Drosera, 17 species were analysed: D. adelae F.Muell., D. aliciae Raym.-Hamet, D. anglica Huds, D. binata
Labill., D. callistos N.G.Marchant & Lowrie, D. capensis L., D. dichrosepala Turcz., D. filiformis Raf., D. intermedia
Hayne, D. leioblastus N.G.Marchant & Lowrie, D. menziesii ssp. menziesii R.Br. ex DC., D. paleacea subsp. roseana
(N.G.Marchant & Lowrie) Schlauer, D. paradoxa Lowrie, D. platystigma Lehm., D. regia Stephens, D. rotundifolia L.,
D. spatulata Labill. Closely related Dionaea muscipula J.Ellis was added to the analysis.
Genus Pinguicula is represented by the following 19 species: P. agnata Casper, P. cyclosecta Casper,
P. ehlersiae Speta & F. Fuchs, P. emarginata Zamudio & Rzed., P. esseriana B. Kirchn., P. gigantea Luhrs, P. gracilis
Zamudio, P. gypsicola Brandegee, P. hemiepiphytica Zamudio & Rzed., P. hirtiflora var. hirtiflora Ten., P. ibarrae
Zamudio, P. jaumavensis Debbert, P. laueana Speta & F. Fuchs, P. medusina Zamudio & Studnička, P. mirandae Zamudio &
A. Salinas, P. moctezumae Zamudio & R.Z. Ortega, P. moranensis Kunth, P. potosiensis Speta & F. Fuchs and P. rectifolia
Speta & F. Fuchs.
IV. No indication of a pollinator-prey conflict in floral functional traits of carnivorous plants
100
Only recognised species were used for calculations. However, the following four variations were also
analysed and are described in the appendix: D. capensis f. alba L., D. capensis f. rubra L., D. spatulata var.
lovellae Labill. and P. moranensis f. alba Kunth.
IV.3.1 ASSESSMENT OF FLORAL PLANT TRAITS
As for analysis of optical flower signal, colour variables are categorical and nominal. Flower colour was
dichotomised for statistical analysis, testing predominantly white corolla colour (purely white flowers
and white flowers with pink nectar guides) vs. reddish flower colour (predominantly violet to pink
colouration, seldom orange or brightly red). Spur colour in Pinguicula is dichotomous (greenish vs.
reddish).
UV signal of flowers was analysed as follows: Flowers were illuminated with UV light and pictures were
taken for frontal and lateral flower displays with a single-lens reflex camera (Nikon R D300s), and an
infrared neutralizer (OPTIK MAKARIO IR NG 52D) in combination with a UV light filter (OPTIK MAKARIO
SP 400 UV 52D). Photos were created with a fixed aperture, but different shutter speeds. Degree of UV
absorbance was coded according to strength of absorbance after 1 sec. UV light exposure. Analysed UV
variables are categorical and ordinal, namely UV signal of the frontal and lateral display, UV signal of the
nectar spur (dichotomous, reflection vs. absorbance – only for Pinguicula) and of anthers (dichotomous,
reflection vs. absorbance – only for Droseraceae). The UV signal of the frontal and lateral flower display
was coded as follows: Strong UV reflection was coded 1, UV reflection in combination with an absorbing
centre was coded 2 (only some frontal flower displays), diffusely absorbing displays were coded 3 and
strongly absorbing displays were coded 4. For spur and anthers, UV signal was coded 1 for reflection
and 2 for absorption.
Presence of an anther dummy signal (stamens mimicked by floral guides, cf. Lunau, 2006), UV pattern of
the anther dummy, anther colour, leaf colour and UV signal of leaf structures were also analysed, but
are to homogenous for statistical analysis (see appendix, table A X.3.2).
Variables of nectar reward, gamete production and flower morphology are metric and ratio scaled.
Three variables were analysed for nectar reward: Amount of nectar production in µl, nectar sugar
concentration in percent and amount of produced sugar in mg. For analysis of nectar production,
flowers were covered with gauze ca. 24 h before sampling to prevent flower visits. Microcapillaries (0.5
and 1 μl minicaps® – Hirschmann Laborgeräte, Germany) were either inserted between petals onto the
receptacle of a flower or placed against the sectioned base of the hypanthium in spurred species to
check for presence of nectar and to collect it. Sugar concentration was measured in degrees Brix with a
hand-held refractometer (neoLab, type 'universal'). For flowers with very low nectar production, nectar
from several flowers was pooled and nectar/sugar amounts were afterwards calculated for the single
flower level.
Nectar sugar production per flower was derived from nectar volume and nectar concentration after
Galetto and Bernadello (2005), with x being the measured concentration:
𝑚𝑔
𝜇𝑙= 0.00226 + (0.00937𝑥) + (0.0000585𝑥2)
Sample size for nectar measurements is ranging between five and 34 flowers per species. In total, nectar
of 321 flowers was measured.
IV. No indication of a pollinator-prey conflict in floral functional traits of carnivorous plants
101
Regarding gamete production, ovule numbers, production of pollen dispersal units (afterwards referred
as PDU) per flower and PDU/ovule ratios were analysed: A PDU is the smallest unit pollen grains are
transported from flower to flower, either as single pollen grains or in more complex structures. In order
to analyse the male reproduction system, PDUs were counted by means of a hemocytometer. Closed
anthers of individual flowers were cut off and dried in tubes for at least three days for each sample.
Afterwards glycerol and distilled water were added in proportion 1:1 (in total 50, 100 or 200 µl solvent
added, depending on pollen production per species). Samples were mixed 2 to 5 minutes in a laboratory
mill, and then placed into an ultrasonic bath for 15 minutes to loosen the PDUs from the anthers.
Probes were then vortexed to ensure equal suspension before counting. Per sample, PDUs on five
squares (each 1x1 mm) of the hemocytometer chamber were counted. Total PDU amount of the sample
was calculated with the following formula (Neuendorf, 2013):
PDUs per sample =counted PDU number
counted surface (mm2) · chamber depth (mm) · dilution (1 ÷ amount of diluent)
Ovule numbers were counted under a stereomicroscope. PDU to ovule ratio was calculated by division,
and pollen to ovule ratio was derived by multiplication of number of pollen grains per PDU. Correlations
are not influenced by higher-order assemblage of pollen grains to PDUs, and correlations are therefore
only shown for pollen production and p/o ratios. However, differences between PDU and pollen
production per flower and between PDU/ovule and p/o ratio were tested statistically.
For variables of gamete production, sample size is usually 12. In few cases only six or three (P. laueana)
data points were available. In total, PDU and ovule numbers of 459 flowers were counted.
Analysed variables of floral morphology are frontal and lateral display size in cm2, as well as frontal to
lateral display size ratio. For Pinguicula, length of nectar spur in cm and size of flower opening in cm2
were also measured. Morphological data were retrieved from flower photographs by means of Adobe®
Photoshop® CS6 imaging software and Magnetic Lasso Tool function. Sample size per morphological
variable and species is usually 5 or 10. For five species only a single flower picture was available. In total,
306 flowers were measured for floral morphology.
For closer inspection of reproductive organs and PDUs, plant material of Dionaea, Drosera capensis,
Pinguicula cyclosecta and P. moranensis were analysed via SEM (Scanning Electron Microscopy).
Material was prepared via critical point drying, fixed to a conducting carrier (SEM stub) and attached
with conductive coal to prevent electric charging. Scanning was performed with Cambridge Stereoscan
200 (Cambridge Instruments Ltd., Cambridge, UK).
Breeding systems were tested experimentally: Flowers were bagged and observed for occurrence of
spontaneous autogamy in a first step. If absent, flowers were bagged and hand-pollinated in order to
check for self-compatibility. Breeding system was coded as categorical and ordinal variable, according to
proneness towards outcrossing: Spontaneous autogamy was coded 1, facultative xenogamy was coded
2 and obligate xenogamy was coded 3. For statistical testing, species were only categorised as
autogamous or xenogamous, because obligate outcrossing was detected seldom.
IV.3.2 STATISTICAL ANALYSIS
Except description of data bandwidth, arithmetic means were used as species-specific profiles for
analysis, due to unequal sample sizes and non-normality of data. Only nectariferous flowers were used
IV. No indication of a pollinator-prey conflict in floral functional traits of carnivorous plants
102
for calculation of arithmetic means of nectar variables, but ratio of dry to nectariferous flowers is
reported in the appendix, table A X.3.3. Due to non-normality of data, correlations between ratio scaled
variables as well correlations between ratio scaled and ordinal variables were calculated with Kendalls´s
τb rank correlation coefficient. Correlations between dichotomous (nominal or ordinal) variables and
ratio scaled variables were calculated with point-biserial correlation coefficient rpbi, and correlations
between dichotomous and ordinal variables were calculated with rank-biserial correlation coefficient rrb.
Group differences were analysed by Kruskal-Wallis test and subsequent group comparisons with
Bonferroni correction via IBM SPSS, version 24. Boxplots were designed with base R, version 3.3.3, and
arithmetic means were visualised with function 'beeswarm'.
IV.4 RESULTS
In the following section the observed data bandwidth is presented: For detailed, species specific
information compare tables A X.3.1 to A X.3.5 in the appendix. For exemplary depictions of flowers and
traps, colouration and UV light signal please compare figure IV.2.
IV.4.1 OPTICAL SIGNAL
Average frontal display size is 1.52 ± 1.81 cm2 in Droseraceae (min.: D. leioblastus, 0.06 cm2; max.:
D. binata, 6.34 cm2; Dionaea: 2.29 cm2), and 3.49 ± 2.56 cm2 in Pinguicula (min.: P. emarginata,
0.48 cm2; max.: P. moctezumae, 9.55 cm2). Average lateral display size is .54 ± .64 cm2 in Droseraceae
(min.: D. leioblastus, 0.02 cm2; max.: D. binata, 2.29 cm2; Dionaea: .83 cm2), and 1.26 ± .81 cm2 in
Pinguicula (min.: P. emarginata, .22 cm2; max.: P. moctezumae, 2.64 cm2). The average frontal to lateral
display size ratio is 3.03 ± .96 cm2 in Droseraceae (min.: D. aliciae and D. dichrosepala, 1.7 cm2; max.:
D. platystigma, 4.9 cm2; Dionaea: 2.9 cm2), and 2.74 ± .67 cm2 in Pinguicula (min.: P. medusina,
P. potosiensis and P. rectifolia, 1.9 cm2; max.: P. ehlersiae, 4.0 cm2).
Regarding flower colour, white flowers are present in Droseraceae (Dionaea and eight species of
Drosera) and Pinguicula (P. gracilis and P. ibarrae). Two species of Pinguicula, P. agnata and
P. emarginata, show white flowers with pinkish nectar guides, while most of the other species analysed
show a reddish, violet to pink colouration. In few cases flower colour is shifted more strongly to the red
spectrum, with reddish-orange colours present in D. callistos and D. platystigma, and red flower colour
in D. adelae and P. laueana.
Spur colour in Pinguicula is usually green, seven species are showing violet to pink spur colour however:
P. cyclosecta, P. gypsicola, P. hemiepiphytica, P. laueana, P. moctezumae, P. moranensis and
P. potosiensis.
UV light pattern of the frontal and lateral flower display shows full absorption for Dionaea. For
Drosera callistos, D. capensis, D. menziesii and D. platystigma the frontal display shows reflection with a
darker, absorbing flower centre, while the lateral display is UV reflecting. Other Drosera predominantly
show a fully absorbing frontal display with a diffuse lateral UV signal. Only D. spatulata shows a
reflecting lateral display beside frontal absorption, and D. adelae shows a diffuse UV signal from lateral
as well as frontal view.
For Pinguicula, UV absorption is present in frontal and lateral flower displays of P. emarginata,
P. gracilis and P. hirtiflora. An absorbing frontal display in combination with a UV reflecting lateral
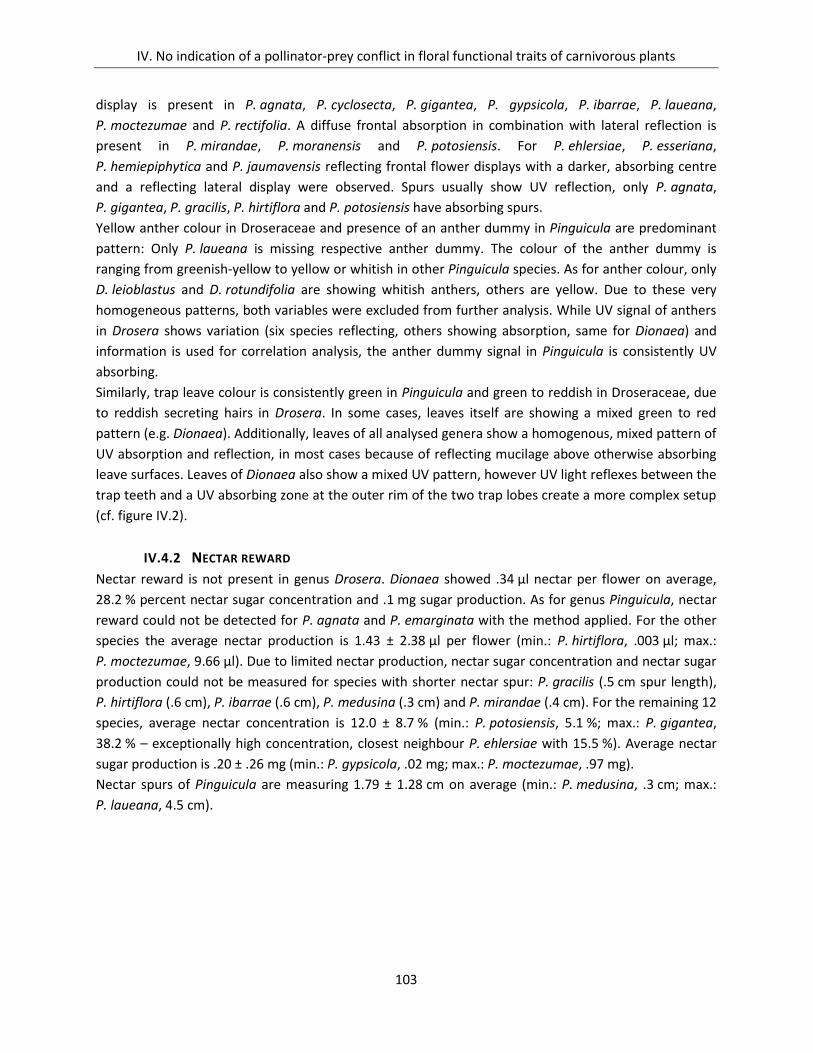
IV. No indication of a pollinator-prey conflict in floral functional traits of carnivorous plants
103
display is present in P. agnata, P. cyclosecta, P. gigantea, P. gypsicola, P. ibarrae, P. laueana,
P. moctezumae and P. rectifolia. A diffuse frontal absorption in combination with lateral reflection is
present in P. mirandae, P. moranensis and P. potosiensis. For P. ehlersiae, P. esseriana,
P. hemiepiphytica and P. jaumavensis reflecting frontal flower displays with a darker, absorbing centre
and a reflecting lateral display were observed. Spurs usually show UV reflection, only P. agnata,
P. gigantea, P. gracilis, P. hirtiflora and P. potosiensis have absorbing spurs.
Yellow anther colour in Droseraceae and presence of an anther dummy in Pinguicula are predominant
pattern: Only P. laueana is missing respective anther dummy. The colour of the anther dummy is
ranging from greenish-yellow to yellow or whitish in other Pinguicula species. As for anther colour, only
D. leioblastus and D. rotundifolia are showing whitish anthers, others are yellow. Due to these very
homogeneous patterns, both variables were excluded from further analysis. While UV signal of anthers
in Drosera shows variation (six species reflecting, others showing absorption, same for Dionaea) and
information is used for correlation analysis, the anther dummy signal in Pinguicula is consistently UV
absorbing.
Similarly, trap leave colour is consistently green in Pinguicula and green to reddish in Droseraceae, due
to reddish secreting hairs in Drosera. In some cases, leaves itself are showing a mixed green to red
pattern (e.g. Dionaea). Additionally, leaves of all analysed genera show a homogenous, mixed pattern of
UV absorption and reflection, in most cases because of reflecting mucilage above otherwise absorbing
leave surfaces. Leaves of Dionaea also show a mixed UV pattern, however UV light reflexes between the
trap teeth and a UV absorbing zone at the outer rim of the two trap lobes create a more complex setup
(cf. figure IV.2).
IV.4.2 NECTAR REWARD
Nectar reward is not present in genus Drosera. Dionaea showed .34 µl nectar per flower on average,
28.2 % percent nectar sugar concentration and .1 mg sugar production. As for genus Pinguicula, nectar
reward could not be detected for P. agnata and P. emarginata with the method applied. For the other
species the average nectar production is 1.43 ± 2.38 µl per flower (min.: P. hirtiflora, .003 µl; max.:
P. moctezumae, 9.66 µl). Due to limited nectar production, nectar sugar concentration and nectar sugar
production could not be measured for species with shorter nectar spur: P. gracilis (.5 cm spur length),
P. hirtiflora (.6 cm), P. ibarrae (.6 cm), P. medusina (.3 cm) and P. mirandae (.4 cm). For the remaining 12
species, average nectar concentration is 12.0 ± 8.7 % (min.: P. potosiensis, 5.1 %; max.: P. gigantea,
38.2 % – exceptionally high concentration, closest neighbour P. ehlersiae with 15.5 %). Average nectar
sugar production is .20 ± .26 mg (min.: P. gypsicola, .02 mg; max.: P. moctezumae, .97 mg).
Nectar spurs of Pinguicula are measuring 1.79 ± 1.28 cm on average (min.: P. medusina, .3 cm; max.:
P. laueana, 4.5 cm).
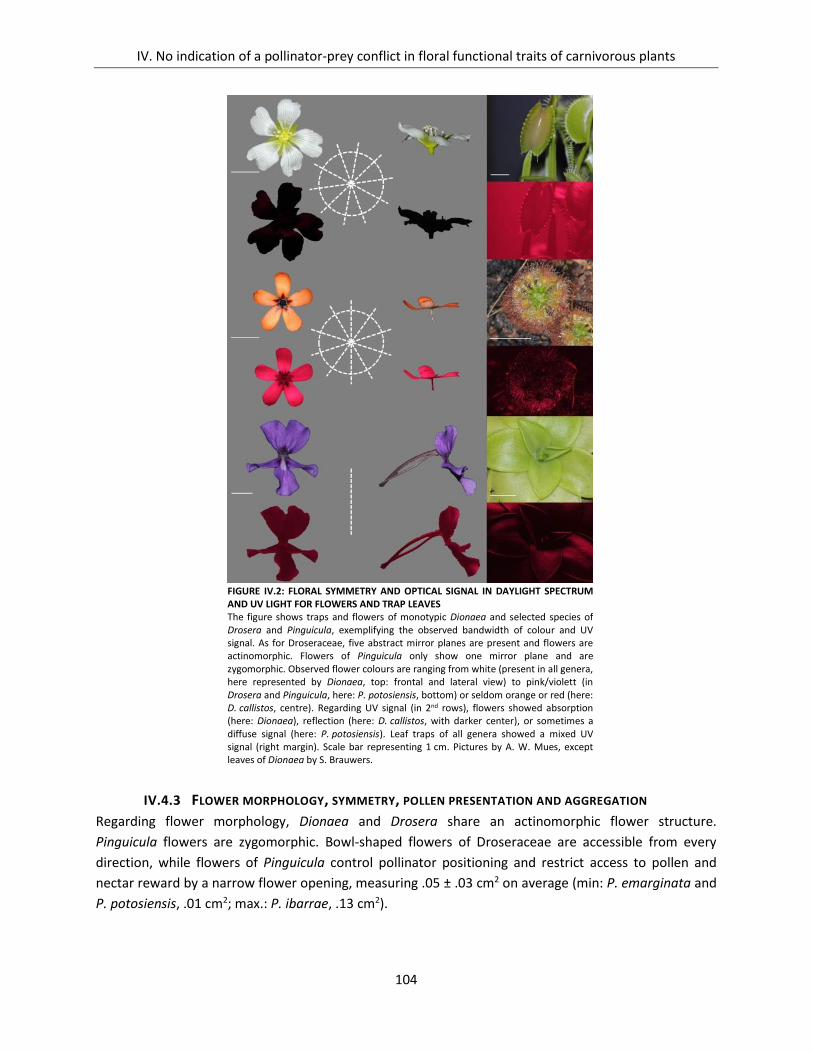
IV. No indication of a pollinator-prey conflict in floral functional traits of carnivorous plants
104
IV.4.3 FLOWER MORPHOLOGY, SYMMETRY, POLLEN PRESENTATION AND AGGREGATION
Regarding flower morphology, Dionaea and Drosera share an actinomorphic flower structure.
Pinguicula flowers are zygomorphic. Bowl-shaped flowers of Droseraceae are accessible from every
direction, while flowers of Pinguicula control pollinator positioning and restrict access to pollen and
nectar reward by a narrow flower opening, measuring .05 ± .03 cm2 on average (min: P. emarginata and
P. potosiensis, .01 cm2; max.: P. ibarrae, .13 cm2).
FIGURE IV.2: FLORAL SYMMETRY AND OPTICAL SIGNAL IN DAYLIGHT SPECTRUM AND UV LIGHT FOR FLOWERS AND TRAP LEAVES The figure shows traps and flowers of monotypic Dionaea and selected species of Drosera and Pinguicula, exemplifying the observed bandwidth of colour and UV signal. As for Droseraceae, five abstract mirror planes are present and flowers are actinomorphic. Flowers of Pinguicula only show one mirror plane and are zygomorphic. Observed flower colours are ranging from white (present in all genera, here represented by Dionaea, top: frontal and lateral view) to pink/violett (in Drosera and Pinguicula, here: P. potosiensis, bottom) or seldom orange or red (here: D. callistos, centre). Regarding UV signal (in 2nd rows), flowers showed absorption (here: Dionaea), reflection (here: D. callistos, with darker center), or sometimes a diffuse signal (here: P. potosiensis). Leaf traps of all genera showed a mixed UV signal (right margin). Scale bar representing 1 cm. Pictures by A. W. Mues, except leaves of Dionaea by S. Brauwers.
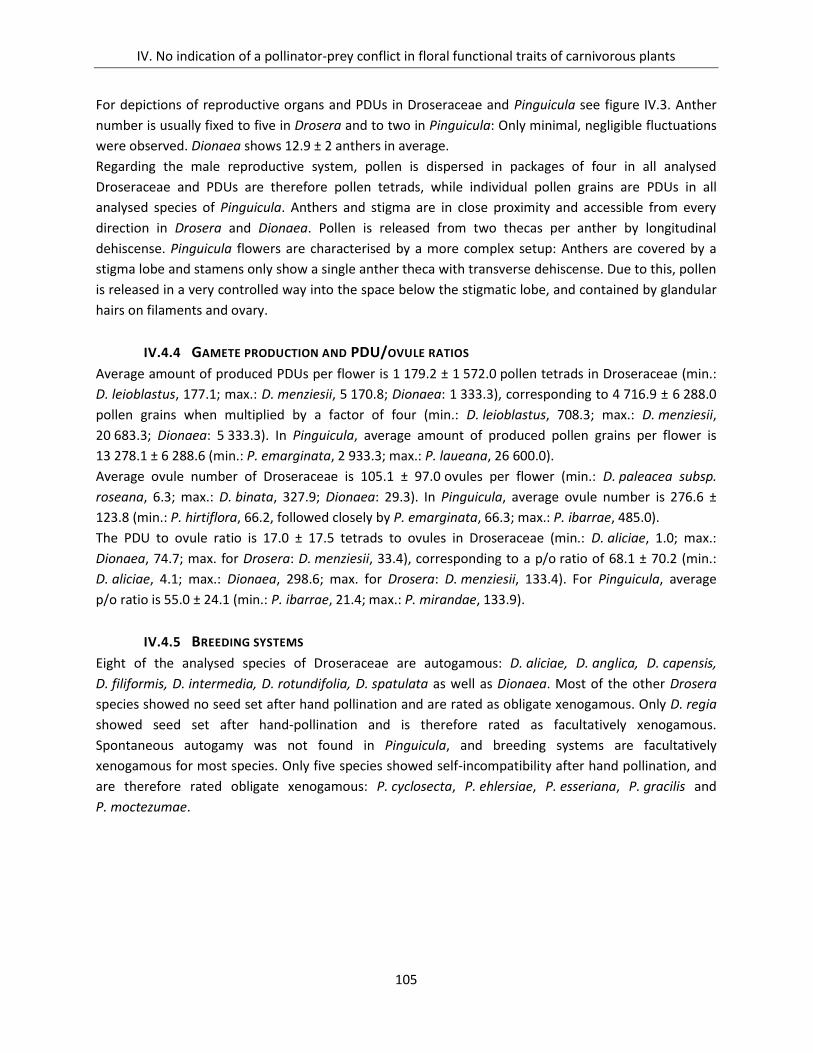
IV. No indication of a pollinator-prey conflict in floral functional traits of carnivorous plants
105
For depictions of reproductive organs and PDUs in Droseraceae and Pinguicula see figure IV.3. Anther
number is usually fixed to five in Drosera and to two in Pinguicula: Only minimal, negligible fluctuations
were observed. Dionaea shows 12.9 ± 2 anthers in average.
Regarding the male reproductive system, pollen is dispersed in packages of four in all analysed
Droseraceae and PDUs are therefore pollen tetrads, while individual pollen grains are PDUs in all
analysed species of Pinguicula. Anthers and stigma are in close proximity and accessible from every
direction in Drosera and Dionaea. Pollen is released from two thecas per anther by longitudinal
dehiscense. Pinguicula flowers are characterised by a more complex setup: Anthers are covered by a
stigma lobe and stamens only show a single anther theca with transverse dehiscense. Due to this, pollen
is released in a very controlled way into the space below the stigmatic lobe, and contained by glandular
hairs on filaments and ovary.
IV.4.4 GAMETE PRODUCTION AND PDU/OVULE RATIOS
Average amount of produced PDUs per flower is 1 179.2 ± 1 572.0 pollen tetrads in Droseraceae (min.:
D. leioblastus, 177.1; max.: D. menziesii, 5 170.8; Dionaea: 1 333.3), corresponding to 4 716.9 ± 6 288.0
pollen grains when multiplied by a factor of four (min.: D. leioblastus, 708.3; max.: D. menziesii,
20 683.3; Dionaea: 5 333.3). In Pinguicula, average amount of produced pollen grains per flower is
13 278.1 ± 6 288.6 (min.: P. emarginata, 2 933.3; max.: P. laueana, 26 600.0).
Average ovule number of Droseraceae is 105.1 ± 97.0 ovules per flower (min.: D. paleacea subsp.
roseana, 6.3; max.: D. binata, 327.9; Dionaea: 29.3). In Pinguicula, average ovule number is 276.6 ±
123.8 (min.: P. hirtiflora, 66.2, followed closely by P. emarginata, 66.3; max.: P. ibarrae, 485.0).
The PDU to ovule ratio is 17.0 ± 17.5 tetrads to ovules in Droseraceae (min.: D. aliciae, 1.0; max.:
Dionaea, 74.7; max. for Drosera: D. menziesii, 33.4), corresponding to a p/o ratio of 68.1 ± 70.2 (min.:
D. aliciae, 4.1; max.: Dionaea, 298.6; max. for Drosera: D. menziesii, 133.4). For Pinguicula, average
p/o ratio is 55.0 ± 24.1 (min.: P. ibarrae, 21.4; max.: P. mirandae, 133.9).
IV.4.5 BREEDING SYSTEMS
Eight of the analysed species of Droseraceae are autogamous: D. aliciae, D. anglica, D. capensis,
D. filiformis, D. intermedia, D. rotundifolia, D. spatulata as well as Dionaea. Most of the other Drosera
species showed no seed set after hand pollination and are rated as obligate xenogamous. Only D. regia
showed seed set after hand-pollination and is therefore rated as facultatively xenogamous.
Spontaneous autogamy was not found in Pinguicula, and breeding systems are facultatively
xenogamous for most species. Only five species showed self-incompatibility after hand pollination, and
are therefore rated obligate xenogamous: P. cyclosecta, P. ehlersiae, P. esseriana, P. gracilis and
P. moctezumae.
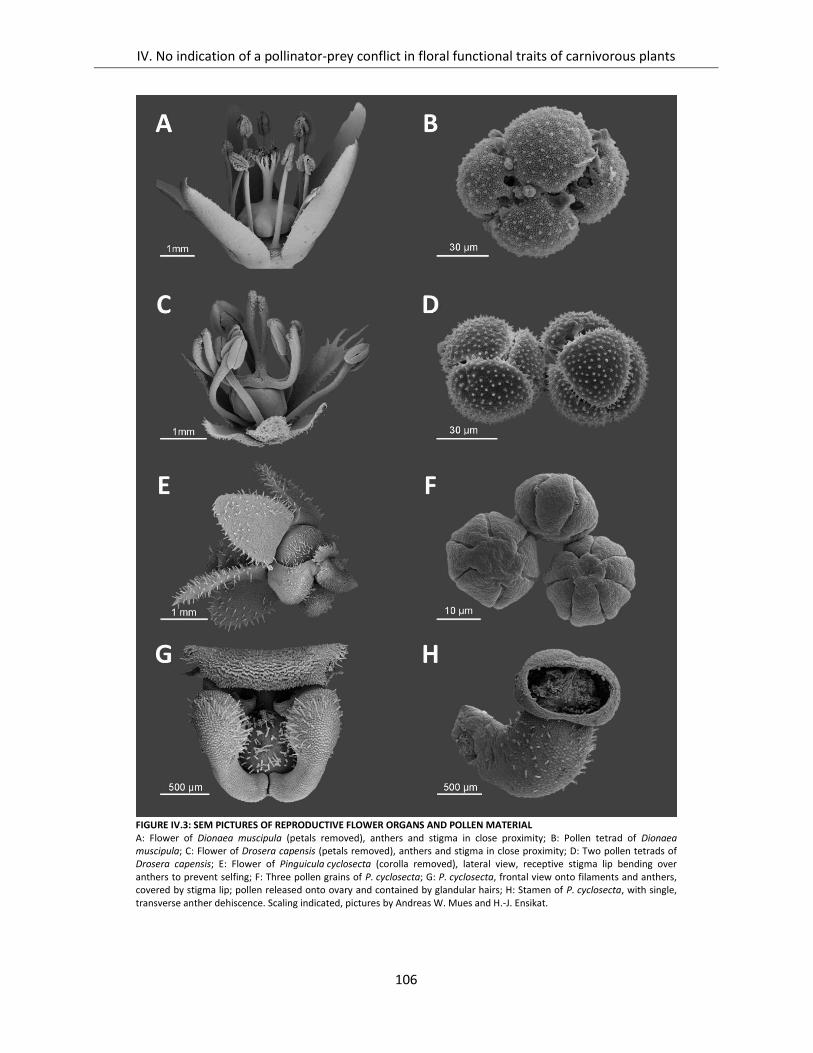
IV. No indication of a pollinator-prey conflict in floral functional traits of carnivorous plants
106
FIGURE IV.3: SEM PICTURES OF REPRODUCTIVE FLOWER ORGANS AND POLLEN MATERIAL A: Flower of Dionaea muscipula (petals removed), anthers and stigma in close proximity; B: Pollen tetrad of Dionaea muscipula; C: Flower of Drosera capensis (petals removed), anthers and stigma in close proximity; D: Two pollen tetrads of Drosera capensis; E: Flower of Pinguicula cyclosecta (corolla removed), lateral view, receptive stigma lip bending over anthers to prevent selfing; F: Three pollen grains of P. cyclosecta; G: P. cyclosecta, frontal view onto filaments and anthers, covered by stigma lip; pollen released onto ovary and contained by glandular hairs; H: Stamen of P. cyclosecta, with single, transverse anther dehiscence. Scaling indicated, pictures by Andreas W. Mues and H.-J. Ensikat.
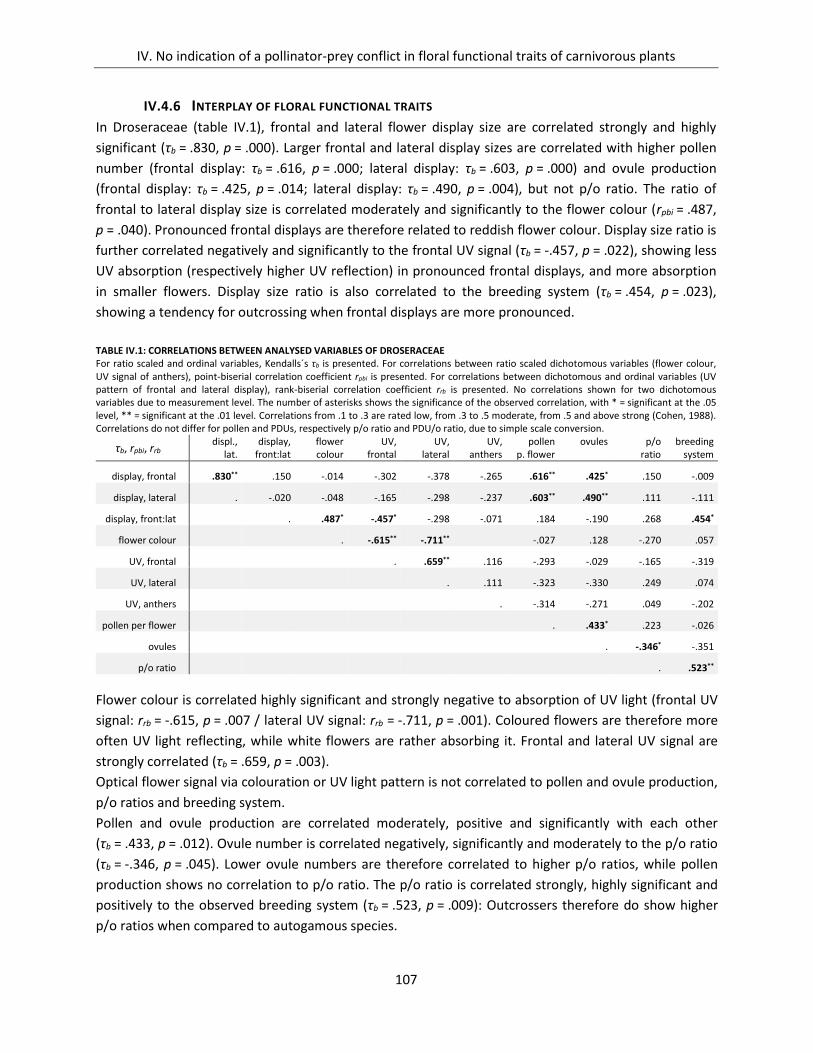
IV. No indication of a pollinator-prey conflict in floral functional traits of carnivorous plants
107
IV.4.6 INTERPLAY OF FLORAL FUNCTIONAL TRAITS
In Droseraceae (table IV.1), frontal and lateral flower display size are correlated strongly and highly
significant (τb = .830, p = .000). Larger frontal and lateral display sizes are correlated with higher pollen
number (frontal display: τb = .616, p = .000; lateral display: τb = .603, p = .000) and ovule production
(frontal display: τb = .425, p = .014; lateral display: τb = .490, p = .004), but not p/o ratio. The ratio of
frontal to lateral display size is correlated moderately and significantly to the flower colour (rpbi = .487,
p = .040). Pronounced frontal displays are therefore related to reddish flower colour. Display size ratio is
further correlated negatively and significantly to the frontal UV signal (τb = -.457, p = .022), showing less
UV absorption (respectively higher UV reflection) in pronounced frontal displays, and more absorption
in smaller flowers. Display size ratio is also correlated to the breeding system (τb = .454, p = .023),
showing a tendency for outcrossing when frontal displays are more pronounced.
TABLE IV.1: CORRELATIONS BETWEEN ANALYSED VARIABLES OF DROSERACEAE For ratio scaled and ordinal variables, Kendalls´s τb is presented. For correlations between ratio scaled dichotomous variables (flower colour, UV signal of anthers), point-biserial correlation coefficient rpbi is presented. For correlations between dichotomous and ordinal variables (UV pattern of frontal and lateral display), rank-biserial correlation coefficient rrb is presented. No correlations shown for two dichotomous variables due to measurement level. The number of asterisks shows the significance of the observed correlation, with * = significant at the .05 level, ** = significant at the .01 level. Correlations from .1 to .3 are rated low, from .3 to .5 moderate, from .5 and above strong (Cohen, 1988). Correlations do not differ for pollen and PDUs, respectively p/o ratio and PDU/o ratio, due to simple scale conversion.
τb, rpbi, rrb displ.,
lat. display,
front:lat flower colour
UV, frontal
UV, lateral
UV, anthers
pollen p. flower
ovules
p/o ratio
breeding system
display, frontal .830** .150 -.014 -.302 -.378 -.265 .616** .425* .150 -.009
display, lateral . -.020 -.048 -.165 -.298 -.237 .603** .490** .111 -.111
display, front:lat . .487* -.457* -.298 -.071 .184 -.190 .268 .454*
flower colour . -.615** -.711** -.027 .128 -.270 .057
UV, frontal . .659** .116 -.293 -.029 -.165 -.319
UV, lateral . .111 -.323 -.330 .249 .074
UV, anthers . -.314 -.271 .049 -.202
pollen per flower . .433* .223 -.026
ovules . -.346* -.351
p/o ratio . .523**
Flower colour is correlated highly significant and strongly negative to absorption of UV light (frontal UV
signal: rrb = -.615, p = .007 / lateral UV signal: rrb = -.711, p = .001). Coloured flowers are therefore more
often UV light reflecting, while white flowers are rather absorbing it. Frontal and lateral UV signal are
strongly correlated (τb = .659, p = .003).
Optical flower signal via colouration or UV light pattern is not correlated to pollen and ovule production,
p/o ratios and breeding system.
Pollen and ovule production are correlated moderately, positive and significantly with each other
(τb = .433, p = .012). Ovule number is correlated negatively, significantly and moderately to the p/o ratio
(τb = -.346, p = .045). Lower ovule numbers are therefore correlated to higher p/o ratios, while pollen
production shows no correlation to p/o ratio. The p/o ratio is correlated strongly, highly significant and
positively to the observed breeding system (τb = .523, p = .009): Outcrossers therefore do show higher
p/o ratios when compared to autogamous species.
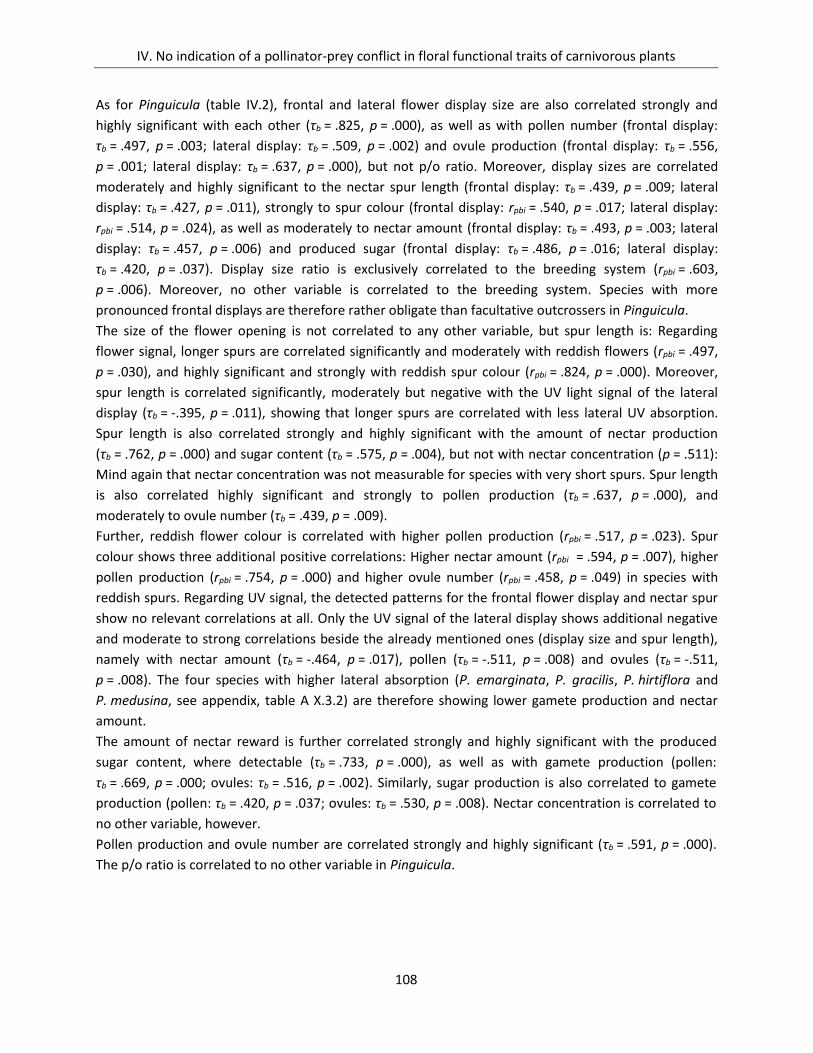
IV. No indication of a pollinator-prey conflict in floral functional traits of carnivorous plants
108
As for Pinguicula (table IV.2), frontal and lateral flower display size are also correlated strongly and
highly significant with each other (τb = .825, p = .000), as well as with pollen number (frontal display:
τb = .497, p = .003; lateral display: τb = .509, p = .002) and ovule production (frontal display: τb = .556,
p = .001; lateral display: τb = .637, p = .000), but not p/o ratio. Moreover, display sizes are correlated
moderately and highly significant to the nectar spur length (frontal display: τb = .439, p = .009; lateral
display: τb = .427, p = .011), strongly to spur colour (frontal display: rpbi = .540, p = .017; lateral display:
rpbi = .514, p = .024), as well as moderately to nectar amount (frontal display: τb = .493, p = .003; lateral
display: τb = .457, p = .006) and produced sugar (frontal display: τb = .486, p = .016; lateral display:
τb = .420, p = .037). Display size ratio is exclusively correlated to the breeding system (rpbi = .603,
p = .006). Moreover, no other variable is correlated to the breeding system. Species with more
pronounced frontal displays are therefore rather obligate than facultative outcrossers in Pinguicula.
The size of the flower opening is not correlated to any other variable, but spur length is: Regarding
flower signal, longer spurs are correlated significantly and moderately with reddish flowers (rpbi = .497,
p = .030), and highly significant and strongly with reddish spur colour (rpbi = .824, p = .000). Moreover,
spur length is correlated significantly, moderately but negative with the UV light signal of the lateral
display (τb = -.395, p = .011), showing that longer spurs are correlated with less lateral UV absorption.
Spur length is also correlated strongly and highly significant with the amount of nectar production
(τb = .762, p = .000) and sugar content (τb = .575, p = .004), but not with nectar concentration (p = .511):
Mind again that nectar concentration was not measurable for species with very short spurs. Spur length
is also correlated highly significant and strongly to pollen production (τb = .637, p = .000), and
moderately to ovule number (τb = .439, p = .009).
Further, reddish flower colour is correlated with higher pollen production (rpbi = .517, p = .023). Spur
colour shows three additional positive correlations: Higher nectar amount (rpbi = .594, p = .007), higher
pollen production (rpbi = .754, p = .000) and higher ovule number (rpbi = .458, p = .049) in species with
reddish spurs. Regarding UV signal, the detected patterns for the frontal flower display and nectar spur
show no relevant correlations at all. Only the UV signal of the lateral display shows additional negative
and moderate to strong correlations beside the already mentioned ones (display size and spur length),
namely with nectar amount (τb = -.464, p = .017), pollen (τb = -.511, p = .008) and ovules (τb = -.511,
p = .008). The four species with higher lateral absorption (P. emarginata, P. gracilis, P. hirtiflora and
P. medusina, see appendix, table A X.3.2) are therefore showing lower gamete production and nectar
amount.
The amount of nectar reward is further correlated strongly and highly significant with the produced
sugar content, where detectable (τb = .733, p = .000), as well as with gamete production (pollen:
τb = .669, p = .000; ovules: τb = .516, p = .002). Similarly, sugar production is also correlated to gamete
production (pollen: τb = .420, p = .037; ovules: τb = .530, p = .008). Nectar concentration is correlated to
no other variable, however.
Pollen production and ovule number are correlated strongly and highly significant (τb = .591, p = .000).
The p/o ratio is correlated to no other variable in Pinguicula.
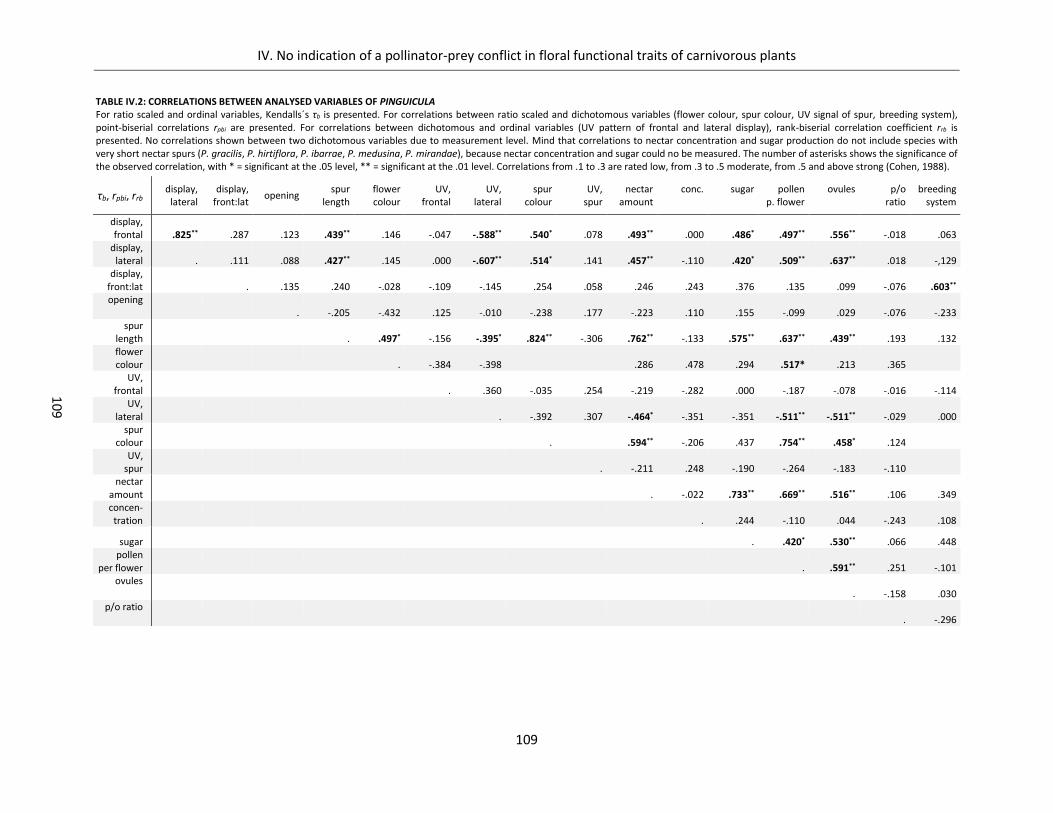
IV. No indication of a pollinator-prey conflict in floral functional traits of carnivorous plants
109
10
9
TABLE IV.2: CORRELATIONS BETWEEN ANALYSED VARIABLES OF PINGUICULA For ratio scaled and ordinal variables, Kendalls´s τb is presented. For correlations between ratio scaled and dichotomous variables (flower colour, spur colour, UV signal of spur, breeding system), point-biserial correlations rpbi are presented. For correlations between dichotomous and ordinal variables (UV pattern of frontal and lateral display), rank-biserial correlation coefficient rrb is presented. No correlations shown between two dichotomous variables due to measurement level. Mind that correlations to nectar concentration and sugar production do not include species with very short nectar spurs (P. gracilis, P. hirtiflora, P. ibarrae, P. medusina, P. mirandae), because nectar concentration and sugar could no be measured. The number of asterisks shows the significance of the observed correlation, with * = significant at the .05 level, ** = significant at the .01 level. Correlations from .1 to .3 are rated low, from .3 to .5 moderate, from .5 and above strong (Cohen, 1988).
τb, rpbi, rrb display,
lateral display,
front:lat opening
spur length
flower colour
UV, frontal
UV, lateral
spur colour
UV, spur
nectar amount
conc.
sugar
pollen p. flower
ovules
p/o ratio
breeding system
display, frontal .825** .287 .123 .439** .146 -.047 -.588** .540* .078 .493** .000 .486* .497** .556** -.018 .063
display, lateral . .111 .088 .427** .145 .000 -.607** .514* .141 .457** -.110 .420* .509** .637** .018 -,129
display, front:lat . .135 .240 -.028 -.109 -.145 .254 .058 .246 .243 .376 .135 .099 -.076 .603**
opening . -.205 -.432 .125 -.010 -.238 .177 -.223 .110 .155 -.099 .029 -.076 -.233
spur length . .497* -.156 -.395* .824** -.306 .762** -.133 .575** .637** .439** .193 .132 flower colour . -.384 -.398 .286 .478 .294 .517* .213 .365
UV, frontal . .360 -.035 .254 -.219 -.282 .000 -.187 -.078 -.016 -.114
UV, lateral . -.392 .307 -.464* -.351 -.351 -.511** -.511** -.029 .000
spur colour . .594** -.206 .437 .754** .458* .124
UV, spur . -.211 .248 -.190 -.264 -.183 -.110
nectar amount . -.022 .733** .669** .516** .106 .349 concen-tration . .244 -.110 .044 -.243 .108
sugar . .420* .530** .066 .448 pollen
per flower . .591** .251 -.101 ovules
. -.158 .030 p/o ratio
. -.296
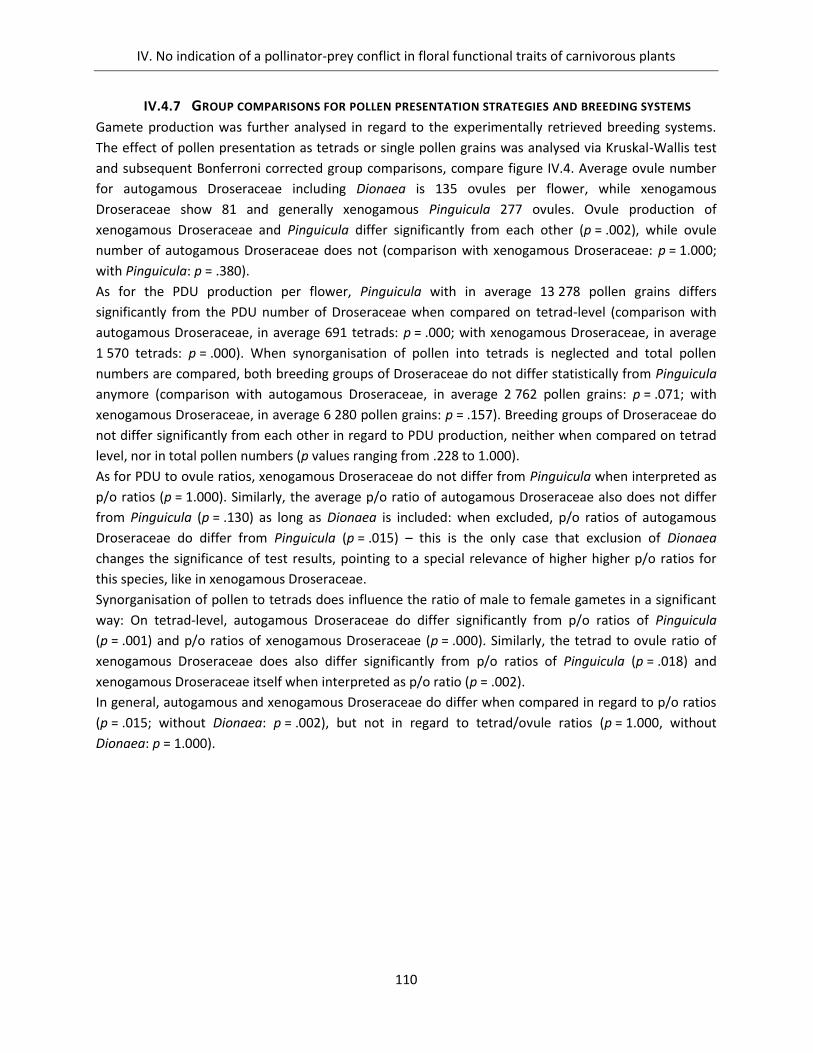
IV. No indication of a pollinator-prey conflict in floral functional traits of carnivorous plants
110
IV.4.7 GROUP COMPARISONS FOR POLLEN PRESENTATION STRATEGIES AND BREEDING SYSTEMS
Gamete production was further analysed in regard to the experimentally retrieved breeding systems.
The effect of pollen presentation as tetrads or single pollen grains was analysed via Kruskal-Wallis test
and subsequent Bonferroni corrected group comparisons, compare figure IV.4. Average ovule number
for autogamous Droseraceae including Dionaea is 135 ovules per flower, while xenogamous
Droseraceae show 81 and generally xenogamous Pinguicula 277 ovules. Ovule production of
xenogamous Droseraceae and Pinguicula differ significantly from each other (p = .002), while ovule
number of autogamous Droseraceae does not (comparison with xenogamous Droseraceae: p = 1.000;
with Pinguicula: p = .380).
As for the PDU production per flower, Pinguicula with in average 13 278 pollen grains differs
significantly from the PDU number of Droseraceae when compared on tetrad-level (comparison with
autogamous Droseraceae, in average 691 tetrads: p = .000; with xenogamous Droseraceae, in average
1 570 tetrads: p = .000). When synorganisation of pollen into tetrads is neglected and total pollen
numbers are compared, both breeding groups of Droseraceae do not differ statistically from Pinguicula
anymore (comparison with autogamous Droseraceae, in average 2 762 pollen grains: p = .071; with
xenogamous Droseraceae, in average 6 280 pollen grains: p = .157). Breeding groups of Droseraceae do
not differ significantly from each other in regard to PDU production, neither when compared on tetrad
level, nor in total pollen numbers (p values ranging from .228 to 1.000).
As for PDU to ovule ratios, xenogamous Droseraceae do not differ from Pinguicula when interpreted as
p/o ratios (p = 1.000). Similarly, the average p/o ratio of autogamous Droseraceae also does not differ
from Pinguicula (p = .130) as long as Dionaea is included: when excluded, p/o ratios of autogamous
Droseraceae do differ from Pinguicula (p = .015) – this is the only case that exclusion of Dionaea
changes the significance of test results, pointing to a special relevance of higher higher p/o ratios for
this species, like in xenogamous Droseraceae.
Synorganisation of pollen to tetrads does influence the ratio of male to female gametes in a significant
way: On tetrad-level, autogamous Droseraceae do differ significantly from p/o ratios of Pinguicula
(p = .001) and p/o ratios of xenogamous Droseraceae (p = .000). Similarly, the tetrad to ovule ratio of
xenogamous Droseraceae does also differ significantly from p/o ratios of Pinguicula (p = .018) and
xenogamous Droseraceae itself when interpreted as p/o ratio (p = .002).
In general, autogamous and xenogamous Droseraceae do differ when compared in regard to p/o ratios
(p = .015; without Dionaea: p = .002), but not in regard to tetrad/ovule ratios (p = 1.000, without
Dionaea: p = 1.000).
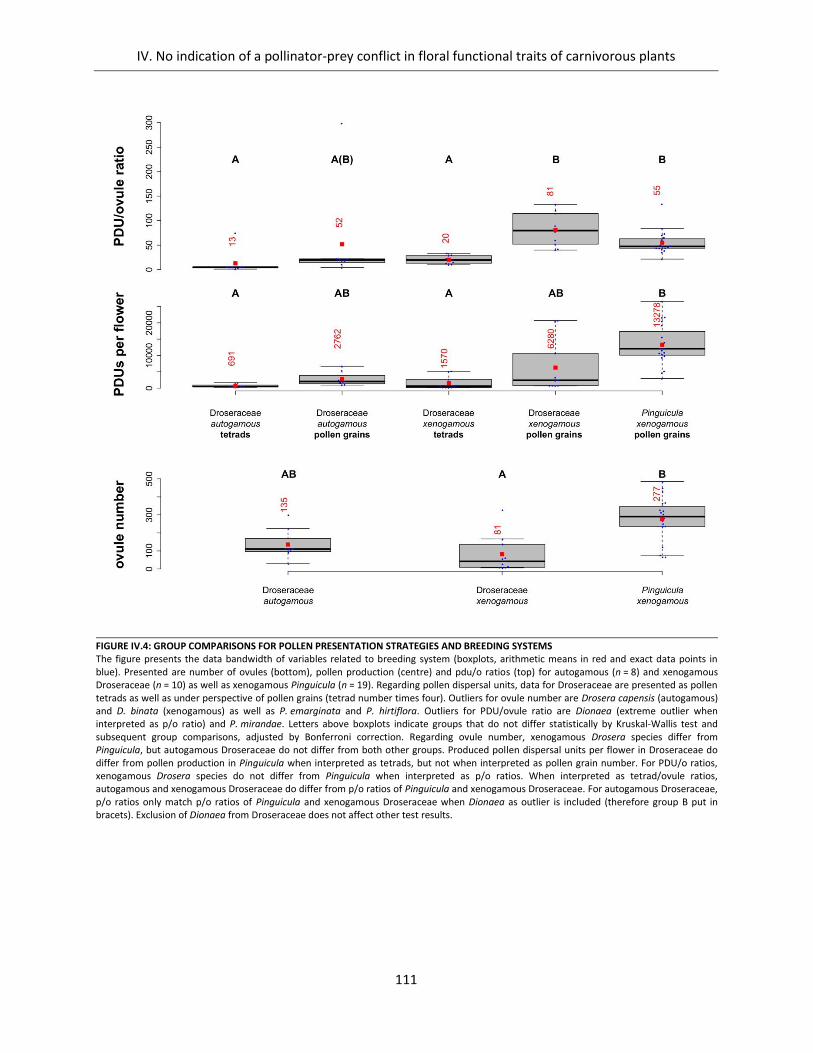
IV. No indication of a pollinator-prey conflict in floral functional traits of carnivorous plants
111
FIGURE IV.4: GROUP COMPARISONS FOR POLLEN PRESENTATION STRATEGIES AND BREEDING SYSTEMS The figure presents the data bandwidth of variables related to breeding system (boxplots, arithmetic means in red and exact data points in blue). Presented are number of ovules (bottom), pollen production (centre) and pdu/o ratios (top) for autogamous (n = 8) and xenogamous Droseraceae (n = 10) as well as xenogamous Pinguicula (n = 19). Regarding pollen dispersal units, data for Droseraceae are presented as pollen tetrads as well as under perspective of pollen grains (tetrad number times four). Outliers for ovule number are Drosera capensis (autogamous) and D. binata (xenogamous) as well as P. emarginata and P. hirtiflora. Outliers for PDU/ovule ratio are Dionaea (extreme outlier when interpreted as p/o ratio) and P. mirandae. Letters above boxplots indicate groups that do not differ statistically by Kruskal-Wallis test and subsequent group comparisons, adjusted by Bonferroni correction. Regarding ovule number, xenogamous Drosera species differ from Pinguicula, but autogamous Droseraceae do not differ from both other groups. Produced pollen dispersal units per flower in Droseraceae do differ from pollen production in Pinguicula when interpreted as tetrads, but not when interpreted as pollen grain number. For PDU/o ratios, xenogamous Drosera species do not differ from Pinguicula when interpreted as p/o ratios. When interpreted as tetrad/ovule ratios, autogamous and xenogamous Droseraceae do differ from p/o ratios of Pinguicula and xenogamous Droseraceae. For autogamous Droseraceae, p/o ratios only match p/o ratios of Pinguicula and xenogamous Droseraceae when Dionaea as outlier is included (therefore group B put in bracets). Exclusion of Dionaea from Droseraceae does not affect other test results.
IV. No indication of a pollinator-prey conflict in floral functional traits of carnivorous plants
112
IV.5 DISCUSSION
IV.5.1 OPTICAL FLOWER SIGNAL IS CRUCIAL FOR SORTING OF POLLINATOR AND PREY TAXA
Optical flower signal in visible and UV light, contrasting the rather homogenous colouration and UV
signal of the trap leaves, appears to be the crucial factor in sorting of pollinator and prey taxa for the
species analysed, at least influencing the duration and/or frequency of pollinator interactions with
flowers. The detected patterns of optical signal are generally highly conserved and invariant, to the
point that some pattern of optical signal are to homogenous for statistical analysis, namely presence
and UV light absorbance of anther dummy signal in Pinguicula flowers, anther colour in Droseraceae, as
well as greenish to reddish colouration of trap leaves in combination with their mixed UV signal
(reflecting mucilage above UV absorbing leaf surface). These very basic patterns of optical signal can be
subsumed under a general need for contrast and its importance for attraction and guidance: The frontal
flower display is contrasting strongly to the trap leaves via UV signal and flower colour for all genera
analysed. Especially the UV light signal of the frontal flower display has to be highlighted. It is either
showing reflection, sometimes in combination with a darker centre, or strong absorption. Moreover,
colouration and UV signal of anthers and anther dummy signal have to be highlighted in regard to
pollinator attraction and guidance. While openly visible anthers are only present in Droseraceae, anther
dummy signal in Pinguicula is compensating for hidden anthers in a more complex flower structure.
Anthers as well as anther dummies are contrasting very well to corolla colouration in visible light
spectrum, and predominantly show UV light absorption in order to enhance clarity of the colour signal
(Lunau, 2006).
IV.5.2 FUNCTIONAL INTEGRATION OF FLOWER TRAITS AND REPORTED POLLINATORS
Beside these highly conserved patterns, the analysed interplay of optical flower signal with other plant
traits is indicative for specialised attraction of pollinator guilds: The actinomorphic and saucer to bowl
shaped flowers of Droseraceae, in combination with predominantly white or pinkish to violet flower
colour and easily accessible anthers offering pollen as reward (beside nectar in Dionaea) are highly
indicative for short-proboscid pollinator guilds (Diptera, Hymenoptera). Detected correlations between
flower size and pollen production indicate an adaption to the body size of pollinators. More pronounced
frontal flower displays (display size ratio) are further correlated to colour, UV signal and true breeding
system, indicating higher resource investment in a pronounced and showy interface for plant-pollinator
interactions in outcrossing species. Otherwise, flower size, flower signal and gamete production are
largely uncorrelated. The p/o ratio is a valid indicator for breeding system in Droseraceae, showing
higher values in xenogamous species. Field observations of flower visitors report a broad spectrum of
short-probiscid pollinators: Scarabaeidae, Rutelinae/Hopliini (Goldblatt et al., 1998); Syrphidae,
Calliphoridae, Dolichopodidae (Murza and Davis, 2005); syrphid flies and tachinid flies (Sciligo, 2009);
bees, syrphid flies, and meloid beetles in D. tracyi (Wilson, 1995) – compare Jürgens et al. (2012). As for
Dionaea, Hymenoptera (mainly bees) and Coleoptera are the most abundant pollen vectors
(Youngsteadt et al., 2018).
In Pinguicula, zygomorphic flower structure and nectar reward hidden in spurs (Lustofin et al., 2019) are
indicative for sucking nectar uptake of insect pollinators with a proboscis (Diptera, Lepidoptera,
Hymenoptera), or even birds. Mind again that missing correlations to nectar concentration in the
IV. No indication of a pollinator-prey conflict in floral functional traits of carnivorous plants
113
dataset at hand are very likely caused by missing measurements for species with shorter nectar spurs:
Fast crystallisation of minute nectar amounts in short spured species indicate higher nectar sugar
concentrations as an adaption to pollinator guilds with shorter proboscis length (possibly
Hymenoptera). In support of this hypothesis, P. gigantea, the only short spured species where nectar
concentration could be measured, showed the highest concentration (38.2 %). As for long-spured
species, nectar concentrations could be assessed and are generally low, representing an adaption to
long-tongued pollinators. Similary like Droseraceae, stouter flowers (display sizes) correlate to higher
investment in pollen and ovule production. Additionally, larger flowers are also correlated to higher
nectar amount and sugar production, pointing to a general link to resource investment, and possibly
body size and nutritional needs of pollinators. Reddish spur and display colour as well as longer spurs
are also indicative for higher resource investment in nectar and pollen production in this dataset,
assumedly due to pollinator specialisation. An example in this context is P. laueana: Bird pollination is
likely and often stated in literature, indicated by red flower colour, missing anther dummy signal and
suitable nectar reward. However, verification in the field is still missing (cf. Lustofin et al., 2019). As for
breeding systems, only a pronounced frontal display size (display size ratio) is indicative for stronger
outcrossing. Other variables are uncorrelated and p/o ratio is of no explanatory value, showing the
breeding system generally disjunct from other floral plant traits.
Reported field observations of flower visitors are rare for Pinguicula. The following flower visitors were
observed for P. vulgaris: Bees (identified: Osmia caementaria Gerst.), an unidentified Lepidopterid and
two beetles (Heslop-Harrison, 2004, citing Muller (sic: Müller) 1881, 1886 (sic: 1883)). For
P. vallisneriifolia following taxa were observed: beeflies (Bombylius sp.) and bees (Andrena sp.,
Anthophora sp., Bombus terrestris, Halictus sp., Lasioglossum sp., Osmia cornuta), hawkmoths,
butterflies, calliphorid flies, small beetles and thrips (Zamora, 1999). For P. moranensis 14 species of
Lepidoptera were observed, beside two Hymenopteran species and one Diptera (Villegas and Alcalá,
2018).
All in all, the concept of pollination syndromes (e.g. Delpino, 1868–1875; Vogel, 1954; van der Pijl, 1961;
Baker and Hurd, 1986; Faergi and van der Pijl, 1979; Rosas-Guerrero et al., 2014; Johnson and Wester,
2017) can be a fruitful perspective in order to explain sorting of pollinators and prey in carnivorous
plants via attraction and guiding. However, more field studies and observations of pollinator and prey
taxa are urgently needed.
IV.5.3 EQUALLY EFFICIENT: ZYGOMORPHY IN PINGUICULA AND POLLEN TETRADS IN DROSERACEAE
Droseraceae and Pinguicula are very different in regard to flower morphology: A zygomorphic flower
structure, a small flower opening and a very sophisticated arrangement of reproductive organs are
controlling pollinator interactions in Pinguicula (Villegas and Alcalá, 2018, give a detailed description for
P. moranensis). This is opposed by actinomorphic flower structures in Droseraceae, allowing pollinators
for uncontrolled access to the reproductive organs. Synorganisation of pollen material into tetrads
heightens reproductive success in Droseraceae: Per pollen tetrad successfully dispersed as a single unit,
four pollen grains are transmitted. Tetrad dispersal emerges as a statistically significant factor,
influencing the interpretation of PDU/ovule ratios. Interestingly, almost identical pollen to ovule ratios
have evolved for xenogamous breeding systems in phylogenetically unrelated lineages of carnivorous
IV. No indication of a pollinator-prey conflict in floral functional traits of carnivorous plants
114
plants. The pollination process is therefore equally efficient, realised by alternative strategies to
improve effectiveness of pollen transmission.
IV.5.4 AUTOGAMY AS REPRODUCTIVE ASSURANCE MECHANISM IN DROSERACEAE
While not realised in Pinguicula, spontaneous autogamy secures reproductive success in some
Droseraceae. Autogamy is another strategy to enhance effectiveness of pollen transmission for the price
of genetic recombination, correlated to lower pollen to ovule ratios. While autogamous Droseraceae do
not differ from Pinguicula in regard to ovule production, ovule numbers are lowered significantly in
xenogamous Drosera to enhance reproductive success. It should be noted that all analysed Drosera
species showing xenogamous breeding systems are of Australian origin, except D. regia. Our findings
complement the results of Chen, James and Stace (1997) who reported self-compatibilty in three out of
20 analysed Western Australian Drosera species. We can validate self-incompatibility for Drosera
menziesii ssp. menziesii, and can newly report obligate xenogamy for the following Australian species:
D. adelae, D. binata, D. callistos, D. dichrosepala, D. leioblastus, D. paleacea subsp. roseana, D. paradoxa
and D. platystigma. While a phylogenetic signal underlying this pattern cannot be excluded, it has to be
regarded of subordinate relevance for the ecological question of effective pollen transmission and
functional breeding strategies in the context of a possible pollinator-prey conflict (see next section).
A special case is with autogamous Dionaea, and two explanations are possible for its higher p/o ratios:
On the one hand, Dionaea is characterised by a very pronounced mellitophilous pollination syndrome.
From observations in Bonn Botanical Garden, Dionaea is by far outdoing other Droseraceae
(comparable in regard to flower shape, colouration and UV signal) in terms of hymenopteran flower
visitations. The presence of nectar reward in Dionaea as pollinator attractant is not to be neglected in
this context. On the other hand, two out of four plant individuals tested showed spontaneous
autogamy, the others not. Both, the high frequency of hymenoptera visitations and therewith
associated pollen loss, as well as presence of different breeding strategies in the genus, need to be
researched further.
IV.5.5 GENERALLY LOW P/O RATIOS INDICATE MISSING POLLINATOR-PREY CONFLICT
When controlling for breeding strategy and taking a closer look at the mere production of pollen grains
in relation to ovule numbers, the differences between Droseraceae and Pinguicula diminish:
Xenogamous Drosera as well as Pinguicula species show a high resemblance in p/o ratios. When
compared to p/o ratios reported in literature, the p/o ratios present here for xenogamous flypaper trap
carnivory have to be rated as extremely low: The respective p/o ratios are rather resembling
autogamous than xenogamous breeding systems. However, p/o ratios as indicators of breeding systems
are no clear-cut thresholds, and research showed that the relationship between p/o ratios and breeding
systems does vary between taxonomic units, usually holding on family level (Cruden, 2000), and is
further influenced by biotic and abiotic environmental variables (Wilmer, 2011). In this sense, very low
p/o ratios in xenogamous breeding systems of flypaper trap carnivory can be interpreted as a coping
strategy in order to deal with the general resource limitation of the nutrition-deprived habitats. More
importantly however, the extremely low p/o ratios in clearly xenogamous breeding systems of active
IV. No indication of a pollinator-prey conflict in floral functional traits of carnivorous plants
115
flypaper plants are a strong indicator that pollen transmission via animal vectors is highly effective, and
pollinator-prey conflict of no relevance for outcrossing efficiency.
IV.6 ACKNOWLEDGEMENTS
We thank Hans-Jürgen Ensikat for assistance with CSEM (Nees Institute, University of Bonn).
IV.7 LITERATURE
Alarcón, M.L., Roquet, C., Aldasoro, J.J., 2011. Evolution of pollen/ovule ratios and breeding system in
Erodium (Geraniaceae). Systematic Botany 36, 661–676.
https://doi.org/10.1600/036364411X583637
Anderson, B., 2010. Did Drosera evolve long scapes to stop their pollinators from being eaten? Annals of
Botany 106, 653–657. https://doi.org/10.1093/aob/mcq155
Anderson, B., Midgley, J.J., 2001. Food or sex; pollinator–prey conflict in carnivorous plants. Ecology
Letters 4, 511–513. https://doi.org/10.1046/j.1461-0248.2001.00258.x
Baker, H.G., Hurd, P.D., 1968. Intrafloral ecology. Annual Review of Entomology 13, 385–414.
https://doi.org/10.1146/annurev.en.13.010168.002125
Chen, L., James, S.H. and Stace, H.M., 1997. Self-incompatibility, seed abortion and clonality in the
breeding systems of several western Australian Drosera species (Droseraceae). Australian
Journal of Botany 45, 191–201. https://doi.org/10.1071/BT96027
Cohen, J., 1988. Statistical power analysis for the behavioral sciences, 2nd ed. L. Erlbaum Associates,
Hillsdale, N.J.
Cruden, R.W., 1977. Pollen-ovule ratios: A conservative indicator of breeding systems in flowering
plants. Evolution 31, 32–46. https://doi.org/10.2307/2407542
Cruden, R.W., 2000. Pollen grains: Why so many? Plant Systematics and Evolution 222, 143–165.
https://doi.org/10.1007/BF00984100
Cruden, R.W., Jensen, K.G., 1979. Viscin threads, pollination efficiency and low pollen-ovule ratios.
American Journal of Botany 66, 875–879. https://doi:10.1002/j.1537-2197.1979.tb06295.x
Cruden, R.W., Lyon, D.L., 1985. Correlations among stigma depth, style length, and pollen grain size: Do
they reflect function or phylogeny? Botanical Gazette 146, 143–149.
https://doi.org/10.1086/337509
Cruden, R.W., Miller-Ward, S., 1981. Pollen-ovule ratio, pollen size, and the ratio of stigmatic area to the
pollen-bearing area of the pollinator: An hypothesis. Evolution 35, 964–974.
https://doi.org/10.2307/2407867
de Jager, M.L., Willis-Jones, E., Critchley, S., Glover, B.J., 2016. The impact of floral spot and ring
markings on pollinator foraging dynamics. Evolutionary Ecology 31, 1–12.
Delpino, F., 1868–1875. Ulteriori osservazione sulla dicogamia nel regno vegetale. Atti della Societa
Italiana di Scienze Naturali Milano, Vols. 1 and 2.
Deppe, J.L., Dress, W.J., Nastase, A.J., Newell, S.J., Luciano, C.S., 2000. Diel variation of sugar amount in
nectar from pitchers of Sarracenia purpurea L. with and without insect visitors. The American
Midland Naturalist 144, 123–132.
https://doi.org/10.1674/0003-0031(2000)144[0123:DVOSAI]2.0.CO;2
IV. No indication of a pollinator-prey conflict in floral functional traits of carnivorous plants
116
Dress, W.J., Newell, S.J., Nastase, A.J., Ford, J.C., 1997. Analysis of amino acids in nectar from pitchers of
Sarracenia purpurea (Sarraceniaceae). American Journal of Botany 84, 1701–1706.
Ellison, A.M., Gotelli, N.J., 2009. Energetics and the evolution of carnivorous plants — Darwin’s ‘most
wonderful plants in the world.’ Journal of Experimental Botany 60, 19–42.
https://doi.org/10.1093/jxb/ern179
El-Sayed, A.M., Byers, J.A., Suckling, D.M., 2016. Pollinator-prey conflicts in carnivorous plants: When
flower and trap properties mean life or death. Scientific Reports 6, 21065.
https://doi.org/10.1038/srep21065
Fægri, K., van der Pijl, L., 1979. The principles of pollination ecology. 3rd ed. Pergamon, Oxford.
Galetto, L., Bernardello, G. (2005). Nectar. In: Dafni, A., Kevan, P.G., Husband, B.C., eds. Practical
pollination biology. Enviroquest Ltd., Cambridge, Ontario. 261–313.
Glossner, F. (1992). Ultraviolet patterns in the traps and flowers of some carnivorous plants.
Botanische Jahrbücher 113, 577–587.
Goldblatt, P., Bernhardt, P., Manning, J.C., 1998. Pollination of petaloid geophytes by monkey beetles
(Scarabaeidae: Rutelinae: Hopliini) in southern Africa. Annals of the Missouri Botanical Garden
85, 215–230. https://doi.org/10.2307/2992006
Gómez, J.M., Perfectti, F., Camacho, J.P.M., 2006. Natural selection on Erysimum mediohispanicum
flower shape: Insights into the evolution of zygomorphy. The American Naturalist 168, 531–545.
https://doi.org/10.1086/507048
Halbritter, H., Hesse, M., Weber, M., 2012. The unique design of pollen tetrads in Dionaea and Drosera.
Grana 51, 148–157. https://doi.org/10.1080/00173134.2012.677856
Harder, L.D., Barrett, S.C.H., 1995. Mating cost of large floral displays in hermaphrodite plants. Nature
373, 512–515. https://doi.org/10.1038/373512a0
Heslop-Harrison, Y., 2004. Pinguicula L. Journal of Ecology 92, 1071–1118.
https://doi.org/10.1111/j.0022-0477.2004.00942.x
Joel, D.M., Juniper, B.E., Dafni, A., 1985. Ultraviolet patterns in the traps of carnivorous plants. New
Phytologist 101, 585–593. https://doi.org/10.1111/j.1469-8137.1985.tb02864.x
Johnson, S.D., Wester, P., 2017. Stefan Vogel’s analysis of floral syndromes in the South African flora: An
appraisal based on 60 years of pollination studies. Flora 232, 200–206.
https://doi.org/10.1016/j.flora.2017.02.005
Juniper, B.E., Robins, R.J., Joel, D.M., 1989. The carnivorous plants. Academic Press, London, San Diego.
Jürgens, A., El-Sayed, A.M., Suckling, D.M., 2009. Do carnivorous plants use volatiles for attracting prey
insects? Functional Ecology 23, 875–887.
Jürgens, A., Sciligo, A., Witt, T., El-Sayed, A.M., Suckling, D.M., 2012. Pollinator-prey conflict in
carnivorous plants. Biological Reviews 87, 602–615.
https://doi.org/10.1111/j.1469-185X.2011.00213.x
Jürgens, A., Witt, T., Sciligo, A., El-Sayed, A.M., 2015. The effect of trap colour and trap-flower distance
on prey and pollinator capture in carnivorous Drosera species. Functional Ecology 29, 1026–
1037. https://doi.org/10.1111/1365-2435.12408
Karron J.D., Ivey, C.T., Mitchell, R.J., Whitehead, M.R., Peakall, R., Case, A.L., 2012. New
perspectives on the evolution of plant mating systems. Annals of Botany 109, 493–503.
IV. No indication of a pollinator-prey conflict in floral functional traits of carnivorous plants
117
Kemp, J.E., Bergh, N.G., Soares, M., Ellis, A.G., 2019. Dominant pollinators drive non-random community
assembly and shared flower colour patterns in daisy communities. Annals of Botany 123, 277–
288. https://doi.org/10.1093/aob/mcy126
Kessler, D., Gase, K., Baldwin, I.T., 2008. Field experiments with transformed plants reveal the sense of
floral scents. Science 321, 1200–1202. https://doi.org/10.1126/science.1160072
Kirk, W.D.J., 1993. Interspecific size and number variation in pollen grains and seeds. Botanical Journal
of the Linnean Society 49, 239–248. https://doi.org/10.1111/j.1095-8312.1993.tb00903.x
Kulbaba, M.W., Worley, A.C., 2012. Selection on floral design in Polemonium brandegeei
(Polemoniaceae): female and male fitness under hawkmoth pollination. Evolution 66,
1344–1359. https://doi.org/10.1111/j.1558-5646.2011.01536.x
Kulbaba, M.W., Worley, A.C., 2013. Selection on Polemonium brandegeei (Polemoniaceae) flowers
under hummingbird pollination: In opposition, parallel, or independent of selection by
hawkmoths? Evolution 67, 2194–2206. https://doi.org/10.1111/evo.12102
Kurup, R., Johnson, A.J., Sankar, S., Hussain, A.A., Kumar, C.S., Sabulal, B., 2013. Fluorescent prey traps
in carnivorous plants. Plant Biology 15, 611–615.
https://doi.org/10.1111/j.1438-8677.2012.00709.x
Larue, A.-A.C., Raguso, R.A., Junker, R.R., 2015. Experimental manipulation of floral scent bouquets
restructures flower-visitor interactions in the field. Journal of Animal Ecology 85, 396–408.
https://doi.org/10.1111/1365-2656.12441
López, J., Rodríguez-Riaño, T., Ortega-Olivencia, A., Antonio Devesa, J., Ruiz, T., 1999. Pollination
mechanisms and pollen-ovule ratios in some Genisteae (Fabaceae) from southwestern Europe.
Plant Systematics and Evolution 216, 23–47. https://doi.org/10.1007/BF00985099
Lozada‐Gobilard, S., Weigend, M., Fischer, E., Janssens, S.B., Ackermann, M., Abrahamczyk, S., 2019.
Breeding systems in Balsaminaceae in relation to pollen/ovule ratio, pollination syndromes, life
history and climate zone. Plant Biology 21, 157–166. https://doi.org/10.1111/plb.12905
Lunau, K., 2006. Stamens and mimic stamens as components of floral colour patterns. Botanische
Jahrbücher 127, 13–41. https://doi.org/10.1127/0006-8152/2006/0127-0013
Lustofin, K., Świątek, P., Miranda, V.F.O., Płachno, B.J., 2019. Flower nectar trichome structure of
carnivorous plants from the genus butterworts Pinguicula L. (Lentibulariaceae). Protoplasma.
https://doi.org/10.1007/s00709-019-01433-8
Merbach, M.A., Zizka, G., Fiala, B., Maschwitz, U., Booth, W.E., 2001. Patterns of nectar secretion in five
Nepenthes species from Brunei Darussalam, northwest Borneo, and implications for ant-plant
relationships. Flora 196, 153–160. https://doi.org/10.1016/S0367-2530(17)30030-0
Michalski, S.G., Durka, W., 2009. Pollination mode and life form strongly affect the relation between
mating system and pollen to ovule ratios. New Phytologist 183, 470–479.
https://doi.org/10.1111/j.1469-8137.2009.02861.x
Miles, H., D., Kokpol, U., Mody, N.V., Hedin, P.A., 1975. Volatiles in Sarracenia flava. Phytochemistry 14,
845–846. https://doi.org/10.1016/0031-9422(75)83066-4
Minnaar, C., Anderson, B., de Jager, M.L., Karron, J.D., 2019. Plant–pollinator interactions along the
pathway to paternity. Annals of Botany 123, 225–245. https://doi.org/10.1093/aob/mcy167
Moran, J.A., 1996. Pitcher dimorphism, prey composition and the mechanisms of prey attraction in the
pitcher plant Nepenthes rafflesiana in Borneo. Journal of Ecology.
IV. No indication of a pollinator-prey conflict in floral functional traits of carnivorous plants
118
https://doi.org/10.2307/2261474
Moran, J.A., Booth, W.E., Charles, J.K., 1999. Aspects of pitcher morphology and spectral characteristics
of six Bornean Nepenthes pitcher plant species: implications for prey capture. Annals of Botany
83, 521–528.
Møller, A.P., 1995. Bumblebee preference for symmetrical flowers. Proceedings of the National
Academy of Sciences 92, 2288–2292. https://doi.org/10.1073/pnas.92.6.2288
Müller, H., 1881. Alpenblumen, ihre Befruchtung durch Insekten und ihre Anpassungen an dieselben.
Leipzig.
Müller, H., Thompson, D.W., 1883. The fertilisation of flowers. Translated and edited by D’Arcy W.
Thompson, with a preface by Charles Darwin. Macmillan, London.
Murza, G.L., Davis, A.R., 2005. Flowering phenology and reproductive biology of Drosera anglica
(Droseraceae). Botanical Journal of the Linnean Society 147, 417–426.
https://doi.org/10.1111/j.1095-8339.2005.00395.x
Murza, G.L., Davis, A.R., 2003. Comparative flower structure of three species of sundew (Drosera
anglica, Drosera linearis, and Drosera rotundifolia) in relation to breeding system. Canadian
Journal of Botany 81, 1129–1142. https://doi.org/10.1139/b03-104
Murza, G.L., Heaver, J.R., Davis, A.R., 2006. Minor pollinator–prey conflict in the carnivorous plant,
Drosera anglica. Plant Ecology 184, 43–52. https://doi.org/10.1007/s11258-005-9050-y
Neuendorf, J., 2013. Das Urinsediment: Mikroskopie-Präanalytik-Auswertung und Befundung. Springer-
Verlag, Berlin, Heidelberg. https://doi.org/10.1007/978-3-642-37810-2
Rodondi, G., Beretta, M., Andreis, C., 2010. Pollen morphology of alpine butterworts (Pinguicula L.,
Lentibulariaceae). Review of Palaeobotany and Palynology 162, 1–10.
https://doi.org/10.1016/j.revpalbo.2010.03.005
Rosas-Guerrero, V., Aguilar, R., Martén-Rodríguez, S., Ashworth, L., Lopezaraiza-Mikel, M., Bastida, J.M.,
Quesada, M., 2014. A quantitative review of pollination syndromes: do floral traits predict
effective pollinators? Ecology Letters 17, 388–400. https://doi.org/10.1111/ele.12224
Sciligo, A.R., 2009. Food or sex: which would you choose? Pollinator-prey conflict and reproductive
assurance in New Zealand Drosera (Thesis). Lincoln University.
Sletvold, N., Trunschke, J., Smit, M., Verbeek, J., Ågren, J., 2016. Strong pollinator-mediated
selection for increased flower brightness and contrast in a deceptive orchid. Evolution 70,
716–724.
Small, E., 1988. Pollen-ovule patterns in tribe Trifolieae (Leguminosae). Plant Systematics and Evolution
160, 195–205. https://doi.org/10.1007/BF00936047
Stanton, M.L., Snow, A.A., Handel, S.N., 1986. Floral evolution: Attractiveness to pollinators increases
male fitness. Science 232, 1625–1627. https://doi.org/10.1126/science.232.4758.1625
van der Pijl, L., 1961. Ecological aspects of flower evolution. II. Zoophilous flower classes. Evolution 15,
44–59. https://doi.org/10.2307/2405842
Villegas, S.G., Alcalá, R.E., 2018. Reproductive ecology of the carnivorous plant Pinguicula moranensis
(Lentibulariaceae). Plant Biology 20, 205–212. https://doi.org/10.1111/plb.12652
Vogel, S., 1954. Blütenbiologische Typen als Elemente der Sippengliederung, dargestellt anhand der
Flora Südafrikas. Botanische Studien 1. Fischer, Jena.
Willmer, P.G., 2011. Pollination and floral ecology. Princeton University Press, Princeton, N.J.
IV. No indication of a pollinator-prey conflict in floral functional traits of carnivorous plants
119
Wilson, P., 1995. Variation in the intensity of pollination in Drosera tracyi: Selection is strongest when
resources are intermediate. Evolutionary Ecology 9, 382–396.
https://doi.org/10.1007/BF01237761
Youngsteadt, E., Irwin, R.E., Fowler, A., Bertone, M.A., Giacomini, S.J., Kunz, M., Suiter, D., Sorenson,
C.E., 2018. Venus flytrap rarely traps its pollinators. The American Naturalist 191, 539–546.
https://doi.org/10.1086/696124
Zamora, R., 1999. Conditional outcomes of interactions: The pollinator-prey conflict of an insectivorous
plant. Ecology 80, 786–795. https://doi.org/10.2307/177017

IV. No indication of a pollinator-prey conflict in floral functional traits of carnivorous plants
120
V. Plasticity of flower traits in Streptocarpus
121
V. PLASTICITY OF FLOWER TRAITS IN STREPTOCARPUS: FLORAL
ARCHITECTURE, OPTICAL SIGNAL, NECTAR REWARD AND REPRODUCTIVE
SYSTEM LARGELY DISJUNCT AND EVOLUTIONARY RECOMBINED
V. Plasticity of flower traits in Streptocarpus Authors A. W. Mues*, T. Liu* and M. Weigend* * Nees Institut für Biodiversität der Pflanzen, Universität Bonn, 53115 Bonn, Germany
V.1 ABSTRACT
Background and aims: Floral types of Streptocarpus are described as indicators of pollination syndromes
in literature. We present quantitative measurements of key reproductive characters (pollen, ovules, p/o
ratios), nectar reward (nectar amount, concentration, sugar content) and floral architecture, combined
with categorical assessment of optical flower signal (daylight and UV light spectrum) and breeding
system for 18 species of Streptocarpus subgenus Streptocarpus. The selected species cover the floral
diversity of the genus to a large extent. We investigate the validity of the pollination syndromes concept
in the genus and the functional integration of floral plant traits. Results are further presented and
discussed in a phylogenetic context.
Methods: Pollen and ovule counting, hand pollination experiments, nectar measurements (amounts,
sugar concentration), UV light photography, hierarchical clustering, Non-metric Multidimensional Scaling
(NMDS), vector fitting, phylogenetic analysis.
Key results: Commonly described floral types of Streptocarpus are only explanatory for floral
architecture. Gamete production and p/o ratios are of no explanatory value for the experimentally
determined breeding systems. Flower size is correlated to pollen and ovule production. Flower length is
correlated to nectar reward. Higher nectar amount and sugar production are correlated to higher pollen
production. Higher nectar concentration is correlated to reddish flowers with stronger UV reflection,
pointing to a coupling between the sensory capacities of pollinators and their nutritional needs.
Otherwise, flower traits are combined freely amongst each other and along the retrieved phylogeny.
Conclusions: The analysed subsets of floral functional traits are largely uncorrelated and show extreme
plasticity, not supporting the idea of clear-cut pollination syndrome pattern – only floral architecture is
supported by floral types. Only few traits seem to be of importance for attraction and interaction with
potential animal pollen vectors. Floral architecture and the link between optical attraction and reward
appear as two different evolutionary driving forces. Both levels appear to be recombined freely. No clear
phylogenetic pattern is evident for floral types, clusters of floral functional traits and pollination
syndromes, indicating almost free recombination along the course of evolution.
Key words: Streptocarpus, pollination, floral architecture, nectar, reward, gametes, pollen, ovules, p/o
ratio, flower signal, UV signal, floral function, clusters, ordination, NMDS, phylogeny.
V. Plasticity of flower traits in Streptocarpus
122
V.2 INTRODUCTION
Streptocarpus Lindl., commonly known as Cape Primroses, have caught the attention of botanists since
their discovery in the early 19th century, and are of considerable interest to horticulturists and plant
breeders. Extensive breeding efforts during the last centuries have created a wide array of cultivars of
high economic importance (Buta et al., 2010; Nishii et al., 2015). Not only is Streptocarpus characterised
by a wide spectrum of very conspicuous flower shapes and colours. Species of Streptocarpus subgenus
Streptocarpus also show highly unusual vegetative morphology and are missing a conventional shoot
apical meristem: One of the cotyledons is growing out into the only leaf of the adult plant
("phyllomorph"), with inflorescences sprouting from the basal portion of the midrib (Hilliard and Burtt,
1971; Möller and Cronk, 2001).
Today, approximately 179 species of Streptocarpus are known, and the genus was recently expanded to
include all African and Malagasy Gesneriaceae genera of subtribe Streptocarpinae, subfamily
Didymocarpoideae tribe Trichosporeae (Möller et al., 2019, citing Darbyshire and Massingue, 2014;
Nishii et al., 2015; Randrianasolo et al., 2018). Many species evolved very recently round about 1.5
million years ago, via radiation in the eastern South Africa (Möller et al., 2019; Möller and Cronk, 2001).
Floral diversity of Streptocarpus has been of long scientific interest. Hilliard and Burtt (1971), wrote:
While "the bare technical description ‘corolla gametopetalous, five-lobed, zygomorphic’" is able to
describe almost the complete range of floral diversity in Gesneriaceae in a morphological way, "one of
the focal points of interest about Streptocarpus is that so great a proportion of the possible diversity is
actually realized within this one genus" when considering the "wide variation in the shape of the corolla"
(Hilliard and Burtt, 1971: 34–35). Therefore, floral diversity in Streptocarpus is diversity of floral
architecture, not floral morphology: floral architecture describes the flower as the outcome of
synorganisation and fusion, differential growth rates (Endress, 1996), and the modification of floral
organs (Jeiter et al., 2017; Jeiter and Weigend, 2018). Latest illustration of floral diversity was presented
by Möller et al. (2019), based on the general framework of open tube, keyhole, personate, small-pouch,
flat-faced Saintpaulia and bird-pollination flower types of Harrison et al. (1999), Hughes et al. (2006)
and modifications by Nishii et al. (2015), further revised by knowledge of pollination mechanisms and
observations and recently discovered species. All in all, Möller et al. (2019) identified seven main flower
types and six subtypes for the open-tube type, of which five major flower types and three subtypes are
analysed in this paper, see also figure V.1:
Flowers of the small-pouch type are predominantly small with short limbs and tubes, allowing
pollinators to fully enter the corolla. The keyhole type is characterised by a laterally strongly
compressed corolla opening, usually showing only a 2-3 mm narrow vertical slit, and an S-shaped
cylindrical corolla tube. Pollinators cannot enter the corolla with their full body: Only the proboscis can
be inserted to access nectar, and pollen material is also deposited on the proboscis of potential vectors.
Flowers of the personate type are characterised by a lower corolla lip that is folded upward at a right
angle, closing the gap between the lips. Pollinators are able to access the flowers by folding down the
lower lip with their body weight. The bird-pollination type is characterised by tubular flowers with
reddish colour signal to attract avian pollinators, only S. dunnii and S. myoporoides belong to this group.
As for the open tube flower type, three subtypes have to be highlighted here:
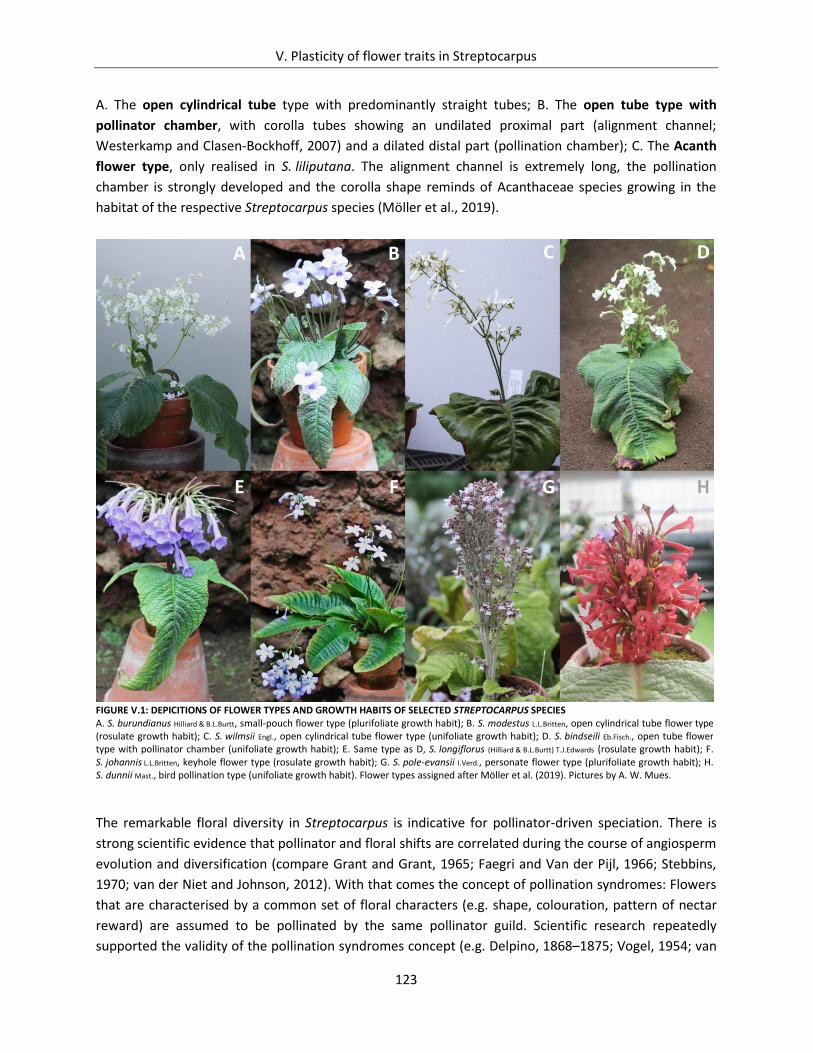
V. Plasticity of flower traits in Streptocarpus
123
A. The open cylindrical tube type with predominantly straight tubes; B. The open tube type with
pollinator chamber, with corolla tubes showing an undilated proximal part (alignment channel;
Westerkamp and Clasen-Bockhoff, 2007) and a dilated distal part (pollination chamber); C. The Acanth
flower type, only realised in S. liliputana. The alignment channel is extremely long, the pollination
chamber is strongly developed and the corolla shape reminds of Acanthaceae species growing in the
habitat of the respective Streptocarpus species (Möller et al., 2019).
The remarkable floral diversity in Streptocarpus is indicative for pollinator-driven speciation. There is
strong scientific evidence that pollinator and floral shifts are correlated during the course of angiosperm
evolution and diversification (compare Grant and Grant, 1965; Faegri and Van der Pijl, 1966; Stebbins,
1970; van der Niet and Johnson, 2012). With that comes the concept of pollination syndromes: Flowers
that are characterised by a common set of floral characters (e.g. shape, colouration, pattern of nectar
reward) are assumed to be pollinated by the same pollinator guild. Scientific research repeatedly
supported the validity of the pollination syndromes concept (e.g. Delpino, 1868–1875; Vogel, 1954; van
FIGURE V.1: DEPICITIONS OF FLOWER TYPES AND GROWTH HABITS OF SELECTED STREPTOCARPUS SPECIES A. S. burundianus Hilliard & B.L.Burtt, small-pouch flower type (plurifoliate growth habit); B. S. modestus L.L.Britten, open cylindrical tube flower type (rosulate growth habit); C. S. wilmsii Engl., open cylindrical tube flower type (unifoliate growth habit); D. S. bindseili Eb.Fisch., open tube flower type with pollinator chamber (unifoliate growth habit); E. Same type as D, S. longiflorus (Hilliard & B.L.Burtt) T.J.Edwards (rosulate growth habit); F. S. johannis L.L.Britten, keyhole flower type (rosulate growth habit); G. S. pole-evansii I.Verd., personate flower type (plurifoliate growth habit); H. S. dunnii Mast., bird pollination type (unifoliate growth habit). Flower types assigned after Möller et al. (2019). Pictures by A. W. Mues.
V. Plasticity of flower traits in Streptocarpus
124
der Pijl, 1961; Baker and Hurd, 1986; Faergi and van der Pijl, 1979; Gegear and Burns, 2007; Johnson,
2010; Gómez et al., 2008; van der Niet and Johnson, 2012; Newman et al., 2014; Rosas-Guerrero et al.,
2014; Abrahamczyk et al., 2017; Johnson and Wester, 2017; Dellinger et al., 2018; Ibañez et al., 2019).
As for Streptocarpus, Harrison et al. (1999) pointed out that the described floral types are indicative of
at least four different pollination syndromes, namely: small fly pollination (pouch type), bee pollination
(open tube and personate type), moth or butterfly pollination (keyhole type), and bird pollination
(S. dunnii). However, pollination biology of Streptocarpus is still poorly known and pollinator
information is almost as scarce as it was 50 years ago, when Hilliard and Burtt (1971) emphasised that
only a functional understanding could explain the diversification. Möller et al. (2019) only report tabanid
and/or nemistrinid long-proboscid flies for S. primulifolius (only two pollinator visits observed after
about a week of observation; Bellstedt, Hughes, Möller, pers. obs.), and Potgieter and Edwards (2006)
report S. formosus to be part of the pollination guild of the nemistrinid long-proboscid fly
Stenobasipteron wiedemanni, along with 18 other plant species of six families (Acanthaceae,
Balsaminaceae, Gesneriaceae, Iridaceae, Lamiaceae, and Orchidaceae). The involvement of long-
tongued flies in the pollination of open tube flower types of Streptocarpus was unexpected (Möller et
al., 2019) due to suggested bee pollination in earlier work (Harrison et. al., 1999). Long assumed bird-
pollination of S. dunnii has been confirmed only a few years ago (one visit by the malachite sunbird,
Nectarinia famosa L., observed by Bellstedt, Hughes, Möller in 2004; published in Möller et al., 2019).
Thus, direct observational data on pollination in Streptocarpus is available only for a total of 3 species,
representing 2 of the flower types outline above. More pollinator observations are urgently needed: For
a comprehensive understanding of floral function the actual process of pollination needs to be studied
in the field and needs to be correlated to floral functional traits.
However, in the absence of comprehensive pollinator data, floral function and pollination syndromes
can be approximated by directly investigating floral functional traits (e.g. Gómez et al., 2008; Rosas-
Guerrero et al., 2014; Wessinger et al., 2014; Abrahamcyk et al., 2017; Johnson and Wester, 2017).
Minnaar et al. (2019) give an overview over the most important plant traits in flower biology, listing e.g.
display size (Harder and Barrett, 1995; Karron et al., 2012), shape of the corolla tube (Kulbaba and
Worley, 2012, 2013), overall colour (Stanton et al., 1986), colour patterns (de Jager et al., 2016; Kemp et
al., 2019), brightness and contrast (Sletvold et al., 2016), shape and symmetry (e.g. Møller, 1995; Gómez
et al., 2006) and nectar as a reward (Zimmerman, 1983; Thomson, 1986; Klinkhamer et al., 1991;
Klinkhamer and de Jong, 1993; Hodges, 1995; Jersáková and Johnson, 2006). Floral functional traits
further include pollen and ovule production, the ratio between the two, and breeding system. These
data are informative on both the likely pollination syndrome, i.e. pollen vector, and on breeding system
(compare Cruden, 1977; Cruden and Jensen, 1979; Cruden and Miller-Ward, 1981; Cruden and Lyon,
1985; Small, 1988; Kirk, 1993; Lopez et al., 1999; Cruden, 2000; Michalski and Durka, 2009; Alarcón et
al., 2011; Abrahamcyk et al., 2017; Lozada-Gobilard et al., 2019).
In the present study we compile data on pollen and ovule numbers, nectar-reward (nectar amount,
concentration and sugar content) and optical flower signal (visual and UV light spectrum) in addition to
flower architecture of 18 species of Streptocarpus subgenus Streptocarpus, covering five major flower
types and three subtypes described by Möller et al. (2019). P/o ratios are calculated as a proxy for
breeding systems, and compared to the results of hand-pollination experiments. Additionally growth
habit, life cycle and habitat preference (light exposure in habitat) are assessed due to possible influence
V. Plasticity of flower traits in Streptocarpus
125
on the flower variables. Further, the interplay of floral functional traits is analysed via ordination and
vector fitting, and retrieved clusters are presented and discussed phylogenetically.
We aim to address the following research questions:
Are the commonly described floral types of Streptocarpus indicative for pollination syndromes, and
supported by the retrieved floral functional clusters (gamete production, nectar reward, optical flower
signal and floral architecture)?
Are the different subsets of floral functional traits correlated to some degree, generally supporting the
idea of pollination syndromes that are characterised by a particular interplay of floral characters?
Are there any evident phylogenetic pattern for flower types, floral functional traits and pollination
syndromes? Is pollinator-driven speciation supported by phylogenetic shifts between floral functional
plant traits?
V.3 MATERIALS AND METHODS
Streptocarpus species were cultivated in a pollinator-protected greenhouse at Botanische Gärten,
Universität Bonn (Bonn University Botanic Gardens), with 18 species selected for analysis: S. bindseili
Eb.Fisch., S. burundianus Hilliard & B.L.Burtt, S. cooperi C.B.Clarke, S. cyaneus ssp. polackii (B.L.Burtt) Weigend &
T.J.Edwards, S. denticulatus Turrill, S. dunnii Mast., S. fasciatus T.J.Edwards & C.Kunhardt, S. gardenii Hook., S. johannis
L.L.Britten, S. liliputana Bellstedt & T.J.Edwards, S. longiflorus (Hilliard & B.L.Burtt) T.J.Edwards, S. modestus L.L.Britten,
S. pole-evansii I.Verd., S. polyanthus ssp. verecundus Hook., S. pusillus Harv. ex C.B.Clarke, S. rexii (Bowie ex Hook.)
Lindl., S. roseoalbus Weigend & T.J.Edwards and S. wilmsii Engl.
V.3.1 FLORAL TYPES
Floral types after Möller et al. (2019) are represented as follows: The small-pouch type is represented by
S. burundianus. The keyhole flower type is represented by S. johannis, S. pusillus and S. polyanthus. The
personate flower type is represented by S. pole-evansii. The bird-pollination type is represented by
S. dunnii. The open tube flower type with three subtypes is represented as follows: The open cylindrical
tube type with predominatly straight tubes is represented by S. modestus, S. wilmsii and S. roseoalbus.
While Möller et al. assign S. modestus and S. wilmsii to further subgroups ("broad" and "narrow
cylindrical tube" subtypes) we do not differentiate between these species, due to similar height and
width of the flower opening and tube length. The open tube flower type with pollinator chamber is
represented by S. bindseili, S. cooperi, S. cyaneus ssp. polackii, S. denticulatus, S. fasciatus, S. gardenii,
S. longiflorus and S. rexii. S. liliputana as only representative of the Acanth flower type is also part of the
analysis.
V.3.2 ASSESSMENT OF PLANT TRAITS
For these species data on pollen and ovule numbers, nectar reward, the optical signal of flowers and
leaves as well as floral architecture were measured. Growth habit and life cycle were assessed and
habitat preferences were checked by literature review. Additionally, breeding systems were tested
experimentally: 100 flowers per species (except S. dunnii, n = 20) were tracked for spontaneous
autogamy, and the effect of cross pollination was tested by pollination within (10 flowers) and between
V. Plasticity of flower traits in Streptocarpus
126
individuals (10 flowers) of each species. The bulk of the data was collected in 2015, some datasets were
complemented in 2016 (S. bindseili and S. burundianus).
UV images were generated for frontal and lateral flower displays and leaf material under UV-light.
Pictures were taken with a single-lens reflex camera (Nikon R D300s) and an infrared neutralizer (OPTIK
MAKARIO IR NG 52D), in combination with a UV light filter (OPTIK MAKARIO SP 400 UV 52D). Photos
were created with a fixed aperture, but different shutter speeds (1/5, 1/4, 1/3, 1/2, 1/1.6, 1, 1.6, 2, 3, 4,
5 sec.). 1 sec. UV light exposure showed the clearest differentiation between species and was therefore
used as standard for coding of the floral UV signal.
Floral architecture was measured from living material. For assessment of flower display sizes,
photographed flowers were measured with Adobe® Photoshop® CS6 imaging software and Magnetic
Lasso Tool function. In total, 17 variables were recorded: frontal and lateral display size in cm2, ratio of
frontal to lateral display size, height and width of the frontal display, height and width of the corolla
opening, height and width of the upper left corolla lobe, height and width of the lower central corolla
lobe, dorsal flower length (from base of corolla to incision between the upper corolla lobes), ventral
flower length (from base of corolla to the tip of the lower central corolla lobe), anther length, filament
length, pistil length and the distance from anther to stigma. Sample size was 10 per variable and
species: In total, 180 flowers were imaged and analysed for display size and 180 additional flowers
measured for the remaining variables of floral architecture.
Nectar reward was measured by inserting microcapillaries (0.5 and 1 μl minicaps®; 5 μl ringcaps® –
Hirschmann Laborgeräte, Germany) into the corolla tube and agitated slightly on the receptacle to
quantiatively extract the nectar. Sugar concentration was measured in degrees Brix with a hand-held
refractometer (neoLab, type 'universal'). Nectar sugar production per flower was calculated from
volume and concentration based on the formula by Galetto and Bernadello (2005), with x being the
concentration measured:
𝑚𝑔
𝜇𝑙= 0.00226 + (0.00937𝑥) + (0.0000585𝑥2)
Usually, nectar was measured for 25 flowers per species, with data points usually equalling single
flowers. Nectar from several flowers (usually 2 to 6) had to be pooled and averaged for S. burundianus,
S. johannis, S. polyanthus, S. pusillus and S. wilmsii due to very low nectar production. For some species
only a smaller number of measurements were possible: Nectar amount could be measured, but not
concentration and therefore sugar content for Streptocarpus burundianus. Only 3 respectively 5 valid
data points could be obtained for S. cooperi and S. wilmsii for nectar concentration and derived nectar
sugar content. In total, 640 flowers were measured for nectar amount, yielding a total of 450 data
points.
For assessment of gamete production, pollen and ovule numbers per flower were obtained by counting
a total of 12 flowers per species, and the p/o ratio was derived afterwards. Pollen counting was
performed with a hemocytometer. The two closed anthers of individual flowers were cut off and dried
in Eppendorf tubes for at least three days. After drying 600 µl of a glycerol-water (1:1) solvent was
added and the samples were mixed for 5 minutes in a laboratory mill, and then placed into an ultrasonic
V. Plasticity of flower traits in Streptocarpus
127
bath for 15 minutes to dislodge pollen grains from the anther walls. Samples were then vortexed to
provide a homogeneous suspension before counting. Pollen was counted on five squares (each 1 x
1 mm) of the hemocytometer chamber and the total pollen amount of the sample was calculated with
the following formula (Neuendorf, 2013):
pollen grains per sample =counted pollen grains
counted surface (mm2) · chamber depth (mm) · dilution (1 ÷ amount of diluent)
Ovule numbers were counted directly under a stereomicroscope by opening the gynoecium lengthwise
with a scalpel and wetting it with water to prevent ovules from drying out during counting. Pollen and
ovule counts were obtained for a total of 216 flowers.
V.3.3 PHYLOGENETIC ANALYSIS
Two chloroplast markers and one nuclear DNA region were selected to evaluate the phylogenetic
relationships of the Streptocarpus-species here studied, based on Nishii et al. (2015). The chloroplast
DNA regions included the gene encoding for the ribosomal protein L20 and the rpl20-rps12 intergenic
spacer (rpL20), as well as the tRNA-Leu gene (trnLF), including the trnL intron, the tRNA-Phe gene (trnF)
and the trnL-trnF intergenic spacer (altogether referred to as trnL-F). The nuclear DNA region included
the internal transcribed spacer of nuclear ribosomal DNA (ITS), including ITS 1, ITS 2 and the 5.8S
ribosomal RNA gene. Existing sequence matrices (Nishii et al., 2015; Möller & Cronk, 2001; de Villiers et
al., 2013) were downloaded from GenBank for most of the ingroup species analysed here, as well as for
the outgroup species Didymocarpus citrinus and Streptocarpus papangae (subgenus Streptocarpella, see
also Jong et al., 2012). GenBank accession numbers are presented in the appendix (table A X.4.8). New
sequences were generated for S. burundianus, S. polyanthus subsp. verecundus, S. cyaneus subsp.
polackii and S. johannis, using universal primers and protocols described in Nishii et al. (2015). DNA
sequence assembly was done in Geneious v. 8.1.2 (Kearse et al., 2012) and were aligned in MAFFT v. 7
(Katoh and Standley, 2013) using the FFT-NS-i option (Katoh et al., 2002). Maximum Likelihood (ML)
phylogenetic analyses were performed in RAxML (Stamatakis, 2014) using the "per-partition branch
length" option. Statistical support for nodes was assessed with 1000 ML bootstrap replicates.
V.3.4 STATISTICAL ANALYSIS
Data exploration and basic statistics were carried out with the IBM software package SPSS, version 24.
Statistical procedures beyond data exploration were performed with arithmetic means on species level
due to unequal sample sizes and non-normality of data. Cluster analysis and multivariate ordination
were performed in order to structure, analyse and visualise the datasets for gamete production, nectar
reward, optical flower signal and floral architecture of Streptocarpus. Both methods were performed
with the arithmetic means of ratio scaled variables and coding of categorical variables with computing
software R.
Categorical variables were assigned via R factor function, and factor levels were labelled as unordered
(nominal) or ordered (ordinal). Categorical and nominal variables are floral types (assigned after Möller
et al. 2019), predominant corolla colour, growth habit, life cycle and habitat preference. Floral types
were coded 1 for open cylindrical tube type, 2 for open tube type with pollinator chamber, 3 for Acanth
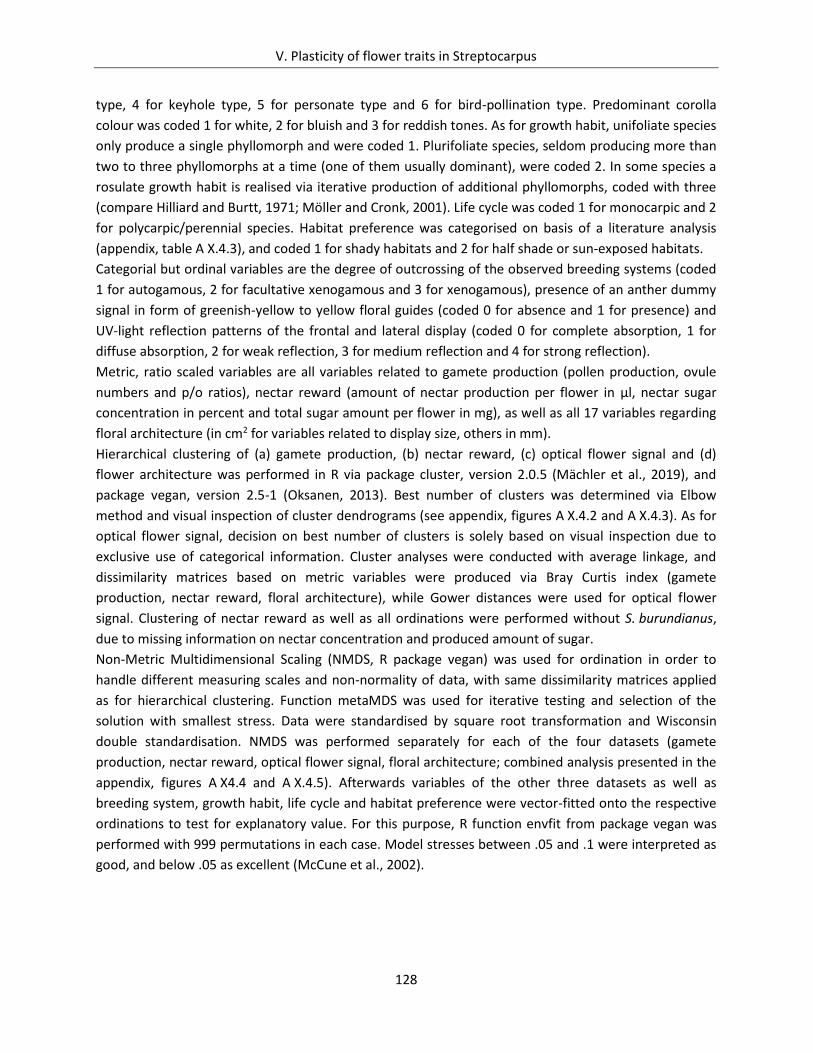
V. Plasticity of flower traits in Streptocarpus
128
type, 4 for keyhole type, 5 for personate type and 6 for bird-pollination type. Predominant corolla
colour was coded 1 for white, 2 for bluish and 3 for reddish tones. As for growth habit, unifoliate species
only produce a single phyllomorph and were coded 1. Plurifoliate species, seldom producing more than
two to three phyllomorphs at a time (one of them usually dominant), were coded 2. In some species a
rosulate growth habit is realised via iterative production of additional phyllomorphs, coded with three
(compare Hilliard and Burtt, 1971; Möller and Cronk, 2001). Life cycle was coded 1 for monocarpic and 2
for polycarpic/perennial species. Habitat preference was categorised on basis of a literature analysis
(appendix, table A X.4.3), and coded 1 for shady habitats and 2 for half shade or sun-exposed habitats.
Categorial but ordinal variables are the degree of outcrossing of the observed breeding systems (coded
1 for autogamous, 2 for facultative xenogamous and 3 for xenogamous), presence of an anther dummy
signal in form of greenish-yellow to yellow floral guides (coded 0 for absence and 1 for presence) and
UV-light reflection patterns of the frontal and lateral display (coded 0 for complete absorption, 1 for
diffuse absorption, 2 for weak reflection, 3 for medium reflection and 4 for strong reflection).
Metric, ratio scaled variables are all variables related to gamete production (pollen production, ovule
numbers and p/o ratios), nectar reward (amount of nectar production per flower in µl, nectar sugar
concentration in percent and total sugar amount per flower in mg), as well as all 17 variables regarding
floral architecture (in cm2 for variables related to display size, others in mm).
Hierarchical clustering of (a) gamete production, (b) nectar reward, (c) optical flower signal and (d)
flower architecture was performed in R via package cluster, version 2.0.5 (Mächler et al., 2019), and
package vegan, version 2.5-1 (Oksanen, 2013). Best number of clusters was determined via Elbow
method and visual inspection of cluster dendrograms (see appendix, figures A X.4.2 and A X.4.3). As for
optical flower signal, decision on best number of clusters is solely based on visual inspection due to
exclusive use of categorical information. Cluster analyses were conducted with average linkage, and
dissimilarity matrices based on metric variables were produced via Bray Curtis index (gamete
production, nectar reward, floral architecture), while Gower distances were used for optical flower
signal. Clustering of nectar reward as well as all ordinations were performed without S. burundianus,
due to missing information on nectar concentration and produced amount of sugar.
Non-Metric Multidimensional Scaling (NMDS, R package vegan) was used for ordination in order to
handle different measuring scales and non-normality of data, with same dissimilarity matrices applied
as for hierarchical clustering. Function metaMDS was used for iterative testing and selection of the
solution with smallest stress. Data were standardised by square root transformation and Wisconsin
double standardisation. NMDS was performed separately for each of the four datasets (gamete
production, nectar reward, optical flower signal, floral architecture; combined analysis presented in the
appendix, figures A X4.4 and A X.4.5). Afterwards variables of the other three datasets as well as
breeding system, growth habit, life cycle and habitat preference were vector-fitted onto the respective
ordinations to test for explanatory value. For this purpose, R function envfit from package vegan was
performed with 999 permutations in each case. Model stresses between .05 and .1 were interpreted as
good, and below .05 as excellent (McCune et al., 2002).
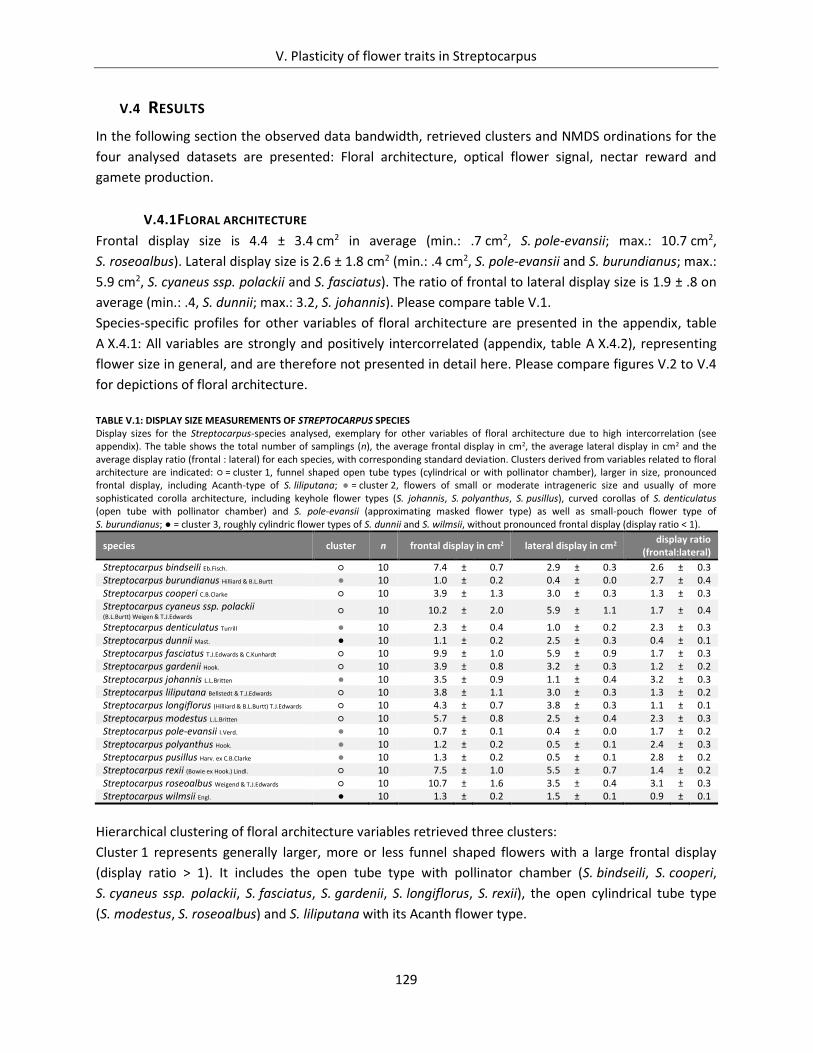
V. Plasticity of flower traits in Streptocarpus
129
V.4 RESULTS
In the following section the observed data bandwidth, retrieved clusters and NMDS ordinations for the
four analysed datasets are presented: Floral architecture, optical flower signal, nectar reward and
gamete production.
V.4.1 FLORAL ARCHITECTURE
Frontal display size is 4.4 ± 3.4 cm2 in average (min.: .7 cm2, S. pole-evansii; max.: 10.7 cm2,
S. roseoalbus). Lateral display size is 2.6 ± 1.8 cm2 (min.: .4 cm2, S. pole-evansii and S. burundianus; max.:
5.9 cm2, S. cyaneus ssp. polackii and S. fasciatus). The ratio of frontal to lateral display size is 1.9 ± .8 on
average (min.: .4, S. dunnii; max.: 3.2, S. johannis). Please compare table V.1.
Species-specific profiles for other variables of floral architecture are presented in the appendix, table
A X.4.1: All variables are strongly and positively intercorrelated (appendix, table A X.4.2), representing
flower size in general, and are therefore not presented in detail here. Please compare figures V.2 to V.4
for depictions of floral architecture.
TABLE V.1: DISPLAY SIZE MEASUREMENTS OF STREPTOCARPUS SPECIES Display sizes for the Streptocarpus-species analysed, exemplary for other variables of floral architecture due to high intercorrelation (see appendix). The table shows the total number of samplings (n), the average frontal display in cm2, the average lateral display in cm2 and the average display ratio (frontal : lateral) for each species, with corresponding standard deviation. Clusters derived from variables related to floral architecture are indicated: = cluster 1, funnel shaped open tube types (cylindrical or with pollinator chamber), larger in size, pronounced frontal display, including Acanth-type of S. liliputana; = cluster 2, flowers of small or moderate intrageneric size and usually of more sophisticated corolla architecture, including keyhole flower types (S. johannis, S. polyanthus, S. pusillus), curved corollas of S. denticulatus (open tube with pollinator chamber) and S. pole-evansii (approximating masked flower type) as well as small-pouch flower type of S. burundianus; = cluster 3, roughly cylindric flower types of S. dunnii and S. wilmsii, without pronounced frontal display (display ratio < 1).
species cluster n frontal display in cm2 lateral display in cm2 display ratio
(frontal:lateral)
Streptocarpus bindseili Eb.Fisch. 10 7.4 ± 0.7 2.9 ± 0.3 2.6 ± 0.3 Streptocarpus burundianus Hilliard & B.L.Burtt 10 1.0 ± 0.2 0.4 ± 0.0 2.7 ± 0.4 Streptocarpus cooperi C.B.Clarke 10 3.9 ± 1.3 3.0 ± 0.3 1.3 ± 0.3 Streptocarpus cyaneus ssp. polackii (B.L.Burtt) Weigen & T.J.Edwards 10 10.2 ± 2.0 5.9 ± 1.1 1.7 ± 0.4
Streptocarpus denticulatus Turrill 10 2.3 ± 0.4 1.0 ± 0.2 2.3 ± 0.3 Streptocarpus dunnii Mast. 10 1.1 ± 0.2 2.5 ± 0.3 0.4 ± 0.1 Streptocarpus fasciatus T.J.Edwards & C.Kunhardt 10 9.9 ± 1.0 5.9 ± 0.9 1.7 ± 0.3 Streptocarpus gardenii Hook. 10 3.9 ± 0.8 3.2 ± 0.3 1.2 ± 0.2 Streptocarpus johannis L.L.Britten 10 3.5 ± 0.9 1.1 ± 0.4 3.2 ± 0.3 Streptocarpus liliputana Bellstedt & T.J.Edwards 10 3.8 ± 1.1 3.0 ± 0.3 1.3 ± 0.2 Streptocarpus longiflorus (Hilliard & B.L.Burtt) T.J.Edwards 10 4.3 ± 0.7 3.8 ± 0.3 1.1 ± 0.1 Streptocarpus modestus L.L.Britten 10 5.7 ± 0.8 2.5 ± 0.4 2.3 ± 0.3 Streptocarpus pole-evansii I.Verd. 10 0.7 ± 0.1 0.4 ± 0.0 1.7 ± 0.2 Streptocarpus polyanthus Hook. 10 1.2 ± 0.2 0.5 ± 0.1 2.4 ± 0.3 Streptocarpus pusillus Harv. ex C.B.Clarke 10 1.3 ± 0.2 0.5 ± 0.1 2.8 ± 0.2 Streptocarpus rexii (Bowie ex Hook.) Lindl. 10 7.5 ± 1.0 5.5 ± 0.7 1.4 ± 0.2 Streptocarpus roseoalbus Weigend & T.J.Edwards 10 10.7 ± 1.6 3.5 ± 0.4 3.1 ± 0.3 Streptocarpus wilmsii Engl. 10 1.3 ± 0.2 1.5 ± 0.1 0.9 ± 0.1
Hierarchical clustering of floral architecture variables retrieved three clusters:
Cluster 1 represents generally larger, more or less funnel shaped flowers with a large frontal display
(display ratio > 1). It includes the open tube type with pollinator chamber (S. bindseili, S. cooperi,
S. cyaneus ssp. polackii, S. fasciatus, S. gardenii, S. longiflorus, S. rexii), the open cylindrical tube type
(S. modestus, S. roseoalbus) and S. liliputana with its Acanth flower type.
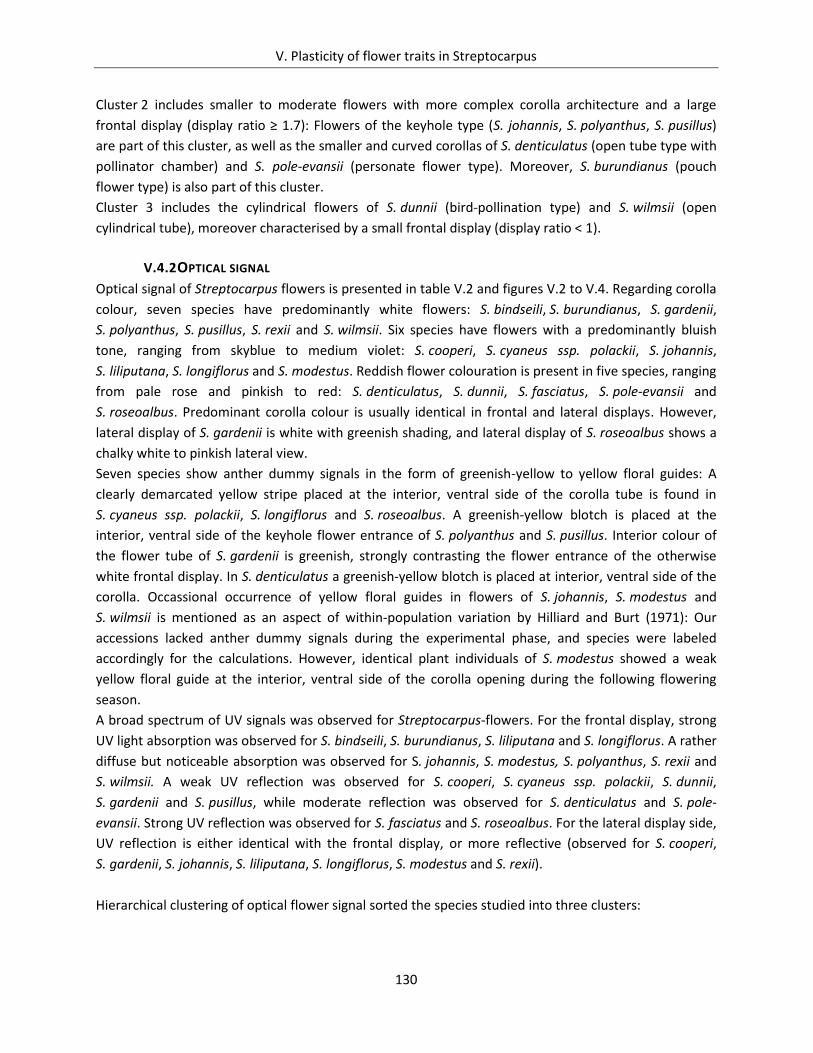
V. Plasticity of flower traits in Streptocarpus
130
Cluster 2 includes smaller to moderate flowers with more complex corolla architecture and a large
frontal display (display ratio ≥ 1.7): Flowers of the keyhole type (S. johannis, S. polyanthus, S. pusillus)
are part of this cluster, as well as the smaller and curved corollas of S. denticulatus (open tube type with
pollinator chamber) and S. pole-evansii (personate flower type). Moreover, S. burundianus (pouch
flower type) is also part of this cluster.
Cluster 3 includes the cylindrical flowers of S. dunnii (bird-pollination type) and S. wilmsii (open
cylindrical tube), moreover characterised by a small frontal display (display ratio < 1).
V.4.2 OPTICAL SIGNAL
Optical signal of Streptocarpus flowers is presented in table V.2 and figures V.2 to V.4. Regarding corolla
colour, seven species have predominantly white flowers: S. bindseili, S. burundianus, S. gardenii,
S. polyanthus, S. pusillus, S. rexii and S. wilmsii. Six species have flowers with a predominantly bluish
tone, ranging from skyblue to medium violet: S. cooperi, S. cyaneus ssp. polackii, S. johannis,
S. liliputana, S. longiflorus and S. modestus. Reddish flower colouration is present in five species, ranging
from pale rose and pinkish to red: S. denticulatus, S. dunnii, S. fasciatus, S. pole-evansii and
S. roseoalbus. Predominant corolla colour is usually identical in frontal and lateral displays. However,
lateral display of S. gardenii is white with greenish shading, and lateral display of S. roseoalbus shows a
chalky white to pinkish lateral view.
Seven species show anther dummy signals in the form of greenish-yellow to yellow floral guides: A
clearly demarcated yellow stripe placed at the interior, ventral side of the corolla tube is found in
S. cyaneus ssp. polackii, S. longiflorus and S. roseoalbus. A greenish-yellow blotch is placed at the
interior, ventral side of the keyhole flower entrance of S. polyanthus and S. pusillus. Interior colour of
the flower tube of S. gardenii is greenish, strongly contrasting the flower entrance of the otherwise
white frontal display. In S. denticulatus a greenish-yellow blotch is placed at interior, ventral side of the
corolla. Occassional occurrence of yellow floral guides in flowers of S. johannis, S. modestus and
S. wilmsii is mentioned as an aspect of within-population variation by Hilliard and Burt (1971): Our
accessions lacked anther dummy signals during the experimental phase, and species were labeled
accordingly for the calculations. However, identical plant individuals of S. modestus showed a weak
yellow floral guide at the interior, ventral side of the corolla opening during the following flowering
season.
A broad spectrum of UV signals was observed for Streptocarpus-flowers. For the frontal display, strong
UV light absorption was observed for S. bindseili, S. burundianus, S. liliputana and S. longiflorus. A rather
diffuse but noticeable absorption was observed for S. johannis, S. modestus, S. polyanthus, S. rexii and
S. wilmsii. A weak UV reflection was observed for S. cooperi, S. cyaneus ssp. polackii, S. dunnii,
S. gardenii and S. pusillus, while moderate reflection was observed for S. denticulatus and S. pole-
evansii. Strong UV reflection was observed for S. fasciatus and S. roseoalbus. For the lateral display side,
UV reflection is either identical with the frontal display, or more reflective (observed for S. cooperi,
S. gardenii, S. johannis, S. liliputana, S. longiflorus, S. modestus and S. rexii).
Hierarchical clustering of optical flower signal sorted the species studied into three clusters:
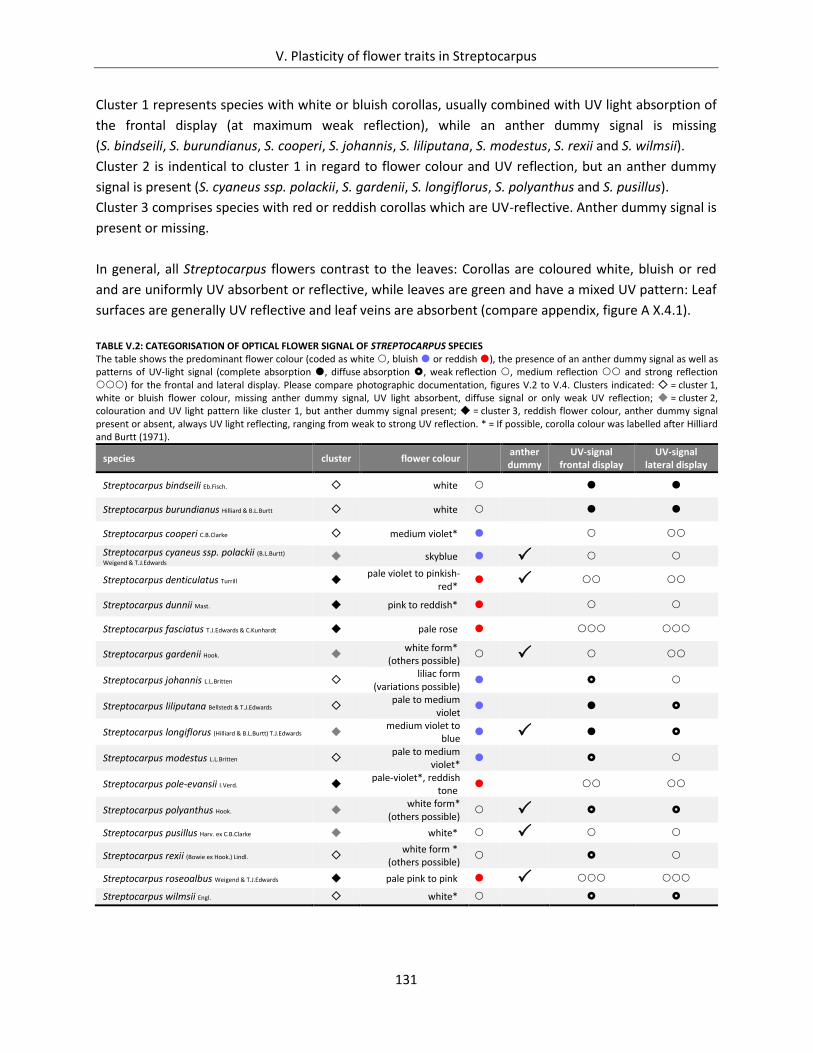
V. Plasticity of flower traits in Streptocarpus
131
Cluster 1 represents species with white or bluish corollas, usually combined with UV light absorption of
the frontal display (at maximum weak reflection), while an anther dummy signal is missing
(S. bindseili, S. burundianus, S. cooperi, S. johannis, S. liliputana, S. modestus, S. rexii and S. wilmsii).
Cluster 2 is indentical to cluster 1 in regard to flower colour and UV reflection, but an anther dummy
signal is present (S. cyaneus ssp. polackii, S. gardenii, S. longiflorus, S. polyanthus and S. pusillus).
Cluster 3 comprises species with red or reddish corollas which are UV-reflective. Anther dummy signal is
present or missing.
In general, all Streptocarpus flowers contrast to the leaves: Corollas are coloured white, bluish or red
and are uniformly UV absorbent or reflective, while leaves are green and have a mixed UV pattern: Leaf
surfaces are generally UV reflective and leaf veins are absorbent (compare appendix, figure A X.4.1).
TABLE V.2: CATEGORISATION OF OPTICAL FLOWER SIGNAL OF STREPTOCARPUS SPECIES The table shows the predominant flower colour (coded as white , bluish or reddish ), the presence of an anther dummy signal as well as patterns of UV-light signal (complete absorption , diffuse absorption , weak reflection , medium reflection and strong reflection ) for the frontal and lateral display. Please compare photographic documentation, figures V.2 to V.4. Clusters indicated: = cluster 1, white or bluish flower colour, missing anther dummy signal, UV light absorbent, diffuse signal or only weak UV reflection; = cluster 2, colouration and UV light pattern like cluster 1, but anther dummy signal present; = cluster 3, reddish flower colour, anther dummy signal present or absent, always UV light reflecting, ranging from weak to strong UV reflection. * = If possible, corolla colour was labelled after Hilliard and Burtt (1971).
species cluster flower colour anther dummy
UV-signal frontal display
UV-signal lateral display
Streptocarpus bindseili Eb.Fisch. white
Streptocarpus burundianus Hilliard & B.L.Burtt white
Streptocarpus cooperi C.B.Clarke medium violet*
Streptocarpus cyaneus ssp. polackii (B.L.Burtt)
Weigend & T.J.Edwards skyblue
Streptocarpus denticulatus Turrill pale violet to pinkish-red*
Streptocarpus dunnii Mast. pink to reddish*
Streptocarpus fasciatus T.J.Edwards & C.Kunhardt pale rose
Streptocarpus gardenii Hook. white form*
(others possible)
Streptocarpus johannis L.L.Britten liliac form
(variations possible)
Streptocarpus liliputana Bellstedt & T.J.Edwards pale to medium
violet
Streptocarpus longiflorus (Hilliard & B.L.Burtt) T.J.Edwards medium violet to
blue
Streptocarpus modestus L.L.Britten pale to medium
violet*
Streptocarpus pole-evansii I.Verd. pale-violet*, reddish
tone
Streptocarpus polyanthus Hook. white form*
(others possible)
Streptocarpus pusillus Harv. ex C.B.Clarke white*
Streptocarpus rexii (Bowie ex Hook.) Lindl. white form *
(others possible)
Streptocarpus roseoalbus Weigend & T.J.Edwards pale pink to pink
Streptocarpus wilmsii Engl. white*
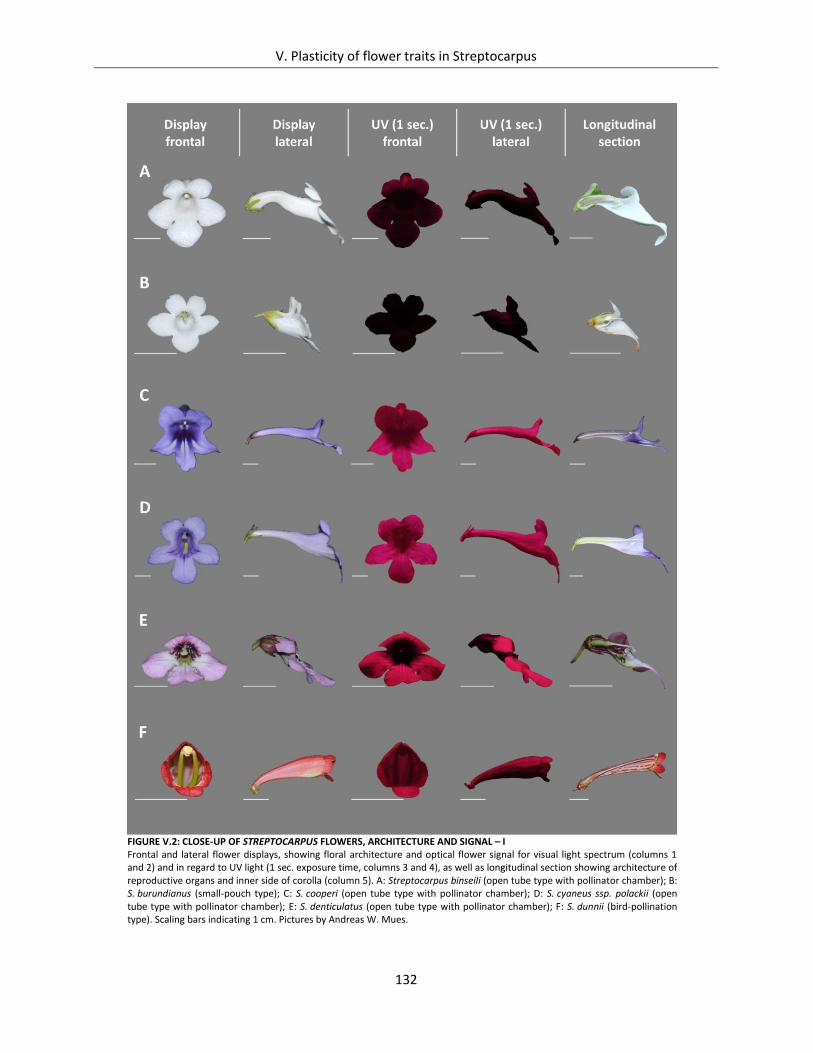
V. Plasticity of flower traits in Streptocarpus
132
FIGURE V.2: CLOSE-UP OF STREPTOCARPUS FLOWERS, ARCHITECTURE AND SIGNAL – I Frontal and lateral flower displays, showing floral architecture and optical flower signal for visual light spectrum (columns 1 and 2) and in regard to UV light (1 sec. exposure time, columns 3 and 4), as well as longitudinal section showing architecture of reproductive organs and inner side of corolla (column 5). A: Streptocarpus binseili (open tube type with pollinator chamber); B: S. burundianus (small-pouch type); C: S. cooperi (open tube type with pollinator chamber); D: S. cyaneus ssp. polackii (open tube type with pollinator chamber); E: S. denticulatus (open tube type with pollinator chamber); F: S. dunnii (bird-pollination type). Scaling bars indicating 1 cm. Pictures by Andreas W. Mues.
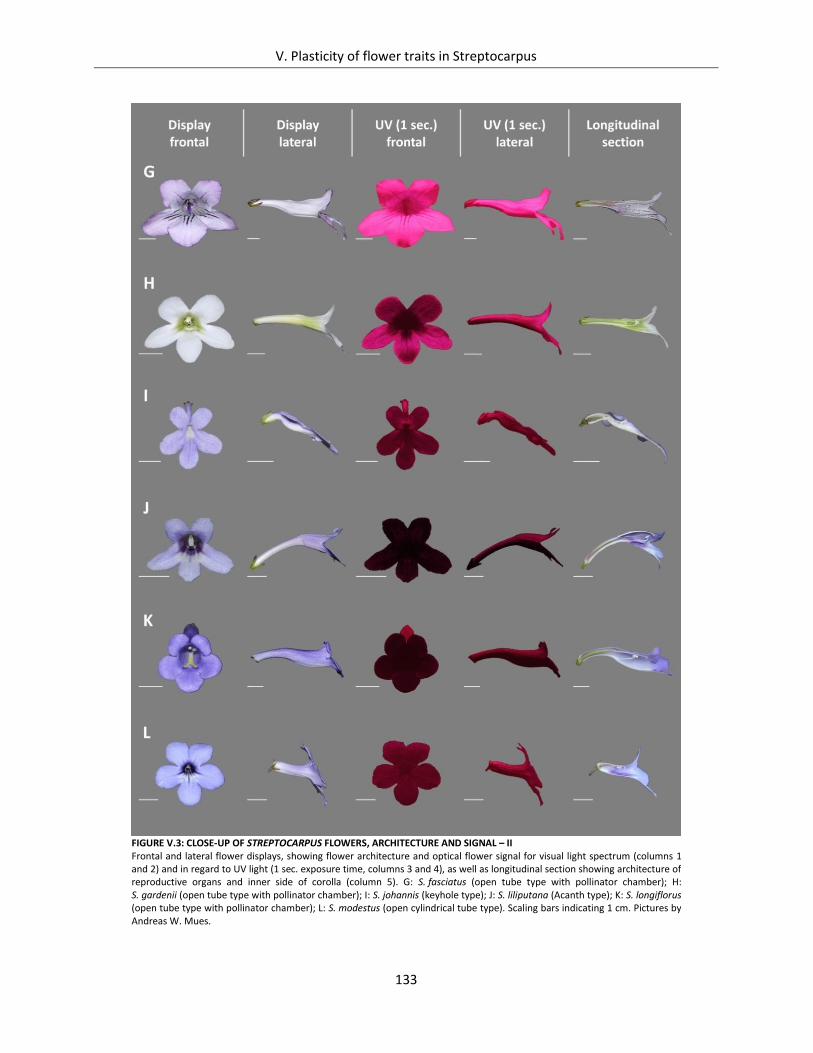
V. Plasticity of flower traits in Streptocarpus
133
FIGURE V.3: CLOSE-UP OF STREPTOCARPUS FLOWERS, ARCHITECTURE AND SIGNAL – II Frontal and lateral flower displays, showing flower architecture and optical flower signal for visual light spectrum (columns 1 and 2) and in regard to UV light (1 sec. exposure time, columns 3 and 4), as well as longitudinal section showing architecture of reproductive organs and inner side of corolla (column 5). G: S. fasciatus (open tube type with pollinator chamber); H: S. gardenii (open tube type with pollinator chamber); I: S. johannis (keyhole type); J: S. liliputana (Acanth type); K: S. longiflorus (open tube type with pollinator chamber); L: S. modestus (open cylindrical tube type). Scaling bars indicating 1 cm. Pictures by Andreas W. Mues.
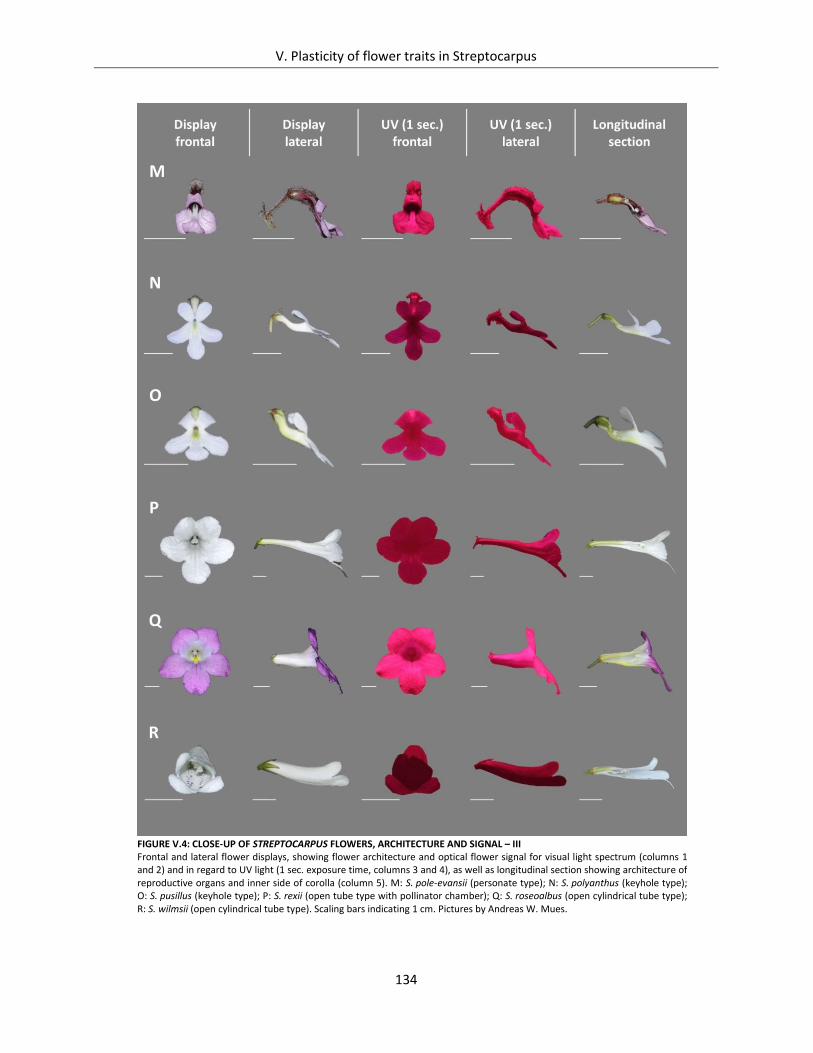
V. Plasticity of flower traits in Streptocarpus
134
FIGURE V.4: CLOSE-UP OF STREPTOCARPUS FLOWERS, ARCHITECTURE AND SIGNAL – III Frontal and lateral flower displays, showing flower architecture and optical flower signal for visual light spectrum (columns 1 and 2) and in regard to UV light (1 sec. exposure time, columns 3 and 4), as well as longitudinal section showing architecture of reproductive organs and inner side of corolla (column 5). M: S. pole-evansii (personate type); N: S. polyanthus (keyhole type); O: S. pusillus (keyhole type); P: S. rexii (open tube type with pollinator chamber); Q: S. roseoalbus (open cylindrical tube type); R: S. wilmsii (open cylindrical tube type). Scaling bars indicating 1 cm. Pictures by Andreas W. Mues.
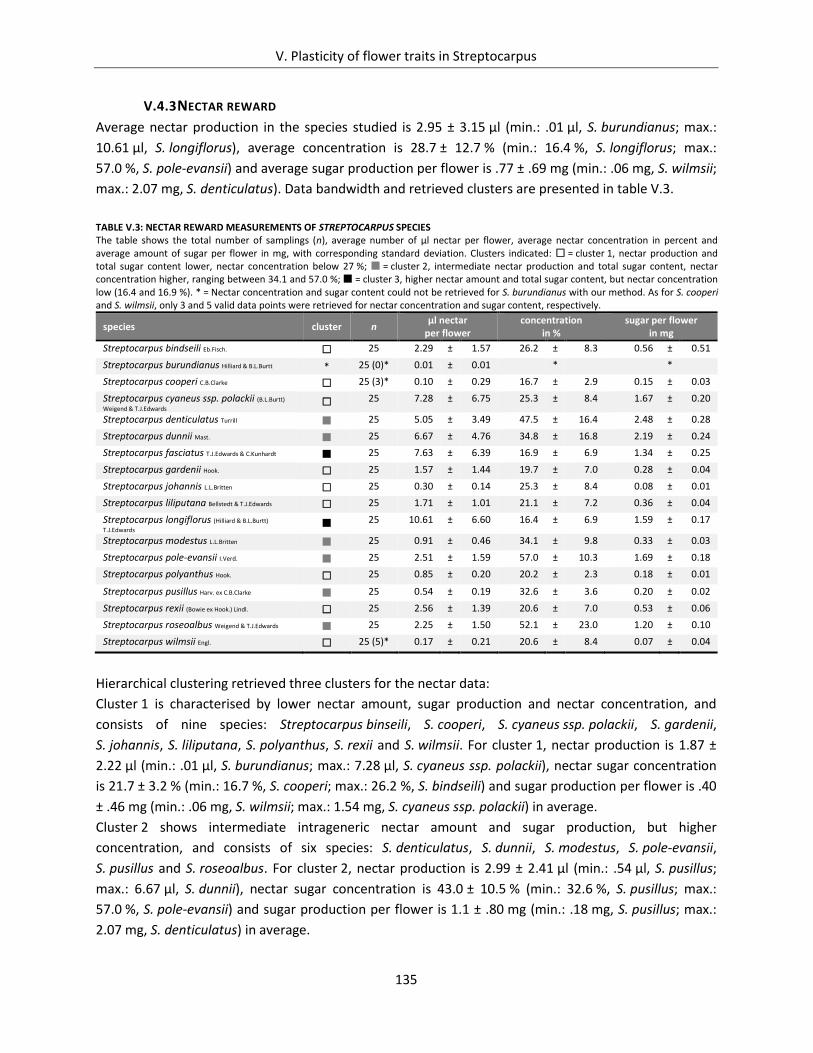
V. Plasticity of flower traits in Streptocarpus
135
V.4.3 NECTAR REWARD
Average nectar production in the species studied is 2.95 ± 3.15 μl (min.: .01 μl, S. burundianus; max.:
10.61 μl, S. longiflorus), average concentration is 28.7 ± 12.7 % (min.: 16.4 %, S. longiflorus; max.:
57.0 %, S. pole-evansii) and average sugar production per flower is .77 ± .69 mg (min.: .06 mg, S. wilmsii;
max.: 2.07 mg, S. denticulatus). Data bandwidth and retrieved clusters are presented in table V.3.
TABLE V.3: NECTAR REWARD MEASUREMENTS OF STREPTOCARPUS SPECIES The table shows the total number of samplings (n), average number of μl nectar per flower, average nectar concentration in percent and average amount of sugar per flower in mg, with corresponding standard deviation. Clusters indicated: = cluster 1, nectar production and total sugar content lower, nectar concentration below 27 %; = cluster 2, intermediate nectar production and total sugar content, nectar concentration higher, ranging between 34.1 and 57.0 %; = cluster 3, higher nectar amount and total sugar content, but nectar concentration low (16.4 and 16.9 %). * = Nectar concentration and sugar content could not be retrieved for S. burundianus with our method. As for S. cooperi and S. wilmsii, only 3 and 5 valid data points were retrieved for nectar concentration and sugar content, respectively.
species cluster n μl nectar
per flower concentration
in % sugar per flower
in mg
Streptocarpus bindseili Eb.Fisch. 25 2.29 ± 1.57 26.2 ± 8.3 0.56 ± 0.51
Streptocarpus burundianus Hilliard & B.L.Burtt * 25 (0)* 0.01 ± 0.01 * *
Streptocarpus cooperi C.B.Clarke 25 (3)* 0.10 ± 0.29 16.7 ± 2.9 0.15 ± 0.03
Streptocarpus cyaneus ssp. polackii (B.L.Burtt)
Weigend & T.J.Edwards 25 7.28 ± 6.75 25.3 ± 8.4 1.67 ± 0.20
Streptocarpus denticulatus Turrill 25 5.05 ± 3.49 47.5 ± 16.4 2.48 ± 0.28
Streptocarpus dunnii Mast. 25 6.67 ± 4.76 34.8 ± 16.8 2.19 ± 0.24
Streptocarpus fasciatus T.J.Edwards & C.Kunhardt 25 7.63 ± 6.39 16.9 ± 6.9 1.34 ± 0.25
Streptocarpus gardenii Hook. 25 1.57 ± 1.44 19.7 ± 7.0 0.28 ± 0.04
Streptocarpus johannis L.L.Britten 25 0.30 ± 0.14 25.3 ± 8.4 0.08 ± 0.01
Streptocarpus liliputana Bellstedt & T.J.Edwards 25 1.71 ± 1.01 21.1 ± 7.2 0.36 ± 0.04
Streptocarpus longiflorus (Hilliard & B.L.Burtt)
T.J.Edwards 25 10.61 ± 6.60 16.4 ± 6.9 1.59 ± 0.17
Streptocarpus modestus L.L.Britten 25 0.91 ± 0.46 34.1 ± 9.8 0.33 ± 0.03
Streptocarpus pole-evansii I.Verd. 25 2.51 ± 1.59 57.0 ± 10.3 1.69 ± 0.18
Streptocarpus polyanthus Hook. 25 0.85 ± 0.20 20.2 ± 2.3 0.18 ± 0.01
Streptocarpus pusillus Harv. ex C.B.Clarke 25 0.54 ± 0.19 32.6 ± 3.6 0.20 ± 0.02
Streptocarpus rexii (Bowie ex Hook.) Lindl. 25 2.56 ± 1.39 20.6 ± 7.0 0.53 ± 0.06
Streptocarpus roseoalbus Weigend & T.J.Edwards 25 2.25 ± 1.50 52.1 ± 23.0 1.20 ± 0.10
Streptocarpus wilmsii Engl. 25 (5)* 0.17 ± 0.21 20.6 ± 8.4 0.07 ± 0.04
Hierarchical clustering retrieved three clusters for the nectar data:
Cluster 1 is characterised by lower nectar amount, sugar production and nectar concentration, and
consists of nine species: Streptocarpus binseili, S. cooperi, S. cyaneus ssp. polackii, S. gardenii,
S. johannis, S. liliputana, S. polyanthus, S. rexii and S. wilmsii. For cluster 1, nectar production is 1.87 ±
2.22 μl (min.: .01 μl, S. burundianus; max.: 7.28 μl, S. cyaneus ssp. polackii), nectar sugar concentration
is 21.7 ± 3.2 % (min.: 16.7 %, S. cooperi; max.: 26.2 %, S. bindseili) and sugar production per flower is .40
± .46 mg (min.: .06 mg, S. wilmsii; max.: 1.54 mg, S. cyaneus ssp. polackii) in average.
Cluster 2 shows intermediate intrageneric nectar amount and sugar production, but higher
concentration, and consists of six species: S. denticulatus, S. dunnii, S. modestus, S. pole-evansii,
S. pusillus and S. roseoalbus. For cluster 2, nectar production is 2.99 ± 2.41 μl (min.: .54 μl, S. pusillus;
max.: 6.67 μl, S. dunnii), nectar sugar concentration is 43.0 ± 10.5 % (min.: 32.6 %, S. pusillus; max.:
57.0 %, S. pole-evansii) and sugar production per flower is 1.1 ± .80 mg (min.: .18 mg, S. pusillus; max.:
2.07 mg, S. denticulatus) in average.
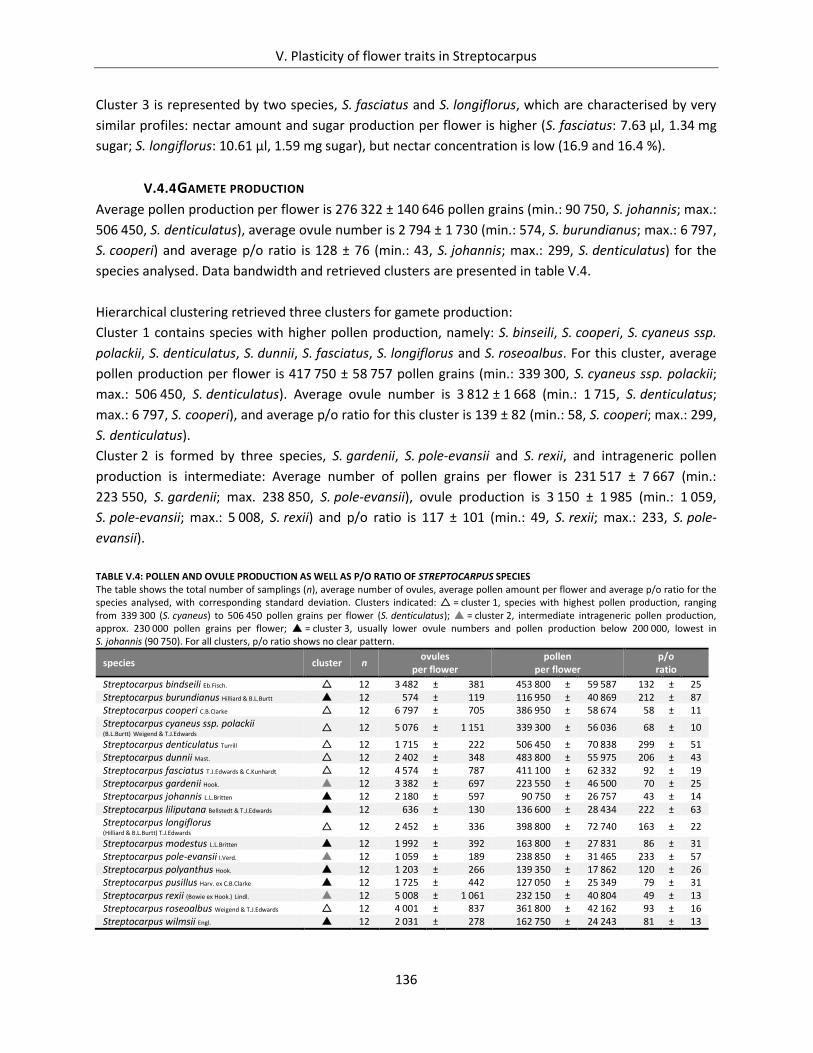
V. Plasticity of flower traits in Streptocarpus
136
Cluster 3 is represented by two species, S. fasciatus and S. longiflorus, which are characterised by very
similar profiles: nectar amount and sugar production per flower is higher (S. fasciatus: 7.63 μl, 1.34 mg
sugar; S. longiflorus: 10.61 μl, 1.59 mg sugar), but nectar concentration is low (16.9 and 16.4 %).
V.4.4 GAMETE PRODUCTION
Average pollen production per flower is 276 322 ± 140 646 pollen grains (min.: 90 750, S. johannis; max.:
506 450, S. denticulatus), average ovule number is 2 794 ± 1 730 (min.: 574, S. burundianus; max.: 6 797,
S. cooperi) and average p/o ratio is 128 ± 76 (min.: 43, S. johannis; max.: 299, S. denticulatus) for the
species analysed. Data bandwidth and retrieved clusters are presented in table V.4.
Hierarchical clustering retrieved three clusters for gamete production:
Cluster 1 contains species with higher pollen production, namely: S. binseili, S. cooperi, S. cyaneus ssp.
polackii, S. denticulatus, S. dunnii, S. fasciatus, S. longiflorus and S. roseoalbus. For this cluster, average
pollen production per flower is 417 750 ± 58 757 pollen grains (min.: 339 300, S. cyaneus ssp. polackii;
max.: 506 450, S. denticulatus). Average ovule number is 3 812 ± 1 668 (min.: 1 715, S. denticulatus;
max.: 6 797, S. cooperi), and average p/o ratio for this cluster is 139 ± 82 (min.: 58, S. cooperi; max.: 299,
S. denticulatus).
Cluster 2 is formed by three species, S. gardenii, S. pole-evansii and S. rexii, and intrageneric pollen
production is intermediate: Average number of pollen grains per flower is 231 517 ± 7 667 (min.:
223 550, S. gardenii; max. 238 850, S. pole-evansii), ovule production is 3 150 ± 1 985 (min.: 1 059,
S. pole-evansii; max.: 5 008, S. rexii) and p/o ratio is 117 ± 101 (min.: 49, S. rexii; max.: 233, S. pole-
evansii).
TABLE V.4: POLLEN AND OVULE PRODUCTION AS WELL AS P/O RATIO OF STREPTOCARPUS SPECIES The table shows the total number of samplings (n), average number of ovules, average pollen amount per flower and average p/o ratio for the species analysed, with corresponding standard deviation. Clusters indicated: = cluster 1, species with highest pollen production, ranging from 339 300 (S. cyaneus) to 506 450 pollen grains per flower (S. denticulatus); = cluster 2, intermediate intrageneric pollen production, approx. 230 000 pollen grains per flower; = cluster 3, usually lower ovule numbers and pollen production below 200 000, lowest in S. johannis (90 750). For all clusters, p/o ratio shows no clear pattern.
species cluster n ovules
per flower pollen
per flower p/o ratio
Streptocarpus bindseili Eb.Fisch. 12 3 482 ± 381 453 800 ± 59 587 132 ± 25 Streptocarpus burundianus Hilliard & B.L.Burtt 12 574 ± 119 116 950 ± 40 869 212 ± 87 Streptocarpus cooperi C.B.Clarke 12 6 797 ± 705 386 950 ± 58 674 58 ± 11 Streptocarpus cyaneus ssp. polackii (B.L.Burtt) Weigend & T.J.Edwards 12 5 076 ± 1 151 339 300 ± 56 036 68 ± 10
Streptocarpus denticulatus Turrill 12 1 715 ± 222 506 450 ± 70 838 299 ± 51 Streptocarpus dunnii Mast. 12 2 402 ± 348 483 800 ± 55 975 206 ± 43 Streptocarpus fasciatus T.J.Edwards & C.Kunhardt 12 4 574 ± 787 411 100 ± 62 332 92 ± 19 Streptocarpus gardenii Hook. 12 3 382 ± 697 223 550 ± 46 500 70 ± 25 Streptocarpus johannis L.L.Britten 12 2 180 ± 597 90 750 ± 26 757 43 ± 14 Streptocarpus liliputana Bellstedt & T.J.Edwards 12 636 ± 130 136 600 ± 28 434 222 ± 63 Streptocarpus longiflorus (Hilliard & B.L.Burtt) T.J.Edwards 12 2 452 ± 336 398 800 ± 72 740 163 ± 22
Streptocarpus modestus L.L.Britten 12 1 992 ± 392 163 800 ± 27 831 86 ± 31 Streptocarpus pole-evansii I.Verd. 12 1 059 ± 189 238 850 ± 31 465 233 ± 57 Streptocarpus polyanthus Hook. 12 1 203 ± 266 139 350 ± 17 862 120 ± 26 Streptocarpus pusillus Harv. ex C.B.Clarke 12 1 725 ± 442 127 050 ± 25 349 79 ± 31 Streptocarpus rexii (Bowie ex Hook.) Lindl. 12 5 008 ± 1 061 232 150 ± 40 804 49 ± 13 Streptocarpus roseoalbus Weigend & T.J.Edwards 12 4 001 ± 837 361 800 ± 42 162 93 ± 16 Streptocarpus wilmsii Engl. 12 2 031 ± 278 162 750 ± 24 243 81 ± 13
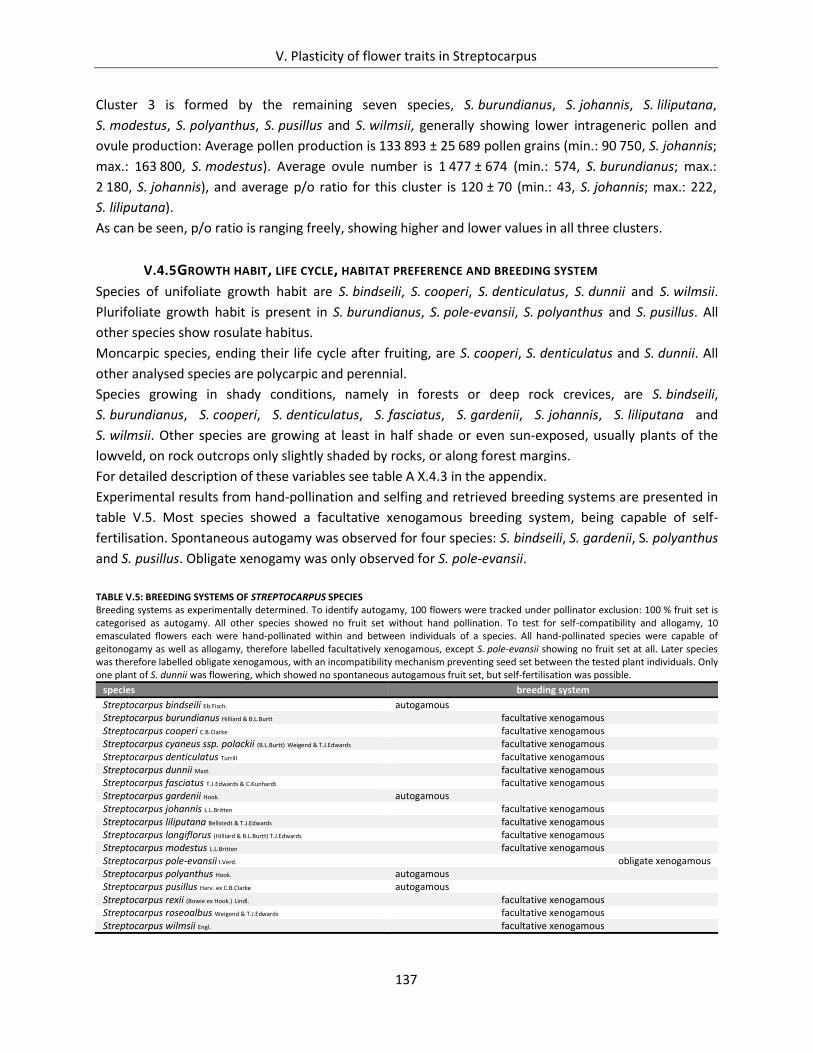
V. Plasticity of flower traits in Streptocarpus
137
Cluster 3 is formed by the remaining seven species, S. burundianus, S. johannis, S. liliputana,
S. modestus, S. polyanthus, S. pusillus and S. wilmsii, generally showing lower intrageneric pollen and
ovule production: Average pollen production is 133 893 ± 25 689 pollen grains (min.: 90 750, S. johannis;
max.: 163 800, S. modestus). Average ovule number is 1 477 ± 674 (min.: 574, S. burundianus; max.:
2 180, S. johannis), and average p/o ratio for this cluster is 120 ± 70 (min.: 43, S. johannis; max.: 222,
S. liliputana).
As can be seen, p/o ratio is ranging freely, showing higher and lower values in all three clusters.
V.4.5 GROWTH HABIT, LIFE CYCLE, HABITAT PREFERENCE AND BREEDING SYSTEM
Species of unifoliate growth habit are S. bindseili, S. cooperi, S. denticulatus, S. dunnii and S. wilmsii.
Plurifoliate growth habit is present in S. burundianus, S. pole-evansii, S. polyanthus and S. pusillus. All
other species show rosulate habitus.
Moncarpic species, ending their life cycle after fruiting, are S. cooperi, S. denticulatus and S. dunnii. All
other analysed species are polycarpic and perennial.
Species growing in shady conditions, namely in forests or deep rock crevices, are S. bindseili,
S. burundianus, S. cooperi, S. denticulatus, S. fasciatus, S. gardenii, S. johannis, S. liliputana and
S. wilmsii. Other species are growing at least in half shade or even sun-exposed, usually plants of the
lowveld, on rock outcrops only slightly shaded by rocks, or along forest margins.
For detailed description of these variables see table A X.4.3 in the appendix.
Experimental results from hand-pollination and selfing and retrieved breeding systems are presented in
table V.5. Most species showed a facultative xenogamous breeding system, being capable of self-
fertilisation. Spontaneous autogamy was observed for four species: S. bindseili, S. gardenii, S. polyanthus
and S. pusillus. Obligate xenogamy was only observed for S. pole-evansii.
TABLE V.5: BREEDING SYSTEMS OF STREPTOCARPUS SPECIES Breeding systems as experimentally determined. To identify autogamy, 100 flowers were tracked under pollinator exclusion: 100 % fruit set is categorised as autogamy. All other species showed no fruit set without hand pollination. To test for self-compatibility and allogamy, 10 emasculated flowers each were hand-pollinated within and between individuals of a species. All hand-pollinated species were capable of geitonogamy as well as allogamy, therefore labelled facultatively xenogamous, except S. pole-evansii showing no fruit set at all. Later species was therefore labelled obligate xenogamous, with an incompatibility mechanism preventing seed set between the tested plant individuals. Only one plant of S. dunnii was flowering, which showed no spontaneous autogamous fruit set, but self-fertilisation was possible.
species breeding system
Streptocarpus bindseili Eb.Fisch. autogamous Streptocarpus burundianus Hilliard & B.L.Burtt facultative xenogamous Streptocarpus cooperi C.B.Clarke facultative xenogamous Streptocarpus cyaneus ssp. polackii (B.L.Burtt) Weigend & T.J.Edwards facultative xenogamous Streptocarpus denticulatus Turrill facultative xenogamous Streptocarpus dunnii Mast. facultative xenogamous Streptocarpus fasciatus T.J.Edwards & C.Kunhardt facultative xenogamous Streptocarpus gardenii Hook. autogamous Streptocarpus johannis L.L.Britten facultative xenogamous Streptocarpus liliputana Bellstedt & T.J.Edwards facultative xenogamous Streptocarpus longiflorus (Hilliard & B.L.Burtt) T.J.Edwards facultative xenogamous Streptocarpus modestus L.L.Britten facultative xenogamous Streptocarpus pole-evansii I.Verd. obligate xenogamous Streptocarpus polyanthus Hook. autogamous Streptocarpus pusillus Harv. ex C.B.Clarke autogamous Streptocarpus rexii (Bowie ex Hook.) Lindl. facultative xenogamous Streptocarpus roseoalbus Weigend & T.J.Edwards facultative xenogamous Streptocarpus wilmsii Engl. facultative xenogamous
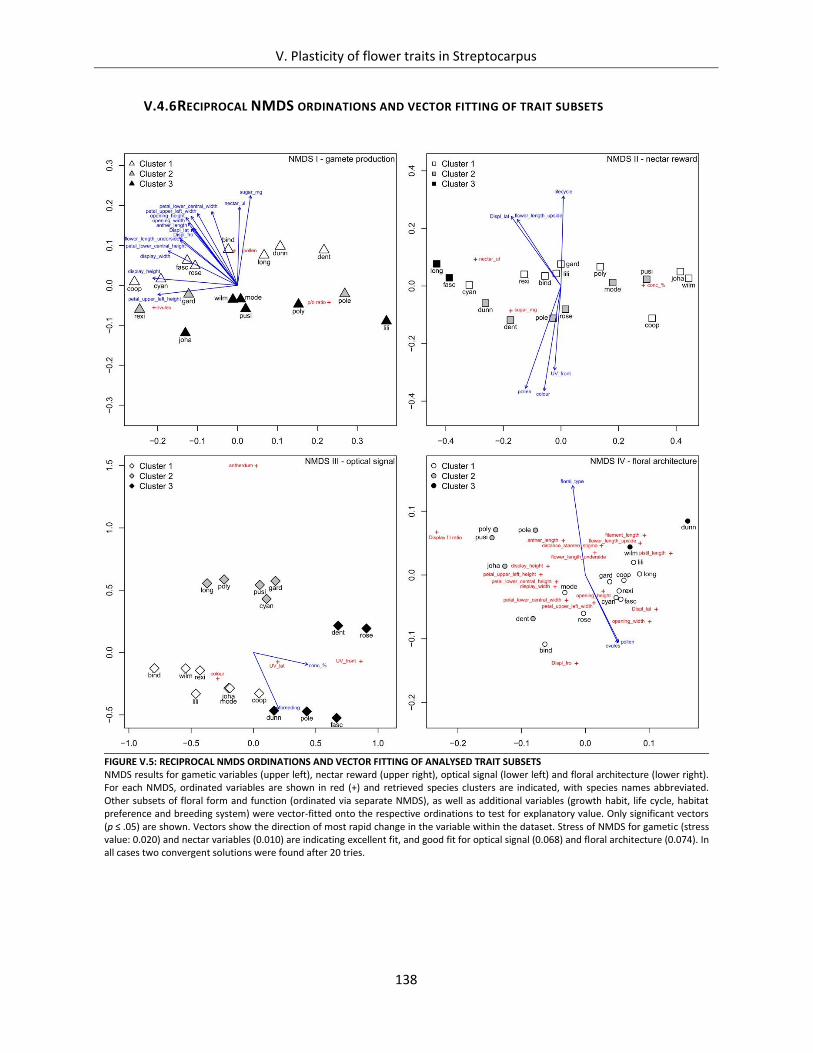
V. Plasticity of flower traits in Streptocarpus
138
V.4.6 RECIPROCAL NMDS ORDINATIONS AND VECTOR FITTING OF TRAIT SUBSETS
FIGURE V.5: RECIPROCAL NMDS ORDINATIONS AND VECTOR FITTING OF ANALYSED TRAIT SUBSETS NMDS results for gametic variables (upper left), nectar reward (upper right), optical signal (lower left) and floral architecture (lower right). For each NMDS, ordinated variables are shown in red (+) and retrieved species clusters are indicated, with species names abbreviated. Other subsets of floral form and function (ordinated via separate NMDS), as well as additional variables (growth habit, life cycle, habitat preference and breeding system) were vector-fitted onto the respective ordinations to test for explanatory value. Only significant vectors (p ≤ .05) are shown. Vectors show the direction of most rapid change in the variable within the dataset. Stress of NMDS for gametic (stress value: 0.020) and nectar variables (0.010) are indicating excellent fit, and good fit for optical signal (0.068) and floral architecture (0.074). In all cases two convergent solutions were found after 20 tries.
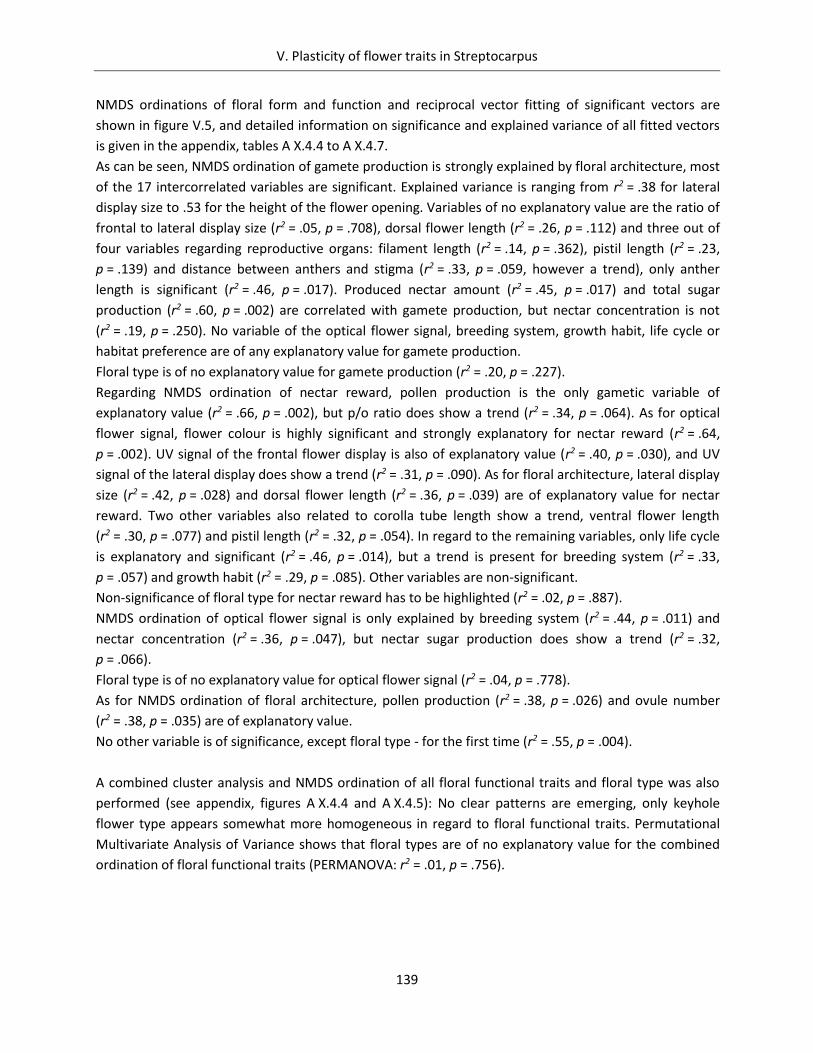
V. Plasticity of flower traits in Streptocarpus
139
NMDS ordinations of floral form and function and reciprocal vector fitting of significant vectors are
shown in figure V.5, and detailed information on significance and explained variance of all fitted vectors
is given in the appendix, tables A X.4.4 to A X.4.7.
As can be seen, NMDS ordination of gamete production is strongly explained by floral architecture, most
of the 17 intercorrelated variables are significant. Explained variance is ranging from r2 = .38 for lateral
display size to .53 for the height of the flower opening. Variables of no explanatory value are the ratio of
frontal to lateral display size (r2 = .05, p = .708), dorsal flower length (r2 = .26, p = .112) and three out of
four variables regarding reproductive organs: filament length (r2 = .14, p = .362), pistil length (r2 = .23,
p = .139) and distance between anthers and stigma (r2 = .33, p = .059, however a trend), only anther
length is significant (r2 = .46, p = .017). Produced nectar amount (r2 = .45, p = .017) and total sugar
production (r2 = .60, p = .002) are correlated with gamete production, but nectar concentration is not
(r2 = .19, p = .250). No variable of the optical flower signal, breeding system, growth habit, life cycle or
habitat preference are of any explanatory value for gamete production.
Floral type is of no explanatory value for gamete production (r2 = .20, p = .227).
Regarding NMDS ordination of nectar reward, pollen production is the only gametic variable of
explanatory value (r2 = .66, p = .002), but p/o ratio does show a trend (r2 = .34, p = .064). As for optical
flower signal, flower colour is highly significant and strongly explanatory for nectar reward (r2 = .64,
p = .002). UV signal of the frontal flower display is also of explanatory value (r2 = .40, p = .030), and UV
signal of the lateral display does show a trend (r2 = .31, p = .090). As for floral architecture, lateral display
size (r2 = .42, p = .028) and dorsal flower length (r2 = .36, p = .039) are of explanatory value for nectar
reward. Two other variables also related to corolla tube length show a trend, ventral flower length
(r2 = .30, p = .077) and pistil length (r2 = .32, p = .054). In regard to the remaining variables, only life cycle
is explanatory and significant (r2 = .46, p = .014), but a trend is present for breeding system (r2 = .33,
p = .057) and growth habit (r2 = .29, p = .085). Other variables are non-significant.
Non-significance of floral type for nectar reward has to be highlighted (r2 = .02, p = .887).
NMDS ordination of optical flower signal is only explained by breeding system (r2 = .44, p = .011) and
nectar concentration (r2 = .36, p = .047), but nectar sugar production does show a trend (r2 = .32,
p = .066).
Floral type is of no explanatory value for optical flower signal (r2 = .04, p = .778).
As for NMDS ordination of floral architecture, pollen production (r2 = .38, p = .026) and ovule number
(r2 = .38, p = .035) are of explanatory value.
No other variable is of significance, except floral type - for the first time (r2 = .55, p = .004).
A combined cluster analysis and NMDS ordination of all floral functional traits and floral type was also
performed (see appendix, figures A X.4.4 and A X.4.5): No clear patterns are emerging, only keyhole
flower type appears somewhat more homogeneous in regard to floral functional traits. Permutational
Multivariate Analysis of Variance shows that floral types are of no explanatory value for the combined
ordination of floral functional traits (PERMANOVA: r2 = .01, p = .756).
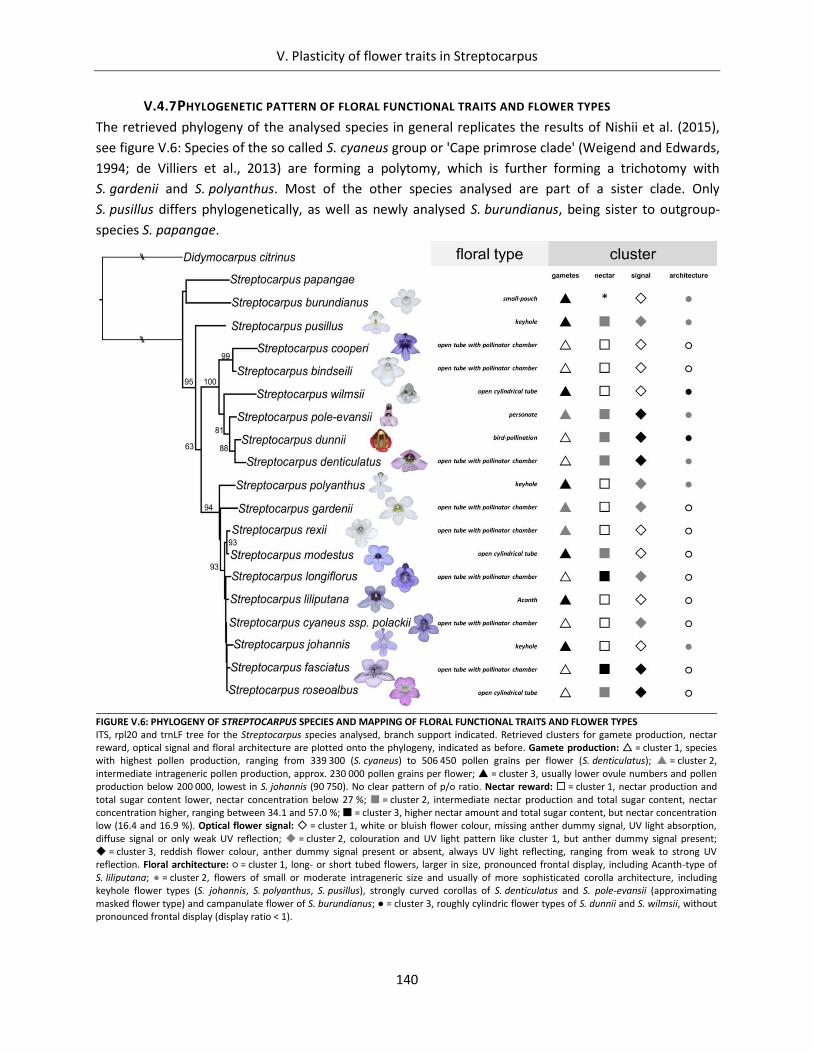
V. Plasticity of flower traits in Streptocarpus
140
V.4.7 PHYLOGENETIC PATTERN OF FLORAL FUNCTIONAL TRAITS AND FLOWER TYPES
The retrieved phylogeny of the analysed species in general replicates the results of Nishii et al. (2015),
see figure V.6: Species of the so called S. cyaneus group or 'Cape primrose clade' (Weigend and Edwards,
1994; de Villiers et al., 2013) are forming a polytomy, which is further forming a trichotomy with
S. gardenii and S. polyanthus. Most of the other species analysed are part of a sister clade. Only
S. pusillus differs phylogenetically, as well as newly analysed S. burundianus, being sister to outgroup-
species S. papangae.
FIGURE V.6: PHYLOGENY OF STREPTOCARPUS SPECIES AND MAPPING OF FLORAL FUNCTIONAL TRAITS AND FLOWER TYPES ITS, rpl20 and trnLF tree for the Streptocarpus species analysed, branch support indicated. Retrieved clusters for gamete production, nectar reward, optical signal and floral architecture are plotted onto the phylogeny, indicated as before. Gamete production: = cluster 1, species with highest pollen production, ranging from 339 300 (S. cyaneus) to 506 450 pollen grains per flower (S. denticulatus); = cluster 2, intermediate intrageneric pollen production, approx. 230 000 pollen grains per flower; = cluster 3, usually lower ovule numbers and pollen production below 200 000, lowest in S. johannis (90 750). No clear pattern of p/o ratio. Nectar reward: = cluster 1, nectar production and total sugar content lower, nectar concentration below 27 %; = cluster 2, intermediate nectar production and total sugar content, nectar concentration higher, ranging between 34.1 and 57.0 %; = cluster 3, higher nectar amount and total sugar content, but nectar concentration low (16.4 and 16.9 %). Optical flower signal: = cluster 1, white or bluish flower colour, missing anther dummy signal, UV light absorption, diffuse signal or only weak UV reflection; = cluster 2, colouration and UV light pattern like cluster 1, but anther dummy signal present; = cluster 3, reddish flower colour, anther dummy signal present or absent, always UV light reflecting, ranging from weak to strong UV reflection. Floral architecture: = cluster 1, long- or short tubed flowers, larger in size, pronounced frontal display, including Acanth-type of S. liliputana; = cluster 2, flowers of small or moderate intrageneric size and usually of more sophisticated corolla architecture, including keyhole flower types (S. johannis, S. polyanthus, S. pusillus), strongly curved corollas of S. denticulatus and S. pole-evansii (approximating masked flower type) and campanulate flower of S. burundianus; = cluster 3, roughly cylindric flower types of S. dunnii and S. wilmsii, without pronounced frontal display (display ratio < 1).
V. Plasticity of flower traits in Streptocarpus
141
In general, distribution of the retrieved clusters of floral form and function reveal high phylogenetic
plasticity and almost free combination in Streptocarpus. Only two exceptions can be highlighted: First,
floral architecture of the Cape primrose polytomy appears to be vaguely homogenous, with
predominantly open tubed flowers (cluster 1 of floral architecture). However, three different flower
subtypes of the open tube flower type (after Möller et al., 2019) are represented within the polytomy:
Open cylindrical tube type, open tube type with pollinator chamber and Acanth type. Moreover,
S. johannis shows a keyhole flower type within the polytomy. The other three subsets of floral functional
traits, gamete production, nectar reward and optical signal, show even greater variation than floral
architecture: The complete bandwidth of observed clusters is represented within the polytomy.
Second, the exotic floral architecture of S. denticulatus and S. pole-evansii as well as the cylindric flowers
of S. dunnii and S. wilmsii are closely related. This trend for unusual intrageneric flower forms is
accompanied by a reddish optical flower signal and higher nectar sugar concentration in S. pole-evansii,
S. dunnii and S. denticulatus. As for the commonly described flower types, these species represent three
very different main flower types realised in close phylogenetic proximity: personate (S. pole-evansii),
bird-pollination (S. dunnii) and open-tube flower type (S. denticulatus, S. wilmsii).
All in all, flower types are distributed almost arbitrary: Open tube flowers constitute the basic floral type,
with cylindrical tube flowers and open tube flowers with pollinator chamber alternating irregularly along
the phylogenetic three. The other floral types analysed here are popping up in between, e.g.
representatives of the keyhole flower type (S. johannis, S. polyanthus and S. pusillus) are spanning
almost the whole spread of the phylogenetic three.
V.5 DISCUSSION
V.5.1 FLORAL TYPES REPORTED FOR STREPTOCARPUS ONLY CORRELATE TO FLORAL ARCHITECTURE
Surprisingly, the established classification of floral types in Streptocarpus is not supported by the
retrieved pattern of gamete production, nectar reward and optical flower signal. Only representatives of
the keyhole flower type appear somewhat more homogeneous (see also ordination of combined data in
the appendix, figure A X.4.5), showing lower pollen and ovule production and less nectar reward than
most – but not all – other species, and no extreme differences in optical signal. For all other flower
types, pattern of gamete production, nectar reward and optical signal appear to be recombined quite
freely and floral types are of no explanatory value for these subsets of floral functional traits
(demonstrated via vector fitting of separate NMDS ordinations, PERMANOVA results of the combined
data and phylogenetic mapping). Floral types are only explanatory for floral architecture, underlining the
fact that the established classification is mainly based on flower shape. Therefore, the assumption of
flower types as indicators of pollinator syndromes is not supported by uniform pattern of floral
functional traits.
V.5.2 FLORAL TRAITS ARE LARGELY UNCORRELATED
Our in-depth analysis of floral plant traits in Streptocarpus subgenus Streptocarpus shows extreme
plasticity of flower function and strong disjunctness of the analysed suites of floral functional traits.
Ordination of gamete production is significantly explained by several variables of floral architecture,
which all could be subsumed to a single factor of influence due to strong intercorrelations – flower size.
V. Plasticity of flower traits in Streptocarpus
142
The solitary influence of the size and stoutness of flowers on pollen and ovule production is further
supported by the missing correlations between gamete production and three out of four variables
measured for reproductive organs (filament length, carpel length, distance between anthers and
stigma). Only anther length is of explanatory value. Moreover, experimentally derived true breeding
systems are of no explanatory value for gamete production in this dataset. P/o ratios as commonly
accepted indicators of breeding systems even appear to be a free floating variable, without any
explanatory value here at all: Several facultative xenogamous species (S. cooperi, S. cyaneus ssp. polackii,
S. johannis, S. rexii) show lower p/o ratios than the autogamous species analysed (S. bindseili, S. gardenii,
S. polyanthus, S. pusillus). Moreover, no variable of the optical flower signal as well as life cycle and
habitat preference are of any explanatory value for gamete production. Produced nectar amount and
sugar content are explanatory for gamete production: Both nectar variables might be linked to higher
gamete production by a general need for higher resource investment. However, nectar concentration,
strongly influencing pollinator interaction via uptake of nectar and handling time of flowers, is not linked
to gamete production.
Ordination of floral architecture is reciprocally explained by pollen and ovule production in a significant
way. Beside the already mentioned link between floral architecture and floral types, no other variable is
of any explanatory value for floral architecture, revealing the extreme plasticity of floral architecture in
regard to combination with other floral functional traits. As for the ordination of nectar reward, only few
variables of the other subsets of floral functional traits are of explanatory value: Floral architecture is
represented by lateral display size, flanked by trends for three other variables related to flower length –
dorsal and ventral flower length as well as filament length. Therefore, the already well researched link
between flower length and investment in nectar reward (see i.e. Plowright, 1981; Harder and Cruzan,
1990; Dafni, 1991; Kaczorowski et al., 2005; Fenster et al., 2006; Ornela et al., 2007; Gomez et al., 2008;
Willmer, 2011) is replicated for Streptocarpus. The amount of pollen is linked to the reward system, but
no other gametic variable (p/o ratio shows a trend however). This points again to the link of general
resource investment already seen for the gametic ordination. Flower colour is strongly linked to nectar
reward pattern, representing higher investment in nectar concentration when flowers are reddish,
which is additionally flanked by higher frontal UV reflection (lateral UV reflection as a trend). As for
other variables assessed, only life cycle is explanatory, again showing higher investment in nectar
concentration for the monocarpic plants that are flowering reddish: S. denticulatus and S. dunnii.
Regarding the ordination of optical flower signal, only two out of the pool of all analysed variables are
explanatory: First, the five species with reddish flower colour and UV light reflection are characterised by
higher nectar concentration. This link between signal and reward already became obvious via ordination
of the nectar system and vector fitting. Second, optical flower signal is the only set of floral functional
traits that is explained by experimentally derived breeding strategies: Autogamy is missing amongst the
five species with reddish flower colour, and S. pole-evansii as only species with verified obligate
xenogamous breeding system is counting amongst them.
All in all, ordinations and vector fitting procedures predominantly show a decoupling between the four
subsets of floral functional traits: Only the correlation of flower size and pollen and ovule production is
linking floral architecture to gamete production, and only the correlation of higher nectar amount and
sugar production to higher pollen production is linking the gamete production to nectar reward. These
links can be subsumed under a general need for higher resource investment, possibly linked to
V. Plasticity of flower traits in Streptocarpus
143
involvement of larger animal vectors in the pollination process with higher nutritional needs, larger
pollen bearing areas, etc. Moreover, optical flower signal and nectar reward are generally correlated by
higher nectar concentration for reddish flowers with stronger UV reflection. Beside these trends, flower
traits are combined quite freely amongst each other.
Instead of rejecting pollination syndromes for the genus, the data might be best interpreted as
supportive for two different evolutionary driving forces shaping plant-animal interaction in
Streptocarpus: Floral architecture controlling for plant-pollinator fit and pollen placement on the one
hand, and the interplay of attraction and reward on the other hand, pointing to a coupling between the
sensory capacities and preferences of the specific pollinator guilds and their nutritional needs.
V.5.3 FLORAL TRAITS SHOW ALMOST FREE RECOMBINATION ALONG THE COURSE OF EVOLUTION
Clusters are also recombined freely along the phylogentic tree, only two trends are present: First, the
Cape primrose polytomy shows a trend for open tubed flowers – however three subtypes are realised
(open cylindrical, open tube with pollinator chamber, Acanth type). Second, the link between reddish
flower colour accompanied by higher investment in nectar reward can be observed for two species of
the polytomy, S. roseoalbus and S. fasciatus, as well as for monophyletic S. pole-evansii, S. deticulatus
and S. dunnii. Roalson and Roberts (2016) have shown the strong evolutionary driving force of reddish
flower colour for New World Clades of Gesneriaceae, but not for Old World Clades like Streptocarpus.
Our study of plant traits might be interpreted in such a way that the shift to reddish flowers in
Streptocarpus is in its evolutionary emergence.
The strong plasticity of Streptocarpus in regard to flower types and floral architecture as well as growth
habit was already presented in previous studies: Möller and Cronk (2001) showed plasticity of growth
habit via ITS phylogeny, showing that the three different growth forms have originated several times
independently. As for flower types, Harrison et al. (1999) and Hughes et al. (2006) showed plasticity of
six floral types also via ITS phylogenies. In this paper we have replicated the phylogenetic plasticity of
floral architecture and flower types, and we have demonstrated phylogenetic plasticity for two other
quantitatively assessed subsets of floral functional traits not shown before: Gamete production and
nectar reward pattern. The cause for this phylogenetic plasticity of flower traits and growth habit might
either reflect independent origins (homoplasy) or the "capture" of molecular markers from dissimilar
parent species (de Villiers et al., 2013; Pirie et al., 2009). Hybridisation has to be assumed as a powerful
evolutionary operative force in Streptocarpus (Hilliard and Burtt, 1971).
V.5.4 FLORAL PLASTICITY AND POLLINATOR-DRIVEN SPECIATION
It remains unresolved in how far phylogenetic shifts between floral functional plant traits are pollinator-
driven: Due to the absence of clear-cut pattern amongst the floral functional traits, combined (!) with
rapid alteration along the phylogenetic tree, pollinator-driven speciation is either not very successful
(not leading to adaptive radiation), or too young to have realised its full potential. The data are rather
supportive for the strong impact of hybridisation on floral plasticity and speciation. Large parts of genus
Streptocarpus are supposedly forming a underlying, shared single gene pool (Hilliard and Burtt, 1971): It
is possible that freak pollination events between genetically insufficiently segregated species keep the
gene flow within the genus ongoing, making Streptocarpus an "active melting pot" of speciation and
V. Plasticity of flower traits in Streptocarpus
144
floral plasticity. If a newly established hybrid swarm with a new combination of functional floral traits is
fitting to sensory capacities and nutritional needs of a potential animal vector, a new species might be
established in a short time frame. This theory might be supported by lowered conflict between ITS and
plastid gene trees demonstrated for keyhole flowers (de Villiers et al., 2013): If such a flower type is once
established, it exerts much higher control on pollinators (and therefore on gene flow) due to highly
restrictive flower access and pollen placement, and therefore a stronger segregation of a part of the
complete gene pool of the genus. All in all, the extreme plasticity of flower function and decoupling of
floral functional traits observed for Streptocarpus link to latest findings on floral plasticity, plant-animal
interactions and evolution that show the strong interplay and malleability of these levels, e.g.: Kemp et
al. (2019) show pollinator influence on plant community level already working via non-random assembly
of complex flower colour patterns in these communities. Parachnowitsch et al. (2019) present that
signal-reward associations are suggesting correlational selection and evolutionary shaping of nectar
traits, and pollinator responses to nectar traits may drive selection. Tong et al. (2019) suggest that gain
(or loss) of nectar quickly results in adaptive behavioural shifts in the pollinator. Zych et al. (2019) even
report ‘adaptive wandering’ in floral characters, meaning observed variation between communities for
Angelica sylvestris, a plant otherwise well adapted to (floral) ecological generalisation.
In this sense, the floral ecological plasticity here presented for Streptocarpus is another example for the
ease evolution is shaping and changing plant-animal interactions and therewith speciation. We agree
with Möller et al. (2019), that "living collections play a key part in this research, helping to unravel the
mechanisms by which plant diversity is established". Nevertheless, future research should complement
the presented findings on floral plant traits in Streptocarpus by pollinator observations in the field.
V.6 ACKNOWLEDGMENTS
We thank Jaco Truter (Isando, South Africa) for provisioning of seed material in 2014, Thomas Joßberger
for collecting vouchers, Nicole Schmandt for DNA sequencing (both Nees Institute, University of Bonn)
and Dr. Juliana Chacón Pinilla (Ludwig-Maximilians-University, Munich) for assistance with phylogenetic
tree construction.
V.7 LITERATURE
Abrahamczyk, S., Lozada-Gobilard, S., Ackermann, M., Fischer, E., Krieger, V., Redling, A., Weigend, M., 2017. A question of data quality – Testing pollination syndromes in Balsaminaceae. PLOS ONE 12, e0186125. https://doi.org/10.1371/journal.pone.0186125
Alarcón, M.L., Roquet, C., Aldasoro, J.J., 2011. Evolution of pollen/ovule ratios and breeding system in Erodium (Geraniaceae). Systematic Botany 36, 661–676.
https://doi.org/10.1600/036364411X583637 Baker, H.G., Hurd, P.D., 1968. Intrafloral ecology. Annual Review of Entomology 13, 385–414.
https://doi.org/10.1146/annurev.en.13.010168.002125
Buta, E., Cantor, M., Buta, M., Zaharia, A., 2010. The effect of rooting substrates on the
development of leaf cuttings in Saintpaulia. Analele Univ. Craiova 15, 110–119.
Cruden, R.W., 1977. Pollen-ovule ratios: A conservative indicator of breeding systems in flowering plants. Evolution 31, 32–46. https://doi.org/10.2307/2407542
V. Plasticity of flower traits in Streptocarpus
145
Cruden, R.W., 2000. Pollen grains: Why so many? Plant Systematics and Evolution 222, 143–165. https://doi.org/10.1007/BF00984100
Cruden, R.W., Jensen, K.G., 1979. Viscin threads, pollination efficiency and low pollen-ovule ratios.
American Journal of Botany 66, 875–879. https://doi:10.1002/j.1537-2197.1979.tb06295.x
Cruden, R.W., Lyon, D.L., 1985. Correlations among stigma depth, style length, and pollen grain size: Do they reflect function or phylogeny? Botanical Gazette 146, 143–149. https://doi.org/10.1086/337509
Cruden, R.W., Miller-Ward, S., 1981. Pollen-ovule ratio, pollen size, and the ratio of stigmatic area to the pollen-bearing area of the pollinator: An hypothesis. Evolution 35, 964–974. https://doi.org/10.2307/2407867
Dafni, A., 1991. Advertisement, flower longevity, reward and nectar production in Labiatae. Acta
Horticulturae 288, 340–346. https://doi.org/10.17660/ActaHortic.1991.288.55
Darbyshire, I., Massingue, A.O., 2014. Two new species of Streptocarpus (Gesneriaceae) from
tropical Africa. Edinburgh Journal of Botany 71, 3–13.
de Jager, M.L., Willis-Jones, E., Critchley, S., Glover, B.J., 2016. The impact of floral spot and ring
markings on pollinator foraging dynamics. Evolutionary Ecology 31, 1–12.
de Villiers, M.J., Pirie, M.D., Hughes, M., Möller, M., Edwards, T.J., Bellstedt, D.U., 2013. An
approach to identify putative hybrids in the ‘coalescent stochasticity zone’, as exemplified in
the African plant genus Streptocarpus (Gesneriaceae). New Phytologist 198, 284–300.
https://doi.org/10.1111/nph.12133
Dellinger, A.S., Chartier, M., Fernández‐Fernández, D., Penneys, D.S., Alvear, M., Almeda, F., Michelangeli, F.A., Staedler, Y., Armbruster, W.S., Schönenberger, J., 2018. Beyond buzz‐pollination – departures from an adaptive plateau lead to new pollination syndromes. New Phytologist 221, 1136–1149. https://doi.org/10.1111/nph.15468
Delpino, F., 1868–1875. Ulteriori osservazione sulla dicogamia nel regno vegetale. Atti della Societa
Italiana di Scienze Naturali Milano, Vols. 1 and 2.
Endress, P.K., 1996. Homoplasy in angiosperm flowers. In: Sanderson, M.J., Hufford, L., eds.
Homoplasy – the recurrence of similarity in evolution. Academic Press, San Diego, 303–325.
Fægri,K., van der Pijl, L., 1966. The principles of pollination ecology. Pergamon, Oxford.
Fægri,K., van der Pijl, L., 1979. The principles of pollination ecology. 3rd ed. Pergamon, Oxford.
Fenster, C.B., Cheely, G., Dudash, M.R., Reynolds, R.J., 2006. Nectar reward and advertisement in hummingbird-pollinated Silene virginica (Caryophyllaceae). American Journal of Botany 93, 1800–1807. https://doi.org/10.3732/ajb.93.12.1800
Galetto, L., Bernardello, G., 2005. Nectar. In: Dafni, A., Kevan, P.G., Husband, B.C., eds. Practical
pollination biology. Enviroquest Ltd., Cambridge, Ontario. 261–313.
Gegear, R., Burns, J., 2007. The birds, the bees, and the virtual flowers: Can pollinator behavior
drive ecological speciation in flowering plants? The American Naturalist 170, 551–566.
doi:10.1086/521230
Gómez, J.M., Bosch, J., Perfectti, F., Fernandez, J.D., Abdelaziz, M., Camacho, J.P.M., 2008. Association between floral traits and rewards in Erysimum mediohispanicum (Brassicaceae). Annals of Botany 101, 1413–1420. https://doi.org/10.1093/aob/mcn053
Gómez, J.M., Perfectti, F., Camacho, J.P.M., 2006. Natural Selection on Erysimum mediohispanicum flower shape: Insights into the evolution of zygomorphy. The American Naturalist 168, 531–545. https://doi.org/10.1086/507048
V. Plasticity of flower traits in Streptocarpus
146
Grant, V., Grant, K.A., 1965. Flower pollination in the Phlox family. Columbia University Press, New York.
Harder, L.D., Barrett, S.C.H., 1995. Mating cost of large floral displays in hermaphrodite plants. Nature 373, 512–515. https://doi.org/10.1038/373512a0
Harder, L.D., Cruzan, M.B., 1990. An evaluation of the physiological and evolutionary influences of inflorescence size and flower depth on nectar production. Functional Ecology 4, 559–572. https://doi.org/10.2307/2389323
Harrison, C., 1999. Evolution and development of floral diversity in Streptocarpus and Saintpaulia.
Annals of Botany 84, 49–60. https://doi.org/10.1006/anbo.1999.0887
Hilliard O.M., Burtt B.L., 1971. Streptocarpus. An African plant study. University of Natal Press,
Pietermaritzburg, South Africa.
Hodges, S.A. 1995. The influence of nectar production on hawkmoth behavior, self pollination, and seed
production in Mirabilis multiflora (Nyctaginaceae). American Journal of Botany 82, 197–204.
https://doi:10.1002/j.1537-2197.1995.tb11488.x
Hughes, M., MacMaster, G., Möller, M., Bellstedt, D.U., Edwards, T.J., 2006. Breeding system of a
plesiomorphic floral type: an investigation of small flowered Streptocarpus (Gesneriaceae)
species. Plant Systematics and Evolution 262, 13–24.
https://doi.org/10.1007/s00606-006-0453-6
Ibañez, A.C., Moré, M., Salazar, G., Leiva, S., Barboza, G.E., Cocucci, A.A., 2019. Crescendo, diminuendo and subito of the trumpets: winds of change in the concerted evolution between flowers and pollinators in Salpichroa (Solanaceae). Molecular Phylogenetics and Evolution 132, 90–99. https://doi.org/10.1016/j.ympev.2018.11.020
Jeiter, J., Hilger, H.H., Smets, E.F., Weigend, M., 2017. The relationship between nectaries and floral architecture: a case study in Geraniaceae and Hypseocharitaceae. Annals of Botany 120, 791–803. https://doi.org/10.1093/aob/mcx101
Jeiter, J., Weigend, M., 2018. Simple scales make complex compartments – ontogeny and
morphology of stamen-corolla tube modifications in Hydrophyllaceae (Boraginales).
Biological Journal of the Linnean Society 125, 802–820.
https://doi.org/10.1093/biolinnean/bly167
Jersáková, J., Johnson, S.D., 2006. Lack of floral nectar reduces self-pollination in a fly-pollinated
orchid. Oecologia 147, 60–68.
Johnson, S.D., 2010. The pollination niche and its role in the diversification and maintenance of the southern African flora. Philosophical Transactions of the Royal Society B: Biological Sciences 365, 499–516. https://doi.org/10.1098/rstb.2009.0243
Johnson, S.D., Wester, P., 2017. Stefan Vogel’s analysis of floral syndromes in the South African flora: An appraisal based on 60 years of pollination studies. Flora 232, 200–206. https://doi.org/10.1016/j.flora.2017.02.005
Jong, K., Christie, F., Paik, J.H., Scott, S.M., Möller, M., 2012. Unusual morphological and anatomical
features of two woody Madagascan endemics, Streptocarpus papangae and S. suffruticosus
(Gesneriaceae), and their potential taxonomic value. South African Journal of Botany 80,
44–56.
Kaczorowski, R.L., Gardener, M.C., Holtsford, T.P., 2005. Nectar traits in Nicotiana section Alatae (Solanaceae) in relation to floral traits, pollinators, and mating system. American Journal of Botany 92, 1270–1283. https://doi.org/10.3732/ajb.92.8.1270
V. Plasticity of flower traits in Streptocarpus
147
Karron J.D., Ivey, C.T., Mitchell, R.J., Whitehead, M.R., Peakall, R., Case, A.L., 2012. New perspectives on
the evolution of plant mating systems. Annals of Botany 109, 493–503.
Katoh, K., Misawa, K., Kuma, K., Miyata, T., 2002. MAFFT: a novel method for rapid multiple sequence alignment based on fast Fourier transform. Nucleic Acids Research 30, 3059–3066. https://doi.org/10.1093/nar/gkf436
Katoh, K., Standley, D.M., 2013. MAFFT multiple sequence alignment software version 7: improvements in performance and usability. Molecular Biology and Evolution 30, 772–780. https://doi.org/10.1093/molbev/mst010
Kearse, M., Moir, R., Wilson, A., Stones-Havas, S., Cheung, M., Sturrock, S., Buxton, S., Cooper, A., Markowitz, S., Duran, C., Thierer, T., Ashton, B., Meintjes, P., Drummond, A., 2012. Geneious Basic: an integrated and extendable desktop software platform for the organization and analysis of sequence data. Bioinformatics 28, 1647–1649. https://doi.org/10.1093/bioinformatics/bts199
Kemp, J.E., Bergh, N.G., Soares, M., Ellis, A.G., 2019. Dominant pollinators drive non-random community assembly and shared flower colour patterns in daisy communities. Annals of Botany 123, 277–288. https://doi.org/10.1093/aob/mcy126
Kirk, W.D.J., 1993. Interspecific size and number variation in pollen grains and seeds. Biological Journal of the Linnean Society 49, 239–248. https://doi.org/10.1111/j.1095-8312.1993.tb00903.x
Klinkhamer, P.G.L, de Jong, T.J., Wesselingh, R.A., 1991. Implications of differences between
hermaphrodite and female flowers for attractiveness to pollinators and seed production.
Netherlands Journal of Zoology 41, 130–143.
Klinkhamer, P.G.L., de Jong, T.J., 1993. Attractiveness to pollinators: A plant’s dilemma. Oikos 66, 180–184. https://doi.org/10.2307/3545212
Kulbaba, M.W., Worley, A.C., 2012. Selection on floral design in Polemonium brandegeei
(Polemoniaceae): female and male fitness under hawkmoth pollination. Evolution 66, 1344–
1359. https://doi.org/10.1111/j.1558-5646.2011.01536.x
Kulbaba, M.W., Worley, A.C., 2013. Selection on Polemonium brandegeei (Polemoniaceae) flowers under hummingbird pollination: In opposition, parallel, or independent of selection by hawkmoths? Evolution 67, 2194–2206. https://doi.org/10.1111/evo.12102
López, J., Rodríguez-Riaño, T., Ortega-Olivencia, A., Antonio Devesa, J., Ruiz, T., 1999. Pollination mechanisms and pollen-ovule ratios in some Genisteae (Fabaceae) from southwestern Europe. Plant Systematics and Evolution 216, 23–47. https://doi.org/10.1007/BF00985099
Lozada‐Gobilard, S., Weigend, M., Fischer, E., Janssens, S.B., Ackermann, M., Abrahamczyk, S., 2019. Breeding systems in Balsaminaceae in relation to pollen/ovule ratio, pollination syndromes, life history and climate zone. Plant Biology 21, 157–166. https://doi.org/10.1111/plb.12905
Mächler, M., Rousseeuw, P., Struyf, A., Hubert, M., Hornik, K., 2019. cluster: Cluster analysis basics
and extensions. R package version 2.1.0.
McCune, B., Grace, J.B., Urban, D.L., 2002. Analysis of ecological communities. MjM Software Design. Michalski, S.G., Durka, W., 2009. Pollination mode and life form strongly affect the relation between
mating system and pollen to ovule ratios. New Phytologist 183, 470–479. https://doi.org/10.1111/j.1469-8137.2009.02861.x
Minnaar, C., Anderson, B., de Jager, M.L., Karron, J.D., 2019. Plant–pollinator interactions along the pathway to paternity. Annals of Botany 123, 225–245. https://doi.org/10.1093/aob/mcy167
Möller, M., Cronk, Q.C.B., 2001. Evolution of morphological novelty: a phylogenetic analysis of
growth patterns in Streptocarpus (Gesneriaceae). Evolution 55, 918–929.
https://doi.org/10.1111/j.0014-3820.2001.tb00609.x
V. Plasticity of flower traits in Streptocarpus
148
Möller, M., Barber, S., Atkins, H.J., Purvis, D.A., 2019. The Living Collection at the Royal Botanic Garden
Edinburgh illustrates the floral diversity in Streptocarpus (Gesneriaceae). Sibbaldia 17, 155–175.
Møller, A.P., 1995. Bumblebee preference for symmetrical flowers. Proceedings of the National Academy of Sciences 92, 2288–2292. https://doi.org/10.1073/pnas.92.6.2288
Neuendorf, J., 2013. Das Urinsediment: Mikroskopie-Präanalytik-Auswertung und Befundung. Springer-Verlag, Berlin, Heidelberg. https://doi.org/10.1007/978-3-642-37810-2
Newman, E., Manning, J., Anderson, B., 2014. Matching floral and pollinator traits through guild convergence and pollinator ecotype formation. Annals of Botany 113, 373–384. https://doi.org/10.1093/aob/mct203
Nishii, K., Hughes, M., Briggs, M., Haston, E., Christie, F., de Villiers, M.J., Hanekom, T., Roos, W.G.,
Bellstedt, D.U., Möller, M., 2015. Streptocarpus redefined to include all Afro-Malagasy
Gesneriaceae: Molecular phylogenies prove congruent with geographical distribution and basic
chromosome numbers and uncover remarkable morphological homoplasies. Taxon 64, 1243–
1274. https://doi.org/10.12705/646.8
Oksanen, J., Blanchet, F.G., Kindt, R., Legendre, P., Minchin, P., O’Hara, R., Simpson, G., Solymos, P., Stevens, M., Wagner, H., 2013. Vegan: Community ecology package. R package version. 2.0-10. CRAN.
Ornelas, J.F., Ordano, M., De-Nova, A.J., Quintero, M.E., Garland, T., 2007. Phylogenetic analysis of interspecific variation in nectar of hummingbird-visited plants: The evolution of nectar. Journal of Evolutionary Biology 20, 1904–1917. https://doi.org/10.1111/j.1420-9101.2007.01374.x
Parachnowitsch, A.L., Manson, J.S., Sletvold, N., 2019. Evolutionary ecology of nectar. Annals of Botany 123, 247–261. https://doi.org/10.1093/aob/mcy132
Pirie, M.D., Humphreys, A.M., Barker, N.P., Linder, H.P. 2009. Reticulation, data combination, and
inferring evolutionary history: an example from Danthonioideae (Poaceae). Systematic Biology
58, 612–628.
Plowright, R.C., 1981. Nectar production in the boreal forest lily Clintonia borealis. Canadian Journal of Botany 59, 156–160. https://doi.org/10.1139/b81-025
Potgieter, C.J., Edwards, T.J., 2005. The Stenobasipteron wiedemanni (Diptera, Nemestrinidae) pollination guild in eastern southern Africa. Annals of the Missouri Botanical Garden 92, 254–267.
Randrianasolo, A., Phillipson, P.B., Lowry II, P.P., Möller, M., 2018: Streptocarpus peltatus
(Gesneriaceae), a distinctive new species from Southeastern Madagascar. Novon 26, 22–27.
Roalson, E.H., Roberts, W.R., 2016. Distinct processes drive diversification in different clades of Gesneriaceae. Systematic Biology 65, 662–684. https://doi.org/10.1093/sysbio/syw012
Rosas-Guerrero, V., Aguilar, R., Martén-Rodríguez, S., Ashworth, L., Lopezaraiza-Mikel, M., Bastida, J.M., Quesada, M., 2014. A quantitative review of pollination syndromes: do floral traits predict effective pollinators? Ecology Letters 17, 388–400. https://doi.org/10.1111/ele.12224
Sletvold, N., Trunschke, J., Smit, M., Verbeek, J., Ågren, J., 2016. Strong pollinator-mediated selection for
increased flower brightness and contrast in a deceptive orchid. Evolution 70, 716–724.
Small, E., 1988. Pollen-ovule patterns in tribe Trifolieae (Leguminosae). Plant Systematics and Evolution 160, 195–205. https://doi.org/10.1007/BF00936047
Stamatakis, A., 2014. RAxML version 8: a tool for phylogenetic analysis and post-analysis of large phylogenies. Bioinformatics 30, 1312–1313. https://doi.org/10.1093/bioinformatics/btu033
Stanton, M.L., Snow, A.A., Handel, S.N., 1986. Floral evolution: Attractiveness to pollinators increases male fitness. Science 232, 1625–1627. https://doi.org/10.1126/science.232.4758.1625
V. Plasticity of flower traits in Streptocarpus
149
Stebbins, G.L., 1970. Adaptive radiation of reproductive characteristics in angiosperms, I: Pollination mechanisms. Annual Review of Ecology and Systematics 1, 307–326. https://doi.org/10.1146/annurev.es.01.110170.001515
Thomson, J.D., 1986. Pollen transport and deposition by bumble bees in Erythronium: Influences of floral nectar and bee grooming. The Journal of Ecology 74, 329–341. https://doi.org/10.2307/2260258
Tong, Z.-Y., Wang, X.-P., Wu, L.-Y., Huang, S.-Q., 2019. Nectar supplementation changes pollinator behaviour and pollination mode in Pedicularis dichotoma: implications for evolutionary transitions. Annals of Botany 123, 373–380. https://doi.org/10.1093/aob/mcy102
van der Niet, T., Johnson, S.D., 2012. Phylogenetic evidence for pollinator-driven diversification of angiosperms. Trends in Ecology & Evolution 27, 353–361. https://doi.org/10.1016/j.tree.2012.02.002
van der Pijl, L., 1961. Ecological aspects of flower evolution. II. Zoophilous flower classes. Evolution 15, 44–59. https://doi.org/10.2307/2405842
Vogel, S., 1954. Blütenbiologische Typen als Elemente der Sippengliederung, dargestellt anhand der
Flora Südafrikas. Botanische Studien 1. Fischer, Jena.
Weigend, M., Edwards, T.J., 1994. Notes on Streptocarpus cyaneus and S. parviflorus. Sendtnera 2,
365–376.
Wessinger, C.A., Hileman, L.C., Rausher, M.D., 2014. Identification of major quantitative trait loci underlying floral pollination syndrome divergence in Penstemon. Philosophical Transactions of the Royal Society B: Biological Sciences 369, 20130349. https://doi.org/10.1098/rstb.2013.0349
Westerkamp, C., Claßen-Bockhoff, R., 2007. Bilabiate flowers: The ultimate response to bees? Annals of Botany 100, 361–374. https://doi.org/10.1093/aob/mcm123
Willmer, P.G., 2011. Pollination and floral ecology. Princeton University Press, Princeton, N.J. Zimmerman, M., 1983. Plant reproduction and optimal foraging: Experimental nectar manipulations in
Delphinium nelsonii. Oikos 41, 57–63. https://doi.org/10.2307/3544346 Zych, M., Junker, R.R., Nepi, M., Stpiczyńska, M., Stolarska, B., Roguz, K., 2019. Spatiotemporal variation
in the pollination systems of a supergeneralist plant: is Angelica sylvestris (Apiaceae) locally adapted to its most effective pollinators? Annals of Botany 123, 415–428. https://doi.org/10.1093/aob/mcy140

V. Plasticity of flower traits in Streptocarpus
150
VI. Vigorous hybrid seed set between three closely related species of Streptocarpus
151
VI. VIGOROUS HYBRID SEED SET BETWEEN THREE CLOSELY RELATED SPECIES OF
STREPTOCARPUS SUBGENUS STREPTOCARPUS INDICATE POSTZYGOTIC
BARRIERS OF NO RELEVANCE FOR REPRODUCTIVE ISOLATION VI. Vigorous hybrid seed set between three closely related species of Streptocarpus Authors A. W. Mues* and M. Weigend* * Nees Institut für Biodiversität der Pflanzen, Universität Bonn, 53115 Bonn, Germany
VI.1 ABSTRACT
Background and aims: The Cape primrose clade or Streptocarpus cyaneus group represents a closely
allied species group within the genus Streptocarpus (Gesneriaceae). Floral architecture is considered as
the crucial factor for reproductive isolation between these closely allied species. We here investigate
the presence of reproductive isolation between three species of the group (S. rexii, S. rosealbus and
S. johannis) by performing crossing experiments.
Methods: Crossing experiment, seed counts, imaging technique, Generalised Linear Modeling (GLM),
Generalised Estimating Equations (GEE).
Key results: F1 hybrids are fertile. Seed set is generally high in interspecific crosses, comparable to
intraspecific siring success. Reduced seed set was primarily observed for experimental groups involving
Streptocarpus johannis as pollen donor. Nevertheless, average seed set per fruit is at least in the
hundreds, often showing round about 1,000 seeds, and in some cases even approximating 2,000 seeds
or more.
Conclusion: The theory of a single large gene pool underlying the Cape primrose clade is strongly
supported, allowing for hybrid speciation due to absence of postzygotic crossing barriers. Prezygotic
barriers such as eco-geographical isolation, including differences in floral architecture and optical signal,
appear to maintain the species distinct in nature.
Key words: Streptocarpus, Cape primrose clade, hybridisation, crossing experiment, seed counting,
ImageJ, Generalised Estimating Equations.
VI.2 INTRODUCTION
Streptocarpus Lindl. comprises round about 179 species, predominantly distributed in southern Africa
and Madagascar. The main diversification in the genus appears to be recent and has been dated to ca.
1.5 million years ago in the eastern South Africa (Möller et al., 2019; Möller and Cronk, 2001). The genus
was recently expanded to include all representatives of Gesneriaceae subfamily Didymocarpoideae in
Africa and Madagascar, including those formerly assigned to other genera such as Saintpaulia H.Wendl.
and Linnaeopsis Engl. (Möller et al., 2019, citing Darbyshire and Massingue, 2014; Nishii et al., 2015;
Randrianasolo et al., 2018).
VI. Vigorous hybrid seed set between three closely related species of Streptocarpus
152
Streptocarpus shows considerable morphological diversity (cf. Hilliard and Burtt, 1971): Vegetative
growth patterns are sometimes eccentric, with some plants only developing a single leaf, and
inflorescences are sprouting from the basal part of the midrib, while other species show more or less
orthodox rosulate or caulescent growth patterns. Flower morphology is even more diverse. Classically,
the flowers of Streptocarpus were classified into open-tube, keyhole, personate, small-pouch, flat-faced
Saintpaulia and bird-pollination flowers (Harrison et al., 1999; Hughes et al., 2006; Nishii et al., 2015).
Möller et al. (2019) further subdivide the open tube type by classification of six subtypes.
Beyond interspecific differences, there is also considerable intraspecific diversity in details of shape and
colour, with many different forms and subtypes described. Natural hybrids do occur in the field that
might be the cause of this variance, and cross-pollination is reported to be frequent, though clearly not
obligatory. Hilliard and Burtt (1971) report 28 instances of suspected hybridisation in their hybrid
catalogue (p. 77 ff.). They conclude that hybridisation "has been powerfully operative in the evolution of
subgenus Streptocarpus" (p. 77), and that "a very large part of (the) subgenus (…) belongs potentially to
a single gene pool (…)" (p. 76). Their claim is supported by the high degree of crossability within the
subgenus. Crossability of Streptocarpus is also of economic importance, with numerous interspecific
hybrids commercialised worldwide, usually involving i.a. S. rexii. However, detailed data on interspecific
fertility and F1 fertility are largely missing (Hilliard and Burtt, 1971: 74–77).
Current research on Streptocarpus is coming back to the possible prevalence of hybridisation first
proposed by Hilliard and Burtt (1971): de Villiers et al. (2013) state that the extreme plasticity of floral
architecture between closely allied species in the ITS phylogenies of Streptocarpus found by Harrison et
al. (1999) and Hughes et al. (2006) could be indicative either of independent origins of similar
morphologies (i.e. homoplasy) or might reflect the 'capture' of a molecular marker from
morphologically dissimilar parent species (de Villiers et al., 2013, citing Pirie et al., 2009) and thus go
back to hybridisation. However, de Villiers et al. (2013) also show for closely related species of subgenus
Streptocarpus, the so called 'Cape primrose clade', that growth form shifts rather than floral plasticity
might be interpreted as evidence for hybrid origin, providing evidence for this based on gene tree
conflicts for S. bolusii, S. vandeleurii, S. grandis, S. fanniniae (with S. gardenii being an additional
candidate). The historical relevance of hybridisation was therefore demonstrated by de Villiers et al.
(2013), but it is unaddressed whether it is still an active force, shaping diversity in the genus as Hilliard
and Burtt (1971) suggested.
We therefore investigate here whether florally divergent taxa are reproductively isolated beyond
ecogeographical isolation, i.e. whether additional pre- or postmating barriers are present. We use the
classical approach of experimental crossing. To test this hypothesis, three members of the Cape
primrose clade were selected for the crossing and seed counting experiments, all showing different
floral architectures and optical flower signals (see figure VI.1): S. rexii (Bowie ex Hook.) Lindl. with its long-
tubed and white corolla colour, S. roseoalbus Weigend & T.J.Edwards with its short-tubed reddish flower and
S. johannis L.L.Britten as representative of the keyhole flower type, with bluish corolla. All species show
rosulate growth pattern. Streptocarpus rexii and S. johannis are sympatric, while S. roseoalbus is
allopatric. Flowering time of the species is overlapping: October to December for S. johannis, October to
April for S. rexii (Hilliard and Burtt, 1971), and December to March for S. roseoalbus (Weigend and
Edwards, 1994).
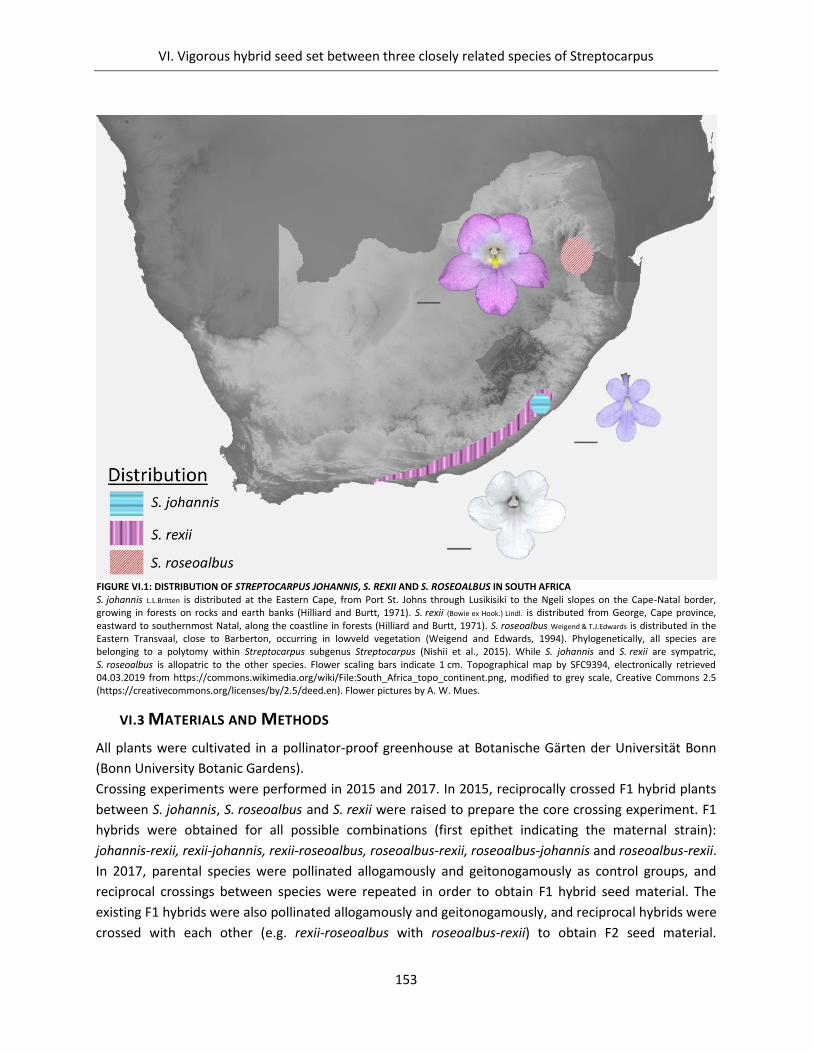
VI. Vigorous hybrid seed set between three closely related species of Streptocarpus
153
VI.3 MATERIALS AND METHODS
All plants were cultivated in a pollinator-proof greenhouse at Botanische Gärten der Universität Bonn
(Bonn University Botanic Gardens).
Crossing experiments were performed in 2015 and 2017. In 2015, reciprocally crossed F1 hybrid plants
between S. johannis, S. roseoalbus and S. rexii were raised to prepare the core crossing experiment. F1
hybrids were obtained for all possible combinations (first epithet indicating the maternal strain):
johannis-rexii, rexii-johannis, rexii-roseoalbus, roseoalbus-rexii, roseoalbus-johannis and roseoalbus-rexii.
In 2017, parental species were pollinated allogamously and geitonogamously as control groups, and
reciprocal crossings between species were repeated in order to obtain F1 hybrid seed material. The
existing F1 hybrids were also pollinated allogamously and geitonogamously, and reciprocal hybrids were
crossed with each other (e.g. rexii-roseoalbus with roseoalbus-rexii) to obtain F2 seed material.
FIGURE VI.1: DISTRIBUTION OF STREPTOCARPUS JOHANNIS, S. REXII AND S. ROSEOALBUS IN SOUTH AFRICA S. johannis L.L.Britten is distributed at the Eastern Cape, from Port St. Johns through Lusikisiki to the Ngeli slopes on the Cape-Natal border, growing in forests on rocks and earth banks (Hilliard and Burtt, 1971). S. rexii (Bowie ex Hook.) Lindl. is distributed from George, Cape province, eastward to southernmost Natal, along the coastline in forests (Hilliard and Burtt, 1971). S. roseoalbus Weigend & T.J.Edwards is distributed in the Eastern Transvaal, close to Barberton, occurring in lowveld vegetation (Weigend and Edwards, 1994). Phylogenetically, all species are belonging to a polytomy within Streptocarpus subgenus Streptocarpus (Nishii et al., 2015). While S. johannis and S. rexii are sympatric, S. roseoalbus is allopatric to the other species. Flower scaling bars indicate 1 cm. Topographical map by SFC9394, electronically retrieved 04.03.2019 from https://commons.wikimedia.org/wiki/File:South_Africa_topo_continent.png, modified to grey scale, Creative Commons 2.5 (https://creativecommons.org/licenses/by/2.5/deed.en). Flower pictures by A. W. Mues.
VI. Vigorous hybrid seed set between three closely related species of Streptocarpus
154
Pollination was carried out with complete pollen material of both anthers of the respective pollen donor
to ensure a sufficient pollen load.
For allogamous pollination and crossing, corollas of newly opened flowers were carefully but completely
removed to prevent self-pollination: Stamens are fused to the ventral part of the corolla, and anthers
were covered with the corolla before removal and pulled away from the gynoecium to prevent
contamination of the stigma. Spontaneous autogamy was not observed in pre-experiments, but
emasculation was deemed necessary to prevent accidental selfing during handling of the plants.
Fruits were harvested at incipient dehiscence, indicated by colour change towards greenish-brown. Fruit
length and ripening time from the day of pollination to the day of harvest were recorded.
All in all, 30 experimental groups based on variation of maternal and paternal contribution, pollination
procedure and generational level were run in 2017, with each group represented by 5 fruits, totalling
N = 150 fruits.
VI.3.1 SEED COUNT
Due to the high seed production in Streptocarpus, seed number was assessed by photographic
documentation and application of freely available image processing software, ImageJ (National Institute
of Health, USA). Counting technique was adjusted from Costa and Yang (2009) as described below.
Harvested fruits were dried separately in paper sachets for ca. three months. Fruits were afterwards
opened on a sheet of paper by twisting the spiralised fruit until seed material was released completely.
As a first cleaning step, seed material was carefully dropped onto a second paper, with lighter debris
sticking electrostatically to the first paper. As a second cleaning step, heavier debris (larger fibres etc.)
was removed with a pair of tweezers, and seed material was distributed evenly on the paper: Attention
was paid to separate seeds from each other in order to prevent miscounts. Pictures were taken with a
single-lens camera (EOS Digital 600D) and stored in jpg format.
Before counting, pictures were trimmed in paint (© Microsoft) and colour inverted to create a
monochromatic, dark background. Processed pictures were loaded into ImageJ and converted to 8-bit
format. Using threshold applications and redfilter function, seeds were recognised as target objects and
remaining debris was filtered out. Subsequently, thresholds were switched to black and white to create
a final, bicromatic picture. Counting of seed material was performed by means of the "analyse particle"
function, with no restrictions placed on parameters size and circularity due to the spindle shape of the
seeds.
VI.3.2 STATISTICAL ANALYSIS
Statistics were carried out with IBM software package SPSS, version 24. The dependent and ratio scaled
variable (DV) to be explained is seed production. Explanatory, independent and nominal variables (IVs)
are "paternal" and "maternal contribution" to siring success (representing pollen donors and pollen
recipients), "generational level" and "pollination procedure". Additionally, "fruit length" and "ripening
time" are ratio scaled covariates, analysed in regard to possible impact on the DV.
Regarding maternal and paternal contribution to siring success, every individual strain involved in a
pollination procedure was labelled conservative as a single unit: Parental species were labelled
according to their species epithets "joha", "rexi" and "rose". Maternal and paternal strains of pollination
VI. Vigorous hybrid seed set between three closely related species of Streptocarpus
155
within the F1 generation were labelled according to the crossing direction they originated from (first
abbreviation always indicating the maternal hybrid origin): "joha-rexi", "joha-rose", "rexi-joha", "rexi-
rose", "rose-joha" and "rose-rexi". Three levels were selected to describe generational level: Pollinations
carried out between plant individuals of the same original species constitute the control group and were
coded "parental". Crossing between parental species was coded "F1" to label fruits and seed material
that constitute the first filial generation. Pollinations, fruit- and seed set between F1 hybrids were coded
"F2". Pollination procedure has also three levels: "Geitonogamy" describes pollination within plant
individuals. "Allogamy" describes pollination between plant individuals of the same genetic makeup.
"Crossing" describes recombination of genetic makeup between original species or between different
strains of the F1.
Statistical analysis of siring success accounts for the nested design of the crossing experiment: Every
combination of maternal and paternal contribution for each generational level and each pollination
procedure represents a separate experimental group. Moreover, every experimental group is
represented by five fruits and measurements of their length, ripening time and seed set (repeated
measurements, nested within the experimental groups). Exploratory analysis of normal distribution of
metric variables was generally verified via Shapiro Wilks test for most of the experimental groups, but
not for the overall distribution of the variables across the groups. Analysis was therefore performed via
Generalised Estimating Equations (GEE, Liang and Zeger, 1986). GEEs are offering the full flexibility of
Generalised Linear (Mixed) Modelling in combination with highly robust estimation procedures (Baltes-
Götz, 2016; Swan, 2006), allowing for estimation of non-normal, nested data structures including
repeated measurements.
In a first step, an Intercepts-Only Model without introduction of predictors was calculated to check for
necessity of multilevel modelling (Tabachnick and Fidell, 2006). Group means for the different
treatments are differing highly significant from the grand mean of seed set (Wald χ² (1, N = 150) =
90,137, p = .000), validating the application of Generalised Linear Modelling techniques. In a second
step, a Covariate Interaction Model was calculated to check for interactions between predictors and the
covariates fruith length and ripening time. Interaction terms were checked for significance in order to
remove insignificant interactions from the final model (Engqvist, 2005). Predictors with interactions
were introduced to the model according to following working hypothesis (model building): First, seed
set is depending on the maternal contribution, due to the general dependence of the seed set from
ovule production of the maternal strain. Second, paternal contribution influences seed set via genetic fit
to the maternal strain, pollen viability and fertility. Third, seed set is assumedly influenced by
generational level, with higher seed set expected for pollination within species (only parental, control
groups) than for F1 hybrid seed material, due to genetic mismatch. Seed set is expected to rise again for
F2 seed material, due to genetic recombination of parental strains. Fourth, pollination procedure is
assumed to be of additional explanatory value, with higher seed set expected for allogamous
outcrossing than geitonogamous pollination or even true crossing. For the final model presented here,
significant interaction terms were introduced, insignificant interaction terms were removed and
predictors without interactions were placed as main effects. Intercepts-Only Model, Covariate
Interaction Model and the complete Final Model are presented in the appendix (A X.5.1 to A X.5.3).
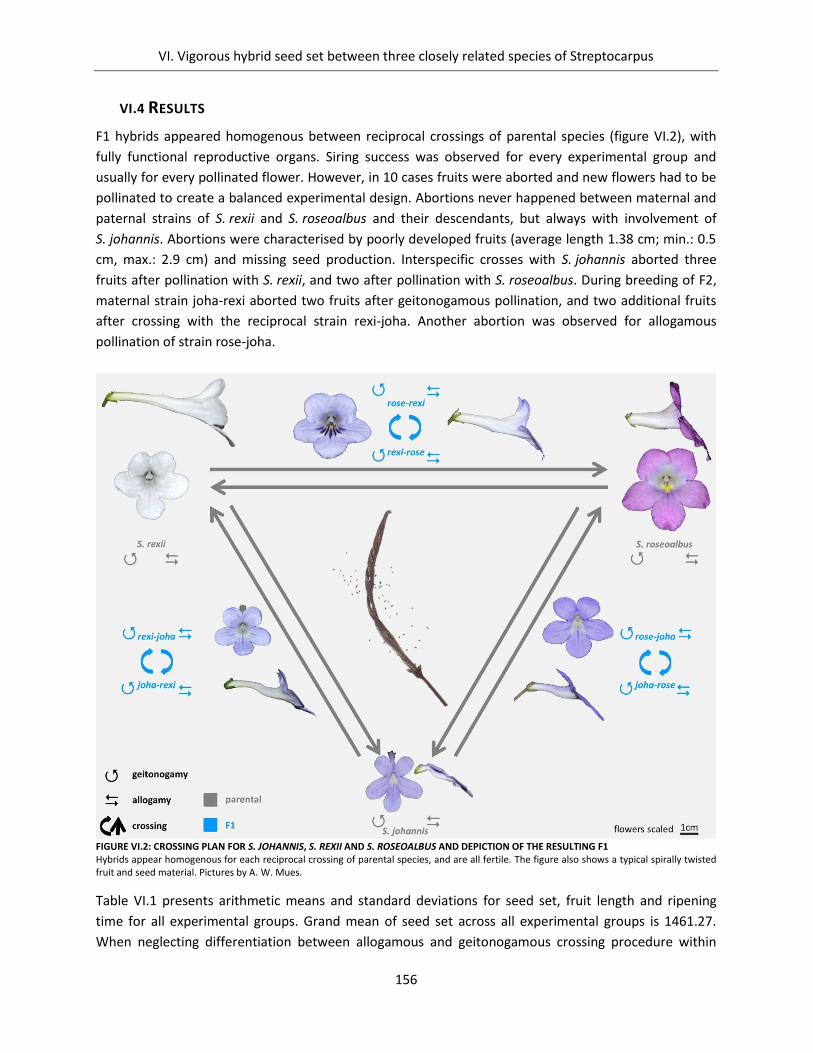
VI. Vigorous hybrid seed set between three closely related species of Streptocarpus
156
VI.4 RESULTS
F1 hybrids appeared homogenous between reciprocal crossings of parental species (figure VI.2), with
fully functional reproductive organs. Siring success was observed for every experimental group and
usually for every pollinated flower. However, in 10 cases fruits were aborted and new flowers had to be
pollinated to create a balanced experimental design. Abortions never happened between maternal and
paternal strains of S. rexii and S. roseoalbus and their descendants, but always with involvement of
S. johannis. Abortions were characterised by poorly developed fruits (average length 1.38 cm; min.: 0.5
cm, max.: 2.9 cm) and missing seed production. Interspecific crosses with S. johannis aborted three
fruits after pollination with S. rexii, and two after pollination with S. roseoalbus. During breeding of F2,
maternal strain joha-rexi aborted two fruits after geitonogamous pollination, and two additional fruits
after crossing with the reciprocal strain rexi-joha. Another abortion was observed for allogamous
pollination of strain rose-joha.
Table VI.1 presents arithmetic means and standard deviations for seed set, fruit length and ripening
time for all experimental groups. Grand mean of seed set across all experimental groups is 1461.27.
When neglecting differentiation between allogamous and geitonogamous crossing procedure within
FIGURE VI.2: CROSSING PLAN FOR S. JOHANNIS, S. REXII AND S. ROSEOALBUS AND DEPICTION OF THE RESULTING F1 Hybrids appear homogenous for each reciprocal crossing of parental species, and are all fertile. The figure also shows a typical spirally twisted fruit and seed material. Pictures by A. W. Mues.
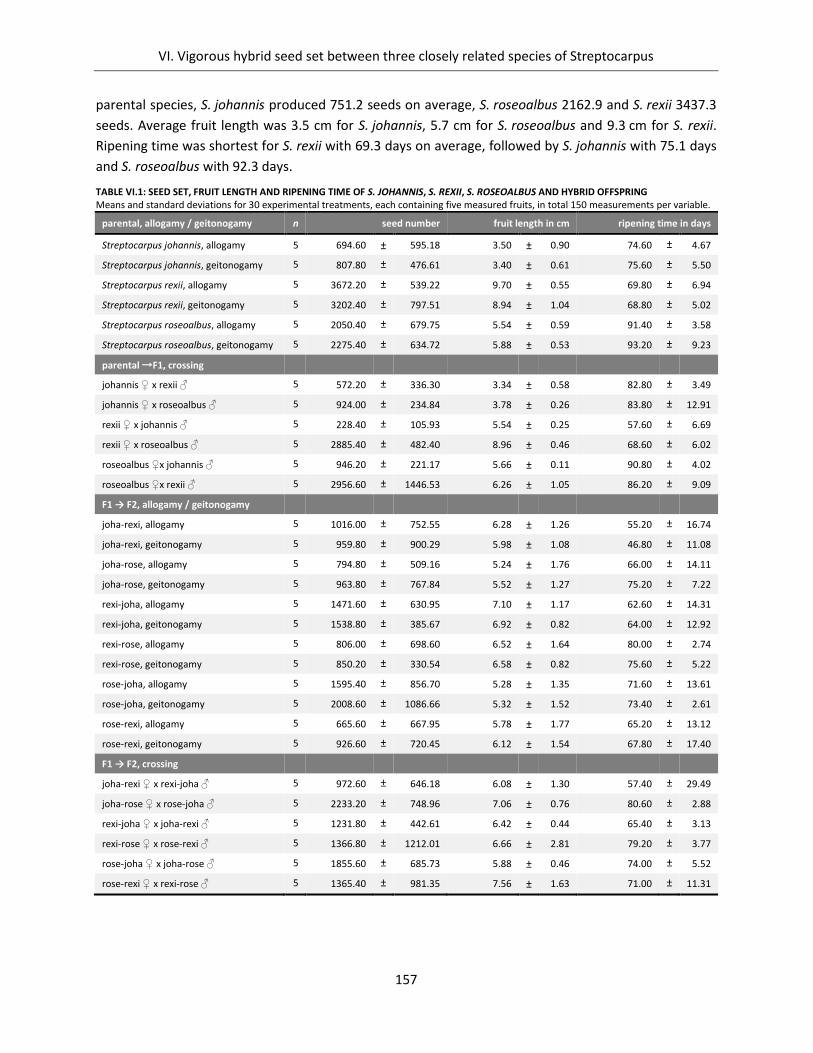
VI. Vigorous hybrid seed set between three closely related species of Streptocarpus
157
parental species, S. johannis produced 751.2 seeds on average, S. roseoalbus 2162.9 and S. rexii 3437.3
seeds. Average fruit length was 3.5 cm for S. johannis, 5.7 cm for S. roseoalbus and 9.3 cm for S. rexii.
Ripening time was shortest for S. rexii with 69.3 days on average, followed by S. johannis with 75.1 days
and S. roseoalbus with 92.3 days.
TABLE VI.1: SEED SET, FRUIT LENGTH AND RIPENING TIME OF S. JOHANNIS, S. REXII, S. ROSEOALBUS AND HYBRID OFFSPRING Means and standard deviations for 30 experimental treatments, each containing five measured fruits, in total 150 measurements per variable.
parental, allogamy / geitonogamy n seed number fruit length in cm ripening time in days
Streptocarpus johannis, allogamy 5 694.60 ± 595.18 3.50 ± 0.90 74.60 ± 4.67
Streptocarpus johannis, geitonogamy 5 807.80 ± 476.61 3.40 ± 0.61 75.60 ± 5.50
Streptocarpus rexii, allogamy 5 3672.20 ± 539.22 9.70 ± 0.55 69.80 ± 6.94
Streptocarpus rexii, geitonogamy 5 3202.40 ± 797.51 8.94 ± 1.04 68.80 ± 5.02
Streptocarpus roseoalbus, allogamy 5 2050.40 ± 679.75 5.54 ± 0.59 91.40 ± 3.58
Streptocarpus roseoalbus, geitonogamy 5 2275.40 ± 634.72 5.88 ± 0.53 93.20 ± 9.23
parental →F1, crossing
johannis x rexii 5 572.20 ± 336.30 3.34 ± 0.58 82.80 ± 3.49
johannis x roseoalbus 5 924.00 ± 234.84 3.78 ± 0.26 83.80 ± 12.91
rexii x johannis 5 228.40 ± 105.93 5.54 ± 0.25 57.60 ± 6.69
rexii x roseoalbus 5 2885.40 ± 482.40 8.96 ± 0.46 68.60 ± 6.02
roseoalbus x johannis 5 946.20 ± 221.17 5.66 ± 0.11 90.80 ± 4.02
roseoalbus x rexii 5 2956.60 ± 1446.53 6.26 ± 1.05 86.20 ± 9.09
F1 → F2, allogamy / geitonogamy
joha-rexi, allogamy 5 1016.00 ± 752.55 6.28 ± 1.26 55.20 ± 16.74
joha-rexi, geitonogamy 5 959.80 ± 900.29 5.98 ± 1.08 46.80 ± 11.08
joha-rose, allogamy 5 794.80 ± 509.16 5.24 ± 1.76 66.00 ± 14.11
joha-rose, geitonogamy 5 963.80 ± 767.84 5.52 ± 1.27 75.20 ± 7.22
rexi-joha, allogamy 5 1471.60 ± 630.95 7.10 ± 1.17 62.60 ± 14.31
rexi-joha, geitonogamy 5 1538.80 ± 385.67 6.92 ± 0.82 64.00 ± 12.92
rexi-rose, allogamy 5 806.00 ± 698.60 6.52 ± 1.64 80.00 ± 2.74
rexi-rose, geitonogamy 5 850.20 ± 330.54 6.58 ± 0.82 75.60 ± 5.22
rose-joha, allogamy 5 1595.40 ± 856.70 5.28 ± 1.35 71.60 ± 13.61
rose-joha, geitonogamy 5 2008.60 ± 1086.66 5.32 ± 1.52 73.40 ± 2.61
rose-rexi, allogamy 5 665.60 ± 667.95 5.78 ± 1.77 65.20 ± 13.12
rose-rexi, geitonogamy 5 926.60 ± 720.45 6.12 ± 1.54 67.80 ± 17.40
F1 → F2, crossing
joha-rexi x rexi-joha 5 972.60 ± 646.18 6.08 ± 1.30 57.40 ± 29.49
joha-rose x rose-joha 5 2233.20 ± 748.96 7.06 ± 0.76 80.60 ± 2.88
rexi-joha x joha-rexi 5 1231.80 ± 442.61 6.42 ± 0.44 65.40 ± 3.13
rexi-rose x rose-rexi 5 1366.80 ± 1212.01 6.66 ± 2.81 79.20 ± 3.77
rose-joha x joha-rose 5 1855.60 ± 685.73 5.88 ± 0.46 74.00 ± 5.52
rose-rexi x rexi-rose 5 1365.40 ± 981.35 7.56 ± 1.63 71.00 ± 11.31
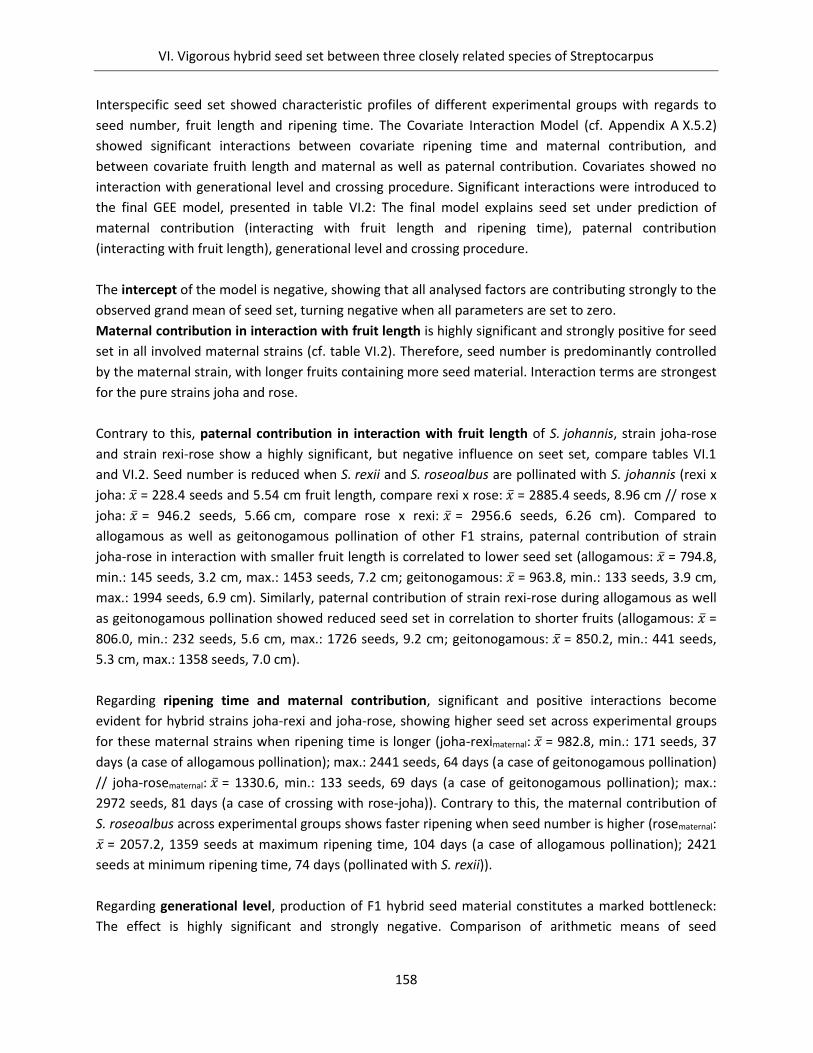
VI. Vigorous hybrid seed set between three closely related species of Streptocarpus
158
Interspecific seed set showed characteristic profiles of different experimental groups with regards to
seed number, fruit length and ripening time. The Covariate Interaction Model (cf. Appendix A X.5.2)
showed significant interactions between covariate ripening time and maternal contribution, and
between covariate fruith length and maternal as well as paternal contribution. Covariates showed no
interaction with generational level and crossing procedure. Significant interactions were introduced to
the final GEE model, presented in table VI.2: The final model explains seed set under prediction of
maternal contribution (interacting with fruit length and ripening time), paternal contribution
(interacting with fruit length), generational level and crossing procedure.
The intercept of the model is negative, showing that all analysed factors are contributing strongly to the
observed grand mean of seed set, turning negative when all parameters are set to zero.
Maternal contribution in interaction with fruit length is highly significant and strongly positive for seed
set in all involved maternal strains (cf. table VI.2). Therefore, seed number is predominantly controlled
by the maternal strain, with longer fruits containing more seed material. Interaction terms are strongest
for the pure strains joha and rose.
Contrary to this, paternal contribution in interaction with fruit length of S. johannis, strain joha-rose
and strain rexi-rose show a highly significant, but negative influence on seet set, compare tables VI.1
and VI.2. Seed number is reduced when S. rexii and S. roseoalbus are pollinated with S. johannis (rexi x
joha: = 228.4 seeds and 5.54 cm fruit length, compare rexi x rose: = 2885.4 seeds, 8.96 cm // rose x
joha: = 946.2 seeds, 5.66 cm, compare rose x rexi: = 2956.6 seeds, 6.26 cm). Compared to
allogamous as well as geitonogamous pollination of other F1 strains, paternal contribution of strain
joha-rose in interaction with smaller fruit length is correlated to lower seed set (allogamous: = 794.8,
min.: 145 seeds, 3.2 cm, max.: 1453 seeds, 7.2 cm; geitonogamous: = 963.8, min.: 133 seeds, 3.9 cm,
max.: 1994 seeds, 6.9 cm). Similarly, paternal contribution of strain rexi-rose during allogamous as well
as geitonogamous pollination showed reduced seed set in correlation to shorter fruits (allogamous: =
806.0, min.: 232 seeds, 5.6 cm, max.: 1726 seeds, 9.2 cm; geitonogamous: = 850.2, min.: 441 seeds,
5.3 cm, max.: 1358 seeds, 7.0 cm).
Regarding ripening time and maternal contribution, significant and positive interactions become
evident for hybrid strains joha-rexi and joha-rose, showing higher seed set across experimental groups
for these maternal strains when ripening time is longer (joha-reximaternal: = 982.8, min.: 171 seeds, 37
days (a case of allogamous pollination); max.: 2441 seeds, 64 days (a case of geitonogamous pollination)
// joha-rosematernal: = 1330.6, min.: 133 seeds, 69 days (a case of geitonogamous pollination); max.:
2972 seeds, 81 days (a case of crossing with rose-joha)). Contrary to this, the maternal contribution of
S. roseoalbus across experimental groups shows faster ripening when seed number is higher (rosematernal:
= 2057.2, 1359 seeds at maximum ripening time, 104 days (a case of allogamous pollination); 2421
seeds at minimum ripening time, 74 days (pollinated with S. rexii)).
Regarding generational level, production of F1 hybrid seed material constitutes a marked bottleneck:
The effect is highly significant and strongly negative. Comparison of arithmetic means of seed
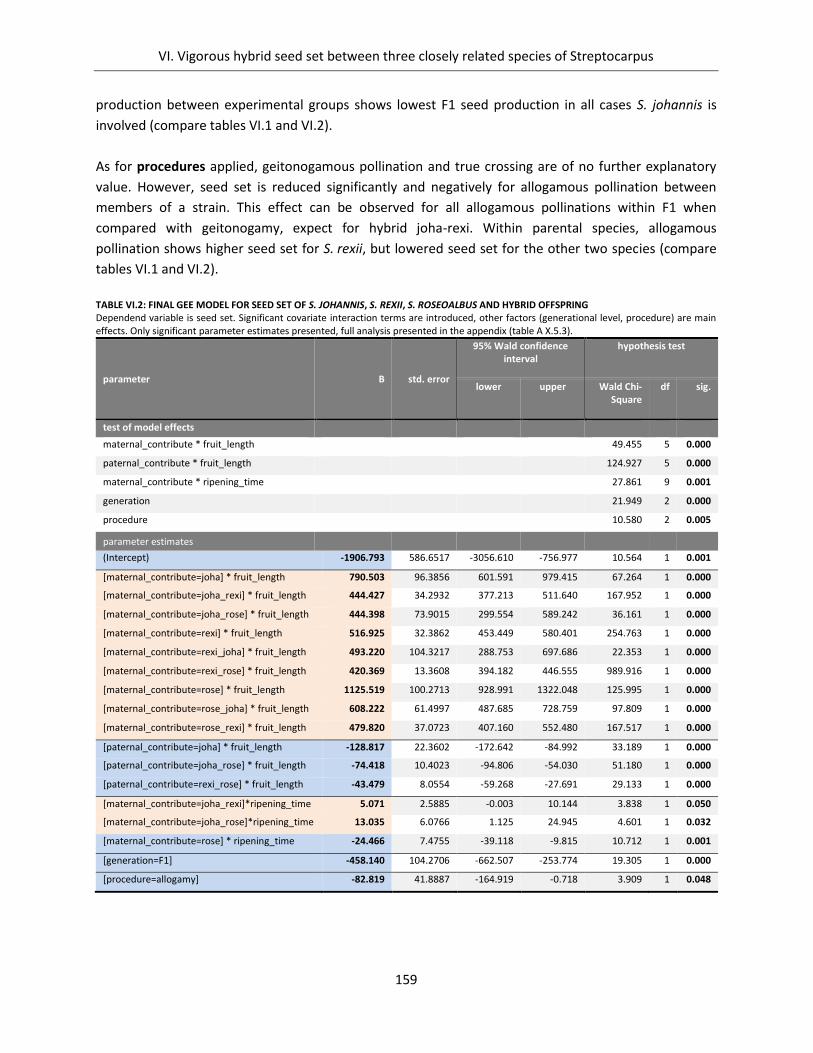
VI. Vigorous hybrid seed set between three closely related species of Streptocarpus
159
production between experimental groups shows lowest F1 seed production in all cases S. johannis is
involved (compare tables VI.1 and VI.2).
As for procedures applied, geitonogamous pollination and true crossing are of no further explanatory
value. However, seed set is reduced significantly and negatively for allogamous pollination between
members of a strain. This effect can be observed for all allogamous pollinations within F1 when
compared with geitonogamy, expect for hybrid joha-rexi. Within parental species, allogamous
pollination shows higher seed set for S. rexii, but lowered seed set for the other two species (compare
tables VI.1 and VI.2).
TABLE VI.2: FINAL GEE MODEL FOR SEED SET OF S. JOHANNIS, S. REXII, S. ROSEOALBUS AND HYBRID OFFSPRING Dependend variable is seed set. Significant covariate interaction terms are introduced, other factors (generational level, procedure) are main effects. Only significant parameter estimates presented, full analysis presented in the appendix (table A X.5.3).
parameter B std. error
95% Wald confidence interval
hypothesis test
lower upper Wald Chi-Square
df sig.
test of model effects
maternal_contribute * fruit_length 49.455 5 0.000
paternal_contribute * fruit_length 124.927 5 0.000
maternal_contribute * ripening_time 27.861 9 0.001
generation 21.949 2 0.000
procedure 10.580 2 0.005
parameter estimates
(Intercept) -1906.793 586.6517 -3056.610 -756.977 10.564 1 0.001
[maternal_contribute=joha] * fruit_length 790.503 96.3856 601.591 979.415 67.264 1 0.000
[maternal_contribute=joha_rexi] * fruit_length 444.427 34.2932 377.213 511.640 167.952 1 0.000
[maternal_contribute=joha_rose] * fruit_length 444.398 73.9015 299.554 589.242 36.161 1 0.000
[maternal_contribute=rexi] * fruit_length 516.925 32.3862 453.449 580.401 254.763 1 0.000
[maternal_contribute=rexi_joha] * fruit_length 493.220 104.3217 288.753 697.686 22.353 1 0.000
[maternal_contribute=rexi_rose] * fruit_length 420.369 13.3608 394.182 446.555 989.916 1 0.000
[maternal_contribute=rose] * fruit_length 1125.519 100.2713 928.991 1322.048 125.995 1 0.000
[maternal_contribute=rose_joha] * fruit_length 608.222 61.4997 487.685 728.759 97.809 1 0.000
[maternal_contribute=rose_rexi] * fruit_length 479.820 37.0723 407.160 552.480 167.517 1 0.000
[paternal_contribute=joha] * fruit_length -128.817 22.3602 -172.642 -84.992 33.189 1 0.000
[paternal_contribute=joha_rose] * fruit_length -74.418 10.4023 -94.806 -54.030 51.180 1 0.000
[paternal_contribute=rexi_rose] * fruit_length -43.479 8.0554 -59.268 -27.691 29.133 1 0.000
[maternal_contribute=joha_rexi]*ripening_time 5.071 2.5885 -0.003 10.144 3.838 1 0.050
[maternal_contribute=joha_rose]*ripening_time 13.035 6.0766 1.125 24.945 4.601 1 0.032
[maternal_contribute=rose] * ripening_time -24.466 7.4755 -39.118 -9.815 10.712 1 0.001
[generation=F1] -458.140 104.2706 -662.507 -253.774 19.305 1 0.000
[procedure=allogamy] -82.819 41.8887 -164.919 -0.718 3.909 1 0.048
VI. Vigorous hybrid seed set between three closely related species of Streptocarpus
160
VI.5 DISCUSSION
In general, our analysis shows that hybrid seed set between selected members of the Cape primrose
clade is only moderately variable across different crossing directions, generational levels and pollination
procedures, consistently resulting in hundreds to thousands of seeds per fruit.
Reduced seed set was primarily observed for experimental groups involving Streptocarpus johannis as
pollen donor, leading to a decline of F1 hybrid seed production. This result is underlined by the
observation of aborted fruits, which were restricted to S. johannis and its descendants.
Apart from some effects on ripening time and fruit length, seed set is generally high in all crossing
groups. Interestingly, lowest seed set between all crossing groups was observed for the two sympatric
crossing scenarios in nature, pollination of S. rexii with S. johannis ( = 228.40) and S. johannis with
S. rexii ( = 572.20). Nevertheless, seed set for these two scenarios is still in the hundreds: When
imagining a freak pollination event between these two species with very different flower architecture
and colour signal, resulting seed numbers would be easily high enough to cause the establishment of a
hybrid swarm. Possibly, reinforcement (or Wallace effect) is an ongoing process for the sympatric
scenario of S. rexii and S. johannis: From the perspective of the crossing experiments, both species are
incipient and hybrid formation is possible.
Although strains joha-rose and rexi-rose showed a negative paternal effect on F2 seed set, seed number
is high, roughly approximating round about 1,000 seeds per fruit. Other experimental groups aiming at
F2 seed set are easily surpassing this threshold, with some crossings leading to more than 2,000 seeds
per fruit.
Our results strongly support the theory of Hilliard and Burtt (1971) of a single large gene pool for the
Cape primrose clade, still allowing for hybridisation and speciation due to missing postmating or specific
postzygotic crossing barriers. Our results further support the findings of de Villiers et al. (2013): They
demonstrated the historical relevance of hybridisation within genus Streptocarpus, and showed that
growth form shifts rather than floral plasticity might be interpreted as evidence for hybrid origins.
Highly specialised keyhole flower types like of S. baudertii, S. polyanthus and S. johannis (often
rumoured to be of hybrid origin) were only present in stable taxa without gene tree conflict, giving
support to the hypothesis that floral architecture has been maintaining reproductive isolation in a
reticulate evolutionary scenario.
Taken together, ecogeographical isolation and prezygotic pollination barriers such as floral architecture
and optical flower signal are likely the crucial factors to guide and control pollinators and keep the
species separate in nature.
VI.6 ACKNOWLEDGEMENTS
We thank Thomas Joßberger for collecting vouchers and Klaus Mahlberg for taking care of the plants in
the greenhouse.
VI. Vigorous hybrid seed set between three closely related species of Streptocarpus
161
VI.7 LITERATURE
Baltes-Götz, B., 2016. Generalisierte lineare Modelle und GEE-Modelle in SPSS Statistics. Retrieved
electronically, https://www.uni-trier.de/fileadmin/urt/doku/gzlm_gee/gzlm_gee.pdf,
10.03.2019.
Costa, C.M., Yang, S., 2009. Counting pollen grains using readily available, free image processing and
analysis software. Annals of Botany 104, 1005–1010. https://doi.org/10.1093/aob/mcp186
Darbyshire, I., Massingue, A.O., 2014. Two new species of Streptocarpus (Gesneriaceae) from tropical
Africa. Edinburgh Journal of Botany 71, 3–13.
de Villiers, M.J., Pirie, M.D., Hughes, M., Möller, M., Edwards, T.J., Bellstedt, D.U., 2013. An approach to
identify putative hybrids in the ‘coalescent stochasticity zone’, as exemplified in the African
plant genus Streptocarpus (Gesneriaceae). New Phytologist 198, 284–300.
https://doi.org/10.1111/nph.12133
Engqvist, L., 2005. The mistreatment of covariate interaction terms in linear model analyses of
behavioural and evolutionary ecology studies. Animal Behaviour 70, 967–971.
https://doi.org/10.1016/j.anbehav.2005.01.016
Harrison, C., 1999. Evolution and development of floral diversity in Streptocarpus and Saintpaulia.
Annals of Botany 84, 49–60. https://doi.org/10.1006/anbo.1999.0887
Hilliard O.M., Burtt B. L., 1971. Streptocarpus. An African plant study. University of Natal Press,
Pietermaritzburg, South Africa.
Hughes, M., MacMaster, G., Möller, M., Bellstedt, D.U., Edwards, T.J., 2006. Breeding system of a
plesiomorphic floral type: an investigation of small flowered Streptocarpus (Gesneriaceae)
species. Plant Systematics and Evolution 262, 13–24.
https://doi.org/10.1007/s00606-006-0453-6
Liang, K., Zeger, S.L., 1986. Longitudinal data analysis using generalized linear models. Biometrika,
73, 13–22.
Möller, M., Barber, S., Atkins, H.J., Purvis, D.A., 2019. The Living Collection at the Royal Botanic Garden
Edinburgh illustrates the floral diversity in Streptocarpus (Gesneriaceae). Sibbaldia 17, 155–175.
Möller, M., Cronk, Q.C.B., 2001. Evolution of morphological novelty: a phylogenetic analysis of growth
patterns in Streptocarpus (Gesneriaceae). Evolution 55, 918–929.
https://doi.org/10.1111/j.0014-3820.2001.tb00609.x
Nishii, K., Hughes, M., Briggs, M., Haston, E., Christie, F., DeVilliers, M.J., Hanekom, T., Roos, W.G.,
Bellstedt, D.U., Möller, M., 2015. Streptocarpus redefined to include all Afro-Malagasy
Gesneriaceae: Molecular phylogenies prove congruent with geographical distribution and basic
chromosome numbers and uncover remarkable morphological homoplasies. Taxon 64, 1243–
1274. https://doi.org/10.12705/646.8
Pirie, M.D., Humphreys, A.M., Barker, N.P., Linder, H.P. 2009. Reticulation, data combination, and
inferring evolutionary history: an example from Danthonioideae (Poaceae). Systematic Biology
58, 612–628.
Randrianasolo, A., Phillipson, P.B., Lowry II, P.P., Möller, M., 2018: Streptocarpus peltatus
(Gesneriaceae), a distinctive new species from southeastern Madagascar. Novon 26, 22–27.
VI. Vigorous hybrid seed set between three closely related species of Streptocarpus
162
Swan, T., 2006. Generalized Estimating Equations when the response variable has a Tweedie
distribution: an application for multi-site rainfall modelling (Honours thesis). University of
Southern Queensland. Retrieved electronically, http://eprints.usq.edu.au/3388/, 10.03.2019.
Tabachnick, B.G., Fidell, L.S., 2006. Using multivariate statistics. Fifth edition. Pearson International
Edition, Boston.
Weigend, M., Edwards, T.J., 1994. Notes on Streptocarpus cyaneus and S. parviflorus. Sendtnera 2, 365–
376.
VII. Functional floral architecture, optical signal and nectar reward in Streptocarpus hybrids
163
VII. FUNCTIONAL FLORAL ARCHITECTURE, OPTICAL SIGNAL AND NECTAR
REWARD IN STREPTOCARPUS HYBRIDS, ALLOWING FOR HOMOPLOID HYBRID
SPECIATION VII. Functional floral architecture, optical signal and nectar reward in Streptocarpus hybrids Authors A. W. Mues*, L. Nicolin*, L. Hoff* and M. Weigend* * Nees Institut für Biodiversität der Pflanzen, Universität Bonn, 53115 Bonn, Germany
VII.1 ABSTRACT
Background and aims: Large parts of genus Streptocarpus are assumed to form a single gene pool.
Hybridisation as a possible cause of speciation within the genus has been discussed for some time in
scientific literature. Here we present crossing experiments to analyse hybridisability of selected species
of Streptocarpus subgenus Streptocarpus, representing the floral diversity of the genus to a large extent.
Obtained F1 hybrids are analysed in regard to floral architecture, optical flower signal, nectar reward
and the heredity of these floral plant traits. Respective factors are of high importance for attraction,
control and sorting of pollinators, and therefore determine hybrid fitness and possible establishment of
hybrid swarms in the field.
Methods: Crossing experiments, refractometer nectar analysis, UV light photography, hierarchical
clustering, Non-metric Multidimensional Scaling (NMDS).
Key results: Hybridisation within the subgenus is often achieved with ease. Flowers of F1 hybrids are
predominantly fully functional: Only floral architecture showed moderate instability within hybrids,
while nectar reward and optical flower signal appeared stable. Only 5 out of 40 hybrids showed severe
malfunctions of the reproductive system. Heredity of floral plant traits showed dominant-recessive
pattern, and F1 phenotypes appeared more homogenous than the parental generation.
Conclusion: Establishment of fully functional hybrid swarms and onset of homoploid hybrid speciation is
possible in nature, if an initial freak pollination event is able to circumvent the evolutionary established
prezygotic crossing barriers (attraction of pollinators via flower signal, control of pollinator access via
floral architecture, suitable nectar reward, etc.), and a compatible pollinator is present.
Key words: Streptocarpus, Cape primrose clade, floral architecture, nectar reward, optical flower signal,
hybridisation, crossing experiment, NMDS, hierarchical clustering, coefficient of variation, plant-
pollinator interaction.
VII. Functional floral architecture, optical signal and nectar reward in Streptocarpus hybrids
164
VII.2 INTRODUCTION
Streptocarpus Lindl. describes a genus of about 179 species accounted for in the wild, commonly known
as Cape Primroses. Recently, Streptocarpus was expanded to include all African and Malagasy
Gesneriaceae genera of subtribe Streptocarpinae, in tribe Trichosporeae, subfamily Didymocarpoideae
(Möller et al., 2019, citing Darbyshire and Massingue, 2014; Nishii et al., 2015; Randrianasolo et al.,
2018). Many species evolved very recently round about 1.5 million years ago, via radiation in the
eastern South Africa (Möller et al., 2019; Möller and Cronk, 2001).
Floral diversity in Streptocarpus has been of scientific and commercial interest for a long time: Extensive
breeding efforts during the last centuries have created a wide array of cultivars of high economic
importance (Buta et al., 2010; Nishii et al., 2015). From a scientific perspective, Streptocarpus is
remarkable for the great proportion of possible floral diversity realised in only one genus (Hilliard and
Burtt, 1971). Latest illustration of floral diversity was presented by Möller et al. (2019), based on the
general framework of open-tube, keyhole, personate, small-pouch, flat-faced Saintpaulia and bird-
pollination flower types of Harrison et al. (1999), Hughes et al. (2006), and modifications presented by
Nishii et al. (2015).
Hybridisation as a possible cause of floral diversity has already been discussed by Hilliard and Burtt
(1971). They concluded that large parts of subgenus Streptocarpus might form a single gene pool, and
reported 28 instances of suspected hybridisation (p. 77 ff.). The possibility of hybridisation in nature is
further supported by the fact that many species share the same habitat, and have overlapping flowering
time (cf. Hilliard and Burtt, 1971). Recent scientific research pays attention to hybridisation in genus
Streptocarpus again: Gene three conflicts and possible capture of foreign genetic information via
hybridisation are rampant in Streptocarpus, correlating to growth form shifts, as evidenced by gene tree
conflicts for S. bolusii, S. vandeleurii, S. grandis, S. fanniniae, and S. gardenii being an additional
candidate (de Villiers et al., 2013).
The importance of hybridisation for speciation has been outlined thoroughly by Buerkle and Rieseberg
(2008), with focus on homoploid hybrid speciation. In this process, independent lineages are formed by
combination of parental genomes without increase in ploidy level. Homoploid hybrid speciation has
been confirmed for some plant and animal taxa (e.g. Rieseberg, 1997; Gross and Rieseberg, 2005;
Howarth and Baum, 2005; Schwarz et al., 2005; Gompert et al., 2006, Mir et al., 2006), but it is
considered to be rare due to possibility of backcrossing with parental lines and missing separation of
gene pools (Rieseberg, 1997; Gross and Rieseberg, 2005; Coyne and Orr, 2007). However, recent and
convincing experimental demonstration for homoploid speciation in Helianthus sunflowers (Rieseberg,
2000; Buerkle and Rieseberg, 2008) and Heliconius butterfly species (Mavárez et al., 2006) showed that
novel ecological or intrinsic, genetic factors can contribute quickly to gene pool separation and
stabilisation, within tens of generations. Rapidity of this process is further supported by simulation
models of hybrid speciation (compare McCarthy et al., 1995; Buerkle et al., 2000).
In Streptocarpus sugenus Streptocarpus, hybridisation as possible aspect of the speciation process
appears to be entirely at the homoploid level: Hilliard and Burtt (1971) already assigned acaulescent
species with a basic chromosome number of x = 16 into subgenus Streptocarpus and caulescent species
with x = 15 into subgenus Streptocarpella. Nishii et al. (2015) generally confirmed this division in their
recent redefinition of Streptocarpus , stating that among all characters analysed only basic chromosome
VII. Functional floral architecture, optical signal and nectar reward in Streptocarpus hybrids
165
number is fully congruent with the topology of the retrieved tree. Moreover, polyploidy in subgenus
Streptocarpus is seldom, and absent in the 'Cape primose clade' or Streptocarpus cyaneus group
(Weigend and Edwards, 1994), with all species being diploid and showing 32 chromosomes. The Cape
primrose clade is of special interest in regard to homoploid hybrid speciation: Members of this group
form a phylogenetically not well resolved polytomy, repeatedly shown for chloroplastic and/or nuclear
markers (Harrison et al., 1999; Hughes et al., 2006; de Villiers et al., 2013; Nishii et al., 2015). Therefore,
at least members of this clade might be connected by an underlying shared gene pool that allows for
hybrid speciation.
For zoophilous Streptocarpus, the bottleneck for exchange of genetic information across species and
possible hybrid speciation is the moment of interaction between plant and pollinator. Unfortunately,
pollinator information is scarce for Streptocarpus. Möller et al. (2019) only report tabanid and/or
nemistrinid long-proboscid flies for S. primulifolius and S. formosus in their review, and Potgier and
Edwards (2006) report S. formosus to be part of the pollination guild of long-proboscid fly
Stenobasipteron wiedemanni, along with 18 other plant species of six different families. Although
information on specific plant-pollinator interaction for Streptocarpus is rare, the described pattern for
Stenobasipteron is common for Southern African pollination systems, which are characterised by a high
level of asymmetric ecological specialisation, convergent floral evolution and specialisation of plant
guilds for particular pollinators (compare Johnson, 2010).
Floral specialisation towards pollinators or pollinator guilds is manifested via specific floral traits and
their interplay. Groups of floral phenotypes that represent specialised plant-animal interactions are
described by the concept of pollination syndromes (c.f. Delpino, 1868–1875; Vogel, 1954; van der Pijl,
1961; Fenster et al., 2004; Vogel, 2006, etc.). As for floral phenotypes recognised in Streptocarpus,
Harrison et al. (1999) stated e.g. that open tube and personate flower types are indicative for bee
pollination, keyhole types are indicative for moth or butterfy pollination, and S. dunnii with its brightly
red flowers shows a bird pollination syndrome.
Homoploid hybrid speciation requires that the isolating mechanisms of floral specialisation of the
original species are circumvented in a first step (cf. Grant, 1949), i.e. by a freak pollination event and
initial hybrid formation. After that, successful homoploid hybrid speciation and establishment of hybrid
swarms in the field depends on the fit between floral plant traits and the pollinators present in the
habitat, like mechanical fit via floral architecture, fit to sensory capacities via floral signal, and fit to
nutritional needs via reward.
In the present chapter a crossing experiment is presented as a classical, experimental approach for
better understanding of hybrid formation in genus Streptocarpus. We investigate general crossability of
selected species of Streptocarpus subgenus Streptocarpus, some of them members of the Cape
primrose clade. Moreover, floral architecture, optical flower signal and nectar reward of parental plants
and obtained hybrids are described and analysed. Clustering and ordination of data is performed in
order to detect correspondence of patterns between hybrids and parental species. Moreover, instability
of pattern is analysed for metric variables (floral architecture and nectar reward) in order to rate
possible loss of hybrid fitness, i.e. via loss of floral symmetry or reliability of produced nectar reward.
VII. Functional floral architecture, optical signal and nectar reward in Streptocarpus hybrids
166
VII.3 MATERIALS AND METHODS
Streptocarpus species and hybrids were cultivated in a pollinator-protected greenhouse at Botanische
Gärten, Universität Bonn (Bonn University Botanic Gardens). For crossing and analysis of floral plant
traits, three to five plant individuals per species and hybrid were used, and data were pooled. Nine
species were selected for the crossing experiment in order to represent basic pattern of floral
architecture, optical flower signal and nectar reward of the subgenus: S. cooperi C.B.Clarke (in
abbreviation: coop), S. dunnii Mast. (dunn), S. johannis L.L.Britten (joha), S. longiflorus (Hilliard & B.L.Burtt)
T.J.Edwards (long), S. modestus L.L.Britten (mode), S. pole-evansii I.Verd. (pole), S. polyanthus ssp. verecundus
Hook. (poly), S. rexii (Bowie ex Hook.) Lindl. (rexi) and S. roseoalbus Weigend & T.J.Edwards (rose). For clarity and
conciseness, abbreviations will be used to refer to species and hybrids in the following. Abbreviations
for hybrids refer to the parental lines involved in the crossing, with the maternal crossing partner
named in the first place (i.e. coop-rexi referring to S. cooperi as maternal and S. rexii as paternal crossing
partner). Accession and voucher numbers are presented in the appendix (table A X.6.6).
VII.3.1 CROSSING PROCEDURES
Crossings between selected species as well as allogamous and geitonogamous pollinations were
performed in 2015. Flower buds intended as maternal crossing partner were emasculated with a
tweezer to prevent accidental self-pollination. Hand-pollinations were performed by placement of the
complete pollen material of the selected paternal flower onto the stigma of the maternal crossing
partner. Tweezers were cleaned with ethanol between handling of different flowers.
At least five hand pollinations were performed per crossing direction. In sum, 485 between-species
pollinations were performed, of them 110 pollinations within the Cape primrose clade (long, rose, joha,
mode, rexi). All possible reciprocal crossings were performed, with both parental lines applied as
maternal as well as paternal partner.
Geitonogamous and allogamous pollination was each performed with 10 pollinations per species.
Allogamy could not be tested for S. dunnii due to only a single flowering individual. All in all, 170
additional within-species pollinations were performed.
VII.3.2 ASSESSMENT OF FLORAL PLANT TRAITS
Analysis of floral architecture, optical signal and nectar reward was also performed in 2015 for original
species, with limited re-examination in 2016 in order to complete data sets. Analysis of floral
architecture of hybrids was performed in 2017, with limited re-examination in 2018. Analysis of optical
flower signal and nectar reward of hybrids was accomplished in 2018.
For analysis of floral architecture, individual flowers were measured and display sizes calculated. For
assessment of display sizes flowers were photographed and measured via Adobe® Photoshop® CS6
imaging software and Magnetic Lasso Tool function. In total, 16 variables regarding flower architecture
were assessed: frontal and lateral display size in cm2, display size ratio (frontal:lateral), height and width
of the frontal display, height and width of the corolla opening, height and width of the unfused part of
the upper left petal of the gamopetalous corolla, height and width of the unfused part of the lower
central petal, dorsal flower length (from base of corolla to incision between the upper petals), ventral
VII. Functional floral architecture, optical signal and nectar reward in Streptocarpus hybrids
167
flower length (from base of corolla to the tip of the lower central petal), anther length, filament length
and carpel length.
Sample size is usually 10 per variable for each species and hybrid. Exceptions for display size variables
are hybrids joha-coop, mode-coop, poly-pole and rose-mode (only single data points), mode-long and
mode-rexi (5 data points per variable), rexi-mode (8) and poly-rose (9). Data points for other variables of
floral architecture are lowered for hybrids mode-rexi (6 data points) and joha-rexi (9).
In total, 441 flowers were pictured and analysed for display sizes (parental: 90; F1: 351), and 485
flowers measured for floral architecture (parental: 90; F1: 395).
For assessment of nectar reward, microcapillaries were inserted into the corolla tube onto the
receptacle of the flower and circled around the nectar disk at the base of the gynoecium to collect
nectar (0.5 and 1 μl minicaps®; 5 μl ringcaps® – Hirschmann Laborgeräte, Germany). Concentration of
nectar sugar was measured in degrees Brix with a hand-held refractometer (neoLab, type 'universal').
Nectar sugar production per flower was derived from nectar volume and nectar concentration after
Galetto and Bernadello (2005), with x being the measured concentration:
𝑚𝑔
𝜇𝑙= 0.00226 + (0.00937𝑥) + (0.0000585𝑥2)
Analysis of nectar reward is therefore based on three variables: nectar amount in µl, nectar sugar
concentration in percent and sugar production in mg. If nectar production of single flowers was not
sufficient for assessment, nectar from several flowers had to be pooled and averaged. In general,
number of data points is 25 per variable and for each species and hybrid. Exceptions are S. cooperi with
only 3 valid data points per nectar variable, as well as hybrids coop-rose (10 data points per variable)
and rexi-joha (3).
In total, 1188 data points per nectar variable (parental: 225; F1: 963) were used for nectar analysis.
For analysis of UV signal, flowers were illuminated with UV light and pictures were taken for frontal and
lateral flower displays with a single-lens reflex camera (Nikon R D300s), and an infrared neutralizer
(OPTIK MAKARIO IR NG 52D) in combination with a UV light filter (OPTIK MAKARIO SP 400 UV 52D).
Photos were created with a fixed aperture, but different shutter speeds (1/5, 1/4, 1/3, 1/2, 1/1.6, 1, 1.6,
2, 3, 4, 5 sec.). Pictures were analysed in regard to UV light responsiveness of the corollas: 1 sec. UV
light exposure showed highest differentiation between species and was therefore used as basis for
coding of the floral UV signal.
VII.3.3 ASSESSMENT OF INSTABILITY OF FLORAL ARCHITECTURE AND NECTAR REWARD
Metric, ratio scaled variables analysed for floral architecture and nectar reward further allowed for
assessment of instability of the observed pattern: Coefficients of variation (CV) were calculated in order
to obtain dimensionless numbers, allowing for comparison between different levels of analysis. CVs
were calculated as follows:
𝐶𝑉 𝑖𝑛 % =𝑠𝑡𝑎𝑛𝑑𝑎𝑟𝑑 𝑑𝑒𝑣𝑖𝑎𝑡𝑖𝑜𝑛 𝜎
𝑎𝑟𝑖𝑡ℎ𝑚𝑒𝑡𝑖𝑐 𝑚𝑒𝑎𝑛 𝑥× 100
VII. Functional floral architecture, optical signal and nectar reward in Streptocarpus hybrids
168
As for floral architecture, all variables except display sizes and variables related to the male
reproduction system were suitable for calculation of CVs. Display size variables had to be excluded due
to single data points for four hybrids, and anther and filament length had to be excluded due to floral
dysfunction in some hybrids, see results. All three variables of nectar reward were suitable for
calculation. CVs were further averaged for variables and retrieved clusters, in order to calculate
superordinate CVs.
VII.3.4 STATISTICAL ANALYSIS
Data exploration and basic statistics were carried out with the IBM software package SPSS, version 24.
Outliers in regard to observed data bandwidth were labelled according to standard conventions.
Statistical procedures beyond data exploration were performed with aggregated data on species level
(arithmetic means, CVs) due to unequal sample sizes and non-normality of data.
Cluster analysis and multivariate ordination were performed in order to structure, analyse and visualise
floral architecture, optical signal and nectar reward of original species and hybrids. Both methods were
performed with computing software R: a) with the arithmetic means of continuous variables and
nominal coding of discrete variables, and b) with CVs for floral architecture and nectar reward. Analysed
categorical, nominal variables are the predominant colour tone of the frontal corolla display (coded 1
for white, 2 for bluish and 3 for reddish tones) and the presence of an anther dummy signal in form of
greenish-yellow to yellow floral guides (coded 0 for absence and 1 for presence). Categorical but ordinal
variables are the UV light reflection patterns of the frontal and lateral display (coded 0 for complete
absorption, 1 for diffuse absorption, 2 for weak reflection, 3 for medium reflection and 4 for strong
reflection). Variables assessed for analysis of floral architecture and nectar reward are metric and ratio
scaled.
Hierarchical clustering of (a) optical flower signal, (b) nectar reward and (c) floral architecture were
performed in R via packages cluster (version 2.0.5; Mächler et al., 2019), NbClust (version 3.0; Charrad
et al., 2014) and vegan (version 2.5-1; Oksanen, 2013). Best number of clusters was determined via a
combination of visual inspection, Elbow method as well as use of multiple indices and selection
according to majority rule. Cluster analyses were conducted with complete linkage to account for the
interrelations between hybrids and parental species, and dissimilarity matrices based on metric
variables were produced via Bray Curtis index (nectar, floral architecture), while Gower distances were
used for optical signal (see appendix, figures A X.6.1 to A X.6.3).
Non-Metric Multidimensional Scaling (NMDS, R package vegan) was used for ordination of arithmetic
means and CVs of variables of floral architecture and nectar reward in order to handle different
measuring scales and non-normality of data. Same dissimilarity matrices were applied as for hierarchical
clustering. Function metaMDS was used for iterative testing and selection of the solution with smallest
stress. Data was standardised by square root transformation and Wisconsin double standardisation.
Model stresses below .2 were interpreted as acceptable, below .1 as good and below .05 as excellent
(McCune et al. 2002).
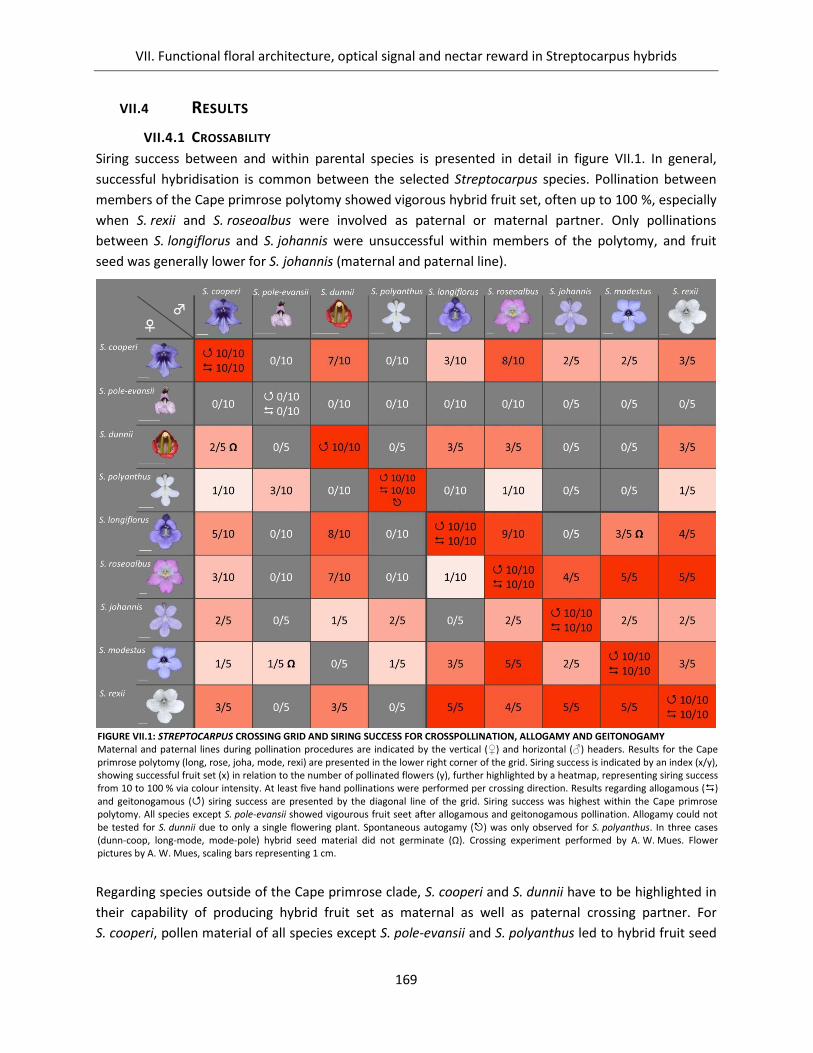
VII. Functional floral architecture, optical signal and nectar reward in Streptocarpus hybrids
169
VII.4 RESULTS
VII.4.1 CROSSABILITY
Siring success between and within parental species is presented in detail in figure VII.1. In general,
successful hybridisation is common between the selected Streptocarpus species. Pollination between
members of the Cape primrose polytomy showed vigorous hybrid fruit set, often up to 100 %, especially
when S. rexii and S. roseoalbus were involved as paternal or maternal partner. Only pollinations
between S. longiflorus and S. johannis were unsuccessful within members of the polytomy, and fruit
seed was generally lower for S. johannis (maternal and paternal line).
Regarding species outside of the Cape primrose clade, S. cooperi and S. dunnii have to be highlighted in
their capability of producing hybrid fruit set as maternal as well as paternal crossing partner. For
S. cooperi, pollen material of all species except S. pole-evansii and S. polyanthus led to hybrid fruit seed
FIGURE VII.1: STREPTOCARPUS CROSSING GRID AND SIRING SUCCESS FOR CROSSPOLLINATION, ALLOGAMY AND GEITONOGAMY Maternal and paternal lines during pollination procedures are indicated by the vertical () and horizontal () headers. Results for the Cape primrose polytomy (long, rose, joha, mode, rexi) are presented in the lower right corner of the grid. Siring success is indicated by an index (x/y), showing successful fruit set (x) in relation to the number of pollinated flowers (y), further highlighted by a heatmap, representing siring success from 10 to 100 % via colour intensity. At least five hand pollinations were performed per crossing direction. Results regarding allogamous () and geitonogamous () siring success are presented by the diagonal line of the grid. Siring success was highest within the Cape primrose polytomy. All species except S. pole-evansii showed vigourous fruit seet after allogamous and geitonogamous pollination. Allogamy could not be tested for S. dunnii due to only a single flowering plant. Spontaneous autogamy () was only observed for S. polyanthus. In three cases (dunn-coop, long-mode, mode-pole) hybrid seed material did not germinate (Ω). Crossing experiment performed by A. W. Mues. Flower pictures by A. W. Mues, scaling bars representing 1 cm.
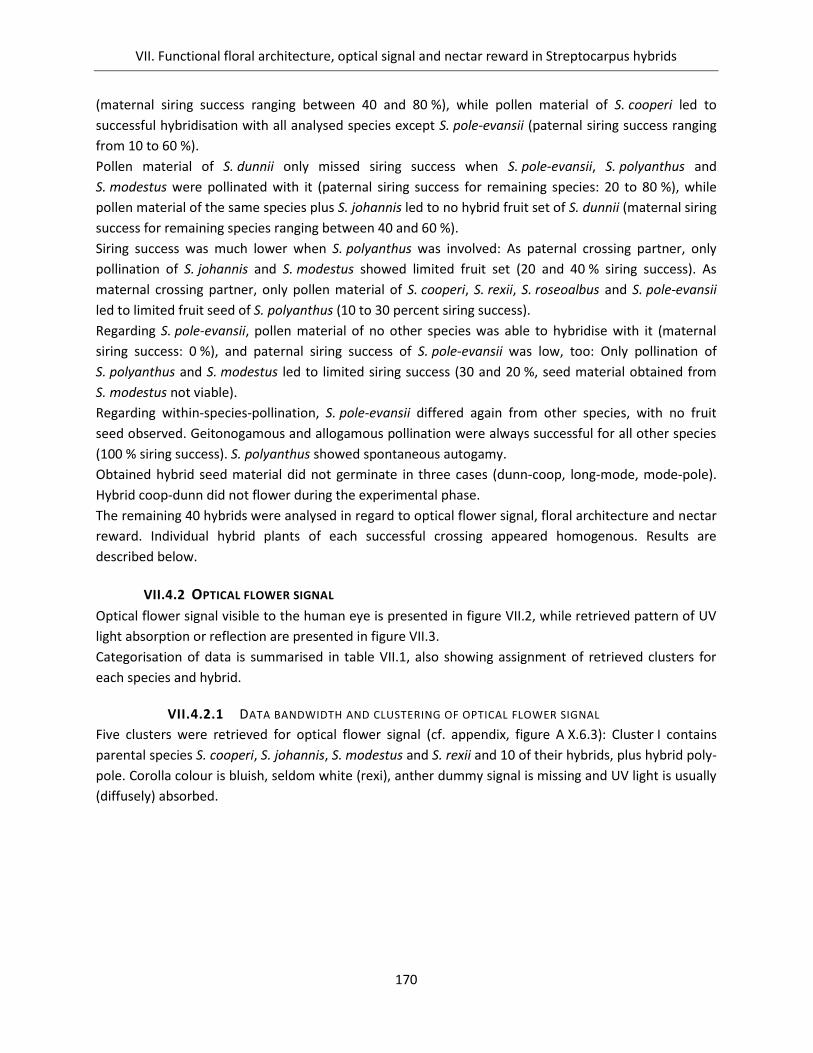
VII. Functional floral architecture, optical signal and nectar reward in Streptocarpus hybrids
170
(maternal siring success ranging between 40 and 80 %), while pollen material of S. cooperi led to
successful hybridisation with all analysed species except S. pole-evansii (paternal siring success ranging
from 10 to 60 %).
Pollen material of S. dunnii only missed siring success when S. pole-evansii, S. polyanthus and
S. modestus were pollinated with it (paternal siring success for remaining species: 20 to 80 %), while
pollen material of the same species plus S. johannis led to no hybrid fruit set of S. dunnii (maternal siring
success for remaining species ranging between 40 and 60 %).
Siring success was much lower when S. polyanthus was involved: As paternal crossing partner, only
pollination of S. johannis and S. modestus showed limited fruit set (20 and 40 % siring success). As
maternal crossing partner, only pollen material of S. cooperi, S. rexii, S. roseoalbus and S. pole-evansii
led to limited fruit seed of S. polyanthus (10 to 30 percent siring success).
Regarding S. pole-evansii, pollen material of no other species was able to hybridise with it (maternal
siring success: 0 %), and paternal siring success of S. pole-evansii was low, too: Only pollination of
S. polyanthus and S. modestus led to limited siring success (30 and 20 %, seed material obtained from
S. modestus not viable).
Regarding within-species-pollination, S. pole-evansii differed again from other species, with no fruit
seed observed. Geitonogamous and allogamous pollination were always successful for all other species
(100 % siring success). S. polyanthus showed spontaneous autogamy.
Obtained hybrid seed material did not germinate in three cases (dunn-coop, long-mode, mode-pole).
Hybrid coop-dunn did not flower during the experimental phase.
The remaining 40 hybrids were analysed in regard to optical flower signal, floral architecture and nectar
reward. Individual hybrid plants of each successful crossing appeared homogenous. Results are
described below.
VII.4.2 OPTICAL FLOWER SIGNAL
Optical flower signal visible to the human eye is presented in figure VII.2, while retrieved pattern of UV
light absorption or reflection are presented in figure VII.3.
Categorisation of data is summarised in table VII.1, also showing assignment of retrieved clusters for
each species and hybrid.
VII.4.2.1 DATA BANDWIDTH AND CLUSTERING OF OPTICAL FLOWER SIGNAL
Five clusters were retrieved for optical flower signal (cf. appendix, figure A X.6.3): Cluster I contains
parental species S. cooperi, S. johannis, S. modestus and S. rexii and 10 of their hybrids, plus hybrid poly-
pole. Corolla colour is bluish, seldom white (rexi), anther dummy signal is missing and UV light is usually
(diffusely) absorbed.
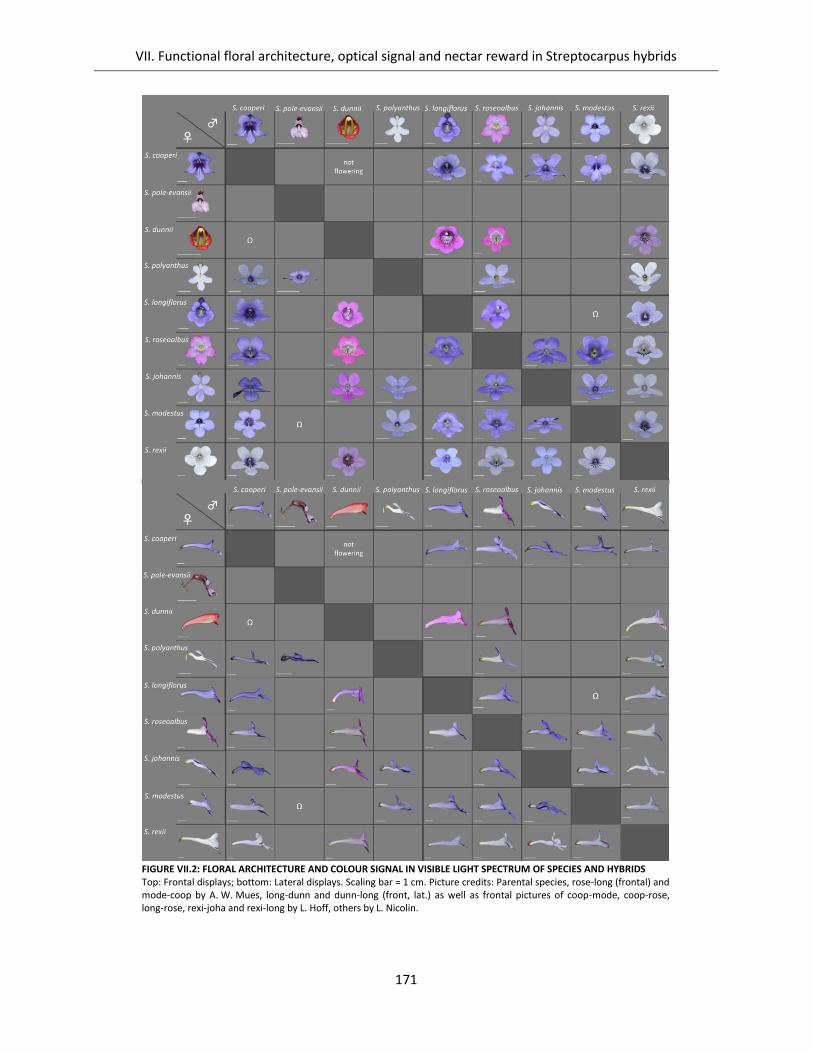
VII. Functional floral architecture, optical signal and nectar reward in Streptocarpus hybrids
171
FIGURE VII.2: FLORAL ARCHITECTURE AND COLOUR SIGNAL IN VISIBLE LIGHT SPECTRUM OF SPECIES AND HYBRIDS Top: Frontal displays; bottom: Lateral displays. Scaling bar = 1 cm. Picture credits: Parental species, rose-long (frontal) and mode-coop by A. W. Mues, long-dunn and dunn-long (front, lat.) as well as frontal pictures of coop-mode, coop-rose, long-rose, rexi-joha and rexi-long by L. Hoff, others by L. Nicolin.
VII. Functional floral architecture, optical signal and nectar reward in Streptocarpus hybrids
172
Cluster II contains parental species S. dunnii and S. pole-evansii as well as three descendents from
S. dunnii (dunn-rexi, rexi-dunn, joha-dunn). Corolla colour is reddish and anther dummy signal is
missing. Regarding UV signal, (diffuse) absorption is the predominant pattern, especially among hybrids.
Moderate reflection was observed at maximum (S. pole-evansii). Cluster III contains S. roseoalbus as
parental species and three hybrids (coop-rose, dunn-long, dunn-rose). Corolla colour is usually reddish
(except coop-rose, bluish corolla), anther dummy is present and UV light is reflected moderately or
strongly (S. roseoalbus). Cluster IV only contains S. polyanthus and its hybrid poly-rexi. Corolla colour is
white, anther dummy is present and UV light is absorbed diffusely. Cluster V is the largest cluster and
contains S. longiflorus as parental species as well as 22 hybrids (8 of them stemming from S. longiflorus).
Corolla colour is predominantly bluish, seldom reddish (hybrids long-dunn and rose-dunn), and anther
dummy is present. Frontal and lateral displays usually show complete or diffuse UV light absorption,
seldom weak (lateral) reflection. It must be noted that all retrieved clusters are representing parental
species as well as hybrids: Thus, the F1 generation does not show any patterns that are absent in the
field. Inheritance patterns are in favour of cluster V, however.
VII.4.2.2 INHERITANCE OF OPTICAL FLOWER SIGNAL
White corolla colour of parental species (poly, rexi) is inherited recessively, only the hybrid between
both white parental species (poly-rexi) showed white corolla colour. However, involvement of white
flowering parental lines is linked to hybrids with less intense flower colours (light-blue and light-red
tones). Blue corolla colours (parentals coop, long, joha, mode) are inherited dominantly over white
corolla colour, and also over pinkish-red corolla colour stemming from S. pole-evansii and S. roseoalbus.
Hybrids stemming from both pinkish-red parental lines showed bluish corolla colour in case the other
parental line showed white corolla colour, compare hybrids poly-pole, poly-rose, rose-rexi and rexi-rose.
The intense red corolla colour of S. dunnii is inherited dominantly however, and led to pinkish corolla
colours when crossed with white or bluish flowering crossing partners.
Anther dummy signal is inherited dominantly: Whenever parental lines with anther dummy signal (long,
poly, rose) were involved, hybrid offspring also showed an anther dummy signal, only exception is
hybrid poly-pole. Interestingly, hybrids coop-mode and mode-coop showed anther dummy signal in
their corollas, although not observed in both parental lines (cf. Hilliard and Burt (1971) for varying
presence of anther dummy signal in S. modestus).
In case reciprocal crossings were successful, the resulting hybrids showed no difference in optical colour
signal in visible light spectrum.
Regarding UV light pattern, the broad bandwidth of parental species is not reflected in the F1. UV light
signal of parental species is ranging from full absorption (long) to strong reflection (rose) with various
intermediate patterns. Hybrids never showed strong reflection, even moderate and weak reflection
were seldom. The F1 predominantly showed diffuse UV light absorption, in some cases full absorption.
When UV reflecting species S. dunnii and S. roseoalbus were involved as parental lines, hybrids showed
a tendency for higher UV reflection in some but not all cases. Contrary to optical signal visible to the
human eye, reciprocal crossings were not always identical in regard to their UV light patterns (i.e. coop-
rose and rose-coop, long-rose and rose-long, dunn-long and long-dunn, etc.).
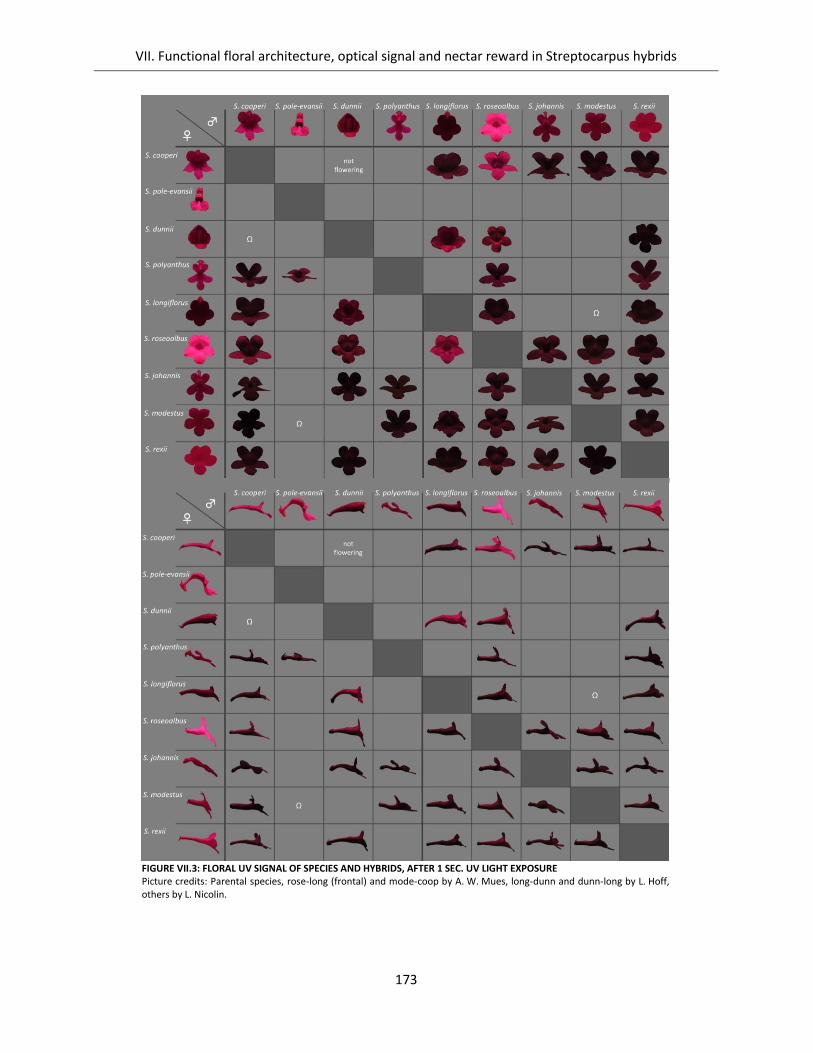
VII. Functional floral architecture, optical signal and nectar reward in Streptocarpus hybrids
173
FIGURE VII.3: FLORAL UV SIGNAL OF SPECIES AND HYBRIDS, AFTER 1 SEC. UV LIGHT EXPOSURE Picture credits: Parental species, rose-long (frontal) and mode-coop by A. W. Mues, long-dunn and dunn-long by L. Hoff, others by L. Nicolin.
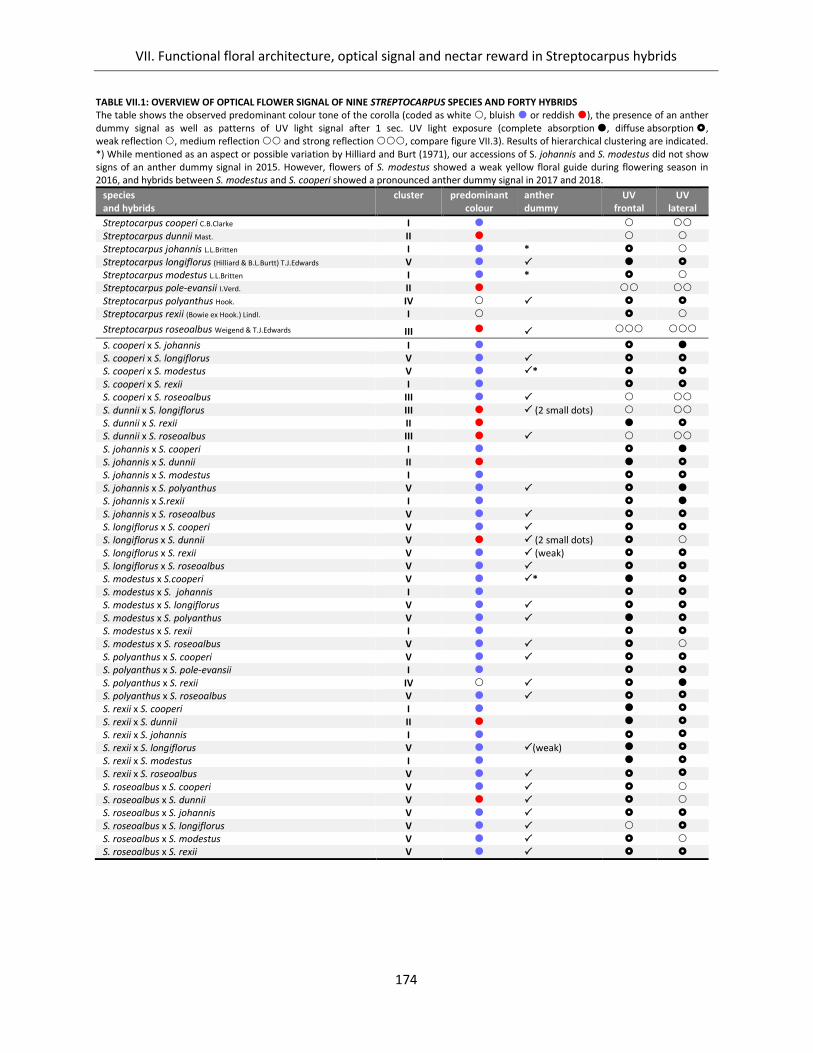
VII. Functional floral architecture, optical signal and nectar reward in Streptocarpus hybrids
174
TABLE VII.1: OVERVIEW OF OPTICAL FLOWER SIGNAL OF NINE STREPTOCARPUS SPECIES AND FORTY HYBRIDS The table shows the observed predominant colour tone of the corolla (coded as white , bluish or reddish ), the presence of an anther dummy signal as well as patterns of UV light signal after 1 sec. UV light exposure (complete absorption , diffuse absorption , weak reflection , medium reflection and strong reflection , compare figure VII.3). Results of hierarchical clustering are indicated. *) While mentioned as an aspect or possible variation by Hilliard and Burt (1971), our accessions of S. johannis and S. modestus did not show signs of an anther dummy signal in 2015. However, flowers of S. modestus showed a weak yellow floral guide during flowering season in 2016, and hybrids between S. modestus and S. cooperi showed a pronounced anther dummy signal in 2017 and 2018.
species and hybrids
cluster
predominant colour
anther dummy
UV frontal
UV lateral
Streptocarpus cooperi C.B.Clarke I Streptocarpus dunnii Mast. II Streptocarpus johannis L.L.Britten I * Streptocarpus longiflorus (Hilliard & B.L.Burtt) T.J.Edwards V Streptocarpus modestus L.L.Britten I * Streptocarpus pole-evansii I.Verd. II Streptocarpus polyanthus Hook. IV Streptocarpus rexii (Bowie ex Hook.) Lindl. I
Streptocarpus roseoalbus Weigend & T.J.Edwards III
S. cooperi x S. johannis I S. cooperi x S. longiflorus V S. cooperi x S. modestus V
*
S. cooperi x S. rexii I S. cooperi x S. roseoalbus III
S. dunnii x S. longiflorus III (2 small dots) S. dunnii x S. rexii II S. dunnii x S. roseoalbus III S. johannis x S. cooperi I S. johannis x S. dunnii II S. johannis x S. modestus I S. johannis x S. polyanthus V S. johannis x S.rexii I S. johannis x S. roseoalbus V S. longiflorus x S. cooperi V S. longiflorus x S. dunnii V (2 small dots) S. longiflorus x S. rexii V (weak) S. longiflorus x S. roseoalbus V S. modestus x S.cooperi V * S. modestus x S. johannis I S. modestus x S. longiflorus V S. modestus x S. polyanthus V S. modestus x S. rexii I S. modestus x S. roseoalbus V S. polyanthus x S. cooperi V S. polyanthus x S. pole-evansii I S. polyanthus x S. rexii IV S. polyanthus x S. roseoalbus V
S. rexii x S. cooperi I
S. rexii x S. dunnii II
S. rexii x S. johannis I
S. rexii x S. longiflorus V (weak)
S. rexii x S. modestus I
S. rexii x S. roseoalbus V
S. roseoalbus x S. cooperi V S. roseoalbus x S. dunnii V S. roseoalbus x S. johannis V S. roseoalbus x S. longiflorus V S. roseoalbus x S. modestus V S. roseoalbus x S. rexii V
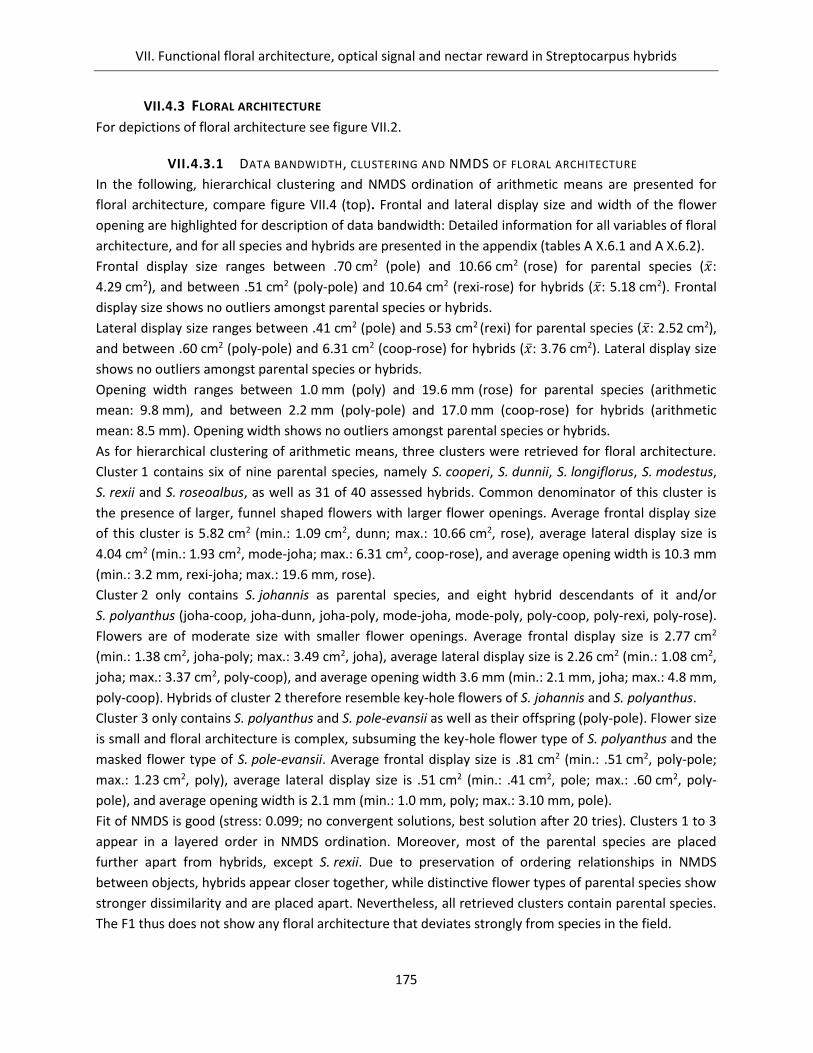
VII. Functional floral architecture, optical signal and nectar reward in Streptocarpus hybrids
175
VII.4.3 FLORAL ARCHITECTURE
For depictions of floral architecture see figure VII.2.
VII.4.3.1 DATA BANDWIDTH, CLUSTERING AND NMDS OF FLORAL ARCHITECTURE
In the following, hierarchical clustering and NMDS ordination of arithmetic means are presented for
floral architecture, compare figure VII.4 (top). Frontal and lateral display size and width of the flower
opening are highlighted for description of data bandwidth: Detailed information for all variables of floral
architecture, and for all species and hybrids are presented in the appendix (tables A X.6.1 and A X.6.2).
Frontal display size ranges between .70 cm2 (pole) and 10.66 cm2 (rose) for parental species (:
4.29 cm2), and between .51 cm2 (poly-pole) and 10.64 cm2 (rexi-rose) for hybrids (: 5.18 cm2). Frontal
display size shows no outliers amongst parental species or hybrids.
Lateral display size ranges between .41 cm2 (pole) and 5.53 cm2 (rexi) for parental species (: 2.52 cm2),
and between .60 cm2 (poly-pole) and 6.31 cm2 (coop-rose) for hybrids (: 3.76 cm2). Lateral display size
shows no outliers amongst parental species or hybrids.
Opening width ranges between 1.0 mm (poly) and 19.6 mm (rose) for parental species (arithmetic
mean: 9.8 mm), and between 2.2 mm (poly-pole) and 17.0 mm (coop-rose) for hybrids (arithmetic
mean: 8.5 mm). Opening width shows no outliers amongst parental species or hybrids.
As for hierarchical clustering of arithmetic means, three clusters were retrieved for floral architecture.
Cluster 1 contains six of nine parental species, namely S. cooperi, S. dunnii, S. longiflorus, S. modestus,
S. rexii and S. roseoalbus, as well as 31 of 40 assessed hybrids. Common denominator of this cluster is
the presence of larger, funnel shaped flowers with larger flower openings. Average frontal display size
of this cluster is 5.82 cm2 (min.: 1.09 cm2, dunn; max.: 10.66 cm2, rose), average lateral display size is
4.04 cm2 (min.: 1.93 cm2, mode-joha; max.: 6.31 cm2, coop-rose), and average opening width is 10.3 mm
(min.: 3.2 mm, rexi-joha; max.: 19.6 mm, rose).
Cluster 2 only contains S. johannis as parental species, and eight hybrid descendants of it and/or
S. polyanthus (joha-coop, joha-dunn, joha-poly, mode-joha, mode-poly, poly-coop, poly-rexi, poly-rose).
Flowers are of moderate size with smaller flower openings. Average frontal display size is 2.77 cm2
(min.: 1.38 cm2, joha-poly; max.: 3.49 cm2, joha), average lateral display size is 2.26 cm2 (min.: 1.08 cm2,
joha; max.: 3.37 cm2, poly-coop), and average opening width 3.6 mm (min.: 2.1 mm, joha; max.: 4.8 mm,
poly-coop). Hybrids of cluster 2 therefore resemble key-hole flowers of S. johannis and S. polyanthus.
Cluster 3 only contains S. polyanthus and S. pole-evansii as well as their offspring (poly-pole). Flower size
is small and floral architecture is complex, subsuming the key-hole flower type of S. polyanthus and the
masked flower type of S. pole-evansii. Average frontal display size is .81 cm2 (min.: .51 cm2, poly-pole;
max.: 1.23 cm2, poly), average lateral display size is .51 cm2 (min.: .41 cm2, pole; max.: .60 cm2, poly-
pole), and average opening width is 2.1 mm (min.: 1.0 mm, poly; max.: 3.10 mm, pole).
Fit of NMDS is good (stress: 0.099; no convergent solutions, best solution after 20 tries). Clusters 1 to 3
appear in a layered order in NMDS ordination. Moreover, most of the parental species are placed
further apart from hybrids, except S. rexii. Due to preservation of ordering relationships in NMDS
between objects, hybrids appear closer together, while distinctive flower types of parental species show
stronger dissimilarity and are placed apart. Nevertheless, all retrieved clusters contain parental species.
The F1 thus does not show any floral architecture that deviates strongly from species in the field.
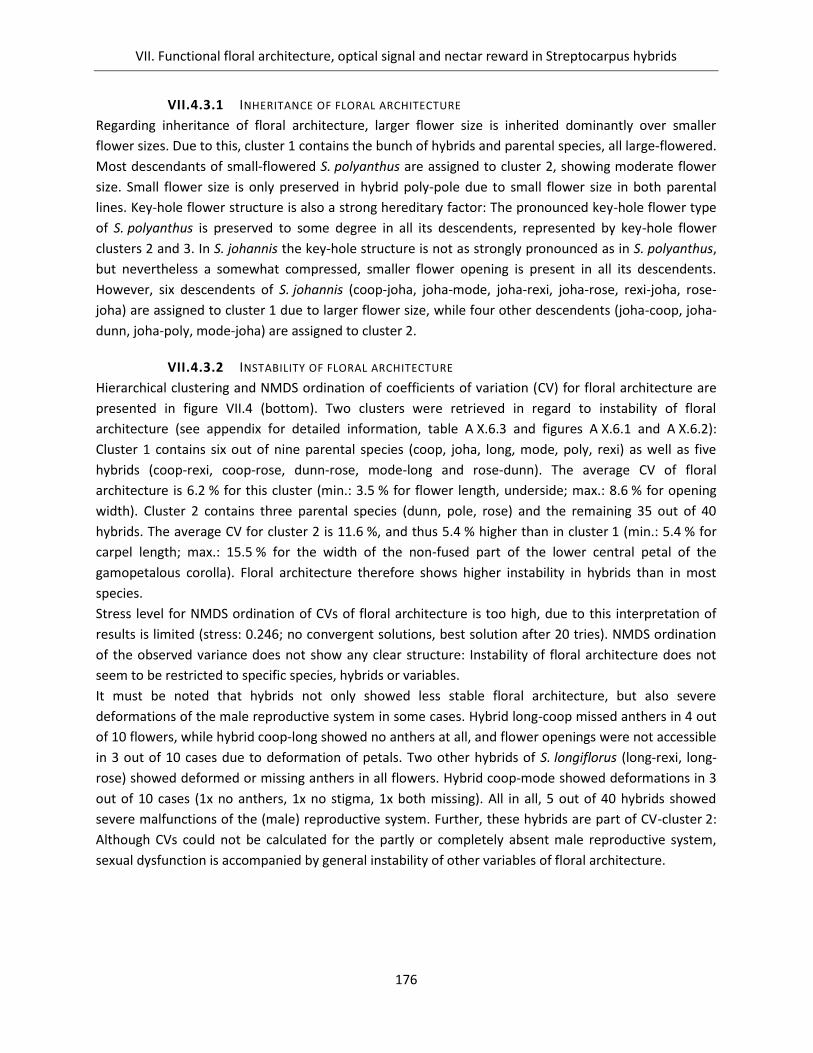
VII. Functional floral architecture, optical signal and nectar reward in Streptocarpus hybrids
176
VII.4.3.1 INHERITANCE OF FLORAL ARCHITECTURE
Regarding inheritance of floral architecture, larger flower size is inherited dominantly over smaller
flower sizes. Due to this, cluster 1 contains the bunch of hybrids and parental species, all large-flowered.
Most descendants of small-flowered S. polyanthus are assigned to cluster 2, showing moderate flower
size. Small flower size is only preserved in hybrid poly-pole due to small flower size in both parental
lines. Key-hole flower structure is also a strong hereditary factor: The pronounced key-hole flower type
of S. polyanthus is preserved to some degree in all its descendents, represented by key-hole flower
clusters 2 and 3. In S. johannis the key-hole structure is not as strongly pronounced as in S. polyanthus,
but nevertheless a somewhat compressed, smaller flower opening is present in all its descendents.
However, six descendents of S. johannis (coop-joha, joha-mode, joha-rexi, joha-rose, rexi-joha, rose-
joha) are assigned to cluster 1 due to larger flower size, while four other descendents (joha-coop, joha-
dunn, joha-poly, mode-joha) are assigned to cluster 2.
VII.4.3.2 INSTABILITY OF FLORAL ARCHITECTURE
Hierarchical clustering and NMDS ordination of coefficients of variation (CV) for floral architecture are
presented in figure VII.4 (bottom). Two clusters were retrieved in regard to instability of floral
architecture (see appendix for detailed information, table A X.6.3 and figures A X.6.1 and A X.6.2):
Cluster 1 contains six out of nine parental species (coop, joha, long, mode, poly, rexi) as well as five
hybrids (coop-rexi, coop-rose, dunn-rose, mode-long and rose-dunn). The average CV of floral
architecture is 6.2 % for this cluster (min.: 3.5 % for flower length, underside; max.: 8.6 % for opening
width). Cluster 2 contains three parental species (dunn, pole, rose) and the remaining 35 out of 40
hybrids. The average CV for cluster 2 is 11.6 %, and thus 5.4 % higher than in cluster 1 (min.: 5.4 % for
carpel length; max.: 15.5 % for the width of the non-fused part of the lower central petal of the
gamopetalous corolla). Floral architecture therefore shows higher instability in hybrids than in most
species.
Stress level for NMDS ordination of CVs of floral architecture is too high, due to this interpretation of
results is limited (stress: 0.246; no convergent solutions, best solution after 20 tries). NMDS ordination
of the observed variance does not show any clear structure: Instability of floral architecture does not
seem to be restricted to specific species, hybrids or variables.
It must be noted that hybrids not only showed less stable floral architecture, but also severe
deformations of the male reproductive system in some cases. Hybrid long-coop missed anthers in 4 out
of 10 flowers, while hybrid coop-long showed no anthers at all, and flower openings were not accessible
in 3 out of 10 cases due to deformation of petals. Two other hybrids of S. longiflorus (long-rexi, long-
rose) showed deformed or missing anthers in all flowers. Hybrid coop-mode showed deformations in 3
out of 10 cases (1x no anthers, 1x no stigma, 1x both missing). All in all, 5 out of 40 hybrids showed
severe malfunctions of the (male) reproductive system. Further, these hybrids are part of CV-cluster 2:
Although CVs could not be calculated for the partly or completely absent male reproductive system,
sexual dysfunction is accompanied by general instability of other variables of floral architecture.
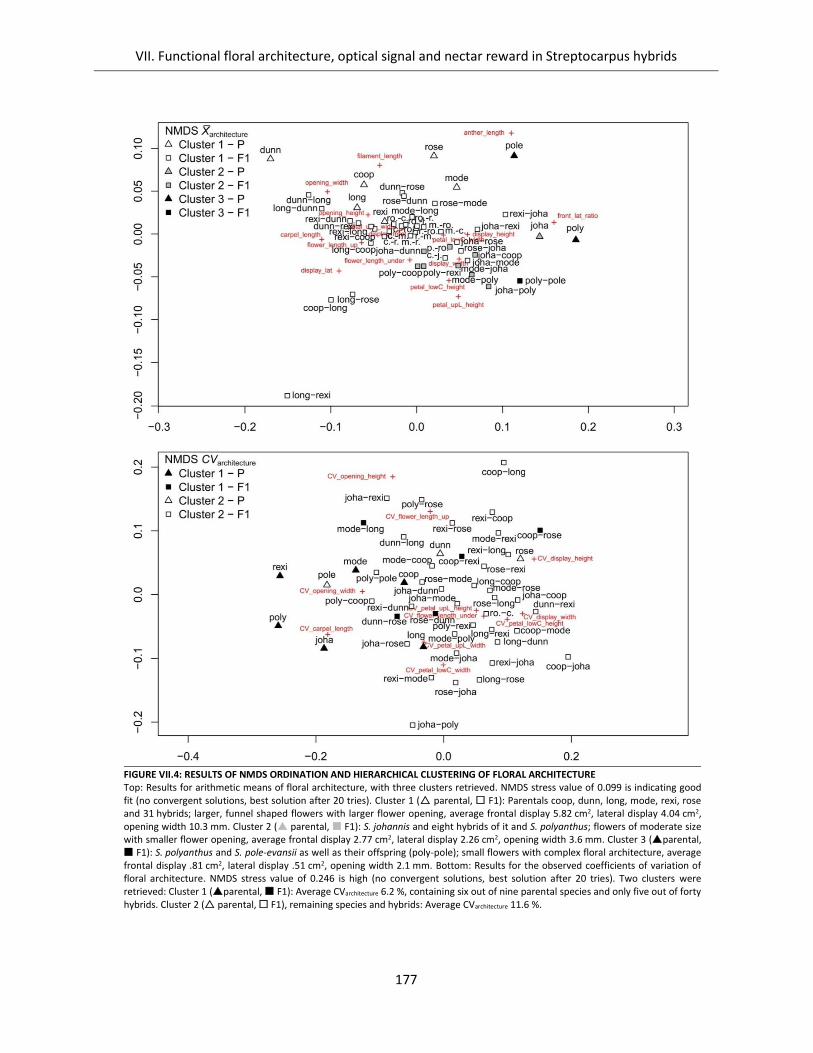
VII. Functional floral architecture, optical signal and nectar reward in Streptocarpus hybrids
177
FIGURE VII.4: RESULTS OF NMDS ORDINATION AND HIERARCHICAL CLUSTERING OF FLORAL ARCHITECTURE Top: Results for arithmetic means of floral architecture, with three clusters retrieved. NMDS stress value of 0.099 is indicating good fit (no convergent solutions, best solution after 20 tries). Cluster 1 ( parental, F1): Parentals coop, dunn, long, mode, rexi, rose and 31 hybrids; larger, funnel shaped flowers with larger flower opening, average frontal display 5.82 cm2, lateral display 4.04 cm2, opening width 10.3 mm. Cluster 2 ( parental, F1): S. johannis and eight hybrids of it and S. polyanthus; flowers of moderate size with smaller flower opening, average frontal display 2.77 cm2, lateral display 2.26 cm2, opening width 3.6 mm. Cluster 3 (parental, F1): S. polyanthus and S. pole-evansii as well as their offspring (poly-pole); small flowers with complex floral architecture, average frontal display .81 cm2, lateral display .51 cm2, opening width 2.1 mm. Bottom: Results for the observed coefficients of variation of floral architecture. NMDS stress value of 0.246 is high (no convergent solutions, best solution after 20 tries). Two clusters were retrieved: Cluster 1 (parental, F1): Average CVarchitecture 6.2 %, containing six out of nine parental species and only five out of forty hybrids. Cluster 2 ( parental, F1), remaining species and hybrids: Average CVarchitecture 11.6 %.
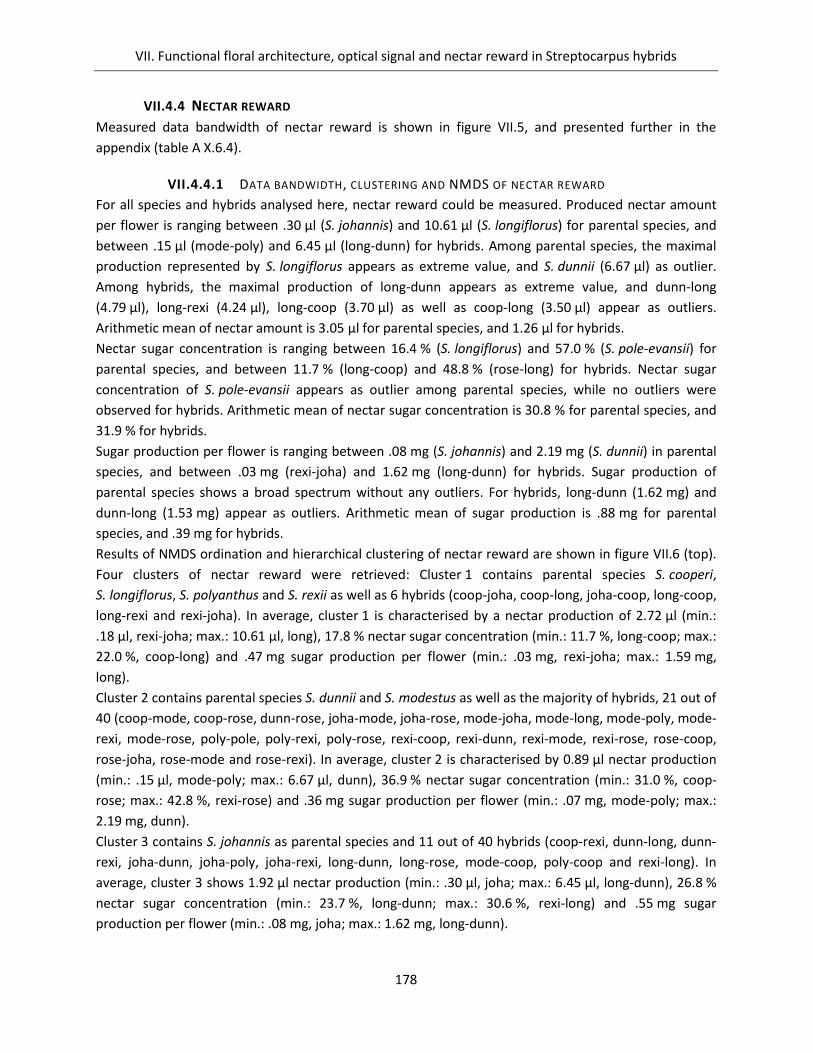
VII. Functional floral architecture, optical signal and nectar reward in Streptocarpus hybrids
178
VII.4.4 NECTAR REWARD
Measured data bandwidth of nectar reward is shown in figure VII.5, and presented further in the
appendix (table A X.6.4).
VII.4.4.1 DATA BANDWIDTH, CLUSTERING AND NMDS OF NECTAR REWARD
For all species and hybrids analysed here, nectar reward could be measured. Produced nectar amount
per flower is ranging between .30 µl (S. johannis) and 10.61 µl (S. longiflorus) for parental species, and
between .15 µl (mode-poly) and 6.45 µl (long-dunn) for hybrids. Among parental species, the maximal
production represented by S. longiflorus appears as extreme value, and S. dunnii (6.67 µl) as outlier.
Among hybrids, the maximal production of long-dunn appears as extreme value, and dunn-long
(4.79 µl), long-rexi (4.24 µl), long-coop (3.70 µl) as well as coop-long (3.50 µl) appear as outliers.
Arithmetic mean of nectar amount is 3.05 µl for parental species, and 1.26 µl for hybrids.
Nectar sugar concentration is ranging between 16.4 % (S. longiflorus) and 57.0 % (S. pole-evansii) for
parental species, and between 11.7 % (long-coop) and 48.8 % (rose-long) for hybrids. Nectar sugar
concentration of S. pole-evansii appears as outlier among parental species, while no outliers were
observed for hybrids. Arithmetic mean of nectar sugar concentration is 30.8 % for parental species, and
31.9 % for hybrids.
Sugar production per flower is ranging between .08 mg (S. johannis) and 2.19 mg (S. dunnii) in parental
species, and between .03 mg (rexi-joha) and 1.62 mg (long-dunn) for hybrids. Sugar production of
parental species shows a broad spectrum without any outliers. For hybrids, long-dunn (1.62 mg) and
dunn-long (1.53 mg) appear as outliers. Arithmetic mean of sugar production is .88 mg for parental
species, and .39 mg for hybrids.
Results of NMDS ordination and hierarchical clustering of nectar reward are shown in figure VII.6 (top).
Four clusters of nectar reward were retrieved: Cluster 1 contains parental species S. cooperi,
S. longiflorus, S. polyanthus and S. rexii as well as 6 hybrids (coop-joha, coop-long, joha-coop, long-coop,
long-rexi and rexi-joha). In average, cluster 1 is characterised by a nectar production of 2.72 µl (min.:
.18 µl, rexi-joha; max.: 10.61 µl, long), 17.8 % nectar sugar concentration (min.: 11.7 %, long-coop; max.:
22.0 %, coop-long) and .47 mg sugar production per flower (min.: .03 mg, rexi-joha; max.: 1.59 mg,
long).
Cluster 2 contains parental species S. dunnii and S. modestus as well as the majority of hybrids, 21 out of
40 (coop-mode, coop-rose, dunn-rose, joha-mode, joha-rose, mode-joha, mode-long, mode-poly, mode-
rexi, mode-rose, poly-pole, poly-rexi, poly-rose, rexi-coop, rexi-dunn, rexi-mode, rexi-rose, rose-coop,
rose-joha, rose-mode and rose-rexi). In average, cluster 2 is characterised by 0.89 µl nectar production
(min.: .15 µl, mode-poly; max.: 6.67 µl, dunn), 36.9 % nectar sugar concentration (min.: 31.0 %, coop-
rose; max.: 42.8 %, rexi-rose) and .36 mg sugar production per flower (min.: .07 mg, mode-poly; max.:
2.19 mg, dunn).
Cluster 3 contains S. johannis as parental species and 11 out of 40 hybrids (coop-rexi, dunn-long, dunn-
rexi, joha-dunn, joha-poly, joha-rexi, long-dunn, long-rose, mode-coop, poly-coop and rexi-long). In
average, cluster 3 shows 1.92 µl nectar production (min.: .30 µl, joha; max.: 6.45 µl, long-dunn), 26.8 %
nectar sugar concentration (min.: 23.7 %, long-dunn; max.: 30.6 %, rexi-long) and .55 mg sugar
production per flower (min.: .08 mg, joha; max.: 1.62 mg, long-dunn).
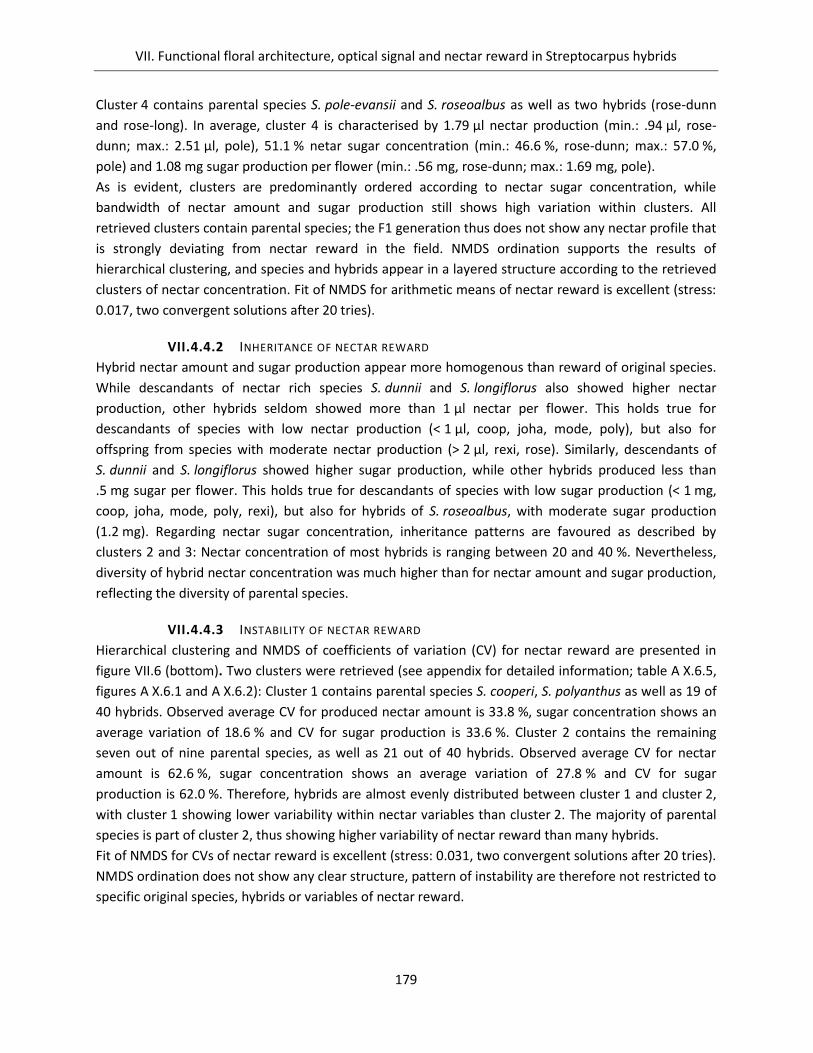
VII. Functional floral architecture, optical signal and nectar reward in Streptocarpus hybrids
179
Cluster 4 contains parental species S. pole-evansii and S. roseoalbus as well as two hybrids (rose-dunn
and rose-long). In average, cluster 4 is characterised by 1.79 µl nectar production (min.: .94 µl, rose-
dunn; max.: 2.51 µl, pole), 51.1 % netar sugar concentration (min.: 46.6 %, rose-dunn; max.: 57.0 %,
pole) and 1.08 mg sugar production per flower (min.: .56 mg, rose-dunn; max.: 1.69 mg, pole).
As is evident, clusters are predominantly ordered according to nectar sugar concentration, while
bandwidth of nectar amount and sugar production still shows high variation within clusters. All
retrieved clusters contain parental species; the F1 generation thus does not show any nectar profile that
is strongly deviating from nectar reward in the field. NMDS ordination supports the results of
hierarchical clustering, and species and hybrids appear in a layered structure according to the retrieved
clusters of nectar concentration. Fit of NMDS for arithmetic means of nectar reward is excellent (stress:
0.017, two convergent solutions after 20 tries).
VII.4.4.2 INHERITANCE OF NECTAR REWARD
Hybrid nectar amount and sugar production appear more homogenous than reward of original species.
While descandants of nectar rich species S. dunnii and S. longiflorus also showed higher nectar
production, other hybrids seldom showed more than 1 µl nectar per flower. This holds true for
descandants of species with low nectar production (< 1 µl, coop, joha, mode, poly), but also for
offspring from species with moderate nectar production (> 2 µl, rexi, rose). Similarly, descendants of
S. dunnii and S. longiflorus showed higher sugar production, while other hybrids produced less than
.5 mg sugar per flower. This holds true for descandants of species with low sugar production (< 1 mg,
coop, joha, mode, poly, rexi), but also for hybrids of S. roseoalbus, with moderate sugar production
(1.2 mg). Regarding nectar sugar concentration, inheritance patterns are favoured as described by
clusters 2 and 3: Nectar concentration of most hybrids is ranging between 20 and 40 %. Nevertheless,
diversity of hybrid nectar concentration was much higher than for nectar amount and sugar production,
reflecting the diversity of parental species.
VII.4.4.3 INSTABILITY OF NECTAR REWARD
Hierarchical clustering and NMDS of coefficients of variation (CV) for nectar reward are presented in
figure VII.6 (bottom). Two clusters were retrieved (see appendix for detailed information; table A X.6.5,
figures A X.6.1 and A X.6.2): Cluster 1 contains parental species S. cooperi, S. polyanthus as well as 19 of
40 hybrids. Observed average CV for produced nectar amount is 33.8 %, sugar concentration shows an
average variation of 18.6 % and CV for sugar production is 33.6 %. Cluster 2 contains the remaining
seven out of nine parental species, as well as 21 out of 40 hybrids. Observed average CV for nectar
amount is 62.6 %, sugar concentration shows an average variation of 27.8 % and CV for sugar
production is 62.0 %. Therefore, hybrids are almost evenly distributed between cluster 1 and cluster 2,
with cluster 1 showing lower variability within nectar variables than cluster 2. The majority of parental
species is part of cluster 2, thus showing higher variability of nectar reward than many hybrids.
Fit of NMDS for CVs of nectar reward is excellent (stress: 0.031, two convergent solutions after 20 tries).
NMDS ordination does not show any clear structure, pattern of instability are therefore not restricted to
specific original species, hybrids or variables of nectar reward.
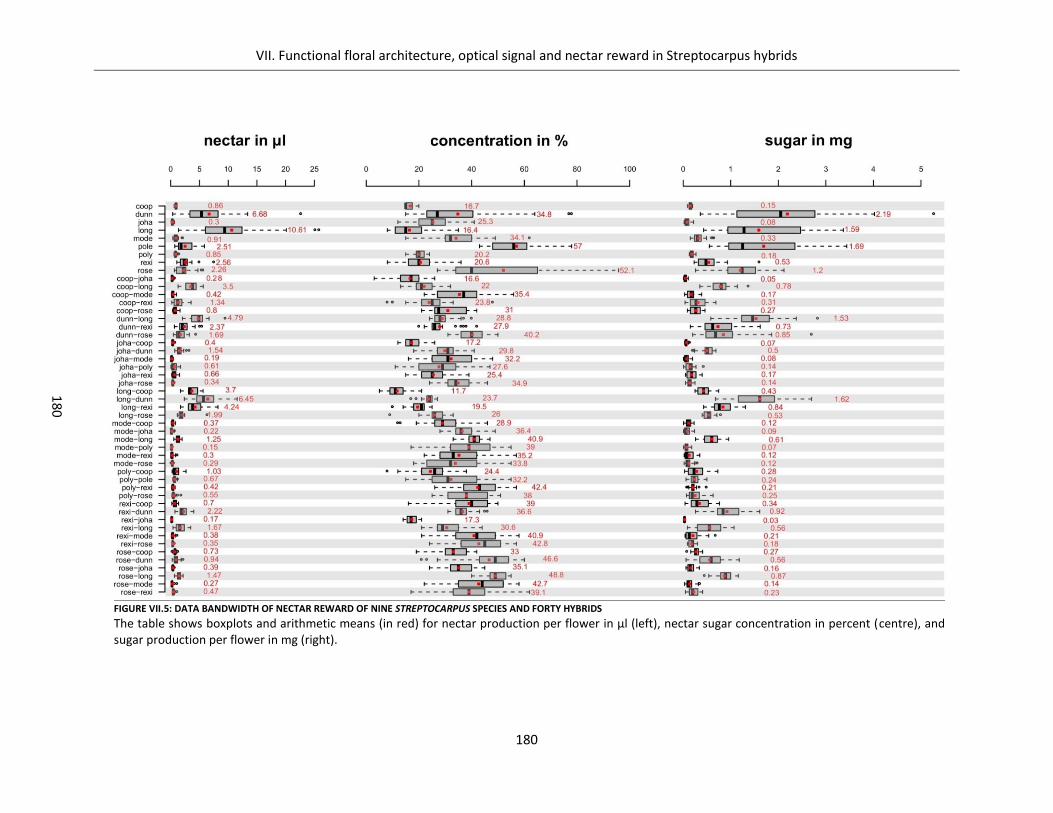
VII. Functional floral architecture, optical signal and nectar reward in Streptocarpus hybrids
180
18
0
FIGURE VII.5: DATA BANDWIDTH OF NECTAR REWARD OF NINE STREPTOCARPUS SPECIES AND FORTY HYBRIDS
The table shows boxplots and arithmetic means (in red) for nectar production per flower in µl (left), nectar sugar concentration in percent (centre), and sugar production per flower in mg (right).
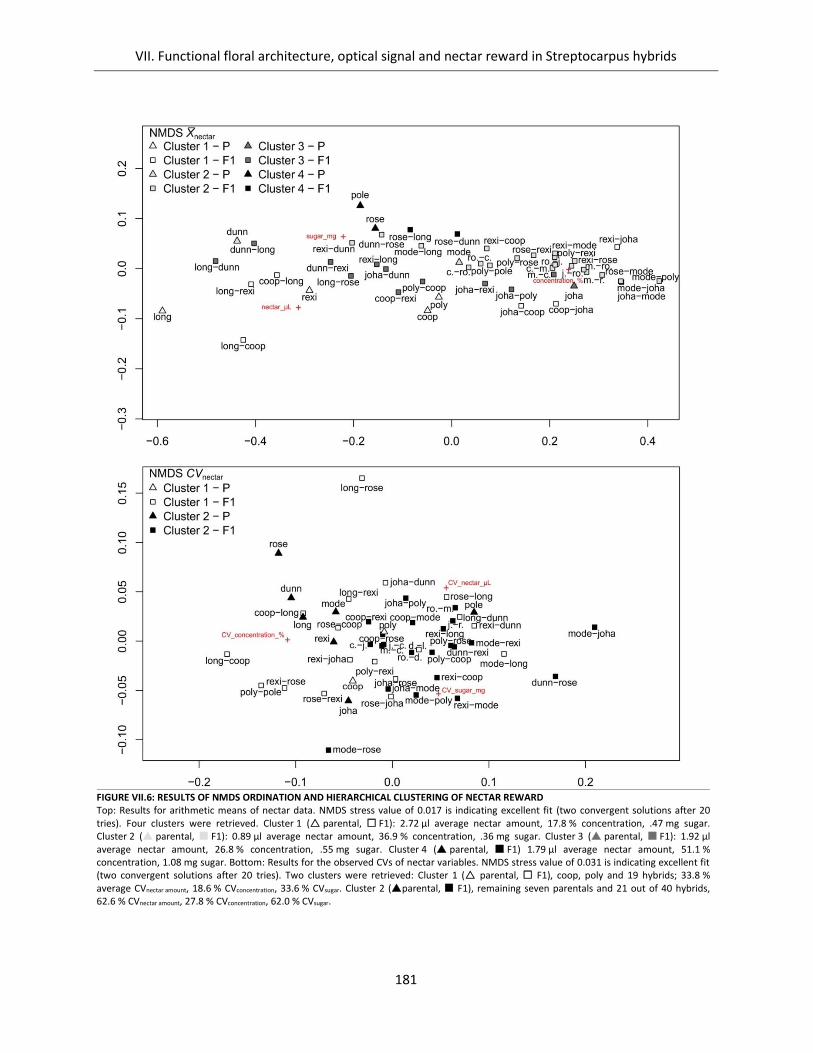
VII. Functional floral architecture, optical signal and nectar reward in Streptocarpus hybrids
181
FIGURE VII.6: RESULTS OF NMDS ORDINATION AND HIERARCHICAL CLUSTERING OF NECTAR REWARD Top: Results for arithmetic means of nectar data. NMDS stress value of 0.017 is indicating excellent fit (two convergent solutions after 20 tries). Four clusters were retrieved. Cluster 1 ( parental, F1): 2.72 µl average nectar amount, 17.8 % concentration, .47 mg sugar. Cluster 2 ( parental, F1): 0.89 µl average nectar amount, 36.9 % concentration, .36 mg sugar. Cluster 3 ( parental, F1): 1.92 µl average nectar amount, 26.8 % concentration, .55 mg sugar. Cluster 4 ( parental, F1) 1.79 µl average nectar amount, 51.1 % concentration, 1.08 mg sugar. Bottom: Results for the observed CVs of nectar variables. NMDS stress value of 0.031 is indicating excellent fit (two convergent solutions after 20 tries). Two clusters were retrieved: Cluster 1 ( parental, F1), coop, poly and 19 hybrids; 33.8 % average CVnectar amount, 18.6 % CVconcentration, 33.6 % CVsugar. Cluster 2 (parental, F1), remaining seven parentals and 21 out of 40 hybrids, 62.6 % CVnectar amount, 27.8 % CVconcentration, 62.0 % CVsugar.
VII. Functional floral architecture, optical signal and nectar reward in Streptocarpus hybrids
182
VII.5 DISCUSSION
VII.5.1 HYBRIDISATION IS ACHIEVED WITH EASE IN STREPTOCARPUS SUBGENUS STREPTOCARPUS
The results presented here show that hybridisation between Streptocarpus species and establishment of
hybrid swarms is generally possible in nature, due to weak or absent postzygotic crossing barriers.
Hilliard and Burt (1971) presented a list of 28 situations that are valid or at least very likely cases of
hybridisation between different species and subspecies of Streptocarpus in the field. We did not
replicate any of these situations, but used different parental plants, thus showing that gene flow
between species is not restricted to hybrids already observed in the field. The ability to hybridise is
rather a general phenomenon within Streptocarpus subgenus Streptocarpus, supporting the idea that
large parts of the genus are potentially still belonging to a single gene pool (Hilliard and Burt, 1971).
Siring success does show differences between species however. While cross-pollination between
members of the Cape primrose clade is largely successful, other species of the subgenus are less
hybridisable.
Two patterns have to be highlighted: First, although S. cooperi and S. dunnii were able to produce hybrid
offspring as maternal or paternal crossing partner with most of the species analysed here, fruit set was
considerably lower than within the Cape primrose clade. Thus, establishment of hybrid swarms in the
field is not impossible for these species, given the large number of seed material a single fruit can
produce, however such a scenario is lowered in its probabilistic occurrence and magnitude due to
lowered fruit set.
Second, species chosen as representatives of more complex floral architecture, namely S. pole-evansii
for the approximated masked flower type as well as S. polyanthus and S. johannis for the keyhole type,
showed (extremely) reduced crossability. For S. johannis fruit set is even lowered within the Cape
primrose clade, and no hybrid seed material was produced with S. longiflorus as maternal and paternal
crossing partner – the only incompatability observed within the clade. The observed lowered crossability
of species with complex floral architecture supports and extends the conclusions of de Villiers et al.
(2013) in regard to hybrid-origin of established Streptocarpus-species: Evolutionary shifts in floral
architecture did not show gene tree conflict in their analysis, only growth form shifts did. Floral
architecture was therefore assumed to maintain reproductive isolation in the genus. Further, highly
specialised keyhole flower types (S. baudertii, S. polyanthus and S. johannis) were only present in stable
taxa without gene tree conflict. Our results indicate that complex floral architecture is not the only
mechanism to enhance reproductive isolation. Rather, complex floral architecture seems to be coupled
with other aspects of incompatibility, thus preventing intrusion of genetic information from other
species. This combined strategy possibly evolved and stabilised in environments with high probability of
hybridisation due to shared pollinators, a plausible scenario for the "zoological desert" of the southern
African habitats of Streptocarpus. S. pole-evansii has to be considered as a special case, even missing
seed set for geitonogamous and allogamous pollination, pointing to a self-incompatibility mechanism
and insufficient genetic variation between individuals used here for the within-species crosspollination
experiment.
VII. Functional floral architecture, optical signal and nectar reward in Streptocarpus hybrids
183
VII.5.2 FULLY FUNCTIONAL F1 HYBRIDS ALLOW FOR HOMOPLOID HYBRID SPECIATION
Analysed hybrids generally showed full floral function for all three levels of analysis (floral architecture,
optical flower signal and nectar reward), and retrieved clusters of hybrid pattern were always
represented by parental species, too. Therefore, functionality of hybrids in natural environments and
compatibility to existing pollinators has to be assumed in general. Combined inheritance of parental
flower traits, and therefore a possible fostering of pollination syndrome evolution, is not supported by
the F1 hybrid data set. F1 hybrids instead showed a trend to homogeneity, due to dominant inheritance
pattern: floral architecture was predominantly funnel shaped, flower size was generally larger (mind low
crossability between large and small flowered species) and offspring of keyhole type species showed
compressed flower openings, however not as pronounced as in the parental generation. Optical signal
was predominantly bluish, anther dummy signal was often present and UV signal was usually diffusely
absorbing. Nectar reward was observed for all hybrids: Nectar sugar concentration predominantly
ranged between ca. 20 and 40 % (two largest nectar clusters), and hybrids showed a trend for lower
nectar amount and sugar production when compared to parental plants.
Analysis of coefficients of variation showed a stabilised nectar production pattern for many of the
hybrids, even more stable than most parental species. Therefore, reliability of pollinator reward is
enhanced in many hybrids. Contrary to this, CVs of floral architecture show higher deviance in hybrids
than in parental species. This might be interpreted as selective disadvantage, generally termed
fluctuating asymmetry hypothesis (compare Neal et al., 1998; Møller, 1995; Møller et al., 1995).
However, fluctuating overall asymmetry for the most hybrids is only 5.4 % higher than the low-
asymmetry cluster representing six out of the nine parental species (coop, joha, long, mode, poly, rexi)
as well as five hybrids. It seems unlikely that such a low increase in floral asymmetry might turn out as a
severe selective disadvantage in the field.
All in all, only 5 out of 40 hybrids showed severe reproductive knock-out anomalies, predominantly loss
of or severe deformity of anthers and filaments. For the remaining 35 hybrids floral form and function
has to be considered suitable for successful plant-pollinator interactions in the field.
Given these facts, and keeping in mind the generally high seed production within the genus, our results
underline the powerful operative force of selective pollinator attraction and control via flower signal and
floral architecture of species found in the field: Although crossability is high within the subgenus, the
named prezygotic crossing barriers seem to be sufficient to separate gene pools. However, in case of a
freak pollination event, the establishment of a fully functional hybrid swarm and onset of homoploid
hybrid speciation is quite likely, if a fitting pollinator population is present, too. Future research should
include in depth pollinator observations of species and hybrids in natural habitats to foster our
understanding of plant-pollinator interactions and of the maintenance of species boundaries. Moreover,
analysis of inheritance and splitting up of trait combinations of F2 hybrids are necessary in order to
assess the possible relevance of pollination syndrome evolution in Streptocarpus.
VII. Functional floral architecture, optical signal and nectar reward in Streptocarpus hybrids
184
VII.6 ACKNOWLEDGMENTS
We thank Tianjun Liu for assistance with nectar collection of parental species, Thomas Joßberger for
collecting vouchers and Klaus Mahlberg for taking care of the plants in the greenhouse.
VII.7 LITERATURE
Buerkle, C.A., Morris, R.J., Asmussen, M.A., Rieseberg, L.H., 2000. The likelihood of homoploid hybrid
speciation. Heredity (Edinb) 84, 441–451.
https://doi.org/10.1046/j.1365-2540.2000.00680.x
Buerkle, C.A., Rieseberg, L.H., 2008. The rate of genome stabilization in homoploid hybrid species.
Evolution 62, 266–275. https://doi.org/10.1111/j.1558-5646.2007.00267.x
Buta, E., Cantor, M., Buta, M., Zaharia, A., 2010. The effect of rooting substrates on the development of
leaf cuttings in Saintpaulia. Analele Univ. Craiova 15, 110–119.
Charrad, M., Ghazzali, N., Boiteau, V., Niknafs, A., 2014. NbClust: An R package for determining the
relevant number of clusters in a data set. Journal of Statistical Software 61, 1–36.
https://doi.org/10.18637/jss.v061.i06
Coyne, J.A., Orr, H.A., 2004. Speciation. Sinauer Associates, Sunderland, Massachusetts.
Darbyshire, I., Massingue, A.O., 2014. Two new species of Streptocarpus (Gesneriaceae) from tropical
Africa. Edinburgh Journal of Botany 71, 3–13.
de Villiers, M.J., Pirie, M.D., Hughes, M., Möller, M., Edwards, T.J., Bellstedt, D.U., 2013. An approach to
identify putative hybrids in the ‘coalescent stochasticity zone’, as exemplified in the African
plant genus Streptocarpus (Gesneriaceae). New Phytologist 198, 284–300.
https://doi.org/10.1111/nph.12133
Delpino, F., 1868–1875. Ulteriori osservazione sulla dicogamia nel regno vegetale. Atti della Societa
Italiana di Scienze Naturali Milano, Vols. 1 and 2.
Fenster, C.B., Armbruster, W.S., Wilson, P., Dudash, M.R., Thomson, J.D., 2004. Pollination syndromes
and floral specialization. Annual Review of Ecology, Evolution, and Systematics 35, 375–403.
https://doi.org/10.1146/annurev.ecolsys.34.011802.132347
Galetto, L., Bernardello, G., 2005. Nectar. In: Dafni, A., Kevan, P.G., Husband, B.C., eds. Practical
pollination biology. Enviroquest Ltd., Cambridge, Ontario. 261–313.
Gompert, Z., Fordyce, J.A., Forister, M.L., Shapiro, A.M., Nice, C.C., 2006. Homoploid hybrid speciation in
an extreme habitat. Science 314, 1923–1925.
https://doi.org/10.1126/science.1135875
Grant, V., 1949. Pollination systems as isolating mechanisms in angiosperms. Evolution 3, 82–97.
https://doi.org/10.1111/j.1558-5646.1949.tb00007.x
Gross, B.L., Rieseberg, L.H., 2005. The ecological genetics of homoploid hybrid speciation. Journal of
Heredity 96, 241–252. https://doi.org/10.1093/jhered/esi026
Harrison, C., 1999. Evolution and development of floral diversity in Streptocarpus and Saintpaulia.
Annals of Botany 84, 49–60. https://doi.org/10.1006/anbo.1999.0887
Howarth, D.G., Baum, D.A., 2005. Genealogical evidence of homoploid hybrid speciation in an adaptive
radiation of Scaevola (Goodeniaceae) in the Hawaiian Islands. Evolution 59, 948–961.
VII. Functional floral architecture, optical signal and nectar reward in Streptocarpus hybrids
185
Hilliard O.M., Burtt B.L., 1971. Streptocarpus. An African plant study. University of Natal Press,
Pietermaritzburg, South Africa.
Hughes, M., MacMaster, G., Möller, M., Bellstedt, D.U., Edwards, T.J., 2006. Breeding system of a
plesiomorphic floral type: an investigation of small flowered Streptocarpus (Gesneriaceae)
species. Plant Systematics and Evolution 262, 13–24.
https://doi.org/10.1007/s00606-006-0453-6
Johnson, S.D., 2010. The pollination niche and its role in the diversification and maintenance of the
southern African flora. Philosophical Transactions of the Royal Society B: Biological Sciences 365,
499–516. https://doi.org/10.1098/rstb.2009.0243
Mächler, M., Rousseeuw, P., Struyf, A., Hubert, M., Hornik, K., 2019. Cluster: Cluster analysis basics and
extensions. R package version 2.1.0.
Mavárez, J., Salazar, C., Bermingham, E., Salcedo, C., Jiggins, C., Linares, M., 2006. Speciation by
hybridization in Heliconius butterflies. Nature 441, 868–871.
https://doi.org/10.1038/nature04738
McCarthy, E.M., Asmussen, M.A., Anderson, W.W., 1995. A theoretical assessment of recombinational
speciation. Heredity 74, 502–509. https://doi.org/10.1038/hdy.1995.71
McCune, B., Grace, J.B., Urban, D.L., 2002. Analysis of ecological communities. MjM Software Design.
Mir, C., Toumi, L., Jarne, P., Sarda, V., Di Giusto, F., Lumaret, R., 2006. Endemic North African Quercus
afares Pomel originates from hybridisation between two genetically very distant oak species
(Q. suber L. and Q. canariensis Willd.): evidence from nuclear and cytoplasmic markers. Heredity
(Edinb) 96, 175–184. https://doi.org/10.1038/sj.hdy.6800782
Möller, M., Cronk, Q.C.B., 2001. Evolution of morphological novelty: a phylogenetic analysis of growth
patterns in Streptocarpus (Gesneriaceae). Evolution 55, 918–929.
https://doi.org/10.1111/j.0014-3820.2001.tb00609.x
Möller, M., Barber, S., Atkins, H.J., Purvis, D.A., 2019. The Living Collection at the Royal Botanic Garden
Edinburgh illustrates the floral diversity in Streptocarpus (Gesneriaceae). Sibbaldia 17, 155–175.
Møller, A.P., 1995. Bumblebee preference for symmetrical flowers. Proceedings of the National
Academy of Sciences 92, 2288–2292. https://doi.org/10.1073/pnas.92.6.2288
Møller, A.P., Eriksson, M., Moller, A.P., 1995. Pollinator preference for symmetrical flowers and sexual
selection in plants. Oikos 73, 15–22. https://doi.org/10.2307/3545720
Neal, P.R., Dafni, A., Giurfa, M., 1998. Floral symmetry and its role in plant-pollinator systems:
Terminology, distribution, and hypotheses. Annual Review of Ecology and Systematics 2, 345–
373.
Nishii, K., Hughes, M., Briggs, M., Haston, E., Christie, F., de Villiers, M.J., Hanekom, T., Roos, W.G.,
Bellstedt, D.U., Möller, M., 2015. Streptocarpus redefined to include all Afro-Malagasy
Gesneriaceae: Molecular phylogenies prove congruent with geographical distribution and basic
chromosome numbers and uncover remarkable morphological homoplasies. Taxon 64, 1243–
1274. https://doi.org/10.12705/646.8
Oksanen, J., Blanchet, F.G., Kindt, R., Legendre, P., Minchin, P., O’Hara, R., Simpson, G., Solymos, P.,
Stevens, M., Wagner, H., 2013. Vegan: Community ecology package. R package version. 2.0-10.
CRAN.
VII. Functional floral architecture, optical signal and nectar reward in Streptocarpus hybrids
186
Potgieter, C.J., Edwards, T.J., 2005. The Stenobasipteron wiedemanni (Diptera, Nemestrinidae)
pollination guild in eastern southern Africa. Annals of the Missouri Botanical Garden 92, 254–
267.
Randrianasolo, A., Phillipson, P.B., Lowry II, P.P., Möller, M., 2018: Streptocarpus peltatus
(Gesneriaceae), a distinctive new species from southeastern Madagascar. Novon 26, 22–27.
Rieseberg, L.H., 2000. Crossing relationships among ancient and experimental sunflower hybrid lineages.
Evolution 54, 859–865. https://doi.org/10.1111/j.0014-3820.2000.tb00086.x
Rieseberg, L.H., 1997. Hybrid origins of plant species. Annual Review of Ecology and Systematics 28,
359–389. https://doi.org/10.1146/annurev.ecolsys.28.1.359
Schwarz, D., Matta, B.M., Shakir-Botteri, N.L., McPheron, B.A., 2005. Host shift to an invasive plant
triggers rapid animal hybrid speciation. Nature 436, 546–549.
https://doi.org/10.1038/nature03800
van der Pijl, L., 1961. Ecological aspects of flower evolution. II. Zoophilous flower classes. Evolution 15,
44–59. https://doi.org/10.2307/2405842
Vogel, S., 1954. Blütenbiologische Typen als Elemente der Sippengliederung, dargestellt anhand der
Flora Südafrikas. Botanische Studien 1. Fischer, Jena.
Vogel, S., 2006. Floral syndromes: empiricism versus typology. Botanische Jahrbücher für Systematik,
Pflanzengeschichte und Pflanzengeographie 127, 5–11.
http://doi.org/10.1127/0006-8152/2006/0127-0005
Weigend, M., Edwards, T.J., 1994. Notes on Streptocarpus cyaneus and S. parviflorus. Sendtnera 2, 365–
376.
VIII. General Conclusions
187
VIII. GENERAL CONCLUSIONS VIII. General Conclusions
The results here presented underline a general statement of Vogel (2006) about the nature of
pollination syndromes: They are superimposed, and constitute a third level of floral organisation,
beyond basal morphology and structural moulding of floral architecture. Pollination syndromes
integrate more elusive floral plant traits like optical signal and nectar reward that are more variable
between and within plant individuals. They are realised within the framework of phylogenetic
constraints, but can display strong plasticity and recombination, i.e. via hybridisation. Only few plant
traits are key elements of successful plant-pollinator interaction: The assemblage of traits represented in
classical pollination syndromes represents different evolutionary driving forces, in combination creating
a fully functional, more or less specialised, plant-pollinator interface. These statements are elaborated in
the following sections, after a brief review of major results of this thesis.
VIII.1 MAJOR RESULTS
In chapter II floral symmetry in Geraniales appeared to be uncorrelated to quantitatively assessed
gamete production (pollen, ovules, p/o ratio) and nectar reward (amount, concentration, sugar
content). Therefore, resource efficiency via pollinator positioning (pollen position hypothesis, reward
wastage hypothesis) cannot account for floral symmetry in Geraniales. Phylogenetic constraints are
present for gamete production, nectar reward and pollinator guilds. While variables of nectar reward
are correlated to pollinator guilds, representing important plant traits for plant-animal interaction,
gamete production is uncorrelated to pollinator guilds. Breeding system related variables are therefore
predominantly influenced by other factors than plant-pollinator interactions in Geraniales: Habitus is of
explanatory value, with higher gamete production detected in plant species with stouter habitus
(shrubs, small trees).
In chapter III clusters of anemophilous, zoophilous and ambophilous pollination syndromes were
retrieved for Hamamelidaceae. Zoophily appears to be reinvented several times from a putatively
ancestral anemophilous state in Hamamelidaceae, and is common in winter flowering species of the
family. Flowering time is uncorrelated to the retrieved pollination modes. Moreover, ambophily was
retrieved for two genera of the family at least dating back to the Eocene, and possibly even the Upper
Cretaceous, arguing against an ephemeral transitional stage of mixed pollination modes.
In chapter IV analysis of floral plant traits of carnivorous active flypaper plants Pinguicula and Drosera
proved absence of a pollinator-prey conflict. Pollinators and prey are separated by highly conserved
patterns of optical flower signal (colour, anther dummies, UV signal) and optical contrast to trap leaves.
In both genera p/o ratios are extremely low in xenogamous breeding systems, clearly arguing against
pollen loss due to a pollinator-prey conflict.
In chapter V subsets of floral functional traits (floral architecture, optical signal, nectar reward, gamete
production) were analysed in depth for members of Streptocarpus subgenus Streptocarpus. The subsets
appeard to be largely uncorrelated from each other and show an arbitrary distribution on the
phylogenetic tree. Reported flower types of the subgenus, commonly described as indicators for
pollination syndromes, only correlate to floral architecture, but are disjunct from the other subsets of
VIII. General Conclusions
188
floral function. Only few floral plant traits appear to be correlated at all, indicating two separate
evoloutionary driving forces: 1. The link between flower size and gamete production indicates a general
aspect of resource investment and mechanical fit to pollinators. 2. The link between variables of optical
flower signal and nectar reward appears to address correlations between sensory systems and
nutritional needs of pollinators.
In chapter VI crossing experiments between three closely related Streptocarpus species of the Cape
primrose clade demonstrated vigorous seed set, with hundreds to thousands of seeds per fruit. The
experiment proved the absence of postzygotic crossing barriers and supports the theory of a large,
single gene pool underlying the subgenus. Prezygotic barriers such as eco-geographical isolation,
including control of plant-animal interactions via floral architecture and optical attraction, appear to
keep the species separated in the field.
In chapter VII a more extensive crossing experiment with nine parental species of Streptocarpus
subgenus Streptocarpus was reported. Hybrids are established with ease within the subgenus, especially
within the Cape primrose clade. 40 hybrids were retrieved and analysed in depth in regard to floral
architecture, optical signal and nectar reward. Hybrids predominantly showed full floral function, only
five hybrids had severe malfunctions of the (male) reproductive system. Floral plant traits showed
dominant-recessive heredity patterns, and observed hybrid patterns always joined into patterns already
present in parental species. Establishment of functional hybrid swarms in the field and onset of
homoploid hybrid speciation is therefore possible and likely, if a freak pollination event circumvents
established prezygotic crossing barriers (eco-geographical isolation, pollinator sorting via floral
architecture, optical attraction, etc.), and a pollinator compatible to the hybrid is constantly present in
the field.
VIII.2 INTERCORRELATION OF FLORAL PLANT TRAITS: BREEDING SYSTEM IS DISJUNCT
The analysis of datasets here reported demonstrated some general aspects of pollination syndromes
that are discussed in the following. In general, pollination syndromes show clear cut pattern when
compared on level of clearly abiotic vs. clearly biotic pollination syndromes, an often neglected aspect of
the debate. The difference between abiotic and biotic pollination systems is well resolved in this thesis
(objective 2, chapter III, Hamamelidaceae), especially by quantitative data assessment of gametic
variables (hypotheses i, ii). However, the detection of ambophilous flowers in Hamamelidaceae, capable
of both wind- and animal pollination, shows that even between these strong polarities functional
pollination modes are possible and realised in nature.
The differentiation between biotic pollination systems is less clear-cut, in literature as well for the
results here presented. In general, results support the grouping of animal taxa according to their
functionality, either to differentiate between functional pollinator guilds according to Fenster et al.
(2004), or between pollinator and prey taxa in carnivorous plants (objectives 1 and 3).
As for the subsets of floral function analysed here (floral structure and symmetry, optical signal, reward
and gamete production), some major trends can be identified in regard to intercorrelation of floral plant
traits:
• Pollen production and flower size often showed significant correlations, cf. objective 2 – carnivorous
plants, and objective 4 – Streptocarpus. The correlation is putatively caused by mechanical fit to
VIII. General Conclusions
189
compatible pollinators, or influence of growth habit. Correlations between pollen production and
flower size are reported in literature (e.g. Young and Stanton, 1990; Worley and Barrett, 2000;
Gómez et al., 2008).
• Significant correlations between corolla tube length or spur length and nectar production have been
found in this thesis, cf. objective 2 – Hamamelidaceae, objective 3 – carnivorous plants, and
objective 4 – Streptocarpus. Many studies have shown that long-tongued pollinators prefer to
forage concealed nectar from deep corollas or nectar spurs, while short-tongued pollinators forage
from openly accessible nectar (e.g. Inouye, 1980; Branquart and Hemptinne, 2000; Gómez et al.,
2008).
• Nectar reward and optical flower signal show correlations, cf. objective 1 – Geraniales, objective 3 –
carnivorous plants, and objective 4 – Streptocarpus. Nectar reward and optical flower signal are
both plant presentation traits, adapted to address the sensory systems of animal taxa and their
nutritional needs. Johnson and Steiner (2000) point out that the role of colour in filtering of flower
visitors has been overemphasised, i.e. because red blindness of bees is doubtful, and flower colour
itself is not significantly correlated to pollination systems. However, the results presented here are
more in line with Fenster et al. (2004): Flower colour appears as important predictor at higher
taxonomic scales (i.e. red colour and bird pollination), while nectar reward can further differentiate
taxa that are more closely related (i.e. Hymenoptera with different tongue-lengths). All in all, the
sheer presence of plant presentation traits, floral signal and reward in biotic pollination systems
cannot be highlighted enough: They are responsible for attraction and guidance of animal
pollinators, and shows functionality even in extreme and special cases like flowering at the fringe of
the growth season (objective 2 – Hamamelidaceae), or by circumventing pollinator-prey conflict in
carnivorous plants (objective 3 – carnivorous plants).
• As a major result of this thesis that is not reported in literature, breeding systems and related
variables of gamete production often appeared strongly disjunct from other subsets of floral
functional traits, cf. objective 1 – Geraniales, objective 3 – carnivorous plants, and objective 4 –
Streptocarpus. Breeding systems and related variables might be controlled more strongly by other
factors, such as phylogenetic signal or life cycle. In line with this, the often assumed correlation
between zygomorphic flower symmetry and higher resource efficiency due to controlled pollen
placement cannot be confirmed by the Geraniales dataset (objective 1). Even p/o ratios in itself,
often used as indicator for breeding systems since Cruden (1977), were of less predictive value in
this thesis whenever true breeding systems were experimentally retrieved (cf. objective 3 –
carnivorous plants, objective 4 – Streptocarpus).
VIII.3 HEREDITY AND GENE FLOW BETWEEN POLLINATION SYNDROMES
Multitrait studies addressing natural variation in syndrome characters are scarce, and usually are unable
to detect selection acting on trait combinations (cf. Fenster et al. 2004). Contrary to this trend,
Wessinger et al. (2014) present evidence that suites of floral traits suitable to bee- or hummingbird
pollination are genetically linked in Penstemon, which could facilitate pollination syndrome evolution.
In this thesis, combination of floral traits and their heredity were tested explicitly for members of
Streptocarpus subgenus Streptocarpus (objective 6). No genetic linkage of floral suites could be
VIII. General Conclusions
190
detected. However, dominant-recessive inheritance pattern were common, and the F1 generation
showed a trend towards homogenisation. Crossing of an F2 generation and analysis of feature splitting
would be necessary to draw final conclusions about genetic linkage of floral traits in Streptocarpus. At
the moment, the data at hand does not indicate genetic linkage of suites of floral plant traits and
heredity of pollination syndromes. The data rather supports Vogel´s stand on this issue: A syndrome can
become diffuse by hybridisation (Vogel, 2006), e.g. via homogenisation of the F1 and dominant-
recessive inheritance pattern.
As for gene flow between syndromes in the field, results presented here emphasise the high importance
of pollinator fidelity and specificity for the prevention of gene flow and hybridisation via praezygotic
crossing barriers (objectives 4 to 6). Members of the Cape primrose clade showed high crossability and
no postzygotic pollination barriers.
All in all, quantitative assessment of gamete production and nectar reward as well integrative analysis of
floral function appear as a promising approach for better understanding of pollination syndrome
evolution (hypothesis iv).
VIII.4 PHYLOGENETIC CONSTRAINTS AND SYNDROME EVOLUTION
In general, research on plant and animal evolution shows that plants have adapted to insect pollinators,
and not the other way round (cf. Neal et al., 1998, and references therein). Van der Niet and Johnson
(2012) argue that co-adaption, co-evolution and pollinator-driven speciation are influenced by "intrinsic
factors" that constrain selection (plant traits such as zygomorphy, nectar spurs etc.) and "extrinsic
factors that provide the selection regime" (i.e. the local pollinator assemblage, hebrivores etc.). This
interplay between intrinsic and extrinsic factors is not strictly directed by species to species interaction:
Vogel (2006) stated that pollination syndromes are the most superficial and evolutionary most labile
organisational level of the flower, and pollination syndromes evolved diffusely between floral guilds and
pollinator guilds. This idea is further supported by statements of Fenster et al. (2004) on trait lability
within species: Fluctuations of pollinator assemblages and gene flow between populations undermines
consistent specialisation, favouring functional groups of animal taxa instead of single pollinating species.
The presence of pollination ecotypes and floral polymorphisms within populations are also evidence for
divergent, pollinator-driven selection (Fenster et al., 2004). This also leads back to the general question
of generalisation vs. specialisation in plant-pollinator interactions. Johnson and Steiner (2000) state that
the dichotomy between generalisation and specialisation is a simplification, plant-pollinator interactions
rather show a continuum. In general, it appears that pollinator-saturated ecosystems tend to specialise,
while unsaturated ecosystems tend to generalise amongst pollinators in order to secure outcrossing
(Willmer, 2011; Waser et al., 1996).
Van der Niet and Johnson (2012) showed that at least 25 percent of documented divergence events
support the idea that pollinator shifts contributed to angiosperm evolution. However, that also leaves
75 percent of divergence events that are not attributable to pollinator shifts, and pollinators are not the
only drivers of angiosperm speciation. Strauss and Whitall (2006) present an overview about biotic and
abiotic factors that influence floral diversity, besides pollinators.
Considering these statements, hypothesis (iii) has to be judged on the individual case: Integrative
assessment of floral plant traits in combination with latest phylogenies were of different explanatory
VIII. General Conclusions
191
value for Geraniales, Hamamelidaceae (showing stronger phylogenetic constrains) and Streptocarpus
(almost no phylogenetic pattern evident).
VIII.5 OUTLOOK
All in all, the quantitative and qualitative, integrative assessment of floral plant traits appears as a
promising approach for better understanding of floral function, and is an improvement compared to the
widespread assessment of pollination syndromes only based on floral colours and shapes.
Further research should try to complement the findings presented here by analysis of other floral
functional traits such as odour or nectar sugar composition, as well as pollinator observations.
Data on pollinator assamblages involved in the pollination of Geraniales are very good, and moderate
for carnivorous plants. Information on wild pollinators of Hamamelidaceae and Streptocarpus species is
very limited however, and should be addressed in the future to complete our understanding of plant-
pollinator interactions for these taxa in the field.
For better understanding of the heredity of pollination syndromes in Streptocarpus, crossing of the F2
generation and analysis of feature splitting is necessary.
To detect selection acting on floral trait combinations, phenotypic manipulation studies that vary traits
should be conducted to test the importance of trait combinations (cf. Fenster et al. 2004), beside
crossing experiments.
VIII.6 LITERATURE
Cruden, R.W., 1977. Pollen-ovule ratios: A conservative indicator of breeding systems in flowering
plants. Evolution 31, 32–46. https://doi.org/10.2307/2407542
Branquart, E., Hemptinne, J.L., 2000. Selectivity in the exploitation of floral resources by hoverflies
(Diptera: Syrphinae). Ecography 23, 732–742.
Fenster, C.B., Armbruster, W.S., Wilson, P., Dudash, M.R., Thomson, J.D., 2004. Pollination syndromes
and floral specialization. Annual Review of Ecology, Evolution, and Systematics 35, 375–403.
https://doi.org/10.1146/annurev.ecolsys.34.011802.132347
Gómez, J.M., Bosch, J., Perfectti, F., Fernandez, J.D., Abdelaziz, M., Camacho, J.P.M., 2008. Association
between floral traits and rewards in Erysimum mediohispanicum (Brassicaceae). Annals of
Botany 101, 1413–1420. https://doi.org/10.1093/aob/mcn053
Inouye, D.W., 1980. The effects of proboscis and corolla tube lengths on patterns and rates of flower
visitation by bumblebees. Oecologia 45, 197–201.
Johnson, S.D., Steiner, K.E., 2000. Generalization vs. specialization in plant pollination systems. Trends in
Ecology and Evolution 15, 140–143.
Neal, P.R., Dafni, A., Giurfa, M., 1998. Floral symmetry and its role in plant-pollinator systems:
Terminology, distribution, and hypotheses. Annual Review of Ecology and Systematics 2, 345–
373. https://doi.org/10.1146/annurev.ecolsys.29.1.345
Strauss, S.Y., Whittall, J.B., 2006. Non-pollinator agents of selection on floral traits. In: Harder, L.D.,
Barrett, S.C.H., eds. Ecology and evolution of flowers. Oxford University Press, Oxford. 120–138.
van der Niet, T., Johnson, S.D., 2012. Phylogenetic evidence for pollinator-driven diversification of
angiosperms. Trends in Ecology & Evolution 27, 353–361.
VIII. General Conclusions
192
https://doi.org/10.1016/j.tree.2012.02.002
Vogel, S., 2006. Floral syndromes: empiricism versus typology. Botanische Jahrbücher für Systematik,
Pflanzengeschichte und Pflanzengeographie 127, 5–11.
http://doi.org/10.1127/0006-8152/2006/0127-0005
Waser, N.M., Chittka, L., Price, M.V., Williams, N.M., Ollerton, J., 1996. Generalization in pollination
systems, and why it matters. Ecology 77, 1043–1060. https://doi.org/10.2307/2265575
Wessinger, C.A., Hileman, L.C., Rausher, M.D., 2014. Identification of major quantitative trait loci
underlying floral pollination syndrome divergence in Penstemon. Philosophical Transactions of
the Royal Society B: Biological Sciences 369, 20130349.
https://doi.org/10.1098/rstb.2013.0349
Willmer, P.G., 2011. Pollination and floral ecology. Princeton University Press, Princeton, N.J.
Worley, A.C., Barrett, S.C.H., 2000. Evolution of floral display in Eichhornia paniculata (Pontederiaceae):
direct and correlated responses to selection on flower size and number. Evolution 54, 1533–
1545.
Young, H.J., Stanton, M.L., 1990. Influences of floral variation on pollen removal and seed production in
wild radish. Ecology 71, 536–547.
IX. Summary
193
IX. SUMMARY IX. Summary
Mues, Andreas Wilhelm (2020): Functional Integration of Floral Plant Traits: Shape and Symmetry,
optical Signal, Reward and Reproduction in the Angiosperm Flower. Doctoral Thesis, Mathematisch-
Naturwissenschaftliche Fakultät, Rheinische Friedrich-Wilhelms-Universität Bonn, Germany.
Pollination syndromes represent floral suites that have originated and diversified in interaction with
biotic and abiotic pollen vectors. Plant trait pattern that constitute respective syndromes have been
used extensively to predict pollen vectors. However, research in this field has seemingly suffered from
poor data quality, especially from overreliance on categorical data, and insufficient integration of
important floral plant traits, especially breeding system related variables (pollen and ovule production,
p/o ratio).
Main objective of this dissertation is to contribute to better understanding of the functional integration
of angiosperm flowers and the concept of pollination syndromes via integrative and quantitative
assessment of floral plant traits, aside with categorical information. The following research questions
were selected to this purpose:
In chapter II diversification of floral plant traits and pollinator guilds are presented for members of order
Geraniales. The order is small but florally diverse, and therefore particularly suitable for comparative
studies. Floral symmetry in Geraniales appears to be uncorrelated to quantitatively assessed gamete
production (pollen, ovules, p/o ratio) and nectar reward (amount, concentration, sugar content).
Therefore, resource efficiency via pollinator positioning (pollen position hypothesis, reward wastage
hypothesis) cannot account for floral symmetry. Phylogenetic constraints are present for gamete
production, nectar reward and pollinator guilds. While variables of nectar reward are correlated to
pollinator guilds, gamete production is uncorrelated.
In chapter III diversification of floral plant traits and flowering time are analysed for Hamamelidaceae, a
small family known for the peculiar flowering time of some of its members in late autumn or winter.
Clear clusters of anemophilous, zoophilous and ambophilous pollination syndromes are retrieved.
Zoophily appears to be reinvented several times from a putatively ancestral anemophilous state and is
common in winter flowering species. Flowering time is not correlated to the retrieved pollination
modes. Moreover, ambophily is retrieved for two genera of the family at least dating back to the
Eocene, and possibly even the Upper Cretaceous, arguing against an ephemeral transitional stage of
mixed pollination modes.
In chapter IV floral plant traits of carnivorous active flypaper plants Pinguicula and Drosera are
compared. Carnivorous plants are animal pollinated, and the potential capture of legitimate pollinators
has long been researched under the term pollinator-prey conflict, usually focusing on sorting between
pollinators and prey by the trap types. Analysis of floral plant traits proves the absence of such a
conflict. Pollinators and prey are separated by highly conserved patterns of optical flower signal and
contrast to trap leaves. In both genera p/o ratios are extremely low in species with xenogamous
breeding systems, clearly arguing against pollen loss due to a pollinator-prey conflict.
IX. Summary
194
In chapter V subsets of floral functional traits (floral architecture, optical signal, nectar reward, gamete
production) are analysed for 18 members of Streptocarpus subgenus Streptocarpus. The subsets appear
to be largely uncorrelated from each other and show an arbitrary distribution on the phylogenetic tree.
Reported flower types of the subgenus, commonly described as indicators for pollination syndromes,
only correlate to floral architecture, but are disjunct from the other subsets of floral function. Only few
floral plant traits appear to be correlated at all, indicating two separate evolutionary driving forces:
Floral architecture controlling for pollinator access, pollen placement and gamete production, and the
interaction of floral signal and nectar reward as an adjustment to sensory capacities and nutritional
needs of pollinator taxa.
In chapter VI crossing experiments between three closely related Streptocarpus species of the Cape
primrose clade demonstrate vigorous seed set, with hundreds to thousands of seeds per fruit. The
experiment proves the absence of postzygotic crossing barriers and supports the theory of a large, single
gene pool underlying the subgenus. Prezygotic barriers such as eco-geographical isolation, including
control of plant-animal interactions via floral architecture and optical attraction, appear to keep the
species separated in the field.
In chapter VII a more extensive crossing experiment with nine parental species of Streptocarpus
subgenus Streptocarpus is presented. Hybrids are established with ease within the subgenus, especially
within the Cape primrose clade. Floral architecture, optical signal and nectar reward of 40 hybrids is
presented. Hybrids predominantly show full floral function, only five hybrids show severe malfunctions
of the (male) reproductive system. Floral plant traits are inherited dominant-recessively, and hybrid
patterns always join into patterns already present in parental species. Establishment of functional hybrid
swarms in the field and onset of homoploid hybrid speciation is therefore possible, if a freak pollination
event circumvents established prezygotic crossing barriers (eco-geographical isolation, pollinator sorting
via floral architecture, optical attraction, etc.), and a pollinator compatible to the hybrid is constantly
present in the field.
Chapter VIII presents general conclusions of this thesis: Significant correlations across the different
datasets were retrieved for pollen production and flower size, corolla tube length / spur length and
nectar production, as well as between nectar reward and optical flower signal. Moreover, breeding
systems and gamete production often appear disjunct from other subsets of floral functional traits. The
results indicate a general split between plant traits relevant for pollinator attraction and interaction
(optical signal, reward) and breeding system (pollen and ovule production, p/o ratio).
All in all, the quantitative and qualitative, integrative assessment of floral plant traits appears as a
promising approach for better understanding of floral function, and is an improvement compared to the
widespread assessment of pollination syndromes only based on floral colours and shapes. Further
research should complement the presented results by additional analysis of other floral functional traits,
such as odour or nectar sugar composition, and pollinator observations in the field.

X. Appendices
195
X. APPENDICES X. Appendices
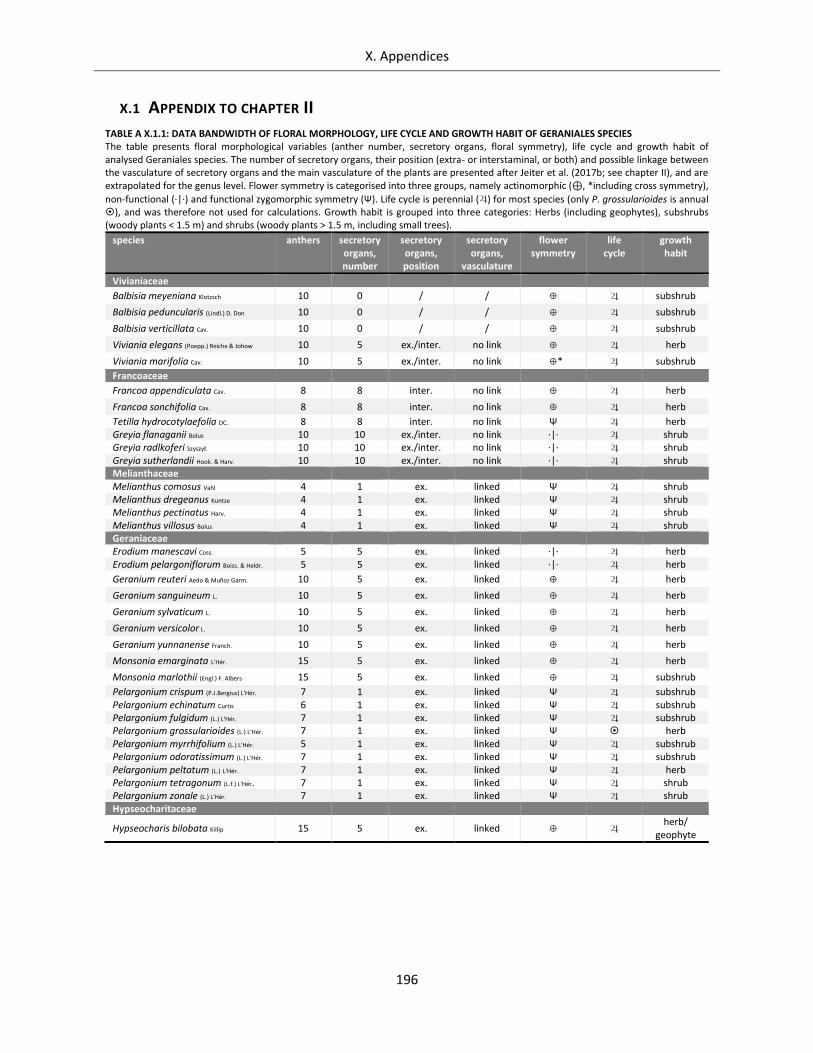
X. Appendices
196
X.1 APPENDIX TO CHAPTER II
TABLE A X.1.1: DATA BANDWIDTH OF FLORAL MORPHOLOGY, LIFE CYCLE AND GROWTH HABIT OF GERANIALES SPECIES The table presents floral morphological variables (anther number, secretory organs, floral symmetry), life cycle and growth habit of analysed Geraniales species. The number of secretory organs, their position (extra- or interstaminal, or both) and possible linkage between the vasculature of secretory organs and the main vasculature of the plants are presented after Jeiter et al. (2017b; see chapter II), and are extrapolated for the genus level. Flower symmetry is categorised into three groups, namely actinomorphic (⊕, *including cross symmetry),
non-functional (·|·) and functional zygomorphic symmetry (Ψ). Life cycle is perennial () for most species (only P. grossularioides is annual ), and was therefore not used for calculations. Growth habit is grouped into three categories: Herbs (including geophytes), subshrubs (woody plants < 1.5 m) and shrubs (woody plants > 1.5 m, including small trees).
species anthers
secretory organs, number
secretory organs, position
secretory organs,
vasculature
flower symmetry
life cycle
growth habit
Vivianiaceae
Balbisia meyeniana Klotzsch 10 0 / / ⊕ subshrub
Balbisia peduncularis (Lindl.) D. Don 10 0 / / ⊕ subshrub
Balbisia verticillata Cav. 10 0 / / ⊕ subshrub
Viviania elegans (Poepp.) Reiche & Johow 10 5 ex./inter. no link ⊕ herb
Viviania marifolia Cav. 10 5 ex./inter. no link *⊕* subshrub
Francoaceae
Francoa appendiculata Cav. 8 8 inter. no link ⊕ herb
Francoa sonchifolia Cav. 8 8 inter. no link ⊕ herb
Tetilla hydrocotylaefolia DC. 8 8 inter. no link Ψ herb Greyia flanaganii Bolus 10 10 ex./inter. no link ·|· shrub Greyia radlkoferi Szyszył. 10 10 ex./inter. no link ·|· shrub Greyia sutherlandii Hook. & Harv. 10 10 ex./inter. no link ·|· shrub Melianthaceae Melianthus comosus Vahl 4 1 ex. linked Ψ shrub Melianthus dregeanus Kuntze 4 1 ex. linked Ψ shrub Melianthus pectinatus Harv. 4 1 ex. linked Ψ shrub Melianthus villosus Bolus 4 1 ex. linked Ψ shrub Geraniaceae Erodium manescavi Coss. 5 5 ex. linked ·|· herb Erodium pelargoniflorum Boiss. & Heldr. 5 5 ex. linked ·|· herb
Geranium reuteri Aedo & Muñoz Garm. 10 5 ex. linked ⊕ herb
Geranium sanguineum L. 10 5 ex. linked ⊕ herb
Geranium sylvaticum L. 10 5 ex. linked ⊕ herb
Geranium versicolor L. 10 5 ex. linked ⊕ herb
Geranium yunnanense Franch. 10 5 ex. linked ⊕ herb
Monsonia emarginata L'Hér. 15 5 ex. linked ⊕ herb
Monsonia marlothii (Engl.) F. Albers 15 5 ex. linked ⊕ subshrub
Pelargonium crispum (P.J.Bergius) L'Hér. 7 1 ex. linked Ψ subshrub Pelargonium echinatum Curtis 6 1 ex. linked Ψ subshrub Pelargonium fulgidum (L.) L'Hér. 7 1 ex. linked Ψ subshrub Pelargonium grossularioides (L.) L'Hér. 7 1 ex. linked Ψ herb Pelargonium myrrhifolium (L.) L'Hér. 5 1 ex. linked Ψ subshrub Pelargonium odoratissimum (L.) L'Hér. 7 1 ex. linked Ψ subshrub Pelargonium peltatum (L.) L'Hér. 7 1 ex. linked Ψ herb Pelargonium tetragonum (L.f.) L'Hér. 7 1 ex. linked Ψ shrub Pelargonium zonale (L.) L'Hér. 7 1 ex. linked Ψ shrub Hypseocharitaceae
Hypseocharis bilobata Killip 15 5 ex. linked ⊕ herb/
geophyte
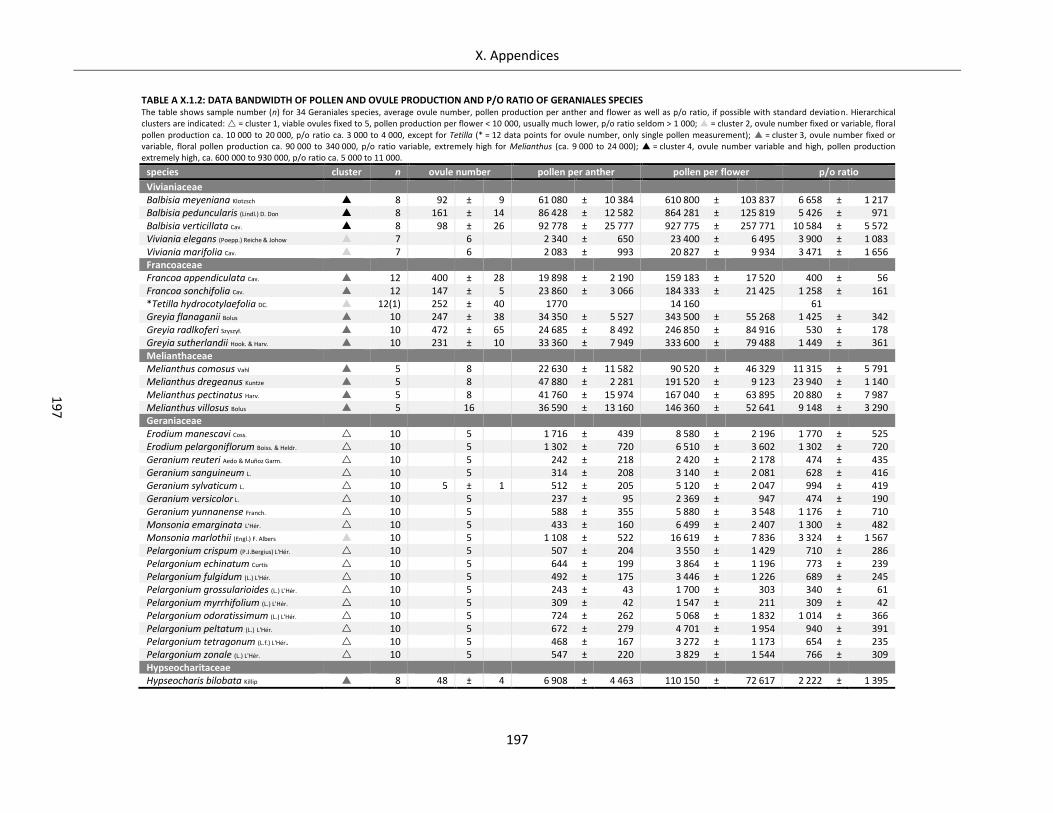
X. Appendices
197
19
7
TABLE A X.1.2: DATA BANDWIDTH OF POLLEN AND OVULE PRODUCTION AND P/O RATIO OF GERANIALES SPECIES The table shows sample number (n) for 34 Geraniales species, average ovule number, pollen production per anther and flower as well as p/o ratio, if possible with standard deviation. Hierarchical clusters are indicated: = cluster 1, viable ovules fixed to 5, pollen production per flower < 10 000, usually much lower, p/o ratio seldom > 1 000; = cluster 2, ovule number fixed or variable, floral pollen production ca. 10 000 to 20 000, p/o ratio ca. 3 000 to 4 000, except for Tetilla (* = 12 data points for ovule number, only single pollen measurement); = cluster 3, ovule number fixed or variable, floral pollen production ca. 90 000 to 340 000, p/o ratio variable, extremely high for Melianthus (ca. 9 000 to 24 000); = cluster 4, ovule number variable and high, pollen production extremely high, ca. 600 000 to 930 000, p/o ratio ca. 5 000 to 11 000.
species cluster n ovule number pollen per anther pollen per flower p/o ratio
Vivianiaceae Balbisia meyeniana Klotzsch 8 92 ± 9 61 080 ± 10 384 610 800 ± 103 837 6 658 ± 1 217 Balbisia peduncularis (Lindl.) D. Don 8 161 ± 14 86 428 ± 12 582 864 281 ± 125 819 5 426 ± 971 Balbisia verticillata Cav. 8 98 ± 26 92 778 ± 25 777 927 775 ± 257 771 10 584 ± 5 572 Viviania elegans (Poepp.) Reiche & Johow 7 6 2 340 ± 650 23 400 ± 6 495 3 900 ± 1 083 Viviania marifolia Cav. 7 6 2 083 ± 993 20 827 ± 9 934 3 471 ± 1 656 Francoaceae Francoa appendiculata Cav. 12 400 ± 28 19 898 ± 2 190 159 183 ± 17 520 400 ± 56 Francoa sonchifolia Cav. 12 147 ± 5 23 860 ± 3 066 184 333 ± 21 425 1 258 ± 161 *Tetilla hydrocotylaefolia DC. 12(1) 252 ± 40 1770 14 160 61 Greyia flanaganii Bolus 10 247 ± 38 34 350 ± 5 527 343 500 ± 55 268 1 425 ± 342 Greyia radlkoferi Szyszył. 10 472 ± 65 24 685 ± 8 492 246 850 ± 84 916 530 ± 178 Greyia sutherlandii Hook. & Harv. 10 231 ± 10 33 360 ± 7 949 333 600 ± 79 488 1 449 ± 361 Melianthaceae Melianthus comosus Vahl 5 8 22 630 ± 11 582 90 520 ± 46 329 11 315 ± 5 791 Melianthus dregeanus Kuntze 5 8 47 880 ± 2 281 191 520 ± 9 123 23 940 ± 1 140 Melianthus pectinatus Harv. 5 8 41 760 ± 15 974 167 040 ± 63 895 20 880 ± 7 987 Melianthus villosus Bolus 5 16 36 590 ± 13 160 146 360 ± 52 641 9 148 ± 3 290 Geraniaceae Erodium manescavi Coss. 10 5 1 716 ± 439 8 580 ± 2 196 1 770 ± 525 Erodium pelargoniflorum Boiss. & Heldr. 10 5 1 302 ± 720 6 510 ± 3 602 1 302 ± 720 Geranium reuteri Aedo & Muñoz Garm. 10 5 242 ± 218 2 420 ± 2 178 474 ± 435 Geranium sanguineum L. 10 5 314 ± 208 3 140 ± 2 081 628 ± 416 Geranium sylvaticum L. 10 5 ± 1 512 ± 205 5 120 ± 2 047 994 ± 419 Geranium versicolor L. 10 5 237 ± 95 2 369 ± 947 474 ± 190 Geranium yunnanense Franch. 10 5 588 ± 355 5 880 ± 3 548 1 176 ± 710 Monsonia emarginata L'Hér. 10 5 433 ± 160 6 499 ± 2 407 1 300 ± 482 Monsonia marlothii (Engl.) F. Albers 10 5 1 108 ± 522 16 619 ± 7 836 3 324 ± 1 567 Pelargonium crispum (P.J.Bergius) L'Hér. 10 5 507 ± 204 3 550 ± 1 429 710 ± 286 Pelargonium echinatum Curtis 10 5 644 ± 199 3 864 ± 1 196 773 ± 239 Pelargonium fulgidum (L.) L'Hér. 10 5 492 ± 175 3 446 ± 1 226 689 ± 245 Pelargonium grossularioides (L.) L'Hér. 10 5 243 ± 43 1 700 ± 303 340 ± 61 Pelargonium myrrhifolium (L.) L'Hér. 10 5 309 ± 42 1 547 ± 211 309 ± 42 Pelargonium odoratissimum (L.) L'Hér. 10 5 724 ± 262 5 068 ± 1 832 1 014 ± 366 Pelargonium peltatum (L.) L'Hér. 10 5 672 ± 279 4 701 ± 1 954 940 ± 391 Pelargonium tetragonum (L.f.) L'Hér. 10 5 468 ± 167 3 272 ± 1 173 654 ± 235 Pelargonium zonale (L.) L'Hér. 10 5 547 ± 220 3 829 ± 1 544 766 ± 309 Hypseocharitaceae Hypseocharis bilobata Killip 8 48 ± 4 6 908 ± 4 463 110 150 ± 72 617 2 222 ± 1 395
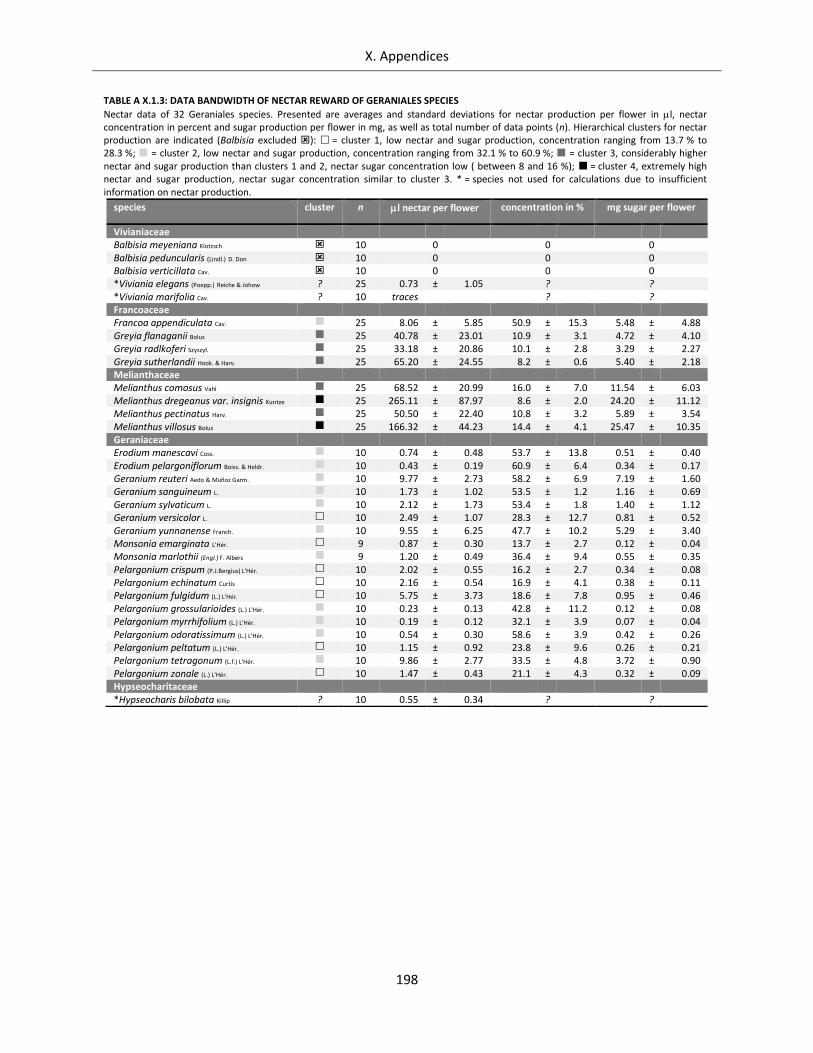
X. Appendices
198
TABLE A X.1.3: DATA BANDWIDTH OF NECTAR REWARD OF GERANIALES SPECIES
Nectar data of 32 Geraniales species. Presented are averages and standard deviations for nectar production per flower in l, nectar concentration in percent and sugar production per flower in mg, as well as total number of data points (n). Hierarchical clusters for nectar production are indicated (Balbisia excluded ): = cluster 1, low nectar and sugar production, concentration ranging from 13.7 % to 28.3 %; = cluster 2, low nectar and sugar production, concentration ranging from 32.1 % to 60.9 %; = cluster 3, considerably higher nectar and sugar production than clusters 1 and 2, nectar sugar concentration low ( between 8 and 16 %); = cluster 4, extremely high nectar and sugar production, nectar sugar concentration similar to cluster 3. * = species not used for calculations due to insufficient information on nectar production.
species cluster n l nectar per flower concentration in %
mg sugar per flower
Vivianiaceae Balbisia meyeniana Klotzsch 10 0 0 0 Balbisia peduncularis (Lindl.) D. Don 10 0 0 0 Balbisia verticillata Cav. 10 0 0 0 *Viviania elegans (Poepp.) Reiche & Johow ? 25 0.73 ± 1.05 ? ? *Viviania marifolia Cav. ? 10 traces ? ? Francoaceae Francoa appendiculata Cav. 25 8.06 ± 5.85 50.9 ± 15.3 5.48 ± 4.88 Greyia flanaganii Bolus 25 40.78 ± 23.01 10.9 ± 3.1 4.72 ± 4.10 Greyia radlkoferi Szyszył. 25 33.18 ± 20.86 10.1 ± 2.8 3.29 ± 2.27 Greyia sutherlandii Hook. & Harv. 25 65.20 ± 24.55 8.2 ± 0.6 5.40 ± 2.18 Melianthaceae Melianthus comosus Vahl 25 68.52 ± 20.99 16.0 ± 7.0 11.54 ± 6.03 Melianthus dregeanus var. insignis Kuntze 25 265.11 ± 87.97 8.6 ± 2.0 24.20 ± 11.12 Melianthus pectinatus Harv. 25 50.50 ± 22.40 10.8 ± 3.2 5.89 ± 3.54 Melianthus villosus Bolus 25 166.32 ± 44.23 14.4 ± 4.1 25.47 ± 10.35 Geraniaceae Erodium manescavi Coss. 10 0.74 ± 0.48 53.7 ± 13.8 0.51 ± 0.40 Erodium pelargoniflorum Boiss. & Heldr. 10 0.43 ± 0.19 60.9 ± 6.4 0.34 ± 0.17 Geranium reuteri Aedo & Muñoz Garm. 10 9.77 ± 2.73 58.2 ± 6.9 7.19 ± 1.60 Geranium sanguineum L. 10 1.73 ± 1.02 53.5 ± 1.2 1.16 ± 0.69 Geranium sylvaticum L. 10 2.12 ± 1.73 53.4 ± 1.8 1.40 ± 1.12 Geranium versicolor L. 10 2.49 ± 1.07 28.3 ± 12.7 0.81 ± 0.52 Geranium yunnanense Franch. 10 9.55 ± 6.25 47.7 ± 10.2 5.29 ± 3.40 Monsonia emarginata L'Hér. 9 0.87 ± 0.30 13.7 ± 2.7 0.12 ± 0.04 Monsonia marlothii (Engl.) F. Albers 9 1.20 ± 0.49 36.4 ± 9.4 0.55 ± 0.35 Pelargonium crispum (P.J.Bergius) L'Hér. 10 2.02 ± 0.55 16.2 ± 2.7 0.34 ± 0.08 Pelargonium echinatum Curtis 10 2.16 ± 0.54 16.9 ± 4.1 0.38 ± 0.11 Pelargonium fulgidum (L.) L'Hér. 10 5.75 ± 3.73 18.6 ± 7.8 0.95 ± 0.46 Pelargonium grossularioides (L.) L'Hér. 10 0.23 ± 0.13 42.8 ± 11.2 0.12 ± 0.08 Pelargonium myrrhifolium (L.) L'Hér. 10 0.19 ± 0.12 32.1 ± 3.9 0.07 ± 0.04 Pelargonium odoratissimum (L.) L'Hér. 10 0.54 ± 0.30 58.6 ± 3.9 0.42 ± 0.26 Pelargonium peltatum (L.) L'Hér. 10 1.15 ± 0.92 23.8 ± 9.6 0.26 ± 0.21 Pelargonium tetragonum (L.f.) L'Hér. 10 9.86 ± 2.77 33.5 ± 4.8 3.72 ± 0.90 Pelargonium zonale (L.) L'Hér. 10 1.47 ± 0.43 21.1 ± 4.3 0.32 ± 0.09 Hypseocharitaceae *Hypseocharis bilobata Killip ? 10 0.55 ± 0.34 ? ?
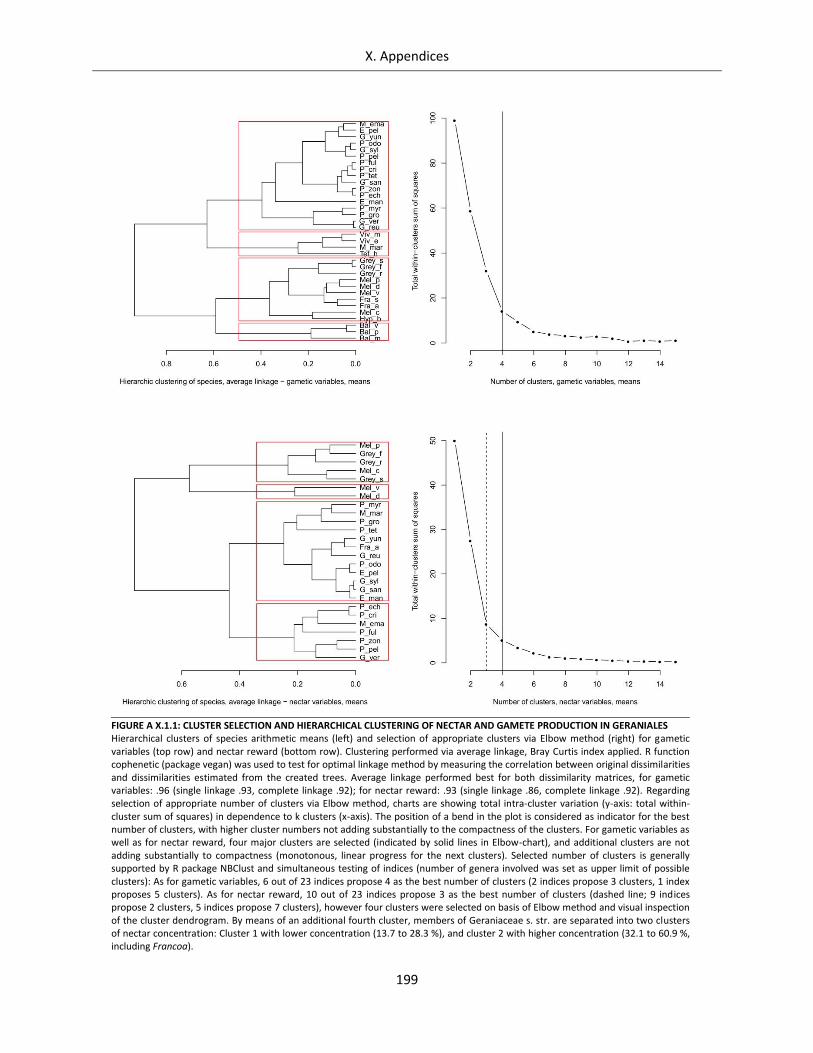
X. Appendices
199
FIGURE A X.1.1: CLUSTER SELECTION AND HIERARCHICAL CLUSTERING OF NECTAR AND GAMETE PRODUCTION IN GERANIALES Hierarchical clusters of species arithmetic means (left) and selection of appropriate clusters via Elbow method (right) for gametic variables (top row) and nectar reward (bottom row). Clustering performed via average linkage, Bray Curtis index applied. R function cophenetic (package vegan) was used to test for optimal linkage method by measuring the correlation between original dissimilarities and dissimilarities estimated from the created trees. Average linkage performed best for both dissimilarity matrices, for gametic variables: .96 (single linkage .93, complete linkage .92); for nectar reward: .93 (single linkage .86, complete linkage .92). Regarding selection of appropriate number of clusters via Elbow method, charts are showing total intra-cluster variation (y-axis: total within-cluster sum of squares) in dependence to k clusters (x-axis). The position of a bend in the plot is considered as indicator for the best number of clusters, with higher cluster numbers not adding substantially to the compactness of the clusters. For gametic variables as well as for nectar reward, four major clusters are selected (indicated by solid lines in Elbow-chart), and additional clusters are not adding substantially to compactness (monotonous, linear progress for the next clusters). Selected number of clusters is generally supported by R package NBClust and simultaneous testing of indices (number of genera involved was set as upper limit of possible clusters): As for gametic variables, 6 out of 23 indices propose 4 as the best number of clusters (2 indices propose 3 clusters, 1 index proposes 5 clusters). As for nectar reward, 10 out of 23 indices propose 3 as the best number of clusters (dashed line; 9 indices propose 2 clusters, 5 indices propose 7 clusters), however four clusters were selected on basis of Elbow method and visual inspection of the cluster dendrogram. By means of an additional fourth cluster, members of Geraniaceae s. str. are separated into two clusters of nectar concentration: Cluster 1 with lower concentration (13.7 to 28.3 %), and cluster 2 with higher concentration (32.1 to 60.9 %, including Francoa).
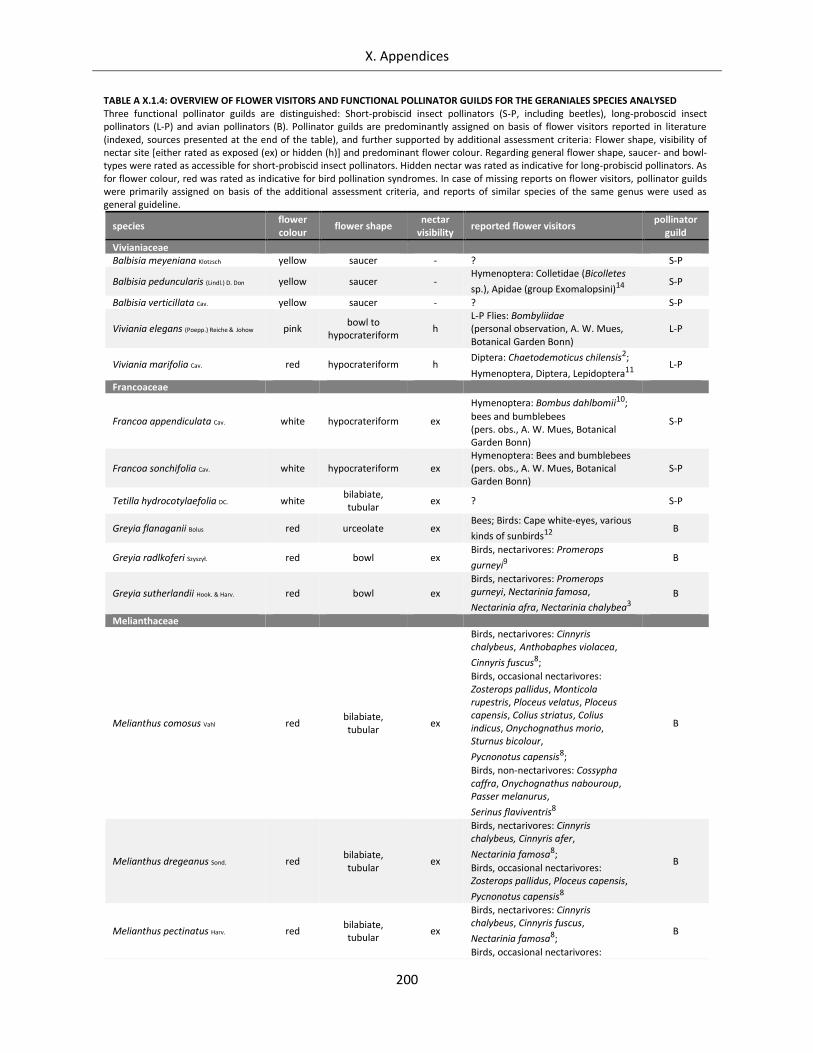
X. Appendices
200
TABLE A X.1.4: OVERVIEW OF FLOWER VISITORS AND FUNCTIONAL POLLINATOR GUILDS FOR THE GERANIALES SPECIES ANALYSED Three functional pollinator guilds are distinguished: Short-probiscid insect pollinators (S-P, including beetles), long-proboscid insect pollinators (L-P) and avian pollinators (B). Pollinator guilds are predominantly assigned on basis of flower visitors reported in literature (indexed, sources presented at the end of the table), and further supported by additional assessment criteria: Flower shape, visibility of nectar site [either rated as exposed (ex) or hidden (h)] and predominant flower colour. Regarding general flower shape, saucer- and bowl-types were rated as accessible for short-probiscid insect pollinators. Hidden nectar was rated as indicative for long-probiscid pollinators. As for flower colour, red was rated as indicative for bird pollination syndromes. In case of missing reports on flower visitors, pollinator guilds were primarily assigned on basis of the additional assessment criteria, and reports of similar species of the same genus were used as general guideline.
species flower colour
flower shape nectar
visibility reported flower visitors
pollinator guild
Vivianiaceae Balbisia meyeniana Klotzsch yellow saucer - ? S-P
Balbisia peduncularis (Lindl.) D. Don yellow saucer - Hymenoptera: Colletidae (Bicolletes
sp.), Apidae (group Exomalopsini)14 S-P
Balbisia verticillata Cav. yellow saucer - ? S-P
Viviania elegans (Poepp.) Reiche & Johow pink bowl to
hypocrateriform h
L-P Flies: Bombyliidae (personal observation, A. W. Mues, Botanical Garden Bonn)
L-P
Viviania marifolia Cav. red hypocrateriform h Diptera: Chaetodemoticus chilensis2;
Hymenoptera, Diptera, Lepidoptera11 L-P
Francoaceae
Francoa appendiculata Cav. white hypocrateriform ex
Hymenoptera: Bombus dahlbomii10;
bees and bumblebees (pers. obs., A. W. Mues, Botanical Garden Bonn)
S-P
Francoa sonchifolia Cav. white hypocrateriform ex Hymenoptera: Bees and bumblebees (pers. obs., A. W. Mues, Botanical Garden Bonn)
S-P
Tetilla hydrocotylaefolia DC. white bilabiate, tubular
ex ? S-P
Greyia flanaganii Bolus red urceolate ex Bees; Birds: Cape white-eyes, various
kinds of sunbirds12 B
Greyia radlkoferi Szyszył. red bowl ex Birds, nectarivores: Promerops
gurneyi9 B
Greyia sutherlandii Hook. & Harv. red bowl ex
Birds, nectarivores: Promerops gurneyi, Nectarinia famosa,
Nectarinia afra, Nectarinia chalybea3
B
Melianthaceae
Melianthus comosus Vahl red bilabiate, tubular
ex
Birds, nectarivores: Cinnyris chalybeus, Anthobaphes violacea,
Cinnyris fuscus8;
Birds, occasional nectarivores: Zosterops pallidus, Monticola rupestris, Ploceus velatus, Ploceus capensis, Colius striatus, Colius indicus, Onychognathus morio, Sturnus bicolour,
Pycnonotus capensis8;
Birds, non-nectarivores: Cossypha caffra, Onychognathus nabouroup, Passer melanurus,
Serinus flaviventris8
B
Melianthus dregeanus Sond. red bilabiate, tubular
ex
Birds, nectarivores: Cinnyris chalybeus, Cinnyris afer,
Nectarinia famosa8;
Birds, occasional nectarivores: Zosterops pallidus, Ploceus capensis,
Pycnonotus capensis8
B
Melianthus pectinatus Harv. red bilabiate, tubular
ex
Birds, nectarivores: Cinnyris chalybeus, Cinnyris fuscus,
Nectarinia famosa8;
Birds, occasional nectarivores:
B
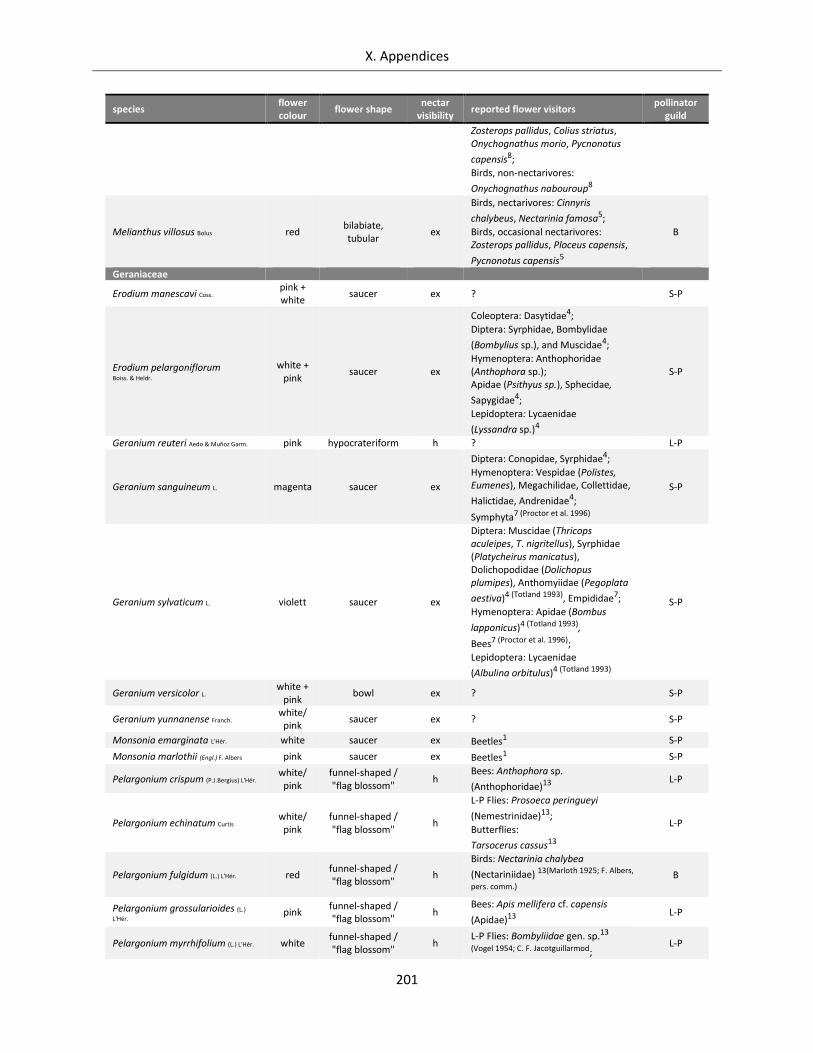
X. Appendices
201
species flower colour
flower shape nectar
visibility reported flower visitors
pollinator guild
Zosterops pallidus, Colius striatus, Onychognathus morio, Pycnonotus
capensis8;
Birds, non-nectarivores:
Onychognathus nabouroup8
Melianthus villosus Bolus red bilabiate, tubular
ex
Birds, nectarivores: Cinnyris
chalybeus, Nectarinia famosa5;
Birds, occasional nectarivores: Zosterops pallidus, Ploceus capensis,
Pycnonotus capensis5
B
Geraniaceae
Erodium manescavi Coss. pink + white
saucer ex ? S-P
Erodium pelargoniflorum Boiss. & Heldr.
white + pink
saucer ex
Coleoptera: Dasytidae4;
Diptera: Syrphidae, Bombylidae
(Bombylius sp.), and Muscidae4;
Hymenoptera: Anthophoridae (Anthophora sp.); Apidae (Psithyus sp.), Sphecidae,
Sapygidae4;
Lepidoptera: Lycaenidae
(Lyssandra sp.)4
S-P
Geranium reuteri Aedo & Muñoz Garm. pink hypocrateriform h ? L-P
Geranium sanguineum L. magenta saucer ex
Diptera: Conopidae, Syrphidae4;
Hymenoptera: Vespidae (Polistes, Eumenes), Megachilidae, Collettidae,
Halictidae, Andrenidae4;
Symphyta7 (Proctor et al. 1996)
S-P
Geranium sylvaticum L. violett saucer ex
Diptera: Muscidae (Thricops aculeipes, T. nigritellus), Syrphidae (Platycheirus manicatus), Dolichopodidae (Dolichopus plumipes), Anthomyiidae (Pegoplata
aestiva)4 (Totland 1993), Empididae7;
Hymenoptera: Apidae (Bombus
lapponicus)4 (Totland 1993),
Bees7 (Proctor et al. 1996);
Lepidoptera: Lycaenidae
(Albulina orbitulus)4 (Totland 1993)
S-P
Geranium versicolor L. white +
pink bowl ex ? S-P
Geranium yunnanense Franch. white/
pink saucer ex ? S-P
Monsonia emarginata L'Hér. white saucer ex Beetles1 S-P
Monsonia marlothii (Engl.) F. Albers pink saucer ex Beetles1 S-P
Pelargonium crispum (P.J.Bergius) L'Hér. white/
pink funnel-shaped / "flag blossom"
h Bees: Anthophora sp.
(Anthophoridae)13 L-P
Pelargonium echinatum Curtis white/
pink funnel-shaped / "flag blossom"
h
L-P Flies: Prosoeca peringueyi
(Nemestrinidae)13;
Butterflies:
Tarsocerus cassus13
L-P
Pelargonium fulgidum (L.) L'Hér. red funnel-shaped / "flag blossom"
h
Birds: Nectarinia chalybea
(Nectariniidae) 13(Marloth 1925; F. Albers,
pers. comm.)
B
Pelargonium grossularioides (L.)
L'Hér. pink funnel-shaped / "flag blossom"
h Bees: Apis mellifera cf. capensis
(Apidae)13 L-P
Pelargonium myrrhifolium (L.) L'Hér. white funnel-shaped / "flag blossom"
h L-P Flies: Bombyliidae gen. sp.13
(Vogel 1954; C. F. Jacotguillarmod; L-P
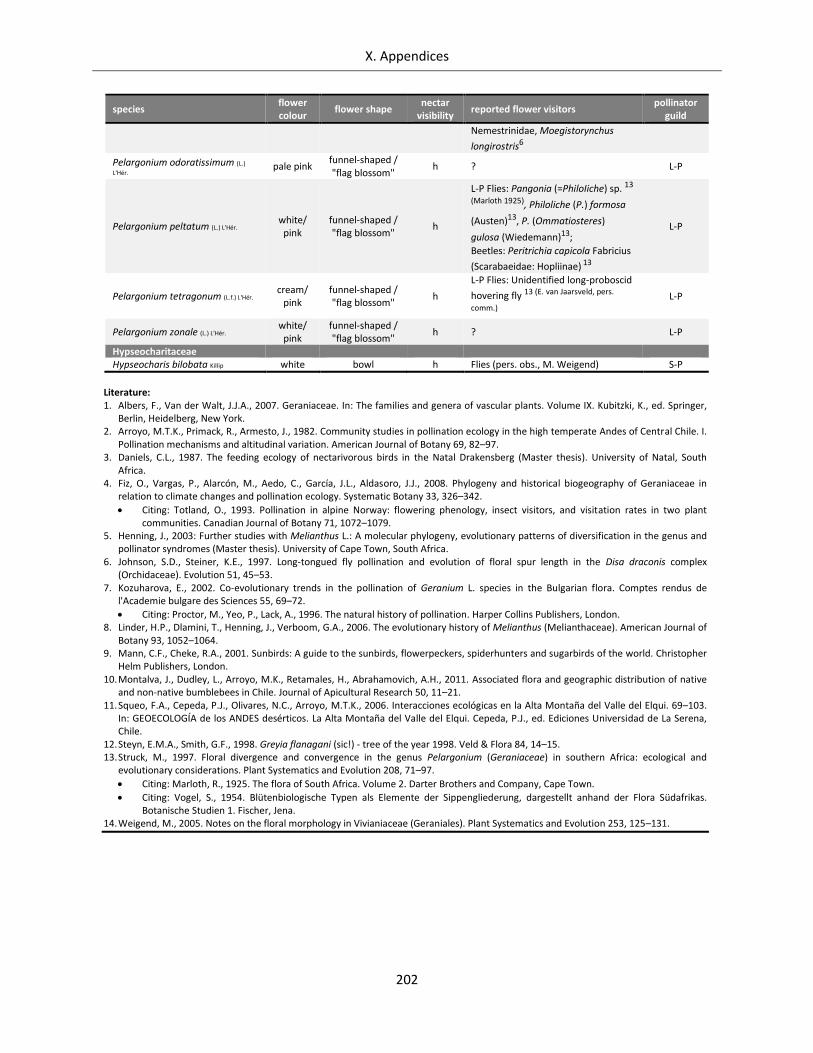
X. Appendices
202
species flower colour
flower shape nectar
visibility reported flower visitors
pollinator guild
Nemestrinidae, Moegistorynchus
longirostris6
Pelargonium odoratissimum (L.)
L'Hér. pale pink funnel-shaped / "flag blossom"
h ? L-P
Pelargonium peltatum (L.) L'Hér. white/
pink funnel-shaped / "flag blossom"
h
L-P Flies: Pangonia (=PhiloIiche) sp. 13
(Marloth 1925), Philoliche (P.) formosa
(Austen)13, P. (Ommatiosteres)
gulosa (Wiedemann)13;
Beetles: Peritrichia capicola Fabricius
(Scarabaeidae: Hopliinae) 13
L-P
Pelargonium tetragonum (L.f.) L'Hér. cream/
pink funnel-shaped / "flag blossom"
h
L-P Flies: Unidentified long-proboscid
hovering fly 13 (E. van Jaarsveld, pers.
comm.)
L-P
Pelargonium zonale (L.) L'Hér. white/
pink funnel-shaped / "flag blossom"
h ? L-P
Hypseocharitaceae Hypseocharis bilobata Killip white bowl h Flies (pers. obs., M. Weigend) S-P
Literature: 1. Albers, F., Van der Walt, J.J.A., 2007. Geraniaceae. In: The families and genera of vascular plants. Volume IX. Kubitzki, K., ed. Springer,
Berlin, Heidelberg, New York. 2. Arroyo, M.T.K., Primack, R., Armesto, J., 1982. Community studies in pollination ecology in the high temperate Andes of Central Chile. I.
Pollination mechanisms and altitudinal variation. American Journal of Botany 69, 82–97. 3. Daniels, C.L., 1987. The feeding ecology of nectarivorous birds in the Natal Drakensberg (Master thesis). University of Natal, South
Africa. 4. Fiz, O., Vargas, P., Alarcón, M., Aedo, C., García, J.L., Aldasoro, J.J., 2008. Phylogeny and historical biogeography of Geraniaceae in
relation to climate changes and pollination ecology. Systematic Botany 33, 326–342.
• Citing: Totland, O., 1993. Pollination in alpine Norway: flowering phenology, insect visitors, and visitation rates in two plant communities. Canadian Journal of Botany 71, 1072–1079.
5. Henning, J., 2003: Further studies with Melianthus L.: A molecular phylogeny, evolutionary patterns of diversification in the genus and pollinator syndromes (Master thesis). University of Cape Town, South Africa.
6. Johnson, S.D., Steiner, K.E., 1997. Long-tongued fly pollination and evolution of floral spur length in the Disa draconis complex (Orchidaceae). Evolution 51, 45–53.
7. Kozuharova, E., 2002. Co-evolutionary trends in the pollination of Geranium L. species in the Bulgarian flora. Comptes rendus de l'Academie bulgare des Sciences 55, 69–72.
• Citing: Proctor, M., Yeo, P., Lack, A., 1996. The natural history of pollination. Harper Collins Publishers, London. 8. Linder, H.P., Dlamini, T., Henning, J., Verboom, G.A., 2006. The evolutionary history of Melianthus (Melianthaceae). American Journal of
Botany 93, 1052–1064. 9. Mann, C.F., Cheke, R.A., 2001. Sunbirds: A guide to the sunbirds, flowerpeckers, spiderhunters and sugarbirds of the world. Christopher
Helm Publishers, London. 10. Montalva, J., Dudley, L., Arroyo, M.K., Retamales, H., Abrahamovich, A.H., 2011. Associated flora and geographic distribution of native
and non-native bumblebees in Chile. Journal of Apicultural Research 50, 11–21. 11. Squeo, F.A., Cepeda, P.J., Olivares, N.C., Arroyo, M.T.K., 2006. Interacciones ecológicas en la Alta Montaña del Valle del Elqui. 69–103.
In: GEOECOLOGÍA de los ANDES desérticos. La Alta Montaña del Valle del Elqui. Cepeda, P.J., ed. Ediciones Universidad de La Serena, Chile.
12. Steyn, E.M.A., Smith, G.F., 1998. Greyia flanagani (sic!) - tree of the year 1998. Veld & Flora 84, 14–15. 13. Struck, M., 1997. Floral divergence and convergence in the genus Pelargonium (Geraniaceae) in southern Africa: ecological and
evolutionary considerations. Plant Systematics and Evolution 208, 71–97.
• Citing: Marloth, R., 1925. The flora of South Africa. Volume 2. Darter Brothers and Company, Cape Town.
• Citing: Vogel, S., 1954. Blütenbiologische Typen als Elemente der Sippengliederung, dargestellt anhand der Flora Südafrikas. Botanische Studien 1. Fischer, Jena.
14. Weigend, M., 2005. Notes on the floral morphology in Vivianiaceae (Geraniales). Plant Systematics and Evolution 253, 125–131.
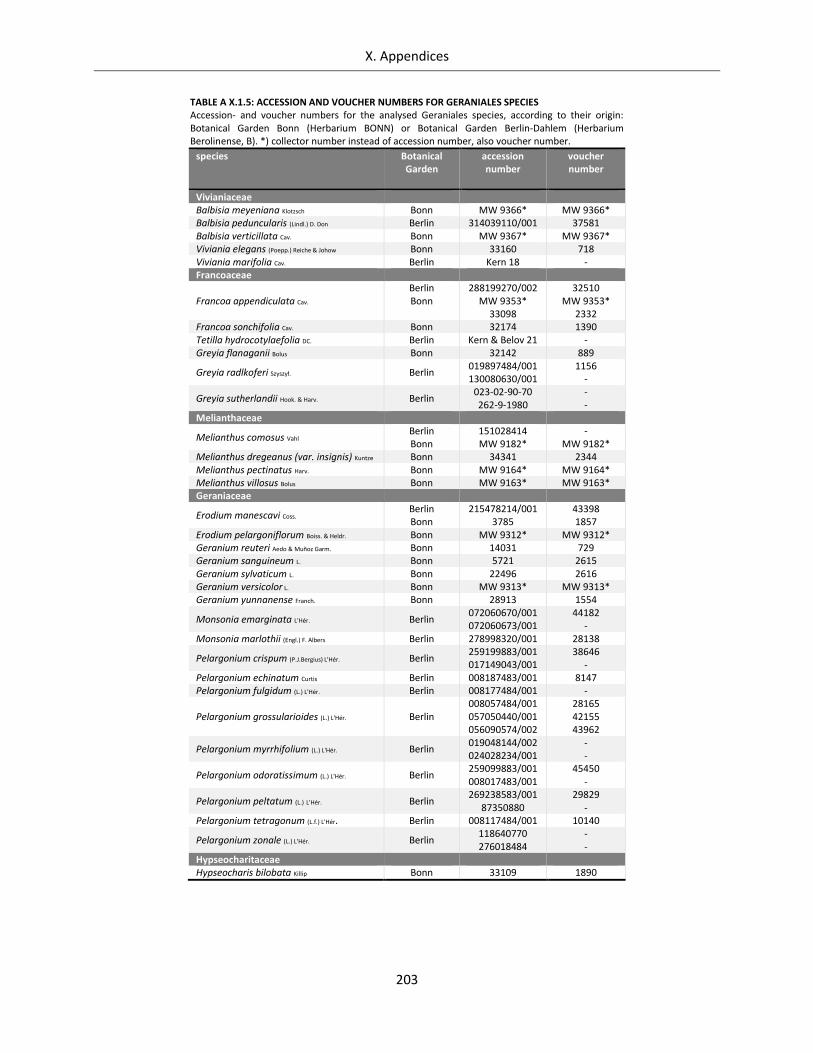
X. Appendices
203
TABLE A X.1.5: ACCESSION AND VOUCHER NUMBERS FOR GERANIALES SPECIES Accession- and voucher numbers for the analysed Geraniales species, according to their origin: Botanical Garden Bonn (Herbarium BONN) or Botanical Garden Berlin-Dahlem (Herbarium Berolinense, B). *) collector number instead of accession number, also voucher number.
species
Botanical Garden
accession number
voucher number
Vivianiaceae Balbisia meyeniana Klotzsch Bonn MW 9366* MW 9366* Balbisia peduncularis (Lindl.) D. Don Berlin 314039110/001 37581 Balbisia verticillata Cav. Bonn MW 9367* MW 9367* Viviania elegans (Poepp.) Reiche & Johow Bonn 33160 718 Viviania marifolia Cav. Berlin Kern 18 - Francoaceae
Francoa appendiculata Cav. Berlin Bonn
288199270/002 MW 9353*
33098
32510 MW 9353*
2332 Francoa sonchifolia Cav. Bonn 32174 1390 Tetilla hydrocotylaefolia DC. Berlin Kern & Belov 21 - Greyia flanaganii Bolus Bonn 32142 889
Greyia radlkoferi Szyszył. Berlin 019897484/001 130080630/001
1156 -
Greyia sutherlandii Hook. & Harv. Berlin 023-02-90-70 262-9-1980
- -
Melianthaceae
Melianthus comosus Vahl Berlin Bonn
151028414 MW 9182*
- MW 9182*
Melianthus dregeanus (var. insignis) Kuntze Bonn 34341 2344 Melianthus pectinatus Harv. Bonn MW 9164* MW 9164* Melianthus villosus Bolus Bonn MW 9163* MW 9163* Geraniaceae
Erodium manescavi Coss. Berlin Bonn
215478214/001 3785
43398 1857
Erodium pelargoniflorum Boiss. & Heldr. Bonn MW 9312* MW 9312* Geranium reuteri Aedo & Muñoz Garm. Bonn 14031 729 Geranium sanguineum L. Bonn 5721 2615 Geranium sylvaticum L. Bonn 22496 2616 Geranium versicolor L. Bonn MW 9313* MW 9313* Geranium yunnanense Franch. Bonn 28913 1554
Monsonia emarginata L'Hér. Berlin 072060670/001 072060673/001
44182 -
Monsonia marlothii (Engl.) F. Albers Berlin 278998320/001 28138
Pelargonium crispum (P.J.Bergius) L'Hér. Berlin 259199883/001 017149043/001
38646 -
Pelargonium echinatum Curtis Berlin 008187483/001 8147 Pelargonium fulgidum (L.) L'Hér. Berlin 008177484/001 -
Pelargonium grossularioides (L.) L'Hér. Berlin 008057484/001 057050440/001 056090574/002
28165 42155 43962
Pelargonium myrrhifolium (L.) L'Hér. Berlin 019048144/002 024028234/001
- -
Pelargonium odoratissimum (L.) L'Hér. Berlin 259099883/001 008017483/001
45450 -
Pelargonium peltatum (L.) L'Hér. Berlin 269238583/001
87350880 29829
- Pelargonium tetragonum (L.f.) L'Hér. Berlin 008117484/001 10140
Pelargonium zonale (L.) L'Hér. Berlin 118640770 276018484
- -
Hypseocharitaceae Hypseocharis bilobata Killip Bonn 33109 1890
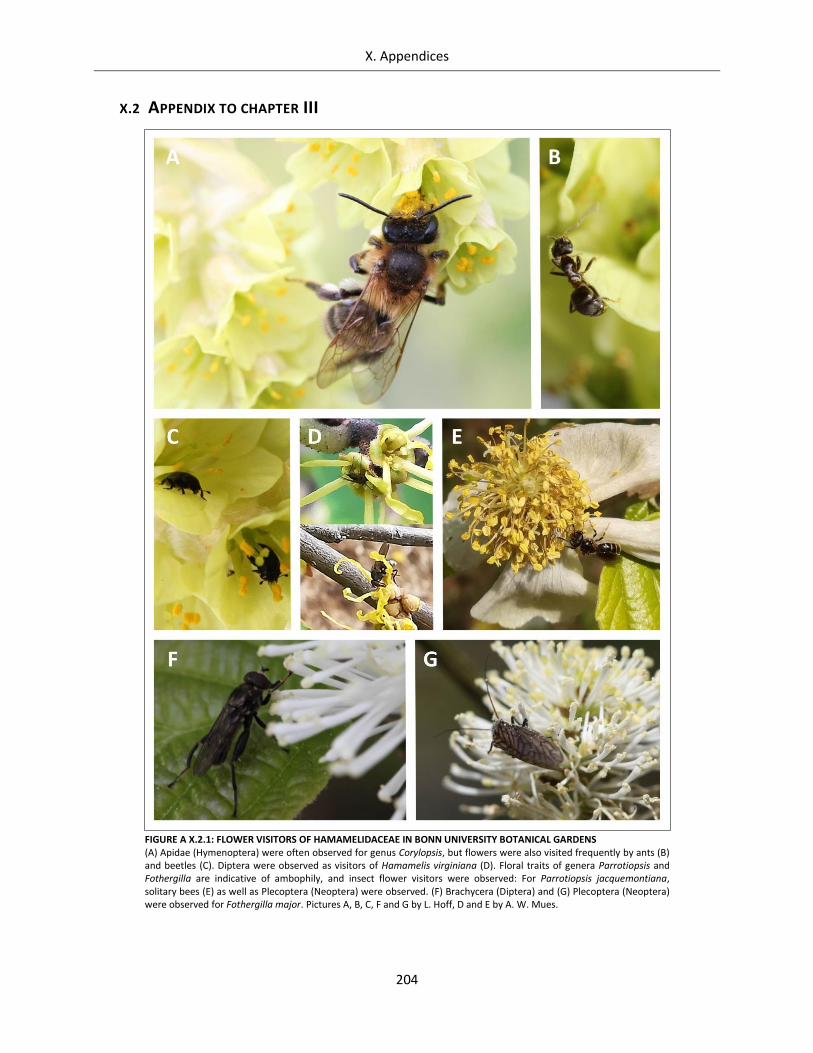
X. Appendices
204
X.2 APPENDIX TO CHAPTER III
FIGURE A X.2.1: FLOWER VISITORS OF HAMAMELIDACEAE IN BONN UNIVERSITY BOTANICAL GARDENS (A) Apidae (Hymenoptera) were often observed for genus Corylopsis, but flowers were also visited frequently by ants (B) and beetles (C). Diptera were observed as visitors of Hamamelis virginiana (D). Floral traits of genera Parrotiopsis and Fothergilla are indicative of ambophily, and insect flower visitors were observed: For Parrotiopsis jacquemontiana, solitary bees (E) as well as Plecoptera (Neoptera) were observed. (F) Brachycera (Diptera) and (G) Plecoptera (Neoptera) were observed for Fothergilla major. Pictures A, B, C, F and G by L. Hoff, D and E by A. W. Mues.
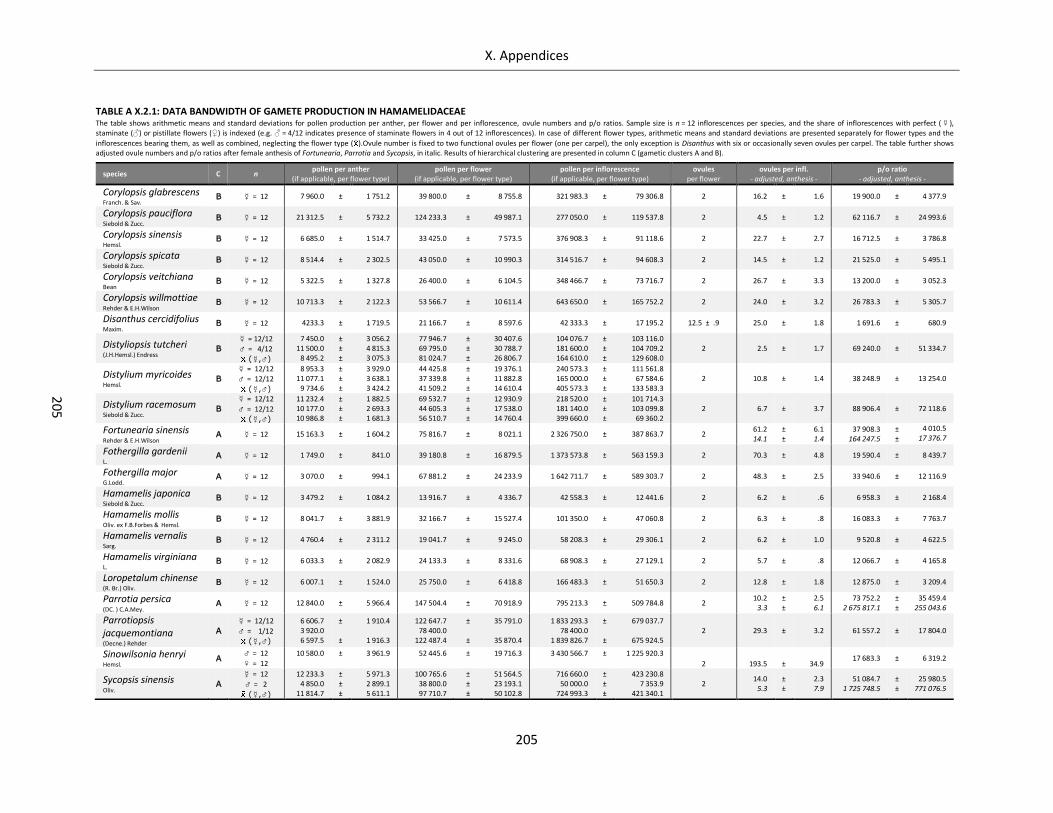
X. Appendices
205
20
5
TABLE A X.2.1: DATA BANDWIDTH OF GAMETE PRODUCTION IN HAMAMELIDACEAE The table shows arithmetic means and standard deviations for pollen production per anther, per flower and per inflorescence, ovule numbers and p/o ratios. Sample size is n = 12 inflorescences per species, and the share of inflorescences with perfect (), staminate () or pistillate flowers () is indexed (e.g. = 4/12 indicates presence of staminate flowers in 4 out of 12 inflorescences). In case of different flower types, arithmetic means and standard deviations are presented separately for flower types and the
inflorescences bearing them, as well as combined, neglecting the flower type ( ).Ovule number is fixed to two functional ovules per flower (one per carpel), the only exception is Disanthus with six or occasionally seven ovules per carpel. The table further shows adjusted ovule numbers and p/o ratios after female anthesis of Fortunearia, Parrotia and Sycopsis, in italic. Results of hierarchical clustering are presented in column C (gametic clusters A and B).
species C n pollen per anther
(if applicable, per flower type) pollen per flower
(if applicable, per flower type) pollen per inflorescence
(if applicable, per flower type) ovules
per flower ovules per infl.
- adjusted, anthesis - p/o ratio
- adjusted, anthesis -
Corylopsis glabrescens Franch. & Sav.
B = 12 7 960.0 ± 1 751.2 39 800.0 ± 8 755.8 321 983.3 ± 79 306.8 2 16.2 ± 1.6 19 900.0 ± 4 377.9
Corylopsis pauciflora Siebold & Zucc.
B = 12 21 312.5 ± 5 732.2 124 233.3 ± 49 987.1 277 050.0 ± 119 537.8 2 4.5 ± 1.2 62 116.7 ± 24 993.6
Corylopsis sinensis Hemsl.
B = 12 6 685.0 ± 1 514.7 33 425.0 ± 7 573.5 376 908.3 ± 91 118.6 2 22.7 ± 2.7 16 712.5 ± 3 786.8
Corylopsis spicata Siebold & Zucc.
B = 12 8 514.4 ± 2 302.5 43 050.0 ± 10 990.3 314 516.7 ± 94 608.3 2 14.5 ± 1.2 21 525.0 ± 5 495.1
Corylopsis veitchiana Bean
B = 12 5 322.5 ± 1 327.8 26 400.0 ± 6 104.5 348 466.7 ± 73 716.7 2 26.7 ± 3.3 13 200.0 ± 3 052.3
Corylopsis willmottiae Rehder & E.H.Wilson
B = 12 10 713.3 ± 2 122.3 53 566.7 ± 10 611.4 643 650.0 ± 165 752.2 2 24.0 ± 3.2 26 783.3 ± 5 305.7
Disanthus cercidifolius Maxim.
B = 12 4233.3 ± 1 719.5 21 166.7 ± 8 597.6 42 333.3 ± 17 195.2 12.5 ± .9 25.0 ± 1.8 1 691.6 ± 680.9
Distyliopsis tutcheri (J.H.Hemsl.) Endress
B
= 12/12
= 4/12
(,)
7 450.0 11 500.0
8 495.2
± ± ±
3 056.2 4 815.3 3 075.3
77 946.7 69 795.0 81 024.7
± ± ±
30 407.6 30 788.7 26 806.7
104 076.7 181 600.0 164 610.0
± ± ±
103 116.0 104 709.2 129 608.0
2 2.5 ± 1.7 69 240.0 ± 51 334.7
Distylium myricoides Hemsl.
B
= 12/12
= 12/12
(,)
8 953.3 11 077.1
9 734.6
± ± ±
3 929.0 3 638.1 3 424.2
44 425.8 37 339.8 41 509.2
± ± ±
19 376.1 11 882.8 14 610.4
240 573.3 165 000.0 405 573.3
± ± ±
111 561.8 67 584.6
133 583.3 2 10.8 ± 1.4 38 248.9 ± 13 254.0
Distylium racemosum Siebold & Zucc.
B
= 12/12
= 12/12
(,)
11 232.4 10 177.0 10 986.8
± ± ±
1 882.5 2 693.3 1 681.3
69 532.7 44 605.3 56 510.7
± ± ±
12 930.9 17 538.0 14 760.4
218 520.0 181 140.0 399 660.0
± ± ±
101 714.3 103 099.8
69 360.2 2 6.7 ± 3.7 88 906.4 ± 72 118.6
Fortunearia sinensis Rehder & E.H.Wilson
A = 12 15 163.3 ± 1 604.2 75 816.7 ± 8 021.1 2 326 750.0 ± 387 863.7 2 61.2 14.1
± ±
6.1 1.4
37 908.3 164 247.5
± ±
4 010.5 17 376.7
Fothergilla gardenii L.
A = 12 1 749.0 ± 841.0 39 180.8 ± 16 879.5 1 373 573.8 ± 563 159.3 2 70.3 ± 4.8 19 590.4 ± 8 439.7
Fothergilla major G.Lodd.
A = 12 3 070.0 ± 994.1 67 881.2 ± 24 233.9 1 642 711.7 ± 589 303.7 2 48.3 ± 2.5 33 940.6 ± 12 116.9
Hamamelis japonica Siebold & Zucc.
B = 12 3 479.2 ± 1 084.2 13 916.7 ± 4 336.7 42 558.3 ± 12 441.6 2 6.2 ± .6 6 958.3 ± 2 168.4
Hamamelis mollis Oliv. ex F.B.Forbes & Hemsl.
B = 12 8 041.7 ± 3 881.9 32 166.7 ± 15 527.4 101 350.0 ± 47 060.8 2 6.3 ± .8 16 083.3 ± 7 763.7
Hamamelis vernalis Sarg.
B = 12 4 760.4 ± 2 311.2 19 041.7 ± 9 245.0 58 208.3 ± 29 306.1 2 6.2 ± 1.0 9 520.8 ± 4 622.5
Hamamelis virginiana L.
B = 12 6 033.3 ± 2 082.9 24 133.3 ± 8 331.6 68 908.3 ± 27 129.1 2 5.7 ± .8 12 066.7 ± 4 165.8
Loropetalum chinense (R. Br.) Oliv.
B = 12 6 007.1 ± 1 524.0 25 750.0 ± 6 418.8 166 483.3 ± 51 650.3 2 12.8 ± 1.8 12 875.0 ± 3 209.4
Parrotia persica (DC. ) C.A.Mey.
A = 12 12 840.0 ± 5 966.4 147 504.4 ± 70 918.9 795 213.3 ± 509 784.8 2 10.2
3.3 ± ±
2.5 6.1
73 752.2 2 675 817.1
± ±
35 459.4 255 043.6
Parrotiopsis jacquemontiana (Decne.) Rehder
A
= 12/12
= 1/12
(,)
6 606.7 3 920.0 6 597.5
± ±
1 910.4
1 916.3
122 647.7 78 400.0
122 487.4
±
±
35 791.0
35 870.4
1 833 293.3 78 400.0
1 839 826.7
±
±
679 037.7
675 924.5 2 29.3 ± 3.2 61 557.2 ± 17 804.0
Sinowilsonia henryi Hemsl.
A = 12
= 12
10 580.0
±
3 961.9
52 445.6
±
19 716.3
3 430 566.7
±
1 225 920.3 2 193.5 ± 34.9
17 683.3 ± 6 319.2
Sycopsis sinensis Oliv.
A
= 12
= 2
(,)
12 233.3 4 850.0
11 814.7
± ± ±
5 971.3 2 899.1 5 611.1
100 765.6 38 800.0 97 710.7
± ± ±
51 564.5 23 193.1 50 102.8
716 660.0 50 000.0
724 993.3
± ± ±
423 230.8 7 353.9
421 340.1 2
14.0 5.3
± ±
2.3 7.9
51 084.7 1 725 748.5
± ±
25 980.5 771 076.5
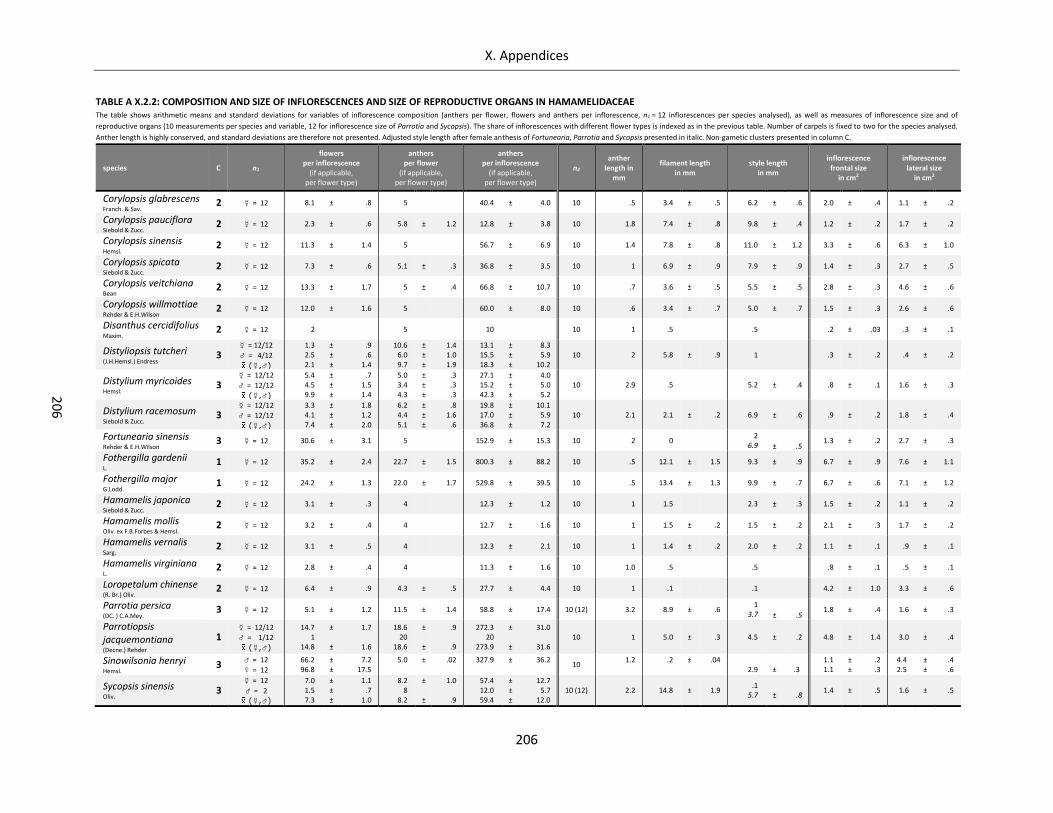
X. Appendices
206
20
6
TABLE A X.2.2: COMPOSITION AND SIZE OF INFLORESCENCES AND SIZE OF REPRODUCTIVE ORGANS IN HAMAMELIDACEAE The table shows arithmetic means and standard deviations for variables of inflorescence composition (anthers per flower, flowers and anthers per inflorescence, n1 = 12 inflorescences per species analysed), as well as measures of inflorescence size and of
reproductive organs (10 measurements per species and variable, 12 for inflorescence size of Parrotia and Sycopsis). The share of inflorescences with different flower types is indexed as in the previous table. Number of carpels is fixed to two for the species analysed.
Anther length is highly conserved, and standard deviations are therefore not presented. Adjusted style length after female anthesis of Fortunearia, Parrotia and Sycopsis presented in italic. Non-gametic clusters presented in column C.
species C n1
flowers per inflorescence
(if applicable, per flower type)
anthers per flower
(if applicable, per flower type)
anthers per inflorescence
(if applicable, per flower type)
n2 anther
length in mm
filament length in mm
style length in mm
inflorescence frontal size
in cm2
inflorescence lateral size
in cm2
Corylopsis glabrescens Franch. & Sav.
2 = 12 8.1 ± .8 5 40.4 ± 4.0 10 .5 3.4 ± .5 6.2 ± .6 2.0 ± .4 1.1 ± .2
Corylopsis pauciflora Siebold & Zucc.
2 = 12 2.3 ± .6 5.8 ± 1.2 12.8 ± 3.8 10 1.8 7.4 ± .8 9.8 ± .4 1.2 ± .2 1.7 ± .2
Corylopsis sinensis Hemsl.
2 = 12 11.3 ± 1.4 5 56.7 ± 6.9 10 1.4 7.8 ± .8 11.0 ± 1.2 3.3 ± .6 6.3 ± 1.0
Corylopsis spicata Siebold & Zucc.
2 = 12 7.3 ± .6 5.1 ± .3 36.8 ± 3.5 10 1 6.9 ± .9 7.9 ± .9 1.4 ± .3 2.7 ± .5
Corylopsis veitchiana Bean
2 = 12 13.3 ± 1.7 5 ± .4 66.8 ± 10.7 10 .7 3.6 ± .5 5.5 ± .5 2.8 ± .3 4.6 ± .6
Corylopsis willmottiae Rehder & E.H.Wilson
2 = 12 12.0 ± 1.6 5 60.0 ± 8.0 10 .6 3.4 ± .7 5.0 ± .7 1.5 ± .3 2.6 ± .6
Disanthus cercidifolius Maxim.
2 = 12 2 5 10 10 1 .5 .5 .2 ± .03 .3 ± .1
Distyliopsis tutcheri (J.H.Hemsl.) Endress
3 = 12/12
= 4/12
(,)
1.3 2.5 2.1
± ± ±
.9
.6 1.4
10.6 6.0 9.7
± ± ±
1.4 1.0 1.9
13.1 15.5 18.3
± ± ±
8.3 5.9
10.2 10 2 5.8 ± .9 1 .3 ± .2 .4 ± .2
Distylium myricoides Hemsl.
3 = 12/12
= 12/12
(,)
5.4 4.5 9.9
± ± ±
.7 1.5 1.4
5.0 3.4 4.3
± ± ±
.3
.3
.3
27.1 15.2 42.3
± ± ±
4.0 5.0 5.2
10 2.9 .5 5.2 ± .4 .8 ± .1 1.6 ± .3
Distylium racemosum Siebold & Zucc.
3 = 12/12
= 12/12
(,)
3.3 4.1 7.4
± ± ±
1.8 1.2 2.0
6.2 4.4 5.1
± ± ±
.8 1.6
.6
19.8 17.0 36.8
± ± ±
10.1 5.9 7.2
10 2.1 2.1 ± .2 6.9 ± .6 .9 ± .2 1.8 ± .4
Fortunearia sinensis Rehder & E.H.Wilson
3 = 12 30.6 ± 3.1 5 152.9 ± 15.3 10 2 0 2
6.9 ± .5 1.3 ± .2 2.7 ± .3
Fothergilla gardenii L.
1 = 12 35.2 ± 2.4 22.7 ± 1.5 800.3 ± 88.2 10 .5 12.1 ± 1.5 9.3 ± .9 6.7 ± .9 7.6 ± 1.1
Fothergilla major G.Lodd.
1 = 12 24.2 ± 1.3 22.0 ± 1.7 529.8 ± 39.5 10 .5 13.4 ± 1.3 9.9 ± .7 6.7 ± .6 7.1 ± 1.2
Hamamelis japonica Siebold & Zucc.
2 = 12 3.1 ± .3 4 12.3 ± 1.2 10 1 1.5 2.3 ± .3 1.5 ± .2 1.1 ± .2
Hamamelis mollis Oliv. ex F.B.Forbes & Hemsl.
2 = 12 3.2 ± .4 4 12.7 ± 1.6 10 1 1.5 ± .2 1.5 ± .2 2.1 ± .3 1.7 ± .2
Hamamelis vernalis Sarg.
2 = 12 3.1 ± .5 4 12.3 ± 2.1 10 1 1.4 ± .2 2.0 ± .2 1.1 ± .1 .9 ± .1
Hamamelis virginiana L.
2 = 12 2.8 ± .4 4 11.3 ± 1.6 10 1.0 .5 .5 .8 ± .1 .5 ± .1
Loropetalum chinense (R. Br.) Oliv.
2 = 12 6.4 ± .9 4.3 ± .5 27.7 ± 4.4 10 1 .1 .1 4.2 ± 1.0 3.3 ± .6
Parrotia persica (DC. ) C.A.Mey.
3 = 12 5.1 ± 1.2 11.5 ± 1.4 58.8 ± 17.4 10 (12) 3.2 8.9 ± .6 1
3.7 ± .5 1.8 ± .4 1.6 ± .3
Parrotiopsis jacquemontiana (Decne.) Rehder
1 = 12/12
= 1/12
(,)
14.7 1
14.8
±
±
1.7
1.6
18.6 20
18.6
± ±
.9
.9
272.3 20
273.9
±
±
31.0
31.6 10 1 5.0 ± .3 4.5 ± .2 4.8 ± 1.4 3.0 ± .4
Sinowilsonia henryi Hemsl.
3 = 12
= 12 66.2 96.8
± ±
7.2 17.5
5.0
±
.02
327.9
±
36.2
10 1.2
.2
±
.04
2.9
±
.3
1.1 1.1
± ±
.2
.3 4.4 2.5
± ±
.4
.6
Sycopsis sinensis Oliv.
3 = 12
= 2
(,)
7.0 1.5 7.3
± ± ±
1.1 .7
1.0
8.2 8
8.2
± ±
1.0
.9
57.4 12.0 59.4
± ± ±
12.7 5.7
12.0 10 (12) 2.2 14.8 ± 1.9
.1 5.7
±
.8
1.4 ± .5 1.6 ± .5
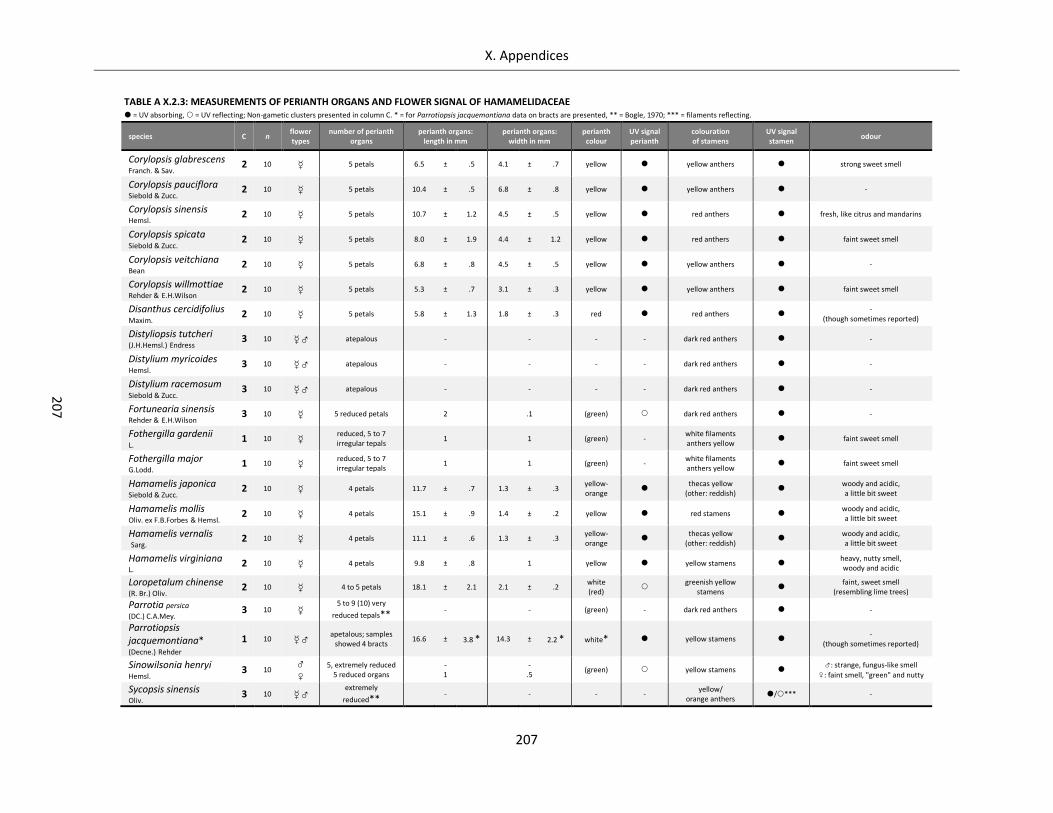
X. Appendices
207
20
7
TABLE A X.2.3: MEASUREMENTS OF PERIANTH ORGANS AND FLOWER SIGNAL OF HAMAMELIDACEAE = UV absorbing, = UV reflecting; Non-gametic clusters presented in column C. * = for Parrotiopsis jacquemontiana data on bracts are presented, ** = Bogle, 1970; *** = filaments reflecting.
species C n flower types
number of perianth organs
perianth organs: length in mm
perianth organs: width in mm
perianth colour
UV signal perianth
colouration of stamens
UV signal stamen
odour
Corylopsis glabrescens Franch. & Sav.
2 10 5 petals 6.5 ± .5 4.1 ± .7 yellow yellow anthers strong sweet smell
Corylopsis pauciflora Siebold & Zucc.
2 10 5 petals 10.4 ± .5 6.8 ± .8 yellow yellow anthers -
Corylopsis sinensis Hemsl.
2 10 5 petals 10.7 ± 1.2 4.5 ± .5 yellow red anthers fresh, like citrus and mandarins
Corylopsis spicata Siebold & Zucc.
2 10 5 petals 8.0 ± 1.9 4.4 ± 1.2 yellow red anthers faint sweet smell
Corylopsis veitchiana Bean
2 10 5 petals 6.8 ± .8 4.5 ± .5 yellow yellow anthers -
Corylopsis willmottiae Rehder & E.H.Wilson
2 10 5 petals 5.3 ± .7 3.1 ± .3 yellow yellow anthers faint sweet smell
Disanthus cercidifolius Maxim.
2 10 5 petals 5.8 ± 1.3 1.8 ± .3 red red anthers -
(though sometimes reported)
Distyliopsis tutcheri (J.H.Hemsl.) Endress
3 10 atepalous - - - - dark red anthers -
Distylium myricoides Hemsl.
3 10 atepalous - - - - dark red anthers -
Distylium racemosum Siebold & Zucc.
3 10 atepalous - - - - dark red anthers -
Fortunearia sinensis Rehder & E.H.Wilson
3 10 5 reduced petals 2 .1 (green) dark red anthers -
Fothergilla gardenii L.
1 10 reduced, 5 to 7 irregular tepals
1 1 (green) - white filaments anthers yellow
faint sweet smell
Fothergilla major G.Lodd.
1 10 reduced, 5 to 7 irregular tepals
1 1 (green) - white filaments anthers yellow
faint sweet smell
Hamamelis japonica Siebold & Zucc.
2 10 4 petals 11.7 ± .7 1.3 ± .3 yellow-orange
thecas yellow
(other: reddish)
woody and acidic, a little bit sweet
Hamamelis mollis Oliv. ex F.B.Forbes & Hemsl.
2 10 4 petals 15.1 ± .9 1.4 ± .2 yellow red stamens woody and acidic, a little bit sweet
Hamamelis vernalis Sarg.
2 10 4 petals 11.1 ± .6 1.3 ± .3 yellow-orange
thecas yellow
(other: reddish)
woody and acidic, a little bit sweet
Hamamelis virginiana L.
2 10 4 petals 9.8 ± .8 1 yellow yellow stamens heavy, nutty smell, woody and acidic
Loropetalum chinense (R. Br.) Oliv.
2 10 4 to 5 petals 18.1 ± 2.1 2.1 ± .2 white (red)
greenish yellow
stamens
faint, sweet smell (resembling lime trees)
Parrotia persica
(DC.) C.A.Mey. 3 10
5 to 9 (10) very
reduced tepals** - - (green) - dark red anthers -
Parrotiopsis jacquemontiana* (Decne.) Rehder
1 10 apetalous; samples
showed 4 bracts 16.6 ± 3.8 * 14.3 ± 2.2 * white* yellow stamens
- (though sometimes reported)
Sinowilsonia henryi Hemsl.
3 10
5, extremely reduced 5 reduced organs
- 1
- .5
(green) yellow stamens : strange, fungus-like smell
: faint smell, "green" and nutty
Sycopsis sinensis Oliv.
3 10 extremely
reduced** - - - -
yellow/ orange anthers
/*** -
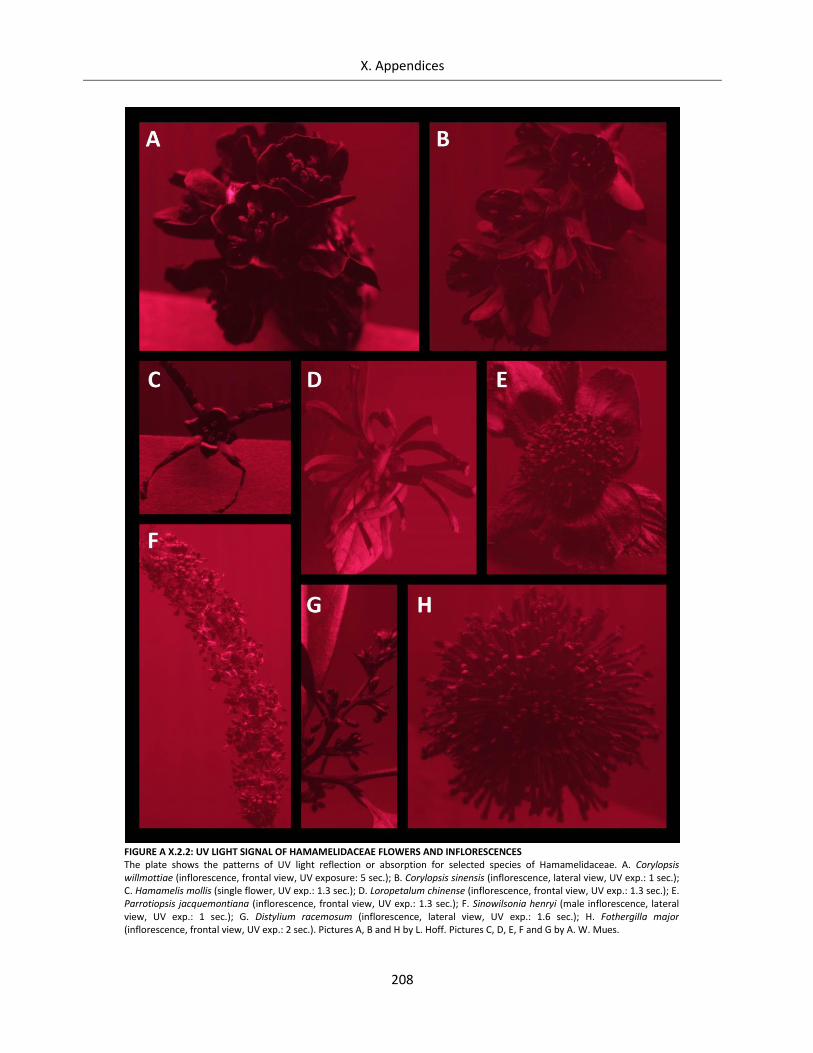
X. Appendices
208
FIGURE A X.2.2: UV LIGHT SIGNAL OF HAMAMELIDACEAE FLOWERS AND INFLORESCENCES The plate shows the patterns of UV light reflection or absorption for selected species of Hamamelidaceae. A. Corylopsis willmottiae (inflorescence, frontal view, UV exposure: 5 sec.); B. Corylopsis sinensis (inflorescence, lateral view, UV exp.: 1 sec.); C. Hamamelis mollis (single flower, UV exp.: 1.3 sec.); D. Loropetalum chinense (inflorescence, frontal view, UV exp.: 1.3 sec.); E. Parrotiopsis jacquemontiana (inflorescence, frontal view, UV exp.: 1.3 sec.); F. Sinowilsonia henryi (male inflorescence, lateral view, UV exp.: 1 sec.); G. Distylium racemosum (inflorescence, lateral view, UV exp.: 1.6 sec.); H. Fothergilla major (inflorescence, frontal view, UV exp.: 2 sec.). Pictures A, B and H by L. Hoff. Pictures C, D, E, F and G by A. W. Mues.
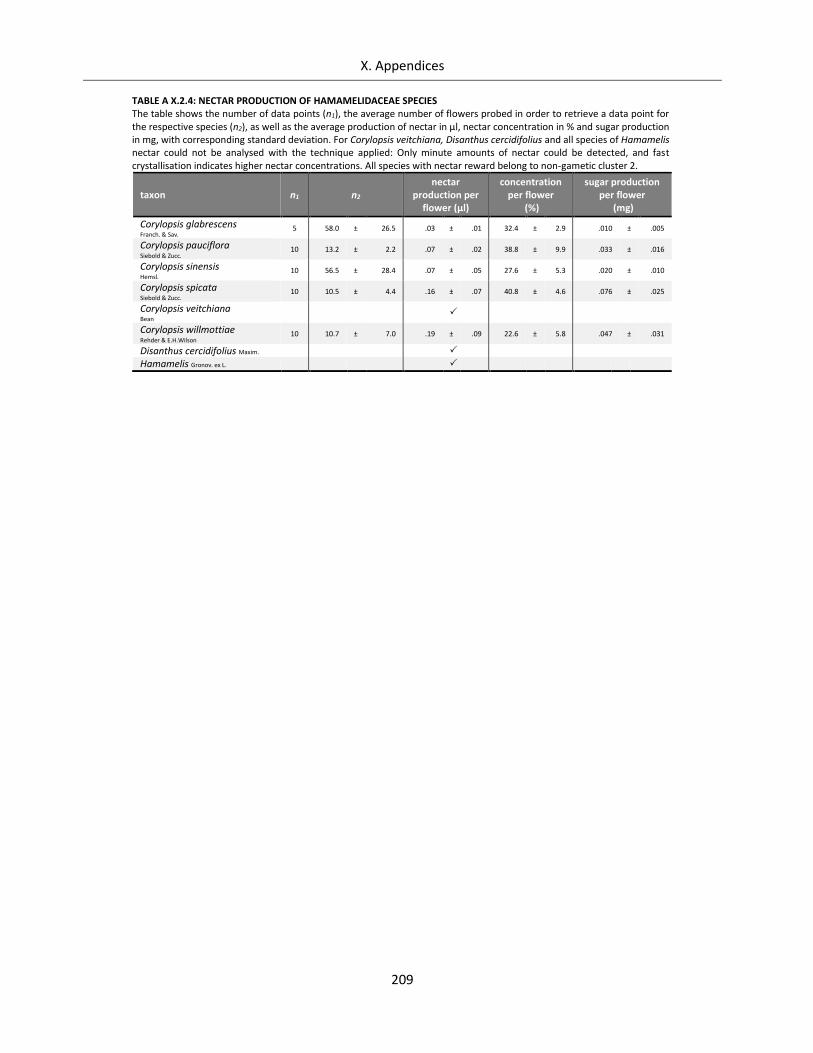
X. Appendices
209
TABLE A X.2.4: NECTAR PRODUCTION OF HAMAMELIDACEAE SPECIES The table shows the number of data points (n1), the average number of flowers probed in order to retrieve a data point for the respective species (n2), as well as the average production of nectar in µl, nectar concentration in % and sugar production in mg, with corresponding standard deviation. For Corylopsis veitchiana, Disanthus cercidifolius and all species of Hamamelis nectar could not be analysed with the technique applied: Only minute amounts of nectar could be detected, and fast crystallisation indicates higher nectar concentrations. All species with nectar reward belong to non-gametic cluster 2.
taxon n1 n2 nectar
production per flower (µl)
concentration per flower
(%)
sugar production per flower
(mg)
Corylopsis glabrescens Franch. & Sav.
5 58.0 ± 26.5 .03 ± .01 32.4 ± 2.9 .010 ± .005
Corylopsis pauciflora Siebold & Zucc.
10 13.2 ± 2.2 .07 ± .02 38.8 ± 9.9 .033 ± .016
Corylopsis sinensis Hemsl.
10 56.5 ± 28.4 .07 ± .05 27.6 ± 5.3 .020 ± .010
Corylopsis spicata Siebold & Zucc.
10 10.5 ± 4.4 .16 ± .07 40.8 ± 4.6 .076 ± .025
Corylopsis veitchiana Bean
Corylopsis willmottiae Rehder & E.H.Wilson
10 10.7 ± 7.0 .19 ± .09 22.6 ± 5.8 .047 ± .031
Disanthus cercidifolius Maxim.
Hamamelis Gronov. ex L.
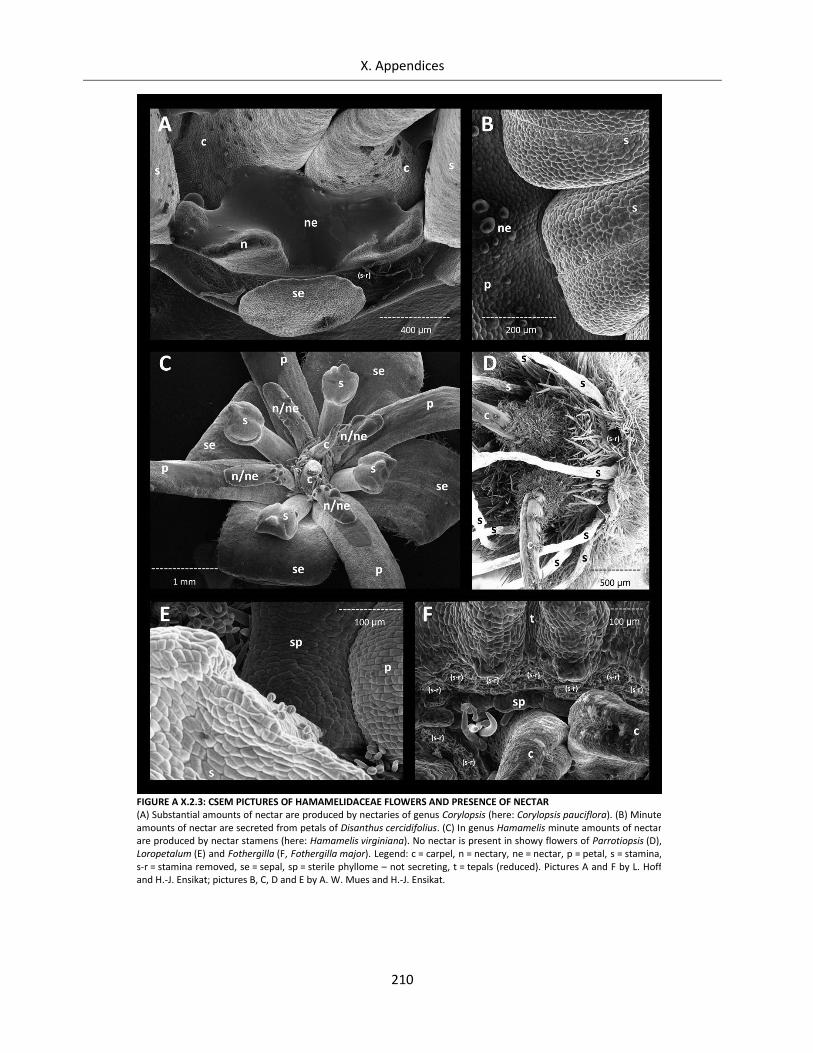
X. Appendices
210
FIGURE A X.2.3: CSEM PICTURES OF HAMAMELIDACEAE FLOWERS AND PRESENCE OF NECTAR (A) Substantial amounts of nectar are produced by nectaries of genus Corylopsis (here: Corylopsis pauciflora). (B) Minute amounts of nectar are secreted from petals of Disanthus cercidifolius. (C) In genus Hamamelis minute amounts of nectar are produced by nectar stamens (here: Hamamelis virginiana). No nectar is present in showy flowers of Parrotiopsis (D), Loropetalum (E) and Fothergilla (F, Fothergilla major). Legend: c = carpel, n = nectary, ne = nectar, p = petal, s = stamina, s-r = stamina removed, se = sepal, sp = sterile phyllome – not secreting, t = tepals (reduced). Pictures A and F by L. Hoff and H.-J. Ensikat; pictures B, C, D and E by A. W. Mues and H.-J. Ensikat.
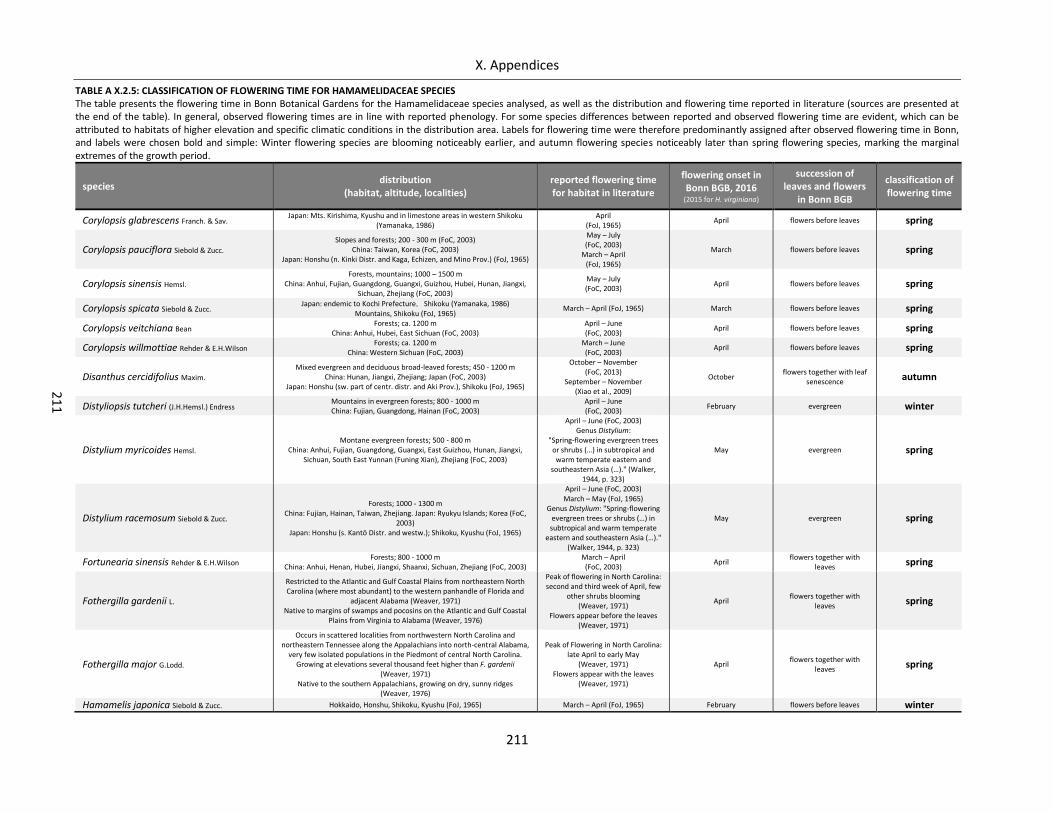
X. Appendices
211
21
1
TABLE A X.2.5: CLASSIFICATION OF FLOWERING TIME FOR HAMAMELIDACEAE SPECIES The table presents the flowering time in Bonn Botanical Gardens for the Hamamelidaceae species analysed, as well as the distribution and flowering time reported in literature (sources are presented at the end of the table). In general, observed flowering times are in line with reported phenology. For some species differences between reported and observed flowering time are evident, which can be attributed to habitats of higher elevation and specific climatic conditions in the distribution area. Labels for flowering time were therefore predominantly assigned after observed flowering time in Bonn, and labels were chosen bold and simple: Winter flowering species are blooming noticeably earlier, and autumn flowering species noticeably later than spring flowering species, marking the marginal extremes of the growth period.
species distribution
(habitat, altitude, localities) reported flowering time for habitat in literature
flowering onset in Bonn BGB, 2016
(2015 for H. virginiana)
succession of leaves and flowers
in Bonn BGB
classification of flowering time
Corylopsis glabrescens Franch. & Sav. Japan: Mts. Kirishima, Kyushu and in limestone areas in western Shikoku
(Yamanaka, 1986) April
(FoJ, 1965) April flowers before leaves spring
Corylopsis pauciflora Siebold & Zucc. Slopes and forests; 200 - 300 m (FoC, 2003)
China: Taiwan, Korea (FoC, 2003) Japan: Honshu (n. Kinki Distr. and Kaga, Echizen, and Mino Prov.) (FoJ, 1965)
May – July (FoC, 2003)
March – April (FoJ, 1965)
March flowers before leaves spring
Corylopsis sinensis Hemsl. Forests, mountains; 1000 – 1500 m
China: Anhui, Fujian, Guangdong, Guangxi, Guizhou, Hubei, Hunan, Jiangxi, Sichuan, Zhejiang (FoC, 2003)
May – July (FoC, 2003)
April flowers before leaves spring
Corylopsis spicata Siebold & Zucc. Japan: endemic to Kochi Prefecture, Shikoku (Yamanaka, 1986)
Mountains, Shikoku (FoJ, 1965) March – April (FoJ, 1965) March flowers before leaves spring
Corylopsis veitchiana Bean Forests; ca. 1200 m
China: Anhui, Hubei, East Sichuan (FoC, 2003) April – June (FoC, 2003)
April flowers before leaves spring
Corylopsis willmottiae Rehder & E.H.Wilson Forests; ca. 1200 m
China: Western Sichuan (FoC, 2003) March – June (FoC, 2003)
April flowers before leaves spring
Disanthus cercidifolius Maxim. Mixed evergreen and deciduous broad-leaved forests; 450 - 1200 m
China: Hunan, Jiangxi, Zhejiang; Japan (FoC, 2003) Japan: Honshu (sw. part of centr. distr. and Aki Prov.), Shikoku (FoJ, 1965)
October – November (FoC, 2013)
September – November (Xiao et al., 2009)
October flowers together with leaf
senescence autumn
Distyliopsis tutcheri (J.H.Hemsl.) Endress Mountains in evergreen forests; 800 - 1000 m China: Fujian, Guangdong, Hainan (FoC, 2003)
April – June (FoC, 2003)
February evergreen winter
Distylium myricoides Hemsl. Montane evergreen forests; 500 - 800 m
China: Anhui, Fujian, Guangdong, Guangxi, East Guizhou, Hunan, Jiangxi, Sichuan, South East Yunnan (Funing Xian), Zhejiang (FoC, 2003)
April – June (FoC, 2003) Genus Distylium:
"Spring-flowering evergreen trees or shrubs (…) in subtropical and warm temperate eastern and
southeastern Asia (…)." (Walker, 1944, p. 323)
May evergreen spring
Distylium racemosum Siebold & Zucc.
Forests; 1000 - 1300 m China: Fujian, Hainan, Taiwan, Zhejiang. Japan: Ryukyu Islands; Korea (FoC,
2003) Japan: Honshu (s. Kantō Distr. and westw.); Shikoku, Kyushu (FoJ, 1965)
April – June (FoC, 2003) March – May (FoJ, 1965)
Genus Distylium: "Spring-flowering evergreen trees or shrubs (…) in subtropical and warm temperate
eastern and southeastern Asia (…)." (Walker, 1944, p. 323)
May evergreen spring
Fortunearia sinensis Rehder & E.H.Wilson Forests; 800 - 1000 m
China: Anhui, Henan, Hubei, Jiangxi, Shaanxi, Sichuan, Zhejiang (FoC, 2003) March – April (FoC, 2003)
April flowers together with
leaves spring
Fothergilla gardenii L.
Restricted to the Atlantic and Gulf Coastal Plains from northeastern North Carolina (where most abundant) to the western panhandle of Florida and
adjacent Alabama (Weaver, 1971) Native to margins of swamps and pocosins on the Atlantic and Gulf Coastal
Plains from Virginia to Alabama (Weaver, 1976)
Peak of flowering in North Carolina: second and third week of April, few
other shrubs blooming (Weaver, 1971)
Flowers appear before the leaves (Weaver, 1971)
April flowers together with
leaves spring
Fothergilla major G.Lodd.
Occurs in scattered localities from northwestern North Carolina and northeastern Tennessee along the Appalachians into north-central Alabama,
very few isolated populations in the Piedmont of central North Carolina. Growing at elevations several thousand feet higher than F. gardenii
(Weaver, 1971) Native to the southern Appalachians, growing on dry, sunny ridges
(Weaver, 1976)
Peak of Flowering in North Carolina: late April to early May
(Weaver, 1971) Flowers appear with the leaves
(Weaver, 1971)
April flowers together with
leaves spring
Hamamelis japonica Siebold & Zucc. Hokkaido, Honshu, Shikoku, Kyushu (FoJ, 1965) March – April (FoJ, 1965) February flowers before leaves winter
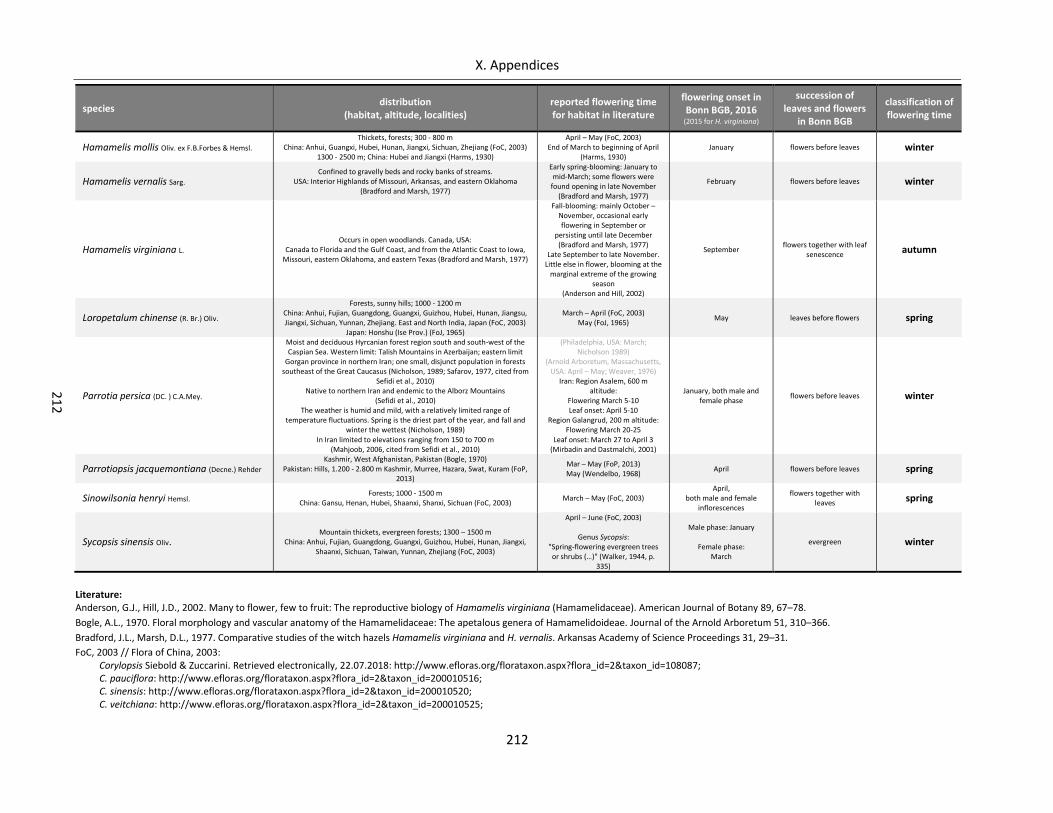
X. Appendices
212
21
2
species distribution
(habitat, altitude, localities) reported flowering time for habitat in literature
flowering onset in Bonn BGB, 2016
(2015 for H. virginiana)
succession of leaves and flowers
in Bonn BGB
classification of flowering time
Hamamelis mollis Oliv. ex F.B.Forbes & Hemsl. Thickets, forests; 300 - 800 m
China: Anhui, Guangxi, Hubei, Hunan, Jiangxi, Sichuan, Zhejiang (FoC, 2003) 1300 - 2500 m; China: Hubei and Jiangxi (Harms, 1930)
April – May (FoC, 2003) End of March to beginning of April
(Harms, 1930) January flowers before leaves winter
Hamamelis vernalis Sarg. Confined to gravelly beds and rocky banks of streams.
USA: Interior Highlands of Missouri, Arkansas, and eastern Oklahoma (Bradford and Marsh, 1977)
Early spring-blooming: January to mid-March; some flowers were
found opening in late November (Bradford and Marsh, 1977)
February flowers before leaves winter
Hamamelis virginiana L. Occurs in open woodlands. Canada, USA:
Canada to Florida and the Gulf Coast, and from the Atlantic Coast to Iowa, Missouri, eastern Oklahoma, and eastern Texas (Bradford and Marsh, 1977)
Fall-blooming: mainly October – November, occasional early flowering in September or
persisting until late December (Bradford and Marsh, 1977)
Late September to late November. Little else in flower, blooming at the
marginal extreme of the growing season
(Anderson and Hill, 2002)
September flowers together with leaf
senescence autumn
Loropetalum chinense (R. Br.) Oliv.
Forests, sunny hills; 1000 - 1200 m China: Anhui, Fujian, Guangdong, Guangxi, Guizhou, Hubei, Hunan, Jiangsu, Jiangxi, Sichuan, Yunnan, Zhejiang. East and North India, Japan (FoC, 2003)
Japan: Honshu (Ise Prov.) (FoJ, 1965)
March – April (FoC, 2003) May (FoJ, 1965)
May leaves before flowers spring
Parrotia persica (DC. ) C.A.Mey.
Moist and deciduous Hyrcanian forest region south and south-west of the Caspian Sea. Western limit: Talish Mountains in Azerbaijan; eastern limit
Gorgan province in northern Iran; one small, disjunct population in forests southeast of the Great Caucasus (Nicholson, 1989; Safarov, 1977, cited from
Sefidi et al., 2010) Native to northern Iran and endemic to the Alborz Mountains
(Sefidi et al., 2010) The weather is humid and mild, with a relatively limited range of
temperature fluctuations. Spring is the driest part of the year, and fall and winter the wettest (Nicholson, 1989)
In Iran limited to elevations ranging from 150 to 700 m (Mahjoob, 2006, cited from Sefidi et al., 2010)
(Philadelphia, USA: March; Nicholson 1989)
(Arnold Arboretum, Massachusetts, USA: April – May; Weaver, 1976)
Iran: Region Asalem, 600 m altitude:
Flowering March 5-10 Leaf onset: April 5-10
Region Galangrud, 200 m altitude: Flowering March 20-25
Leaf onset: March 27 to April 3 (Mirbadin and Dastmalchi, 2001)
January, both male and female phase
flowers before leaves winter
Parrotiopsis jacquemontiana (Decne.) Rehder Kashmir, West Afghanistan, Pakistan (Bogle, 1970)
Pakistan: Hills, 1.200 - 2.800 m Kashmir, Murree, Hazara, Swat, Kuram (FoP, 2013)
Mar – May (FoP, 2013) May (Wendelbo, 1968)
April flowers before leaves spring
Sinowilsonia henryi Hemsl. Forests; 1000 - 1500 m
China: Gansu, Henan, Hubei, Shaanxi, Shanxi, Sichuan (FoC, 2003) March – May (FoC, 2003)
April, both male and female
inflorescences
flowers together with leaves spring
Sycopsis sinensis Oliv. Mountain thickets, evergreen forests; 1300 – 1500 m
China: Anhui, Fujian, Guangdong, Guangxi, Guizhou, Hubei, Hunan, Jiangxi, Shaanxi, Sichuan, Taiwan, Yunnan, Zhejiang (FoC, 2003)
April – June (FoC, 2003)
Genus Sycopsis: "Spring-flowering evergreen trees or shrubs (…)" (Walker, 1944, p.
335)
Male phase: January
Female phase: March
evergreen winter
Literature: Anderson, G.J., Hill, J.D., 2002. Many to flower, few to fruit: The reproductive biology of Hamamelis virginiana (Hamamelidaceae). American Journal of Botany 89, 67–78.
Bogle, A.L., 1970. Floral morphology and vascular anatomy of the Hamamelidaceae: The apetalous genera of Hamamelidoideae. Journal of the Arnold Arboretum 51, 310–366.
Bradford, J.L., Marsh, D.L., 1977. Comparative studies of the witch hazels Hamamelis virginiana and H. vernalis. Arkansas Academy of Science Proceedings 31, 29–31.
FoC, 2003 // Flora of China, 2003: Corylopsis Siebold & Zuccarini. Retrieved electronically, 22.07.2018: http://www.efloras.org/florataxon.aspx?flora_id=2&taxon_id=108087; C. pauciflora: http://www.efloras.org/florataxon.aspx?flora_id=2&taxon_id=200010516; C. sinensis: http://www.efloras.org/florataxon.aspx?flora_id=2&taxon_id=200010520; C. veitchiana: http://www.efloras.org/florataxon.aspx?flora_id=2&taxon_id=200010525;
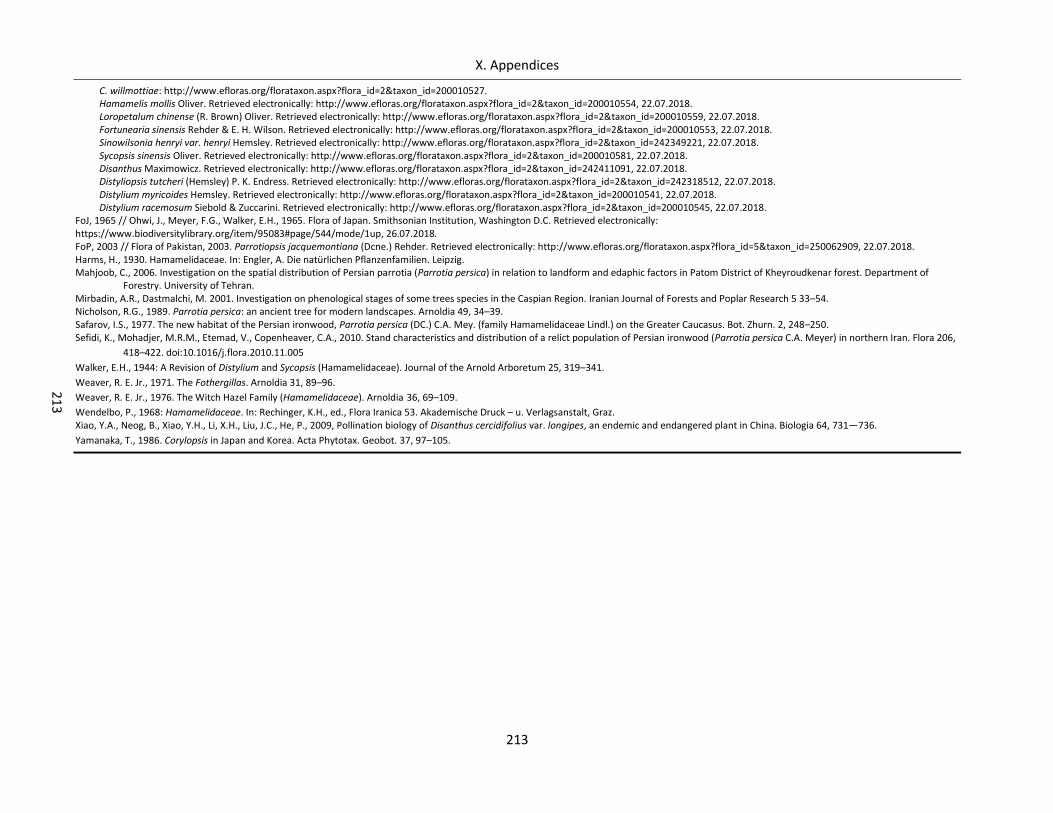
X. Appendices
213
21
3
C. willmottiae: http://www.efloras.org/florataxon.aspx?flora_id=2&taxon_id=200010527. Hamamelis mollis Oliver. Retrieved electronically: http://www.efloras.org/florataxon.aspx?flora_id=2&taxon_id=200010554, 22.07.2018. Loropetalum chinense (R. Brown) Oliver. Retrieved electronically: http://www.efloras.org/florataxon.aspx?flora_id=2&taxon_id=200010559, 22.07.2018. Fortunearia sinensis Rehder & E. H. Wilson. Retrieved electronically: http://www.efloras.org/florataxon.aspx?flora_id=2&taxon_id=200010553, 22.07.2018. Sinowilsonia henryi var. henryi Hemsley. Retrieved electronically: http://www.efloras.org/florataxon.aspx?flora_id=2&taxon_id=242349221, 22.07.2018. Sycopsis sinensis Oliver. Retrieved electronically: http://www.efloras.org/florataxon.aspx?flora_id=2&taxon_id=200010581, 22.07.2018. Disanthus Maximowicz. Retrieved electronically: http://www.efloras.org/florataxon.aspx?flora_id=2&taxon_id=242411091, 22.07.2018. Distyliopsis tutcheri (Hemsley) P. K. Endress. Retrieved electronically: http://www.efloras.org/florataxon.aspx?flora_id=2&taxon_id=242318512, 22.07.2018. Distylium myricoides Hemsley. Retrieved electronically: http://www.efloras.org/florataxon.aspx?flora_id=2&taxon_id=200010541, 22.07.2018. Distylium racemosum Siebold & Zuccarini. Retrieved electronically: http://www.efloras.org/florataxon.aspx?flora_id=2&taxon_id=200010545, 22.07.2018.
FoJ, 1965 // Ohwi, J., Meyer, F.G., Walker, E.H., 1965. Flora of Japan. Smithsonian Institution, Washington D.C. Retrieved electronically: https://www.biodiversitylibrary.org/item/95083#page/544/mode/1up, 26.07.2018. FoP, 2003 // Flora of Pakistan, 2003. Parrotiopsis jacquemontiana (Dcne.) Rehder. Retrieved electronically: http://www.efloras.org/florataxon.aspx?flora_id=5&taxon_id=250062909, 22.07.2018. Harms, H., 1930. Hamamelidaceae. In: Engler, A. Die natürlichen Pflanzenfamilien. Leipzig. Mahjoob, C., 2006. Investigation on the spatial distribution of Persian parrotia (Parrotia persica) in relation to landform and edaphic factors in Patom District of Kheyroudkenar forest. Department of
Forestry. University of Tehran. Mirbadin, A.R., Dastmalchi, M. 2001. Investigation on phenological stages of some trees species in the Caspian Region. Iranian Journal of Forests and Poplar Research 5 33–54. Nicholson, R.G., 1989. Parrotia persica: an ancient tree for modern landscapes. Arnoldia 49, 34–39. Safarov, I.S., 1977. The new habitat of the Persian ironwood, Parrotia persica (DC.) C.A. Mey. (family Hamamelidaceae Lindl.) on the Greater Caucasus. Bot. Zhurn. 2, 248–250. Sefidi, K., Mohadjer, M.R.M., Etemad, V., Copenheaver, C.A., 2010. Stand characteristics and distribution of a relict population of Persian ironwood (Parrotia persica C.A. Meyer) in northern Iran. Flora 206,
418–422. doi:10.1016/j.flora.2010.11.005
Walker, E.H., 1944: A Revision of Distylium and Sycopsis (Hamamelidaceae). Journal of the Arnold Arboretum 25, 319–341.
Weaver, R. E. Jr., 1971. The Fothergillas. Arnoldia 31, 89–96.
Weaver, R. E. Jr., 1976. The Witch Hazel Family (Hamamelidaceae). Arnoldia 36, 69–109.
Wendelbo, P., 1968: Hamamelidaceae. In: Rechinger, K.H., ed., Flora Iranica 53. Akademische Druck – u. Verlagsanstalt, Graz. Xiao, Y.A., Neog, B., Xiao, Y.H., Li, X.H., Liu, J.C., He, P., 2009, Pollination biology of Disanthus cercidifolius var. longipes, an endemic and endangered plant in China. Biologia 64, 731—736.
Yamanaka, T., 1986. Corylopsis in Japan and Korea. Acta Phytotax. Geobot. 37, 97–105.
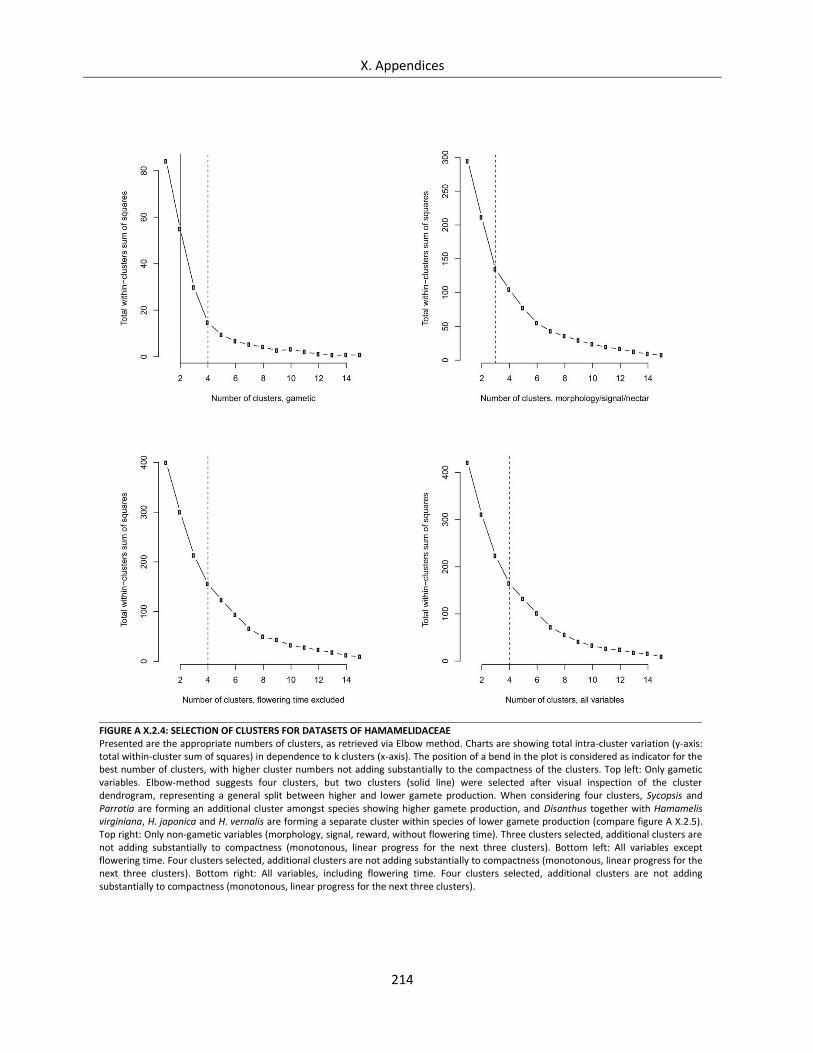
X. Appendices
214
FIGURE A X.2.4: SELECTION OF CLUSTERS FOR DATASETS OF HAMAMELIDACEAE Presented are the appropriate numbers of clusters, as retrieved via Elbow method. Charts are showing total intra-cluster variation (y-axis: total within-cluster sum of squares) in dependence to k clusters (x-axis). The position of a bend in the plot is considered as indicator for the best number of clusters, with higher cluster numbers not adding substantially to the compactness of the clusters. Top left: Only gametic variables. Elbow-method suggests four clusters, but two clusters (solid line) were selected after visual inspection of the cluster dendrogram, representing a general split between higher and lower gamete production. When considering four clusters, Sycopsis and Parrotia are forming an additional cluster amongst species showing higher gamete production, and Disanthus together with Hamamelis virginiana, H. japonica and H. vernalis are forming a separate cluster within species of lower gamete production (compare figure A X.2.5). Top right: Only non-gametic variables (morphology, signal, reward, without flowering time). Three clusters selected, additional clusters are not adding substantially to compactness (monotonous, linear progress for the next three clusters). Bottom left: All variables except flowering time. Four clusters selected, additional clusters are not adding substantially to compactness (monotonous, linear progress for the next three clusters). Bottom right: All variables, including flowering time. Four clusters selected, additional clusters are not adding substantially to compactness (monotonous, linear progress for the next three clusters).
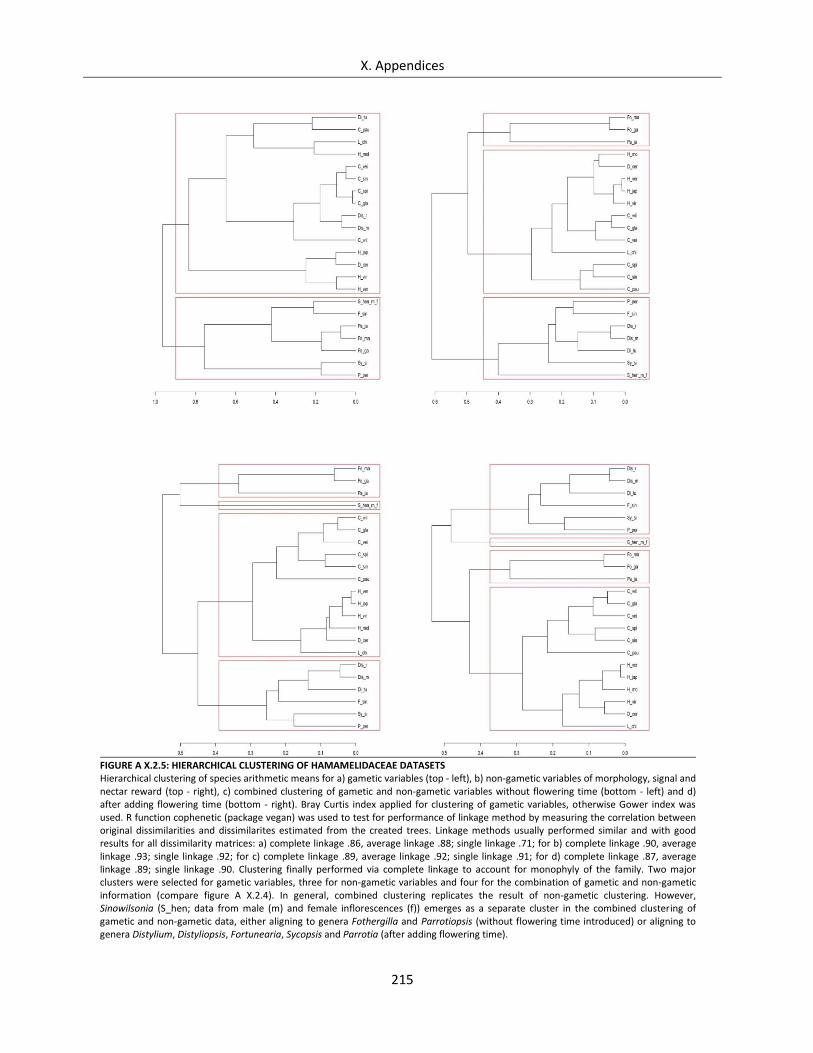
X. Appendices
215
FIGURE A X.2.5: HIERARCHICAL CLUSTERING OF HAMAMELIDACEAE DATASETS Hierarchical clustering of species arithmetic means for a) gametic variables (top - left), b) non-gametic variables of morphology, signal and nectar reward (top - right), c) combined clustering of gametic and non-gametic variables without flowering time (bottom - left) and d) after adding flowering time (bottom - right). Bray Curtis index applied for clustering of gametic variables, otherwise Gower index was used. R function cophenetic (package vegan) was used to test for performance of linkage method by measuring the correlation between original dissimilarities and dissimilarites estimated from the created trees. Linkage methods usually performed similar and with good results for all dissimilarity matrices: a) complete linkage .86, average linkage .88; single linkage .71; for b) complete linkage .90, average linkage .93; single linkage .92; for c) complete linkage .89, average linkage .92; single linkage .91; for d) complete linkage .87, average linkage .89; single linkage .90. Clustering finally performed via complete linkage to account for monophyly of the family. Two major clusters were selected for gametic variables, three for non-gametic variables and four for the combination of gametic and non-gametic information (compare figure A X.2.4). In general, combined clustering replicates the result of non-gametic clustering. However, Sinowilsonia (S_hen; data from male (m) and female inflorescences (f)) emerges as a separate cluster in the combined clustering of gametic and non-gametic data, either aligning to genera Fothergilla and Parrotiopsis (without flowering time introduced) or aligning to genera Distylium, Distyliopsis, Fortunearia, Sycopsis and Parrotia (after adding flowering time).
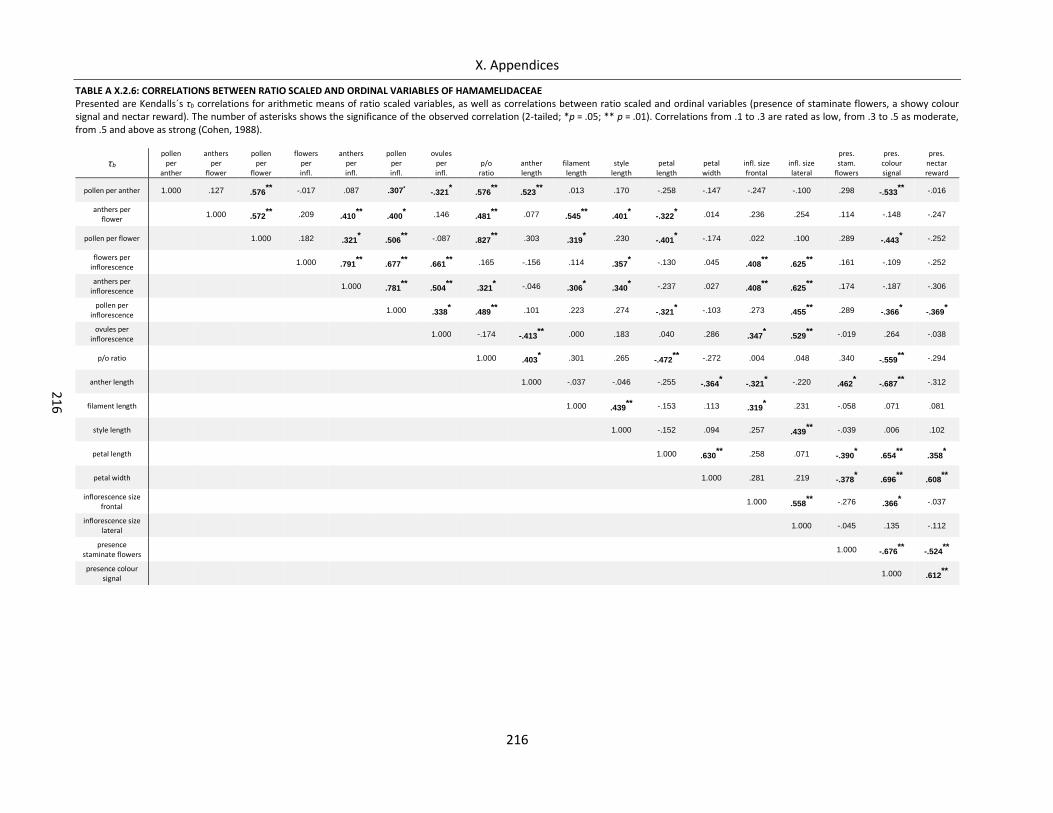
X. Appendices
216
21
6
TABLE A X.2.6: CORRELATIONS BETWEEN RATIO SCALED AND ORDINAL VARIABLES OF HAMAMELIDACEAE Presented are Kendalls´s τb correlations for arithmetic means of ratio scaled variables, as well as correlations between ratio scaled and ordinal variables (presence of staminate flowers, a showy colour signal and nectar reward). The number of asterisks shows the significance of the observed correlation (2-tailed; *p = .05; ** p = .01). Correlations from .1 to .3 are rated as low, from .3 to .5 as moderate, from .5 and above as strong (Cohen, 1988).
τb pollen
per anther
anthers per
flower
pollen per
flower
flowers per infl.
anthers per infl.
pollen per infl.
ovules per infl.
p/o ratio
anther length
filament length
style length
petal length
petal width
infl. size frontal
infl. size lateral
pres. stam.
flowers
pres. colour signal
pres. nectar reward
pollen per anther 1.000 .127 .576**
-.017 .087 .307* -.321* .576
** .523
** .013 .170 -.258 -.147 -.247 -.100 .298 -.533
** -.016
anthers per flower
1.000 .572**
.209 .410**
.400* .146 .481
** .077 .545
** .401
* -.322
* .014 .236 .254 .114 -.148 -.247
pollen per flower 1.000 .182 .321* .506
** -.087 .827
** .303 .319
* .230 -.401
* -.174 .022 .100 .289 -.443
* -.252
flowers per inflorescence
1.000 .791**
.677**
.661**
.165 -.156 .114 .357* -.130 .045 .408
** .625
** .161 -.109 -.252
anthers per inflorescence
1.000 .781**
.504**
.321* -.046 .306
* .340
* -.237 .027 .408
** .625
** .174 -.187 -.306
pollen per inflorescence
1.000 .338* .489
** .101 .223 .274 -.321
* -.103 .273 .455
** .289 -.366
* -.369
*
ovules per inflorescence
1.000 -.174 -.413**
.000 .183 .040 .286 .347* .529
** -.019 .264 -.038
p/o ratio 1.000 .403* .301 .265 -.472
** -.272 .004 .048 .340 -.559
** -.294
anther length 1.000 -.037 -.046 -.255 -.364* -.321
* -.220 .462
* -.687
** -.312
filament length 1.000 .439**
-.153 .113 .319* .231 -.058 .071 .081
style length 1.000 -.152 .094 .257 .439**
-.039 .006 .102
petal length 1.000 .630**
.258 .071 -.390* .654
** .358
*
petal width 1.000 .281 .219 -.378* .696
** .608
**
inflorescence size frontal
1.000 .558**
-.276 .366* -.037
inflorescence size lateral
1.000 -.045 .135 -.112
presence staminate flowers
1.000 -.676**
-.524**
presence colour signal
1.000 .612**
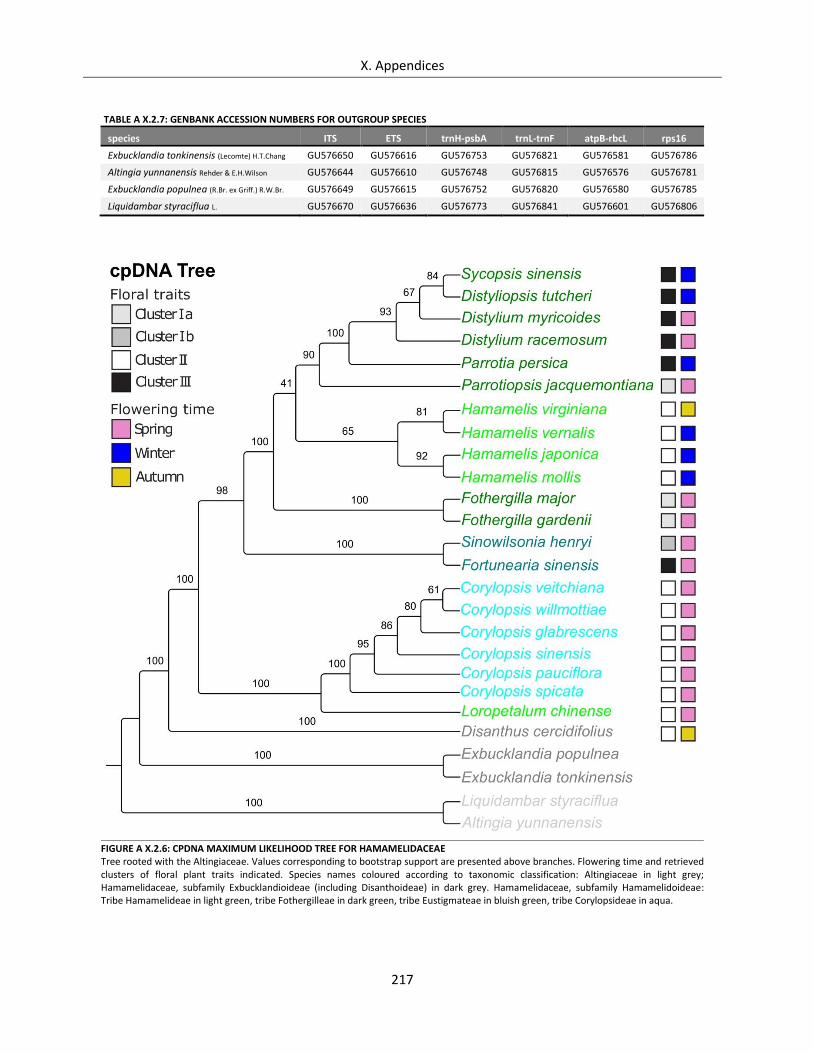
X. Appendices
217
TABLE A X.2.7: GENBANK ACCESSION NUMBERS FOR OUTGROUP SPECIES
species ITS ETS trnH-psbA trnL-trnF atpB-rbcL rps16
Exbucklandia tonkinensis (Lecomte) H.T.Chang GU576650 GU576616 GU576753 GU576821 GU576581 GU576786
Altingia yunnanensis Rehder & E.H.Wilson GU576644 GU576610 GU576748 GU576815 GU576576 GU576781
Exbucklandia populnea (R.Br. ex Griff.) R.W.Br. GU576649 GU576615 GU576752 GU576820 GU576580 GU576785
Liquidambar styraciflua L. GU576670 GU576636 GU576773 GU576841 GU576601 GU576806
FIGURE A X.2.6: CPDNA MAXIMUM LIKELIHOOD TREE FOR HAMAMELIDACEAE Tree rooted with the Altingiaceae. Values corresponding to bootstrap support are presented above branches. Flowering time and retrieved clusters of floral plant traits indicated. Species names coloured according to taxonomic classification: Altingiaceae in light grey; Hamamelidaceae, subfamily Exbucklandioideae (including Disanthoideae) in dark grey. Hamamelidaceae, subfamily Hamamelidoideae: Tribe Hamamelideae in light green, tribe Fothergilleae in dark green, tribe Eustigmateae in bluish green, tribe Corylopsideae in aqua.
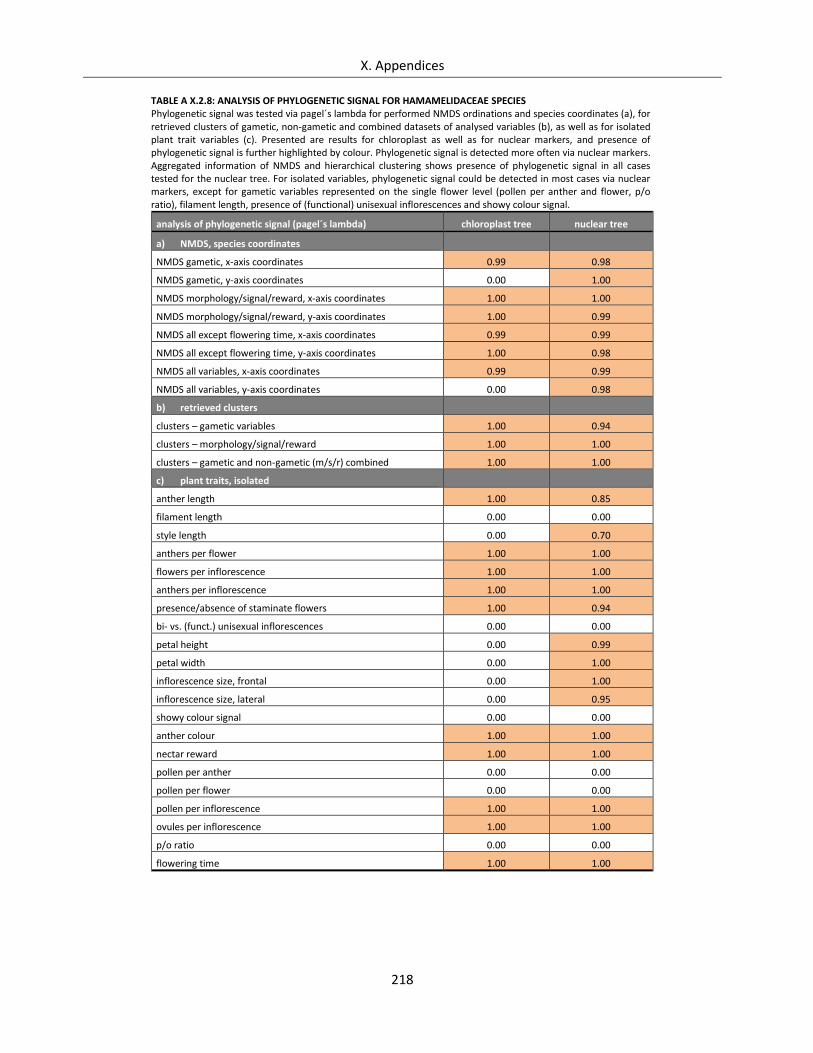
X. Appendices
218
TABLE A X.2.8: ANALYSIS OF PHYLOGENETIC SIGNAL FOR HAMAMELIDACEAE SPECIES Phylogenetic signal was tested via pagel´s lambda for performed NMDS ordinations and species coordinates (a), for retrieved clusters of gametic, non-gametic and combined datasets of analysed variables (b), as well as for isolated plant trait variables (c). Presented are results for chloroplast as well as for nuclear markers, and presence of phylogenetic signal is further highlighted by colour. Phylogenetic signal is detected more often via nuclear markers. Aggregated information of NMDS and hierarchical clustering shows presence of phylogenetic signal in all cases tested for the nuclear tree. For isolated variables, phylogenetic signal could be detected in most cases via nuclear markers, except for gametic variables represented on the single flower level (pollen per anther and flower, p/o ratio), filament length, presence of (functional) unisexual inflorescences and showy colour signal.
analysis of phylogenetic signal (pagel´s lambda) chloroplast tree nuclear tree
a) NMDS, species coordinates
NMDS gametic, x-axis coordinates 0.99 0.98
NMDS gametic, y-axis coordinates 0.00 1.00
NMDS morphology/signal/reward, x-axis coordinates 1.00 1.00
NMDS morphology/signal/reward, y-axis coordinates 1.00 0.99
NMDS all except flowering time, x-axis coordinates 0.99 0.99
NMDS all except flowering time, y-axis coordinates 1.00 0.98
NMDS all variables, x-axis coordinates 0.99 0.99
NMDS all variables, y-axis coordinates 0.00 0.98
b) retrieved clusters
clusters – gametic variables 1.00 0.94
clusters – morphology/signal/reward 1.00 1.00
clusters – gametic and non-gametic (m/s/r) combined 1.00 1.00
c) plant traits, isolated
anther length 1.00 0.85
filament length 0.00 0.00
style length 0.00 0.70
anthers per flower 1.00 1.00
flowers per inflorescence 1.00 1.00
anthers per inflorescence 1.00 1.00
presence/absence of staminate flowers 1.00 0.94
bi- vs. (funct.) unisexual inflorescences 0.00 0.00
petal height 0.00 0.99
petal width 0.00 1.00
inflorescence size, frontal 0.00 1.00
inflorescence size, lateral 0.00 0.95
showy colour signal 0.00 0.00
anther colour 1.00 1.00
nectar reward 1.00 1.00
pollen per anther 0.00 0.00
pollen per flower 0.00 0.00
pollen per inflorescence 1.00 1.00
ovules per inflorescence 1.00 1.00
p/o ratio 0.00 0.00
flowering time 1.00 1.00
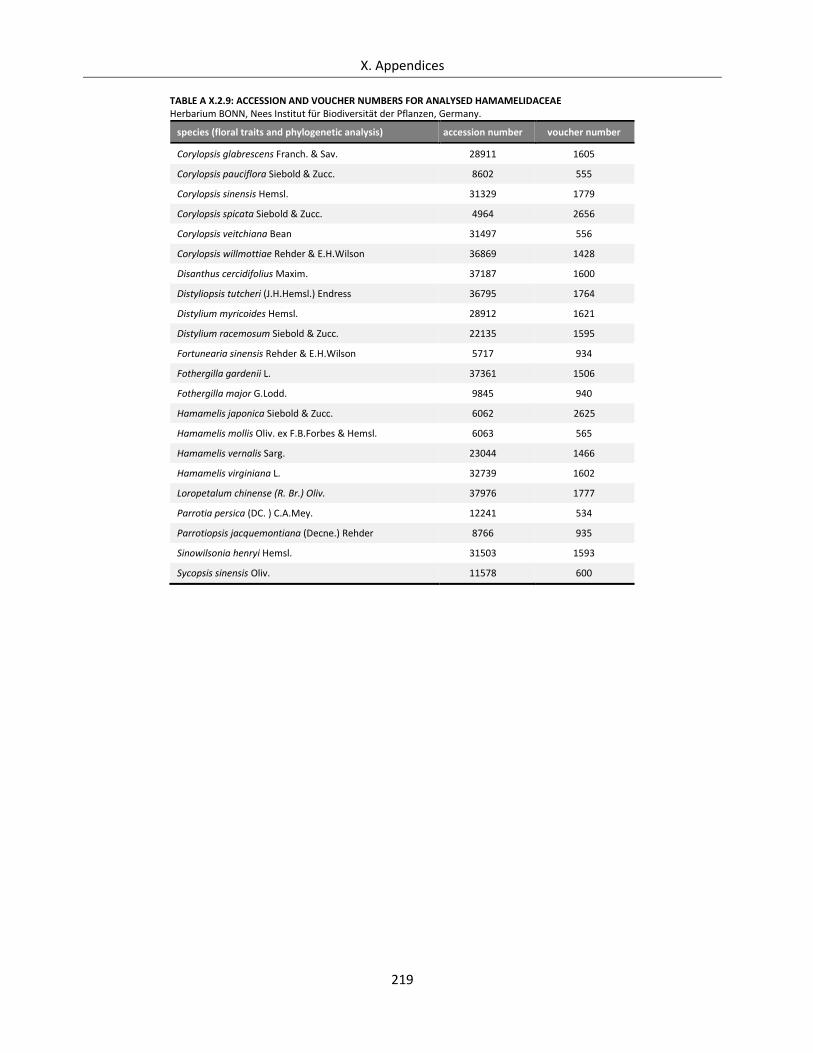
X. Appendices
219
TABLE A X.2.9: ACCESSION AND VOUCHER NUMBERS FOR ANALYSED HAMAMELIDACEAE Herbarium BONN, Nees Institut für Biodiversität der Pflanzen, Germany.
species (floral traits and phylogenetic analysis) accession number voucher number
Corylopsis glabrescens Franch. & Sav. 28911 1605
Corylopsis pauciflora Siebold & Zucc. 8602 555
Corylopsis sinensis Hemsl. 31329 1779
Corylopsis spicata Siebold & Zucc. 4964 2656
Corylopsis veitchiana Bean 31497 556
Corylopsis willmottiae Rehder & E.H.Wilson 36869 1428
Disanthus cercidifolius Maxim. 37187 1600
Distyliopsis tutcheri (J.H.Hemsl.) Endress 36795 1764
Distylium myricoides Hemsl. 28912 1621
Distylium racemosum Siebold & Zucc. 22135 1595
Fortunearia sinensis Rehder & E.H.Wilson 5717 934
Fothergilla gardenii L. 37361 1506
Fothergilla major G.Lodd. 9845 940
Hamamelis japonica Siebold & Zucc. 6062 2625
Hamamelis mollis Oliv. ex F.B.Forbes & Hemsl. 6063 565
Hamamelis vernalis Sarg. 23044 1466
Hamamelis virginiana L. 32739 1602
Loropetalum chinense (R. Br.) Oliv. 37976 1777
Parrotia persica (DC. ) C.A.Mey. 12241 534
Parrotiopsis jacquemontiana (Decne.) Rehder 8766 935
Sinowilsonia henryi Hemsl. 31503 1593
Sycopsis sinensis Oliv. 11578 600
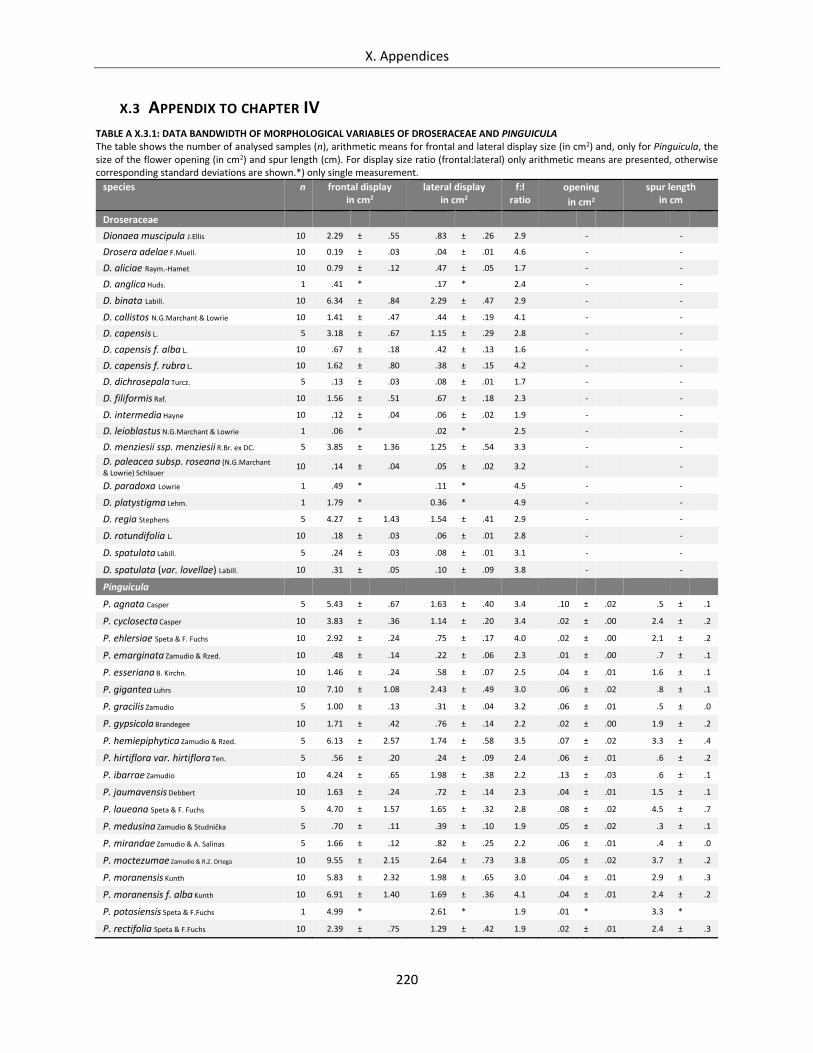
X. Appendices
220
X.3 APPENDIX TO CHAPTER IV
TABLE A X.3.1: DATA BANDWIDTH OF MORPHOLOGICAL VARIABLES OF DROSERACEAE AND PINGUICULA The table shows the number of analysed samples (n), arithmetic means for frontal and lateral display size (in cm2) and, only for Pinguicula, the size of the flower opening (in cm2) and spur length (cm). For display size ratio (frontal:lateral) only arithmetic means are presented, otherwise corresponding standard deviations are shown.*) only single measurement.
species n frontal display in cm2
lateral display in cm2
f:l ratio
opening
in cm2
spur length in cm
Droseraceae
Dionaea muscipula J.Ellis 10 2.29 ± .55 .83 ± .26 2.9 - -
Drosera adelae F.Muell. 10 0.19 ± .03 .04 ± .01 4.6 - -
D. aliciae Raym.-Hamet 10 0.79 ± .12 .47 ± .05 1.7 - -
D. anglica Huds. 1 .41 * .17 * 2.4 - -
D. binata Labill. 10 6.34 ± .84 2.29 ± .47 2.9 - -
D. callistos N.G.Marchant & Lowrie 10 1.41 ± .47 .44 ± .19 4.1 - -
D. capensis L. 5 3.18 ± .67 1.15 ± .29 2.8 - -
D. capensis f. alba L. 10 .67 ± .18 .42 ± .13 1.6 - -
D. capensis f. rubra L. 10 1.62 ± .80 .38 ± .15 4.2 - -
D. dichrosepala Turcz. 5 .13 ± .03 .08 ± .01 1.7 - -
D. filiformis Raf. 10 1.56 ± .51 .67 ± .18 2.3 - -
D. intermedia Hayne 10 .12 ± .04 .06 ± .02 1.9 - -
D. leioblastus N.G.Marchant & Lowrie 1 .06 * .02 * 2.5 - -
D. menziesii ssp. menziesii R.Br. ex DC. 5 3.85 ± 1.36 1.25 ± .54 3.3 - -
D. paleacea subsp. roseana (N.G.Marchant
& Lowrie) Schlauer 10 .14 ± .04 .05 ± .02 3.2 - -
D. paradoxa Lowrie 1 .49 * .11 * 4.5 - -
D. platystigma Lehm. 1 1.79 * 0.36 * 4.9 - -
D. regia Stephens 5 4.27 ± 1.43 1.54 ± .41 2.9 - -
D. rotundifolia L. 10 .18 ± .03 .06 ± .01 2.8 - -
D. spatulata Labill. 5 .24 ± .03 .08 ± .01 3.1 - -
D. spatulata (var. lovellae) Labill. 10 .31 ± .05 .10 ± .09 3.8 - -
Pinguicula
P. agnata Casper 5 5.43 ± .67 1.63 ± .40 3.4 .10 ± .02 .5 ± .1
P. cyclosecta Casper 10 3.83 ± .36 1.14 ± .20 3.4 .02 ± .00 2.4 ± .2
P. ehlersiae Speta & F. Fuchs 10 2.92 ± .24 .75 ± .17 4.0 .02 ± .00 2.1 ± .2
P. emarginata Zamudio & Rzed. 10 .48 ± .14 .22 ± .06 2.3 .01 ± .00 .7 ± .1
P. esseriana B. Kirchn. 10 1.46 ± .24 .58 ± .07 2.5 .04 ± .01 1.6 ± .1
P. gigantea Luhrs 10 7.10 ± 1.08 2.43 ± .49 3.0 .06 ± .02 .8 ± .1
P. gracilis Zamudio 5 1.00 ± .13 .31 ± .04 3.2 .06 ± .01 .5 ± .0
P. gypsicola Brandegee 10 1.71 ± .42 .76 ± .14 2.2 .02 ± .00 1.9 ± .2
P. hemiepiphytica Zamudio & Rzed. 5 6.13 ± 2.57 1.74 ± .58 3.5 .07 ± .02 3.3 ± .4
P. hirtiflora var. hirtiflora Ten. 5 .56 ± .20 .24 ± .09 2.4 .06 ± .01 .6 ± .2
P. ibarrae Zamudio 10 4.24 ± .65 1.98 ± .38 2.2 .13 ± .03 .6 ± .1
P. jaumavensis Debbert 10 1.63 ± .24 .72 ± .14 2.3 .04 ± .01 1.5 ± .1
P. laueana Speta & F. Fuchs 5 4.70 ± 1.57 1.65 ± .32 2.8 .08 ± .02 4.5 ± .7
P. medusina Zamudio & Studnička 5 .70 ± .11 .39 ± .10 1.9 .05 ± .02 .3 ± .1
P. mirandae Zamudio & A. Salinas 5 1.66 ± .12 .82 ± .25 2.2 .06 ± .01 .4 ± .0
P. moctezumae Zamudio & R.Z. Ortega 10 9.55 ± 2.15 2.64 ± .73 3.8 .05 ± .02 3.7 ± .2
P. moranensis Kunth 10 5.83 ± 2.32 1.98 ± .65 3.0 .04 ± .01 2.9 ± .3
P. moranensis f. alba Kunth 10 6.91 ± 1.40 1.69 ± .36 4.1 .04 ± .01 2.4 ± .2
P. potosiensis Speta & F.Fuchs 1 4.99 * 2.61 * 1.9 .01 * 3.3 *
P. rectifolia Speta & F.Fuchs 10 2.39 ± .75 1.29 ± .42 1.9 .02 ± .01 2.4 ± .3
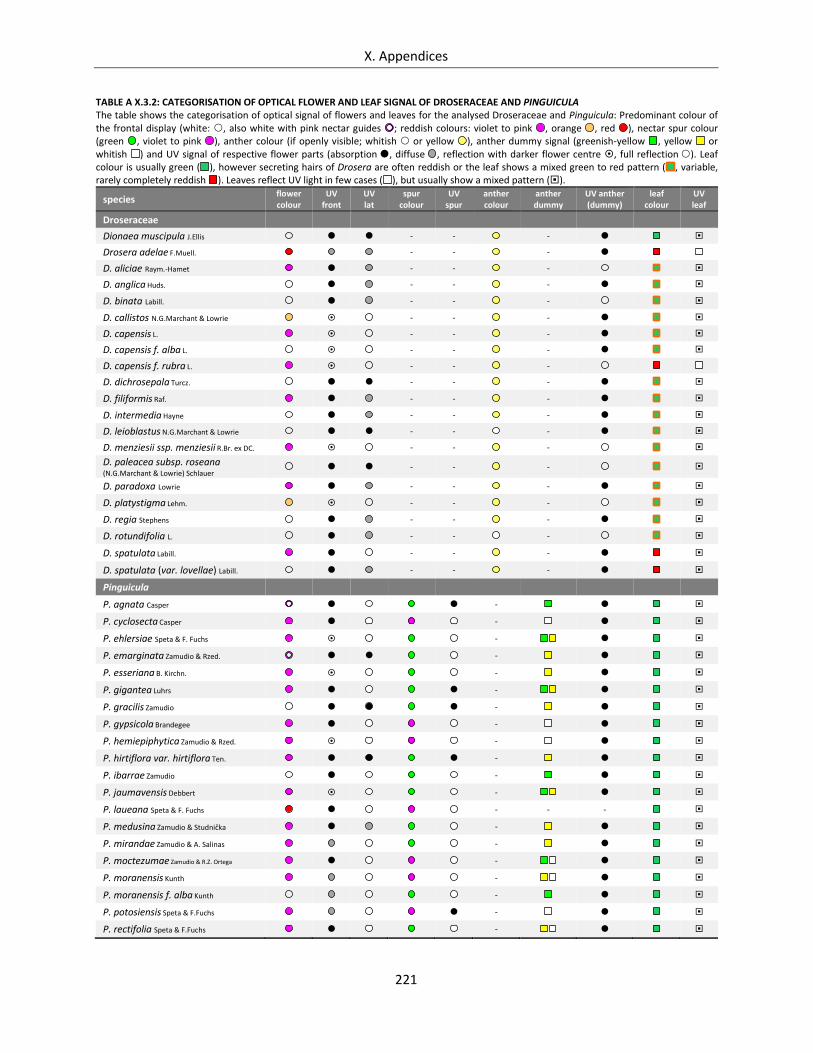
X. Appendices
221
TABLE A X.3.2: CATEGORISATION OF OPTICAL FLOWER AND LEAF SIGNAL OF DROSERACEAE AND PINGUICULA The table shows the categorisation of optical signal of flowers and leaves for the analysed Droseraceae and Pinguicula: Predominant colour of the frontal display (white: , also white with pink nectar guides ; reddish colours: violet to pink , orange , red ), nectar spur colour (green , violet to pink ), anther colour (if openly visible; whitish or yellow ), anther dummy signal (greenish-yellow , yellow or whitish ) and UV signal of respective flower parts (absorption , diffuse , reflection with darker flower centre , full reflection ). Leaf colour is usually green ( ), however secreting hairs of Drosera are often reddish or the leaf shows a mixed green to red pattern ( , variable, rarely completely reddish ). Leaves reflect UV light in few cases ( ), but usually show a mixed pattern ().
species flower colour
UV front
UV lat
spur colour
UV spur
anther colour
anther dummy
UV anther (dummy)
leaf colour
UV leaf
Droseraceae
Dionaea muscipula J.Ellis - - -
Drosera adelae F.Muell. - - -
D. aliciae Raym.-Hamet - - -
D. anglica Huds. - - -
D. binata Labill. - - -
D. callistos N.G.Marchant & Lowrie - - -
D. capensis L. - - -
D. capensis f. alba L. - - -
D. capensis f. rubra L. - - -
D. dichrosepala Turcz. - - -
D. filiformis Raf. - - -
D. intermedia Hayne - - -
D. leioblastus N.G.Marchant & Lowrie - - -
D. menziesii ssp. menziesii R.Br. ex DC. - - -
D. paleacea subsp. roseana
(N.G.Marchant & Lowrie) Schlauer - - -
D. paradoxa Lowrie - - -
D. platystigma Lehm. - - -
D. regia Stephens - - -
D. rotundifolia L. - - -
D. spatulata Labill. - - -
D. spatulata (var. lovellae) Labill. - - -
Pinguicula
P. agnata Casper -
P. cyclosecta Casper -
P. ehlersiae Speta & F. Fuchs -
P. emarginata Zamudio & Rzed. -
P. esseriana B. Kirchn. -
P. gigantea Luhrs -
P. gracilis Zamudio -
P. gypsicola Brandegee -
P. hemiepiphytica Zamudio & Rzed. -
P. hirtiflora var. hirtiflora Ten. -
P. ibarrae Zamudio -
P. jaumavensis Debbert -
P. laueana Speta & F. Fuchs - - -
P. medusina Zamudio & Studnička -
P. mirandae Zamudio & A. Salinas -
P. moctezumae Zamudio & R.Z. Ortega -
P. moranensis Kunth -
P. moranensis f. alba Kunth -
P. potosiensis Speta & F.Fuchs -
P. rectifolia Speta & F.Fuchs -
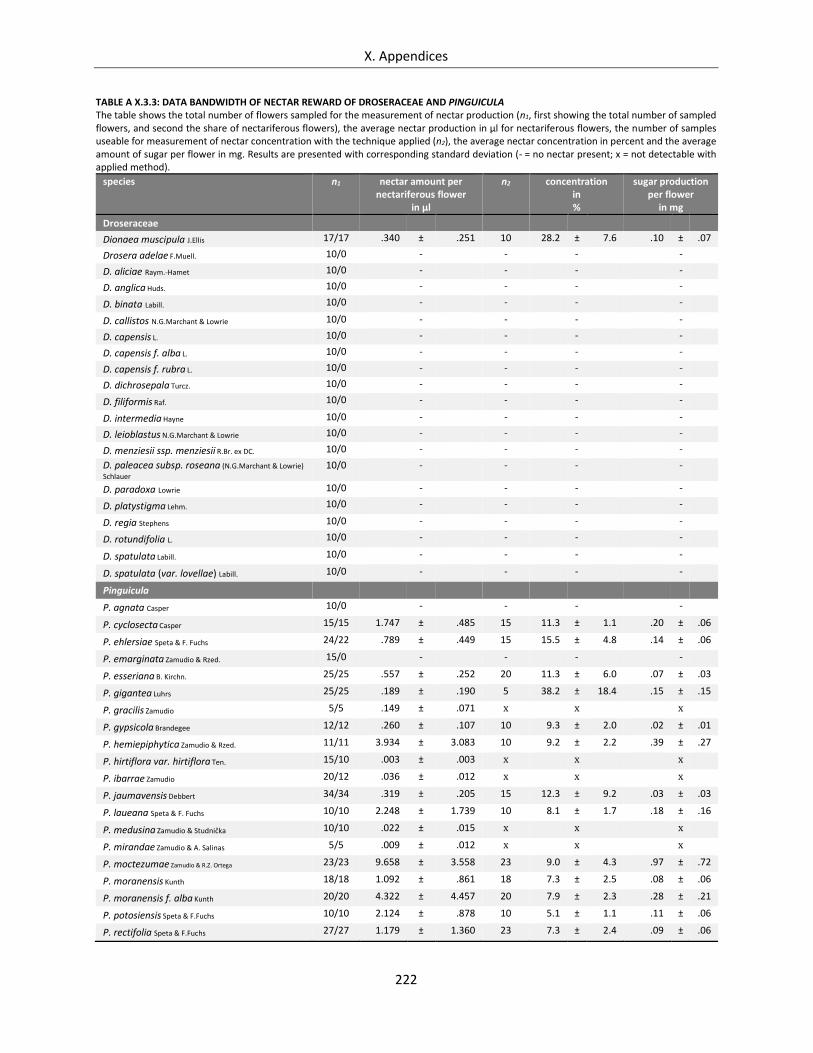
X. Appendices
222
TABLE A X.3.3: DATA BANDWIDTH OF NECTAR REWARD OF DROSERACEAE AND PINGUICULA The table shows the total number of flowers sampled for the measurement of nectar production (n1, first showing the total number of sampled flowers, and second the share of nectariferous flowers), the average nectar production in μl for nectariferous flowers, the number of samples useable for measurement of nectar concentration with the technique applied (n2), the average nectar concentration in percent and the average amount of sugar per flower in mg. Results are presented with corresponding standard deviation (- = no nectar present; x = not detectable with applied method).
species n1
nectar amount per
nectariferous flower in µl
n2 concentration in %
sugar production per flower
in mg
Droseraceae
Dionaea muscipula J.Ellis 17/17 .340 ± .251 10 28.2 ± 7.6 .10 ± .07
Drosera adelae F.Muell. 10/0 - - - -
D. aliciae Raym.-Hamet 10/0 - - - -
D. anglica Huds. 10/0 - - - -
D. binata Labill. 10/0 - - - -
D. callistos N.G.Marchant & Lowrie 10/0 - - - -
D. capensis L. 10/0 - - - -
D. capensis f. alba L. 10/0 - - - -
D. capensis f. rubra L. 10/0 - - - -
D. dichrosepala Turcz. 10/0 - - - -
D. filiformis Raf. 10/0 - - - -
D. intermedia Hayne 10/0 - - - -
D. leioblastus N.G.Marchant & Lowrie 10/0 - - - -
D. menziesii ssp. menziesii R.Br. ex DC. 10/0 - - - -
D. paleacea subsp. roseana (N.G.Marchant & Lowrie)
Schlauer 10/0 - - - -
D. paradoxa Lowrie 10/0 - - - -
D. platystigma Lehm. 10/0 - - - -
D. regia Stephens 10/0 - - - -
D. rotundifolia L. 10/0 - - - -
D. spatulata Labill. 10/0 - - - -
D. spatulata (var. lovellae) Labill. 10/0 - - - -
Pinguicula
P. agnata Casper 10/0 - - - -
P. cyclosecta Casper 15/15 1.747 ± .485 15 11.3 ± 1.1 .20 ± .06
P. ehlersiae Speta & F. Fuchs 24/22 .789 ± .449 15 15.5 ± 4.8 .14 ± .06
P. emarginata Zamudio & Rzed. 15/0 - - - -
P. esseriana B. Kirchn. 25/25 .557 ± .252 20 11.3 ± 6.0 .07 ± .03
P. gigantea Luhrs 25/25 .189 ± .190 5 38.2 ± 18.4 .15 ± .15
P. gracilis Zamudio 5/5 .149 ± .071 x x x
P. gypsicola Brandegee 12/12 .260 ± .107 10 9.3 ± 2.0 .02 ± .01
P. hemiepiphytica Zamudio & Rzed. 11/11 3.934 ± 3.083 10 9.2 ± 2.2 .39 ± .27
P. hirtiflora var. hirtiflora Ten. 15/10 .003 ± .003 x x x
P. ibarrae Zamudio 20/12 .036 ± .012 x x x
P. jaumavensis Debbert 34/34 .319 ± .205 15 12.3 ± 9.2 .03 ± .03
P. laueana Speta & F. Fuchs 10/10 2.248 ± 1.739 10 8.1 ± 1.7 .18 ± .16
P. medusina Zamudio & Studnička 10/10 .022 ± .015 x x x
P. mirandae Zamudio & A. Salinas 5/5 .009 ± .012 x x x
P. moctezumae Zamudio & R.Z. Ortega 23/23 9.658 ± 3.558 23 9.0 ± 4.3 .97 ± .72
P. moranensis Kunth 18/18 1.092 ± .861 18 7.3 ± 2.5 .08 ± .06
P. moranensis f. alba Kunth 20/20 4.322 ± 4.457 20 7.9 ± 2.3 .28 ± .21
P. potosiensis Speta & F.Fuchs 10/10 2.124 ± .878 10 5.1 ± 1.1 .11 ± .06
P. rectifolia Speta & F.Fuchs 27/27 1.179 ± 1.360 23 7.3 ± 2.4 .09 ± .06
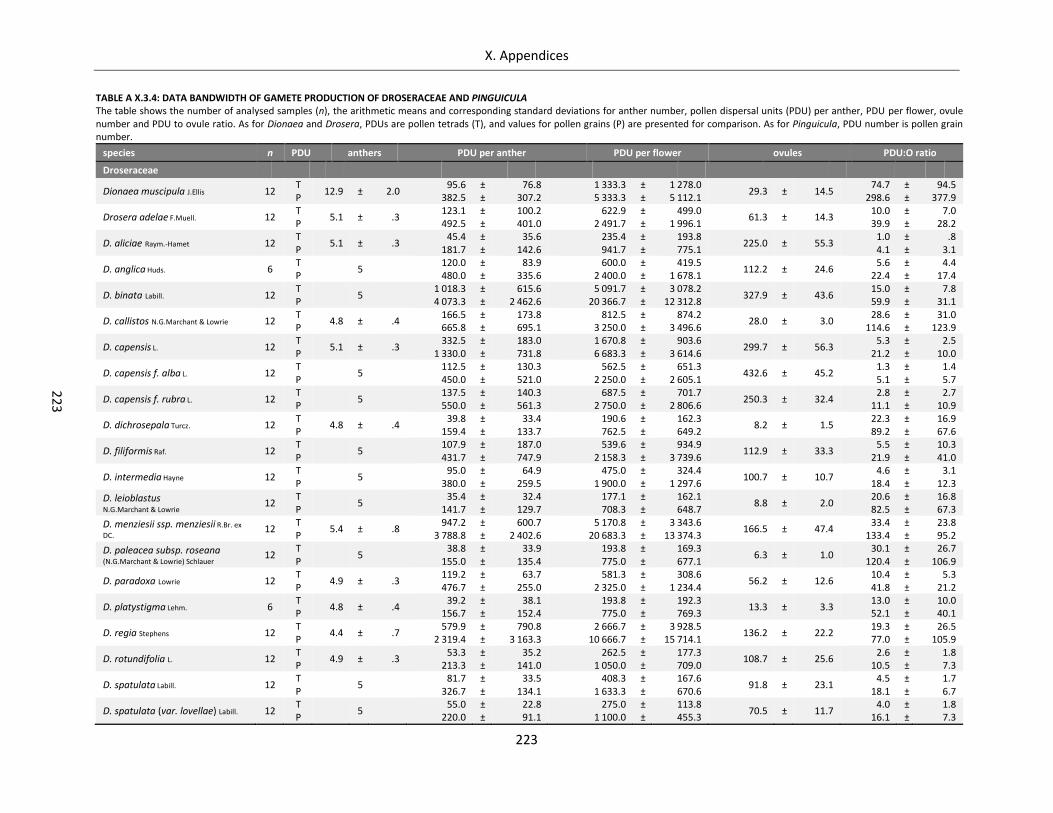
X. Appendices
223
22
3
TABLE A X.3.4: DATA BANDWIDTH OF GAMETE PRODUCTION OF DROSERACEAE AND PINGUICULA The table shows the number of analysed samples (n), the arithmetic means and corresponding standard deviations for anther number, pollen dispersal units (PDU) per anther, PDU per flower, ovule number and PDU to ovule ratio. As for Dionaea and Drosera, PDUs are pollen tetrads (T), and values for pollen grains (P) are presented for comparison. As for Pinguicula, PDU number is pollen grain number.
species n PDU anthers PDU per anther PDU per flower ovules PDU:O ratio
Droseraceae
Dionaea muscipula J.Ellis 12 T P
12.9 ± 2.0 95.6
382.5 ± ±
76.8 307.2
1 333.3 5 333.3
± ±
1 278.0 5 112.1
29.3 ± 14.5 74.7
298.6 ± ±
94.5 377.9
Drosera adelae F.Muell. 12 T P
5.1 ± .3 123.1 492.5
± ±
100.2 401.0
622.9 2 491.7
± ±
499.0 1 996.1
61.3 ± 14.3 10.0 39.9
± ±
7.0 28.2
D. aliciae Raym.-Hamet 12 T P
5.1 ± .3 45.4
181.7 ± ±
35.6 142.6
235.4 941.7
± ±
193.8 775.1
225.0 ± 55.3 1.0 4.1
± ±
.8 3.1
D. anglica Huds. 6 T P
5 120.0 480.0
± ±
83.9 335.6
600.0 2 400.0
± ±
419.5 1 678.1
112.2 ± 24.6 5.6
22.4 ± ±
4.4 17.4
D. binata Labill. 12 T P
5 1 018.3 4 073.3
± ±
615.6 2 462.6
5 091.7 20 366.7
± ±
3 078.2 12 312.8
327.9 ± 43.6 15.0 59.9
± ±
7.8 31.1
D. callistos N.G.Marchant & Lowrie 12 T P
4.8 ± .4 166.5 665.8
± ±
173.8 695.1
812.5 3 250.0
± ±
874.2 3 496.6
28.0 ± 3.0 28.6
114.6 ± ±
31.0 123.9
D. capensis L. 12 T P
5.1 ± .3 332.5
1 330.0 ± ±
183.0 731.8
1 670.8 6 683.3
± ±
903.6 3 614.6
299.7 ± 56.3 5.3
21.2 ± ±
2.5 10.0
D. capensis f. alba L. 12 T P
5 112.5 450.0
± ±
130.3 521.0
562.5 2 250.0
± ±
651.3 2 605.1
432.6 ± 45.2 1.3 5.1
± ±
1.4 5.7
D. capensis f. rubra L. 12 T P
5 137.5 550.0
± ±
140.3 561.3
687.5 2 750.0
± ±
701.7 2 806.6
250.3 ± 32.4 2.8
11.1 ± ±
2.7 10.9
D. dichrosepala Turcz. 12 T P
4.8 ± .4 39.8
159.4 ± ±
33.4 133.7
190.6 762.5
± ±
162.3 649.2
8.2 ± 1.5 22.3 89.2
± ±
16.9 67.6
D. filiformis Raf. 12 T P
5 107.9 431.7
± ±
187.0 747.9
539.6 2 158.3
± ±
934.9 3 739.6
112.9 ± 33.3 5.5
21.9 ± ±
10.3 41.0
D. intermedia Hayne 12 T P
5 95.0
380.0 ± ±
64.9 259.5
475.0 1 900.0
± ±
324.4 1 297.6
100.7 ± 10.7 4.6
18.4 ± ±
3.1 12.3
D. leioblastus
N.G.Marchant & Lowrie 12 T P
5 35.4
141.7 ± ±
32.4 129.7
177.1 708.3
± ±
162.1 648.7
8.8 ± 2.0 20.6 82.5
± ±
16.8 67.3
D. menziesii ssp. menziesii R.Br. ex
DC. 12 T P
5.4 ± .8 947.2
3 788.8 ± ±
600.7 2 402.6
5 170.8 20 683.3
± ±
3 343.6 13 374.3
166.5 ± 47.4 33.4
133.4 ± ±
23.8 95.2
D. paleacea subsp. roseana
(N.G.Marchant & Lowrie) Schlauer 12 T P
5 38.8
155.0 ± ±
33.9 135.4
193.8 775.0
± ±
169.3 677.1
6.3 ± 1.0 30.1
120.4 ± ±
26.7 106.9
D. paradoxa Lowrie 12 T P
4.9 ± .3 119.2 476.7
± ±
63.7 255.0
581.3 2 325.0
± ±
308.6 1 234.4
56.2 ± 12.6 10.4 41.8
± ±
5.3 21.2
D. platystigma Lehm. 6 T P
4.8 ± .4 39.2
156.7 ± ±
38.1 152.4
193.8 775.0
± ±
192.3 769.3
13.3 ± 3.3 13.0 52.1
± ±
10.0 40.1
D. regia Stephens 12 T P
4.4 ± .7 579.9
2 319.4 ± ±
790.8 3 163.3
2 666.7 10 666.7
± ±
3 928.5 15 714.1
136.2 ± 22.2 19.3 77.0
± ±
26.5 105.9
D. rotundifolia L. 12 T P
4.9 ± .3 53.3
213.3 ± ±
35.2 141.0
262.5 1 050.0
± ±
177.3 709.0
108.7 ± 25.6 2.6
10.5 ± ±
1.8 7.3
D. spatulata Labill. 12 T P
5 81.7
326.7 ± ±
33.5 134.1
408.3 1 633.3
± ±
167.6 670.6
91.8 ± 23.1 4.5
18.1 ± ±
1.7 6.7
D. spatulata (var. lovellae) Labill. 12 T P
5 55.0
220.0 ± ±
22.8 91.1
275.0 1 100.0
± ±
113.8 455.3
70.5 ± 11.7 4.0
16.1 ± ±
1.8 7.3
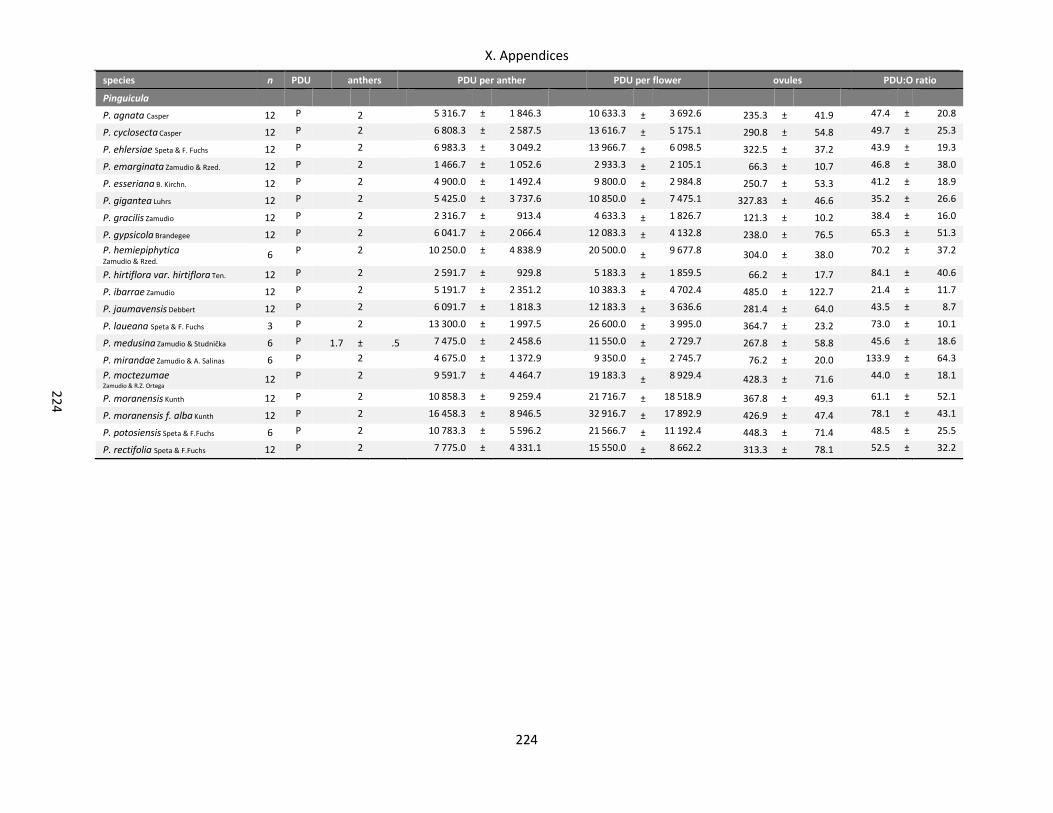
X. Appendices
224
22
4
species n PDU anthers PDU per anther PDU per flower ovules PDU:O ratio
Pinguicula
P. agnata Casper 12 P 2 5 316.7 ± 1 846.3 10 633.3 ± 3 692.6 235.3 ± 41.9 47.4 ± 20.8
P. cyclosecta Casper 12 P 2 6 808.3 ± 2 587.5 13 616.7 ± 5 175.1 290.8 ± 54.8 49.7 ± 25.3
P. ehlersiae Speta & F. Fuchs 12 P 2 6 983.3 ± 3 049.2 13 966.7 ± 6 098.5 322.5 ± 37.2 43.9 ± 19.3
P. emarginata Zamudio & Rzed. 12 P 2 1 466.7 ± 1 052.6 2 933.3 ± 2 105.1 66.3 ± 10.7 46.8 ± 38.0
P. esseriana B. Kirchn. 12 P 2 4 900.0 ± 1 492.4 9 800.0 ± 2 984.8 250.7 ± 53.3 41.2 ± 18.9
P. gigantea Luhrs 12 P 2 5 425.0 ± 3 737.6 10 850.0 ± 7 475.1 327.83 ± 46.6 35.2 ± 26.6
P. gracilis Zamudio 12 P 2 2 316.7 ± 913.4 4 633.3 ± 1 826.7 121.3 ± 10.2 38.4 ± 16.0
P. gypsicola Brandegee 12 P 2 6 041.7 ± 2 066.4 12 083.3 ± 4 132.8 238.0 ± 76.5 65.3 ± 51.3
P. hemiepiphytica
Zamudio & Rzed. 6 P 2 10 250.0 ± 4 838.9 20 500.0 ± 9 677.8 304.0 ± 38.0 70.2 ± 37.2
P. hirtiflora var. hirtiflora Ten. 12 P 2 2 591.7 ± 929.8 5 183.3 ± 1 859.5 66.2 ± 17.7 84.1 ± 40.6
P. ibarrae Zamudio 12 P 2 5 191.7 ± 2 351.2 10 383.3 ± 4 702.4 485.0 ± 122.7 21.4 ± 11.7
P. jaumavensis Debbert 12 P 2 6 091.7 ± 1 818.3 12 183.3 ± 3 636.6 281.4 ± 64.0 43.5 ± 8.7
P. laueana Speta & F. Fuchs 3 P 2 13 300.0 ± 1 997.5 26 600.0 ± 3 995.0 364.7 ± 23.2 73.0 ± 10.1
P. medusina Zamudio & Studnička 6 P 1.7 ± .5 7 475.0 ± 2 458.6 11 550.0 ± 2 729.7 267.8 ± 58.8 45.6 ± 18.6
P. mirandae Zamudio & A. Salinas 6 P 2 4 675.0 ± 1 372.9 9 350.0 ± 2 745.7 76.2 ± 20.0 133.9 ± 64.3
P. moctezumae
Zamudio & R.Z. Ortega 12 P 2 9 591.7 ± 4 464.7 19 183.3 ± 8 929.4 428.3 ± 71.6 44.0 ± 18.1
P. moranensis Kunth 12 P 2 10 858.3 ± 9 259.4 21 716.7 ± 18 518.9 367.8 ± 49.3 61.1 ± 52.1
P. moranensis f. alba Kunth 12 P 2 16 458.3 ± 8 946.5 32 916.7 ± 17 892.9 426.9 ± 47.4 78.1 ± 43.1
P. potosiensis Speta & F.Fuchs 6 P 2 10 783.3 ± 5 596.2 21 566.7 ± 11 192.4 448.3 ± 71.4 48.5 ± 25.5
P. rectifolia Speta & F.Fuchs 12 P 2 7 775.0 ± 4 331.1 15 550.0 ± 8 662.2 313.3 ± 78.1 52.5 ± 32.2
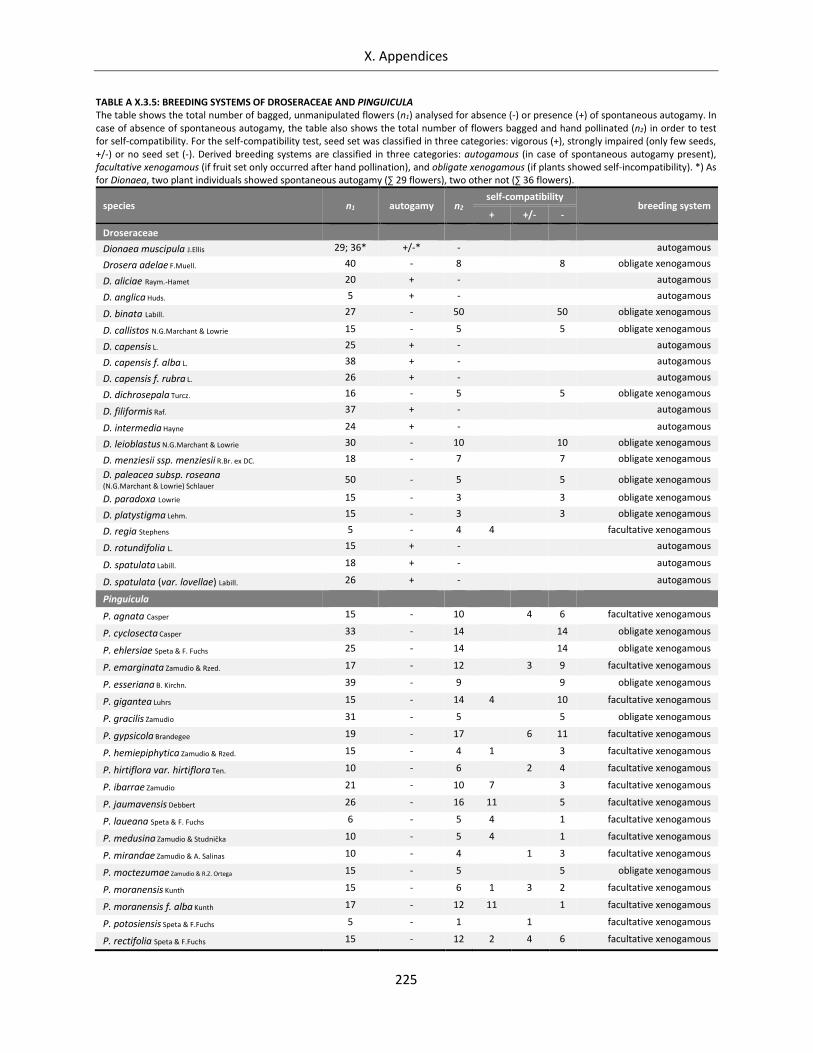
X. Appendices
225
TABLE A X.3.5: BREEDING SYSTEMS OF DROSERACEAE AND PINGUICULA The table shows the total number of bagged, unmanipulated flowers (n1) analysed for absence (-) or presence (+) of spontaneous autogamy. In case of absence of spontaneous autogamy, the table also shows the total number of flowers bagged and hand pollinated (n2) in order to test for self-compatibility. For the self-compatibility test, seed set was classified in three categories: vigorous (+), strongly impaired (only few seeds, +/-) or no seed set (-). Derived breeding systems are classified in three categories: autogamous (in case of spontaneous autogamy present), facultative xenogamous (if fruit set only occurred after hand pollination), and obligate xenogamous (if plants showed self-incompatibility). *) As for Dionaea, two plant individuals showed spontaneous autogamy (∑ 29 flowers), two other not (∑ 36 flowers).
species n1 autogamy n2 self-compatibility
breeding system + +/- -
Droseraceae
Dionaea muscipula J.Ellis 29; 36* +/-* - autogamous
Drosera adelae F.Muell. 40 - 8 8 obligate xenogamous
D. aliciae Raym.-Hamet 20 + - autogamous
D. anglica Huds. 5 + - autogamous
D. binata Labill. 27 - 50 50 obligate xenogamous
D. callistos N.G.Marchant & Lowrie 15 - 5 5 obligate xenogamous
D. capensis L. 25 + - autogamous
D. capensis f. alba L. 38 + - autogamous
D. capensis f. rubra L. 26 + - autogamous
D. dichrosepala Turcz. 16 - 5 5 obligate xenogamous
D. filiformis Raf. 37 + - autogamous
D. intermedia Hayne 24 + - autogamous
D. leioblastus N.G.Marchant & Lowrie 30 - 10 10 obligate xenogamous
D. menziesii ssp. menziesii R.Br. ex DC. 18 - 7 7 obligate xenogamous
D. paleacea subsp. roseana
(N.G.Marchant & Lowrie) Schlauer 50 - 5 5 obligate xenogamous
D. paradoxa Lowrie 15 - 3 3 obligate xenogamous
D. platystigma Lehm. 15 - 3 3 obligate xenogamous
D. regia Stephens 5 - 4 4 facultative xenogamous
D. rotundifolia L. 15 + - autogamous
D. spatulata Labill. 18 + - autogamous
D. spatulata (var. lovellae) Labill. 26 + - autogamous
Pinguicula
P. agnata Casper 15 - 10 4 6 facultative xenogamous
P. cyclosecta Casper 33 - 14 14 obligate xenogamous
P. ehlersiae Speta & F. Fuchs 25 - 14 14 obligate xenogamous
P. emarginata Zamudio & Rzed. 17 - 12 3 9 facultative xenogamous
P. esseriana B. Kirchn. 39 - 9 9 obligate xenogamous
P. gigantea Luhrs 15 - 14 4 10 facultative xenogamous
P. gracilis Zamudio 31 - 5 5 obligate xenogamous
P. gypsicola Brandegee 19 - 17 6 11 facultative xenogamous
P. hemiepiphytica Zamudio & Rzed. 15 - 4 1 3 facultative xenogamous
P. hirtiflora var. hirtiflora Ten. 10 - 6 2 4 facultative xenogamous
P. ibarrae Zamudio 21 - 10 7 3 facultative xenogamous
P. jaumavensis Debbert 26 - 16 11 5 facultative xenogamous
P. laueana Speta & F. Fuchs 6 - 5 4 1 facultative xenogamous
P. medusina Zamudio & Studnička 10 - 5 4 1 facultative xenogamous
P. mirandae Zamudio & A. Salinas 10 - 4 1 3 facultative xenogamous
P. moctezumae Zamudio & R.Z. Ortega 15 - 5 5 obligate xenogamous
P. moranensis Kunth 15 - 6 1 3 2 facultative xenogamous
P. moranensis f. alba Kunth 17 - 12 11 1 facultative xenogamous
P. potosiensis Speta & F.Fuchs 5 - 1 1 facultative xenogamous
P. rectifolia Speta & F.Fuchs 15 - 12 2 4 6 facultative xenogamous
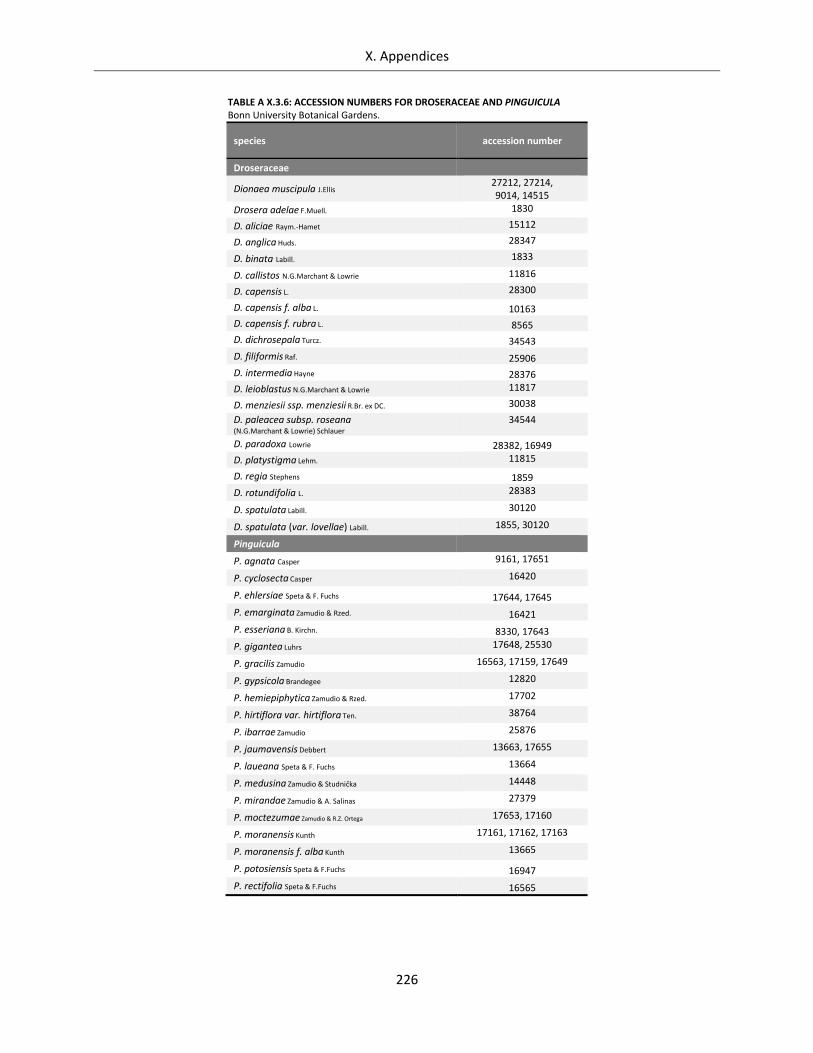
X. Appendices
226
TABLE A X.3.6: ACCESSION NUMBERS FOR DROSERACEAE AND PINGUICULA Bonn University Botanical Gardens.
species accession number
Droseraceae
Dionaea muscipula J.Ellis 27212, 27214, 9014, 14515
Drosera adelae F.Muell. 1830
D. aliciae Raym.-Hamet 15112
D. anglica Huds. 28347
D. binata Labill. 1833
D. callistos N.G.Marchant & Lowrie 11816
D. capensis L. 28300
D. capensis f. alba L. 10163
D. capensis f. rubra L. 8565
D. dichrosepala Turcz. 34543
D. filiformis Raf. 25906
D. intermedia Hayne 28376
D. leioblastus N.G.Marchant & Lowrie 11817
D. menziesii ssp. menziesii R.Br. ex DC. 30038
D. paleacea subsp. roseana
(N.G.Marchant & Lowrie) Schlauer 34544
D. paradoxa Lowrie 28382, 16949
D. platystigma Lehm. 11815
D. regia Stephens 1859
D. rotundifolia L. 28383
D. spatulata Labill. 30120
D. spatulata (var. lovellae) Labill. 1855, 30120
Pinguicula
P. agnata Casper 9161, 17651
P. cyclosecta Casper 16420
P. ehlersiae Speta & F. Fuchs 17644, 17645
P. emarginata Zamudio & Rzed. 16421
P. esseriana B. Kirchn. 8330, 17643
P. gigantea Luhrs 17648, 25530
P. gracilis Zamudio 16563, 17159, 17649
P. gypsicola Brandegee 12820
P. hemiepiphytica Zamudio & Rzed. 17702
P. hirtiflora var. hirtiflora Ten. 38764
P. ibarrae Zamudio 25876
P. jaumavensis Debbert 13663, 17655
P. laueana Speta & F. Fuchs 13664
P. medusina Zamudio & Studnička 14448
P. mirandae Zamudio & A. Salinas 27379
P. moctezumae Zamudio & R.Z. Ortega 17653, 17160
P. moranensis Kunth 17161, 17162, 17163
P. moranensis f. alba Kunth 13665
P. potosiensis Speta & F.Fuchs 16947
P. rectifolia Speta & F.Fuchs 16565
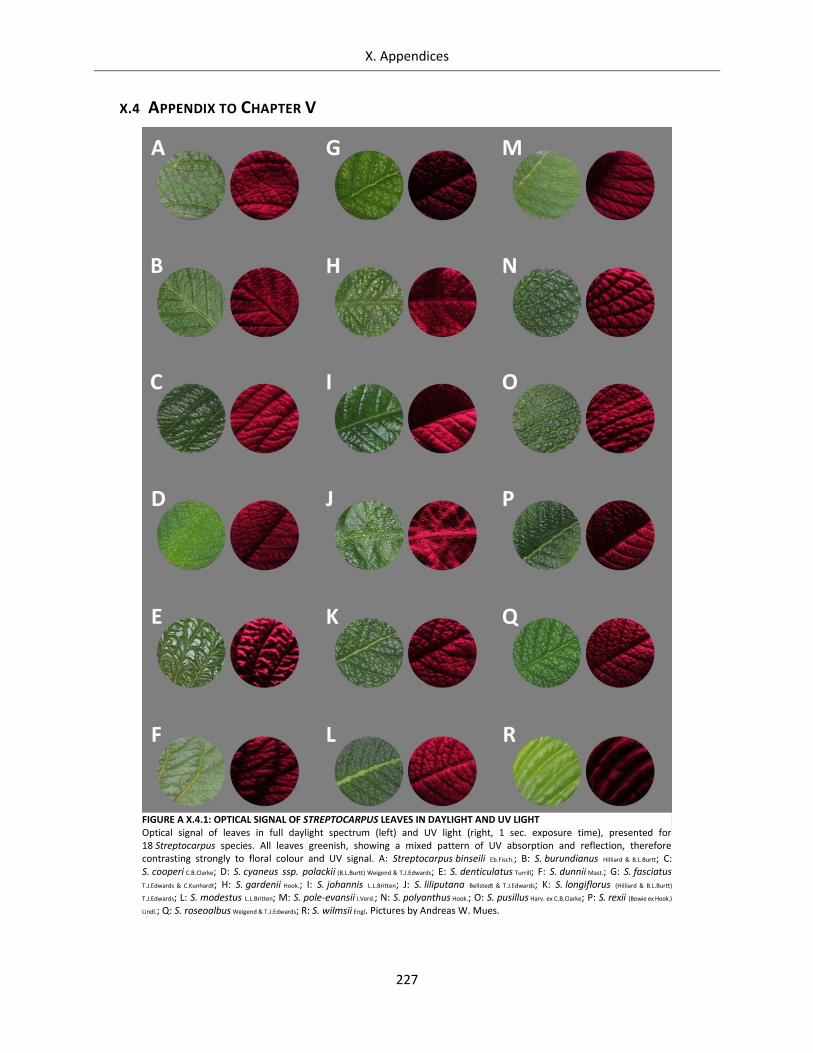
X. Appendices
227
X.4 APPENDIX TO CHAPTER V
FIGURE A X.4.1: OPTICAL SIGNAL OF STREPTOCARPUS LEAVES IN DAYLIGHT AND UV LIGHT Optical signal of leaves in full daylight spectrum (left) and UV light (right, 1 sec. exposure time), presented for 18 Streptocarpus species. All leaves greenish, showing a mixed pattern of UV absorption and reflection, therefore contrasting strongly to floral colour and UV signal. A: Streptocarpus binseili Eb.Fisch.; B: S. burundianus Hilliard & B.L.Burtt; C: S. cooperi C.B.Clarke; D: S. cyaneus ssp. polackii (B.L.Burtt) Weigend & T.J.Edwards; E: S. denticulatus Turrill; F: S. dunnii Mast.; G: S. fasciatus T.J.Edwards & C.Kunhardt; H: S. gardenii Hook.; I: S. johannis L.L.Britten; J: S. liliputana Bellstedt & T.J.Edwards; K: S. longiflorus (Hilliard & B.L.Burtt)
T.J.Edwards; L: S. modestus L.L.Britten; M: S. pole-evansii I.Verd.; N: S. polyanthus Hook.; O: S. pusillus Harv. ex C.B.Clarke; P: S. rexii (Bowie ex Hook.)
Lindl.; Q: S. roseoalbus Weigend & T.J.Edwards; R: S. wilmsii Engl. Pictures by Andreas W. Mues.
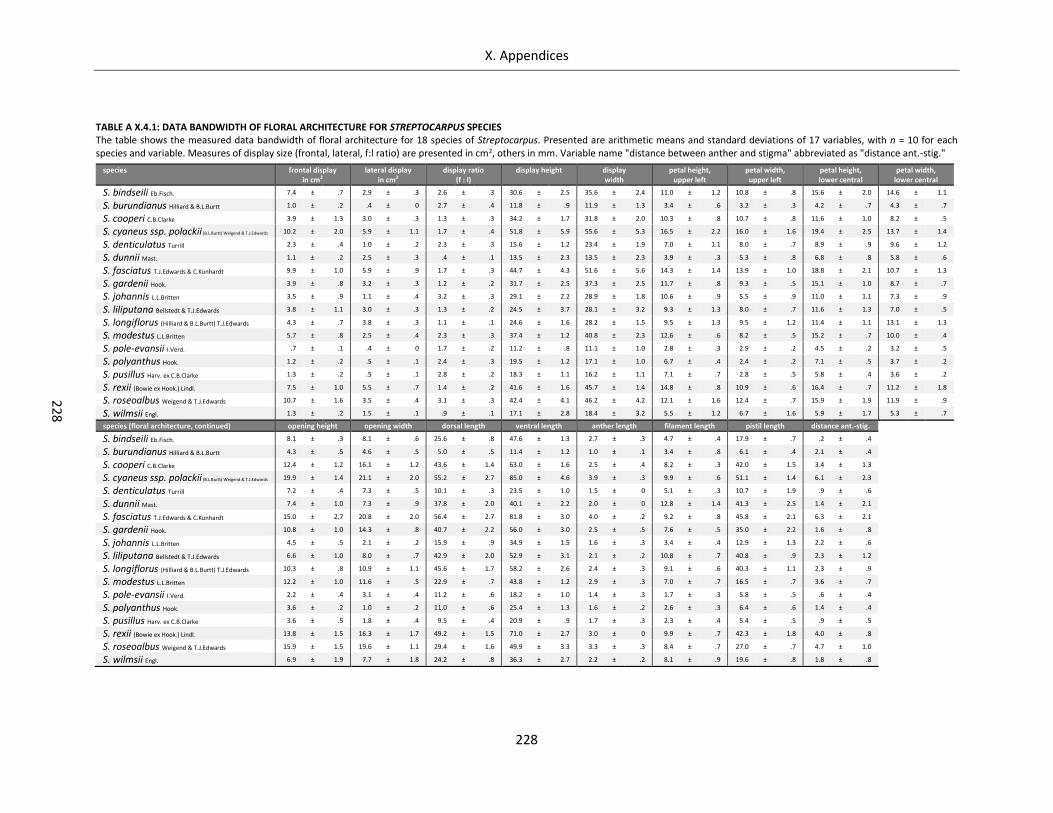
X. Appendices
228
22
8
TABLE A X.4.1: DATA BANDWIDTH OF FLORAL ARCHITECTURE FOR STREPTOCARPUS SPECIES The table shows the measured data bandwidth of floral architecture for 18 species of Streptocarpus. Presented are arithmetic means and standard deviations of 17 variables, with n = 10 for each species and variable. Measures of display size (frontal, lateral, f:l ratio) are presented in cm2, others in mm. Variable name "distance between anther and stigma" abbreviated as "distance ant.-stig."
species frontal display in cm2
lateral display in cm2
display ratio (f : l)
display height display width
petal height, upper left
petal width, upper left
petal height, lower central
petal width, lower central
S. bindseili Eb.Fisch. 7.4 ± .7 2.9 ± .3 2.6 ± .3 30.6 ± 2.5 35.6 ± 2.4 11.0 ± 1.2 10.8 ± .8 15.6 ± 2.0 14.6 ± 1.1
S. burundianus Hilliard & B.L.Burtt 1.0 ± .2 .4 ± 0 2.7 ± .4 11.8 ± .9 11.9 ± 1.3 3.4 ± .6 3.2 ± .3 4.2 ± .7 4.3 ± .7
S. cooperi C.B.Clarke 3.9 ± 1.3 3.0 ± .3 1.3 ± .3 34.2 ± 1.7 31.8 ± 2.0 10.3 ± .8 10.7 ± .8 11.6 ± 1.0 8.2 ± .5
S. cyaneus ssp. polackii (B.L.Burtt) Weigend & T.J.Edwards 10.2 ± 2.0 5.9 ± 1.1 1.7 ± .4 51.8 ± 5.9 55.6 ± 5.3 16.5 ± 2.2 16.0 ± 1.6 19.4 ± 2.5 13.7 ± 1.4
S. denticulatus Turrill 2.3 ± .4 1.0 ± .2 2.3 ± .3 15.6 ± 1.2 23.4 ± 1.9 7.0 ± 1.1 8.0 ± .7 8.9 ± .9 9.6 ± 1.2
S. dunnii Mast. 1.1 ± .2 2.5 ± .3 .4 ± .1 13.5 ± 2.3 13.5 ± 2.3 3.9 ± .3 5.3 ± .8 6.8 ± .8 5.8 ± .6
S. fasciatus T.J.Edwards & C.Kunhardt 9.9 ± 1.0 5.9 ± .9 1.7 ± .3 44.7 ± 4.3 51.6 ± 5.6 14.3 ± 1.4 13.9 ± 1.0 18.8 ± 2.1 10.7 ± 1.3
S. gardenii Hook. 3.9 ± .8 3.2 ± .3 1.2 ± .2 31.7 ± 2.5 37.3 ± 2.5 11.7 ± .8 9.3 ± .5 15.1 ± 1.0 8.7 ± .7
S. johannis L.L.Britten 3.5 ± .9 1.1 ± .4 3.2 ± .3 29.1 ± 2.2 28.9 ± 1.8 10.6 ± .9 5.5 ± .9 11.0 ± 1.1 7.3 ± .9
S. liliputana Bellstedt & T.J.Edwards 3.8 ± 1.1 3.0 ± .3 1.3 ± .2 24.5 ± 3.7 28.1 ± 3.2 9.3 ± 1.3 8.0 ± .7 11.6 ± 1.3 7.0 ± .5
S. longiflorus (Hilliard & B.L.Burtt) T.J.Edwards 4.3 ± .7 3.8 ± .3 1.1 ± .1 24.6 ± 1.6 28.2 ± 1.5 9.5 ± 1.3 9.5 ± 1.2 11.4 ± 1.1 13.1 ± 1.3
S. modestus L.L.Britten 5.7 ± .8 2.5 ± .4 2.3 ± .3 37.4 ± 1.2 40.8 ± 2.3 12.6 ± .6 8.2 ± .5 15.2 ± .7 10.0 ± .4
S. pole-evansii I.Verd. .7 ± .1 .4 ± 0 1.7 ± .2 11.2 ± .8 11.1 ± 1.0 2.8 ± .3 2.9 ± .2 4.5 ± .2 3.2 ± .5
S. polyanthus Hook. 1.2 ± .2 .5 ± .1 2.4 ± .3 19.5 ± 1.2 17.1 ± 1.0 6.7 ± .4 2.4 ± .2 7.1 ± .5 3.7 ± .2
S. pusillus Harv. ex C.B.Clarke 1.3 ± .2 .5 ± .1 2.8 ± .2 18.3 ± 1.1 16.2 ± 1.1 7.1 ± .7 2.8 ± .5 5.8 ± .4 3.6 ± .2
S. rexii (Bowie ex Hook.) Lindl. 7.5 ± 1.0 5.5 ± .7 1.4 ± .2 41.6 ± 1.6 45.7 ± 1.4 14.8 ± .8 10.9 ± .6 16.4 ± .7 11.2 ± 1.8
S. roseoalbus Weigend & T.J.Edwards 10.7 ± 1.6 3.5 ± .4 3.1 ± .3 42.4 ± 4.1 46.2 ± 4.2 12.1 ± 1.6 12.4 ± .7 15.9 ± 1.9 11.9 ± .9
S. wilmsii Engl. 1.3 ± .2 1.5 ± .1 .9 ± .1 17.1 ± 2.8 18.4 ± 3.2 5.5 ± 1.2 6.7 ± 1.6 5.9 ± 1.7 5.3 ± .7
species (floral architecture, continued) opening height opening width dorsal length ventral length anther length filament length pistil length distance ant.-stig.
S. bindseili Eb.Fisch. 8.1 ± .3 8.1 ± .6 25.6 ± .8 47.6 ± 1.3 2.7 ± .3 4.7 ± .4 17.9 ± .7 .2 ± .4
S. burundianus Hilliard & B.L.Burtt 4.3 ± .5 4.6 ± .5 5.0 ± .5 11.4 ± 1.2 1.0 ± .1 3.4 ± .8 6.1 ± .4 2.1 ± .4
S. cooperi C.B.Clarke 12.4 ± 1.2 16.1 ± 1.2 43.6 ± 1.4 63.0 ± 1.6 2.5 ± .4 8.2 ± .3 42.0 ± 1.5 3.4 ± 1.3
S. cyaneus ssp. polackii (B.L.Burtt) Weigend & T.J.Edwards 19.9 ± 1.4 21.1 ± 2.0 55.2 ± 2.7 85.0 ± 4.6 3.9 ± .3 9.9 ± .6 51.1 ± 1.4 6.1 ± 2.3
S. denticulatus Turrill 7.2 ± .4 7.3 ± .5 10.1 ± .3 23.5 ± 1.0 1.5 ± 0 5.1 ± .3 10.7 ± 1.9 .9 ± .6
S. dunnii Mast. 7.4 ± 1.0 7.3 ± .9 37.8 ± 2.0 40.1 ± 2.2 2.0 ± 0 12.8 ± 1.4 41.3 ± 2.5 1.4 ± 2.1
S. fasciatus T.J.Edwards & C.Kunhardt 15.0 ± 2.7 20.8 ± 2.0 56.4 ± 2.7 81.8 ± 3.0 4.0 ± .2 9.2 ± .8 45.8 ± 2.1 6.3 ± 2.1
S. gardenii Hook. 10.8 ± 1.0 14.3 ± .8 40.7 ± 2.2 56.0 ± 3.0 2.5 ± .5 7.6 ± .5 35.0 ± 2.2 1.6 ± .8
S. johannis L.L.Britten 4.5 ± .5 2.1 ± .2 15.9 ± .9 34.9 ± 1.5 1.6 ± .3 3.4 ± .4 12.9 ± 1.3 2.2 ± .6
S. liliputana Bellstedt & T.J.Edwards 6.6 ± 1.0 8.0 ± .7 42.9 ± 2.0 52.9 ± 3.1 2.1 ± .2 10.8 ± .7 40.8 ± .9 2.3 ± 1.2
S. longiflorus (Hilliard & B.L.Burtt) T.J.Edwards 10.3 ± .8 10.9 ± 1.1 45.6 ± 1.7 58.2 ± 2.6 2.4 ± .3 9.1 ± .6 40.3 ± 1.1 2.3 ± .9
S. modestus L.L.Britten 12.2 ± 1.0 11.6 ± .5 22.9 ± .7 43.8 ± 1.2 2.9 ± .3 7.0 ± .7 16.5 ± .7 3.6 ± .7
S. pole-evansii I.Verd. 2.2 ± .4 3.1 ± .4 11.2 ± .6 18.2 ± 1.0 1.4 ± .3 1.7 ± .3 5.8 ± .5 .6 ± .4
S. polyanthus Hook. 3.6 ± .2 1.0 ± .2 11.0 ± .6 25.4 ± 1.3 1.6 ± .2 2.6 ± .3 6.4 ± .6 1.4 ± .4
S. pusillus Harv. ex C.B.Clarke 3.6 ± .5 1.8 ± .4 9.5 ± .4 20.9 ± .9 1.7 ± .3 2.3 ± .4 5.4 ± .5 .9 ± .5
S. rexii (Bowie ex Hook.) Lindl. 13.8 ± 1.5 16.3 ± 1.7 49.2 ± 1.5 71.0 ± 2.7 3.0 ± 0 9.9 ± .7 42.3 ± 1.8 4.0 ± .8
S. roseoalbus Weigend & T.J.Edwards 15.9 ± 1.5 19.6 ± 1.1 29.4 ± 1.6 49.9 ± 3.3 3.3 ± .3 8.4 ± .7 27.0 ± .7 4.7 ± 1.0
S. wilmsii Engl. 6.9 ± 1.9 7.7 ± 1.8 24.2 ± .8 36.3 ± 2.7 2.2 ± .2 8.1 ± .9 19.6 ± .8 1.8 ± .8
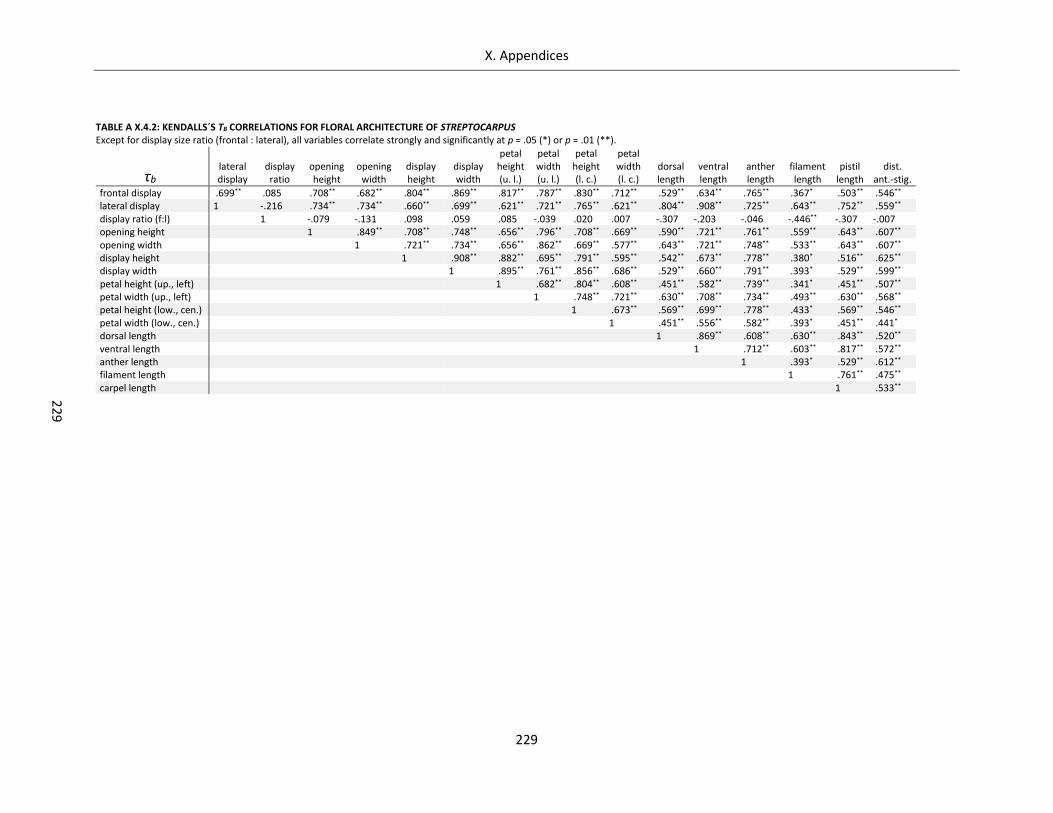
X. Appendices
229
22
9
TABLE A X.4.2: KENDALLS´S ΤB CORRELATIONS FOR FLORAL ARCHITECTURE OF STREPTOCARPUS Except for display size ratio (frontal : lateral), all variables correlate strongly and significantly at p = .05 (*) or p = .01 (**).
τb lateral display
display ratio
opening height
opening width
display height
display width
petal height (u. l.)
petal width (u. l.)
petal height (l. c.)
petal width (l. c.)
dorsal length
ventral length
anther length
filament length
pistil length
dist. ant.-stig.
frontal display .699** .085 .708** .682** .804** .869** .817** .787** .830** .712** .529** .634** .765** .367* .503** .546** lateral display 1 -.216 .734** .734** .660** .699** .621** .721** .765** .621** .804** .908** .725** .643** .752** .559** display ratio (f:l) 1 -.079 -.131 .098 .059 .085 -.039 .020 .007 -.307 -.203 -.046 -.446** -.307 -.007 opening height 1 .849** .708** .748** .656** .796** .708** .669** .590** .721** .761** .559** .643** .607** opening width 1 .721** .734** .656** .862** .669** .577** .643** .721** .748** .533** .643** .607** display height 1 .908** .882** .695** .791** .595** .542** .673** .778** .380* .516** .625** display width 1 .895** .761** .856** .686** .529** .660** .791** .393* .529** .599** petal height (up., left) 1 .682** .804** .608** .451** .582** .739** .341* .451** .507** petal width (up., left) 1 .748** .721** .630** .708** .734** .493** .630** .568** petal height (low., cen.) 1 .673** .569** .699** .778** .433* .569** .546** petal width (low., cen.) 1 .451** .556** .582** .393* .451** .441* dorsal length 1 .869** .608** .630** .843** .520** ventral length 1 .712** .603** .817** .572** anther length 1 .393* .529** .612** filament length 1 .761** .475** carpel length 1 .533**
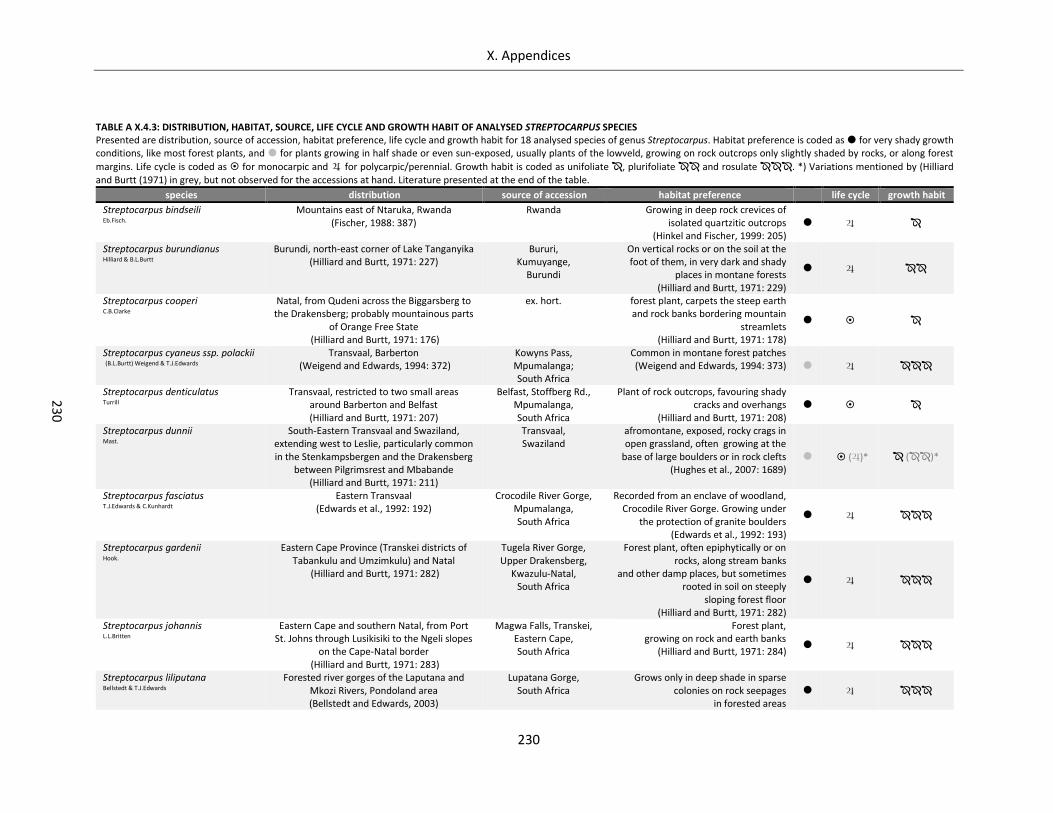
X. Appendices
230
23
0
TABLE A X.4.3: DISTRIBUTION, HABITAT, SOURCE, LIFE CYCLE AND GROWTH HABIT OF ANALYSED STREPTOCARPUS SPECIES Presented are distribution, source of accession, habitat preference, life cycle and growth habit for 18 analysed species of genus Streptocarpus. Habitat preference is coded as for very shady growth conditions, like most forest plants, and for plants growing in half shade or even sun-exposed, usually plants of the lowveld, growing on rock outcrops only slightly shaded by rocks, or along forest
margins. Life cycle is coded as for monocarpic and for polycarpic/perennial. Growth habit is coded as unifoliate , plurifoliate and rosulate . *) Variations mentioned by (Hilliard and Burtt (1971) in grey, but not observed for the accessions at hand. Literature presented at the end of the table.
species distribution source of accession habitat preference life cycle growth habit
Streptocarpus bindseili Eb.Fisch.
Mountains east of Ntaruka, Rwanda (Fischer, 1988: 387)
Rwanda Growing in deep rock crevices of isolated quartzitic outcrops
(Hinkel and Fischer, 1999: 205)
Streptocarpus burundianus Hilliard & B.L.Burtt
Burundi, north-east corner of Lake Tanganyika (Hilliard and Burtt, 1971: 227)
Bururi, Kumuyange,
Burundi
On vertical rocks or on the soil at the foot of them, in very dark and shady
places in montane forests (Hilliard and Burtt, 1971: 229)
Streptocarpus cooperi C.B.Clarke
Natal, from Qudeni across the Biggarsberg to the Drakensberg; probably mountainous parts
of Orange Free State (Hilliard and Burtt, 1971: 176)
ex. hort. forest plant, carpets the steep earth and rock banks bordering mountain
streamlets (Hilliard and Burtt, 1971: 178)
Streptocarpus cyaneus ssp. polackii (B.L.Burtt) Weigend & T.J.Edwards
Transvaal, Barberton (Weigend and Edwards, 1994: 372)
Kowyns Pass, Mpumalanga; South Africa
Common in montane forest patches (Weigend and Edwards, 1994: 373)
Streptocarpus denticulatus Turrill
Transvaal, restricted to two small areas around Barberton and Belfast (Hilliard and Burtt, 1971: 207)
Belfast, Stoffberg Rd., Mpumalanga, South Africa
Plant of rock outcrops, favouring shady cracks and overhangs
(Hilliard and Burtt, 1971: 208)
Streptocarpus dunnii Mast.
South-Eastern Transvaal and Swaziland, extending west to Leslie, particularly common in the Stenkampsbergen and the Drakensberg
between Pilgrimsrest and Mbabande (Hilliard and Burtt, 1971: 211)
Transvaal, Swaziland
afromontane, exposed, rocky crags in open grassland, often growing at the
base of large boulders or in rock clefts (Hughes et al., 2007: 1689)
()* ()*
Streptocarpus fasciatus T.J.Edwards & C.Kunhardt
Eastern Transvaal (Edwards et al., 1992: 192)
Crocodile River Gorge, Mpumalanga, South Africa
Recorded from an enclave of woodland, Crocodile River Gorge. Growing under
the protection of granite boulders (Edwards et al., 1992: 193)
Streptocarpus gardenii Hook.
Eastern Cape Province (Transkei districts of Tabankulu and Umzimkulu) and Natal
(Hilliard and Burtt, 1971: 282)
Tugela River Gorge, Upper Drakensberg,
Kwazulu-Natal, South Africa
Forest plant, often epiphytically or on rocks, along stream banks
and other damp places, but sometimes rooted in soil on steeply
sloping forest floor (Hilliard and Burtt, 1971: 282)
Streptocarpus johannis L.L.Britten
Eastern Cape and southern Natal, from Port St. Johns through Lusikisiki to the Ngeli slopes
on the Cape-Natal border (Hilliard and Burtt, 1971: 283)
Magwa Falls, Transkei, Eastern Cape, South Africa
Forest plant, growing on rock and earth banks
(Hilliard and Burtt, 1971: 284)
Streptocarpus liliputana Bellstedt & T.J.Edwards
Forested river gorges of the Laputana and Mkozi Rivers, Pondoland area (Bellstedt and Edwards, 2003)
Lupatana Gorge, South Africa
Grows only in deep shade in sparse colonies on rock seepages
in forested areas
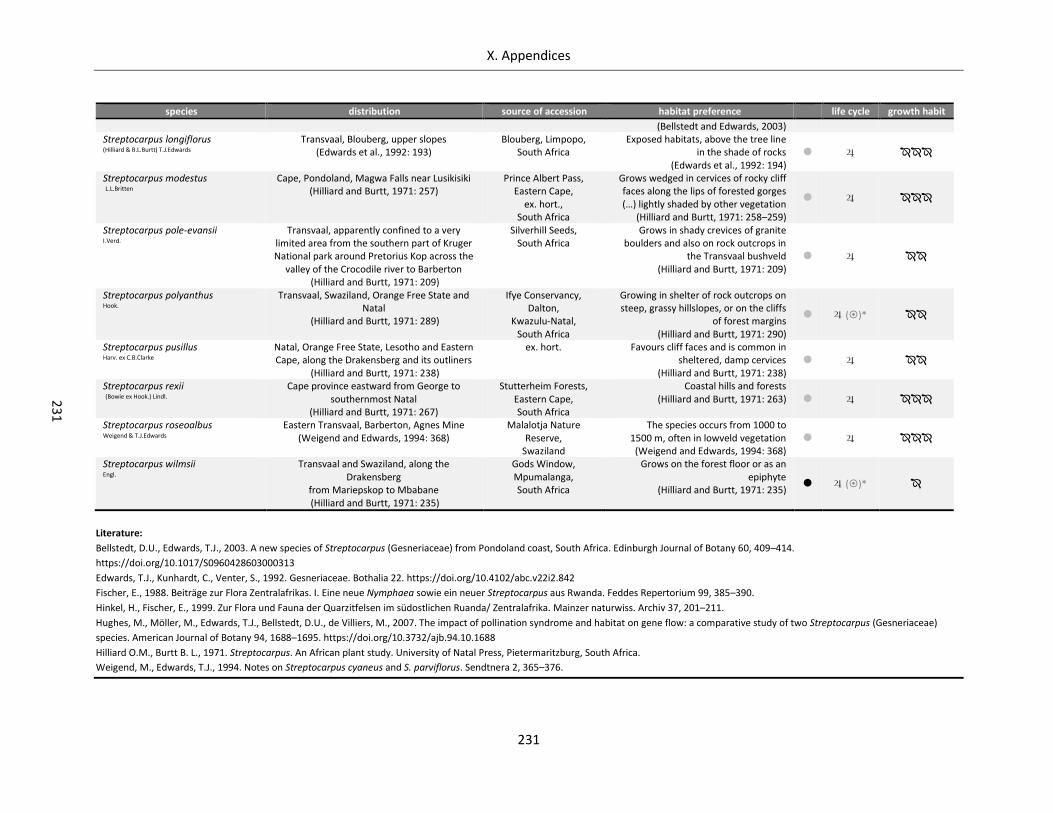
X. Appendices
231
23
1
species distribution source of accession habitat preference life cycle growth habit
(Bellstedt and Edwards, 2003) Streptocarpus longiflorus (Hilliard & B.L.Burtt) T.J.Edwards
Transvaal, Blouberg, upper slopes (Edwards et al., 1992: 193)
Blouberg, Limpopo, South Africa
Exposed habitats, above the tree line in the shade of rocks
(Edwards et al., 1992: 194)
Streptocarpus modestus L.L.Britten
Cape, Pondoland, Magwa Falls near Lusikisiki (Hilliard and Burtt, 1971: 257)
Prince Albert Pass, Eastern Cape,
ex. hort., South Africa
Grows wedged in cervices of rocky cliff faces along the lips of forested gorges (…) lightly shaded by other vegetation
(Hilliard and Burtt, 1971: 258–259)
Streptocarpus pole-evansii I.Verd.
Transvaal, apparently confined to a very limited area from the southern part of Kruger National park around Pretorius Kop across the
valley of the Crocodile river to Barberton (Hilliard and Burtt, 1971: 209)
Silverhill Seeds, South Africa
Grows in shady crevices of granite boulders and also on rock outcrops in
the Transvaal bushveld (Hilliard and Burtt, 1971: 209)
Streptocarpus polyanthus Hook.
Transvaal, Swaziland, Orange Free State and Natal
(Hilliard and Burtt, 1971: 289)
Ifye Conservancy, Dalton,
Kwazulu-Natal, South Africa
Growing in shelter of rock outcrops on steep, grassy hillslopes, or on the cliffs
of forest margins (Hilliard and Burtt, 1971: 290)
()*
Streptocarpus pusillus Harv. ex C.B.Clarke
Natal, Orange Free State, Lesotho and Eastern Cape, along the Drakensberg and its outliners
(Hilliard and Burtt, 1971: 238)
ex. hort. Favours cliff faces and is common in sheltered, damp cervices
(Hilliard and Burtt, 1971: 238)
Streptocarpus rexii (Bowie ex Hook.) Lindl.
Cape province eastward from George to southernmost Natal
(Hilliard and Burtt, 1971: 267)
Stutterheim Forests, Eastern Cape, South Africa
Coastal hills and forests (Hilliard and Burtt, 1971: 263)
Streptocarpus roseoalbus Weigend & T.J.Edwards
Eastern Transvaal, Barberton, Agnes Mine (Weigend and Edwards, 1994: 368)
Malalotja Nature Reserve,
Swaziland
The species occurs from 1000 to 1500 m, often in lowveld vegetation (Weigend and Edwards, 1994: 368)
Streptocarpus wilmsii Engl.
Transvaal and Swaziland, along the Drakensberg
from Mariepskop to Mbabane (Hilliard and Burtt, 1971: 235)
Gods Window, Mpumalanga, South Africa
Grows on the forest floor or as an epiphyte
(Hilliard and Burtt, 1971: 235) ()*
Literature:
Bellstedt, D.U., Edwards, T.J., 2003. A new species of Streptocarpus (Gesneriaceae) from Pondoland coast, South Africa. Edinburgh Journal of Botany 60, 409–414.
https://doi.org/10.1017/S0960428603000313
Edwards, T.J., Kunhardt, C., Venter, S., 1992. Gesneriaceae. Bothalia 22. https://doi.org/10.4102/abc.v22i2.842
Fischer, E., 1988. Beiträge zur Flora Zentralafrikas. I. Eine neue Nymphaea sowie ein neuer Streptocarpus aus Rwanda. Feddes Repertorium 99, 385–390.
Hinkel, H., Fischer, E., 1999. Zur Flora und Fauna der Quarzitfelsen im südostlichen Ruanda/ Zentralafrika. Mainzer naturwiss. Archiv 37, 201–211.
Hughes, M., Möller, M., Edwards, T.J., Bellstedt, D.U., de Villiers, M., 2007. The impact of pollination syndrome and habitat on gene flow: a comparative study of two Streptocarpus (Gesneriaceae)
species. American Journal of Botany 94, 1688–1695. https://doi.org/10.3732/ajb.94.10.1688
Hilliard O.M., Burtt B. L., 1971. Streptocarpus. An African plant study. University of Natal Press, Pietermaritzburg, South Africa.
Weigend, M., Edwards, T.J., 1994. Notes on Streptocarpus cyaneus and S. parviflorus. Sendtnera 2, 365–376.
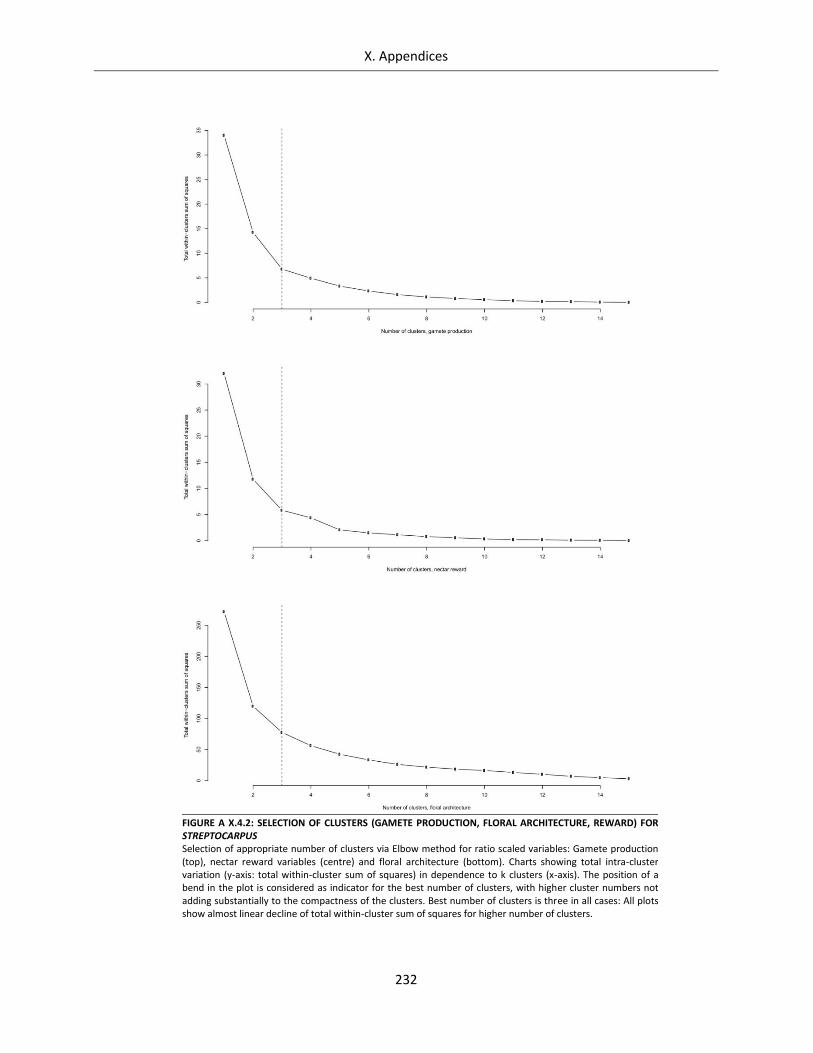
X. Appendices
232
FIGURE A X.4.2: SELECTION OF CLUSTERS (GAMETE PRODUCTION, FLORAL ARCHITECTURE, REWARD) FOR STREPTOCARPUS Selection of appropriate number of clusters via Elbow method for ratio scaled variables: Gamete production (top), nectar reward variables (centre) and floral architecture (bottom). Charts showing total intra-cluster variation (y-axis: total within-cluster sum of squares) in dependence to k clusters (x-axis). The position of a bend in the plot is considered as indicator for the best number of clusters, with higher cluster numbers not adding substantially to the compactness of the clusters. Best number of clusters is three in all cases: All plots show almost linear decline of total within-cluster sum of squares for higher number of clusters.
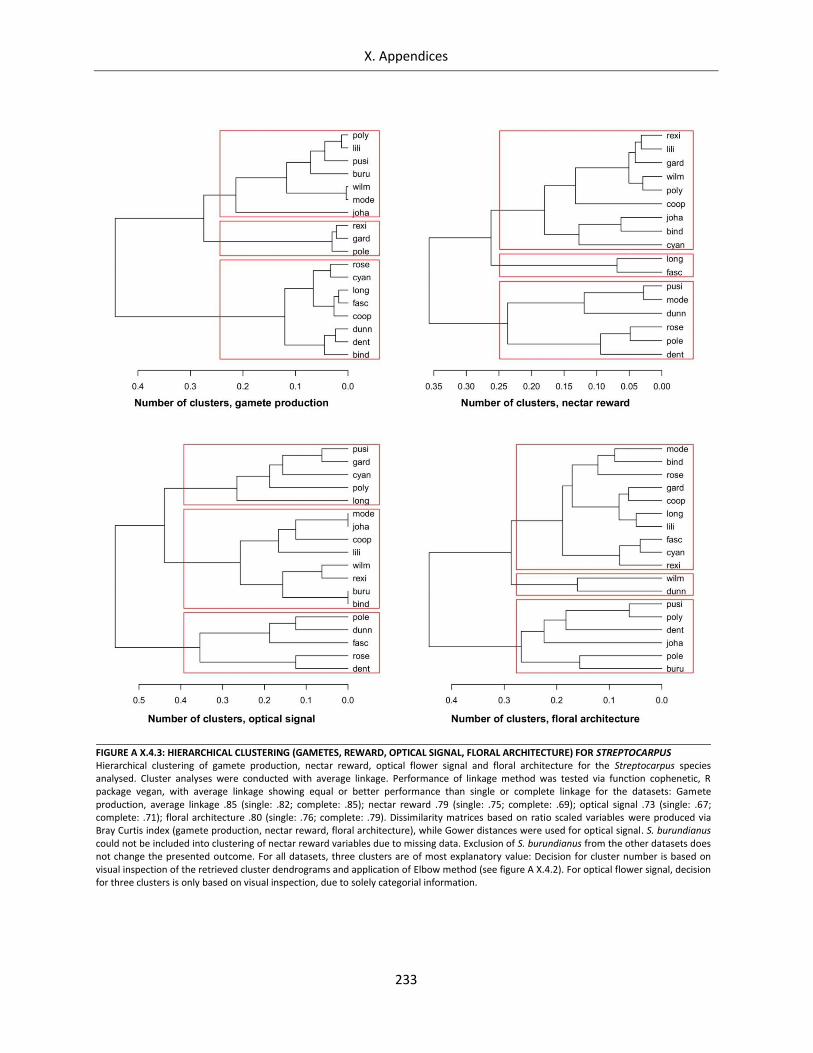
X. Appendices
233
FIGURE A X.4.3: HIERARCHICAL CLUSTERING (GAMETES, REWARD, OPTICAL SIGNAL, FLORAL ARCHITECTURE) FOR STREPTOCARPUS Hierarchical clustering of gamete production, nectar reward, optical flower signal and floral architecture for the Streptocarpus species analysed. Cluster analyses were conducted with average linkage. Performance of linkage method was tested via function cophenetic, R package vegan, with average linkage showing equal or better performance than single or complete linkage for the datasets: Gamete production, average linkage .85 (single: .82; complete: .85); nectar reward .79 (single: .75; complete: .69); optical signal .73 (single: .67; complete: .71); floral architecture .80 (single: .76; complete: .79). Dissimilarity matrices based on ratio scaled variables were produced via Bray Curtis index (gamete production, nectar reward, floral architecture), while Gower distances were used for optical signal. S. burundianus could not be included into clustering of nectar reward variables due to missing data. Exclusion of S. burundianus from the other datasets does not change the presented outcome. For all datasets, three clusters are of most explanatory value: Decision for cluster number is based on visual inspection of the retrieved cluster dendrograms and application of Elbow method (see figure A X.4.2). For optical flower signal, decision for three clusters is only based on visual inspection, due to solely categorial information.
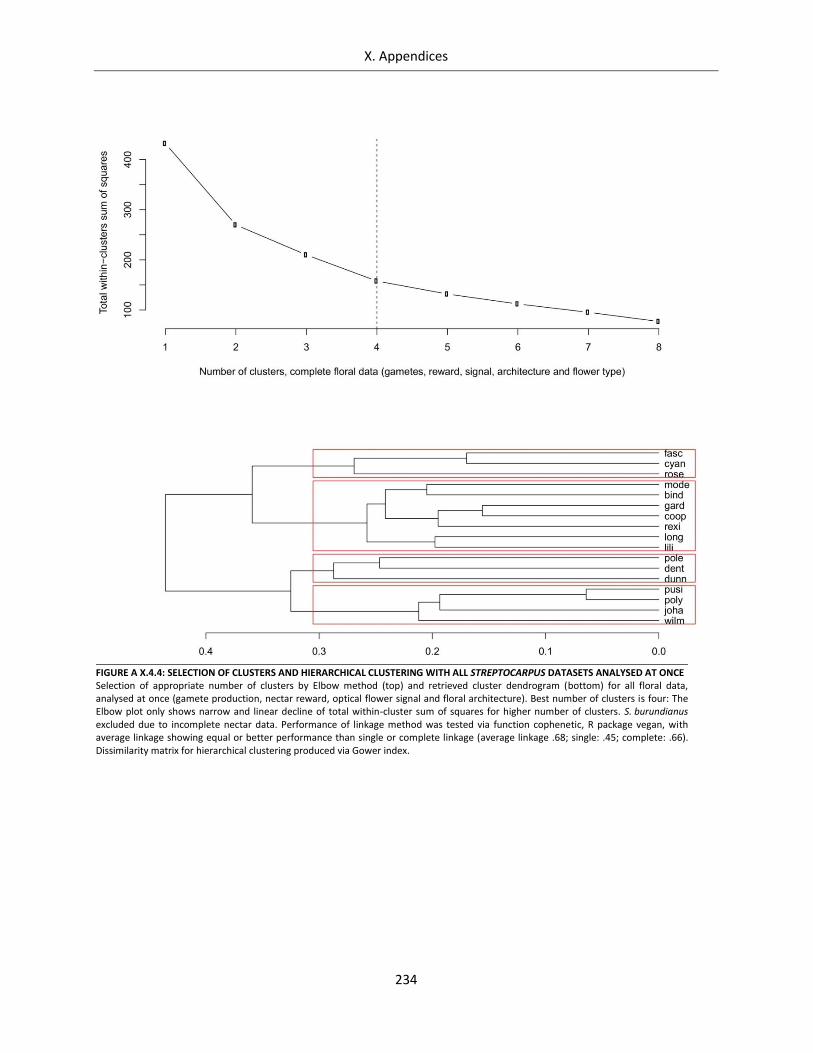
X. Appendices
234
FIGURE A X.4.4: SELECTION OF CLUSTERS AND HIERARCHICAL CLUSTERING WITH ALL STREPTOCARPUS DATASETS ANALYSED AT ONCE Selection of appropriate number of clusters by Elbow method (top) and retrieved cluster dendrogram (bottom) for all floral data, analysed at once (gamete production, nectar reward, optical flower signal and floral architecture). Best number of clusters is four: The Elbow plot only shows narrow and linear decline of total within-cluster sum of squares for higher number of clusters. S. burundianus excluded due to incomplete nectar data. Performance of linkage method was tested via function cophenetic, R package vegan, with average linkage showing equal or better performance than single or complete linkage (average linkage .68; single: .45; complete: .66). Dissimilarity matrix for hierarchical clustering produced via Gower index.
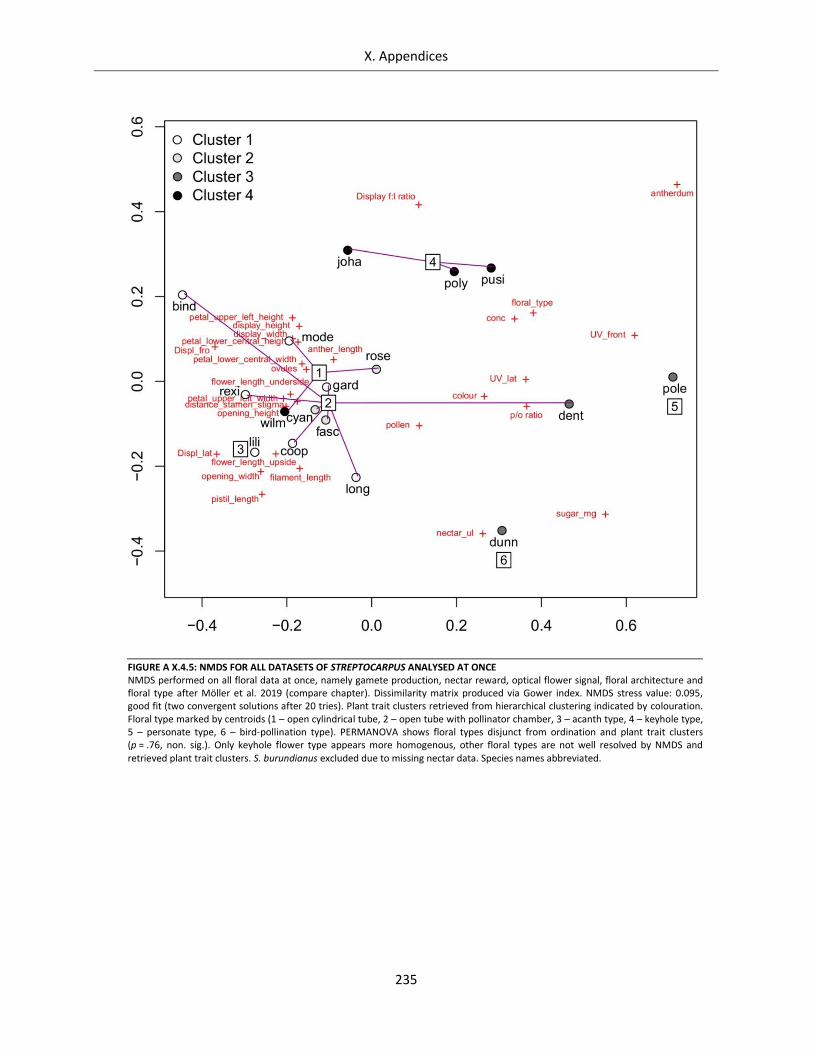
X. Appendices
235
FIGURE A X.4.5: NMDS FOR ALL DATASETS OF STREPTOCARPUS ANALYSED AT ONCE NMDS performed on all floral data at once, namely gamete production, nectar reward, optical flower signal, floral architecture and floral type after Möller et al. 2019 (compare chapter). Dissimilarity matrix produced via Gower index. NMDS stress value: 0.095, good fit (two convergent solutions after 20 tries). Plant trait clusters retrieved from hierarchical clustering indicated by colouration. Floral type marked by centroids (1 – open cylindrical tube, 2 – open tube with pollinator chamber, 3 – acanth type, 4 – keyhole type, 5 – personate type, 6 – bird-pollination type). PERMANOVA shows floral types disjunct from ordination and plant trait clusters (p = .76, non. sig.). Only keyhole flower type appears more homogenous, other floral types are not well resolved by NMDS and retrieved plant trait clusters. S. burundianus excluded due to missing nectar data. Species names abbreviated.
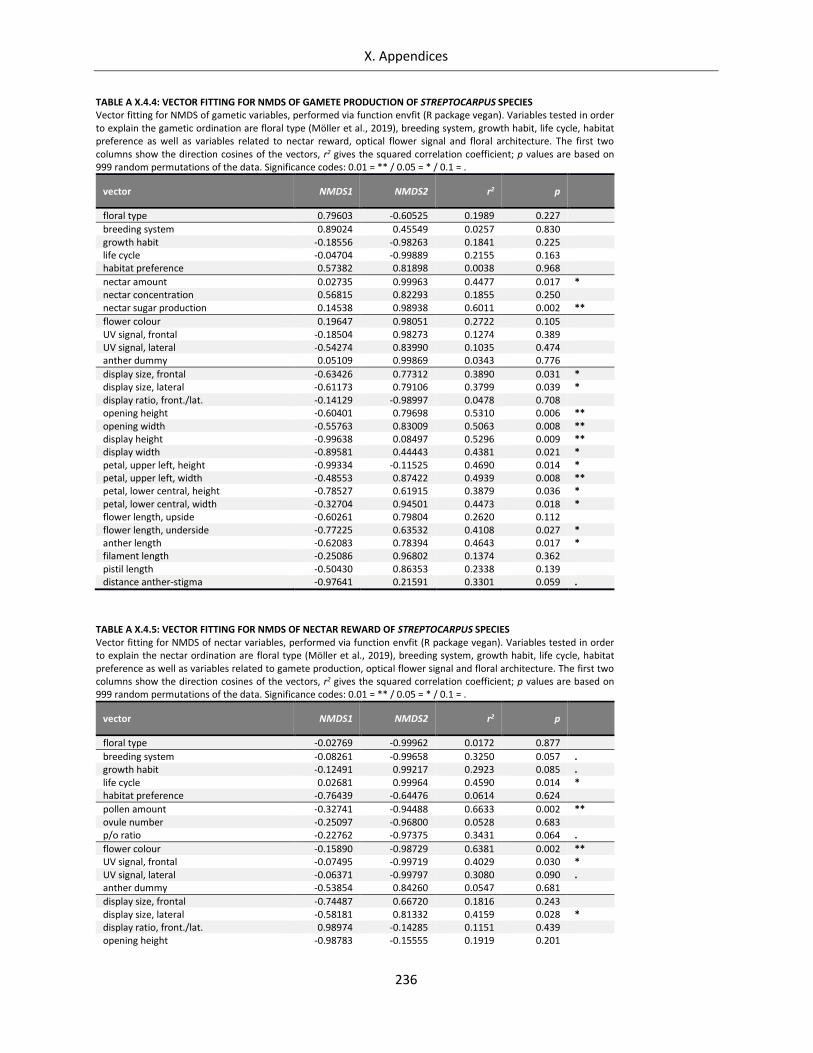
X. Appendices
236
TABLE A X.4.4: VECTOR FITTING FOR NMDS OF GAMETE PRODUCTION OF STREPTOCARPUS SPECIES Vector fitting for NMDS of gametic variables, performed via function envfit (R package vegan). Variables tested in order to explain the gametic ordination are floral type (Möller et al., 2019), breeding system, growth habit, life cycle, habitat preference as well as variables related to nectar reward, optical flower signal and floral architecture. The first two columns show the direction cosines of the vectors, r2 gives the squared correlation coefficient; p values are based on 999 random permutations of the data. Significance codes: 0.01 = ** / 0.05 = * / 0.1 = .
vector NMDS1 NMDS2 r2 p
floral type 0.79603 -0.60525 0.1989 0.227
breeding system 0.89024 0.45549 0.0257 0.830 growth habit -0.18556 -0.98263 0.1841 0.225 life cycle -0.04704 -0.99889 0.2155 0.163 habitat preference 0.57382 0.81898 0.0038 0.968
nectar amount 0.02735 0.99963 0.4477 0.017 * nectar concentration 0.56815 0.82293 0.1855 0.250 nectar sugar production 0.14538 0.98938 0.6011 0.002 **
flower colour 0.19647 0.98051 0.2722 0.105 UV signal, frontal -0.18504 0.98273 0.1274 0.389 UV signal, lateral -0.54274 0.83990 0.1035 0.474 anther dummy 0.05109 0.99869 0.0343 0.776
display size, frontal -0.63426 0.77312 0.3890 0.031 * display size, lateral -0.61173 0.79106 0.3799 0.039 * display ratio, front./lat. -0.14129 -0.98997 0.0478 0.708 opening height -0.60401 0.79698 0.5310 0.006 ** opening width -0.55763 0.83009 0.5063 0.008 ** display height -0.99638 0.08497 0.5296 0.009 ** display width -0.89581 0.44443 0.4381 0.021 * petal, upper left, height -0.99334 -0.11525 0.4690 0.014 * petal, upper left, width -0.48553 0.87422 0.4939 0.008 ** petal, lower central, height -0.78527 0.61915 0.3879 0.036 * petal, lower central, width -0.32704 0.94501 0.4473 0.018 * flower length, upside -0.60261 0.79804 0.2620 0.112 flower length, underside -0.77225 0.63532 0.4108 0.027 * anther length -0.62083 0.78394 0.4643 0.017 * filament length -0.25086 0.96802 0.1374 0.362 pistil length -0.50430 0.86353 0.2338 0.139 distance anther-stigma -0.97641 0.21591 0.3301 0.059 .
TABLE A X.4.5: VECTOR FITTING FOR NMDS OF NECTAR REWARD OF STREPTOCARPUS SPECIES Vector fitting for NMDS of nectar variables, performed via function envfit (R package vegan). Variables tested in order to explain the nectar ordination are floral type (Möller et al., 2019), breeding system, growth habit, life cycle, habitat preference as well as variables related to gamete production, optical flower signal and floral architecture. The first two columns show the direction cosines of the vectors, r2 gives the squared correlation coefficient; p values are based on 999 random permutations of the data. Significance codes: 0.01 = ** / 0.05 = * / 0.1 = .
vector NMDS1 NMDS2 r2 p
floral type -0.02769 -0.99962 0.0172 0.877
breeding system -0.08261 -0.99658 0.3250 0.057 . growth habit -0.12491 0.99217 0.2923 0.085 . life cycle 0.02681 0.99964 0.4590 0.014 * habitat preference -0.76439 -0.64476 0.0614 0.624
pollen amount -0.32741 -0.94488 0.6633 0.002 ** ovule number -0.25097 -0.96800 0.0528 0.683 p/o ratio -0.22762 -0.97375 0.3431 0.064 .
flower colour -0.15890 -0.98729 0.6381 0.002 ** UV signal, frontal -0.07495 -0.99719 0.4029 0.030 * UV signal, lateral -0.06371 -0.99797 0.3080 0.090 . anther dummy -0.53854 0.84260 0.0547 0.681
display size, frontal -0.74487 0.66720 0.1816 0.243 display size, lateral -0.58181 0.81332 0.4159 0.028 * display ratio, front./lat. 0.98974 -0.14285 0.1151 0.439 opening height -0.98783 -0.15555 0.1919 0.201
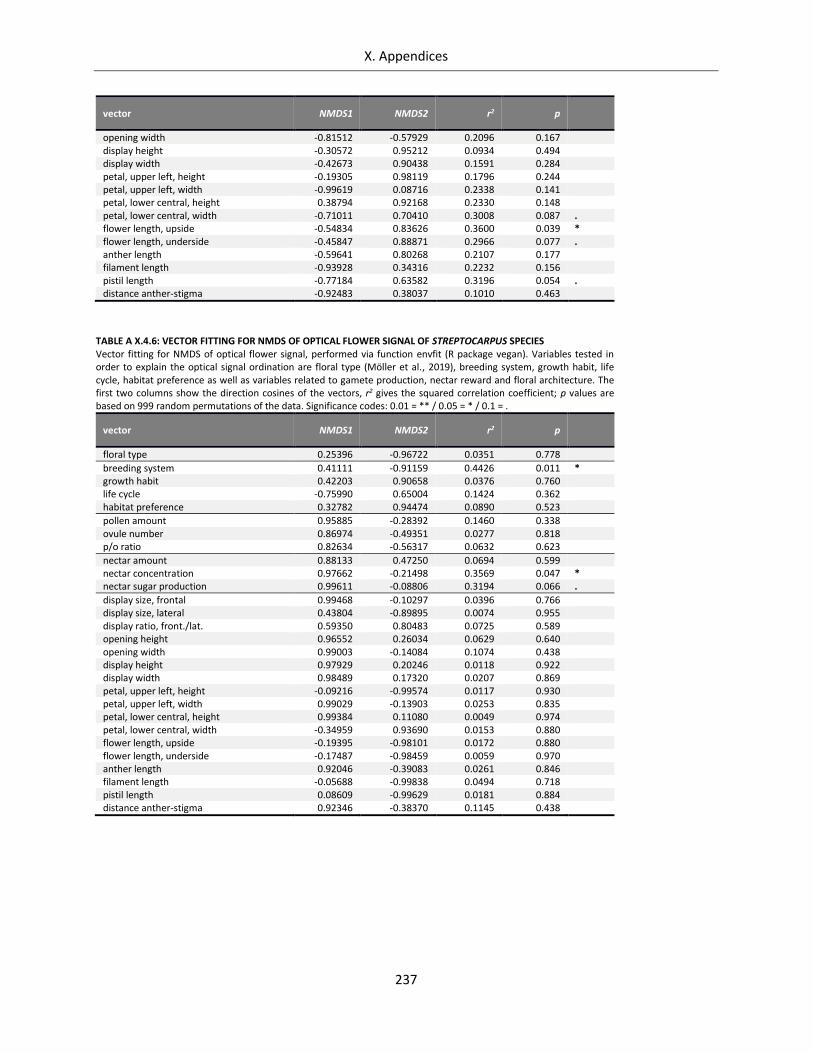
X. Appendices
237
vector NMDS1 NMDS2 r2 p
opening width -0.81512 -0.57929 0.2096 0.167 display height -0.30572 0.95212 0.0934 0.494 display width -0.42673 0.90438 0.1591 0.284 petal, upper left, height -0.19305 0.98119 0.1796 0.244 petal, upper left, width -0.99619 0.08716 0.2338 0.141 petal, lower central, height 0.38794 0.92168 0.2330 0.148 petal, lower central, width -0.71011 0.70410 0.3008 0.087 . flower length, upside -0.54834 0.83626 0.3600 0.039 * flower length, underside -0.45847 0.88871 0.2966 0.077 . anther length -0.59641 0.80268 0.2107 0.177 filament length -0.93928 0.34316 0.2232 0.156 pistil length -0.77184 0.63582 0.3196 0.054 . distance anther-stigma -0.92483 0.38037 0.1010 0.463
TABLE A X.4.6: VECTOR FITTING FOR NMDS OF OPTICAL FLOWER SIGNAL OF STREPTOCARPUS SPECIES Vector fitting for NMDS of optical flower signal, performed via function envfit (R package vegan). Variables tested in order to explain the optical signal ordination are floral type (Möller et al., 2019), breeding system, growth habit, life cycle, habitat preference as well as variables related to gamete production, nectar reward and floral architecture. The first two columns show the direction cosines of the vectors, r2 gives the squared correlation coefficient; p values are based on 999 random permutations of the data. Significance codes: 0.01 = ** / 0.05 = * / 0.1 = .
vector NMDS1 NMDS2 r2 p
floral type 0.25396 -0.96722 0.0351 0.778
breeding system 0.41111 -0.91159 0.4426 0.011 * growth habit 0.42203 0.90658 0.0376 0.760 life cycle -0.75990 0.65004 0.1424 0.362 habitat preference 0.32782 0.94474 0.0890 0.523
pollen amount 0.95885 -0.28392 0.1460 0.338 ovule number 0.86974 -0.49351 0.0277 0.818 p/o ratio 0.82634 -0.56317 0.0632 0.623
nectar amount 0.88133 0.47250 0.0694 0.599 nectar concentration 0.97662 -0.21498 0.3569 0.047 * nectar sugar production 0.99611 -0.08806 0.3194 0.066 .
display size, frontal 0.99468 -0.10297 0.0396 0.766 display size, lateral 0.43804 -0.89895 0.0074 0.955 display ratio, front./lat. 0.59350 0.80483 0.0725 0.589 opening height 0.96552 0.26034 0.0629 0.640 opening width 0.99003 -0.14084 0.1074 0.438 display height 0.97929 0.20246 0.0118 0.922 display width 0.98489 0.17320 0.0207 0.869 petal, upper left, height -0.09216 -0.99574 0.0117 0.930 petal, upper left, width 0.99029 -0.13903 0.0253 0.835 petal, lower central, height 0.99384 0.11080 0.0049 0.974 petal, lower central, width -0.34959 0.93690 0.0153 0.880 flower length, upside -0.19395 -0.98101 0.0172 0.880 flower length, underside -0.17487 -0.98459 0.0059 0.970 anther length 0.92046 -0.39083 0.0261 0.846 filament length -0.05688 -0.99838 0.0494 0.718 pistil length 0.08609 -0.99629 0.0181 0.884 distance anther-stigma 0.92346 -0.38370 0.1145 0.438
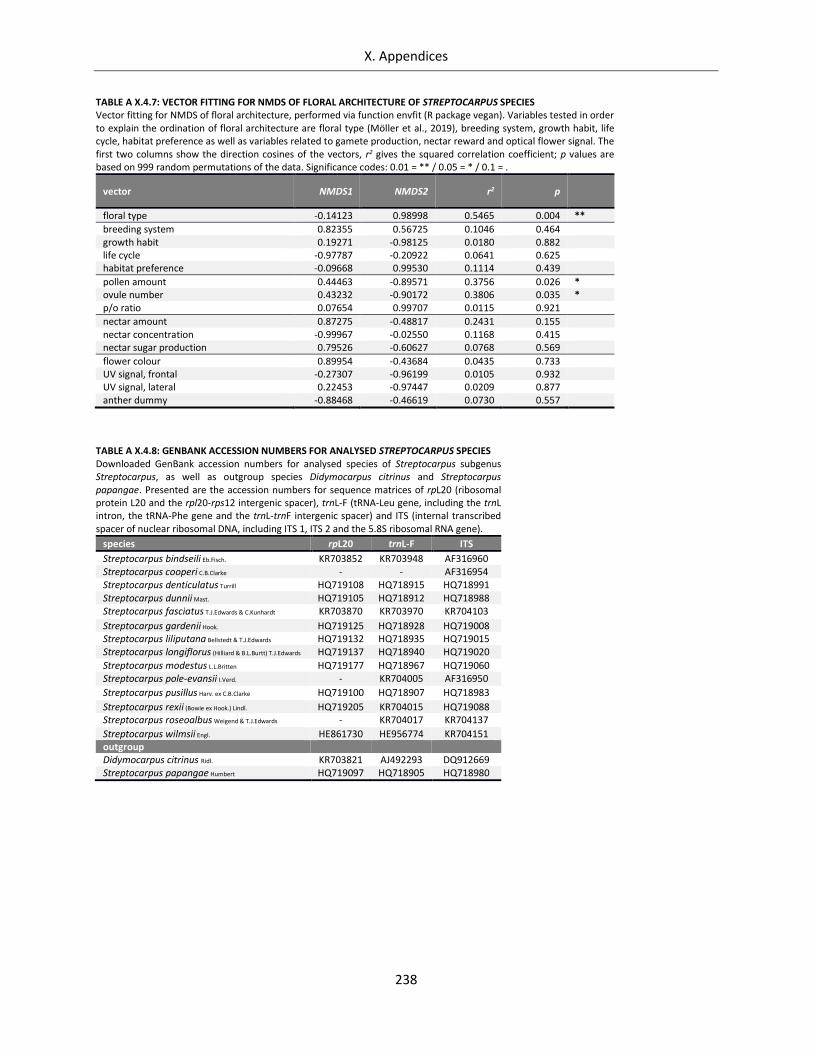
X. Appendices
238
TABLE A X.4.7: VECTOR FITTING FOR NMDS OF FLORAL ARCHITECTURE OF STREPTOCARPUS SPECIES Vector fitting for NMDS of floral architecture, performed via function envfit (R package vegan). Variables tested in order to explain the ordination of floral architecture are floral type (Möller et al., 2019), breeding system, growth habit, life cycle, habitat preference as well as variables related to gamete production, nectar reward and optical flower signal. The first two columns show the direction cosines of the vectors, r2 gives the squared correlation coefficient; p values are based on 999 random permutations of the data. Significance codes: 0.01 = ** / 0.05 = * / 0.1 = .
vector NMDS1 NMDS2 r2 p
floral type -0.14123 0.98998 0.5465 0.004 **
breeding system 0.82355 0.56725 0.1046 0.464 growth habit 0.19271 -0.98125 0.0180 0.882 life cycle -0.97787 -0.20922 0.0641 0.625 habitat preference -0.09668 0.99530 0.1114 0.439
pollen amount 0.44463 -0.89571 0.3756 0.026 * ovule number 0.43232 -0.90172 0.3806 0.035 * p/o ratio 0.07654 0.99707 0.0115 0.921
nectar amount 0.87275 -0.48817 0.2431 0.155 nectar concentration -0.99967 -0.02550 0.1168 0.415 nectar sugar production 0.79526 -0.60627 0.0768 0.569
flower colour 0.89954 -0.43684 0.0435 0.733 UV signal, frontal -0.27307 -0.96199 0.0105 0.932 UV signal, lateral 0.22453 -0.97447 0.0209 0.877 anther dummy -0.88468 -0.46619 0.0730 0.557
TABLE A X.4.8: GENBANK ACCESSION NUMBERS FOR ANALYSED STREPTOCARPUS SPECIES Downloaded GenBank accession numbers for analysed species of Streptocarpus subgenus Streptocarpus, as well as outgroup species Didymocarpus citrinus and Streptocarpus papangae. Presented are the accession numbers for sequence matrices of rpL20 (ribosomal protein L20 and the rpl20-rps12 intergenic spacer), trnL-F (tRNA-Leu gene, including the trnL intron, the tRNA-Phe gene and the trnL-trnF intergenic spacer) and ITS (internal transcribed spacer of nuclear ribosomal DNA, including ITS 1, ITS 2 and the 5.8S ribosomal RNA gene).
species rpL20 trnL-F ITS
Streptocarpus bindseili Eb.Fisch. KR703852 KR703948 AF316960 Streptocarpus cooperi C.B.Clarke - - AF316954 Streptocarpus denticulatus Turrill HQ719108 HQ718915 HQ718991 Streptocarpus dunnii Mast. HQ719105 HQ718912 HQ718988 Streptocarpus fasciatus T.J.Edwards & C.Kunhardt KR703870 KR703970 KR704103
Streptocarpus gardenii Hook. HQ719125 HQ718928 HQ719008 Streptocarpus liliputana Bellstedt & T.J.Edwards HQ719132 HQ718935 HQ719015 Streptocarpus longiflorus (Hilliard & B.L.Burtt) T.J.Edwards HQ719137 HQ718940 HQ719020
Streptocarpus modestus L.L.Britten HQ719177 HQ718967 HQ719060 Streptocarpus pole-evansii I.Verd. - KR704005 AF316950
Streptocarpus pusillus Harv. ex C.B.Clarke HQ719100 HQ718907 HQ718983
Streptocarpus rexii (Bowie ex Hook.) Lindl. HQ719205 KR704015 HQ719088 Streptocarpus roseoalbus Weigend & T.J.Edwards - KR704017 KR704137
Streptocarpus wilmsii Engl. HE861730 HE956774 KR704151 outgroup Didymocarpus citrinus Ridl. KR703821 AJ492293 DQ912669 Streptocarpus papangae Humbert HQ719097 HQ718905 HQ718980
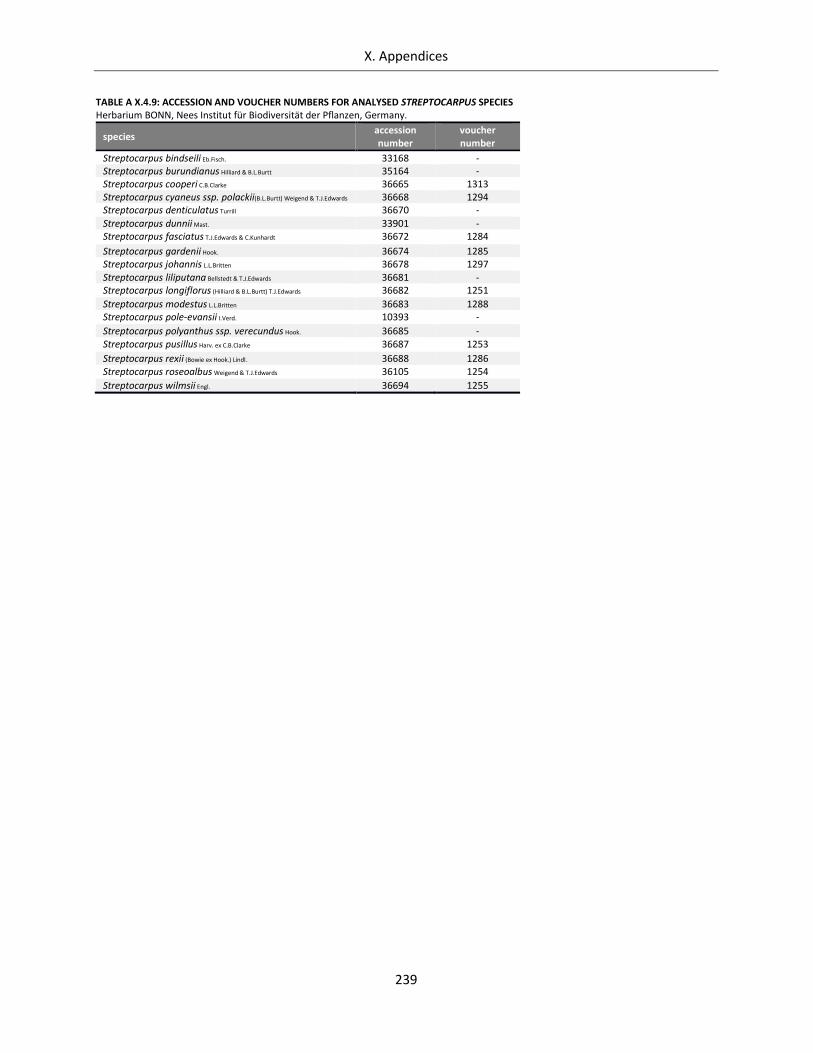
X. Appendices
239
TABLE A X.4.9: ACCESSION AND VOUCHER NUMBERS FOR ANALYSED STREPTOCARPUS SPECIES Herbarium BONN, Nees Institut für Biodiversität der Pflanzen, Germany.
species accession number
voucher number
Streptocarpus bindseili Eb.Fisch. 33168 - Streptocarpus burundianus Hilliard & B.L.Burtt 35164 - Streptocarpus cooperi C.B.Clarke 36665 1313 Streptocarpus cyaneus ssp. polackii(B.L.Burtt) Weigend & T.J.Edwards 36668 1294 Streptocarpus denticulatus Turrill 36670 -
Streptocarpus dunnii Mast. 33901 - Streptocarpus fasciatus T.J.Edwards & C.Kunhardt 36672 1284
Streptocarpus gardenii Hook. 36674 1285 Streptocarpus johannis L.L.Britten 36678 1297 Streptocarpus liliputana Bellstedt & T.J.Edwards 36681 - Streptocarpus longiflorus (Hilliard & B.L.Burtt) T.J.Edwards 36682 1251
Streptocarpus modestus L.L.Britten 36683 1288 Streptocarpus pole-evansii I.Verd. 10393 -
Streptocarpus polyanthus ssp. verecundus Hook. 36685 - Streptocarpus pusillus Harv. ex C.B.Clarke 36687 1253
Streptocarpus rexii (Bowie ex Hook.) Lindl. 36688 1286 Streptocarpus roseoalbus Weigend & T.J.Edwards 36105 1254
Streptocarpus wilmsii Engl. 36694 1255
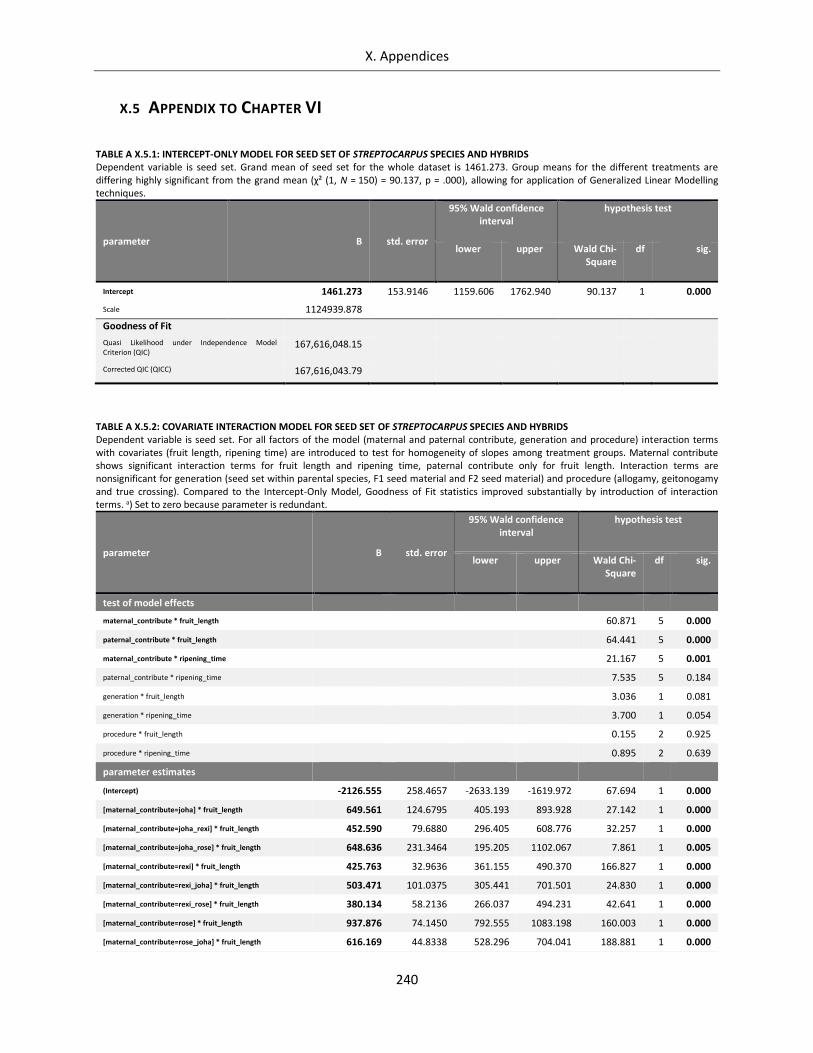
X. Appendices
240
X.5 APPENDIX TO CHAPTER VI
TABLE A X.5.1: INTERCEPT-ONLY MODEL FOR SEED SET OF STREPTOCARPUS SPECIES AND HYBRIDS Dependent variable is seed set. Grand mean of seed set for the whole dataset is 1461.273. Group means for the different treatments are differing highly significant from the grand mean (χ² (1, N = 150) = 90.137, p = .000), allowing for application of Generalized Linear Modelling techniques.
parameter B std. error
95% Wald confidence interval
hypothesis test
lower upper Wald Chi-Square
df sig.
Intercept 1461.273 153.9146 1159.606 1762.940 90.137 1 0.000
Scale 1124939.878
Goodness of Fit
Quasi Likelihood under Independence Model Criterion (QIC)
167,616,048.15
Corrected QIC (QICC) 167,616,043.79
TABLE A X.5.2: COVARIATE INTERACTION MODEL FOR SEED SET OF STREPTOCARPUS SPECIES AND HYBRIDS Dependent variable is seed set. For all factors of the model (maternal and paternal contribute, generation and procedure) interaction terms with covariates (fruit length, ripening time) are introduced to test for homogeneity of slopes among treatment groups. Maternal contribute shows significant interaction terms for fruit length and ripening time, paternal contribute only for fruit length. Interaction terms are nonsignificant for generation (seed set within parental species, F1 seed material and F2 seed material) and procedure (allogamy, geitonogamy and true crossing). Compared to the Intercept-Only Model, Goodness of Fit statistics improved substantially by introduction of interaction terms. a) Set to zero because parameter is redundant.
parameter B std. error
95% Wald confidence interval
hypothesis test
lower upper Wald Chi-Square
df sig.
test of model effects
maternal_contribute * fruit_length 60.871 5 0.000
paternal_contribute * fruit_length 64.441 5 0.000
maternal_contribute * ripening_time 21.167 5 0.001
paternal_contribute * ripening_time 7.535 5 0.184
generation * fruit_length 3.036 1 0.081
generation * ripening_time 3.700 1 0.054
procedure * fruit_length 0.155 2 0.925
procedure * ripening_time 0.895 2 0.639
parameter estimates
(Intercept) -2126.555 258.4657 -2633.139 -1619.972 67.694 1 0.000
[maternal_contribute=joha] * fruit_length 649.561 124.6795 405.193 893.928 27.142 1 0.000
[maternal_contribute=joha_rexi] * fruit_length 452.590 79.6880 296.405 608.776 32.257 1 0.000
[maternal_contribute=joha_rose] * fruit_length 648.636 231.3464 195.205 1102.067 7.861 1 0.005
[maternal_contribute=rexi] * fruit_length 425.763 32.9636 361.155 490.370 166.827 1 0.000
[maternal_contribute=rexi_joha] * fruit_length 503.471 101.0375 305.441 701.501 24.830 1 0.000
[maternal_contribute=rexi_rose] * fruit_length 380.134 58.2136 266.037 494.231 42.641 1 0.000
[maternal_contribute=rose] * fruit_length 937.876 74.1450 792.555 1083.198 160.003 1 0.000
[maternal_contribute=rose_joha] * fruit_length 616.169 44.8338 528.296 704.041 188.881 1 0.000
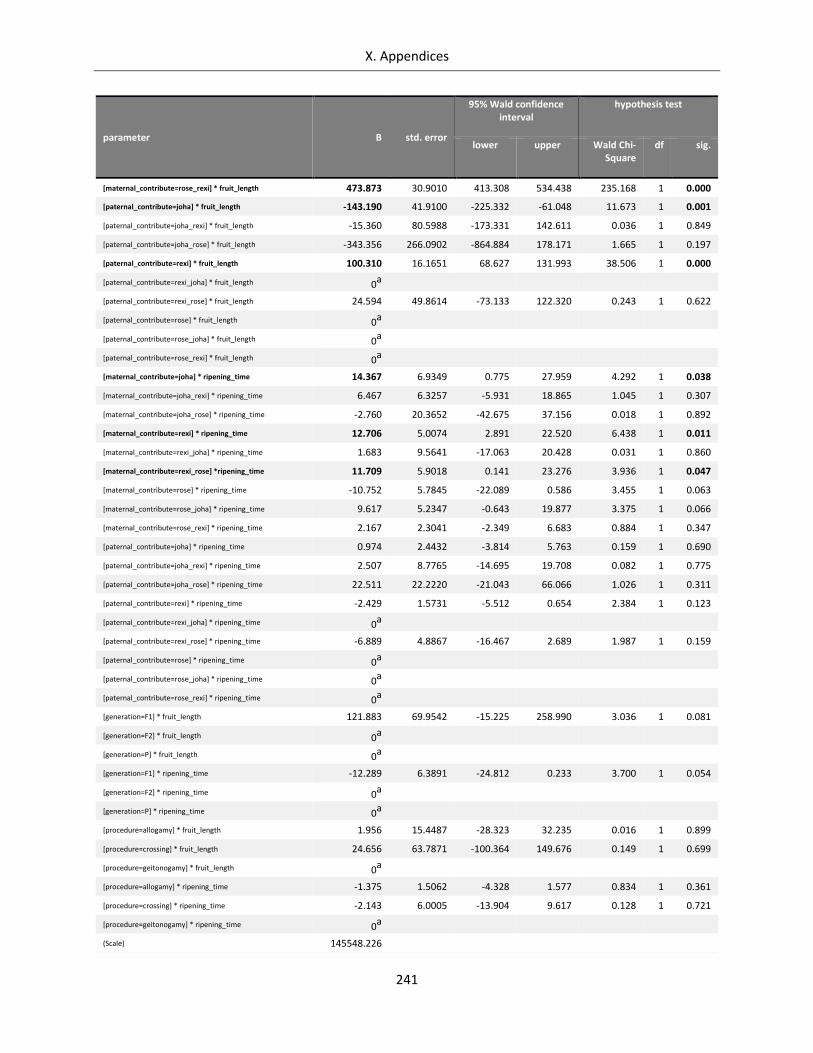
X. Appendices
241
parameter B std. error
95% Wald confidence interval
hypothesis test
lower upper Wald Chi-Square
df sig.
[maternal_contribute=rose_rexi] * fruit_length 473.873 30.9010 413.308 534.438 235.168 1 0.000
[paternal_contribute=joha] * fruit_length -143.190 41.9100 -225.332 -61.048 11.673 1 0.001
[paternal_contribute=joha_rexi] * fruit_length -15.360 80.5988 -173.331 142.611 0.036 1 0.849
[paternal_contribute=joha_rose] * fruit_length -343.356 266.0902 -864.884 178.171 1.665 1 0.197
[paternal_contribute=rexi] * fruit_length 100.310 16.1651 68.627 131.993 38.506 1 0.000
[paternal_contribute=rexi_joha] * fruit_length 0a
[paternal_contribute=rexi_rose] * fruit_length 24.594 49.8614 -73.133 122.320 0.243 1 0.622
[paternal_contribute=rose] * fruit_length 0a
[paternal_contribute=rose_joha] * fruit_length 0a
[paternal_contribute=rose_rexi] * fruit_length 0a
[maternal_contribute=joha] * ripening_time 14.367 6.9349 0.775 27.959 4.292 1 0.038
[maternal_contribute=joha_rexi] * ripening_time 6.467 6.3257 -5.931 18.865 1.045 1 0.307
[maternal_contribute=joha_rose] * ripening_time -2.760 20.3652 -42.675 37.156 0.018 1 0.892
[maternal_contribute=rexi] * ripening_time 12.706 5.0074 2.891 22.520 6.438 1 0.011
[maternal_contribute=rexi_joha] * ripening_time 1.683 9.5641 -17.063 20.428 0.031 1 0.860
[maternal_contribute=rexi_rose] *ripening_time 11.709 5.9018 0.141 23.276 3.936 1 0.047
[maternal_contribute=rose] * ripening_time -10.752 5.7845 -22.089 0.586 3.455 1 0.063
[maternal_contribute=rose_joha] * ripening_time 9.617 5.2347 -0.643 19.877 3.375 1 0.066
[maternal_contribute=rose_rexi] * ripening_time 2.167 2.3041 -2.349 6.683 0.884 1 0.347
[paternal_contribute=joha] * ripening_time 0.974 2.4432 -3.814 5.763 0.159 1 0.690
[paternal_contribute=joha_rexi] * ripening_time 2.507 8.7765 -14.695 19.708 0.082 1 0.775
[paternal_contribute=joha_rose] * ripening_time 22.511 22.2220 -21.043 66.066 1.026 1 0.311
[paternal_contribute=rexi] * ripening_time -2.429 1.5731 -5.512 0.654 2.384 1 0.123
[paternal_contribute=rexi_joha] * ripening_time 0a
[paternal_contribute=rexi_rose] * ripening_time -6.889 4.8867 -16.467 2.689 1.987 1 0.159
[paternal_contribute=rose] * ripening_time 0a
[paternal_contribute=rose_joha] * ripening_time 0a
[paternal_contribute=rose_rexi] * ripening_time 0a
[generation=F1] * fruit_length 121.883 69.9542 -15.225 258.990 3.036 1 0.081
[generation=F2] * fruit_length 0a
[generation=P] * fruit_length 0a
[generation=F1] * ripening_time -12.289 6.3891 -24.812 0.233 3.700 1 0.054
[generation=F2] * ripening_time 0a
[generation=P] * ripening_time 0a
[procedure=allogamy] * fruit_length 1.956 15.4487 -28.323 32.235 0.016 1 0.899
[procedure=crossing] * fruit_length 24.656 63.7871 -100.364 149.676 0.149 1 0.699
[procedure=geitonogamy] * fruit_length 0a
[procedure=allogamy] * ripening_time -1.375 1.5062 -4.328 1.577 0.834 1 0.361
[procedure=crossing] * ripening_time -2.143 6.0005 -13.904 9.617 0.128 1 0.721
[procedure=geitonogamy] * ripening_time 0a
(Scale) 145548.226
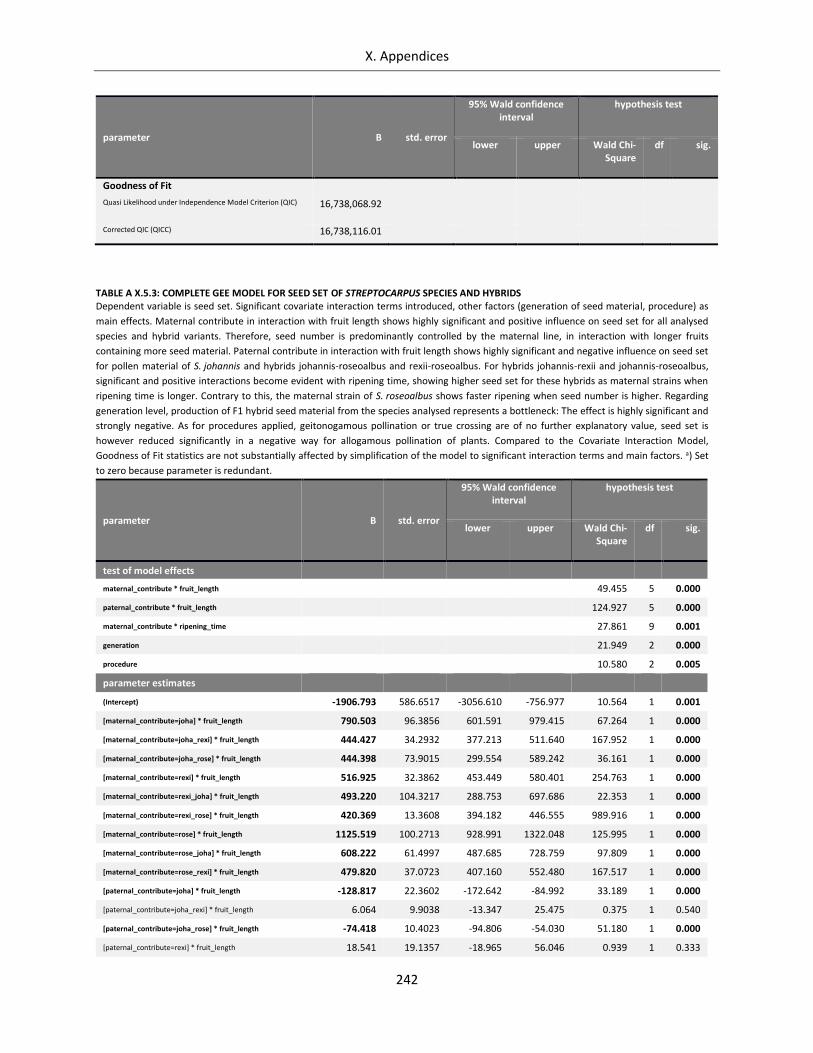
X. Appendices
242
parameter B std. error
95% Wald confidence interval
hypothesis test
lower upper Wald Chi-Square
df sig.
Goodness of Fit
Quasi Likelihood under Independence Model Criterion (QIC) 16,738,068.92
Corrected QIC (QICC) 16,738,116.01
TABLE A X.5.3: COMPLETE GEE MODEL FOR SEED SET OF STREPTOCARPUS SPECIES AND HYBRIDS Dependent variable is seed set. Significant covariate interaction terms introduced, other factors (generation of seed material, procedure) as
main effects. Maternal contribute in interaction with fruit length shows highly significant and positive influence on seed set for all analysed
species and hybrid variants. Therefore, seed number is predominantly controlled by the maternal line, in interaction with longer fruits
containing more seed material. Paternal contribute in interaction with fruit length shows highly significant and negative influence on seed set
for pollen material of S. johannis and hybrids johannis-roseoalbus and rexii-roseoalbus. For hybrids johannis-rexii and johannis-roseoalbus,
significant and positive interactions become evident with ripening time, showing higher seed set for these hybrids as maternal strains when
ripening time is longer. Contrary to this, the maternal strain of S. roseoalbus shows faster ripening when seed number is higher. Regarding
generation level, production of F1 hybrid seed material from the species analysed represents a bottleneck: The effect is highly significant and
strongly negative. As for procedures applied, geitonogamous pollination or true crossing are of no further explanatory value, seed set is
however reduced significantly in a negative way for allogamous pollination of plants. Compared to the Covariate Interaction Model,
Goodness of Fit statistics are not substantially affected by simplification of the model to significant interaction terms and main factors. a) Set
to zero because parameter is redundant.
parameter B std. error
95% Wald confidence interval
hypothesis test
lower upper Wald Chi-Square
df sig.
test of model effects
maternal_contribute * fruit_length 49.455 5 0.000
paternal_contribute * fruit_length 124.927 5 0.000
maternal_contribute * ripening_time 27.861 9 0.001
generation 21.949 2 0.000
procedure 10.580 2 0.005
parameter estimates
(Intercept) -1906.793 586.6517 -3056.610 -756.977 10.564 1 0.001
[maternal_contribute=joha] * fruit_length 790.503 96.3856 601.591 979.415 67.264 1 0.000
[maternal_contribute=joha_rexi] * fruit_length 444.427 34.2932 377.213 511.640 167.952 1 0.000
[maternal_contribute=joha_rose] * fruit_length 444.398 73.9015 299.554 589.242 36.161 1 0.000
[maternal_contribute=rexi] * fruit_length 516.925 32.3862 453.449 580.401 254.763 1 0.000
[maternal_contribute=rexi_joha] * fruit_length 493.220 104.3217 288.753 697.686 22.353 1 0.000
[maternal_contribute=rexi_rose] * fruit_length 420.369 13.3608 394.182 446.555 989.916 1 0.000
[maternal_contribute=rose] * fruit_length 1125.519 100.2713 928.991 1322.048 125.995 1 0.000
[maternal_contribute=rose_joha] * fruit_length 608.222 61.4997 487.685 728.759 97.809 1 0.000
[maternal_contribute=rose_rexi] * fruit_length 479.820 37.0723 407.160 552.480 167.517 1 0.000
[paternal_contribute=joha] * fruit_length -128.817 22.3602 -172.642 -84.992 33.189 1 0.000
[paternal_contribute=joha_rexi] * fruit_length 6.064 9.9038 -13.347 25.475 0.375 1 0.540
[paternal_contribute=joha_rose] * fruit_length -74.418 10.4023 -94.806 -54.030 51.180 1 0.000
[paternal_contribute=rexi] * fruit_length 18.541 19.1357 -18.965 56.046 0.939 1 0.333
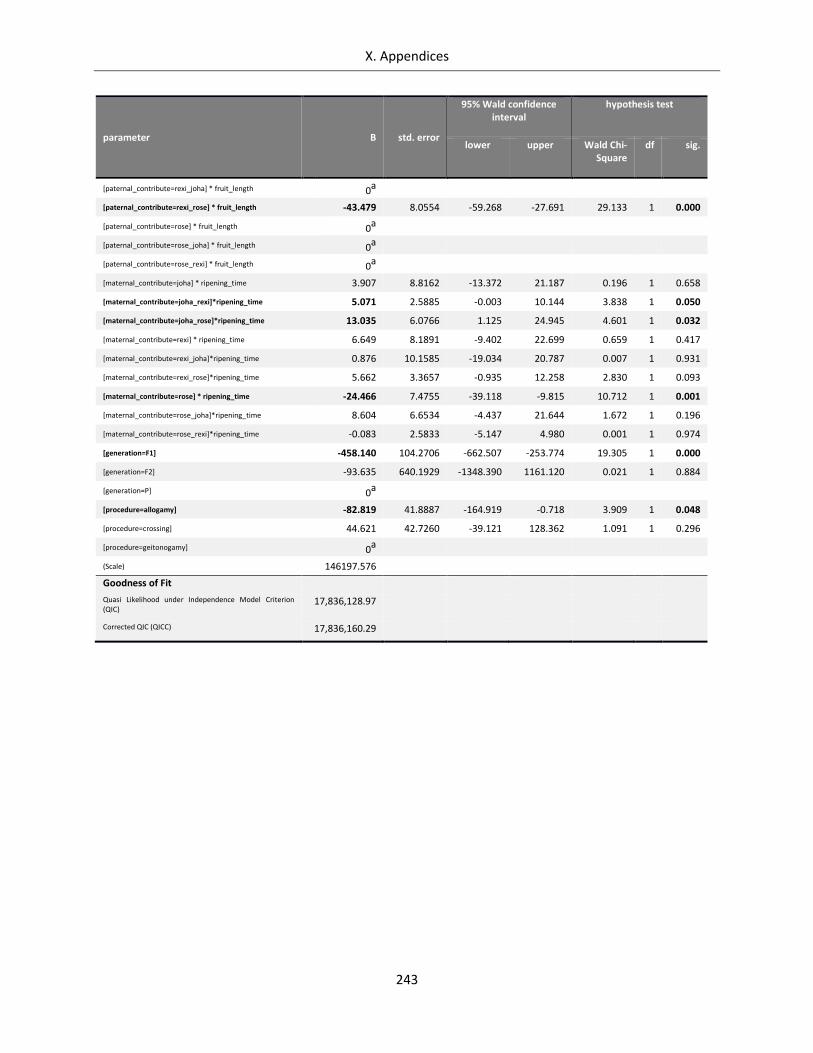
X. Appendices
243
parameter B std. error
95% Wald confidence interval
hypothesis test
lower upper Wald Chi-Square
df sig.
[paternal_contribute=rexi_joha] * fruit_length 0a
[paternal_contribute=rexi_rose] * fruit_length -43.479 8.0554 -59.268 -27.691 29.133 1 0.000
[paternal_contribute=rose] * fruit_length 0a
[paternal_contribute=rose_joha] * fruit_length 0a
[paternal_contribute=rose_rexi] * fruit_length 0a
[maternal_contribute=joha] * ripening_time 3.907 8.8162 -13.372 21.187 0.196 1 0.658
[maternal_contribute=joha_rexi]*ripening_time 5.071 2.5885 -0.003 10.144 3.838 1 0.050
[maternal_contribute=joha_rose]*ripening_time 13.035 6.0766 1.125 24.945 4.601 1 0.032
[maternal_contribute=rexi] * ripening_time 6.649 8.1891 -9.402 22.699 0.659 1 0.417
[maternal_contribute=rexi_joha]*ripening_time 0.876 10.1585 -19.034 20.787 0.007 1 0.931
[maternal_contribute=rexi_rose]*ripening_time 5.662 3.3657 -0.935 12.258 2.830 1 0.093
[maternal_contribute=rose] * ripening_time -24.466 7.4755 -39.118 -9.815 10.712 1 0.001
[maternal_contribute=rose_joha]*ripening_time 8.604 6.6534 -4.437 21.644 1.672 1 0.196
[maternal_contribute=rose_rexi]*ripening_time -0.083 2.5833 -5.147 4.980 0.001 1 0.974
[generation=F1] -458.140 104.2706 -662.507 -253.774 19.305 1 0.000
[generation=F2] -93.635 640.1929 -1348.390 1161.120 0.021 1 0.884
[generation=P] 0a
[procedure=allogamy] -82.819 41.8887 -164.919 -0.718 3.909 1 0.048
[procedure=crossing] 44.621 42.7260 -39.121 128.362 1.091 1 0.296
[procedure=geitonogamy] 0a
(Scale) 146197.576
Goodness of Fit
Quasi Likelihood under Independence Model Criterion (QIC)
17,836,128.97
Corrected QIC (QICC) 17,836,160.29
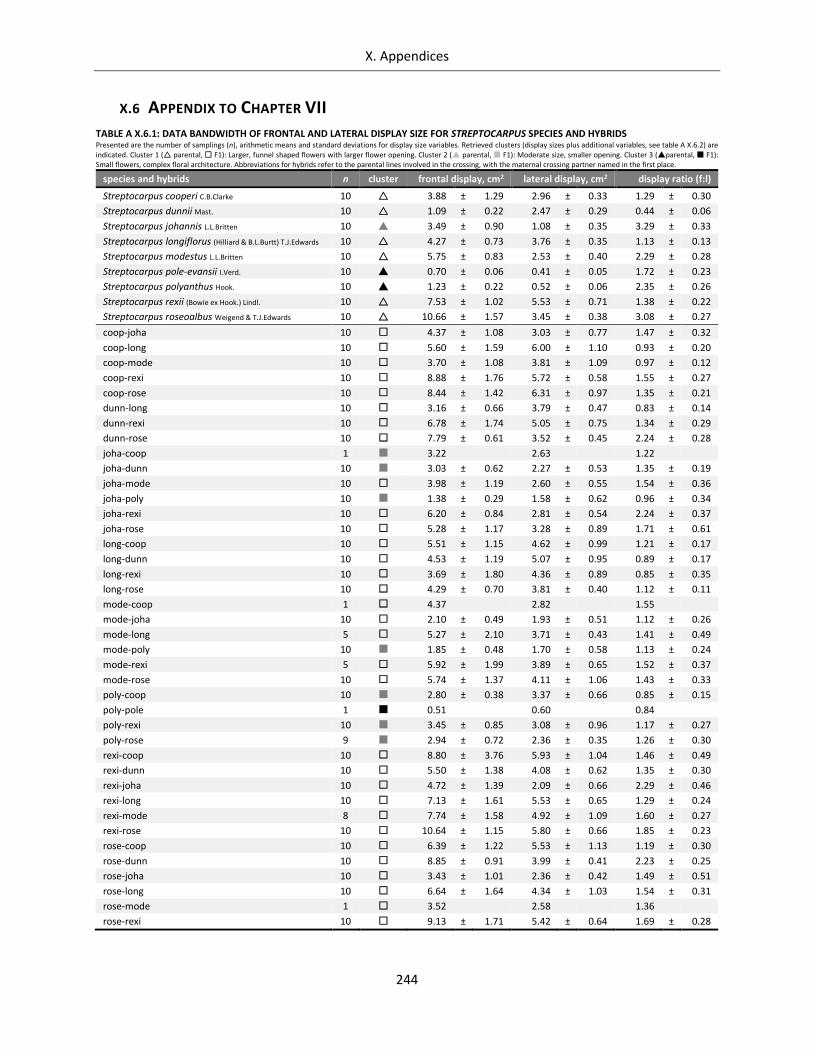
X. Appendices
244
X.6 APPENDIX TO CHAPTER VII
TABLE A X.6.1: DATA BANDWIDTH OF FRONTAL AND LATERAL DISPLAY SIZE FOR STREPTOCARPUS SPECIES AND HYBRIDS Presented are the number of samplings (n), arithmetic means and standard deviations for display size variables. Retrieved clusters (display sizes plus additional variables, see table A X.6.2) are indicated. Cluster 1 ( parental, F1): Larger, funnel shaped flowers with larger flower opening. Cluster 2 ( parental, F1): Moderate size, smaller opening. Cluster 3 (parental, F1): Small flowers, complex floral architecture. Abbreviations for hybrids refer to the parental lines involved in the crossing, with the maternal crossing partner named in the first place.
species and hybrids n cluster frontal display, cm2 lateral display, cm2 display ratio (f:l)
Streptocarpus cooperi C.B.Clarke 10 3.88 ± 1.29 2.96 ± 0.33 1.29 ± 0.30
Streptocarpus dunnii Mast. 10 1.09 ± 0.22 2.47 ± 0.29 0.44 ± 0.06
Streptocarpus johannis L.L.Britten 10 3.49 ± 0.90 1.08 ± 0.35 3.29 ± 0.33
Streptocarpus longiflorus (Hilliard & B.L.Burtt) T.J.Edwards 10 4.27 ± 0.73 3.76 ± 0.35 1.13 ± 0.13
Streptocarpus modestus L.L.Britten 10 5.75 ± 0.83 2.53 ± 0.40 2.29 ± 0.28
Streptocarpus pole-evansii I.Verd. 10 0.70 ± 0.06 0.41 ± 0.05 1.72 ± 0.23
Streptocarpus polyanthus Hook. 10 1.23 ± 0.22 0.52 ± 0.06 2.35 ± 0.26
Streptocarpus rexii (Bowie ex Hook.) Lindl. 10 7.53 ± 1.02 5.53 ± 0.71 1.38 ± 0.22
Streptocarpus roseoalbus Weigend & T.J.Edwards 10 10.66 ± 1.57 3.45 ± 0.38 3.08 ± 0.27
coop-joha 10 4.37 ± 1.08 3.03 ± 0.77 1.47 ± 0.32
coop-long 10 5.60 ± 1.59 6.00 ± 1.10 0.93 ± 0.20
coop-mode 10 3.70 ± 1.08 3.81 ± 1.09 0.97 ± 0.12
coop-rexi 10 8.88 ± 1.76 5.72 ± 0.58 1.55 ± 0.27
coop-rose 10 8.44 ± 1.42 6.31 ± 0.97 1.35 ± 0.21
dunn-long 10 3.16 ± 0.66 3.79 ± 0.47 0.83 ± 0.14
dunn-rexi 10 6.78 ± 1.74 5.05 ± 0.75 1.34 ± 0.29
dunn-rose 10 7.79 ± 0.61 3.52 ± 0.45 2.24 ± 0.28
joha-coop 1 3.22 2.63 1.22
joha-dunn 10 3.03 ± 0.62 2.27 ± 0.53 1.35 ± 0.19
joha-mode 10 3.98 ± 1.19 2.60 ± 0.55 1.54 ± 0.36
joha-poly 10 1.38 ± 0.29 1.58 ± 0.62 0.96 ± 0.34
joha-rexi 10 6.20 ± 0.84 2.81 ± 0.54 2.24 ± 0.37
joha-rose 10 5.28 ± 1.17 3.28 ± 0.89 1.71 ± 0.61
long-coop 10 5.51 ± 1.15 4.62 ± 0.99 1.21 ± 0.17
long-dunn 10 4.53 ± 1.19 5.07 ± 0.95 0.89 ± 0.17
long-rexi 10 3.69 ± 1.80 4.36 ± 0.89 0.85 ± 0.35
long-rose 10 4.29 ± 0.70 3.81 ± 0.40 1.12 ± 0.11
mode-coop 1 4.37 2.82 1.55
mode-joha 10 2.10 ± 0.49 1.93 ± 0.51 1.12 ± 0.26
mode-long 5 5.27 ± 2.10 3.71 ± 0.43 1.41 ± 0.49
mode-poly 10 1.85 ± 0.48 1.70 ± 0.58 1.13 ± 0.24
mode-rexi 5 5.92 ± 1.99 3.89 ± 0.65 1.52 ± 0.37
mode-rose 10 5.74 ± 1.37 4.11 ± 1.06 1.43 ± 0.33
poly-coop 10 2.80 ± 0.38 3.37 ± 0.66 0.85 ± 0.15
poly-pole 1 0.51 0.60 0.84
poly-rexi 10 3.45 ± 0.85 3.08 ± 0.96 1.17 ± 0.27
poly-rose 9 2.94 ± 0.72 2.36 ± 0.35 1.26 ± 0.30
rexi-coop 10 8.80 ± 3.76 5.93 ± 1.04 1.46 ± 0.49
rexi-dunn 10 5.50 ± 1.38 4.08 ± 0.62 1.35 ± 0.30
rexi-joha 10 4.72 ± 1.39 2.09 ± 0.66 2.29 ± 0.46
rexi-long 10 7.13 ± 1.61 5.53 ± 0.65 1.29 ± 0.24
rexi-mode 8 7.74 ± 1.58 4.92 ± 1.09 1.60 ± 0.27
rexi-rose 10 10.64 ± 1.15 5.80 ± 0.66 1.85 ± 0.23
rose-coop 10 6.39 ± 1.22 5.53 ± 1.13 1.19 ± 0.30
rose-dunn 10 8.85 ± 0.91 3.99 ± 0.41 2.23 ± 0.25
rose-joha 10 3.43 ± 1.01 2.36 ± 0.42 1.49 ± 0.51
rose-long 10 6.64 ± 1.64 4.34 ± 1.03 1.54 ± 0.31
rose-mode 1 3.52 2.58 1.36
rose-rexi 10 9.13 ± 1.71 5.42 ± 0.64 1.69 ± 0.28
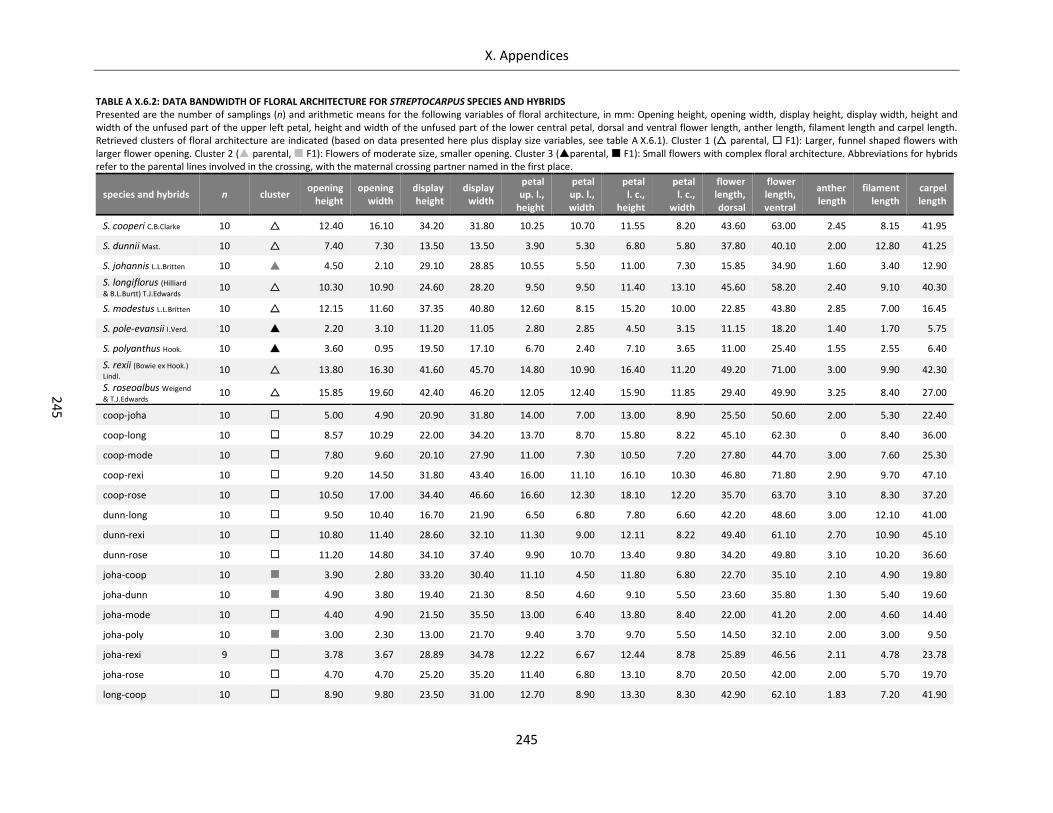
X. Appendices
245
24
5
TABLE A X.6.2: DATA BANDWIDTH OF FLORAL ARCHITECTURE FOR STREPTOCARPUS SPECIES AND HYBRIDS Presented are the number of samplings (n) and arithmetic means for the following variables of floral architecture, in mm: Opening height, opening width, display height, display width, height and width of the unfused part of the upper left petal, height and width of the unfused part of the lower central petal, dorsal and ventral flower length, anther length, filament length and carpel length. Retrieved clusters of floral architecture are indicated (based on data presented here plus display size variables, see table A X.6.1). Cluster 1 ( parental, F1): Larger, funnel shaped flowers with larger flower opening. Cluster 2 ( parental, F1): Flowers of moderate size, smaller opening. Cluster 3 (parental, F1): Small flowers with complex floral architecture. Abbreviations for hybrids refer to the parental lines involved in the crossing, with the maternal crossing partner named in the first place.
species and hybrids n cluster opening
height opening
width display height
display width
petal up. l.,
height
petal up. l., width
petal l. c.,
height
petal l. c.,
width
flower length, dorsal
flower length, ventral
anther length
filament length
carpel length
S. cooperi C.B.Clarke 10 12.40 16.10 34.20 31.80 10.25 10.70 11.55 8.20 43.60 63.00 2.45 8.15 41.95
S. dunnii Mast. 10 7.40 7.30 13.50 13.50 3.90 5.30 6.80 5.80 37.80 40.10 2.00 12.80 41.25
S. johannis L.L.Britten 10 4.50 2.10 29.10 28.85 10.55 5.50 11.00 7.30 15.85 34.90 1.60 3.40 12.90
S. longiflorus (Hilliard
& B.L.Burtt) T.J.Edwards 10 10.30 10.90 24.60 28.20 9.50 9.50 11.40 13.10 45.60 58.20 2.40 9.10 40.30
S. modestus L.L.Britten 10 12.15 11.60 37.35 40.80 12.60 8.15 15.20 10.00 22.85 43.80 2.85 7.00 16.45
S. pole-evansii I.Verd. 10 2.20 3.10 11.20 11.05 2.80 2.85 4.50 3.15 11.15 18.20 1.40 1.70 5.75
S. polyanthus Hook. 10 3.60 0.95 19.50 17.10 6.70 2.40 7.10 3.65 11.00 25.40 1.55 2.55 6.40
S. rexii (Bowie ex Hook.)
Lindl. 10 13.80 16.30 41.60 45.70 14.80 10.90 16.40 11.20 49.20 71.00 3.00 9.90 42.30
S. roseoalbus Weigend
& T.J.Edwards 10 15.85 19.60 42.40 46.20 12.05 12.40 15.90 11.85 29.40 49.90 3.25 8.40 27.00
coop-joha 10 5.00 4.90 20.90 31.80 14.00 7.00 13.00 8.90 25.50 50.60 2.00 5.30 22.40
coop-long 10 8.57 10.29 22.00 34.20 13.70 8.70 15.80 8.22 45.10 62.30 0 8.40 36.00
coop-mode 10 7.80 9.60 20.10 27.90 11.00 7.30 10.50 7.20 27.80 44.70 3.00 7.60 25.30
coop-rexi 10 9.20 14.50 31.80 43.40 16.00 11.10 16.10 10.30 46.80 71.80 2.90 9.70 47.10
coop-rose 10 10.50 17.00 34.40 46.60 16.60 12.30 18.10 12.20 35.70 63.70 3.10 8.30 37.20
dunn-long 10 9.50 10.40 16.70 21.90 6.50 6.80 7.80 6.60 42.20 48.60 3.00 12.10 41.00
dunn-rexi 10 10.80 11.40 28.60 32.10 11.30 9.00 12.11 8.22 49.40 61.10 2.70 10.90 45.10
dunn-rose 10 11.20 14.80 34.10 37.40 9.90 10.70 13.40 9.80 34.20 49.80 3.10 10.20 36.60
joha-coop 10 3.90 2.80 33.20 30.40 11.10 4.50 11.80 6.80 22.70 35.10 2.10 4.90 19.80
joha-dunn 10 4.90 3.80 19.40 21.30 8.50 4.60 9.10 5.50 23.60 35.80 1.30 5.40 19.60
joha-mode 10 4.40 4.90 21.50 35.50 13.00 6.40 13.80 8.40 22.00 41.20 2.00 4.60 14.40
joha-poly 10 3.00 2.30 13.00 21.70 9.40 3.70 9.70 5.50 14.50 32.10 2.00 3.00 9.50
joha-rexi 9 3.78 3.67 28.89 34.78 12.22 6.67 12.44 8.78 25.89 46.56 2.11 4.78 23.78
joha-rose 10 4.70 4.70 25.20 35.20 11.40 6.80 13.10 8.70 20.50 42.00 2.00 5.70 19.70
long-coop 10 8.90 9.80 23.50 31.00 12.70 8.90 13.30 8.30 42.90 62.10 1.83 7.20 41.90
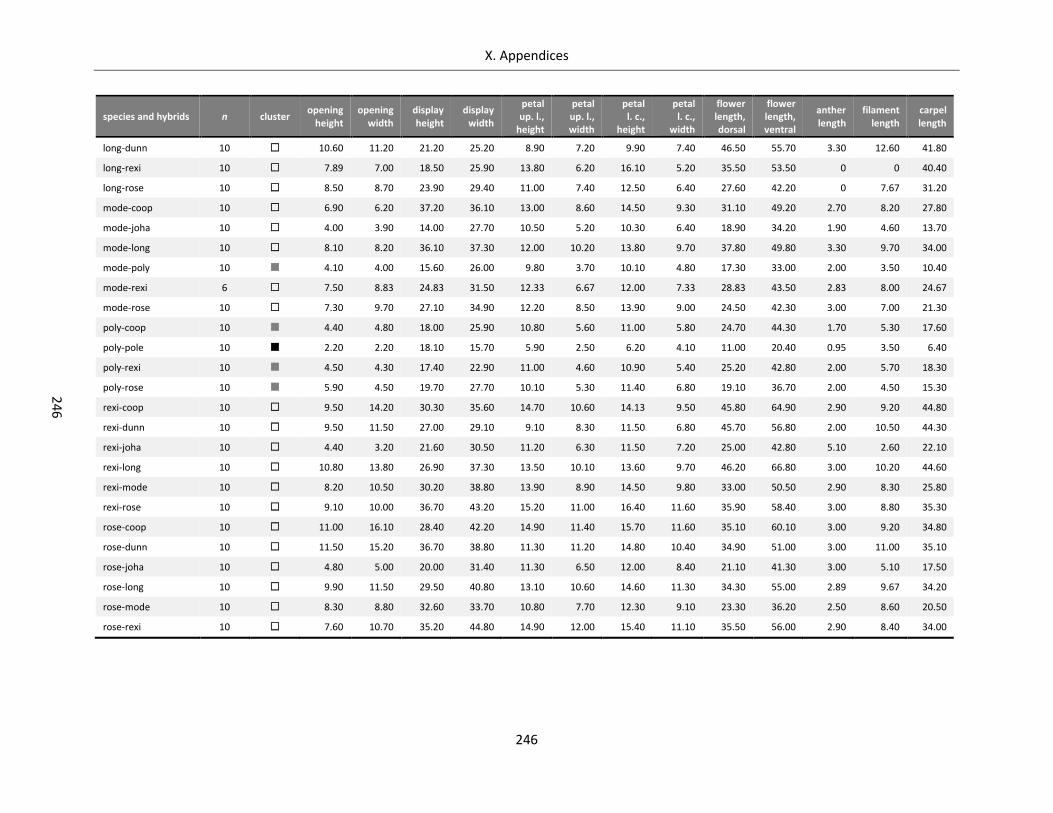
X. Appendices
246
24
6
species and hybrids n cluster opening
height opening
width display height
display width
petal up. l.,
height
petal up. l., width
petal l. c.,
height
petal l. c.,
width
flower length, dorsal
flower length, ventral
anther length
filament length
carpel length
long-dunn 10 10.60 11.20 21.20 25.20 8.90 7.20 9.90 7.40 46.50 55.70 3.30 12.60 41.80
long-rexi 10 7.89 7.00 18.50 25.90 13.80 6.20 16.10 5.20 35.50 53.50 0 0 40.40
long-rose 10 8.50 8.70 23.90 29.40 11.00 7.40 12.50 6.40 27.60 42.20 0 7.67 31.20
mode-coop 10 6.90 6.20 37.20 36.10 13.00 8.60 14.50 9.30 31.10 49.20 2.70 8.20 27.80
mode-joha 10 4.00 3.90 14.00 27.70 10.50 5.20 10.30 6.40 18.90 34.20 1.90 4.60 13.70
mode-long 10 8.10 8.20 36.10 37.30 12.00 10.20 13.80 9.70 37.80 49.80 3.30 9.70 34.00
mode-poly 10 4.10 4.00 15.60 26.00 9.80 3.70 10.10 4.80 17.30 33.00 2.00 3.50 10.40
mode-rexi 6 7.50 8.83 24.83 31.50 12.33 6.67 12.00 7.33 28.83 43.50 2.83 8.00 24.67
mode-rose 10 7.30 9.70 27.10 34.90 12.20 8.50 13.90 9.00 24.50 42.30 3.00 7.00 21.30
poly-coop 10 4.40 4.80 18.00 25.90 10.80 5.60 11.00 5.80 24.70 44.30 1.70 5.30 17.60
poly-pole 10 2.20 2.20 18.10 15.70 5.90 2.50 6.20 4.10 11.00 20.40 0.95 3.50 6.40
poly-rexi 10 4.50 4.30 17.40 22.90 11.00 4.60 10.90 5.40 25.20 42.80 2.00 5.70 18.30
poly-rose 10 5.90 4.50 19.70 27.70 10.10 5.30 11.40 6.80 19.10 36.70 2.00 4.50 15.30
rexi-coop 10 9.50 14.20 30.30 35.60 14.70 10.60 14.13 9.50 45.80 64.90 2.90 9.20 44.80
rexi-dunn 10 9.50 11.50 27.00 29.10 9.10 8.30 11.50 6.80 45.70 56.80 2.00 10.50 44.30
rexi-joha 10 4.40 3.20 21.60 30.50 11.20 6.30 11.50 7.20 25.00 42.80 5.10 2.60 22.10
rexi-long 10 10.80 13.80 26.90 37.30 13.50 10.10 13.60 9.70 46.20 66.80 3.00 10.20 44.60
rexi-mode 10 8.20 10.50 30.20 38.80 13.90 8.90 14.50 9.80 33.00 50.50 2.90 8.30 25.80
rexi-rose 10 9.10 10.00 36.70 43.20 15.20 11.00 16.40 11.60 35.90 58.40 3.00 8.80 35.30
rose-coop 10 11.00 16.10 28.40 42.20 14.90 11.40 15.70 11.60 35.10 60.10 3.00 9.20 34.80
rose-dunn 10 11.50 15.20 36.70 38.80 11.30 11.20 14.80 10.40 34.90 51.00 3.00 11.00 35.10
rose-joha 10 4.80 5.00 20.00 31.40 11.30 6.50 12.00 8.40 21.10 41.30 3.00 5.10 17.50
rose-long 10 9.90 11.50 29.50 40.80 13.10 10.60 14.60 11.30 34.30 55.00 2.89 9.67 34.20
rose-mode 10 8.30 8.80 32.60 33.70 10.80 7.70 12.30 9.10 23.30 36.20 2.50 8.60 20.50
rose-rexi 10 7.60 10.70 35.20 44.80 14.90 12.00 15.40 11.10 35.50 56.00 2.90 8.40 34.00
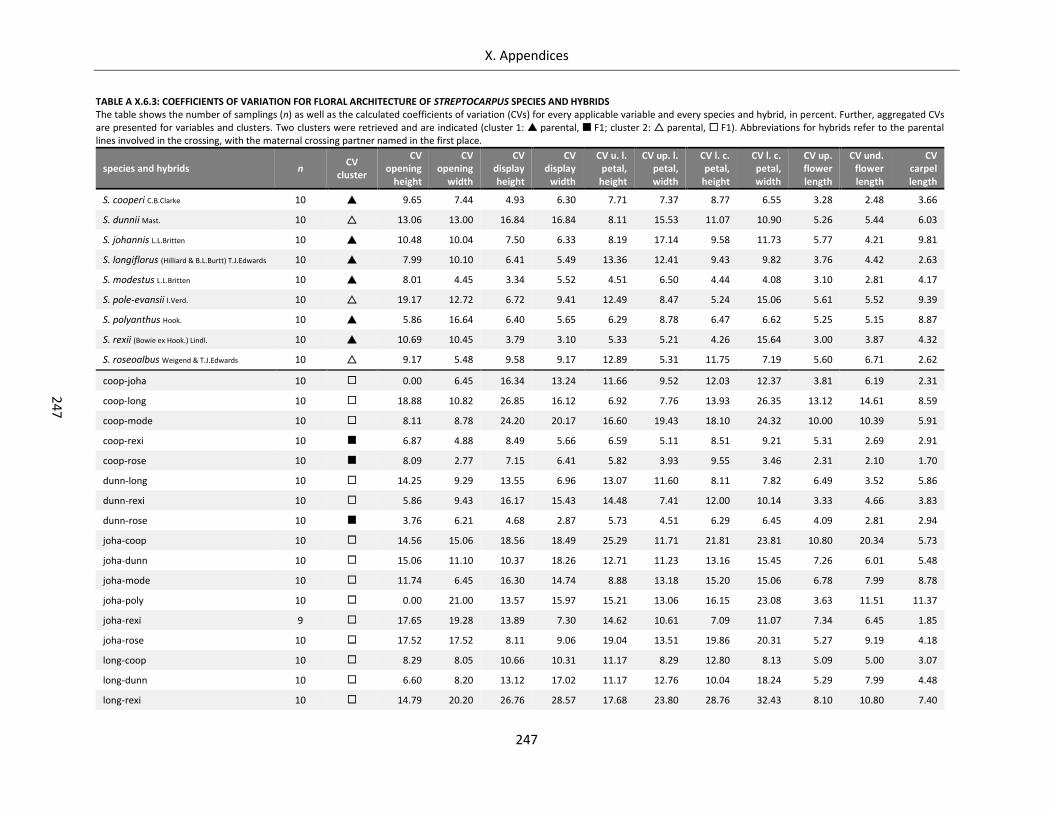
X. Appendices
247
24
7
TABLE A X.6.3: COEFFICIENTS OF VARIATION FOR FLORAL ARCHITECTURE OF STREPTOCARPUS SPECIES AND HYBRIDS The table shows the number of samplings (n) as well as the calculated coefficients of variation (CVs) for every applicable variable and every species and hybrid, in percent. Further, aggregated CVs are presented for variables and clusters. Two clusters were retrieved and are indicated (cluster 1: parental, F1; cluster 2: parental, F1). Abbreviations for hybrids refer to the parental lines involved in the crossing, with the maternal crossing partner named in the first place.
species and hybrids n CV
cluster
CV opening
height
CV opening
width
CV display height
CV display
width
CV u. l. petal,
height
CV up. l. petal, width
CV l. c. petal,
height
CV l. c. petal, width
CV up. flower length
CV und. flower length
CV carpel length
S. cooperi C.B.Clarke 10 9.65 7.44 4.93 6.30 7.71 7.37 8.77 6.55 3.28 2.48 3.66
S. dunnii Mast. 10 13.06 13.00 16.84 16.84 8.11 15.53 11.07 10.90 5.26 5.44 6.03
S. johannis L.L.Britten 10 10.48 10.04 7.50 6.33 8.19 17.14 9.58 11.73 5.77 4.21 9.81
S. longiflorus (Hilliard & B.L.Burtt) T.J.Edwards 10 7.99 10.10 6.41 5.49 13.36 12.41 9.43 9.82 3.76 4.42 2.63
S. modestus L.L.Britten 10 8.01 4.45 3.34 5.52 4.51 6.50 4.44 4.08 3.10 2.81 4.17
S. pole-evansii I.Verd. 10 19.17 12.72 6.72 9.41 12.49 8.47 5.24 15.06 5.61 5.52 9.39
S. polyanthus Hook. 10 5.86 16.64 6.40 5.65 6.29 8.78 6.47 6.62 5.25 5.15 8.87
S. rexii (Bowie ex Hook.) Lindl. 10 10.69 10.45 3.79 3.10 5.33 5.21 4.26 15.64 3.00 3.87 4.32
S. roseoalbus Weigend & T.J.Edwards 10 9.17 5.48 9.58 9.17 12.89 5.31 11.75 7.19 5.60 6.71 2.62
coop-joha 10 0.00 6.45 16.34 13.24 11.66 9.52 12.03 12.37 3.81 6.19 2.31
coop-long 10 18.88 10.82 26.85 16.12 6.92 7.76 13.93 26.35 13.12 14.61 8.59
coop-mode 10 8.11 8.78 24.20 20.17 16.60 19.43 18.10 24.32 10.00 10.39 5.91
coop-rexi 10 6.87 4.88 8.49 5.66 6.59 5.11 8.51 9.21 5.31 2.69 2.91
coop-rose 10 8.09 2.77 7.15 6.41 5.82 3.93 9.55 3.46 2.31 2.10 1.70
dunn-long 10 14.25 9.29 13.55 6.96 13.07 11.60 8.11 7.82 6.49 3.52 5.86
dunn-rexi 10 5.86 9.43 16.17 15.43 14.48 7.41 12.00 10.14 3.33 4.66 3.83
dunn-rose 10 3.76 6.21 4.68 2.87 5.73 4.51 6.29 6.45 4.09 2.81 2.94
joha-coop 10 14.56 15.06 18.56 18.49 25.29 11.71 21.81 23.81 10.80 20.34 5.73
joha-dunn 10 15.06 11.10 10.37 18.26 12.71 11.23 13.16 15.45 7.26 6.01 5.48
joha-mode 10 11.74 6.45 16.30 14.74 8.88 13.18 15.20 15.06 6.78 7.99 8.78
joha-poly 10 0.00 21.00 13.57 15.97 15.21 13.06 16.15 23.08 3.63 11.51 11.37
joha-rexi 9 17.65 19.28 13.89 7.30 14.62 10.61 7.09 11.07 7.34 6.45 1.85
joha-rose 10 17.52 17.52 8.11 9.06 19.04 13.51 19.86 20.31 5.27 9.19 4.18
long-coop 10 8.29 8.05 10.66 10.31 11.17 8.29 12.80 8.13 5.09 5.00 3.07
long-dunn 10 6.60 8.20 13.12 17.02 11.17 12.76 10.04 18.24 5.29 7.99 4.48
long-rexi 10 14.79 20.20 26.76 28.57 17.68 23.80 28.76 32.43 8.10 10.80 7.40
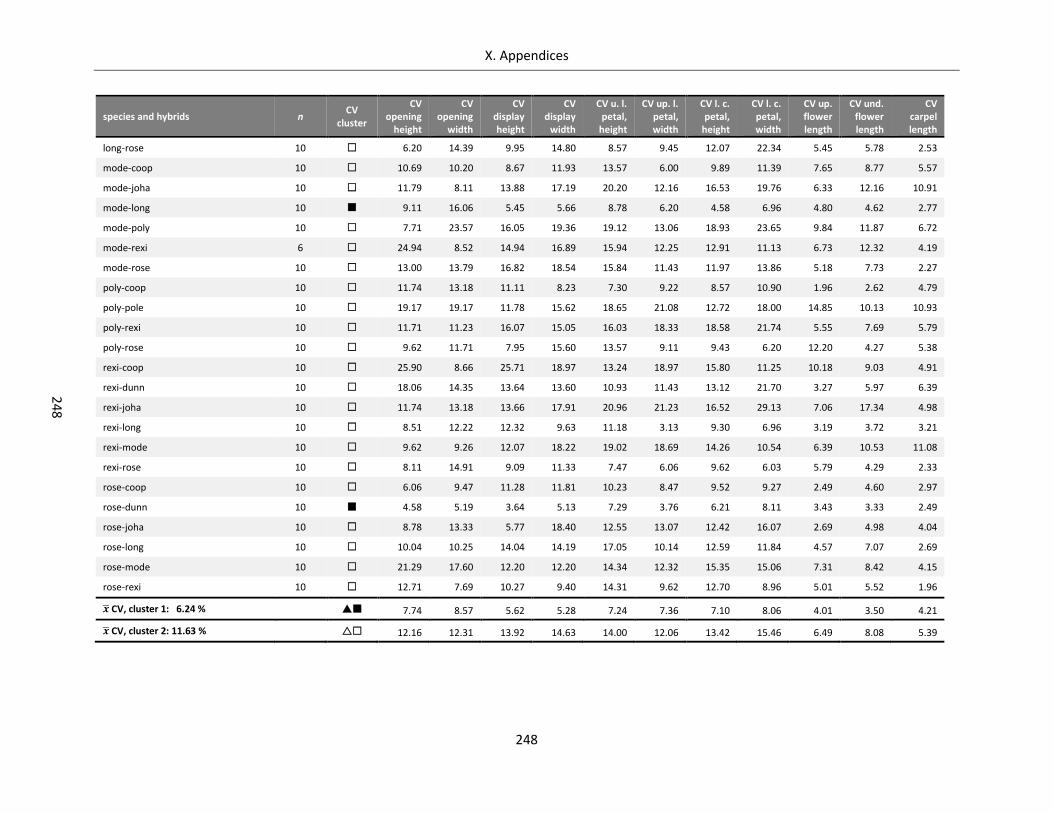
X. Appendices
248
24
8
species and hybrids n CV
cluster
CV opening
height
CV opening
width
CV display height
CV display
width
CV u. l. petal,
height
CV up. l. petal, width
CV l. c. petal,
height
CV l. c. petal, width
CV up. flower length
CV und. flower length
CV carpel length
long-rose 10 6.20 14.39 9.95 14.80 8.57 9.45 12.07 22.34 5.45 5.78 2.53
mode-coop 10 10.69 10.20 8.67 11.93 13.57 6.00 9.89 11.39 7.65 8.77 5.57
mode-joha 10 11.79 8.11 13.88 17.19 20.20 12.16 16.53 19.76 6.33 12.16 10.91
mode-long 10 9.11 16.06 5.45 5.66 8.78 6.20 4.58 6.96 4.80 4.62 2.77
mode-poly 10 7.71 23.57 16.05 19.36 19.12 13.06 18.93 23.65 9.84 11.87 6.72
mode-rexi 6 24.94 8.52 14.94 16.89 15.94 12.25 12.91 11.13 6.73 12.32 4.19
mode-rose 10 13.00 13.79 16.82 18.54 15.84 11.43 11.97 13.86 5.18 7.73 2.27
poly-coop 10 11.74 13.18 11.11 8.23 7.30 9.22 8.57 10.90 1.96 2.62 4.79
poly-pole 10 19.17 19.17 11.78 15.62 18.65 21.08 12.72 18.00 14.85 10.13 10.93
poly-rexi 10 11.71 11.23 16.07 15.05 16.03 18.33 18.58 21.74 5.55 7.69 5.79
poly-rose 10 9.62 11.71 7.95 15.60 13.57 9.11 9.43 6.20 12.20 4.27 5.38
rexi-coop 10 25.90 8.66 25.71 18.97 13.24 18.97 15.80 11.25 10.18 9.03 4.91
rexi-dunn 10 18.06 14.35 13.64 13.60 10.93 11.43 13.12 21.70 3.27 5.97 6.39
rexi-joha 10 11.74 13.18 13.66 17.91 20.96 21.23 16.52 29.13 7.06 17.34 4.98
rexi-long 10 8.51 12.22 12.32 9.63 11.18 3.13 9.30 6.96 3.19 3.72 3.21
rexi-mode 10 9.62 9.26 12.07 18.22 19.02 18.69 14.26 10.54 6.39 10.53 11.08
rexi-rose 10 8.11 14.91 9.09 11.33 7.47 6.06 9.62 6.03 5.79 4.29 2.33
rose-coop 10 6.06 9.47 11.28 11.81 10.23 8.47 9.52 9.27 2.49 4.60 2.97
rose-dunn 10 4.58 5.19 3.64 5.13 7.29 3.76 6.21 8.11 3.43 3.33 2.49
rose-joha 10 8.78 13.33 5.77 18.40 12.55 13.07 12.42 16.07 2.69 4.98 4.04
rose-long 10 10.04 10.25 14.04 14.19 17.05 10.14 12.59 11.84 4.57 7.07 2.69
rose-mode 10 21.29 17.60 12.20 12.20 14.34 12.32 15.35 15.06 7.31 8.42 4.15
rose-rexi 10 12.71 7.69 10.27 9.40 14.31 9.62 12.70 8.96 5.01 5.52 1.96
CV, cluster 1: 6.24 % 7.74 8.57 5.62 5.28 7.24 7.36 7.10 8.06 4.01 3.50 4.21
CV, cluster 2: 11.63 % 12.16 12.31 13.92 14.63 14.00 12.06 13.42 15.46 6.49 8.08 5.39
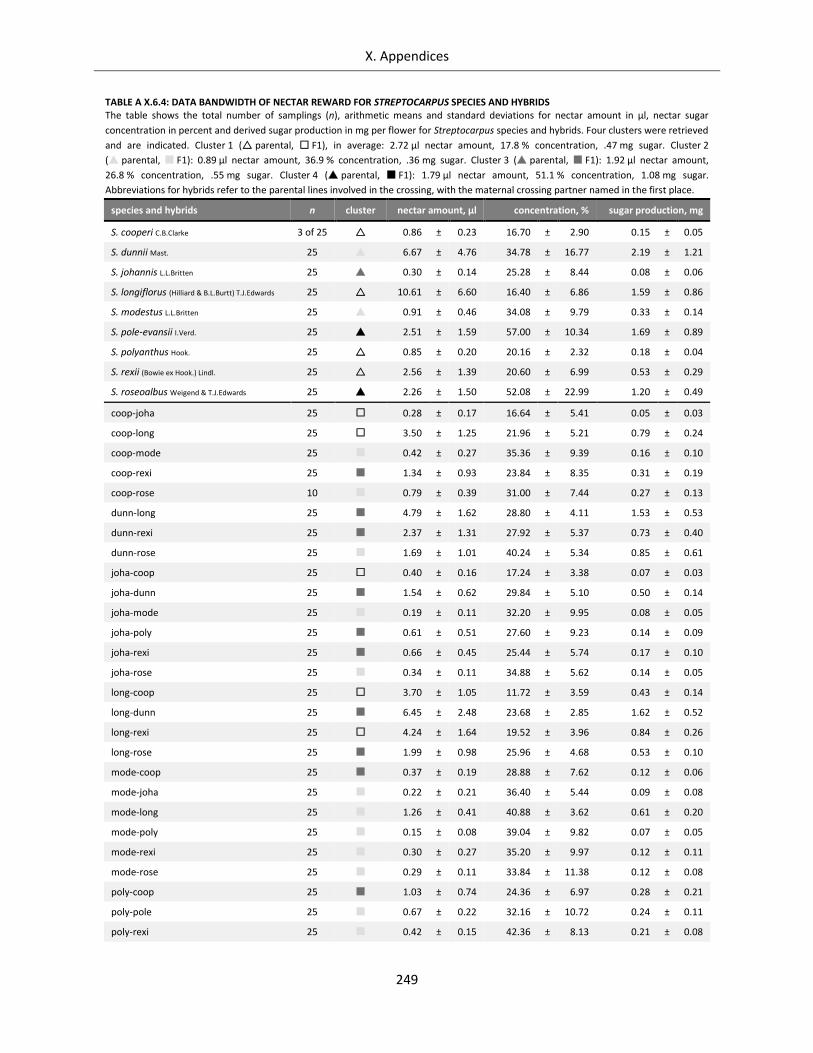
X. Appendices
249
TABLE A X.6.4: DATA BANDWIDTH OF NECTAR REWARD FOR STREPTOCARPUS SPECIES AND HYBRIDS The table shows the total number of samplings (n), arithmetic means and standard deviations for nectar amount in µl, nectar sugar
concentration in percent and derived sugar production in mg per flower for Streptocarpus species and hybrids. Four clusters were retrieved
and are indicated. Cluster 1 ( parental, F1), in average: 2.72 µl nectar amount, 17.8 % concentration, .47 mg sugar. Cluster 2
( parental, F1): 0.89 µl nectar amount, 36.9 % concentration, .36 mg sugar. Cluster 3 ( parental, F1): 1.92 µl nectar amount,
26.8 % concentration, .55 mg sugar. Cluster 4 ( parental, F1): 1.79 µl nectar amount, 51.1 % concentration, 1.08 mg sugar.
Abbreviations for hybrids refer to the parental lines involved in the crossing, with the maternal crossing partner named in the first place.
species and hybrids n cluster nectar amount, µl concentration, % sugar production, mg
S. cooperi C.B.Clarke 3 of 25 0.86 ± 0.23 16.70 ± 2.90 0.15 ± 0.05
S. dunnii Mast. 25 6.67 ± 4.76 34.78 ± 16.77 2.19 ± 1.21
S. johannis L.L.Britten 25 0.30 ± 0.14 25.28 ± 8.44 0.08 ± 0.06
S. longiflorus (Hilliard & B.L.Burtt) T.J.Edwards 25 10.61 ± 6.60 16.40 ± 6.86 1.59 ± 0.86
S. modestus L.L.Britten 25 0.91 ± 0.46 34.08 ± 9.79 0.33 ± 0.14
S. pole-evansii I.Verd. 25 2.51 ± 1.59 57.00 ± 10.34 1.69 ± 0.89
S. polyanthus Hook. 25 0.85 ± 0.20 20.16 ± 2.32 0.18 ± 0.04
S. rexii (Bowie ex Hook.) Lindl. 25 2.56 ± 1.39 20.60 ± 6.99 0.53 ± 0.29
S. roseoalbus Weigend & T.J.Edwards 25 2.26 ± 1.50 52.08 ± 22.99 1.20 ± 0.49
coop-joha 25 0.28 ± 0.17 16.64 ± 5.41 0.05 ± 0.03
coop-long 25 3.50 ± 1.25 21.96 ± 5.21 0.79 ± 0.24
coop-mode 25 0.42 ± 0.27 35.36 ± 9.39 0.16 ± 0.10
coop-rexi 25 1.34 ± 0.93 23.84 ± 8.35 0.31 ± 0.19
coop-rose 10 0.79 ± 0.39 31.00 ± 7.44 0.27 ± 0.13
dunn-long 25 4.79 ± 1.62 28.80 ± 4.11 1.53 ± 0.53
dunn-rexi 25 2.37 ± 1.31 27.92 ± 5.37 0.73 ± 0.40
dunn-rose 25 1.69 ± 1.01 40.24 ± 5.34 0.85 ± 0.61
joha-coop 25 0.40 ± 0.16 17.24 ± 3.38 0.07 ± 0.03
joha-dunn 25 1.54 ± 0.62 29.84 ± 5.10 0.50 ± 0.14
joha-mode 25 0.19 ± 0.11 32.20 ± 9.95 0.08 ± 0.05
joha-poly 25 0.61 ± 0.51 27.60 ± 9.23 0.14 ± 0.09
joha-rexi 25 0.66 ± 0.45 25.44 ± 5.74 0.17 ± 0.10
joha-rose 25 0.34 ± 0.11 34.88 ± 5.62 0.14 ± 0.05
long-coop 25 3.70 ± 1.05 11.72 ± 3.59 0.43 ± 0.14
long-dunn 25 6.45 ± 2.48 23.68 ± 2.85 1.62 ± 0.52
long-rexi 25 4.24 ± 1.64 19.52 ± 3.96 0.84 ± 0.26
long-rose 25 1.99 ± 0.98 25.96 ± 4.68 0.53 ± 0.10
mode-coop 25 0.37 ± 0.19 28.88 ± 7.62 0.12 ± 0.06
mode-joha 25 0.22 ± 0.21 36.40 ± 5.44 0.09 ± 0.08
mode-long 25 1.26 ± 0.41 40.88 ± 3.62 0.61 ± 0.20
mode-poly 25 0.15 ± 0.08 39.04 ± 9.82 0.07 ± 0.05
mode-rexi 25 0.30 ± 0.27 35.20 ± 9.97 0.12 ± 0.11
mode-rose 25 0.29 ± 0.11 33.84 ± 11.38 0.12 ± 0.08
poly-coop 25 1.03 ± 0.74 24.36 ± 6.97 0.28 ± 0.21
poly-pole 25 0.67 ± 0.22 32.16 ± 10.72 0.24 ± 0.11
poly-rexi 25 0.42 ± 0.15 42.36 ± 8.13 0.21 ± 0.08
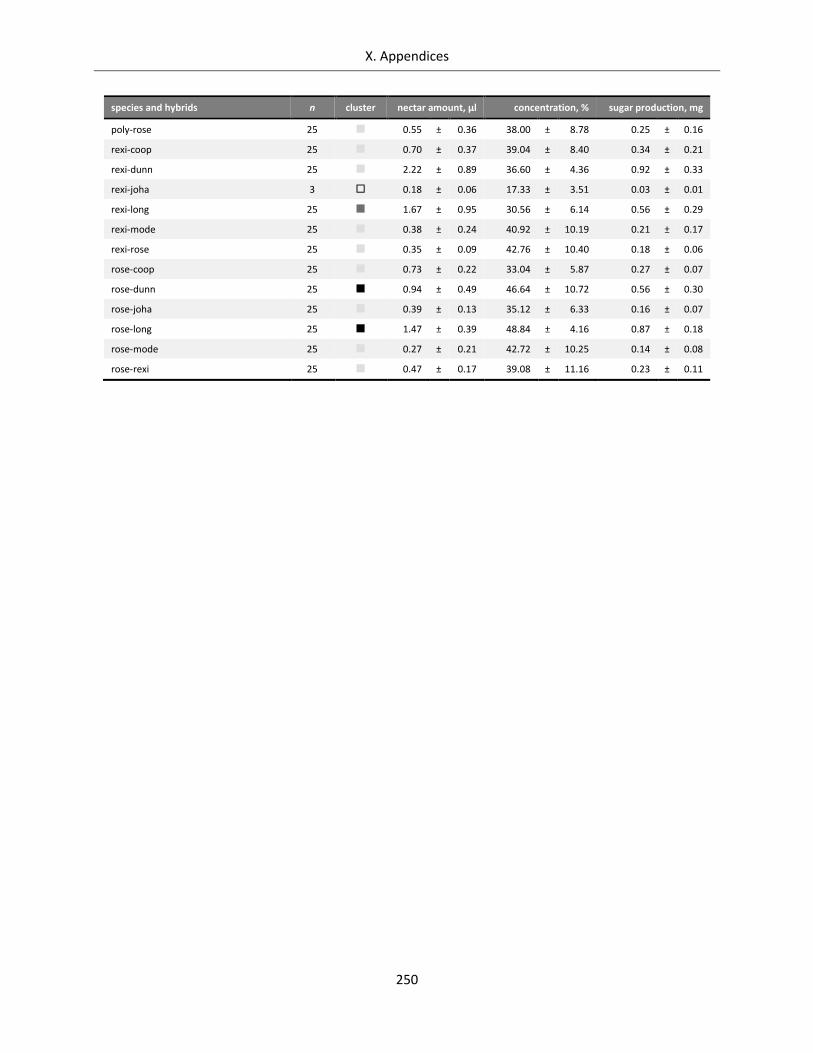
X. Appendices
250
species and hybrids n cluster nectar amount, µl concentration, % sugar production, mg
poly-rose 25 0.55 ± 0.36 38.00 ± 8.78 0.25 ± 0.16
rexi-coop 25 0.70 ± 0.37 39.04 ± 8.40 0.34 ± 0.21
rexi-dunn 25 2.22 ± 0.89 36.60 ± 4.36 0.92 ± 0.33
rexi-joha 3 0.18 ± 0.06 17.33 ± 3.51 0.03 ± 0.01
rexi-long 25 1.67 ± 0.95 30.56 ± 6.14 0.56 ± 0.29
rexi-mode 25 0.38 ± 0.24 40.92 ± 10.19 0.21 ± 0.17
rexi-rose 25 0.35 ± 0.09 42.76 ± 10.40 0.18 ± 0.06
rose-coop 25 0.73 ± 0.22 33.04 ± 5.87 0.27 ± 0.07
rose-dunn 25 0.94 ± 0.49 46.64 ± 10.72 0.56 ± 0.30
rose-joha 25 0.39 ± 0.13 35.12 ± 6.33 0.16 ± 0.07
rose-long 25 1.47 ± 0.39 48.84 ± 4.16 0.87 ± 0.18
rose-mode 25 0.27 ± 0.21 42.72 ± 10.25 0.14 ± 0.08
rose-rexi 25 0.47 ± 0.17 39.08 ± 11.16 0.23 ± 0.11
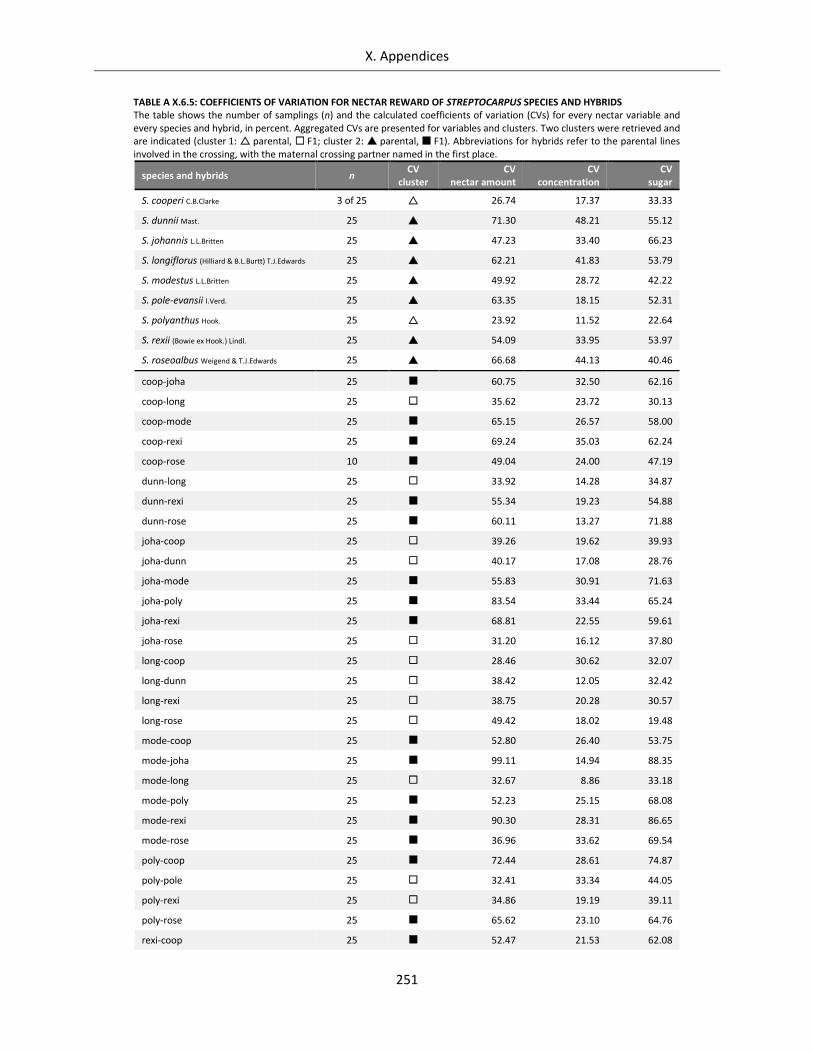
X. Appendices
251
TABLE A X.6.5: COEFFICIENTS OF VARIATION FOR NECTAR REWARD OF STREPTOCARPUS SPECIES AND HYBRIDS The table shows the number of samplings (n) and the calculated coefficients of variation (CVs) for every nectar variable and every species and hybrid, in percent. Aggregated CVs are presented for variables and clusters. Two clusters were retrieved and are indicated (cluster 1: parental, F1; cluster 2: parental, F1). Abbreviations for hybrids refer to the parental lines involved in the crossing, with the maternal crossing partner named in the first place.
species and hybrids n CV
cluster CV
nectar amount CV
concentration CV
sugar
S. cooperi C.B.Clarke 3 of 25 26.74 17.37 33.33
S. dunnii Mast. 25 71.30 48.21 55.12
S. johannis L.L.Britten 25 47.23 33.40 66.23
S. longiflorus (Hilliard & B.L.Burtt) T.J.Edwards 25 62.21 41.83 53.79
S. modestus L.L.Britten 25 49.92 28.72 42.22
S. pole-evansii I.Verd. 25 63.35 18.15 52.31
S. polyanthus Hook. 25 23.92 11.52 22.64
S. rexii (Bowie ex Hook.) Lindl. 25 54.09 33.95 53.97
S. roseoalbus Weigend & T.J.Edwards 25 66.68 44.13 40.46
coop-joha 25 60.75 32.50 62.16
coop-long 25 35.62 23.72 30.13
coop-mode 25 65.15 26.57 58.00
coop-rexi 25 69.24 35.03 62.24
coop-rose 10 49.04 24.00 47.19
dunn-long 25 33.92 14.28 34.87
dunn-rexi 25 55.34 19.23 54.88
dunn-rose 25 60.11 13.27 71.88
joha-coop 25 39.26 19.62 39.93
joha-dunn 25 40.17 17.08 28.76
joha-mode 25 55.83 30.91 71.63
joha-poly 25 83.54 33.44 65.24
joha-rexi 25 68.81 22.55 59.61
joha-rose 25 31.20 16.12 37.80
long-coop 25 28.46 30.62 32.07
long-dunn 25 38.42 12.05 32.42
long-rexi 25 38.75 20.28 30.57
long-rose 25 49.42 18.02 19.48
mode-coop 25 52.80 26.40 53.75
mode-joha 25 99.11 14.94 88.35
mode-long 25 32.67 8.86 33.18
mode-poly 25 52.23 25.15 68.08
mode-rexi 25 90.30 28.31 86.65
mode-rose 25 36.96 33.62 69.54
poly-coop 25 72.44 28.61 74.87
poly-pole 25 32.41 33.34 44.05
poly-rexi 25 34.86 19.19 39.11
poly-rose 25 65.62 23.10 64.76
rexi-coop 25 52.47 21.53 62.08
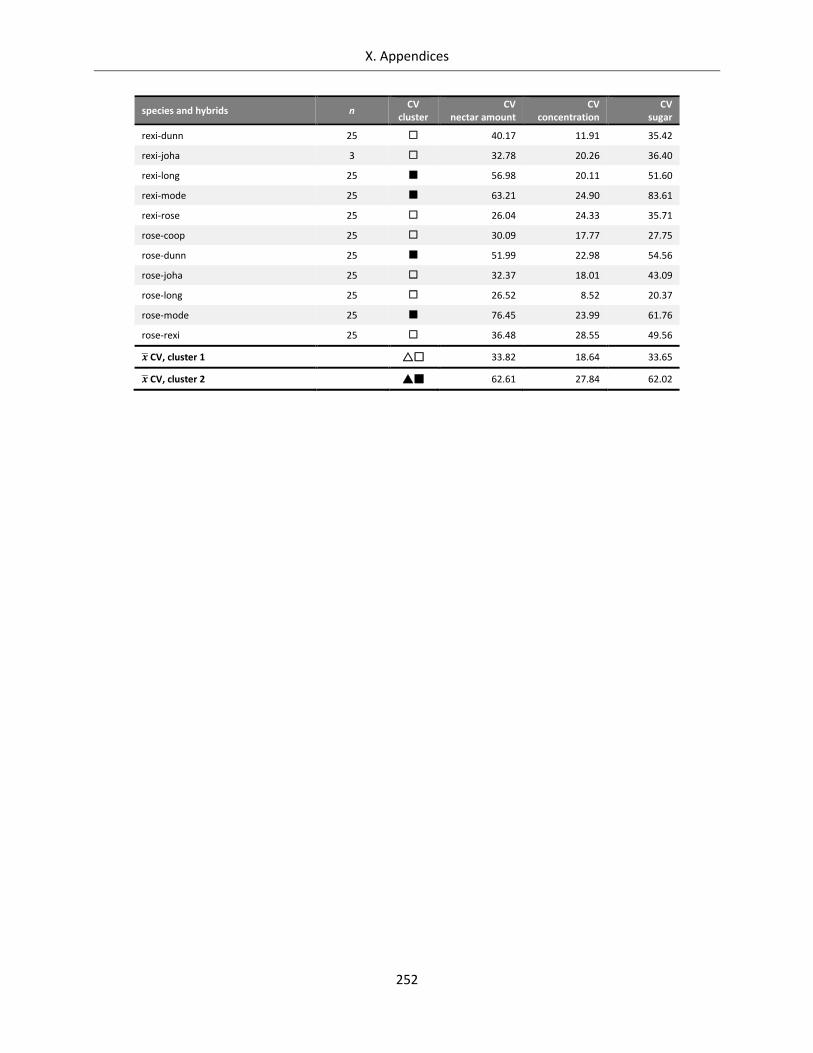
X. Appendices
252
species and hybrids n CV
cluster CV
nectar amount CV
concentration CV
sugar
rexi-dunn 25 40.17 11.91 35.42
rexi-joha 3 32.78 20.26 36.40
rexi-long 25 56.98 20.11 51.60
rexi-mode 25 63.21 24.90 83.61
rexi-rose 25 26.04 24.33 35.71
rose-coop 25 30.09 17.77 27.75
rose-dunn 25 51.99 22.98 54.56
rose-joha 25 32.37 18.01 43.09
rose-long 25 26.52 8.52 20.37
rose-mode 25 76.45 23.99 61.76
rose-rexi 25 36.48 28.55 49.56
CV, cluster 1 33.82 18.64 33.65
CV, cluster 2 62.61 27.84 62.02
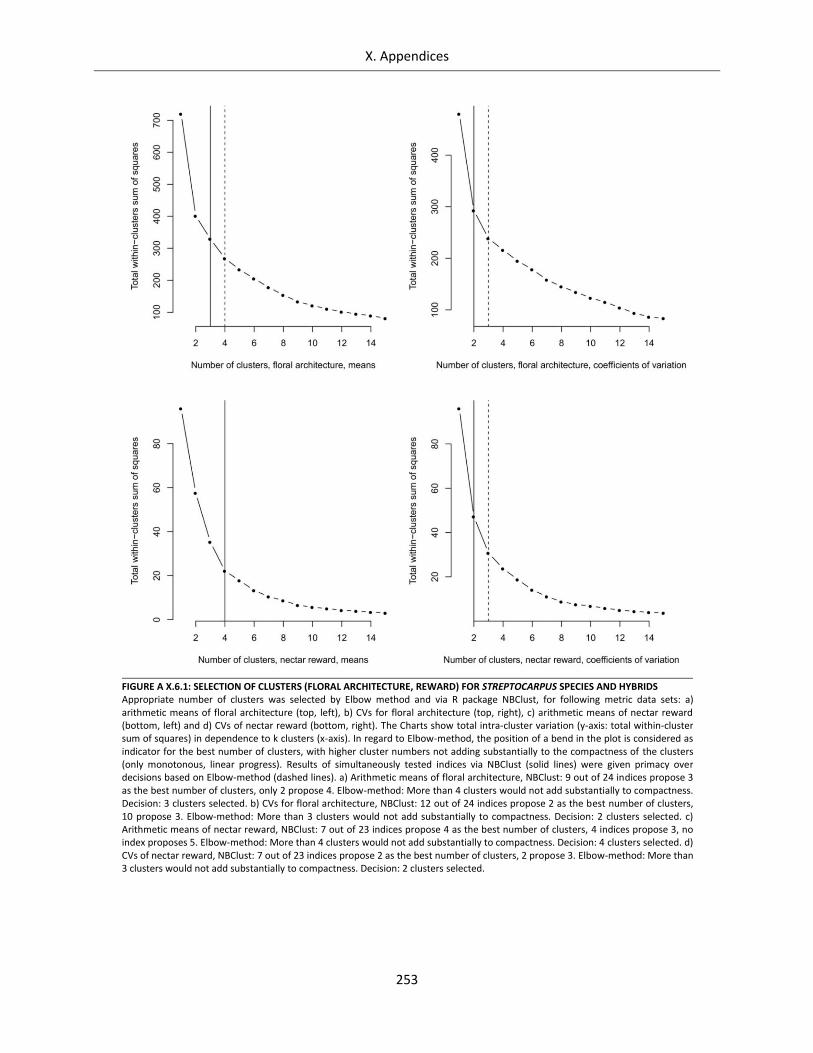
X. Appendices
253
FIGURE A X.6.1: SELECTION OF CLUSTERS (FLORAL ARCHITECTURE, REWARD) FOR STREPTOCARPUS SPECIES AND HYBRIDS Appropriate number of clusters was selected by Elbow method and via R package NBClust, for following metric data sets: a) arithmetic means of floral architecture (top, left), b) CVs for floral architecture (top, right), c) arithmetic means of nectar reward (bottom, left) and d) CVs of nectar reward (bottom, right). The Charts show total intra-cluster variation (y-axis: total within-cluster sum of squares) in dependence to k clusters (x-axis). In regard to Elbow-method, the position of a bend in the plot is considered as indicator for the best number of clusters, with higher cluster numbers not adding substantially to the compactness of the clusters (only monotonous, linear progress). Results of simultaneously tested indices via NBClust (solid lines) were given primacy over decisions based on Elbow-method (dashed lines). a) Arithmetic means of floral architecture, NBClust: 9 out of 24 indices propose 3 as the best number of clusters, only 2 propose 4. Elbow-method: More than 4 clusters would not add substantially to compactness. Decision: 3 clusters selected. b) CVs for floral architecture, NBClust: 12 out of 24 indices propose 2 as the best number of clusters, 10 propose 3. Elbow-method: More than 3 clusters would not add substantially to compactness. Decision: 2 clusters selected. c) Arithmetic means of nectar reward, NBClust: 7 out of 23 indices propose 4 as the best number of clusters, 4 indices propose 3, no index proposes 5. Elbow-method: More than 4 clusters would not add substantially to compactness. Decision: 4 clusters selected. d) CVs of nectar reward, NBClust: 7 out of 23 indices propose 2 as the best number of clusters, 2 propose 3. Elbow-method: More than 3 clusters would not add substantially to compactness. Decision: 2 clusters selected.
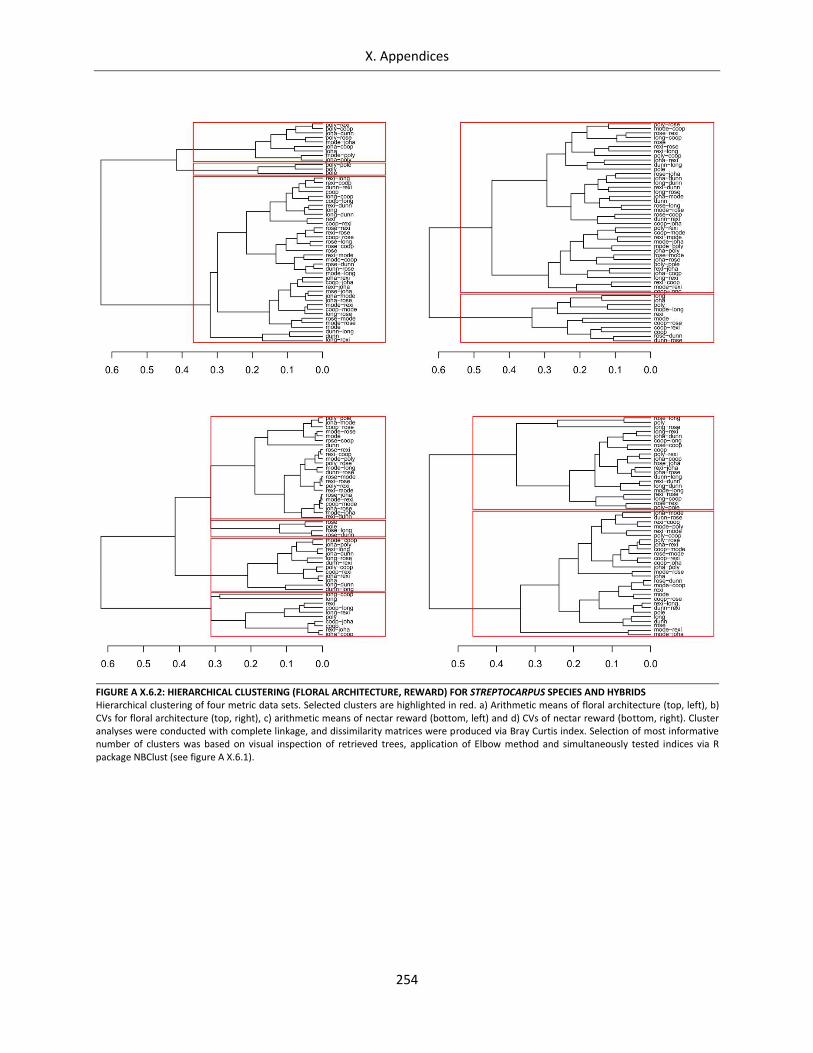
X. Appendices
254
FIGURE A X.6.2: HIERARCHICAL CLUSTERING (FLORAL ARCHITECTURE, REWARD) FOR STREPTOCARPUS SPECIES AND HYBRIDS Hierarchical clustering of four metric data sets. Selected clusters are highlighted in red. a) Arithmetic means of floral architecture (top, left), b) CVs for floral architecture (top, right), c) arithmetic means of nectar reward (bottom, left) and d) CVs of nectar reward (bottom, right). Cluster analyses were conducted with complete linkage, and dissimilarity matrices were produced via Bray Curtis index. Selection of most informative number of clusters was based on visual inspection of retrieved trees, application of Elbow method and simultaneously tested indices via R package NBClust (see figure A X.6.1).
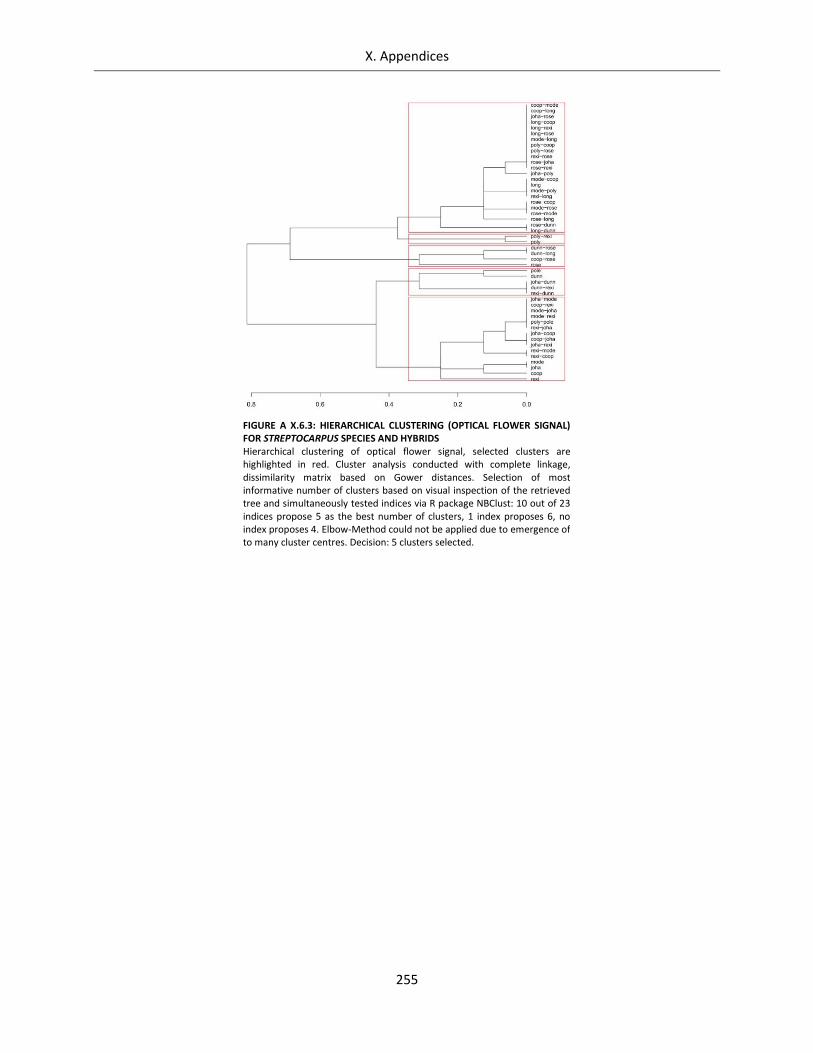
X. Appendices
255
FIGURE A X.6.3: HIERARCHICAL CLUSTERING (OPTICAL FLOWER SIGNAL) FOR STREPTOCARPUS SPECIES AND HYBRIDS Hierarchical clustering of optical flower signal, selected clusters are highlighted in red. Cluster analysis conducted with complete linkage, dissimilarity matrix based on Gower distances. Selection of most informative number of clusters based on visual inspection of the retrieved tree and simultaneously tested indices via R package NBClust: 10 out of 23 indices propose 5 as the best number of clusters, 1 index proposes 6, no index proposes 4. Elbow-Method could not be applied due to emergence of to many cluster centres. Decision: 5 clusters selected.
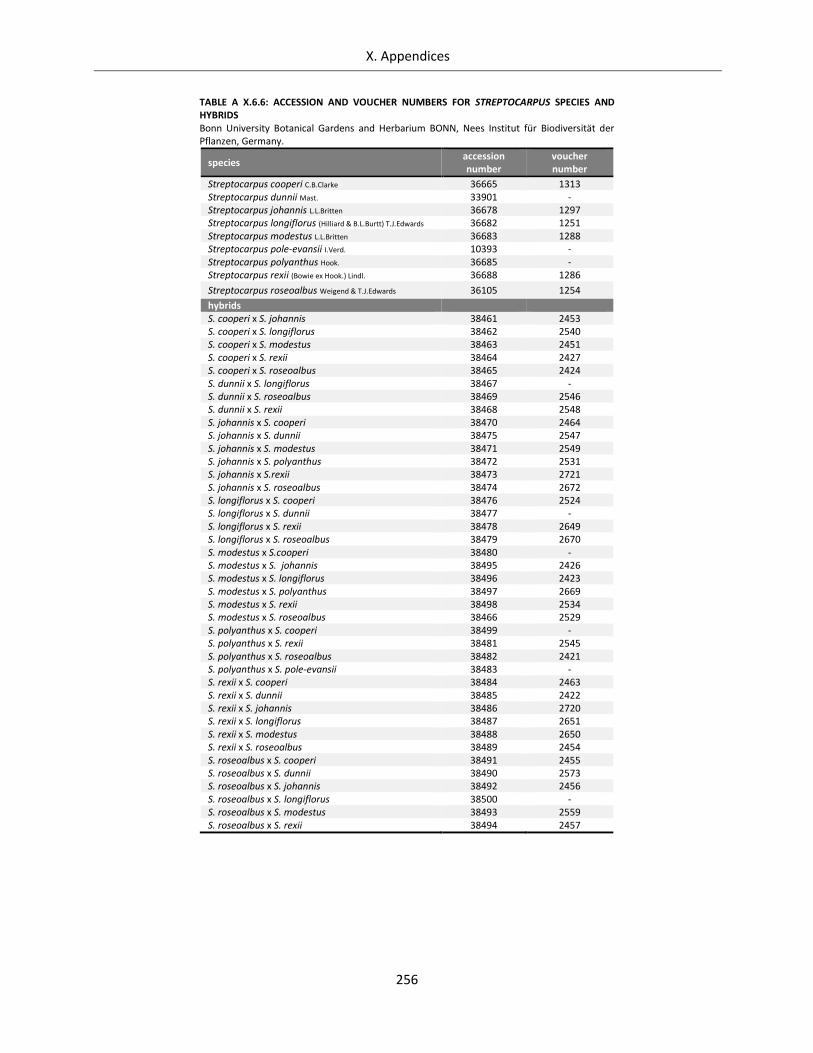
X. Appendices
256
TABLE A X.6.6: ACCESSION AND VOUCHER NUMBERS FOR STREPTOCARPUS SPECIES AND HYBRIDS Bonn University Botanical Gardens and Herbarium BONN, Nees Institut für Biodiversität der Pflanzen, Germany.
species accession number
voucher number
Streptocarpus cooperi C.B.Clarke 36665 1313 Streptocarpus dunnii Mast. 33901 - Streptocarpus johannis L.L.Britten 36678 1297 Streptocarpus longiflorus (Hilliard & B.L.Burtt) T.J.Edwards 36682 1251 Streptocarpus modestus L.L.Britten 36683 1288 Streptocarpus pole-evansii I.Verd. 10393 - Streptocarpus polyanthus Hook. 36685 - Streptocarpus rexii (Bowie ex Hook.) Lindl. 36688 1286
Streptocarpus roseoalbus Weigend & T.J.Edwards 36105 1254
hybrids S. cooperi x S. johannis 38461 2453 S. cooperi x S. longiflorus 38462 2540 S. cooperi x S. modestus 38463 2451 S. cooperi x S. rexii 38464 2427 S. cooperi x S. roseoalbus 38465 2424
S. dunnii x S. longiflorus 38467 - S. dunnii x S. roseoalbus 38469 2546 S. dunnii x S. rexii 38468 2548 S. johannis x S. cooperi 38470 2464 S. johannis x S. dunnii 38475 2547 S. johannis x S. modestus 38471 2549 S. johannis x S. polyanthus 38472 2531 S. johannis x S.rexii 38473 2721 S. johannis x S. roseoalbus 38474 2672 S. longiflorus x S. cooperi 38476 2524 S. longiflorus x S. dunnii 38477 - S. longiflorus x S. rexii 38478 2649 S. longiflorus x S. roseoalbus 38479 2670 S. modestus x S.cooperi 38480 - S. modestus x S. johannis 38495 2426 S. modestus x S. longiflorus 38496 2423 S. modestus x S. polyanthus 38497 2669 S. modestus x S. rexii 38498 2534 S. modestus x S. roseoalbus 38466 2529 S. polyanthus x S. cooperi 38499 - S. polyanthus x S. rexii 38481 2545 S. polyanthus x S. roseoalbus 38482 2421 S. polyanthus x S. pole-evansii 38483 - S. rexii x S. cooperi 38484 2463 S. rexii x S. dunnii 38485 2422 S. rexii x S. johannis 38486 2720 S. rexii x S. longiflorus 38487 2651 S. rexii x S. modestus 38488 2650 S. rexii x S. roseoalbus 38489 2454 S. roseoalbus x S. cooperi 38491 2455 S. roseoalbus x S. dunnii 38490 2573 S. roseoalbus x S. johannis 38492 2456 S. roseoalbus x S. longiflorus 38500 - S. roseoalbus x S. modestus 38493 2559 S. roseoalbus x S. rexii 38494 2457

XI. Curriculum Vitae
257
XI. CURRICULUM VITAE XI. Curriculum Vitae
Removed from public version.